<?xml version="1.0" encoding="UTF-8"?>
<rdf:RDF xmlns:rdf="http://www.w3.org/1999/02/22-rdf-syntax-ns#" xmlns:dc="http://purl.org/dc/elements/1.1/" xmlns="http://purl.org/rss/1.0/" xmlns:l="http://purl.org/rss/1.0/modules/link/" xmlns:content="http://purl.org/rss/1.0/modules/content/">
<channel rdf:about="https://www.vaneck.com/us/en/insights">
  <title>VanEck Blog Rss</title>
  <link>https://www.vaneck.com/us/en/insights</link>
  <description></description>
  <dc:date>2026-04-19</dc:date>
  <dc:language>en-US</dc:language>
</channel><item rdf:about="https://www.vaneck.com/us/en/blogs/thematic-investing/top-ai-companies-to-watch-in-2026/">
  <title>Top AI Companies to Watch in 2026></title>
  <link>https://www.vaneck.com/us/en/blogs/thematic-investing/top-ai-companies-to-watch-in-2026/</link>
  <description><![CDATA[AI is moving from experimentation to infrastructure. For investors, that means watching not just model builders, but the semiconductor companies supplying the compute behind the shift.]]></description>
  <dc:creator>Nick Frasse</dc:creator>
  <dc:date>04/20/2026 06:30:00</dc:date>
<content:encoded><![CDATA[

<p><strong>Key Takeaways:</strong></p>
<ul class="content-list">
<li class="mt-2">AI exposure is not one trade. Investors can think about the space across infrastructure enablers, AI developers and AI adopters.</li>
<li class="mt-2">As AI moves from pilot programs to everyday workflows, demand for compute, memory, networking and fabrication capacity may remain durable.</li>
<li class="mt-2">For investors who want exposure to the building blocks of AI, semiconductor companies offer a way to participate without needing to pick a single application-layer winner.</li>
</ul>
<h2>Why AI Is a Structural Theme, Not a Speculative Trend</h2>
<p>AI is increasingly looking less like a one-cycle technology story and more like a long-duration shift in how software, services and physical devices operate. The key question is no longer whether AI will be used, but how deeply it becomes embedded in enterprise workflows, consumer products and industrial systems.</p>
<p>That distinction matters for investors. As AI tools become more reliable, more integrated and easier to deploy, usage can move from experimentation toward habit. In that environment, demand is no longer tied only to excitement around new models. It is supported by recurring compute needs across training, inference and edge deployment.</p>
<h2 id="point-one" class="anchored-block jump-link-nav" data-jumplink-title="AI Exposure">How Should Investors Think About AI Exposure?</h2>
<p>Investing in AI through public markets is not always as direct as it seems. Many of the companies building the most prominent AI models are not pure-play public investments, and many public companies talking about AI have only partial exposure to the theme.</p>
<p>At a high level, investors can think about AI exposure in three buckets: infrastructure enablers, AI developers and AI adopters.</p>
<p>Infrastructure enablers include the semiconductor, memory, foundry, equipment and networking companies that make AI possible.</p>
<p>AI developers are the model builders and software platforms trying to monetize AI directly.</p>
<p>AI adopters are companies using AI to improve products, operations or productivity.</p>
<p>For investors, that distinction matters. Developers and adopters may offer upside, but semiconductors can be the clearest public-market way to access AI because they sit at the enabling layer of the stack. Every model trained, every inference request processed and every edge device deployed still runs through silicon first.</p>
<p><img loading="lazy" class="desktop-image img-responsive" alt="How Should Investors Think About AI Exposure?" src="https://www.vaneck.com/contentassets/8bcc4d21cff9471d988ea38626f21151/7162_ai-companies-blog_infographic-1_2026-4_v1_desktop.svg" /></p>
<p><img loading="lazy" class="mobile-image img-responsive" alt="How Should Investors Think About AI Exposure?" src="https://www.vaneck.com/contentassets/8bcc4d21cff9471d988ea38626f21151/7162_ai-companies-blog_infographic-1_2026-4_v1_mobile.svg" /></p>
<p class="chart-disclosure">Source: Factset. As of 06/30/2025. These are not recommendations to buy or to sell any security. Securities and holdings may vary.</p>
<h2 id="point-two" class="anchored-block jump-link-nav" data-jumplink-title="Top 5 AI Companies">Top 5 AI Companies to Watch</h2>
<p><i>Top holdings in <a href="/link/39c8d235748b4c26a5930c31d3ac0160.aspx" title="SMH - VanEck Semiconductor ETF"><strong>SMH</strong></a> as of 04/10/2026.</i></p>
<p><strong>1. Nvidia (NVDA) - 18.63% holding in <a href="/link/39c8d235748b4c26a5930c31d3ac0160.aspx" title="SMH - VanEck Semiconductor ETF">SMH</a></strong></p>
<ul class="content-list">
<li class="mt-2"><strong>What They Do:</strong><br />Nvidia remains the most visible company in AI infrastructure. Its GPUs have become the standard for training frontier models, and its software ecosystem gives it influence well beyond the chip itself.</li>
<li class="mt-2"><strong>Outlook for 2026:</strong><br />Nvidia remains central to the AI buildout, but the story is broadening beyond training alone. Investors will likely be watching how much of demand is driven by inference, networking and full-system deployments rather than just standalone accelerator shipments. The more AI usage shifts from experimentation to production, the more important Nvidia&rsquo;s role across the full compute stack becomes.</li>
</ul>
<p><strong>2. Taiwan Semiconductor Manufacturing Co. (TSM) - 11.39% holding in <a href="/link/39c8d235748b4c26a5930c31d3ac0160.aspx" title="SMH - VanEck Semiconductor ETF">SMH</a></strong></p>
<ul class="content-list">
<li class="mt-2"><strong>What They Do:</strong><br />TSMC is the leading advanced foundry manufacturing many of the chips powering the AI ecosystem. It sits at a critical point in the value chain, producing processors designed by many of the industry&rsquo;s most important fabless companies.</li>
<li class="mt-2"><strong>Outlook for 2026:</strong><br />TSMC is a company to watch because AI demand is not only about better chip design. It also depends on whether enough leading-edge manufacturing and advanced packaging capacity can come online to support that demand. As more custom silicon is developed for AI workloads, TSMC remains one of the clearest bottlenecks in the stack.</li>
</ul>
<p><strong>3. Broadcom (AVGO) - 8.21% holding in <a href="/link/39c8d235748b4c26a5930c31d3ac0160.aspx" title="SMH - VanEck Semiconductor ETF">SMH</a></strong></p>
<ul class="content-list">
<li class="mt-2"><strong>What They Do:</strong><br />Broadcom is best known for its connectivity, networking and custom silicon capabilities. In AI, that makes it relevant not only as a chip company, but as an enabler of how large-scale compute systems communicate and scale.</li>
<li class="mt-2"><strong>Outlook for 2026:</strong><br />Broadcom is worth watching as hyperscalers continue building custom AI architectures. If the next phase of AI includes more internal accelerator development and more networking intensity inside data centers, Broadcom may remain important to the buildout even if investor attention stays focused on GPUs.</li>
</ul>
<p><strong>4. Intel (INTC) - 5.38% holding in <a href="/link/39c8d235748b4c26a5930c31d3ac0160.aspx" title="SMH - VanEck Semiconductor ETF">SMH</a></strong></p>
<ul class="content-list">
<li class="mt-2"><strong>What They Do:</strong><br />Intel remains a major semiconductor company with exposure across CPUs, manufacturing and broader compute infrastructure. While it has not been the market&rsquo;s preferred AI name, its position in enterprise computing still makes it relevant.</li>
<li class="mt-2"><strong>Outlook for 2026:</strong><br />Intel is one of the more interesting companies to watch because the upside case is tied less to current AI leadership and more to execution. Investors will likely be monitoring whether improvements in manufacturing, packaging and foundry strategy can reposition the company for a more meaningful role in the next phase of AI infrastructure.</li>
</ul>
<p><strong>5. Lam Research (LRCX) - 4.98% holding in <a href="/link/39c8d235748b4c26a5930c31d3ac0160.aspx" title="SMH - VanEck Semiconductor ETF">SMH</a></strong></p>
<ul class="content-list">
<li class="mt-2"><strong>What They Do:</strong><br />Lam Research provides critical wafer fabrication equipment used to make semiconductors. It sits upstream in the ecosystem, supplying tools needed to increase capacity and manufacture more advanced chips.</li>
<li class="mt-2"><strong>Outlook for 2026:</strong><br />Lam is a reminder that AI demand does not stop with chip designers. If training clusters, inference demand and memory intensity keep rising, the equipment companies that enable new capacity may continue to benefit. Lam gives investors exposure to the buildout behind the buildout.</li>
</ul>
<h2 id="point-three" class="anchored-block jump-link-nav" data-jumplink-title="Risks of AI Investing">What Are the Key Risks of Investing in AI Companies?</h2>
<p>AI remains one of the most compelling long-term themes in the market, but it is not without risk. Valuations across parts of the ecosystem can become extended, and expectations can move faster than realized earnings. The industry is also exposed to export restrictions, supply chain disruptions and geopolitical concentration, especially at the leading edge of manufacturing.</p>
<p>There is also the simple reality that not every company associated with AI will be a long-term winner. Some businesses may benefit from excitement without building durable economics. That is one reason many investors separate exposure between application-layer companies and the infrastructure businesses supplying the compute backbone.</p>
<h3>SMH Sub-Industy Breakdown</h3>
<p><img loading="lazy" class="desktop-image img-responsive" alt="SMH Sub-Industy Breakdown" src="https://www.vaneck.com/contentassets/f112943b2d4c4533a19caee70791d3f9/7162_ai-companies-blog_chart-1_2026-4_v1_desktop.svg" /></p>
<p><img loading="lazy" class="mobile-image img-responsive" alt="SMH Sub-Industy Breakdown" src="https://www.vaneck.com/contentassets/f112943b2d4c4533a19caee70791d3f9/7162_ai-companies-blog_chart-1_2026-4_v1_mobile.svg" /></p>
<p class="chart-disclosure">Source: Factset. As of 12/31/2025. Index holdings and performance are not illustrative of fund holdings or performance. It is not possible to invest directly in an index.</p>

<h2 id="point-four" class="anchored-block jump-link-nav" data-jumplink-title="Investing in Semiconductors">How Can Investors Access AI Exposure Through Semiconductors?</h2>
<p>One of the challenges in AI investing is that the public market does not always offer clean exposure to the parts of the ecosystem getting the most attention. Many software and model-layer companies are diversified businesses, and in some cases the market is still debating how durable their long-term economics will be as competition increases and pricing evolves.</p>
<p>Semiconductors offer a different way to approach the theme. Rather than trying to predict which chatbot, model provider or application layer winner will ultimately capture the most value, investors can focus on the infrastructure that all of them require. Every training run, every inference query and every on-device AI feature still depends on chips, memory, networking and manufacturing capacity.</p>
<p>That is what makes semiconductors such an important part of the AI value chain. They are not dependent on a single AI platform winning. They benefit from the broader expansion of AI usage across the economy. As AI becomes more embedded in enterprise workflows, consumer products and physical devices, the demand for compute can remain central regardless of who owns the end customer relationship.</p>
<p>For investors looking to express that view in public markets, <strong><a href="/link/39c8d235748b4c26a5930c31d3ac0160.aspx?utm_source=google&amp;utm_medium=cpc&amp;utm_campaign=us_search_smh&amp;gad_source=1&amp;gad_campaignid=21142759323&amp;gbraid=0AAAAADLo2eyuP4GyyRbqk5U-Pzg90v3HI&amp;gclid=Cj0KCQjwkYLPBhC3ARIsAIyHi3RqnkYft96IvRIvSH6qdqqH1bLyp76vRPl8Wbox7H_6pfNMXnNiMcwaAkieEALw_wcB" title="SMH - VanEck Semiconductor ETF - Overview">SMH</a></strong> can be one way to access many of those building blocks in a single portfolio. The fund includes companies across the semiconductor stack, from chip designers to foundries to equipment providers, giving investors exposure to the infrastructure layer underlying the AI buildout.</p>
<p>In that sense, the case for semiconductors is not just that they participate in AI. It is that they may represent the most direct and scalable public-market expression of the theme itself.</p>

<p>To receive more <a href="https://www.vaneck.com/us/en/insights/thematic-investing/" title="Thematic Investing Insights"><strong>Thematic Investing</strong></a> insights, <a href="https://www.vaneck.com/us/en/subscribe/" title="Subscription Center"><strong>sign up in our subscription center</strong></a>.</p>
]]></content:encoded>
</item><item rdf:about="https://www.vaneck.com/us/en/blogs/income-investing/etfs-vs-mutual-funds-key-differences-for-investors/">
  <title>ETFs vs. Mutual Funds: Key Differences for Investors></title>
  <link>https://www.vaneck.com/us/en/blogs/income-investing/etfs-vs-mutual-funds-key-differences-for-investors/</link>
  <description><![CDATA[ETFs and mutual funds both offer diversified exposure, but they work differently. Here is what investors should know before choosing the right vehicle for their portfolio.]]></description>
  <dc:creator> </dc:creator>
  <dc:date>04/17/2026 06:30:00</dc:date>
<content:encoded><![CDATA[

<p><strong>Key Takeaways:</strong></p>
<ul class="content-list">
<li class="mt-2">ETFs trade like stocks and are generally more tax efficient than mutual funds. Intraday liquidity and lower costs give ETFs a structural edge.</li>
<li class="mt-2">Mutual funds still make sense in certain situations. Retirement plans, automatic investments, and fractional investing favor mutual funds.</li>
<li class="mt-2">The right vehicle depends on your tax situation, account type, and how you invest. Many strategies are available in both structures.</li>
</ul>
<p>For most investors, the choice between an ETF and a mutual fund comes down to how they prefer to access the market. Both vehicles offer diversified exposure to a range of asset classes and strategies. But the mechanics of how they work, how they are priced, how they are taxed, and how they are accessed are meaningfully different. Understanding those differences is one of the most practical steps an investor can take before building a portfolio.</p>
<h2>What Is an ETF and How Does It Work?</h2>
<p>An exchange-traded fund, or <strong><a href="/link/2636ea7e34a7435994b99512f38ef817.aspx" title="ETF 101: Understanding the Basics">ETF</a></strong>, is a pooled investment vehicle that trades on a stock exchange throughout the day, just like a share of stock. ETFs are typically passively managed, meaning they track an index rather than relying on active security selection, though actively managed ETFs have become increasingly common.</p>
<p>Because ETFs trade on an exchange, they are priced continuously during market hours, and investors can buy or sell at any point during the trading day at the current market price. This intraday liquidity, combined with generally low expense ratios and daily portfolio transparency, has made ETFs the vehicle of choice for a growing number of individual and institutional investors.</p>
<p><strong><a href="/link/2636ea7e34a7435994b99512f38ef817.aspx" title="ETF 101: Understanding the Basics">Read more about what ETFs are and how they work</a>.</strong></p>
<h2>What Is a Mutual Fund and How Does It Work?</h2>
<p>A mutual fund also pools capital from multiple investors to gain exposure to a diversified portfolio of securities. The key structural difference is that mutual funds are priced once per day, after the market closes, at their net asset value, or NAV. Investors place orders to buy or sell during the day, but all transactions are executed at that end-of-day price.</p>
<p>Mutual funds can be either actively or passively managed, and they are often accessed through retirement plans, direct fund company relationships, or brokerage platforms. They have been the foundation of retirement investing for decades and remain widely used across both individual and institutional portfolios.</p>
<h2>ETFs vs. Mutual Funds: How Do They Compare?</h2>
<div class="wrapped-div">
<table style="width: 100%;">
<tbody>
<tr class="tbl-data">
<td class="tbl-header last text-left">Feature</td>
<td class="tbl-header last text-left">ETF</td>
<td class="tbl-header last text-left">Mutual Fund</td>
</tr>
<tr class="tbl-data">
<td class="data-td data last text-left">Trading</td>
<td class="data-td data last text-left">Intraday on an exchange</td>
<td class="data-td data last text-left">Once daily at NAV</td>
</tr>
<tr class="tbl-data">
<td class="data-td data last text-left">Pricing</td>
<td class="data-td data last text-left">Real-time market price</td>
<td class="data-td data last text-left">End-of-day NAV</td>
</tr>
<tr class="tbl-data">
<td class="data-td data last text-left">Minimum Investment</td>
<td class="data-td data last text-left">Price of one share</td>
<td class="data-td data last text-left">Often $500 to $3,000 or more</td>
</tr>
<tr class="tbl-data">
<td class="data-td data last text-left">Tax Efficiency</td>
<td class="data-td data last text-left">Generally more tax efficient</td>
<td class="data-td data last text-left">May distribute capital gains to shareholders</td>
</tr>
<tr class="tbl-data">
<td class="data-td data last text-left">Expense Ratios</td>
<td class="data-td data last text-left">Generally lower</td>
<td class="data-td data last text-left">Can vary widely</td>
</tr>
<tr class="tbl-data">
<td class="data-td data last text-left">Holdings Transparency</td>
<td class="data-td data last text-left">Daily disclosure</td>
<td class="data-td data last text-left">Monthly or quarterly disclosure</td>
</tr>
<tr class="tbl-data">
<td class="data-td data last text-left">Management Style</td>
<td class="data-td data last text-left">Mostly passive, active options available</td>
<td class="data-td data last text-left">Both active and passive available</td>
</tr>
<tr class="tbl-data">
<td class="data-td data last text-left">Accessibility</td>
<td class="data-td data last text-left">Any brokerage account</td>
<td class="data-td data last text-left">May require specific platforms or minimums</td>
</tr>
<tr class="tbl-data">
<td class="data-td data last text-left">Automatic Investment</td>
<td class="data-td data last text-left">Not always available</td>
<td class="data-td data last text-left">Widely available</td>
</tr>
<tr class="tbl-data">
<td class="data-td data last text-left">Fractional Shares</td>
<td class="data-td data last text-left">Depends on brokerage</td>
<td class="data-td data last text-left">Often available directly</td>
</tr>
</tbody>
</table>
</div>
<br />
<h2>What Structural Advantages Do ETFs Have Over Mutual Funds?</h2>
<p>For most investors in taxable accounts, ETFs offer a meaningful structural edge. Their generally lower expense ratios reduce the drag on long-term returns.</p>
<p>Intraday liquidity gives investors the flexibility to enter or exit positions at a precise price rather than waiting for end-of-day NAV. And daily holdings transparency allows investors to see exactly what they own at any given time, which matters for portfolio construction, tax-loss harvesting, and risk management. Taken together, these features make ETFs a highly efficient vehicle for gaining exposure to most asset classes and investment themes.</p>
<h2>When Do Mutual Funds Still Make Sense?</h2>
<p>Despite the structural advantages of ETFs, mutual funds remain the better choice in certain situations. Many workplace retirement plans, including 401(k) plans, offer mutual funds as their primary investment options, making them the practical default for a large portion of retirement savings. Mutual funds also typically offer automatic investment plans, allowing investors to contribute a fixed dollar amount on a regular schedule regardless of share price, which is particularly useful for systematic savings.</p>
<p>For investors who want fractional exposure to a strategy without worrying about share price minimums, certain mutual fund structures offer that flexibility directly. And in some cases, institutional share classes of actively managed mutual funds carry competitive costs that rival or exceed ETF equivalents.</p>
<h2>Tax Efficiency: Why It Matters More Than You Think</h2>
<p>One of the most underappreciated differences between ETFs and mutual funds is how they handle capital gains. When investors in a mutual fund redeem shares, the fund manager may be forced to sell underlying securities to raise cash, potentially triggering capital gains that are distributed to all remaining shareholders, even those who did not sell.</p>
<p>ETFs avoid this through a unique creation and redemption mechanism that allows large institutional investors to exchange baskets of securities directly with the fund without triggering taxable events. For investors in taxable accounts, this structural difference can meaningfully reduce the annual tax drag on returns over time, compounding into a significant advantage over a long investment horizon.</p>
<h2>How Do You Choose Between ETFs and Mutual Funds for Your Portfolio?</h2>
<p>The right vehicle depends on several factors that are specific to your situation. If you are investing in a taxable brokerage account and cost efficiency and tax management are priorities, ETFs are likely the better fit. If you are investing primarily through a workplace retirement plan or want the simplicity of automatic dollar-amount contributions, mutual funds may be more practical.</p>
<p>If you are working with an advisor who has access to institutional mutual fund share classes, the cost difference may narrow considerably. And if you are evaluating a specific strategy, it is worth checking whether both an ETF and a mutual fund version exist, as the same underlying strategy is sometimes available in both structures.</p>
<h2>VanEck Offers Both ETFs and Mutual Funds</h2>
<p>VanEck offers a broad range of ETFs and mutual funds spanning asset classes and themes including semiconductors, digital assets, emerging markets, municipal bonds, and equity strategies. Whether you are considering an ETF or a mutual fund, VanEck provides access to a range of investment strategies across both vehicles. Use our <strong><a href="https://www.vaneck.com/us/en/etf-mutual-fund-finder/etfs/?InvType=etf&amp;AssetClass=c,nr,mi,t,ue,cb,ei,ib,mb,fr,c-ra,c-da,c-g&amp;Funds=emf,grf,iigf,mwmf,embf,ccif&amp;ShareClass=a,c,i,y,z&amp;tab=ov&amp;Sort=name&amp;SortDesc=true" title="Explore Our ETFs and Mutual Funds">ETF and Mutual Fund Finder</a></strong> to explore VanEck's full lineup and find the right fit for your portfolio.</p>
]]></content:encoded>
</item><item rdf:about="https://www.vaneck.com/us/en/blogs/income-investing/clos-pressure-tested-in-q1-built-for-what-comes-next/">
  <title>CLOs: Pressure-Tested in Q1, Built for What Comes Next></title>
  <link>https://www.vaneck.com/us/en/blogs/income-investing/clos-pressure-tested-in-q1-built-for-what-comes-next/</link>
  <description><![CDATA[CLOs proved their mettle in Q1 2026, outperforming most credit sectors as geopolitical shocks and rising rates rattled markets, and the best opportunities may still lie ahead.]]></description>
  <dc:creator> </dc:creator>
  <dc:date>04/17/2026 06:30:00</dc:date>
<content:encoded><![CDATA[

<p><strong>Key Takeaways:</strong></p>
<ul class="content-list">
<li class="mt-2"><strong>CLOs proved their resilience:</strong> IG-rated tranches delivered positive returns even as geopolitical shocks and rising Treasury yields rattled broader credit markets.</li>
<li class="mt-2"><strong>The macro tide has shifted:</strong> A Fed on hold, sticky inflation, and Middle East tensions are keeping rates elevated and spreads under pressure.</li>
<li class="mt-2"><strong>Volatility is creating opportunity:</strong> Conservative positioning and widening spreads are opening selective entry points, particularly lower in the capital stack.</li>
</ul>
<p id="point-one" class="anchored-block jump-link-nav" data-jumplink-title="Overview">CLOs demonstrated relative resilience in Q1 2026, outperforming most credit sectors despite a challenging macro backdrop marked by rising Treasury yields, geopolitical escalation in the Middle East and growing recession concerns in the back half of the quarter. IG-rated tranches posted positive total returns, while mezzanine tranches faced had pressure. A sharp selloff in software loans, the largest sector in the leveraged loan index at roughly 10-15%, was a defining feature of the quarter, driving meaningful dispersion across CLO portfolios and reinforcing the importance of manager and security selection. During the quarter, <a href="/link/e090deaddc774ac699a04b959d9254c6.aspx" title="CLOI - VanEck CLO ETF"><strong>VanEck CLO ETF (CLOI)</strong></a> (30-day SEC yield: 5.12% as of 3/31/2026) underperformed its benchmark, J.P. Morgan CLO IG Index, by 17bps (0.75% vs 0.92%). Meanwhile, <a href="/link/d2f16468a9f14c1e807f6bb7fb597a3e.aspx" title="CLOB - VanEck AA-BB CLO ETF"><strong>VanEck AA-BB CLO ETF (CLOB)</strong></a> (30-day SEC yield: 6.20% as of 3/31/2026) was relatively in line with its benchmark, J.P. Morgan CLOIE Balanced Mezzanine Index (-0.33% vs -0.32%).</p>
<p>CLOs continued to compare favorably to investment grade corporates, high yield bonds, and leveraged loans, reinforcing their role as a compelling source of income and relative value amid heightened uncertainty. Our preference for higher-rated tranches remains given tight valuations and increasing tail risks, although select shorter spread-duration opportunities lower in the capital stack are beginning to present more attractive entry points.</p>
<h2>Average Annual Total Returns<sup>*</sup>&nbsp;(%)</h2>
<div class="subtext">as of 03/31/2026</div>
<div class="wrapped-div">
<table style="width: 100%;">
<tbody>
<tr class="tbl-data">
<td class="tbl-header last">&nbsp;</td>
<td class="tbl-header last text-right">1 MO</td>
<td class="tbl-header last text-right">3 MO</td>
<td class="tbl-header last text-right">YTD</td>
<td class="tbl-header last text-right">1 YR</td>
<td class="tbl-header last text-right">3 YR</td>
<td class="tbl-header last text-right">5 YR</td>
<td class="tbl-header last text-right">10 YR</td>
<td class="tbl-header last text-right">LIFE 06/21/22</td>
</tr>
</tbody>
<tbody>
<tr class="tbl-data">
<td class="data-td last">CLOI (NAV)</td>
<td class="data-td data last text-right">-0.08</td>
<td class="data-td data last text-right">0.75</td>
<td class="data-td data last text-right">5.31</td>
<td class="data-td data last text-right">7.15</td>
<td class="data-td data last text-right">--</td>
<td class="data-td data last text-right">7.22</td>
</tr>
<tr class="tbl-data">
<td class="data-td last">CLOI (Market Price)</td>
<td class="data-td data last text-right">0.00</td>
<td class="data-td data last text-right">0.62</td>
<td class="data-td data last text-right">5.40</td>
<td class="data-td data last text-right">7.08</td>
<td class="data-td data last text-right">--</td>
<td class="data-td data last text-right">7.20</td>
</tr>
<tr class="tbl-data">
<td class="data-td last">J.P. Morgan CLO IG Index</td>
<td class="data-td data last text-right">0.15</td>
<td class="data-td data last text-right">0.92</td>
<td class="data-td data last text-right">5.53</td>
<td class="data-td data last text-right">7.41</td>
<td class="data-td data last text-right">--</td>
<td class="data-td data last text-right">7.13</td>
</tr>
<tr class="tbl-data">
<td class="data-td last">J.P. Morgan Collateralized Loan Obligation Index</td>
<td class="data-td data last text-right">0.06</td>
<td class="data-td data last text-right">0.74</td>
<td class="data-td data last text-right">5.51</td>
<td class="data-td data last text-right">7.78</td>
<td class="data-td data last text-right">--</td>
<td class="data-td data last text-right">7.44</td>
</tr>
</tbody>
</table>
</div>
<br />
<p class="chart-disclosure"><sup>*</sup>Returns less than one year are not annualized.</p>
<p class="chart-disclosure">Effective May 1, 2025, the J.P. Morgan CLO IG Index replaced the J.P. Collateralized Loan Obligation Index as the Fund&rsquo;s benchmark</p>
<p class="chart-disclosure">The performance data quoted represents past performance. Past performance is not a guarantee of future results. Investment return and principal value of an investment will fluctuate so that an investor&rsquo;s shares, when redeemed, may be worth more or less than their original cost. Performance may be lower or higher than performance data quoted. Please call 800.826.2333 or visit vaneck.com for performance current to the most recent month ended.</p>
<p class="chart-disclosure">CLOI&rsquo;s gross expense ratio is 0.36% and the total expense ratio is 0.36%. Van Eck Associates Corporation (the &ldquo;Adviser&rdquo;) will pay all expenses of the Fund, except for the fee payment under the investment management agreement, acquired fund fees and expenses, interest expense, offering costs, trading expenses, taxes and extraordinary expenses. Notwithstanding the foregoing, the Adviser has agreed to pay the offering costs until at least May 1, 2027. &ldquo;Other Expenses&rdquo; have been restated to reflect current fees.</p>
<br />
<h2>Average Annual Total Returns<sup>*</sup>&nbsp;(%)</h2>
<div class="subtext">as of 03/31/2026</div>
<div class="wrapped-div">
<table style="width: 100%;">
<tbody>
<tr class="tbl-data">
<td class="tbl-header last">&nbsp;</td>
<td class="tbl-header last text-right">1 MO</td>
<td class="tbl-header last text-right">3 MO</td>
<td class="tbl-header last text-right">YTD</td>
<td class="tbl-header last text-right">1 YR</td>
<td class="tbl-header last text-right">3 YR</td>
<td class="tbl-header last text-right">5 YR</td>
<td class="tbl-header last text-right">10 YR</td>
<td class="tbl-header last text-right">LIFE 09/24/24</td>
</tr>
</tbody>
<tbody>
<tr class="tbl-data">
<td class="data-td last">CLOB (NAV)</td>
<td class="data-td data last text-right">-0.75</td>
<td class="data-td data last text-right">-0.33</td>
<td class="data-td data last text-right">5.41</td>
<td class="data-td data last text-right">--</td>
<td class="data-td data last text-right">6.28</td>
</tr>
<tr class="tbl-data">
<td class="data-td last">CLOB (Market Price)</td>
<td class="data-td data last text-right">0.23</td>
<td class="data-td data last text-right">-0.42</td>
<td class="data-td data last text-right">5.37</td>
<td class="data-td data last text-right">--</td>
<td class="data-td data last text-right">6.24</td>
</tr>
<tr class="tbl-data">
<td class="data-td last">J.P. Morgan CLOIE Balanced Mezzanine Index</td>
<td class="data-td data last text-right">-0.47</td>
<td class="data-td data last text-right">-0.32</td>
<td class="data-td data last text-right">5.68</td>
<td class="data-td data last text-right">--</td>
<td class="data-td data last text-right">6.37</td>
</tr>
</tbody>
</table>
</div>
<br />
<p class="chart-disclosure"><sup>*</sup>Returns less than one year are not annualized.</p>
<p class="chart-disclosure">The performance data quoted represents past performance. Past performance is not a guarantee of future results. Investment return and principal value of an investment will fluctuate so that an investor&rsquo;s shares, when redeemed, may be worth more or less than their original cost. Performance may be lower or higher than performance data quoted. Please call 800.826.2333 or visit vaneck.com for performance current to the most recent month ended.</p>
<p class="chart-disclosure">CLOB&rsquo;s gross expense ratio is 0.45% and the total expense ratio is 0.45%. Van Eck Associates Corporation (the &ldquo;Adviser&rdquo;) will pay all expenses of the Fund, except for the fee payment under the investment management agreement, acquired fund fees and expenses, interest expense, offering costs, trading expenses, taxes and extraordinary expenses. Notwithstanding the foregoing, the Adviser has agreed to pay the offering costs until at least May 1, 2026. &ldquo;Other Expenses&rdquo; have been restated to reflect current fees.</p>
<h2 id="point-two" class="anchored-block jump-link-nav" data-jumplink-title="Market Update">Market Update</h2>
<p>Total returns were marginally positive for CLOs at the index level in March. The asset class endured its worst monthly return in the past year. However, CLOs held in better than most other asset classes. Investors navigated a confluence of headwinds including an escalating and unresolved conflict in the Middle East centered on the Strait of Hormuz, sharply rising Treasury rates, and ongoing fears of AI disintermediation. The macro backdrop was difficult across risk assets broadly. Brent crude approached $120/bbl before pulling back toward $100/bbl by month-end, the S&amp;P 500 fell 5.0% in March, and 10-year Treasury yields remain more than 30bp above pre-conflict levels, reflecting market uncertainty about the inflationary and growth implications of a prolonged Hormuz closure. The conflict has extended into April, though broader risk markets have caught a bid on hopes of a ceasefire. Despite the difficult tone, two positives are worth noting. Fourth quarter 2025 earnings season was constructive as issuers largely beat expectations and offered cautiously positive guidance and primary market activity held up well. Functioning capital markets suggest the technical picture, while challenged, is not yet in distress territory. Two-, 5- and 10-year Treasury rates traded 42bp, 44bp and 38bp higher, respectively.</p>
<p>Higher rated CLOs outperformed bank loans and investment grade credit and high yield bonds during the quarter.</p>
<div class="wrapped-div">
<table style="width: 100%;">
<tbody>
<tr class="tbl-data">
<td class="tbl-header last text-left">Asset class</td>
<td class="tbl-header last text-right">Q1 2026 Return (%)</td>
<td class="tbl-header last text-right">Yield to Worst (%)</td>
<td class="tbl-header last text-right">Spreads (bps)</td>
</tr>
<tr class="tbl-data">
<td class="data-td last text-left">CLOs</td>
<td class="data-td data last text-right">0.74</td>
<td class="data-td data last text-right">5.53</td>
<td class="data-td data last text-right">179</td>
</tr>
<tr class="tbl-data">
<td class="data-td last text-left">CLOs IG</td>
<td class="data-td data last text-right">0.92</td>
<td class="data-td data last text-right">5.18</td>
<td class="data-td data last text-right">151</td>
</tr>
<tr class="tbl-data">
<td class="data-td last text-left">CLOs Mezz</td>
<td class="data-td data last text-right">-0.26</td>
<td class="data-td data last text-right">7.57</td>
<td class="data-td data last text-right">381</td>
</tr>
<tr class="tbl-data">
<td class="data-td last text-left">AAA</td>
<td class="data-td data last text-right">1.01</td>
<td class="data-td data last text-right">4.91</td>
<td class="data-td data last text-right">125</td>
</tr>
<tr class="tbl-data">
<td class="data-td last text-left">AA</td>
<td class="data-td data last text-right">0.99</td>
<td class="data-td data last text-right">5.22</td>
<td class="data-td data last text-right">156</td>
</tr>
<tr class="tbl-data">
<td class="data-td last text-left">A</td>
<td class="data-td data last text-right">1.05</td>
<td class="data-td data last text-right">5.62</td>
<td class="data-td data last text-right">192</td>
</tr>
<tr class="tbl-data">
<td class="data-td last text-left">BBB</td>
<td class="data-td data last text-right">-0.15</td>
<td class="data-td data last text-right">7.28</td>
<td class="data-td data last text-right">351</td>
</tr>
<tr class="tbl-data">
<td class="data-td last text-left">BB</td>
<td class="data-td data last text-right">-3.15</td>
<td class="data-td data last text-right">12.17</td>
<td class="data-td data last text-right">828</td>
</tr>
<tr class="tbl-data">
<td class="data-td last text-left">B</td>
<td class="data-td data last text-right">-9.80</td>
<td class="data-td data last text-right">17.64</td>
<td class="data-td data last text-right">1,346</td>
</tr>
<tr class="tbl-data">
<td class="data-td last text-left">U.S. Agg</td>
<td class="data-td data last text-right">0.06</td>
<td class="data-td data last text-right">4.60</td>
<td class="data-td data last text-right">32</td>
</tr>
<tr class="tbl-data">
<td class="data-td last text-left">Investment Grade Corporates</td>
<td class="data-td data last text-right">-0.42</td>
<td class="data-td data last text-right">5.15</td>
<td class="data-td data last text-right">90</td>
</tr>
<tr class="tbl-data">
<td class="data-td last text-left">High Yield Bonds</td>
<td class="data-td data last text-right">-0.55</td>
<td class="data-td data last text-right">7.44</td>
<td class="data-td data last text-right">328</td>
</tr>
<tr class="tbl-data">
<td class="data-td last text-left">Leveraged Loans</td>
<td class="data-td data last text-right">-0.44</td>
<td class="data-td data last text-right">8.63</td>
<td class="data-td data last text-right">493</td>
</tr>
</tbody>
</table>
</div>
<br />
<p class="chart-disclosure">Source: JP Morgan and ICE Data Indices as of 3/31/2026. CLOs represented by J.P. Morgan Collateralized Loan Obligation Index, CLOs IG represented by J.P. Morgan Collateralized Loan Obligation IG Index, CLOs Mezz represented by J.P. Morgan Collateralized Loan Obligation Balanced Mezzanine Index, AAA Rated CLOs represented by J.P. Morgan CLO AAA Index, AA Rated CLOs represented by J.P. Morgan CLO AA Index, A Rated CLOs represented by J.P. Morgan CLO A Index, BBB Rated CLOs represented by J.P. Morgan CLO BBB Index, BB Rated CLOs represented by J.P. Morgan CLO BB Index, B Rated CLOs represented by J.P. Morgan CLO B Index, US Agg is represented by the ICE BofA US Broad Market, Investment Grade Corporates represented by ICE BofA US Corporate Index, High Yield Bonds represented by ICE BofA US High Yield Index.and Leveraged Loans represented by JP Morgan Leveraged Loan Index. Past performance is no guarantee of future results. Index performance is not representative of fund performance. It is not possible to invest directly in an index</p>
<br />
<p>CLO new issue supply decreased month-over-month, totaling $17.5bn in March, compared to $20.2bn in February. Refinancing and reset activity also decreased month-over-month, with $11.1bn pricing, after $23.7bn in February. Quarterly new issue volume of over $37bn was roughly in line with Q1 2025, although slightly behind the overall pace from last year, while refi reset volumes were 40% lower than Q1 last year. Retail demand continued, albeit at a slower pace, with CLO ETFs reporting $600mn in inflows in March, following inflows of $1.5bn in February. Total CLO ETF AUM is now over $44bn.</p>
<p>Loan market technicals remained supportive even as demand growth slowed, because repayments outpaced net new loan supply for the month. Institutional loan issuance remained constrained as the limited number of loans trading above par brought repricing activity to a halt. Wider market spreads along with the uncertain macroeconomic outlook limited issuance activity overall. However, the primary market was not fully frozen. Another wave of large M&amp;A and LBO transactions launched during the month, bringing total quarterly volume for these types of transactions to a multi-year high. Retail loan funds saw $3.3bn in outflows in March, down from $4.1bn in February, albeit still elevated.</p>
<p>The trailing twelve-month default rate within the Morningstar US Leveraged Loan Index increased 6bp to 1.44%. As measured by JP Morgan, the default rate including distressed exchanges, decreased 19bp to 3.04%. Activity has been elevated as borrowers with unsustainable capital structures endeavored to manage their liabilities and avoid the bankruptcy process through liability management exercises, keeping the &ldquo;official&rdquo; default rate lower than otherwise. The default rate has declined 148bp off January 2025&rsquo;s high.</p>
<p>CLO credit fundamentals largely remain strong but were marginally softer month-over-month. The overall picture appears stable as evidenced by the trailing 3-month downgrade / upgrade ratio for loans in CLOs at 1.72, down from 2.57 last month. Market value metrics saw some improvement month-over-month, largely driven by relative strength of Software and Services loans during the month, but remain suppressed overall.</p>
<p>US CLO secondary spreads widened in Q1. AAA&rsquo;s tranche widened by 20bps, AA&rsquo;s by 18, As by 29, BBBs by 77, BBs by 161 and Bs by 136. Meanwhile, the JP Morgan Leveraged Loan Index widened 87bps and the ICE BofA US HY Index widened 47bps.</p>
<h2 id="point-three" class="anchored-block jump-link-nav" data-jumplink-title="Portfolio Strategy">Portfolio Strategy</h2>
<p>The borrowing rate for leveraged loan companies remains high following rate increases from central banks in 2022 and 2023. However, borrowing rates moved lower following three rate cuts from the Fed at the end of 2025. The Fed has since shifted to a wait-and-see approach and held rates steady at their January meeting given solid economic growth, a stabilizing labor market and inflation above target. Markets now see the Fed on hold this year after partially pricing in a rate hike at the beginning of the month. This is a dramatic shift from year-end where more than 2 cuts were priced in.</p>
<p>Valuations have improved alongside the recent increase in volatility but still appear expensive overall. Given increasing tail risks in portfolios, we continue to prefer tranche purchases higher in the capital stack. However, selective shorter spread-duration assets for lower rated credits are starting to present more attractive entry points amid increasing geopolitical tensions and signs of a K-shaped economy, where middle and low economic earners continue to demonstrate weakness. This dynamic increases tail risks in portfolios, as evidenced by the recent selloff in the software sector, and underscores the need for rigorous fundamental credit analysis in CLOs, including stressing recoveries for distressed loans. Despite feeling that IG spreads are tight, we are finding value in AAA, AA, and A rated securities. We have also seen increased dispersion between managers lower in the capital stack, which could present attractive opportunities for select purchases of lower rated paper. We also expect there to be additional bouts of volatility in the coming months and would like to maintain the ability to shift further into lower rated tranches during future periods of market weakness. We previously preferred buying in the primary market, but following the software related selloff, buying in the secondary market has become more attractive.</p>
<h3>CLOI Total Return and Credit Allocation</h3>
<p><img loading="lazy" class="desktop-image img-responsive" src="https://www.vaneck.com/EPiServer/CMS/Content/contentassets/eda525c1e0424b218106bc8512df72ca/7160_1q26-clos_chart-1_2026-04_v1_desktop.svg,,372239/Download?epieditmode=False" alt="CLOI Total Return and Credit Allocation" /></p>
<p><img loading="lazy" class="mobile-image img-responsive" src="https://www.vaneck.com/EPiServer/CMS/Content/contentassets/eda525c1e0424b218106bc8512df72ca/7160_1q26-clos_chart-1_2026-04_v1_mobile.svg,,372240/Download?epieditmode=False" alt="CLOI Total Return and Credit Allocation" /></p>
<p class="chart-disclosure">Source: Factset, JP Morgan, VanEck as of 3/31/2026. AAA Rated CLOs represented by J.P. Morgan CLO AAA Index, AA Rated CLOs represented by J.P. Morgan CLO AA Index, A Rated CLOs represented by J.P. Morgan CLO A Index, BBB Rated CLOs represented by J.P. Morgan CLO BBB Index, BB Rated CLOs represented by J.P. Morgan CLO BB Index, Index performance is not representative of Fund performance. It is not possible to invest directly in an index. Past performance is no guarantee of future results. Fund performance current to the most recent month end is available by visiting vaneck.com or by calling 800.826.2333.</p>
<h3>CLOB Total Return and Credit Allocation</h3>
<p><img loading="lazy" class="desktop-image img-responsive" src="https://www.vaneck.com/EPiServer/CMS/Content/contentassets/eda525c1e0424b218106bc8512df72ca/7160_1q26-clos_chart-2_2026-04_v1_desktop.svg,,372241/Download?epieditmode=False" alt="CLOB Total Return and Credit Allocation" /></p>
<p><img loading="lazy" class="mobile-image img-responsive" src="https://www.vaneck.com/EPiServer/CMS/Content/contentassets/eda525c1e0424b218106bc8512df72ca/7160_1q26-clos_chart-2_2026-04_v1_mobile.svg,,372242/Download?epieditmode=False" alt="CLOB Total Return and Credit Allocation" /></p>
<p class="chart-disclosure">Source: Factset, JP Morgan, VanEck as of 3/31/2026. AA Rated CLOs represented by J.P. Morgan CLO AA Index, A Rated CLOs represented by J.P. Morgan CLO A Index, BBB Rated CLOs represented by J.P. Morgan CLO BBB Index, BB Rated CLOs represented by J.P. Morgan CLO BB Index, B Rated CLOs represented by J.P. Morgan CLO B Index. Index performance is not representative of Fund performance. It is not possible to invest directly in an index. Past performance is no guarantee of future results. Fund performance current to the most recent month end is available by visiting vaneck.com or by calling 800.826.2333.</p>

<h2 id="point-four" class="anchored-block jump-link-nav" data-jumplink-title="Outlook">Outlook</h2>
<p>For risk assets generally, oil prices remain the key driver as investors grapple with a broadening supply shock, as well as hopes for deescalation of the Iran conflict. In the near term, we expect geopolitical uncertainty to remain elevated, contributing to increased market volatility and dispersion across issuers. This environment continues to reinforce a highly bifurcated loan market, where performing credits trade at relatively tight levels while a smaller group of stressed and idiosyncratic issuers drive downside risk and increase tail risk in portfolios.</p>
<p>While AI fears have taken a backseat following the onset of the war in Iran, the outcome is likely to have a bigger impact on long-term performance for loan issuers. We continue to see a repricing of risk premia in credit as a result of AI disintermediation in Software and other sectors as well as continued pressure in the Chemicals sector. We have seen this play out more acutely in the private credit market given the asset class&rsquo;s high exposure to Software. However, while risks in the private credit market are notable, we don&rsquo;t believe they pose a systemic threat and don't expect a broader market contagion.</p>
<p>Combined with geopolitical risks and risks to higher inflation, lower growth, and higher long-term rates, we believe that spreads are more likely to widen in the short-term and stay wider over the medium term. Given conservative portfolio positioning at the beginning of the year, we have been and continue to be well positioned to opportunistically add both in the primary and secondary markets across the cap stack, but particularly in strategies that can add BBB and lower rated tranches. However, the bifurcation in the market is notable, particularly for lower mezzanine and equity tranches. More stressed/seasoned CLOs (lower BB MVOCs and equity NAVs) are being heavily punished versus cleaner portfolios. As such, security selection is of paramount importance, and we remain highly selective when purchasing securities lower in the cap stack. We believe our bottoms-up approach of re-underwriting portfolios puts us in a good position to take advantage of security selection as spreads widen, focusing on credit selection.</p>


<p>To receive more <a href="/us/en/blogs/income-investing/" title="Income Investing Insights"><strong>Income Investing</strong></a> insights, <a href="/link/5f45412c2143400497908cea2897f7d3.aspx" title=" Subscription Center"><strong>sign up in our subscription center</strong></a>.</p>
]]></content:encoded>
</item><item rdf:about="https://www.vaneck.com/us/en/blogs/natural-resources/strait-of-hormuz-disruption-and-global-supply-implications/">
  <title>Strait of Hormuz Disruption and Global Supply Implications></title>
  <link>https://www.vaneck.com/us/en/blogs/natural-resources/strait-of-hormuz-disruption-and-global-supply-implications/</link>
  <description><![CDATA[From record gold prices to a fertilizer supply shock, the Strait of Hormuz closure reshaped commodity markets in Q1 2026, accelerating a structural shift in how global resources are valued.]]></description>
  <dc:creator>Shawn Reynolds</dc:creator>
  <dc:date>04/16/2026 06:30:00</dc:date>
<content:encoded><![CDATA[

<p>Quarterly insights from Global Resources Portfolio Manager Shawn Reynolds, featuring his unique views on natural resources and commodities.</p>
<p><strong>Key Takeaways</strong></p>
<ul class="content-list">
<li class="mt-2"><strong>Hormuz disruption tightened global supply.</strong> Nearly 40% of nitrogen trade and 20% of LNG supply were affected, highlighting ongoing supply chain risks.</li>
<li class="mt-2"><strong>Gold and energy led Q1 performance.</strong> Gold reached record highs before a correction, while energy was the only sector with positive returns.</li>
<li class="mt-2"><strong>Natural resources outlook remains supported.</strong> Copper supply deficits, central bank gold demand and critical minerals demand continue to underpin markets.</li>
</ul>
<h2>A Geopolitical Shock Exposes the Cost of Supply Fragility</h2>
<p>Q1 2026 was defined by the outbreak of hostilities between the United States and Iran on February 28, which effectively closed the Strait of Hormuz, a chokepoint for roughly one-fifth of global oil and LNG trade. What began as a quarter of strong metals momentum and disciplined portfolio rotation ended with historic oil price volatility, a cascading fertilizer supply shock and a sharp precious metals correction that partially reversed January&rsquo;s record-setting gains. The effects across commodities, equities and supply chains will likely prove structural rather than transitory.</p>
<h2 id="sector-performance" class="jump-link-nav anchored-block" data-jumplink-title="Sector Performance Recap">Sector Performance Recap</h2>
<p><strong>Oil &amp; Gas</strong></p>
<p>Oil entered the quarter near $61/bbl Brent on a well-supplied market before the Strait of Hormuz closure sent prices surging past $117/bbl. Iranian drone strikes on Qatar&rsquo;s Ras Laffan LNG hub simultaneously disrupted roughly 20% of global LNG supply. By late March, diplomatic progress drove a sharp reversal toward $67 as risk premiums compressed. Energy was the only major equity sector to finish the quarter in positive territory, with refiners, integrated majors, low-cost E&amp;Ps and MENA-exposed oilfield services names all benefiting from the price spike. US natural gas equities also rallied on the LNG supply disruption.</p>
<p><strong>Base &amp; Industrial Metals </strong></p>
<p>Copper touched a record $13,952/MT in late January on supply disruptions, tariff front-running and AI/electrification demand, before surrendering a significant portion of those gains as the Iran conflict stoked demand destruction fears. China&rsquo;s rare earth export controls were the other defining development, triggering a sharp re-rating of ex-China critical minerals producers. Diversified miners and rare earth names outperformed; pure-play copper equities broadly underperformed as the metal reversed through March despite intact long-term fundamentals.</p>
<h3>Average Annual Total Returns* (%) as of March 31, 2026</h3>
<div class="wrapped-div">
<table style="width: 100%;">
<tbody>
<tr class="tbl-data">
<td class="tbl-header last">&nbsp;</td>
<td class="tbl-header last text-right">1Q 26<sup>*</sup></td>
<td class="tbl-header last text-right">YTD</td>
<td class="tbl-header last text-right">1 Yr</td>
<td class="tbl-header last text-right">5 Yr</td>
<td class="tbl-header last text-right">10 Yr</td>
</tr>
</tbody>
<tbody>
<tr class="tbl-data">
<td class="data-td last">Class A: NAV (Inception 11/02/94)</td>
<td class="data-td data last text-right">16.21</td>
<td class="data-td data last text-right">47.18</td>
<td class="data-td data last text-right">11.21</td>
<td class="data-td data last text-right">8.38</td>
</tr>
<tr class="tbl-data">
<td class="data-td last">Class A: Maximum 5.75% load</td>
<td class="data-td data last text-right">9.52</td>
<td class="data-td data last text-right">38.72</td>
<td class="data-td data last text-right">9.90</td>
<td class="data-td data last text-right">7.74</td>
</tr>
<tr class="tbl-data">
<td class="data-td last">SPGNRUN Index<sup>1</sup></td>
<td class="data-td data last text-right">19.67</td>
<td class="data-td data last text-right">44.22</td>
<td class="data-td data last text-right">12.16</td>
<td class="data-td data last text-right">11.40</td>
</tr>
</tbody>
</table>
</div>
<p class="chart-disclosure"><strong>The table above presents past performance which is no guarantee of future results and which may be lower or higher than current performance. Returns reflect applicable fee waivers and/or expense reimbursements. Had the Fund incurred all expenses and fees, investment returns would have been reduced. Investment returns and Fund share values will fluctuate so that investor&rsquo;s shares, when redeemed, may be worth more or less than their original cost. Fund returns assume that dividends and capital gains distributions have been reinvested in the Fund at NAV. Index returns assume that dividends from index constituents have been reinvested. Investing involves risk, including loss of principal; please see disclaimers on last page. Please call 800.826.2333 or visit vaneck.com for performance current to the most recent month end.</strong></p>
<p class="chart-disclosure"><sup>*</sup>&nbsp;Returns less than one year are not annualized.</p>
<p class="chart-disclosure">Expenses: Class A: Gross 1.49%; Net 1.38%. Expenses are capped contractually until 05/01/26 at 1.38% for Class A. Caps exclude acquired fund fees and expenses, interest, trading, dividends, and interest payments of securities sold short, taxes and extraordinary expenses.</p>

<p><strong>Gold &amp; Precious Metals</strong></p>
<p>Gold surged to an all-time high of $5,589/oz on January 28, driven by geopolitical escalation, dollar weakness, the Fed holding rates and continued PBoC buying. Silver briefly crossed $117/oz. A sharp March correction erased nearly 15% from peak on diplomatic progress and a firming dollar, leaving gold near $4,769/oz at quarter-end. Mining equities experienced a dramatic re-rating in January, with junior miners outperforming large-caps by approximately 13% as institutional capital rotated into the sector. PGM equities lagged the gold complex on softer pricing and operational pressures.</p>
<p><strong>Agriculture</strong></p>
<p>The Hormuz closure dramatically reshaped agricultural markets through fertilizer: roughly one-third of globally traded fertilizer transits the strait, and Iranian strikes on Qatar Energy&rsquo;s production hubs removed nearly 40% of global nitrogen trade from the market. Nitrogen fertilizer producers were among the quarter&rsquo;s top-performing equities globally. Protein processors and diversified agribusiness names with export access also performed well on improved soybean trade flows, while crop protection companies were more mixed amid continued farm margin pressure.</p>
<p><strong>Renewables &amp; Alternatives</strong></p>
<p>Clean energy carried positive momentum from late-2025 rate cuts, but US policy headwinds, including IRA rollbacks and tightened tax credit timelines, weighed on domestic developers. The conflict added near-term risk-off pressure on growth names, partially offset by accelerating European urgency to expand domestic capacity. Grid construction equities were the standout performers; solar and wind developers and electrical component manufacturers were broadly pressured as growth multiples de-rated.</p>
<p><strong>Paper &amp; Forest Products</strong></p>
<p>Forest products remained soft, with lumber rangebound and pulp under pressure from prior-year oversupply. US packaging showed early stabilization on e-commerce and industrial recovery while European names continued to face demand and currency headwinds. North American containerboard equities modestly outperformed European counterparts, though valuation dispersion within packaging was wide based on integration execution and balance sheet strength.</p>
<h2 id="portfolio-performance" class="jump-link-nav anchored-block" data-jumplink-title="Portfolio Performance">Portfolio Performance: Drivers and Detractors</h2>
<p>The Fund returned 16.2% versus 19.7% for the S&amp;P Global Natural Resources Index. Oil &amp; Gas was the dominant absolute contributor but detracted on a relative basis, as underweight exposure to integrated majors, which surged 40&ndash;85% on the oil price spike, more than offset strong refining performance from Valero Energy (1.51% of Fund net assets as of 3/31/26), Phillips 66 (2.24% of Fund net assets as of 3/31/26) and Marathon Petroleum (1.11% of Fund net assets as of 3/31/26). E&amp;P and integrated holdings including ConocoPhillips (1.29% of Fund net assets as of 3/31/26), Canadian Natural Resources (1.35% of Fund net assets as of 3/31/26), TotalEnergies (3.21% of Fund net assets as of 3/31/26) and Chevron (2.59% of Fund net assets as of 3/31/26) contributed meaningfully, as did National Energy Services Reunited ("NESR") (0.43% of Fund net assets as of 3/31/26) on accelerating MENA activity.</p>
<p>Gold &amp; Precious Metals was the second-largest absolute contributor but a modest relative detractor. Agnico Eagle (2.71% of Fund net assets as of 3/31/26), Franco-Nevada (1.95% of Fund net assets as of 3/31/26), Kinross Gold (2.41% of Fund net assets as of 3/31/26) and others contributed strongly through January, before disciplined trimming ahead of the March correction preserved gains. PGMs were the primary drag within the sector, with Impala Platinum (0.74% of Fund net assets as of 3/31/26) falling approximately 27% after the Fund&rsquo;s rotation from Valterra (not held as of 3/31/26) and Barrick Mining (2.26% of Fund net assets as of 3/31/26) declining approximately 6%. Renewables &amp; Alternatives and Oil &amp; Gas were effectively tied as the largest relative detractors: the Fund carried approximately 5% in a sector with zero benchmark weight that returned approximately -2.8%, with Ivanhoe Electric (-26%) (0.75% of Fund net assets as of 3/31/26) and Nexans (-10%) (0.94% of Fund net assets as of 3/31/26) the primary culprits, partially offset by MasTec (+48%) (not held as of 3/31/26).</p>
<p>Agriculture was a strong absolute contributor but a notable relative detractor, as the Fund&rsquo;s Nutrien (3.05% of Fund net assets as of 3/31/26) position was underweight the benchmark and it held neither CF Industries (+69%) (not held as of 3/31/26) nor Yara (+41%) (not held as of 3/31/26). JBS N.V. (2.90% of Fund net assets as of 3/31/26), Archer-Daniels-Midland (1.82% of Fund net assets as of 3/31/26) and Bunge Global (1.31% of Fund net assets as of 3/31/26) were the leading contributors within the portfolio. Base &amp; Industrial Metals detracted on both allocation and selection: the copper book underperformed as prices reversed and the Fund was absent from benchmark names including BHP (not held as of 3/31/26), Vale (not held as of 3/31/26) and Teck (not held as of 3/31/26) that performed well. Glencore (3.29% of Fund net assets as of 3/31/26), Lynas Rare Earths (1.23% of Fund net assets as of 3/31/26) and Alcoa (1.30% of Fund net assets as of 3/31/26) partially offset. Paper &amp; Forest Products was the Fund&rsquo;s best relative sector, driven by avoidance of European paper names that fell 6&ndash;12%.</p>
<h3>Portfolio Activity: Q1 2026</h3>
<p>Activity was notably elevated in Q1, with January and February particularly active.</p>
<h3>Notable Adds</h3>
<div class="wrapped-div">
<table style="width: 100%;">
<tbody>
<tr class="tbl-data">
<td class="tbl-header last">Company</td>
<td class="tbl-header last text-left">Sub-Sector</td>
<td class="tbl-header last text-left">Fund Weight (%)</td>
<td class="tbl-header last text-left">Rationale</td>
</tr>
<tr class="tbl-data">
<td class="data-td last">International Paper (IP)</td>
<td class="data-td data last text-left">Paper &amp; Forest / Packaging</td>
<td class="data-td data last text-right">1.18</td>
<td class="data-td data last text-left">One of the world's largest packaging companies. We see an improving earnings outlook as the company integrates a recent acquisition and shifts toward higher-margin products.</td>
</tr>
<tr class="tbl-data">
<td class="data-td last">Bunge Global (BG)</td>
<td class="data-td data last text-left">Agriculture / Processors</td>
<td class="data-td data last text-right">1.31</td>
<td class="data-td data last text-left">A leading global grain and oilseed processor. Strong recent results and early cost savings from a major merger supported our decision to re-establish a position.</td>
</tr>
<tr class="tbl-data">
<td class="data-td last">ConocoPhillips (COP)</td>
<td class="data-td data last text-left">Oil &amp; Gas / E&amp;P</td>
<td class="data-td data last text-right">1.29</td>
<td class="data-td data last text-left">A large, well-run oil and gas producer with several new projects expected to come online beginning in late 2026, which should drive meaningful growth in cash flow.</td>
</tr>
<tr class="tbl-data">
<td class="data-td last">Canadian Natural Resources (CNQ)</td>
<td class="data-td data last text-left">Oil &amp; Gas / E&amp;P</td>
<td class="data-td data last text-right">1.35</td>
<td class="data-td data last text-left">A Canadian oil producer with an exceptionally long-life asset base and low operating costs. We initiated the position during a period of market dislocation related to Venezuela.</td>
</tr>
<tr class="tbl-data">
<td class="data-td last">MP Materials (MP)</td>
<td class="data-td data last text-left">Base Metals / Battery Minerals</td>
<td class="data-td data last text-right">0.82</td>
<td class="data-td data last text-left">The only significant rare earth producer in the US. We re-entered the position following a market mispricing, and see the company as a direct beneficiary of growing restrictions on Chinese rare earth exports.</td>
</tr>
<tr class="tbl-data">
<td class="data-td last">Impala Platinum (IMP SJ)</td>
<td class="data-td data last text-left">Precious Metals / PGMs</td>
<td class="data-td data last text-right">0.74</td>
<td class="data-td data last text-left">A South African platinum group metals producer offering similar commodity exposure to our prior holding, but at a lower valuation and with better potential for returning cash to shareholders.</td>
</tr>
<tr class="tbl-data">
<td class="data-td last">Ovintiv (OVV)</td>
<td class="data-td data last text-left">Oil &amp; Gas / E&amp;P</td>
<td class="data-td data last text-right">1.77</td>
<td class="data-td data last text-left">A North American oil and gas producer operating in two of the continent's most attractive basins, trading at what we consider an undemanding valuation relative to its asset quality.</td>
</tr>
<tr class="tbl-data">
<td class="data-td last">Lynas Rare Earths (LYC AU)</td>
<td class="data-td data last text-left">Base Metals / Battery Minerals</td>
<td class="data-td data last text-right">1.23</td>
<td class="data-td data last text-left">The largest rare earth producer outside of China, with an integrated mining and processing operation. Well-positioned to benefit as countries seek alternatives to Chinese rare earth supply.</td>
</tr>
<tr class="tbl-data">
<td class="data-td last">Neo Performance Materials (NEO CN)</td>
<td class="data-td data last text-left">Base Metals / Battery Minerals</td>
<td class="data-td data last text-right">0.83</td>
<td class="data-td data last text-left">One of the few companies outside China with the technology and capacity to manufacture the high-performance magnets used in electric vehicles and clean energy equipment.</td>
</tr>
<tr class="tbl-data">
<td class="data-td last">Diamondback Energy (FANG)</td>
<td class="data-td data last text-left">Oil &amp; Gas / E&amp;P</td>
<td class="data-td data last text-right">1.16</td>
<td class="data-td data last text-left">A highly efficient Permian Basin oil producer with a strong operational track record and a management team focused on returning value to shareholders.</td>
</tr>
<tr class="tbl-data">
<td class="data-td last">Nat'l Energy Services Reunited (NESR)</td>
<td class="data-td data last text-left">Oil &amp; Gas / OFS</td>
<td class="data-td data last text-right">0.43</td>
<td class="data-td data last text-left">The only oilfield services company focused exclusively on the Middle East and North Africa region, where activity is accelerating, particularly in Saudi Arabia.</td>
</tr>
<tr class="tbl-data">
<td class="data-td last">Vistra (VST)</td>
<td class="data-td data last text-left">Utilities / IPPs</td>
<td class="data-td data last text-right">0.47</td>
<td class="data-td data last text-left">One of the largest independent power producers in the US, with a diversified generation portfolio well-suited to benefit from rising electricity demand driven by data centers and AI infrastructure.</td>
</tr>
</tbody>
</table>
<br />
<h3>Notable Exits</h3>
<div class="wrapped-div">
<table style="width: 100%;">
<tbody>
<tr class="tbl-data">
<td class="tbl-header last">Company</td>
<td class="tbl-header last text-left">Sub-Sector</td>
<td class="tbl-header last text-left">Approx. Wt. at Exit (%)</td>
<td class="tbl-header last text-left">Rationale</td>
</tr>
<tr class="tbl-data">
<td class="data-td last">Shell (SHEL) &mdash; partial</td>
<td class="data-td data last text-left">Oil &amp; Gas / Integrated</td>
<td class="data-td data last text-right">~2.00</td>
<td class="data-td data last text-left">We reduced our position as Shell's long-term production outlook weakens, with limited new projects to replace maturing fields and growth prospects trailing its peers.</td>
</tr>
<tr class="tbl-data">
<td class="data-td last">Valterra Platinum (VALT LN)</td>
<td class="data-td data last text-left">Precious Metals / PGMs</td>
<td class="data-td data last text-right">~0.90</td>
<td class="data-td data last text-left">Rotated proceeds into Impala Platinum, which offers comparable exposure to platinum group metals at a more attractive price and with stronger potential for shareholder returns.</td>
</tr>
<tr class="tbl-data">
<td class="data-td last">Hormel Foods (HRL)</td>
<td class="data-td data last text-left">Agriculture / Protein</td>
<td class="data-td data last text-right">~0.50</td>
<td class="data-td data last text-left">The company's financial recovery has taken longer than expected, and rising costs are adding new pressure to an already delayed earnings improvement.</td>
</tr>
<tr class="tbl-data">
<td class="data-td last">First Solar (FSLR)</td>
<td class="data-td data last text-left">Transitional Energy / Solar</td>
<td class="data-td data last text-right">~0.45</td>
<td class="data-td data last text-left">Exited the position as the risk-reward became less compelling; we may revisit if the valuation and industry backdrop become more attractive.</td>
</tr>
<tr class="tbl-data">
<td class="data-td last">WaterBridge Infrastructure (WBI)</td>
<td class="data-td data last text-left">Industrials / Water</td>
<td class="data-td data last text-right">~0.25</td>
<td class="data-td data last text-left">A well-run business, but with the stock near fair value and limited near-term upside, we redeployed the capital into higher-conviction opportunities.</td>
</tr>
</tbody>
</table>
</div>
</div>
<p class="chart-disclosure">Source: VanEck, FactSet. Data as of March 31, 2026. Not a recommendation to buy or sell any securities referenced herein. Estimated contributions are sourced from FactSet and are not intended as a predictor or guarantee of future results, and are for illustrative purposes only. Portfolio compositions are subject to change at any time.</p>

<h2 id="outlook" class="jump-link-nav anchored-block" data-jumplink-title="Outlook">Outlook</h2>
<p>The events of Q1 2026 have not merely introduced a new risk premium into commodity markets, they have structurally accelerated a transition already underway. What is emerging is a &ldquo;resilience premium,&rdquo; a durable revaluation of assets that provide secure, regionally assured access to critical resources. The Hormuz crisis removed nearly 40% of global nitrogen trade, disrupted 20% of LNG supply and introduced uncertainty across aluminum, chemicals and nickel processing. Every industry is now being forced to price in supply security that simply did not exist two years ago.</p>
<p>In energy, the structural case for natural gas as a bridging fuel has strengthened. The conflict demonstrated the limits of OPEC+ as a buffer, its 206,000 b/d increase was a rounding error against the scale of disruption, reinforcing the importance of domestic non-OPEC supply development. In metals, China&rsquo;s rare earth export controls have created urgent strategic demand for ex-China critical minerals capacity. Copper&rsquo;s long-term deficit story remains intact regardless of the Q1 pullback.</p>
<p>In gold, the March correction notwithstanding, the structural pillars &mdash; central bank buying, ETF inflows, and a mining sector now generating record free cash flow &mdash; remain firmly in place.</p>
<p>Geopolitical risk insurance is a core tenet of this Fund. The combination of structurally constrained supply, rising strategic demand and still-attractive valuations &mdash; energy and materials remain among the cheapest sectors in global equity markets on earnings and cash flow metrics &mdash; continues to underpin our constructive long-term view. Natural resource equities do what they are designed to do when they are supposed to do it. Q1 2026 was exactly such a moment.</p>

<p>To receive more <a href="/us/en/insights/natural-resources/" title="Natural Resources Insights"><strong>Natural Resources</strong></a> insights, <a href="https://www.vaneck.com/us/en/subscribe/" title="Subscription Center"><strong>sign up in our subscription center</strong></a>.</p>
]]></content:encoded>
</item><item rdf:about="https://www.vaneck.com/us/en/blogs/model-portfolios/march-market-recap-fragility-returns-complacency-remains/">
  <title>March Market Recap: Fragility Returns, Complacency Remains></title>
  <link>https://www.vaneck.com/us/en/blogs/model-portfolios/march-market-recap-fragility-returns-complacency-remains/</link>
  <description><![CDATA[As geopolitical shocks resurface and inflation climbs, VanEck's models trim equity exposure and reposition commodities, preparing portfolios for a range of outcomes in an uncertain world.]]></description>
  <dc:creator>David Schassler</dc:creator>
  <dc:date>04/16/2026 06:30:00</dc:date>
<content:encoded><![CDATA[

<p><strong>Key Takeaways:</strong></p>
<ul class="content-list">
<li class="mt-2"><strong>Global fragility has resurfaced:</strong> The Iran conflict highlights how quickly supply chains can be disrupted.</li>
<li class="mt-2"><strong>Volatility is back and it&rsquo;s actionable:</strong> Dislocations across energy and commodities are creating opportunities for tactical positioning.</li>
<li class="mt-2"><strong>Market complacency is rising:</strong> As risks build, our portfolios are positioned for multiple outcomes, not just the most optimistic ones.</li>
</ul>

<h2 id="point-one" class="anchored-block jump-link-nav" data-jumplink-title="Market Review">Cracks in the Foundation</h2>
<p>Globalization powered decades of prosperity. It was efficient, scalable, and deflationary.</p>
<p>Until it wasn&rsquo;t.</p>
<p>The first crack came during COVID, when the complexity behind that system broke under pressure. Supply chains froze. The world was reminded that efficiency and resilience are not the same thing.</p>
<p>The system healed. Trade resumed. Markets moved on.</p>
<p>Now we&rsquo;re getting the second reminder.</p>
<h2>The Second Shock: Fragility Returns</h2>
<p>The Iran conflict has exposed the same vulnerability, this time through a different channel. When stronger powers face asymmetry, the response is rarely conventional.</p>
<p>This time, the focus is the Strait of Hormuz.</p>
<p>This is not just another shipping lane.</p>
<p>It is a critical artery.</p>
<p><img loading="lazy" class="img-responsive" alt="The Second Shock: Fragility Returns" src="https://www.vaneck.com/contentassets/cfffffbdb97d47529c6e7c3afd87ae74/7151_march-models_infog-1_2026-04_v1.svg" /></p>
<p class="chart-disclosure">Source: IMF Portwatch.</p>
<p>When it tightened, the system strained.<br />If it closes, the system breaks.</p>
<p>We recently hosted a webinar on this exact issue. Listen to it. It&rsquo;s worth your time.<br />Antonio de Pinho, Senior Analyst specializing in energy research, breaks down why this is not a quick fix.</p>
<p><a href="https://www.vaneck.com/us/en/webinar-registration/?id=93073618635&amp;utm_source=vaneck&amp;utm_medium=calendar" title="A Macro Playbook for Market Volatility and Geopolitical Conflict"><strong>Webinar Replay: A Macro Playbook for Market Volatility and Geopolitical Conflict</strong></a></p>
<p>Energy markets are reacting accordingly.</p>
<p>Historically, when energy prices surge, equity markets struggle. Higher energy costs act as a tax on the global economy.</p>
<h3 id="point-two" class="anchored-block jump-link-nav" data-jumplink-title="Sectors in Focus">Energy Shocks and Market Selloffs Coincide</h3>
<p><img loading="lazy" class="desktop-image img-responsive" alt="Energy Shocks and Market Selloffs Coincide" src="https://www.vaneck.com/contentassets/95f1dc1a54be42f5b46f36431dc06983/7151_march-models_chart-1_2026-04_v1_desktop.svg" /></p>
<p><img loading="lazy" class="mobile-image img-responsive" alt="Energy Shocks and Market Selloffs Coincide" src="https://www.vaneck.com/contentassets/95f1dc1a54be42f5b46f36431dc06983/7151_march-models_chart-1_2026-04_v1_mobile.svg" /></p>
<p class="chart-disclosure">Source: Bloomberg; as of April 2026. Past performance is no guarantee of future results. Index performance is not illustrative of strategy performance. It is not possible to invest directly in an index.</p>
<p>And yet today, equities are hovering near all-time highs.</p>
<p>That is not a coincidence. It is a statement.</p>
<p>Markets are betting this disruption is temporary. That the Strait will reopen quickly. That the system will once again prove resilient.</p>
<p>That may be right.</p>
<p>We are not willing to assume it is.</p>
<p>We have reduced equity exposure across our Wealth Builder models by about 1%. This was based on recognition that risks have shifted, and that taking profits into strength is prudent.</p>
<h2>Inflation is Back in the Conversation</h2>
<p>At the same time, inflation is no longer theoretical.</p>
<p>CPI has moved to 3.3% year-over-year, with a sharp monthly acceleration. ISM price indices are rising across both services and manufacturing. Survey data shows inflation expectations are moving higher globally.</p>
<p>Could this fade next month? Possibly.</p>
<p>But the direction of travel has changed, and markets are still positioned for the opposite.</p>
<h3>Inflation Takes a Turn in the Wrong Direction</h3>
<p><img loading="lazy" class="desktop-image img-responsive" alt="Inflation Takes a Turn in the Wrong Direction" src="https://www.vaneck.com/contentassets/8c306e4c831d45559298ecf133011701/7151_march-models_chart-2_2026-04_v1_desktop.svg" /></p>
<p><img loading="lazy" class="mobile-image img-responsive" alt="Inflation Takes a Turn in the Wrong Direction" src="https://www.vaneck.com/contentassets/8c306e4c831d45559298ecf133011701/7151_march-models_chart-2_2026-04_v1_mobile.svg" /></p>
<p class="chart-disclosure">Source: BLS, as of April 2026.</p>
<h2>Technology is the Real Driver</h2>
<p>For those still unsure how technology will reshape the world over the next five years, look no further than this conflict. Iran is clearly on the wrong side of technology.</p>
<p>This is not just a geopolitical event. It is a case study in disruption.</p>
<p>Technology is compressing time. It is lowering costs. It is changing how power is projected and how systems are challenged.</p>
<p>The gap between those who adapt and those who do not is widening in real time.</p>
<p>That is the real lesson. This is about using technology as force multiplication.</p>
<p>This dynamic does not stop at the battlefield.</p>
<p>It applies to every sector, every industry, every company, and every individual.</p>
<p>The next five years may present challenges for those who are slow to adapt.</p>
<h2>Volatility Creates Opportunity</h2>
<p>Volatility creates opportunity, and we&rsquo;ve been active.</p>
<p>This is especially true for the VanEck Commodity Strategy ETF (<strong><a href="/link/fae5e7a97c094c9b924c6ee6aec199fd.aspx" title="PIT - VanEck Commodity Strategy ETF - Overview">PIT</a></strong>), a holding within our models. PIT&rsquo;s strategy is designed to ride momentum and take advantage of overbought and oversold conditions.</p>
<p>Last year, our models viewed gold and other metals as overbought and energy as oversold.</p>
<p>So, we did something about it.</p>
<p>We spent the second half of 2025 working down our gold position and buying energy. We purchased diversified baskets of highly correlated energy holdings, such as WTI, Brent, and heating oil. The chart below tracks our energy trades within PIT &mdash; green marks our buys, red marks our sells &mdash; illustrated against WTI prices at the time of our transactions. The light blue line shows our total energy weight.</p>
<h3>PIT Energy Trades</h3>
<p><img loading="lazy" class="desktop-image img-responsive" alt="PIT Energy Trades" src="https://www.vaneck.com/contentassets/9cb21102a4fe4347a5bdbf5a8201f8a9/7151_march-models_chart-3_2026-04_v1_desktop.svg" /></p>
<p><img loading="lazy" class="mobile-image img-responsive" alt="PIT Energy Trades" src="https://www.vaneck.com/contentassets/9cb21102a4fe4347a5bdbf5a8201f8a9/7151_march-models_chart-3_2026-04_v1_mobile.svg" /></p>
<p class="chart-disclosure">Source: VanEck, Bloomberg; as of April 2026. Past performance is no guarantee of future results.</p>

<p>These purchases were funded primarily from sales of metals. We sold diversified baskets of precious and industrial metals, such as gold, silver, and copper. The chart below tracks our metals trades within PIT, shown against gold prices. The dark blue line shows our total metals weight.</p>
<h3>PIT Metals Trades</h3>
<p><img loading="lazy" class="desktop-image img-responsive" alt="PIT Metals Trades" src="https://www.vaneck.com/contentassets/b822903df73a414a8347accba6b77c62/7151_march-models_chart-4_2026-04_v1_desktop.svg" /></p>
<p><img loading="lazy" class="mobile-image img-responsive" alt="PIT Metals Trades" src="https://www.vaneck.com/contentassets/b822903df73a414a8347accba6b77c62/7151_march-models_chart-4_2026-04_v1_mobile.svg" /></p>
<p class="chart-disclosure">Source: VanEck, Bloomberg; as of April 2026. Past performance is no guarantee of future results.</p>
<p>Recently, we have been going the other way.</p>
<p>To us, energy prices look overbought and precious and base metals look oversold.</p>
<p>But the opportunity is not simply directional. It is structural.</p>
<p>Commodity markets, like equities, are expressing a degree of complacency. The backwardated shape of the futures curve for WTI reflects a market that expects energy prices to fall, with near-term contract prices significantly above those that settle further out. It is even more extreme in Heating Oil/Diesel and European Gas Oil.</p>
<h3>PIT's Oil Exposure is Front Heavy</h3>
<p><img loading="lazy" class="desktop-image img-responsive" alt="PIT's Oil Exposure is Front Heavy" src="https://www.vaneck.com/contentassets/4be4fdbdbb104229b36849ab4f0115c6/7151_march-models_chart-5_2026-04_v1_desktop.svg" /></p>
<p><img loading="lazy" class="mobile-image img-responsive" alt="PIT's Oil Exposure is Front Heavy" src="https://www.vaneck.com/contentassets/4be4fdbdbb104229b36849ab4f0115c6/7151_march-models_chart-5_2026-04_v1_mobile.svg" /></p>
<p class="chart-disclosure">Source: VanEck; as of April 2026.</p>
<p>We are not convinced.</p>
<p>We have shifted a significant portion of our energy exposure in PIT from the front-month to contracts that expire in late summer.</p>
<p>This positioning is intentional.</p>
<p>If higher energy prices prove to be sticky, this positioning benefits. If there is a quick resolution and energy prices fall, the front-month contracts we reduced would be expected to decline more sharply.</p>
<h2 id="point-three" class="anchored-block jump-link-nav" data-jumplink-title="Positioning">Position for Both Outcomes</h2>
<p>Markets remain overly complacent.</p>
<p>Equities are near all-time highs. Credit spreads are tight. Energy futures curves are deeply backwardated, suggesting markets expect this to pass quickly.</p>
<p>We are less convinced.</p>
<p>Our job is not to predict outcomes with certainty. It is to define risks and build portfolios that can perform across a range of scenarios.</p>
<p>To receive more <strong><a href="https://www.vaneck.com/us/en/insights/guided-allocation/" title="Model Portfolio Insights">Model Portfolio</a></strong> insights, <strong><a href="https://www.vaneck.com/us/en/subscribe/" title="Subscription Center">sign up in our subscription center</a></strong>.</p>
]]></content:encoded>
</item><item rdf:about="https://www.vaneck.com/us/en/blogs/income-investing/top-income-etf-yields/">
  <title>VanEck’s Top 10 Income ETFs Ranked by ETF Yields></title>
  <link>https://www.vaneck.com/us/en/blogs/income-investing/top-income-etf-yields/</link>
  <description><![CDATA[Today&rsquo;s market environment is pushing investors to look beyond traditional fixed income for higher yield. VanEck&rsquo;s income-focused ETFs provide access across asset classes.]]></description>
  <dc:creator> </dc:creator>
  <dc:date>04/13/2026 06:30:00</dc:date>
<content:encoded><![CDATA[

<p><strong>Key Takeaways:</strong></p>
<ul class="content-list">
<li class="mt-2"><strong><a href="/link/b1c9e5d0029f41e1b5a5869303671518.aspx" title=" MORT-VanEck Mortgage REIT Income ETF">MORT</a> leads the rankings at 13.58%, up from 12.67% last month.</strong> Mortgage REITs continue to capture spreads between income and borrowing costs in a differentiated way and remains the highest-yielding segment in the lineup by a significant margin.</li>
<li class="mt-2"><strong>Business development companies</strong> (<strong>BDCs) hold steady near the top.</strong> <a href="/link/c48bed1be12e47c88f01e1bdbfa51ed2.aspx" title=" BIZD-VanEck BDC Income ETF"><strong>BIZD</strong></a>, yielding 9.19%, provides access to private-credit-like income through publicly traded vehicles.</li>
<li class="mt-2"><strong>Emerging markets debt is well represented across the lineup.</strong> <strong><a href="/link/b572cc2d2799458eb526924e28c41513.aspx" title=" HYEM-VanEck Emerging Markets High Yield Bond ETF">HYEM</a> </strong>rises to #3 this month at 7.23%, offering exposure to high-yield EM corporate bonds with a yield pickup and higher credit quality versus U.S. high yield, while diversifying a U.S.-only high yield allocation. <a href="/link/98c7fd49bdbc456294a1eb859ad166f7.aspx" title=" EMLC-VanEck J.P. Morgan EM Local Currency Bond ETF"><strong>EMLC</strong></a> (6.27%) and <a href="/link/f447bf0c04f64108a3dcff3ca025af4a.aspx" title=" EMBX-VanEck Emerging Markets Bond ETF"><strong>EMBX</strong></a> (5.73%) round out the EM debt presence, providing diversified exposure across local and hard currency bonds.</li>
<li class="mt-2"><strong>Fallen angels gain ground.</strong> <a href="/link/6278aaa8fa7e4afbb46e353ce2efd55f.aspx" title=" ANGL-VanEck Fallen Angel High Yield Bond ETF"><strong>ANGL</strong></a> climbs to 6.75%, a notable move from last month's 6.13%, offering exposure to downgraded investment-grade bonds, a segment that has historically combined attractive income with improving credit profiles. See our latest analysis on the <a href="/us/en/blogs/income-investing/attractive-setup-in-fallen-angels-7-yield-and-new-downgrades/" title=" Attractive Setup in Fallen Angels: 7% Yield and New Downgrades"><strong>attractive setup for fallen angels</strong></a> heading into Q2.</li>
</ul>
<p><i><sup><strong>*</strong></sup><strong>&nbsp;Top performers are shown for information only; nothing herein should be construed as investment advice or recommendations. Other funds may have performed differently during the same period. Yield alone should not be the basis for an investment decision.</strong></i></p>
<h3>VanEck&rsquo;s Top Income-focused ETFs<sup>*</sup></h3>
<p><i>Ranked by current 30-Day SEC yield (as of April 8, 2026).</i></p>
<div class="wrapped-div">
<table style="width: 100%;">
<tbody>
<tr class="tbl-data">
<td class="tbl-header last text-left">Ticker</td>
<td class="tbl-header last text-left">Fund Name</td>
<td class="tbl-header last text-right">30 Day SEC Yield (%)</td>
</tr>
<tr class="tbl-data">
<td class="data-td last text-left"><a href="/link/b1c9e5d0029f41e1b5a5869303671518.aspx"><strong>MORT</strong></a></td>
<td class="data-td last text-left font-weight-bold"><a href="/link/b1c9e5d0029f41e1b5a5869303671518.aspx"><strong>VanEck Mortgage REIT Income ETF</strong></a></td>
<td class="data-td last text-right font-weight-normal">13.58</td>
</tr>
<tr class="tbl-data">
<td class="data-td last text-left"><a href="/link/c48bed1be12e47c88f01e1bdbfa51ed2.aspx"><strong>BIZD</strong></a></td>
<td class="data-td last text-left font-weight-bold"><a href="/link/c48bed1be12e47c88f01e1bdbfa51ed2.aspx"><strong>VanEck BDC Income ETF</strong></a></td>
<td class="data-td last text-right font-weight-normal">9.19</td>
</tr>
<tr class="tbl-data">
<td class="data-td last text-left"><a href="/link/b572cc2d2799458eb526924e28c41513.aspx"><strong>HYEM</strong></a></td>
<td class="data-td last text-left font-weight-bold"><a href="/link/b572cc2d2799458eb526924e28c41513.aspx"><strong>VanEck Emerging Markets High Yield Bond ETF</strong></a></td>
<td class="data-td last text-right font-weight-normal">7.23</td>
</tr>
<tr class="tbl-data">
<td class="data-td last text-left"><a href="/link/6278aaa8fa7e4afbb46e353ce2efd55f.aspx"><strong>ANGL</strong></a></td>
<td class="data-td last text-left font-weight-bold"><a href="/link/6278aaa8fa7e4afbb46e353ce2efd55f.aspx"><strong>VanEck Fallen Angel High Yield Bond ETF</strong></a></td>
<td class="data-td last text-right font-weight-normal">6.75</td>
</tr>
<tr class="tbl-data">
<td class="data-td last text-left"><a href="/link/90451e6acf204dae87d1c8a31d9db407.aspx"><strong>PFXF</strong></a></td>
<td class="data-td last text-left font-weight-bold"><a href="/link/90451e6acf204dae87d1c8a31d9db407.aspx"><strong>VanEck Preferred Securities ex Financials ETF</strong></a></td>
<td class="data-td last text-right font-weight-normal">6.51</td>
</tr>
<tr class="tbl-data">
<td class="data-td last text-left"><a href="/link/98c7fd49bdbc456294a1eb859ad166f7.aspx"><strong>EMLC</strong></a></td>
<td class="data-td last text-left font-weight-bold"><a href="/link/98c7fd49bdbc456294a1eb859ad166f7.aspx"><strong>VanEck J.P. Morgan EM Local Currency Bond ETF</strong></a></td>
<td class="data-td last text-right font-weight-normal">6.27</td>
</tr>
<tr class="tbl-data">
<td class="data-td last text-left"><a href="/link/d2f16468a9f14c1e807f6bb7fb597a3e.aspx"><strong>CLOB</strong></a></td>
<td class="data-td last text-left font-weight-bold"><a href="/link/d2f16468a9f14c1e807f6bb7fb597a3e.aspx"><strong>VanEck AA-BB CLO ETF</strong></a></td>
<td class="data-td last text-right font-weight-normal">6.18</td>
</tr>
<tr class="tbl-data">
<td class="data-td last text-left"><a href="/link/fc018123f20d4f45aaf6b338189ae326.aspx"><strong>XMPT</strong></a></td>
<td class="data-td last text-left font-weight-bold"><a href="/link/fc018123f20d4f45aaf6b338189ae326.aspx"><strong>VanEck CEF Muni Income ETF</strong></a></td>
<td class="data-td last text-right font-weight-normal">6.07</td>
</tr>
<tr class="tbl-data">
<td class="data-td last text-left"><a href="/link/15cb9790ecaa4875aae7f1e3bd279b9f.aspx"><strong>IHY</strong></a></td>
<td class="data-td last text-left font-weight-bold"><a href="/link/15cb9790ecaa4875aae7f1e3bd279b9f.aspx"><strong>VanEck International High Yield Bond ETF</strong></a></td>
<td class="data-td last text-right font-weight-normal">6.07</td>
</tr>
<tr class="tbl-data">
<td class="data-td last text-left"><a href="/link/f447bf0c04f64108a3dcff3ca025af4a.aspx"><strong>EMBX</strong></a></td>
<td class="data-td last text-left font-weight-bold"><a href="/link/f447bf0c04f64108a3dcff3ca025af4a.aspx"><strong>VanEck Emerging Markets Bond ETF</strong></a></td>
<td class="data-td last text-right font-weight-normal">5.73</td>
</tr>
</tbody>
</table>
</div>
<p class="chart-disclosure"><strong>The performance data quoted represents past performance. Past performance is not a guarantee of future results. Investment return and principal value of an investment will fluctuate so that an investor's shares, when redeemed, may be worth more or less than their original cost. Performance may be lower or higher than performance data quoted. Please call 800.826.2333, or for performance current to the most recent month end, visit: <a href="https://www.vaneck.com/us/en/education/investment-ideas/income-ideas/#ETF-Performance" title="Income Investing Yield Monitor - ETF Performance">https://www.vaneck.com/us/en/education/investment-ideas/income-ideas/#ETF-Performance</a></strong></p>


<p>To receive more <a href="/us/en/blogs/income-investing/" title="Income Investing Insights"><strong>Income Investing</strong></a> insights, <a href="/link/5f45412c2143400497908cea2897f7d3.aspx" title=" Subscription Center"><strong>sign up in our subscription center</strong></a>.</p>
]]></content:encoded>
</item><item rdf:about="https://www.vaneck.com/us/en/blogs/emerging-markets-equity/why-vietnam-stands-out-in-em-right-now/">
  <title>Why Vietnam Stands Out in EM Right Now></title>
  <link>https://www.vaneck.com/us/en/blogs/emerging-markets-equity/why-vietnam-stands-out-in-em-right-now/</link>
  <description><![CDATA[Vietnam offers above-peer earnings growth, an attractive valuation, and credible catalysts in index reclassification and manufacturing expansion. VNM provides one-trade access to this opportunity.]]></description>
  <dc:creator>Sunny  Bokhari</dc:creator>
  <dc:date>04/13/2026 06:30:00</dc:date>
<content:encoded><![CDATA[

<p><strong>Key Takeaways:</strong></p>
<ul class="content-list">
<li class="mt-2">Vietnam is growing faster than EM peers yet still trades at a discount. Consensus expects roughly 20% EPS growth in 2026 at an attractive valuation.</li>
<li class="mt-2">FTSE Russell reclassification to Secondary Emerging Market status begins September 2026. MSCI inclusion could follow, potentially unlocking $25 billion in equity inflows by 2030.</li>
<li class="mt-2">Vietnam's manufacturing rise reflects years of real investment. Apple and Samsung have made it a primary production hub, not just a tariff workaround.</li>
</ul>
<p class="chart-disclosure">Index performance is not illustrative of fund performance. It is not possible to invest directly in an index. Past performance is no guarantee of future results. This material is for informational purposes only and is not investment advice or a recommendation. Views and forecasts are subject to change and may not be realized.</p>
<h2>Vietnam&rsquo;s High Growth Without a High Multiple</h2>
<p>Vietnam's GDP grew 7.83% year on year in Q1 2026<sup>1</sup>&nbsp;exceeding expectations even as rising oil prices weighed on growth across EM Asia. Foreign direct investment, manufacturing export momentum, and domestic consumption have continued to support Vietnam&rsquo;s economy through the energy shock, demonstrating the resilience of Vietnam's growth relative to its peers.</p>
<p>Market consensus expects approximately 20% EPS growth in Vietnam in 2026, driven by broad-based consumption gains supported by ongoing tax reforms.<sup>2</sup>&nbsp;Yet Vietnam still trades at a discount to EM Asia peers, placing it near the upper end of the region's growth rankings at one of its more attractive valuations. That combination of above-peer earnings growth and below-peer valuation is increasingly difficult to find in global markets today.</p>
<h3>Vietnam Stocks look attractive vs. Asian Peers</h3>
<p><img loading="lazy" class="desktop-image img-responsive" src="https://www.vaneck.com/contentassets/956e29a5de5c4e4f9792ee77b1a3a5c3/7134_vnm-blog_chart-1_2026-04_v1_desktop.svg" alt="Vietnam Stocks look attractive vs. Asian PeersVietnam Stocks look attractive vs. Asian Peers" /></p>
<p><img loading="lazy" class="mobile-image img-responsive" src="https://www.vaneck.com/contentassets/956e29a5de5c4e4f9792ee77b1a3a5c3/7134_vnm-blog_chart-1_2026-04_v1_mobile.svg" alt="Vietnam Stocks look attractive vs. Asian Peers" /></p>
<p class="chart-disclosure">Source: Bloomberg. Consensus estimate data based on MSCI Indices. Data as of 3/31/2026.</p>

<p>MarketVector<sup>&trade;</sup>&nbsp;Vietnam Local Index (MVVNMLTR) returned approximately 64% in 2025, fueled by a rally in Vietnamese equities ahead of FTSE Russell's October 2025 confirmation of Vietnam's Secondary Emerging Market status. Despite that run, Vietnam continues to trade at a discount to EM peers even as earnings expectations have moved higher.</p>
<h2>Structural Tailwinds of Vietnam</h2>
<p>Three structural pillars support the case for Vietnam going forward, each of which we have covered in prior research.</p>
<ol class="content-list" start="1">
<li class="mt-2" style="font-weight: bold;"><strong>Index Inclusion for Vietnam</strong></li>
</ol>
<p style="margin-left: .25in;">FTSE Russell confirmed on April 7th, 2026 that Vietnam&rsquo;s reclassification from Frontier to Secondary Emerging Market status, is on track, with inclusion in global equity indices commencing September 2026.<sup>3</sup>&nbsp;Vietnam's government moved quickly on the global broker access requirement, allowing foreign investors to place orders via international brokerages without opening onshore accounts and expanding the stock universe eligible for non-prefunding trades.<sup>4</sup></p>
<p style="margin-left: .25in;">These reforms satisfied FTSE's interim review requirements and may also improve Vietnam's standing in MSCI's Global Market Accessibility assessment, particularly in "Clearing and Settlement" and "Investor Registration and Account Setup&rdquo;, two criteria evaluated in MSCI's June 2026 EM Watchlist review. While it&rsquo;s unclear if this will continue, countries that have historically been added to the MSCI EM Watchlist have seen a 15&ndash;60% rally in the following 24 months.<sup>2</sup>&nbsp;Reclassification is also likely to spur broader upgrades to market infrastructure including settlement, clearing, and global broker connectivity, enabling wider institutional access over time.</p>
<ol class="content-list" start="2">
<li style="font-weight: bold;"><strong>Vietnam Has Become a Production Destination</strong></li>
</ol>
<p style="margin-left: .25in;">Vietnam has emerged as the preferred destination for companies diversifying production out of China, supported by competitive labor costs, geographic proximity to China, a young workforce, and an expanding network of free trade agreements. Electronics exports reached nearly $108 billion in 2025, placing Vietnam among the world's top 10 exporters in the sector.<sup>5</sup></p>
<p style="margin-left: .25in;">Apple now sources most of its U.S.-bound electronics from Vietnam, and Samsung produces roughly half of its smartphones there.<sup>6</sup>&nbsp;This is not a tariff-driven adjustment, it reflects years of investment in manufacturing capacity, infrastructure, and workforce development.<sup>7</sup></p>
<ol class="content-list" start="3">
<li class="mt-2" style="font-weight: bold;"><strong>Vietnam&rsquo;s Market and Policy Reforms</strong></li>
</ol>
<p style="margin-left: .25in;">Vietnam's government is enacting structural reforms designed to deepen the private sector and improve the investment climate. Policymakers are targeting private sector contribution to GDP of 60&ndash;70% by 2030, up from approximately 50% today, through initiatives to remove regulatory barriers, protect private property rights, and ensure fair competition.<sup>8</sup></p>
<p style="margin-left: .25in;">On the fiscal side, public investment as a percentage of GDP has reached its highest level since 2012, with more than $160 billion allocated to nationwide transportation infrastructure, and new international financial centers in Ho Chi Minh City and Da Nang designed to attract global investment.<sup>9</sup></p>
<p style="margin-left: .25in;">New tax reforms in 2026 reduce the corporate tax burden on small and medium enterprises and lower personal income taxes for households, both measures intended to stimulate investment and consumption. Together, these policies reinforce the government's 10% economic growth target for 2026.<sup>9</sup></p>
<h3>Vietnam&rsquo;s Public Investment as % of GDP</h3>
<p><img loading="lazy" class="desktop-image img-responsive" src="https://www.vaneck.com/contentassets/fb38e1d0f9fa48c3adc30cb1ec8aca78/7134_vnm-blog_chart-2_2026-04_v1_desktop.svg" alt="Vietnam&rsquo;s Public Investment as % of GDP" /></p>
<p><img loading="lazy" class="mobile-image img-responsive" src="https://www.vaneck.com/contentassets/fb38e1d0f9fa48c3adc30cb1ec8aca78/7134_vnm-blog_chart-2_2026-04_v1_mobile.svg" alt="Vietnam&rsquo;s Public Investment as % of GDP" /></p>
<p class="chart-disclosure">Source: CEIC Data, J.P. Morgan</p>
<h2>Investing in Vietnam</h2>
<p><a href="/link/ee96cb0806fb4d03bc33aa404ce73c2b.aspx" title=" VNM-VanEck Vietnam ETF"><strong>VanEck Vietnam ETF (VNM)</strong></a> is the largest and most liquid U.S.-listed Vietnam ETF, providing investors with one-trade access to the Vietnamese equity market.<sup>10</sup>&nbsp;<a href="/link/ee96cb0806fb4d03bc33aa404ce73c2b.aspx" title=" VNM-VanEck Vietnam ETF"><strong>VNM</strong></a> offers exposure to a market defined by strong earnings momentum, ongoing capital market reforms, and credible catalysts for continued re-rating, while remaining under-owned relative to its potential weight in global portfolios.</p>

<p>To receive more <a href="/us/en/insights/emerging-markets-equity/" title="Emerging Markets Equity Insights"><strong>Emerging Markets Equity</strong></a> insights, <a href="/us/en/subscribe/" title="Subscription Center"><strong>sign up in our subscription center</strong></a>.</p>
]]></content:encoded>
</item><item rdf:about="https://www.vaneck.com/us/en/blogs/municipal-bonds/munis-in-focus-a-q1-2026-recap/">
  <title>Munis in Focus: A Q1 2026 Recap></title>
  <link>https://www.vaneck.com/us/en/blogs/municipal-bonds/munis-in-focus-a-q1-2026-recap/</link>
  <description><![CDATA[Q1 2026 threw a lot at investors: geopolitical tension, rate volatility, and macro uncertainty. Here&rsquo;s why municipal bonds held up, and why the setup heading into Q2 may be even more compelling.]]></description>
  <dc:creator>Drew  Anderson</dc:creator>
  <dc:date>04/13/2026 06:30:00</dc:date>
<content:encoded><![CDATA[

<p><strong>Key Takeaways</strong></p>
<ul class="content-list">
<li>Despite a noisy Q1, high-quality munis continued to pay investors their interest and principal as intended.</li>
<li class="mt-2">Muni yields rose faster than Treasuries in Q1, pushing the 30-year muni/Treasury ratio to near two-year highs, up over 2 points since year-end.</li>
<li class="mt-2">Credit quality remains excellent with state tax collections still running 10%+ higher in key states. This is a rate story, not a credit story.</li>
</ul>
<h2>What Happened to Municipal Bonds in Q1 2026?</h2>
<p>Hard to believe the first quarter is already behind us. And what a quarter it was: geopolitical conflict in the Middle East, another government shutdown, questions around Fed independence, and ongoing noise around AI investment valuations. Markets had a lot to digest in a short amount of time.</p>
<p>Through all of it, high-quality investment-grade municipal bonds did what they&rsquo;re supposed to do: they kept paying investors their interest and principal. That&rsquo;s not a small thing when the rest of the market is dealing with elevated volatility across nearly every asset class.</p>
<h2>Muni Yields Moved. And That&rsquo;s Actually Good News</h2>
<p>Here&rsquo;s what&rsquo;s worth paying attention to from a positioning standpoint heading into Q2. Municipal yields didn&rsquo;t just move in Q1. They moved more than Treasuries. The 10-year AAA muni rose 30 basis points since the start of the year, nearly double the move in the 10-year Treasury over the same period. That kind of relative underperformance in price terms is frustrating if you&rsquo;re already in, but for advisors looking to put money to work, it created a better entry point than we started the year with.</p>
<h3>Ten Year Look Back on AAA Munis</h3>
<p><img loading="lazy" class="desktop-image img-responsive" src="https://www.vaneck.com/contentassets/cc810934453a4bf8bb00bc01cf1e7dcc/7123_q1-muni-recap-blog_chart-1_2026-04_v1_desktop.svg" alt="Ten Year Look Back on AAA Munis" /></p>
<p><img loading="lazy" class="mobile-image img-responsive" src="https://www.vaneck.com/contentassets/cc810934453a4bf8bb00bc01cf1e7dcc/7123_q1-muni-recap-blog_chart-1_2026-04_v1_mobile.svg" alt="Ten Year Look Back on AAA Munis" /></p>
<p class="chart-disclosure">Source: ICE Indices. As of 3/31/26.</p>
<p>At current levels, the 30-year muni/Treasury ratio has climbed over 2 percentage points since year-end and is now near its highest levels in two years. In plain English, munis are cheap relative to Treasuries right now, and history suggests that when ratios get elevated like this, it has tended to be a favorable time to add exposure.</p>
<p>The institutional community is noticing. Major fixed income desks are characterizing this as a meaningfully improved entry point, with some now actively calling for more muni exposure heading into Q2.</p>
<h3>Muni Yields Rising vs Treasuries &ndash; Since 2024</h3>
<p><img loading="lazy" class="desktop-image img-responsive" src="https://www.vaneck.com/contentassets/bcd288052e744baa80b0209854b1ec1a/7123_q1-muni-recap-blog_chart-2_2026-04_v1_desktop.svg" alt="Muni Yields Rising vs Treasuries &ndash; Since 2024" /></p>
<p><img loading="lazy" class="mobile-image img-responsive" src="https://www.vaneck.com/contentassets/bcd288052e744baa80b0209854b1ec1a/7123_q1-muni-recap-blog_chart-2_2026-04_v1_mobile.svg" alt="Muni Yields Rising vs Treasuries &ndash; Since 2024" /></p>
<p class="chart-disclosure">Source: ICE Indices. As of 3/31/26.</p>
<h2>Is This a Credit or Rate Problem for Municipal Bonds?</h2>
<p>One thing worth emphasizing for advisors: the Q1 selloff was driven by rates, not credit. State and local tax collections are still running more than 10% higher in key states, which means the underlying fiscal health of muni issuers remains solid. That distinction matters a lot. It means you&rsquo;re not being asked to take on additional credit risk to capture this opportunity. You&rsquo;re simply being offered better prices on the same high-quality bonds because the broader rate environment moved against them. That&rsquo;s a cleaner setup than most fixed income entry points you get.</p>
<h3>National State and Local Tax Revenue</h3>
<p><img loading="lazy" class="desktop-image img-responsive" src="https://www.vaneck.com/contentassets/2fe02346d6524a51b83d040b5097d0bd/7123_q1-muni-recap-blog_chart-3_2026-04_v1_desktop.svg" alt="National State and Local Tax Revenue" /></p>
<p><img loading="lazy" class="mobile-image img-responsive" src="https://www.vaneck.com/contentassets/2fe02346d6524a51b83d040b5097d0bd/7123_q1-muni-recap-blog_chart-3_2026-04_v1_mobile.svg" alt="National State and Local Tax Revenue" /></p>
<p class="chart-disclosure">Source: U.S. Census Bureau via FRED. As of March 12, 2026.</p>

<h2>What Is the Taxable Equivalent Yield on Municipal Bonds in 2026?</h2>
<p>For clients in the top federal bracket, factoring in the 37% rate plus the 3.8% net investment income tax &mdash; a 4.00% tax-exempt yield translates to roughly a 6.75% taxable equivalent yield. Push out to the 20-year part of the curve and the TEY climbs toward 7%. That&rsquo;s not a reach-for-yield trade. That&rsquo;s investment-grade, tax-exempt income at levels that are genuinely competitive with the taxable market.</p>
<p>With the SALT deduction cap now raised to $40,000 under last year&rsquo;s legislation, some of the deduction-driven urgency around munis has moderated for upper-middle earners. But for clients in the 37% bracket, particularly those in high-tax states, the after-tax math on munis versus taxable alternatives remains a compelling conversation.</p>
<h2>Muni Fund Flows Signal About Demand</h2>
<p>Seventeen consecutive weeks of fund inflows into the muni space is not noise. That&rsquo;s a sustained, deliberate rotation by advisors and their clients. Demand has been consistent even as yields have risen and supply has been heavy. That&rsquo;s a constructive signal.</p>
<h3>Municipal Bond Fund Flows &ndash; Since 2025</h3>
<p><img loading="lazy" class="desktop-image img-responsive" src="https://www.vaneck.com/contentassets/f7d17f05c80946b588f78dff8f0fcc7d/7123_q1-muni-recap-blog_chart-4_2026-04_v1_desktop.svg" alt="Municipal Bond Fund Flows &ndash; Since 2025" /></p>
<p><img loading="lazy" class="mobile-image img-responsive" src="https://www.vaneck.com/contentassets/f7d17f05c80946b588f78dff8f0fcc7d/7123_q1-muni-recap-blog_chart-4_2026-04_v1_mobile.svg" alt="Municipal Bond Fund Flows &ndash; Since 2025" /></p>
<p class="chart-disclosure">Source: Morningstar. As of February 28, 2026. Flows calculated from both Mutual Funds and ETFs.</p>
<p>On the supply side, Q1 came in roughly on pace with last year at around $120 billion. Some forecasters who projected a record 2026 for issuance are starting to revise those numbers lower, largely because higher rates tend to dampen refunding activity. Slower supply growth against steady demand is generally a supportive backdrop for prices heading into Q2.</p>
<h2>Municipal Bond Outlook: Where Do We Go From Here?</h2>
<p>Rate forecasting is always a tricky exercise, and the current macro environment makes it even harder. Forward markets are currently pricing in no Fed changes through the end of 2026, but with the conflict in Iran still unresolved, and the Strait of Hormuz very much in the conversation, oil markets, inflation expectations, and the Fed&rsquo;s next move are all in play. What we do know is that current yields offer an attractive entry point for investors willing to extend duration, and the steep muni curve between 10 and 20 years continues to reward that decision with meaningful additional carry.</p>
<p>For advisors with clients sitting on cash or underweight fixed income, Q1 gave you a better entry point than January 1st did. That&rsquo;s not nothing, especially when quality, tax-exempt income gives you somewhere to be while the picture clarifies.</p>
<p>To receive more <a href="https://www.vaneck.com/us/en/insights/municipal-bonds/" title="Municipal Bonds Insights"><strong>Municipal Bonds</strong></a> insights, <a href="/link/5f45412c2143400497908cea2897f7d3.aspx" title=" Subscription Center"><strong>sign up in our subscription center</strong></a>.</p>
]]></content:encoded>
</item><item rdf:about="https://www.vaneck.com/us/en/blogs/investment-outlook/jan-van-eck-q2-2026-outlook-the-reset-is-your-entry-point/">
  <title>Q2 2026 Outlook: The Reset Is Your Entry Point></title>
  <link>https://www.vaneck.com/us/en/blogs/investment-outlook/jan-van-eck-q2-2026-outlook-the-reset-is-your-entry-point/</link>
  <description><![CDATA[After Q1 volatility, AI monetization, credit repricing and fiscal risks are shaping a more selective but opportunity-rich environment for investors.]]></description>
  <dc:creator>Jan van Eck</dc:creator>
  <dc:date>04/13/2026 06:30:00</dc:date>
<content:encoded><![CDATA[

<p><strong>Key Takeaways:</strong></p>
<ul class="content-list">
<li class="mt-2">Corporate adoption is driving the next phase of AI growth and monetization.</li>
<li class="mt-2">Semiconductor demand remains strong as AI capex continues.</li>
<li class="mt-2">Private credit markets are pricing in stress not supported by current fundamentals, creating opportunity.</li>
<li class="mt-2">Fiscal risks are rising again, reinforcing the need for portfolio hedges like gold.</li>
<li class="mt-2">India remains a long-term growth opportunity, while bitcoin is mixed near term but constructive long term.</li>
</ul>
<h2>Watch Video: Thoughtful Money with Jan van Eck</h2>
<p>After a volatile start to the year, several areas of the market have reset, creating more attractive opportunities in Q2. While macro conditions remain broadly supportive, the opportunity set is increasingly driven by selectivity rather than broad exposure.</p>

<h2>AI Compute and Semiconductor Demand Still Underestimated</h2>
<p>The most important development this quarter is a shift in how AI is being monetized.</p>
<p>While early adoption was driven by consumers, the data now clearly shows that corporate America is opening its wallet. Companies are increasingly willing to invest heavily in AI due to the productivity gains it delivers, often completing tasks in minutes that previously took days.</p>
<p>We are seeing this firsthand at VanEck. Our own token usage has scaled to billions per day following enterprise rollouts of ChatGPT and Claude, offering a real-world example of how quickly these tools are being embedded into workflows.</p>
<p><img loading="lazy" class="desktop-image img-responsive" src="https://www.vaneck.com/EPiServer/CMS/Content/contentassets/9d22459952ea4827a981b42d62cdbbf2/claude_api_tokens_desktop_1_previewfixed2.svg,,371512/Download?epieditmode=False" alt="AI Compute and Semiconductor Demand Still Underestimated" /></p>
<p><img loading="lazy" class="mobile-image img-responsive" src="https://www.vaneck.com/EPiServer/CMS/Content/contentassets/9d22459952ea4827a981b42d62cdbbf2/claude_api_tokens_mobile_1_previewfixed2.svg,,371514/Download?epieditmode=False" alt="AI Compute and Semiconductor Demand Still Underestimated" /></p>
<p class="chart-disclosure"><strong>Source: VanEck. Data as of April 2026.</strong> Any projections and forward-looking statements herein are for illustrative purposes only, reflect current views as of this date, are subject to change without notice, and are not necessarily those of VanEck or its other employees. Nothing herein should be construed as investment advice, a recommendation, or a call to action. Digital assets involve significant risk and may not be suitable for all investors. Investing involves risk, including possible loss of principal. There is no guarantee any strategy will achieve its objectives, and diversification does not ensure a profit or protect against loss. Historical data only. Past performance is no guarantee of future results.</p>
<p>This combination of rising adoption alongside improving efficiency helps explain why total AI spending continues to grow. Even as costs per unit fall, the number of use cases and users is expanding rapidly.</p>
<p>Despite this, markets remain skeptical that current levels of capital expenditure can continue over the longer term. We believe that skepticism may be misplaced. Companies are unlikely to cut spending on a technology that delivers clear efficiency gains.</p>
<p>As a result, semiconductors remain a high-conviction area, with markets potentially underestimating the durability of AI-driven demand</p>
<h2>Private Credit Fear vs. Reality</h2>
<p>Private credit continues to dominate headlines, but the underlying data tells a more measured story.</p>
<p>Default rates remain relatively low, and the broader U.S. economy remains resilient. Yet many business development companies (BDCs) are trading at discounts that imply significantly higher levels of stress than current fundamentals would suggest.</p>
<p>This disconnect creates opportunity. Publicly traded BDCs benefit from structural advantages, such as the absence of forced selling, which make them more resilient than many investors assume.</p>
<p>At the same time, the valuation reset has extended to the managers themselves. Firms such as Ares and Blue Owl, which previously traded at elevated multiples, now appear far more reasonably valued relative to their long-term earnings potential.</p>
<h2>Hedge Fiscal Uncertainty with Gold</h2>
<p>While the fiscal outlook had been improving, new spending proposals have reintroduced uncertainty. Higher deficits could place upward pressure on long-term interest rates, which would have broad implications for financial markets. This is one of the key risks we are monitoring closely.</p>
<p>Gold remains a critical hedge in this environment. Importantly, its long-term drivers extend beyond inflation or short-term geopolitical events. Instead, gold is supported by global wealth growth and a gradual shift away from reliance on the U.S. dollar.</p>
<p>Short-term volatility, such as recent selling tied to energy price shocks, does not change this longer-term trend. We continue to view gold as a strategic allocation, particularly on pullbacks.</p>
<p>More broadly, commodity markets are also being shaped by geopolitical developments. In the near term, shifts in the <strong><a href="/link/269dfcc53b534682bd1a3a11c6d0542a.aspx" title="Commodity Strategies Diverge as Roll Yield Takes Over">futures curve into backwardation</a></strong> can create additional return drivers for investors, particularly through positive roll yield. However, these dynamics are cyclical and should be understood as part of a broader allocation strategy.</p>
<h2>India Remains Long-Term Opportunity Despite Volatility</h2>
<p>India continues to offer compelling long-term growth potential, even after a period of underperformance. Structural reforms, favorable demographics and rapid digital adoption remain intact. At the same time, the market is undergoing a period of adjustment, with traditional business models being disrupted and valuations becoming more attractive.</p>
<p>For long-term investors, this combination of structural growth and improved entry points remains compelling.</p>
<h2>Bitcoin Enters a More Complex Cycle</h2>
<p>Bitcoin&rsquo;s traditional four-year cycle appears to have shifted, creating a more nuanced near-term outlook. While past cycles were marked by sharp drawdowns following halving events, recent price behavior suggests a more range-bound environment. This may reflect broader institutional participation and lower volatility.</p>
<p>While the near-term outlook is mixed, the long-term case for adoption remains intact. Current levels may represent a more constructive entry point for investors with a longer horizon.</p>
<h2>Where to Allocate Now</h2>
<p>Following recent volatility, the investment landscape is offering more targeted opportunities, particularly in areas where fundamentals remain intact despite sentiment weakening and valuations pulling back.</p>
<p>For investors, Q2 is less about broad market direction and more about identifying where resets have created more attractive entry points.</p>
<ul class="content-list">
<li class="mt-2"><strong>Lean into AI and semiconductors </strong>as enterprise demand continues to drive sustained growth.</li>
<li class="mt-2"><strong>Consider adding exposure to BDCs and private credit managers</strong> after recent valuation resets.</li>
<li class="mt-2"><strong>Maintain gold as a portfolio hedge</strong> against rising fiscal risks and higher long-term rates.</li>
<li class="mt-2"><strong>Look to India for long-term growth</strong> as structural trends remain intact despite volatility.</li>
<li class="mt-2"><strong>Approach Bitcoin opportunistically</strong> at current levels with a long-term perspective.</li>
</ul>
<p>To learn more about how our Asset Allocation Committee is building portfolios in the current environment, watch this webinar replay: <strong><a href="https://www.vaneck.com/us/en/webinar-registration/?id=93073618635&amp;utm_source=vaneck&amp;utm_medium=calendar" title="A Macro Playbook for Market Volatility and Geopolitical Conflict">A Macro Playbook for Market Volatility and Geopolitical Conflict</a></strong>.</p>
<p>To receive more <a href="https://www.vaneck.com/us/en/insights/investment-outlook/" title="Investment Outlook Insights"><strong>Investment Outlook</strong></a> insights, <a href="/link/5f45412c2143400497908cea2897f7d3.aspx" title=" Subscription Center"><strong>sign up in our subscription center</strong></a>.</p>
]]></content:encoded>
</item><item rdf:about="https://www.vaneck.com/us/en/blogs/emerging-markets-bonds/what-the-iran-war-means-for-emerging-markets/">
  <title>What the Iran War Means for Emerging Markets></title>
  <link>https://www.vaneck.com/us/en/blogs/emerging-markets-bonds/what-the-iran-war-means-for-emerging-markets/</link>
  <description><![CDATA[The Iran war reshaped global dynamics, boosting EM commodities exporters and CNY as key anchors for emerging market stability.]]></description>
  <dc:creator>Eric Fine</dc:creator>
  <dc:date>04/10/2026 06:30:00</dc:date>
<content:encoded><![CDATA[

<strong>Key Takeaways</strong>
<ul class="content-list">
<li class="mt-2">The Iran conflict already has some permanent implications, elevating China, Latin America, much of Africa, while challenging the Gulf, and undermining Europe.</li>
<li class="mt-2">EM bonds proved resilient once initial war-driven volatility settled, mirroring the early-2025 tariff selloff pattern where EM ultimately rallied.</li>
<li class="mt-2"><strong><a href="/link/f447bf0c04f64108a3dcff3ca025af4a.aspx" title="EMBX - VanEck Emerging Markets Bond ETF - Overview">EMBX</a></strong> offers an attractive 30-day SEC yield of 5.6%.</li>
</ul>
<p>The <strong><a href="/link/f447bf0c04f64108a3dcff3ca025af4a.aspx" title="EMBX - VanEck Emerging Markets Bond ETF - Overview">VanEck Emerging Markets Bond ETF (EMBX)</a></strong> was down 4.18% in March, compared to -4.41% for its benchmark, the 50% J.P. Morgan Government Bond Index - Emerging Markets Global Diversified (GBI-EM) and 50% J.P. Morgan Emerging Markets Bond Index (EMBI) and down 3.11% for the Global Agg. Year to date <a href="/link/f447bf0c04f64108a3dcff3ca025af4a.aspx" title="EMBX - VanEck Emerging Markets Bond ETF - Overview"><strong>EMBX</strong></a> is down 0.90%, compared to -1.75% for its benchmark, and -1.09% for the Global Agg. We went into 2026 reducing some of our high beta EM local exposure, even raising cash early in the war. Before the war started, we went underweight all of MENA, and got completely out very early into the war, also in favor of cash (the MENA bonds remained stable until towards end-March). By end-March, we covered all of our underweights in high-beta local and reduced cash. Local currency exposure is higher at 52%, Carry is 6.84%, yield to worst is 9.29% and duration is 5.89.</p>

<h3 id="point-one" class="anchored-block jump-link-nav" data-jumplink-title="Performance Overview">EMBX Average Annual Total Returns<sup>*</sup>&nbsp;(%) (In USD)</h3>
<div class="wrapped-div">
<table style="width: 100%;">
<tbody>
<tr class="tbl-data">
<td class="tbl-header last text-left">Month End As of March 31, 2026</td>
<td class="tbl-header last text-right">1 Mo</td>
<td class="tbl-header last text-right">3 Mo</td>
<td class="tbl-header last text-right">YTD</td>
<td class="tbl-header last text-right">1 YR</td>
<td class="tbl-header last text-right">3 YR</td>
<td class="tbl-header last text-right">5 YR</td>
<td class="tbl-header last text-right">10 YR</td>
</tr>
<tr class="tbl-data">
<td class="data-td last text-left">EMBX (NAV)</td>
<td class="data-td data last text-right">-4.18</td>
<td class="data-td data last text-right">-0.89</td>
<td class="data-td data last text-right">14.20</td>
<td class="data-td data last text-right">9.28</td>
<td class="data-td data last text-right">4.43</td>
<td class="data-td data last text-right">4.95</td>
</tr>
<tr class="tbl-data">
<td class="data-td last text-left">EMBX (Market Price)</td>
<td class="data-td data last text-right">-3.78</td>
<td class="data-td data last text-right">-0.20</td>
<td class="data-td data last text-right">14.87</td>
<td class="data-td data last text-right">9.49</td>
<td class="data-td data last text-right">4.55</td>
<td class="data-td data last text-right">5.02</td>
</tr>
<tr class="tbl-data">
<td class="data-td last text-left">50% GBI-EM/50% EMBI</td>
<td class="data-td data last text-right">-4.41</td>
<td class="data-td data last text-right">-1.75</td>
<td class="data-td data last text-right">11.11</td>
<td class="data-td data last text-right">8.19</td>
<td class="data-td data last text-right">2.31</td>
<td class="data-td data last text-right">3.22</td>
</tr>
</tbody>
</table>
</div>
<div class="chart-disclosure">
<p><sup>*</sup>&nbsp;Returns less than one year are not annualized.</p>
<p><strong>The performance data quoted represents past performance. Past performance is not a guarantee of future results. Investment return and principal value of an investment will fluctuate so that an investor's shares, when redeemed, may be worth more or less than their original cost. Performance may be lower or higher than performance data quoted. Please call 800.826.2333 or visit vaneck.com for performance current to the most recent month ended.</strong></p>
<p>Prior to 10/06/2025, the Fund operated as the VanEck Emerging Markets Bond mutual fund; performance shown before that date is that fund&rsquo;s NAV performance (Class I, unadjusted for today&rsquo;s ETF expenses).</p>
<p>The "Net Asset Value" (NAV) of a Fund is determined at the close of each business day, and represents the dollar value of one share of the fund; it is calculated by taking the total assets of the fund, subtracting total liabilities, and dividing by the total number of shares outstanding. The NAV is not necessarily the same as the ETF 's intraday trading value. Investors should not expect to buy or sell shares at NAV.</p>
<p><strong>EMBX Total Expense Ratio &ndash; 0.76%.</strong> Van Eck Associates Corporation (the &ldquo;Adviser&rdquo;) will pay all expenses of the Fund, except for the fee payment under the investment management agreement, acquired fund fees and expenses, interest expense, offering costs, trading expenses, taxes and extraordinary expenses. Notwithstanding the foregoing, the Adviser has agreed to pay the offering costs until at least May 1, 2027. &ldquo;Other Expenses&rdquo; have been restated to reflect current fees.</p>
</div>

<p><strong>Some changes are probably irreversible, regardless of the war outcome.</strong> The Gulf (UAE, Saudi, Kuwait, Oman, Bahrain, etc.) is likely forever changed, economically and politically. These are all excellent credits by-and-large, with high reserves and liquidity, and with even more problematic Bahrain solidly backed by Saudi. Egypt, a big name outside the Gulf is a completely different situation, but who doesn&rsquo;t know that already. The problem for the Gulf from our perspective is that Gulf bonds are priced like the good credits they are, but the business model is being profoundly challenged, let&rsquo;s put it that way. So, it&rsquo;s not clear what exposure to the Gulf is really betting on &ndash; even a &ldquo;positive&rdquo; outcome (which is not straightforward to define) generates limited upside. Egypt is the only exception and we went long local currency during the last week of March after a major selloff. Political risk <em>inside</em> the Gulf should also be acknowledged as having risen, just as a matter of logic. Europe&rsquo;s energy access is profoundly challenged along with this. Political relations, of which Europe has few in the region, will be key. Pakistan, China, and Russia have new elevated status. The 5-point plan announced by China and Pakistan&rsquo;s foreign ministers in Islamabad over the last weekend of March is an important development; we remain stunned that it is getting little prominence in western media, though that probably strengthens our view. Your author enjoys his game theory and war-gaming, so feel free to reach out to us if you want to dig deep on this topic. The essence of the situation is that without a competing nuclear power, the Israel-Iran conflict (even or especially assuming USA fades) would have escalated inevitably. That inevitability is perhaps no more, with nuclear-armed Pakistan, and China, leading this new stage (Saudi, Turkey, and Egypt foreign ministers also attended). This was the real mark of a new stage in the war (one that we had been following as it developed&hellip;this is not &ldquo;out-of-the-blue&rdquo;). The fact that it appears unacknowledged only strengthens our view, these days. Latam and sub-saharan Africa gain greater importance, too, due to their commodity-exporting status. Asia faces headwinds, but CNY stability is an anchor. The US faces mostly political consequences, not economic.</p>
<h3>Exhibit 1 &ndash; China Government Bonds Stable, While US Treasuries Fall</h3>
<p><img loading="lazy" class="desktop-image img-responsive" alt="Exhibit 1 &ndash; China Government Bonds Stable, While US Treasuries Fall" src="https://www.vaneck.com/contentassets/2405993804c040acbb8c15fab504a279/7104-embx-monthly-chart-1_2026-4_v1_desktop.svg" /></p>
<p><img loading="lazy" class="mobile-image img-responsive" alt="Exhibit 1 &ndash; China Government Bonds Stable, While US Treasuries Fall" src="https://www.vaneck.com/contentassets/2405993804c040acbb8c15fab504a279/7104-embx-monthly-chart-1_2026-4_v1_mobile.svg" /></p>
<p class="chart-disclosure">Source: Bloomberg As of April 1, 2026. U.S. Treasuries: (FTSE 10-year US Treasuries Index); CGBs: (represented by The J.P. Morgan GBI-EM China Dollar Unhedged Index). Past performance is no guarantee of future results.</p>
<p><strong>But&hellip; Markets digested a lot of war news in March.</strong> There are clear signs that markets want to move on. The last Monday in March was a test. All the war-related news on popular media over the prior weekend was increasingly escalatory. Monday arrives and US Treasuries are finally stable, and Mexican peso is firm. Tuesday (March 31) and Wednesday (April 1) the path becomes clearer. You could say market and economic worries were also behind US efforts to off-ramp, although that is mind-reading. We should also note that emerging markets have many winners in a high-commodities price scenario, so our market has more to be excited about in any period of market stability. Pakistan and China are playing an important role in making any seemingly temporary stability more durable, as we argued above. We show the side-by-side exhibit (Exhibit 2) to compare major bond performances in the 2025 tariff rally, to the war-month of March. What we observe is that this war month of March 2026 saw similar underperformance of our EM bond benchmarks relative to US Treasuries or the Global Agg that we saw at the beginning of the 2025 rally &ndash; generalized &ldquo;market risk&rdquo; hit all bonds at first, only for emerging markets to re-assert once the dust settled.</p>
<h3>Exhibit 2 &ndash; War Sell-off Looks Like Early Part of 2025 When EM Ended Up Rallying</h3>
<div class="row">
<div class="col-md-6">
<p><img loading="lazy" class="desktop-image img-responsive" alt="Exhibit 2 &ndash; War Sell-off Looks Like Early Part of 2025 When EM Ended Up Rallying" src="https://www.vaneck.com/contentassets/35661fde393d4aa790792c7a580cf1ca/7104-embx-monthly-chart-2_2026-4_v1_desktop.svg" /></p>
<p><img loading="lazy" class="mobile-image img-responsive" alt="Exhibit 2 &ndash; War Sell-off Looks Like Early Part of 2025 When EM Ended Up Rallying" src="https://www.vaneck.com/contentassets/35661fde393d4aa790792c7a580cf1ca/7104-embx-monthly-chart-2_2026-4_v1_mobile.svg" /></p>
</div>
<div class="col-md-6">
<p><img loading="lazy" class="desktop-image img-responsive" alt="Exhibit 2 &ndash; War Sell-off Looks Like Early Part of 2025 When EM Ended Up Rallying" src="https://www.vaneck.com/contentassets/35661fde393d4aa790792c7a580cf1ca/7104-embx-monthly-chart-3_2026-4_v1_desktop.svg" /></p>
<p><img loading="lazy" class="mobile-image img-responsive" alt="Exhibit 2 &ndash; War Sell-off Looks Like Early Part of 2025 When EM Ended Up Rallying" src="https://www.vaneck.com/contentassets/35661fde393d4aa790792c7a580cf1ca/7104-embx-monthly-chart-3_2026-4_v1_mobile.svg" /></p>
</div>
</div>
<p class="chart-disclosure"><strong>Source: Bloomberg as of March 30, 2026.</strong> EMBX: VanEck Emerging Markets Bond ETF; EMLC: VanEck JP Morgan EM Local Currency Bond ETF; EMBUX: VanEck Emerging Markets Bond Fund, Class I (predecessor to EMBX); EMB: (50% J.P. Morgan Government Bond Index - Emerging Markets Global Diversified (GBI-EM) and 50% J.P. Morgan Emerging Markets Bond Index (EMBI)); U.S. Treasuries; Global Agg: (Bloomberg Global Aggregat). Index performance is not representative of fund performance. It is not possible to invest directly in an index. Fund performance current to the most recent month end is available by visiting vaneck.com or by calling 800.826.2333.</p>
<p><strong>What is the lesson, so far?</strong> As usual, the &ldquo;risk&rdquo; mostly applies to developed markets (Europe, Japan, UK, the US politically), with emerging markets having many winners and some losers. In fact, look at DM interest rates in March &ndash; they were the real losers from the Iran war with EM bonds simply collateral damage, accentuated by their major rally and inflows in 2025 through early 2026. EMs are not subject to &ldquo;fiscal dominance&rdquo;, so their central banks should and have maintained high real rates (we show Exhibit 3 as support, but it&rsquo;s an old story). And, &ldquo;geopolitical&rdquo; risk can boost EM. The instances are varied, but the key channels are commodities prices, new alliances, and use of each others&rsquo; currencies in trade but increasingly as reserve assets.</p>
<h3>Exhibit 3 &ndash; EM Real Policy Rates vs DM</h3>
<p><img loading="lazy" class="desktop-image img-responsive" alt="EM Real Policy Rates vs DM" src="https://www.vaneck.com/contentassets/55ab80f9eade4c41b0201f57bd09ca86/7104-embx-monthly-chart-4_2026-4_v1_desktop.svg" /></p>
<p><img loading="lazy" class="mobile-image img-responsive" alt="EM Real Policy Rates vs DM" src="https://www.vaneck.com/contentassets/55ab80f9eade4c41b0201f57bd09ca86/7104-embx-monthly-chart-4_2026-4_v1_mobile.svg" /></p>
<p class="chart-disclosure"><strong>Source: Bloomberg as of March 2026.</strong></p>

<h2 id="point-two" class="anchored-block jump-link-nav" data-jumplink-title="Exposure Types and Significant Changes">Exposure Types and Significant Changes</h2>
<p>The changes to our top positions are summarized below. Our largest positions in March were Brazil, South Africa, Poland, Colombia and Malaysia:</p>
<ul class="content-list">
<li class="mt-2">We increased our hard currency corporate exposure in Indonesia and China, as well as local currency exposure in China and Taiwan. The key theme here is relative &ldquo;insulation&rdquo; of these assets from the Middle East turbulence, with the resulting improvement of the technical test scores. China, in particular, is emerging as an island of stability among major EMs, with limited exposure to higher oil prices and a more advantageous geopolitical standing, which improved the technical, economic, and policy test scores for the country.</li>
<li class="mt-2">We also increased our hard currency sovereign exposure in Angola and the Republic of Congo, both of which stand to benefit from the higher price of oil, which is their main export. This relationship strengthened the technical test scores for both countries.</li>
<li class="mt-2">Finally, we increased our hard currency sovereign exposure in Uruguay, and local currency exposure in Chile, Peru, South Africa, Uganda, and Colombia. The key theme in this group is a big improvement in valuations and technicals after the Middle East-related turmoil and the resulting improvement in the technical test scores. Additional country-specific considerations included: (a) Chile&rsquo;s lagging EM peers despite having a market-friendly administration; (b) Peru&rsquo;s central bank deliberately standing on the sidelines and letting the steam off both in local rates and currency; (c) South Africa&rsquo;s central bank maintaining policy credibility after adopting a lower inflation target; and (d) Colombia&rsquo;s central bank frontloading rate hikes and the market being too pessimistic on the outcome of Colombia&rsquo;s presidential election.</li>
<li class="mt-2">We reduced our hard currency sovereign exposure in the United Arab Emirates, Saudi Arabia, Israel, Kuwait, Egypt, Morocco, and Oman. The key theme in this group was the regional proximity to the Middle East conflict, which significantly worsened the policy test scores for these countries. An additional consideration is that many of these bonds had long duration, which got hit due to higher oil prices, worsening the respective technical test scores.</li>
<li class="mt-2">We also reduced our hard currency sovereign duration in Turkey, Malaysia, and Sri Lanka, and local exposure in the Czech Republic, as these countries are particularly vulnerable if oil prices stay high for longer in the case of the protracted conflict in the Middle East. In terms of our investment process, this worsened the technical and economic test scores for this group.</li>
<li class="mt-2">Finally, we reduced our local currency exposure in Mexico and hard currency sovereign exposure in Bolivia. Bolivia&rsquo;s case was relatively benign &ndash; the country paid off 30% of the bond in question. Mexico&rsquo;s local bonds, however, looked overbought, which is a major disadvantage for a high-beta country during a major geopolitical conflict. These factors worsened the technical test score for Mexico.</li>
</ul>
<p>To receive more <a href="https://www.vaneck.com/us/en/insights/emerging-markets-bonds/" title="Emerging Markets Bonds Insights"><strong>Emerging Markets Bonds</strong></a> insights, <a href="/link/5f45412c2143400497908cea2897f7d3.aspx" title=" Subscription Center"><strong>sign up in our subscription center</strong></a>.</p>
]]></content:encoded>
</item><item rdf:about="https://www.vaneck.com/us/en/blogs/income-investing/attractive-setup-in-fallen-angels-7-yield-and-new-downgrades/">
  <title>Attractive Setup in Fallen Angels: 7% Yield and New Downgrades></title>
  <link>https://www.vaneck.com/us/en/blogs/income-investing/attractive-setup-in-fallen-angels-7-yield-and-new-downgrades/</link>
  <description><![CDATA[Two large fallen angels entered the index in Q1, including Paramount at 10% weight. Yields back above 7% and a historically wide price discount may signal a compelling entry point.]]></description>
  <dc:creator>Nicolas  Fonseca, CFA</dc:creator>
  <dc:date>04/10/2026 06:30:00</dc:date>
<content:encoded><![CDATA[

<p><strong>Key Takeaways:</strong></p>
<ul class="content-list">
<li class="mt-2">Wider spreads have driven fallen angel yields above 7%, their highest levels since mid-2025. Yields versus broad high yield have narrowed significantly, with <a href="/link/6278aaa8fa7e4afbb46e353ce2efd55f.aspx" title="ANGL - VanEck Fallen Angel High Yield Bond ETF"><strong>ANGL</strong></a>, yielding 6.73%<sup>*</sup>.</li>
<li class="mt-2">Two large fallen angels entered the index in Q1 2026: Paramount and FS KKR, together adding more than 15% in market value and reshaping sector exposure.</li>
<li class="mt-2">Fallen angels underperformed high yield by 0.76% in Q1 2026, as geopolitical-driven spread widening in March erased gains built through February.</li>
</ul>
<p id="point-one" class="anchored-block jump-link-nav" data-jumplink-title="Q1 2026 Update">Fallen angels underperformed the broad high yield market by 0.76% in Q1 2026 (-1.31% vs. -0.55%), driven by market volatility in March. Through February, fallen angels were outperforming. However, geopolitical tension in the Middle East drove fallen angel spreads wider by 49bps in a single month vs. only 16bps for broad high yield, and the longer duration profile amplified the move. Despite the drawdown, for investors looking at high yield allocations, yields above 7% combined with a historically wide price discount make this a moment worth paying attention to. Further, the differential in yields between fallen angels and the broad market has tightened. Given the significantly higher average credit quality of fallen angels, we believe fallen angels look relatively attractive.</p>
<h3>Q1 2026 Total Returns</h3>
<p><img loading="lazy" class="desktop-image img-responsive" src="https://www.vaneck.com/EPiServer/CMS/Content/contentassets/c01d238c34374d8ab1b74385448dcbea/7107_angl-april-blog_chart-1_2026-4_v1_desktop.svg,,370928/Download?epieditmode=False" alt="Q1 2026 Total Returns" /></p>
<p><img loading="lazy" class="mobile-image img-responsive" src="https://www.vaneck.com/EPiServer/CMS/Content/contentassets/c01d238c34374d8ab1b74385448dcbea/7107_angl-april-blog_chart-1_2026-4_v1_mobile.svg,,370929/Download?epieditmode=False" alt="Q1 2026 Total Returns" /></p>
<p class="chart-disclosure">Source: ICE Data Services, VanEck. Fallen Angels: ICE US Fallen Angel High Yield 10% Constrained Index.; Broad HY: ICE BofA US High Yield Index. Past performance is no guarantee of future results. Index performance is not representative of strategy performance. It is not possible to invest directly in an index.</p>
<p>Looking ahead into the remainder of the year, fallen angel yields of north of 7% provide attractive income levels as they are now above the 1Y, 3Y, 5Y, 10Y and since December 2003 average. We continue to expect returns for the remainder of the year to be driven more by carry and interest rate movements, as spreads, despite widening to end the quarter, are still relatively tight but have been getting closer to their 10Y average. A significant increase in fallen angel activity, however, could drive total returns higher and the recent uptick in downgrade volume may indicate increased probability of this upside scenario. Just in the first days of April, S&amp;P downgraded Centene (approximately $14bn of par amount in the investment grade index) to BB+ from BBB-, stating that it faces structural challenges in its Medicaid and Affordable Care Act product segments which may result in earnings risks. Nevertheless, market stress whether from geopolitics or broader private credit concerns, poses potential downside risk.</p>
<p id="point-two" class="anchored-block jump-link-nav" data-jumplink-title="Overall Statistics"><strong>Fallen Angels Overall Statistics:</strong> Credit spreads were relatively flat in January and February but widened in March as geopolitical tensions in the Middle East escalated, pushing rates and spreads higher. Q1 2026 was the worst quarter for high yield total returns since Q3 2022, as wider spreads and higher rates delivered a dual headwind across the market. Fallen angel spreads widened 60bps in Q1 while broad high yield spreads ended 47bps wider than at the end of last year. The significant difference occurred in March, thus the underperformance, as fallen angels widened by 49bps while broad high yield by just 16bps. Yields followed a similar path, with fallen angels not significantly changed in the first two months and then spiking by 88bps in March, while broad high yield saw a 60bps increase. The last time fallen angel yields were above 7% and broad high yield near 7.5% was following Liberation Day in 2025. Fallen angels' yield of 7.18% sits above the average since December 2003.</p>
<p>With the increase in yield and spreads, fallen angel prices decreased to below $90, which we are watching closely as the more than $5 gap between broad high yield and fallen angels has been a sign of outperformance in the past. Outperformance has been approximately 1% and 2% for the forward 1Y and 3Y periods. Fallen angels&rsquo; duration was flat during the quarter, while broad high yield reversed its course and increased to above 3 years. Duration was a major contributor to fallen angel underperformance in March as the 10Y yield rose sharply before finishing the quarter at 4.30%.</p>
<div class="wrapped-div">
<table style="width: 100%;">
<tbody>
<tr class="tbl-data">
<td class="tbl-header last text-center">&nbsp;</td>
<td class="tbl-header last text-center" style="border-right: outset;" colspan="4">Fallen Angels</td>
<td class="tbl-header last text-center" colspan="4">Broad HY</td>
</tr>
<tr class="tbl-data">
<td class="data-head last text-right">&nbsp;</td>
<td class="data-head last text-right">12/31/25</td>
<td class="data-head last text-right">1/31/26</td>
<td class="data-head last text-right">2/28/26</td>
<td class="data-head last text-right" style="border-right: outset;">3/31/26</td>
<td class="data-head last text-right">12/31/25</td>
<td class="data-head last text-right">1/31/26</td>
<td class="data-head last text-right">2/28/26</td>
<td class="data-head last text-right">3/31/26</td>
</tr>
<tr class="tbl-data">
<td class="data-td last">Yield to Worst</td>
<td class="data-td data last text-right">6.36</td>
<td class="data-td data last text-right">6.37</td>
<td class="data-td data last text-right">6.30</td>
<td class="data-td data last text-right" style="border-right: outset;">7.18</td>
<td class="data-td data last text-right">6.63</td>
<td class="data-td data last text-right">6.74</td>
<td class="data-td data last text-right">6.84</td>
<td class="data-td data last text-right">7.44</td>
</tr>
<tr class="tbl-data">
<td class="data-td last">Par Weighted Price</td>
<td class="data-td data last text-right">93.95</td>
<td class="data-td data last text-right">93.84</td>
<td class="data-td data last text-right">94.25</td>
<td class="data-td data last text-right" style="border-right: outset;">89.75</td>
<td class="data-td data last text-right">98.06</td>
<td class="data-td data last text-right">98.09</td>
<td class="data-td data last text-right">97.88</td>
<td class="data-td data last text-right">96.18</td>
</tr>
<tr class="tbl-data">
<td class="data-td last">Effective Duration</td>
<td class="data-td data last text-right">4.60</td>
<td class="data-td data last text-right">4.63</td>
<td class="data-td data last text-right" style="border-right: outset;">4.62</td>
<td class="data-td data last text-right">2.87</td>
<td class="data-td data last text-right">2.93</td>
<td class="data-td data last text-right">2.89</td>
<td class="data-td data last text-right">3.13</td>
</tr>
<tr class="tbl-data">
<td class="data-td last">Full Market Value ($mn)</td>
<td class="data-td data last text-right">56,444</td>
<td class="data-td data last text-right">56,417</td>
<td class="data-td data last text-right">56,550</td>
<td class="data-td data last text-right" style="border-right: outset;">66,210</td>
<td class="data-td data last text-right">1,474,918</td>
<td class="data-td data last text-right">1,455,106</td>
<td class="data-td data last text-right">1,454,785</td>
<td class="data-td data last text-right">1,440,567</td>
</tr>
<tr class="tbl-data">
<td class="data-td last">OAS</td>
<td class="data-td data last text-right">245</td>
<td class="data-td data last text-right">243</td>
<td class="data-td data last text-right">256</td>
<td class="data-td data last text-right" style="border-right: outset;">305</td>
<td class="data-td data last text-right">281</td>
<td class="data-td data last text-right">300</td>
<td class="data-td data last text-right">312</td>
<td class="data-td data last text-right">328</td>
</tr>
<tr class="tbl-data">
<td class="data-td last">No. of Issues</td>
<td class="data-td data last text-right">113</td>
<td class="data-td data last text-right">112</td>
<td class="data-td data last text-right" style="border-right: outset;">132</td>
<td class="data-td data last text-right">1,922</td>
<td class="data-td data last text-right">1,896</td>
<td class="data-td data last text-right">1,888</td>
<td class="data-td data last text-right">1,893</td>
</tr>
</tbody>
</table>
</div>
<p class="chart-disclosure">Source: ICE Data Services, VanEck. Fallen Angels: ICE US Fallen Angel High Yield 10% Constrained Index. Broad HY: ICE BofA US High Yield Index. OAS refers to &ldquo;option-adjusted spread.&rdquo; Please see definition for this and other terms referenced herein in the disclosures and definitions portion of this blog. Past performance is no guarantee of future results. Index performance is not representative of strategy performance. It is not possible to invest in an index.</p>
<p><strong>Fallen Angels:</strong> There were three fallen angels in Q1: SES SA, Paramount Global and FS KKR. SES SA was downgraded by Moody&rsquo;s in December 2025 and subsequently by Fitch in January 2026, entering the fallen angel index in January. Fitch's downgrade reflects structurally weaker earnings and tighter leverage headroom post-Intelsat amid rising competitive pressure. Paramount and FS KKR entered the index in March and added more than 15% in market value. Fitch downgraded Paramount to BB+ from BBB- in early March, following the Warner Bros. Discovery acquisition. The downgrade reflects continued FCF headwinds from transformation costs and sector-wide pressure. Fitch stated that leverage and FCF could remain stretched beyond what they&rsquo;d normally tolerate for a BBB- name. Paramount joins the index at a 10% exposure and its bonds have showcased the first leg of the fallen angel &ldquo;V-shaped&rdquo; price with its bonds price down ~15% over the past six months. We expect Paramount bonds to recover a portion of that decline over the coming months, as is typical with large fallen angels. FS KKR (a BDC) was downgraded by Moody's to Ba1 from Baa3, citing weaker profitability, NAV erosion vs BDC peers, higher leverage and a less senior asset mix. As seen below, FS KKR bond prices were approximately 3% down over the last 6 months. The entry of FS KKR bonds marks the third BDC in the fallen angel index, alongside Prospect Capital Corp and BlackRock TCP Capital Corp, providing a total exposure of ~6% to BDC bonds. The broader significance of BDC exposure became clearer just days after quarter-end, when Moody's revised its outlook on the entire US BDC sector to negative, citing rising redemption pressures, higher leverage and weakening access to funding markets. The pressure is high among non-traded BDCs, which recorded their first-ever net outflows in early 2026 after strong inflows as recently as Q3 2025. Moody's also flagged software exposure as roughly 20-25% of BDC portfolios may be tied to AI disruption, though they noted that near-term ratings impact is limited given software loan maturities don't increase materially until 2028-2029.</p>
<h3>Price Action over Previous 6 Months to Index Entry</h3>
<p><img loading="lazy" class="desktop-image img-responsive" src="https://www.vaneck.com/EPiServer/CMS/Content/contentassets/0d6289a1d82a499d9e844409ad551f70/7107_angl-april-blog_chart-2_2026-4_v1_desktop.svg,,370943/Download?epieditmode=False" alt="Price Action over Previous 6 Months to Index Entry" /></p>
<p><img loading="lazy" class="mobile-image img-responsive" src="https://www.vaneck.com/EPiServer/CMS/Content/contentassets/0d6289a1d82a499d9e844409ad551f70/7107_angl-april-blog_chart-2_2026-4_v1_mobile.svg,,370944/Download?epieditmode=False" alt="Price Action over Previous 6 Months to Index Entry" /></p>
<p class="chart-disclosure">Source: ICE Data Services, VanEck. Past performance is no guarantee of future results. These are not recommendations to buy or to sell any security. Securities and holdings may vary.</p>

<div class="wrapped-div">
<table style="width: 100%;">
<tbody>
<tr class="tbl-data">
<td class="tbl-header last">Month-end Addition</td>
<td class="tbl-header last">Name</td>
<td class="tbl-header last">Rating</td>
<td class="tbl-header last">Sector</td>
<td class="tbl-header last">Industry</td>
<td class="tbl-header last text-right">% Mkt Value</td>
<td class="tbl-header last text-right">Price</td>
</tr>
<tr class="tbl-data">
<td class="data-td last font-weight-normal">January</td>
<td class="data-td data last text-left">SES S.A.</td>
<td class="data-td data last text-left">BB1</td>
<td class="data-td data last text-left">Telecommunications</td>
<td class="data-td data last text-left">Telecom - Satellite</td>
<td class="data-td data last text-right">1.12</td>
<td class="data-td data last text-right">79.74</td>
</tr>
<tr class="tbl-data">
<td class="data-td last font-weight-normal">March</td>
<td class="data-td data last text-left">FS KKR Capital Corp</td>
<td class="data-td data last text-left">BB1</td>
<td class="data-td data last text-left">Financial Services</td>
<td class="data-td data last text-left">Investments &amp; Misc Financial Services</td>
<td class="data-td data last text-right">5.23</td>
<td class="data-td data last text-right">95.56</td>
</tr>
<tr class="tbl-data">
<td class="data-td last font-weight-normal">March</td>
<td class="data-td data last text-left">Paramount Global</td>
<td class="data-td data last text-left">BB1</td>
<td class="data-td data last text-left">Media</td>
<td class="data-td data last text-left">Media Content</td>
<td class="data-td data last text-right">10.03</td>
<td class="data-td data last text-right">78.19</td>
</tr>
</tbody>
</table>
</div>
<p class="chart-disclosure">Source: ICE Data Services, VanEck. Fallen Angels: ICE US Fallen Angel High Yield 10% Constrained Index. Past performance is no guarantee of future results. Not a recommendation to buy or sell any of the names/securities mentioned herein. Index performance is not representative of strategy performance. It is not possible to invest in an index.</p>
<p>The downgrades among BDCs, driven by stress in the private credit market, stand in contrast to the idiosyncratic downgrades of recent years following COVID. Given the addition of a third BDC to the index, we reviewed the amount of private credit structures of bonds rated BBB3. Our findings show that there are 26 issuers with an estimated par amount of $48bn rated BBB3 but only one issuer, Oaktree Specialty Lending Corp (BDC bonds with less than $1bn in par), has a negative outlook by Moody&rsquo;s and Fitch and a high likelihood of a downgrade to high yield. JP Morgan recently noted that there are $932bn of investment grade bonds rated BBB- by at least one agency. Of that amount, there is approximately 25% on negative watch of which two issuers, Ford and Mylan (Centene was part of this list but the downgrade by S&amp;P in April likely removed it) may just need one agency action as they are already rated high yield by another agency to be downgraded to high yield.</p>
<strong>Rising Stars:</strong> Only one rising star exited the index in Q1. Frontier Florida LLC was upgraded by Fitch to BBB+ following the completion of the company's acquisition by Verizon Communications Inc. Its single bond left the index at $103.50, providing an approximate 1% price return and 8% total return over the last 12 months before its exit.
<div class="wrapped-div">
<table style="width: 100%;">
<tbody>
<tr class="tbl-data">
<td class="tbl-header last">Month-end Exit</td>
<td class="tbl-header last">Name</td>
<td class="tbl-header last">Rating</td>
<td class="tbl-header last">Sector</td>
<td class="tbl-header last">Industry</td>
<td class="tbl-header last text-right">% Mkt Value</td>
<td class="tbl-header last text-right">Price</td>
</tr>
<tr class="tbl-data">
<td class="data-td last font-weight-normal">January</td>
<td class="data-td data last text-left">Frontier Florida LLC</td>
<td class="data-td data last text-left">BB1</td>
<td class="data-td data last text-left">Telecommunications</td>
<td class="data-td data last text-left">Telecom - Wireline Integrated &amp; Services</td>
<td class="data-td data last text-right">0.56</td>
<td class="data-td data last text-right">103.50</td>
</tr>
</tbody>
</table>
</div>
<p class="chart-disclosure">Source: ICE Data Services, VanEck. Fallen Angels: ICE US Fallen Angel High Yield 10% Constrained Index. Past performance is no guarantee of future results. Not a recommendation to buy or sell any of the names/securities mentioned herein. Index performance is not representative of strategy performance. It is not possible to invest in an index.</p>
<p id="point-three" class="anchored-block jump-link-nav" data-jumplink-title="Sector Performance"><strong>Fallen Angels Performance by Sector</strong>: Q1 brought major change to the sector composition of the fallen angel index. Media added approximately 10% with the entry of Paramount and it&rsquo;s now the 4th largest sector exposure, behind Basic Industry, Retail and Autos. Financial Services added about 5% with the addition of FS KKR while all other sectors decreased. The fallen angel index spread widened by 60bps in Q1, as all but Energy and Media saw their spreads widen. Healthcare and Leisure, combining for roughly 4% of exposure, saw spreads widen by more than 100bps but were not the worst performers of the quarter. Basic Industry and Energy posted positive total return while all other 15 sectors had a negative quarter. In terms of relative performance to broad high yield, Basic Industry was the top contributor as its spreads actually tightened slightly in Q1 despite the broader market widening, and its large weight in fallen angels vs a much smaller allocation in broad high yield made the difference. Energy also contributed positively, posting a +1.68% total return as oil-related names held up well amid the geopolitical backdrop. On the other side, Retail was the largest detractor, with a -2.79% return dragging on relative performance given its weight in the index.</p>
<div class="wrapped-div">
<table style="width: 100%;">
<tbody>
<tr class="tbl-data">
<td class="tbl-header last text-center">&nbsp;</td>
<td class="tbl-header last text-center" style="border-right: outset;" colspan="4">Wgt (%)</td>
<td class="tbl-header last text-center" style="border-right: outset;" colspan="4">OAS</td>
<td class="tbl-header last text-center" style="border-right: outset;" colspan="4">Price</td>
<td class="tbl-header last text-center">Total Return</td>
</tr>
<tr class="tbl-data">
<td class="data-head data last text-right">&nbsp;</td>
<td class="data-head data last text-center" style="border-right: outset;">2025</td>
<td class="data-head data last text-center" style="border-right: outset;" colspan="3">2026</td>
<td class="data-head data last text-center" style="border-right: outset;">2025</td>
<td class="data-head data last text-center" style="border-right: outset;" colspan="3">2026</td>
<td class="data-head data last text-center" style="border-right: outset;">2025</td>
<td class="data-head data last text-center" style="border-right: outset;" colspan="3">2026</td>
</tr>
<tr class="tbl-data">
<td class="data-head data last text-right">&nbsp;</td>
<td class="data-head data last text-right" style="border-right: outset;">12/31</td>
<td class="data-head data last text-right">1/31</td>
<td class="data-head data last text-right">2/28</td>
<td class="data-head data last text-right" style="border-right: outset;">3/31</td>
<td class="data-head data last text-right" style="border-right: outset;">12/31</td>
<td class="data-head data last text-right">1/31</td>
<td class="data-head data last text-right">2/28</td>
<td class="data-head data last text-right" style="border-right: outset;">3/31</td>
<td class="data-head data last text-right" style="border-right: outset;">12/31</td>
<td class="data-head data last text-right">1/31</td>
<td class="data-head data last text-right">2/28</td>
<td class="data-head data last text-right" style="border-right: outset;">3/31</td>
<td class="data-head data last text-center">YTD</td>
</tr>
<tr class="tbl-data">
<td class="data-td last">Automotive</td>
<td class="data-td data last text-right">10.94</td>
<td class="data-td data last text-right">10.97</td>
<td class="data-td data last text-right">10.98</td>
<td class="data-td data last text-right" style="border-right: outset;">10.79</td>
<td class="data-td data last text-right">199</td>
<td class="data-td data last text-right">188</td>
<td class="data-td data last text-right">191</td>
<td class="data-td data last text-right" style="border-right: outset;">273</td>
<td class="data-td data last text-right">97.72</td>
<td class="data-td data last text-right">97.93</td>
<td class="data-td data last text-right">98.31</td>
<td class="data-td data last text-right" style="border-right: outset;">95.38</td>
<td class="data-td data last text-right">-1.09</td>
</tr>
<tr class="tbl-data">
<td class="data-td last">Banking</td>
<td class="data-td data last text-right">2.01</td>
<td class="data-td data last text-right">2.03</td>
<td class="data-td data last text-right" style="border-right: outset;">1.76</td>
<td class="data-td data last text-right">143</td>
<td class="data-td data last text-right">126</td>
<td class="data-td data last text-right">147</td>
<td class="data-td data last text-right" style="border-right: outset;">173</td>
<td class="data-td data last text-right">109.70</td>
<td class="data-td data last text-right">109.93</td>
<td class="data-td data last text-right">109.74</td>
<td class="data-td data last text-right" style="border-right: outset;">107.16</td>
<td class="data-td data last text-right">-0.51</td>
</tr>
<tr class="tbl-data">
<td class="data-td last">Basic Industry</td>
<td class="data-td data last text-right">19.10</td>
<td class="data-td data last text-right">19.14</td>
<td class="data-td data last text-right">18.72</td>
<td class="data-td data last text-right" style="border-right: outset;">16.35</td>
<td class="data-td data last text-right">210</td>
<td class="data-td data last text-right">208</td>
<td class="data-td data last text-right">226</td>
<td class="data-td data last text-right" style="border-right: outset;">219</td>
<td class="data-td data last text-right">96.90</td>
<td class="data-td data last text-right">97.26</td>
<td class="data-td data last text-right">97.54</td>
<td class="data-td data last text-right" style="border-right: outset;">96.41</td>
<td class="data-td data last text-right">1.04</td>
</tr>
<tr class="tbl-data">
<td class="data-td last">Capital Goods</td>
<td class="data-td data last text-right">2.37</td>
<td class="data-td data last text-right">2.36</td>
<td class="data-td data last text-right">2.37</td>
<td class="data-td data last text-right" style="border-right: outset;">1.96</td>
<td class="data-td data last text-right">197</td>
<td class="data-td data last text-right">191</td>
<td class="data-td data last text-right">222</td>
<td class="data-td data last text-right" style="border-right: outset;">278</td>
<td class="data-td data last text-right">96.95</td>
<td class="data-td data last text-right">96.98</td>
<td class="data-td data last text-right">97.09</td>
<td class="data-td data last text-right" style="border-right: outset;">90.98</td>
<td class="data-td data last text-right">-4.52</td>
</tr>
<tr class="tbl-data">
<td class="data-td last">Consumer Goods</td>
<td class="data-td data last text-right">6.81</td>
<td class="data-td data last text-right">6.87</td>
<td class="data-td data last text-right">6.93</td>
<td class="data-td data last text-right" style="border-right: outset;">5.66</td>
<td class="data-td data last text-right">279</td>
<td class="data-td data last text-right">268</td>
<td class="data-td data last text-right">279</td>
<td class="data-td data last text-right" style="border-right: outset;">343</td>
<td class="data-td data last text-right">86.52</td>
<td class="data-td data last text-right">86.79</td>
<td class="data-td data last text-right">88.26</td>
<td class="data-td data last text-right" style="border-right: outset;">82.08</td>
<td class="data-td data last text-right">-3.61</td>
</tr>
<tr class="tbl-data">
<td class="data-td last">Energy</td>
<td class="data-td data last text-right">7.84</td>
<td class="data-td data last text-right">7.90</td>
<td class="data-td data last text-right">8.06</td>
<td class="data-td data last text-right" style="border-right: outset;">6.94</td>
<td class="data-td data last text-right">239</td>
<td class="data-td data last text-right">219</td>
<td class="data-td data last text-right">215</td>
<td class="data-td data last text-right" style="border-right: outset;">228</td>
<td class="data-td data last text-right">95.99</td>
<td class="data-td data last text-right">96.91</td>
<td class="data-td data last text-right">98.57</td>
<td class="data-td data last text-right" style="border-right: outset;">96.16</td>
<td class="data-td data last text-right">1.68</td>
</tr>
<tr class="tbl-data">
<td class="data-td last">Financial Services</td>
<td class="data-td data last text-right">2.08</td>
<td class="data-td data last text-right">2.01</td>
<td class="data-td data last text-right">1.97</td>
<td class="data-td data last text-right" style="border-right: outset;">6.91</td>
<td class="data-td data last text-right">347</td>
<td class="data-td data last text-right">393</td>
<td class="data-td data last text-right">456</td>
<td class="data-td data last text-right" style="border-right: outset;">377</td>
<td class="data-td data last text-right">93.18</td>
<td class="data-td data last text-right">90.84</td>
<td class="data-td data last text-right">88.68</td>
<td class="data-td data last text-right" style="border-right: outset;">92.95</td>
<td class="data-td data last text-right">-6.60</td>
</tr>
<tr class="tbl-data">
<td class="data-td last">Healthcare</td>
<td class="data-td data last text-right">2.50</td>
<td class="data-td data last text-right">2.52</td>
<td class="data-td data last text-right">2.53</td>
<td class="data-td data last text-right" style="border-right: outset;">2.07</td>
<td class="data-td data last text-right">195</td>
<td class="data-td data last text-right">187</td>
<td class="data-td data last text-right">214</td>
<td class="data-td data last text-right" style="border-right: outset;">322</td>
<td class="data-td data last text-right">96.29</td>
<td class="data-td data last text-right">96.23</td>
<td class="data-td data last text-right">96.61</td>
<td class="data-td data last text-right" style="border-right: outset;">88.89</td>
<td class="data-td data last text-right">-6.25</td>
</tr>
<tr class="tbl-data">
<td class="data-td last">Insurance</td>
<td class="data-td data last text-right">0.73</td>
<td class="data-td data last text-right">0.74</td>
<td class="data-td data last text-right" style="border-right: outset;">0.64</td>
<td class="data-td data last text-right">245</td>
<td class="data-td data last text-right">230</td>
<td class="data-td data last text-right">280</td>
<td class="data-td data last text-right" style="border-right: outset;">306</td>
<td class="data-td data last text-right">99.06</td>
<td class="data-td data last text-right">99.40</td>
<td class="data-td data last text-right">98.56</td>
<td class="data-td data last text-right" style="border-right: outset;">95.93</td>
<td class="data-td data last text-right">-1.65</td>
</tr>
<tr class="tbl-data">
<td class="data-td last">Leisure</td>
<td class="data-td data last text-right">2.94</td>
<td class="data-td data last text-right">3.01</td>
<td class="data-td data last text-right">3.02</td>
<td class="data-td data last text-right" style="border-right: outset;">2.53</td>
<td class="data-td data last text-right">390</td>
<td class="data-td data last text-right">337</td>
<td class="data-td data last text-right">356</td>
<td class="data-td data last text-right" style="border-right: outset;">502</td>
<td class="data-td data last text-right">90.67</td>
<td class="data-td data last text-right">92.42</td>
<td class="data-td data last text-right">92.50</td>
<td class="data-td data last text-right" style="border-right: outset;">87.85</td>
<td class="data-td data last text-right">-1.74</td>
</tr>
<tr class="tbl-data">
<td class="data-td last">Media</td>
<td class="data-td data last text-right">0.45</td>
<td class="data-td data last text-right" style="border-right: outset;">10.41</td>
<td class="data-td data last text-right">411</td>
<td class="data-td data last text-right">394</td>
<td class="data-td data last text-right">428</td>
<td class="data-td data last text-right" style="border-right: outset;">353</td>
<td class="data-td data last text-right">82.30</td>
<td class="data-td data last text-right">82.91</td>
<td class="data-td data last text-right">82.90</td>
<td class="data-td data last text-right" style="border-right: outset;">78.28</td>
<td class="data-td data last text-right">-0.60</td>
</tr>
<tr class="tbl-data">
<td class="data-td last">Real Estate</td>
<td class="data-td data last text-right">9.21</td>
<td class="data-td data last text-right">8.50</td>
<td class="data-td data last text-right">8.45</td>
<td class="data-td data last text-right" style="border-right: outset;">7.28</td>
<td class="data-td data last text-right">300</td>
<td class="data-td data last text-right">312</td>
<td class="data-td data last text-right">344</td>
<td class="data-td data last text-right" style="border-right: outset;">392</td>
<td class="data-td data last text-right">94.01</td>
<td class="data-td data last text-right">93.78</td>
<td class="data-td data last text-right">93.65</td>
<td class="data-td data last text-right" style="border-right: outset;">91.91</td>
<td class="data-td data last text-right">-0.57</td>
</tr>
<tr class="tbl-data">
<td class="data-td last">Retail</td>
<td class="data-td data last text-right">14.82</td>
<td class="data-td data last text-right">14.70</td>
<td class="data-td data last text-right">14.82</td>
<td class="data-td data last text-right" style="border-right: outset;">11.89</td>
<td class="data-td data last text-right">217</td>
<td class="data-td data last text-right">213</td>
<td class="data-td data last text-right">222</td>
<td class="data-td data last text-right" style="border-right: outset;">276</td>
<td class="data-td data last text-right">91.07</td>
<td class="data-td data last text-right">90.99</td>
<td class="data-td data last text-right">91.68</td>
<td class="data-td data last text-right" style="border-right: outset;">87.00</td>
<td class="data-td data last text-right">-2.79</td>
</tr>
<tr class="tbl-data">
<td class="data-td last">Services</td>
<td class="data-td data last text-right">&nbsp;</td>
<td class="data-td data last text-right" style="border-right: outset;">&nbsp;</td>
<td class="data-td data last text-right">&nbsp;</td>
<td class="data-td data last text-right" style="border-right: outset;">&nbsp;</td>
<td class="data-td data last text-right">&nbsp;</td>
<td class="data-td data last text-right" style="border-right: outset;">&nbsp;</td>
<td class="data-td data last text-right">&nbsp;</td>
</tr>
<tr class="tbl-data">
<td class="data-td last">Technology &amp; Electronics</td>
<td class="data-td data last text-right">3.29</td>
<td class="data-td data last text-right">3.30</td>
<td class="data-td data last text-right">3.29</td>
<td class="data-td data last text-right" style="border-right: outset;">2.86</td>
<td class="data-td data last text-right">301</td>
<td class="data-td data last text-right">310</td>
<td class="data-td data last text-right">324</td>
<td class="data-td data last text-right" style="border-right: outset;">331</td>
<td class="data-td data last text-right">80.72</td>
<td class="data-td data last text-right">80.52</td>
<td class="data-td data last text-right">80.23</td>
<td class="data-td data last text-right" style="border-right: outset;">78.64</td>
<td class="data-td data last text-right">-1.06</td>
</tr>
<tr class="tbl-data">
<td class="data-td last">Telecommunications</td>
<td class="data-td data last text-right">11.43</td>
<td class="data-td data last text-right">11.97</td>
<td class="data-td data last text-right">12.10</td>
<td class="data-td data last text-right" style="border-right: outset;">9.05</td>
<td class="data-td data last text-right">299</td>
<td class="data-td data last text-right">306</td>
<td class="data-td data last text-right">312</td>
<td class="data-td data last text-right" style="border-right: outset;">372</td>
<td class="data-td data last text-right">92.94</td>
<td class="data-td data last text-right">90.76</td>
<td class="data-td data last text-right">91.36</td>
<td class="data-td data last text-right" style="border-right: outset;">86.70</td>
<td class="data-td data last text-right">-1.61</td>
</tr>
<tr class="tbl-data">
<td class="data-td last">Transportation</td>
<td class="data-td data last text-right">0.59</td>
<td class="data-td data last text-right">0.60</td>
<td class="data-td data last text-right" style="border-right: outset;">0.51</td>
<td class="data-td data last text-right">169</td>
<td class="data-td data last text-right">160</td>
<td class="data-td data last text-right">179</td>
<td class="data-td data last text-right" style="border-right: outset;">213</td>
<td class="data-td data last text-right">106.50</td>
<td class="data-td data last text-right">106.60</td>
<td class="data-td data last text-right">107.28</td>
<td class="data-td data last text-right" style="border-right: outset;">102.47</td>
<td class="data-td data last text-right">-2.28</td>
</tr>
<tr class="tbl-data">
<td class="data-td last">Utility</td>
<td class="data-td data last text-right">2.91</td>
<td class="data-td data last text-right">2.94</td>
<td class="data-td data last text-right">2.93</td>
<td class="data-td data last text-right" style="border-right: outset;">2.42</td>
<td class="data-td data last text-right">208</td>
<td class="data-td data last text-right">195</td>
<td class="data-td data last text-right">229</td>
<td class="data-td data last text-right" style="border-right: outset;">272</td>
<td class="data-td data last text-right">100.76</td>
<td class="data-td data last text-right">101.26</td>
<td class="data-td data last text-right">100.50</td>
<td class="data-td data last text-right" style="border-right: outset;">96.23</td>
<td class="data-td data last text-right">-2.86</td>
</tr>
<tr class="tbl-data">
<td class="data-td last">Grand Total</td>
<td class="data-td data last text-right">100</td>
<td class="data-td data last text-right" style="border-right: outset;">100</td>
<td class="data-td data last text-right">245</td>
<td class="data-td data last text-right">241</td>
<td class="data-td data last text-right">256</td>
<td class="data-td data last text-right" style="border-right: outset;">305</td>
<td class="data-td data last text-right">93.95</td>
<td class="data-td data last text-right">93.84</td>
<td class="data-td data last text-right">94.25</td>
<td class="data-td data last text-right" style="border-right: outset;">89.75</td>
<td class="data-td data last text-right">-1.31</td>
</tr>
</tbody>
</table>
</div>
<p class="chart-disclosure">Source: ICE Data Services, VanEck. Returns are based on partial period data. Fallen Angels: ICE US Fallen Angel High Yield 10% Constrained Index. Not intended as a recommendation to invest or divest in any of the sectors mentioned herein. Index performance is not representative of strategy performance. It is not possible to invest in an index.</p>
<p id="point-four" class="anchored-block jump-link-nav" data-jumplink-title="Rating Performance"><strong>Fallen Angels Performance by Rating:</strong> The fallen angel index continues to be dominated by BB-rated bonds which saw a slight increase in Q1. CCC-rated fallen angels, comprised of just four issuers, were the only rating bucket to post positive total return for Q1. Their spreads tightened by 24bps, making them the sole contributors to relative outperformance to vs. broad high yield.</p>
<div class="wrapped-div">
<table style="width: 100%;">
<tbody>
<tr class="tbl-data">
<td class="tbl-header last text-center">&nbsp;</td>
<td class="tbl-header last text-center" style="border-right: outset;" colspan="4">Wgt (%)</td>
<td class="tbl-header last text-center" style="border-right: outset;" colspan="4">OAS</td>
<td class="tbl-header last text-center" style="border-right: outset;" colspan="4">Price</td>
<td class="tbl-header last text-center" colspan="2">Total Return</td>
</tr>
<tr class="tbl-data">
<td class="data-head data last text-right">&nbsp;</td>
<td class="data-head data last text-center" style="border-right: outset;">2025</td>
<td class="data-head data last text-center" style="border-right: outset;" colspan="3">2026</td>
<td class="data-head data last text-center" style="border-right: outset;">2025</td>
<td class="data-head data last text-center" style="border-right: outset;" colspan="3">2026</td>
<td class="data-head data last text-center" style="border-right: outset;">2025</td>
<td class="data-head data last text-center" style="border-right: outset;" colspan="3">2026</td>
</tr>
<tr class="tbl-data">
<td class="data-head data last text-right">&nbsp;</td>
<td class="data-head data last text-right" style="border-right: outset;">12/31</td>
<td class="data-head data last text-right">1/31</td>
<td class="data-head data last text-right">2/28</td>
<td class="data-head data last text-right" style="border-right: outset;">3/31</td>
<td class="data-head data last text-right" style="border-right: outset;">12/31</td>
<td class="data-head data last text-right">1/31</td>
<td class="data-head data last text-right">2/28</td>
<td class="data-head data last text-right" style="border-right: outset;">3/31</td>
<td class="data-head data last text-right" style="border-right: outset;">12/31</td>
<td class="data-head data last text-right">1/31</td>
<td class="data-head data last text-right">2/28</td>
<td class="data-head data last text-right" style="border-right: outset;">3/31</td>
<td class="data-head data last text-center">YTD</td>
</tr>
<tr class="tbl-data">
<td class="data-td last">BB</td>
<td class="data-td data last text-right">85.57</td>
<td class="data-td data last text-right">86.29</td>
<td class="data-td data last text-right">86.19</td>
<td class="data-td data last text-right" style="border-right: outset;">88.48</td>
<td class="data-td data last text-right">201</td>
<td class="data-td data last text-right">196</td>
<td class="data-td data last text-right">210</td>
<td class="data-td data last text-right" style="border-right: outset;">268</td>
<td class="data-td data last text-right">96.56</td>
<td class="data-td data last text-right">96.40</td>
<td class="data-td data last text-right">96.76</td>
<td class="data-td data last text-right" style="border-right: outset;">91.68</td>
<td class="data-td data last text-right">-1.25</td>
</tr>
<tr class="tbl-data">
<td class="data-td last">B</td>
<td class="data-td data last text-right">7.21</td>
<td class="data-td data last text-right">7.13</td>
<td class="data-td data last text-right">7.76</td>
<td class="data-td data last text-right" style="border-right: outset;">6.38</td>
<td class="data-td data last text-right">358</td>
<td class="data-td data last text-right">360</td>
<td class="data-td data last text-right">410</td>
<td class="data-td data last text-right" style="border-right: outset;">483</td>
<td class="data-td data last text-right">90.48</td>
<td class="data-td data last text-right">90.30</td>
<td class="data-td data last text-right">90.83</td>
<td class="data-td data last text-right" style="border-right: outset;">85.67</td>
<td class="data-td data last text-right">-4.17</td>
</tr>
<tr class="tbl-data">
<td class="data-td last">CCC</td>
<td class="data-td data last text-right">6.30</td>
<td class="data-td data last text-right">5.69</td>
<td class="data-td data last text-right">5.16</td>
<td class="data-td data last text-right" style="border-right: outset;">4.47</td>
<td class="data-td data last text-right">471</td>
<td class="data-td data last text-right">486</td>
<td class="data-td data last text-right">456</td>
<td class="data-td data last text-right" style="border-right: outset;">447</td>
<td class="data-td data last text-right">82.76</td>
<td class="data-td data last text-right">82.53</td>
<td class="data-td data last text-right">83.26</td>
<td class="data-td data last text-right" style="border-right: outset;">82.32</td>
<td class="data-td data last text-right">4.48</td>
</tr>
<tr class="tbl-data">
<td class="data-td last">CC</td>
<td class="data-td data last text-right">0.93</td>
<td class="data-td data last text-right">0.90</td>
<td class="data-td data last text-right">0.89</td>
<td class="data-td data last text-right" style="border-right: outset;">0.67</td>
<td class="data-td data last text-right">1920</td>
<td class="data-td data last text-right">2027</td>
<td class="data-td data last text-right">2103</td>
<td class="data-td data last text-right" style="border-right: outset;">2523</td>
<td class="data-td data last text-right">41.00</td>
<td class="data-td data last text-right">39.00</td>
<td class="data-td data last text-right">38.25</td>
<td class="data-td data last text-right" style="border-right: outset;">31.57</td>
<td class="data-td data last text-right">-18.00</td>
</tr>
<tr class="tbl-data">
<td class="data-td last">Total</td>
<td class="data-td data last text-right">100</td>
<td class="data-td data last text-right" style="border-right: outset;">100</td>
<td class="data-td data last text-right">245</td>
<td class="data-td data last text-right">241</td>
<td class="data-td data last text-right">256</td>
<td class="data-td data last text-right" style="border-right: outset;">305</td>
<td class="data-td data last text-right">93.95</td>
<td class="data-td data last text-right">93.84</td>
<td class="data-td data last text-right">94.25</td>
<td class="data-td data last text-right" style="border-right: outset;">89.75</td>
<td class="data-td data last text-right">-1.31</td>
</tr>
</tbody>
</table>
</div>
<p class="chart-disclosure">Source: ICE Data Services, VanEck. Fallen Angels: Fallen Angel High Yield 10% Constrained Index. Not intended as a recommendation to invest or divest in any of the sectors mentioned herein. Index performance is not representative of strategy performance. It is not possible to invest in an index. BB index: ICE BofA BB US High Yield Index; Single-B index: ICE BofA Single-B US High Yield Index; CCC &amp; Lower rated index ICE BofA CCC &amp; Lower US High Yield Index.</p>

<p>To receive more <a href="/us/en/blogs/income-investing/" title="Income Investing Insights"><strong>Income Investing</strong></a> insights, <a href="/link/5f45412c2143400497908cea2897f7d3.aspx" title=" Subscription Center"><strong>sign up in our subscription center</strong></a>.</p>
]]></content:encoded>
</item><item rdf:about="https://www.vaneck.com/us/en/blogs/moat-investing/geopolitical-shock-tests-moat-strategies-as-energy-surges/">
  <title>Geopolitical Shock Tests Moat Strategies as Energy Surges></title>
  <link>https://www.vaneck.com/us/en/blogs/moat-investing/geopolitical-shock-tests-moat-strategies-as-energy-surges/</link>
  <description><![CDATA[U.S. equities fell in March as oil surged on geopolitical tensions. The Moat Index lagged on no energy exposure, while the SMID Moat Index held up with help from energy and materials.]]></description>
  <dc:creator>Coulter Regal, CFA</dc:creator>
  <dc:date>04/10/2026 06:30:00</dc:date>
<content:encoded><![CDATA[

<p><strong>Key Takeaways:</strong></p>
<ul class="content-list">
<li class="mt-2">Moat Index fell 9.55%, lagging as zero energy exposure hurt during the sector&rsquo;s rally.</li>
<li class="mt-2">Fortinet and Palo Alto outperformed, showing resilience despite broader tech weakness.</li>
<li class="mt-2">SMID Moat Index, declining 5.40%, kept pace with mid-cap benchmarks, supported by energy and materials exposure.</li>
<li class="mt-2">SMID Moat leaders included CF Industries, Devon Energy, and EOG, boosted by rising commodity prices.</li>
</ul>
<p class="chart-disclosure">Index performance is not illustrative of fund performance. It is not possible to invest directly in an index. Past performance is no guarantee of future results.</p>
<p class="chart-disclosure">Fair value estimates and price targets referenced herein are those of Morningstar's equity research team, are subject to change without notice, and do not constitute recommendations or investment advice.</p>
<p id="point-one" class="anchored-block jump-link-nav" data-jumplink-title="U.S. Equity Market Review">U.S. equity markets suffered a sharp, broad-based decline in March as the escalation of the U.S.-Iran conflict upended what had been a constructive start to the year. The initiation of U.S. and Israeli military strikes on Iran in late February and Iran&rsquo;s subsequent disruption of oil flows through the Strait of Hormuz sent energy prices surging. Brent crude rose above $100 per barrel during the month. The S&amp;P 500 fell 4.98% in March, while the S&amp;P 500 Equal Weight Index declined 5.97%, reflecting the pervasive nature of the selloff across market capitalizations and styles. Energy was the only positive sector during the month, gaining 10.28%, while industrials, consumer staples, and health care were among the hardest hit, each falling more than 8%. A late-month rally on hopes for a potential ceasefire helped indexes recover from their worst levels, but was not enough to offset a punishing month for equities.</p>
<p>The <strong><a href="/link/9e43dd198c5f4e419f13220685081895.aspx" title="MOAT - VanEck Morningstar Wide Moat ETF">Morningstar Wide Moat Focus Index</a></strong> (the &ldquo;Moat Index&rdquo;) declined 9.55% in March, trailing the S&amp;P 500 by roughly 4.5 percentage points. The Index reached its deepest drawdown around March 27, when cumulative month-to-date losses approached 12%, before a late-month recovery trimmed the gap modestly. Both sector allocation and stock selection weighed on relative performance. The strategy carries no allocation to energy, a reflection of the wide moat requirement for index inclusion, as commodity-oriented businesses rarely develop the durable competitive advantages that Morningstar looks for in assigning wide moat ratings. That absence proved especially costly in March, as energy was the month&rsquo;s only positive sector. Sizable overweights to industrials and consumer staples, two of the worst-performing sectors, compounded the shortfall. For the first quarter, the Moat Index declined 6.49%, trailing the S&amp;P 500&rsquo;s 4.33% loss. Even the NASDAQ Composite fell nearly 7%, illustrating how broadly the geopolitical shock weighed on equities regardless of market capitalization or style.</p>
<p>The <strong><a href="/link/166321dbcfec440590fb51cf0ad629aa.aspx" title="SMOT - VanEck Morningstar SMID Moat ETF">Morningstar US Small-Mid Cap Moat Focus Index</a></strong> (the &ldquo;SMID Moat Index&rdquo;) fell 5.40% in March, essentially matching the S&amp;P MidCap 400&rsquo;s 5.39% decline while trailing the S&amp;P SmallCap 600, which lost 4.07%. Small- and mid-cap stocks broadly declined alongside large-caps during the month, as the geopolitical uncertainty drove a correlated selloff that offered limited diversification benefit across capitalizations. Attribution was roughly neutral between allocation and selection. The strategy&rsquo;s energy exposure, a byproduct of the SMID Moat Index&rsquo;s inclusion of narrow moat companies that broadens the investable universe into sectors like energy where wide moats are scarce, providing a meaningful offset to weakness in consumer discretionary and consumer staples holdings. Materials holdings, led by CF Industries, were the standout positive contributor to relative performance. Through the first quarter, the SMID Moat Index and smaller-cap companies more broadly have fared better than large-cap benchmarks, as the diversified nature of small- and mid-cap exposure has provided a degree of resilience in an uncertain environment.</p>
<h3>Geopolitical Shock Pressures Equities in March</h3>
<p><img loading="lazy" class="desktop-image img-responsive" alt="Geopolitical Shock Pressures Equities in March" src="https://www.vaneck.com/contentassets/adb504ee1eba45b38eb76307da3a03f2/7109_moat-monthly_chart-1_2026-04_v1_desktop.svg" /></p>
<p><img loading="lazy" class="mobile-image img-responsive" alt="Geopolitical Shock Pressures Equities in March" src="https://www.vaneck.com/contentassets/adb504ee1eba45b38eb76307da3a03f2/7109_moat-monthly_chart-1_2026-04_v1_mobile.svg" /></p>
<p class="chart-disclosure"><strong>Source: Morningstar. Data as of 3/31/2026.</strong> Past performance is no guarantee of future results. Index performance is not representative of fund performance. It is not possible to invest directly in an index. Please see index definitions and other important disclosures at the end of this content. Fund performance current to the most recent month end is available by visiting vaneck.com or by calling 800.826.2333.</p>

<h2>Moat Index Leans Into Tech Opportunities at Quarterly Review</h2>
<p>Both the Moat and SMID Moat Indexes underwent quarterly reviews on March 20, 2026. Each quarter, Morningstar&rsquo;s equity research analysts systematically target the most attractively priced, high quality U.S. companies within their respective universes. At the March review, the Moat strategies capitalized on technology dislocations driven by AI uncertainty and geopolitical volatility, adding semiconductor leaders NVIDIA and Broadcom alongside newcomers Palo Alto Networks, Blackstone, and Datadog at attractive valuations. See our <strong><a href="/us/en/blogs/moat-investing/moat-index-leans-into-tech-opportunities/" title="Moat Index Leans into Tech Opportunities">blog covering the recent review</a></strong> for additional context and key takeaways. Full results of the quarterly reviews are also available here: <strong><a href="https://www.vaneck.com/us/en/investments/morningstar-wide-moat-etf-moat/moat-reconstitution.pdf" title="MOAT - VanEck Morningstar Wide Moat ETF" target="_blank" rel="noopener">Moat Index</a></strong> and <strong><a href="https://www.vaneck.com/us/en/investments/morningstar-smid-moat-etf-smot/smot-reconstitution.pdf" title="SMOT - VanEck Morningstar SMID Moat ETF" target="_blank" rel="noopener">SMID Moat Index</a></strong>.</p>
<h2 id="point-two" class="anchored-block jump-link-nav" data-jumplink-title="Moat Highlights">Moat Index Highlights: Cybersecurity Strength in a Difficult Month</h2>
<p>March was a challenging month for the Moat Index from a relative performance standpoint, with both sector allocation and stock selection contributing to the shortfall versus the S&amp;P 500. The strategy&rsquo;s zero exposure to the surging energy sector was a notable headwind, while overweights to industrials and consumer staples, two sectors that bore the brunt of war-related economic concerns, amplified the underperformance. Against this difficult backdrop, the top contributors were concentrated among technology names that managed to buck the broader decline.</p>
<p>Fortinet Inc. (FTNT) and Palo Alto Networks Inc. (PANW) were the leading contributors to Moat Index performance during the month, with both names posting modest gains while the broader technology sector declined. Both are platform-based cybersecurity vendors whose shares held up well amid the market&rsquo;s risk-off posture. Cybersecurity stocks experienced a brief selloff late in March following reports of a new AI model with advanced vulnerability-finding capabilities. However, Morningstar views the development as likely to expand the cybersecurity addressable market rather than diminish it, as more capable AI tools drive demand for both offensive and defensive security solutions. Morningstar assigns wide moat ratings to both Fortinet and Palo Alto, with Fortinet&rsquo;s competitive position underpinned by customer switching costs and a reinforcing network effect derived from its expansive installed base, and Palo Alto&rsquo;s wide moat supported by its entrenched position as a platform vendor with strong customer switching costs across network security, cloud security, and security operations. Both companies trade meaningfully below Morningstar&rsquo;s fair value estimates.</p>
<p>Other notable contributors during the month included Blackstone Inc. (BX), an alternative asset manager that was added to the Index during the quarterly March reconstitution, and Fair Isaac Corp. (FICO), an analytics and decision management company.</p>
<p>Companies detracting the most from Moat Index performance reflected the broad-based nature of the month&rsquo;s selloff. The Estee Lauder Companies Inc. (EL), a prestige beauty company, was the largest detractor, with shares falling roughly 34% amid ongoing operational challenges. Huntington Ingalls Industries Inc. (HII), a defense and shipbuilding company; Clorox Co. (CLX), a consumer products company; United Parcel Service Inc. (UPS), a global logistics provider; and Otis Worldwide Corp. (OTIS), an elevator and escalator manufacturer, also weighed meaningfully on results. The detractors were spread across consumer staples and industrials, the two sectors most heavily overweighted in the portfolio, reflecting the outsized impact those sector tilts had during a month when defensive and cyclical names alike were caught in the downdraft.</p>
<h3>Moat Index Top Contributors and Detractors - March 2026</h3>
<p><strong>Contributors</strong></p>
<div class="wrapped-div">
<table style="width: 100%;">
<tbody>
<tr class="tbl-data">
<td class="tbl-header last text-left">Company</td>
<td class="tbl-header last text-left">Ticker</td>
<td class="tbl-header last text-left">Sector</td>
<td class="tbl-header last text-right">Avg. Weight (%)</td>
<td class="tbl-header last text-right">Contribution (%)</td>
</tr>
<tr class="tbl-data">
<td class="data-td data last text-left">Fortinet Inc.</td>
<td class="data-td data last text-left">FTNT</td>
<td class="data-td data last text-left">Technology</td>
<td class="data-td data last text-right">2.57</td>
<td class="data-td data last text-right">0.08</td>
</tr>
<tr class="tbl-data">
<td class="data-td data last text-left">Blackstone Inc.</td>
<td class="data-td data last text-left">BX</td>
<td class="data-td data last text-left">Financials</td>
<td class="data-td data last text-right">0.30</td>
<td class="data-td data last text-right">0.08</td>
</tr>
<tr class="tbl-data">
<td class="data-td data last text-left">Fair Isaac Corp.</td>
<td class="data-td data last text-left">FICO</td>
<td class="data-td data last text-left">Technology</td>
<td class="data-td data last text-right">0.22</td>
<td class="data-td data last text-right">0.06</td>
</tr>
<tr class="tbl-data">
<td class="data-td data last text-left">Palo Alto Networks Inc.</td>
<td class="data-td data last text-left">PANW</td>
<td class="data-td data last text-left">Technology</td>
<td class="data-td data last text-right">0.28</td>
<td class="data-td data last text-right">0.02</td>
</tr>
<tr class="tbl-data">
<td class="data-td data last text-left">Oracle Corp.</td>
<td class="data-td data last text-left">ORCL</td>
<td class="data-td data last text-left">Technology</td>
<td class="data-td data last text-right">0.88</td>
<td class="data-td data last text-right">0.01</td>
</tr>
</tbody>
</table>
</div>
<br />
<p><strong>Detractors</strong></p>
<div class="wrapped-div">
<table style="width: 100%;">
<tbody>
<tr class="tbl-data">
<td class="tbl-header last text-left">Company</td>
<td class="tbl-header last text-left">Ticker</td>
<td class="tbl-header last text-left">Sector</td>
<td class="tbl-header last text-right">Avg. Weight (%)</td>
<td class="tbl-header last text-right">Contribution (%)</td>
</tr>
<tr class="tbl-data">
<td class="data-td data last text-left">The Estee Lauder</td>
<td class="data-td data last text-left">EL</td>
<td class="data-td data last text-left">Consumer Staples</td>
<td class="data-td data last text-right">2.76</td>
<td class="data-td data last text-right">-0.95</td>
</tr>
<tr class="tbl-data">
<td class="data-td data last text-left">Huntington Ingalls Industries</td>
<td class="data-td data last text-left">HII</td>
<td class="data-td data last text-left">Industrials</td>
<td class="data-td data last text-right">3.55</td>
<td class="data-td data last text-right">-0.52</td>
</tr>
<tr class="tbl-data">
<td class="data-td data last text-left">Clorox Co.</td>
<td class="data-td data last text-left">CLX</td>
<td class="data-td data last text-left">Consumer Staples</td>
<td class="data-td data last text-right">2.75</td>
<td class="data-td data last text-right">-0.51</td>
</tr>
<tr class="tbl-data">
<td class="data-td data last text-left">United Parcel Service Inc.</td>
<td class="data-td data last text-left">UPS</td>
<td class="data-td data last text-left">Industrials</td>
<td class="data-td data last text-right">3.06</td>
<td class="data-td data last text-right">-0.46</td>
</tr>
<tr class="tbl-data">
<td class="data-td data last text-left">Otis Worldwide Corp.</td>
<td class="data-td data last text-left">OTIS</td>
<td class="data-td data last text-left">Industrials</td>
<td class="data-td data last text-right">2.54</td>
<td class="data-td data last text-right">-0.42</td>
</tr>
</tbody>
</table>
</div>
<p class="chart-disclosure"><strong>Source: Morningstar.</strong> Past performance is no guarantee of future results. Index performance is not illustrative of fund performance. Not intended as a recommendation to buy or to sell any of the securities mentioned herein.</p>
<h2 id="point-three" class="anchored-block jump-link-nav" data-jumplink-title="SMID Moat Highlights">SMID Moat Index Highlights: Energy and Materials Offset Broad Weakness</h2>
<p>The SMID Moat Index navigated the turbulent March environment more effectively on a relative basis, with allocation and selection effects roughly neutral versus benchmarks. The strategy&rsquo;s exposure to energy and materials provided a meaningful counterweight to weakness elsewhere, helping the Index keep pace with the S&amp;P MidCap 400 despite the challenging backdrop.</p>
<p>CF Industries Holdings Inc. (CF) was the standout contributor, with shares surging approximately 30% during the month. As the largest nitrogen fertilizer producer in North America, CF Industries is a direct beneficiary of the supply disruption caused by the U.S.-Iran conflict, which has curtailed Middle Eastern nitrogen exports and driven fertilizer prices sharply higher. Morningstar raised its fair value estimate for CF to $135 per share in mid-March, citing expectations that the conflict will support elevated nitrogen prices in the near term. Morningstar assigns CF a narrow moat rating based on the company&rsquo;s cost-advantaged position, as over 90% of its nitrogen production uses low-cost North American natural gas as feedstock, placing it well below the marginal cost of global production.</p>
<p>Devon Energy Corp. (DVN) and EOG Resources Inc. (EOG) also contributed meaningfully, with each gaining roughly 16% during the month as rising oil prices lifted the domestic exploration and production sector broadly. Both companies are positioned at the low end of the U.S. shale cost curve, with Devon&rsquo;s reconstituted portfolio anchored in the Delaware Basin and EOG&rsquo;s multibasin approach emphasizing its highest-return drilling locations. Morningstar assigns both companies narrow moat ratings based on cost advantages derived from access to premier acreage with intrinsically low extraction costs.</p>
<p>Other notable contributors included Akamai Technologies Inc. (AKAM), a content delivery and cybersecurity company, and Marvell Technology Inc. (MRVL), a semiconductor firm.</p>
<p>Several of the SMID Moat Index&rsquo;s largest detractors mirrored those seen in the Moat Index. The Estee Lauder Companies Inc. (EL) and Huntington Ingalls Industries Inc. (HII) were again among the weakest performers, while Carnival Corp. (CCL), a cruise line operator that suffered from rising fuel costs and travel disruption fears, also detracted. Otis Worldwide Corp. (OTIS) and GE HealthCare Technologies Inc. (GEHC), a medical technology company, rounded out the bottom five.</p>
<h3>SMID Moat Index Top Contributors and Detractors - March 2026</h3>
<p><strong>Contributors</strong></p>
<div class="wrapped-div">
<table style="width: 100%;">
<tbody>
<tr class="tbl-data">
<td class="tbl-header last text-left">Company</td>
<td class="tbl-header last text-left">Ticker</td>
<td class="tbl-header last text-left">Sector</td>
<td class="tbl-header last text-right">Avg. Weight (%)</td>
<td class="tbl-header last text-right">Contribution (%)</td>
</tr>
<tr class="tbl-data">
<td class="data-td data last text-left">CF Industries Holdings Inc.</td>
<td class="data-td data last text-left">CF</td>
<td class="data-td data last text-left">Materials</td>
<td class="data-td data last text-right">1.64</td>
<td class="data-td data last text-right">0.50</td>
</tr>
<tr class="tbl-data">
<td class="data-td data last text-left">Akamai Technologies Inc.</td>
<td class="data-td data last text-left">AKAM</td>
<td class="data-td data last text-left">Technology</td>
<td class="data-td data last text-right">0.75</td>
<td class="data-td data last text-right">0.13</td>
</tr>
<tr class="tbl-data">
<td class="data-td data last text-left">Marvell Technology Inc.</td>
<td class="data-td data last text-left">MRVL</td>
<td class="data-td data last text-left">Technology</td>
<td class="data-td data last text-right">0.58</td>
<td class="data-td data last text-right">0.12</td>
</tr>
<tr class="tbl-data">
<td class="data-td data last text-left">Devon Energy Corp.</td>
<td class="data-td data last text-left">DVN</td>
<td class="data-td data last text-left">Energy</td>
<td class="data-td data last text-right">0.75</td>
<td class="data-td data last text-right">0.12</td>
</tr>
<tr class="tbl-data">
<td class="data-td data last text-left">EOG Resources Inc.</td>
<td class="data-td data last text-left">EOG</td>
<td class="data-td data last text-left">Energy</td>
<td class="data-td data last text-right">0.73</td>
<td class="data-td data last text-right">0.12</td>
</tr>
</tbody>
</table>
</div>
<br />
<p><strong>Detractors</strong></p>
<div class="wrapped-div">
<table style="width: 100%;">
<tbody>
<tr class="tbl-data">
<td class="tbl-header last text-left">Company</td>
<td class="tbl-header last text-left">Ticker</td>
<td class="tbl-header last text-left">Sector</td>
<td class="tbl-header last text-right">Avg. Weight (%)</td>
<td class="tbl-header last text-right">Contribution (%)</td>
</tr>
<tr class="tbl-data">
<td class="data-td data last text-left">The Estee Lauder Companies Inc.</td>
<td class="data-td data last text-left">EL</td>
<td class="data-td data last text-left">Consumer Staples</td>
<td class="data-td data last text-right">0.85</td>
<td class="data-td data last text-right">-0.29</td>
</tr>
<tr class="tbl-data">
<td class="data-td data last text-left">Huntington Ingalls Industries Inc.</td>
<td class="data-td data last text-left">HII</td>
<td class="data-td data last text-left">Industrials</td>
<td class="data-td data last text-right">1.99</td>
<td class="data-td data last text-right">-0.29</td>
</tr>
<tr class="tbl-data">
<td class="data-td data last text-left">Carnival Corp.</td>
<td class="data-td data last text-left">CCL</td>
<td class="data-td data last text-left">Consumer Discretionary</td>
<td class="data-td data last text-right">1.46</td>
<td class="data-td data last text-right">-0.26</td>
</tr>
<tr class="tbl-data">
<td class="data-td data last text-left">Otis Worldwide Corp.</td>
<td class="data-td data last text-left">OTIS</td>
<td class="data-td data last text-left">Industrials</td>
<td class="data-td data last text-right">1.42</td>
<td class="data-td data last text-right">-0.24</td>
</tr>
<tr class="tbl-data">
<td class="data-td data last text-left">GE HealthCare Technologies Inc.</td>
<td class="data-td data last text-left">GEHC</td>
<td class="data-td data last text-left">Health Care</td>
<td class="data-td data last text-right">1.41</td>
<td class="data-td data last text-right">-0.22</td>
</tr>
</tbody>
</table>
</div>
<p class="chart-disclosure"><strong>Source: Morningstar.</strong> Past performance is no guarantee of future results. Index performance is not illustrative of fund performance. Not intended as a recommendation to buy or to sell any of the securities mentioned herein.</p>
<h2 id="point-four" class="anchored-block jump-link-nav" data-jumplink-title="Moat Strategies">Choose Your Moat Strategy</h2>
<p>VanEck&rsquo;s suite of <strong><a href="/link/b633817b89cc48d38cf4158f762aaf70.aspx" title="Quality Companies at Attractive Prices">moat investing strategies</a></strong> is powered by Morningstar&rsquo;s equity research team, which seeks quality companies trading at attractive valuations. The below ETFs offer access to US moat companies:</p>
<p><strong><a href="/link/9e43dd198c5f4e419f13220685081895.aspx" title="MOAT - VanEck Morningstar Wide Moat ETF">VanEck Morningstar Wide Moat ETF (MOAT)</a></strong><span>:</span> companies with a wide moat rating, which means Morningstar believes the company is likely to sustain its competitive advantage for at least the next 20 years.</p>
<p><a href="/link/166321dbcfec440590fb51cf0ad629aa.aspx" title="SMOT - VanEck Morningstar SMID Moat ETF"><strong>VanEck Morningstar SMID Moat ETF (SMOT)</strong></a><span>:</span> small and mid-cap moat companies.</p>
<p><a href="/link/fd582da052ba46c79bfc112c078a6256.aspx" title="MVAL - VanEck Morningstar Wide Moat Value ETF"><strong>VanEck Morningstar Wide Moat Value ETF (MVAL)</strong></a><span>:</span> wide moat companies within Morningstar&rsquo;s value style category.</p>
<p>To receive more <a href="https://www.vaneck.com/us/en/insights/moat-investing" title="Moat Investing Insights"><strong>Moat Investing</strong></a> insights, <a href="https://www.vaneck.com/us/en/subscribe/" title="Subscription Center"><strong>sign up in our subscription center</strong></a>.</p>
]]></content:encoded>
</item><item rdf:about="https://www.vaneck.com/us/en/blogs/thematic-investing/the-economy-is-shifting-to-digital-natives-markets-are-following/">
  <title>The Economy Is Shifting to Digital Natives: Markets Are Following></title>
  <link>https://www.vaneck.com/us/en/blogs/thematic-investing/the-economy-is-shifting-to-digital-natives-markets-are-following/</link>
  <description><![CDATA[Gen Z and younger millennials have reshaped finance, work, and entertainment. The <a href="/link/bc13e94806954f2da2fab526cace351b.aspx" title="GENZ - VanEck Digital Native Economy ETF - Overview"><strong>GENZ</strong></a> ETF captures the companies built to serve the economy they created.]]></description>
  <dc:creator>Michael Cohick</dc:creator>
  <dc:date>04/09/2026 06:30:00</dc:date>
<content:encoded><![CDATA[

<p><strong>Key Takeaways:</strong></p>
<ul class="content-list">
<li class="mt-2"><strong>Gen Z was born into digital finance.</strong> 93% use P2P payment apps and cash preference has collapsed to just 7%.</li>
<li class="mt-2"><strong>Three pillars define how this generation lives.</strong> <a href="/link/bc13e94806954f2da2fab526cace351b.aspx" title="GENZ - VanEck Digital Native Economy ETF - Overview"><strong>GENZ</strong></a> covers digital finance, gig platforms, and online sports betting equally.</li>
<li class="mt-2"><strong>Sports betting shows the scale of this shift.</strong> U.S. online betting revenue exploded 55x in just seven years.</li>
</ul>
<h2>Meet the Consumer Who's Never Written a Check: The Case for the Digital Native Economy</h2>
<p>There are 145 million of them in the United States. They are the largest spending cohort in the country's history. And they have never walked into a bank branch to open an account.</p>
<p>Gen Z and younger millennials, roughly anyone born between 1981 and 2012, didn't adopt the digital economy. They were born into it. Their first financial account was an app. Their first job was on a platform. Their first bet was placed on a phone. The economy they participate in looks almost nothing like the one their parents navigated.</p>
<p>Today, VanEck is relaunching the <a href="/link/bc13e94806954f2da2fab526cace351b.aspx" title="GENZ - VanEck Digital Native Economy ETF - Overview"><strong>VanEck Digital Native Economy ETF (GENZ)</strong></a> formerly the VanEck Gaming ETF (BJK) <a href="https://www.vaneck.com/us/en/investments/digital-native-economy-etf-genz/"></a> to capture this structural shift. <strong><a href="/link/bc13e94806954f2da2fab526cace351b.aspx" title="GENZ - VanEck Digital Native Economy ETF - Overview">GENZ</a></strong> seeks to track the MarketVector Digital Native Economy Index (MVGENZTR), a benchmark organized around three segments of the economy that these consumers have reshaped from the ground up.</p>
<h2>Why the Digital Native Economy Is Here to Stay</h2>
<p>We have been watching this transition unfold for years, but the numbers now make it impossible to ignore:</p>
<ul class="content-list">
<li class="mt-2">93% of Gen Z and younger millennials use P2P payment apps. Cash preference has collapsed to just 7% (Source: Billtrust as of 2025).</li>
<li class="mt-2">The gig economy is growing 3x faster than the traditional workforce, with Gen Z leading the charge (Source: Fortune as of 2025).</li>
<li class="mt-2">34% of this cohort bets online regularly. U.S. sports betting revenue has exploded from $248 million in 2017 to $13.7 billion in 2024 a 55x increase in seven years (Source: Transunion as of 2025).</li>
</ul>
<p>These aren't behavioral quirks. They are the permanent financial habits of a generation that has never known anything different. The companies built to serve them, neobanks, gig platforms, digital betting operators are not disrupting incumbents. They are the incumbents for this cohort.</p>
<h2>From BJK to GENZ: Aligning with a New Consumer Reality</h2>
<p>We launched BJK in 2008 to capture the global gaming and leisure sector. It served investors well for nearly two decades. But the world has changed.</p>
<p>The most interesting growth in consumer behavior is no longer confined to gaming. It runs across three distinct pillars of digital-native life and the companies driving that growth increasingly don't fit inside a "gaming" label. We needed a broader, more accurate lens.</p>
<p>That lens is the digital native economy.</p>
<h2>The Three Pillars of GENZ</h2>
<p>The MarketVector Digital Native Economy Index organizes this economy around three segments:</p>
<p><strong>1. Millennial Finance</strong></p>
<p>Traditional banking never got the same foothold with this generation. They discovered finance through apps like Venmo, Cash App, Robinhood and Affirm. Neobanks and fintech platforms now handle billions in daily transactions with no physical presence. The index captures companies across:</p>
<ul class="content-list">
<li class="mt-2">Digital payment networks and peer-to-peer transfer platforms.</li>
<li class="mt-2">Buy-now-pay-later providers and digital lending.</li>
<li class="mt-2">App-first brokerage and investing platforms.</li>
</ul>
<p><strong>2. Gig Economy &amp; Online Forums</strong></p>
<p>Work, for this generation, is not entirely 9-to-5. It's a gig, a freelance contract, a creator monetization deal. Platforms like Fiverr, Etsy, and Reddit don't just connect buyers and sellers, they are the economic infrastructure for tens of millions of people who earn, transact, and build community entirely online. The index captures:</p>
<ul class="content-list">
<li class="mt-2">On-demand labor and freelance marketplace platforms.</li>
<li class="mt-2">Creator economy and community commerce companies.</li>
<li class="mt-2">Online forum and social commerce operators.</li>
</ul>
<p><strong>3. Digital Sports Betting &amp; Video Game Developers</strong></p>
<p>Sports betting has gone from niche to mainstream faster than almost any consumer category in history. Since the Supreme Court struck down federal betting restrictions in 2018, state after state has legalized online wagering. Online operators now generate tens of billions in annual revenue and are among the fastest-growing digital consumer platforms in the country. The index includes:</p>
<ul class="content-list">
<li class="mt-2">Online sports betting operators and iGaming platforms.</li>
<li class="mt-2">Fantasy sports and digital wagering companies.</li>
<li class="mt-2">Technology providers enabling regulated online gambling.</li>
<li class="mt-2">Video game developers.</li>
<li class="mt-2">Sports data and analytics services.</li>
</ul>
<h2>How the Digital Native Economy Index Works</h2>
<p>The MarketVector Digital Native Economy Index applies a rules-based methodology to identify and weight companies across all three segments. Eligible constituents must:</p>
<ul class="content-list">
<li class="mt-2">Derive at least 50% of revenues from digital-native economy activities (25% for existing index components).</li>
<li class="mt-2">Meet minimum market capitalization and liquidity thresholds.</li>
<li class="mt-2">Be listed on a US exchange.</li>
</ul>
<p>The index is rebalanced quarterly and reconstituted on a defined schedule, ensuring the portfolio stays current as companies and market dynamics evolve. Each of the three tiers carries an equal weight of approximately 33.3% at rebalance, with individual security weights capped at 8% to manage concentration risk.</p>

<h2>GENZ Brings Consumer Layer to VanEck's Thematic ETF Suite</h2>
<p><a href="/link/bc13e94806954f2da2fab526cace351b.aspx" title="GENZ - VanEck Digital Native Economy ETF - Overview"><strong>GENZ</strong></a> fits within a broader suite of VanEck thematic ETFs that collectively trace the infrastructure of modern economic life. <strong><a href="/link/39c8d235748b4c26a5930c31d3ac0160.aspx" title="SMH - VanEck Semiconductor ETF - Overview">SMH</a></strong> captures the semiconductor supply chain powering every digital device. <strong><a href="/link/d41cc1b7916f46e5bb3ee751f311c4f2.aspx" title="ESPO - VanEck Video Gaming and eSports ETF - Overview">ESPO</a></strong> covers competitive gaming and esports. <strong><a href="/link/721720af197d4160afe33eccf9d71a52.aspx" title="DAPP - VanEck Digital Transformation ETF - Overview">DAPP</a></strong> provides exposure to digital asset companies. <strong><a href="/link/bc13e94806954f2da2fab526cace351b.aspx" title="GENZ - VanEck Digital Native Economy ETF - Overview">GENZ</a></strong> now adds the consumer layer, the people and platforms where all of that technology meets real economic behavior.</p>
<p>Together, they represent VanEck's conviction that the most durable investment themes are the ones tied to how people actually live, work, and spend not just how they did in the past.</p>

<p>To receive more <a href="https://www.vaneck.com/us/en/insights/thematic-investing/" title="Thematic Investing Insights"><strong>Thematic Investing</strong></a> insights, <a href="https://www.vaneck.com/us/en/subscribe/" title="Subscription Center"><strong>sign up in our subscription center</strong></a>.</p>
]]></content:encoded>
</item><item rdf:about="https://www.vaneck.com/us/en/blogs/emerging-markets-equity/oil-shock-ai-tailwinds-and-portfolio-shifts-across-emerging-markets/">
  <title>Oil Shock, AI Tailwinds, and Portfolio Shifts Across Emerging Markets></title>
  <link>https://www.vaneck.com/us/en/blogs/emerging-markets-equity/oil-shock-ai-tailwinds-and-portfolio-shifts-across-emerging-markets/</link>
  <description><![CDATA[Emerging markets started off strong in 2026, but Middle East conflict and surging oil prices created new headwinds, leading to targeted portfolio changes.]]></description>
  <dc:creator>Ola  El-Shawarby, CFA</dc:creator>
  <dc:date>04/09/2026 06:30:00</dc:date>
<content:encoded><![CDATA[

<p><strong>Key Takeaways:</strong></p>
<ul class="content-list">
<li class="mt-2">Middle East conflict pushed oil above $100, creating near-term pressure on oil-importing EM economies while benefiting exporters.</li>
<li class="mt-2">Long-term conviction in AI supply chain and commodity names held firm despite geopolitical volatility and selective portfolio trimming.</li>
<li class="mt-2">Rate-cutting cycles across EM will likely run shorter and shallower than expected as the energy shock complicates central bank decisions.</li>
</ul>
<p id="point-one" class="anchored-block jump-link-nav" data-jumplink-title="Market Review">Emerging markets entered 2026 with real momentum built through 2025, supported by improving fundamentals, a more constructive policy backdrop, and accelerating structural growth across several key markets. That tailwind met a sharper set of headwinds in the first quarter, chief among them a dramatic escalation of conflict in the Middle East that has reordered near-term priorities for investors across the asset class. The structural stories we have been tracking in AI-driven innovation, China's domestic technology buildout, and a broadening set of opportunities across emerging economies remain intact and are in many cases more compelling.</p>
<p>We continue to believe the structural setup for emerging markets is positive &mdash; year-to-date flows into the asset class have reinforced that longer-term thesis. That said, a stronger U.S. dollar (reflecting safe-haven flows) and the inflation/rate implications of an energy-supply shock are material near-term risks; the policy and market reaction will hinge on how long the energy disruption persists, and we are treating that duration as a key watch-point for any change in positioning.</p>
<p>Navigating this environment requires more than a top-down view. It requires the kind of stock-level, country-by-country work that has always defined our process. We made a number of portfolio adjustments this quarter, reducing exposure where risk profiles have shifted or conviction has eroded, and adding selectively where the thesis remains unchanged, and the price has become more attractive.</p>

<h2>The Conflict: Fluid, Consequential, and Unresolved</h2>
<p>The late-February escalation in the Middle East introduced an unusually large geopolitical shock. Disruption to seaborne oil flows &mdash; including effective closures near the Strait of Hormuz, which handles roughly 20% of seaborne petroleum &mdash; pushed Brent above $100/bbl. This episode&rsquo;s breadth and duration distinguish it from the shorter-lived June 2025 shock.</p>
<p>We have not tried to bet on a specific outcome given the fluidity of scenarios; instead, we assessed implications country by country, holding names where the underlying thesis is unchanged and reducing where the risk profile has materially shifted or where the conflict creates a direct headwind to fundamentals.</p>
<p>The most important first-order effect for emerging markets is energy prices. Oil-importing economies, India most prominently but also parts of Southeast Asia and Central &amp; Eastern Europe, Middle East, and Africa (CEEMEA), face real pressure on current account deficits, currencies, and fiscal positions. Oil exporters, particularly in Latin America and the Gulf, are relative beneficiaries in the near term, though the Gulf carries its own direct risk exposure. For central banks across EM, the energy shock complicates the rate-cutting paths many markets were anticipating. Rate cycles will likely prove shorter and shallower than expected. The longer this conflict runs, the more consequential the economic effects become. We are watching duration closely.</p>
<h2>The AI Trade: Maturing, Dispersing, and Deepening</h2>
<p>AI&rsquo;s evolution creates investable opportunities across both the application layer and the infrastructure stack &mdash; we view both as complementary. We continue to favor platform innovators where AI monetization is credible, while also increasing exposure to the AI supply chain to capture multiple angles of structural demand. <strong>Tencent (4.1% of Fund net assets<sup>*</sup>) </strong>and <strong>Alibaba (2.7% of Fund net assets<sup>*</sup>)</strong> experienced distinct near-term headwinds that affected stock performance, but both remain core holdings given their AI monetization pathways. China&rsquo;s domestic semiconductor industry continues to make progress on advancement and availability of local chips to partially provide local alternatives to support AI deployment in the face of export controls. This may also create a set of investable opportunities beyond the large-cap internet platforms that we are currently exploring. We are diversifying exposure across platforms, supply chain and infrastructure and adding selectively on weakness. <strong>Taiwan Semiconductor Manufacturing Company (&ldquo;TSMC&rdquo;) (12.7% of Fund net assets<sup>*</sup>)</strong> and <strong>Chroma ATE (4.3% of Fund net assets<sup>*</sup>)</strong> were top contributors to performance this quarter, reflecting the quality of their businesses and the durability of structural demand.</p>
<h2>Selective Commodity Exposure: Structural Demand, Quality Discipline</h2>
<p>Commodities are no longer only a cyclical play &mdash; for a subset of metals, they are structural pillars of the next phase of EM growth. We emphasize a structural-growth approach rather than pure cyclical bets. The current energy disruption has reinforced rather than created these dynamics &mdash; our selective commodity inclination predates the conflict and is anchored in long-duration demand drivers. Copper supports durable electrification and AI infrastructure demand, while gold serves as a hedge against broad-based currency weakness and as part of strategic diversification of reserves and trade settlement away from the U.S. dollar. Accordingly, we added <strong>Zijin Mining (0.9% of Fund net assets<sup>*</sup>)</strong>, consistent with our structural growth at a reasonable price (S-GARP) framework, to gain direct hard-asset cashflow exposure and used the recent dislocation to modestly increase exposure to high-quality hard-asset names. Beyond direct miner exposure, we also gain indirect exposure through high-quality exporters &mdash; notably Peru, Chile and South Africa &mdash; which tend to benefit economically when commodity cycles firm. These country positions complement our selective miner holdings while preserving our earnings-and-quality discipline.</p>
<h2 id="point-two" class="anchored-block jump-link-nav" data-jumplink-title="EM Countries &amp; Themes">China: Consumption Recovery, Reflation, and Portfolio Recalibration</h2>
<p>The government has revised growth expectations modestly downward and placed greater emphasis on consumption and domestic innovation. The explicit policy focus has shifted toward addressing deflation. Efforts to reflate the domestic economy and support consumer spending are still taking shape, but initial signs of recovery are visible. Property market data, while still weak in places, may be approaching a bottom. The maturing of prior high-yield deposits, combined with substantially lower rates on new deposits, has created real incentive for savers to redeploy capital into financial markets, a potential source of incremental demand that could support equities.</p>
<p>Alongside consumption and reflation, innovation remains a clear driver &mdash; supporting our conviction in names such as <strong>WuXi Biologics (0.6% of Fund net assets<sup>*</sup>)</strong> and <strong>BeOne Medicines (1.1% of Fund net assets<sup>*</sup>).</strong> WuXi benefits from a strong out-licensing trend and deep domestic R&amp;D capacity, while BeOne offers durable commercial optionality in oncology. We are also looking selectively at industrial names that could benefit from China's domestic technology push. We exited <strong>Tencent Music</strong> and <strong>Trip.com</strong> as conviction on their near-term growth trajectories weakened. An anticipated Xi&ndash;Trump meeting could modestly ease bilateral geopolitical tone and improve sentiment; while we will not bet on a political outcome, any sustained improvement in diplomatic tone would be constructive for flows and market confidence.</p>
<h2>Country Highlights</h2>
<h2>India: Structural Conviction, Near-Term Energy Risk</h2>
<p>Our team conducted an extensive research trip to India this quarter, meeting with management teams across financials, industrials, healthcare, and technology. The structural story is intact. The reset in valuations and earnings expectations over recent quarters has been healthy, and the foundation for the next leg of growth is more solid as a result. Policy reforms continue to support the investment case. The conventional framing of India as an "anti-AI" market is beginning to shift, with data center investment expanding, and global cloud players taking India more seriously as an AI infrastructure destination. The AI buildout has broader implications for India's power infrastructure and grid upgrades, areas where we are seeing accelerating investment.</p>
<p>The near-term caveat is energy. India is a significant oil importer, and the current conflict creates direct pressure on the current account, the rupee, and inflation. India has been partially cushioning the shock through Russian oil purchases, but that avenue has limits. Short-term price action will likely remain volatile as long as the conflict is unresolved. The long-term thesis has not changed.</p>
<h2>Taiwan: Supply Chain Leadership, Staying the Course</h2>
<p>TSMC and Chroma ATE were among the Fund's top contributors for the quarter. The Asia semiconductor supply chain for AI continues to deliver strong earnings and revenue growth. The structural position of these companies, central to global AI infrastructure in ways that are difficult to replicate quickly, gives us conviction to hold through volatility and add selectively on weakness.</p>
<h2>South Korea: Volatility Creates Opportunity, Structural Story Intact</h2>
<p>Korea had a strong start to the year but experienced elevated volatility as geopolitical risk rose. The KOSPI Composite Index sold off sharply in early March as the conflict escalated, reflecting in part the elevated retail positioning in large-cap names. Structurally, the memory and AI supply chain story remains compelling. The "value up" governance reform program continues to progress, with improving alignment between management and shareholders at several held names.</p>
<h2>Brazil: Commodity Tailwinds, Rate Cycle Begins</h2>
<p>Brazil is one of the clearer relative winners in this environment. As a commodity exporter, higher energy prices support the terms of trade. The rate-cutting cycle we have been anticipating since mid-2025 began in March, validating our constructive positioning. The conflict may limit the depth and duration of cuts relative to prior expectations, and we are watching inflation carefully, but the direction is constructive. A market-friendly election outcome would be an additional catalyst for domestic confidence and flows.</p>
<h2>MENA: Derisking with Precision, Selective Where It Counts</h2>
<p>We entered the conflict with a slight overweight to MENA and have reduced risk where country or company profiles shifted most visibly. We trimmed Emaar in the UAE &mdash; where Dubai&rsquo;s safe-haven status appears less certain &mdash; while adding to <strong>ADNOC Drilling (0.7% of Fund net assets<sup>*</sup>)</strong> on weakness as a defensive, oil-sector exposure focused on Abu Dhabi&rsquo;s capacity expansion. We trimmed <strong>Commercial International Bank (1.0% of Fund net assets<sup>*</sup>)</strong> in Egypt, where higher energy prices and potential FX pressures create near-term vulnerability despite the bank&rsquo;s high-quality franchise and capitalization. In Saudi Arabia, we added <strong>Company for Cooperative Insurance (Tawuniya) (0.6% of Fund net assets<sup>*</sup>)</strong> at an attractive valuation: the insurance sector offers structural penetration upside driven by product diversification and regulatory strengthening under the National Insurance Strategy. We continue to monitor the conflict closely but retain selective exposure where risk-reward remains compelling.</p>
<h2>South Africa: Underappreciated Value, Commodity Tailwind</h2>
<p>We initiated positions in <strong>FirstRand (0.8% of Fund net assets<sup>*</sup>)</strong> and <strong>Pepkor (0.4% of Fund net assets*)</strong> this quarter. South Africa offers underappreciated domestic equity value at current valuations. The South African Reserve Bank faces some pressure from tightening global financial conditions and higher energy prices, but the underlying domestic reform story and these companies' positions within it remain intact. South Africa also benefits from its position as a commodity exporter, with gold dynamics and improving terms of trade providing an additional tailwind.</p>
<h2>Mexico: Nearshoring Thesis Holds</h2>
<p>We added Vesta <strong>(0.6% of Fund net assets<sup>*</sup>)</strong>, the industrial real estate company. Nearshoring dynamics continue to support demand for industrial space in northern Mexico, a structural trend progressing independently of the current geopolitical backdrop.</p>
<h2>Portfolio Positioning &amp; Outlook</h2>
<p>Looking ahead, our Q2 posture is selective and evidence-driven. We are positioning with greater conviction in earnings-resilient and structural growth names &mdash; particularly across the AI supply chain, domestically anchored compounders, and innovation-led opportunities across the universe. The conflict remains the dominant near-term variable; we continue to monitor developments closely and assess implications on a case-by-case basis, consistent with the bottom-up, company-level approach that has always defined our process. We will adjust positioning as macro or company-level evidence warrants, guided by our S-GARP discipline.</p>
<h2 id="point-three" class="anchored-block jump-link-nav" data-jumplink-title="Fund Performance">Fund Performance</h2>
<p>The <a href="/link/eb4419e6f6394611b3f80c597020daa4.aspx" title="GBFAX - Emerging Markets Fund - Class A"><strong>VanEck Emerging Markets Fund</strong></a> (the &ldquo;Fund&rdquo;) slightly underperformed the MSCI EM IMI Index on a quarter-to-date basis ending March 31, 2026 (-0.35% for the Fund; -0.24% for the Index). Positive relative performance for the quarter was driven by stock selection in Taiwan and the Philippines. Negative relative performance was driven by stock selection in China and India.</p>
<p>South Korea and Taiwan were the Fund&rsquo;s top contributors for the quarter.</p>
<h3>Average Annual Total Returns (%) as of March 31, 2026</h3>
<div class="wrapped-div">
<table style="width: 100%;">
<tbody>
<tr class="tbl-data">
<td class="tbl-header last">&nbsp;</td>
<td class="tbl-header last text-right">1Q26<sup>&dagger;</sup></td>
<td class="tbl-header last text-right">YTD</td>
<td class="tbl-header last text-right">1YR</td>
<td class="tbl-header last text-right">3YR</td>
<td class="tbl-header last text-right">5YR</td>
<td class="tbl-header last text-right">10YR</td>
</tr>
<tr class="tbl-data">
<td class="data-td last text-left">Class A: NAV (Inception 12/20/93)</td>
<td class="data-td data last text-right">-0.35</td>
<td class="data-td data last text-right">27.30</td>
<td class="data-td data last text-right">11.98</td>
<td class="data-td data last text-right">-1.32</td>
<td class="data-td data last text-right">5.12</td>
</tr>
<tr class="tbl-data">
<td class="data-td last text-left">Class A: Maximum 5.75% Load</td>
<td class="data-td data last text-right">-6.08</td>
<td class="data-td data last text-right">19.98</td>
<td class="data-td data last text-right">9.79</td>
<td class="data-td data last text-right">-2.49</td>
<td class="data-td data last text-right">4.50</td>
</tr>
<tr class="tbl-data">
<td class="data-td last text-left">Class I: NAV (Inception 12/31/07)</td>
<td class="data-td data last text-right">-0.16</td>
<td class="data-td data last text-right">28.06</td>
<td class="data-td data last text-right">12.65</td>
<td class="data-td data last text-right">-0.76</td>
<td class="data-td data last text-right">5.68</td>
</tr>
<tr class="tbl-data">
<td class="data-td last text-left">MSCI Emerging Markets Investable Markets Index (IMI)</td>
<td class="data-td data last text-right">-0.24</td>
<td class="data-td data last text-right">28.88</td>
<td class="data-td data last text-right">14.67</td>
<td class="data-td data last text-right">4.03</td>
<td class="data-td data last text-right">7.82</td>
</tr>
<tr class="tbl-data">
<td class="data-td last text-left">MSCI Emerging Markets IMI Growth Index</td>
<td class="data-td data last text-right">-1.45</td>
<td class="data-td data last text-right">29.63</td>
<td class="data-td data last text-right">13.86</td>
<td class="data-td data last text-right">1.79</td>
<td class="data-td data last text-right">8.06</td>
</tr>
</tbody>
</table>
</div>
<p class="chart-disclosure">The table presents past performance which is no guarantee of future results and which may be lower or higher than current performance. Returns reflect applicable fee waivers and/or expense reimbursements. Had the Fund incurred all expenses and fees, investment returns would have been reduced. Investment returns and Fund shares values will fluctuate so that investor's shares, when redeemed, may be worth more or less than their original cost. Fund returns assume that dividends and capital gains distributions have been reinvested in the Fund at net asset value (NAV). Index returns assume that dividends of the Index constituents in the Index have been reinvested. Performance information current to the most recent month-end is available by calling 800.826.2333 or by visiting vaneck.com.</p>
<p class="chart-disclosure">Expenses: Class A: Gross 1.59%; Net 1.59%; Class I: Gross 1.25%; Net 1.02%. Expenses are capped contractually until 5/1/26 at 1.60% for Class A and 1.00% for Class I. Caps exclude acquired fund fees and expenses, interest, trading, dividends, interest payments of securities sold short, taxes and extraordinary expenses.</p>

<h2 id="point-four" class="anchored-block jump-link-nav" data-jumplink-title="Fund Review">Fund Review</h2>
<p>On a sector level, Information Technology, Consumer Staples and Health Care contributed to relative performance, while Consumer Discretionary, Energy and Financials detracted. On a country level, Taiwan, Philippines and Indonesia contributed to relative performance, while China, India and Brazil detracted.</p>
<h2>Top Contributors</h2>
<p>Top contributors to return on an absolute basis during the quarter:</p>
<ul class="content-list">
<li class="mt-2"><strong>Chroma ATE (4.3% of Fund net assets<sup>*</sup>): </strong>Chroma ATE is a Taiwan-based manufacturer of precision test and measurement equipment, serving semiconductor, battery, and power electronics customers globally. Chroma ATE contributed strongly this quarter, reflecting its positioning as a key enabler of increasing semiconductor complexity. As AI, advanced packaging, and high-performance computing drive more demanding testing and inspection requirements, Chroma's specialized capabilities have become increasingly critical. We view the company as a picks-and-shovels beneficiary of the same structural trends underpinning SK Hynix and TSMC, with a differentiated and defensible niche in semiconductor test equipment supporting continued growth.</li>
<li class="mt-2"><strong>SK hynix (4.9% of Fund net assets<sup>*</sup>):</strong> SK Hynix is a South Korea-based semiconductor company and one of the world's largest producers of memory chips, including DRAM and NAND flash. SK Hynix was once again a leading contributor during the quarter as investors continued to reward its dominant position in high-bandwidth memory, a critical bottleneck in AI infrastructure. The company's leadership in high bandwidth memory (HBM), combined with tight industry supply and strong end-demand, continues to support both volume growth and pricing power, delivering in line with our thesis. We continue to view SK Hynix as one of the strongest structural beneficiaries of the AI investment cycle, where memory has shifted from a commoditized input to a key constraint on system performance. Execution remains strong, and the company is well-positioned to sustain attractive returns as AI-driven demand persists.</li>
<li class="mt-2"><strong>Taiwan Semiconductor Manufacturing Company (&ldquo;TSMC&rdquo;) (12.7% of Fund net assets<sup>*</sup>):</strong> TSMC is the world's leading semiconductor foundry, manufacturing chips on behalf of the majority of the world's leading fabless chip designers, including Nvidia, Apple, and AMD. TSMC remained a major contributor this quarter as its long-term investment thesis continued to play out. The company's dominant position at the leading edge of semiconductor fabrication provides durable pricing power, strong margins, and high visibility into demand. This position has been further reinforced by the surge in AI-related capital expenditure, where leading-edge capacity remains constrained. We continue to monitor for any signs of moderation in AI demand, but TSMC's execution and strategic importance to the semiconductor ecosystem underpin our confidence in its ability to compound shareholder value over the medium term.</li>
</ul>
<h2>Top Detractors</h2>
<p>Top detractors to return on an absolute basis during the quarter:</p>
<ul class="content-list">
<li class="mt-2"><strong>Tencent Holdings (4.1% of Fund net assets</strong><sup><strong>*</strong></sup><strong>):</strong> Tencent is China's largest technology conglomerate, operating across social media and messaging through WeChat, online gaming, digital advertising, cloud services, and fintech. Tencent detracted this quarter as investor concerns mounted around AI positioning and growth sustainability. Management acknowledged falling behind Alibaba and ByteDance on AI development, and guidance that AI capital expenditure will more than double in 2026, alongside lower buybacks and revenue growth outpacing profit growth, reinforced concerns around margin pressure and near-term shareholder returns. On the core business, high base effects, softening ad demand, e-commerce tax law changes, and internal GPU prioritization constraining cloud growth all weighed on sentiment. The broader rotation from Chinese internet into hardware names added further pressure. We are monitoring the AI investment ramp closely and will reassess as execution evidence accumulates.</li>
<li class="mt-2"><strong>HDFC Bank (2.23% of Fund net assets</strong><sup><strong>*</strong></sup><strong>): </strong>HDFC Bank is India's largest private sector bank by assets, offering a broad range of retail and corporate banking, insurance, and financial services products. HDFC Bank detracted from performance this quarter, primarily reflecting weaker relative performance of Indian equities rather than any material deterioration in fundamentals. Operationally, the bank continues to deliver steady loan and deposit growth while maintaining balance sheet discipline. Broader macro concerns, foreign outflows, and softer sentiment toward India weighed on the stock. Given its size in the portfolio, this translated into a meaningful drag on relative returns.</li>
<li class="mt-2"><strong>Reliance Industries (2.4% of Fund net assets</strong><sup><strong>*</strong></sup><strong>): </strong>Reliance Industries is India's largest conglomerate, with operations spanning energy refining and petrochemicals, digital and telecom services through Jio, and organized retail. Reliance Industries detracted this quarter, largely due to India's relative underperformance within emerging markets. The company's diversified business model continues to offer multiple long-term growth drivers, and we see no fundamental change to the investment case. Short-term share price weakness was driven by macro factors and country-level sentiment rather than company-specific issues, but its large weight in the portfolio amplified the impact on returns.</li>
</ul>
<h2>Top Buys &amp; Sells</h2>
<p>During the period, we established new positions in the following:</p>
<ul class="content-list">
<li class="mt-2"><strong>BeOne Medicines Ltd. Sponsored ADR (1.1% of Fund net assets<sup>*</sup>): </strong>BeOne Medicines (formerly BeiGene) is a global oncology company with a commercial portfolio anchored by Brukinsa, the world's leading Bruton tyrosine kinase (BTK) inhibitor, and a deep pipeline spanning hematology and solid tumors. We initiated a position based on a rare transition from growth story to cash-generative compounder, with the pipeline inflecting at the right time. Brukinsa has displaced Imbruvica on efficacy and safety to claim the number one BTK inhibitor position globally, crossing $1 billion in quarterly sales in Q3 2025. Critically, BeOne now owns both components of the next-generation combination therapy, Brukinsa plus Sonrotoclax, which received its first global approval in January 2026, allowing the company to capture 100% of combination treatment economics. The key near-term catalyst is the CELESTIAL trial readout in mid-2026: a win against the AbbVie/Roche standard of care would effectively mandate prescribing and convert a competitive market into a winner-takes-most dynamic. With $4.1 billion in cash, positive free cash flow, and no further dilution risk, we believe the stock at 31x forward two-year earnings is pricing in execution risk that has materially diminished following recent pipeline derisking.</li>
<li class="mt-2"><strong>Company for Cooperative Insurance (&ldquo;Tawuniya&rdquo;) (0.6% of Fund net assets<sup>*</sup>): </strong>Tawuniya is the largest multi-line insurance provider in Saudi Arabia, with leading positions across medical, property and casualty, and motor insurance. We initiated a position to gain exposure to the structural growth of the Saudi insurance market, underpinned by regulatory reform and rising penetration. In February, Saudi Arabia formally approved its National Insurance Strategy, targeting an increase in insurance penetration from 1.8% of GDP to 3.6% by 2030 and insured lives from 14.5 million to 23 million. As market leader, Tawuniya is well-positioned to capture this expansion through its scale, distribution, and underwriting capabilities. Beyond top-line growth, we see a clear pathway to margin improvement driven by underwriting discipline and favorable mix shifts toward higher-margin P&amp;C and life and savings products.</li>
<li class="mt-2"><strong>Corporacion Inmobiliaria Vesta S.A.B. de C.V. (0.6% of Fund net assets<sup>*</sup>): </strong>Vesta is one of Mexico's leading Class-A industrial real estate platforms, with a dollar-denominated asset base and a long-duration development pipeline anchored by its Route 2030 growth plan. Our thesis rests on three pillars: structural nearshoring tailwinds, embedded growth through Route 2030, and a valuation opportunity created by 2024 underperformance. Near-term noise around trade policy has obscured the durability of underlying demand drivers, leaving long-term value creation underappreciated. At current prices, the market appears to be pricing only the stabilized portfolio, effectively valuing the development pipeline at zero. We view the risk-reward as attractive, with meaningful upside tied to the United States-Mexico-Canada Agreement (USMCA) resolution and Route 2030 execution, and limited downside given the quality of the asset base and balance sheet.</li>
<li class="mt-2"><strong>FirstRand Limited (0.8% of Fund net assets<sup>*</sup>): </strong>FirstRand is one of South Africa's largest financial services groups, with leading franchises across retail, commercial, and investment banking. We initiated a position to gain exposure to an improving South African macro and credit cycle, driven by a step-change in policy credibility and reform execution rather than cyclical stimulus. FirstRand stands out for its ability to convert improving conditions into earnings growth through disciplined underwriting, exposure to higher-return segments including SME and commercial banking, and cost discipline that should drive operating leverage as revenues recover. We believe the company offers an attractive balance of earnings growth, capital return, and domestic cycle exposure, while sustaining returns on equity above 20%.</li>
<li class="mt-2"><strong>Pepkor Holdings Ltd. (0.4% of Fund net assets<sup>*</sup>): </strong>Pepkor is South Africa's largest value-segment retailer, operating over 6,500 stores and serving more than 32 million customers. Its everyday low price model provides defensiveness across cycles, benefiting from consumer trade-down in weaker environments while sustaining volume growth when conditions improve. The investment case is increasingly driven by Pepkor's evolution beyond retail into an integrated consumer platform spanning financial services, payments, connectivity, and informal market distribution, businesses that offer structurally higher growth and margins than core retail. We see a clear pathway to improving earnings quality through a growing financial services contribution, maturing credit book economics, and increasing monetization per customer through data and cross-selling. At current valuations, we believe the market underappreciates this shift and that Pepkor offers a compelling combination of defensive retail characteristics and higher-growth adjacencies that should support sustained earnings growth over time.</li>
<li class="mt-2"><strong>SK Square Co., Ltd. (0.6% of Fund net assets<sup>*</sup>):</strong> SK Square is a South Korean holding company whose primary asset is a significant stake in SK Hynix, alongside a portfolio of other technology investments. We initiated a position to complement our existing SK Hynix holding and manage concentration risk as that position grew. SK Square provides continued exposure to the AI memory theme while offering additional return potential through a substantial holding company discount to net asset value and the prospect of discount compression over time. This allows us to retain high-conviction exposure to AI-driven semiconductor demand while managing position sizing more effectively.</li>
<li class="mt-2"><strong>Wuxi Biologics (Cayman) Inc. (0.6% of Fund net assets<sup>*</sup>): </strong>WuXi Biologics is a leading global contract research and manufacturing organization specializing in biologics drug development and production. We initiated a position as the BIOSECURE Act overhang shifted from existential threat to manageable risk, with the final law removing WuXi by name and including a 2032 grandfather clause that aligns with the company's Singapore and U.S. facility buildout timeline. The fundamental thesis rests on a recovering U.S. biotech funding cycle, a $20 billion backlog converting into revenue, and a structural licensing-out boom as Chinese biotech assets are acquired upstream by Big Pharma. At 21x forward earnings, we believe the stock remains undervalued relative to the quality and visibility of the growth opportunity.</li>
<li class="mt-2"><strong>Zijin Mining Group Co., Ltd. Class H (0.9% of Fund net assets<sup>*</sup>): </strong>Zijin Mining is a Chinese-headquartered global mining company with large-scale production across gold, copper, and other base metals. We initiated a position as a play on structurally higher gold and copper prices, with a company-specific operational edge that peers cannot easily replicate. Gold is supported by sustained central bank buying providing a structural price floor, while copper faces a supply deficit driven by declining ore grades, flat industry capex, and 16 to 18-year lead times on new projects. Zijin is the ideal vehicle as the only major miner simultaneously expanding production in both metals, doing so at roughly 60 to 70% of Western peers' capital costs through proprietary processing technology and in-house engineering. (Source: VanEck Research) With all-in sustaining costs around $1,100 per ounce versus a peer average of $1,500 to $1,600, every dollar of commodity upside accrues disproportionately to Zijin.</li>
</ul>
<p>During the period, we exited the following positions:</p>
<ul class="content-list">
<li class="mt-2"><strong>InPost S.A.:</strong> InPost is a leading e-commerce delivery and parcel locker operator in Europe. We exited our position following an all-cash takeover offer at EUR 15.60 per share in February, supported by shareholders representing 48% of outstanding shares. With the stock having re-rated in anticipation of the bid and the likelihood of a materially higher competing offer low, the offer price effectively caps near-term upside. Deal completion became the primary driver of returns, and we redeployed capital into opportunities with a more compelling risk-reward profile.</li>
<li class="mt-2"><strong>JSL S.A.: </strong>JSL is a Brazilian logistics and transportation company. We exited after an extended holding period as the investment case was increasingly challenged by Brazil's persistently high Selic rate (Brazil&rsquo;s benchmark rate), which pressured net income and kept leverage elevated at approximately 3x net debt to EBITDA. Limited share liquidity further constrained our ability to manage the position efficiently. JSL remains a well-run business with healthy organic growth and improving margins, but the combination of leverage, rate sensitivity, and thin liquidity made it difficult to justify relative to better-visibility opportunities elsewhere in the portfolio.</li>
<li class="mt-2"><strong>PKO Bank Polski SA: </strong>PKO Bank Polski is Poland's largest bank, with a dominant domestic franchise spanning retail, corporate, and public sector lending. We exited following strong share price performance that left the risk-reward more balanced. Poland's high fiscal deficit raises the likelihood of further tax measures targeting banks, and the 2027 general election introduces additional political uncertainty. With valuation upside now more limited following the recent re-rating, we chose to realize gains and redeploy capital into more attractive opportunities.</li>
<li class="mt-2"><strong>Prosus N.V. Class N: </strong>Prosus is a global consumer internet holding company with a portfolio spanning food delivery, classifieds, fintech, and e-commerce, with the majority of its value derived from its Tencent stake. We exited as conviction in the company's ecosystem strategy weakened. Food delivery, the core pillar of that strategy, carries limited visibility on profitability in Europe, where competitive intensity remains high, and faces rising competition in Brazil, where iFood's historically strong position is under pressure. With the near-term investment case driven largely by Tencent, we prefer more direct exposure to that theme without the added complexity and execution risk at the holding company level.</li>
<li class="mt-2"><strong>Tencent Music Entertainment Group Sponsored ADR: </strong>Tencent Music is a Chinese music streaming platform offering on-demand listening, live streaming, and social entertainment features. We exited due to a structural threat to its subscription moat, with limited visibility on where earnings stabilize. ByteDance's Soda Music now offers AI-generated content sufficient for casual listeners, effectively eliminating Tencent Music's content exclusivity advantage and accelerating basic membership churn. Management's decision to discontinue subscriber disclosure signals limited confidence in a near-term recovery. At 10x earnings, the stock is only cheap if growth re-accelerates, and a pivot to non-subscription revenue risks simultaneous estimate cuts and multiple compression, with the floor closer to 8x. We preferred to redeploy capital into names with clearer earnings visibility.</li>
<li class="mt-2"><strong>Trip.com Group Ltd. Sponsored ADR: </strong>Trip.com is China's dominant online travel platform, with over 50% share of the domestic online travel agency (OTA) market. We exited following a formal State Administration for Market Regulation (SAMR) antitrust investigation into alleged abuse of market dominance, which introduces meaningful uncertainty around potential penalties and, more importantly, forced changes to platform practices such as commission rates and merchant terms. While near-term travel demand remains solid, the risk of take rate compression pressuring margins and slowing monetization limits earnings visibility. We preferred to rotate into hotel operators and other beneficiaries that may gain from a more favorable supply and demand environment if platform practices are curtailed.</li>
<li class="mt-2"><strong>United International Transportation Co. Ltd. (&ldquo;Budget Saudi&rdquo;):</strong> Budget Saudi is a leading car rental and leasing company in Saudi Arabia, with exposure to both retail and corporate mobility demand. We exited during the quarter as the investment case took longer to materialize than expected. While the long-term story around margin recovery and acquisition synergies retains merit, near-term catalysts remain limited, and the stock has underperformed expectations. We rotated capital into higher-conviction opportunities within Saudi Arabia, where earnings growth and re-rating drivers are clearer.</li>
</ul>

<p>To receive more <a href="/us/en/insights/emerging-markets-equity/" title="Emerging Markets Equity Insights"><strong>Emerging Markets Equity</strong></a> insights, <a href="/us/en/subscribe/" title="Subscription Center"><strong>sign up in our subscription center</strong></a>.</p>
]]></content:encoded>
</item><item rdf:about="https://www.vaneck.com/us/en/blogs/income-investing/how-to-develop-a-dividend-investing-strategy-a-comprehensive-guide/">
  <title>How to Develop a Dividend Investing Strategy: A Comprehensive Guide></title>
  <link>https://www.vaneck.com/us/en/blogs/income-investing/how-to-develop-a-dividend-investing-strategy-a-comprehensive-guide/</link>
  <description><![CDATA[Learn how to develop a dividend investing strategy that generates a steady stream of passive income. Follow these actionable tips and advice to start building your portfolio today.]]></description>
  <dc:creator> </dc:creator>
  <dc:date>04/08/2026 10:49:00</dc:date>
<content:encoded><![CDATA[

<p><strong>Key Takeaways:</strong></p>
<ul class="content-list">
<li class="mt-2">Dividend investing can provide steady income and long-term growth but requires careful selection to avoid unsustainable payouts and dividend traps.</li>
<li class="mt-2">Successful strategies focus not just on high yields or past payments but on forward-looking factors like financial health, balance sheet strength, and valuation.</li>
<li class="mt-2">A disciplined dividend plan should align with your goals and risk tolerance, diversify across quality companies, and avoid chasing yield at the expense of total return.</li>
</ul>
<h2 id="dividend-investing" class="jump-link-nav anchored-block" data-jumplink-title="Dividend Investing">What is Dividend Investing?</h2>
<p>Dividend investing is a strategy that investors use to generate a steady stream of income from their investments. Dividend investing primarily involves buying stocks in companies that pay regular dividends, which are essentially payments made to shareholders out of the company's profits.</p>
<p>Dividend investing is a popular investment strategy because it can provide investors with a source of regular income and the potential for long-term growth. By investing in dividend-paying stocks, investors can receive a regular stream of income in the form of dividends, which can help to supplement their overall investment returns. In addition, companies that pay dividends tend to be more established and financially stable, which can make them less risky than companies that do not pay dividends. Over the long term, dividend-paying stocks have also historically outperformed non-dividend-paying stocks in terms of total return. This is because companies that pay dividends tend to be more profitable and have more consistent earnings growth, which can lead to higher stock prices and capital appreciation over time.</p>
<p>Overall, dividend investing can be a great way for investors to generate income, achieve long-term growth, and reduce portfolio risk. In this guide, we will provide an overview of common dividend investing strategies, explain how to create a dividend investing plan and analyze dividend stocks, and share the benefits and risks of dividend investing.</p>
<h2>Understanding Dividend Investing</h2>
<p>Dividends are a distribution of profits that a company makes to its shareholders. When a company generates excess earnings, it may choose to distribute a portion of those earnings to its shareholders in the form of dividends. Typically, dividends are paid out quarterly or annually and are a way for companies to reward their shareholders for investing in their business. Dividend payments can range from small amounts to significant portions of a company's earnings.</p>
<p>Companies can pay out dividends in different ways, depending on their financial situation and priorities. The most common ways companies pay dividends are:</p>
<ol class="content-list">
<li><strong>Cash Dividends:</strong> This is the most common form of dividend payment. Companies distribute a portion of their profits to shareholders in the form of cash, usually on a quarterly or annual basis. The amount of the cash dividend is typically expressed as a fixed amount per share or as a percentage of the company's earnings.</li>
<li><strong>Stock Dividends:</strong> Companies may also distribute dividends in the form of additional shares of stock instead of cash. This is known as a stock dividend. The number of additional shares that a shareholder receives is usually based on the number of shares they already own, and the dividend is expressed as a percentage.</li>
<li><strong>Property Dividends:</strong> Property dividends are another way that companies can distribute profits to shareholders. This can include physical assets, such as real estate, or other securities, such as bonds or stocks in other companies.</li>
<li><strong>Special Dividends:</strong> A special dividend is a one-time dividend payment that companies may distribute to their shareholders in addition to their regular dividend payments. Special dividends are usually paid out when a company has excess cash or has sold off assets, and they are not typically part of the company's regular dividend policy.</li>
</ol>
<p>Overall, companies have the flexibility to choose how they pay out their dividends based on their financial situation, cash flow needs, and priorities for reinvesting earnings back into the business.</p>
<h2 id="benefits-and-risks" class="jump-link-nav anchored-block" data-jumplink-title="Benefits and Risks">Benefits and Risks of Dividend Investing</h2>
<p>Dividend investing strategies offer investors many potential benefits. For example, over the long term, dividend-paying stocks have historically outperformed non-dividend-paying stocks in terms of total return, providing investors with the potential for long-term growth. Dividend investing can also help to compound investment returns over time, as investors can reinvest their dividends back into the company to purchase additional shares of stock.</p>
<p>Overall, dividend investing can be a sound investment strategy for investors seeking income, growth, and a measure of stability in their portfolios. However, it's important to note that not all companies pay dividends, and the decision to pay dividends is at the discretion of the company's management team. Additionally, the amount of the dividend can vary from quarter to quarter and is not guaranteed. Investing in high dividend yielding companies can come with additional risk. In some cases, a company offers a high dividend yield because shareholders demand a high share of profits due to low or even negative growth prospects. In addition, many dividend paying companies, particularly those with reliable and/or high payouts, are widely owned by income investors. As a result, many of these companies can trade at lofty valuations.</p>
<h2>Analyzing Dividend Stocks</h2>
<p>If you invest in dividend-paying stocks, it&rsquo;s important to understand that the market may shift, and a company's dividend yield may not always be a reliable indicator of its future performance. Investors should carefully research and select companies with sustainable dividends, solid financials, and a strong track record of dividend growth. Whether seeking investment in the highest yielding stocks, companies that consistently pay or grow dividends, or a combination of the two, investors are susceptible to the pitfalls of dividend investing, known as &ldquo;dividend traps.&rdquo;</p>
<p>The term dividend trap refers to a company that lures investors with impressive, but ultimately unsustainable payouts. Dividends are not guaranteed and even long-time dividend paying companies are susceptible to reducing or cutting their dividends altogether. Unhealthy companies put an investor&rsquo;s income stream and principal at risk. Financial distress can lead to dividend cuts or suspensions, share price depreciation and bankruptcy. Additionally, overpaying for yield has become a serious concern. Buying into stock positions at inflated prices can destroy returns when they revert back to fair value.</p>
<p>Retrospective financial metrics have proven to be a poor gauge of a company&rsquo;s future earnings performance and dividend sustainability. However, many dividend strategies still rely exclusively on screens for historical dividend payments or historical dividend growth. Selecting companies based on their history of paying is backward-looking and does not account for future prospects.</p>
<p>A more prudent approach also considers business fundamentals. Companies in businesses with secular growth drivers that have clear competitive advantages, low leverage and strong management teams are better equipped to maintainable profit over time&mdash;even in a tougher macroeconomic and market environment. Carefully selecting dividend paying companies based on their dividend yields coupled with an assessment of their fair value and balance sheet strength may allow for a portfolio with more potential upside (capital appreciation) while still maintaining an attractive dividend yield (income stream).</p>
<h2>How to Create a Dividend Investing Plan</h2>
<p>Creating a dividend investing plan involves several key steps that are critical to achieving long-term success. First, investors need to assess their risk tolerance and determine how much of their portfolio they want to allocate to dividend-paying stocks. This can be influenced by a variety of factors, including age, income, financial goals, and investment experience.</p>
<p>Once an investor has determined their risk tolerance and portfolio allocation, the next step is to choose the right investment vehicles for their dividend investing plan. This may involve investing in individual stocks, exchange-traded funds (ETFs), or mutual funds that specialize in dividend-paying companies. When selecting individual stocks or funds, investors should consider factors such as the company's financial health, dividend history and growth, and the current dividend yield.</p>
<p>Dividend investment strategies can play an important role in a broader portfolio allocation by providing investors with reliable income streams and helping to diversify their investments. One of the primary benefits of dividend investing is the steady income it provides. Because dividend payments are often paid out on a regular basis, they can offer a reliable source of income for investors seeking to supplement their other income sources. This can be especially important for retirees or those living off of their investments, as dividend payments can provide a stable income stream that is less affected by market volatility.</p>
<h2 id="common-strategies" class="jump-link-nav anchored-block" data-jumplink-title="Common Strategies">Common Dividend Investing Strategies</h2>
<p>Common dividend investing strategies include dividend growth investing, dividend value investing, and dividend income investing. These strategies invest across different types of dividend-paying stocks, including those of blue-chip companies, dividend aristocrats, and high-yield dividend stocks.</p>
<p><a href="/link/472627df1e964ab9b69d24a104a6a8e7.aspx" title="DURA - VanEck Durable High Dividend ETF - Overview"><strong>VanEck Durable High Dividend ETF (DURA<sup>&reg;</sup>)</strong></a>is a high dividend yield strategy that seeks to track the Morningstar US Dividend Valuation Index, which screens and weights companies based on dividend yield. The index&rsquo;s process of considering financial health and valuations help address the potential risks of investing in high yielding companies.</p>
<p>High dividend yield strategies focus on companies with high payouts. These strategies tend to offer higher yields than dividend growth strategies and often offer very different exposures. High dividend yield strategies tend to offer value-oriented exposure, while dividend growth strategies tend to provide blended exposure to growth and value companies.</p>
<p>Dividend growth strategies target those companies that have managed to grow their dividends over time. These strategies don&rsquo;t necessarily seek companies with high dividends, but rather consistent dividend growth. Many investors look to these strategies because of the implied financial stability offered by companies that operate in a way that allows them to increasingly share profits with shareholders. However, selecting companies based on their dividend growth history is backward-looking. Beyond selecting companies with a high dividend yield, forward-looking assessments of financial health is a key component to the long-term durability of dividend pay-outs.</p>
<h2 id="implementing-strategy" class="jump-link-nav anchored-block" data-jumplink-title="Implementation">Implementing Your Dividend Investing Strategy</h2>
<p>Dividend payers may serve investors best when investors screen for factors that may signal trouble ahead, such as financial health. <strong><a href="/link/472627df1e964ab9b69d24a104a6a8e7.aspx" title="DURA - VanEck Durable High Dividend ETF - Overview">The VanEck Durable High Dividend ETF (DURA)</a></strong> tracks Morningstar&rsquo;s US Dividend Valuation Index, which evaluates financial health using Morningstar&rsquo;s Distance to Default score. Distance to Default is a measure of financial health that considers a company&rsquo;s balance sheet strength and equity market data to assess the likelihood of bankruptcy. Distance to Default has proven to be an effective predictor of dividend cuts: those companies with the lowest probability of default have had the lowest probability of future dividend cuts, according to Morningstar.</p>
<p>Financial health is a critical consideration for equity income investors. Buying high-yielding shares without regard for the company's ability to sustain its dividend payment is a risky proposition. From financial services and housing-related industries in 2008-09 to commodities and materials in 2015, to a wide array of companies challenged for more idiosyncratic reasons, history provides ample cautionary tales of dividend traps. As a dynamic, market-driven measure of financial health, Distance to Default is an effective screen to help investors avoid balance sheet deterioration. Investors can use it to identify companies whose dividends are at risk. Data from the past 15 years shows that companies with better Distance to Default scores are likelier to sustain their dividends. It has flagged a number of companies spanning sector and geography that have gone on to cut their dividends. As a group, dividend-paying stocks remain good investments, but investors must remember to never prioritize yield at the expense of long-term total return.</p>
<h2 id="mistakes-to-avoid" class="jump-link-nav anchored-block" data-jumplink-title="Mistakes to Avoid">Common Dividend Investing Mistakes to Avoid</h2>
<p>The most common mistake dividend investors make is falling for &ldquo;dividend traps.&rdquo; Selecting companies based on their history of dividend payments is backward-looking and doesn&rsquo;t account for their future prospects. In addition, overpaying for yield as more investors have allocated to and bid up prices for dividend stocks can lead to underperformance over time.</p>
<p>Investors can avoid these mistakes by choosing a dividend investing strategy that considers a company&rsquo;s long-term financial health and valuations.</p>
<h2>Conclusion</h2>
<p>By investing in companies that pay regular dividends, investors can build wealth over time and reduce their risk exposure, making it a valuable tool for anyone looking to grow their portfolio.</p>
<p>Approach dividend investing from a position of strength. Chasing the highest yielding stocks can lead investors to &ldquo;dividend traps&rdquo; and companies unable to sustain payouts. Selecting companies based on their history of paying is backward-looking and doesn&rsquo;t account for their future prospects.</p>
<p>Beyond selecting companies with a high dividend yield, forward-looking assessments of a company&rsquo;s current valuation and financial health are key components to the long-term durability of dividend pay-outs and growth potential.</p>
<p>Learn more about the <a href="/link/472627df1e964ab9b69d24a104a6a8e7.aspx#how-to-buy-etf&amp;utm=DURA-Blog" title="DURA - VanEck Durable High Dividend ETF - Overview"><strong>VanEck Durable Dividend ETF (DURA)</strong></a>.</p>
<style type="text/css">
    .wrapped-div {
        max-width: 100%;
    }

    @media (max-width: 1024px) {
        .wrapped-div {
            overflow-x: scroll;
        }
    }

    .wrapped-div-sector {
        max-width: 100%;
        overflow-x: scroll;
    }
</style>

<p>To receive more <a href="/us/en/blogs/income-investing/" title="Income Investing Insights"><strong>Income Investing</strong></a> insights, <a href="/link/5f45412c2143400497908cea2897f7d3.aspx" title=" Subscription Center"><strong>sign up in our subscription center</strong></a>.</p>
]]></content:encoded>
</item><item rdf:about="https://www.vaneck.com/us/en/blogs/income-investing/sector-performance-drivers-why-mega-cap-exposure-matters/">
  <title>Sector Performance Drivers: Why Mega-Cap Exposure Matters></title>
  <link>https://www.vaneck.com/us/en/blogs/income-investing/sector-performance-drivers-why-mega-cap-exposure-matters/</link>
  <description><![CDATA[Traditional sector ETFs may not fully capture the mega-cap companies that drive sector returns, as regulatory diversification caps can limit exposure to the largest holdings.]]></description>
  <dc:creator>Michael Cohick</dc:creator>
  <dc:date>04/08/2026 06:30:00</dc:date>
<content:encoded><![CDATA[

<p><strong>Key Takeaways:</strong></p>
<ul class="content-list">
<li class="mt-2">Mega-caps drive sector returns, but most ETFs can't fully own them. Regulatory caps force funds to underweight the companies that matter most.</li>
<li class="mt-2">The 25/5/50 rule creates a hidden gap in sector exposure. Investors may think they own the sector, but caps quietly reshape what they actually hold.</li>
<li class="mt-2">TruSector ETFs use a hybrid structure to close that gap. <a href="/link/4b2904882a3c4908b40d77036f2d8889.aspx" title="TRUT - VanEck Technology TruSector ETF - Overview"><strong>TRUT</strong></a>, <a href="/link/691928d6a333465e84b05ddceeb9203a.aspx" title="TRUD - VanEck Consumer Discretionary TruSector ETF - Overview"><strong>TRUD</strong></a>, <a href="/link/ec7c31c056ff476b8e0937e92f7afedd.aspx" title="TRUC - VanEck Communications Services TruSector ETF - Overview"><strong>TRUC</strong></a>, <a href="/link/e55ffe2c80324e60a51bccb9bd670d0b.aspx" title="TRUF - VanEck Financials TruSector ETF - Overview"><strong>TRUF</strong></a>, and <a href="/link/52a9d8d3492c4b2383718e256baffb42.aspx" title="TRUH - VanEck Healthcare TruSector ETF - Overview"><strong>TRUH</strong></a> deliver uncapped market-cap exposure while staying RIC compliant.</li>
</ul>
<h2>The Role of Mega-Cap Companies in Sector Returns</h2>
<p>The U.S. equity market looks very different than it did even five years ago. A small group of mega-cap companies now account for an outsized share of their sectors' market capitalization, earnings, and returns.</p>
<p>The technology sector is the clearest example. As of early 2026, tech represents over 43% of the S&amp;P 500's total market capitalization and roughly 36% of its earnings. Within the sector, the concentration is even more lopsided: NVIDIA, Apple, and Microsoft make up a huge portion of the information technology sector's total weight. In consumer discretionary, Amazon and Tesla hold similarly dominant positions, and in communication services, Alphabet and Meta Platforms tower over the rest.</p>
<p>This isn't a coincidence. These companies are the engines of sector performance. In 2025, information technology and communication services together accounted for over 63% of the S&amp;P 500's total return. Without those two sectors, the index would have returned roughly 6%.</p>
<p>For investors who want targeted sector exposure, the takeaway is simple: capturing the performance of these leading companies isn't optional. Any sector strategy that systematically underweights them is going to face meaningful performance drag.</p>
<h2 id="point-one" class="anchored-block jump-link-nav" data-jumplink-title="How Caps Distort Sector Exposure">How RIC Diversification Caps Distort Sector Exposure</h2>
<p>Most ETFs in the United States are structured as Regulated Investment Companies (RICs) under the Internal Revenue Code. This structure lets funds pass through income and gains to shareholders without paying corporate-level tax. But to qualify, RICs must meet quarterly diversification tests, commonly known as the 25/5/50 rule:</p>
<ul class="content-list">
<li class="mt-2">No single company can represent more than <strong>25%</strong> of the fund's total assets.</li>
<li class="mt-2">All positions exceeding <strong>5%</strong> each cannot, in aggregate, exceed <strong>50%</strong> of the fund.</li>
</ul>
<p>These rules exist to protect investors from excessive concentration risk. For broadly diversified portfolios, they're a non-issue. But in today's concentrated sectors, they create real distortions.</p>
<p>Look at technology. In an uncapped, true market-cap representation of the tech sector, NVIDIA and Microsoft alone can account for over 40% of the sector's weight. RIC rules don't allow that. So a traditional tech sector ETF has to scale those names back and push that weight into smaller companies that contribute far less to sector performance.</p>
<p>What does this mean in practice? Investors who buy a traditional technology sector ETF may think they're getting full, representative exposure to the sector. But they're actually holding a portfolio that's been reshaped by regulatory constraints, one that underweights the companies driving returns and overweights names with a smaller economic footprint.</p>

<h2 id="point-two" class="anchored-block jump-link-nav" data-jumplink-title="Sector-by-Sector Breakdown">Sector-by-Sector Breakdown: Where Capping Hurts Most</h2>
<p>The distortion from RIC caps isn't the same everywhere. It hits hardest in sectors where a few large names make up the bulk of the market cap.</p>
<p><strong>Information Technology:</strong> Tech is the most affected sector. Names like NVIDIA, Apple, Microsoft, and Broadcom command a huge share of the sector's market cap. Capping forces traditional sector funds into a structural underweight relative to these companies' true market-cap weight. On the surface the portfolio looks like the tech sector; underneath, it behaves quite differently.</p>
<p><strong>Consumer Discretionary:</strong> Mega-cap e-commerce and retail names, most notably Amazon and Tesla, drive the majority of this sector's performance. Under capping rules, their influence gets diluted, and exposure shifts toward smaller retailers and consumer companies that contribute less to overall returns.</p>
<p><strong>Communication Services:</strong> A small number of streaming, social media, and digital advertising companies dominate this sector, including Alphabet, Meta Platforms, and Netflix. When these names get capped, benchmark alignment breaks down, introducing performance drag and unintended tilts toward less impactful holdings.</p>
<p>Across all five sectors, the pattern is the same: the companies that investors most want exposure to are exactly the ones that regulatory caps force funds to underweight.</p>
<h2>Tracking Error and What It Means for Sector Investors</h2>
<p>The practical cost of RIC-driven capping is tracking error, or the volatility of the gap between a sector fund's performance and that of an uncapped sector benchmark, many investors often follow.</p>
<p>For asset allocators and model portfolio managers, tracking error is more than a technical footnote. It chips away at the precision of portfolio construction. If a sector allocation is meant to express a specific market view (say, a conviction in technology's growth trajectory) the effectiveness of that view depends on the fund closely mirroring the actual makeup of the sector.</p>
<p>Traditional capped sector ETFs often fall short here. Redistributing weight away from mega-cap leaders and into smaller names introduces stock-level biases and performance differences that compound over time. What looks like a clean sector bet may carry embedded distortions that quietly erode its effectiveness.</p>
<p>For investors who care about attribution clarity and precise exposure, reducing tracking error relative to uncapped benchmarks is a real, tangible improvement.</p>

<h2>The Case for True Market-Cap Sector Investing</h2>
<p>If the goal of sector investing is to capture the economic reality of a market segment, then the approach should reflect how that sector actually exists in the marketplace, not an artificially capped version of it.</p>
<p>True market-cap sector exposure means holding each company at its natural weight, as the market determines it. When NVIDIA represents a significant share of the technology sector's value, the portfolio should reflect that rather than capping it at an arbitrary threshold and redistributing the difference into smaller positions.</p>
<p>This matters for several practical reasons. It produces cleaner attribution, since returns tie more directly to true sector dynamics rather than capping&rsquo;s unanticipated consequences. It cuts down on unintended stock-level biases, making sector investing more precise. And it aligns the portfolio with the actual performance drivers of the market instead of a regulatory approximation of them.</p>
<p>As sectors have become more concentrated, fueled by the scale advantages and AI-driven growth of mega-cap tech and platform companies, the gap between capped and uncapped sector exposure has only widened. For allocators building portfolios around sector views, closing that gap matters more now than it used to.</p>
<h2 id="point-three" class="anchored-block jump-link-nav" data-jumplink-title="VanEck TruSector ETFs">Accessing Precise Sector Exposure with VanEck TruSector ETFs</h2>
<p>VanEck's TruSector ETFs were built to address this structural problem. The suite currently includes five actively managed ETFs targeting the sectors most affected by capping distortions:</p>
<ul class="content-list">
<li class="mt-2"><strong><a href="/link/4b2904882a3c4908b40d77036f2d8889.aspx" title="TRUT - VanEck Technology TruSector ETF - Overview">VanEck Technology TruSector ETF (TRUT)</a>:</strong> Full market-cap exposure to the information technology sector.</li>
<li class="mt-2"><strong><a href="/link/691928d6a333465e84b05ddceeb9203a.aspx" title="TRUD - VanEck Consumer Discretionary TruSector ETF - Overview">VanEck Consumer Discretionary TruSector ETF (TRUD)</a>:</strong> Full market-cap exposure to the consumer discretionary sector.</li>
<li class="mt-2"><strong><a href="/link/ec7c31c056ff476b8e0937e92f7afedd.aspx" title="TRUC - VanEck Communications Services TruSector ETF - Overview">VanEck Communication Services TruSector ETF (TRUC)</a>:</strong>Full market-cap exposure to the communication services sector.</li>
<li class="mt-2"><strong><a href="/link/e55ffe2c80324e60a51bccb9bd670d0b.aspx" title="TRUF - VanEck Financials TruSector ETF - Overview">VanEck Financials TruSector ETF (TRUF)</a>:</strong>Full market-cap exposure to the financials sector.</li>
<li class="mt-2"><strong><a href="/link/52a9d8d3492c4b2383718e256baffb42.aspx" title="TRUH - VanEck Healthcare TruSector ETF - Overview">VanEck Healthcare TruSector ETF (TRUH)</a>:</strong> Full market-cap exposure to the healthcare sector.</li>
</ul>
<p>Each fund uses a hybrid structure that combines direct equity holdings with positions in targeted sector ETFs. The funds hold individual sector stocks up to the maximum allowed by RIC rules, then pick up supplemental exposure through other sector ETFs. Because RIC diversification rules don't "look through" to the underlying holdings of other RICs, those positions do not count toward issuer concentration rules. The result is funds that can offer the economic exposure similar to an uncapped sector benchmark while staying fully RIC compliant.</p>
<p>In practice, this means TruSector ETFs maintain uncapped exposure to each sector's leading contributors (or detractors), avoid the overallocation to smaller names that may plague traditional sector funds, and deliver tighter tracking relative to widely followed benchmarks, all with the operational simplicity and liquidity that ETF investors expect.</p>
<p>For asset allocators who want to express sector views with greater accuracy, VanEck's TruSector ETFs offer a sharper tool for portfolio construction in a market that keeps getting more concentrated.</p>

<p>To receive more <a href="/us/en/blogs/income-investing/" title="Income Investing Insights"><strong>Income Investing</strong></a> insights, <a href="/link/5f45412c2143400497908cea2897f7d3.aspx" title=" Subscription Center"><strong>sign up in our subscription center</strong></a>.</p>
]]></content:encoded>
</item><item rdf:about="https://www.vaneck.com/us/en/blogs/gold-investing/ima-casanova-gold-volatility-amid-geopolitical-crises-what-history-tells-us/">
  <title>Gold Volatility Amid Geopolitical Crises: What History Tells Us></title>
  <link>https://www.vaneck.com/us/en/blogs/gold-investing/ima-casanova-gold-volatility-amid-geopolitical-crises-what-history-tells-us/</link>
  <description><![CDATA[Gold pulled back amid rising rates and a stronger dollar, but history shows volatility is typical in crises. Strong margins leave miners well positioned if gold stabilizes or moves higher.]]></description>
  <dc:creator>Imaru Casanova</dc:creator>
  <dc:date>04/08/2026 06:30:00</dc:date>
<content:encoded><![CDATA[

<p>Monthly gold market and economic insights from <strong><a href="/link/cfa7139e649944fea51aa2a740b2372e.aspx?p=1" target="_blank" rel="noopener" title="Imaru Casanova &mdash; Portfolio Manager, Gold and Precious Metals">Imaru Casanova, Portfolio Manager</a></strong>, featuring her unique views on mining and gold&rsquo;s portfolio benefits.</p>
<p><strong>Key Takeaways:</strong></p>
<ul class="content-list">
<li class="mt-2">Rising interest rates and a stronger U.S. dollar drove the March selloff.</li>
<li class="mt-2">Volatility during crises is not unusual &ndash; past episodes in 2008, 2020 and 2022 show that gold can experience sharp moves under varying conditions.</li>
<li class="mt-2">Gold mining companies continue to generate strong margins and cash flow at current prices.</li>
</ul>

<h2>Volatility in a Crisis Is Not Unusual</h2>
<p>Gold&rsquo;s March performance surprised many investors. Despite a sharp escalation in geopolitical tensions, gold prices pulled back after briefly retesting record highs. That kind of price action may seem counterintuitive, but it is not unusual in periods of crisis.</p>
<p>Gold reached an all-time high of $5,595 per ounce on January 29. Prices pulled back below $5,000 in February but were poised to retest those highs in March as the U.S. and Israel attacked Iran. The attack came on a Saturday and early the following Monday gold moved above $5,400. At that point, it looked like gold was on track to fulfill its role as a safe-haven asset.</p>
<p>However, $5,418 marked the monthly high on March 2. What followed was a sharp selloff, gold plummeted $1,319 to a monthly low of $4,099 on March 23 before finishing March at $4,668.06, down $611, or 11.6% for the month. It appears the bottom may be forming, though volatility remains elevated.</p>
<h2 id="global-uncertainty" class="jump-link-nav anchored-block" data-jumplink-title="Global Uncertainty">Why Does Gold Fall During Global Uncertainty?</h2>
<p>We understand why investors would be disappointed with gold&rsquo;s performance during a month of global turmoil. Selling pressure overwhelmed safe-haven demand and central bank buying. That said, this type of price action is not unusual when viewed in a historical context.</p>
<p>Gold fell sharply at the onset of the financial crisis in 2008 and again during the early stages of the pandemic in 2020. In both cases, the initial reaction was driven by liquidity needs, rising rates and a stronger U.S. dollar. A similar dynamic was observed after Russia invaded Ukraine in 2022. Crude oil rose above $100 per barrel, contributing to higher interest rates and a stronger dollar, and after a short rally, gold declined by roughly 18%.</p>
<p>While each of these periods was shaped by different underlying conditions, they illustrate that gold can experience volatility during the early stages of major global disruptions.</p>
<h2 id="key-drivers" class="jump-link-nav anchored-block" data-jumplink-title="Key Drivers">Oil, Rates and the Dollar Remain Key Drivers</h2>
<p>The current crisis introduces another oil shock and a new level of geopolitical risk. Higher oil prices have raised inflation concerns and contributed to rising interest rates, a more hawkish Federal Reserve outlook and a stronger U.S. dollar. These forces tend to weigh on gold, particularly in the short term, and can be amplified by systematic and algorithm-driven trading.</p>
<p>At the same time, gold has delivered strong gains since 2024, so some degree of profit taking should not be surprising. Heavy outflows from bullion ETFs suggest that investors are locking in gains or raising liquidity, and gold can often serve as a source of liquidity during periods of broader market stress.</p>
<p>Central banks have been an important driver of gold demand, although activity likely slowed during the recent turmoil. Some countries may prioritize liquidity in times of stress. Turkey, for example, reportedly sold or swapped gold in March to support its currency. Several Gulf States have also been among the largest buyers in recent years, and their activity may fluctuate in the near term.</p>
<p>Once conditions stabilize, central bank demand is likely to normalize. In the meantime, the World Gold Council reports continued buying from countries such as Indonesia, Guatemala and Malaysia, including both new and returning participants. The broader trend of reserve diversification, particularly away from the U.S. dollar, remains intact.</p>
<p>We find it encouraging that the $4,000 level held despite rising rates, a stronger dollar, ETF outflows and uncertainty around central bank activity. Even after the March selloff, gold remains up $349, or 8.0% year to date.</p>
<p>Looking ahead, once the current conflict runs its course, the global backdrop is likely to return to a familiar baseline of uncertainty. The U.S. continues to face elevated deficits and rising debt service costs, while efforts by many countries to reduce reliance on the dollar are ongoing. Higher oil prices also present risks to economic growth. In that context, the longer-term case for gold remains intact.</p>
<h2 id="gold-miners" class="jump-link-nav anchored-block" data-jumplink-title="Gold Miners">Gold Miners: Volatility in Prices, Stability in Fundamentals<strong> </strong></h2>
<p>Gold stocks declined alongside the gold price, with the MarketVector Global Gold Miners Index (MVGDXTR)<sup>1</sup>&nbsp;falling 21.4% in March. Even so, the index remains up 5.3% for the year. Despite the volatility, it is largely business as usual for the gold miners.</p>
<h2>Are Gold Miners Still Profitable at Current Prices?</h2>
<p>At current gold prices, profitability remains strong. Gold in the $4,000 range continues to support growth investment, share buybacks and dividends. Operating margins are robust, with All-in Sustaining Costs (AISC) averaging $1,867 per ounce, according to Scotiabank.</p>
<p>A more complete view comes from Fully Loaded Costs, which include taxes, growth capital, exploration, dividends, interest and general and administrative expenses. Scotiabank estimates these costs at approximately $3,525 per ounce. Taxes and royalties make up the largest portion and are largely outside of company control.</p>
<p>Exploration is one area where companies have flexibility and spending has increased meaningfully. S&amp;P Global reports that mine-site exploration reached a record high in 2025, rising 45%, while overall exploration budgets increased 11%. Whether this translates into production growth in the coming years, it will be an important area to watch.</p>
<p>Higher oil prices are expected to push costs higher, but the impact may be more measured than some expect. Energy exposure varies by operation, with open-pit and remote sites more reliant on diesel, though fuel typically accounts for about 7% of AISC. Estimates from BMO Capital Markets suggest costs could rise 10% to 20% with a doubling in oil prices, but this assumes no hedging.</p>
<p>In practice, many miners hedge fuel costs and maintain inventory, which can delay and reduce the impact of rising prices. For example, Kinross Gold Corp. (4.31% of Strategy net assets as of March 31, 2026) has indicated a sensitivity of approximately $3 per ounce for every $10 per barrel move in oil, when hedging and regional pricing factors are considered.</p>
<p>While no shortages have been observed, prolonged disruptions to key shipping routes such as the Strait of Hormuz could create challenges, particularly in parts of Africa and Asia. However, a significant portion of production is based in the Americas and Australia, where energy supply tends to be more stable.</p>
<p>At this stage, we do not expect material changes to earnings expectations across the gold industry as a result of the recent oil shock. Gold and gold equities have come under pressure, but once the current period of volatility subsides, the same drivers that supported gold above $5,000 remain in place.</p>
<p>To receive more <strong><a href="https://www.vaneck.com/us/en/insights/gold-investing/" title="Gold Investing Insights">Gold Investing</a></strong> insights, <strong><a href="https://www.vaneck.com/us/en/subscribe/" title="Subscription Center">sign up in our subscription center</a></strong>.</p>
]]></content:encoded>
</item><item rdf:about="https://www.vaneck.com/us/en/blogs/income-investing/what-actually-makes-a-muni-high-yield/">
  <title>What Actually Makes a Muni &quot;High Yield&quot;?></title>
  <link>https://www.vaneck.com/us/en/blogs/income-investing/what-actually-makes-a-muni-high-yield/</link>
  <description><![CDATA[High yield munis offer tax-exempt income, historically lower default rates than corporate high yield, and distinct sector exposure. Here's what defines this asset class.]]></description>
  <dc:creator>Louise Gedney</dc:creator>
  <dc:date>04/08/2026 06:30:00</dc:date>
<content:encoded><![CDATA[

<p><strong>Key Takeaways:</strong></p>
<ul class="content-list">
<li class="mt-2">High yield munis are project-backed, not government-guaranteed. Healthcare, education, and housing drive this market.</li>
<li class="mt-2">Tax exemption can make after-tax yields highly competitive. High yield munis may exceed corporate high yield on an after-tax basis.</li>
<li class="mt-2">Unrated does not automatically mean low quality. Many unrated munis skip ratings for cost reasons, not credit weakness.</li>
</ul>
<h2>What Is a High Yield Municipal Bond?</h2>
<p>A high yield municipal bond is a tax-exempt debt security issued by a state, county, municipality, or special-purpose entity that carries a credit rating below investment grade, or no credit rating at all. These bonds fund public projects and infrastructure but compensate investors with higher interest payments for taking on additional credit risk.</p>
<p>The muni high yield market is considerably smaller than its corporate counterpart, with thousands of small, project-specific issuances spread across a fragmented landscape. That complexity also creates opportunities for investors who can navigate it.</p>
<h2>What Credit Rating Makes a Municipal Bond &ldquo;High Yield&rdquo;?</h2>
<p>The standard dividing line is BBB-; anything rated below that, or BB+ and lower, is considered high yield, or &ldquo;speculative&rdquo;. In the municipal market, however, definitions can blur. Limited supply of lower-rated bonds has led some participants to include a modest allocation to BBB-rated securities in high yield benchmarks. We take a stricter view and define high yield munis as those rated BB+ and below, along with unrated securities.</p>
<p>A large share of high yield munis carry no rating at all. Some issuers forgo ratings because the cost does not justify the issue size, while others simply would not qualify for investment grade. As a result, unrated bonds can represent a significant portion of the market, making independent credit analysis essential.</p>
<p>It&rsquo;s worth noting that &ldquo;unrated&rdquo; does not automatically mean &ldquo;low quality&rdquo;. In many cases, a well-known issuer with an established track record will skip the rating process because market participants already understand the credit. The issuer&rsquo;s bonds trade on reputation and fundamentals rather than a letter grade. In some instances, if these issuers were to pay for a rating, their bonds could very well land in investment grade territory. For investors, the takeaway is that the unrated portion of the high yield muni market can contain a wider range of credit quality than the label might suggest.</p>
<h2>What Sectors Make Up the High Yield Muni Market?</h2>
<p>Unlike the investment grade muni universe, which is heavily weighted toward general obligation bonds, the high yield market is concentrated in project-driven, revenue-backed sectors:</p>
<div class="wrapped-div">
<table style="width: 100%;">
<tbody>
<tr class="tbl-data">
<td class="tbl-header text-left">Sector</td>
<td class="tbl-header text-left">What It Funds</td>
</tr>
<tr class="tbl-data">
<td class="data-td last font-weight-normal text-left">Healthcare / Senior Living</td>
<td class="data-td last font-weight-normal text-left">Hospitals, nursing facilities, continuing care communities</td>
</tr>
<tr class="tbl-data">
<td class="data-td last font-weight-normal text-left">Education</td>
<td class="data-td last font-weight-normal text-left">Charter schools, private universities, student housing</td>
</tr>
<tr class="tbl-data">
<td class="data-td last font-weight-normal text-left">Housing</td>
<td class="data-td last font-weight-normal text-left">Affordable and multifamily housing developments</td>
</tr>
<tr class="tbl-data">
<td class="data-td last font-weight-normal text-left">Industrial Development</td>
<td class="data-td last font-weight-normal text-left">Manufacturing facilities, economic development projects</td>
</tr>
<tr class="tbl-data">
<td class="data-td last font-weight-normal text-left">Land / Special District</td>
<td class="data-td last font-weight-normal text-left">New community developments, special assessment districts</td>
</tr>
<tr class="tbl-data">
<td class="data-td last font-weight-normal text-left">Tobacco</td>
<td class="data-td last font-weight-normal text-left">Settlement revenue bonds backed by the Master Settlement Agreement</td>
</tr>
</tbody>
</table>
</div>

<h2>Why Are These Sectors More Common in High Yield Munis?</h2>
<p>These sectors share a common thread: repayment is tied to a specific project's revenue (patient fees, tuition, rent) rather than a broad government tax base. That project-level dependence introduces additional credit risk, which is why these bonds carry lower ratings or go unrated.</p>
<p>That said, many high yield munis include structural protections like first mortgage liens, reserve fund requirements, and security covenants that provide layers of protection not always found in similarly rated corporate bonds.</p>
<h2>How Does the Tax Exemption Affect High Yield Muni Returns?</h2>
<p>Because interest on most munis is exempt from federal income taxes, and potentially state and local taxes, the effective yield for investors in higher brackets can be substantially greater than the stated yield. When adjusted to a taxable equivalent yield, high yield munis can meaningfully exceed what's available from corporate high yield, even before accounting for munis' historically lower default rates.</p>
<h2>Diversification Through High Yield Munis</h2>
<p>High yield munis also offer diversification. The sectors driving this market (healthcare, education, housing) have very different economic drivers than the consumer cyclical, communications, and energy sectors dominating corporate high yield. That divergence means high yield munis can behave differently during market stress, potentially reducing overall portfolio volatility.</p>
<p>The <strong><a href="/link/63e99d0ce68b47e79eae26e1c163fd09.aspx" title="HYD - VanEck High Yield Muni ETF">VanEck High Yield Muni ETF (HYD)</a></strong> provides broad exposure to this market, tracking the ICE Broad High Yield Crossover Municipal Index. The index captures the performance of the U.S. dollar-denominated high yield long-term tax-exempt bond market, with built-in features to enhance credit and liquidity, including an investment grade allocation that improves tradability. With one of the lowest expense ratios in the peer group, <strong><a href="/link/63e99d0ce68b47e79eae26e1c163fd09.aspx" title="HYD - VanEck High Yield Muni ETF">HYD</a></strong> offers a cost-efficient way to access this distinctive corner of fixed income.</p>

<p>To receive more <a href="/us/en/blogs/income-investing/" title="Income Investing Insights"><strong>Income Investing</strong></a> insights, <a href="/link/5f45412c2143400497908cea2897f7d3.aspx" title=" Subscription Center"><strong>sign up in our subscription center</strong></a>.</p>
]]></content:encoded>
</item><item rdf:about="https://www.vaneck.com/us/en/blogs/natural-resources/commodity-prices-rise-on-energy-disruptions/">
  <title>Commodity Prices Rise on Energy Disruptions></title>
  <link>https://www.vaneck.com/us/en/blogs/natural-resources/commodity-prices-rise-on-energy-disruptions/</link>
  <description><![CDATA[Supply disruptions from the Iran conflict drove broad commodity gains across energy, agriculture, and metals in Q1 2026.]]></description>
  <dc:creator>Roland Morris</dc:creator>
  <dc:date>04/08/2026 06:30:00</dc:date>
<content:encoded><![CDATA[

<p><strong>Key Takeaways</strong></p>
<ul class="content-list">
<li class="mt-2">Energy disruptions supported broad commodity gains</li>
<li class="mt-2">CMCITR posted strong returns but trailed BCOM</li>
<li class="mt-2">Supply constraints contributed to gains across sectors</li>
</ul>
<h2>Q1 2026 Commodity Market Overview</h2>
<p>Commodity markets moved higher in Q1 2026, supported by supply disruptions linked to the Iran conflict and reduced transit through the Strait of Hormuz. These developments constrained global flows of crude oil and liquefied natural gas (LNG), contributing to higher energy prices.</p>
<p>The impact of reduced LNG availability also extended to other sectors. Lower fertilizer production contributed to tighter agricultural supply conditions and higher crop prices. In industrial metals, regional disruptions affected aluminum production and shipping activity. At the same time, ongoing geopolitical uncertainty supported demand for precious metals.</p>
<p>All major commodity sectors recorded positive returns during the quarter.</p>
<h2>CMCITR vs. BCOM: Performance Summary</h2>
<p>UBS CM Commodity Index (CMCITR) returned 16.68% in Q1 2026, while Bloomberg Commodity Index (BCOM) returned 24.41%.</p>
<p>CMCITR underperformed BCOM, primarily due to lower exposure to precious metals, particularly gold. Gold contributed more significantly to BCOM&rsquo;s performance due to its higher weight. Differences in agricultural exposures, including soybean oil, also contributed modestly, while a higher allocation to industrial metals provided a partial offset.</p>
<p>Energy markets shifted into pronounced backwardation during the quarter, with front-month prices rising more sharply than longer-dated contracts. BCOM&rsquo;s front-month positioning captured more of this move, while CMCITR&rsquo;s exposure further along the curve resulted in relatively lower participation in the rally. In addition, BCOM&rsquo;s early January rebalancing increased exposure to several commodities that subsequently performed well, contributing to a wider performance difference than suggested by static-weight attribution analysis.</p>
<h2>Commodity Sector Performance: Top Contributors to CMCITR in Q1 2026</h2>
<p>A closer look at the commodity sector&rsquo;s performance highlights the primary drivers of CMCITR&rsquo;s returns in Q1 2026, with energy accounting for the majority of returns.</p>
<p><strong><i>The chart below highlights sector contributions to CMCITR&rsquo;s performance in Q1 2026, highlighting the outsized impact of energy alongside gains across other commodity sectors. </i></strong></p>
<h3>Comparative Index Sector Weights</h3>
<p><img loading="lazy" class="desktop-image img-responsive" src="https://www.vaneck.com/contentassets/c368beb6c40f4784a639c4850bcdb105/7096_cmci-blog-april_chart-1_2026-04_v1_desktop.svg" alt="Comparative Index Sector Weights" /></p>
<p><img loading="lazy" class="mobile-image img-responsive" src="https://www.vaneck.com/contentassets/c368beb6c40f4784a639c4850bcdb105/7096_cmci-blog-april_chart-1_2026-04_v1_mobile.svg" alt="Comparative Index Sector Weights" /></p>
<p class="chart-disclosure"><strong>Source:</strong> VanEck, Bloomberg. Data as of March 2026.</p>
<ul class="content-list">
<li class="mt-2"><strong>Energy</strong> was the primary driver of returns. Supply constraints across crude oil and refined products supported broad price increases, with distillates showing particularly strong performance.</li>
<li class="mt-2"><strong>Agriculture</strong> benefited from tighter supply conditions. Fertilizer constraints contributed to higher crop prices, with soybean oil among the strongest performers.</li>
<li class="mt-2"><strong>Industrial metals</strong> posted moderate gains. Aluminum prices were supported by production and transportation disruptions in the Middle East.</li>
<li class="mt-2"><strong>Precious metals</strong> moved higher, supported in part by continued geopolitical uncertainty.</li>
<li class="mt-2"><strong>Livestock</strong> prices increased, reflecting higher input costs and broader market trends.</li>
</ul>

<h2>Commodity Market Outlook: What Could Drive Prices in 2026?</h2>
<p>Commodity markets may continue to be influenced by supply conditions and geopolitical developments. Ongoing constraints affecting energy transportation could continue to support prices in the near term.</p>
<p>Agricultural markets may remain sensitive to input costs, including fertilizer availability. Precious metals could continue to see support if uncertainty persists.</p>
<p>From an index perspective, CMCITR&rsquo;s diversified futures exposure may result in different outcomes depending on the shape of commodity curves. In periods of backwardation, front-month exposure may benefit more directly, while more balanced curve exposure may provide different return characteristics over time.</p>

<p>Learn more about the <strong><a href="/link/218468eae2b54f8989eda6f3f557770d.aspx" title="CMCAX - CM Commodity Index Fund - Class A - Overview">VanEck CM Commodity Index Fund</a></strong> and the <strong><a href="/link/b517b8245a934e7bb2908053bfd688db.aspx" title="CMCI - VanEck CMCI Commodity Strategy ETF - Overview">VanEck CMCI Commodity Strategy ETF (CMCI)</a></strong>, which seek to track, before fees and expenses, the CMCITR.</p>
<p>To receive more <a href="/us/en/insights/natural-resources/" title="Natural Resources Insights"><strong>Natural Resources</strong></a> insights, <a href="https://www.vaneck.com/us/en/subscribe/" title="Subscription Center"><strong>sign up in our subscription center</strong></a>.</p>
]]></content:encoded>
</item><item rdf:about="https://www.vaneck.com/us/en/blogs/thematic-investing/genz-etf-question-answer/">
  <title>GENZ ETF: Question &amp; Answer></title>
  <link>https://www.vaneck.com/us/en/blogs/thematic-investing/genz-etf-question-answer/</link>
  <description><![CDATA[GENZ ETF targets the digital native economy, giving investors exposure to the fintech, gig, and online entertainment platforms built for the next generation of consumers.]]></description>
  <dc:creator> </dc:creator>
  <dc:date>04/08/2026 06:30:00</dc:date>
<content:encoded><![CDATA[

<p>With 145 million digital-native consumers now the dominant U.S. spending cohort, the platforms serving how they earn, spend, and play represent a distinct and growing opportunity. The <a href="/link/bc13e94806954f2da2fab526cace351b.aspx" title="GENZ | VanEck Digital Native Economy ETF"><strong>VanEck Digital Native Economy ETF (GENZ)</strong></a> captures that opportunity across three equal segments, digital finance, gig platforms, and online sports betting, adding a differentiated consumer layer to VanEck's thematic suite.</p>
<ul class="content-list">
<li class="mt-2"><strong><a href="#point-one">What is the digital native economy? </a></strong></li>
<li class="mt-2"><strong><a href="#point-two">Why is the digital native economy a compelling investment theme right now? </a></strong></li>
<li class="mt-2"><strong><a href="#point-three">How does the digital native economy differ from the broader technology sector? </a></strong></li>
<li class="mt-2"><strong><a href="#point-four">What is the VanEck Digital Native Economy ETF (GENZ)? </a></strong></li>
<li class="mt-2"><strong><a href="#point-five">What are the three segments of the index? </a></strong></li>
<li class="mt-2"><strong><a href="#point-six">How does GENZ express its investment thesis through the portfolio? </a></strong></li>
<li class="mt-2"><strong><a href="#point-seven">Why reposition BJK rather than simply launch a new fund? </a></strong></li>
<li class="mt-2"><strong> <a href="#point-eight">How does GENZ fit alongside other VanEck thematic ETFs?</a> </strong></li>
</ul>
<h2 id="point-one" class="anchored-block">What is the digital native economy?</h2>
<p>The digital native economy refers to the ecosystem of companies that primarily serve consumers who have grown up entirely online. These are individuals, mostly Gen Z and younger millennials, for whom digital-first is not a preference but a default. They have never banked at a branch, never hailed a cab from the street, and never placed a bet in person. Their entire financial and economic life runs through platforms, apps, and online communities that did not exist 15 years ago.</p>
<p>For investors, this represents a distinct and growing segment of the economy, one organized around how the next generation actually earns, spends, and plays.</p>
<h2 id="point-two" class="anchored-block">Why is the digital native economy a compelling investment theme right now?</h2>
<p>The behavioral shift is structural, not cyclical. Gen Z and younger millennials are not just adapting to digital financial services, gig work, and online entertainment. They were born into them. These are not preferences that evolve over time, but the default habits of a generation that has never known anything different.</p>
<p>What makes this a compelling investment opportunity is the scale. With 145 million Gen Z and younger millennial consumers now representing the dominant spending cohort in the U.S., the platforms and companies serving them are no longer niche. They are increasingly central to how a significant portion of the economy earns, spends, and plays and that creates durable, structural demand for the companies in the MarketVector Digital Native Economy Index (MVGENZTR).</p>
<h2 id="point-three" class="anchored-block">How does the digital native economy differ from the broader technology sector?</h2>
<p>Most technology ETFs capture hardware manufacturers, cloud providers, and software platforms with broad enterprise and consumer exposure. <strong><a href="/link/bc13e94806954f2da2fab526cace351b.aspx" title="GENZ | VanEck Digital Native Economy ETF">GENZ</a></strong> focuses specifically on the consumer-facing, behavior-driven layer of the digital economy, meaning the companies where this generation actually spends their money. That includes fintech and neobanks, gig and creator platforms, and online sports betting operators. Some of these companies sit inside technology indices, but many do not. The common thread is the consumer, not the technology category.</p>
<h2 id="point-four" class="anchored-block">What is the VanEck Digital Native Economy ETF (GENZ)?</h2>
<p><strong><a href="/link/bc13e94806954f2da2fab526cace351b.aspx" title="GENZ | VanEck Digital Native Economy ETF">GENZ</a></strong> is a relaunch of BJK, which was launched in 2008 as a gaming and leisure ETF. The fund is repositioning as a passively managed ETF that seeks to track the MarketVector Digital Native Economy Index (MVGENZTR). The fund provides targeted exposure to companies at the center of how the next generation earns, spends, and plays, organized across three index segments: Millennial Finance, Gig Economy and Online Forums, and Digital Sports Betting and Gambling. GENZ lists on Nasdaq and carries a unitary fee of 0.50%.</p>
<h2 id="point-five" class="anchored-block">What are the three segments of the index?</h2>
<ol class="content-list">
<li class="mt-2">Millennial Finance: Neobanks, digital payment platforms, buy-now-pay-later providers, and app-first brokerage and investing platforms. Finance for a generation that discovered money through their phone.</li>
<li class="mt-2">Gig Economy and Online Forums: On-demand labor platforms, freelance marketplaces, and creator economy and community commerce companies. Work and community for a generation that earns flexibly and builds identity online.</li>
</ol>
<p>Digital Sports Betting and Video Game Developers: Online sports betting operators, iGaming platforms, video game developers, and sports data and analytics companies. Entertainment for a generation that bets on their phone and streams their gameplay.</p>

<h2 id="point-six" class="anchored-block">How does GENZ express its investment thesis through the portfolio?</h2>
<p><a href="/link/bc13e94806954f2da2fab526cace351b.aspx" title="GENZ | VanEck Digital Native Economy ETF"><strong>GENZ</strong></a> is built around a single conviction: the companies that win with the next generation of consumers will look fundamentally different from those that won with the last one. The portfolio reflects that, holding companies across digital finance, platform-based work, and online entertainment that derive the majority of their revenues from serving digital-native consumers.</p>
<p>Rather than concentrating in any one sector, the index spreads exposure equally across its three tiers, ensuring the thesis is expressed across all three pillars of digital-native economic life.</p>
<h2 id="point-seven" class="anchored-block">Why reposition BJK rather than simply launch a new fund?</h2>
<p>BJK was launched in 2008 as a gaming and leisure ETF. Repositioning the existing fund allows us to bring a restructured investment thesis to an established fund vehicle while maintaining the efficiency and simplicity of a single ETF. The result is a cleaner, more forward-looking exposure for advisors who were already using BJK or who are looking for this type of thematic access.</p>
<h2 id="point-eight" class="anchored-block">How does GENZ fit alongside other VanEck thematic ETFs?</h2>
<p><a href="/link/bc13e94806954f2da2fab526cace351b.aspx" title="GENZ | VanEck Digital Native Economy ETF"><strong>GENZ</strong></a> adds the consumer layer to VanEck's thematic suite. <a href="/link/39c8d235748b4c26a5930c31d3ac0160.aspx" title="SMH | VanEck Semiconductor ETF"><strong>SMH</strong></a> captures the semiconductor supply chain powering every digital device. <strong><a href="/link/d41cc1b7916f46e5bb3ee751f311c4f2.aspx" title="ESPO | VanEck Video Gaming and eSports ETF">ESPO</a></strong> covers competitive gaming and esports. <strong><a href="/link/721720af197d4160afe33eccf9d71a52.aspx" title="DAPP | VanEck Digital Transformation ETF">DAPP</a></strong> provides exposure to digital asset companies. <strong><a href="/link/45b34d8e49864951b62a653766992734.aspx" title="IBOT | VanEck Robotics ETF">IBOT</a></strong> covers robotics and AI. <strong><a href="/link/bc13e94806954f2da2fab526cace351b.aspx" title="GENZ | VanEck Digital Native Economy ETF">GENZ</a></strong> now completes the picture at the consumer level, covering the platforms and services where all of that infrastructure meets real economic behavior. For advisors building thematic allocations, <strong><a href="/link/bc13e94806954f2da2fab526cace351b.aspx" title="GENZ | VanEck Digital Native Economy ETF">GENZ</a></strong> offers a differentiated and complementary exposure with minimal overlap to existing holdings.</p>
<h2 id="point-seven" class="anchored-block">How to buy VanEck ETFs?</h2>
<p><strong><a href="/link/bc13e94806954f2da2fab526cace351b.aspx#how-to-buy-etf&amp;utm=GENZ-Blog" title="How to buy VanEck ETFs?"> Learn more here.</a></strong></p>
<p class="d-none d-lg-block"><a href="mailto:askvaneck@vaneck.com" title="Have More Questions? - Ask VanEck" rel="noopener"><img loading="lazy" class="img-responsive" src="https://www.vaneck.com/globalassets/home/us/insights/blogs/bm-blog-images/cta-faq_desktop-02.svg" alt="Have More Questions? - Ask VanEck" /></a></p>
<p class="d-lg-none"><a href="mailto:askvaneck@vaneck.com" title="Have More Questions? - Ask VanEck" rel="noopener"><img loading="lazy" class="img-responsive" src="https://www.vaneck.com/globalassets/home/us/insights/blogs/bm-blog-images/cta-faq_mobile-01.svg" alt="Have More Questions? - Ask VanEck" /></a></p>
<style type="text/css">
    .wrapped-div {
        max-width: 100%;
    }

    @media (max-width: 768px) {
        .wrapped-div {
            overflow-x: scroll;
        }
    }

    .wrapped-div-sector {
        max-width: 100%;
        overflow-x: scroll;
    }
</style>
<p>To receive more <a href="https://www.vaneck.com/us/en/insights/thematic-investing/" title="Thematic Investing Insights"><strong>Thematic Investing</strong></a> insights, <a href="https://www.vaneck.com/us/en/subscribe/" title="Subscription Center"><strong>sign up in our subscription center</strong></a>.</p>
]]></content:encoded>
</item><item rdf:about="https://www.vaneck.com/us/en/blogs/natural-resources/commodity-strategies-diverge-as-roll-yield-takes-over/">
  <title>Commodity Strategies Diverge as Roll Yield Takes Over></title>
  <link>https://www.vaneck.com/us/en/blogs/natural-resources/commodity-strategies-diverge-as-roll-yield-takes-over/</link>
  <description><![CDATA[Not all commodity funds are built the same. Right now, that matters. The differences are doing more than showing up in performance. They are telling a story investors need to understand.]]></description>
  <dc:creator>Andrew Musgraves</dc:creator>
  <dc:date>04/08/2026 06:30:00</dc:date>
<content:encoded><![CDATA[

<p><strong>Key Takeaways:</strong></p>
<ul class="content-list">
<li class="mt-2">The CMCI Index is built for commodity investing across full market cycles, using maturity diversification to reduce volatility and drawdowns.</li>
<li class="mt-2">Today&rsquo;s market is the exception, not the rule, with steep backwardation favoring front-month, energy-heavy indices like the S&amp;P GSCI.</li>
<li class="mt-2">Contango has been the dominant regime for most of the past two decades, and the CMCI Index's design specifically mitigates that persistent drag.</li>
<li class="mt-2">PIT adapts dynamically, pursuing near-term opportunities and rotating when conditions shift.</li>
<li class="mt-2"><a href="/link/b517b8245a934e7bb2908053bfd688db.aspx" title=" CMCI-VanEck CMCI Commodity Strategy ETF"><strong>CMCI</strong></a> and <strong><a href="/link/fae5e7a97c094c9b924c6ee6aec199fd.aspx" title=" PIT-VanEck Commodity Strategy ETF">PIT</a></strong> provide complementary strategic and tactical commodity exposure.</li>
</ul>
<p>A rare and powerful market dynamic is unfolding.</p>
<p>Energy markets have been turned upside down by a historic supply disruption. A conflict-driven shutdown of Gulf oil production, estimated at nearly 9 million barrels per day, has driven crude oil futures into steep backwardation. As of April 7, front-month WTI is trading near $110 per barrel, while prices for delivery in late 2026 slope down toward the mid-$70s. This creates a powerful positive roll yield tailwind.</p>
<p>In <strong><a href="/us/en/blogs/natural-resources/understanding-the-components-of-commodity-futures-returns/" title=" Understanding the Components of Commodity Futures Returns"><em>Understanding the Components of Commodity Futures Returns</em></a></strong>, we looked at how spot price movement, collateral yield and roll yield drive commodity returns. We&rsquo;re seeing that framework in action today, with roll yield now taking center stage.</p>
<p>When futures curves are backwardated, investors rolling expiring contracts sell high and buy low, earning a positive spread. History shows how consequential this can be. During the structurally backwardated energy markets of the 1970s and early 1980s, S&amp;P Goldman Sachs Commodity Index (S&amp;P GSCI) roll yield averaged 4.77% and 2.41% annualized, respectively. In contrast, when energy contango dominated the 2000s, that same figure turned sharply negative, to -8.25%.</p>
<p>The current environment is squarely in the first camp&mdash;and it is historically rare.</p>
<h2>CMCI: Built for the Long Game</h2>
<p>The UBS Constant Maturity Commodity Index (&ldquo;CMCI Index&rdquo;), the benchmark behind both the<strong> <a href="/link/b517b8245a934e7bb2908053bfd688db.aspx" title=" CMCI-VanEck CMCI Commodity Strategy ETF">VanEck CMCI Commodity Strategy ETF (CMCI)</a></strong> and <a href="/link/218468eae2b54f8989eda6f3f557770d.aspx" title=" CMCAX-CM Commodity Index Fund - Class A"><strong>CM Commodity Index Fund </strong></a>, was designed with a specific, long-term view: commodity futures markets are in contango most of the time, and when in contango, front-month concentration is the most expensive place for investors to sit.</p>
<p>The Index addresses this by spreading exposure across the futures curve, spreading positions three months to three years. Combined with broader commodity diversification, this approach mitigates the negative roll yield impact that has historically been the biggest drag on commodity returns over time.</p>
<p>The numbers bear this out.</p>
<h3>Today&rsquo;s Roll Yield vs. Long-Term Trends</h3>
<img loading="lazy" class="mobile-image img-responsive" alt="Today's Roll Yield vs. Long-Term Trends" src="https://www.vaneck.com/contentassets/f1e690c84e1740fa9fbbc48cc62af79e/7113_cmci-pit-roll-yield-blog_chart-1_2026-4_v1_mobile-chart.svg" /><img loading="lazy" class="desktop-image img-responsive" alt="Today's Roll Yield vs. Long-Term Trends" src="https://www.vaneck.com/contentassets/f1e690c84e1740fa9fbbc48cc62af79e/7113_cmci-pit-roll-yield-blog_chart-1_2026-4_v1_web-chart.svg" />
<p class="chart-disclosure">Source: Bloomberg, VanEck. Data as of 3/31/2026. CMCI: UBS Bloomberg Constant Maturity Commodity Index (CMCITR) ; BCOM: Bloomberg Commodity Index; S&amp;P GSCI: S&amp;P Goldman Sachs Commodity Index. Annualized roll yield refers to the annualized return the amount of return generated from the rolling of a short-term futures contract into a longer-term contract and profits from the convergence of the futures price toward a higher spot or cash price. Past performance is no guarantee of future results. Index performance is not representative of fund performance. It is not possible to invest directly in an index. Please see index definitions and other important disclosures at the end of this content. Fund performance current to the most recent month end is available by visiting vaneck.com or by calling 800.826.2333.</p>

<h2>Why the CMCI Index Is Lagging&mdash;And Why That's Expected</h2>
<p>The feature that makes this strategy a more resilient long-term holding is precisely what is causing it to lag in the current environment, when near-term backwardation is steep.</p>
<p>Spreading maturity exposure across the curve means the strategy holds some exposure in the longer-dated portion of the energy curve, parts of which is still in contango beyond 2027. At the same time, lower energy concentration relative to the S&amp;P GSCI means it captures less of the sector generating the most positive roll yield today.</p>
<p>Neither of these is a flaw. It is a tradeoff.</p>
<p>This strategy was built to mitigate the persistent headwind of contango, not maximize returns during short-lived periods of extreme backwardation. This design has been right for the vast majority of the past two decades, and will be right again when this supply shock resolves and the curve normalizes.</p>
<p>In short: the CMCI strategy is a strategic all-weather commodity allocation. The S&amp;P GSCI is a high-beta, energy-concentrated tactical instrument that may perform well in environments like today&rsquo;s, but carries different risks across cycles. Investors who chose the CMCI approach for its volatility management, drawdown characteristics, and roll efficiency made a sound, well-reasoned decision &mdash; one that is temporarily in an unfavorable regime, not one that has been invalidated.</p>
<h2>The Case for PIT: Tactical Flexibility Across Changing Regimes</h2>
<p>For investors seeking to actively participate in environments like the current one, the <strong><a href="/link/fae5e7a97c094c9b924c6ee6aec199fd.aspx" title=" PIT-VanEck Commodity Strategy ETF">VanEck Commodity Strategy ETF (PIT)</a></strong> offers a different approach. Unlike passive indices, PIT is not constrained to a fixed position on the curve. It can dynamically allocate across maturities and sectors, which means it can lean into front-month energy exposure when backwardation is steep and reposition as conditions evolve.</p>
<p>In a market where front-month energy backwardation is generating positive roll yield and longer-dated contracts remain in contango, that flexibility matters. An active manager can position explicitly to capture that spread. PIT returned 18.64% in March 2026 alone and 36.61% in Q1 2026, its strongest quarter since inception. That performance reflects the tactical advantage of being unconstrained, with the ability to lean into front-month energy exposure today and rotate as fundamentals evolve.</p>
<h3>PIT Cumulative Returns Reflect Tactical Flexibility</h3>
<img loading="lazy" class="desktop-image img-responsive" alt="PIT Cumulative Returns Reflect Tactical Flexibility" src="https://www.vaneck.com/contentassets/c8c4c40c9c484df99458414c50aeb784/7113_cmci-pit-roll-yield-blog_chart-2_2026-4_v1_web-chart.svg" /><img loading="lazy" class="mobile-image img-responsive" alt="PIT Cumulative Returns Reflect Tactical Flexibility" src="https://www.vaneck.com/contentassets/c8c4c40c9c484df99458414c50aeb784/7113_cmci-pit-roll-yield-blog_chart-2_2026-4_v1_mobile-chart.svg" />
<p class="chart-disclosure">Source: Morningstar, VanEck. Data as of March 31, 2026. Inception date of PIT is 12/20/2022. Past performance is no guarantee of future results. Index performance is not representative of fund performance. It is not possible to invest directly in an index. Please see index definitions and other important disclosures at the end of this content. Fund performance current to the most recent month end is available by visiting vaneck.com or by calling 800.826.2333.</p>
<h3>Average Annual Total Returns as of 3/31/2026 (%)</h3>
<div class="wrapped-div">
<table style="width: 100%;">
<tbody>
<tr class="tbl-data">
<td class="tbl-header last">&nbsp;</td>
<td class="tbl-header last text-right">1 Mo</td>
<td class="tbl-header last text-right">YTD</td>
<td class="tbl-header last text-right">1 Yr</td>
<td class="tbl-header last text-right">3 Yr</td>
<td class="tbl-header last text-right">Life (12/20/2022)</td>
</tr>
<tr class="tbl-data">
<td class="data-td last">PIT (NAV)</td>
<td class="data-td data last text-right">18.64</td>
<td class="data-td data last text-right">36.61</td>
<td class="data-td data last text-right">54.19</td>
<td class="data-td data last text-right">21.32</td>
<td class="data-td data last text-right">18.22</td>
</tr>
<tr class="tbl-data">
<td class="data-td last">PIT (Market Price)</td>
<td class="data-td data last text-right">18.54</td>
<td class="data-td data last text-right">37.04</td>
<td class="data-td data last text-right">54.31</td>
<td class="data-td data last text-right">21.48</td>
<td class="data-td data last text-right">18.31</td>
</tr>
<tr class="tbl-data">
<td class="data-td last">Bloomberg Commodity Index</td>
<td class="data-td data last text-right">11.50</td>
<td class="data-td data last text-right">24.41</td>
<td class="data-td data last text-right">32.29</td>
<td class="data-td data last text-right">13.88</td>
<td class="data-td data last text-right">11.07</td>
</tr>
</tbody>
</table>
</div>
<p class="chart-disclosure">Returns less than one year are not annualized.</p>
<p class="chart-disclosure">PIT Gross Expense Ratio: 0.55%</p>
<p class="chart-disclosure">The performance data quoted represents past performance. Past performance is not a guarantee of future results. Investment return and principal value of an investment will fluctuate so that an investor's shares, when redeemed, may be worth more or less than their original cost. Performance may be lower or higher than performance data quoted. Please call 800.826.2333 or visit vaneck.com for performance current to the most recent month end.</p>
<h2>Two Different Paths for Commodity Investing</h2>
<p>The current environment is a reminder that commodity investing involves not only what you own in different regimes, but also how you own it.</p>
<p>Roll yield can dominate outcomes depending on the shape of the futures curve, and different strategies are built to harness or mitigate that effect in varying ways.</p>
<ul class="content-list">
<li class="mt-2"><strong><a href="/link/b517b8245a934e7bb2908053bfd688db.aspx" title=" CMCI-VanEck CMCI Commodity Strategy ETF">VanEck CMCI Commodity Strategy ETF (CMCI)</a></strong> and <a href="/link/63406aff3e1c42f9bf57495bffef0fef.aspx" title=" COMIX-CM Commodity Index Fund - Class I"><strong>CM Commodity Index Fund</strong></a> are designed to deliver a smoother long-term experience across typical market conditions.</li>
<li class="mt-2"><a href="/link/fae5e7a97c094c9b924c6ee6aec199fd.aspx" title=" PIT-VanEck Commodity Strategy ETF"><strong>VanEck Commodity Strategy ETF (PIT)</strong></a> provides the flexibility to adapt across regimes, seeking the strongest opportunities wherever they emerge.</li>
</ul>
<p>These are complementary, not competing, approaches. Understanding how they differ and when those differences matter are essential to making informed allocation decisions in commodities today.</p>

<p>To receive more <a href="/us/en/insights/natural-resources/" title="Natural Resources Insights"><strong>Natural Resources</strong></a> insights, <a href="https://www.vaneck.com/us/en/subscribe/" title="Subscription Center"><strong>sign up in our subscription center</strong></a>.</p>
]]></content:encoded>
</item><item rdf:about="https://www.vaneck.com/us/en/blogs/natural-resources/moo-investing-across-the-global-food-supply-chain/">
  <title>MOO: Investing Across the Global Food Supply Chain></title>
  <link>https://www.vaneck.com/us/en/blogs/natural-resources/moo-investing-across-the-global-food-supply-chain/</link>
  <description><![CDATA[<a href="/link/63b1b78621384fa2a809fb2131edd706.aspx" title="MOO - VanEck Agribusiness ETF"><strong>VanEck Agribusiness ETF (MOO)</strong></a> tracks the global agribusiness value chain, from fertilizers and farm equipment to food processing and distribution, and the companies shaping the future of food.]]></description>
  <dc:creator> </dc:creator>
  <dc:date>04/07/2026 06:30:00</dc:date>
<content:encoded><![CDATA[

<p><strong>Key Takeaways</strong></p>
<ul class="content-list">
<li class="mt-2">Agribusiness investing spans the entire global food supply chain beyond traditional commodity exposure.</li>
<li class="mt-2">Population growth, climate pressures and supply chain disruption are reshaping agriculture as an investment theme.</li>
<li class="mt-2">The <a href="/link/63b1b78621384fa2a809fb2131edd706.aspx" title="MOO - VanEck Agribusiness ETF - Overview"><strong>VanEck Agribusiness ETF (MOO)</strong></a> provides diversified exposure across the agribusiness industry from seeds and fertilizers to farming equipment and food producers.</li>
</ul>
<p>Feeding the world is increasingly viewed as a significant economic and societal challenge.</p>
<p>A growing global population, shifting diets and increasing climate pressures are forcing agricultural systems to produce more with fewer resources and greater efficiency. At the same time, supply chain disruptions and geopolitical tensions have exposed just how fragile those systems can be.</p>
<p>For investors, this is not only a macroeconomic challenge. It may also represent an evolving opportunity across the global food supply chain and the broader agribusiness sector.</p>
<h2>What is Agribusiness?</h2>
<p>Agribusiness refers to the network of companies involved in producing, processing and distributing food and agricultural products. This includes everything from fertilizers, seeds and farm equipment to food processing, trading and distribution.</p>
<p>Rather than focusing solely on farming or commodities, agribusiness encompasses the full value chain that brings food from field to consumer.</p>
<p>The <a href="/link/63b1b78621384fa2a809fb2131edd706.aspx" title="MOO - VanEck Agribusiness ETF - Overview"><strong>VanEck Agribusiness ETF (MOO)</strong></a> offers comprehensive exposure to the agribusiness industry by seeking to replicate the <strong><a href="/link/7e294b7f74644013ada132a617882564.aspx" title="MOO - VanEck Agribusiness ETF - Index">MVIS<sup>&reg;</sup>&nbsp;Global Agribusiness Index (MVMOOTR)</a></strong>. The index comprises a globally diversified group of agribusiness companies, including those engaged in agri-chemicals, animal health and fertilizers, seeds and traits, irrigation equipment and farm machinery, aquaculture and fishing, livestock, cultivation and plantations, and trading of agricultural products.</p>
<p><a href="/link/63b1b78621384fa2a809fb2131edd706.aspx" title="MOO - VanEck Agribusiness ETF - Overview"><strong>MOO</strong></a> targets businesses positioned within key areas of modern food systems. In these areas, factors such as scarcity, geopolitics and climate volatility may influence investment and, in some cases, pricing dynamics.</p>
<h2>How Agribusiness Investing Benefits from Market Disruptions</h2>
<p>Recent years have underscored how vulnerable global food systems can be. Pandemic-related shutdowns, geopolitical tensions and climate-related disruptions have strained supply chains, from fertilizer shortages to transportation bottlenecks.</p>
<p>At the same time, food inflation has remained a key concern for both consumers and policymakers.</p>
<p>While these dynamics can present challenges, they may also reinforce the importance of agribusiness companies. Food demand is inherently inelastic, meaning consumption remains relatively stable across economic cycles. At the same time, many firms have the ability to pass higher input costs through the value chain over time. Supply disruptions can also tighten availability and support pricing for producers and processors.</p>
<p>In this context, agribusiness exposure may serve as a potential buffer during inflationary or supply-constrained environments, although outcomes may vary.</p>
<h2 id="point-one" class="anchored-block jump-link-nav" data-jumplink-title="Agriculture Value Chain">Investing Across the Agriculture Value Chain</h2>
<p>These structural pressures do not impact agriculture uniformly. Instead, they flow through different parts of the value chain in distinct ways.</p>
<p>To understand where these opportunities emerge, it helps to step back and look at the full agribusiness ecosystem:</p>
<p><img loading="lazy" class="desktop-image img-responsive" alt="Agribusiness Ecosystem" src="https://www.vaneck.com/contentassets/97e834c75e874131b1ba97458ae742af/7074_moo-blog-infog-1_2026-4_v1_desktop.svg" /></p>
<p><img loading="lazy" class="mobile-image img-responsive" alt="Agribusiness Ecosystem" src="https://www.vaneck.com/contentassets/97e834c75e874131b1ba97458ae742af/7074_moo-blog-infog-1_2026-4_v2_mobile.svg" /></p>
<p class="chart-disclosure"><i><strong>Source: VanEck.</strong> Chart for illustrative purposes only. This is not an offer to buy or sell, or recommendation to buy or sell any of the securities mentioned herein.</i></p>
<p>Each segment of the value chain responds differently to the same underlying pressures. This creates distinct drivers of growth, risk and return. <a href="/link/63b1b78621384fa2a809fb2131edd706.aspx" title="MOO - VanEck Agribusiness ETF - Overview"><strong>MOO</strong></a> captures this full ecosystem, offering diversified exposure across three key segments:</p>
<h3>1. Agricultural Inputs (Upstream)</h3>
<p>These companies provide the essential farming building blocks:</p>
<ul class="content-list">
<li class="mt-2">Fertilizers &amp; agricultural chemicals (e.g., Nutrien, Ltd, Mosaic Co.)</li>
<li class="mt-2">Seeds &amp; crop protection (e.g., Corteva, Inc.)</li>
<li class="mt-2">Animal health (e.g., Zoetis, Inc.)</li>
</ul>
<p>These businesses play an important role in improving crop yields and efficiency as arable land becomes more constrained.</p>
<p>Animal health, which is less directly tied to commodity cycles, has been a relatively resilient contributor within the portfolio. This may reflect the defensive characteristics of certain subsegments.</p>
<h3>2. Equipment &amp; Infrastructure (Midstream)</h3>
<p>Mechanization and logistics are central to modern agriculture:</p>
<ul class="content-list">
<li class="mt-2">Farm machinery (e.g., Deere &amp; Co., CNH Industrial NV, Kubota Corp.)</li>
<li class="mt-2">Transportation and storage (e.g., rail and grain logistics)</li>
</ul>
<p>These firms may benefit from long-term trends such as precision agriculture and farm automation, while remaining sensitive to farm income cycles.</p>
<h3>3. Processing, Trading &amp; Food Production (Downstream)</h3>
<p>This segment connects farms to consumers:</p>
<ul class="content-list">
<li class="mt-2">Grain traders and processors (e.g., Bunge Global SA)</li>
<li class="mt-2">Protein producers and packaged food companies (e.g., Tyson Foods Inc., Mowi ASA)</li>
</ul>
<p>These companies play an important role in managing global supply chains by sourcing, storing and distributing food where it is needed most. During periods of volatility, their scale and network advantages may become more relevant.</p>
<h2 id="point-two" class="anchored-block jump-link-nav" data-jumplink-title="Portfolio Positioning">Portfolio Positioning at a Glance</h2>
<p>Understanding how <a href="/link/63b1b78621384fa2a809fb2131edd706.aspx" title="MOO - VanEck Agribusiness ETF - Overview"><strong>MOO</strong></a> is constructed helps reinforce how it captures the agribusiness opportunity in practice.</p>
<h3>Top Holdings</h3>
<div class="wrapped-div">
<table style="width: 100%;">
<tbody>
<tr class="tbl-data">
<td class="tbl-header last text-left">Ticker</td>
<td class="tbl-header last text-left">Name</td>
<td class="tbl-header last text-right">Weight (%)</td>
</tr>
<tr class="tbl-data">
<td class="data-td data last text-left">DE</td>
<td class="data-td data last text-left">Deere &amp; Company</td>
<td class="data-td data last text-right">8.94</td>
</tr>
<tr class="tbl-data">
<td class="data-td data last text-left">ZTS</td>
<td class="data-td data last text-left">Zoetis, Inc. Class A</td>
<td class="data-td data last text-right">7.39</td>
</tr>
<tr class="tbl-data">
<td class="data-td data last text-left">506921</td>
<td class="data-td data last text-left">Bayer AG</td>
<td class="data-td data last text-right">6.78</td>
</tr>
<tr class="tbl-data">
<td class="data-td data last text-left">CTVA</td>
<td class="data-td data last text-left">Corteva Inc.</td>
<td class="data-td data last text-right">6.66</td>
</tr>
<tr class="tbl-data">
<td class="data-td data last text-left">NTR</td>
<td class="data-td data last text-left">Nutrien Ltd.</td>
<td class="data-td data last text-right">6.35</td>
</tr>
<tr class="tbl-data">
<td class="data-td data last text-left">ADM</td>
<td class="data-td data last text-left">Archer-Daniels-Midland Company</td>
<td class="data-td data last text-right">5.43</td>
</tr>
<tr class="tbl-data">
<td class="data-td data last text-left">TSN</td>
<td class="data-td data last text-left">Tyson Foods, Inc. Class A</td>
<td class="data-td data last text-right">4.69</td>
</tr>
<tr class="tbl-data">
<td class="data-td data last text-left">6326</td>
<td class="data-td data last text-left">Kubota Corporation</td>
<td class="data-td data last text-right">4.47</td>
</tr>
<tr class="tbl-data">
<td class="data-td data last text-left">CF</td>
<td class="data-td data last text-left">CF Industries Holdings, Inc.</td>
<td class="data-td data last text-right">4.16</td>
</tr>
<tr class="tbl-data">
<td class="data-td data last text-left">BG</td>
<td class="data-td data last text-left">Bunge Global SA</td>
<td class="data-td data last text-right">3.59</td>
</tr>
</tbody>
</table>
</div>
<p class="chart-disclosure"><i><strong>Source: VanEck. Data as of 2/28/2026.</strong> This is not an offer to buy or sell, or recommendation to buy or sell any of the securities mentioned herein. Holdings are subject to change.</i></p>

<p>A snapshot of <a href="/link/63b1b78621384fa2a809fb2131edd706.aspx" title="MOO - VanEck Agribusiness ETF - Overview"><strong>MOO</strong></a>&rsquo;s top holdings highlights exposure to leading global agribusiness companies across inputs, equipment and food production.</p>
<p><strong>Takeaway:</strong> The fund is concentrated in established, globally recognized agribusiness companies that play important roles across the food supply chain.</p>
<h3>Agricultural Supply Chain Weights Exposure</h3>
<p><img loading="lazy" class="desktop-image img-responsive" alt="Agricultural Supply Chain Weights Exposure" src="https://www.vaneck.com/contentassets/cfc34c4b4c734ddfa78602493a39b122/7074_moo-blog-chart-3_2026-4_v1_desktop.svg" /></p>
<p><img loading="lazy" class="mobile-image img-responsive" alt="Agricultural Supply Chain Weights Exposure" src="https://www.vaneck.com/contentassets/cfc34c4b4c734ddfa78602493a39b122/7074_moo-blog-chart-3_2026-4_v1_mobile.svg" /></p>
<p class="chart-disclosure"><i><strong>Source: VanEck. Data as of 2/28/2026.</strong> Chart for illustrative purposes only. Sector allocations are subject to change.</i></p>
<p><a href="/link/63b1b78621384fa2a809fb2131edd706.aspx" title="MOO - VanEck Agribusiness ETF - Overview"><strong>MOO</strong></a>&rsquo;s exposure spans key segments of the agricultural supply chain, reflecting the same value chain framework illustrated earlier. Based on the chart, allocations include approximately 25% to seeds, fertilizers and agricultural chemicals, 21% to farm equipment and machinery, 20% to livestock, aquaculture and fishing, 17% to animal health, 10% to agricultural trading and 6% to cultivation and farming.</p>
<p><strong>Takeaway:</strong> The portfolio is diversified across multiple parts of the agribusiness value chain, with meaningful exposure to both inputs and downstream activities. This balance may help capture different drivers of performance across the global food supply chain.</p>
<h3>Geographic Exposure</h3>
<p><img loading="lazy" class="desktop-image img-responsive" alt="Geographic Exposure" src="https://www.vaneck.com/contentassets/05a250a3c8934c7e816e3058d39f4a4b/7074_moo-blog-chart-2_2026-4_v1_desktop.svg" /></p>
<p><img loading="lazy" class="mobile-image img-responsive" alt="Geographic Exposure" src="https://www.vaneck.com/contentassets/05a250a3c8934c7e816e3058d39f4a4b/7074_moo-blog-chart-2_2026-4_v1_mobile.svg" /></p>
<p class="chart-disclosure"><i><strong>Source: VanEck. Data as of 2/28/2026.</strong> Chart for illustrative purposes only. Country exposures are subject to change.</i></p>
<p>The portfolio spans both developed and emerging markets, providing global exposure to companies operating across the agricultural value chain.</p>
<p><strong>Takeaway:</strong> This global footprint reflects the international nature of food production and distribution, while providing diversified exposure across regions.</p>
<h3>A Distinct Sector Profile</h3>
<p><a href="/link/63b1b78621384fa2a809fb2131edd706.aspx" title="MOO - VanEck Agribusiness ETF - Overview"><strong>MOO</strong></a>&rsquo;s exposure reflects the real economy of food production:</p>
<ul class="content-list">
<li class="mt-2">Heavy allocations to consumer staples, materials and industrials</li>
<li class="mt-2">Minimal exposure to technology-heavy sectors that dominate broad indices</li>
</ul>
<p>This differentiation means <a href="/link/63b1b78621384fa2a809fb2131edd706.aspx" title="MOO - VanEck Agribusiness ETF - Overview"><strong>MOO</strong></a> may behave differently than traditional equity portfolios and may offer diversification benefits, particularly during periods of inflation or market stress.</p>
<h2 id="point-three" class="anchored-block jump-link-nav" data-jumplink-title="Key Trends">Key Trends in Agriculture and Agribusiness Investing</h2>
<p>Structural pressures are accelerating innovation across the system. Precision agriculture and automation are improving yields and reducing costs, while biological inputs and sustainable solutions are gaining traction amid environmental concerns. Companies are also investing in supply chain resilience, and innovation in protein production, including aquaculture, is expanding. These developments are reshaping the landscape for agriculture investing.</p>
<h2>How Food Inflation and Supply Chains Impact Agribusiness</h2>
<p>Inflation and supply disruptions can create short-term volatility, but they also reinforce long-term investment themes. Food security has become a priority for governments and corporations, while higher baseline prices can support revenues across the value chain. At the same time, innovation is accelerating as producers seek to improve efficiency and offset rising costs.</p>
<p>Agribusiness companies are not just exposed to these dynamics. They are also part of the solution.</p>
<h2>What Drives Agribusiness ETF Performance</h2>
<p>Agribusiness sits at the intersection of cyclical and structural forces. In the short term, performance is influenced by:</p>
<ul class="content-list">
<li class="mt-2">Commodity prices</li>
<li class="mt-2">Weather patterns</li>
<li class="mt-2">Input costs</li>
</ul>
<p>Over the long term, key drivers include:</p>
<ul class="content-list">
<li class="mt-2">Population growth</li>
<li class="mt-2">Dietary shifts</li>
<li class="mt-2">Productivity demands</li>
</ul>
<p>This cyclical nature can create entry points for long-term investors.</p>
<h2>Why Invest in the VanEck Agribusiness ETF (MOO)?</h2>
<ul class="content-list">
<li class="mt-2">Global exposure across developed and emerging markets</li>
<li class="mt-2">Pure-play agribusiness focus</li>
<li class="mt-2">Diversified value chain exposure</li>
<li class="mt-2">Structural growth tied to food demand and innovation</li>
<li class="mt-2">Exposure to a non-discretionary industry</li>
<li class="mt-2">Potential diversification benefits</li>
</ul>
<h2>The Bottom Line</h2>
<p>Agriculture is evolving rapidly, driven by technology, sustainability and global demand. The <a href="/link/63b1b78621384fa2a809fb2131edd706.aspx" title="MOO - VanEck Agribusiness ETF - Overview"><strong>VanEck Agribusiness ETF (MOO)</strong></a> provides a way to participate in this transformation through the companies enabling the future of food.</p>
<h2>How can investors buy VanEck ETFs?</h2>
<p><a href="/link/e5fc174dfb2d4bdc8fcb535ffad93759.aspx#how-to-buy-etf&amp;utm=MOO-Blog" title="How to buy VanEck ETFs?"><strong>Learn more here.</strong></a></p>

<p>To receive more <a href="/us/en/insights/natural-resources/" title="Natural Resources Insights"><strong>Natural Resources</strong></a> insights, <a href="https://www.vaneck.com/us/en/subscribe/" title="Subscription Center"><strong>sign up in our subscription center</strong></a>.</p>
]]></content:encoded>
</item><item rdf:about="https://www.vaneck.com/us/en/blogs/income-investing/how-to-invest-in-municipal-bonds-for-tax-free-income/">
  <title>How to Invest in Municipal Bonds for Tax-Free Income></title>
  <link>https://www.vaneck.com/us/en/blogs/income-investing/how-to-invest-in-municipal-bonds-for-tax-free-income/</link>
  <description><![CDATA[Municipal bonds offer tax-free income and improved yields, making them attractive for investors seeking higher after-tax returns. With tax-equivalent yields rising, munis present a compelling opportunity today.]]></description>
  <dc:creator>Louise Gedney</dc:creator>
  <dc:date>04/06/2026 06:30:00</dc:date>
<content:encoded><![CDATA[

<p><strong>Key Takeaways:</strong></p>
<ul class="content-list">
<li class="mt-2">Municipal bonds offer tax-free income, boosting after-tax returns, especially for high-income investors.</li>
<li class="mt-2">Tax-equivalent yields can exceed taxable bonds, often requiring more risk to match muni income levels.</li>
<li class="mt-2">ETFs like <strong><a href="/link/63e99d0ce68b47e79eae26e1c163fd09.aspx" title="HYD - VanEck High Yield Muni ETF - Overview">HYD</a></strong> provide diversified, liquid access to munis while helping optimize tax-efficient income.</li>
</ul>
<h2>What Are Municipal Bonds?</h2>
<p>Municipal bonds, or "munis," are debt securities issued by government entities. When you buy one, you're lending money to the issuer in exchange for regular coupon payments and the return of your principal at maturity.</p>
<h2>Types of Municipal Bonds</h2>
<p>Municipal bonds come in two main types:</p>
<ul class="content-list">
<li class="mt-2"><strong>General obligation (GO) bonds</strong> are backed by the full taxing power of the issuing government, making them among the most creditworthy instruments in the market.</li>
<li class="mt-2"><strong>Revenue bonds</strong> are backed by income from a specific project, such as toll roads or utilities. Revenue bonds carry slightly more risk but often offer modestly higher yields.</li>
</ul>
<p>The critical differentiator is taxation. If you invest $100,000 in a bond yielding 4%, you receive $4,000 in annual income. But for a taxable bond investor in the 37% federal bracket, they're only taking home around $2,500 of that $4,000 after taxes. With a municipal bond, you keep the full $4,000.</p>
<h2>How Does Tax-Equivalent Yield Work?</h2>
<p>Tax-equivalent yield is the most important calculation for any muni investor. It answers: <i>How much would I need to earn on a taxable bond to match this muni's after-tax income?</i></p>
<h3>Tax-Equivalent Yield = Muni Yield &divide; (1 &minus; Marginal Tax Rate)</h3>
<p><strong>For a municipal bond yielding 4.5%:</strong></p>
<div class="wrapped-div">
<table style="width: 75%;">
<tbody>
<tr class="tbl-data">
<td class="tbl-header last text-right">Federal Tax Bracket (%)</td>
<td class="tbl-header last text-right">Effective Rate (incl.NIIT) (%)</td>
<td class="tbl-header last text-right">Tax-Equivalent Yield (%)</td>
</tr>
<tr class="tbl-data">
<td class="data-td data last text-right">24</td>
<td class="data-td data last text-right">24.0</td>
<td class="data-td data last text-right">5.92</td>
</tr>
<tr class="tbl-data">
<td class="data-td data last text-right">32</td>
<td class="data-td data last text-right">32.0</td>
<td class="data-td data last text-right">6.62</td>
</tr>
<tr class="tbl-data">
<td class="data-td data last text-right">35</td>
<td class="data-td data last text-right">35.0</td>
<td class="data-td data last text-right">6.92</td>
</tr>
<tr class="tbl-data">
<td class="data-td data last text-right">37</td>
<td class="data-td data last text-right">40.8<sup>*</sup></td>
<td class="data-td data last text-right">7.60</td>
</tr>
</tbody>
</table>
</div>
<p class="chart-disclosure"><sup>*</sup>&nbsp;Includes the 3.8% Net Investment Income Tax (NIIT).</p>

<p>The takeaway: an investor in the top bracket would need nearly 7.6% from a taxable bond to match a 4.5% muni, a threshold that typically requires taking on significantly more credit risk. Twenty-year AA-rated munis recently offered taxable-equivalent yields approaching 7%, meaningfully above comparable investment-grade corporates.</p>
<h2>Who Benefits Most from Municipal Bonds?</h2>
<p>Munis are most attractive for high-income earners (32%+ federal bracket), investors in high-tax states who can achieve "triple tax-free" status, and those investing in taxable accounts rather than tax-deferred retirement accounts.</p>
<h2>Key Risks of Municipal Bonds</h2>
<p>Municipal bonds have a strong safety record, but "tax-free" does not mean "risk-free."</p>
<ul class="content-list">
<li class="mt-2"><strong>Credit risk</strong> has historically been very low for investment-grade munis. According to Moody's, the 10-year cumulative default rate from 1970 onward was just 0.1% for investment-grade munis, compared to 2.2% for investment-grade corporates. High-profile defaults like Puerto Rico and Detroit remain rare exceptions. High-yield munis carry meaningfully higher default risk and require greater caution.</li>
<li class="mt-2"><strong>Interest rate risk</strong> is especially relevant given munis' typically longer maturities. When rates rise, bond prices fall, and the longer the duration, the larger the decline. This doesn't affect investors who hold to maturity, but matters for those who may need to sell early.</li>
<li class="mt-2"><strong>Liquidity and call risk</strong> round out the picture. The $4.4 trillion muni market is fragmented across thousands of issuers, so some bonds trade infrequently with wider bid-ask spreads. Many munis are also callable, meaning issuers can redeem them early when rates drop potentially forcing reinvestment at lower yields.</li>
</ul>
<h2>Why Are Municipal Bonds Attractive Today?</h2>
<p>Higher interest rates have created more attractive entry points across the muni curve. A 20- to 30-year portfolio rated A or better can currently produce a tax-free yield to worst in the mid-4% range, translating to taxable-equivalent yields above 7.5% for top-bracket investors.</p>
<p>Credit quality remains strong. State and local government balance sheets are generally healthy, with reserve levels built up during the post-pandemic recovery. Certain sectors like senior living and smaller special districts warrant closer scrutiny, but the broad market picture is stable.</p>
<p>If rates stabilize or decline from here, bondholders stand to benefit from both income and potential price appreciation. And with today's elevated yields, even moderate rate increases are cushioned by the higher starting income.</p>
<h2>Using ETFs for Municipal Bond Exposure</h2>
<p>For investors seeking diversification, liquidity, and professional management, municipal bond ETFs offer a practical path into the market&mdash;spreading exposure across hundreds or thousands of issuers and trading on exchanges throughout the day.</p>
<p>The <strong><a href="/link/63e99d0ce68b47e79eae26e1c163fd09.aspx" title="HYD - VanEck High Yield Muni ETF - Overview">VanEck High Yield Muni ETF (HYD)</a></strong> is one vehicle worth evaluating for investors targeting higher income potential. <a href="/link/63e99d0ce68b47e79eae26e1c163fd09.aspx" title="HYD - VanEck High Yield Muni ETF - Overview"><strong>HYD</strong></a> tracks the ICE Broad High Yield Crossover Municipal Index, holds roughly 1,900 securities, and carries one of the lowest expense ratios in the high-yield muni ETF category at 0.32%. High-yield munis do carry more risk than investment-grade bonds, but for investors comfortable with that tradeoff, a diversified vehicle like <a href="/link/63e99d0ce68b47e79eae26e1c163fd09.aspx" title="HYD - VanEck High Yield Muni ETF - Overview"><strong>HYD</strong></a> can be an efficient way to optimize after-tax income.</p>
<h2>Building Your Tax-Efficient Income Strategy with Municipal Bonds</h2>
<p>Municipal bonds offer a rare combination: tax-efficient income, strong historical credit quality, and portfolio diversification. The key is to evaluate opportunities using tax-equivalent yield rather than nominal yield, understand the risks involved, and align your muni allocation with your tax situation, time horizon, and income goals.</p>
<p>For those who prefer a managed approach, ETFs like the <strong><a href="/link/63e99d0ce68b47e79eae26e1c163fd09.aspx" title="HYD - VanEck High Yield Muni ETF - Overview">VanEck High Yield Muni ETF (HYD)</a></strong> can simplify access while offering broad diversification and income potential. In today's yield environment, municipal bonds have earned their place at the table.</p>

<p>To receive more <a href="/us/en/blogs/income-investing/" title="Income Investing Insights"><strong>Income Investing</strong></a> insights, <a href="/link/5f45412c2143400497908cea2897f7d3.aspx" title=" Subscription Center"><strong>sign up in our subscription center</strong></a>.</p>
]]></content:encoded>
</item><item rdf:about="https://www.vaneck.com/us/en/blogs/thematic-investing/sector-leaders-at-true-market-weights/">
  <title>Sector Leaders at True Market Weights></title>
  <link>https://www.vaneck.com/us/en/blogs/thematic-investing/sector-leaders-at-true-market-weights/</link>
  <description><![CDATA[VanEck&rsquo;s TruSector ETFs are designed to deliver full market-cap sector exposure and help asset allocators track sector benchmarks with greater precision.]]></description>
  <dc:creator>Michael Cohick</dc:creator>
  <dc:date>04/02/2026 06:30:00</dc:date>
<content:encoded><![CDATA[

<p>Sectors can be building blocks of an asset allocation strategy with benefits beyond simply investing in a single S&amp;P 500 ETF. However, the tools investors rely on to access them haven&rsquo;t kept pace with how markets have evolved. At VanEck, we believe investors deserve sector exposures that reflect the true size of today&rsquo;s largest companies, not ones constrained by legacy design or outdated assumptions.</p>
<p>This belief led us to develop the actively managed TruSector ETFs, a new approach to sector investing that seeks to deliver more accurate representative exposure to the stocks in each sector that drive long-term performance, including:</p>
<ul class="content-list">
<li class="mt-2" style="font-weight: bold;"><a href="/link/4b2904882a3c4908b40d77036f2d8889.aspx" title="TRUT - VanEck Technology TruSector ETF"><strong>VanEck Technology TruSector ETF (TRUT)</strong></a></li>
<li class="mt-2" style="font-weight: bold;"><a href="/link/691928d6a333465e84b05ddceeb9203a.aspx" title="TRUD - VanEck Consumer Discretionary TruSector ETF"><strong>VanEck Consumer Discretionary TruSector ETF (TRUD)</strong></a></li>
<li class="mt-2" style="font-weight: bold;"><a href="/link/ec7c31c056ff476b8e0937e92f7afedd.aspx" title="TRUC - VanEck Communications Services TruSector ETF"><strong>VanEck Communications Services TruSector ETF (TRUC)</strong></a></li>
<li class="mt-2" style="font-weight: bold;"><a href="/link/e55ffe2c80324e60a51bccb9bd670d0b.aspx" title="TRUF - VanEck Financials TruSector ETF"><strong>VanEck Financials TruSector ETF (TRUF)</strong></a></li>
<li class="mt-2" style="font-weight: bold;"><a href="/link/52a9d8d3492c4b2383718e256baffb42.aspx" title="TRUH - VanEck Healthcare TruSector ETF"><strong>VanEck Healthcare TruSector ETF (TRUH)</strong></a></li>
</ul>
<h2>It&rsquo;s Time for a New Approach to Sector Investing</h2>
<p>Over the past decade, concentration has intensified, especially in areas like the technology and consumer discretionary sectors. A handful of companies now account for a growing share of total performance in each sector, yet most traditional sector ETFs are subject to structural constraints that limit their ability to reflect this reality.</p>
<p>This disconnect has led to two persistent challenges:</p>
<ol class="content-list">
<li class="mt-2">Underrepresentation of dominant companies</li>
<li class="mt-2">Distorted tracking relative to uncapped benchmarks</li>
</ol>
<h3>Capping Weights of Top Constituents Creates Unintended Overweights</h3>
<p><img loading="lazy" class="desktop-image img-responsive w-100" src="https://www.vaneck.com/contentassets/187d12bc60674b349c3ac69bd95b258a/6830_trusector-blog_chart-3_2026-02_v1_desktop.svg" alt="Capping Weights of Top Constituents Creates Unintended Overweights" /></p>
<p><img loading="lazy" class="mobile-image img-responsive w-100" src="https://www.vaneck.com/contentassets/187d12bc60674b349c3ac69bd95b258a/6830_trusector-blog_chart-3_2026-02_v1_mobile.svg" alt="Capping Weights of Top Constituents Creates Unintended Overweights" /></p>
<p class="chart-disclosure">Source: Factset. As of 12/31/2025. Index holdings and performance are not illustrative of fund holdings or performance. It is not possible to invest directly in an index.</p>
<p><img loading="lazy" class="desktop-image img-responsive w-100" src="https://www.vaneck.com/contentassets/cf826813839546dbb762775041349be4/6830_trusector-blog_chart-1_2026-02_v1_desktop.svg" alt="Capping Weights of Top Constituents Creates Unintended Overweights" /></p>
<p><img loading="lazy" class="mobile-image img-responsive w-100" src="https://www.vaneck.com/contentassets/cf826813839546dbb762775041349be4/6830_trusector-blog_chart-1_2026-02_v1_mobile.svg" alt="Capping Weights of Top Constituents Creates Unintended Overweights" /></p>
<p class="chart-disclosure">Source: FactSet as of 06/30/2025. Index holdings are not illustrative of fund holdings. Not intended as a recommendation to buy or sell any names referenced herein. Fund holdings may vary. Visit vaneck.com/trud or vaneck.com/trut for most recent complete holdings information. Please see index definitions below.</p>
<p><img loading="lazy" class="desktop-image img-responsive w-100" src="https://www.vaneck.com/contentassets/367474bffc60402cb6b968ddf3c0a591/6830_trusector-blog_chart-2_2026-02_v1_desktop.svg" alt="Capping Weights of Top Constituents Creates Unintended Overweights" /></p>
<p><img loading="lazy" class="mobile-image img-responsive w-100" src="https://www.vaneck.com/contentassets/367474bffc60402cb6b968ddf3c0a591/6830_trusector-blog_chart-2_2026-02_v1_mobile.svg" alt="Capping Weights of Top Constituents Creates Unintended Overweights" /></p>
<p class="chart-disclosure">Source: Factset. As of 12/31/2025. Index holdings and performance are not illustrative of fund holdings or performance. It is not possible to invest directly in an index.</p>

<p>Rather than trying to retrofit older tools into a new environment, we chose to start fresh with a strategy built for real-world market dynamics and forward-looking portfolio construction.</p>
<h2>The Principles Behind TruSector</h2>
<p>TruSector ETFs are grounded in a few simple but powerful principles:</p>
<ul class="content-list">
<li class="mt-2"><strong>Economic Accuracy:</strong> We aim to reflect the market as it exists, not as regulations might artificially force it, while still complying with diversification rules.</li>
<li class="mt-2"><strong>Strategic Flexibility:</strong> Our team can adjust to changing sector landscapes rather than locking into static weights.</li>
<li class="mt-2"><strong>ETF Simplicity:</strong> Despite the innovation inside, TruSector ETFs are designed to be familiar, transparent, and easy to use, like any other ETF.</li>
</ul>
<h2>Sector Exposure Built with Allocators in Mind</h2>
<p>Whether you are constructing models or refining tactical views, clean sector exposure matters. With TruSector ETFs, we aim to give portfolio builders a more precise tool set, reducing unintended tilts and performance drift that can come from traditional ETFs.</p>
<p>This is not about chasing benchmarks. It is about giving investors access to sectors in a way that is aligned with how the market actually exists.</p>
<h3>Variance in Weights Creates Difference in Performance</h3>
<div class="wrapped-div mb-3">
<table style="width: 100%;">
<tbody>
<tr class="tbl-data">
<td class="tbl-header last text-left">&nbsp;</td>
<td class="tbl-header last text-right"><strong>3M</strong></td>
<td class="tbl-header last text-right"><strong>YTD</strong></td>
<td class="tbl-header last text-right"><strong>1Y</strong></td>
<td class="tbl-header last text-right"><strong>3Y</strong></td>
</tr>
<tr class="tbl-data">
<td class="data-td data last text-left">S&amp;P Technology Select Sector TR</td>
<td class="data-td data last text-right">2.26</td>
<td class="data-td data last text-right">24.72</td>
<td class="data-td data last text-right">33.33</td>
</tr>
<tr class="tbl-data">
<td class="data-td data last text-left">S&amp;P 500 500 Sec/Information Technology TR</td>
<td class="data-td data last text-right">1.42</td>
<td class="data-td data last text-right">24.04</td>
<td class="data-td data last text-right">38.80</td>
</tr>
<tr class="tbl-data">
<td class="data-td data last text-left"><strong>Performance Differentiation</strong></td>
<td class="data-td data last text-right"><strong>0.84</strong></td>
<td class="data-td data last text-right"><strong>0.67</strong></td>
<td class="data-td data last text-right"><strong>(5.47)</strong></td>
</tr>
<tr class="tbl-data">
<td class="data-td data last text-left">S&amp;P Consumer Disc Select Sector TR USD</td>
<td class="data-td data last text-right">-0.15</td>
<td class="data-td data last text-right">7.45</td>
<td class="data-td data last text-right">23.90</td>
</tr>
<tr class="tbl-data">
<td class="data-td data last text-left">S&amp;P 500 Sec/Cons Disc TR USD</td>
<td class="data-td data last text-right">0.71</td>
<td class="data-td data last text-right">6.04</td>
<td class="data-td data last text-right">25.25</td>
</tr>
<tr class="tbl-data">
<td class="data-td data last text-left"><strong>Performance Differentiation</strong></td>
<td class="data-td data last text-right"><strong>(0.86)</strong></td>
<td class="data-td data last text-right"><strong>1.40</strong></td>
<td class="data-td data last text-right"><strong>(1.36)</strong></td>
</tr>
<tr class="tbl-data">
<td class="data-td data last text-left">S&amp;P Cmmncton Svces Select Sector TR USD</td>
<td class="data-td data last text-right">-0.24</td>
<td class="data-td data last text-right">23.08</td>
<td class="data-td data last text-right">36.42</td>
</tr>
<tr class="tbl-data">
<td class="data-td data last text-left">S&amp;P 500 Sec/Commun Services TR USD</td>
<td class="data-td data last text-right">7.26</td>
<td class="data-td data last text-right">33.55</td>
<td class="data-td data last text-right">42.86</td>
</tr>
<tr class="tbl-data">
<td class="data-td data last text-left"><strong>Performance Differentiation</strong></td>
<td class="data-td data last text-right"><strong>-7.50</strong></td>
<td class="data-td data last text-right"><strong>-10.47</strong></td>
<td class="data-td data last text-right"><strong>-6.47</strong></td>
</tr>
</tbody>
</table>
</div>
<p class="chart-disclosure"><strong>Source</strong>: Morningstar, Data as of 12/31/2025.<br />Index performance is not fund performance. TruSector ETFs may not replicate the differential shown. The uncapped approach can also underperform.</p>
<h2>Starting with Tech and Consumer Discretionary</h2>
<p>We launched the TruSector suite with three of the most structurally distorted sectors:</p>
<ul class="content-list">
<li class="mt-2"><a href="/link/4b2904882a3c4908b40d77036f2d8889.aspx" title="VanEck Technology TruSector ETF (TRUT)"><strong>Information Technology (TRUT)</strong></a></li>
<li class="mt-2"><strong><a href="/link/691928d6a333465e84b05ddceeb9203a.aspx" title="VanEck Consumer Discretionary TruSector ETF (TRUD)">Consumer Discretionary (TRUD)</a></strong></li>
<li class="mt-2"><strong><a href="/link/ec7c31c056ff476b8e0937e92f7afedd.aspx" title="TRUC - VanEck Communication Services TruSector ETF - Overview">Communications Services (TRUC</a><a href="/link/ec7c31c056ff476b8e0937e92f7afedd.aspx" title="TRUC - VanEck Communication Services TruSector ETF - Overview">)</a></strong></li>
</ul>
<p>These sectors are increasingly dominated by large firms that traditional ETFs often underweight. TruSector is designed to better reflect these realities.</p>
<h2>Expanding into Financials and Healthcare</h2>
<p>We are now bringing the TruSector methodology to two additional sectors with the launch of the <a href="/link/e55ffe2c80324e60a51bccb9bd670d0b.aspx" title="TRUF - VanEck Financials TruSector ETF"><strong>VanEck Financials TruSector ETF (TRUF)</strong></a> and <a href="/link/52a9d8d3492c4b2383718e256baffb42.aspx" title="TRUH - VanEck Healthcare TruSector ETF"><strong>VanEck Healthcare TruSector ETF (TRUH)</strong></a>. Financials and healthcare have not faced the same concentration&ndash;driven weighting distortions as the initial three sectors, but they share the same need for precise, benchmark-aware construction. <a href="/link/e55ffe2c80324e60a51bccb9bd670d0b.aspx" title=" TRUF - VanEck Financials TruSector ETF"><strong>TRUF</strong></a> and <a href="/link/52a9d8d3492c4b2383718e256baffb42.aspx" title="TRUH - VanEck Healthcare TruSector ETF"><strong>TRUH</strong></a> extend the suite's core philosophy that investors deserve sector exposures built for how markets actually work today, not how they worked decades ago.</p>
<p>TruSector builds on VanEck&rsquo;s legacy of staying ahead of structural shifts in markets and rethinking what&rsquo;s possible in investing. It brings a modern approach to sector exposure, designed to help investors strengthen their core portfolios.</p>

<p>To receive more <a href="https://www.vaneck.com/us/en/insights/thematic-investing/" title="Thematic Investing Insights"><strong>Thematic Investing</strong></a> insights, <a href="https://www.vaneck.com/us/en/subscribe/" title="Subscription Center"><strong>sign up in our subscription center</strong></a>.</p>
]]></content:encoded>
</item><item rdf:about="https://www.vaneck.com/us/en/blogs/natural-resources/copper-companies-with-exposure-to-grid-expansion/">
  <title>Copper Companies with Exposure to Grid Expansion></title>
  <link>https://www.vaneck.com/us/en/blogs/natural-resources/copper-companies-with-exposure-to-grid-expansion/</link>
  <description><![CDATA[Copper sits at the heart of grid expansion, EV adoption, and AI infrastructure, making it a key investment theme as global electrification accelerates.]]></description>
  <dc:creator>Alicia  Barkley</dc:creator>
  <dc:date>04/02/2026 06:30:00</dc:date>
<content:encoded><![CDATA[

<p><strong>Key Takeaways:</strong></p>
<ul class="content-list">
<li class="mt-2">Copper is central to electrification. Grid modernization, EVs, and AI data centers all depend on copper for the buildout ahead.</li>
<li class="mt-2">Structural demand meets cyclical reality. Long-term tailwinds are compelling, but copper remains sensitive to global growth and China demand.</li>
<li class="mt-2">How you access copper matters. Pure-play miners, diversified majors, and ETFs like EMET each offer different risk and return profiles.</li>
</ul>
<h2>Copper Is Emerging as a Strategic Bottleneck in Electrification</h2>
<p>Copper is widely viewed as a critical material for global electrification. Demand is being supported by grid modernization, electric vehicle (EV) adoption, and the expansion of AI-powered data centers. Each of these trends requires significant electricity infrastructure, which in turn relies on copper.</p>
<p>Electrification is often described as a materials-driven shift, and copper sits at the center of that transition. It is used across power systems, transportation, and digital infrastructure. As investment in electricity networks increases, copper demand is becoming more closely linked to long-term infrastructure buildout rather than only short-term industrial cycles.</p>
<p>This evolving role contributes to a more complex investment case. Copper may offer exposure to structural growth trends, but it remains influenced by cyclical conditions and company-specific execution factors.</p>
<h2>Why Copper Matters for Grid Expansion, EVs, and AI Infrastructure</h2>
<p>Copper is essential to electrification because of its conductivity, durability, and broad applicability. It is used throughout the power ecosystem, including generation, transmission, distribution, EV systems, charging infrastructure, and data centers.</p>
<p>Electrification tends to increase copper intensity. Expanding and modernizing grids requires upgrades to transmission lines, substations, and distribution networks. EVs generally require more copper than internal combustion vehicles. Data centers, particularly those supporting AI workloads, depend on both direct copper inputs and significant supporting power infrastructure.</p>
<p>Global grid investment has been increasing as countries upgrade aging systems, expand capacity, and integrate renewable energy. At the same time, new data center capacity is expected to be concentrated in regions that already face grid constraints, including the U.S., China, and Europe.</p>
<p>These dynamics contribute to the view that copper provides exposure to physical infrastructure buildout. It is not only an industrial input but also a key component of the systems supporting electrification.</p>

<h2>Copper as an Investment: Structural Tailwinds and Cyclical Risks</h2>
<p>Copper is frequently associated with long-term electrification trends, but its performance remains tied to broader economic conditions.</p>
<p>On a structural level, demand may be supported by continued grid investment, EV adoption, and increasing electricity usage from digital and AI systems. These trends are often cited as drivers of long-term demand growth.</p>
<p>At the same time, copper is a cyclical asset. Prices are influenced by global growth, industrial activity, and demand from China. Financial conditions, including interest rates and currency movements, may also affect outcomes.</p>
<p>Some market participants frame the copper outlook in terms of sustained demand growth alongside potential supply constraints. This dynamic may influence pricing over time, although outcomes remain uncertain.</p>
<p>Copper can therefore be viewed as a long-term thematic exposure that may experience periods of volatility.</p>
<h2>What Differentiates Copper Companies from an Investment Perspective</h2>
<p>Copper is frequently associated with long-term electrification trends, but its performance remains tied to broader economic conditions.</p>
<p>On a structural level, demand may be supported by continued grid investment, EV adoption, and increasing electricity usage from digital and AI systems. These trends are often cited as drivers of long-term demand growth.</p>
<p>At the same time, copper is a cyclical asset. Prices are influenced by global growth, industrial activity, and demand from China. Financial conditions, including interest rates and currency movements, may also affect outcomes.</p>
<p>Some market participants frame the copper outlook in terms of sustained demand growth alongside potential supply constraints. This dynamic may influence pricing over time, although outcomes remain uncertain.</p>
<p>Copper can therefore be viewed as a long-term thematic exposure that may experience periods of volatility.</p>
<h2>Understanding the Different Types of Copper Exposure</h2>
<p>Copper exposure can be accessed through several types of companies, each with distinct characteristics.</p>
<ul class="content-list">
<li class="mt-2">Diversified mining companies, such as BHP and Rio Tinto, produce copper alongside other commodities. This broader exposure may reduce volatility but can dilute direct sensitivity to copper prices.</li>
<li class="mt-2">Pure-play producers, including companies such as Freeport-McMoRan and Southern Copper, provide more direct exposure to copper market dynamics.</li>
<li class="mt-2">Development-stage companies focus on advancing new projects. These may offer higher potential variability in outcomes due to execution and financing considerations.</li>
</ul>
<p>There are also companies involved in refining, processing, and related materials. These may provide indirect exposure to copper demand within a broader supply chain context.</p>
<p>Understanding these differences can help investors align copper exposure with portfolio objectives and risk tolerance.</p>
<h2>Copper Companies with Exposure to Grid Expansion</h2>
<p>Several large, publicly traded companies are often referenced in discussions of copper exposure tied to electrification and infrastructure.</p>
<ul class="content-list">
<li class="mt-2">Freeport-McMoRan is a major global copper producer with operations in the U.S. and Indonesia. Its scale makes it a commonly cited proxy for copper demand.</li>
<li class="mt-2">BHP is a diversified mining company with meaningful copper exposure alongside other commodities. Its size and financial position may contribute to more stable earnings relative to smaller peers.</li>
<li class="mt-2">Southern Copper operates large-scale assets in Latin America and is often noted for its cost structure and reserve base.</li>
<li class="mt-2">Rio Tinto has been increasing its focus on copper through long-term development projects, which may contribute to future supply.</li>
</ul>
<p>These examples illustrate different approaches to copper exposure and are not intended to represent a recommendation or a complete list.</p>
<h2>Approaches to Investing in Copper</h2>
<p>Investors may access copper exposure through several approaches, each with different characteristics.</p>
<ul class="content-list">
<li class="mt-2"><strong>Commodity-linked products</strong> are designed to reflect copper prices more directly. These instruments track the underlying commodity but do not include company-specific factors.</li>
<li class="mt-2"><strong>Mining equities</strong> provide exposure to both copper prices and company performance. Returns may be influenced by operational efficiency, cost management, and geographic factors.</li>
<li class="mt-2"><strong>Individual stock </strong>selection allows for targeted exposure but increases concentration risk.</li>
<li class="mt-2">Diversified vehicles, such as<strong> ETFs</strong>, provide exposure across multiple companies or materials. This may reduce reliance on any single issuer, though it does not eliminate market risk.</li>
</ul>
<p>The distinction between commodity exposure and equity exposure is important, as each responds differently to market conditions.</p>
<h2>EMET and Broader Critical-Materials Exposure</h2>
<p>The <strong><a href="/link/87d6a3678ec445ee9f240584921cba00.aspx" title="VanEck Copper and Green Metals ETF (EMET)">VanEck Copper and Green Metals ETF (EMET)</a></strong> seeks to provide liquid, diversified exposure to global copper and critical-minerals producers involved in electrification.</p>
<p>EMET tracks the <strong><a href="/link/d52df9865d4344169ef628a966527697.aspx" title="MVIS Global Clean-Tech Metals Index">MVIS Global Clean-Tech Metals Index</a></strong> and includes companies across the production, refining, processing, and recycling of materials used in power infrastructure, EVs, and data systems. Copper represents a central component of this exposure, reflecting its role across electrification technologies.</p>
<p>This approach is based on the view that electrification is supported by an interconnected materials supply chain. Copper sits at the center of that system, while exposure to additional materials may broaden participation across the infrastructure buildout theme.</p>

<h2>Risks to the Copper Investment Thesis</h2>
<p>Investments related to copper are subject to a range of risks.</p>
<ul class="content-list">
<li class="mt-2">Supply dynamics may affect pricing. Higher prices can incentivize new production, which may increase supply over time. Mining projects may also face permitting delays, cost increases, and operational challenges.</li>
<li class="mt-2">Geopolitical and regulatory risks are relevant in many major producing regions. Changes in policy or political conditions may affect operations.</li>
<li class="mt-2">Demand concentration is another consideration. A significant portion of global copper demand is associated with China, which may create sensitivity to changes in economic conditions.</li>
<li class="mt-2">Valuation levels may also affect outcomes. Periods of strong investor interest may lead to higher expectations, which can increase downside risk if conditions change.</li>
<li class="mt-2">Even in the presence of long-term demand drivers, volatility should be expected.</li>
</ul>
<h2>Copper as a Real-Assets Theme</h2>
<p>Copper is closely linked to grid expansion, electrification, and digital infrastructure. These connections make it relevant within real-assets discussions.</p>
<p>As electricity demand evolves, infrastructure investment may also shift. Copper demand is often associated with these developments.</p>
<p>Investors may access this theme through individual companies or diversified strategies. Broader approaches may provide exposure across multiple components of the materials supply chain.</p>
<p>Copper is often considered a central, though not exclusive, element within this broader investment theme.</p>
<p>To receive more <a href="/us/en/insights/natural-resources/" title="Natural Resources Insights"><strong>Natural Resources</strong></a> insights, <a href="https://www.vaneck.com/us/en/subscribe/" title="Subscription Center"><strong>sign up in our subscription center</strong></a>.</p>
]]></content:encoded>
</item><item rdf:about="https://www.vaneck.com/us/en/blogs/income-investing/why-long-munis-look-compelling-right-now/">
  <title>Why Long Munis Look Compelling Right Now></title>
  <link>https://www.vaneck.com/us/en/blogs/income-investing/why-long-munis-look-compelling-right-now/</link>
  <description><![CDATA[The setup for long-duration municipal bonds is as favorable as it's been in years. Rates, the muni curve, and credit quality all point in the same direction for MLN investors.]]></description>
  <dc:creator>Drew  Anderson</dc:creator>
  <dc:date>04/02/2026 06:30:00</dc:date>
<content:encoded><![CDATA[

<p><strong>Key Takeaways:</strong></p>
<ul class="content-list">
<li class="mt-2">30-year AAA munis are offering ~6.9&ndash;7.0% taxable equivalent yield, roughly 120&ndash;140 bps above long corporates</li>
<li class="mt-2">The muni curve spread between 10- and 30-year maturities sits at ~220 bps on a TEY basis, historically steep</li>
<li class="mt-2">This is a rate-driven setup, not a credit story, which makes the risk/reward unusually clean</li>
</ul>
<p><i>Index performance is not illustrative of fund performance. It is not possible to invest directly in an index. Yield alone should not be the basis for an investment decision. Past performance is no guarantee of future results. The views expressed are solely those of the author, are for illustrative purposes only, and are not investment advice. Taxable equivalent yield assumes a 35% federal tax rate and does not account for state or local taxes.</i></p>
<h2>The Setup Advisors Should Be Paying Attention To</h2>
<p>We don't often get a moment where the rate environment, the yield curve, and credit quality all line up at the same time. Right now, with long municipal bonds, that's exactly what's happening.</p>
<p>While the rate path remains uncertain with a new Fed leadership transition underway, the broader direction of the cycle and market expectations for eventual easing continue to favor long-duration fixed income. Additionally, muni supply is running hot. Cities and states issued a record near $600 billion in bonds last year, and 2026 is on pace to top that, driven by aging infrastructure needs and a surge in power sector demand tied to AI buildout. More supply means upward pressure on muni yields, even as the broader rate environment shifts. That combination is rare, and it's creating real value in the long end of the curve.</p>
<h3>Muni Issuance Hits Record High in 2025</h3>
<p><img loading="lazy" class="desktop-image img-responsive" alt="Muni Issuance Hits Record High in 2025" src="https://www.vaneck.com/contentassets/a848f3a07b4c4561bb0f3b83e21dfc02/7071_mln-blog_chart-1_2026-04_v1_desktop.svg" /></p>
<p><img loading="lazy" class="mobile-image img-responsive" alt="Muni Issuance Hits Record High in 2025" src="https://www.vaneck.com/contentassets/a848f3a07b4c4561bb0f3b83e21dfc02/7071_mln-blog_chart-1_2026-04_v1_mobile.svg" /></p>
<p class="chart-disclosure">Source: SIFMA, March 19, 2026.</p>
<h2>The Numbers Are Hard to Ignore</h2>
<p>At roughly 4.5% nominal, 30-year AAA munis are translating to approximately 6.9&ndash;7.0% taxable equivalent yield for investors in the 35% bracket. That puts them about 140&ndash;150 basis points above comparable long corporates, and nearly 200 basis points over Treasuries. That kind of spread is the type of excess income you typically only see during periods of market stress. The difference here is that this isn't a credit dislocation story. It's being driven by rates, which may present a more favorable risk/reward profile relative to historical conditions.</p>
<p><img loading="lazy" class="desktop-image img-responsive" alt="The Numbers Are Hard to Ignore" src="https://www.vaneck.com/contentassets/c5701f3dcc94470cb651589b9cf8871d/7071_mln-blog_chart-2_2026-04_v1_desktop.svg" /></p>
<p><img loading="lazy" class="mobile-image img-responsive" alt="The Numbers Are Hard to Ignore" src="https://www.vaneck.com/contentassets/c5701f3dcc94470cb651589b9cf8871d/7071_mln-blog_chart-2_2026-04_v1_mobile.svg" /></p>
<p class="chart-disclosure">Source: ICE Indices, March 30, 2026.</p>
<h2>The Muni Curve Is Doing Something Worth Watching</h2>
<p>The slope of the muni curve is equally compelling. The spread between 10- and 30-year AAA munis sits at roughly +140 basis points nominal, or around 220 basis points on a taxable-equivalent basis. That's a notably steep configuration by historical standards, and it means investors are genuinely getting paid to extend duration: not just in carry, but in convexity and roll-down benefits as well.</p>
<h3>AAA Yield Curve as of 03/30/26</h3>
<p><img loading="lazy" class="desktop-image img-responsive" alt="AAA Yield Curve as of 03/30/26" src="https://www.vaneck.com/contentassets/232257848a4844598d828220d103952e/7071_mln-blog_chart-3_2026-04_v1_desktop.svg" /></p>
<p><img loading="lazy" class="mobile-image img-responsive" alt="AAA Yield Curve as of 03/30/26" src="https://www.vaneck.com/contentassets/232257848a4844598d828220d103952e/7071_mln-blog_chart-3_2026-04_v1_mobile.svg" /></p>
<p class="chart-disclosure">Source: ICE Indices, March 30, 2026. Index performance is not illustrative of fund performance. It is not possible to invest directly in an index. Yield alone should not be the basis for an investment decision.</p>

<p>For clients in the 37% bracket, the tax-exempt nature of muni income continues to be one of the most efficient tools available. With taxable yields under pressure, the after-tax comparison versus corporates or Treasuries is as favorable as it's been in a while.</p>
<p class="chart-disclosure">State and local income taxes may apply depending on the investor's state of residence and the bonds held, which would reduce the effective taxable-equivalent yield.</p>
<h2>Why This Isn't a Reach-for-Yield Trade</h2>
<p>One thing worth clarifying for advisors: this is not a credit story dressed up as a value opportunity. Long high-grade municipals are competing directly with corporate credit on income while carrying higher credit quality. The valuation case is built on rate dynamics, not on moving down the credit ladder to find yield.</p>
<p>That distinction matters. It means the forward-looking risk/reward isn't dependent on credit conditions holding up. It's dependent on a rate environment that, directionally, is moving the right way.</p>
<h2>Why MLN, and Why Now</h2>
<p>Part of what makes this moment interesting is that long munis have had less institutional attention over the past decade. Banks and insurance companies have largely moved away from 30-year commitments, and SMA structures have shifted toward intermediate bonds in response to curve steepness and lower volatility. That rotation has left the long end of the muni market relatively under-owned, which only adds to the opportunity.</p>
<p>Historically, moving earlier in a rate easing cycle has allowed investors to participate more fully in potential price appreciation in long-duration fixed income (although outcomes can vary and are not guaranteed).. Waiting for the move to be obvious usually means the repricing has already happened.</p>
<h2>How to Access Long-Duration Munis</h2>
<p>Advisors looking to position clients for this setup can access it through the <a href="/link/1ec087c36ce04ebfaf0617b63e908818.aspx" title="MLN - VanEck Long Muni ETF - Overview"><strong>VanEck Long Munis ETF (MLN)</strong></a>, which provides targeted exposure to long-dated investment-grade municipal bonds and is built to reflect the opportunity set that exists at the long end of the muni market today.</p>

<p>To receive more <a href="/us/en/blogs/income-investing/" title="Income Investing Insights"><strong>Income Investing</strong></a> insights, <a href="/link/5f45412c2143400497908cea2897f7d3.aspx" title=" Subscription Center"><strong>sign up in our subscription center</strong></a>.</p>
]]></content:encoded>
</item><item rdf:about="https://www.vaneck.com/us/en/blogs/thematic-investing/trusector-etfs-question-and-answer/">
  <title>TruSector ETFs: Question and Answer></title>
  <link>https://www.vaneck.com/us/en/blogs/thematic-investing/trusector-etfs-question-and-answer/</link>
  <description><![CDATA[VanEck TruSector ETFs offer actively managed sector exposure built to deliver full market-cap representation and precise benchmark tracking.]]></description>
  <dc:creator> </dc:creator>
  <dc:date>04/01/2026 06:30:00</dc:date>
<content:encoded><![CDATA[

<p>Our TruSector ETFs are designed to solve one of the most persistent issues in sector investing: the tracking error caused by regulatory diversification limits that force sector funds to underweight the largest companies in their benchmarks. The <a href="/link/691928d6a333465e84b05ddceeb9203a.aspx" title="TRUD - VanEck Consumer Discretionary TruSector ETF - Overview"><strong>VanEck Consumer Discretionary TruSector ETF (TRUD)</strong></a>, <a href="/link/4b2904882a3c4908b40d77036f2d8889.aspx" title="TRUT - VanEck Technology TruSector ETF - Overview"><strong>VanEck Technology TruSector ETF (TRUT)</strong></a>, <strong><a href="/link/ec7c31c056ff476b8e0937e92f7afedd.aspx" title="TRUC - VanEck Communication Services TruSector ETF - Overview">VanEck Communications Services TruSector ETF (TRUC)</a></strong>, <a href="/link/e55ffe2c80324e60a51bccb9bd670d0b.aspx" title="TRUF - VanEck Financials TruSector ETF - Overview"><strong>VanEck Financial TruSector ETF (TRUF)</strong></a> and <a href="/link/52a9d8d3492c4b2383718e256baffb42.aspx" title="TRUH - VanEck Healthcare TruSector ETF - Overview"><strong>VanEck Healthcare TruSector ETF (TRUH)</strong></a> are designed to give investors full market-cap sector exposure, providing closer alignment with how the market itself defines each sector.</p>
<ul class="content-list">
<li class="mt-2"><strong><a href="#point-one">What are VanEck TruSector ETFs?</a></strong></li>
<li class="mt-2"><strong><a href="#point-two">What differentiates TruSector ETFs from other sector ETFs?</a></strong></li>
<li class="mt-2"><strong><a href="#point-three">Why are sector weightings so distorted in other ETFs?</a></strong></li>
<li class="mt-2"><strong><a href="#point-four">How do TruSector ETFs provide full sector exposure while adhering to regulatory rules?</a></strong></li>
<li class="mt-2"><strong><a href="#point-five">What investment needs are TruSector ETFs designed to address?</a></strong></li>
<li class="mt-2"><strong><a href="#point-six">Who are these funds designed for?</a></strong></li>
<li class="mt-2"><strong><a href="#point-seven">How do RIC diversification rules impact traditional S&amp;P 500 ETFs?</a></strong></li>
<li class="mt-2"><strong><a href="#point-eight">Are TruSector ETFs more expensive than traditional sector ETFs?</a></strong></li>
<li class="mt-2"><strong><a href="#point-nine">Which sectors are most affected by capped weighting rules?</a></strong></li>
<li class="mt-2"><strong><a href="#point-ten">Why introduce new sector ETFs when the market already has so many options?</a></strong></li>
<li class="mt-2"><strong><a href="#point-eleven">How does TruSectors determine which ETFs to hold within each sector?</a></strong></li>
</ul>
<h2 id="point-one" class="anchored-block">What are VanEck TruSector ETFs?</h2>
<p>VanEck TruSector ETFs are a suite of sector-focused exchange-traded funds, actively managed to reflect the full economic composition of each market segment. The current offerings include Information Technology<strong> <a href="/link/4b2904882a3c4908b40d77036f2d8889.aspx" title="TRUT - VanEck Technology TruSector ETF - Overview">(TRUT)</a></strong>, Consumer Discretionary<strong> <a href="/link/691928d6a333465e84b05ddceeb9203a.aspx" title="TRUD - VanEck Consumer Discretionary TruSector ETF - Overview">(TRUD)</a></strong>, Communications Services <a href="/link/ec7c31c056ff476b8e0937e92f7afedd.aspx" title="TRUC - VanEck Communication Services TruSector ETF - Overview"><strong>(TRUC)</strong></a>, Financials <a href="/link/e55ffe2c80324e60a51bccb9bd670d0b.aspx" title="TRUF - VanEck Financials TruSector ETF - Overview"><strong>(TRUF)</strong></a> and Healthcare <a href="/link/52a9d8d3492c4b2383718e256baffb42.aspx" title="TRUH - VanEck Healthcare TruSector ETF - Overview"><strong>(TRUH)</strong></a> sectors. VanEck may consider additional sector exposures over time as part of a broader expansion of this suite.</p>
<h2 id="point-two" class="anchored-block">What differentiates TruSector ETFs from other sector ETFs?</h2>
<p>Many existing sector ETFs are built to track indices that are designed to comply with regulatory diversification limits. These rules often reduce exposure to the largest and most influential companies within a sector, leading to allocations and performance that may differ meaningfully from the sector&rsquo;s actual market composition.</p>
<p>TruSector ETFs are constructed to maintain a closer alignment to the complete market-cap structure of each sector, while still adhering to applicable regulatory requirements. The investment team applies a rules-based quantitative approach to build portfolios that reflect their outlook on the sector&rsquo;s makeup and performance drivers.</p>
<h2 id="point-three" class="anchored-block">Why are sector weightings so distorted in other ETFs?</h2>
<p>Typically, regulatory requirements mandate that an ETF&rsquo;s allocation to a single company can be no more than 25% or more than 50% total to companies that individually exceed 5%. In concentrated sectors like Information Technology, this leads to forced reductions in industry leaders, which can collectively make up over 40% of the sector.</p>
<p>This misalignment can result in performance deviations compared to uncapped benchmarks and can dilute the actual sector exposure investors are seeking.</p>
<h2 id="point-four" class="anchored-block">How do TruSector ETFs provide full sector exposure while adhering to regulatory rules?</h2>
<p>The investment team uses a hybrid portfolio construction process that blends individual equities<sup>1</sup>&nbsp;with ETF exposures. This structure is intended to provide more complete sector representation, reduce tracking error to uncapped sector benchmarks, and limit unintended biases that may arise in traditional sector ETFs.</p>
<h2 id="point-five" class="anchored-block">What investment needs are TruSector ETFs designed to address?</h2>
<p>As sectors become more concentrated, particularly in areas like technology, traditional ETF structures may increasingly diverge from actual market realities due to regulatory caps. TruSector ETFs are designed to offer a more comprehensive and adaptable approach to sector investing, while maintaining the operational simplicity and liquidity that ETF investors expect.</p>
<h2 id="point-six" class="anchored-block">Who are these funds designed for?</h2>
<p>TruSector ETFs are ideal for:</p>
<ul class="content-list">
<li class="mt-2">Asset allocators seeking benchmark-aligned sector exposure</li>
<li class="mt-2">Model portfolio builders looking to reduce performance drift and improve attribution</li>
<li class="mt-2">Investors wanting true sector exposure without hidden biases or overly forced diversification</li>
</ul>
<h2 id="point-seven" class="anchored-block">How do RIC diversification rules impact traditional S&amp;P 500 ETFs?</h2>
<p>Most index ETFs, including those tracking the S&amp;P 500, are structured as <i>Regulated Investment Companies</i> (RICs), which must comply with diversification requirements set by the IRS. These rules limit the weight any single company can represent within a fund. While this ensures diversification from a tax perspective, it also prevents ETFs from reflecting true market-cap weightings. As a result, investors in traditional S&amp;P 500 or sector ETFs may not realize that their exposure to the largest market leaders is often reduced due to regulatory capping.</p>
<h2 id="point-eight" class="anchored-block">Are TruSector ETFs more expensive than traditional sector ETFs?</h2>
<p>TruSector ETFs are designed to remain cost-competitive with traditional sector funds. The objective is not to increase costs but to improve accuracy, giving investors a more authentic view of sector performance through true market-cap representation, all while maintaining low, transparent fees.</p>
<h2 id="point-nine" class="anchored-block">Which sectors are most affected by capped weighting rules?</h2>
<p>Capped methodologies tend to distort sectors dominated by a few large companies. Technology, communication services, and energy are prime examples, areas where the largest firms drive a significant share of the sector&rsquo;s market capitalization and earnings power. Capping these companies can dilute exposure and lead to performance differences relative to the true, uncapped market.</p>
<h2 id="point-ten" class="anchored-block">Why introduce new sector ETFs when the market already has so many options?</h2>
<p>While sector ETFs are well established, most of them rely on capped index methodologies that deviate from actual market-cap representation. TruSectors was developed to offer a more precise alternative, one that tracks each sector as it truly exists in the marketplace. This approach allows investors to align more closely with the real composition and performance of each sector rather than a modified version of it.</p>
<h2 id="point-eleven" class="anchored-block">How does TruSectors determine which ETFs to hold within each sector?</h2>
<p>Each TruSector ETF is constructed to mirror its sector&rsquo;s true market-cap structure as accurately as possible. When multiple ETFs represent the same sector, the methodology prioritizes those that offer the most representative exposure, typically defined by liquidity, depth of holdings, and alignment with the sector&rsquo;s overall market capitalization profile.</p>
<h2>How Can Investors Buy VanEck&rsquo;s TruSector ETFs?</h2>
<p>VanEcks ETFs can be purchased the same way you would by a stock, through a broker or with your advisor.</p>

<p class="d-none d-lg-block"><a href="mailto:askvaneck@vaneck.com" title="Have More Questions? - Ask VanEck" rel="noopener"><img loading="lazy" class="img-responsive" src="https://www.vaneck.com/globalassets/home/us/insights/blogs/bm-blog-images/cta-faq_desktop-02.svg" alt="Have More Questions? - Ask VanEck" /></a></p>
<p class="d-lg-none"><a href="mailto:askvaneck@vaneck.com" title="Have More Questions? - Ask VanEck" rel="noopener"><img loading="lazy" class="img-responsive" src="https://www.vaneck.com/globalassets/home/us/insights/blogs/bm-blog-images/cta-faq_mobile-01.svg" alt="Have More Questions? - Ask VanEck" /></a></p>
<p>To receive more <a href="https://www.vaneck.com/us/en/insights/thematic-investing/" title="Thematic Investing Insights"><strong>Thematic Investing</strong></a> insights, <a href="https://www.vaneck.com/us/en/subscribe/" title="Subscription Center"><strong>sign up in our subscription center</strong></a>.</p>
]]></content:encoded>
</item><item rdf:about="https://www.vaneck.com/us/en/blogs/emerging-markets-equity/vefa-etf-question-and-answer/">
  <title>VEFA ETF: Question &amp; Answer></title>
  <link>https://www.vaneck.com/us/en/blogs/emerging-markets-equity/vefa-etf-question-and-answer/</link>
  <description><![CDATA[This blog answers frequently asked questions about analyst sentiment investing and the VEFA ETF, including how the strategy is constructed and how it may fit in a portfolio.]]></description>
  <dc:creator>John Patrick Lee, CFA</dc:creator>
  <dc:date>04/01/2026 06:30:00</dc:date>
<content:encoded><![CDATA[

<p>Most investors access international developed market equities through passive index funds that make no distinctions between companies, or through active managers whose process can be difficult to evaluate. The <a href="/link/78d1ed9695af4d7b92d802ea158e1789.aspx" title="VEFA - VanEck MSCI EAFE Analyst Sentiment ETF - Overview"><strong>VanEck MSCI EAFE Analyst Sentiment ETF (VEFA)</strong></a> offers a third option: a rules-based ETF that systematically tilts toward stocks where professional analysts are most actively raising their expectations, while keeping risk anchored to the MSCI EAFE benchmark. This blog is intended to answer frequently asked questions about analyst sentiment as an investment signal and, more specifically, the <a href="/link/78d1ed9695af4d7b92d802ea158e1789.aspx" title="VEFA - VanEck MSCI EAFE Analyst Sentiment ETF - Overview"><strong>VanEck MSCI EAFE Analyst Sentiment ETF (VEFA)</strong></a>.</p>
<ul class="content list">
<li class="mt-2"><a href="#point-one"><strong>What is the VanEck MSCI EAFE Analyst Sentiment ETF (VEFA)?</strong></a></li>
<li class="mt-2"><a href="#point-two"><strong>What is Analyst Sentiment?</strong></a></li>
<li class="mt-2"><a href="#point-three"><strong>Why Does Analyst Sentiment Work as an Investment Signal?</strong></a></li>
<li class="mt-2"><a href="#point-four"><strong>How Does the MSCI EAFE Analyst Sentiment Index work?</strong></a></li>
<li class="mt-2"><a href="#point-five"><strong>How is the Index Constructed Step by Step?</strong></a></li>
<li class="mt-2"><a href="#point-six"><strong>Why is Tracking Error Important in VEFA?</strong></a></li>
<li class="mt-2"><a href="#point-seven"><strong>Why Invest in International Developed Markets Now?</strong></a></li>
<li class="mt-2"><a href="#point-eight"><strong>Are Sell-Side Analysts Biased and Does It Matter?</strong></a></li>
<li class="mt-2"><a href="#point-nine"><strong>How Does VEFA Fit in a portfolio?</strong></a></li>
<li class="mt-2"><a href="#point-ten"><strong>How to Buy VanEck ETFs?</strong></a></li>
</ul>
<h2 id="point-one" class="anchored-block">What is the VanEck MSCI EAFE Analyst Sentiment ETF (VEFA)?</h2>
<p><a href="/link/78d1ed9695af4d7b92d802ea158e1789.aspx" title="VEFA - VanEck MSCI EAFE Analyst Sentiment ETF - Overview"><strong>VEFA</strong></a> is a passively managed ETF that tracks the MSCI EAFE Analyst Sentiment Select Index. The fund provides exposure to large- and mid-cap companies across 21 developed markets outside the U.S. and Canada, with a systematic tilt toward stocks where sell-side analysts are becoming more optimistic. It is designed to serve as an enhanced core international equity allocation, not a concentrated tactical bet.</p>
<h2 id="point-two" class="anchored-block">What is Analyst Sentiment?</h2>
<p>Analyst sentiment captures how the views of professional sell-side analysts are changing over time. When analysts raise their earnings estimates, lift their price targets, or upgrade their ratings on a stock, that reflects a shift in their view of the company's forward outlook. The opposite is also true: falling estimates and downgrades signal deteriorating expectations.</p>
<p><a href="/link/78d1ed9695af4d7b92d802ea158e1789.aspx" title="VEFA - VanEck MSCI EAFE Analyst Sentiment ETF - Overview"><strong>VEFA</strong></a>'s underlying index tracks these shifts systematically. Rather than relying on a single data point, the signal equally weights five distinct analyst revision types:</p>
<ul class="content list">
<li class="mt-2"><strong>Earnings per share revisions:</strong> Changes in analyst EPS forecasts, the most widely followed measure of a company's profitability outlook.</li>
<li class="mt-2"><strong>Sales forecast:</strong> Shifts in revenue expectations, which capture top-line momentum before it flows through to earnings.</li>
<li class="mt-2"><strong>Cash flow per share:</strong> Changes in cash flow estimates, reflecting how analysts view a company's ability to generate real cash.</li>
<li class="mt-2"><strong>Price target adjustments:</strong> Moves in the price analysts believe the stock should trade at, representing their overall valuation view.</li>
<li class="mt-2"><strong>Buy/sell recommendation changes:</strong> Upgrades or downgrades in analyst ratings, the most direct expression of whether an analyst thinks the stock is worth owning.</li>
</ul>
<p>By aggregating across all five equally weighted inputs, the signal captures a more complete picture of how professional opinion is shifting. Stocks showing broad improvement across multiple inputs receive the strongest positive signal, identifying companies where the analyst community is broadly becoming more optimistic, not just selectively.</p>
<h2 id="point-three" class="anchored-block">Why Does Analyst Sentiment Work as an Investment Signal?</h2>
<p>There is a clear, well-documented relationship between analyst sentiment and future stock returns. Stocks in the highest decile of analyst sentiment have consistently outperformed those in the lowest decile, with a near-monotonic return gradient from bottom to top across the MSCI EAFE universe.</p>
<h3>Analyst Sentiment Exposure-Return Relationship</h3>
<p><img loading="lazy" class="desktop-image img-responsive" alt="Analyst Sentiment Exposure-Return Relationship" src="https://www.vaneck.com/contentassets/61a7cf2c4bac4a04a1ee0a85dba54366/7056_vefa-launch-blog_chart-1_2026-04_v2_desktop.svg" /></p>
<p><img loading="lazy" class="mobile-image img-responsive" alt="Analyst Sentiment Exposure-Return Relationship" src="https://www.vaneck.com/EPiServer/CMS/Content/contentassets/61a7cf2c4bac4a04a1ee0a85dba54366/7056_vefa-launch-blog_chart-1_2026-04_v2_mobile.svg,,370055/Download?epieditmode=False" /></p>
<p class="chart-disclosure">Source: MSCI. Returns based on MSCI ACWI IMI Index from June 29, 2007, to March 31, 2026. Past performance is no guarantee of future results. Index performance is not representative of fund performance. It is not possible to invest directly in an index.</p>
<p>What makes analyst sentiment distinct from other factors comes down to four properties:</p>
<ul class="content list">
<li class="mt-2"><strong>Forward looking.</strong> It captures changes in earnings expectations rather than relying on backward-looking data like most traditional factors.</li>
<li class="mt-2"><strong>Fundamentally driven.</strong> It reflects actual shifts in business outlooks, unlike price-based signals that tend to revert.</li>
<li class="mt-2"><strong>Resilient across cycles.</strong> Improving fundamentals have driven returns through rising rate periods, growth slowdowns, and periods of elevated volatility.</li>
<li class="mt-2"><strong>Systematic.</strong> It is applied through a rules-based process that removes discretionary judgment from stock selection.</li>
</ul>
<h2 id="point-four" class="anchored-block">How Does the MSCI EAFE Analyst Sentiment Index work?</h2>
<p>The MSCI EAFE Analyst Sentiment Select Index starts with the full MSCI EAFE universe of roughly 800 large- and mid-cap developed market stocks across 21 countries. Each stock is scored on the sentiment signal every quarter. The index then uses an optimization process to build a portfolio that maximizes exposure to high-sentiment stocks while staying within strict risk constraints.</p>
<p>Those constraints are a core design feature. Sector and country weights are anchored to the benchmark, individual security positions are capped and the index targets an ex-ante tracking error of 4% or less versus the MSCI EAFE Index. The portfolio is rebalanced quarterly in line with MSCI's standard review calendar, with sentiment scores refreshed at each rebalance.</p>
<h2 id="point-five" class="anchored-block">How is the Index Constructed Step by Step?</h2>
<p>The MSCI EAFE Analyst Sentiment Select Index follows a disciplined, repeatable process to translate analyst revisions into a systematic portfolio. It moves through five stages:</p>
<ol class="content list">
<li class="mt-2"><strong>MSCI EAFE Universe:</strong> The starting point is the full MSCI EAFE Index, covering large- and mid-cap developed market stocks across 21 countries (excluding the U.S. and Canada), roughly 800 constituents.</li>
<li class="mt-2"><strong>Sentiment Ranking:</strong> Each stock is scored on the analyst sentiment signal. Higher-ranked stocks, those where analysts are most actively raising expectations, receive greater emphasis. Scores are updated every quarter.</li>
<li class="mt-2"><strong>Optimization:</strong> Portfolio weights are determined through a formal optimization process designed to maximize the overall tilt toward high-sentiment stocks while keeping the portfolio investable and diversified.</li>
<li class="mt-2"><strong>Risk Constraints:</strong> Tracking error is targeted ex-ante at 4% or less versus the MSCI EAFE Index. Sector and country weights are anchored to the benchmark, and individual security positions are capped to limit concentration.</li>
<li class="mt-2"><strong>Quarterly Rebalance:</strong> The portfolio is rebalanced in line with MSCI's standard index review calendar. Sentiment scores are refreshed and portfolio adjustments are made as conditions change.</li>
</ol>
<p>The result is a portfolio of approximately 100 securities that systematically overweights stocks with improving analyst sentiment while staying close to the benchmark in terms of overall risk profile.</p>
<h2 id="point-six" class="anchored-block">Why is Tracking Error Important in VEFA?</h2>
<p>High-tracking-error factor portfolios can look very different from their benchmark, which creates uncertainty about what is driving returns and increases the risk of disappointing results versus expectations. That makes them harder to hold through periods of underperformance and harder to use as a core allocation.</p>
<p><a href="/link/78d1ed9695af4d7b92d802ea158e1789.aspx" title="VEFA - VanEck MSCI EAFE Analyst Sentiment ETF - Overview"><strong>VEFA</strong></a>'s underlying index is designed to keep tracking error constrained, so the fund behaves like an enhanced version of an EAFE core holding rather than a standalone factor bet. Portfolio weights stay aligned with benchmark sectors and factors, with relative limits on individual positions, country weights and sector weights to control active risk. The goal is to add value from the sentiment signal without introducing the kind of drift that can undermine investor confidence.</p>
<h2 id="point-seven" class="anchored-block">Why Invest in International Developed Markets Now?</h2>
<p>There are two reasons to pay attention to international developed equities right now.</p>
<p>First, diversification. U.S. equities have become increasingly concentrated in a small number of large technology companies. International developed markets offer a broader, more balanced sector mix and significantly less single-stock concentration, which can help reduce overall portfolio risk.</p>
<p>Second, the trend is starting to shift. After more than a decade of U.S. dominance, international stocks are beginning to gain ground. The performance gap between U.S. and ex-U.S. developed markets peaked in late 2024 and has started to narrow, and there are growing tailwinds for international equities heading into 2026. For investors who have been underweight international stocks, this may be a favorable time to revisit that allocation.</p>
<h3>MSCI EAFE Index versus S&amp;P 500 Index</h3>
<p><img loading="lazy" class="desktop-image img-responsive" alt="MSCI EAFE Index versus S&amp;P 500 Index" src="https://www.vaneck.com/contentassets/1191bbf169574cbeb50f1ca3a4122cb1/7056_vefa-launch-blog_chart-2_2026-04_v2_desktop.svg" /></p>
<p><img loading="lazy" class="mobile-image img-responsive" alt="MSCI EAFE Index versus S&amp;P 500 Index" src="https://www.vaneck.com/contentassets/1191bbf169574cbeb50f1ca3a4122cb1/7056_vefa-launch-blog_chart-2_2026-04_v2_mobile.svg" /></p>
<p class="chart-disclosure">Source: Morningstar as of 03/31/2026. Past performance is no guarantee of future results. Index performance is not representative of fund performance. It is not possible to invest directly in an index.</p>

<h2 id="point-eight" class="anchored-block">Are Sell-Side Analysts Biased and Does It Matter?</h2>
<p>The question of whether sell-side analysts are structurally biased is a fair one, but it targets the wrong metric. <a href="/link/78d1ed9695af4d7b92d802ea158e1789.aspx" title="VEFA - VanEck MSCI EAFE Analyst Sentiment ETF - Overview"><strong>VEFA</strong></a> does not rely on analyst ratings or absolute opinion. It tracks the direction of revisions, which means the question of whether analysts skew optimistic is not the relevant one. The relevant question is whether their views are improving or deteriorating, and on that dimension the signal has been consistent.</p>
<p>A stock being upgraded by its analyst coverage tells you something different than one sitting at a longstanding consensus buy with no recent activity. <a href="/link/78d1ed9695af4d7b92d802ea158e1789.aspx" title="VEFA - VanEck MSCI EAFE Analyst Sentiment ETF - Overview"><strong>VEFA</strong></a> captures that directional shift across five metrics simultaneously: earnings estimates, price targets, sales forecasts, cash flow projections and ratings changes. Whether any individual analyst is optimistic or pessimistic in absolute terms is not the variable that drives the strategy.</p>
<p>It is also worth noting that analyst estimates are public, timestamped and tracked against outcomes by independent data providers. Analysts who miss consistently tend to lose institutional votes and coverage mandates over time. That creates a degree of accountability that reinforces the integrity of the underlying signal, even if it does not guarantee accuracy in any individual case.</p>
<h2 id="point-nine" class="anchored-block">How Does VEFA Fit in a portfolio?</h2>
<p><a href="/link/78d1ed9695af4d7b92d802ea158e1789.aspx" title="VEFA - VanEck MSCI EAFE Analyst Sentiment ETF - Overview"><strong>VEFA</strong></a> is designed to serve as a core international developed market equity allocation. Because the index is built with risk constraints that keep sector, country and factor exposures close to the MSCI EAFE benchmark, it can replace or complement a standard EAFE allocation with the added benefit of a systematic sentiment tilt.</p>
<p>For investors who currently hold passive EAFE exposure and are looking for a way to potentially enhance returns without significantly changing their risk profile, <a href="/link/78d1ed9695af4d7b92d802ea158e1789.aspx" title="VEFA - VanEck MSCI EAFE Analyst Sentiment ETF - Overview"><strong>VEFA</strong></a> offers a straightforward path. It can also serve as a complement alongside active international managers, providing a transparent, rules-based layer of factor exposure.</p>
<h2 id="point-ten" class="anchored-block">How to buy VanEck ETFs?</h2>
<p><a href="/link/78d1ed9695af4d7b92d802ea158e1789.aspx#how-to-buy-etf&amp;utm=VEFA-Blog" title="VEFA - VanEck MSCI EAFE Analyst Sentiment ETF - Overview" target="_top"><strong>Learn more here.</strong></a><a href="mailto:askvaneck@vaneck.com" title="Have More Questions? - Ask VanEck" rel="noopener"></a></p>

<p>To receive more <a href="/us/en/insights/emerging-markets-equity/" title="Emerging Markets Equity Insights"><strong>Emerging Markets Equity</strong></a> insights, <a href="/us/en/subscribe/" title="Subscription Center"><strong>sign up in our subscription center</strong></a>.</p>
]]></content:encoded>
</item><item rdf:about="https://www.vaneck.com/us/en/blogs/emerging-markets-equity/introducing-vefa-analyst-sentiment-meets-eafe/">
  <title>Introducing VEFA: Analyst Sentiment Meets EAFE></title>
  <link>https://www.vaneck.com/us/en/blogs/emerging-markets-equity/introducing-vefa-analyst-sentiment-meets-eafe/</link>
  <description><![CDATA[A new approach to international investing, <a href="/link/78d1ed9695af4d7b92d802ea158e1789.aspx" title="VEFA - VanEck MSCI EAFE Analyst Sentiment ETF"><strong>VEFA</strong></a> uses analyst sentiment to target companies with improving outlooks, offering a rules-based, risk-aware alternative to passive and active EAFE strategies.]]></description>
  <dc:creator>John Patrick Lee, CFA</dc:creator>
  <dc:date>04/01/2026 06:30:00</dc:date>
<content:encoded><![CDATA[

<p><strong>Key Takeaways:</strong></p>
<ul class="content-list">
<li class="mt-2">Analyst sentiment&mdash;measured through revisions to earnings, price targets, and ratings&mdash;has historically shown a persistent return premium across developed markets.</li>
<li class="mt-2">The <a href="/link/78d1ed9695af4d7b92d802ea158e1789.aspx" title="VEFA - VanEck MSCI EAFE Analyst Sentiment ETF"><strong>VanEck MSCI EAFE Analyst Sentiment ETF (VEFA)</strong></a> systematically captures this signal while targeting low ex-ante tracking error (&le;4%) to the MSCI EAFE Index.</li>
<li class="mt-2">The fund is designed as an enhanced core international allocation, offering diversification beyond U.S. equities with a forward-looking factor tilt.</li>
</ul>
<p>Most investors access international developed market equities through passive index funds that make no distinctions between companies, or through active managers whose process can be difficult to evaluate. The <a href="/link/78d1ed9695af4d7b92d802ea158e1789.aspx" title="VEFA - VanEck MSCI EAFE Analyst Sentiment ETF"><strong>VanEck MSCI EAFE Analyst Sentiment ETF (VEFA)</strong></a> is a third option: a rules-based ETF that systematically tilts toward stocks where professional analysts are most actively raising their expectations, while keeping risk anchored to the MSCI EAFE benchmark.</p>
<h2>The Analyst Sentiment Return Premium</h2>
<p>When professional sell-side analysts revise their views by raising earnings estimates, lifting price targets, or upgrading ratings, stocks with the most positive revision momentum have historically generated meaningfully stronger returns than those at the bottom of the sentiment spectrum. This relationship between analyst sentiment and subsequent performance is consistent across developed markets and has persisted through varied market environments.</p>
<p>The chart below illustrates the excess return spread across analyst sentiment deciles within the MSCI global universe as represented by the MSCI ACWI IMI Index. Stocks in the highest decile of analyst sentiment have consistently outperformed the index and those in the lowest decile. This is the signal that the MSCI EAFE Analyst Sentiment Select Index is built to capture.</p>
<h3>Analyst Sentiment Exposure&ndash;Return Relationship</h3>
<p><img loading="lazy" class="desktop-image img-responsive" src="https://www.vaneck.com/EPiServer/CMS/Content/contentassets/a6a88a8ac4dc44bda1cd625c384b67f6/7056_vefa-launch-blog_chart-1_2026-04_v1_desktop.svg,,370017/Download?epieditmode=False" alt="Analyst Sentiment Exposure&ndash;Return Relationship" /></p>
<p><img loading="lazy" class="mobile-image img-responsive" src="https://www.vaneck.com/EPiServer/CMS/Content/contentassets/a6a88a8ac4dc44bda1cd625c384b67f6/7056_vefa-launch-blog_chart-1_2026-04_v1_mobile.svg,,370018/Download?epieditmode=False" alt="Analyst Sentiment Exposure&ndash;Return Relationship" /></p>
<p class="chart-disclosure">Source: MSCI. Returns based on MSCI ACWI IMI Index from June 29, 2007, to March 31, 2026. Past performance is no guarantee of future results. Index performance is not representative of fund performance. It is not possible to invest directly in an index.</p>
<h2>Why Analyst Sentiment Stands Out as a Compelling Factor</h2>
<p>Not all factors are created equal. Analyst sentiment has a set of characteristics that distinguish it from more widely implemented smart beta approaches and that help explain why the return premium has proven durable. Below are the four properties that make it a systematic way to capture and leverage the evolving opinions of sell-side analysts.</p>
<ul class="content-list">
<li class="mt-2"><strong>Forward looking:</strong> Identifies companies with improving forward fundamentals by capturing changes in earnings expectations and valuation outlooks. This is in stark contrast to most traditional factors like growth, value and momentum, which use backward-looking data to determine the factor score.</li>
<li class="mt-2"><strong>Distinct:</strong> Changes in expectations have historically been associated with persistent excess returns, reflecting improving business outlooks. This persistence distinguishes analyst sentiment from price-based signals, which tend to revert, and from static fundamental screens, which lag actual business inflection points.</li>
<li class="mt-2"><strong>Resilient over multiple time frames:</strong> Improving fundamentals have driven returns across market cycles and macro environments. Unlike cyclical factors that outperform only in specific regimes, analyst sentiment has shown consistent efficacy across rising rate periods, growth slowdowns and periods of elevated volatility.</li>
<li class="mt-2"><strong>Systematic:</strong> Rules-based index designed to systematically capture companies with improving prospects, while remaining investable and scalable. The process removes discretionary judgment from stock selection, ensuring consistent application of the sentiment signal across every quarterly rebalance.</li>
</ul>
<h2>What is Analyst Sentiment?</h2>
<p>Analyst sentiment captures how the views of professional sell-side analysts are changing over time. When analysts raise their earnings estimates, lift their price targets, or upgrade their ratings on a stock, that reflects a shift in their view of the company&rsquo;s forward outlook. The opposite is also true: falling estimates and downgrades signal deteriorating expectations.</p>
<p><a href="/link/78d1ed9695af4d7b92d802ea158e1789.aspx" title="VEFA - VanEck MSCI EAFE Analyst Sentiment ETF"><strong>VEFA</strong></a>&rsquo;s underlying index tracks these shifts systematically. Rather than relying on a single data point, the signal equally weights five distinct analyst revision types.</p>
<p><img loading="lazy" class="desktop-image img-responsive" src="https://www.vaneck.com/EPiServer/CMS/Content/contentassets/f343f4e3aebf4c3386715cb483d7cdde/7056_vefa-launch-blog_infog-1_2026-04_v1_desktop.svg,,370037/Download?epieditmode=False" alt="What is Analyst Sentiment?" /></p>
<p><img loading="lazy" class="mobile-image img-responsive" src="https://www.vaneck.com/EPiServer/CMS/Content/contentassets/f343f4e3aebf4c3386715cb483d7cdde/7056_vefa-launch-blog_infog-1_2026-04_v1_mobile.svg,,370038/Download?epieditmode=False" alt="What is Analyst Sentiment?" /></p>
<p>By aggregating across all five equally weighted inputs, the signal captures a more complete picture of how professional opinion is shifting. Stocks showing broad improvement across multiple inputs receive the strongest positive signal, identifying companies where the analyst community is broadly becoming more optimistic, not just selectively.</p>
<h2>Separating Analyst Bias from Analyst Signal</h2>
<h3>The Bias Critique Targets the Wrong Metric</h3>
<p>The question of whether sell-side analysts are structurally biased is a fair one, but it targets the wrong metric. <a href="/link/78d1ed9695af4d7b92d802ea158e1789.aspx" title="VEFA - VanEck MSCI EAFE Analyst Sentiment ETF"><strong>VEFA</strong></a> does not rely on analyst ratings or absolute opinion. It tracks the direction of revisions, which means the question of whether analysts skew optimistic is not the relevant one. The relevant question is whether their views are improving or deteriorating, and on that dimension the signal has been consistent.</p>
<p>A stock being upgraded by its analyst coverage tells you something different than one sitting at a longstanding consensus buy with no recent activity. <a href="/link/78d1ed9695af4d7b92d802ea158e1789.aspx" title="VEFA - VanEck MSCI EAFE Analyst Sentiment ETF"><strong>VEFA</strong></a> captures that directional shift across five metrics simultaneously: earnings estimates, price targets, sales forecasts, cash flow projections and ratings changes. Whether any individual analyst is optimistic or pessimistic in absolute terms is not the variable that drives the strategy.</p>
<p>It is also worth noting that analyst estimates are public, timestamped and tracked against outcomes by independent data providers. Analysts who miss consistently tend to lose institutional votes and coverage mandates over time. That creates a degree of accountability that reinforces the integrity of the underlying signal, even if it does not guarantee accuracy in any individual case.</p>
<h2>A Rules-Based Approach to Capturing Analyst Sentiment</h2>
<p><a href="/link/78d1ed9695af4d7b92d802ea158e1789.aspx" title="VEFA - VanEck MSCI EAFE Analyst Sentiment ETF"><strong>VEFA</strong></a> tracks the MSCI EAFE Analyst Sentiment Select Index, which takes the analyst sentiment signal and builds a portfolio through an optimization process. The objective is to maximize exposure to high-sentiment stocks within strict risk constraints designed to keep the fund usable as a core international allocation.</p>
<p><img loading="lazy" class="desktop-image img-responsive" src="https://www.vaneck.com/EPiServer/CMS/Content/contentassets/f343f4e3aebf4c3386715cb483d7cdde/7056_vefa-launch-blog_infog-2_2026-04_v1_desktop.svg,,370040/Download?epieditmode=False" alt="A Rules-Based Approach to Capturing Analyst Sentiment" /></p>
<p><img loading="lazy" class="mobile-image img-responsive" src="https://www.vaneck.com/EPiServer/CMS/Content/contentassets/f343f4e3aebf4c3386715cb483d7cdde/7056_vefa-launch-blog_infog-2_2026-04_v1_mobile.svg,,370041/Download?epieditmode=False" alt="A Rules-Based Approach to Capturing Analyst Sentiment" /></p>
<p>The 4% tracking error ceiling is a core design feature. High-tracking-error factor portfolios can deviate significantly from investor expectations, making them difficult to hold through periods of underperformance and harder to integrate as a primary building block. <a href="/link/78d1ed9695af4d7b92d802ea158e1789.aspx" title="VEFA - VanEck MSCI EAFE Analyst Sentiment ETF"><strong>VEFA</strong></a> is constructed to behave like an enhanced EAFE core, not a concentrated tactical bet.</p>


<h2>Why EAFE, and Why Now</h2>
<p>There are two reasons to pay attention to international developed equities right now.</p>
<p>First, diversification. U.S. equities have become increasingly concentrated in a small number of large technology companies. International developed markets offer a broader, more balanced sector mix and significantly less single-stock concentration, which can help reduce overall portfolio risk.</p>
<p>Second, the trend is starting to shift. After more than a decade of U.S. dominance, international stocks are beginning to gain ground. The performance gap between U.S. and ex-U.S. developed markets peaked in late 2024 and has started to narrow, and there are growing tailwinds for international equities heading into 2026. For investors who have been underweight international stocks, this may be a favorable time to revisit that allocation.</p>
<h3>MSCI EAFE Index versus S&amp;P 500 Index</h3>
<p><img loading="lazy" class="desktop-image img-responsive" src="https://www.vaneck.com/EPiServer/CMS/Content/contentassets/4c4101bf9e8944deb84f23bd2860200c/7056_vefa-launch-blog_chart-2_2026-04_v2_desktop.svg,,370043/Download?epieditmode=False" alt="MSCI EAFE Index versus S&amp;P 500 Index" /></p>
<p><img loading="lazy" class="mobile-image img-responsive" src="https://www.vaneck.com/EPiServer/CMS/Content/contentassets/4c4101bf9e8944deb84f23bd2860200c/7056_vefa-launch-blog_chart-2_2026-04_v2_mobile.svg,,370044/Download?epieditmode=False" alt="MSCI EAFE Index versus S&amp;P 500 Index" /></p>
<p class="chart-disclosure">Source: Morningstar as of 03/31/2026. Past performance is no guarantee of future results. Index performance is not representative of fund performance. It is not possible to invest directly in an index.</p>
<h2>Investing in VEFA</h2>
<p>For investors looking to put that tailwind to work, <a href="/link/78d1ed9695af4d7b92d802ea158e1789.aspx" title="VEFA - VanEck MSCI EAFE Analyst Sentiment ETF"><strong>VEFA</strong></a> offers a direct way to access it. The VanEck MSCI EAFE Analyst Sentiment ETF tilts toward the stocks where professional analysts are most actively raising their expectations, while keeping risk anchored to the MSCI EAFE benchmark. The result is a fund built for investors who want international developed market exposure that goes beyond passive beta, without taking on the unpredictability of a high-conviction active manager. To learn more about <a href="/link/78d1ed9695af4d7b92d802ea158e1789.aspx" title="VEFA - VanEck MSCI EAFE Analyst Sentiment ETF"><strong>VEFA</strong></a> or to invest, visit vaneck.com.</p>

<p>To receive more <a href="/us/en/insights/emerging-markets-equity/" title="Emerging Markets Equity Insights"><strong>Emerging Markets Equity</strong></a> insights, <a href="/us/en/subscribe/" title="Subscription Center"><strong>sign up in our subscription center</strong></a>.</p>
]]></content:encoded>
</item><item rdf:about="https://www.vaneck.com/us/en/blogs/income-investing/what-drives-returns-in-floating-rate-notes/">
  <title>What Drives Returns in Floating Rate Notes?></title>
  <link>https://www.vaneck.com/us/en/blogs/income-investing/what-drives-returns-in-floating-rate-notes/</link>
  <description><![CDATA[Returns in floating rate notes are driven by two main components: short-term interest rates and credit spreads.]]></description>
  <dc:creator>Nicolas  Fonseca, CFA</dc:creator>
  <dc:date>03/31/2026 06:30:00</dc:date>
<content:encoded><![CDATA[

<p><strong>Key Takeaways</strong></p>
<ul class="content-list">
<li class="mt2">Income rather than price is the primary driver of FRN returns.</li>
<li class="mt2">As policy rates and SOFR move, FRN coupons adjust accordingly, allowing income to rise in higher-rate environments and decline when rates fall.</li>
<li class="mt2">Credit spreads influence yield and spread-related volatility.</li>
<li class="mt2">FRNs can help manage interest rate risk within a fixed income allocation.</li>
</ul>
<h2>What Drives Returns in Floating Rate Notes?</h2>
<p>Corporate floating rate notes (FRNs) are often used to help manage interest rate risk. Unlike fixed-rate bonds, FRNs are structured so that income adjusts with changes in short-term interest rates. As a result, their returns are driven primarily by income rather than price movements, making them potentially attractive when rates are rising or expected to remain elevated.</p>
<h2>What Are Floating Rate Notes (FRNs)?</h2>
<p>Corporate floating rate notes are bonds that pay a coupon linked to a short-term reference rate (usually SOFR), plus a fixed credit spread. The coupon resets periodically, allowing income to rise when short-term rates increase and decline when rates fall. Because coupons adjust regularly, FRN prices exhibit minimal sensitivity to changes in interest rates. Investors therefore avoid the duration-related price declines associated with traditional fixed-rate bonds, although they also do not benefit from falling rates through price appreciation.</p>
<h2>Key Drivers of FRN Returns</h2>
<p>Returns in corporate FRNs are driven by two main components: short-term interest rates and credit spreads.</p>
<div class="pl-4">
<h3>Short-Term Interest Rates and Coupon Income</h3>
<p>The primary source of FRN returns is coupons. As reference rates such as SOFR move in response to monetary policy, FRN coupons reset accordingly. When short-term rates rise, income increases; when rates fall, income declines. Given the low interest-rate duration of FRNs, price volatility from rate movements is minimal, leaving income as the dominant driver of performance.</p>
<h3>Credit Spreads and Spread Duration</h3>
<p>While interest rates drive the level of income, credit spreads determine how much additional yield investors earn for taking on issuer credit risk. Higher credit spreads generally result in higher income but also introduce sensitivity to changes in market credit conditions. This sensitivity, measured by spread duration, is distinct from interest-rate duration and reflects exposure to changes in credit conditions rather than policy rates. In general, a longer time to maturity is reflected in a higher spread duration.</p>
</div>
<h2>How Interest Rate Environments Affect FRNs</h2>
<div class="pl-4">
<h3>FRNs in Rising Rate Environments</h3>
<p>When short-term rates rise, corporate FRN coupons reset higher, increasing income. Because price sensitivity to rates is limited, rising yields do not create the same headwinds for FRNs as they do for fixed-rate bonds. Instead, higher income becomes the primary contributor to returns, as seen during recent &ldquo;higher for longer&rdquo; rate cycles.</p>
<h3>FRNs When Rates Fall</h3>
<p>The same dynamic works in reverse. During the period leading into the COVID-19 pandemic, rapid Federal Reserve rate cuts drove reference rates sharply lower, resulting in declining FRN coupons. While income fell, FRN prices remained relatively stable, reflecting their limited exposure to interest-rate-driven price volatility.</p>
</div>
<h2>Short-Term Rates as the Primary Driver of FRN Income</h2>
<p>Over time, corporate FRN returns reflect the combined effect of prevailing short-term rates and credit spreads. As policy rates and SOFR move, FRN coupons adjust accordingly, allowing investors to earn income that evolves with the rate environment while maintaining low interest-rate risk.</p>
<p><img loading="lazy" class="desktop-image img-responsive w-100" src="https://www.vaneck.com/contentassets/bd20c098bc7245a8bdb2dc2ba6bc06a7/6802_frn-returns-blog_chart-1_2026-02_v1_blog.svg" alt="Short-Term Rates as the Primary Driver of FRN Income" /></p>
<p><img loading="lazy" class="mobile-image img-responsive w-100" src="https://www.vaneck.com/contentassets/bd20c098bc7245a8bdb2dc2ba6bc06a7/6802_frn-returns-blog_chart-1_2026-02_v1_mobile.svg" alt="Short-Term Rates as the Primary Driver of FRN Income" /></p>
<p class="chart-disclosure">Source: New York Fed, ICE Data Services and VanEck. IG FRNs represented by MVIS US Investment Grade Floating Rate Index. Past performance is no guarantee of future results. Index performance is not representative of fund performance. It is not possible to invest directly in an index.</p>
<h2>Why Floating Rate Notes May Help Manage Interest Rate Risk</h2>
<p>Corporate FRNs offer a way to generate income while reducing sensitivity to rate changes. Although investors remain exposed to credit risk and spread volatility, FRNs allow returns to adjust with prevailing short-term rates rather than remaining locked into a fixed yield.</p>
<p>FRNs can serve as a low-duration income allocation for investors seeking yield with limited sensitivity to interest rate movements.</p>

<h2>How to invest in FRNs</h2>
<p><strong><a href="/link/0eff4e75a2114e0f8a7e71694dc0ad16.aspx" title="FLTR - VanEck IG Floating Rate ETF">VanEck IG Floating Rate ETF (FLTR)</a></strong> delivers access to investment grade corporate floating rate notes. <a href="/link/0eff4e75a2114e0f8a7e71694dc0ad16.aspx" title="FLTR - VanEck IG Floating Rate ETF"><strong>FLTR</strong></a>&rsquo;s underlying index has a bias towards longer-maturity notes, which tend to have greater yield while maintaining relatively low interest rate sensitivity.</p>
<p>To receive more <a href="/us/en/blogs/income-investing/" title="Income Investing Insights"><strong>Income Investing</strong></a> insights, <a href="/link/5f45412c2143400497908cea2897f7d3.aspx" title=" Subscription Center"><strong>sign up in our subscription center</strong></a>.</p>
]]></content:encoded>
</item><item rdf:about="https://www.vaneck.com/us/en/blogs/moat-investing/moat-index-leans-into-tech-opportunities/">
  <title>Moat Index Leans into Tech Opportunities></title>
  <link>https://www.vaneck.com/us/en/blogs/moat-investing/moat-index-leans-into-tech-opportunities/</link>
  <description><![CDATA[The Moat Index added NVIDIA, Broadcom and new names following its quarterly review, as tech dislocations created opportunity, while maintaining a value tilt and notable discount to fair value.]]></description>
  <dc:creator> </dc:creator>
  <dc:date>03/30/2026 06:30:00</dc:date>
<content:encoded><![CDATA[

<p><strong>Key Takeaways</strong></p>
<ul class="content-list">
<li class="mt-2">Moat Index is opportunistically accumulating tech names including NVIDIA and Broadcom.</li>
<li class="mt-2">Growth exposure broadly is also increasing to levels last seen following the beginning of the rate hiking cycle in 2022 and 2023.</li>
<li class="mt-2">Contrarian positioning remains with 27% discount to fair value, according to Morningstar&rsquo;s price to fair value ratio.</li>
<li class="mt-2">Value also remains a notable overweight relative to the S&amp;P 500 Index.</li>
</ul>
<p>The Morningstar<sup>&reg;</sup>&nbsp;Wide Moat Focus Index<sup>SM</sup>&nbsp;(the &ldquo;Moat Index&rdquo; or &ldquo;Index&rdquo;) underwent its quarterly review on March 20, 2026. The Index systematically targets attractively priced, high quality U.S. companies each quarter, as identified by Morningstar&rsquo;s equity research analysts. Below are a few highlights from the latest review. The full results are available here:</p>

<h2>Moat Index Review Highlights:</h2>
<ul class="content-list">
<li class="mt-2"><strong>Tech Dislocations Driving Opportunities in Certain Industries</strong>
<p>Continued AI uncertainty paired with the evolving fallout on certain sub-industries within tech are helping to drive opportunities within the sector. The Moat Index put NVIDIA at full weight this quarter and AI-darling, Broadcom, also appeared attractive. Other companies in the software space were added to the Index for the first time. Cyber security company, Palo Alto Networks, and data analysis firm, Datadog, were both added amidst pressure on share prices.</p>
</li>
</ul>
<ul class="content-list">
<li class="mt-2"><strong>First Timers Abound</strong>
<p>Among the 11 companies added to the Index&rsquo;s sub-portfolio under review in March were five newcomers: Blackstone, Broadcom, Datadog, Fair Isaac and Palo Alto Networks. These companies have maintained wide moat ratings for some time with exception of Blackstone and Datadog, who were upgraded in late 2025. Otherwise, most were trading at relatively attractive levels for the first time in many years.</p>
</li>
</ul>
<ul class="content-list">
<li class="mt-2"><strong>SaaSpocalypse Has Muted Impact on Index Review</strong>
<p>While software has been a modest overweight relative to the S&amp;P 500 Index, only three stocks were downgraded in Morningstar&rsquo;s March reassessment of software companies. Adobe, Salesforce and Workday all saw their moat rating downgraded to narrow and began their phase out from the Index this quarter.</p>
</li>
</ul>
<h3>1Q 2026 Moat Index Review Results</h3>
<p><strong>Moat Index Sector Shifts Following 1Q 2026 Review</strong></p>
<p><img loading="lazy" class="desktop-image img-responsive" alt="Moat Index Sector Shifts Following 1Q 2026 Review" src="https://www.vaneck.com/contentassets/2e6042ffc9eb427bb4cef3c472d0d721/7041_moat-index_chart-1_2026-03_v1_desktop.svg" /></p>
<p><img loading="lazy" class="mobile-image img-responsive" alt="Moat Index Sector Shifts Following 1Q 2026 Review" src="https://www.vaneck.com/contentassets/2e6042ffc9eb427bb4cef3c472d0d721/7041_moat-index_chart-1_2026-03_v1_mobile.svg" /></p>
<p><strong>Moat Index Sector Exposure Relative to S&amp;P 500 Index</strong></p>
<p><img loading="lazy" class="desktop-image img-responsive" alt="Moat Index Sector Exposure Relative to S&amp;P 500 Index" src="https://www.vaneck.com/contentassets/2e6042ffc9eb427bb4cef3c472d0d721/7041_moat-index_chart-2_2026-03_v1_desktop.svg" /></p>
<p><img loading="lazy" class="mobile-image img-responsive" alt="Moat Index Sector Exposure Relative to S&amp;P 500 Index" src="https://www.vaneck.com/contentassets/2e6042ffc9eb427bb4cef3c472d0d721/7041_moat-index_chart-2_2026-03_v1_mobile.svg" /></p>
<p><strong>Moat Index Style Exposure Relative to S&amp;P 500 Index: Value Bias Persists, But Growth Increased</strong></p>
<p><img loading="lazy" class="desktop-image img-responsive" alt="Moat Index Style Exposure Relative to S&amp;P 500 Index: Value Bias Persists, But Growth Increased" src="https://www.vaneck.com/contentassets/2e6042ffc9eb427bb4cef3c472d0d721/7041_moat-index_chart-3_2026-03_v1_desktop.svg" /></p>
<p><img loading="lazy" class="mobile-image img-responsive" alt="Moat Index Style Exposure Relative to S&amp;P 500 Index: Value Bias Persists, But Growth Increased" src="https://www.vaneck.com/contentassets/2e6042ffc9eb427bb4cef3c472d0d721/7041_moat-index_chart-3_2026-03_v1_mobile.svg" /></p>
<p class="chart-disclosure">Source: Morningstar. As of 3/20/2026 unless otherwise noted. Index performance is not illustrative of fund performance. It is not possible to invest directly in an index.</p>

<h2>Access Quality Companies at Attractive Valuations</h2>
<p><a href="/link/9e43dd198c5f4e419f13220685081895.aspx" title="MOAT - VanEck Morningstar Wide Moat ETF - Overview"><strong>VanEck Morningstar Wide Moat ETF (MOAT)</strong></a> and <strong><a href="/link/ca0b4e316f1c4e1985e2d0b7d293f0e4.aspx" title="MWMZX - VanEck Morningstar Wide Moat Fund - Class Z">VanEck Morningstar Wide Moat Fund</a></strong> seek to replicate as closely as possible, before fees and expenses the price and yield performance of the Morningstar Wide Moat Focus Index.</p>

<p>To receive more <a href="https://www.vaneck.com/us/en/insights/moat-investing" title="Moat Investing Insights"><strong>Moat Investing</strong></a> insights, <a href="https://www.vaneck.com/us/en/subscribe/" title="Subscription Center"><strong>sign up in our subscription center</strong></a>.</p>
]]></content:encoded>
</item><item rdf:about="https://www.vaneck.com/us/en/blogs/natural-resources/three-forces-powering-the-nuclear-energy-surge/">
  <title>Three Forces Powering the Nuclear Energy Surge></title>
  <link>https://www.vaneck.com/us/en/blogs/natural-resources/three-forces-powering-the-nuclear-energy-surge/</link>
  <description><![CDATA[Nuclear energy is emerging as a vital contributor to meeting the surge in global power demand.]]></description>
  <dc:creator>Brandon Rakszawski</dc:creator>
  <dc:date>03/24/2026 06:30:00</dc:date>
<content:encoded><![CDATA[


<p><strong>Key Takeaways: </strong></p>
<ul class="content-list">
<li class="mt-2">Rapid growth in AI, data centers, EVs, crypto, and climate-driven electricity use is increasing the need for reliable, large-scale power, putting nuclear back in focus.</li>
<li class="mt-2">Nuclear stands out for its low lifecycle emissions, 24/7 reliability, and compact footprint.</li>
<li class="mt-2">Governments worldwide are extending plant lifespans, funding, and enacting pro-nuclear legislation, strengthening the long-term investment case.</li>
</ul>
<p>Nuclear energy is back in the spotlight after years in the shadows, subject to debate over its long-term viability and whether its potential benefits (reliable, clean energy) outweigh its inherent risks (safety perceptions, security concerns, environmental impact). In recent years, it has become clear that nuclear energy will be an important contributor to meeting global power demand moving forward.</p>
<p>Three key forces are currently powering the investment case for the nuclear energy ecosystem:</p>
<p><strong>1. Increasing Electricity Demand: </strong>The International Energy Agency<sup>1</sup>&nbsp;projects that global demand for electricity will increase by 3.7% in 2026, led by emerging economies such as China and India and powered by several trends including:</p>
<ul class="content-list">
<li class="mt-2"><strong>Artificial Intelligence: </strong>Advances in artificial intelligence and other data-heavy technologies are rapidly increasing the need for data centers and their associated power consumption.</li>
<li class="mt-2"><strong>Electric Vehicles: </strong>Electric vehicle ownership is on the rise, along with a range of battery-powered machinery, all requiring electricity for charging.</li>
<li class="mt-2"><strong>Cryptocurrency: </strong>The continued adoption of digital assets is adding to the world&rsquo;s growing power demand.</li>
<li class="mt-2"><strong>Climate/Heatwaves: </strong>Intense heatwaves in many regions have contributed to this elevated electricity demand, straining local power grids.</li>
</ul>
<h3>Sustained, Elevated Power Demand Growth</h3>
<p><img loading="lazy" class="img-responsive" alt="Sustained, Elevated Power Demand Growth" src="https://www.vaneck.com/contentassets/52253c19162247fc98c24a026c513a01/6622_3-forces-powering-nuclear-energy-surge_chart-1_2026-1_v1_blog.svg" /></p>
<style>
#premium-content-model-269910 {
	display: none;
}
</style>
<p class="chart-disclosure">Source: EIA, Goldman Sachs Global Investment Research. For illustrative purposes only. Not intended as a forecast or prediction of future results. Published 10/13/2025.</p>
<p><strong>2.&ensp;Reliable, Clean Energy Source: </strong>Global efforts to reduce greenhouse gas emissions by building out renewable energy capacity have, by many accounts, fallen behind schedule. This has raised the profile of existing nuclear facilities and new construction as important components of the global energy transition.</p>
<p>Nuclear energy has notably lower emissions compared to some renewable energy sources and there are no limits on when nuclear facilities can generate power. Unlike wind and solar energy, which face the hurdles of calm winds and dark skies, nuclear energy can provide consistent and reliable power.</p>
<p>Additionally, nuclear energy requires a fraction of the land compared to solar and wind, making it a compact and efficient source of electricity. For example, the average 1,000-megawatt nuclear plant in the United States needs about 1.3 square miles of land, compared to 31 times more land for solar and 173 more land for wind.</p>
<h3>Nuclear Emits Less During Life Cycle Than Many Renewable Energies<sup>2</sup></h3>
<img loading="lazy" class="img-responsive w-100" alt="Nuclear Emits Less During Life Cycle Than Many Renewable Energies" src="https://www.vaneck.com/contentassets/15e9ea7e0d8b446680919799bc74c408/4849_nlr_chart-2_2024-9_v1_blog.svg" />
<p class="chart-disclosure">Source: World Nuclear Association, Intergovernmental Panel on Climate Change. For illustrative purposes only.</p>
<p><strong>3.&ensp;Increased Regulatory Support</strong><sup>3</sup>: An important tailwind for nuclear energy is the renewed support from many governments. Following the Fukushima nuclear accident in 2011, many countries deprioritized nuclear energy in favor of other sources. However, in recent years, many have reversed their stance or affirmed their commitment, recognizing the critical importance of nuclear energy in the power mix:</p>
<ul class="content-list">
<li class="mt-2"><strong>United States: </strong>The US has reversed course by choosing to extend the life of several nuclear power plants that were set to be decommissioned. Recently, the US Nuclear Regulatory Commission renewed the operating licenses at the North Anna Power Plant in Virginia, extending their operating lifetime by 20 years to nearly 2060. This trend is evident in many regions of the US.
<p class="mt-2 mb-0">Legislative milestones like the ADVANCE Act and the Inflation Reduction Act are providing critical support for nuclear technologies. The ADVANCE Act streamlines regulatory processes, fosters public-private partnerships, and accelerates innovation in small modular reactors (SMRs). Similarly, the Inflation Reduction Act bolsters nuclear energy&rsquo;s competitiveness by offering production tax credits, leveling the playing field with renewable sources like wind and solar.</p>
</li>
<li class="mt-2"><strong>Japan: </strong>Despite Fukushima being fresh in their collective memory, Japanese leaders have begun taking steps toward expanding nuclear capacity. In late August, Prime Minister Fumio Kishida announced plans to hold a ministerial meeting to discuss measures needed to restart existing reactors at a Tokyo Electric Power Company facility.</li>
<li class="mt-2"><strong>China: </strong>China has made significant, strategic investments in nuclear fusion. By some estimates, the Chinese government is spending around $1.5 billion annually on fusion research, nearly twice that of the US.</li>
<li class="mt-2"><strong>Switzerland: </strong>The Swiss Federal Council is set to reverse a 2017 voter-approved ban on the new construction of nuclear power plants.</li>
<li class="mt-2"><strong>India: </strong>India&rsquo;s Department of Atomic Energy currently plans to deploy 50 small modular reactors in the country. They hope to create versions that can easily be deployed in older, non-nuclear power plants.</li>
<li class="mt-2"><strong>Norway: </strong>Norway has entered into a memorandum of understanding with South Korea&rsquo;s DL Energy and DL E&amp;C to explore the construction of a nuclear power plant at one of the country&rsquo;s oil refineries.</li>
</ul>

<h2>Invest in in the Entire Nuclear Ecosystem</h2>
<p>The <a href="/link/49acb0d4174146e9a0269c9cb81c02bb.aspx" title="NLR - VanEck Uranium and Nuclear ETF - Overview"><strong>VanEck Uranium and Nuclear ETF</strong></a> offers investors comprehensive exposure to the nuclear energy ecosystem. In addition to uranium miners, the strategy&rsquo;s targets nuclear energy producers, companies involved in construction, engineering and maintenance of nuclear projects, and those companies providing equipment, technology and/or services to the nuclear power industry.</p>

<p>To receive more <a href="/us/en/insights/natural-resources/" title="Natural Resources Insights"><strong>Natural Resources</strong></a> insights, <a href="https://www.vaneck.com/us/en/subscribe/" title="Subscription Center"><strong>sign up in our subscription center</strong></a>.</p>
]]></content:encoded>
</item><item rdf:about="https://www.vaneck.com/us/en/blogs/emerging-markets-equity/digital-india-the-next-phase/">
  <title>Digital India: The Next Phase></title>
  <link>https://www.vaneck.com/us/en/blogs/emerging-markets-equity/digital-india-the-next-phase/</link>
  <description><![CDATA[India's digital economy is shifting from IT exports to domestic consumption. DGIN's index rebalances toward fintech, e-commerce, and telecom to capture that growth.]]></description>
  <dc:creator>Sunny  Bokhari</dc:creator>
  <dc:date>03/24/2026 06:30:00</dc:date>
<content:encoded><![CDATA[

<p><strong>Key Takeaways:</strong></p>
<ul class="content-list">
<li class="mt-2"><strong>India's digital story has changed.</strong> Growth is no longer driven by global IT exporters like Infosys and Wipro &mdash; it's being driven by domestic consumption, fintech, telecom, and e-commerce serving India's 958 million internet users.</li>
<li class="mt-2"><strong>The MVIS Digital India Index is being repositioned to match.</strong> A new 50% domestic revenue threshold shifts sector weights dramatically &mdash; IT falls from 44% to 7%, while Communication Services, Financials, and Consumer Discretionary rise collectively to 79%.</li>
<li class="mt-2"><strong>The investable universe is expanding fast.</strong> Major domestically focused listings in 2025 (Meesho, Groww) and anticipated 2026 IPOs (Jio Platforms, Flipkart, PhonePe) are bringing the depth of India's digital economy into public markets for the first time.</li>
</ul>
<p>The MVIS Digital India Index &mdash; the underlying benchmark for the VanEck Digital India ETF (DGIN) &mdash; is updating its methodology to better reflect where growth is occurring in India today, shifting exposure away from global IT exporters and toward domestic consumption, financial services, and connectivity. This piece outlines the structural case for India's domestic digital economy and explains what is driving the index change.</p>
<h2>From Export IT to Domestic Digital</h2>
<p>India's listed equity market has long been dominated by large IT services companies that generate the majority of their revenue from clients outside the country. For years, these exporters shaped India's representation in global equity indices. That weighting, however, no longer reflects the composition of India's evolving domestic economy.</p>
<p>Rising smartphone penetration and household income growth are accelerating domestic digital activity across payments, e-commerce, online financial services, and telecom infrastructure. India's GDP has expanded from roughly $2 trillion in 2015 to approximately $3.9 trillion in 2025<sup>1</sup>, with a growing share of economic activity flowing through domestic digital channels. The companies capturing that growth are increasingly different from those that have historically defined India's listed market.</p>
<h2>Structural Drivers</h2>
<p>Three structural factors underpin the expansion of India's domestic digital economy.</p>
<ul class="content-list">
<li class="mt-2"><strong>Connectivity:</strong> India has approximately 958 million active internet users. A nationwide 5G rollout has extended high-speed access to urban and semi-urban markets, while data costs remain among the lowest globally.<sup>2</sup>&nbsp;Together, this infrastructure enables digital businesses to reach consumers across income levels and geographies at low marginal cost.</li>
<li class="mt-2"><strong>Demographics:</strong> India's median age is 28, and its working-age population is large and expanding. Rising disposable incomes are translating into increased spending on digital services across finance, retail, entertainment, and consumer categories.</li>
<li class="mt-2"><strong>Financialization of savings:</strong> Indian households have historically concentrated savings in bank deposits, real estate, and gold. Digital brokerage platforms and fintech networks are changing that, reducing the cost and complexity of accessing capital markets. The number of individual equity investors has grown from roughly 30 million in 2019 to more than 120 million by 2025<sup>3</sup>&mdash; a fourfold increase in six years. The result is a broader, deeper domestic investor base &mdash; one that provides structural support for India's expanding corporate sector.</li>
</ul>
<h2>Recent and Upcoming Listings</h2>
<p>India's equity markets are beginning to reflect this structural shift. In 2025, four domestically focused digital companies &mdash; Meesho, Groww, Lenskart, and PhysicsWallah &mdash; listed on Indian exchanges, collectively representing more than $17 billion in estimated market capitalization at IPO. Among the companies expected to list in 2026, Reliance Jio Platforms and Flipkart represent two of the most anticipated listings in Indian market history. Collectively, this pipeline is expanding the investable universe of India's domestic digital economy and increasing the weight of domestically oriented businesses within listed equities.</p>
<h3>Listed in 2025</h3>
<div class="wrapped-div">
<table style="width: 60%;">
<tbody>
<tr class="tbl-data">
<td class="tbl-header last">Company</td>
<td class="tbl-header last text-left">Theme</td>
<td class="tbl-header last text-right">Est. Market Value at IPO</td>
</tr>
<tr class="tbl-data">
<td class="data-td data last text-left">Meesho</td>
<td class="data-td data last text-left">E-commerce</td>
<td class="data-td data last text-right">~$6B</td>
</tr>
<tr class="tbl-data">
<td class="data-td data last text-left">PhysicsWallah</td>
<td class="data-td data last text-left">EdTech</td>
<td class="data-td data last text-right">~$2-3B</td>
</tr>
<tr class="tbl-data">
<td class="data-td data last text-left">Lenskart</td>
<td class="data-td data last text-left">Direct-to-consumer retail</td>
<td class="data-td data last text-right">~$4B</td>
</tr>
<tr class="tbl-data">
<td class="data-td data last text-left">Groww</td>
<td class="data-td data last text-left">E-commerce</td>
<td class="data-td data last text-right">~$5B</td>
</tr>
</tbody>
</table>
</div>
<h3>Expected in 2026</h3>
<div class="wrapped-div">
<table style="width: 60%;">
<tbody>
<tr class="tbl-data">
<td class="tbl-header last">Company</td>
<td class="tbl-header last text-left">Theme</td>
<td class="tbl-header last text-right">Est. Market Value at IPO</td>
</tr>
<tr class="tbl-data">
<td class="data-td data last text-left">PhonePe</td>
<td class="data-td data last text-left">Digital payments</td>
<td class="data-td data last text-right">~$12-15B</td>
</tr>
<tr class="tbl-data">
<td class="data-td data last text-left">Zepto</td>
<td class="data-td data last text-left">E-commerce</td>
<td class="data-td data last text-right">~$50B+</td>
</tr>
<tr class="tbl-data">
<td class="data-td data last text-left">Reliance Jio Platforms</td>
<td class="data-td data last text-left">Telecom / digital ecosystem</td>
<td class="data-td data last text-right">~$100B+</td>
</tr>
<tr class="tbl-data">
<td class="data-td data last text-left">Flipkart</td>
<td class="data-td data last text-left">E-commerce</td>
<td class="data-td data last text-right">~$60-70B</td>
</tr>
<tr class="tbl-data">
<td class="data-td data last text-left">OYO</td>
<td class="data-td data last text-left">E-travel</td>
<td class="data-td data last text-right">~$800M</td>
</tr>
<tr class="tbl-data">
<td class="data-td data last text-left">SBI Mutual Fund</td>
<td class="data-td data last text-left">E-investments</td>
<td class="data-td data last text-right">~$1.2B</td>
</tr>
<tr class="tbl-data">
<td class="data-td data last text-left">Hero FinCorp</td>
<td class="data-td data last text-left">E-loans</td>
<td class="data-td data last text-right">~$1.8B</td>
</tr>
</tbody>
</table>
</div>
<p class="chart-disclosure">Source: Company disclosures, press reports. 2026 market values are estimates. 2025 values reflect approximate IPO-period valuations. Expected listings are subject to market conditions and may not occur. Not intended as recommendations or investment advice.</p>

<h2>Index Methodology Update</h2>
<p>The MVIS Digital India Index is implementing a rules-based methodology change designed to realign the index with the current shape of India's digital economy. Under the updated rules, companies must generate more than 50% of their revenues from domestic sources to be eligible for inclusion. In practice, this reduces weight in IT services and consulting companies &mdash; primarily large-cap exporters whose revenues are tied to global IT spending &mdash; while increasing exposure to communication services, financials, and consumer discretionary companies that serve India's domestic market.</p>
<p>Concretely, the update reduces weight in names such as Infosys and Wipro, and increases weight in telecom infrastructure, digital payments, and consumer platform companies. The result is an index more directly aligned with the structural growth drivers outlined above &mdash; connectivity, rising incomes, and the financialization of household savings.</p>
<h3>Sector Exposure: Before and After</h3>
<p><i>Information Technology declines from 44% to 7%. Communication Services, Financials, and Consumer Discretionary collectively increase from approximately 44% to 79%.</i></p>
<div class="wrapped-div">
<table style="width: 60%;">
<tbody>
<tr class="tbl-data">
<td class="tbl-header last">Sector</td>
<td class="tbl-header last text-right">Current (%)</td>
<td class="tbl-header last text-right">Old (%)</td>
</tr>
<tr class="tbl-data">
<td class="data-td data last text-left">Communication Services</td>
<td class="data-td data last text-right">30.6</td>
<td class="data-td data last text-right">17.6</td>
</tr>
<tr class="tbl-data">
<td class="data-td data last text-left">Financials</td>
<td class="data-td data last text-right">26.2</td>
<td class="data-td data last text-right">12.7</td>
</tr>
<tr class="tbl-data">
<td class="data-td data last text-left">Consumer Discretionary</td>
<td class="data-td data last text-right">22.5</td>
<td class="data-td data last text-right">13.9</td>
</tr>
<tr class="tbl-data">
<td class="data-td data last text-left">Energy</td>
<td class="data-td data last text-right">8.0</td>
</tr>
<tr class="tbl-data">
<td class="data-td data last text-left">Information Technology</td>
<td class="data-td data last text-right">7.0</td>
<td class="data-td data last text-right">44.0</td>
</tr>
<tr class="tbl-data">
<td class="data-td data last text-left">Industrials</td>
<td class="data-td data last text-right">5.6</td>
<td class="data-td data last text-right">3.3</td>
</tr>
<tr class="tbl-data">
<td class="data-td data last text-left">Health Care</td>
<td class="data-td data last text-right">0.0</td>
<td class="data-td data last text-right">0.5</td>
</tr>
</tbody>
</table>
</div>
<p class="chart-disclosure">Source: MarketVector Indices. Data as of 3/12/2026. Index composition is not directly representative of fund holdings. Not intended as recommendations or investment advice.</p>
<h3>Thematic Exposure: Before and After</h3>
<p><i>IT services and consulting declines from 40% to under 2%. E-commerce and telecommunications combined represent nearly 70% of the updated index.</i></p>
<div class="wrapped-div">
<table style="width: 60%;">
<tbody>
<tr class="tbl-data">
<td class="tbl-header last">Theme</td>
<td class="tbl-header last text-right">Current (%)</td>
<td class="tbl-header last text-right">Old (%)</td>
</tr>
<tr class="tbl-data">
<td class="data-td data last text-left">E-commerce (incl. online financial services)</td>
<td class="data-td data last text-right">36.3</td>
<td class="data-td data last text-right">21.1</td>
</tr>
<tr class="tbl-data">
<td class="data-td data last text-left">Telecommunications services and infrastructure</td>
<td class="data-td data last text-right">32.4</td>
<td class="data-td data last text-right">22.3</td>
</tr>
<tr class="tbl-data">
<td class="data-td data last text-left">Electronic payment processing</td>
<td class="data-td data last text-right">11.0</td>
<td class="data-td data last text-right">3.6</td>
</tr>
<tr class="tbl-data">
<td class="data-td data last text-left">Hardware and communications equipment</td>
<td class="data-td data last text-right">10.9</td>
<td class="data-td data last text-right">4.4</td>
</tr>
<tr class="tbl-data">
<td class="data-td data last text-left">Internet applications</td>
<td class="data-td data last text-right">7.6</td>
<td class="data-td data last text-right">4.0</td>
</tr>
<tr class="tbl-data">
<td class="data-td data last text-left">IT services and consulting</td>
<td class="data-td data last text-right">1.9</td>
<td class="data-td data last text-right">40.1</td>
</tr>
<tr class="tbl-data">
<td class="data-td data last text-left">Software</td>
<td class="data-td data last text-right">0.0</td>
<td class="data-td data last text-right">4.5</td>
</tr>
</tbody>
</table>
</div>
<p class="chart-disclosure">Source: MarketVector Indices. Data as of 3/12/2026. Index composition is not directly representative of fund holdings. Not intended as recommendations or investment advice.</p>
<h2>Positioning with DGIN</h2>
<p>India's domestic digital economy is underpinned by structural rather than cyclical forces: a young and expanding consumer base, growing digital infrastructure, a deepening capital market, and an accelerating pipeline of domestically focused companies entering public markets. We believe the index methodology update repositions <a href="/link/979eec17b7274fcb9dd954ab832450cc.aspx" title="DGIN - VanEck Digital India ETF - Overview"><strong>DGIN</strong></a> to capture that opportunity more directly.</p>
<p><a href="/link/979eec17b7274fcb9dd954ab832450cc.aspx" title="DGIN - VanEck Digital India ETF - Overview"><strong>DGIN</strong></a> offers a single-ticker vehicle for investors seeking exposure to India's domestic digital growth across connectivity, fintech, e-commerce, and consumer platforms.</p>

<p>To receive more <a href="/us/en/insights/emerging-markets-equity/" title="Emerging Markets Equity Insights"><strong>Emerging Markets Equity</strong></a> insights, <a href="/us/en/subscribe/" title="Subscription Center"><strong>sign up in our subscription center</strong></a>.</p>
]]></content:encoded>
</item><item rdf:about="https://www.vaneck.com/us/en/blogs/natural-resources/the-hormuz-domino-effect-from-energy-shock-to-food-crisis/">
  <title>The Hormuz Domino Effect: From Energy Shock to Food Crisis></title>
  <link>https://www.vaneck.com/us/en/blogs/natural-resources/the-hormuz-domino-effect-from-energy-shock-to-food-crisis/</link>
  <description><![CDATA[Discover why Strait of Hormuz disruptions extend beyond oil, how supply shocks are transmitting into agriculture markets, and what third-order commodity effects may mean for portfolios.]]></description>
  <dc:creator>Shawn Reynolds</dc:creator>
  <dc:date>03/24/2026 06:30:00</dc:date>
<content:encoded><![CDATA[

<p><strong>Key Takeaways:</strong></p>
<ul class="content-list">
<li class="mt-2">Strait of Hormuz disruptions extend well beyond oil, impacting global supply chains.</li>
<li class="mt-2">The most notable transmission is into agriculture, where constrained fertilizer supply is raising input costs and reshaping crop dynamics.</li>
<li class="mt-2">Third-order commodity effects may drive broader inflation and create uneven sector outcomes.</li>
</ul>
<p>The Strait of Hormuz carries roughly one-fifth of the world's seaborne oil and LNG trade. When traffic through this corridor falls &mdash; as it has sharply since early March 2026 &mdash; the effects don't stay contained to energy markets. They ripple outward in ways that many investors haven't fully priced.</p>
<h2>Webinar Replay: Hidden Impact of Strait of Hormuz Disruptions</h2>
<p>On March 20, we examined the cascade from tanker disruption to energy supply, fertilizer production, and global crop economics &mdash; and what it may mean for commodity markets and portfolios.</p>
<p><strong>Highlights from the conversation:</strong></p>
<ul class="content-list">
<li class="mt-2"><strong>The disruption is real and structural</strong> &mdash; What began as a short-term energy story has evolved into something longer-term. The scale and duration of this disruption look meaningfully different from recent history, and the repercussions may fundamentally reshape the global economy.</li>
<li class="mt-2"><strong>Alternative routes are ramping, but capacity is limited</strong> &mdash; Crude loadings at Yanbu on Saudi Arabia's Red Sea coast have risen sharply as flows reroute away from the strait. But existing infrastructure can only partially offset the disrupted Gulf export volumes, and a recent Iranian missile strike on Yanbu underscores how fragile even these workarounds remain.</li>
<li class="mt-2"><strong>LNG and natural gas prices are surging</strong> &mdash; European TTF gas prices have spiked to levels not seen since the Russia-Ukraine conflict, reflecting tightening global LNG supply. Disruptions to Qatari exports, including Qatar Energy's declaration of force majeure, are a key driver, with downstream consequences extending well into chemical and fertilizer supply chains.</li>
<li class="mt-2"><strong>Refining margins are spiking</strong> &mdash; European crack spreads have surged well above historical ranges, signaling acute product market tightness as crude flows and refining inputs are disrupted simultaneously.</li>
</ul>
<h2>The Agricultural Transmission: From LNG to the Farm</h2>
<p>The concentration of chemical and fertilizer production in the Persian Gulf reflects the region's abundant, low-cost natural gas, which serves as both an energy source and a raw material feedstock for producing nitrogen, ammonia, and downstream fertilizer products. When that gas supply is disrupted, the effects move directly into agriculture.</p>
<p>Qatar alone produces roughly 5.5 million tons of nitrogen urea per year through QAFCO &mdash; the world's largest single-site urea exporter &mdash; and that output is now effectively zero following force majeure. With no overland export alternative and storage buffers measured in weeks, the clock is ticking. Meanwhile, Iranian drone strikes on Qatar Energy's principal production hubs have halted LNG output and shut down downstream chemicals and methanol production. The conflict has removed close to 40% of global nitrogen trade from the market, with an estimated 1 million tons of fertilizer physically stranded in the strait.</p>
<p>U.S. Gulf fertilizer prices are already responding. Nitrogen prices have risen more than 50% from pre-war levels, approaching levels seen during the Russia-Ukraine conflict. Phosphate has also moved higher, though the more immediate pressure is a margin squeeze: rising sulfur and ammonia input costs &mdash; with sulfur prices exceeding $550 per ton, more than triple year-ago levels &mdash; are compressing producer margins even as output prices increase. Potash remains the least affected nutrient, with its major supply basins in Canada, Belarus, and Russia sitting outside the conflict zone.</p>
<h2>Second and Third-Order Effects: Crops, Food, and the Broader Economy</h2>
<p>The timing matters enormously. Most U.S. and European farmers likely secured their nitrogen needs for spring planting before the conflict escalated. But Brazil is a different story. The country sources over 40% of its nitrogen from the Persian Gulf and is currently planning its spring season. If the disruption extends into the second half of 2026, Brazilian farmers may pull back on corn, a nitrogen-intensive crop, with knock-on effects for ethanol, biofuels, and potentially sugar, as processors flex cane production toward fuel.</p>
<p>Indian nitrogen producers are already curtailing output as the loss of Qatari LNG forces plant shutdowns and pulled-forward maintenance. India is the world's largest single nitrogen importer and depends on LNG imports to run its own production facilities.</p>
<p>Beyond fertilizers, there are several additional areas to watch: aluminum and helium exports from the Gulf represent roughly 10% of global trade each; Indonesian nickel production faces sulfur shortages; and the broader inflationary impulse from higher energy and food costs points toward a stagflationary macro backdrop. Globalization as we knew it may be effectively over, with countries increasingly prioritizing supply chain resilience over efficiency. This represents a structural shift with lasting implications for energy, defense, manufacturing, and AI infrastructure costs.</p>
<h2>The Equity Opportunity: Where the U.S. Stands Out</h2>
<p>Not all markets are moving in lockstep through this cycle, and that divergence creates both risks and opportunities. U.S. nitrogen producers are structurally advantaged: their production costs are pegged to Henry Hub natural gas, which remains cheap relative to global benchmarks, while their revenues are priced off global nitrogen prices that have surged. That spread has widened dramatically since the conflict began. European producers face the opposite dynamic as rising output prices are offset by surging TTF-linked feedstock costs.</p>
<p>Energy equities more broadly are benefiting from the price windfall, though ramping U.S. production meaningfully takes nine months to a year, meaning the near-term supply gap is not easily filled. OPEC increases have been modest. For investors, the more durable opportunity may lie in diversified resource equity strategies that can capture exposure across oil and gas, agriculture, and metals and mining as these dynamics continue to unfold.</p>
<p>Despite macro tailwinds, energy and materials sector valuations remain at or below their 10-year medians on EV/EBITDA, while offering above-median free cash flow yields and dividend yields, suggesting the market has not yet fully priced the structural shift underway.</p>

<p>To receive more <a href="/us/en/insights/natural-resources/" title="Natural Resources Insights"><strong>Natural Resources</strong></a> insights, <a href="https://www.vaneck.com/us/en/subscribe/" title="Subscription Center"><strong>sign up in our subscription center</strong></a>.</p>
]]></content:encoded>
</item><item rdf:about="https://www.vaneck.com/us/en/blogs/income-investing/how-bdcs-make-money-a-deep-dive/">
  <title>How BDCs Make Money: A Deep Dive></title>
  <link>https://www.vaneck.com/us/en/blogs/income-investing/how-bdcs-make-money-a-deep-dive/</link>
  <description><![CDATA[<p>BDCs lend to middle-market companies via floating-rate loans, generating high yields. Evaluate credit quality, dividend coverage and leverage before investing. <strong><a href="/link/c48bed1be12e47c88f01e1bdbfa51ed2.aspx" title="BIZD | VanEck BDC Income ETF">BIZD</a></strong> offers diversified BDC exposure.</p>]]></description>
  <dc:creator>Coulter Regal, CFA</dc:creator>
  <dc:date>03/23/2026 06:30:00</dc:date>
<content:encoded><![CDATA[

<p><strong>Key Takeaways</strong></p>
<ul class="content-list">
<li class="mt-2">BDCs lend to middle-market companies via floating-rate, senior secured loans that support high dividend payouts.</li>
<li class="mt-2">Income streams include loan interest, equity co-investments, warrants and fees, fueling potential special dividends.</li>
<li class="mt-2">BDCs must distribute 90%+ of taxable income, so evaluate credit quality, dividend coverage and leverage carefully.</li>
</ul>
<p>As investors search for income beyond traditional bonds, <strong><a href="/link/bc1fe84cbada4050b2ff9b45b2c5892c.aspx" title="VanEck&rsquo;s Top 10 Income ETFs Ranked by ETF Yields">private credit has emerged as an attractive alternative</a></strong>. Business Development Companies (BDCs) play a central role in this market by lending to middle-market businesses and generating income primarily through interest on floating-rate loans, supplemented by fees and equity participation.</p>
<p><a href="/link/c48bed1be12e47c88f01e1bdbfa51ed2.aspx" title="BIZD | VanEck BDC Income ETF"><strong>VanEck&rsquo;s BDC Income ETF (BIZD)</strong></a> provides diversified exposure to publicly traded BDCs, offering investors a liquid and efficient way to access this high-yield segment of private credit while mitigating single-issuer concentration risk.</p>
<h2>What is a BDC?</h2>
<p>A Business Development Company is a type of closed-end investment fund created by Congress in 1980 under the Small Business Investment Incentive Act. The intent was straightforward: channel capital from public investors into small and mid-sized businesses that struggle to access traditional financing.</p>
<p>BDCs occupy a unique niche in the capital markets. Their typical borrowers are middle-market companies, businesses with annual revenues generally between $10 million and $1 billion. These companies are too large and complex for most community banks, yet too small or private to issue bonds in public credit markets. BDCs step in to fill the gap, providing flexible financing in exchange for attractive yields and, frequently, equity kickers.</p>
<p>To qualify as a BDC, a fund must register under the Investment Company Act of 1940, invest at least 70% of assets in qualifying U.S. private or thinly traded companies, and elect to be treated as a regulated investment company (RIC) for tax purposes. That last point is critical: by distributing at least 90% of taxable income to shareholders, BDCs avoid corporate-level taxes, which is a key factor as to why their dividends tend to be so high.</p>
<h2>How BDCs Make Money</h2>
<p>At its core, a BDC is a lending business. It raises capital through equity offerings, debt issuance, and credit facilities and deploys that capital into loans to private companies. The spread between what it costs to borrow and what it earns on its loans is the engine of profitability.</p>
<p>But the revenue model runs deeper than a simple spread. BDCs also take equity positions alongside their loans, collect origination and structuring fees. Together, these streams create a layered income model that, when well-managed, can deliver consistent, high-yield distributions to investors.</p>
<h2>Main Revenue Streams</h2>
<ol class="content-list">
<li class="mt-2"><strong>Interest Income from Loans to Middle-Market Companies: </strong>BDCs earn most of their income through floating-rate, senior secured loans to middle-market companies, with all-in yields historically ranging from 8% to 14%, depending on market conditions &mdash; a meaningful premium over investment-grade public credit that is the foundation of the high dividends investors receive.</li>
<li class="mt-2"><strong>Equity Upside and Capital Gains:</strong> Alongside their loans, BDCs frequently negotiate warrants or direct equity co-investments that can generate capital gains, typically distributed as special dividends, when a portfolio company is sold or taken public.</li>
</ol>
<style>
.content-list li::marker {
  font-weight: bold;
}
</style>

<h2>Why BDCs are Attractive Now</h2>
<p>BDCs have historically offered some of the highest yields in public markets, the MVIS US Business Development Companies Index dividend yield was 11.3%<sup>1&nbsp;</sup>as of December 31, 2025. That income has only grown more attractive in recent years: as banks pulled back from middle-market lending post-2008, BDCs filled the void and expanded their opportunity set, while the floating-rate nature of most BDC loans means portfolios repriced sharply higher as the Fed raised rates, keeping all-in yields well above pre-2022 levels even as cuts have followed. Watch our <strong><a href="https://www.vaneck.com/us/en/webinar-registration/?id=94048758213" title="High Yield Opportunities in BDCs">recent webinar</a></strong> to learn more about high yield opportunities in BDCs.</p>
<h2>Webinar: High Yield Opportunities in BDCs</h2>

<h2>What to Consider When Investing in BDCs</h2>
<p><strong>Credit Quality and Default Risk</strong></p>
<p>BDCs lend to companies that carry greater credit risk than investment-grade borrowers. Default rates in the middle market rise during economic downturns, and BDCs with weakly underwritten portfolios can experience significant write-downs. Investors should examine non-accrual rates (the percentage of loans no longer paying interest), sector and borrower concentration, and how the manager has navigated prior credit cycles. A low non-accrual rate and diversified portfolio are positive signals.</p>
<p><strong>Dividend Sustainability and Coverage</strong></p>
<p>A high yield is only valuable if it is sustainable. The key metric is dividend coverage: whether a BDC's net investment income (NII) exceeds the dividend it distributes. A coverage ratio above 1.0x means the dividend is fully funded by earnings; below 1.0x signals potential risk of a dividend reduction. Investors should look for BDCs with consistent over-coverage and be cautious of those relying on return of capital to fund distributions.</p>
<p><strong>Leverage and Fee Structure</strong></p>
<p>BDCs may borrow up to 2:1 debt-to-equity under current regulations, though most operate in the 1.0x to 1.5x range. Higher leverage amplifies both income and losses. Fee structures, particularly incentive fees, directly erode net returns to shareholders. When evaluating BDCs, the total expense ratio (management fees plus incentive fees plus operating costs) is an important factor in determining net yield after costs.</p>
<h2>How to Invest in BDCs</h2>
<p>For broader exposure, ETFs offer a diversified approach. The <strong><a href="/link/c48bed1be12e47c88f01e1bdbfa51ed2.aspx" title="BIZD | VanEck BDC Income ETF">VanEck BDC Income ETF (BIZD)</a></strong> tracks the MVIS US Business Development Companies Index, providing access to a basket of publicly traded BDCs in a single, cost-efficient wrapper. <strong><a href="/link/c48bed1be12e47c88f01e1bdbfa51ed2.aspx" title="BIZD | VanEck BDC Income ETF">BIZD</a></strong> is designed specifically for income-oriented investors seeking exposure to this asset class without the concentration risk of individual names. For those interested in the underlying loan market, the <strong><a href="/link/e090deaddc774ac699a04b959d9254c6.aspx" title="CLOI | VanEck CLO ETF">VanEck CLO ETF (CLOI)</a></strong> provides exposure to the senior tranches of collateralized loan obligations, a complementary private credit vehicle that also benefits from floating-rate dynamics.</p>

<p>To receive more <a href="/us/en/blogs/income-investing/" title="Income Investing Insights"><strong>Income Investing</strong></a> insights, <a href="/link/5f45412c2143400497908cea2897f7d3.aspx" title=" Subscription Center"><strong>sign up in our subscription center</strong></a>.</p>
]]></content:encoded>
</item><item rdf:about="https://www.vaneck.com/us/en/blogs/income-investing/how-risky-are-bdcs-really/">
  <title>How Risky Are BDCs Really?></title>
  <link>https://www.vaneck.com/us/en/blogs/income-investing/how-risky-are-bdcs-really/</link>
  <description><![CDATA[Understanding how BDCs lend, manage credit risk, and navigate interest rate environments can help investors better evaluate their role in a diversified income portfolio.]]></description>
  <dc:creator>Coulter Regal, CFA</dc:creator>
  <dc:date>03/23/2026 06:30:00</dc:date>
<content:encoded><![CDATA[

<p><strong>Key Takeaways</strong></p>
<ul class="content-list">
<li class="mt-2">BDCs tend to offer higher income potential because they lend to middle-market companies that may not have access to traditional financing.</li>
<li class="mt-2">Many BDC portfolios focus on senior secured, floating-rate loans, which can help manage credit and interest rate risk.</li>
<li class="mt-2">Market price volatility does not always reflect underlying portfolio fundamentals, potentially creating opportunities for long-term investors.</li>
</ul>
<h2>How BDCs Manage Credit Risk</h2>
<p>While BDCs operate in a higher yielding segment of the credit market, their portfolios are typically structured with risk management in mind. First, many BDCs focus on senior secured loans. These loans sit higher in a borrower&rsquo;s capital structure and are backed by collateral, which can improve recovery prospects in the event of financial stress.</p>
<p>Second, BDC portfolios are usually diversified across industries and borrowers. This diversification helps reduce the impact of any single credit event. Lastly, experienced BDC managers rely on active underwriting and ongoing monitoring. Because many of these loans are privately negotiated, managers often maintain close relationships with borrowers and can respond more quickly to changes in company performance.</p>
<h2>Interest Rates and Floating Rate Income</h2>
<p>Interest rate exposure is another factor investors often consider when evaluating BDCs. A large portion of BDC loans are structured as floating-rate instruments. The interest payments on these loans adjust with changes in benchmark rates such as SOFR. When interest rates rise, the income generated by these loans may increase. When rates decline, income from floating-rate loans may fall. That said, lower borrowing costs can ease financial pressure on borrowers, which may help support credit quality. In that sense, interest rate changes can have offsetting effects within a BDC portfolio.</p>
<h2>Dividend Stability and Income Generation</h2>
<p>One reason BDCs are popular with income-focused investors is their distribution structure. BDCs are required to distribute most of their taxable income to shareholders, which supports the relatively high yields associated with the asset class. Many BDCs also maintain dividend coverage ratios, which provides indication of whether portfolio income comfortably supports the dividend. Some maintain spillover income, representing earnings retained from previous periods that can help support distributions during weaker quarters. These features can help smooth income volatility and provide greater visibility into dividend sustainability. Watch our <strong><a href="https://www.vaneck.com/us/en/webinar-registration/?id=94048758213&amp;utm_source=vaneck&amp;utm_medium=calendar" title="High Yield Opportunities in BDCs">webinar</a></strong> for a deeper look at BDC yield sustainability and credit quality.</p>
<h2>High Yield Opportunities in BDCs</h2>
<h2>Market Volatility vs. Portfolio Fundamentals</h2>
<p>Listed BDCs trade publicly on equity markets, which means their share prices can fluctuate based on broader investor sentiment. During periods of market stress, BDC stocks may trade at discounts to their net asset value, or NAV. These discounts can sometimes reflect short-term concerns rather than changes in the underlying loan portfolio.</p>
<p>For long-term investors, such dislocations can present potential opportunities. Buying BDCs at a discount to NAV can allow investors to access the income stream of the underlying portfolio at a more attractive valuation.</p>
<h2>Investing in BDCs</h2>
<p>BDCs are not risk-free investments. Their focus on middle market lending means they operate in a segment of the credit market that carries higher risk than traditional investment grade bonds.</p>
<p>However, the asset class also incorporates structural features designed to manage that risk. Senior secured lending, diversification, floating rate structures, and active credit management all play a role.</p>
<p>For investors seeking income and exposure to private credit markets, BDCs may represent a differentiated source of yield. As always, understanding the underlying portfolio structure and credit strategy is key when evaluating the opportunity. The <a href="/link/c48bed1be12e47c88f01e1bdbfa51ed2.aspx" title="BIZD - VanEck BDC Income ETF - Overview"><strong>VanEck BDC Income ETF (BIZD)</strong></a> offers diversified exposure to publicly traded BDCs. Rather than picking individual BDCs, which carry concentration risk tied to specific managers and borrower pools, <a href="/link/c48bed1be12e47c88f01e1bdbfa51ed2.aspx" title="BIZD - VanEck BDC Income ETF - Overview"><strong>BIZD</strong></a> tracks the MVIS US Business Development Companies Index across the industry&rsquo;s largest names.</p>

<p>To receive more <a href="/us/en/blogs/income-investing/" title="Income Investing Insights"><strong>Income Investing</strong></a> insights, <a href="/link/5f45412c2143400497908cea2897f7d3.aspx" title=" Subscription Center"><strong>sign up in our subscription center</strong></a>.</p>
]]></content:encoded>
</item><item rdf:about="https://www.vaneck.com/us/en/blogs/thematic-investing/buzz-investing-geopolitical-shocks-trigger-broad-market-retreat/">
  <title>BUZZ Investing: Geopolitical Shocks Trigger Broad Market Retreat></title>
  <link>https://www.vaneck.com/us/en/blogs/thematic-investing/buzz-investing-geopolitical-shocks-trigger-broad-market-retreat/</link>
  <description><![CDATA[U.S. equity markets shifted from a sector rotation driven by AI disruption fears to a broad sell-off fueled by geopolitical shocks in Iran and a surprisingly weak jobs report, raising stagflation concerns.]]></description>
  <dc:creator> </dc:creator>
  <dc:date>03/20/2026 06:30:00</dc:date>
<content:encoded><![CDATA[

<p><i>Market movements discussed below reflect a range of factors, and specific drivers are based on market observations and may not fully explain performance. Past performance is no guarantee of future results. Other investments may have performed differently during the same period.</i></p>
<p><strong>Key takeaways</strong></p>
<ul class="content-list">
<li class="mt-2">U.S. equities shifted from an orderly sector rotation, dubbed the "immaculate rotation," into a broad risk-off sell-off as geopolitical shocks from U.S.-Israel strikes on Iran and a worse-than-expected jobs report reignited stagflation fears.</li>
<li class="mt-2">Netflix and Nebius led <strong><a href="/link/459289f4c5ea4648bd9dfcf70d847cd7.aspx" title="BUZZ - VanEck Social Sentiment ETF - Overview">BUZZ</a></strong> Index gains on disciplined capital allocation and AI infrastructure validation, while Applied Digital and SoFi weighed on performance amid neocloud financing concerns and high-beta positioning unwinds.</li>
<li class="mt-2">Defense contractor RTX and fintech disruptor Block entered the <strong><a href="/link/459289f4c5ea4648bd9dfcf70d847cd7.aspx" title="BUZZ - VanEck Social Sentiment ETF - Overview">BUZZ</a></strong> Index in March, reflecting surging sentiment around military spending following the Iran conflict and investor enthusiasm for Block&rsquo;s aggressive AI-driven workforce restructuring.</li>
</ul>
<p>U.S. equity markets transitioned from a tactical rotation to a broader, more defensive retrenchment during the recent period between selection dates (February 11, 2026 &ndash; March 12, 2026, the &ldquo;Period&rdquo;). During the latter half of February, the "SaaS-pocalypse" narrative intensified, as investors aggressively de-rated enterprise software leaders like Salesforce, Atlassian, and Workday over fears that autonomous AI agents would disrupt traditional per-seat licensing models. Leadership rotated toward financials, industrials, healthcare, and select cyclical segments as last year&rsquo;s dominant mega-cap names lagged. Some coined this dynamic an &ldquo;immaculate rotation,&rdquo; reflecting the market&rsquo;s ability to reallocate capital away from crowded leadership without materially disrupting index-level stability. However, this relative index-level stability proved fleeting as the Period progressed, with the S&amp;P 500 and Nasdaq Composite ultimately declining, erasing earlier year-to-date gains. Against this backdrop, the BUZZ NextGen AI US Sentiment Leaders Index (the &ldquo;<strong><a href="/link/459289f4c5ea4648bd9dfcf70d847cd7.aspx" title="BUZZ - VanEck Social Sentiment ETF - Overview">BUZZ</a></strong> Index&rdquo;) exhibited relative resilience, declining 1.4% compared with declines of 3.7% and 3.2% in the S&amp;P 500 and Nasdaq Composite, respectively.</p>
<p>The market&rsquo;s tone shifted in early March, as a confluence of macro shocks triggered a shift from sector-specific dispersion to broad-based liquidation. The February 28 coordinated military strikes by the U.S. and Israel on Iranian targets introduced a sudden wave of geopolitical instability, resulting in a surge in Brent crude prices amid shipping disruptions in the Strait of Hormuz. This inflationary shock was compounded by the March 6 Department of Labor report, which revealed a larger than expected contraction of 92,000 jobs and a rise in the unemployment rate to 4.4%, the highest in nearly two years. These dual shocks effectively collapsed the "soft landing" narrative, replacing it with fears of stagflation and a potential "policy trap" for the Federal Reserve. As risk-off sentiment took hold, safe-haven assets like gold and silver reached new highs while speculative appetite vanished, leaving equities to digest a high-correlation sell-off as the Period concluded near its session lows.</p>
<p>The <strong><a href="/link/459289f4c5ea4648bd9dfcf70d847cd7.aspx" title="BUZZ - VanEck Social Sentiment ETF - Overview">BUZZ</a></strong> Index returned -7.03% during the month of February compared to a return of -0.76% for the S&amp;P 500 Index during the same period. Year-to-date, the <strong><a href="/link/459289f4c5ea4648bd9dfcf70d847cd7.aspx" title="BUZZ - VanEck Social Sentiment ETF - Overview">BUZZ</a></strong> Index lags the S&amp;P 500 with returns of -5.32% and 0.68%, respectively, as of the end of February.</p>
<h2>Netflix and Nebius Lead BUZZ Gains on Strategic Developments</h2>
<p>Shares of Netflix, Inc. (NASDAQ: NFLX) were among the leading contributors to <strong><a href="/link/459289f4c5ea4648bd9dfcf70d847cd7.aspx" title="BUZZ - VanEck Social Sentiment ETF - Overview">BUZZ</a></strong> Index performance during the Period. The stock advanced following the company&rsquo;s decision to withdraw from its proposed acquisition of Warner Bros. Discovery, allowing Paramount Skydance to pursue the transaction while collecting a $2.8 billion breakup fee. Investors appeared to view the outcome favorably, as it removed the need for Netflix to assume significant incremental debt and regulatory uncertainty associated with a complex media merger. The move also reinforced management&rsquo;s longstanding preference for organic growth and disciplined capital allocation. With the potential distraction of a large-scale acquisition removed, market attention returned to Netflix&rsquo;s core strengths, including its global content production engine and established track record of generating high engagement across its platform.</p>
<p>Nebius Group N.V. (NASDAQ: NBIS) was another notable contributor, rising following the announcement of a strategic partnership with Nvidia that includes a planned $2 billion investment to support the deployment of artificial intelligence infrastructure. The agreement is expected to enable Nebius to expand its AI cloud capabilities and deploy large-scale Nvidia systems as demand for accelerated computing continues to grow. Nebius has positioned itself as an emerging provider of AI-focused cloud capacity, and the endorsement from Nvidia was interpreted by investors as a meaningful validation of the company&rsquo;s technology and growth strategy. Shares responded positively to the announcement, reflecting broader investor interest in companies building the infrastructure required to support the expanding AI ecosystem.</p>

<h3 id="top-contributors" class="jump-link-nav anchored-block" data-jumplink-title="Top Contributors">Top BUZZ Index Contributors: February 11, 2026 &ndash; March 12, 2026</h3>
<div class="wrapped-div">
<table style="width: 100%;">
<tbody>
<tr class="tbl-data">
<td class="tbl-header last text-left">Company</td>
<td class="tbl-header last text-left">Ticker</td>
<td class="tbl-header last text-right">Average Weight (%)</td>
<td class="tbl-header last text-right">Return Contribution (%)</td>
</tr>
<tr class="tbl-data">
<td class="data-td data last text-left">Netflix Inc</td>
<td class="data-td data last text-left">NFLX</td>
<td class="data-td data last text-right">3.05</td>
<td class="data-td data last text-right">0.58</td>
</tr>
<tr class="tbl-data">
<td class="data-td data last text-left">Nebius Group NV</td>
<td class="data-td data last text-left">NBIS</td>
<td class="data-td data last text-right">2.39</td>
<td class="data-td data last text-right">0.55</td>
</tr>
<tr class="tbl-data">
<td class="data-td data last text-left">Palantir Technologies Inc</td>
<td class="data-td data last text-left">PLTR</td>
<td class="data-td data last text-right">3.00</td>
<td class="data-td data last text-right">0.39</td>
</tr>
<tr class="tbl-data">
<td class="data-td data last text-left">Coinbase Global Inc</td>
<td class="data-td data last text-left">COIN</td>
<td class="data-td data last text-right">1.64</td>
<td class="data-td data last text-right">0.35</td>
</tr>
<tr class="tbl-data">
<td class="data-td data last text-left">Strategy Inc</td>
<td class="data-td data last text-left">MSTR</td>
<td class="data-td data last text-right">3.04</td>
<td class="data-td data last text-right">0.26</td>
</tr>
<tr class="tbl-data">
<td class="data-td data last text-left">PayPal Holdings Inc</td>
<td class="data-td data last text-left">PYPL</td>
<td class="data-td data last text-right">2.72</td>
<td class="data-td data last text-right">0.25</td>
</tr>
<tr class="tbl-data">
<td class="data-td data last text-left">Moderna Inc</td>
<td class="data-td data last text-left">MRNA</td>
<td class="data-td data last text-right">0.49</td>
<td class="data-td data last text-right">0.13</td>
</tr>
<tr class="tbl-data">
<td class="data-td data last text-left">Venture Global Inc</td>
<td class="data-td data last text-left">VG</td>
<td class="data-td data last text-right">0.43</td>
<td class="data-td data last text-right">0.12</td>
</tr>
<tr class="tbl-data">
<td class="data-td data last text-left">Rivian Automotive Inc</td>
<td class="data-td data last text-left">RIVN</td>
<td class="data-td data last text-right">1.20</td>
<td class="data-td data last text-right">0.09</td>
</tr>
<tr class="tbl-data">
<td class="data-td data last text-left">Amazon.com Inc</td>
<td class="data-td data last text-left">AMZN</td>
<td class="data-td data last text-right">2.95</td>
<td class="data-td data last text-right">0.08</td>
</tr>
</tbody>
</table>
</div>
<p class="chart-disclosure">Source: BUZZ Holdings ULC, Bloomberg. Past performance is no guarantee of future results. Index performance is not illustrative of fund performance. Not intended as a recommendation to buy or to sell any of the securities mentioned herein.</p>

<h2>AI Infrastructure and Fintech Weakness Weigh on BUZZ Performance</h2>
<p>Applied Digital Corp. (NASDAQ: APLD) was among the largest detractors from <strong><a href="/link/459289f4c5ea4648bd9dfcf70d847cd7.aspx" title="BUZZ - VanEck Social Sentiment ETF - Overview">BUZZ</a></strong> Index performance during the Period, as investor sentiment toward AI infrastructure operators softened. Shares declined amid broader volatility across the emerging &ldquo;neocloud&rdquo; segment following reports that financing challenges had surfaced around a large data-center development associated with CoreWeave. While the situation did not directly involve Applied Digital, the news appeared to raise broader questions about the availability and cost of capital required to fund large-scale GPU clusters and next-generation data centers. Additional pressure followed disclosures that Nvidia had exited its equity stake in the company during the fourth quarter, a move that some investors interpreted cautiously despite Nvidia&rsquo;s history of actively rotating its investment portfolio. Taken together, the developments highlighted the sensitivity of capital-intensive AI infrastructure businesses to changes in credit conditions and investor expectations around funding timelines.</p>
<p>SoFi Technologies, Inc. (NASDAQ: SOFI) was another notable detractor during the Period as shares continued a difficult start to the year. The stock had declined meaningfully year-to-date, with weakness appearing to reflect a combination of valuation sensitivity, high beta exposure, and a moderation in retail-driven momentum that had previously supported the shares. Some analysts suggested that positioning rather than fundamental deterioration may have been a key factor, as the broader digital banking segment also experienced pressure. During the Period, CEO Anthony Noto purchased approximately $1 million of stock in the open market, a move that historically has been interpreted by some investors as a signal of confidence in the company&rsquo;s longer-term outlook, even as the shares faced near-term volatility.</p>
<h3 id="bottom-contributors" class="jump-link-nav anchored-block" data-jumplink-title="Bottom Contributors">Bottom BUZZ Index Contributors: February 11, 2026 &ndash; March 12, 2026</h3>
<div class="wrapped-div">
<table style="width: 100%;">
<tbody>
<tr class="tbl-data">
<td class="tbl-header last text-left">Company</td>
<td class="tbl-header last text-left">Ticker</td>
<td class="tbl-header last text-right">Average Weight (%)</td>
<td class="tbl-header last text-right">Return Contribution (%)</td>
</tr>
<tr class="tbl-data">
<td class="data-td data last text-left">Applied Digital Corp</td>
<td class="data-td data last text-left">APLD</td>
<td class="data-td data last text-right">2.72</td>
<td class="data-td data last text-right">-0.86</td>
</tr>
<tr class="tbl-data">
<td class="data-td data last text-left">SoFi Technologies Inc</td>
<td class="data-td data last text-left">SOFI</td>
<td class="data-td data last text-right">2.54</td>
<td class="data-td data last text-right">-0.36</td>
</tr>
<tr class="tbl-data">
<td class="data-td data last text-left">AST SpaceMobile Inc</td>
<td class="data-td data last text-left">ASTS</td>
<td class="data-td data last text-right">2.86</td>
<td class="data-td data last text-right">-0.36</td>
</tr>
<tr class="tbl-data">
<td class="data-td data last text-left">Tesla Inc</td>
<td class="data-td data last text-left">TSLA</td>
<td class="data-td data last text-right">2.96</td>
<td class="data-td data last text-right">-0.24</td>
</tr>
<tr class="tbl-data">
<td class="data-td data last text-left">Intel Corp</td>
<td class="data-td data last text-left">INTC</td>
<td class="data-td data last text-right">2.93</td>
<td class="data-td data last text-right">-0.20</td>
</tr>
<tr class="tbl-data">
<td class="data-td data last text-left">Advanced Micro Devices Inc</td>
<td class="data-td data last text-left">AMD</td>
<td class="data-td data last text-right">2.77</td>
<td class="data-td data last text-right">-0.20</td>
</tr>
<tr class="tbl-data">
<td class="data-td data last text-left">Carvana Co</td>
<td class="data-td data last text-left">CVNA</td>
<td class="data-td data last text-right">0.96</td>
<td class="data-td data last text-right">-0.20</td>
</tr>
<tr class="tbl-data">
<td class="data-td data last text-left">QuantumScape Corp</td>
<td class="data-td data last text-left">QS</td>
<td class="data-td data last text-right">0.81</td>
<td class="data-td data last text-right">-0.19</td>
</tr>
<tr class="tbl-data">
<td class="data-td data last text-left">Apple Inc</td>
<td class="data-td data last text-left">AAPL</td>
<td class="data-td data last text-right">2.68</td>
<td class="data-td data last text-right">-0.17</td>
</tr>
<tr class="tbl-data">
<td class="data-td data last text-left">Meta Platforms Inc</td>
<td class="data-td data last text-left">META</td>
<td class="data-td data last text-right">3.07</td>
<td class="data-td data last text-right">-0.15</td>
</tr>
</tbody>
</table>
</div>
<p class="chart-disclosure">Source: BUZZ Holdings ULC, Bloomberg. Past performance is no guarantee of future results. Index performance is not illustrative of fund performance. Not intended as a recommendation to buy or to sell any of the securities mentioned herein.</p>
<h2>BUZZ Index March 2026 Rebalance Highlights</h2>
<p><strong>RTX Corporation</strong></p>
<p>After weeks of escalating rhetoric and military positioning, the United States announced on March 1 that it had carried out missile strikes targeting Iran&rsquo;s leadership. The operation reportedly targeted senior Iranian leadership, according to media reports, and was intended to destabilize the current regime and halt Iran&rsquo;s nuclear weapons ambitions. While the initial reaction in equity markets was relatively muted, sector-level impacts soon began to emerge. Oil prices moved sharply higher after the Strait of Hormuz, which runs along Iran&rsquo;s southern coast and handles nearly 20% of global daily oil traffic, was effectively shut down. The U.S. defense sector also rallied, as military conflicts historically tend to increase demand for defense spending. RTX Corp (NYSE: RTX), one of the largest U.S. defense contractors, saw a notable surge in investor sentiment following the onset of the strikes. Sentiment continued to climb as the month progressed after it became increasingly clear that the conflict was unlikely to quickly resolve. This month, RTX enters the <strong><a href="/link/459289f4c5ea4648bd9dfcf70d847cd7.aspx" title="BUZZ - VanEck Social Sentiment ETF - Overview">BUZZ</a></strong> with a 1.22% weight.</p>
<p><strong>Block, Inc.</strong></p>
<p>On February 26, Block, Inc. (NYSE: XYZ), led by former Twitter founder Jack Dorsey, reported earnings alongside a sweeping restructuring announcement. The company revealed plans to lay off roughly 4,000 employees, approximately 40% of its workforce, and transition many of those functions to AI-driven teams. While investors have long expected artificial intelligence to gradually replace certain human tasks, the speed and scale of Block&rsquo;s move was a shock for many. Management framed the restructuring as a major efficiency initiative aimed at lowering costs and streamline operations through automation. The market&rsquo;s reaction was overwhelmingly positive, with shares jumping 20% the following day. Investor sentiment also surged, as many retail investors pointed to the move as a clear example of real-world AI adoption beginning to reshape companies. XYZ joins the <strong><a href="/link/459289f4c5ea4648bd9dfcf70d847cd7.aspx" title="BUZZ - VanEck Social Sentiment ETF - Overview">BUZZ</a></strong> Index in March with a 0.69% weight.</p>
<p>For more on rebalancing results and a full breakdown of index constituents added and removed for the month, view the <a href="/us/en/blogs/thematic-investing/buzz-reconstitution-march-2026.pdf" title="BUZZ - VanEck Social Sentiment ETF"><strong>BUZZ Index reconstitution</strong></a> report.</p>

<p>To receive more <a href="https://www.vaneck.com/us/en/insights/thematic-investing/" title="Thematic Investing Insights"><strong>Thematic Investing</strong></a> insights, <a href="https://www.vaneck.com/us/en/subscribe/" title="Subscription Center"><strong>sign up in our subscription center</strong></a>.</p>
]]></content:encoded>
</item><item rdf:about="https://www.vaneck.com/us/en/blogs/emerging-markets-equity/a-guide-to-emerging-markets-investing-solutions/">
  <title>A Guide to Emerging Markets Investing Solutions></title>
  <link>https://www.vaneck.com/us/en/blogs/emerging-markets-equity/a-guide-to-emerging-markets-investing-solutions/</link>
  <description><![CDATA[VanEck has over three decades of experience in emerging markets spanning equity and fixed income. Explore our full suite of broad EM and targeted single-country solutions.]]></description>
  <dc:creator> </dc:creator>
  <dc:date>03/19/2026 06:30:00</dc:date>
<content:encoded><![CDATA[

<p><strong>Key Takeaways:</strong></p>
<ul class="content-list">
<li class="mt-2">EM is significantly underrepresented in global equity indices, creating a long-term allocation gap.</li>
<li class="mt-2">Robust growth opportunities exist across the EM equity and fixed income landscape.</li>
<li class="mt-2">Investors can address specific allocation objectives through our purpose-built strategies across emerging, developing and frontier markets.</li>
</ul>
<p>Emerging markets are home to roughly 87% of the world's population, are on pace to account for approximately 60% of global GDP by 2026 and yet represent just 13% of the market capitalization of all international equities. That disparity between economic weight and investment representation has created a long-term structural opportunity for investors.</p>
<h2 id="capabilities" class="jump-link-nav anchored-block" data-jumplink-title="Capabilities">VanEck's Emerging Markets Equities Capabilities</h2>
<p>Founded in 1955 by John van Eck, VanEck has always looked beyond U.S. borders for investment opportunities and was one of the first U.S. asset managers to offer global investing. Recognizing the opportunity created by Europe and Japan&rsquo;s post-war recovery, John van Eck launched International Investors Incorporated, one of the first international equity mutual funds available to U.S. investors.</p>
<p>In the early 1990s, when John&rsquo;s sons Derek and Jan joined the firm, VanEck expanded into emerging markets equities and fixed income, as well as natural resources and commodities, identifying the rise of China and the growing influence of EM economies as a major structural shift.</p>
<p>VanEck launched its Emerging Markets Fund in December 1992, at a time when the concept of emerging markets as an investable asset class was still in its early stages. The fund adopted its current EM-focused mandate in December 2002 and has been running that strategy for over two decades since.</p>
<p>VanEck&rsquo;s emerging markets equities platform today reflects more than three decades of commitment to that approach.</p>
<ul class="content-list">
<li class="mt-2">VanEck manages $8.1 billion in emerging markets assets across a variety of active and passive investment solutions</li>
<li class="mt-2">Dedicated team of 20 portfolio managers and analysts</li>
<li class="mt-2">3 active and 30 passive strategies</li>
</ul>
<img loading="lazy" class="desktop-image img-responsive" alt="AUM" src="https://www.vaneck.com/contentassets/da670c74be8840e3a7fd07b98f13e4bc/6971_em-capabilities_chart-1_2026-3_v1_desktop.svg" /><img loading="lazy" class="mobile-image img-responsive" alt="AUM" src="https://www.vaneck.com/contentassets/da670c74be8840e3a7fd07b98f13e4bc/6971_em-capabilities_chart-1_2026-3_v1_mobile.svg" />
<p class="chart-disclosure"><strong>Source: VanEck.</strong> Data as of December 31, 2025. Past performance is no guarantee of future results. Index performance is not representative of fund performance. It is not possible to invest directly in an index.</p>
<h2 id="active-em-mutual-fund" class="jump-link-nav anchored-block" data-jumplink-title="Active EM Mutual Fund">Diversified Active Approach: The VanEck Emerging Markets Fund</h2>
<p>The <strong>VanEck Emerging Markets Fund (<a href="/link/eb4419e6f6394611b3f80c597020daa4.aspx" title=" GBFAX-Emerging Markets Fund - Class A">GBFAX </a>| <a href="/link/d985962ee33b463da6997ab0ac0d5fac.aspx" title=" EMRCX-Emerging Markets Fund - Class C">EMRCX </a>| <a href="/link/e87134045cd440bfb003e7a3b131dd17.aspx" title=" EMRIX-Emerging Markets Fund - Class I">EMRIX </a>| <a href="/link/2484ce9ecae8447bbc75e6d8570b375b.aspx" title=" EMRYX-Emerging Markets Fund - Class Y">EMRYX</a>) </strong>is an actively managed mutual fund that seeks long-term capital appreciation by investing in equity securities across emerging markets globally. The fund has operated under its current investment mandate since December 2002, giving it over two decades of history as a dedicated EM equity strategy.</p>
<p>The fund&rsquo;s investment philosophy is built around Structural Growth at a Reasonable Price, or S-GARP, with an emphasis on identifying companies positioned to benefit from the structural, long-term trends reshaping EM economies: rising domestic consumption, expanding middle classes, digital adoption, and the development of local financial systems. This focus on domestic demand themes often leads the team toward smaller- and mid-capitalization companies that reflect where EM economies are headed rather than where they have been.</p>
<p>What distinguishes the investment process is the degree to which it is driven by direct, localized research. The team does not rely on sell-side coverage or secondhand data to form its views. Instead, analysts are consistently in the field: meeting company management, visiting facilities, speaking with local industry contacts, and building firsthand knowledge of the markets they cover. Many members of the team have lived and worked in the countries they analyze, giving them cultural and institutional context that is difficult to replicate from a desk. The team&rsquo;s view is that emerging markets reward investors who do the work on the ground, and that meaningful informational advantages in EM come from proprietary research rather than consensus interpretation.</p>
<p>The process is bottom-up and fundamental. Before a stock is considered for the portfolio, the team screens the EM universe to filter out companies with poor corporate governance, unreasonable valuations, liquidity concerns, or limited structural growth potential. Fundamental research into individual businesses begins only after that initial screen. That screen eliminates a significant portion of the investable universe before the team conducts deeper company-level work, which itself draws heavily on direct engagement with management teams and on-the-ground industry knowledge. Knowing what not to own is treated as equally important as identifying what to buy.</p>
<p>The fund is led by Portfolio Manager <a href="/link/f98f0ec11c0043b3803f14238bacfd2d.aspx?p=1" title="Ola El-Shawarby &mdash; Portfolio Manager, Emerging Markets Equity"><strong>Ola El-Shawarby, CFA</strong></a>, who has over 20 years of dedicated emerging markets investment experience. She is supported by Deputy Portfolio Manager <a href="/link/a4a403b248a844f28e08d14b8997586b.aspx?p=1" title="Angus Shillington &mdash; Portfolio Manager"><strong>Angus Shillington</strong></a>, who joined VanEck in 2009 and has deep expertise in Asia and broader EM equity markets. The broader team consists of career emerging markets analysts who bring on-the-ground perspective to the research process.</p>
<p>The strategy is also available as a separately managed account through <strong><a href="/link/9693620792bb48508b2a7622224fd8bc.aspx" title="VanEck's Emerging Markets Equity ADR strategy">VanEck's Emerging Markets Equity ADR strategy</a></strong>. While related in philosophy and approach, the SMA is a distinct vehicle that invests in U.S.-listed ADRs and direct listings of EM companies, and is structured for investors who require a separately managed account format rather than a mutual fund.</p>

<h2 id="access-india-exposure" class="jump-link-nav anchored-block" data-jumplink-title="Access India Exposure">The Next Face of EM: India</h2>
<p>India is a significant focus across VanEck&rsquo;s emerging markets platform, and the firm offers both active and passive strategies for U.S. investors seeking exposure. With a population exceeding 1.4 billion, a median age of approximately 28, and a sustained program of structural reforms and digital infrastructure investment, India has become one of the most closely watched equity markets in the world.</p>
<p>VanEck believes India warrants dedicated attention and that a single generic exposure is not sufficient for investors who want to access the market with precision. The firm offers two rules-based index strategies and one actively managed fund, each designed to give U.S. investors a distinct and well-constructed entry point.</p>
<h3>Over 20 Years, India Outperformed EM</h3>
<img loading="lazy" class="desktop-image img-responsive" alt="Over 20 Years, India Outperformed EM" src="https://www.vaneck.com/contentassets/268d2efcada04a1f872fa4317244aa8e/6971_em-capabilities_chart-2_2026-3_desktop.svg" /><img loading="lazy" class="mobile-image img-responsive" alt="Over 20 Years, India Outperformed EM" src="https://www.vaneck.com/contentassets/268d2efcada04a1f872fa4317244aa8e/6971_em-capabilities_chart-2_2026-3_mobile.svg" />
<p class="chart-disclosure">Source: Morningstar and VanEck as of 2/28/2026. MSCI India IMI NR USD refers to the MSCI India Investable Market Index Net Return Index (USD), MSCI EM IMI NR USD refers to the MSCI Emerging Markets Investable Market Index Net Return Index (USD), and S&amp;P 500 TR USD refers to the S&amp;P 500 Total Return Index (USD). Past performance is no guarantee of future results. Index performance is not representative of fund performance. It is not possible to invest directly in an index.</p>

<p>The <a href="/link/dd53a10baf8a4537a6312fe8750490a5.aspx" title=" INDZ-VanEck India Select ETF"><strong>VanEck India Select ETF (INDZ)</strong></a> is VanEck&rsquo;s actively managed India strategy, and the one most closely aligned with the bottom-up, fundamental approach of the broader emerging markets equity team. Rather than tracking an index, INDZ applies active stock selection to identify Indian companies well-positioned to benefit from digitization, structural reform, and long-term economic development, with the flexibility to shift positioning as conditions and opportunities evolve.</p>
<p>The <a href="/link/1beb1b15b7a04673a42da3b3a1a96233.aspx" title=" GLIN-VanEck India Growth Leaders ETF"><strong>VanEck India Growth Leaders ETF (GLIN)</strong></a> is a rules-based index strategy that tracks the MarketGrader India All-Cap Growth Leaders Index, a fundamentals-driven index that selects 80 Indian companies across the full market-cap spectrum based on growth potential, financial quality, and valuation. The index is not market-cap weighted; it uses a proprietary scoring methodology to identify companies with strong fundamental characteristics. GLIN is designed for investors seeking broad India exposure through a quality-screened, passive vehicle.</p>
<p>The <a href="/link/979eec17b7274fcb9dd954ab832450cc.aspx" title=" DGIN-VanEck Digital India ETF"><strong>VanEck Digital India ETF (DGIN)</strong></a> is a passive strategy that offers targeted index exposure to Indian companies involved in the country&rsquo;s digital economy, including software services, internet businesses, fintech, and related infrastructure. India&rsquo;s digital buildout over the past decade has been significant, from the scale of the Unified Payments Interface to the expansion of broadband access and mobile commerce. DGIN is designed to capture the equity market implications of that transformation through a rules-based index approach.</p>

<h2 id="single-country-etfs" class="jump-link-nav anchored-block" data-jumplink-title="Single-Country ETFs">Single-Country ETFs: Precision Exposure Across Emerging and Frontier Markets</h2>
<p>Beyond its active strategies, VanEck has built one of the most extensive suites of passive single-country and regional emerging markets ETFs available to U.S. investors. These are index-based funds designed to give investors precise, rules-based access to specific markets. They reflect the firm&rsquo;s view that emerging markets are not a single, homogeneous opportunity but a collection of distinct economies, each with its own growth drivers, political environment, market structure, and risk profile.</p>
<p>The <a href="/link/3e02ab55f09e40faa6a8897fa593015e.aspx" title=" CNXT-VanEck ChiNext ETF"><strong>VanEck ChiNext ETF (CNXT)</strong></a> provides exposure to the ChiNext market, a segment of the Shenzhen Stock Exchange focused on innovative and high-growth Chinese companies in sectors such as technology, healthcare, and consumer services. ChiNext is distinct from the broader Chinese equity market in its emphasis on domestic innovation-driven businesses, and CNXT offers U.S. investors a targeted way to access that portion of China&rsquo;s equity market.</p>
<p>The <a href="/link/76bc9dcce4f84375ad2289bbf97f6615.aspx" title=" AFK-VanEck Africa Index ETF"><strong>VanEck Africa Index ETF</strong> <strong>(AFK)</strong></a> provides broad, one-trade access to one of the world's last major untapped investment frontiers. The fund invests in companies incorporated in Africa or deriving at least 50% of their revenues from the continent. Holdings span basic materials, financials, and communications across major economies including South Africa, Morocco, and Nigeria. AFK captures both the continent's vast resource wealth, including gold, copper, and other minerals central to the energy transition, and its growing financial and consumer sectors. The result is a unique entry point into a region defined by rapid urbanization, expanding financial systems, and significant long-term growth potential.</p>
<p>The <a href="/link/8f9cea7b8c24497cb71ef9646e309ea6.aspx" title=" BRF-VanEck Brazil Small-Cap ETF"><strong>VanEck Brazil Small-Cap ETF (BRF)</strong></a> is a passive, index-based strategy that tracks small-capitalization Brazilian companies, offering a more targeted angle on Brazil's domestic economy than a broad large-cap allocation would provide. Brazil is the largest economy in Latin America, with a substantial consumer base, significant agricultural and natural resource wealth, and a financial system that has matured considerably over the past two decades. Small-cap companies in Brazil tend to be more domestically oriented than the large-cap exporters and commodity producers that dominate broader Brazil indices, making BRF a more direct expression of Brazil's internal growth dynamics.</p>
<p>The <a href="/link/e74d8b5d6f3a410cb43cfa77fcce96bb.aspx" title=" IDX-VanEck Indonesia Index ETF"><strong>VanEck Indonesia Index ETF (IDX)</strong></a> tracks the MVIS Indonesia Index, providing rules-based exposure to the largest and most liquid Indonesian companies. Indonesia is one of the largest emerging economies in Southeast Asia, with a population exceeding 275 million, a growing consumer base, and significant natural resource wealth.</p>
<p>The <a href="/link/ee96cb0806fb4d03bc33aa404ce73c2b.aspx" title=" VNM-VanEck Vietnam ETF"><strong>VanEck Vietnam ETF (VNM)</strong></a> launched in 2009, is the largest and most liquid U.S.-listed ETF providing access to Vietnamese equities. Vietnam has long been classified as a frontier market, but that is changing: FTSE Russell has initiated the process of upgrading Vietnam to emerging market status, with other major index providers expected to follow. That reclassification, when complete, would bring significant passive capital flows into Vietnamese equities. VNM investors have had exposure to that potential since 2009. The fund tracks the MarketVector Vietnam Local Index, composed exclusively of locally incorporated Vietnamese companies, providing direct access to the domestic market. Vietnam's investment case is supported by strong GDP growth, favorable demographics, a young and growing middle class, and its emergence as a preferred manufacturing destination as companies diversify supply chains away from China.</p>

<h2 id="summary" class="jump-link-nav anchored-block" data-jumplink-title="Summary">Summary</h2>
<p>VanEck's emerging markets equities capabilities span active broad-market management, dedicated single-country strategies, and exposure to frontier markets that have not yet reached emerging market classification. The platform is built on over three decades of direct EM investment experience, a specialist team with deep on-the-ground knowledge, and a consistent philosophy centered on bottom-up fundamental research, governance discipline, and long-term structural growth.</p>
<p>For U.S. investors seeking access to the growth potential of emerging and frontier markets, VanEck offers a range of purpose-built strategies designed to meet different allocation objectives with precision.</p>
<img loading="lazy" class="desktop-image img-responsive" alt="VanEck&rsquo;s Guide to Emerging Markets Investment Solutions" src="https://www.vaneck.com/contentassets/55525dab1c194866b581d8077faae4e9/6971_em-capabilities_chart-3_2026-3_v1_desktop.svg" /><img loading="lazy" class="mobile-image img-responsive" alt="VanEck&rsquo;s Guide to Emerging Markets Investment Solutions" src="https://www.vaneck.com/contentassets/55525dab1c194866b581d8077faae4e9/6971_em-capabilities_chart-3_2026-3_v1_mobile.svg" />
<p class="chart-disclosure">Data as of February 28, 2026.</p>
<p>To receive more <a href="/us/en/insights/emerging-markets-equity/" title="Emerging Markets Equity Insights"><strong>Emerging Markets Equity</strong></a> insights, <a href="/us/en/subscribe/" title="Subscription Center"><strong>sign up in our subscription center</strong></a>.</p>
]]></content:encoded>
</item><item rdf:about="https://www.vaneck.com/us/en/blogs/digital-assets/matthew-sigel-vaneck-mid-march-2026-bitcoin-chaincheck/">
  <title>VanEck Mid-March 2026 Bitcoin ChainCheck></title>
  <link>https://www.vaneck.com/us/en/blogs/digital-assets/matthew-sigel-vaneck-mid-march-2026-bitcoin-chaincheck/</link>
  <description><![CDATA[Bitcoin stabilized after a 19% drawdown as futures leverage cooled, options demand for downside protection hit cycle highs, and miner selling stayed contained.]]></description>
  <dc:creator>Patrick Bush</dc:creator>
  <dc:date>03/19/2026 06:30:00</dc:date>
<content:encoded><![CDATA[

<p><strong>Please note that VanEck has exposure to bitcoin.</strong></p>
<p><strong>Key takeaways</strong></p>
<ul class="content-list">
<li class="mt-2"><strong>Bitcoin consolidates after sharp drawdown: </strong> The 30-day average bitcoin (BTC) price fell <strong>19%,</strong> but spot prices stabilized as realized volatility dropped from <strong>80 </strong>to <strong>50 </strong>and futures funding rates declined from <strong>4.1% </strong>to <strong>2.7%</strong>.</li>
<li class="mt-2"><strong>Options signal peak defensiveness: </strong> The put/call open interest ratio averaged 0.77, its highest since June 2021, while put premiums relative to spot volume hit an all-time high of 4 basis points.</li>
<li class="mt-2"><strong>Onchain activity and miner selling remain subdued: </strong> Transfer volume fell <strong>31%</strong>, daily fees dropped <strong>27%</strong>, and long-term holder distribution slowed, while miners sold roughly all newly issued BTC.</li>
</ul>
<h3 id="chaincheck-dashboard" class="jump-link-nav anchored-block" data-jumplink-title="ChainCheck Dashboard">Bitcoin ChainCheck Monthly Dashboard and Highlights</h3>
<p><img loading="lazy" class="img-responsive" src="https://www.vaneck.com/contentassets/677db01927a5473fa114d5ecd5d620fd/6988_bitcoin-chaincheck-mid-march_table-1_2026-3_v2.svg" alt="Bitcoin ChainCheck Monthly Dashboard and Highlights" /></p>
<p class="chart-disclosure"><sup>1</sup>&nbsp;30 day change &amp; 365 day change are relative to the 30-day avg, not absolute.</p>
<p class="chart-disclosure">Source: Artemis XYZ, Glassnode as of 3/13/2026. <strong>Past performance is not a guarantee of future results. Not intended as a recommendation to buy or sell any securities named herein.</strong></p>
<h2 id="price-action" class="jump-link-nav anchored-block" data-jumplink-title="Price Action">Price Action and Volatility</h2>
<p>Bitcoin markets entered a period of consolidation over the past month as volatility declined and derivatives positioning remained subdued. While spot prices stabilized following the earlier drawdown, the 30-day average BTC price remained <strong>19%</strong> below the prior period, reflecting weaker prices earlier in the month. Realized volatility fell sharply from roughly <strong>80 </strong>to just above <strong>50</strong>, suggesting speculative trading activity cooled significantly during the period. Realized volatility measures actual observed price swings over a given period, as opposed to implied volatility, which reflects the market&rsquo;s forward-looking expectations.</p>
<p>Futures markets show a similar dynamic. Funding rates averaged <strong>2.7%, </strong>down from <strong>4.1%</strong> the prior month, while average BTC futures open interest declined <strong>1%</strong> month-over-month, suggesting leverage remains subdued even as market conditions begin to stabilize.</p>
<p>The combination of falling volatility and declining leverage is consistent with a post-stress positioning reset, as traders de-risk and funding premiums normalize.</p>
<h2>Options Positioning</h2>
<p>Bitcoin options markets suggest investors remain defensive. Total options open interest rose to $<strong>33.4B</strong> (+3% m/m), indicating derivatives exposure remains elevated even as futures leverage has cooled.</p>
<p>The put/call open interest ratio, which compares the volume of bearish options bets to bullish ones, peaked at <strong>0.84</strong> and averaged <strong>0.77</strong>, the highest level since June 2021, when China banned bitcoin mining. At current levels, the ratio sits in the 91<sup>st&nbsp;</sup>percentile of observations since mid-2019, highlighting unusually strong demand for downside hedging relative to bullish positioning.</p>
<p><strong>The put/call open interest ratio averaged 0.77, its highest since June 2021, sitting in the 91st percentile of observations since mid-2019.</strong></p>
<h2>Demand for Downside Protection</h2>
<p>Traders continue to pay significant premiums for downside protection. Total premiums paid to purchase puts declined <strong>24%</strong> month-over-month, but at <strong>$685M</strong> over the past 30 days, they remain above <strong>77%</strong> of monthly observations since the start of 2025.</p>
<p>Relative to spot volume, put premiums reached an all-time high of roughly 4 basis points, roughly <strong>3x </strong>the levels seen in mid-2022 following the Terra/Luna stablecoin collapse and the Ethereum staking liquidity crisis. Meanwhile, premiums paid to purchase calls fell <strong>12%</strong> to approximately <strong>$562M</strong>, extending their recent weakness and highlighting a shift toward defensive positioning. Despite declining volatility, investors continue allocating significant capital toward hedging downside risk.</p>
<h3>Put Premiums Relative to BTC Spot Volume Reached 2x Previous Cycle All-Time High</h3>
<p><img loading="lazy" class="desktop-image img-responsive" src="https://www.vaneck.com/contentassets/677db01927a5473fa114d5ecd5d620fd/6988_bitcoin-chaincheck-mid-march_chart-1_2026-3_v1_desktop.svg" alt="Put Premiums Relative to BTC Spot Volume Reached 2x Previous Cycle All-Time High" /></p>
<p><img loading="lazy" class="mobile-image img-responsive" src="https://www.vaneck.com/contentassets/677db01927a5473fa114d5ecd5d620fd/6988_bitcoin-chaincheck-mid-march_chart-1_2026-3_v1_mobile.svg" alt="Put Premiums Relative to BTC Spot Volume Reached 2x Previous Cycle All-Time High" /></p>
<p class="chart-disclosure">Source: Glassnode, VanEck Research as of 3/13/2026. <strong>Past performance is not a guarantee of future results. Not intended as a recommendation to buy or sell any securities named herein.</strong></p>
<h2 id="options-skew" class="jump-link-nav anchored-block" data-jumplink-title="Options Skew">Options Skew and Volatility Premium</h2>
<p>Not only is demand for protection elevated, the cost of that protection is rising. For the 30-day period ending March 3, 2026, the put/call premiums paid ratio reached 2.0, the highest level since summer 2022. Implied volatility on puts averaged ~66, approximately 16 points above realized volatility of ~50 and roughly 17 points above implied call volatility. This differential ranks in the 89<sup>th&nbsp;</sup>percentile since August 2019, indicating that puts are substantially more expensive than calls as investors aggressively hedge downside risk.</p>
<p>This level of implied volatility skew has historically been associated with positive forward BTC returns over both short and longer time horizons. Over the past 6 years, skew readings in this decile have corresponded to average BTC returns of <strong>+13%</strong> over the following 90 days and <strong>+133%</strong> over the subsequent 360 days, compared with average BTC returns of <strong>-4.6%</strong> and <strong>+102%</strong>, respectively.</p>
<p>The table below divides all historical options skew readings into 10 equal buckets (deciles), from D1 (puts cheapest relative to calls) to D10 (puts most expensive). The current reading falls in D9, the second-highest bucket. For each decile, the table shows the average bitcoin return over the following 90 and 360 days, along with how that return ranks against all other deciles. D9 has produced the strongest average 90-day return (+13.2%, ranked #1) and the 3rd-strongest 360-day return (+133.2%), suggesting that extreme put demand at current levels has historically preceded meaningful price recoveries.</p>
<h3>Current Skew is in the D9 Decile</h3>
<div class="wrapped-div">
<table style="width: 100%; height: 268.75px;">
<tbody>
<tr class="tbl-data" style="height: 22.3958px;">
<td class="tbl-header last text-left" style="height: 22.3958px;">Decile</td>
<td class="tbl-header last text-right" style="height: 22.3958px;">90d Mean (%)</td>
<td class="tbl-header last text-right" style="height: 22.3958px;">90d Rank</td>
<td class="tbl-header last text-right" style="height: 22.3958px;">360d Mean (%)</td>
<td class="tbl-header last text-right" style="height: 22.3958px;">360d Rank</td>
</tr>
<tr class="tbl-data" style="height: 22.3958px;">
<td class="data-td last text-left font-weight-normal" style="height: 22.3958px;">D1 (Most Negative)</td>
<td class="data-td last text-right font-weight-normal" style="height: 22.3958px;">-30.50</td>
<td class="data-td last text-right font-weight-normal" style="height: 22.3958px;">10</td>
<td class="data-td last text-right font-weight-normal" style="height: 22.3958px;">176.30</td>
<td class="data-td last text-right font-weight-normal" style="height: 22.3958px;">2</td>
</tr>
<tr class="tbl-data" style="height: 22.3958px;">
<td class="data-td last text-left font-weight-normal" style="height: 22.3958px;">D2</td>
<td class="data-td last text-right font-weight-normal" style="height: 22.3958px;">-11.00</td>
<td class="data-td last text-right font-weight-normal" style="height: 22.3958px;">7</td>
<td class="data-td last text-right font-weight-normal" style="height: 22.3958px;">221.90</td>
<td class="data-td last text-right font-weight-normal" style="height: 22.3958px;">1</td>
</tr>
<tr class="tbl-data" style="height: 22.3958px;">
<td class="data-td last text-left font-weight-normal" style="height: 22.3958px;">D3</td>
<td class="data-td last text-right font-weight-normal" style="height: 22.3958px;">9.30</td>
<td class="data-td last text-right font-weight-normal" style="height: 22.3958px;">2</td>
<td class="data-td last text-right font-weight-normal" style="height: 22.3958px;">41.90</td>
<td class="data-td last text-right font-weight-normal" style="height: 22.3958px;">10</td>
</tr>
<tr class="tbl-data" style="height: 22.3958px;">
<td class="data-td last text-left font-weight-normal" style="height: 22.3958px;">D4</td>
<td class="data-td last text-right font-weight-normal" style="height: 22.3958px;">6.50</td>
<td class="data-td last text-right font-weight-normal" style="height: 22.3958px;">3</td>
<td class="data-td last text-right font-weight-normal" style="height: 22.3958px;">60.00</td>
<td class="data-td last text-right font-weight-normal" style="height: 22.3958px;">7</td>
</tr>
<tr class="tbl-data" style="height: 22.3958px;">
<td class="data-td last text-left font-weight-normal" style="height: 22.3958px;">D5</td>
<td class="data-td last text-right font-weight-normal" style="height: 22.3958px;">-4.00</td>
<td class="data-td last text-right font-weight-normal" style="height: 22.3958px;">6</td>
<td class="data-td last text-right font-weight-normal" style="height: 22.3958px;">45.90</td>
<td class="data-td last text-right font-weight-normal" style="height: 22.3958px;">9</td>
</tr>
<tr class="tbl-data" style="height: 22.3958px;">
<td class="data-td last text-left font-weight-normal" style="height: 22.3958px;">D6</td>
<td class="data-td last text-right font-weight-normal" style="height: 22.3958px;">-21.80</td>
<td class="data-td last text-right font-weight-normal" style="height: 22.3958px;">9</td>
<td class="data-td last text-right font-weight-normal" style="height: 22.3958px;">87.80</td>
<td class="data-td last text-right font-weight-normal" style="height: 22.3958px;">6</td>
</tr>
<tr class="tbl-data" style="height: 22.3958px;">
<td class="data-td last text-left font-weight-normal" style="height: 22.3958px;">D7</td>
<td class="data-td last text-right font-weight-normal" style="height: 22.3958px;">-12.00</td>
<td class="data-td last text-right font-weight-normal" style="height: 22.3958px;">8</td>
<td class="data-td last text-right font-weight-normal" style="height: 22.3958px;">105.00</td>
<td class="data-td last text-right font-weight-normal" style="height: 22.3958px;">4</td>
</tr>
<tr class="tbl-data" style="height: 22.3958px;">
<td class="data-td last text-left font-weight-normal" style="height: 22.3958px;">D8</td>
<td class="data-td last text-right font-weight-normal" style="height: 22.3958px;">5.20</td>
<td class="data-td last text-right font-weight-normal" style="height: 22.3958px;">4</td>
<td class="data-td last text-right font-weight-normal" style="height: 22.3958px;">90.90</td>
<td class="data-td last text-right font-weight-normal" style="height: 22.3958px;">5</td>
</tr>
<tr class="tbl-data" style="height: 22.3958px;">
<td class="data-td last text-left font-weight-normal" style="height: 22.3958px;"><strong>D9</strong></td>
<td class="data-td last text-right font-weight-normal" style="height: 22.3958px;"><strong>13.20</strong></td>
<td class="data-td last text-right font-weight-normal" style="height: 22.3958px;"><strong>1</strong></td>
<td class="data-td last text-right font-weight-normal" style="height: 22.3958px;"><strong>133.20</strong></td>
<td class="data-td last text-right font-weight-normal" style="height: 22.3958px;"><strong>3</strong></td>
</tr>
<tr class="tbl-data" style="height: 22.3958px;">
<td class="data-td last text-left font-weight-normal" style="height: 22.3958px;">D10 (Most Positive)</td>
<td class="data-td last text-right font-weight-normal" style="height: 22.3958px;">-1.10</td>
<td class="data-td last text-right font-weight-normal" style="height: 22.3958px;">5</td>
<td class="data-td last text-right font-weight-normal" style="height: 22.3958px;">59.80</td>
<td class="data-td last text-right font-weight-normal" style="height: 22.3958px;">8</td>
</tr>
<tr class="tbl-data" style="height: 22.3958px;">
<td class="data-td last text-left font-weight-normal" style="height: 22.3958px;"><strong>Overall BTC Average</strong></td>
<td class="data-td last text-right font-weight-normal" style="height: 22.3958px;"><strong>-4.6</strong></td>
<td class="data-td last text-right font-weight-normal" style="height: 22.3958px;"><strong>N/A</strong></td>
<td class="data-td last text-right font-weight-normal" style="height: 22.3958px;"><strong>102.2</strong></td>
<td class="data-td last text-right font-weight-normal" style="height: 22.3958px;"><strong>N/A</strong></td>
</tr>
</tbody>
</table>
</div>
<br />
<p class="chart-disclosure">Source: Glassnode as of 3/13/2026. <strong>Past performance is not a guarantee of future results. Not intended as a recommendation to buy or sell any securities named herein.</strong></p>
<p>In plain terms: when options markets have been this fearful in the past, bitcoin has tended to recover. The current level of defensiveness, while warranted by recent price action, has historically marked periods closer to market bottoms than tops.</p>
<h2>Onchain Network Activity</h2>
<p>Onchain activity, which measures transactions settled directly on the bitcoin blockchain, declined broadly month-over-month across most major network indicators.</p>
<p>Over the past 30 days:</p>
<ul class="content-list">
<li class="mt-2">Transfer volume declined <strong>31%</strong></li>
<li class="mt-2">Total daily fees fell <strong>27%</strong></li>
<li class="mt-2">Daily active addresses declined <strong>5%</strong></li>
<li class="mt-2">Mean transaction fees dropped <strong>40%</strong></li>
</ul>
<p>Total transaction count was the one bright spot, rising modestly during the period.</p>
<p>Muted network activity suggests limited speculative participation directly onchain, though this dynamic may also reflect the increasing role of offchain trading venues, derivatives markets, and ETPs. As Bitcoin becomes more financialized, a growing share of trading activity occurs without generating onchain settlement transactions.</p>
<p>Traditional network activity metrics may therefore capture a shrinking share of total market activity compared with earlier cycles.</p>
<h2>Long-Term Holder Distribution</h2>
<p>Long-term holder selling appears to be slowing, a potentially constructive signal. Transfer volume declined month-over-month across every age cohort, indicating that older coins (which tend to represent long-term investors and early holders) are being spent less frequently. Declining transfer activity among these cohorts typically signals reduced distribution pressure from experienced market participants.</p>
<p>This reduction in long-term holder spending coincided with a decline in active long-term Bitcoin supply from <strong>31%</strong> to <strong>30%,</strong> suggesting that a slightly smaller share of circulating BTC has transacted recently.</p>
<h3>Transfer Volume Fell for Each Age Band</h3>
<p><img loading="lazy" class="desktop-image img-responsive" src="https://www.vaneck.com/contentassets/677db01927a5473fa114d5ecd5d620fd/6988_bitcoin-chaincheck-mid-march_chart-2_2026-3_v1_desktop.svg" alt="Transfer Volume Fell for Each Age Band" /></p>
<p><img loading="lazy" class="mobile-image img-responsive" src="https://www.vaneck.com/contentassets/677db01927a5473fa114d5ecd5d620fd/6988_bitcoin-chaincheck-mid-march_chart-2_2026-3_v1_mobile.svg" alt="Transfer Volume Fell for Each Age Band" /></p>
<p class="chart-disclosure">Source: Glassnode as of 3/13/2026. <strong>Past performance is not a guarantee of future results. Not intended as a recommendation to buy or sell any securities named herein.</strong></p>
<h2 id="miner-economics" class="jump-link-nav anchored-block" data-jumplink-title="Miner Economics">Miner Economics</h2>
<p>Economic pressure on bitcoin miners intensified during the past month. Total miner revenues declined <strong>11%</strong>, while bitcoin mining equities fell roughly <strong>7%</strong>, reflecting weaker profitability across the sector.</p>
<p>Despite this deterioration in economics, miners did not meaningfully increase selling pressure. Miner outflows to exchanges rose only <strong>1%</strong> in BTC terms, suggesting most operators are attempting to preserve their remaining reserves rather than aggressively liquidating holdings.</p>
<p>Industry developments highlight growing strategic shifts within the mining sector. Bitdeer has sold its entire BTC treasury, while Core Scientific, MARA, and others have signaled plans to monetize holdings as they pivot toward AI infrastructure businesses. These moves underscore the increasing capital pressures facing miners as the economics of pure-play Bitcoin mining tighten.</p>
<p>Total miner balances (excluding wallets attributed to Satoshi Nakamoto, bitcoin&rsquo;s pseudonymous creator) currently sit at approximately <strong>684,000</strong> BTC, down only <strong>~0.5%</strong> year-over-year. Over the same period, roughly <strong>164,000</strong> new BTC were mined, suggesting miners effectively sold the entire newly issued supply.</p>
<p>Aggregate miner balances have been gradually declining since late 2023, indicating that the industry has steadily distributed coins to fund operations and capital expenditures. Should Bitcoin prices remain depressed, miners may be forced to accelerate BTC sales to cover recurring dollar-denominated costs, potentially increasing supply pressure.</p>
<h3>Total Miner BTC Holdings Have Been Falling Since Fall 2023</h3>
<p><img loading="lazy" class="desktop-image img-responsive" src="https://www.vaneck.com/contentassets/677db01927a5473fa114d5ecd5d620fd/6988_bitcoin-chaincheck-mid-march_chart-3_2026-3_v1_desktop.svg" alt="Total Miner BTC Holdings Have Been Falling Since Fall 2023" /></p>
<p><img loading="lazy" class="mobile-image img-responsive" src="https://www.vaneck.com/contentassets/677db01927a5473fa114d5ecd5d620fd/6988_bitcoin-chaincheck-mid-march_chart-3_2026-3_v1_mobile.svg" alt="Total Miner BTC Holdings Have Been Falling Since Fall 2023" /></p>
<p class="chart-disclosure">Source: Glassnode as of 3/13/2026. <strong>Past performance is not a guarantee of future results. Not intended as a recommendation to buy or sell any securities named herein.</strong></p>
<h2>Trader Profit and Loss</h2>
<p>Trailing 30-day realized profit and loss, which tracks the net value of coins sold above or below their purchase price, offers an additional lens into investor sentiment.&nbsp; Elevated realized losses typically coincide with capitulation during late-stage drawdowns, while declining realized losses may signal seller exhaustion, a precondition for price stabilization. Monitoring this metric alongside the derivatives signals discussed above may help identify inflection points where selling pressure fades and a floor begins to form.</p>
<h3>Trailing 30 Day Realized Profit and Loss</h3>
<p><img loading="lazy" class="desktop-image img-responsive" src="https://www.vaneck.com/contentassets/677db01927a5473fa114d5ecd5d620fd/6988_bitcoin-chaincheck-mid-march_chart-4_2026-3_v1_desktop.svg" alt="Trailing 30 Day Realized Profit and Loss" /></p>
<p><img loading="lazy" class="mobile-image img-responsive" src="https://www.vaneck.com/contentassets/677db01927a5473fa114d5ecd5d620fd/6988_bitcoin-chaincheck-mid-march_chart-4_2026-3_v1_mobile.svg" alt="Trailing 30 Day Realized Profit and Loss" /></p>
<p class="chart-disclosure">Source: Glassnode as of 3/13/2026. <strong>Past performance is not a guarantee of future results. Not intended as a recommendation to buy or sell any securities named herein.</strong></p>
<h2>Market Structure Conclusions</h2>
<p>Taken together, current market dynamics suggest:</p>
<ul class="content-list">
<li class="mt-2">Cooling speculative leverage in futures markets</li>
<li class="mt-2">Elevated demand for downside hedging in options markets</li>
<li class="mt-2">Subdued onchain activity as trading shifts toward ETPs and derivatives</li>
<li class="mt-2">Declining distribution from long-term holders</li>
<li class="mt-2">Moderate but manageable miner supply pressure</li>
</ul>
<p>While bitcoin prices have stabilized in recent weeks, investor positioning across derivatives and onchain activity remains cautious, suggesting markets may still be consolidating following earlier volatility.</p>
<h2>Frequently Asked Questions</h2>
<p><strong>What does the bitcoin put/call ratio indicate about market sentiment?</strong></p>
<p>The put/call open interest ratio measures the relative demand for downside protection (puts) versus bullish bets (calls). At <strong>0.77, </strong>the current ratio sits in the 91<sup>st</sup>&nbsp;percentile of all observations since mid-2019, indicating that investors are unusually defensive. Historically, extreme readings in this metric have preceded meaningful price recoveries, with average 90-day returns of <strong>+13%</strong> when the ratio reaches this decile.</p>
<p><strong>Why is bitcoin onchain activity declining even as prices stabilize?</strong></p>
<p>Onchain transaction volume and fees have declined because a growing share of bitcoin trading occurs through offchain venues, including derivatives markets, centralized exchanges, and ETPs. As Bitcoin becomes more financialized, traditional network metrics capture a shrinking portion of total market activity, making them less reliable as standalone sentiment indicators compared to earlier market cycles.</p>
<p><strong>Are bitcoin miners selling their holdings?</strong></p>
<p>Bitcoin miners have been gradually reducing their holdings since late 2023, with aggregate balances (excluding Satoshi) currently at approximately <strong>684,000</strong> BTC. While miners have effectively sold all newly issued supply over the past year (roughly <strong>164,000</strong> BTC), outflows to exchanges rose only <strong>1%</strong> month-over-month, suggesting most operators are managing reserves conservatively rather than aggressively liquidating.</p>
<p><strong>Links to third party websites are provided as a convenience and the inclusion of such links does not imply any endorsement, approval, investigation, verification or monitoring by us of any content or information contained within or accessible from the linked sites. By clicking on the link to a non-VanEck webpage, you acknowledge that you are entering a third-party website subject to its own terms and conditions. VanEck disclaims responsibility for content, legality of access or suitability of the third-party websites.</strong></p>
<p>To receive more <strong><a href="https://www.vaneck.com/us/en/insights/digital-assets/" title="Digital Assets Insights">Digital Assets</a></strong> insights, <strong><a href="https://www.vaneck.com/us/en/subscribe/" title="Subscription Center">sign up in our subscription center</a></strong>.</p>
]]></content:encoded>
</item><item rdf:about="https://www.vaneck.com/us/en/blogs/digital-assets/bitcoin-vs-ethereum/">
  <title>Bitcoin vs. Ethereum in 2026: Comparison &amp; Outlook></title>
  <link>https://www.vaneck.com/us/en/blogs/digital-assets/bitcoin-vs-ethereum/</link>
  <description><![CDATA[Explore the key differences of bitcoin and Ethereum in our comprehensive guide. Understand the underlying technology, and how each fits within the market space.]]></description>
  <dc:creator> </dc:creator>
  <dc:date>03/18/2026 06:30:00</dc:date>
<content:encoded><![CDATA[

<h2>Bitcoin vs Ethereum: Understanding the Key Differences and Similarities</h2>
<p>In the rapidly evolving world of digital finance, two names consistently stand out: Bitcoin and Ethereum. These blockchain-based giants are not just cryptocurrencies; they represent the forefront of a financial evolution. Over the years, both have grown from niche experiments into major assets influencing global markets. While Bitcoin and Ethereum share the common ground of being blockchain-based cryptocurrencies, their differences are significant. Bitcoin, the original cryptocurrency, was created as a decentralized digital currency and potential store of value. Meanwhile, Ethereum is a programmable platform that enables smart contracts and decentralized applications (Dapps) to be built and operated without downtime, fraud, or interference.</p>
<ul class="content-list">
<li class="mt-2">Bitcoin: Often compared to digital gold, it is designed primarily for secure value transfer and storage.</li>
<li class="mt-2">Ethereum: A decentralized software platform powering an ecosystem of applications beyond currency, from finance to gaming &ndash; via smart contracts.</li>
</ul>
<p>Both assets have matured significantly, capturing headlines and investor interest worldwide. Below, we explore their origins, technical makeup, market performance, use cases, and what the future may hold for each.</p>
<ul class="content-list">
<li><a href="#genesis-of-bitcoin-ethereum"><strong>Genesis of Bitcoin &amp; Ethereum</strong></a></li>
<li><a href="#technical-comparison"><strong>Technical Comparison</strong></a></li>
<li><a href="#market-performance"><strong>Market Performance</strong></a></li>
<li><a href="#practical-uses"><strong>Practical Uses</strong></a></li>
<li><a href="#developer-ecosystem"><strong>Developer Ecosystem</strong></a></li>
<li><a href="#investment-perspectives"><strong>Investment Perspectives</strong></a></li>
<li><a href="#long-term-outlooks"><strong>Long Term Outlooks</strong></a></li>
</ul>
<h2>The Growing Interest in Bitcoin and Ethereum</h2>
<p>Bitcoin and Ethereum's rising popularity signals more than a trend; it marks crypto's deeper integration into mainstream finance. Often referred to as digital gold, Bitcoin appeals to retail and institutional investors as a potential store of value. Ethereum's smart contracts expand blockchain's role into areas like DeFi, gaming, and decentralized governance.</p>
<p>By 2024, interest surged further. Major financial firms began offering crypto products, and U.S. regulators approved the first Bitcoin and Ethereum ETPs, fueling institutional inflows. The growing overlap between Wall Street and crypto highlights how digital assets have moved from the margins to the financial mainstream.</p>
<p><a href="https://www.vaneck.com/us/en/investments/bitcoin-etf-hodl/overview/" title="HODL VanEck Bitcoin Trust" rel="noopener"><img loading="lazy" class="img-responsive w-100 d-none d-sm-block" src="https://www.vaneck.com/contentassets/e813b07a4c0742e4b245aca9770507fe/hodl-no-fees-bnr-ad-desktop.png" alt="HODL VanEck Bitcoin Trust" /></a></p>
<p><a href="https://www.vaneck.com/us/en/investments/bitcoin-etf-hodl/overview/" title="HODL VanEck Bitcoin Trust" rel="noopener"><img loading="lazy" class="img-responsive w-100 d-sm-none" src="https://www.vaneck.com/contentassets/e813b07a4c0742e4b245aca9770507fe/hodl-no-fees-bnr-ad-mobile.png" alt="HODL VanEck Bitcoin Trust" /></a></p>
<h2>Digital Market Dynamics: Bitcoin and Ethereum</h2>
<p>Bitcoin and Ethereum have reshaped digital markets, advancing crypto adoption for investment and innovation. Bitcoin's decentralized design and recognition make it a key entry point into digital assets. Ethereum powers Web3, a blockchain-based internet layer that enables decentralized apps in finance, social media, and gaming.</p>
<p>Macroeconomic forces now heavily influence both assets. Bitcoin is seen as an inflation hedge, while Ethereum's on-chain ecosystem ties it to market liquidity and tech trends. They're discussed not just in crypto circles but in central bank briefings and institutional portfolios.</p>
<h2>Differing Philosophies and Technological Underpinnings</h2>
<p>The philosophical and technological foundations of Bitcoin and Ethereum differ significantly. Bitcoin emphasizes decentralization, security, and digital scarcity, serving as a ledger for peer-to-peer value transfer. Ethereum expands on this by enabling programmable contracts and a decentralized world computer.</p>
<p><strong>Consensus Mechanism:</strong></p>
<p>Bitcoin uses Proof-of-Work (PoW), where miners secure the network through computational energy, prioritizing security, but with high energy costs. Ethereum shifted to Proof-of-Stake (PoS) in 2022's "Merge," where validators stake Ether, cutting energy use by over 99% and boosting scalability. The two networks reflect divergent paths: Bitcoin reinforcing PoW's reliability and Ethereum optimizing for sustainability.</p>
<p><strong>Economic Model:</strong></p>
<p>Bitcoin enforces a hard cap of 21 million BTC, supporting its store-of-value status, most recently reinforced by the 2024 halving. Ethereum has no fixed cap; it issues Ether to validators but burns fees (via EIP-1559), allowing for dynamic supply and occasional deflation. Bitcoin follows strict scarcity; Ethereum opts for flexible utility.</p>
<p><strong>Use and Functionality:</strong></p>
<p>Bitcoin is built for secure, straightforward transactions, with limited scripting to ensure reliability and minimal risk. Ethereum's Turing-complete platform enables complex applications from DeFi to digital collectibles&mdash;bitcoin champions censorship-resistant money and Ethereum censorship-resistant applications.</p>
<p>Despite these contrasts, both networks continue to evolve along their respective paths&mdash;Bitcoin as a secure monetary asset and Ethereum as a versatile innovation platform. Yet both remain grounded in decentralization and open development.</p>
<h2 id="genesis-of-bitcoin-ethereum" class="anchored-block">The Genesis of Bitcoin and Ethereum</h2>
<p>The inception of Bitcoin and Ethereum marked significant milestones in the evolution of digital finance, introducing the world to the concepts of blockchain and decentralized finance (DeFi). These technologies have since revolutionized how we perceive money, investment, and the internet's architecture, laying the groundwork for a more transparent, secure, and accessible financial system.</p>
<p><strong>Bitcoin Origins</strong></p>
<p>Bitcoin, introduced in a 2008 white paper by the pseudonymous Satoshi Nakamoto and launched in January 2009, solved the "double-spending" problem without needing a central authority, enabling secure, peer-to-peer digital transactions via a decentralized blockchain.</p>
<p>Initially embraced by cryptography enthusiasts and libertarians, Bitcoin demonstrated that a decentralized network could protect significant value. With a capped supply and energy-intensive creation process, it established itself as a scarce, censorship-resistant asset often compared to digital gold.</p>
<p><strong>Ethereum Origins</strong></p>
<p>Proposed by Vitalik Buterin in 2013 and launched in 2015, Ethereum expanded blockchain's potential by introducing smart contracts, self-executing code that powers decentralized applications (DApps) beyond simple payments.</p>
<p>Unlike Bitcoin&rsquo;s single-purpose design, Ethereum was built as a multipurpose platform, laying the groundwork for programmable money and Web3. Early use cases included DeFi, tokenized assets, and ICOs. Despite launching later, Ethereum quickly became central to the decentralized web, fueled by a dynamic developer community committed to ongoing innovation.</p>
<h2 id="technical-comparison" class="jump-link-nav anchored-block" data-jumplink-title="Technical comparison">Bitcoin vs Ethereum: A Technical Comparison</h2>
<p>Technologically, Bitcoin and Ethereum differ in purpose, consensus, and architecture, each reflecting a distinct vision. Below is a high-level comparison of key technical aspects.</p>
<p><strong>Consensus Mechanism:</strong></p>
<p>Bitcoin uses Proof of Work (PoW), where miners validate transactions by solving cryptographic puzzles. This method is highly secure but energy-intensive. Since 2022's Merge, Ethereum has used Proof of Stake (PoS), where validators stake Ether to propose blocks. PoS cuts energy use and improves scalability, aligning with Ethereum's sustainability goals.</p>
<p><strong>Block Time:</strong></p>
<p>Bitcoin produces a block every ~10 minutes, leading to slower transaction confirmations. Ethereum's PoS design allows blocks every ~12 seconds, enabling more transactions per minute. Both use scaling solutions like Bitcoin's Lightning Network and Ethereum's layer-2 rollups to increase throughput beyond the base layer.</p>
<p><strong>Smart Contracts and DApps:</strong></p>
<p>Bitcoin supports limited scripting, prioritizing security over programmability. With its Turing-complete environment and smart contract support (via Solidity and the EVM), Ethereum enables a wide range of DApps&mdash;from DeFi to NFTs. Bitcoin focuses on secure transfers; Ethereum enables programmable logic.</p>
<p><strong>Supply and Issuance:</strong></p>
<p>Bitcoin's supply is capped at 21 million, and mining rewards halve every four years, making it a disinflationary asset. Ethereum has no fixed cap, but since EIP-1559, part of each transaction fee is burned. ETH can become deflationary during high usage, balancing rewards with supply control.</p>
<p>These technical differences reflect core philosophies: Bitcoin is stable and secure for digital money; Ethereum is adaptable and innovative for decentralized services. Both have driven blockchain&rsquo;s evolution in complementary ways.</p>
<h2>Key Bitcoin Features</h2>
<p>Bitcoin&rsquo;s architecture includes several core features that have fueled its success as the first decentralized digital currency.</p>
<p><strong>Blockchain Ledger:</strong></p>
<p>Bitcoin's blockchain is a decentralized ledger recording all transactions across a global network. Each block contains verified transactions added through a public, tamper-resistant process. This ensures security and independence from central authorities, reducing fraud and censorship risks.</p>
<p><strong>Mining Process:</strong></p>
<p>Bitcoin uses Proof of Work (PoW), where miners solve mathematical puzzles to validate transactions and secure the network. In return, they receive new bitcoins, introducing a predictable issuance schedule.</p>
<p><strong>Transaction Speed and Scalability:</strong></p>
<p>Bitcoin&rsquo;s base layer processes a block every ~10 minutes, handling 5&ndash;7 transactions per second. This limited throughput can lead to congestion and high fees. Upgrades like SegWit improved block efficiency, while the Lightning Network, a Layer-2 solution, enables instant, low-cost off-chain payments, which, by 2025, support microtransactions and advanced use cases.</p>
<p><strong>Ongoing Innovations:</strong></p>
<p>While cautious in its evolution, Bitcoin continues to advance. The 2021 Taproot upgrade enhanced privacy and flexibility through Schnorr signatures and Merkelized scripts. Projects like sidechains (Liquid, Rootstock) further expand Bitcoin's capabilities while maintaining its core value of minimizing trust.</p>
<p>Read <a href="https://www.vaneck.com/us/en/blogs/digital-assets/bitcoin-101-a-beginners-guide/" title="Bitcoin 101: A Beginner's Guide"><strong>VanEck's Bitcoin 101: A Beginner's Guide</strong></a> to learn more.</p>
<h2>Key Ethereum Features</h2>
<p>Ethereum's architecture introduces key innovations that extend blockchain utility beyond simple transactions.</p>
<p><strong>Smart Contracts:</strong></p>
<p>Ethereum pioneered smart contracts, a self-executing code that automates agreements without intermediaries. A contract might release a loan when collateral is posted or reclaim it if terms aren't met. This logic powers decentralized finance (DeFi), NFTs, supply chains, and more, enabling transparent, autonomous applications.</p>
<p><strong>Ethereum Virtual Machine (EVM):</strong></p>
<p>The EVM runs all smart contracts on Ethereum, acting as a global decentralized computer. Every node computes the same outcome for a given contract, ensuring consensus. Its developer-friendly design has made Ethereum the standard for decentralized app (DApp) development, with many blockchains adopting EVM compatibility.</p>
<p><strong>Major Upgrades (The Merge and Beyond):</strong></p>
<p>Ethereum&rsquo;s 2022 transition to Proof of Stake (The Merge) slashed energy use and laid the groundwork for further scaling. Future upgrades aim to improve throughput and cost-efficiency while preserving Ethereum&rsquo;s programmability.</p>
<p><strong>Ecosystem and Token Standards:</strong></p>
<p>Ethereum&rsquo;s token standards; ERC-20 for fungible tokens and ERC-721 for NFTs, sparked major crypto trends like ICOs and digital collectibles. Ethereum hosts tokenized assets from stablecoins to securities, reinforcing its role as a flexible platform for digital value creation.</p>
<p>To learn more about how Ethereum works, read <a href="https://www.vaneck.com/us/en/blogs/digital-assets/ethereum-101-a-beginners-guide/" title="Bitcoin 101: A Beginner's Guide"><strong>VanEck's Ethereum 101: A Beginner's Guide</strong></a>.</p>
<h2>Bitcoin and Ethereum Core Differences</h2>
<p>Bitcoin and Ethereum's technological frameworks and future scalability plans highlight their unique positions and objectives within the cryptocurrency ecosystem. The chart below highlights the core technical differences between the two cryptocurrencies:</p>
<h3>Bitcoin vs. Ethereum: Key Differences</h3>
<div class="wrapped-div">
<table style="width: 100%;">
<tbody>
<tr class="tbl-data">
<td class="tbl-header last text-left">&nbsp;</td>
<td class="tbl-header last text-left">Bitcoin</td>
<td class="tbl-header last text-left">Ethereum</td>
</tr>
<tr class="tbl-data">
<td class="data-td last text-left">Creator(s)</td>
<td class="data-td data last text-left">Satoshi Nakamoto</td>
<td class="data-td data last text-left">Vitalik Buterin, Charles Hoskinson, Gavin Wood, Joseph Lubin, and Anthony Di Iorio</td>
</tr>
<tr class="tbl-data">
<td class="data-td last text-left">Launch Date</td>
<td class="data-td data last text-left">January 2009</td>
<td class="data-td data last text-left">July 2015</td>
</tr>
<tr class="tbl-data">
<td class="data-td last text-left">Currency vs. Platform</td>
<td class="data-td data last text-left">A credible alternative to traditional fiat currencies (medium of exchange, potential store of value)</td>
<td class="data-td data last text-left">A platform to run programmatic contracts and applications via Ether</td>
</tr>
<tr class="tbl-data">
<td class="data-td last text-left">Consensus Algorithm</td>
<td class="data-td data last text-left">Proof-of-Work (PoW)</td>
<td class="data-td data last text-left">Proof-of-Stake (PoS)</td>
</tr>
<tr class="tbl-data">
<td class="data-td last text-left">Block Time</td>
<td class="data-td data last text-left">10 minutes on average</td>
<td class="data-td data last text-left">12 seconds on average</td>
</tr>
<tr class="tbl-data">
<td class="data-td last text-left">Transaction Throughput</td>
<td class="data-td data last text-left">7 transactions per second (TPS)</td>
<td class="data-td data last text-left">14 transactions per second (TPS)</td>
</tr>
<tr class="tbl-data">
<td class="data-td last text-left">Supply</td>
<td class="data-td data last text-left">Finite supply-capped at 21 million BTC</td>
<td class="data-td data last text-left">Infinite supply</td>
</tr>
<tr class="tbl-data">
<td class="data-td last text-left">Scalability Solutions</td>
<td class="data-td data last text-left">SegWit, Lightning Network</td>
<td class="data-td data last text-left">Ethereum 2.0, Sharding, Plasma</td>
</tr>
</tbody>
</table>
</div>
<br />
<h2>Technological Frameworks</h2>
<p>Bitcoin is purpose-built for secure, decentralized value transfer. Its development is conservative, and changes like SegWit and Taproot are incremental and backward-compatible. Ethereum, by contrast, is a flexible platform designed to evolve. Originally PoW-based, it now runs on PoS and supports smart contracts, with ongoing upgrades proposed via EIPs. Bitcoin favors stability; Ethereum prioritizes adaptability.</p>
<h2>Scalability Approach</h2>
<p>Bitcoin scales via off-chain solutions like the Lightning Network, preserving its lean base layer and full-node accessibility. Ethereum uses both on-chain upgrades and Layer-2 solutions (e.g., Rollups), with sharding planned to expand base-layer capacity. Bitcoin&rsquo;s model keeps complexity low; Ethereum's boosts throughput with a more dynamic, modular architecture.</p>
<h2 id="market-performance" class="jump-link-nav anchored-block" data-jumplink-title="Market Performance">Market Performance: Bitcoin Price vs Ethereum</h2>
<p>The market performance of Bitcoin and Ethereum provides a fascinating glimpse into the dynamics of cryptocurrency markets. Both have experienced significant price fluctuations over the years, shaped by various factors.</p>
<h2>Historical Price Trends</h2>
<p>Both Bitcoin and Ethereum have seen notable volatility over the past two years, but Bitcoin has clearly outperformed. Following the April 2024 halving and the launch of U.S. spot Bitcoin ETPs, which drew significant institutional capital toward BTC. Bitcoin rose roughly 16% through March 2025 while Ethereum dropped nearly 50% over the same period. Bitcoin&rsquo;s singular role as a potential store of value has proven particularly appealing in uncertain markets, offering relative stability while Ethereum navigated its own headwinds.</p>
<p>That dynamic has shifted dramatically in early 2026. Ethereum has surged over 50% in the past week alone, reflecting renewed appetite for ETH as macro conditions evolve and its ecosystem regains momentum. Bitcoin, meanwhile, has remained comparatively stable, underscoring how differently these two assets behave across market cycles.</p>
<h2>Factors Influencing Price</h2>
<p>Several key factors influence the price of Bitcoin and Ethereum, including market demand, technological upgrades, and investor sentiment.</p>
<p><strong>Market Demand &amp; Adoption:</strong></p>
<p>Bitcoin continues to benefit from its reputation as a hedge against inflation and monetary instability. Ethereum&rsquo;s demand is more utility-driven, spikes in DeFi activity, NFTs, or broader smart contract usage tend to move ETH price. By 2026, growing adoption from retail investors, institutions, and even governments has deepened demand for both assets.</p>
<p><strong>Technological Upgrades &amp; Innovations:</strong></p>
<p>Major protocol upgrades often influence prices. Bitcoin&rsquo;s halving events reduce new supply and have historically preceded bull runs. Technical improvements like SegWit or growing Lightning Network adoption also boost confidence. For Ethereum, milestones like The Merge and upcoming sharding plans increase scalability and reduce supply growth, often triggering positive sentiment. These upgrades enhance utility and signal progress, which can attract new investors.</p>
<p><strong>Investor Sentiment &amp; Macro Trends:</strong></p>
<p>Short-term price action is heavily shaped by news flow, institutional moves, and macro conditions. ETP approvals, corporate treasury allocations, and regulatory clarity can spark sharp rallies, as seen with Bitcoin&rsquo;s post-halving run in 2024. Conversely, hacks or economic fear drive selloffs. Bitcoin tends to benefit from inflation concerns and distrust in fiat systems; Ethereum gains when innovation within its ecosystem is strong, as appears to be the case heading into mid-2026.</p>
<h3>Bitcoin vs Ethereum Performance</h3>
<p><img loading="lazy" alt="Bitcoin vs Ethereum Performance" class="desktop-image img-responsive" src="https://www.vaneck.com/contentassets/ee3ccdc712d644fd879f3b0a1910e314/6972_bitcoin-vs-ethereum-update_chart-1_2026-03_v1_desktop.svg" /></p>
<p><img loading="lazy" alt="Bitcoin vs Ethereum Performance" class="mobile-image img-responsive" src="https://www.vaneck.com/contentassets/ee3ccdc712d644fd879f3b0a1910e314/6972_bitcoin-vs-ethereum-update_chart-1_2026-03_v1_mobile.svg" /></p>
<p class="chart-disclosure"><strong>Source: Morningstar 2026. Past performance is no guarantee of future results. Not intended as a recommendation to buy or sell any securities named herein.</strong></p>
<h2 id="practical-uses" class="jump-link-nav anchored-block" data-jumplink-title="Practical Uses">Practical Uses: From Everyday Transactions to Smart Contracts</h2>
<p>Bitcoin and Ethereum differ in primary use cases, shaped by their core design philosophies.</p>
<p><strong>Bitcoin&rsquo;s Uses:</strong></p>
<p>Bitcoin functions as both digital money and a store of value. It's used for cross-border payments and remittances and as an alternative currency in regions with unstable economies. With tools like the Lightning Network, Bitcoin now supports fast, low-cost micro-transactions. However, by 2026, its dominant role will be as a potential store of value, a hedge against inflation held by investors, companies, and even nation-states. Its finite supply and resilience have cemented its status as a macro asset and financial reserve in the crypto ecosystem.</p>
<p><strong>Ethereum&rsquo;s Uses:</strong></p>
<p>Ethereum powers a broad array of decentralized applications. It's the foundation of DeFi platforms (like Uniswap and Aave), NFT marketplaces, and DAOs that govern projects via token-based voting. Beyond finance and art, Ethereum supports blockchain gaming, social platforms, and supply chain tracking. It also hosts most stablecoins (like USDC), facilitating global, near-instant digital dollar transfers. In the future, institutions plan to use Ethereum to tokenize real-world assets like bonds and funds, reinforcing its role as a general-purpose platform for programmable value and ownership.</p>
<h2 id="developer-ecosystem" class="jump-link-nav anchored-block" data-jumplink-title="Developer Ecosystem">Community and Developer Ecosystem: Bitcoin vs Ethereum</h2>
<p>Bitcoin and Ethereum have vibrant, open-source ecosystems fueled by developers, entrepreneurs, investors, and enthusiasts, though each reflects its culture and priorities.</p>
<p><strong>Bitcoin&rsquo;s Community &amp; Ecosystem:</strong></p>
<p>Bitcoin&rsquo;s community is pragmatic and security-focused. Development through Bitcoin Core is slow and deliberate, with changes like SegWit, Taproot, and Lightning focused on scalability and privacy without compromising the base layer. A network of exchanges, miners, custodians, and nonprofits (like Brink) supports its infrastructure. The Lightning Network, in particular, has attracted a subcommunity building wallets, payments, and even smart contract-like functions. Sidechains like Liquid and RSK show that while conservative, Bitcoin's developers still explore expanded use cases in ways that preserve Bitcoin's core principles of decentralization and resilience.</p>
<p><strong>Ethereum&rsquo;s Community &amp; Ecosystem:</strong></p>
<p>Ethereum's community is innovation-driven and collaborative. The Ethereum Foundation and EIPs steer development, but independent projects, hackathons, and DAOs power the broader ecosystem. Its vibrant application layer spans DeFi, NFTs, gaming, identity, and social networks. Layer-2 teams like Arbitrum, Optimism, and Polygon are integral to scaling efforts, and enterprise alliances (e.g., the EEA) show growing corporate interest. Ethereum embraces experimentation, which drives rapid evolution, sometimes with challenges like congestion or high fees, but also continuous progress.</p>
<p><strong>Collaboration and Bridging Traditional Finance:</strong></p>
<p>Both networks engage with traditional finance. Bitcoin's partnerships (e.g., Lightning integrations with fintech apps) are making BTC usable in real-world payments. Ethereum sees institutions using its network or stablecoins for settlements and asset tokenization. These collaborations reflect growing adoption and ecosystem maturity.</p>
<p>Bitcoin&rsquo;s community is laser-focused on secure, decentralized money, while Ethereum&rsquo;s community pushes the boundaries of decentralized applications. Together, they represent complementary pillars of blockchain's future&mdash;deeply supported by passionate, global communities.</p>
<h2 id="investment-perspectives" class="anchored-block">Investment Perspectives: Bitcoin and Ethereum</h2>
<p>From an investment standpoint, Bitcoin and Ethereum offer distinct but complementary value propositions that both institutional and retail investors increasingly recognize.</p>
<p>Bitcoin is widely viewed as a potential store of value, prized for its scarcity, resilience, and independence from centralized monetary policy. Its appeal as a hedge against inflation and macro uncertainty has grown, especially post-2024 halving and with the rise of regulated Bitcoin ETPs. Bitcoin's relatively low correlation to traditional assets adds portfolio diversification benefits, though its volatility demands prudent risk management. Today, a range of institutions, hedge funds, pensions, and retail platforms have integrated Bitcoin into portfolios, further legitimizing it as a long-term, accessible investment.</p>
<p>Ethereum is seen as a bet on the decentralized internet and financial innovation. Its value stems from being the core infrastructure for DeFi, NFTs, and tokenized assets. With Proof of Stake, ETH holders can now earn staking rewards (4&ndash;6% annually), adding an income dimension. Fee-burning (via EIP-1559) introduces deflationary potential, enhancing ETH's appeal as both a utility asset and a potential store of value. Institutional interest is growing, evidenced by Ether ETPs, though Ethereum carries more complexity and execution risk than Bitcoin.</p>
<h2 id="long-term-outlooks" class="jump-link-nav anchored-block" data-jumplink-title="Long-term Outlook">Bitcoin vs Ethereum: Long-Term Outlooks</h2>
<p>Predictions for Bitcoin and Ethereum over the next 5&ndash;10 years are generally optimistic, though they acknowledge risks and volatility. Both have defied skeptics, and their futures will be shaped by tech upgrades, regulatory developments, and global macro trends.</p>
<p><strong>Bitcoin:</strong></p>
<p>Bitcoin&rsquo;s long-term case remains compelling and relatively straightforward. The April 2024 halving further tightened its already scarce issuance, reinforcing the stock-to-flow dynamics that appeal to long-term holders. Institutional adoption has accelerated meaningfully. U.S. spot Bitcoin ETPs now hold approximately 12%<sup>*</sup>&nbsp;of total supply, and corporate treasury allocations continue to grow in 2026. Its continued success depends primarily on deepening adoption as a hedge and reserve asset, a narrative that has only strengthened as sovereign debt concerns and dollar debasement fears persist into 2026.</p>
<p><strong>Ethereum:</strong></p>
<p>Ethereum's future is more complex. It leads in decentralized applications but must execute a challenging roadmap (e.g., rollups, sharding) to sustain growth. While upgrades like the Merge and Shanghai laid the groundwork, the transition to a rollup-centric model raises concerns, particularly around fee capture and Layer-1 value retention. Some worry that Ethereum's base layer risks becoming a "commodity backbone" as more activity shifts to Layer-2s.</p>
<p>How Ethereum navigates fee capture, Layer-2 fragmentation, and competition from high-throughput chains like Solana will define its trajectory through the rest of the decade. The recent 50% price surge in early 2026 suggests the market sees reasons for optimism, but execution risk remains the defining variable.</p>
<h2>Conclusion: Navigating the Bitcoin and Ethereum Landscape</h2>
<p>Bitcoin and Ethereum each offer distinct yet complementary roles in shaping digital finance's future. Bitcoin stands as a secure, decentralized potential store of value, while Ethereum powers a dynamic ecosystem of decentralized applications and digital ownership. As of March 2026, both have matured significantly, Bitcoin with growing institutional adoption and Ethereum through major protocol upgrades and expanding use cases. BTC and ETH present unique opportunities for investors. Rather than an either/or decision, many portfolios include both to balance risk and utility. Despite volatility and evolving regulations, staying informed, patient, and engaged with the space has historically benefited long-term believers. Together, Bitcoin and Ethereum continue to redefine global finance and technology, cementing their roles as foundational pillars of the blockchain era.</p>
]]></content:encoded>
</item><item rdf:about="https://www.vaneck.com/us/en/blogs/digital-assets/the-investment-case-for-bitcoin/">
  <title>The Investment Case for Bitcoin></title>
  <link>https://www.vaneck.com/us/en/blogs/digital-assets/the-investment-case-for-bitcoin/</link>
  <description><![CDATA[Learn more about bitcoin and the investment rationale driving its mainstream adoption.]]></description>
  <dc:creator>Kyle DaCruz</dc:creator>
  <dc:date>03/17/2026 06:30:00</dc:date>
<content:encoded><![CDATA[<!-- Hide alreat promo banner. Make height 0 to account for the HeaderHeightCalculation scripts -->
<style>
header.site-header .alert-bar {
    display:none!important;
    height: 0!important;
    overflow:hidden!important;
}
</style>


<p><strong>Please note that VanEck has exposure to bitcoin.</strong></p>
<p><strong><i>Investments in digital assets are subject to significant risk and are not suitable for all investors. The value of digital assets is highly volatile, and it is possible to lose your entire principal investment. Past performance is no guarantee of future results.</i></strong></p>
<p><strong>Key takeaways:</strong></p>
<ul class="content-list">
<li class="mt-2"><strong>Scarcity by design:</strong> Bitcoin&rsquo;s hard cap of 21 million coins and periodic halvings reduce new supply over time, distinguishing it from fiat currencies and supporting its potential long-term store-of-value thesis.</li>
<li class="mt-2"><strong>Adoption accelerates across institutions and ETPs:</strong> U.S. spot bitcoin ETPs now hold over 1.2 million BTC, while corporations, governments, and institutional allocators continue to increase their exposure.</li>
<li class="mt-2"><strong>Portfolio diversifier with outsized long-term returns:</strong> A small bitcoin allocation has historically improved cumulative returns in a 60/40 portfolio, and bitcoin has been the top-performing asset class in 9 of the past 12 years, though investors should be prepared for significant volatility.</li>
</ul>
<p>The investment case for bitcoin is built on four key elements:</p>
<ul class="content-list">
<li class="mt-2"><strong>Limited supply:</strong> Bitcoin has a maximum supply of 21 million coins. This scarcity means its price may rise over time as adoption grows.</li>
<li class="mt-2"><strong>Increasing adoption:</strong> Bitcoin continues to gain traction among individuals, corporations, and institutions. The spot bitcoin ETF wrapper has also expanded access for investors who prefer traditional market infrastructure.</li>
<li class="mt-2"><strong>Potential inflation hedge:</strong> Bitcoin's fixed supply schedule means it is not subject to discretionary monetary expansion, which may support its use as a possible long-term store of value.</li>
<li class="mt-2"><strong>Diversification benefits:</strong> Bitcoin's returns have historically shown a low-to-moderate correlation with traditional asset classes over longer horizons, though correlations can rise during periods of market stress.</li>
</ul>
<p>However, unlike gold, bitcoin is:</p>
<ul class="content-list">
<li class="mt-2">Divisible</li>
<li class="mt-2">Transparent</li>
</ul>
<h2>Bitcoin's Limited Supply Creates Scarcity and May Increase Its Value Over Time</h2>
<p>There will only ever be 21 million bitcoin. This supply cap is built into the protocol and is one of bitcoin's defining characteristics. Bitcoin also has periodic "halvings," which reduce the block subsidy paid to miners by 50% roughly every four years. Over time, this reduces the rate at which new bitcoin is introduced until the maximum supply is reached (estimated around the year 2140).</p>
<p>The fourth halving occurred in April 2024, reducing the block subsidy to 3.125 BTC. Historically, bitcoin has often performed strongly in the months surrounding halvings, but the timing and magnitude of post-halving moves have varied meaningfully across cycles. After reaching new highs in late 2025, bitcoin has also experienced a notable drawdown into early 2026, underscoring that halving-related supply dynamics do not eliminate volatility.</p>
<h3>Bitcoin Halvings are Typically Associated with Strong Returns</h3>
<p><img loading="lazy" class="desktop-image img-responsive" src="https://www.vaneck.com/contentassets/5d9fb3f102ba47d49bebb88347ccb3d1/3882_crypto-prediction_chart-3_2023-12_v1_blog.svg" alt="Bar chart showing return percentage for Bitcoin with a line chart overlay showing Bitcoin price peaks" /></p>
<p><img loading="lazy" class="mobile-image img-responsive" alt="Bar chart showing return percentage for Bitcoin with a line chart overlay showing Bitcoin price peaks" src="https://www.vaneck.com/contentassets/5d9fb3f102ba47d49bebb88347ccb3d1/3882_crypto-prediction_chart-3_2023-12_v1_blog-2.svg" /></p>
<p class="chart-disclosure">Source: Bloomberg; VanEck research as of 12/31/2025. <strong>Past performance is not indicative of future results. Not intended as a recommendation to buy or sell any securities named herein.</strong></p>
<p>These halvings reduce the new supply of bitcoin over time. In addition, bitcoin's finite supply makes it distinct from fiat currencies, whose supply can expand based on policy choices. Periods of rapid monetary expansion and persistent inflation have renewed investor interest in assets perceived as scarce. In that context, bitcoin's fixed issuance schedule may support the thesis that it can possibly function as a long-term store of value and an alternative to gold for certain investors.</p>
<p>As of February 13, 2026, bitcoin is trading around $68,747 per coin (based on daily close data). This is approximately 45% below its October 2025 peak near $125,173.</p>
<h2>Bitcoin Adoption Continues</h2>
<p>In its early years, bitcoin was used primarily by technologists and early adopters. Acquiring it was cumbersome, use cases were limited, and few merchants accepted it as payment. That has changed. Over the past several years, adoption has grown substantially as infrastructure around custody, trading, and payments has matured, and more merchants and businesses now accept bitcoin.</p>
<p>The development of user-friendly wallets, exchanges, and marketplaces has reduced technical barriers. At the same time, institutional participation has expanded: hedge funds, asset managers, and other allocators increasingly evaluate bitcoin as a potential store of value and portfolio diversifier.</p>
<p>One of the most notable developments in adoption has been the growth of U.S. spot bitcoin ETFs. As of February 13, 2026, U.S. spot bitcoin ETPs collectively hold 1,268,383 BTC (approximately $87.2B in market value), representing about 6.04% of bitcoin's maximum supply. (Source: Bitbo, February 13, 2026.)</p>
<p>Beyond ETPs, bitcoin is also held by corporations and governments. Treasury trackers collectively report millions of bitcoin held by public companies, private entities, and sovereign holders (for example, Bitbo's treasuries tracker reports roughly 3,767,992 BTC held by tracked entities).</p>
<h3>Bitcoin Holdings in Publicly Traded, Private Companies, ETPs, and Countries</h3>
<p><img loading="lazy" class="desktop-image img-responsive" alt="BTC Holdings in Publicly Traded, Private Companies, ETFs and Countries" src="https://www.vaneck.com/contentassets/5d9fb3f102ba47d49bebb88347ccb3d1/5962_bitcoin-inv-case-blog_chart-2_2025-7_blog.svg" /></p>
<p><img loading="lazy" class="mobile-image img-responsive" alt="BTC Holdings in Publicly Traded, Private Companies, ETFs and Countries" src="https://www.vaneck.com/contentassets/5d9fb3f102ba47d49bebb88347ccb3d1/5962_bitcoin-inv-case-blog_chart-2_2025-7_blog-1.svg" /></p>
<p class="chart-disclosure">Source: Buybitcoinworldwide as of 02/17/2026.&nbsp;<strong>Past performance is not a guarantee of future results. Not intended as a recommendation to buy or sell any securities named herein.</strong></p>
<p>Layer 2 solutions may be the next step in boosting adoption by enabling faster and lower-cost transactions while retaining bitcoin's security model. Built on top of the bitcoin blockchain, the Lightning Network has pushed the boundaries of bitcoin's payments capability through lower fees and faster settlement for small transactions. Other technologies, such as the RGB protocol, aim to enable more complex digital assets and smart-contract-like functionality on top of bitcoin while minimizing changes to the base layer.</p>
<h2>Potential Hedge Against Inflation</h2>
<p>The rapid expansion in global money supply over the past several years has heightened inflation concerns and renewed interest in assets perceived as scarce. Bitcoin's supply schedule is transparent and cannot be altered without broad network consensus, a feature that distinguishes it from fiat currencies. For some investors, this fixed issuance schedule supports the thesis that bitcoin may serve as a hedge against inflation over long time horizons.</p>
<p>That said, bitcoin's price can still be influenced by liquidity conditions, investor risk appetite, and broader market cycles. Investors considering bitcoin as an inflation hedge should be prepared for periods when bitcoin does not behave like a near-term hedge, even if the long-term scarcity thesis remains intact.</p>
<h2>The Role of Bitcoin in a Diversified Portfolio</h2>
<p>Beyond its standalone merits, bitcoin may enhance risk-return profiles in diversified portfolios. As shown below, even a small allocation has historically improved cumulative returns for a traditional 60/40 portfolio (equities/bonds) while only modestly increasing overall volatility. That said, outcomes depend on entry points and holding periods, and bitcoin&rsquo;s volatility can materially increase drawdowns at higher allocations.</p>
<h3 id="small-bitcoin-exposure-enhances-results" class="mb-4 anchored-block">Small Bitcoin Exposure Enhances Results</h3>
<p><img loading="lazy" class="desktop-image img-responsive" alt="Small Bitcoin Exposure Enhances Results" src="https://www.vaneck.com/contentassets/f372ce60ddba4ce69f68fe2888479c05/4980_bitcoin_chart-1_2024-10_v1_blog.svg" /></p>
<p class="chart-disclosure"><img loading="lazy" class="mobile-image img-responsive" alt="Small Bitcoin Exposure Enhances Results" src="https://www.vaneck.com/contentassets/f372ce60ddba4ce69f68fe2888479c05/4980_bitcoin_chart-1_2024-10_v1_blog-2.svg" /></p>
<p class="chart-disclosure">Source: Morningstar; VanEck research as of 12/31/2025. Equities are represented by the S&amp;P 500 Index, Bonds are represented by the Bloomberg Barclays US Aggregate Index, Bitcoin is represented by the MarketVector Bitcoin Index. Past performance is no guarantee of future results. Not intended as a recommendation to buy or sell any securities mentioned herein, to adopt any investment strategy, or as any call to action. Index performance is not representative of fund performance. It is not possible to invest directly in an index. Please see important disclosures at the end of this commentary regarding hypothetical performance.</p>
<div class="wrapped-div">
<table style="width: 100%;">
<tbody>
<tr class="tbl-data">
<td class="tbl-header last">&nbsp;</td>
<td class="tbl-header last text-right">1 year<br />Return</td>
<td class="tbl-header last text-right">3 year<br />Return</td>
<td class="tbl-header last text-right">5 year<br />Return</td>
<td class="tbl-header last text-right">Since Inception<br />Return<br />(Annualized)</td>
<td class="tbl-header last text-right">Since Inception<br />Std Dev</td>
<td class="tbl-header last text-right">Since Inception<br />Max<br />Drawdown</td>
<td class="tbl-header last text-right">Since Inception <br />Sharpe Ratio</td>
</tr>
<tr class="tbl-data">
<td class="data-td last">60% Equities / 40% Bonds</td>
<td class="data-td data last text-right">11.62</td>
<td class="data-td data last text-right">12.75</td>
<td class="data-td data last text-right">9.62</td>
<td class="data-td data last text-right">9.45</td>
<td class="data-td data last text-right">12.21</td>
<td class="data-td data last text-right">-21.54</td>
<td class="data-td data last text-right">0.96</td>
</tr>
<tr class="tbl-data">
<td class="data-td last">59.75% Equities / 39.75% Bonds / 0.5% Bitcoin</td>
<td class="data-td data last text-right">11.62</td>
<td class="data-td data last text-right">12.66</td>
<td class="data-td data last text-right">9.60</td>
<td class="data-td data last text-right">9.85</td>
<td class="data-td data last text-right">10.49</td>
<td class="data-td data last text-right">-20.35</td>
<td class="data-td data last text-right">1.03</td>
</tr>
<tr class="tbl-data">
<td class="data-td last">59.5% Equities / 39.5% Bonds / 1% Bitcoin</td>
<td class="data-td data last text-right">11.92</td>
<td class="data-td data last text-right">13.00</td>
<td class="data-td data last text-right">9.93</td>
<td class="data-td data last text-right">10.49</td>
<td class="data-td data last text-right">10.54</td>
<td class="data-td data last text-right">-20.58</td>
<td class="data-td data last text-right">1.11</td>
</tr>
<tr class="tbl-data">
<td class="data-td last">58.5% Equities / 38.5% Bonds / 3% Bitcoin</td>
<td class="data-td data last text-right">13.14</td>
<td class="data-td data last text-right">14.35</td>
<td class="data-td data last text-right">11.27</td>
<td class="data-td data last text-right">13.03</td>
<td class="data-td data last text-right">10.99</td>
<td class="data-td data last text-right">-21.53</td>
<td class="data-td data last text-right">1.37</td>
</tr>
</tbody>
</table>
</div>
<br />
<p class="chart-disclosure">Source: Morningstar; VanEck research as of 12/31/2025. <strong>Past performance is no guarantee of future results. Not intended as a recommendation to buy or sell any securities mentioned herein, to adopt any investment strategy, or as any call to action. Index performance is not representative of fund performance. It is not possible to invest directly in an index.</strong></p>
<h2>Bitcoin's History of Robust Performance</h2>
<p>Despite its well-known volatility, bitcoin has delivered outsized long-term returns relative to many traditional asset classes. Those returns, however, have not been linear; large drawdowns are a recurring feature of bitcoin&rsquo;s market cycles. The 2025&ndash;2026 drawdown is a reminder that investors should size positions appropriately and maintain a time horizon aligned with the asset&rsquo;s risk profile.</p>
<p>Below are bitcoin's historical returns for various holding periods (based on daily close prices as of February 13, 2026; nearest available look-back dates were used when needed). (Source: Bloomberg)</p>
<ul class="content-list">
<li class="mt-2">1 year: -28.66%</li>
<li class="mt-2">3 years: +217.57%</li>
<li class="mt-2">5 years: +44.19%</li>
<li class="mt-2">7 years: +1809.10%</li>
<li class="mt-2">10 years: +17894.50%</li>
</ul>
<p>These figures underscore bitcoin's long-term growth potential, while also highlighting the importance of risk management through position sizing, rebalancing discipline, and a willingness to tolerate volatility.</p>
<h3>Bitcoin Has Been the Best Performing Asset Class in 9 Out of the Past 13 Years</h3>
<p><img loading="lazy" class="img-responsive w-100" src="https://www.vaneck.com/contentassets/3d15e37ac8084c8d9955cd8c75334b70/3999_3-reasons_table_2024-01_v1.svg" alt="Bitcoin Has Been the Best Performing Asset Class in 8 Out of the Past 11 Years" /></p>
<p class="chart-disclosure">Source: Morningstar; VanEck research as of 12/31/2025. Bitcoin is represented by MarketVector Bitcoin PR USD; US Equities are represented by the S&amp;P 500 TR USD; Gold is represented by the S&amp;P GSCI Gold Spot; Emerging Markets is represented by Fidelity Emerging Markets TR; Real Estate is represented by the NASDAQ Global Real Estate TR USD; US Bonds are represented by Bloomberg US Aggregate Bond USD; Treasuries are represented by the Bloomberg Aggregate Bond Treasury TR USD; Commodities are represented by the Bloomberg Commodity TR USD. <strong>Past performance is no guarantee of future results.</strong></p>
<h2>How Might Bitcoin Shine Brighter Than Gold?</h2>
<p>Bitcoin and gold both derive appeal from scarcity, but bitcoin offers distinct advantages that may make it more practical in a digital economy.</p>
<p><strong>Divisible:</strong> Gold can only be divided into smaller units up to a point, which can make smaller transactions cumbersome. Bitcoin is divisible to eight decimal places (the smallest unit is a Satoshi), making it easier to use for small-value payments and precise allocations.</p>
<p><strong>Transparent:</strong> Bitcoin transactions are recorded on a public blockchain, allowing users to verify supply and track transfers on-chain. This transparency makes bitcoin difficult to counterfeit and provides a level of auditability that physical commodities generally cannot match.</p>
<p>Gold has served as a store of value for centuries, and both assets may be considered as hedges against currency debasement and macro uncertainty. With its divisibility and on-chain transparency, bitcoin may continue to compete with gold for a share of &ldquo;store of value&rdquo; allocations among retail and institutional investors alike.</p>
<style type="text/css">
    .wrapped-div {
        max-width: 100%;
    }

    @media (max-width: 1240px) {
        .wrapped-div {
            overflow-x: scroll;
        }
 

    }
     .hypothetical-footer{
    display:none;
    }
</style>
<p>To receive more <strong><a href="https://www.vaneck.com/us/en/insights/digital-assets/" title="Digital Assets Insights">Digital Assets</a></strong> insights, <strong><a href="https://www.vaneck.com/us/en/subscribe/" title="Subscription Center">sign up in our subscription center</a></strong>.</p>
]]></content:encoded>
</item><item rdf:about="https://www.vaneck.com/us/en/blogs/natural-resources/global-resources-portfolio-manager-transition-plans-faq/">
  <title>Global Resources Portfolio Manager Transition Plans FAQ></title>
  <link>https://www.vaneck.com/us/en/blogs/natural-resources/global-resources-portfolio-manager-transition-plans-faq/</link>
  <description><![CDATA[We address questions investors may have about Shawn Reynolds stepping back and Sam Halpert and Geoff King taking over as Co-Portfolio Managers for the VanEck Global Resources Fund.]]></description>
  <dc:creator> </dc:creator>
  <dc:date>03/16/2026 06:30:00</dc:date>
<content:encoded><![CDATA[

<p>Effective May 1, 2026, <strong><a href="/link/ea4377f66b48462aad6f1a8f2ea4aca2.aspx?p=1" title="Shawn Reynolds &mdash; Portfolio Manager, Global Resources">Shawn Reynolds</a></strong> will be stepping back from his current role as Portfolio Manager of the <strong><a href="/link/166837347eb349dc81ff131cd1514f52.aspx" title="GHAAX | Global Resources Fund - Class A">VanEck Global Resources Fund</a></strong>, and Sam Halpert and Geoff King will be appointed Co-Portfolio Managers of the Fund. Mr. Reynolds will remain on the investment team as Natural Resources Strategist.</p>
<ul class="content-list">
<li class="mt-2"><strong><a href="#point-one">What are the planned portfolio management changes for the VanEck Global Resources Fund?</a></strong></li>
<li class="mt-2"><strong><a href="#point-two">Who are Sam Halpert and Geoff King? What are their backgrounds and portfolio management experience in the asset class?</a></strong></li>
<li class="mt-2"><strong><a href="#point-three">Why were Mr. Halpert and Mr. King chosen to lead the Fund?</a></strong></li>
<li class="mt-2"><strong><a href="#point-four">What will Mr. Reynolds&rsquo; responsibilities be going forward?</a></strong></li>
<li class="mt-2"><strong><a href="#point-five">Why is this change happening? </a></strong></li>
<li class="mt-2"><strong><a href="#point-six">Will the investment philosophy, process or portfolio characteristics change? </a></strong></li>
<li class="mt-2"><strong><a href="#point-seven">Will the Fund merge with another strategy?</a></strong></li>
<li class="mt-2"><strong><a href="#point-eight">Why did Mr. Halpert and Mr. King leave previously, and why did they return?</a></strong></li>
<li class="mt-2"><strong><a href="#point-nine">What level of interaction did Mr. Halpert and Mr. King have with Mr. Reynolds during their prior tenure at VanEck?</a></strong></li>
</ul>
<h2 id="point-one" class="anchored-block">What are the planned portfolio management changes for the VanEck Global Resources Fund?</h2>
<p>Sam Halpert and Geoff King will be appointed Co-Portfolio Managers of the <a href="/link/166837347eb349dc81ff131cd1514f52.aspx" title="GHAAX | Global Resources Fund - Class A"><strong>VanEck Global Resources Fund</strong></a>. Charles Cameron will continue in his current role as Deputy Portfolio Manager.</p>
<p>Shawn Reynolds, who has served as Portfolio Manager since 2010, will step back from day-to-day portfolio management responsibilities and remain with the Global Resources investment team as a Natural Resources Strategist.</p>
<p>The transition has been thoughtfully planned and is already underway to ensure continuity, including routine team meetings, evaluation of current positioning and exposures, and coordination across the broader Global Resources investment team.</p>
<h2 id="point-two" class="anchored-block">Who are Sam Halpert and Geoff King? What are their backgrounds and portfolio management experience in the asset class?</h2>
<p>Sam Halpert <strong><a href="/link/d3e76f9595394409b632a9483e26c796.aspx" title="Sam Halpert and Geoffrey King Return to VanEck">rejoined VanEck in October 2025</a></strong> as a Portfolio Manager for a broad suite of natural resource focused portfolios. Prior to this, Mr. Halpert served as Head of Global Natural Resources Equity at Macquarie Asset Management, a role he assumed in July 2018. Prior to joining Macquarie, Mr. Halpert worked at VanEck for 18 years both as an analyst and portfolio manager. He covered many sectors including steel, refining, coal, agriculture, shipping, paper and forest products and managed Global Real Estate portfolios for eight years. Before VanEck, Mr. Halpert worked at Goldman Sachs, on a macro hedge fund, and at Citibank and Refco covering hedge funds and CTAs in commodities and macro markets. Mr. Halpert graduated from Harvard College with a Bachelor of Arts in English and American literature.</p>
<p>Geoff King rejoined VanEck in October 2025 as a Portfolio Manager for a broad suite of natural resource focused portfolios. Prior to this, Mr. King served as Portfolio Manager on the Global Natural Resources Equity Team at Macquarie Asset Management, a role he assumed in July 2018. Prior to joining Macquarie, Mr. King was vice president and Chief Financial Officer at publicly traded Abraxas Petroleum, where he orchestrated a substantial turnaround, streamlining the company and focusing it on core assets in the midst of a serious bear market in crude oil. Before this, Mr. King worked at VanEck for almost six years as a member of the Global Resources investment team covering energy. He sat next to Mr. Halpert and worked with over half the current team in place at VanEck today. Early in his career, Mr. King worked at Petrie Parkman in banking and sales alongside Mr. Reynolds. Mr. King earned a Bachelor of Arts in both economics and history from Davidson College, and holds the CFA designation.</p>
<h2 id="point-three" class="anchored-block">Why were Mr. Halpert and Mr. King chosen to lead the Fund?</h2>
<p>Mr. Halpert and Mr. King were selected based on several key factors: 1) their direct experience as co-portfolio managers of an already well-established global natural resources strategy; 2) their demonstrated track record managing that strategy through multiple market environments; and, 3) their long tenures at VanEck earlier in their careers and deep familiarity with VanEck&rsquo;s culture, philosophy and Global Resources investment team.</p>
<p>Their return strengthens the bench of senior portfolio management talent and supports long-term continuity for the Fund.</p>
<h2 id="point-four" class="anchored-block">What will Mr. Reynolds&rsquo; responsibilities be going forward?</h2>
<p>As Natural Resources Strategist, Mr. Reynolds will remain a highly visible and influential member of the Global Resources investment team, continuing to engage with clients and portfolio companies while playing a meaningful leadership role within the firm. A recognized expert in energy markets, he will continue to contribute to VanEck&rsquo;s content initiatives by delivering timely, thoughtful insights to clients and serving as a resource across investment teams and strategies. His responsibilities will include, among others:</p>
<ul class="content-list">
<li class="mt-2">Investment Committee Member: Contributing member of the firm&rsquo;s Investment Committee, helping oversee people, process, and performance across VanEck&rsquo;s actively managed strategies.</li>
<li class="mt-2">Member, Global Resources investment team: Serving as a thought leader within the natural resources asset class, leading thematic research and white papers, supporting the promotion of VanEck&rsquo;s active and passive natural resource strategies, and identifying public and private investment opportunities.</li>
<li class="mt-2">Private Investments: Sourcing, evaluating, and monitoring private, venture, and special purpose vehicle (SPV) opportunities within the natural resources space, including direct engagement with founders and management teams. Mr. Reynolds has had significant experience with private investments within the Firm, and this area continues to expand.</li>
<li class="mt-2">SPV / Private Investments Committee: Committee member responsible for identifying, coordinating, and approving SPV opportunities for VanEck and its clients.</li>
</ul>
<p>This structure enables Mr. Reynolds to focus on his core strengths in energy and strategic research while continuing to deliver significant value to clients and the broader investment platform.</p>

<h2 id="point-five" class="anchored-block">Why is this change happening?</h2>
<p>VanEck continually evaluates business continuity and succession planning to ensure stability and long-term consistency across its actively managed strategies. This transition reflects a proactive, planned approach to leadership evolution within the Global Resources investment team.</p>
<p>Similar thoughtful succession efforts have occurred across other active strategies at the firm, including leadership transitions within the International Investors Gold Fund and Emerging Markets Fund.</p>
<p>The objective is to maintain consistency in investment philosophy and process while ensuring a smooth transition as the business evolves and progresses through its natural product life cycle. The broader team structure and research framework remain firmly in place.</p>
<h2 id="point-six" class="anchored-block">Will the investment philosophy, process or portfolio characteristics change?</h2>
<p>The Fund&rsquo;s investment objective and core philosophy remain unchanged. The strategy will continue to be managed within its established research framework and supported by the broader Global Resources investment team.</p>
<p>At a high level, the strategies currently managed by Mr. Halpert and Mr. King and the Fund share many common elements in approach and philosophy.</p>
<p>Key similarities:</p>
<ul class="content-list">
<li class="mt-2">Common Benchmark: Both strategies have been managed relative to the same benchmark in recent years (S&amp;P Global Natural Resources Index).</li>
<li class="mt-2">Investment Process: The fundamental, bottom-up research process focused on global natural resource equities are central to the strategies.</li>
<li class="mt-2">Team Experience: The team brings together extensive financial market expertise and direct industry experience across the natural resources value chain.</li>
<li class="mt-2">Collaborative Portfolio Management: Portfolio decisions are made through a collaborative process designed to promote discipline and shared accountability.</li>
<li class="mt-2">Risk Awareness: Benchmark-aware sector allocation parameters are incorporated to help guide positioning while allowing for active investment views.</li>
</ul>
<p>Key differences:</p>
<ul class="content-list">
<li class="mt-2">Portfolio Concentration: Historically, the strategies managed by Mr. Halpert and Mr. King have been somewhat more concentrated, typically holding between 28 and 43 positions. (The Fund has averaged around 75 positions in the last three years)</li>
<li class="mt-2">Analyst Structure: Analysts for Mr. Halpert&rsquo;s and Mr. King&rsquo;s natural resources strategies have maintained primary coverage responsibilities within core subsectors (e.g., energy or metals &amp; mining) while also contributing across adjacent natural resource segments. This structure is intended to enhance capital allocation decisions and broaden opportunity assessment.</li>
</ul>
<h2 id="point-seven" class="anchored-block">Will the Fund merge with another strategy?</h2>
<p>There are no plans to merge the Fund with another strategy.</p>
<p>There is currently overlap between the natural resources portfolios managed by Mr. Halpert and Mr. King and the Fund, including similarities in certain holdings and subsector exposures. Over time, portfolio positioning may evolve based on investment opportunities, market conditions, tax considerations and transaction costs.</p>
<p>The transition will be implemented in a measured manner, with an emphasis on continuity and prudent portfolio management.</p>
<h2 id="point-eight" class="anchored-block">Why did Mr. Halpert and Mr. King leave previously, and why did they return?</h2>
<p>Mr. Halpert and Mr. King previously left VanEck to pursue separate opportunities, including, eventually, to serve as portfolio managers of the Nomura&nbsp;Global Natural Resources Fund.</p>
<p>Their return reflects VanEck&rsquo;s commitment to expanding and strengthening its natural resources capabilities. Given their long prior tenures at the firm and deep familiarity with the team and philosophy, the reunion was a natural fit and aligned with VanEck&rsquo;s long-term strategic objectives.</p>
<h2 id="point-nine" class="anchored-block">What level of interaction did Mr. Halpert and Mr. King have with Mr. Reynolds during their prior tenure at VanEck?</h2>
<p>During their prior time at VanEck, Mr. Halpert, Mr. King and Mr. Reynolds were members of the same Global Resources investment team. They worked closely together, sat in close proximity and collaborated daily on sector research and company analysis. Their professional relationship spans many years, including overlap earlier in their careers, and reflects a longstanding working dynamic within the team.</p>

<p>To receive more <a href="/us/en/insights/natural-resources/" title="Natural Resources Insights"><strong>Natural Resources</strong></a> insights, <a href="https://www.vaneck.com/us/en/subscribe/" title="Subscription Center"><strong>sign up in our subscription center</strong></a>.</p>
]]></content:encoded>
</item><item rdf:about="https://www.vaneck.com/us/en/blogs/digital-assets/bitcoin-taxes-explained-what-investors-need-to-know-in-2026/">
  <title>Bitcoin Taxes Explained: What Investors Need to Know in 2026></title>
  <link>https://www.vaneck.com/us/en/blogs/digital-assets/bitcoin-taxes-explained-what-investors-need-to-know-in-2026/</link>
  <description><![CDATA[Everything investors need to know about capital gains, mining income, and the tax advantages of Bitcoin ETFs.]]></description>
  <dc:creator> </dc:creator>
  <dc:date>03/13/2026 06:30:00</dc:date>
<content:encoded><![CDATA[

<p><strong>Key Takeaways:</strong></p>
<ul class="content-list">
<li class="mt-2">The IRS classifies Bitcoin as property, meaning most transactions trigger capital gains or losses.</li>
<li class="mt-2">Selling, trading, spending, mining, and staking Bitcoin are all taxable events under current U.S. tax law.</li>
<li class="mt-2">Holding periods matter: long-term gains (held over one year) are taxed at preferential rates.</li>
<li class="mt-2">Spot Bitcoin ETFs may simplify tax reporting and reduce or eliminate the need for wallet-level transaction tracking.</li>
</ul>
<h2>How is Bitcoin Taxed in the U.S.?</h2>
<p>Bitcoin is treated as property by the IRS, not currency. This means most transactions, including selling, trading, or spending Bitcoin, trigger capital gains or losses.</p>
<p>Here, we break down the current U.S. tax treatment of Bitcoin, covering capital gains, mining and staking income, ETF structures, and what long-term investors should keep in mind.</p>
<h2>Why the IRS Treats Bitcoin as Property</h2>
<p>In 2014, the IRS issued Notice 2014-21, establishing that virtual currencies would be treated as property for federal tax purposes, not as foreign currency. This classification places Bitcoin in the same broad category as stocks, real estate, and other capital assets.</p>
<p>The distinction matters. If Bitcoin were treated as foreign currency, gains and losses would be governed by a different (and in some cases more favorable) set of rules. Instead, the property classification means that virtually every disposition of Bitcoin, whether selling for cash, trading for another token, or spending at a retailer, is a taxable event that may generate a capital gain or loss.</p>
<p>For investors, this framework has been in place for over a decade, and subsequent IRS guidance has only reinforced it. The practical effect is that Bitcoin holders need to track their cost basis and holding periods with the same discipline required for traditional investment assets.</p>
<h2>When Do You Owe Taxes on Bitcoin?</h2>
<p>Not every interaction with Bitcoin triggers a tax obligation. The IRS draws a clear line between taxable events and non-taxable activity.</p>
<h3>Taxable events for Bitcoin investors include:</h3>
<ul class="content-list">
<li class="mt-2">Selling Bitcoin for U.S. dollars or other fiat currency</li>
<li class="mt-2">Trading Bitcoin for another cryptocurrency (e.g., BTC to ETH)</li>
<li class="mt-2">Using Bitcoin to purchase goods or services</li>
<li class="mt-2">Receiving Bitcoin as compensation for work or services</li>
<li class="mt-2">Earning Bitcoin through mining operations</li>
<li class="mt-2">Receiving staking rewards or interest income denominated in Bitcoin</li>
</ul>
<p>Each of these events requires the investor to calculate and report a gain or loss based on the difference between the fair market value at the time of disposition and the original cost basis.</p>
<h2>Non-Taxable Events</h2>
<p>Certain activities do not trigger a taxable event:</p>
<ul class="content-list">
<li class="mt-2">Buying and holding Bitcoin (no disposition has occurred)</li>
<li class="mt-2">Transferring Bitcoin between your own wallets or accounts</li>
<li class="mt-2">Gifting Bitcoin, provided the value falls within annual gift tax exclusion limits</li>
</ul>
<h2>Is Bitcoin Taxed as Capital Gains or Income?</h2>
<p>The answer depends on how the Bitcoin was acquired and how long it was held. For Bitcoin purchased as an investment, the holding period determines the tax rate.</p>
<div class="wrapped-div">
<table style="width: 100%;">
<tbody>
<tr class="tbl-data">
<td class="tbl-header last">Holding Period</td>
<td class="tbl-header last text-left">Tax Treatment</td>
<td class="tbl-header last text-left">Rate Range</td>
</tr>
<tr class="tbl-data">
<td class="data-td last">One year or less</td>
<td class="data-td data last text-left">Short-term capital gain</td>
<td class="data-td data last text-left">Ordinary income rates (10&ndash;37%)</td>
</tr>
<tr class="tbl-data">
<td class="data-td last">More than one year</td>
<td class="data-td data last text-left">Long-term capital gain</td>
<td class="data-td data last text-left">Preferential rates (0%, 15%, or 20%)</td>
</tr>
</tbody>
</table>
</div>
<br />
<p>Short-term capital gains are taxed at the investor&rsquo;s ordinary income rate, which currently ranges from 10% to 37%. Long-term capital gains, by contrast, benefit from preferential rates of 0%, 15%, or 20%, depending on taxable income. For high-net-worth investors, there may also be an additional 3.8% net investment income tax.</p>
<p>This differential makes holding period management a key planning tool for Bitcoin investors. The difference between selling one day before versus one day after the one-year mark can meaningfully affect after-tax returns.</p>
<h2>How Are Bitcoin Mining and Staking Rewards Taxed?</h2>
<p>Bitcoin earned through mining or staking is taxed as ordinary income at its fair market value when received. If later sold, investors also owe capital gains tax on any appreciation.</p>
<p>Bitcoin earned through mining or staking is treated differently from Bitcoin purchased on an exchange. When a miner validates a transaction and receives Bitcoin as a reward, that income is taxed as ordinary income at its fair market value on the date of receipt.</p>
<p>The same principle applies to staking rewards. Whether earned through a proof-of-stake protocol or a centralized lending platform, the fair market value at the time the reward is received establishes the taxable income amount, and the cost basis for future disposition.</p>
<p>If the mined or staked Bitcoin is subsequently sold, the investor owes capital gains tax on any appreciation above the cost basis established at receipt. In effect, mining and staking can create a dual tax obligation: ordinary income when the Bitcoin is received, and capital gains when it&rsquo;s sold.</p>
<h2>How Bitcoin ETFs Are Taxed</h2>
<p>The introduction of spot Bitcoin ETFs in the U.S. has meaningfully simplified the tax picture for investors seeking Bitcoin exposure. Spot Bitcoin ETFs are generally taxed like other equity ETFs: investors owe capital gains tax when they sell their shares at a profit, and losses may be used to offset other gains.</p>
<p>In a Bitcoin ETF, there is no wallet-level tracking, and the ETF structure offers a simplified way to access crypto from a tax perspective:</p>
<ul class="content-list">
<li class="mt-2">Capital gains or losses recognized upon the sale of ETF shares</li>
<li class="mt-2">Potential distributions or dividends, if applicable, which are taxed as ordinary income</li>
<li class="mt-2">Standard 1099 reporting through the investor&rsquo;s brokerage, no specialized crypto tax software required</li>
<li class="mt-2">No exposure to the new Form 1099-DA reporting regime or wallet-by-wallet accounting requirements that now apply to direct cryptocurrency holders</li>
</ul>
<p><em>The discussion below is for general informational purposes only and does not constitute tax advice. Investors should consult their tax advisor regarding their individual circumstances.</em></p>
<p>Importantly, not all Bitcoin ETFs are structured the same way. The <strong><a href="/link/c754aca617ab4535a8e611ded6d5b13c.aspx" title="HODL VanEck Bitcoin ETF">VanEck Bitcoin ETF (HODL)</a></strong> is organized as a grantor trust under the Securities Act of 1933, not as a '40 Act investment company. This distinction matters for tax purposes: the IRS "looks through" the grantor trust wrapper and treats shareholders as directly owning a pro rata share of the underlying Bitcoin.</p>
<p class="chart-disclosure"><span style="font-size: 10pt;"><strong>An investment in the VanEck Bitcoin ETF (&ldquo;HODL,&rdquo; or the &ldquo;Trust&rdquo;) is subject to significant risk and may not be suitable for all investors. The value of Bitcoin is highly volatile, and you can lose your entire principal investment. HODL is not an investment company registered under the Investment Company Act of 1940 (the &ldquo;1940 Act&rdquo;) and therefore is not subject to the same protections as mutual funds or ETFs registered under the 1940 Act.</strong></span></p>
<h2>Are Bitcoin Taxes Different for Long-Term Investors?</h2>
<p>In a word, yes, and the difference can be substantial. Long-term Bitcoin investors who hold their positions for more than one year benefit from preferential capital gains rates, which top out at 20% compared to 37% for short-term gains taxed as ordinary income.</p>
<p>For investors with a conviction-driven, multi-year time horizon, the tax incentive to hold rather than trade is significant. Each taxable disposition resets the clock, and frequent trading can erode returns through accumulated short-term capital gains. The tax code, in this sense, rewards patience.</p>
<h2>How Do Bitcoin Taxes Compare to Other Investments?</h2>
<p>Bitcoin&rsquo;s tax treatment shares some characteristics with traditional investments but differs in several important ways.</p>
<div class="wrapped-div">
<table style="width: 100%;">
<tbody>
<tr class="tbl-data">
<td class="tbl-header last">Asset</td>
<td class="tbl-header last text-left">Taxed As</td>
<td class="tbl-header last text-left">Wash Sale Rule</td>
<td class="tbl-header last text-left">Income Component</td>
</tr>
<tr class="tbl-data">
<td class="data-td last">Bitcoin</td>
<td class="data-td data last text-left">Property</td>
<td class="data-td data last text-left">Currently no*</td>
<td class="data-td data last text-left">Mining/staking income</td>
</tr>
<tr class="tbl-data">
<td class="data-td last">Stocks</td>
<td class="data-td data last text-left">Securities</td>
<td class="data-td data last text-left">Yes</td>
<td class="data-td data last text-left">Dividends</td>
</tr>
<tr class="tbl-data">
<td class="data-td last">Gold</td>
<td class="data-td data last text-left">Collectible</td>
<td class="data-td data last text-left">No</td>
<td class="data-td data last text-left">None</td>
</tr>
</tbody>
</table>
</div>
<br />
<p class="chart-disclosure"><sup>*</sup>Note: Under current IRS guidance, the wash sale rule under IRC &sect;1091 does not apply to cryptocurrency, which is classified as property rather than a security. This also extends to spot Bitcoin ETFs structured as grantor trusts (such as HODL), where the IRS looks through the fund wrapper and treats investors as holding Bitcoin directly. Bitcoin ETFs structured as '40 Act funds, however, may be subject to wash sale rules. Legislative proposals have been introduced to extend wash sale rules to digital assets, and investors should monitor this area closely.</p>
<p>One notable difference: physical gold held directly is taxed as a collectible, with a maximum long-term capital gains rate of 28%, higher than the 20% maximum for Bitcoin. Stocks, meanwhile, are subject to wash sale rules that prevent investors from harvesting a loss and immediately repurchasing the same security. Bitcoin currently enjoys more flexibility on that front, though proposed legislation could change this.</p>
<h2>What This Means for Crypto Investors</h2>
<p>Bitcoin taxes can be complex because the IRS treats cryptocurrency as property, triggering capital gains events for many common transactions. Investors should understand holding periods, income classification, and reporting requirements to manage tax exposure efficiently.</p>
<h2>Gaining Bitcoin Exposure Through ETFs</h2>
<p>For investors who want exposure to Bitcoin&rsquo;s return profile without the operational and tax complexity of direct ownership, spot Bitcoin ETFs offer a compelling alternative.</p>
<p>The structural advantages are straightforward:</p>
<ul class="content-list">
<li class="mt-2">No private keys to manage, and no risk of wallet loss or theft</li>
<li class="mt-2">Accessible through any traditional brokerage account</li>
<li class="mt-2">Standard 1099 reporting, consistent with how stocks and other ETFs are handled</li>
<li class="mt-2">Simplified tax reporting that eliminates wallet-by-wallet transaction tracking</li>
</ul>
<p>For investors already comfortable with ETF wrappers across equities, fixed income, and commodities, a spot Bitcoin ETF may represent one of the most familiar and operationally efficient ways to add digital asset exposure to a diversified portfolio.</p>
<h2>Explore VanEck&rsquo;s Bitcoin ETF Solution</h2>
<p>The <a href="/link/c754aca617ab4535a8e611ded6d5b13c.aspx" title="HODL VanEck Bitcoin ETF"><strong>VanEck Bitcoin ETF (HODL)</strong></a> offers a convenient way to gain exposure to Bitcoin without the complexities of direct ownership. It may be a cost-efficient method to obtain bitcoin exposure, managed by VanEck, a well-established ETF issuer with extensive experience in crypto-related products. <a href="/link/c754aca617ab4535a8e611ded6d5b13c.aspx" title="HODL VanEck Bitcoin ETF"><strong>HODL</strong></a> also benefits from expert management and qualified custody of bitcoin.</p>
<p>Direct bitcoin ownership requires interacting with a crypto exchange, managing storage, and ensuring security, all of which can be complex. <a href="/link/c754aca617ab4535a8e611ded6d5b13c.aspx" title="HODL VanEck Bitcoin ETF"><strong>HODL</strong></a> can be bought and sold on traditional stock exchanges, making it accessible through brokerage accounts, simplifying the process for investors.</p>

<p>To receive more <strong><a href="https://www.vaneck.com/us/en/insights/digital-assets/" title="Digital Assets Insights">Digital Assets</a></strong> insights, <strong><a href="https://www.vaneck.com/us/en/subscribe/" title="Subscription Center">sign up in our subscription center</a></strong>.</p>
]]></content:encoded>
</item><item rdf:about="https://www.vaneck.com/us/en/blogs/emerging-markets-equity/chinas-next-chapter-investing-in-industrial-innovators/">
  <title>China’s Next Chapter: Investing in Industrial Innovators></title>
  <link>https://www.vaneck.com/us/en/blogs/emerging-markets-equity/chinas-next-chapter-investing-in-industrial-innovators/</link>
  <description><![CDATA[China&rsquo;s next growth phase is driven by advanced manufacturing, electrification and AI infrastructure. The ChiNext Index provides targeted exposure to these industrial innovators.]]></description>
  <dc:creator>Sunny  Bokhari</dc:creator>
  <dc:date>03/13/2026 06:30:00</dc:date>
<content:encoded><![CDATA[

<p><strong>Key Takeaways:</strong></p>
<ul class="content-list">
<li class="mt-2">China&rsquo;s innovation story has shifted from consumer internet platforms to industrial and technology infrastructure.</li>
<li class="mt-2">The ChiNext Index provides concentrated exposure to predominantly private-sector companies in advanced manufacturing, AI hardware, EV supply chains and clean energy.</li>
<li class="mt-2">ChiNext&rsquo;s differentiated sector composition has historically led to competitive performance and lower correlation versus broader China equity benchmarks.</li>
</ul>
<p>When investors seek exposure to innovative companies in China, they typically gravitate towards consumer internet names such as Alibaba, Tencent and e-commerce companies included in broad beta China indexes. We believe these companies represent an earlier phase of China&rsquo;s innovation, and investors may be overlooking the firms powering the next phase of China&rsquo;s technological leadership. The &lsquo;new&rsquo; China narrative centers on domestic industrial production, advanced manufacturing, AI hardware, datacenter infrastructure, EV supply chains, automation and medical technology. These rapidly growing industries benefit from direct policy support from Beijing and are tapping onshore capital markets that reward innovation.</p>
<h2>Webinar: Access the Companies Driving China's Innovation Economy</h2>
<p>On March 16 at 11 AM ET, we hosted a webinar on investing in China&rsquo;s fastest-growing innovators with concentrated ChiNext exposure.</p>
<p>The World Economic Forum has dubbed China&rsquo;s new strategic ambition &ldquo;Made in China 2.0,&rdquo;<sup>1</sup>&nbsp;an AI-augmented, green-energy-powered, self-reliance-oriented transformation of the world&rsquo;s most formidable industrial base. The Chinese government is actively supporting private enterprises to develop domestic manufacturing prowess in strategic sectors like solar energy, electric vehicles (EVs), humanoid robots, enterprise-grade AI systems and semiconductors. It is providing state funding, tax incentives and targeted programs such as the &ldquo;Private Economy Promotion Law&rdquo; to foster self-reliance in cutting-edge technology.<sup>2</sup>ChiNext is comprised of these market driven, predominantly private sector companies benefiting from both market dynamics and government policy support.</p>
<h2>What Is the ChiNext Market?</h2>
<p>The ChiNext board, operated by the Shenzhen Stock Exchange, serves as China&rsquo;s flagship platform for innovative and predominantly privately owned enterprises. It represents a distinct segment of the A-share universe that is designed specifically to support fast growing companies operating in strategic emerging industries. The ChiNext board lists companies that are building advanced manufacturing systems, clean energy technologies, medical devices, AI hardware, enterprise software and automation platforms among other forward-looking industries.</p>
<p>Unlike traditional main board listings dominated by state-owned banks, insurers and energy conglomerates, ChiNext provides targeted exposure to predominantly private-sector companies focused on technological advancement. This structural orientation differentiates ChiNext companies from both the companies listed on the state-heavy Shanghai main board and the consumer internet-oriented companies listed in Hong Kong or the United States.</p>
<h2>ChiNext&rsquo;s Sector Exposure: Industrials and Technology</h2>
<p>One of the defining characteristics of the ChiNext Index<sup>3</sup>&nbsp;is its sector composition that maintains a pronounced allocation to information technology and industrials sectors. This exposure underscores the Index&rsquo;s focus on engineering-intensive industries such as hardware technology, advanced electronics, automation systems and renewable energy equipment. The Index maintains meaningful exposure to businesses supplying critical hardware for global data center expansion, and to leading battery and inverter manufacturers.</p>
<h3>China's Innovation Economy: Concentrated Where It Counts</h3>
<p><strong>ChiNext's exposure to high-growth hardware and electronics sectors dwarfs every major China benchmark </strong></p>
<img loading="lazy" class="desktop-image img-responsive" alt="China's Innovation Economy: Concentrated Where It Counts" src="https://www.vaneck.com/contentassets/ebeba2ff8f0f4ea38f7f0847ed914b22/6970_cnxt-blog_chart-1_2026-3_v1_desktop.svg" /><img loading="lazy" class="mobile-image img-responsive" alt="China's Innovation Economy: Concentrated Where It Counts" src="https://www.vaneck.com/contentassets/ebeba2ff8f0f4ea38f7f0847ed914b22/6970_cnxt-blog_chart-1_2026-3_v1_mobile.svg" />
<p class="chart-disclosure">Source: FactSet. Data as of 2/28/2026. Past performance is no guarantee of future results.</p>

<p>This exposure stands in marked contrast to broader China indexes, which allocate significantly to financials, communication services and consumer discretionary sectors. Broad China indexes lean heavily towards state-owned enterprises, while offshore internet-heavy indexes are typically dominated by consumer internet-based business companies. In contrast, the ChiNext Index offers a differentiated exposure to China&rsquo;s emerging industrial leaders poised to drive the country&rsquo;s next phase of growth.</p>
<h2>Innovation Leaders Powering the Next Decade</h2>
<p>The largest constituents within ChiNext Index are companies that operate as global leaders in specialized industries. These include electric vehicle battery manufacturers that supply critical components to multinational automakers, producers of solar inverters and renewable energy equipment used in utility-scale installations worldwide, and manufacturers of high-speed optical components essential for hyperscale data centers and AI servers.</p>


<p class="chart-disclosure">Source: VanEck.<br />Portfolio Weights as of 2/28/2026. Fund and index holdings are subject to change. Not intended as a recommendation to buy or sell any names referenced. Visit vaneck.com/cnxt for complete holdings data.</p>
<p>These companies provide critical inputs that are essential to AI computing infrastructure, renewable energy systems, advanced manufacturing processes and medical technology development. Their earnings tend to be less sensitive to consumer demand-driven shocks as they are often tied to capital expenditure cycles and structural growth trends.</p>
<h2>Performance and Diversification Benefits</h2>
<p>The ChiNext Index&rsquo;s structural orientation has translated into competitive performance across multiple time horizons. It has outperformed a broad range of China equity benchmarks over trailing one, three and five-year periods. This outperformance is driven by the Index&rsquo;s concentration in companies benefiting from AI infrastructure buildouts, electrification trends and industrial upgrading as opposed to legacy consumer internet-based businesses present in most China indexes.</p>
<h3>Outperforming Across 1, 3, and 5 Years</h3>
<p><strong>ChiNext has delivered stronger returns than a broad field of China indexes over the last five years</strong></p>
<div class="wrapped-div">
<table style="width: 100%;">
<tbody>
<tr class="tbl-data">
<td class="tbl-header last text-right">&nbsp;</td>
<td class="tbl-header last text-right">YTD</td>
<td class="tbl-header last text-right">1-year</td>
<td class="tbl-header last text-right">3-Years</td>
<td class="tbl-header last text-right">5-Year</td>
<td class="tbl-header last text-right">10-Years</td>
</tr>
<tr class="tbl-data">
<td class="data-td last">ChiNext Index</td>
<td class="data-td data last text-right">5.35</td>
<td class="data-td data last text-right">64.04</td>
<td class="data-td data last text-right">12.63</td>
<td class="data-td data last text-right">2.26</td>
<td class="data-td data last text-right">6.10</td>
</tr>
<tr class="tbl-data">
<td class="data-td last">MSCI China Index</td>
<td class="data-td data last text-right">-1.34</td>
<td class="data-td data last text-right">14.74</td>
<td class="data-td data last text-right">11.06</td>
<td class="data-td data last text-right">-4.62</td>
<td class="data-td data last text-right">7.11</td>
</tr>
<tr class="tbl-data">
<td class="data-td last">MSCI China A Onshore Index</td>
<td class="data-td data last text-right">6.90</td>
<td class="data-td data last text-right">39.15</td>
<td class="data-td data last text-right">8.92</td>
<td class="data-td data last text-right">0.15</td>
<td class="data-td data last text-right">5.82</td>
</tr>
<tr class="tbl-data">
<td class="data-td last">FTSE China Incl A 25% Tech Capped Index</td>
<td class="data-td data last text-right">0.47</td>
<td class="data-td data last text-right">18.96</td>
<td class="data-td data last text-right">8.18</td>
<td class="data-td data last text-right">-9.67</td>
<td class="data-td data last text-right">5.24</td>
</tr>
<tr class="tbl-data">
<td class="data-td last">CSI Overseas China Internet Index</td>
<td class="data-td data last text-right">-8.66</td>
<td class="data-td data last text-right">-2.20</td>
<td class="data-td data last text-right">5.69</td>
<td class="data-td data last text-right">-15.88</td>
<td class="data-td data last text-right">1.98</td>
</tr>
</tbody>
</table>
</div>
<p class="chart-disclosure">Source: Morningstar. Data as of 2/28/2026. Index performance is not illustrative of fund performance. It is not possible to invest directly in an index. Past performance is no guarantee of future results.</p>
<p>Its differentiated exposure has also resulted in a return profile that does not move in lockstep with global equity benchmarks. Historically, ChiNext has exhibited lower correlation to major global indexes than many other China equity benchmarks, providing an additional layer of diversification within global portfolios.<sup>4</sup></p>
<h2>Positioning for China&rsquo;s Next Phase</h2>
<p>China&rsquo;s innovation story has broadened and is no longer defined solely by offshore consumer internet platforms. China&rsquo;s next economic chapter will be written by domestic industrial champions building the physical infrastructure that supports AI, electrification and advanced manufacturing.</p>
<p>Companies participating in China&rsquo;s transition toward technological self-reliance and industrial modernization are likely to benefit from these structural trends. Investors whose China allocations continue to track legacy benchmarks dominated by mega-cap internet and financial companies may benefit from gaining exposure to the ChiNext Index.</p>
<p>With minimal overlap with traditional China benchmarks, the ChiNext Index offers a differentiated exposure and a distinct return profile geared towards China&rsquo;s future innovators. The VanEck ChiNext ETF offers access to innovative companies in China and may appeal to investors seeking growth or technology exposure in emerging markets.</p>
<p>To receive more <a href="/us/en/insights/emerging-markets-equity/" title="Emerging Markets Equity Insights"><strong>Emerging Markets Equity</strong></a> insights, <a href="/us/en/subscribe/" title="Subscription Center"><strong>sign up in our subscription center</strong></a>.</p>
]]></content:encoded>
</item><item rdf:about="https://www.vaneck.com/us/en/blogs/income-investing/interval-funds-a-primer/">
  <title>Interval Funds: A Primer></title>
  <link>https://www.vaneck.com/us/en/blogs/income-investing/interval-funds-a-primer/</link>
  <description><![CDATA[This primer offers a concise overview of interval funds&mdash;how they work, how they differ from other investment vehicles, and how investors can buy and redeem shares. Explore whether interval funds may fit within your portfolio strategy.]]></description>
  <dc:creator> </dc:creator>
  <dc:date>03/12/2026 06:30:00</dc:date>
<content:encoded><![CDATA[


<h2>Interval Fund Structure Vs. Other Vehicles</h2>
<div class="wrapped-div">
<table style="width: 100%;">
<tbody>
<tr class="tbl-data">
<td class="tbl-header last">Feature</td>
<td class="tbl-header last text-left">Interval Fund</td>
<td class="tbl-header last text-left">Tender Offer Fund</td>
<td class="tbl-header last text-left">Mutual Fund</td>
<td class="tbl-header last text-left">ETF</td>
<td class="tbl-header last text-left">Listed Closed-End Fund</td>
</tr>
<tr class="tbl-data">
<td class="data-td last">Trading</td>
<td class="data-td data last text-left">Direct with fund</td>
<td class="data-td data last text-left">Exchange</td>
</tr>
<tr class="tbl-data">
<td class="data-td last">Pricing</td>
<td class="data-td data last text-left">NAV</td>
<td class="data-td data last text-left">Market price</td>
</tr>
<tr class="tbl-data">
<td class="data-td last">Redemption</td>
<td class="data-td data last text-left">Required periodic repurchases (typically 5% of shares outstanding quarterly)</td>
<td class="data-td data last text-left">Periodic repurchases at Fund&rsquo;s discretion (typically quarterly)</td>
<td class="data-td data last text-left">Daily</td>
<td class="data-td data last text-left">None (sell on exchange)</td>
</tr>
<tr class="tbl-data">
<td class="data-td last">Liquidity</td>
<td class="data-td data last text-left">Periodic</td>
<td class="data-td data last text-left">Discretionary</td>
<td class="data-td data last text-left">Daily</td>
<td class="data-td data last text-left">Intraday</td>
</tr>
<tr class="tbl-data">
<td class="data-td last">Premium/Discount</td>
<td class="data-td data last text-left">No</td>
<td class="data-td data last text-left">Possible</td>
<td class="data-td data last text-left">Common</td>
</tr>
<tr class="tbl-data">
<td class="data-td last">Liquidity</td>
<td class="data-td data last text-left">Typical (up to 33.3 1/3% with debt; 50% with preferred stock)</td>
<td class="data-td data last text-left">Not typical (up to 33.3 1/3% with debt)</td>
<td class="data-td data last text-left">Typical (up to 33.3 1/3% with debt; 50% with preferred stock)</td>
</tr>
</tbody>
</table>
</div>
<br /><br />
<h2>How to Purchase Shares</h2>
<p class="mb-3">Investing in an interval fund is straightforward and similar to purchasing shares of a mutual fund:</p>
<div class="row mt-4 align-items-center">
<div class="col-md-3 col-xs-12 col-lg-1"><img loading="lazy" class="img-responsive w-100 center-image" src="https://www.vaneck.com/contentassets/80fd4a2deaf04267854e1209fec33891/financial-advisor.svg" alt="Hedges Against Financial and Geopolitical Risk" /></div>
<div class="col-md-9 col-xs-12 col-lg-11">
<p><strong>Through a Financial Advisor:</strong></p>
<p>Most interval funds are distributed through broker-dealers and registered investment advisors, who facilitate the purchase and manage the subscription process.</p>
</div>
</div>
<hr style="border: 1px solid #E6E7E8;" />
<div class="row mt-4 align-items-center">
<div class="col-md-3 col-xs-12 col-lg-1"><img loading="lazy" class="img-responsive w-100 center-image" src="https://www.vaneck.com/contentassets/80fd4a2deaf04267854e1209fec33891/directly-with-fund.svg" alt="Acts as a Store of Value" /></div>
<div class="col-md-9 col-xs-12 col-lg-11">
<p><strong>Directly with the Fund:</strong></p>
<p>Eligible investors may purchase shares directly through the fund&rsquo;s transfer agent by completing a subscription agreement.</p>
</div>
</div>
<hr style="border: 1px solid #E6E7E8;" />
<div class="row mt-4 align-items-center">
<div class="col-md-3 col-xs-12 col-lg-1"><img loading="lazy" class="img-responsive w-100 center-image" src="https://www.vaneck.com/contentassets/80fd4a2deaf04267854e1209fec33891/custodial-platforms.svg" alt="Hedges Against Financial and Geopolitical Risk" /></div>
<div class="col-md-9 col-xs-12 col-lg-11">
<p><strong>Custodial Platforms:</strong></p>
<p>Many interval funds are available on major custodial platforms (e.g., Schwab, Fidelity, Pershing, etc.), allowing seamless integration with existing brokerage accounts.</p>
</div>
</div>
<hr style="border: 1px solid #E6E7E8;" />
<div class="row mt-4 align-items-center">
<div class="col-md-3 col-xs-12 col-lg-1"><img loading="lazy" class="img-responsive w-100 center-image" src="https://www.vaneck.com/contentassets/80fd4a2deaf04267854e1209fec33891/pricing.svg" alt="Hedges Against Financial and Geopolitical Risk" /></div>
<div class="col-md-9 col-xs-12 col-lg-11">
<p><strong>Pricing:</strong></p>
<p>Shares are purchased at the next calculated NAV after an order is received. Most funds calculate NAV daily.</p>
</div>
</div>
<br /><br />
<h2>How to Redeem Shares</h2>
<p class="mb-3">Interval funds offer liquidity through periodic repurchase offers:</p>
<div class="row mt-4 align-items-center">
<div class="col-md-3 col-xs-12 col-lg-1"><img loading="lazy" class="img-responsive w-100 center-image" src="https://www.vaneck.com/contentassets/80fd4a2deaf04267854e1209fec33891/notification.svg" alt="Hedges Against Financial and Geopolitical Risk" /></div>
<div class="col-md-9 col-xs-12 col-lg-11">
<p><strong>Step 1 - Notification:</strong></p>
<p>The fund announces the repurchase offer, specifying the percentage of shares offered (typically 5%), the request deadline, and the repurchase pricing date.</p>
</div>
</div>
<hr style="border: 1px solid #E6E7E8;" />
<div class="row mt-4 align-items-center">
<div class="col-md-3 col-xs-12 col-lg-1"><img loading="lazy" class="img-responsive w-100 center-image" src="https://www.vaneck.com/contentassets/80fd4a2deaf04267854e1209fec33891/submit-request.svg" alt="Acts as a Store of Value" /></div>
<div class="col-md-9 col-xs-12 col-lg-11">
<p><strong>Step 2 - Submit Request:</strong></p>
<p>Shareholders submit a repurchase request through their broker, advisor, or directly to the fund's transfer agent before the deadline.</p>
</div>
</div>
<hr style="border: 1px solid #E6E7E8;" />
<div class="row mt-4 align-items-center">
<div class="col-md-3 col-xs-12 col-lg-1"><img loading="lazy" class="img-responsive w-100 center-image" src="https://www.vaneck.com/contentassets/80fd4a2deaf04267854e1209fec33891/prorata-allocation.svg" alt="Hedges Against Financial and Geopolitical Risk" /></div>
<div class="col-md-9 col-xs-12 col-lg-11">
<p><strong>Step 3 - Pro-Rata Allocation:</strong></p>
<p>If total requests exceed the offer amount, requests are fulfilled on a pro-rata basis. For example, if the fund offers to repurchase 5% of shares but receives requests for 10%, each investor receives 50% of their requested amount.</p>
</div>
</div>
<hr style="border: 1px solid #E6E7E8;" />
<div class="row mt-4 align-items-center">
<div class="col-md-3 col-xs-12 col-lg-1"><img loading="lazy" class="img-responsive w-100 center-image" src="https://www.vaneck.com/contentassets/80fd4a2deaf04267854e1209fec33891/receive-proceeds.svg" alt="Hedges Against Financial and Geopolitical Risk" /></div>
<div class="col-md-9 col-xs-12 col-lg-11">
<p><strong>Step 4 - Receive Proceeds:</strong></p>
<p>Proceeds are typically paid within 7 days after the repurchase pricing date, either by check or direct deposit to your account.</p>
</div>
</div>
<br /><br />
<h2>Redemption Timing Explained</h2>
<p>Understanding the redemption timeline is critical for liquidity planning:</p>
<div class="wrapped-div">
<table style="width: 70%;">
<tbody>
<tr class="tbl-data">
<td class="tbl-header last text-left">Timeline</td>
<td class="tbl-header last text-left">Event</td>
</tr>
<tr class="tbl-data">
<td class="data-td last">Day 1</td>
<td class="data-td data last text-left">Fund announces repurchase offer (notification sent to shareholders)</td>
</tr>
<tr class="tbl-data">
<td class="data-td last">Days 1-21</td>
<td class="data-td data last text-left">Offer window open - shareholders may submit repurchase requests (minimum 21 days)</td>
</tr>
<tr class="tbl-data">
<td class="data-td last">Day 21</td>
<td class="data-td data last text-left">Request Deadline - all repurchase requests must be received</td>
</tr>
<tr class="tbl-data">
<td class="data-td last">Days 21-35</td>
<td class="data-td data last text-left">Repurchase Pricing Date - NAV calculated (within 14 days of deadline)</td>
</tr>
<tr class="tbl-data">
<td class="data-td last">Days 28-42</td>
<td class="data-td data last text-left">Payment - proceeds distributed (within 7 days of pricing date)</td>
</tr>
</tbody>
</table>
<br /><br />
<h2>Advantages and Risks of Interval Funds</h2>
<div class="wrapped-div">
<table style="width: 70%;">
<tbody>
<tr class="tbl-data">
<td class="tbl-header last">Advantages</td>
<td class="tbl-header last text-left">Risks</td>
</tr>
<tr class="tbl-data">
<td class="data-td data last text-left">
<ul class="content-list">
<li class="mt-2">Access to alternative investments</li>
<li class="mt-2">NAV pricing (no premium/discount)</li>
<li class="mt-2">Lower minimums than private funds</li>
<li class="mt-2">1099 tax reporting</li>
<li class="mt-2">SEC oversight and transparency</li>
<li class="mt-2">Potential for yield enhancement</li>
</ul>
</td>
<td class="data-td data last text-left">
<ul class="content-list">
<li class="mt-2">Limited redemption windows</li>
<li class="mt-2">Possible pro-rata redemptions</li>
<li class="mt-2">Underlying asset illiquidity</li>
<li class="mt-2">Unobservable market prices</li>
<li class="mt-2">Typically higher expense ratios than MFs/ETFs</li>
<li class="mt-2">No secondary market</li>
</ul>
</td>
</tr>
</tbody>
</table>
</div>
<br /><br />
<h2>Who Should Invest in Interval Funds?</h2>
<p>Interval funds may be appropriate for investors who:</p>
<ul class="content-list">
<li class="mt-2">Seek exposure to alternative investments without private fund complexity</li>
<li class="mt-2">Have longer investment horizons and can accept limited liquidity</li>
<li class="mt-2">Want potential yield enhancement or diversification benefits</li>
<li class="mt-2">Prefer NAV-based pricing over exchange-traded price volatility</li>
<li class="mt-2">Value 1940 Act protections and transparent reporting</li>
</ul>
</div>
<style type="text/css">
    @media (max-width: 767px) {
        .center-image {
            display: block;
            margin-left: auto;
            margin-right: auto;
            width: 300px !important;
            padding-bottom: 15px;
        }
    }
</style>
]]></content:encoded>
</item><item rdf:about="https://www.vaneck.com/us/en/blogs/model-portfolios/february-market-recap-history-rewards-the-prepared/">
  <title>February Market Recap: History Rewards the Prepared></title>
  <link>https://www.vaneck.com/us/en/blogs/model-portfolios/february-market-recap-history-rewards-the-prepared/</link>
  <description><![CDATA[Today&rsquo;s economic landscape is fundamentally different than in past periods of conflict. As structural inflation, supply constraints, and de-globalization build, traditional 60/40 portfolios may struggle in this new diversification era.]]></description>
  <dc:creator>David Schassler</dc:creator>
  <dc:date>03/12/2026 06:30:00</dc:date>
<content:encoded><![CDATA[

<p><strong>Key Takeaways:</strong></p>
<ul class="content-list">
<li class="mt-2"><strong>Conflict Duration Matters:</strong> Early tactical success does not eliminate the risk of extended economic disruption.</li>
<li class="mt-2"><strong>Energy Is the Transmission Mechanism:</strong> Oil and commodity shocks remain the fastest channel from geopolitics to inflation and market volatility.</li>
<li class="mt-2"><strong>Portfolio Construction Must Evolve:</strong> In a structurally shifting regime, investors need to think beyond traditional 60/40 allocations to include real assets as a source of resilience.</li>
</ul>

<h2 id="market-review" class="anchored-block jump-link-nav" data-jumplink-title="Market Review">Wars Rarely End on Schedule</h2>
<p>We have seen this movie before.</p>
<p>Russia expected to sweep Ukraine in days. Years later, the war continues.</p>
<p>Every war begins with confidence. Few end on schedule.</p>
<p>In 1914, European leaders believed World War I would end by Christmas. It lasted more than four years.</p>
<p>The Soviet Union entered Afghanistan in 1979 expecting a short campaign. The conflict dragged on for nearly a decade.</p>
<p>The United States toppled Saddam Hussein&rsquo;s regime in weeks in 2003. The war that followed lasted years.</p>
<p>It would be unwise for markets to ignore that history.</p>
<p>Technology wins battles. Production wins wars.</p>
<p><strong>The duration of the conflict is unknowable. Extrapolating early military success into a near-term victory while discounting the risk of prolonged economic disruption would be a mistake. </strong></p>
<p>In a single week, the U.S. and Israel launched more than 5,000 air attacks. That is industrial-scale engagement.</p>
<p>Wars are not fought only on battlefields. They are fought in factories and energy markets.</p>
<p>And factories and energy markets eventually show up in CPI.</p>
<p>Modern conflicts are hallmarked by long-duration economic contests, not short military campaigns.</p>
<h2>Wars Move Faster Than Factories</h2>
<p>During World War II, America converted automobile plants into tank factories and retrained millions of workers.</p>
<p>It worked because the United States was already an industrial economy.</p>
<p>Today, the U.S. is primarily a service-driven economy.</p>
<p>Good luck turning an accountant into a welder overnight.</p>
<p>Industrial capacity takes time. Supply chains take time. Skilled labor takes time.</p>
<p>Wars move faster than factories.</p>
<p>The chart below shows total global military expenditure. As rapidly advancing technology meets geopolitical instability, military spending is likely to move structurally higher in the years ahead.</p>
<h3>Unprecedented Rise in Global Military Expenditure</h3>
<p><img loading="lazy" class="desktop-image img-responsive" src="https://www.vaneck.com/EPiServer/CMS/Content/contentassets/5960f17778da4afa8e4965c074d7d18b/6969_-february-market-recap_chart-1_2026-3_v1_desktop.svg,,364476/Download?epieditmode=False" alt="Unprecedented Rise in Global Military Expenditure" /></p>
<p><img loading="lazy" class="mobile-image img-responsive" src="https://www.vaneck.com/EPiServer/CMS/Content/contentassets/5960f17778da4afa8e4965c074d7d18b/6969_-february-market-recap_chart-1_2026-3_v1_mobile.svg,,364477/Download?epieditmode=False" alt="Unprecedented Rise in Global Military Expenditure" /></p>
<p class="chart-disclosure">Source: SIPRI. As of 2025.</p>
<h2>The Inventory Problem</h2>
<p>The Wall Street Journal recently reported that the U.S. is racing to complete its Iran mission before munitions inventories run low. Reuters reported that defense executives were called to the White House to accelerate production.</p>
<p>That is inventory stress.</p>
<p>$20,000 Iranian drones are attacking billion-dollar infrastructure and being defended against with multi-million-dollar munitions.</p>
<p>This is how superpowers bleed: through sustained imbalance.</p>
<p>Iran cannot defeat the U.S. militarily, but it can exploit structural vulnerabilities. The immediate pressure point is energy. With roughly 20% of global oil flowing through the Strait of Hormuz, even brief disruption can send prices sharply higher and trigger cascading volatility across global markets. This is the modern battlefield.</p>
<h2>Inflation Risks Are Back</h2>
<p>Two weeks ago, we avoided the &ldquo;i&rdquo; word.</p>
<p>Not anymore.</p>
<p>Historically, major conflicts have coincided with rising inflation.</p>
<h3>YoY CPI Over Time</h3>
<p><img loading="lazy" class="desktop-image img-responsive" src="https://www.vaneck.com/EPiServer/CMS/Content/contentassets/e4886c525b4a419b9ddb44b4d866a338/6969_-february-market-recap_chart-2_2026-3_v1_desktop.svg,,364479/Download?epieditmode=False" alt="YoY CPI Over Time" /></p>
<p><img loading="lazy" class="mobile-image img-responsive" src="https://www.vaneck.com/EPiServer/CMS/Content/contentassets/e4886c525b4a419b9ddb44b4d866a338/6969_-february-market-recap_chart-2_2026-3_v1_mobile.svg,,364480/Download?epieditmode=False" alt="YoY CPI Over Time" /></p>
<p class="chart-disclosure">Source: Bloomberg. As of 1/31/2026.</p>
<p>Inflation rarely arrives in a straight line. The 1940&rsquo;s experiences multiple waves. The 1970s had more than one spike. You only know it is over years after the fact.</p>
<h2>Inflation Comes in Waves</h2>
<p><strong>1940s Inflation</strong></p>
<p><img loading="lazy" class="desktop-image img-responsive" src="https://www.vaneck.com/EPiServer/CMS/Content/contentassets/fb847f2b0bde409ab6c753bcc68b31ff/6969_-february-market-recap_chart-3_2026-3_v1_desktop.svg,,364482/Download?epieditmode=False" alt="1940s Inflation" /></p>
<p><img loading="lazy" class="mobile-image img-responsive" src="https://www.vaneck.com/EPiServer/CMS/Content/contentassets/fb847f2b0bde409ab6c753bcc68b31ff/6969_-february-market-recap_chart-3_2026-3_v1_mobile.svg,,364483/Download?epieditmode=False" alt="1940s Inflation" /></p>
<p><strong>1970s Inflation</strong></p>
<p><img loading="lazy" class="desktop-image img-responsive" src="https://www.vaneck.com/EPiServer/CMS/Content/contentassets/fb847f2b0bde409ab6c753bcc68b31ff/6969_-february-market-recap_chart-4_2026-3_v1_desktop.svg,,364484/Download?epieditmode=False" alt="1970s Inflation" /></p>
<p><img loading="lazy" class="mobile-image img-responsive" src="https://www.vaneck.com/EPiServer/CMS/Content/contentassets/fb847f2b0bde409ab6c753bcc68b31ff/6969_-february-market-recap_chart-4_2026-3_v1_mobile.svg,,364485/Download?epieditmode=False" alt="1970s Inflation" /></p>
<p class="chart-disclosure">Source: Bloomberg. As of 12/31/1997.</p>
<p>Oil has already briefly moved near $120 per barrel and could move significantly higher.</p>
<p>Oil is in your airline ticket, your grocery bill, and the plastic wrapped around both.</p>
<p><strong>When oil spikes, nearly everyone feels it. </strong></p>
<h3>Oil Neared $120 Per Barrel in Early March</h3>
<p><strong>Date Range: March 4, 2026 to March 10, 2026</strong></p>
<p><img loading="lazy" class="desktop-image img-responsive" src="https://www.vaneck.com/EPiServer/CMS/Content/contentassets/8f7442f7cc9240dfbbd89d78ea6b026e/6969_-february-market-recap_chart-5_2026-3_v1_desktop.svg,,364487/Download?epieditmode=False" alt="Oil Neared $120 Per Barrel in Early March" /></p>
<p><img loading="lazy" class="mobile-image img-responsive" src="https://www.vaneck.com/EPiServer/CMS/Content/contentassets/8f7442f7cc9240dfbbd89d78ea6b026e/6969_-february-market-recap_chart-5_2026-3_v1_mobile.svg,,364488/Download?epieditmode=False" alt="Oil Neared $120 Per Barrel in Early March" /></p>
<p class="chart-disclosure">Source: Bloomberg. Data from 3/4/2026&ndash;3/10/2026.</p>
<h2 id="portfolio-implications" class="jump-link-nav anchored-block" data-jumplink-title="Portfolio Implications">Portfolio Implications</h2>
<p>The global economy is already operating in a new structural regime.</p>
<p>The post-COVID world is defined by a collision between technological acceleration and real-world constraints: energy, labor, supply chains, and geopolitics. At the same time, de-globalization is shifting the focus toward national resilience and strategic independence.</p>
<p>The result is a system that increasingly favors independence, accountability, and the compounding advantages of technological leadership.</p>
<p>These forces are structural and likely to unfold over many years.</p>
<p>The portfolio implications are profound.</p>
<p>For decades, investors relied on a simple framework: a 60/40 portfolio of stocks and bonds. That framework worked in a world shaped by globalization and declining interest rates.</p>
<p><strong>That world has changed.</strong></p>
<p>Diversification beyond the traditional 60/40 portfolio is becoming increasingly important.</p>
<p>Real assets are already responding.</p>
<p><strong>Portfolios built for the last regime may struggle in the next one. This is the diversification era.</strong></p>
<div class="wrapped-div">
<table style="width: 50%;">
<tbody>
<tr class="tbl-data">
<td class="tbl-header last text-left">INDEX</td>
<td class="tbl-header last text-right">YTD Price Change (%)</td>
</tr>
<tr class="tbl-data">
<td class="data-td data last text-left">Bloomberg Gold Subindex Index</td>
<td class="data-td data last text-right">+16.70</td>
</tr>
<tr class="tbl-data">
<td class="data-td data last text-left">Bloomberg Commodity Index</td>
<td class="data-td data last text-right">+21.77</td>
</tr>
<tr class="tbl-data">
<td class="data-td data last text-left">S&amp;P Global Natural Resources Index</td>
<td class="data-td data last text-right">+16.45</td>
</tr>
</tbody>
</table>
</div>
<p class="chart-disclosure">Source: Bloomberg. As of 3/9/2026. Index performance is not illustrative of strategy performance. It is not possible to invest directly in an index.</p>

<h2 id="macro-themes" class="anchored-block jump-link-nav" data-jumplink-title="Macro themes we&rsquo;re watching">Macro themes we&rsquo;re watching:</h2>

<p>Today&rsquo;s predominant macro forces are driving the key themes and exposures in VanEck&rsquo;s models, including the core allocation of the <a href="https://www.vaneck.com/us/en/investments/wealth-builder-plus-portfolios/overview/" title="VanEck Wealth Builder Plus Portfolios"><strong>VanEck Wealth Builder Plus Portfolios</strong></a>. The allocations below are representative of the Moderate Portfolio.</p>
<p class="d-none d-lg-block"><img loading="lazy" class="img-responsive" src="https://www.vaneck.com/contentassets/8889e957e3bb4292b5643dd074587ffd/6398_models-monthly-october_pie-chart-1_2025-11_v1_desktop.svg" alt="Asset Allocation" /></p>
<p style="width: 345px;" class="d-lg-none"><img loading="lazy" class="img-responsive" src="https://www.vaneck.com/contentassets/8889e957e3bb4292b5643dd074587ffd/6398_models-monthly-october_pie-chart-1_2025-11_v1_mobile_blog.svg" alt="Asset Allocation" /></p>
<p class="chart-disclosure">Source: VanEck, 2/28/2026. Not intended as a recommendation to buy or sell any securities or digital assets, or as investment or any call to action.</p>
<div class="wrapped-div">
<table style="width: 100%;">
<tbody>
<tr class="tbl-data">
<td class="tbl-header last text-left">Asset Class</td>
<td class="tbl-header last text-right">Allocation</td>
<td class="tbl-header last text-left">Related Products</td>
</tr>
<tr class="tbl-data">
<td class="tbl-header last text-left">Equity</td>
<td class="tbl-header last text-right">&nbsp;</td>
<td class="tbl-header last text-left">&nbsp;</td>
</tr>
<tr class="tbl-data">
<td class="data-td data last text-left">Economic Moats</td>
<td class="data-td data last text-right">3.6%</td>
<td class="data-td data last text-left"><a href="/link/9e43dd198c5f4e419f13220685081895.aspx" title="MOAT - VanEck Morningstar Wide Moat ETF"><strong>MOAT</strong></a> | <a href="/link/166321dbcfec440590fb51cf0ad629aa.aspx" title="SMOT - VanEck Morningstar SMID Moat ETF"><strong>SMOT</strong></a></td>
</tr>
<tr class="tbl-data">
<td class="data-td data last text-left">AI &amp; Technology</td>
<td class="data-td data last text-right">2.4%</td>
<td class="data-td data last text-left"><a href="/link/018811e6db344b7691fd273a97737194.aspx" title="GPZ - VanEck Alternative Asset Manager ETF"><strong>SMH</strong></a></td>
</tr>
<tr class="tbl-data">
<td class="data-td data last text-left">Private Markets</td>
<td class="data-td data last text-right">2.0%</td>
<td class="data-td data last text-left"><a href="/link/018811e6db344b7691fd273a97737194.aspx" title="GPZ - VanEck Alternative Asset Manager ETF"><strong>GPZ</strong></a> | <a href="/link/c48bed1be12e47c88f01e1bdbfa51ed2.aspx" title="BIZD - VanEck BDC Income ETF"><strong>BIZD</strong></a></td>
</tr>
<tr class="tbl-data">
<td class="data-td data last text-left">Leapfrog Innovation</td>
<td class="data-td data last text-right">0.7%</td>
<td class="data-td data last text-left"><a href="/link/6eb23584c31940ce96a2427607da5914.aspx" title="GLIN - VanEck India Growth Leaders ETF"><strong>GLIN</strong></a></td>
</tr>
<tr class="tbl-data">
<td class="tbl-header last text-left">Fixed Income</td>
<td class="tbl-header last text-right">&nbsp;</td>
<td class="tbl-header last text-left">&nbsp;</td>
</tr>
<tr class="tbl-data">
<td class="data-td data last text-left">Attractive Valuation</td>
<td class="data-td data last text-right">4.7%</td>
<td class="data-td data last text-left"><a href="/link/edc87d2b16cf4498a2884c1752ac9fe0.aspx" title="MIG - VanEck Moody&rsquo;s Analytics IG Corporate Bond ETF"><strong>MIG</strong></a></td>
</tr>
<tr class="tbl-data">
<td class="data-td data last text-left">Yield &amp; Safety</td>
<td class="data-td data last text-right">2.6%</td>
<td class="data-td data last text-left"><a href="/link/e090deaddc774ac699a04b959d9254c6.aspx" title="CLOI - VanEck CLO ETF"><strong>CLOI</strong></a></td>
</tr>
<tr class="tbl-data">
<td class="data-td data last text-left">Yield &amp; Low Duration</td>
<td class="data-td data last text-right">2.5%</td>
<td class="data-td data last text-left"><a href="/link/0eff4e75a2114e0f8a7e71694dc0ad16.aspx" title="FLTR - VanEck IG Floating Rate ETF"><strong>FLTR</strong></a></td>
</tr>
<tr class="tbl-data">
<td class="data-td data last text-left">High Quality High Yield</td>
<td class="data-td data last text-right">2.3%</td>
<td class="data-td data last text-left"><a href="/link/6278aaa8fa7e4afbb46e353ce2efd55f.aspx" title="ANGL - VanEck Fallen Angel High Yield Bond ETF"><strong>ANGL</strong></a></td>
</tr>
<tr class="tbl-data">
<td class="data-td data last text-left">Emerging Markets</td>
<td class="data-td data last text-right">1.7%</td>
<td class="data-td data last text-left"><a href="/link/b572cc2d2799458eb526924e28c41513.aspx" title="HYEM - VanEck Emerging Markets High Yield Bond ETF"><strong>HYEM</strong></a></td>
</tr>
<tr class="tbl-data">
<td class="tbl-header last text-left">Real Assets</td>
<td class="tbl-header last text-right">&nbsp;</td>
<td class="tbl-header last text-left">&nbsp;</td>
</tr>
<tr class="tbl-data">
<td class="data-td data last text-left">De-Dollarization</td>
<td class="data-td data last text-right">4.2%</td>
<td class="data-td data last text-left"><a href="/link/982ab5546e32473b85c7b266bc6b2be6.aspx" title="OUNZ - VanEck Merk Gold ETF"><strong>OUNZ</strong></a></td>
</tr>
<tr class="tbl-data">
<td class="data-td data last text-left">Diversified Real Assets</td>
<td class="data-td data last text-right">2.1%</td>
<td class="data-td data last text-left"><a href="/link/310be2aebcad4c5cb5a89a82fd128841.aspx" title="RAAX - VanEck Real Assets ETF"><strong>RAAX</strong></a></td>
</tr>
<tr class="tbl-data">
<td class="data-td data last text-left">Energy Transition</td>
<td class="data-td data last text-right">1.9%</td>
<td class="data-td data last text-left"><a href="/link/49acb0d4174146e9a0269c9cb81c02bb.aspx" title="NLR - VanEck Uranium and Nuclear ETF"><strong>NLR</strong></a> | <a href="/link/5f7e90d690b947acabb6e7a0cc30e35c.aspx" title="EINC - VanEck Energy Income ETF"><strong>EINC</strong></a></td>
</tr>
<tr class="tbl-data">
<td class="tbl-header last text-left">Digital Assets</td>
<td class="tbl-header last text-right">&nbsp;</td>
<td class="tbl-header last text-left">&nbsp;</td>
</tr>
<tr class="tbl-data">
<td class="data-td data last text-left">De-Dollarization</td>
<td class="data-td data last text-right">2.2%</td>
<td class="data-td data last text-left"><strong><a href="/link/c754aca617ab4535a8e611ded6d5b13c.aspx" title="HODL - VanEck Bitcoin ETF">HODL</a></strong></td>
</tr>
</tbody>
</table>
</div>
<p class="chart-disclosure">Source: VanEck, FactSet. As of 2/28/2026. For illustrative purposes only. Not intended as an offer or recommendation to buy or sell any securities referenced herein. Strategy allocations will vary. Holdings exclude cash.</p>
<p>To receive more <strong><a href="https://www.vaneck.com/us/en/insights/guided-allocation/" title="Model Portfolio Insights">Model Portfolio</a></strong> insights, <strong><a href="https://www.vaneck.com/us/en/subscribe/" title="Subscription Center">sign up in our subscription center</a></strong>.</p>
]]></content:encoded>
</item><item rdf:about="https://www.vaneck.com/us/en/blogs/moat-investing/defense-lifts-moat-stocks-as-tech-stumbles/">
  <title>Defense Lifts Moat Stocks As Tech Stumbles></title>
  <link>https://www.vaneck.com/us/en/blogs/moat-investing/defense-lifts-moat-stocks-as-tech-stumbles/</link>
  <description><![CDATA[Valuation discipline and sector allocation tilted exposure towards consumer staples, industrials and health care, supporting gains as software lagged.]]></description>
  <dc:creator>Coulter Regal, CFA</dc:creator>
  <dc:date>03/11/2026 06:30:00</dc:date>
<content:encoded><![CDATA[

<p><strong>Key Takeaways:</strong></p>
<ul class="content-list">
<li class="mt-2">Moat Index gained 2.13% in February, outperforming the S&amp;P 500 by nearly 3 percentage points as defensive rotation favored its equal-weighted, valuation-conscious approach.</li>
<li class="mt-2">Top contributors to Moat Index gains were Applied Materials, driven by strong earnings and confidence in AI infrastructure spending, and Bristol-Myers Squibb, which climbed on pipeline momentum and improving sentiment.</li>
<li class="mt-2">SMID Moat Index rose 1.11% in February, trailing small- and mid-cap benchmarks as technology stock selection weighed on relative performance despite positive sector allocation.</li>
<li class="mt-2">The SMID Moat Index was led by Hershey, thanks to easing cocoa cost headwinds and strong earnings, and Generac, boosted by data center backup power demand.</li>
</ul>
<p class="chart-disclosure"><sup>*</sup>&nbsp;Index performance is not illustrative of fund performance.</p>
<p id="point-one" class="anchored-block jump-link-nav" data-jumplink-title="U.S. Equity Market Review">U.S. equity markets experienced a notable divergence in February. An accelerating rotation out of mega-cap technology stocks and into more defensive and cyclical areas of the market drove starkly different outcomes across benchmarks. The S&amp;P 500 declined 0.76% during the month, pulled lower by its heavy concentration in technology names, while the S&amp;P 500 Equal Weight Index rose 3.55%, underscoring the breadth of participation outside of the largest constituents. The NASDAQ Composite fell more than 3%, reflecting the pronounced weakness among technology and software companies.</p>
<p>Concerns around artificial intelligence disruption of traditional software business models intensified early in the month, triggering a multi-day selloff in enterprise software names that extended a pattern of weakness that had been building in recent months. Leadership came from sectors positioned away from the AI disruption narrative, with utilities, energy, materials, and consumer staples all gaining between 8% and 10%.</p>
<p>The <strong><a href="/link/9e43dd198c5f4e419f13220685081895.aspx?epsremainingpath=index" title="MOAT - VanEck Morningstar Wide Moat ETF">Morningstar Wide Moat Focus Index</a></strong> (the &ldquo;Moat Index&rdquo;) gained 2.13% in February, outperforming the S&amp;P 500 by nearly 3 percentage points as the Index's equal-weighted, valuation-conscious approach proved well suited to the month's rotation away from mega-cap technology. Sector allocation was the overwhelming driver of relative performance, as the strategy's substantial overweights in consumer staples and industrials contributed meaningfully. The Moat Index's overweight to health care also provided a tailwind, while its underweight to information technology, which declined roughly 3.6%, was beneficial on a relative basis. Year-to-date through February, the Moat Index has gained 3.38%, leading the S&amp;P 500's 0.68% return.</p>
<p>The <strong><a href="/link/166321dbcfec440590fb51cf0ad629aa.aspx?epsremainingpath=index" title="SMOT - VanEck Morningstar SMID Moat ETF">Morningstar US Small-Mid Cap Moat Focus Index</a></strong> (the "SMID Moat Index") rose 1.11% in February but trailed both the S&amp;P MidCap 400, which gained 4.12%, and the S&amp;P SmallCap 600, which rose 2.17%. Small- and mid-cap stocks broadly outperformed large-caps during the month, consistent with the ongoing rotation into more cyclical and value-oriented areas of the market. Within the SMID Moat Index, stock selection was the primary headwind to relative performance this month, with weakness concentrated among information technology holdings. Sector allocation was modestly positive, with the strategy's overweight to materials and underweight to financials contributing favorably.</p>
<h3>Defensive Leadership Lifts Moat Strategies in February</h3>
<p><img loading="lazy" class="desktop-image img-responsive" src="https://www.vaneck.com/EPiServer/CMS/Content/contentassets/eeece7f536394e18b5e9d1eac528fe63/6940_moat-monthly-march_chart-1_2026-03_v1_desktop.svg,,363844/Download?epieditmode=False" alt="Defensive Leadership Lifts Moat Strategies in February" /></p>
<p><img loading="lazy" class="mobile-image img-responsive" src="https://www.vaneck.com/EPiServer/CMS/Content/contentassets/eeece7f536394e18b5e9d1eac528fe63/6940_moat-monthly-march_chart-1_2026-03_v1_mobile.svg,,363845/Download?epieditmode=False" alt="Defensive Leadership Lifts Moat Strategies in February" /></p>
<p class="chart-disclosure"><strong>Source: Morningstar. Data as of 2/28/2026.</strong> Past performance is no guarantee of future results. Index performance is not representative of fund performance. It is not possible to invest directly in an index. Please see index definitions and other important disclosures at the end of this content. Fund performance current to the most recent month end is available by visiting vaneck.com or by calling 800.826.2333.</p>

<h2 id="point-two" class="anchored-block jump-link-nav" data-jumplink-title="Moat Highlights">Moat Index Highlights: Earnings Strength Overcomes Software Drag</h2>
<p>In February, relative performance within the Moat Index was driven almost entirely by sector allocation, while stock selection was effectively neutral. Overweights in consumer staples and industrials were the primary contributors to relative performance versus the S&amp;P 500, while the strategy's overweight to health care and underweight to information technology also proved beneficial during a month in which the cap-weighted benchmark was weighed down by its heavy concentration in technology names.</p>
<p>Applied Materials Inc. (AMAT) was the top contributor to Moat Index performance during the month, with shares rising approximately 16%. The company reported strong quarterly earnings results in mid-February and provided an impressive outlook for 2026, with management guiding for more than 20% growth in equipment sales driven by an accelerating AI infrastructure buildout cycle. Investor enthusiasm reflected growing confidence in a sustained, multi-year expansion in wafer fabrication equipment demand, as AI chip supply constraints continue to far outstrip available capacity. Morningstar views Applied Materials' position as the world's largest and most diversified supplier of wafer fabrication equipment as central to its wide economic moat, underpinned by intangible assets from its industry-leading research and development spending and steep switching costs from the complexity of its equipment and embedded customer relationships.</p>
<p>Bristol-Myers Squibb Co. (BMY) was the second-largest contributor, with shares gaining approximately 13%. The company reported full-year 2025 results in early February that demonstrated its ability to hold revenue roughly steady despite significant headwinds from generic competition for legacy oncology drugs. Growth in newer therapies, including Camzyos in cardiology, Reblozyl in hematology, and Breyanzi and Opdualag in oncology, reinforced the company's ability to diversify beyond maturing franchises. An active late-stage pipeline with numerous catalysts expected through the end of 2026 also supported investor sentiment, as the market increasingly looks toward Bristol-Myers' trajectory beyond the patent cliffs for Eliquis and Opdivo in 2028. Morningstar assigns Bristol-Myers a wide economic moat, supported by a broad lineup of patent-protected drugs, an entrenched salesforce, and economies of scale, and views shares as undervalued heading into a year filled with pipeline readouts.</p>
<p>Other notable contributors during the month included Clorox Co. (CLX), a household cleaning and consumer products company; United Parcel Service Inc. (UPS), a global package delivery and logistics provider; and The Hershey Co. (HSY), a confectionery and snack food company whose shares surged more than 22% following encouraging quarterly results and improving sentiment around easing cocoa cost headwinds.</p>
<p>Companies detracting the most from Moat Index performance in February were concentrated within technology and software, reflecting the broader market's intensifying concerns around AI disruption of traditional enterprise software business models. Workday Inc. (WDAY), a human capital management and financial software firm, was the largest detractor, with shares falling roughly 24%. Adobe Inc. (ADBE), a digital media and creative software company; Salesforce Inc. (CRM), a provider of enterprise cloud software; and Microsoft Corp. (MSFT) also weighed on results, as each was caught in the rolling selloff that impacted software names throughout the month. LPL Financial Holdings Inc. (LPLA), a brokerage platform supporting independent financial advisors, was the only non-software detractor among the bottom five.</p>
<h3>Moat Index Top Contributors and Detractors - February 2026</h3>
<p><strong>Contributors</strong></p>
<div class="wrapped-div">
<table style="width: 100%;">
<tbody>
<tr class="tbl-data">
<td class="tbl-header last text-left">Company</td>
<td class="tbl-header last text-left">Ticker</td>
<td class="tbl-header last text-left">Sector</td>
<td class="tbl-header last text-right">Avg. Weight (%)</td>
<td class="tbl-header last text-right">Contribution (%)</td>
</tr>
<tr class="tbl-data">
<td class="data-td data last text-left">Applied Materials Inc.</td>
<td class="data-td data last text-left">AMAT</td>
<td class="data-td data last text-left">Technology</td>
<td class="data-td data last text-right">2.37</td>
<td class="data-td data last text-right">0.37</td>
</tr>
<tr class="tbl-data">
<td class="data-td data last text-left">Bristol-Myers Squibb Co.</td>
<td class="data-td data last text-left">BMY</td>
<td class="data-td data last text-left">Health Care</td>
<td class="data-td data last text-right">2.73</td>
<td class="data-td data last text-right">0.36</td>
</tr>
<tr class="tbl-data">
<td class="data-td data last text-left">Clorox Co.</td>
<td class="data-td data last text-left">CLX</td>
<td class="data-td data last text-left">Consumer Staples</td>
<td class="data-td data last text-right">2.48</td>
<td class="data-td data last text-right">0.32</td>
</tr>
<tr class="tbl-data">
<td class="data-td data last text-left">United Parcel Service Inc.</td>
<td class="data-td data last text-left">UPS</td>
<td class="data-td data last text-left">Industrials</td>
<td class="data-td data last text-right">2.86</td>
<td class="data-td data last text-right">0.31</td>
</tr>
<tr class="tbl-data">
<td class="data-td data last text-left">The Hershey Co.</td>
<td class="data-td data last text-left">HSY</td>
<td class="data-td data last text-left">Consumer Staples</td>
<td class="data-td data last text-right">1.32</td>
<td class="data-td data last text-right">0.29</td>
</tr>
</tbody>
</table>
</div>
<br />
<p><strong>Detractors</strong></p>
<div class="wrapped-div">
<table style="width: 100%;">
<tbody>
<tr class="tbl-data">
<td class="tbl-header last text-left">Company</td>
<td class="tbl-header last text-left">Ticker</td>
<td class="tbl-header last text-left">Sector</td>
<td class="tbl-header last text-right">Avg. Weight (%)</td>
<td class="tbl-header last text-right">Contribution (%)</td>
</tr>
<tr class="tbl-data">
<td class="data-td data last text-left">Workday Inc.</td>
<td class="data-td data last text-left">WDAY</td>
<td class="data-td data last text-left">Technology</td>
<td class="data-td data last text-right">1.88</td>
<td class="data-td data last text-right">-0.45</td>
</tr>
<tr class="tbl-data">
<td class="data-td data last text-left">Adobe Inc.</td>
<td class="data-td data last text-left">ADBE</td>
<td class="data-td data last text-left">Technology</td>
<td class="data-td data last text-right">2.06</td>
<td class="data-td data last text-right">-0.22</td>
</tr>
<tr class="tbl-data">
<td class="data-td data last text-left">LPL Financial Inc.</td>
<td class="data-td data last text-left">LPLA</td>
<td class="data-td data last text-left">Financials</td>
<td class="data-td data last text-right">1.22</td>
<td class="data-td data last text-right">-0.21</td>
</tr>
<tr class="tbl-data">
<td class="data-td data last text-left">Microsoft Corp.</td>
<td class="data-td data last text-left">MSFT</td>
<td class="data-td data last text-left">Technology</td>
<td class="data-td data last text-right">2.09</td>
<td class="data-td data last text-right">-0.18</td>
</tr>
<tr class="tbl-data">
<td class="data-td data last text-left">Salesforce Inc.</td>
<td class="data-td data last text-left">CRM</td>
<td class="data-td data last text-left">Technology</td>
<td class="data-td data last text-right">2.01</td>
<td class="data-td data last text-right">-0.17</td>
</tr>
</tbody>
</table>
</div>
<p class="chart-disclosure"><strong>Source: Morningstar.</strong> Past performance is no guarantee of future results. Index performance is not illustrative of fund performance. Not intended as a recommendation to buy or to sell any of the securities mentioned herein.</p>
<h2 id="point-three" class="anchored-block jump-link-nav" data-jumplink-title="SMID Moat Highlights">SMID Moat Index Highlights: Defensive Contributors Offset Tech Weakness</h2>
<p>The SMID Moat Index posted a positive return in February, supported by contributions from consumer staples, health care and industrial holdings, though performance trailed small- and mid-cap benchmarks as stock selection within information technology weighed heavily. Sector allocation was modestly positive during the month, while the overall shortfall relative to benchmarks was attributable to company-specific weakness among several technology-oriented names.</p>
<p>The Hershey Co. (HSY) was the top contributor to SMID Moat Index performance, with shares rising more than 22%. Fourth-quarter results included 6% organic sales growth, and management's fiscal 2026 outlook called for more than 30% growth in adjusted earnings per share, signaling that the worst of the cocoa inflation headwinds may be easing. Morningstar views Hershey's dominant position in the U.S. confectionery aisle, where it holds more than one third of chocolate market share against minimal private-label competition, as the foundation of its wide economic moat, underpinned by strong intangible brand assets and an entrenched retail distribution network.</p>
<p>Generac Holdings Inc. (GNRC) was the second-largest contributor, with shares advancing approximately 34% during the month. The company reported fourth-quarter earnings that highlighted growing traction in the data center backup power market, with management guiding for 30% growth in commercial and industrial sales in 2026 as it executes against its growing backlog. Morningstar assigns Generac a narrow moat, supported by its dominant brand in home standby generators and cost advantages stemming from its unmatched scale in sales and distribution within the category.</p>
<p>Other notable contributors included Hasbro Inc. (HAS), a toy and entertainment company benefiting from its shift toward higher-margin digital gaming properties; Royalty Pharma PLC (RPRX), a buyer of biopharmaceutical royalties; and Zimmer Biomet Holdings Inc. (ZBH), a medical device company specializing in orthopedic implants.</p>
<p>Detractors from SMID Moat Index performance during February included several technology and software names, consistent with the pattern observed in the Moat Index. EPAM Systems Inc. (EPAM), a provider of digital platform engineering and software development services, was the largest detractor, with shares falling more than 32%. Zoom Communications Inc. (ZM), a provider of video communications and collaboration tools, declined roughly 20%, while Mattel Inc. (MAT), a toy manufacturer, fell approximately 19%. Workday Inc. (WDAY) and LPL Financial Holdings Inc. (LPLA) also detracted. The weakness among technology holdings reflected the same AI disruption concerns that pressured software names across the broader market, as investors reassessed the viability of traditional software business models in the face of rapidly advancing AI capabilities.</p>
<h3>SMID Moat Index Top Contributors and Detractors - February 2026</h3>
<p><strong>Contributors</strong></p>
<div class="wrapped-div">
<table style="width: 100%;">
<tbody>
<tr class="tbl-data">
<td class="tbl-header last text-left">Company</td>
<td class="tbl-header last text-left">Ticker</td>
<td class="tbl-header last text-left">Sector</td>
<td class="tbl-header last text-right">Avg. Weight (%)</td>
<td class="tbl-header last text-right">Contribution (%)</td>
</tr>
<tr class="tbl-data">
<td class="data-td data last text-left">The Hershey Co.</td>
<td class="data-td data last text-left">HSY</td>
<td class="data-td data last text-left">Consumer Staples</td>
<td class="data-td data last text-right">1.42</td>
<td class="data-td data last text-right">0.31</td>
</tr>
<tr class="tbl-data">
<td class="data-td data last text-left">Generac Holdings Inc.</td>
<td class="data-td data last text-left">GNRC</td>
<td class="data-td data last text-left">Industrials</td>
<td class="data-td data last text-right">0.67</td>
<td class="data-td data last text-right">0.23</td>
</tr>
<tr class="tbl-data">
<td class="data-td data last text-left">Hasbro Inc.</td>
<td class="data-td data last text-left">HAS</td>
<td class="data-td data last text-left">Consumer Discretionary</td>
<td class="data-td data last text-right">1.49</td>
<td class="data-td data last text-right">0.18</td>
</tr>
<tr class="tbl-data">
<td class="data-td data last text-left">Royalty Pharma</td>
<td class="data-td data last text-left">RPRX</td>
<td class="data-td data last text-left">Health Care</td>
<td class="data-td data last text-right">1.52</td>
<td class="data-td data last text-right">0.17</td>
</tr>
<tr class="tbl-data">
<td class="data-td data last text-left">Zimmer Biomet Inc.</td>
<td class="data-td data last text-left">ZBH</td>
<td class="data-td data last text-left">Health Care</td>
<td class="data-td data last text-right">1.19</td>
<td class="data-td data last text-right">0.16</td>
</tr>
</tbody>
</table>
</div>
<br />
<p><strong>Detractors</strong></p>
<div class="wrapped-div">
<table style="width: 100%;">
<tbody>
<tr class="tbl-data">
<td class="tbl-header last text-left">Company</td>
<td class="tbl-header last text-left">Ticker</td>
<td class="tbl-header last text-left">Sector</td>
<td class="tbl-header last text-right">Avg. Weight (%)</td>
<td class="tbl-header last text-right">Contribution (%)</td>
</tr>
<tr class="tbl-data">
<td class="data-td data last text-left">EPAM Systems Inc.</td>
<td class="data-td data last text-left">EPAM</td>
<td class="data-td data last text-left">Technology</td>
<td class="data-td data last text-right">0.86</td>
<td class="data-td data last text-right">-0.28</td>
</tr>
<tr class="tbl-data">
<td class="data-td data last text-left">Zoom Communications Inc.</td>
<td class="data-td data last text-left">ZM</td>
<td class="data-td data last text-left">Technology</td>
<td class="data-td data last text-right">1.40</td>
<td class="data-td data last text-right">-0.28</td>
</tr>
<tr class="tbl-data">
<td class="data-td data last text-left">Mattel Inc.</td>
<td class="data-td data last text-left">MAT</td>
<td class="data-td data last text-left">Consumer Discretionary</td>
<td class="data-td data last text-right">1.47</td>
<td class="data-td data last text-right">-0.28</td>
</tr>
<tr class="tbl-data">
<td class="data-td data last text-left">Workday Inc.</td>
<td class="data-td data last text-left">WDAY</td>
<td class="data-td data last text-left">Technology</td>
<td class="data-td data last text-right">1.03</td>
<td class="data-td data last text-right">-0.25</td>
</tr>
<tr class="tbl-data">
<td class="data-td data last text-left">LPL Financial Inc.</td>
<td class="data-td data last text-left">LPLA</td>
<td class="data-td data last text-left">Financials</td>
<td class="data-td data last text-right">1.38</td>
<td class="data-td data last text-right">-0.24</td>
</tr>
</tbody>
</table>
</div>
<p class="chart-disclosure"><strong>Source: Morningstar.</strong> Past performance is no guarantee of future results. Index performance is not illustrative of fund performance. Not intended as a recommendation to buy or to sell any of the securities mentioned herein.</p>
<h2 id="point-four" class="anchored-block jump-link-nav" data-jumplink-title="Moat Strategies">Choose Your Moat Strategy</h2>
<p>VanEck&rsquo;s suite of <strong><a href="/us/en/blogs/moat-investing/moat-investing-powered-by-morningstar/" title="Quality Companies at Attractive Prices">moat investing strategies</a></strong> is powered by Morningstar&rsquo;s equity research team, which seeks quality companies trading at attractive valuations. The below ETFs offer access to US moat companies:</p>
<p><strong><a href="/link/9e43dd198c5f4e419f13220685081895.aspx" title="MOAT - VanEck Morningstar Wide Moat ETF">VanEck Morningstar Wide ETF (MOAT)</a></strong><span>:</span> companies with a wide moat rating, which means Morningstar believes the company is likely to sustain its competitive advantage for at least the next 20 years.</p>
<p><a href="/link/166321dbcfec440590fb51cf0ad629aa.aspx" title="SMOT - VanEck Morningstar SMID Moat ETF"><strong>VanEck Morningstar SMID Moat ETF (SMOT)</strong></a><span>:</span> small and mid-cap moat companies.</p>
<p><strong><a href="/link/fd582da052ba46c79bfc112c078a6256.aspx" title="MVAL - VanEck Morningstar Wide Moat Value ETF">VanEck Morningstar Wide Moat Value ETF (MVAL)</a></strong><span>:</span> wide moat companies within Morningstar&rsquo;s value style category.</p>

<p>To receive more <a href="https://www.vaneck.com/us/en/insights/moat-investing" title="Moat Investing Insights"><strong>Moat Investing</strong></a> insights, <a href="https://www.vaneck.com/us/en/subscribe/" title="Subscription Center"><strong>sign up in our subscription center</strong></a>.</p>
]]></content:encoded>
</item><item rdf:about="https://www.vaneck.com/us/en/blogs/emerging-markets-bonds/embx-actively-navigating-iran-driven-risks-in-em-debt/">
  <title>EMBX: Actively Navigating Iran-Driven Risks in EM Debt></title>
  <link>https://www.vaneck.com/us/en/blogs/emerging-markets-bonds/embx-actively-navigating-iran-driven-risks-in-em-debt/</link>
  <description><![CDATA[Iran-driven risks are reshaping EM debt markets. EMBX reduced Gulf exposure as valuations failed to reflect rising conflict risk and shifted toward resilient Latam and SSA commodity exporters.]]></description>
  <dc:creator>Eric Fine</dc:creator>
  <dc:date>03/11/2026 06:30:00</dc:date>
<content:encoded><![CDATA[

<p><strong>Key Takeaways:</strong></p>
<ul class="content-list">
<li class="mt-2">The team reduced Gulf exposure as Iran-driven risks increased but valuations failed to adjust, creating an unfavorable risk/reward backdrop.</li>
<li class="mt-2">We favor selective exposure to commodity exporters in Latin America and Sub-Saharan Africa, which appear better positioned across multiple geopolitical scenarios than the Gulf region.</li>
<li class="mt-2">Emerging markets bonds offer a significant yield cushion during this geopolitical event, with EMBX offering 7.41% YTW while actively adjusting exposures to manage evolving regional risks.</li>
</ul>
<p>The <a href="/link/f447bf0c04f64108a3dcff3ca025af4a.aspx" title="EMBX - VanEck Emerging Markets Bond ETF - Overview"><strong>VanEck Emerging Markets Bond ETF (EMBX)</strong></a> was up 1.20% in February, compared to 1.34% for its benchmark, the 50% J.P. Morgan Government Bond Index - Emerging Markets Global Diversified (GBI-EM) and 50% J.P. Morgan Emerging Markets Bond Index (EMBI) and 1.10% for the Global Agg and 2.74% for Treasuries. Year to date (YTD), EMBX is up 3.42% compared to 2.78% for its benchmark. We reduced Gulf and local currency exposure before Iran events, looking to increase both on weakness. That game plan is more intact in EM local currency than in Gulf bonds which, as we said above, didn&rsquo;t get cheaper and potentially got riskier. Local currency exposure is at 45%, Carry is 6.49%, yield to worst (YTW) is 7.41%, and duration is 5.17.</p>
<h3>Average Annual Total Returns<sup>*</sup>&nbsp;(%) (In USD)</h3>
<div class="wrapped-div">
<table style="width: 100%;">
<tbody>
<tr class="tbl-data">
<td class="tbl-header last text-left">Month End As of February 28, 2026</td>
<td class="tbl-header last text-right">1 Mo</td>
<td class="tbl-header last text-right">3 Mo</td>
<td class="tbl-header last text-right">YTD</td>
<td class="tbl-header last text-right">1 Yr</td>
<td class="tbl-header last text-right">3 Yrs</td>
<td class="tbl-header last text-right">5 Yrs</td>
<td class="tbl-header last text-right">10 Yrs</td>
</tr>
<tr class="tbl-data">
<td class="data-td last text-left">EMBX (NAV)</td>
<td class="data-td data last text-right">1.20</td>
<td class="data-td data last text-right">4.90</td>
<td class="data-td data last text-right">3.43</td>
<td class="data-td data last text-right">18.86</td>
<td class="data-td data last text-right">11.41</td>
<td class="data-td data last text-right">4.89</td>
<td class="data-td data last text-right">5.74</td>
</tr>
<tr class="tbl-data">
<td class="data-td last text-left">EMBX (Market Price)</td>
<td class="data-td data last text-right">1.46</td>
<td class="data-td data last text-right">4.88</td>
<td class="data-td data last text-right">3.72</td>
<td class="data-td data last text-right">19.06</td>
<td class="data-td data last text-right">11.47</td>
<td class="data-td data last text-right">4.92</td>
<td class="data-td data last text-right">5.76</td>
</tr>
<tr class="tbl-data">
<td class="data-td last text-left">50% GBI-EM/50% EMBI</td>
<td class="data-td data last text-right">1.34</td>
<td class="data-td data last text-right">3.92</td>
<td class="data-td data last text-right">2.79</td>
<td class="data-td data last text-right">16.69</td>
<td class="data-td data last text-right">10.75</td>
<td class="data-td data last text-right">2.82</td>
<td class="data-td data last text-right">4.30</td>
</tr>
</tbody>
</table>
</div>
<h3>Average Annual Total Returns<sup>*</sup>&nbsp;(%) (In USD)</h3>
<div class="wrapped-div">
<table style="width: 100%;">
<tbody>
<tr class="tbl-data">
<td class="tbl-header last text-left">Quarter End As of December 31, 2025</td>
<td class="tbl-header last text-right">1 Mo</td>
<td class="tbl-header last text-right">3 Mo</td>
<td class="tbl-header last text-right">YTD</td>
<td class="tbl-header last text-right">1 Yr</td>
<td class="tbl-header last text-right">3 Yrs</td>
<td class="tbl-header last text-right">5 Yrs</td>
<td class="tbl-header last text-right">10 Yrs</td>
</tr>
<tr class="tbl-data">
<td class="data-td last text-left">EMBX (NAV)</td>
<td class="data-td data last text-right">1.41</td>
<td class="data-td data last text-right">3.15</td>
<td class="data-td data last text-right">19.04</td>
<td class="data-td data last text-right">10.84</td>
<td class="data-td data last text-right">3.87</td>
<td class="data-td data last text-right">5.49</td>
</tr>
<tr class="tbl-data">
<td class="data-td last text-left">EMBX (Share Price)</td>
<td class="data-td data last text-right">1.12</td>
<td class="data-td data last text-right">3.03</td>
<td class="data-td data last text-right">18.91</td>
<td class="data-td data last text-right">10.80</td>
<td class="data-td data last text-right">3.85</td>
<td class="data-td data last text-right">5.48</td>
</tr>
<tr class="tbl-data">
<td class="data-td last text-left">50% GBI-EM/50% EMBI</td>
<td class="data-td data last text-right">1.11</td>
<td class="data-td data last text-right">3.32</td>
<td class="data-td data last text-right">16.80</td>
<td class="data-td data last text-right">10.08</td>
<td class="data-td data last text-right">1.50</td>
<td class="data-td data last text-right">4.20</td>
</tr>
</tbody>
</table>
</div>
<div class="chart-disclosure">
<p><sup>*</sup>&nbsp;Returns less than one year are not annualized.</p>
<p><strong>The performance data quoted represents past performance. Past performance is not a guarantee of future results. Investment return and principal value of an investment will fluctuate so that an investor's shares, when redeemed, may be worth more or less than their original cost. Performance may be lower or higher than performance data quoted. Please call 800.826.2333 or visit vaneck.com for performance current to the most recent month ended.</strong></p>
<p>Prior to 10/06/2025, the Fund operated as the VanEck Emerging Markets Bond mutual fund; performance shown before that date is that fund&rsquo;s NAV performance (Class I, unadjusted for today&rsquo;s ETF expenses).</p>
<p>The "Net Asset Value" (NAV) of a Fund is determined at the close of each business day, and represents the dollar value of one share of the fund; it is calculated by taking the total assets of the fund, subtracting total liabilities, and dividing by the total number of shares outstanding. The NAV is not necessarily the same as the ETF 's intraday trading value. Investors should not expect to buy or sell shares at NAV.</p>
<p><strong>EMBX Total Expense Ratio &ndash; 0.76%.</strong> Van Eck Associates Corporation (the &ldquo;Adviser&rdquo;) will pay all expenses of the Fund, except for the fee payment under the investment management agreement, acquired fund fees and expenses, interest expense, offering costs, trading expenses, taxes and extraordinary expenses. Notwithstanding the foregoing, the Adviser has agreed to pay the offering costs until at least May 1, 2027. &ldquo;Other Expenses&rdquo; have been restated to reflect current fees.</p>
</div>

<p><strong>The bulk of the relevant asset prices directly affected by Iran are in the Gulf; that&rsquo;s what matters and has superior analyzability.</strong> Gulf bonds were largely unchanged, yet the risks to the region have clearly risen. What is our portfolio view? We went home on February 27 with underweights in the Gulf (Saudi, UAE, Qatar, Kuwait, in particular), because an event was obviously on the way and we wanted room to accumulate, assuming asset prices cheapened and the likely outcome was benign. On Monday, March 2, when markets opened, we were struck that these asset prices didn&rsquo;t move. Risks certainly seemed higher to us &ndash; on Friday we went home with the market having a base-case of a &lt;1 week conflict and now we have a conflict set for what looks like a minimum of many weeks. Risks higher, prices unchanged, you sell, which we did, and continued Tuesday, March 3. Iran matters mostly to the Gulf (as opposed to other EM regions) and represents to us a reason to be underweight at least in the region.</p>
<p><strong>We see two scenarios, fairly balanced in probabilities &ndash; either Iran will be able to project meaningful force in the Gulf, or it will not.</strong> A &ldquo;noisy&rdquo; but toothless Iran is not the same as an Iran unable to materially affect the Gulf. If Iran is incapable of generating risk to the region, the discount of the region should decline. And, the region is the most analyzable in terms of Iran (due to obvious proximity/materiality) and has the bulk of the assets. The problem with a bullish scenario is that those assets didn&rsquo;t get cheaper as we noted above. And, despite a &ldquo;regime change&rdquo; objective on the part of US/Israel, the regime has not changed and has an explicit strategy of surviving &ldquo;60-90 days&rdquo;. That&rsquo;s pretty specific and fits the game-theory &ndash; &ldquo;I see your four weeks and raise you to 3 months&rdquo;. Risks must remain high to our eye and 50/50 seems the least bad odds.</p>
<p><strong>EM has many potential winners in both scenarios.</strong> Commodities exporters in Latam and Sub-Saharan Africa are serious potential winners in both scenarios. The Gulf is a potential winner only in one scenario. Our primary concern is whether we&rsquo;ll even get a buying opportunity. We noted that Gulf assets were remarkably stable in the face of proximate risks. Well, EM assets generally weakened&hellip;but not that much. And, we were not explicitly waiting for them to cheapen as we were with the Gulf. Latam and SSA were already replacing Russia as Europe&rsquo;s commodities supplier. In a scenario in which Iran remains a material risk to the region, but is in a prolonged conflict, Latam and SSA are winners, in our view. The only issue is how much of a generic &ldquo;risk-off&rdquo; moment we get in this Iran situation (i.e., all risk assets correlated).</p>
<h2>Exposure Types and Significant Changes</h2>
<p>The changes to our top positions are summarized below. Our largest positions in February were South Africa, Mexico, Poland, Thailand and China:</p>
<ul class="content-list">
<li class="mt-2">We increased our hard currency sovereign exposure in Saudi Arabia. This reflected our views on global duration, which was expected to benefit from the removal of the IEEPA tariffs, as well as a slower growth in the U.S. In terms of our investment process, this improved the technical test score for the country.</li>
<li class="mt-2">We also increased our local currency exposure in China, Thailand, and the Philippines. China continues to guide the currency stronger in an effort to boost domestic consumption and lower trade surpluses. China also continues to support domestic demand, albeit at a modest pace. In terms of our investment process, this improved the economic and policy test scores for the country. The Philippine local bonds are among the least correlated with EM peers, longer-dated bonds have decent valuations, and there is potential for more policy rate cuts. These factors strengthen policy and technical test scores for the Philippines. Thailand&rsquo;s exposure in question is local duration, which continues to benefit from very low inflation, while the currency has the high correlation with the Chinese renminbi. These factors improved technical and economic test scores for the country.</li>
<li class="mt-2">We reduced our local currency exposure in Mexico and Indonesia. Indonesia&rsquo;s policy mix continues to deteriorate, as the pro-growth agenda seems to the top priority both for the government and for the central bank, weighing on Indonesia&rsquo;s policy test score. In Mexico, we were concerned by a combination of stretched long positioning and a spike of cartel-related violence, which worsened the technical and policy test scores for the country.</li>
<li class="mt-2">We also reduced our local currency exposure in Chile and Brazil. Chile&rsquo;s local bond valuations are not attractive (the lowest valuation bucket), while softer global activity is a headwind for copper prices. These factors worsened Chile&rsquo;s technical test score. Brazil&rsquo;s local bonds and FX positioning became very elevated after a massive year-to-date rally, worsening the technical test score for the country.</li>
</ul>

<p>To receive more <a href="https://www.vaneck.com/us/en/insights/emerging-markets-bonds/" title="Emerging Markets Bonds Insights"><strong>Emerging Markets Bonds</strong></a> insights, <a href="/link/5f45412c2143400497908cea2897f7d3.aspx" title=" Subscription Center"><strong>sign up in our subscription center</strong></a>.</p>
]]></content:encoded>
</item><item rdf:about="https://www.vaneck.com/us/en/blogs/gold-investing/ima-casanova-sustaining-strength-in-a-higher-gold-price-environment/">
  <title>Sustaining Strength in a Higher Gold Price Environment></title>
  <link>https://www.vaneck.com/us/en/blogs/gold-investing/ima-casanova-sustaining-strength-in-a-higher-gold-price-environment/</link>
  <description><![CDATA[Gold miners are generating record margins and free cash flow as prices remain elevated. With disciplined capital allocation and costs below $2,000 per ounce, the sector appears well positioned for 2026.]]></description>
  <dc:creator>Imaru Casanova</dc:creator>
  <dc:date>03/10/2026 06:30:00</dc:date>
<content:encoded><![CDATA[

<p>Monthly gold market and economic insights from <strong><a href="/link/cfa7139e649944fea51aa2a740b2372e.aspx" title="Imaru Casanova &mdash; Portfolio Manager, Gold and Precious Metals">Imaru Casanova, Portfolio Manager</a></strong>, featuring her unique views on mining and gold&rsquo;s portfolio benefits.</p>
<p><strong>Key Takeaways:</strong></p>
<ul class="content-list">
<li class="mt-2">Strong free cash flow and industry costs below $2,000 per ounce support durable gold miner profitability, even if gold prices stabilize.</li>
<li class="mt-2">Gold mining companies are prioritizing disciplined capital allocation, shareholder returns and organic growth.</li>
<li class="mt-2">Gold mining equities remain <a href="/link/ef84c623d9a4472fb3164798fa5f65e8.aspx" title="Gold Price and Investment Outlook: 2026 and Beyond"><strong>well positioned to outperform in 2026</strong></a> if prices stay elevated or rise further.</li>
</ul>

<h2>How Sustained High Gold Prices Are Shifting Valuations</h2>
<p>Investors continue to ask whether gold prices can rise further from here. We believe that remains likely. We live in a world where a new gold catalyst seems to emerge every month. Market participants, many still watching from the sidelines, have observed gold&rsquo;s relentless rally over the past couple of years and now appear increasingly convinced that these record prices are here to stay.</p>
<p>Even without upward revisions to gold price forecasts, this shift in perception has meaningful implications for gold miners. As confidence builds that gold can remain at elevated levels, the market progressively embeds higher long-term gold price assumptions into equity valuations.</p>
<p>This durability of record or near-record margins and cash flow generation, even if the gold price holds at current levels, is a central driver of our conviction in gold mining equities for 2026.</p>
<h2>Gold Miner Margins, Costs and the Math Behind the Opportunity</h2>
<p>In a flat gold price environment, margin erosion would need to come from rising production costs. Companies have provided 2026 all-in sustaining cost (AISC) guidance that, so far, aligns with our expectation of roughly a 10&ndash;12% increase versus 2025.</p>
<p>The gold price closed at $5,278.93 per ounce on February 27, up $384.69 per ounce or 7.86% for the month, and $959.60 per ounce or 22.22% year to date. The math remains compelling: margins have already expanded year over year, and with estimated average industry AISC below $2,000 per ounce, the sector demonstrates substantial resilience at current price levels.</p>
<p>These strong fundamentals support our view that gold mining equities are well positioned to outperform the metal again in 2026. The stocks demonstrated strong outperformance in February. The MarketVector Global Gold Miners Index<sup>1</sup>&nbsp;rose 21.01% for the month.</p>

<h2>Key Takeaways from the 2026 BMO Global Metals and Mining Conference</h2>
<p>We had the opportunity to meet with more than 40 gold mining companies at BMO&rsquo;s 2026 Global Metals and Mining Conference in Hollywood, Florida this past month. Our discussions with producers, developers and royalty and streaming companies reinforced our view that the sector is in a cash-generative, disciplined phase, not a reckless expansion cycle.</p>
<p>Key themes from our meetings included:</p>
<ul class="content-list">
<li class="mt-2">High margins are driving record free cash flow generation, allowing companies to comfortably fund capital needs.</li>
<li class="mt-2">Returning capital to shareholders, in some cases 40%&ndash;50% of free cash flow, through dividends and share buybacks remains a priority.</li>
<li class="mt-2">With leverage well within target ranges and cash balances building rapidly, companies are focused on avoiding &ldquo;lazy&rdquo; balance sheets by accelerating optimization initiatives, expanding exploration programs and advancing project pipelines.</li>
<li class="mt-2">Abundant capital is likely to revitalize industry activity, which could eventually tighten labor, services, equipment and materials markets. For now, most companies are not experiencing sustained cost pressures, though conditions vary by geography and activity type (e.g., exploration versus construction).</li>
<li class="mt-2">Scale may prove advantageous in tighter markets. One large producer emphasized that its procurement strength, supplier relationships and reputation position it well to mitigate potential cost pressures.</li>
<li class="mt-2">Jurisdictional risk management remains front and center. Despite ample capital for M&amp;A, companies are maintaining discipline. Growth for growth&rsquo;s sake is no longer acceptable. Acquisitions must enhance portfolio quality and reduce risk, with geographic exposure a key consideration.</li>
<li class="mt-2">Permitting remains slow and complex. While governments in the U.S. and Canada have signaled efforts to streamline processes, companies report limited tangible impact on timelines to date, aside from some improvements in jurisdictions such as New Zealand.</li>
<li class="mt-2">Higher gold prices should ultimately support reserve growth as more ounces become economic, yet companies continue to use conservative gold price assumptions (around $2,000 per ounce) in reserve calculations.</li>
<li class="mt-2">In the near term, larger exploration budgets should support reserve growth through resource conversion drilling.</li>
<li class="mt-2">Over the longer term, increased exploration spending could drive new discoveries. Many companies are expanding drilling programs within existing land packages, favoring organic growth, which is typically more accretive than M&amp;A and supportive of stronger returns on capital.</li>
</ul>
<h2>Why Gold Mining Equities Are Positioned for 2026</h2>
<p>Overall, the tone across meetings was constructive and confident. Companies are generating record margins, balance sheets are strong and capital allocation is notably more disciplined than in past cycles. Management teams are prioritizing returns, investing selectively in high-quality growth and advancing projects with greater technical rigor and lower risk.</p>
<p>While permitting hurdles and geopolitical risks remain part of the landscape, the sector appears better positioned than ever, supported by resilient assets, improving operational execution and a clear commitment to long-term value creation.</p>
<p>With free cash flow robust even under conservative gold price assumptions, the sector appears fundamentally <strong><a href="/us/en/blogs/gold-investing/gold-investing-outlook/" title="Gold Price and Investment Outlook: 2026 and Beyond">well positioned for 2026</a></strong>. If gold prices remain near current levels, or move higher, gold mining equities have both the financial strength and operational leverage to continue outperforming the metal.</p>

<p>To receive more <strong><a href="https://www.vaneck.com/us/en/insights/gold-investing/" title="Gold Investing Insights">Gold Investing</a></strong> insights, <strong><a href="https://www.vaneck.com/us/en/subscribe/" title="Subscription Center">sign up in our subscription center</a></strong>.</p>
]]></content:encoded>
</item><item rdf:about="https://www.vaneck.com/us/en/blogs/emerging-markets-bonds/why-investors-should-consider-an-emerging-markets-bonds-allocation-in-2026/">
  <title>Why Investors Should Consider an Emerging Markets Bonds Allocation in 2026></title>
  <link>https://www.vaneck.com/us/en/blogs/emerging-markets-bonds/why-investors-should-consider-an-emerging-markets-bonds-allocation-in-2026/</link>
  <description><![CDATA[EM bonds outperformed in 2025 and the case of allocating continues to be supported by a weaker US dollar and stronger EM fundamentals in 2026.]]></description>
  <dc:creator> </dc:creator>
  <dc:date>03/06/2026 06:30:00</dc:date>
<content:encoded><![CDATA[

<p><strong>Key Takeaways:</strong></p>
<ul class="content-list">
<li class="mt-2">Emerging markets bonds beat US and global bonds in 2025 despite tariffs and China growth concerns.</li>
<li class="mt-2">EM Bonds yield 6.9%, vs Global and US Bonds which yield 3.6% and 4.2%, respectively.<sup>i</sup></li>
<li class="mt-2">A weakening US dollar and stronger EM balance sheets create supportive conditions.</li>
<li class="mt-2">Combining local- and hard-currency EM bonds can help diversify returns across cycles.</li>
</ul>
<p>In 2025, emerging markets faced headwinds from the Trump administration&rsquo;s tariff policies, which expected to weigh on EM economies, as well as consumer and corporate weakness in China that was feared would spill over across Asia.</p>
<p>Instead, emerging markets thrived, challenging outdated perceptions of political and economic instability.</p>
<p>As shown in Table 1, emerging markets bonds outperformed global developed markets bonds by 8.71% in 2025 and US bonds by 9.64%.</p>
<h3>Table 1: EM Bonds Outperformed Global and US Bonds in 2025</h3>
<div class="wrapped-div">
<table style="width: 50%;">
<tbody>
<tr class="tbl-data">
<td class="tbl-header last text-left">Asset Class</td>
<td class="tbl-header last text-right">2025 Return</td>
</tr>
<tr class="tbl-data">
<td class="data-td data last text-left">Emerging Market Bonds</td>
<td class="data-td data last text-right">16.79</td>
</tr>
<tr class="tbl-data">
<td class="data-td data last text-left">Global Bonds</td>
<td class="data-td data last text-right">8.08</td>
</tr>
<tr class="tbl-data">
<td class="data-td data last text-left">US Bonds</td>
<td class="data-td data last text-right">7.15</td>
</tr>
</tbody>
</table>
</div>
<p class="chart-disclosure">Source: VanEck. Emerging market bonds are represented by the 50% J.P. Morgan Emerging Market Bond Index Global Diversified and 50% J.P. Morgan Government Bond-Emerging Market Index Global Diversified. Global Bonds is represented by the ICE BofA Global Broad Market Index. US Bonds is represented by the ICE BofA US Broad Market Index. Past performance is no guarantee of future results. Index performance is not representative of fund performance. It is not possible to invest directly in an index.</p>
<h3>Average Annual Total Returns<sup>*</sup>&nbsp;(%) (In USD)</h3>
<div class="wrapped-div">
<table style="width: 100%;">
<tbody>
<tr class="tbl-data">
<td class="tbl-header last text-left">Month End As of February 28, 2026</td>
<td class="tbl-header last text-right">1 Mo</td>
<td class="tbl-header last text-right">3 Mo</td>
<td class="tbl-header last text-right">YTD</td>
<td class="tbl-header last text-right">1 Yr</td>
<td class="tbl-header last text-right">3 Yrs</td>
<td class="tbl-header last text-right">5 Yrs</td>
<td class="tbl-header last text-right">10 Yrs</td>
</tr>
<tr class="tbl-data">
<td class="data-td last text-left">EMBX (NAV)</td>
<td class="data-td data last text-right">1.20</td>
<td class="data-td data last text-right">4.90</td>
<td class="data-td data last text-right">3.43</td>
<td class="data-td data last text-right">18.86</td>
<td class="data-td data last text-right">11.41</td>
<td class="data-td data last text-right">4.89</td>
<td class="data-td data last text-right">5.74</td>
</tr>
<tr class="tbl-data">
<td class="data-td last text-left">EMBX (Market Price)</td>
<td class="data-td data last text-right">1.46</td>
<td class="data-td data last text-right">4.88</td>
<td class="data-td data last text-right">3.72</td>
<td class="data-td data last text-right">19.06</td>
<td class="data-td data last text-right">11.47</td>
<td class="data-td data last text-right">4.92</td>
<td class="data-td data last text-right">5.76</td>
</tr>
<tr class="tbl-data">
<td class="data-td last text-left">50% GBI-EM/50% EMBI</td>
<td class="data-td data last text-right">1.34</td>
<td class="data-td data last text-right">3.92</td>
<td class="data-td data last text-right">2.79</td>
<td class="data-td data last text-right">16.69</td>
<td class="data-td data last text-right">10.75</td>
<td class="data-td data last text-right">2.82</td>
<td class="data-td data last text-right">4.30</td>
</tr>
</tbody>
</table>
</div>
<h3>Average Annual Total Returns<sup>*</sup>&nbsp;(%) (In USD)</h3>
<div class="wrapped-div">
<table style="width: 100%;">
<tbody>
<tr class="tbl-data">
<td class="tbl-header last text-left">Quarter End As of December 31, 2025</td>
<td class="tbl-header last text-right">1 Mo</td>
<td class="tbl-header last text-right">3 Mo</td>
<td class="tbl-header last text-right">YTD</td>
<td class="tbl-header last text-right">1 Yr</td>
<td class="tbl-header last text-right">3 Yrs</td>
<td class="tbl-header last text-right">5 Yrs</td>
<td class="tbl-header last text-right">10 Yrs</td>
</tr>
<tr class="tbl-data">
<td class="data-td last text-left">EMBX (NAV)</td>
<td class="data-td data last text-right">1.41</td>
<td class="data-td data last text-right">3.15</td>
<td class="data-td data last text-right">19.04</td>
<td class="data-td data last text-right">10.84</td>
<td class="data-td data last text-right">3.87</td>
<td class="data-td data last text-right">5.49</td>
</tr>
<tr class="tbl-data">
<td class="data-td last text-left">EMBX (Share Price)</td>
<td class="data-td data last text-right">1.12</td>
<td class="data-td data last text-right">3.03</td>
<td class="data-td data last text-right">18.91</td>
<td class="data-td data last text-right">10.80</td>
<td class="data-td data last text-right">3.85</td>
<td class="data-td data last text-right">5.48</td>
</tr>
<tr class="tbl-data">
<td class="data-td last text-left">50% GBI-EM/50% EMBI</td>
<td class="data-td data last text-right">1.11</td>
<td class="data-td data last text-right">3.32</td>
<td class="data-td data last text-right">16.80</td>
<td class="data-td data last text-right">10.08</td>
<td class="data-td data last text-right">1.50</td>
<td class="data-td data last text-right">4.20</td>
</tr>
</tbody>
</table>
</div>
<div class="chart-disclosure">
<p><sup>*</sup>&nbsp;Returns less than one year are not annualized.</p>
<p>EMBX Gross Expense Ratio: 0.76%</p>
<p>The performance data quoted represents past performance. Past performance is not a guarantee of future results. Investment return and principal value of an investment will fluctuate so that an investor's shares, when redeemed, may be worth more or less than their original cost. Performance may be lower or higher than performance data quoted. Please call 800.826.2333 or visit <a href="http://vaneck.com/" title="http://vaneck.com">vaneck.com</a> for performance current to the most recent month ended.</p>
<p>Prior to 10/06/2025, the Fund operated as the VanEck Emerging Markets Bond mutual fund; performance shown before that date is that fund&rsquo;s NAV performance (Class I, unadjusted for today&rsquo;s ETF expenses).</p>
</div>
<p>Many investors missed this opportunity, but it&rsquo;s not too late.</p>
<h2 id="point-one" class="anchored-block jump-link-nav" data-jumplink-title="The Case for EMB">Why Emerging Markets Bonds Were Ignored, and Why That&rsquo;s Changing in 2026</h2>
<p>The fundamental case for investing in emerging markets bonds has been building for some time, but investors have shown little interest in the asset class over the past several years. Many investors view emerging markets bonds as risky. However, we believe that is changing. emerging markets bonds are now entering a favorable phase. Despite heightened geopolitical noise and renewed trade tensions, emerging markets bonds rallied in 2025.</p>
<h3>Exhibit 1: Emerging Markets Bonds Rallied in 2025</h3>
<p><img loading="lazy" class="desktop-image img-responsive" alt="Emerging Markets Bonds Rallied in 2025" src="https://www.vaneck.com/contentassets/328adc61180f4b7a9a0fb602d42ee1ff/6921_why-consider-emb_chart-1_2026-03_v1_desktop.svg" /></p>
<p><img loading="lazy" class="mobile-image img-responsive" alt="Emerging Markets Bonds Rallied in 2025" src="https://www.vaneck.com/contentassets/328adc61180f4b7a9a0fb602d42ee1ff/6921_why-consider-emb_chart-1_2026-03_v1_mobile.svg" /></p>
<p class="chart-disclosure">Source: Morningstar as of 31/12/2024 to 31/12/2025. Global Broad Market is represented by the ICE BofA Global Broad Market Index. US Broad Market is represented by the ICE BofA US Broad Market Index. Past performance is no guarantee of future results. Index performance is not representative of fund performance. It is not possible to invest directly in an index.</p>
<p>This mirrors the early stages of the 2018 trade war (between US and China), but with a key difference: the US dollar is weakening, and markets are increasingly positioning for this shift. Actual performance, rather than headlines, is driving investor outcomes.</p>
<h3>Exhibits 2 and 3: EM Bonds Under Trump&rsquo;s Tariffs in 2018 and 2025 Differ</h3>
<p><strong>EM Fixed Income in Early Stages of Trade War 1.0 (2018/19)</strong></p>
<p><img loading="lazy" class="desktop-image img-responsive" alt="EM Fixed Income in Early Stages of Trade War 1.0 (2018/19)" src="https://www.vaneck.com/contentassets/c57df142506944558437b1e512bd2189/6921_why-consider-emb_chart-2_2026-03_v1_desktop.svg" /></p>
<p><img loading="lazy" class="mobile-image img-responsive" alt="EM Fixed Income in Early Stages of Trade War 1.0 (2018/19)" src="https://www.vaneck.com/contentassets/c57df142506944558437b1e512bd2189/6921_why-consider-emb_chart-2_2026-03_v1_mobile.svg" /></p>
<p><strong>EM Fixed Income in Early Stages of Trade War 2.0 (2025/26)</strong></p>
<p><img loading="lazy" class="desktop-image img-responsive" alt="EM Fixed Income in Early Stages of Trade War 2.0 (2025/26)" src="https://www.vaneck.com/contentassets/c57df142506944558437b1e512bd2189/6921_why-consider-emb_chart-3_2026-03_v1_desktop.svg" /></p>
<p><img loading="lazy" class="mobile-image img-responsive" alt="EM Fixed Income in Early Stages of Trade War 2.0 (2025/26)" src="https://www.vaneck.com/contentassets/c57df142506944558437b1e512bd2189/6921_why-consider-emb_chart-3_2026-03_v1_mobile.svg" /></p>
<p class="chart-disclosure">Source: VanEck Research. Data as of February 2026. EM Corporate is represented by the J.P. Morgan CEMBI Broad Diversified Index which tracks the performance of US dollar-denominated bonds issued by emerging market corporate entities.; EM Local is represented by the J.P. Morgan GBI-EM Global Core which tracks local currency bonds issued by emerging markets governments. The index weighting methodology limits the weight of countries with larger debt stocks, with a maximum of 10% and a minimum of 1% to 3% depending on the amount of the country&rsquo;s eligible debt outstanding.; EM Sovereign is represented by the J.P. Morgan EMBI Global Diversified Index which is comprised of U.S. dollar-denominated Brady bonds, Eurobonds, and traded loans issued by emerging markets sovereign and quasi-sovereign entities. The index weighting methodology limits the weight of countries with larger debt stocks. Past performance is no guarantee of future results. Index performance is not representative of fund performance. It is not possible to invest directly in an index.</p>
<h2>US Stagflation Risk is a Structural Tailwind</h2>
<p>One of the reasons the US dollar is depreciating is that the US currently faces rising stagflation risk. Inflation is remaining elevated relative to growth. In contrast, inflation across many emerging markets, particularly China, has been structurally lower. Historically, such inflation differentials point to currency weakness in higher-inflation economies, reinforcing the case for US dollar depreciation. Valuation measures support this view, with the US dollar appearing overvalued and the Chinese yuan undervalued on a real effective basis.</p>
<h3>Exhibit 4: The US Dollar Appears Overvalued vs. the Chinese Yuan</h3>
<p><strong>USD and CNY - Real Effective Exchange Rates</strong></p>
<p><img loading="lazy" class="desktop-image img-responsive" alt="USD and CNY - Real Effective Exchange Rates" src="https://www.vaneck.com/contentassets/376ba97f17f841c2bb616f006de9844b/6921_why-consider-emb_chart-4_2026-03_v1_desktop.svg" /></p>
<p><img loading="lazy" class="mobile-image img-responsive" alt="USD and CNY - Real Effective Exchange Rates" src="https://www.vaneck.com/contentassets/376ba97f17f841c2bb616f006de9844b/6921_why-consider-emb_chart-4_2026-03_v1_mobile.svg" /></p>
<p class="chart-disclosure">Source: VanEck Research; Bloomberg LP. Data as of January 2026. Not intended as a prediction of future results. For illustrative purposes only. Past performance is not indicative of future performance.</p>

<h2>External Balance Sheets Advantage; Compelling Yields</h2>
<p>Net international investment position (NIIP) data show that many emerging markets countries, particularly in Asia, are net external creditors, while the US remains a large net debtor. These accumulated surpluses of emerging markets are significant and enhance fundamental quality. In addition, many accumulated surpluses may be re-shored to home or other non-US shores. This dynamic implies either a weaker US dollar or structurally higher US rates; both outcomes are supportive for emerging market bonds.</p>
<h3>Exhibit 5: NIIP Projects a Weaker USD</h3>
<p><strong>Net International Investment Position (NIIP)</strong></p>
<p><img loading="lazy" class="desktop-image img-responsive" alt="NIIP Projects a Weaker USD" src="https://www.vaneck.com/contentassets/edfce9b68ddb49ef8997fcecf29391fe/6921_why-consider-emb_chart-5_2026-03_v1_desktop.svg" /></p>
<p><img loading="lazy" class="mobile-image img-responsive" alt="NIIP Projects a Weaker USD" src="https://www.vaneck.com/contentassets/edfce9b68ddb49ef8997fcecf29391fe/6921_why-consider-emb_chart-5_2026-03_v1_mobile.svg" /></p>
<p class="chart-disclosure">Source: Deutsche Bank. Data as of December 2025. Not intended as a prediction of future results. For illustrative purposes only. Past performance is not indicative of future performance.</p>
<p>In addition, when hedged into Asian currencies, US Treasuries now offer low or unattractive yields, while onshore Asian and emerging markets bonds remain compelling on a relative basis. Exhibit 6 shows 30-year government bond yields hedged back into Japanese yen. When Japanese (or other Asian) investors hedge US Treasuries or European government bonds back into their home currency, the hedging cost wipes out most of the yield. As a result, hedged US Treasuries deliver low returns compared with domestic bonds such as Japanese government bonds (JGBs). This highlights a structural shift: for global investors who manage currency risk, holding US Treasuries is no longer compelling, while local Asian bonds look relatively more attractive. The chart also points out that as this reality sinks in, hedging behavior is evolving, reinforcing capital flows away from USD assets and supporting non-USD bond markets, including emerging market local-currency bonds.</p>
<h3>Exhibit 6: Yields Wiped Out by Hedging Costs</h3>
<p><strong>30-Year Government Bonds Hedged Back into JPY</strong></p>
<p><img loading="lazy" class="desktop-image img-responsive" alt="30-Year Government Bonds Hedged Back into JPY" src="https://www.vaneck.com/contentassets/e1daba24e01f490eb23e16ed9c560a8e/6921_why-consider-emb_chart-6_2026-03_v1_desktop.svg" /></p>
<p><img loading="lazy" class="mobile-image img-responsive" alt="30-Year Government Bonds Hedged Back into JPY" src="https://www.vaneck.com/contentassets/e1daba24e01f490eb23e16ed9c560a8e/6921_why-consider-emb_chart-6_2026-03_v1_mobile.svg" /></p>
<p class="chart-disclosure">Source: VanEck Research; Bloomberg LP. Data as of February 2026. Past performance is not indicative of future performance.</p>
<p>We believe an allocation to emerging markets bonds is supported by the above. It is important to take the right approach.</p>
<h2 id="point-two" class="anchored-block jump-link-nav" data-jumplink-title="Why Active, Blended">Why Active, Blended?</h2>
<p>Over the past 20 years, local currency was the best performing category within emerging markets bonds for 7 years, while the US dollar (emerging markets sovereign) took the spot for 13 years. A blended approach allows for less extreme results while capturing potential outperformance.</p>
<p>Exhibit 7 plots the 12-month rolling return difference between emerging markets US dollar sovereign bonds (EMBIG) and emerging markets local currency bonds (GBI-EM). When the line is above zero, US dollar emerging markets bonds outperformed. When it is below zero, local currency emerging markets bonds outperformed. Over the past 20 years, leadership has rotated frequently and sharply between the two.</p>
<p>This variability means that allocating to only one segment requires strong and often uncertain macro calls. A blended emerging markets bond approach helps smooth outcomes across market cycles, reduces reliance on forecasting currency or rate moves, and allows investors to capture diversified sources of return from both credit and local market dynamics.</p>
<h3>Exhibit 7: Leadership Between Local and US Dollar Denominated EM Bonds Rotate Frequently and Sharply</h3>
<p><strong>EMBIG-GBI EM Total Return Differential, (12m rolling, bps)</strong></p>
<p><img loading="lazy" class="desktop-image img-responsive" alt="EMBIG-GBI EM Total Return differential, (12m rolling, bps)" src="https://www.vaneck.com/contentassets/9e5dedc831a84a3c959e2e2e4ef270d1/6921_why-consider-emb_chart-7_2026-03_v1_desktop.svg" /></p>
<p><img loading="lazy" class="mobile-image img-responsive" alt="EMBIG-GBI EM Total Return differential, (12m rolling, bps)" src="https://www.vaneck.com/contentassets/9e5dedc831a84a3c959e2e2e4ef270d1/6921_why-consider-emb_chart-7_2026-03_v1_mobile.svg" /></p>
<p class="chart-disclosure">Source: VanEck Research, Bloomberg LP. Data as of December 2025. EMBIG is represented by J.P. Morgan Emerging Market Bond Index Global Diversified, GBI-EM is represented by the JPMorgan Government Bond Index-Emerging Markets Global Diversified Index. Past performance is no guarantee of future results. Index performance is not representative of fund performance. It is not possible to invest directly in an index.</p>
<h2 id="point-three" class="anchored-block jump-link-nav" data-jumplink-title="Why EMBX">Ready to Allocate? We Recommend an Active Blended Approach</h2>
<p>In addition, due to the idiosyncrasies between the countries included in the emerging markets bond universe and the nuances between the different types of bonds available, we believe an active, unconstrained, blended approach, like the one employed by the <a href="/link/f447bf0c04f64108a3dcff3ca025af4a.aspx" title="EMBX - VanEck Emerging Markets Bond ETF - Overview"><strong>VanEck Emerging Markets Bond ETF (EMBX)</strong></a> is an ideal way for investors to access this important asset class.</p>
<p>VanEck&rsquo;s unconstrained approach offers several benefits, including greater diversification versus approaches limited to only hard or local currency. We believe an optimal portfolio of EM bonds is unconstrained by indices and invests in bonds that offer the best value relative to their fundamentals while actively managing risk.</p>

<p>To receive more <a href="https://www.vaneck.com/us/en/insights/emerging-markets-bonds/" title="Emerging Markets Bonds Insights"><strong>Emerging Markets Bonds</strong></a> insights, <a href="/link/5f45412c2143400497908cea2897f7d3.aspx" title=" Subscription Center"><strong>sign up in our subscription center</strong></a>.</p>
]]></content:encoded>
</item><item rdf:about="https://www.vaneck.com/us/en/blogs/income-investing/what-is-driving-bdc-valuations/">
  <title>What is Driving BDC Valuations?></title>
  <link>https://www.vaneck.com/us/en/blogs/income-investing/what-is-driving-bdc-valuations/</link>
  <description><![CDATA[BDC valuations reflect NII, dividend coverage, credit quality and rate expectations. With P/B below average, markets may already price in cuts, creating potential income opportunities.]]></description>
  <dc:creator>Coulter Regal, CFA</dc:creator>
  <dc:date>03/04/2026 06:30:00</dc:date>
<content:encoded><![CDATA[

<p><strong>Key Takeaways:</strong></p>
<ul class="content-list">
<li class="mt-2">BDC valuations hinge on NII, dividend coverage, credit quality and price to NAV levels.</li>
<li class="mt-2">Current P/B of 0.83x sits below the 0.97x average, reflecting rate and credit concerns.</li>
<li class="mt-2">BDC yields near 12% highlight durable spread income across rate cycles.<sup>*</sup></li>
</ul>
<h2 id="point-one" class="anchored-block jump-link-nav" data-jumplink-title="BDC Valuations">What Drives BDC Valuations?</h2>
<p>Business development companies (BDCs) are publicly traded investment vehicles that lend to small and mid-sized U.S. businesses, primarily through floating-rate loans. Because BDCs are required to distribute the majority of their taxable income, they are popular among income-focused investors. Several key factors drive how the market values public BDCs:</p>
<ul class="content-list">
<li class="mt-2"><strong>Net investment income (NII):</strong> The core earnings measure for BDCs, reflecting the spread between income earned on the loan portfolio and operating/financing costs. NII is the primary source of shareholder dividends.</li>
<li class="mt-2"><strong>Dividend yield and coverage:</strong> Whether a BDC's earnings sufficiently cover its distribution is a key signal of sustainability.</li>
<li class="mt-2"><strong>Price-to-NAV (book value):</strong> BDCs report NAV quarterly, but shares trade in the secondary market at prices that may differ. A discount to NAV may reflect macro concerns; a premium often signals confidence in management and portfolio quality.</li>
<li class="mt-2"><strong>Credit quality and leverage:</strong> Non-accrual rates, portfolio composition, and balance sheet leverage influence risk assessment.</li>
<li class="mt-2"><strong>Macro conditions and sentiment:</strong> GDP projections, rate policy, the credit environment, and investor appetite for income assets all shape valuations. More recently, concerns about potential credit deterioration and the impact of AI-driven disruption on certain BDC borrowers have weighed on sentiment, sometimes independently of underlying fundamentals.</li>
</ul>
<h2>Why Interest Rates Matter for BDC Performance</h2>
<p>Because BDC loan portfolios are predominantly floating rate, typically benchmarked to SOFR, changes in Federal Reserve rate policy flow directly through to BDC earnings. When rates are elevated, BDCs earn more on their assets. When rates decline, floating-rate coupons reset lower, reducing income.</p>
<p>The impact is not entirely one-sided, however. Lower rates can also reduce a BDC's own borrowing costs, partially offsetting the decline in asset income. Many BDC loans also include interest rate floors that set a minimum coupon, providing a cushion in a rate-cutting cycle. The Fed currently holds the federal funds rate at a target range of 3.50% to 3.75% following three consecutive cuts in late 2025, with FOMC members divided on the path forward.</p>
<h2>Are BDC Valuations Pricing in Rate Cuts?</h2>
<p>One of the clearest ways to gauge whether the market has already adjusted for rate expectations is to examine the price-to-book (P/B) ratio of the public BDC universe. Using the MVIS US Business Development Companies Index (the index underlying BIZD), the index-level P/B ratio as of February 27, 2026 sits at approximately 0.83x, well below the long-term historical average of roughly 0.97x. That is a discount of about 14% relative to the historical norm.</p>
<h3>Historical BDC Price-to-Book Ratios:</h3>
<div class="wrapped-div">
<table style="width: 100%;">
<tbody>
<tr class="tbl-data">
<td class="tbl-header last text-left">Period</td>
<td class="tbl-header last text-left">Price/Book Ratio</td>
<td class="tbl-header last text-left">Context</td>
</tr>
<tr class="tbl-data">
<td class="data-td data last text-left">Sep 2015 (pre-hike low)</td>
<td class="data-td data last text-left">0.83x</td>
<td class="data-td data last text-left">Energy/credit concerns</td>
</tr>
<tr class="tbl-data">
<td class="data-td data last text-left">Jan 2016 (selloff trough)</td>
<td class="data-td data last text-left">0.81x</td>
<td class="data-td data last text-left">Energy sector stress</td>
</tr>
<tr class="tbl-data">
<td class="data-td data last text-left">Aug 2016 (recovery)</td>
<td class="data-td data last text-left">1.00x</td>
<td class="data-td data last text-left">Credit stabilization</td>
</tr>
<tr class="tbl-data">
<td class="data-td data last text-left">Mar 2020 (COVID low)</td>
<td class="data-td data last text-left">0.63x</td>
<td class="data-td data last text-left">Pandemic-driven selloff</td>
</tr>
<tr class="tbl-data">
<td class="data-td data last text-left">Late 2024 (recent high)</td>
<td class="data-td data last text-left">1.10x</td>
<td class="data-td data last text-left">Strong BDC fundamentals</td>
</tr>
<tr class="tbl-data">
<td class="data-td data last text-left">Feb 2026 (current)</td>
<td class="data-td data last text-left">0.83x</td>
<td class="data-td data last text-left">Credit/rate sentiment discount</td>
</tr>
<tr class="tbl-data">
<td class="data-td last text-left">Long-term average</td>
<td class="data-td last text-left">0.97x</td>
<td class="data-td last text-left">Aug 2011 to Feb 2026</td>
</tr>
</tbody>
</table>
</div>
<p class="chart-disclosure">Source: MVIS US Business Development Companies Index. Data as of 2/27/2026. Past performance is not indicative of future results. Index performance is not illustrative of fund performance. It is not possible to invest directly in an index.</p>
<p>The current P/B level is comparable to the discount seen in September 2015, just before the first Fed rate hike in nearly a decade, and early 2016, when energy sector stress weighed on credit sentiment. In both cases, valuations subsequently recovered as conditions stabilized, with the index reaching 1.00x by August 2016. While some of the current discount reflects expectations for lower NII as rates come down, it also captures a broader shift in sentiment around private credit. Concerns about credit quality in certain pockets of BDC lending, particularly among software and technology-exposed borrowers facing potential disruption from artificial intelligence, have contributed to the recent selloff. For investors with a constructive view on the overall credit environment, this type of valuation backdrop has historically represented attractive entry points.</p>
<h2 id="point-two" class="anchored-block jump-link-nav" data-jumplink-title="BDC Yields">BDC Yields in Historical Context</h2>
<p>While yields across asset classes naturally fluctuate with interest rate cycles, BDC yields have historically remained in an attractive range regardless of the prevailing rate environment. As illustrated in the chart below, the MVIS BDC Index dividend yield has generally stayed between roughly 8% and 12% over the past 14 years, even as the effective federal funds rate moved from near zero to above 5% and back down.</p>
<p><img loading="lazy" class="desktop-image img-responsive" alt="BDC Yields in Historical Context" src="https://www.vaneck.com/contentassets/5da0ccddaf364407a77ffe273337929c/6908_bizd-aeo-blog_chart-1_2026-03_v1_desktop.svg" /></p>
<p><img loading="lazy" class="mobile-image img-responsive" alt="BDC Yields in Historical Context" src="https://www.vaneck.com/contentassets/5da0ccddaf364407a77ffe273337929c/6908_bizd-aeo-blog_chart-1_2026-03_v1_mobile.svg" /></p>
<p class="chart-disclosure">Source: FactSet; Federal Reserve Bank of St. Louis. BDCs represented by MVIS US Business Development Companies Index (MVBDCTRG); Index data prior to June 19, 2023 reflects that of the MVIS US Business Development Companies Liquid Index (MVBIZDTG). From June 19, 2023 forward, the index data reflects that of the MVIS US Business Development Companies Index (MVBDCTRG). Index history which includes periods prior to June 19, 2023 links the performance of the indices and is not intended for third party use. Past performance is no guarantee of future results. Index performance is not illustrative of fund performance. It is not possible to invest directly in an index.</p>

<p>This durability reflects the fact that a significant portion of BDC income comes from the credit spread above base rates, the premium that middle-market borrowers pay for private financing. That spread component has historically persisted across rate cycles, helping to support BDC yields even when base rates decline. As of February 2026, the index dividend yield sits at approximately 12.2%, with the federal funds rate in the mid threes.</p>
<h2 id="point-three" class="anchored-block jump-link-nav" data-jumplink-title="BDCs When Rates Fall">How Do BDCs Perform When Rates Fall?</h2>
<p>While declining rates can reduce the floating-rate income BDCs earn on their loan portfolios, the impact is often partially offset by lower borrowing costs and by the credit spreads BDCs earn above base rates. Historically, BDCs have continued to deliver attractive income across a variety of rate environments, particularly when credit fundamentals remain sound.</p>
<p>Looking at past cycles, the 2019 rate cuts saw BDC P/B ratios remain near or above 1.0x as the economic backdrop stayed supportive. The rate hiking cycle of 2022 to 2023 was particularly favorable for BDC earnings as floating-rate income surged and credit fundamentals remained strong. The key takeaway is that rates are just one variable. Credit performance, borrower fundamentals, and manager quality all play significant roles in determining outcomes, and periods where sentiment overshoots to the downside have often been followed by recoveries once underlying credit data stabilized.</p>
<h2>What This Means for Income Investors</h2>
<p>Are BDC dividends at risk if rates fall? Dividends may see some adjustment as base rates decline, given that underlying loans are predominantly floating rate. However, BDC managers have several levers to help mitigate the impact, including optimizing portfolio spreads, generating fee income from origination activity, managing leverage, and reducing operating costs. The credit spread component of BDC income, the premium borrowers pay above the base rate, has historically been a durable source of yield that persists across rate environments.</p>
<h2>Diversification Benefits of BDC Exposure</h2>
<p>For income-focused investors, BDCs can play a complementary role within a broader portfolio. Their floating-rate orientation provides a differentiated return profile relative to traditional fixed-rate bonds, which tend to lose value when rates rise but benefit when rates fall. BDCs offer essentially the opposite dynamic, making them a useful diversifier alongside core fixed income holdings.</p>
<p>BDCs also provide accessible exposure to private credit markets, which have historically offered attractive yields and low correlation to bonds and other core areas of the income market. For investors looking to broaden income sources beyond Treasuries, investment-grade corporates, and high-yield bonds, BDCs represent an accessible way to tap into private lending with the transparency, liquidity, and regulatory oversight of publicly traded securities.</p>
<h2>Gaining Exposure Through the VanEck BDC Income ETF (BIZD)</h2>
<p>The <strong><a href="/link/c48bed1be12e47c88f01e1bdbfa51ed2.aspx?utm_source=google&amp;utm_medium=cpc&amp;utm_campaign=us_search_bizd" title="BIZD - VanEck BDC Income ETF - Overview">VanEck BDC Income ETF (BIZD)</a></strong> offers diversified exposure to publicly traded BDCs in a single, liquid vehicle. Rather than picking individual BDCs, which carry concentration risk tied to specific managers and borrower pools, <strong><a href="/link/c48bed1be12e47c88f01e1bdbfa51ed2.aspx?utm_source=google&amp;utm_medium=cpc&amp;utm_campaign=us_search_bizd" title="BIZD - VanEck BDC Income ETF - Overview">BIZD</a></strong> tracks the MVIS US Business Development Companies Index across the industry's largest names. For investors who believe that much of the recent selling in BDCs reflects sentiment rather than a fundamental deterioration in credit quality, the current environment may represent an attractive entry point for private credit income.</p>

<p>To receive more <a href="/us/en/blogs/income-investing/" title="Income Investing Insights"><strong>Income Investing</strong></a> insights, <a href="/link/5f45412c2143400497908cea2897f7d3.aspx" title=" Subscription Center"><strong>sign up in our subscription center</strong></a>.</p>
]]></content:encoded>
</item><item rdf:about="https://www.vaneck.com/us/en/blogs/natural-resources/iran-oil-disruption-geopolitics-and-global-energy-markets/">
  <title>Iran Oil Disruption: Geopolitics and Global Energy Markets></title>
  <link>https://www.vaneck.com/us/en/blogs/natural-resources/iran-oil-disruption-geopolitics-and-global-energy-markets/</link>
  <description><![CDATA[Escalating Middle East tensions, tightening supply and rising AI-driven demand may be shifting oil markets from temporary risk premiums to sustained structural disruption.]]></description>
  <dc:creator>Shawn Reynolds</dc:creator>
  <dc:date>03/03/2026 06:30:00</dc:date>
<content:encoded><![CDATA[

<p><strong>Key Takeaways:</strong></p>
<ul class="content-list">
<li class="mt-2"><strong>This may be more than a temporary oil shock.</strong> Geopolitical escalation in Iran intersects with constrained structural supply, raising the probability of prolonged disruption rather than a short-lived risk premium.</li>
<li class="mt-2"><strong>Energy markets face tightening supply buffers.</strong> Limited OPEC+ spare capacity and Strait of Hormuz disruption increase the likelihood that crude remains elevated above $60/bbl.</li>
<li class="mt-2"><strong>Demand megatrends continue to accelerate.</strong> AI, electrification and infrastructure expansion are reinforcing long-term energy and materials demand at a time when supply flexibility is deteriorating.</li>
</ul>
<p>As we have noted recently, geopolitics matter greatly when it comes to global oil and LNG prices. The attacks on Iran and the risk of escalation in a region central to global energy flows are a reminder of how quickly supply concerns can resurface. While geopolitical machinations clearly impact short-term pricing and create a &ldquo;risk premium,&rdquo; it is ultimately the balance between supply and demand that determines the fundamental direction of prices.</p>
<p>The term &ldquo;risk premium&rdquo; suggests a temporary effect and often it is. It is not uncommon to see crude prices jump $5&ndash;$10/bbl following major international disruptions. Markets have, at times, grown almost impervious to one-off events. This moment feels different.</p>
<p>Rather than a transitory shock, we may be entering a situation that lasts months. Supply of crude oil and LNG is very likely to be disrupted, perhaps for a meaningful period. The implications extend beyond headline risk and into the structural functioning of the energy ecosystem.</p>
<h2>Webinar: Energy Markets Enter a New Regime</h2>
On March 4, Shawn Reynolds, Portfolio Manager, discussed how recent geopolitical developments are reshaping energy markets and what it means for investors.
<h2>Iran Oil Risk Premium vs. Structural Supply Disruption</h2>
<p>Recent developments have distinctly, but not unexpectedly, altered the calculus of crude oil and LNG prices. Initial equity and commodity reactions in the Gulf region reflected knee-jerk volatility, with moves in the 5&ndash;10% range that partially settled. Investors initially hoped for a contained outcome.</p>
<p>We continue to lean toward the scenario that negotiations are unlikely to materialize in a durable way, increasing the probability of a deadly, disruptive and prolonged conflict. The structural impacts could span infrastructure, transportation, production and refining. Even early actions are likely to create ripple effects across the entire oil and LNG ecosystem.</p>
<p>Several developments reinforce this view:</p>
<ul class="content-list">
<li class="mt-2">
<p><strong>Leadership vacuum and retaliation risk</strong><br />The death of senior Iranian leadership figures and vows of revenge introduce profound uncertainty. A power vacuum increases the probability of responsive actions taken with limited restraint.</p>
</li>
<li class="mt-2">
<p><strong>Strait of Hormuz disruption</strong><br />Shipping through the Strait has halted amid tanker attacks, and major regional ports have suspended operations. Roughly 15&ndash;20% of global crude oil and approximately 20% of LNG flows through the Strait of Hormuz. The longer this persists, the more profound the impact on global energy markets.</p>
</li>
<li class="mt-2">
<p><strong>Limited OPEC+ offset</strong><br />OPEC+ has agreed to resume production increases, adding 206,000 bbl/d, only modestly above prior plans. This suggests the group is either unwilling or, in our view, unable to raise production significantly enough to offset potential regional interruptions.</p>
</li>
<li class="mt-2">
<p><strong>Gulf states isolate Iran</strong><br />Gulf states&mdash;including Saudi Arabia, the UAE, Qatar, Oman, Kuwait and Bahrain&mdash;have hardened their stance, virtually isolating Iran. This raises the risk of retaliatory strikes and reinforces the likelihood of a severe and extended conflict.</p>
</li>
</ul>
<p>Taken together, these factors point toward oil prices reflecting this situation over a longer horizon than just days. Longer-term impacts could suggest meaningful upward pressure under a prolonged disruption scenario, however, a swift diplomatic resolution or de-escalation could put downward pressure on prices.</p>

<h2>Oil Price Scenarios: Why Crude Could Stay Above $60 per Barrel</h2>
<p>Even before the most recent escalation in Iran, scenario analysis across a range of outcomes, from early-stage negotiations to sustained attacks and aggressive OPEC+ action, already indicated that crude prices were likely to remain structurally elevated. The emerging structural disruptions only reinforce that view and potentially push the equilibrium higher. Alternatively, a rapid de-escalation or demand slowdown could result in materially lower prices.</p>
<h2>The Demand Side: A Megatrend Accelerating</h2>
<p>At the same time, the global economy faces the reality of rapidly expanding AI influence and the massive amounts of energy, and critical minerals, required to power it. This appears to be a megatrend.</p>
<p>AI is not simply &ldquo;turning on your computer.&rdquo; It demands scalable power generation, transmission infrastructure and material inputs at the very front edge of the ecosystem. Ensuring sufficient energy and accessible materials is becoming a real challenge.</p>
<p>As demand for natural resources continues its march up and to the right, perhaps even inflecting upward, supply conditions are being fundamentally disrupted.</p>
<h2>The Investment Case</h2>
<p>In this environment, the &ldquo;zero terminal value&rdquo; narrative for traditional energy appears to have evaporated. Instead, we see:</p>
<ul class="content-list">
<li class="mt-2">Cheap valuation multiples</li>
<li class="mt-2">Rock-solid balance sheets</li>
<li class="mt-2">Strong dividend and share repurchase commitments</li>
</ul>
<p>Crude oil, LNG and the companies that produce them tend to do what they are supposed to do when they are supposed to do it. In a world of rising structural demand and constrained supply, the outperformance of this sector can continue.</p>
<p>This moment feels different, not because geopolitics matter more than before, but because they are intersecting with tightening structural supply and accelerating long-term demand.</p>
<div class="wrapped-div mt-3">
<table style="width: 100%;">
<tbody>
<tr class="tbl-data">
<td class="tbl-header last">Ticker</td>
<td class="tbl-header last">Fund Name</td>
<td class="tbl-header last">Fund Highlights</td>
</tr>
<tr class="tbl-data">
<td class="data-td data last"><a href="/link/8339ad0b563143d98a7d2e61afbc5425.aspx" title="OIH | VanEck Oil Services ETF - Overview"><strong>OIH</strong></a></td>
<td class="data-td data last"><a href="/link/8339ad0b563143d98a7d2e61afbc5425.aspx" title="OIH | VanEck Oil Services ETF - Overview"><strong>VanEck Oil Services ETF</strong></a></td>
<td class="data-td data last">Targets the companies behind global oil and gas production: drillers, equipment providers and service leaders whose revenues are closely tied to upstream capex cycles and rig activity. Offers concentrated exposure to the operational backbone of the energy industry.</td>
</tr>
<tr class="tbl-data">
<td class="data-td data last"><a href="/link/a7dbc67770ac4eb8a7c25f4c0afe1bd3.aspx" title="CRAK | VanEck Oil Refiners ETF - Overview"><strong>CRAK</strong></a></td>
<td class="data-td data last"><a href="/link/a7dbc67770ac4eb8a7c25f4c0afe1bd3.aspx" title="CRAK | VanEck Oil Refiners ETF - Overview"><strong>VanEck Oil Refiners ETF</strong></a></td>
<td class="data-td data last">Focuses on downstream energy companies that turn crude into usable fuels and petrochemicals. Designed to capture refining margins and global fuel demand dynamics rather than crude price direction alone.</td>
</tr>
<tr class="tbl-data">
<td class="data-td data last"><a href="/link/166837347eb349dc81ff131cd1514f52.aspx" title="GHAAX | Global Resources Fund - Class A - Overview"><strong>GHAAX</strong></a></td>
<td class="data-td data last"><a href="/link/166837347eb349dc81ff131cd1514f52.aspx" title="GHAAX | Global Resources Fund - Class A - Overview"><strong>VanEck Global Resources Fund</strong></a></td>
<td class="data-td data last">Actively invests across a wide global resource equity landscape, from energy to base and precious metals, seeking long-term capital appreciation through diversified exposure to companies benefiting from core resource demand and structural growth trends.</td>
</tr>
<tr class="tbl-data">
<td class="data-td data last"><a href="/link/8035c2a4153d4a16bd871a6b15c949b3.aspx" title="HAP | VanEck Natural Resources ETF - Overview"><strong>HAP</strong></a></td>
<td class="data-td data last"><a href="/link/8035c2a4153d4a16bd871a6b15c949b3.aspx" title="HAP | VanEck Natural Resources ETF - Overview"><strong>VanEck Natural Resources ETF</strong></a></td>
<td class="data-td data last">Broad natural resources exposure spanning energy, metals, agriculture and industrial materials. Designed as a diversified real-asset allocation aligned with global growth, inflation sensitivity and commodity cycles.</td>
</tr>
</tbody>
</table>
</div>

<p>To receive more <a href="/us/en/insights/natural-resources/" title="Natural Resources Insights"><strong>Natural Resources</strong></a> insights, <a href="https://www.vaneck.com/us/en/subscribe/" title="Subscription Center"><strong>sign up in our subscription center</strong></a>.</p>
]]></content:encoded>
</item><item rdf:about="https://www.vaneck.com/us/en/blogs/thematic-investing/nvidia-q4-earnings-call-what-it-means-for-smh/">
  <title>Nvidia Q4 Earnings Call: What It Means for SMH></title>
  <link>https://www.vaneck.com/us/en/blogs/thematic-investing/nvidia-q4-earnings-call-what-it-means-for-smh/</link>
  <description><![CDATA[Nvidia delivered another record quarter driven by AI data center demand and guided higher. The results reinforce continued strength across the semiconductor and AI ecosystem.]]></description>
  <dc:creator>Nick Frasse</dc:creator>
  <dc:date>03/03/2026 06:30:00</dc:date>
<content:encoded><![CDATA[

<p><strong>Key Takeaways:</strong></p>
<ul class="content-list">
<li class="mt-2">Record revenue and EPS beat driven by data center AI demand.</li>
<li class="mt-2">Strong forward guidance signals continued AI infrastructure buildout.</li>
<li class="mt-2">Management emphasized sustained enterprise and hyperscaler investment.</li>
<li class="mt-2">AI spending momentum remains concentrated but broadening across use cases.</li>
</ul>
<h2>What Did Nvidia Report?</h2>
<p>Nvidia reported record Q4 revenue of approximately $68.1 billion and earnings per share of about $1.62, both ahead of expectations, driven primarily by continued strength in its data center segment. Data center revenue remained the dominant contributor as hyperscalers and enterprises accelerated AI infrastructure deployment. Management emphasized ongoing AI compute demand and the ramp of next-generation platforms as key focal points during the call.</p>
<h2>Webinar -&nbsp;AI&rsquo;s Shift from Buildout to&nbsp;Deployment</h2>
<h2>Why NVDA Earnings Call Matters for the Market</h2>
<ul class="content-list">
<li class="mt-2">Signals sustained AI infrastructure spending across the semiconductor ecosystem.</li>
<li class="mt-2">Highlights continued pricing power and scale benefits in advanced compute.</li>
<li class="mt-2">Provides insight into enterprise and hyperscaler AI capex trends.</li>
</ul>
<p>Nvidia&rsquo;s results serve as a read-through on broader semiconductor demand, particularly in high-performance computing, advanced packaging, memory, and AI networking.</p>
<h2>What This Means for SMH</h2>
<p>These results reinforce trends relevant through the <strong><a href="/link/39c8d235748b4c26a5930c31d3ac0160.aspx" title="SMH - VanEck Semiconductor ETF - Overview">VanEck Semiconductor ETF (SMH)</a></strong> and the <strong><a href="/link/9b8fb1812bc74764bf11fc85767838f9.aspx" title="SMHX - VanEck Fabless Semiconductor ETF - Overview">VanEck Fabless Semiconductor ETF (SMHX)</a></strong>, particularly exposure to:</p>
<ul class="content-list">
<li class="mt-2">Leading-edge chip designers powering AI training and inference.</li>
<li class="mt-2">Foundries and manufacturing capacity supporting advanced nodes.</li>
<li class="mt-2">Memory and high-bandwidth memory providers critical for AI workloads.</li>
<li class="mt-2">AI infrastructure suppliers benefiting from continued hyperscale investment.</li>
</ul>
<p>Nvidia&rsquo;s earnings underscore the central role of semiconductors in enabling AI model development and deployment. As AI workloads scale, demand extends beyond a single company to the broader chip ecosystem represented across <strong><a href="/link/39c8d235748b4c26a5930c31d3ac0160.aspx" title="SMH - VanEck Semiconductor ETF - Overview">SMH</a></strong> and <strong><a href="/link/9b8fb1812bc74764bf11fc85767838f9.aspx" title="SMHX - VanEck Fabless Semiconductor ETF - Overview">SMHX</a></strong>.</p>
<h2>Nvidia&rsquo;s Outlook for the Next Quarter</h2>
<p>Nvidia guided revenue to approximately $76&ndash;79.5 billion for the upcoming quarter, above consensus expectations.</p>
<div class="wrapped-div">
<table style="width: 100%;">
<tbody>
<tr class="tbl-data">
<td class="tbl-header last text-left">Risks</td>
<td class="tbl-header last text-left">Opportunities</td>
</tr>
<tr class="tbl-data">
<td class="data-td data last text-left">Concentration among large hyperscale customers</td>
<td class="data-td data last text-left">Continued AI training and inference expansion</td>
</tr>
<tr class="tbl-data">
<td class="data-td data last text-left">Export restrictions and geopolitical pressures</td>
<td class="data-td data last text-left">Enterprise AI adoption beyond hyperscalers</td>
</tr>
<tr class="tbl-data">
<td class="data-td data last text-left">Cyclicality in semiconductor capital spending</td>
<td class="data-td data last text-left">Next-generation platform ramps driving incremental demand</td>
</tr>
</tbody>
</table>
</div>
<br />
<h2>Who Should Be Paying Attention</h2>
<p>Investors focused on AI infrastructure trends or monitoring semiconductor demand cycles may find these earnings particularly relevant.</p>
<h2>How to Access Semiconductors</h2>
<p>Investors looking for exposure to semiconductors can access it through the <strong><a href="/link/39c8d235748b4c26a5930c31d3ac0160.aspx" title="SMH - VanEck Semiconductor ETF - Overview">VanEck Semiconductor ETF (SMH)</a></strong> and the <strong><a href="/link/9b8fb1812bc74764bf11fc85767838f9.aspx" title="SMHX - VanEck Fabless Semiconductor ETF - Overview">VanEck Fabless Semiconductor ETF (SMHX)</a></strong>, which provides targeted exposure to leading chip designers and the broader semiconductor value chain.</p>

<p>To receive more <a href="https://www.vaneck.com/us/en/insights/thematic-investing/" title="Thematic Investing Insights"><strong>Thematic Investing</strong></a> insights, <a href="https://www.vaneck.com/us/en/subscribe/" title="Subscription Center"><strong>sign up in our subscription center</strong></a>.</p>
]]></content:encoded>
</item><item rdf:about="https://www.vaneck.com/us/en/blogs/gold-investing/gold-investing-outlook/">
  <title>Gold Price &amp; Investment Outlook: 2026 &amp; Beyond></title>
  <link>https://www.vaneck.com/us/en/blogs/gold-investing/gold-investing-outlook/</link>
  <description><![CDATA[Leveraging over 50 years of gold investing leadership, we offer timely insight into why this precious metal remains essential in today's uncertain macroeconomic and geopolitical climate.]]></description>
  <dc:creator> </dc:creator>
  <dc:date>02/27/2026 06:30:00</dc:date>
<content:encoded><![CDATA[

<p><strong>Key Takeaways:</strong></p>
<ul class="content-list">
<li class="mt-2">Gold&rsquo;s bull market remains intact despite volatility, with record highs driven by global uncertainty.</li>
<li class="mt-2">Inflation, de-dollarization and central bank demand are structurally supporting gold prices.</li>
<li class="mt-2">Gold and gold equities offer diversification, crisis resilience and long-term upside potential.</li>
</ul>
<p><strong><i>The information, valuation scenarios and price targets presented on gold in this blog are not intended as financial advice, a recommendation to buy or sell gold, or any call to action. There may be risks or other factors not accounted for in these scenarios that may impede the performance of gold; its actual future performance is unknown, and may differ significantly from any valuation scenarios or projections/forecasts herein. Any projections, forecasts or forward-looking statements included herein are the results of a simulation based on our research, are valid as of the date of this communication and subject to change without notice, and are for illustrative purposes only. Please conduct your own research and draw your own conclusions.</i></strong></p>
<p>Gold is one of the most vital metals in the world and a unique asset, with the ability to enhance portfolio diversification, act as store of value, and hedge against systemic risk. VanEck has long been considered a leader in gold-related investments and has been managing gold funds since 1968, including the nation's first open-ended gold equity mutual fund.</p>
<p>As we look to the future of gold investment, understanding the evolving dynamics and fundamentals of this precious metal is crucial. This article will provide a recap of the current state of gold investing, some of VanEck's gold market predictions, and the Firm's general outlook for the metal in the coming years.</p>
<h2 id="point-one" class="anchored-block jump-link-nav" data-jumplink-title="Gold Investing Trends">Recent Trends in Gold Investing</h2>
<p>In 2024 and 2025, gold prices soared to successive record highs, and 2026 has continued the trend with even greater momentum. Gold has surged above $5,000 per ounce, having reached an intraday high of $5,595 on January 29, 2026, before pulling back. It has been the best-performing major asset class over the past two years, nearly doubling the returns of the S&amp;P 500 over the trailing 12 months.</p>
<p>This surge has been driven, in part, by robust central bank demand, including from emerging markets such as China, India, and Turkey. Gold prices are significantly influenced by global economic conditions, including inflation rates and geopolitical tensions.</p>
<p>More recently, gold has benefited from deteriorating macroeconomic conditions, including geopolitical uncertainty globally, tariff and sanctions policy volatility, and growing questions about U.S. dollar reserve status&mdash;all of which are driving demand for alternatives to the dollar. As the chart below shows, foreign central banks now hold more gold than U.S. Treasuries.</p>
<h3>Value of Gold vs. U.S. Treasuries Held at Foreign Central Banks</h3>
<p><img loading="lazy" class="desktop-image img-responsive" alt="Value of Gold vs. U.S. Treasuries Held at Foreign Central Banks" src="https://www.vaneck.com/contentassets/5b0a76289b1644eaa6b053c5d7ee1323/6890_update-gold-price-outlook_chart-1_2026-02_v1_desktop.svg" /></p>
<p><img loading="lazy" class="mobile-image img-responsive" alt="Value of Gold vs. U.S. Treasuries Held at Foreign Central Banks" src="https://www.vaneck.com/contentassets/5b0a76289b1644eaa6b053c5d7ee1323/6890_update-gold-price-outlook_chart-1_2026-02_v1_mobile.svg" /></p>
<p class="chart-disclosure">Source: Visual Capitalist. Data as of December 2025. Past performance is no guarantee of future results.</p>
<p>However, despite the new highs gold made in 2026, its price movements have been extremely volatile. While the long-term outlook for gold remains bright, investors in gold should expect periods of volatility. Looking at the current gold environment through the lens of the two previous major bull markets provides helpful context: the 1976&ndash;1980 cycle (which produced roughly 500% cumulative returns) and the 2001&ndash;2011 cycle (roughly 600% cumulative returns). The current cycle, which began in 2022, has generated approximately 200% so far. Importantly, both prior bull markets experienced five corrections of 10% or more along the way. The recent pullback represents the second such correction in this cycle and falls well within historical norms.</p>
<p>Historically, gold has reacted to various global events such as financial crises and shifts in monetary policy. The current trend mirrors past periods where gold strengthened amid global uncertainties, suggesting a recurring pattern of investor behavior during times of economic and geopolitical uncertainty.</p>
<h2 id="point-two" class="anchored-block jump-link-nav" data-jumplink-title="Historical Gold Prices">Historical Lookback of Gold Prices</h2>
<p>For centuries, gold has served as a form of exchange, a safe haven investment (in times of financial market turmoil) as well as a hedge against severe inflation. As an investment, gold helps enhance portfolio diversification, acts as store of value, and offers a hedge against systemic risk. In addition, gold has outperformed traditional asset classes over the last 25 years.</p>
<h3>Historical Gold Outperformance Since 2000</h3>
<p><img loading="lazy" class="desktop-image img-responsive" alt="Historical Gold Outperformance Since 2000" src="https://www.vaneck.com/contentassets/72ba884f49d24fee8b21d293875be523/6890_update-gold-price-outlook_chart-2_2026-02_v1_desktop.svg" /></p>
<p><img loading="lazy" class="mobile-image img-responsive" alt="Historical Gold Outperformance Since 2000" src="https://www.vaneck.com/contentassets/72ba884f49d24fee8b21d293875be523/6890_update-gold-price-outlook_chart-2_2026-02_v1_mobile.svg" /></p>
<p class="chart-disclosure">Source: FactSet, VanEck. Data as of December 2025. U.S. Stocks represented by S&amp;P<sup>&reg;</sup>&nbsp;500 Index; U.S.Bonds represented by Bloomberg Barclays U.S. Aggregate Bond Index; Gold ($/oz) represented by LBMA PM Gold Price; U.S. Treasuries represented by the Bloomberg Barclays U.S. 1-3 Year Treasury Bond Index. Past performance is no guarantee of future results. Index performance is not illustrative of product performance. It is not possible to invest directly in an index.</p>
<h2 id="point-three" class="anchored-block jump-link-nav" data-jumplink-title="Key Factors">Key Factors Affecting Gold Prices</h2>
<p>Understanding the macroeconomic, geopolitical, and technological factors that influence the price of gold is crucial for investors seeking to navigate the complexities of the market. The impact of interest rates and global economic policies collectively shape the investment landscape of gold.</p>
<h2>Macroeconomic Factors Affecting Gold Prices</h2>
<p>Gold prices are significantly influenced by macroeconomic factors, particularly interest rates and monetary policy. Typically, when interest rates are low, the opportunity cost of holding non-yielding assets like gold decreases, making gold more attractive to investors. Conversely, higher interest rates can strengthen the dollar and make yield-bearing assets more appealing, often leading to a decline in gold prices. However, current trends deviate from this norm due to sustained inflationary pressures and de-dollarization, which has helped sustain strong investment demand for gold.</p>
<p>The recent nomination of Kevin Warsh as the next Fed Chair introduced fresh volatility into the gold market, with gold initially falling 9% on the announcement before stabilizing. Markets are now pricing in the possibility of multiple rate cuts in 2026, which should provide a supportive backdrop for gold going forward.</p>
<p>Looking forward, continued inflationary pressures and geopolitical risks are likely to further bolster gold's appeal as a hedge against market volatility.</p>
<h2>Geopolitical Influences</h2>
<p>Historical data shows that gold prices often increase during times of geopolitical unrest or instability, as investors seek stability. This sensitivity to global political dynamics contributes to gold's status as a "safe haven" asset.</p>
<p>In the current market environment, gold and gold stocks should ultimately benefit from the heightened level of risk across the global economy and global financial system. With U.S. exceptionalism increasingly in question, the potential for a weaker dollar should continue to drive de-dollarization, which also benefits gold. Rising geopolitical tensions involving Venezuela, Iran, and Greenland, combined with persistent U.S. tariff and sanctions threats, have added further fuel to gold's rally. In general, the unpredictability of economic policies and heightened market volatility should boost gold's appeal as the preferred safe-haven asset during times of global uncertainty. This should support a continued shift in investor sentiment towards gold and related equities.</p>
<h2 id="point-four" class="anchored-block jump-link-nav" data-jumplink-title="Gold Outlook">Gold Investing Outlook and Why Gold Could Go Higher in 2026</h2>
<p>Here we explore what these developments could mean for gold prices in 2026 and beyond, examining both short-term forecasts and longer-term projections based on current and emerging market influences.</p>
<h2>Short-term Forecast: 2026 Gold Predictions</h2>
<p>Gold had a phenomenal&mdash;if very volatile&mdash;start to 2026. The move above $5,000 on January 26 appeared to unleash a wave of speculative buying, pushing gold to an intraday high of $5,595 by January 29. That kind of price action made a pullback almost inevitable, and gold ended January at $4,894, still up over 13% for the month.</p>
<p>January's price action is a reminder of both gold's uncontested role as a safe haven and the increased volatility that comes with trading at record levels. In our view, these sharp swings should not distract or deter gold investors. Gold's longer-term outlook remains supported by the same forces that drove it in 2025: central banks and investors seeking protection, diversification, and de-dollarization in their reserves and portfolios. Rising geopolitical risks and trade tensions, inflation concerns, a potentially weaker dollar, and the risk of a meaningful correction in stretched equity markets should all continue to support gold in 2026. However, investors may want to hold gold for the long term but be prepared for near-term pullbacks given its significantly strong run.</p>
<h2>By Historical Standards, We View Gold&rsquo;s Bull Market Is in Its Infancy</h2>
<p><strong>Gold - Cumulative Total Return</strong></p>
<p><img loading="lazy" class="desktop-image img-responsive" alt="Gold - Cumulative Total Return" src="https://www.vaneck.com/contentassets/e3d9d1cd0cd04d8ba31374f0fd483da9/6890_update-gold-price-outlook_chart-3_2026-02_v1_desktop.svg" /></p>
<p><img loading="lazy" class="mobile-image img-responsive" alt="Gold - Cumulative Total Return" src="https://www.vaneck.com/contentassets/e3d9d1cd0cd04d8ba31374f0fd483da9/6890_update-gold-price-outlook_chart-3_2026-02_v1_mobile.svg" /></p>
<p class="chart-disclosure">Source: VanEck, Bloomberg. Data as of January 2026. Past performance is no guarantee of future results.</p>
<h2>Side Note: For Miners, It's About More Than Just the Gold Price</h2>
<p>A rising gold price environment has historically been accompanied by strong performance by gold equities. The sector outperformers must also demonstrate that they are fundamentally positioned and have a sound strategy that will translate higher gold prices into improved cash flow and higher returns, which will deliver growth. Organic growth does not come easy in the gold sector. Finding new gold deposits, or defining/expanding existing ones, is a difficult, lengthy, and capital-intensive process. Most senior and mid-tier companies struggle to simply replace their annual production. To significantly expand their depleting reserve and resource base, companies generally must acquire other companies or assets. All things equal, the more advanced a project is, the higher its valuation and the faster the company can deliver growth.</p>
<p>Gold equities remain in catch-up mode. The MarketVector Global Gold Miners Index have delivered strong gains but still underperformed the metal. This dynamic reflects a feature of the past decade: gold mining equities have been consistently valued using gold price assumptions that lag the spot price. However, we are seeing a notable shift. Equity and commodity analysts are increasingly publishing gold price forecasts that not only point to higher prices in 2026 but assume sustained or elevated price levels through 2028&ndash;2029. This should translate into stronger consensus expectations for valuations, earnings, and cash flows across the sector and help support a long-overdue re-rating of gold mining equities. Gold miners are generating record cash flows, with robust margins even at lower gold prices, enabling increased shareholder returns and accelerating investment in the sector's long-term growth pipeline.</p>
<p>Gold stocks' leverage to the gold price, combined with their attractive valuations relative to the broader equity markets, and their low correlation with most other asset classes, should lead to a re-rating of the sector as investors look for a safer place to rotate capital to and as they look to diversify their portfolios.</p>
<h2>5 Year Forecast: Gold Price Forecast for 2027&ndash;2031</h2>
<p>Gold was built for the shifting trends currently unfolding in the global economy: inflation, war, uncertainty and growing financial instability. As the chart below illustrates, gold has dominated every major asset class across over the past five years. Over the past year, gold has delivered an annualized return of roughly 65%&mdash;nearly four times the return of U.S. stocks and more than eight times that of U.S. bonds. Over two and three years, gold's annualized returns of approximately 45% and 33%, respectively, have roughly doubled those of U.S. equities. Even over the full five-year period, gold's annualized return of approximately 18% has outpaced stocks, bonds, and commodities alike. As these trends continue to play out over the next five years and reshape the global economic order, we believe gold has the potential to continue to trade at elevated levels, with further upside as structural demand drivers intensify.</p>
<h3>Annualized Total Return</h3>
<p><img loading="lazy" class="desktop-image img-responsive" alt="Annualized Total Return" src="https://www.vaneck.com/contentassets/d45091ad74ae457684d12067e059c922/6890_update-gold-price-outlook_chart-4_2026-02_v1_desktop.svg" /></p>
<p><img loading="lazy" class="mobile-image img-responsive" alt="Annualized Total Return" src="https://www.vaneck.com/contentassets/d45091ad74ae457684d12067e059c922/6890_update-gold-price-outlook_chart-4_2026-02_v1_new_mobile.svg" /></p>
<p class="chart-disclosure">Source: VanEck, Bloomberg. Data as of December 2025. For illustrative purposes only. Past performance is no guarantee of future results. &ldquo;Gold&rdquo; is represented by the spot price of gold. &ldquo;U.S. Stocks&rdquo; represented by the S&amp;P 500 Index. &ldquo;U.S. Bonds&rdquo; represented by the Bloomberg U.S. Aggregate Bond index. &ldquo;Commodities&rdquo; represented by the Bloomberg Commodity Index. Index performance is not illustrative of product performance. It is not possible to invest directly in an index.</p>
<h2>Long-term Gold Forecast: 2031 &amp; Beyond</h2>
<p><i>The following analysis is a theoretical balance-sheet exercise and is not intended as an expected price level. For illustrative purposes only.</i></p>
<p>Longer term, investors should expect gold to continue to act as a hedge against broader market volatility and uncertainty. Since 2008, gold has outperformed U.S. stocks and Treasuries during the most notable of market crises. This reflects gold's role as a hedge against financial risks and safe haven amid uncertainty.</p>
<p>Our Emerging Markets Bond team recently published a thought-provoking analysis <strong><a href="/link/49427424c92d4a648b1ad78dde2fae2c.aspx" title="If the Dollar Loses Reserve Status, Could Gold Surpass $39k?">examining what would happen if the U.S. dollar were to lose its reserve status</a></strong>. Using balance-sheet math&mdash;dividing central bank money liabilities by gold reserves and weighting by FX turnover&mdash;they calculate that the price of gold equalizing central bank M0 liabilities would be approximately $39,000 per ounce. Under a broader M2 framework, the implied price reaches approximately $184,000 per ounce. VanEck's view remains that the dollar will not lose its reserve status outright but will gradually share it with other currencies, including gold. Still, the analysis illustrates how dramatically gold could be repriced in a scenario where confidence in the dollar meaningfully erodes, and underscores the structural case for gold in a world where de-dollarization is an accelerating trend.</p>
<h2 id="point-five" class="anchored-block jump-link-nav" data-jumplink-title="Conclusion">Conclusion: Investing in Gold Is a Cornerstone of a Diversified Portfolio</h2>
<p>Gold continues to be an indispensable asset in the global financial landscape, demonstrating remarkable resilience and adaptability amidst fluctuating macroeconomic conditions and geopolitical tensions. From 2024 through early 2026, gold prices have surged to new highs, driven by a mix of geopolitical uncertainty, record investment demand, and substantial buying from emerging market central banks. This trend underscores gold's enduring role as a safe haven during times of economic uncertainty and its appeal as a hedge against systemic risks and inflation.</p>
<p>Looking ahead, the investment outlook for gold remains positive, with expectations of continued strength in the market. Factors such as ongoing geopolitical risks, trade policy uncertainty and sustained inflationary pressures are likely to further enhance gold's attractiveness. Additionally, technological advancements in mining and shifts in consumer demand in industries like electronics and jewelry will continue to influence gold production and prices.</p>
<p>For investors, the strategic implications are clear: we believe gold should be considered a vital component of a diversified investment portfolio, not only for its traditional benefits but also for its potential to deliver significant returns in a complex global economic environment. The insights provided here aim to equip investors with the knowledge to navigate the evolving gold market, ensuring informed decision-making for both short-term opportunities and long-term investment strategies.</p>
<p>VanEck has provided investors access to gold, one of the most vital metals in the world, for over 50 years with both actively and passively managed solutions.</p>
<p>To receive more <strong><a href="https://www.vaneck.com/us/en/insights/gold-investing/" title="Gold Investing Insights">Gold Investing</a></strong> insights, <strong><a href="https://www.vaneck.com/us/en/subscribe/" title="Subscription Center">sign up in our subscription center</a></strong>.</p>
]]></content:encoded>
</item><item rdf:about="https://www.vaneck.com/us/en/blogs/thematic-investing/the-etfs-powering-the-ai-supply-chain/">
  <title>The ETFs Powering the AI Supply Chain></title>
  <link>https://www.vaneck.com/us/en/blogs/thematic-investing/the-etfs-powering-the-ai-supply-chain/</link>
  <description><![CDATA[Artificial intelligence doesn&rsquo;t run on software alone. It depends on semiconductors, energy, and critical materials. Explore the ETFs providing exposure to the AI buildout.]]></description>
  <dc:creator> </dc:creator>
  <dc:date>02/27/2026 06:30:00</dc:date>
<content:encoded><![CDATA[

<h2 id="point-one" class="anchored-block jump-link-nav" data-jumplink-title="AI Supply Chain">What Actually Powers AI?</h2>
<p>It&rsquo;s easy to think of AI as a purely digital phenomenon built on code and data floating in the cloud. But every model runs on physical hardware, consumes real electricity, and depends on materials that are pulled from the ground.</p>
<p>Training a frontier model like GPT-4 reportedly consumed around 50 gigawatt-hours of energy, which is enough to power San Francisco for three days.<sup>1</sup>&nbsp;And that&rsquo;s just the training phase. Inference, which is the process of actually serving AI to hundreds of millions of users, demands even more sustained power over time.</p>
<p>All of that computation flows through three critical layers:</p>
<ul class="content-list">
<li class="mt-2"><strong>Semiconductors</strong> that do the math.</li>
<li class="mt-2"><strong>Energy</strong> that keeps the data centers running around the clock.</li>
<li class="mt-2"><strong>Strategic metals</strong> embedded in the hardware itself.</li>
</ul>
<p>When any of those layers hits a bottleneck like a chip shortage, a power constraint, or an export ban on critical minerals, it affects every corner of the AI economy.</p>
<h2>How Can You Invest in the AI Supply Chain?</h2>
<p>Rather than chasing the handful of software names that dominate AI headlines, investors can target the physical infrastructure that every one of those companies depends on. VanEck offers three ETFs, each mapped to a distinct layer of the AI supply chain.</p>
<div class="wrapped-div">
<table style="width: 100%;">
<tbody>
<tr class="tbl-data">
<td class="tbl-header last text-left">ETF</td>
<td class="tbl-header last text-left">Role in AI Supply Chain</td>
<td class="tbl-header last text-left">Why It Matters for AI</td>
<td class="tbl-header last text-left">Why Invest</td>
</tr>
<tr class="tbl-data">
<td class="data-td last text-left"><a href="/link/39c8d235748b4c26a5930c31d3ac0160.aspx" title="SMH - VanEck Semiconductor ETF - Overview"><strong>SMH</strong></a></td>
<td class="data-td data last text-left">The advanced chips: GPUs, AI accelerators, that perform the trillions of calculations behind model training and inference.</td>
<td class="data-td data last text-left">Hyperscalers are spending hundreds of billions on AI compute. No chips, no AI.</td>
<td class="data-td data last text-left">Concentrated access to the 25 largest U.S.-listed semiconductor companies.</td>
</tr>
<tr class="tbl-data">
<td class="data-td last text-left"><a href="/link/49acb0d4174146e9a0269c9cb81c02bb.aspx" title="NLR - VanEck Uranium and Nuclear ETF - Overview"><strong>NLR</strong></a></td>
<td class="data-td data last text-left">Uranium mining, reactor construction, and nuclear power generation: the 24/7 baseload electricity AI requires.</td>
<td class="data-td data last text-left">Data center power demand is set to double by 2030. Nuclear is the only scalable zero-carbon option.</td>
<td class="data-td data last text-left">Full nuclear value chain exposure, from miners to utilities.</td>
</tr>
<tr class="tbl-data">
<td class="data-td last text-left"><a href="/link/71e51530eb0e4adbbd16a7847361abc7.aspx" title="REMX - VanEck Rare Earth and Strategic Metals ETF - Overview"><strong>REMX</strong></a></td>
<td class="data-td data last text-left">Rare earth and strategic metals embedded in every server and data center.</td>
<td class="data-td data last text-left">China controls ~90% of rare earth processing. Supply chain risk is real and growing.</td>
<td class="data-td data last text-left">Pure-play global exposure to miners, refiners, and recyclers of critical metals.</td>
</tr>
</tbody>
</table>
</div>
<p class="chart-disclosure">Source: VanEck. These are not recommendations to buy or to sell any security.</p>
<h2>How the AI Supply Chain Works</h2>
<p>AI runs on physical infrastructure. Before a model can answer a question or generate an image, semiconductors have to process the data, power plants have to keep the servers running, and raw materials have to be mined, refined, and built into hardware. Each layer depends on the one below it. Here&rsquo;s how the three layers connect.</p>
<p><img loading="lazy" class="desktop-image img-responsive" alt="How the AI Supply Chain Works" src="https://www.vaneck.com/contentassets/51b98c14423a4584bfa714e902338059/6872_ai-stack-blog_infographic_2026-02_v3_web.svg" /></p>
<p><img loading="lazy" class="mobile-image img-responsive" alt="How the AI Supply Chain Works" src="https://www.vaneck.com/contentassets/51b98c14423a4584bfa714e902338059/6872_ai-stack-blog_infographic_2026-02_v3_web--email-mobile.svg" /></p>
<p class="chart-disclosure">Source: VanEck. These are not recommendations to buy or to sell any security.</p>
<h2 id="point-two" class="anchored-block jump-link-nav" data-jumplink-title="Semiconductors">Why Semiconductors Are Critical to AI?</h2>
<p>Without advanced chips, none of this works. GPUs and custom accelerators handle the trillions of matrix multiplications required to train large language models, generate images, and run autonomous systems. <strong><a href="/us/en/blogs/thematic-investing/if-you-are-reading-this-semiconductors-and-ai-are-taking-over/" title="If You&rsquo;re Reading This Semiconductors &amp; AI Are Taking Over">The entire AI wave is, at its core, a semiconductor demand story</a></strong><a>.</a></p>
<p>The semiconductor industry also has a structural <strong><a href="https://www.vaneck.com/us/en/videos/what-is-an-economic-moat/" title="What Is an Economic Moat?">moat</a></strong> and only a handful of companies worldwide can manufacture the most advanced chips. That concentration creates real pricing power and long-duration demand for the companies at the top of the food chain.</p>
<h3>SMH: Invest in the Semiconductors Driving AI</h3>
<p>The <strong><a href="/link/39c8d235748b4c26a5930c31d3ac0160.aspx" title="SMH - VanEck Semiconductor ETF - Overview">VanEck Semiconductor ETF (SMH)</a></strong> tracks the MVIS<sup>&reg;</sup>&nbsp;US Listed Semiconductor 25 Index, covering the largest U.S.-listed chip companies across design, manufacturing, and equipment. It&rsquo;s a single way to access the core of the AI buildout.</p>
<h2 id="point-three" class="anchored-block jump-link-nav" data-jumplink-title="Nuclear Energy">Why AI Needs Reliable Energy</h2>
<p>The challenge is that most of the U.S. energy grid was built decades ago. Solar and wind help, but they&rsquo;re intermittent&mdash;and a data center can&rsquo;t afford to go dark when the wind stops blowing.</p>
<p>That&rsquo;s why nuclear is getting serious attention. Microsoft, Meta, and Amazon have all announced plans to <strong><a href="/us/en/blogs/natural-resources/ai-and-nuclear-power/" title="AI's Impact on the Surge of Nuclear Investments: Everything You Need to Know">secure nuclear power for their AI infrastructure</a></strong>. The federal government has moved to ease nuclear plant regulations and fund next-generation reactor designs. Nuclear delivers exactly what a data center needs: reliable, scalable, zero-carbon baseload power, 24 hours a day.</p>
<h3>NLR: Invest in the Industry Powering AI</h3>
<p>The <strong><a href="/link/49acb0d4174146e9a0269c9cb81c02bb.aspx" title="NLR - VanEck Uranium and Nuclear ETF - Overview">VanEck Uranium and Nuclear ETF (NLR)</a></strong> covers the full nuclear value chain&mdash;uranium mining, reactor construction and engineering, maintenance, and electricity generation. The fund tracks the MVIS<sup>&reg;</sup>&nbsp;Global Uranium &amp; Nuclear Energy Index. For investors looking to position for the nuclear renaissance that AI is accelerating, NLR offers a direct way in.</p>
<h2 id="point-four" class="anchored-block jump-link-nav" data-jumplink-title="Rare Earths">What Materials Are Important to AI?</h2>
<p><a href="/us/en/blogs/natural-resources/copper-and-the-materials-behind-global-electrification/" title="Copper and the Materials Behind Global Electrification"><strong>Every AI chip, server rack, and cooling system is built from a cocktail of specialized metals.</strong></a> Here are a few raw materials that matter most:</p>
<ul class="content-list">
<li class="mt-2"><strong>Neodymium and dysprosium</strong> power the high-strength permanent magnets inside hard drives, server fans, and cooling pumps.</li>
<li class="mt-2"><strong>Copper</strong> carries massive electrical currents through the busbars and wiring that connect clustered AI systems.</li>
<li class="mt-2"><strong>Tantalum</strong> goes into the capacitors that regulate voltage in GPUs and memory modules during rapid workload shifts.</li>
<li class="mt-2"><strong>Gallium and germanium</strong> are essential for advanced chip fabrication and the high-speed fiber optics inside data centers.</li>
</ul>
<p>The geopolitical dimension here is hard to ignore. China produces the majority of the world&rsquo;s rare earths and controls nearly all of the processing capacity. The Chinese government recently imposed export licensing rules that require foreign buyers to disclose end-use applications&mdash;effectively restricting access for U.S. defense and advanced technology purchasers.</p>
<p>Western governments are investing in domestic mining and processing alternatives, but reshoring these supply chains is a multi-year project. Demand from the AI buildout, meanwhile, keeps climbing.</p>
<h3>REMX: Invest in the Materials Building AI</h3>
<p>The <strong><a href="/link/71e51530eb0e4adbbd16a7847361abc7.aspx" title="REMX - VanEck Rare Earth and Strategic Metals ETF - Overview">VanEck Rare Earth and Strategic Metals ETF (REMX)</a></strong> tracks the MVIS<sup>&reg;</sup>&nbsp;Global Rare Earth/Strategic Metals Index, which requires constituent companies to derive at least 50% of revenue from the rare earth and strategic metals industry.</p>
<h2>Invest in the AI Buildout with VanEck</h2>
<p>The biggest AI winners over the next decade may not be the companies writing the models. They may be the companies making the chips those models run on, generating the electricity those chips consume, and mining the metals that make all the hardware possible.</p>
<p>VanEck&rsquo;s AI supply chain ETFs let investors gain targeted exposure to the physical infrastructure that every AI company depends on.</p>

<p>To receive more <a href="https://www.vaneck.com/us/en/insights/thematic-investing/" title="Thematic Investing Insights"><strong>Thematic Investing</strong></a> insights, <a href="https://www.vaneck.com/us/en/subscribe/" title="Subscription Center"><strong>sign up in our subscription center</strong></a>.</p>
]]></content:encoded>
</item><item rdf:about="https://www.vaneck.com/us/en/blogs/natural-resources/why-golds-pullback-is-a-setup-not-a-setback/">
  <title>Why Gold&#39;s Pullback is a Setup, Not a Setback></title>
  <link>https://www.vaneck.com/us/en/blogs/natural-resources/why-golds-pullback-is-a-setup-not-a-setback/</link>
  <description><![CDATA[Discover why we believe gold drawdowns are normal, why the bull market has room to run, and the case for including real assets in every portfolio.]]></description>
  <dc:creator> </dc:creator>
  <dc:date>02/26/2026 06:30:00</dc:date>
<content:encoded><![CDATA[

<p><strong>Key Takeaways:</strong></p>
<ul class="content-list">
<li class="mt-2">Real assets may be entering a new regime driven by AI, rising power demand, and shifting monetary dynamics.</li>
<li class="mt-2">Gold&rsquo;s bull market may still be early by historical standards, and periodic corrections are normal.</li>
<li class="mt-2">A diversified real asset allocation, such as the <a href="/link/310be2aebcad4c5cb5a89a82fd128841.aspx" title="RAAX - VanEck Real Assets ETF"><strong>RAAX</strong></a> ETF, can help position portfolios for monetary debasement.</li>
</ul>
<p>A new regime for real assets may be underway, driven by surging electricity demand, AI infrastructure buildout, and shifting monetary dynamics. Against this backdrop, we examine gold&rsquo;s role in the cycle, why periodic corrections are historically normal for the metal, silver&rsquo;s potential, and how diversified real asset exposure through the&nbsp;<strong><a href="/link/310be2aebcad4c5cb5a89a82fd128841.aspx" title="RAAX - VanEck Real Assets ETF">VanEck Real Assets ETF (RAAX)</a></strong> can help position portfolios for the debasement era.</p>
<h2>Gold Just Blinked. Investors Shouldn&rsquo;t</h2>
David Schassler, Head of Multi-Asset Solutions; Charles Cameron, Deputy Portfolio Manager; and Patrick Schramm, Head of National Accounts, discuss current market conditions and how RAAX delivers disciplined gold and real asset exposure.
<p><strong>Highlights from the conversation:</strong></p>
<ul class="content-list">
<li class="mt-2"><strong>A new regime for real assets</strong> (3:27)</li>
</ul>
<p class="ml-5">Old-world assets are building and powering the digital economy, and five-year returns across energy, infrastructure, and natural resources have quietly outpaced equities.</p>
<ul class="content-list">
<li class="mt-2"><strong>Electricity demand is soaring </strong>(6:07)</li>
</ul>
<p class="ml-5">Global electricity demand is expected to double by 2025.</p>
<ul class="content-list">
<li class="mt-2"><strong>The AI buildout bolsters U.S. GDP growth</strong> (7:01)</li>
</ul>
<p class="ml-5">Data center CAPEX and electricity demand are surging, making energy and infrastructure the bottleneck&mdash;and the opportunity&mdash;of the AI era.</p>
<ul class="content-list">
<li class="mt-2"><strong>Old rules broken, new rules begin</strong> (8:12)</li>
</ul>
<p class="ml-5">Prior to 2020, there was price stability, assets appreciated in both dollars and gold, and the dollar&rsquo;s role as the world&rsquo;s reserve currency was unquestioned; we&rsquo;re in a new debasement era, and gold is the beneficiary.</p>
<ul class="content-list">
<li class="mt-2"><strong>Gold&rsquo;s bull market is in its infancy</strong> (10:40)</li>
</ul>
<p class="ml-5">At roughly 200% cumulative returns, the current cycle is well below the 500&ndash;600% gains of prior gold bull markets, and the recent correction is historically normal.</p>
<ul class="content-list">
<li class="mt-2"><strong>Silver amplifies the move</strong> (13:09)</li>
</ul>
<p class="ml-5">Silver&rsquo;s dual monetary and industrial demand has historically magnified gold-led rallies, with structural support from solar, semiconductor, and electronics applications.</p>
<ul class="content-list">
<li class="mt-2"><strong><a href="/link/310be2aebcad4c5cb5a89a82fd128841.aspx" title="RAAX - VanEck Real Assets ETF">RAAX</a>: one-stop real asset allocation</strong> (17:48)</li>
</ul>
<p class="ml-5">In our view, investors should consider a 10% allocation to diversified real assets to position portfolios for the new debasement era.</p>
<h2 id="point-one" class="jump-link-nav anchored-block" data-jumplink-title="Gold Rally Update">The Gold Rally Has More Upside</h2>
<p>Looking at the current gold environment through the lens of the two previous major bull markets provides helpful context: the 1976&ndash;1980 cycle (which produced roughly 500% cumulative returns) and the 2001&ndash;2011 cycle (roughly 600% cumulative returns). The current cycle, which began in 2022, has generated approximately 200% so far. Importantly, both prior bull markets experienced five corrections of 10% or more along the way. The recent pullback represents the second such correction in this cycle and falls well within historical norms.</p>
<ul class="content-list">
<li class="mt-2">Prior gold bull markets produced 500&ndash;600% cumulative returns; the current cycle has delivered roughly 200%.</li>
<li class="mt-2">Both the 1970s and 2000s bull markets experienced five corrections of 10% or more.</li>
<li class="mt-2">The recent pullback is the second such correction in this cycle and is consistent with historical patterns.</li>
</ul>
<!--h3 id="point-two" class="jump-link-nav anchored-block" data-jumplink-title="Bull Market History">By Historical Standards, We View Gold&rsquo;s Bull Market Is in Its Infancy</h3>
<p><strong>Gold &ndash; Cumulative Total Return</strong></p>
<p><img loading="lazy" class="desktop-image img-responsive" src="https://www.vaneck.com/EPiServer/CMS/Content/contentassets/9a6dcf86acac495fa6a1bf90e2212f3d/6846_raax-recap-blog_chart-1_2026-2_v1_desktop.svg,,362181/Download?epieditmode=False" alt="Gold &ndash; Cumulative Total Return"></p>
<p><img loading="lazy" class="mobile-image img-responsive" src="https://www.vaneck.com/EPiServer/CMS/Content/contentassets/9a6dcf86acac495fa6a1bf90e2212f3d/6846_raax-recap-blog_chart-1_2026-2_v1_mobile.svg,,362182/Download?epieditmode=False" alt="Gold &ndash; Cumulative Total Return"></p-->
<p class="chart-disclosure">Source: VanEck, Bloomberg. Data as of January 2026. The views expressed are for illustrative purposes only, subject to change without notice, do not constitute investment advice or recommendations, and are those of the author(s) and not necessarily those of VanEck or its other employees. Past performance is no guarantee of future results.</p>
<h2 id="point-three" class="jump-link-nav anchored-block" data-jumplink-title="RAAX ETF">The RAAX ETF: A One-Stop Real Asset Allocation</h2>
<p>The <strong><a href="/link/310be2aebcad4c5cb5a89a82fd128841.aspx" title="RAAX - VanEck Real Assets ETF">VanEck Real Assets ETF (RAAX)</a></strong> primarily allocates to exchange-traded products that provide exposure to real assets. Over the past five years, a portfolio of 55% stocks, 35% bonds, and 10% <a href="/link/310be2aebcad4c5cb5a89a82fd128841.aspx" title="RAAX - VanEck Real Assets ETF"><strong>RAAX</strong></a> delivered a 47.5% cumulative return with an annualized standard deviation of 10.3%&mdash;outperforming a traditional 60/40 portfolio with virtually identical risk.</p>
<h3>RAAX Average Annual Total Returns as of 12/31/2025* (%)</h3>
<div class="wrapped-div">
<table style="width: 100%;">
<tbody>
<tr class="tbl-data">
<td class="tbl-header last text-left">Quarter End as of 12/31/2025</td>
<td class="tbl-header last text-right">1 MO</td>
<td class="tbl-header last text-right">3 MO</td>
<td class="tbl-header last text-right">YTD</td>
<td class="tbl-header last text-right">1 YR</td>
<td class="tbl-header last text-right">3 YR</td>
<td class="tbl-header last text-right">5 YR</td>
<td class="tbl-header last text-right">10 YR</td>
<td class="tbl-header last text-right">LIFE 04/09/18</td>
</tr>
<tr class="tbl-data">
<td class="data-td data last text-left">RAAX (NAV)</td>
<td class="data-td data last text-right">0.38</td>
<td class="data-td data last text-right">3.78</td>
<td class="data-td data last text-right">27.20</td>
<td class="data-td data last text-right">14.92</td>
<td class="data-td data last text-right">14.77</td>
<td class="data-td data last text-right">--</td>
<td class="data-td data last text-right">7.95</td>
</tr>
<tr class="tbl-data">
<td class="data-td data last text-left">RAAX (Share Price)</td>
<td class="data-td data last text-right">0.44</td>
<td class="data-td data last text-right">3.73</td>
<td class="data-td data last text-right">26.80</td>
<td class="data-td data last text-right">15.05</td>
<td class="data-td data last text-right">14.80</td>
<td class="data-td data last text-right">--</td>
<td class="data-td data last text-right">7.97</td>
</tr>
<tr class="tbl-data">
<td class="data-td data last text-left">Bloomberg Commodity Index</td>
<td class="data-td data last text-right">-0.32</td>
<td class="data-td data last text-right">5.85</td>
<td class="data-td data last text-right">15.77</td>
<td class="data-td data last text-right">3.96</td>
<td class="data-td data last text-right">10.64</td>
<td class="data-td data last text-right">--</td>
<td class="data-td data last text-right">5.67</td>
</tr>
</tbody>
</table>
</div>
<p class="chart-disclosure">RAAX Gross Expense Ratio: 0.89%</p>
<p class="chart-disclosure"><sup>*</sup>&nbsp;Returns less than one year are not annualized.</p>
<p class="chart-disclosure">All benchmark indices are unmanaged and include the reinvestment of all dividends, but do not reflect the payment of transaction costs, advisory fees or expenses that are associated with an investment in the Fund. An index&rsquo;s performance is not illustrative of the Fund&rsquo;s performance. Benchmark indices are not securities in which investments can be made.</p>
<p class="chart-disclosure"><strong>The performance data quoted represents past performance. Past performance is not a guarantee of future results. Investment return and principal value of an investment will fluctuate so that an investor's shares, when redeemed, may be worth more or less than their original cost. Performance may be lower or higher than performance data quoted. Please call 800.826.2333 or visit vaneck.com for performance current to the most recent month ended.</strong></p>

<h3 id="point-four" class="jump-link-nav anchored-block" data-jumplink-title="Allocation Guide">Examining a 10% Shift for a New Regime</h3>
<p><strong>Allocation Guide and Associated 5-Year Risk / Return</strong></p>
<h3>Weighting Stocks vs. Bonds vs. Real Assets</h3>
<p><img loading="lazy" class="desktop-image img-responsive" src="https://www.vaneck.com/EPiServer/CMS/Content/contentassets/17f667b1551648da9ab9d24178d6e9bf/6846_raax-recap-blog_chart-2_2026-2_v1_desktop.svg,,362199/Download?epieditmode=False" alt="Weighting Stocks vs. Bonds vs. Real Assets" /></p>
<p><img loading="lazy" class="mobile-image img-responsive" src="https://www.vaneck.com/EPiServer/CMS/Content/contentassets/17f667b1551648da9ab9d24178d6e9bf/6846_raax-recap-blog_chart-2_2026-2_v1_mobile.svg,,362200/Download?epieditmode=False" alt="Weighting Stocks vs. Bonds vs. Real Assets" /></p>
<h3>5-Year Cumulative Return and Annualized Risk</h3>
<p><img loading="lazy" class="desktop-image img-responsive" src="https://www.vaneck.com/EPiServer/CMS/Content/contentassets/17f667b1551648da9ab9d24178d6e9bf/6846_raax-recap-blog_chart-3_2026-2_v1_desktop.svg,,362201/Download?epieditmode=False" alt="5-Year Cumulative Return and Annualized Risk" /></p>
<p><img loading="lazy" class="mobile-image img-responsive" src="https://www.vaneck.com/EPiServer/CMS/Content/contentassets/17f667b1551648da9ab9d24178d6e9bf/6846_raax-recap-blog_chart-3_2026-2_v1_mobile.svg,,362202/Download?epieditmode=False" alt="5-Year Cumulative Return and Annualized Risk" /></p>
<p class="chart-disclosure">Source: VanEck, FactSet. As of December 31, 2025. The views expressed are for illustrative purposes only, subject to change without notice, do not constitute investment advice or recommendations, and are those of the author(s) and not necessarily those of VanEck or its other employees. Past performance is no guarantee of future results. &ldquo;Stocks&rdquo; represented by S&amp;P 500 Index. &ldquo;Bonds&rdquo; represented by Bloomberg U.S. Aggregate Bond Index. &ldquo;Real Assets&rdquo; represented by VanEck Real Assets ETF (RAAX). Index descriptions included at the end of this presentation. Index performance is not illustrative of fund performance. It is not possible to invest directly in an index. Index and allocation performance figures shown are shown are historical and for educational purposes only and do not reflect actual investor accounts or guaranteed outcomes.</p>

<p>The <strong><a href="/link/310be2aebcad4c5cb5a89a82fd128841.aspx" title="RAAX - VanEck Real Assets ETF">RAAX</a></strong> ETF is structured around three pillars: growth-oriented holdings (54.5%), including commodities, resource equities, and infrastructure; income-producing assets (17.5%), including MLPs, REITs, and utilities; and capital preservation (26%), anchored by gold bullion and gold miners. Its active, rules-based allocation process has added incremental performance at each step relative to both a 60/40 benchmark and an equal-weight proxy of its investment universe.</p>
<p><strong><a href="/link/310be2aebcad4c5cb5a89a82fd128841.aspx" title="RAAX - VanEck Real Assets ETF">RAAX</a></strong> has also demonstrated an ability to generate consistent returns relative to both commodities and inflation.</p>
<h3 id="point-five" class="anchored-block jump-link-nav" data-jumplink-title="Commodities and Inflation">Ability to Outperform Commodities, Inflation Through Time</h3>
<p><strong>Annualized Trailing Total Return</strong></p>
<p><img loading="lazy" class="desktop-image img-responsive" src="https://www.vaneck.com/EPiServer/CMS/Content/contentassets/6b8ddef884a9419393a70a801ce68bac/6846_raax-recap-blog_chart-4_2026-2_v1_desktop.svg,,362208/Download?epieditmode=False" alt="Annualized Trailing Total Return" /></p>
<p><img loading="lazy" class="mobile-image img-responsive" src="https://www.vaneck.com/EPiServer/CMS/Content/contentassets/6b8ddef884a9419393a70a801ce68bac/6846_raax-recap-blog_chart-4_2026-2_v1_mobile.svg,,362209/Download?epieditmode=False" alt="Annualized Trailing Total Return" /></p>
<p class="chart-disclosure">Source: FactSet. Data as of December 31, 2025. &nbsp;<sup>*</sup>As of 4/9/2018. The views expressed are for illustrative purposes only, subject to change without notice, do not constitute investment advice or recommendations, and are those of the author(s) and not necessarily those of VanEck or its other employees. Past performance is no guarantee of future results. Index performance is not illustrative of fund performance. It is not possible to invest directly in an index. Index performance figures shown are shown are historical and for educational purposes only and do not reflect actual investor accounts or guaranteed outcomes.</p>
<p>To receive more <a href="/us/en/insights/natural-resources/" title="Natural Resources Insights"><strong>Natural Resources</strong></a> insights, <a href="https://www.vaneck.com/us/en/subscribe/" title="Subscription Center"><strong>sign up in our subscription center</strong></a>.</p>
]]></content:encoded>
</item><item rdf:about="https://www.vaneck.com/us/en/blogs/emerging-markets-equity/navigating-emerging-europe-pragmatism-politics-and-the-path-forward/">
  <title>Navigating Emerging Europe: Pragmatism, Politics, and the Path Forward></title>
  <link>https://www.vaneck.com/us/en/blogs/emerging-markets-equity/navigating-emerging-europe-pragmatism-politics-and-the-path-forward/</link>
  <description><![CDATA[Emerging Europe stabilizes as politics, defense spending, and selective stock picking drive the next phase of growth.]]></description>
  <dc:creator>Candy Chao</dc:creator>
  <dc:date>02/26/2026 06:30:00</dc:date>
<content:encoded><![CDATA[

<p><strong>Key Takeaways:</strong></p>
<ul class="content-list">
<li class="mt-2">Macro stress has eased across CEE, setting the stage for a gradual shift toward consumption-led growth.</li>
<li class="mt-2">Political dynamics now play a decisive role in valuations, increasing dispersion across markets.</li>
<li class="mt-2">Defense spending, EU funding, and financial deepening, especially in Poland and Central Asia, offer durable structural opportunities.</li>
</ul>
<p>During a two-week research trip across Prague, Warsaw, Budapest, and Istanbul, VanEck&rsquo;s Emerging Markets portfolio management team attended 45 meetings spanning company leadership, site visits, investors, and policy makers. The most striking takeaway from these meetings was regional resilience. The macro stress of the past has eased faster than expected and what is emerging in its place is a more normalized but also differentiated investment landscape, one where politics, demographics, and selection matter more than headline inflation alone. Against this backdrop, we see the most compelling opportunities in companies aligned with long-term structural themes, including defense spending, and investment-led growth.</p>
<h2>From Stress to Normalization</h2>
<p>Central and Eastern Europe (CEE) has moved past the acute macro stress of the last two years. Inflation shocks, aggressive tightening, and crisis-driven uncertainty have eased faster than expected in several markets. Disinflation in energy and food prices, combined with early signs of labor market cooling, has reduced pressure on households and policymakers alike. Central banks across the region remain cautious but the direction of travel has shifted from restrictive toward more accommodative, creating room for gradual easing through 2026.</p>
<p>CEE economies such as Poland, the Czech Republic, Hungary, and Romania are growing steadily supported by an exceptionally strong labor market. Labor shortages remain a structural feature across Europe, estimated at roughly 15&ndash;17% in many countries.<sup>1</sup>&nbsp;This scarcity anchors wage growth, limits the risk of sharp cyclical downturns, and supports continued growth in domestic consumption.</p>
<p>While disinflation has stabilized household balance sheets, a broad-based recovery in consumer demand has not yet fully materialized. Savings rates remain elevated, housing activity subdued, and discretionary spending cautious.</p>
<p>Importantly, this caution appears cyclical rather than structural. As real incomes continue to recover and monetary policy shifts gradually toward easing, we believe the region is approaching an inflection point. The next leg of growth will be increasingly consumption-led, as improving economic conditions restore confidence and unlock pent-up demand.</p>
<h2>Politics Sets the Ceiling</h2>
<p>While macro stabilization has reduced downside risks across the region, political dynamics are increasingly shaping investment outcomes and relative performance across equity markets. In Poland, institutional friction between the presidency and parliament has slowed policy execution. In Hungary, the April 2026 parliamentary election dominates the short-term outlook as uncertainty over EU relations reinforce a wait-and-see posture among investors and corporates. In Turkey, despite a credible disinflation path, recurring political noise has underscored how fragile confidence remains.</p>
<p>Across the region, the message was consistent: stabilization helps, but politics sets the ceiling for valuation. Fiscal deficits remain elevated across parts of the region, but markets are increasingly discerning, rewarding countries where deficits fund productive investment while penalizing weaker fiscal discipline.</p>
<h2 id="defense-spending" class="jump-link-nav anchored-block" data-jumplink-title="Defense Spending">Defense Spending as a Structural Anchor</h2>
<p>Defense spending has become the clearest expression of policy pragmatism across the region given current geopolitical tensions and elevated security risks from the Russia-Ukraine war. After decades of underinvestment, European and NATO defense markets are now undergoing a structural reset &mdash; with ammunition and land systems among the most capacity-constrained and strategically critical segments.</p>
<h3>Defense Spending as a Share of GDP in Selected Countries</h3>
<p><img loading="lazy" class="desktop-image img-responsive" src="https://www.vaneck.com/contentassets/27f4ffc2e0624943bd5036f0f0919fdb/6886_navigating-emerging-europe_chart-1_2026-02_v1_desktop.svg" alt="Defense Spending as a Share of GDP in Selected Countries" /></p>
<p><img loading="lazy" class="mobile-image img-responsive" src="https://www.vaneck.com/contentassets/27f4ffc2e0624943bd5036f0f0919fdb/6886_navigating-emerging-europe_chart-1_2026-02_v1_mobile.svg" alt="Defense Spending as a Share of GDP in Selected Countries" /></p>
<p class="chart-disclosure">Source: NATO, as of June 3, 2025.</p>
<p>NATO commitments and EU-level financing make defense spending sustainable and long-dated. Importantly, this investment extends well beyond military procurement. It is supporting domestic manufacturing, logistics capabilities, rail, ports, and broader infrastructure, creating a spillover effect across multiple industries. Unlike cyclical stimulus, defense investment offers multi-year visibility and reinforces domestic industrial capacity, making it one of the most durable capital-allocation themes in the region.</p>
<h2 id="emerging-europe" class="jump-link-nav anchored-block" data-jumplink-title="Emerging Europe">Poland: The Star of CEE</h2>
<p>Among all countries visited, Poland stood out as the region&rsquo;s structural outperformer. The country continues to benefit from substantial EU funding, elevated defense spending, and a robust infrastructure pipeline. 2026 is shaping up to be a pivotal year, with Recovery and Resilience Facility inflows expected to more than triple versus 2025, alongside rising absorption of cohesion funds and low-interest loans for defense investments from the EU.</p>
<h3>Poland EU Fund Inflows</h3>
<p><img loading="lazy" class="desktop-image img-responsive" src="https://www.vaneck.com/contentassets/4854c33db6d14c96a99d2b87e02a3815/6886_navigating-emerging-europe_chart-2_2026-02_v1_desktop.svg" alt="Poland EU Fund Inflows" /></p>
<p><img loading="lazy" class="mobile-image img-responsive" src="https://www.vaneck.com/contentassets/4854c33db6d14c96a99d2b87e02a3815/6886_navigating-emerging-europe_chart-2_2026-02_v1_mobile.svg" alt="Poland EU Fund Inflows" /></p>
<p class="chart-disclosure">Source: Schuman Associates, as of December 2024.</p>
<p>Poland is also benefiting from a strong labor market that has improved wage growth and household income. Given the tight labor market and monetary easing, we believe household consumption is poised to reaccelerate as easing policy and sustained wage growth restore confidence.</p>
<h2 id="central-asia" class="jump-link-nav anchored-block" data-jumplink-title="Central Asia">Central Asia: A Different Growth Engine</h2>
<p>An unexpected, but increasingly important, theme that emerged during meetings on the ground was growth in Central Asia, particularly Kazakhstan and Uzbekistan. These economies are sustaining 5&ndash;7% real GDP growth, driven by young demographics, urbanization, rising productivity, and increasing domestic investment. Financial penetration remains low, creating long runways for credit growth. <strong>Kaspi<sup>*</sup></strong>, Kazakhstan&rsquo;s leading super app, continues to drive the formalization of payments, e-commerce penetration, and financial inclusion.</p>
<p>Uzbekistan is at earlier-stage in its economic development but that is precisely what makes it compelling. The country has been moving away from a closed economy towards a more open one, introducing new regulations to develop its capital market and attract investment. Rising investor interest reflects the government&rsquo;s privatization drive and its objective of lifting GDP from $150 billion today to above $200 billion by 2030. Foreign companies are seeking to actively expand in the country, drawn to its high growth profile and regional champions are already positioning for this next phase of growth. Large banks such as <strong>OTP Bank<sup>*</sup></strong> are expanding in Uzbekistan, seeking to capture structurally higher credit growth than is available in slower-growing European markets.</p>
<p>Taken together, Central Asia provides a complementary growth engine to Emerging Europe: less constrained by demographics, earlier in its financial development, and offering the kind of structural growth that defined emerging markets in earlier decades. For investors willing to look beyond traditional regional buckets, the opportunity set is both familiar and increasingly investable.</p>
<h2 id="selective-exposure" class="jump-link-nav anchored-block" data-jumplink-title="Selective Exposure">Selective Exposure Across Emerging Europe and Central Asia</h2>
<p>Across the region, our <strong><a href="/link/eb4419e6f6394611b3f80c597020daa4.aspx" title="GBFAX - Emerging Markets Fund - Class A - Overview">VanEck Emerging Markets Fund</a></strong> remains selective. <strong>OTP Bank<sup>*</sup></strong>, Hungary&rsquo;s largest commercial bank is likely to benefit from a pickup in corporate lending in 2026. We believe the bank could deliver strong lending growth with decent net interest margins across all its addressable markets. The bank also has ambitions to strengthen its presence in Uzbekistan after acquiring a majority stake in one of the country&rsquo;s top lenders.</p>
<p><strong>PKO Bank Polska<sup>*</sup></strong> is likely to benefit from accelerating loan growth as EU-funded projects transition to bank-financed investment. Similarly, <strong>InPost<sup>*</sup></strong> with its comprehensive business logistics and consumer focused services is poised to benefit from industrial and discretionary consumption trends in Poland and broader EU region. In contrast to the companies benefitting from macro trends, <strong>Diagnostyka<sup>*</sup></strong> provides healthcare exposure to Poland&rsquo;s underpenetrated medical diagnostics industry that is benefiting from industry consolidation and rising demand for diagnostic services.</p>
<p>We believe <strong>MLP Sağlık<sup>*</sup></strong>, the largest hospital group in Turkey could deliver strong earnings growth. The company is well positioned to benefit from consolidation in the industry and enjoys significant pricing power that boosts its profit margins.</p>
<p>One of Georgia&rsquo;s largest banks, <strong>Bank of Georgia<sup>*</sup></strong> with over 40% market share offers scale and operating leverage. We believe the company will continue to grow its Armenian operations, benefitting from Armenia&rsquo;s lower banking penetration and rapid loan growth.</p>
<p>We also believe Greek banks, <strong>Piraeus Bank<sup>*</sup></strong> and <strong>Eurobank<sup>*</sup></strong> will benefit from strong loan growth in 2026 and beyond supported by private consumption and a multi-year investment cycle tied to EU fund inflows.</p>

<h2>Positioning for Growth</h2>
<p>Our meetings reinforced the view that with the macro reset largely behind us, the Emerging Europe opportunity now lies more in active selection. Investment-led themes including defense, EU-funded infrastructure, financial deepening, and consumption recovery offer the clearest visibility. Politics and institutions will continue to drive dispersion, but for investors willing to be selective, the opportunity set is compelling. In Emerging Europe, durability and execution matter more than narrative, and that is where we see the strongest potential for returns.</p>
<p>To receive more <a href="/us/en/insights/emerging-markets-equity/" title="Emerging Markets Equity Insights"><strong>Emerging Markets Equity</strong></a> insights, <a href="/us/en/subscribe/" title="Subscription Center"><strong>sign up in our subscription center</strong></a>.</p>
]]></content:encoded>
</item><item rdf:about="https://www.vaneck.com/us/en/blogs/digital-assets/investing-in-digital-assets-without-full-crypto-exposure/">
  <title>Investing in Digital Assets Without Full Crypto Exposure></title>
  <link>https://www.vaneck.com/us/en/blogs/digital-assets/investing-in-digital-assets-without-full-crypto-exposure/</link>
  <description><![CDATA[Digital assets are moving into the real economy, but pure crypto exposure is often hard for advisors to justify. <a href="/link/54b98110e4034531bd63d27f035b8bd9.aspx" title="NODE - VanEck Onchain Economy ETF"><strong>NODE</strong></a> provides a measured way to participate, targeting companies driving adoption.]]></description>
  <dc:creator>Drew  Anderson</dc:creator>
  <dc:date>02/25/2026 06:30:00</dc:date>
<content:encoded><![CDATA[

<p><strong>Key Takeaways:</strong></p>
<ul class="content-list">
<li class="mt-2">Advisors seek digital asset exposure but want to manage volatility and downside risk.</li>
<li class="mt-2">Adoption is shifting to real-world infrastructure, finance and computing use cases.</li>
<li class="mt-2"><a href="/link/54b98110e4034531bd63d27f035b8bd9.aspx" title="NODE - VanEck Onchain Economy ETF"><strong>NODE</strong></a> provides diversified equity exposure to the onchain economy in an ETF structure.</li>
</ul>
<p><strong><i>This material is for informational purposes only and is not a recommendation to buy or sell any security. Fund holdings are subject to change. Investments in digital assets are subject to significant risk and are not suitable for all investors. The value of digital assets is highly volatile, and it is possible to lose your entire principal investment.</i></strong></p>
<h2>Advisors Want Exposure, But Not Excess Risk</h2>
<p>Many financial advisors recognize the long-term potential of digital assets. At the same time, they face practical constraints.</p>
<p>Sharp drawdowns, client discomfort, and unfamiliar risk profiles make &ldquo;all-in&rdquo; crypto exposure a challenging fit for most portfolios. For many advisors, the real question isn&rsquo;t whether to gain exposure, but how to do so responsibly.</p>
<p>That distinction matters.</p>
<h2>Digital Asset Adoption Is Moving into the Real Economy</h2>
<p>Digital assets are no longer confined to trading activity or token prices. Increasingly, blockchain technology is showing up in real-world economic functions, powering infrastructure, improving financial processes, and supporting data-intensive computing.</p>
<p>In many cases, this adoption is being led not by cryptocurrencies themselves, but by public companies with tangible assets, revenues, and governance structures. That shift opens the door to a more familiar way of accessing the opportunity.</p>
<h2>Digital Asset Adoption in Today&rsquo;s Real World</h2>
<p>Companies are already using digital asset infrastructure in practical, revenue-generating ways.</p>
<p>Some firms are building data centers specifically designed for high-density computing, with the power and cooling required to support AI and blockchain workloads. One clear example is Applied Digital. Applied Digital ($APLD) develops data centers built to handle the power and cooling demands of high-density computing, supporting both blockchain networks and AI workloads. It shows how digital asset exposure can come from owning critical infrastructure, rather than relying solely on cryptocurrency prices.</p>
<p>Others are adapting existing digital asset infrastructure to create more stable, contracted revenue streams. A different example comes from Core Scientific ($CORZ). The company has entered into long-term hosting agreements that bring its contracted high-performance computing (HPC) capacity to roughly <strong><a href="https://www.vaneck.com/us/en/offsite-disclaimer/?id=362219&amp;button=no&amp;url=https://investors.corescientific.com/news-events/press-releases/detail/110/core-scientific-and-coreweave-announce-1-2-billion-expansion-at-denton-tx-site" title="Press Release - Core Scientific and CoreWeave Announce $1.2 Billion Expansion at Denton, TX Site" target="_blank" rel="noopener">590 megawatts across multiple data center sites</a></strong>. At that scale, 590 megawatts are enough power to support multiple hyperscale data centers running around the clock. This shift shows how digital asset infrastructure can move beyond mining and toward predictable, usage-based revenue supported by long-term contracts.</p>
<h3>Core Scientific Data Centers and AI Factories Across Seven States</h3>
<p><img loading="lazy" class="desktop-image img-responsive" src="https://www.vaneck.com/EPiServer/CMS/Content/contentassets/f863461b99c74582876f281034e91e11/6834_node-blog-map_2026-2_v2_desktop.svg,,361648/Download?epieditmode=False" alt="Core Scientific Data Centers and AI Factories Across Seven States" /></p>
<p><img loading="lazy" class="mobile-image img-responsive" src="https://www.vaneck.com/EPiServer/CMS/Content/contentassets/f863461b99c74582876f281034e91e11/6834_node-blog-map_2026-2_v2_mobile.svg,,361649/Download?epieditmode=False" alt="Core Scientific Data Centers and AI Factories Across Seven States" /></p>
<p class="chart-disclosure">Source: Core Scientific as of 2.11.26.</p>
<p>In financial services, blockchain is being used to reduce costs rather than create speculation. Figure Technology Solutions ($FIGR) uses blockchain as the system of record for home equity lending, allowing loans to be funded in as few as five days rather than weeks. By relying on automated valuation models instead of manual appraisals and reconciliation, <strong><a href="https://www.vaneck.com/us/en/offsite-disclaimer/?id=362221&amp;button=no&amp;url=https://www.figure.com/blog/are-there-closing-costs-on-a-heloc/#:~:text=Traditional%20bank%20HELOCs%20typically%20charge,greater%20convenience%20than%20traditional%20lenders." title="Differences in HELOC Fees: Traditional Bank vs. Figure" target="_blank" rel="noopener">Figure</a></strong> reduces or eliminates appraisal fees, avoids annual line fees, and removes early closure penalties. Together, these changes show how blockchain can materially lower costs and speed up settlement in traditional lending while improving customer experience.</p>
<p>Taken together, these examples highlight a common theme: digital assets are increasingly about infrastructure and efficiency, not just price movements. But that does not mean all forms of digital asset exposure are equally easy to use in client portfolios.</p>
<h2>Why Pure Crypto Exposure Can Be Hard to Use</h2>
<p>Despite these developments, direct crypto exposure remains difficult for many advisors to incorporate.</p>
<p>Rapid drawdowns can be challenging to explain to clients. Leverage and speculative behavior can amplify downside risk. And token-based investments often don&rsquo;t align neatly with traditional portfolio construction frameworks.</p>
<p>This caution isn&rsquo;t resistance to innovation. It&rsquo;s prudent risk management.</p>
<h2>How NODE Approaches Digital Assets Differently</h2>
<p>The <strong><a href="/link/54b98110e4034531bd63d27f035b8bd9.aspx?utm_source=google&amp;utm_medium=cpc&amp;utm_campaign=node_search_us&amp;gad_source=1&amp;gad_campaignid=22582420073&amp;gbraid=0AAAAADLo2expb_MTh9V3HXp_prCoxG1RR&amp;gclid=Cj0KCQiA7rDMBhCjARIsAGDBuECNlHmvtdLCCFQGq8ro5COQ-f2HV-G3731YWe3UQc5XabogURXC_NsaArCFEALw_wcB" title="NODE - VanEck Onchain Economy ETF">VanEck Onchain Economy ETF NODE</a></strong> is built around the idea that participation does not require full exposure.</p>
<p>Rather than focusing primarily on tokens, <strong><a href="/link/54b98110e4034531bd63d27f035b8bd9.aspx?utm_source=google&amp;utm_medium=cpc&amp;utm_campaign=node_search_us&amp;gad_source=1&amp;gad_campaignid=22582420073&amp;gbraid=0AAAAADLo2expb_MTh9V3HXp_prCoxG1RR&amp;gclid=Cj0KCQiA7rDMBhCjARIsAGDBuECNlHmvtdLCCFQGq8ro5COQ-f2HV-G3731YWe3UQc5XabogURXC_NsaArCFEALw_wcB" title="NODE - VanEck Onchain Economy ETF">NODE</a></strong> emphasizes equity exposure to the onchain economy, investing in companies that build, operate, and benefit from digital asset infrastructure. The portfolio spans areas such as data centers, energy, fintech, and selectively chosen digital asset instruments.</p>
<p>The strategy is actively managed with explicit awareness of volatility, seeking to participate in long-term adoption while avoiding unnecessary concentration and leverage.</p>
<p>In simple terms, <strong><a href="/link/54b98110e4034531bd63d27f035b8bd9.aspx?utm_source=google&amp;utm_medium=cpc&amp;utm_campaign=node_search_us&amp;gad_source=1&amp;gad_campaignid=22582420073&amp;gbraid=0AAAAADLo2expb_MTh9V3HXp_prCoxG1RR&amp;gclid=Cj0KCQiA7rDMBhCjARIsAGDBuECNlHmvtdLCCFQGq8ro5COQ-f2HV-G3731YWe3UQc5XabogURXC_NsaArCFEALw_wcB" title="NODE - VanEck Onchain Economy ETF">NODE</a></strong> is designed to engage with the theme, without taking on the full volatility profile of pure crypto exposure.</p>
<h2>A Different Way to Participate in the Onchain Economy</h2>
<p>Structure matters, especially when introducing emerging investment themes.</p>
<p><strong><a href="/link/54b98110e4034531bd63d27f035b8bd9.aspx?utm_source=google&amp;utm_medium=cpc&amp;utm_campaign=node_search_us&amp;gad_source=1&amp;gad_campaignid=22582420073&amp;gbraid=0AAAAADLo2expb_MTh9V3HXp_prCoxG1RR&amp;gclid=Cj0KCQiA7rDMBhCjARIsAGDBuECNlHmvtdLCCFQGq8ro5COQ-f2HV-G3731YWe3UQc5XabogURXC_NsaArCFEALw_wcB" title="NODE - VanEck Onchain Economy ETF">NODE</a></strong> offers exposure through a familiar ETF wrapper, with holdings in publicly traded companies that often have multiple drivers of performance beyond digital asset prices alone. This diversified approach can help smooth outcomes over time and make the story easier for clients to understand.</p>
<p>The goal isn&rsquo;t to eliminate volatility, but to manage it thoughtfully.</p>

<h2>A Practical Role for Digital Assets in Portfolios</h2>
<p>For many advisors, <a href="/link/54b98110e4034531bd63d27f035b8bd9.aspx?utm_source=google&amp;utm_medium=cpc&amp;utm_campaign=node_search_us&amp;gad_source=1&amp;gad_campaignid=22582420073&amp;gbraid=0AAAAADLo2expb_MTh9V3HXp_prCoxG1RR&amp;gclid=Cj0KCQiA7rDMBhCjARIsAGDBuECNlHmvtdLCCFQGq8ro5COQ-f2HV-G3731YWe3UQc5XabogURXC_NsaArCFEALw_wcB" title="NODE - VanEck Onchain Economy ETF"><strong>NODE</strong></a> can serve as:</p>
<ul class="content-list">
<li class="mt-2">A measured entry point into digital asset exposure</li>
<li class="mt-2">A complement to existing crypto allocations</li>
<li class="mt-2">A satellite position tied to long-term digital transformation</li>
</ul>
<p>This flexibility allows advisors to scale exposure as conviction and client comfort evolve.</p>
<h2>The Future of Digital Assets</h2>
<p>Digital asset adoption is becoming more economic and less speculative as it spreads across infrastructure, finance, and computing.</p>
<p>Advisors no longer have to choose between participating in this shift and maintaining disciplined risk management. <strong><a href="/link/54b98110e4034531bd63d27f035b8bd9.aspx?utm_source=google&amp;utm_medium=cpc&amp;utm_campaign=node_search_us&amp;gad_source=1&amp;gad_campaignid=22582420073&amp;gbraid=0AAAAADLo2expb_MTh9V3HXp_prCoxG1RR&amp;gclid=Cj0KCQiA7rDMBhCjARIsAGDBuECNlHmvtdLCCFQGq8ro5COQ-f2HV-G3731YWe3UQc5XabogURXC_NsaArCFEALw_wcB" title="NODE - VanEck Onchain Economy ETF">NODE</a></strong> is designed to help bridge that gap, offering access to digital asset leaders with an active approach that balances growth and stability as market conditions change.</p>

<p>To receive more <strong><a href="https://www.vaneck.com/us/en/insights/digital-assets/" title="Digital Assets Insights">Digital Assets</a></strong> insights, <strong><a href="https://www.vaneck.com/us/en/subscribe/" title="Subscription Center">sign up in our subscription center</a></strong>.</p>
]]></content:encoded>
</item><item rdf:about="https://www.vaneck.com/us/en/blogs/digital-assets/matthew-sigel-avalanche-201-the-institutional-platform/">
  <title>Avalanche 201: The Institutional Platform></title>
  <link>https://www.vaneck.com/us/en/blogs/digital-assets/matthew-sigel-avalanche-201-the-institutional-platform/</link>
  <description><![CDATA[This piece explores Avalanche&rsquo;s second act as the network shifts toward becoming institutional-grade blockchain infrastructure for tokenization, payments, and real-world financial systems.]]></description>
  <dc:creator>Patrick Bush</dc:creator>
  <dc:date>02/25/2026 06:30:00</dc:date>
<content:encoded><![CDATA[

<p><strong>Please note that VanEck may have a position(s) in the digital asset(s) described below.</strong></p>
<p><strong>Key takeaways:</strong></p>
<ul>
<li class="mt-2"><strong>Avalanche is a high-speed, multi-chain platform:</strong> It is a system of many blockchains designed to solve scalability issues by allowing applications to run on their own dedicated, purpose-built networks.</li>
<li class="mt-2"><strong>Enterprise adoption anchors long-term value:</strong> Major financial institutions such as J.P. Morgan, Apollo, and Citi are using Avalanche for real-world asset tokenization and backend infrastructure.</li>
<li class="mt-2"><strong>Strategic pricing shift drives network activity:</strong> Recent fee reductions have successfully sparked growth in daily active users and transaction volume, positioning the network for broader mainstream adoption.</li>
</ul>
<h2 id="point-one" class="anchored-block jump-link-nav" data-jumplink-title="Introduction">Introduction to Avalanche</h2>
<p>Avalanche is a high-performance platform that powers a network of interconnected, customizable blockchains. It has attracted both crypto-native users and enterprises, with Avalanche L1s processing about 40M transactions per day and supporting roughly 38M daily active users across 81 active blockchains. Avalanche has also brought $1.4B of real-world asset value onchain through institutions such as BlackRock, Janus Henderson, Franklin Templeton, and Republic. These teams are drawn to Avalanche&rsquo;s predictable performance and scaling model built to support tens of millions of future users.</p>
<p>From the start, Avalanche was built around different priorities than many legacy blockchains. Rather than centering the &ldquo;digital gold&rdquo; narrative, Avalanche focused on performance and scale, pioneering a novel consensus design and a multi-chain architecture. After launching in 2020, early adoption came from crypto-native users who wanted a faster alternative to Ethereum. Avalanche still maintains meaningful activity in DeFi and gaming, but it has increasingly evolved into a leading platform for custom Layer 1 blockchains, real-world asset tokenization, and enterprise deployment.</p>
<p>Today, Avalanche focuses on enterprise, financial institution, and public sector use cases through its &ldquo;AvaCloud&rdquo; offering. The goal is to operate as a scalable, reliable backend infrastructure while preserving the core benefits of blockchain: transparency, fast settlement, and interoperability.</p>
<p>We believe Avalanche&rsquo;s long-term opportunity depends on whether it can convert enterprise interest into sustained production deployments. Progress to date is encouraging, even if broad adoption is still in its early stages. Overall, Avalanche offers investors differentiated exposure to a &ldquo;suit and tie&rdquo; platform that is working to bring large organizations onchain.</p>
<h3>Avalanche Stablecoin Transfer Volume Up 330% Y/Y in 2025</h3>
<p><img loading="lazy" class="img-responsive w-100" src="https://www.vaneck.com/contentassets/9f01899823304e249d57473def77b38e/6756_avalanche-201-blog_chart-1_2026-2_v1.svg" alt="Avalanche Stablecoin Transfer Volume Up 330% Y/Y in 2025" /></p>
<p class="chart-disclosure">Source: Artemis XYZ as of 2/06/2026. <strong>Past performance is no guarantee of future results. Not intended as a recommendation to buy or sell any securities named herein.</strong></p>
<h2>Avalanche Design for Rapid Consensus: Snowman</h2>
<p>Avalanche offers a key breakthrough called the &ldquo;Snowman Consensus.&rdquo; Consensus is the method by which a chain agrees on blocks, and Avalanche&rsquo;s innovation is to implement a more efficient, faster polling technique between validators. This allows it to produce blocks at a faster rate with more transaction capacity in each block than Ethereum.</p>
<p>On legacy blockchains, this means far more communication than necessary, slowing block processing time. By contrast, Avalanche does not have a fixed &ldquo;leader,&rdquo; and instead allows any validator to propose blocks from the transactions they observe. Avalanche validators then ping one another in small, randomly selected groups to conduct repeated polls on the correct ledger and its content. Validators repeat these small-group polls until they have enough mathematical confidence that their view has finalized, and the network will converge on the same ledger.</p>
<p>The result of this process is that Avalanche can process a block every 1.2 seconds, and the transactions within each block are considered &ldquo;final&rdquo; almost instantly. Avalanche competitor Ethereum produces blocks every 12 seconds while finality takes around 12.8 minutes. This allows Avalanche users to recognize settlement of their transactions within a few seconds, giving the chain significant practical advantages for financial use cases.</p>
<h2 id="point-two" class="anchored-block jump-link-nav" data-jumplink-title="Multi-Chain Architecture">Avalanche&rsquo;s Multi-Chain Architecture</h2>
<p>Avalanche is not a single blockchain but a system composed of many blockchains built using Avalanche&rsquo;s software. There are 81 live blockchains in the ecosystem, with hundreds more in development. Each Avalanche L1 can bootstrap its own validators or use core validators operating on Avalanche&rsquo;s primary chains. Many L1s also modify Avalanche&rsquo;s core software to tailor performance, governance, and functionality, including cross-chain connections to other Avalanche L1s and to the Avalanche C-Chain. Some L1s are public while others are private and permissioned.</p>
<p>The Avalanche Primary Network comprises the three original Avalanche chains. These are the C, P, and X chains. While the C-Chain is the epicenter of Avalanche&rsquo;s crypto activity, the P-Chain is the network that coordinates Avalanche&rsquo;s validators. The X-chain is currently only used to mint inflationary AVAX tokens. Each of these chains uses AVAX as the native token for payments and usage.</p>
<p>The Avalanche C-Chain is the most economically valuable blockchain in the Avalanche ecosystem and, on average, processes $528M in economic activity each day. It uses the Ethereum Virtual Machine, which allows Avalanche developers to use the same smart contract language and tooling used to build Ethereum applications. Thus, Ethereum developers can quickly deploy their applications to Avalanche with only a few tweaks. In practice, this opened the aperture for new entrants to the Avalanche ecosystem by tapping into a huge pool of potential builders.</p>
<p>The C-Chain offers economic and scaling advantages over Ethereum. It can process (+88%) more transaction throughput (measured by gas) while pricing transactions at 1/50<sup>th</sup>the cost of Ethereum&rsquo;s fees. Avalanche also has the unique ability to rapidly increase its block size during periods of high demand, meaning that Avalanche&rsquo;s throughput advantage grows during stressful periods.</p>
<h3>Avalanche Prices Transaction Fees are Lower Than Competitors</h3>
<p><img loading="lazy" class="img-responsive w-100" src="https://www.vaneck.com/contentassets/9f01899823304e249d57473def77b38e/6756_avalanche-201-blog_chart-2_2026-2_v1.svg" alt="Avalanche Prices Transaction Fees are Lower Than Competitors" /></p>
<p class="chart-disclosure">Source: Artemis XYZ as of 1/28/2026. <strong>Past performance is no guarantee of future results. Not intended as a recommendation to buy or sell any securities named herein.</strong></p>
<p>Outside of the Primary Network, an L1 with notable traction is Binary Holdings, which runs a rewards and loyalty program for South Asian telecommunications firms. It reports 36M daily active addresses and roughly 40M transactions per day, reflecting a &ldquo;blockchain-as-infrastructure&rdquo; thesis where end users may not even realize they are interacting with a blockchain.</p>
<p>Another is Dexalot L1, designed to provide centralized-exchange-like speed and capacity while preserving onchain transparency. Dexalot operates a dual-chain setup: users bridge and deposit via Avalanche C-Chain and execute trades on a customized L1 optimized for large trading volumes.</p>
<h2 id="point-three" class="anchored-block jump-link-nav" data-jumplink-title="Enterprise Adoption">Enterprise Adoption for Traditional Finance and Tokenization</h2>
<p>Avalanche has launched public pilots for private markets tokenization with well-known traditional finance participants. For example, Apollo tokenized a $50M credit fund on Avalanche in January 2026. Avalanche has also pursued distribution-oriented partnerships aligned with enterprise requirements, including AWS support for government-oriented deployment and compliance pathways.</p>
<p>Deloitte has used Avalanche to create a platform intended to improve the speed, security, and accuracy of FEMA reimbursements following disasters. These examples highlight the direction of travel: Avalanche is positioning itself as infrastructure that can plug into real workflows, not just crypto-native applications.</p>
<p>Avalanche has key advantages over competing blockchains, but a practical question is: &ldquo;Why would someone want to deploy an Avalanche L1 instead of an Ethereum L2?&rdquo;</p>
<h2>Service and accountability</h2>
<p>Avalanche offers builders a dedicated, for-profit engineering organization, Ava Labs, that can provide direct support, implementation assistance, and customization in a way that feels closer to a SaaS vendor relationship. Ethereum has excellent vendors and L2 teams, but creating an L2 on Ethereum typically requires a builder to choose a team with an opinionated framework. In some cases, those Ethereum L2 consultants may also push design decisions that benefit their own economic model rather than the builder&rsquo;s.</p>
<h2>Sovereign chain design</h2>
<p>An Avalanche L1 is a sovereign network where the deployer can set rules, define execution, and choose the virtual machine. That flexibility matters when an application or use case cannot be implemented within the EVM's limits, or when the builder needs to tune governance and performance for a specific workflow.</p>
<h2>Operational and compliance flexibility</h2>
<p>Avalanche offers SOC 2 certified infrastructure that supports enterprise-grade security, with options for compliant operations in regulated sectors. An enterprise can define validator requirements, including hardware standards and participation restrictions tied to governance or compliance. In practice, this can be harder to replicate on Ethereum L2s without adding extra trust assumptions around sequencers, committees, or bespoke bridging.</p>
<h2>Enterprise-friendly economics</h2>
<p>Avalanche L1s can define their own fee markets and use the token of their choice, meaning they do not need to use AVAX for gas. Operating costs are also easier for enterprises to budget because they are tied more directly to the validator footprint than to fluctuating usage. Avalanche&rsquo;s L1 validator fee model is structured as an ongoing charge to run validators, whereas Ethereum is closer to a pay-as-you-go business arrangement. As a result, Avalanche L1s can feel more like SaaS licensing models with costs that scale with deployment requirements rather than short-term demand spikes. This makes the costs for Avalanche L1 operators more predictable.</p>
<h2>Risk and performance isolation</h2>
<p>Ethereum L2s ultimately inherit key constraints from Ethereum, especially around settlement back to L1 and the specific rollup's design choices. For example, optimistic rollup L2s have built-in delay periods for withdrawals that would prevent L2 users from quickly withdrawing funds. Additionally, Ethereum L2 can still experience congestion if Ethereum Mainnet is overloaded with activity.</p>
<p>Because Avalanche L1s isolate performance and fees from other chains, enterprises can avoid congestion problems caused by unrelated activity. Also, Avalanche L1s can adjust throughput, latency, and governance to fit the needs of the application.</p>
<h2>Simplicity of deployment</h2>
<p>Avalanche has built the tooling and support to allow potential developers to quickly create Avalanche blockchains. In fact, builders without deep coding experience can create an Avalanche L1 without code and deploy it within minutes. Because Avalanche offers cross-chain support out of the box, sophisticated developers can create dozens of blockchains that act in concert to meet their needs.</p>
<h2>Key partnerships</h2>
<ol>
<li class="mt-2">Cloud and infrastructure partners for lowering the operational friction of operating Avalanche blockchains or using Avalanche blockchains,</li>
</ol>
<p style="margin-left: .5in;"><strong>Partners:</strong> Amazon Web Services (AWS), Alibaba Cloud, Tencent Cloud.</p>
<ol>
<li value="2">Public sector and government process partners modernizing heavy workflows, improving auditability, and reducing fraud and administrative overhead in government adjacent processes.</li>
</ol>
<p style="margin-left: .5in;"><strong>Partners:</strong> Deloitte and the California Department of Motor Vehicles (DMV).</p>
<ol>
<li value="3">Payments and onboarding partners that reduce the adoption bottleneck for users and mainstream applications, allowing them to quickly get funds onchain while abiding by compliance rules.</li>
</ol>
<p style="margin-left: .5in;"><strong>Partners:</strong> Stripe, Mastercard, Visa</p>
<ol>
<li value="4">Capital markets, banking, and institutional tokenization partners to prove Avalanche&rsquo;s potential to operate backend infrastructure for major financial institutions, including tokenization, fund operations, and credit market infrastructure.</li>
</ol>
<p style="margin-left: .5in;"><strong>Partners:</strong> Sumitomo Corporation, FIS and Intain, Citi and Wellington Management and WisdomTree and ABN AMRO and DTCC Digital Assets and Tokeny, J.P. Morgan Onyx and Apollo and WisdomTree and LayerZero, Securitize.</p>
<ol>
<li value="5">Commerce and consumer distribution partners that see digital assets and onchain experiences as additive to customer acquisition and retention.</li>
</ol>
<p style="margin-left: .5in;"><strong>Partners:</strong> FIFA, Uptop, Sports Illustrated, EVEN, TITAN</p>
<p style="margin-left: .5in;"><i>The corporate partnerships in this blog reflect the use of the Avalanche network and do not imply endorsement of AVAX as an investment.</i></p>
<h3>Avalanche C-Chain Revenue</h3>
<p><img loading="lazy" class="img-responsive w-100" src="https://www.vaneck.com/contentassets/9f01899823304e249d57473def77b38e/6756_avalanche-201-blog_chart-3_2026-2_v1.svg" alt="Avalanche C-Chain Revenue" /></p>
<p class="chart-disclosure">Source: Artemis XYZ as of 2/06/2026. <strong>Past performance is no guarantee of future results. Not intended as a recommendation to buy or sell any securities named herein.</strong></p>
<p>The AVAX token is the &ldquo;native token&rdquo; of all Avalanche blockchains but is most used on Avalanche&rsquo;s C-Chain. This means that all transactions on that network necessitate AVAX to be processed. Because the C-Chain&rsquo;s capacity for transactions is limited, as the level of activity increases, the amount of AVAX needed to transact rises as well. Like Ethereum, Avalanche also implements an economic policy that burns base fees to offset inflation. As Avalanche transaction velocity increases, more AVAX tokens are burned, and the total can be enormous during times of high activity. To date, 4.9M AVAX has been permanently removed from circulation.</p>
<p>The current supply of AVAX is 431M, while the maximum supply of the token is 720M. To reach the maximum supply of AVAX, Avalanche mints new tokens to reward validators and stakers for running and securing the network. The current inflation rate for new AVAX tokens is (~3.5%) per year, and the number of new tokens emitted fluctuates based on the number of AVAX staked and their staking duration.</p>
<p>Because Avalanche is a Proof-of-Stake (PoS) blockchain, AVAX is used to back validators who run and secure Avalanche&rsquo;s C-Chain. Each validator must be backed by a minimum of 2,000 AVAX &ldquo;bond&rdquo; to operate on the blockchain, but in practice, validator stakes are often much larger because larger validators can receive more rewards (up to 3M AVAX). To satisfy the bonding requirement, validators often source AVAX bonds from tokenholders seeking to earn rewards on their AVAX holdings. However, validators who are dishonest or who demonstrate poor uptime can lose their access to rewards or even be booted from the network. This economic incentive drives stakers to seek high-quality validators.</p>
<p>The current reward rate for Avalanche stakers is (&gt;7%), which is greater than the rate of inflation because not all AVAX tokens on Avalanche are staked. To stake on Avalanche, someone must bond a minimum of 25 AVAX and choose the duration of their lock-up. Those who choose to delegate their AVAX to a validator for longer periods receive higher rewards than those who opt for shorter bonding periods.</p>
<p>Outside of Avalanche C-Chain, validators of other Avalanche L1s must pay a per-validator fee of 1.33 AVAX per month. These fees are burned. With ~850 L1 validators, this amounts to $160k in annual revenue.</p>
<h2 id="point-four" class="anchored-block jump-link-nav" data-jumplink-title="Bear and Bull Case">The Bear and Bull Case for AVAX</h2>
<p><strong>The Bear Case: Declining Metrics and Competitive Pressures</strong></p>
<p>Currently, Avalanche is at a crossroads, making some bearish about its future. Once a member of the &ldquo;SOLUNAVAX&rdquo; triad meme spawned by immense returns in the summer of 2021 (&gt;+1000% returns in 4 months), AVAX has lost (-62%) of its value in the past year. Aside from broad, weak alt-token performance (<a href="https://www.marketvector.com/indexes/digital-assets/marketvector-smart-contract-leaders" title="MVSCLE - MarketVector Smart Contract Leaders Index" target="_blank" rel="noopener"><strong>MarketVector Smart Contract Leaders Index</strong></a>: -37% y/y), competitive pressures have driven Avalanche to reduce its transaction pricing on the C-Chain by (-96%). This has led to a (-42%) y/y reduction in revenues.</p>
<p>Avalanche onchain metrics have also generally lagged those of its competitors. Revenue has fallen to 13<sup>th</sup>in the 30-day trailing period, down from 8<sup>th</sup>place 2 years ago and 4<sup>th</sup>place 4 years ago. In TVL, over the past four years, it has dropped from the 3<sup>rd</sup>-ranked blockchain to the 7<sup>th</sup>-ranked blockchain.</p>
<p>At the same time, there is concern that Avalanche L1s do not remit enough value to AVAX because they have little use in their frameworks. This is due to the lack of requirement to use AVAX as a native token on Avalanche L1s. Previously, Avalanche L1s (formerly 'Subnets') were required to stake 2,000 AVAX per validator, but this requirement was nixed, removing a major token sink for AVAX.</p>
<p><strong>Potential risks </strong></p>
<ol>
<li class="mt-2">Competition from other blockchains</li>
<li class="mt-2">Value of blockchain technologies accruing to existing financial institutions</li>
<li class="mt-2">Emerging blockchains offering better technology</li>
<li class="mt-2">Regulation of DeFi</li>
<li class="mt-2">Increase in the inflation rate or expansion of the token supply</li>
<li class="mt-2">Technical risks and hacking attacks</li>
<li class="mt-2">Potential risks related to team dynamics and strategic priorities of core developers</li>
</ol>
<p><strong>The Bull Case: Pivot to Enterprise and Ecosystem Growth</strong></p>
<p>However, it is important to remember that investors valuing tokens like AVAX must look to the future, not Avalanche&rsquo;s past identity. Avalanche technology was initially used to facilitate speculation, and it was presumed that this would evolve towards more sustainable financial products and services. However, the speculative narrative has evaporated as systematically overvalued cryptocurrencies failed to mature into more sustainable use cases. At the same time, existing financial institutions began adopting the most promising components of crypto to navigate many blockchain ecosystems effectively. As a result, Avalanche is moving towards enterprise use cases and real-world assets to build the products that can attract corporate interest. In this enterprise-centric new vision, Avalanche is an absolute leader compared to most other crypto projects.</p>
<p>Avalanche&rsquo;s new approach to long-term token holder value is to bring as many users as possible into its network of blockchains. This includes substantial price decreases alongside marketing focus on Avalanche L1s. Thus, one can view its price decreases as an opportunity to attract new users and expand use cases. Once Avalanche has proved its value to a large user base, it is presumed to be able to capture more value from its blockchain&rsquo;s activity. Thus far, some of the steps to attract new activity have been working.</p>
<p>The deliberate choice to reduce C-Chain fees has led to transactions growing (+370%) and (DAAs) surging (+368%) y/y. Likewise, Avalanche L1 outreach has attracted nearly 4M DAAs to Avalanche&rsquo;s L1s (2-3x more DAUs than Ethereum&rsquo;s ecosystem), collectively generating ~$25k in fees per day. At the same time, tokenization efforts have led to $1.4B in assets on Avalanche through partnerships with some of the world&rsquo;s most important financial institutions. If Avalanche can continue to prove itself as an important backend financial infrastructure, it stands to benefit greatly from tokenization.</p>
<p><strong>Potential catalysts</strong></p>
<ol>
<li class="mt-2">Tokenization is increasing usership and usage of the Avalanche blockchains</li>
<li class="mt-2">Re-institution Avalanche L1 validator AVAX holding requirements</li>
<li class="mt-2">AVAX native token being adopted by Avalanche L1s</li>
<li class="mt-2">Avalanche&rsquo;s growing gaming system is driving wallet growth</li>
<li class="mt-2">The launch of high-velocity financial products</li>
<li class="mt-2">Additional Avalanche L1 launches</li>
</ol>
<h2>The Token vs Contributor Interests Debate</h2>
<p>A key consideration for AVAX, as with many smart contract platforms, is the relationship between the token and the organizations that materially contribute to the ecosystem&rsquo;s development and commercialization. Ava Labs is a major contributor to Avalanche&rsquo;s core software and provides services to teams building on Avalanche technology. As a for-profit company, Ava Labs will make business decisions around resourcing, pricing, partnerships, and product focus based on its own operational needs and stakeholder obligations, which may not always align perfectly with the preferences of AVAX holders.</p>
<p>That said, the linkage is indirect. Ava Labs does not control AVAX&rsquo;s market price, and Avalanche&rsquo;s open-source ecosystem includes many independent developers and participants. Over time, successful ecosystem growth, whether through C-Chain activity or application-specific L1s, can support network usage and broader awareness, which may be constructive for the asset.</p>
<p>From a risk perspective, the main issues are practical rather than mechanical. If key ecosystem contributors were to face operational disruption, such as funding constraints, strategic shifts, or other business pressures, the pace of development, ecosystem support, or market confidence could be affected. Conversely, a well-capitalized, execution-oriented contributor base can help Avalanche remain competitive. We therefore view Ava Labs as a net positive for Avalanche today, while recognizing that AVAX&rsquo;s long-term outcome ultimately depends on adoption and the broader ecosystem, not any single company.</p>
<h3>Avalanche Blockchain Fundamental Metrics</h3>
<div class="wrapped-div">
<table style="width: 100%;">
<tbody>
<tr class="tbl-data">
<td class="tbl-header last text-left">Metric</td>
<td class="tbl-header last text-right">30D Average</td>
<td class="tbl-header last text-right">Ranking Out of Top 21 Blockchains</td>
</tr>
<tr class="tbl-data">
<td class="data-td data last text-left">Daily Revenue</td>
<td class="data-td data last text-right">$8,094</td>
<td class="data-td data last text-right">13</td>
</tr>
<tr class="tbl-data">
<td class="data-td data last text-left">Daily Active Users</td>
<td class="data-td data last text-right">324,667</td>
<td class="data-td data last text-right">9</td>
</tr>
<tr class="tbl-data">
<td class="data-td data last text-left">Total Value Locked</td>
<td class="data-td data last text-right">$1,229,944,070</td>
<td class="data-td data last text-right">7</td>
</tr>
<tr class="tbl-data">
<td class="data-td data last text-left">Daily Transactions</td>
<td class="data-td data last text-right">2,322,136</td>
<td class="data-td data last text-right">9</td>
</tr>
<tr class="tbl-data">
<td class="data-td data last text-left">Stablecoin Supply</td>
<td class="data-td data last text-right">$1,703,767,118</td>
<td class="data-td data last text-right">7</td>
</tr>
<tr class="tbl-data">
<td class="data-td data last text-left">Daily DEX Volume</td>
<td class="data-td data last text-right">$169,839,958</td>
<td class="data-td data last text-right">6</td>
</tr>
<tr class="tbl-data">
<td class="data-td data last text-left">Daily Stablecoin Transfer Volume</td>
<td class="data-td data last text-right">$2,397,119,748</td>
<td class="data-td data last text-right">7</td>
</tr>
<tr class="tbl-data">
<td class="data-td data last text-left">Daily Economic Activity</td>
<td class="data-td data last text-right">$528,572,767</td>
<td class="data-td data last text-right">5</td>
</tr>
<tr class="tbl-data">
<td class="data-td data last text-left">Twitter Followers</td>
<td class="data-td data last text-right">1,121,086</td>
<td class="data-td data last text-right">6</td>
</tr>
<tr class="tbl-data">
<td class="data-td data last text-left">MAUs</td>
<td class="data-td data last text-right">1,051,674</td>
<td class="data-td data last text-right">6</td>
</tr>
<tr class="tbl-data">
<td class="data-td data last text-left">Daily New Users</td>
<td class="data-td data last text-right">49,838</td>
<td class="data-td data last text-right">7</td>
</tr>
<tr class="tbl-data">
<td class="data-td data last text-left">Total Onchain Lending</td>
<td class="data-td data last text-right">$1,339,098,882</td>
<td class="data-td data last text-right">5</td>
</tr>
<tr class="tbl-data">
<td class="data-td data last text-left">Average Transaction Cost</td>
<td class="data-td data last text-right">$0.004</td>
<td class="data-td data last text-right">3</td>
</tr>
<tr class="tbl-data">
<td class="data-td data last text-left">Staked Value</td>
<td class="data-td data last text-right">$2,698,841,179</td>
<td class="data-td data last text-right">4</td>
</tr>
</tbody>
</table>
<br />
<p class="chart-disclosure">Source: Artemis XYZ as of 1/28/2026. <strong>Past performance is no guarantee of future results. Not intended as a recommendation to buy or sell any securities named herein.</strong></p>
<h2>Avalanche Leadership Team</h2>
<p><i>Emin G&uuml;n Sirer - CEO</i></p>
<p>Computer scientist and co-founder who helped create the Avalanche consensus approach and leads the technical direction of Ava Labs. He is also a Cornell computer science professor and has held leadership roles in academic crypto research, including as a co-director of IC3.</p>
<p><i>John Wu - President</i></p>
<p>Leads commercial strategy, business development, and partnerships. Before Ava Labs, he built his career as a buy-side tech investor, including at Tiger Management, and later ran investment and operating roles across fintech, including leading Sureview Capital and managing a technology portfolio at Kingdon Capital.</p>
<p><i>Charley Cooper - Chief Operating Officer</i></p>
<p>Runs operations with deep experience across market structure and regulation. Previously served in senior leadership at the CFTC and held senior roles in financial markets infrastructure, including at State Street&rsquo;s trading and clearing organization, with earlier experience at Deutsche Bank.</p>
<p><i>John Nahas &ndash; Chief Business Officer</i></p>
<p>Leads business development and ecosystem growth for Ava Labs and the Avalanche network, overseeing partnerships and go-to-market across multiple verticals (including institutional/capital markets, enterprise, wallets &amp; exchanges, retail/consumer, gaming, and DeFi) and driving international expansion through regional teams globally.</p>
<p><i>Wee Ming Choon - Chief Legal Officer</i></p>
<p>Leads legal and regulatory strategy with a rare combination of software engineering and law. Prior to Ava Labs, his background includes roles at major tech and crypto-native organizations, including Meta and ConsenSys, as well as private practice at Latham &amp; Watkins.</p>
<h2 id="point-five" class="anchored-block jump-link-nav" data-jumplink-title="Conclusion">The Bottom Line on Avalanche's Value Proposition</h2>
<p>Overall, we recognize the conflict embedded in Avalanche&rsquo;s structure, but we believe the value Ava Labs provides to AVAX holders outweighs these concerns, especially if the scaling strategy succeeds and AVAX&rsquo;s role in value capture strengthens over time.</p>
</div>
<p>To receive more <strong><a href="https://www.vaneck.com/us/en/insights/digital-assets/" title="Digital Assets Insights">Digital Assets</a></strong> insights, <strong><a href="https://www.vaneck.com/us/en/subscribe/" title="Subscription Center">sign up in our subscription center</a></strong>.</p>
]]></content:encoded>
</item><item rdf:about="https://www.vaneck.com/us/en/blogs/thematic-investing/i-went-to-techfest-2026-here-are-my-takeaways-on-robotics-today/">
  <title>I Went to TechFest 2026. Here Are My Takeaways on Robotics Today></title>
  <link>https://www.vaneck.com/us/en/blogs/thematic-investing/i-went-to-techfest-2026-here-are-my-takeaways-on-robotics-today/</link>
  <description><![CDATA[At TechFest 2026, robotics progress looked practical and disciplined. Growth is steady, AI enhances capability, and long-term service and system coordination drive real-world adoption.]]></description>
  <dc:creator>Drew  Anderson</dc:creator>
  <dc:date>02/25/2026 06:30:00</dc:date>
<content:encoded><![CDATA[

<p><strong>Key Takeaways:</strong></p>
<ul class="content-list">
<li class="mt-2">Robotics adoption is steady, specialized, and driven by measurable ROI.</li>
<li class="mt-2">AI enhances execution and vision, but usability and integration remain critical.</li>
<li class="mt-2">Long-term service and software coordination are key competitive advantages.</li>
</ul>
<p>I attended TechFest 2026 in Tampa to see how robotics technology is progressing in real industrial settings. Two industry leaders, FANUC and Cognex, were represented. After speaking with both teams, I came away with a clearer view of where the industry stands today.</p>
<p>My overall takeaway: robotics is advancing in meaningful ways, but adoption remains practical, steady, and grounded in operational needs.</p>
<p><img loading="lazy" class="img-responsive" alt="Drew Anderson, Associate Product Manager at the TechFest 2026, Tampa" src="https://www.vaneck.com/contentassets/4c2c34dd8f354650ac628d4b7ac78014/6864_techfest-aeo-blog_picture-1_2026-02_v1_desktop.jpg" /></p>
<h2>Robots Are Built for Defined Tasks</h2>
<p>Despite increasing AI integration, most industrial robots are still designed to perform specific, repeatable functions.</p>
<p>FANUC emphasized that customers deploy robots for welding, painting, pick-and-place, palletizing, and similar tasks. Flexibility continues to improve, but buyers prioritize reliability and precision within a defined workflow.</p>
<p>Manufacturers focus on uptime, consistency, and measurable return on investment. That mindset continues to shape deployment decisions.</p>
<p><img loading="lazy" class="img-responsive" alt="Robots Are Built for Defined Tasks" src="https://www.vaneck.com/contentassets/2e7d41818a5643d0a95727eb251671dd/6864_techfest-aeo-blog_picture-2_2026-02_v1_desktop.jpg" /></p>
<p class="chart-disclosure"><span style="font-size: 10pt;">FANUC&rsquo;s CRX-5iA collaborative robot brings safe, flexible automation to the factory floor with intuitive programming and precision handling.</span></p>

<h2>Collaborative Robots Expand Access, Not Complexity</h2>
<p>Collaborative robots are gaining traction because they can operate safely alongside humans and require less extensive safety infrastructure.</p>
<p>When I asked whether companies are rotating cobots across multiple functions, the impression was that most deployments remain task-oriented. The value today is safer interaction and easier integration rather than broad general-purpose capability.</p>
<h2>Robotics Growth Is Structural and Measured</h2>
<p>FANUC expects continued growth, supported in part by AI enhancements, but not driven by a single breakthrough moment.</p>
<p>Asia remains a primary driver of demand, particularly China, where demographic pressures and labor shortages reinforce the case for automation. Globally, robotics adoption continues to expand in a steady and disciplined way.</p>
<p>This remains an industry defined by engineering depth, integration expertise, and long-term customer relationships.</p>
<h2>Robotics Service and Longevity Matter</h2>
<p>One point that stood out was FANUC&rsquo;s long-term service commitment. Supporting robots for 15 years or more reduces operational risk for customers.</p>
<p>Downtime is costly. Buyers are not only purchasing hardware. They are purchasing reliability and support infrastructure.</p>
<p>In industrial automation, long-term service capability can be as important as product performance.</p>
<h2>Humanoids Still Face Practical Limits</h2>
<p>Humanoid robotics continues to generate interest, but replicating human dexterity and tactile precision remains technically challenging.</p>
<p>For most industrial applications today, specialized robotic systems remain more economically practical.</p>
<h2>Cognex: The Intelligence Layer of Automation</h2>
<p>If FANUC represents execution, Cognex represents interpretation and coordination.</p>
<p>Originally founded as a software company, Cognex&rsquo;s strength remains machine vision and barcode systems that support automated production.</p>
<h2>Machine Vision Is Core Infrastructure</h2>
<p>Automated inspection and traceability are essential in modern manufacturing. Cognex systems operate across medical, automotive, electronics, and industrial applications.</p>
<p>Their AI-driven vision tools identify defects, verify assemblies, and read barcodes at high speed and accuracy. In many automated lines, vision is foundational rather than optional.</p>
<h2>The Spreadsheet Architecture Is a Meaningful Advantage</h2>
<p>One of the more interesting demonstrations was Cognex&rsquo;s spreadsheet-style interface.</p>
<p>The design allows inspection tools, 3D vision systems, and barcode readers to operate within a unified framework. Data can move across systems without extensive custom integration.</p>
<p>The familiar structure reduces training time and improves troubleshooting. More importantly, it allows machines to coordinate more effectively.</p>
<p>As automation increases, interoperability becomes more important. Systems that can communicate seamlessly reduce friction on the factory floor. Cognex appears to have built its architecture with that coordination in mind.</p>
<p><img loading="lazy" class="img-responsive" alt="The Spreadsheet Architecture Is a Meaningful Advantage" src="https://www.vaneck.com/contentassets/dce61846762d47108643194bf4e73949/6864_techfest-aeo-blog_picture-3_2026-02_v1_desktop.jpg" /></p>
<p class="chart-disclosure"><span style="font-size: 10pt;">Cognex In-Sight Spreadsheet empowers vision systems with intuitive, spreadsheet-style logic for fast configuration and reliable industrial inspection.</span></p>
<h2>Advanced AI, Delivered Practically</h2>
<p>Cognex shared that one recent release had to be simplified because it was initially too advanced for real-world deployment.</p>
<p>That detail reinforces a broader point. In industrial settings, AI must be powerful, but it must also be usable. Proprietary AI is most valuable when it integrates cleanly into established workflows.</p>
<h2>What TechFest Reinforced</h2>
<p>Three themes stood out:</p>
<ul class="content-list">
<li class="mt-2">Robotics growth is steady and economically driven.</li>
<li class="mt-2">Specialization still defines most industrial deployment.</li>
<li class="mt-2">Software coordination and long-term service are critical value layers.</li>
</ul>
<p>The level of technological advancement on display was impressive. Systems are becoming more intelligent, more efficient, and easier to integrate. AI is clearly enhancing capability across inspection, coordination, and precision tasks.</p>
<p>At the same time, some of the broader narratives around AI replacing wide swaths of labor or humanoid robots reshaping factories overnight appear overstated, at least for now. What I saw was an industry focused on practical efficiency gains, not disruption for its own sake.</p>
<p>Robotics is evolving quickly. It is also evolving pragmatically. That combination may ultimately be what makes the progress durable.</p>
<p>To receive more <a href="https://www.vaneck.com/us/en/insights/thematic-investing/" title="Thematic Investing Insights"><strong>Thematic Investing</strong></a> insights, <a href="https://www.vaneck.com/us/en/subscribe/" title="Subscription Center"><strong>sign up in our subscription center</strong></a>.</p>
]]></content:encoded>
</item><item rdf:about="https://www.vaneck.com/us/en/blogs/thematic-investing/buzz-investing-early-year-strength-meets-february-reset/">
  <title>BUZZ Investing: Early-Year Strength Meets February Reset></title>
  <link>https://www.vaneck.com/us/en/blogs/thematic-investing/buzz-investing-early-year-strength-meets-february-reset/</link>
  <description><![CDATA[U.S. equities faced volatility in early 2026 as AI spending concerns, tariff fears, and sector disruption narratives drove sharp selloffs, with semiconductors outperforming while fintech and health names lagged.]]></description>
  <dc:creator> </dc:creator>
  <dc:date>02/25/2026 06:30:00</dc:date>
<content:encoded><![CDATA[

<p>U.S. equities navigated a volatile and increasingly risk-averse period from January 8 to February 11, 2026 (the &ldquo;Period&rdquo;), as early-year momentum gave way to aggressive selling pressure in early February. While markets entered the year on a constructive footing, building on January&rsquo;s modest gains with the S&amp;P 500 briefly surpassing 7,000 for the first time and small caps showing relative strength, broad indices faced renewed headwinds as investor scrutiny intensified around artificial intelligence investment cycles, capital expenditure burdens, and potential disruption to incumbent sectors. The S&amp;P 500 declined notably in the first two weeks of February, reflecting sharp pullbacks in technology and software names amid fears that AI-driven shifts could erode margins and displace traditional models, while broader dispersion widened between perceived AI winners and losers. Against this backdrop, the <strong><a href="/link/459289f4c5ea4648bd9dfcf70d847cd7.aspx" title="BUZZ - VanEck Social Sentiment ETF - Overview">BUZZ</a></strong> NextGen AI US Sentiment Leaders Index (the &ldquo;<strong><a href="/link/459289f4c5ea4648bd9dfcf70d847cd7.aspx" title="BUZZ - VanEck Social Sentiment ETF - Overview">BUZZ</a></strong> Index&rdquo;) experienced amplified downside during the Period, falling 9.1%, consistent with its concentrated exposure to certain thematic market segments, including high-sentiment AI-linked equities undergoing rapid reassessment.</p>
<p>The sell-off in early February was driven by a confluence of factors that heightened caution after three years of strong equity performance. Concerns over escalating AI capital spending raised questions about near-term returns on invested capital and sustainability of profitability in related ecosystems. AI-related productivity gains shaped a narrative which fueled sharp declines in software, IT services, and adjacent sectors seen as vulnerable to disruption. At the same time, geopolitical tensions and evolving tariff discussions re-entered the narrative, prompting a rotation toward perceived defensive and commodity-linked areas of the market. Corporate earnings remained broadly constructive on an absolute basis, but investor reactions were increasingly asymmetric, with guidance scrutiny intensifying and valuation sensitivity rising. As the market digests these dynamics, dispersion may persist, rewarding companies that can validate growth narratives while pressuring those reliant on narrative momentum alone.</p>
<p>The <strong><a href="/link/459289f4c5ea4648bd9dfcf70d847cd7.aspx" title="BUZZ - VanEck Social Sentiment ETF - Overview">BUZZ</a></strong> Index returned 1.75% during the month of January compared to a return of 1.45% for the S&amp;P 500 Index during the same period. Year-to-date, the <strong><a href="/link/459289f4c5ea4648bd9dfcf70d847cd7.aspx" title="BUZZ - VanEck Social Sentiment ETF - Overview">BUZZ</a></strong> Index leads the S&amp;P 500 with returns of 1.75% and 1.45%, respectively, as of the end of January.</p>
<h2>Micron and Intel Lead BUZZ Gains; Memory Tightness and AI Tailwinds Lift Semis</h2>
<p>Micron Technology (NASDAQ: MU) and Intel Corporation (NASDAQ: INTC) were the leading contributors to <strong><a href="/link/459289f4c5ea4648bd9dfcf70d847cd7.aspx" title="BUZZ - VanEck Social Sentiment ETF - Overview">BUZZ</a></strong> Index performance during the Period, advancing approximately 25 percent and 18 percent, respectively.</p>
<p>Micron benefited from persistent tightness in global memory markets and mounting evidence that AI-driven demand for high-performance chips would continue to outstrip available supply well into 2026 and beyond. The catalyst may have come from Samsung Electronics&rsquo; earnings update, where executives emphasized broad-based shortages across key memory categories and described 2026 as a potential &ldquo;Golden Era&rdquo; for the industry, with constrained supply growth and meaningful price increases expected early in the year. These comments reinforced the favorable pricing and margin environment for memory suppliers, and Micron&rsquo;s established role as a major provider into data centers and AI infrastructure positioned it to potentially capture a significant share of this multi-year upcycle.</p>
<p>Intel posted solid net gains despite notable intra-period volatility following its fourth-quarter earnings release in late January. The company exceeded expectations on revenue and profitability but shares initially pulled back sharply on cautious near-term guidance and commentary around supply constraints and challenges in meeting surging AI-related demand. The stock recovered in the days that followed as investors shifted focus to the longer-term trajectory, including progress in regaining manufacturing leadership and expanding its footprint in the growing AI PC and high-performance computing markets. In our view, the overall advance reflected renewed confidence in Intel&rsquo;s strategic turnaround and its potential to participate meaningfully in the broadening AI ecosystem, even as the company works through near-term execution hurdles.</p>

<h3 id="top-contributors" class="jump-link-nav anchored-block" data-jumplink-title="Top Contributors">Top BUZZ Index Contributors: January 8, 2026 &ndash; February 11, 2026</h3>
<div class="wrapped-div">
<table style="width: 100%;">
<tbody>
<tr class="tbl-data">
<td class="tbl-header last text-left">Company</td>
<td class="tbl-header last text-left">Ticker</td>
<td class="tbl-header last text-right">Average Weight (%)</td>
<td class="tbl-header last text-right">Return Contribution (%)</td>
</tr>
<tr class="tbl-data">
<td class="data-td data last text-left">Micron Technology Inc</td>
<td class="data-td data last text-left">MU</td>
<td class="data-td data last text-right">3.20</td>
<td class="data-td data last text-right">0.68</td>
</tr>
<tr class="tbl-data">
<td class="data-td data last text-left">Intel Corp</td>
<td class="data-td data last text-left">INTC</td>
<td class="data-td data last text-right">3.01</td>
<td class="data-td data last text-right">0.49</td>
</tr>
<tr class="tbl-data">
<td class="data-td data last text-left">Applied Digital Corp</td>
<td class="data-td data last text-left">APLD</td>
<td class="data-td data last text-right">3.39</td>
<td class="data-td data last text-right">0.42</td>
</tr>
<tr class="tbl-data">
<td class="data-td data last text-left">GameStop Corp</td>
<td class="data-td data last text-left">GME</td>
<td class="data-td data last text-right">3.27</td>
<td class="data-td data last text-right">0.37</td>
</tr>
<tr class="tbl-data">
<td class="data-td data last text-left">Super Micro Computer Inc</td>
<td class="data-td data last text-left">SMCI</td>
<td class="data-td data last text-right">2.47</td>
<td class="data-td data last text-right">0.20</td>
</tr>
<tr class="tbl-data">
<td class="data-td data last text-left">AST SpaceMobile Inc</td>
<td class="data-td data last text-left">ASTS</td>
<td class="data-td data last text-right">3.61</td>
<td class="data-td data last text-right">0.16</td>
</tr>
<tr class="tbl-data">
<td class="data-td data last text-left">First Majestic Silver Corp</td>
<td class="data-td data last text-left">AG</td>
<td class="data-td data last text-right">0.67</td>
<td class="data-td data last text-right">0.15</td>
</tr>
<tr class="tbl-data">
<td class="data-td data last text-left">Advanced Micro Devices Inc</td>
<td class="data-td data last text-left">AMD</td>
<td class="data-td data last text-right">2.67</td>
<td class="data-td data last text-right">0.13</td>
</tr>
<tr class="tbl-data">
<td class="data-td data last text-left">Apple Inc</td>
<td class="data-td data last text-left">AAPL</td>
<td class="data-td data last text-right">1.93</td>
<td class="data-td data last text-right">0.12</td>
</tr>
<tr class="tbl-data">
<td class="data-td data last text-left">Bloom Energy Corp</td>
<td class="data-td data last text-left">BE</td>
<td class="data-td data last text-right">0.47</td>
<td class="data-td data last text-right">0.11</td>
</tr>
</tbody>
</table>
</div>
<p class="chart-disclosure"><i>Source: BUZZ Holdings ULC, Bloomberg. Past performance is no guarantee of future results. Index performance is not illustrative of fund performance. Not intended as a recommendation to buy or to sell any of the securities mentioned herein.</i></p>

<h2>Hims &amp; Hers and Opendoor Weigh on BUZZ Index as Structural Pressures Resurface</h2>
<p>Hims &amp; Hers Health Inc. (NYSE: HIMS) and Opendoor Technologies Inc. (NASDAQ: OPEN) were the leading detractors to <strong><a href="/link/459289f4c5ea4648bd9dfcf70d847cd7.aspx" title="BUZZ - VanEck Social Sentiment ETF - Overview">BUZZ</a></strong> Index performance during the Period, declining approximately 50 percent and 26 percent, respectively.</p>
<p>Hims &amp; Hers Health experienced one of the Period&rsquo;s sharpest declines after the company halted sales of its compounded version of Novo Nordisk&rsquo;s popular weight-loss drug Wegovy. The decision followed intense regulatory scrutiny from the FDA and a referral to the Department of Justice, as well as a lawsuit from Novo Nordisk alleging patent infringement, unsafe compounding practices, and deceptive marketing. These developments triggered a rapid loss of investor confidence in the sustainability of the company&rsquo;s recent growth drivers, particularly as broader concerns around decelerating revenue and subscriber trends also resurfaced.</p>
<p>Opendoor Technologies posted a meaningful decline amid heightened risk aversion and spillover effects from the broader &ldquo;AI scare trade&rdquo; that pressured real estate-linked names. Investors grew increasingly concerned that advancing AI tools could disrupt traditional home-buying processes and fee-based models, weighing on sentiment across the sector even though Opendoor operates a technology-first iBuying platform. Recent price action appeared to reflect both profit-taking after a run of outsized gains and caution ahead of upcoming earnings that will be closely watched for signs of operational progress under new leadership.</p>
<h3 id="bottom-contributors" class="jump-link-nav anchored-block" data-jumplink-title="Bottom Contributors">Bottom BUZZ Index Contributors: January 8, 2026 &ndash; February 11, 2026</h3>
<div class="wrapped-div">
<table style="width: 100%;">
<tbody>
<tr class="tbl-data">
<td class="tbl-header last text-left">Company</td>
<td class="tbl-header last text-left">Ticker</td>
<td class="tbl-header last text-right">Average Weight (%)</td>
<td class="tbl-header last text-right">Return Contribution (%)</td>
</tr>
<tr class="tbl-data">
<td class="data-td data last text-left">Hims &amp; Hers Health Inc</td>
<td class="data-td data last text-left">HIMS</td>
<td class="data-td data last text-right">1.26</td>
<td class="data-td data last text-right">-0.75</td>
</tr>
<tr class="tbl-data">
<td class="data-td data last text-left">Opendoor Technologies Inc</td>
<td class="data-td data last text-left">OPEN</td>
<td class="data-td data last text-right">2.72</td>
<td class="data-td data last text-right">-0.75</td>
</tr>
<tr class="tbl-data">
<td class="data-td data last text-left">Strategy Inc</td>
<td class="data-td data last text-left">MSTR</td>
<td class="data-td data last text-right">2.74</td>
<td class="data-td data last text-right">-0.72</td>
</tr>
<tr class="tbl-data">
<td class="data-td data last text-left">Palantir Technologies Inc</td>
<td class="data-td data last text-left">PLTR</td>
<td class="data-td data last text-right">2.73</td>
<td class="data-td data last text-right">-0.68</td>
</tr>
<tr class="tbl-data">
<td class="data-td data last text-left">Robinhood Markets Inc</td>
<td class="data-td data last text-left">HOOD</td>
<td class="data-td data last text-right">1.94</td>
<td class="data-td data last text-right">-0.68</td>
</tr>
<tr class="tbl-data">
<td class="data-td data last text-left">SoFi Technologies Inc</td>
<td class="data-td data last text-left">SOFI</td>
<td class="data-td data last text-right">2.37</td>
<td class="data-td data last text-right">-0.66</td>
</tr>
<tr class="tbl-data">
<td class="data-td data last text-left">Rocket Lab Corp</td>
<td class="data-td data last text-left">RKLB</td>
<td class="data-td data last text-right">2.89</td>
<td class="data-td data last text-right">-0.57</td>
</tr>
<tr class="tbl-data">
<td class="data-td data last text-left">Amazon.com Inc</td>
<td class="data-td data last text-left">AMZN</td>
<td class="data-td data last text-right">2.67</td>
<td class="data-td data last text-right">-0.49</td>
</tr>
<tr class="tbl-data">
<td class="data-td data last text-left">PayPal Holdings Inc</td>
<td class="data-td data last text-left">PYPL</td>
<td class="data-td data last text-right">1.40</td>
<td class="data-td data last text-right">-0.47</td>
</tr>
<tr class="tbl-data">
<td class="data-td data last text-left">Oracle Corp</td>
<td class="data-td data last text-left">ORCL</td>
<td class="data-td data last text-right">2.62</td>
<td class="data-td data last text-right">-0.46</td>
</tr>
</tbody>
</table>
</div>
<p class="chart-disclosure"><i>Source: BUZZ Holdings ULC, Bloomberg. Past performance is no guarantee of future results. Index performance is not illustrative of fund performance. Not intended as a recommendation to buy or to sell any of the securities mentioned herein.</i></p>
<h2>BUZZ Index February 2026 Rebalance Highlights</h2>
<p><strong>Resilient Conviction: Maximum Weight Stocks</strong></p>
<p>The S&amp;P 500&rsquo;s modest year-to-date performance through the recent <strong><a href="/link/459289f4c5ea4648bd9dfcf70d847cd7.aspx" title="BUZZ - VanEck Social Sentiment ETF - Overview">BUZZ</a></strong> rebalance has masked sharply higher dispersion and volatility beneath the surface. The &ldquo;Magnificent 7&rdquo; group of stocks has fallen roughly 4% so far in 2026, Bitcoin has retraced about 23%, and several former high-momentum names have suffered single-day drops exceeding 10%. Software stocks have endured one of their most severe stretches since 2008, driven by growing investor reassessment of how deeply artificial intelligence may disrupt traditional SaaS models and profitability paths, a phenomenon some market participants have dubbed &ldquo;SaaSMageddon&rdquo; to reflect the intensity of the drawdowns. Despite this pressure on recent leaders, the number of <strong><a href="/link/459289f4c5ea4648bd9dfcf70d847cd7.aspx" title="BUZZ - VanEck Social Sentiment ETF - Overview">BUZZ</a></strong> Index constituents at the maximum 3% weight increased from 13 to 18 this month. Notably, Apple (AAPL), Microsoft (MSFT), and Amazon (AMZN), all core Magnificent 7 members, have returned to the 3% maximum weight cap. AAPL was last capped at 3% in September 2025, MSFT in November 2024, and AMZN in November 2025. While mainstream commentary increasingly warns of a potential market top, sentiment data and <strong><a href="/link/459289f4c5ea4648bd9dfcf70d847cd7.aspx" title="BUZZ - VanEck Social Sentiment ETF - Overview">BUZZ</a></strong> positioning indicate that conviction in select high-quality names may remain relatively durable.</p>
<p><strong>Salesforce, Inc.</strong></p>
<p>Salesforce, Inc. (NYSE: CRM) has been a defining name in enterprise software for more than two decades. From trading near $5 per share in the depths of the 2008&ndash;2009 financial crisis, the company transformed itself into the category leader in cloud-based customer relationship management as internet infrastructure matured and SaaS adoption accelerated. The stock&rsquo;s journey has been marked by sharp cycles. After peaking near $300 in late 2021, CRM fell with the broader technology sector to around $130 per share. The emergence of generative AI sparked a renewed rally, fueled in part by Salesforce&rsquo;s launch of Agentforce and other AI-native capabilities, which carried shares to approximately $360 by January 2025. Since then, the stock has given back roughly half its value, reflecting broader market concerns over the capital intensity of AI investment and questions about the pace at which increasingly sophisticated AI agents may encroach on traditional CRM workflows and value propositions. Despite the recent pullback, CRM re-enters the <strong><a href="/link/459289f4c5ea4648bd9dfcf70d847cd7.aspx" title="BUZZ - VanEck Social Sentiment ETF - Overview">BUZZ</a></strong> Index this month at a 0.40% weight, indicating that some market participants retain confidence in the company&rsquo;s ability to adapt its platform and remain competitive through significant technological shifts.</p>
<p>For more on rebalancing results and a full breakdown of index constituents added and removed for the month, view the <strong><a href="/us/en/blogs/thematic-investing/buzz-reconstitution-february-2026.pdf" title="BUZZ - VanEck Social Sentiment ETF" target="_blank" rel="noopener">BUZZ Index reconstitution</a></strong> report.</p>

<p>To receive more <a href="https://www.vaneck.com/us/en/insights/thematic-investing/" title="Thematic Investing Insights"><strong>Thematic Investing</strong></a> insights, <a href="https://www.vaneck.com/us/en/subscribe/" title="Subscription Center"><strong>sign up in our subscription center</strong></a>.</p>
]]></content:encoded>
</item><item rdf:about="https://www.vaneck.com/us/en/blogs/emerging-markets-equity/rsx-rsxj-liquidation-faq/">
  <title>RSX / RSXJ Liquidation FAQ></title>
  <link>https://www.vaneck.com/us/en/blogs/emerging-markets-equity/rsx-rsxj-liquidation-faq/</link>
  <description><![CDATA[VanEck has commenced plans to liquidate the VanEck Russia ETF (RSX) and VanEck Russia Small-Cap ETF (RSXJ). We answer some frequently asked questions on the process.]]></description>
  <dc:creator> </dc:creator>
  <dc:date>02/24/2026 06:30:00</dc:date>
<content:encoded><![CDATA[

<p>We remain committed to keeping shareholders informed regarding the status of the VanEck Russia ETF (RSX) and VanEck Russia Small-Cap ETF (RSXJ) (collectively, the &ldquo;Funds&rdquo;). At this time, no significant legal, regulatory, or market developments have occurred that we are aware of that would enable the Funds to sell their underlying securities.</p>
<p>The Funds' plan of liquidation remains in effect. If future developments allow for the lawful sale of these securities, proceeds will be distributed to shareholders in accordance with the plan. Additionally, the plan of liquidation may be amended or terminated by the Board of Trustees in certain circumstances.</p>
<p>VanEck continues to manage the Funds as a fiduciary, and we believe the plan of liquidation has been designed to provide shareholders the potential to realize future value of the underlying Russian investments, if market conditions change in the future. Additionally, the plan of liquidation may be amended or terminated by the Board of Trustees.</p>
<p>We will provide further updates as new information becomes available.</p>
<p>As detailed in a prior&nbsp;<a href="https://www.vaneck.com/us/en/blogs/investment-outlook/shareholder-notice-rsx-and-rsxj-liquidation/" title="Shareholder Notice: RSX and RSXJ Liquidation"><strong>Shareholder Notice</strong></a>, VanEck has commenced plans to liquidate the Funds. This note attempts to answer some frequently asked questions.</p>
<ul class="content-list">
<li><a href="#point-one"><strong>Why is VanEck liquidating the Funds?</strong></a></li>
<li><a href="#point-two"><strong>What does liquidation mean?</strong></a></li>
<li><a href="#point-three"><strong>What</strong> <strong>are the current holdings in the Fund?</strong></a></li>
<li><a href="#point-four"><strong>Why are the Russian stocks in the portfolio fair valued even though they are trading in the local market?</strong></a></li>
<li><a href="#point-five"><strong>Can I sell my shares?</strong></a></li>
<li><a href="#point-six"><strong>Can I receive my portion of the underlying positions instead of cash?</strong></a></li>
<li><a href="#point-seven"><strong>How will you sell the Russian stocks that are still in the portfolios?</strong></a></li>
<li><a href="#point-eight"><strong>When will the liquidation period end?</strong></a></li>
<li><a href="#point-nine"><strong>Why didn&rsquo;t the Funds distribute all of the cash holdings in the initial liquidating distribution?</strong></a></li>
<li><a href="#point-ten"><strong>Was the Fund terminated on December 31, 2023?</strong></a></li>
<li><a href="#point-eleven"><strong>When will I receive my liquidating distribution?</strong></a></li>
<li><a href="#point-twelve"><strong>What liquidating distributions have been paid out?</strong></a></li>
<li><a href="#point-thirteen"><strong>What will happen if market and regulatory conditions change so that the underlying stocks can be traded again?</strong></a></li>
<li><a href="#point-fourteen"><strong>What Indexes do the Funds seek to track?</strong></a></li>
<li><a href="#point-fifteen"><strong>What&rsquo;s the impact of the Russian Presidential Decree 840?</strong></a></li>
<li><a href="#point-sixteen"><strong>RSX&rsquo;s December 2025 Distribution Update</strong></a></li>
<li><a href="#point-seventeen"><strong>RSX&rsquo;s January 2026 Operational Update</strong></a></li>
</ul>
<h2 id="point-one" class="anchored-block">Why is VanEck liquidating the Funds?</h2>
<p>The Funds were delisted by Cboe BZX Exchange on January 12, 2023, following a prior halting from trading in March 2022.&nbsp; Given that the Funds are no longer trading on an exchange and that there are ongoing restrictions relating to Russian securities, the Funds are not able to meet their investment objectives.</p>
<h2 id="point-two" class="anchored-block">What does liquidation mean?</h2>
<p>Liquidation means that the Funds are in the process of liquidating their assets and winding up their business pursuant to a plan of liquidation.</p>
<h2 id="point-three" class="anchored-block">What are the current holdings in the Funds?</h2>
<p>There are currently two types of assets in the Funds: cash and illiquid securities (liquid securities have been sold for cash pursuant to the plan of liquidation). <a href="#point-" title="RSX - VanEck Russia ETF - Holdings"><strong>Click here</strong></a> to see an up-to-date list of portfolio holdings for RSX. <a href="/link/c4462b9878324bdcb9085902fb54fc99.aspx" title="RSXJ - VanEck Russia Small-Cap ETF - Holdings"><strong>Click here</strong></a> to see an up-to-date list of portfolio holdings for RSXJ.</p>
<p><u>Cash.</u>&nbsp;Cash has been estimated and reserved in an amount to allow the Funds to continue to operate through their final termination according to the plan of liquidation. Excess cash has been distributed through the liquidating distributions. &nbsp;The cash reserve amount accounts for the possibility of an extended liquidation period.</p>
<p><u>Illiquid Securities</u>. VanEck continues to manage all funds as a fiduciary, and we believe the plan of liquidation has been designed to provide shareholders the potential to realize future value of the underlying Russian investments, if market conditions change in the future. It is possible that the liquidation period may continue for an extended period of time. However, there can be no assurance that will occur or that any value will&nbsp;materialize.</p>
<h2 id="point-four" class="anchored-block">Why are the Russian stocks in the portfolio fair valued even though they are trading in the local market?</h2>
<p>Due to the inability to trade Russian securities, the Funds&rsquo; assets are valued using a fair value methodology.&nbsp; The actual price received by the Funds for their assets may differ substantially from the fair value assigned to such assets.</p>
<h2 id="point-five" class="anchored-block">Can I sell my shares?</h2>
<p>No. Trading in shares of the Funds was halted by the Cboe BZX Exchange (Cboe) on March 4, 2022 and the Funds were subsequently delisted by Cboe.&nbsp; No secondary market exists for the Funds.</p>
<h2 id="point-six" class="anchored-block">Can I receive my portion of the underlying positions instead of cash?</h2>
<p>No. There is currently no operational capability to transfer positions in-kind to individual shareholders. &nbsp;Further, current government sanctions would currently prohibit such a&nbsp;transfer.</p>
<h2 id="point-seven" class="anchored-block">How will you sell the Russian stocks that are still in the portfolios?</h2>
<p>Regulatory and market conditions do not currently permit the Funds to conduct transactions in the local Russian market.&nbsp; The Funds are managed to seek to remain in compliance with all applicable sanctions.</p>
<p>It is possible that the Funds may be able to sell some or all of their positions in Russian securities and depositary receipts and to convert the proceeds of those sales to U.S. dollars. If, at any time prior to the Funds&rsquo; termination date, VanEck determines that legal, regulatory, or market developments have occurred so that the Funds may lawfully sell such securities, such securities may be sold as soon as reasonably practicable consistent with seeking best execution. The net proceeds of any sale are expected to be distributed in one or more additional liquidating distributions within 60 days after their receipt. However, such distribution may be delayed for up to an additional 90 days (or such longer period as VanEck may determine to be in the best interests of shareholders) if VanEck determines in its discretion that actual or potential legal, regulatory, or market developments are such that additional securities may be sold during that period, whose proceeds may be combined with those previously received and undistributed.</p>
<h2 id="point-eight" class="anchored-block">When will the liquidation period end?</h2>
<p>The Funds will be terminated as soon as practicable after payment of the final liquidating distribution and redemption of all outstanding shares of the Funds. It is also possible that the Funds may be terminated if the Russian securities held by the Funds cease to represent valid interests in their issuers.</p>
<h2 id="point-nine" class="anchored-block">Why didn&rsquo;t the Funds distribute all of the cash holdings in the initial liquidating distribution?</h2>
<p>The initial liquidating distribution amount to shareholders was based on a pro-rata share of then current liquid assets less a reserve to cover operating and liquidation expenses for an extended period.&nbsp; The reserve was set at an amount intended to provide substantial flexibility for the Funds&rsquo; to remain in liquidation for an extended period of time<strong>. </strong><strong>If, at </strong><strong>any</strong><strong> time prior to the Funds&rsquo; termination date, VanEck determines that legal, regulatory, or market developments have occurred so </strong><strong>that</strong><strong> the Funds may lawfully sell such securities and to convert the proceeds of those sales to U.S. dollars in certain types of transactions, such securities may be sold as soon as reasonably practicable consistent with seeking best&nbsp;execution.</strong></p>
<h2 id="point-ten" class="anchored-block">Was the Fund terminated on December 31, 2023?</h2>
<p>No. The plan of liquidation provides that the Funds will terminate (a) after payment of a final liquidating distribution and redemption of all shares outstanding, (b) after the Russian securities held by the Funds cease to represent valid interests in their issuers, or if earlier than (a) or (b) on a date after December 31, 2023 as determined by the Funds&rsquo; Board of Trustees upon recommendation of the Funds&rsquo; investment adviser.&nbsp; It is possible that the liquidation period could extend well beyond December 31, 2023. Due to the uncertainty involved, there can be no assurance that shareholders would receive any liquidating distribution relating to the Russian securities and depositary receipts after the initial distribution, described above. The distribution to shareholders of sale proceeds of Russian securities and depositary receipts, if any, will be reduced by expenses related to the sale and the distribution; other Fund operating and liquidation expenses will be paid out of the reserve.</p>
<h2 id="point-eleven" class="anchored-block">When will I receive my liquidating distribution?</h2>
<p>The Funds made an initial liquidating distribution to shareholders of a pro-rata share of current liquid assets, less a reserve to cover operating and liquidation expenses for an extended period. The initial distribution occurred on January 12, 2023. In addition, RSX made additional liquidating distributions on July 27, 2023, September 29, 2023, April 19, 2024, October 7, 2024 and December 24, 2024. In addition, RSXJ made an additional liquidating distribution on October 7, 2024. The Funds may make additional liquidating distributions, although additional distributions may not occur.</p>
<h2 id="point-twelve" class="anchored-block">What liquidating distributions have been paid out?</h2>
<p>Both RSX and RSXJ have paid liquidating distributions to shareholders. Further details can be found <strong><a href="https://www.vaneck.com/us/en/vaneck-etf-2023-rsx-and-rsxj-distributions-through-july.pdf" title="VanEck Russia ETF (RSX) and VanEck Russia Small-Cap (RSXJ) Liquidating Distributions" target="_blank" rel="noopener">here</a></strong>. A summary of these distributions is below:</p>
<ul class="content-list">
<li><a><strong>January 12, 2023</strong> &ndash; RSX and RSXJ made an initial liquidating distribution to shareholders of a pro-rata share of current liquid assets held by the Funds on the date the distribution was declared, less a reserve to cover operating and liquidation expenses for an extended period.</a></li>
<li><strong>July 27, 2023</strong> &ndash; As a result of subsequent transactions, RSX made an additional liquidating distribution on this date.</li>
<li><strong>September 29, 2023 </strong>- As a result of subsequent transactions, RSX made an additional liquidating distribution on this date.</li>
<li><strong>April 19, 2024 </strong>- As a result of subsequent transactions, RSX made an additional liquidating distribution on this date.</li>
<li><strong>October 07, 2024 </strong>- As a result of subsequent transactions, RSX and RSXJ made an additional liquidating distribution on this date.</li>
<li><strong>December 24, 2024 </strong>- As a result of subsequent transactions, RSX made an additional liquidating distribution on this date.&nbsp;</li>
<li><strong>December 26, 2025</strong> - As a result of income received, RSXJ made an additional distribution on this date.</li>
</ul>
<h2 id="point-thirteen" class="anchored-block">What will happen if market and regulatory conditions change so that the underlying stocks can be traded again?</h2>
<p>It is possible that the Funds may be able to sell some or all of their positions in Russian securities and depositary receipts and to convert the proceeds of those sales to U.S. dollars, although there can be no assurance that will occur. If it should become possible for the Funds to sell any Russian securities and depositary receipts and to convert the proceeds to U.S. dollars, the Funds will sell the securities and receipts when it is reasonable and practicable to do so. If VanEck determines that legal, regulatory, or market developments have occurred so that the Funds may lawfully sell such securities, the Funds may sell such securities as soon as reasonably practicable consistent with seeking best execution. The net proceeds of any sale will be distributed in one or more additional liquidating distributions within 60 days after their receipt (however, such distribution may be delayed if additional securities can be sold in that period, and such net proceeds combined into one distribution).</p>
<p>The liquidation plan may also be amended or terminated by the Board of Trustees in certain&nbsp;circumstances.</p>
<h2 id="point-fourteen" class="anchored-block">What Indexes do the Funds seek to track?</h2>
<p>VanEck Russia ETF&rsquo;s (RSX) stated investment objective is to seek to replicate as closely as possible, before fees and expenses, the price and yield performance of the MVIS Russia Index. VanEck Russia Small-Cap ETF&rsquo;s (RSXJ) stated investment objective is to seek to replicate as closely as possible, before fees and expenses, the price and yield performance of the MVIS Russia Small-Cap&nbsp;Index.</p>
<p>However, both indexes have been discontinued by the index provider. &nbsp;Due to the discontinuation of the MVIS Russia Index and MVIS Russia Small-Cap Index, in addition to the ongoing restrictions relating to Russian securities, the Funds have been unable to meet their investment&nbsp;objectives.</p>
<h2 id="point-fifteen" class="anchored-block">What&rsquo;s the impact of the Russian Presidential Decree 840?</h2>
<p>On October 2, 2024 the president of Russia issued Decree 840, requiring that all Russian custodians transfer shares of Russian joint-stock companies held in Type S custody accounts from the National Settlement Depository (&ldquo;NSD&rdquo;) to the local Russian registrars of such companies. The Funds&rsquo; global custodian has informed us that equity securities held by the Funds that were previously at the NSD have been transferred to the local registrars. The Office of Foreign Assets Control (&ldquo;OFAC&rdquo;) has cautioned that such transfers may be considered null and void pursuant to OFAC&rsquo;s regulations.&nbsp;</p>
<h2 id="point-sixteen" class="anchored-block">RSX&rsquo;s December 2025 Distribution Update</h2>
<p>Please be advised that RSX&rsquo;s December 2025 distribution is currently being delayed pending regulatory approval related to sanctions rules. The distribution payment is being held by the Depository Trust &amp; Clearing Corporation (DTCC) pending Office of Foreign Assets Control (OFAC) approval to release it.</p>
<p>Unless such restrictions are lifted, RSX will be unable to meet the requirement to pay &nbsp;distributions of its investment company taxable income and realized capital gains, if any, and will no longer be qualified as a regulated investment company after certain deadlines have passed. The loss of qualification is likely to result in income tax liability for RSX and result in economic loss for the shareholders of RSX. Please consult your personal tax advisor about RSX's potential loss of regulated investment company qualification.</p>
<h2 id="point-seventeen" class="anchored-block">RSX's January 2026 Operational Update</h2>
<p>Due to regulatory restrictions imposed upon RSX and certain of its service providers and operational counterparties, RSX's ability to process financial transactions and make payments, including distributions to shareholders, has been completely restricted. Such restrictions may exist for a prolonged period of time. During this period, RSX may not be able to meet its obligations and certain regulatory requirements, which will have a negative impact on RSX and its shareholders.</p>
<p>We will provide more information when it becomes available.</p>

]]></content:encoded>
</item><item rdf:about="https://www.vaneck.com/us/en/blogs/income-investing/bdcs-the-liquid-way-to-access-to-private-credit/">
  <title>BDCs: The Liquid Way to Access to Private Credit></title>
  <link>https://www.vaneck.com/us/en/blogs/income-investing/bdcs-the-liquid-way-to-access-to-private-credit/</link>
  <description><![CDATA[With attractive yields, improving credit fundamentals, and a growing role as a liquid access point to private credit markets, BDCs offer a compelling alternative to traditional fixed income.]]></description>
  <dc:creator>Coulter Regal, CFA</dc:creator>
  <dc:date>02/24/2026 06:30:00</dc:date>
<content:encoded><![CDATA[

<p>Business development companies (BDCs) are regaining momentum with attractive yields (<a href="/link/c48bed1be12e47c88f01e1bdbfa51ed2.aspx/performance" title="BIZD - VanEck BDC Income ETF - Performance"><strong>BIZD 30-day SEC yield: 8.56%</strong></a> as of 2/18/2026) and credit risk largely priced in. For income-focused investors looking beyond traditional bonds, <strong><a href="/link/c48bed1be12e47c88f01e1bdbfa51ed2.aspx" title="BIZD - VanEck BDC Income ETF - Overview">VanEck&rsquo;s BDC Income ETF (BIZD)</a></strong> provides a diversified, liquid way to access the growing private credit market.</p>
<p>In a recent webinar, VanEck&rsquo;s Coulter Regal, CFA and Nico Cortese, CFA discussed the key factors supporting BDCs, including their institutional scale, more conservative portfolio construction, and stable credit quality.</p>
<p>For the full discussion, <strong><a href="https://vaneck.zoom.us/rec/play/O4XGtp_EhlWBFwKWvR-aKMngmE0x0C9DLjCscnZykMiSDBcaZtun4KSHSBtTHf-wlXadh_EI-TfS5lIB.m_L64vienhZqFGsd?eagerLoadZvaPages=sidemenu.billing.plan_management&amp;accessLevel=meeting&amp;canPlayFromShare=true&amp;from=share_recording_detail&amp;continueMode=true&amp;componentName=rec-play&amp;originRequestUrl=https%3A%2F%2Fvaneck.zoom.us%2Frec%2Fshare%2F_cunfvFvqUNqxLIe7cp2wZgKrV8YvI7AIjilk5iyeA9kbhd_kTaTtU0SbMPallfK.KK_RaOf9_u6C2JvU" title="High Yield Opportunities in BDCs - Shared screen with speaker view">watch the replay of High Yield Opportunities in BDCs</a></strong>.</p>
<p><strong>Key takeaways:</strong></p>
<ul class="content-list">
<li class="mt-2"><strong>Investors are increasing allocations to private credit</strong> - The BDC market has grown rapidly, reflecting a broader institutional shift toward private credit (2:50).</li>
<li class="mt-2"><strong>How BDCs offer consistent high yield potential relative to other income-oriented investments</strong> - At 11.3%, the MVIS US BDC Index dividend yield is nearly double those of leveraged loans and high yield bonds, and roughly triple the 10-year Treasury, creating a compelling income advantage in today&rsquo;s market (4:56).</li>
<li class="mt-2"><strong>More conservative portfolio construction</strong> - The BDC industry has meaningfully de-risked its portfolio construction over recent years (13:25).</li>
<li class="mt-2"><strong>Insights from <a href="https://www.vaneck.com/us/en/offsite-disclaimer/?id=358390&amp;button=no&amp;url=https://cdn.hl.com/pdf/2025/bdc-monitor-fall-2025.pdf" target="_blank" title="Houlihan Lokey: BDC Monitor - Fall 2025" rel="noopener">Houlihan Lokey&rsquo;s BDC Monitor</a></strong> - Industry leverage has fallen, nonaccrual rates are low, and loan prices remain near par, signaling that the recent price weakness is a sentiment-driven discount, not a credit problem (15:15).</li>
<li class="mt-2"><strong>Benefits of a diversified BDC investment approach</strong> - <strong><a href="/link/c48bed1be12e47c88f01e1bdbfa51ed2.aspx" title="BIZD - VanEck BDC Income ETF - Overview">The VanEck BDC Income ETF (BIZD)</a></strong> provides broad, liquid access to the publicly traded BDC market, eliminating single-manager concentration risk while capturing the asset class&rsquo;s income premium (26:45).</li>
</ul>
<h2>High Yield Opportunities in BDCs</h2>
<h2>How Do BDC Yields Compare to High Yield Bonds, Leveraged Loans and Treasuries?</h2>
<p>BDCs stand out as one of the highest-yielding income-oriented asset classes available today. As of December 31, 2025, BDCs' MVIS US Business Development Companies Index dividend yield was 11.3%, nearly double that of leveraged loans (6.8%) and U.S. high yield bonds (6.5%), and roughly triple the yield on 10-year Treasuries (4.2%). This yield advantage reflects the structural premium investors earn for accessing middle-market private credit through a publicly traded vehicle.</p>
<h3>Investors Are Increasing Allocations to Private Credit</h3>
<p><img loading="lazy" class="desktop-image img-responsive" src="https://www.vaneck.com/contentassets/455f920564194d00829791376578067f/6861_bdc-webinar-blog_chart-1_2026-02_v1_desktop.svg" alt="Investors Are Increasing Allocations to Private Credit" /></p>
<p><img loading="lazy" class="mobile-image img-responsive" src="https://www.vaneck.com/contentassets/455f920564194d00829791376578067f/6861_bdc-webinar-blog_chart-1_2026-02_v1_mobile.svg" alt="Investors Are Increasing Allocations to Private Credit" /></p>
<p class="chart-disclosure">Source: FactSet and ICE Data Indices. Past performance is no guarantee of future results. Yield for Mortgage REITs, BDCs, Equity REITs, and Utilities Stocks represented by dividend yield. Yield for Leveraged Loans, U.S. HY Bonds, U.S. IG Bonds, and 10 Yr Treasury represented by yield-to-worst. Mortgage REITs represented by MVIS US Mortgage REITs Index; BDCs represented by MVIS US Business Development Companies Index, U.S. HY Bonds represented by ICE BofA US High Yield Index; U.S. IG Bonds represented by ICE BofA U.S. Corporate Index; U.S. 10 Yr Treasury represented by ICE BofA Current 10-Year US Treasury Index; Equity REITs represented by FTSE NAREIT All Equity REITs Index; Utilities Stocks represented by S&amp;P Utilities Index; Leveraged Loans represented by Bloomberg US Leveraged Loan (Ba/B) Index. See important disclosures and descriptions at end.</p>
<h2>BDC Credit Quality Remains Strong</h2>
<p>Multiple indicators confirm that BDC credit quality is healthy. Nonaccrual rates, investments where borrowers have stopped making payments, sit at just 1.2% of total portfolios as of Q2 2025, well below the 5.2% peak during the COVID era and below pre-pandemic levels. Weighted average loan prices for first-lien debt remain near par at 99.3%, and the vast majority of BDC investments are priced above 97% of par value. PIK (payment-in-kind) income, a potential early warning sign of borrower stress, has also remained manageable at 6.4% of total interest income.</p>
<ul class="content-list">
<li class="mt-2">Nonaccrual rates are at 1.2%, well below the COVID-era peak of 5.2% and below pre-pandemic levels.</li>
<li class="mt-2">First-lien weighted average loan prices are near par at 99.3%.</li>
<li class="mt-2">PIK income remains manageable at 6.4% of total interest income.</li>
<li class="mt-2">Loan price distribution shows 87% of investments are priced above 97% of par.</li>
</ul>
<h2>BIZD: Diversified BDC Exposure in a Single ETF</h2>
<p><strong><a href="/link/c48bed1be12e47c88f01e1bdbfa51ed2.aspx" title="BIZD - VanEck BDC Income ETF - Overview">The VanEck BDC Income ETF (BIZD)</a></strong> provides investors with diversified access to the publicly traded BDC market. Rather than picking individual BDCs, which carry concentration risk tied to specific managers, sectors, and borrower pools, <a href="/link/c48bed1be12e47c88f01e1bdbfa51ed2.aspx" title="BIZD - VanEck BDC Income ETF - Overview"><strong>BIZD</strong></a> offers broad exposure across the industry&rsquo;s largest and most liquid names. For income-focused investors looking beyond traditional bonds, <a href="/link/c48bed1be12e47c88f01e1bdbfa51ed2.aspx" title="BIZD - VanEck BDC Income ETF - Overview"><strong>BIZD</strong></a> provides a way to capture the BDC yield premium with institutional-scale diversification and daily liquidity.</p>
<ul class="content-list">
<li class="mt-2"><a href="/link/c48bed1be12e47c88f01e1bdbfa51ed2.aspx" title="BIZD - VanEck BDC Income ETF - Overview"><strong>BIZD</strong></a> offers diversified exposure across the largest publicly traded BDCs.</li>
<li class="mt-2">The ETF eliminates single-BDC concentration risk tied to specific managers or borrower pools.</li>
<li class="mt-2">Daily liquidity and broad diversification make it an accessible way to capture the BDC income premium.</li>
</ul>

<p>To receive more <a href="/us/en/blogs/income-investing/" title="Income Investing Insights"><strong>Income Investing</strong></a> insights, <a href="/link/5f45412c2143400497908cea2897f7d3.aspx" title=" Subscription Center"><strong>sign up in our subscription center</strong></a>.</p>
]]></content:encoded>
</item><item rdf:about="https://www.vaneck.com/us/en/blogs/income-investing/preferred-securities-vs-bonds-vs-equity-an-investors-guide/">
  <title>Preferred Securities vs Bonds vs Equity: An Investor’s Guide></title>
  <link>https://www.vaneck.com/us/en/blogs/income-investing/preferred-securities-vs-bonds-vs-equity-an-investors-guide/</link>
  <description><![CDATA[Preferred securities offer income potential above bonds and lower volatility than equities. Understanding sector differences helps investors position preferreds within diversified portfolios.]]></description>
  <dc:creator>Coulter Regal, CFA</dc:creator>
  <dc:date>02/24/2026 06:30:00</dc:date>
<content:encoded><![CDATA[

<p><strong>Key Takeaways:</strong></p>
<ul class="content-list">
<li class="mt-2">Preferreds bridge bonds and equities, historically offering higher income than bonds with typically lower volatility than stocks.</li>
<li class="mt-2">Bonds provide capital structure protection and stability; equities drive long-term growth.</li>
<li class="mt-2">Sector exposure matters. Financials, REITs, utilities and industrials respond differently to rate and credit cycles.</li>
</ul>
<h2>Understanding Preferred Securities</h2>
<p>Preferred securities are hybrid instruments that combine characteristics of both fixed income and equity. They typically pay a stated dividend or coupon, often at a higher yield than investment-grade bonds, while ranking senior to common equity but junior to bonds in a company&rsquo;s capital structure.</p>
<p>Most preferreds are perpetual securities with callable features, meaning income is the primary driver of returns over time. Because preferred dividends are generally fixed or fixed-to-floating, their prices tend to be sensitive to interest rates, credit spreads, and issuer-specific fundamentals.</p>
<h2>Who Should Invest in Preferred Securities?</h2>
<p>Preferred securities may be appropriate for investors seeking enhanced income potential with lower volatility than equities, but who are willing to accept more risk than traditional investment-grade bonds.</p>
<p>They are often used by income-oriented investors looking to diversify fixed income allocations, enhance yield, or reduce reliance on common equity dividends. Because preferreds sit lower in the capital structure than bonds, credit analysis and active management can play an important role in managing risk.</p>
<h2>Preferred Securities by Sector</h2>
<p><strong>Financials Preferreds</strong></p>
<p>Financial institutions represent the largest segment of the preferred market, driven by regulatory capital requirements.</p>
<ul class="content-list">
<li class="mt-2">Can carry elevated regulatory and credit risk during periods of financial stress</li>
<li class="mt-2">Exposure to banking and insurance fundamentals</li>
<li class="mt-2">Sensitivity to credit conditions and interest rate changes</li>
</ul>
<p>Because financials dominate the preferred universe, investors may face concentrated exposure to banking-sector risks. For those seeking preferred income potential without financial sector concentration, strategies such as the <strong><a href="/link/90451e6acf204dae87d1c8a31d9db407.aspx" title="PFXF - VanEck Preferred Securities ex Financials ETF - Overview">VanEck Preferred Securities ex Financials ETF (PFXF)</a></strong> provide access to REITs, utilities and industrial issuers, offering differentiated sector exposure beyond traditional financial-heavy benchmarks.</p>
<p><strong>REITs Preferreds</strong></p>
<p>REIT preferreds provide income exposure supported by real estate cash flows.</p>
<ul class="content-list">
<li class="mt-2">Yields tied to property-level or mortgage income</li>
<li class="mt-2">Sensitivity to real estate fundamentals and financing costs</li>
<li class="mt-2">Perpetual structures with call features</li>
</ul>
<p><strong>Utilities Preferreds</strong></p>
<p>Utility preferreds are typically issued by regulated companies with stable revenue profiles.</p>
<ul class="content-list">
<li class="mt-2">Potentially lower yields but higher perceived stability</li>
<li class="mt-2">Less cyclical cash flows</li>
<li class="mt-2">More bond-like rate sensitivity</li>
</ul>
<p><strong>Industrials Preferreds</strong></p>
<p>Industrial preferreds are less common but can provide diversification benefits.</p>
<ul class="content-list">
<li class="mt-2">Opportunistic issuance tied to corporate financing needs</li>
<li class="mt-2">Wide variation in credit quality and structure</li>
<li class="mt-2">Issuer-specific risk considerations</li>
</ul>
<h2>Understanding Bonds</h2>
<p>Bonds are fixed income securities representing debt obligations issued by governments or corporations. Bondholders receive contractual interest payments and have priority over preferred and common shareholders in the event of liquidation.</p>
<p>Bond prices are sensitive to changes in interest rates and credit spreads, with duration playing a key role in price volatility. Investment-grade bonds generally offer lower yields than preferred securities but provide greater capital structure protection.</p>
<h2>Who Should Invest in Bonds?</h2>
<p>Bonds are typically suited for investors prioritizing capital preservation, income stability, and lower credit risk. They often serve as the foundation of diversified portfolios, particularly for conservative investors or those with defined income needs.</p>
<h2>Understanding Equities</h2>
<p>Equities represent ownership in a company. Common shareholders participate in corporate earnings growth through price appreciation and dividends but rank lowest in the capital structure in the event of liquidation.</p>
<p>Equity returns are driven primarily by company fundamentals, earnings growth, and market sentiment, and they tend to exhibit higher volatility than bonds or preferred securities.</p>
<h2>Who Should Invest in Equities?</h2>
<p>Equities are generally appropriate for investors with a long-term time horizon who are seeking capital appreciation and are willing to tolerate higher short-term volatility. They are often used as the primary growth engine within diversified portfolios.</p>

<h3>Key Features of Preferred Securities vs. Bonds vs. Equities</h3>
<div class="wrapped-div">
<table style="width: 100%;">
<tbody>
<tr class="tbl-data">
<td class="tbl-header last text-left">Feature</td>
<td class="tbl-header last text-left">Preferred Securities</td>
<td class="tbl-header last text-left">Bonds</td>
<td class="tbl-header last text-left">Equities</td>
</tr>
<tr class="tbl-data">
<td class="data-td last text-left">Capital structure</td>
<td class="data-td data last text-left">Below bonds, above equity</td>
<td class="data-td data last text-left">Senior to preferreds</td>
<td class="data-td data last text-left">Lowest</td>
</tr>
<tr class="tbl-data">
<td class="data-td last text-left">Income</td>
<td class="data-td data last text-left">Higher, stated dividends or interest</td>
<td class="data-td data last text-left">Contractual interest</td>
<td class="data-td data last text-left">Variable dividends</td>
</tr>
<tr class="tbl-data">
<td class="data-td last text-left">Volatility</td>
<td class="data-td data last text-left">Moderate</td>
<td class="data-td data last text-left">Low to moderate</td>
<td class="data-td data last text-left">High</td>
</tr>
<tr class="tbl-data">
<td class="data-td last text-left">Growth potential</td>
<td class="data-td data last text-left">Limited</td>
<td class="data-td data last text-left">None</td>
<td class="data-td data last text-left">Highest</td>
</tr>
<tr class="tbl-data">
<td class="data-td last text-left">Rate sensitivity</td>
<td class="data-td data last text-left">Moderate</td>
<td class="data-td data last text-left">Varies by duration</td>
<td class="data-td data last text-left">Indirect</td>
</tr>
</tbody>
</table>
</div>
<br />
<h2>When to Invest in Preferreds vs. Bonds vs. Equities</h2>
<p>Each asset class serves a distinct role in portfolio construction:</p>
<ul class="content-list">
<li class="mt-2"><strong>Preferreds</strong> may be used when income generation is a priority and investors seek higher yield than bonds with typically lower volatility than equities.</li>
<li class="mt-2"><strong>Bonds</strong> may be appropriate when capital preservation, predictability and seniority in the capital structure are primary objectives.</li>
<li class="mt-2"><strong>Equities</strong> may be appropriate when long-term growth and participation in corporate earnings expansion are the main goals.</li>
</ul>
<p>Blending these exposures can help investors balance income, growth and risk across varying market environments.</p>
<h2>How to Invest in Preferred Securities</h2>
<p>Investors seeking diversified preferred exposure beyond financials may consider the <a href="/link/90451e6acf204dae87d1c8a31d9db407.aspx" title="PFXF - VanEck Preferred Securities ex Financials ETF - Overview"><strong>VanEck Preferred Securities ex Financials ETF (PFXF)</strong></a>. By focusing on other areas of the preferreds market, such as REITs, utilities and industrial issuers, <strong><a href="/link/90451e6acf204dae87d1c8a31d9db407.aspx" title="PFXF - VanEck Preferred Securities ex Financials ETF - Overview">PFXF</a></strong> provides differentiated sector exposure and has historically generated a portion of income from dividends that may qualify as QDI, potentially enhancing after-tax income relative to certain bond strategies.</p>
<p>The <strong><a href="/link/90451e6acf204dae87d1c8a31d9db407.aspx" title="PFXF - VanEck Preferred Securities ex Financials ETF - Overview">VanEck Preferred Securities ex Financials ETF (PFXF)</a></strong> seeks to replicate as closely as possible, before fees and expenses, the price and yield performance of the ICE Exchange-Listed Fixed &amp; Adjustable Rate Non-Financial Preferred Securities Index, which is intended to track the overall performance of U.S. exchange-listed hybrid debt, preferred stock and convertible preferred stock issued by non-financial corporations.</p>

<p>To receive more <a href="/us/en/blogs/income-investing/" title="Income Investing Insights"><strong>Income Investing</strong></a> insights, <a href="/link/5f45412c2143400497908cea2897f7d3.aspx" title=" Subscription Center"><strong>sign up in our subscription center</strong></a>.</p>
]]></content:encoded>
</item><item rdf:about="https://www.vaneck.com/us/en/blogs/income-investing/how-floating-rate-notes-perform-when-credit-spreads-widen/">
  <title>How Floating Rate Notes Perform When Credit Spreads Widen></title>
  <link>https://www.vaneck.com/us/en/blogs/income-investing/how-floating-rate-notes-perform-when-credit-spreads-widen/</link>
  <description><![CDATA[How do floating rate notes perform when credit spreads widen? Learn how spread risk, income and low duration shape corporate FRN returns.]]></description>
  <dc:creator>Nicolas  Fonseca, CFA</dc:creator>
  <dc:date>02/23/2026 06:30:00</dc:date>
<content:encoded><![CDATA[

<p><strong>Key Takeaways :</strong></p>
<ul class="content-list">
<li class="mt-2">When credit spreads widen, corporate FRN prices may decline temporarily as investors demand greater compensation for credit risk.</li>
<li class="mt-2">Despite spread-driven volatility, the higher income associated with investment-grade FRNs has historically supported recovery over longer horizons.</li>
<li class="mt-2">Because FRNs have minimal interest-rate duration, they have typically experienced smaller drawdowns than traditional fixed-rate corporate bonds during rate-driven selloffs.</li>
</ul>
<h2>How Floating Rate Notes Perform When Credit Spreads Widen</h2>
<p>Corporate floating Rate Notes (FRNs) are often discussed when talking about interest rate risk, but credit conditions also play an important role in shaping returns. While FRN coupons adjust with prevailing short-term interest rates, changes in credit spreads can affect valuations and introduce short-term volatility.</p>
<h2>Interest Rate Sensitivity vs. Credit Sensitivity in Corporate FRNs</h2>
<p>FRN coupons reset periodically based on short-term reference rates, which means prices have virtually no sensitivity to changes in interest rates. Investors generally do not experience significant price losses when rates rise, nor do they benefit meaningfully from falling rates through price appreciation.</p>
<p>Credit conditions, however, do matter. The fixed spread over the reference rate compensates investors for credit risk, and changes in issuer creditworthiness or broader market sentiment can affect valuations as market credit spreads move.</p>
<h2>What Happens to Corporate FRNs When Credit Spreads Widen?</h2>
<p>When credit spreads widen, FRN prices may decline to compensate investors for the higher perceived level of risk. This spread exposure can lead to short-term volatility and drawdowns that are larger than those seen in non-credit-sensitive instruments such as Treasury FRNs or T-bills. However, the higher yield associated with credit exposure has historically allowed investment-grade FRNs to recover and outperform over longer horizons, particularly relative to traditional fixed-rate corporate bonds.</p>
<h2>Recent Examples of Spread Widening and FRN Performance</h2>
<p>Recent market experience illustrates this behavior. For example, during brief credit-spread widening episodes in 2023 and mid-2025 driven by economic slowdown concerns, IG FRNs experienced limited, short-lived price declines before quickly recovering as corporate fundamentals remained solid.</p>
<p>Although credit spreads can impact valuations, the low interest-rate duration of FRNs helped shield investors from the larger rate-driven drawdowns that can affect traditional fixed-rate bonds during periods such as 2022.</p>
<h3>IG FRNs Outperformed (10 Years)</h3>
<p><img loading="lazy" class="desktop-image w-100 img-responsive" alt="IG FRNs Outperformed (10 Years)" src="https://www.vaneck.com/contentassets/24b469cb98774f2abb7846e3aab0fbb7/6845_frns-when-spreads-widen_chart-1_2026-02_v1_desktop.svg" /></p>
<p><img loading="lazy" class="mobile-image w-100 img-responsive" alt="IG FRNs Outperformed (10 Years)" src="https://www.vaneck.com/contentassets/24b469cb98774f2abb7846e3aab0fbb7/6845_frns-when-spreads-widen_chart-1_2026-02_v1_mobile.svg" /></p>
<p class="chart-disclosure">Source: Morningstar Direct, as of 11/30/2025. IG FRNs represented by MVIS US Investment Grade Floating Rate Index, US Treasury FRN by ICE BofA US Floating Rate Treasury Index, IG Corporates OAS (RHS) by ICE BofA US Corporate Index Option-Adjusted Spread.</p>
<p class="chart-disclosure">(Right Hand Side) and IG Corporates by ICE BofA US Corporate Index. Past performance is no guarantee of future results. Index performance is not representative of fund performance. It is not possible to invest directly in an index.</p>

<h2>Corporate FRNs and Drawdowns Over Longer Horizons</h2>
<p>Over longer time horizons, the combination of low interest-rate duration and higher income has resulted in more stable return profiles for investment-grade FRNs relative to traditional investment-grade corporate bonds. Historically, this has translated into lower drawdowns and reduced volatility, even during periods of spread widening.</p>
<h3>IG FRNs Lower Drawdowns than IG Corporates (10 Years)</h3>
<p><img loading="lazy" class="desktop-image w-100 img-responsive" alt="IG FRNs Lower Drawdowns than IG Corporates (10 Years)" src="https://www.vaneck.com/contentassets/28f1d75b63924e98a28fb61319c88461/6845_frns-when-spreads-widen_chart-2_2026-02_v1_desktop.svg" /></p>
<p><img loading="lazy" class="mobile-image w-100 img-responsive" alt="IG FRNs Lower Drawdowns than IG Corporates (10 Years)" src="https://www.vaneck.com/contentassets/28f1d75b63924e98a28fb61319c88461/6845_frns-when-spreads-widen_chart-2_2026-02_v1_mobile.svg" /></p>
<h3>Comparing Volatility and Drawdowns Across Fixed Income Segments</h3>
<div class="wrapped-div mt-3">
<table style="width: 100%;">
<tbody>
<tr class="tbl-data">
<td class="data-head last text-left">&nbsp;</td>
<td class="data-head last text-right">1 Year</td>
<td class="data-head last text-right">3 Years</td>
<td class="data-head last text-right">5 Years</td>
<td class="data-head last text-right">10 Years</td>
<td class="data-head last text-right">Std Dev 10Y</td>
<td class="data-head last text-right">Max Drawdown 10Y</td>
</tr>
<tr class="tbl-data">
<td class="data-td data last text-left">US IG FRNs</td>
<td class="data-td data last text-right">5.48</td>
<td class="data-td data last text-right">6.78</td>
<td class="data-td data last text-right">4.16</td>
<td class="data-td data last text-right">3.46</td>
<td class="data-td data last text-right">2.52</td>
<td class="data-td data last text-right">-5.84</td>
</tr>
<tr class="tbl-data">
<td class="data-td data last text-left">Treasury FRNs</td>
<td class="data-td data last text-right">4.43</td>
<td class="data-td data last text-right">5.16</td>
<td class="data-td data last text-right">3.45</td>
<td class="data-td data last text-right">2.42</td>
<td class="data-td data last text-right">0.58</td>
<td class="data-td data last text-right">-0.05</td>
</tr>
<tr class="tbl-data">
<td class="data-td data last text-left">IG Corporates</td>
<td class="data-td data last text-right">6.20</td>
<td class="data-td data last text-right">6.32</td>
<td class="data-td data last text-right">0.27</td>
<td class="data-td data last text-right">3.30</td>
<td class="data-td data last text-right">6.73</td>
<td class="data-td data last text-right">-20.11</td>
</tr>
</tbody>
</table>
</div>
<p class="chart-disclosure">Source: Morningstar Direct, as of 11/30/2025. IG FRNs represented by MVIS US Investment Grade Floating Rate Index, US Treasury FRN by ICE BofA US Floating Rate Treasury Index and IG Corporates by ICE BofA US Corporate Index. Past performance is no guarantee of future results. Index performance is not representative of fund performance. It is not possible to invest directly in an index.</p>
<h2>How to invest in FRNs</h2>
<p>Investors seeking exposure to investment grade corporate floating rate notes can access the asset class through the <a href="/link/0eff4e75a2114e0f8a7e71694dc0ad16.aspx" title="VanEck IG Floating Rate ETF | Overview" target="_top"><strong>VanEck IG Floating Rate ETF (FLTR)</strong></a>. FLTR&rsquo;s underlying index has a bias towards longer-maturity notes, which tend to have greater yield without an increase in interest rate risk.</p>

<p>To receive more <a href="/us/en/blogs/income-investing/" title="Income Investing Insights"><strong>Income Investing</strong></a> insights, <a href="/link/5f45412c2143400497908cea2897f7d3.aspx" title=" Subscription Center"><strong>sign up in our subscription center</strong></a>.</p>
]]></content:encoded>
</item><item rdf:about="https://www.vaneck.com/us/en/blogs/thematic-investing/rethinking-sector-exposure-why-traditional-etfs-struggle-to-capture-todays-market-leaders/">
  <title>Rethinking Sector Exposure: Why Traditional ETFs Struggle to Capture Today’s Market Leaders></title>
  <link>https://www.vaneck.com/us/en/blogs/thematic-investing/rethinking-sector-exposure-why-traditional-etfs-struggle-to-capture-todays-market-leaders/</link>
  <description><![CDATA[Mega-cap stocks now dominate sectors, but regulatory limits can distort exposure. VanEck&rsquo;s TruSector ETFs offer a new way to align portfolios with today&rsquo;s true market leadership.]]></description>
  <dc:creator>Michael Cohick</dc:creator>
  <dc:date>02/20/2026 06:30:00</dc:date>
<content:encoded><![CDATA[

<p><strong>Key Takeaways:</strong></p>
<ul class="content-list">
<li class="mt-2">Mega-cap companies now drive much of sector performance, often across multiple industries.</li>
<li class="mt-2">Regulatory diversification rules can limit how closely some ETFs track sector leaders.</li>
<li class="mt-2">VanEck&rsquo;s TruSector ETFs offer a new approach for achieving more precise, market-cap-aligned exposure.</li>
</ul>
<h2>Rethinking Sector Exposure: Why Traditional ETFs Struggle to Capture Today&rsquo;s Market Leaders</h2>
<p>The U.S. equity landscape has evolved dramatically over the past decade. Market leadership has become increasingly concentrated in a small group of mega-cap companies whose influence extends across multiple sectors. Yet, many investors may not realize that the sector ETFs they use to gain targeted exposure often fail to fully capture these dominant names.</p>
<p>This isn&rsquo;t a flaw in index design; it&rsquo;s a consequence of regulatory constraints baked into the very structure of U.S. exchange-traded funds. Understanding these limitations, and how to overcome them, has become essential for asset allocators seeking precision in their portfolio construction.</p>
<h2 id="limits-of-sector-etfs" class="jump-link-nav anchored-block" data-jumplink-title="Limits of Sector ETFs">The Hidden Limits of Sector ETFs</h2>
<p>Most investors assume that when they buy a sector ETF &mdash; say, a technology or consumer discretionary fund &mdash; they&rsquo;re getting exposure that closely mirrors the S&amp;P 500 sector indexes. But in reality that may not be the case.</p>
<p>Because most ETFs are structured as Registered Investment Companies (RICs) under the Investment Company Act of 1940, they must adhere to diversification rules that cap position sizes. These rules are designed to protect investors from concentration risk, but they also introduce a structural limitation:</p>
<ul class="content-list">
<li class="mt-2">No single company can exceed 25% of a fund&rsquo;s assets.</li>
<li class="mt-2">The sum of all positions over 5% each cannot exceed 50% of the fund.</li>
</ul>
<p>In practice, this means that when a few companies dominate a sector, think Apple and Microsoft in Technology, or Amazon and Tesla in Consumer Discretionary, traditional sector ETFs are forced to underweight these mega-caps and overweight smaller companies to stay compliant.</p>
<p>The result is a mismatch between what investors think they own and what they may actually hold.</p>
<h2>A Growing Mismatch in Market Exposure</h2>
<p>This diversification issue isn&rsquo;t confined to one or two industries, it&rsquo;s pervasive. According to VanEck&rsquo;s research, seven of the eleven GICS sectors in the U.S. large-cap universe currently exhibit significant concentration at the top.</p>
<p>Technology and Consumer Discretionary sectors, for example, are dominated by just a handful of household names. As these companies continue to drive market performance, the gap between market-cap-weighted benchmarks and RIC-constrained ETFs only widens.</p>
<p>For investors aiming to express precise sector views or match benchmark performance, these gaps can meaningfully distort outcomes &mdash; especially in portfolios that rely on sector rotation, tactical tilts, or benchmark replication.</p>
<h2>How Allocators Have Tried to Compensate</h2>
<p>Many advisors and portfolio managers are acutely aware of this issue. In conversations with allocators, VanEck has heard a variety of workarounds designed to &ldquo;patch&rdquo; the problem, each with trade-offs.</p>
<p>Some investors have tried doubling up on multiple ETFs with overlapping exposures to push their aggregate weighting in mega-cap names closer to full market capitalization levels. Others have layered in equal-weight or alternative index products that include the same large-cap leaders in different proportions.</p>
<p>While creative, these solutions introduce complexity and inefficiency. They can result in unintended concentration or dilution, overweighting both the very largest and very smallest companies &mdash; ultimately blurring the intended sector exposure even further.</p>
<h2 id="vaneck-trusector-etfs" class="jump-link-nav anchored-block" data-jumplink-title="VanEck TruSector ETFs">Introducing VanEck TruSector ETFs</h2>
<p>Recognizing this challenge, VanEck developed the TruSector ETF suite &mdash; a lineup of sector ETFs designed to provide investors with true market-cap exposure while remaining fully RIC-compliant.</p>
<p>At its core, the TruSector approach is built around a hybrid structure that blends direct stock holdings with positions in underlying ETFs. This innovation enables the funds to replicate the economic exposure of an uncapped benchmark without breaching diversification limits.</p>
<p>Here&rsquo;s how it works:</p>
<ol class="content-list">
<li class="mt-2"><strong>Direct Equity Exposure: </strong>Each TruSector ETF directly holds stocks from its target sector &mdash; up to the maximum allowed by RIC rules (no more than 25% in any one company, and no more than 50% total across names above 5%).</li>
<li class="mt-2"><strong>Supplemental ETF Exposure: </strong>Once those caps are reached, the fund allocates the remaining exposure through other sector ETFs that already hold those same mega-cap names.</li>
</ol>
<p>Because the diversification rules apply at the fund level, the additional exposure obtained indirectly through other ETFs doesn&rsquo;t count toward the 25%/50% issuer limits. Avoiding the look-through treatment down to the stocks in the ETF holding, allows the fund to achieve truer exposure while staying fully RIC compliant.</p>
<p>The result is a structure that mirrors an uncapped, market-cap-weighted benchmark &mdash; capturing today&rsquo;s true sector leaders in proportion to their real market influence.</p>
<h2>Current Focus and Sector Coverage</h2>
<p>While VanEck has filed for all eleven GICS sectors, the firm&rsquo;s initial focus has been on those representing the largest share of the U.S. large-cap universe and the areas where concentration is most acute and investor demand is highest.</p>

<p>Both are listed on Nasdaq and represent sectors where traditional ETFs have the largest deviations from benchmark weights.</p>
<p>Additional TruSector ETFs targeting Financials, Communications Services, Healthcare, Industrials, and Consumer Staples are expected to follow. Together, these sectors account for the majority of U.S. large-cap market capitalization and are where precision exposure matters most to allocators.</p>
<h2>Who Benefits from TruSector ETFs</h2>
<p>The TruSector design aims to serve institutional and professional investors who demand benchmark accuracy without operational complexity. Key use cases include:</p>
<ul class="content-list">
<li class="mt-2">Asset managers looking to fine-tune weights in sector-focused portfolios with closer alignment to their target performance benchmarks.</li>
<li class="mt-2">ETF model portfolio providers who need precise tracking to optimize rebalancing and avoiding excess overlap caused by holding similar ETFs to get to desired stock weights.</li>
<li class="mt-2">Portfolio managers seeking to express active sector views without distorting exposure.</li>
<li class="mt-2">Advisors and individual investors who want a cleaner, more intuitive way to access true market-cap-weighted sector performance when expressing a bullish view on a certain sector.</li>
</ul>
<p>By restoring alignment between investor expectations and actual exposure, TruSector ETFs can serve as better building blocks for today&rsquo;s sector-focused portfolios.</p>
<h2>Why Precision Matters More Than Ever</h2>
<p>In today&rsquo;s market, a small handful of companies account for an outsized share of index returns. For example, the top 10 stocks in the S&amp;P 500 represent nearly one-third of its total market capitalization, a level of concentration not seen in decades.</p>
<p>For sector-based investing, this dynamic is even more pronounced. When a few firms drive most of the gains, missing or underweighting those names can significantly skew performance.</p>
<p>Traditional sector ETFs, seeking to track indexes designed around RIC limits, effectively force investors to take on unintended active share risk, deviating from the original uncapped benchmarks previously had been very similar to. Over time, that risk compounds, leading to tracking error, unexpected returns, and misaligned exposures.</p>
<p>By solving this structural mismatch, TruSector ETFs give investors the ability to capture the market as it truly is &mdash; not as regulation distorts it.</p>
<h2 id="true-market-cap-exposure" class="jump-link-nav anchored-block" data-jumplink-title="True Market-Cap Exposure">A Simpler Path to True Market-Cap Exposure</h2>
<p>VanEck&rsquo;s TruSector ETFs reflect a broader shift in ETF innovation &mdash; from broad-based access products to precision tools designed to solve specific portfolio challenges.</p>
<p>Rather than reinventing the wheel, the TruSector structure works within existing regulatory frameworks to deliver a cleaner outcome. It doesn&rsquo;t rely on leverage, derivatives, or exotic exposures. Instead, it leverages the ETF ecosystem itself to efficiently achieve full market capitalization weights while staying compliant.</p>
<p>For investors and advisors striving for transparency, alignment, and simplicity, this represents a meaningful step forward.</p>
<p>Sector ETFs have long been foundational tools for asset allocators &mdash; but as markets evolve, so must the tools themselves. The concentration of market leadership among a few mega-cap names has exposed a hidden flaw in traditional sector ETFs: they can&rsquo;t always give investors what they think they&rsquo;re buying.</p>
<p>VanEck&rsquo;s TruSector ETFs address this challenge head-on, offering a practical and compliant way to capture the true shape of today&rsquo;s market.</p>
<p>In an environment where precision is performance, the ability to align exposures with reality &mdash; not regulation &mdash; may prove to be one of the most important advantages investors can have.</p>

<p>To receive more <a href="https://www.vaneck.com/us/en/insights/thematic-investing/" title="Thematic Investing Insights"><strong>Thematic Investing</strong></a> insights, <a href="https://www.vaneck.com/us/en/subscribe/" title="Subscription Center"><strong>sign up in our subscription center</strong></a>.</p>
]]></content:encoded>
</item><item rdf:about="https://www.vaneck.com/us/en/blogs/digital-assets/matthew-sigel-vaneck-mid-february-2026-bitcoin-chaincheck/">
  <title>VanEck Mid-February 2026 Bitcoin ChainCheck></title>
  <link>https://www.vaneck.com/us/en/blogs/digital-assets/matthew-sigel-vaneck-mid-february-2026-bitcoin-chaincheck/</link>
  <description><![CDATA[Bitcoin has seen a sharp sentiment and leverage reset, but resilient onchain activity, slowing mid-cycle distribution, and tightening miner supply suggest fundamentals are stronger than price implies.]]></description>
  <dc:creator>Patrick Bush</dc:creator>
  <dc:date>02/20/2026 06:30:00</dc:date>
<content:encoded><![CDATA[

<p><strong><u>Please note that VanEck has exposure to bitcoin.</u></strong></p>
<p><strong>Key takeaways</strong></p>
<ul class="content-list">
<li class="mt-2"><strong>Sentiment deteriorates as BTC declines:</strong> Bitcoin fell <strong>29%</strong> over the last 30 days, pushing NUPL toward the anxiety zone and briefly into fear, while leverage reset and open interest returned to levels last seen in September 2024.</li>
<li class="mt-2"><strong>Mid-cycle holders drive distribution but selling slows:</strong> Realized selling remains concentrated in the 1-to-5-year cohorts, though distribution from &gt;1 year coins has slowed meaningfully over the past month.</li>
<li class="mt-2"><strong>Miner margins tighten as hash rate contracts:</strong> Hash rate has declined roughly 14% over the past 90 days amid tighter mining economics, a setup that has historically preceded stronger forward BTC returns.</li>
</ul>
<h2 id="point-one" class="anchored-block jump-link-nav" data-jumplink-title="Price Weakness">Sentiment Reset and Price Weakness</h2>
<p>Price action has been nothing short of dismal over the past 30 days, with BTC down <strong>(-27% m/m)</strong>, trading at lower prices <strong>(~$67k)</strong> than the deepest tariff tantrum troughs <strong>(~$76k).</strong> 30-day Average NUPL (net unrealized profit/loss) presently reads 0.33, which is off <strong>(-43%)</strong> y/y, placing it in the &ldquo;optimism/anxiety&rdquo; zone. On a daily basis, NUPL breached the &ldquo;fear&rdquo; zone, dropping to 0.12 during the dramatic price decline on February 2, 2026. Currently, the 30-day MA (moving average) of Bitcoin addresses that are in profit is <strong>(76%)</strong> compared to <strong>(96%)</strong> a year ago. During bear markets, the percentage of addresses in profit has reached as low as <strong>(40%),</strong> while the most recent bear market bottom was <strong>(52%)</strong> in December 2022.</p>
<h3>Bitcoin Net Unrealized Profit and Loss 30 Day Moving Average</h3>
<p><img loading="lazy" class="desktop-image img-responsive" src="https://www.vaneck.com/EPiServer/CMS/Content/contentassets/bb257d93016a475eb57b8da0319806f2/6849_bitcoin-chaincheck-mid-feb_chart-1_2026-02_v1_desktop.svg,,361900/Download?epieditmode=False" alt="Bitcoin Net Unrealized Profit and Loss 30 Day Moving Average" /></p>
<p><img loading="lazy" class="mobile-image img-responsive" src="https://www.vaneck.com/EPiServer/CMS/Content/contentassets/bb257d93016a475eb57b8da0319806f2/6849_bitcoin-chaincheck-mid-feb_chart-1_2026-02_v1_mobile.svg,,361901/Download?epieditmode=False" alt="Bitcoin Net Unrealized Profit and Loss 30 Day Moving Average" /></p>
<br />
<p class="chart-disclosure">Source: Glassnode as of 2/14/2026. <strong>Past performance is not a guarantee of future results. Not intended as a recommendation to buy or sell any securities named herein.</strong></p>
<p>The negative price action has led to speculation fading. Futures annualized basis is now <strong>(4.2%),</strong> placing it in the 22nd percentile in Bitcoin&rsquo;s history. Futures open interest, measured in BTC, stands at <strong>362k</strong>, slightly below the 3-year average of <strong>366k</strong>. When assessed in dollar terms, open interest in Bitcoin is at its lowest levels since September 2024.</p>
<h2 id="point-two" class="anchored-block jump-link-nav" data-jumplink-title="Network Activity">Network Activity Remains Elevated</h2>
<p>Onchain activity looks healthier than price action suggests. Over the last 30 days, daily transactions are only modestly lower (-1% m/m) but remain elevated in historical context, sitting in the 90<sup>th</sup>&nbsp;percentile relative to all-time history. Meanwhile, Avg Daily Transfer Volume (USD) rose (+2% m/m) and remains in the 87<sup>th</sup>&nbsp;percentile. These figures remain elevated due to increased Bitcoin trading volume. At the same time, Daily Inscriptions dropped <strong>(-32% m/m),</strong> and Avg Daily Fees (USD) declined <strong>(-7% m/m) </strong>and are down <strong>(-62%)</strong> y/y, pointing to lower demand for Bitcoin block space and lower network revenues. As a result of elevated network activity, the Active Supply over the last 180 days reached <strong>(31%),</strong> and while Supply Dormant &gt;3Yr reached <strong>(43%),</strong> which ranks in the 89<sup>th</sup>&nbsp;percentile all time.</p>
<h2 id="point-three" class="anchored-block jump-link-nav" data-jumplink-title="Who&rsquo;s Selling?">Where the Selling Is Coming From</h2>
<p>In our <strong><a href="/us/en/blogs/digital-assets/matthew-sigel-vaneck-mid-november-2025-bitcoin-chaincheck/#bitcoin-investors-are-afraid" title="VanEck Mid-November 2025 Bitcoin ChainCheck">prior analysis of Bitcoin long-term holders</a></strong>, we focused on the number of tokens that had remained dormant for longer periods. Token dormancy is a useful proxy for investor behavior because it indicates whether older Bitcoin is being stored or sold. If a coin has not moved in 3.5 years, for example, it falls into the 3yr-5yr dormancy band. Once it is transferred to a new address, it moves to the youngest age cohort, and we consider that it was sold to a new owner.</p>
<p>Dormancy balances, however, can shift for mechanical reasons as coins age from one band to the next. To isolate coins actually being spent, we use spent-volume age-band data. SVAB measures the age distribution of coins at the moment they are transferred, providing a clearer view of realized selling pressure by cohort.</p>
<h3>Cyclical Selling Concentrated in 1-Year to 5-Year Cohorts Based on Spent Volume Data</h3>
<div class="wrapped-div">
<table style="width: 100%;">
<tbody>
<tr class="tbl-data">
<td class="tbl-header last text-left">SVAB</td>
<td class="tbl-header last text-right">1yr-2yr</td>
<td class="tbl-header last text-right">2yr-3yr</td>
<td class="tbl-header last text-right">3yr-5yr</td>
<td class="tbl-header last text-right">5yr-7yr</td>
<td class="tbl-header last text-right">7yr-10yr</td>
<td class="tbl-header last text-right">&gt;10yr</td>
</tr>
<tr class="tbl-data">
<td class="data-td last text-left font-weight-normal">2012</td>
<td class="data-td last text-right font-weight-normal">438,875</td>
<td class="data-td last text-right font-weight-normal">59,164</td>
<td class="data-td last text-right font-weight-normal">1,151</td>
<td class="data-td last text-right font-weight-normal">0</td>
</tr>
<tr class="tbl-data">
<td class="data-td last text-left font-weight-normal">2013</td>
<td class="data-td last text-right font-weight-normal">1,514,798</td>
<td class="data-td last text-right font-weight-normal">631,846</td>
<td class="data-td last text-right font-weight-normal">85,416</td>
<td class="data-td last text-right font-weight-normal">0</td>
</tr>
<tr class="tbl-data">
<td class="data-td last text-left font-weight-normal">2014</td>
<td class="data-td last text-right font-weight-normal">795,550</td>
<td class="data-td last text-right font-weight-normal">544,017</td>
<td class="data-td last text-right font-weight-normal">94,906</td>
<td class="data-td last text-right font-weight-normal">1,480</td>
<td class="data-td last text-right font-weight-normal">0</td>
</tr>
<tr class="tbl-data">
<td class="data-td last text-left font-weight-normal">2015</td>
<td class="data-td last text-right font-weight-normal">1,052,489</td>
<td class="data-td last text-right font-weight-normal">290,445</td>
<td class="data-td last text-right font-weight-normal">141,679</td>
<td class="data-td last text-right font-weight-normal">2,323</td>
<td class="data-td last text-right font-weight-normal">0</td>
</tr>
<tr class="tbl-data">
<td class="data-td last text-left font-weight-normal">2016</td>
<td class="data-td last text-right font-weight-normal">1,263,772</td>
<td class="data-td last text-right font-weight-normal">710,073</td>
<td class="data-td last text-right font-weight-normal">354,412</td>
<td class="data-td last text-right font-weight-normal">64,998</td>
<td class="data-td last text-right font-weight-normal">0</td>
</tr>
<tr class="tbl-data">
<td class="data-td last text-left font-weight-normal">2017</td>
<td class="data-td last text-right font-weight-normal">2,196,118</td>
<td class="data-td last text-right font-weight-normal">1,145,497</td>
<td class="data-td last text-right font-weight-normal">2,235,652</td>
<td class="data-td last text-right font-weight-normal">523,463</td>
<td class="data-td last text-right font-weight-normal">72,946</td>
<td class="data-td last text-right font-weight-normal">0</td>
</tr>
<tr class="tbl-data">
<td class="data-td last text-left font-weight-normal">2018</td>
<td class="data-td last text-right font-weight-normal">1,359,986</td>
<td class="data-td last text-right font-weight-normal">321,913</td>
<td class="data-td last text-right font-weight-normal">1,124,111</td>
<td class="data-td last text-right font-weight-normal">253,927</td>
<td class="data-td last text-right font-weight-normal">26,720</td>
<td class="data-td last text-right font-weight-normal">0</td>
</tr>
<tr class="tbl-data">
<td class="data-td last text-left font-weight-normal">2019</td>
<td class="data-td last text-right font-weight-normal">3,710,141</td>
<td class="data-td last text-right font-weight-normal">867,428</td>
<td class="data-td last text-right font-weight-normal">717,879</td>
<td class="data-td last text-right font-weight-normal">348,344</td>
<td class="data-td last text-right font-weight-normal">43,438</td>
<td class="data-td last text-right font-weight-normal">0</td>
</tr>
<tr class="tbl-data">
<td class="data-td last text-left font-weight-normal">2020</td>
<td class="data-td last text-right font-weight-normal">4,350,477</td>
<td class="data-td last text-right font-weight-normal">2,496,133</td>
<td class="data-td last text-right font-weight-normal">705,187</td>
<td class="data-td last text-right font-weight-normal">236,285</td>
<td class="data-td last text-right font-weight-normal">120,677</td>
<td class="data-td last text-right font-weight-normal">19,116</td>
</tr>
<tr class="tbl-data">
<td class="data-td last text-left font-weight-normal">2021</td>
<td class="data-td last text-right font-weight-normal">4,129,873</td>
<td class="data-td last text-right font-weight-normal">3,044,837</td>
<td class="data-td last text-right font-weight-normal">3,419,775</td>
<td class="data-td last text-right font-weight-normal">249,410</td>
<td class="data-td last text-right font-weight-normal">388,891</td>
<td class="data-td last text-right font-weight-normal">57,941</td>
</tr>
<tr class="tbl-data">
<td class="data-td last text-left font-weight-normal">2022</td>
<td class="data-td last text-right font-weight-normal">4,144,841</td>
<td class="data-td last text-right font-weight-normal">1,156,913</td>
<td class="data-td last text-right font-weight-normal">1,521,787</td>
<td class="data-td last text-right font-weight-normal">572,237</td>
<td class="data-td last text-right font-weight-normal">211,415</td>
<td class="data-td last text-right font-weight-normal">51,849</td>
</tr>
<tr class="tbl-data">
<td class="data-td last text-left font-weight-normal">2023</td>
<td class="data-td last text-right font-weight-normal">2,626,936</td>
<td class="data-td last text-right font-weight-normal">1,071,507</td>
<td class="data-td last text-right font-weight-normal">702,083</td>
<td class="data-td last text-right font-weight-normal">487,834</td>
<td class="data-td last text-right font-weight-normal">82,454</td>
<td class="data-td last text-right font-weight-normal">58,171</td>
</tr>
<tr class="tbl-data">
<td class="data-td last text-left font-weight-normal">2024</td>
<td class="data-td last text-right font-weight-normal">3,555,412</td>
<td class="data-td last text-right font-weight-normal">1,663,498</td>
<td class="data-td last text-right font-weight-normal">2,872,341</td>
<td class="data-td last text-right font-weight-normal">1,478,015</td>
<td class="data-td last text-right font-weight-normal">470,341</td>
<td class="data-td last text-right font-weight-normal">136,499</td>
</tr>
<tr class="tbl-data">
<td class="data-td last text-left font-weight-normal">2025</td>
<td class="data-td last text-right font-weight-normal">3,587,671</td>
<td class="data-td last text-right font-weight-normal">1,422,846</td>
<td class="data-td last text-right font-weight-normal">3,306,952</td>
<td class="data-td last text-right font-weight-normal">704,274</td>
<td class="data-td last text-right font-weight-normal">512,483</td>
<td class="data-td last text-right font-weight-normal">298,764</td>
</tr>
<tr class="tbl-data">
<td class="data-td last text-left font-weight-normal">2026</td>
<td class="data-td last text-right font-weight-normal">414,110</td>
<td class="data-td last text-right font-weight-normal">123,462</td>
<td class="data-td last text-right font-weight-normal">144,641</td>
<td class="data-td last text-right font-weight-normal">46,879</td>
<td class="data-td last text-right font-weight-normal">65,855</td>
<td class="data-td last text-right font-weight-normal">20,473</td>
</tr>
</tbody>
</table>
</div>
<br />
<p class="chart-disclosure">Spent Volume by Age Band. Source: Glassnode as of 2/14/2026. <strong>Past performance is not a guarantee of future results. Not intended as a recommendation to buy or sell any securities named herein.</strong></p>
<p>The table above confirms our previous assertion that most of the cyclical selling is occurring in the 1yr-5yr cohorts, while the &gt;5yr cohorts are parting with relatively smaller amounts of their coins. Across most age clusters, we can also see cyclical selling patterns that tend to conform to the &ldquo;4-year cycle.&rdquo; Among age groups, the most dramatic swings in transfer volume have occurred in the 3yr-5yr segment. Historically, this cohort has tended to distribute more in the year after the halvening while reducing transfer activity in other years.</p>
<p>In the current cycle, we believe some investors pulled forward sales due to the January 2024 ETP launch and the November 2024 election of Donald Trump. Both events coincided with sharp price appreciation and may have increased the incentive to realize gains sooner than in prior cycles.</p>
<h2>Distribution Is Slowing</h2>
<p>However, over the past month, selling from older cohorts, &gt;1yr, has fallen significantly to an expected total of <strong>517k</strong> BTC in February, which would place it in the 33<sup>rd</sup>&nbsp;percentile of all time. In the 1yr-2yr band, token sales have dropped the most dramatically, falling to a pace of <strong>190k</strong>, which places it in the 9<sup>th</sup>&nbsp;percentile since January 2020. The key point is not that distribution has ended, but that the most active selling cohorts appear to be stepping back as Bitcoin trades at a lower price. As demonstrated by the 1y-2y cohort, who would have accumulated at an average price of <strong>~$72.7k</strong> over their buying period, the lack of selling is likely because many are underwater on their token buys. However, this has not prevented investors from realizing painful losses as sellers have absorbed <strong>-$22.5B</strong> over the past 30 days, which ranks in the 91<sup>st</sup>&nbsp;percentile since 2020.</p>
<h3>Spent Volume by Age Band Shows Broad Increase in Selling in November 2025</h3>
<p><img loading="lazy" class="desktop-image img-responsive" src="https://www.vaneck.com/EPiServer/CMS/Content/contentassets/bb257d93016a475eb57b8da0319806f2/6849_bitcoin-chaincheck-mid-feb_chart-2_2026-02_v1_desktop.svg,,361915/Download?epieditmode=False" alt="Spent Volume by Age Band Shows Broad Increase in Selling in November 2025" /></p>
<p><img loading="lazy" class="mobile-image img-responsive" src="https://www.vaneck.com/EPiServer/CMS/Content/contentassets/bb257d93016a475eb57b8da0319806f2/6849_bitcoin-chaincheck-mid-feb_chart-2_2026-02_v1_mobile.svg,,361916/Download?epieditmode=False" alt="Spent Volume by Age Band Shows Broad Increase in Selling in November 2025" /></p>
<br />
<p class="chart-disclosure">Spent Volume by Age Band. Source: Glassnode as of 2/16/2026.<strong> Past performance is not a guarantee of future results. Not intended as a recommendation to buy or sell any securities named herein.</strong></p>
<h2 id="point-four" class="anchored-block jump-link-nav" data-jumplink-title="Bitcoin Miners">Bitcoin Miners&rsquo; Economics Tighten</h2>
<h2>Hash Rate Declines</h2>
<p>Bitcoin miners operate in a challenging environment due to the combination of volatile revenues and costs, a structurally declining block subsidy, and a highly competitive production landscape. Revenue is volatile because it is tied to the Bitcoin price and to a miner&rsquo;s relative share of the network's hashing power. On the cost side, the main operating input is electricity, and power prices often swing independently of Bitcoin&rsquo;s price. Halvening cycles reduce the block subsidy over time, so miners are competing for a structurally smaller reward pool unless Bitcoin price or network transaction fees rise enough to offset the decline in block subsidies.</p>
<p>To stay competitive, miners must continuously reinvest in more efficient ASICs and infrastructure. Because network hashing power tends to increase over time, miners also need to expand their hashing power to maintain their share of block rewards. If they do not upgrade, they risk losing share as their machines become uncompetitive. If they do upgrade, they take on significant CAPEX with uncertain payback periods given the volatility of Bitcoin&rsquo;s price, network difficulty, and power costs.</p>
<h3>Antminer S19 XP Is Uneconomical to Operate Above $0.07 kWh</h3>
<p><img loading="lazy" class="desktop-image img-responsive" src="https://www.vaneck.com/EPiServer/CMS/Content/contentassets/bb257d93016a475eb57b8da0319806f2/6849_bitcoin-chaincheck-mid-feb_chart-3_2026-02_v1_desktop.svg,,361918/Download?epieditmode=False" alt="Antminer S19 XP Is Uneconomical to Operate Above $0.07 kWh" /></p>
<p><img loading="lazy" class="mobile-image img-responsive" src="https://www.vaneck.com/EPiServer/CMS/Content/contentassets/bb257d93016a475eb57b8da0319806f2/6849_bitcoin-chaincheck-mid-feb_chart-3_2026-02_v1_mobile.svg,,361919/Download?epieditmode=False" alt="Antminer S19 XP Is Uneconomical to Operate Above $0.07 kWh" /></p>
<br />
<p class="chart-disclosure">Source: Glassnode, VanEck Research as of 2/16/2026. <strong>Past performance is not a guarantee of future results. Not intended as a recommendation to buy or sell any securities named herein.</strong></p>
<p>When Bitcoin&rsquo;s price falls, miner revenue typically declines almost immediately. Both realized BTC pricing and the hash price (revenue per unit of hashing power) compress, while major variable costs, such as electricity, generally remain unchanged. In downturns, some miners reach a point where the marginal cost of running certain ASICs exceeds the marginal revenue. When that happens, they power down machines that are no longer economical to run.</p>
<h2>Hash Rate Contraction and Forward Returns</h2>
<p>At current BTC prices, for example, the Antminer S19 XP becomes unprofitable for miners paying more than about $0.07/kWh. Once fixed overhead is included, some operators can be deeply unprofitable on an all-in basis. Riot illustrates this dynamic. For its 3Q2025 earnings report, it cites an estimated cost to mine one bitcoin of roughly $46,000 excluding depreciation, versus about $89,000 including depreciation.</p>
<p>Consistent with these pressures, the Bitcoin network hash rate has declined by roughly <strong>(-14%)</strong> over the past 90 days. Sustained 90-day hash rate drawdowns are relatively uncommon. We have identified 12 notable periods in which the hash rate fell for over 90 days. The most severe decline of the industrial-scale mining era (post-2013) occurred in summer 2021, when China&rsquo;s mining ban contributed to an approximate <strong>(-40%)</strong> drop-in network hash rate.</p>
<p>Finally, as noted in our prior research, these periods of hash rate contraction have historically preceded strong forward BTC returns over the subsequent 90 days. An interesting feature of the latest decline in hash rate is that it may relate to record cold weather across North America. Therefore, we are unsure as to the extent voluntary curtailment, rather than economic rationale, is causing the has rate drops. We will continue to monitor the situation to assess network health.</p>
<h3>Bitcoin Network Hash Rate Declines</h3>
<div class="wrapped-div">
<table style="width: 100%;">
<tbody>
<tr class="tbl-data">
<td class="tbl-header last text-left">#</td>
<td class="tbl-header last text-left">Start Date</td>
<td class="tbl-header last text-left">End Date</td>
<td class="tbl-header last text-right">Duration (Days)</td>
<td class="tbl-header last text-right">Highest Drop in <br />Hash Rate (%)</td>
<td class="tbl-header last text-right">Avg BTC 90-Day <br />Forward Return (%)</td>
</tr>
<tr class="tbl-data">
<td class="data-td last text-left font-weight-normal">1</td>
<td class="data-td last text-left font-weight-normal">2009-05-09</td>
<td class="data-td last text-left font-weight-normal">2009-10-21</td>
<td class="data-td last text-right font-weight-normal">166</td>
<td class="data-td last text-right font-weight-normal">-62.11</td>
<td class="data-td last text-right font-weight-normal">No Price</td>
</tr>
<tr class="tbl-data">
<td class="data-td last text-left font-weight-normal">2</td>
<td class="data-td last text-left font-weight-normal">2011-10-14</td>
<td class="data-td last text-left font-weight-normal">2012-01-27</td>
<td class="data-td last text-right font-weight-normal">106</td>
<td class="data-td last text-right font-weight-normal">-37.50</td>
<td class="data-td last text-right font-weight-normal">52.73</td>
</tr>
<tr class="tbl-data">
<td class="data-td last text-left font-weight-normal">3</td>
<td class="data-td last text-left font-weight-normal">2013-01-21</td>
<td class="data-td last text-left font-weight-normal">2013-02-16</td>
<td class="data-td last text-right font-weight-normal">27</td>
<td class="data-td last text-right font-weight-normal">-6.04</td>
<td class="data-td last text-right font-weight-normal">492.78</td>
</tr>
<tr class="tbl-data">
<td class="data-td last text-left font-weight-normal">4</td>
<td class="data-td last text-left font-weight-normal">2018-11-24</td>
<td class="data-td last text-left font-weight-normal">2019-02-28</td>
<td class="data-td last text-right font-weight-normal">97</td>
<td class="data-td last text-right font-weight-normal">-26.43</td>
<td class="data-td last text-right font-weight-normal">42.89</td>
</tr>
<tr class="tbl-data">
<td class="data-td last text-left font-weight-normal">5</td>
<td class="data-td last text-left font-weight-normal">2020-05-21</td>
<td class="data-td last text-left font-weight-normal">2020-06-22</td>
<td class="data-td last text-right font-weight-normal">33</td>
<td class="data-td last text-right font-weight-normal">-10.94</td>
<td class="data-td last text-right font-weight-normal">16.90</td>
</tr>
<tr class="tbl-data">
<td class="data-td last text-left font-weight-normal">6</td>
<td class="data-td last text-left font-weight-normal">2020-11-15</td>
<td class="data-td last text-left font-weight-normal">2020-11-21</td>
<td class="data-td last text-right font-weight-normal">7</td>
<td class="data-td last text-right font-weight-normal">-0.87</td>
<td class="data-td last text-right font-weight-normal">186.16</td>
</tr>
<tr class="tbl-data">
<td class="data-td last text-left font-weight-normal">7</td>
<td class="data-td last text-left font-weight-normal">2020-12-24</td>
<td class="data-td last text-left font-weight-normal">2020-12-29</td>
<td class="data-td last text-right font-weight-normal">6</td>
<td class="data-td last text-right font-weight-normal">-1.19</td>
<td class="data-td last text-right font-weight-normal">111.76</td>
</tr>
<tr class="tbl-data">
<td class="data-td last text-left font-weight-normal">8</td>
<td class="data-td last text-left font-weight-normal">2020-12-31</td>
<td class="data-td last text-left font-weight-normal">2021-01-05</td>
<td class="data-td last text-right font-weight-normal">6</td>
<td class="data-td last text-right font-weight-normal">-1.15</td>
<td class="data-td last text-right font-weight-normal">87.01</td>
</tr>
<tr class="tbl-data">
<td class="data-td last text-left font-weight-normal">9</td>
<td class="data-td last text-left font-weight-normal">2021-06-09</td>
<td class="data-td last text-left font-weight-normal">2021-09-20</td>
<td class="data-td last text-right font-weight-normal">104</td>
<td class="data-td last text-right font-weight-normal">-40.36</td>
<td class="data-td last text-right font-weight-normal">36.37</td>
</tr>
<tr class="tbl-data">
<td class="data-td last text-left font-weight-normal">10</td>
<td class="data-td last text-left font-weight-normal">2022-07-21</td>
<td class="data-td last text-left font-weight-normal">2022-09-08</td>
<td class="data-td last text-right font-weight-normal">50</td>
<td class="data-td last text-right font-weight-normal">-9.06</td>
<td class="data-td last text-right font-weight-normal">-17.58</td>
</tr>
<tr class="tbl-data">
<td class="data-td last text-left font-weight-normal">11</td>
<td class="data-td last text-left font-weight-normal">2024-06-23</td>
<td class="data-td last text-left font-weight-normal">2024-08-03</td>
<td class="data-td last text-right font-weight-normal">42</td>
<td class="data-td last text-right font-weight-normal">-6.59</td>
<td class="data-td last text-right font-weight-normal">4.69</td>
</tr>
<tr class="tbl-data">
<td class="data-td last text-left font-weight-normal">12</td>
<td class="data-td last text-left font-weight-normal">2026-01-11</td>
<td class="data-td last text-left font-weight-normal">2026-02-16</td>
<td class="data-td last text-right font-weight-normal">37</td>
<td class="data-td last text-right font-weight-normal">-14.22</td>
<td class="data-td last text-right font-weight-normal">Unknown</td>
</tr>
</tbody>
</table>
</div>
<br />
<p class="chart-disclosure">Source: Glassnode as of 2/16/2026. <strong>Past performance is not a guarantee of future results. Not intended as a recommendation to buy or sell any securities named herein.</strong></p>
<h2>The AI Pivot in Bitcoin Mining</h2>
<p>One theme that has continued to disrupt the mining space is miners converting their facilities into AI data centers. Of the Bitcoin miners in our coverage universe, all have allocated some portion of their current or future production facilities to AI. One miner that remains committed to being a pure play is Bitdeer, which is pursuing a limited AI buildout alongside commitments to expand hashing power and mining efficiency through self-produced machines.</p>
<p>On weaker tape, the market is paying for near-term resilience and cash flow visibility, which helps explain why BTC miners credibly converting capacity into AI data center operations are being rewarded. The AI pivot is viewed as a path to higher, more stable future revenue per MW, so miners with believable AI buildouts often trade at higher valuation multiples on their power portfolios. By contrast, a miner that remains more exposed to pure mining economics can underperform AI-evolving peers during BTC drawdowns, even as it improves operationally, because its earnings remain tightly linked to the BTC price and network difficulty. BTDR fits that profile. Its stock has also faced a specific AI overhang tied to its inability to move forward with AI plans at its Clarington, OH facility, but the broader driver of relative weakness is its more concentrated exposure to BTC mining. As a result, BTDR&rsquo;s equity price is down <strong>(-40%)</strong> in the past month.</p>
<h2>Bitdeer Operational Progress</h2>
<p>Operationally, Bitdeer has made meaningful progress. The company substantially increased fleet efficiency from 30.4 J/TH in 4Q2024 to 17.9 J/TH in 4Q2025. Likewise, the company ended January 2026 with over 63 EH/s of self-mining hashing power, up from just 9.2 EH/s in January 2025. Bitdeer management has not disclosed the extent of its hash power expansion through 2026, but we estimate it has around 413 MW where it can deploy its new, proprietary SEALMINER A3 ASICs. If the company can deploy 50k SEALMINERS to this power in 2026, it could add 33 EH/s, bringing its total to 96 EH/s. If this were accomplished, Bitdeer would generate an additional <strong>$335M</strong> of BTC at current Bitcoin prices and hash rates.</p>
<p>The practical implication is that efficiency gains alone may not be enough to change investor perception in the short run. If BTC remains weak and difficulty stays high, the AI pivoters will continue to outperform. For Bitdeer, it will be important to monitor its progress in deploying new miners&rsquo; rigs, how quickly it can deploy new capacity, and whether it can fund expansion without diluting shareholders at unfavorable prices.</p>
<p><i><strong>Update:</strong> On February 19, prior to market open, Bitdeer announced a $300M convertible bond issuance. The stock declined approximately 15% pre-market following the announcement. We hold no position.</i></p>
<p><strong>Links to third party websites are provided as a convenience and the inclusion of such links does not imply any endorsement, approval, investigation, verification or monitoring by us of any content or information contained within or accessible from the linked sites. By clicking on the link to a non-VanEck webpage, you acknowledge that you are entering a third-party website subject to its own terms and conditions. VanEck disclaims responsibility for content, legality of access or suitability of the third-party websites.</strong></p>
<p>To receive more <strong><a href="https://www.vaneck.com/us/en/insights/digital-assets/" title="Digital Assets Insights">Digital Assets</a></strong> insights, <strong><a href="https://www.vaneck.com/us/en/subscribe/" title="Subscription Center">sign up in our subscription center</a></strong>.</p>
]]></content:encoded>
</item><item rdf:about="https://www.vaneck.com/us/en/blogs/emerging-markets-equity/indz-question-and-answer/">
  <title>INDZ ETF: Question &amp; Answer></title>
  <link>https://www.vaneck.com/us/en/blogs/emerging-markets-equity/indz-question-and-answer/</link>
  <description><![CDATA[The INDZ&nbsp;ETF is designed to provide selective exposure to Indian equities, focusing on higher-quality companies to reduce index drag and support long-term compounding.]]></description>
  <dc:creator>Angus Shillington</dc:creator>
  <dc:date>02/20/2026 06:30:00</dc:date>
<content:encoded><![CDATA[

<p>India is one of the highest-returning major equity markets outside the United States, yet it remains an immaterial weight in global equity benchmarks. The country's structural growth story&mdash;driven by reform momentum, favorable demographics, and rapid technology adoption&mdash;continues to expand the investment opportunity.</p>
<p>However, India is also a high-dispersion market where a relatively small subset of companies drives the majority of index returns, making broad, passive exposure a costly approach. This blog is intended to answer frequently asked questions about investing in Indian equities and, more specifically, the <a href="/link/dd53a10baf8a4537a6312fe8750490a5.aspx" title="VanEck India Select ETF | Overview" target="_top"><strong>VanEck India Select ETF (INDZ)</strong></a>&nbsp;<strong>.</strong></p>
<ul class="content list">
<li class="mt-2"><a href="#point-one"><strong>What is the VanEck India Select ETF (INDZ)</strong></a></li>
<li class="mt-2"><a href="#point-two"><strong>Why does India require a selective investment approach?</strong></a></li>
<li class="mt-2"><a href="#point-three"><strong>What makes India an attractive investment opportunity?</strong></a></li>
<li class="mt-2"><a href="#point-four"><strong>How does the INDZ investment process work?</strong></a></li>
<li class="mt-2"><a href="#point-five"><strong>How is the INDZ portfolio constructed?</strong></a></li>
<li class="mt-2"><a href="#point-six"><strong>What risk controls does INDZ employ?</strong></a></li>
<li class="mt-2"><a href="#point-seven"><strong>When might INDZ underperform its benchmark?</strong></a></li>
<li class="mt-2"><a href="#point-eight"><strong>What are the risks of investing in Indian equities?</strong></a></li>
<li class="mt-2"><a href="#point-nine"><strong>Who manages INDZ?</strong></a></li>
<li class="mt-2"><a href="#point-ten"><strong>How can INDZ fit into a portfolio?</strong></a></li>
<li class="mt-2"><a href="#point-eleven"><strong>How to Buy VanEck ETFs?</strong></a></li>
</ul>
<h2 id="point-one" class="anchored-block jump-link-nav" data-jumplink-title="About INDZ">What is the VanEck India Select ETF (INDZ)?</h2>
<p>The <a href="/link/dd53a10baf8a4537a6312fe8750490a5.aspx" title="VanEck India Select ETF | Overview" target="_top"><strong>VanEck India Select ETF (INDZ)</strong></a> is an actively managed exchange-traded fund that seeks long-term capital appreciation by providing selective exposure to Indian equities across market capitalizations. Rather than tracking a broad market-cap weighted index, <a href="/link/dd53a10baf8a4537a6312fe8750490a5.aspx" title="VanEck India Select ETF | Overview" target="_top"><strong>INDZ</strong></a>&nbsp;uses a disciplined, multi-step investment process designed to identify companies with strong long-term return profiles, high capital efficiency, and resilient business models. The fund is benchmarked against the MSCI India IMI Index, which covers large-, mid-, and small-cap segments of the Indian market.</p>
<p><a href="/link/dd53a10baf8a4537a6312fe8750490a5.aspx" title="VanEck India Select ETF | Overview" target="_top"><strong>INDZ</strong></a>&nbsp;trades on the NYSE Arca, has a net expense ratio of 0.75%, and anticipates annual dividend distributions. For more information on&nbsp;<a href="/link/dd53a10baf8a4537a6312fe8750490a5.aspx" title="VanEck India Select ETF | Overview" target="_top"><strong>INDZ</strong></a>, visit the product webpage&nbsp;<a href="/link/dd53a10baf8a4537a6312fe8750490a5.aspx" title="VanEck India Select ETF | Overview" target="_top"><strong>here</strong></a>.</p>
<h2 id="point-two" class="anchored-block">Why does India require a selective investment approach?</h2>
<p>India's equity returns are driven by a much smaller subset of stocks than the U.S. market. Over the last twenty years, approximately 1.7% of Indian stocks generated 50% of index returns, compared to roughly 2.7% in the U.S. Similarly, only about 7% of Indian stocks generated 90% of index returns, versus nearly 12% in the U.S. This means that capturing most of the market's gains in India requires far greater security selection rather than broad index exposure.</p>
<h3>Smaller Subset of Companies Drive Returns in India</h3>
<p><img loading="lazy" class="desktop-image img-responsive w-100" src="https://www.vaneck.com/contentassets/5fd8ba02cb234786918dcc0e9d0e7294/6825_indz-launch-blog_chart-1_2026-02_v1_desktop.svg" alt="Smaller Subset of Companies Drive Returns in India" /></p>
<p><img loading="lazy" class="mobile-image img-responsive w-100" src="https://www.vaneck.com/contentassets/5fd8ba02cb234786918dcc0e9d0e7294/6825_indz-launch-blog_chart-1_2026-02_v1_mobile.svg" alt="Smaller Subset of Companies Drive Returns in India" /></p>
<p class="chart-disclosure"><strong>Source:</strong> VanEck, FactSet. Data as of February 28, 2006 - January 31, 2026. India is represented by the MSCI India Index. U.S. is represented by the S&amp;P 500 Index. Past performance is no guarantee of future results. Index performance is not representative of fund performance. It is not possible to invest directly in an index.</p>

<p>Market-cap weighted indexes allocate capital indiscriminately across businesses with widely divergent quality, durability, and return potential. This structure embeds persistent performance drag by diluting exposure to the companies that matter most for long-term compounding. In a market where dispersion is this pronounced, owning everything equally is costly. Selectivity is essential to capturing durable returns.</p>
<h2 id="point-three" class="anchored-block">What makes India an attractive investment opportunity?</h2>
<p>India has delivered the highest equity returns among major economies outside the U.S. over the past two decades, with an annualized return profile that mirrors the growth characteristics of the U.S. market. India's GDP growth rate has significantly exceeded that of other major regions, and Indian companies have demonstrated a strong ability to translate that economic growth into shareholder value, generating meaningful excess stock returns above GDP growth over time.</p>
<p>Looking forward, India's investment case is supported by several independent structural drivers that form a self-reinforcing compounding system: policy and institutional reform, physical infrastructure build-out, digital infrastructure and technology adoption, favorable demographics, and rising consumer aspirations. When these forces align, they attract capital, talent, and innovation, which in turn improves profitability and returns on invested capital, funding the next cycle of growth.</p>
<h2 id="point-four" class="anchored-block jump-link-nav" data-jumplink-title="Investment Process">How does the INDZ investment process work?</h2>
<p>The <a href="/link/dd53a10baf8a4537a6312fe8750490a5.aspx" title="VanEck India Select ETF | Overview" target="_top"><strong>INDZ</strong></a>&nbsp;ETF is actively managed but follows a repeatable, rules-driven framework. Twice a year, the portfolio goes through a full rebalance designed to keep the strongest businesses and remove the weakest. The process starts with a broad universe of over 1,200 Indian public companies and narrows it down through a series of filters:</p>
<ol class="content-list">
<li class="mt-2"><strong>Quality and durability: </strong>First, the process identifies companies with long track records of growing capital over time. The team also adds select earlier-stage companies with high conviction based on active research. This step narrows the universe to roughly 275 names.</li>
<li class="mt-2"><strong>Earnings strength: </strong>Next, any company showing signs of weakening profitability or declining returns on capital is removed, bringing the list down to about 150.</li>
<li class="mt-2"><strong>Valuation: </strong>Companies that appear overvalued relative to their own historical pricing are cut, leaving around 70 to 100 names.</li>
<li class="mt-2"><strong>Portfolio construction: </strong>The remaining companies are ranked and assembled into a focused portfolio of 60 to 90 holdings, with position sizes and sector weights governed by defined risk controls.</li>
</ol>
<p>Between resets, ongoing research and risk oversight allow the portfolio to adapt to changing conditions, with off-cycle trades executed selectively when warranted.</p>
<h2 id="point-five" class="anchored-block">How is the INDZ portfolio constructed?</h2>
<p>The portfolio uses a core-satellite framework that balances stability with innovation. The <strong>core sleeve</strong> is anchored in large-cap companies with stable, compounding returns and serves as a volatility dampener for the portfolio. Surrounding this core are <strong>satellite positions</strong> in mid- and small-cap businesses that represent innovative, scalable lifecycle winners and early-stage disruptors, where return dispersion and mispricing tend to be most pronounced.</p>
<p>Position sizes are governed by a modified equal-weight approach, which helps prevent any single position from dominating risk or returns. Minimum liquidity thresholds and institutional risk controls limit concentration and tracking error. Together, this structure allows the portfolio to pursue long-term growth across India's most compelling companies without sacrificing diversification or risk discipline.</p>
<h2 id="point-six" class="anchored-block">What risk controls does INDZ employ?</h2>
<p>Risk management is built into every stage of the portfolio's lifecycle. Exposures are formally reviewed at each semiannual rebalance and monitored on a monthly basis to make sure the portfolio stays within its intended risk profile.</p>
<p>The framework sets clear boundaries around how much of the portfolio can go into any single stock, sector, or market cap segment, and it limits how far the portfolio can drift from the benchmark before action is taken. If the portfolio moves outside those boundaries between rebalances, the portfolio manager will trade to bring it back in line. Independent oversight is provided by the VanEck Multi-Asset Solutions group and the Investment Committee.</p>
<h2 id="point-seven" class="anchored-block">When might INDZ underperform its benchmark?</h2>
<p>Like any disciplined, long-term strategy, there will be periods where <a href="/link/dd53a10baf8a4537a6312fe8750490a5.aspx" title="VanEck India Select ETF | Overview" target="_top"><strong>INDZ</strong></a>&nbsp;lags its benchmark. This is expected, and it tends to happen in a few specific environments:</p>
<p><strong>When smaller companies sell off broadly.</strong> The portfolio holds more mid- and small-cap names than the index, which can mean more volatility during periods of market stress, even though these are the areas where the best opportunities tend to emerge.</p>
<p><strong>When value stocks lead the market.</strong> <a href="/link/dd53a10baf8a4537a6312fe8750490a5.aspx" title="VanEck India Select ETF | Overview" target="_top"><strong>INDZ</strong></a>&nbsp;naturally tilts toward companies with strong growth characteristics. When the market favors cheaper, slower-growing stocks, that tilt can weigh on short-term relative performance.</p>
<p><strong>When momentum takes over.</strong> The strategy avoids overpaying for stocks, which means it may sit out short-term rallies driven by hype or momentum rather than fundamentals.</p>
<p>These are deliberate trade-offs. The goal is long-term compounding, not chasing whatever is working in the moment.</p>
<h2 id="point-eight" class="anchored-block">What are the risks of investing in Indian equities?</h2>
<p>Investing in India involves several key risk considerations:</p>
<ul class="content-list">
<li class="mt-2"><strong>Political and regulatory risk </strong>stems from the fact that India's regulatory and policy environment materially influences economic outcomes; shifts in government policy or political stability may affect market conditions and investment returns.</li>
<li class="mt-2"><strong>Economic and currency risk </strong>includes emerging market macro risks such as currency volatility, capital flow restrictions, and potential government intervention affecting capital mobility.</li>
<li class="mt-2"><strong>Corporate governance risk </strong>reflects the fact that reporting and disclosure standards in India may differ from developed markets, potentially affecting information quality and timeliness.</li>
<li class="mt-2"><strong>Market and liquidity risk </strong>arise because Indian equity markets may experience higher volatility and lower liquidity, particularly in smaller-cap securities, and foreign investment limits may impact execution during periods of stress.</li>
</ul>
<h2 id="point-nine" class="anchored-block">Who manages INDZ?</h2>
<p><a href="/link/dd53a10baf8a4537a6312fe8750490a5.aspx" title="VanEck India Select ETF | Overview" target="_top"><strong>INDZ</strong></a>&nbsp;is managed by Angus Shillington, who brings 32 years of global equity markets experience spanning portfolio management, research, trading, and institutional distribution across developed and emerging markets, including over 16 years at VanEck. He also serves as Deputy Portfolio Manager for the VanEck Emerging Markets Fund. Prior to VanEck, Mr. Shillington held senior leadership roles, including Managing Director and Head of International Equity at ABN AMRO NA, overseeing global equities and equity derivatives platforms, as well as positions at BNP Paribas and ABN AMRO in Asia and the U.S. The <a href="/link/dd53a10baf8a4537a6312fe8750490a5.aspx" title="VanEck India Select ETF | Overview" target="_top"><strong>INDZ</strong></a>&nbsp;portfolio is subject to oversight by VanEck's Investment Committee.</p>
<h2 id="point-ten" class="anchored-block jump-link-nav" data-jumplink-title="Allocation">How can INDZ fit into a portfolio?</h2>
<p><a href="/link/dd53a10baf8a4537a6312fe8750490a5.aspx" title="VanEck India Select ETF | Overview" target="_top"><strong>INDZ</strong></a>&nbsp;can serve as a dedicated India allocation within a broader emerging markets or international equity portfolio. Given that India remains underrepresented in global equity benchmarks relative to its return potential and economic growth profile, <a href="/link/dd53a10baf8a4537a6312fe8750490a5.aspx" title="VanEck India Select ETF | Overview" target="_top"><strong>INDZ</strong></a>&nbsp;provides a way for investors to express a targeted view on India's structural growth story with the benefit of active security selection. The fund's selective, quality-focused approach is designed to complement broader emerging market or international holdings by concentrating exposure on the subset of Indian companies best positioned to compound value over time.</p>
<p>Ready to invest in <a href="/link/dd53a10baf8a4537a6312fe8750490a5.aspx" title="VanEck India Select ETF | Overview" target="_top"><strong>INDZ</strong></a>? Visit the&nbsp;<a href="/link/dd53a10baf8a4537a6312fe8750490a5.aspx" title="VanEck India Select ETF | Overview" target="_top"><strong>fund page</strong></a> for the fact sheet, <a href="/link/dd53a10baf8a4537a6312fe8750490a5.aspx?epsremainingpath=holdings" title="VanEck India Select ETF | Holdings" target="_top"><strong>holdings</strong></a>, <a href="/link/dd53a10baf8a4537a6312fe8750490a5.aspx?epsremainingpath=performance" title="VanEck India Select ETF | Performance" target="_top"><strong>performance</strong></a>, and more.</p>
<h2 id="point-eleven" class="anchored-block">How to buy VanEck ETFs?</h2>
<p><a href="/link/dd53a10baf8a4537a6312fe8750490a5.aspx#how-to-buy-etf&amp;utm=INDZ-Blog" title="VanEck Semiconductor ETF | Overview" target="_top"><strong>Learn more here.</strong></a><a href="mailto:askvaneck@vaneck.com" title="Have More Questions? - Ask VanEck" rel="noopener"></a></p>

<p>To receive more <a href="/us/en/insights/emerging-markets-equity/" title="Emerging Markets Equity Insights"><strong>Emerging Markets Equity</strong></a> insights, <a href="/us/en/subscribe/" title="Subscription Center"><strong>sign up in our subscription center</strong></a>.</p>
]]></content:encoded>
</item><item rdf:about="https://www.vaneck.com/us/en/blogs/emerging-markets-equity/selective-exposure-to-indias-dynamic-opportunity/">
  <title>Selective Exposure to India’s Dynamic Opportunity></title>
  <link>https://www.vaneck.com/us/en/blogs/emerging-markets-equity/selective-exposure-to-indias-dynamic-opportunity/</link>
  <description><![CDATA[<a href="/link/dd53a10baf8a4537a6312fe8750490a5.aspx" title="VanEck India Select ETF | Overview" target="_top"><strong>INDZ</strong></a> is an actively managed India ETF designed to reduce passive index drag by selecting high-quality Indian companies with durable earnings power and disciplined valuations.]]></description>
  <dc:creator>Angus Shillington</dc:creator>
  <dc:date>02/19/2026 06:30:00</dc:date>
<content:encoded><![CDATA[

<p><strong>Key Takeaways</strong></p>
<ul class="content-list">
<li class="mt-2">Active exposure in India is crucial to avoid underperforming companies that create performance drag.</li>
<li class="mt-2">Equity performance in India is driven by company-level fundamentals.</li>
<li class="mt-2"><a href="/link/dd53a10baf8a4537a6312fe8750490a5.aspx" title="VanEck India Select ETF | Overview" target="_top"><strong>INDZ</strong></a> seeks to minimize passive index drag through disciplined active selection.</li>
</ul>
<!--<p class="jump-link-nav anchored-block" data-jumplink-title="JUMP LINK">-->
<p>India is a high-dispersion equity market where long-term outcomes are driven primarily by company-level fundamentals. While market-cap weighted indexes provide broad exposure, they also allocate capital indiscriminately across businesses with widely divergent quality, durability, and return potential. This structure embeds persistent performance drag by diluting exposure to the companies that matter most for long-term compounding.</p>
<p>Structural growth, reform momentum, and rapid technology adoption continue to expand India&rsquo;s opportunity set, but they also sustain index exposure to businesses that lack capital discipline or the ability to adapt. In this environment, owning everything equally is costly. Selectivity is essential to capturing durable returns.</p>
<p>Our mission is to minimize passive index drag by systematically focusing on higher-quality companies with durable earnings power and disciplined valuations.</p>
<h2><strong>Why Active Management Matters in India</strong></h2>
<p>India&rsquo;s equity returns are driven by a much smaller subset of stocks than the U.S., meaning that capturing most of the market&rsquo;s gains in India requires far greater security selection rather than broad index exposure.</p>
<h2><strong>What Is the VanEck India Select ETF (INDZ)?</strong></h2>
<p>The <a href="/link/dd53a10baf8a4537a6312fe8750490a5.aspx" title="VanEck India Select ETF | Overview" target="_top"><strong>VanEck India Select ETF (INDZ)</strong></a> is designed to provide selective exposure across high-quality Indian companies, combining active research with rules-driven discipline to support consistent, long-term compounding in a market defined by dispersion.</p>
<h3><strong>Smaller Subset of Companies Drive Returns in India</strong></h3>
<p><img loading="lazy" class="desktop-image img-responsive w-100" src="https://www.vaneck.com/contentassets/e782f035e53c43009606079f4cea8024/6825_indz-launch-blog_chart-1_2026-02_v1_desktop.svg" alt="Smaller Subset of Companies Drive Returns in India" /></p>
<p><img loading="lazy" class="mobile-image img-responsive w-100" src="https://www.vaneck.com/contentassets/e782f035e53c43009606079f4cea8024/6825_indz-launch-blog_chart-1_2026-02_v1_mobile.svg" alt="Smaller Subset of Companies Drive Returns in India" /></p>
<p class="chart-disclosure"><strong>Source:</strong> VanEck, FactSet. Data as of February 28, 2006 - January 31, 2026. India is represented by the MSCI India Index. U.S. is represented by the S&amp;P 500 Index. Past performance is no guarantee of future results. Index performance is not representative of fund performance. It is not possible to invest directly in an index.</p>
<!--<p class="jump-link-nav anchored-block" data-jumplink-title="JUMP LINK">-->
<h2>INDZ&rsquo;s Philosophy: Active with Systematic Discipline</h2>
<p><a href="/link/dd53a10baf8a4537a6312fe8750490a5.aspx" title="VanEck India Select ETF | Overview" target="_top"><strong>INDZ</strong></a>&rsquo;s process is active by design but anchored in systematic discipline. We combine fundamental research with a rules-based framework to build a repeatable, risk-aware portfolio focused on long-term compounding rather than short-term trading. The goal is to be selective and deliberate, while maintaining consistency through market cycles.</p>
<p>At the front end, active research is used to curate an investable universe of high-quality businesses with visible earnings power, durable competitive advantages, disciplined balance sheets, and resilience to disruption. This is paired with an institutional risk framework designed to manage tracking error, limit unintended concentration, and reduce the risk of permanent capital impairment.</p>
<p>Portfolio decisions are reassessed through a disciplined semiannual reset, where the opportunity set is comprehensively reviewed using updated fundamental insights and quantitative signals. This structure allows the portfolio to evolve as leadership shifts across compounders, emerging innovators, and businesses facing disruption. Between resets, ongoing research and risk oversight allow the portfolio to adapt to changing conditions, with off-cycle trades executed selectively when warranted.</p>
<p>Construction is governed by discipline rather than discretion. A modified equal-weight approach helps prevent any single position from dominating risk or returns, while rules-based constraints reduce behavioral bias and concentration risk. By emphasizing active research over frequent trading, the process seeks to control costs and support long-term compounding.</p>
<h2>India Select Investment Process</h2>
<p>The portfolio of <a href="/link/dd53a10baf8a4537a6312fe8750490a5.aspx" title="VanEck India Select ETF | Overview" target="_top"><strong>INDZ</strong></a>&nbsp;is built through a disciplined semiannual rebalance designed to separate long-term durable compounders from deteriorating businesses.</p>
<p>Starting from a broad universe of Indian public companies, the process applies sequential screens for liquidity, durability of business models, profitability, and valuation, progressively narrowing the opportunity set.</p>
<p>Securities that exhibit weakening earnings power, declining returns on capital, or elevated forward-looking risk are removed, while high-quality performers and emerging lifecycle winners are retained. The remaining stocks are ranked and optimized within defined risk controls to construct a focused portfolio of 60 to 90 holdings.</p>
<p>This approach is designed for a high-dispersion market, enabling the portfolio to systematically adapt as leadership shifts among durable compounders, emerging innovators, and businesses exposed to disruption, while maintaining consistency in risk management and valuation discipline. The result is a process that remains rules-driven, repeatable, and forward-looking.</p>
<p><img loading="lazy" class="desktop-image img-responsive w-100" src="https://www.vaneck.com/contentassets/42daffc846e54323b0872b10153773ad/6825_indz-launch-blog_image-1_2026-02_v2_web-chart.svg" alt="India Select Investment Process" /></p>
<p><img loading="lazy" class="mobile-image img-responsive w-100" src="https://www.vaneck.com/contentassets/42daffc846e54323b0872b10153773ad/6825_indz-launch-blog_image-1_2026-02_v1_mobile.svg" alt="India Select Investment Process" /></p>
<p class="chart-disclosure"><strong>Source:</strong> VanEck</p>

<!--<p class="jump-link-nav anchored-block" data-jumplink-title="JUMP LINK">-->
<h2>INDZ&rsquo;s Core-Satellite Portfolio Construction</h2>
<p>The portfolio is constructed using a core-satellite framework that balances stability with innovation. The core sleeve is anchored in large-cap companies with stable, compounding returns and serves as a volatility dampener for the portfolio.</p>
<p>Surrounding this core are satellite positions in mid- and small-cap businesses that represent innovative, scalable lifecycle winners and early-stage disruptors, where return dispersion and mispricing tend to be most pronounced. Position sizes are governed by an adjusted equal-weight approach and minimum liquidity thresholds, while institutional risk controls limit concentration and tracking error.</p>
<p>Together, this structure allows the portfolio to pursue long-term growth across India&rsquo;s most compelling companies without sacrificing diversification or risk discipline.</p>
<p><img loading="lazy" class="desktop-image img-responsive w-100" src="https://www.vaneck.com/contentassets/f33878c007474cc6b30116015f403cb0/6825_indz-launch-blog_image-2_2026-02_v1_desktop.svg" alt="INDZ&rsquo;s Core-Satellite Portfolio Construction" /></p>
<p><img loading="lazy" class="mobile-image img-responsive w-100" src="https://www.vaneck.com/contentassets/f33878c007474cc6b30116015f403cb0/6825_indz-launch-blog_image-2_2026-02_v1_mobile.svg" alt="INDZ&rsquo;s Core-Satellite Portfolio Construction" /></p>
<p class="chart-disclosure"><strong>Source:</strong> VanEck</p>
<h2>Ongoing Optimization and Portfolio Risk Controls</h2>
<p>Risk management is embedded throughout the lifecycle of the portfolio and implemented using an institutional framework designed to maintain a stable risk profile relative to the benchmark over time. Portfolio exposures are formally reviewed and optimized at each semiannual rebalance, with additional monitoring conducted on a monthly basis to ensure concentrations, factor exposures, and overall risk remain within defined parameters.</p>
<p>Oversight is provided by the VanEck Multi-Asset Solutions group and the Investment Committee, reinforcing discipline and accountability. If the portfolio drifts outside established ranges between rebalances, the portfolio manager will proactively trade to realign exposures and preserve capital.</p>
<h2>Sources of Potential Relative Underperformance</h2>
<p>The strategy&rsquo;s disciplined, rules-driven construction is intentionally designed to avoid the behavioral and concentration risks that can arise in discretionary or momentum-driven approaches. Periods of relative underperformance are a natural byproduct of a long-term, selective investment process, and setting clear expectations around these dynamics is essential.</p>
<p>The strategy maintains a structural tilt toward smaller-cap companies, where pricing inefficiencies are more prevalent but volatility can be higher, particularly during periods of market stress. It also carries an intentional growth bias, reflecting a focus on businesses with strong earnings compounding potential, which can lag during periods when value stocks lead.</p>
<p>Finally, strict valuation discipline can limit participation in momentum-driven rallies, especially when highly valued stocks move sharply in the short term. These trade-offs are deliberate and reflect a commitment to long-term capital compounding rather than short-term performance chasing.</p>

<p>To receive more <a href="/us/en/insights/emerging-markets-equity/" title="Emerging Markets Equity Insights"><strong>Emerging Markets Equity</strong></a> insights, <a href="/us/en/subscribe/" title="Subscription Center"><strong>sign up in our subscription center</strong></a>.</p>
]]></content:encoded>
</item><item rdf:about="https://www.vaneck.com/us/en/blogs/thematic-investing/true-market-cap-exposure-to-communication-services/">
  <title>True Market-Cap Exposure to Communication Services></title>
  <link>https://www.vaneck.com/us/en/blogs/thematic-investing/true-market-cap-exposure-to-communication-services/</link>
  <description><![CDATA[VanEck&rsquo;s TruSector ETFs are designed to deliver full market-cap sector exposure and help asset allocators track sector benchmarks with greater precision.]]></description>
  <dc:creator>Michael Cohick</dc:creator>
  <dc:date>02/19/2026 06:30:00</dc:date>
<content:encoded><![CDATA[

<p><strong>Key Takeaways:</strong></p>
<ul class="content-list">
<li class="mt2">Traditional sector ETFs may underweight mega-cap leaders due to diversification caps.</li>
<li class="mt2">The <a href="/link/ec7c31c056ff476b8e0937e92f7afedd.aspx" title="TRUC - VanEck Communication Services TruSector ETF"><strong>TRUC</strong></a> ETF seeks to replicate true market-cap Communication Services exposure through a hybrid structure designed to reflect today&rsquo;s market realities.</li>
<li class="mt2">By combining direct holdings and targeted ETF exposure, <a href="/link/ec7c31c056ff476b8e0937e92f7afedd.aspx" title="TRUC - VanEck Communication Services TruSector ETF"><strong>TRUC</strong></a> helps reduce artificial weighting distortions.</li>
</ul>
<p>The <strong><a href="/link/ec7c31c056ff476b8e0937e92f7afedd.aspx" title="TRUC - VanEck Communication Services TruSector ETF - Overview">VanEck Communication Services TruSector ETF (TRUC)</a></strong> offers investors a new way to gain true market-cap exposure to the Communication Services sector.</p>
<h2>The Problem: Traditional Sector ETFs Can Fall Short</h2>
<p>In today&rsquo;s market, a small number of mega-cap companies often dominate the performance of their sectors. Yet many traditional sector ETFs are structurally unable to mirror those market realities because of regulatory diversification rules that govern most U.S. ETFs. These rules:</p>
<ul class="content-list">
<li class="mt2">Cap any single holding at 25% of a fund&rsquo;s assets.</li>
<li class="mt2">Limit the total weight of names above 5% to no more than 50% of the portfolio.</li>
</ul>
<p>While designed to protect investors from concentration risk, these limits can force traditional sector funds to underweight the largest companies that drive performance and overweight smaller names to stay compliant, creating a mismatch between what investors think they own and what they actually hold.</p>
<h2>Our Solution: TruSector ETF Structure</h2>
<p>VanEck&rsquo;s TruSector ETF suite, including <strong><a href="/link/691928d6a333465e84b05ddceeb9203a.aspx" title="TRUD - VanEck Consumer Discretionary TruSector ETF - Overview">TRUD</a></strong> and <strong><a href="/link/4b2904882a3c4908b40d77036f2d8889.aspx" title="TRUT - VanEck Technology TruSector ETF - Overview">TRUT</a></strong>, addresses this challenge by delivering full market-cap sector exposure while remaining compliant with ETF diversification rules. The TruSector approach uses a hybrid structure that combines:</p>
<ul class="content-list">
<li class="mt2">Direct equity holdings in individual sector stocks up to regulatory limits.</li>
<li class="mt2">Positions in targeted sector ETFs for incremental exposure that does not count toward issuer concentration caps.</li>
</ul>
<p>This structure allows <a href="/link/ec7c31c056ff476b8e0937e92f7afedd.aspx" title="TRUC - VanEck Communication Services TruSector ETF"><strong>TRUC</strong></a> to replicate the economic exposure of an uncapped sector benchmark &mdash; giving investors exposure to today&rsquo;s true market leaders in Communication Services, without artificial weighting distortions.</p>
<h2>Why the TRUC ETF Matters</h2>
<p>With the launch of <a href="/link/ec7c31c056ff476b8e0937e92f7afedd.aspx" title="TRUC - VanEck Communication Services TruSector ETF"><strong>TRUC</strong></a>, investors and allocators now have a new precision tool for expressing a view on the Communication Services sector, one that:</p>
<ul class="content-list">
<li class="mt2">Aligns more closely with actual market-cap weights.</li>
<li class="mt2">Reduces unintended tracking differences relative to traditional sector funds.</li>
<li class="mt2">Fits seamlessly within diversified portfolios.</li>
</ul>
<p><a href="/link/ec7c31c056ff476b8e0937e92f7afedd.aspx" title="TRUC - VanEck Communication Services TruSector ETF"><strong>TRUC</strong></a> joins VanEck&rsquo;s growing TruSector lineup, built to bring clarity and accuracy to sector investing in an evolving market environment.</p>
<h2>Choose Your TruSector Strategy</h2>
<p><a href="/link/ec7c31c056ff476b8e0937e92f7afedd.aspx" title="TRUC | VanEck Communication Services TruSector ETF - Overview"><strong>VanEck Communication Services TruSector ETF (TRUC)</strong></a>: Gain true market-cap exposure to the Communication Services sector.</p>
<p><a href="/link/4b2904882a3c4908b40d77036f2d8889.aspx" title="TRUT | VanEck Technology TruSector ETF - Overview"><strong>VanEck Technology TruSector ETF (TRUT)</strong></a>: Delivers full market-cap sector exposure with greater precision without the limitations of traditional sector funds.</p>
<p><a href="/link/691928d6a333465e84b05ddceeb9203a.aspx" title="TRUD | VanEck Consumer Discretionary TruSector ETF- Overview"><strong>VanEck Consumer Discretionary TruSector ETF (TRUD)</strong></a>: Delivers full market-cap sector exposure with greater precision without the limitations of traditional sector funds.</p>

<p>To receive more <a href="https://www.vaneck.com/us/en/insights/thematic-investing/" title="Thematic Investing Insights"><strong>Thematic Investing</strong></a> insights, <a href="https://www.vaneck.com/us/en/subscribe/" title="Subscription Center"><strong>sign up in our subscription center</strong></a>.</p>
]]></content:encoded>
</item><item rdf:about="https://www.vaneck.com/us/en/blogs/thematic-investing/the-robotics-market-is-becoming-too-large-to-ignore/">
  <title>The Robotics Market is Becoming Too Large to Ignore></title>
  <link>https://www.vaneck.com/us/en/blogs/thematic-investing/the-robotics-market-is-becoming-too-large-to-ignore/</link>
  <description><![CDATA[Robotics is scaling globally, with installations near record highs and adoption expanding beyond factories into logistics and healthcare, driving durable automation growth.]]></description>
  <dc:creator>Drew  Anderson</dc:creator>
  <dc:date>02/18/2026 06:30:00</dc:date>
<content:encoded><![CDATA[

<p><strong>Key Takeaways:</strong></p>
<ul class="content-list">
<li class="mt-2">Industrial robot installations remain near record levels and are projected to keep rising through 2028.</li>
<li class="mt-2">Growth is broadening beyond automotive as collaborative robots expand across industries.</li>
<li class="mt-2">Service and medical robots are accelerating adoption beyond the factory floor.</li>
</ul>
<p>The robotics market is scaling into a meaningful force in the global economy. Industrial robot installations remain near record highs. The installed base continues to expand. Adoption is spreading beyond factory floors into logistics and healthcare.</p>
<p>The latest World Robotics 2025 report confirms that robotics industry growth remains steady and broad based. Economic cycles may create short term volatility. The long-term direction is clear. Automation continues to compound across industries and regions.</p>
<h2>Robotic Installations Remain Near Record Levels</h2>
<p>Industrial robot demand has stabilized at an elevated level.</p>
<p>In 2024, 542,000 industrial robots were installed globally, one of the strongest years on record. The global operational stock reached 4.66 million units, up 9 percent year over year.</p>
<h3>Global Operational Stock of Industrial Robots</h3>
<p><img loading="lazy" class="img-responsive" alt="Global Operational Stock of Industrial Robots" src="https://www.vaneck.com/contentassets/9bb573b373a4464fb452e9fb6bd2f0ba/6833_ibot-blog_chart-1_2026-02_v1_desktop.svg" /></p>
<p class="chart-disclosure">Source: International Federation of Robotics as of 2025.</p>

<p>That installed base is critical. Once automation is integrated into production systems, it is rarely removed. It creates recurring demand for software, machine vision systems, semiconductors, and system upgrades.</p>
<p>Installations are projected to reach 708,000 units by 2028, implying roughly 7 percent annual growth. Growth is steady and supported by a growing foundation of deployed systems.</p>
<h3>Global Annual Installations of Industrial Robots</h3>
<p><img loading="lazy" class="img-responsive" alt="Global Annual Installations of Industrial Robots" src="https://www.vaneck.com/contentassets/aac4d615a3ce430b9748e78aee3dbd4b/6833_ibot-blog_chart-2_2026-02_v1_desktop.svg" /></p>
<p class="chart-disclosure">Source: International Federation of Robotics as of 2025. Not intended as a forecast or prediction of future results.</p>

<h2>Robotics Growth Is Broadening Beyond Automotive</h2>
<p>Robotics is no longer dependent on automotive cycles.</p>
<p>While automotive remains important, general industries are gaining share. Electronics, metal and machinery, plastics, and food production are increasing automation investment.</p>
<p><strong><a href="/us/en/blogs/thematic-investing/meet-the-collaborative-robots/" title="Meet the Collaborative Robots">Collaborative robots</a></strong>, often called cobots, are contributing to that shift. Cobots are designed to work safely alongside humans. Installations reached 64,542 units in 2024 and continue to grow at double digit rates. They reduce cost and complexity for small and mid-sized manufacturers.</p>
<p>The robotics market is becoming more diversified and less tied to a single sector.</p>
<h2>Asia Leads in Robotics, but Adoption Is Global</h2>
<p>Asia remains the largest robotics market. China accounted for 54 percent of global installations in 2024 and 43 percent of total operational stock.</p>
<h3>Share in Annual Installations of Robots</h3>
<p><img loading="lazy" class="img-responsive" alt="Share in Annual Installations of Robots" src="https://www.vaneck.com/EPiServer/CMS/Content/contentassets/67e833c6cb454ad2836055ac3979b9b1/6833_ibot-blog_chart-3_2026-02_v2_desktop.svg,,361858/Download?epieditmode=False" /></p>
<p class="chart-disclosure">Source: International Federation of Robotics as of 2025.</p>
<p>But this is not a single region story.</p>
<p>The United States recorded one of its highest installation levels on record. India continues to rise in global rankings. Across regions, companies are automating to address labor shortages, rising wages, and supply chain resilience.</p>
<p>Automation is increasingly viewed as a requirement for competitiveness rather than a discretionary upgrade.</p>
<h2>Robotics Is Expanding Beyond the Factory Floor</h2>
<p>The robotics ecosystem now extends into logistics, healthcare, and services.</p>
<p>In 2024:</p>
<ul class="content-list">
<li class="mt-2">199,000 professional service robots were deployed, up 9 percent.</li>
<li class="mt-2">16,700 medical robots were installed, up 91 percent.</li>
<li class="mt-2">Consumer service robots exceeded 20 million units globally.</li>
</ul>
<p>Medical robotics showed particularly strong gains in diagnostics and laboratory automation. This expansion increases the total addressable market and broadens the investment universe beyond traditional industrial automation.</p>
<h2>A Practical Role for Robotics in Portfolios</h2>
<p>The robotics market is becoming too large to ignore because the drivers are structural and the installed base is compounding.</p>
<p>Demographic shifts are tightening labor markets. Productivity pressure is pushing companies toward automation. Advances in physical AI, embedded machine learning, and semiconductor systems continue to improve performance and returns.</p>
<p>More than 4 million robots are already deployed globally. That scale creates durability. Automation is embedded in modern production systems, and once deployed, it tends to expand rather than contract.</p>
<p>For investors, robotics exposure should reflect the full value chain. Industrial automation systems, machine vision, semiconductor manufacturing equipment, embedded AI, and robotic surgical platforms all contribute to industry growth.</p>
<p><a href="/link/45b34d8e49864951b62a653766992734.aspx" title="IBOT - VanEck Robotics ETF - Overview"><strong>The VanEck Robotics ETF (IBOT)</strong></a> tracks the BlueStar Robotics Index, which emphasizes companies deriving meaningful revenue from robotics related activities across multiple subthemes. The structure is designed to capture growth across the broader automation ecosystem rather than concentrating in a single segment.</p>
<h2>The Future of Robotics</h2>
<p>World Robotics 2025 confirms that global robot installations remain near record levels and are projected to rise steadily through 2028.</p>
<p>Robotics is no longer emerging. It is embedded. Adoption is broadening. The installed base is compounding. The economic footprint continues to expand.</p>
<p>The robotics market is becoming too large to ignore because of scale, not hype.</p>
<p>To receive more <a href="https://www.vaneck.com/us/en/insights/thematic-investing/" title="Thematic Investing Insights"><strong>Thematic Investing</strong></a> insights, <a href="https://www.vaneck.com/us/en/subscribe/" title="Subscription Center"><strong>sign up in our subscription center</strong></a>.</p>
]]></content:encoded>
</item><item rdf:about="https://www.vaneck.com/us/en/blogs/municipal-bonds/tax-exempt-yield-in-2026-our-playbook/">
  <title>Tax-Exempt Yield in 2026: Our Playbook></title>
  <link>https://www.vaneck.com/us/en/blogs/municipal-bonds/tax-exempt-yield-in-2026-our-playbook/</link>
  <description><![CDATA[With rates elevated, munis may provide a way to convert cash allocations into tax-exempt income in today&rsquo;s yield environment.. Strong flows, attractive after-tax yields, and ETF access make munis a practical planning tool in 2026.]]></description>
  <dc:creator>Michael Cohick</dc:creator>
  <dc:date>02/17/2026 06:30:00</dc:date>
<content:encoded><![CDATA[

<p><strong>Key Takeaways:</strong></p>
<ul class="content-list">
<li class="mt-2">Cash yields float, while munis allow investors to lock in tax exempt income at today&rsquo;s higher rates.</li>
<li class="mt-2">After tax municipal yields are competitive again for high bracket taxable investors.</li>
<li class="mt-2">A structured muni approach matters more than predicting the next move in rates.</li>
</ul>
<p><strong><a href="https://www.vaneck.com/us/en/etf-mutual-fund-finder/" title="ETF and Mutual Fund Finder">Click here</a> to view each fund&rsquo;s standardized performance.</strong> Yield alone should not be the basis for an investment decision. Please see 30-Day SEC Yield definition below.</p>
<p><strong><i>The performance data quoted represents past performance. Past performance is not a guarantee of future results. Investment return and principal value of an investment will fluctuate so that an investor's shares, when redeemed, may be worth more or less than their original cost. Performance may be lower or higher than performance data quoted. Please call 800.826.2333 or visit vaneck.com for performance current to the most recent month ended.</i></strong></p>
<p>Many clients started 2026 with the same comfortable portfolio feature they carried through 2024&ndash;2025: a large cash or cash‑plus allocation that finally paid them something again. That posture made sense while the path of policy rates was uncertain and price volatility was punishing duration.</p>
<p>But now the conversation is shifting from: What&rsquo;s my money market yielding today? to a more advisor-relevant question: How do I turn today&rsquo;s still-elevated rate environment into a structured source of tax-advantaged income while current yields remain elevated?</p>
<p>With the Federal Reserve maintaining the federal funds target range at 3.50%&ndash;3.75% at its late‑January meeting, the market has clearer visibility than it did a year ago. That does not guarantee where rates go next, but it does make a practical planning point easier: cash is a floating-rate instrument, while municipal bonds are one of the more scalable ways to lock in tax‑exempt income across maturities and credit tiers.</p>
<h2 id="why-muni-bonds" class="jump-link-nav anchored-block" data-jumplink-title="Why Muni Bonds?">Why Municipal Bonds Are Attractive Again in 2026</h2>
<p>The strongest muni pitch in 2026 isn&rsquo;t that rates are about to fall. It&rsquo;s that the market is offering a workable tradeoff between income and risk again, especially for taxable accounts, while technicals remain supportive.</p>
<p>One factor is simply the level of all‑in, after‑fee tax‑exempt yield available in the public market. As of 02/09/2026, VanEck&rsquo;s national municipal lineup spans from short-duration exposure with a 2.44% 30‑Day SEC Yield to higher‑income approaches north of 5%, depending on structure and underlying risk. For many high‑bracket households, that is enough yield to make munis work again versus taxable alternatives once you do the tax math.</p>
<p>Another factor is reinvestment. Advisors don&rsquo;t need to be tactical traders to appreciate that the muni market is seasonal and flow driven. Multiple market commentaries have highlighted sizable early‑year principal-and-interest redemptions that typically create reinvestment demand.</p>
<p>For example, some analysts have estimated outsized reinvestment flows, including $47B arriving February 1 and $32B on March 1, alongside an expectation that 2026 supply could approach $600B. When reinvestment demand is heavy and the calendar is manageable, bid levels can stay firm even without a risk‑on backdrop.</p>
<p>Finally, now matters because the short end can move quickly. When clients sit in cash waiting for the perfect entry point, they&rsquo;re often making an implicit bet that cash yields will remain attractive long enough to justify the reinvestment risk. In the event of a pause‑then‑cut cycle, that can be an expensive assumption.</p>
<h2 id="muni-bond-yields" class="jump-link-nav anchored-block" data-jumplink-title="Muni Bond Yields">How Advisors Can Explain Municipal Bond Yields to Clients</h2>
<p>The most effective muni conversations rarely start with tax-free. They start with taxable equivalent yield.</p>
<p>A simple framing is: if a client is in the 37% federal bracket, a 4.09% tax‑exempt yield is comparable to about 6.5% taxable on a federal-only basis (4.09 &divide; (1 &minus; 0.37)). Using <strong><a href="/link/1ec087c36ce04ebfaf0617b63e908818.aspx" title="MLN - VanEck Long Muni ETF - Overview">VanEck Long Muni ETF (MLN)</a></strong> as an example, VanEck listed a 4.09% 30‑Day SEC Yield as of 02/09/2026. That&rsquo;s before any state-tax considerations, which can materially widen the gap for clients in high‑tax states<sup>1</sup>.</p>
<p>If you want to be more precise for high-income households, remember that the comparison taxable yield may also be exposed to the 3.8% Net Investment Income Tax (NIIT), while tax‑exempt municipal bond interest itself is generally excluded from NIIT. In other words, the taxable alternative may have a higher effective tax rate than the headline federal bracket suggests. The usual caveats apply such as client-specific thresholds, filing status, and income mix matter.</p>
<p>One more planning nuance that is easy to miss in client conversations: even though muni interest is federally tax‑exempt, tax‑exempt interest can be included in MAGI for Medicare IRMAA calculations, which can affect Parts B and D premiums for higher‑income retirees. For clients near IRMAA cliffs, that is not a reason to avoid munis, but it is a reason to coordinate fixed income choices with professional tax planning.</p>

<h2 id="acess-the-muni-market" class="jump-link-nav anchored-block" data-jumplink-title="Access the Muni Market">A Practical Toolkit: Using Vaneck ETFs to Access the Muni Market</h2>
<p>For many practices, individual bonds remain the gold standard for customization, ladders, and cash-flow planning. But ETFs solve problems advisors face every day: instant diversification, liquidity, account scalability, and operational simplicity across households.</p>
<p>VanEck&rsquo;s municipal lineup is built around clear maturity and credit lanes, which can make portfolio construction more modular. Here is a snapshot of several commonly used exposures:</p>
<h3>VanEck&rsquo;s Municipal Lineup</h3>
<div class="wrapped-div">
<table style="width: 100%;">
<tbody>
<tr class="tbl-data">
<td class="tbl-header last text-left">Ticker</td>
<td class="tbl-header last text-left">Name</td>
<td class="tbl-header last text-right">30-Day SEC Yield (%)</td>
<td class="tbl-header last text-right">Total Expense Ratio (%)</td>
<td class="tbl-header last text-left">How to use it</td>
</tr>
<tr class="tbl-data">
<td class="data-td last text-left"><a href="/link/af71e9a11e4441edbea8e95251ef5747.aspx" title="SMB - VanEck Short Muni ETF - Overview"><strong>SMB</strong></a></td>
<td class="data-td last text-left font-weight-normal">VanEck Short Muni ETF (investment grade 0-6 yrs)</td>
<td class="data-td last text-right font-weight-normal">2.44</td>
<td class="data-td last text-right font-weight-normal">0.07</td>
<td class="data-td last text-left font-weight-normal">A cash complement for taxable accounts where stability matters</td>
</tr>
<tr class="tbl-data">
<td class="data-td last text-left"><a href="/link/34b93d6c4ba74006913a58769f7e7e77.aspx" title="ITM - VanEck Intermediate Muni ETF - Overview"><strong>ITM</strong></a></td>
<td class="data-td last text-left font-weight-normal">VanEck Intermediate Muni ETF (investment grade 6-17 yrs)</td>
<td class="data-td last text-right font-weight-normal">2.92</td>
<td class="data-td last text-right font-weight-normal">0.18</td>
<td class="data-td last text-left font-weight-normal">Core muni exposure balancing income and rate sensitivity</td>
</tr>
<tr class="tbl-data">
<td class="data-td last text-left"><a href="/link/1ec087c36ce04ebfaf0617b63e908818.aspx" title="MLN - VanEck Long Muni ETF - Overview"><strong>MLN</strong></a></td>
<td class="data-td last text-left font-weight-normal">VanEck Long Muni ETF (investment grade 17-30 yrs)</td>
<td class="data-td last text-right font-weight-normal">4.09</td>
<td class="data-td last text-right font-weight-normal">0.24</td>
<td class="data-td last text-left font-weight-normal">Extending duration to seek higher tax exempt income</td>
</tr>
<tr class="tbl-data">
<td class="data-td last text-left"><a href="/link/1881686e84234b1b9ca2b6d56f2e25a0.aspx" title="SHYD - VanEck Short High Yield Muni ETF - Overview"><strong>SHYD</strong></a></td>
<td class="data-td last text-left font-weight-normal">VanEck Short High Yield Muni ETF (1&ndash;12 yrs)</td>
<td class="data-td last text-right font-weight-normal">3.54</td>
<td class="data-td last text-right font-weight-normal">0.32</td>
<td class="data-td last text-left font-weight-normal">Adding income with less duration than long high yield</td>
</tr>
<tr class="tbl-data">
<td class="data-td last text-left"><a href="/link/63e99d0ce68b47e79eae26e1c163fd09.aspx" title="HYD - VanEck High Yield Muni ETF - Overview"><strong>HYD</strong></a></td>
<td class="data-td last text-left font-weight-normal">VanEck High Yield Muni ETF (1-30 yrs)</td>
<td class="data-td last text-right font-weight-normal">4.37</td>
<td class="data-td last text-right font-weight-normal">0.32</td>
<td class="data-td last text-left font-weight-normal">A yield sleeve for clients who can bear credit risk and volatility</td>
</tr>
<tr class="tbl-data">
<td class="data-td last text-left"><a href="/link/fc018123f20d4f45aaf6b338189ae326.aspx" title="XMPT - VanEck CEF Muni Income ETF - Overview"><strong>XMPT</strong></a></td>
<td class="data-td last text-left font-weight-normal">Muni CEF portfolio (ETF of muni closed-end funds)</td>
<td class="data-td last text-right font-weight-normal">5.81</td>
<td class="data-td last text-right font-weight-normal">1.97</td>
<td class="data-td last text-left font-weight-normal">Opportunistic income with CEF discounts/leverage dynamics</td>
</tr>
</tbody>
</table>
</div>
<p class="chart-disclosure">Source: VanEck. As of 2/9/2026. <i>Past performance is no guarantee of future results. Yield alone should not be the basis for an investment decision.</i> Please see 30 Day SEC Yield definition below. Van Eck Associates Corporation (the &ldquo;Adviser&rdquo;) will pay all expenses of the Funds, except for the fee payments under the investment management agreements, acquired fund fees and expenses, interest expense, offering costs, trading expenses, taxes and extraordinary expenses. Notwithstanding the foregoing, the Adviser has agreed to pay the offering costs until at least September 1, 2026.</p>


<p>A few advisor-oriented implementation observations follow naturally from that menu.</p>
<p>In households where muni exposure is replacing some portion of cash, <strong><a href="/link/af71e9a11e4441edbea8e95251ef5747.aspx" title="SMB - VanEck Short Muni ETF - Overview">SMB</a></strong> (short muni) is often the cleanest behavioral bridge: you are not asking the client to make a dramatic duration bet, you are asking them to convert floating yield into tax‑exempt yield while keeping volatility relatively contained. The tradeoff is obvious and honest, <strong><a href="/link/af71e9a11e4441edbea8e95251ef5747.aspx" title="SMB - VanEck Short Muni ETF - Overview">SMB</a></strong> will not keep up with long munis if the curve rallies, but it can reduce reinvestment risk compared with staying entirely in cash.</p>
<p>For the core allocation in taxable accounts, intermediate maturity tends to be the most defensible anchor because it is easier to hold through drawdowns. <a href="/link/34b93d6c4ba74006913a58769f7e7e77.aspx" title="ITM - VanEck Intermediate Muni ETF - Overview"><strong>ITM&rsquo;s</strong></a> role is not to win a rate-call contest; it is to keep clients invested in a segment of the curve that can deliver tax‑exempt income without the headline volatility of the long end.</p>
<p>When the objective is explicitly to lock in income, <a href="/link/1ec087c36ce04ebfaf0617b63e908818.aspx" title="MLN - VanEck Long Muni ETF - Overview"><strong>MLN</strong></a> (long munis) is the more direct expression. VanEck&rsquo;s published 30‑Day SEC Yield* for <a href="/link/1ec087c36ce04ebfaf0617b63e908818.aspx" title="MLN - VanEck Long Muni ETF - Overview"><strong>MLN</strong></a> as of 02/09/2026 was 4.09%. That is the type of number that can reframe the money markets feel safe conversation, particularly for clients whose time horizon and risk capacity allow them to tolerate market swings.</p>
<p>For clients asking for more yield than high‑grade munis offer, <strong><a href="/link/1881686e84234b1b9ca2b6d56f2e25a0.aspx" title="SHYD - VanEck Short High Yield Muni ETF - Overview">SHYD</a></strong> and <strong><a href="/link/63e99d0ce68b47e79eae26e1c163fd09.aspx" title="HYD - VanEck High Yield Muni ETF - Overview">HYD</a></strong> provide a choice that is often under-discussed: do you want to take additional credit risk primarily in the front part of the curve (<strong><a href="/link/1881686e84234b1b9ca2b6d56f2e25a0.aspx" title="SHYD - VanEck Short High Yield Muni ETF - Overview">SHYD</a></strong>), or do you want both credit risk and more duration (<strong><a href="/link/63e99d0ce68b47e79eae26e1c163fd09.aspx" title="HYD - VanEck High Yield Muni ETF - Overview">HYD</a></strong>). VanEck listed <strong><a href="/link/1881686e84234b1b9ca2b6d56f2e25a0.aspx" title="SHYD - VanEck Short High Yield Muni ETF - Overview">SHYD</a></strong>&rsquo;s 30‑Day SEC Yield at 3.54% and <strong><a href="/link/63e99d0ce68b47e79eae26e1c163fd09.aspx" title="HYD - VanEck High Yield Muni ETF - Overview">HYD&rsquo;s</a></strong> at 4.37% as of 02/09/2026. Advisors can use that distinction to align the yield sleeve with the client&rsquo;s real risk tolerance rather than simply chasing the highest headline yield.</p>
<p><strong><a href="/link/fc018123f20d4f45aaf6b338189ae326.aspx" title="XMPT - VanEck CEF Muni Income ETF - Overview">XMPT</a></strong> is a different animal and should be presented that way. It is an ETF that provides exposure to municipal closed-end funds, which often use leverage and can trade at discounts or premiums to NAV. That structure can boost income (5.81% 30‑Day SEC Yield as of 02/09/2026) but it also introduces additional layers of risk and cost; VanEck listed a 1.97% total expense ratio for <strong><a href="/link/fc018123f20d4f45aaf6b338189ae326.aspx" title="XMPT - VanEck CEF Muni Income ETF - Overview">XMPT</a></strong>. In practice, many advisors treat this as an opportunistic satellite allocation rather than a core muni holding.</p>
<h2>Risk Management Points That Matter In 2026</h2>
<p>A muni re‑entry story is only as strong as the risk framing that accompanies it.</p>
<p>Interest-rate risk is still the biggest behavioral risk, especially in long duration. If you use <a href="/link/1ec087c36ce04ebfaf0617b63e908818.aspx" title="MLN - VanEck Long Muni ETF - Overview"><strong>MLN</strong></a> or <strong><a href="/link/63e99d0ce68b47e79eae26e1c163fd09.aspx" title="HYD - VanEck High Yield Muni ETF - Overview">HYD</a></strong> to lock in income, you should also set expectations that these exposures can experience meaningful drawdowns when rates rise, even if credit is stable. That conversation is not a compliance chore; it is what keeps clients invested long enough to harvest the income they said they wanted.</p>
<p>Credit risk is not theoretical in munis, particularly in high yield and in sectors that can be vulnerable to idiosyncratic pressure. The broader municipal market has historically exhibited low default incidence relative to corporates, but low does not mean none, and sector selection matters. Moody&rsquo;s long-run default study is a useful reminder that defaults can be rare overall yet still show up in pockets.</p>
<p>Call risk and reinvestment risk are also easy to underestimate. Many munis are callable, and if rates fall meaningfully, portfolios can experience call activity that returns principal when clients least want it returned. This is another reason to avoid overselling a single &ldquo;set it and forget it&rdquo; yield number, what matters is the income path through a cycle.</p>
<p>Finally, due diligence and disclosure are part of the product. For advisors who want a clean, repeatable way to help clients understand the bonds behind the funds (or to research individual CUSIPs when needed), EMMA is the SEC-designated public source for municipal disclosures and data.</p>
<h2>Making Munis a Planning Decision, Not A Market Call</h2>
<p>If you are looking for a clean message to bring to clients in early 2026, it&rsquo;s this: municipal bonds are not a prediction; they are a planning tool. With policy rates still elevated, reinvestment flows supportive and tax-equivalent yields compelling for many taxable households, advisors can reposition some cash into a structured muni allocation that matches time horizon and risk capacity, without pretending to know the exact path of rates.</p>
<p>VanEck&rsquo;s municipal ETFs can function as straightforward building blocks across maturity and credit exposures, from cash‑adjacent short munis to longer and higher‑income sleeves. The best outcome is not picking the perfect point on the curve. It&rsquo;s getting clients into a portfolio they can hold long enough for tax‑exempt income to do its job.</p>

<p>To receive more <a href="https://www.vaneck.com/us/en/insights/municipal-bonds/" title="Municipal Bonds Insights"><strong>Municipal Bonds</strong></a> insights, <a href="/link/5f45412c2143400497908cea2897f7d3.aspx" title=" Subscription Center"><strong>sign up in our subscription center</strong></a>.</p>
]]></content:encoded>
</item><item rdf:about="https://www.vaneck.com/us/en/blogs/income-investing/green-bonds-impact-investing-report/">
  <title>Green Bonds: Impact Investing Report></title>
  <link>https://www.vaneck.com/us/en/blogs/income-investing/green-bonds-impact-investing-report/</link>
  <description><![CDATA[How much environmental impact does an investor have when they invest in green bonds? In this report, we quantify the impact of every $1M of investment in the VanEck Green Bond ETF (GRNB).]]></description>
  <dc:creator>William Sokol</dc:creator>
  <dc:date>02/16/2026 06:30:00</dc:date>
<content:encoded><![CDATA[
<p><a href="https://www.vaneck.com/us/en/blogs/sustainable-investing/grnb-question-and-answer/" title="GRNB: Question and Answer"><strong>Green bonds</strong></a> are financing projects all over the world that have a positive environmental impact and provide a pathway to sustainable development. But how much impact does an investor have when they invest in green bonds? In this report, we quantify the environmental impact of every $1M of investment in the <strong><a href="/link/c4c8a4bd476b421eb7359c524962cdd4.aspx" title="GRNB - VanEck Green Bond ETF - Overview">VanEck Green Bond ETF (GRNB)</a></strong>.</p>
<div class="row">
<div class="col-md-4 col-xs-12"><a href="https://www.youtube.com/embed/zk8omlpazFA" data-video="https://youtu.be/zk8omlpazFA" class="popup-youtube" title="Watch Video"><img loading="lazy" class="img-responsive" style="margin-right: 15px; margin-top: 0px;" src="https://www.vaneck.com/contentassets/d3f09184a8b94392895a88852206e486/4268_grnb-impact-report-video-thumbnail_2024-08_v1.jpg" alt="Watch Video" align="left" /></a></div>
<div class="col-md-8 col-xs-12"><br /><strong><a href="https://www.youtube.com/embed/zk8omlpazFA" data-video=" https://youtu.be/zk8omlpazFA" class="popup-youtube" title="Watch Video">Watch Video</a><br /></strong><a href="https://www.youtube.com/embed/zk8omlpazFA" data-video="https://youtu.be/zk8omlpazFA" class="popup-youtube" title="Watch Video" style="font-size: 16px; font-weight: bold; padding: 10px 0px 0px; margin-right: 20px; width: 202px;">VanEck Green Bond ETF (GRNB): Income with Impact</a></div>
</div>
<br />
<p>Green bonds offer investors a way to build <a href="https://www.vaneck.com/us/en/blogs/sustainable-investing/green-bonds-income-with-impact/" title="Green Bonds: Income with Impact
"><strong>sustainable core fixed income portfolios</strong></a> without significantly affecting risk and return, and leverage the size and diversity of the global bond markets to help achieve climate goals. GRNB provides access to a diverse group of issuers who are proactively investing in climate solutions, including renewable energy, green buildings, clean transportation and more.</p>
<p>Download the report to learn more about how investment in GRNB translates into real-world results. Topics include:</p>
<ul class="content-list">
<li>The impact per $1M of investment in GRNB, including energy savings, CO2 reduction and clean energy generation.</li>
<li>Alignment with UN Sustainable Development Goals.</li>
<li>Top 10 issuer highlights and project examples.</li>
<li>Use of proceeds by project type.</li>
</ul>

<p>To receive more <a href="/us/en/insights/income-investing/" title="Income Investing Insights"><strong>Income Investing</strong></a> insights, <a href="/link/5f45412c2143400497908cea2897f7d3.aspx" title=" Subscription Center"><strong>sign up in our subscription center</strong></a>.</p>
]]></content:encoded>
</item><item rdf:about="https://www.vaneck.com/us/en/blogs/natural-resources/copper-and-the-materials-behind-global-electrification/">
  <title>Copper and the Materials Behind Global Electrification></title>
  <link>https://www.vaneck.com/us/en/blogs/natural-resources/copper-and-the-materials-behind-global-electrification/</link>
  <description><![CDATA[Electrification, AI and clean energy are reshaping global infrastructure. Copper and critical metals are foundational inputs driving long-term demand across grids, data centers and EVs.]]></description>
  <dc:creator> </dc:creator>
  <dc:date>02/13/2026 06:30:00</dc:date>
<content:encoded><![CDATA[

<p><strong>Key Takeaways:</strong></p>
<ul class="content-list">
<li class="mt-2">Electrification is driving structurally higher copper demand across grids, EVs and clean energy.</li>
<li class="mt-2">AI and data center growth are reinforcing metals intensity in global infrastructure.</li>
<li class="mt-2">Supply constraints may amplify copper&rsquo;s long-term importance as electrification accelerates.</li>
</ul>
<h2>Metals Powering Electrification: Copper and the Critical Materials Behind a More Electric World</h2>
<p>The global economy is becoming more electrified, more automated and more data-driven. While these shifts are often discussed in digital terms i.e. artificial intelligence (AI), cloud computing and clean technologies, their foundation is physical. Electrification, AI and data centers all depend on metals that enable power transmission, connectivity and reliability at scale.</p>
<p>As a result, the future of infrastructure is increasingly a materials story. At the center of that story is copper, supported by a broader group of critical metals essential to electrification.</p>
<h2>Electrification Is Driving Structural Metals Demand</h2>
<p>Electrification extends far beyond electric vehicles (EVs). It includes power generation, grid modernization, energy storage, industrial automation and charging infrastructure. Compared with fossil-fuel-based systems, electrified technologies tend to be more materials-intensive, particularly when it comes to conductive and energy-related metals.</p>
<p>Copper plays a foundational role due to its electrical conductivity, durability and efficiency. It is widely used across electrified systems, including:</p>
<ul class="content-list">
<li class="mt-2">Power transmission and distribution networks</li>
<li class="mt-2">Electric motors, transformers and wiring</li>
<li class="mt-2">Renewable energy installations</li>
<li class="mt-2">Electric vehicle charging infrastructure</li>
</ul>
<p>As electrification expands, copper demand grows not only because more infrastructure is being built, but because electrified systems require significantly more copper per unit of energy delivered than conventional alternatives.</p>
<h2>Grid Expansion and the Rising Role of Copper</h2>
<p>Modern power grids are becoming larger, more interconnected and more complex. Integrating renewable energy, supporting distributed power sources and meeting rising electricity demand all require extensive upgrades to transmission and distribution networks.</p>
<p>Each of these upgrades increases copper consumption through new transmission lines, substations, transformers and grid-scale energy storage. As global electrification accelerates, grid expansion is expected to remain one of the most significant long-term drivers of copper demand.</p>
<h2>AI, Data Centers and Physical Infrastructure</h2>
<p>The rapid adoption of AI has accelerated global investment in data centers, facilities that require reliable power delivery, advanced cooling systems and dense electrical interconnections, directly increasing metals demand.</p>
<p>Copper remains essential for power distribution, cabling and cooling systems within data centers. Aluminum is widely used for structural components and heat management due to its lightweight properties. Meanwhile, specialty and minor metals, such as gallium and germanium, play critical roles in semiconductors, optical components and advanced chips that support AI workloads.</p>
<p>As data centers scale in size and computing intensity, metal usage per facility has increased, reinforcing the link between digital growth and physical infrastructure.</p>
<h2>Electric Vehicles, Clean Energy and Critical Metals</h2>
<p>Electric vehicles are materially different from internal combustion engine vehicles. EVs typically require several times more copper due to electric motors, inverters, wiring harnesses and charging systems. Clean energy sources like wind and solar also require a range of critical metals.</p>
<ul class="content-list">
<li class="mt-2"><strong>Lithium, nickel and cobalt</strong>, which influence battery energy density and longevity</li>
<li class="mt-2"><strong>Manganese</strong>, used in certain battery chemistries and wind turbines</li>
<li class="mt-2"><strong>Rare earth elements</strong>, essential for high-performance permanent magnets</li>
</ul>
<p>Together, these materials form the core inputs for electrified transportation and clean energy systems.</p>
<h2>What Drives Copper Prices</h2>
<p>Copper prices are influenced by a combination of structural and cyclical factors. Long-term demand growth tied to electrification, renewable energy and digital infrastructure is a key structural driver. On the supply side, mine production, declining ore grades and development timelines play an important role.</p>
<p>Macroeconomic factors, including global growth trends and inflation, can also influence copper prices. Because copper is embedded across construction, manufacturing, energy and technology, it is often viewed as both an indicator of economic activity and a beneficiary of long-term electrification trends.</p>
<p>Studies have shown that copper demand is expected to grow from 28 million metric tons per year in 2025 to 42 million metric tons by 2040, an increase of 50% above current levels.</p>
<h3>Chart 1: Global copper demand by sector (2025 &ndash; 2040)</h3>
<p><i> Million metric tons copper (MMt Cu) </i></p>
<p><img loading="lazy" class="img-responsive w-100" src="https://www.vaneck.com/EPiServer/CMS/Content/contentassets/82d73a1489b64d6d8c386e8328c568dc/6776_emet-gmet-blog_chart-1_2026-02_v1.svg,,361217/Download?epieditmode=False" alt="Global copper demand by sector (2025 &ndash; 2040)" /></p>
<p class="chart-disclosure"><sup>1.</sup>Includes copper demand from construction, cooling, appliances, fossil power generation, machinery and internal combustion engine (ICE) vehicles.<sup>2.</sup>Includes copper demand from clean energy technologies, transmission and distribution (T&amp;D) and EVs.<br />Source: S&amp;P Global &copy; 2026 S&amp;P Global. Not intended as a forecast or prediction of future results. For illustrative purposes only.</p>


<h2>Supply Constraints and the Importance of New Investment</h2>
<p>Copper is not scarce in absolute terms, but expanding supply has become increasingly challenging. New mine development is capital-intensive and can take many years from discovery to production. At the same time, declining ore grades mean more material must be processed to produce the same amount of copper.</p>
<p>Similar supply challenges exist across other electrification metals, many of which have geographically concentrated supply chains. These dynamics can limit how quickly supply responds to rising demand, increasing the importance of sustained investment and innovation across the mining and processing ecosystem.</p>
<h3>Chart 2: Copper&rsquo;s Looming Supply Gap</h3>
<p><img loading="lazy" class="img-responsive" alt="Copper&rsquo;s Looming Supply Gap" src="https://www.vaneck.com/EPiServer/CMS/Content/contentassets/d17989db9c834e768ed0f6e13f87a381/6776_emet-gmet-blog_chart-1_2026-02_v1.svg,,361254/Download?epieditmode=False" /></p>
<p class="chart-disclosure">Source: Wood Mackenzie, Goldmans Sachs. Data as of December 2025.</p>
<p>Copper exposure is significantly important to the <a href="/link/87d6a3678ec445ee9f240584921cba00.aspx" title="EMET | VanEck Copper and Green Metals ETF - Overview"><strong>VanEck Copper and Green Metals ETF (EMET)</strong></a>.</p>
<h3>Chart 3: Highlights the weights of the metal exposures based on revenue generation in the fund</h3>
<p><img loading="lazy" class="img-responsive w-100" src="https://www.vaneck.com/EPiServer/CMS/Content/contentassets/057848ad01d64c40bba02169c90216a7/6776_emet-gmet-blog_chart-3_2026-02_v2.svg,,361196/Download?epieditmode=False" alt="Highlights the weights of the metal exposures based on revenue generation in the fund" /></p>
<p class="chart-disclosure">Source: VanEck Research. Data as of December 2025. *PGMs: Platinum Group Metals (platinum, palladium, rhodium, ruthenium, iridium, and osmium). Fund holdings and exposure weights may vary. Visit vaneck.com/emet for most recent holdings data.</p>
<h2>Positioning for a More Electrified Economy</h2>
<p>Electrification, AI and data center expansion are often viewed as separate themes, yet they share a common reliance on metals that enable power, connectivity and performance. Copper plays an important role in this transformation, supported by battery metals, rare earth elements and specialty materials.</p>
<p>The <a href="/link/87d6a3678ec445ee9f240584921cba00.aspx" title="EMET | VanEck Copper and Green Metals ETF - Overview"><strong>VanEck Copper and Green Metals ETF (EMET)</strong></a> highlights copper and critical electrification metals as essential inputs for modern infrastructure and long-term structural growth.</p>
<p>To receive more <a href="/us/en/insights/natural-resources/" title="Natural Resources Insights"><strong>Natural Resources</strong></a> insights, <a href="https://www.vaneck.com/us/en/subscribe/" title="Subscription Center"><strong>sign up in our subscription center</strong></a>.</p>
]]></content:encoded>
</item><item rdf:about="https://www.vaneck.com/us/en/blogs/natural-resources/emet-etf-question-answer/">
  <title>EMET ETF: Question &amp; Answer></title>
  <link>https://www.vaneck.com/us/en/blogs/natural-resources/emet-etf-question-answer/</link>
  <description><![CDATA[Global electrification is accelerating demand for copper, a critical metal with limited substitutes. This FAQ explores the investment case and how investors can gain exposure to copper.]]></description>
  <dc:creator>Andrew Musgraves</dc:creator>
  <dc:date>02/13/2026 05:04:37</dc:date>
<content:encoded><![CDATA[

<p>Metals markets have taken center stage in recent years as demand has increased sharply, while supply has often struggled to keep pace. A major driver of base and industrial metals markets has been global electrification&mdash;expanding power generation, modernizing grid infrastructure, and building out the technologies that move, store, and use electricity more efficiently.</p>
<p>At the heart of this buildout is <strong>copper</strong>, a foundational industrial metal with few practical substitutes in many electrical applications. Investor interest has grown accordingly, but there are relatively few straightforward public equity options designed to capture upstream exposure to copper and other metals tied to electrification through the companies that produce, refine, process, and recycle them. This FAQ answers frequently asked questions on copper, select &ldquo;green metals,&rdquo; and how investors can access this theme through the <strong><a href="/link/87d6a3678ec445ee9f240584921cba00.aspx" title="EMET - VanEck Copper and Green Metals ETF - Overview">VanEck Copper and Green Metals ETF (EMET)</a>.</strong></p>
<ul class="content-list">
<li><strong><a href="#point-one">Why copper?</a></strong></li>
<li><strong><a href="#point-two">How are green metals used?</a></strong></li>
<li><strong><a href="#point-three">How can investors access exposure to these metals?</a></strong></li>
<li><strong><a href="#point-four">What are the risks of investing in these metals?</a></strong></li>
<li><strong><a href="#point-five">How prominent is China&rsquo;s role in these supply chains? </a></strong></li>
<li><strong><a href="#point-six">How do portfolios in this theme typically gain exposure to Chinese companies?</a></strong></li>
<li><strong><a href="#point-seven">Do equity-based approaches generate Schedule K-1 tax statements?</a></strong></li>
<li><strong><a href="#point-eight">How can investors buy VanEck ETFs?</a></strong></li>
</ul>
<h2 id="point-one" class="anchored-block">Why copper?</h2>
<p>Copper is a widely used base metal prized for its electrical conductivity, durability, and workability. It is essential to the &ldquo;electricity value chain&rdquo;&mdash;from generation and transmission to distribution, end-use wiring, and electrified transportation.</p>
<p>Electrification is ultimately about moving electricity reliably and efficiently&mdash;and copper is one of the main materials that makes that possible. Copper&rsquo;s importance tends to show up in four places:</p>
<ol class="content-list">
<li class="mt-2"><strong>Grid infrastructure and buildout</strong><br />Transmission and distribution systems rely heavily on conductive metals. As grids expand to connect new generation and utilities upgrade aging infrastructure, copper demand is often tied to the physical scale of wiring, transformers, substations, and distribution networks.</li>
<li class="mt-2"><strong>Power generation and interconnection</strong><br />Adding capacity&mdash;especially when it requires new interconnections&mdash;can mean more conductors, cabling, and electrical equipment across the system.</li>
<li class="mt-2"><strong>Electrified transportation</strong><br />Electric vehicles and charging networks add copper in motors, inverters, wiring harnesses, and charging equipment, alongside the copper embedded in the power system that supplies them.</li>
<li class="mt-2"><strong>Electrification of buildings and industry</strong><br />Upgrades like heat pumps, electrical retrofits, data centers, and industrial electrification can raise copper intensity through wiring, busbars, and power management equipment.</li>
</ol>
<p>Because many copper applications have limited near-term substitution options without sacrificing performance, copper often serves as a &ldquo;picks and shovels&rdquo; input to the electrification theme.</p>
<h2>Upcoming Webinar - <br />Copper: The Electrification Trade</h2>
<h2 id="point-two" class="anchored-block">How are green metals used?</h2>
<p>&ldquo;Green metals&rdquo; is a practical umbrella term for metals and minerals commonly used in electrification and related technologies. To be specific, in addition to copper this can include battery materials (e.g., lithium, nickel, cobalt, manganese, graphite), industrial and specialty inputs (e.g., zinc, tin, molybdenum, vanadium), platinum group metals (e.g., platinum, palladium, rhodium), and rare earth elements used in certain magnets (e.g., neodymium, praseodymium, dysprosium, terbium).</p>
<p>While copper is the backbone of electrical infrastructure, these other metals support key technologies built on top of that backbone:</p>
<ul class="content-list">
<li class="mt-2"><strong>Batteries / energy storage:</strong> lithium, nickel, cobalt, manganese, and graphite are common inputs depending on battery chemistry.</li>
<li class="mt-2"><strong>Motors and magnets:</strong> rare earth elements like neodymium and praseodymium are often used in permanent magnets for high-efficiency motors and generators; dysprosium and terbium can be used to improve high-temperature performance in some magnet applications.</li>
<li class="mt-2"><strong>Power electronics and specialty components:</strong> metals like tin, indium, and others can appear in soldering, coatings, and electronics-related uses.</li>
<li class="mt-2"><strong>Catalysts and industrial processes:</strong> platinum group metals can be used in catalysts and select industrial applications tied to cleaner fuels and emissions-reduction technologies.</li>
</ul>
<p>The key point: <strong>copper connects the system</strong>, while the broader set of metals supports specific technologies within electrification and clean-tech supply chains.</p>
<h2 id="point-three" class="anchored-block">How can investors access exposure to these metals?</h2>
<p>Physical investment in many of these metals is often impractical for most investors. Some have futures markets, but futures can be complex and introduce risks tied to market structure (including contango/backwardation), roll yield, and position management.</p>
<p>A common alternative is <strong>equity exposure</strong> through companies involved in:</p>
<ul class="content-list">
<li class="mt-2">Mining and production</li>
<li class="mt-2">Refining and processing</li>
<li class="mt-2">Recycling and recovery</li>
</ul>
<p>These businesses&rsquo; revenues and profitability can be influenced&mdash;sometimes significantly&mdash;by the supply/demand balance for the metals they produce and process, along with operating costs, capital intensity, permitting timelines, and geopolitics.</p>
<p>For investors seeking a more streamlined way to access this theme, the <a href="/link/87d6a3678ec445ee9f240584921cba00.aspx" title="EMET - VanEck Copper and Green Metals ETF - Overview"><strong>VanEck Copper and Green Metals ETF (EMET)</strong></a> is designed to provide liquid, diversified exposure to global producers of copper and other critical minerals that underpin electrification and grid buildout<strong>.</strong></p>
<div class="epi-contentfragment">faq-banner-cta</div>
<h2 id="point-four" class="anchored-block">What are the risks of investing in these metals?</h2>
<p>Investing in copper- and electrification-metals-related equities can involve several categories of risk:</p>
<ul class="content-list">
<li class="mt-2"><strong>Commodity cycle risk:</strong> prices can be volatile and driven by growth expectations, inventory cycles, and supply disruptions.</li>
<li class="mt-2"><strong>Operational and project risk:</strong> mining and processing projects are capital-intensive and can face delays, cost overruns, and technical challenges.</li>
<li class="mt-2"><strong>Regulatory and permitting risk:</strong> environmental standards, permitting timelines, and community/social license issues can affect supply growth.</li>
<li class="mt-2"><strong>Equity market risk:</strong> even if metal prices rise, equity performance can be influenced by broader market sentiment and company-specific execution.</li>
<li class="mt-2"><strong>Geopolitical and supply-chain concentration risk:</strong> governments may intervene to secure supply chains or restrict trade; disruptions can affect prices and margins.</li>
</ul>
<h2 id="point-five" class="anchored-block">How prominent is China&rsquo;s role in these supply chains?</h2>
<p>China is a major participant in processing and refining across several metals used in electrification and clean-tech supply chains, and it has historically been particularly prominent in rare earths and portions of the battery-materials supply chain. As a result, policy shifts, export controls, and industrial strategy can influence global pricing and availability.</p>
<p>At the same time, many countries are investing to diversify supply chains through domestic production, &ldquo;friend-shoring,&rdquo; expanded recycling, and new processing capacity&mdash;efforts that may evolve over multiple years given the long lead times in mining and refining.</p>
<h2 id="point-six" class="anchored-block">How do portfolios in this theme typically gain exposure to Chinese companies?</h2>
<p>Exposure can come through companies listed in Hong Kong, the U.S. (ADRs), or mainland listings accessed via market access programs (where eligible). The exact mechanics vary by vehicle and strategy, but the broader concept is straightforward: because China is significant in parts of these supply chains, global baskets of producers and processors often include Chinese firms.</p>
<h2 id="point-seven" class="anchored-block">Do equity-based approaches generate Schedule K-1 tax statements?</h2>
<p>Typically, equity-based approaches that invest in operating companies (miners, refiners, processors, recyclers) do not generate Schedule K-1s the way many commodity pool / partnership structures can. (As always, investors should review a product&rsquo;s tax documentation for specifics.)</p>
<h2 id="point-eight" class="anchored-block">How can investors buy VanEck ETFs?</h2>
<p><strong><a href="/link/3f62ce8a611f419890a9c9c75dc5c4d1.aspx#how-to-buy-etf&amp;amp;utm=GMET-Blog" title="How to buy VanEck ETFs?">Learn more here.</a></strong></p>
<p class="d-none d-lg-block"><a href="mailto:askvaneck@vaneck.com" title="Have More Questions? - Ask VanEck" rel="noopener"><img loading="lazy" class="img-responsive" src="https://www.vaneck.com/globalassets/home/us/insights/blogs/bm-blog-images/cta-faq_desktop-02.svg" alt="Have More Questions? - Ask VanEck" /></a></p>
<p class="d-lg-none"><a href="mailto:askvaneck@vaneck.com" title="Have More Questions? - Ask VanEck" rel="noopener"><img loading="lazy" class="img-responsive" src="https://www.vaneck.com/globalassets/home/us/insights/blogs/bm-blog-images/cta-faq_mobile-01.svg" alt="Have More Questions? - Ask VanEck" /></a></p>
<p>To receive more <a href="/us/en/blogs/natural-resources/" title="Natural Resources Insights"><strong>Natural Resources</strong></a> insights, <a href="https://www.vaneck.com/us/en/subscribe/" title="Subscription Center"><strong>sign up in our subscription center</strong></a>.</p>
]]></content:encoded>
</item><item rdf:about="https://www.vaneck.com/us/en/blogs/thematic-investing/what-is-the-video-gaming-and-esports-industry/">
  <title>What Is the Video Gaming and Esports Industry?></title>
  <link>https://www.vaneck.com/us/en/blogs/thematic-investing/what-is-the-video-gaming-and-esports-industry/</link>
  <description><![CDATA[Video gaming and esports are fast-growing, global industries. Learn how they generate revenue, and how investors can gain targeted exposure with VanEck&rsquo;s <a href="/link/d41cc1b7916f46e5bb3ee751f311c4f2.aspx" title="ESPO - VanEck Video Gaming and eSports ETF"><strong>ESPO</strong></a> ETF.]]></description>
  <dc:creator> </dc:creator>
  <dc:date>02/12/2026 06:30:00</dc:date>
<content:encoded><![CDATA[

<p><strong>Key Takeaways:</strong></p>
<ul class="content-list">
<li class="mt-2">Gaming is a mainstream form of entertainment with a large global audience.</li>
<li class="mt-2">Business models have shifted toward ongoing spending inside games.</li>
<li class="mt-2">Esports adds a spectator layer that can deepen engagement around leading titles.</li>
</ul>
<h2>What Is the Video Gaming and Esports Industry?</h2>
<p>Gaming is already part of daily life for billions of people. It shows up on phones during commutes, on consoles at night, and on PCs with friends on weekends. It is also showing up in a new place. Live competition.</p>
<p>That is where esports comes in. Esports is competitive gaming. Players and teams compete in organized matches and tournaments. Fans watch online and at live events. Some follow teams the way they follow traditional sports.</p>
<p>Gaming is the big category. Esports is one part of it.</p>
<p>Newzoo estimates the global games market at $188.8B in 2025 with 3.6B players.</p>
<h3>Global Forecasted Players &amp; Game Revenues Into 2028</h3>
<p><img loading="lazy" class="img-responsive" alt="Global Forecasted Players &amp; Game Revenues Into 2028" src="https://www.vaneck.com/EPiServer/CMS/Content/contentassets/fb87a0b067e34f99bb0b4c593ce6018d/6785_espo-blog_chart-1_2026-01_v1.svg,,360928/Download?epieditmode=False" /></p>
<p class="chart-disclosure">Source: NewZoo, as of 2025. For illustrative purposes only. Not intended as a forecast or prediction of future results.</p>

<h2>Video Gaming vs. Esports: What&rsquo;s the Difference?</h2>
<p>A simple way to think about it is this.</p>
<p>Gaming is what people do. Esports is what some people compete in and what many people watch.</p>
<div class="wrapped-div">
<table style="width: 100%;">
<tbody>
<tr class="tbl-data">
<td class="tbl-header last text-left">Category</td>
<td class="tbl-header last text-left">Video Gaming</td>
<td class="tbl-header last text-left">Esports</td>
</tr>
<tr class="tbl-data">
<td class="data-td last text-left font-weight-normal">What it is</td>
<td class="data-td last text-left font-weight-normal">Playing video games</td>
<td class="data-td last text-left font-weight-normal">Organized competitive gaming</td>
</tr>
<tr class="tbl-data">
<td class="data-td last text-left font-weight-normal">Who takes part</td>
<td class="data-td last text-left font-weight-normal">Anyone who plays</td>
<td class="data-td last text-left font-weight-normal">Competitive players, teams, and leagues</td>
</tr>
<tr class="tbl-data">
<td class="data-td last text-left font-weight-normal">Why people do it</td>
<td class="data-td last text-left font-weight-normal">Fun, social play, progress</td>
<td class="data-td last text-left font-weight-normal">Winning matches and titles</td>
</tr>
<tr class="tbl-data">
<td class="data-td last text-left font-weight-normal">Where it happens</td>
<td class="data-td last text-left font-weight-normal">Console, PC, mobile</td>
<td class="data-td last text-left font-weight-normal">Streams, leagues, live events</td>
</tr>
<tr class="tbl-data">
<td class="data-td last text-left font-weight-normal">How money is made</td>
<td class="data-td last text-left font-weight-normal">Game sales, in game spending, subscriptions, ads</td>
<td class="data-td last text-left font-weight-normal">Sponsorships, ads, media deals, tickets, merchandise</td>
</tr>
</tbody>
</table>
<br />
<h2>How the Industry Makes Money</h2>
<p>Gaming used to be mostly a one time purchase. You bought a game and you were done.</p>
<p>That still exists, but the center of the business has shifted. Many of today&rsquo;s biggest games are built to run for years. They add new content, new modes, and new seasons. Players can choose to spend over time on extras like cosmetic items or season passes.</p>
<p>Esports adds another set of revenue sources. Brands sponsor teams and events. Streams and broadcasts sell ads. Large events sell tickets and merchandise. For some titles, a strong competitive scene can keep the community active longer.</p>
<h3>Global Gaming Revenue By Platform Type</h3>
<p><img loading="lazy" class="img-responsive" alt="Global Gaming Revenue By Platform Type" src="https://www.vaneck.com/EPiServer/CMS/Content/contentassets/da864ed106094e36b730ab47ccc15bdb/6785_espo-blog_chart-2_2026-01_v1.svg,,360933/Download?epieditmode=False" /></p>
</div>
<p class="chart-disclosure">Source: Inkwood research, as of 2024. For illustrative purposes only. Not intended as a forecast or prediction of future results.</p>

<h2>The Video Gaming and Esports Network</h2>
<p>This is not a single business. It is a network of companies that support how games are made, played, and watched.</p>
<ul class="content-list">
<li class="mt-2">Game developers and publishers create games and build franchises.</li>
<li class="mt-2">Platforms and storefronts distribute games to players.</li>
<li class="mt-2">Hardware companies sell consoles, PCs, chips, and accessories.</li>
<li class="mt-2">Creators and streamers turn games into daily content.</li>
<li class="mt-2">Leagues and tournament organizers run competitive events.</li>
<li class="mt-2">Fans and players drive the whole cycle through time spent and spending.</li>
</ul>
<p>When a title becomes a hit, the impact can spread across this whole network. More players can lead to more content, more viewing, and more spending.</p>
<h2>Why Gaming and Esports Are Considered Growth Industries</h2>
<p>Gaming keeps growing because people keep choosing it. It is social. It is interactive. It works across devices. It travels globally.</p>
<p>There is also a business reason. Many games now earn money over a longer period. That can create steadier revenue than the old &ldquo;launch weekend&rdquo; model.</p>
<p>Esports fits here because it can turn a game into something people watch year round, not only something they play.</p>
<h2>Approaching the Video Gaming and Esports Opportunity</h2>
<p>For investors, the challenge is focus.</p>
<p>The industry includes publishers, platforms, and hardware firms that earn meaningful revenue from interactive entertainment. It also includes large companies where gaming is only a small side business. Those can dilute exposure if your goal is to target the theme.</p>
<p>That is where a dedicated approach can help.</p>
<p><a href="/link/d41cc1b7916f46e5bb3ee751f311c4f2.aspx" title="ESPO - VanEck Video Gaming and eSports ETF"><strong>VanEck Video Gaming and eSports ETF (ESPO)</strong></a> seeks to track the MVIS Global Video Gaming and eSports Index, which is built around companies involved in video game development, esports, and related hardware and software.</p>
<p>One design choice matters here. Companies must derive at least 50% of revenue from video gaming and or esports to be eligible for the Index. This rule is meant to keep exposure tied to the companies most directly connected to the theme.</p>
<p>For investors who want access to gaming and esports without relying on a single title or a single stock, <strong><a href="/link/d41cc1b7916f46e5bb3ee751f311c4f2.aspx" title="ESPO - VanEck Video Gaming and eSports ETF">ESPO</a></strong> offers a focused way to get exposure across the space.</p>
<p>To receive more <a href="https://www.vaneck.com/us/en/insights/thematic-investing/" title="Thematic Investing Insights"><strong>Thematic Investing</strong></a> insights, <a href="https://www.vaneck.com/us/en/subscribe/" title="Subscription Center"><strong>sign up in our subscription center</strong></a>.</p>
]]></content:encoded>
</item><item rdf:about="https://www.vaneck.com/us/en/blogs/moat-investing/moat-stocks-gain-on-defensive-sector-strength/">
  <title>Moat Stocks Gain on Defensive Sector Strength></title>
  <link>https://www.vaneck.com/us/en/blogs/moat-investing/moat-stocks-gain-on-defensive-sector-strength/</link>
  <description><![CDATA[In January, moat stocks found support as leadership broadened beyond mega-cap tech, with energy, materials, and staples leading and small-caps outperforming.]]></description>
  <dc:creator>Coulter Regal, CFA</dc:creator>
  <dc:date>02/12/2026 06:30:00</dc:date>
<content:encoded><![CDATA[

<p><strong>Key Takeaways:</strong></p>
<ul class="content-list">
<li class="mt2">Moat Index gained 1.2% in January, aided by industrials and staples as leadership broadened beyond mega-cap tech.</li>
<li class="mt2">Huntington Ingalls, Entegris, and Applied Materials led gains, driven by defense spending and improving semiconductor sentiment.</li>
<li class="mt2">SMID Moat Index rose 1.7%, led by materials and energy as smaller-cap stocks outperformed to start 2026.</li>
</ul>
<p>U.S. equity markets opened 2026 with a constructive tone, posting gains across major benchmarks despite notable swings during the month. The S&amp;P 500 rose 1.5% in January, supported by steady economic data and some easing in inflation-related concerns, even as investors continued to assess shifting policy expectations under the new administration. Market leadership broadened modestly beyond the largest mega-cap technology names. More defensive sectors such as energy, materials, and consumer staples led performance, while financials, technology, and health care lagged. Smaller-cap stocks outperformed large-caps during the month, highlighting renewed interest in cyclical and valuation-sensitive areas of the market.</p>
<p>Within this market environment, the <a href="/link/9e43dd198c5f4e419f13220685081895.aspx" title="MOAT - VanEck Morningstar Wide Moat ETF - Overview"><strong>Morningstar Wide Moat Focus Index</strong></a> (the &ldquo;Moat Index&rdquo;) gained 1.2% in January. While the Index finished the month just behind the S&amp;P 500, it got off to a strong start and was up roughly 4% mid-month, leading the benchmark through most of January. Relative performance shifted late in the month as concerns around artificial intelligence disrupting software business models weighed on markets, with a more pronounced impact on the Moat Index. Sector allocation, particularly overweights in industrials and consumer staples, was the primary driver of relative performance versus the S&amp;P 500, while stock selection detracted during the month.</p>
<p>Smaller-cap equities posted stronger gains during the month, notably outpacing large-cap stocks as market leadership broadened early in the year. The <strong><a href="/link/166321dbcfec440590fb51cf0ad629aa.aspx" title="SMOT - VanEck Morningstar SMID Moat ETF - Overview">Morningstar US Small-Mid Cap Moat Focus Index</a></strong> (the &ldquo;SMID Moat Index&rdquo;) rose 1.7% in January but underperformed both small- and mid-cap benchmarks. Relative performance was weighed down primarily by stock selection, while sector allocation was largely neutral during the month. Despite the underperformance, performance across smaller-cap companies more broadly reflected improving sentiment toward economically sensitive businesses at the start of the year.</p>
<h3>Smaller-Cap Lead the Way to Start 2026</h3>
<p><img loading="lazy" class="img-responsive" alt="Smaller-Cap Lead the Way to Start 2026" src="https://www.vaneck.com/contentassets/92e461fb3eef4711b46995980f180540/6799_moat-monthly-feb_chart-1_2026-02_v1.svg" width="1044" height="540" /></p>
<p class="chart-disclosure"><strong>Source: Morningstar. Data as of 1/31/2026.</strong> Past performance is no guarantee of future results. Index performance is not representative of fund performance. It is not possible to invest directly in an index. Please see index definitions and other important disclosures at the end of this content. Fund performance current to the most recent month end is available by visiting vaneck.com or by calling 800.826.2333.</p>
<h2 id="point-one" class="anchored-block jump-link-nav" data-jumplink-title="Moat Index">Moat Index Highlights: Industrials and Semiconductors Drive Gains</h2>
<p>In January, relative performance within the Moat Index was driven primarily by sector allocation, while stock selection detracted during the month. Overweights in industrials and consumer staples were the largest contributors to relative performance versus the S&amp;P 500, helping offset headwinds from security selection. While technology holdings featured among the top individual contributors, overall selection effects were negative, consistent with broader market pressure on several software and technology-oriented names late in the month.</p>
<p>Huntington Ingalls Industries Inc. (HII) was the top contributor to Moat Index performance during the month, with shares rising roughly 24%. The stock benefited from renewed investor focus on U.S. defense spending and shipbuilding capacity, following commentary around higher long-term defense budgets and increased emphasis on naval modernization. Morningstar continues to view Huntington Ingalls&rsquo; position as the largest independent U.S. military shipbuilder as a key source of its wide economic moat, supported by long-dated contracts and high barriers to entry.</p>
<p>Semiconductor-related holdings were also key contributors during the month, led by Entegris Inc. (ENTG) and Applied Materials Inc. (AMAT). Shares of Entegris surged more than 40% in January, reflecting improving sentiment around semiconductor capital spending and advanced chip manufacturing. Applied Materials gained roughly 25% during the month, as investors responded to its exposure to leading-edge wafer fabrication and advanced packaging. Morningstar views Entegris&rsquo; proprietary materials and high switching costs, alongside Applied Materials&rsquo; broad equipment portfolio and deep customer integration, as central to the durable competitive positions of both companies within the semiconductor ecosystem.</p>
<p>Other top contributors within the Moat Index during the month included Constellation Brands Inc. (STZ), a global beverage alcohol producer, and IDEX Corp. (IEX), a diversified industrial manufacturer.</p>
<p>Companies detracting the most from Moat Index performance in January were concentrated within technology, particularly among software-oriented companies. Weakness in these names aligned with late-month market concerns around artificial intelligence disrupting traditional software business models. Detractors included Salesforce Inc. (CRM), a provider of enterprise cloud software; Workday Inc. (WDAY), a human capital management and financial software firm; Tyler Technologies Inc. (TYL), a software provider focused on the public sector; Adobe Inc. (ADBE), a digital media and software company; and Broadridge Financial Solutions Inc. (BR), a provider of investor communications and technology solutions.</p>
<h3>Moat Index Top Contributors and Detractors - January 2026</h3>
<p><strong>Contributors</strong></p>
<div class="wrapped-div">
<table style="width: 100%;">
<tbody>
<tr class="tbl-data">
<td class="tbl-header last text-left">Company</td>
<td class="tbl-header last text-left">Ticker</td>
<td class="tbl-header last text-left">Sector</td>
<td class="tbl-header last text-right">Avg. Weight (%)</td>
<td class="tbl-header last text-right">Contribution (%)</td>
</tr>
<tr class="tbl-data">
<td class="data-td last text-left">Huntington Ingalls Industries Inc.</td>
<td class="data-td data last text-left">HII</td>
<td class="data-td data last text-left">Industrials</td>
<td class="data-td data last text-right">2.80</td>
<td class="data-td data last text-right">0.66</td>
</tr>
<tr class="tbl-data">
<td class="data-td last text-left">Entegris Inc.</td>
<td class="data-td data last text-left">ENTG</td>
<td class="data-td data last text-left">Technology</td>
<td class="data-td data last text-right">1.24</td>
<td class="data-td data last text-right">0.50</td>
</tr>
<tr class="tbl-data">
<td class="data-td last text-left">Applied Materials Inc.</td>
<td class="data-td data last text-left">AMAT</td>
<td class="data-td data last text-left">Technology</td>
<td class="data-td data last text-right">1.91</td>
<td class="data-td data last text-right">0.49</td>
</tr>
<tr class="tbl-data">
<td class="data-td last text-left">Constellation Brands Inc.</td>
<td class="data-td data last text-left">STZ</td>
<td class="data-td data last text-left">Consumer Staples</td>
<td class="data-td data last text-right">2.35</td>
<td class="data-td data last text-right">0.34</td>
</tr>
<tr class="tbl-data">
<td class="data-td last text-left">IDEX Corp.</td>
<td class="data-td data last text-left">IEX</td>
<td class="data-td data last text-left">Industrials</td>
<td class="data-td data last text-right">2.57</td>
<td class="data-td data last text-right">0.31</td>
</tr>
</tbody>
</table>
</div>
<br />
<p><strong>Detractors</strong></p>
<div class="wrapped-div">
<table style="width: 100%;">
<tbody>
<tr class="tbl-data">
<td class="tbl-header last text-left">Company</td>
<td class="tbl-header last text-left">Ticker</td>
<td class="tbl-header last text-left">Sector</td>
<td class="tbl-header last text-right">Avg. Weight (%)</td>
<td class="tbl-header last text-right">Contribution (%)</td>
</tr>
<tr class="tbl-data">
<td class="data-td last text-left">Salesforce Inc.</td>
<td class="data-td data last text-left">CRM</td>
<td class="data-td data last text-left">Technology</td>
<td class="data-td data last text-right">2.54</td>
<td class="data-td data last text-right">-0.50</td>
</tr>
<tr class="tbl-data">
<td class="data-td last text-left">Workday Inc.</td>
<td class="data-td data last text-left">WDAY</td>
<td class="data-td data last text-left">Technology</td>
<td class="data-td data last text-right">2.32</td>
<td class="data-td data last text-right">-0.42</td>
</tr>
<tr class="tbl-data">
<td class="data-td last text-left">Tyler Technologies Inc.</td>
<td class="data-td data last text-left">TYL</td>
<td class="data-td data last text-left">Technology</td>
<td class="data-td data last text-right">2.21</td>
<td class="data-td data last text-right">-0.41</td>
</tr>
<tr class="tbl-data">
<td class="data-td last text-left">Adobe Inc.</td>
<td class="data-td data last text-left">ADBE</td>
<td class="data-td data last text-left">Technology</td>
<td class="data-td data last text-right">2.48</td>
<td class="data-td data last text-right">-0.40</td>
</tr>
<tr class="tbl-data">
<td class="data-td last text-left">Broadridge Financial Solutions Inc.</td>
<td class="data-td data last text-left">BR</td>
<td class="data-td data last text-left">Industrials</td>
<td class="data-td data last text-right">2.30</td>
<td class="data-td data last text-right">-0.27</td>
</tr>
</tbody>
</table>
</div>
<p class="chart-disclosure"><strong>Source: Morningstar</strong>. Past performance is no guarantee of future results. Index performance is not illustrative of fund performance. Not intended as a recommendation to buy or to sell any of the securities mentioned herein.</p>

<h2 id="point-two" class="anchored-block jump-link-nav" data-jumplink-title="SMID Moat Index">SMID Moat Index Highlights: Materials and Energy Lead</h2>
<p>The SMID Moat Index finished January higher, supported by strong contributions from materials, energy, and industrial holdings. Sector allocation was broadly neutral during the month, and relative performance reflected a mix of positive contributors and areas of weakness. More broadly, performance trends pointed to improving sentiment toward smaller and more economically sensitive companies at the start of the year.</p>
<p>Albemarle Corp. (ALB) was the top contributor to SMID Moat Index performance during the month, with shares rising 20.6% amid improving sentiment across the lithium complex. The stock benefited from signs that lithium pricing may be stabilizing after a prolonged downturn, alongside growing confidence in supply discipline across the industry. Investors also favored Albemarle&rsquo;s position near the low end of the cost curve, with its high-quality brine assets and integrated production footprint viewed as advantages in a still-challenged pricing environment. Morningstar assigns the company an economic moat, driven by its low-cost lithium and bromine production, and believes Albemarle is well positioned to benefit as the lithium market moves toward better balance over time.</p>
<p>SLB Ltd. (SLB) was another key contributor, with shares rising roughly 26% during the month as energy markets strengthened and visibility improved around global offshore and international oilfield activity. SLB provides oilfield services, technology, and digital solutions to energy producers worldwide. Morningstar views the company&rsquo;s scale, technological leadership, and extensive customer relationships as central to its moat, particularly as energy companies prioritize efficiency and capital discipline.</p>
<p>Huntington Ingalls Industries Inc. (HII) also contributed positively within the SMID Moat Index, alongside CF Industries Holdings Inc. (CF), a producer of nitrogen fertilizers, and Nordson Corp. (NDSN), a manufacturer of precision dispensing and industrial technology equipment.</p>
<p>Companies detracting the most from SMID Moat Index performance during January included Humana Inc. (HUM), a health insurance provider; Workday Inc. (WDAY), an enterprise software company; Fidelity National Information Services Inc. (FIS), a financial technology firm; Acuity Inc. (AYI), a lighting and building management solutions provider; and Atlassian Corp. (TEAM), a collaboration software company.</p>
<h3>SMID Moat Index Top Contributors and Detractors - January 2025</h3>
<p><strong>Contributors</strong></p>
<div class="wrapped-div">
<table style="width: 100%;">
<tbody>
<tr class="tbl-data">
<td class="tbl-header last text-left">Company</td>
<td class="tbl-header last text-left">Ticker</td>
<td class="tbl-header last text-left">Sector</td>
<td class="tbl-header last text-right">Avg. Weight (%)</td>
<td class="tbl-header last text-right">Contribution (%)</td>
</tr>
<tr class="tbl-data">
<td class="data-td last text-left">Albemarle Corp.</td>
<td class="data-td data last text-left">ALB</td>
<td class="data-td data last text-left">Materials</td>
<td class="data-td data last text-right">1.92</td>
<td class="data-td data last text-right">0.40</td>
</tr>
<tr class="tbl-data">
<td class="data-td last text-left">SLB Ltd.</td>
<td class="data-td data last text-left">SLB</td>
<td class="data-td data last text-left">Energy</td>
<td class="data-td data last text-right">1.42</td>
<td class="data-td data last text-right">0.37</td>
</tr>
<tr class="tbl-data">
<td class="data-td last text-left">Huntington Ingalls Industries Inc.</td>
<td class="data-td data last text-left">HII</td>
<td class="data-td data last text-left">Industrials</td>
<td class="data-td data last text-right">1.56</td>
<td class="data-td data last text-right">0.37</td>
</tr>
<tr class="tbl-data">
<td class="data-td last text-left">CF Industries Holdings Inc.</td>
<td class="data-td data last text-left">CF</td>
<td class="data-td data last text-left">Materials</td>
<td class="data-td data last text-right">1.31</td>
<td class="data-td data last text-right">0.27</td>
</tr>
<tr class="tbl-data">
<td class="data-td last text-left">Nordson Corp.</td>
<td class="data-td data last text-left">NDSN</td>
<td class="data-td data last text-left">Industrials</td>
<td class="data-td data last text-right">1.43</td>
<td class="data-td data last text-right">0.20</td>
</tr>
</tbody>
</table>
</div>
<br />
<p><strong>Detractors</strong></p>
<div class="wrapped-div">
<table style="width: 100%;">
<tbody>
<tr class="tbl-data">
<td class="tbl-header last text-left">Company</td>
<td class="tbl-header last text-left">Ticker</td>
<td class="tbl-header last text-left">Sector</td>
<td class="tbl-header last text-right">Avg. Weight (%)</td>
<td class="tbl-header last text-right">Contribution (%)</td>
</tr>
<tr class="tbl-data">
<td class="data-td last text-left">Humana Inc.</td>
<td class="data-td data last text-left">HUM</td>
<td class="data-td data last text-left">Health Care</td>
<td class="data-td data last text-right">1.24</td>
<td class="data-td data last text-right">-0.30</td>
</tr>
<tr class="tbl-data">
<td class="data-td last text-left">Workday Inc.</td>
<td class="data-td data last text-left">WDAY</td>
<td class="data-td data last text-left">Technology</td>
<td class="data-td data last text-right">1.29</td>
<td class="data-td data last text-right">-0.23</td>
</tr>
<tr class="tbl-data">
<td class="data-td last text-left">Fidelity National Information Services Inc.</td>
<td class="data-td data last text-left">FIS</td>
<td class="data-td data last text-left">Financials</td>
<td class="data-td data last text-right">1.35</td>
<td class="data-td data last text-right">-0.23</td>
</tr>
<tr class="tbl-data">
<td class="data-td last text-left">Acuity Inc.</td>
<td class="data-td data last text-left">AYI</td>
<td class="data-td data last text-left">Industrials</td>
<td class="data-td data last text-right">1.38</td>
<td class="data-td data last text-right">-0.20</td>
</tr>
<tr class="tbl-data">
<td class="data-td last text-left">Atlassian Corp.</td>
<td class="data-td data last text-left">TEAM</td>
<td class="data-td data last text-left">Technology</td>
<td class="data-td data last text-right">0.64</td>
<td class="data-td data last text-right">-0.17</td>
</tr>
</tbody>
</table>
</div>
<p class="chart-disclosure"><strong>Source: Morningstar</strong>. Past performance is no guarantee of future results. Index performance is not illustrative of fund performance. Not intended as a recommendation to buy or to sell any of the securities mentioned herein.</p>

<h2 id="point-three" class="anchored-block jump-link-nav" data-jumplink-title="Choose Your Moat Strategy">Choose Your Moat Strategy</h2>
<p>VanEck&rsquo;s suite of <strong><a href="/us/en/blogs/moat-investing/moat-investing-powered-by-morningstar/" title="Quality Companies at Attractive Prices">moat investing strategies</a></strong> is powered by Morningstar&rsquo;s equity research team, which seeks quality companies trading at attractive valuations. The below ETFs offer access to US moat companies:</p>
<p><a href="/link/9e43dd198c5f4e419f13220685081895.aspx" title="MOAT - VanEck Morningstar Wide Moat ETF - Overview"><strong>VanEck Morningstar Wide ETF (MOAT)</strong></a>: companies with a wide moat rating, which means Morningstar believes the company is likely to sustain its competitive advantage for at least the next 20 years.</p>
<p><a href="/link/166321dbcfec440590fb51cf0ad629aa.aspx" title="SMOT - VanEck Morningstar SMID Moat ETF - Overview"><strong>VanEck Morningstar SMID Moat ETF (SMOT)</strong></a>: small and mid-cap moat companies.</p>
<p><a href="/link/fd582da052ba46c79bfc112c078a6256.aspx" title="MVAL - VanEck Morningstar Wide Moat Value ETF - Overview"><strong>VanEck Morningstar Wide Moat Value ETF (MVAL)</strong></a>: wide moat companies within Morningstar&rsquo;s value style category.</p>
<p>To receive more <a href="https://www.vaneck.com/us/en/insights/moat-investing" title="Moat Investing Insights"><strong>Moat Investing</strong></a> insights, <a href="https://www.vaneck.com/us/en/subscribe/" title="Subscription Center"><strong>sign up in our subscription center</strong></a>.</p>
]]></content:encoded>
</item><item rdf:about="https://www.vaneck.com/us/en/blogs/model-portfolios/january-market-recap-a-roadmap-for-a-gold-bull-market/">
  <title>January Market Recap: A Roadmap for a Gold Bull Market></title>
  <link>https://www.vaneck.com/us/en/blogs/model-portfolios/january-market-recap-a-roadmap-for-a-gold-bull-market/</link>
  <description><![CDATA[Gold&rsquo;s surge reflects a structural bull market driven by debt, currency debasement, and geopolitics, with pullbacks normal and ownership still low.]]></description>
  <dc:creator>David Schassler</dc:creator>
  <dc:date>02/12/2026 00:30:00</dc:date>
<content:encoded><![CDATA[

<p><strong>Key Takeaways</strong></p>
<ul class="content-list">
<li class="mt-2">This is the third major gold bull market in modern history, and history suggests it&rsquo;s still in progress.</li>
<li class="mt-2">Structural forces including debt, geopolitics, and currency debasement, are driving gold, not short-term cycles.</li>
<li class="mt-2">Despite strong long-term performance and diversification benefits, most investors remain materially under-allocated to gold.</li>
</ul>

<h2>Gold at Plaid Speed</h2>
<p>The gold bull market has reached Plaid Speed. It started at Light Speed: Gold moved from $2,000 in early 2024 to $3,000 by March 2025. Then came Ludicrous Speed: $4,000 by October. Next was Plaid Speed: $5,400 as we entered 2026. And that changes the conversation around gold.</p>
<h3>Gold&rsquo;s Consistent Outperformance</h3>
<p><img loading="lazy" class="img-responsive" alt="Gold&rsquo;s Consistent Outperformance" src="https://www.vaneck.com/EPiServer/CMS/Content/contentassets/05b2fc2ee0ee446ba4bc7d4297e422a2/6805_models-monthly-feb_chart-1_2026-02_v1.svg,,360978/Download?epieditmode=False" /></p>
<p class="chart-disclosure">Source: Morningstar, as of 1/31/2026. Past performance is no guarantee of future results.</p>
<h2 id="point-one" class="anchored-block jump-link-nav" data-jumplink-title="Three Types of Gold Investors">Three Types of Gold Investors</h2>
<p>We tend to speak with three types of investors. The first group has loved gold for a long time. They have owned it for years. This is a small but passionate group that warned about runaway government spending well before it became fashionable. They feel vindicated. They are not surprised.</p>
<p>The second group is newer to gold. They are not gold bugs. They simply recognize that the world has changed. Debt levels are extreme. Geopolitics matter again. Currency credibility can no longer be taken for granted. Gold now makes sense to them.</p>
<p>The third group is the most difficult. These investors avoided gold for most of their careers. They believe gold is dead money. They would rather invest almost anywhere else. This group remains uncomfortable. And it is large. We will come back to them.</p>
<h2>Then It Happened</h2>
<p>After reaching new highs, gold prices pulled back sharply. Crocodile tears followed.</p>
<p>This is usually the moment when investors lose perspective.</p>
<p>Now is the time to look backward for context. This commentary is meant to serve as a roadmap for the gold bull market.</p>
<h2>This Is Not the First Gold Bull Market</h2>
<p>This is the third major gold bull market in modern times.</p>
<p>The first occurred in the 1970s. The second unfolded in the 2000s.</p>
<p>Those two bull markets delivered returns of roughly 500% and 600%, respectively.</p>
<p>The current bull market, which began in 2022, has already returned 200%.</p>
<p>History does not suggest this move is over, rather, still in progress.</p>
<h2>Bull Markets Include Pullbacks</h2>
<p>Bull markets do not move in straight lines. None of them do.</p>
<p>During the prior two gold bull markets, there were five corrections of 10% or more. Said more simply, when you make a lot of money quickly, you should expect to give some of it back.</p>
<p>The current gold bull market has already experienced two corrections of 10% or more.</p>
<p>The takeaway is straightforward: Gold is acting like gold in a gold bull market.</p>
<h3>Gold Historical Drawdowns</h3>
<p><img loading="lazy" class="img-responsive" alt="Gold Historical Drawdowns" src="https://www.vaneck.com/EPiServer/CMS/Content/contentassets/0b1070109360455db7401b0ff7bb2298/6805_models-monthly-feb_chart-2_2026-02_v1_blog.svg,,360986/Download?epieditmode=False" /></p>
<p class="chart-disclosure">Source: Bloomberg. As of 2026.</p>
<h2>Why We Believe This Bull Market is Structural</h2>
<p>We have been vocal in our views on gold for years. We view this gold bull market as structural, not cyclical.</p>
<p>Debt levels are extreme. Future government spending tied to the global technology race is unavoidable. Together, these forces point toward persistent currency debasement.</p>
<p>At the same time, the United States has demonstrated that the dollar is not a neutral custodian. This has accelerated the global search for reserve assets outside the control of any single government.</p>
<p>Gold sits at the intersection of these forces. It is both a hedge against debasement and a neutral reserve asset in a fragmenting financial system.</p>
<h2>A Critical Structural Asymmetry</h2>
<p>There is another structural point that matters.</p>
<p>The ratio of the market capitalization of global equity markets to the gold market has exploded.</p>
<p>This matters because incremental reallocation demand does not need to be large to drive meaningful price moves in gold.</p>
<p>Small shifts have the potential to push gold to levels that would make even the gold bug&rsquo;s blush.</p>
<p>That same dynamic also implies higher volatility.</p>
<h3>Ratio of Market Cap/Gold</h3>
<p><strong>1996-2025</strong></p>
<p><img loading="lazy" class="img-responsive" alt="Ratio of Market Cap/Gold 1996-2025" src="https://www.vaneck.com/EPiServer/CMS/Content/contentassets/9601f3421b824e21b07937b227c202f0/6805_models-monthly-feb_chart-3_2026-02_v1.svg,,360994/Download?epieditmode=False" /></p>
<p class="chart-disclosure">Source: USGS. As of 2025.</p>
<h2>Everyone is Talking About Gold. Few Own It.</h2>
<p>We speak with a lot of investors. Everyone is talking about gold. Few own it in size.</p>
<p>We believe a prudent gold allocation is around 5%. Many investors have far less. Many have none.</p>
<p>CNBC recently reported that nearly three quarters of family offices surveyed said they have zero gold exposure.</p>
<p>This is a good moment to revisit those three types of gold investors.</p>
<h2 id="point-two" class="anchored-block jump-link-nav" data-jumplink-title="Gold&rsquo;s Role in Your Asset Allocation">Gold&rsquo;s Role in Your Asset Allocation</h2>
<p>Before addressing the dead money argument, it is important to zoom out.</p>
<p>We like assets with strong long-term performance.</p>
<p>Gold is the second top performing asset over the long term. Not as strong as stocks. Far better than bonds.</p>
<h3>Gold Performance vs. Other Asset Classes</h3>
<p><strong>1972-2026</strong></p>
<p><img loading="lazy" class="img-responsive" alt="Gold Performance vs. Other Asset Classes 1972-2026" src="https://www.vaneck.com/EPiServer/CMS/Content/contentassets/faedc22faa2c4e2da4deb415d9cb98e1/6805_models-monthly-feb_chart-4_2026-02_v1.svg,,361003/Download?epieditmode=False" /></p>
<p class="chart-disclosure">Source: Bloomberg. As of 2025.</p>
<p>We really like assets with low correlations to other asset classes. Gold has virtually no correlation to stocks or bonds. And we love assets that perform when others do not. Gold just might be that asset, and it may be the only one.</p>
<h3>Gold Correlation vs. Other Asset Classes</h3>
<div class="wrapped-div">
<table style="width: 100%;">
<tbody>
<tr class="tbl-data">
<td class="tbl-header last text">&nbsp;</td>
<td class="tbl-header last text-right">US Stocks</td>
<td class="tbl-header last text-right">US Bonds</td>
<td class="tbl-header last text-right">Gold</td>
</tr>
<tr class="tbl-data">
<td class="data-td last text-left font-weight-normal">US Stocks</td>
<td class="data-td last text-right font-weight-normal">1.00</td>
<td class="data-td last text-right font-weight-normal">-</td>
</tr>
<tr class="tbl-data">
<td class="data-td last text-left font-weight-normal">US Bonds</td>
<td class="data-td last text-right font-weight-normal">0.11</td>
<td class="data-td last text-right font-weight-normal">1.00</td>
<td class="data-td last text-right font-weight-normal">-</td>
</tr>
<tr class="tbl-data">
<td class="data-td last text-left font-weight-normal">Gold</td>
<td class="data-td last text-right font-weight-normal">0.02</td>
<td class="data-td last text-right font-weight-normal">0.06</td>
<td class="data-td last text-right font-weight-normal">1.00</td>
</tr>
</tbody>
</table>
</div>
<p class="chart-disclosure">Source: Bloomberg, as of 2026.</p>
<h3>Gold Average Return During Drawdowns in US Stocks, Bonds and Commodities</h3>
<p><strong>1972-2026</strong></p>
<p><img loading="lazy" class="img-responsive" alt="Gold Average Return During Drawdowns in US Stocks, Bonds and Commodities 1972-2026" src="https://www.vaneck.com/EPiServer/CMS/Content/contentassets/9e16b420621e4ac5a6eaccfc5a9abbce/6805_models-monthly-feb_chart-5_2026-02_v1.svg,,361030/Download?epieditmode=False" /></p>
<p class="chart-disclosure">Source: Bloomberg, as of 2026.</p>
<h2>On the Myth of Dead Money</h2>
<p>One of the most common arguments we hear is that gold is dead money and that this period is the exception.</p>
<p>As if the current gold bull market is random.</p>
<p>As if it offers no information about risk and opportunity.</p>
<p>We reject that idea.</p>
<p>We define dead money as the number of calendar days required to surpass a previous high. In other words, the time spent clawing capital back from losses.</p>
<p>When we examine the historical distribution of dead money events for gold and the S&amp;P 500, the results are instructive.</p>
<p>Stocks experience more short-term dead money events than gold.</p>
<p>Over medium and long horizons, the results are similar.</p>
<p>History does not justify this concern relative to equities (or bonds, but that&rsquo;s a subject for another day).</p>
<h3>Gold vs. S&amp;P 500 Dead Money Events: Calendar Days to Surpass Previous High</h3>
<p><strong>1927-2025</strong></p>
<p><img loading="lazy" class="img-responsive" alt="Gold vs. S&amp;P 500 Dead Money Events: Calendar Days to Surpass Previous High 1927-2025" src="https://www.vaneck.com/EPiServer/CMS/Content/contentassets/cde658d84c0242b8a031f95f4ddd9f37/6805_models-monthly-feb_chart-6_2026-02_v1.svg,,361041/Download?epieditmode=False" /></p>
<p class="chart-disclosure">Source: Bloomberg, as of 2025.</p>
<h2>A Final Thought</h2>
<p>We could be wrong.</p>
<p>It is possible that debt and deficits stop mattering. That heavily leveraged countries grow and save their way out of this cycle while funding massive investments in AI, automation, energy, and other critical infrastructure.</p>
<p>It is possible that wealth becomes more evenly distributed, that geopolitical tensions fade, that global leaders once again view the U.S. dollar as the most trusted and neutral custodian of wealth.</p>
<p>After all, anything is possible.</p>
<p>We will keep our gold just in case.</p>

<h2 id="point-three" class="anchored-block jump-link-nav" data-jumplink-title="Macro themes we&rsquo;re watching">Macro themes we&rsquo;re watching:</h2>

<p>Today&rsquo;s predominant macro forces are driving the key themes and exposures in VanEck&rsquo;s models, including the core allocation of the <a href="https://www.vaneck.com/us/en/investments/wealth-builder-plus-portfolios/overview/" title="VanEck Wealth Builder Plus Portfolios"><strong>VanEck Wealth Builder Plus Portfolios</strong></a>. The allocations below are representative of the Moderate Portfolio.</p>
<p class="d-none d-lg-block"><img loading="lazy" class="img-responsive" src="https://www.vaneck.com/contentassets/d11c4b8e0f5f4cfcbc522aa3e045a64d/6398_models-monthly-october_pie-chart-1_2025-11_v1_desktop.svg" alt="Asset Allocation" /></p>
<p style="width: 345px;" class="d-lg-none"><img loading="lazy" class="img-responsive" src="https://www.vaneck.com/contentassets/d11c4b8e0f5f4cfcbc522aa3e045a64d/6398_models-monthly-october_pie-chart-1_2025-11_v1_mobile_blog.svg" alt="Asset Allocation" /></p>
<p class="chart-disclosure">Source: VanEck, 11/30/2025. Not intended as a recommendation to buy or sell any securities or digital assets, or as investment or any call to action.</p>
<div class="wrapped-div">
<table style="width: 100%;">
<tbody>
<tr class="tbl-data">
<td class="tbl-header last text-left">Asset Class</td>
<td class="tbl-header last text-right">Allocation</td>
<td class="tbl-header last text-left">Related Products</td>
</tr>
<tr class="tbl-data">
<td class="tbl-header last text-left">Equity</td>
<td class="tbl-header last text-right">&nbsp;</td>
<td class="tbl-header last text-left">&nbsp;</td>
</tr>
<tr class="tbl-data">
<td class="data-td data last text-left">Economic Moats</td>
<td class="data-td data last text-right">3.5%</td>
<td class="data-td data last text-left"><a href="/link/9e43dd198c5f4e419f13220685081895.aspx" title="MOAT - VanEck Morningstar Wide Moat ETF"><strong>MOAT</strong></a> | <a href="/link/166321dbcfec440590fb51cf0ad629aa.aspx" title="SMOT - VanEck Morningstar SMID Moat ETF"><strong>SMOT</strong></a></td>
</tr>
<tr class="tbl-data">
<td class="data-td data last text-left">AI &amp; Technology</td>
<td class="data-td data last text-right">2.5%</td>
<td class="data-td data last text-left"><a href="/link/018811e6db344b7691fd273a97737194.aspx" title="GPZ - VanEck Alternative Asset Manager ETF"><strong>SMH</strong></a></td>
</tr>
<tr class="tbl-data">
<td class="data-td data last text-left">Private Markets</td>
<td class="data-td data last text-right">2.0%</td>
<td class="data-td data last text-left"><a href="/link/018811e6db344b7691fd273a97737194.aspx" title="GPZ - VanEck Alternative Asset Manager ETF"><strong>GPZ</strong></a> | <a href="/link/c48bed1be12e47c88f01e1bdbfa51ed2.aspx" title="BIZD - VanEck BDC Income ETF"><strong>BIZD</strong></a></td>
</tr>
<tr class="tbl-data">
<td class="data-td data last text-left">Leapfrog Innovation</td>
<td class="data-td data last text-right">0.5%</td>
<td class="data-td data last text-left"><a href="/link/6eb23584c31940ce96a2427607da5914.aspx" title="GLIN - VanEck India Growth Leaders ETF"><strong>GLIN</strong></a></td>
</tr>
<tr class="tbl-data">
<td class="tbl-header last text-left">Fixed Income</td>
<td class="tbl-header last text-right">&nbsp;</td>
<td class="tbl-header last text-left">&nbsp;</td>
</tr>
<tr class="tbl-data">
<td class="data-td data last text-left">Attractive Valuation</td>
<td class="data-td data last text-right">5.0%</td>
<td class="data-td data last text-left"><a href="/link/edc87d2b16cf4498a2884c1752ac9fe0.aspx" title="MIG - VanEck Moody&rsquo;s Analytics IG Corporate Bond ETF"><strong>MIG</strong></a></td>
</tr>
<tr class="tbl-data">
<td class="data-td data last text-left">Yield &amp; Safety</td>
<td class="data-td data last text-right">2.5%</td>
<td class="data-td data last text-left"><a href="/link/e090deaddc774ac699a04b959d9254c6.aspx" title="CLOI - VanEck CLO ETF"><strong>CLOI</strong></a></td>
</tr>
<tr class="tbl-data">
<td class="data-td data last text-left">Yield &amp; Low Duration</td>
<td class="data-td data last text-right">2.5%</td>
<td class="data-td data last text-left"><a href="/link/0eff4e75a2114e0f8a7e71694dc0ad16.aspx" title="FLTR - VanEck IG Floating Rate ETF"><strong>FLTR</strong></a></td>
</tr>
<tr class="tbl-data">
<td class="data-td data last text-left">High Quality High Yield</td>
<td class="data-td data last text-right">2.5%</td>
<td class="data-td data last text-left"><a href="/link/6278aaa8fa7e4afbb46e353ce2efd55f.aspx" title="ANGL - VanEck Fallen Angel High Yield Bond ETF"><strong>ANGL</strong></a></td>
</tr>
<tr class="tbl-data">
<td class="data-td data last text-left">Emerging Markets</td>
<td class="data-td data last text-right">1.5%</td>
<td class="data-td data last text-left"><a href="/link/b572cc2d2799458eb526924e28c41513.aspx" title="HYEM - VanEck Emerging Markets High Yield Bond ETF"><strong>HYEM</strong></a></td>
</tr>
<tr class="tbl-data">
<td class="tbl-header last text-left">Real Assets</td>
<td class="tbl-header last text-right">&nbsp;</td>
<td class="tbl-header last text-left">&nbsp;</td>
</tr>
<tr class="tbl-data">
<td class="data-td data last text-left">De-Dollarization</td>
<td class="data-td data last text-right">4.0%</td>
<td class="data-td data last text-left"><a href="/link/982ab5546e32473b85c7b266bc6b2be6.aspx" title="OUNZ - VanEck Merk Gold ETF"><strong>OUNZ</strong></a></td>
</tr>
<tr class="tbl-data">
<td class="data-td data last text-left">Diversified Real Assets</td>
<td class="data-td data last text-right">2.0%</td>
<td class="data-td data last text-left"><a href="/link/310be2aebcad4c5cb5a89a82fd128841.aspx" title="RAAX - VanEck Real Assets ETF"><strong>RAAX</strong></a></td>
</tr>
<tr class="tbl-data">
<td class="data-td data last text-left">Energy Transition</td>
<td class="data-td data last text-right">2.0%</td>
<td class="data-td data last text-left"><a href="/link/49acb0d4174146e9a0269c9cb81c02bb.aspx" title="NLR - VanEck Uranium and Nuclear ETF"><strong>NLR</strong></a> | <a href="/link/5f7e90d690b947acabb6e7a0cc30e35c.aspx" title="EINC - VanEck Energy Income ETF"><strong>EINC</strong></a></td>
</tr>
<tr class="tbl-data">
<td class="tbl-header last text-left">Digital Assets</td>
<td class="tbl-header last text-right">&nbsp;</td>
<td class="tbl-header last text-left">&nbsp;</td>
</tr>
<tr class="tbl-data">
<td class="data-td data last text-left">De-Dollarization</td>
<td class="data-td data last text-right">2.5%</td>
<td class="data-td data last text-left"><strong><a href="/link/c754aca617ab4535a8e611ded6d5b13c.aspx" title="HODL - VanEck Bitcoin ETF">HODL</a></strong></td>
</tr>
</tbody>
</table>
</div>
<p class="chart-disclosure">Source: VanEck, FactSet. As of 01/31/2026. For illustrative purposes only. Not intended as an offer or recommendation to buy or sell any securities referenced herein. Strategy allocations will vary. Holdings exclude cash.</p>
<p>To receive more <strong><a href="https://www.vaneck.com/us/en/insights/guided-allocation/" title="Model Portfolio Insights">Model Portfolio</a></strong> insights, <strong><a href="https://www.vaneck.com/us/en/subscribe/" title="Subscription Center">sign up in our subscription center</a></strong>.</p>
]]></content:encoded>
</item><item rdf:about="https://www.vaneck.com/us/en/blogs/economic-trends/understanding-debasement-and-its-portfolio-implications/">
  <title>Understanding Debasement and Its Portfolio Implications></title>
  <link>https://www.vaneck.com/us/en/blogs/economic-trends/understanding-debasement-and-its-portfolio-implications/</link>
  <description><![CDATA[Debasement is back in focus. Here&rsquo;s what&rsquo;s driving it, what could reverse it and how we&rsquo;re positioning portfolios for both scenarios.]]></description>
  <dc:creator>Patrick Schramm</dc:creator>
  <dc:date>02/10/2026 06:30:00</dc:date>
<content:encoded><![CDATA[

<p><strong>Key Takeaways:</strong></p>
<ul class="content-list">
<li class="mt-2">Debasement occurs when fiat currencies lose purchasing power and investor confidence over time.</li>
<li class="mt-2">Fiscal stress, monetary easing and geopolitical risk drive demand for alternative stores of value like gold.</li>
<li class="mt-2">AI-driven productivity gains, policy credibility and currency stability could unwind debasement.</li>
<li class="mt-2">Our Wealth Builder Portfolios balance debasement hedges with exposure to assets that may benefit from reversal.</li>
</ul>
<p><i>An investment in the VanEck Bitcoin ETF (&ldquo;<a href="/link/c754aca617ab4535a8e611ded6d5b13c.aspx" title="HODL - VanEck Bitcoin ETF - Overview"><strong>HODL</strong></a>&rdquo;) and VanEck Merk Gold ETF (&ldquo;<strong><a href="/link/982ab5546e32473b85c7b266bc6b2be6.aspx" title="OUNZ - VanEck Merk Gold ETF - Overview">OUNZ</a></strong>,&rdquo; and together with <a href="/link/c754aca617ab4535a8e611ded6d5b13c.aspx" title="HODL - VanEck Bitcoin ETF - Overview"><strong>HODL</strong></a>, the &ldquo;Trusts&rdquo;) is subject to significant risk and may not be suitable for all investors. The value of Bitcoin is highly volatile, and you can lose your entire principal investment. <a href="/link/c754aca617ab4535a8e611ded6d5b13c.aspx" title="HODL - VanEck Bitcoin ETF - Overview"><strong>HODL</strong></a> and <a href="/link/982ab5546e32473b85c7b266bc6b2be6.aspx" title="OUNZ - VanEck Merk Gold ETF - Overview"><strong>OUNZ</strong></a> are not investment companies registered under the Investment Company Act of 1940 (the &ldquo;1940 Act&rdquo;) and therefore are not subject to the same protections as mutual funds or ETFs registered under the 1940 Act.</i></p>
<p>Debasement is a popular term that has gotten a lot of press in the past year and a topic we have written frequently about as a core part of our <strong><a href="https://www.vaneck.com/us/en/insights/investment-outlook/?p=1" title="Investment Outlook Insights">quarterly outlooks</a></strong> and <strong><a href="https://www.vaneck.com/us/en/insights/model-portfolios/?p=1" title="Model Portfolios Insights">model portfolio positioning</a></strong>.</p>
<p>In this blog, we define what debasement is, outline the conditions that have brought it back into focus, explore what could reverse it and explain how we reflect that balance in our model portfolios.</p>
<h2 id="point-one" class="anchored-block jump-link-nav" data-jumplink-title="What Is Debasement">What Is Debasement?</h2>
<p>Debasement refers to the erosion of confidence and purchasing power of fiat currency.</p>
<p>It typically emerges as the result of money supply expansion, quantitative easing and sustained low interest rates. These conditions erode the real value of fiat money over time through inflation or financial repression. When money is worth less and fixed rate investments do not compensate investors for these risks, they tend to seek out alternative potential stores of value.</p>
<p>Debasement is not a modern phenomenon. It has played a part in some of history&rsquo;s greatest boom-bust cycles. Around 64AD, Roman emperor Nero began reducing the silver content in the Denarius, the Roman currency, in order to raise revenues to support and strengthen his empire. Over time, repeated debasements diluted the currency from pure silver to roughly 5% silver by the end of the 3rd century, dramatically expanding supply.</p>
<p>This caused significant inflation, leading to economic instability, which was a key factor in the crumbling of the Roman empire.</p>
<h2 id="point-two" class="anchored-block jump-link-nav" data-jumplink-title="Key Drivers">Conditions that Drive Debasement</h2>
<p>Fast forward to today. We have new policy tools, but the same economic forces. Debasement tends to emerge when several fiscal, monetary and geopolitical forces converge:</p>
<ul class="content-list">
<li class="mt-2"><strong>High and rising sovereign debt levels: </strong>US debt at $37T now exceeds GDP, and annual interest expense is approximately $1T. When debt service becomes large and potentially unsustainable, people lose confidence in the debtor (in this case G10 sovereigns) and either sell their bonds or demand a higher interest rate as compensation.</li>
<li class="mt-2"><strong>Large and expanding deficits</strong>: Massive deficit expansion has led to an increase in money supply during a period of below average interest rates. This policy cocktail is inflationary and erodes the purchasing power of fiat currency.</li>
<li class="mt-2"><strong>Sustained monetary easing and low real yields</strong>: Low interest rates allow governments to spend more, because it costs less. Once they start spending, it&rsquo;s hard to stop. This is also inflationary and as an incremental dollar spent becomes less productive, investors lose confidence in the government as an effective allocator of capital. When inflation is higher than the real yield an investor can earn from holding a fixed rate investment, investors reallocate capital towards potential store of value assets.</li>
<li class="mt-2"><strong>Loss of confidence in institutions and fiat money</strong>: Fiscal stress can leads to political conflict in the form of how much to spend and on what, which leads to government shutdowns and partisan bickering. Investors lose confidence in the system and seek out alternative stores of value.</li>
<li class="mt-2"><strong>Geopolitical uncertainty</strong>: Trade wars, tariffs and the instability of hostile nations expand the loss of confidence from onshore to being a global phenomenon, which leads other central banks to act and diversify away from fiat currency into alternative stores of value.</li>
</ul>
<p>These conditions should sound familiar. We are currently living through versions of all of them today, which is why alternative stores of value, like gold and silver in particular, have been among the best performing assets over the past year.</p>
<h2 id="point-three" class="anchored-block jump-link-nav" data-jumplink-title="Reversal Conditions">What Could Reverse the Debasement Trade</h2>
<p>With these forces in place for over a year, it is equally important to consider what could shift the narrative.</p>
<p><strong>Fiscal credibility returns and debt stabilizes</strong>: Sustained deficit reduction, through spending restraint, increases in tax collection, entitlement reform or growth, may begin to outpace debt accumulation. As investors start to believe the debt can be serviced, demand for alternative stores of value is reduced.</p>
<p><strong>Strong productivity leads growth, which results in disinflation: </strong>Real growth driven by technology-led productivity may boost output and tax collection, putting downward pressure on prices. Disinflationary growth reduces debt and makes holding bonds or cash more rewarding.</p>
<p><strong>Fiat currency stabilizes: </strong>Currency values are relative, so capital goes towards where it is most productive. Positive currency returns lead to investment capital returning to assets denominated in that currency.</p>
<p><strong>Reduction in geopolitical uncertainty: </strong>The perception of lower systemic risk reduces the demand for alternative stores of value and brings support to fiat currency and risk assets.</p>
<p><strong>Inflation returns to target, restoring policy credibility: </strong>Persistent low inflation alongside growth that is at or above trend drives investor confidence in policy and the overall direction of the economy, which supports risk assets over alternative stores of value.</p>
<p>Just as the conditions that create the debasement phenomenon are not mutually exclusive, the conditions that can unwind it are not either. Instead, progress in one or two of these areas can reinforce others. For example, if the advancements of AI lead to sustainable productivity gains, that could act to lower inflation, tighten monetary conditions, improve debt sustainability and drive currency stability. This reinforcement loop would reduce the demand for alternative stores of value and increase the demand for both risk assets (equities) and fixed rate investments (bonds).</p>
<h2 id="point-four" class="anchored-block jump-link-nav" data-jumplink-title="How to Allocate">How Are We Playing This in Our Model Portfolios?</h2>
<p>VanEck&rsquo;s Wealth Builder <a href="/link/66b1175c2973436da185f1eb7be4c319.aspx" title="VanEck Wealth Builder Core Portfolios"><strong>Core Portfolios</strong></a> and <strong><a href="/link/6e9d9147570e4f1f93468eee6ea2af7a.aspx" title="VanEck Wealth Builder Plus Portfolios">Plus Portfolios</a></strong> are positioned to reflect both sides of the debasement narrative in measured proportions. We are providing investors with protection from further erosion in purchasing power while maintaining exposure to assets that may benefit from a reversal in conditions.</p>
<p>On the debasement side, we have exposure to real assets such as gold via the <strong><a href="/link/982ab5546e32473b85c7b266bc6b2be6.aspx" title="OUNZ - VanEck Merk Gold ETF - Overview">VanEck Merk Gold ETF (OUNZ)</a></strong>, broad commodities via the <strong><a href="/link/310be2aebcad4c5cb5a89a82fd128841.aspx" title="RAAX - VanEck Real Assets ETF - Overview">VanEck Real Assets ETF (RAAX)</a></strong> and digital assets via the <a href="/link/c754aca617ab4535a8e611ded6d5b13c.aspx" title="HODL - VanEck Bitcoin ETF - Overview"><strong>VanEck Bitcoin ETF (HODL)</strong></a>. These allocations are intended to provide exposure to assets that have historically been viewed as potential hedges in environments characterized by inflation, financial repression or declining confidence in fiat currencies.<sup>1</sup></p>


<p>At the same time, we also own cyclical and growth equities which have historically benefited when similar conditions improved. Within growth, we tilt our exposure away from the more expensive parts of the market and towards AI beneficiaries. Of the above-mentioned risks to the debasement trade, AI-led productivity gains stand out, and we want to maintain exposure to this structural theme.</p>
<p>Our fixed income allocations are selectively exposed to interest rate risks, emphasizing lower duration fixed rate exposure with tilts towards floating rate non sovereign debt in the form of CLOs via the <strong><a href="/link/e090deaddc774ac699a04b959d9254c6.aspx" title="CLOI - VanEck CLO ETF - Overview">VanEck CLO ETF (CLOI)</a></strong> and business development companies via the <strong><a href="/link/c48bed1be12e47c88f01e1bdbfa51ed2.aspx" title="BIZD - VanEck BDC Income ETF - Overview">VanEck BDC Income ETF (BIZD)</a></strong>.</p>

<p>In the current environment we continue to favor owning debasement and inflation fighting assets in higher proportion relative to historical average, while remaining aware of the conditions that can shift this dynamic.</p>
<p>To receive more <strong><a href="https://www.vaneck.com/us/en/insights/economic-trends/" title="Economic Trends Insights">Economic Trends</a></strong> insights, <strong><a href="https://www.vaneck.com/us/en/subscribe/" title="Subscription Center">sign up in our subscription center</a></strong>.</p>
]]></content:encoded>
</item><item rdf:about="https://www.vaneck.com/us/en/blogs/emerging-markets-bonds/em-debt-strength-holds-as-dm-policy-noise-grows/">
  <title>EM Debt Strength Holds as DM Policy Noise Grows></title>
  <link>https://www.vaneck.com/us/en/blogs/emerging-markets-bonds/em-debt-strength-holds-as-dm-policy-noise-grows/</link>
  <description><![CDATA[EM bonds outperformed as higher yields and carry dominated outcomes, with local currency exposure benefiting from rate volatility and geopolitical shocks that favored EM over DM.]]></description>
  <dc:creator>Eric Fine</dc:creator>
  <dc:date>02/10/2026 06:30:00</dc:date>
<content:encoded><![CDATA[

<p id="performance-overview" class="jump-link-nav anchored-block" data-jumplink-title="Performance Overview"><strong>Key Takeaways:</strong></p>
<ul class="content-list">
<li class="mt-2">Emerging markets have recently outperformed developed markets despite ongoing rate volatility.</li>
<li class="mt-2">Local currency exposure and carry are driving returns, even as rising U.S. yields weigh on USD bonds.</li>
<li class="mt-2">Geopolitical shocks benefited EM assets again, reinforcing their relative value compared to developed markets. <a href="/link/f447bf0c04f64108a3dcff3ca025af4a.aspx" title="EMBX - VanEck Emerging Markets Bond ETF - Overview"><strong>EMBX</strong></a> is currently yielding 5.56% (30-Day SEC Yield)<sup>*</sup></li>
</ul>
<div class="chart-disclosure">
<p><sup>*</sup>Past performance is no guarantee of future results. Please see 30-Day SEC Yield definition and disclosures at the end of this content.</p>
<p><i>The views and opinions stated herein should not be construed as any call to action, are not recommendations to buy or sell any security, or to adopt any investment strategy, are for illustrative purposes only, are subject to change without notice, and are those of the author(s) and not necessarily those of VanEck or its other employees.</i></p>
</div>
<p>The <a href="/link/f447bf0c04f64108a3dcff3ca025af4a.aspx" title="EMBX - VanEck Emerging Markets Bond ETF - Overview"><strong>VanEck Emerging Markets Bond ETF (EMBX)</strong></a> is yielding 5.56% (30-Day SEC Yield), and was up 2.19% in January, compared to 1.43% for its benchmark, the 50% J.P. Morgan Government Bond Index - Emerging Markets Global Diversified (GBI-EM) and 50% J.P. Morgan Emerging Markets Bond Index (EMBI), 0.96% for the Global Agg, and -0.26% for the planet&rsquo;s favorite &ldquo;safe haven&rdquo;, low volatility asset, US Treasuries. In 2025, the ETF was up 19.05% compared to 16.79% for its benchmark. Local currency led the month, with USD bonds able to rally but held back by &ldquo;risk&rdquo; in the &ldquo;risk-free&rdquo; asset, Treasuries (i.e., yields rose). We made few material changes, despite a very strong January and 2025. Local currency exposure is at 48%, Carry is 6.5%, yield to worst (YTW) is 7.5% and duration is 5.2.</p>
<h3>Average Annual Total Returns<sup>*</sup>&nbsp;(%) (In USD)</h3>
<div class="wrapped-div">
<table style="width: 100%;">
<tbody>
<tr class="tbl-data">
<td class="tbl-header last text-left">Month End As of January 31, 2026</td>
<td class="tbl-header last text-right">1 Mo</td>
<td class="tbl-header last text-right">3 Mo</td>
<td class="tbl-header last text-right">YTD</td>
<td class="tbl-header last text-right">1 Yr</td>
<td class="tbl-header last text-right">3 Yrs</td>
<td class="tbl-header last text-right">5 Yrs</td>
<td class="tbl-header last text-right">10 Yrs</td>
</tr>
<tr class="tbl-data">
<td class="data-td last text-left">EMBX (NAV)</td>
<td class="data-td data last text-right">2.20</td>
<td class="data-td data last text-right">4.47</td>
<td class="data-td data last text-right">2.20</td>
<td class="data-td data last text-right">19.17</td>
<td class="data-td data last text-right">9.93</td>
<td class="data-td data last text-right">4.48</td>
<td class="data-td data last text-right">5.76</td>
</tr>
<tr class="tbl-data">
<td class="data-td last text-left">EMBX (Share Price)</td>
<td class="data-td data last text-right">2.23</td>
<td class="data-td data last text-right">4.40</td>
<td class="data-td data last text-right">2.23</td>
<td class="data-td data last text-right">19.07</td>
<td class="data-td data last text-right">9.89</td>
<td class="data-td data last text-right">4.46</td>
<td class="data-td data last text-right">5.75</td>
</tr>
<tr class="tbl-data">
<td class="data-td last text-left">50% GBI-EM/50% EMBI</td>
<td class="data-td data last text-right">1.43</td>
<td class="data-td data last text-right">3.45</td>
<td class="data-td data last text-right">1.43</td>
<td class="data-td data last text-right">16.43</td>
<td class="data-td data last text-right">9.26</td>
<td class="data-td data last text-right">2.00</td>
<td class="data-td data last text-right">4.34</td>
</tr>
</tbody>
</table>
</div>
<h3>Average Annual Total Returns<sup>*</sup>&nbsp;(%) (In USD)</h3>
<div class="wrapped-div">
<table style="width: 100%;">
<tbody>
<tr class="tbl-data">
<td class="tbl-header last text-left">Quarter End As of December 31, 2025</td>
<td class="tbl-header last text-right">1 Mo</td>
<td class="tbl-header last text-right">3 Mo</td>
<td class="tbl-header last text-right">YTD</td>
<td class="tbl-header last text-right">1 Yr</td>
<td class="tbl-header last text-right">3 Yrs</td>
<td class="tbl-header last text-right">5 Yrs</td>
<td class="tbl-header last text-right">10 Yrs</td>
</tr>
<tr class="tbl-data">
<td class="data-td last text-left">EMBX (NAV)</td>
<td class="data-td data last text-right">1.41</td>
<td class="data-td data last text-right">3.15</td>
<td class="data-td data last text-right">19.04</td>
<td class="data-td data last text-right">10.84</td>
<td class="data-td data last text-right">3.87</td>
<td class="data-td data last text-right">5.49</td>
</tr>
<tr class="tbl-data">
<td class="data-td last text-left">EMBX (Share Price)</td>
<td class="data-td data last text-right">1.12</td>
<td class="data-td data last text-right">3.03</td>
<td class="data-td data last text-right">18.91</td>
<td class="data-td data last text-right">10.80</td>
<td class="data-td data last text-right">3.85</td>
<td class="data-td data last text-right">5.48</td>
</tr>
<tr class="tbl-data">
<td class="data-td last text-left">50% GBI-EM/50% EMBI</td>
<td class="data-td data last text-right">1.11</td>
<td class="data-td data last text-right">3.32</td>
<td class="data-td data last text-right">16.80</td>
<td class="data-td data last text-right">10.08</td>
<td class="data-td data last text-right">1.50</td>
<td class="data-td data last text-right">4.20</td>
</tr>
</tbody>
</table>
</div>
<div class="chart-disclosure">
<p><sup>*</sup>&nbsp;Returns less than one year are not annualized.</p>
<p><strong>The performance data quoted represents past performance. Past performance is not a guarantee of future results. Investment return and principal value of an investment will fluctuate so that an investor's shares, when redeemed, may be worth more or less than their original cost. Performance may be lower or higher than performance data quoted. Please call 800.826.2333 or visit vaneck.com for performance current to the most recent month ended.</strong></p>
<p>Prior to 10/06/2025, the Fund operated as the VanEck Emerging Markets Bond mutual fund; performance shown before that date is that fund&rsquo;s NAV performance (Class I, unadjusted for today&rsquo;s ETF expenses).</p>
<p>The "Net Asset Value" (NAV) of a Fund is determined at the close of each business day, and represents the dollar value of one share of the fund; it is calculated by taking the total assets of the fund, subtracting total liabilities, and dividing by the total number of shares outstanding. The NAV is not necessarily the same as the ETF 's intraday trading value. Investors should not expect to buy or sell shares at NAV.</p>
<p><strong>EMBX Total Expense Ratio &ndash; 0.76%.</strong> Van Eck Associates Corporation (the &ldquo;Adviser&rdquo;) will pay all expenses of the Fund, except for the fee payment under the investment management agreement, acquired fund fees and expenses, interest expense, offering costs, trading expenses, taxes and extraordinary expenses. Notwithstanding the foregoing, the Adviser has agreed to pay the offering costs until at least May 1, 2027. &ldquo;Other Expenses&rdquo; have been restated to reflect current fees.</p>
</div>

<p><strong>Warsh happened. World panicked. EM rallied.</strong> We like to comment when we have something to say that you might not have heard before, or to re-explain something that might be poorly explained/understood. Nothing to say here. Dovish for rates and hawkish for balance sheet? This is well-discussed terrain. Our only framing is that central banking is hyper-politicized in the US. Now, we&rsquo;re open to the idea that Warsh could be viewed as anti-politicization, too. The market&rsquo;s view is the former. Is that what you want as a reserve asset?</p>
<p><strong>Venezuela happened. World panicked. EM rallied.</strong> In fact, Venezuela bonds gapped higher and neighboring Colombia did the opposite of panicking by being the strongest local currency YTD (we are overweight). We were overweight Venezuela bonds (in USD) through the critical weekend after which bonds gapped higher. And we bought more since (on a brief pullback)<sup>1</sup>. We&rsquo;ve written in detail on both Venezuela and Colombia (Dave Austerweil and Natalia Gurushina have a truly great and geeky piece coming out on how our process values Venezuela, stay tuned). The appropriate spin is yet again &ldquo;geopolitical risk boosts EM&rdquo;. Your author is in Dubai as he writes, and they are worried about Iran &ldquo;risk&rdquo;. Just like everyone was worried about Venezuela &ldquo;risk&rdquo;. I believe the market&rsquo;s perception of risk appeared asymmetric during this period. Your author is struck by the consensus here that Iran represents &ldquo;risk,&rdquo; Let&rsquo;s state this simply: a significant negative outcome for Iran could, paradoxically, reduce the risk and discount rate that should be applied to assets elsewhere in the region, (those that are not in Iran). We think it&rsquo;s bullish.. And it will create potential opportunities.</p>

<h2 id="exposure-types-and-significant-changes" class="jump-link-nav anchored-block" data-jumplink-title="Exposure Types and Significant Changes">Exposure Types and Significant Changes</h2>
<p>The changes to our top positions are summarized below. Our largest positions in January were Mexico, Brazil, Malaysia, Poland, and Colombia:</p>
<ul class="content-list">
<li class="mt-2">We increased our hard currency sovereign exposure in Ecuador. The country&rsquo;s fiscal consolidation is on track, and at the end of December the IMF approved the fourth<sup>h</sup>review of the Extended Fund Facility program, unlocking additional disbursements. The government also successfully tapped the international financial market (USD4B), lowering the risk associated with forthcoming maturities. In terms of our investment process, this improved the policy/politics test score for the country.</li>
<li class="mt-2">We also increased our hard currency sovereign exposure in Venezuela, following the dramatic shift in the political landscape that resulted in the removal of President Maduro and the appointment of Delcy Rodriguez as the acting president. Rodriguez is considered practical and intent on working together with the U.S., which increases the probability of the &ldquo;goldilocks&rdquo; scenario with subsequent elections and inflows in Venezuela&rsquo;s oil sector. This scenario also increases the chances of a creditor-positive debt restructuring with high recovery value for bondholders. In terms of our investment process, this improved the policy/politics test score for the country.</li>
<li class="mt-2">We reduced our local currency exposure in Uruguay, where the central bank surprised with a massive 100 bps rate cut in order to weaken the currency and make sure that inflation does not fall below the target range. Uruguay was a popular long among investors in EM local debt, but the rate worsened the policy/politics test score for the country, leading to profit-taking.</li>
<li class="mt-2">We also reduced our hard currency sovereign exposure in South Africa. South Africa&rsquo;s sovereign spread closed the gap with BB-rated sovereigns (which opened in the middle of 2023) as the market almost fully priced in structural and policy improvements under the government of national unity. In the absence of new positive catalysts, this worsened the technical test score for the country, exposing it to the negative influence of exogenous factors.</li>
</ul>
<p>To receive more <a href="https://www.vaneck.com/us/en/insights/emerging-markets-bonds/" title="Emerging Markets Bonds Insights"><strong>Emerging Markets Bonds</strong></a> insights, <a href="/link/5f45412c2143400497908cea2897f7d3.aspx" title=" Subscription Center"><strong>sign up in our subscription center</strong></a>.</p>
]]></content:encoded>
</item><item rdf:about="https://www.vaneck.com/us/en/blogs/gold-investing/ima-casanova-gold-bull-market-endures-early-2026-volatility/">
  <title>Gold Bull Market Endures Early 2026 Volatility></title>
  <link>https://www.vaneck.com/us/en/blogs/gold-investing/ima-casanova-gold-bull-market-endures-early-2026-volatility/</link>
  <description><![CDATA[Gold price swings in January highlighted volatility, not weakness. Strong demand, central bank buying and improving miner fundamentals continue to support a durable long-term bull market in 2026.]]></description>
  <dc:creator>Imaru Casanova</dc:creator>
  <dc:date>02/10/2026 06:30:00</dc:date>
<content:encoded><![CDATA[

<p>Monthly gold market and economic insights from <strong><a href="/link/cfa7139e649944fea51aa2a740b2372e.aspx?p=1" title="Imaru Casanova &mdash; Portfolio Manager, Gold and Precious Metals">Imaru Casanova, Portfolio Manager</a></strong>, featuring her unique views on mining and gold&rsquo;s portfolio benefits.</p>
<p><strong>Key Takeaways:</strong></p>
<ul class="content-list">
<li class="mt-2">Gold&rsquo;s January spike and drop highlight volatility, but the bull market thesis remains intact.</li>
<li class="mt-2">2025 demand hit records as ETFs surged and central banks remained strong buyers.</li>
<li class="mt-2">Miners are catching up as higher long-term gold forecasts support re-rating potential.</li>
</ul>

<h2>Gold&rsquo;s Volatile Start to 2026</h2>
<p>Gold had a phenomenal, albeit very volatile, start to the year. Rising geopolitical tensions around the world, in particular, developments involving Venezuela, Iran and Greenland, combined with persistent U.S. tariff and sanctions threats, pushed gold above $5,000 per ounce on January 26. Breaking through that psychological level appeared to unleash a wave of speculative buying. By January 29, gold was trading at an intraday high of $5,595 per ounce, nearly $1,300 higher than at the end of 2025.</p>
<p>That kind of price action made a pullback almost inevitable, and markets quickly found a catalyst in the nomination of Kevin Warsh as the next Fed Chair on January 30. Gold fell 9% on the day. Warsh was initially seen as a more hawkish choice, supportive of the U.S. dollar and generally negative for gold, signaling potentially less accommodative monetary policy ahead. That said, after the initial reaction, the implied probability of Fed rate cuts ticked up slightly, possibly reflecting Warsh&rsquo;s comments suggesting alignment with President Trump&rsquo;s preference for lower rates. Gold closed January 30 at $4,894.23 per ounce, ending the month up $574.86, or 13.31%.</p>
<h3>Chart 1: 3-Month Gold Price</h3>
<p><img loading="lazy" class="img-responsive" alt="Gold&rsquo;s Volatile Start to 2026" src="https://www.vaneck.com/contentassets/c5ed21f653014ac5bcc9cb7e9fb22208/6793_gold-blog-feb_chart-1_2026-01_v1.svg" /></p>
<p class="chart-disclosure">Source: FactSet. Data as of January 4, 2026.</p>
<h2>Key Gold Price Drivers Remain in Place</h2>
<p>January&rsquo;s price action is a reminder of both gold&rsquo;s uncontested role as a safe haven and U.S. dollar alternative, and the increased volatility that comes with trading at record levels. In our view, these sharp swings should not distract or deter gold investors. Gold's longer-term outlook remains supported by the same forces that drove it in 2025: central banks and investors seeking protection, diversification and de-dollarization in their reserves and portfolios. Rising geopolitical risks and trade tensions, inflation concerns, a potentially weaker dollar and the risk of a meaningful correction in stretched equity markets should all continue to support gold in 2026. While new highs are likely to be followed by pullbacks and periods of range-bound trading, we believe this gold bull market still has several years to run.</p>
<p>The World Gold Council published its <a href="https://www.vaneck.com/us/en/offsite-disclaimer/?id=360915&amp;button=no&amp;url=https://www.gold.org/goldhub/research/gold-demand-trends/gold-demand-trends-full-year-2025" title="Gold Demand Trends: Q4 and Full Year 2025" target="_blank" rel="noopener"><strong>2025 Gold Demand Trends:</strong></a> Total gold demand in 2025 exceeded 5,000 tonnes for the first time, a value of $555 billion which represented a 45% increase year-on-year. Stronger investment flows fueled overall demand growth, with global gold bullion ETF holdings rising by 801 tonnes the second-largest annual increase on record, while bar and coin demand accelerated to a 12-year high. Central banks purchased 863 tonnes of gold. Although official sector buying eased in 2025, from the recent pace of around 1,000 tonnes annually, it remains historically high and broadly diversified across regions.</p>
<h2>Gold Equities Still in Catch-up Mode</h2>
<p>Gold equity markets had little time to absorb the sharp rise in gold prices during the first month of 2026. The MarketVector Global Gold Miners Index delivered a strong gain of 10.91% over the month but still underperformed the metal itself. This dynamic highlights a feature of the sector over the past decade: gold mining equities have been consistently valued using gold price assumptions that lag the spot price.</p>
<p>In recent years, as markets begin to gain confidence that higher gold prices are sustainable and adjust valuation assumptions accordingly, the gold price itself often continues to move higher, leaving equities in a persistent catch-up mode. This year, however, we are seeing a notable shift. Equity and commodity analysts are increasingly publishing gold price forecasts that not only point to higher prices in 2026 but also assume sustained or elevated price levels through 2028&ndash;2029. This should translate into stronger consensus expectations for valuations, earnings and cash flows across the sector and help support a long-overdue re-rating of gold mining equities.</p>
<h2>Outlook for Gold Mining Companies</h2>
<p>Looking ahead, most gold mining companies will report their Q4 2025 and full-year results, along with 2026 guidance, in February. While outcomes will likely vary based on company-specific factors, particularly with respect to cost increases expected in 2026, we expect a clear and consistent message to emerge. Even at lower gold prices, gold miners are generating record cash flows with robust margins, enabling increased shareholder returns and accelerating investment in the sector&rsquo;s long-term growth pipeline.</p>
<p>To receive more <strong><a href="https://www.vaneck.com/us/en/insights/gold-investing/" title="Gold Investing Insights">Gold Investing</a></strong> insights, <strong><a href="https://www.vaneck.com/us/en/subscribe/" title="Subscription Center">sign up in our subscription center</a></strong>.</p>
]]></content:encoded>
</item><item rdf:about="https://www.vaneck.com/us/en/blogs/income-investing/corporate-frns-vs-t-bills-an-investors-guide/">
  <title>Corporate FRNs vs T-Bills: An Investor’s Guide></title>
  <link>https://www.vaneck.com/us/en/blogs/income-investing/corporate-frns-vs-t-bills-an-investors-guide/</link>
  <description><![CDATA[Corporate FRNs pay floating coupons tied to short-term rates plus a credit spread, offering higher yields with minimal interest rate sensitivity. T-bills are short, zero-coupon Treasuries.]]></description>
  <dc:creator> </dc:creator>
  <dc:date>02/09/2026 06:30:00</dc:date>
<content:encoded><![CDATA[

<p><strong>Key Takeaways:</strong></p>
<ul class="content-list">
<li class="mt-2">Corporate FRNs offer yield that resets with short-term rates.</li>
<li class="mt-2">T-bills are the safest short-term cash with zero-coupon Treasuries with high liquidity and minimal credit risk.</li>
</ul>
<h2>What Is a Floating Rate Note (FRN)?</h2>
<p>A corporate floating rate note (FRN) pays a coupon which resets periodically based on a short-term reference rate (typically SOFR) plus a fixed credit spread, causing income to rise when short-term rates increase and decline when rates fall. Because these coupons adjust regularly, FRNs prices have minimal sensitivity to interest rate movements, unlike fixed-rate bonds, making income the primary source of returns over time.</p>
<h2>Who Should Invest in FRNs?</h2>
<p>Corporate floating rate notes may be appropriate for investors seeking an enhanced yield versus risk-free rates with minimal interest-rate risk. Because FRN coupons reset with prevailing reference rates, they can be particularly useful in environments where rates are elevated, volatile, or uncertain, and where traditional fixed-rate bonds face price pressure from rising yields.</p>
<p>FRNs can also function as a cash complement for investors with intermediate holding periods who are willing to accept modest volatility in exchange for higher income potential than money market instruments or Treasury bills. While corporate FRN prices tend to be stable due to low duration, returns are still influenced by credit spreads, meaning short-term volatility is possible during periods of market stress.</p>
<h2>What Is a T-Bill?</h2>
<p>Treasury bills (T-bills) are short-term U.S. government securities issued with maturities from a few days up to 52 weeks. T-bills are sold at a discount to par and pay par at maturity, they are zero-coupon instruments.</p>
<h2>Who Should Invest in T-Bills?</h2>
<p>Investors needing the safest, most liquid cash alternative, or a short-term parking place for capital should consider investing in T-bills.</p>
<h3>Key Features of FRNs vs T-Bills</h3>
<div class="wrapped-div">
<table style="width: 100%;">
<tbody>
<tr class="tbl-data">
<td class="tbl-header last text-left">Feature</td>
<td class="tbl-header last text-left">IG Floating-Rate Notes (FRNs)</td>
<td class="tbl-header last text-left">U.S. Treasury Bills (T-Bills)</td>
</tr>
<tr class="tbl-data">
<td class="data-td last text-left">Issuer</td>
<td class="data-td last text-left font-weight-normal">Corporations (financial &amp; non-financial)</td>
<td class="data-td last text-left font-weight-normal">U.S. Treasury</td>
</tr>
<tr class="tbl-data">
<td class="data-td last text-left">Credit risk</td>
<td class="data-td last text-left font-weight-normal">Low - tied to issuer credit (spread compensates)</td>
<td class="data-td last text-left font-weight-normal">Minimal - full faith &amp; credit of U.S.</td>
</tr>
<tr class="tbl-data">
<td class="data-td last text-left">Interest type</td>
<td class="data-td last text-left font-weight-normal">Floating coupon (resets)</td>
<td class="data-td last text-left font-weight-normal">Zero-coupon (discount to par)</td>
</tr>
<tr class="tbl-data">
<td class="data-td last text-left">Reference rate</td>
<td class="data-td last text-left font-weight-normal">Usually SOFR (often compounded for the period)</td>
<td class="data-td last text-left font-weight-normal">N/A</td>
</tr>
<tr class="tbl-data">
<td class="data-td last text-left">Spread</td>
<td class="data-td last text-left font-weight-normal">Fixed margin over reference (e.g., +50 bps)</td>
<td class="data-td last text-left font-weight-normal">None</td>
</tr>
<tr class="tbl-data">
<td class="data-td last text-left">Payment</td>
<td class="data-td last text-left font-weight-normal">Typically periodic (e.g., quarterly)</td>
<td class="data-td last text-left font-weight-normal">Paid at maturity only</td>
</tr>
<tr class="tbl-data">
<td class="data-td last text-left">Duration / rate sensitivity</td>
<td class="data-td last text-left font-weight-normal">Very low (&asymp;0.25) - near zero to policy rate moves</td>
<td class="data-td last text-left font-weight-normal">Very low - varies by tenor (short)</td>
</tr>
<tr class="tbl-data">
<td class="data-td last text-left">Price volatility</td>
<td class="data-td last text-left font-weight-normal">Low to moderate - can be impacted by credit-spread moves</td>
<td class="data-td last text-left font-weight-normal">Very low</td>
</tr>
<tr class="tbl-data">
<td class="data-td last text-left">Typical use</td>
<td class="data-td last text-left font-weight-normal">Enhanced cash, yield pickup vs. risk-free, limited interest rate risk</td>
<td class="data-td last text-left font-weight-normal">Cash management, safety, collateral, risk-free benchmark</td>
</tr>
</tbody>
</table>
</div>

<h2>When to Invest in FRNs vs T-Bills</h2>
<p>Corporate FRNs and T-bills both serve as short-term building blocks, but they solve different investor problems: <strong>FRNs</strong> are a yield-seeking, low-duration solution with minimal credit exposure; <strong>T-bills</strong> are the safety-first, ultra-liquid, government alternative. The right choice depends on your objectives, safety and liquidity vs. income with minimal credit risk.</p>
<ul class="content-list">
<li class="mt-2"><strong>Use FRNs</strong> when you want to harvest <strong>higher income vs risk free rates</strong> in environments where short-term rates are elevated or expected to rise, but you want to avoid the duration losses of fixed-rate bonds. FRNs are appropriate when you accept <strong>issuer credit risk</strong> in exchange for spread-based yield.</li>
<li class="mt-2"><strong>Use T-Bills</strong> when <strong>capital preservation, minimal credit risk, and liquidity</strong> are the primary objectives. T-bills are the default cash instrument for short-term liquidity, regulatory or collateral use, and conservative cash allocations.</li>
</ul>
<h2>How to Invest in FRNs</h2>
<p>Investors looking to potentially benefit from rising or uncertain interest rates can access corporate floating rate notes through ETFs tailored for today&rsquo;s evolving market environment. <strong><a href="/link/0eff4e75a2114e0f8a7e71694dc0ad16.aspx" title="FLTR - VanEck IG Floating Rate ETF">The VanEck IG Floating Rate ETF (FLTR)</a></strong> offers targeted exposure to investment grade corporate floating rate notes, providing an efficient way to add rate-responsive, investment grade income to a diversified portfolio.</p>

<p>To receive more <a href="/us/en/blogs/income-investing/" title="Income Investing Insights"><strong>Income Investing</strong></a> insights, <a href="/link/5f45412c2143400497908cea2897f7d3.aspx" title=" Subscription Center"><strong>sign up in our subscription center</strong></a>.</p>
]]></content:encoded>
</item><item rdf:about="https://www.vaneck.com/us/en/blogs/digital-assets/matthew-sigel-what-triggered-bitcoins-major-selloff-in-february-2026/">
  <title>What Triggered Bitcoin’s Major Selloff in February 2026?></title>
  <link>https://www.vaneck.com/us/en/blogs/digital-assets/matthew-sigel-what-triggered-bitcoins-major-selloff-in-february-2026/</link>
  <description><![CDATA[Bitcoin&rsquo;s February selloff reflects orderly deleveraging rather than capitulation. Despite a roughly 20% YTD decline, leverage has normalized and volatility remains below prior bear-market levels.]]></description>
  <dc:creator>Matthew  Sigel</dc:creator>
  <dc:date>02/09/2026 06:30:00</dc:date>
<content:encoded><![CDATA[

<p><strong>Please note that VanEck may have a position(s) in the digital asset(s) described below.</strong></p>
<p><strong>Note:</strong> This commentary was written on <strong>February 5</strong>, when Bitcoin was trading in the mid-<strong>$60,000s</strong>. For a quick take on the selloff, see our <i>Trends with Benefits</i> quickie <strong><a href="https://www.youtube.com/watch?v=RsWcD-yQtHM" title="Bitcoin&rsquo;s Next Move: Volatility, Cycles &amp; Signals" target="_blank" rel="noopener">here</a></strong>.</p>
<p><strong>Key Takeaways</strong></p>
<ul class="content-list">
<li class="mt-2"><strong>Deleveraging Without Capitulation:</strong> Leverage has been reduced meaningfully, while price action has remained orderly rather than disorderly.</li>
<li class="mt-2"><strong>Statistical Stress, Not Structural Failure:</strong> Multiple indicators reflect elevated stress levels, even as underlying market structure and fundamentals remain intact.</li>
<li class="mt-2"><strong>Mean Reversion Bias Emerging:</strong> Velocity, distance-from-trend, and positioning measures suggest growing potential for stabilization rather than continued acceleration lower.</li>
</ul>
<h2 id="bitcoin-deleveraging" class="jump-link-nav anchored-block" data-jumplink-title="Bitcoin Deleveraging">Deleveraging is Driving the Bitcoin Drawdown</h2>
<p>Bitcoin has experienced a sharp drawdown over the past week, with prices falling roughly <strong>19%</strong> and currently trading in the mid-<strong>$60,000s</strong>. The move has been driven by a rapid unwind of leverage rather than a single liquidation shock.</p>
<p>BTC futures open interest has fallen from roughly <strong>$61 billion</strong> one week ago to about <strong>$49 billion</strong> today, a decline of more than <strong>20%</strong> in notional exposure in just a few sessions. More broadly, futures open interest peaked above <strong>$90 billion</strong> in early October ahead of the <strong>10/10</strong> inflection, meaning the market has now shed over <strong>45%</strong> of peak leverage.</p>
<h3>Bitcoin Price Movement</h3>
<p>Bitcoin&rsquo;s price has declined by a similar magnitude over the same period. This symmetry cuts both ways. On one hand, it suggests leverage has been reduced alongside price rather than driving a disorderly unwind. On the other hand, it implies the market has not yet experienced a classic capitulation event where price overshoots leverage reduction. Over the past week, crypto markets experienced approximately <strong>$3 to $4 billion</strong> in total liquidations, with an estimated <strong>$2 to $2.5 billion</strong> concentrated in Bitcoin futures, indicating meaningful but not climactic forced selling.</p>
<h2 id="tail-event-move" class="jump-link-nav anchored-block" data-jumplink-title="Tail Event Move">A Tail-Event Move in Terms of Speed</h2>
<p>While the magnitude of the drawdown has been orderly relative to leverage reduction, the speed of the move has been extreme.</p>
<p>On February <strong>5</strong>, Bitcoin registered a <strong>-6.05&sigma;</strong> move on the rate-of-change Z-score, placing it among the fastest single-day crashes in crypto history. <i>In simple terms, &sigma; measures how unusual a move is, and a reading this large means the drop was far bigger and faster than what normally happens.</i> For context:</p>
<ul class="content-list">
<li class="mt-2">COVID crash: <strong>-9.15&sigma;</strong></li>
<li class="mt-2">FTX collapse: <strong>-4.07&sigma;</strong></li>
<li class="mt-2">February <strong>5, 2026</strong>: <strong>-6.05&sigma;</strong></li>
</ul>
<p class="chart-disclosure"><i>Source: Crash velocity and ROC Z-score analysis sourced from MarketVector Indexes, <strong><a href="https://x.com/mleinweber2/status/2019762280640971066?s=20" title="Martin Leinweber on X" target="_blank" rel="noopener">research shared by Martin Leinweber</a></strong> as of 2/5/26. <strong>Past performance is no guarantee of future results.</strong></i></p>
<p>This places the recent selloff firmly in tail-event territory. Among the <strong>15</strong> fastest crashes on record, February <strong>5</strong> ranks near the extreme end of the distribution. Historically, events of this velocity tend to exhaust panic selling rather than initiate prolonged cascades, particularly when not accompanied by systemic failure.</p>
<h2>Distance From Trend Reaches an Extreme</h2>
<p>The most striking signal emerges when viewing Bitcoin&rsquo;s distance from its long-term trend.</p>
<p>Bitcoin is currently trading <strong>-2.88&sigma;</strong> below its <strong>200-day</strong> moving average, a level not observed at any point in the past <strong>10</strong> years, including during COVID or the FTX collapse. In historical terms, <strong>0.0%</strong> of observations have been further below the <strong>200-day</strong> moving average.</p>
<p>For comparison:</p>
<ul class="content-list">
<li class="mt-2"><strong>BTC: -2.88&sigma;</strong> (<strong>0.0%</strong> of history)</li>
<li class="mt-2"><strong>SOL: -2.05&sigma;</strong> (<strong>0.3%</strong> of history)</li>
<li class="mt-2"><strong>ETH: -1.50&sigma;</strong> (<strong>5.8%</strong> of history)</li>
</ul>
<p class="chart-disclosure"><i>Source: Distance-from-trend Z-score analysis based on MarketVector Indexes, via research shared by Martin Leinweber as of 2/5/26. <strong>Past performance is no guarantee of future results.</strong></i></p>
<p>This places Bitcoin at an unprecedented distance from its long-term trend, reinforcing the view that price has become statistically disconnected from underlying trend dynamics.</p>
<h2 id="drawdown-comparison" class="jump-link-nav anchored-block" data-jumplink-title="Drawdown Comparison">Drawdowns Are Deep but Not Generational</h2>
<p>From a drawdown perspective, Bitcoin is now approaching a <strong>50%</strong> peak-to-trough decline:</p>
<ul class="content-list">
<li class="mt-2"><strong>BTC: -47.5%</strong> (worst: <strong>-83.6%</strong>)</li>
<li class="mt-2"><strong>ETH: -60.7%</strong> (worst: <strong>-94.0%</strong>)</li>
<li class="mt-2"><strong>SOL: -69.5%</strong> (worst: <strong>-96.3%</strong>)</li>
</ul>
<p class="chart-disclosure"><i>Source: Drawdown distributions and historical comparisons sourced from MarketVector Indexes <strong><a href="https://x.com/mleinweber2/status/2019762280640971066?s=20" title="Martin Leinweber on X" target="_blank" rel="noopener">research shared by Martin Leinweber</a></strong> as of 2/5/26. <strong>Past performance is no guarantee of future results.</strong></i></p>
<p>While these are severe declines, they do not yet represent generational lows. However, the key distinction is that drawdowns of this depth are now coinciding with extreme velocity, extreme distance from trend, and compressed volatility, a combination that historically marks late-stage stress rather than early-cycle deterioration.</p>
<h2>Volatility Is Lower Than Prior Bitcoin Bear Markets</h2>
<p>Importantly, this drawdown has occurred alongside materially lower realized volatility than in prior bear markets. <strong>90-day</strong> realized volatility currently sits near <strong>38</strong>, roughly half the levels observed during the <strong>2022</strong> bear market, when realized volatility exceeded <strong>70</strong> and Bitcoin ultimately declined approximately <strong>78%</strong> peak to trough.</p>
<p>The combination of a deep price drawdown and materially lower volatility suggests that a significant portion of downside risk has already been absorbed. Absent a new, Bitcoin-specific negative catalyst, relative value dynamics may begin to assert themselves.</p>
<h2>Positioning and Mean Reversion Signals Align</h2>
<p>Short-term positioning metrics reinforce the view that stress is becoming late-cycle in nature.</p>
<p>Current <strong>7-day</strong> declines rank in the <strong>99<sup>th</sup></strong> percentile of historical outcomes:</p>
<ul class="content-list">
<li class="mt-2"><strong>BTC: -22.2%</strong> (worse than <strong>98.9%</strong> of history)</li>
<li class="mt-2"><strong>ETH: -29.7%</strong> (worse than <strong>99.0%</strong> of history)</li>
<li class="mt-2"><strong>SOL: -32.0%</strong> (worse than <strong>98.8%</strong> of history)</li>
</ul>
<p class="chart-disclosure"><i>Source: Drawdown distributions and historical comparisons sourced from MarketVector Indexes, <strong><a href="https://x.com/mleinweber2/status/2019762280640971066?s=20" title="Martin Leinweber on X" target="_blank" rel="noopener">research shared by Martin Leinweber</a></strong> as of 2/5/26. <strong>Past performance is no guarantee of future results.</strong></i></p>
<p>When markets reach the far tails of negative outcomes, mean reversion becomes increasingly probable. This is echoed in derivatives markets, where funding rates across ETH and SOL have turned negative and Bitcoin funding has compressed sharply, signaling de-risking via position reduction rather than aggressive short formation.</p>
<p>Momentum indicators reflect similar stress. On Bitcoin futures continuation charts, RSI has fallen below <strong>21</strong>, an extreme oversold level that has historically preceded periods of stabilization and relief rallies.</p>
<h2>Narrative Pressure Without Structural Damage</h2>
<p>The selloff has been amplified by deterioration in adjacent risk narratives. Weakness in the AI trade has spilled into crypto, particularly impacting miners pursuing AI and high-performance computing strategies. As financing conditions tightened, miners faced pressure to sell Bitcoin to support balance sheets and capex, adding incremental spot supply at a fragile moment.</p>
<p>At the same time, governance concerns and renewed discussion of long-term risks, including quantum computing and post-quantum security, have re-entered the conversation. Notably, quantum-related equities have sold off alongside broader risk assets, making it difficult to reconcile existential threat narratives with market-implied timelines.</p>
<p>Crucially, none of these dynamics point to a failure of the underlying crypto infrastructure. Stablecoin adoption continues to accelerate, institutional tokenization efforts are expanding, and market plumbing has functioned as designed throughout the selloff.</p>
<p>This remains a macro-driven bear market, not a technology-driven one.</p>
<h2 id="bitcoin-setup-suggestion" class="jump-link-nav anchored-block" data-jumplink-title="Bitcoin Setup Suggestion">What This Setup Suggests for Bitcoin</h2>
<p>Taken together, the data paints a consistent picture:</p>
<ul class="content-list">
<li class="mt-2">Historic crash velocity</li>
<li class="mt-2">Unprecedented distance from long-term trend</li>
<li class="mt-2"><strong>99<sup>th</sup></strong> percentile downside moves</li>
<li class="mt-2">Deep, but non-terminal drawdowns</li>
</ul>
<p class="chart-disclosure"><i>Source: Short-term return distribution analysis sourced from MarketVector Indexes, via <strong><a href="https://x.com/mleinweber2/status/2019762280640971066?s=20" title="Martin Leinweber on X" target="_blank" rel="noopener">research shared by Martin Leinweber</a></strong> as of 2/5/26.<strong> Past performance is no guarantee of future results.</strong></i></p>
<p>Multiple signals are aligning. Even if this is not the bottom, the evidence increasingly supports the formation of a localized bottom.</p>
<p>Statistically:</p>
<ul class="content-list">
<li class="mt-2">Velocity panic appears exhausted</li>
<li class="mt-2">Distance from trend is unsustainable</li>
<li class="mt-2">Mean reversion is probable</li>
</ul>
<p><strong>Links to third party websites are provided as a convenience and the inclusion of such links does not imply any endorsement, approval, investigation, verification or monitoring by us of any content or information contained within or accessible from the linked sites. By clicking on the link to a non-VanEck webpage, you acknowledge that you are entering a third-party website subject to its own terms and conditions. VanEck disclaims responsibility for content, legality of access or suitability of the third-party websites.</strong></p>
<p>To receive more <strong><a href="https://www.vaneck.com/us/en/insights/digital-assets/" title="Digital Assets Insights">Digital Assets</a></strong> insights, <strong><a href="https://www.vaneck.com/us/en/subscribe/" title="Subscription Center">sign up in our subscription center</a></strong>.</p>
]]></content:encoded>
</item><item rdf:about="https://www.vaneck.com/us/en/blogs/thematic-investing/how-ai-is-reshaping-drug-discovery-and-healthcare-investing/">
  <title>How AI Is Reshaping Drug Discovery and Healthcare Investing></title>
  <link>https://www.vaneck.com/us/en/blogs/thematic-investing/how-ai-is-reshaping-drug-discovery-and-healthcare-investing/</link>
  <description><![CDATA[AI is quietly reshaping drug discovery, improving early-stage efficiency and influencing how biotech innovators and pharmaceutical leaders approach pipeline development and long-term growth.]]></description>
  <dc:creator> </dc:creator>
  <dc:date>02/06/2026 06:30:00</dc:date>
<content:encoded><![CDATA[

<p><strong>Key Takeaways:</strong></p>
<ul class="content-list">
<li class="mt-2">AI boosts efficiency in early, high-failure R&amp;D, improving success rates and capital efficiency across biotech and pharma.</li>
<li class="mt-2">Biotech uses AI for breakthrough discovery, while large pharma scales it to strengthen pipelines and manage patent risk.</li>
<li class="mt-2">VanEck&rsquo;s <strong><a href="/link/8c70259022ce47bca46cea693f49c4df.aspx" title="BBH | VanEck Biotech ETF - Overview">BBH</a></strong> and <strong><a href="/link/08c7d3f4029b4e1a85ec8795516a6f02.aspx" title="PPH | VanEck Pharmaceutical ETF - Overview">PPH</a></strong> ETFs provide complementary exposure to AI-driven innovation across healthcare.</li>
</ul>
<h2>How Is AI Changing Drug Discovery and What Does It Mean for Investors?</h2>
<p>AI is reshaping drug discovery by improving efficiency in the earliest and most failure-prone stages of development, with implications for both biotech innovators and large pharmaceutical companies.</p>
<p>Drug discovery has traditionally been slow, expensive, and uncertain. Artificial intelligence is now being deployed to improve how potential drugs are identified, designed, and evaluated, long before clinical trials begin. As the <strong><a href="https://www.vaneck.com/us/en/offsite-disclaimer/?id=360697&amp;button=no&amp;url=https://www.economist.com/science-and-technology/2026/01/05/an-ai-revolution-in-drugmaking-is-under-way" title="An AI revolution in drugmaking is under way" target="_blank" rel="noopener">Economist recently highlighted in the article <em>An AI revolution in drugmaking is under way</em></a></strong><em>,</em> this shift is already altering the economics of research and development across healthcare.</p>
<h2>What Problems Is AI Solving in Drug Development?</h2>
<p>AI helps address inefficiencies in early-stage drug discovery, where most failures occur and costs are hardest to control.</p>
<p>Historically, companies have relied on trial-and-error approaches that require screening vast numbers of compounds with low success rates. AI tools are now being used to narrow the field earlier and more intelligently.</p>
<p><strong>Key ways AI is being applied in drug development include:</strong></p>
<ul class="content-list">
<li class="mt-2">Identifying biological targets using large-scale genomic and proteomic data</li>
<li class="mt-2">Designing molecules digitally rather than relying solely on lab-based experimentation</li>
<li class="mt-2">Predicting safety or efficacy issues before candidates enter costly trial phases</li>
</ul>
<p>By improving decision-making earlier in the process, AI may help reduce wasted R&amp;D spending while increasing the number of viable drug candidates.</p>
<h2>Where Is AI Adoption Happening Across Healthcare?</h2>
<p>AI is being adopted across both biotech and pharmaceutical companies, but in different ways.</p>
<div class="wrapped-div">
<table style="width: 100%;">
<tbody>
<tr class="tbl-data">
<td class="tbl-header last">Segment</td>
<td class="tbl-header last">How AI Is Used</td>
<td class="tbl-header last">Investment Implication</td>
</tr>
<tr class="tbl-data">
<td class="data-td last font-weight-normal">Biotechnology</td>
<td class="data-td last font-weight-normal">AI-driven platforms for novel target discovery and early-stage innovation</td>
<td class="data-td last font-weight-normal">Exposure to potential breakthroughs and licensing opportunities</td>
</tr>
<tr class="tbl-data">
<td class="data-td last font-weight-normal">Pharmaceuticals</td>
<td class="data-td last font-weight-normal">AI applied across large pipelines to improve R&amp;D efficiency and pipeline durability</td>
<td class="data-td last font-weight-normal">Support for long-term revenue stability and capital discipline</td>
</tr>
</tbody>
</table>
</div>
<br />
<p>Smaller biotech firms often lead innovation, while large pharma companies benefit from scale, data depth, and diversified pipelines.</p>
<h2>Does AI Reduce Risk in Drug Discovery?</h2>
<p>AI does not eliminate risk, but it may improve the odds of bringing a drug to market.</p>
<p>Drug development remains complex, highly regulated, and uncertain. However, even modest improvements in hit rates or development timelines can be meaningful in an industry where returns depend on a small number of successful drugs.</p>
<p>For investors, the key takeaway is not faster blockbuster creation, but better capital efficiency over time.</p>
<h2>Why Is AI-Driven Healthcare Innovation Especially Important Now?</h2>
<p>AI adoption in the healthcare space coincides with a major wave of pharmaceutical patent expirations.</p>
<p>Large, liquid pharma companies have the scale, clinical expertise, and global reach to participate meaningfully in the next generation of therapeutic innovation, including the expansion of peptide-based medicines. AI assisted drug discovery may also help these firms refresh pipelines more efficiently at a time when the industry is preparing for notable patent expirations.</p>
<h3>Patent Expiration Risk for Total Worldwide Drug RX Revenues 2025-2030</h3>
<p><img loading="lazy" class="img-responsive" src="https://www.vaneck.com/EPiServer/CMS/Content/contentassets/8a85f738f93e4ecfa25341e83727435b/6765_ai-in-healthcare_chart-1_2026-2_v1_blog.svg,,360640/Download?epieditmode=False" alt="Patent Expiration Risk for Total Worldwide Drug RX Revenues 2025-2030" /></p>
<p class="chart-disclosure">Source: Worldwide; Evaluate (EvaluatePharma), as of May 2025 Past performance is no guarantee of future results.</p>
<p>If AI improves efficiency in the critical &ldquo;0 to 1&rdquo; phase, it may help established pharma companies refresh pipelines more consistently and respond more effectively to patent turnover.</p>
<p><strong>Related content: <a href="https://www.vaneck.com/us/en/blogs/thematic-investing/why-are-investors-re-evaluating-large-pharmaceutical-companies/">Why Are Investors Re-Evaluating Large Pharmaceutical Companies?</a></strong></p>
<h2><strong>How Is the AI-Enabled Healthcare Market Expected to Grow?</strong></h2>
<p>The market for AI-enabled drug discovery is expected to grow rapidly over the next decade as adoption expands across research, development, and clinical applications.</p>
<p>According to industry estimates, spending on AI tools in drug discovery is projected to accelerate meaningfully through 2032 as pharmaceutical and biotech companies increasingly embed AI into core R&amp;D workflows. This growth reflects rising confidence that AI can improve productivity in early-stage research, where costs are high and failure rates are steep.</p>
<h3><strong>Forecasted Market Growth for Global AI Drug Discovery (2023-2032)</strong></h3>
<p><img loading="lazy" class="img-responsive" src="https://www.vaneck.com/EPiServer/CMS/Content/contentassets/87dcdf5d7234484497f4e7a30677313c/6765_ai-in-healthcare_chart-2_2026-2_v1_blog.svg,,360648/Download?epieditmode=False" alt="Forecasted Market Growth for Global AI Drug Discovery (2023-2032)" /></p>
<p class="chart-disclosure">Source: Market.us, as of October 2023. Past performance is no guarantee of future results. Not intended as a forecast or prediction of future results.</p>

<p>This growth underscores why AI is increasingly viewed as a structural shift rather than a niche tool within healthcare R&amp;D.</p>
<h2><strong>How Can Investors Access These AI-Driven Healthcare Trends?</strong></h2>
<p>Investors can gain targeted exposure through biotech and pharmaceutical ETFs designed to capture different parts of the innovation cycle.</p>
<p>The <strong><a href="/link/8c70259022ce47bca46cea693f49c4df.aspx" title="BBH | VanEck Biotech ETF - Overview">VanEck Biotech ETF (BBH)</a></strong> offers access to the innovation side of AI-driven drug development:</p>
<ul class="content-list">
<li class="mt-2">Focuses on leading biotechnology companies</li>
<li class="mt-2">Provides exposure to firms at the forefront of drug discovery and innovation</li>
<li class="mt-2">Includes companies actively using AI-enabled research platforms</li>
</ul>
<p>The <strong><a href="/link/08c7d3f4029b4e1a85ec8795516a6f02.aspx" title="PPH | VanEck Pharmaceutical ETF - Overview">VanEck Pharmaceutical ETF (PPH)</a></strong> is designed to capture established global drugmakers with scale, diversified revenue streams, and proven commercialization capabilities:</p>
<ul class="content-list">
<li class="mt-2"><strong>Highly liquid companies:&nbsp;</strong>Tracks the largest most liquid pharmaceutical companies</li>
<li class="mt-2"><strong>Industry leaders:</strong>&nbsp;Favors established industry leaders with meaningful scale</li>
<li class="mt-2"><strong>Global scope:</strong>&nbsp;Provides exposure to U.S. and international equities for global industry representation</li>
</ul>
<h2>The Bottom Line: Why AI Matters for Healthcare Investors</h2>
<p>AI is not transforming drug discovery overnight, but it is steadily reshaping how innovation is pursued.</p>
<p>By improving efficiency at the earliest stages of development, AI may help:</p>
<ul class="content-list">
<li class="mt-2">Increase the productivity of R&amp;D spending</li>
<li class="mt-2">Support pipeline replenishment amid patent expirations</li>
<li class="mt-2">Strengthen the long-term outlook for both biotech innovators and pharmaceutical leaders</li>
</ul>

<p>For investors seeking to position around these trends, <strong><a href="/link/8c70259022ce47bca46cea693f49c4df.aspx" title="BBH | VanEck Biotech ETF - Overview">BBH</a> and <a href="/link/08c7d3f4029b4e1a85ec8795516a6f02.aspx" title="PPH | VanEck Pharmaceutical ETF - Overview">PPH</a> offer complementary ways to access AI-driven change across the healthcare value chain</strong>.</p>
<p>To receive more <a href="https://www.vaneck.com/us/en/insights/thematic-investing/" title="Thematic Investing Insights"><strong>Thematic Investing</strong></a> insights, <a href="https://www.vaneck.com/us/en/subscribe/" title="Subscription Center"><strong>sign up in our subscription center</strong></a>.</p>
]]></content:encoded>
</item><item rdf:about="https://www.vaneck.com/us/en/blogs/income-investing/bdcs-vs-private-credit-funds-key-differences-for-investors/">
  <title>BDCs vs. Private Credit Funds: Key Differences for Investors></title>
  <link>https://www.vaneck.com/us/en/blogs/income-investing/bdcs-vs-private-credit-funds-key-differences-for-investors/</link>
  <description><![CDATA[BDCs and private credit funds finance middle-market firms but differ in access. BDCs offer liquidity and transparency; private credit funds are less liquid with limited access and longer lock-ups.]]></description>
  <dc:creator> </dc:creator>
  <dc:date>02/02/2026 06:30:00</dc:date>
<content:encoded><![CDATA[

<h2 id="bdcs-overview" class="jump-link-nav anchored-block" data-jumplink-title="BDCs Overview">What Is a Business Development Company (BDC)?</h2>
<p>A business development company (BDC) is a publicly regulated investment vehicle investment that helps small and mid-sized U.S. businesses get money when they cannot borrow from banks.. BDCs were approved under the Investment Company Act of 1940 and are designed to support economic growth while providing investors with access to private credit markets.</p>
<h2>Publicly Traded vs. Non-Traded BDCs</h2>
<p>Not all BDCs are the same from an investor experience perspective. Broadly, BDCs fall into two categories:</p>
<ul class="content-list">
<li class="mt-2"><strong>Publicly traded BDCs</strong> trade on major stock exchanges and offer daily liquidity, transparent market pricing, and ongoing disclosure through regular financial reporting.</li>
<li class="mt-2"><strong>Non-traded BDCs</strong> are not listed on exchanges, typically offer limited liquidity through periodic redemption programs, and rely on periodic net asset value (NAV) estimates rather than continuous market pricing.</li>
</ul>
<p>When investors refer to BDCs in the context of liquidity, daily pricing, and ETF access, they are generally referring to publicly traded BDCs. These are also the types of BDCs accessed through exchange-traded funds such as the <a href="/link/c48bed1be12e47c88f01e1bdbfa51ed2.aspx" title="BIZD | VanEck BDC Income ETF - Overview"><strong>VanEck BDC Income ETF (BIZD)</strong></a>.</p>
<h2>How BDCs Work</h2>
<p>BDCs collect money from investors and arrange it primarily into senior secured loans, subordinated debt, and sometimes equity investments of middle-market companies. To keep their special tax status, BDCs elect to be regulated investment companies (RICs), which requires them to distribute the majority of their taxable income to shareholders.</p>
<p>Because BDCs are regulated and publicly listed (in the case of traded BDCs), investors benefit from standardized disclosures, portfolio transparency, and market-driven pricing.</p>
<h2>Key Characteristics of BDCs</h2>
<ul class="content-list">
<li class="mt-2">Focus on lending to U.S. middle-market companies</li>
<li class="mt-2">High income orientation due to required distributions</li>
<li class="mt-2">Publicly traded BDCs offer daily liquidity and transparent pricing</li>
<li class="mt-2">Subject to regulatory oversight and leverage limits</li>
<li class="mt-2">Income typically taxed as ordinary income</li>
</ul>
<h2 id="private-credit-funds" class="jump-link-nav anchored-block" data-jumplink-title="Private Credit Funds">What Are Private Credit Funds?</h2>
<p>Private credit funds are investment vehicles that lend money directly to private companies, often supported by private equity firms. These funds operate outside of public markets and are typically structured as private partnerships.</p>
<h2>How Private Credit Funds Operate</h2>
<p>Private credit funds raise capital from institutional investors and high-net-worth individuals. The money is usually committed for several years and used slowly over time as investment opportunities arise. In exchange, investors receive periodic income and eventual return of capital as loans mature or are refinanced.</p>
<p>Unlike publicly traded vehicles, private credit funds generally do not offer daily liquidity and may restrict withdrawals entirely during the life of the fund.</p>
<h2>Key Characteristics of Private Credit Funds</h2>
<ul class="content-list">
<li class="mt-2">Limited access, often restricted to accredited or institutional investors</li>
<li class="mt-2">Long lock-up periods with limited or no interim liquidity</li>
<li class="mt-2">Valuations based on periodic NAV estimates</li>
<li class="mt-2">Less frequent public disclosure</li>
<li class="mt-2">Potentially higher yields, but with reduced flexibility</li>
</ul>
<h2>BDCs vs. Private Credit Funds: Key Differences</h2>
<div class="wrapped-div">
<table style="width: 100%;">
<tbody>
<tr class="tbl-data">
<td class="tbl-header last">Feature</td>
<td class="tbl-header last">Publicly Traded BDCs</td>
<td class="tbl-header last">Private Credit Funds</td>
</tr>
<tr class="tbl-data">
<td class="data-td last font-weight-normal">Investor Access</td>
<td class="data-td last font-weight-normal">Broad retail and institutional access</td>
<td class="data-td last font-weight-normal">Typically accredited or institutional only</td>
</tr>
<tr class="tbl-data">
<td class="data-td last font-weight-normal">Liquidity</td>
<td class="data-td last font-weight-normal">Daily liquidity via stock exchanges</td>
<td class="data-td last font-weight-normal">Limited or no liquidity</td>
</tr>
<tr class="tbl-data">
<td class="data-td last font-weight-normal">Regulation</td>
<td class="data-td last font-weight-normal">SEC-regulated</td>
<td class="data-td last font-weight-normal">Less standardized</td>
</tr>
<tr class="tbl-data">
<td class="data-td last font-weight-normal">Pricing</td>
<td class="data-td last font-weight-normal">Market-based, real-time pricing</td>
<td class="data-td last font-weight-normal">Periodic NAV estimates</td>
</tr>
<tr class="tbl-data">
<td class="data-td last font-weight-normal">Transparency</td>
<td class="data-td last font-weight-normal">Regular public reporting</td>
<td class="data-td last font-weight-normal">Limited public disclosure</td>
</tr>
<tr class="tbl-data">
<td class="data-td last font-weight-normal">Investment Structure</td>
<td class="data-td last font-weight-normal">Public company / RIC</td>
<td class="data-td last font-weight-normal">Private partnership</td>
</tr>
</tbody>
</table>
</div>

<h2>Yield, Risk, and Volatility Considerations of BDCs</h2>
<p>Both BDCs and private credit funds are designed to generate income, but the investor experience can differ meaningfully.</p>
<h2>Income Potential of BDCs</h2>
<p>BDCs often offer attractive yields primarily because they lend to smaller, less-established companies that command higher credit spreads as compensation for increased credit risk. While many BDC loans are floating rate, which has boosted income in higher-rate environments, the underlying driver of yield is the elevated spread above base rates earned on middle-market credit. Private credit funds may target similar or higher headline yields, but those returns are often tied to longer holding periods, less frequent pricing, and reduced liquidity.</p>
<h2 id="Risk-Factors-of-BDCs" class="jump-link-nav anchored-block" data-jumplink-title="Risk Factors of BDCs">Risk Factors to Consider with BDCs</h2>
<p>Key risks across both structures include credit risk, economic sensitivity, borrower defaults, and interest rate risk related to the floating-rate nature of most private credit loans. While floating-rate structures can increase income when rates rise, they may also lead to declining income and loan repricing pressures if base rates fall. Publicly traded BDCs may also experience market price volatility, particularly during periods of broader equity market stress. However, diversification through an ETF structure can help mitigate single-issuer risk.</p>
<h2>How Investors Can Access BDCs and Private Credit Through ETFs</h2>
<p>Exchange-traded funds have expanded access to income-oriented strategies by offering diversified exposure, daily liquidity, and operational simplicity.</p>
<h2 id="Access-BDCs" class="jump-link-nav anchored-block" data-jumplink-title="Access BDCs">Accessing BDCs with the VanEck BDC Income ETF (BIZD)</h2>
<p>The<strong> <a href="/link/c48bed1be12e47c88f01e1bdbfa51ed2.aspx" title="BIZD | VanEck BDC Income ETF - Overview">VanEck BDC Income ETF (BIZD)</a></strong> provides diversified exposure to publicly traded BDCs in a single, liquid vehicle. By focusing on exchange-listed public BDCs, <a href="/link/c48bed1be12e47c88f01e1bdbfa51ed2.aspx" title="BIZD | VanEck BDC Income ETF - Overview"><strong>BIZD</strong></a> allows investors to access private credit-oriented income streams while maintaining daily liquidity, real-time market pricing, and ease of trading.</p>
<p>For investors seeking income from middle-market lending without the lock-ups and access limitations of private funds, <strong><a href="/link/c48bed1be12e47c88f01e1bdbfa51ed2.aspx" title="BIZD | VanEck BDC Income ETF - Overview">BIZD</a></strong> may serve as a practical solution.</p>
<p>The <a href="/link/c48bed1be12e47c88f01e1bdbfa51ed2.aspx" title="BIZD | VanEck BDC Income ETF - Overview"><strong>VanEck BDC Income ETF (BIZD</strong>)</a> seeks to replicate as closely as possible, before fees and expenses, the price and yield performance of the MVIS&reg;US Business Development Companies Index (MVBDCTRG), which tracks the overall performance of publicly traded business development companies.</p>


<h2>Accessing Alternative Asset Managers with the VanEck Alternative Asset Manager ETF (GPZ)</h2>
<p>The <a href="/link/018811e6db344b7691fd273a97737194.aspx" title="GPZ | VanEck Alternative Asset Manager ETF - Overview"><strong>VanEck Alternative Asset Manager ETF (GPZ)</strong></a> provides exposure to the publicly traded equity of alternative asset management companies. Rather than offering direct or income-focused exposure to private credit, <a href="/link/018811e6db344b7691fd273a97737194.aspx" title="GPZ | VanEck Alternative Asset Manager ETF - Overview"><strong>GPZ</strong></a> is designed to give investors a public, liquid, and indirect way to participate in the growth of private markets more broadly.</p>
<p>The companies held in <a href="/link/018811e6db344b7691fd273a97737194.aspx" title="GPZ | VanEck Alternative Asset Manager ETF - Overview"><strong>GPZ</strong></a> typically earn management fees and performance-based revenues across a range of alternative strategies, including private equity, private credit, real assets, and other non-traditional investments. As a result, <a href="/link/018811e6db344b7691fd273a97737194.aspx" title="GPZ | VanEck Alternative Asset Manager ETF - Overview"><strong>GPZ</strong></a> is better viewed as a growth-oriented complement to alternative income strategies, rather than a yield-focused solution.</p>
<p>The <strong><a href="/link/018811e6db344b7691fd273a97737194.aspx" title="GPZ | VanEck Alternative Asset Manager ETF - Overview">VanEck Alternative Asset Manager ETF (GPZ)</a></strong> seeks to track as closely as possible, before fees and expenses, the price and yield performance of the MarketVector Alternative Asset Managers Index (MVAALTTR), which is intended to track the overall performance of alternative asset managers across private equity, venture capital, private credit, private real estate, and private infrastructure.</p>
<h2>BDCs vs. Private Credit: Which May Be Right for Investors?</h2>
<p><strong>BDCs May Appeal To:</strong></p>
<ul class="content-list">
<li class="mt-2">Investors seeking high income with daily liquidity</li>
<li class="mt-2">Those who value transparency and public market access</li>
<li class="mt-2">Investors using ETFs as part of a diversified income strategy</li>
</ul>
<p><strong>Private Credit Funds May Appeal To:</strong></p>
<ul class="content-list">
<li class="mt-2">Investors able to commit capital for longer periods</li>
<li class="mt-2">Those comfortable with limited liquidity</li>
<li class="mt-2">Institutional or accredited investors seeking bespoke structures</li>
</ul>
<h2>Complementary Approaches to Private Lending</h2>
<p>BDCs and private credit funds are not mutually exclusive. In fact, they can serve complementary roles within a broader income-focused portfolio. Publicly traded BDCs offer liquidity and transparency, while private credit funds may provide longer-term, less liquid exposure for investors with appropriate time horizons.</p>
<p>For many investors, ETFs that focus on publicly traded BDCs can help bridge the gap, providing access to private lending markets with the flexibility of public markets.</p>
<p>To receive more <a href="/us/en/blogs/income-investing/" title="Income Investing Insights"><strong>Income Investing</strong></a> insights, <a href="/link/5f45412c2143400497908cea2897f7d3.aspx" title=" Subscription Center"><strong>sign up in our subscription center</strong></a>.</p>
]]></content:encoded>
</item><item rdf:about="https://www.vaneck.com/us/en/blogs/income-investing/why-taxes-matter-for-equity-income-and-where-pfxf-fits/">
  <title>Why Taxes Matter for Equity Income, and Where PFXF Fits></title>
  <link>https://www.vaneck.com/us/en/blogs/income-investing/why-taxes-matter-for-equity-income-and-where-pfxf-fits/</link>
  <description><![CDATA[Headline yield shows income potential, but taxes reduce what you keep. Equity investors should focus on after-tax yield. Preferreds may help boost income and improve tax efficiency.]]></description>
  <dc:creator> </dc:creator>
  <dc:date>01/30/2026 06:30:00</dc:date>
<content:encoded><![CDATA[

<h2>What Taxes Should Equity Income Investors Consider?</h2>
<p>For advisors constructing income-focused portfolios, understanding after-tax yield is critical to managing client outcomes. Taxes can substantially reduce the income investors keep. Understanding how different sources of equity income are taxed is important to evaluate true after-tax yield. For income-focused portfolios, headline yield can be misleading. Taxes play a major role in determining how much income ultimately reaches a client&rsquo;s pocket.</p>
<ul class="content-list">
<li class="mt-2">Taxes can significantly reduce realized income, especially when distributions are taxed at ordinary income rates.</li>
<li class="mt-2">Different income types receive different tax treatments, meaning two investments with the same yield can produce very different after-tax results.</li>
<li class="mt-2">Higher yields may come with higher tax drag, particularly when income is not eligible for preferential tax rates.</li>
</ul>
<h2>Understanding How Equity Income Is Taxed</h2>
<p>Not all dividends are taxed the same way. Qualified dividends benefit from lower federal tax rates, making them especially attractive for taxable clients seeking income. These differences mean that from a portfolio construction standpoint, income source can matter as much as income level.</p>
<div class="wrapped-div">
<table style="width: 100%;">
<tbody>
<tr class="tbl-data">
<td class="tbl-header last">Income Type</td>
<td class="tbl-header last">Typical Tax Rate</td>
<td class="tbl-header last">Examples</td>
</tr>
<tr class="tbl-data">
<td class="data-td last font-weight-normal">Qualified Dividends</td>
<td class="data-td last font-weight-normal">Long-term capital gains</td>
<td class="data-td last font-weight-normal">U.S. common stocks, certain preferreds</td>
</tr>
<tr class="tbl-data">
<td class="data-td last font-weight-normal">Ordinary Dividends</td>
<td class="data-td last font-weight-normal">Ordinary income rates</td>
<td class="data-td last font-weight-normal">REITs, bond ETFs</td>
</tr>
<tr class="tbl-data">
<td class="data-td last font-weight-normal">Capital Gains Distributions</td>
<td class="data-td last font-weight-normal">Capital gains rates</td>
<td class="data-td last font-weight-normal">ETFs, mutual funds</td>
</tr>
</tbody>
</table>
</div>

<h2>Preferred Securities and Tax Treatment</h2>
<p>Preferred securities are a unique type of investment that sit between common stocks and bonds, offering higher income potential than common equity while still paying dividends rather than interest. Many preferred securities pay dividends that qualify as qualified dividend income (QDI)<sup>1</sup>&nbsp;. When eligible, these dividends are taxed at long-term capital gains rates, rather than higher income tax rates. This can improve after-tax income, particularly for clients in higher tax brackets. Not all preferred dividends qualify, but when they do, the tax advantage can significantly differentiate preferred-based income strategies from other high-yield equity or fixed income alternatives.</p>
<h2>Common Tax Challenges for Income-Focused Equity Investors</h2>
<p>Tax dynamics can complicate income planning, especially for clients seeking yield without increasing tax drag.<br />Even well-diversified income portfolios can face tax-related headwinds:</p>
<ul class="content-list">
<li class="mt-2">Tax drags on high-yield investments, where ordinary income taxation reduces net yield</li>
<li class="mt-2">Unexpected capital gains distributions, which can create tax liabilities even when a client has not sold shares</li>
<li class="mt-2">Complex income classification, making it harder to estimate after-tax returns</li>
</ul>
<p>These challenges reinforce the importance of understanding not just how much income an investment pays, but how that income is taxed when evaluating allocation decisions.</p>
<h2>Where PFXF Fits in a Tax-Aware Income Strategy</h2>
<p><a href="/link/90451e6acf204dae87d1c8a31d9db407.aspx" title="PFXF | VanEck Preferred Securities ex Financials ETF - Overview"><strong>The VanEck Preferred Securities ex Financials ETF (PFXF)</strong></a> provides exposure to preferred securities outside the financial sector, with a focus on income generation and diversification. From an advisor perspective, <a href="/link/90451e6acf204dae87d1c8a31d9db407.aspx" title="PFXF - VanEck Preferred Securities ex Financials ETF - Overview"><strong>PFXF</strong></a> may serve as a complementary addition to income portfolios where after-tax efficiency is a consideration. A key consideration for taxable investors is that a portion of <a href="/link/90451e6acf204dae87d1c8a31d9db407.aspx" title="PFXF - VanEck Preferred Securities ex Financials ETF - Overview"><strong>PFXF</strong></a>&rsquo;s income has historically been derived from dividends that may qualify as QDI, depending on issuer and structure. When dividends are qualified, clients may benefit from lower effective tax rates compared to ordinary income-producing investments. By capturing preferred dividends, and not just interest income, <a href="/link/90451e6acf204dae87d1c8a31d9db407.aspx" title="PFXF - VanEck Preferred Securities ex Financials ETF - Overview"><strong>PFXF</strong></a> can potentially deliver more tax-efficient income relative to other high-yield strategies.</p>

<h2>Portfolio Placement Matters: Taxable vs. Tax-Advantaged Accounts</h2>
<p>While preferred securities can offer tax advantages, account placement still matters:</p>
<ul class="content-list">
<li class="mt-2">Taxable accounts may benefit more from QDI-eligible income</li>
<li class="mt-2">Tax-advantaged accounts (IRAs, 401(k)s) can help shelter ordinary income and capital gains</li>
</ul>
<p>Understanding where preferred-focused strategies like <a href="/link/90451e6acf204dae87d1c8a31d9db407.aspx" title="PFXF | VanEck Preferred Securities ex Financials ETF - Overview"><strong>PFXF</strong></a> fit within an overall portfolio can help clients optimize after-tax income, not just pre-tax yield, and better align income generation with client objectives.</p>
<p>The <strong><a href="/link/90451e6acf204dae87d1c8a31d9db407.aspx" title="PFXF | VanEck Preferred Securities ex Financials ETF - Overview">VanEck Preferred Securities ex Financials ETF (PFXF)</a></strong> seeks to replicate as closely as possible, before fees and expenses, the price and yield performance of the ICE Exchange-Listed Fixed &amp; Adjustable Rate Non-Financial Preferred Securities Index (PFAN4PM), which is intended to track the overall performance of U.S. exchange-listed hybrid debt, preferred stock and convertible preferred stock issued by non-financial corporations.</p>
<p>To receive more <a href="/us/en/blogs/income-investing/" title="Income Investing Insights"><strong>Income Investing</strong></a> insights, <a href="/link/5f45412c2143400497908cea2897f7d3.aspx" title=" Subscription Center"><strong>sign up in our subscription center</strong></a>.</p>
]]></content:encoded>
</item><item rdf:about="https://www.vaneck.com/us/en/blogs/natural-resources/venezuelas-oil-rebuild-and-the-case-for-oilfield-services-and-refiners/">
  <title>Venezuela’s Oil Rebuild and the Case for Oilfield Services and Refiners></title>
  <link>https://www.vaneck.com/us/en/blogs/natural-resources/venezuelas-oil-rebuild-and-the-case-for-oilfield-services-and-refiners/</link>
  <description><![CDATA[Venezuela&rsquo;s oil sector is reentering the global conversation, and the path toward rebuilding production is likely to favor oilfield services companies first, before any material increase in crude supply reaches the market and benefits refiners thereafter.]]></description>
  <dc:creator> </dc:creator>
  <dc:date>01/29/2026 06:30:00</dc:date>
<content:encoded><![CDATA[

<h2 id="venezuelan-news" class="jump-link-nav anchored-block" data-jumplink-title="Venezuelan News">Can U.S. Oil Benefit from a Rebuild of Venezuela&rsquo;s Oil Sector?</h2>
<p>Venezuela&rsquo;s oil sector is back on investors&rsquo; radar after years of stagnation. While recent geopolitical developments have driven headlines, the longer-term reconstruction of the country&rsquo;s oil industry could create sustained opportunities for U.S. oilfield services companies and, over time, downstream refiners.</p>
<p>Years of underinvestment have severely degraded Venezuela&rsquo;s oil infrastructure. Wells, surface equipment, power systems, and pipelines require extensive maintenance and rehabilitation, meaning that any meaningful increase in production would depend first on workovers, repairs, and field redevelopment rather than rapid new supply.</p>
<p>Recent U.S. engagement has signaled interest in restoring operating capacity, not simply moving existing barrels to market. If investment momentum shifts toward redevelopment, oilfield services providers with technical scale, compliance capabilities, and heavy-oil experience could be among the earliest beneficiaries. Refiners would likely benefit later, as improved reliability of Venezuelan crude supply feeds into global trade flows.</p>
<p>Risks remain significant. Sanctions durability, security conditions, and payment certainly continue to cloud the outlook. Investors should monitor whether policy developments support sustained redevelopment rather than short-term stabilization.</p>
<p>Key factors to watch include:</p>
<ul class="content-list">
<li class="mt2">A shift from stabilization toward long-term field redevelopment.</li>
<li class="mt2">The scale of required maintenance and infrastructure rehabilitation.</li>
<li class="mt2">Whether U.S. engagement supports upstream operating capacity.</li>
<li class="mt2">Ongoing sanctions, security, and financial risks.</li>
</ul>
<h2>Why Is Venezuela&rsquo;s Oil Sector Back in Focus?</h2>
<p><strong>What Changed in Venezuela&rsquo;s Oil Outlook?</strong></p>
<p>Recent political developments have widened the range of possible outcomes for Venezuela&rsquo;s oil sector. The removal of President Nicol&aacute;s Maduro and subsequent governance uncertainty have increased the potential of policy change, foreign engagement, and gradual normalization. Markets are responding to a shift in probabilities rather than a single defined outcome.</p>
<p>From and investment perspective, two broad paths now appear plausible:</p>
<ul class="content-list">
<li class="mt2"><strong>Constructive scenario:</strong> Incremental governance improvement and expanded foreign participation support sustained investment.</li>
<li class="mt2"><strong>Muddle-through scenario:</strong> Reforms stall, uncertainty persists, and capital remains cautious.</li>
</ul>
<p>Market sentiment appears to assign more weight to the constructive path than in recent years, even as risks remain elevated.</p>
<p><strong>Why Are Investors Paying Attention Now?</strong></p>
<p>Renewed interest in Venezuela is less about near-term production gains and more about optionality. The country holds the world&rsquo;s largest proven oil reserves, yet years of mismanagement and underinvestment have left production and infrastructure far below potential.</p>
<p>Even limited progress toward normalization, such as clearer legal frameworks or pilot projects, could unlock a multi-year investment cycle. That cycle would likely begin upstream with oilfield services demand before translating into higher output and downstream benefits for refiners.</p>
<h2 id="venezuela-oil-today" class="jump-link-nav anchored-block" data-jumplink-title="Venezuela Oil Today">Venezuela&rsquo;s Oil Industry Today: Large Reserves, Limited Output</h2>
<p>Venezuela holds approximately <strong>303 billion barrels of proven oil reserves</strong>, the largest in the world. However, crude production remains at a fraction of historical levels, currently well below one million barrels per day, far beneath its late-1990s peak.</p>
<p>Venezuela holds the world&rsquo;s largest oil reserves, but the number of operational drilling rigs is near a historic low.</p>
<h3>Oil Rig Count Venezuela</h3>
<p><img loading="lazy" class="img-responsive w-100" src="https://www.vaneck.com/contentassets/88ee03726b6644a8b363d7c5f08b85b7/6707_oil-reform-blog_chart-1_2026-1_v1_blog.svg" alt="Oil Rig Count Venezuela" /></p>
<p class="chart-disclosure">Source: Baker Hughes.</p>

<p><strong>Why Did Oil Production Collapse?</strong></p>
<p>The decline was driven by institutional and operational failures rather than geology:</p>
<ul class="content-list">
<li class="mt2">Chronic underinvestment and politicized management weakened PDVSA&rsquo;s operating capacity.</li>
<li class="mt2">Nationalization and workforce purges eroded technical expertise.</li>
<li class="mt2">Sanctions restricted access to capital, technology, and diluents.</li>
<li class="mt2">Infrastructure decay impaired both production and refining capacity.</li>
</ul>
<p>Despite vast reserves, these factors have left Venezuela unable to sustain output at scale.</p>
<p><strong>Why Does This Matter for Oil Services?</strong></p>
<p>Because the decline reflects operational breakdown rather than resource depletion, rebuilding would be services intensive. Restoring production would require well workovers, maintenance, pipeline and power repairs, and eventually enhanced recovery techniques. The country&rsquo;s extra-heavy crude further increases demand for specialized expertise, creating potential opportunities for oilfield services firms if conditions stabilize.</p>
<h2 id="how-is-us-oil-impacted" class="jump-link-nav anchored-block" data-jumplink-title="How is US Oil Impacted">How Does a Venezuelan Oil Comeback Impact American Oil Refiners?</h2>
<p>A resurgence of Venezuelan exports could be structurally positive for <strong>U.S. Gulf Coast refiners</strong>, which are among the most complex globally and designed to process heavy, sour crude. Improved access to discounted Venezuelan barrels could enhance feedstock flexibility and support refining margins. However, benefits would be concentrated among refiners with advanced conversion capacity and would depend on supply reliability and policy durability.</p>
<h2>What Would a Venezuelan Oil Rebuild Actually Require?</h2>
<p>Rebuilding Venezuela&rsquo;s oil sector would be a <strong>long-cycle, capital-intensive process</strong>, not a rapid production restart. Decades of underinvestment have left infrastructure degraded, requiring years of coordinated technical work and significant capital before exports meaningfully increase.</p>
<p>While recent engagement suggests interest in deeper operational recovery, risks around sanctions, security, and regulatory clarity remain high. Any credible rebuild would favor service providers with scale, compliance strength, and heavy-oil expertise.</p>
<p><strong>What Do Oilfield Services Companies Do, and Why Do They Benefit First?</strong></p>
<p>Oilfield services companies provide the technical backbone of upstream activity, including drilling, completions, diagnostics, maintenance, and production optimization. In degraded basins, demand for these services often rises before production volumes recover.</p>
<p>Rebuilds typically begin by repairing existing assets rather than launching new projects. In Venezuela, deferred maintenance alone could drive early services demand, historically benefiting services providers before producers or refiners.</p>
<h2>How Could U.S. Oil Services and Refiners Be Exposed?</h2>
<p>If foreign participation expands, U.S. oilfield services firms could support field rehabilitation, heavy-oil recovery, and equipment modernization. At the same time, refiners configured for heavy crude could benefit downstream as Venezuelan supply reenters global markets and reshapes crude flows.</p>
<p>Markets often price this dynamic early: expectations for future upstream investment can lift oil services equities ahead of realized activity, while refiners may benefit later as supply becomes more reliable.</p>
<h2 id="invest-in-oil" class="jump-link-nav anchored-block" data-jumplink-title="Invest in Oil">Could Venezuela Act as a Catalyst for Oil Services and Refiners ETFs?</h2>
<p>A Venezuelan rebuild would unfold over years, making it unsuitable as a short-term production thesis but relevant as <strong>long-dated optionality</strong>. Early signals such as, policy shifts, pilot projects, or limited-service activity, can influence sentiment well before capital spending peaks.</p>
<p><strong>Why the <a href="/link/8339ad0b563143d98a7d2e61afbc5425.aspx" title="OIH - VanEck Oil Services ETF - Overview">VanEck Oil Services ETF (OIH)</a>?</strong></p>
<p><a href="/link/8339ad0b563143d98a7d2e61afbc5425.aspx" title="OIH - VanEck Oil Services ETF - Overview"><strong>OIH</strong></a> provides targeted exposure to companies central to drilling and field activity, which have historically been early beneficiaries when upstream investment expectations improve.</p>
<p><strong>Why the <a href="/link/a7dbc67770ac4eb8a7c25f4c0afe1bd3.aspx" title="CRAK - VanEck Oil Refiners ETF - Overview">VanEck Oil Refiners ETF (CRAK)</a>?</strong></p>
<p><a href="/link/a7dbc67770ac4eb8a7c25f4c0afe1bd3.aspx" title="CRAK - VanEck Oil Refiners ETF - Overview"><strong>CRAK</strong></a> offers focused exposure to U.S. refiners positioned to benefit from increased access to discounted heavy crude, without direct reliance on upstream oil prices.</p>
<h2>What Risks Should Investors Consider?</h2>
<p>Political uncertainty remains high. Sanctions changes, governance setbacks, and uneven capital deployment could delay progress. Diversified ETFs such as OIH and CRAK can help mitigate single-country risk.</p>

<h2>What Does This Mean for Energy-Focused Investors?</h2>
<p>Venezuela should not be viewed as a standalone investment thesis, but as a potential <strong>tailwind</strong>. For oil services investors, it adds upside asymmetry. For refiners, it represents a possible margin and feedstock advantage over time. Within a diversified energy allocation, services and refining exposure allows participation in recovery cycles without relying on a single outcome.</p>
<h2>Conclusion: A Services-First Recovery Story</h2>
<p>A rebuild of Venezuela&rsquo;s oil sector would be slow, complex, and capital-intensive. That reality favors oilfield services first, with refiners positioned to benefit later as supply normalizes. Even limited progress could reshape expectations for global services demand, reinforcing the strategic role of oil services and select refiners within a diversified energy portfolio.</p>
<p>To receive more <a href="/us/en/insights/natural-resources/" title="Natural Resources Insights"><strong>Natural Resources</strong></a> insights, <a href="https://www.vaneck.com/us/en/subscribe/" title="Subscription Center"><strong>sign up in our subscription center</strong></a>.</p>
]]></content:encoded>
</item><item rdf:about="https://www.vaneck.com/us/en/blogs/economic-trends/turning-vanecks-2026-outlook-into-portfolio-allocations/">
  <title>Turning VanEck’s 2026 Outlook into Portfolio Allocations></title>
  <link>https://www.vaneck.com/us/en/blogs/economic-trends/turning-vanecks-2026-outlook-into-portfolio-allocations/</link>
  <description><![CDATA[CEO Jan van Eck&rsquo;s 2026 outlook highlights where visibility is improving. Here we show how we express those views in portfolios.]]></description>
  <dc:creator>Patrick Schramm</dc:creator>
  <dc:date>01/27/2026 06:30:00</dc:date>
<content:encoded><![CDATA[

<p><strong>Key takeaways</strong></p>
<ul class="content-list">
<li class="mt-2">Visibility is improving, but selectivity remains essential.</li>
<li class="mt-2">Debasement supports allocations to gold and other real assets.</li>
<li class="mt-2">Digitization drives opportunities across AI, semiconductors and infrastructure.</li>
<li class="mt-2">Decarbonization reinforces the need for reliable energy and materials.</li>
<li class="mt-2">Public, liquid income strategies can complement private credit exposure.</li>
</ul>
<p>&ldquo;Visibility means risk on&rdquo; is the headline of <strong><a href="/us/en/blogs/investment-outlook/jan-van-eck-q1-2026-outlook-visibility-means-risk-on/" title="Q1 2026 Outlook: Visibility Means Risk On">CEO Jan van Eck&rsquo;s 2026 investment outlook</a></strong>. While our views are grounded in long term structural changes rather than short-term market calls, a defining feature of VanEck&rsquo;s model portfolio approach is the ability to remain adaptive, seeking to participate in upside while actively managing risk across both frothy markets and oversold conditions.</p>
<p>In this blog, we translate Jan&rsquo;s 2026 outlook into portfolio implementation. We&rsquo;ll outline the macro backdrop and show how we are allocating across the key theme within our model portfolios.</p>
<h2 id="three-themes-driving-2026-positioning" class="jump-link-nav anchored-block" data-jumplink-title="Three Themes Driving 2026 Positioning">Three Themes Driving 2026 Positioning</h2>
<p>VanEck&rsquo;s investment framework is built around identifying durable themes that shape markets over time. Heading into 2026, three themes sit at the core of our portfolio construction:</p>
<ul class="content-list">
<li class="mt-2"><strong>Debasement</strong>: The global search for alternative stores of value and diversification away from the US dollar amid elevated debt, deficits, conflict and inflationary pressures.</li>
<li class="mt-2"><strong>Digitalization</strong>: The continued expansion of AI as it moves from infrastructure build-out to adoption and ultimately proliferation, reshaping productivity across industries.</li>
<li class="mt-2"><strong>Decarbonization</strong>: Less about energy transition and alternative energy, and more about energy addition, focusing on capacity, reliability and efficiency as the world demands more power to support electrification, AI and growth.</li>
</ul>
<p>These themes form the foundation for how we think about asset allocation in 2026.</p>
<h2>Macro Dynamics Reinforcing Our 2026 Themes</h2>
<p>The Federal Reserve (Fed) remains caught between the risk of reaccelerating inflation and a potential inflection in the labor market. While labor conditions have softened, they have not deteriorated enough to warrant significant accommodation. Inflation remains above the Fed&rsquo;s 2% target, and a neutral rate in the 3% range seems prudent in an environment of slightly elevated inflation, assuming nominal growth continues to be supported by policy and fiscal support.</p>
<p>At the same time, debt and deficit dynamics are contributing to a weaker US dollar and a flatter yield curve with elevated long-term rates. While near-term fiscal restraint may improve headline deficit numbers, the structural problem is not going away. In a highly politicized environment, we expect policy headlines to create volatility across both equity and fixed income markets, particularly in a historically volatile midterm election year.</p>
<p>Another notable dynamic is the K shaped economy. Spending, wage growth and asset ownership remain concentrated in the higher income cohorts, while inflation, housing affordability and student debt are continuing to pressure younger people and lower wage earners. Policies aimed at addressing the bottom of the K is likely to be deficit expansionary and potentially inflationary, but also may play a decisive role in upcoming elections.</p>
<p>As we discussed in <strong><a href="/us/en/blogs/economic-trends/building-a-2025-portfolio-inflation-hedges-and-ai-plays/" title="Building a 2025 Portfolio: Inflation Hedges and AI Plays">Jan&rsquo;s outlook last year</a></strong>, the world has been over-indexed to the US dollar for over a decade. That dynamic began to shift in 2025, as some of the best performing assets included precious metals and international equities.Diversification remains a powerful tool for managing risk, particularly as returns become more concentrated, and investors may benefit from reassessing where risk and returns are truly coming from in their portfolios. If a small handful of companies are driving the majority of returns in a &ldquo;globally diversified&rdquo; portfolio, it may be time for a portfolio review.</p>
<h2>Translating Themes to Allocations in Our Wealth Builder Framework</h2>
<p>VanEck&rsquo;s Wealth Builder <strong><a href="/link/66b1175c2973436da185f1eb7be4c319.aspx" title="VanEck Wealth Builder Core Portfolios - Overview">Core Portfolios</a></strong> and <a href="/link/6e9d9147570e4f1f93468eee6ea2af7a.aspx" title="VanEck Wealth Builder Plus Portfolios - Overview"><strong>Plus Portfolios</strong></a> are designed to translate these macro and thematic views into diversified, multi-asset allocations. While the models maintain long-term structural tilts, they are also built to be adaptive by rebalancing, managing exposure after rallies and adding opportunistically during periods of dislocation.</p>
<p>Risk management is central to this process. Using ETFs within the model portfolios as implementation vehicles, the models seek diversified exposure across asset classes, regions, and risk factors.</p>
<h2 id="the-case-for-gold" class="jump-link-nav anchored-block" data-jumplink-title="The Case for Gold">Debasement and the Case for Gold</h2>
<p>There is an old adage in investing: &ldquo;Don&rsquo;t fight the Fed.&rdquo; But what happens when there are 20 of them? There are over 20 global central banks today actively diversifying their reserves, with gold playing a central role in their efforts. In addition to central bank demand, gold has benefited from its safe-haven characteristics and diversification benefits, as traditional stock and bond indexes trade near historical highs.</p>
<p>Within the Wealth Builder model portfolios, we maintain exposure to both gold bullion through the <strong><a href="/link/982ab5546e32473b85c7b266bc6b2be6.aspx" title="OUNZ - VanEck Merk Gold ETF - Overview">VanEck Merk Gold ETF (OUNZ)</a></strong> and gold equities through the <a href="/link/310be2aebcad4c5cb5a89a82fd128841.aspx" title="RAAX - VanEck Real Assets ETF - Overview"><strong>VanEck Real Assets ETF (RAAX)</strong></a>. Physical gold bullion, with its lower volatility profile and diversification characteristic, represents a larger share of exposure relative to gold mining equities, which historically exhibit higher volatility and a higher correlation to equities.</p>
<p>With risk management at key to our process, as gold prices moved higher, the models capitalized on upside volatility to trim exposure into strength, while remaining structurally overweight relative to traditional benchmarks.</p>

<h2 id="digitization" class="jump-link-nav anchored-block" data-jumplink-title="Digitization">Digitization Beyond the AI Hype Cycle</h2>
<p>AI adoption continues to accelerate at a historically unprecedented pace. With such rapid growth, market forces will naturally question the sustainability of the valuations. Instead of reacting to the boom-bust hype, we continue to view AI adoption through our three phase model.</p>
<p>Phase one is the infrastructure arms race, where hyperscalers invest aggressively to avoid falling behind competitors. At the end of 2025, expectations began to reset as markets punished companies facing rapid debt accumulation, slowing earnings and weaker guidance. As irrational exuberance gives way to more rational growth expectations, a company&rsquo;s ability to show both growth and profitability by generating returns above the cost of capital becomes increasingly important.</p>
<p>Phase two is the adoption phase, where AI agents move meaningfully into everyday workflows, driving efficiency gains and productivity improvements that support profitability and margins. A few leaders are moving into this phase.</p>
<p>Phase 3 is the automation phase, where the convergence of AI and robotics redefine labor and productivity, and the first signs of this are beginning to appear. Each of these phases has specific company, sector and geographic dynamics to consider, reinforcing the importance of diversified exposure.</p>
<p>Within the Wealth Builder models, AI exposure is expressed through a combination of semiconductor companies, which we hold through the <a href="/link/39c8d235748b4c26a5930c31d3ac0160.aspx" title="SMH - VanEck Semiconductor ETF - Overview"><strong>VanEck Semiconductor ETF (SMH)</strong></a>, broader technology allocations and emerging areas like quantum computing. At the same time, we find it prudent to own complementary exposures that are less sensitive to AI-driven volatility, including defense, infrastructure and critical metals. These long-cycle growth themes are supported by policy, geopolitics and supply chain fundamentals, and historically exhibit lower correlations to pure-play AI returns.</p>
<h2 id="decarbonization" class="jump-link-nav anchored-block" data-jumplink-title="Decarbonization">Decarbonization as Energy Addition</h2>
<p>Even without AI, global energy and infrastructure were already facing a structural supply-demand imbalance. AI has acted as an accelerant, significantly increasing projected power demand as data centers and advanced computing expand. Old world assets, like raw materials and commodities, needed to build new world infrastructure and the digital economy.</p>
<p>Nuclear power is central to these theme due to its high capacity factor, competitive cost, cleaner carbon profile and more reliable uptime relative to other alternative energy sources. As the market grapple with valuation concerns amid the massive investment implications, our Wealth Builder models have actively managed exposure, trimming during rallies and adding during periods of dislocation, to maintain long-term conviction in this theme. For exposure across the nuclear value chain, the model holds the <a href="/link/49acb0d4174146e9a0269c9cb81c02bb.aspx" title="NLR - VanEck Uranium and Nuclear ETF - Overview"><strong>VanEck Uranium and Nuclear ETF (NLR)</strong></a>.</p>
<h2 id="income-positioning" class="jump-link-nav anchored-block" data-jumplink-title="Income Positioning">Income Positioning in a Changing Credit Landscape</h2>
<p>Outside of equities we continue to see selective opportunities in income-oriented assets, particularly as private credit competes for investor attention and capital. Crowding into less liquid segments of the credit market has pushed some investors toward riskier corners of credit. Early cracks in this boom cycle were felt in 2025 with the bankruptcies of First Brands and TriColor, which sparked calls for a broader acceleration of defaults and downgrades.</p>
<p>Publicly traded business development companies (BDCs), given their liquidity and transparency, acted as a release valve for investors looking to reduce private credit exposure. The resulting selloff pushed valuations below book value across much of the sector, creating a potentially attractive setup for income investors for 2026. VanEck&rsquo;s Wealth Builder portfolios hold the <a href="/link/c48bed1be12e47c88f01e1bdbfa51ed2.aspx" title="BIZD - VanEck BDC Income ETF - Overview"><strong>VanEck BDC Income ETF (BIZD)</strong>,</a> which the models use to gain exposure to a diversified index of BDCs and can be used as a complement or replacement for private credit and leveraged loans.</p>
<h2>Turning Visibility into Action</h2>
<p>&ldquo;Visibility means risk on&rdquo; underscores the importance of disciplined diversification, active risk management and thoughtful implementation. By anchoring portfolios around the themes of debasement, digitization and decarbonization, we believe investors can participate in long-term opportunities while remaining mindful of evolving risks. <a href="/link/6e9d9147570e4f1f93468eee6ea2af7a.aspx" title="VanEck Wealth Builder Plus Portfolios" target="_top"><strong>VanEck&rsquo;s Wealth Builder model portfolios</strong></a> offer a way to put that framework into practice in 2026.</p>
]]></content:encoded>
</item><item rdf:about="https://www.vaneck.com/us/en/blogs/municipal-bonds/a-municipal-investors-guide-to-understanding-infrastructure-financing/">
  <title>A Municipal Investor’s Guide to Understanding Infrastructure Financing></title>
  <link>https://www.vaneck.com/us/en/blogs/municipal-bonds/a-municipal-investors-guide-to-understanding-infrastructure-financing/</link>
  <description><![CDATA[Brightline East and West show that some munis depend more on the cash flow of a single project. Learn how to spot risk factors and make smarter infrastructure investing decisions.]]></description>
  <dc:creator>Gregory Yencharis</dc:creator>
  <dc:date>01/26/2026 06:30:00</dc:date>
<content:encoded><![CDATA[

<p><strong>Key Takeaways:</strong></p>
<ul class="content-list">
<li class="mt-2">Some tax-exempt bonds rely on one project&rsquo;s cash flow, where liquidity and refinancing matter more than tax bases.</li>
<li class="mt-2">Brightline East is an operating credit focused on liquidity and near-term payment walls, while West is a development credit driven by construction, funding durability, and capital structure resets.</li>
<li class="mt-2">Amendments, deferrals, exchanges, and sponsor support, not ridership headlines, drive risk, spreads, and outcomes in higher-rate environments.</li>
</ul>
<h2 id="what-is-project-finance" class="jump-link-nav anchored-block" data-jumplink-title="What is Project Finance?">What is Project Finance?</h2>
<p>Project finance is a way of funding infrastructure where bond repayment depends mainly on the performance of a single project, not on a government&rsquo;s tax revenues. Investors are paid from the project&rsquo;s own cash flow and liquidity, which means factors like execution, operating results, and access to refinancing play a central role. When municipal bonds are structured this way, they behave less like traditional munis and more like stand-alone businesses that must manage cash carefully to survive changing market conditions.</p>
<h2>Brightline East and Brightline West: Municipal Bonds Backed by One Project&rsquo;s Cash Flow</h2>
<p>Municipal investors are used to sorting credits by familiar labels: general obligation, essential service revenue, appropriation, and the rest. Brightline is a useful reminder that another category exists inside the tax-exempt market: private, single-asset infrastructure financed with private activity bonds, where the ultimate driver of outcomes is not a tax base but enterprise cash flow, liquidity, and access to refinancing.</p>
<p>That distinction matters because Brightline&rsquo;s story has shifted. It&rsquo;s no longer just about building rails and growing ridership. It&rsquo;s also about capital structure, amendments, exchange mechanics, and how stakeholders allocate pain (and upside) when the original plan collides with the reality of higher rates, slower ramps, cost increases and tighter risk tolerance.</p>
<h2 id="brightline-east-vs-west" class="jump-link-nav anchored-block" data-jumplink-title="Brightline East vs West">Brightline East vs West: Munis in Focus</h2>
<ul class="content-list">
<li class="mt-2"><strong>Brightline Florida</strong> (often casually called Brightline East) is a completed high-speed intercity passenger rail currently connecting Miami and Orlando, with connections in between. The underwriting question for its senior bonds is fundamentally an operating one: can ridership, pricing power, and cost control translate into durable debt service capacity and enough liquidity to withstand volatility without repeatedly returning to the market on disadvantageous terms?</li>
<li class="mt-2"><strong>Brightline West</strong> is a planned greenfield high-speed rail system connecting Las Vegas and Southern California. Its underwriting question is fundamentally a development one: can the project execute construction on time and on budget, assemble a resilient capital stack, and convert a megaproject plan into an operating business without overleveraging the ramp?</li>
</ul>
<p>If you approach both as &ldquo;infrastructure munis,&rdquo; you&rsquo;ll miss what actually drives spread, ratings pressure and restructuring risk.</p>
<h2>Why Brightline&rsquo;s Municipal Bonds Started Trading Like Project Finance</h2>
<p>Project finance credits often look fine until a specific combination of conditions hits: higher rates, weak liquidity, cost increases and a maturity wall that forces refinancing at the exact wrong time. When that happens, the conversation quickly shifts from long-term ridership potential to near-term survival: covenant headroom, collateral packages, intercreditor dynamics, and sponsor support. That shift has been visible in Brightline&rsquo;s recent debt actions.</p>
<h2>Brightline Florida: From Growth to Liability Management</h2>
<p>Over the past year, Brightline Florida&rsquo;s capital structure has shown the classic signs of a project-finance issuer managing through a constrained window.</p>
<p>First, the subordinated level of the stack demonstrated real flexibility in form but stress in substance. Brightline deferred interest payments in both July 2025 and January 2026 on a large tranche of high coupon, subordinated tax-exempt bonds. The ability to defer is part of how some of these securities are designed, but the act of using that feature is a meaningful signal: when cash is scarce, the subordinated layer becomes a pressure valve.</p>
<p>Second, a near-term payment wall forces a market-facing solution. Brightline Florida senior bonds were initially structured with what most people considered substantial reserves, allowing it a perceived adequate timeframe to ramp up its business to sustainable, recurring levels.</p>
<p>Those reserves are now expected to be fully used to help pay debt service in 2026, leaving the interest payment due in January of 2027 in question without a meaningful uplift in operations. This has forced Brightline to explore the issuance of up to $100 million in additional debt to help bolster liquidity, in part. Further, the subordinated tax-exempt Brightline Florida bonds have the ability to defer interest payments up to three times without triggering an event of default.</p>
<p>Although this provides better internal liquidity in the interim, it will also increase total interest cost for this tranche, and the question remains whether Brightline will be able to pay these bonds going forward without an external equity contribution.</p>
<p>For muni investors, that&rsquo;s the point where &ldquo;tax-exempt&rdquo; stops being the headline and &ldquo;liquidity risk&rdquo; becomes the headline. A higher coupon and a short fuse on upcoming payments can keep the lights on, but it also hardwires a new deadline into the credit story.</p>
<p>The practical takeaway for Florida is that operating momentum matters, but it must be judged through the lens of liquidity and upcoming checkpoints. If monthly ridership and revenue are improving, the question becomes whether that improvement is sufficient to rebuild cash reserves and reduce the need for repeated high-cost payment maneuvers.</p>
<p>In this kind of structure, &ldquo;good news&rdquo; is not a record month; &ldquo;good news&rdquo; is a credible path to sustainable coverage plus liquidity that&rsquo;s large enough to make the next refinancing optional rather than mandatory.</p>

<h2>Brightline West: Restructuring to a New Muni Bond Structure</h2>
<p>Brightline West&rsquo;s recent developments are even more explicit: the bonds were recently restructured while the project is still being financed and built.</p>
<p>A transaction support agreement established the framework for a bond exchange designed to transition existing holders to a new bond structure through a combination of both private and public processes. The substance of the deal provided a window into what creditors are demanding at this stage of the project:</p>
<ul class="content-list">
<li class="mt-2">A new senior secured bond series that sits ahead of legacy bonds that did not participate.</li>
<li class="mt-2">A meaningful repurchase of prior bonds for participating holders, reducing outstanding debt.</li>
<li class="mt-2">Warrants that allow creditors potential equity participation.</li>
<li class="mt-2">A timed equity-raise commitment, with staged injections and an earmark to redeem part of the new issuance.</li>
</ul>
<p>Stepping back, that&rsquo;s a specific template: de-risk the stack by moving up in seniority, reduce leverage via repurchase, and secure upside participation via warrants while requiring fresh equity to prove sponsor commitment.</p>
<p>For muni investors, this is the cleanest way to understand Brightline West right now: it&rsquo;s not yet a ridership story. It&rsquo;s a capital formation story. The primary risk factors are cost inflation, schedule slippage, and funding durability. A well-structured exchange can buy time and reset incentives, but it also tells you that the original structure no longer fits the market&rsquo;s tolerance.</p>
<h2>What Infrastructure Investors Should Know About Brightline Muni Bonds</h2>
<p>Brightline is not an argument against passenger rail. It&rsquo;s an argument for precise underwriting.</p>
<p>These credits can belong in a muni portfolio, but they should be treated more like single-asset, user-fee project finance than like traditional essential-service revenue bonds. That means investors should watch different things and interpret events differently.</p>
<h2 id="checklist-for-infrastructure-munis" class="jump-link-nav anchored-block" data-jumplink-title="Checklist for Infrastructure Munis">Checklist for Evaluating Infrastructure Municipal Bonds</h2>
<p><strong>Key Risk Indicators for Brightline Florida:</strong></p>
<ul class="content-list">
<li class="mt-2">Liquidity trajectory: cash reserves and the likelihood of additional deferrals or additional debt raises.</li>
<li class="mt-2">Pricing and mix: whether revenue quality is improving, not just passenger counts.</li>
<li class="mt-2">Operating leverage: how incremental revenue converts to operating cash flow after costs.</li>
<li class="mt-2">Sponsor behavior: evidence of equity support or other actions that permanently improve flexibility rather than merely extending the runway.</li>
</ul>
<p><strong>Key Risk Indicators for Brightline West:</strong></p>
<ul class="content-list">
<li class="mt-2">Funding stack durability: how grants, bonds, loans, and equity fit together over time.</li>
<li class="mt-2">Cost and schedule discipline: whether scope and contingency planning keep the project financeable through completion.</li>
<li class="mt-2">Equity timing: whether commitments are translated into cash on the dates that matter.</li>
</ul>
<h2 id="access-diversified-muni-etfs" class="jump-link-nav anchored-block" data-jumplink-title="Access Diversified Muni ETFs">How Diversified Muni ETFs Help Manage Risk in a Changing Market</h2>
<p>Brightline East and West are a case study in the evolution of &ldquo;muni&rdquo; toward infrastructure project finance. The tax-exempt label may reduce cost of capital at the margin, but it doesn&rsquo;t change the underlying physics: user-fee assets live and die by liquidity, execution, and refinancing access. In a higher-rate world, capital structure is not a footnote to the story. It is the story.</p>
<p>Brightline doesn&rsquo;t mean infrastructure is un-investable, it means labels can be misleading. When &ldquo;muni&rdquo; is really project finance, investors should demand a different checklist: liquidity runway, refinancing optionality, construction and funding durability, and evidence of sponsor support that&rsquo;s real, not rhetorical.</p>
<p>The broader takeaway is that you don&rsquo;t have to swing at every high-spread story to use munis effectively. VanEck&rsquo;s suite of <strong><a href="https://www.vaneck.com/us/en/etf-mutual-fund-finder/etfs/income/municipal-bond/" title="Explore Our ETFs and Mutual Funds">municipal bond ETFs</a></strong> provides purposeful muni exposure, anchoring portfolios with diversified core allocations. Targeted exposures can then be added when the risk/reward is truly compensating, so the after-tax income story isn&rsquo;t dependent on the next amendment, exchange, or maturity wall.</p>

<p>To receive more <a href="https://www.vaneck.com/us/en/insights/municipal-bonds/" title="Municipal Bonds Insights"><strong>Municipal Bonds</strong></a> insights, <a href="/link/5f45412c2143400497908cea2897f7d3.aspx" title=" Subscription Center"><strong>sign up in our subscription center</strong></a>.</p>
]]></content:encoded>
</item><item rdf:about="https://www.vaneck.com/us/en/blogs/income-investing/clos-on-solid-footing-with-carry-driving-returns-into-2026/">
  <title>CLOs on Solid Footing with Carry Driving Returns into 2026></title>
  <link>https://www.vaneck.com/us/en/blogs/income-investing/clos-on-solid-footing-with-carry-driving-returns-into-2026/</link>
  <description><![CDATA[CLOs showed strong momentum into Q4 2025, with higher-rated tranches favored amid volatility and selective lower-rated opportunities extending into 2026.]]></description>
  <dc:creator> </dc:creator>
  <dc:date>01/23/2026 06:30:00</dc:date>
<content:encoded><![CDATA[

<p><strong>Key takeaways:</strong></p>
<ul class="content-list">
<li class="mt-2">Higher-rated tranches remain favored given uncertain policy environment.</li>
<li class="mt-2">Increased dispersion in lower rated tranches could create select opportunities.</li>
<li class="mt-2">Despite near-term volatility risks, CLOs have strong potential to maintain carry into 2026.</li>
</ul>
<p id="overview" class="jump-link-nav anchored-block" data-jumplink-title="Overview">CLOs sustained their positive momentum into the fourth quarter, delivering positive returns across the capital stack despite a more volatile macro backdrop and shifting investor sentiment towards the end of the year. During the quarter, <a href="/link/e090deaddc774ac699a04b959d9254c6.aspx" title="CLOI - VanEck CLO ETF - Overview"><strong>CLOI</strong></a> (30-day SEC yield: 5.24%) slightly outperformed its benchmark, the J.P. Morgan CLO IG Index, by 3bps (1.31% vs 1.28%) and outperformed on a year-to-date (YTD) basis by 6pbs (5.76% vs 5.70%). The <a href="/link/d2f16468a9f14c1e807f6bb7fb597a3e.aspx" title="CLOB - VanEck AA-BB CLO ETF - Overview"><strong>VanEck AA-BB CLO ETF (CLOB)</strong></a> (30-day SEC yield: 6.18%) underperformed its benchmark, the J.P. Morgan CLOIE Balanced Mezzanine Index, in the quarter by 4bps (1.30% vs 1.34%) and by 16bps in 2025 (6.94% vs 7.10%). CLOs continued to compare favorably to many traditional fixed income sectors, reinforcing their role as a compelling source of income and relative value as investors look ahead to a more uncertain, but still supportive, policy environment entering 2026. Our preference for higher rated tranches remains, given tight valuations in the presence of underlying risks, but increased dispersion in lower rated tranches could create select opportunities. With volatility expected in coming months, the portfolio is positioned to shift into lower rated tranches when value emerges.</p>
<h3>CLOI Average Annual Total Returns<sup>*</sup>&nbsp;(%)</h3>
<div class="wrapped-div">
<table style="width: 100%;">
<tbody>
<tr class="tbl-data">
<td class="tbl-header last" colspan="9">As of December 31, 2025</td>
</tr>
<tr class="tbl-data">
<td class="data-head last text-right">&nbsp;</td>
<td class="data-head last text-right">1 MO</td>
<td class="data-head last text-right">3 MO</td>
<td class="data-head last text-right">YTD</td>
<td class="data-head last text-right">1 YR</td>
<td class="data-head last text-right">3 YR</td>
<td class="data-head last text-right">5 YR</td>
<td class="data-head last text-right">10 YR</td>
<td class="data-head last text-right">LIFE<br />06/21/22</td>
</tr>
<tr class="tbl-data">
<td class="data-td last text-left">CLOI (NAV)</td>
<td class="data-td data last text-right">0.90</td>
<td class="data-td data last text-right">1.31</td>
<td class="data-td data last text-right">5.76</td>
<td class="data-td data last text-right">7.75</td>
<td class="data-td data last text-right">--</td>
<td class="data-td data last text-right">7.52</td>
</tr>
<tr class="tbl-data">
<td class="data-td last text-left">CLOI (Share Price)</td>
<td class="data-td data last text-right">1.08</td>
<td class="data-td data last text-right">1.32</td>
<td class="data-td data last text-right">5.85</td>
<td class="data-td data last text-right">7.67</td>
<td class="data-td data last text-right">--</td>
<td class="data-td data last text-right">7.54</td>
</tr>
<tr class="tbl-data">
<td class="data-td last text-left">J.P. Morgan CLO IG Index</td>
<td class="data-td data last text-right">0.49</td>
<td class="data-td data last text-right">1.28</td>
<td class="data-td data last text-right">5.70</td>
<td class="data-td data last text-right">7.76</td>
<td class="data-td data last text-right">--</td>
<td class="data-td data last text-right">7.37</td>
</tr>
<tr class="tbl-data">
<td class="data-td last text-left">J.P. Morgan Collateralized Loan Obligation Index</td>
<td class="data-td data last text-right">0.51</td>
<td class="data-td data last text-right">1.26</td>
<td class="data-td data last text-right">5.87</td>
<td class="data-td data last text-right">8.22</td>
<td class="data-td data last text-right">--</td>
<td class="data-td data last text-right">7.75</td>
</tr>
</tbody>
</table>
</div>
<p class="chart-disclosure"><sup>*</sup>Returns less than one year are not annualized. <br />Effective May 1, 2025, the J.P. Morgan CLO IG Index replaced the J.P. Collateralized Loan Obligation Index as the Fund's benchmark</p>
<p class="chart-disclosure"><strong>The performance data quoted represents past performance. Past performance is not a guarantee of future results. Investment return and principal value of an investment will fluctuate so that an investor's shares, when redeemed, may be worth more or less than their original cost. Performance may be lower or higher than performance data quoted. Please call 800.826.2333 or visit vaneck.com for performance current to the most recent month ended.</strong></p>
<p class="chart-disclosure">CLOI&rsquo;s gross expense ratio is 0.36% and the total expense ratio is 0.36%. Van Eck Associates Corporation (the &ldquo;Adviser&rdquo;) will pay all expenses of the Fund, except for the fee payment under the investment management agreement, acquired fund fees and expenses, interest expense, offering costs, trading expenses, taxes and extraordinary expenses. Notwithstanding the foregoing, the Adviser has agreed to pay the offering costs until at least May 1, 2027. &ldquo;Other Expenses&rdquo; have been restated to reflect current fees.</p>
<h3>CLOB Average Annual Total Returns<sup>*</sup>&nbsp;(%)</h3>
<div class="wrapped-div">
<table style="width: 100%;">
<tbody>
<tr class="tbl-data">
<td class="tbl-header last" colspan="9">As of December 31, 2025</td>
</tr>
<tr class="tbl-data">
<td class="data-head last text-right">&nbsp;</td>
<td class="data-head last text-right">1 MO</td>
<td class="data-head last text-right">3 MO</td>
<td class="data-head last text-right">YTD</td>
<td class="data-head last text-right">1 YR</td>
<td class="data-head last text-right">3 YR</td>
<td class="data-head last text-right">5 YR</td>
<td class="data-head last text-right">10 YR</td>
<td class="data-head last text-right">LIFE<br />09/24/24</td>
</tr>
<tr class="tbl-data">
<td class="data-td last text-left">CLOB (NAV)</td>
<td class="data-td data last text-right">1.14</td>
<td class="data-td data last text-right">1.30</td>
<td class="data-td data last text-right">6.94</td>
<td class="data-td data last text-right">--</td>
<td class="data-td data last text-right">7.82</td>
</tr>
<tr class="tbl-data">
<td class="data-td last text-left">CLOB (Share Price)</td>
<td class="data-td data last text-right">1.18</td>
<td class="data-td data last text-right">1.61</td>
<td class="data-td data last text-right">6.95</td>
<td class="data-td data last text-right">--</td>
<td class="data-td data last text-right">7.85</td>
</tr>
<tr class="tbl-data">
<td class="data-td last text-left">J.P. Morgan CLOIE Balanced Mezzanine Index</td>
<td class="data-td data last text-right">0.71</td>
<td class="data-td data last text-right">1.34</td>
<td class="data-td data last text-right">7.10</td>
<td class="data-td data last text-right">--</td>
<td class="data-td data last text-right">7.92</td>
</tr>
</tbody>
</table>
</div>
<p class="chart-disclosure"><sup>*</sup>Returns less than one year are not annualized.</p>
<p class="chart-disclosure"><strong>The performance data quoted represents past performance. Past performance is not a guarantee of future results. Investment return and principal value of an investment will fluctuate so that an investor's shares, when redeemed, may be worth more or less than their original cost. Performance may be lower or higher than performance data quoted. Please call 800.826.2333 or visit vaneck.com for performance current to the most recent month ended.</strong></p>
<p class="chart-disclosure">CLOB&rsquo;s gross expense ratio is 0.45% and the total expense ratio is 0.45%. Van Eck Associates Corporation (the &ldquo;Adviser&rdquo;) will pay all expenses of the Fund, except for the fee payment under the investment management agreement, acquired fund fees and expenses, interest expense, offering costs, trading expenses, taxes and extraordinary expenses. Notwithstanding the foregoing, the Adviser has agreed to pay the offering costs until at least May 1, 2026. &ldquo;Other Expenses&rdquo; have been restated to reflect current fees.</p>
<h2 id="market-update" class="jump-link-nav anchored-block" data-jumplink-title="Market Update">Market Update</h2>
<p>In December, CLOs generated positive returns across the capital stack. During the month, investors navigated a &ldquo;hawkish cut&rdquo; from the Federal Reserve, resilient economic data and active capital markets. November payrolls were relatively distortion-free, increasing by 64k and saw an acceleration in private payrolls. The unemployment rate, however, increased to 4.6%, reflecting an uptick in temporary layoffs. The November CPI report came in lower than expected at 2.7% versus economist forecasts of 3.1%. However, the report was materially distorted by the shelter component. The Fed cut the federal funds rate by 25 bps for the third consecutive meeting, bringing the target range between 3.5%-3.75%. However, comments from FOMC speakers indicate that the Fed has shifted back to a data dependent stance amid a rising unemployment rate while hiring demand is stable and business surveys point to solid growth. Retail demand softened during the month with CLO ETFs reporting $88mn of outflows in December. 5- and 10-year Treasury rates traded 13 bps and 15 bps higher, respectively.</p>
<p>Overall, CLOs outperformed investment grade credit, but underperformed high yield bonds and bank loans during the quarter. Lower rated CLO tranches, BB-Bs CLOs in particular, outperformed in 2025, followed by high yield corporates.</p>
<div class="wrapped-div">
<table width="100%">
<tbody>
<tr class="tbl-data">
<td class="tbl-header last text-left">Asset class</td>
<td class="tbl-header last text-right">Q4 2025 Return (%)</td>
<td class="tbl-header last text-right">YTD 2025 Return (%)</td>
<td class="tbl-header last text-right">Yield to Worst (%)</td>
<td class="tbl-header last text-right">Spreads (bps)</td>
</tr>
<tr class="tbl-data">
<td class="data-td last font-weight-normal text-left">CLOs</td>
<td class="data-td data last text-right">1.26</td>
<td class="data-td data last text-right">5.86</td>
<td class="data-td data last text-right">5.05</td>
<td class="data-td data last text-right">151</td>
</tr>
<tr class="tbl-data">
<td class="data-td last font-weight-normal text-left">CLOs IG</td>
<td class="data-td data last text-right">1.28</td>
<td class="data-td data last text-right">5.70</td>
<td class="data-td data last text-right">4.80</td>
<td class="data-td data last text-right">127</td>
</tr>
<tr class="tbl-data">
<td class="data-td last font-weight-normal text-left">CLOs Mezz</td>
<td class="data-td data last text-right">1.34</td>
<td class="data-td data last text-right">7.10</td>
<td class="data-td data last text-right">6.78</td>
<td class="data-td data last text-right">321</td>
</tr>
<tr class="tbl-data">
<td class="data-td last font-weight-normal text-left">AAA</td>
<td class="data-td data last text-right">1.22</td>
<td class="data-td data last text-right">5.45</td>
<td class="data-td data last text-right">4.58</td>
<td class="data-td data last text-right">106</td>
</tr>
<tr class="tbl-data">
<td class="data-td last font-weight-normal text-left">AA</td>
<td class="data-td data last text-right">1.37</td>
<td class="data-td data last text-right">5.93</td>
<td class="data-td data last text-right">4.91</td>
<td class="data-td data last text-right">136</td>
</tr>
<tr class="tbl-data">
<td class="data-td last font-weight-normal text-left">A</td>
<td class="data-td data last text-right">1.41</td>
<td class="data-td data last text-right">6.28</td>
<td class="data-td data last text-right">5.20</td>
<td class="data-td data last text-right">163</td>
</tr>
<tr class="tbl-data">
<td class="data-td last font-weight-normal text-left">BBB</td>
<td class="data-td data last text-right">1.54</td>
<td class="data-td data last text-right">7.09</td>
<td class="data-td data last text-right">6.31</td>
<td class="data-td data last text-right">275</td>
</tr>
<tr class="tbl-data">
<td class="data-td last font-weight-normal text-left">BB</td>
<td class="data-td data last text-right">1.04</td>
<td class="data-td data last text-right">9.11</td>
<td class="data-td data last text-right">10.32</td>
<td class="data-td data last text-right">667</td>
</tr>
<tr class="tbl-data">
<td class="data-td last font-weight-normal text-left">B</td>
<td class="data-td data last text-right">-0.99</td>
<td class="data-td data last text-right">11.57</td>
<td class="data-td data last text-right">16.03</td>
<td class="data-td data last text-right">1,210</td>
</tr>
<tr class="tbl-data">
<td class="data-td last font-weight-normal text-left">U.S. Agg</td>
<td class="data-td data last text-right">0.96</td>
<td class="data-td data last text-right">7.15</td>
<td class="data-td data last text-right">4.37</td>
<td class="data-td data last text-right">29</td>
</tr>
<tr class="tbl-data">
<td class="data-td last font-weight-normal text-left">Investment Grade Corporates</td>
<td class="data-td data last text-right">0.77</td>
<td class="data-td data last text-right">7.78</td>
<td class="data-td data last text-right">4.84</td>
<td class="data-td data last text-right">79</td>
</tr>
<tr class="tbl-data">
<td class="data-td last font-weight-normal text-left">High Yield Bonds</td>
<td class="data-td data last text-right">1.35</td>
<td class="data-td data last text-right">8.50</td>
<td class="data-td data last text-right">6.62</td>
<td class="data-td data last text-right">281</td>
</tr>
<tr class="tbl-data">
<td class="data-td last font-weight-normal text-left">Leveraged Loans</td>
<td class="data-td data last text-right">1.33</td>
<td class="data-td data last text-right">5.99</td>
<td class="data-td data last text-right">7.73</td>
<td class="data-td data last text-right">406</td>
</tr>
</tbody>
</table>
</div>
<p class="chart-disclosure">Source: JP Morgan and ICE Data Indices as of 12/31/2025. CLOs represented by J.P. Morgan Collateralized Loan Obligation Index, CLOs IG represented by J.P. Morgan Collateralized Loan Obligation IG Index, CLOs Mezz represented by J.P. Morgan Collateralized Loan Obligation Balanced Mezzanine Index, AAA Rated CLOs represented by J.P. Morgan CLO AAA Index, AA Rated CLOs represented by J.P. Morgan CLO AA Index, A Rated CLOs represented by J.P. Morgan CLO A Index, BBB Rated CLOs represented by J.P. Morgan CLO BBB Index, BB Rated CLOs represented by J.P. Morgan CLO BB Index, B Rated CLOs represented by J.P. Morgan CLO B Index, US Agg is represented by the ICE BofA US Broad Market, Investment Grade Corporates represented by ICE BofA US Corporate Index, High Yield Bonds represented by ICE BofA US High Yield Index, and Leveraged Loans represented by JP Morgan Leveraged Loan Index. Past performance is no guarantee of future results. Index performance is not representative of fund performance. It is not possible to invest directly in an index.</p>

<p>CLO new issue supply declined during the month, with the market slowing during the holiday season over the back half of the month. New issue supply totaled $12.7bn in December, compared to $21.1bn in November. Total 2025 new issuance of $201bn set an annual record for the second straight year. Refinancing and reset activity also decreased and was the lowest volume since May, with $17.2bn pricing, after $21.1bn in November. Total annual refinancing/reset activity of $341bn was also an annual record.</p>
<p>Loan market technicals reverted to a net-supply shortage in December as a pickup in repayments offset slower growth in demand for loans. Loan repayments increased to $24.6bn in December, up from $13.2bn in November, because of several corporate M&amp;A transactions. Loan issuance increased in December versus the prior month as loan prices stabilized although volumes were capped by seasonal trends with activity limited during the holiday period. Despite the slower pace heading into year-end, 2025 primary market activity reached the second highest level on record, only falling short of the record set in 2024, and posted the third straight year of new-money deal growth. Net retail outflows increased to $1.1bn in December, from $0.8bn in November, as the Fed continued to cut rates with additional rate cuts forecasted in 2026.</p>
<p>The trailing twelve-month default rate within the Morningstar US Leveraged Loan Index decreased 2bp to 1.23%. As measured by JP Morgan, the default rate including distressed exchanges, decreased 45bp to 2.87%. Activity has been elevated as borrowers with unsustainable capital structures endeavored to manage their liabilities and avoid the bankruptcy process through liability management exercises, keeping the &ldquo;official&rdquo; default rate lower than otherwise. However, the default rate is now 165bp below the 4.5 year high set in January.</p>
<p>US CLO secondary market spreads were widened in the fourth quarter. The AAA tranche widened 5bps, AAs were flat; As widened by 5bps; BBBs by 11bps; BBs by 41bps; and single-Bs tightened by 25bps. Meanwhile, the JP Morgan Leveraged Loan Index widened by 47bps and the ICE BofA US High Yield Index widened 1bp.</p>
<h2 id="portfolio-strategy" class="jump-link-nav anchored-block" data-jumplink-title="Portfolio Strategy">Portfolio Strategy</h2>
<p>The borrowing rate for leveraged loan companies remains high following rate increases from central banks in 2022 and 2023. However, borrowing rates moved lower following rate cuts from the Fed at their last three meetings. Cuts were driven by increasing concern over the downside risk to employment, despite inflation remaining above the Fed&rsquo;s target and faster economic growth than anticipated. The language from the Fed coming out of the December meeting was more hawkish around the extent and timing of further cuts. The market now expects two rate cuts during the back half of 2026. The Fed is in a tricky position as inflation remains above target and labor market weakness lingers. Renewed pressure from the Trump Administration in the form of a criminal probe into Fed Chairman Powell has again increased fears about the Fed&rsquo;s independence and thrown the longer-term policy path into question. Any additional cuts will ultimately provide relief for more stressed borrowers.</p>
<p>Valuations still appear expensive amid signs of U.S. economic weakening, particularly in the labor market, as well as continued global trade war risks and rising geopolitical tensions related to Venezuela and Iran. As a result, we prefer higher-tranche purchases in the capital stack, with selective exposure to shorter spread-duration assets for lower-rated credits. Despite feeling that IG spreads are tight, we are finding value in AAA, AA, and A rated securities. Despite our preference for higher rated paper, we have also seen increased dispersion between managers lower in the capital stack, which could present attractive opportunities for select purchases of lower rated paper. We also expect there to be additional bouts of volatility in the coming months and would like to maintain the ability to shift further into lower rated tranches during future periods of market weakness. Given the rally since April 2025, buying in the secondary market has become less attractive, in general, and we prefer purchases in the primary market, even when taking an increase in spread duration into account.</p>
<h3>CLOI Total Return and Credit Allocation</h3>
<p><img loading="lazy" class="img-responsive" alt="CLOI Total Return and Credit Allocation" src="https://www.vaneck.com/EPiServer/CMS/Content/contentassets/c8360e3efc6d436d94d27b9305742211/6687_cloi-4q25_chart-1_2026-1_v1_blog.svg,,359722/Download?epieditmode=False" /></p>
<p class="chart-disclosure">Source: Factset, JP Morgan, VanEck as of 12/31/2025. AAA Rated CLOs represented by J.P. Morgan CLO AAA Index, AA Rated CLOs represented by J.P. Morgan CLO AA Index, A Rated CLOs represented by J.P. Morgan CLO A Index, BBB Rated CLOs represented by J.P. Morgan CLO BBB Index, BB Rated CLOs represented by J.P. Morgan CLO BB Index, Index performance is not representative of Fund performance. It is not possible to invest directly in an index. Past performance is no guarantee of future results. Fund performance current to the most recent month end is available by visiting vaneck.com or by calling 800.826.2333.</p>
<h3>CLOB Total Return and Credit Allocation</h3>
<p><img loading="lazy" class="img-responsive" alt="CLOB Total Return and Credit Allocation" src="https://www.vaneck.com/EPiServer/CMS/Content/contentassets/65be3f8133a74f1bbfa6ddf9c2e4278d/6687_cloi-4q25_chart-2_2026-1_v1_blog.svg,,359741/Download?epieditmode=False" /></p>
<p class="chart-disclosure">Source: Factset, JP Morgan, VanEck as of 12/31/2025. AA Rated CLOs represented by J.P. Morgan CLO AA Index, A Rated CLOs represented by J.P. Morgan CLO A Index, BBB Rated CLOs represented by J.P. Morgan CLO BBB Index, BB Rated CLOs represented by J.P. Morgan CLO BB Index, B Rated CLOs represented by J.P. Morgan CLO B Index. Index performance is not representative of Fund performance. It is not possible to invest directly in an index. Past performance is no guarantee of future results. Fund performance current to the most recent month end is available by visiting vaneck.com or by calling 800.826.2333.</p>
<h2 id="outlook" class="jump-link-nav anchored-block" data-jumplink-title="Outlook">Outlook</h2>
<p>Despite concerns that credit issues are looming following the recent isolated, but high-profile, bankruptcies, our more cautiously optimistic view is that credit markets and their infrastructure remain solid and in our view will be buoyed by improving economic conditions in 2026, driven by supportive fiscal and monetary policy, US tax cuts and deregulation, and, critically, ongoing AI expansion &ndash; a key area to watch. Fixed income markets tend to thrive in periods of low and steady growth, without extremes &ndash; conditions that align with our supportive central case scenario for 2026. While we will be keeping an eye to structural shifts and emerging risks in credit markets &ndash; particularly the impact of AI-related issuance and stress in lower-income segments &ndash; we think investors need not be alarmed by idiosyncratic credit issues, or fear that they portend a credit cycle explosion. We view such an outcome as highly unlikely barring a major economic downturn (which we likewise don&rsquo;t expect).</p>
<p>While current tight valuations can limit upside potential in fixed income in 2026, we believe CLOs remain an attractive asset class. We believe CLOs offer attractive opportunities to maintain carry in fixed income portfolios relative to other equivalently rated fixed income assets amid current conditions. Institutional demand for CLOs remains robust, and CLO ETFs saw more than 20 consecutive weeks of inflows through mid-October before experiencing some reversals heading into year-end. Recent geopolitical developments in Venezuela and Iran and renewed attacks on Fed independence did not trigger a significant immediate market reaction, but they highlight the presence of underlying risks that can quickly translate into market volatility. Despite likely headline-driven volatility in the coming months, we believe risks are balanced, though tight valuations tilt us toward an incrementally more defensive bias. We believe a nimble and robust bottom-up approach to security selection is paramount given the dispersion in the loan market, in which certain CLO portfolios holding weaker credits may eventually experience impairments to the lowest-rated debt tranches &ndash; which could result in attractive opportunities to move down the capital stack.</p>


<p>To receive more <a href="/us/en/blogs/income-investing/" title="Income Investing Insights"><strong>Income Investing</strong></a> insights, <a href="/link/5f45412c2143400497908cea2897f7d3.aspx" title=" Subscription Center"><strong>sign up in our subscription center</strong></a>.</p>
]]></content:encoded>
</item><item rdf:about="https://www.vaneck.com/us/en/blogs/digital-assets/matthew-sigel-vaneck-mid-january-2026-bitcoin-chaincheck/">
  <title>VanEck Mid-January 2026 Bitcoin ChainCheck></title>
  <link>https://www.vaneck.com/us/en/blogs/digital-assets/matthew-sigel-vaneck-mid-january-2026-bitcoin-chaincheck/</link>
  <description><![CDATA[Bitcoin rallied with renewed ETP inflows and a decoupling from equities, while miners pivot to AI and undervalued DATs ripen for consolidation.]]></description>
  <dc:creator>Patrick Bush</dc:creator>
  <dc:date>01/22/2026 06:30:00</dc:date>
<content:encoded><![CDATA[

<p><strong><u>Please note that VanEck has exposure to bitcoin.</u></strong></p>
<p><strong>Key takeaways</strong></p>
<ul class="content-list">
<li class="mt-2"><strong>Bitcoin bounces back with low volatility:</strong> Bitcoin returned <strong>+12%</strong> over the last 30 days while volatility fell significantly.</li>
<li class="mt-2"><strong>Miners pivot to AI as hash rate falls:</strong> Mining activity trended lower with difficulty down <strong>(-2%)</strong> and hash rate dropping <strong>(-6%).</strong> This decline is partly due to miners powering down rigs to service the exploding demand for AI data centers.</li>
<li class="mt-2"><strong>DAT consolidation heats up:</strong> Digital Asset Treasuries (DATs) are facing mNAV discounts, prompting a wave of potential mergers and acquisitions. We highlight the recent Strive Inc./Semler Scientific merger and identify Bitcoin Group, Empery Digital, and Sequans as potential acquisition targets.</li>
</ul>
<p>Bitcoin was a strong performer over the last 30 days, <strong>returning (+12%)</strong> as trailing 30-day volatility fell <strong>(-29%)</strong> to <strong>(Vol = 27)</strong>. Bitcoin&rsquo;s lack of energy over the past 30 days sapped volatility, bringing it to levels just below the 13<sup>th</sup>&nbsp;percentile over the past year. After what many would describe as <i>&ldquo;tax loss harvesting,&rdquo;</i> driving early December sales, which actually seemed to start in October this year, Bitcoin prices melted up through the first half of January.</p>
<p>We attribute Bitcoin&rsquo;s buoyancy to a host of factors, including softer inflation readings, Fed independence fears, CLARITY ACT optimism, and generally oversold conditions. This optimism catalyzed ETP inflows of <strong>$440M</strong> over the past 30 days, compared with outflows of <strong>-$1.3B</strong> over the prior 30-day period. In fact, between 1/12/2026 and 1/14/2026, BTC ETP inflows were <strong>+$1.66B.</strong></p>
<p>As measured by 30-day correlation, Bitcoin became untethered from the S&amp;P500, reaching <strong>0.18</strong>, which corresponds to the 9<sup>th</sup>&nbsp;percentile over the past year. This is the lowest correlation reading for BTC/SP500 since October 2025. Meanwhile, BTC moved more in lockstep with gold, with the 30-day correlation reaching <strong>0.28</strong>, which ranks a tad above the 80<sup>th</sup>&nbsp;percentile over the last year.</p>
<p>The positive price action in Bitcoin over the past 30 days translated into <strong>(+7%)</strong> growth in open interest in BTC to reach <strong>$32.4B</strong>. Though BTC open interest measured in BTC was actually down <strong>(-2.3%)</strong> since December 15, demand for speculation crept back into the markets as Bitcoin 90-day perp funding reached <strong>(4.8%)</strong>, increasing from <strong>(3.7%)</strong> in mid-December.</p>
<h3 id="btc-perp-funding" class="jump-link-nav anchored-block" data-jumplink-title="BTC Perp Funding">Bitcoin Perp Funding has Trended Down Since October 2025</h3>
<p><img loading="lazy" class="img-responsive w-100" alt="Bitcoin Perp Funding has Trended Down Since October 2025" src="https://www.vaneck.com/contentassets/1f6286f07d5f4a4ba714347ff389438c/6672_bitcoin-chaincheck-mid-jan_chart-1_2026-1_v1_blog.svg" /></p>
<br />
<p class="chart-disclosure">Source: Glassnode as of 1/15/2026. <strong>Past performance is not a guarantee of future results. Not intended as a recommendation to buy or sell any securities named herein.</strong></p>
<p>Onchain metrics were negative for Bitcoin, with most network health KPIs deteriorating, while other onchain metrics suggest that supply dynamics are improving. Some of the more concerning 30-day changes include daily network revenues <strong>(-15%),</strong> active addresses <strong>(-6%),</strong> new addresses <strong>(-4%),</strong> and active supply <strong>(+7%).</strong> These readings indicate that Bitcoin blockspace demand has fallen with fewer new and existing users transferring value on the network. At the same time, the increase in active supply indicates that the breadth of Bitcoin holders churning their positions has increased.</p>
<h2 id="miners-pivot" class="jump-link-nav anchored-block" data-jumplink-title="Miners Pivot">Miners Pivot to AI as Hash Rate Declines</h2>
<h3>Bitcoin Hash Rate Suffers Longest Sustained Drop Since Spring 2024</h3>
<p><img loading="lazy" class="img-responsive w-100" alt="Bitcoin Hash Rate Suffers Longest Sustained Drop Since Spring 2024" src="https://www.vaneck.com/contentassets/1f6286f07d5f4a4ba714347ff389438c/6672_bitcoin-chaincheck-mid-jan_chart-2_2026-1_v1_blog.svg" /></p>
<br />
<p class="chart-disclosure">Source: Glassnode as of 1/15/2026. <strong>Past performance is not a guarantee of future results. Not intended as a recommendation to buy or sell any securities named herein.</strong></p>
<p>Mining activity also continued to trend lower, with the 30-day average difficulty down <strong>(-2%)</strong> from 646 to 635, mirroring the drop in estimated global miner power consumption <strong>(-2%)</strong> from 206 TWh to 203 TWh. The 30-day moving-average hash rate is down <strong>(-6%)</strong> since its peak in mid-November 2025. The concurrent drop in difficulty, estimated power consumption, and hash rate suggests that miners are simply turning off their mining rigs. We partly attribute this dynamic to seasonal winter curtailment with entities like Riot earning <strong>$6.2M</strong> in power credits, up <strong>(+113%)</strong> from November 2025 and <strong>(+520%)</strong> from December 2024.</p>
<p>However, we believe the larger, more systematic factor driving the reduction in hash rate stems from deteriorating economics for Bitcoin mining, as AI data center power demand explodes. We expect AI data center demand to persist over the coming years, with a <strong>(+24%)</strong> CAGR through 2030, and expect Bitcoin miners to increasingly devote power resources to servicing the buildout of artificial intelligence. As Ben Gagnon, CEO of Bitcoin miner Bitfarms, notes in a recent Wired interview, &ldquo;It&rsquo;s that HPC creates so much more value per unit of energy and does so predictably for years into the future that the company can&rsquo;t justify further investment into bitcoin mining.&rdquo;</p>
<p>Bitcoin holder dynamics offered a few bright spots that should provide investors with some comfort. Onchain transfer volume fell <strong>(-11%),</strong> while miner transfer volume to exchanges declined <strong>(-6%)</strong>. Lower onchain transfer volume suggests reduced &ldquo;churn&rdquo; because less BTC is changing hands even as holder churn expands. We view the overall drop in BTC churn outweigh the breadth changes cited above.</p>
<h2 id="btc-long-term-holders" class="jump-link-nav anchored-block" data-jumplink-title="BTC Long-Term Holders">Bitcoin Long-Term Holder Resilience</h2>
<h3>BTC Supply Dormant &gt;3 Yrs. Average Since 2020: ~38%</h3>
<p><img loading="lazy" class="img-responsive w-100" alt="BTC Supply Dormant &gt;3 Yrs. Average Since 2020: ~38%" src="https://www.vaneck.com/contentassets/1f6286f07d5f4a4ba714347ff389438c/6672_bitcoin-chaincheck-mid-jan_chart-3_2026-1_v1_blog.svg" /></p>
<br />
<p class="chart-disclosure"><strong>Source: </strong>Glassnode as of 1/15/2026. <strong>Past performance is not a guarantee of future results. Not intended as a recommendation to buy or sell any securities named herein.</strong></p>
<p>Over the last 30 days, we have observed positive net changes in Bitcoin positioning across most long-term holder cohorts. In our <strong><a href="/us/en/blogs/digital-assets/matthew-sigel-vaneck-mid-december-2025-bitcoin-chaincheck/" title="VanEck Mid-December 2025 Bitcoin ChainCheck">December ChainCheck</a></strong>, we note massive reductions in BTC dormancy amongst the 1-2yr, 2-3yr, and 3-5yr cohorts of (-900bps), (-1250bps), and (-550bps) m/m, respectively, whereas 5yr+ cohorts increased balances. Due to the medium-term sellers, the net effect was a total reduction in dormant supply of (-380bps) m/m in December.</p>
<p>By contrast, in January, we saw growth or deceleration in losses amongst the 1-2yr/2-3yr/3-5yr holder bands of (+205bps), (-174bps), and (-213bps) respectively. Additionally, BTC supply inactive &gt;5 years ago was up (+176bps) over the past 30 days, with <strong>+95.5K</strong> BTC aging into these supply cohorts. From the trough on December 15, 2025, through January 14, 2026, the share of BTC not moved in over a year increased by (+69bps). Stepping back, middle-term holders are still hemorrhaging supply, but longer-term holders appear to be standing pat.</p>
<h2 id="dat-ma" class="jump-link-nav anchored-block" data-jumplink-title="DAT M&amp;A">Bitcoin Digital Asset Treasury Mergers and Acquisitions</h2>
<h3>mNAVs De-Rated Prior to Bitcoin Price Declines</h3>
<p><img loading="lazy" class="img-responsive w-100" alt="mNAVs De-Rated Prior to Bitcoin Price Declines" src="https://www.vaneck.com/contentassets/1f6286f07d5f4a4ba714347ff389438c/6672_bitcoin-chaincheck-mid-jan_chart-4_2026-1_v1_blog.svg" /></p>
<br />
<p class="chart-disclosure"><strong>Source:</strong> Artemis XYZ, Bloomberg, VanEck Research as of 1/15/2026. <strong>Past performance is not a guarantee of future results. Not intended as a recommendation to buy or sell any securities named herein.</strong></p>
<p>One of the most substantial challenges we believe Bitcoin faces is the potential liquidation of Bitcoin holdings by digital asset treasury companies (DATs). DATs use financial alchemy to buy more BTC in a strategy that gives shareholders recursive exposure to Bitcoin&rsquo;s price movements. These companies&rsquo; primary KPI is to increase the amount of BTC held per share, which is achieved by issuing debt and equity securities to fund Bitcoin purchases. The best indicator of a DAT&rsquo;s health is its mNAV (enterprise value/value of Bitcoin holdings), as this metric signals the DAT&rsquo;s ability to continue purchasing Bitcoin through financing.</p>
<p>Trying to replicate the success of Strategy, many DATs formed in the spring and summer of 2025, and we estimate that the current number of &ldquo;true&rdquo; DATs holding more than 1k BTC to be 26. These DATs have gobbled up more than 867k BTC <strong>(4.3%)</strong> of the floating BTC supply, worth around <strong>$82.5B</strong>. However, since the mass entry of new BTC DATs, many DATs have seen their mNAVs falter. Of the 26 with more than 1k BTC, only 6 have mNAV &gt; 1.0x. We believe this discount phenomenon is a substantial factor weighing on Bitcoin&rsquo;s price due to the uncertainty around these entities persisting as going concerns. If these companies were forced to wind down, the result would be a surge in Bitcoin sales.</p>
<p>Thus, until these companies attain a healthy financial outlook, many investors fear a looming storm of Bitcoin being market-sold by the living estates of these companies. As these companies&rsquo; financial health pictures are recursive to the price of Bitcoin, if BTC goes up, it allows these companies to not only finance new Bitcoin purchases (pushing up BTC price), but also extend their operating runway. However, if Bitcoin prices continue their decline, the result could trigger reflexive selling of Bitcoin as DATs are dissolved in bankruptcy.</p>
<h3>Options Open Interest ($M): MSTR vs. Mag7 and Indices</h3>
<div class="wrapped-div">
<table style="width: 100%;">
<tbody>
<tr class="tbl-data">
<td class="tbl-header last text-left">Asset</td>
<td class="tbl-header last text-right">Total Open Interest&nbsp;($M)</td>
<td class="tbl-header last text-right">Put Open Interest&nbsp;($M)</td>
<td class="tbl-header last text-right">Call Open Interest&nbsp;($M)</td>
</tr>
<tr class="tbl-data">
<td class="data-td data last text-left">MSTR</td>
<td class="data-td data last text-right">52,462</td>
<td class="data-td data last text-right">23,240</td>
<td class="data-td data last text-right">29,222</td>
</tr>
<tr class="tbl-data">
<td class="data-td last text-left">Magnificent 7</td>
<td>&nbsp;</td>
<td>&nbsp;</td>
<td>&nbsp;</td>
</tr>
<tr class="tbl-data">
<td class="data-td data last text-left">GOOG</td>
<td class="data-td data last text-right">183,133</td>
<td class="data-td data last text-right">83,956</td>
<td class="data-td data last text-right">99,178</td>
</tr>
<tr class="tbl-data">
<td class="data-td data last text-left">META</td>
<td class="data-td data last text-right">177,105</td>
<td class="data-td data last text-right">65,658</td>
<td class="data-td data last text-right">111,448</td>
</tr>
<tr class="tbl-data">
<td class="data-td data last text-left">NVDA</td>
<td class="data-td data last text-right">345,324</td>
<td class="data-td data last text-right">162,983</td>
<td class="data-td data last text-right">182,341</td>
</tr>
<tr class="tbl-data">
<td class="data-td data last text-left">TSLA</td>
<td class="data-td data last text-right">328,103</td>
<td class="data-td data last text-right">147,499</td>
<td class="data-td data last text-right">180,604</td>
</tr>
<tr class="tbl-data">
<td class="data-td data last text-left">AMZN</td>
<td class="data-td data last text-right">110,647</td>
<td class="data-td data last text-right">46,825</td>
<td class="data-td data last text-right">63,822</td>
</tr>
<tr class="tbl-data">
<td class="data-td data last text-left">MSFT</td>
<td class="data-td data last text-right">117,045</td>
<td class="data-td data last text-right">46,679</td>
<td class="data-td data last text-right">70,367</td>
</tr>
<tr class="tbl-data">
<td class="data-td data last text-left">AAPL</td>
<td class="data-td data last text-right">141,244</td>
<td class="data-td data last text-right">57,628</td>
<td class="data-td data last text-right">83,616</td>
</tr>
<tr class="tbl-data">
<td class="data-td last text-left">Indices</td>
<td>&nbsp;</td>
<td>&nbsp;</td>
<td>&nbsp;</td>
</tr>
<tr class="tbl-data">
<td class="data-td data last text-left">GLD</td>
<td class="data-td data last text-right">235,429</td>
<td class="data-td data last text-right">76,486</td>
<td class="data-td data last text-right">158,942</td>
</tr>
<tr class="tbl-data">
<td class="data-td data last text-left">VNQ</td>
<td class="data-td data last text-right">433</td>
<td class="data-td data last text-right">288</td>
<td class="data-td data last text-right">145</td>
</tr>
<tr class="tbl-data">
<td class="data-td data last text-left">IBIT</td>
<td class="data-td data last text-right">36,898</td>
<td class="data-td data last text-right">13,475</td>
<td class="data-td data last text-right">23,423</td>
</tr>
<tr class="tbl-data">
<td class="data-td data last text-left">QQQ</td>
<td class="data-td data last text-right">580,155</td>
<td class="data-td data last text-right">351,856</td>
<td class="data-td data last text-right">228,299</td>
</tr>
<tr class="tbl-data">
<td class="data-td data last text-left">BND</td>
<td class="data-td data last text-right">17</td>
<td class="data-td data last text-right">6</td>
<td class="data-td data last text-right">11</td>
</tr>
<tr class="tbl-data">
<td class="data-td data last text-left">SPY</td>
<td class="data-td data last text-right">1,177,213</td>
<td class="data-td data last text-right">827,230</td>
<td class="data-td data last text-right">349,983</td>
</tr>
</tbody>
</table>
</div>
<br />
<p class="chart-disclosure"><strong>Source:</strong> Strategy as of 1/16/2026. <strong>Past performance is not a guarantee of future results. Not intended as a recommendation to buy or sell any securities named herein.</strong></p>
<p>However, there is another option for DATs, and that is consolidation. We have seen the beginning stages of the DAT merger activity, and we believe this trend will accelerate. Given the advantages offered to larger DATs, we expect only a few dominant DATs. This is because DATs must rely on liquidity in their debt, equity, and capital markets to absorb financing for Bitcoin purchases. The best liquidity is available to the biggest players. For example, although MSTR&rsquo;s market cap is only 1/60<sup>th</sup>&nbsp;the average size of Mag7 stocks, its options open interest has at times exceeded that of Mag7 stocks. Therefore, MSTR has a tremendous financial advantage over competitors who cannot efficiently tap the financial markets. Over time, this dynamic should lead to persistent mNAV premiums for larger players compared to smaller ones.</p>
<p>As a result, we forecast that the best outcome for Bitcoin would be for the larger Bitcoin DATs to buy the smaller ones when those smaller entities trade at a discount. This dynamic would benefit both parties. While the shareholders of the acquirer would get access to cheaper Bitcoin than market-priced BTC to boost BTC per share, the owners of the acquiree would be able to recoup the discounted valuation of Bitcoin by getting a boosted mNAV. Of course, there is uncertainty over the definition of &ldquo;fair tradeoff&rdquo; for each party. However, the recently completed merger between Strive Inc. and Semler Scientific provides some insights.</p>
<h2>Case Study: The Strive Inc. &amp; Semler Scientific Merger</h2>
<p>On September 22, 2025, around Bitcoin&rsquo;s 2025 price peak, Strive Inc. (ASST) made Semler Scientific (SMLR) a lucrative merger offer: 21.05 ASST shares for 1 SMLR share. Initially, the deal was valued at <strong>$1.42B</strong>, representing a <strong>210%</strong> premium to SMLR&rsquo;s enterprise value. While the mNAV of SMLR was low <strong>(0.90),</strong> the premium implied by the deal was equivalent to buying BTC at <strong>~190%</strong> of its then-market price. However, this excessive value was likely an overstatement, as ASST was trading at a very high mNAV of ~4x. Therefore, it was expected that the deal&rsquo;s premium would decline as ASST&rsquo;s mNAV declined to reflect the deal-related share dilution.</p>
<p>By New Year&rsquo;s Eve 2025, Bitcoin had posted a few months of negative price action, falling <strong>(-20%)</strong> since the September deal date. Most of the DATs performed even worse. ASST shares fell <strong>(-73%)</strong> from the day before the merger announcement from <strong>$2.75 </strong>to <strong>$0.74</strong>, and mNAV dropped to <strong>1.2x</strong>. SMLR shares were down <strong>(-49%),</strong> and mNAV deteriorated to <strong>0.77x</strong>. As a result, the premium for the deal shrank to only <strong>(+1.6%)</strong> over market prices at that point in time.</p>
<p>Under those conditions, SMLR holders would be getting a modest mNAV lift to around <strong>0.78x.</strong> Meanwhile, ASST holders would be improving their Bitcoin share exposure from <strong>8.5 BTC </strong>per million shares to <strong>10.4 BTC</strong> per million shares. However, on January 16, 2026, the deal closed with SMLR mNAV at <strong>0.87.</strong> On the flip side, SMLR shareholders lost BTC per share exposure, moving from <strong>332 BTC/m shares</strong> to <strong>219 BTC/m shares</strong>. Meanwhile, ASST holders gave up mNAV, which moved from <strong>1.37x</strong> to <strong>1.06x</strong> the day after the merger. Thus, we can see the trade-offs each party was willing to make to get the deal done.</p>
<h3>Potential Acquisition Targets: BTC Holdings and Valuation Metrics</h3>
<div class="wrapped-div">
<table style="width: 100%;">
<tbody>
<tr class="tbl-data">
<td class="tbl-header last text-left">Company</td>
<td class="tbl-header last text-left">BTC</td>
<td class="tbl-header last text-right">EV ($M)</td>
<td class="tbl-header last text-left">mNAV (EV)</td>
<td class="tbl-header last text-left">Domicile</td>
</tr>
<tr class="tbl-data">
<td class="data-td data last text-left">Bitcoin Group SE</td>
<td class="data-td data last text-left">3,605</td>
<td class="data-td data last text-right">181</td>
<td class="data-td data last text-left">0.53</td>
<td class="data-td data last text-left">Germany</td>
</tr>
<tr class="tbl-data">
<td class="data-td data last text-left">Empery Digital</td>
<td class="data-td data last text-left">4,081</td>
<td class="data-td data last text-right">273</td>
<td class="data-td data last text-left">0.7</td>
<td class="data-td data last text-left">US</td>
</tr>
<tr class="tbl-data">
<td class="data-td data last text-left">Sequans Communications</td>
<td class="data-td data last text-left">2,264</td>
<td class="data-td data last text-right">111</td>
<td class="data-td data last text-left">0.52</td>
<td class="data-td data last text-left">France</td>
</tr>
</tbody>
</table>
</div>
<br />
<p class="chart-disclosure"><strong>Source:</strong> Bitcoin Treasuries Net as of 1/16/2026. <strong>Past performance is not a guarantee of future results. Not intended as a recommendation to buy or sell any securities named herein.</strong></p>
<p>Looking ahead, we see great potential for the intrepid DAT to acquire another &ldquo;Bitcoin company.&rdquo; To us, three entities stand out: Bitcoin Group, Empery Digital, and Sequans Communications. Each of these companies has an mNAV below <strong>1.0x</strong> while holding enough BTC to make the legal acquisition of each worthwhile. Of the bunch, we believe that the most likely acquiree is Empery Digital.</p>
<p>Bitcoin Group, based in Germany, has always been one of the most enigmatic crypto companies we cover. The stock trades at one of the steepest discounts in the peer group, even though the business appears profitable. The company reported earnings of &euro;1.8 million in 2024. Bitcoin Group operates a crypto trading platform, Bitcoin.de, and a crypto custody business. The main hurdle is that the company owns and operates a regulated financial services entity in the EU, which makes it harder for someone to acquire it quickly or easily. An acquirer would need regulatory approval and a great deal of patience. Also, Bitcoin Group has an anchor shareholder, Priority AG, which holds&gt;25% of the voting rights. However, given its juicy discount, it can be enticing to a sophisticated bidder who can navigate the pitfalls.</p>
<p>Empery Digital is nominally a &ldquo;powersports/off-road vehicle&rdquo; business. In practice, that operating unit is immaterial, generating only about <strong>$200k</strong> of earnings in 3Q2025. The more compelling feature is the sizable mNAV discount, but any prospective buyer has to contend with meaningful governance and anti-takeover friction.</p>
<p>Stockholders have limited ability to quickly change the board. Directors can be removed or replaced only at a duly scheduled meeting, and shareholders cannot call special meetings, sharply constraining rapid board turnover. That makes a proxy contest harder to run and harder to win on a tight timeline. On top of that, if an acquirer crosses 15%, Delaware law can restrict certain business combination activity for three years, effectively delaying a merger path. The board also has the ability to issue preferred shares, which could be used to dilute or otherwise deter an unsolicited bid.</p>
<p>That said, a patient DAT-style acquirer could simply wait for the next annual meeting in May 2026. If the mNAV discount persists, the run-up to that meeting could get interesting. Overall, Empery looks like a better candidate than Bitcoin Group given the more familiar jurisdiction, but any M&amp;A path is more likely to be a process than an imminent event.</p>
<p>The first issue with Sequans is structural complexity. The company is based in France, but it owns subsidiaries across multiple jurisdictions, including the UK, US, Singapore, Israel, and Finland. Any buyer is stepping into a multi-country setup with more moving parts and more opportunities for process risk to surface.</p>
<p>Sequans also has a real operating business. It is a fabless semiconductor company that was profitable in 2024, reporting about <strong>$57 million</strong> in net income. That matters because an acquirer cannot treat this as a simple balance-sheet buy. The operating business would need to be valued on its own and either managed long-term or separated, which likely pushes you toward a more complex structure like a carve-out or spin or forces the buyer to run a business they may not know well.</p>
<p>On the takeover side, France adds another hurdle. Under French takeover rules, crossing roughly 30% ownership can trigger a mandatory tender offer. That makes it difficult to build a stake quietly and then move fast, and it can turn the process into something slower and more procedural. The board also has tools that can make life harder for an outside buyer, including the ability to issue shares in ways that dilute a potential acquirer or favor friendly parties. Similar to Empery, board and shareholder actions run on set meeting timelines, which adds time and market risk.</p>
<p>Finally, because this is a semiconductor business, it can draw government scrutiny. French authorities can review and potentially restrict foreign buyers, which adds another layer of uncertainty on top of everything else. Given the many challenges confronting potential buyers, Sequans is the least attractive of the small group.</p>
<h3>Bitcoin ChainCheck Monthly Dashboard and Highlights</h3>
<p><img loading="lazy" class="img-responsive w-100" alt="Bitcoin ChainCheck Monthly Dashboard and Highlights" src="https://www.vaneck.com/contentassets/1f6286f07d5f4a4ba714347ff389438c/6672_bitcoin-chaincheck-mid-jan_table-1_2026-1_v1_blog.svg" /></p>
<br />
<p class="chart-disclosure"><sup>1</sup>&nbsp;30 day change &amp; 365 day change are relative to the 30-day avg, not absolute.</p>
<p class="chart-disclosure"><strong>Source:</strong> Glassnode as of 1/16/2026. <strong>Past performance is not a guarantee of future results. Not intended as a recommendation to buy or sell any securities named herein.</strong></p>
<p><strong>Links to third party websites are provided as a convenience and the inclusion of such links does not imply any endorsement, approval, investigation, verification or monitoring by us of any content or information contained within or accessible from the linked sites. By clicking on the link to a non-VanEck webpage, you acknowledge that you are entering a third-party website subject to its own terms and conditions. VanEck disclaims responsibility for content, legality of access or suitability of the third-party websites.</strong></p>
<p>To receive more <strong><a href="https://www.vaneck.com/us/en/insights/digital-assets/" title="Digital Assets Insights">Digital Assets</a></strong> insights, <strong><a href="https://www.vaneck.com/us/en/subscribe/" title="Subscription Center">sign up in our subscription center</a></strong>.</p>
]]></content:encoded>
</item><item rdf:about="https://www.vaneck.com/us/en/blogs/natural-resources/top-oil-companies-to-invest-in-for-an-oil-sector-revival/">
  <title>Top Oil Companies to Invest in for an Oil Sector Revival></title>
  <link>https://www.vaneck.com/us/en/blogs/natural-resources/top-oil-companies-to-invest-in-for-an-oil-sector-revival/</link>
  <description><![CDATA[With the energy sector back in headlines, these are several oilfield services companies and refiners to watch in 2026.]]></description>
  <dc:creator> </dc:creator>
  <dc:date>01/21/2026 06:30:00</dc:date>
<content:encoded><![CDATA[

<p><strong>Key Takeaways</strong></p>
<ul class="content-list">
<li class="mt-2">Oilfield services and refiners face short-term volatility, but structural demand supports a cautiously constructive outlook for 2026.</li>
<li class="mt-2">Large, technology-driven oilfield services companies and sophisticated refiners are best positioned to benefit from complex global oil systems and constrained capacity.</li>
<li class="mt-2">Targeted oil exposure across services and refining may add diversification and inflation sensitivity when used as a modest allocation within a broader portfolio.</li>
</ul>
<h2>2026 Outlook for Oil Stocks</h2>
<p>Energy markets enter 2026 with a mix of near-term uncertainty and longer-term structural opportunity across multiple segments of the oil value chain. While global crude markets remain well supplied, keeping pressure on prices and reinforcing capital discipline among producers, both oilfield services companies and refiners stand to benefit from distinct, and in some cases complementary, dynamics.</p>
<p>For oilfield services providers, the opportunity is tied to the need for maintenance, rehabilitation, and technical reinvestment in aging and underdeveloped oil systems globally. For refiners, particularly in the U.S., value is driven by crude quality mismatches, constrained refining capacity, and the ability to process heavier and more complex barrels.</p>
<p>Recent geopolitical developments in Venezuela have brought these dynamics into sharper focus. Political changes and increased U.S. engagement with the country&rsquo;s energy sector have renewed investor attention not because of immediate production gains, but because of the potential for gradual reinvestment and improved heavy-crude availability.</p>
<p>This shift has supported market interest in large oilfield services companies, such as Schlumberger (SLB), Halliburton (HAL), and Baker Hughes (BKR), on the view that any recovery would be services-led. At the same time, it has reinforced the strategic position of sophisticated refiners that benefit from access to heavy crude and tight refining capacity.</p>
<h2>Top Oil Companies to Watch</h2>
<p>As global energy demand remains resilient, investment is increasingly focused on maintaining and optimizing existing production and infrastructure. Oilfield services companies and refiners are positioned to benefit from long-term spending needs and the growing complexity of global energy systems.</p>
<p><strong>1. Schlumberger (SLB)</strong></p>
<p>Schlumberger is the biggest oilfield services company in the world. It works heavily on international and offshore projects. Its strength comes from advanced technology, digital services, and reservoir knowledge.</p>
<p>Energy producers depend on these to get the most from existing fields. Global production is shifting to more complex reservoirs. Schlumberger will benefit from the demand for valuable, technology-driven services.</p>
<p><strong>2. Halliburton (HAL)</strong></p>
<p>Halliburton is a leading provider of drilling and completion services, with particular strength in North American shale. The company tends to benefit early in upcycles as producers increase activity and service intensity. Halliburton focuses on efficiency and execution. This supports profit margins, even with more careful growth in the industry.</p>
<p><strong>3. Baker Hughes (BKR)</strong></p>
<p>Baker Hughes operates at the intersection of traditional oil services and energy technology. The company is well-known for its work in liquefied natural gas infrastructure, turbines, and industrial energy equipment along with its main oilfield services business.</p>
<p>This diversified exposure allows Baker Hughes to invest in oil and gas now, while also positioning for longer-term changes in the global energy system.</p>
<p><strong>4. Phillips 66 (PSX)</strong></p>
<p>Phillips 66 is a leading downstream energy company with a strong focus on refining, midstream, and chemicals. The company benefits from U.S. refining capacity constraints and strong product demand, particularly for transportation fuels. Its diversified income and careful spending have made it a steady producer of cash flow, even with changing oil prices.</p>
<p><strong>5. Valero (VLO)</strong></p>
<p>Valero is one of the largest independent refiners in the world, with a strong focus in the U.S. Gulf Coast. The company gains from advanced refineries that can process cheaper heavy and sour crude. This helps maintain strong profits when feedstock prices vary. This puts Valero in a good position, especially in a time of limited refining capacity.</p>

<h2>What 3 Things to Consider When Investing in Oil</h2>
<p><strong>1. Inflation Protection and Global Demand</strong></p>
<p>Oil services companies have historically performed well during inflationary periods when higher energy prices translate into increased activity and earnings.. These companies may also benefit from global energy demand in the long run. Emerging economies continue to grow and need reliable power sources.</p>
<p><strong>2. Volatility and Structural Risks</strong></p>
<p>Oil is a cyclical industry and price swings can be significant. Periods of oversupply, economic slowdowns, or sharp corrections in oil prices can weigh heavily on returns. Longer term, the global shift toward sustainable energy introduces uncertainty, even as many traditional energy companies adapt their business models.</p>
<p><strong>3. Portfolio Role and Implementation</strong></p>
<p>Exposure to oilfield services and refiners is often best used as a modest allocation within a diversified portfolio. It can complement core holdings by adding diversification and inflation sensitivity. Investors can also use strategies like the <strong><a href="/link/8339ad0b563143d98a7d2e61afbc5425.aspx" title="OIH | VanEck Oil Services ETF - Overview">VanEck Oil Services ETF (OIH)</a></strong> to express shorter-term views, benefiting from liquidity, low costs, and straightforward tax treatment without K-1 forms.</p>
<h2>How to Invest in Oil</h2>
<p>For investors looking for targeted exposure to oilfield services, one approach is through a diversified ETF rather than individual stocks. The <a href="/link/8339ad0b563143d98a7d2e61afbc5425.aspx" title="OIH | VanEck Oil Services ETF - Overview"><strong>VanEck Oil Services ETF (OIH)</strong></a> is designed to track the performance of U.S.-listed oil services companies that support upstream oil and gas production, including drilling, equipment, and related services.</p>
<p><strong><a href="/link/8339ad0b563143d98a7d2e61afbc5425.aspx" title="OIH | VanEck Oil Services ETF - Overview">OIH</a></strong> focuses on highly liquid, industry-leading companies, with an index methodology that emphasizes market capitalization and trading volume. This results in exposure to the largest and most established players in the oil services space. The fund may also include U.S.-listed foreign companies, providing broader industry representation while maintaining liquidity and transparency.</p>
<p>As a result, <strong><a href="/link/8339ad0b563143d98a7d2e61afbc5425.aspx" title="OIH | VanEck Oil Services ETF - Overview">OIH</a></strong> can be a main choice for investors wanting longer-term exposure to oilfield services or as a tactical tool to express a view on rising global energy investment, without the complexity of owning individual stocks or commodity-linked structures.</p>
<p>Investors seeking refining exposure may also consider ETFs focused on downstream companies, such as the <a href="/link/a7dbc67770ac4eb8a7c25f4c0afe1bd3.aspx" title="CRAK | VanEck Oil Refiners ETF - Overview"><strong>VanEck Oil Refiners ETF (CRAK)</strong></a>, which targets firms benefiting from refining margins, capacity constraints, and crude quality dynamics.</p>
<p>To receive more <a href="/us/en/insights/natural-resources/" title="Natural Resources Insights"><strong>Natural Resources</strong></a> insights, <a href="https://www.vaneck.com/us/en/subscribe/" title="Subscription Center"><strong>sign up in our subscription center</strong></a>.</p>
]]></content:encoded>
</item><item rdf:about="https://www.vaneck.com/us/en/blogs/emerging-markets-bonds/a-new-era-for-latin-america-what-it-could-mean-for-em-bonds/">
  <title>A New Era for Latin America? What It Could Mean for EM Bonds></title>
  <link>https://www.vaneck.com/us/en/blogs/emerging-markets-bonds/a-new-era-for-latin-america-what-it-could-mean-for-em-bonds/</link>
  <description><![CDATA[EMBX outperformed in 2025 as higher carry, selective local currency exposure, and evolving Venezuelan dynamics support EM bond opportunities and potential regional convergence.]]></description>
  <dc:creator>Eric Fine</dc:creator>
  <dc:date>01/20/2026 06:30:00</dc:date>
<content:encoded><![CDATA[

<p id="performance-overview" class="jump-link-nav anchored-block" data-jumplink-title="Performance Overview"><strong>Key Takeaways:</strong></p>
<ul class="content-list">
<li class="mt-2">EMBX outperformed across time frames, delivering 19.04% in 2025 and 3.9% annualized over five years, materially ahead of its benchmark and developed-market fixed income alternatives.</li>
<li class="mt-2">Easing global monetary conditions and improving EM policy credibility are creating a more supportive macro backdrop for local currency debt, enhancing income potential without extending duration risk.</li>
<li class="mt-2">Shifting geopolitics in South America, led by Venezuela&rsquo;s re-entry path, could drive regional convergence in growth, inflation, and capital access, reshaping the EM opportunity set.</li>
</ul>
<p>In 2025, the <a href="/link/f447bf0c04f64108a3dcff3ca025af4a.aspx" title="EMBX - VanEck Emerging Markets Bond ETF - Overview"><strong>VanEck Emerging Markets Bond ETF (EMBX</strong></a>) was up 19.04%, compared to 16.80% for its benchmark, the 50% J.P. Morgan Government Bond Index - Emerging Markets Global Diversified (GBI-EM) and 50% J.P. Morgan Emerging Markets Bond Index (EMBI) and 8.09% and 8.2% for the Global Agg and 10-year Treasuries, respectively. In the past five years, EMBX has returned 3.9% per year, compared to 1.5% for its benchmark, and -2.5%, and -2.4% per year for the Global Agg and 10-year Treasuries, respectively. EMBX was up 1.4% in December, compared to 1.11% for its benchmark. After pulling in our horns in December, EMBX has returned to its mean exposures of the past year, with local currency exposure up to around 55% from 40%. Carry is 6.3%, yield to worst is 7.6% and duration is 5.5, right near benchmark duration.</p>
<h3>Average Annual Total Returns<sup>*</sup>&nbsp;(%) (In USD)</h3>
<div class="wrapped-div">
<table style="width: 100%;">
<tbody>
<tr class="tbl-data">
<td class="tbl-header last text-left">Month End As of December 31, 2025</td>
<td class="tbl-header last text-right">1 Mo</td>
<td class="tbl-header last text-right">3 Mo</td>
<td class="tbl-header last text-right">YTD</td>
<td class="tbl-header last text-right">1 Yr</td>
<td class="tbl-header last text-right">3 Yrs</td>
<td class="tbl-header last text-right">5 Yrs</td>
<td class="tbl-header last text-right">10 Yrs</td>
</tr>
<tr class="tbl-data">
<td class="data-td last text-left">EMBX (NAV)</td>
<td class="data-td data last text-right">1.41</td>
<td class="data-td data last text-right">3.15</td>
<td class="data-td data last text-right">19.04</td>
<td class="data-td data last text-right">10.84</td>
<td class="data-td data last text-right">3.87</td>
<td class="data-td data last text-right">5.49</td>
</tr>
<tr class="tbl-data">
<td class="data-td last text-left">EMBX (Share Price)</td>
<td class="data-td data last text-right">1.12</td>
<td class="data-td data last text-right">3.03</td>
<td class="data-td data last text-right">18.91</td>
<td class="data-td data last text-right">10.80</td>
<td class="data-td data last text-right">3.85</td>
<td class="data-td data last text-right">5.48</td>
</tr>
<tr class="tbl-data">
<td class="data-td last text-left">50% GBI-EM/50% EMBI</td>
<td class="data-td data last text-right">1.11</td>
<td class="data-td data last text-right">3.32</td>
<td class="data-td data last text-right">16.80</td>
<td class="data-td data last text-right">10.08</td>
<td class="data-td data last text-right">1.50</td>
<td class="data-td data last text-right">4.20</td>
</tr>
</tbody>
</table>
</div>
<div class="chart-disclosure">
<p><sup>*</sup>&nbsp;Returns less than one year are not annualized.</p>
<p><strong>The performance data quoted represents past performance. Past performance is not a guarantee of future results. Investment return and principal value of an investment will fluctuate so that an investor's shares, when redeemed, may be worth more or less than their original cost. Performance may be lower or higher than performance data quoted. Please call 800.826.2333 or visit vaneck.com for performance current to the most recent month ended.</strong></p>
<p>Prior to 10/06/2025, the Fund operated as the VanEck Emerging Markets Bond mutual fund; performance shown before that date is that fund&rsquo;s NAV performance (Class I, unadjusted for today&rsquo;s ETF expenses).</p>
<p>The "Net Asset Value" (NAV) of a Fund is determined at the close of each business day, and represents the dollar value of one share of the fund; it is calculated by taking the total assets of the fund, subtracting total liabilities, and dividing by the total number of shares outstanding. The NAV is not necessarily the same as the ETF 's intraday trading value. Investors should not expect to buy or sell shares at NAV.</p>
<p><strong>EMBX Total Expense Ratio &ndash; 0.76%.</strong> Van Eck Associates Corporation (the &ldquo;Adviser&rdquo;) will pay all expenses of the Fund, except for the fee payment under the investment management agreement, acquired fund fees and expenses, interest expense, offering costs, trading expenses, taxes and extraordinary expenses. Notwithstanding the foregoing, the Adviser has agreed to pay the offering costs until at least May 1, 2027. &ldquo;Other Expenses&rdquo; have been restated to reflect current fees.</p>
</div>

<p><strong>Venezuelan developments are important for Venezuelan asset prices. </strong>Venezuela went from having no path to increased production, an end to sanctions, an elected government and a debt restructuring, to having a path. The market is still adjusting to this new state-of-nature, despite a tremendous rally in Venezuela and PDVSA bonds following Maduro&rsquo;s arrest. You can see the price action in Exhibit 1. Bonds in the Venezuela/PSVSA complex went up around 10 points from the high 20s to the low 40s. Let&rsquo;s step back a second to focus on the bonds and the type of restructuring that could maintain. There are basically two key determinants of their present value &ndash; how long it takes to get a deal, and what the deal looks like. On how long it takes, well, that&rsquo;s obviously a judgment going forward but it&rsquo;s also obviously a possibility today when it wasn&rsquo;t just a few days ago. On the deal we&rsquo;ll get, there is great uncertainty, but fund managers can&rsquo;t wait for the outcome of course. The main points to consider are as follows:</p>
<ul class="content-list">
<li class="mt-2">The numbers are unknown/highly uncertain. Debt/GDP may be 160%, but there are estimates of over 200%.</li>
<li class="mt-2">Production could increase by 250k bpd under the current transitory political scenario.</li>
<li class="mt-2">Political stability and new elections would change the nature of the investment environment and permit far greater production increases over time.</li>
<li class="mt-2">China could get sidelined as a bilateral creditor. The US could dominate all discussions, including over the IMF, whose involvement is not certain.</li>
<li class="mt-2">The US, in Bolivia and Argentina, favored policies that supported a quick return to market access. We see more information here than in the Iraq precedent.</li>
<li class="mt-2">The &ldquo;exit yield&rdquo; to discount restructured cash flows could be very low or very high depending on political stability, which is a necessary condition for a positive outcome.</li>
</ul>
<h3>Exhibit 1 &ndash; Venezuela Bonds I-Shaped</h3>
<p><img loading="lazy" class="img-responsive w-100" alt="Exhibit 1 &ndash; Venezuela Bonds I-Shaped" src="https://www.vaneck.com/EPiServer/CMS/Content/contentassets/a0f1f9a99174428ca54142fa9026de6f/6656_embx-monthly-dec_chart-1_2026-1_v1_blog.svg,,358400/Download?epieditmode=False" /></p>

<p class="chart-disclosure">Source: Bloomberg. Data as of January 2026. Past performance is no guarantee of future results.</p>
<p><strong>Venezuelan developments are also important for neighbors, such as Colombia. </strong>Colombia&rsquo;s local market leads emerging markets (EM) so far in 2026, as markets discount new scenarios that could impact, politics and policy. Mexico and Brazil are also more in-focus. Colombia&rsquo;s political environment has stronger institutions and is very divided. It also faces serious fiscal challenges that even market-friendly candidates may find difficult to successfully address. Nonetheless, US involvement next door is an unquestionable change in the mood music. And Colombia&rsquo;s military is a strong institution whose closeness to the US may come to bear, depending on political scenarios. Brazil also faces presidential elections this year. The market-friendly candidate would normally be a frontrunner, but because his name might be Bolsonaro we have a bit of a soap opera. A bit more binary here, but we continue to think the risk remains of a tilt toward the right in Brazil, with only the right in the way of a victory for the right.</p>
<p><strong>Venezuelan developments are important for South America, with regional &ldquo;convergence&rdquo; now a long-term possibility. </strong>What might &ldquo;successful&rdquo; US regionalism generate? A stable financial, economic, social, and inflation outcome for many countries, for one. Convergence is a real economic (and other dimension) phenomenon. We say this because for too many, the first question following Venezuelan developments was &ldquo;what does this mean for Taiwan?&rdquo; &ldquo;What does this mean for Iran?&rdquo; was another favorite &ndash; everyone thinks they&rsquo;re on CNN. There are a lot of steps between Venezuela and Taiwan, and none to Colombia and few to Mexico and Brazil. One scenario we believe we&rsquo;ll be hearing a lot more about is &ldquo;convergence&rdquo;. It&rsquo;s a natural or created phenomenon but it&rsquo;s real. Your author was part of the great European &ldquo;convergence trade&rdquo;, in which large institutions bought, for example, Polish zloty bonds as Polish inflation and growth and institutions converged to Germany&rsquo;s (which used to be a good thing&hellip;now Poland just grows on its own). Anyway, our point is to have some memory (you don&rsquo;t even need imagination). If politics and economics are converging, shouldn&rsquo;t inflation and other variables critical to asset prices? It&rsquo;s far less of a stretch than figuring out what Venezuela means for Iran. Some concrete examples of US policy forbearance in such &ldquo;convergence&rdquo; situations happened in our own portfolio just in 2025 &ndash; Bolivia and Argentina! We wrote about each at the time, but in both situations the US Treasury was deeply involved in managing a smooth transition. In Bolivia, emergency fuel supplies were provided right after elections, and we all know the extraordinary support lent to Argentina. Both situations led to rallies in USD bonds, and both were characterized by a wall of worry and lists of all the obstacles to progress&hellip;which happened.</p>
<h2 id="exposure-types-and-significant-changes" class="jump-link-nav anchored-block" data-jumplink-title="Exposure Types and Significant Changes">Exposure Types and Significant Changes</h2>
<p>The changes to our top positions are summarized below. Our largest positions in December were South Africa, Mexico, Poland, Thailand and Malaysia:</p>
<ul class="content-list">
<li class="mt-2">
<p>We increased our local currency exposure in Mexico, Colombia, and Brazil. Mexico&rsquo;s local bonds should be able to piggyback on additional policy easing in the U.S. against the backdrop of on-going fiscal consolidation. Mexico also stands to benefit from global AI investments. In terms of our investment process, this improved the technical and policy test scores for the country. Colombia&rsquo;s fiscal situation is concerning, but the central bank&rsquo;s stance is credible, and local bonds can benefit from the potential return of pension funds&rsquo; money into the domestic debt market, which would improve the technical test score for the country. Brazil is on the cusp of a credible rate-cutting cycle, which should improve the policy test score for the country after the year-end period of tight liquidity is over.</p>
</li>
<li class="mt-2">
<p>We also increased our local currency exposure in Poland and South Korea. Poland&rsquo;s lower than expected inflation leaves room for additional rate cuts, improving the policy and economic test scores for the country. The South Korean won&rsquo;s strong correlation with the Japanese Yen (which is likely to be supported by the Bank of Japan) improved the technical test score for local bonds.</p>
</li>
<li class="mt-2">
<p>Finally, we increased our hard currency sovereign exposure in Israel and Zambia, and hard currency sub-sovereign and corporate exposure in Argentina. Compelling valuations in Zambia and Israel improved the technical test scores for both countries. Argentina&rsquo;s regions and regions and companies no longer look expensive vs. the sovereign, which rallied on the back of a positive shift in the FX regime and reserves accumulation. In terms of our investment process, this improved the technical and policy test scores for the country.</p>
</li>
<li class="mt-2">
<p>We reduced our local currency exposure in South Africa, Thailand, and Paraguay. South Africa&rsquo;s valuations look expensive (the worst valuation quartile) after a monster rally, following the adoption of the new inflation target. In terms of our investment process, this worsened the technical test score for the country. Thailand is a low yielder with less attractive valuations, which also worsened the technical test score.</p>
</li>
<li class="mt-2">
<p>We also reduced our hard currency sovereign exposure in Saudi Arabia and the Philippines due to our concerns about global duration, which worsened the technical test scores for both countries.</p>
</li>
<li class="mt-2">
<p>Finally, we reduced our hard currency corporate exposure in Nigeria and hard currency sovereign exposure in Peru and Indonesia. The key driver in Nigeria was the negative oil price dynamics, which worsened the technical test score. The worsening technical test score was also the main factor in Peru and Indonesia, where we had meaningful duration exposure. In addition, concerns about Petroperu&rsquo;s rating downgrades, the company&rsquo;s top management &ldquo;revolving door&rdquo;, and uncertain restructuring plans lowered the policy test score for the company.</p>
</li>
</ul>
<p>To receive more <a href="https://www.vaneck.com/us/en/insights/emerging-markets-bonds/" title="Emerging Markets Bonds Insights"><strong>Emerging Markets Bonds</strong></a> insights, <a href="/link/5f45412c2143400497908cea2897f7d3.aspx" title=" Subscription Center"><strong>sign up in our subscription center</strong></a>.</p>
]]></content:encoded>
</item><item rdf:about="https://www.vaneck.com/us/en/blogs/thematic-investing/buzz-investing-macro-recalibration-and-valuation-discipline-shape-performance/">
  <title>BUZZ Investing: Macro Recalibration and Valuation Discipline Shape Performance></title>
  <link>https://www.vaneck.com/us/en/blogs/thematic-investing/buzz-investing-macro-recalibration-and-valuation-discipline-shape-performance/</link>
  <description><![CDATA[Investor sentiment turned more selective as markets rewarded tangible fundamentals and execution over elevated expectations entering 2026.]]></description>
  <dc:creator> </dc:creator>
  <dc:date>01/20/2026 06:30:00</dc:date>
<content:encoded><![CDATA[

<p><strong>Key Takeaways</strong></p>
<ul>
<li class="mt-2">Markets moved into a more cautious and selective phase, with investors emphasizing valuation discipline, earnings durability, and near-term visibility as scrutiny increased across high-growth and AI-related stocks.</li>
<li class="mt-2">Leadership narrowed as company-specific fundamentals and execution increasingly drove performance, leading to greater dispersion across sectors.</li>
<li class="mt-2">Investor interest favored companies with tangible contract wins and improving industry dynamics, highlighting a shift toward more defensible sources of growth.</li>
</ul>
<p>U.S. equities moved through a more cautious and transitional period between index selection dates (December 11, 2025 &ndash; Jan 9, 2026, the &ldquo;Period&rdquo;), as markets closed out the year and began to recalibrate expectations for 2026. While headline indices were relatively stable, underlying market dynamics became more defensive, with investors increasingly focused on valuation discipline, earnings durability, and visibility into near-term returns. Large-cap technology and other leadership cohorts that had dominated much of 2025 faced renewed scrutiny, particularly where optimism around AI investment cycles appeared to outpace evidence of near-term monetization. Against this backdrop, the <a href="/link/459289f4c5ea4648bd9dfcf70d847cd7.aspx" title="BUZZ - VanEck Social Sentiment ETF - Overview"><strong>BUZZ</strong></a> NextGen AI US Sentiment Leaders Index (the &ldquo;<a href="/link/459289f4c5ea4648bd9dfcf70d847cd7.aspx" title="BUZZ - VanEck Social Sentiment ETF - Overview"><strong>BUZZ</strong></a> Index&rdquo;) declined 1.2% during the Period, reflecting its greater exposure to stocks undergoing this valuation reassessment.</p>
<p>Policy and data developments reinforced the more selective tone. The Federal Reserve&rsquo;s December rate cut was widely anticipated, but accompanying communications suggested a more measured stance heading into early 2026, tempering expectations for additional near-term easing. As the calendar turned, attention shifted quickly to labor-market data and early corporate commentary, with investors weighing signs of cooling employment conditions against still-elevated cost pressures. The first week of January further highlighted dispersion across sectors, as technology and digital-asset-linked equities lagged while more defensively positioned areas held up better. Overall, the Period was characterized less by broad macro direction and more by a tightening of standards, with performance increasingly shaped by company-specific execution and the ability to justify elevated expectations entering the new year.</p>
<p>The <a href="/link/459289f4c5ea4648bd9dfcf70d847cd7.aspx" title="BUZZ - VanEck Social Sentiment ETF - Overview"><strong>BUZZ</strong></a> Index returned -2.83% during the month of December compared to a return of 0.06% for the S&amp;P 500 Index during the same period. Year-to-date, the <a href="/link/459289f4c5ea4648bd9dfcf70d847cd7.aspx" title="BUZZ - VanEck Social Sentiment ETF - Overview"><strong>BUZZ</strong></a> Index leads the S&amp;P 500 with returns of 31.10% and 17.88%, respectively, as of the end of December.</p>
<p><strong>Rocket Lab Drives BUZZ Gains During the Period; Micron Advances on Tightening Memory Markets</strong><br />Shares of Rocket Lab (NASDAQ: RKLB) were the top contributor to <a href="/link/459289f4c5ea4648bd9dfcf70d847cd7.aspx" title="BUZZ - VanEck Social Sentiment ETF - Overview"><strong>BUZZ</strong></a> Index performance during the Period, advancing on the back of a significant national-security contract that further elevated the company&rsquo;s role within the U.S. space-defense ecosystem. Rocket Lab was awarded an $816 million contract by the U.S. Space Development Agency under the Tracking Layer Tranche 3 program, calling for the design and manufacture of 18 missile-warning and tracking satellites. The program is focused on persistent global detection of emerging threats, including hypersonic systems, and is part of the Department of Defense&rsquo;s broader push toward resilient, proliferated satellite constellations. Investors appeared to view the award as both a meaningful revenue anchor and a strong validation of Rocket Lab&rsquo;s expanding space-systems capabilities beyond launch services, reinforcing confidence in its ability to scale complex manufacturing programs and secure additional defense-related work.</p>
<p>Micron Technology (NASDAQ: MU) was the next-largest contributor, continuing to benefit from tightening conditions across global memory markets. Shares moved higher as renewed strength across the semiconductor complex highlighted accelerating demand for DRAM and NAND tied to AI-driven infrastructure buildouts. Industry commentary pointed to rising spot prices, constrained supply, and improving pricing power heading into 2026, reinforcing expectations that memory may be entering a more pronounced upcycle. Micron&rsquo;s positioning as a key supplier into data centers and AI workloads left it well placed to capture these dynamics, and investors appeared to respond to growing evidence that elevated demand is translating into a more favorable earnings backdrop.</p>

<h3 id="top-contributors" class="jump-link-nav anchored-block" data-jumplink-title="Top Contributors">Top BUZZ Index Contributors: December 11, 2025 &ndash; January 9, 2026</h3>
<div class="wrapped-div">
<table width="100%">
<tbody>
<tr class="tbl-data">
<td class="tbl-header last text-left"><strong>Company</strong></td>
<td class="tbl-header last text-left"><strong>Ticker</strong></td>
<td class="tbl-header last text-right"><strong>Average Weight (%)</strong></td>
<td class="tbl-header last text-right"><strong>Return Contribution (%)</strong></td>
</tr>
<tr class="tbl-data">
<td class="data-td data last text-left">Rocket Lab Corp</td>
<td class="data-td data last text-left">RKLB</td>
<td class="data-td data last text-right">2.02</td>
<td class="data-td data last text-right">0.52</td>
</tr>
<tr class="tbl-data">
<td class="data-td data last text-left">Micron Technology Inc</td>
<td class="data-td data last text-left">MU</td>
<td class="data-td data last text-right">1.06</td>
<td class="data-td data last text-right">0.30</td>
</tr>
<tr class="tbl-data">
<td class="data-td data last text-left">Rivian Automotive Inc</td>
<td class="data-td data last text-left">RIVN</td>
<td class="data-td data last text-right">1.60</td>
<td class="data-td data last text-right">0.22</td>
</tr>
<tr class="tbl-data">
<td class="data-td data last text-left">IREN Ltd</td>
<td class="data-td data last text-left">IREN</td>
<td class="data-td data last text-right">2.76</td>
<td class="data-td data last text-right">0.21</td>
</tr>
<tr class="tbl-data">
<td class="data-td data last text-left">Amazon.com Inc</td>
<td class="data-td data last text-left">AMZN</td>
<td class="data-td data last text-right">2.74</td>
<td class="data-td data last text-right">0.18</td>
</tr>
<tr class="tbl-data">
<td class="data-td data last text-left">Alphabet Inc</td>
<td class="data-td data last text-left">GOOGL</td>
<td class="data-td data last text-right">2.86</td>
<td class="data-td data last text-right">0.16</td>
</tr>
<tr class="tbl-data">
<td class="data-td data last text-left">Boeing Co/The</td>
<td class="data-td data last text-left">BA</td>
<td class="data-td data last text-right">0.96</td>
<td class="data-td data last text-right">0.12</td>
</tr>
<tr class="tbl-data">
<td class="data-td data last text-left">Lululemon Athletica Inc</td>
<td class="data-td data last text-left">LULU</td>
<td class="data-td data last text-right">0.82</td>
<td class="data-td data last text-right">0.11</td>
</tr>
<tr class="tbl-data">
<td class="data-td data last text-left">Celsius Holdings Inc</td>
<td class="data-td data last text-left">CELH</td>
<td class="data-td data last text-right">0.66</td>
<td class="data-td data last text-right">0.10</td>
</tr>
<tr class="tbl-data">
<td class="data-td data last text-left">Nebius Group NV</td>
<td class="data-td data last text-left">NBIS</td>
<td class="data-td data last text-right">2.90</td>
<td class="data-td data last text-right">0.09</td>
</tr>
</tbody>
</table>
</div>
<p class="chart-disclosure">Source: BUZZ Holdings ULC, Bloomberg. Past performance is no guarantee of future results. Index performance is not illustrative of fund performance. Not intended as a recommendation to buy or to sell any of the securities mentioned herein.</p>

<p><strong>Rigetti and QuantumScape Drag BUZZ Amid Execution and Commercialization Questions</strong><br />Shares of Rigetti Computing (NASDAQ: RGTI) declined during the Period, weighing on Index performance after a period of significant momentum. The stock faced pressure as market participants appeared to recalibrate expectations following its exclusion from the next phase of a high-profile government benchmarking initiative, which may have raised questions about its near-term competitive standing. Combined with a valuation that could be perceived as extended relative to current revenue, the absence of new incremental catalysts may have contributed to a pullback as positioning reset entering the new year.</p>
<p>QuantumScape Corp (NYSE: QS) was also a detractor during the Period, retreating despite meeting its annual goal for pilot production equipment installation. The stock&rsquo;s movement may suggest that expectations may have moved ahead of near-term fundamentals, potentially leading to a "sell the news" dynamic as investor focus shifted toward the multi-year hurdles of commercial scaling. While technical progress and partnership validation remain intact, a breakdown below key moving averages might have accelerated downside momentum during a seasonally quieter trading window.</p>
<h3 id="bottom-contributors" class="jump-link-nav anchored-block" data-jumplink-title="Bottom Contributors">Bottom BUZZ Index Contributors: December 11, 2025 &ndash; January 9, 2026</h3>
<div class="wrapped-div">
<table width="100%">
<tbody>
<tr class="tbl-data">
<td class="tbl-header last text-left"><strong>Company</strong></td>
<td class="tbl-header last text-left"><strong>Ticker</strong></td>
<td class="tbl-header last text-right"><strong>Average Weight (%)</strong></td>
<td class="tbl-header last text-right"><strong>Return Contribution (%)</strong></td>
</tr>
<tr class="tbl-data">
<td class="data-td data last text-left">Rigetti Computing Inc</td>
<td class="data-td data last text-left">RGTI</td>
<td class="data-td data last text-right">1.50</td>
<td class="data-td data last text-right">-0.38</td>
</tr>
<tr class="tbl-data">
<td class="data-td data last text-left">QuantumScape Corp</td>
<td class="data-td data last text-left">QS</td>
<td class="data-td data last text-right">1.22</td>
<td class="data-td data last text-right">-0.26</td>
</tr>
<tr class="tbl-data">
<td class="data-td data last text-left">Super Micro Computer Inc</td>
<td class="data-td data last text-left">SMCI</td>
<td class="data-td data last text-right">1.71</td>
<td class="data-td data last text-right">-0.24</td>
</tr>
<tr class="tbl-data">
<td class="data-td data last text-left">Hims &amp; Hers Health Inc</td>
<td class="data-td data last text-left">HIMS</td>
<td class="data-td data last text-right">1.78</td>
<td class="data-td data last text-right">-0.22</td>
</tr>
<tr class="tbl-data">
<td class="data-td data last text-left">Strategy Inc</td>
<td class="data-td data last text-left">MSTR</td>
<td class="data-td data last text-right">2.62</td>
<td class="data-td data last text-right">-0.21</td>
</tr>
<tr class="tbl-data">
<td class="data-td data last text-left">Opendoor Technologies Inc</td>
<td class="data-td data last text-left">OPEN</td>
<td class="data-td data last text-right">2.61</td>
<td class="data-td data last text-right">-0.20</td>
</tr>
<tr class="tbl-data">
<td class="data-td data last text-left">Advanced Micro Devices Inc</td>
<td class="data-td data last text-left">AMD</td>
<td class="data-td data last text-right">2.88</td>
<td class="data-td data last text-right">-0.18</td>
</tr>
<tr class="tbl-data">
<td class="data-td data last text-left">Palantir Technologies Inc</td>
<td class="data-td data last text-left">PLTR</td>
<td class="data-td data last text-right">3.08</td>
<td class="data-td data last text-right">-0.18</td>
</tr>
<tr class="tbl-data">
<td class="data-td data last text-left">SoundHound AI Inc</td>
<td class="data-td data last text-left">SOUN</td>
<td class="data-td data last text-right">1.33</td>
<td class="data-td data last text-right">-0.17</td>
</tr>
<tr class="tbl-data">
<td class="data-td data last text-left">Robinhood Markets Inc</td>
<td class="data-td data last text-left">HOOD</td>
<td class="data-td data last text-right">2.55</td>
<td class="data-td data last text-right">-0.16</td>
</tr>
</tbody>
</table>
</div>
<p class="chart-disclosure">Source: BUZZ Holdings ULC, Bloomberg. Past performance is no guarantee of future results. Index performance is not illustrative of fund performance. Not intended as a recommendation to buy or to sell any of the securities mentioned herein. .</p>
<h2>BUZZ Index January 2026 Rebalance Highlights</h2>
<p><strong>Cipher Mining Inc.</strong></p>
<p>Cipher Mining (NASDAQ: CIFR) entered the <a href="/link/459289f4c5ea4648bd9dfcf70d847cd7.aspx" title="BUZZ - VanEck Social Sentiment ETF - Overview"><strong>BUZZ</strong></a> Index this month for the first time, reflecting increased investor attention toward operators of large-scale bitcoin mining data centers. Cipher became a public company in 2021 through a merger with SPAC GoodWorks Acquisition Corp, entering during a window when high-growth thematic segments experienced elevated capital inflows. As market conditions tightened through 2022 and 2023, shifting risk appetite and broader pressure on speculative assets weighed on valuations across the sector, including CIFR. More recently, the operating backdrop has evolved as a recovery in digital asset pricing suggested a renewed focus on mining capacity and scalable development pipelines. Cipher has sought to position itself within this landscape, with multiple sites scheduled to come online over the next one to three years. In November 2025, the company announced a 10-year agreement with cloud-computing provider Fluidstack, a contract partially supported by Alphabet (NASDAQ: GOOGL). Shares have advanced significantly since early Q4, accompanied by increasing online engagement. CIFR joins the <a href="/link/459289f4c5ea4648bd9dfcf70d847cd7.aspx" title="BUZZ - VanEck Social Sentiment ETF - Overview"><strong>BUZZ</strong></a> Index this month with a 0.79% weight.</p>
<p><strong>Venture Global, Inc.</strong></p>
<p>In January 2025, Venture Global (NYSE: VG), a leading global exporter of liquefied natural gas, debuted on the NYSE at $25 in one of the largest IPOs of the past five years. The offering raised $1.75 billion and valued the company at approximately $65 billion. At first glance, the transaction appeared to signal a reopening of the IPO market. Beneath the surface, however, signs of strain were already evident. Venture Global initially targeted a $2.3 billion raise at a $110 billion valuation. Within three months, the stock declined to roughly $7 per share, making it one of the year&rsquo;s most disappointing IPOs. Since then, trading has been volatile, with shares briefly rebounding toward $20 before retreating again toward prior lows. More recently, the energy sector has drawn increased attention and engagement across online forums, potentially reflecting a broader thematic rotation as the advancement of a pro-energy agenda by President Trump appears to be regaining sector momentum. As part of this month&rsquo;s rebalance, Venture Global enters the <a href="/link/459289f4c5ea4648bd9dfcf70d847cd7.aspx" title="BUZZ - VanEck Social Sentiment ETF - Overview"><strong>BUZZ</strong></a> Index for the first time with a 0.32% weight, alongside Exxon Mobil (NYSE: XOM) at 0.28% and Chevron (NYSE: CVX) at 0.58%.</p>
<p>For more on rebalancing results and a full breakdown of index constituents added and removed for the month, view the <strong><a href="/us/en/investments/social-sentiment-etf-buzz/buzz-reconstitution.pdf" title="BUZZ - VanEck Social Sentiment ETF" target="_blank" rel="noopener">BUZZ Index reconstitution</a></strong> report.</p>

<p>To receive more <a href="https://www.vaneck.com/us/en/insights/thematic-investing/" title="Thematic Investing Insights"><strong>Thematic Investing</strong></a> insights, <a href="https://www.vaneck.com/us/en/subscribe/" title="Subscription Center"><strong>sign up in our subscription center</strong></a>.</p>
]]></content:encoded>
</item><item rdf:about="https://www.vaneck.com/us/en/blogs/model-portfolios/recap-innovation-matures-constraints-tighten-money-evolves/">
  <title>December Market Recap: Innovation Matures, Constraints Tighten, Money Evolves></title>
  <link>https://www.vaneck.com/us/en/blogs/model-portfolios/recap-innovation-matures-constraints-tighten-money-evolves/</link>
  <description><![CDATA[As we enter 2026, markets are being shaped less by opportunity alone and more by constraint. The themes driving returns are evolving, and how investors access them now matters more than ever.]]></description>
  <dc:creator>David Schassler</dc:creator>
  <dc:date>01/16/2026 06:30:00</dc:date>
<content:encoded><![CDATA[

<p><strong>Key Takeaways</strong></p>
<ul class="content-list">
<li class="mt-2"><strong>Innovation is maturing.</strong> AI is shifting from build-out to adoption, where execution and returns matter most.</li>
<li class="mt-2"><strong>Real assets are the bottleneck.</strong> Energy, materials, and infrastructure will constrain how fast the digital economy can scale.</li>
<li class="mt-2"><strong>Money is changing.</strong> Policy is being constrained by debt, deficits, and market liquidity, elevating the role of hard assets.</li>
</ul>

<p><strong><i>The views expressed are for illustrative purposes only, subject to change without notice, do not constitute investment advice or recommendations, and are those of the author(s) and not necessarily those of VanEck or its other employees. Past performance is no guarantee of future results.</i></strong></p>
<h2>2025 Was a Year of Change. 2026 Will Be Defined by Constraints.</h2>
<p>2026 started with a bang. A big New York welcome to the city&rsquo;s newest power couple, Nicol&aacute;s and Cilia Flores Maduro.</p>
<p>The geopolitical and economic consequences of this moment will unfold over time, with real implications for capital flows, scarce resources, and how investors must be diversified to navigate a rapidly changing world.</p>
<p>2025 was a good year for almost everyone. The investors who did best embraced structural change. Those who struggled were positioned for a world that no longer exists.</p>
<p>Equities worked. Real assets worked better. Even bonds worked a little.</p>
<p>For thematic investors, this remains a target rich environment.</p>
<p>Anyone who follows us knows the themes we focus on.</p>
<ol class="content-list">
<li class="mt-2">Disruptive technological innovation.</li>
<li class="mt-2">Old world assets building the new world.</li>
<li class="mt-2">Debasement protection.</li>
</ol>
<p>Those themes are not changing in 2026. How investors access these evolving themes makes all the difference.</p>
<h3>A Great Year for Asset Owners</h3>
<p><img loading="lazy" class="img-responsive" alt="A Great Year for Asset Owners" src="https://www.vaneck.com/EPiServer/CMS/Content/contentassets/f2dd37f2f3e841f4ad7182fd4ae41bcd/6659_models-monthly-dec_chart-1_2026-1_v1_blog.svg,,358323/Download?epieditmode=False" /></p>
<p class="chart-disclosure">Source: Morningstar, as of 12/31/2025. Past performance is no guarantee of future results.</p>
<h2 id="theme-one-innovation-is-going-mainstream" class="jump-link-nav anchored-block" data-jumplink-title="Theme One: Innovation is Going Mainstream">Theme One: Innovation is Going Mainstream</h2>
<p>The race in compute continues and it&rsquo;s having an outsized impact on economic growth.</p>
<p>However, this innovation cycle is maturing, and the center of gravity is shifting from build to adopt. What matters now is integration, execution, and return-on-capital.</p>
<p>AI is moving into workflows, automation, and physical systems where it solves real problems. One of the clearest examples is warfare.</p>
<h3>AI&rsquo;s Contribution to U.S. GDP Growth</h3>
<p><img loading="lazy" class="img-responsive" alt="AI&rsquo;s Contribution to U.S. GDP Growth" src="https://www.vaneck.com/EPiServer/CMS/Content/contentassets/1ad4bebcd2764ecba46a1bba1812bf95/6659_models-monthly-dec_chart-2_2026-1_v1_blog.svg,,358325/Download?epieditmode=False" /></p>
<p class="chart-disclosure">Source: Barclays.</p>
<p>Military power is shifting from manpower to machines. Artificial intelligence, autonomy, robotics, and advanced systems are reshaping how conflicts are fought and how deterrence is maintained. Speed, precision, and technological superiority now matter more than scale alone.</p>
<p>This is not cyclical. It is structural. Defense spending has been rising globally.</p>
<h3>Global Military Expenditure Rose by 9.4% in 2024</h3>
<p><img loading="lazy" class="img-responsive" alt="Global Military Expenditure Rose by 9.4% in 2024" src="https://www.vaneck.com/EPiServer/CMS/Content/contentassets/d179ffc955b04df79e1f656b816ac071/6659_models-monthly-dec_chart-3_2026-1_v1_blog.svg,,358327/Download?epieditmode=False" /></p>
<p class="chart-disclosure">Source: SIPRI. As of April 2025.</p>
<p>Elevated geopolitical risk is accelerating the pace and scale of investment. President Trump recently announced on Truth Social that &ldquo;in these very troubled and dangerous times, our Military Budget for the year 2027 should not be $1 Trillion Dollars, but rather $1.5 Trillion Dollars.&rdquo;</p>
<p>We recently added direct exposure to defense and aerospace. These companies sit at the intersection of advanced computing, autonomy, and national security. The investment backdrop is long-duration and materially less sensitive to traditional economic cycles.</p>
<h2 id="theme-two-real-assets-are-the-constraint" class="jump-link-nav anchored-block" data-jumplink-title="Theme Two: Real Assets are the Constraint">Theme Two: Real Assets are the Constraint</h2>
<p>The next phase of this cycle will be defined by constraint. AI, electrification, automation, and reshoring all compete for the same finite resources.</p>
<p>The future must be built in the physical world. As an example, this chart demonstrates the outsized investments in data centers.</p>
<p>Yes, data centers need power. Factories need inputs. Supply chains need redundancy.</p>
<p>Old world assets are building the new world.</p>
<p>This is why real assets matter so much. They determine how fast innovation can scale.</p>
<h3>Data Center CAPEX Has Surged Since 2022</h3>
<p><strong>Real Private Nonresidential Fixed Investment, Quarterly</strong></p>
<p><img loading="lazy" class="img-responsive" alt="Data Center CAPEX Has Surged Since 2022" src="https://www.vaneck.com/EPiServer/CMS/Content/contentassets/db712ba1475f4deea60bea492413b563/6659_models-monthly-dec_chart-4_2026-1_v1_blog.svg,,358329/Download?epieditmode=False" /></p>
<p class="chart-disclosure">Source: BofA Global Research, as of 2025.</p>
<p>One of the clearest examples is Silver.</p>
<p>Silver&rsquo;s exceptional electrical and thermal conductivity make it essential to solar panels, electronics, semiconductors, and industrial systems. It is now moving deeper into the next generation of battery technology.</p>
<p>Incremental innovation increasingly runs into material limits. Silver markets were already tight before this development. Industrial demand has exceeded mine supply for several years. When new demand meets constrained supply, prices adjust.</p>
<p>Silver rose nearly 130% in 2025 and 50% in the fourth quarter alone. Silver is not unique. It is representative.</p>
<p>The digital economy is accelerating, but it rests on a physical foundation that cannot be expanded instantly. Energy, materials, and infrastructure are bottlenecks.</p>
<p>Real assets are increasingly central to how the next phase of growth is built.</p>
<h3>Silver Shines for Best Year on Record</h3>
<p><img loading="lazy" class="img-responsive" alt="Silver Shines for Best Year on Record" src="https://www.vaneck.com/EPiServer/CMS/Content/contentassets/a4cc14017688476b964b186cd9dfa864/6659_models-monthly-dec_chart-5_2026-1_v1_blog.svg,,358331/Download?epieditmode=False" /></p>
<p class="chart-disclosure">Source: Bloomberg, as of 2025. Past performance is no guarantee of future results.</p>
<h2 id="theme-three-money-is-changing" class="jump-link-nav anchored-block" data-jumplink-title="Theme Three: Money is Changing">Theme Three: Money is Changing</h2>
<p>Gold did not become one of the top-performing assets by accident. It was information. But the story is bigger than gold. We have moved from monetary dominance to fiscal dominance.</p>
<p>For decades, monetary policy drove outcomes. Interest rates moved lower and lower. Governments borrowed freely, but debt service remained manageable.</p>
<p>Now the constraints are visible!</p>
<p>Fiscal dominance occurs when monetary policy is forced to operate within the constraints of government financing, market liquidity, and debt sustainability.</p>
<p>This is not theory. It is observable.</p>
<p>Interest Expense is now an issue, and as such, one must ask: are U.S. Treasuries still the unquestioned reserve asset? Gold and foreign central banks are saying no as foreign governments now hold more gold than U.S. Treasuries.</p>
<p>Central banks are not buying gold for nostalgia. They are buying it because gold carries no counterparty risk, no sanction risk, and no political dependency</p>
<p>Money is changing.</p>
<h3>US Budget Deficit Persists Outside of Recessions</h3>
<p><img loading="lazy" class="img-responsive" alt="US Budget Deficit Persists Outside of Recessions" src="https://www.vaneck.com/EPiServer/CMS/Content/contentassets/aaefd1e1483c43e39952f5b4c986274b/6659_models-monthly-dec_chart-6_2026-1_v1_blog.svg,,358333/Download?epieditmode=False" /></p>
<p class="chart-disclosure">Source: Bloomberg, as of 2025.</p>
<h3>Debt as a Percentage of GDP Rises</h3>
<p><img loading="lazy" class="img-responsive" alt="Debt as a Percentage of GDP Rises" src="https://www.vaneck.com/EPiServer/CMS/Content/contentassets/aaefd1e1483c43e39952f5b4c986274b/6659_models-monthly-dec_chart-7_2026-1_v1_blog.svg,,358334/Download?epieditmode=False" /></p>
<p class="chart-disclosure">Source: Bloomberg, as of 2025.</p>
<h3>Foreign Central Bank Now Hold More Gold Than US Treasuries</h3>
<p><img loading="lazy" class="img-responsive" alt="Foreign Central Bank Now Hold More Gold Than US Treasuries" src="https://www.vaneck.com/EPiServer/CMS/Content/contentassets/aaefd1e1483c43e39952f5b4c986274b/6659_models-monthly-dec_chart-8_2026-1_v1_blog.svg,,358335/Download?epieditmode=False" /></p>
<p class="chart-disclosure">Source: Visual Capitalist, as of 2025.</p>
<h2>The Bottom Line</h2>
<p>Our themes are accelerating as they are being recognized by the broader investment community.</p>
<p>Technological innovation is going mainstream.</p>
<p>The physical world is constraining the digital one.</p>
<p>Fiscal dominance is redefining policy and money.</p>
<p>This is the new world investors are navigating.</p>
<p>There&rsquo;s no going back.</p>
<h2 id="macro-themes" class="jump-link-nav anchored-block" data-jumplink-title="Macro Themes">Macro themes we&rsquo;re watching:</h2>

<p>Today&rsquo;s predominant macro forces are driving the key themes and exposures in VanEck&rsquo;s models, including the core allocation of the <a href="https://www.vaneck.com/us/en/investments/wealth-builder-plus-portfolios/overview/" title="VanEck Wealth Builder Plus Portfolios"><strong>VanEck Wealth Builder Plus Portfolios</strong></a>. The allocations below are representative of the Moderate Portfolio.</p>
<p class="d-none d-lg-block"><img loading="lazy" class="img-responsive" src="https://www.vaneck.com/contentassets/d11c4b8e0f5f4cfcbc522aa3e045a64d/6398_models-monthly-october_pie-chart-1_2025-11_v1_desktop.svg" alt="Asset Allocation" /></p>
<p style="width: 345px;" class="d-lg-none"><img loading="lazy" class="img-responsive" src="https://www.vaneck.com/contentassets/d11c4b8e0f5f4cfcbc522aa3e045a64d/6398_models-monthly-october_pie-chart-1_2025-11_v1_mobile_blog.svg" alt="Asset Allocation" /></p>
<p class="chart-disclosure">Source: VanEck, 11/30/2025. Not intended as a recommendation to buy or sell any securities or digital assets, or as investment or any call to action.</p>
<div class="flourish-embed flourish-table" data-src="visualisation/27227878?2429575"><script src="https://public.flourish.studio/resources/embed.js"></script><noscript><img loading="lazy" src="https://public.flourish.studio/visualisation/27227878/thumbnail" width="100%" alt="table visualization" /></noscript></div>
<p class="chart-disclosure">Source: VanEck, FactSet. As of 12/31/2025. For illustrative purposes only. Not intended as an offer or recommendation to buy or sell any securities referenced herein. Strategy allocations will vary. Holdings exclude cash.</p>

<h3>Standardized Performance</h3>
<div class="wrapped-div blog-post content">
<table style="width: 100%;">
<tbody>
<tr class="tbl-data">
<td class="data-head last">&nbsp;</td>
<td class="data-head last text-right">Inception Date</td>
<td class="data-head last text-right">1M</td>
<td class="data-head last text-right">3M</td>
<td class="data-head last text-right">YTD</td>
<td class="data-head last text-right">1Y</td>
<td class="data-head last text-right">3Y</td>
<td class="data-head last text-right">5Y</td>
<td class="data-head last text-right">Since Inception</td>
</tr>
<tr class="tbl-data">
<td class="data-td data last text-left">Wealth Builder Plus Conservative Strategy</td>
<td class="data-td data last text-right">7/1/2024</td>
<td class="data-td data last text-right">&nbsp;</td>
</tr>
<tr class="tbl-data">
<td class="data-td data last text-left">Net</td>
<td class="data-td data last text-right">&nbsp;</td>
<td class="data-td data last text-right">-0.16</td>
<td class="data-td data last text-right">1.03</td>
<td class="data-td data last text-right">10.21</td>
<td class="data-td data last text-right">--</td>
<td class="data-td data last text-right">9.02</td>
</tr>
<tr class="tbl-data">
<td class="data-td data last text-left">Gross</td>
<td class="data-td data last text-right">&nbsp;</td>
<td class="data-td data last text-right">-0.16</td>
<td class="data-td data last text-right">1.03</td>
<td class="data-td data last text-right">10.21</td>
<td class="data-td data last text-right">--</td>
<td class="data-td data last text-right">9.02</td>
</tr>
<tr class="tbl-data">
<td class="data-td data last text-left">20% ACWI/80% ICE Broad Market Index</td>
<td class="data-td data last text-right">&nbsp;</td>
<td class="data-td data last text-right">-0.04</td>
<td class="data-td data last text-right">1.39</td>
<td class="data-td data last text-right">9.89</td>
<td class="data-td data last text-right">--</td>
<td class="data-td data last text-right">8.31</td>
</tr>
<tr class="tbl-data">
<td class="data-td data last text-left">Wealth Builder Plus Moderate Strategy</td>
<td class="data-td data last text-right">7/1/2024</td>
<td class="data-td data last text-right">&nbsp;</td>
</tr>
<tr class="tbl-data">
<td class="data-td data last text-left">Net</td>
<td class="data-td data last text-right">&nbsp;</td>
<td class="data-td data last text-right">0.11</td>
<td class="data-td data last text-right">1.67</td>
<td class="data-td data last text-right">15.41</td>
<td class="data-td data last text-right">--</td>
<td class="data-td data last text-right">13.77</td>
</tr>
<tr class="tbl-data">
<td class="data-td data last text-left">Gross</td>
<td class="data-td data last text-right">&nbsp;</td>
<td class="data-td data last text-right">0.11</td>
<td class="data-td data last text-right">1.67</td>
<td class="data-td data last text-right">15.41</td>
<td class="data-td data last text-right">--</td>
<td class="data-td data last text-right">13.77</td>
</tr>
<tr class="tbl-data">
<td class="data-td data last text-left">60% ACWI/40% ICE Broad Market Index</td>
<td class="data-td data last text-right">&nbsp;</td>
<td class="data-td data last text-right">0.45</td>
<td class="data-td data last text-right">2.23</td>
<td class="data-td data last text-right">15.31</td>
<td class="data-td data last text-right">--</td>
<td class="data-td data last text-right">12.71</td>
</tr>
<tr class="tbl-data">
<td class="data-td data last text-left">Wealth Builder Plus Aggressive Strategy</td>
<td class="data-td data last text-right">7/1/2024</td>
<td class="data-td data last text-right">&nbsp;</td>
</tr>
<tr class="tbl-data">
<td class="data-td data last text-left">Net</td>
<td class="data-td data last text-right">&nbsp;</td>
<td class="data-td data last text-right">0.26</td>
<td class="data-td data last text-right">2.09</td>
<td class="data-td data last text-right">18.33</td>
<td class="data-td data last text-right">--</td>
<td class="data-td data last text-right">16.32</td>
</tr>
<tr class="tbl-data">
<td class="data-td data last text-left">Gross</td>
<td class="data-td data last text-right">&nbsp;</td>
<td class="data-td data last text-right">0.26</td>
<td class="data-td data last text-right">2.09</td>
<td class="data-td data last text-right">18.33</td>
<td class="data-td data last text-right">--</td>
<td class="data-td data last text-right">16.32</td>
</tr>
<tr class="tbl-data">
<td class="data-td data last text-left">80% ACWI/20% ICE Broad Market Index</td>
<td class="data-td data last text-right">&nbsp;</td>
<td class="data-td data last text-right">0.70</td>
<td class="data-td data last text-right">2.64</td>
<td class="data-td data last text-right">17.98</td>
<td class="data-td data last text-right">--</td>
<td class="data-td data last text-right">14.84</td>
</tr>
<tr class="tbl-data">
<td class="data-td data last text-left">Thematic Disruption Strategy</td>
<td class="data-td data last text-right">12/24/2021</td>
<td class="data-td data last text-right">&nbsp;</td>
</tr>
<tr class="tbl-data">
<td class="data-td data last text-left">Net</td>
<td class="data-td data last text-right">&nbsp;</td>
<td class="data-td data last text-right">0.45</td>
<td class="data-td data last text-right">-0.21</td>
<td class="data-td data last text-right">23.89</td>
<td class="data-td data last text-right">23.35</td>
<td class="data-td data last text-right">--</td>
<td class="data-td data last text-right">6.12</td>
</tr>
<tr class="tbl-data">
<td class="data-td data last text-left">Gross</td>
<td class="data-td data last text-right">&nbsp;</td>
<td class="data-td data last text-right">0.46</td>
<td class="data-td data last text-right">-0.19</td>
<td class="data-td data last text-right">24.01</td>
<td class="data-td data last text-right">23.63</td>
<td class="data-td data last text-right">--</td>
<td class="data-td data last text-right">6.44</td>
</tr>
<tr class="tbl-data">
<td class="data-td data last text-left">MSCI ACWI IMI Growth Index</td>
<td class="data-td data last text-right">&nbsp;</td>
<td class="data-td data last text-right">0.22</td>
<td class="data-td data last text-right">2.73</td>
<td class="data-td data last text-right">22.12</td>
<td class="data-td data last text-right">25.27</td>
<td class="data-td data last text-right">--</td>
<td class="data-td data last text-right">9.06</td>
</tr>
<tr class="tbl-data">
<td class="data-td data last text-left">Real Assets Strategy</td>
<td class="data-td data last text-right">8/16/2017</td>
<td class="data-td data last text-right">&nbsp;</td>
</tr>
<tr class="tbl-data">
<td class="data-td data last text-left">Net</td>
<td class="data-td data last text-right">&nbsp;</td>
<td class="data-td data last text-right">0.46</td>
<td class="data-td data last text-right">4.37</td>
<td class="data-td data last text-right">29.11</td>
<td class="data-td data last text-right">15.69</td>
<td class="data-td data last text-right">13.99</td>
<td class="data-td data last text-right">8.05</td>
</tr>
<tr class="tbl-data">
<td class="data-td data last text-left">Gross</td>
<td class="data-td data last text-right">&nbsp;</td>
<td class="data-td data last text-right">0.46</td>
<td class="data-td data last text-right">4.37</td>
<td class="data-td data last text-right">29.11</td>
<td class="data-td data last text-right">15.88</td>
<td class="data-td data last text-right">14.34</td>
<td class="data-td data last text-right">8.46</td>
</tr>
<tr class="tbl-data">
<td class="data-td data last text-left">Bloomberg Commodity Index</td>
<td class="data-td data last text-right">&nbsp;</td>
<td class="data-td data last text-right">-0.32</td>
<td class="data-td data last text-right">5.85</td>
<td class="data-td data last text-right">15.77</td>
<td class="data-td data last text-right">3.96</td>
<td class="data-td data last text-right">10.64</td>
<td class="data-td data last text-right">6.14</td>
</tr>
<tr class="tbl-data">
<td class="data-td data last text-left">Select Opportunities Strategy</td>
<td class="data-td data last text-right">12/20/2024</td>
<td class="data-td data last text-right">&nbsp;</td>
</tr>
<tr class="tbl-data">
<td class="data-td data last text-left">Net</td>
<td class="data-td data last text-right">&nbsp;</td>
<td class="data-td data last text-right">0.34</td>
<td class="data-td data last text-right">1.94</td>
<td class="data-td data last text-right">27.22</td>
<td class="data-td data last text-right">--</td>
<td class="data-td data last text-right">25.15</td>
</tr>
<tr class="tbl-data">
<td class="data-td data last text-left">Gross</td>
<td class="data-td data last text-right">&nbsp;</td>
<td class="data-td data last text-right">0.34</td>
<td class="data-td data last text-right">1.94</td>
<td class="data-td data last text-right">27.22</td>
<td class="data-td data last text-right">--</td>
<td class="data-td data last text-right">25.15</td>
</tr>
<tr class="tbl-data">
<td class="data-td data last text-left">MSCI ACWI Index</td>
<td class="data-td data last text-right">&nbsp;</td>
<td class="data-td data last text-right">1.04</td>
<td class="data-td data last text-right">3.29</td>
<td class="data-td data last text-right">22.34</td>
<td class="data-td data last text-right">--</td>
<td class="data-td data last text-right">21.86</td>
</tr>
<tr class="tbl-data">
<td class="data-td data last text-left">Income Builder Strategy</td>
<td class="data-td data last text-right">9/30/2021</td>
<td class="data-td data last text-right">&nbsp;</td>
</tr>
<tr class="tbl-data">
<td class="data-td data last text-left">Net</td>
<td class="data-td data last text-right">&nbsp;</td>
<td class="data-td data last text-right">-0.14</td>
<td class="data-td data last text-right">--</td>
<td class="data-td data last text-right">-0.14</td>
</tr>
<tr class="tbl-data">
<td class="data-td data last text-left">Gross</td>
<td class="data-td data last text-right">&nbsp;</td>
<td class="data-td data last text-right">-0.14</td>
<td class="data-td data last text-right">--</td>
<td class="data-td data last text-right">-0.14</td>
</tr>
<tr class="tbl-data">
<td class="data-td data last text-left">ICE BofA US Broad Market Index</td>
<td class="data-td data last text-right">&nbsp;</td>
<td class="data-td data last text-right">-0.29</td>
<td class="data-td data last text-right">--</td>
<td class="data-td data last text-right">-0.29</td>
</tr>
</tbody>
</table>
</div>
<p class="chart-disclosure">Source: VanEck. As of 12/31/2025. Returns greater than 1 year are annualized. <strong>The performance data quoted represents past performance. Past performance is not a guarantee of future results. Performance may be lower or higher than performance data quoted. Performance figures presented herein are preliminary and may differ slightly from final performance figures. Please contact us at info@vaneck.com for additional information.</strong></p>
<p>To receive more <strong><a href="https://www.vaneck.com/us/en/insights/guided-allocation/" title="Model Portfolio Insights">Model Portfolio</a></strong> insights, <strong><a href="https://www.vaneck.com/us/en/subscribe/" title="Subscription Center">sign up in our subscription center</a></strong>.</p>
]]></content:encoded>
</item><item rdf:about="https://www.vaneck.com/us/en/blogs/income-investing/fallen-angels-deliver-again-with-an-eye-towards-2026/">
  <title>Fallen Angels Deliver Again with an Eye Towards 2026></title>
  <link>https://www.vaneck.com/us/en/blogs/income-investing/fallen-angels-deliver-again-with-an-eye-towards-2026/</link>
  <description><![CDATA[Fallen angels outperformed broad high yield in 2025, driven by security selection, longer duration, and resilient credit quality. Attractive yields and selective downgrades support 2026.]]></description>
  <dc:creator>Nicolas  Fonseca, CFA</dc:creator>
  <dc:date>01/15/2026 06:30:00</dc:date>
<content:encoded><![CDATA[


<p><strong>Key Takeaways:</strong></p>
<ul class="content-list">
<li class="mt-2">Fallen angels outperformed broad high yield by 0.53% YTD, driven by security selection and duration. This marks 15 years of historical outperformance out of the last 22 calendar years<sup>*</sup>.</li>
<li class="mt-2">There were 10 fallen angels in 2025 vs 7 risings stars.</li>
<li class="mt-2">JP Morgan estimates $84bn of fallen angels in 2026.</li>
</ul>
<p id="q4-2025-update" class="jump-link-nav anchored-block" data-jumplink-title="Q4 2025 Update">Fallen angels outperformed the broad high yield market by 0.53% in 2025 (9.03% vs. 8.50%), despite underperforming in Q4 by 0.25% (1.11% vs 1.35%). In a year marked by macro volatility and shifting rate expectations, fallen angels once again demonstrated their ability to deliver resilient returns through a volatile macro backdrop.</p>
<p>While fallen angels lagged in parts of Q4 amid renewed rate volatility, those short-term headwinds were more than offset by consistent issuer level outperformance earlier in the year. The outperformance in 2025 was driven primarily by security selection within sectors. In particular, some of the newer fallen angels (Basic Industry: Celanese and Huntsman, Autos: Nissan and Aptiv and Consumer Goods: Whirlpool) were top contributors to outperformance vs broad high yield. As has historically been the case, many of these newer fallen angels entered the high yield market at discounted prices following forced selling, creating attractive entry points ahead of a technical recovery. Duration also contributed positively to outperformance as fallen angels were on average 1.7 years longer than high yield. 2025 marks 15 years of outperformance out of the last 22 calendar years for fallen angels&rsquo; over broad high yield.</p>
<h3>2025 Total Returns</h3>
<p><img loading="lazy" class="img-responsive" alt="2025 Total Returns" src="https://www.vaneck.com/EPiServer/CMS/Content/contentassets/865a13ee90f34c52934eca0131f0ca16/6651_angl-december-2025-blog_chart-1_2026-1_v1.svg,,357811/Download?epieditmode=False" /></p>
<p class="chart-disclosure">Source: ICE Data Services, VanEck. Past performance is no guarantee of future results.</p>
<h2>2025 in Review</h2>
<ul class="content-list">
<li class="mt-2">Fallen angels outpaced rising stars in 2025 for the first time since 2020. Fallen angel activity reflected idiosyncratic credit migration rather than broad-based sector downgrades. Fallen angels added more than $22bn to the index market value while rising stars removed approximately $5bn, which contrasts with the pattern seen in the prior years.</li>
<li class="mt-2">The Basic Industry sector was most impacted by fallen angels, as Celanese, Huntsman International and FMC Corp added approximately $10bn. No rising star removed more than $1bn of face value. The fallen angel index finished 2025 with Basic Industry, Retail, Telecom and Autos as the sectors with more than 10% each of exposure. These will be the sectors to watch in 2026 as they, combined, represented more than 50% of the fallen angel index.</li>
<li class="mt-2">Investors closely monitored President Trump&rsquo;s feed, tariffs announcements, and inflation and labor market indicators. Towards the middle to end of the year, Fed rate cuts expectations took center stage. This resulted in continued yield curve steepening (2-10s), which began in 2023, from 32bps to 71bps. The 2Y yield decreased the most to 3.47% while the 30Y yield increased slightly to 4.84%.</li>
<li class="mt-2">Corporate balance sheets remained strong in 2025. Fallen angels had no defaults while the broad high yield market had 7 issuers for a total number of 14 bonds, adding to $14.2bn of face value. The absence of defaults among fallen angels in 2025 highlights the higher-quality bias of the segment, particularly when compared with pockets of stress that persisted in the lower-rated tiers of high yield.</li>
<li class="mt-2">Credit spreads were volatile in the beginning of the year but ended very close to where they started and below long-term historical averages. IG spreads tightened by 3bps to 79bps, HY tightened by 11bps to 281and fallen angels tightened by 4bps to 245.</li>
</ul>
<h2>2026 Expectations</h2>
<ul class="content-list">
<li class="mt-2">We believe that long-term rates are unlikely to significantly decrease but short-term rates may decline modestly as monetary policy becomes friendlier. Interest rates are closer to neutral with the median dot plot only showing one 25bps rate cut in 2026.</li>
<li class="mt-2">Fallen angels&rsquo; yield of 6.36%, though lower than at the beginning of 2025, is still above the 5y and 10y averages, offers higher quality compared to the past 10 years. Spreads continue to be tight but the higher quality of fallen angel&rsquo;s vs broad high yield, may play in our favor if spreads were to widen. Spreads are still a very low percentage of overall yield (currently at 39%), so movements in Treasury yields will likely drive price returns.</li>
<li class="mt-2">Balance sheets remain strong, which give credit markets the ability to absorb slower growth, as many are expecting, in 2026 without demanding wider spreads. While absolute spreads remain tight, fallen angels enter 2026 with a healthy credit profile, suggesting less downside asymmetry should growth slow or volatility resurface.</li>
<li class="mt-2">In terms of rating migrations, 2026 is expected to remain idiosyncratic in nature as there is no specific sector on watch for widespread downgrades. As it occurs with downgrades, fallen angels are offering distinct sector exposures vs the high yield market.</li>
<li class="mt-2">JP Morgan expects approximately $84bn of fallen angels, though the majority of this number is tied back to potential downgrades of Ford and Paramount. Importantly, much of the projected downgrade volume remains concentrated in a small number of large issuers, limiting the likelihood of broad-based pressure across the high yield market.</li>
<li class="mt-2">Consistent with broader high yield forecasts, we expect returns in 2026 to be driven more by carry and rate movements than by spread compression, but with downside risks that may arise from unexpected labor market weakness, another flare up in broader credit concerns or a host of political or geopolitical factors. Given how tight spreads are, we see little upside from further spread tightening from here.</li>
</ul>
<p>As we start 2026, we believe fallen angels have the potential to perform well in the context of a lower-growth, rate-sensitive environment, supported by higher quality and attractive yields with a history of outperformance.</p>
<p id="overall-statistics" class="jump-link-nav anchored-block" data-jumplink-title="Overall Statistics"><strong>Fallen Angels Overall Statistics:</strong> Credit spreads widened early to mid-October as trade tensions resurfaced, the US government was shut down but tightened back at the end as the Fed delivered a cut. November was somewhat similar as spreads widened early in the month but then trended back down to finish the year very close to where they started it. Volatility elevated, particularly in first half of the year. Liberation Day in April, the second round of tariffs in August, and the Government shut down all contributed to spread volatility this year. Ultimately, fallen angel spreads ended just 4bps tighter while broad high yield spreads ended 11bps tighter than at the beginning of the year. Yields followed the spreads path outlined above, as they reach year highs in early April (7.69 for fallen angels and 8.66 for broad high yield) but then trended back down to finish the in 6-handle. Both finished the year close to their multi-year lows, especially broad high yield as it is reaching levels not seen since early 2022. Fallen angels&rsquo; duration was flat during the quarter, while broad high yield continued to hit all-time lows (2.80) during the year as issuers deferred refinancing. Duration was a major contributor to outperformance this past year, as fallen angels were longer, on average, 1.7 years longer than high yield.</p>
<div class="wrapped-div">
<table style="width: 100%;">
<tbody>
<tr class="tbl-data">
<td class="tbl-header last text-center">&nbsp;</td>
<td class="tbl-header last text-center" style="border-right: outset;" colspan="5">Fallen Angels</td>
<td class="tbl-header last text-center" colspan="5">Broad HY</td>
</tr>
<tr class="tbl-data">
<td class="data-head last text-right">&nbsp;</td>
<td class="data-head last text-right">12/31/24</td>
<td class="data-head last text-right">3/31/25</td>
<td class="data-head last text-right">6/30/25</td>
<td class="data-head last text-right">9/30/25</td>
<td class="data-head last text-right" style="border-right: outset;">12/31/25</td>
<td class="data-head last text-right">12/31/24</td>
<td class="data-head last text-right">3/31/25</td>
<td class="data-head last text-right">6/30/25</td>
<td class="data-head last text-right">9/30/25</td>
<td class="data-head last text-right">12/31/25</td>
</tr>
<tr class="tbl-data">
<td class="data-td last">Yield to Worst</td>
<td class="data-td data last text-right">7.00</td>
<td class="data-td data last text-right">6.72</td>
<td class="data-td data last text-right">6.43</td>
<td class="data-td data last text-right">6.23</td>
<td class="data-td data last text-right" style="border-right: outset;">6.36</td>
<td class="data-td data last text-right">7.47</td>
<td class="data-td data last text-right">7.73</td>
<td class="data-td data last text-right">7.06</td>
<td class="data-td data last text-right">6.74</td>
<td class="data-td data last text-right">6.63</td>
</tr>
<tr class="tbl-data">
<td class="data-td last">Par Weighted Price</td>
<td class="data-td data last text-right">91.52</td>
<td class="data-td data last text-right">93.11</td>
<td class="data-td data last text-right">93.70</td>
<td class="data-td data last text-right">95.19</td>
<td class="data-td data last text-right" style="border-right: outset;">93.95</td>
<td class="data-td data last text-right">95.48</td>
<td class="data-td data last text-right">94.97</td>
<td class="data-td data last text-right">97.12</td>
<td class="data-td data last text-right">98.08</td>
<td class="data-td data last text-right">98.06</td>
</tr>
<tr class="tbl-data">
<td class="data-td last">Effective Duration</td>
<td class="data-td data last text-right">4.89</td>
<td class="data-td data last text-right">4.56</td>
<td class="data-td data last text-right">4.88</td>
<td class="data-td data last text-right">4.59</td>
<td class="data-td data last text-right" style="border-right: outset;">4.60</td>
<td class="data-td data last text-right">3.22</td>
<td class="data-td data last text-right">3.19</td>
<td class="data-td data last text-right">2.89</td>
<td class="data-td data last text-right">2.93</td>
<td class="data-td data last text-right">2.87</td>
</tr>
<tr class="tbl-data">
<td class="data-td last">Full Market Value ($mn)</td>
<td class="data-td data last text-right">53,393</td>
<td class="data-td data last text-right">67,566</td>
<td class="data-td data last text-right">63,035</td>
<td class="data-td data last text-right">61,626</td>
<td class="data-td data last text-right" style="border-right: outset;">56,444</td>
<td class="data-td data last text-right">1,338,887</td>
<td class="data-td data last text-right">1,357,142</td>
<td class="data-td data last text-right">1,375,495</td>
<td class="data-td data last text-right">1,437,209</td>
<td class="data-td data last text-right">1,474,918</td>
</tr>
<tr class="tbl-data">
<td class="data-td last">OAS</td>
<td class="data-td data last text-right">249</td>
<td class="data-td data last text-right">257</td>
<td class="data-td data last text-right">237</td>
<td class="data-td data last text-right">230</td>
<td class="data-td data last text-right" style="border-right: outset;">245</td>
<td class="data-td data last text-right">292</td>
<td class="data-td data last text-right">355</td>
<td class="data-td data last text-right">296</td>
<td class="data-td data last text-right">280</td>
<td class="data-td data last text-right">281</td>
</tr>
<tr class="tbl-data">
<td class="data-td last">No. of Issues</td>
<td class="data-td data last text-right">122</td>
<td class="data-td data last text-right">134</td>
<td class="data-td data last text-right">126</td>
<td class="data-td data last text-right">121</td>
<td class="data-td data last text-right" style="border-right: outset;">113</td>
<td class="data-td data last text-right">1,879</td>
<td class="data-td data last text-right">1,902</td>
<td class="data-td data last text-right">1,868</td>
<td class="data-td data last text-right">1,909</td>
<td class="data-td data last text-right">1,922</td>
</tr>
</tbody>
</table>
</div>
<p class="chart-disclosure">Source: ICE Data Services, VanEck. Fallen Angels: ICE US Fallen Angel High Yield 10% Constrained Index. Broad HY: ICE BofA US High Yield Index. OAS refers to &ldquo;option-adjusted spread.&rdquo; Please see definition for this and other terms referenced herein in the disclosures and definitions portion of this blog. Past performance is no guarantee of future results. Index performance is not representative of strategy performance. It is not possible to invest in an index.</p>
<p><strong>Fallen Angels:</strong> There was only one fallen angel in Q4: FMC Corp, that joined in the index in November. It was downgraded by S&amp;P due to persistently weak credit metrics and rising uncertainty around its future earnings and cash flow. It entered the index at $82.45, a decline of approximately 6% over the last 6 months. FMC marked the 10<sup>th</sup>&nbsp;fallen angel in 2025, which combined added more than $22bn to the index market value which is the largest amount of fallen angels since the 2020 Covid downgrade. This time around, it was the Basic Industry sector that brought in the higher exposure of fallen angels and now comprised the largest exposure within the fallen angel index.</p>
<h3>FMC Corp Bonds Average Price:</h3>
<p><img loading="lazy" class="img-responsive" alt="FMC Corp Bonds Average Price" src="https://www.vaneck.com/EPiServer/CMS/Content/contentassets/38ad96be7e184e6498b3500892c60c06/6651_angl-december-2025-blog_chart-2_2026-1_v2.svg,,357824/Download?epieditmode=False" /></p>
<p class="chart-disclosure">Source: ICE Data Services, VanEck. Past performance is no guarantee of future results.</p>

<p>With 2025 over, JP Morgan updated its forecast and expects approximately $85bn of index eligible debts to be downgraded. Note that the bulk of this figure continues to be Paramount, Ford and Centene.</p>
<div class="wrapped-div">
<table style="width: 100%;">
<tbody>
<tr class="tbl-data">
<td class="tbl-header last">Month-end Addition</td>
<td class="tbl-header last">Name</td>
<td class="tbl-header last">Rating</td>
<td class="tbl-header last">Sector</td>
<td class="tbl-header last">Industry</td>
<td class="tbl-header last text-right">% Mkt Value</td>
<td class="tbl-header last text-right">Price</td>
</tr>
<tr class="tbl-data">
<td class="data-td last font-weight-normal">January</td>
<td class="data-td data last text-left">Aptiv PLC / Aptiv Global Financing DAC</td>
<td class="data-td data last text-left">BB1</td>
<td class="data-td data last text-left">Automotive</td>
<td class="data-td data last text-left">Auto Parts &amp; Equipment</td>
<td class="data-td data last text-right">0.95</td>
<td class="data-td data last text-right">99.71</td>
</tr>
<tr class="tbl-data">
<td class="data-td last font-weight-normal">February</td>
<td class="data-td data last text-left">Celanese US Holdings Llc</td>
<td class="data-td data last text-left">BB1</td>
<td class="data-td data last text-left">Basic Industry</td>
<td class="data-td data last text-left">Chemicals</td>
<td class="data-td data last text-right">10.06</td>
<td class="data-td data last text-right">103.69</td>
</tr>
<tr class="tbl-data">
<td class="data-td last font-weight-normal">February</td>
<td class="data-td data last text-left">Nissan Motor Acceptance Co LLC</td>
<td class="data-td data last text-left">BB1</td>
<td class="data-td data last text-left">Automotive</td>
<td class="data-td data last text-left">Auto Loans</td>
<td class="data-td data last text-right">4.82</td>
<td class="data-td data last text-right">97.64</td>
</tr>
<tr class="tbl-data">
<td class="data-td last font-weight-normal">February</td>
<td class="data-td data last text-left">Nissan Motor Co Ltd.</td>
<td class="data-td data last text-left">BB1</td>
<td class="data-td data last text-left">Automotive</td>
<td class="data-td data last text-left">Automakers</td>
<td class="data-td data last text-right">5.41</td>
<td class="data-td data last text-right">97.26</td>
</tr>
<tr class="tbl-data">
<td class="data-td last font-weight-normal">May</td>
<td class="data-td data last text-left">Whirlpool Corp.</td>
<td class="data-td data last text-left">BB1</td>
<td class="data-td data last text-left">Consumer Goods</td>
<td class="data-td data last text-left">Personal &amp; Household Products</td>
<td class="data-td data last text-right">4.23</td>
<td class="data-td data last text-right">85.52</td>
</tr>
<tr class="tbl-data">
<td class="data-td last font-weight-normal">July</td>
<td class="data-td data last text-left">Huntsman International LLC</td>
<td class="data-td data last text-left">BB1</td>
<td class="data-td data last text-left">Basic Industry</td>
<td class="data-td data last text-left">Chemicals</td>
<td class="data-td data last text-right">2.29</td>
<td class="data-td data last text-right">91.46</td>
</tr>
<tr class="tbl-data">
<td class="data-td last font-weight-normal">July</td>
<td class="data-td data last text-left">WarnerMedia Holdings Inc.</td>
<td class="data-td data last text-left">BB2</td>
<td class="data-td data last text-left">Media</td>
<td class="data-td data last text-left">Media Content</td>
<td class="data-td data last text-right">0.39</td>
<td class="data-td data last text-right">79.25</td>
</tr>
<tr class="tbl-data">
<td class="data-td last font-weight-normal">August</td>
<td class="data-td data last text-left">PacifiCorp.</td>
<td class="data-td data last text-left">BB1</td>
<td class="data-td data last text-left">Utility</td>
<td class="data-td data last text-left">Electric-Integrated</td>
<td class="data-td data last text-right">1.47</td>
<td class="data-td data last text-right">103.77</td>
</tr>
<tr class="tbl-data">
<td class="data-td last font-weight-normal">August</td>
<td class="data-td data last text-left">BlackRock TCP Capital Corp.</td>
<td class="data-td data last text-left">BB1</td>
<td class="data-td data last text-left">Financial Services</td>
<td class="data-td data last text-left">Investments &amp; Misc Financial Services</td>
<td class="data-td data last text-right">0.55</td>
<td class="data-td data last text-right">102.98</td>
</tr>
<tr class="tbl-data">
<td class="data-td last font-weight-normal">November</td>
<td class="data-td data last text-left">FMC Corp.</td>
<td class="data-td data last text-left">BB1</td>
<td class="data-td data last text-left">Basic Industry</td>
<td class="data-td data last text-left">Chemicals</td>
<td class="data-td data last text-right">2.85</td>
<td class="data-td data last text-right">82.45</td>
</tr>
</tbody>
</table>
</div>
<p class="chart-disclosure">Source: ICE Data Services, VanEck. Fallen Angels: ICE US Fallen Angel High Yield 10% Constrained Index. Past performance is no guarantee of future results. Not a recommendation to buy or sell any of the names/securities mentioned herein. Index performance is not representative of strategy performance. It is not possible to invest in an index.</p>
<p><strong>Rising Stars: </strong>There were 4 issuers upgraded from high yield to investment grade in Q4, with a total of 7 rising stars issuers in 2025.&nbsp; Topaz Solar Farms was upgraded by Fitch in October to BBB- from BB+ as its sole revenue counterpart (PG&amp;E) was also upgraded. In November, Standard Chartered PLC Tier 1 notes were upgraded by S&amp;P, after it reappraised the defaults risk of several European bank capital requirements. Finally, December had two rising stars: Spirit Aerosystems, which was upgraded as Boeing completed its acquisition and with Boeing guaranteeing Spirit&rsquo;s debt and integrating it as a core subsidiary, and Toledo Hospital which was upgraded by Moody&rsquo;s and S&amp;P on significant operational improvement. These 4 rising stars provided an approximately 6% price return over the last 12 months while in the index. Overall, 2025 rising stars removed approximately 8.4% of the index market value.</p>
<div class="wrapped-div">
<table style="width: 100%;">
<tbody>
<tr class="tbl-data">
<td class="tbl-header last">Month-end Exit</td>
<td class="tbl-header last">Name</td>
<td class="tbl-header last">Rating</td>
<td class="tbl-header last">Sector</td>
<td class="tbl-header last">Industry</td>
<td class="tbl-header last text-right">% Mkt Value</td>
<td class="tbl-header last text-right">Price</td>
</tr>
<tr class="tbl-data">
<td class="data-td last font-weight-normal">February</td>
<td class="data-td data last text-left">Western Alliance Bancorp</td>
<td class="data-td data last text-left">BB1</td>
<td class="data-td data last text-left">Banking</td>
<td class="data-td data last text-right">1.05</td>
<td class="data-td data last text-right">93.75</td>
</tr>
<tr class="tbl-data">
<td class="data-td last font-weight-normal">May</td>
<td class="data-td data last text-left">Constellation Insurance Inc.</td>
<td class="data-td data last text-left">BB1</td>
<td class="data-td data last text-left">Insurance</td>
<td class="data-td data last text-left">Life Insurance</td>
<td class="data-td data last text-right">1.04</td>
<td class="data-td data last text-right">95.74</td>
</tr>
<tr class="tbl-data">
<td class="data-td last font-weight-normal">May</td>
<td class="data-td data last text-left">Royal Caribbean Group</td>
<td class="data-td data last text-left">BB1</td>
<td class="data-td data last text-left">Leisure</td>
<td class="data-td data last text-left">Recreation &amp; Travel</td>
<td class="data-td data last text-right">1.27</td>
<td class="data-td data last text-right">99.78</td>
</tr>
<tr class="tbl-data">
<td class="data-td last font-weight-normal">October</td>
<td class="data-td data last text-left">Topaz Solar Farms LLC</td>
<td class="data-td data last text-left">BB1</td>
<td class="data-td data last text-left">Utility</td>
<td class="data-td data last text-left">Electric-Generation</td>
<td class="data-td data last text-right">0.83</td>
<td class="data-td data last text-right">100.00</td>
</tr>
<tr class="tbl-data">
<td class="data-td last font-weight-normal">November</td>
<td class="data-td data last text-left">Standard Chartered PLC</td>
<td class="data-td data last text-left">BB1</td>
<td class="data-td data last text-left">Banking</td>
<td class="data-td data last text-right">1.38</td>
<td class="data-td data last text-right">105.01</td>
</tr>
<tr class="tbl-data">
<td class="data-td last font-weight-normal">December</td>
<td class="data-td data last text-left">Spirit AeroSystems Inc</td>
<td class="data-td data last text-left">CCC1</td>
<td class="data-td data last text-left">Capital Goods</td>
<td class="data-td data last text-left">Aerospace/Defense</td>
<td class="data-td data last text-right">1.20</td>
<td class="data-td data last text-right">100.12</td>
</tr>
<tr class="tbl-data">
<td class="data-td last font-weight-normal">December</td>
<td class="data-td data last text-left">Toledo Hospital</td>
<td class="data-td data last text-left">BB2</td>
<td class="data-td data last text-left">Healthcare</td>
<td class="data-td data last text-left">Health Facilities</td>
<td class="data-td data last text-right">1.62</td>
<td class="data-td data last text-right">94.47</td>
</tr>
</tbody>
</table>
</div>
<p class="chart-disclosure">Source: ICE Data Services, VanEck. Fallen Angels: ICE US Fallen Angel High Yield 10% Constrained Index. Past performance is no guarantee of future results. Not a recommendation to buy or sell any of the names/securities mentioned herein. Index performance is not representative of strategy performance. It is not possible to invest in an index.</p>
<p><strong>Fallen Angels Performance by Sector</strong>: Q4 brought minor changes to the sector composition of the fallen angel index. Basic Industry added more than 3% with the addition of FMC Corp in November and continues to be the largest exposure. Retail increased by approximately 1.5%, but its exposure is significantly less than at the beginning of the year. Banking, Capital Goods and Healthcare saw their exposure shrink by more than 1% throughout the quarter and the Services sector no longer has exposure, as the sole bond from Steelcase was removed from the index as HNI Corporation acquired Steelcase and its debt was exchanged. The fallen angel index spread widened by 15bps in Q4, but it was relatively flat for the year. In Q4, the Media sectors spreads widened by more than 100 bps (it is just a small issue from Warner Bros Discovery) while the Retail sectors spreads tightened by 21bps and provided the highest total return for Q4 (2.82%). For 2025, all sectors except Tech provided positive total returns with Real Estate being top performer with 15% return. Retail, Real Estate and Basic Industry were the top contributors to relative performance vs broad high yield during the year, while Media, Services and Healthcare detracted the most from relative performance. For 2026, Basic Industry, Retail, Telecom and Autos should be drivers of returns as they combined approximately 55% exposure within the fallen angel index.</p>
<div class="wrapped-div">
<table style="width: 100%;">
<tbody>
<tr class="tbl-data">
<td class="tbl-header last text-center">&nbsp;</td>
<td class="tbl-header last text-center" style="border-right: outset;" colspan="5">Wgt (%)</td>
<td class="tbl-header last text-center" style="border-right: outset;" colspan="5">OAS</td>
<td class="tbl-header last text-center" style="border-right: outset;" colspan="5">Price</td>
<td class="tbl-header last text-right" colspan="2">Total Return</td>
</tr>
<tr class="tbl-data">
<td class="data-head data last text-right">&nbsp;</td>
<td class="data-head data last text-center" style="border-right: outset;">2024</td>
<td class="data-head data last text-center" style="border-right: outset;" colspan="4">2025</td>
<td class="data-head data last text-center" style="border-right: outset;">2024</td>
<td class="data-head data last text-center" style="border-right: outset;" colspan="4">2025</td>
<td class="data-head data last text-center" style="border-right: outset;">2024</td>
<td class="data-head data last text-center" style="border-right: outset;" colspan="4">2025</td>
</tr>
<tr class="tbl-data">
<td class="data-head data last text-right">&nbsp;</td>
<td class="data-head data last text-right" style="border-right: outset;">12/31</td>
<td class="data-head data last text-right">3/31</td>
<td class="data-head data last text-right">6/30</td>
<td class="data-head data last text-right">9/30</td>
<td class="data-head data last text-right" style="border-right: outset;">12/31</td>
<td class="data-head data last text-right">3/31</td>
<td class="data-head data last text-right">6/30</td>
<td class="data-head data last text-right">9/30</td>
<td class="data-head data last text-right" style="border-right: outset;">12/31</td>
<td class="data-head data last text-right">3/31</td>
<td class="data-head data last text-right">6/30</td>
<td class="data-head data last text-right">9/30</td>
<td class="data-head data last text-right" style="border-right: outset;">12/31</td>
<td class="data-head data last text-right">QTD</td>
<td class="data-head data last text-right">YTD</td>
</tr>
<tr class="tbl-data">
<td class="data-td last">Automotive<sup>*</sup></td>
<td class="data-td data last text-right">&nbsp;</td>
<td class="data-td data last text-right">10.80</td>
<td class="data-td data last text-right">10.78</td>
<td class="data-td data last text-right">10.86</td>
<td class="data-td data last text-right" style="border-right: outset;">10.94</td>
<td class="data-td data last text-right">&nbsp;</td>
<td class="data-td data last text-right">182</td>
<td class="data-td data last text-right">253</td>
<td class="data-td data last text-right">200</td>
<td class="data-td data last text-right" style="border-right: outset;">199</td>
<td class="data-td data last text-right">&nbsp;</td>
<td class="data-td data last text-right">96.58</td>
<td class="data-td data last text-right">95.34</td>
<td class="data-td data last text-right">97.25</td>
<td class="data-td data last text-right" style="border-right: outset;">97.72</td>
<td class="data-td data last text-right">1.64</td>
<td class="data-td data last text-right">3.37</td>
</tr>
<tr class="tbl-data">
<td class="data-td last">Banking</td>
<td class="data-td data last text-right">4.94</td>
<td class="data-td data last text-right">3.92</td>
<td class="data-td data last text-right">3.19</td>
<td class="data-td data last text-right">3.21</td>
<td class="data-td data last text-right" style="border-right: outset;">2.01</td>
<td class="data-td data last text-right">181</td>
<td class="data-td data last text-right">176</td>
<td class="data-td data last text-right">142</td>
<td class="data-td data last text-right">138</td>
<td class="data-td data last text-right" style="border-right: outset;">143</td>
<td class="data-td data last text-right">96.00</td>
<td class="data-td data last text-right">103.69</td>
<td class="data-td data last text-right">107.29</td>
<td class="data-td data last text-right">108.14</td>
<td class="data-td data last text-right" style="border-right: outset;">109.70</td>
<td class="data-td data last text-right">1.22</td>
<td class="data-td data last text-right">4.90</td>
</tr>
<tr class="tbl-data">
<td class="data-td last">Basic Industry</td>
<td class="data-td data last text-right">4.94</td>
<td class="data-td data last text-right">14.03</td>
<td class="data-td data last text-right">14.55</td>
<td class="data-td data last text-right">15.75</td>
<td class="data-td data last text-right" style="border-right: outset;">19.10</td>
<td class="data-td data last text-right">181</td>
<td class="data-td data last text-right">188</td>
<td class="data-td data last text-right">148</td>
<td class="data-td data last text-right">204</td>
<td class="data-td data last text-right" style="border-right: outset;">210</td>
<td class="data-td data last text-right">96.00</td>
<td class="data-td data last text-right">100.89</td>
<td class="data-td data last text-right">102.86</td>
<td class="data-td data last text-right">100.06</td>
<td class="data-td data last text-right" style="border-right: outset;">96.90</td>
<td class="data-td data last text-right">1.78</td>
<td class="data-td data last text-right">8.42</td>
</tr>
<tr class="tbl-data">
<td class="data-td last">Capital Goods</td>
<td class="data-td data last text-right">5.55</td>
<td class="data-td data last text-right">4.52</td>
<td class="data-td data last text-right">4.56</td>
<td class="data-td data last text-right">3.98</td>
<td class="data-td data last text-right" style="border-right: outset;">2.37</td>
<td class="data-td data last text-right">179</td>
<td class="data-td data last text-right">209</td>
<td class="data-td data last text-right">157</td>
<td class="data-td data last text-right">146</td>
<td class="data-td data last text-right" style="border-right: outset;">197</td>
<td class="data-td data last text-right">96.48</td>
<td class="data-td data last text-right">95.90</td>
<td class="data-td data last text-right">97.92</td>
<td class="data-td data last text-right">99.28</td>
<td class="data-td data last text-right" style="border-right: outset;">96.95</td>
<td class="data-td data last text-right">0.90</td>
<td class="data-td data last text-right">8.90</td>
</tr>
<tr class="tbl-data">
<td class="data-td last">Consumer Goods</td>
<td class="data-td data last text-right">4.37</td>
<td class="data-td data last text-right">3.41</td>
<td class="data-td data last text-right">6.41</td>
<td class="data-td data last text-right">6.34</td>
<td class="data-td data last text-right" style="border-right: outset;">6.81</td>
<td class="data-td data last text-right">184</td>
<td class="data-td data last text-right">243</td>
<td class="data-td data last text-right">220</td>
<td class="data-td data last text-right">230</td>
<td class="data-td data last text-right" style="border-right: outset;">279</td>
<td class="data-td data last text-right">98.89</td>
<td class="data-td data last text-right">95.87</td>
<td class="data-td data last text-right">88.78</td>
<td class="data-td data last text-right">88.84</td>
<td class="data-td data last text-right" style="border-right: outset;">86.52</td>
<td class="data-td data last text-right">-1.12</td>
<td class="data-td data last text-right">3.62</td>
</tr>
<tr class="tbl-data">
<td class="data-td last">Energy</td>
<td class="data-td data last text-right">9.16</td>
<td class="data-td data last text-right">7.53</td>
<td class="data-td data last text-right">8.18</td>
<td class="data-td data last text-right">8.57</td>
<td class="data-td data last text-right" style="border-right: outset;">7.84</td>
<td class="data-td data last text-right">273</td>
<td class="data-td data last text-right">305</td>
<td class="data-td data last text-right">301</td>
<td class="data-td data last text-right">241</td>
<td class="data-td data last text-right" style="border-right: outset;">239</td>
<td class="data-td data last text-right">91.72</td>
<td class="data-td data last text-right">91.82</td>
<td class="data-td data last text-right">91.21</td>
<td class="data-td data last text-right">95.90</td>
<td class="data-td data last text-right" style="border-right: outset;">95.99</td>
<td class="data-td data last text-right">1.84</td>
<td class="data-td data last text-right">11.48</td>
</tr>
<tr class="tbl-data">
<td class="data-td last">Financial Services</td>
<td class="data-td data last text-right">3.22</td>
<td class="data-td data last text-right">2.05</td>
<td class="data-td data last text-right">2.35</td>
<td class="data-td data last text-right">2.44</td>
<td class="data-td data last text-right" style="border-right: outset;">2.08</td>
<td class="data-td data last text-right">282</td>
<td class="data-td data last text-right">357</td>
<td class="data-td data last text-right">261</td>
<td class="data-td data last text-right">294</td>
<td class="data-td data last text-right" style="border-right: outset;">347</td>
<td class="data-td data last text-right">91.46</td>
<td class="data-td data last text-right">89.83</td>
<td class="data-td data last text-right">93.67</td>
<td class="data-td data last text-right">94.60</td>
<td class="data-td data last text-right" style="border-right: outset;">93.18</td>
<td class="data-td data last text-right">0.54</td>
<td class="data-td data last text-right">8.04</td>
</tr>
<tr class="tbl-data">
<td class="data-td last">Healthcare</td>
<td class="data-td data last text-right">4.10</td>
<td class="data-td data last text-right">3.45</td>
<td class="data-td data last text-right">3.83</td>
<td class="data-td data last text-right">3.93</td>
<td class="data-td data last text-right" style="border-right: outset;">2.50</td>
<td class="data-td data last text-right">195</td>
<td class="data-td data last text-right">214</td>
<td class="data-td data last text-right">173</td>
<td class="data-td data last text-right">157</td>
<td class="data-td data last text-right" style="border-right: outset;">195</td>
<td class="data-td data last text-right">90.40</td>
<td class="data-td data last text-right">91.71</td>
<td class="data-td data last text-right">94.14</td>
<td class="data-td data last text-right">95.84</td>
<td class="data-td data last text-right" style="border-right: outset;">96.29</td>
<td class="data-td data last text-right">1.06</td>
<td class="data-td data last text-right">11.72</td>
</tr>
<tr class="tbl-data">
<td class="data-td last">Insurance</td>
<td class="data-td data last text-right">2.49</td>
<td class="data-td data last text-right">1.67</td>
<td class="data-td data last text-right">0.68</td>
<td class="data-td data last text-right" style="border-right: outset;">0.73</td>
<td class="data-td data last text-right">193</td>
<td class="data-td data last text-right">214</td>
<td class="data-td data last text-right">208</td>
<td class="data-td data last text-right">230</td>
<td class="data-td data last text-right" style="border-right: outset;">245</td>
<td class="data-td data last text-right">98.34</td>
<td class="data-td data last text-right">99.12</td>
<td class="data-td data last text-right">100.04</td>
<td class="data-td data last text-right">99.42</td>
<td class="data-td data last text-right" style="border-right: outset;">99.06</td>
<td class="data-td data last text-right">1.09</td>
<td class="data-td data last text-right">3.20</td>
</tr>
<tr class="tbl-data">
<td class="data-td last">Leisure</td>
<td class="data-td data last text-right">4.53</td>
<td class="data-td data last text-right">3.70</td>
<td class="data-td data last text-right">2.68</td>
<td class="data-td data last text-right">2.74</td>
<td class="data-td data last text-right" style="border-right: outset;">2.94</td>
<td class="data-td data last text-right">220</td>
<td class="data-td data last text-right">280</td>
<td class="data-td data last text-right">374</td>
<td class="data-td data last text-right">334</td>
<td class="data-td data last text-right" style="border-right: outset;">390</td>
<td class="data-td data last text-right">93.65</td>
<td class="data-td data last text-right">93.18</td>
<td class="data-td data last text-right">90.10</td>
<td class="data-td data last text-right">92.05</td>
<td class="data-td data last text-right" style="border-right: outset;">90.67</td>
<td class="data-td data last text-right">-0.19</td>
<td class="data-td data last text-right">5.82</td>
</tr>
<tr class="tbl-data">
<td class="data-td last">Media<sup>*</sup></td>
<td class="data-td data last text-right">&nbsp;</td>
<td class="data-td data last text-right">0.42</td>
<td class="data-td data last text-right" style="border-right: outset;">0.45</td>
<td class="data-td data last text-right">&nbsp;</td>
<td class="data-td data last text-right">302</td>
<td class="data-td data last text-right" style="border-right: outset;">411</td>
<td class="data-td data last text-right">&nbsp;</td>
<td class="data-td data last text-right">86.61</td>
<td class="data-td data last text-right" style="border-right: outset;">82.30</td>
<td class="data-td data last text-right">-3.82</td>
<td class="data-td data last text-right">4.47</td>
</tr>
<tr class="tbl-data">
<td class="data-td last">Real Estate</td>
<td class="data-td data last text-right">10.71</td>
<td class="data-td data last text-right">8.30</td>
<td class="data-td data last text-right">9.10</td>
<td class="data-td data last text-right" style="border-right: outset;">9.21</td>
<td class="data-td data last text-right">450</td>
<td class="data-td data last text-right">448</td>
<td class="data-td data last text-right">299</td>
<td class="data-td data last text-right">263</td>
<td class="data-td data last text-right" style="border-right: outset;">300</td>
<td class="data-td data last text-right">86.94</td>
<td class="data-td data last text-right">87.85</td>
<td class="data-td data last text-right">93.17</td>
<td class="data-td data last text-right">94.59</td>
<td class="data-td data last text-right" style="border-right: outset;">94.01</td>
<td class="data-td data last text-right">1.14</td>
<td class="data-td data last text-right">15.00</td>
</tr>
<tr class="tbl-data">
<td class="data-td last">Retail</td>
<td class="data-td data last text-right">22.15</td>
<td class="data-td data last text-right">18.18</td>
<td class="data-td data last text-right">16.72</td>
<td class="data-td data last text-right">13.33</td>
<td class="data-td data last text-right" style="border-right: outset;">14.82</td>
<td class="data-td data last text-right">219</td>
<td class="data-td data last text-right">221</td>
<td class="data-td data last text-right">225</td>
<td class="data-td data last text-right">238</td>
<td class="data-td data last text-right" style="border-right: outset;">217</td>
<td class="data-td data last text-right">86.26</td>
<td class="data-td data last text-right">88.43</td>
<td class="data-td data last text-right">87.64</td>
<td class="data-td data last text-right">89.65</td>
<td class="data-td data last text-right" style="border-right: outset;">91.07</td>
<td class="data-td data last text-right">2.82</td>
<td class="data-td data last text-right">13.89</td>
</tr>
<tr class="tbl-data">
<td class="data-td last">Services</td>
<td class="data-td data last text-right">0.83</td>
<td class="data-td data last text-right">0.67</td>
<td class="data-td data last text-right">0.77</td>
<td class="data-td data last text-right">0.76</td>
<td class="data-td data last text-right" style="border-right: outset;">&nbsp;</td>
<td class="data-td data last text-right">189</td>
<td class="data-td data last text-right">234</td>
<td class="data-td data last text-right">145</td>
<td class="data-td data last text-right">147</td>
<td class="data-td data last text-right" style="border-right: outset;">&nbsp;</td>
<td class="data-td data last text-right">95.97</td>
<td class="data-td data last text-right">96.12</td>
<td class="data-td data last text-right">99.63</td>
<td class="data-td data last text-right">99.75</td>
<td class="data-td data last text-right" style="border-right: outset;">&nbsp;</td>
<td class="data-td data last text-right">0.50</td>
<td class="data-td data last text-right">8.49</td>
</tr>
<tr class="tbl-data">
<td class="data-td last">Technology &amp; Electronics</td>
<td class="data-td data last text-right">6.78</td>
<td class="data-td data last text-right">5.45</td>
<td class="data-td data last text-right">3.26</td>
<td class="data-td data last text-right">3.18</td>
<td class="data-td data last text-right" style="border-right: outset;">3.29</td>
<td class="data-td data last text-right">208</td>
<td class="data-td data last text-right">262</td>
<td class="data-td data last text-right">269</td>
<td class="data-td data last text-right">296</td>
<td class="data-td data last text-right" style="border-right: outset;">301</td>
<td class="data-td data last text-right">90.50</td>
<td class="data-td data last text-right">88.87</td>
<td class="data-td data last text-right">87.07</td>
<td class="data-td data last text-right">84.69</td>
<td class="data-td data last text-right" style="border-right: outset;">80.72</td>
<td class="data-td data last text-right">-3.14</td>
<td class="data-td data last text-right">-0.36</td>
</tr>
<tr class="tbl-data">
<td class="data-td last">Telecommunications</td>
<td class="data-td data last text-right">12.56</td>
<td class="data-td data last text-right">10.07</td>
<td class="data-td data last text-right">10.40</td>
<td class="data-td data last text-right">10.63</td>
<td class="data-td data last text-right" style="border-right: outset;">11.43</td>
<td class="data-td data last text-right">311</td>
<td class="data-td data last text-right">366</td>
<td class="data-td data last text-right">326</td>
<td class="data-td data last text-right">302</td>
<td class="data-td data last text-right" style="border-right: outset;">299</td>
<td class="data-td data last text-right">92.24</td>
<td class="data-td data last text-right">89.80</td>
<td class="data-td data last text-right">92.06</td>
<td class="data-td data last text-right">94.18</td>
<td class="data-td data last text-right" style="border-right: outset;">92.94</td>
<td class="data-td data last text-right">0.51</td>
<td class="data-td data last text-right">9.48</td>
</tr>
<tr class="tbl-data">
<td class="data-td last">Transportation</td>
<td class="data-td data last text-right">0.59</td>
<td class="data-td data last text-right">0.48</td>
<td class="data-td data last text-right">0.54</td>
<td class="data-td data last text-right">0.55</td>
<td class="data-td data last text-right" style="border-right: outset;">0.59</td>
<td class="data-td data last text-right">156</td>
<td class="data-td data last text-right">217</td>
<td class="data-td data last text-right">174</td>
<td class="data-td data last text-right">162</td>
<td class="data-td data last text-right" style="border-right: outset;">169</td>
<td class="data-td data last text-right">104.16</td>
<td class="data-td data last text-right">102.60</td>
<td class="data-td data last text-right">105.77</td>
<td class="data-td data last text-right">107.13</td>
<td class="data-td data last text-right" style="border-right: outset;">106.50</td>
<td class="data-td data last text-right">0.97</td>
<td class="data-td data last text-right">8.87</td>
</tr>
<tr class="tbl-data">
<td class="data-td last">Utility</td>
<td class="data-td data last text-right">2.22</td>
<td class="data-td data last text-right">1.78</td>
<td class="data-td data last text-right">1.99</td>
<td class="data-td data last text-right">3.51</td>
<td class="data-td data last text-right" style="border-right: outset;">2.91</td>
<td class="data-td data last text-right">173</td>
<td class="data-td data last text-right">217</td>
<td class="data-td data last text-right">191</td>
<td class="data-td data last text-right">172</td>
<td class="data-td data last text-right" style="border-right: outset;">208</td>
<td class="data-td data last text-right">96.71</td>
<td class="data-td data last text-right">95.53</td>
<td class="data-td data last text-right">97.28</td>
<td class="data-td data last text-right">102.06</td>
<td class="data-td data last text-right" style="border-right: outset;">100.76</td>
<td class="data-td data last text-right">-0.36</td>
<td class="data-td data last text-right">7.50</td>
</tr>
<tr class="tbl-data">
<td class="data-td last">Grand Total</td>
<td class="data-td data last text-right">100</td>
<td class="data-td data last text-right" style="border-right: outset;">100</td>
<td class="data-td data last text-right">249</td>
<td class="data-td data last text-right">257</td>
<td class="data-td data last text-right">237</td>
<td class="data-td data last text-right">230</td>
<td class="data-td data last text-right" style="border-right: outset;">245</td>
<td class="data-td data last text-right">91.52</td>
<td class="data-td data last text-right">93.11</td>
<td class="data-td data last text-right">93.70</td>
<td class="data-td data last text-right">95.19</td>
<td class="data-td data last text-right" style="border-right: outset;">93.95</td>
<td class="data-td data last text-right">1.11</td>
<td class="data-td data last text-right">9.03</td>
</tr>
</tbody>
</table>
</div>
<p class="chart-disclosure"><sup>*</sup>Does not have securities for all months. Returns are based on partial period data.</p>
<p class="chart-disclosure">Source: ICE Data Services, VanEck.<sup>*</sup>Returns are based on partial period data. Fallen Angels: ICE US Fallen Angel High Yield 10% Constrained Index. Not intended as a recommendation to invest or divest in any of the sectors mentioned herein. Index performance is not representative of strategy performance. It is not possible to invest in an index.</p>
<p><strong>Fallen Angels Performance by Rating</strong>:&nbsp;The fallen angel index continues to be dominated by BB-rated bonds which saw a small increase year over year. Fallen angels continue to have higher concentrations of BB-rated bonds with approximately 30% more. In terms of relative performance vs broad high yield, BB-rated were the only contributors to outperformance as lower rated bonds detracted from performance.</p>
<div class="wrapped-div">
<table style="width: 100%;">
<tbody>
<tr class="tbl-data">
<td class="tbl-header last text-center">&nbsp;</td>
<td class="tbl-header last text-center" style="border-right: outset;" colspan="5">Wgt (%)</td>
<td class="tbl-header last text-center" style="border-right: outset;" colspan="5">OAS</td>
<td class="tbl-header last text-center" style="border-right: outset;" colspan="5">Price</td>
<td class="tbl-header last text-right" colspan="2">Total Return</td>
</tr>
<tr class="tbl-data">
<td class="data-head data last text-right">&nbsp;</td>
<td class="data-head data last text-center" style="border-right: outset;">2024</td>
<td class="data-head data last text-center" style="border-right: outset;" colspan="4">2025</td>
<td class="data-head data last text-center" style="border-right: outset;">2024</td>
<td class="data-head data last text-center" style="border-right: outset;" colspan="4">2025</td>
<td class="data-head data last text-center" style="border-right: outset;">2024</td>
<td class="data-head data last text-center" style="border-right: outset;" colspan="4">2025</td>
</tr>
<tr class="tbl-data">
<td class="data-head data last text-right">&nbsp;</td>
<td class="data-head data last text-right" style="border-right: outset;">12/31</td>
<td class="data-head data last text-right">3/31</td>
<td class="data-head data last text-right">6/30</td>
<td class="data-head data last text-right">9/30</td>
<td class="data-head data last text-right" style="border-right: outset;">12/31</td>
<td class="data-head data last text-right">3/31</td>
<td class="data-head data last text-right">6/30</td>
<td class="data-head data last text-right">9/30</td>
<td class="data-head data last text-right" style="border-right: outset;">12/31</td>
<td class="data-head data last text-right">3/31</td>
<td class="data-head data last text-right">6/30</td>
<td class="data-head data last text-right">9/30</td>
<td class="data-head data last text-right" style="border-right: outset;">12/31</td>
<td class="data-head data last text-right">QTD</td>
<td class="data-head data last text-right">YTD</td>
</tr>
<tr class="tbl-data">
<td class="data-td last">BB</td>
<td class="data-td data last text-right">83.93</td>
<td class="data-td data last text-right">82.22</td>
<td class="data-td data last text-right">79.91</td>
<td class="data-td data last text-right">83.19</td>
<td class="data-td data last text-right" style="border-right: outset;">85.57</td>
<td class="data-td data last text-right">197</td>
<td class="data-td data last text-right">220</td>
<td class="data-td data last text-right">197</td>
<td class="data-td data last text-right">192</td>
<td class="data-td data last text-right" style="border-right: outset;">201</td>
<td class="data-td data last text-right">93.33</td>
<td class="data-td data last text-right">95.43</td>
<td class="data-td data last text-right">96.30</td>
<td class="data-td data last text-right">97.26</td>
<td class="data-td data last text-right" style="border-right: outset;">96.56</td>
<td class="data-td data last text-right">1.36</td>
<td class="data-td data last text-right">7.62</td>
</tr>
<tr class="tbl-data">
<td class="data-td last">B</td>
<td class="data-td data last text-right">10.09</td>
<td class="data-td data last text-right">13.22</td>
<td class="data-td data last text-right">14.98</td>
<td class="data-td data last text-right">7.55</td>
<td class="data-td data last text-right" style="border-right: outset;">7.21</td>
<td class="data-td data last text-right">474</td>
<td class="data-td data last text-right">322</td>
<td class="data-td data last text-right">294</td>
<td class="data-td data last text-right">314</td>
<td class="data-td data last text-right" style="border-right: outset;">358</td>
<td class="data-td data last text-right">86.36</td>
<td class="data-td data last text-right">88.45</td>
<td class="data-td data last text-right">88.79</td>
<td class="data-td data last text-right">92.71</td>
<td class="data-td data last text-right" style="border-right: outset;">90.48</td>
<td class="data-td data last text-right">1.61</td>
<td class="data-td data last text-right">19.34</td>
</tr>
<tr class="tbl-data">
<td class="data-td last">CCC</td>
<td class="data-td data last text-right">4.72</td>
<td class="data-td data last text-right">3.78</td>
<td class="data-td data last text-right">4.16</td>
<td class="data-td data last text-right">8.19</td>
<td class="data-td data last text-right" style="border-right: outset;">6.30</td>
<td class="data-td data last text-right">425</td>
<td class="data-td data last text-right">496</td>
<td class="data-td data last text-right">477</td>
<td class="data-td data last text-right">375</td>
<td class="data-td data last text-right" style="border-right: outset;">471</td>
<td class="data-td data last text-right">88.24</td>
<td class="data-td data last text-right">86.54</td>
<td class="data-td data last text-right">86.63</td>
<td class="data-td data last text-right">88.40</td>
<td class="data-td data last text-right" style="border-right: outset;">82.76</td>
<td class="data-td data last text-right">-0.18</td>
<td class="data-td data last text-right">11.40</td>
</tr>
<tr class="tbl-data">
<td class="data-td last">CC</td>
<td class="data-td data last text-right">1.26</td>
<td class="data-td data last text-right">0.78</td>
<td class="data-td data last text-right">0.95</td>
<td class="data-td data last text-right">1.07</td>
<td class="data-td data last text-right" style="border-right: outset;">0.93</td>
<td class="data-td data last text-right">1262</td>
<td class="data-td data last text-right">1955</td>
<td class="data-td data last text-right">1651</td>
<td class="data-td data last text-right">1510</td>
<td class="data-td data last text-right" style="border-right: outset;">1920</td>
<td class="data-td data last text-right">54.65</td>
<td class="data-td data last text-right">39.08</td>
<td class="data-td data last text-right">45.75</td>
<td class="data-td data last text-right">49.89</td>
<td class="data-td data last text-right" style="border-right: outset;">41.00</td>
<td class="data-td data last text-right">-12.81</td>
<td class="data-td data last text-right">-10.22</td>
</tr>
<tr class="tbl-data">
<td class="data-td last">Total</td>
<td class="data-td data last text-right">100.00</td>
<td class="data-td data last text-right" style="border-right: outset;">100.00</td>
<td class="data-td data last text-right">249</td>
<td class="data-td data last text-right">257</td>
<td class="data-td data last text-right">237</td>
<td class="data-td data last text-right">230</td>
<td class="data-td data last text-right" style="border-right: outset;">245</td>
<td class="data-td data last text-right">91.52</td>
<td class="data-td data last text-right">93.11</td>
<td class="data-td data last text-right">93.70</td>
<td class="data-td data last text-right">95.19</td>
<td class="data-td data last text-right" style="border-right: outset;">93.95</td>
<td class="data-td data last text-right">1.11</td>
<td class="data-td data last text-right">9.03</td>
</tr>
</tbody>
</table>
</div>
<p class="chart-disclosure">Source: ICE Data Services, VanEck. Fallen Angels: Fallen Angel High Yield 10% Constrained Index. Not intended as a recommendation to invest or divest in any of the sectors mentioned herein. Index performance is not representative of strategy performance. It is not possible to invest in an index. BB index: ICE BofA BB US High Yield Index; Single-B index: ICE BofA Single-B US High Yield Index; CCC &amp; Lower rated index ICE BofA CCC &amp; Lower US High Yield Index.</p>

<p>To receive more <a href="/us/en/blogs/income-investing/" title="Income Investing Insights"><strong>Income Investing</strong></a> insights, <a href="/link/5f45412c2143400497908cea2897f7d3.aspx" title=" Subscription Center"><strong>sign up in our subscription center</strong></a>.</p>
]]></content:encoded>
</item><item rdf:about="https://www.vaneck.com/us/en/blogs/natural-resources/power-demand-redefines-global-resources/">
  <title>Power Demand Redefines Global Resources></title>
  <link>https://www.vaneck.com/us/en/blogs/natural-resources/power-demand-redefines-global-resources/</link>
  <description><![CDATA[AI-driven power demand and electrification are reshaping resource markets as commodities diverge, metals outperform, energy lags and supply constraints return to focus.]]></description>
  <dc:creator>Shawn Reynolds</dc:creator>
  <dc:date>01/14/2026 06:30:00</dc:date>
<content:encoded><![CDATA[

<p>Quarterly insights from Global Resources Portfolio Manager Shawn Reynolds, featuring his unique views on natural resources and commodities.</p>
<p><strong>Key Takeaways:</strong></p>
<ul class="content-list">
<li class="mt-2"><strong>Commodities diverged:</strong> Gold, copper, and aluminum strengthened; oil and agriculture lagged amid oversupply and weak pricing.</li>
<li class="mt-2"><strong>Power demand reshapes resources:</strong> AI, electrification and grid buildout are boosting natural gas and copper while exposing years of underinvestment.</li>
<li class="mt-2"><strong>Selective opportunity ahead:</strong> Constrained supply, disciplined capital allocation and geopolitical risk support a constructive long-term outlook for quality resource equities.</li>
</ul>

<h2 id="commodities-diverge" class="jump-link-nav anchored-block" data-jumplink-title="Commodities Diverge">Commodities Diverge as Power Demand Accelerates</h2>
<p>Risk appetite held up into year-end, supported by sustained enthusiasm for AI-related capex and expectations that policy rates could drift lower over time. At the same time, trade policy uncertainty and tariff dynamics remained recurring drivers of commodity price dislocations, most visibly in oil and copper.</p>
<p>Resource equities split along commodity lines. Metals and mining equities outperformed on strong copper and precious metals price action, while energy equities lagged as crude&rsquo;s downtrend and oversupply narrative weighed on confidence in forward earnings and capital allocation.</p>
<h2 id="q4-recap" class="jump-link-nav anchored-block" data-jumplink-title="Sector Performance Recap">Sector Performance Recap</h2>
<p><strong>Oil &amp; Gas</strong></p>
<ul class="content-list">
<li class="mt-2">2025 was a notably weak year for crude oil with WTI down ~19% (its largest annual decline since 2020). The fourth quarter largely reflected the same pressure points seen earlier in the year, ample supply versus only modest demand, keeping rallies short-lived despite periodic geopolitical headlines.</li>
<li class="mt-2">Natural gas remained weather-sensitive in the near term, but the structural demand narrative strengthened, as the U.S. surpassed 100 million metric tons of liquid natural gas exports for the first time, supported by new capacity and sustained European demand. By the fourth quarter, gas was increasingly framed as a feedstock for global energy security, rather than solely a domestic heating and power fuel.</li>
<li class="mt-2">With crude prices range-bound, capital discipline and durable return frameworks remained central to upstream positioning, favoring balance-sheet strength over growth.</li>
<li class="mt-2">Gas-levered E&amp;Ps and midstream operators benefited from firmer pricing and the AI-related power demand narrative linking gas supply to data center and grid infrastructure buildout.</li>
</ul>
<p><strong>Renewables &amp; Alternatives</strong></p>
<ul class="content-list">
<li class="mt-2">Renewable energy delivered a stronger than expected fourth quarter and 2025 overall, particularly as financing conditions began to stabilize.</li>
<li class="mt-2">The key macro driver remained the cost of capital: developers and yield-sensitive infrastructure improved as rate pressures eased, while utilities increasingly traded on load growth from data centers and the scale of required grid investment.</li>
<li class="mt-2">Clean power procurement accelerated, with hyperscalers continuing to pull forward demand through long-term, structured supply arrangements.</li>
</ul>
<p><strong>Base &amp; Industrial Metals</strong></p>
<ul class="content-list">
<li class="mt-2">Copper was the standout cyclical bellwether, pushing to new highs in December amid tariff-driven trade distortions, mine disruptions, supply constraints and a demand narrative increasingly tied to electrification and AI-driven data center expansion.</li>
<li class="mt-2">Copper producers and diversified miners traded on leverage to underlying prices, supported by solid project execution and longer-term supply scarcity driven by long lead times, permitting challenges and capital intensity across new supply.</li>
<li class="mt-2">Steel markets were more mixed, with prices largely range-bound amid ample capacity and uneven global demand. Steel producers emphasized cost control, balance-sheet discipline and trade protection in the face of ongoing import pressure.</li>
</ul>
<p><strong>Gold &amp; Precious Metals</strong></p>
<ul class="content-list">
<li class="mt-2">Gold extended its 2025 rally into year-end, reaching new record highs in late December, supported by geopolitical risk, sustained central bank demand, ETF inflows and expectations for future Fed easing.</li>
<li class="mt-2">Price action remained resilient, with the market consistently treating pullbacks as buying opportunities, reflecting late-cycle behavior as real-rate expectations softened and macro uncertainty persisted.</li>
<li class="mt-2">Producers broadly benefited from the stronger price tape, though dispersion remained driven by cost inflation, mine sequencing, jurisdictional exposure and capital allocation decisions.</li>
<li class="mt-2">Precious metals equities re-rated quickly in Q4, reinforcing their sensitivity to policy expectations and liquidity conditions rather than purely geopolitical developments.</li>
</ul>
<p><strong>Agriculture</strong></p>
<ul class="content-list">
<li class="mt-2">The 2025 agricultural backdrop was defined by weak pricing and farm income stress, prompting the USDA to announce a $12B aid package in early December aimed at offsetting losses tied to low crop prices and trade disruptions.</li>
<li class="mt-2">Processors and traders faced a challenging fourth quarter, with weak crush margins, cautious policy signals and less favorable selling conditions.</li>
<li class="mt-2">Ag input suppliers showed mixed performance: fertilizer markets were relatively constructive on firmer pricing and security-of-supply narratives, while crop protection remained pressured by affordability constraints.</li>
</ul>
<p><strong>Paper &amp; Forest Products</strong></p>
<ul class="content-list">
<li class="mt-2">Pricing remained soft across forest products in the fourth quarter, with lumber largely range-bound after summer weakness and pulp prices still under pressure following their mid-year peak. End markets such as housing and packaging stabilized but did not meaningfully recover.</li>
<li class="mt-2">Supply discipline dominated industry behavior, with curtailments, mill closures and restructuring actions aimed at rebalancing markets and protecting cash flow.</li>
<li class="mt-2">Equity performance reflected macro sensitivity, as timber REITs lagged on housing and rate concerns, while private timberland transactions and strategic M&amp;A highlighted long-term asset value despite cyclical weakness.</li>
</ul>

<h2 id="portfolio-performance" class="jump-link-nav anchored-block" data-jumplink-title="Portfolio Performance">Portfolio Performance: Drivers and Detractors</h2>
<p>Year-to-date, Global Resources Fund (<a href="/link/166837347eb349dc81ff131cd1514f52.aspx" title="Global Resources Fund - Class A - Overview"><strong>Class A</strong></a>; excluding fees and expenses, the &ldquo;Fund&rdquo;) continued to generate strong absolute and relative performance, returning 36.11% versus 28.86% for the S&amp;P Global Natural Resources Index to round out the year. In the fourth quarter, the Fund returned 6.52%, compared with 6.71% for the Index. On an absolute basis, returns were driven primarily by exposure to Gold &amp; Precious Metals, Base &amp; Industrial Metals and Oil &amp; Gas. On a relative basis, Gold &amp; Precious Metals, Renewables &amp; Alternatives and Industrials &amp; Utilities were the largest contributors, while Agriculture, Oil &amp; Gas and Base &amp; Industrial Metals detracted.</p>
<p>Top absolute contributors included Gold &amp; Precious Metals companies Barrick Mining (3.65% of Fund assets) and Pan American Silver (2.10% of Fund assets), both of which benefited from sustained rallies in gold and silver prices, as well as aluminum producer Alcoa (1.21% of Fund assets). Alcoa outperformed on the back of strong aluminum price appreciation, tight supply-demand fundamentals and rising demand expectations tied to power infrastructure and AI-related electrification.</p>
<p>Top detractors included fertilizer producers Mosaic (1.29% of Fund assets) and FMC Corp. (not held), as well as Gold &amp; Precious Metals streaming and royalty company Franco-Nevada (2.11% of Fund assets). Fertilizer producers detracted amid weak farm economics, lower crop prices and concerns around new supply additions, while Franco-Nevada was negatively impacted by valuation sensitivity to interest rates and company-specific production and guidance headwinds.</p>
<h3>Average Annual Total Returns* (%) Quarter End as of 12/31/25</h3>
<div class="wrapped-div mb-3">
<table style="width: 100%;">
<tbody>
<tr class="tbl-data">
<td class="tbl-header last" colspan="9">VanEck Global Resources Fund: Class A</td>
</tr>
<tr class="tbl-data">
<td class="data-head data last text-right">&nbsp;</td>
<td class="data-head data last text-right">1 MO</td>
<td class="data-head data last text-right">3 MO</td>
<td class="data-head data last text-right">YTD</td>
<td class="data-head data last text-right">1 YR</td>
<td class="data-head data last text-right">3 YR</td>
<td class="data-head data last text-right">5 YR</td>
<td class="data-head data last text-right">10 YR</td>
<td class="data-head data last text-right">LIFE<br />(11/02/94)</td>
</tr>
<tr class="tbl-data">
<td class="data-td last text-left">At Net Asset Value</td>
<td class="data-td data last text-right">2.53</td>
<td class="data-td data last text-right">6.52</td>
<td class="data-td data last text-right">36.11</td>
<td class="data-td data last text-right">8.24</td>
<td class="data-td data last text-right">10.14</td>
<td class="data-td data last text-right">7.90</td>
<td class="data-td data last text-right">--</td>
</tr>
<tr class="tbl-data">
<td class="data-td last text-left">At Maximum 5.75% Sales Charge</td>
<td class="data-td data last text-right">-3.36</td>
<td class="data-td data last text-right">0.39</td>
<td class="data-td data last text-right">28.28</td>
<td class="data-td data last text-right">6.13</td>
<td class="data-td data last text-right">8.84</td>
<td class="data-td data last text-right">7.27</td>
<td class="data-td data last text-right">--</td>
</tr>
<tr class="tbl-data">
<td class="data-td last text-left">S&amp;P Global Natural Resources Net Total Return Index</td>
<td class="data-td data last text-right">3.41</td>
<td class="data-td data last text-right">6.71</td>
<td class="data-td data last text-right">28.86</td>
<td class="data-td data last text-right">6.68</td>
<td class="data-td data last text-right">10.61</td>
<td class="data-td data last text-right">10.38</td>
<td class="data-td data last text-right">--</td>
</tr>
<tr class="tbl-data">
<td class="data-td last text-left">S&amp;P North American Natural Resources Sector Index</td>
<td class="data-td data last text-right">1.00</td>
<td class="data-td data last text-right">3.17</td>
<td class="data-td data last text-right">21.11</td>
<td class="data-td data last text-right">10.72</td>
<td class="data-td data last text-right">20.56</td>
<td class="data-td data last text-right">9.76</td>
<td class="data-td data last text-right">--</td>
</tr>
</tbody>
</table>
</div>
<p class="chart-disclosure"><sup>*</sup>&nbsp;Returns less than one year are not annualized.</p>
<p class="chart-disclosure"><strong>The table presents past performance which is no guarantee of future results and which may be lower or higher than current performance. Returns reflect temporary contractual fee waivers and/or expense reimbursements. Had the Fund incurred all expenses and fees, investment returns would have been reduced. Expenses: Class A: Gross 1.49% and Net 1.38%. Expenses are capped contractually through 05/01/26 at 1.38% for Class A. Investment returns and Fund share values will fluctuate so that investors' shares, when redeemed, may be worth more or less than their original cost. Fund returns assume that dividends and capital gains distributions have been reinvested in the Fund at NAV. </strong></p>
<h3>Notable Adds</h3>
<div class="wrapped-div mt-3">
<table style="width: 100%;">
<tbody>
<tr class="tbl-data">
<td class="tbl-header last">Company</td>
<td class="tbl-header last">Sector</td>
<td class="tbl-header last text-right">Weight&nbsp;(%)</td>
<td class="tbl-header last">Rationale</td>
</tr>
<tr class="tbl-data">
<td class="data-td data last">Packaging Corp of America</td>
<td class="data-td data last">Paper &amp; Forest</td>
<td class="data-td data last text-right">1.26</td>
<td class="data-td data last">North American manufacturer of containerboard and corrugated packaging products with continued revenue and earnings growth despite a challenging macro backdrop. The recent acquisition of a containerboard business should add capacity, enhance vertical integration and meaningfully expand margins as synergies are realized. This operational momentum underpins our favorable outlook for 2026.</td>
</tr>
<tr class="tbl-data">
<td class="data-td data last">Smurfit WestRock</td>
<td class="data-td data last">Paper &amp; Forest</td>
<td class="data-td data last text-right">1.26</td>
<td class="data-td data last">Packaging company serving food &amp; beverage, e-commerce and industrial end markets. Formed through the merger of two industry leaders, the company represents a compelling self-help opportunity. While integration was initially challenging, we expect improving execution as efficiency gains are captured through network optimization, mill rationalization and procurement savings, supporting solid earnings growth and margin expansion.</td>
</tr>
<tr class="tbl-data">
<td class="data-td data last">International Paper</td>
<td class="data-td data last">Paper &amp; Forest</td>
<td class="data-td data last text-right">1.01</td>
<td class="data-td data last">Global leader in packaging solutions and the world&rsquo;s largest pulp and paper company. A recent acquisition strengthened its footprint across North American and EMEA packaging markets. We expect attractive earnings growth as the company integrates the acquisition, streamlines its portfolio and continues shifting toward higher-margin packaging and containerboard operations.</td>
</tr>
</tbody>
</table>
<h3>Notable Exits</h3>
<div class="wrapped-div mt-3">
<table style="width: 100%;">
<tbody>
<tr class="tbl-data">
<td class="tbl-header last">Company</td>
<td class="tbl-header last">Sector</td>
<td class="tbl-header last text-right">Weight&nbsp;(%)</td>
<td class="tbl-header last">Rationale</td>
</tr>
<tr class="tbl-data">
<td class="data-td data last">Teck Resources</td>
<td class="data-td data last">Base &amp; Indust. Mtls.</td>
<td class="data-td data last text-right">(Not held)</td>
<td class="data-td data last">Exited the position due to concerns around potential downside risk to production volumes.</td>
</tr>
<tr class="tbl-data">
<td class="data-td data last">Ball Corp</td>
<td class="data-td data last">Other Materials</td>
<td class="data-td data last text-right">(Not held)</td>
<td class="data-td data last">Exited the position after determining that, despite eight consecutive quarters of earnings beats, the market has not rewarded the company with multiple expansion. We believe this is unlikely to change until North American beer demand recovers to pre-COVID levels.</td>
</tr>
<tr class="tbl-data">
<td class="data-td data last">Rio Tinto</td>
<td class="data-td data last">Base &amp; Indust. Mtls.</td>
<td class="data-td data last text-right">(Not held)</td>
<td class="data-td data last">Exited the position amid growing concerns related to the ramp-up and ownership structure of the Simandou iron ore project, as well as ongoing bribery allegations in Mongolia.</td>
</tr>
</tbody>
</table>
<br />
<h2>Outlook</h2>
<p>Heading into 2026, natural resources are being shaped by a dominant force: a structural power crunch. Global electricity demand is rising at its fastest pace in decades as AI data centers, widespread electrification, manufacturing re-shoring and ongoing urbanization drive unprecedented load growth. This wave of demand is colliding with energy systems built for a different era: security of resource supply, insufficient generation capacity, aging transmission networks and disruptive supply chains that are increasingly vulnerable to geopolitical pressure.</p>
<p>Energy availability and affordability have shifted from technical considerations to strategic determinants of economic competitiveness. Nations are now racing to secure fuels, critical minerals, grid equipment and next-generation power technologies. At the same time, multiple years of underinvestment across both energy and materials have created tight supply conditions in several markets, from natural gas to copper and other transition metals.</p>
<p>While policy uncertainty, interest-rate paths, China&rsquo;s growth trajectory and geopolitical tensions may heighten volatility, the broader setup remains supportive. Secular demand growth from electrification, grid expansion and data-center build-out intersects with slow, complex supply responses&mdash;particularly in mining, where multi-year permitting cycles and rising project costs constrain new production. Taken together, these forces underpin a constructive long-term outlook for natural resource equities.</p>
<p>The most compelling investment opportunities emerge where structural demand growth meets constrained supply.</p>
<p>In energy, natural gas remains a critical bridging fuel as grids struggle to accommodate accelerating load growth. Producers with low break-evens, disciplined capital allocation and well-positioned infrastructure continue to benefit from resilient demand patterns. Select oil and integrated energy companies also remain attractive given steady product margins, strong free-cash-flow generation and ongoing portfolio optimization. U.S. output has been responsible for almost all the global supply growth over the last 15 years. This will not be the case in 2026 and beyond and new sources of production will need to be found.</p>
<p>In metals and mining, copper is especially well positioned. Supply disruptions, limited project pipelines and long development timelines are intersecting with rising demand from EVs, grid investment and digital infrastructure. Companies with high-quality assets, clean balance sheets and visible production growth are poised to benefit from these durable trends.</p>
<p>Beyond traditional resource sectors, next-generation power technologies, including advanced nuclear, geothermal, hydrogen systems, long-duration energy storage and AI-optimized grid solutions, represent emerging areas of investment as countries pursue secure, scalable and affordable power.</p>
<p>Across the natural resources landscape, valuations remain attractive, cash generation is robust and secular tailwinds are strengthening. For long-term investors, opportunities lie in owning companies positioned to supply, enable or secure the world's rapidly evolving power systems.</p>
<h2 id="geopolitical-implications" class="jump-link-nav anchored-block" data-jumplink-title="Geopolitical Implications">Geopolitical Implications</h2>
<p>Geopolitical risk insurance is a core tenet of <a href="/link/166837347eb349dc81ff131cd1514f52.aspx" title="Global Resources Fund - Class A - Overview"><strong>VanEck&rsquo;s Global Resources Fund</strong></a>, and recent developments in Venezuela serve as a timely reminder of why exposure to natural resource equities remains an important component of a diversified investment portfolio. Whether it is Venezuela today, Syria and Nigeria last month, Iran over the summer or countless other flashpoints over the past several decades, geopolitical turbulence has consistently influenced the availability, affordability and security of natural resources and the companies that produce them. These factors are foundational to economic stability, industrial activity and national defense.</p>
<p>Venezuela, in particular, underscores that geopolitical risk is neither confined to the Middle East nor limited to the periphery of the former Soviet sphere. It also highlights how geopolitical events are rarely one-dimensional, often reflecting layered national and strategic priorities. The capture of Nicol&aacute;s Maduro and subsequent arrangements to redirect Venezuelan crude toward U.S. markets demonstrate how quickly geopolitics can reshape traditional supply-and-demand dynamics, alter market expectations and influence investor sentiment.</p>
<p>These developments further reinforce the value of active management. Shifting geopolitical regimes inevitably create both winners and losers and an active investment approach is better positioned to respond to evolving fundamentals than passive, beta-oriented strategies. In this instance, Venezuela has once again illustrated how rapidly conditions can change and why flexibility matters.</p>
<p>Ultimately, this episode highlights the importance of incorporating geopolitical risk as one of the four pillars of our investment framework for this strategy: inflation protection, leverage to global growth, diversification and geopolitical risk insurance. While today&rsquo;s environment may feel unusually uncertain, such conditions are not the exception, they are the norm.</p>
</div>
</div>

<p>To receive more <a href="/us/en/insights/natural-resources/" title="Natural Resources Insights"><strong>Natural Resources</strong></a> insights, <a href="https://www.vaneck.com/us/en/subscribe/" title="Subscription Center"><strong>sign up in our subscription center</strong></a>.</p>
]]></content:encoded>
</item><item rdf:about="https://www.vaneck.com/us/en/blogs/gold-investing/ima-casanova-a-golden-year-with-more-leverage-ahead/">
  <title>A Golden Year, with More Leverage Ahead></title>
  <link>https://www.vaneck.com/us/en/blogs/gold-investing/ima-casanova-a-golden-year-with-more-leverage-ahead/</link>
  <description><![CDATA[Gold hit record highs in 2025 as central banks and investors boosted demand. Mining stocks outpaced bullion, and despite sharp gains, attractive valuations and strong margins point to more upside in 2026.]]></description>
  <dc:creator>Imaru Casanova</dc:creator>
  <dc:date>01/14/2026 06:30:00</dc:date>
<content:encoded><![CDATA[

<p>Monthly gold market and economic insights from <strong><a href="/link/cfa7139e649944fea51aa2a740b2372e.aspx?p=1" title="Imaru Casanova &mdash; Portfolio Manager, Gold and Precious Metals">Imaru Casanova, Portfolio Manager</a></strong>, featuring her unique views on mining and gold&rsquo;s portfolio benefits.</p>
<p><strong>Key Takeaways:</strong></p>
<ul class="content-list">
<li class="mt-2">Gold posted its strongest annual gains in decades, driven by central banks and investors.</li>
<li class="mt-2">Gold stocks surged in 2025 but remain undervalued versus history and bullion.</li>
<li class="mt-2">Strong margins and low allocations support continued gold stock outperformance in 2026.</li>
</ul>

<h2>A Banner Year for Gold</h2>
<p>What a year for gold! The metal closed at an all-time high of $4,533.21 on December 26. Some profit taking was not surprising, given gold&rsquo;s spectacular performance in 2025, which pushed prices lower during the final week of the year to close at $4,319.37 per ounce on December 31. Gold finished the year up 64.58%.</p>
<p>The drivers behind this strength were twofold: central banks around the world continued net purchases of gold near record levels as they advance their de-dollarization agenda; and investors more broadly increasing their gold exposure to hedge against market uncertainty, volatility, and geopolitical risk. Gold also benefited from a growing need to diversify and protect portfolios globally, particularly as real rates declined and gold became a more attractive investment.</p>
<h2>Gold Stocks Steal the Spotlight</h2>
<p>Gold performance in 2025 was impressive&mdash;its best annual gain since 1979. But gold stocks stole the spotlight, more than doubling bullion&rsquo;s gains. The MarketVector Global Gold Miners Index (MVGDXTR)<sup>1</sup>&nbsp;and the NYSE Arca Gold Miners Index (GDMNTR)<sup>2</sup>&nbsp;were up 163.2% and 158.3%, respectively, during the year.</p>
<p>After years of underperformance, gold mining stocks finally benefited from a gold rally that included the Western investor as one of the main driving forces&mdash;unlike recent years, when central bank demand was largely behind gold&rsquo;s strength. As investors returned to gold, their appetite extended to gold stocks in search of a leveraged play. This flow of capital, while still modest relative to the broader equity markets, had a significant impact on the deeply oversold and comparatively tiny gold equity universe, which we estimate increased to just around $1 trillion of combined market cap at the end of 2025.</p>
<h2>Valuations Still Compelling After the Re-Rating</h2>
<p>Despite triple digit gains in 2025, we believe gold stocks could continue to outperform gold in 2026. Gold companies remain at historically low valuations based on most metrics. While stocks experienced a re-rating in the second half of 2025, this came after almost two decades of persistent de-rating.</p>
<p>Gold stocks are rebounding from very oversold levels, so even after last year&rsquo;s rally, valuations remain attractive.</p>
<h3>Gold Miners Price/Earnings Ratio</h3>
<p><i>Gold miners&rsquo; price-to-earnings ratios remain below historical averages, even after the strong performance seen in 2025.</i></p>
<p><img loading="lazy" class="img-responsive" alt="Gold miners&rsquo; price-to-earnings ratios remain below historical averages, even after the strong performance seen in 2025" src="https://www.vaneck.com/contentassets/8f8320a87181484d882af1a39275e706/6642_gold-monthly_dec_chart-1_2026-1_v1_blog.svg" /></p>
<p class="chart-disclosure"><i>Source: FactSet. Data as of December 2025.</i> "Gold Miners" represented by the NYSE Arca Gold Miners Index.</p>
<h3>Gold &amp; Precious Metals Miners versus Gold</h3>
<p><i>Gold and precious metals mining equities continue to trade at lower levels relative to gold.</i></p>
<p><img loading="lazy" class="img-responsive" alt="Gold and precious metals mining equities continue to trade at lower levels relative to gold." src="https://www.vaneck.com/contentassets/cdc477cf0faa4c399dd04b1ed7277578/6642_gold-monthly_dec_chart-2_2026-1_v1_blog.svg" /></p>
<p class="chart-disclosure"><i>Source: Bloomberg. Data as of December 2025.</i> &ldquo;Gold &amp; Precious Metals Miners&rdquo; represented by the Philadelphia (PHLX) Gold/Silver Miners Index (TR)<sup>3</sup>. Past performance is not indicative of future results. It is not possible to directly invest in an index.</p>
<h2>Room for Capital Rotation</h2>
<p>Our outlook for higher gold prices in 2026 is supported by increasing investment demand for gold, which should also translate into investment demand for gold stocks.</p>
<p>As shown in the chart below, gold and precious metals remain a relatively small allocation within global portfolios. With only an estimated 1&ndash;2% of assets globally currently allocated to gold and gold stocks, there is plenty of room for increased gold exposure across global portfolios.</p>
<h3>U.S. Precious Metals Fund Allocations (MF + ETF, Gold Equity + Gold Bullion)</h3>
<p><img loading="lazy" class="img-responsive" alt="Chart 3: U.S. Precious Metals Fund Allocations (MF + ETF, Gold Equity + Gold Bullion)" src="https://www.vaneck.com/contentassets/26b9f4c3d0f749e6a7264811f79a35b6/6642_gold-monthly_dec_chart-3_2026-1_v1_blog.svg" /></p>
<p class="chart-disclosure"><i>Source:Morningstar, VanEck. Data as of December 2025.</i> Bloomberg Precious Metals Index (BCOMPR) tracks the performance of futures contracts for precious metals like gold and silver. Past performance is not indicative of future results. It is not possible to directly invest in an index.</p>

<p>While gold bullion may be the first stop for many investors, as they search for excess returns and look for alternatives to sectors with richer valuations, the gold stocks should emerge as a solid option. It won&rsquo;t take much capital rotation to get gold stocks moving again in 2026. In addition, strong fundamentals should support further re-rating of the sector.</p>
<h2>Leverage Works&mdash;Both Ways</h2>
<p>In a rising gold price environment, the case for gold equities will be easy to make, especially after a firm demonstration of leverage in 2025. If gold goes up, gold stocks should go up even more&mdash;most market participants would agree. Historically, gold stocks have outperformed gold when the gold price increases and underperformed gold when the gold price decreases or is trading sideways/rangebound.</p>
<p>There is a case to be made, however, that even in an environment where gold prices are sustained&mdash;perhaps rangebound around or even slightly below these record levels, the gold stocks have the potential to continue to re-rate and outperform the metal.</p>
<h2>Gold Price Assumptions Remain Conservative</h2>
<p>We estimate that senior gold producers are trading at valuations that imply, on average, a gold price assumption of around $3,400 per ounce. This leaves ample room for valuations to increase as markets grow more confident that gold prices will remain near current spot levels of around $4,400 per ounce and as stocks progressively price in higher long-term gold price assumptions.</p>
<p>In this scenario, even if gold stays at current levels, the stocks could continue to post gains.</p>
<h2>Record Margins Provide a Strong Cushion</h2>
<p>Gold miners are enjoying record margins, by a long shot. For reference, at the peak of the last gold bull market in 2011, when the gold traded around $1,800 per ounce, average all-in-sustaining costs (AISC) were about $1,200 per ounce. In 2025, AISC for the sector was around $1,600 per ounce, compared to an average gold price of $3,440 per ounce.</p>
<p>Even the highest-cost producers are profitable at current spot prices, with more than 90% of all global gold production at AISC below $2,500 per ounce. This provides considerable runway for miners to maintain record levels of cash flow generation, even if gold prices were to decline.</p>
<h2>Costs Likely to Rise&mdash;but Discipline Remains</h2>
<p>We have a very positive outlook on gold prices, which is why we expect margins won&rsquo;t compress materially in 2026. That said, we do anticipate higher AISC for the industry. Miners continue to focus on cost control and operational optimization to offset industry cost inflation. Another factor that can increase unit costs is the processing of lower grade ores leads to higher unit costs.</p>
<p>However, processing plants at major producers are operating at capacity, and as a group, the companies don&rsquo;t appear to have plans to drop their cutoff grade. These cost control initiatives and production discipline give us comfort that costs won&rsquo;t begin to spiral out of control. In addition, mine plans, reserve assumptions and project economics are being done at conservative gold price assumptions, significantly below spot prices.</p>
<h2>Gold Price Itself Is a Cost Driver</h2>
<p>With that said, certain elements of the cost structure remain outside of the miners&rsquo; control most significantly the gold price itself. Higher gold prices can contribute to higher demand for equipment, consumables, services, and labor, leading to industry-wide cost inflation. Higher gold prices can also strengthen foreign currencies in gold-producing countries, which in turn leads to higher U.S. dollar-denominated costs.</p>
<p>Beyond that, some costs are directly linked to the gold price such as royalties, production taxes, and profit-sharing agreements. The higher the gold price, the higher these costs will be. While the impact varies greatly from company to company, we estimate ballpark figures of about $100/oz increase in costs for every $1,000/oz increase in the gold price.</p>
<p>The gold price today is about $1,000/oz higher than the average price in 2025; this alone suggests costs in 2026 to be about $100/oz higher. Combined with industry-guided cost inflation of 3&ndash;5% annually, we expect total costs to rise approximately 10&ndash;12% versus 2025.</p>
<h2>Outlook: Still Exceptionally Attractive</h2>
<p>Companies will be providing 2026 annual production and cost guidance when they report their fourth-quarter 2025 results, starting at the end of February. The production cost sensitivity to the gold price appears to us to be well telegraphed. In our view, the sector remains exceptionally attractive.</p>
<p>Even if realized gold price doesn&rsquo;t fully offset the costs increases this year, gold mining companies&rsquo; margins and free cash flow generation should be very robust and remain significantly above historical levels&mdash;while their stocks still trade at historically low multiples.</p>
<p>To receive more <strong><a href="https://www.vaneck.com/us/en/insights/gold-investing/" title="Gold Investing Insights">Gold Investing</a></strong> insights, <strong><a href="https://www.vaneck.com/us/en/subscribe/" title="Subscription Center">sign up in our subscription center</a></strong>.</p>
]]></content:encoded>
</item><item rdf:about="https://www.vaneck.com/us/en/blogs/natural-resources/a-resources-investor-returns-to-vaneck/">
  <title>A Resources Investor Returns to VanEck></title>
  <link>https://www.vaneck.com/us/en/blogs/natural-resources/a-resources-investor-returns-to-vaneck/</link>
  <description><![CDATA[Portfolio Manager Sam Halpert reflects on his return to VanEck and why today&rsquo;s AI-driven concentration echoes the compelling dot-com setup for resource investors.]]></description>
  <dc:creator>Sam Halpert</dc:creator>
  <dc:date>01/13/2026 06:30:00</dc:date>
<content:encoded><![CDATA[

<p><strong>Key Takeaways:</strong></p>
<ul class="content-list">
<li class="mt2">Sam started at VanEck in 2000, where a small hands-on team created a collaborative learning environment.</li>
<li class="mt2">He returned 25 years later to a larger firm that feels familiar and is still highly collaborative.</li>
<li class="mt2">Market cycles are repeating, with tech dominance again creating opportunities in resource equities.</li>
<li class="mt2">We believe resource equities are in a secular bull market, supported by demand, discipline and constrained supply.</li>
<li class="mt2">VanEck remains a proven home for resource investors, with established depth, experience and support.</li>
</ul>
<h2>Inside My Early Days at VanEck</h2>
<p>I first started at VanEck during the peak of the dot-com era or more precisely, the very end of it, around March of 2000. At the time, there were just over 30 of us at the firm. Despite a long history in gold and natural resources, our hedge fund managed approximately $3 million, and the long-only business was probably under $100 million.</p>
<p>My background was largely in macro markets and commodities, with less experience in equities. Despite the temptation to try to monetize clicks and mint millions buying up domain names, coming to VanEck felt like an opportunity to broaden my skill set while keeping much of what I had already learned.</p>
<p>It was a really fun environment, with everyone doing everything. I remember binding pitch books with Derek van Eck, the then head of the investment side of the business and co-CEO with his brother Jan, before going on marketing trips. My seat was on the trading desk, across from Charlie Cameron and Greg Krenzer. Jan had a small office halfway between our desk and founder John van Eck&rsquo;s corner office.</p>
<h2>Returning to VanEck: Different Cycle, Same Setup</h2>
<p>More than 25 years later, I returned to VanEck, starting here again on October 1, 2025, perched about three feet from my old desk, and once again across from Charlie Cameron and Greg Krenzer. I was &ldquo;away&rdquo; for seven years at Macquarie, managing natural resource funds with Geoff King, who had also sat next to me at VanEck for seven years.</p>
<p>The return was easy and familiar. The office is still fun, collaboration remains high, and there is the same sense of hopefulness around natural resource equities that I felt coming out of the dot-com bubble.</p>
<p>There are some changes though. There are more people, there&rsquo;s now a digital assets team, gold has gone from $1,300/ounce to $4,300 and the firm&rsquo;s AUM is substantially higher. As in March of 2000, tech is once again king. Then it was the dot-com companies. Today, it&rsquo;s the Magnificent 7 and AI. Similarly, benchmarks are highly concentrated, and valuations are relatively high. There&rsquo;s lots of talk about a bubble again. Back then, this backdrop marked a compelling opportunity for resource investors.</p>

<h2>The Next Act for Resource Equities</h2>
<p>We believe that we are already in the midst of a secular bull market in resources. Negative crude oil prices during the COVID-19 pandemic may mark the low point. While cycles are inevitable, we expect to see a prolonged period in which natural resource equities deliver strong returns, driven by four key factors.</p>
<ul class="content-list">
<li class="mt2">Sustained demand is being driven by global onshoring and nearshoring, the energy transition (whose demise is greatly exaggerated), and the buildout of AI and data center infrastructure.</li>
<li class="mt2">The supply side still has challenges though we are monitoring the rush of investment.</li>
<li class="mt2">Companies and management teams are broadly disciplined with their capital allocation strategies (including buybacks and dividends) and balance sheets.</li>
<li class="mt2">As an added kicker, investor exposure remains low to the space (see energy and materials as a percentage of the S&amp;P 500).</li>
</ul>
<h2>A Proven Home for Resource Investors</h2>
<p>Macquarie (now Nomura) was a great chapter for Geoff and me, but VanEck is a special place to be a resource investor. Few firms have track records of the same length and depth in the space, bolstered by an outstanding brand. We have the support of a team of seasoned analysts and portfolio managers, along with a sales organization that understands the asset class.</p>
<p>Our goal is to generate outstanding returns for clients and, in the process, grow the natural resource equity business beyond where it was the last time around.</p>
<p>Resource investing is never easy. Despite a strong five-year run, marked by record-high gold prices and copper pushing into uncharted territory, it feels like investors are only just starting to care. Materials and energy as a percentage of the S&amp;P 500 remain at or close to all-time lows, but the intrepid are allocating. That&rsquo;s a good thing, as we still see broad opportunity across the space.</p>
<p>We&rsquo;ve been able to hit the ground running since returning to VanEck. It helps that we&rsquo;ve navigated cycles like this once before, so the playbook already exists. I recognize that some of our success was luck last time, but a lot of hard work and discipline also contributed. I am looking forward to the next period here at VanEck and the chance to improve on what we accomplished before.</p>
<p>To receive more <a href="/us/en/insights/natural-resources/" title="Natural Resources Insights"><strong>Natural Resources</strong></a> insights, <a href="https://www.vaneck.com/us/en/subscribe/" title="Subscription Center"><strong>sign up in our subscription center</strong></a>.</p>
]]></content:encoded>
</item><item rdf:about="https://www.vaneck.com/us/en/blogs/natural-resources/precious-metals-define-commodity-performance-in-2025/">
  <title>Precious Metals Define Commodity Performance in 2025></title>
  <link>https://www.vaneck.com/us/en/blogs/natural-resources/precious-metals-define-commodity-performance-in-2025/</link>
  <description><![CDATA[In 2025, gold and silver drove commodity returns. Looking ahead, structural supply dynamics, geopolitical developments, and global demand trends remain key factors influencing commodity markets.]]></description>
  <dc:creator>Roland Morris</dc:creator>
  <dc:date>01/13/2026 06:30:00</dc:date>
<content:encoded><![CDATA[

<p><strong>Key Takeaways:</strong></p>
<ul class="content-list">
<li class="mt-2">Precious metals dominated commodity returns in 2025.</li>
<li class="mt-2">Sector allocation drove relative performance outcomes.</li>
<li class="mt-2">Index construction shaped commodity return profiles.</li>
</ul>
<p><strong>Market Overview</strong></p>
<p>Commodity performance in both the fourth quarter and full year 2025 was largely driven by precious metals, particularly gold and silver, with returns concentrated in a limited number of commodities. Year-to-date, the UBS CM Commodity Index (&ldquo;CMCITR&rdquo;) returned 9.5%, while the Bloomberg Commodity Index (&ldquo;BCOM&rdquo;) returned 15.8%. CMCITR performance was supported by gains in metals and livestock, despite weakness in energy and agriculture. Differences in performance primarily reflected variations in sector composition&mdash;most notably CMCITR&rsquo;s lower structural exposure to precious metals&mdash;rather than broad-based weakness across the commodity complex.</p>
<p>A defining feature of CMCITR is its greater allocation to industrial metals and reduced allocation to precious metals relative to broader commodity benchmarks. In 2025, this positioning influenced relative outcomes, as precious metals accounted for a significant share of overall commodity returns.</p>
<p><strong><i>The chart below highlights the differing allocations to precious metals and industrial metals between CMCITR and BCOM. </i></strong></p>
<p><strong>Comparative Index Sector Weights</strong></p>
<p><img loading="lazy" class="img-responsive w-100" src="https://www.vaneck.com/EPiServer/CMS/Content/contentassets/4993895946614036a07a6e2b3427f1ad/6636_cmci-jan_chart-1_2026-1_v1_blog.svg,,357471/Download?epieditmode=False" alt="Comparative Index Sector Weights" /></p>
<p class="chart-disclosure"><strong>Source:</strong> VanEck, Bloomberg. Data as of December 2025.</p>
<h2>Sector Performance Summary</h2>
<p>Sector-level returns highlight the divergence across commodity markets during the year:</p>
<ul class="content-list">
<li class="mt-2"><strong>Precious metals</strong> rose 74.7%, representing the largest positive contribution to CMCITR returns. Gold gained approximately 63%, while silver rose roughly 139%, marking historically strong annual performance for both metals.</li>
<li class="mt-2"><strong>Industrial metals</strong> increased 28.6%, supported by strong gains in copper and aluminum.</li>
<li class="mt-2"><strong>Livestock</strong> gained 25.2%, driven primarily by higher live cattle prices.</li>
<li class="mt-2"><strong>Energy</strong> declined 5.9%, reflecting persistent oversupply conditions.</li>
<li class="mt-2"><strong>Agriculture</strong> fell 4.1%, with weakness across several major crops.</li>
</ul>
<p>Despite headwinds in energy and agriculture, gains in metals and livestock supported a positive full-year outcome for the index.</p>
<h2>Precious Metals: Concentrated Source of Returns</h2>
<p>Precious metals&rsquo; performance was supported by a combination of factors, including geopolitical uncertainty, sustained central-bank demand, and reserve diversification trends. A roughly 9% decline in the U.S. dollar provided additional support. Trade policy uncertainty, ongoing conflicts in the Middle East and Ukraine, and continued central bank purchases contributed to elevated demand. During the second half of the year, investor participation increased, with notable inflows into gold, silver, and mining-related investment vehicles.</p>
<h2>Industrial Metals: Relative Strength</h2>
<p>Industrial metals were the strongest-performing sector outside of precious metals, supported by supply constraints and rising expectations for demand related to electrification and data-center infrastructure. Copper led the sector with a gain of approximately 44%, while aluminum rose about 20%.</p>
<h2>Livestock: Tight Supply Conditions</h2>
<p>Livestock prices contributed positively, led by live cattle, which rose roughly 30%. U.S. cattle inventories remain near multi-decade lows, and herd rebuilding is expected to occur gradually, influencing supply conditions.</p>
<h2>Energy Markets: Supply-Driven Pressures Persist</h2>
<p>Energy markets were a consistent drag on performance. Crude oil prices remained under pressure amid ample global supply following OPEC production increases. Both Brent and WTI crude declined by approximately 9%, while natural gas fell about 11%. Supply conditions suggest energy markets remain well balanced, with near-term price impacts uncertain.</p>
<h2>Agriculture: Mixed but Generally Weak</h2>
<p>Agricultural markets produced mixed results but trended lower overall. Cocoa and sugar recorded the largest declines, while soybeans finished modestly higher. Corn prices declined, reflecting favorable supply conditions.</p>
<h2>Outlook for 2026</h2>
<p>Looking ahead, commodities may continue to play an important role in diversified portfolios. Structural supply dynamics, geopolitical developments, and global demand trends remain key factors influencing commodity markets. While price volatility is likely to persist, commodities may offer diversification characteristics within broader asset allocation frameworks.</p>
<p>Learn more about the&nbsp;<strong><a href="/link/218468eae2b54f8989eda6f3f557770d.aspx" title="CMCAX - CM Commodity Index Fund - Class A - Overview">VanEck CM Commodity Index Fund</a></strong>&nbsp;and the&nbsp;<strong><a href="/link/b517b8245a934e7bb2908053bfd688db.aspx" title="CMCI - VanEck CMCI Commodity Strategy ETF - Overview">VanEck CMCI Commodity Strategy ETF (CMCI)</a></strong>, which seek to track, before fees and expenses, the&nbsp;CMCITR.</p>


<p>To receive more <a href="/us/en/insights/natural-resources/" title="Natural Resources Insights"><strong>Natural Resources</strong></a> insights, <a href="https://www.vaneck.com/us/en/subscribe/" title="Subscription Center"><strong>sign up in our subscription center</strong></a>.</p>
]]></content:encoded>
</item><item rdf:about="https://www.vaneck.com/us/en/blogs/investment-outlook/jan-van-eck-q1-2026-outlook-visibility-means-risk-on/">
  <title>Q1 2026 Outlook: Visibility Means Risk On></title>
  <link>https://www.vaneck.com/us/en/blogs/investment-outlook/jan-van-eck-q1-2026-outlook-visibility-means-risk-on/</link>
  <description><![CDATA[Entering 2026, clearer fiscal and monetary signals support a more risk-on outlook, as AI, private credit, gold, India and crypto reset into more compelling opportunities.]]></description>
  <dc:creator>Jan van Eck</dc:creator>
  <dc:date>01/12/2026 06:30:00</dc:date>
<content:encoded><![CDATA[

<a href="/us/en/blogs/investment-outlook/jan-van-eck-q2-2026-outlook-the-reset-is-your-entry-point/" title="Jan van Eck's Latest Outlook"><strong>Looking for the latest outlook? Read the Q2 2026 Outlook.</strong></a>
<p><strong>Key Takeaways:</strong></p>
<ul class="content-list">
<li class="mt-2">Improving fiscal discipline and a less activist Fed support a clearer, more risk-on outlook for 2026.</li>
<li class="mt-2">Late-2025 AI selloffs reset valuations, improving opportunities across AI and related themes like nuclear.</li>
<li class="mt-2">After a tough 2025, BDCs and managers like Ares now offer more attractive yields and valuations.</li>
<li class="mt-2">Gold continues to re-emerge as a global monetary asset, and pullbacks offer better entry points.</li>
<li class="mt-2">India remains a high-conviction growth story, while crypto is long-term bullish but near-term mixed.</li>
</ul>
<h2>Watch Video: Thoughtful Money with Jan van Eck</h2>
<p>Jan discusses the fiscal and monetary signals shaping his 2026 risk-on outlook, highlighting entry points in AI, private credit, gold and more.</p>
<p>As we move into 2026, markets are operating in an environment with something investors have not had in years: visibility. That clarity around fiscal policy, monetary direction and major investment themes supports a more constructive, risk-on posture, even as selectivity remains critical.</p>

<h2>Fewer Fiscal and Monetary Surprises Ahead</h2>
<p>One of the most important developments for markets is the gradual improvement in the U.S. fiscal picture. While deficits remain elevated, they are shrinking as a percentage of GDP from the historic highs reached during the COVID period. This fiscal stabilization is helping anchor longer-term interest rates and reduce tail risks.</p>
<p>At the same time, Treasury Secretary Scott Bessent has articulated a new Federal Reserve philosophy that is less activist and more restrained. His comments suggest that the upcoming Fed Chair appointment process in May should be smooth, alleviating fears of institutional disruption or politicized monetary policy.</p>
<p>On rates, Bessent&rsquo;s characterization of current interest levels as &ldquo;normal&rdquo; is telling. Markets should not expect aggressive or destabilizing short-term rate cuts in 2026. Instead, the outlook points to steady policy, modest adjustments, and fewer shocks&mdash;another contributor to improved visibility.</p>
<h2>AI Bubble Has Popped, Creating Good Setup</h2>
<p>After a sharp selloff in selected AI-related stocks late last year, the AI trade looks more attractive today than it did at the &ldquo;nosebleed&rdquo; levels seen in October. Importantly, the correction has occurred even as underlying demand for compute, tokens and productivity gains remain strong.</p>
<p>Adjacent themes, such as nuclear power tied to AI-driven electricity demand, have also repriced meaningfully. In our view, this reset improves the risk-reward profile for investors with a medium-term horizon.</p>
<h3>Nuclear Stocks Corrected in Q4</h3>
<p><img loading="lazy" class="img-responsive" alt="Nuclear Stocks Corrected in Q4" src="https://www.vaneck.com/contentassets/1dc5f9bdf69a41a494ce9d09b0dec42e/6646_jve-outlook_chart-1_2026-1_v1_blog.svg" /></p>
<p class="chart-disclosure"><strong>Source: Bloomberg. </strong>Data as of December 31, 2025. Past performance is no guarantee of future results. Index performance is not illustrative of strategy performance. It is not possible to invest directly in an index.</p>
<h2>BDCs Back in Focus</h2>
<p>Business development companies (BDCs) experienced a difficult 2025, but that correction has created opportunity. With yields remaining attractive and credit fears largely priced in, BDCs now look more compelling than they did a year ago.</p>
<p>The same is true for the management companies behind them, such as Ares, which now trade at valuations that are far more reasonable relative to their long-term earnings power and track records.</p>
<h2>Gold: A Global Monetary Asset</h2>
<p>Gold continues to re-emerge as a leading global currency, driven by central bank demand and a world that is increasingly less dollar-centric. While gold appears somewhat extended from a technical standpoint, we view pullbacks as opportunities to add exposure. The structural case remains intact.</p>
<h3>Gold Above Support But Demand Isn&rsquo;t Going Away</h3>
<p><img loading="lazy" class="img-responsive" alt="Gold Above Support But Demand Isn&rsquo;t Going Away" src="https://www.vaneck.com/contentassets/5ac3bfb178a54ab6919cfb41b10c7b2f/6646_jve-outlook_chart-2_2026-1_v1_blog.svg" width="1044" height="540" /></p>
<p class="chart-disclosure"><strong>Source: Bloomberg.</strong> Data as of December 31, 2025. Past performance is no guarantee of future results.</p>
<h2>Opportunities in India and Crypto</h2>
<p>Beyond U.S. markets, India remains a high-conviction, long-term opportunity, supported by structural reforms and durable growth dynamics.</p>
<p>In crypto, Bitcoin&rsquo;s traditional four-year cycle broke in 2025, complicating short-term signals. While our near-term view is mixed, we remain long-term bullish, recognizing both the volatility and the structural adoption trends at play.</p>
<p>To receive more <a href="https://www.vaneck.com/us/en/insights/investment-outlook/" title="Investment Outlook Insights"><strong>Investment Outlook</strong></a> insights, <a href="/link/5f45412c2143400497908cea2897f7d3.aspx" title=" Subscription Center"><strong>sign up in our subscription center</strong></a>.</p>
]]></content:encoded>
</item><item rdf:about="https://www.vaneck.com/us/en/blogs/moat-investing/stage-set-for-moat-stocks-after-strong-2025-close/">
  <title>Stage Set for Moat Stocks After Strong 2025 Close></title>
  <link>https://www.vaneck.com/us/en/blogs/moat-investing/stage-set-for-moat-stocks-after-strong-2025-close/</link>
  <description><![CDATA[A strong December capped a year of resilience for moat strategies, as quality stock selection and renewed exposure to mega-caps position them for 2026.]]></description>
  <dc:creator>Coulter Regal, CFA</dc:creator>
  <dc:date>01/12/2026 06:30:00</dc:date>
<content:encoded><![CDATA[

<p><strong>Key Takeaways:</strong></p>
<ul class="content-list">
<li class="mt-2">Moat Index gained 1.7% in December, led by strong stock selection in technology, industrials and consumer staples.</li>
<li class="mt-2">Est&eacute;e Lauder and Salesforce led Moat Index gains, driven by improving beauty demand and AI-related software momentum.</li>
<li class="mt-2">SMID Moat Index rose 1.0%, outperforming broad small- and mid-cap benchmarks despite mixed sector trends.</li>
<li class="mt-2">Norwegian Cruise Line and Carnival led the SMID Moat Index, as travel demand and onboard spending remained resilient.</li>
</ul>
<p id="us-equity-market-review" class="jump-link-nav anchored-block" data-jumplink-title="U.S. Equity Market Review">U.S. equity markets closed out 2025 on steady footing, with minor gains masking notable dispersion beneath the surface. The S&amp;P 500 finished the month just above flat, gaining 0.06%, as investor optimism around easing inflation and resilient economic data was balanced by year-end positioning and profit taking activity. Market leadership remained concentrated, though participation broadened modestly compared with earlier in the year. Sector performance was mixed, led by financials, with communication services and materials also among the stronger performers. Defensives like utilities and staples lagged, as investors favored more cyclical exposure into year-end.</p>
<p>Against this backdrop, the <strong><a href="/link/9e43dd198c5f4e419f13220685081895.aspx" title="MOAT - VanEck Morningstar Wide Moat ETF - Overview">Morningstar Wide Moat Focus Index</a></strong> (the &ldquo;Moat Index&rdquo;) gained 1.7% in December, outperforming the S&amp;P 500. Looking beyond the single month, the fourth quarter proved particularly strong for the Moat Index, which outperformed both the cap-weighted and equal-weighted S&amp;P 500 amid improving market participation and a rotation away from the most crowded mega-cap trades. While the Index trailed the S&amp;P 500 slightly on a full-year basis, this outcome reflects its equal-weighted, valuation-conscious approach and limited exposure to richly valued mega-cap technology. In a year characterized by narrow leadership and heavy concentration in the largest stocks, the Moat Index&rsquo;s ability to remain competitive while offering differentiated exposure can be viewed as a relative strength.</p>
Smaller-cap equities also posted gains during the month. The <strong><a href="/link/166321dbcfec440590fb51cf0ad629aa.aspx" title="SMOT - VanEck Morningstar SMID Moat ETF - Overview">Morningstar US Small-Mid Cap Moat Focus Index</a></strong> (the &ldquo;SMID Moat Index&rdquo;) rose 1.0% in December, outperforming broad small- and mid-cap benchmarks. Full-year performance, however, reflected a more challenging environment for smaller-cap equities amid elevated interest rates and periodic pullbacks in risk appetite. Even so, the strategy&rsquo;s emphasis on durable competitive advantages and attractive valuations helped it remain competitive throughout a volatile year.
<h3>Moat Stocks Close the Year on a Strong Note</h3>
<p><img loading="lazy" class="img-responsive" alt="Moat Stocks Close the Year on a Strong Note" src="https://www.vaneck.com/EPiServer/CMS/Content/contentassets/d658c4b2ad244a128a758c54ed563087/6634_moat-monthly-jan_chart-1_2026-1_v1_blog.svg,,357339/Download?epieditmode=False" /></p>
<p class="chart-disclosure"><strong>Source: Morningstar. Data as of 12/31/2025.</strong> Past performance is no guarantee of future results. Index performance is not representative of fund performance. It is not possible to invest directly in an index. Please see index definitions and other important disclosures at the end of this content. Fund performance current to the most recent month end is available by visiting vaneck.com or by calling 800.826.2333.</p>

<h2>Moat Index Welcomes Back Select Mag 7 Names at Quarterly Review</h2>
<p>Both the Moat and SMID Moat Indexes underwent quarterly reviews on December 19, 2025. Each quarter, Morningstar&rsquo;s equity research analysts systematically target the most attractively priced, high quality U.S. companies within their respective universes. At the December review, the Moat strategies took advantage of valuation opportunities that emerged amid year-end volatility, including renewed exposure to several mega-cap technology names trading at more attractive valuations. See our <strong><a href="/us/en/blogs/moat-investing/moat-index-welcomes-back-cheap-mag-7-names/" title="Moat Index Welcomes Back Cheap Mag 7 Names">blog covering the recent review</a></strong> for additional context and key takeaways. Full results of the quarterly reviews are also available here: <strong><a href="https://www.vaneck.com/us/en/investments/morningstar-wide-moat-etf-moat/moat-reconstitution.pdf" title="MOAT - VanEck Morningstar Wide Moat ETF">Moat Index</a></strong> and <strong><a href="https://www.vaneck.com/us/en/investments/morningstar-smid-moat-etf-smot/smot-reconstitution.pdf" title="SMOT - VanEck Morningstar SMID Moat ETF">SMID Moat Index</a></strong>.</p>
<h2 id="moat-highlights" class="jump-link-nav anchored-block" data-jumplink-title="Moat Highlights">Moat Index Highlights: Beauty, Software and Defense Lead</h2>
<p>In December, performance within the Moat Index was driven by strong stock selection across several sectors. While sector allocation detracted modestly, individual company performance more than offset these effects. Technology and industrial holdings featured prominently among the top contributors, reflecting investor preference for companies with visible earning power and durable competitive advantages.</p>
<p>The Est&eacute;e Lauder Companies Inc. (EL) was the top contributor to Moat Index performance during the month, with shares rising approximately 11% in December. Shares advanced as investors responded positively to improving trends in premium beauty demand and continued progress on operational initiatives. Morningstar continues to view Est&eacute;e Lauder&rsquo;s portfolio of prestige brands, global scale and strong retail relationships as key drivers of its wide economic moat.</p>
<p>Salesforce Inc. (CRM) was also a leading contributor, gaining roughly 15% during December. The stock benefited from continued momentum in enterprise software demand and improving sentiment surrounding the company&rsquo;s artificial intelligence offerings. Morningstar views Salesforce&rsquo;s high switching costs and deeply embedded customer relationships as central to its wide moat rating. The company&rsquo;s broad cloud portfolio and growing adoption of AI-driven tools continue to reinforce its strategic importance within customers&rsquo; core business operations.</p>
<p>Other top contributors within the Moat Index during the month included Boeing Co. (BA), a global aerospace and defense manufacturer, Huntington Ingalls Industries Inc. (HII), the largest independent U.S. military shipbuilder, and NXP Semiconductors NV (NXPI), a supplier of automotive and industrial semiconductors.</p>
<p>Companies detracting the most from Moat Index performance in December were concentrated within health care and consumer staples. Detractors included Agilent Technologies Inc. (A), a provider of life sciences and diagnostics tools; Zimmer Biomet Holdings Inc. (ZBH), a manufacturer of orthopedic implants; Amgen Inc. (AMGN), a biotechnology company; Clorox Co. (CLX), a consumer products manufacturer, and Brown-Forman Corp. (BF.B), a global spirits producer.</p>
<h2>Moat Index Top Contributors and Detractors - December 2025</h2>
<h3>Contributors</h3>
<div class="wrapped-div">
<table width="100%">
<tbody>
<tr class="tbl-data">
<td class="tbl-header last text-left"><strong>Company</strong></td>
<td class="tbl-header last text-left"><strong>Ticker</strong></td>
<td class="tbl-header last text-left"><strong>Sector</strong></td>
<td class="tbl-header last text-right"><strong>Avg. Weight (%)</strong></td>
<td class="tbl-header last text-right"><strong>Contribution (%)</strong></td>
</tr>
<tr class="tbl-data">
<td class="data-td data last text-left"><strong>The Estee Lauder Companies Inc.</strong></td>
<td class="data-td data last text-left"><strong>EL</strong></td>
<td class="data-td data last text-left">Consumer Stables</td>
<td class="data-td data last text-right">2.84</td>
<td class="data-td data last text-right">0.32</td>
</tr>
<tr class="tbl-data">
<td class="data-td data last text-left"><strong>Salesforce Inc.</strong></td>
<td class="data-td data last text-left"><strong>CRM</strong></td>
<td class="data-td data last text-left">Technology</td>
<td class="data-td data last text-right">2.07</td>
<td class="data-td data last text-right">0.31</td>
</tr>
<tr class="tbl-data">
<td class="data-td data last text-left"><strong>Boeing Co.</strong></td>
<td class="data-td data last text-left"><strong>BA</strong></td>
<td class="data-td data last text-left">Industrials</td>
<td class="data-td data last text-right">1.98</td>
<td class="data-td data last text-right">0.29</td>
</tr>
<tr class="tbl-data">
<td class="data-td data last text-left"><strong>Huntington Ingalls Industries Inc.</strong></td>
<td class="data-td data last text-left"><strong>HII</strong></td>
<td class="data-td data last text-left">Industrials</td>
<td class="data-td data last text-right">2.98</td>
<td class="data-td data last text-right">0.25</td>
</tr>
<tr class="tbl-data">
<td class="data-td data last text-left"><strong>NXP Semiconductors</strong></td>
<td class="data-td data last text-left"><strong>NXPI</strong></td>
<td class="data-td data last text-left">Technology</td>
<td class="data-td data last text-right">2.10</td>
<td class="data-td data last text-right">0.25</td>
</tr>
</tbody>
</table>
</div>
<br />
<h3>Detractors</h3>
<div class="wrapped-div">
<table width="100%">
<tbody>
<tr class="tbl-data">
<td class="tbl-header last text-left"><strong>Company</strong></td>
<td class="tbl-header last text-left"><strong>Ticker</strong></td>
<td class="tbl-header last text-left"><strong>Sector</strong></td>
<td class="tbl-header last text-right"><strong>Avg. Weight (%)</strong></td>
<td class="tbl-header last text-right"><strong>Contribution (%)</strong></td>
</tr>
<tr class="tbl-data">
<td class="data-td data last text-left"><strong>Agilent Technologies Inc.</strong></td>
<td class="data-td data last text-left"><strong>A</strong></td>
<td class="data-td data last text-left">Health Care</td>
<td class="data-td data last text-right">2.96</td>
<td class="data-td data last text-right">-0.34</td>
</tr>
<tr class="tbl-data">
<td class="data-td data last text-left"><strong>Zimmer Biomet Inc.</strong></td>
<td class="data-td data last text-left"><strong>ZBH</strong></td>
<td class="data-td data last text-left">Health Care</td>
<td class="data-td data last text-right">2.34</td>
<td class="data-td data last text-right">-0.18</td>
</tr>
<tr class="tbl-data">
<td class="data-td data last text-left"><strong>Amgen Inc.</strong></td>
<td class="data-td data last text-left"><strong>AMGN</strong></td>
<td class="data-td data last text-left">Health Care</td>
<td class="data-td data last text-right">2.87</td>
<td class="data-td data last text-right">-0.15</td>
</tr>
<tr class="tbl-data">
<td class="data-td data last text-left"><strong>Clorox Co.</strong></td>
<td class="data-td data last text-left"><strong>CLX</strong></td>
<td class="data-td data last text-left">Consumer Staples</td>
<td class="data-td data last text-right">2.01</td>
<td class="data-td data last text-right">-0.13</td>
</tr>
<tr class="tbl-data">
<td class="data-td data last text-left"><strong>Brown-Forman Corp.</strong></td>
<td class="data-td data last text-left"><strong>BF.B</strong></td>
<td class="data-td data last text-left">Consumer Staples</td>
<td class="data-td data last text-right">1.27</td>
<td class="data-td data last text-right">-0.12</td>
</tr>
</tbody>
</table>
</div>
<p class="chart-disclosure"><strong>Source: Morningstar.</strong> Past performance is no guarantee of future results. Index performance is not illustrative of fund performance. Not intended as a recommendation to buy or to sell any of the securities mentioned herein.</p>

<h2 id="smid-highlights" class="jump-link-nav anchored-block" data-jumplink-title="SMID Moat Highlights">SMID Moat Index Highlights: Travel Demand Drives Gains</h2>
<p>The SMID Moat Index finished December higher, supported by strong contributions from consumer discretionary holdings. Stock selection was the primary driver of performance, while sector allocation detracted modestly. Travel-related companies featured prominently among the top contributors, reflecting continued interest in leisure and travel-related spending.</p>
<p>Norwegian Cruise Line Holdings Ltd. (NCLH) and Carnival Corp. (CCL) together led SMID Moat Index performance in December, as shares rose approximately 21% and 18%, respectively. Both companies benefited from continued strength in global leisure travel demand, firm pricing and resilient onboard spending trends. Norwegian operates a global cruise portfolio across multiple brands, while Carnival is the world&rsquo;s largest cruise operator, serving a broad customer base through a diversified fleet. The strong performance of both stocks reflected ongoing investor confidence in the cruise industry&rsquo;s recovery and cash flow generation.</p>
<p>Expedia Group Inc. (EXPE) was the third-largest contributor and rose roughly 11% during December. Expedia operates a leading global online travel platform that connects consumers with lodging, air travel, and destination services. The stock&rsquo;s performance reflected steady travel demand and investor confidence in the company&rsquo;s scaled marketplace and brand portfolio. Other top contributors within the SMID Moat Index included Huntington Ingalls Industries Inc. (HII), a U.S. defense shipbuilder, and Warner Music Group Corp. (WMG), a multinational music entertainment company.</p>
<p>Companies detracting the most from SMID Moat Index performance during the month spanned several sectors. These included Lamb Weston Holdings Inc. (LW), a major U.S. food processing company; Agilent Technologies Inc. (A), a life sciences tools provider; WESCO International Inc. (WCC), an electrical and industrial distribution company; Ionis Pharmaceuticals Inc. (IONS), a biotechnology firm focused on RNA-targeted therapies, and Mattel Inc. (MAT), a global toy manufacturer.</p>
<h2>SMID Moat Index Top Contributors and Detractors - December 2025</h2>
<h3>Contributors</h3>
<div class="wrapped-div">
<table width="100%">
<tbody>
<tr class="tbl-data">
<td class="tbl-header last text-left"><strong>Company</strong></td>
<td class="tbl-header last text-left"><strong>Ticker</strong></td>
<td class="tbl-header last text-left"><strong>Sector</strong></td>
<td class="tbl-header last text-right"><strong>Avg. Weight (%)</strong></td>
<td class="tbl-header last text-right"><strong>Contribution (%)</strong></td>
</tr>
<tr class="tbl-data">
<td class="data-td data last text-left"><strong>Norwegian Cruise Line Ltd.</strong></td>
<td class="data-td data last text-left"><strong>NCLH</strong></td>
<td class="data-td data last text-left">Consumer Discretionary</td>
<td class="data-td data last text-right">1.16</td>
<td class="data-td data last text-right">0.24</td>
</tr>
<tr class="tbl-data">
<td class="data-td data last text-left"><strong>Carnival Corp.</strong></td>
<td class="data-td data last text-left"><strong>CCL</strong></td>
<td class="data-td data last text-left">Consumer Discretionary</td>
<td class="data-td data last text-right">1.26</td>
<td class="data-td data last text-right">0.23</td>
</tr>
<tr class="tbl-data">
<td class="data-td data last text-left"><strong>Expedia Group Inc.</strong></td>
<td class="data-td data last text-left"><strong>EXPE</strong></td>
<td class="data-td data last text-left">Consumer Discretionary</td>
<td class="data-td data last text-right">1.74</td>
<td class="data-td data last text-right">0.19</td>
</tr>
<tr class="tbl-data">
<td class="data-td data last text-left"><strong>Huntington Ingalls Industries Inc.</strong></td>
<td class="data-td data last text-left"><strong>HII</strong></td>
<td class="data-td data last text-left">Industrials</td>
<td class="data-td data last text-right">1.70</td>
<td class="data-td data last text-right">0.14</td>
</tr>
<tr class="tbl-data">
<td class="data-td data last text-left"><strong>Warner Music Group Corp.</strong></td>
<td class="data-td data last text-left"><strong>WMG</strong></td>
<td class="data-td data last text-left">Communication Services</td>
<td class="data-td data last text-right">1.26</td>
<td class="data-td data last text-right">0.11</td>
</tr>
</tbody>
</table>
</div>
<br />
<h3>Detractors</h3>
<div class="wrapped-div">
<table width="100%">
<tbody>
<tr class="tbl-data">
<td class="tbl-header last text-left"><strong>Company</strong></td>
<td class="tbl-header last text-left"><strong>Ticker</strong></td>
<td class="tbl-header last text-left"><strong>Sector</strong></td>
<td class="tbl-header last text-right"><strong>Avg. Weight (%)</strong></td>
<td class="tbl-header last text-right"><strong>Contribution (%)</strong></td>
</tr>
<tr class="tbl-data">
<td class="data-td data last text-left"><strong>Lamb Weston Holdings Inc.</strong></td>
<td class="data-td data last text-left"><strong>LW</strong></td>
<td class="data-td data last text-left">Consumer Staples</td>
<td class="data-td data last text-right">0.70</td>
<td class="data-td data last text-right">-0.20</td>
</tr>
<tr class="tbl-data">
<td class="data-td data last text-left"><strong>Agilent Technologies Inc.</strong></td>
<td class="data-td data last text-left"><strong>A</strong></td>
<td class="data-td data last text-left">Health Care</td>
<td class="data-td data last text-right">1.69</td>
<td class="data-td data last text-right">-0.19</td>
</tr>
<tr class="tbl-data">
<td class="data-td data last text-left"><strong>WESCO International Inc.</strong></td>
<td class="data-td data last text-left"><strong>WCC</strong></td>
<td class="data-td data last text-left">Industrials</td>
<td class="data-td data last text-right">1.84</td>
<td class="data-td data last text-right">-0.15</td>
</tr>
<tr class="tbl-data">
<td class="data-td data last text-left"><strong>Ionis Pharmaceuticals Inc.</strong></td>
<td class="data-td data last text-left"><strong>IONS</strong></td>
<td class="data-td data last text-left">Health Care</td>
<td class="data-td data last text-right">2.41</td>
<td class="data-td data last text-right">-0.11</td>
</tr>
<tr class="tbl-data">
<td class="data-td data last text-left"><strong>Mattel Inc.</strong></td>
<td class="data-td data last text-left"><strong>MAT</strong></td>
<td class="data-td data last text-left">Consumer Discretionary</td>
<td class="data-td data last text-right">1.52</td>
<td class="data-td data last text-right">-0.09</td>
</tr>
</tbody>
</table>
</div>
<p class="chart-disclosure"><strong>Source: Morningstar.</strong> Past performance is no guarantee of future results. Index performance is not illustrative of fund performance. Not intended as a recommendation to buy or to sell any of the securities mentioned herein.</p>

<h2 id="moat-strategies" class="jump-link-nav anchored-block" data-jumplink-title="Moat Strategies">Choose Your Moat Strategy</h2>
<p>VanEck&rsquo;s suite of <strong><a href="/us/en/blogs/moat-investing/moat-investing-powered-by-morningstar/" title="Quality Companies at Attractive Prices">moat investing strategies</a></strong> is powered by Morningstar&rsquo;s equity research team, which seeks quality companies trading at attractive valuations. The below ETFs offer access to US moat companies:</p>
<p><strong><a href="/link/9e43dd198c5f4e419f13220685081895.aspx" title="MOAT - VanEck Morningstar Wide Moat ETF - Overview">VanEck Morningstar Wide ETF (MOAT)</a></strong><span>:</span> companies with a wide moat rating, which means Morningstar believes the company is likely to sustain its competitive advantage for at least the next 20 years.&nbsp;</p>
<p><strong><a href="/link/166321dbcfec440590fb51cf0ad629aa.aspx" title="SMOT - VanEck Morningstar SMID Moat ETF - Overview">VanEck Morningstar SMID Moat ETF (SMOT)</a></strong><span>:</span> small and mid-cap moat companies.</p>
<p><strong><a href="/link/fd582da052ba46c79bfc112c078a6256.aspx" title="MVAL - VanEck Morningstar Wide Moat Value ETF - Overview">VanEck Morningstar Wide Moat Value ETF (MVAL)</a></strong><span>:</span> wide moat companies within Morningstar&rsquo;s value style category.</p>
<p>To receive more <a href="https://www.vaneck.com/us/en/insights/moat-investing" title="Moat Investing Insights"><strong>Moat Investing</strong></a> insights, <a href="https://www.vaneck.com/us/en/subscribe/" title="Subscription Center"><strong>sign up in our subscription center</strong></a>.</p>
]]></content:encoded>
</item><item rdf:about="https://www.vaneck.com/us/en/blogs/emerging-markets-equity/navigating-an-emerging-markets-inflection-innovation-discipline-and-quality-growth/">
  <title>Navigating an Emerging Markets Inflection: Innovation, Discipline, and Quality Growth></title>
  <link>https://www.vaneck.com/us/en/blogs/emerging-markets-equity/navigating-an-emerging-markets-inflection-innovation-discipline-and-quality-growth/</link>
  <description><![CDATA[Emerging markets rebounded in 2025, outperforming U.S. and global equities as easing inflation, supportive policy and AI-led innovation drove a durable shift toward renewed leadership.]]></description>
  <dc:creator>Ola  El-Shawarby, CFA</dc:creator>
  <dc:date>01/09/2026 06:30:00</dc:date>
<content:encoded><![CDATA[


<p><strong>Key Takeaways:</strong></p>
<ul class="content-list">
<li class="mt-2">Emerging markets reached a clear inflection point, reversing multi-year underperformance as fundamentals, policy support and a weaker dollar aligned.</li>
<li class="mt-2">AI, digital infrastructure and energy transition themes powered earnings growth, with Asia demonstrating structural advantages in innovation and scale.</li>
<li class="mt-2">Valuations are still attractive and many investors remain under-allocated, creating room for continued gains as confidence in emerging markets improves.</li>
</ul>
<p id="market-review" class="jump-link-nav anchored-block" data-jumplink-title="Market Review">Emerging markets ended 2025 with renewed strength, marking what we believe is an important inflection point for the asset class. Improving fundamentals, more supportive policy dynamics, and accelerating structural growth drivers drove a broader and more durable recovery than in recent years. Importantly, emerging markets delivered clear relative outperformance versus both U.S. and broader global equity markets in 2025, reversing a multi-year period of underperformance and signaling a meaningful shift in market leadership. While the year included periods of volatility, it ended with many of the conditions for sustained emerging markets outperformance firmly in place.</p>
<p>A tentative rebound early in the year evolved into a more convincing advance as inflation moderated, policy cycles turned supportive, and growth re-accelerated across several key emerging economies. Greater clarity around global trade, particularly a shift from escalation toward a more stable, though still complex, U.S.&ndash;China equilibrium, reduced a meaningful source of uncertainty. A weaker U.S. dollar further eased financial conditions and supported capital flows into emerging markets.</p>
<p>Structural themes became central to performance. Artificial intelligence (AI) adoption, digital infrastructure investment, the energy transition, and domestically driven growth models translated into tangible earnings momentum across a growing set of companies. Emerging markets, particularly across Asia, demonstrated a clear advantage in their ability to innovate and scale new technologies rapidly and cost-effectively. Deep engineering talent, integrated supply chains, supportive policy frameworks, and large domestic markets enabled faster commercialization, allowing leading companies to convert innovation into sustainable earnings growth more efficiently than in prior cycles.</p>
<p>From a portfolio perspective, the year underscored the importance of on-the-ground research and process discipline. Our Emerging Markets Equity team&rsquo;s investment decisions were grounded in deep fundamental analysis, direct company engagement, and ongoing risk assessment, enabling data-driven, risk-informed positioning throughout the cycle. This approach allowed us to capture the turn in the cycle while managing volatility, with a continued focus on high-quality businesses, strong balance sheets, and durable long-term growth drivers.</p>
<p>Looking ahead, we are increasingly confident that the improvement in emerging markets reflects more than a short-term cycle. Accelerating innovation is strengthening earnings visibility and long-term growth potential, while valuations remain reasonable relative to history and developed markets. Investor positioning remains relatively light, providing scope for further reallocation as confidence builds. With clearer policy signals, supportive macro conditions, and a strengthening earnings backdrop, we believe emerging markets are entering a more constructive, structurally supported phase.</p>

<h2 id="em-countries" class="jump-link-nav anchored-block" data-jumplink-title="EM Countries &amp; Themes">China: AI- and Innovation-Led Recovery Supported by a More Pragmatic Policy Backdrop</h2>
<p>Chinese equities delivered strong performance over 2025, with gains building steadily through the year but consolidating in the fourth quarter. Market leadership reflected a clear shift in investor focus towards AI-driven innovation and technological self-reliance, led by private sector champions such as <strong>Tencent (4.1% of Fund net assets<sup>*</sup>)</strong> and <strong>Alibaba </strong><strong>(3.0% of Fund net assets<sup>*</sup>)</strong> alongside emerging innovators like DeepSeek. These advances underscored the resilience and global competitiveness of China&rsquo;s technology ecosystem, supported by a more pragmatic and increasingly supportive policy environment.</p>
<p>While overall domestic growth remained uneven in 2025, constrained by weak property-sector data and still-cautious consumer sentiment, policy signals grew more constructive over the course of the year. Government efforts to support domestic consumption and stabilize the property market became more decisive, though actual progress on the ground has so far been modest. In parallel, initiatives aimed at curbing irrational competition that has weighed on industry returns are directionally positive, even if meaningful improvements will take time to emerge. Importantly, local and regional capital flows into Chinese equities provided incremental support to market performance throughout the year.</p>
<p>Taken together, these dynamics allowed innovation-led earnings growth and improving regulatory signals to outweigh lingering macro headwinds in 2025. After several difficult years, valuations remained attractive, reinforcing the case for selective exposure. We remain constructive on China, with a continued emphasis on high-quality companies best positioned to benefit from long-term structural drivers in technology, AI, and selective areas of consumption.</p>
<h2>India: Valuation Reset within a Durable Growth Story</h2>
<p>India&rsquo;s structural growth fundamentals remain compelling, supported by robust domestic consumption, sustained infrastructure investment, and the government&rsquo;s &ldquo;Make in India&rdquo; manufacturing agenda. A stable political backdrop following the 2024 elections, easing inflation, and an ongoing interest-rate cutting cycle have improved macro visibility and policy support as the growth cycle matures.</p>
<p>After several years of strong performance, Indian equities consolidated in 2025 as elevated starting valuations, foreign investor outflows, and softer near-term growth data weighed on returns. Market performance lagged global peers, and we view this pause as a healthy reset rather than a deterioration in fundamentals.</p>
<p>The resulting valuation normalization created opportunities to add selectively to high-conviction positions, and our stock selection contributed positively to portfolio performance over the year. Looking ahead to 2026, we are constructive on the setup following a meaningful reset in valuations and earnings expectations versus a year ago. With inflation structurally lower, interest rates already declining and potentially easing further, and incremental policy reforms, particularly around the GST framework, India is well positioned for a renewed earnings re-acceleration. We remain disciplined in areas where valuations are still elevated, concentrating our exposure on high-quality growth companies with durable fundamentals and long-term compounding potential aligned with our investment process.</p>
<h2>South Korea: AI Momentum and a Value-Up-Driven Re-Rating Opportunity</h2>
<p>Korean equities built on earlier momentum in Q4 to cap a stellar 2025, with performance driven by an AI-led inflection in the global semiconductor cycle and improving sentiment around corporate reform. Semiconductor leaders were at the center of the rally: <strong>SK hynix (6.2% of Fund net assets<sup>*</sup>)</strong> benefited from exceptionally strong supply&ndash;demand dynamics in high bandwidth memory (HBM) driven by AI server demand, while Samsung Electronics gained as the DRAM cycle tightened and pricing momentum improved. Our stock selection was a key contributor to performance, complemented by exposure to <strong>Hyundai Electric (1.2% of Fund net assets<sup>*</sup>) </strong>where tight capacity and accelerating U.S. grid investment tied to AI-driven data center build-outs supported strong pricing and order growth.</p>
<p>Beyond semiconductors, Korea&rsquo;s longer-term opportunity set is becoming more compelling. The government&rsquo;s &ldquo;Value-Up&rdquo; program, which is aimed at improving capital discipline, shareholder returns, and corporate governance, represents an important structural shift. While implementation will take time, continued progress on shareholder-friendly reforms increases the potential for the rally to broaden beyond large-cap technology leaders and narrow historical valuation discounts. With earnings momentum improving and Korea well positioned as a structural beneficiary of global AI investment, we remain constructive while emphasizing bottom-up stock selection.</p>
<h2>Taiwan: At the Center of the Global AI Supply Chain</h2>
<p>Taiwan&rsquo;s market enjoyed solid gains in the quarter, thanks in large part to its world-class semiconductor industry, reflecting strong global demand for high-end chips powering AI and cloud computing. <strong>Taiwan Semiconductor (&ldquo;TSMC&rdquo;) (10.7% of Fund net assets<sup>*</sup>) </strong>and related technology firms benefited from ramped-up orders for advanced processors, reinforcing Taiwan&rsquo;s critical role in the AI supply chain. Outside of tech, Taiwan&rsquo;s exporters also saw resilient orders as companies diversify production across Asia. We remain well positioned in Taiwan&rsquo;s technology leaders including TSMC and <strong>Chroma ATE (2.4% of Fund net assets<sup>*</sup>)</strong> given their technological moat and secular growth trajectory, while staying vigilant about potential volatility from geopolitics or U.S. export restrictions. Overall, Taiwan enters 2026 with healthy fundamentals and a key position in the ongoing tech innovation wave.</p>
<h2>Brazil: Disinflation, a Turning Rate Cycle, and Improving Growth Prospects</h2>
<p>Brazilian equities finished the year on a positive note, building on improving macroeconomic underpinnings. Investor confidence was supported by a more stable fiscal outlook and growing confidence that earlier monetary tightening has successfully brought inflation under control. We continued to see attractive value in the Brazilian market and maintained an overweight position, with strong stock selection contributing meaningfully to performance, although we trimmed some exposure following the rally.</p>
<p>Looking into 2026, Brazil&rsquo;s outlook remains constructive, supported by a continued disinflationary trend and rising expectations for meaningful interest-rate cuts from very elevated real yield levels. While political developments will warrant close monitoring as the country approaches an election year, the macro backdrop is becoming more supportive for growth-oriented assets. Beyond the cyclical setup, accelerating fintech adoption, rising technology investment, and ongoing financial deepening continue to support high-quality domestic compounders.</p>
<h2>Mexico: Policy Stability and Improving Trade Visibility Support a Constructive Outlook</h2>
<p>Mexican equities delivered additional gains in the fourth quarter, reinforcing a year of steady and positively surprising outperformance. Entering 2025, we expected a transition year following the 2024 leadership change and the start of a new phase in USMCA- and tariff-related negotiations. Political uncertainty has since eased meaningfully, with a smooth transition to the new administration. Our conversations with corporate management teams reflect constructive engagement between policymakers and the private sector, reinforcing investor confidence.</p>
<p>Early signs of progress in the renegotiation of the USMCA framework support a more constructive outlook for renewed foreign direct investment and improved visibility into 2026 and beyond as trade-related uncertainties subside. Against this backdrop, we maintain a selectively positive view on Mexico, favoring companies in industrials, financials, and consumer staples that benefit from these structural tailwinds and exhibit resilient business models with strong compounding characteristics aligned with our investment process.</p>
<h2>CEE and Central Asia: Reflation, Defense Spending and Geopolitical Optionality</h2>
<p>2025 was a positive year, particularly for financials, as Europe began to see a shift toward fiscal and monetary expansion, supporting growth and the reflation trade. The team recently returned from meetings in Poland, Hungary, and the Czech Republic. Poland stands out as a clear beneficiary of rising defense spending across Europe, especially in Germany, which is supporting economic activity. Real wage growth is also accelerating, improving the outlook for domestic consumption. Hungary is entering an election year, creating near-term uncertainty. A potential shift toward a more EU-friendly government could unlock significant investment, though we are not positioning for that outcome. Our holding,<strong> OTP Bank (1.3% of Fund net assets<sup>*</sup>),</strong> has continued to perform well across its regional footprint. Across the broader region, risk premia could compress and capital flows could increase if progress toward a Russia-Ukraine agreement materializes. Central Asia is seeing an acceleration in growth, with our long-time holding in <strong>Lion Finance Group (previously known as Bank of Georgia) (1.7% of Fund net assets<sup>*</sup>)</strong> delivering another strong year of performance. Kazakhstan&rsquo;s outlook is also improving, as inflation is expected to decline and interest rates may follow, which would support economic activity. Both markets stand to benefit from any sustained improvement in the geopolitical environment.</p>
<h2>GCC: Resilient Performance and Improving Medium-Term Optionality</h2>
<p>Gulf equity markets delivered steady, moderate gains in Q4, providing relative stability amid broader emerging-market volatility. Performance across the region was differentiated, with the UAE delivering stronger and more consistent returns, supported by solid macro fundamentals, robust activity in travel, tourism, and services, and its role as a regional safe haven for capital. In contrast, Saudi Arabia experienced a more challenging year as elevated expectations and uneven execution weighed on returns. Our relative underweight in Saudi proved beneficial and supported overall portfolio performance. Portfolio activity reflected our disciplined investment process. <strong>Talabat Holdings</strong> faced increased competitive uncertainty following Meituan&rsquo;s market entry, which reduced near-term visibility. In response, we exited the position and redeployed capital toward opportunities with stronger fundamentals and clearer earnings trajectories, improving the overall quality of the portfolio. Looking ahead, the outlook across the Gulf is becoming more constructive. The UAE continues to benefit from broad-based growth drivers and ongoing capital-markets development, while Saudi Arabia appears better positioned following a year of adjustment. Both markets are also emerging as potential AI-enabled growth and reform stories, supported by low-cost energy, improving access to advanced chips, and continued capital-markets modernization.</p>
<h2>Egypt and Africa: Macro Stabilization Unlocking Structural Growth</h2>
<p>Across Africa, macro conditions are improving for the first time in several years, with easing inflation, stabilizing external balances, and strengthening policy frameworks creating increasingly attractive selective opportunities.</p>
<p>In Egypt, 2025 was a strong year for the equity market following several difficult years, driven by tangible progress on macro stabilization. Our sole holding, <strong>Commercial International Bank (&ldquo;CIB&rdquo;), (1.2% of Fund net assets<sup>*</sup>)</strong> contributed very positively to performance. On-the-ground research points to meaningful disinflation, enabling interest-rate cuts with scope for further easing, while improved foreign currency availability, supported by large GCC-backed investment agreement, has materially reduced prior constraints. Corporate sentiment has strengthened, and we see compelling structural growth opportunities ahead, particularly in financials and fintech.</p>
<p>Elsewhere, reform momentum is building. Our pan-African holding, <strong>Helios Towers (1.2% of Fund net assets<sup>*</sup>),</strong> delivered strong performance on the back of continued growth, profitability, and cash-flow expansion. In South Africa, early signs of economic improvement are emerging, and we added <strong>Channel VAS Investments Limited (also known as &ldquo;Optasia&rdquo;) (0.5% of Fund net assets<sup>*</sup>),</strong> a structural growth company leveraging AI-driven credit assessment. Overall, we are increasingly optimistic about Africa&rsquo;s opportunity set as macro repair and structural growth reinforce one another.</p>
<h2>Portfolio Positioning &amp; Outlook</h2>
<p>As we enter 2026, the <strong><a href="/link/eb4419e6f6394611b3f80c597020daa4.aspx" title="GBFAX - Emerging Markets Fund - Class A">VanEck Emerging Markets Equity Fund </a></strong>is positioned to capture the next phase of opportunity across the asset class, with a clear emphasis on technology, innovation, and high-quality growth companies with durable competitive moats and resilient domestic demand. We focus on areas where emerging markets demonstrate structural advantages&mdash;most notably across the AI application layer and supply chain, digital infrastructure, and technology-enabled business models&mdash;where scale, cost leadership, deep talent pools, and large domestic markets are translating into sustained earnings growth and improving returns on invested capital.</p>
<p>At the portfolio level, we remain disciplined and selective. We have reallocated capital toward high-conviction compounders benefiting from innovation-led growth and manufacturing realignment, while trimming exposure where valuations became stretched or earnings visibility weakened. Our active positioning reflects markets and companies where improving fundamentals, supportive policy backdrops, and attractive valuations intersect, including Brazil, China, South Korea, and India, while remaining selective in areas that appear fully valued in the near term.</p>
<p>Looking ahead, we believe emerging markets are entering a more durable, structurally supported phase of growth. Innovation is increasingly driving earnings visibility, valuations remain reasonable relative to history and developed markets, and investor positioning remains light. While near-term volatility is inevitable, our focus on quality&mdash;companies with strong balance sheets, sustainable competitive advantages, resilient business models, and attractive, improving returns on invested capital&mdash;positions the portfolio to navigate uncertainty and deliver attractive long-term returns.</p>
<h2 id="fund-performance" class="jump-link-nav anchored-block" data-jumplink-title="Fund Performance">Fund Performance</h2>
<p>The <strong><a href="/link/eb4419e6f6394611b3f80c597020daa4.aspx" title="GBFAX - Emerging Markets Fund - Class A">VanEck Emerging Markets Fund</a></strong> (the &ldquo;Fund&rdquo;) slightly underperformed the MSCI Emerging Markets Investable Market Index Index on the quarter-to-date basis ending December 31, 2025 (+4.00% for the Fund; +4.31% for the Index). Positive relative performance for the quarter was driven by stock selection in South Korea and India. Negative relative performance was driven by stock selection in China and Brazil.</p>
<p>South Korea and Taiwan were the Fund&rsquo;s top contributors for the quarter.</p>
<h3>Average Annual Total Returns (%) as of December 31, 2025</h3>
<div class="wrapped-div">
<table style="width: 100%;">
<tbody>
<tr class="tbl-data">
<td class="tbl-header last">&nbsp;</td>
<td class="tbl-header last text-right">4Q25<sup>&dagger;</sup></td>
<td class="tbl-header last text-right">YTD</td>
<td class="tbl-header last text-right">1YR</td>
<td class="tbl-header last text-right">3YR</td>
<td class="tbl-header last text-right">5YR</td>
<td class="tbl-header last text-right">10YR</td>
</tr>
<tr class="tbl-data">
<td class="data-td last text-left">Class A: NAV (Inception 12/20/93)</td>
<td class="data-td data last text-right">4.00</td>
<td class="data-td data last text-right">30.26</td>
<td class="data-td data last text-right">12.84</td>
<td class="data-td data last text-right">-1.15</td>
<td class="data-td data last text-right">4.99</td>
</tr>
<tr class="tbl-data">
<td class="data-td last text-left">Class A: Maximum 5.75% Load</td>
<td class="data-td data last text-right">-1.98</td>
<td class="data-td data last text-right">22.77</td>
<td class="data-td data last text-right">10.63</td>
<td class="data-td data last text-right">-2.31</td>
<td class="data-td data last text-right">4.37</td>
</tr>
<tr class="tbl-data">
<td class="data-td last text-left">Class I: NAV (Inception 12/31/07)</td>
<td class="data-td data last text-right">4.09</td>
<td class="data-td data last text-right">31.00</td>
<td class="data-td data last text-right">13.48</td>
<td class="data-td data last text-right">-0.61</td>
<td class="data-td data last text-right">5.53</td>
</tr>
<tr class="tbl-data">
<td class="data-td last text-left">MSCI Emerging Markets Investable Markets Index (IMI)</td>
<td class="data-td data last text-right">4.31</td>
<td class="data-td data last text-right">31.38</td>
<td class="data-td data last text-right">16.25</td>
<td class="data-td data last text-right">4.66</td>
<td class="data-td data last text-right">8.37</td>
</tr>
<tr class="tbl-data">
<td class="data-td last text-left">MSCI Emerging Markets IMI Growth Index</td>
<td class="data-td data last text-right">2.99</td>
<td class="data-td data last text-right">32.03</td>
<td class="data-td data last text-right">16.02</td>
<td class="data-td data last text-right">2.36</td>
<td class="data-td data last text-right">8.53</td>
</tr>
</tbody>
</table>
</div>
<style>
    .data-td.data {
        padding-right: 5px !important;
        padding-left: 5px !important;
    }

    .wrapped-div {
        max-width: 100%;
    }

    @media (max-width: 1240px) {
        .wrapped-div {
            overflow-x: scroll;
        }
    }

    .wrapped-div-sector {
        max-width: 100%;
        overflow-x: scroll;
    }
</style>
<p class="chart-disclosure">The table presents past performance which is no guarantee of future results and which may be lower or higher than current performance. Returns reflect applicable fee waivers and/or expense reimbursements. Had the Fund incurred all expenses and fees, investment returns would have been reduced. Investment returns and Fund shares values will fluctuate so that investor's shares, when redeemed, may be worth more or less than their original cost. Fund returns assume that dividends and capital gains distributions have been reinvested in the Fund at net asset value (NAV). Index returns assume that dividends of the Index constituents in the Index have been reinvested. Performance information current to the most recent month end is available by calling 800.826.2333 or by visiting vaneck.com.</p>
<p class="chart-disclosure">Expenses: Class A: Gross 1.59%; Net 1.59%; Class I: Gross 1.25%; Net 1.02%. Expenses are capped contractually until 5/1/26 at 1.60% for Class A and 1.00% for Class I. Caps exclude acquired fund fees and expenses, interest, trading, dividends, interest payments of securities sold short, taxes and extraordinary expenses.</p>

<h2 id="fund-review" class="jump-link-nav anchored-block" data-jumplink-title="Fund Review">Fund Review</h2>
<p>On a sector level, Information Technology, Health Care and Consumer Staples contributed to relative performance, while Consumer Discretionary, Industrials and Materials detracted. On a country level, South Korea, India and Taiwan contributed to relative performance, while China, Brazil and Singapore detracted.</p>
<h2>Top Contributors</h2>
<p>Top contributors to return on an absolute basis during the quarter:</p>
<ul class="content-list">
<li class="mt-2"><strong>SK hynix (6.2% of Fund net assets<sup>*</sup>): </strong>SK hynix is a leading global semiconductor manufacturer and the supply constrained market leader in High Bandwidth Memory, a critical component for AI accelerators such as GPUs and TPUs. Over the past two years, our semiconductor strategy has focused on the scarcest resources in the AI capital expenditure cycle, with SK hynix standing out due to its dominant position in HBM. This leadership has enabled the company to expand supply, exercise pricing power, and grow margins, while reinvesting strong cash flows to defend its technology edge and deepen customer relationships. When we initiated the position in 2023, shares traded at a valuation that understated the company&rsquo;s earnings and growth potential. These expectations were realized in 2025 through significant earnings expansion and a valuation rerating, delivering exceptional performance for the Fund despite periods of volatility. While we remain attentive to the risk that industry conditions may eventually normalize, SK hynix remains one of the Fund&rsquo;s largest positions as we continue to monitor risk closely.</li>
<li class="mt-2"><strong>Taiwan Semiconductor Manufacturing Company (&ldquo;TSMC&rdquo;) (10.7% of Fund net assets<sup>*</sup>):</strong> TSMC is the world&rsquo;s leading pure play semiconductor foundry, manufacturing advanced chips for leading designers including NVIDIA and Broadcom. TSMC benefits from unmatched scale, leading edge process technology, and a track record of consistent execution that creates formidable barriers to entry. These advantages allow the company to earn industry leading margins, maintain high utilization, and grow its already substantial business at attractive rates. Strong demand for advanced logic tied to AI workloads drove meaningful earnings growth and share price appreciation during the year, making TSMC one of the Fund&rsquo;s top contributors to performance in 2025.</li>
<li class="mt-2"><strong>Samsung Electronics (3.7% of Fund net assets<sup>*</sup>):</strong> Samsung Electronics is a diversified global semiconductor and electronics company with exposure to memory, logic, and contract manufacturing. While Samsung operates across many of the same end markets as SK hynix and TSMC, it trails both in leading edge technology and exposure to the most advanced nodes. Our investment thesis was that rapid industry capital reallocation toward High Bandwidth Memory and AI related silicon would constrain supply in more commoditized memory and mature node segments where Samsung has a dominant presence. This shift materialized in the second half of the year, driving a sharp expansion in volumes and margins. The resulting earnings upgrades and valuation rerating underpinned strong share price performance for the Fund in the fourth quarter of 2025.</li>
</ul>
<h2>Top Detractors</h2>
<p>Top detractors to return on an absolute basis during the quarter:</p>
<ul class="content-list">
<li class="mt-2"><strong>Alibaba Group Holding Limited (3.0% of Fund net assets<sup>*</sup>):</strong> Alibaba is a leading Chinese technology platform spanning e-commerce, cloud computing, logistics, and digital services. Alibaba remains a top China holding despite weak Q4 share price performance, which was driven primarily by broad based derating rather than company specific fundamentals. Cloud revenue accelerated to 34% year over year in the September quarter, reinforcing Alibaba&rsquo;s position as China&rsquo;s most advanced full stack AI infrastructure provider. Early AI monetization through AliCloud and e-commerce, expanding adoption of AI marketing tools, and improving quick commerce execution support the long-term thesis. Management indicated that investment intensity likely peaked in September, with margins expected to improve as spending moderates.</li>
<li class="mt-2"><strong>Tencent Holdings Ltd (4.1% of Fund net assets<sup>*</sup>):</strong> Tencent is a leading Chinese internet company with core businesses in gaming, social media, advertising, and cloud services. Tencent remains a core holding, with recent weakness driven by macro sentiment and lower reported capex rather than a change in fundamentals. Capex declined in 3Q25 due to chip supply constraints, not reduced AI ambition, and supply conditions should improve following approval for Nvidia H200 sales to China. Tencent&rsquo;s Hunyuan model continues to gain traction and is increasingly embedded across gaming, advertising, and cloud, while AI driven efficiency and monetization support durable long-term growth. International games revenue grew 43% year over year, reinforcing the strength of its global franchise.</li>
<li class="mt-2"><strong>Xiaomi Corporation Class B (1.1% of Fund net assets<sup>*</sup>):</strong> Xiaomi is a leading Chinese consumer electronics company best known for smartphones, smart home devices, and a rapidly expanding Internet of Things ecosystem. Xiaomi has underperformed due to near term margin pressure from elevated memory costs, which we view as cyclical rather than structural. Despite this headwind, the company continues to execute well operationally, with strong growth in its international IoT business and solid progress in domestic handset premiumization. As input costs normalize, we expect margins to recover, supported by an improving product mix and expanding ecosystem revenues. While near term performance may remain uneven, we believe the longer-term investment thesis remains intact and are comfortable remaining patient with the position.</li>
</ul>
<h2>Top Buys &amp; Sells</h2>
<p>During the period, we established new positions in the following:</p>
<ul class="content-list">
<li class="mt-2"><strong>Channel VAS Investments Limited (Optasia) (0.5% of Fund net assets<sup>*</sup>): </strong>Channel VAS Investments Limited, operating as Optasia, is a fintech platform providing micro credit and airtime financing to underbanked consumers through an AI driven credit decisioning engine. Optasia recently listed on the Johannesburg Stock Exchange, and we initiated a position given its exposure to large, structurally underpenetrated markets and an attractive medium term growth profile. The company processes more than 32 million loan transactions daily, reaches approximately 121 million monthly active users, and has access to over 860 million mobile subscribers across 38 countries in Africa, the Middle East, Asia, and Europe. The business benefits from strong secular tailwinds, including rising mobile penetration, rapid digital wallet adoption, and a large unbanked population across its footprint. We believe Optasia can sustain mid 20% earnings growth over the medium term through organic expansion and disciplined geographic rollout while maintaining strong profitability. At current valuations, the stock trades at a discount to global and regional fintech peers despite clear growth visibility, offering attractive risk reward and differentiated exposure to high growth digital financial services.</li>
<li class="mt-2"><strong>Kuaishou Technology (0.5% of Fund net assets<sup>*</sup>): </strong>Kuaishou is China&rsquo;s second largest short video platform, generating revenue primarily from live streaming and advertising, with roughly half of ad revenue tied to its own ecommerce ecosystem. Shares were weak in the fourth quarter following the introduction of new ecommerce tax regulations that limit merchant spending on advertising and traffic acquisition. Despite this near-term pressure, we remain constructive and believe AI will structurally enhance online advertising efficiency. Platforms with strong user data and feedback loops, such as Kuaishou, are well positioned to capture a growing share of ad budgets. We also see optionality from Kling, Kuaishou&rsquo;s AI text to video model, which holds an estimated 30% global market share and is gaining traction internationally. While still a small revenue contributor, Kling&rsquo;s rapid adoption overseas has driven renewed investor interest in the stock.</li>
<li class="mt-2"><strong>ADNOC Drilling Company PJSC (0.5% of Fund net assets<sup>*</sup>): </strong>ADNOC Drilling is the largest national drilling company in the Middle East and the exclusive provider of drilling services to Abu Dhabi National Oil Company. We initiated a position to gain exposure to Abu Dhabi&rsquo;s long term oil and gas expansion plans in a highly defensive structure. The company operates more than 140 rigs under long term contracts that provide strong cash flow visibility and insulation from oil price volatility. ADNOC Drilling is well positioned to benefit from rising oil production capacity targets, gas self sufficiency initiatives, and increased domestic energy demand, including from AI related infrastructure. Additional upside exists from growth in oilfield services and potential unconventional gas development. We view the company as offering an attractive combination of visible growth, strong free cash flow generation, and a progressive dividend profile.</li>
</ul>
<p><strong>During the period, we exited the following positions:</strong></p>
<ul class="content-list">
<li class="mt-2"><strong>Ayala Land Inc.: </strong>Ayala Land is one of the Philippines&rsquo; largest property developers, with exposure across residential, commercial, and mixed use real estate. We exited the position due to a prolonged high interest rate environment that has weighed on residential demand and sector sentiment. Elevated borrowing costs and high inventory levels have limited near term visibility, and we see few catalysts for improvement in the current macro backdrop.</li>
<li class="mt-2"><strong>JD.com, Inc.:</strong> JD is a major Chinese e-commerce platform with a strong logistics network and significant exposure to consumer electronics and home appliances. We exited JD due to increasing concerns around its expansion into food delivery, which has required heavy investment without clear evidence of sustainable returns. With limited visibility on unit economics, competitive pressure from Alibaba, and softening demand in its core home appliance category, we no longer viewed the risk reward as attractive.</li>
<li class="mt-2"><strong>Ping An Bank Co. Ltd.: </strong>Ping An Bank is a large Chinese commercial bank with exposure to retail and corporate lending. We exited the position amid ongoing pressure from interest rate cuts, weak consumer confidence, and property related credit risks. With elevated provisions and limited near term earnings upside, we no longer viewed the risk reward as attractive.</li>
<li class="mt-2"><strong>POYA International Co., Ltd.:</strong> Poya International is a Taiwanese beauty and personal care retailer focused on cosmetics, skincare, and everyday consumer essentials. We exited the position as a softer consumer environment and rising operating costs pressured sales momentum and profitability. With limited visibility into a near term demand recovery, we chose to redeploy capital elsewhere.</li>
<li class="mt-2"><strong>Talabat Holding Plc:</strong> Talabat is the leading online food delivery platform in the MENA region, with strong positions across restaurant delivery, grocery, and retail. We exited the position as competitive intensity has increased and profitability appears near peak. Management has indicated that higher reinvestment in marketing and customer retention will be required to defend market share, likely weighing on margins, while sector sentiment remains weak. Given limited visibility on sustained margin expansion, we reallocated capital to opportunities with more attractive risk reward profiles.</li>
</ul>
<h2 id="conclusion" class="jump-link-nav anchored-block" data-jumplink-title="Conclusion">Conclusion</h2>
<p>We remain grounded by our investment process and our positioning reflects our convictions from a bottom-up perspective. Our process has created some positioning differentials versus the benchmark. Brazil remains overweight to start the quarter (6.5% Fund weight versus 4.0% Index weight), as does Georgia (1.7% versus 0.0% Index weight).</p>
<p>Taiwan and South Africa remain underweight versus the benchmark.</p>
<p>The Fund&rsquo;s objective is to find long-term structural growth companies at fair prices (S-GARP). Investments are chosen based on individual company analysis, focusing on quality, governance, innovative business models and low disruption risk, with active management and detailed research guiding our selection process.</p>

<p>To receive more <a href="/us/en/insights/emerging-markets-equity/" title="Emerging Markets Equity Insights"><strong>Emerging Markets Equity</strong></a> insights, <a href="/us/en/subscribe/" title="Subscription Center"><strong>sign up in our subscription center</strong></a>.</p>
]]></content:encoded>
</item><item rdf:about="https://www.vaneck.com/us/en/blogs/digital-assets/matthew-sigel-vaneck-bitcoin-long-term-capital-market-assumptions/">
  <title>Bitcoin Long-Term Capital Market Assumptions></title>
  <link>https://www.vaneck.com/us/en/blogs/digital-assets/matthew-sigel-vaneck-bitcoin-long-term-capital-market-assumptions/</link>
  <description><![CDATA[We outline our long-term Bitcoin capital market assumptions, projecting a 15% base-case CAGR, a $2.9M valuation by 2050, and implications for strategic asset allocation.]]></description>
  <dc:creator>Matthew  Sigel</dc:creator>
  <dc:date>01/08/2026 06:30:00</dc:date>
<content:encoded><![CDATA[

<p><strong> Please note that VanEck may have a position(s) in the digital asset(s) described below.</strong></p>
<p><strong>Key Takeaways:</strong></p>
<ul class="content-list">
<li class="mt-2"><strong>Structural Valuation (15% CAGR):</strong> Our Base Case model has Bitcoin reaching <strong>$2.9 million by 2050</strong>, driven by its adoption as a settlement currency for&nbsp;<strong>5-10% of global trade</strong> and a reserve asset comprising <strong>2.5% of central bank balance sheets.</strong></li>
<li class="mt-2"><strong>Strategic Portfolio Role:</strong> We identify a strategic allocation of <strong>1-3%</strong> for diversified portfolios. For investors with higher risk tolerance, our analysis suggests that allocations up to <strong>20%</strong> have historically optimized Sharpe ratios, capitalizing on Bitcoin's convex return profile.</li>
<li class="mt-2"><strong>The Opportunity Cost:</strong> As developed markets face a sovereign debt super-cycle, the risk of zero exposure to the most established non-sovereign reserve asset may now exceed the volatility risk of the position itself.</li>
</ul>
<p>As Bitcoin transitions from a peripheral speculative asset toward an institutionally integrated monetary instrument, the demand for a rigorous Capital Market Assumption (CMA) framework has never been higher. Investment committees require more than narrative; they require a quantifiable basis for expected returns, volatility, and correlation over a secular horizon.</p>
<p>Our analysis suggests that while short-term price action remains a function of global liquidity cycles and leverage, the long-term value accrual will be driven by Bitcoin&rsquo;s convergence with the structural deficiencies of the sovereign debt system.</p>
<p>Below, we outline our formal 25-year CMAs, grounded in our <strong><a href="/us/en/blogs/digital-assets/matthew-sigel-bitcoin-2050-valuation-scenarios-global-medium-of-exchange-and-reserve-asset/" title="Bitcoin 2050 Valuation Scenarios: Global Medium of Exchange and Reserve Asset">2050 Valuation Scenarios</a></strong> and tempered by the tactical realities of our 2026 cyclical roadmap.</p>
<h2 id="executive-summary" class="jump-link-nav anchored-block" data-jumplink-title="Executive Summary">Executive Summary: Bitcoin Capital Market Assumptions</h2>
<p>For long-term allocators, our analysis suggests Bitcoin functions as a convex, low-correlation reserve asset with a 15% base-case CAGR and meaningful portfolio efficiency benefits.</p>
<div class="wrapped-div">
<table style="width: 100%;">
<tbody>
<tr class="tbl-data">
<td class="tbl-header last text-left"><strong>CMA Component</strong></td>
<td class="tbl-header last text-left"><strong>Assumption / Output</strong></td>
</tr>
<tr class="tbl-data">
<td class="data-td data last text-left"><strong>Time Horizon</strong></td>
<td class="data-td data last text-left">25 Years (2026&ndash;2050)</td>
</tr>
<tr class="tbl-data">
<td class="data-td data last text-left"><strong>Base Case Expected Return</strong></td>
<td class="data-td data last text-left"><strong>15%</strong> CAGR (Non-linear market path characterized by volatility and re-rating cycles)</td>
</tr>
<tr class="tbl-data">
<td class="data-td data last text-left"><strong>Bear Case Expected Return</strong></td>
<td class="data-td data last text-left"><strong>2%</strong> CAGR</td>
</tr>
<tr class="tbl-data">
<td class="data-td data last text-left"><strong>Primary Return Driver</strong></td>
<td class="data-td data last text-left">Global liquidity expansion (M2) and monetary debasement</td>
</tr>
<tr class="tbl-data">
<td class="data-td data last text-left"><strong>Primary Risk</strong></td>
<td class="data-td data last text-left">Regulatory constraints and barriers to global settlement-layer adoption</td>
</tr>
<tr class="tbl-data">
<td class="data-td data last text-left"><strong>Volatility Profile</strong></td>
<td class="data-td data last text-left"><strong>Annualized: ~40&ndash;70%</strong> (Comparable to frontier equities or early-stage tech)</td>
</tr>
<tr class="tbl-data">
<td class="data-td data last text-left"><strong>Correlation Profile</strong></td>
<td class="data-td data last text-left"><strong>Historically low</strong> to equities, bonds, and gold<br /><strong>Long-term strong negative correlation</strong> to U.S. Dollar (DXY)</td>
</tr>
<tr class="tbl-data">
<td class="data-td data last text-left"><strong>Intended Portfolio Role</strong></td>
<td class="data-td data last text-left">Diversifier, Convex Return Enhancer, Sovereign Risk Hedge</td>
</tr>
<tr class="tbl-data">
<td class="data-td data last text-left"><strong>Suggested Allocation</strong></td>
<td class="data-td data last text-left">Strategic: <strong>1&ndash;3%</strong><br />High Risk-Tolerant Optimization: <strong>Up to 20%</strong></td>
</tr>
</tbody>
</table>
</div>
<p class="chart-disclosure"><strong>Source:</strong> VanEck Research as of 12/31/2025. <strong>Past performance is no guarantee of future results. The information, valuation scenarios, and price targets in this blog are not intended as financial advice or any call to action, a recommendation to buy or sell, or as a projection of how bitcoin will perform in the future. Actual future performance of bitcoin is unknown, and may differ significantly from the hypothetical results depicted here. There may be risks or other factors not accounted for in the scenarios presented that may impede the performance. These are solely the results of a simulation based on our research, and are for illustrative purposes only. Please conduct your own research and draw your own conclusions.</strong></p>
<h2>I. CMA Framework and Scope</h2>
<p><strong>Capital Market Assumptions (CMAs)</strong> represent long-term expectations for asset class returns, volatility, and correlation that inform strategic asset allocation decisions. Our 25-year CMAs for Bitcoin are designed for institutional allocators evaluating its role within diversified portfolios.</p>
<p>Our framework separates <strong>secular valuation drivers</strong> from <strong>cyclical deployment considerations</strong>, providing both long-horizon return assumptions and near-term implementation guidance. While near-term price movements remain influenced by liquidity conditions and leveraged positions, our CMA framework is anchored in long-duration adoption and balance-sheet dynamics.</p>
<h2 id="valuation-thesis" class="jump-link-nav anchored-block" data-jumplink-title="Valuation Thesis">II. Secular Valuation Thesis (2026-2050)</h2>
<p>Standard equity valuation models (DCF, P/E) fail to capture the utility of a non-sovereign reserve asset like Bitcoin. Our valuation framework instead models Bitcoin&rsquo;s penetration into two specific total addressable markets (TAMs): <strong>Global Medium of Exchange (MoE)</strong> and <strong>Central Bank Reserve Assets</strong>.</p>
<p>In our <strong>Base Case</strong>, we project Bitcoin will reach <strong>$2.9 million per coin by 2050</strong>, implying a <strong>15% Compound Annual Growth Rate (CAGR)</strong> from current levels.</p>
<h3>Bitcoin 2050 Valuation Scenarios: Key Assumptions and Price Targets</h3>
<div class="wrapped-div">
<table style="width: 100%;">
<tbody>
<tr class="tbl-data">
<td class="tbl-header last text-left">&nbsp;</td>
<td class="tbl-header last text-right"><strong>Bear</strong></td>
<td class="tbl-header last text-right"><strong>Base</strong></td>
<td class="tbl-header last text-right"><strong>Bull</strong></td>
</tr>
<tr class="tbl-data">
<td class="data-td data last text-left"><strong>Bitcoin Share of Trade (%)</strong></td>
<td class="data-td data last text-right">~0%</td>
<td class="data-td data last text-right">5-10%</td>
<td class="data-td data last text-right">20%</td>
</tr>
<tr class="tbl-data">
<td class="data-td data last text-left"><strong>Bitcoin Share of Domestic GDP (%)</strong></td>
<td class="data-td data last text-right">~0%</td>
<td class="data-td data last text-right">5%</td>
<td class="data-td data last text-right">10%</td>
</tr>
<tr class="tbl-data">
<td class="data-td data last text-left"><strong>Annual Trade in BTC <i>($ billions)</i></strong></td>
<td class="data-td data last text-right">$2,750</td>
<td class="data-td data last text-right">$13,751</td>
<td class="data-td data last text-right">$27,503</td>
</tr>
<tr class="tbl-data">
<td class="data-td data last text-left"><strong>Price Per Bitcoin ($)</strong></td>
<td class="data-td data last text-right">$130k</td>
<td class="data-td data last text-right">$2.9M</td>
<td class="data-td data last text-right">$53.4M</td>
</tr>
<tr class="tbl-data">
<td class="data-td data last text-left"><strong>CAGR (%)</strong></td>
<td class="data-td data last text-right">2%</td>
<td class="data-td data last text-right">15%</td>
<td class="data-td data last text-right">29%</td>
</tr>
<tr class="tbl-data">
<td class="data-td data last text-left"><strong>Percent of World Financial Assets (%)</strong></td>
<td class="data-td data last text-right">0.07%</td>
<td class="data-td data last text-right">1.66%</td>
<td class="data-td data last text-right">29.79%</td>
</tr>
</tbody>
</table>
</div>
<p class="chart-disclosure">Note: Current Bitcoin price is approximately $88,000 as of 12/31/2025. This price is used solely as the baseline value for calculating the implied CAGR for the Bear, Base, and Bull scenarios shown above.</p>
<p class="chart-disclosure"><strong>Source:</strong> VanEck Research as of 12/31/2025. <strong>Past performance is no guarantee of future results. The information, valuation scenarios, and price targets in this blog are not intended as financial advice or any call to action, a recommendation to buy or sell, or as a projection of how bitcoin will perform in the future. Actual future performance of bitcoin is unknown, and may differ significantly from the hypothetical results depicted here. There may be risks or other factors not accounted for in the scenarios presented that may impede the performance. These are solely the results of a simulation based on our research, and are for illustrative purposes only. Please conduct your own research and draw your own conclusions.</strong></p>
<p>This <strong>15%</strong> annualized return <strong>(Base Case)</strong> is predicated on two structural pivots:</p>
<ul class="content-list">
<li class="mt-2"><strong>The Settlement Pivot:</strong> We project Bitcoin will settle <strong>5-10% of global international trade</strong> and <strong>5% of domestic trade</strong> by 2050.</li>
<li class="mt-2"><strong>The Reserve Pivot:</strong> As trust in G7 sovereign debt erodes, we model central banks allocating capital to Bitcoin as a hedge against fiscal dominance.</li>
</ul>
<p><strong>Bull Case Scenario ($53.4M):</strong> In a &ldquo;hyper-bitcoinization&rdquo; scenario where Bitcoin captures 20% of international trade and 10% of domestic GDP, the implied value per coin could reach $53.4 million<strong> (29% CAGR)</strong>. This scenario requires Bitcoin to achieve parity with or surpass gold as a primary global reserve asset, constituting nearly 30% of world financial assets.</p>
<p><strong>Current Baseline (~$88k):</strong> Our valuation model uses the current price of <strong>~$88k</strong> as the baseline for the following projections. Notably, our &ldquo;Bear Case&rdquo; target ($130k, 2% CAGR) is modestly above current levels, suggesting that even in a stagnation scenario where adoption stalls, the asset has priced in significant utility.</p>
<h2>III. CMA Inputs: Expected Returns, Volatility, and Correlation</h2>
<p>To operationalize these findings for Mean-Variance Optimization (MVO) models, we distill our research into the following formal inputs:</p>
<ul class="content-list">
<li class="mt-2"><strong>Expected Returns:</strong> We model a <strong>15% annualized return</strong> (Base Case) driven by the monetization of the asset class. This is tempered by a Bear Case of&nbsp;<strong>2%</strong>, providing a weighted probability framework for risk models.</li>
<li class="mt-2"><strong>Volatility Assumptions:</strong> For long-term capital market assumptions, we utilize an annualized volatility range of <strong>~40-70%</strong>. This is comparable to frontier equities, early-stage technology, or commodity-linked stocks with embedded optionality. While recent spot market realized volatility has occasionally compressed toward 27% (see Section V), valid long-term stress testing requires the more conservative 40-70% assumption.</li>
<li class="mt-2"><strong>Correlation Assumptions:</strong> We project a low to moderate correlation to global equities, bonds, and gold overfull cycles with episodic convergence during global liquidity contractions. The single most persistent long-term relationship remains its negative correlation with the <strong>U.S. Dollar (DXY)</strong>, reinforcing its role as a hedge against monetary debasement.</li>
</ul>
<h2>IV. Correlation Drivers: Liquidity and the Dollar</h2>
<p>For portfolio construction, the &ldquo;why&rdquo; matters less than the &ldquo;what&rdquo;. Contrary to the popular narrative that Bitcoin is a levered tech beta, our regression analysis confirms it acts primarily as a liquidity sponge.</p>
<h3>Global M2 vs. Bitcoin Price</h3>
<p><img loading="lazy" class="img-responsive" alt="Global M2 vs. Bitcoin Price" src="https://www.vaneck.com/contentassets/8c920d8c433b4fc58eb43bf247d2446a/6593_bitcoin-long-term-cms_chart-1_2025-12_v1_blog.svg" /></p>
<p class="chart-disclosure"><strong>Source:</strong> VanEck Research; Bloomberg as of 11/30/2025.</p>
<p>Changes in M2 explain over 50% of Bitcoin's Price Variance <i>(r<sup>2</sup>=0.54, F=26)</i>.</p>
<p><strong>Correlation Profile:</strong></p>
<ul class="content-list">
<li class="mt-2"><strong>Global Liquidity is the Signal:</strong> Since 2014, Bitcoin&rsquo;s price has demonstrated a 0.43 correlation <i>(r<sup>2</sup>=0.19)</i> with Total Global M2. When applying multivariable analysis to the top 5 currencies (USD, EUR, CNY, JPY, GBP), we find that <strong>M2 changes explain over 54% of Bitcoin&rsquo;s price variance</strong> <i>(F=26)</i>.</li>
<li class="mt-2"><strong>Decoupling from the Dollar:</strong> The inverse correlation to the DXY is structurally moderating. While historically strong <i>(r<sup>2</sup>=0.7</i> from 2014-2020), this relationship has weakened to <i>r<sup>2</sup>=0.45</i> in the current cycle <i>(t=-13)</i>.</li>
</ul>
<h3>BTC Inverse Correlation with DXY Eased in 2025</h3>
<p><img loading="lazy" class="img-responsive" alt="BTC Inverse Correlation with DXY Eased in 2025" src="https://www.vaneck.com/contentassets/ec5fd33ca14942f69c1d2a7224e26075/6593_bitcoin-long-term-cms_chart-2_2025-12_v1_blog.svg" /></p>
<p class="chart-disclosure"><strong>Source:</strong> VanEck Research; Bloomberg as of 12/31/2025.</p>
<p>The inverse relationship between Bitcoin and the US Dollar (DXY) has moderated since 2020, suggesting Bitcoin is increasingly responding to global fiscal instability rather than just US currency strength.</p>
<h2>V. Volatility and Market Structure</h2>
<p>For institutional models, understanding the <i>source</i> of volatility is as important as the number itself. Data indicates that Bitcoin's volatility is increasingly structural rather than behavioral, driven by derivative leverage rather than spot selling.</p>
<h3>Bitcoin Futures Open Interest vs. Price</h3>
<p><img loading="lazy" class="img-responsive" alt="Bitcoin Futures Open Interest vs. Price" src="https://www.vaneck.com/contentassets/0ba3a5aae26445cdade22c84cd8c3120/6593_bitcoin-long-term-cms_chart-3_2025-12_v1_blog.svg" /></p>
<p class="chart-disclosure"><strong>Source:</strong> VanEck Research; Bloomberg as of 12/31/2025.</p>
<p>Since October 2020, nearly 73% of Bitcoin price variance can be explained by changes in BTC Futures Open Interest <i>(t=71)</i>.</p>
<ul class="content-list">
<li class="mt-2"><strong>The Leverage Factor:</strong> Changes in futures Open Interest currently impact Bitcoin price with an average beta of <strong>0.68x</strong>, though during volatile periods this can spike to <strong>2.0x</strong>. This &ldquo;reflexivity&rdquo; means volatility events are often mechanical deleveraging moments rather than fundamental thesis breaks.</li>
<li class="mt-2"><strong>Market Maturation:</strong> Realized volatility has structurally declined, recently hitting multi-year lows near <strong>27%</strong>.</li>
</ul>
<h3>Bitcoin Annualized Average Hourly Returns by Trading Session (Asian/US/Euro)</h3>
<p><img loading="lazy" class="img-responsive" alt="Bitcoin Annualized Average Hourly Returns by Trading Session (Asian/US/Euro)" src="https://www.vaneck.com/contentassets/2905cc22f5a049f8bc038b4b15965d1a/6593_bitcoin-log-team-cms_chart-4_2026-1_v2_blog.svg" /></p>
<p class="chart-disclosure"><strong>Source:</strong> VanEck Research; Bloomberg as of 12/31/2025.</p>
<p>Market competition has tightened. While Asian trading hours lagged in 2021, they now lead price discovery, indicating a 24/7 mature market structure.</p>
<h2>VI. Tactical Deployment Considerations (2026 Roadmap)</h2>
<p>While the secular thesis is robust, the path is rarely linear. For allocators deploying capital in the 2026 window, we utilize specific onchain metrics to manage entry risk.</p>
<p><strong>1. The &ldquo;Overheated&rdquo; Signal: Relative Unrealized Profit (RUP)</strong> We closely monitor the Relative Unrealized Profit (RUP) metric. Historically, when the 30 DMA RUP exceeds 0.70, tactical cycle tops are imminent.</p>
<p>We closely monitor the Relative Unrealized Profit (RUP) metric. Historically, when the 30 DMA RUP <strong>exceeds 0.70</strong>, tactical cycle tops are imminent.</p>
<ul class="content-list">
<li class="mt-2"><strong>Current Status:</strong> At <strong>0.43</strong> (as of 12/31/25), Bitcoin&rsquo;s RUP remains within the range that historically produces the best 1-2 year returns and suggests we are mid-cycle.</li>
</ul>
<h3>High Levels of Relative Unrealized Profit (RUP) Often Signal Peak Prices</h3>
<p><img loading="lazy" class="img-responsive" alt="Relative Unrealized Profit (RUP) Chart" src="https://www.vaneck.com/EPiServer/CMS/Content/contentassets/bc72389a54e54e81951af8555c9e513e/6593_bitcoin-long-term-cms_chart-5_2025-12_v1_blog_blog.svg,,356717/Download?epieditmode=False" /></p>
<h3>Average BTC Forward Returns by 30-Day Moving Average (MA) RUP Level</h3>
<p><img loading="lazy" class="img-responsive" alt="Average BTC Returns Versus 30d Moving Average Relative Unrealized Profits (RUP)" src="https://www.vaneck.com/contentassets/bc72389a54e54e81951af8555c9e513e/6593_bitcoin-long-term-cms_table-3_2026-1_v2.svg" /></p>
<p class="chart-disclosure"><strong>Source:</strong> VanEck Research; Bloomberg as of 12/31/2025. <strong>Relative Unrealized Profit</strong> is a blockchain metric that compares the total unrealized gains of all holders to the market cap, used to evaluate market sentiment and identify potential cycle tops. <strong>Not intended as an offer or recommendation to buy or sell any digital assets referenced herein. Digital assets are subject to significant risk and are not suitable for all investors. It is possible to lose your entire principal investment. Past performance is not guarantee of future results. Not intended as a forecast or prediction of future results.</strong></p>
<p><strong>2. Futures Funding Rates</strong></p>
<p>Leverage remains the primary driver of short-term volatility. Sustained perpetual futures funding rates above 10% typically signal overly bullish sentiment that often precedes cycle tops. Current rates <strong>(~4.9%)</strong> suggest further upside potential.</p>
<h2 id="strategic-allocation" class="jump-link-nav anchored-block" data-jumplink-title="Strategic Allocation">VII. Role in Strategic Asset Allocation</h2>
<p>Bitcoin is not a tactical trade in this framework; it functions as a long-duration hedge against adverse monetary regime outcomes.</p>
<ul class="content-list">
<li class="mt-2"><strong>Strategic Allocation:</strong> Our updated analysis suggests a strategic allocation of <strong>1-3%</strong> in diversified portfolios.</li>
<li class="mt-2"><strong>Optimization:</strong> For investors with higher risk tolerance, allocations up to <strong>20%</strong> have historically improved Sharpe ratios, capturing the asset's unique convex return profile.</li>
</ul>
<p>Our analysis confirms that small allocations have an outsized positive impact on portfolio efficiency due to the asset's unique combination of high convexity and low correlation. While our CMAs are forward-looking, historical data validates this &ldquo;efficiency&rdquo; thesis.</p>
<p>Our research into the <strong>Impact of Bitcoin Allocations on 60/40 Portfolios</strong> demonstrates that asset - level volatility does not necessarily translate into proportionate portfolio risk when position sizing is disciplined.</p>
<h3>Impact of Bitcoin Allocation on a Traditional 60/40 Portfolio</h3>
<p><img loading="lazy" class="img-responsive" alt="Impact of Bitcoin Allocation on a Traditional 60/40 Portfolio" src="https://www.vaneck.com/contentassets/ac93015a6684464aaf92cdb92fda4620/6593_bitcoin-long-term-cms_chart-6_2025-12_v2_blog.svg" /></p>
<p class="chart-disclosure"><strong>Source:</strong> Morningstar as of 12/31/2025. Equities are represented by the S&amp;P 500 Index, Bonds are represented by the Bloomberg Barclays US Aggregate Index, Bitcoin is represented by the MarketVector Bitcoin Index. <strong>Past performance is no guarantee of future results. Not intended as a recommendation to buy or sell any securities mentioned herein, to adopt any investment strategy, or as any call to action. Index performance is not representative of fund performance. It is not possible to invest directly in an index. Please see important disclosures at the end of this commentary regarding hypothetical performance.</strong></p>

<p>A 3% allocation to Bitcoin in a traditional 60/40 portfolio has historically yielded the highest return per unit of risk.</p>
<div class="wrapped-div">
<table style="width: 100%;">
<tbody>
<tr class="tbl-data">
<td class="tbl-header last">&nbsp;</td>
<td class="tbl-header last text-right">1 year<br />Return</td>
<td class="tbl-header last text-right">3 year<br />Return</td>
<td class="tbl-header last text-right">5 year<br />Return</td>
<td class="tbl-header last text-right">Since Inception<br />Return<br />(Annualized)</td>
<td class="tbl-header last text-right">Since Inception<br />Std Dev</td>
<td class="tbl-header last text-right">Since Inception<br />Max<br />Drawdown</td>
<td class="tbl-header last text-right">Since Inception <br />Sharpe Ratio</td>
</tr>
<tr class="tbl-data">
<td class="data-td last">60% Equities / 40% Bonds</td>
<td class="data-td data last text-right">13.70</td>
<td class="data-td data last text-right">15.46</td>
<td class="data-td data last text-right">8.47</td>
<td class="data-td data last text-right">9.68</td>
<td class="data-td data last text-right">9.11</td>
<td class="data-td data last text-right">-20.10</td>
<td class="data-td data last text-right">0.88</td>
</tr>
<tr class="tbl-data">
<td class="data-td last">59.75% Equities / 39.75% Bonds / 0.5% Bitcoin</td>
<td class="data-td data last text-right">13.23</td>
<td class="data-td data last text-right">15.33</td>
<td class="data-td data last text-right">8.40</td>
<td class="data-td data last text-right">10.04</td>
<td class="data-td data last text-right">8.83</td>
<td class="data-td data last text-right">-19.69</td>
<td class="data-td data last text-right">0.95</td>
</tr>
<tr class="tbl-data">
<td class="data-td last">59.5% Equities / 39.5% Bonds / 1% Bitcoin</td>
<td class="data-td data last text-right">13.16</td>
<td class="data-td data last text-right">15.84</td>
<td class="data-td data last text-right">8.57</td>
<td class="data-td data last text-right">10.64</td>
<td class="data-td data last text-right">9.03</td>
<td class="data-td data last text-right">-19.89</td>
<td class="data-td data last text-right">0.99</td>
</tr>
<tr class="tbl-data">
<td class="data-td last">58.5% Equities / 38.5% Bonds / 3% Bitcoin</td>
<td class="data-td data last text-right">12.87</td>
<td class="data-td data last text-right">16.89</td>
<td class="data-td data last text-right">9.24</td>
<td class="data-td data last text-right">13.05</td>
<td class="data-td data last text-right">10.32</td>
<td class="data-td data last text-right">-20.70</td>
<td class="data-td data last text-right">1.08</td>
</tr>
</tbody>
</table>
</div>
<br />
<p class="chart-disclosure"><strong>Source:</strong> Morningstar as of 12/31/2025. Equities are represented by the S&amp;P 500 Index, Bonds are represented by the Bloomberg Barclays US Aggregate Index, Bitcoin is represented by the MarketVector Bitcoin Index. Past performance is no guarantee of future results. Not intended as a recommendation to buy or sell any securities mentioned herein, to adopt any investment strategy, or as any call to action. Index performance is not representative of fund performance. It is not possible to invest directly in an index. Please see important disclosures at the end of this commentary regarding hypothetical performance.</p>
<ul class="content-list">
<li class="mt-2"><strong>The 3% Sweet Spot:</strong> Historically, replacing small portions <strong>(1&ndash;3%)</strong> of a traditional equity/bond portfolio with Bitcoin has increased annualized returns while simultaneously <strong>improving the Sharpe Ratio</strong>.</li>
<li class="mt-2"><strong>Asymmetric Impact:</strong> Because Bitcoin&rsquo;s correlation to stocks and bonds remains historically low, its volatility tends to wash out at the portfolio level, leaving behind the pure "alpha" of its adoption curve.</li>
</ul>
<h2 id="conclusion" class="jump-link-nav anchored-block" data-jumplink-title="Conclusion">Conclusion: The Allocator's Case</h2>
<p>For the diversified allocator, the argument is one of efficiency. Historically, a small allocation to an asset with low correlation and high idiosyncratic convexity improves the portfolio's Sharpe Ratio. As we approach a sovereign debt super-cycle, the cost of zero exposure, effectively shorting a scarce non-sovereign reserve asset, may now rival &ndash; or exceed &ndash; the volatility of a modest, disciplined allocation.</p>
<p>To receive more <strong><a href="https://www.vaneck.com/us/en/insights/digital-assets/" title="Digital Assets Insights">Digital Assets</a></strong> insights, <strong><a href="https://www.vaneck.com/us/en/subscribe/" title="Subscription Center">sign up in our subscription center</a></strong>.</p>
]]></content:encoded>
</item><item rdf:about="https://www.vaneck.com/us/en/blogs/emerging-markets-bonds/if-the-dollar-loses-reserve-status-could-gold-surpass-39k/">
  <title>If the Dollar Loses Reserve Status, Could Gold Surpass $39k?></title>
  <link>https://www.vaneck.com/us/en/blogs/emerging-markets-bonds/if-the-dollar-loses-reserve-status-could-gold-surpass-39k/</link>
  <description><![CDATA[What if gold replaced the US dollar as the reserve standard? In this paper, our Emerging Markets Bonds team values gold by matching central bank money liabilities to gold reserves, implying $39k&ndash;$184k per ounce.]]></description>
  <dc:creator>Eric Fine</dc:creator>
  <dc:date>01/07/2026 06:30:00</dc:date>
<content:encoded><![CDATA[

<h2>How the EM Bond Team &ldquo;Values&rdquo; Gold</h2>
<h3><span zm="">Executive Summary</span></h3>
<strong>What if Gold Replaces US Treasuries?</strong>
<p>One of the most frequent questions of the past few years in economics and finance has been &ldquo;will the US dollar (USD) maintain its reserve status, and what does it mean if it loses this status?&rdquo;</p>
<strong>Central Banks Care and are Reacting</strong>
<p>The question became serious after the Global Financial Crisis (GFC) and acute after US sanctions on the Central Bank of Russia&rsquo;s US treasury reserves.</p>
<strong>Developed Markets (DMs) Always Stimulate in Response to Adversity</strong>
<p>DMs are arguably subject to &ldquo;fiscal dominance&rdquo;, a common situation in which central banks lose traction due to high government debt. This refocuses attention on the central bank balance sheet.</p>
<strong>The Definition of Money Keeps Expanding From M-0 to &ldquo;M-infinity&rdquo;</strong>
<p>A quick reminder that the M0, M1, M2, M3 aggregates came about due to runs. The Fed and Treasury backstopped the global financial system during the GFC, and that modality was repeated in the 2020 Lockdowns.</p>
<strong>We Are Just Dividing Two Numbers &ndash; Money Liabilities by Gold Reserves</strong>
<p>All we do is divide money liabilities (M0, M2) by gold reserves.</p>
<strong>Central Bank M0 Money Liabilities Divided by Gold Reserves = $39,000 Per Ounce (weighted by daily FX turnover)</strong>
<p>Using a sample of major global central banks&rsquo; M0 money liabilities divided by their gold reserves and weighted by their share of global daily FX turnover, we calculate the price of gold that equalizes M0 is $39,210.</p>
<strong>Central Bank M2 Money Liabilities Divided by Gold Reserves = $184,000 Per Ounce (weighted by daily FX turnover)</strong>
<p>Using global M2 (where we have a global series unlike for M0), we calculate the global price of gold that equalizes M2 is around $100,000 per ounce. Weighted by daily FX turnover (for our sample), the gold price that equalizes M2 is $184,211</p>
<strong>Our View on US Dollar Status</strong>
<p>Our view remains that the USD will not lose its reserve status, rather it will gradually share that status with other deserving currencies, including gold but also government bonds of fiscally sustainable emerging markets (EM) countries.</p>
<strong>Fun Observations</strong>
<ul class="content-list">
<li class="mt-2">The poster children for DM fiscal dominance - the UK and Japan - look incredibly levered on these metrics and Gilts and Japanese Government Bond (JGBs) trade like it.</li>
<li class="mt-2">Kazakhstan and Russia have enough gold and so few money liabilities that they could peg their currencies to gold.</li>
<li class="mt-2">China would have to purchase around 325 million troy ounces in order to have a peg to gold (they currently have 74 million ounces excluding state banks).</li>
<li class="mt-2">South Africa&rsquo;s gold backs roughly 60% of Rand M0 and their 10-year bonds pay over 8%, while Japan&rsquo;s gold backs only around 3% of Yen M0 and their 10-year bonds pay just under 2%.</li>
</ul>

<h2 id="monetary-policy-shift" class="jump-link-nav anchored-block" data-jumplink-title="Monetary Policy Shift">What if Gold Replaces Treasuries?</h2>
<p>One of this era&rsquo;s key questions in economics and finance has been &ldquo;will the USD maintain its reserve status, and what does it mean if it loses this status?&rdquo; One can say the question is ridiculous, very unlikely, or even that it&rsquo;s your central case. We are explicitly <em>not</em> discussing the likelihood of this scenario other than by restating our longstanding view that the USD will not lose its status but will likely gradually share this status with other deserving currencies. But again, the point of this paper is not to make <em>that</em> case one way or another. The point of this paper is simply to answer the question asked &ndash; what would it mean if the USD lost its reserve status, regardless of what one thinks of the question. Too often, the answer to the question is prose or maybe technical analysis normalizing the gold price move relative to an economic variable (like inflation, fiscal policy, interest rates, money supply, etc.).</p>
<p>We attempt here to have a precise answer on the gold price, across all the major currencies/central banks, using consistent econometrics and a simple framework. Each gold price in our exhibits will be that central banks&rsquo; &ldquo;answer&rdquo; to the question on what the impact of a loss of USD status would be on the gold price (for that central bank). Presumably any such development would affect all balance sheets, so the output could be especially useful in their <em>relative</em> effects (between the central banks).</p>
<h2>Central Banks Care and are Reacting</h2>
<p>The question about USD reserve status became a legitimate concern after the further rounds of monetary and fiscal forbearance in the GFC but became acute after US sanctions on the Central Bank of Russia&rsquo;s US treasury reserves. <strong><a href="https://www.realclearmarkets.com/blog/eric-fine-how-to-measure-strains-created-by-the-new-financial-architecture.pdf" title="Money Supply to Infinity How to Measure Strains Created by the New Financial Architecture" target="_blank" rel="noopener">We wrote our initial paper</a></strong> in August 2012, (before sanctions) following the forensic understanding of the GFC (remembering that the contemporaneous understanding of the GFC being a &ldquo;one in a thousand years storm&rdquo; differed significantly from the ex-post analysis, the heroes of which are Laurence Kotlikoff of Boston University and Mark Pittman and Bob Ivry of Bloomberg News, which sued the Fed for documents and won). Our impulse was simple &ndash; something that wasn&rsquo;t supposed to happen to US markets happened. Our framing was also simple &ndash; the global financial system was essentially backstopped by the Fed and Treasury in the GFC, and the re-emergence of this forbearance in the 2020 lockdowns means they are permanent.</p>
<p>Sanctions, though, added urgency to this general concern over &ldquo;fiscal dominance&rdquo; and the examples of endless monetary forbearance above. Sanctions injected actual concerns of total loss of your asset due to politics, which happened to the reserves of the Central Bank of Russia (CBR), and prominent economists have described it as a form of default. This is clearly the opposite feature one wants in a reserve asset, so the permanent rise in concern on the part of reserve managers was inevitable. Moreover, sanctions were imposed by countries with large domestic <em>and external </em>financing requirements &ndash; it is a clear sign of a deep commitment to sanctions that DMs are willing to sanction their lenders despite their large offshore borrowing requirements. Sanctions triggered the latest move higher in gold prices.</p>
<h3>Exhibit 1 &ndash; Central Bank Gold Purchases Surge After Sanctions</h3>
<p><img loading="lazy" class="img-responsive w-100" src="https://www.vaneck.com/contentassets/a1a1bb154d294c4d90806aa197b8ade4/6585_embx-commentary-on-gold-blog-blog_chart_1_2025-12_v2.svg" alt="Exhibit 1 - Central Bank Gold Purchases Surge After Sanctions" /></p>
<p class="chart-disclosure">Source: Bloomberg, IMF. As of September 30, 2025</p>
<h2>DMs Always Stimulate in Response to Adversity</h2>
<p>DMs employ monetary and fiscal forbearance as a policy tool with little reluctance, viewing higher risky asset prices as a means of boosting demand (the &ldquo;portfolio balance channel&rdquo;), whereas EM authorities are much more cautious about taking on liabilities and more focused on inflation and financial stability.<strong> </strong>We like to remind that Thailand let its largest bank, Finance One, default in the 1997 Asia crisis, whereas the US changed the definition of &ldquo;state-owned&rdquo; (as the IMF&rsquo;s largest shareholder) when the IMF told them to clarify the status of Fannie and Freddie during the GFC. EMs cannot afford these expansions of government financial liabilities and therefore avoid them. The US jumped in with forbearance in its GFC, though. As EM economists, this reminded us of the &ldquo;fiscal dominance&rdquo; and resultant monetary forbearance that used to characterize EMs before their crises in the late 1990s. We&rsquo;ve written about this extensively in other reports, but we should highlight that the problem in the GFC was not the &ldquo;save&rdquo; by monetary experimentation (QE, etc.) which was likely necessary. The problem was the absence of moral hazard &ndash; the &ldquo;save&rdquo; became <i>permanent</i>. For example, US Treasury borrowing from offshore hedge fund financing using near-zero-cost repo is the latest obvious example.</p>
<h2 id="story-of-m" class="jump-link-nav anchored-block" data-jumplink-title="Story of &ldquo;M&rdquo;s">The Definition of Money Keeps Expanding Due to Runs &ndash; The Story of &ldquo;M&rdquo;s</h2>
<p>A quick reminder on economics and history. You might remember your monetary policy class in which you are taught the central bank&rsquo;s money liabilities. M0, M1, M2, M3, etc. It is worth reminding how those aggregates became money liabilities as a result of runs. The &ldquo;story&rdquo; is: once runs and crisis interventions made clear which promises the state would effectively stand behind as cash‑equivalents, central banks recast M0, M1, and M2 as structured stacks of specific short‑term liabilities&mdash;central bank reserves and notes, then bank deposits, then near‑money claims like money market mutual funds (MMFs)&mdash;rather than as a loose conceptual spectrum of liquidity. MMF runs exposed which instruments the public really treated as payable‑on‑demand cash. The MMF crises in 2008 and 2020 then forced regulators to pin down whether MMF shares were effectively part of broad money (and run‑prone bank‑like liabilities), tightening the perimeter of what is regulated as money and what remains a portfolio. Exhibit 2 summarizes how they were and are defined in the US.</p>
<h3>Exhibit 2 &ndash; US &ldquo;M&rdquo;s Today and Yesterday</h3>
<div class="wrapped-div blog-post content">
<table style="width: 100%;">
<tbody>
<tr class="tbl-data">
<td class="data-head last text-left"><strong>Aggregate</strong></td>
<td class="data-head last text-left"><strong>Current definition (US / standard)</strong></td>
<td class="data-head last text-left"><strong>Historical origin / rationale</strong></td>
</tr>
<tr class="tbl-data">
<td class="data-td data last text-left"><strong>M0</strong> (Monetary base)</td>
<td class="data-td data last text-left">Central bank money: physical currency (notes and coins) in circulation plus commercial banks&rsquo; reserves at the central bank.</td>
<td class="data-td data last text-left">First focus of official statistics because gold/specie and central bank notes were what disappeared in classic pre FDIC panics; later formalized as the &ldquo;monetary base&rdquo; once central banks were modeled via balance sheets.</td>
</tr>
<tr class="tbl-data">
<td class="data-td data last text-left"><strong>M1</strong> (Narrow money)</td>
<td class="data-td data last text-left">Currency outside banks plus checkable and other highly liquid deposits (in the US: currency + demand deposits + &ldquo;other liquid deposits,&rdquo; after 2020 redefinition).</td>
<td class="data-td data last text-left">Created to track the instruments used for everyday transactions and hit first in runs&mdash;currency and demand deposits&mdash;after Depression era experience showed deposit runs were as systemically important as cash drains.</td>
</tr>
<tr class="tbl-data">
<td class="data-td data last text-left"><strong>M2</strong> (Broad household money)</td>
<td class="data-td data last text-left">M1 plus small time deposits (e.g., CDs &lt; $100k) and retail money market mutual funds; main broad aggregate of household cash and near cash.</td>
<td class="data-td data last text-left">Introduced when savings accounts, small CDs and retail MMFs proved highly interest sensitive and runnable in post war and 1970s&ndash;80s episodes; monetarist targeting made M2 the workhorse broad aggregate.</td>
</tr>
<tr class="tbl-data">
<td class="data-td data last text-left"><strong>M3</strong> (Very broad money)</td>
<td class="data-td data last text-left">Conceptually M2 plus large time deposits, institutional MMFs, certain repos and short term bank paper; still published by some (e.g., ECB) but not by the Fed since 2006.</td>
<td class="data-td data last text-left">Added to capture wholesale &ldquo;near money&rdquo; (large CDs, repos, Eurodollars, institutional MMFs) that fuel credit booms and are runnable in crises; US dropped official publication, but M3 style measures remain in research and market monitoring.</td>
</tr>
</tbody>
</table>
</div>
<p class="chart-disclosure">Source: Federal Reserve, Richmond Fed, Investopedia, Wikipedia</p>
<p>Let&rsquo;s quickly describe how these &ldquo;M&rdquo;s came about due to runs. M0, M1, M2, and M3 emerged as increasingly broad &ldquo;run maps&rdquo; of what the public actually treats as money once crises force governments to decide which promises they will back.</p>
<ul class="content-list">
<li class="mt-2">Early era &ndash; vague &ldquo;money in circulation&rdquo;: Initially, official statistics focused on currency and bank reserves (what is now M0/monetary base), because notes and specie were the things people ran <i>to</i> and banks ran <i>out of</i> in panics.​</li>
<li class="mt-2">Deposit runs &rarr; M1: After repeated banking panics and then the Great Depression, policymakers realized sight deposits behave like money in a run. &ldquo;Narrow money&rdquo; (M1) was defined as currency plus checkable/demand deposits, i.e., exactly the instruments that can be withdrawn immediately at par and cause classic retail bank runs.</li>
<li class="mt-2">Savings/time deposits, thrifts, MMFs &rarr; M2/M3: Post‑war financial innovation and the 1970s&ndash;80s disintermediation waves showed that savings accounts, small time deposits, and then money‑market funds are also runnable when rates move or confidence cracks. Broad aggregates (M2, later M3) were built to add those &ldquo;near‑money&rdquo; claims that had shown, in crises, that the state would likely protect or support them.​</li>
<li class="mt-2">Why the layers matter: Each step up the ladder reflects a <u>political</u> recognition: once a category has <i>actually</i> run and forced intervention (thrifts, MMFs, repo), it tends to get pulled into the conceptual money/credit perimeter, even if labels and publication practices change (e.g., the Fed dropping public M3 in 2006 while still tracking broad liquidity).​</li>
</ul>
<h2>We Are Just Dividing Two Numbers: Money Liabilities and Gold Reserves</h2>
<p>All we do in the output below is answer the question: what if the USD loses its reserve status and is replaced by gold as the sole global reserve currency? Now, even in such a scenario, gold is <i>extremely</i> unlikely to be the <i>sole</i> reserve. Capital controls would also likely be part of such a mix, but that is part of the usual blah blah blah prose you get, and muddies the calculation aimed to answer a simple question. So, that is a layer (of game theory, basically) we won&rsquo;t conduct, we assume no capital controls only for this exercise &ndash; we use the gold price only to measure strains central bank balance sheet by central bank balance sheet because it is the most complete and econometrically reasonable exercise. And central banks have actually been buying gold and have always treated it as a reserve currency. If one wants to divide the strain to be spread onto more than just gold prices, please go ahead, that&rsquo;s a commendable exercise, but not one we are conducting. One price, in gold, for every central bank, assuming USD is replaced by gold, is what we are calculating (and then we &ldquo;add&rdquo; them up into headline &ldquo;global&rdquo; numbers for you, of course). All that is involved in the exercise is dividing gold reserves (on the asset side) by money liabilities (we calculate using only M0 and M2).</p>
<p>Although we noted above that the Fed/Treasury backstopped the global financial system in the GFC, we won&rsquo;t calculate &ldquo;M-infinity&rdquo; itself. Our only point was that we assume this backstop and forbearance is permanent. (We do have an initial internal paper on this &ldquo;M-infinity&rdquo; framework and calculation, <a href="mailto:info@vaneck.com" title="info@vaneck.com"><strong>reach out</strong></a> if you&rsquo;d like to be part of that discussion.) In any case we already know that dividing infinity by <i>any </i>gold reserves divided by &ldquo;infinity&rdquo; money is an <i>extremely</i> high number. We just wanted to remind of that key context. In the following exercise, every central bank has a different amount of formal M0 or M2 liabilities that are known and a different amount of gold in reserves which is known, with all data from the same source/econometrics. We use only central bank balance sheets, not state banks, for econometric consistency, but we would normally include state banks in a country-specific report (but doing that for all sovereigns is econometrically challenging and would require a lot of assumptions). Note that we translate money liabilities into US dollars at mid-December exchange rates; we translate gold reserves at market prices too, of course (the underlying data is number of troy ounces). Whenever we say &ldquo;ounce&rdquo; we mean troy ounce.</p>
<p>No individual academic is &ldquo;credited&rdquo; with this framework as it is essentially dual-entry accounting at its core, but these measures were called things like the &ldquo;gold reserve ratio&rdquo; and they were codified in Britain&rsquo;s Bank Charter Act of 1844 and the US&rsquo; Gold Standard Act of 1900. In EMs, &ldquo;currency boards&rdquo; pegging a home currency to a different offshore currency by holding government bonds in/of the offshore currency was one of the standard policy options and your authors have been economists and traders of such countries over the decades (Argentina and Bulgaria are examples). One could also point out that certain methodologies like the &ldquo;balance sheet approach to money&rdquo; are similar to what we are conducting. Today, most modern central‑bank and BIS/IMF documents talk about the &ldquo;central bank balance sheet,&rdquo; &ldquo;quality of assets,&rdquo; &ldquo;capital and risk buffers,&rdquo; and &ldquo;credibility of the monetary authority,&rdquo; but do not canonize a specific phrase like &ldquo;asset‑quality valuation model of currency.&rdquo; Our first paper was authored by <a href="/link/db5971bd4f1b4eaab24e30c743613c84.aspx" title="Eric Fine &mdash; Portfolio Manager, Active Emerging Markets Debt"><strong>Eric Fine</strong></a> and David Austerweil in August 2012, and our follow-up papers have been written by Eric Fine, <a href="/link/3ae0ed199d78429f955d3f15d7f53f86.aspx" title="Natalia Gurushina &mdash; Chief Economist, Emerging Markets Fixed Income"><strong>Natalia Gurushina</strong></a>, and David Austerweil. See our latest IMF recap below.&nbsp;</p>

<h2>Central Bank M0 Divided by Gold Reserves is $39,000 Per Ounce (weighted by global daily FX turnover)</h2>
<p>We&rsquo;ll start by using the M0 liability of central banks, so M0 divided by reserve gold holdings. Already we have an econometric problem because we don&rsquo;t have a good data series on &ldquo;global&rdquo; M0 (we do on M2, more on that later). So, we use M0 for the selected central banks in Exhibit 3 below and calculated the mean and median outcome for that set instead - $31,612 for the mean, $18,205 for the median. Exhibit 3 shows the answer on a central-bank-by-central-bank basis, using the existing exchange rates (as of mid-December 2025). Now, (according to the original data from the BIS&rsquo;s 2025 triennial survey) the USD is 50% of global daily FX turnover in our sample (EUR is 16%, JPY is 9%, etc.), so we applied these weights to the respective country&rsquo;s money-equalizing gold price (US counts 50%, EUR counts 16%, etc.) That FX-turnover weighted average is $39,210. A separate idea we&rsquo;re filling in, of course, is that we are also trying to measure the strains on individual central banks relative to each other. All central banks would be under strain in such a situation, but some far more than others, and the <i>relative</i> magnitude of the differences <i>between</i> central banks could be viewed as a measure of the strain. (Again, capital controls would be imposed long before such a scenario materializes, but that kills any ability to make these calculations which are basically measures of the strain itself.) Those central banks whose gold price in these calculations varies the most from current prices would be the most strained. Also note that money liabilities and gold reserves vary considerably, that&rsquo;s why we&rsquo;re doing these calculations <i>&ndash; it is not the amount of reserve, it is the amount of reserve relative to the liability</i>. And then, those central banks&rsquo; ratios relative to each other.</p>
<h3>Exhibit 3 &ndash; Price of Gold (in USD) That Equalizes Gold/M0 Ratio</h3>
<p><img loading="lazy" class="img-responsive w-100" src="https://www.vaneck.com/contentassets/f80c92dc44cd425880439f79c3609ebf/6585_embx-commentary-on-gold-blog-blog_chart_2_2025-12_v2.svg" alt="Exhibit 3 - Price of Gold (in USD) That Equalizes Gold/M0 Ratio" /></p>
<p class="chart-disclosure">Source: VanEck Research, IMF, Bloomberg LP; exchange rates as of December 18, 2025</p>
<p>This framework sure seems to have predicted the core asset price paths (yields higher, currency weaker) of the UK and Japan! These two countries are poster-children for &ldquo;fiscal dominance&rdquo; in the DM. Why do we say this here? The numerator in the calculation above is the M0 money liability, and fiscal dominance says central banks are essentially co-opted when government debt is too high. Seems to be the perfect framing, and it&rsquo;s a reminder that it is not so much the low amount of gold on the asset side, but more the <i>high amount of money liability</i>. We won&rsquo;t analyze every central bank here; we mainly wanted to riff off of these results to give you a sense of our interpretation. Let&rsquo;s look at the opposite extreme &ndash; Kazakhstan and Russia (countries your authors have long and deep experience in). According to the output above, both countries could have a credible currency board against gold, literally having enough gold to back M0, at <i>below current market prices </i>for gold and for their respective currencies. Remember you get paid a yield in bonds denominated in those currencies, too. Their asset sides (gold) are actually fairly high, but again it is the low money liability that is arguably much more important. (We are not making a policy prescription out of a ratio, just making observations.) These are extreme versions of EM countries that abhor leverage and have to go to great lengths to establish stability is our point. The table above says some have already.</p>
<h2>Gold M2/Gold Reserves = $184,000 Per Ounce (weighted by FX turnover)</h2>
<p>Now, we do have a good data series on total global M2 and the respective gold reserves, which you see in Exhibit 4 below. The gold price which equalizes global M2 to gold reserves is circa $100,000 per ounce. You can eyeball the steep climbs during the 2008 GFC as well as following the 2020 lockdowns in the chart. We also did the same calculation as we did above with M0 &ndash; weight the M2-equalizing gold price by the major trading FXs (USD, EUR, etc.) and that weighted average is $184,211. As we stated at the beginning, we are not addressing the odds of gold becoming the sole reserve, nor are we addressing whether strains will be from M0, M2, in fact we alluded above that the real strain will be from M-infinity. This context must be kept in mind because the notional of derivatives is incomprehensibly large and many in the market have glossed over the reality of the GFC.</p>
<h3>Exhibit 4 &ndash; Global Gold Reserves/M2 Nearing $100,000 Per Troy Ounce</h3>
<p><img loading="lazy" class="img-responsive w-100" src="https://www.vaneck.com/contentassets/fdcfc1b66dc64bdba158f11dcef8fcf5/6585_embx-commentary-on-gold-blog-blog_chart_3_2025-12_v2.svg" alt="Exhibit 4 - Global Gold Reserves/M2 Nearing $100,000 Per Troy Ounce" /></p>
<p class="chart-disclosure">Source: VanEck Research; IMF - World Reserve Gold Holdings (001.046 index); Bloomberg - Global M2 CIX index (.glmosupp index)</p>
<h2>A Table Summarizing the Calculations</h2>
<p>So, we calculated the gold price that equalizes the monetary base for:</p>
<p>M0, for each central bank, weighted by latest BIS FX daily turnover - $39,210</p>
<p>M2, for each central bank, weighted by latest BIS FX daily turnover - $184,211</p>
<p>The exhibit below lays it out in detail for convenience. Note that we didn&rsquo;t publish the graph on M2 by <i>every</i> central bank as we did with M0. The ranking of central banks using M0 and M2 was in the same general order.</p>
<h3>Exhibit 5 &ndash; How Gold Price to Equalize Monetary Base and M2 Weighted by FX Daily Turnover Works</h3>
<p><strong>Weighted Averages Based on Daily FX Turnovers (BIS Triennial Survey, 2025)</strong><br /><i>(weights are rebased from BIS original numbers for the current sample)</i></p>
<div class="wrapped-div blog-post content">
<table style="width: 60%;" cellpadding="6">
<tbody>
<tr class="tbl-data">
<td class="data-head last text-left"><strong>&nbsp;</strong></td>
<td class="data-head last text-right"><strong>Price of Gold Implied<br />by Monetary Base</strong></td>
<td class="data-head last text-right"><strong>Price of Gold Implied<br />by M2</strong></td>
</tr>
</tbody>
<tbody>
<tr class="tbl-data">
<td class="data-td data last text-left"><strong>All countries</strong></td>
<td class="data-td data last text-right"><strong>39,210</strong></td>
<td class="data-td data last text-right"><strong>184,211</strong></td>
</tr>
<tr class="tbl-data">
<td class="data-td data last text-center" colspan="3"><em>including</em></td>
</tr>
<tr class="tbl-data">
<td class="data-td data last text-left">U.S. (49.9% weight)</td>
<td class="data-td data last text-right">20,503</td>
<td class="data-td data last text-right">85,270</td>
</tr>
<tr class="tbl-data">
<td class="data-td data last text-left">Eurozone (16% weight)</td>
<td class="data-td data last text-right">14,691</td>
<td class="data-td data last text-right">53,737</td>
</tr>
<tr class="tbl-data">
<td class="data-td data last text-left">Japan (9.5% weight)</td>
<td class="data-td data last text-right">144,741</td>
<td class="data-td data last text-right">301,726</td>
</tr>
<tr class="tbl-data">
<td class="data-td data last text-left">U.K. (weight 5.7%)</td>
<td class="data-td data last text-right">102,154</td>
<td class="data-td data last text-right">428,056</td>
</tr>
<tr class="tbl-data">
<td class="data-td data last text-left">China (weight 4.8%)</td>
<td class="data-td data last text-right">26,334</td>
<td class="data-td data last text-right">645,862</td>
</tr>
<tr class="tbl-data">
<td class="data-td data last text-center" colspan="3"><em>memo item</em></td>
</tr>
<tr class="tbl-data">
<td class="data-td data last text-left"><strong>All countries median</strong></td>
<td class="data-td data last text-right"><strong>18,205</strong></td>
<td class="data-td data last text-right"><strong>99,651</strong></td>
</tr>
</tbody>
</table>
</div>
<p class="chart-disclosure">Source: VanEck Research, BIS, Bloomberg, IMF</p>
<h2>How Did This Output Compare to Our First Calculations in 2012?</h2>
<p>Because we&rsquo;ve been following this issue (largely through the lens of &ldquo;fiscal dominance&rdquo;, which forces you to look at the central bank&rsquo;s balance sheet with greater attention), it&rsquo;s reasonable to ask what changed since 2012 that is noteworthy. Keep in mind that all our calculations use contemporaneous exchange rates, which have obviously moved, but also official ounces of gold holdings, which also move. We present the results of the intertemporal comparison between our first exercise in 2012 and the latest data in the table below. One thing that pops out immediately is that most emerging markets posted significant improvements over this period (i.e. the &ldquo;equalizing&rdquo; price of gold went <u>down</u>), whereas advanced economies found themselves on the opposite end (the &ldquo;equalizing&rdquo; price of gold went <u>up</u>&hellip;by a lot). This divergence reflected a slower pace of monetary expansion in EM compared to advanced peers, consistent with our framing that &ldquo;fiscal dominance&rdquo; characterizes some DMs, while many EMs are not characterizable that way. EMs are more closely scrutinized by the market and rating agencies, and transgressions are swiftly punished. EMs have to work hard for financing, generally speaking, compared to DMs. Thus, EM orthodoxy &ndash; we&rsquo;ve written about this history, and the best initial scrutiny came from the IMF itself with its lending programs and conditionality in the 1997 Asia crisis. And, of course, there was a major pickup in the reserve gold purchases by EM central banks after the GFC in 2008. China&rsquo;s &ldquo;no change&rdquo; status also stands out &ndash; the authorities were routinely criticized for their leverage-based growth model, and China&rsquo;s money supply went ballistic after the pandemic. However, China leads EM (and the world) in the gold reserve accumulation, and the official numbers that we used in this exercise are most likely very conservative because state banks are excluded from calculations as explained earlier.</p>
<h3>Exhibit 6 &ndash; How These Measurements Changed Since 2012</h3>
<p><img loading="lazy" class="mobile-image img-responsive" src="https://www.vaneck.com/contentassets/1e329dbfe6b046168d9d041629a52a07/6585_embx-commentary-on-gold_commentary-table-01_2025-12_v1.svg" alt="Exhibit 6 - How These Measurements Changed Since 2012" /></p>
<p><img loading="lazy" class="desktop-image img-responsive" src="https://www.vaneck.com/contentassets/1e329dbfe6b046168d9d041629a52a07/6585_embx-commentary-on-gold_table-01_2025-12_v1_blog.svg" alt="Exhibit 6 - How These Measurements Changed Since 2012" /></p>
<p class="chart-disclosure">Source: VanEck Research, IMF, Bloomberg</p>
<p>Note: Hungary is an obvious outlier. It started the series with very low gold reserves (it was in a unique situation for many reasons, two of your authors were sell-side Hungary economists since the 1990s if you want to discuss), and the authorities subsequently embarked on a publicly-discussed gold purchasing program (you can maybe be public if you are small). This is behind its outlier performance, though we aren&rsquo;t doing country-by-country analysis in this piece; we just wanted to comment on this outcome.</p>
<h2>What Are Central Bank Gold Holdings Across the Number of Central Banks?</h2>
<p>Some may be interested in the distribution of results by <i>number</i> of central banks, which we show in the Exhibit below. It seems a straightforward conclusion that there are a large number of central banks with very low gold holdings. Also noteworthy is that 50% of central banks hold zero gold according to IMF data, generally poor countries with low overall reserves (i.e., including treasuries, etc.). This is food for further thought, like &lsquo;what might they have to buy&rsquo; (putting on our trading hats), with CNY being an appealing option for many central banks, perhaps.</p>
<h3>Exhibit 7 &ndash; Central Bank Gold Holdings by Number of Central Banks</h3>
<p><img loading="lazy" class="img-responsive w-100" src="https://www.vaneck.com/contentassets/d710ccb7b5ba4c089512014a162159ed/6585_embx-commentary-on-gold-blog-blog_chart_4_2025-12_v2.svg" alt="Exhibit 7 - Central Bank Gold Holdings by Number of Central Banks" /></p>
<p class="chart-disclosure">Source: VanEck Research; IMF; Bloomberg LP</p>

<h2 id="major-implications" class="jump-link-nav anchored-block" data-jumplink-title="Major Implications">Major Implications for Relative Exchange Rates</h2>
<p>In the scenario when/if the dollar loses its reserve status, it would lead to gold prices being higher like suggested by our estimates. But this is not the only implication &ndash; this scenario would also lead to a massive relative price adjustment of individual exchange rates vs. the dollar. Using the prices of gold in dollars for each country might give us at least some idea about a new exchange rate for those countries relative to the dollar. Our estimates suggest that some currencies might experience significant appreciations (assuming no intervention from central banks), while others will move in the opposite direction. There will be big shifts both in FX adjustments and gold price increases until they reach a new equilibrium. But this is the topic for the new research paper. Stay tuned!</p>
<p>To receive more <a href="https://www.vaneck.com/us/en/insights/emerging-markets-bonds/" title="Emerging Markets Bonds Insights"><strong>Emerging Markets Bonds</strong></a> insights, <a href="/link/5f45412c2143400497908cea2897f7d3.aspx" title=" Subscription Center"><strong>sign up in our subscription center</strong></a>.</p>
]]></content:encoded>
</item><item rdf:about="https://www.vaneck.com/us/en/blogs/digital-assets/matthew-sigel-vaneck-crypto-monthly-recap-for-december-2025/">
  <title>VanEck Crypto Monthly Recap for December 2025></title>
  <link>https://www.vaneck.com/us/en/blogs/digital-assets/matthew-sigel-vaneck-crypto-monthly-recap-for-december-2025/</link>
  <description><![CDATA[December saw broad crypto market weakness, but continued progress in Ethereum scaling, stablecoin settlement, and early institutional tokenization efforts.]]></description>
  <dc:creator>Matthew  Sigel</dc:creator>
  <dc:date>01/06/2026 06:30:00</dc:date>
<content:encoded><![CDATA[

<p><strong>Please note that VanEck may have a position(s) in the digital asset(s) described&nbsp;below.</strong></p>
<p><strong>Key takeaways:</strong></p>
<ul class="content-list">
<li class="mt-2"><strong>Year-end risk appetite faded:</strong> Crypto markets declined broadly in December with volatility compression and subdued institutional activity, reflecting caution rather than disorderly selling.</li>
<li class="mt-2"><strong>Fundamentals diverged from price:</strong> Ethereum and Solana continued to demonstrate strong onchain usage, particularly in stablecoin settlement, Layer-2 throughput, and revenue tied to real economic activity.</li>
<li class="mt-2"><strong>Token design remains a key risk</strong>: The AAVE episode highlighted ongoing challenges around tokenholder value capture, reinforcing the need for clearer alignment between governance and economic control.</li>
</ul>
<p>December delivered muted price action across crypto markets. Bitcoin fell <strong>(-4%),</strong> Ethereum fell <strong>(-3%),</strong> and altcoins as proxied by MVSCLE (<strong>MarketVector Smart Contract Leaders Index)</strong> dropped <strong>8%.</strong> Of the <strong>35 </strong>smart contract platform tokens we track, <strong>33</strong> posted negative returns. Hopes for a seasonal &ldquo;Santa Claus rally&rdquo; failed to materialize.</p>
<h3 id="price-returns" class="jump-link-nav anchored-block" data-jumplink-title="Price Returns">Price Returns</h3>
<div class="wrapped-div">
<table style="width: 100%;">
<tbody>
<tr class="tbl-data">
<td class="tbl-header last text-left">Index/Asset</td>
<td class="tbl-header last text-right">December (%)</td>
<td class="tbl-header last text-right">YTD (%)</td>
</tr>
<tr class="tbl-data">
<td class="data-td data last text-left">S&amp;P 500 Index</td>
<td class="data-td data last text-right">0.05</td>
<td class="data-td data last text-right">16.39</td>
</tr>
<tr class="tbl-data">
<td class="data-td data last text-left">Nasdaq Index</td>
<td class="data-td data last text-right">-0.80</td>
<td class="data-td data last text-right">20.16</td>
</tr>
<tr class="tbl-data">
<td class="data-td data last text-left">Ethereum</td>
<td class="data-td data last text-right">-1.49</td>
<td class="data-td data last text-right">-11.02</td>
</tr>
<tr class="tbl-data">
<td class="data-td data last text-left">Bitcoin</td>
<td class="data-td data last text-right">-3.87</td>
<td class="data-td data last text-right">-6.47</td>
</tr>
<tr class="tbl-data">
<td class="data-td data last text-left">MarketVector Smart Contract Leaders Index</td>
<td class="data-td data last text-right">-8.46</td>
<td class="data-td data last text-right">-37.39</td>
</tr>
<tr class="tbl-data">
<td class="data-td data last text-left">MarketVector Global Digital Assets Equity Index</td>
<td class="data-td data last text-right">-14.51</td>
<td class="data-td data last text-right">14.38</td>
</tr>
<tr class="tbl-data">
<td class="data-td data last text-left">MarketVector Decentralized Finance Leaders Index</td>
<td class="data-td data last text-right">-15.73</td>
<td class="data-td data last text-right">-66.50</td>
</tr>
<tr class="tbl-data">
<td class="data-td data last text-left">Coinbase</td>
<td class="data-td data last text-right">-17.11</td>
<td class="data-td data last text-right">-8.92</td>
</tr>
<tr class="tbl-data">
<td class="data-td data last text-left">MarketVector Meme Coin Index</td>
<td class="data-td data last text-right">-17.63</td>
<td class="data-td data last text-right">-73.34</td>
</tr>
<tr class="tbl-data">
<td class="data-td data last text-left">MarketVector Infrastructure Application Leaders Index</td>
<td class="data-td data last text-right">-19.73</td>
<td class="data-td data last text-right">-67.44</td>
</tr>
</tbody>
</table>
</div>
<br />
<p class="chart-disclosure">Source: Bloomberg as of 12/31/2025. <strong><i>Index performance is not representative of fund performance. It is not possible to invest directly in an index. Past performance is no guarantee of future results. Not intended as a recommendation to buy or sell any securities named herein.</i></strong></p>
<p>The selloff was gradual rather than disorderly. Volatility declined <strong>8%</strong> for BTC and <strong>15%</strong> for ETH. Bitcoin&rsquo;s 30-day volatility ended the month at <strong>40%</strong>, roughly the 52nd percentile for the year, while ETH volatility fell to <strong>59%</strong>, placing it in the 14th percentile of 2025. Historically, December tends to see volatility compression: BTC volatility has declined in 7 of the last 11 Decembers, with prices rising in 6 of those years.</p>
<p>Digital asset treasury (DAT) activity was subdued. Public companies we track purchased just 22.2k BTC and 414k ETH, marking the second-lowest monthly total for both BTC and ETH DATs in 2025 since the ETH accumulation cycle began in July 2025. Investor fatigue also showed up in ETP flows, with December outflows of 12.5k BTC (-1% AUM) and 212k ETH (-3% AUM).</p>
<p>Onchain data echoed this caution. Bitcoin long-term holders reduced positions every day in December, while Ethereum long-term holders modestly increased balances during the final four days of the month.</p>
<h3>Long-Term ETH Holders Turned to Accumulators After Long Distribution</h3>
<p><img loading="lazy" class="img-responsive" alt="Long-Term ETH Holders Turned to Accumulators After Long Distribution" src="https://www.vaneck.com/EPiServer/CMS/Content/contentassets/b41428beff584240b64f01a9b92d75c7/6601_crypto-monthly-dec-2025_chart-1_2026-1_v1_blog.svg,,356823/Download?epieditmode=False" /></p>
<p class="chart-disclosure">Source: Artemis XYZ as of 12/29/2025. <strong><i>Past performance is no guarantee of future results. Not intended as a recommendation to buy or sell any securities named herein.</i></strong><br />Note: &ldquo;LT Holder&rdquo; is considered an address that has held ETH &gt; 155 days</p>
<p>DEX spot volumes declined <strong>22%</strong> m/m, though <strong>Solana</strong> remained dominant, accounting for 35% of total DEX spot volume. Notably, Solana&rsquo;s DEX share exceeded that of Ethereum and all Ethereum L2s combined for the first time since June 2025.</p>
<p>From a revenue standpoint, <strong>Hyperliquid</strong> again led L1s, generating approximately $45M in revenue through December 28. Stablecoin supply edged slightly lower to $285B, down from $286B in November, while transfer volumes increased <strong>12%</strong> m/m. <strong>Base</strong> continued to lead stablecoin transfer activity, capturing an estimated <strong>41%</strong> market share in December.</p>
<p>Tokenized real-world assets (RWAs) onchain totaled $18.7B, up <strong>2.5%</strong> m/m. Private credit assets not included in this figure, such as Figure Technologies&rsquo; HELOCs, grew 4%, from $18.8B to $19.8B.</p>
<p><strong>Major news in December:</strong></p>
<ol class="content-list">
<li class="mt-2">Ethereum activated the Fusaka upgrade, increasing blob capacity via the BPO-1 fork on December 17 and setting the stage for a further increase with BPO-2 on January 7, 2026.</li>
<li class="mt-2">China&rsquo;s PBOC intensified scrutiny of digital assets, citing KYC/AML concerns, prompting Ant Group and JD.com to pause stablecoin initiatives. 400,000 Bitcoin mining machines were reportedly disconnected in China, leading to the biggest overall decline in the Bitcoin hashrate since 2024, before recovering at month-end.</li>
<li class="mt-2">Circle and Ripple were granted preliminary approvals to establish national trust banks, while BitGo, Paxos, and Fidelity began converting state trust charters to national trust charters.</li>
<li class="mt-2">Vanguard, long an anti-crypto advocate, allowed trading of crypto ETPs on its platform despite continuing to avoid launching proprietary products.</li>
<li class="mt-2">Hong Kong&rsquo;s insurance regulator proposed rules that would allow insurance capital into crypto/infrastructure, with a 100% risk capital charge for crypto assets.</li>
<li class="mt-2">Visa expanded USDC settlement for B2B payments through its pilot with Lead Bank and Cross River.</li>
<li class="mt-2">SoFi launched its stablecoin SoFiUSD.</li>
<li class="mt-2">Klarna announced plans to partner with Coinbase to launch a stablecoin.</li>
</ol>
<h2 id="ethereum-developments" class="jump-link-nav anchored-block" data-jumplink-title="Ethereum Developments">Ethereum Technical Developments and Outperformance</h2>
<h3>Ethereum L2 Blob Count is +30% Y/Y in December 2025</h3>
<p><img loading="lazy" class="img-responsive" alt="Ethereum L2 Blob Count is +30% Y/Y in December 2025" src="https://www.vaneck.com/EPiServer/CMS/Content/contentassets/b41428beff584240b64f01a9b92d75c7/6601_crypto-monthly-dec-2025_chart-2_2026-1_v1_blog.svg,,356827/Download?epieditmode=False" /></p>
<p class="chart-disclosure">Source: Dune, @Hildobby as of 12/29/2025. <strong><i>Past performance is no guarantee of future results. Not intended as a recommendation to buy or sell any securities named herein.</i></strong></p>
<p>Although ETH underperformed on price in December, the network made meaningful technical progress. The <strong>Fusaka upgrade</strong>, initiated on December 3, improves the user experience, makes the network more resilient to spam and abuse, and boosts throughput across both L1 and L2.</p>
<p><strong>Key changes include:</strong></p>
<ul class="content-list">
<li class="mt-2">EIP-7951, enabling simpler wallet authentication via precompiles.</li>
<li class="mt-2">Improved gas pricing and transaction limits to reduce attack surfaces.</li>
<li class="mt-2">An increase in the L1 gas limit to 60M from 45M.</li>
<li class="mt-2">A 66% increase in blob throughput on December 17, with another increase scheduled for January 7, bringing total L2 transaction capacity up 133%.</li>
</ul>
<p>Ethereum fees have already declined roughly <strong>25%</strong> since the upgrade. The network is also advancing toward data sampling, reducing node storage requirements. With the Ethereum blockchain now exceeding 1.4 TB and growing at approximately 21% CAGR, these optimizations are critical for preserving decentralization and lowering participation costs.</p>
<p>We view Ethereum&rsquo;s relative resilience versus Bitcoin in December as early positioning for 2026 narratives, particularly around tokenization, settlement, and institutional blockchain adoption. Unlike Bitcoin, Ethereum&rsquo;s programmability enables use cases such as asset tokenization, collateral management, and onchain recordkeeping. These applications increasingly drive adoption independent of speculative trading.</p>
<h2 id="token-vs-equity" class="jump-link-nav anchored-block" data-jumplink-title="Token vs Equity">Token vs Equity: A December Case Study</h2>
<h3>AAVE is Earning $720M in Annualized Revenue</h3>
<p><img loading="lazy" class="img-responsive" alt="AAVE is Earning $720M in Annualized Revenue" src="https://www.vaneck.com/EPiServer/CMS/Content/contentassets/b41428beff584240b64f01a9b92d75c7/6601_crypto-monthly-dec-2025_chart-3_2026-1_v1_blog.svg,,356828/Download?epieditmode=False" /></p>
<p class="chart-disclosure">Source: Artemis XYZ as of 12/30/2025.<strong><i>Past performance is no guarantee of future results. Not intended as a recommendation to buy or sell any securities named herein.</i></strong> <br />Note: AAVE DAO received ~14% of Revenues in cashflows in 2025</p>
<p>Crypto tokens continue to straddle an ambiguous space between commodity and quasi-equity. While teams seek to create tokenholder value, legal uncertainty often leads to unclear or fragile value-accrual mechanisms. Tokens may capture fees, enable governance, or function as payment units, but they frequently lack enforceable claims on underlying cash flows.</p>
<p>This tension surfaced prominently at AAVE in December. Although the AAVE DAO governs protocol parameters, a separate for-profit entity, Aave Labs, controls key commercial relationships, including front-end distribution. A new arrangement with CoW Swap redirected certain fees away from the DAO and toward Labs, reversing the prior precedent set with partners like ParaSwap.</p>
<p>Community estimates suggest the CoW Swap integration could generate up to $200k in fees per week. In response to backlash, AAVE founder Stani Kulechov purchased approximately $15M of AAVE tokens. A subsequent DAO vote to transfer brand assets from Labs to the DAO failed. Despite protocol TVL increasing 4.2% in December, AAVE&rsquo;s token price fell <strong>15%,</strong> reaching levels last seen during the April 2025 tariff selloff.</p>
<p>This episode highlights a broader risk across crypto: tokenholders may exert governance influence without controlling the economic surface area that determines value. Unless clearer alignment mechanisms emerge, tokens risk being structurally subordinated to equity interests.</p>

<h2 id="looking-ahead" class="jump-link-nav anchored-block" data-jumplink-title="Looking Ahead">Looking Ahead: Tokenization, Velocity, and Settlement</h2>
<h3>Share of Blockchain Revenues from Stablecoin Transfers</h3>
<img loading="lazy" class="img-responsive" alt="Share of Blockchain Revenues from Stablecoin Transfers" src="https://www.vaneck.com/EPiServer/CMS/Content/contentassets/45a1e3536e504f4597d1ac8f6e94c593/6601_crypto-monthly-dec-2025_chart-5_2026-1_v1_blog.svg,,356832/Download?epieditmode=False" />
<p class="chart-disclosure">Source: Artemis XYZ as of 12/29/2025.<strong><i>Past performance is no guarantee of future results. Not intended as a recommendation to buy or sell any securities named herein.</i></strong></p>
<p>Despite ongoing challenges around token value accrual, we remain constructive on blockchains with demonstrated usage, improving economics, and credible paths to monetization, particularly Ethereum and Solana. Both networks increasingly generate revenue from stablecoin activity, signaling a shift toward real-world financial flows rather than purely speculative trading.</p>
<p>In 2025, stablecoin transfers accounted for approximately <strong>43%</strong> of Ethereum&rsquo;s total fees and <strong>10%</strong> of Solana&rsquo;s. Stablecoin velocity on Solana is especially high, with roughly <strong>74%</strong> of supply turning over daily, compared to <strong>36%</strong> on Ethereum. Viewed through a fee-capture lens, Solana currently earns roughly 13 basis points annually on its stablecoin supply, while Ethereum earns approximately 10 basis points.</p>
<p>Ethereum processes fewer, higher-value transfers, averaging $77k per transaction, while Solana processes smaller transfers averaging $1.3k. However, Solana facilitates more than 10x the number of daily stablecoin transfers, approximately 7.5 million versus 700k. In practice, lower transaction costs enable greater economic activity, allowing Solana to generate comparable or higher aggregate revenue despite minimal per-transaction fees.</p>
<p>As tokenization accelerates, blockchains may increasingly function as settlement and collateral management infrastructure rather than primary trading venues. While centralized exchanges remain superior for execution and liquidity concentration, public blockchains can materially improve settlement speed and collateral mobility across venues.</p>
<p>Today, collateral is typically siloed at individual exchanges, custodians, or clearing members to meet margin and settlement requirements. Faster, programmable settlement could reduce these capital inefficiencies, allowing the same collateral to support activity across multiple venues. This dynamic could lower liquidity buffers, increase capital velocity, and enable emerging markets such as prediction markets to scale more efficiently.</p>
<p>If atomic settlement becomes more widely adopted, with multi-leg trades executing only if all components settle simultaneously, settlement risk could decline further. In this framework, blockchains like Ethereum and Solana function less as speculative assets and more as financial infrastructure, providing core plumbing for capital markets activity.</p>
<p>Under this model, network valuations may be supported by usage and fee generation even if native tokens do not function primarily as monetary assets. For example, if Solana were to host $10 trillion in tokenized assets and maintain a take rate similar to its current stablecoin activity, annual network revenue could approach $13 billion.</p>
<p>For context, the combined value of U.S. equities, Treasuries, corporate bonds, and M2 money supply exceeds $130 trillion. While large-scale tokenized settlement and collateral mobility remain long-dated, early institutional efforts already point in this direction. One example that worked in December is the Canton Network, a blockchain-based settlement framework designed to enable regulated financial institutions to tokenize assets and settle transactions on shared infrastructure. In December, Canton Coin (CC), the network&rsquo;s native token, rallied from roughly $0.07 to $0.15 following increased institutional validation and visibility around Canton&rsquo;s role in tokenization initiatives, including participation by firms such as DTCC, Goldman Sachs, Nasdaq, Tradeweb, DRW, and Figure Technologies. While this price action highlights growing investor interest in purpose-built consortium models aligned with regulated finance, it does not resolve broader questions about token value capture, reinforcing the need to evaluate such opportunities on a case-by-case basis and making index strategies less interesting in this space.</p>
<p><strong>Links to third party websites are provided as a convenience and the inclusion of such links does not imply any endorsement, approval, investigation, verification or monitoring by us of any content or information contained within or accessible from the linked sites. By clicking on the link to a non-VanEck webpage, you acknowledge that you are entering a third-party website subject to its own terms and conditions. VanEck disclaims responsibility for content, legality of access or suitability of the third-party websites.</strong></p>
<p>To receive more <strong><a href="https://www.vaneck.com/us/en/insights/digital-assets/" title="Digital Assets Insights">Digital Assets</a></strong> insights, <strong><a href="https://www.vaneck.com/us/en/subscribe/" title="Subscription Center">sign up in our subscription center</a></strong>.</p>
]]></content:encoded>
</item><item rdf:about="https://www.vaneck.com/us/en/blogs/thematic-investing/buzz-investing-early-volatility-gives-way-to-stock-specific-leadership/">
  <title>BUZZ Investing: Early Volatility Gives Way to Stock-Specific Leadership></title>
  <link>https://www.vaneck.com/us/en/blogs/thematic-investing/buzz-investing-early-volatility-gives-way-to-stock-specific-leadership/</link>
  <description><![CDATA[Investors shifted toward selective, fundamentals-driven positioning, favoring companies with clearer execution paths while reassessing crowded or expectation-heavy trades.]]></description>
  <dc:creator> </dc:creator>
  <dc:date>12/23/2025 06:30:00</dc:date>
<content:encoded><![CDATA[

<p><strong>Key Takeaways:</strong></p>
<ul class="content-list">
<li class="mt-2"><strong>Stock picking overtook macro narrative: </strong> Markets moved away from Fed-driven trading toward company-specific fundamentals, with execution and earnings visibility driving returns.</li>
<li class="mt-2"><strong>Selective risk appetite returned:</strong> Space and quantum stocks led gains as investors rewarded tangible milestones and clearer paths to commercialization rather than broad speculative themes.</li>
<li class="mt-2"><strong>Expectations reset quickly: </strong> Former leaders pulled back as valuations were reassessed, while sentiment shifts lifted new names, underscoring how fast momentum can turn when execution lags.</li>
</ul>
<p>U.S. equities navigated a choppy but ultimately constructive period between index selection dates (November 13, 2025 &ndash; December 11, 2025, the &ldquo;Period&rdquo;), with markets transitioning from mid-November volatility toward stabilization and selective leadership by early December. After an initial pullback driven in part by continued pressure on several large-cap technology leaders, performance broadened as investors re-engaged with company-specific fundamentals and earnings visibility improved. Several high-profile stocks that had weighed on indices earlier in the month began to stabilize or recover, while strength emerged across select AI infrastructure and technology-adjacent names. Against this backdrop, the <a href="/link/459289f4c5ea4648bd9dfcf70d847cd7.aspx" title="BUZZ - VanEck Social Sentiment ETF - Overview"><strong>BUZZ</strong></a>&nbsp;NextGen AI US Sentiment Leaders Index (the &ldquo;<a href="/link/459289f4c5ea4648bd9dfcf70d847cd7.aspx" title="BUZZ - VanEck Social Sentiment ETF - Overview"><strong>BUZZ</strong></a>&nbsp;Index&rdquo;) declined early in the Period but rebounded sharply, finishing with a gain of 4.7 percent and outperforming both the S&amp;P 500 and Nasdaq Composite over the same window.</p>
<p>Stock-specific developments played a meaningful role in shaping returns. In technology, renewed scrutiny around AI capital spending and competitive dynamics pressured several mega-cap names in November, including NVIDIA and Oracle, following earnings updates that raised questions about the pace of near-term returns on large infrastructure investments. At the same time, other segments of the technology ecosystem benefited from improving visibility into demand, pricing dynamics, and execution. The Federal Reserve&rsquo;s December rate cut helped stabilize financing conditions, but markets appeared increasingly driven by company-level developments rather than broad policy expectations. Overall, the Period was characterized by an early reset followed by renewed leadership, with performance increasingly determined by differentiation at the individual stock level rather than broad macro direction.</p>
<p>The <a href="/link/459289f4c5ea4648bd9dfcf70d847cd7.aspx" title="BUZZ - VanEck Social Sentiment ETF - Overview"><strong>BUZZ</strong></a>&nbsp;Index returned -12.42% during the month of November compared to a return of 0.25% for the S&amp;P 500 Index during the same period. Year-to-date, the <a href="/link/459289f4c5ea4648bd9dfcf70d847cd7.aspx" title="BUZZ - VanEck Social Sentiment ETF - Overview"><strong>BUZZ</strong></a>&nbsp;Index leads the S&amp;P 500 with returns of 34.85% and 17.81%, respectively, as of the end of November.</p>
<h2>Space and Quantum Names Drive BUZZ Gains During the Period</h2>
<p>Shares of AST SpaceMobile (NASDAQ: ASTS) and Rocket Lab USA (NASDAQ: RKLB) were among the leading contributors to <a href="/link/459289f4c5ea4648bd9dfcf70d847cd7.aspx" title="BUZZ - VanEck Social Sentiment ETF - Overview"><strong>BUZZ</strong></a>&nbsp;Index performance during the Period, as investor focus returned to tangible execution milestones within the commercial space sector. ASTS advanced following a series of operational updates that underscored progress toward scaled deployment, including the expansion of manufacturing capacity in Texas and Florida and preparations for the launch of its BlueBird 6 satellite later this month. The company also reiterated its goal of deploying 45 to 60 satellites by the end of next year, supported by over $1 billion in contracted revenue commitments from partners. Rocket Lab also gained as the company continued its steady cadence of launches, including the upcoming &ldquo;Raise and Shine&rdquo; Electron mission for the Japan Aerospace Exploration Agency and confirmation that two NASA-backed spacecraft had begun their journey toward Mars. Together, the developments may have reinforced confidence in each company&rsquo;s ability to translate long-term commercial opportunities into near-term operational progress.</p>
<p>Quantum computing stocks also rebounded meaningfully during the Period, with D-Wave Quantum Inc. (NYSE: QBTS) and Rigetti Computing, Inc. (NASDAQ: RGTI) contributing after a sharp correction earlier in the quarter. Shares moved higher as both companies benefited from renewed interest following the stabilization of broader technology markets and company-specific initiatives aimed at commercialization. D-Wave gained after announcing the formation of a dedicated U.S. government-focused business unit, signaling an increased emphasis on securing public-sector contracts tied to national security and infrastructure applications. Rigetti also advanced as its shares broke higher from a multi-week consolidation, reflecting improved technical conditions and renewed buying interest following a deep pullback. The rebound across quantum names may suggest a recalibration after an earlier reset, with investors once again engaging selectively with companies demonstrating clearer paths to adoption and revenue generation.</p>

<h3 id="top-contributors" class="jump-link-nav anchored-block" data-jumplink-title="Top Contributors">Top BUZZ Index Contributors: November 13, 2025 &ndash; December 11, 2025</h3>
<div class="wrapped-div">
<table width="100%">
<tbody>
<tr class="tbl-data">
<td class="tbl-header last text-left"><strong>Company</strong></td>
<td class="tbl-header last text-left"><strong>Ticker</strong></td>
<td class="tbl-header last text-right"><strong>Average Weight (%)</strong></td>
<td class="tbl-header last text-right"><strong>Return Contribution (%)</strong></td>
</tr>
<tr class="tbl-data">
<td class="data-td data last text-left">AST SpaceMobile Inc</td>
<td class="data-td data last text-left">ASTS</td>
<td class="data-td data last text-right">2.85</td>
<td class="data-td data last text-right">1.19</td>
</tr>
<tr class="tbl-data">
<td class="data-td data last text-left">Applied Digital Corp</td>
<td class="data-td data last text-left">APLD</td>
<td class="data-td data last text-right">3.30</td>
<td class="data-td data last text-right">1.05</td>
</tr>
<tr class="tbl-data">
<td class="data-td data last text-left">Rocket Lab Corp</td>
<td class="data-td data last text-left">RKLB</td>
<td class="data-td data last text-right">1.44</td>
<td class="data-td data last text-right">0.62</td>
</tr>
<tr class="tbl-data">
<td class="data-td data last text-left">Rigetti Computing Inc</td>
<td class="data-td data last text-left">RGTI</td>
<td class="data-td data last text-right">2.65</td>
<td class="data-td data last text-right">0.38</td>
</tr>
<tr class="tbl-data">
<td class="data-td data last text-left">D-Wave Quantum Inc</td>
<td class="data-td data last text-left">QBTS</td>
<td class="data-td data last text-right">1.38</td>
<td class="data-td data last text-right">0.36</td>
</tr>
<tr class="tbl-data">
<td class="data-td data last text-left">Tesla Inc</td>
<td class="data-td data last text-left">TSLA</td>
<td class="data-td data last text-right">3.23</td>
<td class="data-td data last text-right">0.34</td>
</tr>
<tr class="tbl-data">
<td class="data-td data last text-left">DraftKings Inc</td>
<td class="data-td data last text-left">DKNG</td>
<td class="data-td data last text-right">1.56</td>
<td class="data-td data last text-right">0.31</td>
</tr>
<tr class="tbl-data">
<td class="data-td data last text-left">Intel Corp</td>
<td class="data-td data last text-left">INTC</td>
<td class="data-td data last text-right">3.26</td>
<td class="data-td data last text-right">0.31</td>
</tr>
<tr class="tbl-data">
<td class="data-td data last text-left">UiPath Inc</td>
<td class="data-td data last text-left">PATH</td>
<td class="data-td data last text-right">1.12</td>
<td class="data-td data last text-right">0.29</td>
</tr>
<tr class="tbl-data">
<td class="data-td data last text-left">Carvana Co</td>
<td class="data-td data last text-left">CVNA</td>
<td class="data-td data last text-right">0.64</td>
<td class="data-td data last text-right">0.28</td>
</tr>
</tbody>
</table>
</div>
<p class="chart-disclosure">Source: BUZZ Holdings ULC, Bloomberg. Past performance is no guarantee of future results. Index performance is not illustrative of fund performance. Not intended as a recommendation to buy or to sell any of the securities mentioned herein.</p>

<h2>Opendoor and AMD Weigh on BUZZ as Expectations Recalibrate</h2>
<p>Shares of Opendoor Technologies (NASDAQ: OPEN) declined during the Period, weighing on <a href="/link/459289f4c5ea4648bd9dfcf70d847cd7.aspx" title="BUZZ - VanEck Social Sentiment ETF - Overview"><strong>BUZZ</strong></a>&nbsp;Index performance following an exceptional run earlier in the year. The stock faced renewed pressure as investors reassessed execution risk and valuation against the company&rsquo;s still-developing path to profitability. While management has articulated a multi-year turnaround strategy centered on higher transaction volumes, faster inventory turnover, and improved contribution margins, recent trading suggested that expectations may have moved ahead of near-term fundamentals. The absence of new incremental catalysts during the Period, combined with heightened sensitivity to any signs of margin or cash-flow volatility, contributed to a pullback that left OPEN among the Index&rsquo;s detractors.</p>
<p>Advanced Micro Devices (NASDAQ: AMD) was also a detractor during the Period, retreating after a strong October rally that followed several high-profile AI partnership announcements. Investor focus shifted toward near-term competitive dynamics within the datacenter and accelerator markets, particularly as questions emerged around the pace at which AMD&rsquo;s MI450 platform can meaningfully close the gap with NVIDIA&rsquo;s entrenched ecosystem. While recent customer wins and long-term revenue ambitions remain intact, the stock appeared to consolidate as market participants recalibrated expectations following a rapid re-rating earlier in the fall. The resulting pullback may reflect a reassessment of execution timing and margin trajectory rather than a change in the longer-term strategic narrative but nonetheless weighed on Index performance during the Period.</p>
<h3 id="bottom-contributors" class="jump-link-nav anchored-block" data-jumplink-title="Bottom Contributors">Bottom BUZZ Index Contributors: November 13, 2025 &ndash; December 11, 2025</h3>
<div class="wrapped-div">
<table width="100%">
<tbody>
<tr class="tbl-data">
<td class="tbl-header last text-left"><strong>Company</strong></td>
<td class="tbl-header last text-left"><strong>Ticker</strong></td>
<td class="tbl-header last text-right"><strong>Average Weight (%)</strong></td>
<td class="tbl-header last text-right"><strong>Return Contribution (%)</strong></td>
</tr>
<tr class="tbl-data">
<td class="data-td data last text-left">Opendoor Technologies Inc</td>
<td class="data-td data last text-left">OPEN</td>
<td class="data-td data last text-right">2.76</td>
<td class="data-td data last text-right">-0.74</td>
</tr>
<tr class="tbl-data">
<td class="data-td data last text-left">Advanced Micro Devices Inc</td>
<td class="data-td data last text-left">AMD</td>
<td class="data-td data last text-right">2.86</td>
<td class="data-td data last text-right">-0.49</td>
</tr>
<tr class="tbl-data">
<td class="data-td data last text-left">IREN Ltd</td>
<td class="data-td data last text-left">IREN</td>
<td class="data-td data last text-right">2.77</td>
<td class="data-td data last text-right">-0.25</td>
</tr>
<tr class="tbl-data">
<td class="data-td data last text-left">Snap Inc</td>
<td class="data-td data last text-left">SNAP</td>
<td class="data-td data last text-right">1.29</td>
<td class="data-td data last text-right">-0.24</td>
</tr>
<tr class="tbl-data">
<td class="data-td data last text-left">Webull Corp</td>
<td class="data-td data last text-left">BULL</td>
<td class="data-td data last text-right">0.58</td>
<td class="data-td data last text-right">-0.21</td>
</tr>
<tr class="tbl-data">
<td class="data-td data last text-left">Netflix Inc</td>
<td class="data-td data last text-left">NFLX</td>
<td class="data-td data last text-right">1.12</td>
<td class="data-td data last text-right">-0.21</td>
</tr>
<tr class="tbl-data">
<td class="data-td data last text-left">MARA Holdings Inc</td>
<td class="data-td data last text-left">MARA</td>
<td class="data-td data last text-right">0.22</td>
<td class="data-td data last text-right">-0.20</td>
</tr>
<tr class="tbl-data">
<td class="data-td data last text-left">Strategy Inc</td>
<td class="data-td data last text-left">MSTR</td>
<td class="data-td data last text-right">2.36</td>
<td class="data-td data last text-right">-0.19</td>
</tr>
<tr class="tbl-data">
<td class="data-td data last text-left">QuantumScape Corp</td>
<td class="data-td data last text-left">QS</td>
<td class="data-td data last text-right">1.86</td>
<td class="data-td data last text-right">-0.17</td>
</tr>
<tr class="tbl-data">
<td class="data-td data last text-left">Amazon.com Inc</td>
<td class="data-td data last text-left">AMZN</td>
<td class="data-td data last text-right">2.98</td>
<td class="data-td data last text-right">-0.12</td>
</tr>
</tbody>
</table>
</div>
<p class="chart-disclosure">Source: BUZZ Holdings ULC, Bloomberg. Past performance is no guarantee of future results. Index performance is not illustrative of fund performance. Not intended as a recommendation to buy or to sell any of the securities mentioned herein.</p>
<h2>BUZZ Index December 2025 Rebalance Highlights</h2>
<p><strong>SentinelOne, Inc.</strong></p>
<p>Since President Trump&rsquo;s return to office, geopolitical risk has moved from a background concern to a more tangible market consideration. Early tariff rhetoric, initially discounted by investors, translated into concrete policy actions in April that briefly disrupted risk assets. Although markets recovered and pushed to new highs, tensions between the U.S. and key global counterparts remain elevated. Competition for strategic resources has intensified, particularly around rare-earth supply chains, as China moves to restrict exports and the U.S. accelerates efforts to rebuild domestic production capacity. These dynamics sit squarely within a broader national security framework that spans defense, infrastructure, and cybersecurity. Against this backdrop, SentinelOne (NYSE: S) is the largest new addition to the <a href="/link/459289f4c5ea4648bd9dfcf70d847cd7.aspx" title="BUZZ - VanEck Social Sentiment ETF - Overview"><strong>BUZZ</strong></a>&nbsp;Index this month. The AI-driven cybersecurity firm operates in a segment closely aligned with these priorities but has lagged higher-profile peers such as CrowdStrike (NASDAQ: CRWD) on a share-price basis this year. In recent weeks, online investor activity has increasingly focused on this divergence, driving a sharp rise in engagement and positioning. SentinelOne enters the <a href="/link/459289f4c5ea4648bd9dfcf70d847cd7.aspx" title="BUZZ - VanEck Social Sentiment ETF - Overview"><strong>BUZZ</strong></a>&nbsp;Index this month with 1.32 percent weight.</p>
<p><strong>Broadcom Inc.</strong></p>
<p>Broadcom (NASDAQ: AVGO) reported earnings on December 11, the <a href="/link/459289f4c5ea4648bd9dfcf70d847cd7.aspx" title="BUZZ - VanEck Social Sentiment ETF - Overview"><strong>BUZZ</strong></a>&nbsp;Index selection date for the month, delivering solid revenue results and constructive forward guidance. The release was followed by a sharp move lower in after-hours trading, which quickly drew heightened attention across online investor forums. The debate around valuation, AI infrastructure spending, and Broadcom&rsquo;s role within the broader semiconductor ecosystem intensified in the hours following the release. Notably, despite the immediate price reaction, the increase in discussion was accompanied by a net rise in positive sentiment, as many investors may have viewed the pullback as excessive relative to the fundamentals presented in the earnings report. As a result, Broadcom&rsquo;s weight in the <a href="/link/459289f4c5ea4648bd9dfcf70d847cd7.aspx" title="BUZZ - VanEck Social Sentiment ETF - Overview"><strong>BUZZ</strong></a>&nbsp;Index rises this month from 0.51 percent to 1.61 percent, reflecting the strength and direction of investor sentiment surrounding the earnings event.</p>
<p>For more on rebalancing results and a full breakdown of index constituents added and removed for the month, view the <strong><a title="BUZZ Index reconstitution report" href="https://www.vaneck.com/us/en/investments/social-sentiment-etf-buzz/buzz-reconstitution.pdf" target="_blank" rel="noopener"> BUZZ Index reconstitution</a></strong> report.</p>

<p>To receive more <a href="https://www.vaneck.com/us/en/insights/thematic-investing/" title="Thematic Investing Insights"><strong>Thematic Investing</strong></a> insights, <a href="https://www.vaneck.com/us/en/subscribe/" title="Subscription Center"><strong>sign up in our subscription center</strong></a>.</p>
]]></content:encoded>
</item><item rdf:about="https://www.vaneck.com/us/en/blogs/thematic-investing/why-are-investors-re-evaluating-large-pharmaceutical-companies/">
  <title>Why Are Investors Re-Evaluating Large Pharmaceutical Companies?></title>
  <link>https://www.vaneck.com/us/en/blogs/thematic-investing/why-are-investors-re-evaluating-large-pharmaceutical-companies/</link>
  <description><![CDATA[Pharmaceutical companies are navigating a changing landscape defined by GLP-1 innovation, AI-supported drug discovery, and evolving healthcare consumption patterns.]]></description>
  <dc:creator>Nick Frasse</dc:creator>
  <dc:date>12/23/2025 06:30:00</dc:date>
<content:encoded><![CDATA[

<p><strong>Key Takeaways:</strong></p>
<ul class="content-list">
<li class="mt-2">Large pharmaceutical companies are entering a period of renewed relevance as therapeutic innovation accelerates, particularly through peptide-based medicines like GLP-1s.</li>
<li class="mt-2">AI is becoming an important tool in early-stage drug discovery, helping major pharma companies improve pipeline efficiency as they approach significant patent expirations.</li>
<li class="mt-2">Shifts in patient behavior, drug distribution, and pricing transparency are creating new opportunities for large pharma.</li>
</ul>
<h2>Why Are Investors Re-Evaluating Large Pharmaceutical Companies?</h2>
<p>Pharma is sitting in an interesting spot right now. It is a sector many investors think they already understand, yet the forces shaping it today look very different from what shaped it even a few years ago. While attention has been focused on AI and other high-growth themes, the <a href="/us/en/blogs/thematic-investing/top-pharmaceutical-companies-shaping-the-future-of-healthcare/" title="Top Pharmaceutical Companies Shaping the Future of Healthcare" target="_top"><strong>largest pharmaceutical companies</strong></a> have been moving into a period that may offer more long term opportunity than the market currently reflects.</p>
<h2>GLP-1 Therapies Are Changing the Pharma Investment Landscape</h2>
<p>A major reason interest is returning to pharma is the shift occurring in therapeutic innovation. The rise of peptide-based medicines, particularly GLP-1 therapies, has highlighted how treatment approaches for metabolic and cardiometabolic disease are evolving. These products have reset expectations around what large scale drug platforms can look like and have helped reestablish pharma as a source of meaningful medical advances. Their continued development may create a broader foundation for future growth as companies refine formulations, explore new indications, and expand access. This renewed focus on metabolic health reinforces the relevance of the established global drug makers that form the core of <a href="/link/08c7d3f4029b4e1a85ec8795516a6f02.aspx" title="VanEck Pharmaceutical ETF | Overview" target="_top"><strong>PPH.</strong></a></p>
<h3>GLP-1 Adoption Has Increased Most Rapidly Among Middle-Aged U.S. Adults</h3>
<p><img loading="lazy" class="img-responsive" src="https://www.vaneck.com/contentassets/6b6ccb4c9e184929ae2ab5c8d5953996/6567_pph-blog_dec_chart-01_2025-12_v1_blog.svg" alt="GLP-1 Adoption Has Increased Most Rapidly Among Middle-Aged U.S. Adults" /></p>
<p class="chart-disclosure"><i>CHART 1 : Source: NCHS, CDC as of August 2025</i></p>
<h2>What Role Does AI Play in the Future of Drug Pipelines?</h2>
<p>AI is also becoming an important part of the story as the industry prepares for notable patent expirations over the next several years. Many of the largest pharma companies are integrating AI into early-stage research to streamline target discovery, accelerate molecule design, and reduce the number of unsuccessful paths that historically slow pipeline development. If these tools help improve efficiency in the 0 to 1 phase, companies may be able to refresh their pipelines more consistently and respond more effectively to the natural turnover created by patents expiring on legacy products. AI does not remove the complexity of drug development, but it may provide a way to generate and evaluate new candidates at a faster pace. This potential to backfill future pipelines supports a more constructive long-term outlook for the established names represented in <a href="/link/08c7d3f4029b4e1a85ec8795516a6f02.aspx" title="VanEck Pharmaceutical ETF | Overview"><strong>PPH.</strong></a></p>
<h3>Forecasted Market Growth for Global AI Drug Discovery (2023-2032)</h3>
<p><img loading="lazy" class="img-responsive" src="https://www.vaneck.com/contentassets/e0f72037c75648b4be6892dfd8d4b229/6567_pph-blog_dec_chart-02_2025-12_v1_blog.svg" alt="Forecasted Market Growth for Global AI Drug Discovery (2023-2032)" /></p>
<p class="chart-disclosure"><i>Source: Market.us, as of October, 2023. Past performance is no guarantee of future results. Not intended as a forecast or prediction of future results. For illustrative purposes only.</i></p>
<h2>Shifts in Consumer Health Behavior</h2>
<p>At the same time, the broader healthcare landscape is shifting. Patients are increasingly taking a more active role in managing chronic conditions, supported by telemedicine, home diagnostics, and direct to consumer platforms. This movement toward self-directed care has encouraged several large pharmaceutical companies to explore new ways of connecting with patients, improving education, and simplifying the path to treatment. These efforts may help reduce friction for individuals who are managing long term conditions and may strengthen engagement with established therapies. For companies with scale and recognized brands, this environment can create opportunities to support chronic disease management more effectively.</p>
<h2>Evolving Drug Distribution and Pricing Dynamics</h2>
<p>With this shift in active health management there is also continued scrutiny of traditional drug distribution and pricing structures. As policymakers, employers, and consumers call for more transparency, parts of the system are beginning to shift toward clearer pricing models and more direct channels. Large pharmaceutical companies are paying close attention to these developments and are testing ways to work more efficiently within an evolving framework. Greater clarity around the path from manufacturer to patient may help smooth access, reduce certain bottlenecks, and allow companies to communicate value more directly. For the established pharma names, this environment may support more stable relationships with patients and providers as the industry adapts to new expectations.</p>
<h2>Why Pharma May Be Entering an Opportunistic Phase</h2>
<p>These developments create a backdrop that appears more constructive for pharma than recent sentiment suggests. The large, liquid pharma companies have the scale, clinical expertise, and global reach to participate meaningfully in the next generation of therapeutic innovation, including the expansion of peptide-based medicines. AI assisted drug discovery may also help these firms refresh pipelines more efficiently at a time when the industry is preparing for notable patent expirations. Their established commercial networks allow them to adapt to shifting consumer behavior and new access models that are emerging across healthcare. As distribution and pricing structures evolve, these companies may also find clearer pathways to reach patients and communicate value. Taken together, this environment positions major pharma as a segment that could play a more important long-term role than current market attention implies.</p>
<h3>Patent Expiration Risk for Total Worldwide Drug RX Revenues 2025-2030</h3>
<p><img loading="lazy" class="img-responsive" src="https://www.vaneck.com/contentassets/7621b2b981454bf19877601d037fa7d2/6567_pph-blog_dec_chart-03_2025-12_v1_blog.svg" alt="Patent Expiration Risk for Total Worldwide Drug RX Revenues 2025-2030" /></p>
<p class="chart-disclosure">Source: Statista, as of May, 2025. Past performance is no guarantee of future results. Not intended as a forecast or prediction of future results. For illustrative purposes only.</p>

<h2><strong>What makes PPH different from broader healthcare ETFs?</strong></h2>
<p>The VanEck Pharmaceutical ETF, PPH is built to capture this part of the industry in a clean and focused way. It concentrates on the largest and most liquid pharmaceutical companies and stops there. It does not broaden into biotech or early-stage science, which helps keep the exposure tied directly to established global drug makers with scale, diversified revenue streams, and proven commercial capabilities. This purity is a key differentiator, giving investors a straightforward way to access pharma without diluting the exposure with businesses that behave differently.</p>
<h3><a href="/link/08c7d3f4029b4e1a85ec8795516a6f02.aspx" title="PPH - VanEck Pharmaceutical ETF - Holdings">Top 10 Holdings in VanEck Pharmaceutical ETF (PPH)</a></h3>
<div class="wrapped-div blog-post content">
<table style="width: 100%;">
<tbody>
<tr class="tbl-data">
<td class="data-head last text-left"><strong>Ticker</strong></td>
<td class="data-head last text-left"><strong>Company</strong></td>
<td class="data-head last text-right"><strong>Weight (%)</strong></td>
</tr>
<tr class="tbl-data">
<td class="data-td data last text-left">LLY</td>
<td class="data-td data last text-left">Eli Lilly and Company</td>
<td class="data-td data last text-right">24.69</td>
</tr>
<tr class="tbl-data">
<td class="data-td data last text-left">NVS</td>
<td class="data-td data last text-left">Novartis AG Sponsored ADR</td>
<td class="data-td data last text-right">8.70</td>
</tr>
<tr class="tbl-data">
<td class="data-td data last text-left">MRK</td>
<td class="data-td data last text-left">Merck &amp; Co., Inc.</td>
<td class="data-td data last text-right">8.17</td>
</tr>
<tr class="tbl-data">
<td class="data-td data last text-left">NVO</td>
<td class="data-td data last text-left">Novo Nordisk A/S Sponsored ADR Class B</td>
<td class="data-td data last text-right">6.05</td>
</tr>
<tr class="tbl-data">
<td class="data-td data last text-left">MCK</td>
<td class="data-td data last text-left">McKesson Corporation</td>
<td class="data-td data last text-right">4.87</td>
</tr>
<tr class="tbl-data">
<td class="data-td data last text-left">GSK</td>
<td class="data-td data last text-left">GSK plc Sponsored ADR</td>
<td class="data-td data last text-right">4.61</td>
</tr>
<tr class="tbl-data">
<td class="data-td data last text-left">JNJ</td>
<td class="data-td data last text-left">Johnson &amp; Johnson</td>
<td class="data-td data last text-right">4.59</td>
</tr>
<tr class="tbl-data">
<td class="data-td data last text-left">PFE</td>
<td class="data-td data last text-left">Pfizer Inc.</td>
<td class="data-td data last text-right">4.54</td>
</tr>
<tr class="tbl-data">
<td class="data-td data last text-left">AZN</td>
<td class="data-td data last text-left">AstraZeneca PLC Sponsored ADR</td>
<td class="data-td data last text-right">4.47</td>
</tr>
<tr class="tbl-data">
<td class="data-td data last text-left">ABBV</td>
<td class="data-td data last text-left">AbbVie, Inc.</td>
<td class="data-td data last text-right">4.19</td>
</tr>
</tbody>
</table>
</div>
<p class="chart-disclosure"><i>Source: Factset as of 11/28/2025. Not intended as a recommendation to buy or sell any names mentioned herein. Fund holdings may vary. Visit vaneck.com/pph for complete holdings information.</i></p>
<h2>Why Does PPH Matter in Today&rsquo;s Pharma Landscape?</h2>
<p>Pharma&rsquo;s story traditionally centers around scale, reliability, and steady medical progress. With new therapeutic platforms emerging and AI reshaping early research, that story is entering a different rhythm. Innovation is beginning to move faster, pipelines are evolving, and the largest global drug makers are positioned at the center of this shift.</p>
<p>For investors looking to engage with the future of established healthcare, <a href="/link/08c7d3f4029b4e1a85ec8795516a6f02.aspx" title="VanEck Pharmaceutical ETF | Overview"><strong>VanEck&rsquo;s Pharmaceutical ETF (PPH)</strong></a> offers a focused way to do so. The fund provides targeted exposure to the world&rsquo;s leading pharmaceutical companies, reflecting the firms driving advancements in metabolic health, next generation drug development, and AI supported research. By tracking the MVIS US Listed Pharmaceutical 25 Index, <a href="/link/08c7d3f4029b4e1a85ec8795516a6f02.aspx" title="VanEck Pharmaceutical ETF | Overview"><strong>PPH</strong></a> captures the performance of major pharma companies that continue to shape treatment standards across global healthcare systems.</p>

<p>To receive more <a href="https://www.vaneck.com/us/en/insights/thematic-investing/" title="Thematic Investing Insights"><strong>Thematic Investing</strong></a> insights, <a href="https://www.vaneck.com/us/en/subscribe/" title="Subscription Center"><strong>sign up in our subscription center</strong></a>.</p>
]]></content:encoded>
</item><item rdf:about="https://www.vaneck.com/us/en/blogs/moat-investing/moat-index-welcomes-back-cheap-mag-7-names/">
  <title>Moat Index Welcomes Back Cheap Mag 7 Names></title>
  <link>https://www.vaneck.com/us/en/blogs/moat-investing/moat-index-welcomes-back-cheap-mag-7-names/</link>
  <description><![CDATA[The 4Q 2025 reconstitution of the Morningstar&reg; Wide Moat Focus Index saw selective additions to the Magnificent 7, including NVIDIA and Meta, as AI-driven volatility created valuation opportunities. Despite adding growth-oriented tech names, the Index remains contrarian.]]></description>
  <dc:creator>Brandon Rakszawski</dc:creator>
  <dc:date>12/23/2025 06:30:00</dc:date>
<content:encoded><![CDATA[

<p><strong>Key Takeaways: </strong></p>
<ul class="content-list">
<li class="mt-2">Moat Index, long underweight the Magnificent 7, selectively welcomes back cheap names including NVIDIA.</li>
<li class="mt-2">16 companies moved in and out of the Index, including four brand-new names.</li>
<li class="mt-2">Contrarian positioning remains with 19% discount to fair value, according to Morningstar&rsquo;s price to fair value ratio.</li>
</ul>
<p>The Morningstar<sup>&reg;</sup>&nbsp;Wide Moat Focus Index<sup>SM</sup>&nbsp;(the &ldquo;Moat Index&rdquo; or &ldquo;Index&rdquo;) underwent its quarterly review on December 19, 2025. The Index systematically targets attractively priced, high quality U.S. companies each quarter, as identified by Morningstar&rsquo;s equity research analysts. Below are a few highlights from the latest review. The full results are available here:</p>

<h2>Moat Index Review Highlights:</h2>
<ul class="content-list">
<li class="mt-2"><strong>AI Uncertainty Leads to Valuation Opportunities in Magnificent 7 and Others</strong>
<p>Following an uncertain quarter for AI investors, several Mag 7 companies flashed value including NVIDIA (NVDA) and Meta Platforms (META). Microsoft&rsquo;s positioning was also increased this quarter, but AI darling Alphabet (GOOGL) was removed from the portfolio as a result of its strong relative performance. Other AI-related names added to the portfolio this quarter were the victims of short-term souring market sentiment: Oracle and ServiceNow.</p>
</li>
</ul>
<ul class="content-list">
<li class="mt-2"><strong>Another High Turnover Quarter Brings First-Time Entrants</strong>
<p>There were 16 total companies added and removed from the sub-portfolio under review this quarter. This follows a high turnover quarter in September when 17 names were swapped in the Index. Among the additions in December were four companies that are being added to the Moat Index for the first time, some due to moat rating changes and some that are attractively priced for the first time in quite some time: Chipotle, LPL Financial, Motorola Solutions, and Zoetis.</p>
</li>
</ul>
<ul class="content-list">
<li class="mt-2"><strong>Value Bias Remains, Though Not as Strong as Recent Periods</strong>
<p>The value style remains a notable overweight relative to the broad market. This trend has been in place for the better part of the last two years as U.S. equity markets have appreciated consistently, despite periods of short-term volatility. However, the current value style overweight is much smaller than much of 2025 with the addition of growth-oriented tech names this quarter. The Moat Index&rsquo;s price-to-fair value was reduced from about 0.86 to 0.81 following the review, implying an 19% discount to fair value. This stands in stark contrast to the S&amp;P 500 Index, which is currently near fair value at a 0.98 price-to-fair-value ratio.</p>
</li>
</ul>
<h3>4Q 2025 Moat Index Review Results</h3>
<p><strong>Moat Index Sector Shifts Following 4Q 2025 Review</strong></p>
<p><img loading="lazy" class="img-responsive" alt="Moat Index Sector Shifts Following 4Q 2025 Review" src="https://www.vaneck.com/contentassets/27ed67acff34464baf8baa2134b39e12/6580_moat-4q-index-review_blog-chart-1_2025-12_v1.svg" /></p>
<p><strong>Moat Index Sector Exposure Relative to S&amp;P 500 Index</strong></p>
<p><img loading="lazy" class="img-responsive" alt="Moat Index Sector Exposure Relative to S&amp;P 500 Index" src="https://www.vaneck.com/contentassets/27ed67acff34464baf8baa2134b39e12/6580_moat-4q-index-review_blog-chart-2_2025-12_v1.svg" /></p>
<p><strong>Moat Index Style Exposure Relative to S&amp;P 500 Index: Value Bias Persists</strong></p>
<p><img loading="lazy" class="img-responsive" alt="Moat Index Style Exposure Relative to S&amp;P 500 Index: Value Bias Persists" src="https://www.vaneck.com/contentassets/27ed67acff34464baf8baa2134b39e12/6580_moat-4q-index-review_blog-chart-3_2025-12_v1.svg" /></p>
<p class="chart-disclosure">Source: Morningstar. As of 12/19/2025 unless otherwise noted. Index performance is not illustrative of fund performance. It is not possible to invest directly in an index.</p>
<h2>Access Quality Companies at Attractive Valuations</h2>
<p><a href="/link/9e43dd198c5f4e419f13220685081895.aspx" title="MOAT - VanEck Morningstar Wide Moat ETF - Overview"><strong>VanEck Morningstar Wide Moat ETF (MOAT)</strong></a> and <strong><a href="/link/ca0b4e316f1c4e1985e2d0b7d293f0e4.aspx" title="MWMZX - VanEck Morningstar Wide Moat Fund - Class Z">VanEck Morningstar Wide Moat Fund</a></strong> seek to replicate as closely as possible, before fees and expenses the price and yield performance of the Morningstar Wide Moat Focus Index.</p>


<p>To receive more <a href="https://www.vaneck.com/us/en/insights/moat-investing" title="Moat Investing Insights"><strong>Moat Investing</strong></a> insights, <a href="https://www.vaneck.com/us/en/subscribe/" title="Subscription Center"><strong>sign up in our subscription center</strong></a>.</p>
]]></content:encoded>
</item><item rdf:about="https://www.vaneck.com/us/en/blogs/digital-assets/matthew-sigel-vaneck-mid-december-2025-bitcoin-chaincheck/">
  <title>VanEck Mid-December 2025 Bitcoin ChainCheck></title>
  <link>https://www.vaneck.com/us/en/blogs/digital-assets/matthew-sigel-vaneck-mid-december-2025-bitcoin-chaincheck/</link>
  <description><![CDATA[Under our GEO framework, Bitcoin shows weak onchain activity but improving liquidity conditions and a reset in speculative leverage, pointing to cautious optimism beneath the selloff.]]></description>
  <dc:creator>Patrick Bush</dc:creator>
  <dc:date>12/22/2025 06:30:00</dc:date>
<content:encoded><![CDATA[

<p><strong>Key takeaways:</strong></p>
<ul class="content-list">
<li class="mt-2"><strong>Corporations buy the dip as ETPs fade: </strong>While Bitcoin ETP investors retreated, DATs stepped in, adding <strong>42k </strong>BTC (their largest accumulation since July 2025).</li>
<li class="mt-2"><strong>Miner capitulation may signal a bottom: </strong>The network hash rate dropped 4% (sharpest since April 2024), historically a bullish contrarian signal.</li>
<li class="mt-2"><strong>The "diamond hands" divergence: </strong>Medium-term holders (1-5y) are selling, while long-term holders (&gt;5y) remain unmoved.</li>
</ul>
<h3 id="geo-framework" class="jump-link-nav anchored-block" data-jumplink-title="GEO Framework">The GEO (Global Liquidity, Ecosystem Leverage, Onchain Activity) Framework to Assess Bitcoin's Price Potential</h3>
<p><img loading="lazy" class="img-responsive w-100" alt="The GEO (Global Liquidity, Ecosystem Leverage, Onchain Activity) Framework to Assess Bitcoin's Price Potential" src="https://www.vaneck.com/EPiServer/CMS/Content/contentassets/931770db79aa4b10b250804a4ad492db/6562_bitcoin-chaincheck-mid-dec_table-1_2025-12_v1_blog.svg,,356070/Download?epieditmode=False" /></p>
<p class="chart-disclosure"><strong>Source:</strong> Bloomberg as of 12/17/2025.<strong> Past performance is no guarantee of future results. The information, valuation scenarios, and price targets in this blog are not intended as financial advice or any call to action, a recommendation to buy or sell, or as a projection of how bitcoin will perform in the future. Actual future performance of bitcoin is unknown, and may differ significantly from the hypothetical results depicted here. There may be risks or other factors not accounted for in the scenarios presented that may impede the performance. These are solely the results of a simulation based on our research, and are for illustrative purposes only. Please conduct your own research and draw your own conclusions.</strong></p>
<p>GEO is our qualitative framework that scores three key pillars of the Bitcoin ecosystem to cut through daily price noise and assess the structural health of the market.</p>
<h2>December Bitcoin Performance and Volatility</h2>
<p>Another painful 30 days for Bitcoin with price falling <strong>(-9%)</strong> as volatility reached its highest levels (30-day Vol &gt;45) since April 2025. The low of the print for Bitcoin came on November 22, when BTC traded around $80.7k, causing the 30-day RSI to bottom at around 32. The diminished appetite for speculation caused Bitcoin perpetual future basis rates to fall to <strong>(5%)</strong> annualized, while sagging as low as <strong>(3.7%)</strong>. This compares to the year&rsquo;s average of <strong>(7.4%)</strong>. Most onchain metrics for Bitcoin were poor, with hash rate dropping <strong>(-1% m/m)</strong>, daily fees down <strong>(-14% m/m)</strong> in dollar terms, and new addresses stagnating at <strong>(-1% m/m)</strong>.</p>
<h2>Treasuries Accumulate While ETPs Retract</h2>
<p>A positive development in the last 30 days was an increase in the pace of BTC purchases by Bitcoin DATs (Digital Asset Treasuries). From mid-November to mid-December, DATs bought the dip, adding 42k (+4% m/m) BTC, bringing aggregate holdings to 1.09m BTC. This is the largest Bitcoin purchase by DATs since the period between July 16 and August 15, 2025, when DATs added 128.1k BTC (+15% m/m) to their total DAT holdings.</p>
<p>With mNAVs dropping below 1.0x for many DATs, the majority of Bitcoin purchases in the past 30 days <strong>(29.4k BTC)</strong> were made by Strategy, which can issue common stock to buy BTC because mNAV&gt;1. Going forward, we believe many DATs&rsquo; strategy will be to move away from common stock issuance and instead finance BTC purchases with proceeds from preference share sales. For example, on December 22, 2025, the Japanese DAT Metaplanet will hold a shareholder vote to issue preferred stock to fund BTC purchases and operating expenses. Unfortunately, the BTC ETP investors were less bullish on Bitcoin with BTC holdings declining (-120bps m/m), dropping to 1.308m BTC.</p>
<h3>Longer-Term BTC Holders are Selling Tokens to New Holders</h3>
<p><img loading="lazy" class="img-responsive w-100" alt="Longer-Term BTC Holders are Selling Tokens to New Holders" src="https://www.vaneck.com/EPiServer/CMS/Content/contentassets/931770db79aa4b10b250804a4ad492db/6562_bitcoin-chaincheck-mid-dec_chart-1_2025-12_v1_blog.svg,,356071/Download?epieditmode=False" /></p>
<p class="chart-disclosure"><strong>Source:</strong> Glassnode as of 12/15/2025. <strong>Past performance is no guarantee of future results. Not intended as a recommendation to buy or sell any securities named herein.</strong></p>
<h2 id="divergent-behavior-btc-holders" class="jump-link-nav anchored-block" data-jumplink-title="Divergent Behavior BTC Holders">Divergent Behavior Between Long- and Medium-Term Holders</h2>
<p>Tracking the age of Bitcoins since they were last moved is an important indicator of hodler sentiment. Generally, if a token is not moved for a long time, greater than a few years, it indicates whoever holds it is confident in Bitcoin&rsquo;s long-term prospects. When older tokens are moved, they instantly join the newest cohorts, and we believe this churn may signal a short/medium-term price peak. However, this measure is complicated because coins age into older cohorts at different rates due to changes in Bitcoin inflation and earlier movements by token holders. Also, many long-term holders may be rotating balances to take advantage of the security and liquidity offered by ETPs and DATs. Additionally, some holders may also be rotating addresses or moving to newer, more secure wallets.</p>
<p>Looking onchain, we see increased movement of medium-term tokens with deep reductions in the balances of 1-2yr (-900 bps m/m), 2-3yr (-1250 bps m/m), and 3-5yr (-550bps m/m) cohorts. Looking at longer-term token balances, older hodlers appear to be holding the line with slight changes: 5-7yr (+27bps m/m), 7-10yr (-18bps m/m), &gt;10yr (+50bps m/m). If we step back and look more broadly at token balances older than 6 months, we have seen aggregate reductions (-190bps) in token balances. Thus, we see a nuanced picture in which the larger group of &ldquo;long-term&rdquo; holders, represented by coins that have not moved in the past 6 months, is reducing their balances. However, the longest-held coins do not appear to be following this trend, which means the oldest cohorts of hodlers are not selling. For the time being, we believe that short/medium-term cyclical players are dumping tokens while long-term Bitcoin bulls are holding.</p>
<h3>Breakeven Electricity Prices needed for S19 XP ASIC</h3>
<p><img loading="lazy" class="img-responsive w-100" alt="Breakeven Electricity Prices needed for S19 XP ASIC" src="https://www.vaneck.com/EPiServer/CMS/Content/contentassets/931770db79aa4b10b250804a4ad492db/6562_bitcoin-chaincheck-mid-dec_chart-2_2025-12_v1_blog.svg,,356081/Download?epieditmode=False" /></p>
<p class="chart-disclosure"><strong>Source:</strong> Glassnode as of 12/15/2025. <strong>Past performance is no guarantee of future results. Not intended as a recommendation to buy or sell any securities named herein.</strong></p>
<h2 id="miner-hash-rate-trends" class="jump-link-nav anchored-block" data-jumplink-title="Miner Hash Rate Trends">Miner Profitability and Network Hash Rate Trends</h2>
<p>A looming issue facing Bitcoin is the sustainability of the Bitcoin mining complex. Bitcoin miners face a tough structural squeeze: Bitcoin&rsquo;s block subsidy &ldquo;halving&rdquo; cuts revenue roughly every four years, even as network hash rate has compounded at about (+62%) CAGR since 2020. As a result, Bitcoin miners must continue to add hashing power through CAPEX to keep up with the network&rsquo;s growth. To make mining profitable, Bitcoin&rsquo;s price must make up for the reduction in supply and the growth of the hash rate. Recent weakness in the BTC price has made mining substantially less profitable, and a good indicator of this dynamic is the drop in breakeven electricity prices. In December 2024, the breakeven price on a 2022-era miner&rsquo;s (S19 XP) electricity cost was around $0.12, and for December 2025 (through 12/15), this figure has fallen to $0.077.</p>
<p>While Bitcoin hash has grown about 10x since 2020, it has been shrinking tactically over the past few months. Network hashing power, measured on a 30-day moving average, fell <strong>(-4%)</strong> over the past 30 days. This is the largest decline since April 2024. Bitcoin&rsquo;s hashing rate reached an all-time high in early November, and we typically expect the rate to drop during large pullbacks in Bitcoin price. Recently, a host of factors have also been affecting the mining rate, including news that Chinese BTC miners in Xinjiang shut down 1.3 GW of capacity amid government scrutiny. This is likely due to shifting the power generation to AI demand and may result in the removal of up to <strong>10%</strong> of Bitcoin network hashing power. It is estimated that nearly 400k mining machines have been shut down. While profitability for miners has been poor recently, many entities continue to mine despite periods of poor economics because they believe in Bitcoin's future. To support the long-term hash rate of the Bitcoin network, we believe up to 13 nations are mining with support from their central governments.</p>
<h2>Why a Falling Hash Rate Might Be Bullish</h2>
<p>Many Bitcoin enthusiasts worry about a sustained reduction in the hash rate because it could demonstrate that the mining industry is threatened as a going concern. Obviously, this would translate into people selling their BTC, thus worsening miner economics and therefore being reflexively bearish for Bitcoin price. Some empirical evidence suggests drops in hash rate can be bullish for long-term holders.</p>
<p>Looking at 90-day forward BTC returns vs 30-day past changes in Bitcoin hashing rate since 2014, we find that forward returns are more likely to be positive when Bitcoin hash rate is shrinking than when it is growing (<strong>65% vs. 54%</strong>). At the same time, we find that average 180-day forward returns are higher by around 30 bps <strong>(+20.5% vs 20.2%)</strong> when the Bitcoin hash rate is falling than when it is increasing.</p>
<p>Additionally, when hash rate compression persists over longer periods, positive forward returns tend to occur more often and with greater magnitude. Across the 346 days since 2014, when the 90-day hash rate growth was negative, 180-day forward BTC returns were positive <strong>(77%)</strong> of the time, with an average return of <strong>(+72%)</strong>. Outside of those days, 180-day forward BTC returns were positive <strong>(~61%)</strong> of the time and averaged <strong>(+48%)</strong>.</p>
<p>Thus, buying BTC when 90-day hash rate growth is negative, rather than at any time, has historically improved 180-day forward returns by (+2400 bps).</p>
<h3>Bitcoin ChainCheck Monthly Dashboard and Highlights</h3>
<p><img loading="lazy" class="img-responsive w-100" alt="Bitcoin ChainCheck Monthly Dashboard and Highlights" src="https://www.vaneck.com/EPiServer/CMS/Content/contentassets/931770db79aa4b10b250804a4ad492db/6562_bitcoin-chaincheck-mid-dec_table-2_2025-12_v1_blog.svg,,356082/Download?epieditmode=False" /></p>
<p class="chart-disclosure"><sup>1</sup>&nbsp;30 day change &amp; 365 day change are relative to the 30-day avg, not absolute. <br /><strong>Source:</strong> Glassnode, Bloomberg, Artemis XYZ as of 12/15/2025. <strong>Past performance is no guarantee of future results. Not intended as a recommendation to buy or sell any securities named herein.</strong></p>
<p>To receive more <strong><a href="https://www.vaneck.com/us/en/insights/digital-assets/" title="Digital Assets Insights">Digital Assets</a></strong> insights, <strong><a href="https://www.vaneck.com/us/en/subscribe/" title="Subscription Center">sign up in our subscription center</a></strong>.</p>
]]></content:encoded>
</item><item rdf:about="https://www.vaneck.com/us/en/blogs/natural-resources/hap-etf-question-and-answer/">
  <title>HAP ETF: Question &amp; Answer></title>
  <link>https://www.vaneck.com/us/en/blogs/natural-resources/hap-etf-question-and-answer/</link>
  <description><![CDATA[Explore why natural resources matter today and how the VanEck Natural Resources ETF (HAP) provides diversified exposure across energy, metals, agriculture, and renewables.]]></description>
  <dc:creator>Alicia  Barkley</dc:creator>
  <dc:date>12/19/2025 06:30:00</dc:date>
<content:encoded><![CDATA[

<p>Natural resources play a critical role in today&rsquo;s evolving global economy, supported by long-term demand across energy, metals, agriculture, and renewables. VanEck&rsquo;s approach to resource equity investing focuses on capturing this opportunity through differentiated exposure and disciplined portfolio construction. This Q&amp;A brings these themes together by highlighting what sets the <a href="/link/8035c2a4153d4a16bd871a6b15c949b3.aspx" title="HAP - VanEck Natural Resources ETF"><strong>VanEck Natural Resources ETF (HAP)</strong></a> apart and why natural resources remain relevant in the current market environment.</p>
<ul class="content-list">
<li class="mt-2"><a href="#point-one"><strong>What Are Natural Resources?</strong></a></li>
<li class="mt-2"><a href="#point-two"><strong>Why Invest in Natural Resources Today?</strong></a></li>
<li class="mt-2"><a href="#point-three"><strong>Why Invest in Natural Resources Over Commodities?</strong></a></li>
<li class="mt-2"><a href="#point-four"><strong>What is the HAP ETF and What Sets it Apart in the Market?</strong></a></li>
<li class="mt-2"><a href="#point-five"><strong>What Trends Are Driving Resource Demand?</strong></a></li>
<li class="mt-2"><a href="#point-six"><strong>What Role Do Natural Resource Equities Play in a Broader Portfolio?</strong></a></li>
<li class="mt-2"><a href="#point-seven"><strong>What Are the Key Risks of Investing in HAP?</strong></a></li>
<li class="mt-2"><a href="#point-eight"><strong>How Can Investors Buy VanEck ETFs?</strong></a></li>
</ul>
<h2 id="point-one" class="anchored-block">What Are Natural Resources?</h2>
<p>Natural resources are the cornerstone of global economic growth, providing the raw materials and energy that power every aspect of modern life. This broad asset class includes energy sources (oil, natural gas, and renewables), metals and minerals critical to industrial production and technology, agricultural commodities that sustain populations, and materials such as forest products and water systems. These assets are indispensable to global supply chains&mdash;fueling manufacturing, infrastructure development, data centers, and food systems worldwide.</p>
<p>Companies operating in this space play a pivotal role in extracting, refining, and managing these resources efficiently and responsibly. VanEck&rsquo;s perspective goes beyond traditional commodities to reflect the evolution of the resource economy, incorporating exposures ranging from renewable power producers to agritech innovators, all of which are shaping the future of the natural resources sector.</p>
<h2 id="point-two" class="anchored-block">Why Invest in Natural Resources Today?</h2>
<p>Natural resources equities serve as both inflation hedges and growth drivers, offering a dual source of potential portfolio value. Historically, resource companies tend to perform well during periods of moderate to high inflation, as rising input prices can translate directly into higher profits. They also benefit from long-term structural demand, driven by population growth, industrial expansion, and the accelerating modernization of emerging markets. Meanwhile, tightening supply chains and global infrastructure investment are increasing the strategic importance of real assets as anchors of portfolio stability.</p>
<p>Beyond inflation resilience, the sector is supported by secular trends&mdash;from the energy transition and decarbonization efforts to technological innovation and agricultural modernization. As economies around the world continue to rebuild and decarbonize, demand for raw materials and sustainable inputs is set to expand. These forces together position natural resources as a core pillar of real asset exposure, providing a balance between cyclical opportunity and enduring long-term growth.</p>
<h2 id="point-three" class="anchored-block">Why Invest in Natural Resources Over Commodities?</h2>
<p>While commodities provide direct exposure to raw material prices, natural resource equities represent ownership in the companies that discover, extract, refine, and distribute these materials. This approach offers two key advantages:</p>
<ul class="content-list">
<li class="mt-2"><strong>Income potential and capital appreciation:</strong> Resource companies can generate cash flow, reinvest in growth, and pay dividends&mdash;benefits not available through direct commodity exposure alone.</li>
<li class="mt-2"><strong>Diversified value-chain exposure:</strong> Equity investments gain access to the full resource lifecycle, from exploration and production to processing, innovation, and renewable development, rather than being limited to futures contracts or single-commodity exposure.</li>
</ul>
<p>In essence, natural resource equities blend real asset exposure with corporate efficiency and innovation, providing a more stable, long-term way to capture the upside of global resource cycles.</p>
<h2 id="point-four" class="anchored-block">What is the HAP ETF and What Sets it Apart in the Market?</h2>
<p>The <a href="/link/8035c2a4153d4a16bd871a6b15c949b3.aspx" title="HAP - VanEck Natural Resources ETF"><strong>VanEck Natural Resources ETF (HAP)</strong></a> seeks to replicate the&nbsp;<a href="/link/d52df9865d4344169ef628a966527697.aspx" title="Prices &amp; Returns - Equity ETF Indices"><strong>MarketVector<sup>&reg;</sup>&nbsp;Global Natural Resources Index (MVGNRTR)</strong></a>, providing a comprehensive, balanced exposure across the natural resources spectrum. <a href="/link/8035c2a4153d4a16bd871a6b15c949b3.aspx" title="HAP - VanEck Natural Resources ETF"><strong>HAP</strong></a> includes energy (30%), metals (30%), agriculture (24%), renewable energy (12%), and forest products (3%).</p>
<p><a href="/link/8035c2a4153d4a16bd871a6b15c949b3.aspx" title="HAP - VanEck Natural Resources ETF"><strong>HAP</strong></a> uniquely integrates renewable energy into its allocation&mdash;an area absent from traditional benchmarks like the S&amp;P Global Natural Resources Index. It also emphasizes agribusiness innovation, such as agricultural machinery, fertilizers, and crop science, reflecting a forward-looking view of the sector. Its methodology limits single-stock exposure (5% cap) and rebalances quarterly, ensuring broad, risk-aware diversification.</p>

<h2 id="point-five" class="anchored-block">What Trends Are Driving Resource Demand?</h2>
<p>Several long-term structural forces are supporting sustained demand for natural resources:</p>
<ul class="content-list">
<li class="mt-2"><strong>Energy transition:</strong> The global move toward decarbonization and electrification is fueling investment in renewable power, copper, and battery materials.</li>
<li class="mt-2"><strong>Digital infrastructure growth:</strong> Data centers and AI computing are rapidly expanding electricity demand.</li>
<li class="mt-2"><strong>Agricultural innovation:</strong> The global agriculture market is forecasted to expand significantly over the coming decade, supported by sustainable farming and food technology.</li>
<li class="mt-2"><strong>Monetary diversification:</strong> Central banks and investors continue to accumulate gold and strategic metals as hedges against currency volatility and geopolitical uncertainty.</li>
</ul>
<p>Collectively, these trends highlight natural resources as a long-term, multi-sector growth theme aligned with both industrial evolution and sustainability goals.</p>
<h2 id="point-six" class="anchored-block">What Role Do Natural Resource Equities Play in a Broader Portfolio?</h2>
<p>Natural resource equities provide low correlation to traditional asset classes like U.S. stocks and bonds, enhancing diversification and resilience. They can mitigate inflation risk, stabilize returns, and capture cyclical opportunities that are often uncorrelated with technology or consumer sectors.</p>
<p>Within a diversified portfolio, <a href="/link/8035c2a4153d4a16bd871a6b15c949b3.aspx" title="HAP - VanEck Natural Resources ETF"><strong>HAP</strong></a> can serve as a core real assets component, complementing equities and fixed income while providing exposure to both traditional and renewable resource growth. Its global composition allows investors to access a blend of developed and emerging market producers, thereby reducing country-specific concentration risk.</p>
<h2 id="point-seven" class="anchored-block">What Are the Key Risks of Investing in HAP?</h2>
<p>While natural resources can enhance portfolio balance, they come with distinct risks:</p>
<ul class="content-list">
<li class="mt-2"><strong>Geopolitical risk:</strong> Conflicts, sanctions, or political instability in commodity-producing regions may disrupt supply and affect prices.</li>
<li class="mt-2"><strong>Regulatory and repatriation risk:</strong> Governments may impose capital controls or nationalize assets.</li>
<li class="mt-2"><strong>Commodity price volatility:</strong> Shifts in global supply and demand, weather patterns, or energy policy can influence resource company performance.</li>
<li class="mt-2"><strong>Trade policy risk:</strong> Tariffs or export restrictions can distort global commodity flows.</li>
</ul>
<p><a href="/link/8035c2a4153d4a16bd871a6b15c949b3.aspx" title="HAP - VanEck Natural Resources ETF"><strong>HAP</strong></a> should be viewed as a strategic, long-term allocation&mdash;balancing potential volatility with its ability to hedge inflation and capture secular growth trends.</p>

<h2 id="point-eight" class="anchored-block">How Can Investors Buy VanEck ETFs?</h2>
<p><a href="/link/8035c2a4153d4a16bd871a6b15c949b3.aspx" title="HAP - VanEck Natural Resources ETF"><strong>Learn more here</strong></a>.</p>
<p><span style="font-size: 14pt;"><strong>How to Buy HAP?</strong></span></p>
<p>VanEck ETFs can be purchased the same way you would buy a stock, through a broker or with your advisor.</p>
<p class="d-none d-lg-block"><a href="mailto:askvaneck@vaneck.com" title="Have More Questions? - Ask VanEck" rel="noopener"><img loading="lazy" class="img-responsive" src="https://www.vaneck.com/globalassets/home/us/insights/blogs/bm-blog-images/cta-faq_desktop-02.svg" alt="Have More Questions? - Ask VanEck" /></a></p>
<p class="d-lg-none"><a href="mailto:askvaneck@vaneck.com" title="Have More Questions? - Ask VanEck" rel="noopener"><img loading="lazy" class="img-responsive" src="https://www.vaneck.com/globalassets/home/us/insights/blogs/bm-blog-images/cta-faq_mobile-01.svg" alt="Have More Questions? - Ask VanEck" /></a></p>
<p>To receive more <a href="/us/en/insights/natural-resources/" title="Natural Resources Insights"><strong>Natural Resources</strong></a> insights, <a href="https://www.vaneck.com/us/en/subscribe/" title="Subscription Center"><strong>sign up in our subscription center</strong></a>.</p>
]]></content:encoded>
</item><item rdf:about="https://www.vaneck.com/us/en/blogs/investment-outlook/plan-for-2026-predictions-from-our-portfolio-managers/">
  <title>Plan for 2026: Predictions from Our Portfolio Managers></title>
  <link>https://www.vaneck.com/us/en/blogs/investment-outlook/plan-for-2026-predictions-from-our-portfolio-managers/</link>
  <description><![CDATA[Get your portfolio ready for 2026 with detailed insights from VanEck&rsquo;s investment team about the factors driving risk and returns in their respective asset classes.]]></description>
  <dc:creator> </dc:creator>
  <dc:date>12/18/2025 06:30:00</dc:date>
<content:encoded><![CDATA[

<p>CEO Jan van Eck <strong><a href="/us/en/blogs/investment-outlook/jan-van-eck-q4-2025-outlook-escaping-the-reckoning/" title="Q4 2025 Outlook: Escaping the Reckoning?">recently discussed </a></strong> why he is cautiously optimistic heading into 2026. Fiscal progress is real and markets are finding balance, but selectivity still matters as AI evolves, credit tightens and policy shifts continue.</p>
<p>To complement these macro-level insights, we asked our portfolio managers to share their outlooks for their respective asset classes and highlight the most significant investment opportunities. Their insights below provide a view across various asset classes, offering guidance to empower your investment decisions for the year ahead.</p>
<ul class="content-list mb-4">
<li class="mt-2"><a href="#multi-asset" title="Multi Asset: Three Mega Themes for 2026"><strong>Multi Asset: Three Mega Themes for 2026</strong></a></li>
<li class="mt-2"><a href="#global-resources" title="Gold: Fundamental Drivers Remain Powerful"><strong>Gold: Fundamental Drivers Remain Powerful</strong></a></li>
<li class="mt-2"><a href="#natural-resources" title="Natural Resources: The Structural Power Crunch Begins"><strong>Natural Resources: The Structural Power Crunch Begins</strong></a></li>
<li class="mt-2"><a href="#fixed-income" title="Fixed Income: Focused on Relative Value and Capital Preservation"><strong>Fixed Income: Focused on Relative Value and Capital Preservation</strong></a></li>
<li class="mt-2"><a href="#municipal-bonds" title="Municipal Bonds: Another Year of Strong Issuance Expected"><strong>Municipal Bonds: Another Year of Strong Issuance Expected</strong></a></li>
<li class="mt-2"><a href="#emerging-markets-debt" title="Emerging Markets Debt: Fiscal Dominance"><strong>Emerging Markets Debt: Fiscal Dominance</strong></a></li>
<li class="mt-2"><a href="#emerging-markets-equity" title="Emerging Markets Equity: Set Up for a Fundamentals-Led Year"><strong>Emerging Markets Equity: Set Up for a Fundamentals-Led Year</strong></a></li>
<li class="mt-2"><a href="#digital-assets" title="Digital Assets: Bitcoin Mining&rsquo;s Pivot Creates Opportunities"><strong>Digital Assets: Bitcoin Mining&rsquo;s Pivot Creates Opportunities</strong></a></li>
</ul>
<h2 id="multi-asset" class="jump-link-nav anchored-block" data-jumplink-title="Multi Asset">Multi Asset: Three Mega Themes for 2026</h2>
<div class="d-flex justify-content-between align-items-center row my-3">
<div class="col-md-12">
<div class="row align-items-center">
<div class="col-md-12">
<div class="byline__author">
<div class="porthole porthole--lg byline__author-image no-print mr-3" style="background-image: url('/EPiServer/CMS/Content/globalassets/home/corp/our-firm/investment-professionals/david-schassler.jpg,,89744/?epieditmode=False');"><img loading="lazy" alt="David Schassler Head of Multi-Asset Solutions" class="porthole__image" src="https://www.vaneck.com/globalassets/home/corp/our-firm/investment-professionals/david-schassler.jpg" /></div>
<div style="position: relative;" class="byline__author-content"><a data-ve-gtm="blog-author" class="byline__author-name-link" href="/us/en/news-and-insights/thought-leaders/david-schassler/" title="David Schassler &mdash; Head of Multi-Asset Solutions">
<h3 class="byline__author-name mt-0">David Schassler</h3>
</a>
<div class="byline__author-title">Head of Multi-Asset Solutions</div>
</div>
</div>
</div>
</div>
</div>
</div>
<!-- -->
<p><strong>Outlook</strong></p>
<p>Heading into 2026, three mega-themes are driving markets:</p>
<ol class="content-list">
<li class="mt-2">A technological revolution</li>
<li class="mt-2">Old-world assets building the new world</li>
<li class="mt-2">Monetary debasement picking up the tab</li>
</ol>
<p>Against this backdrop, we expect more volatility in tech. AI is shifting from phase 1, build-out, to phase 2, adoption. Phase 1 rewarded scale and storytelling, while phase 2 requires a credible path to ROI on the largest tech cap-ex cycle in history. That transition exposes hard truths that markets may not want to hear. But in a technological revolution, volatility is a feature. It creates entry points.</p>
<p><strong>Investment Opportunities</strong></p>
<p>The long game is unchanged: AI and robotics will over-deliver. Just don&rsquo;t expect that full payoff in 2026. Real assets are in a stealth bull market. Natural-resource equities and other real-asset exposures are outperforming QQQ this year as under-the-radar beneficiaries of AI infrastructure, energy transitions and re-shoring. We&rsquo;re still in the early innings of a decade-long real-asset super-cycle. Debasement is becoming the shadow financial strategy for funding yesterday&rsquo;s liabilities and tomorrow&rsquo;s ambitions. That risk needs to be hedged with scarce assets, such as gold and Bitcoin.</p>
<p>Gold is one of the strongest major assets this year, and we expect that momentum to carry it to $5,000 in 2026. The gold bull market will introduce real volatility to what has historically been a calm asset. That&rsquo;s not a flaw; it&rsquo;s an opportunity.</p>
<p>In 2025, Bitcoin has lagged technology stocks by about 30% and gold by about 70%, creating a compelling setup. That relative underperformance reflects Bitcoin&rsquo;s high sensitivity to financial conditions during periods of cautious risk-taking, not a broken thesis. As financial conditions gradually ease, Bitcoin is expected to be the ultimate beneficiary. We have been buying.</p>

<h2 id="global-resources" class="jump-link-nav anchored-block" data-jumplink-title="Global Resources">Gold: Fundamental Drivers Remain Powerful</h2>
<div class="d-flex justify-content-between align-items-center row my-3">
<div class="col-md-12">
<div class="row align-items-center">
<div class="col-md-6">
<div class="byline__author">
<div class="porthole porthole--lg byline__author-image no-print mr-3" style="background-image: url('https://www.vaneck.com/globalassets/home/corp/our-firm/investment-professionals/imaru-casanova.jpg');"><img loading="lazy" alt="Imaru Casanova Portfolio Manager, Gold and Precious Metals" class="porthole__image" src="https://www.vaneck.com/globalassets/home/corp/our-firm/investment-professionals/imaru-casanova.jpg" /></div>
<div style="position: relative;" class="byline__author-content"><a data-ve-gtm="blog-author" class="byline__author-name-link" href="/us/en/news-and-insights/thought-leaders/imaru-casanova/" title="Imaru Casanova &mdash; Portfolio Manager, Gold and Precious Metals">
<h3 class="byline__author-name mt-0">Imaru Casanova</h3>
</a>
<div>
<div class="byline__author-title">Portfolio Manager, Gold and Precious Metals</div>
</div>
</div>
</div>
</div>
</div>
</div>
</div>
<!-- -->
<p><strong>Outlook</strong></p>
<p>Gold&rsquo;s performance in 2025 has been exceptional, recently breaking above the $4,000 level and establishing itself in a much higher trading range than earlier in the year. While some consolidation from these record levels would be natural, we expect any pullbacks to occur around a higher base, likely in the $3,500&ndash;$3,600 range rather than signaling a reversal. The fundamental drivers supporting gold remain powerful and durable.</p>
<p>Two forces continue to anchor this bull market. First, central banks have been buying gold at record levels for three consecutive years as they diversify reserves and, in many cases, actively reduce reliance on the US dollar. This structural shift in official-sector behavior appears set to continue. Second, Western investment demand&mdash;historically the key driver of major price moves&mdash;has finally turned higher. Gold ETF holdings remain well below prior peaks, suggesting substantial room for additional inflows.</p>
<p>Layered on top of these demand dynamics is a macro backdrop marked by heightened geopolitical risk, concerns over stretched equity market valuations, and a renewed desire for portfolio diversification. In this environment, gold continues to act as a reliable source of protection and resilience. For investors without an existing allocation, we believe it is not too late to begin building one.</p>
<p><strong>Investment Opportunities</strong></p>
<p>The most compelling opportunity in our space remains gold equities. Despite strong performance this year, the sector continues to trade at depressed valuation multiples relative to both the broader market and its own long-term history. This disconnect persists even as gold miners deliver some of the strongest fundamentals in decades: record revenues and cash flow, expanding margins, disciplined capital allocation, and healthier balance sheets.</p>
<p>Importantly, companies are maintaining conservative reserve price assumptions, often far below spot, while still generating enough free cash flow to fund organic growth, dividends, buybacks, and selective M&amp;A. Yet the asset class remains significantly under-owned. With the total market cap of gold equities still around $1 trillion, even a modest rotation out of crowded segments of the equity market could drive meaningful re-rating.</p>
<p>We believe the sector is at the early stages of a long-overdue normalization in valuation. As investors increasingly recognize that today&rsquo;s miners offer both leverage to rising gold prices and improving fundamentals, gold equities may finally earn a durable, strategic role in global multi-asset portfolios.</p>

<h2>Natural Resources: The Structural Power Crunch Begins</h2>
<div class="d-flex justify-content-between align-items-center row my-3">
<div class="col-md-12">
<div class="byline__author">
<div class="porthole porthole--lg byline__author-image no-print mr-3" style="background-image: url('/EPiServer/CMS/Content/globalassets/home/corp/our-firm/investment-professionals/shawn-reynolds.jpg,,87154?epieditmode=false');"><img loading="lazy" alt="Shawn Reynolds Portfolio Manager, Global Resources" class="porthole__image" src="https://www.vaneck.com/globalassets/home/corp/our-firm/investment-professionals/shawn-reynolds.jpg" /></div>
<div style="position: relative;" class="byline__author-content"><a data-ve-gtm="blog-author" class="byline__author-name-link" href="/us/en/news-and-insights/thought-leaders/shawn-reynolds/" title="Shawn Reynolds &mdash; Portfolio Manager, Global Resources">
<h3 class="byline__author-name mt-0">Shawn Reynolds</h3>
</a>
<div class="byline__author-title">Portfolio Manager, Global Resources</div>
</div>
</div>
</div>
</div>
<!-- -->
<p><strong>Outlook</strong></p>
<p>Natural resources head into 2026 being shaped by a dominant force: the world is entering a structural power crunch. Global electricity demand is rising at its fastest pace in decades as AI data centers, widespread electrification, manufacturing re-shoring and ongoing urbanization drive unprecedented load growth. This wave of demand is colliding with energy systems built for a different era&mdash;security of resource supply, insufficient generation capacity, aging transmission networks and disruptive supply chains that are increasingly vulnerable to geopolitical pressure.</p>
<p>Energy availability and affordability have shifted from technical considerations to strategic determinants of economic competitiveness. Nations are now racing to secure fuels, critical minerals, grid equipment and next-generation power technologies. At the same time, multiple years of underinvestment across both energy and materials have created tight supply conditions in several markets, from natural gas to copper and other transition metals.</p>
<p>While policy uncertainty, interest-rate paths, <strong><a href="https://www.vaneck.com/us/en/blogs/natural-resources/the-power-divide-china-us-and-the-future-of-the-grid/" title="The Power Divide: China, U.S. and the Future of the Grid">China&rsquo;s growth trajectory</a></strong> and geopolitical tensions may heighten volatility, the broader setup remains supportive. Secular demand growth from electrification, grid expansion and data-center build-out intersects with slow, complex supply responses&mdash;particularly in mining, where multi-year permitting cycles and rising project costs constrain new production. Taken together, these forces underpin a constructive long-term outlook for natural resource equities.</p>
<p><strong>Investment Opportunities</strong></p>
<p>The most compelling investment opportunities emerge where structural demand growth meets constrained supply.</p>
<p>In energy, natural gas remains a critical bridging fuel as grids struggle to accommodate accelerating load growth. Producers with low break-evens, disciplined capital allocation and well-positioned infrastructure continue to benefit from resilient demand patterns. Select oil and integrated energy companies also remain attractive given steady product margins, strong free-cash-flow generation and ongoing portfolio optimization. US output has been responsible for almost all the global supply growth over the last 15 years. This will not be the case in 2026 and beyond, and new, secure sources of production will need to be found.</p>
<p>In metals and mining, copper is especially well-positioned. Supply disruptions, limited project pipelines and long development timelines are intersecting with rising demand from EVs, grid investment and digital infrastructure. Companies with high-quality assets, clean balance sheets and visible production growth are poised to benefit from these durable trends.</p>
<p>Beyond traditional resource sectors, next-generation power technologies&mdash;including advanced nuclear, geothermal, hydrogen systems, long-duration energy storage and AI-optimized grid solutions&mdash;represent emerging areas of investment as countries pursue secure, scalable and affordable power.</p>
<p>Across the natural resources landscape, valuations remain attractive, cash generation is robust and secular tailwinds are strengthening. For long-term investors, opportunities lie in owning companies positioned to supply, enable or secure the world's rapidly evolving power systems.</p>

<h2 id="fixed-income" class="jump-link-nav anchored-block" data-jumplink-title="Income">Fixed Income: Focused on Relative Value and Capital Preservation</h2>
<div class="d-flex justify-content-between align-items-center row my-3">
<div class="col-md-12">
<div class="byline__author">
<div class="porthole porthole--lg byline__author-image no-print mr-3" style="background-image: url('/EPiServer/CMS/Content/globalassets/home/corp/our-firm/investment-professionals/fran-rodilosso.jpg,,87146?epieditmode=false');"><img loading="lazy" alt="Fran Rodilosso Head of Fixed Income ETF Portfolio Management" class="porthole__image" src="https://www.vaneck.com/globalassets/home/corp/our-firm/investment-professionals/fran-rodilosso.jpg" /></div>
<div style="position: relative;" class="byline__author-content"><a data-ve-gtm="blog-author" class="byline__author-name-link" href="/us/en/news-and-insights/thought-leaders/fran-rodilosso/" title="Fran Rodilosso &mdash; Head of Fixed Income ETF Portfolio Management">
<h3 class="byline__author-name mt-0">Fran Rodilosso</h3>
</a>
<div class="byline__author-title">Head of Fixed Income ETF Portfolio Management</div>
</div>
</div>
</div>
</div>
<!-- -->
<p><strong>Outlook</strong></p>
<p>Fixed income largely fulfilled its role in 2025, delivering mid-to-high single-digit returns across most sectors and mid-teens gains in emerging markets debt. Returns were supported not only by carry but also by declining yields, tighter credit spreads and, in the case of emerging markets debt, a weaker US dollar. By year-end, however, most markets were at materially lower yield levels than where they began, pointing to more modest baseline returns for 2026. Those prospects are further supported by historically tight credit spreads, even as spread levels are supported by strong corporate fundamentals. With developed- and emerging-market easing cycles nearing their end, and with sovereign debt concerns rising&mdash;notably around US deficits and Japan&rsquo;s policy dilemma that pits currency stability versus debt sustainability&mdash;the backdrop still remains moderately constructive for private sector and EM credit.</p>
<p>Against the setting of a strong fundamental starting point and tight spreads, we expect credit returns in 2026 to be shaped in part by episodic volatility rather than trending markets, creating opportunities to add credit risk at more attractive valuations. At the same time, we remain cautious on duration: the trend of the US yield curve steepening while the Fed continues to cut should remain intact. The Fed also faces a policy dilemma as anticipated weakness in the employment picture coincides with upside growth surprises and sticky inflation. Meanwhile, Japan&rsquo;s experience underscores the vulnerability of long-end yields amid fiscal and currency pressures, and Europe has also shown this year that policy rate cuts do not guarantee declining 10-year yields.</p>
<p><strong>Investment Opportunities</strong></p>
<p>With lower starting yields, and spreads that leave little room for additional capital appreciation, we begin 2026 focused on relative value and capital preservation rather than momentum. We continue to see value in investment-grade and mezzanine CLOs, but within our actively managed CLO strategies, we are tilting up in quality, which should afford us room to pivot should valuations correct. Emerging markets local-currency debt remains a compelling alternative to US or global aggregate exposure by most key fundamental and technical measures. It is important to note that although currency gains versus the US dollar stand at about 8% YTD 2025 (less than 50% of total return), those currencies actually have lagged the Euro by 5% over the same period, indicating the potential for a broader rally in EMFX and continued support for local currencies. Fallen Angel high yield stands out as a higher quality approach to risky credit, and there should be opportunities to add exposure there during spread-widening episodes. These asset classes also offer meaningful diversification to a traditional bond market allocation strategy, where current yields and valuations do not warrant extending risk. The potential for higher returns exists only at the margin and at the risk of defeating the stabilizing effect fixed income is meant to play in a diversified portfolio.</p>


<h2 id="municipal-bonds" class="anchored-block">Municipal Bonds: Another Year of Strong Issuance Expected</h2>
<!-- <p><a href="/EPiServer/CMS/Content/en/us/insights/thought-leaders/tamara-lowin,,247359/?epieditmode=false" title="Tamara Lowin - Senior Credit Analyst, Municipal Bonds"><strong>Tamara Lowin, Senior Credit Analyst, Municipal Bonds</strong></a></p> -->
<div class="d-flex justify-content-between align-items-center row my-3">
<div class="col-md-12">
<div class="row align-items-center">
<div class="col-md-6">
<div class="byline__author">
<div class="porthole porthole--lg byline__author-image no-print mr-3" style="background-image: url('https://www.vaneck.com/globalassets/home/us/insights/thought-leaders/tamara-lowin_2022.06_v1.jpg');"><img loading="lazy" alt="Tamara Lowin Senior Municipal Credit Analyst" class="porthole__image" src="https://www.vaneck.com/globalassets/home/us/insights/thought-leaders/tamara-lowin_2022.06_v1.jpg" /></div>
<div style="position: relative;" class="byline__author-content"><a data-ve-gtm="blog-author" class="byline__author-name-link" href="/link/9217c92d0f9a407e8b869d637f8a9cce.aspx" title="Tamara Lowin &mdash; Senior Municipal Credit Analyst">
<h3 class="byline__author-name mt-0">Tamara Lowin</h3>
</a>
<div>
<div class="byline__author-title">Senior Municipal Credit Analyst</div>
</div>
</div>
</div>
</div>
</div>
</div>
</div>
<!-- -->
<p><strong>Outlook</strong></p>
<p>Record supply the past two years was led by new money revenue bonds as the quadrennial challenge to the muni tax exemption encouraged issuers to &ldquo;pull forward&rdquo; their calendar of deals to the market and suppressed refunding opportunities. Contributing to the heightened supply were the inflation-induced construction cost increases. The observable impact was a 7% increase in the average deal size year-over-year (through December).</p>
<p>For 2026, reassurance of the tax-exemption remaining in place and Fed Funds rate cuts will stimulate proportional increases in state and local G.O. issuance as well as opportunistic refunding, which was just 12% of issuance in 2025, when historically the figure was regularly responsible for over one-third of new issuance.</p>
<p>Structurally, the long-standing 30-year maximum maturity standard has now extended to a &ldquo;new normal&rdquo; of 35 years as inflation and higher construction costs increase project budgets. To afford annual debt service payments for new projects, borrowers will continue to push repayment plans out to 35 and sometimes even 40 years. At the same time, many borrowers are shortening the traditional 10-year call protection period, with the hope that lower short rates in the next 3-7 years and/or credit quality improvements will enable refinancing to reduce debt service expenses. Borrowers that increase their fees for services in the future can better absorb these expenses and refinance at lower rates with these changes in place.</p>
<p><strong>Investment Opportunities</strong></p>
<p>Treasury rates and municipal demand will dictate investment-grade municipal opportunities in 2026. We expect a treasury bull-steepener to emerge in the first half of the year. Two or three rate cuts by the Fed and continued elevated supply will keep muni yields high at the long end of the curve to compete with taxable debt. A proliferation of longer maturities will pressure yields wider as well, as retail investors will need to be compensated to move beyond the 20-year part of the curve. On this note, we expect to find continued value in the intermediate part of the muni curve, especially with short call structures, which shelters investors from duration risk and volatility on the long end.</p>
<p>In muni high yield, certain sectors are struggling with long-term demographic and policy shifts that stress their financials beyond inflation-induced higher construction and operating expenses. Higher education, charter schools, hospitals, senior living and tobacco are especially exposed and we expect further spread widening as the overall risks permeate these sectors. The need for individual evaluation of investments is critical to maintain exposure to these sectors and minimize risk.</p>

<h2 id="emerging-markets-debt" class="jump-link-nav anchored-block" data-jumplink-title="Emerging Markets">Emerging Markets Debt: Fiscal Dominance</h2>
<div class="d-flex justify-content-between align-items-center row my-3">
<div class="col-md-12">
<div class="byline__author">
<div class="porthole porthole--lg byline__author-image no-print mr-3" style="background-image: url('/EPiServer/CMS/Content/globalassets/home/corp/our-firm/investment-professionals/eric-fine.jpg,,87145?epieditmode=false');"><img loading="lazy" alt="Eric Fine Portfolio Manager, Head of Active Emerging Markets Debt" class="porthole__image" src="https://www.vaneck.com/globalassets/home/corp/our-firm/investment-professionals/eric-fine.jpg" /></div>
<div style="position: relative;" class="byline__author-content"><a data-ve-gtm="blog-author" class="byline__author-name-link" href="/us/en/news-and-insights/thought-leaders/eric-fine" title="Eric Fine  &mdash; Portfolio Manager, Head of Active Emerging Markets Debt">
<h3 class="byline__author-name mt-0">Eric Fine</h3>
</a>
<div>
<div class="byline__author-title">Portfolio Manager, Head of Active Emerging Markets Debt</div>
</div>
</div>
</div>
</div>
</div>
<!-- -->
<p><strong>Outlook</strong></p>
<p>Our outlook on emerging markets bonds is positive for 2026. EM bonds have been overlooked despite outperforming developed market bonds on an absolute- and volatility adjusted basis for over two decades. EM bonds carry at 6.4%, compared to 3.2% for the Global Aggregate, as of 11/30/2025, and carry has historically driven these superior returns (source: JP Morgan and ICE Data).</p>
<p>EM is largely not subject to the &ldquo;fiscal dominance&rdquo; that characterizes many developed market bonds, which dominate investor portfolios. EMs generally have about &frac12; to ⅓ the level of central government debt compared to developed markets. This means they have superior debt profiles. Initially, the key beneficiary was USD-denominated debt of these EMs, and their spreads and spread volatility collapsed in the initial phase. But EMs, particularly in Asia, have maintained this fiscal orthodoxy for decades now. This has anchored inflation and inflation expectations, and many EMs have seen their borrowing costs in their own currencies collapse as well. China has both USD bonds trading at lower yields than US Treasuries, as well as bonds in CNY that trade at lower nominal yields than US Treasuries. China is actively pursuing the internationalization of the RMB, including as a reserve asset.</p>
<p><strong>Investment Opportunities</strong></p>
<p>EMs not only provide geographic diversification and superior fiscal stances, but they are largely either commodities exporters (LatAm) or large trade surplus countries (Asia). This exposes investors to different underlying factors than what typically characterizes investor positions in bonds.</p>
<p>In this environment, central banks are not asleep. They are buying gold as a reserve asset, of course. And they never sent a press release on that one. As they search for new reserve assets, EM bonds are likely to fall on their radar. All those headlines we saw over the past several years about the UAE, Brazil, India and China trading in each other&rsquo;s currencies is just a short step away from buying each other&rsquo;s bonds as reserve assets. And the central banks won&rsquo;t send a press release on this, either.</p>

<h2 id="emerging-markets-equity" class="anchored-block">Emerging Markets Equity Set Up for a Fundamentals-Led Year</h2>
<div class="d-flex justify-content-between align-items-center row my-3">
<div class="col-md-12">
<div class="row align-items-center">
<div class="col-md-6">
<div class="byline__author">
<div class="porthole porthole--lg byline__author-image no-print mr-3" style="background-image: url('/EPiServer/CMS/Content/globalassets/home/corp/our-firm/investment-professionals/ola-el-shawarby_2022.06_v1.jpg,,174295?epieditmode=false');"><img loading="lazy" alt="Ola El-Shawarby, CFA Portfolio Manager, Emerging Markets Equity" class="porthole__image" src="https://www.vaneck.com/globalassets/home/corp/our-firm/investment-professionals/ola-el-shawarby_2022.06_v1.jpg" /></div>
<div style="position: relative;" class="byline__author-content"><a data-ve-gtm="blog-author" class="byline__author-name-link" href="/link/f98f0ec11c0043b3803f14238bacfd2d.aspx" title="Ola El-Shawarby, CFA &mdash; Portfolio Manager, Emerging Markets Equity">
<h3 class="byline__author-name mt-0">Ola El-Shawarby, CFA</h3>
</a>
<div>
<div class="byline__author-title">Portfolio Manager, Emerging Markets Equity</div>
</div>
</div>
</div>
</div>
</div>
</div>
</div>
<!-- -->
<p><strong>Outlook</strong></p>
<p>Emerging markets enter 2026 with a more balanced and fundamentally supported backdrop after several years of macro uncertainty. Following a liquidity- and valuation-driven 2025, we expect returns this year to be increasingly earnings-driven, selective, and aligned with long-duration structural trends, resulting in greater dispersion across countries and sectors. Moderating inflation, increased central bank flexibility, and a US dollar that is unlikely to strengthen meaningfully&mdash;potentially softening as global rate cuts unfold&mdash;create a more constructive setting for EM. At the same time, renewed interest in global diversification is drawing investors back to the asset class as AI adoption, the energy transition, and manufacturing realignment become more globally distributed.</p>
<p>Despite this improving backdrop, investor positioning in EM remains light by historical standards, providing room for reallocation. China appears early in a multi-year repair cycle supported by rapid AI innovation, supply-side reforms, and steady efforts to lift consumption, even as property-sector pressures persist. India enters 2026 with more realistic earnings expectations, healthier valuations after last year&rsquo;s pullback, and early rate-cut support; after notable underperformance versus China in 2025, we expect performance dispersion to narrow. In the Gulf, the UAE continues to benefit from solid, broad-based fundamentals, while both the UAE and Saudi Arabia are emerging as potential AI-enabled growth and reform stories, supported by low-cost energy, improved access to advanced chips, and ongoing capital markets modernization. Across Africa, macro conditions are improving for the first time in years as inflation eases and policy frameworks strengthen. Any movement toward a more durable peace outcome in Ukraine, and the resulting stabilization across Eastern Europe, could further support sentiment and reopen selective opportunities.</p>
<p><strong>Investment Opportunities</strong></p>
<p>The most compelling opportunities in 2026 lie at the intersection of structural growth, improving fundamentals, and supportive policy trends.</p>
<ul class="content-list">
<li class="mt-2"><strong> China: </strong> Targeted reforms, better liquidity conditions, and AI-driven productivity gains are creating attractive opportunities across internet platforms, automation, advanced technology, and early signs of consumption recovery.</li>
<li class="mt-2"><strong>India: </strong> A durable long-term story, with financials, high-quality consumer franchises, and industrials well positioned to benefit from strengthening demand within a more balanced macro environment.</li>
<li class="mt-2"><strong>Korea and Taiwan: </strong> Key beneficiaries of structural semiconductor demand tied to AI. While we acknowledge the risk that hyperscalers may reassess near-term capex intensity, underlying supply-demand and return dynamics remain favorable. Korea&rsquo;s Value-Up program is also helping narrow long-standing valuation discounts.</li>
<li class="mt-2"><strong>Brazil: </strong> Moderating inflation and the potential for quicker rate cuts from historically high real yields support a more favorable backdrop for credit conditions, earnings momentum, and equities overall.</li>
<li class="mt-2"><strong>Mexico: </strong> Investment may accelerate as USMCA discussions progress constructively and nearshoring trends continue to gain traction.</li>
<li class="mt-2"><strong>Gulf: </strong> The UAE and Saudi Arabia offer rising AI-linked growth potential, with Saudi Arabia&rsquo;s valuation reset and capital markets reform agenda providing additional upside.</li>
<li class="mt-2"><strong>Africa and Frontier: </strong> Select markets may re-emerge as macro stability improves and reforms advance, while Eastern Europe could benefit meaningfully if geopolitical risks continue to ease.</li>
</ul>
<p>Across emerging markets, we continue to favor high-quality companies with strong balance sheets, durable earnings power, and exposure to long-duration structural themes. These businesses are best positioned to lead a more fundamentals-driven 2026 and compound value for shareholders over time.</p>

<h2 id="digital-assets" class="jump-link-nav anchored-block" data-jumplink-title="Digital Assets">Digital Assets: Bitcoin Mining&rsquo;s Pivot Creates Opportunities</h2>
<!--<p><a href="/EPiServer/CMS/Content/en/us/insights/thought-leaders/matthew-sigel,,128171/?epieditmode=false" title="Matthew Sigel - Head of Digital Assets Research"><strong>Matthew Sigel, Head of Digital Assets Research</strong></a></p>-->
<div class="d-flex justify-content-between align-items-center row my-3">
<div class="col-md-12">
<div class="byline__author">
<div class="porthole porthole--lg byline__author-image no-print mr-3" style="background-image: url('https://www.vaneck.com/globalassets/home/us/insights/thought-leaders/img-tl-matthew-sigel-645px.jpg');"><img loading="lazy" alt="David Schassler Head of Multi-Asset Solutions" class="porthole__image" src="https://www.vaneck.com/globalassets/home/us/insights/thought-leaders/img-tl-matthew-sigel-645px.jpg" /></div>
<div style="position: relative;" class="byline__author-content"><a data-ve-gtm="blog-author" class="byline__author-name-link" href="/link/b2b937a9c48a476890a9e6e7ad308413.aspx" title="Matthew Sigel &mdash; Head of Digital Assets Research">
<h3 class="byline__author-name mt-0">Matthew Sigel</h3>
</a>
<div class="byline__author-title">Head of Digital Assets Research</div>
</div>
</div>
</div>
</div>
<!-- -->
<p><strong>Outlook</strong></p>
<p>Digital assets enter 2026 with mixed but constructive signals. Bitcoin fell about 80% in the last cycle, but realized volatility has since dropped by roughly half, which implies a proportional drawdown of about 40% this time. The market has already absorbed roughly 35%. At the same time, Bitcoin&rsquo;s historical four-year cycle, which tends to peak in the immediate post-election window, remains intact following the early October 2025 high. That pattern suggests 2026 is more likely a consolidation year than a melt-up or a collapse.</p>
<p>Our outlook follows a three-lens framework:</p>
<ol class="content-list">
<li class="mt-2">Global liquidity is mixed: likely rate cuts provide support, but US liquidity is tightening somewhat because AI-driven capex fears have collided with a more fragile funding market and pushed credit spreads wider.</li>
<li class="mt-2">Leverage in the crypto ecosystem has reset after several washouts.</li>
<li class="mt-2">On-chain activity, while still soft, is beginning to improve.</li>
</ol>
<p><strong>Investment Opportunities</strong></p>
<p>Against this backdrop, we favor a disciplined 1 to 3% Bitcoin allocation built through dollar cost averaging and by adding exposure during leverage unwinds and trimming into speculative excess.</p>
<p>We also note that quantum security has become an active topic inside the community, and while not an immediate threat, any coordinated response could resemble the first blocksize debates, where a transparent and technically rich public process pulled large numbers of new observers into the ecosystem and strengthened long-term engagement.</p>
<p>For 2026, we continue to see the strongest opportunity in the capital-intensive pivot underway in Bitcoin mining. Operators are trying to fund both hash-rate expansion and AI and HPC infrastructure at the same time. This is pushing balance sheets to their limits and widening the spread in cost of capital across the sector. Miners with hyperscaler partnerships are now raising straight debt on comparatively attractive terms, while second-tier operators are relying on dilutive converts or selling Bitcoin into weakness. We think this creates the cleanest consolidation setup since 2020 to 2021, and see the best risk-reward in miners transitioning into energy-backed compute platforms with credible HPC economics, advantaged power, and financing paths that do not require serial dilution.</p>
<p>A second but more selective opportunity is emerging in digital payments and stablecoin settlement. Stablecoins are entering genuine business-to-business payment flows, where they can improve working-capital management and reduce cross-border settlement costs. However, pure-play public equities remain scarce, and many investors remain wary of volatile layer-one tokens. The more investable angle may sit in fintech and e-commerce platforms that can unlock margin leverage by shifting supplier payments, payouts, and cross-border settlement onto stablecoins. High-throughput chains will support much of this activity, and a few tokens tied to genuine usage may benefit, but we believe the most durable opportunity may lie in the operating companies enabling adoption rather than in broad token exposure.</p>

<p>To receive more <a href="https://www.vaneck.com/us/en/insights/investment-outlook/" title="Investment Outlook Insights"><strong>Investment Outlook</strong></a> insights, <a href="/link/5f45412c2143400497908cea2897f7d3.aspx" title=" Subscription Center"><strong>sign up in our subscription center</strong></a>.</p>
]]></content:encoded>
</item><item rdf:about="https://www.vaneck.com/us/en/blogs/thematic-investing/the-next-phase-of-retail-how-consumer-behavior-and-technology-are-shaping-the-industry/">
  <title>The Next Phase of Retail: How Consumer Behavior and Technology Are Shaping the Industry></title>
  <link>https://www.vaneck.com/us/en/blogs/thematic-investing/the-next-phase-of-retail-how-consumer-behavior-and-technology-are-shaping-the-industry/</link>
  <description><![CDATA[Consumer spending is holding up even as shoppers shift toward value, flexibility and convenience. Retailers with strong digital, logistics and AI capabilities are best positioned to meet rising expectations.]]></description>
  <dc:creator>Louise Gedney</dc:creator>
  <dc:date>12/16/2025 06:30:00</dc:date>
<content:encoded><![CDATA[

<p><strong>Key Takeaways:</strong></p>
<ul class="content-list">
<li class="mt-2">Consumers are spending steadily but shifting toward smaller, more frequent, value-focused purchases.</li>
<li class="mt-2">Retailers are modernizing with digital tools, automation and hybrid shopping to meet evolving expectations.</li>
<li class="mt-2">AI-driven shopping tools enhance convenience, boosting engagement without changing core shopping habits.</li>
</ul>
<h2>Shoppers Are Spending Differently, Not Less</h2>
<p>U.S. retail is adjusting as consumers become more intentional about how they shop. Many households, especially in the middle- and lower-income brackets, are choosing smaller, more frequent purchases as they manage higher living costs.</p>
<p>Even with these changes, overall demand remains steady. Recent government data shows retail and food-service sales rising 4.3 percent year over year to $733.3 billion in September 2025, confirming that consumers are still spending, even if they are doing so in new ways.<sup>*</sup></p>
<p>Younger shoppers continue to buy essentials, convenience products and occasional small discretionary items, while older generations show consistent demand for core household categories. These trends point to a shift in timing and habits rather than a decline in spending, with shoppers placing greater weight on value, flexibility and convenience.</p>
<h3>Total US Retail Sales 2022 - 2028 (in trillion USD)</h3>
<p><img loading="lazy" alt="Total US Retail Sales 2022 - 2028 (in trillion USD)" class="img-responsive" src="https://www.vaneck.com/EPiServer/CMS/Content/contentassets/ba8399e152074d5283c0589586271bbf/6549_rth-blog-dec_chart-1_2025-12_v1_blog.svg,,355779/Download?epieditmode=False" /></p>
<p class="chart-disclosure"><sup>*</sup>Projected. Source: Statista. For illustrative purposes only. Not intended as a forecast or prediction of future results.</p>

<h2>Retailers Modernize to Meet Evolving Shopping Habits</h2>
<p>As these habits evolve, retailers are updating their operations to make shopping simpler and more flexible. Many companies are investing in digital commerce, loyalty programs and supply-chain upgrades that allow customers to move easily between channels, whether they are browsing online, checking stock on their phones or picking up an order in store.</p>
<p>These improvements reflect rising expectations for convenience, particularly as shoppers spread purchases across more frequent trips. Modernization also increasingly includes automation inside distribution centers, where more retailers are adopting robotics to improve speed, accuracy and overall processing capacity as fulfillment demands grow.</p>
<h3>Global warehouse robotics market size, 2024 - 2032 (USD billions)</h3>
<p><img loading="lazy" alt="Global warehouse robotics market size, 2024 - 2032 (USD billions)" class="img-responsive" src="https://www.vaneck.com/EPiServer/CMS/Content/contentassets/7d2bff0aeb9643d2b3eed0528b3359b4/6549_rth-blog-dec_chart-2_2025-12_v1_option-1_blog.svg,,355788/Download?epieditmode=False" /></p>
<p class="chart-disclosure"><sup>*</sup>Based on a compound annual growth rate (CAGR) of 15.6% from 2025 to 2032. Source: Fortune Business Insights. For illustrative purposes only. Not intended as a forecast or prediction of future results.</p>
<p>Hybrid shopping has become a central part of the retail landscape. Services like curbside pickup, buy-online pick-up-in-store and same-day delivery have shifted from optional add-ons to daily routines. Retailers with strong logistics networks and well-integrated store operations, such as Amazon, Walmart, Costco, Target and Home Depot, are better positioned to meet these expectations. Their ability to connect online and in-store experiences helps them serve customers reliably as spending patterns evolve.</p>
<h2>AI Tools Are Shaping How Consumers Shop</h2>
<p>A growing number of retailers are also using AI-supported tools to make shopping feel more intuitive. These features build on familiar habits rather than changing how people shop. Target, for instance, introduced a conversational shopping experience powered by ChatGPT that helps customers search for products and build baskets through simple prompts.</p>
<p>Walmart has used similar tools to guide shoppers through busy periods, and its AI-assisted deal finders, gift planners and in-store navigation aids helped support one of its strongest Black Fridays on record. In each case, the tools are designed to reduce small points of friction and help customers move through decisions with less effort.</p>
<p>Consumers, especially younger ones, have been quick to adopt these enhancements. Many appreciate having helpful suggestions when comparing products or trying to stretch their budgets. For retailers, these tools offer a way to deepen engagement without altering the core shopping experience. They enhance the experience quietly, smoothing out routine decisions and helping shoppers move from browsing to buying with greater ease.</p>
<h3>Impact of AI and Machine Learning Use on Retail Performance 2022-2024</h3>
<p><img loading="lazy" alt="Impact of AI and ML use on retail performance 2022-2024" class="img-responsive" src="https://www.vaneck.com/EPiServer/CMS/Content/contentassets/a0779b226ab247418e73ec959e7f1f8f/6549_rth-blog-dec_chart-3_2025-12_v1_blog.svg,,355790/Download?epieditmode=False" /></p>
<p class="chart-disclosure">Source: Statista.</p>
<h2>Positioning for the Next Phase of Retail</h2>
<p>The combination of steady consumer demand, value-driven shopping and rising use of digital tools continues to favor retailers with meaningful scale. These companies have the infrastructure, technology and nationwide reach to serve customers reliably across channels, a dynamic that is likely to shape the upcoming holiday season as shoppers prioritize convenience and value.</p>
<p>This backdrop supports the positioning of the <a href="/link/b638061645774dbeab416e78589cf25c.aspx" title="RTH - VanEck Retail ETF"><strong>VanEck Retail ETF (RTH)</strong></a>, which holds many of the country&rsquo;s most influential and adaptable retailers. Their broad store footprints, modern digital capabilities and efficient supply chains place them in a strong position to meet shifting expectations and support consistent sales momentum.</p>
<h3>RTH Top 10 Holdings</h3>
<div class="wrapped-div">
<table width="100%">
<tbody>
<tr class="tbl-data">
<td class="tbl-header last text-left"><strong>Holding Name</strong></td>
<td class="tbl-header last text-left"><strong>Ticker</strong></td>
<td class="tbl-header last text-right"><strong>% of Net Assets</strong></td>
</tr>
<tr class="tbl-data">
<td class="data-td data last text-left">AMAZON.COM INC</td>
<td class="data-td data last text-left">AMZN</td>
<td class="data-td data last text-right">19.78</td>
</tr>
<tr class="tbl-data">
<td class="data-td data last text-left">WALMART INC</td>
<td class="data-td data last text-left">WMT</td>
<td class="data-td data last text-right">9.88</td>
</tr>
<tr class="tbl-data">
<td class="data-td data last text-left">COSTCO WHOLESALE CORP</td>
<td class="data-td data last text-left">COST</td>
<td class="data-td data last text-right">7.45</td>
</tr>
<tr class="tbl-data">
<td class="data-td data last text-left">HOME DEPOT INC/THE</td>
<td class="data-td data last text-left">HD</td>
<td class="data-td data last text-right">6.61</td>
</tr>
<tr class="tbl-data">
<td class="data-td data last text-left">MCKESSON CORP</td>
<td class="data-td data last text-left">MCK</td>
<td class="data-td data last text-right">5.48</td>
</tr>
<tr class="tbl-data">
<td class="data-td data last text-left">TJX COS INC/THE</td>
<td class="data-td data last text-left">TJX</td>
<td class="data-td data last text-right">5.31</td>
</tr>
<tr class="tbl-data">
<td class="data-td data last text-left">CVS HEALTH CORP</td>
<td class="data-td data last text-left">CVS</td>
<td class="data-td data last text-right">4.69</td>
</tr>
<tr class="tbl-data">
<td class="data-td data last text-left">O'REILLY AUTOMOTIVE INC</td>
<td class="data-td data last text-left">ORLY</td>
<td class="data-td data last text-right">4.25</td>
</tr>
<tr class="tbl-data">
<td class="data-td data last text-left">LOWE'S COS INC</td>
<td class="data-td data last text-left">LOW</td>
<td class="data-td data last text-right">4.00</td>
</tr>
<tr class="tbl-data">
<td class="data-td data last text-left">CENCORA INC</td>
<td class="data-td data last text-left">COR</td>
<td class="data-td data last text-right">3.64</td>
</tr>
<tr class="tbl-data">
<td class="data-td data last text-left"><strong>Top 10 Total</strong></td>
<td class="data-td data last text-left">&nbsp;</td>
<td class="data-td data last text-right"><strong>71.09</strong></td>
</tr>
</tbody>
</table>
</div>
<p class="chart-disclosure">As of November 30, 2025. These are not recommendations to buy or sell any security. Securities and holdings may vary.</p>

<p>For investors seeking diversified exposure to the evolution of the retail industry, the <a href="/link/b638061645774dbeab416e78589cf25c.aspx" title="RTH - VanEck Retail ETF"><strong>VanEck Retail ETF (RTH)</strong></a> offers a focused way to access the companies leading and adapting to these shifts.</p>
<p>To receive more <a href="https://www.vaneck.com/us/en/insights/thematic-investing/" title="Thematic Investing Insights"><strong>Thematic Investing</strong></a> insights, <a href="https://www.vaneck.com/us/en/subscribe/" title="Subscription Center"><strong>sign up in our subscription center</strong></a>.</p>
]]></content:encoded>
</item><item rdf:about="https://www.vaneck.com/us/en/blogs/thematic-investing/what-if-ai-went-away-today-a-simple-look-at-semiconductors/">
  <title>What If AI Went Away Today? A Simple Look at Semiconductors></title>
  <link>https://www.vaneck.com/us/en/blogs/thematic-investing/what-if-ai-went-away-today-a-simple-look-at-semiconductors/</link>
  <description><![CDATA[AI accelerates chip demand, but semiconductors thrive on broader, durable markets. Even without AI, innovation, diversified end uses, and long-term growth would keep the industry advancing.]]></description>
  <dc:creator>Nick Frasse</dc:creator>
  <dc:date>12/12/2025 06:30:00</dc:date>
<content:encoded><![CDATA[

<p><strong>Key Takeaways:</strong></p>
<ul class="content-list">
<li class="mt-2">AI boosts chip demand, but semiconductors rely on many long-standing, diversified end markets.</li>
<li class="mt-2">Even without AI, core sectors would drive steady innovation and rising semiconductor content.</li>
<li class="mt-2">Long-term semiconductor growth is resilient, supported by global tech needs across dozens of markets.</li>
</ul>
<h2>What Would Happen If AI Disappeared Tomorrow?</h2>
<p>AI has taken over most of the conversation about semiconductors. It is easy to forget that the industry existed long before the first large language model and has powered almost every technology cycle for decades. So, what would happen if AI disappeared tomorrow? The goal here is to explore how much of the semiconductor story still stands on its own and why the long term case for the asset class is broader than the AI boom.</p>
<p>AI currently drives a large share of incremental demand. Training clusters, inference chips, networking components, and memory all benefit from the rapid buildout of AI data centers. Without AI, the industry would lose a major growth engine.</p>
<p>However, the foundation of semiconductor demand sits across dozens of end markets that remain essential to the global economy. These markets have been expanding for years and reflect needs that are not tied to AI cycles.</p>
<h2>Key sectors that would continue to support semiconductor demand</h2>
<ul class="content-list">
<li class="mt-2">Cloud computing and general data center upgrades</li>
<li class="mt-2">PCs, laptops, tablets, and consumer electronics</li>
<li class="mt-2">Smartphones with advanced graphics and connectivity</li>
<li class="mt-2">Automotive technologies including EVs and assisted driving systems</li>
<li class="mt-2">Industrial automation and robotics</li>
<li class="mt-2">Communications infrastructure and 5G networks</li>
<li class="mt-2">The expanding base of connected devices across homes, cities, and factories</li>
</ul>
<p>Each of these categories relies on steady advances in logic, memory, sensors, analog components, and power management. Even without AI, chips would keep getting smaller, faster, more energy efficient, and more widely used. Companies would still compete on innovation, cost, and performance. Supply chains would still be global and capital intensive. The long term trend of more silicon in more products would not change.</p>
<h2>Semiconductors&rsquo; Core Demand Trend</h2>
<p>AI has amplified the cycle, but it has not created the core demand trend. Semiconductor revenue over multiple decades shows that the industry has grown through recessions, product transitions, and technology shifts. If AI vanished, the pace of growth might slow, but the direction would still point toward a world that uses more chips over time.</p>
<h3>The Semiconductor Landscape If AI Demand Were to Disappear Completely</h3>
<p>Below is a simple scenario table that frames how the semiconductor landscape could look if AI demand were to disappear completely.</p>
<div class="wrapped-div">
<table width="100%">
<tbody>
<tr class="tbl-data">
<td class="tbl-header last text-left"><strong>Scenario</strong></td>
<td class="tbl-header last text-left"><strong>Description</strong></td>
<td class="tbl-header last text-left"><strong>Implications</strong></td>
</tr>
<tr class="tbl-data">
<td class="data-td data last text-left"><strong>Bull Case</strong></td>
<td class="data-td data last text-left">Non-AI markets grow faster than expected. Cloud spending stays strong. Automotive, industrial, and connected device adoption accelerate.</td>
<td class="data-td data last text-left">Broad demand supports healthy revenue trends. Innovation cycles in logic, memory, and connectivity drive new chip usage.</td>
</tr>
<tr class="tbl-data">
<td class="data-td data last text-left"><strong>Base Case</strong></td>
<td class="data-td data last text-left">AI demand disappears but core markets grow at a steady pace. PCs, smartphones, autos, and industrials show gradual improvement.</td>
<td class="data-td data last text-left">Industry growth continues at a slower but stable rate. Semiconductor content increases across everyday products.</td>
</tr>
<tr class="tbl-data">
<td class="data-td data last text-left"><strong>Bear Case</strong></td>
<td class="data-td data last text-left">AI demand disappears and global tech spending weakens. Consumer electronics and autos face pressure.</td>
<td class="data-td data last text-left">Short term softness in orders and capacity utilization, but long term structural demand for semiconductors remains present.</td>
</tr>
</tbody>
</table>
</div>


<p>The thought experiment highlights a simple idea. AI is an important chapter in the semiconductor story, but not the story itself. The industry is built on broad, diversified demand that reflects how modern life works. Whether AI grows rapidly or faces volatility, semiconductors remain central to the digital economy.</p>
<p>To receive more <a href="https://www.vaneck.com/us/en/insights/thematic-investing/" title="Thematic Investing Insights"><strong>Thematic Investing</strong></a> insights, <a href="https://www.vaneck.com/us/en/subscribe/" title="Subscription Center"><strong>sign up in our subscription center</strong></a>.</p>
]]></content:encoded>
</item><item rdf:about="https://www.vaneck.com/us/en/blogs/income-investing/what-is-preferred-stock/">
  <title>What is Preferred Stock? Understanding Types &amp; Benefits></title>
  <link>https://www.vaneck.com/us/en/blogs/income-investing/what-is-preferred-stock/</link>
  <description><![CDATA[Learn what preferred stock is, its types, and how it differs from common stock. Understand the benefits and potential risks with VanEck.]]></description>
  <dc:creator> </dc:creator>
  <dc:date>12/11/2025 06:30:00</dc:date>
<content:encoded><![CDATA[

<p><strong>Key Takeaways:</strong></p>
<ul class="content-list">
<li class="mt-2">Preferred stock offers higher, steady dividends with priority over common stock for income-focused investors.</li>
<li class="mt-2">Different preferred types, such as cumulative, convertible, and callable balance income stability, flexibility, and risk.</li>
<li class="mt-2">Preferred stock can diversify portfolios, but investors must manage interest-rate, credit, and sector-concentration risks.</li>
</ul>
<h2 id="what-is-preferred-stock" class="jump-link-nav anchored-block" data-jumplink-title="What is Preferred Stock?">What is Preferred Stock?</h2>
<p>Preferred stock is a unique type of equity that blends characteristics of both common stock and bonds. As a hybrid security, preferred stock offers a fixed dividend, much like a bond, but also represents ownership in the company, similar to common stock. However, what sets preferred stock apart is its "preferred" status&mdash;holders of preferred shares enjoy priority over common shareholders when it comes to receiving dividends and in the event of a company's liquidation. For income-focused investors, preferred stock is often an attractive option due to its higher and more consistent dividend yields compared to common stock.</p>
<h2>Preferred Stock vs Common Stock: Key Differences</h2>
<p>While both preferred and common stock are forms of equity, they serve different purposes and appeal to different types of investors. See below for a summary of key differences between common stock and preferred stock:</p>
<ul class="content-list">
<li class="mt-2"><strong>Dividend Payments</strong>: Preferred stockholders are entitled to fixed dividends, paid before any dividends are distributed to common shareholders. In contrast, common stockholders receive dividends that are variable and depend on the company's profitability.</li>
<li class="mt-2"><strong>Voting Rights</strong>: Common stockholders usually have voting rights in corporate matters, giving them a say in company decisions. Preferred shareholders, on the other hand, generally do not have voting privileges.</li>
<li class="mt-2"><strong>Risk</strong>: Preferred stock carries less risk than common stock, primarily because of its fixed dividend payments and priority claim on assets in the event of bankruptcy. However, preferred stock does not offer the same growth potential as common stock, which can appreciate significantly if the company performs well.</li>
</ul>
<p>For investors, preferred stock is typically seen as a safer, more stable income stream, while common stock is ideal for those seeking growth opportunities with a higher risk tolerance.</p>

<h2 id="types-of-preferred-stock" class="jump-link-nav anchored-block" data-jumplink-title="Types of Preferred Stock">Types of Preferred Stock</h2>
<p>There are several variations of preferred stock, each with its own characteristics and benefits:</p>
<ul class="content-list">
<li class="mt-2"><strong>Cumulative Preferred Stock</strong>: If a company skips dividend payments, cumulative preferred shareholders are entitled to receive those missed dividends before common shareholders can be paid.</li>
<li class="mt-2"><strong>Non-Cumulative Preferred Stock</strong>: These shares do not accumulate unpaid dividends. If the company misses a dividend payment, the shareholder has no claim on those missed payments in the future.</li>
<li class="mt-2"><strong>Convertible Preferred Stock</strong>: Holders of these shares have the option to convert their preferred shares into a specified number of common shares, offering the potential for capital appreciation.</li>
<li class="mt-2"><strong>Callable Preferred Stock</strong>: These shares can be "called" or redeemed by the issuing company at a predetermined price after a specified date.</li>
</ul>
<p>In addition to these types, there is also the broader category of <strong>preferred securities</strong>, which includes hybrid instruments like convertible preferreds that combine features of both equity and debt.</p>
<h2>Cumulative vs Non-Cumulative Preferred Stock</h2>
<p><strong>Cumulative preferred stock</strong> provides a critical safety net for income-focused investors. This feature ensures that if a company is unable to pay a dividend, those unpaid dividends accumulate and must be paid out before any dividends are distributed to common shareholders. For investors seeking steady and reliable income, this "cumulative" feature offers additional protection, making these shares more attractive, particularly during times of financial uncertainty or market downturns.</p>
<p><strong>Example: General Electric&rsquo;s Cumulative Preferred Stock</strong></p>
<p>A well-known example of cumulative preferred stock comes from <strong>General Electric (GE)</strong>, a major industrial conglomerate. During the 2008 financial crisis, many companies&mdash;including GE&mdash;faced financial challenges that forced them to suspend dividend payments on their common stock. However, GE&rsquo;s cumulative preferred stockholders were still entitled to receive their missed dividends once the company regained its financial footing. As the company stabilized, GE made good on these arrears, paying the accumulated dividends to its preferred shareholders before resuming any payments to common stockholders. This example highlights how cumulative preferred stock can act as a buffer for investors even in turbulent times.</p>
<p>In this scenario, cumulative preferred shareholders were prioritized over common stockholders in terms of dividend payments, protecting their income stream and ensuring they eventually received what was owed.</p>
<p><strong>Non-cumulative preferred stock</strong>, on the other hand, lacks this safety net. If a company skips a dividend payment on non-cumulative preferred shares, the investor forfeits the right to receive that missed payment in the future. While non-cumulative preferred shares can sometimes offer higher yields, the risk is also greater, especially in cases where companies are facing financial difficulties or economic uncertainty.</p>
<p><strong>Example: Bank of America&rsquo;s Non-Cumulative Preferred Stock</strong></p>
<p>An example of <strong>non-cumulative preferred stock</strong> can be seen with <strong>Bank of America (BAC)</strong>, which issued various non-cumulative preferred shares. In the event of financial distress or underperformance, if the bank decides to suspend dividends on these shares, the missed payments are not accrued, and investors have no claim to receive those dividends later. This was a notable concern during the 2008 financial crisis when several banks, including Bank of America, suspended their preferred stock dividends to preserve capital.</p>
<p>Non-cumulative preferred stock tends to appeal more to investors who are willing to take on slightly higher risk in exchange for the potential of a higher dividend yield. However, this comes at the cost of less certainty in dividend payments, especially during times of corporate distress.</p>
<h2>Key Takeaways:</h2>
<ul class="content-list">
<li class="mt-2"><strong>Cumulative preferred stock</strong> offers protection for investors because it guarantees that missed dividends will be paid out before common shareholders receive any dividends. This is beneficial for those looking for a steady and predictable income stream.</li>
<li class="mt-2"><strong>Non-cumulative preferred stock</strong>, while sometimes offering higher yields, presents more risk since missed dividends cannot be recovered in the future.</li>
</ul>
<h2>Convertible vs Non-Convertible Preferred Stock</h2>
<p><strong>Convertible preferred stock</strong> provides a unique advantage to investors by offering the option to convert their preferred shares into a predetermined number of common shares. This can be particularly advantageous when the company's common stock experiences significant price appreciation, giving the investor the potential for capital gains while continuing to benefit from stable dividend payments during the holding period.</p>
<p>For example, if a company&rsquo;s common stock price rises substantially, investors holding convertible preferred shares can choose to convert them into common shares and benefit from the price increase. This feature adds an element of growth potential to the otherwise income-focused nature of preferred stock, making it an attractive option for investors seeking both income and the possibility of future capital gains.</p>
<p><strong>Example: Tesla&rsquo;s Convertible Preferred Stock</strong></p>
<p>A notable example of convertible preferred stock comes from <strong>Tesla (TSLA)</strong>. In 2013, Tesla issued convertible preferred shares to raise capital during its earlier growth phase. These shares offered investors regular dividend payments, but more importantly, gave them the option to convert into common shares if Tesla&rsquo;s stock price increased significantly. As Tesla&rsquo;s stock surged in subsequent years, investors who had purchased the convertible preferred shares had the opportunity to convert them into common stock, realizing significant gains as Tesla became one of the most valuable companies in the world.</p>
<p>For investors, this scenario illustrates how convertible preferred stock can provide both stability through dividends and growth through capital appreciation, especially if the issuing company experiences strong performance.</p>
<p>On the other hand, <strong>non-convertible preferred stock</strong> does not offer this option. Investors who choose non-convertible preferred shares are typically seeking a stable, long-term income stream rather than exposure to the potential growth of the company&rsquo;s common stock. These investors are more focused on the predictable dividend payments that come with preferred stock and are less concerned with capital appreciation.</p>
<p><strong>Example: Bank of America&rsquo;s Non-Convertible Preferred Stock</strong></p>
<p>An example of non-convertible preferred stock is <strong>Bank of America (BAC)</strong>, which has issued several series of non-convertible preferred shares. These shares are popular with investors who prioritize steady, reliable dividend income over the potential for stock price appreciation. Non-convertible preferred shareholders in Bank of America enjoy relatively high dividend yields, especially compared to common stockholders, but they do not have the option to convert their shares into common stock, even if Bank of America&rsquo;s stock price increases substantially.</p>
<p>While non-convertible preferred stock can be seen as less flexible, it offers income-focused investors the certainty of consistent dividend payments, making it suitable for those with long-term, stable income goals, such as retirees or conservative investors.</p>
<h2>Convertable vs. Non-Convertable Preffered Stock</h2>
<ul class="content-list">
<li class="mt-2"><strong>Convertible preferred stock</strong> offers flexibility, allowing investors to convert their shares into common stock and benefit from capital appreciation if the company&rsquo;s common stock performs well. This feature makes convertible preferred shares appealing to investors who want income stability but also the potential for future growth.</li>
<li class="mt-2"><strong>Non-convertible preferred stock</strong> is more focused on providing consistent, long-term dividend income. Investors in non-convertible shares typically prioritize income over growth, making these shares attractive for those seeking stability rather than market-driven gains.</li>
</ul>

<h2 id="preferred-stock-dividends" class="jump-link-nav anchored-block" data-jumplink-title="Preferred Stock Dividends">Preferred Stock Dividends: What You Need to Know</h2>
<p>One of the primary reasons investors are drawn to preferred stock is the relatively high and consistent dividend payments. Preferred stock dividends are typically fixed, meaning they are set at the time of issuance and remain the same over the life of the security, unless the terms specify otherwise. These fixed payments provide a predictable income stream, which is particularly appealing to income-focused investors, such as retirees or those looking to supplement their income.</p>
<h2>Fixed vs. Floating Dividend Rates</h2>
<p>While most preferred stocks offer fixed dividend payments, some preferred stocks come with floating dividend rates. These rates fluctuate based on a benchmark interest rate, such as the Secured Overnight Financing Rate (SOFR) or the U.S. Treasury rate. For instance, a floating rate preferred stock might specify that the dividend will be set at a rate of 2% above the current SOFR rate. In a rising interest rate environment, floating-rate preferred stocks become more attractive because their dividends increase along with prevailing interest rates, offering protection against inflation and rising rates.</p>
<h2>Payment Frequency and Priority</h2>
<p>Preferred stock dividends are typically paid on a quarterly, semi-annual, or annual basis, depending on the issuing company. These payments are prioritized over common stock dividends, meaning that companies must pay preferred stockholders their dividends before distributing any to common shareholders. In the event of financial trouble or limited cash flow, companies may suspend or reduce dividends to common stockholders, but preferred stockholders usually continue to receive their payments, provided the company can afford it.</p>
<p>For cumulative preferred stock, if a company skips a dividend payment, the missed payments accumulate. The company must pay these back to preferred shareholders in full before paying dividends to common shareholders. This gives cumulative preferred stockholders added protection and ensures they receive their due income over time.</p>
<h2>Tax Considerations for Preferred Dividends</h2>
<p>Another important aspect of preferred stock dividends is their tax treatment. In the U.S., many preferred dividends qualify for favorable tax treatment. These qualified dividends are taxed at a lower rate than ordinary income, typically between 0% and 20% depending on the investor&rsquo;s taxable income. However, not all preferred dividends are considered qualified. Some preferred dividends may be treated as ordinary income, which is taxed at a higher rate.</p>
<p>The tax implications of preferred dividends can significantly impact the overall return on investment, especially for investors in higher tax brackets. For example, dividends from foreign preferred stock or certain REIT-preferred stock may not qualify for the lower tax rates on qualified dividends. Investors should consult with a tax advisor to fully understand the tax treatment of their preferred dividends and how it fits into their broader tax strategy.</p>
<h2>Timing of Dividend Payments and Missed Payments</h2>
<p>Dividend payments on preferred stock are generally reliable, but companies can sometimes miss payments due to financial distress. With cumulative preferred stock, any missed dividends accumulate and must be paid out before the company can distribute dividends to common shareholders. This makes cumulative preferred shares a safer option for investors seeking steady income, as they are more likely to receive their dividend eventually, even if payments are temporarily delayed.</p>
<p>With non-cumulative preferred stock, however, if a company skips a dividend payment, those payments are lost forever, and investors cannot recover the missed income. As a result, non-cumulative preferred stock carries more risk, especially for companies in volatile industries or those with uncertain financial futures.</p>
<h2 id="why-invest" class="jump-link-nav anchored-block" data-jumplink-title="Why Invest?">Why Invest in Preferred Stock?</h2>
<p>Preferred stock offers several advantages for income-focused investors, including higher yields and greater stability compared to common stock. Additionally, in the event of a company&rsquo;s liquidation, preferred shareholders have priority over common shareholders, which can provide some downside protection.</p>
<p>Compared to bonds, preferred stock offers the potential for slightly higher yields, while still being less risky than common stock. Also, in an environment of falling rates, preferred stock might be a more attractive option for investors seeking income, as bond yields tend to be lower during these periods. Looking back at the performance of preferreds during the last four rate hiking cycles, after interest rates peak, returns in the preferreds market have been strong for the next two years. <strong><a href="https://www.vaneck.com/us/en/blogs/income-investing/preferreds-look-attractive-but-mind-the-financials/" title="Preferred Securities Look Attractive, but Mind the Financials">On average preferreds have returned over 15% in the two years following the final rate hike of the cycle. This average return increases to over 20% if you exclude the 2005-2008 rate cycle which was impacted by the Global Financial Crisis.</a></strong> While past performance is not a predictor of future outcomes, this data provides a favorable historical foundation.</p>
<h2 id="risks-and-considerations" class="jump-link-nav anchored-block" data-jumplink-title="Risks and Considerations">Risks and Considerations of Preferred Stock</h2>
<p>Like any investment, preferred stock carries risks. These include:</p>
<ul class="content-list">
<li class="mt-2"><strong>Interest Rate Sensitivity</strong>: Preferred stock prices tend to decline when interest rates rise, as the fixed dividend becomes less attractive compared to new issuances with higher yields.</li>
<li class="mt-2"><strong>Credit Risk</strong>: If the issuing company faces financial difficulties, preferred shareholders might not receive their expected dividends, and in a worst-case scenario, the value of their shares may drop significantly.</li>
<li class="mt-2"><strong>Liquidity Concerns</strong>: Preferred stock is generally less liquid than common stock, meaning it may be harder to sell quickly at a desired price.</li>
</ul>
<p>In addition, the preferred securities market faces significant concentration risk due to its heavy exposure to the financial sector, particularly banks. Following the 2008 financial crisis, banks and financial institutions issued large amounts of preferred securities to meet regulatory capital requirements. Today, <strong><a href="https://www.vaneck.com/us/en/blogs/income-investing/preferreds-look-attractive-but-mind-the-financials/" title="Preferred Securities Look Attractive, but Mind the Financials">the financial sector makes up over 80% of the U.S. preferreds market</a></strong>, with banks alone accounting for roughly half of this concentration. This reliance on the financial industry poses a substantial risk, especially in the current environment of high interest rates and stressed commercial real estate portfolios. Investors should carefully manage their exposure to the preferreds market, just as they do with concentrated sectors in other parts of their portfolios.</p>
<h2>How to Invest in Preferred Stock</h2>
<p>Investing in preferred stock is relatively straightforward and can be done through a brokerage account, much like investing in common stock or bonds. However, for those seeking diversification, preferred stock <strong>ETFs</strong> (Exchange-Traded Funds) offer a convenient option.</p>
<p>Those looking to take advantage of the valuation and yield opportunities present in the preferreds market while also avoiding bank exposure should consider the <a href="https://www.vaneck.com/us/en/investments/preferred-securities-ex-financials-etf-pfxf/overview/" title="PFXF - VanEck Preferred Securities ex Financials ETF - Holdings and Performance"><strong>VanEck Preferred Securities ex Financials ETF (PFXF)</strong></a>. PFXF offers investors access to the U.S.-listed preferred securities market that excludes securities issued by financials, which many might find particularly attractive given the current banking concerns.</p>
<p>Beyond the benefits of excluding financials in the current market, ex-financial preferreds generally also offer a number of other benefits over the broad preferreds market that investors might find attractive. Historically higher yield, greater sector diversification and strong relative performance compared to broad preferreds universe.</p>
<h2>Learn more about PFXF</h2>
<p>VanEck Preferred Securities ex Financials ETF Fund Profile</p>
<h2>Conclusion</h2>
<p>Preferred stock serves as a hybrid between common stock and bonds, offering investors the benefits of fixed dividend payments along with a priority claim on assets and income over common shareholders. It is especially appealing for income-focused investors seeking a reliable dividend yield with less risk compared to common stock.</p>
<p>The choice between cumulative and non-cumulative, convertible and non-convertible preferred shares depends on the investor's objectives, whether it&rsquo;s for steady income or potential capital appreciation. Additionally, preferred stock can provide a diversified income stream with less volatility than common stocks but carries risks such as interest rate sensitivity and concentration in certain sectors, particularly financial institutions.</p>
<p>By understanding the various types of preferred stock and their respective features, investors can make more informed decisions about how preferred securities fit into their broader investment strategy. Always consider factors such as dividend yield, credit rating, and market conditions when selecting preferred stock, and diversify to mitigate potential risks.</p>
<p>To receive more <a href="/us/en/blogs/income-investing/" title="Income Investing Insights"><strong>Income Investing</strong></a> insights, <a href="/link/5f45412c2143400497908cea2897f7d3.aspx" title=" Subscription Center"><strong>sign up in our subscription center</strong></a>.</p>
]]></content:encoded>
</item><item rdf:about="https://www.vaneck.com/us/en/blogs/emerging-markets-bonds/em-bonds-outshine-dm-as-fundamentals-drive-stability/">
  <title>EM Bonds Outshine DM as Fundamentals Drive Stability></title>
  <link>https://www.vaneck.com/us/en/blogs/emerging-markets-bonds/em-bonds-outshine-dm-as-fundamentals-drive-stability/</link>
  <description><![CDATA[EM bonds have remained resilient and outperformed DM bonds in 2025 as strong fundamentals and positioning drive continued defensive behavior.]]></description>
  <dc:creator>Eric Fine</dc:creator>
  <dc:date>12/10/2025 06:30:00</dc:date>
<content:encoded><![CDATA[

<p id="performance-overview" class="jump-link-nav anchored-block" data-jumplink-title="Performance Overview"><strong>Key Takeaways:</strong></p>
<ul class="content-list">
<li class="mt-2">EMBX continued to outperform in 2025, supported by strong country selection and disciplined positioning.</li>
<li class="mt-2">EM assets acted like defensive havens despite global equity volatility, with Korea exemplifying EM &ldquo;graduates&rdquo; showing resilience.</li>
<li class="mt-2">Fiscal dominance remains a DM problem, as Japan&rsquo;s market dynamics diverge sharply from stronger-positioned EM countries.</li>
</ul>
<p>The <a href="/link/f447bf0c04f64108a3dcff3ca025af4a.aspx" title="EMBX - VanEck Emerging Markets Bond ETF - Overview"><strong>VanEck Emerging Markets Bond ETF (EMBX)</strong></a> was up 0.79% in November, compared to 0.83% for its benchmark. Year to date, EMBX is up 17.38%, compared to 15.47% for its benchmark, the 50% J.P. Morgan Government Bond Index - Emerging Markets Global Diversified (GBI-EM) and 50% J.P. Morgan Emerging Markets Bond Index (EMBI) and 8.09% and 8.95% for the Global Agg and 10-Year Treasuries, respectively. In the past five years, EMBX has returned 4.3% per year, compared to 1.76% for its benchmark, and negative -2.29% and negative -2.31% per year for the Global Agg and 10-Year Treasuries, respectively. South Africa continued to outperform, Chile benefited from market-friendly elections, while small exposures in &ldquo;frontier&rdquo; Zambia local currency and Bolivia hard-currency rounded out these winners. Our underweight in Poland local led underperformers, and Uganda local also generated some underperformance. We pulled in our horns even more in November, after very strong performance. Local currency exposure is now even lower at 40%. We have no meaningful overweights in majors outside of Chile in local currency, and don&rsquo;t own India local currency. Carry is 6.4%, yield to worst (YTW) is 7.4% and duration is 5.5, right near benchmark duration.</p>
<h3>Average Annual Total Returns<sup>*</sup>&nbsp;(%) (In USD)</h3>
<div class="wrapped-div">
<table style="width: 100%;">
<tbody>
<tr class="tbl-data">
<td class="tbl-header last text-left">Month End As of November 30, 2025</td>
<td class="tbl-header last text-right">1 Mo</td>
<td class="tbl-header last text-right">3 Mo</td>
<td class="tbl-header last text-right">YTD</td>
<td class="tbl-header last text-right">1 Yr</td>
<td class="tbl-header last text-right">3 Yrs</td>
<td class="tbl-header last text-right">5 Yrs</td>
<td class="tbl-header last text-right">10 Yrs</td>
</tr>
<tr class="tbl-data">
<td class="data-td last text-left">EMBX (NAV)</td>
<td class="data-td data last text-right">0.79</td>
<td class="data-td data last text-right">3.44</td>
<td class="data-td data last text-right">17.38</td>
<td class="data-td data last text-right">15.48</td>
<td class="data-td data last text-right">11.39</td>
<td class="data-td data last text-right">4.26</td>
<td class="data-td data last text-right">5.13</td>
</tr>
<tr class="tbl-data">
<td class="data-td last text-left">EMBX (Share Price)</td>
<td class="data-td data last text-right">0.99</td>
<td class="data-td data last text-right">3.63</td>
<td class="data-td data last text-right">17.60</td>
<td class="data-td data last text-right">15.69</td>
<td class="data-td data last text-right">11.46</td>
<td class="data-td data last text-right">4.29</td>
<td class="data-td data last text-right">5.15</td>
</tr>
<tr class="tbl-data">
<td class="data-td last text-left">50% GBI-EM/50% EMBI</td>
<td class="data-td data last text-right">0.83</td>
<td class="data-td data last text-right">3.76</td>
<td class="data-td data last text-right">15.47</td>
<td class="data-td data last text-right">13.55</td>
<td class="data-td data last text-right">10.11</td>
<td class="data-td data last text-right">1.80</td>
<td class="data-td data last text-right">3.89</td>
</tr>
<tr class="tbl-data">
<td class="data-td last text-left">Nikkei 225 Average JPY</td>
<td class="data-td data last text-right">-5.50</td>
<td class="data-td data last text-right">--</td>
<td class="data-td data last text-right">28.97</td>
<td class="data-td data last text-right">28.84</td>
<td class="data-td data last text-right">19.35</td>
<td class="data-td data last text-right">6.91</td>
<td class="data-td data last text-right">9.33</td>
</tr>
<tr class="tbl-data">
<td class="data-td last text-left">KOSPI 200 KRW</td>
<td class="data-td data last text-right">-7.38</td>
<td class="data-td data last text-right">--</td>
<td class="data-td data last text-right">74.49</td>
<td class="data-td data last text-right">61.48</td>
<td class="data-td data last text-right">15.67</td>
<td class="data-td data last text-right">3.79</td>
<td class="data-td data last text-right">5.97</td>
</tr>
</tbody>
</table>
</div>
<br />
<div class="wrapped-div">
<table style="width: 100%;">
<tbody>
<tr class="tbl-data">
<td class="tbl-header last text-left">Quarter End As of September 30, 2025</td>
<td class="tbl-header last text-right">1 Mo</td>
<td class="tbl-header last text-right">3 Mo</td>
<td class="tbl-header last text-right">YTD</td>
<td class="tbl-header last text-right">1 Yr</td>
<td class="tbl-header last text-right">3 Yrs</td>
<td class="tbl-header last text-right">5 Yrs</td>
<td class="tbl-header last text-right">10 Yrs</td>
</tr>
<tr class="tbl-data">
<td class="data-td last text-left">EMBX (NAV)</td>
<td class="data-td data last text-right">1.70</td>
<td class="data-td data last text-right">4.40</td>
<td class="data-td data last text-right">15.41</td>
<td class="data-td data last text-right">9.72</td>
<td class="data-td data last text-right">13.39</td>
<td class="data-td data last text-right">4.87</td>
<td class="data-td data last text-right">5.27</td>
</tr>
<tr class="tbl-data">
<td class="data-td last text-left">EMBX (Share Price)</td>
<td class="data-td data last text-right">1.70</td>
<td class="data-td data last text-right">4.40</td>
<td class="data-td data last text-right">15.41</td>
<td class="data-td data last text-right">9.72</td>
<td class="data-td data last text-right">13.39</td>
<td class="data-td data last text-right">4.87</td>
<td class="data-td data last text-right">5.27</td>
</tr>
<tr class="tbl-data">
<td class="data-td last text-left">50% GBI-EM/50% EMBI</td>
<td class="data-td data last text-right">1.59</td>
<td class="data-td data last text-right">3.78</td>
<td class="data-td data last text-right">13.05</td>
<td class="data-td data last text-right">7.98</td>
<td class="data-td data last text-right">11.82</td>
<td class="data-td data last text-right">2.34</td>
<td class="data-td data last text-right">3.93</td>
</tr>
</tbody>
</table>
</div>
<div class="chart-disclosure">
<p><sup>*</sup>&nbsp;Returns less than one year are not annualized.</p>
<p><strong>The performance data quoted represents past performance. Past performance is not a guarantee of future results. Investment return and principal value of an investment will fluctuate so that an investor's shares, when redeemed, may be worth more or less than their original cost. Performance may be lower or higher than performance data quoted. Please call 800.826.2333 or visit vaneck.com for performance current to the most recent month ended.</strong></p>
<p>Prior to 10/06/2025, the Fund operated as the VanEck Emerging Markets Bond mutual fund; performance shown before that date is that fund&rsquo;s NAV performance (Class I, unadjusted for today&rsquo;s ETF expenses).</p>
<p>The "Net Asset Value" (NAV) of a Fund is determined at the close of each business day, and represents the dollar value of one share of the fund; it is calculated by taking the total assets of the fund, subtracting total liabilities, and dividing by the total number of shares outstanding. The NAV is not necessarily the same as the ETF 's intraday trading value. Investors should not expect to buy or sell shares at NAV.</p>
<p><strong>EMBX Total Expense Ratio &ndash; 0.76%.</strong> Van Eck Associates Corporation (the &ldquo;Adviser&rdquo;) will pay all expenses of the Fund, except for the fee payment under the investment management agreement, acquired fund fees and expenses, interest expense, offering costs, trading expenses, taxes and extraordinary expenses. Notwithstanding the foregoing, the Adviser has agreed to pay the offering costs until at least May 1, 2027. &ldquo;Other Expenses&rdquo; have been restated to reflect current fees.</p>
</div>

<p><strong>Emerging markets keep running the table.</strong> Despite a spike in global equity volatility associated with the AI/tech narrative challenge, EM bonds keep chugging along like defensive assets. The Kospi was an epicenter of the volatility spike, yet the Korean won (KRW) and Korean govvies rallied, and for good reasons &ndash; Korea is an EM &ldquo;graduate&rdquo;, like many others, particularly in Asia. EMBX has exposure to Korean government bonds and given the spike weaker in the Japanese yen (JPY) and Japanese government bonds (JGBs), we thought it might be worth a brief mention. Perhaps it&rsquo;s an indulgence on the part of your PM, who has ingrained in him great worry (always good in bonds) over <i>any</i> developments in funding markets, particularly Japan&rsquo;s. Japan was and remains an important source of &ldquo;carry trade&rdquo; funding. And this is always the moment where we remind investors that Japan is a poster child for our thesis of &ldquo;fiscal dominance&rdquo; in the DM &ndash; it makes sense for Japanese investors faced with rising interest rates and a weakening currency to seek safer harbors offshore, whether it is US tech stocks or South African government bonds. Anyhoo, when funding currencies flip, a balance sheet stock becomes a flow very quickly, thus the worry. But, Korea is one of our favorite &ldquo;graduates&rdquo;, characterized by net creditor status, in US dollar (USD) terms, strong positive net international investment position (NIIP), good fiscal policy, and a central bank focused on inflation. It, too, therefore, owns and funds a lot of offshore assets, but is <i>not</i> subject to fiscal dominance. So, how did it fare in this vol spike that your indulgent PM worried about? It fared well, due to large current account surpluses, and this despite penned-up USD selling on the part of exporters. Equally importantly the bias towards offshore assets on the part of onshore savers is a structural feature and one that is now well-established and managed. The demand for offshore assets is supported by policymakers accommodating savers in a demographic decline (you kind-of <i>have</i> to own companies offshore in that situation). The National Pension System (NPS) actively manages hedging policies on FX (there&rsquo;s a tactical and a strategic hedge bucket, but we won&rsquo;t get into that here). The bottom line is that because NPS&rsquo; foreign assets are now on the order of the country&rsquo;s FX reserves, even a 10% hedge implies the capacity to supply roughly USD 30&ndash;50 billion to the FX market via derivatives or asset sales when activated, which is large relative to average daily USD/KRW turnover. You see the results of these initial conditions in the exhibit below. KRW vol spiked lower recently, due to NPS action.</p>
<h3>Exhibit 1 &ndash; KRW Vol at Lows Despite Kospi Vol at Highs</h3>
<p><img loading="lazy" class="img-responsive" alt="KRW Vol at Lows Despite Kospi Vol at Highs" src="https://www.vaneck.com/contentassets/a0d90a0bd5cb4c8aa5d45702e16dfcc6/6509_emb-monthly-december_chart-1_2025-12_v1_blog.svg" /></p>
<p class="chart-disclosure">Source: Bloomberg, as of December 3, 2025.</p>
<p><strong>Is it JPY, JGB, or JOL (Japan out of luck)?</strong> Japan is the poster child for DM fiscal dominance and has an important stock of offshore assets we care about in its &ldquo;carry trade&rdquo;. The key meaning is that <i>Japan</i> is problematic, period; there&rsquo;s no evidence of contagion, if anything many Asian bond markets are behaving like flight-to-quality assets, as they should. It&rsquo;s only an overly worried or indulgent PM invoking risks to a &ldquo;graduate&rdquo; EM like Korea, when both rates and the exchange rate are weakening in Japan. And the exhibit below shows that Japan <i>is</i> behaving differently, however subtly, relative to Korea. In the chart below you will see that JPY vol has not had the secular decline that characterized KRW vol. Moreover, JPY vol rose a bit recently on just a very minor uptick in Nikkei vol. Thanks for your indulgence. Fiscal dominance characterizes DMs, not EMs, and the recent bout of global risk off supports this once again.</p>
<h3>Exhibit 2 &ndash; JPY Volatility Remained Low Despite Spikes in the Nikkei</h3>
<p><img loading="lazy" class="img-responsive" alt="JPY Volatility Remained Low Despite Spikes in the Nikkei" src="https://www.vaneck.com/contentassets/4241cdbdee3b4af992847f9c240d14ca/6509_emb-monthly-december_chart-2_2025-12_v1_blog.svg" /></p>
<p class="chart-disclosure">Source: Bloomberg, as of December 3, 2025.</p>

<h2 id="exposure-types-and-significant-changes" class="jump-link-nav anchored-block" data-jumplink-title="Exposure Types and Significant Changes">Exposure Types and Significant Changes</h2>
<p>The changes to our top positions are summarized below. Our largest positions in November were Brazil, Malaysia, South Africa, Thailand, and Chile:</p>
<ul class="content-list">
<li class="mt-2">We increased our local currency exposure in the Czech Republic. Czech local bonds continue to look attractive vs. fundamentals and might benefit from the peak U.S. Dollar bullishness. In addition, the new government is not making any suspicious moves on the fiscal front. In terms of our investment process, this improved the policy and technical test scores for the country.</li>
<li class="mt-2">We also increased our hard currency sovereign exposure in India, Malaysia, the Philippines, Peru, Morocco, Saudi Arabia, the United Arab Emirates, and Poland. The move reflected our intention to piggyback on global duration (which strengthened the technical test scores for the countries in question), but in some cases (Poland, Malaysia) the shift also reflected our year-end de-risking from local bonds (which posted significant year-to-date total returns).</li>
<li class="mt-2">Finally, we increased our hard currency sovereign exposure in Laos and Bolivia. The bond in Laos was an attractively priced new issue, whereas Bolivian sovereign bonds continue to benefit from the market-friendly results of the presidential election, which improved the policy/politics test score for the country.</li>
<li class="mt-2">We reduced our local currency exposure in Mexico, Brazil, Turkey, Uganda, and South Africa. The year-end de-risking (due to tighter liquidity) is a key reason here, especially in less liquid names like Uganda, where the impact of global moves can be amplified. Additional country-specific factors included (1) the worsening political test score in Mexico on the back of mass protests against the deteriorating domestic security situation; (2) less attractive valuations in Brazil; and (3) a limited room for rate cuts in Turkey due to rising inflation expectations (which worsened the policy test score).</li>
<li class="mt-2">We also reduced our hard currency sovereign exposure in Argentina, Cote d&rsquo;Ivoire, and Ecuador. We took profits in Argentina after the midterms rally, as there are unresolved issues related to the accumulation of international reserves and the exchange rate mechanism, which worsen the policy test score for the country. Cote d&rsquo;Ivoire&rsquo;s very tight spreads and less attractive valuations made it vulnerable to spillovers from a potential debt restructuring situation in Senegal, worsening the technical test score for the country. The referendum&rsquo;s failure in Ecuador raised doubts about President Noboa&rsquo;s ability to advance reforms, worsening the policy/politics test score for the country.</li>
<li class="mt-2">Finally, we reduced our hard currency corporate exposure in Singapore and Hong Kong. Our focus in Singapore was on a high-yield corporate bond (with some ties to real estate in the region), which can get affected by the year-end&rsquo;s tight liquidity. Regarding Hong Kong, we decided to take profits due the company&rsquo;s exchange of outstanding perpetual securities.</li>
</ul>
<p>To receive more <a href="https://www.vaneck.com/us/en/insights/emerging-markets-bonds/" title="Emerging Markets Bonds Insights"><strong>Emerging Markets Bonds</strong></a> insights, <a href="/link/5f45412c2143400497908cea2897f7d3.aspx" title=" Subscription Center"><strong>sign up in our subscription center</strong></a>.</p>
]]></content:encoded>
</item><item rdf:about="https://www.vaneck.com/us/en/blogs/gold-investing/ima-casanova-as-gold-soars-opportunity-lies-in-better-not-bigger-mining-acquisitions/">
  <title>As Gold Soars, Opportunity Lies in ‘Better, Not Bigger’ Mining Acquisitions></title>
  <link>https://www.vaneck.com/us/en/blogs/gold-investing/ima-casanova-as-gold-soars-opportunity-lies-in-better-not-bigger-mining-acquisitions/</link>
  <description><![CDATA[Gold rallied above $4,200 as markets shifted rate expectations. Record prices are driving disciplined mining-sector M&amp;A, with the strongest opportunities in targeted regional consolidation.]]></description>
  <dc:creator>Imaru Casanova</dc:creator>
  <dc:date>12/09/2025 06:30:00</dc:date>
<content:encoded><![CDATA[

<p>Monthly gold market and economic insights from <strong><a href="/link/cfa7139e649944fea51aa2a740b2372e.aspx?p=1" title="Imaru Casanova &mdash; Portfolio Manager, Gold and Precious Metals">Imaru Casanova, Portfolio Manager</a></strong>, featuring her unique views on mining and gold&rsquo;s portfolio benefits.</p>
<p><strong>Key Takeaways:</strong></p>
<ul class="content-list">
<li class="mt-2">Gold broke above $4,200 in November as markets rapidly shifted rate expectations.</li>
<li class="mt-2">Record prices are driving more mining sector deal activity, with discipline outweighing scale.</li>
<li class="mt-2">The most compelling opportunities lie in focused, regional consolidation, not large, complex acquisitions.</li>
</ul>

<h2>Gold Surges as Markets Reprice Fed Expectations</h2>
<p>Gold spent November comfortably hovering around the $4,000 mark, even as the odds of a December Fed rate cut declined early in the month. But once markets began actively pricing in a cut, gold took off. The implied probability of a December rate cut jumped from 23% on November 19 to 83% by month-end and gold responded exactly as historical patterns would suggest. Lower rates reduce the opportunity cost of holding gold, allowing its safe-haven appeal to shine a little brighter.</p>
<p>By November 28, gold closed at $4,239.43 per ounce, a gain of $236.52, or 5.91%, for the month. And while equity markets and alternative assets attempted to rebound from their lows, none kept pace. The S&amp;P 500<sup>1</sup>&nbsp;finished roughly flat at 0.25%, the NASDAQ<sup>2</sup>&nbsp;slipped 1.51%, and bitcoin<sup>3</sup>&nbsp;fell 17%. Meanwhile, gold ended the month just $117 shy of its all-time high of $4,356, and gold equities rallied right alongside it, as both the GDMNTR<sup>4</sup>&nbsp;and MVGDXTR<sup>5</sup>&nbsp;Index jumped 15%.</p>
<h3>Rate Cut Hopes Fuel a Gold Rally in November</h3>
<p><img loading="lazy" class="img-responsive" alt="Rate Cut Hopes Fuel a Gold Rally in November" src="https://www.vaneck.com/contentassets/d36dc82293db4413895e61daef38e1e7/golds-performance-november2025-v3.svg" /></p>
<h2>Record Prices Fuel Rising Transaction Activity</h2>
<p>Record gold prices are driving greater deal activity across the mining sector. Strong cash flow generation and improved valuations are giving companies more flexibility to expand and optimize their portfolios. In 2025, the industry saw an uptick in asset sales and purchases, minority equity investments in earlier-stage companies and a rise in corporate-level mergers and acquisitions.</p>
<p>Senior producers have generally focused on portfolio rationalization, using strong gold and silver prices to divest non-core assets at attractive valuations. Rather than pursuing large-scale acquisitions, many are choosing to make smaller, entry-level equity investments in earlier-stage companies to strengthen their longer-term project pipelines. The preference across the industry is clear: funding internally generated, prudently phased growth with operating cash flow rather than higher-risk acquisitions that often require issuing equity, particularly at a time when many companies&rsquo; shares still trade at historically low valuations. As a result, companies of all sizes across the sector are taking a disciplined and rigorous approach to M&amp;A.</p>
<h2>Why Scale Alone Doesn&rsquo;t Create Value</h2>
<p>Bigger is not always better in the gold mining industry, becoming too large has often created more challenges than benefits. Companies are not looking to grow for growth&rsquo;s sake. They aim to create value by lowering costs, extending mine life, improving returns on invested capital and reducing operational risk. Achieving all of this is no small task. Miners struggle to find assets of sufficient size and quality to justify the substantial acquisition premiums sellers expect in a strong gold-price environment. This reality helps explain why M&amp;A activity has not accelerated as much as many expected during this cycle.</p>
<p>As shareholders, we welcome this discipline. There are ample opportunities around the world for meaningful regional consolidation, and these tend to be the types of transactions that make the most strategic sense. Mining operations can benefit significantly from synergies created when multiple assets operate as a single district, hub or complex&mdash;sharing critical infrastructure, equipment, labor, leadership and technical talent, supply chains and in-country or regional expertise, among other advantages.</p>
<h2>Integration Risks: Lessons From Past Consolidations</h2>
<p>Even the most obvious consolidation opportunities carry meaningful risks. Consider the challenges Barrick Mining (5.97% of Strategy assets) faced integrating its Nevada assets with Newmont&rsquo;s (8.44% of Strategy assets) to create the Nevada Gold Mines joint venture, the largest gold mining complex in the world. This combination was clearly necessary, yet it still took years to fully integrate, optimize and fine-tune operations. These assets were not far-flung: they were in the same country, the same state, and in close proximity&mdash;mature operations run by the two largest gold mining companies in the world when the JV was formed in 2019.</p>
<p>Integration challenges are amplified when operations differ in geology, mining and processing methods. These challenges grow further when operations are spread across countries or continents that vary in language, levels of government and community involvement, mining codes, regulatory environments, labor laws and operating and safety cultures. Layer onto that the complexity of proper due diligence and the risks compound quickly. Is the deposit&rsquo;s size and quality truly what the seller claims? Was the feasibility study underpinning the valuation conducted with sufficient technical and economic rigor? Have years of underinvestment or mismanagement compromised operations, infrastructure or community relationships? The list goes on.</p>
<p>Buying a mining asset is nothing like acquiring a factory that simply produces more of what a company already makes, it brings far greater challenges. That&rsquo;s why companies must carefully evaluate each transaction and weigh these well-known risks against the synergies and improvements they expect to achieve. Reviewing the most common sources of merger and acquisition synergies highlights just how complex it can be to estimate potential value gains.</p>
<h2>Types of Synergies and Why They&rsquo;re Hard to Capture</h2>
<p><strong>Operational Synergies</strong></p>
<ul class="content-list">
<li class="mt-2"><strong>Economies of scale:</strong> Spreading fixed costs, improving bargaining power with suppliers and reducing per-unit operating costs.</li>
<li class="mt-2"><strong>Economies of scope: </strong>Sharing infrastructure, technical expertise and equipment.</li>
<li class="mt-2"><strong>Elimination of duplication:</strong> Consolidating overlapping functions (HR, finance, IT), reducing overhead and excess capacity in plants or logistics.</li>
</ul>
<p><strong>Financial Synergies</strong></p>
<ul class="content-list">
<li class="mt-2"><strong>Lower cost of capital:</strong> Larger, more diversified balance sheets often secure cheaper debt and better financing terms.</li>
<li class="mt-2"><strong>Tax advantages:</strong> Using loss carryforwards, asset revaluations and structural tax efficiencies.</li>
<li class="mt-2"><strong>Optimized capital allocation: </strong>Surplus cash from one business can be redeployed into other higher-return opportunities.</li>
</ul>
<p><strong>Strategic Synergies</strong></p>
<ul class="content-list">
<li class="mt-2"><strong>Increased market power:</strong> Greater market cap, liquidity, broader investor base and the ability to compete in larger transactions.</li>
<li class="mt-2"><strong>Diversification benefits:</strong> Revenues generated from multiple mines, allowing more flexibility in meeting companywide targets.</li>
<li class="mt-2"><strong>Enhanced innovation:</strong> Combined R&amp;D teams, shared IP and unified technology platforms drive productivity improvements and exploration success.</li>
<li class="mt-2"><strong>Talent lift:</strong> Stronger portfolio and improved ability to attract, retain and develop talent.</li>
</ul>
<p>While these examples may sound compelling, and often appear straightforward on paper, many transactions ultimately fall short of delivering their promised synergies. Common pitfalls include overestimated cost savings or productivity gains, unrealistic integration or development timelines, cultural misalignment, loss of key personnel, complex systems and process integration challenges, and regulatory, labor or community obstacles.</p>
<h2>When Breaking Up Creates More Value</h2>
<p>Breaking up a company, through a spin-off, split, or divestiture, is often the mirror image of a merger. The premise is that the costs of complexity outweigh the benefits of keeping assets together. A simplified structure can deliver several advantages:</p>
<ul class="content-list">
<li class="mt-2">Sharper management focus on a core portfolio of assets, unlocking new optimization opportunities.</li>
<li class="mt-2">Better alignment of leadership skills with the specific needs of each business.</li>
<li class="mt-2">Greater transparency and clarity in setting performance targets, along with stronger ownership and accountability for achieving them.</li>
<li class="mt-2">More efficient allocation of capital and technical expertise directed where it creates the most value.</li>
<li class="mt-2">Improved valuation transparency, as investors can more easily assess the business model and risk profile of a streamlined entity.</li>
<li class="mt-2">Potential market re-rating, with higher-quality assets no longer weighed down by weaker, riskier or underperforming segments.</li>
<li class="mt-2">A broader investor base, as the newly independent company may meet the criteria of a larger pool of investors.</li>
<li class="mt-2">Enhanced growth prospects, as a more focused company can pursue a concentrated set of opportunities with greater impact on overall performance.</li>
</ul>
<p>Most companies promise substantial synergies and value creation when announcing transactions, yet only a few track or disclose the actual gains in the years that follow. This lack of transparency makes it difficult for the market to assess the true economic impact of a merger or breakup, and understandably fuels skepticism.</p>
<h2>Our Perspective as Shareholders</h2>
<p>As shareholders, we evaluate each transaction closely, assessing both the potential synergies and the likelihood of realizing them. Do the expected benefits truly outweigh the risks? Are we being adequately compensated for any additional risk, or are we leaving value on the table? We then monitor the financial, operational and stock-price performance of the pro forma entities to gauge how successful these transactions ultimately are.</p>
<p>We believe strongly in the need for consolidation in the gold mining sector. The industry remains highly fragmented, yet only a limited number of groups worldwide have the proven capability to find, develop, build and operate mines at the highest standards. In such a complex business, the scarcity of top-tier management is a real structural risk; poor leadership destroys value at every stage of the mining cycle.</p>
<p>From an equity investor&rsquo;s perspective, placing more assets in the best hands expands our investable universe. This is most effectively achieved in the small-cap and mid-tier space, where opportunities to capture synergies, particularly among geographically proximate operations, are most compelling.</p>
<p>We also see natural limits to scalability in this industry. Even exceptional teams can lose focus as organizations grow too large and talent becomes stretched, ultimately eroding performance. In mining, bigger isn&rsquo;t always better, but stronger certainly is. The sector faces a wide and constantly shifting range of risks, and long-term value creation largely depends on management&rsquo;s ability to eliminate, reduce or manage those risks from discovery through production.</p>

<p>To receive more <strong><a href="https://www.vaneck.com/us/en/insights/gold-investing/" title="Gold Investing Insights">Gold Investing</a></strong> insights, <strong><a href="https://www.vaneck.com/us/en/subscribe/" title="Subscription Center">sign up in our subscription center</a></strong>.</p>
]]></content:encoded>
</item><item rdf:about="https://www.vaneck.com/us/en/blogs/moat-investing/moat-stocks-gain-on-health-care-strength-tech-slowdown/">
  <title>Moat Stocks Gain on Health Care Strength, Tech Slowdown></title>
  <link>https://www.vaneck.com/us/en/blogs/moat-investing/moat-stocks-gain-on-health-care-strength-tech-slowdown/</link>
  <description><![CDATA[Market breadth improved in November, lifting both the Moat Index and SMID Moat Index, with health care and materials driving gains despite weakness in technology and consumer names.]]></description>
  <dc:creator>Coulter Regal, CFA</dc:creator>
  <dc:date>12/09/2025 06:30:00</dc:date>
<content:encoded><![CDATA[

<p><strong>Key Takeaways:</strong></p>
<ul class="content-list">
<li class="mt-2">Moat Index gained 1.53% in November, supported by health care and broader market participation.</li>
<li class="mt-2">Merck and Amgen were top Moat Index contributors, benefiting from strong demand and pipelines.</li>
<li class="mt-2">SMID Moat Index rose 1.43%, aided by materials strength but offset by consumer discretionary and technology weakness.</li>
<li class="mt-2">Sealed Air and Albemarle led SMID Moat Index contributors on M&amp;A activity and a lithium rebound.</li>
</ul>
<p id="us-equity-market-review" class="jump-link-nav anchored-block" data-jumplink-title="U.S. Equity Market Review">U.S. equities delivered a modest gain in November, but market dynamics shifted meaningfully beneath the surface. While the S&amp;P 500 added just 0.25% during the month, performance broadened across the market, with the equal-weighted S&amp;P 500 rising 1.90% and outpacing its market-cap-weighted counterpart. The wider participation marked a contrast to the narrow leadership seen most of the year. Sector leadership rotated as well, with health care posting the strongest returns of any major segment, while technology, after a stretch of sustained outperformance, saw a notable pullback. Investors continued to digest a mix of economic data and evolving expectations around Federal Reserve policy, creating a backdrop that favored more defensive and valuation-supported areas of the market.</p>
<p>In November the <strong><a href="/link/9e43dd198c5f4e419f13220685081895.aspx" title="MOAT - VanEck Morningstar Wide Moat ETF">Morningstar Wide Moat Focus Index</a></strong> (the &ldquo;Moat Index) benefited from sector positioning, gaining 1.53% and outperforming the S&amp;P 500. The Moat Index&rsquo;s overweight to health care, which was the top-performing sector during the month, provided a meaningful tailwind, while its underweight to technology helped soften the impact of weakness across that segment. Improved market breadth also aided performance relative to prior months, during which narrow leadership had presented a challenge for equal-weighted strategies.</p>
<p>Smaller-cap equities also participated in November&rsquo;s broader advance, though to varying degrees across size cohorts. The <a href="/link/166321dbcfec440590fb51cf0ad629aa.aspx" title="SMOT - VanEck Morningstar SMID Moat ETF"><strong>Morningstar US Small-Mid Cap Moat Focus Index</strong></a> (the &ldquo;SMID Moat Index&rdquo;) rose 1.43% during the month, outperforming the S&amp;P 500 but trailing more pure small-cap segments. As with the Moat Index, sector positioning within health care contributed positively, as did strong selection within the materials segment, though pockets of weakness in consumer discretionary and technology weighed on overall results.</p>
<h3>November Health Care Rebound Supports Moat Strategies</h3>
<p><img loading="lazy" class="img-responsive" alt="November Health Care Rebound Supports Moat Strategies" src="https://www.vaneck.com/contentassets/3e4cd73e6cf0400eb1218cc32294e193/6507_moat-monthly-blog-chart_2025-12_v1.svg" /></p>
<p class="chart-disclosure"><strong>Source: Morningstar. Data as of 11/30/2025.</strong> Past performance is no guarantee of future results. Index performance is not representative of fund performance. It is not possible to invest directly in an index. Please see index definitions and other important disclosures at the end of this content. Fund performance current to the most recent month end is available by visiting vaneck.com or by calling 800.826.2333.</p>

<h2 id="moat-highlights" class="jump-link-nav anchored-block" data-jumplink-title="Moat Highlights">Moat Index Highlights: Health Care Leads the Charge</h2>
<p>In November, the Moat Index benefited from a favorable combination of broader market participation and a strong rebound in health care, a sector to which the strategy is overweight. The Moat Index&rsquo;s allocation to the area contributed meaningfully to relative performance. At the same time, the strategy&rsquo;s underweight to technology, which lagged the broader market, provided an additional tailwind to relative performance.</p>
<p>The drug manufacturer, Merck &amp; Co. (MRK), was the top contributor to the Moat Index in November, with share price gains of more than 20%, as the company continued to demonstrate durable performance across its diversified pharmaceutical portfolio. Merck&rsquo;s leadership position in oncology, including its flagship immunotherapy Keytruda, and its growing presence across vaccines and cardiometabolic care remain central to Morningstar&rsquo;s wide-moat assessment. Analysts also highlight the strength of Merck&rsquo;s pipeline, which includes late-stage programs capable of supporting revenue through the next decade.</p>
<p>Also within the top contributors this month was fellow health care leader Amgen Inc. (AMGN). Amgen benefited from renewed investor confidence in its broad portfolio of biologic therapies and its expanding pipeline in cardiology, oncology, and immunology. Morningstar continues to view Amgen&rsquo;s free cash flow generation as a key competitive advantage, supported by biologics that carry strong pricing power and by the company&rsquo;s growing biosimilar franchise. Shares advanced 16% during the month, as the market rewarded businesses with stable demand dynamics amid heightened uncertainty in more cyclical sectors.</p>
<p>Rounding out the top contributors were consumer health company Kenvue Inc. (KVUE); semiconductor equipment provider Applied Materials Inc. (AMAT); and the technology conglomerate and AI leader Alphabet Inc. (GOOGL).</p>
<p>Companies detracting the most in November notably belonged within technology, reflecting the broader sector&rsquo;s pullback. Names include customer relationship management technology firm Salesforce Inc. (CRM); enterprise software solutions company Workday Inc. (WDAY); semiconductor materials and filtration specialist Entegris Inc. (ENTG); and chipmaker NXP Semiconductors (NXPI). Outside of technology, aerospace and defense company Boeing Co. (BA) detracted modestly.</p>
<h2>Moat Index Top Contributors and Detractors - November 2025</h2>
<h3>Contributors</h3>
<div class="wrapped-div">
<table style="width: 100%;">
<tbody>
<tr class="tbl-data">
<td class="tbl-header last text-left">Company</td>
<td class="tbl-header last text-left">Ticker</td>
<td class="tbl-header last text-left">Sector</td>
<td class="tbl-header last text-right">Avg. Weight (%)</td>
<td class="tbl-header last text-right">Contribution (%)</td>
</tr>
<tr class="tbl-data">
<td class="data-td last text-left">Merck &amp; Co. Inc.</td>
<td class="data-td data last text-left">MRK</td>
<td class="data-td data last text-left">Health Care</td>
<td class="data-td data last text-right">2.52</td>
<td class="data-td data last text-right">0.55</td>
</tr>
<tr class="tbl-data">
<td class="data-td last text-left">Amgen Inc.</td>
<td class="data-td data last text-left">AMGN</td>
<td class="data-td data  last text-left">Health Care</td>
<td class="data-td  data last text-right">2.51</td>
<td class="data-td data  last text-right">0.42</td>
</tr>
<tr class="tbl-data">
<td class="data-td last text-left">Kenvue Inc.</td>
<td class="data-td data  last text-left">KVUE</td>
<td class="data-td  data last text-left">Consumer Staples</td>
<td class="data-td  data last text-right">1.74</td>
<td class="data-td  data last text-right">0.39</td>
</tr>
<tr class="tbl-data">
<td class="data-td last text-left">Applied Materials Inc.</td>
<td class="data-td  data last text-left">AMAT</td>
<td class="data-td  data last text-left">Technology</td>
<td class="data-td  data last text-right">3.36</td>
<td class="data-td  data last text-right">0.28</td>
</tr>
<tr class="tbl-data">
<td class="data-td last text-left">Alphabet Inc.</td>
<td class="data-td  data last text-left">GOOGL</td>
<td class="data-td  data last text-left">Technology</td>
<td class="data-td  data last text-right">1.85</td>
<td class="data-td  data last text-right">0.26</td>
</tr>
</tbody>
</table>
</div>
<h3>Detractors</h3>
<div class="wrapped-div">
<table style="width: 100%;">
<tbody>
<tr class="tbl-data">
<td class="tbl-header last text-left">Company</td>
<td class="tbl-header last text-left">Ticker</td>
<td class="tbl-header last text-left">Sector</td>
<td class="tbl-header last text-right">Avg. Weight (%)</td>
<td class="tbl-header last text-right">Contribution (%)</td>
</tr>
<tr class="tbl-data">
<td class="data-td last text-left">Salesforce Inc.</td>
<td class="data-td  data last text-left">CRM</td>
<td class="data-td  data last text-left">Technology</td>
<td class="data-td  data last text-right">2.37</td>
<td class="data-td  data last text-right">-0.27</td>
</tr>
<tr class="tbl-data">
<td class="data-td last text-left">Workday Inc.</td>
<td class="data-td  data last text-left">WDAY</td>
<td class="data-td  data last text-left">Technology</td>
<td class="data-td  data last text-right">2.36</td>
<td class="data-td  data last text-right">-0.24</td>
</tr>
<tr class="tbl-data">
<td class="data-td last text-left">Entegris Inc.</td>
<td class="data-td  data last text-left">ENTG</td>
<td class="data-td  data last text-left">Technology</td>
<td class="data-td  data last text-right">1.37</td>
<td class="data-td  data last text-right">-0.22</td>
</tr>
<tr class="tbl-data">
<td class="data-td last text-left">NXP Semiconductors</td>
<td class="data-td  data last text-left">NXPI</td>
<td class="data-td  data last text-left">Technology</td>
<td class="data-td  data last text-right">2.28</td>
<td class="data-td  data last text-right">-0.15</td>
</tr>
<tr class="tbl-data">
<td class="data-td last text-left">Boeing Co.</td>
<td class="data-td  data last text-left">BA</td>
<td class="data-td  data last text-left">Industrials</td>
<td class="data-td  data last text-right">2.13</td>
<td class="data-td  data last text-right">-0.13</td>
</tr>
</tbody>
</table>
</div>
<p class="chart-disclosure">Source: Morningstar. Past performance is no guarantee of future results. Index performance is not illustrative of fund performance. Not intended as a recommendation to buy or to sell any of the securities mentioned herein.</p>

<h2 id="smid-highlights" class="jump-link-nav anchored-block" data-jumplink-title="SMID Moat Highlights">SMID Moat Index Highlights: Packaging and Lithium Lead</h2>
<p>The SMID Moat Index ended November with a positive return, supported by contributions from companies across several sectors. Similarly to the Moat Index, the strategy&rsquo;s overweight to health care offered support given the strength of the broader sector. Materials also proved additive, with three of the top five contributors for the month belonging to the sector. However, weakness in consumer discretionary and technology, alongside select communication services holdings, offset some of these gains.</p>
<p>The packaging solutions company, Sealed Air Corp. (SEE), was the top contributor to the SMID Moat Index in November, as shares surged following the announcement that the company had agreed to be acquired by CD&amp;R in a transaction valued at approximately $10.3 billion, or $42.15 per share. The all-cash offer represented a meaningful premium to Sealed Air&rsquo;s prior trading levels and immediately drove a sharp rerating in the stock during the month. The market responded positively to the deal&rsquo;s valuation and certainty, with shares rising significantly and contributing meaningfully to Index performance.</p>
<p>Albemarle Corp. (ALB), a fully integrated lithium producer, was also a leading contributor, supported by a rebound in lithium-related equities after a period of volatility. Morningstar continues to view Albemarle&rsquo;s low-cost lithium and bromine operations as core components of its moat rating, with long-lived resources and scale advantages that position the company well for long-term demand growth. While near-term lithium pricing remains uncertain, the firm&rsquo;s competitive position and disciplined capital management supported a strong share price recovery in November as shares of ALB gained more than 30%.</p>
<p>Other top contributors within the SMID Moat Index during the month included Expedia Group Inc. (EXPE), a leading global online travel platform; Ionis Pharmaceuticals Inc. (IONS), a biotechnology company focused on RNA-targeted therapies; and DuPont de Nemours Inc. (DD), a diversified manufacturer of specialty materials and chemical solutions.</p>
<p>Companies detracting the most in November within the SMID Moat Index spanned multiple sectors, but consumer discretionary stood out. Names included Norwegian Cruise Line (NCLH), a global cruise operator; HubSpot Inc. (HUBS), a cloud-based marketing software provider; Etsy Inc. (ETSY), an online marketplace; Bath &amp; Body Works Inc. (BBWI), a retailer of personal care and home fragrance products; and Warner Music Group (WMG), a multinational music entertainment company.</p>
<h2>SMID Moat Index Top Contributors and Detractors - November 2025</h2>
<h3>Contributors</h3>
<div class="wrapped-div">
<table style="width: 100%;">
<tbody>
<tr class="tbl-data">
<td class="tbl-header last text-left">Company</td>
<td class="tbl-header last text-left">Ticker</td>
<td class="tbl-header last text-left">Sector</td>
<td class="tbl-header last text-right">Avg. Weight (%)</td>
<td class="tbl-header last text-right">Contribution (%)</td>
</tr>
<tr class="tbl-data">
<td class="data-td last text-left">Sealed Air Corp.</td>
<td class="data-td data last text-left">SEE</td>
<td class="data-td data last text-left">Materials</td>
<td class="data-td data last text-right">1.35</td>
<td class="data-td data last text-right">0.38</td>
</tr>
<tr class="tbl-data">
<td class="data-td last text-left">Albemarle Corp.</td>
<td class="data-td data last text-left">ALB</td>
<td class="data-td data last text-left">Materials</td>
<td class="data-td data last text-right">0.82</td>
<td class="data-td data last text-right">0.27</td>
</tr>
<tr class="tbl-data">
<td class="data-td last text-left">Expedia Group Inc.</td>
<td class="data-td data last text-left">EXPE</td>
<td class="data-td data last text-left">Consumer Discretionary</td>
<td class="data-td data last text-right">1.50</td>
<td class="data-td data last text-right">0.25</td>
</tr>
<tr class="tbl-data">
<td class="data-td last text-left">Ionis Pharmaceuticals Inc.</td>
<td class="data-td data last text-left">IONS</td>
<td class="data-td data last text-left">Health Care</td>
<td class="data-td data last text-right">2.15</td>
<td class="data-td data last text-right">0.24</td>
</tr>
<tr class="tbl-data">
<td class="data-td last text-left">DuPont de Nemours Inc.</td>
<td class="data-td data last text-left">DD</td>
<td class="data-td data last text-left">Materials</td>
<td class="data-td data last text-right">1.49</td>
<td class="data-td data last text-right">0.23</td>
</tr>
</tbody>
</table>
</div>
<h3>Detractors</h3>
<div class="wrapped-div">
<table style="width: 100%;">
<tbody>
<tr class="tbl-data">
<td class="tbl-header last text-left">Company</td>
<td class="tbl-header last text-left">Ticker</td>
<td class="tbl-header last text-left">Sector</td>
<td class="tbl-header last text-right">Avg. Weight (%)</td>
<td class="tbl-header last text-right">Contribution (%)</td>
</tr>
<tr class="tbl-data">
<td class="data-td last text-left">Norwegian Cruise Line</td>
<td class="data-td data last text-left">NCLH</td>
<td class="data-td data last text-left">Consumer Discretionary</td>
<td class="data-td data last text-right">1.40</td>
<td class="data-td data last text-right">-0.25</td>
</tr>
<tr class="tbl-data">
<td class="data-td last text-left">HubSpot Inc.</td>
<td class="data-td data last text-left">HUBS</td>
<td class="data-td data last text-left">Technology</td>
<td class="data-td data last text-right">0.68</td>
<td class="data-td data last text-right">-0.17</td>
</tr>
<tr class="tbl-data">
<td class="data-td last text-left">Etsy Inc.</td>
<td class="data-td data last text-left">ETSY</td>
<td class="data-td data last text-left">Consumer Discretionary</td>
<td class="data-td data last text-right">1.32</td>
<td class="data-td data last text-right">-0.17</td>
</tr>
<tr class="tbl-data">
<td class="data-td last text-left">Bath &amp; Body Works Inc.</td>
<td class="data-td data last text-left">BBWI</td>
<td class="data-td data last text-left">Consumer Discretionary</td>
<td class="data-td data last text-right">0.59</td>
<td class="data-td data last text-right">-0.16</td>
</tr>
<tr class="tbl-data">
<td class="data-td last text-left">Warner Music Group</td>
<td class="data-td data last text-left">WMG</td>
<td class="data-td data last text-left">Communication Services</td>
<td class="data-td data last text-right">1.42</td>
<td class="data-td data last text-right">-0.16</td>
</tr>
</tbody>
</table>
</div>
<p class="chart-disclosure">Source: Morningstar. Past performance is no guarantee of future results. Index performance is not illustrative of fund performance. Not intended as a recommendation to buy or to sell any of the securities mentioned herein.</p>
<h2 id="moat-strategies" class="jump-link-nav anchored-block" data-jumplink-title="Moat Strategies">Choose Your Moat Strategy</h2>
<p>VanEck&rsquo;s suite of <strong><a href="/us/en/blogs/moat-investing/moat-investing-powered-by-morningstar/" title="Quality Companies at Attractive Prices">moat investing strategies</a></strong> is powered by Morningstar&rsquo;s equity research team, which seeks quality companies trading at attractive valuations. The below ETFs offer access to US moat companies:</p>
<p><a href="/link/9e43dd198c5f4e419f13220685081895.aspx" title="MOAT - VanEck Morningstar Wide Moat ETF - Overview"><strong>VanEck Morningstar Wide ETF (MOAT)</strong></a>: companies with a wide moat rating, which means Morningstar believes the company is likely to sustain its competitive advantage for at least the next 20 years.</p>
<p><a href="/link/166321dbcfec440590fb51cf0ad629aa.aspx" title="SMOT - VanEck Morningstar SMID Moat ETF - Overview"><strong>VanEck Morningstar SMID Moat ETF (SMOT)</strong></a>: small and mid-cap moat companies.</p>
<p><strong><a href="/link/fd582da052ba46c79bfc112c078a6256.aspx" title="MVAL - VanEck Morningstar Wide Moat Value ETF - Overview">VanEck Morningstar Wide Moat Value ETF (MVAL)</a></strong>: wide moat companies within Morningstar&rsquo;s value style category.</p>
<p>To receive more <a href="https://www.vaneck.com/us/en/insights/moat-investing" title="Moat Investing Insights"><strong>Moat Investing</strong></a> insights, <a href="https://www.vaneck.com/us/en/subscribe/" title="Subscription Center"><strong>sign up in our subscription center</strong></a>.</p>
]]></content:encoded>
</item><item rdf:about="https://www.vaneck.com/us/en/blogs/municipal-bonds/municipal-bond-stress-is-isolated-heres-why-it-matters/">
  <title>Municipal Bond Stress Is Isolated — Here’s Why It Matters></title>
  <link>https://www.vaneck.com/us/en/blogs/municipal-bonds/municipal-bond-stress-is-isolated-heres-why-it-matters/</link>
  <description><![CDATA[Municipal defaults remain rare, but recent data shows a widening gap between the safest and riskiest sectors, highlighting the need for careful credit research and selective sector exposure.]]></description>
  <dc:creator>Tamara  Lowin</dc:creator>
  <dc:date>12/09/2025 06:30:00</dc:date>
<content:encoded><![CDATA[

<p><strong>Key Takeaways:</strong></p>
<ul class="content-list">
<li class="mt-2">&ldquo;Risky&rdquo; muni sectors show rising defaults while &ldquo;safe&rdquo; sectors defaults remain near zero.</li>
<li class="mt-2">Senior living, charter schools, and Industrial Development Bonds drive most default activity.</li>
<li class="mt-2">Diversification and focus on essential-service credits remain crucial in the muni sector.</li>
</ul>
<h2>Municipal Defaults Are Still Low, But the Risk Gap Is Widening</h2>
<p>If you follow the municipal bond market, you know &ldquo;defaults&rdquo; tend to get more attention than they deserve. They&rsquo;re rare, especially among initially rated issuers, but they still provide useful information.</p>
<p>Recent data from the Municipal Market Analytics (MMA) Default Study shows a clear trend. Overall credit quality is still strong. However, the gap between the safest and riskiest parts of the market is growing.</p>
<h2>Historical Municipal Bond Default Rates</h2>
<p>Over the past decade, annual municipal default rates have sat between 0.03% and 0.15% of par outstanding<sup>1</sup>,&nbsp;levels that are extremely low compared to corporate debt. The more interesting development isn&rsquo;t the level of defaults, but the dispersion between sectors. MMA divides the municipal borrowers into 32 sectors and categorizes each sector as a &ldquo;safe&rdquo; or &ldquo;risky&rdquo; sector.</p>
<p>Since 2015, 94% of the 682 borrowers that defaulted were in risky sectors. As a percent of outstanding debt, annual defaults remain steady.</p>
<p>However, risky sector bonds are seeing more defaults. The widening spread shows a growing gap. This gap is between strong, essential-service issuers and riskier, project-based borrowers. It reminds us that the muni market is not one thing. It is a mix of credits that act differently based on their purpose and structure.</p>
<h2>First Time Payment Defaults</h2>
<p><img loading="lazy" class="img-responsive w-100" alt="First Time Payment Defaults" src="https://www.vaneck.com/EPiServer/CMS/Content/contentassets/724e03df99df405d8c901f25c1c681e4/6508_muni-blog-dec_chart-01_2025-12_v1_blog.svg,,355342/Download?epieditmode=False" /></p>
<p class="chart-disclosure">Source: Municipal Market Analytics (MMA) Research. FY2025 through October 31.</p>

<h2>The Weak Spots of the Municipal Market</h2>
<p>Since 2015, certain sectors stand out for their higher or more volatile defaults. Retirement and senior living facilities are the most prolific defaulters, seeing 2-4% outstanding debt default annually. These projects are sensitive to broader economic and demographic trends including declines in the residential real estate market, growing health care workers outpacing supply, and weakening coverage of governmental health insurance.</p>
<p>Charter schools have shown wide swings as well, with annual default rates often surpassing 1% of its sectors&rsquo; debt outstanding. Success in this sector depends upon strengthening enrollment trends, sophisticated oversight, and quality school management, as well as favorable local demographics and state policies.</p>
<p>Industrial Development Bonds (IDBs) also exhibit elevated default activity, particularly in recent years, due to their project-specific nature and closer resemblance to corporate-style risk. Many of these projects use new technology which often results in expensive challenges; other issues these face are, lower demand for end product than forecast, lower plant productivity, and elevated construction costs.</p>
<h2>The Safe Havens of the Municipal Market</h2>
<p>By contrast, traditional public-purpose sectors continue to show remarkable stability. State and local government debt, as well as utilities, public higher education, local housing authorities, and transportation credits all post near-zero default rates year after year. These sectors benefit from essential-service demand, broad, reliable revenue streams, and, in many cases, explicit or implicit government support.</p>
<p>Their consistency underscores why they form the foundation of most high-quality municipal portfolios. As safe sectors currently represent about 70% of municipal debt outstanding, the risk of borrower default remains very low for most of the issuance.</p>
<h2>What the Muni Market Means for Investors</h2>
<p>For investors, the key takeaway is that municipal bonds remain a fundamentally resilient asset class. Defaults are still extremely low, but the growing dispersion underscores the value of credit research and thoughtful sector allocation. Diversification across issuers and sectors remains crucial, and investors should favor essential-service credits with stable revenues over niche or highly leveraged projects. In an ETF context, broad market exposure continues to provide natural insulation against the idiosyncratic risks that show up in smaller, less diversified portfolios.</p>
<p>The muni market&rsquo;s recent credit trends don&rsquo;t signal systemic weakness, they signal selectivity. We&rsquo;re in an environment where strong issuers are staying strong, but weaker ones are starting to show stress. For long-term investors, that means the opportunity isn&rsquo;t in chasing yield, but in owning quality credits that will keep paying reliably through whatever cycle comes next. Municipal defaults may still be rare, but understanding where they&rsquo;re concentrated is key to preserving the stability the asset class is known for.</p>
<p>For more information visit <a href="https://www.vaneck.com/us/en/etf-mutual-fund-finder/etfs/income/municipal-bond/" title="Explore Our ETFs and Mutual Funds"><strong>VanEck&rsquo;s suite of Muni ETFs</strong></a>.</p>
<p>To receive more <a href="https://www.vaneck.com/us/en/insights/municipal-bonds/" title="Municipal Bonds Insights"><strong>Municipal Bonds</strong></a> insights, <a href="/link/5f45412c2143400497908cea2897f7d3.aspx" title=" Subscription Center"><strong>sign up in our subscription center</strong></a>.</p>
]]></content:encoded>
</item><item rdf:about="https://www.vaneck.com/us/en/blogs/model-portfolios/ai-adoption-surges-and-tight-liquidity-creates-opportunity/">
  <title>November Market Recap: AI Adoption Surges &amp; Tight Liquidity Creates Opportunity></title>
  <link>https://www.vaneck.com/us/en/blogs/model-portfolios/ai-adoption-surges-and-tight-liquidity-creates-opportunity/</link>
  <description><![CDATA[Liquidity tightened, Bitcoin signaled early stress, AI adoption gained traction, and real assets continued to lead in a shifting market regime.]]></description>
  <dc:creator>David Schassler</dc:creator>
  <dc:date>12/09/2025 06:30:00</dc:date>
<content:encoded><![CDATA[

<p id="overview" class="jump-link-nav anchored-block" data-jumplink-title="Overview"><strong>Key Takeaways</strong></p>
<ul class="content-list">
<li class="mt-2">Liquidity stress tightened markets, with Bitcoin leading risk-asset weakness as the earliest barometer.</li>
<li class="mt-2">AI signals shifted from infrastructure build-out toward real enterprise adoption.</li>
<li class="mt-2">Real assets outperformed as late-cycle macro meets early-cycle technology demand.</li>
</ul>

<p><strong><i>The views expressed are for illustrative purposes only, subject to change without notice, do not constitute investment advice or recommendations, and are those of the author(s) and not necessarily those of VanEck or its other employees. Past performance is no guarantee of future results.</i></strong></p>
<p>November showed how fast sentiment can flip when liquidity gets scarce. As we&rsquo;ve come to expect, as funding costs rose and repo markets showed, the most sensitive assets were the first to get hit. Bitcoin dropped nearly 30% from its October high before stabilizing. High-growth tech stocks corrected about 10%. Timing told the real story: Bitcoin began rolling over on October 6, while the tech sector&rsquo;s meaningful leg down didn&rsquo;t begin until October 29. That three-week lead is why we treat Bitcoin as the market&rsquo;s earliest liquidity barometer: when the plumbing begins to clog, it leaks first.</p>
<p>We used the sell-off to add.</p>
<h3>Bitcoin: A Signal For Tech Stocks</h3>
<p><img loading="lazy" class="img-responsive" alt="Bitcoin: A Signal For Tech Stocks" src="https://www.vaneck.com/contentassets/e978e7585ef841469d90ae7e8c6d4bee/6513_models-monthly-december_chart-1_2025-12_v1_blog.svg" /></p>
<p class="chart-disclosure">Source: Bloomberg, as of 11/30/2025. Past performance is no guarantee of future results.</p>
<p>On November 21, as Bitcoin touched its low, our models flagged a clear mean-reversion setup: the decline was too sharp relative to its own history and too disconnected from the rest of the portfolio. We increased exposure when fear was peaking. That&rsquo;s exactly what the process is designed to do.</p>
<p>Alongside the liquidity dynamics, November provided steady, incremental signals pointing toward a shift in the AI cycle from Phase 1 (infrastructure) into Phase 2 (adoption).</p>
<h2>The Framework</h2>
<ul class="content-list">
<li>Phase 1: Chips, data centers, power: the build-out</li>
<li>Phase 2: AI embedded in actual products and workflows: real revenue</li>
<li>Phase 3: Automation and robotics at scale: labor transformation Two verifiable developments stood out:</li>
<li>Cisco raised full-year guidance on continued AI-driven networking demand.</li>
<li>CrowdStrike lifted its outlook after sustained enterprise take-up of its AI-native security platform.</li>
</ul>
<p>These are not explosive moves, but they are consistent with the transition from experimentation to deployment. A recent Economist article highlighted just how wide the gap remains between &ldquo;we have an AI subscription&rdquo; and &ldquo;AI is embedded in production workflows.&rdquo;</p>
<p>That gap is the hallmark of the productivity J-curve: friction today, bigger payoff later. We remain positioned for the latter.</p>
<p><img loading="lazy" class="img-responsive" alt="The black box" src="https://www.vaneck.com/contentassets/fb188cb2d7254900babfcd1f7d0cc613/6513_models-monthly-december_infog-1_2025-12_v1_blog.jpg" /></p>
<p class="chart-disclosure">Source: The Economist, as of 2025.</p>
<h2>Late-Cycle Backdrop, Early-Cycle Technology</h2>
<p>The tension is obvious: an early-cycle technology boom is running head-first into a late-cycle economy.</p>
<p>Circular AI revenue, onshoring costs, tariffs, geopolitical friction, a shrinking middle class, and political gridlock that shows no sign of ending. The root cause is simple: the system is working for some, not most. That divergence showed up at the ballot box on November 4, with economic worries driving record turnout in the NYC mayoral race &mdash; where Zohran Mamdani won on a platform of rent freezes and affordability &mdash; and Democratic sweeps in Virginia and New Jersey, as voters punished the status quo for persistent inflation and job stagnation.</p>
<p>AI will drive productivity and growth. But first it will displace knowledge workers. Later, when robotics scale, the impact spreads vastly wider. Public debt in that environment becomes an even larger problem.</p>
<h2>Real Asset Backbone Behind AI Adoption</h2>
<p>There is another story developing beneath the surface: old-world assets are quietly building the new world. A diversified basket of real-asset companies, aka the businesses powering infrastructure, energy, industrial metals, transportation, and manufacturing, is outperforming the Nasdaq 100 Index year-to-date.</p>
<h3>Real Assets: The Bull Market Nobody Is Paying Attention To</h3>
<p><img loading="lazy" class="img-responsive" alt="Real Assets: The Bull Market Nobody Is Paying Attention To" src="https://www.vaneck.com/contentassets/584ad70169a84b189cd5fa42d2b24a9d/6513_models-monthly-december_chart-2_2025-12_v1_blog.svg" /></p>
<p class="chart-disclosure">Source: FactSet, as of 11/30/2025. Past performance is no guarantee of future results.</p>
<p>The next decade of AI, automation, and reshoring simply cannot happen without this backbone. Data centers need power. Robotics need materials. Supply chains need redundancy. Innovation needs infrastructure. And the bill for all of it is being financed through monetary dilution and persistent fiscal deficits. This is why we continue to own real assets for upside participation &mdash; and gold to protect against the debasement that ultimately pays for the next wave of growth.</p>
<h2>Debt and Liquidity: Stress, Not Panic</h2>
<p>Roughly $9.2 trillion in U.S. Treasuries mature in 2025; a large but manageable rolling refinancing task. During the post-COVID period, the Treasury shifted issuance toward short-term bills, doubling T-Bills&rsquo; share of the Treasuries market from ~12% in 2015 to ~22% by 2025. The move has effectively served as a form of yield-curve control by flooding the front end and compressing long-term rates.</p>
<p>The trade-off is more frequent rollovers and greater sensitivity to liquidity swings.</p>
<h3>Bills Make Up More Than 20% of Treasuries Market</h3>
<p><img loading="lazy" class="img-responsive" alt="Bill Make Up More Than 20% of Treasuries Market" src="https://www.vaneck.com/contentassets/0f442596b6ad40d299064becb4e10a15/6513_models-monthly-december_chart-3_2025-12_v1_blog.svg" /></p>
<p class="chart-disclosure">Source: Bloomberg, as of 2025.</p>
<p>The Treasury General Account (TGA) adds another important layer to the picture. The Treasury built up a sizable cash balance, funded predominantly through bill issuance, which drained a significant amount of reserves from the banking system over the course of the year.</p>
<p>That tightening became most visible in the repo markets. Toward the end of November, funding pressures surfaced: repo rates climbed, SOFR briefly moved above the Fed&rsquo;s target range, and strains appeared in parts of the financial plumbing.</p>
<p>In response, the Federal Reserve brought its Treasury QT runoff to an earlier end than many had anticipated and made clear it was paying close attention to funding conditions. It wasn&rsquo;t a crisis&mdash;just a sharp reminder that liquidity still matters, and the most sensitive parts of the money markets feel it first.</p>
<h2 id="how-we-handled-november" class="jump-link-nav anchored-block" data-jumplink-title="How We Handled November">How We Handled November</h2>
<ul class="content-list">
<li>Increased Bitcoin when sellers panicked</li>
<li>Remained positioned in companies delivering measurable AI adoption</li>
<li>Continued to benefit from reshoring and real-asset exposure</li>
<li>Gold worked again: up over 5% in the month, now above $4,200 after starting last December below $2,600</li>
</ul>
<h2>The Bottom Line</h2>
<p>There&rsquo;s no going back.</p>
<p>We are in a new regime: governments will debase currency to service yesterday&rsquo;s debt and fund tomorrow&rsquo;s ambitions. At the same time, extreme innovation, led by AI, is rewriting productivity, profitability, and power.</p>
<p>We believe the winning portfolio owns both sides of that equation:</p>
<ul class="content-list">
<li>Assets that potentially protect and profit from debasement (Bitcoin, gold, real assets)</li>
<li>Companies and themes that may capture the capex surge and the productivity explosion</li>
</ul>
<p>Diversification across these forces is no longer optional. It is the new foundation for generating returns in a world that is changing fast.</p>
<h2 id="macro-themes-we-are-watching" class="jump-link-nav anchored-block" data-jumplink-title="Macro Themes We&rsquo;re Watching">Macro themes we&rsquo;re watching:</h2>

<p>Today&rsquo;s predominant macro forces are driving the key themes and exposures in VanEck&rsquo;s models, including the core allocation of the <a href="https://www.vaneck.com/us/en/investments/wealth-builder-plus-portfolios/overview/" title="VanEck Wealth Builder Plus Portfolios"><strong>VanEck Wealth Builder Plus Portfolios</strong></a>. The allocations below are representative of the Moderate Portfolio.</p>
<p class="d-none d-lg-block"><img loading="lazy" class="img-responsive" src="https://www.vaneck.com/contentassets/d11c4b8e0f5f4cfcbc522aa3e045a64d/6398_models-monthly-october_pie-chart-1_2025-11_v1_desktop.svg" alt="Asset Allocation" /></p>
<p style="width: 345px;" class="d-lg-none"><img loading="lazy" class="img-responsive" src="https://www.vaneck.com/contentassets/d11c4b8e0f5f4cfcbc522aa3e045a64d/6398_models-monthly-october_pie-chart-1_2025-11_v1_mobile_blog.svg" alt="Asset Allocation" /></p>
<p class="chart-disclosure">Source: VanEck, 11/30/2025. Not intended as a recommendation to buy or sell any securities or digital assets, or as investment or any call to action.</p>
<div class="flourish-embed flourish-table" data-src="visualisation/26699289?2429575"><script src="https://public.flourish.studio/resources/embed.js"></script><noscript><img loading="lazy" src="https://public.flourish.studio/visualisation/26699289/thumbnail" width="100%" alt="table visualization" /></noscript></div>
<p class="chart-disclosure">Source: VanEck, FactSet. As of 11/30/2025. For illustrative purposes only. Not intended as an offer or recommendation to buy or sell any securities referenced herein. Strategy allocations will vary. Holdings exclude cash.</p>

<h3>Standardized Performance</h3>
<div class="wrapped-div blog-post content">
<table style="width: 100%;">
<tbody>
<tr class="tbl-data">
<td class="data-head last">&nbsp;</td>
<td class="data-head last text-right">Inception Date</td>
<td class="data-head last text-right">1M</td>
<td class="data-head last text-right">3M</td>
<td class="data-head last text-right">YTD</td>
<td class="data-head last text-right">1Y</td>
<td class="data-head last text-right">3Y</td>
<td class="data-head last text-right">5Y</td>
<td class="data-head last text-right">Since Inception</td>
</tr>
<tr class="tbl-data">
<td class="data-td data last text-left">Wealth Builder Plus Conservative Strategy</td>
<td class="data-td data last text-right">7/1/2024</td>
<td class="data-td data last text-right">&nbsp;</td>
</tr>
<tr class="tbl-data">
<td class="data-td data last text-left">Net</td>
<td class="data-td data last text-right">&nbsp;</td>
<td class="data-td data last text-right">0.28</td>
<td class="data-td data last text-right">3.23</td>
<td class="data-td data last text-right">10.39</td>
<td class="data-td data last text-right">8.06</td>
<td class="data-td data last text-right">--</td>
<td class="data-td data last text-right">9.71</td>
</tr>
<tr class="tbl-data">
<td class="data-td data last text-left">Gross</td>
<td class="data-td data last text-right">&nbsp;</td>
<td class="data-td data last text-right">0.28</td>
<td class="data-td data last text-right">3.23</td>
<td class="data-td data last text-right">10.39</td>
<td class="data-td data last text-right">8.06</td>
<td class="data-td data last text-right">--</td>
<td class="data-td data last text-right">9.71</td>
</tr>
<tr class="tbl-data">
<td class="data-td data last text-left">20% ACWI/80% ICE Broad Market Index</td>
<td class="data-td data last text-right">&nbsp;</td>
<td class="data-td data last text-right">0.48</td>
<td class="data-td data last text-right">3.02</td>
<td class="data-td data last text-right">9.94</td>
<td class="data-td data last text-right">7.99</td>
<td class="data-td data last text-right">--</td>
<td class="data-td data last text-right">8.86</td>
</tr>
<tr class="tbl-data">
<td class="data-td data last text-left">Wealth Builder Plus Moderate Strategy</td>
<td class="data-td data last text-right">7/1/2024</td>
<td class="data-td data last text-right">&nbsp;</td>
</tr>
<tr class="tbl-data">
<td class="data-td data last text-left">Net</td>
<td class="data-td data last text-right">&nbsp;</td>
<td class="data-td data last text-right">-0.06</td>
<td class="data-td data last text-right">4.83</td>
<td class="data-td data last text-right">15.28</td>
<td class="data-td data last text-right">11.95</td>
<td class="data-td data last text-right">--</td>
<td class="data-td data last text-right">14.57</td>
</tr>
<tr class="tbl-data">
<td class="data-td data last text-left">Gross</td>
<td class="data-td data last text-right">&nbsp;</td>
<td class="data-td data last text-right">-0.06</td>
<td class="data-td data last text-right">4.83</td>
<td class="data-td data last text-right">15.28</td>
<td class="data-td data last text-right">11.95</td>
<td class="data-td data last text-right">--</td>
<td class="data-td data last text-right">14.57</td>
</tr>
<tr class="tbl-data">
<td class="data-td data last text-left">60% ACWI/40% ICE Broad Market Index</td>
<td class="data-td data last text-right">&nbsp;</td>
<td class="data-td data last text-right">0.19</td>
<td class="data-td data last text-right">4.34</td>
<td class="data-td data last text-right">14.79</td>
<td class="data-td data last text-right">12.37</td>
<td class="data-td data last text-right">--</td>
<td class="data-td data last text-right">13.16</td>
</tr>
<tr class="tbl-data">
<td class="data-td data last text-left">Wealth Builder Plus Aggressive Strategy</td>
<td class="data-td data last text-right">7/1/2024</td>
<td class="data-td data last text-right">&nbsp;</td>
</tr>
<tr class="tbl-data">
<td class="data-td data last text-left">Net</td>
<td class="data-td data last text-right">&nbsp;</td>
<td class="data-td data last text-right">-0.22</td>
<td class="data-td data last text-right">5.76</td>
<td class="data-td data last text-right">18.02</td>
<td class="data-td data last text-right">14.22</td>
<td class="data-td data last text-right">--</td>
<td class="data-td data last text-right">17.17</td>
</tr>
<tr class="tbl-data">
<td class="data-td data last text-left">Gross</td>
<td class="data-td data last text-right">&nbsp;</td>
<td class="data-td data last text-right">-0.22</td>
<td class="data-td data last text-right">5.76</td>
<td class="data-td data last text-right">18.02</td>
<td class="data-td data last text-right">14.22</td>
<td class="data-td data last text-right">--</td>
<td class="data-td data last text-right">17.17</td>
</tr>
<tr class="tbl-data">
<td class="data-td data last text-left">80% ACWI/20% ICE Broad Market Index</td>
<td class="data-td data last text-right">&nbsp;</td>
<td class="data-td data last text-right">0.04</td>
<td class="data-td data last text-right">4.99</td>
<td class="data-td data last text-right">17.16</td>
<td class="data-td data last text-right">14.49</td>
<td class="data-td data last text-right">--</td>
<td class="data-td data last text-right">15.23</td>
</tr>
<tr class="tbl-data">
<td class="data-td data last text-left">Thematic Disruption Strategy</td>
<td class="data-td data last text-right">12/24/2021</td>
<td class="data-td data last text-right">&nbsp;</td>
</tr>
<tr class="tbl-data">
<td class="data-td data last text-left">Net</td>
<td class="data-td data last text-right">&nbsp;</td>
<td class="data-td data last text-right">-5.16</td>
<td class="data-td data last text-right">6.96</td>
<td class="data-td data last text-right">23.33</td>
<td class="data-td data last text-right">23.62</td>
<td class="data-td data last text-right">20.17</td>
<td class="data-td data last text-right">--</td>
<td class="data-td data last text-right">6.14</td>
</tr>
<tr class="tbl-data">
<td class="data-td data last text-left">Gross</td>
<td class="data-td data last text-right">&nbsp;</td>
<td class="data-td data last text-right">-5.15</td>
<td class="data-td data last text-right">6.98</td>
<td class="data-td data last text-right">23.45</td>
<td class="data-td data last text-right">23.74</td>
<td class="data-td data last text-right">20.47</td>
<td class="data-td data last text-right">--</td>
<td class="data-td data last text-right">6.46</td>
</tr>
<tr class="tbl-data">
<td class="data-td data last text-left">MSCI ACWI IMI Growth Index</td>
<td class="data-td data last text-right">&nbsp;</td>
<td class="data-td data last text-right">-1.36</td>
<td class="data-td data last text-right">7.27</td>
<td class="data-td data last text-right">21.85</td>
<td class="data-td data last text-right">21.59</td>
<td class="data-td data last text-right">22.92</td>
<td class="data-td data last text-right">--</td>
<td class="data-td data last text-right">9.20</td>
</tr>
<tr class="tbl-data">
<td class="data-td data last text-left">Real Assets Strategy</td>
<td class="data-td data last text-right">8/16/2017</td>
<td class="data-td data last text-right">&nbsp;</td>
</tr>
<tr class="tbl-data">
<td class="data-td data last text-left">Net</td>
<td class="data-td data last text-right">&nbsp;</td>
<td class="data-td data last text-right">3.20</td>
<td class="data-td data last text-right">9.21</td>
<td class="data-td data last text-right">28.52</td>
<td class="data-td data last text-right">22.01</td>
<td class="data-td data last text-right">14.55</td>
<td class="data-td data last text-right">15.39</td>
<td class="data-td data last text-right">8.08</td>
</tr>
<tr class="tbl-data">
<td class="data-td data last text-left">Gross</td>
<td class="data-td data last text-right">&nbsp;</td>
<td class="data-td data last text-right">3.20</td>
<td class="data-td data last text-right">9.21</td>
<td class="data-td data last text-right">28.52</td>
<td class="data-td data last text-right">22.01</td>
<td class="data-td data last text-right">14.76</td>
<td class="data-td data last text-right">15.75</td>
<td class="data-td data last text-right">8.49</td>
</tr>
<tr class="tbl-data">
<td class="data-td data last text-left">Bloomberg Commodity Index</td>
<td class="data-td data last text-right">&nbsp;</td>
<td class="data-td data last text-right">3.20</td>
<td class="data-td data last text-right">8.47</td>
<td class="data-td data last text-right">16.15</td>
<td class="data-td data last text-right">17.33</td>
<td class="data-td data last text-right">3.21</td>
<td class="data-td data last text-right">11.79</td>
<td class="data-td data last text-right">6.24</td>
</tr>
<tr class="tbl-data">
<td class="data-td data last text-left">Select Opportunities Strategy</td>
<td class="data-td data last text-right">12/20/2024</td>
<td class="data-td data last text-right">&nbsp;</td>
</tr>
<tr class="tbl-data">
<td class="data-td data last text-left">Net</td>
<td class="data-td data last text-right">&nbsp;</td>
<td class="data-td data last text-right">-2.54</td>
<td class="data-td data last text-right">9.08</td>
<td class="data-td data last text-right">26.79</td>
<td class="data-td data last text-right">--</td>
<td class="data-td data last text-right">25.65</td>
</tr>
<tr class="tbl-data">
<td class="data-td data last text-left">Gross</td>
<td class="data-td data last text-right">&nbsp;</td>
<td class="data-td data last text-right">-2.54</td>
<td class="data-td data last text-right">9.08</td>
<td class="data-td data last text-right">26.79</td>
<td class="data-td data last text-right">--</td>
<td class="data-td data last text-right">25.65</td>
</tr>
<tr class="tbl-data">
<td class="data-td data last text-left">MSCI ACWI Index</td>
<td class="data-td data last text-right">&nbsp;</td>
<td class="data-td data last text-right">-0.01</td>
<td class="data-td data last text-right">5.93</td>
<td class="data-td data last text-right">21.07</td>
<td class="data-td data last text-right">--</td>
<td class="data-td data last text-right">21.39</td>
</tr>
<tr class="tbl-data">
<td class="data-td data last text-left">Dynamic High Income Strategy</td>
<td class="data-td data last text-right">9/30/2021</td>
<td class="data-td data last text-right">&nbsp;</td>
</tr>
<tr class="tbl-data">
<td class="data-td data last text-left">Net</td>
<td class="data-td data last text-right">&nbsp;</td>
<td class="data-td data last text-right">1.05</td>
<td class="data-td data last text-right">1.00</td>
<td class="data-td data last text-right">7.14</td>
<td class="data-td data last text-right">4.71</td>
<td class="data-td data last text-right">7.63</td>
<td class="data-td data last text-right">--</td>
<td class="data-td data last text-right">3.18</td>
</tr>
<tr class="tbl-data">
<td class="data-td data last text-left">Gross</td>
<td class="data-td data last text-right">&nbsp;</td>
<td class="data-td data last text-right">1.05</td>
<td class="data-td data last text-right">1.00</td>
<td class="data-td data last text-right">7.14</td>
<td class="data-td data last text-right">4.71</td>
<td class="data-td data last text-right">7.69</td>
<td class="data-td data last text-right">--</td>
<td class="data-td data last text-right">3.25</td>
</tr>
<tr class="tbl-data">
<td class="data-td data last text-left">ICE BofA Global HY Corp. &amp; Sov. Index</td>
<td class="data-td data last text-right">&nbsp;</td>
<td class="data-td data last text-right">0.49</td>
<td class="data-td data last text-right">1.74</td>
<td class="data-td data last text-right">10.69</td>
<td class="data-td data last text-right">10.03</td>
<td class="data-td data last text-right">11.26</td>
<td class="data-td data last text-right">--</td>
<td class="data-td data last text-right">3.94</td>
</tr>
</tbody>
</table>
</div>
<p class="chart-disclosure">Source: VanEck. As of 11/30/2025. Returns greater than 1 year are annualized. <strong>The performance data quoted represents past performance. Past performance is not a guarantee of future results. Performance may be lower or higher than performance data quoted. Performance figures presented herein are preliminary and may differ slightly from final performance figures. Fees paid represent acquired fund fees of the underlying funds held by the Strategies. Please contact us at info@vaneck.com for additional information.</strong></p>
<p>To receive more <strong><a href="https://www.vaneck.com/us/en/insights/guided-allocation/" title="Model Portfolio Insights">Model Portfolio</a></strong> insights, <strong><a href="https://www.vaneck.com/us/en/subscribe/" title="Subscription Center">sign up in our subscription center</a></strong>.</p>
]]></content:encoded>
</item><item rdf:about="https://www.vaneck.com/us/en/blogs/thematic-investing/buzz-etf-question-and-answer/">
  <title>BUZZ ETF: Question &amp; Answer></title>
  <link>https://www.vaneck.com/us/en/blogs/thematic-investing/buzz-etf-question-and-answer/</link>
  <description><![CDATA[We answer frequently asked questions on the VanEck Social Sentiment ETF (BUZZ).]]></description>
  <dc:creator> </dc:creator>
  <dc:date>12/05/2025 06:30:00</dc:date>
<content:encoded><![CDATA[

<p>This FAQ is designed to address common questions about investing through the lens of social sentiment, how <a href="/link/459289f4c5ea4648bd9dfcf70d847cd7.aspx" title="BUZZ - VanEck Social Sentiment ETF"><strong>BUZZ</strong></a>&rsquo;s AI-driven approach identifies these opportunities, and what makes the strategy distinct within today&rsquo;s market.</p>
<ul class="content-list">
<li class="mt-2"><strong><a href="#point-one">Is BUZZ an Active or Passive ETF?</a></strong></li>
<li class="mt-2"><strong><a href="#point-two">Why Should Investors Consider Investing in BUZZ?</a></strong></li>
<li class="mt-2"><strong><a href="#point-three">How Does the Index Work?</a></strong></li>
<li class="mt-2"><strong><a href="#point-four">How Does BUZZ Differ from other Thematic ETFs?</a></strong></li>
<li class="mt-2"><strong><a href="#point-five">Is BUZZ a Momentum Strategy?</a></strong></li>
<li class="mt-2"><strong><a href="#point-six">What Happens When Sentiment Turns Negative Across the Market?</a></strong></li>
<li class="mt-2"><strong><a href="#point-seven">How Does BUZZ Ensure Sentiment Data Integrity?</a></strong></li>
<li class="mt-2"><strong><a href="#point-eight">How Can Investors buy VanEck ETFs?</a></strong></li>
</ul>
<h2 id="point-one" class="anchored-block">Is BUZZ an Active or Passive ETF?</h2>
<p><a href="/link/459289f4c5ea4648bd9dfcf70d847cd7.aspx" title="BUZZ - VanEck Social Sentiment ETF"><strong>BUZZ</strong></a> is a passive ETF. It seeks to track the <a href="/link/459289f4c5ea4648bd9dfcf70d847cd7.aspx" title="BUZZ - VanEck Social Sentiment ETF"><strong>BUZZ</strong></a> NextGen AI US Sentiment Leaders Index. The index is composed of 75 large-cap U.S. equities that exhibit the highest degree of positive investor sentiment, based on the index provider&rsquo;s analysis of millions of data points each month across social media, news, blogs, and other online sources. The index is reconstituted monthly using this rules-based methodology.</p>
<h2 id="point-two" class="anchored-block">Why Should Investors Consider Investing in BUZZ?</h2>
<p>Investors may consider <a href="/link/459289f4c5ea4648bd9dfcf70d847cd7.aspx" title="BUZZ - VanEck Social Sentiment ETF"><strong>BUZZ</strong></a> because it represents a next-generation approach to equity investing, one that harnesses the collective voice of online investors. Rather than relying solely on traditional financial data or analyst forecasts, <a href="/link/459289f4c5ea4648bd9dfcf70d847cd7.aspx" title="BUZZ - VanEck Social Sentiment ETF"><strong>BUZZ</strong></a> taps into real-time investor sentiment, identifying where optimism, confidence, and conviction are building in the market.</p>

<h2 id="point-three" class="anchored-block">How Does the Index Work?</h2>
<p>Every month, millions of unique data points from online sources, including social media, financial news, and blogs, are aggregated and analyzed.</p>
<p><strong>The process includes:</strong></p>
<ul class="content-list">
<li class="mt-2"><strong>Universe Selection:</strong> Starts with U.S. large-cap stocks (typically over $5 billion market cap) with robust and diverse online engagement.</li>
<li class="mt-2"><strong>Sentiment Analysis:</strong> AI models classify and score the tone of online discussions (positive, neutral, negative) using Natural Language Processing (NLP).</li>
<li class="mt-2"><strong>Scoring and Ranking:</strong> Each stock is ranked by overall sentiment and breadth of discussion.</li>
<li class="mt-2"><strong>Portfolio Construction:</strong> The top 75 ranked stocks are selected and weighted according to their sentiment scores, subject to a 3% cap per constituent.</li>
<li class="mt-2"><strong>Monthly Rebalancing:</strong> The process repeats monthly to capture evolving investor sentiment.</li>
</ul>
<p>This systematic, data-driven approach allows <a href="/link/459289f4c5ea4648bd9dfcf70d847cd7.aspx" title="BUZZ - VanEck Social Sentiment ETF"><strong>BUZZ</strong></a> to reflect shifting investor attitudes in real time, adapting naturally to where enthusiasm and confidence are growing across sectors.</p>
<h2 id="point-four" class="anchored-block">How Does BUZZ Differ from other Thematic ETFs?</h2>
<p>Unlike thematic ETFs that focus on sectors or technologies, <a href="/link/459289f4c5ea4648bd9dfcf70d847cd7.aspx" title="BUZZ - VanEck Social Sentiment ETF"><strong>BUZZ</strong></a> is behavioral. Its holdings evolve based on sentiment, not sector or theme. This provides a unique blend of diversification and adaptability to market psychology. As a result, <a href="/link/459289f4c5ea4648bd9dfcf70d847cd7.aspx" title="BUZZ - VanEck Social Sentiment ETF"><strong>BUZZ</strong></a>&rsquo;s sector exposures evolve organically based on where market attention and optimism are strongest. The strategy is adaptive, not static, capturing changing market narratives such as enthusiasm around innovation, consumer trends, or leadership performance.</p>
<h2 id="point-five" class="anchored-block">Is BUZZ a Momentum Strategy?</h2>
<p>Not in the traditional sense. While sentiment-driven stocks can sometimes overlap with momentum leaders, the <a href="/link/459289f4c5ea4648bd9dfcf70d847cd7.aspx" title="BUZZ - VanEck Social Sentiment ETF"><strong>BUZZ</strong></a> index is not built on price action or trend-following factors. Instead, it organizes companies based on collective investor sentiment, where optimism, conviction, and confidence are strongest across online communities.</p>
<p>This approach can certainly highlight companies with strong performance recognition, but it also has the flexibility to surface contrarian or deep value opportunities. For instance, when investor discussions turn positive around companies that have fallen out of favor or undergone meaningful change, <a href="/link/459289f4c5ea4648bd9dfcf70d847cd7.aspx" title="BUZZ - VanEck Social Sentiment ETF"><strong>BUZZ</strong></a>&rsquo;s underlying index methodology can capture that shift in perception. Over time, this has allowed <a href="/link/459289f4c5ea4648bd9dfcf70d847cd7.aspx" title="BUZZ - VanEck Social Sentiment ETF"><strong>BUZZ</strong></a> to hold both high-growth innovators and turnaround stories within the same portfolio.</p>
<p>In that way, <a href="/link/459289f4c5ea4648bd9dfcf70d847cd7.aspx" title="BUZZ - VanEck Social Sentiment ETF"><strong>BUZZ</strong></a> is better described as a behavioral strategy, one that reflects where the collective voice of investors is most constructive, regardless of whether that enthusiasm is driven by momentum or by contrarian conviction.</p>
<h2 id="point-six" class="anchored-block">What Happens When Sentiment Turns Negative Across the Market?</h2>
<p><a href="/link/459289f4c5ea4648bd9dfcf70d847cd7.aspx" title="BUZZ - VanEck Social Sentiment ETF"><strong>BUZZ</strong></a> is designed to identify the <i>most positive</i> sentiment among eligible stocks, even during pessimistic market cycles. If all stocks are being discussed negatively, <a href="/link/459289f4c5ea4648bd9dfcf70d847cd7.aspx" title="BUZZ - VanEck Social Sentiment ETF"><strong>BUZZ</strong></a> will still select the &ldquo;least negative&rdquo; group, maintaining relatively better sentiment compared to peers.</p>
<p>This approach ensures the strategy continues to reflect real-time investor psychology, providing ongoing exposure to where confidence is strongest, even in challenging environments.</p>
<h2 id="point-seven" class="anchored-block">How Does BUZZ Ensure Sentiment Data Integrity?</h2>
<p>To protect integrity, the <a href="/link/459289f4c5ea4648bd9dfcf70d847cd7.aspx" title="BUZZ - VanEck Social Sentiment ETF"><strong>BUZZ</strong></a> Index uses filtering mechanisms designed to exclude bot-generated or manipulative content. Posts are screened to help confirm they represent genuine investor sentiment rather than automated noise or coordinated campaigns.</p>
<p>In addition, the index focuses on large-cap companies and requires a sustained and diverse level of online conversation for inclusion. This combination helps reduce susceptibility to manipulation and helps ensure that the data analyzed reflects genuine investor perspectives.</p>
<h2 id="point-eight" class="anchored-block">How Can Investors buy VanEck ETFs?</h2>
<p><a href="/link/459289f4c5ea4648bd9dfcf70d847cd7.aspx" title="BUZZ - VanEck Social Sentiment ETF"><strong>Learn more here.</strong></a></p>
<p><span style="font-size: 14pt;"><strong>How to buy BUZZ?</strong></span></p>
<p>VanEck ETFs can be purchased the same way you would buy a stock, through a broker or with your advisor.</p>
<p class="d-none d-lg-block"><a href="mailto:askvaneck@vaneck.com" title="Have More Questions? - Ask VanEck" rel="noopener"><img loading="lazy" class="img-responsive" src="https://www.vaneck.com/globalassets/home/us/insights/blogs/bm-blog-images/cta-faq_desktop-02.svg" alt="Have More Questions? - Ask VanEck" /></a></p>
<p class="d-lg-none"><a href="mailto:askvaneck@vaneck.com" title="Have More Questions? - Ask VanEck" rel="noopener"><img loading="lazy" class="img-responsive" src="https://www.vaneck.com/globalassets/home/us/insights/blogs/bm-blog-images/cta-faq_mobile-01.svg" alt="Have More Questions? - Ask VanEck" /></a></p>
<p>To receive more <a href="https://www.vaneck.com/us/en/insights/thematic-investing/" title="Thematic Investing Insights"><strong>Thematic Investing</strong></a> insights, <a href="https://www.vaneck.com/us/en/subscribe/" title="Subscription Center"><strong>sign up in our subscription center</strong></a>.</p>
]]></content:encoded>
</item><item rdf:about="https://www.vaneck.com/us/en/blogs/emerging-markets-bonds/yield-advantage-why-em-local-bonds-are-leading-dm-bonds-in-2025/">
  <title>Yield Advantage: Why EM Local Bonds Are Leading DM Bonds in 2025></title>
  <link>https://www.vaneck.com/us/en/blogs/emerging-markets-bonds/yield-advantage-why-em-local-bonds-are-leading-dm-bonds-in-2025/</link>
  <description><![CDATA[EM local-currency bonds offer high real yields, strong 2025 returns, and resilience to shocks, driven by credible policy and solid fundamentals.]]></description>
  <dc:creator>Fran Rodilosso</dc:creator>
  <dc:date>12/05/2025 06:30:00</dc:date>
<content:encoded><![CDATA[

<p><strong>Key Takeaways</strong></p>
<ul class="content-list">
<li class="mt-2">EM local currency bonds have delivered high real yields and strong 2025 performance.</li>
<li class="mt-2">Improved policy credibility has boosted resilience EM local currency bonds to shocks.</li>
<li class="mt-2">Elevated income and diversification make the EM local currency bonds appealing.</li>
</ul>
<p>Emerging market (EM) local currency bonds have delivered astounding performance in 2025 despite initial fears around local currency devaluation versus the US dollar due to tariffs. Year-to-date, the asset class outpaced most fixed income segments including US high yield and the broad US and global markets. EM local bonds are an attractive option for fixed income portfolios, offering high yields from issuers with credible monetary policy in a world where developed markets grapple with sticky inflation and limits on central bank effectiveness. With strong fundamentals and higher yields, the asset class has shown that it is resilient to external risk-off shocks.</p>
<h2>Higher Yields, Better Value</h2>
<p>Worries about rising inflation and debt levels in the US prompted investors to consider the diversification benefits of non-US dollar assets, raising the appeal for EM local bonds, but that&rsquo;s only half of the story. On top of that, sovereign bond yields in EM countries remain high, as many EM central banks started tightening in 2021 well ahead of advanced economies, front-loading hikes to contain post-pandemic inflation. The result has been high real yields which continue to be an important driver of return.</p>
<h3>High Yields in EM Cushion Market Turbulence</h3>
<p><img loading="lazy" class="img-responsive" alt="High Yields in EM Cushion Market Turbulence" src="https://www.vaneck.com/contentassets/b80b94b9d45d4b0a9cff1c82bb9414a2/6501_emlc-december-charts_chart-1_2025-12_v1.svg" /></p>
<p class="chart-disclosure">Source: VanEck, Bloomberg, J.P. Morgan, ICE Data Indices, LLC. Data as of 9/30/2025. See disclosures below for information on the indices that represent each category above. US HY is represented by the ICE BofA US High Yield Index. EM LC Sov is represented by the J.P. Morgan GBIEM Global Core Index. EM HY Corp is represented by the ICE BofA Diversified HY US Emerging Markets Corporate Plus Index. EM USD Sov is represented by the JPM EMBI Global Diversified Index. EM Corp is represented by the ICE BofA EM Diversified Corporate Index. US IG Corp is represented by the ICE BofA US Corporate Index. US Agg is represented by the ICE BofA US Broad Market Index. Global Agg is represented by the ICE BofA Global Broad Market Plus Index. Real yield is the nominal yield minus the forecasted rate of inflation. Past performance is no guarantee of future results. Index performance is not representative of fund performance. It is not possible to invest directly in an index.</p>
<h3>EM Sovereign Local Bond Returns Exceed Those In Developed Markets YTD</h3>
<p><img loading="lazy" class="img-responsive" alt="EM Sovereign Local Bond Returns Exceed Those In Developed Markets YTD" src="https://www.vaneck.com/contentassets/c629870c4086489780dd936a84cc1d8d/6501_emlc-december-charts_chart-2_2025-12_v1.svg" /></p>
<p class="chart-disclosure">Source: Morningstar. Data as of November 2025. See disclosures below for information on the indices that represent each category above. EM Local Bonds is represented by the J.P. Morgan GBI-EM Global Diversified Index. 50:50 EM is represented by the 50% J.P. Morgan EMBI Global Diversified Index/50% J.P. Morgan GBI-EM Global Diversified Index. USD EM Sovereign is represented by the J.P. Morgan EMBI Global Diversified Index. EM Corporates is represented by the J.P. Morgan CEMBI Broad Diversified Index. Global Broad Market is represented by the ICE BofA Global Broad Market Index. US Corporates is represented by the ICE BofA US Corporate Index. US High Yield is represented by the ICE BofA US High Yield Index. U.S. Broad Market is represented by the ICE BofA US Broad Market Index. US 10Y Treasuries is represented by the ICE BofA 10-Year Current Treasury Index. DM Sovereign is represented by the ICE BofA Developed Markets Sovereign Bond Index. Past performance is no guarantee of future results. Index performance is not representative of fund performance. It is not possible to invest directly in an index. See important disclosures and index definitions at the end of the presentation.</p>

<h2>Resilient Markets</h2>
<p>Emerging markets have proven to be resilient to external risk-off shocks this year, displaying a significant improvement post the Global Financial Crisis. Even this year, after April&rsquo;s US tariff tantrum, EM local bonds quickly regained their footing and have led the fixed income category year to date. This isn&rsquo;t a work of magic, but policy driven: EM policymakers have built credibility through years of disciplined spending and orthodox monetary policy, resulting in more anchored inflation expectations and stronger fundamentals versus developed markets. Further, higher funding in local currency and better debt management have reduced their sensitivity to global/external shocks.</p>
<p>After an outstanding run in 2025, EM local currency bonds have regained investor attention &ndash; leading with performance and explained by fundamentals. Strong debt management and responsible monetary policies have provided EMs with room to cut rates, while local yields remain elevated. We believe the high level of income, robust fundamentals and diversification benefits make emerging markets local currency bonds an attractive addition to a global fixed income portfolio.</p>
<p>To receive more <a href="https://www.vaneck.com/us/en/insights/emerging-markets-bonds/" title="Emerging Markets Bonds Insights"><strong>Emerging Markets Bonds</strong></a> insights, <a href="/link/5f45412c2143400497908cea2897f7d3.aspx" title=" Subscription Center"><strong>sign up in our subscription center</strong></a>.</p>
]]></content:encoded>
</item><item rdf:about="https://www.vaneck.com/us/en/blogs/emerging-markets-bonds/em-high-yield-corporates-superior-yields-low-defaults/">
  <title>EM High Yield Corporates: Superior Yields, Low Defaults></title>
  <link>https://www.vaneck.com/us/en/blogs/emerging-markets-bonds/em-high-yield-corporates-superior-yields-low-defaults/</link>
  <description><![CDATA[EM high yield has extended its 2025 momentum, delivering strong carry and compelling yields. With higher credit quality and lower defaults, the segment offers a more attractive risk profile than US high yield.]]></description>
  <dc:creator>David Barros</dc:creator>
  <dc:date>12/04/2025 06:30:00</dc:date>
<content:encoded><![CDATA[

<p><strong>Key Takeaways</strong></p>
<ul class="content-list">
<li class="mt-2"><strong>Strong Momentum:</strong> EM high yield corporates have extended their outperformance in 2025, supported by improving fundamentals.</li>
<li class="mt-2"><strong>Compelling Yields:</strong> The segment provides one of the most appealing income opportunities in fixed income, offering strong carry and attractive compensation for risk.</li>
<li class="mt-2"><strong>Attractive Risk Profile:</strong> Despite perceptions, EM high yield issuers now exhibit higher average credit quality, lower defaults, and lower leverage than US peers.</li>
</ul>
<p>Emerging market high yield corporate bonds continued their momentum in 2025, outpacing US and major global credit benchmarks after a robust gain of approximately 13% in 2024. Over the past 15 years, this EM debt segment has more than doubled in size, evolving into a broader and deeper market. Today, the asset class benefits from improving fundamentals, higher credit quality and lower default rates than US high yield, while offering a substantial yield cushion.</p>
<h2>Mind the Yield</h2>
<p>EM high yield corporates continue to offer some of the most attractive yields in the fixed income space. The income portion of the return has been the dominant driver of performance, providing steady carry that cushions volatility and smooths drawdowns through market swings. This dynamic, where carry leads the way over larger price gains, can deliver consistent returns without relying on further spread tightening.</p>
<p><img loading="lazy" class="img-responsive w-100" alt="In-App Purchases Are a Material Driver of Revenues" src="https://www.vaneck.com/EPiServer/CMS/Content/contentassets/a2e280d5671b4bfb842dfef4d4f5d5f5/6493_hyem-income-blog_chart-01_2025-12_v1_blog.svg,,354826/Download?epieditmode=False" /></p>
<p class="chart-disclosure">Source: Morningstar. Data as of October 2025. Please see below for indices that represent each category. Index performance is not illustrative of fund performance. It is not possible to invest directly in an index. Past performance is no guarantee of future results.</p>
<h2>Attractive Compensation for Risk</h2>
<p>EM high yield corporate bonds are often perceived as riskier than those in the US and other developed markets, yet they exhibit higher credit quality, lower defaults and superior compensation for risk. The EM high yield index tilts more toward higher quality, with approximately 62% rated BB versus 55% in US high yield. Default rates spiked post‐COVID in 2022‐2023 following China&rsquo;s property sector collapse and Russian sanctions but have since normalized to levels below US high yield. Further, EM high yield corporate issuers often display wider spreads and lower leverage than US high yield, offering a relatively more favorable risk/reward profile.</p>
<h3>Lower Leverage than US HY</h3>
<p><img loading="lazy" class="img-responsive w-100" alt="In-App Purchases Are a Material Driver of Revenues" src="https://www.vaneck.com/EPiServer/CMS/Content/contentassets/9c6d33018308490d918ff4d39a264b4a/6493_hyem-income-blog_chart-02_2025-12_v1_blog.svg,,354827/Download?epieditmode=False" /></p>
<p class="chart-disclosure">Source: Bank of America. Data as of December 2024.</p>

<p>The EM high yield corporate debt market has matured into a larger, more diversified market that presents an attractive opportunity for income investors: higher yields and improved credit quality relative to US high yield.</p>
<p>To receive more <a href="https://www.vaneck.com/us/en/insights/emerging-markets-bonds/" title="Emerging Markets Bonds Insights"><strong>Emerging Markets Bonds</strong></a> insights, <a href="/link/5f45412c2143400497908cea2897f7d3.aspx" title=" Subscription Center"><strong>sign up in our subscription center</strong></a>.</p>
]]></content:encoded>
</item><item rdf:about="https://www.vaneck.com/us/en/blogs/thematic-investing/ai-in-biotech/">
  <title>AI in Pharma and Biotech: Market Trends 2025 and Beyond></title>
  <link>https://www.vaneck.com/us/en/blogs/thematic-investing/ai-in-biotech/</link>
  <description><![CDATA[AI is reshaping innovation across biotech by accelerating drug discovery, improving genomics, and advancing precision medicine.]]></description>
  <dc:creator>Louise Gedney</dc:creator>
  <dc:date>12/03/2025 06:30:00</dc:date>
<content:encoded><![CDATA[

<p><strong>Key Takeaways:</strong></p>
<ul class="content-list">
<li class="mt-2">AI powers digital twins of cells/molecules, speeding early drug discovery and cutting trial-and-error work.</li>
<li class="mt-2">Biotech firms use AI in trials to target patients more accurately and predict side effects, boosting safety and speed.</li>
<li class="mt-2">AI, genomics, and gene therapy are expanding biotech&rsquo;s market and unlocking new routes to growth.</li>
</ul>
<h2>How Artificial Intelligence is Shaping the Future of Biotechnology</h2>
<p>Biotechnology has long stood at the intersection of science and innovation, driving advances that transform human health. But in 2025, a new catalyst is redefining the pace and potential of the field: artificial intelligence. Across genomics, drug discovery, and personalized medicine, AI is enabling biotech companies to uncover insights that once took years, now in days or even hours.</p>
<p>The global biotech industry continues to expand, supported by aging populations, growing healthcare needs, and breakthrough therapies. Yet what&rsquo;s igniting fresh excitement is not just scientific progress, but computational power. By combining biological data with AI, biotech firms are decoding disease mechanisms at unprecedented speed, redefining what&rsquo;s possible in healthcare innovation.</p>
<h3>Biotechnology Market Size 2025 to 2034 (USD Trillion)</h3>
<p><img loading="lazy" class="img-responsive w-100" alt="It's Not Just Kids Playing Video Games" src="https://www.vaneck.com/EPiServer/CMS/Content/contentassets/77d54df13b8f405c87427661c1afb060/6487_seo-bbh-blog_chart-1_2025-11_v1_blog.svg,,354579/Download?epieditmode=False" /></p>
<p class="chart-disclosure">Source: Precedence Research. Data as of 11/2025. For illustrative purposes only. Not intended as a forecast or prediction of future results.</p>

<h2>AI is Taking Over Every Step of Drug Discovery</h2>
<p>The convergence of biology and machine learning is transforming every stage of the biotech value chain. AI models can now predict how molecules will interact with disease targets, significantly shortening development timelines and reducing costs. Genomic analysis, once a massive computational challenge, has become faster and more precise, enabling researchers to identify new genetic drivers of disease.</p>
<p>Industry leaders across the biotech landscape are already applying AI at scale to accelerate discovery, enhance precision, and reduce development costs. Advanced modeling and machine learning tools are helping researchers predict molecular interactions, identify new therapeutic targets, and optimize clinical trial design, transforming drug development from a process of trial and error into one of data-driven insight.</p>
<p>Together, these advancements mark a clear shift from trial-and-error experimentation to a new era of data-driven precision. As artificial intelligence becomes foundational to research and development, biotechnology is evolving into a discipline where insight and innovation move at the speed of computation.</p>
<h2>How AI is Already Changing Drug Development</h2>
<p>Artificial intelligence isn&rsquo;t replacing biology, it&rsquo;s amplifying it. By compressing research cycles and improving predictive accuracy, AI has the potential to boost success rates in drug development, historically a costly and uncertain process.</p>
<p>Across the industry, researchers are building &ldquo;digital twins&rdquo; of molecules and cells to simulate behavior before entering the lab. AI-driven tools are also improving clinical trial design by identifying optimal patient cohorts and predicting adverse reactions earlier. The result is reduced risk, greater efficiency, and a faster path from concept to clinic.</p>
<h3>AI Impact on Clinical Development</h3>
<p><img loading="lazy" class="img-responsive w-100" alt="In-App Purchases Are a Material Driver of Revenues" src="https://www.vaneck.com/EPiServer/CMS/Content/contentassets/b5663496a77c44d0b928108ac652266e/6487_seo-bbh-blog_chart-2_2025-11_v1_blog.svg,,354580/Download?epieditmode=False" /></p>
<p class="chart-disclosure">Source: McKinsey &amp; Company.</p>
<p>Recent studies suggest that AI is already driving measurable efficiency gains across nearly every stage of development, from protocol design to regulatory submission. As these technologies mature, they are set to transform how biotech companies innovate, operate, and grow.</p>
<h2>Why BBH is Positioned for the AI-Biotech Convergence</h2>
<p>The convergence of artificial intelligence, genomics, and gene therapy is shaping one of the most powerful innovation trends in healthcare. As AI expands the addressable market for biotech firms and accelerates time from concept to clinic, the industry is entering a new phase of productivity and profitability, setting the stage for renewed investor opportunity. Within this transformation, <a href="/link/8c70259022ce47bca46cea693f49c4df.aspx" title="BBH - VanEck Biotech ETF"><strong>VanEck&rsquo;s Biotech ETF (BBH)</strong></a> is positioned at the forefront. The fund&rsquo;s holdings include companies pioneering breakthrough therapies while leveraging AI to accelerate research, improve precision, and unlock new frontiers in personalized medicine.</p>
<h3>Top 10 Holdings</h3>
<div class="wrapped-div">
<table width="100%">
<tbody>
<tr class="tbl-data">
<td class="tbl-header last text-left"><strong>Holding Name</strong></td>
<td class="tbl-header last text-left"><strong>Ticker</strong></td>
<td class="tbl-header last text-right"><strong>% of Net Assets</strong></td>
</tr>
<tr class="tbl-data">
<td class="data-td data last text-left">AMGEN INC</td>
<td class="data-td data last text-left">AMGN US</td>
<td class="data-td data last text-right">12.43</td>
</tr>
<tr class="tbl-data">
<td class="data-td data last text-left">GILEAD SCIENCES INC</td>
<td class="data-td data last text-left">GILD US</td>
<td class="data-td data last text-right">12.16</td>
</tr>
<tr class="tbl-data">
<td class="data-td data last text-left">VERTEX PHARMACEUTICALS INC</td>
<td class="data-td data last text-left">VRTX US</td>
<td class="data-td data last text-right">9.42</td>
</tr>
<tr class="tbl-data">
<td class="data-td data last text-left">REGENERON PHARMACEUTICALS INC</td>
<td class="data-td data last text-left">REGN US</td>
<td class="data-td data last text-right">5.34</td>
</tr>
<tr class="tbl-data">
<td class="data-td data last text-left">INSMED INC</td>
<td class="data-td data last text-left">INSM US</td>
<td class="data-td data last text-right">5.33</td>
</tr>
<tr class="tbl-data">
<td class="data-td data last text-left">ARGENX SE</td>
<td class="data-td data last text-left">ARGX US</td>
<td class="data-td data last text-right">4.89</td>
</tr>
<tr class="tbl-data">
<td class="data-td data last text-left">IQVIA HOLDINGS INC</td>
<td class="data-td data last text-left">IQV US</td>
<td class="data-td data last text-right">4.83</td>
</tr>
<tr class="tbl-data">
<td class="data-td data last text-left">NATERA INC</td>
<td class="data-td data last text-left">NTRA US</td>
<td class="data-td data last text-right">4.7</td>
</tr>
<tr class="tbl-data">
<td class="data-td data last text-left">ALNYLAM PHARMACEUTICALS INC</td>
<td class="data-td data last text-left">ALNY US</td>
<td class="data-td data last text-right">4.43</td>
</tr>
<tr class="tbl-data">
<td class="data-td data last text-left">BEONE MEDICINES LTD</td>
<td class="data-td data last text-left">ONC US</td>
<td class="data-td data last text-right">3.91</td>
</tr>
<tr class="tbl-data">
<td class="data-td data last text-left"><strong>Top 10 Total</strong></td>
<td class="data-td data last text-left">&nbsp;</td>
<td class="data-td data last text-right"><strong>67.43</strong></td>
</tr>
</tbody>
</table>
</div>
<p class="chart-disclosure">As of October 31, 2025. These are not recommendations to buy or to sell any security. Securities and holdings may vary.</p>
<p>Across <a href="/link/8c70259022ce47bca46cea693f49c4df.aspx" title="BBH - VanEck Biotech ETF"><strong>BBH</strong></a>&rsquo;s holdings, innovation is compounding. Amgen is expanding its research pipeline through AI-driven molecular modeling; Vertex is harnessing machine learning to advance gene-editing technologies; Regeneron is using genomics-based AI to decode complex disease mutations faster than ever; and Gilead Sciences is applying AI to uncover novel therapeutic strategies in virology and oncology. Together, these leaders exemplify how artificial intelligence is transforming biotechnology from experimentation to foresight and precision.</p>
<p>With its focus on established innovators, <a href="/link/8c70259022ce47bca46cea693f49c4df.aspx" title="BBH - VanEck Biotech ETF"><strong>BBH</strong></a> provides exposure to companies with strong balance sheets, proven development capabilities, and deep data ecosystems, qualities that are increasingly critical as AI becomes central to biotech&rsquo;s evolution.</p>
<h2>AI Accelerating the Next Generation of Medical Innovation</h2>
<p>Biotech&rsquo;s story has always been one of discovery. Now, with artificial intelligence, that story is accelerating. Algorithms are helping scientists predict, model, and test with unprecedented speed and precision, unlocking therapies that were once beyond reach.</p>

<p>For investors looking to participate in the next generation of medical innovation, <a href="/link/8c70259022ce47bca46cea693f49c4df.aspx" title="BBH - VanEck Biotech ETF"><strong>VanEck&rsquo;s Biotech ETF (BBH)</strong></a> offers a focused, research-driven way to do so. The fund sits at the forefront of the AI revolution in healthcare, providing targeted exposure to companies leading this transformation. Tracking the MVIS<sup>&reg;</sup>&nbsp;US Listed Biotech 25 Index, <a href="/link/8c70259022ce47bca46cea693f49c4df.aspx" title="BBH - VanEck Biotech ETF"><strong>BBH</strong></a> captures the performance of firms driving advancements in genetic analysis, diagnostic innovation, and the development and commercialization of next-generation therapies.</p>
<p>To receive more <a href="https://www.vaneck.com/us/en/insights/thematic-investing/" title="Thematic Investing Insights"><strong>Thematic Investing</strong></a> insights, <a href="https://www.vaneck.com/us/en/subscribe/" title="Subscription Center"><strong>sign up in our subscription center</strong></a>.</p>
]]></content:encoded>
</item><item rdf:about="https://www.vaneck.com/us/en/blogs/digital-assets/matthew-sigel-vaneck-crypto-monthly-recap-for-november-2025/">
  <title>VanEck Crypto Monthly Recap for November 2025></title>
  <link>https://www.vaneck.com/us/en/blogs/digital-assets/matthew-sigel-vaneck-crypto-monthly-recap-for-november-2025/</link>
  <description><![CDATA[Price and onchain metrics weakened, but institutional participation and lower volatility point to a milder drawdown than last cycle&rsquo;s -78% decline.]]></description>
  <dc:creator>Matthew  Sigel</dc:creator>
  <dc:date>12/03/2025 06:30:00</dc:date>
<content:encoded><![CDATA[

<p><strong>Please note that VanEck may have a position(s) in the digital asset(s) described&nbsp;below.</strong></p>
<p><strong>Key Takeaways:</strong></p>
<ul class="content-list">
<li class="mt-2">Aggressive selling pressure drove one of Bitcoin&rsquo;s weakest momentum readings since 2022, and US trading hours accounted for most of November&rsquo;s decline.</li>
<li class="mt-2">Onchain activity weakened across all major categories, with blockchain revenues, DEX volumes, and perp funding rates falling sharply while stablecoin supply pulled back from October&rsquo;s peak.</li>
<li class="mt-2">Market structure signals caution but not collapse, as leverage reset to April lows, ETP outflows remained manageable, and institutional participation, combined with lower volatility, point to a smaller drawdown than prior cycles.</li>
</ul>
<h3 id="price-returns" class="jump-link-nav anchored-block" data-jumplink-title="Price Returns">Price Returns</h3>
<div class="wrapped-div">
<table style="width: 100%;">
<tbody>
<tr class="tbl-data">
<td class="tbl-header last text-left">Index/Asset</td>
<td class="tbl-header last text-right">November (%)</td>
<td class="tbl-header last text-right">YTD (%)</td>
</tr>
<tr class="tbl-data">
<td class="data-td data last text-left">S&amp;P 500 Index</td>
<td class="data-td data last text-right">0.13</td>
<td class="data-td data last text-right">16.45</td>
</tr>
<tr class="tbl-data">
<td class="data-td data last text-left">Nasdaq Index</td>
<td class="data-td data last text-right">-1.51</td>
<td class="data-td data last text-right">21.00</td>
</tr>
<tr class="tbl-data">
<td class="data-td data last text-left">MarketVector Decentralized Finance Leaders Index</td>
<td class="data-td data last text-right">-7.57</td>
<td class="data-td data last text-right">-59.83</td>
</tr>
<tr class="tbl-data">
<td class="data-td data last text-left">Bitcoin</td>
<td class="data-td data last text-right">-16.90</td>
<td class="data-td data last text-right">-2.80</td>
</tr>
<tr class="tbl-data">
<td class="data-td data last text-left">MarketVector Global Digital Assets Equity Index</td>
<td class="data-td data last text-right">-19.69</td>
<td class="data-td data last text-right">35.07</td>
</tr>
<tr class="tbl-data">
<td class="data-td data last text-left">Coinbase</td>
<td class="data-td data last text-right">-20.64</td>
<td class="data-td data last text-right">9.88</td>
</tr>
<tr class="tbl-data">
<td class="data-td data last text-left">Ethereum</td>
<td class="data-td data last text-right">-21.16</td>
<td class="data-td data last text-right">-8.82%</td>
</tr>
<tr class="tbl-data">
<td class="data-td data last text-left">MarketVector Smart Contract Leaders Index</td>
<td class="data-td data last text-right">-21.43</td>
<td class="data-td data last text-right">-31.71</td>
</tr>
<tr class="tbl-data">
<td class="data-td data last text-left">MarketVector Meme Coin Index</td>
<td class="data-td data last text-right">-21.61</td>
<td class="data-td data last text-right">-67.18</td>
</tr>
<tr class="tbl-data">
<td class="data-td data last text-left">MarketVector Infrastructure Application Leaders Index</td>
<td class="data-td data last text-right">-22.55</td>
<td class="data-td data last text-right">-59.02</td>
</tr>
</tbody>
</table>
</div>
<p class="chart-disclosure">Source: Bloomberg as of 12/01/2025. <strong><i>Index performance is not representative of fund performance. It is not possible to invest directly in an index. Past performance is no guarantee of future results. Not intended as a recommendation to buy or sell any securities named&nbsp;herein.</i></strong></p>
<p>Crypto investors felt like they were tossed through a washing machine in November, as relentless selling pressure shook coins loose from weaker hands. The result was that Bitcoin reached the lowest 30-day Relative Strength Index (RSI) readings <strong>(~32) </strong>since the de-peg of Lido ETH in June 2022. RSI measures the speed and magnitude of recent price changes to identify overbought or oversold conditions. BTC, ETH, and SOL each fell <strong>(-23%),</strong> <strong>(-27%),</strong> and <strong>(-31%).</strong> Crypto selloffs were heavily concentrated during US trading sessions, which contributed roughly 85% of November BTC losses.</p>
<p>Though the Coinbase Premium Index, which tracks Coinbase&rsquo;s BTC price premium to non-US exchanges, briefly turned positive over Thanksgiving weekend, the index was negative for the vast majority of November. The &ldquo;flush&rdquo; in November 2025 somewhat mirrors the one crypto experienced after Trump&rsquo;s tariffs in April 2025, when BTC fell from <strong>$109K</strong> to <strong>$76K</strong>. The result of recent price action is that <strong>(~55%)</strong> of Bitcoin&rsquo;s supply is in profit, which marks the lowest reading since September 2023. In the previous bear market, Bitcoin supply in profit reached a low of <strong>(~31%)</strong> in November 2022 after the collapse of FTX.</p>
<h3><a href="https://www.marketvector.com/indexes/digital-assets/marketvector-smart-contract-leaders" title="MVSCLE MarketVector&trade; Smart Contract Leaders Index" target="_blank" rel="noopener">MarketVector Smart Contract Leaders Index (MVSCLE)</a> Fell by -25% in November</h3>
<!--img loading="lazy" class="img-responsive" alt="MarketVector Smart Contract Leaders Index (MVSCLE) Fell by -25% in November" src="/EPiServer/CMS/Content/contentassets/499cfdf17fc44194a4a70496e25d045b/6491_crypto-monthly-november_blog-chart-1_2025-12_v1.svg,,354607?epieditmode=false">

</p-->
<div class="flourish-embed flourish-chart" data-src="visualisation/26591586?2428759"><script src="https://public.flourish.studio/resources/embed.js"></script><noscript><img loading="lazy" src="https://public.flourish.studio/visualisation/26591586/thumbnail" width="100%" alt="MarketVector Smart Contract Leaders Index (MVSCLE) Fell by -25% in November" /></noscript></div>
<p class="chart-disclosure">Source: Artemis XYZ as of 11/25/2025. <strong><i>Index performance is not representative of fund performance. It is not possible to invest directly in an index. Past performance is no guarantee of future results. Not intended as a recommendation to buy or sell any securities named herein.</i></strong></p>

<p>Open interest in crypto futures continued to decline from October, reaching the lowest levels, <strong>$29B</strong>, since the chaos of the tariff market reaction in April 2025. BTC ETP outflows in BTC terms were (-<strong>2.5%)</strong> while ETH ETP redemptions corresponded to <strong>(-8%)</strong> of AUM measured in ETH. The extreme levels of uncertainty drove 30-day trailing volatility to the mid-40s, approaching the lower levels seen in April 2025, when volatility averaged above 50. Besides broader concerns about AI spending and Federal Reserve policy, crypto traders worried about emerging narratives around quantum computing affecting Bitcoin encryption, Digital Asset Treasury (DAT) weakness, and selling by ancient whales.</p>
<h3>Cumulative BTC Returns by Session 10/24 - 11/24</h3>
<!--p><img loading="lazy" class="img-responsive" alt="Cumulative BTC Returns by Session 10/24 - 11/24" src="https://www.vaneck.com/EPiServer/CMS/Content/contentassets/6a856be43ddc43e1953940489e220975/6491_crypto-monthly-november_blog-chart-2_2025-12_v1.svg,,354609?epieditmode=false"></p-->
<div class="flourish-embed flourish-chart" data-src="visualisation/26591944?2428759"><script src="https://public.flourish.studio/resources/embed.js"></script><noscript><img loading="lazy" src="https://public.flourish.studio/visualisation/26591944/thumbnail" width="100%" alt="Cumulative BTC Returns by Session 10/24 - 11/24" /></noscript></div>
<p class="chart-disclosure">Source: Glassnode as of 11/25/2025. <i><strong>Past performance is no guarantee of future results.&nbsp;</strong></i></p>
<p>This dismal backdrop translated into weak onchain fundamentals with blockchain revenues down <strong>(-37%)</strong> m/m to reach <strong>~$200M</strong> in November. DEX volumes across all chains were down <strong>(-26%)</strong> m/m and <strong>(-35%)</strong> y/y. Meanwhile, Hyperliquid gained more market share of blockchain earnings, reaching <strong>(40%) </strong>of the market to gross <strong>$80M</strong> on the month. After the conclusion of the perpetual future DEX mania of October, BNB&rsquo;s revenues have fallen <strong>(-76%)</strong> m/m, dropping it to fifth place in blockchain revenues. Stablecoin transfer volumes were down <strong>(-19%)</strong> m/m across all chains, but still showed y/y growth of <strong>(+54%).</strong> In that category, Ethereum continues to dominate, posting roughly the same volumes as the next four competitors combined.</p>
<h3 id="hyperliquid-revenue" class="jump-link-nav anchored-block" data-jumplink-title="Hyperliquid Revenue">Hyperliquid Revenue Gains as BNB Fades</h3>
<!--p><img loading="lazy" class="img-responsive" alt="Hyperliquid Revenue Gains as BNB Fades" src="https://www.vaneck.com/EPiServer/CMS/Content/contentassets/101728117c4e46ef893186311aa82661/6491_crypto-monthly-november_blog-chart-3_2025-12_v1.svg,,354611?epieditmode=false"></p-->
<div class="flourish-embed flourish-chart" data-src="visualisation/26592126?2428759"><script src="https://public.flourish.studio/resources/embed.js"></script><noscript><img loading="lazy" src="https://public.flourish.studio/visualisation/26592126/thumbnail" width="100%" alt="Hyperliquid Revenue Gains as BNB Fades" /></noscript></div>
<p class="chart-disclosure">Source: Artemis XYZ as of 11/15/2025. <strong><i>Past performance is no guarantee of future results. Not intended as a recommendation to buy or sell any securities named herein.</i></strong></p>
<p>Stablecoins on blockchain also pulled back after reaching an all-time high of <strong>308B</strong> in October, declining to <strong>304B</strong> at the end of November. Though USDC lost <strong>(-2%) </strong>or <strong>1.2B</strong> of its market capitalization, Ethena&rsquo;s USDE lost <strong>(-30%)</strong> m/m or nearly <strong>(-50%)</strong> off its mid-October high (<strong>14B-$7B). </strong>The decline in overall stablecoins partly relates to the compressing rates environment for crypto. The best gauge of blockchain yields, the trailing 30-day perp funding rates, fell as low as <strong>(3.8%)</strong> after averaging <strong>(7-8%)</strong> over the summer. These yields reflect crypto traders&rsquo; willingness to take directional risk, and current levels are the lowest since October 2023. With respect to Ethena, the substantial decline is most likely attributable to the peg break it experienced due to market chaos on October 10, when some exchanges priced USDE as low as $0.65 rather than $1.00. Another bit of bad news for stablecoins came at the end of the month when S&amp;P downgraded Tether&rsquo;s rating for peg stability from 4 (constrained) to 5 (weak), which is S&amp;P&rsquo;s lowest rating.</p>
<h3>Top Blockchains by Key Metrics in November</h3>
<div class="wrapped-div">
<table style="width: 100%;">
<tbody>
<tr class="tbl-data">
<td class="tbl-header last text-left" colspan="6">November's Leaderboard</td>
</tr>
<tr class="tbl-data">
<td class="data-td last text-left"><strong>Price</strong></td>
<td class="data-td data last text-right">&nbsp;</td>
</tr>
<tr class="tbl-data">
<td class="data-td data last text-left pl-3">Blockchain</td>
<td class="data-td data last text-left">ICP</td>
<td class="data-td data last text-left">STRK</td>
<td class="data-td data last text-left">ZK</td>
<td class="data-td data last text-left">GNO</td>
<td class="data-td data last text-left">TRX</td>
</tr>
<tr class="tbl-data">
<td class="data-td data last text-left pl-3">Price Change (%)</td>
<td class="data-td data last text-left">31.76</td>
<td class="data-td data last text-left">12.97</td>
<td class="data-td data last text-left">6.19</td>
<td class="data-td data last text-left">-7.99</td>
<td class="data-td data last text-left">-11.67</td>
</tr>
<tr class="tbl-data">
<td class="data-td last text-left"><strong>Revenue</strong></td>
<td class="data-td data last text-right">&nbsp;</td>
</tr>
<tr class="tbl-data">
<td class="data-td data last text-left pl-3">Blockchain</td>
<td class="data-td data last text-left">HYPE</td>
<td class="data-td data last text-left">TRX</td>
<td class="data-td data last text-left">ETH</td>
<td class="data-td data last text-left">SOL</td>
<td class="data-td data last text-left">BNB</td>
</tr>
<tr class="tbl-data">
<td class="data-td data last text-left pl-3">Monthly Revenues ($)</td>
<td class="data-td data last text-left">81,308,728</td>
<td class="data-td data last text-left">30,740,951</td>
<td class="data-td data last text-left">26,591,272</td>
<td class="data-td data last text-left">21,302,909</td>
<td class="data-td data last text-left">16,866,025</td>
</tr>
<tr class="tbl-data">
<td class="data-td last text-left"><strong>DEX Volumes</strong></td>
<td class="data-td data last text-right">&nbsp;</td>
</tr>
<tr class="tbl-data">
<td class="data-td data last text-left pl-3">Blockchain</td>
<td class="data-td data last text-left">SOL</td>
<td class="data-td data last text-left">BNB</td>
<td class="data-td data last text-left">ETH</td>
<td class="data-td data last text-left">BASE</td>
<td class="data-td data last text-left">ARB</td>
</tr>
<tr class="tbl-data">
<td class="data-td data last text-left pl-3">Daily DEX Volumes ($)</td>
<td class="data-td data last text-left">3,707,010,706</td>
<td class="data-td data last text-left">2,824,826,960</td>
<td class="data-td data last text-left">2,655,630,616</td>
<td class="data-td data last text-left">1,322,406,299</td>
<td class="data-td data last text-left">673,806,137</td>
</tr>
<tr class="tbl-data">
<td class="data-td last text-left"><strong>Users</strong></td>
<td class="data-td data last text-right">&nbsp;</td>
</tr>
<tr class="tbl-data">
<td class="data-td data last text-left pl-3">Blockchain</td>
<td class="data-td data last text-left">TRX</td>
<td class="data-td data last text-left">SOL</td>
<td class="data-td data last text-left">NEAR</td>
<td class="data-td data last text-left">BNB</td>
<td class="data-td data last text-left">APT</td>
</tr>
<tr class="tbl-data">
<td class="data-td data last text-left pl-3">Average DAUs</td>
<td class="data-td data last text-left">3,040,612</td>
<td class="data-td data last text-left">2,982,806</td>
<td class="data-td data last text-left">2,817,338</td>
<td class="data-td data last text-left">2,626,616</td>
<td class="data-td data last text-left">1,349,250</td>
</tr>
<tr class="tbl-data">
<td class="data-td last text-left"><strong>Stablecoin Volume</strong></td>
<td class="data-td data last text-right">&nbsp;</td>
</tr>
<tr class="tbl-data">
<td class="data-td data last text-left pl-3">Blockchain</td>
<td class="data-td data last text-left">ETH</td>
<td class="data-td data last text-left">BASE</td>
<td class="data-td data last text-left">TRX</td>
<td class="data-td data last text-left">BNB</td>
<td class="data-td data last text-left">SOL</td>
</tr>
<tr class="tbl-data">
<td class="data-td data last text-left pl-3">Daily Transfer Volume ($)</td>
<td class="data-td data last text-left">92,352,126,412</td>
<td class="data-td data last text-left">44,746,344,414</td>
<td class="data-td data last text-left">23,935,162,853</td>
<td class="data-td data last text-left">14,069,905,867</td>
<td class="data-td data last text-left">13,023,037,371</td>
</tr>
</tbody>
</table>
</div>
<p class="chart-disclosure">Source: Artemis XYZ as of 11/25/2025. <strong><i>Past performance is no guarantee of future results. Not intended as a recommendation to buy or sell any securities named herein.</i></strong></p>
<p>As an ending note, we would like to remember one of the best F1 drivers of all time, Ayrton Senna. Ayrton relished rainy race days because wet conditions amplified his bold, precise skills allowing him to overcome substantial deficits to win races. When other drivers dialed back their risk tolerances, Ayrton increased his and benefited enormously. Chaotic times offer immense opportunities for the disciplined investor. While we do not know when this downpour will end, we are carefully positioning our portfolios for the sunny times to come.</p>
<h3>30-Day Correlation BTC/Nasdaq Broke 1-Year Highs</h3>
<!--p><img loading="lazy" class="img-responsive" alt="30-Day Correlation BTC/Nasdaq Broke 1-Year Highs" src="https://www.vaneck.com/EPiServer/CMS/Content/contentassets/b6aebd22ccaa4ad7846ba34e96b4cf17/6491_crypto-monthly-november_blog-chart-4_2025-12_v1.svg,,354613?epieditmode=false"></p-->
<div class="flourish-embed flourish-chart" data-src="visualisation/26591731?2428759"><script src="https://public.flourish.studio/resources/embed.js"></script><noscript><img loading="lazy" src="https://public.flourish.studio/visualisation/26591731/thumbnail" width="100%" alt="30-Day Correlation BTC/Nasdaq Broke 1-Year Highs" /></noscript></div>
<p class="chart-disclosure">Source: Artemis XYZ as of 11/25/2025.<strong> Past performance is no guarantee of future results. Not intended as a recommendation to buy or sell any securities named herein.</strong></p>
<h2 id="top-crypto-questions" class="jump-link-nav anchored-block" data-jumplink-title="Top Crypto Questions">Top Crypto Questions from Clients This Month</h2>
<ol class="content-list" start="1">
<li class="mt-2" style="font-weight: bold;"><strong>Are bitcoin whales selling?</strong></li>
</ol>
<h3>Bitcoin Spent Volume from 5+ Year Holders (30-Day Moving Average)</h3>
<!--p><img loading="lazy" class="img-responsive" alt="Bitcoin Spent Volume from 5+ Year Holders (30-Day Moving Average)" src="https://www.vaneck.com/EPiServer/CMS/Content/contentassets/84db4167fe1b41b1a669d99fbac24fd8/6491_crypto-monthly-november_blog-chart-5_2025-12_v1.svg,,354615?epieditmode=false"></p-->
<div class="flourish-embed flourish-chart" data-src="visualisation/26591818?2428759"><script src="https://public.flourish.studio/resources/embed.js"></script><noscript><img loading="lazy" src="https://public.flourish.studio/visualisation/26591818/thumbnail" width="100%" alt="Bitcoin Spent Volume from 5+ Year Holders (30-Day Moving Average)" /></noscript></div>
<p class="chart-disclosure">Source: Glassnode as of 11/26/2025. <strong>Past performance is no guarantee of future results. Not intended as a recommendation to buy or sell any securities named herein.</strong></p>
<p>We have seen a modest uptick in selling of older cohorts of BTC holdings. As we can see in the chart above, this selling by older cohorts is far below earlier peaks. The largest reductions in positions have occurred in the 2-5-year holding band. This cohort has dropped in total BTC holdings by <strong>(-31%)</strong> since November 2023. These holders appear to be positioning based on their interpretation of Bitcoin&rsquo;s place in the 4-year cycle. Zooming out, while the percentage of supply &gt;5 years old has remained consistent at <strong>(30.5%),</strong> we have seen a massive drop in % the supply &gt;2 years old category, moving from <strong>(57%)</strong> in January 2024 to <strong>(48%) </strong>today. All the while, short-term active supply, &lt;6M Old, has surged from <strong>(22%)</strong> in June 2025 to <strong>(31%)</strong> today, which is the highest level since July 2021.</p>
<ol class="content-list" start="2">
<li class="mt-2" style="font-weight: bold;"><strong>Is it too late to buy bitcoin?</strong></li>
</ol>
<p>In our opinion, it is difficult to call any level &lsquo;too late&rsquo; for BTC, and these levels may reflect short-term panic more than a long-term view of fundamental potential. BTC recently experienced a greater than <strong>(-30%)</strong> drawdown, which mirrors past pullbacks during bull markets in 2017 and 2021.</p>
<ol class="content-list" start="3">
<li class="mt-2" style="font-weight: bold;"><strong>Is crypto in a bubble?</strong></li>
</ol>
<p>Some crypto tokens certainly need to be repriced, including those associated with ghost blockchains and low-utility applications. However, we believe there are still worthwhile investment opportunities for those with a very high risk tolerance.</p>
<ol class="content-list" start="4">
<li class="mt-2" style="font-weight: bold;"><strong>Have we passed the price peak in Bitcoin's 4-year cycle?</strong></li>
</ol>
<p>Many 4-year cycle forecasters divine that we have already reached the price apex of this cycle. However, lower volatility and the explosion in real-money involvement suggest a smaller drawdown than previous cycles. Thus, VanEck bought the dip in model portfolios at <strong>~$80K</strong> on Friday, November 21st, seeing an attractive risk/reward, with technical indicators signaling a near-term bottom. However, we remain flexible and not dogmatic about the cycle with a healthy respect for the 4-year patterns.</p>
<p>The underlying dynamics of the 4-year cycle may have changed as Bitcoin miners diversified their income streams and institutional players viewed BTC as a unique macro asset. That noted, many in the crypto community, including large whales, believe that the Bitcoin 4-year cycle is infallible. If these parties act, they will likely weigh on prices.</p>
<p><strong>Links to third party websites are provided as a convenience and the inclusion of such links does not imply any endorsement, approval, investigation, verification or monitoring by us of any content or information contained within or accessible from the linked sites. By clicking on the link to a non-VanEck webpage, you acknowledge that you are entering a third-party website subject to its own terms and conditions. VanEck disclaims responsibility for content, legality of access or suitability of the third-party websites.</strong></p>
<p>To receive more <strong><a href="https://www.vaneck.com/us/en/insights/digital-assets/" title="Digital Assets Insights">Digital Assets</a></strong> insights, <strong><a href="https://www.vaneck.com/us/en/subscribe/" title="Subscription Center">sign up in our subscription center</a></strong>.</p>
]]></content:encoded>
</item><item rdf:about="https://www.vaneck.com/us/en/blogs/natural-resources/the-power-divide-china-us-and-the-future-of-the-grid/">
  <title>The Power Divide: China, U.S. and the Future of the Grid></title>
  <link>https://www.vaneck.com/us/en/blogs/natural-resources/the-power-divide-china-us-and-the-future-of-the-grid/</link>
  <description><![CDATA[Half the world&rsquo;s electricity comes from two nations: China and the U.S. Their competing grids will define how the world powers the digital age.]]></description>
  <dc:creator>Antonio  De Pinho</dc:creator>
  <dc:date>12/02/2025 06:30:00</dc:date>
<content:encoded><![CDATA[

<p><strong>Key Takeaways:</strong></p>
<ul class="content-list">
<li class="mt-2">China keeps power prices steady while U.S. costs rise with fuel, policy, and investment.</li>
<li class="mt-2">China coordinates its grid, whereas the U.S. lets markets compete for control.</li>
<li class="mt-2">China powers production, and the U.S. fuels consumption and comfort.</li>
<li class="mt-2">Electricity is more than infrastructure and now embodies digital intelligence, strategy and sovereignty.</li>
</ul>
<h2 id="power-consumption" class="jump-link-nav anchored-block" data-jumplink-title="Power Consumption">Two Differing Blueprints for the Global Power Grid</h2>
<p>Every second, half of the electricity running through the world&rsquo;s grids originates from two countries: China and the U.S. China&rsquo;s State Grid Corporation now transmits more electrons each day than all of Europe combined.</p>
<p>Scale, however, hides a deeper asymmetry. The U.S. still consumes roughly twice as much electricity per person as China. China&rsquo;s grid powers production, steel, solar panels, batteries, and machinery exported to the world. America&rsquo;s grid powers consumption, homes, data centers, transport, and comfort.</p>
<h3>China and the U.S. Produce Half the World&rsquo;s Electricity</h3>
<p><img loading="lazy" class="img-responsive" alt="China and the U.S. Produce Half the World&rsquo;s Electricity" src="https://www.vaneck.com/contentassets/2900ad2390cb449db0661251e87e1764/6464_grf-us-china-energy_chart-1_2025-11_v1_blog.svg" /></p>
<p class="chart-disclosure">Source: IEA, VanEck.</p>
<h3>Electricity Consumption Per Person in U.S. Twice as High as China&rsquo;s</h3>
<p><img loading="lazy" class="img-responsive" alt="Electricity Consumption Per Person in U.S. Twice as High as China&rsquo;s" src="https://www.vaneck.com/contentassets/5586893b27864e128e228ba4332565de/6464_grf-us-china-energy_chart-2_2025-11_v1_blog.svg" /></p>
<p class="chart-disclosure">Source: IEA, VanEck.</p>
<p>Energy-use structures underline that contrast. In 2023, industry absorbed nearly 60 percent of China&rsquo;s final energy consumption, while in the U.S., commercial and residential accounted for more than 70 percent.</p>
<h3>China Electrifies Production; the U.S. Electrifies Consumption</h3>
<p><img loading="lazy" class="img-responsive" alt="China Electrifies Production; the U.S. Electrifies Consumption" src="https://www.vaneck.com/contentassets/80b928f8e7f14160a988d19e19f1088d/6464_grf-us-china-energy_chart-3_2025-11_v1_blog.svg" /></p>
<p class="chart-disclosure">Source: IEA, VanEck.</p>
<p>These differences are structural. China&rsquo;s grid serves factories, an instrument of industrial growth. America&rsquo;s powers lifestyles, energy treated as a market commodity. How a nation uses electricity reveals not just its economy, but its ambitions.</p>
<h2 id="regulatory-frameworks" class="jump-link-nav anchored-block" data-jumplink-title="Regulatory Frameworks">Philosophies of Power: China Monetizes Control, America Monetizes Volatility</h2>
<p>Electricity does not just power economies. It reveals how they think. The way a nation builds, owns, and governs its grid is an X-ray of its political DNA. China&rsquo;s grid is an instrument of the state; America&rsquo;s is a marketplace.</p>
<p>From Beijing to the provinces, China plans and delivers electricity through a single vertical chain. In the U.S., a patchwork of markets and commissions argues and adapts.</p>
<p>In China, energy planning runs through the National Development and Reform Commission (NDRC) and the National Energy Administration (NEA) to provincial execution. The NDRC sets investment and pricing frameworks and approves key policies; the NEA oversees dispatch, supervises implementation, and manages the energy transition. The State Grid Corporation of China (SGCC) controls five northern and central regions covering more than 80 percent of the population. One of its key tasks is to build and operate ultra-high-voltage transmission lines that carry power from resource rich western and northern areas to the major load centers in the east and south. The China Southern Power Grid (CSG) oversees the southern manufacturing belt, and the Inner Mongolia Power Group, a regional subsidiary of State Grid, manages the western Inner Mongolia network. Together they form the world&rsquo;s largest coordinated electricity system.</p>
<p>Generation is dominated by six state-owned giants, China Energy Investment, State Power Investment, Huaneng, Datang, Huadian, and Three Gorges, which build and operate plants to meet national quotas. Overlap is deliberate: redundancy guarantees supply. The outcome is speed, scale, and predictability.</p>
<h3>China&rsquo;s Regulatory Framework</h3>
<p><img loading="lazy" class="img-responsive" alt="China&rsquo;s Regulatory Framework" src="https://www.vaneck.com/contentassets/6bf2ea1dd32349e787b2b2a940f496ea/6464_grf-us-china-energy-blog-infographic-1_2025-12_v2.svg" /></p>
<p class="chart-disclosure">Source: China&rsquo;s Power System (Top Owners), BloombergNEF.</p>
<p>The U.S. operates through a decentralized web of regulators, markets, and utilities rather than a single national system. The Federal Energy Regulatory Commission (FERC) oversees interstate transmission and wholesale power markets, while fifty state commissions regulate retail prices and distribution utilities. Regional transmission organizations such as PJM, MISO, and CAISO coordinate generation and grid operations across multiple states but own no assets. ERCOT in Texas runs largely on its own, reflecting the state&rsquo;s long-standing preference for competition and independence from federal oversight.</p>
<p>Ownership is equally diverse. Investor-owned utilities such as NextEra, Duke, and Southern Company coexist with public power agencies and rural cooperatives. Independent producers including Vistra, Constellation, and NRG compete in deregulated wholesale markets. This combination of private capital and public oversight encourages innovation and efficiency but often at the expense of coordination.</p>
<h3>U.S.&rsquo;s Regulatory Framework</h3>
<p><img loading="lazy" class="img-responsive" alt="US&rsquo;s Regulatory Framework" src="https://www.vaneck.com/contentassets/a34dee5638bb4dc4a231958397c39b35/6464_grf-us-china-energy-blog-infographic-2_2025-12_v2.svg" /></p>
<p class="chart-disclosure">Source: Regulatory Regime USA, BloombergNEF.</p>
<p>In China, money flows through state banks to meet industrial and employment goals. In the U.S., it moves through markets, directed by investors seeking profit. China grows through coordination, while America advances through competition. One builds certainty; the other builds choice.</p>
<h2 id="expansion" class="jump-link-nav anchored-block" data-jumplink-title="Expansion">The Scale of Power in Two Growth Stories</h2>
<p>Electricity generation tells a story of scale and direction. Since 2005, China&rsquo;s power output has expanded nearly fivefold, growing at a compound annual rate of about 8 percent. The U.S., already a mature system, has grown by less than 1 percent a year. In 2005, America generated roughly twice as much electricity as China; today, the positions have reversed. China now produces more than twice as much power as the U.S.</p>
<h3>China&rsquo;s Capacity Expanded Nearly Fivefold While U.S. Growth Flat</h3>
<p><img loading="lazy" class="img-responsive" alt="China's Capacity Expanded Nearly Fivefold While U.S. Growth Flat" src="https://www.vaneck.com/contentassets/31866e17f02c4b469c94d5ad4ca32d0d/6464_grf-us-china-energy_chart-4_2025-11_v1_blog.svg" /></p>
<p class="chart-disclosure">Source: Bloomberg, VanEck. Power Generation, China and the U.S. (2005&ndash;2024).</p>
<p>The composition of that growth is equally revealing. China&rsquo;s system has diversified without slowing. Coal remains the backbone, but new capacity in wind, solar, hydro, and nuclear has added more than six trillion kilowatt-hours since 2005. The result is a power system that is both immense and varied, built for industry, expanding through renewables, and guided by state design.</p>
<h3>China: Coal Dominates, But Renewables and Nuclear Power Expand Rapidly</h3>
<p><img loading="lazy" class="img-responsive" alt="China: Coal Dominates, But Renewables and Nuclear Power Expand Rapidly" src="https://www.vaneck.com/contentassets/32dce349049e4a33b11f413953d1a050/6464_grf-us-china-energy_chart-5_2025-11_v1_blog.svg" /></p>
<p class="chart-disclosure">China Power Generation by Source, (2005 vs 2024).</p>
<p>The U.S. system has evolved more than it has expanded. Natural gas replaced coal as the dominant source, while renewables, particularly wind and solar, grew rapidly from a low base. Yet total generation has barely increased. The American grid has become cleaner and more efficient, but not larger, a reflection of modest demand growth and rising efficiency rather than industrial expansion.</p>
<h3>U.S.: Gas Replaces Coal, While Renewables Rise from a Small Base</h3>
<p><img loading="lazy" class="img-responsive" alt="U.S.: Gas Replaces Coal, While Renewables Rise from a Small Base" src="https://www.vaneck.com/contentassets/7ff3c05be1044c0abbc7ec1283add635/6464_grf-us-china-energy_chart-6_2025-11_v1_blog.svg" /></p>
<p class="chart-disclosure">Figure 8. U.S. Power Generation by Source, (2005 vs 2024).</p>

<p>The data highlight the core difference between the two models. China&rsquo;s growth is physical, driven by construction and scale. America&rsquo;s growth is compositional, driven by substitution and efficiency. One builds new capacity; the other optimizes the old.</p>
<h2 id="pricing" class="jump-link-nav anchored-block" data-jumplink-title="Pricing">When Electricity Pricing Reflects Policy</h2>
<p>Chinese electricity costs about half the U.S. level and fluctuates far less. The difference is structural. China finances and regulates power as infrastructure; America prices it as a market commodity.</p>
<p>In China, the National Development and Reform Commission (NDRC) sets benchmark tariffs and allows prices to move within a &plusmn;20 percent band, giving limited flexibility while preserving stability for households and factories. When fuel costs rise, state utilities often absorb part of the increase rather than pass it to consumers. Centralized procurement and low-cost domestic engineering keep capital recovery per kilowatt hour modest. Prices vary by region but remain tightly managed: eastern coastal provinces, Hainan, Guangdong, Jiangsu, Zhejiang, Shanghai, and Beijing, typically record tariffs 20&ndash;30 percent above the national average, reflecting higher demand and denser load centers.</p>
<p>Market reforms are widening the space for competition but within state boundaries. In 2023, power-trading centers handled nearly 5,700 terawatt hours, equal to approximately 60 percent of national consumption, up from less than 17 percent in 2016. Most trading remains within provinces, though inter-provincial exchanges are expanding as Beijing builds toward a unified national power market by 2030. Even as trading grows, the state anchors prices. Financing, fuel, and infrastructure remain publicly controlled, and most generation is funded by low-cost state credit. The result is a guided market, competitive in allocation, not in price. Stability outweighs transparency, and affordability outranks return.</p>
<p>Across the Pacific, America follows the opposite creed. It prices electricity as a market, not a mandate. Every cost, fuel, finance, or failure, flows straight to the consumer. Volatility is the price of freedom. The Federal Energy Regulatory Commission (FERC) oversees interstate transmission and wholesale pricing, while fifty state commissions regulate retail tariffs and distribution. Power markets are coordinated by regional transmission organizations such as PJM, MISO, and CAISO, which balance generation across states but own no assets. ERCOT in Texas runs largely on its own, reflecting the state&rsquo;s preference for independence and competition.</p>
<p>This fragmentation defines the U.S. grid. Eastern coastal states, Maine, New York, New Jersey, and Massachusetts, record regional averages about 40&ndash;60 percent above the national level, while California and Hawaii stand as extremes, with some of the highest electricity costs in the U.S. The U.S. system passes costs through instantly. When gas prices or capacity payments rise, utilities adjust tariffs through riders (automatic cost pass-through clauses) and surcharges. Market-based dispatch and private ownership encourage efficiency and innovation, but they also amplify price swings.</p>
<h3>The Great Price Divide: China Anchors, America Accelerates</h3>
<p><strong>Residential</strong></p>
<p><img loading="lazy" class="img-responsive" alt="The Great Price Divide: China Anchors, America Accelerates - Residential" src="https://www.vaneck.com/contentassets/c90425e7cfac4d6e95d8640f48b43c28/6464_grf-us-china-energy_chart-7_2025-11_v1_blog.svg" width="1044" height="540" /></p>
<p class="chart-disclosure">Projected Electricity Prices 2024&ndash;2050, Residential Users. Source: U.S. EIA, IEA, CET, VanEck. For illustrative purposes only.</p>
<p><strong>Commercial</strong></p>
<p><img loading="lazy" class="img-responsive" alt="The Great Price Divide: China Anchors, America Accelerates - Commercial" src="https://www.vaneck.com/contentassets/feec2b371bc842a793ae80bf60a0e425/6464_grf-us-china-energy_chart-8_2025-11_v1_blog.svg" /></p>
<p class="chart-disclosure">Projected Electricity Prices 2024&ndash;2050, Commercial Users. Source: U.S. EIA, IEA, CET, VanEck. For illustrative purposes only.</p>
<p class="chart-disclosure">Model Assumptions. Projections combine U.S. data from the EIA reference and side-case scenarios with the VanEck proprietary China Power Model, a continuously updated, data-driven framework that tests multiple growth trajectories rather than a single forecast. The model simulates the interaction of four structural drivers, fuel costs, electricity demand, renewable share, and carbon or regulatory costs, each calibrated through observed elasticities. The reference case assumes steady demand growth and balanced policy; the high and low cases bracket outcomes shaped by faster digitalization and efficiency gains or by weaker construction and slower industrial recovery. Over time, the model captures the system&rsquo;s structural decoupling from fossil fuel prices as renewables expand and policy coordination deepens.</p>
<p>The two systems could not be more different. China regulates electricity to shield its economy from volatility; the U.S. prices it to expose its economy to efficiency. One builds certainty, the other choice. Both succeed on their own terms, one through control, the other through competition. Yet both now face the same frontier: as the grid becomes intelligent and demand more digital, the line between command and competition is beginning to blur.</p>
<h2>The Age of Electric Sovereignty Is the Next Frontier</h2>
<p>In the decade ahead, three forces&mdash;state, market, and cloud&mdash;will converge into an intelligent power economy, where algorithms, not administrators, balance the flow of energy across nations.</p>
<p>China will embed digital intelligence within its hierarchy, and the U.S. will unleash it through competition. Both are racing toward the same horizon: a self-governing grid that manages itself in real time.</p>
<p>The world&rsquo;s largest technology firms are already building that future. Their data centers are no longer passive consumers of power but active governors of it, buying, storing, and trading electricity like capital. Energy is becoming liquidity, moving instantly across networks and borders.</p>
<p>The nation-state will endure, but it will now share the stage with digital empires that command both computation and current. China&rsquo;s strength lies in abundance and control; America&rsquo;s in innovation and capital. Yet both face a new kind of rival: the corporations that command the cloud.</p>
<p>Electricity is no longer infrastructure. It is digital intelligence, strategy, and sovereignty combined. The next superpower may not be a country at all, but whoever masters the current that powers both machines and minds.</p>
<p>To receive more <a href="/us/en/insights/natural-resources/" title="Natural Resources Insights"><strong>Natural Resources</strong></a> insights, <a href="https://www.vaneck.com/us/en/subscribe/" title="Subscription Center"><strong>sign up in our subscription center</strong></a>.</p>
]]></content:encoded>
</item><item rdf:about="https://www.vaneck.com/us/en/blogs/income-investing/fltr-question-and-answer/">
  <title>FLTR ETF: Question &amp; Answer></title>
  <link>https://www.vaneck.com/us/en/blogs/income-investing/fltr-question-and-answer/</link>
  <description><![CDATA[This blog is intended to answer frequently asked questions on floating rate notes and more specifically, VanEck&rsquo;s IG Floating Rate ETF (FLTR).]]></description>
  <dc:creator>William Sokol</dc:creator>
  <dc:date>12/01/2025 06:30:00</dc:date>
<content:encoded><![CDATA[

<ul class="content-list">
<li class="mt-2"><a href="#point-one"><strong>What are floating rate notes and how big is the market?</strong></a></li>
<li class="mt-2"><a href="#point-two"><strong>How does an FRN coupon adjust?</strong></a></li>
<li class="mt-2"><a href="#point-three"><strong>How do FRN Rate Reset Mechanics work?</strong></a></li>
<li class="mt-2"><a href="#point-four"><strong>What impacts the price of FRNs?</strong></a></li>
<li class="mt-2"><a href="#point-five"><strong>What happens to FRNs when spreads widen?</strong></a></li>
<li class="mt-2"><a href="#point-six"><strong>How do FRNs differ from loans or other short duration strategies?</strong></a></li>
<li class="mt-2"><a href="#point-seven"><strong>Why are FRNs attractive now?</strong></a></li>
<li class="mt-2"><a href="#point-eight"><strong>How can investors use FRNs within a portfolio?</strong></a></li>
<li class="mt-2"><a href="#point-nine"><strong>What makes FLTR&rsquo;s strategy unique?</strong></a></li>
<li class="mt-2"><a href="#point-ten"><strong>Who should own FRNs?</strong></a></li>
<li class="mt-2"><a href="#point-eleven"><strong>How to buy VanEck ETFs?</strong></a></li>
</ul>
<h2 id="point-one" class="anchored-block jump-link-nav" data-jumplink-title="What are FRNs?">What are floating rate notes and how big is the market?</h2>
<p>Unlike other bonds which typically pay a fixed coupon, floating rate notes (or &ldquo;FRNs&rdquo;) pay a coupon that adjusts periodically with prevailing interest rates. Because FRN coupons reflect current interest rates, the price of the bonds are not sensitive to changes in rates. This is in contrast to fixed rate bonds in which the coupon does not change with interest rates but the price will increase/decrease as rates decline/increase. As a result, FRN prices have near-zero sensitivity to interest rates and coupons will actually increase as rates go up, making them potentially attractive in rising rate environments. In other respects such as credit risk, they are similar to other bonds from the same issuer.</p>
<p>The FRN market was approximately $720 billion in size as of 10/31/2025<sup>1</sup>. The size of the market tends to correlate with the level of short-term interest rates, as demand for FRNs tends to increase as rates rise and vice versa. Both the Secured Overnight Financing Rate (SOFR) and target Fed Funds rate increased significantly since the beginning of 2022, and accordingly the market size has increased over the past couple of years with JP Morgan seeing approximately $107bn in issuance through October 2025, $82bn in 2024 and $48bn in 2023.</p>
<p>Following the most aggressive Federal Reserve tightening cycle in four decades, short-term yields have remained elevated. This environment has continued to support strong demand for FRNs as investors seek floating-rate exposure that benefits from higher income levels while maintaining limited price sensitivity. Even as markets begin to anticipate potential rate cuts in 2026, FRNs remain attractive due to their spread above SOFR and insulation from interest rate driven volatility. The FRN market&rsquo;s steady expansion underscores investor confidence in the asset class as a tool for managing interest rate uncertainty.</p>
<h3>SOFR vs Fed Funds</h3>
<p><img loading="lazy" class="img-responsive w-100" alt="SOFR vs Fed Funds" src="https://www.vaneck.com/contentassets/7fae314b4df745d88148f754dcb557e2/6465_fltr-faq_chart-1_2025-11_v1_blog.svg" /></p>
<p class="chart-disclosure">Source: New York Fed.</p>
<p>FRNs are often issued as a component of multi-tranche issuances along with fixed rate bonds. Banks and other financial companies tend to be the largest issuers of floating rate notes, as they help to match the duration of their assets. Non-corporate issuers, including the U.S. Treasury and government agencies, are also very active in the market. The overall FRN market is predominantly rated investment grade and is concentrated in bonds with maturities of less than five years.</p>
<h2 id="point-two" class="anchored-block">How does an FRN coupon adjust?</h2>
<p>The terms of an FRN issue specify a coupon formula, which is generally a fixed spread above a floating rate. In the majority of cases, the floating rate is defined as SOFR. The spread over the floating rate primarily compensates investors for the additional credit risk (e.g., the risk of a deterioration in credit quality including a potential default) they are assuming by investing in the bond. Credit spreads generally increase as the creditworthiness of an issuer decreases. In addition, credit spreads for longer maturities are typically higher than lower maturities.</p>
<h3>Spreads Tend to Increase with Maturity</h3>
<p><img loading="lazy" class="img-responsive w-100" alt="Spreads Tend to Increase with Maturity" src="https://www.vaneck.com/contentassets/514dde1bc7b5412388afb7d5d92571f1/6465_fltr-faq_chart-2_2025-11_v1_blog.svg" /></p>
<p class="chart-disclosure">Source: ICE Data Services, as of 10/31/2025. Based on constituents of the MVS US Investment Grade Floating Rate Index.</p>
<p>For example, an FRN may specify a quarterly coupon compounded daily SOFR over each period plus a fixed spread of 1.04% plus. If compounded daily SOFR were to be 4%, the coupon rate for the period would be 5.04%.</p>
<h2 id="point-three" class="anchored-block">How do FRN Rate Reset Mechanics work?</h2>
<p>Floating rate notes (FRNs) offer investors a coupon that is equal to a fixed spread over a short-term reference rate (usually SOFR) that adjusts each period. Because the coupon adjusts with prevailing interest rates, FRNs have near zero sensitivity to changes in interest rates, unlike fixed coupon bonds which decline in price as rates move up. In addition, the spread on corporate FRNs allow investors to earn additional yield above the risk-free rate. Among FRNs, it is typical for SOFR (which is an overnight rate) to be compounded over the period.</p>
<p>To simplify: Coupon = reference rate + fixed spread. This is illustrated below:</p>
<h3>FRN Coupons Adjust Each Period</h3>
<p class="d-none d-lg-block"><img loading="lazy" class="img-responsive" src="https://www.vaneck.com/EPiServer/CMS/Content/contentassets/6b6838b210ae47329eca527f0cfae774/6750_fltr-faq-blog_inforg-1_2026-01_v1_desktop.svg,,360307/Download?epieditmode=False" alt="How do FRN Rate Reset Mechanics work?" /></p>
<p class="d-lg-none"><img loading="lazy" class="img-responsive" src="https://www.vaneck.com/EPiServer/CMS/Content/contentassets/6b6838b210ae47329eca527f0cfae774/6750_fltr-faq-blog_inforg-1_2026-01_v1_mobile.svg,,360334/Download?epieditmode=False" alt="How do FRN Rate Reset Mechanics work?" /></p>
<h2 id="point-four" class="anchored-block">What impacts the price of FRNs?</h2>
<p>As mentioned, FRN coupons adjust with prevailing short-term interest rates. As a result, prices have virtually no sensitivity to changes in interest rates. Investors will not suffer mark-to-market losses as interest rates rise but will also not benefit from interest rate declines. This is in contrast to fixed coupon bonds, which will exhibit a sensitivity to interest rates that is measured by interest rate duration. Longer maturity bonds have longer durations, all else equal.</p>
<p>Other changes in the market can impact FRN prices, however, primarily due to the fixed spread that is specified for each bond. The spread paid above the floating rate does not change over the life of the bond. Because this spread primarily reflects credit risk, changes in the creditworthiness of the issuer and general changes in credit conditions can impact FRNs.</p>
<h2 id="point-five" class="anchored-block">What happens to FRNs when spreads widen?</h2>
<p>If credit spreads widen, the value of an FRN may decline to compensate investors for the additional spread that is needed. This sensitivity is referred to as spread duration. In contrast to interest rate duration, which measures price sensitivity to interest rates, spread duration measures sensitivity to a change in credit spreads of that issuer. Longer maturities and more credit oriented sectors will generally have higher spread durations than lower maturities and non-credit issuers such as government agencies. Investors are typically compensated for this additional spread risk through a higher spread, and therefore a higher coupon.</p>
<p>The result of this spread exposure is potentially higher volatility and drawdowns when spreads widen as compared to non-credit sensitive FRNs such as those issued by the U.S. Treasury, but also a higher yield which historically has allowed FRNs to recover and outperform in the long-term. Recent market experience reinforces this behavior. For example, during brief credit-spread widening episodes in 2023 and mid-2025 which were driven by economic slowdown concerns, FRNs experienced limited, short-lived price declines before quickly recovering as corporate fundamentals remained solid. Although credit spreads can impact valuations, the low interest-rate duration of FRNs helped shield investors from the larger rate-driven drawdowns that can affect traditional fixed-rate bonds.</p>
<p>In many ways, the risk profile of corporate FRNs is closer to short-term corporate bonds, which also have credit exposure but also greater sensitivity to interest rate movements compared to corporate FRNs. This rate exposure may help or hurt performance depending on the interest rate environment. Recently, performance of fixed coupon bonds, even with shorter maturities, has suffered due to rate volatility.</p>
<h3>FRNs with Higher Spread Exposure Outperformed (10 Years)</h3>
<p><img loading="lazy" class="img-responsive w-100" alt="FRNs with Higher Spread Exposure Outperformed (10 Years)" src="https://www.vaneck.com/contentassets/6b6838b210ae47329eca527f0cfae774/6465_fltr-faq_chart-3_2025-11_v1_blog.svg" /></p>
<p class="chart-disclosure">Source: Morningstar Direct. IG Corps represented by MVIS US Investment Grade Floating Rate Index, US Treasury FRN by ICE BofA US Floating Rate Treasury Index and 1-3Y Fixed Corp by ICE BofA 1-3Y US Corp Index. Past performance is no guarantee of future results. Index performance is not representative of fund performance. It is not possible to invest directly in an index.</p>

<h2 id="point-four" class="anchored-block">How do FRNs differ from loans or other short duration strategies?</h2>
<p>Compared to investment grade short term bonds (e.g., 1-3 year or 1-5 year fixed coupon strategies), the primary difference is that FRNs have a near-zero duration and virtually no sensitivity to changes in interest rates. Therefore, investors looking to shorten their overall exposure to interest rate may find an allocation to FRNs attractive. Since FRNs are also investment grade, this does not entail assuming significantly more credit risk. The yield on FRNs will vary based on prevailing rates and spread levels. Currently FRNs offer a yield pick-up over fixed rate short-term bonds.</p>
<h3>FRNs offering Higher Yields</h3>
<p><img loading="lazy" class="img-responsive w-100" alt="FRNs offering Higher Yields" src="https://www.vaneck.com/contentassets/068fc8844cc244ce90f6472444572b10/6465_fltr-faq_chart-4_2025-11_v1_blog.svg" /></p>
<p class="chart-disclosure">Source: ICE Data Services, as of 10/31/25. IG FRNs represented by the MVIS US Investment Grade Floating Rate Index, 1-5Y US Corp by ICE BofA 1-5 Year US Corporate Index, 1-3Y Corp by ICE BofA 1-3 Year US Corporate Index, UST FRNs by ICE BofA US Floating Rate Treasury Index, 1-5Y US Corp/Gov by ICE BofA 1-5 Year US Corporate &amp; Government Index and 2Y US Treasury by ICE BofA Current 2-Year US Treasury Index. Past performance is no guarantee of future results. Index performance is not representative of fund performance. It is not possible to invest directly in an index.</p>

<p>Similar to FRNs, bank loans also have coupons that are based on floating rates and therefore have very little sensitivity to changes in interest rates. In that sense, both can be attractive as portfolio diversifiers, particularly if rates are rising or expected to rise. However, FRNs and bank loans have very different credit profiles. Although generally secured by an issuer&rsquo;s assets, the loan universe is predominantly high yield, and therefore investors earn higher spreads to reflect the much higher level of credit risk. Loans tend to be more illiquid and often have extended settlement periods. This can be a concern in periods of high volatility and risk-off environments, where it may be more difficult to sell loans to satisfy redemptions. Loan returns have also exhibited much higher volatility compared to FRNs historically.</p>
<h2 id="point-seven" class="anchored-block">Why are FRNs attractive now?</h2>
<p>After two years of yield-curve inversion, the curve has turned positive again as the Federal Reserve begins a measured easing cycle, lowering the policy rate to 3.75 &ndash; 4.00 % in October 2025 while long-term yields stay elevated amid persistent inflation and heavy Treasury supply. Investors continue to hold near-record cash balances in money-market funds, yet those vehicles offer limited upside once policy rates peak. In this environment, IG FRNs remain a compelling short-duration income solution with a yield of 5.12% exceeding short-term and fixed-rate corporate bonds, while exhibiting far less price volatility. For more info, please check out this <a href="/us/en/blogs/income-investing/floating-rates-capturing-short-term-yields-as-the-yield-curve-normalizes/" title="Floating Rates: Capturing Short-Term Yields as the Yield Curve Normalizes"><strong>blog</strong></a>.</p>
<h2 id="point-eight" class="anchored-block">How can investors use FRNs within a portfolio?</h2>
<p>The unique characteristics of FRNs provide several benefits within a fixed income portfolio:</p>
<ul class="content-list">
<li class="mt-2"><strong>Protection against rising or volatile rates</strong>: the near-zero duration makes FRN prices insensitive to movements in interest rates, which may be particularly attractive when long-term bond yields are rising or volatile.</li>
<li class="mt-2"><strong>Enhanced yield</strong>: FRNs currently offer higher yields comparable to short-term fixed securities as the reference rate (SOFR) is still relatively high.</li>
<li class="mt-2"><strong>Diversification</strong>: Because they are insensitive to movements in interest rates, FRNs have a lower correlation to other fixed rate asset classes than short-term bonds. Further, the sector mix of the FRN universe differs from that of the broader corporate bond market, so may provide sector and issuer diversification as well.</li>
<li class="mt-2"><strong>High quality</strong>: FRNs are rated investment grade, as opposed to bank loans which are issued by high yield borrowers and generally have lower levels of liquidity.</li>
</ul>
<p>The high quality and near-zero duration can also make FRNs attractive as a cash alternative or complement for investors with longer holding periods who can tolerate a degree of volatility that comes from movements in credit spreads. They can serve as a tactical allocation for investors who wish to earn higher yields than money markets while avoiding the interest-rate sensitivity of longer-duration bonds.</p>
<h2 id="point-nine" class="anchored-block jump-link-nav" data-jumplink-title="What is FLTR?">What makes <a href="/link/0eff4e75a2114e0f8a7e71694dc0ad16.aspx" title="FLTR - VanEck IG Floating Rate ETF - Overview"><strong>FLTR</strong></a>&rsquo;s strategy unique?</h2>
<p><a href="/link/0eff4e75a2114e0f8a7e71694dc0ad16.aspx" title="FLTR - VanEck IG Floating Rate ETF - Overview"><strong>VanEck<sup>&reg;</sup>&nbsp;IG Floating Rate ETF (FLTR<sup>&reg;</sup>)</strong></a>&nbsp;provides access to corporate FRNs, allowing investors to efficiently gain exposure to this segment. Investors may also benefit from the diversification and high credit quality that FRNs can provide.</p>
<p>Further, <a href="/link/0eff4e75a2114e0f8a7e71694dc0ad16.aspx" title="FLTR - VanEck IG Floating Rate ETF - Overview"><strong>FLTR</strong></a>&rsquo;s index is designed to provide an enhanced yield versus the broader FRN universe. This is done in two ways. First, <a href="/link/0eff4e75a2114e0f8a7e71694dc0ad16.aspx" title="FLTR - VanEck IG Floating Rate ETF - Overview"><strong>FLTR</strong></a>&rsquo;s index focuses on corporate FRNs only, and does not include non-credit issuers such as the U.S. Treasury and government agencies. This results in a higher average spread and a higher overall yield versus the broad market. Second, <a href="/link/0eff4e75a2114e0f8a7e71694dc0ad16.aspx" title="FLTR - VanEck IG Floating Rate ETF - Overview"><strong>FLTR</strong></a>&rsquo;s index re-weights constituents so that there is a higher weight towards longer maturity bonds. As mentioned above, credit spread curves tend to be upwards sloping, and a higher weight to longer maturities results in higher spreads, without assuming additional interest rate risk.</p>
<h3>Designed to Provide Higher Yield Potential</h3>
<p><img loading="lazy" class="img-responsive w-100" alt="Designed to Provide Higher Yield Potential" src="https://www.vaneck.com/contentassets/f0934a9c14df4fef8d2b08944b428ae5/6465_fltr-faq_chart-5_2025-11_v1_blog.svg" /></p>
<p class="chart-disclosure">Source: ICE Data Services, as of 10/31/2025. Past performance is no guarantee of future results. Index performance is not representative of fund performance. It is not possible to invest directly in an index.</p>
<p>The result of this unique design is a higher yielding strategy that has outperformed other ultrashort investment options historically.</p>
<h3>Performance Relative to the Morningstar Open End Funds &ndash; U.S. Ultrashort Bond Category</h3>
<p><img loading="lazy" class="img-responsive w-100" alt="Performance Relative to the Morningstar Open End Funds &ndash; U.S. &ndash; Ultrashort Bond Category" src="https://www.vaneck.com/contentassets/56e9ab3494c341f4b7f788aa6278dac1/6465_fltr-faq_chart-6_2025-11_v1_blog.svg" /></p>
<br />
<div class="wrapped-div-full dont-scroll-desktop">
<table>
<tbody>
<tr class="tbl-data">
<td class="tbl-header last text-left">Trailing Returns</td>
<td class="tbl-header last text-right">1 Year</td>
<td class="tbl-header last text-right">Peer group percentile</td>
<td class="tbl-header last text-right">Peer group rank</td>
<td class="tbl-header last text-right">3 Years</td>
<td class="tbl-header last text-right">Peer group percentile</td>
<td class="tbl-header last text-right">Peer group rank</td>
<td class="tbl-header last text-right">5 Years</td>
<td class="tbl-header last text-right">Peer group percentile</td>
<td class="tbl-header last text-right">Peer group rank</td>
<td class="tbl-header last text-right">10 Years</td>
<td class="tbl-header last text-right">Peer group percentile</td>
<td class="tbl-header last text-right">Peer group rank</td>
<td class="tbl-header last text-right">5/1/2011 - 10/31/2025</td>
<td class="tbl-header last text-right">Peer group percentile</td>
<td class="tbl-header last text-right">Peer group rank</td>
</tr>
<tr class="tbl-data">
<td class="data-td data last text-left">VanEck IG Floating Rate ETF</td>
<td class="data-td data last text-right">5.51</td>
<td class="data-td data last text-right">9</td>
<td class="data-td data last text-right">23</td>
<td class="data-td data last text-right">6.82</td>
<td class="data-td data last text-right">5</td>
<td class="data-td data last text-right">9</td>
<td class="data-td data last text-right">4.13</td>
<td class="data-td data last text-right">7</td>
<td class="data-td data last text-right">11</td>
<td class="data-td data last text-right">3.27</td>
<td class="data-td data last text-right">8</td>
<td class="data-td data last text-right">2.47</td>
<td class="data-td data last text-right">10</td>
<td class="data-td data last text-right">9</td>
</tr>
<tr class="tbl-data">
<td class="data-td data last text-left">US Fund Ultrashort Bond</td>
<td class="data-td data last text-right">4.92</td>
<td class="data-td data last text-right">45</td>
<td class="data-td data last text-right">121</td>
<td class="data-td data last text-right">5.56</td>
<td class="data-td data last text-right">41</td>
<td class="data-td data last text-right">93</td>
<td class="data-td data last text-right">3.21</td>
<td class="data-td data last text-right">45</td>
<td class="data-td data last text-right">91</td>
<td class="data-td data last text-right">2.44</td>
<td class="data-td data last text-right">55</td>
<td class="data-td data last text-right">88</td>
<td class="data-td data last text-right">1.86</td>
<td class="data-td data last text-right">50</td>
<td class="data-td data last text-right">51</td>
</tr>
<tr class="tbl-data">
<td class="data-td data last text-left"># Investments in Peer Group</td>
<td class="data-td data last text-right">245</td>
<td class="data-td data last text-right">&nbsp;</td>
<td class="data-td data last text-right">215</td>
<td class="data-td data last text-right">&nbsp;</td>
<td class="data-td data last text-right">193</td>
<td class="data-td data last text-right">&nbsp;</td>
<td class="data-td data last text-right">2.71</td>
<td class="data-td data last text-right">147</td>
<td class="data-td data last text-right">&nbsp;</td>
<td class="data-td data last text-right">90</td>
<td class="data-td data last text-right">&nbsp;</td>
</tr>
<tr class="tbl-data">
<td class="data-td data last text-left">25th Percentile</td>
<td class="data-td data last text-right">5.16</td>
<td class="data-td data last text-right">&nbsp;</td>
<td class="data-td data last text-right">5.82</td>
<td class="data-td data last text-right">&nbsp;</td>
<td class="data-td data last text-right">3.36</td>
<td class="data-td data last text-right">&nbsp;</td>
<td class="data-td data last text-right">2.71</td>
<td class="data-td data last text-right">&nbsp;</td>
<td class="data-td data last text-right">2.11</td>
<td class="data-td data last text-right">&nbsp;</td>
</tr>
<tr class="tbl-data">
<td class="data-td data last text-left">50th Percentile</td>
<td class="data-td data last text-right">4.86</td>
<td class="data-td data last text-right">&nbsp;</td>
<td class="data-td data last text-right">5.44</td>
<td class="data-td data last text-right">&nbsp;</td>
<td class="data-td data last text-right">3.14</td>
<td class="data-td data last text-right">&nbsp;</td>
<td class="data-td data last text-right">2.48</td>
<td class="data-td data last text-right">&nbsp;</td>
<td class="data-td data last text-right">1.83</td>
<td class="data-td data last text-right">&nbsp;</td>
</tr>
<tr class="tbl-data">
<td class="data-td data last text-left">75th Percentile</td>
<td class="data-td data last text-right">4.49</td>
<td class="data-td data last text-right">&nbsp;</td>
<td class="data-td data last text-right">5.04</td>
<td class="data-td data last text-right">&nbsp;</td>
<td class="data-td data last text-right">2.95</td>
<td class="data-td data last text-right">&nbsp;</td>
<td class="data-td data last text-right">2.19</td>
<td class="data-td data last text-right">&nbsp;</td>
<td class="data-td data last text-right">1.46</td>
<td class="data-td data last text-right">&nbsp;</td>
</tr>
</tbody>
</table>
</div>
<p class="chart-disclosure">Source: &copy; Morningstart, Inc. All Rights Reserved. Data as of 10/31/2025. The information contained herein: (1) is proprietary to Morningstar; (2) may not be copied or distributed; and (3) is not warranted to be accurate, complete or timely. Neither Morningstar nor its content providers are responsible for any damages or losses arising from any use of this information. Past performance is no guarantee of future results. The peer group chart presents trailing total return percentile rankings against the Morningstar Open End Funds &ndash; U.S. &ndash; Ultrashort Bond category, which comprised 245 funds as of 10/31/2025.</p>
<p>This chart is for illustrative purposes only. Performance information for the Fund reflects temporary waivers of expenses and/or fees. Had the Fund incurred all expenses, investment returns would have been reduced. Investment return and value of the shares of the Fund will fluctuate so that an investor's shares, when sold, may be worth more or less than their original cost. Performance may be lower or higher than performance data quoted. Fund returns reflect dividends and capital gains distributions. Performance current to the most recent month end is available by calling 800.826.2333 or on vaneck.com. <strong>Please click <a href="https://www.vaneck.com/us/en/investments/ig-floating-rate-etf-fltr/performance/" title="FLTR - VanEck IG Floating Rate ETF - Overview">here</a> for FLTR standardized performance.</strong> VanEck IG Floating Rate ETF commenced on 4/25/2011. See disclosures at the end of this commentary. See descriptions for active mutual fund open-end peer group universe and category average (including mutual funds and ETFs) at the end of this commentary.</p>
<h2 id="point-ten" class="anchored-block jump-link-nav" data-jumplink-title="How to Buy VanEck ETFs">Who should own FRNs?</h2>
<p>Floating rate notes may be appropriate for investors seeking an enhanced yield versus risk-free rates with minimal interest-rate risk. Because FRN coupons reset with prevailing reference rates, they can be particularly useful in environments where rates are elevated, volatile, or uncertain, and where traditional fixed-rate bonds face price pressure from rising yields.</p>
<p>FRNs can also function as a cash complement for investors with intermediate holding periods who are willing to accept modest volatility in exchange for higher income potential than money market instruments or Treasury bills. While FRN prices tend to be stable due to low duration, returns are still influenced by credit spreads, meaning short-term volatility is possible during periods of market stress.</p>
<p id="point-eleven" class="anchored-block"><span style="font-size: 14pt;"><strong>How to buy FLTR?</strong></span></p>
<p>VanEck ETFs can be purchased the same way you would buy a stock, through a broker or with your advisor.</p>
<p class="d-none d-lg-block"><a href="mailto:askvaneck@vaneck.com" title="Have More Questions? - Ask VanEck" rel="noopener"><img loading="lazy" class="img-responsive" src="https://www.vaneck.com/globalassets/home/us/insights/blogs/bm-blog-images/cta-faq_desktop-02.svg" alt="Have More Questions? - Ask VanEck" /></a></p>
<p class="d-lg-none"><a href="mailto:askvaneck@vaneck.com" title="Have More Questions? - Ask VanEck" rel="noopener"><img loading="lazy" class="img-responsive" src="https://www.vaneck.com/globalassets/home/us/insights/blogs/bm-blog-images/cta-faq_mobile-01.svg" alt="Have More Questions? - Ask VanEck" /></a></p>
<p>To receive more <a href="/us/en/blogs/income-investing/" title="Income Investing Insights"><strong>Income Investing</strong></a> insights, <a href="/link/5f45412c2143400497908cea2897f7d3.aspx" title=" Subscription Center"><strong>sign up in our subscription center</strong></a>.</p>
]]></content:encoded>
</item><item rdf:about="https://www.vaneck.com/us/en/blogs/municipal-bonds/smb-etf-question-and-answer/">
  <title>SMB ETF: Question &amp; Answer></title>
  <link>https://www.vaneck.com/us/en/blogs/municipal-bonds/smb-etf-question-and-answer/</link>
  <description><![CDATA[This blog covers short-term municipal bonds, their key advantages, and the VanEck Short Muni ETF (SMB).]]></description>
  <dc:creator> </dc:creator>
  <dc:date>12/01/2025 06:30:00</dc:date>
<content:encoded><![CDATA[

<ul class="content-list">
<li><a href="#point-one"><strong>What are short-term municipal bonds, and how big is the market?</strong></a></li>
<li><a href="#point-two"><strong>What makes short-term municipal bonds attractive relative to other types of bonds?</strong></a></li>
<li><a href="#point-three"><strong>What is the VanEck Short Muni ETF (SMB)?</strong></a></li>
<li><a href="#point-four"><strong>How is the Fund&rsquo;s index constructed?</strong></a></li>
<li><a href="#point-five"><strong>Why might investors be interested in short-term munis?</strong></a></li>
<li><a href="#point-six"><strong>How do short-term munis compare in the risk/reward profile?</strong></a></li>
<li><a href="#point-seven"><strong>How do short-term munis perform in different rate environments?</strong></a></li>
<li><a href="#point-eight"><strong>Who might consider allocating to short-term munis?</strong></a></li>
<li><a href="#point-nine"><strong>How does the portfolio management team decide which bonds in the index to own?</strong></a></li>
<li><a href="#point-ten"><strong>How can investors buy the VanEck Short Muni ETF (SMB)?</strong></a></li>
</ul>
<h2 id="point-one" class="anchored-block">What are short-term municipal bonds, and how big is the market?</h2>
<p>Short-term municipal bonds are debt securities issued by states, municipalities, and other local governments with investment-grade credit ratings (BBB-/Baa3 or higher) and maturities at the short end of the municipal yield curve.</p>
<p>They are used to finance public infrastructure and other essential projects, including transportation, utilities, and local services.</p>
<p>As of Q2 2025, the overall U.S. municipal bond market totaled roughly $4.3 trillion in outstanding debt, according to SIFMA. While short-term issuance represents a smaller portion of that market, it serves as a key segment for investors seeking tax-exempt income with reduced interest rate risk.</p>
<h2 id="point-two" class="anchored-block">What makes short-term municipal bonds attractive relative to other types of bonds?</h2>
<ul class="content-list">
<li class="mt-2"><strong>Lower Duration, Lower Volatility:</strong> Short-term munis carry less sensitivity to interest rate movements, which may help reduce volatility when rates rise.</li>
<li class="mt-2"><strong>Attractive After-Tax Income:</strong> Interest income from municipal bonds is exempt from federal income tax and may also be exempt from state and local taxes, depending on the investor&rsquo;s residence.</li>
<li class="mt-2"><strong>High Credit Quality:</strong> Investment-grade municipal bonds have historically experienced very low default rates compared to other fixed income sectors.</li>
<li class="mt-2"><strong>Liquidity and Flexibility:</strong> The short maturity profile provides a steady stream of reinvestment opportunities, allowing investors to benefit from potential shifts in rate environments.</li>
</ul>
<h2 id="point-three" class="anchored-block">What is the VanEck Short Muni ETF (SMB)?</h2>
<p>The <a href="/link/af71e9a11e4441edbea8e95251ef5747.aspx" title="SMB - VanEck Short Muni ETF - Overview"><strong>VanEck Short Muni ETF (SMB)</strong></a> seeks to track the performance of the ICE Short AMT-Free Broad National Municipal Index (MBNS), which measures the U.S. dollar-denominated, short-maturity (less than six years), investment-grade, tax-exempt bond market. The fund provides diversified exposure to high-quality municipal issuers across states and sectors, aiming to deliver stable tax-exempt income with limited duration risk.</p>

<h2 id="point-four" class="anchored-block">How is the Fund&rsquo;s index constructed?</h2>
<p>The ICE Short AMT-Free Broad National Municipal Index (MBNS) includes:</p>
<ul class="content-list">
<li class="mt-2"><strong>Maturities:</strong> Less than six years to final maturity.</li>
<li class="mt-2"><strong>Credit Quality:</strong> Minimum rating of Baa3/BBB- or higher, based on Moody&rsquo;s, S&amp;P, or Fitch.</li>
<li class="mt-2"><strong>Minimum Size:</strong> At least $10 million outstanding per bond and $100 million original deal size.</li>
<li class="mt-2"><strong>Exclusions:</strong> Private placements, variable rate demand notes, commercial paper, floating rate debt, and securities in legal default.</li>
<li class="mt-2"><strong>Rebalancing:</strong> Monthly, with market value weighting.</li>
</ul>
<p>This methodology ensures broad and representative exposure to the short end of the investment-grade municipal curve.</p>
<h2 id="point-five" class="anchored-block">Why might investors be interested in short-term munis?</h2>
<p>Short-term munis offer tax-exempt income at competitive yields with prices less sensitive to rate changes.</p>
<p>In periods of rate uncertainty or expected policy easing, short-term munis may benefit from:</p>
<ul class="content-list">
<li class="mt-2">Faster price recovery as bonds roll down the curve.</li>
<li class="mt-2">Attractive reinvestment opportunities if yields remain elevated.</li>
<li class="mt-2">Potential to serve as a defensive core within a tax-exempt income strategy.</li>
</ul>
<p>Historically, this segment has offered a compelling blend of income and stability, particularly when compared to cash or Treasuries on a taxable-equivalent yield basis.</p>
<h2 id="point-six" class="anchored-block">How do short-term munis compare in the risk/reward profile?</h2>
<p>Short-term municipal bonds generally offer lower risk and more stable returns than longer-duration or lower-rated fixed income assets.</p>
<p>From 2019 to 2024, short-term investment-grade munis historically demonstrated:</p>
<ul class="content-list">
<li class="mt-2">Minimal default risk (average 5-year default rate below 0.1%).</li>
<li class="mt-2">Strong risk-adjusted returns, outperforming many taxable short-duration peers on a tax-equivalent basis.</li>
</ul>
<h2 id="point-seven" class="anchored-block">How do short-term munis perform in different rate environments?</h2>
<p>Short-term munis have historically held up well in rising-rate environments due to their limited duration and frequent reinvestment opportunities. During easing cycles, they can experience modest price gains as yields decline. This balance helps support steady, tax-efficient income through different phases of the rate cycle.</p>
<h2 id="point-eight" class="anchored-block">Who might consider allocating to short-term munis?</h2>
<p>Short-term munis can suit investors seeking tax-exempt income with limited volatility and principal stability. Examples include high-net-worth individuals, retirees, or those managing liquidity within a broader fixed income portfolio. They can also serve as a core allocation for investors looking to stay invested while maintaining flexibility to adjust duration as market conditions change.</p>
<h2 id="point-nine" class="anchored-block">How does the portfolio management team decide which bonds in the index to own?</h2>
<p><a href="/link/af71e9a11e4441edbea8e95251ef5747.aspx" title="SMB - VanEck Short Muni ETF - Overview"><strong>SMB</strong></a> uses a sampling approach similar to other VanEck muni ETFs. The team selects a representative basket of bonds that match the index&rsquo;s risk and return characteristics, optimizing for liquidity, transaction cost efficiency, and credit diversification. This approach seeks to minimize tracking error while maintaining the fund&rsquo;s short-duration profile and income consistency.</p>
<p><img loading="lazy" alt="How does the portfolio management team decide which bonds in the index to own?" class="img-responsive" src="https://www.vaneck.com/EPiServer/CMS/Content/contentassets/1cacfa456ed54e5e934c92547e513d34/6461_mln-faq-blog_infographic-1_2025-11_v2_blog.svg,,353861/Download?epieditmode=False" /></p>
<p class="chart-disclosure">Source: VanEck.</p>

<h2 id="point-ten" class="anchored-block">How can investors buy the VanEck Short Muni ETF (SMB)?</h2>
<p><strong><a href="/link/af71e9a11e4441edbea8e95251ef5747.aspx" title="SMB - VanEck Short Muni ETF - Overview">Learn more here.</a></strong></p>
<p><span style="font-size: 14pt;"><strong>How to buy SMB?</strong></span></p>
<p>VanEck ETFs can be purchased the same way you would buy a stock, through a broker or with your advisor.</p>
<p class="d-none d-lg-block"><a href="mailto:askvaneck@vaneck.com" title="Have More Questions? - Ask VanEck" rel="noopener"><img loading="lazy" class="img-responsive" src="https://www.vaneck.com/globalassets/home/us/insights/blogs/bm-blog-images/cta-faq_desktop-02.svg" alt="Have More Questions? - Ask VanEck" /></a></p>
<p class="d-lg-none"><a href="mailto:askvaneck@vaneck.com" title="Have More Questions? - Ask VanEck" rel="noopener"><img loading="lazy" class="img-responsive" src="https://www.vaneck.com/globalassets/home/us/insights/blogs/bm-blog-images/cta-faq_mobile-01.svg" alt="Have More Questions? - Ask VanEck" /></a></p>
<p>To receive more <a href="https://www.vaneck.com/us/en/insights/municipal-bonds/" title="Municipal Bonds Insights"><strong>Municipal Bonds</strong></a> insights, <a href="/link/5f45412c2143400497908cea2897f7d3.aspx" title=" Subscription Center"><strong>sign up in our subscription center</strong></a>.</p>
]]></content:encoded>
</item><item rdf:about="https://www.vaneck.com/us/en/blogs/natural-resources/the-global-power-crunch-the-new-geopolitical-and-economic-frontier/">
  <title>The Global Power Crunch: The New Geopolitical and Economic Frontier></title>
  <link>https://www.vaneck.com/us/en/blogs/natural-resources/the-global-power-crunch-the-new-geopolitical-and-economic-frontier/</link>
  <description><![CDATA[Global power demand is surging, energy security is the new macro imperative and innovation across grids and generation is redefining what &ldquo;secure power&rdquo; means for investors.]]></description>
  <dc:creator>Shawn Reynolds</dc:creator>
  <dc:date>12/01/2025 06:30:00</dc:date>
<content:encoded><![CDATA[

<p><strong>Key Takeaways:</strong></p>
<ul class="content-list">
<li class="mt-2"><strong>Global power demand is surging</strong> as AI data centers, electrification and manufacturing re-shoring drive record electricity consumption worldwide.</li>
<li class="mt-2"><strong>Energy security is now a geopolitical and investment imperative</strong>, as aging infrastructure strains under modern demand and control of fuels, minerals and grids defines competitiveness.</li>
<li class="mt-2"><strong>Innovation is unlocking opportunity</strong>, with next-generation geothermal, nuclear, fusion, hydrogen, storage and AI-optimized grids set to redefine &ldquo;secure power&rdquo; and reshape global investment themes.</li>
</ul>
<p>A global power crunch is emerging as one of the defining economic and geopolitical forces of the 21st century. Electricity now sits at the heart of today&rsquo;s global economy and demand is growing at an unprecedented pace &ndash; driven certainly by the headline-grabbing artificial intelligence (AI) race and the electrification of everything, as well as manufacturing re-shoring and accelerating urbanization.</p>
<p>This surge in demand is colliding with a power system that was built for an earlier era, in an earlier era. Yet today&rsquo;s electricity networks around the world cannot keep up with current demand. Power availability, affordability and national security have become not just technical challenges, but strategic imperatives that will determine a country&rsquo;s economic competitiveness and geopolitical influence.</p>
<h2>Structural Shifts in Global Power Demand</h2>
<p>As Michael Porter noted in his seminal work <em>The Competitive Advantage of Nations</em> more than 35 years ago, labor, infrastructure and technological capacity are the advanced factors driving a nation&rsquo;s economic strength. The U.S. clearly excels in its technological capabilities. As former Fed Governor Kevin Warsh wrote in <em>The Wall Street Journal</em> (November 17, 2025), America&rsquo;s comparative advantage remains in its labor force, &ldquo;workers of all stripes &ndash; a nation of doers, risk-takers and builders&rdquo;. The technology leadership and innovation of the US is indisputable.</p>
<p>However, the U.S., like most of the world, lags in infrastructure, particularly power infrastructure. Generation, transmission and distribution capacity are insufficient. Traditional solutions including &ldquo;conventional&rdquo; renewables are necessary but not enough. Breakthrough innovations must fill the gap and will determine the success and security of our future.</p>
<p>The world is entering a structural phase of electricity demand growth. According to the International Energy Agency (IEA), global power consumption rose approximately 4% in 2024 &ndash; the fastest pace in decades. The IEA also projects that global electricity consumption between 2025 and 2027 will be unprecedented, equivalent to adding the demand of Japan to the global total each year. Spending on power generation and end-use electrification accounts for roughly half of today&rsquo;s total energy investment. Much of this growth is attributed to AI data centers and the seemingly infinite demand for low cost and firm power. AI, however, is only part of the story. Re-shoring and near-shoring of manufacturing and the ceaseless increase in per capita consumption are the major new sources of demand that form a new baseline.</p>

<h2>The Return of Energy as a Weapon</h2>
<p>Energy&rsquo;s resurgence as a tool of statecraft is unmistakable. Jason Bordoff and Meghan O&rsquo;Sullivan argue in <em>Foreign Affairs</em>, that the &ldquo;energy weapon&rdquo; has returned in new and more complex forms. States controlling fuels, critical minerals, technologies and grid equipment now hold outsized geopolitical leverage.</p>
<p>While the concept dates back to the 1970s oil-embargos, it now extends to LNG (liquified natural gas), rare earth metals, graphite and solar panels. Mary Gallagher&rsquo;s recent column in <em>World Politics Review</em> details how dominance of the rare earth metals&rsquo; sector has served as a controlling force against Japan and the U.S.</p>
<p>The weaponization of energy during recent conflicts revealed how fragile global interdependence has become. Power generation, transmission resilience and supply-chain autonomy are now treated as elements of national deterrence, and key to preserving both technological and military advantage.</p>
<p>Hence, the imperatives of growth, affordability and security are more critical than ever. Despite record levels of investment, today&rsquo;s energy mix is insufficient. Incremental improvements will not close the gap. A transformation in power technology is required.</p>
<h2>Transformational Technologies: Building Abundance and Security</h2>
<p>A new generation of energy sources is emerging, aimed at solving the energy trilemma of access, affordability and security. An &ldquo;all of the above&rdquo; approach needs to be genuinely pursued and includes confronting the realities of NIMBYism (&ldquo;Not In My Back Yard&rdquo;), geology, economics and proof of concept.</p>
<p>New sources of fossil fuels, established solar and wind technologies, restarting and optimizing conventional nuclear reactors, next generation nuclear fission innovations, advanced geothermal systems, fusion energy systems, hydrogen utilization and long-duration battery storage are all parts of a comprehensive solution.</p>
<h2>Conclusion: Power as the New Sovereignty</h2>
<p>Power is power and those who control generation, cost and security will lead the way. The world needs energy addition, not pure substitution. Those who recognize and pursue that path will hold the economic and strategic high ground of the next industrial age.</p>
<p>To receive more <a href="/us/en/insights/natural-resources/" title="Natural Resources Insights"><strong>Natural Resources</strong></a> insights, <a href="https://www.vaneck.com/us/en/subscribe/" title="Subscription Center"><strong>sign up in our subscription center</strong></a>.</p>
]]></content:encoded>
</item><item rdf:about="https://www.vaneck.com/us/en/blogs/municipal-bonds/long-duration-munis-offer-rare-value-in-a-shifting-rate-environment/">
  <title>Long-Duration Munis Offer Rare Value in a Shifting Rate Environment></title>
  <link>https://www.vaneck.com/us/en/blogs/municipal-bonds/long-duration-munis-offer-rare-value-in-a-shifting-rate-environment/</link>
  <description><![CDATA[With the Fed easing and muni supply surging, long-duration municipal bonds stand out, offering tax-exempt yields that now rival or exceed Treasuries and even some riskier fixed income assets.]]></description>
  <dc:creator>A. J. Talukdar</dc:creator>
  <dc:date>12/01/2025 06:30:00</dc:date>
<content:encoded><![CDATA[

<p><strong>Key Takeaways:</strong></p>
<ul class="content-list">
<li class="mt-2">The Fed&rsquo;s rate cuts may spark a rally in long-term bonds, favoring long-duration munis.</li>
<li class="mt-2">Record muni issuance is boosting yields, creating rare value in long maturities.</li>
<li class="mt-2">Long-duration munis now out-yield Treasuries after taxes for high-income investors.</li>
</ul>
<h2>The Fed&rsquo;s Rate Cuts May Ignite a Long-Bond Rally</h2>
<p>After holding steady for most of 2025, the Federal Reserve has now delivered two consecutive rate cuts in September and October, lowering the federal funds rate to a 3.75&ndash;4.0% range. Markets increasingly appear to be pricing in a broader easing cycle, and even the possibility of renewed quantitative support if growth softens.</p>
<p>When the Fed starts easing the impact often shows up first, and most dramatically, in long-term bonds. In a rate-cutting environment, yields across the long end of the curve could have room to compress; a scenario that shines favor on high-quality, long-duration municipal bonds. These tax-exempt instruments tend to outperform as rates fall, benefiting from both income and price appreciation.</p>
<p>At the same time, record new-issue supply has weighed on prices. SIFMA data shows that 2025 issuance has been approaching near historic highs, roughly $495 billion year-to-date through October, up almost 9% year-over-year with forecasts calling for total issuance to exceed 2024&rsquo;s record year.</p>
<h2>Record Municipal Bond Issuance Creates Value Opportunities</h2>
<p>This surge in long-maturity supply has pressured valuations and boosted yields, with the Muni-to-Treasury yield ratio climbing to near-parity marking a rare alignment in nominal income potential. For high earning investors, that equivalence translates into a significant after-tax yield premium, underscoring long-duration munis&rsquo; relative value at current levels.</p>
<h3>Yield to Maturity: MBNL vs 30Yr Treasuries</h3>
<p><img loading="lazy" class="img-responsive" alt="Yield to Maturity: MBNL vs 30Yr Treasuries" src="https://www.vaneck.com/contentassets/eef8edd4415c4583b918f6ff8358f318/6475_mln-blog_chart-1_2025-11_v1_blog.svg" /></p>
<p class="chart-disclosure">Source: ICE Data Indices. As of 10/31/2025. <strong>Past performance is not a guarantee of future results. Index performance is not representative of fund performance. It is not possible to invest directly in an index.</strong></p>
<h2>Treasury Trap for the Tax Brackets</h2>
<p>At five-year highs, long duration municipal bonds now out-yield Treasuries where it counts: after tax. As the graph shows, long Investment Grade Munis (tracked by MBNL) now yield approximately on par with, or slightly below, comparable 30Y Treasuries. Yet because Municipal Bond interest income is tax-exempt at the state, and sometimes even local level, their taxable-equivalent yield far exceeds that of Treasuries for investors in high income brackets.</p>
<h3>MBNL vs 30Yr Treasury: Effective Yields as of 10/31/2025</h3>
<p><img loading="lazy" class="img-responsive" alt="MBNL vs 30Yr Treasury: Effective Yields as of 10/31/2025" src="https://www.vaneck.com/contentassets/37a87311bba0454fa91362f8ad175a8f/6475_mln-blog_chart-2_2025-11_v1_blog.svg" /></p>
<p class="chart-disclosure">Source: ICE Data Indices. As of 10/31/2025. MBNL Represented by &ldquo;ICE Long AMT-Free Broad National Municipal Bond Index (MBNL)&rdquo; Tracks long-maturity, investment-grade U.S. municipal bonds that are exempt from the alternative minimum tax (AMT). 30Y Treasury Represented by &ldquo;ICE U.S. Treasury 30-Year Index&rdquo; Measures the performance of U.S. dollar&ndash;denominated, fixed-rate Treasury securities with approximately 30 years to maturity. <strong>Past performance is not a guarantee of future results. Index performance is not representative of fund performance. It is not possible to invest directly in an index.</strong></p>

<p>For income-oriented investors, the relative value proposition for munis is notably significant. The graphic above illustrates the taxable equivalent yield (TEY) required for a Treasury investor to match the income produced by long-dated municipal bonds. In the current environment, a long duration muni yielding roughly 4.1% translates to a TEY of nearly 6.8% for investors in the highest federal bracket; a yield well above comparable 30-year Treasuries. Even at lower tax rates, the advantage goes to munis: 30Y Treasuries would need to yield significantly more than 5.5% to compete on a post-tax basis. With both markets offering multi-year-high nominal yields, the post-tax spread tilts decisively towards long-duration municipal bonds.</p>
<p>Through a broader lens, the relative income advantage of long-duration municipal bonds becomes even more apparent. As of October 31, 2025 investment-grade long munis yield roughly 4.6% on a tax-exempt basis equivalent to 6.1% for investors in the 24% bracket and 7.3% for those in the 37% bracket. That taxable-equivalent income rivals or surpasses what income investors are earning from high-yield corporates or emerging-market debt. Even when compared with traditional core bond benchmarks like the Bloomberg U.S. Aggregate Index or investment grade corporates, the post-tax income from long munis stands out. In short, today&rsquo;s market offers a rare alignment: municipal yields competitive with riskier assets, but without taking on their inherent asset class risks - an opportunity reflected in <strong><a href="/link/1ec087c36ce04ebfaf0617b63e908818.aspx?utm_source=google&amp;utm_medium=cpc&amp;utm_campaign=us_search_mln&amp;gad_source=1&amp;gad_campaignid=23158581582&amp;gbraid=0AAAAADLo2ez41Gu1qItAQpdCy5XoYnDXB&amp;gclid=Cj0KCQiAxJXJBhD_ARIsAH_JGjhxTgJGj4BOU4wQb0KwWVVb2UH45CFv8BV4AjizN0p6XsTnRt30PmMaApA_EALw_wcB" title="MLN - VanEck Long Muni ETF - Overview">MLN's</a></strong> portfolio of long-term, tax-exempt municipal bonds.</p>
<h3>Yield to Maturity as of 10/31/2025</h3>
<p><img loading="lazy" class="img-responsive" alt="Yield to Maturity as of 10/31/2025" src="https://www.vaneck.com/contentassets/01ce3dc197774ac4a5875d0c514d4320/6475_mln-blog_chart-3_2025-11_v1_blog.svg" /></p>
<p class="chart-disclosure">Source: Bloomberg. As of 10/31/2025.</p>
<p class="chart-disclosure">The example assumes a 37% and 24% federal income tax. Bloomberg U.S. Corporate High Yield Bond Index (LF98STAT Index), Bloomberg EM USD Bond Index (EMUSSTAT Index), Bloomberg U.S. Corporate Bond Index (LUACSTAT Index), Bloomberg U.S. Aggregate Bond Index (LBUSSTAT Index), Bloomberg U.S. Treasury Bond Index (LUATSTAT Index), Bloomberg U.S. Municipal Bond Index (LMBISTAT Index), Bloomberg Global Aggregate ex-USD Bond Index (LG38STAT Index). Indexes are unmanaged, do not incur management fees, costs and expenses and cannot be invested in directly. <strong>Past performance is no guarantee of future results. Index performance is not representative of fund performance. It is not possible to invest directly in an index.</strong></p>
<h2>Long-Duration Munis Offer Rare Value Today</h2>
<p>Assuming credit and tax dynamics remain stable, the current policy shift leaves long-duration munis well positioned to regain an edge&hellip; and <a href="/link/1ec087c36ce04ebfaf0617b63e908818.aspx?utm_source=google&amp;utm_medium=cpc&amp;utm_campaign=us_search_mln&amp;gad_source=1&amp;gad_campaignid=23158581582&amp;gbraid=0AAAAADLo2ez41Gu1qItAQpdCy5XoYnDXB&amp;gclid=Cj0KCQiAxJXJBhD_ARIsAH_JGjhxTgJGj4BOU4wQb0KwWVVb2UH45CFv8BV4AjizN0p6XsTnRt30PmMaApA_EALw_wcB" title="MLN - VanEck Long Muni ETF - Overview"><strong>MLN</strong></a> offers investors transparent, broad municipal market exposure to such a possible scenario. The <strong><a href="/link/1ec087c36ce04ebfaf0617b63e908818.aspx" title="MLN - VanEck Long Muni ETF - Overview">VanEck Long Municipal Bond ETF</a></strong> is a passive, exchange-traded fund which tracks the ICE Long AMT-Free Broad National Municipal Bond Index (MBNL); targeting long-maturity, investment-grade income from municipal bonds - a segment well positioned to benefit from lower Fed interest rates.</p>
<p>To receive more <a href="https://www.vaneck.com/us/en/insights/municipal-bonds/" title="Municipal Bonds Insights"><strong>Municipal Bonds</strong></a> insights, <a href="/link/5f45412c2143400497908cea2897f7d3.aspx" title=" Subscription Center"><strong>sign up in our subscription center</strong></a>.</p>
]]></content:encoded>
</item><item rdf:about="https://www.vaneck.com/us/en/blogs/municipal-bonds/shyd-etf-question-and-answer/">
  <title>SHYD ETF: Question &amp; Answer></title>
  <link>https://www.vaneck.com/us/en/blogs/municipal-bonds/shyd-etf-question-and-answer/</link>
  <description><![CDATA[This blog highlights the short-term high yield municipal bond market and how the SHYD ETF provides exposure.]]></description>
  <dc:creator> </dc:creator>
  <dc:date>12/01/2025 06:30:00</dc:date>
<content:encoded><![CDATA[

<ul class="content-list">
<li><a href="#point-one"><strong>What are short-term high yield municipal bonds, and how big is the market?</strong></a></li>
<li><a href="#point-two"><strong>What makes short-term high yield municipal bonds attractive relative to other types of bonds?</strong></a></li>
<li><a href="#point-three"><strong>Are short-term high yield municipal bonds safer than high yield corporate bonds?</strong></a></li>
<li><a href="#point-four"><strong>What makes the SHYD ETF unique?</strong></a></li>
<li><a href="#point-five"><strong>How is SHYD&rsquo;s index constructed?</strong></a></li>
<li><a href="#point-six"><strong>Why does the Fund include investment-grade bonds?</strong></a></li>
<li><a href="#point-seven"><strong>Why does the index cap its exposure to unrated / non-rated bonds?</strong></a></li>
<li><a href="#point-eight"><strong>Why could slippage be higher in this asset class?</strong></a></li>
<li><a href="#point-nine"><strong>How does the portfolio management team decide which bonds in the index to hold?</strong></a></li>
<li><a href="#point-ten"><strong>How can investors buy the VanEck Short High Yield Muni ETF (SHYD)?</strong></a></li>
</ul>
<h2 id="point-one" class="anchored-block">What are short-term high yield municipal bonds, and how big is the market?</h2>
<p>Short-term high yield municipal bonds are municipal debt securities issued by U.S. states, territories, counties or other local government entities, which carry below-investment-grade credit ratings (or are unrated) and mature in the short-term window (in VanEck&rsquo;s view: 1-12 years to maturity).</p>
<p>These bonds finance public infrastructure or other municipal projects (general obligation or revenue bonds).</p>
<p>While exact figures for the short-term high yield municipal segment are not always published separately, the broader high yield and non-rated municipal bond market in the United States represents a substantial portion of overall municipal debt outstanding, amounting to hundreds of billions of dollars. This segment has grown over time as municipalities seek alternative funding sources and investors look for higher after-tax income opportunities within the municipal market. VanEck offers exposure to this segment through the <strong><a href="/link/1881686e84234b1b9ca2b6d56f2e25a0.aspx" title="SHYD - VanEck Short High Yield Muni ETF">VanEck Short High Yield Muni ETF (SHYD)</a></strong>.</p>

<h2 id="point-two" class="anchored-block">What makes short-term high yield municipal bonds attractive relative to other types of bonds?</h2>
<ul class="content-list">
<li class="mt-2"><strong>Potential for higher yields:</strong> Compared to investment-grade muni bonds, the below-investment-grade municipal sector typically offers higher interest payments reflecting extra credit risk.</li>
<li class="mt-2"><strong>Tax advantages:</strong> Interest from municipal bonds is generally exempt from federal income tax and may also be exempt from state and local taxes (depending on issuer and investor state). This makes the after-tax (or taxable-equivalent) yield of muni bonds especially attractive for higher-tax-bracket investors.</li>
<li class="mt-2"><strong>Shorter duration:</strong> Because <strong><a href="/link/1881686e84234b1b9ca2b6d56f2e25a0.aspx">VanEck Short High Yield Muni ETF (SHYD)</a></strong> focuses on bonds with maturities in the 1 to 12 year range, interest rate exposure (duration risk) is lower than many longer-term bonds (including long-term high yield munis). This can help cushion the portfolio in rising interest-rate environments.</li>
<li class="mt-2"><strong>Diversification:</strong> Adding this exposure provides a distinct slice of the muni market, high yield and short maturity, which can complement other fixed income holdings in a portfolio.</li>
</ul>
<h2 id="point-three" class="anchored-block">Are short-term high yield municipal bonds safer than high yield corporate bonds?</h2>
<p>While &ldquo;safer&rdquo; is always a relative term and no bond is risk-free, municipal bonds historically tend to experience lower default rates than comparably rated corporate bonds. This difference stems from structural features unique to the municipal market, including the taxing authority of issuers, dedicated revenue streams tied to essential services, and legal provisions that often prioritize debt repayment.</p>
<p>In the short-term high yield municipal segment, those same characteristics apply. However, investors should still be mindful that these securities carry credit risk, potential liquidity constraints, and sensitivity to broader market conditions. Careful issuer evaluation and diversification remain important components of managing risk in this asset class.</p>
<h2 id="point-four" class="anchored-block">What makes the SHYD ETF unique?</h2>
<ul class="content-list">
<li class="mt-2"><strong>High yield and shorter maturity focus:</strong> The index that <strong><a href="/link/1881686e84234b1b9ca2b6d56f2e25a0.aspx">SHYD</a></strong> tracks comprises municipal bonds with 1-12 year maturities, targeting the high yield short-term tax-exempt bond market.</li>
<li class="mt-2"><strong>Enhanced liquidity / credit-enhancing features:</strong> The index includes a component of investment-grade exposure (for example, a portion of BBB and A-rated bonds) and caps on not-rated bonds to improve liquidity and credit profile.</li>
<li class="mt-2"><strong>Lower duration:</strong> Because the maturity window is shorter, interest-rate sensitivity is reduced compared to long-term high yield muni strategies.</li>
<li class="mt-2"><strong>Cost efficiency &amp; ETF structure:</strong> As an ETF, <strong><a href="/link/1881686e84234b1b9ca2b6d56f2e25a0.aspx">SHYD</a></strong> offers intraday trading flexibility, transparency and potentially narrower spreads compared with individual bond holdings.</li>
</ul>
<h2 id="point-five" class="anchored-block">How is SHYD&rsquo;s index constructed?</h2>
<p>The Fund seeks to replicate (before fees and expenses) the performance of the ICE 1-12 Year Broad High Yield Crossover Municipal Index (MIHX), which is intended to track the U.S. dollar-denominated high yield short-term tax-exempt bond market.</p>
<p>Key construction features include:</p>
<ul class="content-list">
<li class="mt-2"><strong>Maturity constraint:</strong> Bonds are selected with maturities between 1 and 12 years.</li>
<li class="mt-2"><strong>Credit quality / liquidity filters:</strong> The index includes allowances for some investment-grade bonds (e.g., up to ~20% BBB or ~10% A) and places a cap on non-rated bonds (e.g., ~25%).</li>
<li class="mt-2"><strong>Sector diversification:</strong> The index spans multiple municipal sectors (industrial development revenue, local general obligation, hospitals, education, utilities, etc.).</li>
</ul>
<h2 id="point-six" class="anchored-block">Why does the Fund include investment-grade bonds?</h2>
<p>Although <a href="/link/1881686e84234b1b9ca2b6d56f2e25a0.aspx"><strong>SHYD</strong></a> is focused on high-yield munis, incorporating a modest portion of investment-grade bonds (BBB/A) enhances liquidity and helps reduce tracking error/slippage. Short-term high yield muni bonds can trade less frequently and may be less liquid than investment-grade equivalents; the IG component assists in managing trading costs and replication accuracy.</p>
<h2 id="point-seven" class="anchored-block">Why does the index cap its exposure to unrated / non-rated bonds?</h2>
<p>Bonds that are not rated by major credit agencies may carry additional risk (credit, valuation, liquidity) and may trade less frequently. By capping exposure to non-rated bonds (e.g., ~25% as per <a href="/link/1881686e84234b1b9ca2b6d56f2e25a0.aspx"><strong>SHYD</strong></a>&rsquo;s index description), the structure mitigates the potential volatility, illiquidity, and valuation uncertainty associated with that segment of the market.</p>
<h2 id="point-eight" class="anchored-block">Why could slippage be higher in this asset class?</h2>
<p>Short-term high yield municipal bonds can face the following market constraints:</p>
<ul class="content-list">
<li class="mt-2"><strong>Lower issuance and trading frequency:</strong> These bonds are issued less frequently and trade less often than larger investment-grade or corporate issues, which can widen bid-ask spreads and increase transaction costs.</li>
<li class="mt-2"><strong>Sensitivity to market stress:</strong> Periods of volatility or imbalances in supply and demand can reduce liquidity, making index replication more challenging and amplifying slippage.</li>
<li class="mt-2"><strong>Sampling in portfolio construction:</strong> Because high yield muni indices may include hundreds of securities, portfolios often hold only a representative sample, which can lead to tracking differences relative to the index.</li>
<li class="mt-2"><strong>Treatment of defaults in indices:</strong> When bonds in an index default, it is typically removed soon after a missed payment or principal event. As a result, index losses may appear smaller than those realized in actual portfolios, where managers must work through the credit event and may face more significant price declines.</li>
</ul>
<h2 class="anchored-block">How does the portfolio management team decide which bonds in the index to hold?</h2>
<p>The Fund uses an optimization process to replicate the index rather than holding every single constituent security. The portfolio management team selects a subset of bonds that reflect the index&rsquo;s characteristics (credit quality, maturity, sector diversification, yield) while seeking cost-efficient replication. The process aims to balance tracking accuracy, liquidity, transaction costs, and tax considerations.</p>
<p><img loading="lazy" class="img-responsive" src="https://www.vaneck.com/EPiServer/CMS/Content/contentassets/1cacfa456ed54e5e934c92547e513d34/6461_mln-faq-blog_infographic-1_2025-11_v2_blog.svg,,353861/Download?epieditmode=False" /></p>
<h2 id="point-nine" class="anchored-block"></h2>
<p class="chart-disclosure">Source: VanEck.</p>

<h2 id="point-ten" class="anchored-block">How can investors buy the VanEck Short High Yield Muni ETF (SHYD)?</h2>
<p>You can purchase <a href="/link/1881686e84234b1b9ca2b6d56f2e25a0.aspx"><strong>SHYD</strong></a> just like a stock through your brokerage account or via your financial advisor. It trades intraday on an exchange, offers liquidity similar to other ETFs, and can be added to a fixed income allocation or muni income sleeve.</p>
<p>To receive more <a href="https://www.vaneck.com/us/en/insights/municipal-bonds/" title="Municipal Bonds Insights"><strong>Municipal Bonds</strong></a> insights, <a href="/link/5f45412c2143400497908cea2897f7d3.aspx" title=" Subscription Center"><strong>sign up in our subscription center</strong></a>.</p>
]]></content:encoded>
</item><item rdf:about="https://www.vaneck.com/us/en/blogs/municipal-bonds/how-municipal-bond-yields-look-relative-to-history/">
  <title>How Municipal Bond Yields Look Relative to History></title>
  <link>https://www.vaneck.com/us/en/blogs/municipal-bonds/how-municipal-bond-yields-look-relative-to-history/</link>
  <description><![CDATA[Municipal bond yields remain compelling versus history. High-yield munis may offer tax-exempt income, healthy credit spreads, and attractive entry points creating one of today&rsquo;s most attractive income opportunities.]]></description>
  <dc:creator>Louise Gedney</dc:creator>
  <dc:date>12/01/2025 06:30:00</dc:date>
<content:encoded><![CDATA[

<p><strong>Key Takeaways:</strong></p>
<ul class="content-list">
<li class="mt-2">High-yield muni yields stay elevated, potentially offering rare above-average, tax-free income potential.</li>
<li class="mt-2">Spreads remain stable and balanced, signaling healthy credit conditions across muni markets.</li>
<li class="mt-2">After-tax yields beat corporates, giving investors strong income efficiency with lower risk.</li>
</ul>
<h2>How Municipal Bond Yields Look Relative to History</h2>
<p>Municipal bond investors continue to find meaningful income opportunities. While interest rates have come down from their peaks, yields across the muni market remain attractive by historical standards. Strong credit fundamentals and steady demand have helped preserve that value even as the broader rate environment has shifted.</p>
<p>Within that landscape, high-yield municipal bonds stand out. Even as rates have eased, yields remain elevated relative to history, allowing investors to capture above-average income while maintaining exposure to an asset class with a strong credit record. After years of muted returns, the market has effectively reset, creating an income profile not seen in more than a decade.</p>
<h2>Yields Remain Elevated Compared with History</h2>
<p>High-yield muni yields have risen sharply since 2020, climbing from below 3% to around 5% and holding near those levels for much of the past two years. These elevated yields mark a sharp break from the low-rate years of the last cycle, giving investors a chance to lock in meaningful, tax-exempt income while the opportunity lasts.</p>
<p>In 2025, high-yield munis cheapened further for several sector-specific reasons. Their longer-dated maturity profile made them more sensitive to curve steepening mid-year, while renewed credit scrutiny in areas such as charter schools, private higher education, and senior living added to spread widening. Heavy new-issue supply, wider concessions, and bouts of risk-off sentiment in broader credit markets also created periodic volatility and attractive entry points.</p>
<h3>Absolute Yields and Taxable Equivalent Yield</h3>
<p><img loading="lazy" class="img-responsive w-100" src="https://www.vaneck.com/contentassets/eca1dbc0e8534bffa79613ceecf902bf/6472_hyd-blog_chart-1_2025-11_v1_blog.svg" alt="Absolute Yields and Taxable Equivalent Yield" /></p>
<p class="chart-disclosure">Source: ICE Data Indices as of 11/1/2025. This is not an offer to buy or sell, or a recommendation to buy or sell any of the securities mentioned herein. Past performance not indicative of future results. Index performance is not representative of fund performance. It is not possible to invest directly in an index. See index definitions at end.</p>

<p>The chart above shows the taxable-equivalent yield (TEY), the yield a taxable bond would need to offer to match a muni&rsquo;s after-tax income, based on a 37% federal tax bracket. On that basis, a 5% tax-free yield equates to roughly 8% taxable-equivalent income. Since mid-2024, the TEY on the ICE High Yield Municipal Bond Index has exceeded the yield on the ICE BofA U.S. High Yield Corporate Index, underscoring how high-yield munis continue to deliver competitive after-tax income with stronger credit quality and lower default risk.</p>
<h3>Credit Spreads Reflect a Healthy Market</h3>
<p><strong>Credit Spread &ndash; HY Muni vs AAA Muni (Bps)</strong></p>
<p><img loading="lazy" class="img-responsive w-100" src="https://www.vaneck.com/contentassets/46f8fb15f9fb46cc9f5dba073c83d8bf/6472_hyd-blog_chart-2_2025-11_v1_blog.svg" alt="Credit Spreads Reflect a Healthy Market" /></p>
<p class="chart-disclosure">Source: ICE Data Indices as of 11/1/2025. Past performance is no guarantee of future results.</p>

<p>The spread between high-yield and AAA-rated municipal bonds currently sits near 1.66%, modestly above the four-year average of roughly 1.56%. This mild widening points to valuations that remain balanced, offering incremental yield advantage without suggesting any credit stress.</p>
<p>As the chart shows, spreads have fluctuated within a narrow range since 2021, tightening through periods of strong demand and widening briefly during heavier issuance or short-term volatility. The current level places high-yield munis in a steady, well-functioning market where investors continue to receive reasonable compensation for taking on additional credit exposure.</p>
<p>That steadiness stands out in a landscape where other credit sectors have shown greater variability. High-yield muni issuers, typically hospitals, housing authorities, and education-related projects, have demonstrated durable credit strength across cycles. With fundamentals solid and spreads sitting slightly above their recent average, the sector continues to offer appealing income potential without excessive risk.</p>
<h3>The Power of Tax-Exempt Income</h3>
<p><strong>Nominal vs Taxable Equivalent Yields </strong></p>
<p><img loading="lazy" class="img-responsive w-100" src="https://www.vaneck.com/contentassets/448ed398e18f412c8608e71c7dfd022c/6472_hyd-blog_chart-3_2025-11_v1_blog.svg" alt="The Power of Tax-Exempt Income" /></p>
<p class="chart-disclosure">Source: ICE Data as of 9/30/2025. For illustrative purposes only. Past performance is no guarantee of future results.</p>
<p>The chart above shows how tax treatment influences real income potential. With nominal yields holding near the upper end of recent ranges, the tax-exempt advantage of municipals remains substantial. When adjusted for taxes, municipal high yield offers a clearer edge in after-tax income compared with taxable high yield. For investors in higher brackets, that differential translates directly into retained income rather than return lost to taxes.</p>
<p>That efficiency helps keep municipal high yield competitive, even as broader interest rates have moderated. In an environment where nominal yields across sectors have converged, the ability to preserve more of what&rsquo;s earned continues to set municipals apart.</p>
<h2>Why Invest in High Yield Munis Now?</h2>
<p>Yields remain elevated, spreads are stable, and municipal credit is on firm footing. Market fundamentals are well supported, with recession risks appearing contained and state and local issuers continuing to benefit from steady tax revenues and disciplined balance sheets. High issuance and temporary flow volatility earlier in the year helped cheapen valuations, leaving investors with more attractive entry points at today&rsquo;s levels.</p>
<p>For investors seeking diversified exposure, <a href="/link/63e99d0ce68b47e79eae26e1c163fd09.aspx" title="HYD - VanEck High Yield Muni ETF - Performance and Holdings"><strong>VanEck&rsquo;s High Yield Muni ETF (HYD)</strong></a> provides efficient access to this market through a single, liquid vehicle. With credit fundamentals intact and after-tax yields that continue to compare favorably to corporate high yield, high-yield munis offer one of the most balanced and tax-efficient sources of income available in fixed income today.</p>
<p>To receive more <a href="https://www.vaneck.com/us/en/insights/municipal-bonds/" title="Municipal Bonds Insights"><strong>Municipal Bonds</strong></a> insights, <a href="/link/5f45412c2143400497908cea2897f7d3.aspx" title=" Subscription Center"><strong>sign up in our subscription center</strong></a>.</p>
]]></content:encoded>
</item><item rdf:about="https://www.vaneck.com/us/en/blogs/municipal-bonds/why-xmpt-could-shine-in-a-rate-cut-cycle/">
  <title>Why XMPT Could Shine in a Rate-Cut Cycle></title>
  <link>https://www.vaneck.com/us/en/blogs/municipal-bonds/why-xmpt-could-shine-in-a-rate-cut-cycle/</link>
  <description><![CDATA[As the Fed shifts to rate cuts, <strong><a href="/link/fc018123f20d4f45aaf6b338189ae326.aspx" title="XMPT - VanEck CEF Muni Income ETF - Performance and Holdings">XMPT</a></strong> may benefit. Lower rates can boost muni CEF prices, cut leverage costs, and expand new opportunities enhancing both income and total return potential.]]></description>
  <dc:creator>Drew  Anderson</dc:creator>
  <dc:date>12/01/2025 06:30:00</dc:date>
<content:encoded><![CDATA[

<p><strong>Key Takeaways:</strong></p>
<ul class="content-list">
<li class="mt-2">Rate cuts lift muni bond values, driving stronger total returns for <strong><a href="/link/fc018123f20d4f45aaf6b338189ae326.aspx" title="XMPT - VanEck CEF Muni Income ETF - Performance and Holdings">XMPT's</a></strong> CEF holdings.</li>
<li class="mt-2">Cheaper leverage boosts income, widening spreads and improving fund efficiency.</li>
<li class="mt-2">Record muni issuance fuels growth, offering more opportunities for yield and diversification.</li>
</ul>
<h2>Why XMPT Could Shine in a Rate-Cut Cycle</h2>
<p>After two years of tight monetary policy, the market is finally starting to get some long-anticipated relief in the form of interest rate cuts. For municipal bond investors, that shift isn&rsquo;t just about higher prices. It also changes how income is generated inside leveraged closed-end municipal funds. That&rsquo;s especially relevant for <strong><a href="/link/fc018123f20d4f45aaf6b338189ae326.aspx" title="XMPT - VanEck CEF Muni Income ETF - Performance and Holdings">XMPT</a></strong>, which holds a diversified basket of municipal bond closed-end funds (CEFs).</p>
<p>When rates move lower, three forces tend to work in <strong><a href="/link/fc018123f20d4f45aaf6b338189ae326.aspx" title="XMPT - VanEck CEF Muni Income ETF - Performance and Holdings">XMPT's</a></strong> favor.</p>
<h2>1. Muni CEF performance gets a boost</h2>
<p>Lower rates tend to lift the entire municipal bond market. As yields begin to fall, prices on existing bonds rise because their higher coupons become more valuable compared to newly issued debt. That repricing can drive strong total returns for investors in longer-term municipal bonds, where muni CEFs tend to have significant exposure.</p>
<p>Falling rates can also spark renewed demand from investors looking for tax-exempt income. When cash and short-term yields come down, investors often move back into munis for better after-tax income potential and stability. At the same time, lower financing costs can improve sentiment across the leveraged side of the market, setting the stage for CEFs to perform well as income generation improves.</p>
<h3>Muni CEFs Benefit from Lower Rates</h3>
<p><strong>Previous 10 Years</strong></p>
<p><img loading="lazy" class="img-responsive w-100" src="https://www.vaneck.com/contentassets/0c2053ff4a9444b09a631523ded7c121/6473_xmpt-blog-chart-1_2025-11_v1.svg" alt="Muni CEFs Benefit from Lower Rates" /></p>
<p class="chart-disclosure">Source: Morningstar. As of 10/31/2025.<br /><strong>Past performance is no guarantee of future results.</strong></p>

<h2>2. Cheaper leverage helps CEFs become more efficient</h2>
<p>Leverage is a key feature of municipal closed-end funds. In simple terms, managers use leverage to amplify their exposure. Funds borrow at short-term rates and reinvest the proceeds to increase their overall position size. This magnifies both income and performance. It can help boost returns when conditions are favorable but also works in the opposite direction when markets weaken.</p>
<p>Leverage has historically worked well for muni CEFs because the underlying bonds tend to provide stable income and low credit risk. By using leverage, these funds can increase the flow of tax-exempt income and deliver higher yields than unleveraged municipal strategies.</p>
<p>The challenge comes when borrowing costs rise. As short-term rates move higher, the cost of maintaining leverage increases and the spread between what a fund earns and what it pays to finance its holdings narrows. For example, if a fund earns 6% on its portfolio and borrows at 4%, its spread is 2%. If borrowing costs rise to 5%, that spread shrinks to 1%, which can reduce the income available to distribute.</p>
<p>When rates fall, the opposite occurs. Borrowing costs decline, the spread widens, and more of the fund&rsquo;s earnings flow through to shareholders. Using the same example, if borrowing costs drop from 3% to 1%, that spread increases from 2% to 3%, improving distributable income without any change in holdings. In that environment, leverage works in favor of income generation and overall performance.</p>
<p>Lower leverage costs can directly translate into higher net income, making the same portfolio more efficient and allowing more of its earnings to flow through to investors.</p>
<div class="wrapped-div">
<table style="width: 100%;">
<tbody>
<tr class="tbl-data">
<td class="tbl-header last">&nbsp;</td>
<td class="tbl-header last" style="text-align: right;"><strong>Unlevered Fund</strong><br />No Borrowing Costs</td>
<td class="tbl-header last" style="text-align: right;"><strong>Levered Fund</strong><br />Low Borrowing Costs</td>
<td class="tbl-header last" style="text-align: right;"><strong>Levered Fund</strong><br />High Borrowing Costs</td>
</tr>
<tr class="tbl-data">
<td class="data-td data last" style="text-align: left;">Net Assets</td>
<td class="data-td data last" style="text-align: right;">$100</td>
</tr>
<tr class="tbl-data">
<td class="data-td data last" style="text-align: left;">Leverage</td>
<td class="data-td data last" style="text-align: right;">$0</td>
<td class="data-td data last" style="text-align: right;">$50</td>
</tr>
<tr class="tbl-data">
<td class="data-td data last" style="text-align: left;">Total Managed Assets</td>
<td class="data-td data last" style="text-align: right;">$100</td>
<td class="data-td data last" style="text-align: right;">$150</td>
</tr>
<tr class="tbl-data">
<td class="data-td data last" style="text-align: left;">Leverage Ratio</td>
<td class="data-td data last" style="text-align: right;">0%</td>
<td class="data-td data last" style="text-align: right;">33%</td>
</tr>
<tr class="tbl-data">
<td class="data-td data last" style="text-align: left;" colspan="4">&nbsp;</td>
</tr>
<tr class="tbl-data">
<td class="data-td data last" style="text-align: left;">Return (before cost)</td>
<td class="data-td data last" style="text-align: right;">+5.0%</td>
<td class="data-td data last" style="text-align: right;">+7.5%</td>
</tr>
<tr class="tbl-data">
<td class="data-td data last" style="text-align: left;">Borrowing Cost<br />(as percentage of<br />Net Assets)</td>
<td class="data-td data last" style="text-align: right;">0%</td>
<td class="data-td data last" style="text-align: right;">1%</td>
<td class="data-td data last" style="text-align: right;">3%</td>
</tr>
<tr class="tbl-data">
<td class="data-td data last" style="text-align: left;">Total Return<br />(after cost)</td>
<td class="data-td data last" style="text-align: right;">+5.0%</td>
<td class="data-td data last" style="text-align: right;">+6.5%</td>
<td class="data-td data last" style="text-align: right;">+4.5%</td>
</tr>
</tbody>
</table>
</div>
<p class="chart-disclosure">Source: Internal. Used for illustrative purposes only.</p>

<h2>3. New opportunities from record muni issuance</h2>
<p>Municipal bond issuance has been running at record levels in 2025. With borrowing costs expected to move lower, many issuers are refinancing older, higher-rate debt while continuing to issue new bonds for infrastructure and other long-term projects.</p>
<p>During the Fed&rsquo;s rate hikes in 2022 and 2023, refunding activity fell sharply as higher yields made refinancing uneconomical. Over the past two years, refunding has started to recover toward pre-COVID levels, while new-money issuance has climbed to all-time highs. The chart below highlights both trends, showing how lower borrowing costs are helping bring issuers back to the market.</p>
<h3>Municipal Bond Issuance Hitting All-Time Highs</h3>
<p><img loading="lazy" class="img-responsive w-100" src="https://www.vaneck.com/contentassets/0c8ab45204db493d953587b9a1e42657/6473_xmpt-blog-chart-2_2025-11_v1.svg" alt="Municipal Bond Issuance Hitting All-Time Highs" /></p>
<p class="chart-disclosure">Source: SIFMA, Oct 31, 2025. Estimate based on 2024 issuance numbers.<br /><strong>Past performance is no guarantee of future results.</strong></p>
<p>This activity is a positive sign for the health of the market. Refinancing helps municipalities lock in lower long-term costs, which can strengthen their credit quality. At the same time, an active new-issue calendar expands the opportunity set for managers running the CEFs inside <strong><a href="/link/fc018123f20d4f45aaf6b338189ae326.aspx" title="XMPT - VanEck CEF Muni Income ETF - Performance and Holdings">XMPT</a></strong>. A steady flow of new bonds allows these managers to rotate into more attractive structures or higher coupons, supporting both income and diversification.</p>
<h2>Putting it together</h2>
<p><strong><a href="/link/fc018123f20d4f45aaf6b338189ae326.aspx" title="XMPT - VanEck CEF Muni Income ETF - Performance and Holdings">XMPT's</a></strong> structure is built to capture the benefits of a falling-rate environment. Lower rates ease leverage costs, strengthen underlying muni valuations, and keep the market well supplied with new opportunities. Together, these factors can enhance both income potential and total return.</p>
<p>In addition, <strong><a href="/link/fc018123f20d4f45aaf6b338189ae326.aspx" title="XMPT - VanEck CEF Muni Income ETF - Performance and Holdings">XMPT's</a></strong> income is largely exempt from federal taxes. On a tax-equivalent basis, its yield remains among the highest in the muni ETF universe.</p>
<p>If the Fed continues cutting rates, the backdrop for leveraged municipal income looks increasingly favorable. <strong><a href="/link/fc018123f20d4f45aaf6b338189ae326.aspx" title="XMPT - VanEck CEF Muni Income ETF - Performance and Holdings">XMPT</a></strong> provides a straightforward, cost-efficient and liquid way to access the opportunity.</p>
<p>To receive more <a href="https://www.vaneck.com/us/en/insights/municipal-bonds/" title="Municipal Bonds Insights"><strong>Municipal Bonds</strong></a> insights, <a href="/link/5f45412c2143400497908cea2897f7d3.aspx" title=" Subscription Center"><strong>sign up in our subscription center</strong></a>.</p>
]]></content:encoded>
</item><item rdf:about="https://www.vaneck.com/us/en/blogs/income-investing/income-investing-playbook/">
  <title>Income Investing Playbook 2026: Find Yield in a Volatile Rate Environment></title>
  <link>https://www.vaneck.com/us/en/blogs/income-investing/income-investing-playbook/</link>
  <description><![CDATA[Amid an uncertain backdrop for Fed policy, fixed income investors are asking a key question: Where can I find attractive sources of yield in 2026?]]></description>
  <dc:creator> </dc:creator>
  <dc:date>11/29/2025 06:30:00</dc:date>
<content:encoded><![CDATA[

<p><strong>Key Takeaways:</strong></p>
<ul class="content-list">
<li class="mt-2">Emerging markets bonds lead with strong fundamentals and compelling yield.</li>
<li class="mt-2">CLOs deliver resilient income and floating-rate protection.</li>
<li class="mt-2">BDCs offer private-credit-like yield without the liquidity trade-off.</li>
<li class="mt-2">Equity income adds diversification and non-bond sources of yield.</li>
<li class="mt-2">Munis and investment grade bonds remain key selective opportunities.</li>
</ul>
<h2>Introduction to Income Investing</h2>
<p>Income investing is a strategy that aims to generate a steady stream of income from investments, typically through interest payments or dividends. Income investing is often favored by investors who prioritize regular cash flow. Income investments include a range of assets such as bonds, dividend-paying stocks and real estate investment trusts (REITs). While income investing may offer less potential for significant capital gains, it can provide a reliable source of income and help diversify an investment portfolio.</p>
<p><strong>Types of Income Investments</strong></p>
<p>Below are three of the most common types of income investments:</p>
<ul class="content-list">
<li class="mt-2">Bonds: Fixed income securities issued by corporations, governments, municipalities and securitized fixed income that pay a predetermined rate of interest to investors.</li>
<li class="mt-2">Dividend-paying stocks: Stocks of companies that pay out a portion of their earnings to shareholders in the form of dividends.</li>
<li class="mt-2">Real estate investment trusts (REITs): Companies that own and manage income-generating properties such as office buildings, shopping centers and apartment complexes.</li>
</ul>
<p>VanEck offers a comprehensive suite of income strategies across the full spectrum of the global fixed income market. For the latest data and yields for VanEck&rsquo;s income investing solutions, please refer to our <a href="/link/e87ff6a44d1d41d1b0181cc2de1e33cc.aspx" title="Income Investing Yield Monitor"><strong>Income Investing Yield Monitor</strong></a>.</p>
<h2>Opportunities for Income Investing in 2026</h2>
<p>After more than a decade of extraordinary monetary intervention that kept rates extremely low, the interest rate environment has recently started to normalize. However, with the Fed shifting back to easing, income-seeking investors are reassessing where to find yield in 2026. In our view, the Fed&rsquo;s rate-cutting cycle is likely to be shallow. As inflationary pressures and fiscal concerns may persist, we expect continued volatility, and potentially higher, longer-term yields.</p>
<h2>Income Investing in 2026: Where to Focus</h2>
<p>In addition to uncertainty surrounding Fed policy, investors continue to face a more uncertain economic environment in 2026, with slower growth in the U.S. along with elevated geopolitical risk that is causing periods of volatility. While many areas of the fixed income market offer compelling value, two areas stand out for their ability to deliver attractive income without taking excessive duration or credit risk: <a href="/us/en/blogs/income-investing/position-for-higher-yields-with-clos-and-em-debt/" title="Position for Higher Yields with CLOs and EM Debt"><strong>collateralized loan obligations (CLOs) and emerging markets bonds</strong></a>.</p>
<p>Of course, determining the right mix of income investments for a broader strategic allocation will depend on each investor&rsquo;s individual risk appetite. In a changing rate environment, success rarely comes from chasing the market&rsquo;s knee-jerk reactions. Instead, investors are best served by combining long-term thinking with tactical flexibility, reassessing duration exposure, sector positioning, and alternative income sources without losing sight of overarching portfolio goals. In the sections that follow, we provide the resources you need to better understand the yield, risk and return dynamics across the full spectrum of the income investing landscape.</p>

<ul class="content-list">
<li class="mt-2" style="font-weight: bold;"><strong><a href="#point-one">Emerging Market Bonds Offer Attractive Yield and Diversification Potential</a></strong></li>
<li class="mt-2" style="font-weight: bold;"><strong><a href="#point-two">CLOs: Engineered for Income with Built-in Risk Protections</a></strong></li>
<li class="mt-2" style="font-weight: bold;"><strong><a href="#point-three">Gain Exposure to Private Credit (Without Sacrificing Liquidity) through BDCs</a></strong></li>
<li class="mt-2" style="font-weight: bold;"><strong><a href="#point-four">Don&rsquo;t Forget About Equity Income</a></strong></li>
<li class="mt-2" style="font-weight: bold;"><strong><a href="#point-five">Municipal Bonds Are a Staple of Any Income Allocation</a></strong></li>
<li class="mt-2" style="font-weight: bold;"><strong><a href="#point-six">Investment Grade Bonds Are Attractive&hellip;If You Know Where to Look</a></strong></li>
<li class="mt-2" style="font-weight: bold;"><strong><a href="#point-seven">VanEck Income Investing Solutions</a></strong></li>
</ul>
<h2 id="point-one" class="anchored-block">Emerging Market Bonds: Attractive Yield and Diversification Potential</h2>
<p>Emerging markets debt has been one of 2025&rsquo;s strongest performers, with local currency bonds outpacing U.S. and global developed-market benchmarks by a wide margin. The asset class also offers attractive yields relative to other areas of the fixed income market. Heading into 2026, the asset class remains well positioned as it continues to be underpinned by strong fundamentals. Unlike developed markets, EM sovereigns entered this cycle with lower debt-to-GDP ratios, stronger fiscal positions, and positive current accounts. Many central banks hiked earlier and more aggressively post-COVID, leaving them with ample room to ease now.</p>
<p>However, while fundamentals increasingly favor emerging markets, the opportunities swing by country, currency, and cycle, and VanEck offers different ways to access the asset class. The <a href="/link/98c7fd49bdbc456294a1eb859ad166f7.aspx" title="EMLC - VanEck J.P. Morgan EM Local Currency Bond ETF - Overview"><strong>VanEck J.P. Morgan EM Local Currency Bond ETF (EMLC)</strong></a> offers yield and diversification benefits within a broader portfolio, while the <a href="/link/b572cc2d2799458eb526924e28c41513.aspx" title="HYEM - VanEck Emerging Markets High Yield Bond ETF - Overview"><strong>VanEck Emerging Markets High Yield Bond ETF (HYEM)</strong></a> delivers exposure to EM corporates that can provide several benefits within a broader high yield portfolio, including yield pickup, higher quality and diversification. The actively managed <a href="/link/f447bf0c04f64108a3dcff3ca025af4a.aspx" title="EMBX - VanEck Emerging Markets Bond ETF - Overview"><strong>VanEck Emerging Markets Bond ETF (EMBX)</strong></a>\ invests across sovereigns, corporates and both hard- and local-currency EM debt.</p>
<h2 id="point-two" class="anchored-block">CLOs: Engineered for Income with Built-in Risk Protections</h2>
<p>CLOs are securitized pools of senior secured loans, and the asset class has become one of the most resilient sources of credit income in the market over the past decade. CLOs&rsquo; unique structure channels cashflows through a &ldquo;waterfall&rdquo; that prioritizes payments to the most senior tranches first, while lower tranches absorb risk. The built-in risk protections of CLOs have resulted in a very strong track record of low defaults that compares favorably versus other corporate credit investments with the same ratings.</p>
<p>In addition to its strong track record from a risk perspective, CLOs offer a yield pickup versus similarly rated bonds, and have historically offered a consistent and significant spread pickup. These attractive yield levels and built-in risk protections make CLOs a compelling source of relative value. VanEck offers investment grade exposure to this asset class through the <a href="/link/e090deaddc774ac699a04b959d9254c6.aspx" title="CLOI - VanEck CLO ETF - Overview"><strong>VanEck CLO ETF (CLOI)</strong></a> and more targeted exposure to the mezzanine tranches of CLOs through the <a href="/link/d2f16468a9f14c1e807f6bb7fb597a3e.aspx" title="CLOB - VanEck AA-BB CLO ETF - Overview"><strong>VanEck AA-BB CLO ETF (CLOB)</strong></a>.</p>
<p>CLOs are also floating rate instruments, and while the risk of significantly higher rates has decreased with long-term yields at current levels, investments with less sensitivity to rate movements are still an important part of any broader fixed income allocation. In addition to CLOs, investors can turn to <a href="/us/en/blogs/income-investing/fltr-question-and-answer/" title="FLTR ETF: Question &amp; Answer"><strong>investment grade floating rate notes (FRNs)</strong></a> to gain floating-rate exposure. FRNs have coupons that are based on a short-term base rate, typically the Secured Overnight Funding Rate (SOFR), which reflect short-term funding costs, and an additional fixed spread that reflects the credit risk of the issuer. In our view, investment grade corporate FRNs may be an attractive complement to a cash-like portfolio that investors can access via the <a href="/link/0eff4e75a2114e0f8a7e71694dc0ad16.aspx" title="FLTR - VanEck IG Floating Rate ETF - Overview"><strong>VanEck IG Floating Rate ETF (FLTR)</strong></a>.</p>
<h2 id="point-three" class="anchored-block">Gain Exposure to Private Credit (Without Sacrificing Liquidity) Through BDCs</h2>
<p>Demand for private credit is surging. The market size has nearly doubled since 2020, exceeding an estimated $1.5 trillion in 2024. This growth is expected to continue, with projections suggesting it could hit $3 trillion by 2028.<sup>1</sup></p>
<p>For investors, private credit offers the potential for higher yields and diversification. However, traditional private credit investments come with a drawback: illiquidity. Unlike publicly traded stocks or bonds, these investments often involve long lock-up periods, typically several years. This means your money is tied up for the duration, inaccessible for immediate needs or strategic portfolio adjustments.</p>
<p><a href="/us/en/blogs/income-investing/bdcs-an-alternative-way-to-access-the-benefits-of-private-credit/" title="BDCs: An Alternative Way to Access the Benefits of Private Credit"><strong>Business development companies (BDCs)</strong></a> are another floating rate option for investors and can be a compelling way to gain exposure to the potential benefits of private credit without sacrificing the ability to access capital when necessary. BDCs generate income by lending to, and investing in, middle market companies. BDCs provide capital to small businesses, and in turn, give investors access the high-income potential of middle market loans that are generally exclusive and difficult to access. While not without risk, BDCs have historically offered yields well above other high yielding asset classes. VanEck offers access to this liquid area of the private credit market through the <a href="/link/c48bed1be12e47c88f01e1bdbfa51ed2.aspx" title="BIZD - VanEck BDC Income ETF - Overview"><strong>VanEck BDC Income ETF (BIZD)</strong></a>.</p>
<h2 id="point-four" class="anchored-block">Don&rsquo;t Forget About Equity Income</h2>
<p>Equity-income investing offers several compelling benefits within a broader income-oriented playbook and can serve as a <strong>diversifier</strong> since equity income allocations often respond differently than bonds during economic and rate-cycle shifts.</p>
<p>In the context of this framework, the <a href="/link/b1c9e5d0029f41e1b5a5869303671518.aspx" title="MORT - VanEck Mortgage REIT Income ETF - Overview"><strong>VanEck Mortgage REIT Income ETF (MORT)</strong></a> and <a href="/link/90451e6acf204dae87d1c8a31d9db407.aspx" title="PFXF - VanEck Preferred Securities ex Financials ETF - Overview"><strong>VanEck Preferred Securities ex Financials ETF (PFXF)</strong></a> illustrate how equity-income tools can be deployed tactically:</p>
<ul class="content-list">
<li class="mt-2">MORT delivers access to the high-yield potential of U.S. mortgage REITs and offers a yield‐enhancement overlay within an income-seeking portfolio.</li>
<li class="mt-2">PFXF provides exposure to preferred shares (a hybrid between equity and debt) issued by non-financial corporations, offering higher income than many common stocks, greater diversification and lower banking sector concentration risk.</li>
</ul>
<p>Together, these strategies illustrate how equity-income tools can complement a broader income playbook by <strong>layering sources of yield beyond traditional bonds</strong><strong>, </strong>while also <strong>offering differentiated equity-risk exposures</strong><strong>.</strong></p>
<h2 id="point-five" class="anchored-block">Municipal Bonds Are a Staple of Any Income Allocation</h2>
<p>Municipal bonds present a compelling opportunity for income investors in 2026 due to their tax-exempt interest income. With the U.S. national debt exceeding $36 trillion and annual interest payments surpassing $1 trillion, fiscal pressures may lead to higher taxes or reduced government spending, further enhancing the appeal of these bonds. The Fed's ongoing rate-cutting cycle, expected to continue in 2026, historically increases demand for fixed income assets like municipal bonds. Additionally, President Trump&rsquo;s policies aim to reduce tax burdens but could also increase the national deficit, potentially leading to higher long-term interest rates. In this context, municipal bonds offer a stable and tax-advantaged option for income-focused investors navigating fiscal uncertainty and shifting tax policies.</p>
<p>VanEck offers broad exposure to the municipal bond asset class through the <a href="/link/fc018123f20d4f45aaf6b338189ae326.aspx" title="XMPT - VanEck CEF Muni Income ETF - Overview"><strong>VanEck CEF Muni Income ETF (XMPT)</strong></a>, and more targeted exposure via the <a href="/link/1ec087c36ce04ebfaf0617b63e908818.aspx" title="MLN - VanEck Long Muni ETF - Overview"><strong>VanEck Long Muni ETF (MLN)</strong></a> and <a href="/link/63e99d0ce68b47e79eae26e1c163fd09.aspx" title="HYD - VanEck High Yield Muni ETF - Overview"><strong>VanEck High Yield Muni ETF (HYD)</strong></a>.</p>
<h2 id="point-six" class="anchored-block">Investment Grade Bonds Are Attractive&hellip;If You Know Where to Look</h2>
<p>With <a href="/us/en/blogs/income-investing/ig-bonds-valuation-and-selectivity-matters/" title="IG Bonds: Valuation and Selectivity Matters"><strong>investment grade corporate bond yields providing meaningful income</strong></a> while corporate bond spreads remain tight, we believe <a href="https://www.vaneck.com/us/en/blogs/income-investing/mig-and-mbbb-etfs-question-answer/#point-three" title="MIG and MBBB ETFs: Question &amp; Answer"><strong>focusing on attractively valued bonds</strong></a> will continue to be important in 2026. In particular, this approach has historically provided significant <a href="https://www.vaneck.com/us/en/blogs/income-investing/mig-and-mbbb-etfs-question-answer/#point-seven" title="MIG and MBBB ETFs: Question &amp; Answer"><strong>outperformance</strong></a> relative to the broader corporate bond market, driven by price gains as bond spreads compress as well as risk management as this strategy avoids bonds that don&rsquo;t offer enough compensation for the risks involved. The market is not homogenous, and there is significant scope for mispricing to exist, particularly as market volatility continues and as we continue to navigate an uncertain economic environment. Investors can access investment grade corporate bonds through the <a href="/link/7990b344b89a462396880c6d210ada6c.aspx" title="MBBB - VanEck Moody&rsquo;s Analytics BBB Corporate Bond ETF - Overview"><strong>VanEck Moody&rsquo;s Analytics BBB Corporate Bond ETF (MBBB)</strong></a> and the <a href="/link/edc87d2b16cf4498a2884c1752ac9fe0.aspx" title="MIG - VanEck Moody&rsquo;s Analytics IG Corporate Bond ETF - Overview"><strong>VanEck Moody&rsquo;s Analytics IG Corporate Bond ETF (MIG)</strong></a>.</p>
<h2 id="point-seven" class="anchored-block">VanEck Income Investing Solutions</h2>
<div class="wrapped-div">
<table style="width: 100%;">
<tbody>
<tr class="tbl-data">
<td class="tbl-header last">&nbsp;</td>
<td class="tbl-header last">Name</td>
<td class="tbl-header last">Symbol</td>
<td class="tbl-header last">Exposure</td>
</tr>
<tr class="tbl-data">
<td class="data-td data last" style="border-top: 1px solid #b2b3b2;" rowspan="4"><strong>Floating Rate</strong></td>
<td class="data-td data last" style="text-align: left;"><a href="https://www.vaneck.com/us/en/investments/bdc-income-etf-bizd/overview/" title="BIZD - VanEck BDC Income ETF - Holdings and Performance"><strong>BDC Income ETF</strong></a></td>
<td class="data-td data last" style="text-align: left;"><strong><a href="https://www.vaneck.com/us/en/investments/bdc-income-etf-bizd/overview/" title="BIZD - VanEck BDC Income ETF - Holdings and Performance">BIZD</a></strong></td>
<td class="data-td data last" style="text-align: left;">Publicly traded business development companies.</td>
</tr>
<tr class="tbl-data">
<td class="data-td data last" style="text-align: left;"><a href="https://www.vaneck.com/us/en/investments/clo-etf-cloi/overview/" title="CLOI - VanEck CLO ETF - Holdings and Performance"><strong>CLO ETF</strong></a></td>
<td class="data-td data last" style="text-align: left;"><strong><a href="https://www.vaneck.com/us/en/investments/clo-etf-cloi/overview/" title="CLOI - VanEck CLO ETF - Holdings and Performance">CLOI</a></strong></td>
<td class="data-td data last" style="text-align: left;">Investment grade-rated tranches of CLOs of any maturity.</td>
</tr>
<tr class="tbl-data">
<td class="data-td data last" style="text-align: left;"><a href="https://www.vaneck.com/us/en/investments/aa-bb-clo-etf-clob/overview/" title="CLOB - VanEck AA-BB CLO ETF - Holdings and Performance"><strong>AA-BB CLO ETF</strong></a></td>
<td class="data-td data last" style="text-align: left;"><strong><a href="https://www.vaneck.com/us/en/investments/aa-bb-clo-etf-clob/overview/" title="CLOB - VanEck AA-BB CLO ETF - Holdings and Performance">CLOB</a></strong></td>
<td class="data-td data last" style="text-align: left;">AA to BB rated tranches of CLOs of any maturity.</td>
</tr>
<tr class="tbl-data">
<td class="data-td data last" style="text-align: left;"><strong><a href="https://www.vaneck.com/us/en/investments/ig-floating-rate-etf-fltr/overview/" title="FLTR - VanEck IG Floating Rate ETF - Holdings and Performance">IG Floating Rate ETF</a></strong></td>
<td class="data-td data last" style="text-align: left;"><strong><a href="https://www.vaneck.com/us/en/investments/ig-floating-rate-etf-fltr/overview/" title="FLTR - VanEck IG Floating Rate ETF - Holdings and Performance">FLTR</a></strong></td>
<td class="data-td data last" style="text-align: left;">U.S. dollar denominated floating rate notes issued by corporate issuers and rated investment grade.</td>
</tr>
<tr class="tbl-data">
<td class="data-td data last" style="border-top: 1px solid #b2b3b2;" rowspan="3"><strong>Corporate Bond</strong></td>
<td class="data-td data last" style="text-align: left;"><strong><a href="https://www.vaneck.com/us/en/investments/angel-high-yield-bond-etf-angl/overview/" title="ANGL - VanEck Fallen Angel High Yield Bond ETF - Holdings and Performance">Fallen Angel High Yield Bond ETF</a></strong></td>
<td class="data-td data last" style="text-align: left;"><strong><a href="https://www.vaneck.com/us/en/investments/angel-high-yield-bond-etf-angl/overview/" title="ANGL - VanEck Fallen Angel High Yield Bond ETF - Holdings and Performance">ANGL</a></strong></td>
<td class="data-td data last" style="text-align: left;">Below investment grade corporate bonds denominated in U.S. dollars, issued in the U.S. domestic market and that were rated investment grade at the time of issuance.</td>
</tr>
<tr class="tbl-data">
<td class="data-td data last" style="text-align: left;"><strong><a href="https://www.vaneck.com/us/en/investments/moodys-analytics-bbb-corporate-bond-etf-mbbb/overview/" title="MBBB - VanEck Moody&rsquo;s Analytics BBB Corporate Bond ETF - Holdings and Performance">Moody&rsquo;s Analytics BBB Corporate Bond ETF</a></strong></td>
<td class="data-td data last" style="text-align: left;"><strong><a href="https://www.vaneck.com/us/en/investments/moodys-analytics-bbb-corporate-bond-etf-mbbb/overview/" title="MBBB - VanEck Moody&rsquo;s Analytics BBB Corporate Bond ETF - Holdings and Performance">MBBB</a></strong></td>
<td class="data-td data last" style="text-align: left;">BBB rated corporate bonds that have attractive valuations and a lower probability of being downgraded to high yield compared to other BBB rated bonds.</td>
</tr>
<tr class="tbl-data">
<td class="data-td data last" style="text-align: left;"><strong><a href="https://www.vaneck.com/us/en/investments/moodys-analytics-ig-corporate-bond-etf-mig/overview/" title="MIG - VanEck Moody&rsquo;s Analytics IG Corporate Bond ETF - Holdings and Performance">Moody&rsquo;s Analytics IG Corporate Bond ETF</a></strong></td>
<td class="data-td data last" style="text-align: left;"><strong><a href="https://www.vaneck.com/us/en/investments/moodys-analytics-ig-corporate-bond-etf-mig/overview/" title="MIG - VanEck Moody&rsquo;s Analytics IG Corporate Bond ETF - Holdings and Performance">MIG</a></strong></td>
<td class="data-td data last" style="text-align: left;">Investment grade corporate bonds that have attractive valuations and a lower probability of being downgraded to high yield compared to other investment grade bonds.</td>
</tr>
<tr class="tbl-data">
<td class="data-td data last" style="border-top: 1px solid #b2b3b2;" rowspan="5"><strong>Equity Income</strong></td>
<td class="data-td data last" style="text-align: left;"><strong><a href="https://www.vaneck.com/us/en/investments/energy-income-etf-einc/overview/" title="EINC - VanEck Energy Income ETF - Holdings and Performance">Energy Income ETF</a></strong></td>
<td class="data-td data last" style="text-align: left;"><strong><a href="https://www.vaneck.com/us/en/investments/energy-income-etf-einc/overview/" title="EINC - VanEck Energy Income ETF - Holdings and Performance">EINC</a></strong></td>
<td class="data-td data last" style="text-align: left;">North American companies involved in the midstream energy segment, which includes MLPs, and corporations involved in oil and gas storage and transportation.</td>
</tr>
<tr class="tbl-data">
<td class="data-td data last" style="text-align: left;"><strong><a href="https://www.vaneck.com/us/en/investments/durable-high-dividend-etf-dura/overview/" title="DURA - VanEck Durable High Dividend ETF - Holdings and Performance">Durable High Dividend ETF</a></strong></td>
<td class="data-td data last" style="text-align: left;"><strong><a href="https://www.vaneck.com/us/en/investments/durable-high-dividend-etf-dura/overview/" title="DURA - VanEck Durable High Dividend ETF - Holdings and Performance">DURA</a></strong></td>
<td class="data-td data last" style="text-align: left;">High dividend yielding U.S. companies with strong financial health and attractive valuations according to Morningstar.</td>
</tr>
<tr class="tbl-data">
<td class="data-td data last" style="text-align: left;"><strong><a href="https://www.vaneck.com/us/en/investments/mortgage-reit-income-mort/overview/" title="MORT - VanEck Mortgage REIT Income ETF - Holdings and Performance">Mortgage REIT Income ETF</a></strong></td>
<td class="data-td data last" style="text-align: left;"><strong><a href="https://www.vaneck.com/us/en/investments/mortgage-reit-income-mort/overview/" title="MORT - VanEck Mortgage REIT Income ETF - Holdings and Performance">MORT</a></strong></td>
<td class="data-td data last" style="text-align: left;">U.S. mortgage real estate investment trusts.</td>
</tr>
<tr class="tbl-data">
<td class="data-td data last" style="text-align: left;"><strong><a href="https://www.vaneck.com/us/en/investments/office-and-commercial-reit-desk/overview/" title="DESK - VanEck Office and Commercial REIT ETF - Holdings and Performance">Office and Commercial REIT ETF</a></strong></td>
<td class="data-td data last" style="text-align: left;"><strong><a href="https://www.vaneck.com/us/en/investments/office-and-commercial-reit-desk/overview/" title="DESK - VanEck Office and Commercial REIT ETF - Holdings and Performance">DESK</a></strong></td>
<td class="data-td data last" style="text-align: left;">U.S. office and commercial real estate investment trusts.</td>
</tr>
<tr class="tbl-data">
<td class="data-td data last" style="text-align: left;"><strong><a href="https://www.vaneck.com/us/en/investments/preferred-securities-ex-financials-etf-pfxf/overview/" title="PFXF - VanEck Preferred Securities ex Financials ETF - Holdings and Performance">Preferred Securities ex Financials ETF</a></strong></td>
<td class="data-td data last" style="text-align: left;"><strong><a href="https://www.vaneck.com/us/en/investments/preferred-securities-ex-financials-etf-pfxf/overview/" title="PFXF - VanEck Preferred Securities ex Financials ETF - Holdings and Performance">PFXF</a></strong></td>
<td class="data-td data last" style="text-align: left;">U.S. exchange-listed hybrid debt, preferred stock and convertible preferred stock issued by non-financial corporations.</td>
</tr>
<tr class="tbl-data">
<td class="data-td data last" style="border-top: 1px solid #b2b3b2;" rowspan="6"><strong>International Bond</strong></td>
<td class="data-td data last" style="text-align: left;"><strong><a href="/link/f447bf0c04f64108a3dcff3ca025af4a.aspx" title="CBON - VanEck China Bond ETF - Holdings and Performance">Emerging Markets Bond ETF</a></strong></td>
<td class="data-td data last" style="text-align: left;"><a href="/link/f447bf0c04f64108a3dcff3ca025af4a.aspx" title="CBON - VanEck China Bond ETF - Holdings and Performance"><strong>EMBX</strong></a></td>
<td class="data-td data last" style="text-align: left;">Actively managed; debt securities issued by governments, quasi-government entities or corporations in emerging market countries, denominated in any currency</td>
</tr>
<tr class="tbl-data">
<td class="data-td data last" style="text-align: left;"><strong><a href="https://www.vaneck.com/us/en/investments/chinaamc-china-bond-etf-cbon/overview/" title="CBON - VanEck China Bond ETF - Holdings and Performance">China Bond ETF</a></strong></td>
<td class="data-td data last" style="text-align: left;"><a href="https://www.vaneck.com/us/en/investments/chinaamc-china-bond-etf-cbon/overview/" title="CBON - VanEck China Bond ETF - Holdings and Performance"><strong>CBON</strong></a></td>
<td class="data-td data last" style="text-align: left;">Fixed-rate, Renminbi-denominated bonds issued in the People's Republic of China by Chinese credit, governmental and quasi-governmental (e.g., policy banks) issuers.</td>
</tr>
<tr class="tbl-data">
<td class="data-td data last" style="text-align: left;"><strong><a href="https://www.vaneck.com/us/en/investments/emerging-markets-high-yield-bond-etf-hyem/overview/" title="HYEM - Emerging Markets High Yield Bond ETF - Holdings and Performance">Emerging Markets High Yield Bond ETF</a></strong></td>
<td class="data-td data last" style="text-align: left;"><strong><a href="https://www.vaneck.com/us/en/investments/emerging-markets-high-yield-bond-etf-hyem/overview/" title="HYEM - Emerging Markets High Yield Bond ETF - Holdings and Performance">HYEM</a></strong></td>
<td class="data-td data last" style="text-align: left;">U.S. dollar-denominated bonds issued by non-sovereign emerging markets issuers that are rated below investment grade and that are issued in the major domestic and Eurobond markets.</td>
</tr>
<tr class="tbl-data">
<td class="data-td data last" style="text-align: left;"><strong><a href="https://www.vaneck.com/us/en/investments/green-bond-etf-grnb/overview/" title="GRNB - VanEck Green Bond ETF - Holdings and Performance">Green Bond ETF</a></strong></td>
<td class="data-td data last" style="text-align: left;"><strong><a href="https://www.vaneck.com/us/en/investments/green-bond-etf-grnb/overview/" title="GRNB - VanEck Green Bond ETF - Holdings and Performance">GRNB</a></strong></td>
<td class="data-td data last" style="text-align: left;">U.S. dollar-denominated green bonds that are issued to finance environmentally friendly projects, and includes bonds issued by supranational, government, and corporate issuers globally.</td>
</tr>
<tr class="tbl-data">
<td class="data-td data last" style="text-align: left;"><strong><a href="https://www.vaneck.com/us/en/investments/international-high-yield-bond-etf-ihy/overview/" title="IHY - VanEck International High Yield Bond ETF - Holdings and Performance">International High Yield Bond ETF</a></strong></td>
<td class="data-td data last" style="text-align: left;"><strong><a href="https://www.vaneck.com/us/en/investments/international-high-yield-bond-etf-ihy/overview/" title="IHY - VanEck International High Yield Bond ETF - Holdings and Performance">IHY</a></strong></td>
<td class="data-td data last" style="text-align: left;">U.S. dollar, Canadian dollar, pound sterling, and euro denominated below investment grade corporate bonds issued by non-U.S. corporations in the major domestic or Eurobond markets.</td>
</tr>
<tr class="tbl-data">
<td class="data-td data last" style="text-align: left;"><strong><a href="https://www.vaneck.com/us/en/investments/jp-morgan-em-local-currency-bond-etf-emlc/overview/" title="EMLC - J.P. Morgan EM Local Currency Bond ETF - Holdings and Performance">J.P. Morgan EM Local Currency Bond ETF</a></strong></td>
<td class="data-td data last" style="text-align: left;"><strong><a href="https://www.vaneck.com/us/en/investments/jp-morgan-em-local-currency-bond-etf-emlc/overview/" title="EMLC - J.P. Morgan EM Local Currency Bond ETF - Holdings and Performance">EMLC</a></strong></td>
<td class="data-td data last" style="text-align: left;">Bonds issued by emerging market governments and denominated in the local currency of the issuer.</td>
</tr>
<tr class="tbl-data">
<td class="data-td data last" style="border-top: 1px solid #b2b3b2;" rowspan="6"><strong>Municipal Bond</strong></td>
<td class="data-td data last" style="text-align: left;"><strong><a href="https://www.vaneck.com/us/en/investments/cef-municipal-income-etf-xmpt/overview/" title="XMPT - VanEck CEF Muni Income ETF - Holdings and Performance">CEF Muni Income ETF</a></strong></td>
<td class="data-td data last" style="text-align: left;"><strong><a href="https://www.vaneck.com/us/en/investments/cef-municipal-income-etf-xmpt/overview/" title="XMPT - VanEck CEF Muni Income ETF - Holdings and Performance">XMPT</a></strong></td>
<td class="data-td data last" style="text-align: left;">U.S.-listed closed-end funds that invest in U.S. dollar denominated tax-exempt market.</td>
</tr>
<tr class="tbl-data">
<td class="data-td data last" style="text-align: left;"><strong><a href="https://www.vaneck.com/us/en/investments/high-yield-muni-etf-hyd/overview/" title="HYD - VanEck High Yield Muni ETF - Holdings and Performance">High Yield Muni ETF</a></strong></td>
<td class="data-td data last" style="text-align: left;"><strong><a href="https://www.vaneck.com/us/en/investments/high-yield-muni-etf-hyd/overview/" title="HYD - VanEck High Yield Muni ETF - Holdings and Performance">HYD</a></strong></td>
<td class="data-td data last" style="text-align: left;">U.S. dollar denominated high yield long-term tax-exempt bond market.</td>
</tr>
<tr class="tbl-data">
<td class="data-td data last" style="text-align: left;"><strong><a href="https://www.vaneck.com/us/en/investments/intermediate-muni-etf-itm/overview/" title="ITM - VanEck Intermediate Muni ETF - Holdings and Performance">Intermediate Muni ETF</a></strong></td>
<td class="data-td data last" style="text-align: left;"><strong><a href="https://www.vaneck.com/us/en/investments/intermediate-muni-etf-itm/overview/" title="ITM - VanEck Intermediate Muni ETF - Holdings and Performance">ITM</a></strong></td>
<td class="data-td data last" style="text-align: left;">U.S. dollar denominated intermediate-term tax-exempt bond market.</td>
</tr>
<tr class="tbl-data">
<td class="data-td data last" style="text-align: left;"><strong><a href="https://www.vaneck.com/us/en/investments/long-muni-etf-mln/overview/" title="MLN - VanEck Long Muni ETF - Holdings and Performance">Long Muni ETF</a></strong></td>
<td class="data-td data last" style="text-align: left;"><strong><a href="https://www.vaneck.com/us/en/investments/long-muni-etf-mln/overview/" title="MLN - VanEck Long Muni ETF - Holdings and Performance">MLN</a></strong></td>
<td class="data-td data last" style="text-align: left;">U.S. dollar denominated long-term tax-exempt bond market.</td>
</tr>
<tr class="tbl-data">
<td class="data-td data last" style="text-align: left;"><strong><a href="https://www.vaneck.com/us/en/investments/short-high-yield-muni-etf-shyd/overview/" title="SHYD - VanEck Short High Yield Muni ETF - Holdings and Performance">Short High Yield Muni ETF</a></strong></td>
<td class="data-td data last" style="text-align: left;"><strong><a href="https://www.vaneck.com/us/en/investments/short-high-yield-muni-etf-shyd/overview/" title="SHYD - VanEck Short High Yield Muni ETF - Holdings and Performance">SHYD</a></strong></td>
<td class="data-td data last" style="text-align: left;">U.S. dollar denominated high yield short-term tax-exempt bond market.</td>
</tr>
<tr class="tbl-data">
<td class="data-td data last" style="text-align: left;"><a href="https://www.vaneck.com/us/en/investments/short-muni-etf-smb/overview/" title="SMB - VanEck Short Muni ETF - Holdings and Performance"><strong>Short Muni ETF</strong></a></td>
<td class="data-td data last" style="text-align: left;"><strong><a href="https://www.vaneck.com/us/en/investments/short-muni-etf-smb/overview/" title="SMB - VanEck Short Muni ETF - Holdings and Performance">SMB</a></strong></td>
<td class="data-td data last" style="text-align: left;">U.S. dollar denominated short-term tax-exempt bond market.</td>
</tr>
</tbody>
</table>
</div>
<p>To receive more <a href="/us/en/blogs/income-investing/" title="Income Investing Insights"><strong>Income Investing</strong></a> insights, <a href="/link/5f45412c2143400497908cea2897f7d3.aspx" title=" Subscription Center"><strong>sign up in our subscription center</strong></a>.</p>
]]></content:encoded>
</item><item rdf:about="https://www.vaneck.com/us/en/blogs/income-investing/bdcs-emerge-as-a-high-yield-haven-as-private-credit-shifts/">
  <title>BDCs Emerge as a High-Yield Haven as Private Credit Shifts></title>
  <link>https://www.vaneck.com/us/en/blogs/income-investing/bdcs-emerge-as-a-high-yield-haven-as-private-credit-shifts/</link>
  <description><![CDATA[BDCs continue to offer some of the highest yields in private credit and pullbacks may allow investors to capture tax benefits while staying invested.]]></description>
  <dc:creator>Kendall Duncan </dc:creator>
  <dc:date>11/26/2025 06:30:00</dc:date>
<content:encoded><![CDATA[

<p><strong>Key Takeaways:</strong></p>
<ul class="content-list">
<li class="mt-2">Investors facing losses in individual BDC holdings may use tax loss harvesting to reset cost basis without stepping away from high yield private credit exposure.</li>
<li class="mt-2">BDCs continue to outyield many traditional income categories, supported by lending to smaller private companies at higher interest rates.</li>
<li class="mt-2">Despite short term volatility, private credit remains supported by strong demand and disciplined underwriting, keeping long term income potential in focus.</li>
</ul>
<p>As investors search for income beyond traditional bonds, private credit has emerged as a resilient alternative. Business Development Companies (BDCs) provide access to this growing market, offering yields that often exceed those of conventional income sources. <strong><a href="https://www.vaneck.com/us/en/investments/bdc-income-etf-bizd/overview/" title="BIZD - VanEck BDC Income ETF">VanEck&rsquo;s BDC Income ETF (BIZD)</a></strong> offers a diversified, liquid way to invest across the BDC universe, helping investors stay positioned for income opportunities as market conditions evolve.</p>
<h2>High Yield Potential in a Diversified Package</h2>
<p>One of the most compelling reasons investors turn to <strong><a href="https://www.vaneck.com/us/en/investments/bdc-income-etf-bizd/overview/" title="BIZD - VanEck BDC Income ETF">BIZD</a></strong> is its consistent high yield potential relative to other income-oriented investments. Many BDCs generate substantial income that often exceeds yields available in other income oriented assets such as investment grade bonds, high yield bonds, utilities, or dividend paying stocks.</p>
<p><strong><a href="https://www.vaneck.com/us/en/investments/bdc-income-etf-bizd/overview/" title="BIZD - VanEck BDC Income ETF">BIZD</a></strong> provides a single ticker with diversified exposure to this high income segment of private credit, while reducing the company specific risks of holding a single BDC.</p>
<h3>Yield Comparison Across Income Opportunities</h3>
<p><img loading="lazy" class="img-responsive w-100" src="https://www.vaneck.com/EPiServer/CMS/Content/contentassets/ef89f50c9a8342469334709d44ea3239/6429_bizd-harvesting_chart-1_2025-11_v1.svg,,353724/Download?epieditmode=False" alt="Yield Comparison Across Income Opportunities / October 2025" /></p>
<p class="chart-disclosure">Source: FactSet and ICE Data Indices as of 10/31/2025. <strong>Past performance is no guarantee of future results.</strong> Yield for BDCs, Equity REITs, Utilities Stocks, and U.S. Stocks represented by dividend yield. Yield for U.S. HY Bonds, U.S. IG Bonds, and 10 Yr Treasury represented by yield-to-worst. BDCs represented by MVIS US Business Development Companies Index; U.S. HY Bonds represented by ICE BofA US High Yield Index; U.S. IG Bonds represented by ICE BofA U.S. Corporate Index; Equity REITs represented by FTSE NAREIT All Equity REITs Index; Utilities Stocks represented by S&amp;P Utilities Index; U.S. Stocks represented by S&amp;P 500 Index; U.S. 10 Yr Treasury represented by ICE BofA Current 10-Year US Treasury Index.</p>

<h2>The Broader Case for Private Credit and BDCs</h2>
<p>Private credit has gained significant traction as investors seek yield and diversification away from traditional bonds. BDCs, which provide financing to small and mid-sized U.S. businesses, play a crucial role in this growing ecosystem. While BDCs and other private credit vehicles have historically benefited from floating-rate structures during periods of rising interest rates, these same floating-rate exposures can also serve as a valuable diversifier alongside traditional fixed-rate bond holdings as the rate environment evolves going forward.</p>
<p>Despite short-term fluctuations, the long-term fundamentals of private credit remain strong, driven by growing demand for alternative financing and disciplined underwriting across many BDCs. Additionally, the structural shift in capital markets underscores how private credit continues to gain share from traditional high yield.</p>
<h3>Private Credit Continues to Take Share From High Yield Bonds</h3>
<p><img loading="lazy" class="img-responsive w-100" src="https://www.vaneck.com/EPiServer/CMS/Content/contentassets/6107bb399a5b459e9944ddcf95a792bc/6429_bizd-harvesting_chart-2_2025-11_v1.svg,,353736/Download?epieditmode=False" alt="Demand for Private Credit is Growing: Global Private Credit AUM ($Trillions)" /></p>
<p class="chart-disclosure"><i>Source: Man Group, <strong><a href="https://www.man.com/insights/private-credit-dispelling-myths" title="Private Credit: Dispelling the Myths">Private Credit: Dispelling the Myths</a></strong>; PitchBook, as of June 2024.</i></p>
<h2>Turning Market Pullbacks into Opportunity</h2>
<p>Market pullbacks can be unsettling, but they often create opportunities, especially for investors using tax-loss harvesting as part of their year-end or ongoing portfolio strategy. As private credit continues to expand as an asset class, business development companies (BDCs) have emerged as a unique, income generating way to access this market.</p>
<p>Recent volatility in BDCs has pushed prices lower, and the BDC industry, in aggregate, now trades below its long-term average price-to-book ratio for the first time in several years. For some investors, that means unrealized losses in individual BDC holdings. Rather than viewing these losses as setbacks, investors can potentially turn them into a tax advantage, and stay invested in the sector&rsquo;s long-term growth story by reallocating to a diversified, high-yield vehicle like <strong><a href="https://www.vaneck.com/us/en/investments/bdc-income-etf-bizd/overview/" title="BIZD - VanEck BDC Income ETF">BIZD</a></strong>.</p>
<h3>BDCs Now Trade Below Their Long-Term Average Valuation</h3>
<p><img loading="lazy" class="img-responsive w-100" src="https://www.vaneck.com/EPiServer/CMS/Content/contentassets/654d6c5b6dbe402ab86c60d69c411e9a/6429_bizd-harvesting_chart-3_2025-11_v1.svg,,353750/Download?epieditmode=False" alt="Demand for Private Credit is Growing: Global Private Credit AUM ($Trillions)" /></p>
<p class="chart-disclosure"><i>Source: FactSet as of 11/19/2025. BDCs represented by MVIS US Business Development Companies Index; A weighted harmonic average is used to calculate Price-to-book; Index data prior to June 19, 2023 reflects that of MarketVector US Business Development Companies Liquid Index (MVBIZDTG). From June 19, 2023 forward, the index data reflects that of the MVIS US Business Development Companies Index (MVBDCTRG). Index history which includes periods prior to June 19, 2023 links the performance of MVBIZDTG and MVBDCTRG and is not intended for third party use. Past performance is no guarantee of future results. See important disclosures and index descriptions at end.</i></p>

<h2>The Benefits of a Diversified BDC Investment Approach</h2>
<p><strong><a href="https://www.vaneck.com/us/en/investments/bdc-income-etf-bizd/overview/" title="BIZD - VanEck BDC Income ETF">VanEck&rsquo;s BDC Income ETF (BIZD)</a></strong> provides broad exposure to publicly traded BDCs through a single liquid ticker. This helps solve several structural challenges of investing directly in individual private credit vehicles.</p>
<p><strong>Key potential benefits of using <strong><a href="https://www.vaneck.com/us/en/investments/bdc-income-etf-bizd/overview/" title="BIZD - VanEck BDC Income ETF">BIZD</a></strong> for BDC exposure:</strong></p>
<ul class="content-list">
<li class="mt-2">Diversified exposure across many BDCs rather than single name concentration</li>
<li class="mt-2">High income potential relative to traditional fixed income categories</li>
<li class="mt-2">Daily liquidity and transparency</li>
<li class="mt-2">Ease of access through the ETF wrapper</li>
<li class="mt-2">Potential ability to remain invested in private credit while harvesting tax losses elsewhere</li>
</ul>
<p>For investors who want to stay in the income producing private credit space but reduce single company risk or reset tax basis, <strong><a href="https://www.vaneck.com/us/en/investments/bdc-income-etf-bizd/overview/" title="BIZD - VanEck BDC Income ETF">BIZD</a></strong> may provide an efficient solution.</p>
<p>To receive more <a href="/us/en/blogs/income-investing/" title="Income Investing Insights"><strong>Income Investing</strong></a> insights, <a href="/link/5f45412c2143400497908cea2897f7d3.aspx" title=" Subscription Center"><strong>sign up in our subscription center</strong></a>.</p>
]]></content:encoded>
</item><item rdf:about="https://www.vaneck.com/us/en/blogs/income-investing/active-management-is-the-edge-clo-investors-cant-afford-to-miss/">
  <title>Active Management is the Edge CLO Investors Can’t Afford to Miss></title>
  <link>https://www.vaneck.com/us/en/blogs/income-investing/active-management-is-the-edge-clo-investors-cant-afford-to-miss/</link>
  <description><![CDATA[Francis Rodilosso and William Sokol appeared on Bloomberg&rsquo;s Inside Active Podcast to discuss how active management is essential in CLO investing.]]></description>
  <dc:creator>Fran Rodilosso</dc:creator>
  <dc:date>11/26/2025 06:30:00</dc:date>
<content:encoded><![CDATA[

<iframe style="width: 100%; overflow: hidden; border-radius: 10px;" src="https://embed.podcasts.apple.com/us/podcast/vanecks-rodilosso-sokol-on-mitigating-clo-risk/id1758115746?i=1000736305243" height="175" frameborder="0" sandbox="allow-forms allow-popups allow-same-origin allow-scripts allow-storage-access-by-user-activation allow-top-navigation-by-user-activation" allow="autoplay *; encrypted-media *; fullscreen *; clipboard-write"></iframe>
<h2>Why CLOs Stand Out in Fixed Income</h2>
<p>CLOs continue to present a compelling value proposition for investors seeking floating‐rate income and diversified credit exposure. Their structural protections and active management components help mitigate credit risk while capturing enhanced yields compared with traditional corporate bonds.</p>
<p><strong>Key Takeaways:</strong></p>
<ul class="content‐list">
<li class="mt‐2"> CLOs may strengthen core bond portfolios and ETFs may provide broader access to the asset class.</li>
<li class="mt‐2"> CLOs may offer a yield advantage versus similarly rated IG corporates while maintaining floating‐rate exposure that reduces duration risk.</li>
<li class="mt‐2"> Manager expertise, strong security selection, tranche analysis, and experience drive performance dispersion in CLOs, making active management critical.</li>
<li class="mt‐2"> Investors are paying closer attention because of credit concerns with First Brands and Tricolor. These risks seem specific to those companies, not the broader market. Weaker credits could come under some pressure, but careful security selection, especially in mezzanine tranches, should help keep the impact limited.</li>
<li class="mt‐2"> CLOs offer value, but selectivity is vital amid rate shifts, tariffs, and credit market risks.</li>
</ul>
<h2>How to Invest in CLOs</h2>
<p>VanEck has partnered with PineBridge Investments on the <strong><a href="/link/e090deaddc774ac699a04b959d9254c6.aspx" title="CLOI - VanEck CLO ETF">VanEck CLO ETF (CLOI)</a></strong>, which provides access to investment grade floating‐rate CLOs, as well as the <strong><a href="/link/d2f16468a9f14c1e807f6bb7fb597a3e.aspx" title="CLOB ‐ VanEck AA‐BB CLO ETF">VanEck AA‐BB CLO ETF (CLOB)</a></strong>, which offers more targeted exposure to the mezzanine tranches of CLOs. Both CLOI and CLOB benefit from PineBridge's decades of CLO market experience, both as a CLO manager and CLO tranche investor, and deep leveraged finance expertise. CLOI's current 30‐day SEC yield is 5.43% and CLOB's is 6.59% (as of 10/31/2025).</p>
<p>For the latest data and yields for VanEck's full suite of income investing solutions, please refer to our <strong><a href="/link/e87ff6a44d1d41d1b0181cc2de1e33cc.aspx" title="Income Investing Yield Monitor">Income Investing Yield Monitor</a></strong>.</p>


<p>To receive more <a href="/us/en/blogs/income-investing/" title="Income Investing Insights"><strong>Income Investing</strong></a> insights, <a href="/link/5f45412c2143400497908cea2897f7d3.aspx" title=" Subscription Center"><strong>sign up in our subscription center</strong></a>.</p>
]]></content:encoded>
</item><item rdf:about="https://www.vaneck.com/us/en/blogs/thematic-investing/buzz-investing-high-valuation-tech-stocks-reset/">
  <title>BUZZ Investing: High-Valuation Tech Stocks Reset></title>
  <link>https://www.vaneck.com/us/en/blogs/thematic-investing/buzz-investing-high-valuation-tech-stocks-reset/</link>
  <description><![CDATA[U.S. stocks were broadly steady, but policy uncertainty and a pullback in high-valuation tech and AI names created a choppier market that weighed on many sentiment-driven and innovation-focused companies.]]></description>
  <dc:creator> </dc:creator>
  <dc:date>11/26/2025 06:30:00</dc:date>
<content:encoded><![CDATA[

<p><strong>Key Takeaways:</strong></p>
<ul class="content-list">
<li class="mt-2">Market volatility rose as investors reassessed high-valuation tech and AI sectors.</li>
<li class="mt-2">BUZZ Index reflected shifts in sentiment toward growth and innovation themes.</li>
<li class="mt-2">Macro factors like policy signals and trade tensions shaped recent market trends.</li>
</ul>
<p>U.S. equities were broadly stable during the recent period between index selection dates (October 9, 2025 &ndash; November 13, 2025, the &ldquo;Period&rdquo;), with both the S&amp;P 500 and Nasdaq Composite posting only minor net changes. Beneath the surface, however, renewed trade tensions, an extended government shutdown, and shifting expectations around Federal Reserve policy created a more uneven backdrop for risk assets. Technology stocks, particularly the large-cap AI and growth-oriented companies that had driven market leadership for much of the year, experienced a valuation reset. This shift weighed on several of the high-profile names that have frequently ranked among the strongest contributors to <a href="/link/459289f4c5ea4648bd9dfcf70d847cd7.aspx" title="BUZZ - VanEck Social Sentiment ETF - Overview"><strong>BUZZ</strong></a> Index performance. As a result, the <a href="/link/459289f4c5ea4648bd9dfcf70d847cd7.aspx" title="BUZZ - VanEck Social Sentiment ETF - Overview"><strong>BUZZ</strong></a> NextGen AI US Sentiment Leaders Index (the &ldquo;<a href="/link/459289f4c5ea4648bd9dfcf70d847cd7.aspx" title="BUZZ - VanEck Social Sentiment ETF - Overview"><strong>BUZZ</strong></a> Index&rdquo;) declined 15.2 percent during the Period. Year to date, the <a href="/link/459289f4c5ea4648bd9dfcf70d847cd7.aspx" title="BUZZ - VanEck Social Sentiment ETF - Overview"><strong>BUZZ</strong></a> Index remains solidly positive relative to broader equity benchmarks.</p>
<p>Macroeconomic developments added further complexity. The prolonged government shutdown limited the availability of key economic data, reducing visibility into labor, inflation, and spending trends. At the October meeting, the Federal Reserve delivered its second consecutive 25 basis point rate cut, but subsequent communications from policymakers signaled a more cautious stance toward additional easing, pushing Treasury yields higher into early November. At the same time, escalating U.S. and China tariff announcements and stalled progress in bilateral discussions contributed to renewed concerns around global supply chains and the inflation outlook. While these crosscurrents weighed on high valuation segments of the market, corporate earnings through the heart of the third quart high-valuation segments of the market, corporate earnings through the heart of the third-quarter er reporting season were broadly constructive, with a high proportion of companies exceeding expectations. Overall, the Period reflected a more selective market environment shaped by policy uncertainty, geopolitical friction, and a recalibration within the technology sector.</p>
<p>The <a href="/link/459289f4c5ea4648bd9dfcf70d847cd7.aspx" title="BUZZ - VanEck Social Sentiment ETF - Overview"><strong>BUZZ</strong></a> Index returned 6.03% during the month of October compared to a return of 2.34% for the S&amp;P 500 Index during the same period. Year-to-date, the <a href="/link/459289f4c5ea4648bd9dfcf70d847cd7.aspx" title="BUZZ - VanEck Social Sentiment ETF - Overview"><strong>BUZZ</strong></a> Index leads the S&amp;P 500 with returns of 53.97% and 17.52%, respectively, as of the end of October.</p>
<h2>Opendoor Tops BUZZ Contributors while Micro Extends its AI-Driven Rally</h2>
<p>Shares of Opendoor Technologies (NASDAQ: OPEN) advanced during the Period, making it the largest contributor to <a href="/link/459289f4c5ea4648bd9dfcf70d847cd7.aspx" title="BUZZ - VanEck Social Sentiment ETF - Overview"><strong>BUZZ</strong></a> Index performance. The stock continued to benefit from renewed optimism around the company&rsquo;s multi-year turnaround effort, reinforced by commentary from JPMorgan that highlighted a &ldquo;major transformation&rdquo; underway under new leadership. Management&rsquo;s pivot toward a volume-driven acquisition strategy, combined with recalibrated pricing models and a push to clear legacy inventory, was viewed as an important step toward stabilizing contribution margins. Opendoor signaled that home acquisitions are expected to rise at least 35% quarter over quarter in Q4 and reiterated its goal of achieving net-income breakeven by the end of 2026. Investors appeared encouraged by the company&rsquo;s increased emphasis on AI-enabled pricing tools, workflow automation, and the expansion of ancillary services such as mortgage and warranty offerings, which may enhance transaction economics over time.</p>
<p>Micron Technology (NASDAQ: MU) was another leading contributor, continuing its rally on the back of an increasingly tight memory-chip supply environment. The stock rose as industry data pointed to accelerating demand tied to AI-related infrastructure build-outs and rapidly rising DRAM and NAND pricing. Reports indicating that major competitors such as SK Hynix and Samsung had sold out or paused contract pricing due to surging demand reinforced expectations of a robust pricing cycle heading into year-end. Research firm TrendForce projected fourth-quarter DRAM price increases of 18% to 23%, a backdrop that may meaningfully improve Micron&rsquo;s profitability outlook. The combination of strong industry fundamentals and growing evidence of supply constraints helped support Micron&rsquo;s gains during the Period.</p>

<h3 id="top-contributors" class="jump-link-nav anchored-block" data-jumplink-title="Top Contributors">Top BUZZ Index Contributors: October 9, 2025 &ndash; November 13, 2025</h3>
<div class="wrapped-div">
<table width="100%">
<tbody>
<tr class="tbl-data">
<td class="tbl-header last text-left"><strong>Company</strong></td>
<td class="tbl-header last text-left"><strong>Ticker</strong></td>
<td class="tbl-header last text-right"><strong>Average Weight (%)</strong></td>
<td class="tbl-header last text-right"><strong>Return Contribution (%)</strong></td>
</tr>
<tr class="tbl-data">
<td class="data-td data last text-left">Opendoor Technologies Inc</td>
<td class="data-td data last text-left">OPEN</td>
<td class="data-td data last text-right">2.33</td>
<td class="data-td data last text-right">0.54</td>
</tr>
<tr class="tbl-data">
<td class="data-td data last text-left">Micron Technology Inc</td>
<td class="data-td data last text-left">MU</td>
<td class="data-td data last text-right">1.34</td>
<td class="data-td data last text-right">0.25</td>
</tr>
<tr class="tbl-data">
<td class="data-td data last text-left">Alphabet Inc</td>
<td class="data-td data last text-left">GOOGL</td>
<td class="data-td data last text-right">1.73</td>
<td class="data-td data last text-right">0.23</td>
</tr>
<tr class="tbl-data">
<td class="data-td data last text-left">Rivian Automotive Inc</td>
<td class="data-td data last text-left">RIVN</td>
<td class="data-td data last text-right">0.90</td>
<td class="data-td data last text-right">0.20</td>
</tr>
<tr class="tbl-data">
<td class="data-td data last text-left">Advanced Micro Devices Inc</td>
<td class="data-td data last text-left">AMD</td>
<td class="data-td data last text-right">3.43</td>
<td class="data-td data last text-right">0.18</td>
</tr>
<tr class="tbl-data">
<td class="data-td data last text-left">Amazon.com Inc</td>
<td class="data-td data last text-left">AMZN</td>
<td class="data-td data last text-right">2.62</td>
<td class="data-td data last text-right">0.18</td>
</tr>
<tr class="tbl-data">
<td class="data-td data last text-left">Apple Inc</td>
<td class="data-td data last text-left">AAPL</td>
<td class="data-td data last text-right">2.21</td>
<td class="data-td data last text-right">0.11</td>
</tr>
<tr class="tbl-data">
<td class="data-td data last text-left">Barrick Mining Corp</td>
<td class="data-td data last text-left">B</td>
<td class="data-td data last text-right">0.56</td>
<td class="data-td data last text-right">0.08</td>
</tr>
<tr class="tbl-data">
<td class="data-td data last text-left">ROBLOX Corp</td>
<td class="data-td data last text-left">RBLX</td>
<td class="data-td data last text-right">0.25</td>
<td class="data-td data last text-right">0.07</td>
</tr>
<tr class="tbl-data">
<td class="data-td data last text-left">Unity Software Inc</td>
<td class="data-td data last text-left">U</td>
<td class="data-td data last text-right">0.91</td>
<td class="data-td data last text-right">0.06</td>
</tr>
</tbody>
</table>
</div>
<p class="chart-disclosure"><i>Source: BUZZ Holdings ULC, Bloomberg. Past performance is no guarantee of future results. Index performance is not illustrative of fund performance. Not intended as a recommendation to buy or to sell any of the securities mentioned herein.</i></p>

<h2>Widespread Declines Across Innovation Themes Pressure BUZZ Index Returns</h2>
<p>The <a href="/link/459289f4c5ea4648bd9dfcf70d847cd7.aspx" title="BUZZ - VanEck Social Sentiment ETF - Overview"><strong>BUZZ</strong></a> Index&rsquo;s decline during the Period was driven by a broad-based pullback across several of its larger-weighted, thematically technology-oriented constituents, with each of the top ten detractors falling by more than 20 percent during the Period. A cluster of AI-linked and infrastructure names including Applied Digital Corporation (NASDAQ: APLD), Nebius Group N.V. (NASDAQ: NBIS), Super Micro Computer Inc. (NASDAQ: SMCI), Rigetti Computing Inc. (NASDAQ: RGTI), SoundHound AI Inc. (NASDAQ: SOUN), and AST SpaceMobile Inc. (NASDAQ: ASTS) all declined sharply as investors reassessed valuations across segments tied to data centers, AI hardware, quantum computing, and next-generation connectivity. These companies operate in fast-advancing segments of the technology ecosystem, and their valuations may be more sensitive to shifts in macro uncertainty, higher discount rates, or a market that, during the Period, placed greater weight on near-term execution rather than longer-term potential. While positive online sentiment remained elevated for many of these stocks, price action may reflect a valuation reset rather than a deterioration in their standing within the <a href="/link/459289f4c5ea4648bd9dfcf70d847cd7.aspx" title="BUZZ - VanEck Social Sentiment ETF - Overview"><strong>BUZZ</strong></a> framework.</p>
<p>At the same time, companies linked to digital assets and retail trading activity also weighed on returns. MicroStrategy Inc. (NASDAQ: MSTR) and IREN Ltd. (NASDAQ: IREN) declined alongside renewed volatility in crypto-related markets, while Webull Corporation (NASDAQ: BULL) and Robinhood Markets Inc. (NASDAQ: HOOD) faced pressure in an environment that turned less supportive for high-beta, retail-engagement-driven business models. Together, the drawdowns across AI infrastructure, emerging technology platforms, and trading or crypto-adjacent names reflected a broad cooling in investor appetite for higher-volatility innovation themes during the Period, particularly against a backdrop of shifting policy expectations and a rotation toward more defensive positioning.</p>
<h3 id="bottom-contributors" class="jump-link-nav anchored-block" data-jumplink-title="Bottom Contributors">Bottom BUZZ Index Contributors: October 9, 2025 &ndash; November 13, 2025</h3>
<div class="wrapped-div">
<table style="height: 246.4px;" width="100%">
<tbody>
<tr class="tbl-data" style="height: 22.4px;">
<td class="tbl-header last text-left" style="height: 22.4px;"><strong>Company</strong></td>
<td class="tbl-header last text-left" style="height: 22.4px;"><strong>Ticker</strong></td>
<td class="tbl-header last text-right" style="height: 22.4px;"><strong>Average Weight (%)</strong></td>
<td class="tbl-header last text-right" style="height: 22.4px;"><strong>Return Contribution (%)</strong></td>
</tr>
<tr class="tbl-data" style="height: 22.4px;">
<td class="data-td data last text-left" style="height: 22.4px;">Applied Digital Corp</td>
<td class="data-td data last text-left" style="height: 22.4px;">APLD</td>
<td class="data-td data last text-right" style="height: 22.4px;">2.59</td>
<td class="data-td data last text-right" style="height: 22.4px;">-1.28</td>
</tr>
<tr class="tbl-data" style="height: 22.4px;">
<td class="data-td data last text-left" style="height: 22.4px;">Rigetti Computing Inc</td>
<td class="data-td data last text-left" style="height: 22.4px;">RGTI</td>
<td class="data-td data last text-right" style="height: 22.4px;">1.44</td>
<td class="data-td data last text-right" style="height: 22.4px;">-1.00</td>
</tr>
<tr class="tbl-data" style="height: 22.4px;">
<td class="data-td data last text-left" style="height: 22.4px;">SoundHound AI Inc</td>
<td class="data-td data last text-left" style="height: 22.4px;">SOUN</td>
<td class="data-td data last text-right" style="height: 22.4px;">1.56</td>
<td class="data-td data last text-right" style="height: 22.4px;">-0.92</td>
</tr>
<tr class="tbl-data" style="height: 22.4px;">
<td class="data-td data last text-left" style="height: 22.4px;">Nebius Group NV</td>
<td class="data-td data last text-left" style="height: 22.4px;">NBIS</td>
<td class="data-td data last text-right" style="height: 22.4px;">2.60</td>
<td class="data-td data last text-right" style="height: 22.4px;">-0.92</td>
</tr>
<tr class="tbl-data" style="height: 22.4px;">
<td class="data-td data last text-left" style="height: 22.4px;">Super Micro Computer Inc</td>
<td class="data-td data last text-left" style="height: 22.4px;">SMCI</td>
<td class="data-td data last text-right" style="height: 22.4px;">2.02</td>
<td class="data-td data last text-right" style="height: 22.4px;">-0.87</td>
</tr>
<tr class="tbl-data" style="height: 22.4px;">
<td class="data-td data last text-left" style="height: 22.4px;">Strategy Inc</td>
<td class="data-td data last text-left" style="height: 22.4px;">MSTR</td>
<td class="data-td data last text-right" style="height: 22.4px;">2.11</td>
<td class="data-td data last text-right" style="height: 22.4px;">-0.81</td>
</tr>
<tr class="tbl-data" style="height: 22.4px;">
<td class="data-td data last text-left" style="height: 22.4px;">AST SpaceMobile Inc</td>
<td class="data-td data last text-left" style="height: 22.4px;">ASTS</td>
<td class="data-td data last text-right" style="height: 22.4px;">3.40</td>
<td class="data-td data last text-right" style="height: 22.4px;">-0.77</td>
</tr>
<tr class="tbl-data" style="height: 22.4px;">
<td class="data-td data last text-left" style="height: 22.4px;">IREN Ltd</td>
<td class="data-td data last text-left" style="height: 22.4px;">IREN</td>
<td class="data-td data last text-right" style="height: 22.4px;">2.38</td>
<td class="data-td data last text-right" style="height: 22.4px;">-0.64</td>
</tr>
</tbody>
</table>
</div>
<p class="chart-disclosure"><i>Source: BUZZ Holdings ULC, Bloomberg. Past performance is no guarantee of future results. Index performance is not illustrative of fund performance. Not intended as a recommendation to buy or to sell any of the securities mentioned herein.</i></p>
<h2>BUZZ Index November 2025 Rebalance Highlights</h2>
<p><strong>Meta Platforms, Inc.</strong></p>
<p>Meta Platforms (NASDAQ: META) has seen its <a href="/link/459289f4c5ea4648bd9dfcf70d847cd7.aspx" title="BUZZ - VanEck Social Sentiment ETF - Overview"><strong>BUZZ</strong></a> Index weight decline from the 3 percent maximum in May to less than half that level over recent months, as investor attention gravitated toward the highest-profile AI names such as NVIDIA (NASDAQ: NVDA), Microsoft (NASDAQ: MSFT), and Alphabet (NASDAQ: GOOGL). While META&rsquo;s share performance has trailed that cohort, the past month brought a meaningful rise in positive online sentiment despite limited stock-specific news. Market participants may be increasingly attentive to META&rsquo;s significant investment in foundational AI models and its efforts to integrate AI into next-generation consumer hardware, including its smart-glasses platform. The sentiment shift suggests a potential recalibration of investor expectations around META&rsquo;s AI roadmap. Accordingly, META&rsquo;s weighting increases this month to the Index&rsquo;s maximum 3 percent level.</p>
<p><strong>MP Materials</strong></p>
<p>This month, the <a href="/link/459289f4c5ea4648bd9dfcf70d847cd7.aspx" title="BUZZ - VanEck Social Sentiment ETF - Overview"><strong>BUZZ</strong></a> Index adds a first-time entrant, MP Materials (NYSE: MP). The company operates Mountain Pass, the only rare-earth mine in the United States, an asset once owned by Molycorp before its 2015 bankruptcy and subsequent revival through a 2020 SPAC merger with Fortress Value Acquisition Corp. Rising global demand for rare-earth minerals has elevated the strategic importance of domestic supply, particularly as the U.S. seeks to reduce reliance on China for inputs used in batteries, magnets, and other advanced technologies. Rare earths have increasingly been framed as critical to national security, a shift that has brought substantial federal support for MP, including recent policy actions such as newly announced 25 percent tariffs on Chinese rare-earth imports and the U.S. Department of Defense becoming the company&rsquo;s largest shareholder. Against this backdrop, investor sentiment has accelerated, bringing MP Materials into the <a href="/link/459289f4c5ea4648bd9dfcf70d847cd7.aspx" title="BUZZ - VanEck Social Sentiment ETF - Overview"><strong>BUZZ</strong></a> Index for the first time at a 0.73 percent weight.</p>
<p>For more on rebalancing results and a full breakdown of index constituents added and removed for the month, view the <a href="https://www.vaneck.com/us/en/investments/social-sentiment-etf-buzz/buzz-reconstitution.pdf" title="BUZZ Index reconstitution report" target="_blank" rel="noopener"><strong>BUZZ Index reconstitution report</strong></a>.</p>

<p>To receive more <a href="https://www.vaneck.com/us/en/insights/thematic-investing/" title="Thematic Investing Insights"><strong>Thematic Investing</strong></a> insights, <a href="https://www.vaneck.com/us/en/subscribe/" title="Subscription Center"><strong>sign up in our subscription center</strong></a>.</p>
]]></content:encoded>
</item><item rdf:about="https://www.vaneck.com/us/en/blogs/municipal-bonds/mln-etf-question-and-answer/">
  <title>MLN ETF: Question &amp; Answer></title>
  <link>https://www.vaneck.com/us/en/blogs/municipal-bonds/mln-etf-question-and-answer/</link>
  <description><![CDATA[This blog explores the benefits of long-duration municipal bonds and how the VanEck Long Muni ETF (MLN) provides access.]]></description>
  <dc:creator>A. J. Talukdar</dc:creator>
  <dc:date>11/26/2025 06:30:00</dc:date>
<content:encoded><![CDATA[

<ul class="content-list">
<li><a href="#point-one"><strong>What are long-duration municipal bonds, and how big is the municipal bond market?</strong></a></li>
<li><a href="#point-two"><strong>What makes long-term municipal bonds attractive relative to other types of bonds?</strong></a></li>
<li><a href="#point-three"><strong>What is the VanEck Long Muni ETF (MLN)?</strong></a></li>
<li><a href="#point-four"><strong>How is the Fund&rsquo;s index constructed?</strong></a></li>
<li><a href="#point-five"><strong>Why might investors be interested in long-term municipal bonds?</strong></a></li>
<li><a href="#point-six"><strong>How do long-term munis compare in the risk/reward profile?</strong></a></li>
<li><a href="#point-seven"><strong>How do changing interest rate expectations impact long-term muni performance?</strong></a></li>
<li><a href="#point-eight"><strong>Can long-term munis play a role in retirement income planning?</strong></a></li>
<li><a href="#point-nine"><strong>How does the portfolio management team decide which bonds in the index to own?</strong></a></li>
<li><a href="#point-ten"><strong>How can investors buy the VanEck Long Muni ETF (MLN)?</strong></a></li>
</ul>
<h2 id="point-one" class="anchored-block">What are long-duration municipal bonds, and how big is the municipal bond market?</h2>
<p>Long-duration municipal bonds are debt securities issued by states, municipalities, and other local governments with investment-grade credit ratings (BBB-/Baa3 or higher) and maturities at the long end of the investment-grade municipal yield curve.</p>
<p>They are used to finance major infrastructure and public benefit projects such as transportation systems, water and sewer facilities, schools, and healthcare institutions.</p>
<p>As of 6/30/2025, the overall U.S. municipal bond market totaled roughly <strong>$4.3 trillion</strong> in outstanding debt, according to SIFMA. Long-term maturities represent a substantial portion of that market, often appealing to investors seeking stable, tax-exempt income with higher yield potential compared to shorter maturities.</p>
<h2 id="point-two" class="anchored-block">What makes long-term municipal bonds attractive relative to other types of bonds?</h2>
<ul class="content-list">
<li class="mt-2"><strong>Higher Income Potential:</strong> Long-duration municipal bonds typically offer higher yields than short- or intermediate-term bonds, compensating investors for locking in capital over a longer horizon.</li>
<li class="mt-2"><strong>Tax-Exempt Income:</strong> Interest income from municipal bonds is exempt from federal income tax and may also be exempt from state and local taxes, depending on the investor&rsquo;s residence.</li>
<li class="mt-2"><strong>Credit Strength:</strong> Investment-grade municipals have historically exhibited very low default rates compared to other fixed income sectors, including corporates.</li>
<li class="mt-2"><strong>Portfolio Diversification:</strong> Long-term municipals may provide balance to portfolios by offering both income stability and potential price appreciation if interest rates decline.</li>
</ul>
<h2 id="point-three" class="anchored-block">What is the VanEck Long Muni ETF (MLN)?</h2>
<p>The <strong><a href="https://www.vaneck.com/us/en/investments/long-muni-etf-mln/overview/" title="MLN - VanEck Long Muni ETF">VanEck Long Muni ETF (MLN)</a></strong> seeks to track the performance of the <strong>ICE Long AMT-Free Broad National Municipal Index (MBNL)</strong>, which measures the U.S. dollar-denominated, long-maturity (17 years and longer), investment-grade, tax-exempt bond market. The fund provides diversified exposure to high-quality municipal issuers across the United States, targeting income and total return opportunities at the long end of the yield curve. Dividends are distributed to shareholders monthly, and capital gains are distributed on an annual basis.</p>

<h2 id="point-four" class="anchored-block">How is the Fund&rsquo;s index constructed?</h2>
<p>The ICE Long AMT-Free Broad National Municipal Index (MBNL) includes:</p>
<ul class="content-list">
<li class="mt-2"><strong>Maturities:</strong> 17 years or longer to final maturity.</li>
<li class="mt-2"><strong>Credit Quality:</strong> Minimum rating of Baa3/BBB- or higher, based on Moody&rsquo;s, S&amp;P, or Fitch.</li>
<li class="mt-2"><strong>Minimum Size:</strong> At least $10 million outstanding per bond and $100 million original deal size.</li>
<li class="mt-2"><strong>Exclusions:</strong> Private placements, variable rate demand notes, commercial paper, floating rate debt, and securities in legal default.</li>
<li class="mt-2"><strong>Rebalancing:</strong> Monthly, with market value weighting.</li>
</ul>
<p>This methodology ensures broad and representative exposure to the long end of the investment-grade municipal curve.</p>
<h2 id="point-five" class="anchored-block">Why might investors be interested in long-term municipal bonds?</h2>
<p>The long end of the municipal yield curve offers among the highest tax-exempt yields available in today&rsquo;s investment-grade fixed income bond market. For investors who can tolerate modest price volatility, long-duration munis present the opportunity to lock in elevated income levels and potentially benefit from price appreciation if interest rates move lower.</p>
<p>Historically, long-term municipal bonds have provided strong after-tax income and attractive total return potential, especially during periods of declining or stable rate environments. With yields near multi-year highs, investors may find this an opportune time to establish or extend duration within a tax-efficient portfolio.</p>
<h2 id="point-six" class="anchored-block">How do long-term munis compare in the risk/reward profile?</h2>
<p>Long-term municipal bonds generally offer higher income potential than shorter-duration fixed income assets, but they also carry greater price sensitivity to changes in interest rates.</p>
<p>Over time, however, investment-grade long munis have demonstrated a compelling risk-adjusted profile: combining the stability of municipal credit quality with higher yields and potential capital appreciation when rates decline. For investors seeking durable, tax-efficient income and longer-term total return, they can serve as a cornerstone allocation within a municipal bond strategy.</p>
<h2 id="point-seven" class="anchored-block">How do changing interest rate expectations impact long-term muni performance?</h2>
<p>Because long-duration bonds are more sensitive to interest rate changes, their prices can fluctuate more than short-term maturities. When rates fall, long munis typically outperform due to price appreciation; when rates rise, they can lag. For investors with a multi-year horizon, however, reinvested income and the potential for rate stabilization often help smooth total returns over time. Understanding this dynamic can help investors stay focused on long-term income rather than short-term volatility.</p>
<h2 id="point-eight" class="anchored-block">Can long-term munis play a role in retirement income planning?</h2>
<p>Yes. For investors seeking predictable, tax-exempt income in retirement, long-duration municipal bonds can help lock in higher yields for decades. While they carry more duration risk, their stable credit quality and federally tax-free income can complement other fixed income holdings - especially for those in higher tax brackets looking to preserve after-tax income stability through market cycles.</p>
<h2 id="point-nine" class="anchored-block">How does the portfolio management team decide which bonds in the index to own?</h2>
<p><strong><a href="https://www.vaneck.com/us/en/investments/long-muni-etf-mln/overview/" title="MLN - VanEck Long Muni ETF">MLN</a></strong> uses a sampling approach similar to other VanEck muni ETFs. The team selects a representative basket of bonds that match the index&rsquo;s risk and return characteristics, optimizing for liquidity, transaction cost efficiency, and credit diversification. This approach seeks to minimize tracking error while maintaining the fund&rsquo;s long-duration profile and income consistency.</p>
<p><img loading="lazy" class="img-responsive" src="https://www.vaneck.com/EPiServer/CMS/Content/contentassets/1cacfa456ed54e5e934c92547e513d34/6461_mln-faq-blog_infographic-1_2025-11_v2_blog.svg,,353861/Download?epieditmode=False" /></p>
<p class="chart-disclosure">Source: VanEck.</p>

<h2 id="point-ten" class="anchored-block">How can investors buy the VanEck Long Muni ETF (MLN)?</h2>
<p><strong><a href="https://www.vaneck.com/us/en/investments/long-muni-etf-mln/overview/" title="MLN - VanEck Long Muni ETF">Find more information here</a>.</strong></p>
<p><span style="font-size: 14pt;"><strong>How to buy MLN?</strong></span></p>
<p>VanEck ETFs can be purchased the same way you would buy a stock, through a broker or with your advisor.</p>
<p class="d-none d-lg-block"><a href="mailto:askvaneck@vaneck.com" title="Have More Questions? - Ask VanEck" rel="noopener"><img loading="lazy" class="img-responsive" src="https://www.vaneck.com/globalassets/home/us/insights/blogs/bm-blog-images/cta-faq_desktop-02.svg" alt="Have More Questions? - Ask VanEck" /></a></p>
<p class="d-lg-none"><a href="mailto:askvaneck@vaneck.com" title="Have More Questions? - Ask VanEck" rel="noopener"><img loading="lazy" class="img-responsive" src="https://www.vaneck.com/globalassets/home/us/insights/blogs/bm-blog-images/cta-faq_mobile-01.svg" alt="Have More Questions? - Ask VanEck" /></a></p>
<p>To receive more <a href="https://www.vaneck.com/us/en/insights/municipal-bonds/" title="Municipal Bonds Insights"><strong>Municipal Bonds</strong></a> insights, <a href="/link/5f45412c2143400497908cea2897f7d3.aspx" title=" Subscription Center"><strong>sign up in our subscription center</strong></a>.</p>
]]></content:encoded>
</item><item rdf:about="https://www.vaneck.com/us/en/blogs/income-investing/what-drives-double-digit-yields-in-mortgage-reits/">
  <title>What Drives Double-Digit Yields in Mortgage REITs></title>
  <link>https://www.vaneck.com/us/en/blogs/income-investing/what-drives-double-digit-yields-in-mortgage-reits/</link>
  <description><![CDATA[Mortgage REITs are regaining attention as falling short-term rates widen interest-rate spreads and revive the potential for double-digit income.]]></description>
  <dc:creator>Coulter Regal, CFA</dc:creator>
  <dc:date>11/25/2025 06:30:00</dc:date>
<content:encoded><![CDATA[

<p><strong>Key Takeaways:</strong></p>
<ul class="content‐list">
<li class="mt‐2">Mortgage REITs generate high income by borrowing short and investing long, so their double-digit yields largely reflect interest-rate spreads amplified by leverage.</li>
<li class="mt‐2">Falling short-term rates and a steepening yield curve can support mREIT earnings, but funding costs, prepayments, and credit conditions remain key swing factors.</li>
<li class="mt‐2">Strategies vary widely across the mREIT universe, making diversified exposure through a vehicle like <a href="/link/b1c9e5d0029f41e1b5a5869303671518.aspx" title="MORT - VanEck Mortgage REIT Income ETF"><strong>MORT</strong></a> a practical way to capture yield while limiting single-name risk.</li>
</ul>
<p>The Federal Reserve has shifted back toward easing, prompting many income-focused investors to reconsider their options. When short-term rates decline, the search for yield often widens beyond traditional bonds. Mortgage real estate investment trusts, or <a href="/us/en/blogs/income-investing/investing-in-mortgage-reits/" title="Investing in Mortgage REITs"><strong>mortgage REITs (mREITs)</strong>,</a> stand out because of their potential for high income. Yields in this segment have often been in the double digits, which explains why mortgage REITs frequently come to mind when investors seek to boost portfolio income.</p>
<h3>Mortgage REIT Yields vs Other High Yield Investments</h3>
<p><img loading="lazy" class="img-responsive" alt="Mortgage REIT Yields vs Other High Yield Investments" src="https://www.vaneck.com/contentassets/43e256e46e1f45749f5df80a3dbfe1b3/6442_reits-mort-high-income-blog_chart_2025-11_v1.svg" /></p>
<p class="chart-disclosure"><strong>Source: FactSet and ICE Data Indices. Data as of 10/31/2025. Past performance is no guarantee of future results.</strong> Yield for Mortgage REITs, Equity REITs, Utilities Stocks, and U.S. Stocks represented by dividend yield. Yield for U.S. HY Bonds, U.S. IG Bonds, and 10 Yr Treasury represented by yield-to-worst. Mortgage REITs represented by MVIS US Mortgage REITs Index; U.S. HY Bonds represented by ICE BofA US High Yield Index; U.S. IG Bonds represented by ICE BofA U.S. Corporate Index; Equity REITs represented by FTSE NAREIT All Equity REITs Index; Utilities Stocks represented by S&amp;P Utilities Index; U.S. Stocks represented by S&amp;P 500 Index; U.S. 10 Yr Treasury represented by ICE BofA Current 10-Year US Treasury Index.</p>

<h2>How Does a Mortgage REIT Make Money?</h2>
<p>So where does that double-digit yield come from? In short, mortgage REITs earn income on interest rate spreads. They first obtain short-term funding, often through repurchase agreements, and then use that financing to purchase longer-term mortgage-related assets that pay interest. The difference between the interest earned on assets and the interest paid on funding is known as the net interest margin, which generates income that funds dividends to shareholders. Many mREITs also utilize leverage, borrowing several dollars for every dollar of equity, to convert a modest spread into a more substantial income.</p>
<p>Since mREITs typically borrow at short maturities and then invest in longer-dated mortgage assets, the curve of the yield market matters. When short-term rates fall, the cost of that funding usually declines, which can widen the spread between borrowing costs and the yields earned on assets. A steeper yield curve, where long-term rates sit above short-term rates, can be especially supportive because asset yields tend to follow longer maturities, while funding costs follow shorter ones. With the Fed easing again, these dynamics can be a constructive backdrop for mREIT business models.</p>
<p>The various types of assets owned by mREITs are also worth covering. Some focus on mortgage-backed securities guaranteed by agencies such as Fannie Mae and Freddie Mac, where credit risk is minimal. Others invest in non-agency or credit-sensitive mortgages that may offer higher yields. There are residential mortgage REITs that focus on home loans, and there are commercial mortgage REITs that originate or hold loans tied to office buildings, apartments, industrial properties, and other commercial segments. Some may also own mortgage servicing rights, which generate a fee for collecting monthly payments and are a source of revenue alongside interest income.</p>
<h2>Are Mortgage REITs a Safe Investment?</h2>
<p>While Mortgage REITs can offer high income, that income does come with certain trade-offs that are worth understanding before investing. The primary risks stem from fluctuations in interest rates, borrower behavior, and the ease with which firms can secure their short-term funding.</p>
<ul class="content-list">
<li class="mt-2"><strong>Interest Rate Risk</strong>: Rapid or unexpected rate changes can impact book values, hedges, and the cost of financing. If short-term rates rise quickly, spreads can compress.</li>
<li><strong>Prepayment Risk</strong>: When homeowners refinance or pay off loans sooner, cash flows return earlier and must be reinvested at potentially lower yields.</li>
<li class="mt-2"><strong>Credit Risk</strong>: REITs that own non-agency or commercial mortgages take on borrower credit risk. Economic weakness or property-specific stress can lead to losses.</li>
<li class="mt-2"><strong>Rollover Risk</strong>: Since funding is short-term, borrowings must be rolled over frequently. If market liquidity tightens or lenders pull back, funding could become more expensive or harder to access.</li>
</ul>
<p>Accessing mortgage REITs through a diversified portfolio can help mitigate some of these risks. Investors often turn to ETFs like the <strong><a href="/link/b1c9e5d0029f41e1b5a5869303671518.aspx" title="MORT - VanEck Mortgage REIT Income ETF - Overview">VanEck Mortgage REIT Income ETF (MORT)</a></strong> for convenient exposure to a diverse range of mortgage REITs without the need to maintain a roaster of individual holdings.</p>
<h2>Mortgage REIT Strategies Differ</h2>
<p>It is also important to note that the mREIT category is broad, and differences in strategy can result in significantly different outcomes. What each REIT owns, the amount of leverage it uses, and how it hedges interest rate exposure all influence dividend levels and volatility. For context, investors will see variation across several dimensions.</p>
<ul class="content-list">
<li class="mt-2"><strong>Asset Mix</strong>: Residential versus commercial focus, agency versus non-agency exposure, and the degree to which mortgage servicing rights are used as a stabilizing, fee-like component.</li>
<li class="mt-2"><strong>Hedging Approach</strong>: The use of swaps, futures, and options to manage interest rate sensitivity can differ significantly.</li>
<li class="mt-2"><strong>Leverage</strong>: Target leverage and capital buffers shape both income potential and downside risk.</li>
<li class="mt-2"><strong>Other factors,</strong> such as geographic concentration, borrower types, and sector preferences within commercial real estate, can also matter.</li>
</ul>
<p>Evaluating all of these factors across dozens of REITs can be time consuming, which is why some investors prefer a diversified vehicle.</p>
<h2>How to Invest in Mortgage REITs with an ETF</h2>
<p>The <strong><a href="/link/b1c9e5d0029f41e1b5a5869303671518.aspx" title="MORT - VanEck Mortgage REIT Income ETF - Overview">VanEck Mortgage REIT Income ETF (MORT)</a></strong> provides diversified access to a broad range of U.S. mortgage REITs through a single ticker. MORT&rsquo;s portfolio approach helps spread company-specific and strategy-specific risks, while preserving the key reason investors look at the space in the first place: the potential for elevated income. It also offers the convenience, transparency, and trading flexibility of an ETF wrapper, making it a practical entry point for investors seeking exposure to mortgage REITs without the need to build and maintain a portfolio of individual holdings.</p>
<p>The <strong><a href="/link/b1c9e5d0029f41e1b5a5869303671518.aspx" title="MORT - VanEck Mortgage REIT Income ETF - Overview">VanEck Mortgage REIT Income ETF (MORT)</a></strong> seeks to replicate, before fees and expenses, the price and yield performance of the MVIS US Mortgage REITs Index, which is designed to track the overall performance of U.S. mortgage real estate investment trusts.</p>

<p>To receive more <a href="/us/en/blogs/income-investing/" title="Income Investing Insights"><strong>Income Investing</strong></a> insights, <a href="/link/5f45412c2143400497908cea2897f7d3.aspx" title=" Subscription Center"><strong>sign up in our subscription center</strong></a>.</p>
]]></content:encoded>
</item><item rdf:about="https://www.vaneck.com/us/en/blogs/income-investing/floating-rates-capturing-short-term-yields-as-the-yield-curve-normalizes/">
  <title>Floating Rates: Capturing Short-Term Yields as the Yield Curve Normalizes></title>
  <link>https://www.vaneck.com/us/en/blogs/income-investing/floating-rates-capturing-short-term-yields-as-the-yield-curve-normalizes/</link>
  <description><![CDATA[With the yield curve normalized and rates easing, now is the time for investors to seek higher yield and stability through floating rate notes and diversified income strategies.]]></description>
  <dc:creator> </dc:creator>
  <dc:date>11/25/2025 06:30:00</dc:date>
<content:encoded><![CDATA[

<p><strong>Key Takeaways:</strong></p>
<ul class="content-list">
<li class="mt-2">Investors may benefit from shifting toward floating rate notes to capture higher yields and move beyond low-return cash holdings.</li>
<li class="mt-2">Investment grade floating rate notes currently yield 5.12%, offering attractive income potential while minimizing duration risk.</li>
<li class="mt-2">Combining FRNs with CLO exposure can enhance portfolio resilience through diversified, floating-rate income streams.</li>
</ul>
<p>After two years of inversion, the yield curve has normalized. On October 31, 2025, the 2s/10s spread closed at +0.49% following the late October policy cut, with longer-maturity yields remaining elevated as markets reassess inflation and Treasury supply conditions. The Fed lowered the policy rate to 3.75%&ndash;4.00% on October 29 and indicated it will halt balance-sheet runoff on December 1.</p>
<p>Investors, however, continue to sit on record levels of cash with money market fund assets at approximately $7 trillion. While cash has been a safe rate-sensitive haven, it provides limited upside once policy rates peak. With the curve only modestly positive, a rate cutting cycle that is expected to be shallow, and continued pressure on long-term bond yields, investment-grade floating-rate notes (FRNs) remain a compelling short duration income option.</p>
<h2>The Curve Continues to Normalize</h2>
<p>The steepening marks a transition from the &ldquo;higher-for-longer&rdquo; stance that defined 2023 - 2024. However, the slow pace and shallow magnitude of rate cuts have continued to make floating rate an attractive option within an income portfolio. Market-implied expectations point to modest, maybe 2 or 3, additional cuts through 2026, contingent on data. If the labor market softens faster, easing could come sooner; if growth holds, cuts may be delayed. Elevated inflation, widening fiscal deficits and geopolitical tension have kept upward pressure on long term yields even as the Fed cuts rates.</p>
<h3>Difference Between 10-Year and 2-Year US Treasury Yields</h3>
<p><img loading="lazy" class="img-responsive w-100" alt="Difference Between 10-Year and 2-Year US Treasury Yields" src="https://www.vaneck.com/contentassets/02ecddf88dff49bbb0f5f266547e7700/6460_fltr-blog_chart-1_2025-11_v1_blog.svg" /></p>
<p class="chart-disclosure">Source: ICE Data Services, VanEck.Past performance is no guarantee of future results.</p>

<p>For investors, this environment challenges traditional playbooks. Long-duration bonds, which prospered during decades of falling yields, now offer limited price appreciation and heightened downside if yields rise again. The recent volatility in Treasuries reflects shifting expectations for inflation and policy. Extending duration preemptively could prove costly should long yields remain stubbornly high.</p>
<h2>Why Floating Rate Notes Still Make Sense</h2>
<p>We believe that these factors continue to support an allocation to the short end of the yield where FRNs may provide a way to earn attractive income while minimizing exposure to rate volatility.</p>
<p>Floating rate notes, such as the <a href="/link/0eff4e75a2114e0f8a7e71694dc0ad16.aspx" title="FLTR - VanEck IG Floating Rate ETF - Overview"><strong>VanEck IG Floating Rate ETF (FLTR)</strong></a>, offer an efficient way to navigate today&rsquo;s shifting rate environment. FRNs pay coupons that reset, usually quarterly, based on SOFR plus fixed spread, giving them near-zero duration and insulating prices from rate swings.</p>
<p>At the end of October, IG FRNs yielded 5.12%, comparing favorably with short- and fixed-rate corporate bonds (3.82% and 4.82%, respectively). Because their coupons adjust with market rates, FRNs exhibit low price sensitivity across both tightening and easing cycles. This structure helps reduce mark-to-market volatility while preserving income potential.</p>
<p>In short, FRNs capture today&rsquo;s elevated short-term yields without adding duration risk. If short term rates decline, coupon income adjusts lower, but prices typically remain stable, a balanced trade-off between income and capital stability.</p>

<h2>Building Resilience Through Diversification</h2>
<p>To further strengthen an ultrashort duration approach, investors can pair FRNs with exposure to CLOs through <a href="/link/e090deaddc774ac699a04b959d9254c6.aspx" title="CLOI - VanEck CLO ETF - Overview"><strong>VanEck CLO ETF (CLOI)</strong></a> and <a href="/link/d2f16468a9f14c1e807f6bb7fb597a3e.aspx" title="CLOB - VanEck AA-BB CLO ETF - Overview"><strong>VanEck AA&ndash;BB CLO ETF (CLOB)</strong></a>. CLOs are portfolios of senior secured loans with floating coupons and structural credit protection.</p>
<ul class="content-list">
<li class="mt-2"><a href="/link/e090deaddc774ac699a04b959d9254c6.aspx" title="CLOI - VanEck CLO ETF - Overview"><strong>CLOI</strong></a> focuses on IG tranches which were yielding yields 4.95% and have low credit risk. Notably, no investment grade CLO has ever defaulted post GFC.</li>
<li class="mt-2"><a href="/link/d2f16468a9f14c1e807f6bb7fb597a3e.aspx" title="CLOB - VanEck AA-BB CLO ETF - Overview"><strong>CLOB</strong></a> primarily holds AA&ndash;BB rated tranches which recently offered yields of 6.82%.</li>
</ul>
<p>CLO structures also include built-in protections such as diversification across hundreds of loans and priority in payment waterfalls. These features have helped maintain strong performance through past cycles. For investors seeking to maintain income without extending duration, CLOs represent an attractive complement to corporate FRNs.</p>

<p>To receive more <a href="/us/en/blogs/income-investing/" title="Income Investing Insights"><strong>Income Investing</strong></a> insights, <a href="/link/5f45412c2143400497908cea2897f7d3.aspx" title=" Subscription Center"><strong>sign up in our subscription center</strong></a>.</p>
]]></content:encoded>
</item><item rdf:about="https://www.vaneck.com/us/en/blogs/income-investing/preferred-stocks-emerge-as-a-high-monthly-income-source/">
  <title>Preferred Stocks Emerge as a High Monthly Income Source></title>
  <link>https://www.vaneck.com/us/en/blogs/income-investing/preferred-stocks-emerge-as-a-high-monthly-income-source/</link>
  <description><![CDATA[A rare pocket of high monthly income has emerged in ex-financial preferreds, creating an opening for investors looking to boost yield.]]></description>
  <dc:creator>Kendall Duncan </dc:creator>
  <dc:date>11/24/2025 06:30:00</dc:date>
<content:encoded><![CDATA[

<p><strong>Key Points</strong></p>
<ul class="content-list">
<li class="mt-2">Preferred securities can help investors maximize yields during times of falling rates due to their unique structure that sits between bonds and common equity.</li>
<li class="mt-2">Preferred securities can be imbalanced towards financial companies. By excluding financials investors have a more balanced and differentiated portfolio.</li>
<li class="mt-2">The <a title="VanEck Preferred Securities ex Financials ETF | Overview" href="/link/90451e6acf204dae87d1c8a31d9db407.aspx"><strong>VanEck Preferred Securities ex Financials ETF (PFXF)</strong></a> provides diversified exposure to U.S.-listed preferred securities without the financial sector risk.</li>
</ul>
<h2 id="maximizing-yields" class="jump-link-nav anchored-block" data-jumplink-title="Maximizing Yields">Maximizing Yields for Falling Rates</h2>
<p>In an environment where income is harder to come by, <strong><a href="/us/en/blogs/income-investing/what-is-preferred-stock/" title="What is Preferred Stock? Understanding Types and Benefits">preferred securities</a></strong> remain appealing. These hybrid instruments sit between bonds and common equity in a company&rsquo;s capital structure, offering higher coupons than bonds while retaining seniority over common stock. The appeal is amplified now, as many income-oriented investors brace for muted bond returns and look for additional yield.</p>
<p>By avoiding preferred securities issued by financial institutions (banks, insurers, etc.), <a href="/link/90451e6acf204dae87d1c8a31d9db407.aspx" title="PFXF - VanEck Preferred Securities ex Financials ETF - Overview"><strong>PFXF</strong></a> focuses on high-yielding preferreds from utilities, REITs, industrial hybrids, and other non-financial issuers. That distinction matters in late 2025, as the financial sector faces renewed uncertainty.</p>
<p>Ex-financial preferreds sit toward the top of the income spectrum. At roughly 6.9% current yield, they outpace not only the S&amp;P 500&rsquo;s 1.1% dividend yield but also Treasuries (4.2%), high-grade corporates (4.7%), and even broad preferred-stock benchmarks (6.1%). In a market where traditional income sources remain compressed, that incremental yield can make a meaningful difference in total return potential and portfolio diversification.</p>
<h3>Ex-Financial Preferreds Yield Comparison</h3>
<p><img loading="lazy" class="img-responsive" alt="Ex-Financial Preferreds Yield Comparison" src="https://www.vaneck.com/contentassets/7c51bb59e31c41da90f4b82ce8d08a1e/6444_pfxf-high-income-blog_2025-11_v1_blog-01.svg" /></p>
<p class="chart-disclosure">Source: ICE Data Indices, FactSet as of October 2025. Yields presented are current yields (ratio of annual interest payment and the security&rsquo;s current price), except for Equities&rsquo; dividend yield (dividend per share, divided by the price per share. Broad Preferred Securities universe is represented by the ICE Exchange-Listed Fixed &amp; Adjustable Rate Preferred Securities Index (PFAR), Ex-Financial Preferreds represented by the ICE Exchange-Listed Fixed &amp; Adjustable Rate Non-Financial Preferred Securities Index (PFAN), 10-Year U.S. Treasury represents ICE BofA Current 10-Year US Treasury Index (GA10), Equities represents S&amp;P 500<sup>&reg;</sup>&nbsp;Index (SPX), High Grade Corporate Bonds represents ICE BofA US Corporate Index (C0A0), and High Yield Corporate Bonds represents ICE BofA US High Yield Index (H0A0). See disclaimers and index descriptions at the end of this presentation. An index's performance is not illustrative of a fund's performance. Indices are not securities in which investments can be made. <strong>Past performance is not a guarantee of future results.</strong></p>

<h2>Why Concentration Risk Adds Weight to the &ldquo;Ex-Financials&rdquo; Case</h2>
<p>While investors often discuss &ldquo;Mag 7&rdquo; concentration in equities, few recognize that preferreds face an even greater imbalance toward Financials. Banks and insurers issue most preferred securities, leaving most broad preferred strategies heavily concentrated in one sector. This concentration means that shifts in regulation, credit conditions, or capital requirements can move a large portion of the preferreds market at once, reducing diversification and increasing volatility.</p>
<p>At the same time, the financial landscape itself is evolving. Growth in digital assets and stablecoin adoption is reshaping conversations around payments, deposits, and balance-sheet design. These changes are still developing, but they highlight how quickly business models at traditional financial institutions can shift. For preferred investors, that backdrop reinforces the value of reducing heavy exposure to any one sector.</p>
<p>By excluding Financials, <a href="/link/90451e6acf204dae87d1c8a31d9db407.aspx" title="PFXF - VanEck Preferred Securities ex Financials ETF - Overview"><strong>PFXF</strong></a> avoids that concentration and provides access to preferred income sourced from utilities, REITs, industrial hybrids, and other non-financial issuers. The result is a more balanced and differentiated preferreds profile that complements, rather than mirrors, the financial sector&rsquo;s cycle.</p>
<h2 id="manage-call-risk" class="jump-link-nav anchored-block" data-jumplink-title="Manage Call Risk">How to Manage Call Risk and Reinvestment Stability</h2>
<p>A key differentiator for <a href="/link/90451e6acf204dae87d1c8a31d9db407.aspx" title="PFXF - VanEck Preferred Securities ex Financials ETF - Overview"><strong>PFXF</strong></a> is its lower exposure to callable and perpetual preferred securities compared to the broader preferreds market. Many traditional preferreds can be called by issuers when rates decline, forcing investors to reinvest proceeds at lower yields, a dynamic known as call risk.</p>
<p>Because <a href="/link/90451e6acf204dae87d1c8a31d9db407.aspx" title="PFXF - VanEck Preferred Securities ex Financials ETF - Overview"><strong>PFXF</strong></a>&rsquo;s underlying holdings feature fewer perpetual and long-dated issues, the fund is naturally positioned with less call exposure. This structure helps preserve yield stability and reduces reinvestment risk during periods of falling rates or renewed issuance activity.</p>
<div class="wrapped-div">
<table style="width: 100%;">
<tbody>
<tr class="tbl-data">
<td class="tbl-header last">Characteristics</td>
<td class="tbl-header text-right">Ex-Financial Preferreds Index</td>
<td class="tbl-header last text-right">Broad Preferreds Index</td>
</tr>
<tr class="tbl-data">
<td class="data-td last font-weight-normal">Perpetual (%)</td>
<td class="data-td data last text-right">44.64</td>
<td class="data-td data last text-right">63.01</td>
</tr>
<tr class="tbl-data">
<td class="data-td last font-weight-normal">Modified Duration (Yrs)</td>
<td class="data-td data last text-right">8.62</td>
<td class="data-td data last text-right">12.66</td>
</tr>
<tr class="tbl-data">
<td class="data-td last font-weight-normal">Effective Duration (Yrs)</td>
<td class="data-td data last text-right">4.62</td>
<td class="data-td data last text-right">7.56</td>
</tr>
<tr class="tbl-data">
<td class="data-td last font-weight-normal">Callable (%)</td>
<td class="data-td data last text-right">68.52</td>
<td class="data-td data last text-right">99.66</td>
</tr>
</tbody>
</table>
</div>
<p class="chart-disclosure">Source: ICE Data Indices, FactSet. Data as of 9/30/2025. Ex-Financial Preferreds represented by the ICE Exchange-Listed Fixed &amp; Adjustable Rate Non-Financial Preferred Securities Index (PFAN) and Broad Preferred universe is represented by the ICE Exchange-Listed Fixed &amp; Adjustable Rate Preferred Securities Index (PFAR). See disclaimers and index descriptions at the end of this presentation. An index's performance is not illustrative of a fund's performance. Indices are not securities in which investments can be made.</p>

<h2>Access to Income and Diversification</h2>
<p>The <a href="/link/90451e6acf204dae87d1c8a31d9db407.aspx" title="PFXF - VanEck Preferred Securities ex Financials ETF - Overview"><strong>VanEck Preferred Securities ex Financials ETF (PFXF)</strong></a> provides diversified exposure to U.S.-listed preferred securities without the financial sector risk. By focusing on issuers such as utilities, REITs, and industrials, <a href="/link/90451e6acf204dae87d1c8a31d9db407.aspx" title="PFXF - VanEck Preferred Securities ex Financials ETF - Overview"><strong>PFXF</strong></a> offers access to attractive income potential with broader sector diversification. The ETF combines high-yield opportunity, reduced bank exposure, and the convenience of a single, transparent vehicle for investors seeking preferreds without managing individual holdings.</p>
<p>The <a href="/link/90451e6acf204dae87d1c8a31d9db407.aspx" title="PFXF - VanEck Preferred Securities ex Financials ETF - Overview"><strong>VanEck Preferred Securities ex Financials ETF (PFXF)</strong></a> seeks to replicate as closely as possible, before fees and expenses, the price and yield performance of the ICE Exchange-Listed Fixed &amp; Adjustable Rate Non-Financial Preferred Securities Index (PFAN4PM), which is intended to track the overall performance of U.S. exchange-listed hybrid debt, preferred stock and convertible preferred stock issued by non-financial corporations.</p>
<p>To receive more <a href="/us/en/blogs/income-investing/" title="Income Investing Insights"><strong>Income Investing</strong></a> insights, <a href="/link/5f45412c2143400497908cea2897f7d3.aspx" title=" Subscription Center"><strong>sign up in our subscription center</strong></a>.</p>
]]></content:encoded>
</item><item rdf:about="https://www.vaneck.com/us/en/blogs/natural-resources/pit-etf-question-and-answer/">
  <title>PIT ETF: Question &amp; Answer></title>
  <link>https://www.vaneck.com/us/en/blogs/natural-resources/pit-etf-question-and-answer/</link>
  <description><![CDATA[This blog answers commonly asked questions about the PIT ETF and explores the role of commodities in the global economy and their portfolio benefits.]]></description>
  <dc:creator> </dc:creator>
  <dc:date>11/21/2025 06:30:00</dc:date>
<content:encoded><![CDATA[

<p>Commodities are the foundation of the global economy &mdash; from the energy that powers industries to the metals, grains, and livestock that sustain growth and everyday life. Their prices are influenced by a wide range of factors, including supply and demand, geopolitical developments, weather, and broader economic trends, making the asset class both dynamic and diverse. Because commodities often behave differently from traditional assets like stocks and bonds, they can enhance portfolio diversification and provide a potential hedge against inflation. Against this backdrop, the <a href="https://www.vaneck.com/us/en/investments/commodity-strategy-etf-pit/overview/" title="PIT - VanEck Commodity Strategy ETF - Overview"><strong>VanEck Commodity Strategy ETF (PIT)</strong></a> offers investors an efficient, actively managed approach to gaining broad exposure to global commodities through a single investment.</p>
<ul class="content-list">
<li class="mt-2"><a href="#point-one"><strong>Why commodities?</strong></a></li>
<li class="mt-2"><a href="#point-two"><strong>How does the VanEck Commodity Strategy ETF (PIT) invest?</strong></a></li>
<li class="mt-2"><a href="#point-three"><strong>What is roll yield methodology and how does it impact the Fund?</strong></a></li>
<li class="mt-2"><a href="#point-four"><strong>What makes the PIT ETF different from other commodity ETFs?</strong></a></li>
<li class="mt-2"><a href="#point-five"><strong>How can PIT fit into a portfolio?</strong></a></li>
<li class="mt-2"><a href="#point-six"><strong>What are the key risks of investing in PIT?</strong></a></li>
<li class="mt-2"><a href="#point-seven"><strong>How is PIT structured and taxed?</strong></a></li>
<li class="mt-2"><a href="#point-eight"><strong>How can investors buy the VanEck Commodity Strategy ETF (PIT)?</strong></a></li>
</ul>
<h2 id="point-one" class="anchored-block">Why commodities?</h2>
<p>Commodities have historically served as both a portfolio diversifier and an inflation hedge. Because they often move differently from stocks and bonds, they can help smooth out portfolio returns over time and tend to perform well during periods of rising inflation.</p>
<h2 id="point-two" class="anchored-block">How does the <a href="https://www.vaneck.com/us/en/investments/commodity-strategy-etf-pit/overview/" title="PIT - VanEck Commodity Strategy ETF - Overview">VanEck Commodity Strategy ETF (PIT)</a> invest?</h2>
<p>The <strong><a href="/link/fae5e7a97c094c9b924c6ee6aec199fd.aspx" title="PIT VanEck Commodity Strategy ETF">PIT</a></strong> ETF invests primarily in commodity futures contracts and other instruments that track the prices of raw materials such as oil, metals, and agricultural products. The Fund covers five key sectors &mdash; energy, precious metals, industrial metals, agriculture, and livestock &mdash; providing diversified exposure across global commodities markets. The investment team uses a systematic, research-driven process to identify which commodities and contract maturities offer the most attractive risk-adjusted opportunities. The Fund also holds U.S. Treasury bills and cash equivalents as collateral. Because <strong><a href="/link/fae5e7a97c094c9b924c6ee6aec199fd.aspx" title="PIT VanEck Commodity Strategy ETF">PIT</a></strong> is actively managed, sector weights and holdings can shift over time as market conditions evolve. It does not hold physical commodities directly.</p>

<h2 id="point-three" class="anchored-block">What is roll yield methodology and how does it impact the Fund?</h2>
<p>Roll yield refers to the gain or loss that occurs when rolling futures contracts forward as they near expiration. A negative roll yield can occur when longer-dated contracts are more expensive than near-term contracts (a condition known as contango), while a positive roll yield arises when the opposite is true (backwardation). <strong><a href="/link/fae5e7a97c094c9b924c6ee6aec199fd.aspx" title="PIT VanEck Commodity Strategy ETF">PIT's</a></strong> portfolio construction process seeks to invest at points on the futures curve that maximize potential roll yield opportunities.</p>
<h2 id="point-four" class="anchored-block">What makes the <strong><a href="/link/fae5e7a97c094c9b924c6ee6aec199fd.aspx" title="PIT VanEck Commodity Strategy ETF">PIT</a></strong> ETF different from other commodity ETFs?</h2>
<p>Unlike many commodity funds that passively track an index, <strong><a href="/link/fae5e7a97c094c9b924c6ee6aec199fd.aspx" title="PIT VanEck Commodity Strategy ETF">PIT</a></strong> is actively managed. This means the portfolio managers have the flexibility to adjust exposures based on changing market conditions, price momentum, and roll-yield dynamics. Guided by VanEck&rsquo;s long-standing expertise in real assets and quantitative investing, the team applies a disciplined, data-driven approach to pursue attractive risk-adjusted returns. For tax efficiency and broader access to global commodity markets, the Fund may invest up to 25% of its assets in a wholly owned Cayman Islands subsidiary that holds certain commodity positions.</p>
<h2 id="point-five" class="anchored-block">How can PIT fit into a portfolio?</h2>
<p><strong><a href="/link/fae5e7a97c094c9b924c6ee6aec199fd.aspx" title="PIT VanEck Commodity Strategy ETF">PIT</a></strong> can play several roles &mdash; as a diversifier, a tactical inflation hedge, or a strategic long-term allocation to real assets. Because commodity returns have historically had low correlation with equities and bonds, even a modest allocation can help improve the overall balance and resilience of a diversified portfolio.</p>
<h2 id="point-six" class="anchored-block">What are the key risks of investing in <strong><a href="/link/fae5e7a97c094c9b924c6ee6aec199fd.aspx" title="PIT VanEck Commodity Strategy ETF">PIT</a></strong>?</h2>
<p>Commodities can be volatile and are influenced by supply and demand, geopolitical events, and economic cycles. Futures-based investments may be affected by factors such as contango or backwardation (changes in futures pricing over time). Additional risks include liquidity, active-management, and regulatory risks. As with all ETFs, shares may trade at prices above or below their net asset value, particularly during periods of market volatility.</p>

<h2 id="point-seven" class="anchored-block">How is <strong><a href="/link/fae5e7a97c094c9b924c6ee6aec199fd.aspx" title="PIT VanEck Commodity Strategy ETF">PIT</a></strong> structured and taxed?</h2>
<p><strong><a href="/link/fae5e7a97c094c9b924c6ee6aec199fd.aspx" title="PIT VanEck Commodity Strategy ETF">PIT</a></strong> is structured to provide efficient access to commodities within U.S. tax rules. <strong>No Schedule K-1 is required.</strong> However, because the Fund trades futures contracts and uses a subsidiary structure, its tax treatment may differ from that of a traditional stock or bond fund. Investors should consult a tax advisor for details on their specific situation.</p>
<p id="point-eight" class="anchored-block"><span style="font-size: 14pt;"><strong>How to buy PIT?</strong></span></p>
<p>VanEck ETFs can be purchased the same way you would buy a stock, through a broker or with your advisor.</p>
<p class="d-none d-lg-block"><a href="mailto:askvaneck@vaneck.com" title="Have More Questions? - Ask VanEck" rel="noopener"><img loading="lazy" class="img-responsive" src="https://www.vaneck.com/globalassets/home/us/insights/blogs/bm-blog-images/cta-faq_desktop-02.svg" alt="Have More Questions? - Ask VanEck" /></a></p>
<p class="d-lg-none"><a href="mailto:askvaneck@vaneck.com" title="Have More Questions? - Ask VanEck" rel="noopener"><img loading="lazy" class="img-responsive" src="https://www.vaneck.com/globalassets/home/us/insights/blogs/bm-blog-images/cta-faq_mobile-01.svg" alt="Have More Questions? - Ask VanEck" /></a></p>
<p>To receive more <a href="/us/en/insights/natural-resources/" title="Natural Resources Insights"><strong>Natural Resources</strong></a> insights, <a href="https://www.vaneck.com/us/en/subscribe/" title="Subscription Center"><strong>sign up in our subscription center</strong></a>.</p>
]]></content:encoded>
</item><item rdf:about="https://www.vaneck.com/us/en/blogs/digital-assets/matthew-sigel-top-5-builders-driving-solanas-dominance/">
  <title>Top 5 Builders Driving Solana’s Dominance></title>
  <link>https://www.vaneck.com/us/en/blogs/digital-assets/matthew-sigel-top-5-builders-driving-solanas-dominance/</link>
  <description><![CDATA[We examine the top 5 builders powering Solana&rsquo;s accelerating dominance by driving trading activity, liquidity, real-world infrastructure adoption, and billions in onchain economic value.]]></description>
  <dc:creator>Patrick Bush</dc:creator>
  <dc:date>11/20/2025 13:30:00</dc:date>
<content:encoded><![CDATA[

<p><strong>Please note that VanEck may have a position(s) in the digital asset(s) described below.</strong></p>
<p><strong>Key Takeaways:</strong></p>
<ul class="content-list">
<li class="mt-2">Solana drives meaningful onchain trading activity with <strong>$1.4T </strong>in decentralized exchange (DEX) volume and <strong>$4.5T</strong> in stablecoin transfers YTD.</li>
<li class="mt-2">Creator-coin platforms are generating significant revenue, with pump.fun nearing <strong>$900M</strong> lifetime and hitting a <strong>$6M</strong> fee day.</li>
<li class="mt-2">Distribution fuels usage, with Phantom&rsquo;s <strong>3M </strong>monthly average users (MAUs) executing over <strong>200M</strong> swaps worth <strong>$38B </strong>YTD.</li>
</ul>
<p>Solana&rsquo;s commitment to being at the apex of blockchain network design is converting many crypto software developers into Solana evangelists. This is important because these builders are creating applications hosted on Solana that will drive revenues to the Solana network and its stakers. The most important catalysts of Solana&rsquo;s activity are front‑of‑house applications such as decentralized exchanges (DEXes), creator‑coin rails, wallets, Decentralized Physical Infrastructure Networks (DePIN), and non‑custodial derivatives. To facilitate these applications, Solana offers a network that settles transactions quickly and cheaply. Most importantly, Solana hosts a strong community of well-capitalized, intrepid supporters who will use novel applications.</p>
<p>In this piece, we highlight <strong>5</strong> builders adding meaningful value to Solana: Pump.fun, Phantom, Helium, Drift, and Ellipsis Labs.</p>
<div class="row pt-3 pb-3 align-items-center">
<div class="col-md-9 col-xs-12 col-lg-10">
<h2 id="pump-fun" class="jump-link-nav anchored-block" data-jumplink-title="pump.fun">1) pump.fun: The Creator‑Coin Factory (and New User Funnel)</h2>
</div>
<div class="col-md-3 col-6 col-lg-2 mx-auto">
<p class="my-2"><img loading="lazy" class="img-responsive w-100" src="https://www.vaneck.com/EPiServer/CMS/Content/contentassets/63bc8da2ff5d4246992b461a49265700/pump_fun_300x200.png,,353315/Download?epieditmode=False" alt="pump.fun" /></p>
</div>
</div>
<p><strong>What it does:</strong> Provides a simple framework for non-technical users to launch tokens instantly.</p>
<p><strong>Why it matters for Solana:</strong> Pump.fun consumes significant Solana blockspace by generating new assets that drive trading activity. At peak, pump.fun assets accounted for more than <strong>90%</strong> of all Solana trading volume and delivered millions of dollars per day in revenue to Solana stakers.</p>
<p><strong>Monetization and mechanics:</strong> The platform charges <strong>~1.25%</strong> on swaps for a token until that token reaches a defined market cap threshold. As a token grows, the associated fees step down.</p>
<p><strong>Moat and competition:</strong> Pump.fun&rsquo;s primary moat is network effects from being first to market. Additionally, its developer team churns out products people want to use because they are easy and addictive. Long-term, Pump must retain creators and users while keeping an eye on competitor fees.</p>
<p><strong>Key risks:</strong> The main risk is that competing platforms could design more appealing speculative experiences that capture Pump&rsquo;s core user base. There is also ongoing criticism that Pump&rsquo;s trading mechanics create a zero-sum environment where most users lose money. If this perception persists, users could migrate to speculative platforms they view as fairer.</p>
<h3>Pump.fun's Revenue is Highly Volatile</h3>
<p><img loading="lazy" class="img-responsive" alt="Pump.fun's Revenue is Highly Volatile" src="https://www.vaneck.com/contentassets/63bc8da2ff5d4246992b461a49265700/6425_solana-top-5-companies_chart-1_2025-11_v1.svg" /></p>
<p class="chart-disclosure">Source: Token Terminal as of 11/11/2025. <strong>Past performance is no guarantee of future results. Not intended as a recommendation to buy or sell any securities named herein.</strong></p>
<p><strong>KPIs to watch:</strong> Daily fees, weekly share vs. peers, graduation rates to DEXs, median and mean holder dispersion.</p>
<p><strong>Catalysts (3&ndash;6 months):</strong> Moderation and product updates, fee adjustments, wallets and social media integrations, competitive responses.</p>
<div class="row pt-3 pb-3 align-items-center">
<div class="col-md-9 col-xs-12 col-lg-10">
<h2 id="phantom" class="jump-link-nav anchored-block" data-jumplink-title="Phantom">2) Phantom: The Consumer Gateway</h2>
</div>
<div class="col-md-3 col-6 col-lg-2 mx-auto">
<p class="my-2"><img loading="lazy" class="img-responsive" alt="Phantom" src="https://www.vaneck.com/EPiServer/CMS/Content/contentassets/63bc8da2ff5d4246992b461a49265700/phantom-logo2x.png,,353370/Download?epieditmode=False" /></p>
</div>
</div>
<p><strong>What it does:</strong> Phantom is a self-custody wallet with built-in applications such as token swaps, prediction markets, and NFT trading. It also provides important safety features that protect user funds from malicious transactions and user mistakes. It can be thought of as a browser for onchain users, and users often stick to the first wallet they adopt. Engagement is also high with <strong>&gt;12</strong> opens per day. Phantom generates revenue when users perform actions within the &ldquo;walled garden&rdquo; applications it offers within the wallet.</p>
<p><strong>Why it matters for Solana:</strong> Phantom is the most important entry-level user interface for new Solana users. It removes friction, simplifies application discovery, and helps curious users convert into active participants across Solana&rsquo;s ecosystem.</p>
<p><strong>Moat and roadmap:</strong> Phantom has a strong brand that is deeply embedded into Solana and serves as the first touchpoint for many users. Phantom is also expanding its presence to other blockchains like Sui and Ethereum. Going forward, the roadmap includes more embedded applications, such as payments and identity, which may enable the trading of restricted assets.</p>
<h3>Phantom Earns Revenue Through Embedded Apps</h3>
<p><img loading="lazy" class="img-responsive" alt="Phantom Earns Revenue Through Embedded Apps" src="https://www.vaneck.com/contentassets/63bc8da2ff5d4246992b461a49265700/6425_solana-top-5-companies_chart-2_2025-11_v1.svg" /></p>
<p class="chart-disclosure">Source: Dune as of 11/11/2025. <strong>Past performance is no guarantee of future results. Not intended as a recommendation to buy or sell any securities named herein.</strong></p>
<p><strong>KPIs to watch:</strong> MAUs, swap volumes, share of Actions and Blinks usage, fraud‑loss rates, and fiat on‑ramp conversion.</p>
<p><strong>Catalysts (3&ndash;6 months):</strong> Actions and Blinks distribution, identity, and embedded payments, and changes in app‑store policy.</p>
<div class="row pt-3 pb-3 align-items-center">
<div class="col-md-9 col-xs-12 col-lg-10">
<h2 id="helium" class="jump-link-nav anchored-block" data-jumplink-title="Helium">3) Helium: DePIN at Solana Scale</h2>
</div>
<div class="col-md-3 col-6 col-lg-2 mx-auto">
<p class="my-2"><img loading="lazy" class="img-responsive" alt="Helium" src="https://www.vaneck.com/EPiServer/CMS/Content/contentassets/63bc8da2ff5d4246992b461a49265700/helium-logo2x.jpg,,353373/Download?epieditmode=False" /></p>
</div>
</div>
<p><strong>What it does:</strong> Helium operates decentralized wireless networks and is currently focused on 5G cellular service. The Helium community migrated to Solana in 2023 and minted nearly <strong>1M </strong>hotspot NFTs using Solana&rsquo;s state compression technology, which reduces storage costs and enables fast credentialing at scale.</p>
<p><strong>Why it matters for Solana:</strong> Helium proves that Solana can serve as the leading home for large-scale Decentralized Physical Infrastructure Networks (DePIN). Helium&rsquo;s migration showed that Solana can support millions of device credentials at low cost while also connecting to Solana&rsquo;s broader defi ecosystem for payments, liquidity, and incentive mechanisms.</p>
<p><strong>Architecture and economics:</strong> Helium demonstrates that real-world businesses can use Solana&rsquo;s blockchain as backend infrastructure. Helium earns <strong>&gt;$1.5M</strong> per month in revenue and has grown <strong>+700%</strong> YoY.</p>
<h3>Helium Networks Revenues +700% YoY</h3>
<p><img loading="lazy" class="img-responsive" alt="Helium Networks Revenues +700% YoY" src="https://www.vaneck.com/contentassets/63bc8da2ff5d4246992b461a49265700/6425_solana-top-5-companies_chart-3_2025-11_v1.svg" /></p>
<p class="chart-disclosure">Source: Dune as of 11/11/2025. <strong>Past performance is no guarantee of future results. Not intended as a recommendation to buy or sell any securities named herein.</strong></p>
<p><strong>KPIs to watch:</strong> Revenues, 5G radios, network utilization (data throughput), mobile subs, payout economics, and geographic distribution.</p>
<p><strong>Catalysts (3&ndash;6 months):</strong> Mobile Virtual Network Operator (MVNO) and enterprise partnerships, new hardware, and tokenomics updates.</p>
<div class="row pt-3 pb-3 align-items-center">
<div class="col-md-9 col-xs-12 col-lg-10">
<h2 id="jupiter" class="jump-link-nav anchored-block" data-jumplink-title="Jupiter">4) Jupiter: Solana&rsquo;s Trading Epicenter</h2>
</div>
<div class="col-md-3 col-6 col-lg-2 mx-auto">
<p class="my-2"><img loading="lazy" class="img-responsive" alt="Jupiter" src="https://www.vaneck.com/EPiServer/CMS/Content/contentassets/63bc8da2ff5d4246992b461a49265700/jupiter-logo2x.png,,353372/Download?epieditmode=False" /></p>
</div>
</div>
<p><strong>What it does:</strong> Jupiter is Solana&rsquo;s primary venue for onchain trading across both perpetual futures (perps) and spot crypto tokens. Traders can use leverage and place directional bets or even provide liquidity to other speculators to earn fees. Amongst Solana perps DEXes, Jupiter is the most widely used exchange. For spot trading, Jupiter is classified as an aggregator DEX which means that Jupiter pings prices and liquidity simultaneously across many different DEXes to give traders the best pricing.</p>
<p><strong>Scale and economics:</strong> Over the last 30 days, Jupiter Perps processed <strong>$17.4B</strong> in notional volume and generated <strong>$954M</strong> in annualized fees to take <strong>$238M</strong> in annualized revenues. On the spot side, Jupiter remains the dominant Solana DEX aggregator by volume/share and Jupiter has processed <strong>$716B</strong> in token volumes in 2025.</p>
<p><strong>Why it matters for Solana:</strong> Perps are crypto&rsquo;s most used trading instrument by dollar value. Delivering perps trading on chain provides Solana with a large user base that will perform lots of transactions to drive revenues to Solana.</p>
<p><strong>Moat and competition:</strong> Jupiter benefits from deep routing network effects in spot trading, as it integrates with the most important decentralized exchanges. Additionally, Jupiter has a proven risk engine that has effectively handled liquidations through many turbulent market conditions. Competition includes centralized venues such as Binance and Coinbase, other Solana perps peers like Drift and Zeta. Additionally, there are many competing aggregators on Solana, such as Rubic and KyberSwap.</p>
<h3>Jupiter Grows Platform Revenues +295% YoY</h3>
<p><img loading="lazy" class="img-responsive" alt="Jupiter Grows Platform Revenues +295% YoY" src="https://www.vaneck.com/contentassets/63bc8da2ff5d4246992b461a49265700/6425_solana-top-5-companies_chart-4_2025-11_v1.svg" /></p>
<p class="chart-disclosure">Source: Artemis XYZ as of 11/11/2025. <strong>Past performance is no guarantee of future results. Not intended as a recommendation to buy or sell any securities named herein.</strong></p>
<p><strong>KPIs to watch:</strong> Trading volumes, Open interest, taker/maker fees and rebates, funding behavior relative to CEXs, market‑impact costs.</p>
<p><strong>Catalysts (3&ndash;6 months):</strong> New listings, cross‑margin and portfolio margin refinements, integrations with new tokenized assets, and the growth of proprietary liquidity pools.</p>
<div class="row pt-3 pb-3 align-items-center">
<div class="col-md-9 col-xs-12 col-lg-10">
<h2 id="kamino-finance" class="jump-link-nav anchored-block" data-jumplink-title="Kamino Finance">5) Kamino Finance: Solana&rsquo;s Decentralized Prime Broker</h2>
</div>
<div class="col-md-3 col-6 col-lg-2 mx-auto">
<p class="my-2"><img loading="lazy" class="img-responsive" alt="Kamino Finance" src="https://www.vaneck.com/EPiServer/CMS/Content/contentassets/63bc8da2ff5d4246992b461a49265700/kamino-logo2x.png,,353371/Download?epieditmode=False" /></p>
</div>
</div>
<p><strong>What it does:</strong> Kamino is Solana&rsquo;s most important hub for borrowing and lending digital assets. It serves as a central venue where users supply assets to earn yield, while traders and market makers borrow assets to take leveraged positions or access liquidity without swapping their holdings. Risk management is automated at the protocol level, allowing Kamino to serve as Solana&rsquo;s primary source of secure, programmatic liquidity.</p>
<p><strong>Scale and economics:</strong> As of November 2025, Kamino retains <strong>~$2.74B</strong> in deposits on Solana and <strong>~$1.36B</strong> in outstanding borrows. Its central importance in Solana&rsquo;s financial ecosystem has allowed it to earn <strong>$95M</strong> in 2025. Kamino has various risk mechanisms to ensure that the collateral underpinning loans does not violate risk parameters and cost LPs losses.</p>
<p><strong>Why it matters for Solana:</strong> Kamino provides the deep liquidity that powers market making, leverage, and active trading across Solana. It acts as the core funding market that enables the broader Solana financial ecosystem to function efficiently.</p>
<p><strong>Moat and competition:</strong> Kamino benefits from strong network effects driven by deep liquidity, consistent usage, and a long track record without security incidents. Its risk engine has earned significant trust by protecting LPs during volatile market periods. Competing platforms include Solend and MarginFi.</p>
<h3>Kamino Earned More Than $95 Million YTD 2025</h3>
<p><img loading="lazy" class="img-responsive" alt="Kamino Earned More Than $95 Million YTD 2025" src="https://www.vaneck.com/contentassets/63bc8da2ff5d4246992b461a49265700/6425_solana-top-5-companies_chart-5_2025-11_v1.svg" /></p>
<p class="chart-disclosure">Source: Artemis XYZ as of 11/11/2025. <strong>Past performance is no guarantee of future results. Not intended as a recommendation to buy or sell any securities named herein.</strong></p>
<p><strong>KPIs to watch:</strong> Borrow and lend rates, net TVL, borrow amounts, new tokens onboarded, new liquidity pools, new lending strategies, broader Solana DEX volumes, and onchain yields.</p>
<p><strong>Catalysts (3&ndash;6 months):</strong> New cross‑margin partnerships, trading expansion, new asset listings, RWAs, and new products.</p>
<h2>Catalysts to Watch (2025&ndash;2026)</h2>
<ul class="content-list">
<li class="mt-2">Launchpad competition and fee structures, plus how pump.fun users graduate into deeper DEX liquidity; moderation and compliance practices will shape sustainability.</li>
<li class="mt-2">Broader client diversity and performance improvements on Solana through Firedancer and Agave clients, along with UX improvements such as actions and blinks.</li>
<li class="mt-2">Growth or contraction in Solana&rsquo;s stablecoin supply, which serves as a real-time signal of liquidity demand for trading.</li>
<li class="mt-2">New RWAs, tokenized equities, and other tokenized assets that can increase transaction flow and expand Solana&rsquo;s trading universe.</li>
</ul>
<h2>Risks and How This List Could Change</h2>
<ul class="content-list">
<li class="mt-2"><strong>Data integrity:</strong> Wash trading (DEXes) and bot‑driven token factories (launchpads) can distort metrics, triangulate dashboards, and haircut headline figures.</li>
<li class="mt-2"><strong>Regulation: </strong>Evolving frameworks for prediction markets and creator‑coins, plus wallet and app‑store policies, can shift access quickly.</li>
<li class="mt-2"><strong>Market structure:</strong> Fee compression, incentive fatigue, or network incidents that can reshuffle competitive positioning on short notice.</li>
<li class="mt-2"><strong>Competition:</strong> Rapid emergence of new applications or token formats that attract speculative flow away from today&rsquo;s leaders.</li>
<li class="mt-2"><strong>MEV changes</strong>: New MEV protections on Solana may redirect user activity toward.</li>
</ul>

<p>To receive more <strong><a href="https://www.vaneck.com/us/en/insights/digital-assets/" title="Digital Assets Insights">Digital Assets</a></strong> insights, <strong><a href="https://www.vaneck.com/us/en/subscribe/" title="Subscription Center">sign up in our subscription center</a></strong>.</p>
]]></content:encoded>
</item><item rdf:about="https://www.vaneck.com/us/en/blogs/income-investing/find-smarter-yield-with-selective-core-credit/">
  <title>Find Smarter Yield with Selective Core Credit></title>
  <link>https://www.vaneck.com/us/en/blogs/income-investing/find-smarter-yield-with-selective-core-credit/</link>
  <description><![CDATA[Higher yields have returned, but not all credit opportunities are created equal. A selective approach to investment grade bonds can help investors capture income while maintaining quality.]]></description>
  <dc:creator> </dc:creator>
  <dc:date>11/20/2025 06:30:00</dc:date>
<content:encoded><![CDATA[

<p><strong>Key takeaways:</strong></p>
<ul class="content-list">
<li class="mt-2">Selectivity drives higher yield without added volatility.</li>
<li class="mt-2">Moody&rsquo;s Analytics models identify undervalued bonds.</li>
<li class="mt-2">Systematic credit analysis reduces downgrade risk.</li>
<li class="mt-2">Targeted exposure may enhance income and total return.</li>
<li class="mt-2">The 30-Day SEC yield is 4.59% for the <a href="https://www.vaneck.com/us/en/investments/moodys-analytics-ig-corporate-bond-etf-mig/overview/" title="MIG - VanEck Moody's Analytics IG Corporate Bond ETF"><strong>MIG</strong></a> and 4.73% for <a href="https://www.vaneck.com/us/en/investments/moodys-analytics-bbb-corporate-bond-etf-mbbb/overview/" title="MBBB - VanEck Moody's Analytics BBB Corporate Bond ETF"><strong>MBBB</strong></a>, as of October 31, 2025.</li>
</ul>
<p>Advisors are navigating a fixed income market unlike any we've seen in more than a decade. Higher yields, persistent inflation, and tighter financial conditions are creating both opportunities and challenges. With high quality corporate bonds offering yields of approximately 4.9%, and BBB corporates offering 5.1%, investors can build income-generating portfolios without venturing into non-investment grade or illiquid corners of the market. But constructing a resilient core still requires selectivity because not all corporate bonds are created equal.</p>
<p>We believe in a smarter approach to corporate credit. One that provides the benefits of income and potential total return, but with discipline and forward-looking risk control. Through the <a href="https://www.vaneck.com/us/en/investments/moodys-analytics-ig-corporate-bond-etf-mig/overview/" title="MIG - VanEck Moody's Analytics IG Corporate Bond ETF"><strong>VanEck Moody&rsquo;s Analytics IG Corporate Bond ETF (MIG)</strong></a> and the <a href="https://www.vaneck.com/us/en/investments/moodys-analytics-bbb-corporate-bond-etf-mbbb/overview/" title="MBBB - VanEck Moody's Analytics BBB Corporate Bond ETF"><strong>VanEck Moody's Analytics BBB Corporate Bond ETF (MBBB)</strong></a>, investors can access a data-driven framework that targets bonds offering attractive value relative to their risk while avoiding issuers more likely to face downgrades or defaults.</p>
<p>Traditional credit ratings, while useful, are often slow to reflect changes in fundamentals. Relying solely on them can expose investors to issuers whose credit health may be deteriorating faster than their ratings imply. In this environment, success depends on not just owning investment grade credit, but owning the right investment grade credit.</p>
<h3>Deviation from Fair Value Creates Opportunity ‐ Investment Grade Universe</h3>
<p><img loading="lazy" class="img-responsive" src="https://www.vaneck.com/EPiServer/CMS/Content/contentassets/064ef3dccd8649df87932fba58bb35a7/6431_mig-mbbb-blog-chart_01_2025-11_v1_blog.svg,,353433/Download?epieditmode=False" alt="Deviation from Fair Value Creates Opportunity &ndash; Investment Grade Universe" /></p>
<p class="chart-disclosure"><i>Source: Moody&rsquo;s Analytics, ICE Data Services and VanEck, as of 10/31/2025. Past performance is no guarantee of future results.</i></p>
<p>We use Moody&rsquo;s Analytics&rsquo; proprietary credit risk models to assess the fair value of every bond in the U.S. corporate universe. By comparing each bond&rsquo;s modeled fair value against its market spread, the process identifies securities offering a significant excess spread above what&rsquo;s required for their underlying risk. In simple terms, it looks out for bonds that the market is overcompensating relative to their true risk profile.</p>
<p>This systematic approach removes subjective bias and focuses on risk-adjusted value. Portfolios tilt toward issuers with stronger fundamentals and away from those that appear overvalued or at higher risk of downgrade. This means exposure to high-quality, attractively valued bonds designed to participate in the income potential of corporate markets while managing downside risk.</p>
<h3>Relative Value Not Driven by Only Rating, Size or Maturity</h3>
<p><strong>Selected BBB3, &gt;$1 billion Bonds 5 Year Bonds (As of 9/30/2025)</strong></p>
<p><img loading="lazy" class="img-responsive" src="https://www.vaneck.com/EPiServer/CMS/Content/contentassets/74ef8081bdec455f957e2e4d548072c8/6431_mig-mbbb-blog-chart_02_2025-11_v1_blog.svg,,353447/Download?epieditmode=False" alt="Relative Value Not Drive by Only Rating, Size or Maturity" /></p>
<p class="chart-disclosure"><i>Source: Moody&rsquo;s Analytics, ICE Data Services and VanEck, as of 10/31/2025. This is not an offer to buy or sell or a solicitation of any offer to buy or sell any of the securities mentioned herein.</i></p>
<p>Despite recent Fed cuts, the broader environment still points to higher structural long-term yields. For advisors, that means an opportunity to build a core income portfolio with better long-term total return potential. By integrating forward-looking credit analytics into portfolio construction, we aim to turn market dispersion into an advantage, one that may enhance risk-adjusted returns over time.</p>
<p>The result has been portfolios that are both resilient in their focus on high-quality issuers and responsive through systematic, model-driven selection that adapts as conditions evolve. As shown below, a selective approach that invests in the most attractively valued bonds increased return by 0.84% versus the broad corporate market with no additional volatility. The BBB segment increased risk slightly but added an additional 1.20% over the broad market.</p>
<h3>Selective Approach Drove Improved Returns: 5Y Risk‐Return</h3>
<p><img loading="lazy" class="img-responsive" src="https://www.vaneck.com/EPiServer/CMS/Content/contentassets/ddafab04b6f5423d811600763c1276df/6431_mig-mbbb-blog-chart_03_2025-11_v1_blog.svg,,353449/Download?epieditmode=False" alt="Selective Approach Drove Improved Returns: 5Y Risk‐Return" /></p>
<p class="chart-disclosure"><i>Source: Morningstar Direct, as of 10/31/2025. Past performance is no guarantee of future results. Index performance is not representative of fund performance. It is not possible to invest directly in an index.</i></p>
<h3>Selectivity Adds Value</h3>
<p>Below we illustrate how incorporating attractively valued investment grade credit alongside a traditional core bond exposure can improve portfolio characteristics. Replacing a portion of broad investment grade holdings with attractively valued bonds increases yield potential with only a modest impact on duration. For investors willing to assume additional credit risk within the investment grade space, targeted exposure to attractively valued BBB-rated corporates may further enhance total return potential.</p>
<div class="wrapped-div">
<table style="width: 100%;">
<tbody>
<tr class="tbl-data">
<td class="tbl-header last">Portfolio mix</td>
<td class="tbl-header text-left">YTW</td>
<td class="tbl-header last text-left">OAS</td>
<td class="tbl-header last text-left">Effective Duration</td>
</tr>
<tr class="tbl-data">
<td class="data-td last font-weight-normal">Core Bonds</td>
<td class="data-td data last text-left">4.37</td>
<td class="data-td data last text-left">31</td>
<td class="data-td data last text-left">5.95</td>
</tr>
<tr class="tbl-data">
<td class="data-td last font-weight-normal">50% Core / 50% IG</td>
<td class="data-td data last text-left">4.62</td>
<td class="data-td data last text-left">59</td>
<td class="data-td data last text-left">6.28</td>
</tr>
<tr class="tbl-data">
<td class="data-td last font-weight-normal">50% Core / 35% IG / 15% BBB</td>
<td class="data-td data last text-left">4.65</td>
<td class="data-td data last text-left">61</td>
<td class="data-td data last text-left">6.23</td>
</tr>
</tbody>
</table>
</div>
<p class="chart-disclosure"><i>Source: ICE Data Services, as of 10/31/25. Core Bonds is represented by the ICE BofA US Broad Market Index, Attractively Valued IG Corps by the MVIS Moody&rsquo;s Analytics US Investment Grade Corporate Bond Index and Attractively Valued BBB Corps by the MVIS Moody&rsquo;s Analytics US BBB Corporate Bond Index. Past performance is no guarantee of future results. Index performance is not representative of fund performance. It is not possible to invest directly in an index. See important definitions below.</i></p>
<p>Today&rsquo;s bond market rewards precision. Broad exposures may deliver yield, but selective exposures can deliver smarter yield. The <a href="https://www.vaneck.com/us/en/investments/moodys-analytics-ig-corporate-bond-etf-mig/overview/" title="MIG - VanEck Moody&rsquo;s Analytics IG Corporate Bond ETF"><strong>VanEck Moody&rsquo;s Analytics IG Corporate Bond ETF (MIG)</strong></a> and the <a href="https://www.vaneck.com/us/en/investments/moodys-analytics-bbb-corporate-bond-etf-mbbb/overview/" title="MBBB - VanEck Moody&rsquo;s Analytics BBB Corporate Bond ETF"><strong>VanEck Moody&rsquo;s Analytics BBB Corporate Bond ETF (MBBB)</strong></a> use quantitative credit insight, provided by Moody&rsquo;s Analytics and used by over 1,000 of the world&rsquo;s largest banks, asset managers, insurance companies and corporations, to help advisors position client portfolios for today&rsquo;s evolving fixed income landscape. As of October 31, 2025, MIG&rsquo;s 30-Day SEC yield is 4.59% and MBBB&rsquo;s is 4.73%.</p>
<p>To find the latest data and yields for VanEck&rsquo;s income investing solutions, visit the <a href="https://www.vaneck.com/us/en/education/investment-ideas/income-ideas/" title="Income Investing Yield Monitor"><strong>Income Investing Yield Monitor</strong></a>.</p>

<p>To receive more <a href="/us/en/blogs/income-investing/" title="Income Investing Insights"><strong>Income Investing</strong></a> insights, <a href="/link/5f45412c2143400497908cea2897f7d3.aspx" title=" Subscription Center"><strong>sign up in our subscription center</strong></a>.</p>
]]></content:encoded>
</item><item rdf:about="https://www.vaneck.com/us/en/blogs/digital-assets/matthew-sigel-vaneck-mid-november-2025-bitcoin-chaincheck/">
  <title>VanEck Mid-November 2025 Bitcoin ChainCheck></title>
  <link>https://www.vaneck.com/us/en/blogs/digital-assets/matthew-sigel-vaneck-mid-november-2025-bitcoin-chaincheck/</link>
  <description><![CDATA[Bitcoin&rsquo;s selloff is being driven by mid-cycle holders, not long-term whales, with futures markets flashing deeply oversold conditions after tariff-driven liquidations.]]></description>
  <dc:creator>Patrick Bush</dc:creator>
  <dc:date>11/19/2025 06:30:00</dc:date>
<content:encoded><![CDATA[

<p><strong><u>Please note that VanEck has exposure to bitcoin.</u></strong></p>
<p><strong>Key takeaways</strong></p>
<ul class="content-list">
<li class="mt-2">Long-term whales are still holding, with 5+ year coins continuing to grow.</li>
<li class="mt-2">Selling is concentrated in mid-cycle holders, not the oldest wallets.</li>
<li class="mt-2">Futures markets look washed out, with funding and open interest at oversold levels.</li>
</ul>
<h3 id="bitcoin-investors-are-afraid" class="jump-link-nav anchored-block" data-jumplink-title="Bitcoin Investors are Afraid">Bitcoin (BTC) Investors are Afraid</h3>
<p><img loading="lazy" class="img-responsive w-100" alt="Bitcoin (BTC) Investors are Afraid" src="https://www.vaneck.com/contentassets/9c9e62f28cec46fd8f5f6c3276659979/6428_bitcoin-chaincheck-mid-nov_chart-1_2025-11_v2_blog.svg" /></p>
<p class="chart-disclosure">Source: Glassnode as of 11/13/2025. <strong>Past performance is no guarantee of future results. Not intended as a recommendation to buy or sell any securities named herein.</strong></p>
<h2>ETP Outflows Drive Early Weakness</h2>
<p>The last 30 days of price action have been particularly unkind to HOLDers with BTC down <strong>-13%</strong> on highly motivated selling. Since October 10, 2025, BTC ETP balances have bled <strong>49.3K</strong> BTC, around <strong>-2% </strong>of total AUM, as the weak hands who bought near the price peak capitulated amid rate cut uncertainty and wobbles in the AI narrative. More concerning, many are pointing the finger at early BTC whales for the price weakness. For example, a <a href="https://x.com/GoingParabolic/status/1988423220467478861?s=20" title="Jason Ai. Williams on X" target="_blank" rel="noopener"><strong>&ldquo;Satoshi Era&rdquo; Whale sold $1.5B of BTC</strong></a>, his entire wallet, the week of November 14, 2025. Many suppose that tenured whales often telegraph long-term moves in BTC by buying or selling BTC at pivotal junctures. As a result, the crypto community has become bearish, as indicated by the fear/greed index hitting its lowest level since March 2025 at the beginning of the tariff tantrum.</p>
<h2>Smaller Whales Accumulate Over 1-2 Years as Largest Whales Distribute; Recent Net Change is Flat</h2>
<h3>Whales Positions Lower Long-Term, Higher Short Term</h3>
<p><img loading="lazy" class="img-responsive w-100" alt="Whales Positions Lower Long-Term, Higher Short Term" src="https://www.vaneck.com/contentassets/9c9e62f28cec46fd8f5f6c3276659979/6428_bitcoin-chaincheck-mid-nov_chart-2_2025-11_v1_blog.svg" /></p>
<div class="wrapped-div">
<table style="width: 100%;">
<tbody>
<tr class="tbl-data">
<td class="data-head last text-left">&nbsp;</td>
<td class="data-head last text-right">100-1K (%)</td>
<td class="data-head last text-right">1K-10K (%)</td>
<td class="data-head last text-right">10K-100K (%)</td>
<td class="data-head last text-right">above 100K (%)</td>
<td class="data-head last text-right">Total Whale Holdings (%)</td>
</tr>
<tr class="tbl-data">
<td class="data-td last text-left">30 Day Change</td>
<td class="data-td data last text-right">-1</td>
<td class="data-td data last text-right">0</td>
<td class="data-td data last text-right">3</td>
<td class="data-td data last text-right">1</td>
<td class="data-td data last text-right">0</td>
</tr>
<tr class="tbl-data">
<td class="data-td last text-left">60 Day Change</td>
<td class="data-td data last text-right">2</td>
<td class="data-td data last text-right">-3</td>
<td class="data-td data last text-right">3</td>
<td class="data-td data last text-right">-2</td>
<td class="data-td data last text-right">0</td>
</tr>
<tr class="tbl-data">
<td class="data-td last text-left">90 Day Change</td>
<td class="data-td data last text-right">3</td>
<td class="data-td data last text-right">-3</td>
<td class="data-td data last text-right">1</td>
</tr>
<tr class="tbl-data">
<td class="data-td last text-left">180 Day Change</td>
<td class="data-td data last text-right">9</td>
<td class="data-td data last text-right">1</td>
<td class="data-td data last text-right">-6</td>
<td class="data-td data last text-right">-2</td>
<td class="data-td data last text-right">1</td>
</tr>
<tr class="tbl-data">
<td class="data-td last text-left">1 Year Change</td>
<td class="data-td data last text-right">23</td>
<td class="data-td data last text-right">-3</td>
<td class="data-td data last text-right">-11</td>
<td class="data-td data last text-right">-8</td>
<td class="data-td data last text-right">3</td>
</tr>
<tr class="tbl-data">
<td class="data-td last text-left">2 Year Change</td>
<td class="data-td data last text-right">31</td>
<td class="data-td data last text-right">-5</td>
<td class="data-td data last text-right">-9</td>
<td class="data-td data last text-right">-4</td>
<td class="data-td data last text-right">6</td>
</tr>
</tbody>
</table>
</div>
<br />
<p class="chart-disclosure">Source: Glassnode as of 11/13/2025. <strong>Past performance is no guarantee of future results. Not intended as a recommendation to buy or sell any securities named herein.</strong></p>
<p>Rather than assuming recent weakness stems from large holder selling, it helps to examine the full distribution of flows across cohorts. The onchain picture shows a more nuanced rotation than simple &ldquo;<i>whale dumping.&rdquo;</i> If we look at holdings of whales with more than <strong>1,000 BTC</strong>, we can see clearly that they have been reducing their BTC exposure since November 2023. In fact, whales with <strong>10K-100K</strong> BTC have reduced their supply by <strong>-6%</strong> and <strong>-11%</strong> over the last 6 months and 12 months. This supply has been absorbed by &ldquo;minnows&rdquo; holding between <strong>100</strong> and <strong>1,000</strong> BTC. This smaller class of investors has increased holdings <strong>+9%</strong> and <strong>+23%</strong> over the past 6 months and 12 months, respectively. For context, BTC itself is up <strong>~170%</strong> over the last two years.</p>
<h3>Bitcoin Futures (BTC) Open Interest +6% in November</h3>
<p><img loading="lazy" class="img-responsive w-100" alt="Bitcoin Futures (BTC) Open Interest +6% in November" src="https://www.vaneck.com/contentassets/9c9e62f28cec46fd8f5f6c3276659979/6428_bitcoin-chaincheck-mid-nov_chart-3_2025-11_v1_blog.svg" /></p>
<p class="chart-disclosure">Source: Glassnode as of 11/13/2025. <strong>Past performance is no guarantee of future results. Not intended as a recommendation to buy or sell any securities named herein.</strong></p>
<h2>Short-Term Whales Flip to Net Buyers</h2>
<p>Short-term data tells a different story: some whale cohorts have been accumulating. The <strong>10K&ndash;100K</strong> BTC group has increased holdings by about <strong>+3%,</strong> <strong>+2.5%,</strong> and <strong>+84 bps</strong> over the last 30, 60, and 90 days. This likely reflects the tariff-driven selloff and subsequent liquidations, which cut BTC futures open interest by about <strong>19%</strong> in 12 hours and pushed the price lower by more than 20%.</p>
<h3>Oldest BTC Whales Are Holding While Mid-Cycle Traders Sell</h3>
<p><img loading="lazy" class="img-responsive w-100" alt="Oldest BTC Whales Are Holding While Mid-Cycle Traders Sell" src="https://www.vaneck.com/contentassets/9c9e62f28cec46fd8f5f6c3276659979/6428_bitcoin-chaincheck-mid-nov_chart-4_2025-11_v1_blog.svg" /></p>
<div class="wrapped-div">
<table style="width: 100%;">
<tbody>
<tr class="tbl-data">
<td class="data-head last text-left">&nbsp;</td>
<td class="data-head last text-right">Last Active 6m-2y</td>
<td class="data-head last text-right">Last Active 3y-5y</td>
<td class="data-head last text-right">Last Active 5y-10y</td>
<td class="data-head last text-right">Last Active &gt;10y</td>
</tr>
<tr class="tbl-data">
<td class="data-td last text-left">30 Day Change</td>
<td class="data-td data last text-right">-202,674</td>
<td class="data-td data last text-right">-272,996</td>
<td class="data-td data last text-right">82,500</td>
<td class="data-td data last text-right">9,608</td>
</tr>
<tr class="tbl-data">
<td class="data-td last text-left">180 Day Change</td>
<td class="data-td data last text-right">705,516</td>
<td class="data-td data last text-right">-592,745</td>
<td class="data-td data last text-right">20,079</td>
<td class="data-td data last text-right">-22,381</td>
</tr>
<tr class="tbl-data">
<td class="data-td last text-left">1 Year Change</td>
<td class="data-td data last text-right">176,954</td>
<td class="data-td data last text-right">-855,050</td>
<td class="data-td data last text-right">-113,033</td>
<td class="data-td data last text-right">39,374</td>
</tr>
<tr class="tbl-data">
<td class="data-td last text-left">2 Year Change</td>
<td class="data-td data last text-right">204,266</td>
<td class="data-td data last text-right">-1,706,293</td>
<td class="data-td data last text-right">-92,959</td>
<td class="data-td data last text-right">382,379</td>
</tr>
</tbody>
</table>
</div>
<br />
<p class="chart-disclosure">Source: Glassnode as of 11/13/2025. <strong>Past performance is no guarantee of future results. Not intended as a recommendation to buy or sell any securities named herein.</strong></p>
<h2>Mid-Cycle Holders Are the Real Sellers</h2>
<p>However, simply analyzing &ldquo;whale data&rdquo; by holder size provides an incomplete picture. This view overlooks the rotation of aged, experienced whales transferring their coins to newer, greenhorn holders. To deepen our understanding, we examine Bitcoin balances by &ldquo;last actively moved,&rdquo; which indicates the time elapsed since the token was last transferred. The implication of a transfer is that the tokens were likely sold to different holders.</p>
<p>Over the past 30 days, selling pressure has been concentrated in the &lt;5-year age bands, while older tokens have largely retained or increased their holdings. Interestingly, over the last 6 months, ownership has shifted from the (3&ndash;5 yr) group to the (6m&ndash;2 yr) cluster, signaling a move from mid-term holders toward newer participants.</p>
<p>Among the older cohort, those whose coins last moved &gt;5 years ago, token turnover remains low relative to other groups. In contrast, the largest churn has occurred among tokens last moved 3&ndash;5 yrs ago, a band that has consistently declined across each study period. Over the past two years, supply in this tranche has dropped <strong>by 32%</strong> as coins were sent to new addresses. Given that many of these tokens were likely accumulated during the doldrums of the previous Bitcoin cycle, their holders appear to be opportunistic cycle traders rather than long-term investors.</p>
<p>Meanwhile, tokens last moved &gt;5 yrs ago have seen a net increase of <strong>+278K BTC</strong> compared to two years ago. This gain reflects younger coins aging into the 5+ yr category rather than renewed accumulation, yet it still indicates continued conviction among long-term whales. While further granularity could yield additional insights, the overarching trend remains encouraging: the longest-term holders continue to accumulate and hold.</p>
<h3>BTC Futures Basis at Lowest Levels Since Fall 2023</h3>
<p><img loading="lazy" class="img-responsive w-100" alt="BTC Futures Basis at Lowest Levels Since Fall 2023" src="https://www.vaneck.com/contentassets/9c9e62f28cec46fd8f5f6c3276659979/6428_bitcoin-chaincheck-mid-nov_chart-5_2025-11_v1_blog.svg" /></p>
<p class="chart-disclosure">Source: Glassnode as of 11/13/2025. <strong><i>Past performance is no guarantee of future results. Not intended as a recommendation to buy or sell any securities named herein.</i></strong></p>
<h2>Futures Markets Show a Speculation Reset</h2>
<p>One of the best measures of speculation is the annualized basis costs paid by traders willing to be long Bitcoin perpetual futures (perps). Because perps never settle, perp prices are brought in line with spot prices by means of an interest rate charged to one counterparty of the trade. If the perp&rsquo;s price is above the spot price, the long side of the trade must pay the short side an interest rate relative to the magnitude of the spot/perp price difference. Because crypto has asymmetric upside, perp basis is almost always positive.</p>
<p>During periods of lower demand for long crypto like BTC, the basis collapses. Recently, we saw a dramatic collapse in open interest for Bitcoin perps, down <strong>-20%</strong> in BTC terms since October 9, 2025, and <strong>-32%</strong> in USD terms. This partly explains the substantial collapse in funding rates. Of course, if people were bullish about BTC, this rate would quickly climb.</p>
<p>In the past, long-term downturns in BTC price were often preceded by blow-off tops of speculation where perp funding averaged <strong>40%</strong> on some days. We have not seen that sort of acceleration of funding since March 2024. However, to cloud the picture a bit, it is important to remember that projects like Ethena as well as sophisticated traders have accumulated massive basis positions of long spot crypto and short perps. Ethena alone had reached TVL of <strong>$14B</strong> in October 2025, and it has since seen its TVL collapse to <strong>$8.3B.</strong> These large figures of basis trades may artificially depress funding rates, making the indicator no longer effective.</p>
<p>That caveat noted, funding rate collapses of the magnitude we have just witnessed are typically associated with oversold conditions. This is particularly true when we see a concurrent collapse in perps open interest of the ferocity that recently transpired. Additionally, NUPL, or Net Unrealized Profit/Loss ratio, has hit tactically oversold levels that match those seen during the Tariff Tantrum in Spring 2025 and the Yen implosion in August 2024. Armed with this data, investors can proceed more tactically bullish after a month of very dramatic selling, in our opinion.</p>
<h3 id="dashboard-update" class="jump-link-nav anchored-block" data-jumplink-title="Dashboard Update">Bitcoin Chain Check Monthly Dashboard and Highlights</h3>
<div class="wrapped-div">
<table style="width: 100%;">
<tbody>
<tr class="tbl-data">
<td class="tbl-header last text-left">As of November 14th, 2025</td>
<td class="tbl-header last text-right">30-day avg</td>
<td class="tbl-header last text-right">30 day change (%)<sup>1</sup></td>
<td class="tbl-header last text-right">365 day change(%)</td>
<td class="tbl-header last text-right">Last 30 days Percentile vs all-time history (%)</td>
</tr>
<tr class="tbl-data">
<td class="data-td data last text-left">Bitcoin Price</td>
<td class="data-td data last text-right">$105,666</td>
<td class="data-td data last text-right">-8</td>
<td class="data-td data last text-right">40</td>
<td class="data-td data last text-right">97.2</td>
</tr>
<tr class="tbl-data">
<td class="data-td data last text-left">Daily Active Addresses</td>
<td class="data-td data last text-right">695,396</td>
<td class="data-td data last text-right">-5</td>
<td class="data-td data last text-right">-11</td>
<td class="data-td data last text-right">59.8</td>
</tr>
<tr class="tbl-data">
<td class="data-td data last text-left">Daily New Addresses</td>
<td class="data-td data last text-right">306,541</td>
<td class="data-td data last text-right">-2</td>
<td class="data-td data last text-right">-6</td>
<td class="data-td data last text-right">56.0</td>
</tr>
<tr class="tbl-data">
<td class="data-td data last text-left">Daily Transactions</td>
<td class="data-td data last text-right">460,192</td>
<td class="data-td data last text-right">-3</td>
<td class="data-td data last text-right">-22</td>
<td class="data-td data last text-right">92.6</td>
</tr>
<tr class="tbl-data">
<td class="data-td data last text-left">Daily Inscriptions</td>
<td class="data-td data last text-right">112,631</td>
<td class="data-td data last text-right">123</td>
<td class="data-td data last text-right">220</td>
<td class="data-td data last text-right">63.9</td>
</tr>
<tr class="tbl-data">
<td class="data-td data last text-left">Total Transfer Volume (USD)</td>
<td class="data-td data last text-right">$81,723,087,403</td>
<td class="data-td data last text-right">-6</td>
<td class="data-td data last text-right">41</td>
<td class="data-td data last text-right">91.2</td>
</tr>
<tr class="tbl-data">
<td class="data-td data last text-left">% Supply Active, last 180 days</td>
<td class="data-td data last text-right">27%</td>
<td class="data-td data last text-right">7</td>
<td class="data-td data last text-right">20</td>
<td class="data-td data last text-right">25.6</td>
</tr>
<tr class="tbl-data">
<td class="data-td data last text-left">% Supply Dormant for 3+ Years</td>
<td class="data-td data last text-right">43%</td>
<td class="data-td data last text-right">-0.00481946</td>
<td class="data-td data last text-right">-8</td>
<td class="data-td data last text-right">89.1</td>
</tr>
<tr class="tbl-data">
<td class="data-td data last text-left">Avg Fees (USD)</td>
<td class="data-td data last text-right">$308,918.13</td>
<td class="data-td data last text-right">-20</td>
<td class="data-td data last text-right">-77</td>
<td class="data-td data last text-right">57.6</td>
</tr>
<tr class="tbl-data">
<td class="data-td data last text-left">Avg Fees (BTC)</td>
<td class="data-td data last text-right">2.94</td>
<td class="data-td data last text-right">-13</td>
<td class="data-td data last text-right">-83</td>
<td class="data-td data last text-right">5.4</td>
</tr>
<tr class="tbl-data">
<td class="data-td data last text-left">Percent of BTC Addresses in profit</td>
<td class="data-td data last text-right">88%</td>
<td class="data-td data last text-right">-0.070263733</td>
<td class="data-td data last text-right">-10</td>
<td class="data-td data last text-right">71.0</td>
</tr>
<tr class="tbl-data">
<td class="data-td data last text-left">Unrealized profit/loss ratio</td>
<td class="data-td data last text-right">47%</td>
<td class="data-td data last text-right">-11</td>
<td class="data-td data last text-right">-15</td>
<td class="data-td data last text-right">63.3</td>
</tr>
<tr class="tbl-data">
<td class="data-td data last text-left">ASIC Global Power Consumption (GWh)</td>
<td class="data-td data last text-right">214</td>
<td class="data-td data last text-right">4</td>
<td class="data-td data last text-right">52</td>
<td class="data-td data last text-right">99.6</td>
</tr>
<tr class="tbl-data">
<td class="data-td data last text-left">Total Daily BTC Miner Revenues (USD)</td>
<td class="data-td data last text-right">$48,282,902</td>
<td class="data-td data last text-right">-9</td>
<td class="data-td data last text-right">31</td>
<td class="data-td data last text-right">92.3</td>
</tr>
<tr class="tbl-data">
<td class="data-td data last text-left">Total Crypto Equities' Market Cap<sup>*</sup>&nbsp;(USD) (MM)</td>
<td class="data-td data last text-right">$311,767,427,455</td>
<td class="data-td data last text-right">-9</td>
<td class="data-td data last text-right">77</td>
<td class="data-td data last text-right">95.1</td>
</tr>
<tr class="tbl-data">
<td class="data-td data last text-left">Transfer volume from Miners to Exchanges (USD)</td>
<td class="data-td data last text-right">$13,431,933</td>
<td class="data-td data last text-right">-24</td>
<td class="data-td data last text-right">-14</td>
<td class="data-td data last text-right">91.3</td>
</tr>
<tr class="tbl-data">
<td class="data-td data last text-left">Bitcoin Dominance</td>
<td class="data-td data last text-right">59%</td>
<td class="data-td data last text-right">2</td>
<td class="data-td data last text-right">1</td>
<td class="data-td data last text-right">78.8</td>
</tr>
<tr class="tbl-data">
<td class="data-td data last text-left">Bitcoin Futures Annualized Basis</td>
<td class="data-td data last text-right">5%</td>
<td class="data-td data last text-right">-40</td>
<td class="data-td data last text-right">-54</td>
<td class="data-td data last text-right">32.2</td>
</tr>
<tr class="tbl-data">
<td class="data-td data last text-left">Mining Difficulty (T)</td>
<td class="data-td data last text-right">653</td>
<td class="data-td data last text-right">3</td>
<td class="data-td data last text-right">55</td>
<td class="data-td data last text-right">99.6</td>
</tr>
</tbody>
</table>
</div>
<br />
<p class="chart-disclosure"><sup>1</sup>&nbsp;30 day change &amp; 365 day change are relative to the 30-day avg, not absolute.</p>
<p class="chart-disclosure">Source: Glassnode as of 11/13/2025. <strong>Past performance is no guarantee of future results. Not intended as a recommendation to buy or sell any securities named herein.</strong></p>
<p><strong>Links to third party websites are provided as a convenience and the inclusion of such links does not imply any endorsement, approval, investigation, verification or monitoring by us of any content or information contained within or accessible from the linked sites. By clicking on the link to a non-VanEck webpage, you acknowledge that you are entering a third-party website subject to its own terms and conditions. VanEck disclaims responsibility for content, legality of access or suitability of the third-party websites.</strong></p>
<style>
    .data-td.data {
        padding-right: 5px !important;
        padding-left: 5px !important;
    }

    .wrapped-div {
        max-width: 100%;
    }

    @media (max-width: 1240px) {
        .wrapped-div {
            overflow-x: scroll;
        }
    }

    .wrapped-div-sector {
        max-width: 100%;
        overflow-x: scroll;
    }
</style>
<p>To receive more <strong><a href="https://www.vaneck.com/us/en/insights/digital-assets/" title="Digital Assets Insights">Digital Assets</a></strong> insights, <strong><a href="https://www.vaneck.com/us/en/subscribe/" title="Subscription Center">sign up in our subscription center</a></strong>.</p>
]]></content:encoded>
</item><item rdf:about="https://www.vaneck.com/us/en/blogs/gold-investing/ima-casanova-golds-rally-holds-strong-above-4000/">
  <title>Gold’s Rally Holds Strong Above $4,000></title>
  <link>https://www.vaneck.com/us/en/blogs/gold-investing/ima-casanova-golds-rally-holds-strong-above-4000/</link>
  <description><![CDATA[Gold&rsquo;s rally above $4,000 shows strength amid tight supply and steady demand. Miners remain undervalued, offering potential opportunities if current market trends persist.]]></description>
  <dc:creator>Imaru Casanova</dc:creator>
  <dc:date>11/18/2025 06:30:00</dc:date>
<content:encoded><![CDATA[

<p><strong>Key Takeaways:</strong></p>
<ul class="content-list">
<li class="mt-2">Gold is holding firm: Despite sharp swings, prices remain strong above $4,000.</li>
<li class="mt-2">Demand is driving gains: Tight supply and steady buying continue to support the market.</li>
<li class="mt-2">Miners gaining ground: Solid profits and low valuations set up potential upside.</li>
</ul>

<h2>A Relentless Rally &mdash; and a Reality Check</h2>
<p>Gold surpassed the $4,000 per ounce mark in October, continuing a relentless rally to reach a record close of $4,356.30 per ounce on October 20. The jaw-dropping move&mdash;almost $400 per ounce (+10%) in just seven trading sessions&mdash;signaled to us that markets were becoming overbought. It appears a wave of investors, fearful of missing out on the year&rsquo;s best-performing trade, rushed in and triggered an aggressive price reaction.</p>
<p>Unsurprisingly, the gold price then pulled back, erasing those gains just as quickly&mdash;likely clearing out the more speculative positions. Despite heightened volatility and the predictable &ldquo;gold comes crashing down&rdquo; commentaries that followed, gold still posted another strong month, closing at $4,002.92 per ounce on October 31&mdash;a $143.65 per ounce (+3.73%) gain for the month.</p>
<h2>Tight Market, Elastic Demand</h2>
<p>October&rsquo;s price action is a powerful reminder of the tightness of the gold market. When it comes to gold and gold stocks, it doesn&rsquo;t take much to move the needle. Gold supply remains inelastic&mdash;it&rsquo;s the demand side of the equation that drives the story.</p>
<p>Solid and consistent support from the official sector, combined with pent-up jewelry demand serving as a floor as prices pull back, suggest to us that fresh investment demand could propel gold prices even higher. Investment demand for gold bullion tends to eventually translate into demand for gold equities as participants want to increase their exposure and leverage to the gold price.</p>
<p>And in a space with total market capitalization of only around $1 trillion&mdash;even after this year&rsquo;s surge&mdash;it doesn&rsquo;t take much capital to move stock prices up significantly. While the prevailing perception among many investors is that gold and gold stocks must be &ldquo;crowded trades&rdquo;, due to phenomenal performance so far this year, the reality is the opposite. The gold asset class remains significantly underowned. Ask a group of money managers what the most crowded trade of the year is, and they&rsquo;ll likely say &ldquo;gold.&rdquo; Ask them how much gold exposure they hold, and the answer will probably be &ldquo;none.&rdquo;</p>
<h2>Rallying Beyond $4,000</h2>
<p>In our view, $4,000 gold does not mark the end of this bull market. Historical correlations between gold bullion ETF flows and price performance suggest that renewed investment demand&mdash;such as levels seen in 2020&mdash;could provide further support for prices.</p>
<h3>Chart 1: Ample Headroom: Gold Allocations Remain Far from Past Peaks</h3>
<p><i>Central banks and private investors have steadily increased their gold allocations in recent years, signaling a renewed appreciation for gold&rsquo;s strategic role. Despite this resurgence, gold&rsquo;s share of global assets and reserves remains well below historical peaks reached in the 1970s and early 1980s.</i></p>
<p><img loading="lazy" class="img-responsive" alt="Chart 1: Ample Headroom: Gold Allocations Remain Far from Past Peaks" src="https://www.vaneck.com/contentassets/f96bbb2a85144588877b8c5d17af185e/6401_gold-commentary-october_chart-1_2025-11_v1_blog.svg" /></p>
<p class="chart-disclosure">Source: World Gold Council. Data as of June 2025. Past performance is not indicative of future results.</p>
<p>We also see potential for a modest rotation of capital from richly valued broader equities&mdash;particularly the tech/AI segment&mdash;as investors seek diversification amid rising risks of a market correction. Such a shift could favor gold stocks.</p>
<h2>Gold Miners: Value Hiding in Plain Sight</h2>
<h3>Chart 2: Attractive Relative Valuations Support Re-Rating Potential</h3>
<p><i>Gold miners trade at roughly one-third the valuation of the S&amp;P 500 and a fraction of the &ldquo;Mag 7&rdquo; on both EV/EBITDA and Price-to-Cash-Flow metrics. While gold miner valuations have risen to the top of their 5-year range, they still sit well below broader market levels, underscoring the sector&rsquo;s relative attractiveness.</i></p>
<p><img loading="lazy" class="img-responsive" alt="Chart 2: Attractive Relative Valuations Support Re-Rating Potential" src="https://www.vaneck.com/contentassets/810e219846b244a58d970eccfd8fd260/6401_gold-commentary-october_chart-2_2025-11_v1_blog.svg" /></p>
<p class="chart-disclosure">Source: FactSet. Data as of September 2025. &ldquo;Mag 7&rdquo; represented by the harmonic average values of Alphabet, Amazon, Apple, Meta, Microsoft, Nvidia, Tesla. &ldquo;Gold Miners&rdquo; represented by NYSE Arca Gold Miners Index. Not a recommendation to buy or sell any security mentioned herein. Past performance is not indicative of future results.</p>
<p>Our positive view on gold stocks is supported by our outlook for higher gold prices, but also by very strong fundamentals. Gold miners are enjoying record margins, with profitability that remains attractive and sustainable, even at much lower gold prices (chart 3).</p>
<p>Yet, despite these favorable dynamics, valuations remain at historically low levels. October&rsquo;s volatility caused miners to lag gold&rsquo;s performance, with the NYSE Arca Gold Miners Index (GDMNTR)<sup>1</sup>&nbsp;and the MarketVector Global Gold Miners Index (MVGDXTR)<sup>2</sup>&nbsp;down 5.40% and 5.70%, respectively, for the month.</p>
<h3>Chart 3: Gold&rsquo;s Strength Keeps Nearly All Producers Profitable</h3>
<p><i>The industry cost curve shows that the vast majority of global gold production remains profitable at current prices near $4,000/oz. Even higher-cost producers sit well below current gold prices, indicating a robust profitability buffer across the sector.</i></p>
<p><img loading="lazy" class="img-responsive" alt="Chart 3: Gold's Strength Keeps Nearly All Producers Profitable" src="https://www.vaneck.com/contentassets/ab1b00450f0c4763afa5f1c02bdb9663/6401_gold-commentary-october_chart-3_2025-11_v1_blog.svg" /></p>
<p class="chart-disclosure">Source: World Gold Council. Data as of June 30, 2025.</p>

<h2>Earning Their Place in Portfolios</h2>
<p>We expect the attractive valuations of the gold miners, along with consistent delivery against their targets, to become increasingly difficult for investors to ignore. Gold companies started reporting their Q3 2025 results at the end of October, reaffirming our view that costs in the industry are being contained, companies are exercising excellent capital discipline, and as a group, they are meeting or beating their operational targets.</p>
<p>We may be at the cusp of a historical transition where the gold mining sector finally earns a sleeve, a place, an allocation, or, at the very least, a consideration within global multi-asset portfolios.</p>
<p>To receive more <strong><a href="https://www.vaneck.com/us/en/insights/gold-investing/" title="Gold Investing Insights">Gold Investing</a></strong> insights, <strong><a href="https://www.vaneck.com/us/en/subscribe/" title="Subscription Center">sign up in our subscription center</a></strong>.</p>
]]></content:encoded>
</item><item rdf:about="https://www.vaneck.com/us/en/blogs/natural-resources/top-american-metals-companies-to-consider-for-2026/">
  <title>Top American Metals and Rare Earth Companies to Consider for 2026></title>
  <link>https://www.vaneck.com/us/en/blogs/natural-resources/top-american-metals-companies-to-consider-for-2026/</link>
  <description><![CDATA[The trade war is accelerating a U.S. rare-earth revival and other countries are following suit&mdash;these are some of the top companies to watch as we head into 2026.]]></description>
  <dc:creator> </dc:creator>
  <dc:date>11/18/2025 06:30:00</dc:date>
<content:encoded><![CDATA[

<p><strong>Key Takeaways</strong></p>
<ul class="content-list">
<li class="mt-2">Countries are accelerating rare earth and strategic metals production, led by MP Materials, Albemarle, and Lithium Americas in North America.</li>
<li class="mt-2">Global metals companies expanding rare earth supply outside China include Lynas, Pilbara Minerals, and Iluka Resources.</li>
<li class="mt-2">Policy support and rising clean energy demand are driving long-term growth in rare earth investments.</li>
</ul>
<h2>How North American Metals Companies are Facing a Trade War</h2>
<p>Rare earths and strategic metals are the invisible backbone of modern life. They help power technology such as EV motors, wind turbines, smartphones, MRI machines, and advanced defense systems. Rare earth elements possess unique properties like magnetic strength, heat resistance, and light transmission. These are not easily substituted, making them essential in sectors where performance is critical.</p>
<p>Amid an ongoing trade war between the United States and China, the United States is focused on reviving its supply chains, creating a durable investable theme and new opportunities outside of China-based companies.</p>
<h2>The Rare Earth Opportunity Set is Expanding Beyond China</h2>
<p>China has long dominated mining, refining, and magnet manufacturing. In 2025, Beijing expanded export controls on rare earths, processing tech, and even extraterritorial rules for products containing Chinese-origin materials. That tightened the screws on global buyers and galvanized U.S. industrial policy, widening the opportunity for domestic projects and suppliers. And while Washington has wielded tariffs&mdash;up to triple-digit levels on select Chinese goods&mdash;as a negotiating lever, both countries have recently struck a narrow, near-term accommodation aimed at stabilizing rare-earth flows and reducing immediate supply shock. But even this temporary easing doesn&rsquo;t change the strategic long-term trajectory: the U.S. is still pushing to onshore critical mineral supply chains. Federal funding, long-term offtakes, and permitting priority continue to channel toward projects that can deliver not just ore but finished inputs like magnets and battery-grade lithium&mdash;signaling that reshoring remains a long-game initiative, regardless of short-term diplomatic calm.</p>
<p>Other nations are following suit with governments and corporations mobilizing to build rare earth and strategic metals supply chains outside China. Several notable, recent announcements highlight the size, scope, and global coordination of that effort:</p>
<div class="wrapped-div">
<table style="width: 100%;">
<tbody>
<tr class="tbl-data">
<td class="tbl-header last text-left">Country</td>
<td class="tbl-header last text-left">Organization / Lead Entity</td>
<td class="tbl-header last text-left">2025 Headline Investment / Project Announcement</td>
</tr>
<tr class="tbl-data">
<td class="data-td data last text-left">U.S.</td>
<td class="data-td data last text-left">Department of Defense</td>
<td class="data-td data last text-left">US$400m preferred-equity investment in MP Materials to build rare earth supply</td>
</tr>
<tr class="tbl-data">
<td class="data-td data last text-left">U.S.</td>
<td class="data-td data last text-left">Apple</td>
<td class="data-td data last text-left">US$500m multi-year offtake commitment with MP Materials</td>
</tr>
<tr class="tbl-data">
<td class="data-td data last text-left">E.U.</td>
<td class="data-td data last text-left">European Commission</td>
<td class="data-td data last text-left">Expected &euro;22.5b covering 47 mining/refining projects across 13 member states</td>
</tr>
<tr class="tbl-data">
<td class="data-td data last text-left">Australia</td>
<td class="data-td data last text-left">National Reconstruction Fund</td>
<td class="data-td data last text-left">AU$200m equity stake in Arafura&rsquo;s Nolans rare earth mine and refinery</td>
</tr>
<tr class="tbl-data">
<td class="data-td data last text-left">India</td>
<td class="data-td data last text-left">National Critical Mineral Mission</td>
<td class="data-td data last text-left">State geological survey tasked with identifying 1,200 exploration projects</td>
</tr>
<tr class="tbl-data">
<td class="data-td data last text-left">Japan</td>
<td class="data-td data last text-left">JOGMEC</td>
<td class="data-td data last text-left">&euro;110m equity/debt for a rare earth refining facility in France</td>
</tr>
<tr class="tbl-data">
<td class="data-td data last text-left">U.K.</td>
<td class="data-td data last text-left">CirculaREEconomy</td>
<td class="data-td data last text-left">&pound;11m grant for building UK magnet-recycling chain</td>
</tr>
<tr class="tbl-data">
<td class="data-td data last text-left">South Korea</td>
<td class="data-td data last text-left">Supply Chain Stabilization Fund</td>
<td class="data-td data last text-left">₩50b per year fund for public-private overseas mine stakes and stockpiles</td>
</tr>
</tbody>
</table>
</div>
<p class="chart-disclosure">Source: IEA, Reuters. Data as of August 2025.</p>

<h2 id="metals-companies" class="jump-link-nav anchored-block" data-jumplink-title="Metals Companies">Top North American Metals Companies to Keep an Eye On</h2>
<p>As this dynamic plays out, these domestic companies are among those well-positioned to benefit:</p>
<p><strong>MP Materials (MP) </strong></p>
<p>MP Materials is America's only fully integrated rare earth producer, with operations spanning mining, processing, and the manufacturing of rare earth magnets. The company owns and operates the Mountain Pass mine in California, which is one of the world's richest rare earth deposits. With more than $500 million in funding and offtake agreements from both the Department of Defense and Apple, MP is scaling magnet production and downstream processing.</p>
<p><strong>Lithium Americas (LAC) </strong></p>
<p>Lithium Americas is a Canadian company focused on developing the Thacker Pass lithium mine in Nevada, which is one of the largest known lithium deposits in the U.S. The company is working with partners like General Motors to produce battery-quality lithium carbonate from the site to support North America's sustainable energy transition. Recent developments include the U.S. government taking an equity stake in the company as part of a restructured loan agreement.</p>
<p><strong>Albemarle (ALB) </strong></p>
<p>Albemarle Corporation is a global specialty chemicals company that produces critical ingredients for a wide range of products, with a focus on lithium, bromine, and catalysts. It is one of the world's largest lithium producers, with its products used in energy storage (like electric vehicle batteries), and also provides chemicals for electronics, pharmaceuticals, construction, and transportation.</p>
<h2>Top Metals Companies to Watch Outside of China</h2>
<p>As more countries across the world look to onshore supply of critical natural resources, these companies outside of China are among those well-positioned to benefit:</p>
<p><strong>Lynas Rare Earths (LYC)</strong></p>
<p>Lynas Rare Earths is the largest non-Chinese producer of separated rare earth materials, operating the Mt Weld mine in Western Australia&mdash;one of the highest-grade rare earth deposits in the world. The company also runs a processing facility in Malaysia and is building a U.S.-based separation plant to support Western supply chain diversification. Lynas supplies essential materials for EV motors, wind turbines, and advanced manufacturing, positioning itself as a key partner for governments seeking to reduce reliance on China.</p>
<p><strong>Pilbara Minerals (PLS)</strong></p>
<p>Pilbara Minerals is a leading Australian lithium producer and the owner of the world-class Pilgangoora lithium-tantalum project, one of the largest hard-rock lithium deposits globally. The company provides spodumene concentrate to major battery and chemical producers and is expanding downstream conversion capacity through joint ventures. With strong production growth, long-term contracts, and a balance sheet fortified by high-cycle lithium prices, Pilbara plays a central role in securing lithium supply for the global energy transition.</p>
<p><strong>Iluka Resources (ILU)</strong></p>
<p>Iluka Resources is a mineral sands producer and a key emerging supplier of rare earth oxides through its Eneabba project in Western Australia. Historically known for zircon and titanium minerals, Iluka is now developing one of the world&rsquo;s only fully integrated rare earth refinery systems outside China. Backed by a strategic financing package from the Australian government, the Eneabba refinery will produce separated rare earth oxides essential for permanent magnets used in defense, EVs, and clean energy technologies.</p>

<h2 id="what-to-consider" class="jump-link-nav anchored-block" data-jumplink-title="What to Consider">What to Consider When Investing in Rare Earth Metals Companies</h2>
<p>Investing in American rare earths isn&rsquo;t like buying another software stock. It&rsquo;s closer to funding a moonshot factory&mdash;part policy project, part heavy-industry build, part commodity cycle. The upside is real, but so are the moving parts. Here&rsquo;s how to think about the risks.</p>
<p><strong>Policy &amp; Geopolitics: The invisible hand on the tiller</strong></p>
<p>In this space, headlines can change cash flows. Export controls, tariffs, and U.S. policy decisions don&rsquo;t just shape narratives&mdash;they alter project timelines, financing costs, and long-term offtakes. It&rsquo;s important for investors to watch the policy calendar as closely as earnings season and track China&rsquo;s counter-moves alongside U.S. incentives.</p>
<p><strong>Commodity &amp; Project Risk: Models meet metallurgy</strong></p>
<p>Rare earth and lithium prices swing&mdash;sometimes violently&mdash;and projects swing with them. Even great deposits face real-world friction: permitting delays, capex creep, commissioning hiccups, and lower-than-modeled recovery rates (especially in first-of-kind U.S. facilities).</p>
<p><strong>Supply-Chain Depth: Where the margin really lives</strong></p>
<p>The most attractive margins accrue as materials move from ore to metal to alloys to finished components (magnets, cathodes) and finally into OEM contracts. Accordingly, investors must consider how companies control things like processing, conversion, and locked-in offtakes with autos/tech/defense&mdash;it&rsquo;s not just about a company&rsquo;s pure rock-in-the-ground exposure.</p>
<h2 id="outlook" class="jump-link-nav anchored-block" data-jumplink-title="2026 Outlook">2026 Outlook</h2>
<p>Markets have already started to price the tension of the ongoing trade war, with magnet materials like neodymium and tungsten seeing significant price increases due to tighter supply. While some of those price gains have diminished following the near-term agreement between the United States and China, the longer-term trajectory of onshoring supply of these critical natural resources remains intact. Because the bigger story heading into 2026 isn&rsquo;t price&mdash;it&rsquo;s policy. China&rsquo;s dominance in this space was built through decades of centralized state strategy, with the country consolidating mines, subsidizing refining, and allowing less stringent environmental standards. And China has shown a willingness to use its position strategically, tightening export restrictions when geopolitics heat up. For the U.S. and its allies, access to these materials is no longer just an economic question. It&rsquo;s a matter of national security and energy independence. As a result, the investment momentum behind rare earths and strategic metals companies outside of China is accelerating. They&rsquo;re no longer a niche materials trade&mdash;they&rsquo;ve become a strategic lever in the evolving economic world order and a compelling opportunity for 2026 and beyond.</p>
<h2>How to Invest</h2>
<p>Directly purchasing rare earths isn&rsquo;t feasible for most investors&mdash;these materials are not traded on traditional commodity exchanges. That&rsquo;s where REMX comes in.</p>
<p>The <a href="/link/71e51530eb0e4adbbd16a7847361abc7.aspx" title="REMX - VanEck Rare Earth and Strategic Metals ETF - Overview"><strong>VanEck Rare Earth and Strategic Metals ETF (REMX)</strong></a> provides <strong>pure-play, comprehensive, global exposure</strong> with holdings generating at least 50% of revenues from rare earths and strategic metals.</p>
<p><span style="font-size: 14pt;"><strong>How to Buy REMX?</strong></span></p>
<p>VanEck ETFs can be purchased the same way you would buy a stock, through a broker or with your advisor.</p>
<p>To receive more <a href="/us/en/insights/natural-resources/" title="Natural Resources Insights"><strong>Natural Resources</strong></a> insights, <a href="https://www.vaneck.com/us/en/subscribe/" title="Subscription Center"><strong>sign up in our subscription center</strong></a>.</p>
]]></content:encoded>
</item><item rdf:about="https://www.vaneck.com/us/en/blogs/thematic-investing/top-blockchain-companies-to-watch-leading-into-2026/">
  <title>Top Blockchain Companies to Watch Leading into 2026></title>
  <link>https://www.vaneck.com/us/en/blogs/thematic-investing/top-blockchain-companies-to-watch-leading-into-2026/</link>
  <description><![CDATA[Learn more about the top onchain companies revolutionizing the sector, the industries being impacted, and key investment trends shaping the future of the digital asset ecosystem.]]></description>
  <dc:creator>Drew  Anderson</dc:creator>
  <dc:date>11/17/2025 06:30:00</dc:date>
<content:encoded><![CDATA[

<p><strong>Key Takeaways:</strong></p>
<ul class="content-list">
<li class="mt-2">Blockchain leaders span multiple sectors, from mining and fintech to energy and semiconductors.</li>
<li class="mt-2">Major companies like Coinbase, Nvidia, and Block are driving real-world blockchain adoption.</li>
<li class="mt-2">Tokenization, stablecoins, and onchain settlement are transforming capital markets heading into 2026.</li>
</ul>
<h2>What is Blockchain and Why Is It Important for Crypto?</h2>
<p>Blockchain is a decentralized digital ledger that records transactions across a network of computers, ensuring transparency, security, and immutability without the need for a central authority. Each &ldquo;block&rdquo; in the chain contains a set of verified transactions, and once added, it cannot be altered&mdash;creating a trustworthy, tamper-resistant record. This technology is the foundation of all cryptocurrencies, enabling peer-to-peer transfer of value, smart contracts, and decentralized applications. By removing intermediaries and reducing the risk of fraud, blockchain has become essential to the growth and credibility of the crypto economy.</p>
<div class="row mb-3">
<div class="col-md-4 col-xs-12"><a href="https://www.youtube.com/embed/AK_nY4Cx7DQ" data-video="https://youtu.be/AK_nY4Cx7DQ" class="popup-youtube" title="Watch Video"><img loading="lazy" class="img-responsive" style="margin-right: 15px; margin-top: 0px;" src="https://www.vaneck.com/contentassets/9254f7c88ecf43e1b5ab5d4dc51fdf43/6375_node-top-blockchain-companies_thumbnail_2025-12_v1.jpg" alt="Watch Video" align="left" /></a></div>
<div class="col-md-8 col-xs-12"><br /><strong><a href="https://www.youtube.com/embed/AK_nY4Cx7DQ" data-video=" https://youtu.be/AK_nY4Cx7DQ" class="popup-youtube" title="Watch Video">Watch Video</a><br /></strong><a href="https://www.youtube.com/embed/AK_nY4Cx7DQ" data-video="https://youtu.be/AK_nY4Cx7DQ" class="popup-youtube" title="Watch Video" style="font-size: 16px; font-weight: bold; padding: 10px 0px 0px; margin-right: 20px; width: 202px;">Top Blockchain Companies for 2026</a></div>
</div>
<p>The onchain economy is rapidly evolving as blockchain technology continues to mature and integrate into mainstream finance. Against this backdrop, a growing ecosystem of companies and investment instruments is driving this transformation, building the infrastructure that supports digital assets, expanding access to tokenized markets, and creating new avenues for exposure to blockchain-based innovation. These leaders are not only shaping the future of decentralized finance but also redefining how value is created, exchanged, and secured across the global economy.</p>
<h2>The Top Blockchain Companies to Watch</h2>
<p>The onchain economy spans multiple sectors, each playing a distinct role in supporting, expanding, and innovating within the blockchain ecosystem. From digital asset exchanges that facilitate trading, to miners powering the network, to fintech firms bridging traditional and decentralized finance, these companies represent the most significant players shaping the future of digital value creation. Below is a breakdown of key leaders across core categories driving blockchain adoption and infrastructure as we head into 2026.</p>

<h2>Exchanges</h2>
<p><strong>Coinbase Global Inc. (COIN) (2.58% of NODE assets)</strong></p>
<p>The largest U.S.-based cryptocurrency exchange, Coinbase serves as the gateway for millions of investors to access, trade, and custody digital assets. Its institutional offerings and regulatory leadership continue to make it a cornerstone of the crypto economy.</p>
<p><strong>Robinhood Markets Inc (HOOD) (2.24% of NODE assets)</strong></p>
<p>Known for democratizing stock trading, Robinhood has expanded into crypto, offering easy access to digital assets for retail investors. Its integration of traditional equities and crypto under one platform helps blur the lines between legacy finance and the blockchain world.</p>
<h2>Mining</h2>
<p><strong>Core Scientific Inc. (CORZ) (3.93% of NODE Assets)</strong></p>
<p>One of the largest Bitcoin miners in North America, Core Scientific is evolving beyond crypto mining by transforming its infrastructure to support AI and high-performance computing workloads&mdash;bridging two of the fastest-growing digital frontiers.</p>
<p><strong>Cipher Mining INC. (CIFR) (6.42% of NODE Assets) &amp; Bitfarms Ltd/Canada (BITF) (1.10% of NODE Assets)</strong></p>
<p>Both companies have delivered standout performance recently. They exemplify the resurgence of the mining sector as Bitcoin&rsquo;s price and network activity strengthen.</p>
<h2>TradFi Enablers &amp; FinTech</h2>
<p><strong>Mercadolibre Inc. (MELI) (1.07% of NODE Assets)</strong></p>
<p>Often called the &ldquo;Amazon of Latin America,&rdquo; MercadoLibre has become a fintech powerhouse, integrating digital payments and crypto services into its e-commerce ecosystem, accelerating financial inclusion across the region.</p>
<h2>Asset Managers &amp; &ldquo;HODLers&rdquo;</h2>
<p><strong>Strategy Inc. (MSTR) (0.24% of NODE Assets)</strong></p>
<p>The largest corporate holder of Bitcoin, MicroStrategy has transformed from a software firm into a de facto Bitcoin investment vehicle, with a treasury strategy that underscores its conviction in Bitcoin as a long-term store of value.</p>
<p><strong>Galaxy Digital Inc (GLXY) (4.35% of NODE Holdings)</strong></p>
<p>A diversified digital asset financial services firm, Galaxy operates across trading, asset management, and investment banking for the crypto economy, positioning itself as a key institutional gateway into blockchain markets.</p>
<h2>Energy Infrastructure</h2>
<p><strong>Kinder Morgan Inc. (KMI) (0.54% of NODE Assets)</strong></p>
<p>A major natural gas provider in the U.S., Kinder Morgan plays an indirect but essential role in the crypto economy by powering the data centers and mining operations that sustain blockchain networks.</p>

<h2>What Are Some Real-World Use Cases of Blockchain in 2025?</h2>
<p>Blockchain is often framed as a backend technology&mdash;but in 2025, it&rsquo;s driving real, visible change in how money moves, how capital markets work, and how institutions manage liquidity. The story now revolves around tokenization, programmable settlement, and embedding yield-bearing assets onchain.</p>
<p>For example, picture a global merchant paying suppliers in dozens of countries, but no longer relying on SWIFT and banks. Stripe&rsquo;s rollout of USDC payments in 50+ countries lets businesses settle instantaneously in stablecoins, eliminating delays and heavy foreign exchange costs. Beyond payments, stablecoins now collateralize and fund onchain lending at scale; Visa&rsquo;s analysis shows monthly borrowing hit fresh highs in 2025, underscoring stablecoins&rsquo; role as working capital in DeFi money markets. Meanwhile, big banks are also rethinking the plumbing of finance. JPMorgan&rsquo;s Kinexys platform lets institutions post tokenized securities as collateral and move them across venues without traditional settlement friction.</p>
<p>These examples hint at broader shifts: capital markets are becoming more modular, liquidity is more dynamic, and assets are gaining a programmable layer. In this new world, blockchain isn&rsquo;t experimental&mdash;it&rsquo;s becoming foundational. Check out <a href="https://www.vaneck.com/us/en/investments/onchain-economy-etf-node/performance/" title="NODE - VanEck Onchain Economy ETF - Overview"><strong>VanEck&rsquo;s Onchain Economy ETF (NODE)</strong></a> for more insights.</p>
<p>To receive more <a href="https://www.vaneck.com/us/en/insights/thematic-investing/" title="Thematic Investing Insights"><strong>Thematic Investing</strong></a> insights, <a href="https://www.vaneck.com/us/en/subscribe/" title="Subscription Center"><strong>sign up in our subscription center</strong></a>.</p>
]]></content:encoded>
</item><item rdf:about="https://www.vaneck.com/us/en/blogs/income-investing/position-for-higher-yields-with-clos-and-em-debt/">
  <title>Position for Higher Yields with CLOs and EM Debt></title>
  <link>https://www.vaneck.com/us/en/blogs/income-investing/position-for-higher-yields-with-clos-and-em-debt/</link>
  <description><![CDATA[CLOs and emerging markets bonds can deliver exposure to resilient income and strong fundamentals.]]></description>
  <dc:creator>Fran Rodilosso</dc:creator>
  <dc:date>11/17/2025 06:30:00</dc:date>
<content:encoded><![CDATA[

<p><strong>Key Takeaways:</strong></p>
<ul class="content-list">
<li class="mt-2">The Fed&rsquo;s rate-cutting cycle is likely to be shallow and, as inflationary pressures may persist, we expect continued volatility and potentially higher, longer-term yields.</li>
<li class="mt-2">CLOs offer higher income and lower volatility than many fixed income sectors, supported by structural protections and a strong track record through multiple cycles.</li>
<li class="mt-2">Emerging markets bonds stand out for their attractive yield and strong fundamentals.</li>
</ul>
<p>At its recent October meeting, the Federal Reserve&rsquo;s rate cut was expected&mdash;but the press conference that followed was the real event. While the Fed trimmed rates by 25 basis points, the message was clear: future cuts are far from guaranteed.</p>
<p>In a <strong><a title="Webinar : What the Fed's Next Move Means for Fixed Income Portfolios" href="https://www.vaneck.com/us/en/webinar-registration/?id=94733909741&amp;utm_source=vaneck&amp;utm_medium=calendar">recent webinar</a></strong>, VanEck&rsquo;s <a href="/link/88a6b22d9b51473ebbfd1063b2473f55.aspx" title="Fran Rodilosso &mdash; Head of Fixed Income ETF Portfolio Management"><strong>Fran Rodilosso</strong></a> and Bill Sokol discuss how this backdrop is creating opportunities in two areas that can deliver attractive income without taking excessive duration or credit risk: Collateralized loan obligations (CLOs) and emerging markets bonds.</p>
<h2>What the Fed's Next Move Means for Fixed Income Portfolios</h2>
<h2>CLOs: Engineered for Income with Built-in Risk Protections</h2>
<p>CLOs are structured pools of senior secured loans, and the asset class has quietly become one of the most resilient sources of credit income in the market. CLOs&rsquo; unique structure channels cash flows through a &ldquo;waterfall&rdquo; that prioritizes payments to the most senior tranches first, while lower tranches absorb risk. The built-in risk protections of CLOs have resulted in a very strong track record of low defaults, especially versus other corporate credit investments.</p>
<h3>Resilience to Defaults</h3>
<p><strong>Annual global defaults rates</strong><sup><strong>1</strong></sup><strong>: CLO vs Corporates and Leveraged Loan (2001 - 2024)</strong></p>
<p><img loading="lazy" class="img-responsive" src="https://www.vaneck.com/contentassets/2ab43457baa34f1ca9dbff1185a623e8/6393_income-webinar-recap-blog_chart-1_2025-11_v1_blog.svg" alt="Resilience to Defaults" /></p>
<p><strong>US CLO defaults by original rating</strong><sup><strong>1</strong></sup><strong>&nbsp;(1994 - 2024)</strong></p>
<div class="wrapped-div">
<table style="width: 100%;">
<tbody>
<tr class="tbl-data">
<td class="tbl-header last text-left">&nbsp;</td>
<td class="tbl-header last text-center" colspan="3">Issued pre-GFC &ldquo;CLO 1.0&rdquo;</td>
<td class="tbl-header last text-center" colspan="3">Issued post-GFC &ldquo;CLO 2.0/3.0&rdquo;<sup>2</sup></td>
</tr>
<tr class="tbl-data">
<td class="tbl-header last text-left">Tranche Rating</td>
<td class="tbl-header last text-right"># Ratings</td>
<td class="tbl-header last text-right"># Defaults</td>
<td class="tbl-header last text-right">% Defaulted (%)</td>
<td class="tbl-header last text-right"># Ratings</td>
<td class="tbl-header last text-right"># Defaults</td>
<td class="tbl-header last text-right">% Defaulted (%)</td>
</tr>
<tr class="tbl-data">
<td class="data-td data last text-left">AAA</td>
<td class="data-td data last text-right">1,540</td>
<td class="data-td data last text-right">0</td>
<td class="data-td data last text-right">0.00</td>
<td class="data-td data last text-right">4,918</td>
<td class="data-td data last text-right">0</td>
<td class="data-td data last text-right">0.00</td>
</tr>
<tr class="tbl-data">
<td class="data-td data last text-left">AA</td>
<td class="data-td data last text-right">616</td>
<td class="data-td data last text-right">1</td>
<td class="data-td data last text-right">0.20</td>
<td class="data-td data last text-right">3,817</td>
<td class="data-td data last text-right">0</td>
<td class="data-td data last text-right">0.00</td>
</tr>
<tr class="tbl-data">
<td class="data-td data last text-left">A</td>
<td class="data-td data last text-right">790</td>
<td class="data-td data last text-right">5</td>
<td class="data-td data last text-right">0.60</td>
<td class="data-td data last text-right">3,178</td>
<td class="data-td data last text-right">0</td>
<td class="data-td data last text-right">0.00</td>
</tr>
<tr class="tbl-data">
<td class="data-td data last text-left">BBB</td>
<td class="data-td data last text-right">783</td>
<td class="data-td data last text-right">9</td>
<td class="data-td data last text-right">1.10</td>
<td class="data-td data last text-right">3,167</td>
<td class="data-td data last text-right">0</td>
<td class="data-td data last text-right">0.00</td>
</tr>
<tr class="tbl-data">
<td class="data-td data last text-left">BB</td>
<td class="data-td data last text-right">565</td>
<td class="data-td data last text-right">22</td>
<td class="data-td data last text-right">3.90</td>
<td class="data-td data last text-right">2,370</td>
<td class="data-td data last text-right">12</td>
<td class="data-td data last text-right">0.50</td>
</tr>
</tbody>
</table>
</div>
<p class="chart-disclosure">Source:<sup>1</sup>&nbsp;S&amp;P Global: Default, Transition, and Recovery: 2024 Annual Global Leveraged Loan CLO Default And Rating Transition Study and J.P. Morgan.<sup>2</sup>&nbsp;CLO 2.0/3.0 are CLOs issued 2010 and after. Past performance is not indicative of future results. This is not an offer to buy or sell, or recommendation to buy or sell any of the securities mentioned herein. Default rate for CLOS and Corporate includes all rated entities. Corporate (Sec-grade) includes only companies rated BB+ and below. CLOs, Corporates (Speculative Grade), and Leveraged Loans represent aggregated default-rate data from S&amp;P Global and J.P. Morgan research studies and are not investable indices. Tranche ratings (AAA&ndash;BB) reflect credit quality categories assigned by rating agencies, not benchmark indices.</p>
<p>In addition to its strong track record from a risk perspective, the CLO asset class has historically offered greater compensation for risk compared to similarly rated bonds, a characteristic that holds true in the current market environment. This is illustrated in the chart below, which compares credit spreads of CLOs versus corporate bonds. These higher spreads mean that CLOs can provide attractive yield even in periods where the Fed is cutting rates, which along with built-in risk protections make CLOs a compelling source of relative value.</p>
<h3>Consistent Spread Pickup Compared to Similarly Rated Bonds</h3>
<p><strong>CLO vs Corporate Bond Average Spread by Rating<sup>1</sup>&nbsp;(in bps as of 9/30/2025)</strong></p>
<p><img loading="lazy" class="img-responsive" alt="CLO vs Corporate Bond Average Spread by Rating" src="https://www.vaneck.com/contentassets/8a83eabc64c0423c992353bc3b558d65/6393_income-webinar-recap-blog_chart-2_2025-11_v2_blog.svg" /></p>
<p class="chart-disclosure"><sup>1</sup>&nbsp;Source: JP Morgan and ICE Data Services. Using OAS for corporate bonds and discount margins for CLOs. AAA Rated CLOs represented by J.P. Morgan CLO AAA Index, AA Rated CLOs represented by J.P. Morgan CLO AA Index, A Rated CLOs represented by J.P. Morgan CLO A Index, BBB Rated CLOs represented by J.P. Morgan CLO BBB Index, BB Rated CLOs represented by J.P. Morgan CLO BB Index, B Rated CLOs represented by J.P. Morgan CLO B Index. AAA Rated Corps represented by the ICE BofA AAA US Corporate Index, AA Rated Corps represented by the ICE BofA AA US Corporate Index, A Rated Corps represented by the ICE BofA A US Corporate Index, BBB Rated Corps represented by the ICE BofA BBB US Corporate Index, BB Rated Corps represented by the ICE BofA BB US High Yield Index and B Rated Corps represented by the ICE BofA Single-B US High Yield Index. Past performance is no guarantee of future results. Index performance is not representative of fund performance. It is not possible to invest directly in an index.</p>
<h2>Emerging Markets Bonds: Attractive Yield and Diversification Potential</h2>
<p>Emerging markets debt has been one of 2025&rsquo;s strongest performers, with local currency bonds outpacing U.S. and global developed-market benchmarks by a wide margin. The asset class also offers attractive yields relative to other areas of the fixed income market.</p>
<h3>Attractive Yield Potential</h3>
<p><strong>Yield Comparison (as of 9/30/2025)</strong></p>
<p><img loading="lazy" class="img-responsive" alt="Yeild Comparison" src="https://www.vaneck.com/contentassets/24448a7a1e3942d2a1ed43d171de5e98/6393_income-webinar-recap-blog_chart-3_2025-11_v1_blog.svg" /></p>
<p class="chart-disclosure">Source: VanEck, Bloomberg, J.P. Morgan, ICE Data Indices, LLC. US HY is represented by the ICE BofA US High Yield Index. EM LC Sov is represented by the J.P. Morgan GBIEM Global Core Index. EM HY Corp is represented by the ICE BofA Diversified HY US Emerging Markets Corporate Plus Index. EM USD Sov is represented by the JPM EMBI Global Diversified Index. EM Corp is represented by the ICE BofA EM Diversified Corporate Index. US IG Corp is represented by the ICE BofA US Corporate Index. US Agg is represented by the ICE BofA US Broad Market Index. Global Agg is represented by the ICE BofA Global Broad Market Plus Index. Data as of 9/30/2025. Real yield is the nominal yield minus the forecasted rate of inflation. Past performance is no guarantee of future results. Index performance is not representative of fund performance. It is not possible to invest directly in an index.</p>
<h2>Strong Fundamentals</h2>
<p>In addition to these strong returns and attractive yields, EM bonds are underpinned by strong fundamentals. Unlike developed markets, EM sovereigns entered this cycle with lower debt-to-GDP ratios, stronger fiscal positions, and positive current accounts. Many central banks hiked earlier and more aggressively post-COVID, leaving them with ample room to ease now.</p>
<h3>EM Nations Have Lower Debt than DMs</h3>
<p><strong>Gross Debt to GDP (%)</strong></p>
<p><img loading="lazy" class="img-responsive w-100" src="https://www.vaneck.com/contentassets/386028693fd345deb1a25c5683279ba2/6393_income-webinar-recap-blog_chart-4_2025-11_v1_blog.svg" alt="&gt;EM Nations Have Lower Debt than DMs" /></p>
<p class="chart-disclosure">Source: International Monetary Fund, as of April 2025. EM: Emerging markets; DM: Developed Markets. For illustrative purposes only. Not intended as a forecast or prediction of future results. Past performance is no guarantee of future results. Index performance is not representative of fund performance. It is not possible to invest directly in an index. Emerging Markets and Developed Markets represent aggregated IMF country group data, not investable indices.</p>
<h2>How to Invest</h2>
<p>After years of relentless tightening, the Fed&rsquo;s shift marks a new phase for income investors&mdash;one defined by modest easing, persistent inflation, and opportunity beyond traditional core bonds. In this landscape:</p>
<ul>
<li class="mt-2">CLOs provide structural insulation, attractive yield, and proven resilience</li>
<li class="mt-2">Emerging markets bonds offer yield, diversification, and improving fundamentals</li>
</ul>
<p>VanEck offers exposure to these asset classes through the following:</p>
<ul>
<li class="mt-2"><strong><a href="/link/e090deaddc774ac699a04b959d9254c6.aspx" title="CLOI - VanEck CLO ETF">CLOI | VanEck CLO ETF</a></strong></li>
<li class="mt-2"><strong><a href="/link/d2f16468a9f14c1e807f6bb7fb597a3e.aspx" title="CLOB - VanEck AA-BB CLO ETF">CLOB | VanEck AA-BB CLO ETF</a></strong></li>
<li class="mt-2"><strong><a href="/link/f447bf0c04f64108a3dcff3ca025af4a.aspx" title="EMBX - VanEck Emerging Markets Bond ETF">EMBX | VanEck Emerging Markets Bond ETF</a></strong></li>
<li class="mt-2"><strong><a href="/link/98c7fd49bdbc456294a1eb859ad166f7.aspx" title="EMBX - VanEck Emerging Markets Bond ETF">EMLC | VanEck J.P. Morgan EM Local Currency Bond ETF</a></strong></li>
<li class="mt-2"><strong><a href="/link/b572cc2d2799458eb526924e28c41513.aspx" title="HYEM - VanEck Emerging Markets High Yield Bond ETF">HYEM | VanEck Emerging Markets High Yield Bond ETF</a></strong></li>
</ul>
<p>To receive more <a href="/us/en/blogs/income-investing/" title="Income Investing Insights"><strong>Income Investing</strong></a> insights, <a href="/link/5f45412c2143400497908cea2897f7d3.aspx" title=" Subscription Center"><strong>sign up in our subscription center</strong></a>.</p>
]]></content:encoded>
</item><item rdf:about="https://www.vaneck.com/us/en/blogs/digital-assets/vsol-etf-question-and-answer/">
  <title>VSOL ETF: Question &amp; Answer></title>
  <link>https://www.vaneck.com/us/en/blogs/digital-assets/vsol-etf-question-and-answer/</link>
  <description><![CDATA[The VanEck Solana ETF delivers convenient exposure to Solana&mdash;in this blog you&rsquo;ll find answers to the most frequently asked questions about VSOL.]]></description>
  <dc:creator>Denis   Zinoviev</dc:creator>
  <dc:date>11/17/2025 06:30:00</dc:date>
<content:encoded><![CDATA[

<p><strong>An investment in the VanEck Solana ETF (&ldquo;VSOL,&rdquo; or the &ldquo;Trust&rdquo;) is subject to significant risk and may not be suitable for all investors. The value of Solana is highly volatile, and you can lose your entire principal investment. VSOL is not an investment company registered under the Investment Company Act of 1940 (the &ldquo;1940 Act&rdquo;) and therefore is not subject to the same protections as mutual funds or ETFs registered under the 1940 Act.</strong></p>
<p><i>Staking SOL through third parties involves liquidity, validator, and counterparty risks. Locked staking periods may delay redemptions, and validator errors can trigger penalties or losses. Providers&rsquo; reliability and security add operational risk. Rewards face fees, taxes, and timing uncertainty, while regulatory or tax changes could affect staking legality or the Trust&rsquo;s status.</i></p>
<p>Solana is a blockchain network that enables decentralized applications and smart contracts. Solana (SOL) is its native cryptocurrency and &ldquo;SOL&rdquo; is its trading symbol.</p>
<p>VSOL: <strong><a href="https://www.vaneck.com/us/en/investments/solana-etf-vsol/vsol-prospectus.pdf" title="VSOL Prospectus" target="_blank" rel="noopener">Prospectus</a></strong></p>
<ul class="content-list">
<li class="mt-2"><a href="#point-1"><strong>Why should investors consider VSOL?</strong></a></li>
<li class="mt-2"><a href="#point-2"><strong>Why consider exposure to Solana?</strong></a></li>
<li class="mt-2"><a href="#point-3"><strong>What is the investment strategy for VSOL?</strong></a></li>
<li class="mt-2"><a href="#point-4"><strong>How does VSOL compare to direct Solana ownership?</strong></a></li>
<li class="mt-2"><a href="#point-5"><strong>What are the differences between VSOL and other Solana investment options?</strong></a></li>
<li class="mt-2"><a href="#point-6"><strong>How does the fund's creation/redemption process work?</strong></a></li>
<li class="mt-2"><a href="#point-7"><strong>What are the tax implications compared to direct Solana investment?</strong></a></li>
<li class="mt-2"><a href="#point-8"><strong>What is staking?</strong></a></li>
<li class="mt-2"><a href="#point-9"><strong>Does VSOL participate in staking?</strong></a></li>
<li class="mt-2"><a href="#point-10"><strong>Who is the Trust's validator?</strong></a></li>
<li class="mt-2"><a href="#point-11"><strong>Are there distributions of staking rewards?</strong></a></li>
<li class="mt-2"><a href="#point-12"><strong>How do staking rewards show up in NAV?</strong></a></li>
<li class="mt-2"><a href="#point-13"><strong>Are staking rewards guaranteed? What yield should I expect?</strong></a></li>
<li class="mt-2"><a href="#point-14"><strong>How long does unstaking (deactivation) take? Will that impact redemptions?</strong></a></li>
<li class="mt-2"><a href="#point-15"><strong>What is "slashing," and can it affect my investment?</strong></a></li>
<li class="mt-2"><a href="#point-16"><strong>What kind of fees does VSOL have?</strong></a></li>
<li class="mt-2"><a href="#point-17"><strong>How is the Solana for VSOL custodied?</strong></a></li>
<li class="mt-2"><a href="#point-18"><strong>Who is Gemini?</strong></a></li>
<li class="mt-2"><a href="#point-19"><strong>Who is Coinbase?</strong></a></li>
<li class="mt-2"><a href="#point-20"><strong>What are the risks involved in buying VSOL?</strong></a></li>
<li class="mt-2"><a href="#point-21"><strong>How does the Trust audit its Solana?</strong></a></li>
<li class="mt-2"><a href="#point-22"><strong>How can Investors Buy VSOL?</strong></a></li>
<li class="mt-2"><a href="#point-23"><strong>Who Created Solana?</strong></a></li>
<li class="mt-2"><a href="#point-24"><strong>How is New Solana Created?</strong></a></li>
<li class="mt-2"><a href="#point-25"><strong>What is Solana "Mainnet"?</strong></a></li>
<li class="mt-2"><a href="#point-26"><strong>How Does Solana Compare to Bitcoin?</strong></a></li>
<li class="mt-2"><a href="#point-27"><strong>What is Proof of History?</strong></a></li>
<li class="mt-2"><a href="#point-28"><strong>What is Solana Used For?</strong></a></li>
</ul>
<h2 id="point-1" class="jump-link-nav anchored-block" data-jumplink-title="Why VSOL?">Why should investors consider VSOL?</h2>
<p>VSOL offers convenient exposure to <a href="https://www.vaneck.com/us/en/blogs/digital-assets/solana-101-a-beginners-guide/" title="Solana 101: A Beginner&rsquo;s Guide"><strong>Solana</strong></a> without the complexities of direct ownership. It&rsquo;s a cost-efficient solution to obtain Solana exposure, managed by VanEck, a well-established ETF issuer with extensive experience in crypto-related products. VSOL also benefits from expert management and qualified custody of Solana. This product allows investors to access Solana price exposure within a traditional investment vehicle.</p>
<h2 id="point-2" class="jump-link-nav anchored-block" data-jumplink-title="Why Solana?">Why consider exposure to Solana?</h2>
<p>Solana is designed for high throughput and low transaction costs, making it attractive for consumer apps, DeFi, NFTs and payments. As a digital asset, Solana offers:</p>
<ul class="content-list">
<li class="mt-2"><strong>Utility and Demand:</strong> SOL is used to pay for transaction fees and computation on Solana.</li>
<li class="mt-2"><strong>Smart Contract Platform:</strong> Solana supports scalable decentralized applications (dApps), with growing developer activity.</li>
<li class="mt-2"><strong>Portfolio Diversification:</strong> Investing in Solana can provide potential portfolio diversification benefits, as it operates differently from traditional financial assets.</li>
<li class="mt-2"><strong>Adoption and Growth:</strong> With a robust development community and growing mainstream acceptance, Solana's role in the digital economy is expanding rapidly.</li>
</ul>
<h2 id="point-3" class="anchored-block">What is the investment strategy for VSOL?</h2>
<p>The Trust&rsquo;s investment objective is to reflect the performance of the price of Solana (&ldquo;SOL&rdquo;) and rewards from staking a portion of the Trust&rsquo;s SOL, less the expenses of the Trust&rsquo;s operations. The value of the SOL of the Trust is determined by reference to the underlying Index price, the <a href="https://www.marketvector.com/indexes/digital-assets/marketvector-solana-benchmark-rate" title=" MarketVector&trade; Solana Benchmark Rate" target="_blank" rel="noopener">MarketVector Solana Benchmark Rate</a>. The Trust is a passive investment vehicle that does not seek to pursue any investment strategy beyond reflecting the performance of the price of SOL and any rewards from staking a portion of the Trust&rsquo;s SOL.</p>
<h2 id="point-4" class="anchored-block">How does VSOL compare to direct Solana ownership?</h2>
<p>Direct Solana ownership requires interacting with a crypto exchange, managing storage, and ensuring security, all of which can be complex. VSOL can be bought and sold on traditional stock exchanges, making it accessible through brokerage accounts, simplifying the process for investors.</p>

<h2 id="point-5" class="anchored-block">What are the differences between VSOL and other Solana investment options?</h2>
<div class="wrapped-div">
<table style="width: 100%;">
<tbody>
<tr class="tbl-data">
<td class="tbl-header last text-left">Investment Option</td>
<td class="tbl-header last text-left">Pros</td>
<td class="tbl-header last text-left">Cons</td>
</tr>
<tr class="tbl-data">
<td class="data-td data last text-left">Direct Solana Investing</td>
<td class="data-td data last text-left">Full ownership, high control</td>
<td class="data-td data last text-left">Requires significant knowledge, complex storage, and security management</td>
</tr>
<tr class="tbl-data">
<td class="data-td data last text-left">Solana ETNs/ETPs (e.g., VSOL)</td>
<td class="data-td data last text-left">Easy trading, managed by experienced issuers</td>
<td class="data-td data last text-left">Management fees, dependent on ETP structure performance</td>
</tr>
<tr class="tbl-data">
<td class="data-td data last text-left">Crypto Hedge Funds</td>
<td class="data-td data last text-left">Professional management, potential for higher returns</td>
<td class="data-td data last text-left">High initial investment, lock-up periods, complex fee structures</td>
</tr>
</tbody>
</table>
</div>
<br />
<h2 id="point-6" class="anchored-block">How does the fund's creation/redemption process work?</h2>
<p>The Trust can create or redeem shares either in-kind with SOL or in cash. These transactions occur in multiples of a creation unit (25,000 shares per unit) through an Authorized Participant in the primary market, where each unit represents a pro-rata slice of the trust. In an in-kind creation, SOL is delivered to the Trust and the corresponding number of ETP shares is issued based on the creation unit; In an in-kind redemption, ETP shares are returned and the corresponding amount of SOL is delivered out from the Trust. For cash creations, the Authorized Participant delivers cash to the trust and the corresponding SOL is purchased; For cash redemptions the corresponding SOL is sold and cash is delivered out to the redeeming Authorized Participant. In both instances, all trading costs are borne by the Authorized Participant.</p>
<h2 id="point-7" class="anchored-block">What are the tax implications compared to direct Solana investment?</h2>
<p>The VanEck Solana ETF is a grantor trust for U.S. federal income tax purposes. As a result, the Trust itself is not subject to U.S. federal income tax. Instead, the Trust&rsquo;s income and expenses &ldquo;flow through&rdquo; to the Shareholders. Shareholders generally will be treated, for U.S. federal income tax purposes, as if they directly owned a pro rata share of the underlying assets held in the Trust. Shareholders also will be treated as if they directly received their respective pro rata shares of the Trust&rsquo;s income and proceeds, and directly incurred their pro rata share of the Trust&rsquo;s expenses. Most state and local tax authorities follow U.S. Income tax rules in this regard. However, Shareholders should contact their own tax advisors as to the tax consequences of ownership of VSOL shares.</p>
<h2 id="point-8" class="anchored-block">What is staking?</h2>
<p>Staking is the process of delegating SOL in independent network operators called validators to help secure and operate the Solana network. In return, the protocol may issue staking rewards. Delegation does not transfer ownership of the Trust's SOL to the validator: the Trust's SOL remains in qualified, custodied accounts, while the staked portion is subject to protocol rules (e.g., activation/deactivation across network epochs). Staking rewards are variable and not guaranteed; the Sponsor may adjust, pause, or reallocate staking at any time for operational reasons.</p>
<h2 id="point-9" class="jump-link-nav anchored-block" data-jumplink-title="Does VSOL Participate in Staking? ">Does VSOL participate in staking?</h2>
<p>Yes. The Trust delegates a portion of its SOL to help secure the Solana network and earn staking rewards. Staking levels may vary over time and the Sponsor may adjust staking to support Trust operations.</p>
<h2 id="point-10" class="anchored-block">Who is the Trust's validator?</h2>
<p>The Trust currently uses OrangeFin as its validator for delegated stake. The Sponsor may add, remove, or reallocate among validators over time.</p>
<h2 id="point-11" class="anchored-block">Are there distributions of staking rewards?</h2>
<p>No. The Trust does not make distributions of staking rewards. Any net staking rewards accrue to the Trust and are reflected in the NAV, subject to fees and expenses. Overtime, this can increase the amount of SOL represented per share, net of the Sponsor's fee, validator commission, and other Trust expenses.</p>
<h2 id="point-12" class="anchored-block">How do staking rewards show up in NAV?</h2>
<p>Rewards are credited per protocol mechanics (e.g., by epoch) and, once realized by the Trust, increases the Trust's SOL holdings. This accrual is captured in daily NAV calculations.</p>
<h2 id="point-13" class="anchored-block">Are staking rewards guaranteed? What yield should I expect?</h2>
<p>Staking rewards, if any are variable and depend on network conditions, validator performance, and onchain parameters. There is no guarantee the Trust will earn rewards during any period. Past performance is no guarantee of future results.</p>
<h2 id="point-14" class="anchored-block">How long does unstaking (deactivation) take? Will that impact redemptions?</h2>
<p>Unstaking generally required one or more network epochs to complete, during which the staked SOL becomes available for transfer after protocol timing. The sponsor may reduce staking to support creation/redemption activity.</p>
<h2 id="point-15" class="anchored-block">What is "slashing," and can it affect my investment?</h2>
<p><strong>Slashing</strong> is a mechanism used by some proof of stake blockchains, like Ethereum, to penalize validators that act dishonestly or fail to follow network rules. These penalties can reduce a validator's staked tokens if the network detects improper behavior. Solana, which also uses a proof of stake system, does not currently apply automatic slashing. The network is laying the groundwork for future slashing rules through several published improvement proposals, but these changes are not expected to activate until a major consensus upgrade planned for 2026.</p>
<h2 id="point-16" class="anchored-block">What kind of fees does VSOL have?</h2>
<p>VSOL charges an annual sponsor fee of 0.30%. <i>During the period commencing on November 17, 2025 and ending on February 17, 2026, the Sponsor will waive the entire Sponsor Fee for the first $1 billion of the Trust&rsquo;s assets. The Trust&rsquo;s third-party staking service provider has also agreed to waive its fee for its staking services during this same period. If the Trust&rsquo;s assets exceed $1 billion prior to February 17, 2026, the Sponsor Fee charged on assets over $1 billion will be 0.30%. All investors will incur the same Sponsor Fee, which is the weighted average of those fee rates. After February 17, 2026, the Sponsor Fee will be 0.30%. <strong>Brokerage fees and commissions may apply. Please check with your broker.</strong></i></p>
<h2 id="point-17" class="anchored-block">How is the Solana for VSOL custodied?</h2>
<p>The Trust&rsquo;s Solana is held by its crypto custodians (currently, Gemini Trust Company, LLC and Coinbase Custody Trust, LLC), which act as the Solana Custodian, responsible for securely storing all of the Trust&rsquo;s Solana related to its Solana Account and Clearing Account.</p>

<h2 id="point-18" class="anchored-block">Who is Gemini?</h2>
<p>Gemini is a leading cryptocurrency exchange and custodian known for its robust security measures and regulatory compliance.</p>
<ul class="content-list">
<li class="mt-2"><strong>Regulation</strong>: Full-reserve exchange and custodian, regulated by NYDFS (New York Department of Financial Services), licensed in all 50 US states, and holds multiple licenses globally.</li>
<li class="mt-2"><strong>Security:</strong> Includes multisignature technology, role-based governance protocols, physical security, multiple layers of biometric access controls, and $100M in digital asset insurance coverage. Completed SOC 1 Type II and SOC 2 Type II audits, and ISO 27001 certified (a global standard for information security management, ensuring organizations implement and maintain strong data protection and risk management controls).</li>
<li class="mt-2"><strong>Operational Standards:</strong> Ensures all customer funds are held 1:1 and are available for withdrawal, adheres to strict compliance and operational protocols to safeguard customer assets.</li>
</ul>
<p><strong>Gemini Storage Solutions:</strong></p>
<ul class="content-list">
<li class="mt-2"><strong>Cold Storage:</strong> Gemini is required to hold the Trust&rsquo;s Solana in cold storage, which involves storing private keys completely offline to protect against unauthorized access and cyber threats. Cold storage is used for long-term security.</li>
<li class="mt-2"><strong>Hot Storage:</strong> Solana that needs to be accessible temporarily for operations, such as creations, redemptions, or to pay the Sponsor Fee and extraordinary expenses, is held in hot wallets. These wallets are connected to the internet but are used only for short periods.</li>
</ul>
<p><strong>Custody Structure and Security:</strong></p>
<ul class="content-list">
<li class="mt-2">Gemini employs hardware security modules (HSMs) to generate, store, and manage private keys for both cold and hot storage.</li>
<li class="mt-2">Multi-signature technology and geographically diverse storage locations across the United States are used to enhance security and reduce risks.</li>
<li class="mt-2">All private keys are stored in air-gapped environments with multiple levels of physical security and monitoring controls.</li>
</ul>
<p><strong>Regulatory Compliance:</strong></p>
<ul class="content-list">
<li class="mt-2">As a fiduciary under Section 100 of the New York Banking Law, Gemini is held to stringent capital reserve requirements and banking compliance standards.</li>
<li class="mt-2">Gemini is subject to various U.S. federal and state laws, including anti-money laundering regulations, the Bank Secrecy Act, and the USA PATRIOT Act.</li>
</ul>
<p><strong>Insurance Coverage:</strong></p>
<ul class="content-list">
<li class="mt-2">Gemini maintains a $100 million policy covering fraud, theft, and cyber-security breaches, and a $25 million crime policy. This insurance applies to all digital assets held by Gemini, including those of the Trust.</li>
<li class="mt-2">This insurance applies to all digital assets held by Gemini, including those of the Trust, but does not cover losses due to market fluctuations or declines in the value of Solana.</li>
<li class="mt-2">The Trust is not a named beneficiary of Gemini's insurance policy, and coverage applies only to specific losses (e.g., theft or fraud). <i>In the event of a covered loss, the policy may not fully compensate for all losses incurred by the Trust</i>.</li>
<li class="mt-2">The availability and sufficiency of Gemini's insurance are not guaranteed and are not specific to the Trust.</li>
</ul>
<h2 id="point-19" class="anchored-block">Who is Coinbase?</h2>
<p>Coinbase is a prominent cryptocurrency exchange and custodian acclaimed for its extensive security protocols and regulatory adherence:</p>
<ul class="content-list">
<li class="mt-2"><strong>Regulation: </strong>Full-reserve exchange and custodian, regulated by NYDFS (New York Department of Financial Services), licensed in all 50 US states, and holds multiple licenses globally.</li>
<li class="mt-2"><strong>Security: </strong>Includes multisignature technology, role-based governance protocols, physical security, multiple layers of biometric access controls, and $100M in digital asset insurance coverage. Completed SOC 1 Type II and SOC 2 Type II audits, and ISO 27001 certified (a global standard for information security management, ensuring organizations implement and maintain strong data protection and risk management controls).</li>
<li class="mt-2"><strong>Operational Standards: </strong>Ensures all customer funds are held 1:1 and are available for withdrawal, adheres to strict compliance and operational protocols to safeguard customer assets.</li>
</ul>
<p><strong>Information Security Management Program:</strong></p>
<ul class="content-list">
<li class="mt-2">Led by the Chief Security Officer with independent SOC 1 (a report evaluating internal controls relevant to financial reporting) and SOC 2 Type II (a report assessing the effectiveness of security, availability, processing integrity, confidentiality and privacy controls over time) attestations.</li>
<li class="mt-2">Includes policies, procedures, and standards to manage information security risks</li>
<li class="mt-2">Detailed Physical Security program with access control processes, emergency procedures, CCTV, and security systems governed by a board-approved policy.</li>
</ul>
<p><strong>Custody and Security of Assets:</strong></p>
<ul class="content-list">
<li class="mt-2"><strong>Vault wallet:</strong> Assets are secured within a cold storage environment with segregated wallets. Extensive key management technology, operations, and personnel ensure security.</li>
<li class="mt-2"><strong>Trading balance:</strong> majority of assets kept in cold storage with some in hot wallets.</li>
</ul>
<p><strong>Secure Storage of Client Keys/Assets:</strong></p>
<ul class="content-list">
<li class="mt-2"><strong>Vault wallet:</strong> secure key generation, dual encrypted private key material, and geographically redundant storage. Transactions require cryptographic consensus across multiple operators.</li>
<li class="mt-2"><strong>Trading wallet:</strong> private keys are stored within high security online environments, encrypted at rest, and transactions are signed in protected environments.</li>
</ul>
<p><strong>Insurance Coverage:</strong></p>
<p>Coinbase maintains a Commercial Crime insurance policy covering certain losses of client assets, including employee collusion, theft, security breaches, and fraudulent transfers.</p>
<ul class="content-list">
<li class="mt-2">This insurance does not cover declines in the value of Solana and is not specific to the Trust.</li>
<li class="mt-2">While Coinbase has maintained this coverage since 2013, there is no guarantee that it will be sufficient to cover all potential losses or that claims will be fully paid.</li>
</ul>
<h2 id="point-20" class="anchored-block">What are the risks involved in buying VSOL?</h2>
<ul class="content-list">
<li class="mt-2"><strong>Solana Market Risks:</strong> The value of Solana can be extremely volatile and unpredictable. Digital assets such as Solana were only introduced within the past decade, and their medium-to-long-term value is subject to various factors, including the development of blockchain technology and the evolving investment characteristics of digital assets, which are uncertain and difficult to evaluate.</li>
<li class="mt-2"><strong>Regulatory Risks</strong>: The regulatory landscape for digital assets continues to evolve. While some Solana trading platforms may be subject to regulation in certain jurisdictions, they may not be in full compliance or may operate with limited oversight. This lack of transparency creates risks of fraud, manipulation, security failures, and operational disruptions, all of which may negatively impact the value of Solana and, consequently, the value of VSOL shares.</li>
<li class="mt-2"><strong>Operational Risks:</strong> The Trust relies on third-party custodians for the safekeeping of its Solana holdings. There can be no assurance that current security measures or custody practices will function as intended or fully protect against loss, theft, or unauthorized access. Additionally, while custodians maintain certain insurance policies, such coverage may not be sufficient to cover all potential losses.</li>
<li class="mt-2"><strong>Market Trading Risks:</strong> VSOL shares may trade at a premium or discount to the Trust&rsquo;s net asset value (NAV), and liquidity in the secondary market is not guaranteed. If market participants experience disruptions or reduced interest in digital asset investment vehicles, it could negatively affect trading activity and price efficiency.</li>
<li class="mt-2"><strong>Staking Risks: </strong>Staking involves risks, including limited liquidity while assets are locked during activation or withdrawal periods. Validators may fail or act improperly, resulting in penalties or &ldquo;slashing&rdquo; losses. Using third-party providers adds counterparty, operational, and cybersecurity risks. Staking rewards, if any, may be reduced by fees or taxes, and their timing and treatment may be uncertain. Legal or regulatory changes could affect the availability, treatment, or costs of staking activities.</li>
</ul>
<h2 id="point-21" class="anchored-block">How does the Trust audit its Solana?</h2>
<p>On a daily basis, the sponsor and the accounting agent reconcile the Solana position at Gemini and Coinbase. As part of the Trust's annual audit, auditors confirm the existence of Solana positions. Gemini and Coinbase have a SOC 1 Report produced by an independent auditor outlining controls around the safekeeping of assets.</p>
<h2 id="point-22" class="anchored-block">How can Investors Buy VSOL?</h2>
<p>Investors are able to purchase VSOL shares through their existing brokerage accounts, making it a straightforward addition to any investment portfolio.</p>
<h2 id="point-23" class="anchored-block">Who Created Solana?</h2>
<p>Anatoly Yakovenko first published the Solana Whitepaper that now serves as the framework for the Solana network and its core design in November of 2017. Solana Labs, the core development company, was founded in 2018. Since April 8, 2020, the Solana Foundation owns and manages the Solana protocol IP previously held by Solana Labs - making it the ecosystem's organizational hub.</p>
<h2 id="point-24" class="anchored-block">How is New Solana Created?</h2>
<p>On Solana&rsquo;s mainnet, the ledger is advanced by a rotating Leader node that generates a verifiable &ldquo;Proof of History&rdquo; (PoH) sequence, orders and executes transactions, and broadcasts the resulting state. Verifier nodes must replay the same transactions, vote on the state, and once a supermajority (2/3) of stake-weighted votes is reached, the network accepts the new branch of the ledger and mints new SOL per the inflation schedule. If the Leader fails, the network elects a new Leader and continues.</p>
<h2 id="point-25" class="anchored-block">What is Solana "Mainnet"?</h2>
<p>Mainnet, historically Mainnet-Beta, is Solana's production/network cluster, the authoritative ledger for SOL transfers and settlements.</p>
<h2 id="point-26" class="anchored-block">How Does Solana Compare to Bitcoin?</h2>
<p>They solve different problems. <a href="https://www.vaneck.com/us/en/blogs/digital-assets/bitcoin-101-a-beginners-guide/" title="Bitcoin 101: A Beginner's Guide"><strong>Bitcoin</strong></a> is a purpose-built digital currency with a fixed 21 million cap on supply, secured by proof-of-work miners and optimized for durability and user control. Solana builds on that foundation from storing and transferring value to building and running applications, with the addition of smart contracts and near-instant, low-cost settlement using Proof-of-Work with Proof-of-History.</p>
<h2 id="point-27" class="anchored-block">What is Proof of History?</h2>
<p><strong>Proof of History (PoH)</strong> is Solana&rsquo;s built-in, tamper-evident clock - a continuous cryptographic chronology that provides all users the same, provable order of events. PoH isn&rsquo;t consensus by itself; it executes with Proof-of-Stake (PoS) where validators vote to finalize blocks. Because transactions arrive already time-stamped and ordered, the Solana network spends less time coordinating and more time verifying; cutting roundtrips, enabling deterministic leader scheduling and parallel checks, so confirmations are faster and fees can be lower than in PoS-only designs. In short, PoH reduces time spent on verification; PoS secures and finalizes the ledger entries.</p>
<h2 id="point-28" class="anchored-block">What is Solana Used For?</h2>
<p>Production use of Solana is already live and expanding across merchants, networks, and applications. Visa accepts Solana to settle USDC payments between clients as part of its stablecoin settlement program. On the merchant side, Stripe has enabled U.S. businesses to accept stablecoin payments, including USDC on Solana, with funds settling in USD in Stripe. Complementing this, merchants on Shopify can add Solana Pay as an approved app integration to accept USDC at checkout. More recent developments include Western Union announcing the U.S. Dollar Payment System (USDPT), a dollar-denominated stablecoin to be issued by Anchorage Digital Bank and hosted on the Solana blockchain as part of a new Digital Asset Network, with an initial launch targeted for the first half of 2026 to support faster, lower-cost, cross-border transfers and treasury use cases for customers, agents, and partners.</p>
<p><span style="font-size: 14pt;"><strong>How to buy VSOL?</strong></span></p>
<p>VanEck ETFs can be purchased the same way you would buy a stock, through a broker or with your advisor.</p>
<p class="d-none d-lg-block"><a href="mailto:askvaneck@vaneck.com" title="Have More Questions? - Ask VanEck" rel="noopener"><img loading="lazy" class="img-responsive" src="https://www.vaneck.com/globalassets/home/us/insights/blogs/bm-blog-images/cta-faq_desktop-02.svg" alt="Have More Questions? - Ask VanEck" /></a></p>
<p class="d-lg-none"><a href="mailto:askvaneck@vaneck.com" title="Have More Questions? - Ask VanEck" rel="noopener"><img loading="lazy" class="img-responsive" src="https://www.vaneck.com/globalassets/home/us/insights/blogs/bm-blog-images/cta-faq_mobile-01.svg" alt="Have More Questions? - Ask VanEck" /></a></p>
<p>To receive more <strong><a href="https://www.vaneck.com/us/en/insights/digital-assets/" title="Digital Assets Insights">Digital Assets</a></strong> insights, <strong><a href="https://www.vaneck.com/us/en/subscribe/" title="Subscription Center">sign up in our subscription center</a></strong>.</p>
]]></content:encoded>
</item><item rdf:about="https://www.vaneck.com/us/en/blogs/model-portfolios/october-market-recap-when-a-late-cycle-economy-meets-an-early-cycle-tech-boom/">
  <title>October Market Recap: When a Late-Cycle Economy Meets an Early-Cycle Tech Boom></title>
  <link>https://www.vaneck.com/us/en/blogs/model-portfolios/october-market-recap-when-a-late-cycle-economy-meets-an-early-cycle-tech-boom/</link>
  <description><![CDATA[A late-cycle economy is colliding with an early-cycle tech boom. Debt is piling up just as disruption accelerates, and the U.S. is funding a historic wave of AI, automation, and energy investment with record leverage.&nbsp;]]></description>
  <dc:creator>David Schassler</dc:creator>
  <dc:date>11/14/2025 06:30:00</dc:date>
<content:encoded><![CDATA[

<p><strong>Key Takeaways</strong></p>
<ul class="content-list">
<li class="mt-2"><strong>Debt Meets Disruption: </strong>Fiscal excess is fueling innovation and instability</li>
<li class="mt-2"><strong>AI&rsquo;s Three Phases:</strong> Builders spend, Adopters save, Automators replace</li>
<li class="mt-2"><strong>Scarcity Is the Hedge: </strong>Gold, Bitcoin, and commodities remain the opt-outs</li>
</ul>

<h2 id="debt-meets-disruption" class="jump-link-nav anchored-block" data-jumplink-title="Debt Meets Disruption">Debt Meets Disruption</h2>
<p>Congratulations to Zohran Mamdani, New York City&rsquo;s new mayor &mdash; bringing socialism to the capital of capitalism.</p>
<p>It&rsquo;s the perfect symbol of a world straining under inflation, inequality, and automation. Populism was inevitable. Now we&rsquo;ll see how far it goes.</p>
<p>We&rsquo;re in a strange place &mdash; a late-cycle economy colliding with an early-cycle innovation boom. Debt is piling up just as disruption accelerates. The U.S. is simultaneously at the end of a credit cycle and the beginning of a historic investment cycle in AI, automation, and energy. Debt meets disruption &mdash; and that collision will define the next decade.</p>
<h2>The Three Phases of AI</h2>
<p>We see AI unfolding in three clear phases:</p>
<ol class="content-list">
<li class="mt-2">Builders &ndash; the companies creating and powering the technology.</li>
<li class="mt-2">Adopters &ndash; the companies using it to drive efficiency and cut costs.</li>
<li class="mt-2">Automators &ndash; the convergence of AI and robotics that will redefine labor and productivity.</li>
</ol>
<p>Most of the world is still in phase 1. A few leaders are moving into phase 2. And the first signs of phase 3 are beginning to appear.</p>
<h2 id="phase-1-builders-still-building" class="jump-link-nav anchored-block" data-jumplink-title="Phase 1 - Builders Still Building">Phase 1 - Builders Still Building</h2>
<p>The builders are proving both the promise and the price of AI &mdash; and investors are starting to question what the bill looks like.</p>
<ul class="content-list">
<li class="mt-2">Microsoft: $77 billion in revenue and $30 billion in profit, but investors focused on rising AI-infrastructure costs and cautious guidance.</li>
<li class="mt-2">Meta: 26% revenue growth, but the stock fell after management warned that AI spending will remain elevated &mdash; a reminder that building the future isn&rsquo;t cheap.</li>
</ul>
<p>Both stocks declined after reporting. The &ldquo;price&rdquo; of AI isn&rsquo;t just the chips and servers &mdash; it&rsquo;s the strain on cash flow, the pressure on margins, and the patience it demands from investors.</p>
<p>This is what Phase 1 looks like in real time: the world&rsquo;s largest technology firms pouring capital into compute, cloud, and data infrastructure while markets demand to know when it pays off.</p>
<p>The story is shifting from growth at any cost to growth with accountability. The &ldquo;build&rdquo; phase is still running, but markets are starting to ask the right question: when does all this spending translate into profits?</p>
<h3>MSFT and META Dip: AI Spending Strains Balance Sheets</h3>
<p><img loading="lazy" class="img-responsive" alt="MSFT and META Dip: AI Spending Strains Balance Sheets" src="https://www.vaneck.com/contentassets/dbc0a60e1307411685b9b4d2958df771/6398_models-monthly-october_chart-1_2025-11_v1.svg" /></p>
<p class="chart-disclosure">Source: Bloomberg, as of 11/6/2025. Past performance is no guarantee of future results.</p>
<h2 id="phase-2-adopters-reshape-work" class="jump-link-nav anchored-block" data-jumplink-title="Phase 2 - Adopters Reshape Work">Phase 2 - Adopters Reshape Work</h2>
<p>While investors questioned the Builders&rsquo; soaring budgets, the Adopters are showing how AI can improve efficiency &mdash; and reshape work in the process.</p>
<p>Amazon, the second-largest U.S. employer, offered one of the clearest examples in October. Its shares rose about 11% after earnings as revenue climbed roughly 13% year-over-year to $180 billion and profit surged nearly 40%. Growth in AWS &mdash; up ~20% to $33 billion &mdash; reassured investors that Amazon is turning AI investments into results.</p>
<h3>Amazon Rises: AI-Adoption Efficiencies Enhances Outlook</h3>
<p><img loading="lazy" class="img-responsive" alt="Amazon Rises: AI-Adoption Efficiencies Enhances Outlook" src="https://www.vaneck.com/contentassets/a34cdbfd03d44ac08ad854db0536b193/6398_models-monthly-october_chart-2_2025-11_v1.svg" /></p>
<p class="chart-disclosure">Source: Bloomberg, as of 11/5/2025. Past performance is no guarantee of future results.</p>
<p>Earlier in the year, CEO Andy Jassy had noted that AI would allow Amazon to operate more efficiently and reduce the need for some corporate roles. That message has since become visible in the data: the company has announced about 14k corporate job cuts, with plans to eliminate as many as 30k positions. Its own automation and machine-learning tools are increasingly handling tasks once done by analysts, managers, and recruiters. Investors rewarded evidence that adoption is improving productivity and lowering costs, not just driving spending.</p>
<p>Accenture followed a similar path. It&rsquo;s a business built to cut costs and modernize &mdash; exactly what AI does. The irony is rich: the company that spent decades automating people out of jobs is now being automated itself. Earlier this year, it announced 11,000 layoffs as part of a pivot toward AI, but the threat runs deeper. Generative AI can now do much of what Accenture sells &mdash; writing code, analyzing data, and redesigning workflows &mdash; potentially cutting the firm out entirely. The stock is down nearly 30% this year, as the market starts to price in that risk.</p>
<p>The data echo the headlines. A recent Economist analysis, based on a study of 300,000 companies, found that firms integrating AI into daily operations are already reducing junior-level roles 7.7% faster than those that haven&rsquo;t, while senior positions remain stable. It&rsquo;s a subtle but telling signal: AI isn&rsquo;t replacing managers yet &mdash; it&rsquo;s replacing the people who once worked for them. This is a peek behind the curtain of what&rsquo;s coming &mdash; the early outlines of a labor market being quietly rewritten. Phase 2 isn&rsquo;t a corporate trend; it&rsquo;s the new operating model.</p>
<h3>AI Has Heightened Impact for Junior Employees</h3>
<p><img loading="lazy" class="img-responsive" alt="AI Has Heightened Impact for Junior Employees" src="https://www.vaneck.com/contentassets/0b0de81a8274494badd5e6ece2b7819b/6398_models-monthly-october_chart-3_2025-11_v3_blog.svg" /></p>
<p class="chart-disclosure">Source: &ldquo;Generative AI as seniority-biased technological change&rdquo; by S.M. Hosseini &amp; G. Lichtinger, SSRN working paper, 2025.</p>

<h2 id="phase-3-automation-takes-the-floor" class="jump-link-nav anchored-block" data-jumplink-title="Phase 3 - Automation Takes the Floor">Phase 3 - Automation Takes the Floor</h2>
<p>Some companies have entered phase 3, but what&rsquo;s experimental today will soon be standard. Inside Amazon&rsquo;s warehouses, Blue Jay &mdash; a new AI-powered robotic arm &mdash; now picks, sorts, and consolidates roughly 75% of items, guided by Project Eluna. This AI system that manages workflow and predicts bottlenecks. For now, this is early-stage automation at scale &mdash; limited to logistics &mdash; but it&rsquo;s a preview of what&rsquo;s next. When the second-largest employer in America builds machines that can replace both managers and movers, it&rsquo;s more than efficiency &mdash; it&rsquo;s evolution. Amazon is in the early innings of phase 3, but its scale ensures the ripple effects won&rsquo;t stay contained.</p>
<p>AI will bring extraordinary productivity gains &mdash; but also widespread job displacement. This will be a structural shift, not a temporary shock. The U.S. will eventually be forced to support displaced workers through larger social spending. Add that to the tab.</p>
<h2>Debt, Liquidity, and the Opt-Out</h2>
<p>While technology races ahead, the financial system keeps falling behind. The U.S. is choking on debt and entering a massive capital-expenditure cycle to win at all costs &mdash; in technology, efficiency, and energy independence. Fiscal restraint doesn&rsquo;t fit. Gold and Bitcoin have both corrected sharply after extraordinary runs. Bitcoin, which topped $125,000 earlier this year, recently fell back below $100,000. Gold hit $4,356 before slipping under $4,000. These are meaningful moves, but they&rsquo;re not signs of weakness &mdash; they&rsquo;re the natural volatility of assets built on conviction rather than cash flow.</p>
<p>We said last month that gold&rsquo;s bull market would come with higher volatility &mdash; and it has. The long-term setup hasn&rsquo;t changed: the world is spending to fund progress, not to pay down debt. In that environment, scarce assets remain the opt-outs &mdash; stores of value that can&rsquo;t be printed to fund excess.</p>
<p>And here&rsquo;s our view: in six months, we believe you&rsquo;ll wish you bought these assets at today&rsquo;s prices. We also believe they could go lower first. The only thing we know for sure is that trying to pick the bottom is a loser&rsquo;s game. Don&rsquo;t be cute. Nibble at it. Volatility is your friend.</p>
<h2>Late-Cycle Credit Risk</h2>
<p>Jamie Dimon recently likened the emergence of bad loans to spotting cockroaches &mdash; if you see one, there are more. He&rsquo;s right, but this isn&rsquo;t about a few bad borrowers. It&rsquo;s about being late cycle, when the economy still looks strong, markets are confident, and the ugly side of excess starts to show.</p>
<p>The worst loans are made at the best of times. Private credit has exploded to more than $1.6 trillion, fueled by investors chasing yield and convinced that risk has been engineered out of the system. Regional banks, meanwhile, are being squeezed by higher funding costs and a wall of commercial-real-estate refinancing that doesn&rsquo;t work at current rates. The market is catching on. The S&amp;P&reg; Regional Banks Select Industry Index (SPSIRBKT) and the MarketVector Alternative Asset Managers Index (MVAALTTR) have both materially underperformed the broader market since September, when these risks began to surface. Together, they capture two ends of the same problem &mdash; the lenders that fund private credit and the funds that rely on that funding.</p>
<p>This isn&rsquo;t 2008 &mdash; bank capital is stronger &mdash; but the pattern is familiar. Risk migrates, leverage builds, and when the music stops, losses move from private to public balance sheets. Credit stress becomes fiscal stress.</p>
<h3>Lenders Lag the Broad Market</h3>
<p><img loading="lazy" class="img-responsive" alt="Lenders Lag the Broad Market" src="https://www.vaneck.com/contentassets/5dd48d5017a0457587391deb11777e39/6398_models-monthly-october_chart-4_2025-11_v1.svg" /></p>
<p class="chart-disclosure">Source: Bloomberg, as of 11/6/2025. Past performance is no guarantee of future results.</p>
<h2>The GENIUS Act and Digital Demand</h2>
<p>Amid all of this, new forces are shaping liquidity in unexpected ways.</p>
<p>The GENIUS Act is quietly creating structural buyers of dollars and Treasuries by requiring stablecoins to hold reserves in short-term U.S. debt.</p>
<p>That policy change is already visible in the data. The market capitalizations of USDT and USDC have surged since the election, accelerating as regulatory clarity improved. More stablecoin use means more Treasury demand &mdash; digital dollars backed by real T-bills.</p>
<p>It&rsquo;s ironic that digital assets were once viewed as a risk to the dollar. Now stablecoins are extending the reach of the dollar in a world seemingly desperate to de-dollarize. In that regard, the GENIUS Act really was genius.</p>
<h3>Stablecoins Accelerate Demand for USD</h3>
<p><img loading="lazy" class="img-responsive" alt="Stablecoins Accelerate Demand for USD" src="https://www.vaneck.com/contentassets/2735d5d7b3174c03bd138accc2931cfc/6398_models-monthly-october_chart-5_2025-11_v1.svg" /></p>
<p class="chart-disclosure">Source: Bloomberg, as of 11/6/2025. Past performance is no guarantee of future results.</p>

<p>Today&rsquo;s predominant macro forces are driving the key themes and exposures in VanEck&rsquo;s models, including the core allocation of the <a href="https://www.vaneck.com/us/en/investments/wealth-builder-plus-portfolios/overview/" title="VanEck Wealth Builder Plus Portfolios"><strong>VanEck Wealth Builder Plus Portfolios</strong></a>. The allocations below are representative of the Moderate Portfolio.</p>
<p class="d-none d-lg-block"><img loading="lazy" class="img-responsive" src="https://www.vaneck.com/contentassets/d11c4b8e0f5f4cfcbc522aa3e045a64d/6398_models-monthly-october_pie-chart-1_2025-11_v1_desktop.svg" alt="Asset Allocation" /></p>
<p style="width: 345px;" class="d-lg-none"><img loading="lazy" class="img-responsive" src="https://www.vaneck.com/contentassets/d11c4b8e0f5f4cfcbc522aa3e045a64d/6398_models-monthly-october_pie-chart-1_2025-11_v1_mobile_blog.svg" alt="Asset Allocation" /></p>
<div class="flourish-embed flourish-table" data-src="visualisation/26236523?2428759"><script src="https://public.flourish.studio/resources/embed.js"></script><noscript><img loading="lazy" src="https://public.flourish.studio/visualisation/26236523/thumbnail" width="100%" alt="Table visualization" /></noscript></div>
<p>To receive more <strong><a href="https://www.vaneck.com/us/en/insights/guided-allocation/" title="Model Portfolio Insights">Model Portfolio</a></strong> insights, <strong><a href="https://www.vaneck.com/us/en/subscribe/" title="Subscription Center">sign up in our subscription center</a></strong>.</p>
]]></content:encoded>
</item><item rdf:about="https://www.vaneck.com/us/en/blogs/digital-assets/solana-101-a-beginners-guide/">
  <title>Solana 101: A Beginner’s Guide></title>
  <link>https://www.vaneck.com/us/en/blogs/digital-assets/solana-101-a-beginners-guide/</link>
  <description><![CDATA[Solana is a fast, low-cost blockchain designed to make digital transactions and applications quick, affordable, and open to everyone.]]></description>
  <dc:creator> </dc:creator>
  <dc:date>11/14/2025 06:30:00</dc:date>
<content:encoded><![CDATA[

<p><strong>Please note that VanEck may have a position(s) in the digital asset(s) described below.</strong></p>
<p><strong>Key Takeaways:</strong></p>
<ul class="content-list">
<li class="mt-2"><strong>Speed and usability:</strong> Solana handles thousands of transactions per second for less than a cent, making it practical for payments, trading, and apps.</li>
<li class="mt-2"><strong>How it stays efficient and secure:</strong> A built-in Proof of History clock keeps the network coordinated, while staking helps protect it and reward participants.</li>
<li class="mt-2"><strong>Opportunities and risks:</strong> Solana continues to expand its reach, but it still faces volatility, technical issues, and shifting regulations.</li>
</ul>
<p>Solana is one of the fastest-growing blockchains in the world. It is built to make sending money, trading assets, and building apps online fast, affordable, and open to everyone. If you have heard about Solana&rsquo;s &ldquo;speed&rdquo; or &ldquo;low fees&rdquo; and wondered what that really means, this guide explains the basics without the jargon.</p>
<h2 id="what-is-solana" class="jump-link-nav anchored-block" data-jumplink-title="What is Solana?">What is Solana?</h2>
<p><strong>Solana</strong> is a public blockchain, a shared digital record maintained by thousands of computers around the world. Anyone can use it to send money, trade digital assets, or build apps. Every transaction is recorded on a transparent ledger that anyone can verify.</p>
<p>What makes Solana stand out is its <strong>speed</strong> and <strong>low cost</strong>. A typical transaction costs less than one cent and settles in under a second.</p>
<h3 id="what-makes-solana-different" class="jump-link-nav anchored-block" data-jumplink-title="What makes Solana different?">How is Solana different from Bitcoin and Ethereum?</h3>
<div class="wrapped-div">
<table style="width: 100%;">
<tbody>
<tr class="tbl-data">
<td class="tbl-header last text-left"><strong>Feature</strong></td>
<td class="tbl-header last text-left"><strong>Bitcoin</strong></td>
<td class="tbl-header last text-left"><strong>Ethereum</strong></td>
<td class="tbl-header last text-left"><strong>Solana</strong></td>
</tr>
<tr class="tbl-data">
<td class="data-td last text-left"><strong>Main purpose</strong></td>
<td class="data-td data last text-left">Potential digital store of value</td>
<td class="data-td data last text-left">Platform for decentralized apps</td>
<td class="data-td data last text-left">High-speed apps and payments</td>
</tr>
<tr class="tbl-data">
<td class="data-td last text-left"><strong>Speed</strong></td>
<td class="data-td data last text-left">Minutes</td>
<td class="data-td data last text-left">Seconds to minutes</td>
<td class="data-td data last text-left">Under a second</td>
</tr>
<tr class="tbl-data">
<td class="data-td last text-left"><strong>Typical fee</strong></td>
<td class="data-td data last text-left">High</td>
<td class="data-td data last text-left">Variable</td>
<td class="data-td data last text-left">Often &lt; $0.01</td>
</tr>
<tr class="tbl-data">
<td class="data-td last text-left"><strong>Consensus system</strong></td>
<td class="data-td data last text-left">Proof of Work</td>
<td class="data-td data last text-left">Proof of Stake</td>
<td class="data-td data last text-left">Proof of History + Proof of Stake</td>
</tr>
</tbody>
</table>
</div>
<ul class="content-list">
<li class="mt-2"><strong>Bitcoin</strong> was created to serve as a decentralized digital currency and a potential store of value. It is designed to be simple, transparent, and highly secure, but it processes transactions slowly and has higher fees.</li>
<li class="mt-2"><strong>Ethereum</strong> expanded on that idea by allowing developers to create decentralized applications and smart contracts, introducing more flexibility but also higher costs when the network is busy.</li>
<li class="mt-2"><strong>Solana</strong> builds on both by combining speed, scalability, and low fees. It can handle thousands of transactions per second and is designed for apps that need quick and inexpensive interactions, such as payments, trading, and gaming.</li>
</ul>
<p>In short, Bitcoin focuses on reliability, Ethereum focuses on flexibility, and Solana focuses on speed and affordability.</p>
<h2>How does Solana work <i>in plain English</i>?</h2>
<p>Every blockchain needs a way for all the computers in the network to agree on the order of transactions. Most blockchains slow down because those computers have to keep checking with each other before recording what happened.</p>
<p>Solana&rsquo;s founder, Anatoly Yakovenko, saw that the real problem was time. Without a shared clock, computers waste energy figuring out when each transaction took place. His solution was something called <strong>Proof of History</strong><sup>1,2</sup>.</p>
<p>Proof of History works like a built-in clock that keeps every computer on the same schedule. Each tick of this clock creates a record that proves when something happened and what came before it. Because everyone is already in sync, Solana can confirm transactions almost instantly and keep fees very low.</p>
<h2>How does Solana stay secure?</h2>
<p>Solana uses something called <strong>Proof of Stake</strong> to protect the network. People who own Solana&rsquo;s token, called <strong>SOL</strong>, can <strong>&ldquo;stake&rdquo;</strong> it by locking up some of their tokens to help verify transactions<sup>3</sup>.&nbsp;In return, they can earn additional SOL as <strong>rewards.</strong></p>
<p>When you stake, your tokens remain in your control but are temporarily assigned to a validator who helps process transactions and keep the network safe.</p>
<p><strong>Slashing,</strong> which means losing part of your stake if a validator acts maliciously, is rare on Solana and not automatic.</p>
<h2 id="what-is-sol" class="jump-link-nav anchored-block" data-jumplink-title="What is SOL?">What is SOL and how is it used?</h2>
<p>SOL is the token that powers everything on Solana. It is used to:</p>
<ul class="content-list">
<li class="mt-2">Pay for transactions</li>
<li class="mt-2">Earn staking rewards</li>
<li class="mt-2">Take part in decisions about the network&rsquo;s future</li>
</ul>
<p>Each transaction includes a small base fee and, sometimes, an extra priority fee to move faster during busy times. The base fee is 5,000 lamports (0.000005 SOL)<sup>4</sup>.&nbsp;Half of it is burned, which means permanently removed from supply, and the other half goes to the validator who processes the transaction. Even when demand is high, the total cost per transaction usually stays under one cent<sup>5</sup>.</p>
<h2>Why do investors pay attention to Solana?</h2>
<p>Many investors see Solana as part of the next generation of blockchain technology that could support real-world uses like payments, trading, and gaming<sup>6</sup>.</p>
<h2>Reasons investors follow Solana</h2>
<ul class="content-list">
<li class="mt-2"><strong>Performance: </strong>One of the fastest and most efficient networks</li>
<li class="mt-2"><strong>Low fees: </strong>Costs stay very low even when demand is high</li>
<li class="mt-2"><strong>Staking rewards: </strong>Holders can earn SOL for helping secure the network</li>
<li class="mt-2"><strong>Developer growth: </strong>Thousands of projects and apps are already building on Solana</li>
</ul>
<p><strong><i>As with all digital assets, SOL is highly volatile and may not be appropriate for all investors. You can lose your entire principal investment. Always consider your risk tolerance, time horizon, and whether the asset fits your broader allocation.</i></strong></p>
<h2>What are Solana&rsquo;s investment risks?</h2>
<ul class="content-list">
<li class="mt-2"><strong>Market risk and volatility:</strong> SOL&rsquo;s price can move sharply and unpredictably.</li>
<li class="mt-2"><strong>Technology and security risk:</strong> Software bugs, validator outages, or network incidents could impair functionality or confidence in Solana contributing to SOL weakness.</li>
<li class="mt-2"><strong>Fee‑market dynamics:</strong> During peak demand, users may pay optional priority fees for inclusion. Design changes to fees or execution may alter user economics over time. There is also the risk that private actors may figure out ways to avoid priority fees and thus decrease the network&rsquo;s revenues.</li>
<li class="mt-2"><strong>Staking risks:</strong> Validator misconfiguration, downtime, commissions, or changes to the staking program can impact rewards; operational and custody risks also apply. (Protocol‑level slashing is not currently enabled, but future changes are possible.)</li>
<li class="mt-2"><strong>Regulatory risk:</strong> Rules and guidance for digital assets continue to evolve, potentially impacting access, market structure, and taxation.</li>
<li class="mt-2"><strong>Inflation Risk:</strong> Solana&rsquo;s network is run by validators who earn rewards in the form of inflation. Many rely upon these subsidies to operate, and any reduction in inflationary rewards may cause the network to become uneconomical for validators.</li>
</ul>
<p>This list isn&rsquo;t exhaustive. Do your own research and consult a financial professional before investing.</p>
<h2>How can I get exposure to Solana?</h2>
<ol class="content-list">
<li><strong>Direct ownership of SOL</strong><br />Purchase SOL through a crypto exchange or wallet and optionally stake it for rewards.This approach gives you full control but requires understanding custody and security.</li>
<li><strong>Regulated products (e.g., ETFs/ETPs where available)</strong><br />Exchange-traded products or funds can provide exposure to SOL within a traditional brokerage account. These products handle custody and operations for you, but fees and structures vary. Always review the prospectus and disclosures before investing.</li>
</ol>
<h2>How does Solana fit into the idea of Internet Capital Markets?</h2>
<p>In traditional finance, most transactions pass through intermediaries such as banks, brokers, and payment processors. These institutions help move money and keep records, but also add fees, delays, and limits on who can participate.</p>
<p><strong>Internet Capital Markets</strong> aim to change that by running on open networks instead of private systems. Here, assets such as stocks, art, or real estate can move online as easily as messages. Transactions settle instantly, and anyone with a phone and a wallet can take part.<sup>7</sup>.</p>
<p>Solana&rsquo;s speed and low costs make this possible. It helps build markets that are always open, transparent, and accessible to more people around the world.</p>
<h2>What is the bottom line on Solana?</h2>
<p>Solana combines speed, low cost, and open access to make blockchain technology practical for everyday use. For investors, it is an example of how digital networks could reshape finance, though it still carries the risks and uncertainty of any new technology.</p>
<p>As with any investment, research carefully, diversify, and understand your risk before getting started.</p>

<p>To receive more <strong><a href="https://www.vaneck.com/us/en/insights/digital-assets/" title="Digital Assets Insights">Digital Assets</a></strong> insights, <strong><a href="https://www.vaneck.com/us/en/subscribe/" title="Subscription Center">sign up in our subscription center</a></strong>.</p>
]]></content:encoded>
</item><item rdf:about="https://www.vaneck.com/us/en/blogs/digital-assets/three-factors-driving-bitcoins-price/">
  <title>Three Factors Driving Bitcoin’s Price></title>
  <link>https://www.vaneck.com/us/en/blogs/digital-assets/three-factors-driving-bitcoins-price/</link>
  <description><![CDATA[Bitcoin&rsquo;s price consistently responds to three powerful forces&mdash;global liquidity, leverage in the system, and on-chain fundamentals.]]></description>
  <dc:creator> </dc:creator>
  <dc:date>11/13/2025 06:30:00</dc:date>
<content:encoded><![CDATA[

<p><strong>Key Takeaways</strong></p>
<ul class="content-list">
<li class="mt-2">Bitcoin tends to rise when global money supply expands and struggles when liquidity tightens.</li>
<li class="mt-2">Borrowing and derivatives magnify both rallies and corrections for Bitcoin.</li>
<li class="mt-2">Network activity and investor behavior provide a pulse on sentiment, helping distinguish healthy accumulation from speculative excess.</li>
</ul>
<p>Bitcoin&rsquo;s price can look chaotic from the outside. In reality, it tends to respond to three core forces: global liquidity, leverage in the system, and on-chain fundamentals.</p>
<p>In a recent webinar, VanEck CEO Jan van Eck and Head of Digital Assets Research Matthew Sigel discuss how understanding these drivers can make Bitcoin feel far less mysterious&mdash;and much more familiar to anyone who has ever studied macro cycles or market psychology.</p>
<h2>Bitcoin, Leverage, and Liquidity: What&rsquo;s Driving the Next Cycle?</h2>
<h2>Global Liquidity: The Tide That Lifts All Coins</h2>
<p>Since 2014, Bitcoin has shown a powerful correlation with global money supply (M2). VanEck&rsquo;s research finds that changes in M2 explain over half of Bitcoin&rsquo;s price variance, with the Euro&rsquo;s M2 supply most strongly aligned to Bitcoin&rsquo;s trajectory.</p>
<h3>BTC Price and Global M2 Are Highly Correlated</h3>
<p><strong>Global M2 Changes Explain Over 50% of Bitcoin&rsquo;s Price Movement</strong></p>
<p><img loading="lazy" class="img-responsive" alt="BTC Price Changes Correlates Highly with Changes in Global M2" src="https://www.vaneck.com/contentassets/c61b8da7f76f497e804fbc2d8cf53346/6399_recap-blog-crypto-webinar_chart-1_2025-11_v2_blog.svg" /></p>
<p class="chart-disclosure">Source: VanEck Research; Bloomberg. August 2025. <strong>Past performance is no guarantee of future results. Not intended as a recommendation to buy or sell any securities named herein.</strong></p>

<h2>Leverage: The Accelerator and the Brake</h2>
<p>Leverage acts as Bitcoin&rsquo;s volume knob. When risk appetite is high, traders and institutions take on leverage through futures, derivatives, ETFs, corporate balance sheets, and even on-chain lending platforms. That leverage can turbocharge rallies&mdash;but it can also unwind quickly and aggressively, leading to violent sell-offs.</p>
<p>Importantly, crypto leverage today looks more &ldquo;professional&rdquo; than in past cycles, migrating from unregulated crypto lenders to regulated exchanges and ETFs:</p>
<ul class="content-list">
<li class="mt-2">Major exchanges handle derivatives</li>
<li class="mt-2">ETFs concentrate exposure in regulated channels</li>
<li class="mt-2">Corporate borrowers have diversified revenue streams</li>
<li class="mt-2">Miner financing increasingly links to AI infrastructure</li>
</ul>
<p>Still, Bitcoin&rsquo;s biggest peaks tend to coincide with periods of speculative enthusiasm and widespread leverage. And its sharpest drawdowns often come when that leverage unwinds just as quickly.</p>
<h2>On-Chain Fundamentals: The Network&rsquo;s Pulse</h2>
<p>The blockchain offers a unique window into Bitcoin&rsquo;s health&mdash;real-time digital plumbing you can actually inspect.</p>
<p>Rising activity, healthy transaction levels, and expanding participation generally reinforce long-term strength. So does the share of holders in profit who aren&rsquo;t rushing for the exits all at once.</p>
<p>But Bitcoin isn&rsquo;t a Web3 tech growth story. It's more of a monetary ecosystem than a consumer network. Daily users and developer activity matter&mdash;but they matter less than global liquidity and market structure.</p>
<p>Instead, one of the most useful on-chain signals is investor behavior. When holders collectively sit on large unrealized gains and sentiment turns euphoric, risk tends to rise. When long-term holders are accumulating quietly, drawdowns often set the stage for future rallies.</p>
<p>To receive more <strong><a href="https://www.vaneck.com/us/en/insights/digital-assets/" title="Digital Assets Insights">Digital Assets</a></strong> insights, <strong><a href="https://www.vaneck.com/us/en/subscribe/" title="Subscription Center">sign up in our subscription center</a></strong>.</p>
]]></content:encoded>
</item><item rdf:about="https://www.vaneck.com/us/en/blogs/emerging-markets-bonds/clear-horizon-emerging-markets-shine-amid-uncertainty/">
  <title>Clear Horizon: Emerging Markets Shine Amid Uncertainty></title>
  <link>https://www.vaneck.com/us/en/blogs/emerging-markets-bonds/clear-horizon-emerging-markets-shine-amid-uncertainty/</link>
  <description><![CDATA[Emerging markets offer a &ldquo;clear horizon&rdquo; amid developed market uncertainty&mdash;higher yields, lower volatility, resilient fundamentals, and China&rsquo;s strong yuan keep EM assets shining.]]></description>
  <dc:creator> </dc:creator>
  <dc:date>11/12/2025 06:30:00</dc:date>
<content:encoded><![CDATA[

<p id="performance-overview" class="jump-link-nav anchored-block" data-jumplink-title="Performance Overview"><strong>Key Takeaways:</strong></p>
<ul class="content-list">
<li class="mt-2">Developed markets face uncertainty, while emerging markets offer higher yields and lower volatility.</li>
<li class="mt-2">EMBX 30-day SEC yield: 6.4%<sup>&dagger;</sup></li>
<li class="mt-2">IMF highlights EM resilience; fiscal pressures in developed markets support EM and gold.</li>
<li class="mt-2">China&rsquo;s stable, strengthening yuan underpins EM strength and global trade shifts.</li>
</ul>
<p>The <a href="/link/f447bf0c04f64108a3dcff3ca025af4a.aspx" title="EMBX - VanEck Emerging Markets Bond ETF - Overview"><strong>VanEck Emerging Markets Bond ETF (EMBX)</strong></a> was up 0.91% in October, compared to up 1.29% for its benchmark. Year-to-date, the fund is up 16.46%, compared to 14.51% for its benchmark, the 50% J.P. Morgan Government Bond Index - Emerging Markets Global Diversified (GBI-EM) and 50% J.P. Morgan Emerging Markets Bond Index (EMBI) and 7.81% and 7.80% for the Global Agg and 10-year treasuries, respectively. As of October 31, 2025, the fund had an average yield to worst (YTW) of 8.3%, a carry of 6.7%, and a duration of 5.3 years. As of November 11, 2025, the 30-day SEC yield was 6.4%. In the past 5 years, the fund has returned 5.06% per year, compared to 2.55% for its benchmark, negative 2.03% and negative 2.52% for the Global Agg and 10-year treasuries, respectively. Argentina was the biggest outperformer again. In October, we were simply overweight, whereas earlier outperformance was due to not owning it for the bond price collapse two months ago as well as buying the collapse. Our overweight in South Africa local currency continues to shine and we saw an excellent rally in Bolivia USD bonds following important elections. Romania and Saudi were underperformers. We have pulled in our horns after very strong performance. Local currency exposure is lower at 49%, and we are reducing overweight positions in selected USD and local-currency markets.</p>
<h3>Average Annual Total Returns<sup>*</sup>&nbsp;(%) (In USD)</h3>
<div class="wrapped-div">
<table style="width: 100%;">
<tbody>
<tr class="tbl-data">
<td class="tbl-header last text-left">Month End As of October 31, 2025</td>
<td class="tbl-header last text-right">1 Mo</td>
<td class="tbl-header last text-right">3 Mo</td>
<td class="tbl-header last text-right">YTD</td>
<td class="tbl-header last text-right">1 Yr</td>
<td class="tbl-header last text-right">3 Yrs</td>
<td class="tbl-header last text-right">5 Yrs</td>
<td class="tbl-header last text-right">10 Yrs</td>
</tr>
<tr class="tbl-data">
<td class="data-td last text-left">EMBX (NAV)</td>
<td class="data-td data last text-right">0.91</td>
<td class="data-td data last text-right">5.49</td>
<td class="data-td data last text-right">16.46</td>
<td class="data-td data last text-right">13.74</td>
<td class="data-td data last text-right">14.72</td>
<td class="data-td data last text-right">5.07</td>
<td class="data-td data last text-right">5.05</td>
</tr>
<tr class="tbl-data">
<td class="data-td last text-left">EMBX (Share Price)</td>
<td class="data-td data last text-right">0.91</td>
<td class="data-td data last text-right">5.49</td>
<td class="data-td data last text-right">16.46</td>
<td class="data-td data last text-right">13.74</td>
<td class="data-td data last text-right">14.72</td>
<td class="data-td data last text-right">5.07</td>
<td class="data-td data last text-right">5.05</td>
</tr>
<tr class="tbl-data">
<td class="data-td last text-left">50% GBI-EM/50% EMBI</td>
<td class="data-td data last text-right">1.29</td>
<td class="data-td data last text-right">4.85</td>
<td class="data-td data last text-right">14.51</td>
<td class="data-td data last text-right">12.96</td>
<td class="data-td data last text-right">12.44</td>
<td class="data-td data last text-right">2.57</td>
<td class="data-td data last text-right">3.69</td>
</tr>
</tbody>
</table>
</div>
<br />
<div class="wrapped-div">
<table style="width: 100%;">
<tbody>
<tr class="tbl-data">
<td class="tbl-header last text-left">Quarter End As of September 30, 2025</td>
<td class="tbl-header last text-right">1 Mo</td>
<td class="tbl-header last text-right">3 Mo</td>
<td class="tbl-header last text-right">YTD</td>
<td class="tbl-header last text-right">1 Yr</td>
<td class="tbl-header last text-right">3 Yrs</td>
<td class="tbl-header last text-right">5 Yrs</td>
<td class="tbl-header last text-right">10 Yrs</td>
</tr>
<tr class="tbl-data">
<td class="data-td last text-left">EMBX (NAV)</td>
<td class="data-td data last text-right">1.70</td>
<td class="data-td data last text-right">4.40</td>
<td class="data-td data last text-right">15.41</td>
<td class="data-td data last text-right">9.72</td>
<td class="data-td data last text-right">13.39</td>
<td class="data-td data last text-right">4.87</td>
<td class="data-td data last text-right">5.27</td>
</tr>
<tr class="tbl-data">
<td class="data-td last text-left">EMBX (Share Price)</td>
<td class="data-td data last text-right">1.70</td>
<td class="data-td data last text-right">4.40</td>
<td class="data-td data last text-right">15.41</td>
<td class="data-td data last text-right">9.72</td>
<td class="data-td data last text-right">13.39</td>
<td class="data-td data last text-right">4.87</td>
<td class="data-td data last text-right">5.27</td>
</tr>
<tr class="tbl-data">
<td class="data-td last text-left">50% GBI-EM/50% EMBI</td>
<td class="data-td data last text-right">1.59</td>
<td class="data-td data last text-right">3.78</td>
<td class="data-td data last text-right">13.05</td>
<td class="data-td data last text-right">7.98</td>
<td class="data-td data last text-right">11.82</td>
<td class="data-td data last text-right">2.34</td>
<td class="data-td data last text-right">3.93</td>
</tr>
</tbody>
</table>
</div>
<div class="chart-disclosure">
<p><sup>*</sup>&nbsp;Returns less than one year are not annualized.</p>
<p><strong>The performance data quoted represents past performance. Past performance is not a guarantee of future results. Investment return and principal value of an investment will fluctuate so that an investor's shares, when redeemed, may be worth more or less than their original cost. Performance may be lower or higher than performance data quoted. Please call 800.826.2333 or visit vaneck.com for performance current to the most recent month ended.</strong></p>
<p>Prior to 10/06/2025, the Fund operated as the VanEck Emerging Markets Bond mutual fund; performance shown before that date is that fund&rsquo;s NAV performance (Class I, unadjusted for today&rsquo;s ETF expenses).</p>
<p>The "Net Asset Value" (NAV) of a Fund is determined at the close of each business day, and represents the dollar value of one share of the fund; it is calculated by taking the total assets of the fund, subtracting total liabilities, and dividing by the total number of shares outstanding. The NAV is not necessarily the same as the ETF 's intraday trading value. Investors should not expect to buy or sell shares at NAV.</p>
<p><strong>EMBX Total Expense Ratio &ndash; 0.76%.</strong> Van Eck Associates Corporation (the &ldquo;Adviser&rdquo;) will pay all expenses of the Fund, except for the fee payment under the investment management agreement, acquired fund fees and expenses, interest expense, offering costs, trading expenses, taxes and extraordinary expenses. Notwithstanding the foregoing, the Adviser has agreed to pay the offering costs until at least May 1, 2027. &ldquo;Other Expenses&rdquo; have been restated to reflect current fees.</p>
</div>

<p id="why-em-outshine-dm-amid-uncertainty" class="jump-link-nav anchored-block" data-jumplink-title="Why EM Outshine DM Amid Uncertainty"><strong>There&rsquo;s a lot of white space, or is it just a clear horizon?</strong> The white space argument is that the tariff issue is basically only delayed for a year, the U.S. government is shut down, the labor market is uncertain, as is inflation and monetary policy, geopolitics still loom, with markets at highs. Enough about developed markets (DM). The clear horizon argument is that EM bonds&rsquo; higher carry and superior fundamentals should keep outperforming DM, as has been the case for decades, regardless. These two framings have game-theoretic implications. The white space scenario has DM markets buffeted by&hellip;who knows? That&rsquo;s the scenario &ndash; markets at highs and nobody knows what&rsquo;s coming. The clear horizon scenario says you&rsquo;ll get paid (EM has higher carry) and the risk is that the volatility in EM bonds continues to be lower than that of DM bonds (true for over 5 years now). Higher carry and lower volatility in EM bonds, which remains the case, is going to become harder and harder for investors to ignore (it&rsquo;s pretty amazing to be able to resist decades long return/volatility statistics, but you are doing it!) &hellip;even if we have a bumpy road into December, as we expect.</p>
<p><strong>The IMF saw white space for DM and a clear horizon for EM.</strong> We published our takeaways <a href="/link/e53ab61b4d954afe8c039c8c844e1882.aspx" title="EM Momentum, DM Fatigue: 2025 IMF Fall Takeaways"><strong>here</strong></a>. The worry is DM sovereign risk, which maps directly to the financial system and derivatives. That is <u>the</u> risk for any country, short of alien invasion&hellip;but post-GFC forbearance should be assumed. EM was described as &ldquo;resilient&rdquo;. This is our &ldquo;fiscal dominance&rdquo; thesis, which the IMF has continued to echo (to our joy) but which markets are resisting (also to our joy, we&rsquo;re here to make money). The GFC has real implications, and one is that the sovereign (U.S.) has to backstop global derivatives markets. This preserves &ldquo;the system&rdquo; of course. But, the financial repression it involves simply transmits to the currency. Thus the rally in gold, for example. This rally was caused by central banks fleeing greater risks in treasuries following sanctions on the Russian central bank. Ken Rogoff called these sanctions a default. But, the system is being preserved, the asset price implications (higher gold prices) are being ignored while they can be. One asset price being ignored at great cost, moreover, is CNY, which has been remarkably stable/strengthening. Remember, all the cool kids predicted a devaluation in response to tariffs that would hit all EMFX. The opposite happened, and the market still ignores this CNY rally. We absolutely love that the market continues to ignore this and wrote &ldquo;<strong><a href="/link/7667e60d56d34a6e8067f635cb7cee52.aspx" title="The Curiously Unpopular Case for RMB/CNY Appreciation">The Curiously Unpopular Case for RMB Appreciation</a></strong>&rdquo; to share this love.</p>
<p><strong>China had a &ldquo;glow up&rdquo;.</strong> Now that DMs are pursuing state-directed capitalism, &ldquo;overproduction&rdquo; and &ldquo;overcapacity&rdquo; are no-longer being used to describe the Chinese economy&hellip;because DMs are copying China! Everyone was bullish China, nobody was long. China has presided over arguably the greatest economic growth in history over the past 50 years. The IMF has arguably presided over a major balance-of-payments imbalance over the past 30 years. The one that allowed China, Asia and many EMs to pile up massive mercantilist surpluses that were part of the bullish EM argument all along. A core argument in our &ldquo;RMB Appreciation&rdquo; piece is simple game theory &ndash; China and others are up to their necks in USD and tariff negotiations are telling them USD must go down against their own currency&hellip;you don&rsquo;t need to be a world-class trader to know that you sell (or hedge) your USD, which is exactly what is happening right now as we speak. The CNY stability and strength that is resulting is central for EMs because they trade more with China than with the U.S. <i>We love that there is no attention to this central development, still.</i></p>

<h2 id="exposure-types-and-significant-changes" class="jump-link-nav anchored-block" data-jumplink-title="Exposure Types and Significant Changes">EXPOSURE TYPES AND SIGNIFICANT CHANGES</h2>
<p>The changes to our top positions are summarized below. Our largest positions in October were South Africa, Mexico, Poland, Thailand and Brazil:</p>
<ul class="content-list">
<li class="mt-2">We increased our hard currency sovereign exposure in Brazil and Romania. Brazil&rsquo;s geopolitical story is getting better (President Trump-President Lula &ldquo;bromance&rdquo;), but these factors can boost President Lula&rsquo;s domestic popularity in the run up to the elections, which is something that local bond investors might not appreciate. In terms of our investment process, this improved the policy/politics test score for Brazil&rsquo;s sovereign bonds. Romania&rsquo;s duration is expected to benefit from the on-going (albeit gradual) progress in fiscal consolidation and the central bank&rsquo;s tight policy stance. The former also bodes well for the EU funds&rsquo; inflows. These factors improved the policy test score for Romania.</li>
<li class="mt-2">We also increased our local currency exposure in Turkey and hard currency sovereign exposure in Bolivia. The Turkish cabinet confirmed its anti-inflation stance, which might require the stable lira. On-going disinflation and fiscal consolidation leave room for more (cautious) rate cuts, improving the policy/politics test score for the country. Bolivia&rsquo;s policy/politics test score got a major boost after the market-friendly presidential elections outcome, which supports hopes about the eventual IMF engagement and points to the availability of funds to make bond payments.</li>
<li class="mt-2">Finally, we increased our hard currency sovereign exposure in the United Arab Emirates, Kuwait and Egypt in order to get more duration exposure (reflecting the improved technical test score). In addition, Kuwait&rsquo;s new bond was attractively priced, while Egyptian assets were expected to benefit from the regional geopolitical stabilization.</li>
<li class="mt-2">We reduced our local currency exposure in Poland and the Czech Republic. The euro&rsquo;s inability to get sustainably above 1.18/U.S. dollar despite elevated longs is a yellow flag, which worsens the technical test score for the region. Poland&rsquo;s fiscal concerns are on the rise, and the new less-EU oriented government in the Czech Republic signals that the budget deficit might widen in the current months, worsening the policy test score for the country.</li>
<li class="mt-2">We also reduced our local currency exposure in Colombia and hard currency sovereign exposure in Morocco. Colombia&rsquo;s fiscal backdrop is deteriorating against the backdrop of the trade war tensions with the U.S. Some members of the central bank&rsquo;s board sound hawkish, but the board is split, so that the extreme negative dovish tail is not getting smaller, worsening the policy test score for the country. Morocco&rsquo;s street protests also worsened the country&rsquo;s policy/politics test score.</li>
<li class="mt-2">Finally, we reduced our hard currency corporate exposure in China and Paraguay and local currency exposure in China. China&rsquo;s local yields likely to continue creeping higher as the government employs more policy stimulus to prop up growth, while there are no meaningful positive catalysts in the housing sector. These factors worsened the policy test score for the country. Regarding the Paraguayan corporate bond, our decision reflected specific governance concerns.</li>
</ul>
<p>To receive more <a href="https://www.vaneck.com/us/en/insights/emerging-markets-bonds/" title="Emerging Markets Bonds Insights"><strong>Emerging Markets Bonds</strong></a> insights, <a href="/link/5f45412c2143400497908cea2897f7d3.aspx" title=" Subscription Center"><strong>sign up in our subscription center</strong></a>.</p>
]]></content:encoded>
</item><item rdf:about="https://www.vaneck.com/us/en/blogs/moat-investing/moat-stocks-climb-in-a-concentrated-market/">
  <title>Moat Stocks Climb in a Concentrated Market></title>
  <link>https://www.vaneck.com/us/en/blogs/moat-investing/moat-stocks-climb-in-a-concentrated-market/</link>
  <description><![CDATA[Markets extended gains in October as earnings strength, AI investment, and Fed easing supported sentiment, helping moat strategies show selective strength.]]></description>
  <dc:creator>Coulter Regal, CFA</dc:creator>
  <dc:date>11/10/2025 06:30:00</dc:date>
<content:encoded><![CDATA[

<p><strong>Key Takeaways:</strong></p>
<ul class="content-list">
<li class="mt-2">Moat Index outpaced the S&amp;P 500 in October, driven by strong stock selection.</li>
<li class="mt-2">Teradyne and Thermo Fisher Scientific led Moat Index contributors.</li>
<li class="mt-2">SMID Moat Index declined 0.6%, but held up better than small-cap peers amid consumer weakness.</li>
<li class="mt-2">WESCO International and Ionis Pharmaceuticals were top SMID Moat Index contributors.</li>
</ul>
<p id="us-equity-market-review" class="jump-link-nav anchored-block" data-jumplink-title="U.S. Equity Market Review">In October, the S&amp;P 500 marked its sixth straight monthly gain and set fresh record highs, as a strong third quarter earnings season and announcements of continued AI-driven capital spending kept risk appetite intact. Equities were further supported by the Federal Reserve&rsquo;s second 25 basis point cut of the year and the signaling of an end to quantitative tightening. Hopes for an incremental thaw in U.S.-China trade relations also helped, rounding out a constructive backdrop heading into November. However, market breadth remained narrow during the month. Leadership continued to be concentrated in the typical mega-cap technology names, while small caps faced pressure from the continued government shutdown and resulting gaps in critical economic data releases.</p>
<p>The <a href="/link/9e43dd198c5f4e419f13220685081895.aspx" title="MOAT - VanEck Morningstar Wide Moat ETF - Overview"><strong>Morningstar Wide Moat Focus Index</strong></a> (the &ldquo;Moat Index&rdquo;) gained 2.66% in October, outpacing the S&amp;P 500 which advanced 2.34%. Strong stock selection was the primary driver of relative outperformance, led by health care and industrials where several holdings beat sector peers. The outperformance was despite headwinds to equal-weight strategies during the month, illustrated by the equal-weight S&amp;P 500, which finished down nearly a full percentage point.</p>
<p>In contrast, smaller cap companies trailed, as investors continued to favor large-cap technology leaders even after another quarter point rate cut. The <strong><a href="/link/166321dbcfec440590fb51cf0ad629aa.aspx" title="SMOT - VanEck Morningstar SMID Moat ETF - Overview">Morningstar US Small-Mid Cap Moat Focus Index</a></strong> (the &ldquo;SMID Moat Index&rdquo;) declined 0.60% during the month, falling in between the broad small- and mid-cap benchmarks given the strategy&rsquo;s mixed size exposure.</p>
<h3>Wide Moat Stock Shows Strength as Market Breadth Shrinks</h3>
<p><img loading="lazy" class="img-responsive" alt="Wide Moat Stock Shows Strength as Market Breadth Shrinks" src="https://www.vaneck.com/contentassets/731a9522f0684c8caeca338ea6affa68/6386_moat-monthly-chart-1_2025-11_v1_blog.svg" /></p>
<p class="chart-disclosure"><strong>Source: Morningstar. Data as of 10/31/2025.</strong> Past performance is no guarantee of future results. Index performance is not representative of fund performance. It is not possible to invest directly in an index. Please see index definitions and other important disclosures at the end of this content. Fund performance current to the most recent month end is available by visiting vaneck.com or by calling 800.826.2333.</p>

<h2 id="moat-highlights" class="jump-link-nav anchored-block" data-jumplink-title="Moat Highlights">Moat Index Highlights: Semis and Science Lead</h2>
<p>In October, the Moat Index finished ahead of the S&amp;P 500, overcoming headwinds faced generally by equal-weighted strategies during the month. Strong stock selection was the primary driver of relative performance, but sector allocations in certain segments, namely overweights in health care and industrials, also proved beneficial during the month.</p>
<p>Teradyne (TER) was the top contributor to the Moat Index in October as shares rose 32% following a strong earnings release. Third quarter sales rose 4%, which was at the high end of guidance, and management called for additional revenue growth in the fourth quarter on accelerating AI demand. Morningstar highlights a stronger position in AI chip testing, including custom accelerators from Broadcom and high bandwidth memory, with rising confidence that Teradyne can qualify as a second testing source for GPUs at Nvidia and AMD. With AI now the primary growth driver and mobile becoming less central, Morningstar raised its fair value estimate to $140 per share from $115 and reiterates a wide moat view on the firm&rsquo;s automated test leadership. While the stock looks slightly rich to that estimate after the move, Morningstar expects double digit chip testing growth over the next two years as AI buildouts add capacity and complexity.</p>
<p>Also within the top contributors this month was Thermo Fisher Scientific Inc. (TMO), a global leader in life science tools and services that span instruments, consumables, logistics, and clinical trial support. Shares gained 17% in October after the company announced the $8.9B acquisition of Clario Holdings, a provider of clinical trial data solutions, with closing targeted for mid-2026. Clario&rsquo;s end point data software is used in roughly 70% of U.S. drug approvals and will expand Thermo Fisher&rsquo;s clinical trial solutions portfolio. Management expects Clario&rsquo;s $1.25B revenue base to grow at a high single-digit rate and be immediately accretive to adjusted operating margin. TMO&rsquo;s wide moat reflects unmatched scale, a one stop shop portfolio, and switching costs that come from deep integration with pharma workflows and a large base of recurring consumables and services. Morningstar maintains a $630 per share fair value estimate and a wide moat rating.</p>
<p>Other top contributors within the Moat Index during the month included semiconductor equipment leader Applied Materials Inc. (AMAT), life science tools and diagnostics provider Agilent Technologies Inc. (A), and global package delivery and logistics provider United Parcel Service Inc. (UPS).</p>
<p>Companies detracting the most in October included consumer health company Kenvue Inc. (KVUE), semiconductor leader NXP Semiconductors (NXPI), global food and beverage company Mondelez International Inc. (MDLZ), household products maker Clorox Co. (CLX), and athletic footwear and apparel brand Nike Inc. (NKE).</p>
<h2>Moat Index Top Contributors and Detractors - October 2025</h2>
<h3>Contributors</h3>
<div class="wrapped-div">
<table style="width: 100%;">
<tbody>
<tr class="tbl-data">
<td class="tbl-header last text-left">Company</td>
<td class="tbl-header last text-left">Ticker</td>
<td class="tbl-header last text-left">Sector</td>
<td class="tbl-header last text-right">Avg. Weight (%)</td>
<td class="tbl-header last text-right">Contribution (%)</td>
</tr>
<tr class="tbl-data">
<td class="data-td last text-left">Teradyne Inc.</td>
<td class="data-td data last text-left">TER</td>
<td class="data-td data last text-left">Technology</td>
<td class="data-td data last text-right">1.89</td>
<td class="data-td data last text-right">0.61</td>
</tr>
<tr class="tbl-data">
<td class="data-td last text-left">Thermo Fisher Scientific Inc.</td>
<td class="data-td data last text-left">TMO</td>
<td class="data-td data last text-left">Health Care</td>
<td class="data-td data last text-right">2.67</td>
<td class="data-td data last text-right">0.45</td>
</tr>
<tr class="tbl-data">
<td class="data-td last text-left">Applied Materials Inc.</td>
<td class="data-td data last text-left">AMAT</td>
<td class="data-td data last text-left">Technology</td>
<td class="data-td data last text-right">3.03</td>
<td class="data-td data last text-right">0.42</td>
</tr>
<tr class="tbl-data">
<td class="data-td last text-left">Agilent Technologies Inc.</td>
<td class="data-td data last text-left">A</td>
<td class="data-td data last text-left">Health Care</td>
<td class="data-td data last text-right">2.57</td>
<td class="data-td data last text-right">0.36</td>
</tr>
<tr class="tbl-data">
<td class="data-td last text-left">United Parcel Service Inc.</td>
<td class="data-td data last text-left">UPS</td>
<td class="data-td data last text-left">Industrials</td>
<td class="data-td data last text-right">2.25</td>
<td class="data-td data last text-right">0.35</td>
</tr>
</tbody>
</table>
</div>
<h3>Detractors</h3>
<div class="wrapped-div">
<table style="width: 100%;">
<tbody>
<tr class="tbl-data">
<td class="tbl-header last text-left">Company</td>
<td class="tbl-header last text-left">Ticker</td>
<td class="tbl-header last text-left">Sector</td>
<td class="tbl-header last text-right">Avg. Weight (%)</td>
<td class="tbl-header last text-right">Contribution (%)</td>
</tr>
<tr class="tbl-data">
<td class="data-td last text-left">Kenvue Inc</td>
<td class="data-td data last text-left">KVUE</td>
<td class="data-td data last text-left">Consumer Staples</td>
<td class="data-td data last text-right">2.02</td>
<td class="data-td data last text-right">-0.23</td>
</tr>
<tr class="tbl-data">
<td class="data-td last text-left">NXP Semiconductors</td>
<td class="data-td data last text-left">NXPI</td>
<td class="data-td data last text-left">Technology</td>
<td class="data-td data last text-right">2.54</td>
<td class="data-td data last text-right">-0.21</td>
</tr>
<tr class="tbl-data">
<td class="data-td last text-left">Mondelez International Inc.</td>
<td class="data-td data last text-left">MDLZ</td>
<td class="data-td data last text-left">Consumer Staples</td>
<td class="data-td data last text-right">2.38</td>
<td class="data-td data last text-right">-0.19</td>
</tr>
<tr class="tbl-data">
<td class="data-td last text-left">Clorox Co.</td>
<td class="data-td data last text-left">CLX</td>
<td class="data-td data last text-left">Consumer Staples</td>
<td class="data-td data last text-right">2.39</td>
<td class="data-td data last text-right">-0.19</td>
</tr>
<tr class="tbl-data">
<td class="data-td last text-left">Nike Inc.</td>
<td class="data-td data last text-left">NKE</td>
<td class="data-td data last text-left">Consumer Discretionary</td>
<td class="data-td data last text-right">2.51</td>
<td class="data-td data last text-right">-0.19</td>
</tr>
</tbody>
</table>
</div>
<p class="chart-disclosure"><strong>Source: Morningstar.</strong> Past performance is no guarantee of future results. Index performance is not illustrative of fund performance. Not intended as a recommendation to buy or to sell any of the securities mentioned herein.</p>

<h2 id="smid-highlights" class="jump-link-nav anchored-block" data-jumplink-title="SMID Moat Highlights">SMID Moat Index Highlights: Cables and Capsules Climb</h2>
<p>The SMID Moat Index performance was muted this month, falling in between the small- and mid-cap benchmarks given its exposure to both size cohorts. The strategy benefited from its overweight allocation in health care, a top performing sector during the month, as well as from its underweight to the financials. However, headwinds to consumer discretionary names acted as an offset.</p>
<p>WESCO International (WCC) was the top contributor to the SMID Moat Index in October as shares rallied 23% on strong quarterly earnings results. Organic sales increased and EPS grew year-over-year despite some margin pressure. Momentum remained strongest in data center solutions, marking a fifth straight quarter with sales up more than 50% and bringing that end market to nearly 20% of Wesco&rsquo;s revenue. Wesco is also benefiting from U.S. infrastructure spending and multiyear projects where it provides value added services. Morningstar raised its fair value estimate to $240 and maintained WCC&rsquo;s economic moat. The moat reflects scale, broad supplier and product reach, and service capabilities such as vendor managed inventory that deepen customer relationships and support a cost advantage.</p>
<p>Ionis Pharmaceuticals Inc. (IONS) was a top contributor for the second consecutive month, rising about 13% in October. Momentum followed strong uptake for their rare disease drug, Tryngolza, which delivered $32M in quarterly sales and grew 68% sequentially, prompting a higher revenue guidance outlook. Management is also planning near-term U.S. filings for two additional products, olezarsen and zilganersen, and Morningstar assigns a 90% approval probability to each with launches expected in 2026. Ionis&rsquo; narrow moat is supported by its proprietary antisense platform and layered intellectual property, and by progress building independent commercial capabilities. Morningstar maintains a $74 fair value estimate and a positive long-term outlook.</p>
<p>Other top contributors include Agilent Technologies Inc. (A), a life science tools and diagnostics provider, Huntington Ingalls Industries (HII), the largest U.S. military shipbuilder, and Albemarle Corp. (ALB), a leading lithium producer serving electric vehicle supply chains.</p>
<p>Companies detracting the most in October within the SMID Moat Index spanned multiple sectors, but consumer discretionary was the notable stand out. Names included online sports betting firm DraftKings Inc. (DKNG), cruise operator Norwegian Cruise Line Ltd. (NCLH), sleep and respiratory care device maker ResMed Inc. (RMD), confectionery company The Hershey Co. (HSY), and alternative asset manager The Carlyle Group Inc. (CG).</p>
<h2>SMID Moat Index Top Contributors and Detractors - October 2025</h2>
<h3>Contributors</h3>
<div class="wrapped-div">
<table style="width: 100%;">
<tbody>
<tr class="tbl-data">
<td class="tbl-header last text-left">Company</td>
<td class="tbl-header last text-left">Ticker</td>
<td class="tbl-header last text-left">Sector</td>
<td class="tbl-header last text-right">Avg. Weight (%)</td>
<td class="tbl-header last text-right">Contribution (%)</td>
</tr>
<tr class="tbl-data">
<td class="data-td last text-left">WESCO International Inc.</td>
<td class="data-td data last text-left">WCC</td>
<td class="data-td data last text-left">Industrials</td>
<td class="data-td data last text-right">1.44</td>
<td class="data-td data last text-right">0.33</td>
</tr>
<tr class="tbl-data">
<td class="data-td last text-left">Ionis Pharmaceuticals Inc.</td>
<td class="data-td data last text-left">IONS</td>
<td class="data-td data last text-left">Health Care</td>
<td class="data-td data last text-right">1.89</td>
<td class="data-td data last text-right">0.26</td>
</tr>
<tr class="tbl-data">
<td class="data-td last text-left">Agilent Technologies Inc.</td>
<td class="data-td data last text-left">A</td>
<td class="data-td data last text-left">Health Care</td>
<td class="data-td data last text-right">1.40</td>
<td class="data-td data last text-right">0.20</td>
</tr>
<tr class="tbl-data">
<td class="data-td last text-left">Huntington Ingalls Industries Inc.</td>
<td class="data-td data last text-left">HII</td>
<td class="data-td data last text-left">Industrials</td>
<td class="data-td data last text-right">1.55</td>
<td class="data-td data last text-right">0.18</td>
</tr>
<tr class="tbl-data">
<td class="data-td last text-left">Albemarle Corp.</td>
<td class="data-td data last text-left">ALB</td>
<td class="data-td data last text-left">Materials</td>
<td class="data-td data last text-right">0.67</td>
<td class="data-td data last text-right">0.14</td>
</tr>
</tbody>
</table>
<h3>Detractors</h3>
<div class="wrapped-div">
<table style="width: 100%;">
<tbody>
<tr class="tbl-data">
<td class="tbl-header last text-left">Company</td>
<td class="tbl-header last text-left">Ticker</td>
<td class="tbl-header last text-left">Sector</td>
<td class="tbl-header last text-right">Avg. Weight (%)</td>
<td class="tbl-header last text-right">Contribution (%)</td>
</tr>
<tr class="tbl-data">
<td class="data-td last text-left">DraftKings Inc.</td>
<td class="data-td data last text-left">DKNG</td>
<td class="data-td data last text-left">Consumer Discretionary</td>
<td class="data-td data last text-right">1.22</td>
<td class="data-td data last text-right">-0.22</td>
</tr>
<tr class="tbl-data">
<td class="data-td last text-left">Norwegian Cruise Line Ltd.</td>
<td class="data-td data last text-left">NCLH</td>
<td class="data-td data last text-left">Consumer Discretionary</td>
<td class="data-td data last text-right">1.53</td>
<td class="data-td data last text-right">-0.14</td>
</tr>
<tr class="tbl-data">
<td class="data-td last text-left">ResMed Inc.</td>
<td class="data-td data last text-left">RMD</td>
<td class="data-td data last text-left">Health Care</td>
<td class="data-td data last text-right">1.37</td>
<td class="data-td data last text-right">-0.13</td>
</tr>
<tr class="tbl-data">
<td class="data-td last text-left">The Hershey Co.</td>
<td class="data-td data last text-left">HSY</td>
<td class="data-td data last text-left">Consumer Staples</td>
<td class="data-td data last text-right">1.40</td>
<td class="data-td data last text-right">-0.13</td>
</tr>
<tr class="tbl-data">
<td class="data-td last text-left">The Carlyle Group Inc.</td>
<td class="data-td data last text-left">CG</td>
<td class="data-td data last text-left">Financials</td>
<td class="data-td data last text-right">0.87</td>
<td class="data-td data last text-right">-0.13</td>
</tr>
</tbody>
</table>
</div>
</div>
<p class="chart-disclosure"><strong>Source: Morningstar.</strong> Past performance is no guarantee of future results. Index performance is not illustrative of fund performance. Not intended as a recommendation to buy or to sell any of the securities mentioned herein.</p>

<h2 id="moat-strategies" class="jump-link-nav anchored-block" data-jumplink-title="Moat Strategies">Choose Your Moat Strategy</h2>
<p>VanEck&rsquo;s suite of <strong><a href="/link/b633817b89cc48d38cf4158f762aaf70.aspx" title="Quality Companies at Attractive Prices">moat investing strategies</a></strong> is powered by Morningstar&rsquo;s equity research team, which seeks quality companies trading at attractive valuations. The below ETFs offer access to US moat companies:</p>
<p><a href="/link/9e43dd198c5f4e419f13220685081895.aspx" title="MOAT - VanEck Morningstar Wide Moat ETF - Overview"><strong>VanEck Morningstar Wide ETF (MOAT)</strong></a>: companies with a wide moat rating, which means Morningstar believes the company is likely to sustain its competitive advantage for at least the next 20 years.</p>
<p><a href="/link/166321dbcfec440590fb51cf0ad629aa.aspx" title="SMOT - VanEck Morningstar SMID Moat ETF - Overview"><strong>VanEck Morningstar SMID Moat ETF (SMOT)</strong></a>: small and mid-cap moat companies.</p>
<p><strong><a href="/link/fd582da052ba46c79bfc112c078a6256.aspx" title="MVAL - VanEck Morningstar Wide Moat Value ETF - Overview">VanEck Morningstar Wide Moat Value ETF (MVAL)</a></strong>: wide moat companies within Morningstar&rsquo;s value style category.</p>
<p>To receive more <a href="https://www.vaneck.com/us/en/insights/moat-investing" title="Moat Investing Insights"><strong>Moat Investing</strong></a> insights, <a href="https://www.vaneck.com/us/en/subscribe/" title="Subscription Center"><strong>sign up in our subscription center</strong></a>.</p>
]]></content:encoded>
</item><item rdf:about="https://www.vaneck.com/us/en/blogs/digital-assets/ethereum-101-a-beginners-guide/">
  <title>Ethereum 101: A Beginner’s Guide></title>
  <link>https://www.vaneck.com/us/en/blogs/digital-assets/ethereum-101-a-beginners-guide/</link>
  <description><![CDATA[This guide breaks down what Ethereum is, differentiating it from Bitcoin, likening it to a web "app store". It highlights features like smart contracts and its currency, ether.]]></description>
  <dc:creator> </dc:creator>
  <dc:date>11/07/2025 06:30:00</dc:date>
<content:encoded><![CDATA[

<p>Key Takeaways:</p>
<ul class="content-list">
<li class="mt-2">Ethereum is like a digital app store, powering decentralized apps and contracts with its currency, ether.</li>
<li class="mt-2">Unlike Bitcoin, Ethereum enables smart contracts and dApps, making it more than just a cryptocurrency.</li>
<li class="mt-2">Ethereum&rsquo;s innovation drives adoption, but risks include scalability, competition, and regulatory pressures.</li>
</ul>
<p><strong>Please note that VanEck may have a position(s) in the digital asset(s) described below.</strong></p>
<p><i>Investments in digital assets are subject to significant risk and are not suitable for all investors. The value of digital assets is highly volatile, and you can lose your entire principal investment.</i></p>
<p>Getting started with Ethereum (and cryptocurrency in general) can be a bit overwhelming, especially when faced with jargon like "dApps" and "smart contracts". Think of Ethereum as an online app store. Just like Bitcoin, Ethereum involves digital money, but it offers so much more than just that. In this "app store", developers can create and launch their own applications without any centralized control. The "currency" used to buy, sell, or operate within these applications is called ether. One of the coolest features of this digital app store is "smart contracts", which are like automated agreements or deals. These tools have the potential to change many industries, from banking to art.</p>
<p>If Ethereum sounds complicated, don't worry. In this guide, we'll break things down to help you understand what Ethereum is, its standout features, and why it's such a big deal.</p>
<ul class="content-list">
<li><strong><a href="#what-is-ethereum">What is Ethereum?</a></strong></li>
<li><strong><a href="#bitcoin-vs-ethereum-difference">Bitcoin vs. Ethereum: What's the Difference?</a></strong></li>
<li><strong><a href="#how-do-ethereum-smart-contracts-work">How Do Ethereum's Smart Contracts Work?</a></strong></li>
<li><strong><a href="#why-invest-in-ethereum">Why Invest in Ethereum?</a></strong></li>
<li><strong><a href="#ethereum-investment-risks">What are Ethereum's Investment Risks?</a></strong></li>
</ul>
<h2 id="what-is-ethereum" class="jump-link-nav anchored-block" data-jumplink-title="What is Ethereum?">What is Ethereum?</h2>
<p>Ethereum is a digital platform that lets people build and use decentralized applications on the internet. Think of it like your smartphone's app store, where you can download all sorts of apps to help you do different things. Just as the app store has a system behind it (like iOS or Android), Ethereum operates as an "app store" for the web, powered by its unique digital currency, ether.</p>
<p>When people talk about investing in Ethereum, they're usually referring to buying its primary digital currency, ether or ETH, much like buying bitcoin means acquiring the cryptocurrency BTC.</p>
<p><strong>To break it down further:</strong></p>
<p><strong>Ethereum:</strong> This is the whole digital system that lets people make and use special online applications and automated agreements, known as dApps and smart contracts. You can think of it as the backbone or the foundation that everything runs on.</p>
<p><strong>Ether (ETH):</strong> This is Ethereum's own kind of digital money. If you're investing, trading, or paying fees on the Ethereum platform, you're using ether. Besides being a form of investment, ether is the "power source" that makes everything on Ethereum work, from running apps to sealing agreements.</p>
<p>So, when someone says they're putting money into Ethereum, they're generally buying ether, hoping its value will increase over time.</p>

<h2 id="bitcoin-vs-ethereum-difference" class="jump-link-nav anchored-block" data-jumplink-title="Bitcoin vs. Ethereum?">Bitcoin vs. Ethereum: What's the Difference?</h2>
<p>At first glance, both Bitcoin and Ethereum are cryptocurrencies. But while they share some similarities, they also have fundamental differences:</p>
<ul class="content-list">
<li class="mt-2"><strong>Origin:</strong> Bitcoin was introduced in 2008, aiming to be a decentralized digital currency or, as some like to say, "digital gold." Ethereum, on the other hand, was launched in 2015 with a broader vision than just being a currency.</li>
<li class="mt-2"><strong>Purpose:</strong> Bitcoin is primarily a medium of exchange or potential store of value. Ethereum, while having its native currency called Ether, is more than just a cryptocurrency platform. It&rsquo;s a platform that enables smart contracts and decentralized applications (dApps). In simple terms, while Bitcoin offers a new way of transferring money, Ethereum provides a new way of doing business and creating decentralized platforms.</li>
<li class="mt-2"><strong>Supply:</strong> Bitcoin's supply is capped at 21 million, making it deflationary. Ethereum doesn't have a max supply, which allows it more flexibility but introduces different economic considerations.</li>
</ul>
<h2 id="how-do-ethereum-smart-contracts-work" class="anchored-block">How Do Ethereum's Smart Contracts Work?</h2>
<p>The power of blockchain lies in its transparency and security. Because so many people have copies and they always verify new pages together, it's incredibly difficult for someone to cheat or make false entries. The advantage of blockchain is its decentralized nature. When information is stored across multiple nodes, it becomes tamper-resistant. Any malicious activity or inconsistency can be quickly detected and corrected. While Bitcoin introduced the world to blockchain and cryptocurrencies, <strong><a href="https://www.vaneck.com/us/en/blogs/digital-assets/what-are-smart-contracts/" title="What are Smart Contracts?">Ethereum introduced a revolutionary concept: smart contracts</a></strong>. As the examples below highlight, Ethereum enhances blockchain capabilities with its smart contracts:</p>
<ul class="content-list">
<li class="mt-2"><strong>Decentralized Apps (dApps):</strong> Developers can build applications on Ethereum that inherit the security and decentralized features of its blockchain.</li>
<li class="mt-2"><strong>Decentralized Autonomous Organizations (DAOs):</strong> These are like digital companies or organizations where decisions are made based on predefined rules in smart contracts, without centralized control. Governance power is distributed across token holders who collectively cast votes.</li>
<li class="mt-2"><strong>Digital Identity:</strong> Individuals can have a digital identity on the Ethereum blockchain, ensuring personal data is secure and giving control back to the user.</li>
<li class="mt-2"><strong>Licensing and Royalties:</strong> Artists and creators can use Ethereum to ensure they get paid their dues every time their work is used or sold.</li>
</ul>
<p>Consider a traditional contract, like an agreement to buy a car. Usually, you'd involve third parties like banks or lawyers to ensure everyone keeps their promises. Imagine a digital contract that automatically does what it's supposed to when certain conditions are met without needing a middleman. That's a smart contract! Ethereum is a platform that allows these smart contracts to operate. Its own cryptocurrency, ether, powers these contracts and ensures they run smoothly.</p>
<h2 id="why-invest-in-ethereum" class="anchored-block">Why Invest in Ethereum?</h2>
<p>The investment case for Ethereum is strong and diverse:</p>
<ul class="content-list">
<li class="mt-2"><strong>Technological Edge:</strong> Ethereum's platform allows for creating smart contracts, programs that automatically execute when certain conditions are met. This feature has huge potential in reshaping industries, from finance to art.</li>
<li class="mt-2"><strong>Market Share:</strong> Ethereum's platform supports numerous other cryptocurrencies. Its influence is clear when you consider that, as of November 2025, 6 of the top 20 cryptocurrencies are based on or linked to Ethereum.</li>
<li class="mt-2"><strong>Applications:</strong> Ethereum is versatile. Beyond cryptocurrencies, it's used in decentralized finance, games, and by major organizations looking to integrate blockchain technology.</li>
</ul>
<p><strong>Ethereum's Growing Role</strong></p>
<p>Ethereum is quickly becoming important in the digital world, with more than 5,000 apps running on its system<sup>1</sup>. Different sectors, from finance to art, are finding ways to use Ethereum for new ideas and improvements. It reminds some of the early internet days when everything felt new and full of possibilities. More and more people are exploring Ethereum and its currency, ether, because of the opportunities they present. Simply put, Ethereum isn't just digital money; it's a platform for innovation and could be a major part of the future.</p>
<p><strong>Network Upgrades: What it Means for Investors</strong></p>
<p>Ethereum continues to evolve in measured steps. Recent upgrades have focused on making the network more scalable, more usable and easier to operate.</p>
<p>The latest upgrade, commonly called Pectra, advances three themes:</p>
<ol class="content-list">
<li class="mt-2">Wallet experience: Moved Ethereum further toward &ldquo;smart&rdquo; wallets, enabling features like bundled transactions, safer approvals and flexible recovery-without requiring users to switch addresses.</li>
<li class="mt-2">Staking &amp; operations: improved validators quality-of-life and exist mechanics, helping staking tools operate more efficiently with clearer safeguards.</li>
<li class="mt-2">Layer-2 throughput: expands data capacity used by rollups, supporting lower-cost activity on layer-2 networks as adoption grows.</li>
</ol>
<h2 id="ethereum-investment-risks" class="anchored-block">What are Ethereum's Investment Risks?</h2>
<p>While the investment case for Ethereum is compelling, it's important to recognize the risks that could affect its growth and market position:</p>
<ul>
<li><strong>Scalability and Competition: </strong>Ethereum has faced challenges scaling its Layer 1 (L1) blockchain, leading to the rise of Layer 2 (L2) solutions. While L2s improve transaction speeds and lower costs, there's a risk that value may shift from Ethereum's main network to these connected blockchains. Competitors like Solana and Tron are also gaining market share due to their lower fees and faster transaction times, which could further erode Ethereum's dominance.</li>
<li><strong>Declining Transaction Fees: </strong>Ethereum's network relies heavily on transaction fees for revenue. However, the average Ethereum transaction fee has fallen significantly, with Layer 2 networks charging much lower fees. This decline in fees, while beneficial for users, could hurt Ethereum's network economics over time, especially if it loses its edge in providing unique applications.</li>
<li><strong>Technological and Regulatory Risks:</strong></li>
<ul class="content-list">
<li class="mt-2"><strong>Software Vulnerabilities: </strong>Any flaws in Ethereum's code could potentially disrupt the network, leading to operational risks.</li>
<li class="mt-2"><strong>Regulatory Threats: </strong>Over-regulation of DeFi projects on Ethereum could stifle innovation and reduce its base of decentralized applications.</li>
<li class="mt-2"><strong>Stablecoin Risks: </strong>Ethereum hosts major stablecoins like USDC and USDT. A liquidity crisis or collapse in the value of these stablecoins could destabilize the entire Ethereum ecosystem.</li>
<li class="mt-2"><strong>The Shift to Layer 2 Solutions: </strong>As Layer 2 blockchains grow, there is a concern that the value generated by these networks might not fully benefit ETH holders. Instead, L2s could capture a larger portion of the economic value, leaving Ethereum's Layer 1 network to play a diminished role.</li>
</ul>
</ul>
<p>Overall, while Ethereum has experienced considerable growth and innovation, these risks underscore the significant challenges it must navigate to sustain its position as a leading platform in the rapidly evolving and highly competitive blockchain ecosystem.</p>
<p>To receive more <strong><a href="https://www.vaneck.com/us/en/insights/digital-assets/" title="Digital Assets Insights">Digital Assets</a></strong> insights, <strong><a href="https://www.vaneck.com/us/en/subscribe/" title="Subscription Center">sign up in our subscription center</a></strong>.</p>
]]></content:encoded>
</item><item rdf:about="https://www.vaneck.com/us/en/blogs/digital-assets/bitcoin-101-a-beginners-guide/">
  <title>Bitcoin 101: A Beginner&#39;s Guide></title>
  <link>https://www.vaneck.com/us/en/blogs/digital-assets/bitcoin-101-a-beginners-guide/</link>
  <description><![CDATA[In this guide, we explain in simple terms what bitcoin is and answer some of the most frequently asked questions about bitcoin ETPs.]]></description>
  <dc:creator> </dc:creator>
  <dc:date>11/07/2025 06:30:00</dc:date>
<content:encoded><![CDATA[

<p>Once a fringe concept, bitcoin has evolved into a new asset, drawing global investor interest. To fully grasp bitcoin, it's beneficial first to understand the fundamental concept of money. This guide begins by exploring the basics of money and then provides a simple overview of bitcoin and critical considerations for investors evaluating bitcoin ETFs.</p>
<ul class="content-list">
<li><a href="#what-is-money"><strong>What is Money?</strong></a></li>
<li><a href="#what-is-bitcoin"><strong>What is Bitcoin?</strong></a></li>
<li><a href="#what-is-a-blockchain"><strong>What is a Blockchain?</strong></a></li>
<li><a href="#why-invest-in-bitcoin"><strong>Why invest in Bitcoin?</strong></a></li>
<li><a href="#what-is-a-bitcoin-etf"><strong>What is a Bitcoin ETF?</strong></a></li>
<li><a href="#are-bitcoin-etfs-regulated"><strong>Are Bitcoin ETFs Regulated?</strong></a></li>
<li><a href="#bitcoin-etfs-in-iras-tax-benefits"><strong>Bitcoin ETFs in IRAs: Tax Benefits?</strong></a></li>
<li><a href="#investing-in-a-bitcoin-etf-what-to-consider"><strong>Investing in a Bitcoin ETF: What to Consider?</strong></a></li>
</ul>
<h2 id="what-is-money" class="anchored-block">What is Money?</h2>
<p>Money might make you think of cash and coins, but actually, most of what we use as money today doesn't have a physical form&mdash;it's just numbers on a computer. Money is merely a concept, a way for humans to store value and exchange for real goods and services. Different items have stood in for money throughout history, including shiny shells, paper currency, precious metals, grains, and even salt. The key is the shared belief in its value; as long as everyone agrees on its worth, anything can serve the role of money. There are three major functions of money: medium of exchange, unit of account, and store of value.</p>
<p><a href="https://www.vaneck.com/us/en/investments/bitcoin-etf-hodl/overview/" title="HODL VanEck Bitcoin Trust" rel="noopener"><img loading="lazy" class="img-responsive w-100 d-none d-sm-block" src="https://www.vaneck.com/contentassets/04f174ca91b34d15b7fa3aa0ca9794f9/hodl-no-fees-bnr-ad-desktop.png" alt="HODL VanEck Bitcoin Trust" /></a></p>
<p><a href="https://www.vaneck.com/us/en/investments/bitcoin-etf-hodl/overview/" title="HODL VanEck Bitcoin Trust" rel="noopener"><img loading="lazy" class="img-responsive w-100 d-sm-none" src="https://www.vaneck.com/contentassets/04f174ca91b34d15b7fa3aa0ca9794f9/hodl-no-fees-bnr-ad-mobile.png" alt="HODL VanEck Bitcoin Trust" /></a></p>
<p class="jump-link-nav anchored-block" data-jumplink-title="What is Bitcoin?"><strong><span style="text-decoration: underline;"><span style="color: rgb(0, 0, 0); text-decoration: underline;">HODL Fees:</span></span> During the period commencing on November 25, 2024 and ending on January 10, 2026, the Sponsor will waive the entire Sponsor Fee for the first $2.5 billion of the Trust&rsquo;s assets. If the Trust&rsquo;s assets exceed $2.5 billion prior to January 10, 2026, the Sponsor Fee charged on assets over $2.5 billion will be 0.20%. All investors will incur the same Sponsor Fee which is the weighted average of those fee rates. After January 10, 2026, the Sponsor Fee will be 0.20%. <em>Brokerage fees and commissions may apply. Please check with your broker.</em></strong></p>
<h2 id="what-is-bitcoin" class="jump-link-nav anchored-block" data-jumplink-title="What is Bitcoin?">What is Bitcoin?</h2>
<p>Bitcoin acts like a new form of digital money, or more specifically, as a &lsquo;potential store of value&rsquo; due to its scarcity and utilization by millions of individuals worldwide. For those familiar with traditional finance, bitcoin can be thought of as having characteristics of both a commodity and a currency. Bitcoin is likened by some to &ldquo;digital gold,&rdquo; since its quantity is limited, with only 21 million ever to be created<sup>1</sup>, making it finite and potentially more valuable over time. Some people buy it hoping its value will go up, similar to how people invest in gold or silver. But unlike gold, you can't touch bitcoin because it only exists on the internet. It's stored in a special way using a technology called 'blockchain'.</p>
<p>Bitcoin is the first and most well-known cryptocurrency and was created in 2008 after the financial crisis by an unknown person or group using the pseudonym Satoshi Nakamoto. The original aim? To make a type of money that people could send directly to each other over the internet, without having to go through a bank or any other third party.</p>
<h2 id="what-is-a-blockchain" class="anchored-block">What is a Blockchain?</h2>
<p>A blockchain is a digital ledger recording transactions, maintained across several computers linked in a peer-to-peer network. Each 'block' in the chain contains a number of transactions, and when a new transaction occurs, it's added to every participant's ledger. This decentralized and public verification process makes it nearly impossible to alter transaction records, enhancing security. Blockchain is the technology underpinning Bitcoin, allowing it to operate independently of a central authority, thus reducing the risk of fraud.</p>
<h2 id="why-invest-in-bitcoin" class="jump-link-nav anchored-block" data-jumplink-title="Why invest in Bitcoin?">Why Invest in Bitcoin?</h2>
<p><strong>1. Potential Store of Value</strong></p>
<ul class="content-list">
<li class="mt-2"><strong>Finite Supply:</strong> Bitcoin has a fixed limit of 21 million coins, in stark contrast to government-issued currencies, which can be printed in unlimited quantities. Governments often &lsquo;print&rsquo; more money to manage national debt or stimulate spending, but this can devalue the currency over time. Bitcoin's capped supply means it could become more valuable as it becomes more scarce, classifying it as a deflationary asset, which is less likely to be devalued by such government actions.</li>
<ul class="content-list">
<li class="mt-2"><strong>&lsquo;Halving&rsquo; Events:</strong> The Bitcoin network reduces bitcoin issuance by half every 210,000 blocks or approximately every four years, a process known as 'halving.' This gradual reduction continues until about the year 2140, when the last bitcoin is mined.</li>
</ul>
</ul>
<ul class="content-list">
<li class="mt-2"><strong>Possible Inflation-Hedge:</strong> As bitcoin is often likened to &ldquo;digital gold,&rdquo; it has the potential to appreciate in value and serve as a possible hedge against inflation and flight to quality.</li>
<ul class="content-list">
<li class="mt-2"><strong>Bitcoin has a predictable monetary policy, unlike government-issued fiat currencies.&nbsp;</strong></li>
</ul>
</ul>
<p><strong>2. Institutional Interest:</strong></p>
<p><strong>Mainstream access via regulated vehicles.</strong> Regulated exchange traded products and listed derivatives give institutions a familiar way to gain bitcoin exposure within established brokerage and custody workflows.</p>
<p><strong>Broader platform availability.</strong> Coverage across major wealth, custody and prime brokerage platforms has expanded, though firm specific policies, suitability screens and training requirements still apply.</p>
<p><strong>Maturing market structure.</strong> Depth and price discovery on regulated venues have improved. Institutions increasingly rely on institutional grade custody, compliance, audit and risk controls that align with existing operating standards.</p>
<p><strong><br />3. Growing Adoption:</strong></p>
<p><strong>Corporate and institutional holders.</strong> A number of public companies, asset managers and pensions hold bitcoin&mdash;directly or through regulated products&mdash;typically as modest, risk managed allocations.</p>
<p><strong>Global footprint.</strong> Multiple jurisdictions list spot or physically backed crypto ETPs, giving investors local market access and broadening participation beyond any single region.</p>
<p><strong>Advisor integration.</strong> Financial advisors are incorporating bitcoin exposure&mdash;where suitable&mdash;via standardized due diligence, portfolio guidelines and disciplined rebalancing, often alongside education and client communication frameworks.</p>
<h2 id="what-is-a-bitcoin-etf" class="jump-link-nav anchored-block" data-jumplink-title="What is a Bitcoin ETF?">What is a Bitcoin ETP?</h2>
<p>Exchange-traded products (ETPs) are investment funds that hold a collection of assets and can be bought and sold on exchanges like stocks. Like stocks, each ETP has a unique ticker used to identify it. A bitcoin ETP is a type of ETP that seeks to track the price of bitcoin. People can invest directly in Bitcoin by buying an ETP instead of buying bitcoin on a crypto exchange, which can be complex for some. It's designed for those who want to invest in bitcoin in a simpler and more familiar way, like buying stocks in their brokerage accounts or stock trading apps.</p>
<h2 id="are-bitcoin-etfs-regulated" class="anchored-block">Are Bitcoin ETPs Regulated?</h2>
<p>Yes, they are. Like other ETPs and mutual funds, financial agencies regulate bitcoin ETPs. This regulation has grown as more countries, including the U.S., Canada, and Europe, start recognizing bitcoin ETPs. These ETPs show the increasing acceptance of cryptocurrency in both traditional finance and digital asset markets.</p>
<h2>Spot Bitcoin ETP vs. Bitcoin Futures ETP?</h2>
<p>A spot ETP directly holds bitcoin, aiming to track its market price closely. On the other hand, a bitcoin futures ETP holds bitcoin futures contracts, a type of contract enabling speculation on future price movements without direct bitcoin ownership. Both product types are regulated financial products.</p>
<h2 id="bitcoin-etfs-in-iras-tax-benefits" class="anchored-block">Bitcoin ETPs in Individual Retirement Accounts (IRAs): Tax Benefits?</h2>
<p>Investing in a bitcoin ETP within an Individual Retirement Account (IRA) offers tax advantages compared to buying bitcoin directly on a cryptocurrency exchange. Your investments, including a bitcoin ETP, in a traditional IRA, grow tax-deferred. This means you only pay taxes on gains once you withdraw them, potentially leading to more substantial growth over time. A Roth IRA, on the other hand, allows for tax-free growth; contributions are made with after-tax money, but withdrawals, including profits from the bitcoin ETP, are tax-free in retirement. Both types of IRAs provide a more regulated and secure environment for your bitcoin investment while also being more tax efficient than typical crypto exchanges. Consequently, choosing a bitcoin ETP for your IRA investment strategy can be a more secure and tax-efficient way to include Bitcoin in your retirement planning.</p>
<p>Here's a more specific breakdown:</p>
<p><strong>1. Traditional IRA:</strong></p>
<ul class="content-list">
<li class="mt-2"><strong>Tax-Deferred Growth:</strong> Contributions to a traditional IRA may be tax-deductible depending on your income and other factors. The investments in the account, including a bitcoin ETP, grow tax-deferred. This means you don't pay taxes on the earnings (capital gains or dividends) as they accrue.</li>
<li class="mt-2"><strong>Taxes on Withdrawals:</strong> You pay taxes on the money you withdraw during retirement. The withdrawals are taxed as ordinary income at your tax rate.</li>
</ul>
<p><strong>2. Roth IRA:</strong></p>
<ul class="content-list">
<li class="mt-2"><strong>Tax-Free Growth:</strong> Contributions to a Roth IRA are made with after-tax dollars; they are not tax-deductible. However, the advantage is that the investments, including any gains from a bitcoin ETP, grow tax-free.</li>
<li class="mt-2"><strong>No Taxes on Qualified Withdrawals:</strong> Withdrawals in retirement are tax-free as long as they are qualified (generally, the account must have been open for at least five years, and the account holder must be 59&frac12; years or older).</li>
</ul>
<h2 id="investing-in-a-bitcoin-etf-what-to-consider" class="anchored-block">Investing in a Bitcoin ETP: What to Consider?</h2>
<p>Investing in a Bitcoin ETP involves weighing several factors, including risk tolerance, investment objectives, and cryptocurrency market acumen. While some investors may gravitate towards direct ownership of Bitcoin for complete control and decentralization, others might favor the accessibility and regulatory comfort that ETPs provide.</p>
<p>As Bitcoin has grown in popularity, investors are now presented with the opportunity to gain access to the asset class through more familiar options.&nbsp;<strong><a href="/link/343cf2f03fec405589c8319433a957f6.aspx" title="Investing in Bitcoin and Digital Assets">VanEck is proud to have played a key role in educating investors on the benefits of an ETP</a></strong>&nbsp;access vehicle for those wanting to participate in the Bitcoin investment story. Read our <a href="https://www.vaneck.com/us/en/blogs/digital-assets/vanecks-journey-with-bitcoin/" title="VanEck&rsquo;s Journey with Bitcoin"><strong>recent blog</strong></a> to learn more about VanEck&rsquo;s journey with Bitcoin.</p>
<p>To receive more <strong><a href="https://www.vaneck.com/us/en/insights/digital-assets/" title="Digital Assets Insights">Digital Assets</a></strong> insights, <strong><a href="https://www.vaneck.com/us/en/subscribe/" title="Subscription Center">sign up in our subscription center</a></strong>.</p>
]]></content:encoded>
</item><item rdf:about="https://www.vaneck.com/us/en/blogs/gold-investing/gold-in-2025-a-new-era-of-structural-strength-and-enduring-appeal/">
  <title>Gold in 2025: A New Era of Structural Strength and Enduring Appeal></title>
  <link>https://www.vaneck.com/us/en/blogs/gold-investing/gold-in-2025-a-new-era-of-structural-strength-and-enduring-appeal/</link>
  <description><![CDATA[Gold hit record highs in 2025, driven by central bank demand, de-dollarization, and investor return.]]></description>
  <dc:creator> </dc:creator>
  <dc:date>11/07/2025 06:30:00</dc:date>
<content:encoded><![CDATA[

<p><strong>Key Takeaways:</strong></p>
<ul class="content-list">
<li class="mt-2">Central banks are buying gold at record levels, signaling long-term diversification away from the USD.</li>
<li class="mt-2">Gold miners surged 120% YTD but remain undervalued, with strong margins and improved capital discipline.</li>
<li class="mt-2">Structural trends point to gold potentially reaching $5,000/oz by 2030 as demand and uncertainty grow.</li>
</ul>
<h2 id="history-of-gold" class="jump-link-nav anchored-block" data-jumplink-title="History of Gold">A Brief Historical Context</h2>
<p>Gold has always been more than a commodity. Across centuries, it has functioned as a universal store of value, a hedge against uncertainty, and a symbol of enduring wealth. Historically, gold&rsquo;s role in global portfolios has evolved alongside monetary regimes &mdash; from the classical gold standard to today&rsquo;s fiat-dominated system. Each transition, whether marked by inflationary pressures, financial crises, or geopolitical turbulence, has reaffirmed the metal&rsquo;s resilience.</p>
<p>Over the past decade, gold has transitioned from a cyclical safe haven to what many analysts now describe as a <i>structural necessity</i> in diversified portfolios. Its performance through multiple economic cycles &mdash; the global financial crisis, pandemic-era stimulus, and post-2020 inflationary pressures &mdash; has underscored its ability to preserve value when conventional assets falter.</p>
<h2>The Current Landscape: Record Highs and Renewed Demand</h2>
<h3>Gold and gold equities have dominated 2025 performance, outpacing all asset classes.</h3>
<p><img loading="lazy" class="img-responsive" alt="Gold and gold equities have dominated 2025 performance, outpacing all asset classes." src="https://www.vaneck.com/contentassets/a60932d15d5947e7a49b46556366e9e8/6379_gold-price-outlook_chart-1_2025-11_v1_blog.svg" /></p>
<p class="chart-disclosure">Source: Morningstar. Data as of October 9, 2025. Past performance is not indicative of future results. &ldquo;Gold Stocks&rdquo; represented by NYSE Arca Gold Miners Index. &ldquo;U.S. Stocks&rdquo; represented by the S&amp;P 500 Index. &ldquo;EM Stocks&rdquo; represented by MSCI Emerging Markets Index. &ldquo;REITs&rdquo; represented by FTSE NAREIT All Equity REITs Index. &ldquo;International (Int&rsquo;l) Stocks&rdquo; represented by MSCI AC World ex USA Index. &ldquo;Commodities&rdquo; represented by Bloomberg Commodity Index. &ldquo;U.S. TIPS&rdquo; represented by Bloomberg U.S. TIPS (1-3 Year) Index. &ldquo;U.S. Bonds&rdquo; represented by Bloomberg U.S. Aggregate Bond Index. &ldquo;International (Int&rsquo;l) Bonds&rdquo; represented by Bloomberg Global Aggregate ex U.S. Index. Index performance is not representative of strategy performance. It is not possible to invest directly in an index.</p>
<p>As of late 2025, gold trades above $4,000 per ounce, having gained over 50% year-to-date, making it a top-performing major asset class worldwide.</p>
<p>This rally, while remarkable, is not without historical precedent&mdash;similar surges occurred in the 1970s and 1980s during periods of currency debasement and heightened geopolitical stress.</p>
<p>Gold&rsquo;s recent ascent is fueled by the convergence of two dominant forces:</p>
<ol class="content-list">
<li>Persistent central bank accumulation, particularly from emerging markets, marking one of the strongest official buying streaks in modern history.</li>
<li>A resurgence of Western investor participation, after years of under-allocation to precious metals.</li>
</ol>
<p>Together, these sources of demand have created a structurally stronger market base than in previous bull cycles.</p>
<h2 id="price-of-gold-factors" class="jump-link-nav anchored-block" data-jumplink-title="Price of Gold Factors">What&rsquo;s Driving the Price of Gold</h2>
<p>Several key themes define the current gold narrative:</p>
<p><strong>1. Central Bank Buying and De-dollarization</strong></p>
<h3>Central banks have become consistent net buyers of gold, marking one of the strongest buying streaks in modern history.</h3>
<p><img loading="lazy" class="img-responsive" alt="Central banks have become consistent net buyers of gold, marking one of the strongest buying streaks in modern history." src="https://www.vaneck.com/contentassets/ca5d56ee876a42db87f45702e135442d/6379_gold-price-outlook_chart-2_2025-11_v1_blog.svg" /></p>
<p class="chart-disclosure">Source: World Gold Council. Data as of June 2025. For illustrative purposes only.</p>
<p>Since 2022, central banks have purchased over 1,000 tonnes of gold annually &mdash; roughly twice the decade-long average. Emerging economies &mdash; notably China, Turkey, Poland, and India &mdash; are leading this trend, signaling a long-term diversification away from the U.S. dollar. This behavior underscores a global realignment in currency reserves: as the dollar&rsquo;s share of official reserves declines, gold&rsquo;s share continues to rise as a neutral, non-sovereign store of value.</p>
<h3>Gold&rsquo;s rise parallels a gradual de-dollarization trend as central banks diversify reserves.</h3>
<p><img loading="lazy" class="img-responsive" alt="Gold&rsquo;s rise parallels a gradual de-dollarization trend as central banks diversify reserves." src="https://www.vaneck.com/contentassets/7786c46161a34c1baab2a418860c7e35/6379_gold-price-outlook_chart-3_2025-11_v1_blog.svg" /></p>
<p class="chart-disclosure">Source: Deutsche Bank. Data as of June 30, 2025. For illustrative purposes only. Past performance is no guarantee of future results.</p>
<p><strong>2. The Return of Western Investors</strong></p>
<p>After several years of ETF outflows, Western investment demand for gold has decisively returned in 2025, with inflows into gold ETFs strengthening month over month. Gold ETF holdings remain well below previous peaks, suggesting that investor engagement with the asset class has room to normalize relative to historical levels.</p>
<h3>After years of outflows, gold ETF holdings are rising again, signaling renewed Western demand.</h3>
<p><img loading="lazy" class="img-responsive" alt="After years of outflows, gold ETF holdings are rising again, signaling renewed Western demand." src="https://www.vaneck.com/contentassets/f761a4d3aade4702a0fa3b17ef5cb8b9/6379_gold-price-outlook_chart-4_2025-11_v1_blog.svg" /></p>
<p class="chart-disclosure">Source: World Gold Council. Data as of September 2025. For illustrative purposes only.</p>
<p><strong>3. Geopolitical and Macroeconomic Catalysts</strong></p>
<p>Geopolitical tension, rising global debt burdens, and policy uncertainty have contributed to a <i>&ldquo;catalyst-rich environment&rdquo;</i> for gold. Investors are responding not just to episodic crises, but to a longer-term structural erosion of confidence in fiat systems. As one strategist put it, we are witnessing <i>&ldquo;a shift in currency regime unlike anything in a century&rdquo;</i> &mdash; echoing the transition from the British pound to the U.S. dollar as the global reserve currency.</p>
<h2 id="gold-equities-and-miners" class="jump-link-nav anchored-block" data-jumplink-title="Gold Equities and Miners">Gold Equities and Miners: Undervalued Leverage</h2>
<p>Gold miners have staged a spectacular rebound in 2025, rising over 120% year-to-date, and yet remain fundamentally undervalued relative to the metal itself.</p>
<h3>Gold&rsquo;s strength keeps nearly all producers profitable.</h3>
<p><img loading="lazy" class="img-responsive" alt="Gold&rsquo;s strength keeps nearly all producers profitable." src="https://www.vaneck.com/contentassets/94331420944049d3b300dddf65e311fc/6379_gold-price-outlook_chart-5_2025-11_v1_blog.svg" /></p>
<p class="chart-disclosure">Source: World Gold Council. Data as of June 30, 2025. For illustrative purposes only.</p>
<p>With all-in sustaining costs averaging around $1,600/oz, nearly every producer remains profitable at current prices near $4,000/oz, resulting in record margins across the industry. Miners are displaying improved capital discipline and stronger balance sheets&mdash;a key differentiator from previous cycles when high prices often led to overspending.</p>
<h2>Portfolio Perspective: Gold as a Core Allocation</h2>
<p>Gold&rsquo;s low correlation to equities and bonds reinforces its role as a powerful portfolio diversifier. Historically, gold has generated positive returns during every major risk event of the past 25 years &mdash; from the Global Financial Crisis to the 2025 tariff wars.</p>
<p><i>Over the past 25 years, gold has delivered cumulative returns exceeding 1,300%, outpacing global bonds and rivaling major equity indices. The metal&rsquo;s resilience across cycles underscores its role as both a diversifier and long-term store of value.</i></p>
<h3>25-Year Cumulative Returns of Gold vs. Other Asset Classes</h3>
<p><img loading="lazy" class="img-responsive" alt="25-Year Cumulative Returns of Gold vs. Other Asset Classes" src="https://www.vaneck.com/contentassets/ba53d080c73c4a3aafafb2644f6ce6ca/6379_gold-price-outlook_chart-6_2025-11_v1_blog.svg" /></p>
<p class="chart-disclosure">Source: FactSet, VanEck. Data as of September 2025. Gold ($/oz) represented by LBMA PM Gold Price; U.S. Stocks represented by S&amp;P<sup>&reg;</sup>&nbsp;500 Index; Global Stocks represented by MSCI World Index; Global Bonds represented by Bloomberg Global Aggregate Index. Past performance is no guarantee of future results. Index performance is not representative of strategy performance. It is not possible to invest directly in an index.</p>
<p>While allocations vary by investor type, some investment professionals view a modest allocation to gold&mdash;often cited in the 5&ndash;10% range &mdash; as one potential way to enhance diversification by balancing bullion and gold equities for both defensive stability and growth exposure.</p>
<h2 id="gold-price-forecast" class="jump-link-nav anchored-block" data-jumplink-title="Gold Price Forecast">Gold Investing Outlook and Why Gold Could Go Higher in 2026</h2>
<p>Recent developments are evaluated for their potential impact on gold prices through 2025 and in the longer term, based on prevailing and emerging market conditions.</p>
<h2>Short-term Forecast: 2026 Gold Predictions</h2>
<p>Gold has the potential to trade even higher in 2026. In recent years, strong rallies, such as the one gold has recently been enjoying, have often been followed by periods of consolidation around an established, higher level, with the metal trading in a sideways pattern until a new catalyst emerges to drive prices even higher. 'Gold tends to outperform during later phases of inflationary cycles, when investors seek protection from social, geopolitical, and financial instability.</p>
<h3>Dividing the Bull Market into Two Halves</h3>
<p><img loading="lazy" class="img-responsive" alt="Dividing the Bull Market into Two Halves" src="https://www.vaneck.com/contentassets/ba3ec98e853c44a09f646140f6fc15fb/6379_gold-price-outlook_chart-7_2025-11_v1_blog.svg" /></p>
<p class="chart-disclosure">Source: Bloomberg, VanEck. &ldquo;Commodities&rdquo; represented by the Bloomberg Commodity Index. Past performance is no guarantee of future results. Any projections, forecasts and other forward-looking statements are not indicative of actual results, are for illustrative purposes only, are valid as of the date of this communication, and are subject to change without notice. Past performance is no guarantee of future results. Index performance is not representative of strategy performance. It is not possible to invest directly in an index.</p>

<p>Looking forward, gold is well positioned to continue its rally, especially as more Western investors continue their return to the market. The ongoing uncertainty surrounding tariffs, along with continued inflationary pressures and geopolitical risks, are likely to further bolster gold's appeal as a hedge against global market volatility. With this backdrop, gold prices could break through their inflation-adjusted highs and climb to new trading ranges above $4,000 per ounce in the near term.</p>
<p>However, <a href="/link/096d8d0acb0e4b4d8f7ad967cdf64a75.aspx" title="Q4 2025 Outlook: Escaping the Reckoning?"><strong>as our CEO recently noted</strong></a>, gold&rsquo;s long-term case stays strong as central bank demand, fiscal strain, and inflation risk continue to support the metal.</p>
<h2>Side Note: For Miners, It&rsquo;s About More Than Just the Gold Price</h2>
<p>A rising gold price environment has historically been accompanied by strong performance by gold equities. The sector outperformers must also demonstrate that they are fundamentally positioned and have a sound strategy that will translate higher gold prices into improved cash flow and higher returns, which will deliver growth. Organic growth does not come easy in the gold sector. Finding new gold deposits, or defining/expanding existing ones, is a difficult, lengthy, and capital-intensive process. Most senior and mid-tier companies struggle to simply replace their annual production. To significantly expand their depleting reserve and resource base, companies generally must acquire other companies or assets. All things equal, the more advanced a project is, the higher its valuation and the faster the company can deliver growth.</p>
<p>Gold stocks&rsquo; leverage to the gold price, combined with their attractive valuations relative to the broader equity markets, and their low correlation with most other asset classes, should lead to a re-rating of the sector as investors look for a safer place to rotate capital to and as they look to diversify their portfolios.</p>
<h2>5 Year Forecast: Gold Price Forecast for 2026-2030</h2>
<p>Gold was built for the shifting trends currently unfolding in the global economy: inflation, war, uncertainty and growing financial instability. 'As of late 2025, gold continues to outperform major equity benchmarks, including the S&amp;P 500, over multiple time horizons. In the past 12 months alone, gold has more than doubled the returns of the S&amp;P 500 Index.</p>
<p>As these trends continue to play out and reshape the global economic order in the coming years, gold has the potential to ascend toward $5,000 per ounce.</p>
<h2>Long-term Gold Forecast: 2030 &amp; Beyond</h2>
<p>Longer term, investors should expect gold to continue to act as a hedge against broader market volatility and uncertainty. Since 2008, gold has outperformed U.S. stocks and Treasuries during the most notable of market crises. This reflects gold&rsquo;s role as a hedge against financial risks and safe haven amid uncertainty. Some of VanEck&rsquo;s own experts suggest that the case for gold may grow stronger due to the U.S. dollar&rsquo;s reserve status potential decline, and emerging market central bank&rsquo;s gold holdings continue to rise.</p>
<h2>Gold&rsquo;s Renaissance</h2>
<p>Gold&rsquo;s 2025 performance is not a speculative anomaly &mdash; it&rsquo;s a reflection of shifting global fundamentals. In an era defined by currency realignment, fiscal excess, and geopolitical volatility, gold has reasserted its historic role as the ultimate store of value and a cornerstone of prudent portfolio construction.</p>
<p>For investors still asking, <i>&ldquo;Did I miss it?&rdquo;</i> &mdash; the answer remains clear:<br /><strong>The gold story is far from over.</strong></p>
<p>To receive more <strong><a href="https://www.vaneck.com/us/en/insights/gold-investing/" title="Gold Investing Insights">Gold Investing</a></strong> insights, <strong><a href="https://www.vaneck.com/us/en/subscribe/" title="Subscription Center">sign up in our subscription center</a></strong>.</p>
]]></content:encoded>
</item><item rdf:about="https://www.vaneck.com/us/en/blogs/digital-assets/inside-active-management-how-we-invest-in-the-crypto-economy/">
  <title>Inside Active Management: How We Invest in the Crypto Economy></title>
  <link>https://www.vaneck.com/us/en/blogs/digital-assets/inside-active-management-how-we-invest-in-the-crypto-economy/</link>
  <description><![CDATA[We examine how disciplined research and active judgment, not hype, guide investing decisions in the emerging onchain economy.]]></description>
  <dc:creator>Drew  Anderson</dc:creator>
  <dc:date>11/06/2025 06:30:00</dc:date>
<content:encoded><![CDATA[

<p><strong>Key Takeaways:</strong></p>
<ul class="content-list">
<li class="mt-2">Discipline turns volatility into opportunity by grounding crypto investing in research, not speculation.</li>
<li class="mt-2">Conviction builds when company fundamentals and onchain activity confirm the same trend.</li>
<li class="mt-2">Active positioning across market cycles helps capture innovation while protecting against excess.</li>
</ul>
<h2>Active Management Starts with Discipline</h2>
<p>In our previous <a href="/us/en/blogs/digital-assets/three-reasons-active-management-matters-in-crypto/" title="Three Reasons Active Management Matters in Crypto"><strong>post</strong></a>, we explored why active management matters in crypto, how adaptability helps investors navigate powerful cycles and shifting opportunities. But adaptability alone isn&rsquo;t enough. True active management comes from <em>discipline</em>: applying structured research, judgment, and balance to every decision.</p>
<p>In the onchain economy, this means blending traditional financial analysis with blockchain-specific insights, knowing how to assess, adjust, and remain composed when conditions change.</p>
<h2>1. Building the Investable Universe</h2>
<p>Every active strategy begins with defining the opportunity set. In digital assets, that means identifying publicly traded companies meaningfully exposed to Bitcoin and the broader adoption of digital assets. This wide universe includes companies across every GICS sector, predominantly spanning fintech, e-commerce, energy infrastructure, and AI computing.</p>
<p>From thousands of global equities, we narrow the universe through three filters:</p>
<ul class="content-list">
<li class="mt-2"><strong>Relevance:</strong> Companies must derive real revenue or strategic value from blockchain or digital assets.</li>
<li class="mt-2"><strong>Scale and Strength</strong>: We focus on listed equities with meaningful size, liquidity, and sound balance sheets.</li>
<li class="mt-2"><strong>Governance:</strong> Transparency and prudent financial management are essential; excessive leverage or weak oversight is screened out early.</li>
</ul>
<p>This disciplined foundation identifies companies built for endurance from data-center operators powering AI workloads to fintechs integrating blockchain payments.</p>
<p><img loading="lazy" class="img-responsive" alt="Building the Investable Universe" src="https://www.vaneck.com/contentassets/56bd03dad7ba4370a1efd86b27844cac/6369_node-active-management_chart-1_2025-11_v1_blog.svg" /></p>
<h2>2. Combining Fundamental and Onchain Research</h2>
<p>Traditional equity analysis still matters because cash flow growth, profitability, and competitive advantage form the backbone of long-term success. But active research goes further.</p>
<p>If research is like coaching a college football team, it&rsquo;s about evaluating the play calls, execution, and game management, not just looking at the final score. A single flashy win doesn&rsquo;t make a championship team, and one bad quarter doesn&rsquo;t define a season. The same applies to digital asset companies. We care about consistency, execution, and how they perform under pressure.</p>
<p>Onchain metrics like transaction volumes or network fees provide real-time visibility into blockchain activity. Macro indicators like global liquidity, dollar strength, or policy shifts help us understand the playing field. And fundamental research reveals whether a company has a sustainable game plan.</p>
<p>Just as a coach desires to build a team with a solid run game, disciplined defense, and a quarterback who protects the football, we favor companies with reliable revenue, manageable leverage, and leadership we can trust. Those are the teams that may not always dominate the highlight reel but are most poised to endure and come away victorious.</p>
<p>When fundamentals, onchain data, and macro context align, conviction builds. When they diverge, it&rsquo;s time to reassess the playbook.</p>
<h2>3. Positioning Across Market Cycles</h2>
<p>Crypto markets remain cyclical, with volatility often centered around Bitcoin&rsquo;s halving cycle. For active managers, the goal isn&rsquo;t to predict each turn but to position intelligently through them.</p>
<h3>Bitcoin Returns Across Expansion and Contraction Cycles Over the Last 10 Calendar Years (%)</h3>
<p><img loading="lazy" class="img-responsive" alt="Bitcoin Returns Across Expansion and Contraction Cycles Over the Last 10 Calendar Years (%)" src="https://www.vaneck.com/EPiServer/CMS/Content/contentassets/23ef8fc637834232952be9c658b185d0/6369_node-active-management_chart-2_2025-11_v1_blog.svg,,352039/Download?epieditmode=False" /></p>
<p class="chart-disclosure"><strong>Source: Morningstar, as of December 2024.</strong> Chart shows cumulative percentage returns for Bitcoin from January 2015 and does not reflect spot price levels. <strong>Expansion:</strong> periods beginning at a market trough and continuing until the next 10% decline. Expansions encompass recovery through the prior peak or a new all-time high. <strong>Contraction:</strong> periods beginning at a market peak and continuing through the subsequent trough that includes a decline of 10% or more. References to Bitcoin market cycles are based on historical data and are provided for illustrative purposes only. <strong>Past performance is no guarantee of future results. Please see important disclosures at the end of the presentation.</strong></p>

<p>Just as great coaches adjust the game plan depending on their opponent, active managers adapt exposure based on where we are in the market cycle.</p>
<ul class="content-list">
<li class="mt-2">In expansion phases, exposure tilts toward higher-beta areas&mdash;miners and exchanges that thrive on liquidity and optimism.</li>
<li class="mt-2">In downturns, companies with diversified revenue and durable balance sheets, such as semiconductor or infrastructure firms may get added exposure.</li>
</ul>
<p>It&rsquo;s about sticking to the game plan, protecting against turnovers, keeping it manageable on third down, and taking your shot when the opportunity arises. The process generally underweights leverage, avoiding companies or instruments reliant on borrowed exposure. That discipline helps reduce the impact of speculative excess that often defines crypto bull markets.</p>
<h2>4. Continuous Monitoring and Risk Management</h2>
<p>Markets, like seasons, shift quickly. Constant evaluation ensures the strategy stays disciplined even as conditions change.</p>
<p>Teams track earnings, governance, and onchain data alongside macro signals that influence sentiment. The goal is to spot subtle cracks before they widen, such as rising leverage, slowing network activity, or liquidity stress.</p>
<p>Sentiment indicators such as futures funding rates and Relative Unrealized Profit help identify overheated or oversold markets, offering cues to adjust before volatility spikes. When red flags emerge, exposure can be trimmed or exited, an option passive strategies lack. Meanwhile, new<strong> entrants are continuously assessed as innovation reshapes the opportunity set.</strong></p>
<p><img loading="lazy" class="img-responsive" alt="Continuous Monitoring and Risk Management" src="https://www.vaneck.com/contentassets/728b854a53ab4182bc7e93e59259f43c/6369_node-active-management_chart-3_2025-11_v2_blog.svg" /></p>
<h2>5. From Research to Real-World Impact</h2>
<p>The payoff of this process is clarity. Decisions rest on measurable fundamentals and data-backed conviction, not momentum or hype. Active management provides a framework to participate in one of the most dynamic corners of global markets while maintaining a balance between opportunity and risk.</p>
<p>Much like a team that plays a complete game, successful active management means not being one-dimensional or careless with the football. It&rsquo;s about preparation, adaptability, and execution across every phase of the market, putting investors in a position to win over the long run.</p>
<h2>Lasting Advantage Comes from Discipline</h2>
<p>Active management in the onchain economy is ultimately about discipline: integrating research, real-time data, and risk awareness to navigate an evolving market.</p>
<p>For investors seeking a structured, research-driven approach, <strong><a href="/link/54b98110e4034531bd63d27f035b8bd9.aspx" title="NODE - VanEck Onchain Economy ETF - Overview">VanEck&rsquo;s Onchain Economy ETF (NODE)</a></strong> applies active management to companies leading the digital asset transition.</p>

<p>To receive more <strong><a href="https://www.vaneck.com/us/en/insights/digital-assets/" title="Digital Assets Insights">Digital Assets</a></strong> insights, <strong><a href="https://www.vaneck.com/us/en/subscribe/" title="Subscription Center">sign up in our subscription center</a></strong>.</p>
]]></content:encoded>
</item><item rdf:about="https://www.vaneck.com/us/en/blogs/digital-assets/matthew-sigel-vaneck-crypto-monthly-recap-for-october-2025/">
  <title>VanEck Crypto Monthly Recap for October 2025></title>
  <link>https://www.vaneck.com/us/en/blogs/digital-assets/matthew-sigel-vaneck-crypto-monthly-recap-for-october-2025/</link>
  <description><![CDATA[October&rsquo;s crypto rally unraveled after a Trump tariff tweet sparked liquidations, froze Binance&rsquo;s trading engine, and left Ethereum L2s weak with Zcash leading a quiet privacy revival.]]></description>
  <dc:creator>Matthew  Sigel</dc:creator>
  <dc:date>11/05/2025 06:30:00</dc:date>
<content:encoded><![CDATA[

<p><strong>Please note that VanEck may have a position(s) in the digital asset(s) described below.</strong></p>
<p><strong>Three key takeaways for October:</strong></p>
<ul class="content-list">
<li class="mt-2"><strong>Tariff shock ends &ldquo;Uptober&rdquo;:</strong> Bitcoin&rsquo;s rally reversed abruptly after a Trump tariff tweet triggered a swift liquidation wave that erased weeks of gains.</li>
<li class="mt-2"><strong>Binance breaks under pressure:</strong> Oracle errors and a trading engine freeze at crypto&rsquo;s largest exchange magnified losses, underscoring systemic fragility in market infrastructure.</li>
<li class="mt-2"><strong>Privacy and innovation advance:</strong> Digital-asset treasuries kept accumulating through the drawdown while experimenting with new financing tools, and Zcash led a renewed push toward zero-knowledge privacy tech.</li>
</ul>
<h3 id="price-returns" class="jump-link-nav anchored-block" data-jumplink-title="Price Returns">Price Returns</h3>
<div class="wrapped-div">
<table style="width: 100%;">
<tbody>
<tr class="tbl-data">
<td class="tbl-header last text-left">&nbsp;</td>
<td class="tbl-header last text-right">October (%)</td>
<td class="tbl-header last text-right">YTD (%)</td>
</tr>
<tr class="tbl-data">
<td class="data-td data last text-left">MarketVector Global Digital Assets Equity Index</td>
<td class="data-td data last text-right">11.13</td>
<td class="data-td data last text-right">68.2</td>
</tr>
<tr class="tbl-data">
<td class="data-td data last text-left">Nasdaq Index</td>
<td class="data-td data last text-right">4.7</td>
<td class="data-td data last text-right">22.86</td>
</tr>
<tr class="tbl-data">
<td class="data-td data last text-left">S&amp;P 500 Index</td>
<td class="data-td data last text-right">2.27</td>
<td class="data-td data last text-right">16.3</td>
</tr>
<tr class="tbl-data">
<td class="data-td data last text-left">Coinbase</td>
<td class="data-td data last text-right">1.86</td>
<td class="data-td data last text-right">38.45</td>
</tr>
<tr class="tbl-data">
<td class="data-td data last text-left">Bitcoin</td>
<td class="data-td data last text-right">-3.88</td>
<td class="data-td data last text-right">16.98</td>
</tr>
<tr class="tbl-data">
<td class="data-td data last text-left">Ethereum</td>
<td class="data-td data last text-right">-6.31</td>
<td class="data-td data last text-right">15.7</td>
</tr>
<tr class="tbl-data">
<td class="data-td data last text-left">MarketVector Infrastructure Application Leaders Index</td>
<td class="data-td data last text-right">-10.88</td>
<td class="data-td data last text-right">-45.88</td>
</tr>
<tr class="tbl-data">
<td class="data-td data last text-left">MarketVector Smart Contract Leaders Index</td>
<td class="data-td data last text-right">-11.51</td>
<td class="data-td data last text-right">-11.56</td>
</tr>
<tr class="tbl-data">
<td class="data-td data last text-left">MarketVector Meme Coin Index</td>
<td class="data-td data last text-right">-18.24</td>
<td class="data-td data last text-right">-57.88</td>
</tr>
<tr class="tbl-data">
<td class="data-td data last text-left">MarketVector Decentralized Finance Leaders Index</td>
<td class="data-td data last text-right">-21.84</td>
<td class="data-td data last text-right">-54.69</td>
</tr>
</tbody>
</table>
</div>
<br />
<p class="chart-disclosure">Source: Bloomberg as of 10/31/2025. <strong>Index performance is not representative of fund performance. It is not possible to invest directly in an index. Past performance is no guarantee of future results. Not intended as a recommendation to buy or sell any securities named herein.</strong></p>
<h2>&ldquo;Uptober&rdquo; Averted</h2>
<p>October began like a victory lap for Bitcoin holders. The halving trade had aged well, volatility was subdued, and institutional inflows through ETPs and DATs were steady. On October 6, Bitcoin notched a new all-time high near <strong>$126,000</strong>, its third consecutive monthly close in six figures. Traders dubbed it &ldquo;Uptober.&rdquo;</p>
<p>Then came the tweet.</p>
<p>At 10:41 a.m. EST on October 10, former President Trump posted: &ldquo;As President, I will impose <strong>100%</strong> tariffs on all Chinese goods. America First. China pays.&rdquo;</p>
<p>Within minutes, the macro dominoes began to fall: the dollar surged, risk assets sold off, and Bitcoin, the most liquid expression of speculative risk, turned violently south. Leveraged longs were vaporized. Roughly <strong>$19B</strong> in crypto futures positions disappeared in less than 12 hours as prices breached six figures across major venues. On some smaller exchanges, cascading margin calls pushed BTC near <strong>$100K</strong>.</p>
<h3>Volatility Spikes Amid Tariff Tempest</h3>
<p><img loading="lazy" class="img-responsive w-100" alt="Volatility Spikes Amid Tariff Tempest" src="https://www.vaneck.com/contentassets/2a744af4f0a64cd3bca526e9d35ccfc6/6368_crypto-monthly-oct_chart-1_2025-11_v1_blog.svg" /></p>
<p class="chart-disclosure">Source: Glassnode as of 10/27/2025.<strong> Index performance is not representative of fund performance. It is not possible to invest directly in an index. Past performance is no guarantee of future results. Not intended as a recommendation to buy or sell any securities named herein. MarketVector Smart Contract Leaders Index (MVSCLE) is designed to track the performance of the largest and most liquid smart contract assets, and is an investable subset of MarketVector Smart Contract Index.</strong></p>
<h3>BTC Futures Open Interest Drops -19% in 5 Hours</h3>
<p><img loading="lazy" class="img-responsive w-100" alt="BTC Futures Open Interest Drops -19% in 5 Hours" src="https://www.vaneck.com/contentassets/2a744af4f0a64cd3bca526e9d35ccfc6/6368_crypto-monthly-oct_chart-2_2025-11_v1_blog.svg" /></p>
<p class="chart-disclosure">Source: Glassnode as of 10/27/2025.<strong> Past performance is no guarantee of future results. Not intended as a recommendation to buy or sell any securities named herein.</strong></p>
<p>We&rsquo;ve seen a lot of market unwinds in this space, but this one was particularly cinematic. On October 9, perpetual funding rates were still near <strong>40%</strong> annualized, and social sentiment screamed, <strong>&ldquo;$150K next.&rdquo;</strong> By the morning of the 11th, traders were instead watching liquidation bots chew through billions.</p>
<p>The aftermath was textbook. Bitcoin stabilized near <strong>$103K</strong>, then drifted to a <strong>$115K</strong> close, down roughly <strong>9%</strong> on the month before rallying somewhat to end October <strong>-4%.</strong> ETH followed a similar path, closing around <strong>$3,700</strong> on October 11th and ending October near its lows, down <strong>6%.</strong></p>
<h2>Binance Exchange Wobbles During the Crypto Panic of October 10</h2>
<p>Every cycle produces one day when the infrastructure gets stress tested. October 10 was that day for Binance.</p>
<p>The exchange handled <strong>30&ndash;40%</strong> of global crypto spot and futures volume going into the selloff. During the worst of the volatility, multiple assets on Binance depegged from their redemption value &mdash; including the USDE stablecoin (-<strong>35%</strong>) and wBETH, a wrapped version of staked ETH that momentarily traded down <strong>90%.</strong></p>
<p>The catalyst: a <strong>$90M</strong> market sell order that ripped through Binance&rsquo;s internal order books, which also feed its own oracle pricing. With no external reference points, the price collapse became self-reinforcing. That&rsquo;s the crypto equivalent of a clearing house marking collateral to fire-sale prices and calling in more margin just as liquidity vanishes.</p>
<p>Then came the real problem: <i>latency.</i></p>
<p>Binance&rsquo;s trading engine seized under the load. For roughly 100 minutes, thousands of traders reported &ldquo;order rejected&rdquo; errors while watching their collateral evaporate. Some couldn&rsquo;t sell; others couldn&rsquo;t buy the dip. Liquidity providers, normally the shock absorbers, were frozen out. The result was the kind of price dislocation that only happens when human and machine panic meet.</p>
<p>In the chaos, Binance triggered its auto-deleveraging (ADL) system, a last-ditch safety valve that forcibly closes profitable positions to cover losing ones. In traditional markets, clearing members absorb defaults; in crypto, that role doesn&rsquo;t exist. ADL is an algorithmic clearing member of last resort.</p>
<p>In traditional finance, exchanges like the CME and CBOE rely on clearing members: firms that stand between traders and the exchange, absorbing losses if a client goes bust. They&rsquo;re effectively risk sponges that prevent the kind of forced winner-liquidations we saw on Binance. In crypto, that layer doesn&rsquo;t exist. Everything is peer-to-peer margining, automated and unforgiving. Until decentralized markets or prime brokers evolve to take on that role, episodes like October 10 will keep exposing how thin the protection layer really is.</p>
<p>The twist this time: Binance still had more than <strong>$1B</strong> in its reserve fund. That prompted a heated debate among traders: why invoke ADL if the fund wasn&rsquo;t exhausted? One answer might be that the ADL logic runs on price triggers, not judgment. It&rsquo;s a system designed for survival, not fairness.</p>
<p>We doubt the event was malicious; it was just a perfect storm of incentive misalignment, overconfidence, and self-referential pricing. Still, reputational scars matter. Whether Binance can rebuild trust with its heaviest users, particularly market makers, will be a key metric for November.</p>
<p><strong>What we&rsquo;re watching next:</strong></p>
<ul class="content-list">
<li class="mt-2">Whether Binance diversifies its oracle sources</li>
<li class="mt-2">Engine uptime under load</li>
<li class="mt-2">Potential migration of professional traders toward exchanges that stayed online: Hyperliquid, CME, or even decentralized perps</li>
</ul>
<h2>Winners and Losers</h2>
<p>While the market convulsed, one ecosystem actually printed gains: BNB Chain.</p>
<p>BNB rose <strong>+13%</strong> in October, propelled by a new decentralized exchange (DEX) called Aster, which briefly topped all decentralized derivatives platforms by volume. Incentive-driven trading (&ldquo;<i>points farming&rdquo; </i>by another name) drew users like moths to flame. At one point, Aster processed more notional volume than dYdX and Hyperliquid combined.</p>
<p>But as always, the details matter. DefiLlama (a credible data aggregator) later excluded Aster&rsquo;s volumes from its DEX rankings, citing probable wash trading. We&rsquo;re not ready to call that verdict final, but it reinforces a theme: liquidity in crypto often lives where incentives flow, not necessarily where organic demand resides.</p>
<p>BNB&rsquo;s fundamentals did improve, though. Chain revenue jumped <strong>+235%</strong> month-over-month, placing it second behind Hyperliquid&rsquo;s <strong>$3M</strong>/day run rate. Meanwhile, Ethereum reclaimed its title as the top DEX chain by daily volume <strong>($4.5B</strong>, edging Solana by just <strong>1%</strong>).</p>
<p>The losers were concentrated in Ethereum Layer 2 tokens &mdash; governance coins without gas utility. LINEA fell <strong>43%,</strong> adding to a brutal stretch for new L2 entrants. The structural problem is clear: users pay ETH, not LINEA, for gas. Unless these tokens capture a share of network fees, they remain governance placeholders. Ex-Mantle <strong>(+187%</strong> YoY), the group&rsquo;s average one-year return sits around -<strong>60%</strong>, compared with <strong>+65%</strong> for BTC and <strong>+62%</strong> for ETH.</p>
<p>The divergence tells a story: real economic utility&mdash;blockspace, stablecoin velocity, fee throughput&mdash;is what holds up during volatility. Narrative-only tokens don&rsquo;t.</p>
<div class="wrapped-div">
<table style="width: 100%;">
<tbody>
<tr class="tbl-data">
<td class="tbl-header last text-left" colspan="6">Top 5 Blockchains by Average Daily Revenue</td>
</tr>
<tr class="tbl-data">
<td class="data-td last text-left">Top Chains This Month</td>
<td class="data-td data last text-right">HYPE</td>
<td class="data-td data last text-right">BNB</td>
<td class="data-td data last text-right">ETH</td>
<td class="data-td data last text-right">TRX</td>
<td class="data-td data last text-right">SOL</td>
</tr>
<tr class="tbl-data">
<td class="data-td last text-left pl-3">Avg Daily Revenue (%)</td>
<td class="data-td data last text-right">2,998,109</td>
<td class="data-td data last text-right">2,482,632</td>
<td class="data-td data last text-right">1,413,767</td>
<td class="data-td data last text-right">1,273,748</td>
<td class="data-td data last text-right">885,535</td>
</tr>
<tr class="tbl-data">
<td class="data-td last text-left">3 Months Ago</td>
<td class="data-td data last text-right">HYPE</td>
<td class="data-td data last text-right">TRX</td>
<td class="data-td data last text-right">ETH</td>
<td class="data-td data last text-right">SOL</td>
<td class="data-td data last text-right">BTC</td>
</tr>
<tr class="tbl-data">
<td class="data-td last text-left pl-3">Avg Daily Revenue (%)</td>
<td class="data-td data last text-right">3,053,961</td>
<td class="data-td data last text-right">1,969,500</td>
<td class="data-td data last text-right">1,622,759</td>
<td class="data-td data last text-right">1,373,473</td>
<td class="data-td data last text-right">533,495</td>
</tr>
<tr class="tbl-data">
<td class="data-td last text-left">6 Months Ago</td>
<td class="data-td data last text-right">TRX</td>
<td class="data-td data last text-right">HYPE</td>
<td class="data-td data last text-right">SOL</td>
<td class="data-td data last text-right">ETH</td>
<td class="data-td data last text-right">BTC</td>
</tr>
<tr class="tbl-data">
<td class="data-td last text-left pl-3">Avg Daily Revenue (%)</td>
<td class="data-td data last text-right">1,717,101</td>
<td class="data-td data last text-right">1,461,224</td>
<td class="data-td data last text-right">1,232,219</td>
<td class="data-td data last text-right">706,354</td>
<td class="data-td data last text-right">534,226</td>
</tr>
<tr class="tbl-data">
<td class="data-td last text-left">9 Months Ago</td>
<td class="data-td data last text-right">SOL</td>
<td class="data-td data last text-right">ETH</td>
<td class="data-td data last text-right">HYPE</td>
<td class="data-td data last text-right">TRX</td>
<td class="data-td data last text-right">BTC</td>
</tr>
<tr class="tbl-data">
<td class="data-td last text-left pl-3">Avg Daily Revenue (%)</td>
<td class="data-td data last text-right">8,184,682</td>
<td class="data-td data last text-right">4,947,904</td>
<td class="data-td data last text-right">1,974,547</td>
<td class="data-td data last text-right">1,820,250</td>
<td class="data-td data last text-right">663,422</td>
</tr>
<tr class="tbl-data">
<td class="data-td last text-left">12 Months Ago</td>
<td class="data-td data last text-right">ETH</td>
<td class="data-td data last text-right">SOL</td>
<td class="data-td data last text-right">TRX</td>
<td class="data-td data last text-right">BTC</td>
<td class="data-td data last text-right">BNB</td>
</tr>
<tr class="tbl-data">
<td class="data-td last text-left pl-3">Avg Daily Revenue (%)</td>
<td class="data-td data last text-right">4,597,496</td>
<td class="data-td data last text-right">2,311,049</td>
<td class="data-td data last text-right">1,583,214</td>
<td class="data-td data last text-right">1,420,527</td>
<td class="data-td data last text-right">350,757</td>
</tr>
</tbody>
</table>
</div>
<br />
<p class="chart-disclosure">Source: Artemis XYZ as of 10/28/2025.<strong> Past performance is no guarantee of future results. Not intended as a recommendation to buy or sell any securities named herein.</strong></p>
<h2 id="dat-update" class="jump-link-nav anchored-block" data-jumplink-title="DAT Update">Digital Asset Treasuries (DAT) Updates</h2>
<p>Even as markets convulsed, the digital-asset treasuries (DATs) kept stacking.</p>
<p>October ranked among the year&rsquo;s strongest accumulation months for ETH and SOL. Yet, despite that buying, DAT market values still slipped as token prices corrected.</p>
<p>DATs added roughly <strong>+4bps</strong> of BTC supply, <strong>+59bps</strong> of ETH, and <strong>+39bps</strong> of SOL. The contrast was striking: the marginal buyer remained the public treasury, not the hedge fund.</p>
<p>Yet valuations compressed. BTC&rsquo;s 30-day volatility jumped from <strong>24%</strong> to <strong>42%,</strong> but DAT share prices lagged, reflecting fatigue among investors still more enchanted by AI equities than crypto beta. We can&rsquo;t blame them: most AI names kept printing higher highs while pure-play miners and treasuries went sideways.</p>
<p>What impressed us this month was the financing innovation inside the DAT cohort:</p>
<p>DFDV issued tradable warrants (0.1 per share) that give holders upside exposure, a creative twist on traditional equity-linked financing.</p>
<p>BNMR raised capital via a mix of stock and warrants, issuing roughly <strong>5.2 million</strong> shares paired with <strong>10.4 million</strong> warrants to expand its crypto holdings ahead of year-end.</p>
<p>In Japan, Metaplanet secured a <strong>$500M</strong> debt facility specifically to fund a share repurchase program, a rare signal of confidence amid sector volatility.</p>
<p>The headline move came from Strategy (formerly MicroStrategy). After years of lobbying rating agencies to consider Bitcoin collateral, S&amp;P finally assigned Strategy a B- rating on its securities. That&rsquo;s still speculative-grade, and the analysis gave MSTR&rsquo;s Bitcoin holdings (!) zero credit, but it's still symbolically massive.</p>
<p>Over time, these credit ratings could open a new buyer base: yield-hungry credit funds that might soon be exposed to MSTR converts or preferreds. For years, DATs were considered equity curiosities. This rating starts to move them into the broader capital-market conversation.</p>
<h3>BTC DAT Holding Growth Slows in October</h3>
<p><img loading="lazy" class="img-responsive w-100" alt="BTC DAT Holding Growth Slows in October" src="https://www.vaneck.com/contentassets/2a744af4f0a64cd3bca526e9d35ccfc6/6368_crypto-monthly-oct_chart-3_2025-11_v1_blog.svg" /></p>
<p class="chart-disclosure">Source: The Block as of 10/27/2025.<strong> Past performance is no guarantee of future results. Not intended as a recommendation to buy or sell any securities named herein.</strong></p>
<h2>Privacy Strikes Back: The Zcash (ZEC) Revival</h2>
<p>Amid the chaos, a quieter revolution brewed in privacy. Zcash (ZEC), the oldest active zero-knowledge chain, rallied <strong>+162%</strong> in October.</p>
<p>Three things happened almost simultaneously:</p>
<ol class="content-list">
<li class="mt-2">Grayscale reopened its Zcash Trust to accredited investors for the first time in years.</li>
<li class="mt-2">A Solana bridge went live, powered by NEAR&rsquo;s OmniBridge, allowing direct swaps between ZEC and SPL tokens with no centralized intermediary required.</li>
<li class="mt-2">A protocol upgrade (&ldquo;Orchard&rdquo;) accelerated the migration to shielded transactions, which now represent <strong>~29%</strong> of total circulating ZEC, up <strong>456%</strong> since 2022.</li>
</ol>
<p>The privacy pendulum swings every few years in crypto. In 2016&ndash;2018, privacy coins were synonymous with regulatory risk. By 2021, they were functionally sidelined. But as blockchain surveillance has intensified, especially through Chainalysis-like forensics, the appetite for credible privacy options appears to be returning.</p>
<p>This isn&rsquo;t about hiding illicit activity; it&rsquo;s about reintroducing financial discretion into systems that have grown too transparent for comfort. When every transaction is public, even legitimate actors hesitate to move size.</p>
<p>Zcash&rsquo;s revival is also symbolic. It&rsquo;s proof that zero-knowledge proofs aren&rsquo;t just for scaling; they&rsquo;re also for preserving autonomy. The integrations with NEAR and Brave Wallet broaden ZEC&rsquo;s potential use cases beyond ideological circles.</p>
<p>We suspect the next regulatory wave - the one that tries to codify digital-asset privacy rather than ban it - could make ZEC and similar assets relevant again.</p>
<h3>ZEC Hits Highs in Valuation and Liquidity Amid Institutional Investment This October</h3>
<p><img loading="lazy" class="img-responsive w-100" alt="ZEC Hits Highs in Valuation and Liquidity Amid Institutional Investment This October" src="https://www.vaneck.com/contentassets/2a744af4f0a64cd3bca526e9d35ccfc6/6368_crypto-monthly-oct_chart-4_2025-11_v1_blog.svg" /></p>
<p class="chart-disclosure">Source: Artemis as of 10/30/25.<strong> Past performance is no guarantee of future results. Not intended as a recommendation to buy or sell any securities named herein.</strong></p>
<h3>Shielded ZEC Hit 29% of Circulating Supply in Q4 2025</h3>
<p><img loading="lazy" class="img-responsive w-100" alt="Shielded ZEC Hit 29% of Circulating Supply in Q4 2025" src="https://www.vaneck.com/contentassets/2a744af4f0a64cd3bca526e9d35ccfc6/6368_crypto-monthly-oct_chart-5_2025-11_v1_blog.svg" /></p>
<p class="chart-disclosure">Source: TheBlock as of 10/30/25.<strong> Past performance is no guarantee of future results. Not intended as a recommendation to buy or sell any securities named herein.</strong></p>
<p>To receive more <strong><a href="https://www.vaneck.com/us/en/insights/digital-assets/" title="Digital Assets Insights">Digital Assets</a></strong> insights, <strong><a href="https://www.vaneck.com/us/en/subscribe/" title="Subscription Center">sign up in our subscription center</a></strong>.</p>
]]></content:encoded>
</item><item rdf:about="https://www.vaneck.com/us/en/blogs/municipal-bonds/what-happens-to-munis-if-fema-ends/">
  <title>What Happens to Munis If FEMA Ends?></title>
  <link>https://www.vaneck.com/us/en/blogs/municipal-bonds/what-happens-to-munis-if-fema-ends/</link>
  <description><![CDATA[FEMA's potential phaseout could reshape municipal bond risk, pricing, and resilience, spotlighting issuer strength over federal backstops.]]></description>
  <dc:creator>Michael Cohick</dc:creator>
  <dc:date>11/05/2025 06:30:00</dc:date>
<content:encoded><![CDATA[

<p><strong>Key Takeaways:</strong></p>
<ul class="content-list">
<li class="mt-2">FEMA's exit could raise muni borrowing costs in disaster-prone areas.</li>
<li class="mt-2">Credit spreads may reflect local risk more than ever before.</li>
<li class="mt-2">Fiscal resilience becomes key in muni bond evaluations.</li>
</ul>
<p>The municipal bond market has entered a period of renewed attention from investors seeking tax-exempt income and relative stability amid uncertain interest-rate and policy environments. Yields remain elevated compared with their long-term averages, credit fundamentals are broadly healthy, and demand for high-quality tax-advantaged income has returned. Yet beneath those favorable conditions lies a policy risk that could reshape the market&rsquo;s long-standing assumptions about safety and support.</p>
<p>As political debate intensifies around the size and role of the federal government, proposals have surfaced to scale back or even eliminate the Federal Emergency Management Agency (FEMA). While mostly hypothetical, the idea raises a critical question for municipal investors: what happens when the most reliable source of post-disaster fiscal relief disappears?</p>
<p>Understanding that answer is essential not just for assessing headline risk, but for positioning within the municipal universe. If FEMA&rsquo;s role were reduced or removed, it could alter credit spreads, borrowing costs, and the risk dynamics across regions and sectors, ultimately reshaping how investors perceive the value of tax-exempt income.</p>
<h2 id="fema-and-municipal-credit" class="jump-link-nav anchored-block" data-jumplink-title="FEMA &amp; Municipal Credit">The Federal Footprint Beneath Municipal Credit</h2>
<p>For decades, FEMA has served as an invisible stabilizer for municipal credit. After natural disasters, from hurricanes and floods to wildfires and earthquakes, FEMA grants and reimbursements provide billions in liquidity to states and localities. Those funds help repair infrastructure, replace public assets, and offset emergency spending that would otherwise drain local budgets.</p>
<h3>FEMA Payments to Local Goverments 1998-2004 (Cumulative)</h3>
<p><img loading="lazy" class="img-responsive" alt="FEMA Payments to Local Goverments 1998-2004 (Cumulative)" src="https://www.vaneck.com/contentassets/05588d0930a74550af14f5e76367ac67/6367_muni-fema-blog_chart-1_2025-10_v1_blog.svg" /></p>
<p class="chart-disclosure"><strong>Public Assistance (PA)</strong> means grant funding for state, tribal, and local governments, and certain non-profits to respond to and recover from major disasters. It helps pay for costs like debris removal, emergency protective measures, and repairing public infrastructure such as roads, schools, and utilities. Unlike Individual Assistance, which is for individuals, Public Assistance provides money for communities to rebuild public facilities and services.</p>
<p>That federal presence has a measurable effect on credit. Rating agencies routinely cite FEMA&rsquo;s role in supporting post-disaster recovery as a mitigating factor against downgrades. Research from the Brookings Institution has shown that municipal bonds tied to uninsured or single-project revenues underperform sharply when federal aid is delayed or limited. The expectation of FEMA assistance effectively lowers risk premiums for a broad swath of issuers; an implicit subsidy embedded in municipal borrowing costs.</p>
<p>In other words, FEMA doesn&rsquo;t just rebuild after disasters; it underpins how the market prices risk before they happen.</p>
<h2>A World Without the FEMA Disaster Relief Fund</h2>
<p>If FEMA were eliminated or its funding drastically curtailed, that implicit safety net would vanish. The consequences would not be uniform, but they would be significant.</p>
<p>Issuers in high-exposure regions, coastal communities facing hurricanes, western states battling wildfires, or river-valley towns vulnerable to floods, would immediately confront higher perceived risk. Without federal reimbursements to cover emergency costs, these municipalities would rely more heavily on reserves, local borrowing, or higher taxes to fund recovery. That strain would weaken balance sheets and could lead to rating pressure.</p>
<p>The result would likely be a repricing of credit risk across geographies. Spreads for issuers in disaster-prone regions could widen, pushing borrowing costs higher even for well-managed governments. A Florida county or a California utility might need to offer yields 50 to 100 basis points above similarly rated inland issuers simply to attract investors. Over time, that dispersion could reshape the muni yield curve, rewarding fiscal strength and geographic stability over sheer credit size or legacy reputation.</p>
<p>For investors, the change would make credit quality and geography more decisive drivers of returns than they&rsquo;ve been in years.</p>
<h2>Fiscal Resilience Becomes the New Differentiator</h2>
<p>Without a federal backstop, state and local governments would need to rely more on their own resources. Many are entering this period from a position of strength. Rainy-day funds reached record levels in 2024, bolstered by pandemic-era aid and robust tax receipts. Those reserves could provide an important buffer in a world with less federal support.</p>
<p>Still, not all issuers are equally equipped. Smaller municipalities, special-purpose districts, and entities dependent on narrow revenue streams could struggle to absorb disaster-related losses. For these issuers, the absence of FEMA aid could be existential, not just expensive.</p>
<p>Over time, that might encourage more conservative fiscal behavior, larger reserves, higher self-insurance levels, and more explicit disclosure of disaster exposure. Some issuers could explore innovative financing tools such as catastrophe bonds or parametric insurance, which provide immediate payouts based on event triggers rather than lengthy damage assessments. While such structures add cost, they could evolve into a substitute for federal relief in maintaining market access.</p>
<p>This shift wouldn&rsquo;t necessarily weaken the municipal market overall. Instead, it would deepen the distinction between fiscally resilient issuers and those reliant on outside aid, a differentiation the market has been slow to recognize but one that may soon define it.</p>
<h3>Days Each State Could Run on Only Rainy Day Funds</h3>
<p><img loading="lazy" class="img-responsive" alt="Days Each State Could Run on Only Rainy Day Funds" src="https://www.vaneck.com/contentassets/c401e380d49f4c98bfdaec52e163d145/6367_muni-fema-blog_chart-2_2025-10_v2_blog.svg" /></p>
<p class="chart-disclosure">Source: Pew analysis of data from the National Association of State Budget Officers. As of March 2025.</p>

<h2 id="market-dynamics-shift" class="jump-link-nav anchored-block" data-jumplink-title="Market Dynamics Shift">How Market Dynamics Could Shift</h2>
<p>A FEMA-free environment would ripple through both sides of the supply-demand equation. On the supply side, higher perceived risk would increase borrowing costs for certain regions, potentially dampening issuance in those areas. Infrastructure projects in coastal or high-risk zones might be delayed or repriced. On the demand side, investors seeking tax-exempt income would need to weigh attractive yields against the uneven geography of climate and policy risk.</p>
<p>Historically, the municipal market has not been particularly quick to price environmental exposure. The elimination of FEMA could change that, forcing investors to internalize disaster risk that was once externalized through federal relief. The result would likely be a more fragmented yield landscape, one where &ldquo;safe&rdquo; states and sectors trade at tighter spreads while vulnerable regions must pay a premium.</p>
<p>For diversified muni portfolios, that dispersion could actually present opportunities. Higher yields from risk-adjusted credit could improve overall income potential, while broader awareness of fiscal fundamentals could make the market more efficient.</p>
<h2>Policy Risk and the Changing Nature of &ldquo;Safe&rdquo;</h2>
<p>The potential loss of FEMA underscores how intertwined federal policy and municipal credit have become. Disaster aid, infrastructure grants, healthcare transfers, and tax exemptions all shape local fiscal health. Investors tend to treat municipal bonds as a reflection of local governance, but the reality is that federal policy quietly underwrites a meaningful share of that stability.</p>
<p>If FEMA were withdrawn, it would mark not just the loss of a funding source but a philosophical shift: disaster costs would be localized rather than socialized. Municipalities would be expected to shoulder full responsibility for rebuilding, regardless of their fiscal capacity. That could widen disparities between wealthy and resource-constrained jurisdictions, reinforcing the need for investors to look beyond ratings and consider the durability of each issuer&rsquo;s revenue base and reserves.</p>
<p>From a market-structure perspective, this would not necessarily spell turmoil. The municipal market has proven remarkably adaptive, from the Great Depression to the financial crisis to the pandemic. But it would represent a new phase of risk awareness, where credit spreads more directly reflect environmental exposure and policy dependence.</p>
<h2 id="implications-for-investors" class="jump-link-nav anchored-block" data-jumplink-title="Implications for Investors">Implications for Investors</h2>
<p>For municipal investors, the takeaway is not to retreat from the market but to rethink how policy and geography intersect with long-term credit risk. The possibility of a reduced FEMA footprint highlights the need to understand the underlying fiscal strength of issuers, the diversity of their revenue streams, and the adaptability of their budgets to unforeseen events.</p>
<p>Tax-exempt income remains one of the most powerful tools for investors seeking durable after-tax returns, and municipals continue to offer historically attractive yields relative to Treasuries on a tax-adjusted basis. But the sources of safety are evolving. A shrinking federal role would make local governance, reserves, and fiscal policy the new anchors of confidence.</p>
<p>That evolution doesn&rsquo;t diminish the appeal of the market; it clarifies it. Investors who recognize the distinction between perceived and actual safety will be better positioned to capture value. The muni landscape may become more complex, but it will also become more transparent, rewarding those who align their exposure with fiscal resilience rather than historical assumptions of federal rescue.</p>
<h2>A Market That Reflects Its Own Strength</h2>
<p>The idea of FEMA disappearing may seem remote, but thinking through its implications reveals something essential about the municipal market&rsquo;s character. It has always reflected both the challenges and the ingenuity of the governments that issue its bonds. If that federal safety net were removed, the market would adapt, repricing risk, rewarding discipline, and continuing to fund the infrastructure and services that underpin American communities.</p>
<p>In that sense, the story isn&rsquo;t about the loss of FEMA. It&rsquo;s about the emergence of a more self-reliant municipal ecosystem, one where credit spreads tell a clearer story about resilience, governance, and local capacity. For investors, that environment may ultimately strengthen the case for municipals as a cornerstone of long-term, tax-efficient portfolios, a market tested not by policy guarantees but by the fiscal independence it was designed to showcase.</p>
<p>As policy and fiscal dynamics evolve, <strong><a href="/us/en/blogs/municipal-bonds/municipal-bond-etfs-expect-more-from-your-munis/" title="Municipal Bond ETFs &ndash; Expect More from Your Munis">VanEck&rsquo;s suite of municipal bond ETFs</a></strong> aim to help investors stay positioned for the next phase of the market by offering control over portfolio yield, duration, and credit exposure. Learn more here: <strong><a href="/us/en/blogs/municipal-bonds/municipal-bond-etfs-expect-more-from-your-munis/" title="Municipal Bond ETFs &ndash; Expect More from Your Munis">Expect More from Your Munis</a></strong>.</p>
<p>To receive more <a href="https://www.vaneck.com/us/en/insights/municipal-bonds/" title="Municipal Bonds Insights"><strong>Municipal Bonds</strong></a> insights, <a href="/link/5f45412c2143400497908cea2897f7d3.aspx" title=" Subscription Center"><strong>sign up in our subscription center</strong></a>.</p>
]]></content:encoded>
</item><item rdf:about="https://www.vaneck.com/us/en/blogs/natural-resources/top-nuclear-energy-companies-shaping-the-future-of-clean-power/">
  <title>Top Nuclear Energy Companies Shaping the Future of Clean Power></title>
  <link>https://www.vaneck.com/us/en/blogs/natural-resources/top-nuclear-energy-companies-shaping-the-future-of-clean-power/</link>
  <description><![CDATA[Nuclear energy is gaining momentum as a clean, reliable solution powered by innovation across mining, technology, and utilities.]]></description>
  <dc:creator>Coulter Regal, CFA</dc:creator>
  <dc:date>11/04/2025 06:30:00</dc:date>
<content:encoded><![CDATA[

<p><strong>Key Takeaways:</strong></p>
<ul class="content-list">
<li class="mt-2">Nuclear energy offers stable, carbon-free power critical for global electrification and AI-driven demand.</li>
<li class="mt-2">Innovation across mining, reactors, and utilities is reshaping the nuclear energy value chain.</li>
<li class="mt-2">Government support and new technologies are creating long-term opportunities in the nuclear sector.</li>
</ul>
<p>As the demand for clean, reliable energy surges, nuclear power is stepping into the spotlight as a critical player in the global shift away from fossil fuels. With the ability to generate massive amounts of electricity without harmful emissions, nuclear energy offers a sustainable solution to the world's energy needs. Unlike solar and wind, which depend on weather conditions, nuclear power provides a steady, around-the-clock energy supply that is ideal for supporting the increasingly power-hungry infrastructure of modern society and new technologies like artificial intelligence.</p>
<p>But nuclear energy isn&rsquo;t just about the reactors we&rsquo;ve seen in the past; today&rsquo;s leading companies are reimagining the potential of nuclear power with new technologies like small modular reactors (SMRs), advances in nuclear fuels, and even portable microreactors. These innovations promise to make nuclear safer, more efficient, and accessible for a wider range of applications, from powering cities to remote industrial sites.</p>
<p>But who are the key players driving innovation in this industry? From industry stalwarts with decades of expertise to ambitious newcomers revolutionizing technology, the top nuclear energy companies are shaping a cleaner, more resilient energy landscape. Let&rsquo;s dive into the leading companies at the forefront of this exciting transformation.</p>
<h2 id="top-nuclear-companies" class="jump-link-nav anchored-block" data-jumplink-title="Top Nuclear Companies">The Top Nuclear Energy Companies Leading the Industry</h2>
<p>When most people think about the nuclear energy industry, uranium and the companies mining the element often come to mind first. After all, uranium is the essential fuel that powers nuclear reactors, and these miners sit at the very beginning of the nuclear supply chain. From exploration to extraction, uranium mining companies are crucial players, and they have, until recently, attracted most of the attention in the space, especially from investors eager to capitalize on the rising demand for nuclear energy.</p>
<p>However, the nuclear industry extends well beyond uranium miners. In fact, some of the most groundbreaking innovations are happening further down the line in the Industrials and Utilities segments. Industrial companies are leading the charge in developing next-generation reactors, modular technologies, and advanced safety solutions that make nuclear power more efficient and versatile than ever. Meanwhile, Utilities play a key role in generating and distributing nuclear power to cities and industries, supporting everything from household electricity to the ever-growing needs of data centers and AI. Let&rsquo;s take a closer look at the leading companies across these three segments&mdash;Uranium Miners, Industrials, and Utilities&mdash;that are shaping the future of nuclear energy.</p>

<h2 id="uranium-miners" class="jump-link-nav anchored-block" data-jumplink-title="Uranium Miners">Uranium Miners</h2>
<p><strong>Cameco Corp. (CCJ) (7.56% of NLR assets)</strong><br />One of the world&rsquo;s largest uranium producers, Cameco operates high-grade mines in Canada, the United States and Kazakhstan. As global demand for nuclear energy rises, Cameco is positioned to play a key role, supplying uranium to fuel reactors around the world. The company&rsquo;s commitment to sustainability and operational efficiency also sets it apart in the mining industry.</p>
<p><strong>Denison Mines Corp. (DNN) (4.53% of NLR assets)</strong><br />A Canadian uranium company developing high-grade projects in the Athabasca Basin of northern Saskatchewan. Its main asset, the Wheeler River Project, includes some of the world&rsquo;s richest uranium deposits and aims for low-cost, efficient production. With a stake in the McClean Lake mill and growing global demand for nuclear energy, Denison offers strong potential for investors seeking exposure to the expanding uranium market.</p>
<p><strong>NexGen Energy (NXE) (4.52% of NLR assets)</strong><br />NexGen Energy is advancing one of the largest development-stage uranium projects at the moment, the high-grade Rook I project in Canada. With plans for innovative mining and processing techniques, NexGen aims to set new standards for efficiency and environmental responsibility in uranium production.</p>
<h2 id="nuclear-industrials" class="jump-link-nav anchored-block" data-jumplink-title="Nuclear Industrials">Nuclear Industrials</h2>
<p><strong>Oklo Inc. (OKLO) (6.78% of NLR assets)</strong><br />Oklo is working on ultra-compact, micro-reactors designed to power remote locations, industrial sites, and data centers. Its advanced reactor technology uses recycled nuclear fuel, making it a sustainable solution for the future of nuclear energy, especially in areas where conventional power grids are impractical.</p>
<p><strong>BWX Technologies (BWXT) (5.97% of NLR assets)</strong><br />BWX traces its history to the 1800s and was involved in the Manhattan Project of the 1940s. Today, it specializes in nuclear components and services, with a strong focus on advanced nuclear reactors for both commercial and military applications. The company is a leader in small modular reactor technology and is also at the forefront of nuclear fuel innovation.</p>
<p><strong>Centrus Energy Corp. (LEU) (5.70% of NLR assets)</strong><br />Centrus Energy, a U.S.-based nuclear-fuel supplier, provides low-enriched uranium (LEU) and is developing high-assay, low-enriched uranium (HALEU) for advanced reactors. Headquartered in Bethesda, Maryland, it operates enrichment and technical-services facilities, including a key plant in Piketon, Ohio. With global demand for clean, reliable nuclear power rising and new reactor designs in development, Centrus stands out as an investment opportunity thanks to its role in the fuel-supply chain, domestic manufacturing capability, and positioning in a strategic growth market.</p>
<h2 id="nuclear-utilities" class="jump-link-nav anchored-block" data-jumplink-title="Nuclear Utilities">Nuclear Utilities</h2>
<p><strong>Constellation Energy Corp. (CEG) (7.37% of NLR assets)</strong><br />As the largest producer of carbon-free energy in the United States, Constellation Energy operates a fleet of nuclear plants that supply reliable, emissions-free electricity. Constellation is actively exploring partnerships to support next-generation nuclear technologies, as well as agreements to power datacenters for large technology companies like Microsoft.</p>
<p><strong>Public Service Enterprise Group (PEG) (4.58% of NLR assets)</strong><br />PEG owns and operates nuclear plants in the U.S. as part of its commitment to a low-carbon future. By investing in nuclear as a core part of its energy mix, PEG is helping meet regional power demands while supporting state and federal decarbonization goals.</p>
<p><strong>PG&amp;E Corp (PCG) (4.11% of NLR assets)</strong><br />Pacific Gas and Electric (PG&amp;E) operates the Diablo Canyon Power Plant, California&rsquo;s last remaining nuclear power plant, which provides vital baseload power for the state&rsquo;s energy grid. With plans to extend the plant's lifespan, PG&amp;E aims to ensure a stable, low-emission power supply for millions of customers in California as the state transitions to renewable energy sources.</p>

<h2 id="considerations" class="jump-link-nav anchored-block" data-jumplink-title="Considerations">What to Consider When Investing in Nuclear Energy Companies</h2>
<p>As the world shifts toward clean energy and decarbonization, nuclear energy companies are increasingly becoming an area of the market that investors are looking at. However, nuclear power comes with unique risks and factors that investors should weigh carefully.</p>
<p>Regulatory risks in the space are notable, as nuclear power is one of the most heavily regulated industries. Regulatory changes or heightened safety requirements can impact companies in numerous ways, making it essential to stay informed about the regulatory landscape. Geopolitical factors also play a role, especially in uranium mining, where operations in politically unstable regions can disrupt supply and influence pricing.</p>
<p>On the positive side, government support for nuclear power is growing as countries aim to meet decarbonization targets. Many governments offer incentives for advanced nuclear technologies, particularly small modular reactors, which could spur growth across the sector. Additionally, rising demand for clean, reliable energy, driven by sectors like data centers and AI, underscores nuclear&rsquo;s role as a stable, round-the-clock energy source.</p>
<p>Finally, nuclear is a long-term investment, with new power facilities and technology often requiring years to construct and bring online. A diversified and global approach can help mitigate the risks tied to the nuclear industry, allowing investors to benefit from the sector&rsquo;s robust potential while managing volatility for a more balanced return over the long term.</p>
<h2>Invest in the Top Nuclear Companies Powering the Future</h2>
<p>Investing in nuclear energy offers exciting potential as the world moves toward cleaner, more reliable power sources. From understanding the role of key industry players across uranium mining, advanced reactor technology, and power generation to carefully considering the unique risks and opportunities, investors can make informed decisions in this evolving sector.</p>
<p>The <a href="/link/49acb0d4174146e9a0269c9cb81c02bb.aspx" title="NLR - VanEck Uranium and Nuclear ETF - Overview"><strong>VanEck Uranium and Nuclear ETF</strong></a> offers investors comprehensive exposure to the nuclear energy ecosystem. In addition to uranium miners, the strategy&rsquo;s targets nuclear energy producers, companies involved in construction, engineering and maintenance of nuclear projects, and those companies providing equipment, technology and/or services to the nuclear power industry.</p>
<p>To receive more <a href="/us/en/insights/natural-resources/" title="Natural Resources Insights"><strong>Natural Resources</strong></a> insights, <a href="https://www.vaneck.com/us/en/subscribe/" title="Subscription Center"><strong>sign up in our subscription center</strong></a>.</p>
]]></content:encoded>
</item><item rdf:about="https://www.vaneck.com/us/en/blogs/income-investing/fallen-angels-outperform-again-in-q3-amid-fed-cut-and-trade-noise/">
  <title>Fallen Angels Outperform Again in Q3 Amid Fed Cut and Trade Noise></title>
  <link>https://www.vaneck.com/us/en/blogs/income-investing/fallen-angels-outperform-again-in-q3-amid-fed-cut-and-trade-noise/</link>
  <description><![CDATA[Fallen angels outperformed in Q3 2025, boosted by longer duration and strong security selection. Four new entrants joined the index as solid fundamentals support spreads into Q4.]]></description>
  <dc:creator>Nicolas  Fonseca, CFA</dc:creator>
  <dc:date>10/30/2025 06:30:00</dc:date>
<content:encoded><![CDATA[

<p id="q3-2025-update" class="jump-link-nav anchored-block" data-jumplink-title="Q3 2025 Update">Fallen angels (as represented by the ICE US Fallen Angel High Yield 10% Constrained Index, &ldquo;H0CF&rdquo;) outperformed the broad high yield market (as represented by the ICE BofA US High Yield Index, &ldquo;H0A0&rdquo;) by 0.59% in Q3 (2.99% vs. 2.40%), widening the year-to-date gap to 0.78% (7.84% vs. 7.06%). After underperforming in July by 0.13%, fallen angels rebounded in August and September with outperformance of 0.10% and 0.62%, respectively. Most of the relative strength occurred in September, as the longer duration profile of fallen angels benefited from lower treasury yields. While overall yields declined, the yield curve continued to steepen, with short-term yields falling more than long-term yields, potentially signaling more caution about the longer-term inflation outlook.</p>
<p>The third quarter differed meaningfully from the second, despite also featuring a tariff announcement on August 1. Credit spreads widened, though to a much lesser extent than during the April 2 episode. This time, the move was less of a surprise, as some degree of policy risk was already embedded in markets. In addition, anticipation of the Fed&rsquo;s latest rate cutting cycle, in response to softening labor market conditions, helped to cushion the impact and support spread recovery.</p>
<p>Looking ahead to Q4, we expect dispersion in the high yield market to remain elevated, as a slowing economy and renewed tariff uncertainty continue to create idiosyncratic pressures across issuers. While these factors may drive isolated fallen angel events, we see limited signs of a broad downgrade wave. Spreads are likely to remain supported by solid corporate fundamentals, low default rates and continued investor demand for yield.</p>
<p>Within high yield market, BB rated bonds continue to lead performance, while CCC &amp; lower rated bonds keep climbing back.</p>
<h3>BB still outperforming YTD but CCC and lower rated outperformed in Q3</h3>
<p><img loading="lazy" class="img-responsive" alt="BB still outperforming YTD but CCC and lower rated outperformed in Q3" src="https://www.vaneck.com/contentassets/c8bb0925f191402297de7eb667887a9a/6272_angl-september-2025_chart-1_2025-10_v1_blog.svg" /></p>
<p class="chart-disclosure">Source: ICE Data Services as of 9/30/2025, VanEck. BB represented by ICE BofA BB US High Yield Index; B represented by ICE BofA Single-B US High Yield Index; CCC and below represented by ICE BofA CCC &amp; Lower US High Yield Index. ICE BofA BB US High Yield Index is a subset of ICE BofA US High Yield Index including all securities rated BB1 through BB3, inclusive. ICE BofA Single-B US High Yield Index is a subset of ICE BofA US High Yield Index including all securities rated B1 through B3, inclusive. ICE BofA CCC &amp; Lower US High Yield Index is a subset of ICE BofA US High Yield Index including all securities rated CCC1 and below.</p>
<p id="overall-statistics" class="jump-link-nav anchored-block" data-jumplink-title="Overall Statistics"><strong>Fallen Angels Overall Statistics:</strong> Credit spreads were notably more stable in Q3, despite a short-lived spike on August 1 following the new tariff announcement, before resuming a tightening trend. Spreads now sit approximately 30 bps (fallen angels) and 39 bps (broad high yield) from their cycle lows and continue to represent roughly 30% of total yield. Although tight, current high yield spread levels are notably above their 2021 tights, in contrast to investment grade bonds, which reached their tightest levels in September. Spread tightening was a positive contributor to Q3 outperformance, but the main drivers were security selection and duration. Despite both seeing modest declines in duration during the quarter, fallen angels remain longer by roughly 1.6. Broad high yield duration fell to a new all-time low of 2.83 years.</p>
<p>From a pricing perspective, both indices are now above their historical averages (since December 2003) by $0.13 for fallen angels and $1.88 for broad high yield, suggesting continued potential for relative outperformance, consistent with year-to-date trends.</p>
<div class="wrapped-div">
<table style="width: 100%;">
<tbody>
<tr class="tbl-data">
<td class="tbl-header last text-center">&nbsp;</td>
<td class="tbl-header last text-center" style="border-right: outset;" colspan="4">Fallen Angels</td>
<td class="tbl-header last text-center" colspan="4">Broad HY</td>
</tr>
<tr class="tbl-data">
<td class="data-head last text-right">&nbsp;</td>
<td class="data-head last text-right">12/31/2024</td>
<td class="data-head last text-right">3/31/2025</td>
<td class="data-head last text-right">6/30/2025</td>
<td class="data-head last text-right" style="border-right: outset;">9/30/2025</td>
<td class="data-head last text-right">12/31/2024</td>
<td class="data-head last text-right">3/31/2025</td>
<td class="data-head last text-right">6/30/2025</td>
<td class="data-head last text-right">9/30/2025</td>
</tr>
<tr class="tbl-data">
<td class="data-td last">Yield to Worst</td>
<td class="data-td data last text-right">7.00</td>
<td class="data-td data last text-right">6.72</td>
<td class="data-td data last text-right">6.43</td>
<td class="data-td data last text-right" style="border-right: outset;">6.23</td>
<td class="data-td data last text-right">7.47</td>
<td class="data-td data last text-right">7.73</td>
<td class="data-td data last text-right">7.06</td>
<td class="data-td data last text-right">6.74</td>
</tr>
<tr class="tbl-data">
<td class="data-td last">Par Weighted Price</td>
<td class="data-td data last text-right">91.52</td>
<td class="data-td data last text-right">93.11</td>
<td class="data-td data last text-right">93.70</td>
<td class="data-td data last text-right" style="border-right: outset;">95.19</td>
<td class="data-td data last text-right">95.48</td>
<td class="data-td data last text-right">94.97</td>
<td class="data-td data last text-right">97.12</td>
<td class="data-td data last text-right">98.08</td>
</tr>
<tr class="tbl-data">
<td class="data-td last">Effective Duration</td>
<td class="data-td data last text-right">4.89</td>
<td class="data-td data last text-right">4.56</td>
<td class="data-td data last text-right">4.88</td>
<td class="data-td data last text-right" style="border-right: outset;">4.59</td>
<td class="data-td data last text-right">3.22</td>
<td class="data-td data last text-right">3.19</td>
<td class="data-td data last text-right">2.89</td>
<td class="data-td data last text-right">2.83</td>
</tr>
<tr class="tbl-data">
<td class="data-td last">Full Market Value ($mn)</td>
<td class="data-td data last text-right">53,393</td>
<td class="data-td data last text-right">67,566</td>
<td class="data-td data last text-right">63,035</td>
<td class="data-td data last text-right" style="border-right: outset;">61,626</td>
<td class="data-td data last text-right">1,338,887</td>
<td class="data-td data last text-right">1,357,142</td>
<td class="data-td data last text-right">1,375,495</td>
<td class="data-td data last text-right">1,437,209</td>
</tr>
<tr class="tbl-data">
<td class="data-td last">OAS</td>
<td class="data-td data last text-right">249</td>
<td class="data-td data last text-right">257</td>
<td class="data-td data last text-right">237</td>
<td class="data-td data last text-right" style="border-right: outset;">230</td>
<td class="data-td data last text-right">292</td>
<td class="data-td data last text-right">355</td>
<td class="data-td data last text-right">296</td>
<td class="data-td data last text-right">280</td>
</tr>
<tr class="tbl-data">
<td class="data-td last">No. of Issues</td>
<td class="data-td data last text-right">122</td>
<td class="data-td data last text-right">134</td>
<td class="data-td data last text-right">126</td>
<td class="data-td data last text-right" style="border-right: outset;">121</td>
<td class="data-td data last text-right">1,879</td>
<td class="data-td data last text-right">1,902</td>
<td class="data-td data last text-right">1,868</td>
<td class="data-td data last text-right">1,909</td>
</tr>
</tbody>
</table>
</div>
<p class="chart-disclosure">Source: ICE Data Services, VanEck. Fallen Angels: ICE US Fallen Angel High Yield 10% Constrained Index. Broad HY: ICE BofA US High Yield Index. OAS refers to &ldquo;option-adjusted spread.&rdquo; Please see definition for this and other terms referenced herein in the disclosures and definitions portion of this blog. Past performance is no guarantee of future results. Index performance is not representative of strategy performance. It is not possible to invest in an index</p>
<p><strong>Fallen Angels:</strong> Fallen angels continued to exhibit their idiosyncratic profile in Q3. Two new fallen angels entered in the index in July: Huntsman International and WarnerMedia Holdings. Huntsman senior unsecured ratings were downgraded by Moody&rsquo;s to Ba1 from Baa3 citing earning weakness, elevated leverage and governance concerns. WarnerMedia&rsquo;s inclusion followed a large downgrade that had been anticipated since June but was delayed due to uncertainty around the company&rsquo;s debt restructuring. The sole qualifying issue entered the index in July at an approximate 10% discount, recovering most of that within two months.</p>
<h3>WarnerMedia</h3>
<p><img loading="lazy" class="img-responsive" alt="WarnerMedia" src="https://www.vaneck.com/contentassets/16e64c1d545940e9957b959257384a3e/6272_angl-september-2025_chart-2_2025-10_v1_blog.svg" /></p>
<p class="chart-disclosure">ICE Data Services as of 9/30/2025, VanEck. Past performance is no guarantee of future results. Not intended as a recommendation to buy or sell any securities referenced herein.</p>

<p>August saw another two issuers enter the index. S&amp;P downgraded PacifiCorp junior subordinated notes to BB+ from BBB- primarily because its financial performance weakened and regulatory outcome in Utah that limited cost recovery, leading to persistently low cash flow to debt levels. BlackRock TCP Capital Corp senior secured debt and senior unsecured debt were downgraded by Fitch to BB+ from BBB-, due to deterioration on their asset quality which caused high realized loss rates in the first half of 2025. Fitch noted that BDCs may face continued credit headwinds through the second half of 2025 amid weaker earnings, tighter funding and risk of elevated losses.</p>
<p>JP Morgan updated its forecast for its fallen angel pipeline for the remainder of the year, with no fallen angels in sight. However, the BBB- universe continues to shrink, with approximately $63bn of BBB- debt carrying both a high-yield rating and a negative rating outlook from at least one of the three rating agencies. The names include Paramount, Ford and Centene.</p>
<div class="wrapped-div">
<table style="width: 100%;">
<tbody>
<tr class="tbl-data">
<td class="tbl-header last">Month-end Addition</td>
<td class="tbl-header last">Name</td>
<td class="tbl-header last">Rating</td>
<td class="tbl-header last">Sector</td>
<td class="tbl-header last">Industry</td>
<td class="tbl-header last text-right">% Mkt Value</td>
<td class="tbl-header last text-right">Price</td>
</tr>
<tr class="tbl-data">
<td class="data-td last font-weight-normal">January</td>
<td class="data-td data last text-left">Aptiv PLC / Aptiv Global Financing DAC</td>
<td class="data-td data last text-left">BB1</td>
<td class="data-td data last text-left">Automotive</td>
<td class="data-td data last text-left">Auto Parts &amp; Equipment</td>
<td class="data-td data last text-right">0.95</td>
<td class="data-td data last text-right">99.71</td>
</tr>
<tr class="tbl-data">
<td class="data-td last font-weight-normal">February</td>
<td class="data-td data last text-left">Celanese US Holdings Llc</td>
<td class="data-td data last text-left">BB1</td>
<td class="data-td data last text-left">Basic Industry</td>
<td class="data-td data last text-left">Chemicals</td>
<td class="data-td data last text-right">10.06</td>
<td class="data-td data last text-right">103.69</td>
</tr>
<tr class="tbl-data">
<td class="data-td last font-weight-normal">February</td>
<td class="data-td data last text-left">Nissan Motor Acceptance Co LLC</td>
<td class="data-td data last text-left">BB1</td>
<td class="data-td data last text-left">Automotive</td>
<td class="data-td data last text-left">Auto Loans</td>
<td class="data-td data last text-right">4.82</td>
<td class="data-td data last text-right">97.64</td>
</tr>
<tr class="tbl-data">
<td class="data-td last font-weight-normal">February</td>
<td class="data-td data last text-left">Nissan Motor Co Ltd.</td>
<td class="data-td data last text-left">BB1</td>
<td class="data-td data last text-left">Automotive</td>
<td class="data-td data last text-left">Automakers</td>
<td class="data-td data last text-right">5.41</td>
<td class="data-td data last text-right">97.26</td>
</tr>
<tr class="tbl-data">
<td class="data-td last font-weight-normal">May</td>
<td class="data-td data last text-left">Whirlpool Corp.</td>
<td class="data-td data last text-left">BB1</td>
<td class="data-td data last text-left">Consumer Goods</td>
<td class="data-td data last text-left">Personal &amp; Household Products</td>
<td class="data-td data last text-right">4.23</td>
<td class="data-td data last text-right">85.52</td>
</tr>
<tr class="tbl-data">
<td class="data-td last font-weight-normal">July</td>
<td class="data-td data last text-left">Huntsman International LLC.</td>
<td class="data-td data last text-left">BB1</td>
<td class="data-td data last text-left">Basic Industry</td>
<td class="data-td data last text-left">Chemicals</td>
<td class="data-td data last text-right">2.29</td>
<td class="data-td data last text-right">91.46</td>
</tr>
<tr class="tbl-data">
<td class="data-td last font-weight-normal">July</td>
<td class="data-td data last text-left">WarnerMedia Holdings Inc..</td>
<td class="data-td data last text-left">BB2</td>
<td class="data-td data last text-left">Media</td>
<td class="data-td data last text-left">Media Content</td>
<td class="data-td data last text-right">0.39</td>
<td class="data-td data last text-right">79.25</td>
</tr>
<tr class="tbl-data">
<td class="data-td last font-weight-normal">August</td>
<td class="data-td data last text-left">PacifiCorp..</td>
<td class="data-td data last text-left">BB1</td>
<td class="data-td data last text-left">Utility</td>
<td class="data-td data last text-left">Electric-Integrated</td>
<td class="data-td data last text-right">1.47</td>
<td class="data-td data last text-right">103.77</td>
</tr>
<tr class="tbl-data">
<td class="data-td last font-weight-normal">August</td>
<td class="data-td data last text-left">BlackRock TCP Capital Corp..</td>
<td class="data-td data last text-left">BB1</td>
<td class="data-td data last text-left">Financial Services</td>
<td class="data-td data last text-left">Investments &amp; Misc Financial Services</td>
<td class="data-td data last text-right">0.55</td>
<td class="data-td data last text-right">102.98</td>
</tr>
</tbody>
</table>
</div>
<p class="chart-disclosure">Source: ICE Data Services, VanEck. Fallen Angels: ICE US Fallen Angel High Yield 10% Constrained Index. Past performance is no guarantee of future results. Not a recommendation to buy or sell any of the names/securities mentioned herein. Index performance is not representative of strategy performance. It is not possible to invest in an index.</p>
<p><strong>Rising Stars:</strong> No rising stars in Q3.</p>
<div class="wrapped-div">
<table style="width: 100%;">
<tbody>
<tr class="tbl-data">
<td class="tbl-header last">Month-end Exit</td>
<td class="tbl-header last">Name</td>
<td class="tbl-header last">Rating</td>
<td class="tbl-header last">Sector</td>
<td class="tbl-header last">Industry</td>
<td class="tbl-header last text-right">% Mkt Value</td>
<td class="tbl-header last text-right">Price</td>
</tr>
<tr class="tbl-data">
<td class="data-td last font-weight-normal">February</td>
<td class="data-td data last text-left">Western Alliance Bancorp</td>
<td class="data-td data last text-left">BB1</td>
<td class="data-td data last text-left">Banking</td>
<td class="data-td data last text-right">1.05</td>
<td class="data-td data last text-right">93.75</td>
</tr>
<tr class="tbl-data">
<td class="data-td last font-weight-normal">May</td>
<td class="data-td data last text-left">Constellation Insurance Inc.</td>
<td class="data-td data last text-left">BB1</td>
<td class="data-td data last text-left">Insurance</td>
<td class="data-td data last text-left">Life Insurance</td>
<td class="data-td data last text-right">1.04</td>
<td class="data-td data last text-right">95.74</td>
</tr>
<tr class="tbl-data">
<td class="data-td last font-weight-normal">May</td>
<td class="data-td data last text-left">Royal Caribbean Group</td>
<td class="data-td data last text-left">BB1</td>
<td class="data-td data last text-left">Leisure</td>
<td class="data-td data last text-left">Recreation &amp; Travel</td>
<td class="data-td data last text-right">1.27</td>
<td class="data-td data last text-right">99.78</td>
</tr>
</tbody>
</table>
</div>
<p class="chart-disclosure">Source: ICE Data Services, VanEck. Fallen Angels: ICE US Fallen Angel High Yield 10% Constrained Index. Past performance is no guarantee of future results. Not a recommendation to buy or sell any of the names/securities mentioned herein. Index performance is not representative of strategy performance. It is not possible to invest in an index.</p>
<p><strong>Fallen Angels Performance by Sector</strong>: Q3 brought changes to the sector composition, as Huntsman International added approximately 2% to the Basic Industry Sector, making it the largest exposure in the Fallen Angel Index. The sole issue of WarnerMedia meant a new sector in the Fallen Angel Index, Media, which had not been part of the index since the summer of 2019. Utility increased due to the entrance of PacifiCorp and Retail, which had been the largest exposure after the Energy/Covid downgrade wave, saw its exposure decrease as Walgreens was removed from the index due to size requirements in Q3. Spreads tightened across the majority of sectors with Energy having the biggest impact, thus providing the highest total return for Q3. Retail, Autos and Energy were the top contributors to relative performance vs broad high yield during the quarter, while Media, Financial Services and Services detracted the most from relative performance. YTD, the top contributors are Retail, Real Estate and Telecom while the detractors remain the same.</p>
<div class="wrapped-div-full">
<table style="width: 100%;">
<tbody>
<tr class="tbl-data">
<td class="tbl-header last text-center">&nbsp;</td>
<td class="tbl-header last text-center" style="border-right: outset;" colspan="3">Wgt (%)</td>
<td class="tbl-header last text-center" style="border-right: outset;" colspan="3">OAS</td>
<td class="tbl-header last text-center" style="border-right: outset;" colspan="3">Price</td>
<td class="tbl-header last text-right" colspan="2">Total Return</td>
</tr>
<tr class="tbl-data">
<td class="data-head data last text-right">&nbsp;</td>
<td class="data-head data last text-right">12/31/24</td>
<td class="data-head data last text-right">6/30/25</td>
<td class="data-head data last text-right" style="border-right: outset;">9/30/25</td>
<td class="data-head data last text-right">12/31/24</td>
<td class="data-head data last text-right">6/30/25</td>
<td class="data-head data last text-right" style="border-right: outset;">9/30/25</td>
<td class="data-head data last text-right">12/31/24</td>
<td class="data-head data last text-right">6/30/25</td>
<td class="data-head data last text-right" style="border-right: outset;">9/30/25</td>
<td class="data-head data last text-right">QTD</td>
<td class="data-head data last text-right">YTD</td>
</tr>
<tr class="tbl-data">
<td class="data-td last">Automotive<sup>*</sup></td>
<td class="data-td data last text-right">&nbsp;</td>
<td class="data-td data last text-right">10.78</td>
<td class="data-td data last text-right" style="border-right: outset;">10.86</td>
<td class="data-td data last text-right">&nbsp;</td>
<td class="data-td data last text-right">253</td>
<td class="data-td data last text-right" style="border-right: outset;">200</td>
<td class="data-td data last text-right">&nbsp;</td>
<td class="data-td data last text-right">95.34</td>
<td class="data-td data last text-right" style="border-right: outset;">97.25</td>
<td class="data-td data last text-right">3.26</td>
<td class="data-td data last text-right">1.70</td>
</tr>
<tr class="tbl-data">
<td class="data-td last">Banking</td>
<td class="data-td data last text-right">4.94</td>
<td class="data-td data last text-right">3.19</td>
<td class="data-td data last text-right" style="border-right: outset;">3.21</td>
<td class="data-td data last text-right">181</td>
<td class="data-td data last text-right">142</td>
<td class="data-td data last text-right" style="border-right: outset;">138</td>
<td class="data-td data last text-right">96.00</td>
<td class="data-td data last text-right">107.29</td>
<td class="data-td data last text-right" style="border-right: outset;">108.14</td>
<td class="data-td data last text-right">2.54</td>
<td class="data-td data last text-right">3.64</td>
</tr>
<tr class="tbl-data">
<td class="data-td last">Basic Industry</td>
<td class="data-td data last text-right">4.94</td>
<td class="data-td data last text-right">14.55</td>
<td class="data-td data last text-right" style="border-right: outset;">15.75</td>
<td class="data-td data last text-right">181</td>
<td class="data-td data last text-right">148</td>
<td class="data-td data last text-right" style="border-right: outset;">204</td>
<td class="data-td data last text-right">96.00</td>
<td class="data-td data last text-right">102.86</td>
<td class="data-td data last text-right" style="border-right: outset;">100.06</td>
<td class="data-td data last text-right">0.64</td>
<td class="data-td data last text-right">6.53</td>
</tr>
<tr class="tbl-data">
<td class="data-td last">Capital Goods</td>
<td class="data-td data last text-right">5.55</td>
<td class="data-td data last text-right">4.56</td>
<td class="data-td data last text-right" style="border-right: outset;">3.98</td>
<td class="data-td data last text-right">179</td>
<td class="data-td data last text-right">157</td>
<td class="data-td data last text-right" style="border-right: outset;">146</td>
<td class="data-td data last text-right">96.48</td>
<td class="data-td data last text-right">97.92</td>
<td class="data-td data last text-right" style="border-right: outset;">99.28</td>
<td class="data-td data last text-right">3.36</td>
<td class="data-td data last text-right">7.93</td>
</tr>
<tr class="tbl-data">
<td class="data-td last">Consumer Goods</td>
<td class="data-td data last text-right">4.37</td>
<td class="data-td data last text-right">6.41</td>
<td class="data-td data last text-right" style="border-right: outset;">6.34</td>
<td class="data-td data last text-right">184</td>
<td class="data-td data last text-right">220</td>
<td class="data-td data last text-right" style="border-right: outset;">230</td>
<td class="data-td data last text-right">98.89</td>
<td class="data-td data last text-right">88.78</td>
<td class="data-td data last text-right" style="border-right: outset;">88.84</td>
<td class="data-td data last text-right">1.51</td>
<td class="data-td data last text-right">4.80</td>
</tr>
<tr class="tbl-data">
<td class="data-td last">Energy</td>
<td class="data-td data last text-right">9.16</td>
<td class="data-td data last text-right">8.18</td>
<td class="data-td data last text-right" style="border-right: outset;">8.57</td>
<td class="data-td data last text-right">273</td>
<td class="data-td data last text-right">301</td>
<td class="data-td data last text-right" style="border-right: outset;">241</td>
<td class="data-td data last text-right">91.72</td>
<td class="data-td data last text-right">91.21</td>
<td class="data-td data last text-right" style="border-right: outset;">95.90</td>
<td class="data-td data last text-right">6.64</td>
<td class="data-td data last text-right">9.47</td>
</tr>
<tr class="tbl-data">
<td class="data-td last">Financial Services</td>
<td class="data-td data last text-right">3.22</td>
<td class="data-td data last text-right">2.35</td>
<td class="data-td data last text-right" style="border-right: outset;">2.44</td>
<td class="data-td data last text-right">282</td>
<td class="data-td data last text-right">261</td>
<td class="data-td data last text-right" style="border-right: outset;">294</td>
<td class="data-td data last text-right">91.46</td>
<td class="data-td data last text-right">93.67</td>
<td class="data-td data last text-right" style="border-right: outset;">94.60</td>
<td class="data-td data last text-right">1.24</td>
<td class="data-td data last text-right">7.47</td>
</tr>
<tr class="tbl-data">
<td class="data-td last">Healthcare</td>
<td class="data-td data last text-right">4.10</td>
<td class="data-td data last text-right">3.83</td>
<td class="data-td data last text-right" style="border-right: outset;">3.93</td>
<td class="data-td data last text-right">195</td>
<td class="data-td data last text-right">173</td>
<td class="data-td data last text-right" style="border-right: outset;">157</td>
<td class="data-td data last text-right">90.40</td>
<td class="data-td data last text-right">94.14</td>
<td class="data-td data last text-right" style="border-right: outset;">95.84</td>
<td class="data-td data last text-right">3.21</td>
<td class="data-td data last text-right">10.55</td>
</tr>
<tr class="tbl-data">
<td class="data-td last">Insurance</td>
<td class="data-td data last text-right">2.49</td>
<td class="data-td data last text-right">0.68</td>
<td class="data-td data last text-right" style="border-right: outset;">0.68</td>
<td class="data-td data last text-right">193</td>
<td class="data-td data last text-right">208</td>
<td class="data-td data last text-right" style="border-right: outset;">230</td>
<td class="data-td data last text-right">98.34</td>
<td class="data-td data last text-right">100.04</td>
<td class="data-td data last text-right" style="border-right: outset;">99.42</td>
<td class="data-td data last text-right">0.82</td>
<td class="data-td data last text-right">2.08</td>
</tr>
<tr class="tbl-data">
<td class="data-td last">Leisure</td>
<td class="data-td data last text-right">4.53</td>
<td class="data-td data last text-right">2.68</td>
<td class="data-td data last text-right" style="border-right: outset;">2.74</td>
<td class="data-td data last text-right">220</td>
<td class="data-td data last text-right">374</td>
<td class="data-td data last text-right" style="border-right: outset;">334</td>
<td class="data-td data last text-right">93.65</td>
<td class="data-td data last text-right">90.10</td>
<td class="data-td data last text-right" style="border-right: outset;">92.05</td>
<td class="data-td data last text-right">3.48</td>
<td class="data-td data last text-right">6.02</td>
</tr>
<tr class="tbl-data">
<td class="data-td last">Media<sup>*</sup></td>
<td class="data-td data last text-right">&nbsp;</td>
<td class="data-td data last text-right" style="border-right: outset;">0.42</td>
<td class="data-td data last text-right">&nbsp;</td>
<td class="data-td data last text-right" style="border-right: outset;">302</td>
<td class="data-td data last text-right">&nbsp;</td>
<td class="data-td data last text-right" style="border-right: outset;">86.61</td>
<td class="data-td data last text-right">8.62</td>
</tr>
<tr class="tbl-data">
<td class="data-td last">Real Estate</td>
<td class="data-td data last text-right">10.71</td>
<td class="data-td data last text-right">9.10</td>
<td class="data-td data last text-right" style="border-right: outset;">9.10</td>
<td class="data-td data last text-right">450</td>
<td class="data-td data last text-right">299</td>
<td class="data-td data last text-right" style="border-right: outset;">263</td>
<td class="data-td data last text-right">86.94</td>
<td class="data-td data last text-right">93.17</td>
<td class="data-td data last text-right" style="border-right: outset;">94.59</td>
<td class="data-td data last text-right">2.73</td>
<td class="data-td data last text-right">13.71</td>
</tr>
<tr class="tbl-data">
<td class="data-td last">Retail</td>
<td class="data-td data last text-right">22.15</td>
<td class="data-td data last text-right">16.72</td>
<td class="data-td data last text-right" style="border-right: outset;">13.33</td>
<td class="data-td data last text-right">219</td>
<td class="data-td data last text-right">225</td>
<td class="data-td data last text-right" style="border-right: outset;">238</td>
<td class="data-td data last text-right">86.26</td>
<td class="data-td data last text-right">87.64</td>
<td class="data-td data last text-right" style="border-right: outset;">89.65</td>
<td class="data-td data last text-right">4.21</td>
<td class="data-td data last text-right">10.77</td>
</tr>
<tr class="tbl-data">
<td class="data-td last">Services</td>
<td class="data-td data last text-right">0.83</td>
<td class="data-td data last text-right">0.77</td>
<td class="data-td data last text-right" style="border-right: outset;">0.76</td>
<td class="data-td data last text-right">189</td>
<td class="data-td data last text-right">145</td>
<td class="data-td data last text-right" style="border-right: outset;">147</td>
<td class="data-td data last text-right">95.97</td>
<td class="data-td data last text-right">99.63</td>
<td class="data-td data last text-right" style="border-right: outset;">99.75</td>
<td class="data-td data last text-right">1.41</td>
<td class="data-td data last text-right">7.95</td>
</tr>
<tr class="tbl-data">
<td class="data-td last">Technology &amp; Electronics</td>
<td class="data-td data last text-right">6.78</td>
<td class="data-td data last text-right">3.26</td>
<td class="data-td data last text-right" style="border-right: outset;">3.18</td>
<td class="data-td data last text-right">208</td>
<td class="data-td data last text-right">269</td>
<td class="data-td data last text-right" style="border-right: outset;">296</td>
<td class="data-td data last text-right">90.50</td>
<td class="data-td data last text-right">87.07</td>
<td class="data-td data last text-right" style="border-right: outset;">84.69</td>
<td class="data-td data last text-right">1.29</td>
<td class="data-td data last text-right">2.88</td>
</tr>
<tr class="tbl-data">
<td class="data-td last">Telecommunications</td>
<td class="data-td data last text-right">12.56</td>
<td class="data-td data last text-right">10.40</td>
<td class="data-td data last text-right" style="border-right: outset;">10.63</td>
<td class="data-td data last text-right">311</td>
<td class="data-td data last text-right">326</td>
<td class="data-td data last text-right" style="border-right: outset;">302</td>
<td class="data-td data last text-right">92.24</td>
<td class="data-td data last text-right">92.06</td>
<td class="data-td data last text-right" style="border-right: outset;">94.18</td>
<td class="data-td data last text-right">4.11</td>
<td class="data-td data last text-right">8.93</td>
</tr>
<tr class="tbl-data">
<td class="data-td last">Transportation</td>
<td class="data-td data last text-right">0.59</td>
<td class="data-td data last text-right">0.54</td>
<td class="data-td data last text-right" style="border-right: outset;">0.55</td>
<td class="data-td data last text-right">156</td>
<td class="data-td data last text-right">174</td>
<td class="data-td data last text-right" style="border-right: outset;">162</td>
<td class="data-td data last text-right">104.16</td>
<td class="data-td data last text-right">105.77</td>
<td class="data-td data last text-right" style="border-right: outset;">107.13</td>
<td class="data-td data last text-right">2.83</td>
<td class="data-td data last text-right">7.83</td>
</tr>
<tr class="tbl-data">
<td class="data-td last">Utility</td>
<td class="data-td data last text-right">2.22</td>
<td class="data-td data last text-right">1.99</td>
<td class="data-td data last text-right" style="border-right: outset;">3.51</td>
<td class="data-td data last text-right">173</td>
<td class="data-td data last text-right">191</td>
<td class="data-td data last text-right" style="border-right: outset;">172</td>
<td class="data-td data last text-right">96.71</td>
<td class="data-td data last text-right">97.28</td>
<td class="data-td data last text-right" style="border-right: outset;">102.06</td>
<td class="data-td data last text-right">4.29</td>
<td class="data-td data last text-right">7.89</td>
</tr>
<tr class="tbl-data">
<td class="data-td last">Grand Total</td>
<td class="data-td data last text-right">100</td>
<td class="data-td data last text-right" style="border-right: outset;">100</td>
<td class="data-td data last text-right">249</td>
<td class="data-td data last text-right">237</td>
<td class="data-td data last text-right" style="border-right: outset;">230</td>
<td class="data-td data last text-right">91.52</td>
<td class="data-td data last text-right">93.70</td>
<td class="data-td data last text-right" style="border-right: outset;">95.19</td>
<td class="data-td data last text-right">2.99</td>
<td class="data-td data last text-right">7.84</td>
</tr>
</tbody>
</table>
</div>
<p class="chart-disclosure">*Doesn&rsquo;t have securities for all months. Returns are based on partial period data.</p>
<p class="chart-disclosure">Source: ICE Data Services, VanEck. *Returns are based on partial period data. Fallen Angels: ICE US Fallen Angel High Yield 10% Constrained Index. Not intended as a recommendation to invest or divest in any of the sectors mentioned herein. Index performance is not representative of strategy performance. It is not possible to invest in an index.</p>
<p><strong>Fallen Angels Performance by Rating:</strong> BB-rated exposure increased during the quarter with the addition of new fallen angels, while CCC-rated exposure increased with the downgrades of Services Properties Trust (REITS) and Xerox (Tech) to CCC from Single-B. In terms of relative performance vs broad high yield, BB-rated were the top contributors in Q3 and YTD.</p>
<div class="wrapped-div">
<table style="width: 100%;">
<tbody>
<tr class="tbl-data">
<td class="tbl-header last text-center">&nbsp;</td>
<td class="tbl-header last text-center" style="border-right: outset;" colspan="3">Wgt (%)</td>
<td class="tbl-header last text-center" style="border-right: outset;" colspan="3">OAS</td>
<td class="tbl-header last text-center" style="border-right: outset;" colspan="3">Price</td>
<td class="tbl-header last text-right" colspan="2">Total Return</td>
</tr>
<tr class="tbl-data">
<td class="data-head data last text-right">&nbsp;</td>
<td class="data-head data last text-right">12/31/24</td>
<td class="data-head data last text-right">6/30/25</td>
<td class="data-head data last text-right" style="border-right: outset;">9/30/25</td>
<td class="data-head data last text-right">12/31/24</td>
<td class="data-head data last text-right">6/30/25</td>
<td class="data-head data last text-right" style="border-right: outset;">9/30/25</td>
<td class="data-head data last text-right">12/31/24</td>
<td class="data-head data last text-right">6/30/25</td>
<td class="data-head data last text-right" style="border-right: outset;">9/30/25</td>
<td class="data-head data last text-right">QTD</td>
<td class="data-head data last text-right">YTD</td>
</tr>
<tr class="tbl-data">
<td class="data-td last">BB</td>
<td class="data-td data last text-right">83.93</td>
<td class="data-td data last text-right">79.91</td>
<td class="data-td data last text-right" style="border-right: outset;">83.19</td>
<td class="data-td data last text-right">197</td>
<td class="data-td data last text-right" style="border-right: outset;">192</td>
<td class="data-td data last text-right">93.33</td>
<td class="data-td data last text-right">96.30</td>
<td class="data-td data last text-right" style="border-right: outset;">97.26</td>
<td class="data-td data last text-right">2.57</td>
<td class="data-td data last text-right">6.18</td>
</tr>
<tr class="tbl-data">
<td class="data-td last">B</td>
<td class="data-td data last text-right">10.09</td>
<td class="data-td data last text-right">14.98</td>
<td class="data-td data last text-right" style="border-right: outset;">7.55</td>
<td class="data-td data last text-right">474</td>
<td class="data-td data last text-right">294</td>
<td class="data-td data last text-right" style="border-right: outset;">314</td>
<td class="data-td data last text-right">86.36</td>
<td class="data-td data last text-right">88.79</td>
<td class="data-td data last text-right" style="border-right: outset;">92.71</td>
<td class="data-td data last text-right">2.75</td>
<td class="data-td data last text-right">17.45</td>
</tr>
<tr class="tbl-data">
<td class="data-td last">CCC</td>
<td class="data-td data last text-right">4.72</td>
<td class="data-td data last text-right">4.16</td>
<td class="data-td data last text-right" style="border-right: outset;">8.19</td>
<td class="data-td data last text-right">425</td>
<td class="data-td data last text-right">477</td>
<td class="data-td data last text-right" style="border-right: outset;">375</td>
<td class="data-td data last text-right">88.24</td>
<td class="data-td data last text-right">86.63</td>
<td class="data-td data last text-right" style="border-right: outset;">88.40</td>
<td class="data-td data last text-right">9.76</td>
<td class="data-td data last text-right">11.60</td>
</tr>
<tr class="tbl-data">
<td class="data-td last">CC</td>
<td class="data-td data last text-right">1.26</td>
<td class="data-td data last text-right">0.95</td>
<td class="data-td data last text-right" style="border-right: outset;">1.07</td>
<td class="data-td data last text-right">1262</td>
<td class="data-td data last text-right">1651</td>
<td class="data-td data last text-right" style="border-right: outset;">1510</td>
<td class="data-td data last text-right">54.65</td>
<td class="data-td data last text-right">45.75</td>
<td class="data-td data last text-right" style="border-right: outset;">49.89</td>
<td class="data-td data last text-right">13.15</td>
<td class="data-td data last text-right">2.96</td>
</tr>
<tr class="tbl-data">
<td class="data-td last">Total</td>
<td class="data-td data last text-right">100.00</td>
<td class="data-td data last text-right" style="border-right: outset;">100.00</td>
<td class="data-td data last text-right">249</td>
<td class="data-td data last text-right">237</td>
<td class="data-td data last text-right" style="border-right: outset;">230</td>
<td class="data-td data last text-right">91.52</td>
<td class="data-td data last text-right">93.70</td>
<td class="data-td data last text-right" style="border-right: outset;">95.19</td>
<td class="data-td data last text-right">2.99</td>
<td class="data-td data last text-right">7.84</td>
</tr>
</tbody>
</table>
</div>
<p class="chart-disclosure">Source: ICE Data Services, VanEck. Fallen Angels: ICE US Fallen Angel High Yield 10% Constrained Index. Not intended as a recommendation to invest or divest in any of the sectors mentioned herein. Index performance is not representative of strategy performance. It is not possible to invest in an index. BB index: ICE BofA BB US High Yield Index; Single-B index: ICE BofA Single-B US High Yield Index; CCC &amp; Lower rated index ICE BofA CCC &amp; Lower US High Yield Index</p>

<p>To receive more <a href="/us/en/blogs/income-investing/" title="Income Investing Insights"><strong>Income Investing</strong></a> insights, <a href="/link/5f45412c2143400497908cea2897f7d3.aspx" title=" Subscription Center"><strong>sign up in our subscription center</strong></a>.</p>
]]></content:encoded>
</item><item rdf:about="https://www.vaneck.com/us/en/blogs/income-investing/bdcs-the-liquid-alternative-to-private-credit/">
  <title>BDCs: The Liquid Alternative to Private Credit></title>
  <link>https://www.vaneck.com/us/en/blogs/income-investing/bdcs-the-liquid-alternative-to-private-credit/</link>
  <description><![CDATA[In the current market environment where liquidity is highly prized, BDCs present a compelling, liquid alternative to traditional private credit strategies.]]></description>
  <dc:creator>Coulter Regal, CFA</dc:creator>
  <dc:date>10/29/2025 06:30:00</dc:date>
<content:encoded><![CDATA[

<p><strong>Key Takeaways:</strong></p>
<ul class="content-list">
<li class="mt-2">BDCs provide exposure to private lending while performing in line with direct credit markets.</li>
<li class="mt-2">Liquidity matters in volatile markets, making BDCs attractive over illiquid private credit.</li>
<li class="mt-2">BDCs balance yield and access, giving investors flexibility to redeploy capital quickly.</li>
</ul>
<p>In the ever-evolving financial landscape, investors are constantly seeking innovative ways to diversify their portfolios and achieve optimal returns. Over the last decade, private equity and credit strategies have surged in popularity due to their unique return and yield potential. However, these typically come with the trade-off of reduced liquidity due to lockup periods. Recently, though, the importance of liquidity, especially in a market rife with uncertainties, is becoming more pronounced. In today's market where liquidity is highly prized, public Business Development Companies (BDCs) present a compelling, liquid alternative to traditional private credit strategies.</p>
<h2>Demand for Private Credit (and Liquidity) is Growing</h2>
<p>Private credit strategies have soared in popularity, offering attractive return and diversification opportunities. They have granted investors access to niche markets and to distinct return profiles, which has fueled asset growth in the space with market estimates predicting this growth to continue as assets under management are expected to eclipse $3 trillion by 2028.</p>
<h3>Demand for Private Credit Expected to Continue | 2014-2024</h3>
<p><img loading="lazy" class="img-responsive" alt="Demand for Private Credit Expected to Continue | 2014-2024" src="https://www.vaneck.com/contentassets/0e6ce7bf5d4148ebb1a7e937edc159c5/6303_bdcs-la-pc_chart-1_2025-10_v3_blog.svg" /></p>
<p class="chart-disclosure">Source: Preqin, Moody&rsquo;s Ratings. As of 12/31/2024. Moody&rsquo;s estimate uses Preqin's historical private debt fund AUM figures, which are not inclusive of all private credit AUM. Data does not include asset-based financing, real estate and infrastructure PC assets, assets in non-fund structures and leverage on these funds.</p>
<p>However, as geopolitical tensions, economic fluctuations and changing trade policy factors introduce volatility and unpredictability into the financial landscape, the value of liquidity has skyrocketed. Investors, now more than ever, are prioritizing the ability to access and redeploy capital swiftly. This heightened emphasis on liquidity is leading many to reconsider the long lockup periods associated with traditional private market strategies, resulting in a pivot towards more liquid investment vehicles, like public BDCs, that can offer a similar exposure without liquidity constraints.</p>
<h2>BDCs: The Liquid Alternative to Private Credit</h2>
<p>Business Development Companies are publicly traded entities focused on lending to and investing in private businesses. Established to promote investment in small and mid-sized firms, BDCs open doors to private credit markets. A standout advantage of public BDCs is their inherent liquidity. Unlike traditional private credit funds, which often have multi-year lockup periods, public BDCs are listed on major stock exchanges and can be traded daily. This grants investors the ability to modify their positions in response to market changes, personal financial needs or altered investment tactics.</p>
<p>Although there is no true index for the entire private credit market, the PitchBook Private Debt All US Index, which represents the performance of all closed-end private debt funds in the United States within PitchBook&rsquo;s universe, can be used as a general proxy to understand how the performance of public BDCs compares to the broad private credit market. Looking at the below performance chart, BDCs have largely performed in line with private credit over the last 10 years. During this period, public BDCs have exhibited a high correlation to the private credit market with the most visible difference between the two return streams being the apparent lack of volatility in the private market. However, this is more a result of lower liquidity and lack of price discovery in traditional private markets.</p>
<h3>Long Term BDC Performance in Line with Private Credit Market | 2014-2024</h3>
<p><img loading="lazy" class="img-responsive" alt="Long Term BDC Performance in Line with Private Credit Market | 2014-2024" src="https://www.vaneck.com/contentassets/0e6ce7bf5d4148ebb1a7e937edc159c5/6303_bdcs-la-pc_chart-2_2025-10_v1_blog.svg" /></p>
<p class="chart-disclosure">Source:Morningstar Direct. As of 12/31/2024. US Business Development Companies represented by the VanEck BDC Income ETF. Private Credit Proxy Index represented by the PitchBook Private Debt All US Index. The performance data quoted represents past performance. Past performance is not a guarantee of future results. Investment return and principal value of an investment will fluctuate so that an investor's shares, when redeemed, may be worth more or less than their original cost. Performance may be lower or higher than performance data quoted. Please call 800.826.2333 or visit vaneck.com for performance current to the most recent month ended.</p>
<h3>Average Total Quarter End Returns as of 9/30/2025 (%)<sup>*</sup></h3>
<div class="wrapped-div">
<table style="width: 100%;">
<tbody>
<tr class="tbl-data">
<td class="data-head last text-left">Ticker</td>
<td class="data-head last text-left">&nbsp;</td>
<td class="data-head last text-left">Investment Objective</td>
<td class="data-head last text-left">Fund Type (Active/Passive)</td>
<td>&nbsp;</td>
<td class="data-head last text-right">1 YR</td>
<td class="data-head last text-right">3 YR</td>
<td class="data-head last text-right">5 YR</td>
<td class="data-head last text-right">10 YR</td>
<td class="data-head last text-right">Life 02/11/13</td>
<td class="data-head last text-left">Gross Expense Ratio</td>
</tr>
<tr class="tbl-data">
<td class="data-td last text-left" rowspan="2">BIZD</td>
<td class="data-td data last text-left" rowspan="2">The VanEck BDC Income ETF</td>
<td class="data-td data last text-left" rowspan="2">seeks to replicate as closely as possible, before fees and expenses, the price and yield performance of the MVIS&reg;US Business Development Companies Index (MVBDCTRG), which tracks the overall performance of publicly traded business development companies.</td>
<td class="data-td data last text-left" rowspan="2">Passive</td>
<td class="data-td data last text-left">NAV</td>
<td class="data-td data last text-right">0.64</td>
<td class="data-td data last text-right">15.54</td>
<td class="data-td data last text-right">15.58</td>
<td class="data-td data last text-right">9.92</td>
<td class="data-td data last text-left">7.21</td>
<td class="data-td data last text-left" rowspan="2">12.86%</td>
</tr>
<tr class="tbl-data">
<td class="data-td data last text-left text-nowrap">Market Price</td>
<td class="data-td data last text-right">0.69</td>
<td class="data-td data last text-right">15.57</td>
<td class="data-td data last text-right">15.61</td>
<td class="data-td data last text-right">9.94</td>
<td class="data-td data last text-left">7.22</td>
</tr>
</tbody>
</table>
</div>
<br />
<div class="chart-disclosure">
<p><strong><sup>*</sup>&nbsp;Returns less than one year are not annualized.</strong></p>
<p><strong>Source: VanEck.</strong> Van Eck Absolute Return Advisers Corporation (the &ldquo;Adviser&rdquo;) will pay all expenses of the Fund, except for the fee payment under the investment management agreement, acquired fund fees and expenses, interest expense, offering costs, trading expenses, taxes and extraordinary expenses. Notwithstanding the foregoing, the Adviser has agreed to pay the offering costs until at September 1, 2026. &ldquo;Other Expenses&rdquo; have been restated to reflect current fees.</p>
<p><strong>The performance data quoted represents past performance. Past performance is not a guarantee of future results. Investment return and principal value of an investment will fluctuate so that an investor's shares, when redeemed, may be worth more or less than their original cost. Performance may be lower or higher than performance data quoted. Please call 800.826.2333 or visit <a title="ETF and Mutual Fund Manager" href="http://vaneck.com">http://vaneck.com</a> for performance current to the most recent month ended.</strong></p>
</div>
<p>In unstable market scenarios, the capacity for a swift exit or position reduction is invaluable. Private debt or credit fund lockup periods can be both an asset and a liability. While they can insulate investors from short-term market fluctuations, they can also hinder capital access during extended downturns or unexpected liquidity requirements. Thus, an increasing number of investors are opting for BDCs as a more liquid alternative.</p>
<h2>The Merits of a Diverse BDC Investment Strategy</h2>
<p>There are many publicly traded BDCs available in the market today, each with distinct risk profiles based on their asset structures, sector and credit exposures, financing terms and management quality. Investing in individual BDCs demands rigorous research to fully understand each entity. A holistic market approach to BDC investment can offer industry-wide diversification, negating the need for granular BDC assessments.</p>
<p>The <a href="/link/c48bed1be12e47c88f01e1bdbfa51ed2.aspx" title="BIZD - VanEck BDC Income ETF | Overview"><strong>VanEck BDC Income ETF (BIZD)</strong></a> offers broad market exposure to publicly traded U.S. business development companies and may be appealing for those looking for a liquid alternative to private credit funds. BIZD seeks to replicate as closely as possible, before fees and expenses, the price and yield performance of the&nbsp;<a href="/link/c48bed1be12e47c88f01e1bdbfa51ed2.aspx" title="BIZD - VanEck BDC Income ETF | Overview"><strong>MVIS<sup>&reg;</sup>&nbsp;US Business Development Companies Index</strong></a>, which tracks the overall performance of publicly traded business development companies.</p>
<style type="text/css">
    .wrapped-div {
        max-width: 100%;
    }

    @media (max-width: 1240px) {
        .wrapped-div {
            overflow-x: scroll;
        }


    }
</style>

]]></content:encoded>
</item><item rdf:about="https://www.vaneck.com/us/en/blogs/income-investing/why-clos-still-matter-in-a-rate-cutting-cycle/">
  <title>Why CLOs Still Matter in a Rate-Cutting Cycle></title>
  <link>https://www.vaneck.com/us/en/blogs/income-investing/why-clos-still-matter-in-a-rate-cutting-cycle/</link>
  <description><![CDATA[Discover why CLOs remain attractive during rate cuts, offering yield, diversification, and resilience.]]></description>
  <dc:creator> </dc:creator>
  <dc:date>10/29/2025 06:30:00</dc:date>
<content:encoded><![CDATA[

<p><strong>Key Takeaways:</strong></p>
<ul class="content-list">
<li class="mt-2">CLOs provide diversification and resilience across market and rate cycles.</li>
<li class="mt-2">CLOs have performed well in past rate-cutting cycles due to high carry and insulation from rate volatility.</li>
<li class="mt-2">Active management helps capture opportunities across the CLO capital structure.</li>
</ul>
<h2 id="clos-matter-amid-rate-cutting" class="jump-link-nav anchored-block" data-jumplink-title="CLOs Matter Amid Rate-Cutting">Why CLOs Still Matter in a Rate-Cutting Cycle</h2>
<p>One of the most common questions we receive from investors is: Why would we invest in collateralized loan obligations (CLOs), which pay floating rate coupons, if the Federal Reserve is cutting interest rates?</p>
<p>Our answer is simple: diversification, protection against volatility, higher credit spreads, and lower risk support the case for a strategic allocation to CLOs through market cycles. In addition, changing market environments can provide compelling opportunities for actively managed CLO strategies that can take advantage of higher yields.</p>
<p>Fundamentally, building a diversified portfolio that does not take outsized duration or credit bets can help to achieve better outcomes through market cycles, and we believe including credit-sensitive floating rate instruments like CLOs should be part of that. Their higher yield and low default risk, as well as floating rate nature, have driven this performance through varying market environments. Over the past decade, which has seen both easing and hiking cycles and both recessionary and strong growth periods, investment grade CLOs have outperformed core U.S. fixed income and mezzanine CLOs have outperformed U.S. high yield and leveraged loans.</p>
<h3>Strong Performance Through Market Cycles (9/30/2015 to 9/30/2025)</h3>
<p><img loading="lazy" class="img-responsive w-100" src="https://www.vaneck.com/contentassets/7bbca2327b484bfe8dcc31f11333d29c/6340_why-clos-still-matter_chart-1_2025-10_v1_blog.svg" alt="Strong Performance Through Market Cycles" /></p>
<p class="chart-disclosure"><i>Source: J.P. Morgan and ICE Data Indices as of 9/30/2025. IG CLOs represented by J.P. Morgan CLO Investment Grade Index; Mezz CLO represented by J.P. Morgan Balanced Mezzanine CLO Index; HY Corporates represented by ICE BofA US High Yield Index; US IG Corp represented by ICE BofA US Corporate Index; US Broad Market represented by ICE BofA US Broad Market Index. Leveraged Loans represented by Morningstar LSTA US Leveraged Loan 100 Index. Past performance is no guarantee of future results. Index performance is not representative of fund performance. It is not possible to invest directly in an index.</i></p>

<h2 id="performance-in-easing-cycles" class="jump-link-nav anchored-block" data-jumplink-title="Performance in Easing Cycles">Performance in Easing Cycles</h2>
<p>There have been three distinct easing cycles over the history of the J.P. Morgan CLO Index. Looking at these periods is instructive, but each situation is unique. For example, 2019&rsquo;s &ldquo;mid-cycle adjustment&rdquo; was characterized by slowing growth, persistently below target inflation and a flat yield curve. The dramatic easing during COVID was done to maintain financial market stability in a deep recessionary environment &ndash; hardly what we are experiencing today. We believe the 2024 easing cycle is most like what we are in now. Similar to today, we expect the current cycle to be fairly shallow. Inflation remains above target, growth has been resilient, the yield curve continues to steepen and many of the same geopolitical and trade tensions exist. During that period, Treasuries underperformed as long-term rates increased, tempering broad market returns. Intermediate duration asset classes like U.S. IG corporates fared better, and the credit environment remained strong. Investment grade CLOs outperformed the broad market but did not benefit from a duration tailwind, while more credit sensitive mezzanine tranches outperformed both leveraged loans and high yield.</p>
<div class="wrapped-div">
<table style="width: 100%;">
<tbody>
<tr class="tbl-data">
<td class="tbl-header last">&nbsp;</td>
<td class="tbl-header last text-right">IG CLOs</td>
<td class="tbl-header last text-right">Mezz CLO</td>
<td class="tbl-header last text-right">US Broad Market</td>
<td class="tbl-header last text-right">IG Corporates</td>
<td class="tbl-header last text-right">Leveraged Loans</td>
<td class="tbl-header last text-right">US HY</td>
</tr>
<tr class="tbl-data">
<td class="data-td last">All easing cycles</td>
<td class="data-td data last text-right">-1.43%</td>
<td class="data-td data last text-right">13.33%</td>
<td class="data-td data last text-right">-0.03%</td>
<td class="data-td data last text-right">7.22%</td>
<td class="data-td data last text-right">8.38%</td>
<td class="data-td data last text-right">10.92%</td>
</tr>
<tr class="tbl-data">
<td class="data-td last">All easing cycles ex. COVID</td>
<td class="data-td data last text-right">1.45%</td>
<td class="data-td data last text-right">-2.28%</td>
<td class="data-td data last text-right">0.31%</td>
<td class="data-td data last text-right">-3.27%</td>
<td class="data-td data last text-right">0.53%</td>
<td class="data-td data last text-right">-2.63%</td>
</tr>
<tr class="tbl-data">
<td class="data-td last">Last easing cycle (Sep. 2024 to Dec. 2024)</td>
<td class="data-td data last text-right">2.34%</td>
<td class="data-td data last text-right">14.42%</td>
<td class="data-td data last text-right">-1.76%</td>
<td class="data-td data last text-right">6.37%</td>
<td class="data-td data last text-right">8.15%</td>
<td class="data-td data last text-right">10.53%</td>
</tr>
</tbody>
</table>
</div>
<p class="chart-disclosure"><i>Source: J.P. Morgan and ICE Data Indices. Represents returns from 8/31/2024 to 12/31/2024. IG CLOs represented by J.P. Morgan CLO Investment Grade Index; Mezz CLO represented by J.P. Morgan Balanced Mezzanine CLO Index; HY Corporates represented by ICE BofA US High Yield Index; IG Corporates represented by ICE BofA US Corporate Index; US Broad Market represented by ICE BofA US Broad Market Index. Leveraged Loans represented by Morningstar LSTA US Leveraged Loan 100 Index. Past performance is no guarantee of future results. Index performance is not representative of fund performance. It is not possible to invest directly in an index.</i></p>
<p>Broadening our perspective, performance since the first rate cut in 2024 until now has been similarly robust. Investment grade CLOs have strongly outperformed other core fixed income asset classes, and mezzanine CLOs (AA-BB) have outperformed high yield bonds and loans.</p>
<h3 id="fi-returns-since-last-easing" class="jump-link-nav anchored-block" data-jumplink-title="FI Returns Since Last Easing">Fixed Income Returns Since the Last Easing Cycle</h3>
<p><img loading="lazy" class="img-responsive w-100" alt="Fixed Income Returns Since the Last Easing Cycle" src="https://www.vaneck.com/contentassets/dd736c05c52344aeaba694f86e495307/6340_why-clos-still-matter_chart-2_2025-10_v1_blog.svg" /></p>
<p class="chart-disclosure"><i>Source: J.P. Morgan and ICE Data Indices. Represents returns from 8/31/24 to 9/30/2025. IG CLOs represented by J.P. Morgan CLO Investment Grade Index; Mezz CLO represented by J.P. Morgan Balanced Mezzanine CLO Index; HY Corporates represented by ICE BofA US High Yield Index; IG Corporates represented by ICE BofA US Corporate Index; US Broad Market represented by ICE BofA US Broad Market Index. Leveraged Loans represented by Morningstar LSTA US Leveraged Loan 100 Index. Past performance is no guarantee of future results. Index performance is not representative of fund performance. It is not possible to invest directly in an index.</i></p>
<p>Why have CLOs performed well since the last cycle? In short, high carry and diversification. When evaluating CLOs in a rate cutting environment, it&rsquo;s important to note that because coupons adjust with prevailing short-term rates, CLO prices are not materially impacted by rate declines. Another key point: because CLOs are securitized pools of leveraged loans, returns are largely driven by credit exposure, and that provides unique opportunities when market conditions change &ndash; for example when the economy enters a new rate cycle. The spreads achievable on CLOs, particularly within mezzanine tranches, is indicative of this significant credit element. For example, in the case of BB CLOs, the coupon spread above the 3-month Secured Overnight Funding Rate (&ldquo;SOFR&rdquo;) is greater than SOFR itself. The ability to take advantage of the full CLO capital structure provides for more attractive opportunities within an income portfolio, versus a AAA-constrained strategy.</p>
<h3>CLO Coupons Well Above SOFR</h3>
<p><img loading="lazy" class="img-responsive w-100" src="https://www.vaneck.com/contentassets/dc6ba64d47ae4cdaa084a0994e777d2f/6340_why-clos-still-matter_chart-3_2025-10_v2.svg" alt="CLO Coupons Well Above SOFR" /></p>
<p class="chart-disclosure"><i>Source: J.P. Morgan and Bloomberg, as of 10/17/2025</i></p>
<p>Historically, credit spreads tend to be negatively correlated with the direction of interest rates. For example, high yield bond spreads and 3-month T-bill returns have exhibited a correlation of -18% since 12/31/2003, and the relationship is -40% compared to the 10-year U.S. Treasury bond.<sup>1</sup>&nbsp;When rates are declining, this means investors may be able to capture higher spreads, particularly in lower rated tranches, allowing for the potential to both participate in upside price recovery and capture high absolute yields. To benefit from this dynamic, however, the ability to dynamically allocate to higher or lower quality tranches is necessary.</p>
<p>Lastly it is worth emphasizing that Fed rate cuts do not necessarily mean lower long-term bond yields. High inflation, fiscal irresponsibility, political dysfunction and attacks on Fed independence may all be factors keeping long-term rates higher even as the Fed eases. Further, the yield curve is not historically steep, as shown below. In this context, and long-term rates may not decline or could even increase. Lastly, higher rates and the end of quantitative easing has meant higher rate volatility in recent years. All of these factors, in our opinion, support an allocation to floating rate, credit sensitive CLOs within a bond portfolio.</p>
<h3>Difference Between 10-Year and 2-Year U.S. Treasury Yields</h3>
<p><img loading="lazy" class="img-responsive w-100" src="https://www.vaneck.com/contentassets/f024b0ead2364fe7874119e93c3af7f2/6340_why-clos-still-matter_chart-4_2025-10_v1_blog.svg" alt="Difference Between 10-Year and 2-Year U.S. Treasury Yields" /></p>
<p class="chart-disclosure">Source: ICE Data Indices as of 9/30/2025. This is not an offer to buy or sell, or a recommendation to buy or sell any of the securities mentioned herein. See index descriptions at the end of presentation. Past performance not indicative of future results. Index performance is not representative of fund performance. It is not possible to invest directly in an index.</p>
<p>Every situation is different, and the reason for rate declines will ultimately drive the opportunity. The current rate cutting cycle, for instance, has so far been characterized by continued economic growth and strong corporate fundamentals, and accordingly, tight credit spreads. Rich valuations may favor a cautious approach in this environment rather than full &ldquo;risk-on&rdquo; positioning. Within loans, however, pricing dispersion reflects more challenged fundamentals among certain issuers and sectors. If this becomes a broader trend, spread widening will provide more attractive opportunities than what exists currently. In a more recessionary scenario, we would expect more significant rate cuts and significant widening throughout the capital stack but most acutely in BBB and below. This is when the most attractive opportunities may arise further down in the capital structure, and investors may benefit from both price appreciation and a high level of carry &ndash; despite low base rates.</p>
<p>However, one does not need to wait for extreme environments to benefit from the higher spreads that CLOs can provide. CLOs have consistently provided significantly greater spreads versus bonds and loans of the same rating in all rate environments. In other words, CLO investors can earn more while not necessarily taking on additional credit risk.</p>
<h3 id="earn-more-without-more-risk" class="jump-link-nav anchored-block" data-jumplink-title="Earn More Without More Risk">CLO Investors Can Earn More Without Taking On Additional Credit Risk</h3>
<p><img loading="lazy" class="img-responsive w-100" src="https://www.vaneck.com/contentassets/fd449d599b7c4d43a732c38bd4fbb719/6340_why-clos-still-matter_chart-5_2025-10_v2.svg" alt="CLO Investors Can Earn More Without Taking On Additional Credit Risk" /></p>
<p class="chart-disclosure"><i>Source: JP Morgan and ICE Data Services as of 9/30/2025. Using OAS for corporate bonds and discount margins for CLOs. AAA Rated CLOs represented by J.P. Morgan CLO AAA Index, AA Rated CLOs represented by J.P. Morgan CLO AA Index, A Rated CLOs represented by J.P. Morgan CLO A Index, BBB Rated CLOs represented by J.P. Morgan CLO BBB Index, BB Rated CLOs represented by J.P. Morgan CLO BB Index, B Rated CLOs represented by J.P. Morgan CLO B Index AAA Rated Corps represented by the ICE BofA AAA US Corporate Index, AA Rated Corps represented by the ICE BofA AA US Corporate Index, A Rated Corps represented by the ICE BofA A US Corporate Index, BBB Rated Corps represented by the ICE BofA BBB US Corporate Index, BB Rated Corps represented by the ICE BofA BB US High Yield Index and B Rated Corps represented by the ICE BofA Single-B US High Yield Index. Index descriptions at the end of this presentation. Past performance is not indicative of future results. Index performance is not representative of fund performance. It is not possible to invest directly in an index. This is not an offer to buy or sell, or recommendation to buy or sell any of the securities mentioned herein.</i></p>
<p>One reason CLOs in aggregate can perform well in differing rate environments is that they have a full capital structure, from AAA to BB, and different tranches can behave differently because of their different exposures to the underlying loan portfolio. Opportunities may arise in one part of the capital structure and become relatively attractive versus other parts. The key is to invest in a strategy that can take advantage of these opportunities within the capital structure. An experienced manager can assess relative value and add or de-risk at the right time, while also adding value through rigorous bottom-up analysis of every unique CLO.</p>
The <a href="/link/e090deaddc774ac699a04b959d9254c6.aspx" title="CLOI - VanEck CLO ETF - Overview"><strong>VanEck CLO ETF (CLOI)</strong></a>, launched in June 2022, focuses on investment grade CLOs and offers investors a compelling way to add CLO exposure to their core bond portfolio. For investors seeking greater yield potential and who are able to tolerate additional volatility, the <a href="/link/d2f16468a9f14c1e807f6bb7fb597a3e.aspx" title="CLOB - VanEck AA-BB CLO ETF - Overview"><strong>VanEck AA-BB CLO ETF (CLOB)</strong></a> provides a way to access lower rated, or &ldquo;mezzanine,&rdquo; tranches between the AAA and equity tranches. Both ETFs are actively managed by PineBridge Investments, which has decades of experience in the CLO market.

<p>To receive more <a href="/us/en/blogs/income-investing/" title="Income Investing Insights"><strong>Income Investing</strong></a> insights, <a href="/link/5f45412c2143400497908cea2897f7d3.aspx" title=" Subscription Center"><strong>sign up in our subscription center</strong></a>.</p>
]]></content:encoded>
</item><item rdf:about="https://www.vaneck.com/us/en/blogs/thematic-investing/how-ai-is-powering-the-next-era-of-video-gaming/">
  <title>How AI is Powering the Next Era of Video Gaming></title>
  <link>https://www.vaneck.com/us/en/blogs/thematic-investing/how-ai-is-powering-the-next-era-of-video-gaming/</link>
  <description><![CDATA[AI is transforming video gaming by accelerating development and enhancing player engagement, while the growth of mobile and in-game spending is redefining how games are monetized and experienced.]]></description>
  <dc:creator>Nick Frasse</dc:creator>
  <dc:date>10/29/2025 06:30:00</dc:date>
<content:encoded><![CDATA[

<p><strong>Key Takeaways:</strong></p>
<ul class="content-list">
<li class="mt-2">Gaming growth stays strong, driven by AI, monetization, and rising global engagement.</li>
<li class="mt-2">Top publishers/platforms led performance via mobile gains, strong content, and margin growth.</li>
<li class="mt-2">Gaming remains a scalable, recurring form of digital entertainment despite shifting leadership.</li>
</ul>
<h2>The Expanding World of Interactive Entertainment</h2>
<p>Video gaming has evolved into one of the most influential forces in global entertainment, now engaging more than 3.4 billion players worldwide. Revenues are projected to rise another 3 to 4 percent in 2025, showing the continued strength of a sector that grows even as broader media habits shift. What drives this momentum is accessibility, digital connectivity, and cultural ubiquity. Gaming today spans generations, with nearly half of players identifying as female and a rising share of older adults now playing weekly. It is no longer just a pastime; it has become a primary channel for entertainment, creativity, and social interaction.</p>
<h3>It&rsquo;s Not Just Kids Playing Video Games</h3>
<p><img loading="lazy" class="img-responsive w-100" alt="It's Not Just Kids Playing Video Games" src="https://www.vaneck.com/contentassets/fe641a483cde4f03942461c0dc5a758c/6350_espo-blog-charts_chart-1_2025-10_v1_blog.svg" /></p>
<p class="chart-disclosure">Source: theesa.com as of 02.2025.</p>

<p>At the same time, the gaming business model has matured. Mobile now accounts for about half of global industry revenues, and in-game spending has become the dominant source of monetization. The shift from one-time purchases to ongoing digital transactions has created more predictable revenue streams and stronger engagement cycles. As studios continue to extend the lifespan of popular titles through updates, expansions, and live events, gaming has become a recurring digital economy rather than a series of standalone releases.</p>
<h3>In-App Purchases Are a Material Driver of Revenues</h3>
<p><img loading="lazy" class="img-responsive w-100" alt="In-App Purchases Are a Material Driver of Revenues" src="https://www.vaneck.com/contentassets/32286833de3e4a9b9d4246baabc0a431/6350_espo-blog-charts_chart-2_2025-10_v1.svg" /></p>
<p class="chart-disclosure">Source: Statista, as of 06.2025. For illustrative purposes only. Not a projection of future results. Past performance is no guarantee of future results.</p>
<h2>Inside the ESPO Story: Who&rsquo;s Driving Growth</h2>
<p>The <strong><a href="/link/d41cc1b7916f46e5bb3ee751f311c4f2.aspx" title="ESPO - VanEck Video Gaming and eSports ETF - Overview">VanEck Video Gaming and eSports ETF (ESPO)</a></strong> reflects this evolution. Over the past year, strong results from Nintendo, Roblox, and NetEase show how publishers are finding new ways to expand engagement and monetize their audiences. AppLovin was a standout contributor, as its AI-driven ad platform helped developers optimize user acquisition and improve profitability. Tencent also added to returns through steady performance across its global gaming operations.</p>
<p>Some of these names, including AppLovin and AMD, are no longer part of the index due to ESPO&rsquo;s strict requirement that at least half of company revenue comes from gaming and esports. This approach ensures exposure stays pure and aligns with the industry&rsquo;s long-term growth drivers, not broader tech trends.</p>
<p>Key themes behind performance include:</p>
<ul>
<li class="mt-2">Expansion of mobile and in-game revenue models supporting recurring growth.</li>
<li class="mt-2">Strong content pipelines from global publishers extending franchise longevity.</li>
<li class="mt-2">Increased use of AI tools in development, marketing, and player engagement.</li>
</ul>
<h2>The AI Acceleration Moment</h2>
<p>Artificial intelligence is emerging as the next major catalyst for gaming. In his recent appearance on the Thoughtful Money podcast, VanEck CEO Jan van Eck discussed how <strong><a href="/us/en/blogs/investment-outlook/jan-van-eck-q4-2025-outlook-escaping-the-reckoning/" title="Q4 2025 Outlook: Escaping the Reckoning?">AI may be undervalued</a></strong> by markets when it comes to creative industries. He noted that the leveraged buyout of Electronic Arts highlights how investors may be missing the intersection between AI and gaming&rsquo;s potential for innovation.</p>
<p>Gaming companies are poised to embrace AI faster than many other industries because experimentation and rapid iteration are already central to their culture. AI streamlines every layer of the value chain, from how games are made, to how they are played, to how they are marketed.</p>
<p>Developers are using AI to build and test new worlds in days instead of months. Gameplay is becoming more adaptive, with storylines and NPCs that respond to player behavior. Studios are marketing smarter, using data to target players and personalize content. Together, these advances are reshaping production cycles, improving engagement, and expanding profitability potential across the ecosystem.</p>
<h3>AI Game Developers are Adopting AI Tools in All Aspects of Development</h3>
<p><img loading="lazy" class="img-responsive w-100" alt="AI Game Developers are Adopting AI Tools in All Aspects of Development" src="https://www.vaneck.com/contentassets/7ea254e910a340fa9a339851ce013e5b/6350_espo-blog-charts_chart-3_2025-10_v1_blog.svg" /></p>
<p class="chart-disclosure">Source: Konvoy, as of 2025. For illustrative purposes only.</p>
<h2>Gaming&rsquo;s New Playbook</h2>
<p>The intersection of gaming and AI represents one of the most compelling growth frontiers in digital media. As AI tools lower production costs, enhance storytelling, and deepen engagement, gaming is positioned to remain one of the most globally connected and innovative industries. Leadership within the space will evolve, but the underlying growth drivers, including scalable intellectual property, recurring digital revenues, and expanding player engagement, remain firmly intact.</p>
<p>The VanEck ESPO ETF captures this evolution through a focused portfolio of companies at the heart of the video gaming and esports ecosystem. By maintaining strict inclusion criteria and global diversification, it offers exposure to a sector that is not only growing but redefining how entertainment, technology, and digital identity intersect.</p>
<h2>Approaching the Video Gaming and eSports Opportunity</h2>
<p>For investors, gaining exposure to this fast-changing sector requires focus. The video gaming and esports industry spans publishers, hardware manufacturers, and software platforms that directly generate revenue from interactive entertainment.</p>
<p>The <strong><a href="/link/d41cc1b7916f46e5bb3ee751f311c4f2.aspx" title="ESPO - VanEck Video Gaming and eSports ETF - Overview">VanEck Video Gaming and eSports ETF (ESPO)</a></strong> tracks the MVIS Global Video Gaming and eSports Index, which includes companies deriving at least 50 percent of revenue from gaming and esports-related activities. This rule ensures that the portfolio remains centered on companies truly driving industry growth rather than broader tech conglomerates with peripheral exposure.</p>
<p>By combining exposure across publishers, developers, and hardware makers, the <strong><a href="/link/d41cc1b7916f46e5bb3ee751f311c4f2.aspx" title="ESPO - VanEck Video Gaming and eSports ETF - Overview">VanEck ESPO ETF</a></strong> provides a comprehensive view into one of the most creative, innovative, and high-growth corners of global media. As AI accelerates how games are developed and experienced, <a href="/link/d41cc1b7916f46e5bb3ee751f311c4f2.aspx" title="ESPO - VanEck Video Gaming and eSports ETF - Overview"><strong>ESPO</strong></a> offers a way to access that transformation through a disciplined, research-driven lens.</p>

<p>To receive more <a href="https://www.vaneck.com/us/en/insights/thematic-investing/" title="Thematic Investing Insights"><strong>Thematic Investing</strong></a> insights, <a href="https://www.vaneck.com/us/en/subscribe/" title="Subscription Center"><strong>sign up in our subscription center</strong></a>.</p>
]]></content:encoded>
</item><item rdf:about="https://www.vaneck.com/us/en/blogs/natural-resources/ai-and-nuclear-power/">
  <title>AI&#39;s Impact on the Surge of Nuclear Investments: Everything You Need to Know></title>
  <link>https://www.vaneck.com/us/en/blogs/natural-resources/ai-and-nuclear-power/</link>
  <description><![CDATA[Explore how AI fuels nuclear investments, drives energy demand, and attracts tech giants to nuclear power.]]></description>
  <dc:creator>Coulter Regal, CFA</dc:creator>
  <dc:date>10/28/2025 06:30:00</dc:date>
<content:encoded><![CDATA[


<p><strong>Key Takeaways:</strong></p>
<ul class="content-list">
<li class="mt-2">AI is fueling a surge in energy demand, pushing tech giants to seek stable, low-carbon power sources.</li>
<li class="mt-2">Nuclear energy offers reliability, cost efficiency, and sustainability, making it ideal for powering data centers.</li>
<li class="mt-2">Companies like Amazon, Google, and Gates-backed TerraPower are leading a new wave of nuclear investment.</li>
</ul>
<p>Artificial intelligence (AI) is transforming industries worldwide. One unexpected beneficiary is the nuclear energy sector. The rapid growth of AI has led to a significant increase in energy demand, prompting tech giants to explore <a href="https://www.vaneck.com/us/en/blogs/natural-resources/a-resurgence-of-nuclear-energy/" title="A Resurgence of Nuclear Energy?"><strong>nuclear power</strong></a> as a sustainable solution. In this blog we will break down how AI is driving nuclear investments, the reasons behind tech companies' shift to nuclear energy, key players in the market, and investment strategies for the future.</p>
<div class="row">
<div class="col-md-4 col-xs-12"><a href="https://www.youtube.com/embed/ccjlfCIGcbE" data-video="https://youtu.be/ccjlfCIGcbE" class="popup-youtube" title="Watch Video"><img loading="lazy" class="img-responsive" style="margin-right: 15px; margin-top: 0px;" src="https://www.vaneck.com/EPiServer/CMS/Content/contentassets/en/9691f0ae2b2f4e08ab402c5793c97b92/4885_nlr-ai_coulter-regal_thumbnail_2024-10_v1.jpg,,295765/Download?epieditmode=False" alt="Watch Video" align="left" /></a></div>
<div class="col-md-8 col-xs-12"><br /><strong><a href="https://www.youtube.com/embed/ccjlfCIGcbE" data-video=" https://youtu.be/ccjlfCIGcbE" class="popup-youtube" title="Watch Video">Watch Video</a><br /></strong><a href="https://www.youtube.com/embed/ccjlfCIGcbE" data-video="https://youtu.be/ccjlfCIGcbE" class="popup-youtube" title="Watch Video" style="font-size: 16px; font-weight: bold; padding: 10px 0px 0px; margin-right: 20px; width: 202px;">AI's Impact on the Surge of Nuclear Investments</a></div>
</div>
<br />
<h2 id="AI-and-Energy-Demand" class="jump-link-nav anchored-block" data-jumplink-title="AI and Energy Demand">AI is Contributing to an Increasing Demand in Energy</h2>
<p>The growing popularity of artificial intelligence is creating a surge in energy consumption. The primary reason for this related increase in energy consumption is because data centers, essential for AI operations, are energy-intensive, leading to a substantial rise in electricity demand.</p>
<p>As AI technologies advance, the number and size of data centers are expected to grow exponentially. Leading tech companies are ramping up their investments in data centers to support AI development and deployment. This trend is expected to continue, further increasing energy consumption.</p>
<p>According to the International Energy Agency, <a href="https://www.iea.org/news/ai-is-set-to-drive-surging-electricity-demand-from-data-centres-while-offering-the-potential-to-transform-how-the-energy-sector-works" title="AI is set to drive surging electricity demand from data centres while offering the potential to transform how the energy sector works" target="_blank" rel="noopener"><strong>electricity demand from data centers worldwide is set to more than double by 2030</strong></a>.</p>
<h2 id="Technology-and-Nuclear-Power" class="jump-link-nav anchored-block" data-jumplink-title="Technology and Nuclear Power">Why are Tech Companies Turning to Nuclear Power?</h2>
<p>Tech companies are increasingly considering nuclear power to meet their energy needs for several reasons. Here&rsquo;s an in-depth look at the key factors driving this shift:</p>
<h3>Low Carbon Emissions</h3>
<p>Nuclear power offers a robust solution to tech giants' ambitious <a href="https://www.vaneck.com/us/en/blogs/sustainable-investing/sustainability-simplified-net-zero-vs-carbon-neutral/" title="Sustainability Simplified: Net Zero vs. Carbon Neutral"><strong>net-zero carbon</strong></a> goals. Unlike fossil fuels, nuclear energy produces minimal greenhouse gas emissions during electricity generation. This feature is crucial for companies like Google, Microsoft, and Amazon, which have committed to significant sustainability targets.</p>
<p>Moreover, the long-term nature of nuclear power plants, which typically operate for 40-60 years or more, ensures a prolonged period of low-emission energy production, further aiding in the fight against climate change.</p>
<h3>Cost and Stability</h3>
<p>One of the significant advantages of nuclear power is its ability to provide a stable and cost-effective energy source. Data centers require consistent and reliable power to function efficiently. Nuclear energy's inherent characteristics make it an ideal candidate to meet these needs for several reasons:</p>
<ul class="content-list">
<li><strong>Stable Energy Supply</strong>: Unlike renewable sources like wind and solar, which are intermittent and dependent on weather conditions, nuclear power plants offer a continuous and stable energy output. This reliability is crucial for data centers that cannot afford interruptions.</li>
<li><strong>Cost-Effectiveness</strong>: Over the long term, nuclear energy can be more cost-effective than other energy sources. While the initial capital investment for building nuclear power plants is high, the operational costs are relatively low, and the fuel costs are stable. This economic predictability is beneficial for tech companies planning their long-term energy expenditures.</li>
</ul>
<p>Furthermore, the high energy density of nuclear power means that a small amount of nuclear fuel can produce a large amount of energy. This efficiency translates into lower operational costs over time, making nuclear energy an economically viable option for powering extensive data center operations.</p>
<h3>ADVANCE Act</h3>
<p>The ADVANCE Act plays a crucial role in facilitating the development and deployment of advanced nuclear technologies. This legislation provides a supportive framework that makes it easier for companies to invest in nuclear power. Key provisions of the ADVANCE Act include:</p>
<ul class="content-list">
<li><strong>Research and Development Support</strong>: The Act allocates funds and resources for the research and development of new nuclear technologies, such as small modular reactors (SMRs) and advanced reactor designs. These innovations promise safer, more efficient, and more flexible nuclear power solutions, appealing to tech companies looking for cutting-edge energy sources.</li>
<li><strong>Regulatory Streamlining</strong>: By simplifying the regulatory processes involved in developing and operating nuclear facilities, the ADVANCE Act reduces the bureaucratic hurdles that companies might face. This streamlining accelerates the timeline from conception to operation, making nuclear projects more attractive and feasible for tech companies.</li>
<li><strong>Public-Private Partnerships</strong>: The Act encourages collaborations between the public sector and private companies. Such partnerships can leverage government support and private sector innovation, resulting in more robust and advanced nuclear energy solutions.</li>
</ul>
<p>By addressing both technological and regulatory challenges, the ADVANCE Act paves the way for more widespread adoption of nuclear energy. This legislative support is crucial for tech companies as they navigate the complexities of transitioning to nuclear power.</p>
<p>In summary, the convergence of sustainability goals, cost and stability benefits, and supportive legislation is making nuclear power an increasingly attractive option for tech companies. As these firms continue to expand their AI capabilities and data center operations, the role of nuclear energy in meeting their growing energy demands is set to become more prominent.</p>
<h2 id="Nuclear-Power-Demand" class="jump-link-nav anchored-block" data-jumplink-title="Nuclear Power Demand">Signals of Nuclear Power Demand</h2>
<h3>Amazon's $650 Million Data Center</h3>
<p>Amazon's acquisition of a data center near the Susquehanna nuclear power plant in Berwick, PA, for $650 million is a prime example of the strategic importance of nuclear energy for tech infrastructure. This data center, powered entirely by the adjacent Susquehanna Steam Electric Station, signifies Amazon's commitment to integrating clean energy into its operations. The plant, which is one of the largest nuclear power facilities in the United States, ensures a stable and continuous power supply crucial for Amazon Web Services (AWS) operations.</p>
<p>This move aligns with Amazon's broader sustainability goals, including its Climate Pledge to be net-zero carbon by 2040. By utilizing nuclear energy, Amazon can significantly reduce its carbon footprint while ensuring energy reliability. In addition, the fixed-price nuclear power agreement with Talen Energy offers Amazon economic predictability and stability, essential for long-term operational planning.</p>
<h3>Bill Gates and TerraPower</h3>
<p>Bill Gates' investment in TerraPower highlights confidence in the future of advanced nuclear reactor designs. TerraPower, co-founded by Gates, focuses on developing next-generation nuclear reactors, including the Natrium reactor, which aims to enhance safety, efficiency, and cost-effectiveness.</p>
<p>TerraPower's Natrium reactor features a unique design that uses molten salt as a coolant, providing enhanced safety and efficiency compared to traditional water-cooled reactors. This design also allows for better load-following capabilities, making it suitable for integrating with renewable energy sources. TerraPower is also exploring nuclear fusion and other cutting-edge technologies, positioning itself as a leader in the nuclear energy sector. Gates' investment underscores the importance of innovation and research in achieving sustainable energy solutions.</p>
<h3>Google and Chevron's Investment in TAE Technologies</h3>
<p>Google and Chevron's investment in TAE Technologies, a company focused on nuclear fusion, reflects a broader trend of tech companies exploring advanced nuclear technologies. TAE Technologies is at the forefront of developing clean fusion energy, which has the potential to provide virtually limitless and carbon-free power.</p>
<p>Nuclear fusion promises a revolutionary energy source by fusing atomic nuclei to release energy, similar to the processes powering the sun. Unlike traditional nuclear fission, fusion produces minimal radioactive waste and has no risk of catastrophic failure.</p>
<p>TAE Technologies is working on advanced plasma physics and proprietary technologies to make fusion energy a practical reality. This includes the use of advanced particle accelerators and magnetic confinement systems. Google and Chevron's investments support TAE's research and development efforts, providing the necessary capital and technological expertise to accelerate the commercialization of fusion energy. These investments also highlight the strategic importance of diversifying energy portfolios to include innovative and sustainable solutions.</p>
<style>
#premium-content-model-269910 {
	display: none;
}
</style>

<h2 id="Rising-Nuclear-Companies" class="jump-link-nav anchored-block" data-jumplink-title="Rising Nuclear Companies">Nuclear Companies on the Rise</h2>
<p>The increased interest in nuclear energy is driving significant traction for several key companies in the industry. These companies are not only developing advanced nuclear technologies but also positioning themselves as crucial players in the evolving energy landscape. Here&rsquo;s an in-depth look at some of the prominent nuclear companies gaining attention:</p>
<h3>Public Service Enterprise Group (PSEG)</h3>
<p>PSEG benefits from its substantial nuclear power generation capacity. As a major utility with several nuclear plants, PSEG is poised to meet the increasing demand for clean and reliable energy. Nuclear energy's role in achieving carbon reduction targets enhances PSEG's market position as a provider of low-carbon electricity. PSEG&rsquo;s commitment to maintaining and potentially expanding its nuclear fleet aligns with broader policy trends favoring nuclear energy for its low emissions and reliability.</p>
<h3>Constellation Energy Corp</h3>
<p>Constellation Energy Corp, formerly part of Exelon, operates one of the largest fleets of nuclear power plants in the United States. The company's extensive nuclear portfolio positions it to benefit significantly from the rising demand for clean energy. Constellation&rsquo;s nuclear plants provide stable and reliable baseload power, which is crucial as the energy grid incorporates more intermittent renewable sources like wind and solar.</p>
<p>Constellation&rsquo;s strategy includes maintaining and upgrading its existing nuclear plants to ensure they remain operational and efficient. This approach not only helps meet current energy demands but also positions the company to benefit from future increases in nuclear energy adoption driven by policies aimed at reducing greenhouse gas emissions.</p>
<h3>Cameco Corp</h3>
<p>Cameco Corp is one of the world&rsquo;s largest uranium producers, and its position in the nuclear fuel supply chain gives it a unique advantage as demand for nuclear energy grows. Cameco&rsquo;s extensive uranium mining operations and its recent strategic partnership with Brookfield Renewable to acquire Westinghouse Electric Company highlight its comprehensive approach to the nuclear sector.</p>
<p>The strategic positioning and comprehensive capabilities of Public Service Enterprise Group, Constellation Energy Corp, and Cameco Corp enable these companies to capitalize on the growing demand for nuclear energy. Their investments in nuclear technology, production capacity, and long-term supply agreements position them to benefit from the increasing emphasis on clean, reliable, and low-carbon energy solutions.</p>
<h2 id="Investing-in-Nuclear-Power" class="jump-link-nav anchored-block" data-jumplink-title="Investing in Nuclear Power">Investing in Nuclear Power: Investing Strategies</h2>
<p>The nuclear and uranium sectors are on the brink of substantial expansion. According to recent reports, global uranium production is expected to grow at an 8% CAGR (Compound Annual Growth Rate) reaching 91.6 kilotonnes by 2030. (<a href="https://www.mining-technology.com/analyst-comment/global-uranium-production-grow-modestly-2025/" title="Global uranium production expected to grow modestly in 2025, due to temporary mine disruptions" target="_blank" rel="noopener"><strong>Mining Technology</strong></a>).</p>
<p>The World Nuclear Association (WNA) projects that global nuclear capacity will rise significantly, with estimates suggesting a growth from 391 gigawatts (GW) in mid-2023 to 686 GW by 2040 (<a href="https://www.nucnet.org/news/uranium-demand-expected-to-surge-by-28-by-2030-9-5-2023" title="Nuclear Fuel Report / Uranium Demand Expected To Surge By 28% By 2030" target="_blank" rel="noopener"><strong>NUCNET</strong></a>). This growth is fueled by the development of new reactors, particularly in China and India, as well as the extension of the operating lifetimes of existing plants.</p>
<p>The demand for uranium is also expected to surge, with WNA anticipating a 28% increase by 2030 and nearly doubling by 2040 as countries ramp up nuclear power capacity to meet zero-carbon targets (<a href="https://www.nucnet.org/news/uranium-demand-expected-to-surge-by-28-by-2030-9-5-2023" title="Nuclear Fuel Report / Uranium Demand Expected To Surge By 28% By 2030" target="_blank" rel="noopener"><strong>NUCNET</strong></a>). This upward trend in uranium demand highlights the critical role nuclear energy will play in future energy strategies.</p>
<h3>Investment Strategies</h3>
<p>Investing in the nuclear sector requires a strategic approach to maximize returns and mitigate risks. Here are some strategies to consider:</p>
<ol class="content-list">
<li><strong>Diversification</strong>: Diversifying investments across companies involved in different aspects of nuclear technology, from reactor development to uranium mining, can help balance the portfolio. This approach reduces exposure to sector-specific risks and leverages growth opportunities in various segments of the industry.</li>
<li><strong>Focus on Key Players</strong>: Investing in established companies that are at the forefront of nuclear technology and development can be advantageous</li>
<li><strong>Long-term Perspective</strong>: Given the lengthy development and operational timelines of nuclear projects, a long-term investment perspective is essential. Investors should be prepared for gradual returns as nuclear plants and technologies take time to mature and become fully operational.</li>
<li><strong>Monitoring Policy Changes</strong>: Staying informed about regulatory changes and government policies is crucial. Supportive policies, such as the ADVANCE Act in the U.S., can significantly impact the growth and profitability of nuclear investments.</li>
</ol>
<p>By understanding these dynamics and strategically positioning investments, investors can capitalize on the promising growth trajectory of the nuclear sector.</p>

<br />
<h2>Conclusion</h2>
<p>The intersection of AI and nuclear power is creating a new frontier in energy investments. As AI drives up energy demand, tech giants are turning to nuclear power for its sustainability and reliability. Key companies like PSEG, Constellation Energy Corp, and Cameco Corp are leading the charge, and strategic investments in this sector hold promise for significant growth potential over time.</p>
<p>To learn more about how to capitalize on this investment opportunity explore <a href="https://www.vaneck.com/us/en/investments/uranium-nuclear-energy-etf-nlr/overview/" title="NLR - VanEck Uranium and Nuclear ETF - Holdings and Performance"><strong>VanEck&rsquo;s Uranium and Nuclear ETF (NLR).</strong></a></p>
<p>To receive more <a href="/us/en/insights/natural-resources/" title="Natural Resources Insights"><strong>Natural Resources</strong></a> and <a href="https://www.vaneck.com/us/en/insights/thematic-investing/" title="Thematic Investing Insights"><strong>Thematic Investing</strong></a> insights, <a href="https://www.vaneck.com/us/en/subscribe/" title="Subscription Center"><strong>sign up in our subscription center</strong></a>.</p>
]]></content:encoded>
</item><item rdf:about="https://www.vaneck.com/us/en/blogs/emerging-markets-bonds/em-momentum-dm-fatigue-2025-imf-fall-takeaways/">
  <title>EM Momentum, DM Fatigue: 2025 IMF Fall Takeaways></title>
  <link>https://www.vaneck.com/us/en/blogs/emerging-markets-bonds/em-momentum-dm-fatigue-2025-imf-fall-takeaways/</link>
  <description><![CDATA[The EM Debt team just returned from the Fall IMF Annual Meeting, here are their takeaways.]]></description>
  <dc:creator>Eric Fine</dc:creator>
  <dc:date>10/28/2025 06:30:00</dc:date>
<content:encoded><![CDATA[

<p id="key-takeaways" class="jump-link-nav anchored-block" data-jumplink-title="Key Takeaways"><i>The Emerging Markets Debt team just returned from 2025 IMF Annual Meetings, seeing finance and central bank officials, and market participants. Your authors have been reporting on these meetings for three decades, so there will be meta-observations as well.</i></p>
<p><strong>Key Takeaways:</strong></p>
<ul class="content-list">
<li class="mt-2">AI-driven capex is extending U.S. growth, tempering stagflation fears but keeping inflation risks alive.</li>
<li class="mt-2">Emerging markets show structural strength and policy discipline as developed markets face debt strains.</li>
<li class="mt-2">A more pragmatic, data-based tone dominated discussions, especially around U.S. policy and trade dynamics.</li>
</ul>
<p id="imf-meeting-observations" class="jump-link-nav anchored-block" data-jumplink-title="IMF Meeting Observations"><strong>The outlook on the US economy started with recession fear in April, which morphed into stagflation concerns&hellip;but now the recovery is looking K-shaped.</strong> AI capex is having a large and likely durable impact on US growth, likely ranging between 0.1% and 0.5% (we have a separate comment on AI, which came up in all meetings, later). Ongoing fiscal expansion, easy financial conditions, combined with an AI capex cycle won the day (or quarters, more literally), <i>over</i> the consensus concern at the <a href="/us/en/blogs/emerging-markets-bonds/imf-2025-spring-takeaways-the-era-of-em-exceptionalism/" title="IMF 2025 Spring Takeaways: The Era of EM Exceptionalism"><strong>April IMF meetings</strong></a> that a downturn was nigh. The US labor market is a key focus, but still indeterminate to our eyes (because the reduction in labor supply due to migration policy might&rsquo;ve been non-inflationary because of a cyclical decline in labor demand&hellip;the demand decline that was the consensus view in April). This set up led many or most participants to fall back on the argument &ldquo;yet&rdquo; for inflation rises and growth weakness, so &ldquo;stagflation&rdquo; still looms in the background. How could it not in rooms filled with bond investors in an era of high developed markets (DM) debt. However, there was an undeniable tint of growth for coming months or quarters. Making the April consensus on an economic downturn more acute was a near-universal rejection of Trump Administration economic policy&hellip;which decidedly waned at these October meetings.</p>
<p><strong>Politics moving to the right (i.e., market friendly) was noted as presenting further upside risks.</strong> Particularly in Latin America, with elections upcoming in Chile, Brazil, Colombia, and Peru. (Key to us are also elections in much-smaller Bolivia, Guyana, Honduras, and Costa Rica.) Before you say &ldquo;I know&rdquo;, the paradigm is not Argentina, which is still cornered by its heterodoxy on the exchange rate (our opinion), and legacy clientelist political structures. Argentina is certainly capturing the &ldquo;right wing&rdquo; limelight, but it is much more complicated (more on Argentina later). Ecuador is a better representative of this phenomenon, El Salvador too. Essentially, all we&rsquo;d like&hellip;and could easily get&hellip;are countries embarking on IMF programs that entail structural reform and fiscal discipline. This is well underway in Ecuador, with subsidy reform happening despite the obvious political obstacles, under an expanded IMF program. And it&rsquo;s about to happen in El Salvador (the formal IMF part, as reform is already in-train), in our view. (To be clear, we are not saying Chile itself is going to have an IMF program, we&rsquo;re only describing the type of economic orthodoxy that we and the market would welcome after political changes.) The politics underneath this phenomenon are undeniable, even in Brazil, and the &ldquo;right&rdquo; is often gifted with rising concerns over crime, which has been a political windfall. (We graphed the popularity of reformist EM governments in our <a href="/us/en/blogs/emerging-markets-bonds/em-debt-resilient-despite-perceived-risks-from-us-protectionism/" title="EM Debt Resilient Despite Perceived Risks from US Protectionism"><strong>November monthly</strong></a>.) Looming over all of these is the Trump administration&rsquo;s many agendas which directly touch basically every country in the region. The security agenda is the shiniest one right now, and US strategic considerations are obvious in the Ecuador IMF program, and many others. We got a reminder of these mid-meetings with announcements that CIA activities have been approved in Venezuela (more on Venezuela later).</p>
<p><strong>Trump administration policies were analyzed less ideologically, more empirically.</strong> This had always bugged us at previous meetings &ndash; our profession is supposed to screen-in only empiricists, and I&rsquo;m not supposed to be able to detect ideology <i>ever</i>. Yet, these meetings (which have a heavy European representation) consistently exhibited strong ideological preferences that were un-acknowledged. No more. Trump administration representatives were now normal features on panels. It was much more the way it used to be &ndash; just analyze policies and outcomes. Tariffs were lamented (as they should be, in purely economic terms, in our view), but the sky hadn&rsquo;t fallen which was the bar this cohort set. We should riff that this makes us now <em>more</em> concerned about coming inflation, on the margin, because tariffs <em>should</em> be inflationary with lags (which may be &ldquo;worth&rdquo; the geopolitical and wealth-distribution objectives that are also behind tariffs, but these are not our day-jobs). This cohort is throwing in the towel on inflation concerns because they are trapped by their initial consensus &ldquo;sky is falling&rdquo; view, not because one can confidently extrapolate from the past two quarters of benign inflation, in our view. Sigh. Nonetheless, there was acknowledgement of a growing bi-partisan consensus on trade imbalances in the US. We also noticed that market participants had a decidedly &ldquo;meh&rdquo; attitude on the issue of Fed independence (which may be bad or good, but our point is the greater acceptance of empiricism).</p>
<p><strong>Europe is set for a cyclical economic upturn based on German defense spending, but has missed its opportunity and everything else is negative.</strong> Germany ended its famous debt-brake, approved defense spending, etc. And that&rsquo;s fully it. The rest is horrible. First, let&rsquo;s go back to the April meetings. The talk was all about investors&rsquo; search for a reserve currency to benefit from declining relative interest in holding USD assets. This was Europe and the Euro&rsquo;s chance. Remember the Draghi plan prior to April? Nothing since. We still have an ECB with tight interest rate policy on the one hand (leading to an overvalued EUR?), and very stimulative policy on its asset side (capping sovereign bond yields). And try talking to a European official about the gold price rise and whether a key recent driver was basically capital flight from Europe and you will get&hellip;a blank stare. Europe lags on AI (which was obviously a hot topic in every meeting), and digital currency policy seems to be a capital control structure to our eye. So, on two hot vectors Europe is nowhere or going backwards. The politics underneath are obviously fragile and should be well-known. But they aren&rsquo;t much addressed; analysis and forecasting is potentially meaningless in such a context. A new depth of denial seems to surround Europe in the eyes of many meeting participants. This, when meeting participants&rsquo; email inboxes were filled with research reports updating intra-sovereign EZ spreads. And this author&rsquo;s birthplace, France&rsquo;s, sovereign rating was downgraded by S&amp;P on the Friday close of meetings. Sigh.</p>
<p><strong>China had a &ldquo;glow-up&rdquo;, to our eye &ndash; everyone is now copying state-industrial policy.</strong> For too long, we saw great under-appreciation of China&rsquo;s policymaking at IMF meetings. And to be fair to that cynicism, other than for a few years there, China doesn&rsquo;t have the kind of presence at IMF or in general that other countries do (because they don&rsquo;t need the offshore financing), adding a (easily addressable) wrinkle to country analysis. And for a country said to have capital controls (remember, there are no serious controls on gold purchases in China, so this standby description of &ldquo;controls&rdquo; to describe China is extremely anomalous and should be diluted). Now to be fair to China, their officials presided over what is arguably the greatest economic success in history over the past 50 years. Further, the IMF presided over a massive balance of payments (their formal mandate despite creeping into fiscal support) imbalance over the past 30 years, so they aren&rsquo;t perfect (though we love the IMF staff always). Anyway, the China-is-serious denial seemed to fade noticeably; it&rsquo;s not our day-job but we noticed a lot of surprise at/recognition of their tech innovation across many sectors. A lot of this is again due to this cohort&rsquo;s &ldquo;sky is falling&rdquo; view on China. As we noted in &ldquo;The Curiously Unpopular Case for RMB Appreciation&rdquo;, all the cool kids thought CNY would depreciate due to tariffs. It did the opposite. We remain intellectually frustrated that this CNY appreciation wasn&rsquo;t central to every EM discussion (after all, EM trades more with China than with US, we aren&rsquo;t asking for a lot), but we saw sparks of recognition. For example, Kenya&rsquo;s swap of USD-denominated debt for CNY-denominated debt, India&rsquo;s first use of CNY in oil purchases both occurred during the meetings. Not that you even needed those reminders after China, India, Saudi, UAE, Brazil and others steadily agreed to trade in each others&rsquo; currencies with virtually no media attention for years&hellip;but then, particular moments get noticed often for reasons of previous denial. Remember, correlation is the mother of superstition, and this is a superstitious group so we&rsquo;ll go with the idea that these relatively minor headlines somehow reminded that something deep is going on. Nobody said it (other than us), but this is how money demand (demand for CNY in this case) expansion begins. I guess the best example of breaking denial is that nobody was criticizing China for &ldquo;over-capacity&rdquo; due to &ldquo;state capitalism&rdquo;. This is 100 percent because &ldquo;state capitalism&rdquo; is coming to a DM near you! &ldquo;We&rdquo; are copying Chinese industrial policy. Everything at the meetings was &ldquo;strategic&rdquo;, meaning we&rsquo;re using national security as the rationale. And, it was all &ldquo;good&rdquo; to participants&rsquo; eyes. &ldquo;Taking&rdquo; stakes in strategic resources, directing production to favored sectors is, all-of-a-sudden, &ldquo;good&rdquo;. It reminds me of the GFC when, all-of-a-sudden, the central bank and treasury were supposed to co-operate, not be independent. How&rsquo;d that work out? Anyway, China&rsquo;s currency stability, the continued internationalization of RMB, acknowledged centrality to the global economy (rare earths were obviously another theme to the meetings) all conspired to give China a quiet &ldquo;glow up&rdquo;. Because they have a stable currency with a central bank that has anchored inflation is the real reason, but we&rsquo;ll take any others.</p>
<p><strong>Cockroaches in the DM credit cycle, Butterflies in EM.</strong> The financial media have covered some evidence of credit stress in the US. This was part of discussions which broke no new ground (balance sheets strong, but spreads at record tights, how boring can you get). Since the &ldquo;news&rdquo; was largely focused on corporate situations (i.e., not sovereign), our bias remains that the corporate bond market does not contain a lot of information right now. This is due to its illiquidity combined with all-time tight spreads, and decades of increased allocations to credit. So credit selling off from these conditions hardly seems interesting. Now, if USD interest rates are rising, yes you could <em>absolutely</em> get some problematic refinancings at unsustainable rates. But, the steepener has been the biggest consensus all year. And, fiscal outturns in the US have outperformed (part of the selloff in 30s was due to fiscal worries), tariff inflation hasn&rsquo;t materialized (whether yet or ever), and we have a new Fed next year likely focused on getting nominal rates down across the curve according to almost every newspaper (sometimes they&rsquo;re on to something). So, we don&rsquo;t see a rising rate scenario in the next quarter or so (after that, it&rsquo;s another story). On the last day of the meetings, however, your author&rsquo;s birthplace, France&rsquo;s, sovereign rating was downgraded by S&amp;P. Sigh. Now that is something to be alert to. You saw our Europe view above. What we&rsquo;d note about the whole setup is that swap spreads (which reflect bank liquidity more than credit risk per se) had been rising into all of this. If included, these spreads were sending signals <i>prior</i> to the headlines that got generated only when there were some <i>specific</i> credit spreads that gapped in supposed information-rich sectors like auto lending. This earlier rise in swap spreads reflects more profound risks at the sovereign level, in DMs mostly, as we and the IMF have been warning. Oh, we also had a brief mini-crash (mini so far) in US regional banks! It&rsquo;s a good thing the IMF warned us all&hellip;again.</p>
<p><strong>The gist of the IMF&rsquo;s must-read GFSR (Global Financial Stability Report) was that the risks are in DM, at the sovereign level, and map to the financial system.</strong> It&rsquo;s better when that sentence is re-read slowly, as it doesn&rsquo;t get more basic than that. Have you re-read it? <u>Other than war or alien invasion, this is <i>it</i> when it comes to economics and finance.</u> We believe the IMF is spot-on and way too diplomatic (keep in mind, the IMF&rsquo;s biggest shareholder is the US, followed by &ldquo;Europe&rdquo;). The only good news is that they gave a similar warning in their April GFSR which we analyzed in detail in our &ldquo;Takeaways&rdquo; then. Even newspaper readers get the storyline. The IMF notes the rise in UK Gilt yields, the Silicon Valley Bank episode, and how these map to derivatives markets like swap spreads (they say they map to the spread but we think it is more descriptive to say that they map to derivative markets themselves structurally, which we&rsquo;ve discussed in detail over the decades). Anyway, re-read our last &ldquo;Takeaways&rdquo; as they get into all of that. This new GFSR explicitly warns that 0 percent haircuts on US Treasuries in repo financing have amplified leverage risks by encouraging huge (&ldquo;large-scale&rdquo;) basis trades (arbing bond futures and cash bonds). Hedge funds are creating large levered treasury positions due to the cheap funding in short-term repo markets. Any change in leverage would be a big deal, let&rsquo;s agree. This is not a good context. But, this also reflects attempts by policymakers to influence the yield curve and we don&rsquo;t know why in the post-GFC era we shouldn&rsquo;t just assume that whatever tools are required will be deployed.</p>
<p><strong>The gist of the IMF&rsquo;s must read WEO (World Economic Outlook) was of &ldquo;EM Exceptionalism&rdquo; (our phrasing) and &ldquo;resilience&rdquo; (their phrasing), and worries over Europe.</strong> EMs are now structurally more robust than they were a decade ago, while DMs face policy fatigue and &ldquo;persistent downside risks from protectionism and high debt levels&rdquo;. Echoing the GFSR, they say that &ldquo;fiscal vulnerabilities and market corrections could interact dangerously in DMs&rdquo;. The growth forecasts are consistent with this &ndash; 1.5% for the DMs (or &ldquo;Advanced Economies&rdquo;), and low 4s for the EMs (&ldquo;Developing Economies&rdquo;). The report again highlights EM central bank independence that has anchored inflation (something we&rsquo;ve written about for decades). It also underlined Europe&rsquo;s questionable productivity prospects. Yawn. Total yawn. But the nice relaxing kind if you are in EM, where you earn carry when you sleep.</p>
<p><strong>AI featured properly in meetings &ndash; the &ldquo;hype&rdquo; was focused where it <i>should</i> be, on the <i>actual</i> Capex, not on the productivity utopia that might obtain.</strong> I feel incredibly embarrassed writing about AI&rsquo;s productivity impact, so never did. The idea that anyone should have strong opinions on the productivity implications of AI strikes me as ridiculous. All the horizons are out past 5 years, which should be a non-starter for any confidence. The profession can&rsquo;t even calculate productivity well <i>ex-post</i> with all the &ldquo;data&rdquo;. So, it was great to see that meeting participants implicitly agreed. You were allowed to say you had no clue whether it would &ldquo;work out&rdquo;, how many jobs would be &ldquo;destroyed&rdquo;, and you were even able to argue that jobs would be created. The main point is that those discussions were taken with the appropriate grain of salt and were not the focus of attention. What was the focus of attention was the amount of AI capex which is adding between 0.1% and 0.5% to US growth in its cycle. FDI into the US increased by 100% in the first half of 2025&hellip;and US investment overseas declined by 14%. So, the US is seen as a clear leader and winner (maybe that&rsquo;s not correct, but it&rsquo;s the perception and capex lends support to this idea). (And, importantly, keep the USD hedging which <i>actually </i>occurred in 2025 separate from sales of US securities that were <i>imputed</i> (and after a time lag there&rsquo;s now a bit more information on actual securities sales)<i>,</i> but have not yet been proved during 2025; we don&rsquo;t care about this mechanism in this case, because we are investing in the core FX and rates markets of EM, but it&rsquo;s an important distinction for folks who like to make planetary/thematic conclusions about sales of &ldquo;US assets&rdquo;, which we do not like to do.) The depth and durability of the investment flow was also noticed, with sovereign support for AI development coming up in every single meeting &ndash; wherever this ends up, the runway seems long. It's &ldquo;strategic&rdquo;. That&rsquo;s the right framing, in our view &ndash; there <i>should</i> be hype about the capex cycle, the rest is speculative.</p>
<p><strong>A &ldquo;moment&rdquo; for EM &ndash; the presence of obvious DM problems was yet again juxtaposed against the absence of such problems in EM.</strong> Market participants are slowly accepting the framing that we&rsquo;ve been suggesting &ndash; EM versus DM &ndash; as a way to understand global developments. The IMF joined us in that framing in the April meetings and are continuing now in the October meetings. The IMF should rightly be celebrating EM successes, because they are largely what we call EM &ldquo;graduates&rdquo;. They were on IMF programs or learned the lessons on their own, but the IMF was a big part of their success either directly through funding programs, or just intellectually. But, their biggest shareholders are the over-indebted DMs (funny that). So good on the amazing IMF staff for doing their job and being empiricists! There was much talk/hope/experience of inflows into EM. Can&rsquo;t really hang your hat on those projections, but they were there. There were perhaps too many &ldquo;frontier&rdquo; experts for our &ldquo;exuberance&rdquo;-meters. Argentina and Venezuela saw overflow rooms. But, there was a sense that something that had been going on for a while (EM being better than DM) was cemented and perhaps looking at a new stage higher.</p>
<p><strong>Sentiment was very bearish on USD and very bullish on everything EM &ndash; this tilts us USD bullish against the majors on the margin.</strong> We generally agree with the bullish EM local-currency conclusion, and have been positioned that way for years (mostly via Asia), and particularly this year (via higher-beta EMFX). But remember, the investor cohort was somewhat reluctantly dragged into this bullish EMFX view and got excited when newspapers started writing &ldquo;Dollar Something-or-Other&rdquo; stories. These are all fair stories for their time horizons, but old (we&rsquo;ve been writing about them for over a decade) and still seem way overdone at the moment to us. A month or few of USD strength could be just what market positioning/psychology needs - a test &ndash; it&rsquo;s a bit too much for us. We should emphasize, though, that everything we do is country-by-country, bond-by-bond, so we are speaking at a very high-altitude level here, consistent with the tenor of IMF meetings. In particular, EUR could falter here, that&rsquo;s more what we&rsquo;re thinking.</p>
<h2 id="observations-on-key-ems" class="jump-link-nav anchored-block" data-jumplink-title="Observations on Key EMs">Observations on Key EMs</h2>
<p><strong>Mexico is among the success stories.</strong> It is a key beneficiary of the trade war (a combination of President Sheinbaum&rsquo;s prudent approach and the USMCA &ldquo;safety net&rdquo;) and on-going fiscal consolidation, which allows the central bank to continue its gradual easing. Mexico&rsquo;s local bonds are loving it! Mexico just moved to the top spot in the EM local debt league, supplanting Brazil.</p>
<p><strong>South Africa&rsquo;s progress&nbsp;on fiscal policy and SOE reform are being recognized more widely.</strong> The country did not generate too many headlines during the IMF week, but its monetary and exchange rate policies are beyond reproach, the country&rsquo;s terms of trade are benefiting from gold&rsquo;s dynamics, and the bi-partisan support in the U.S. for the AGOA framework is a boon for South Africa&rsquo;s geopolitical backdrop. It also has greater exposure to China and it&rsquo;s slowly strengthening currency.</p>
<p><strong>Chile needs to use this time to build resilience, including external buffers.</strong> Trade fragmentation remains a major risk, but most of Chile&rsquo;s exports are exempt from tariffs, which reduces direct risks. The budget might require some corrective action, but the medium-term fiscal outlook remains benign as both right-leaning presidential candidates are shown to have better chances in the second round, according to surveys. A problem is the need for external buffers can constrain upside to CLP. The counter to this is that local pension funds have very low exposure to their own local market.</p>
<p><strong>Brazil is examining initial conditions going into an important election and the market is fairly relaxed.</strong> Brazil has amazing external accounts but looming fiscal problems due to a simply high level of government debt. Upcoming elections will ultimately determine the fiscal outcomes, but in the mean time a super-hawkish central bank is anchoring the market. And this market calm despite a boost to market-unfriendly President Lula&rsquo;s popularity after a nationalist standoff with US President Trump.</p>
<p><strong>Argentina&rsquo;s economic team kept trying desperately to convince a skeptical market that it really did have the support of US Treasury.</strong> The actions of US Treasury (buying ARS, signing swap agreement, funding bond tender) continue to match the speech of Argentina&rsquo;s economic team. The problem for the market is that it remains very overweight Argentine assets, and it is terrified that Milei will suffer another crushing defeat in the upcoming midterms and afterwards lose the support of US Treasury. Once the midterm elections are in the rearview mirror and the uncertainty is gone, US Treasury support should become an overwhelming support for Argentine bonds.</p>
<p><strong>Venezuelan regime change never seemed this close.</strong> The Trump administration is taking direct military action to pressure the Maduro government and the Machado-led opposition is talking to investors about their detailed plans to govern once they are in power, including fully privatizing the oil sector and engaging with bondholders. It all has the feeling of being imminent and inevitable. But even if Maduro does not survive this time, a Venezuelan transition may not be so simple with other powerful Chavista figures who can make it difficult for an opposition government to fully control Venezuela&rsquo;s sovereign assets. The difference with Argentina is that Venezuelan bonds are under-owned and potentially undervalued and so will continue to move higher on positive headlines.</p>

<p>To receive more <a href="https://www.vaneck.com/us/en/insights/emerging-markets-bonds/" title="Emerging Markets Bonds Insights"><strong>Emerging Markets Bonds</strong></a> insights, <a href="/link/5f45412c2143400497908cea2897f7d3.aspx" title=" Subscription Center"><strong>sign up in our subscription center</strong></a>.</p>
]]></content:encoded>
</item><item rdf:about="https://www.vaneck.com/us/en/blogs/thematic-investing/top-pharmaceutical-companies-shaping-the-future-of-healthcare/">
  <title>Top Pharmaceutical Companies Shaping the Future of Healthcare></title>
  <link>https://www.vaneck.com/us/en/blogs/thematic-investing/top-pharmaceutical-companies-shaping-the-future-of-healthcare/</link>
  <description><![CDATA[Pharma's strong pipelines, reduced policy risks, and demand growth drive renewed investor interest. PPH offers targeted access to top innovators like Eli Lilly and Merck.]]></description>
  <dc:creator>Nick Frasse</dc:creator>
  <dc:date>10/27/2025 06:30:00</dc:date>
<content:encoded><![CDATA[

<p><strong>Key Takeaways:</strong></p>
<ul class="content-list">
<li class="mt-2">Aging populations and clearer U.S. drug pricing boost long-term pharma outlook.</li>
<li class="mt-2">Leaders like Eli Lilly and Merck lead in GLP-1s, oncology, and pipeline strength.</li>
<li class="mt-2">Strong cash flows and innovation make pharma a compelling core healthcare play.</li>
</ul>
<p>Pharmaceuticals sit at the intersection of innovation and defensiveness, where pipelines turn science into cash flows and global demand adds resiliency. With policy clarity improving and investors rotating back to quality, the setup for large-cap pharma looks attractive.</p>
<p>Recent developments in U.S. drug pricing negotiations have reduced policy uncertainty, improving sentiment and driving a sector re-rating as valuations catch up to broader market levels.</p>
<h2>Why Pharmaceuticals, Why Now</h2>
<ul class="content-list">
<li class="mt-2">Secular demand from aging populations and broader healthcare access remain durable growth drivers.</li>
<li class="mt-2">The pace of FDA drug approvals has risen over the past decade, creating new sources of long-term revenue.</li>
<li class="mt-2">Large pharmaceutical companies continue to pursue mergers and acquisitions to refresh pipelines and scale manufacturing.</li>
<li class="mt-2">GLP-1 drugs have opened a multi-year growth opportunity in metabolic disease, with potential spillover into related therapeutic areas</li>
</ul>
<h2>PPH: Top 5 Holdings (as of 9/30/2025)</h2>
<p><strong>Eli Lilly and Company (LLY) &ndash; 19.89% weight</strong></p>
<p>Eli Lilly continues to dominate the obesity and diabetes treatment space with its GLP-1 portfolio, driving investor enthusiasm and strong long-term sentiment. While the stock has seen periods of consolidation following a long stretch of outperformance, confidence remains high given its expanding late-stage pipeline and leadership in next-generation therapeutics.</p>
<p><strong>Novartis AG (NVS) &ndash; 9.71% weight</strong></p>
<p>Novartis has been one of the steadier performers in the large-cap space this year, supported by its ongoing transformation toward a pure-play innovative medicines company. Execution on cost efficiency, coupled with promising new therapies in oncology and cardiovascular disease, has strengthened its market positioning.</p>
<p><strong>Novo Nordisk A/S (NVO) &ndash; 7.72% weight</strong></p>
<p>Novo Nordisk remains central to the weight-loss drug narrative and continues to see strong global demand. After a period of sharp gains earlier in the year, the stock has moved sideways as investors digest capacity constraints and competitive headlines. However, long-term fundamentals remain intact as manufacturing ramps and new formulations approach the market.</p>
<p><strong>Merck &amp; Co., Inc. (MRK) &ndash; 7.43% weight</strong></p>
<p>Merck has performed solidly, supported by its oncology leadership and the continued strength of Keytruda. The company&rsquo;s investments in antibody-drug conjugates and vaccine platforms have positioned it to sustain growth beyond major patent expirations, making it a key anchor in the sector&rsquo;s defensive appeal.</p>
<p><strong>Pfizer Inc. (PFE) &ndash; 5.10% weight</strong></p>
<p>Pfizer&rsquo;s share price has stabilized as the company transitions from its pandemic-era revenue base toward a more diversified pipeline. Recent acquisitions and restructuring efforts have improved visibility, and sentiment has turned more constructive as investors refocus on long-term product launches and operational discipline.</p>
<h2>What to Watch in Pharma</h2>
<ul class="content-list">
<li class="mt-2">Continued innovation and pipeline productivity</li>
<li class="mt-2">Patent expirations and lifecycle management of major drugs</li>
<li class="mt-2">Evolution of U.S. pricing frameworks and global reimbursement policies</li>
<li class="mt-2">Expansion and competitive dynamics in the GLP-1 market</li>
<li class="mt-2">Ongoing M&amp;A activity and integration of newly acquired assets</li>
</ul>
<h2>Why Consider PPH Now</h2>
<p>Pharmaceuticals are reasserting themselves as a core allocation within healthcare, offering a rare blend of defensive characteristics and innovation-driven growth. The sector&rsquo;s strong balance sheets, resilient cash flows, and improving policy backdrop create an appealing setup in an uncertain macro environment.</p>
<p><a href="/link/08c7d3f4029b4e1a85ec8795516a6f02.aspx" title="PPH - VanEck Pharmaceutical ETF - Overview"><strong>VanEck&rsquo;s Pharmaceutical ETF (PPH)</strong></a> provides investors with targeted exposure to the world&rsquo;s leading pharmaceutical companies, capturing the innovation and stability that defines the space. By focusing on established global players with deep pipelines and proven earnings power, PPH offers a practical way to participate in the next phase of healthcare advancement.</p>


<p>To receive more <a href="https://www.vaneck.com/us/en/insights/thematic-investing/" title="Thematic Investing Insights"><strong>Thematic Investing</strong></a> insights, <a href="https://www.vaneck.com/us/en/subscribe/" title="Subscription Center"><strong>sign up in our subscription center</strong></a>.</p>
]]></content:encoded>
</item><item rdf:about="https://www.vaneck.com/us/en/blogs/emerging-markets-bonds/portfolio-optimization-with-em-debt/">
  <title>Portfolio Optimization with EM Debt></title>
  <link>https://www.vaneck.com/us/en/blogs/emerging-markets-bonds/portfolio-optimization-with-em-debt/</link>
  <description><![CDATA[Adding an emerging markets bond allocation to a 60/40 portfolio can enhance risk-adjusted returns.]]></description>
  <dc:creator>Eric Fine</dc:creator>
  <dc:date>10/27/2025 06:30:00</dc:date>
<content:encoded><![CDATA[

<h2 id="diversification-benefits-of-em-bonds" class="jump-link-nav anchored-block" data-jumplink-title="Diversification Benefits of EM Bonds">The Efficient Frontier</h2>
<p>The diversification benefits of EM bonds, combined with the added potential of active management, support giving them a greater role in fixed income portfolios&mdash;even if that means reducing traditional DM-heavy exposure.</p>
<p>To understand the benefits of adding EM bonds to a strategic asset allocation, consider the Efficient Frontier, which is derived from the Modern Portfolio Theory (MPT), and suggests the most &lsquo;efficient&rsquo; investment portfolios to generate returns for a set level of risk. The risk measure used is the standard deviation of returns.</p>
<p>Below, we show the output from using the frontier on global fixed income asset classes. These are the f ixed-income investments investors may consider in constructing their portfolios, including EM debt. Analysis of a historical data stream going back 20 years (using the 50/50 benchmark) shows that an optimal allocation to EM in a fixed income portfolio would have been around 27% for a mid-level volatility level of 7.5.</p>
<p>The Efficient Frontier is a formal framework used by investors for thinking about asset allocation, and we wouldn&rsquo;t suggest an unbounded model. Considering portfolio limits, it&rsquo;s likely that this optimal allocation of 27% is far higher than most investors maintain. The point is that the allocation should be higher than zero. It also means that the optimal allocation to other fixed-income categories in the analysis, which tend to be the largest and most popular allocations, like global aggregate or U.S. government bonds, is much lower than most investors maintain.</p>
<h3>What Does the Efficient Frontier Say About the Optimal Level of EM Bonds?</h3>
<p><img loading="lazy" class="img-responsive" alt="What Does the Efficient Frontier Say About the Optimal Level of EM Bonds?" src="https://www.vaneck.com/contentassets/5bbf5c68b8a44652885ca1f491af3625/6329_portfolio-optimization-em-debt_table_2025-10_v1-01.svg" /></p>
<p class="chart-disclosure">Source: VanEck Research; Bloomberg LP. Data as of December 2024. GBI-EM is represented by the J.P. Morgan Global Diversified Index; EMBIG HY is represented by the J.P. Morgan EMBI Global Diversified Investment Grade Index; CEMBI HY+ is represented by the J.P. Morgan CEMBI High Yield Index; Global Aggregate is represented by the Bloomberg Global Aggregate Bond Index; Global Treasury is represented by Bloomberg Global Treasury Index; Global government related is represented by Bloomberg Global Aggregate Government Related Index; Global corporates represented by Bloomberg Global Aggregate Corporate Index; Global securitized represented by Bloomberg Global Aggregate - Securitized Index; U.S. Aggregate represented by Bloomberg U.S. Aggregate Bond Index; U.S. HY represented by Bloomberg U.S. Corporate High Yield Bond Index; Euro Agg represented by Bloomberg Euro-Aggregate Index; U.S. Treasury represented by Bloomberg U.S. Treasury Index; CEMBI IG+ represented by J.P. Morgan CEMBI Investment Grade Index; EMBIG IG represented by J.P. Morgan EMBI Global Diversified Investment Grade Index; EM FI represented by an equally weighted blend of the J.P. Morgan GBI-EM Global Diversified Index, the J.P. Morgan EMBI Global Diversified Index and J.P. Morgan CEMBI Broad Diversified Index. <strong>Efficient frontier comprises investment portfolios that offer the highest expected return for a specific level of risk. Standard deviation measures how much the investment returns deviate from the mean of the probability distribution of investments. Past performance is not a guarantee of future results. Index performance is not representative of fund performance. It is not possible to invest directly in an index. Please see index definitions and other important disclosures at the end of this content.</strong></p>

<h2 id="performance-track-record" class="jump-link-nav anchored-block" data-jumplink-title="Performance Track Record">Track Record of Strong Outperformance</h2>
<p>Adding EM bonds to a broader strategic asset allocation is a good way to enhance the efficiency of a 60/40 portfolio. Adding an actively managed approach can be even better. Because of the idiosyncrasies among the nations in the EM universe and the nuances across different bond types, we believe an active approach&mdash;such as the one employed by the VanEck Emerging Markets Bond ETF, which invests in hard-currency sovereign, local-currency sovereign, and hard-currency corporate bonds&mdash;is essential. This approach allows investors to potentially benefit from opportunities wherever they exist in the entire investment universe and sidestep potential problems in an increasingly uncertain world&mdash;generating a track record of outperformance over time.</p>
<p>The chart below shows fund performance versus other areas of fixed income. High nominal and real yields provide significant carry and added cushion to withstand market turbulence and a strong USD in recent years. Another contributing factor to outperformance has been its exposure to local-currency bonds, which can benefit from EMFX appreciation against the U.S. dollar. Your choice of fixed income category should not be a proxy decision on USD performance when you can avoid it. The fund and EM bonds overall have benefited from these dynamics, substantially outpacing U.S. and global fixed income.</p>
<h3>Outperformance Over the Past 5 years</h3>
<p><img loading="lazy" class="img-responsive" alt="Outperformance Over the Past 5 years" src="https://www.vaneck.com/contentassets/3c32704d908743c68a0c33d401b28eb9/6329_portfolio-optimization-em-debt_chart-1_2025-10_v1_blog.svg" /></p>
<p class="chart-disclosure">Source: VanEck Research, Bloomberg LP. Data as of June 2025. Past performance is no guarantee of future results. Index performance is not representative of fund performance. It is not possible to invest directly in an index. <strong>Fund performance current to the most recent month end is available by visiting vaneck.com or by calling 800.826.2333.</strong></p>
<h3>Average Annual Total Returns<sup>*</sup>&nbsp;(%) (In USD)</h3>
<div class="wrapped-div">
<table style="width: 100%;">
<tbody>
<tr class="tbl-data">
<td class="data-head last text-left">as of 9/30/2025</td>
<td class="data-head last text-right">MTD</td>
<td class="data-head last text-right">3MO</td>
<td class="data-head last text-right">YTD</td>
<td class="data-head last text-right">1 Year</td>
<td class="data-head last text-right">3 Years</td>
<td class="data-head last text-right">5 Years</td>
<td class="data-head last text-right">10 Years</td>
<td class="data-head last text-right">Since Inception</td>
</tr>
<tr class="tbl-data">
<td class="data-td data last text-left">VanEck Emerging Markets Bond ETF</td>
<td class="data-td data last text-right">1.70</td>
<td class="data-td data last text-right">4.40</td>
<td class="data-td data last text-right">15.41</td>
<td class="data-td data last text-right">9.72</td>
<td class="data-td data last text-right">13.39</td>
<td class="data-td data last text-right">4.87</td>
<td class="data-td data last text-right">5.27</td>
<td class="data-td data last text-right">3.39</td>
</tr>
<tr class="tbl-data">
<td class="data-td data last text-left">50%JPM GBI-EM GD and 50%JPM EMBI GD</td>
<td class="data-td data last text-right">1.59</td>
<td class="data-td data last text-right">3.78</td>
<td class="data-td data last text-right">13.04</td>
<td class="data-td data last text-right">7.98</td>
<td class="data-td data last text-right">11.80</td>
<td class="data-td data last text-right">2.33</td>
<td class="data-td data last text-right">3.92</td>
<td class="data-td data last text-right">2.48</td>
</tr>
<tr class="tbl-data">
<td class="data-td data last text-left">ICE BofA Gbl Brd Mkt TR USD</td>
<td class="data-td data last text-right">0.78</td>
<td class="data-td data last text-right">0.75</td>
<td class="data-td data last text-right">8.12</td>
<td class="data-td data last text-right">2.36</td>
<td class="data-td data last text-right">5.24</td>
<td class="data-td data last text-right">-2.00</td>
<td class="data-td data last text-right">0.93</td>
<td class="data-td data last text-right">0.66</td>
</tr>
<tr class="tbl-data">
<td class="data-td data last text-left">ICE BofA Current 10-Y US Trsy TR USD</td>
<td class="data-td data last text-right">0.94</td>
<td class="data-td data last text-right">1.81</td>
<td class="data-td data last text-right">6.93</td>
<td class="data-td data last text-right">1.35</td>
<td class="data-td data last text-right">2.85</td>
<td class="data-td data last text-right">-3.08</td>
<td class="data-td data last text-right">0.53</td>
<td class="data-td data last text-right">0.74</td>
</tr>
</tbody>
</table>
</div>
<div class="chart-disclosure">
<p>Source: VanEck. <strong>EMBX Expense Ratio:</strong> Gross: 0.75% | Net: 0.75%</p>
<p>Van Eck Associates Corporation (the &ldquo;Adviser&rdquo;) will pay all expenses of the Fund, except for the fee payment under the investment management agreement, acquired fund fees and expenses, interest expense, offering costs, trading expenses, taxes and extraordinary expenses. Notwithstanding the foregoing, the Adviser has agreed to pay the offering costs until at least May 1, 2027. &ldquo;Other Expenses&rdquo; have been restated to reflect current fees.</p>
<p><strong>The performance data quoted represents past performance. Past performance is not a guarantee of future results. Investment return and principal value of an investment will fluctuate so that an investor's shares, when redeemed, may be worth more or less than their original cost. Performance may be lower or higher than performance data quoted. Please call 800.826.2333 or visit <a title="VanEck" href="http://vaneck.com">http://vaneck.com</a> for performance current to the most recent month ended.</strong></p>
<p>Prior to 10/06/2025, the Fund operated as the VanEck Emerging Markets Bond mutual fund; performance shown before that date is that fund&rsquo;s NAV performance (Class I, unadjusted for today&rsquo;s ETF expenses).</p>
</div>
<h2 id="portfolio-benefits-of-em-debt" class="jump-link-nav anchored-block" data-jumplink-title="Portfolio Benefits of EM Debt">Portfolio Benefits of EM Debt</h2>
<p>It&rsquo;s natural, then, for investors to wonder about risk. The Sharpe ratio combines the return measure with the volatility (risk) measure to quantify the relationship between the returns and risk. Staying within the U.S. investor&rsquo;s bond menu, let&rsquo;s look at the same data, showing the change in Sharpe to a US 60/40 portfolio from the addition of emerging markets bonds, as measured by a blend of hard and local currency bonds, and the VanEck Emerging Markets Bond ETF to a fixed income portfolio. Let&rsquo;s consider how it changes the Sharpe ratio for each 1% of additional allocation of the benchmark, or the Fund, to a fixed income portfolio. You can see that the benchmark is additive, and the Fund more so. This is both about EM bonds and their relative attractiveness to DM bonds, as well as the evidence of the alpha achieved by the Fund. Alpha can be generated on top of the basic asset allocation decision to just add EM bonds.</p>
<h3>Sharpe Ratios improve after adding EM Bonds to a U.S. 60/40 portfolio</h3>
<p><img loading="lazy" class="img-responsive" alt="Sharpe Ratios improve after adding EM Bonds to a U.S. 60/40 portfolio" src="https://www.vaneck.com/contentassets/bae429d5012147248ed3b854765795e2/6329_portfolio-optimization-em-debt_chart-2_2025-10_v1_blog.svg" /></p>
<p class="chart-disclosure">Source: VanEck Research, Bloomberg LP. 50:50 EMD is represented by the 50% J.P. Morgan Emerging Market Bond Global Diversified / 50% J.P. Morgan Government Bond-Emerging Market Global Diversified Index. US bond portfolio is represented by the Bloomberg US Bond Aggregate. <strong>The Sharpe ratio is a useful measure of risk-adjusted return, but it assumes normally distributed returns and may not fully reflect downside risk or extreme market volatility. Investors should evaluate it alongside other performance metrics when assessing fund risk and return. Sharpe ratio results are based on historical data, are sensitive to the selected period and risk-free rate, and may not fully capture asymmetric or non-normal return patterns. Sharpe ratio shown is based on performance over the 5-year period ending in June 2025. Calculated using 10-Year US Treasury yield as the risk-free rate. Past performance is no guarantee of future results. Index performance is not representative of fund performance. It is not possible to invest directly in an index. Please see index definitions and other important disclosures at the end of this content.</strong></p>

<p>The bottom line? We think investors&rsquo; allocations to EM bond strategies that can capture alpha are too low.</p>
<h2>VanEck Emerging Markets Bond Strategy</h2>
<p>The <a href="/link/f447bf0c04f64108a3dcff3ca025af4a.aspx" title="EMBX - VanEck Emerging Markets Bond ETF - Overview"><strong>VanEck Emerging Markets Bond ETF</strong></a> was one of the first blended emerging markets bond strategies in the market. The Strategy adopts a comprehensive approach, investing across the entire EM bond spectrum to maximize opportunity and manage risk in a complex global environment. Despite global disruptions such as the COVID pandemic, the war in Ukraine and economic troubles in China, the fund has consistently outperformed both global and U.S. bond benchmarks. VanEck&rsquo;s active strategy, which focuses on fundamental value relative to bond risk premia, aims to capitalize on these shifts and avoid troubled issuers, making a compelling case for a diversified, actively managed EM bond allocation.</p>
<p>To receive more <a href="https://www.vaneck.com/us/en/insights/emerging-markets-bonds/" title="Emerging Markets Bonds Insights"><strong>Emerging Markets Bonds</strong></a> insights, <a href="/link/5f45412c2143400497908cea2897f7d3.aspx" title=" Subscription Center"><strong>sign up in our subscription center</strong></a>.</p>
]]></content:encoded>
</item><item rdf:about="https://www.vaneck.com/us/en/blogs/thematic-investing/etf-101-understanding-the-basics/">
  <title>ETF 101: Understanding the Basics></title>
  <link>https://www.vaneck.com/us/en/blogs/thematic-investing/etf-101-understanding-the-basics/</link>
  <description><![CDATA[This five-part educational series will provide you with a better understanding of ETFs, from what they are to how to potentially use them within an investment portfolio. In this first part, let&rsquo;s start with the basics.]]></description>
  <dc:creator> </dc:creator>
  <dc:date>10/27/2025 06:30:00</dc:date>
<content:encoded><![CDATA[

<script>
    //Temporary script
    $(function () {
        $(".popup-youtube, .popup-vimeo, .popup-gmaps").on("click", function (e) {
            e.preventDefault();
            var width = $(window).width();
            if (width > 768) {
                openSimpleIframeModalDialog($(this).attr('href'), "video-modal");
            } else if ($(this).is('.popup-youtube')) {
                var target = $(this).attr('data-video');
                self.location = target;
            }
        });
    });
</script>
<style>
    .modal.fade.video-modal div.modal-dialog {
        margin: 7% auto !important;
    }

    .modal-simple-iframe .close span {
        font-size: 35px;
        line-height: 1;
    }
</style>
<p><strong>Key Takeaways:</strong></p>
<ul class="content-list">
<li class="mt-2">ETFs are low-cost, tax-efficient investment funds that trade like stocks and offer access to a wide range of asset classes and strategies.</li>
<li class="mt-2">Key benefits include daily transparency, intraday tradability, and broad accessibility, making ETFs flexible tools for portfolio diversification.</li>
<li class="mt-2">Compared to mutual funds, ETFs generally have lower fees, no minimum investments, and can be bought or sold throughout the trading day.</li>
</ul>
<p>ETF 101: Understanding the Basics<br /><a href="/us/en/blog/thematic-investing/etf-102-the-inner-workings-of-etf-creations-and-redemptions/" title="ETF 102: The Inner Workings of ETF Creations and Redemptions"><strong>ETF 102: The Inner Workings of ETF Creations and Redemptions</strong></a><br /><strong><a href="/us/en/blogs/income-investing/etf-edu-103-right-for-your-portfolio/">ETF 103: Is This ETF Right for You?</a></strong><br /><strong><a href="https://www.vaneck.com/blogs/etf-insights/etf-edu-104-getting-most-out-of-your-etf-trades">ETF 104: Getting the Most Out of Your ETF Trades</a></strong><br /><strong><a href="/blogs/etf-insights/etf-edu-105-gain-efficient-access-to-bond-markets-with-fixed-income-etfs">ETF 105: Gaining Efficient Access to Bond Markets</a></strong><br /><strong><a href="/us/en/blogs/income-investing/etf-106-debunking-fixed-income-myths/" title="ETF 106: Debunking Fixed Income Myths">ETF 106: Debunking Fixed Income Myths</a><br /><a href="/us/en/blogs/thematic-investing/etf-107-passive-vs-active-etfs-and-mutual-funds-whats-the-difference/" title="ETF 107: Passive vs. Active ETFs Explained">ETF 107: Passive vs. Active ETFs Explained</a> <br /></strong></p>
<h2 class="sub">Options for Investors</h2>
<p>An ETF (Exchange Traded Fund) is a diversified collection of assets similar to a mutual fund, though a key difference is that an ETF trades on an exchange throughout the day like a stock. Being relatively low cost, tax efficient, and generally easy to buy and sell, ETFs have become a popular choice for many investors.</p>
<p>As of June 2025, there were more than 4,300 ETFs available in the U.S. market alone<sup>1</sup>. Through ETFs, investors can gain access to a wide variety of asset classes and strategies&mdash;from <strong><a href="/link/d835663826f44348843c6b6c539e877c.aspx">stocks</a></strong> and <strong><a href="/link/e1f766c9dc9e4c0a9a629b2e75ebc115.aspx">bonds</a></strong> to <strong><a href="/link/d835663826f44348843c6b6c539e877c.aspx?sg=c-c&amp;uty=false&amp;min=0&amp;max=9.95&amp;tab=ov&amp;sort=assetClass&amp;asc=false">commodities</a></strong>, domestic and foreign markets, individual sectors, alternative investments and sophisticated active strategies. Investors can use ETFs to support a range of their investment goals, whether ETFs form the core of a portfolio or are used to add diversification or manage potential risk.</p>
<h2 class="sub">Key Attributes of an ETF</h2>
<p><strong>Low Cost</strong></p>
<p>ETFs are known for their relatively low cost and simple fee structures. Unlike mutual funds, there are no minimum investment amounts beyond the share price of the ETF. Buying and selling an ETF is akin to trading a stock. Therefore brokerage commissions and trading spreads are considerations when evaluating the total cost of an ETF.</p>
<p><strong>Transparency</strong></p>
<p>Underlying ETF holdings are generally disclosed in full on a daily basis, and share prices are updated in real time. Investors can gain up-to-date insight into their range of exposures, which can empower more informed asset allocation decisions.</p>
<p><strong>Tax Efficient</strong></p>
<p>Thanks to their structure, ETFs may be considered some of the most tax-efficient investment vehicles available to investors today. The underlying mechanics, such as the way ETF shares are created and redeemed, generally result in daily operations that generate relatively few taxable events. This, in turn, can translate into lower taxes for investors.</p>
<p><strong>Tradability and Accessibility</strong></p>
<p>Investors can quickly gain access to different asset classes, geographic regions, sectors, or strategies, from niche to broad. ETFs can offer exposure to investments that might otherwise be difficult to access, such as commodities or currencies. Investors are also able to trade ETFs intraday and employ trading strategies not possible with mutual funds, such as selling short or using limit orders.</p>
<p><strong>ETFs and Mutual Funds Compared</strong></p>
<p>Both ETFs and mutual funds have attractive investor benefits including portfolio diversification and professional management. They also have some key differences of which investors should be aware. Below is a summary comparison of key attributes of each structure.</p>
<table class="tbl-data data-list" style="height: 285px;">
<tbody>
<tr style="height: 15px;">
<td style="height: 15px;">&nbsp;</td>
<td class="data-head black" style="width: 235px; height: 15px;"><strong>ETFs</strong></td>
<td class="data-head black" style="width: 131px; height: 15px;"><strong>Mutual Funds</strong></td>
</tr>
<tr style="height: 15px;">
<td class="black" style="width: 235px; height: 15px;">Pooled fund of securities offering diversification benefits</td>
<td style="width: 235px; height: 15px; text-align: center;">X</td>
<td style="width: 131px; height: 15px; text-align: center;">X</td>
</tr>
<tr style="height: 15px;">
<td style="width: 235px; height: 15px;">Professionally managed</td>
<td class="data-head" style="width: 235px; height: 15px;">X</td>
<td class="data-head" style="width: 131px; height: 15px;">X</td>
</tr>
<tr style="height: 15px;">
<td style="width: 235px; height: 15px;">Returns based on fund's underlying holdings</td>
<td class="data-head" style="width: 235px; height: 15px;">X</td>
<td class="data-head" style="width: 131px; height: 15px;">X</td>
</tr>
<tr style="height: 15px;">
<td class="black" style="width: 235px; height: 15px; text-align: left;">Intraday Trading</td>
<td style="width: 235px; height: 15px; text-align: center;">X</td>
<td style="width: 131px; height: 15px;">&nbsp;</td>
</tr>
<tr style="height: 15px;">
<td style="width: 235px; height: 15px;">Minimum Investment Size</td>
<td class="data-head" style="width: 235px; height: 15px;">&nbsp;</td>
<td class="data-head" style="width: 131px; height: 15px;">X</td>
</tr>
<tr style="height: 15px;">
<td style="width: 235px; height: 15px;">Sales Commissions (front-end or back-end loads)</td>
<td class="data-head" style="width: 235px; height: 15px;">&nbsp;</td>
<td class="data-head" style="width: 131px; height: 15px;">X</td>
</tr>
<tr style="height: 15px;">
<td style="width: 235px; height: 15px;">Trading Spread</td>
<td class="data-head" style="width: 235px; height: 15px;">X</td>
<td class="data-head" style="width: 131px; height: 15px;">&nbsp;</td>
</tr>
<tr style="height: 15px;">
<td style="width: 235px; height: 15px;">Brokerage Commission</td>
<td class="data-head" style="width: 235px; height: 15px;">X</td>
<td class="data-head" style="width: 131px; height: 15px;">&nbsp;</td>
</tr>
<tr style="height: 15px;">
<td style="width: 235px; height: 15px;">Transparency</td>
<td class="data-head" style="width: 235px; height: 15px;">Holdings disclosed daily</td>
<td class="data-head" style="width: 131px; height: 15px;">Holdings disclosed monthly, quarterly or semi-anually</td>
</tr>
<tr style="height: 15px;">
<td style="width: 235px; height: 15px;">Average net expense ratio<sup>2</sup></td>
<td class="data-head" style="width: 235px; height: 15px;">0.34%</td>
<td class="data-head" style="width: 131px; height: 15px;">0.34%</td>
</tr>
</tbody>
</table>
<h2 class="sub">ETF Investing</h2>
<p>ETFs are versatile tools for investors, suitable for a wide range of investment goals. Being able to trade ETFs on exchanges like stocks gives investors flexibility to employ different trading strategies and offers a relatively quick way for investors to add diversification to their portfolio. Features such as daily transparency of holdings, simple fee structures, and tax efficient operations make ETFs historically a cost-effective and straightforward investment vehicle.</p>
<p>ETF issuers are continually introducing new strategies, from traditional index-tracking funds to innovative funds constructed around investment themes. As with any investment, investors should carefully evaluate an ETF to determine whether it fits well within their portfolio.</p>
<h2 class="sub">Explore Our ETFs</h2>
<p><strong><a href="/link/d835663826f44348843c6b6c539e877c.aspx">Equity ETFs</a></strong></p>
<p><strong><a href="/link/e1f766c9dc9e4c0a9a629b2e75ebc115.aspx">Income ETFs</a></strong></p>
<p><a href="/link/e1f766c9dc9e4c0a9a629b2e75ebc115.aspx?sg=c-c&amp;uty=false&amp;min=0&amp;max=10.02&amp;tab=ov&amp;sort=assetClass&amp;asc=true"><strong>Commodity ETFs</strong></a></p>
<style>
	.tbl-data { padding: 15px; margin-right: 10px; margin-bottom: 10px; width: 303px; }
		.tbl-data td, .tbl-header, span.tbl-disc { color: #6e6f72; font-size: 12px; }
	.tbl-header { font-weight: bold; border-top: 2px solid #b2b3b2; padding: 10px 5px 5px 5px; }
	.data-td { border-top: 1px solid #b2b3b2; padding: 5px; line-height: 14px; }
		.data-td.data { color: #6e6f72; text-align: right; padding-right: 15px; }
	.align-right { text-align: right; padding-right: 10px; }
	
	.tbl-data.data-list { width:100%; }
	.data-list ul li { margin-left: 25px; list-style-type:  disc; }
	.data-list td { border-top: 1px solid #b2b3b2; padding:5px; }
	.data-head { color:#6e6f72; text-align: center; }
	.black strong { color:#000; }
	.pale-blue { background-color: #D9E2F3; }
	ul.content-list li { margin-bottom: 0px; }
	.td2 { text-align: center !important; border: 1px solid #b2b3b2; font-size: 12px; width: 18%;  }
	.data-td.align-left { text-align: left !important; }
	
	td.neg { background-color: #dbefea; }

	
	@media (max-width: 500px) {
		.tbl-data { width: 400px; }
	}
</style>
<style>
	div.disclosure {
    font-size=12.6px;
    }
</style>

]]></content:encoded>
</item><item rdf:about="https://www.vaneck.com/us/en/blogs/thematic-investing/buzz-investing-buzz-index-surges-as-fed-cut-and-ai-leaders-drive-gains/">
  <title>BUZZ Investing: BUZZ Index Surges as Fed Cut and AI Leaders Drive Gains></title>
  <link>https://www.vaneck.com/us/en/blogs/thematic-investing/buzz-investing-buzz-index-surges-as-fed-cut-and-ai-leaders-drive-gains/</link>
  <description><![CDATA[Investors cheered a dovish Fed pivot and resilient tech earnings as U.S. equities extended gains, with retail-fueled sentiment lifting select high-growth names.]]></description>
  <dc:creator> </dc:creator>
  <dc:date>10/23/2025 06:30:00</dc:date>
<content:encoded><![CDATA[

<p><strong>Key Takeaways:</strong></p>
<ul class="content-list">
<li class="mt-2"><strong>Fed Pivot:</strong> Markets rallied on the Federal Reserve&rsquo;s rate cut and hints at further easing amid soft labor data.</li>
<li class="mt-2"><strong>AI Tailwind: </strong> Intel and AST SpaceMobile soared on landmark AI and telecom partnerships, driving sentiment higher.</li>
<li class="mt-2"><strong>Retail Surge:</strong> Meme-like momentum returned with Opendoor and Webull drawing outsized interest from online investors.</li>
</ul>
<div class="row mb-3">
<div class="col-md-4 col-xs-12"><a href="https://www.youtube.com/embed/d768h0UMH0A" data-video="https://youtu.be/d768h0UMH0A" class="popup-youtube" title="Watch Video"><img loading="lazy" class="img-responsive" style="margin-right: 15px; margin-top: 0px;" src="https://www.vaneck.com/EPiServer/CMS/Content/contentassets/860aad51dbd24d5d8a3dc43d81f09ad4/6374_buzz-top-companies_video-thumbnail_2025-11_v1.jpg,,353244/Download?epieditmode=False" alt="Watch Video" align="left" /></a></div>
<div class="col-md-8 col-xs-12"><br /><strong><a href="https://www.youtube.com/embed/d768h0UMH0A" data-video=" https://youtu.be/d768h0UMH0A" class="popup-youtube" title="Watch Video">Watch Video</a><br /></strong><a href="https://www.youtube.com/embed/d768h0UMH0A" data-video="https://youtu.be/d768h0UMH0A" class="popup-youtube" title="Watch Video" style="font-size: 16px; font-weight: bold; padding: 10px 0px 0px; margin-right: 20px; width: 202px;">Top Trending Stocks to Invest In</a></div>
</div>
<p>U.S. equities posted further gains during the recent period between index selection dates (September 11, 2025 &ndash; October 9, 2025, the &ldquo;Period&rdquo;), extending their late-summer momentum and pushing major benchmarks to new highs. The S&amp;P 500 rose and the Nasdaq Composite outperformed, supported by optimism surrounding the Federal Reserve&rsquo;s long-anticipated 25-basis-point rate cut in mid-September. While the decision was widely expected, the accompanying statement struck a notably dovish tone, with policymakers signaling that additional easing may be appropriate should labor conditions continue to soften. Large-cap technology stocks led performance once again, buoyed by resilient earnings and continued enthusiasm around artificial intelligence. Broader markets benefited from the perception that policy is now pivoting toward supporting growth, helping sustain the rally despite lingering geopolitical and trade-related uncertainty. The BUZZ NextGen AI US Sentiment Leaders Index (the &ldquo;BUZZ Index&rdquo;) returned 17.4% during the Period versus 2.3% for the S&amp;P 500. Year to date, the BUZZ Index has risen 57.9%, compared to the S&amp;P&rsquo;s 15.7%.</p>
<p>Monetary policy developments loomed large. On September 17, the Fed delivered a 25 basis point rate cut to bring its benchmark to 4.00-4.25%, citing rising downside risks to employment and affirming expectations for more cuts this year. The statement noted that downside risks to the labor market have increased. Treasury yields broadly fell on the news. Labor data remained soft: the August payrolls miss and rising unemployment had already stoked easing expectations; the weak report still appeared to validate the Fed&rsquo;s shift. Inflation data showed mixed signals, with core measures remaining sticky even as headline prints flirted with moderation. Tariff risk re-entered the equation, notably with new duties announced on lumber and furniture, complicating the outlook for goods inflation. Overall, the Period was defined by equities pressing higher under the tailwind of monetary easing, while macro crosscurrents around inflation and trade reminded markets that the path ahead may not be entirely smooth.</p>
<p>The BUZZ Index returned 12.14% during the month of September compared to a return of 3.65% for the S&amp;P 500 Index during the same period. Year-to-date, the BUZZ Index leads the S&amp;P 500 with returns of 45.21% and 14.83%, respectively, as of the end of September.</p>
<h2>AST SpaceMobile and Intel Lead BUZZ Performance on Landmark Partnership Announcements</h2>
<p>Shares of AST SpaceMobile (NASDAQ: ASTS) surged 126.2% during the Period, leading contributors to BUZZ Index performance. The move followed the October 8 announcement of a definitive commercial agreement with Verizon (NYSE: VZ) to offer direct-to-cell service to Verizon customers beginning in 2026, leveraging Verizon&rsquo;s 850 MHz spectrum alongside ASTS&rsquo;s space-based network. The deal built on successful voice, video, and messaging demonstrations using unmodified smartphones and was widely viewed as a milestone toward commercial rollout, helping re-rate growth expectations for the space-to-cell category.</p>
<p>Intel (NASDAQ: INTC) rose 53.6% during the Period, supported by a series of high-profile announcements that may have reshaped the company&rsquo;s AI and PC road map. On September 18, NVIDIA (NASDAQ: NVDA) disclosed a $5 billion investment in Intel stock alongside a multi-year collaboration to co-develop data-center and PC products, including x86 system-on-chips integrating RTX GPU chiplets and deeper NVLink connectivity. The partnership was interpreted as a notable vote of confidence in Intel&rsquo;s technology stack and potential role in next-generation AI platforms. Momentum may have also reflected the U.S. government&rsquo;s previously announced 9.9% equity stake in Intel in late August, which aimed to bolster domestic semiconductor capacity and added to the sense of balance-sheet support heading into the fall.</p>

<h3 id="top-contributors" class="jump-link-nav anchored-block" data-jumplink-title="Top Contributors">Top BUZZ Index Contributors: September 11, 2025 &ndash; October 9, 2025</h3>
<div class="wrapped-div">
<table width="100%">
<tbody>
<tr class="tbl-data">
<td class="tbl-header last text-left"><strong>Company</strong></td>
<td class="tbl-header last text-left"><strong>Ticker</strong></td>
<td class="tbl-header last text-right"><strong>Average Weight (%)</strong></td>
<td class="tbl-header last text-right"><strong>Return Contribution (%)</strong></td>
</tr>
<tr class="tbl-data">
<td class="data-td data last text-left">AST SpaceMobile Inc</td>
<td class="data-td data last text-left">ASTS</td>
<td class="data-td data last text-right">3.65</td>
</tr>
<tr class="tbl-data">
<td class="data-td data last text-left">Intel Corp</td>
<td class="data-td data last text-left">INTC</td>
<td class="data-td data last text-right">3.57</td>
<td class="data-td data last text-right">1.63</td>
</tr>
<tr class="tbl-data">
<td class="data-td data last text-left">Nebius Group NV</td>
<td class="data-td data last text-left">NBIS</td>
<td class="data-td data last text-right">3.32</td>
<td class="data-td data last text-right">1.44</td>
</tr>
<tr class="tbl-data">
<td class="data-td data last text-left">Advanced Micro Devices Inc</td>
<td class="data-td data last text-left">AMD</td>
<td class="data-td data last text-right">2.91</td>
<td class="data-td data last text-right">1.43</td>
</tr>
<tr class="tbl-data">
<td class="data-td data last text-left">Rocket Lab Corp</td>
<td class="data-td data last text-left">RKLB</td>
<td class="data-td data last text-right">2.69</td>
<td class="data-td data last text-right">0.92</td>
</tr>
<tr class="tbl-data">
<td class="data-td data last text-left">Super Micro Computer Inc</td>
<td class="data-td data last text-left">SMCI</td>
<td class="data-td data last text-right">2.96</td>
<td class="data-td data last text-right">0.92</td>
</tr>
<tr class="tbl-data">
<td class="data-td data last text-left">Robinhood Markets Inc</td>
<td class="data-td data last text-left">HOOD</td>
<td class="data-td data last text-right">3.11</td>
<td class="data-td data last text-right">0.88</td>
</tr>
<tr class="tbl-data">
<td class="data-td data last text-left">Tesla Inc</td>
<td class="data-td data last text-left">TSLA</td>
<td class="data-td data last text-right">3.30</td>
<td class="data-td data last text-right">0.61</td>
</tr>
<tr class="tbl-data">
<td class="data-td data last text-left">Oklo Inc</td>
<td class="data-td data last text-left">OKLO</td>
<td class="data-td data last text-right">0.87</td>
<td class="data-td data last text-right">0.61</td>
</tr>
<tr class="tbl-data">
<td class="data-td data last text-left">MARA Holdings Inc</td>
<td class="data-td data last text-left">MARA</td>
<td class="data-td data last text-right">1.67</td>
<td class="data-td data last text-right">0.60</td>
</tr>
</tbody>
</table>
</div>
<p class="chart-disclosure">Source: BUZZ Holdings ULC, Bloomberg. Past performance is no guarantee of future results. Index performance is not illustrative of fund performance. Not intended as a recommendation to buy or to sell any of the securities mentioned herein.</p>

<h2>Rocket and DraftKings Pull Back; Execution Risks and New Competition Pressure Shares</h2>
<p>Shares of Rocket Companies (NYSE: RKT) declined during the Period, ranking among the leading detractors to BUZZ Index performance. The weakness followed the completion of its acquisition of Mr. Cooper Group (NASDAQ: COOP) on October 1, a transformative deal that created the largest mortgage originator and servicer in the U.S. While strategically compelling, investors may have been cautious about near-term integration risks, potential margin dilution, and execution complexity. Index rebalancing around the close added further technical pressure, as S&amp;P Dow Jones Indices announced the removal of Mr. Cooper from the S&amp;P SmallCap 600 and the inclusion of Western Union in its place. The shift, combined with subdued housing-market sentiment and persistent interest-rate uncertainty, may have contributed to selling pressure even as the combined platform positions Rocket for long-term scale advantages.</p>
<p>DraftKings (NASDAQ: DKNG) was another notable detractor, retreating amid growing concerns over new forms of competition in online wagering. Shares fell sharply in late September after reports highlighted surging trading volumes on federally regulated prediction-market platforms such as Kalshi and Polymarket, which allow users to trade event-based contracts outside traditional state-regulated sports-betting frameworks. The platforms&rsquo; nationwide accessibility and favorable tax treatment drew attention from investors who viewed them as potential disruptors to the sports-betting duopoly of DraftKings and FanDuel. The decline erased much of the stock&rsquo;s summer gains, as traders reassessed near-term growth prospects despite DraftKings&rsquo; continued expansion in legalized markets and steady progress toward profitability.</p>
<h3 id="bottom-contributors" class="jump-link-nav anchored-block" data-jumplink-title="Bottom Contributors">Bottom BUZZ Index Contributors: September 11, 2025 &ndash; October 9, 2025</h3>
<div class="wrapped-div">
<table width="100%">
<tbody>
<tr class="tbl-data">
<td class="tbl-header last text-left"><strong>Company</strong></td>
<td class="tbl-header last text-left"><strong>Ticker</strong></td>
<td class="tbl-header last text-right"><strong>Average Weight (%)</strong></td>
<td class="tbl-header last text-right"><strong>Return Contribution (%)</strong></td>
</tr>
<tr class="tbl-data">
<td class="data-td data last text-left">Rocket Cos Inc</td>
<td class="data-td data last text-left">RKT</td>
<td class="data-td data last text-right">1.17</td>
<td class="data-td data last text-right">-0.22</td>
</tr>
<tr class="tbl-data">
<td class="data-td data last text-left">DraftKings Inc</td>
<td class="data-td data last text-left">DKNG</td>
<td class="data-td data last text-right">0.51</td>
<td class="data-td data last text-right">-0.15</td>
</tr>
<tr class="tbl-data">
<td class="data-td data last text-left">Affirm Holdings Inc</td>
<td class="data-td data last text-left">AFRM</td>
<td class="data-td data last text-right">0.44</td>
<td class="data-td data last text-right">-0.10</td>
</tr>
<tr class="tbl-data">
<td class="data-td data last text-left">Reddit Inc</td>
<td class="data-td data last text-left">RDDT</td>
<td class="data-td data last text-right">0.62</td>
<td class="data-td data last text-right">-0.10</td>
</tr>
<tr class="tbl-data">
<td class="data-td data last text-left">ROBLOX Corp</td>
<td class="data-td data last text-left">RBLX</td>
<td class="data-td data last text-right">1.13</td>
<td class="data-td data last text-right">-0.08</td>
</tr>
<tr class="tbl-data">
<td class="data-td data last text-left">Upstart Holdings Inc</td>
<td class="data-td data last text-left">UPST</td>
<td class="data-td data last text-right">0.54</td>
<td class="data-td data last text-right">-0.08</td>
</tr>
<tr class="tbl-data">
<td class="data-td data last text-left">Strategy Inc</td>
<td class="data-td data last text-left">MSTR</td>
<td class="data-td data last text-right">2.74</td>
<td class="data-td data last text-right">-0.06</td>
</tr>
<tr class="tbl-data">
<td class="data-td data last text-left">Dutch Bros Inc</td>
<td class="data-td data last text-left">BROS</td>
<td class="data-td data last text-right">0.11</td>
<td class="data-td data last text-right">-0.06</td>
</tr>
<tr class="tbl-data">
<td class="data-td data last text-left">GameStop Corp</td>
<td class="data-td data last text-left">GME</td>
<td class="data-td data last text-right">2.97</td>
<td class="data-td data last text-right">-0.06</td>
</tr>
<tr class="tbl-data">
<td class="data-td data last text-left">Rivian Automotive Inc</td>
<td class="data-td data last text-left">RIVN</td>
<td class="data-td data last text-right">0.95</td>
<td class="data-td data last text-right">-0.06</td>
</tr>
</tbody>
</table>
</div>
<p class="chart-disclosure">Source: BUZZ Holdings ULC, Bloomberg. Past performance is no guarantee of future results. Index performance is not illustrative of fund performance. Not intended as a recommendation to buy or to sell any of the securities mentioned herein.</p>
<h2>BUZZ Index October 2025 Rebalance Highlights</h2>
<p><strong>New Entrants to the BUZZ Index</strong></p>
<p>This month, the BUZZ Index welcomes several first-time entrants; many tied to high-profile themes dominating market and social media discussions. IREN Limited (NASDAQ: IREN) and Applied Digital Corporation (NASDAQ: APLD) highlight the continued enthusiasm surrounding AI infrastructure and data center development. Rigetti Computing, Inc. (NASDAQ: RGTI) and D-Wave Quantum Inc. (NYSE: QBTS), both leaders in quantum computing, have also gained attention as optimism builds around the path toward commercial adoption of quantum technologies. Shares of QuantumScape Corporation (NYSE: QS), which operates in the lithium battery space, have quadrupled since June amid renewed interest in next-generation energy storage. Collectively, these stocks reflect strong price momentum and elevated investor engagement. The exception is Webull Corporation (NASDAQ: BULL), the online trading platform that went public in April through its merger with SPAC SK Growth Opportunities Corp. After an early surge which saw its shares rally from $11 to an intra-day high of near $80, the stock quickly retraced to the $11 range and has since mostly traded sideways. Sentiment, however, had remained positive, buoyed by favorable comparisons to Robinhood Markets, Inc. (NASDAQ: HOOD), which has gained more than fourfold since spring. BULL enters the Index as the third-largest new addition this month, with a 2.87% weight.</p>
<p><strong>Opendoor Technologies Inc.</strong></p>
<p>Amid this month&rsquo;s wave of new entrants to the Index, none has drawn more attention than Opendoor Technologies (NASDAQ: OPEN). The stock&rsquo;s remarkable rally has evoked comparisons to the early days of the meme-stock era led by GameStop. Between July 1 and July 21, shares surged from $0.50 to $5.00, driven by a rapidly expanding online community of retail investors. Much of the renewed enthusiasm centered on Toronto hedge fund manager Eric Jackson, whose unconventional campaign to spotlight Opendoor&rsquo;s &ldquo;value&rdquo; potential, including daily appearances outside rapper Drake&rsquo;s Toronto residence holding a sign for the &ldquo;$OPEN Army&rdquo;, went viral across social media. Following an initial pullback to $2, the stock extended its advance through August and September, reaching over $10 per share before drifting lower. Sentiment across online platforms remains exceptionally strong, underscoring sustained retail engagement and optimism surrounding the company&rsquo;s recovery narrative. This month, OPEN holds the highest positive sentiment score in the eligible universe and enters the BUZZ Index at the maximum 3% weight.</p>
<p>For more on rebalancing results and a full breakdown of index constituents added and removed for the month, view the <strong><a title="BUZZ Index reconstitution report" href="https://www.vaneck.com/us/en/investments/social-sentiment-etf-buzz/buzz-reconstitution.pdf" target="_blank" rel="noopener">BUZZ Index reconstitution report.</a></strong></p>

<p>To receive more <a href="https://www.vaneck.com/us/en/insights/thematic-investing/" title="Thematic Investing Insights"><strong>Thematic Investing</strong></a> insights, <a href="https://www.vaneck.com/us/en/subscribe/" title="Subscription Center"><strong>sign up in our subscription center</strong></a>.</p>
]]></content:encoded>
</item><item rdf:about="https://www.vaneck.com/us/en/blogs/digital-assets/matthew-sigel-vaneck-mid-october-2025-bitcoin-chaincheck/">
  <title>VanEck Mid-October 2025 Bitcoin ChainCheck></title>
  <link>https://www.vaneck.com/us/en/blogs/digital-assets/matthew-sigel-vaneck-mid-october-2025-bitcoin-chaincheck/</link>
  <description><![CDATA[Bitcoin&rsquo;s October pullback reflects a liquidity-driven mid-cycle reset. Leverage has normalized, on-chain activity is rising, and digital assets&rsquo; macro role continues to strengthen.]]></description>
  <dc:creator>Nathan  Frankovitz</dc:creator>
  <dc:date>10/22/2025 06:30:00</dc:date>
<content:encoded><![CDATA[

<p><strong>Please note that VanEck has exposure to bitcoin.</strong></p>
<p><strong>Three key takeaways for mid-September &ndash; mid-October:</strong></p>
<ol class="content-list">
<li class="mt-2"><strong>Liquidity Drives the Cycle:</strong> Global M2 growth continues to explain more than half of Bitcoin&rsquo;s price variance, reaffirming Bitcoin&rsquo;s role as an anti&ndash;money printing asset. Asian trading hours leading price discovery over the past year suggests that tightening regional liquidity is driving near-term volatility.</li>
<li class="mt-2"><strong>Leverage Flush Creates Opportunity:</strong> Futures open interest peaked at <strong>$52B</strong> before cascading liquidations drove Bitcoin&rsquo;s <strong>~18%</strong> drawdown in early October. With leverage now normalized to the <strong>61st</strong> percentile and prices near one-year lows relative to gold, we view this as a mid-cycle correction, not the start of a bear market.</li>
<li class="mt-2"><strong>Onchain Activity Reflects a Maturing Market:</strong> Strong revenue-to-price correlations among L1s and sustained Bitcoin treasury accumulation point to Bitcoin&rsquo;s maturation, underscoring the asset class&rsquo;s growing importance in model portfolios.</li>
</ol>
<h2 id="chart-of-the-month" class="jump-link-nav anchored-block" data-jumplink-title="Chart of the Month">Chart of the Month</h2>
<h3>Total Bitcoin Miner Debt (<i>USD Billions</i>)</h3>
<p><img loading="lazy" class="img-responsive" alt="Total Bitcoin Miner Debt (USD Billions)" src="https://www.vaneck.com/contentassets/27942b9059b5472ea7b08f75a75caa7e/6302_bitcoin-chaincheck-mid-oct_chart-1_2025-10_v1_blog.svg" /></p>
<p class="chart-disclosure">Source: VanEck estimates, FactSet as of 10/15/2025. <strong>Past performance is no guarantee of future results. Not intended as a recommendation to buy or sell any securities named herein.</strong></p>
<p>Bitcoin miners&rsquo; total debt has surged over the past 12 months from <strong>~$2.1B</strong> in Q2 2024 to <strong>~$12.7B</strong> in Q2 2025. Bitcoin mining is a challenging business; without continued investment in the latest ASICs, a miner&rsquo;s share of the global hash rate deteriorates, resulting in a reduced pro rata share of the finite number of Bitcoin awarded daily. We refer to this dynamic as &ldquo;the melting ice cube problem&rdquo;. Historically, miners relied on equity markets, not debt, to fund these steep Capex costs. This stems from the fact that miners&rsquo; revenues are difficult to underwrite as they rely almost entirely on the price of Bitcoin, which is speculative. Importantly, equity tends to be a more expensive form of capital than debt.</p>
<p>As we have covered extensively since Q3 2024, miners have progressively pivoted greater amounts of power from mining Bitcoin to supporting the energy-hungry AI/HPC data center business. In doing so, miners have secured more predictable cash flows backed by multi-year contracts. The relative predictability of these cash flows has enabled miners to tap into debt markets, diversifying their revenues from Bitcoin&rsquo;s speculative and cyclical prices and lowering their overall cost of capital.</p>
<p>What does this mean for Bitcoin&rsquo;s network? Rather than being a threat to network hash rate, we think AI&rsquo;s priority for electrons is a net benefit to Bitcoin. Bitcoin mining remains an easy way to quickly monetize excess electricity in remote or developing energy markets, effectively subsidizing the development of data centers that are designed with AI/HPC convertibility in mind. In addition, AI inference experiences cyclical demand over the course of the day based on human activity. A number of Bitcoin miners we have spoken to have reported that they are exploring ways to monetize excess electrical capacity when demand for AI inference is low. In doing so, for certain use cases, they may be able to offset or even eliminate costly components of backup electrical power systems such as diesel generators, which can cost as much as <strong>$4M/MW</strong> despite running only <strong>&lt;1%</strong> of the year, effectively internally capturing the value of curtailment that has proven successful in markets like ERCOT. While this remains conceptual, we think it represents a logical next step in the unique synergies between Bitcoin and AI that lead to greater efficiency in the use of capital, both financial and electrical.</p>
<h3 id="dashboard-update" class="jump-link-nav anchored-block" data-jumplink-title="Dashboard Update">Bitcoin ChainCheck Monthly Dashboard and Highlights</h3>
<div class="wrapped-div">
<table style="width: 100%;">
<tbody>
<tr class="tbl-data">
<td class="tbl-header last text-left">As of October 16th, 2025</td>
<td class="tbl-header last text-right">30-day avg</td>
<td class="tbl-header last text-right">30 day change (%)<sup>1</sup></td>
<td class="tbl-header last text-right">365 day change(%)</td>
<td class="tbl-header last text-right">Last 30 days Percentile vs<br />all-time history (%)</td>
</tr>
<tr class="tbl-data">
<td class="data-td data last text-left">Bitcoin Price</td>
<td class="data-td data last text-right">$ 114,868</td>
<td class="data-td data last text-right">2</td>
<td class="data-td data last text-right">79</td>
<td class="data-td data last text-right">99</td>
</tr>
<tr class="tbl-data">
<td class="data-td data last text-left">Daily Active Addresses</td>
<td class="data-td data last text-right">722,857</td>
<td class="data-td data last text-right">2</td>
<td class="data-td data last text-right">64</td>
</tr>
<tr class="tbl-data">
<td class="data-td data last text-left">Daily New Addresses</td>
<td class="data-td data last text-right">310,903</td>
<td class="data-td data last text-right">0</td>
<td class="data-td data last text-right">6</td>
<td class="data-td data last text-right">57</td>
</tr>
<tr class="tbl-data">
<td class="data-td data last text-left">Daily Transactions</td>
<td class="data-td data last text-right">472,824</td>
<td class="data-td data last text-right">-8</td>
<td class="data-td data last text-right">-24</td>
<td class="data-td data last text-right">75</td>
</tr>
<tr class="tbl-data">
<td class="data-td data last text-left">Daily Inscriptions</td>
<td class="data-td data last text-right">52,908</td>
<td class="data-td data last text-right">-21</td>
<td class="data-td data last text-right">167</td>
<td class="data-td data last text-right">38</td>
</tr>
<tr class="tbl-data">
<td class="data-td data last text-left">Total Transfer Volume (USD)</td>
<td class="data-td data last text-right">$ 86,316,806,627</td>
<td class="data-td data last text-right">21</td>
<td class="data-td data last text-right">101</td>
<td class="data-td data last text-right">93</td>
</tr>
<tr class="tbl-data">
<td class="data-td data last text-left">% Supply Active, last 180 days</td>
<td class="data-td data last text-right">24</td>
<td class="data-td data last text-right">4</td>
<td class="data-td data last text-right">22</td>
<td class="data-td data last text-right">38</td>
</tr>
<tr class="tbl-data">
<td class="data-td data last text-left">% Supply Dormant for 3+ Years</td>
<td class="data-td data last text-right">43</td>
<td class="data-td data last text-right">-1</td>
<td class="data-td data last text-right">-6</td>
<td class="data-td data last text-right">90</td>
</tr>
<tr class="tbl-data">
<td class="data-td data last text-left">Avg Fees (USD)</td>
<td class="data-td data last text-right">$ 97,383.77</td>
<td class="data-td data last text-right">-6</td>
<td class="data-td data last text-right">-17</td>
<td class="data-td data last text-right">79</td>
</tr>
<tr class="tbl-data">
<td class="data-td data last text-left">Avg Fees (BTC)</td>
<td class="data-td data last text-right">0.83971</td>
<td class="data-td data last text-right">-9</td>
<td class="data-td data last text-right">-53</td>
<td class="data-td data last text-right">56</td>
</tr>
<tr class="tbl-data">
<td class="data-td data last text-left">Percent of BTC Addresses in profit</td>
<td class="data-td data last text-right">95</td>
<td class="data-td data last text-right">0</td>
<td class="data-td data last text-right">4</td>
<td class="data-td data last text-right">83</td>
</tr>
<tr class="tbl-data">
<td class="data-td data last text-left">Unrealized profit/loss ratio</td>
<td class="data-td data last text-right">0.53</td>
<td class="data-td data last text-right">-1</td>
<td class="data-td data last text-right">5</td>
<td class="data-td data last text-right">73</td>
</tr>
<tr class="tbl-data">
<td class="data-td data last text-left">Global Power Consumption (TWh)</td>
<td class="data-td data last text-right">205</td>
<td class="data-td data last text-right">15</td>
<td class="data-td data last text-right">68</td>
<td class="data-td data last text-right">100</td>
</tr>
<tr class="tbl-data">
<td class="data-td data last text-left">Total Daily BTC Miner Revenues (USD)</td>
<td class="data-td data last text-right">$ 52,671,544</td>
<td class="data-td data last text-right">-2</td>
<td class="data-td data last text-right">72</td>
<td class="data-td data last text-right">96</td>
</tr>
<tr class="tbl-data">
<td class="data-td data last text-left">Total Crypto Equities' Market Cap<sup>*</sup>&nbsp;(USD) (MM)</td>
<td class="data-td data last text-right">$ 345,355</td>
<td class="data-td data last text-right">18</td>
<td class="data-td data last text-right">159</td>
<td class="data-td data last text-right">100</td>
</tr>
<tr class="tbl-data">
<td class="data-td data last text-left">Transfer volume from Miners to Exchanges (USD)</td>
<td class="data-td data last text-right">$ 17,556,460</td>
<td class="data-td data last text-right">14</td>
<td class="data-td data last text-right">125</td>
<td class="data-td data last text-right">96</td>
</tr>
<tr class="tbl-data">
<td class="data-td data last text-left">Bitcoin Dominance</td>
<td class="data-td data last text-right">58</td>
<td class="data-td data last text-right">-4</td>
<td class="data-td data last text-right">4</td>
<td class="data-td data last text-right">76</td>
</tr>
<tr class="tbl-data">
<td class="data-td data last text-left">Bitcoin Futures Annualized Basis</td>
<td class="data-td data last text-right">9</td>
<td class="data-td data last text-right">18</td>
<td class="data-td data last text-right">12</td>
<td class="data-td data last text-right">58</td>
</tr>
<tr class="tbl-data">
<td class="data-td data last text-left">Mining Difficulty (T)</td>
<td class="data-td data last text-right">147</td>
<td class="data-td data last text-right">10</td>
<td class="data-td data last text-right">63</td>
<td class="data-td data last text-right">100</td>
</tr>
</tbody>
</table>
</div>
<br />
<p class="chart-disclosure"><sup>*</sup>&nbsp;DAPP market cap as a proxy, as of October 19th, 2025. "All-time" data as of 6.8.23, not since index inception.</p>
<p class="chart-disclosure"><sup>1</sup>&nbsp;30 day change &amp; 365 day change are relative to the 30-day avg, not absolute.</p>
<p class="chart-disclosure">Source: Glassnode as of 10/19/2025. <strong>Past performance is no guarantee of future results. Not intended as a recommendation to buy or sell any securities named herein.</strong></p>
<p><strong>Bitcoin Price &amp; Futures Annualized Basis:</strong> Bitcoin&rsquo;s price made new all-time highs above <strong>$125K</strong> on October 6th before dropping to a low around <strong>$105K</strong> by the 10th, with its 30-day moving average up <strong>2%</strong> on the month. The steep selloff was driven by a mix of macro risks such as developing U.S.-China trade tensions, high levels of futures open interest, and whale profit-taking, triggering a cascade of liquidations (margin calls) in perpetual futures markets. Futures borrowing rates averaged <strong>9%</strong> over the last 30 days, <strong>18%</strong> higher than the previous month, accompanied by highs in open interest prior to the crash (discussed in detail below). However, without a clear or ongoing &ldquo;black swan&rdquo; event in play, this looks more like a mid-cycle selloff than the start of a bear market.</p>
<p><strong>Global Power Consumption &amp; Mining Difficulty:</strong> Bitcoin&rsquo;s global power consumption (+7%) and mining difficulty (+10%) reached new all-time highs this month, reflecting ongoing mining fleet expansions and ASIC upgrades. Though AI-geared GPUs continue to displace Bitcoin mining ASICs located in key AI data center geographies, miners continue to gravitate towards low-cost power.</p>
<p><strong>Transfer Volume from Miners to Exchanges:</strong> Transfer volumes from miners to exchanges increased <strong>14%</strong> this month versus only <strong>2%</strong> in BTC price gains, reflecting miners monetizing their production instead of holding. We think this reflects the steep capex requirements faced by the increasing number of miner AI-pivots as well as de-risking amid price volatility.</p>
<p><strong>Total Crypto Equities&rsquo; Market Cap:</strong> The&nbsp;<a href="https://www.marketvector.com/indexes/sector/mvis-global-digital-assets-equity" title="MVDAPP - MVIS Global Digital Assets Equity Index" target="_blank" rel="noopener"><strong>MVIS<sup>&reg;</sup>&nbsp;Global Digital Assets Equity Index (MVDAPP)</strong></a>&rsquo;s 30-day moving average rose <strong>18%</strong> over the past month as miners such as APLD, IREN, and CIFR continued to be rewarded for pivoting scarce power assets toward meeting AI&rsquo;s growing energy demands.</p>
<h2 id="three-key-factors-driving-bitcoin" class="jump-link-nav anchored-block" data-jumplink-title="3 Key Factors Driving Bitcoin">What Drives Bitcoin&rsquo;s Price: 3 Key Factors</h2>
<p>Allocating to Bitcoin, like most emerging asset classes, remains part art and part science. Yet three measurable factors have consistently explained much of Bitcoin&rsquo;s price behavior over time: <i>global liquidity, leverage, and onchain activity.</i> Together, these forces provide investors with a practical framework for sizing and timing exposure to digital assets.</p>
<h2>1. Global Liquidity</h2>
<h3>BTC Price Correlates Highly with Global M2</h3>
<p><img loading="lazy" class="img-responsive" alt="BTC Price Correlates Highly with Global M2" src="https://www.vaneck.com/contentassets/27942b9059b5472ea7b08f75a75caa7e/6302_bitcoin-chaincheck-mid-oct_chart-2_2025-10_v1_blog.svg" /></p>
<p class="chart-disclosure">Source: Artemis, FRED as of 10/10/2025. <strong>Past performance is no guarantee of future results. Not intended as a recommendation to buy or sell any securities named herein.</strong></p>
<p>Bitcoin&rsquo;s price has long been tethered to the ebb and flow of global money supply. Since 2014, Bitcoin has exhibited roughly a <strong>0.5 correlation (r&sup2; = 0.25)</strong> with total global M2 growth, meaning that changes in the availability of fiat currency liquidity have explained a meaningful portion of its long-term returns.</p>
<p>While this relationship tends to weaken during short-lived shocks, such as COVID in 2020, the 2024 election, or the &ldquo;Tariff Tantrum&rdquo; of 2025, broader trends in monetary expansion continue to dominate Bitcoin&rsquo;s cycles. A multivariable regression of the top five fiat currency supplies against Bitcoin price shows that changes in M2 explain <strong>more than half (r&sup2; = 0.54)</strong> of Bitcoin&rsquo;s variance over the past decade.</p>
<p>Since 2013, global liquidity across the top five currencies has roughly <strong>doubled from $50 trillion to nearly $100 trillion</strong>, during which Bitcoin&rsquo;s price has increased <strong>over 700x</strong>. Among individual currencies, the euro M2 money supply remains the strongest explanatory variable <strong>(r = 0.69, t = 10)</strong>, highlighting Bitcoin&rsquo;s growing role as a neutral reserve asset amid synchronized currency debasement.</p>
<p>VanEck&rsquo;s historical macro views align with this data. In March 2023, <strong><a href="https://www.cnbc.com/video/2023/03/24/jan-van-eck-were-at-very-beginning-of-several-year-bull-cycle-for-gold-and-bitcoin.html?__source=sharebar|linkedin&amp;par=sharebar" title="VanEck CEO: We&rsquo;re at very beginning of several-year bull cycle for gold and bitcoin" target="_blank" rel="noopener">CEO Jan Van Eck said on CNBC</a></strong> that both gold and Bitcoin looked primed to enter a multi-year bull cycle as the Fed neared the end of tightening. In that framework, the firm&rsquo;s thesis was that Bitcoin functions as &ldquo;digital gold,&rdquo; poised to benefit when banks showed weakness as liquidity was setting up to expand again amid looming rate cuts.</p>
<p>When it comes to Bitcoin price discovery, regional market dynamics have shifted meaningfully over the past two years. As shown below, Asian trading hours now lead global BTC returns after lagging Western sessions earlier this cycle and in the 2020-2022 cycle. This year, we observed that Asia led the recent move higher through late summer and is now also leading the latest decline. This rotation may reflect tightening liquidity in Asian markets, as central banks in India and China defend their currencies at the expense of domestic money growth. This pattern is consistent with Bitcoin&rsquo;s role as an &lsquo;anti&ndash;money printing&rsquo; asset within global liquidity cycles.</p>
<h3>Annualized Average Hourly Returns of BTC By Trading Session</h3>
<p><img loading="lazy" class="img-responsive" alt="Annualized Average Hourly Returns of BTC By Trading Session" src="https://www.vaneck.com/contentassets/27942b9059b5472ea7b08f75a75caa7e/6302_bitcoin-chaincheck-mid-oct_chart-3_2025-10_v1_blog.svg" /></p>
<p class="chart-disclosure">Source: Glassnode as of 10/10/2025. <strong>Past performance is no guarantee of future results. Not intended as a recommendation to buy or sell any securities named herein.</strong></p>
<h2>2. Leverage</h2>
<h3>BTC Price Correlates Strongly to BTC Futures Open Interest (OI)</h3>
<p><img loading="lazy" class="img-responsive" alt="BTC Price Correlates Strongly to BTC Futures Open Interest
" src="https://www.vaneck.com/contentassets/27942b9059b5472ea7b08f75a75caa7e/6302_bitcoin-chaincheck-mid-oct_chart-4_2025-10_v1_blog.svg" /></p>
<p class="chart-disclosure">Source: Artemis as of 10/10/2025. <strong>Past performance is no guarantee of future results. Not intended as a recommendation to buy or sell any securities named herein.</strong></p>
<p>Leverage is both a driver and a consequence of Bitcoin&rsquo;s monetization process. Since October 2020, nearly <strong>73%</strong> of Bitcoin&rsquo;s price variance has been explained by changes in futures open interest (t = 71), underscoring the reflexive relationship between speculative positioning and spot price. Periods of exuberant leverage have historically preceded corrections, while orderly deleveraging phases have marked attractive entry points.</p>
<h3>BTC Futures Open Interest (OI) Climbed 2.5x YoY Before Crashing in October</h3>
<p><img loading="lazy" class="img-responsive" alt="BTC Futures OI Climbed 2.5x YoY Before Crashing In October" src="https://www.vaneck.com/contentassets/27942b9059b5472ea7b08f75a75caa7e/6302_bitcoin-chaincheck-mid-oct_chart-5_2025-10_v2_blog.svg" /></p>
<p class="chart-disclosure">Source: Glassnode as of 10/16/2025. <strong>Past performance is no guarantee of future results. Not intended as a recommendation to buy or sell any securities named herein.</strong></p>
<p>As of early October 2025, futures leverage sat near its <strong>95th</strong> percentile, with the cash collateral backing Bitcoin futures at record highs <strong>(~$145B)</strong>. Open interest peaked at <strong>$52B</strong> on October 6th before falling to <strong>$39B</strong> on October 10th following an 8-hour, <strong>20%</strong> BTC drawdown, a reminder of how margin calls can cascade through the system. Notably, leverage has <i>never</i> sustained levels above <strong>30%</strong> for more than <strong>75</strong> days, suggesting a limit on sustained risk appetite. As of mid-October, Bitcoin&rsquo;s futures leverage ratio is at the <strong>61st</strong> percentile of its historical ranges over the past <strong>5.25</strong> years.</p>
<p>At the same time, the composition of leverage has matured. Greater participation from institutions, miners, and ETF market makers has shifted activity toward regulated venues like CME, where longer-dated and hedging-oriented contracts dominate. Leverage remains a dual-edged sword, amplifying drawdowns but also reflecting growing confidence in Bitcoin as a financial asset.</p>
<p>Against the backdrop of this month&rsquo;s deleveraging event and Bitcoin prices reaching lows relative to Gold not seen since October 2024, we view the current market as a buying opportunity.</p>
<h2>3. Onchain Activity</h2>
<h3>1 Year Correlation Blockchain Revenue with Token Price</h3>
<p><img loading="lazy" class="img-responsive" alt="1 Yr Correlation Blockchain Revenue with Token Price" src="https://www.vaneck.com/contentassets/27942b9059b5472ea7b08f75a75caa7e/6302_bitcoin-chaincheck-mid-oct_chart-6_2025-10_v1_blog.svg" /></p>
<p class="chart-disclosure">Source: Artemis as of 10/10/2025. <strong>Past performance is no guarantee of future results. Not intended as a recommendation to buy or sell any securities named herein.</strong></p>
<p>While macro liquidity and market structure provide indicators of Bitcoin&rsquo;s shorter-term cycles, which generally drive risk appetite across the broader crypto market, onchain fundamentals offer the clearest window into crypto&rsquo;s real adoption. Across major networks, token prices have shown statistically significant relationships with the revenues their blockchains generate, evidence that usage and value are intertwined.</p>
<p>Among large chains, Solana exhibits the strongest link between network revenue and token performance <strong>(r<sup>2</sup>&nbsp;= 0.71, t = 30)</strong>, while Binance Chain&rsquo;s BNB shows the weakest <strong>(r<sup>2</sup>&nbsp;= 0.13)</strong>. The causal direction is complex: higher token prices catalyze more revenue-generating user activity, yet consistent fee generation reinforces long-term valuations. As chains&rsquo; app ecosystems mature, they offer new channels for activity, which can improve the relationship between price and onchain revenues. As the newest entrant on the six blockchains in the graph above, Sui&rsquo;s network developments in DeFi and consumer gaming/NFT apps over the past two years most clearly demonstrate this relationship.</p>
<p>For Bitcoin, onchain metrics like transaction volume and network fees remain less predictive of daily price moves than liquidity or leverage. However, they still serve as tangible proof of network health. We think Bitcoin&mdash;and to a lesser extent, Ethereum&mdash;are relatively disconnected from these fundamentals versus other blockchain networks due to their growing adoption as store-of-value monetary assets held by off chain treasuries and ETPs. Notwithstanding these factors advantaging BTC and ETH, sustained growth in onchain revenues and user activity provides the most concrete evidence of a blockchain network&rsquo;s value proposition extending beyond speculation.</p>
<p>Onchain metrics aside, while Bitcoin remains, as Jan van Eck described in 2023, &ldquo;an eight-year-old child&rdquo; in its adoption curve, its growing correlation with global liquidity and leverage suggests it is progressing from speculative asset to a macro hedge against fiat currency debasement. Today, Bitcoin is more akin to a teenager; though Bitcoin is growing up, we expect the mood swings to continue in the years ahead.</p>
<h2>Practical Takeaways for Investors</h2>
<p>With Bitcoin comprising <strong>~2%</strong> of global money supply, we believe digital assets can play an increasingly important role in investment portfolios; arguably, owning less than <strong>~2%</strong> Bitcoin or other digital assets is implicitly expressing a short position on the asset class. With fiat debasement accelerating in recent years, that is not a bet VanEck is willing to take.</p>
<p>For these reasons, some of our <strong><a href="/link/39fe1617e2e94666bb799654d182e126.aspx" title="Model Portfolios">Model Portfolios</a></strong> include exposure to digital assets. We advise systematic allocations within certain risk budgets that have portfolio manager discretion. Current Fact Sheets show Digital Assets allocations at <strong>1.47%</strong>, <strong>4.56%</strong>, and <strong>6.08%</strong> across model portfolios.</p>
<p>In our active strategies, we take a more targeted approach by searching for particular best ideas and buying max fear events. For example, our 3-factor view of Bitcoin helps inform our allocations to Bitcoin and other digital asset ETPs, as well as high-beta sectors like Bitcoin miners. These Bitcoin-informed investment decisions can be combined with allocations to crypto-adjacent sectors like data center, energy, and software companies in an effort to maximize Bitcoin cycles while providing defensive, lower-volatility differentiation.</p>
<p><strong>Links to third party websites are provided as a convenience and the inclusion of such links does not imply any endorsement, approval, investigation, verification or monitoring by us of any content or information contained within or accessible from the linked sites. By clicking on the link to a non-VanEck webpage, you acknowledge that you are entering a third-party website subject to its own terms and conditions. VanEck disclaims responsibility for content, legality of access or suitability of the third-party websites.</strong></p>
<style>
    .data-td.data {
        padding-right: 5px !important;
        padding-left: 5px !important;
    }

    .wrapped-div {
        max-width: 100%;
    }

    @media (max-width: 1240px) {
        .wrapped-div {
            overflow-x: scroll;
        }
    }

    .wrapped-div-sector {
        max-width: 100%;
        overflow-x: scroll;
    }
</style>
<p>To receive more <strong><a href="https://www.vaneck.com/us/en/insights/digital-assets/" title="Digital Assets Insights">Digital Assets</a></strong> insights, <strong><a href="https://www.vaneck.com/us/en/subscribe/" title="Subscription Center">sign up in our subscription center</a></strong>.</p>
]]></content:encoded>
</item><item rdf:about="https://www.vaneck.com/us/en/blogs/investment-outlook/jan-van-eck-q4-2025-outlook-escaping-the-reckoning/">
  <title>Q4 2025 Outlook: Escaping the Reckoning?></title>
  <link>https://www.vaneck.com/us/en/blogs/investment-outlook/jan-van-eck-q4-2025-outlook-escaping-the-reckoning/</link>
  <description><![CDATA[In Jan&rsquo;s Q4 2025 investment outlook, he explains his cautious optimism heading into year-end, amid AI&rsquo;s expanding footprint, fiscal progress and tightening credit conditions.]]></description>
  <dc:creator>Jan van Eck</dc:creator>
  <dc:date>10/21/2025 06:30:00</dc:date>
<content:encoded><![CDATA[

<a href="/us/en/blogs/investment-outlook/jan-van-eck-q2-2026-outlook-the-reset-is-your-entry-point/" title="Jan van Eck's Latest Outlook"><strong>Looking for the latest outlook? Read the Q2 2026 Outlook.</strong></a>
<p>When CEO Jan van Eck joined Adam Taggart on the Thoughtful Money podcast to share his latest quarterly outlook, he said that he is &ldquo;happy with eyes wide open&rdquo;. Fiscal progress is real and markets are finding balance, but selectivity still matters as AI evolves, credit tightens and policy shifts continue. In this wide-ranging discussion, Jan outlines where he sees resilience and risk as we approach 2026.</p>
<h2>Watch Video: Thoughtful Money with Jan van Eck</h2>
<p>Jan discusses the forces shaping markets today, ranging from AI's growth and implications to improving fiscal discipline.</p>
<p>Here are key moments from the conversation:</p>
<ul class="content-list">
<li class="mt-2"> <strong>Understand the AI compute shortage:</strong> Token demand is up 38x, but chip and model efficiency help balance supply.&nbsp;</li>
<li class="mt-2"> <strong>Nvidia may not be overpriced:</strong> Growth rate and visible demand through 2027 suggest valuations are justified. &nbsp;</li>
<li class="mt-2"> <strong>Watch nuclear valuations:</strong> After exceptional returns, this theme now trades at nosebleed levels</li>
<li class="mt-2"> <strong>Open AI&rsquo;s weak link:</strong> Now part of the new &ldquo;Mag 8&rdquo;, its financing remains a vulnerability.</li>
<li class="mt-2"> <strong>Gaming emerges as AI surprise:</strong> Faster development and improved video quality may make gaming the next major AI beneficiary.</li>
<li class="mt-2"> <strong>Gold&rsquo;s long-term case stays strong:</strong> Central bank demand, fiscal strain, and inflation risk continue to support the metal.</li>
<li class="mt-2"> <strong>Private credit faces quality test:</strong> Recent bankruptcies emphasize need for liquidity and underwriting strength.</li>
<li class="mt-2"> <strong>Not all BDCs are created equal:</strong> Investors should watch premium and discounts as "escape valve" for private credit&nbsp;&nbsp;</li>
<li class="mt-2"> <strong>Fiscal progress takes shape:</strong> U.S. deficit has narrowed to roughly 5.9% of GDP, a modest but meaningful improvement.</li>
</ul>

<p>To receive more <a href="https://www.vaneck.com/us/en/insights/investment-outlook/" title="Investment Outlook Insights"><strong>Investment Outlook</strong></a> insights, <a href="/link/5f45412c2143400497908cea2897f7d3.aspx" title=" Subscription Center"><strong>sign up in our subscription center</strong></a>.</p>
]]></content:encoded>
</item><item rdf:about="https://www.vaneck.com/us/en/blogs/income-investing/clos-sustaining-strength-as-the-fed-shifts-to-easing/">
  <title>CLOs: Sustaining Strength as the Fed Shifts to Easing></title>
  <link>https://www.vaneck.com/us/en/blogs/income-investing/clos-sustaining-strength-as-the-fed-shifts-to-easing/</link>
  <description><![CDATA[CLOs extended their gains in Q3 with broad-based positive returns. Despite tight spreads and trade tensions, we remain constructive on higher-rated tranches amid balanced risk and strong demand.]]></description>
  <dc:creator> </dc:creator>
  <dc:date>10/20/2025 06:30:00</dc:date>
<content:encoded><![CDATA[

<p><strong>Key takeaways:</strong></p>
<ul class="content-list">
<li class="mt-2">CLOs delivered steady results in Q3, supported by solid fundamentals and continued investor interest.</li>
<li class="mt-2">Higher-quality tranches remain a focus, given their balanced risk and return profile.</li>
<li class="mt-2">Market conditions appear supportive, though some near-term volatility is possible.</li>
</ul>
<p id="overview" class="jump-link-nav anchored-block" data-jumplink-title="Overview">CLOs carried their momentum into the third quarter, delivering positive returns across the capital stack and extending their streak of monthly gains, driven by strong fundamental and technical factors. During the quarter, <strong><a href="/link/e090deaddc774ac699a04b959d9254c6.aspx" title="CLOI - VanEck CLO ETF - Overview">CLOI</a></strong> slightly outperformed its benchmark by 8bps (1.59% vs 1.51%) and was approximately in line on a year-to-date (YTD) basis (4.39% vs 4.36%). The <strong><a href="/link/d2f16468a9f14c1e807f6bb7fb597a3e.aspx" title="CLOB - VanEck AA-BB CLO ETF - Overview">VanEck AA-BB CLO ETF (CLOB)</a></strong> outperformed its benchmark in the quarter, the J.P. Morgan CLOIE Balanced Mezzanine Index, by 3bps (2.21% vs 2.18%), and has slightly underperformed YTD by 13bps.</p>
<p>Although corporate balance sheets remain strong overall, we prefer tranches higher in the capital stack given weakness in the U.S. labor market and ongoing trade tensions. Increased dispersion lower in the capital stack is a theme that has continued to play out following recent auto sector defaults. Manager, vintage and portfolio selection remain key and could present attractive opportunities for select purchases of lower rated paper. Despite tight valuations we believe risk is balanced overall, but expect additional bouts of volatility over the coming months and continue to maintain the ability to shift into lower rated tranches during future periods of market weakness.</p>
<h3>CLOI Average Annual Total Returns<sup>*</sup>&nbsp;(%)</h3>
<div class="wrapped-div">
<table style="width: 100%;">
<tbody>
<tr class="tbl-data">
<td class="tbl-header last" colspan="9">As of September 30, 2025</td>
</tr>
<tr class="tbl-data">
<td class="data-head last text-right">&nbsp;</td>
<td class="data-head last text-right">1 MO</td>
<td class="data-head last text-right">3 MO</td>
<td class="data-head last text-right">YTD</td>
<td class="data-head last text-right">1 YR</td>
<td class="data-head last text-right">3 YR</td>
<td class="data-head last text-right">5 YR</td>
<td class="data-head last text-right">10 YR</td>
<td class="data-head last text-right">LIFE<br />06/21/22</td>
</tr>
<tr class="tbl-data">
<td class="data-td last text-left">CLOI (NAV)</td>
<td class="data-td data last text-right">0.48</td>
<td class="data-td data last text-right">1.59</td>
<td class="data-td data last text-right">4.39</td>
<td class="data-td data last text-right">6.23</td>
<td class="data-td data last text-right">8.40</td>
<td class="data-td data last text-right">--</td>
<td class="data-td data last text-right">7.69</td>
</tr>
<tr class="tbl-data">
<td class="data-td last text-left">CLOI (Share Price)</td>
<td class="data-td data last text-right">0.59</td>
<td class="data-td data last text-right">1.70</td>
<td class="data-td data last text-right">4.47</td>
<td class="data-td data last text-right">6.27</td>
<td class="data-td data last text-right">7.98</td>
<td class="data-td data last text-right">--</td>
<td class="data-td data last text-right">7.71</td>
</tr>
<tr class="tbl-data">
<td class="data-td last text-left">J.P. Morgan CLO IG Index</td>
<td class="data-td data last text-right">0.51</td>
<td class="data-td data last text-right">1.51</td>
<td class="data-td data last text-right">4.36</td>
<td class="data-td data last text-right">6.13</td>
<td class="data-td data last text-right">8.32</td>
<td class="data-td data last text-right">--</td>
<td class="data-td data last text-right">7.54</td>
</tr>
<tr class="tbl-data">
<td class="data-td last text-left">J.P. Morgan Collateralized Loan Obligation Index</td>
<td class="data-td data last text-right">0.53</td>
<td class="data-td data last text-right">1.61</td>
<td class="data-td data last text-right">4.54</td>
<td class="data-td data last text-right">6.46</td>
<td class="data-td data last text-right">8.85</td>
<td class="data-td data last text-right">--</td>
<td class="data-td data last text-right">7.96</td>
</tr>
</tbody>
</table>
</div>
<p class="chart-disclosure"><strong><sup>*</sup>&nbsp;Returns less than one year are not annualized. Effective May 1, 2025, the J.P. Morgan CLO IG Index replaced the J.P. Collateralized Loan Obligation Index as the Fund's benchmark.</strong></p>
<p class="chart-disclosure"><strong>The performance data quoted represents past performance. Past performance is not a guarantee of future results. Investment return and principal value of an investment will fluctuate so that an investor's shares, when redeemed, may be worth more or less than their original cost. Performance may be lower or higher than performance data quoted. Please call 800.826.2333 or visit vaneck.com for performance current to the most recent month ended.</strong></p>
<p class="chart-disclosure">CLOI&rsquo;s gross expense ratio is 0.40% and the total expense ratio is 0.40%. Van Eck Associates Corporation (the &ldquo;Adviser&rdquo;) will pay all expenses of the Fund, except for the fee payment under the investment management agreement, acquired fund fees and expenses, interest expense, offering costs, trading expenses, taxes and extraordinary expenses. Notwithstanding the foregoing, the Adviser has agreed to pay the offering costs until at least May 1, 2025. &ldquo;Other Expenses&rdquo; have been restated to reflect current fees.</p>
<h3>CLOB Average Annual Total Returns<sup>*</sup>&nbsp;(%)</h3>
<div class="wrapped-div">
<table style="width: 100%;">
<tbody>
<tr class="tbl-data">
<td class="tbl-header last" colspan="9">As of September 30, 2025</td>
</tr>
<tr class="tbl-data">
<td class="data-head last text-right">&nbsp;</td>
<td class="data-head last text-right">1 MO</td>
<td class="data-head last text-right">3 MO</td>
<td class="data-head last text-right">YTD</td>
<td class="data-head last text-right">1 YR</td>
<td class="data-head last text-right">3 YR</td>
<td class="data-head last text-right">5 YR</td>
<td class="data-head last text-right">10 YR</td>
<td class="data-head last text-right">LIFE<br />09/24/24</td>
</tr>
<tr class="tbl-data">
<td class="data-td last text-left">CLOB (NAV)</td>
<td class="data-td data last text-right">0.63</td>
<td class="data-td data last text-right">2.21</td>
<td class="data-td data last text-right">5.56</td>
<td class="data-td data last text-right">8.26</td>
<td class="data-td data last text-right">--</td>
<td class="data-td data last text-right">8.46</td>
</tr>
<tr class="tbl-data">
<td class="data-td last text-left">CLOB (Share Price)</td>
<td class="data-td data last text-right">0.58</td>
<td class="data-td data last text-right">2.09</td>
<td class="data-td data last text-right">5.25</td>
<td class="data-td data last text-right">7.90</td>
<td class="data-td data last text-right">--</td>
<td class="data-td data last text-right">8.17</td>
</tr>
<tr class="tbl-data">
<td class="data-td last text-left">J.P. Morgan CLOIE Balanced Mezzanine Index</td>
<td class="data-td data last text-right">0.68</td>
<td class="data-td data last text-right">2.18</td>
<td class="data-td data last text-right">5.69</td>
<td class="data-td data last text-right">8.42</td>
<td class="data-td data last text-right">--</td>
<td class="data-td data last text-right">8.55</td>
</tr>
</tbody>
</table>
</div>
<p class="chart-disclosure"><strong><sup>*</sup>&nbsp;Returns less than one year are not annualized. Effective May 1, 2025, the J.P. Morgan CLO IG Index replaced the J.P. Collateralized Loan Obligation Index as the Fund's benchmark.</strong></p>
<p class="chart-disclosure"><strong>The performance data quoted represents past performance. Past performance is not a guarantee of future results. Investment return and principal value of an investment will fluctuate so that an investor's shares, when redeemed, may be worth more or less than their original cost. Performance may be lower or higher than performance data quoted. Please call 800.826.2333 or visit vaneck.com for performance current to the most recent month ended.</strong></p>
<p class="chart-disclosure">CLOB&rsquo;s gross expense ratio is 0.45% and the total expense ratio is 0.45%. Van Eck Associates Corporation (the &ldquo;Adviser&rdquo;) will pay all expenses of the Fund, except for the fee payment under the investment management agreement, acquired fund fees and expenses, interest expense, offering costs, trading expenses, taxes and extraordinary expenses. Notwithstanding the foregoing, the Adviser has agreed to pay the offering costs until at least May 1, 2026. &ldquo;Other Expenses&rdquo; have been restated to reflect current fees.</p>
<h2 id="market-update" class="jump-link-nav anchored-block" data-jumplink-title="Market Update">Market Update</h2>
<p>CLOs generated positive returns across the capital stack in September and total returns were positive for the asset class for the 30th consecutive month. Positive sentiment was helped by the Federal Reserve, which cut interest rates by a quarter-point as a precautionary measure. This was done even as the economy was growing faster than expected, thanks to strong consumer spending. Investor demand remained steady, with CLO ETFs reporting $1.7bn inflows. CLO ETFs have seen 20 consecutive weeks of inflows and total CLO ETF AUM surpassed $34bn. US Treasury rates were mixed with 5-year yields backing up 5 basis points (bp) to end the month at 3.74% while 10-year yields rallied 8bp to end the month at 4.15%.</p>
<p>Floating rate CLOs and bank loans underperformed high yield bonds and investment grade credit, as duration benefited from lower treasury yields.</p>
<div class="wrapped-div">
<table width="100%">
<tbody>
<tr class="tbl-data">
<td class="tbl-header last text-left">Asset class</td>
<td class="tbl-header last text-right">Q3 2025 Return (%)</td>
<td class="tbl-header last text-right">YTD 2025 Return (%)</td>
<td class="tbl-header last text-right">Yield to Worst (%)</td>
<td class="tbl-header last text-right">Spreads (bps)</td>
</tr>
<tr class="tbl-data">
<td class="data-td last font-weight-normal text-left">CLOs</td>
<td class="data-td data last text-right">1.61</td>
<td class="data-td data last text-right">4.54</td>
<td class="data-td data last text-right">5.21</td>
<td class="data-td data last text-right">148</td>
</tr>
<tr class="tbl-data">
<td class="data-td last font-weight-normal text-left">CLOs IG</td>
<td class="data-td data last text-right">1.51</td>
<td class="data-td data last text-right">4.36</td>
<td class="data-td data last text-right">4.97</td>
<td class="data-td data last text-right">122</td>
</tr>
<tr class="tbl-data">
<td class="data-td last font-weight-normal text-left">CLOs Mezz</td>
<td class="data-td data last text-right">2.18</td>
<td class="data-td data last text-right">5.69</td>
<td class="data-td data last text-right">6.82</td>
<td class="data-td data last text-right">306</td>
</tr>
<tr class="tbl-data">
<td class="data-td last font-weight-normal text-left">AAA</td>
<td class="data-td data last text-right">1.43</td>
<td class="data-td data last text-right">4.17</td>
<td class="data-td data last text-right">4.75</td>
<td class="data-td data last text-right">101</td>
</tr>
<tr class="tbl-data">
<td class="data-td last font-weight-normal text-left">AA</td>
<td class="data-td data last text-right">1.54</td>
<td class="data-td data last text-right">4.50</td>
<td class="data-td data last text-right">5.13</td>
<td class="data-td data last text-right">135</td>
</tr>
<tr class="tbl-data">
<td class="data-td last font-weight-normal text-left">A</td>
<td class="data-td data last text-right">1.58</td>
<td class="data-td data last text-right">4.81</td>
<td class="data-td data last text-right">5.37</td>
<td class="data-td data last text-right">158</td>
</tr>
<tr class="tbl-data">
<td class="data-td last font-weight-normal text-left">BBB</td>
<td class="data-td data last text-right">2.20</td>
<td class="data-td data last text-right">5.47</td>
<td class="data-td data last text-right">6.39</td>
<td class="data-td data last text-right">264</td>
</tr>
<tr class="tbl-data">
<td class="data-td last font-weight-normal text-left">BB</td>
<td class="data-td data last text-right">3.43</td>
<td class="data-td data last text-right">7.98</td>
<td class="data-td data last text-right">10.01</td>
<td class="data-td data last text-right">626</td>
</tr>
<tr class="tbl-data">
<td class="data-td last font-weight-normal text-left">B</td>
<td class="data-td data last text-right">5.59</td>
<td class="data-td data last text-right">12.69</td>
<td class="data-td data last text-right">16.22</td>
<td class="data-td data last text-right">1,235</td>
</tr>
<tr class="tbl-data">
<td class="data-td last font-weight-normal text-left">U.S. Agg</td>
<td class="data-td data last text-right">2.06</td>
<td class="data-td data last text-right">6.13</td>
<td class="data-td data last text-right">4.40</td>
<td class="data-td data last text-right">31</td>
</tr>
<tr class="tbl-data">
<td class="data-td last font-weight-normal text-left">Investment Grade Corporates</td>
<td class="data-td data last text-right">2.65</td>
<td class="data-td data last text-right">6.96</td>
<td class="data-td data last text-right">4.82</td>
<td class="data-td data last text-right">76</td>
</tr>
<tr class="tbl-data">
<td class="data-td last font-weight-normal text-left">High Yield Bonds</td>
<td class="data-td data last text-right">2.40</td>
<td class="data-td data last text-right">7.06</td>
<td class="data-td data last text-right">6.74</td>
<td class="data-td data last text-right">280</td>
</tr>
<tr class="tbl-data">
<td class="data-td last font-weight-normal text-left">Leveraged Loans</td>
<td class="data-td data last text-right">1.70</td>
<td class="data-td data last text-right">4.60</td>
<td class="data-td data last text-right">7.59</td>
<td class="data-td data last text-right">360</td>
</tr>
</tbody>
</table>
</div>
<p class="chart-disclosure">Source: JP Morgan and ICE Data Indices as of 9/30/2025. CLOs represented by J.P. Morgan Collateralized Loan Obligation Index, CLOs IG represented by J.P. Morgan Collateralized Loan Obligation IG Index, CLOs Mezz represented by J.P. Morgan Collateralized Loan Obligation Balanced Mezzanine Index, AAA Rated CLOs represented by J.P. Morgan CLO AAA Index, AA Rated CLOs represented by J.P. Morgan CLO AA Index, A Rated CLOs represented by J.P. Morgan CLO A Index, BBB Rated CLOs represented by J.P. Morgan CLO BBB Index, BB Rated CLOs represented by J.P. Morgan CLO BB Index, B Rated CLOs represented by J.P. Morgan CLO B Index, US Agg is represented by the ICE BofA US Broad Market, Investment Grade Corporates represented by ICE BofA US Corporate Index, High Yield Bonds represented by ICE BofA US High Yield Index.and Leveraged Loans represented by JP Morgan Leveraged Loan Index. Past performance is no guarantee of future results. Index performance is not representative of fund performance. It is not possible to invest directly in an index.</p>

<p>CLO new issue supply decreased for the second consecutive month following the strongest issuance of the year in July, with $11.0bn pricing in September, compared to $18.8bn in August. Refinancing and reset activity declined, but remained strong overall, with $35.9bn pricing, after $39.2bn in August. Total issuance of $415.2bn is the largest volume to start a year on record, bolstered by a record -setting quarterly new issuance of Middle Market CLOs.</p>
<p>Loan market technicals posted a rare net-supply surplus in September, albeit a modest one. Net loan supply picked up in part as repayment activity slowed during the month and as transactions launched in prior months closed and were added to the Index. Primary market activity during the month remained skewed toward opportunistic transactions as issuers continued to take advantage of borrower-friendly capital markets to reprice their debt. Net outflows from retail loan funds picked up in September, increasing to $879mn from net outflows totaling $376mn in August.</p>
<p>In September we saw the largest payment default since April 2023, but also no distressed exchanges for the first time since July 2022. The trailing twelve-month default rate within the Morningstar US Leveraged Loan Index increased 31bp to 1.47%. As measured by JP Morgan, the default rate including distressed exchanges, increased 17bp to 3.49%. Activity has been elevated as borrowers with unsustainable capital structures endeavored to manage their liabilities and avoid the bankruptcy process through liability management exercises, keeping the &ldquo;official&rdquo; default rate lower than otherwise. We anticipate the default rate to remain below historical averages in the near-term for the leveraged loan market as a result. None-the-less, our expectations are that defaults, including distressed exchanges, will remain above the long-term historical average of ~3%, with the path for the default rate uncertain given rapidly changing trade policy and the result of the high probability of distressed exchange transactions, ultimately, failing.</p>
<p>US CLO secondary market spreads tightened across most of the capital stack in the quarter. The AAA tranche tightened 5bp; AA&rsquo;s, 2bp; single-A&rsquo;s, were flat; BBB&rsquo;s, 21bp; BB&rsquo;s, 35bp and single-B&rsquo;s, 33bp. Meanwhile, the Morningstar LSTA Leveraged Loan Index widened 4bp and the Bloomberg US HY Index tightened 5bp.</p>
<h2 id="portfolio-strategy" class="jump-link-nav anchored-block" data-jumplink-title="Portfolio Strategy">Portfolio Strategy</h2>
<p>The borrowing rate for leveraged loan companies remains high following rate increases from central banks in 2022 and 2023. However, borrowing rates are set to move lower following the reinitiation of rate cuts from the Fed in September despite inflation remaining above the Fed&rsquo;s target, a low unemployment rate, albeit into a weakening labor market, and faster economic growth than anticipated. The market now expects two more rate cuts before year-end. While the Fed has signaled a more dovish stance during comments made by Fed Chairman Powell at Jackson hole, the Fed remains in a very tricky position as US trade policy changes rapidly, inflation remains above target, and hard economic data post the imposition of tariffs has yet to come through. However, the government shutdown delayed key releases, leaving recent labor market softness lingering and likely reinforcing the Fed&rsquo;s dovish stance in October. Cuts will ultimately provide relief for more stressed borrowers.</p>
<p>The market has stabilized since the tariff escalation and de-escalation back and forth in April, with spreads tightening materially off the wides and prices rallying back to levels seen in mid-March, when most of the loan and CLO tranche markets were pricing above par. However, given signs of economic weakening in the US, particularly in the labor market, and the continued prospects of a global trade war including recent inflamed tensions with China, we prefer tranche purchases higher in the capital stack, with selective purchases of shorter spread-duration assets for lower rated credits. We believe current AAA spreads are tight, so given our up in quality bias, we believe adding AA and A rated securities make the most sense. However, recent demand dynamics have decreased the basis between higher and lower rated investment grade tranches. Despite our preference for higher rated paper, we have also seen increased dispersion between managers lower in the capital stack, which could present attractive opportunities for select purchases of lower rated paper. We also expect there to be additional bouts of volatility in the coming months and would like to maintain the ability to shift further into lower rated tranches during future periods of market weakness. Given the rally since April, buying in the secondary market has become less attractive, and we prefer purchases in the primary market, even when taking an increase in spread duration into account.</p>
<h3>CLOI Total Return and Credit Allocation</h3>
<p><img loading="lazy" class="img-responsive" alt="CLOI Total Return and Credit Allocation" src="https://www.vaneck.com/contentassets/9ccc5653bb974b7c9520886942de1fee/6291_cloi-3q25_chart-1_2025-10_v1_blog.svg" /></p>
<p class="chart-disclosure">Source: Factset, JP Morgan, VanEck as of 9/30/2025. AAA Rated CLOs represented by J.P. Morgan CLO AAA Index, AA Rated CLOs represented by J.P. Morgan CLO AA Index, A Rated CLOs represented by J.P. Morgan CLO A Index, BBB Rated CLOs represented by J.P. Morgan CLO BBB Index, BB Rated CLOs represented by J.P. Morgan CLO BB Index, Index performance is not representative of Fund performance. It is not possible to invest directly in an index. Past performance is no guarantee of future results. Fund performance current to the most recent month end is available by visiting vaneck.com or by calling 800.826.2333.</p>
<h3>CLOB Total Return and Credit Allocation</h3>
<p><img loading="lazy" class="img-responsive" alt="CLOB Total Return and Credit Allocation" src="https://www.vaneck.com/contentassets/0f84a82591aa467dbdfe58aafb1d16c5/6291_cloi-3q25_chart-2_2025-10_v2_blog.svg" /></p>
<p class="chart-disclosure">Source: Factset, JP Morgan, VanEck as of 9/30/2025. AA Rated CLOs represented by J.P. Morgan CLO AA Index, A Rated CLOs represented by J.P. Morgan CLO A Index, BBB Rated CLOs represented by J.P. Morgan CLO BBB Index, BB Rated CLOs represented by J.P. Morgan CLO BB Index, B Rated CLOs represented by J.P. Morgan CLO B Index. Index performance is not representative of Fund performance. It is not possible to invest directly in an index. Past performance is no guarantee of future results. Fund performance current to the most recent month end is available by visiting vaneck.com or by calling 800.826.2333.</p>
<h2 id="outlook" class="jump-link-nav anchored-block" data-jumplink-title="Outlook">Outlook</h2>
<p>While GDP, income, and consumption have slowed this year, they remain pretty resilient nonetheless. Job growth, on the other hand, has slowed more significantly. The Fed&rsquo;s mandate encompasses employment and inflation, not growth and inflation &ndash; so it&rsquo;s no surprise that the FOMC cut the policy rate 25 basis points without pushback to market expectations for more cuts. We expect rate cuts to continue until employment shows green shoots, which could take a while, with a lack of hiring thinning out after a long period of post-Covid labor hoarding. More tariff pass-throughs likely remain ahead, despite the impact to date being less than expected. While we believe the slowdown and inflation risks will not be behind us for a few more months, their threat is nonetheless receding, and an upcoming cyclical reacceleration and secular growth in 2026 are drawing nearer. From a fundamental standpoint, 2Q25 earnings season was generally positive. While leverage levels continue to increase modestly, corporate balance sheets remain in good shape versus historic averages.</p>
<p>While CLO spreads remain on the tight end of historical averages, there is a case to be made that tight valuations are warranted in the face of an accommodative fundamental back-drop of low, but positive, growth combined with tailwinds from both monetary stimulus and upcoming positive impact from stimulative fiscal policy actions through tax cuts. The technical backdrop is also poised to remain supportive. Loan repricings have put pressure on equity arbitrage, making it more challenging to bring new deals to market. Tighter liability spreads are helping offset lower asset coupons, but not entirely. CLO demand is also expected to remain strong given ongoing inflows to CLO ETFs, and with the Federal Reserve cutting rates and the Bank of Japan gradually pursuing a tightening monetary policy, demand for CLOs from yen-based investors may strengthen as hedging costs decline. Redemptions also continued to constrain net supply, with $20bn of redemption volume in 3Q, the highest quarterly volume of redemptions in history. With the percentage of the CLO market post reinvestment period down to only 14%, we should see fewer CLO redemptions in the coming quarters.</p>
<p>While the team does not expect significant spread compression from here, it believes returns will be driven by carry going forward. We think CLOs have attractive total return potential relative to other equivalently rated fixed income assets under these conditions. That said, roller coaster trade dynamics and other currents will keep markets fluid, and we expect to see both positive shocks, in the form of deal announcements or teases, and negative ones, such as more aggressive policies or deal disappointments. Despite likely headline-driven volatility in the coming months, we believe the risk is balanced. None-the-less, tight valuations tilt incrementally toward a more defensive portfolio bias.</p>
<p>The Fed resumed cutting rates in September and appears poised to continue cutting over the next several meetings. However, over the next twelve months we believe they will take a more measured approach than the market is pricing, and interest rates will stay higher than the market currently expects. In a world where interest rates will be higher for longer, floating rate assets continue to be attractive. Across many portfolios, we repositioned higher in the capital stack as spreads tightened off the lows and are awaiting opportunities to rotate down from AAA/AA tranches to A/BBB, and opportunistically BB-rated tranches where allowed, during future bouts of volatility. We continue to see spreads and yields attractive under most market scenarios over the next twelve months. That said, we believe having a nimble approach is of paramount importance given the pace of news flow which is rapidly shifting consumer and business sentiment. In addition, a robust bottoms-up approach to security selection remains key given the significant tail risks to the fundamental backdrop and a market bifurcated between vintages and, relatedly, between deals in and out of their reinvestment periods. Given the dispersion seen in the loan market, certain CLO portfolios holding weaker credits may eventually experience impairments to the lowest rated debt tranches, something we have begun to see play out following the recent and fast-moving bankruptcy filing of a supplier of aftermarket automotive parts. As a result, vintage, portfolio, and manager selection remains key.</p>


<p>To receive more <a href="/us/en/blogs/income-investing/" title="Income Investing Insights"><strong>Income Investing</strong></a> insights, <a href="/link/5f45412c2143400497908cea2897f7d3.aspx" title=" Subscription Center"><strong>sign up in our subscription center</strong></a>.</p>
]]></content:encoded>
</item><item rdf:about="https://www.vaneck.com/us/en/blogs/emerging-markets-bonds/3-steps-for-active-em-bond-investing/">
  <title>3 Steps for Active EM Bond Investing></title>
  <link>https://www.vaneck.com/us/en/blogs/emerging-markets-bonds/3-steps-for-active-em-bond-investing/</link>
  <description><![CDATA[Emerging markets bonds offer high yields, low debt, and policy-driven resilience &ndash; this is our three-step process for capturing alpha in the space.]]></description>
  <dc:creator>Eric Fine</dc:creator>
  <dc:date>10/17/2025 06:30:00</dc:date>
<content:encoded><![CDATA[

<p>Emerging markets (EM) bonds have grown into one of the most compelling opportunities in fixed income. With lower debt levels, more independent central banks, and attractive real yields, many EMs are better positioned than developed markets to deliver stability and growth. Yet, EM debt remains under-owned, in part because outcomes can diverge dramatically between countries and currencies. Below, we summarize the investment process for the actively managed <strong><a href="/link/f447bf0c04f64108a3dcff3ca025af4a.aspx" title="EMBX - VanEck Emerging Markets Bond ETF">VanEck Emerging Markets Bond ETF</a></strong>, which aims to capitalize on these disparities and opportunities across the EM debt spectrum.</p>
<h2>A Valuation-Based Investment Process</h2>
<p>At the core of our EM bond strategy is a simple principle: buy cheap bonds, not good or bad risks. To do that, step 1 of our investment process builds a radar chart showing each country&rsquo;s superiority, or inferiority, relative to the global average measured in units of standard deviation across a range of 16 fundamental metrics. These metrics include:</p>
<ul class="content-list">
<li class="mt-2">Standard measures such as general government debt/GDP</li>
<li class="mt-2">Flow measures such as the current account deficit/GDP</li>
<li class="mt-2">Structural measures, such as the banking system&rsquo;s common equity-to-assets ratio</li>
</ul>
<p>We display these as a radar chart, as shown below. When the country result is inside the global mean result, it is superior to the global mean. Conversely, when the result is outside the global mean, it is inferior to the global average.</p>
<h3>Brazil&rsquo;s Radar Chart Measuring Fundamental Risk</h3>
<p><img loading="lazy" class="img-responsive w-100" src="https://www.vaneck.com/contentassets/401641e2c5664bf687aea1213eabec4c/6256_3-steps-for-active-emb_chart-1_2025-10_v1_blog.svg" alt="Brazil's Radar Chart Measuring Fundamental Risk" /></p>
<p class="chart-disclosure">Source: Bloomberg LP. Data as of June 2025. Past performance does not guarantee future results.</p>

<p>From there, we then &ldquo;line up&rdquo; all the radar charts for the countries and companies in the investable universe. We do this by calculating a z-score (a way of measuring how far a data point is from the average of a dataset) based on each country&rsquo;s superiority, or inferiority, to the global mean, as measured by the metrics detailed in the chart. We compare these z-scores and bonds with similar yields. You can see the fundamental z-score on the x-axis in the chart below. Those with superior fundamentals are on the left, inferior to the right. We highlight Brazil and see that the real yields (y-axis) of Brazil&rsquo;s 10-year local-currency bonds are higher than the predicted level (along the dotted line), based on all the other EM 10-year local-currency bonds. They are therefore considered cheap. We conduct this exercise for every tenor of bond. And we conduct it for hard-currency bonds using yield or spread on the y-axis, which you can see in the chart below.</p>
<p>In this chart, you can see that Brazilian hard-currency bonds are expensive. The output of Step 1 in our process is a list of the cheapest bonds in EM, whether local, hard, sovereign, or corporate, based entirely on their deviation from the predicted level. The cheaper they are, the more they are liked and therefore the higher they are on the list. You may notice that Step 1 favors tenors/duration based entirely on cheapness relative to fundamentals, not the investment teams&rsquo; top-down opinion on U.S. &lsquo;duration&rsquo;. If the 20-year Brazilian local currency bond was cheaper relative to the predicted level than the 10-year Brazilian local currency bond, the 20-year bond is higher in the ranking.</p>
<h3>Real 10-year Local Currency Valuations and Country Fundamentals Determine which 10-year Local Currency Bonds Pay Real Yields that are Relatively Too High</h3>
<p><img loading="lazy" class="img-responsive w-100" src="https://www.vaneck.com/contentassets/edc02a62b3a74888a43631771625ec7f/6256_3-steps-for-active-emb_chart-2_2025-10_v1_blog.svg" alt="Real 10-year Local Currency Valuations and Country Fundamentals Determine which 10-year Local Currency Bonds Pay Real Yields that are Relatively Too High" /></p>
<p class="chart-disclosure">Source: VanEck Research; IMF; World Bank; Moody&rsquo;s; Bloomberg LP. Data as of June 2025. Past performance is not indicative of future results. Z-score is a statistical measurement that describes a value&rsquo;s relationship to the mean of a group of values.</p>

<h3>Sovereign 5-year Bond Valuations and Country Fundamentals Determine which 5-year Hard Currency Sovereign Bonds Pay Yields that Are Relatively Too High</h3>
<p><img loading="lazy" class="img-responsive w-100" src="https://www.vaneck.com/contentassets/6f4ce2d7406d479f97161380ce006af9/6256_3-steps-for-active-emb_chart-3_2025-10_v1_blog.svg" alt="Sovereign 5-year Bond Valuations and Country Fundamentals Determine which 5-year Hard Currency Sovereign Bonds Pay Yields that Are Relatively Too High" /></p>
<p class="chart-disclosure">Source: VanEck Research; IMF; World Bank; Moody&rsquo;s; Bloomberg LP. Data as of June 2025. Past performance is not indicative of future results. Z-score is a statistical measurement that describes a value&rsquo;s relationship to the mean of a group of values.</p>
<p>The result of Step 1 is a list of the cheapest bonds in EM, without reference to whether they are local currency, hard-currency sovereign, or hard-currency corporate. It is an entirely quantitative process. In EM, however, there are many non-systematic risks, such as politics, elections, index exclusions/inclusions, global trade partnerships and treaties that are not appropriately managed by the quantitative framework in Step 1.</p>
<p>This is why we have Step 2, which may eliminate or impact the ranking of bonds chosen by Step 1. Step 2 of the process involves three &lsquo;tests&rsquo;:</p>
<ol class="content-list">
<li class="mt-2">Political/policy</li>
<li class="mt-2">Economic</li>
<li class="mt-2">Technical A &lsquo;strong fail&rsquo; result on any of these removes a bond from the list.</li>
</ol>
<p>Each test is applied bond-by-bond, so the investment team can fail a 10-year local currency bond from a country but not a 5-year hard-currency bond from the same country. All changes in Step 2 are subjective and documented by the investment team monthly.</p>
<p>Step 3 is portfolio construction. In Step 1, the cheaper a bond is relative to the predicted level, the greater the allocation. If a bond is in the top quartile of cheapness, it gets the maximum allocation of 1.5 times the benchmark weight for that country. If a bond is in the second quartile, the maximum allocation is 1.25 times the benchmark weight for that country and so on, until the portfolio is full. The portfolio is constructed in consideration of risk constraints.</p>
<h2>VanEck Emerging Markets Bond Strategy</h2>
<p>The <a href="/link/f447bf0c04f64108a3dcff3ca025af4a.aspx" title="EMBX - VanEck Emerging Markets Bond ETF"><strong>VanEck Emerging Markets Bond ETF</strong></a> was one of the first blended emerging markets bond strategies in the market. The Strategy adopts a comprehensive approach, investing across the entire EM bond spectrum to maximize opportunity and manage risk in a complex global environment. Despite global disruptions such as the COVID pandemic, the war in Ukraine and economic troubles in China, the fund has consistently outperformed both global and U.S. bond benchmarks, earning top-quartile rankings from Morningstar over the past five years. This outperformance, both absolute and risk-adjusted, is also evident when compared to the fund&rsquo;s benchmark, which includes the same EM bonds but without active management. VanEck&rsquo;s active strategy, which focuses on fundamental value relative to bond risk premia, aims to capitalize on these shifts and avoid troubled issuers, making a compelling case for a diversified, actively managed EM bond allocation.</p>
<p>Use these links to learn more about the <a>investment case for EM bonds, the power of adding EM bonds to a 60/40 portfolio, and the benefits of an actively managed EM approach.</a></p>
<p>To receive more <a href="https://www.vaneck.com/us/en/insights/emerging-markets-bonds/" title="Emerging Markets Bonds Insights"><strong>Emerging Markets Bonds</strong></a> insights, <a href="/link/5f45412c2143400497908cea2897f7d3.aspx" title=" Subscription Center"><strong>sign up in our subscription center</strong></a>.</p>
]]></content:encoded>
</item><item rdf:about="https://www.vaneck.com/us/en/blogs/investment-outlook/culture-connection-and-70-years-of-vaneck/">
  <title>Culture, Connection and 70 Years of VanEck></title>
  <link>https://www.vaneck.com/us/en/blogs/investment-outlook/culture-connection-and-70-years-of-vaneck/</link>
  <description><![CDATA[Behind every milestone in VanEck&rsquo;s 70-year journey are the people whose ideas, integrity and collaboration keep its culture thriving.]]></description>
  <dc:creator> </dc:creator>
  <dc:date>10/17/2025 06:30:00</dc:date>
<content:encoded><![CDATA[

<p>Seventy years is a long time in finance. Markets evolve, technologies shift, and trends come and go. Yet some things, like purpose, principles and people endure.</p>
<p>At VanEck, culture has always been more than an internal talking point. It&rsquo;s a shared belief that how we work matters just as much as what we achieve. And for the people who have spent years, or even decades, helping shape this firm, that spirit is what makes VanEck feel less like a company and more like a community.</p>
<p>As we celebrate our 70th anniversary, we asked employees to share what the firm&rsquo;s culture has meant to them. What emerged was not just a story about work, but about people, pride and a place that feels like home.</p>
<h2>A Foundation Built on People</h2>
<p>When Alison Emanuel, Paralegal, joined VanEck in 1996, she was a new immigrant from Guyana looking for an opportunity to grow. &ldquo;VanEck offered me the chance to work hard and achieve meaningful goals,&rdquo; she says, recalling how HR threw her a small celebration when she became a U.S. citizen. &ldquo;That gesture spoke volumes about the culture here.&rdquo;</p>
<p>Twenty-nine years later, she&rsquo;s still rising at 5:00 a.m. to get to the office early when there&rsquo;s a board meeting. &ldquo;It&rsquo;s a habit I never dropped.&rdquo; And she still finds joy in meeting board members, assisting legal teams, and reflecting on just how far things have come, from typewritten board minutes to digital governance. &ldquo;VanEck has always felt like a family-oriented company. I&rsquo;m proud to be part of this legacy,&rdquo; she says.</p>
<h2 class="mt-4">&ldquo;I learned that you get more out of people not only when there&rsquo;s a shared mission, but when people care about each other as well.&rdquo;</h2>
<div class="d-flex justify-content-between align-items-center row mt-3 mb-4">
<div class="col-md-12">
<div class="byline__author">
<div class="porthole porthole--lg byline__author-image no-print mr-3" style="background-image: url('https://www.vaneck.com/EPiServer/CMS/Content/globalassets/home/us/blogs/bm-blog-images/kristen-capuano_headshot_web.jpg,,350704/Download?epieditmode=False');"><img loading="lazy" alt="Kristen Capuano, CMO and Co-COO" class="porthole__image" src="https://www.vaneck.com/EPiServer/CMS/Content/globalassets/home/us/blogs/bm-blog-images/kristen-capuano_headshot_web.jpg,,350704/Download?epieditmode=False" /></div>
<div style="position: relative;" class="byline__author-content">
<h3 class="byline__author-name mt-0">Kristen Capuano</h3>
<div class="byline__author-title">CMO and Co-COO</div>
</div>
</div>
</div>
</div>
<p>That sense of belonging&mdash;of being seen and supported&mdash;is echoed across the firm. &ldquo;I met the family I chose here,&rdquo; says CMO and Co-COO Kristen Capuano, who joined in 2007 when the marketing team had just a handful of people. &ldquo;I learned that you get more out of people not only when there&rsquo;s a shared mission, but when people care about each other as well.&rdquo;</p>
<p>It&rsquo;s a balance that continues to define the firm&rsquo;s culture today. &ldquo;On day one, I felt like more than a number,&rdquo; says Managing Director Pat Finn. &ldquo;We&rsquo;ve grown, but we still retain the best parts of the firm&mdash;the collaboration of ideas and inputs across many levels. That&rsquo;s what keeps it special.&rdquo;</p>
<p>&ldquo;Be yourself. If you have good ideas, you matter at VanEck,&rdquo; says CEO Jan van Eck. &ldquo;We&rsquo;re not a huge company. Everyone matters. There&rsquo;s no negative connotation to ideas that don&rsquo;t work. We want people to bring their best ideas forward to make the firm better or give more value to clients.&rdquo;</p>
<h2>Carrying the Legacy Forward</h2>
<p>Culture at VanEck has never been static, but has been carried forward and refined. Shawn Reynolds, Portfolio Manager, recalls how Derek van Eck instilled that people-first philosophy. &ldquo;Derek&rsquo;s approach was always that family comes first, the team comes first,&rdquo; he says. &ldquo;That&rsquo;s a vital part of this organization, and we try to fulfill his legacy with regards to that.&rdquo;</p>
<p>Deputy Portfolio Manager Angus Shillington saw that legacy tested firsthand after Derek&rsquo;s passing. &ldquo;Jan&rsquo;s grit and determination, together with the leadership team and the Board, not only moved the firm forward but did it in a way that stayed true to principle,&rdquo; he reflects.</p>
<p>For many, what defines VanEck isn&rsquo;t just the opportunities they&rsquo;ve been given, but the relationships they&rsquo;ve built. &ldquo;Some of my best days were spent just talking to other employees about their lives,&rdquo; says Senior Analyst Paul Weltchek. &ldquo;It&rsquo;s those relationships that promote such a great working atmosphere.&rdquo;</p>
<h2 class="mt-3">&ldquo;Be yourself. If you have good ideas, you matter at VanEck&rdquo;</h2>
<div class="d-flex justify-content-between align-items-center row mt-3 mb-4">
<div class="col-md-12">
<div class="byline__author">
<div class="porthole porthole--lg byline__author-image no-print mr-3" style="background-image: url('https://www.vaneck.com/EPiServer/CMS/Content/globalassets/home/us/blogs/bm-blog-images/jan-van-eck-100x100.jpg,,78173/Download?epieditmode=False;');"><img loading="lazy" alt="Jan van Eck, Chief Executive Officer" class="porthole__image" src="https://www.vaneck.com/EPiServer/CMS/Content/globalassets/home/us/blogs/bm-blog-images/jan-van-eck-100x100.jpg,,78173/Download?epieditmode=False" /></div>
<div style="position: relative;" class="byline__author-content">
<h3 class="byline__author-name mt-0">Jan van Eck</h3>
<div class="byline__author-title">Chief Executive Officer</div>
</div>
</div>
</div>
</div>
<p>VP Associate General Counsel Laura Martinez remembers being employee number 99 at 99 Park Avenue&mdash;&ldquo;either symbolic or suspicious,&rdquo; she jokes&mdash;and realizing early on that this wasn&rsquo;t a typical firm. Rather than being grilled about case law, her interview was a conversation about movies and hobbies. This set the tone for her. &ldquo;VanEck has given me room to grow, incredible colleagues who are now close friends, and a community that mixes innovation with kindness&mdash;and occasionally, some excellent elevator banter.&rdquo;</p>
<p>As Jan notes, &ldquo;We tried to always have VanEck be a collegial place, but with very high achievement standards.&rdquo;</p>
<p>Even as the company has grown into a global organization, that closeness remains part of the fabric. Philipp Schlegel, who&rsquo;s worked with VanEck for two decades across Europe&mdash;first as an investor before joining the firm&mdash;hopes that never changes. &ldquo;As the firm grows, I hope VanEck never loses the qualities that make it special: its entrepreneurial mindset, its collaborative culture, and above all, its integrity. From my first experience as an investor to my years working within the company, one constant has been the commitment to doing what is best for clients.&rdquo;</p>
<h2>Evolution with Purpose</h2>
<p>From gold and emerging markets to ETFs and digital assets, VanEck&rsquo;s story has always been one of curiosity and courage. Across departments, the same mindset applies. &ldquo;Culture, access, and integrity of mission&mdash;they&rsquo;re still here,&rdquo; says Angus. &ldquo;The firm&rsquo;s legacy is built not only on innovation or market insight, but on character.&rdquo;</p>
<p>&ldquo;What&rsquo;s remarkable,&rdquo; says Arian Neiron, CEO and Managing Director of VanEck Asia Pacific, &ldquo;is that VanEck has always stood for more than investment products. It has stood for access, innovation, and integrity in a constantly changing world.&rdquo;</p>
<p>As Jane Pigott, Board Chair, says, &ldquo;It&rsquo;s not just one person or one moment. It&rsquo;s been a continuous way of thinking about how to deliver on our promise to investors. That continuity is what makes VanEck exceptional.&rdquo;</p>
<h2 class="mt-4">&ldquo;VanEck has always stood for more than investment products. It has stood for access, innovation, and integrity in a constantly changing world.&rdquo;</h2>
<div class="d-flex justify-content-between align-items-center row mt-3 mb-4">
<div class="col-md-12">
<div class="byline__author">
<div class="porthole porthole--lg byline__author-image no-print mr-3" style="background-image: url('https://www.vaneck.com/EPiServer/CMS/Content/globalassets/home/us/blogs/bm-blog-images/arian-neiron_headshot_web.jpg,,350703/Download?epieditmode=False');"><img loading="lazy" alt="Arian Neiron, CEO and Managing Director of VanEck Asia Pacific" class="porthole__image" src="https://www.vaneck.com/EPiServer/CMS/Content/globalassets/home/us/blogs/bm-blog-images/arian-neiron_headshot_web.jpg,,350703/Download?epieditmode=False" /></div>
<div style="position: relative;" class="byline__author-content">
<h3 class="byline__author-name mt-0">Arian Neiron</h3>
<div class="byline__author-title">CEO and Managing Director of VanEck Asia Pacific</div>
</div>
</div>
</div>
</div>
<p>Jan echoes that sentiment. &ldquo;There&rsquo;s no way this company would be here without the contributions of the team and the individuals,&rdquo; he says. &ldquo;We&rsquo;ve gone through so many stresses in the financial markets over 70 years. It really takes a team. It&rsquo;s been great to work with so many talented people.&rdquo;</p>
<p>From the days of typewriters and graph paper to ETFs and digital assets, the tools have changed, but the ethos hasn&rsquo;t. People, purpose, and principle remain the constants. That, more than anything, is why the story of VanEck&rsquo;s first 70 years feels less like history and more like a beginning.</p>
<p>To receive more <a href="https://www.vaneck.com/us/en/insights/investment-outlook/" title="Investment Outlook Insights"><strong>Investment Outlook</strong></a> insights, <a href="/link/5f45412c2143400497908cea2897f7d3.aspx" title=" Subscription Center"><strong>sign up in our subscription center</strong></a>.</p>
]]></content:encoded>
</item><item rdf:about="https://www.vaneck.com/us/en/blogs/thematic-investing/is-ai-a-bubble-the-dot-com-bubble-vs-todays-ai-revolution/">
  <title>Is AI a Bubble? The Dot-Com Bubble vs. Today’s AI Revolution></title>
  <link>https://www.vaneck.com/us/en/blogs/thematic-investing/is-ai-a-bubble-the-dot-com-bubble-vs-todays-ai-revolution/</link>
  <description><![CDATA[AI&rsquo;s growth is unlike the dot-com bubble, driven by profitable firms reinvesting in real infrastructure. Semiconductor innovation and power expansion underpin a lasting tech transformation.]]></description>
  <dc:creator>Nick Frasse</dc:creator>
  <dc:date>10/15/2025 06:30:00</dc:date>
<content:encoded><![CDATA[

<p><strong>Key Takeaways:</strong></p>
<ul class="content-list">
<li class="mt-2">Today&rsquo;s AI surge is built on real profits and infrastructure, not speculation.</li>
<li class="mt-2">Semiconductor demand spans GPUs, memory, and design tools, driving sustained growth.</li>
<li class="mt-2"><strong><a href="/link/39c8d235748b4c26a5930c31d3ac0160.aspx" title="SMH - VanEck Semiconductor ETF - Overview">SMH</a></strong> and <strong><a href="/link/9b8fb1812bc74764bf11fc85767838f9.aspx" title="SMHX - VanEck Fabless Semiconductor ETF - Overview">SMHX</a></strong> offer investors exposure to both AI hardware build-out and chip design innovation.</li>
</ul>
<h2>The Rise of AI Companies</h2>
<p>Artificial intelligence is driving one of the most significant infrastructure build-outs in modern history. Unlike the dot-com boom of the late 1990s, today&rsquo;s AI expansion is being led by profitable global companies deploying existing cash flow. Additionally, OpenAI&rsquo;s partnerships with NVIDIA, AMD, Intel, and Oracle highlight how critical computing power has become as AI moves from experimentation to commercial applications. While outcomes remain uncertain, the current environment suggests that semiconductors may continue to play a central role in this evolving technological era. For investors, <a href="/link/39c8d235748b4c26a5930c31d3ac0160.aspx" title="SMH - VanEck Semiconductor ETF - Overview"><strong>VanEck&rsquo;s Semiconductor ETF (SMH)</strong></a> and <strong><a href="/link/9b8fb1812bc74764bf11fc85767838f9.aspx" title="SMHX - VanEck Fabless Semiconductor ETF - Overview">VanEck&rsquo;s Fabless Semiconductor ETF (SMHX)</a></strong> offer two distinct ways to access the ecosystem behind this compute build-out.</p>
<p>Artificial intelligence has become what Morningstar calls a <i>&ldquo;generational demand driver&rdquo;</i> across the semiconductor value chain. Demand is rising not just for GPUs but also for the networking, memory, and design software that support them, underscoring how pervasive this build-out has become.</p>
<h2 id="ai-bubble-vs-dot-com" class="jump-link-nav anchored-block" data-jumplink-title="AI&rsquo;s Bubble vs. Dot-Com">AI &ldquo;Bubble&rdquo; vs. Dot-Com Bubble Breakdown</h2>
<p>The late 1990s were defined by startups chasing growth with limited revenue and easy access to capital. Today&rsquo;s AI expansion looks very different. The world&rsquo;s largest technology companies are reinvesting substantial free cash flow into physical infrastructure because they view AI as essential to their long-term competitiveness.</p>
<p>Amazon anticipates approximately $100 billion in capital expenditures for 2025, with a significant portion allocated to cloud and AI. Microsoft plans to invest about $80 billion, Alphabet has raised its target to $85 billion, and Meta anticipates investing between $66 billion and $72 billion. These are balance-sheet decisions, not speculative ventures.</p>
<h3>Hyperscaler Planned Spend Through 2025</h3>
<p><img loading="lazy" class="img-responsive" alt="Hyperscaler Planned Spend Through 2025" src="https://www.vaneck.com/contentassets/21e626b67aa846e4b1082213fa52fa06/6278_smh-smhx-blog-chart-01_2025-10_v1_blog.svg" /></p>
<p class="chart-disclosure">* Company&rsquo;s anticipated capital expenditures for 2025.</p>
<p class="chart-disclosure">Source: Amazon, Microsoft, Alphabet, Meta as of 2025. Not intended as a recommendation to buy or sell any securities referenced herein. For illustrative purposes only. Past performance is no guarantee of future results.</p>
<p>Industry data show that semiconductor firms reinvest roughly 60% of their distributable capital in R&amp;D and capacity expansion, a level that has doubled over the past eight years, with an annualized growth rate of nearly 10%. That suggests today&rsquo;s capex is being fueled mostly by profits and innovation, not by speculative financing.</p>
<p>The macro backdrop is also distinct. In 2000, the Federal Reserve was tightening policy to rein in an overheating economy. As of September 2025, the Fed&rsquo;s target range is 4.00 to 4.25 percent, reflecting a shift toward easing. While monetary policy could shift again, the present environment is more supportive of long-term capital investment than it was during the dot-com era.</p>
<h3>S&amp;P 500 Returns vs. Federal Interest Rates in the Dot-Com Bubble</h3>
<p><img loading="lazy" class="img-responsive" alt="S&amp;P 500 Returns vs. Federal Interest Rates in the Dot-Com Bubble" src="https://www.vaneck.com/contentassets/f19c7ffe028743539bc4a70d68736016/6278_smh-smhx-blog-chart-02_2025-10_v1_blog.svg" /></p>
<p class="chart-disclosure">Source: Morningstar, FRED<sup>&reg;</sup>&nbsp;as of 10.9.2025. Past performance is no guarantee of future results.</p>
<h2 id="ai-power-race" class="jump-link-nav anchored-block" data-jumplink-title="AI Power Race">The New Race for AI computing Power</h2>
<p>OpenAI sits at the center of the current AI infrastructure race. Its agreements across the semiconductor ecosystem underscore how competitive and strategic access to compute power has become.</p>
<p>With NVIDIA, OpenAI signed a letter of intent to deploy at least 10 gigawatts of systems beginning in 2026. NVIDIA has indicated plans to invest up to $100 billion in OpenAI as that deployment progresses. OpenAI also reached a definitive agreement with AMD to purchase 6 gigawatts of hardware over several years, including a warrant for up to 160 million AMD shares tied to deployment milestones.</p>
<p>Beyond GPUs, OpenAI is expanding its compute footprint through Oracle Cloud Infrastructure alongside Microsoft&rsquo;s Azure. Oracle&rsquo;s participation includes the development of new multi-gigawatt &ldquo;Stargate&rdquo; data center campuses across the United States. Meanwhile, NVIDIA and Intel have partnered to address ongoing packaging bottlenecks, with Intel expected to assist in advanced packaging and assembly.</p>
<h3>AI Circular Deals</h3>
<div class="wrapped-div">
<table width="100%">
<tbody>
<tr class="tbl-data">
<td class="tbl-header last text-left"><strong>Partnership</strong></td>
<td class="tbl-header last text-left"><strong>Announced / Updated</strong></td>
<td class="tbl-header last text-left"><strong>Scope / Capacity</strong></td>
<td class="tbl-header last text-left"><strong>Timing</strong></td>
<td class="tbl-header last text-left"><strong>Strategic Rationale</strong></td>
</tr>
<tr class="tbl-data">
<td class="data-td data last text-left">OpenAI &harr; NVIDIA</td>
<td class="data-td data last text-left">Sep-25</td>
<td class="data-td data last text-left">LOI for &ge;10 GW of NVIDIA systems; up to $100B investment</td>
<td class="data-td data last text-left">3rd Qtr. 2026 start</td>
<td class="data-td data last text-left">Secures GPU supply and deepens alignment</td>
</tr>
<tr class="tbl-data">
<td class="data-td data last text-left">OpenAI &harr; AMD</td>
<td class="data-td data last text-left">Oct-25</td>
<td class="data-td data last text-left">6 GW GPU deal; warrant for up to 160M AMD shares</td>
<td class="data-td data last text-left">3rd Qtr 2026 start</td>
<td class="data-td data last text-left">Adds second source and supply diversity</td>
</tr>
<tr class="tbl-data">
<td class="data-td data last text-left">OpenAI &harr; Oracle (w/ Microsoft)</td>
<td class="data-td data last text-left">2025</td>
<td class="data-td data last text-left">Azure AI extended to OCI; five &ldquo;Stargate&rdquo; sites (~10 GW)</td>
<td class="data-td data last text-left">2025&ndash;2027</td>
<td class="data-td data last text-left">Expands compute footprint and redundancy</td>
</tr>
<tr class="tbl-data">
<td class="data-td data last text-left">NVIDIA &harr; Intel</td>
<td class="data-td data last text-left">2025</td>
<td class="data-td data last text-left">Collaboration on advanced packaging; $5B NVDA investment</td>
<td class="data-td data last text-left">2025 onward</td>
<td class="data-td data last text-left">Eases packaging bottlenecks at TSMC</td>
</tr>
</tbody>
</table>
</div>
<p class="chart-disclosure">Not intended as a recommendation to buy or sell any securities referenced herein. For illustrative purposes only. Past performance is no guarantee of future results.</p>

<p>Forecasts from the U.S. Department of Energy and McKinsey indicate that cloud and hyperscaler capital spending could exceed $450 billion by 2027, up from roughly $150 billion in 2023. Those figures illustrate the sheer scale of infrastructure investment now underway to support AI demand.</p>
<h2 id="bottle-necks" class="jump-link-nav anchored-block" data-jumplink-title="Bottlenecks">The Bottlenecks Ahead</h2>
<p>Despite this wave of spending, capacity remains limited in key areas. TSMC&rsquo;s advanced packaging process, for example, is expected to reach around 75,000 wafers per month in 2025, yet that may still fall short of global demand. The supply of high-bandwidth memory (HBM) is also tight, as SK Hynix, Samsung, and Micron work to improve yields on the latest HBM3E technology.</p>
<p>According to data from Gartner, HBM represented roughly 17&ndash;20% of DRAM (Dynamic Random Access Memory) demand in 2024 and could reach nearly 50% by 2029, with suppliers expected to more than double capacity in 2025. Advanced packaging is also emerging as a key enabler of AI performance, expected to grow around 8% annually this decade as chip designers adopt chiplet and 3D stacking techniques.</p>
<p>Power and cooling constraints present another challenge. The development of multi-gigawatt data center campuses depends on local grid expansion, permitting, and environmental planning&mdash;factors that can delay or cap the pace of deployment.</p>
<h2>From Build-Out to Scale-Out</h2>
<p>For investors, these developments highlight two complementary parts of the semiconductor landscape.</p>
<p><strong><a href="/link/39c8d235748b4c26a5930c31d3ac0160.aspx" title="SMH - VanEck Semiconductor ETF - Overview">SMH</a></strong> represents the companies responsible for building the physical backbone of AI. It tracks the MVIS US Listed Semiconductor 25 Index, which is composed of large, liquid semiconductor and equipment companies that generate at least half of their revenue from the industry. These are the companies that produce the chips, tools, and systems that enable the world&rsquo;s compute expansion.</p>
<p><strong><a href="/link/9b8fb1812bc74764bf11fc85767838f9.aspx" title="SMHX - VanEck Fabless Semiconductor ETF - Overview">SMHX</a></strong> captures the fabless innovators driving AI&rsquo;s scale-out. It tracks the MarketVector US Listed Fabless Semiconductor Index, which includes chip designers creating architectures and connectivity solutions aimed at improving efficiency and overcoming memory and power constraints.</p>
<p>Beyond manufacturing, design-led innovation remains critical. Fabless chip designers, EDA software firms, and IP licensors have delivered some of the strongest growth and margin expansion in recent years&mdash;a dynamic that directly connects to <strong><a href="/link/9b8fb1812bc74764bf11fc85767838f9.aspx" title="SMHX - VanEck Fabless Semiconductor ETF - Overview">SMHX&rsquo;s</a></strong> focus on the fabless, innovation-driven segment of the market.</p>
<h3>Designers Have Best Growth; Designers, TSMC, Equipment Have Great Margins</h3>
<p><strong>Historical revenue CAGR and average operating margins from 2018 to 2014.</strong></p>
<p><img loading="lazy" class="img-responsive" alt="Designers Have Best Growth; Designers, TSMC, Equipment Have Great Margins" src="https://www.vaneck.com/contentassets/bd7e1bee4f324786bdf5f465b13a1bb1/6278_smh-smhx-blog-chart-03_2025-10_v1_blog.svg" /></p>
<p class="chart-disclosure">Source: Morningstar as of 2025. Not intended as a recommendation to buy or sell any securities referenced herein. For illustrative purposes only. Past performance is no guarantee of future results.</p>
<p>Together, these two funds provide diversified exposure across the semiconductor value chain. <strong><a href="/link/39c8d235748b4c26a5930c31d3ac0160.aspx" title="SMH - VanEck Semiconductor ETF - Overview">SMH</a></strong> reflects the structural build-out of manufacturing and infrastructure, while <strong><a href="/link/9b8fb1812bc74764bf11fc85767838f9.aspx" title="SMHX - VanEck Fabless Semiconductor ETF - Overview">SMHX</a></strong> focuses on the design-side innovation that helps AI systems run faster and more efficiently.</p>
<h2 id="bubble-or-transformation" class="jump-link-nav anchored-block" data-jumplink-title="Bubble or Transformation">Bubble or Structural Transformation in Motion?</h2>
<p>Every major technological shift begins with years of foundational investment. Railroads, electrification, and the rise of the internet all followed this path, with infrastructure build-outs paving the way for future productivity gains. The current expansion of AI compute infrastructure may represent a similar phase in technological progress.</p>
<p>According to projections from the U.S. Department of Energy and McKinsey, AI-driven data center power demand is compounding at 22% to 33% annually, far outpacing historical energy-use growth. This reflects how the AI revolution extends well beyond semiconductors&mdash;it is transforming the physical infrastructure of compute itself.</p>
<p>While no one can predict how this will ultimately unfold, the magnitude and composition of current spending point to a longer-term structural trend rather than short-lived speculation. The semiconductor industry sits at the center of this transformation.</p>
<p><a href="/link/39c8d235748b4c26a5930c31d3ac0160.aspx" title="SMH - VanEck Semiconductor ETF - Overview"><strong>SMH</strong></a> offers a way to participate in the broader infrastructure build-out, while <strong><a href="/link/9b8fb1812bc74764bf11fc85767838f9.aspx" title="SMHX - VanEck Fabless Semiconductor ETF - Overview">SMHX</a></strong> focuses on enabling designers and innovators to scale AI. Together, they provide diversified access to the companies shaping what may prove to be one of the most important technology transitions of our lifetime.</p>

<p>To receive more <a href="https://www.vaneck.com/us/en/insights/thematic-investing/" title="Thematic Investing Insights"><strong>Thematic Investing</strong></a> insights, <a href="https://www.vaneck.com/us/en/subscribe/" title="Subscription Center"><strong>sign up in our subscription center</strong></a>.</p>
]]></content:encoded>
</item><item rdf:about="https://www.vaneck.com/us/en/blogs/moat-investing/from-magnificent-to-stretched-rethink-us-equity-allocations/">
  <title>From Magnificent to Stretched: Rethink US Equity Allocations></title>
  <link>https://www.vaneck.com/us/en/blogs/moat-investing/from-magnificent-to-stretched-rethink-us-equity-allocations/</link>
  <description><![CDATA[US equity market dominance by a handful of giants is leaving many investors with overlapping exposure and expensive holdings. Here&rsquo;s why diversification matters more than ever.]]></description>
  <dc:creator>Brandon Rakszawski</dc:creator>
  <dc:date>10/15/2025 06:30:00</dc:date>
<content:encoded><![CDATA[

<p><strong>Key takeaways:</strong></p>
<ul class="content-list">
<li class="mt-2">A small number of companies dominate US equity market size and earnings, making investors reliant on the fortunes of a select few.</li>
<li class="mt-2">Many broadly owned investment solutions hold the same top stocks, creating overlap that amplifies investor exposure to these stocks.</li>
<li class="mt-2">Stretched valuations and heavy exposure may weigh on long-term return potential.</li>
</ul>
<p>The dominance of the "Magnificent 7" companies over the last several years has been well-documented. Now, unsurprisingly, other companies are gaining spotlight as their standout returns catch the attention of investors and spur new descriptions, like the Fab Four, Big Six and Elite Eight.</p>
<p>There is no hiding from the impact that a select few companies are having on the US stock market. While these dynamics have certainly strained differentiated and valuation-focused strategies like that of the <a href="/link/9e43dd198c5f4e419f13220685081895.aspx" title="MOAT - VanEck Morningstar Wide Moat ETF - Overview"><strong>VanEck Morningstar Wide Moat ETF (MOAT)</strong></a>, they also serve as a reminder of the need for diversification in equity allocations.</p>
<h2>The Outsized Impact of US Equity Market Leaders</h2>
<p>The dominance of the largest US companies has been on full display in recent years. Look no further than the influence the 10 largest companies in the S&amp;P 500 Index are having on markets. These companies now account for an eye-popping portion of both total market size and share of corporate profits in the US.</p>
<h3>Largest US Companies Are Dominating the Market</h3>
<p><strong>10 Largest Companies as Share of the S&amp;P 500 Index (1985 &ndash; 2025)</strong></p>
<p><img loading="lazy" class="img-responsive" alt="Largest US Companies Are Dominating the Market" src="https://www.vaneck.com/contentassets/3583a708946b41df8aefc2e5446e00ef/6280_moat-diversification_chart-1_2025-10_v3.png" /></p>
<p class="chart-disclosure">Source: Compustat, IBES, FactSet, Goldman Sachs Global Investment Research. Past performance is not a guarantee of future results. Index performance is not illustrative of fund performance. It is not possible to invest in an index.</p>
<h2>Look Through the Illusion of Differentiation</h2>
<p>The concentration within the S&amp;P 500 Index is not an isolated situation. Many investment strategies, often available to investors in ETF format, also hold significant exposure to many of the same companies that dominate the S&amp;P 500. As of September 30, 2025, there were nine companies in the US with a trillion-dollar market capitalization. Those companies have notable, if not significant, exposure across many different US investment approaches.</p>
<h3>Exposure to $1 Trillion Companies</h3>
<p><strong>Weight Associated with US Companies with $1T Market Cap (as of 9/30/2025)</strong></p>
<p><img loading="lazy" class="img-responsive" alt="Exposure to $1 Trillion Companies" src="https://www.vaneck.com/contentassets/de4da0b576074e9e994ba0ee5eecbf3c/6280_moat-diversification_chart-2_2025-10_v1_blog.svg" /></p>
<p class="chart-disclosure">Source: Morningstar. All data as of 9/30/2025 except for S&amp;P US Dividend Growers Index which is as of 8/31/20225. Trillion-dollar companies comprise NVIDIA, Microsoft, Apple, Alphabet, Amazon.com, Meta, Broadcom, Tesla, and Berkshire Hathaway. Past performance is not a guarantee of future results. Index performance is not illustrative of fund performance. It is not possible to invest in an index. Not intended as a recommendation to buy or to sell any of the securities mentioned herein.</p>
<p>Take a look at the top 10 holdings of many widely popular indexes that underlie mutual funds and ETFs. Below is a sample of popular indexes &mdash; ranging from factor indexes to dividend indexes&mdash;linked to funds with hundreds of billions of dollars in assets under management.</p>
<p>For ease of reading, we have highlighted below the holdings that are unique among the top 10 for each index. Outside of the Morningstar Wide Moat Focus Index, which underlies our&nbsp;<strong><a href="/link/9e43dd198c5f4e419f13220685081895.aspx" title="MOAT - VanEck Morningstar Wide Moat ETF - Overview">VanEck Morningstar Wide Moat ETF (MOAT)</a></strong>, almost all of the top 10 holdings of these popular indexes significantly overlap with the others.</p>
<h3>Unique Top 10 Holdings Rare Among Popular U.S. Large Cap Indexes</h3>
<p><strong>Shading Represents&nbsp;Unique Holdings Among the Group&rsquo;s Top Ten (as of 9/30/2025)</strong></p>
<p><img loading="lazy" class="img-responsive w-100 d-none d-sm-none d-md-block d-lg-block" src="https://www.vaneck.com/contentassets/3c1597bb17c3408a902a0c11103003a4/6280_moat-diversification-blog-october-2025_table_2025-10_v1.svg" alt="Unique Top 10 Holdings Rare Among Popular U.S. Large Cap Indexes" /></p>
<p><img loading="lazy" class="img-responsive w-100 d-block d-sm-block d-md-none" src="https://www.vaneck.com/contentassets/3c1597bb17c3408a902a0c11103003a4/6280_moat-diversification-blog-october-2025_table_mobile_2025-10_v1.svg" alt="Unique Top 10 Holdings Rare Among Popular U.S. Large Cap Indexes" /></p>
<!--
<div class="row">
<div class="col-sm-12 col-md-6 col-lg-6 mb-4">
<div class="wrapped-div">
<table style="width: 100%;">
<tbody>
<tr class="tbl-data">
<td class="tbl-header last" colspan="3">S&amp;P 500 Index</td>
</tr>
<tr class="tbl-data">
<td class="data-td last">Name</td>
<td class="data-td last">Ticker</td>
<td class="data-head last text-right">Weight</td>
</tr>
<tr class="tbl-data">
<td class="data-td last font-weight-normal">NVIDIA</td>
<td class="data-td last font-weight-normal">NVDA</td>
<td class="data-td data last text-right">8.0</td>
</tr>
<tr class="tbl-data">
<td class="data-td last font-weight-normal">Microsoft</td>
<td class="data-td last font-weight-normal">MSFT</td>
<td class="data-td data last text-right">6.7</td>
</tr>
<tr class="tbl-data">
<td class="data-td last font-weight-normal">Apple</td>
<td class="data-td last font-weight-normal">AAPL</td>
<td class="data-td data last text-right">6.6</td>
</tr>
<tr class="tbl-data">
<td class="data-td last font-weight-normal">Amazon</td>
<td class="data-td last font-weight-normal">AMZN</td>
<td class="data-td data last text-right">3.7</td>
</tr>
<tr class="tbl-data">
<td class="data-td last font-weight-normal">Meta</td>
<td class="data-td last font-weight-normal">META</td>
<td class="data-td data last text-right">2.8</td>
</tr>
<tr class="tbl-data">
<td class="data-td last font-weight-normal">Broadcom</td>
<td class="data-td last font-weight-normal">AVGO</td>
<td class="data-td data last text-right">2.7</td>
</tr>
<tr class="tbl-data">
<td class="data-td last font-weight-normal">Alphabet A</td>
<td class="data-td last font-weight-normal">GOOGL</td>
<td class="data-td data last text-right">2.5</td>
</tr>
<tr class="tbl-data">
<td class="data-td last font-weight-normal">Tesla</td>
<td class="data-td last font-weight-normal">TSLA</td>
<td class="data-td data last text-right">2.2</td>
</tr>
<tr class="tbl-data">
<td class="data-td last font-weight-normal">Alphabet C</td>
<td class="data-td last font-weight-normal">GOOG</td>
<td class="data-td data last text-right">2.0</td>
</tr>
<tr class="tbl-data">
<td class="data-td last font-weight-normal">Berkshire Hathaway</td>
<td class="data-td last font-weight-normal">BRK.B</td>
<td class="data-td data last text-right">1.6</td>
</tr>
</tbody>
</table>
</div>
</div>
<div class="col-sm-12 col-md-6 col-lg-6 mb-4">
<div class="wrapped-div">
<table style="width: 100%;">
<tbody>
<tr class="tbl-data">
<td class="tbl-header last" colspan="3">Morningstar Wide Moat Focus Index</td>
</tr>
<tr class="tbl-data">
<td class="data-td last">Name</td>
<td class="data-td last">Ticker</td>
<td class="data-head last text-right">Weight</td>
</tr>
<tr class="tbl-data">
<td class="data-td last font-weight-normal"><strong>Applied Materials Inc</strong></td>
<td class="data-td last font-weight-normal"><strong>AMAT</strong></td>
<td class="data-td data last text-right"><strong>3.0</strong></td>
</tr>
<tr class="tbl-data">
<td class="data-td last font-weight-normal"><strong>Huntington Ingalls Industries</strong></td>
<td class="data-td last font-weight-normal"><strong>HII</strong></td>
<td class="data-td data last text-right"><strong>2.8</strong></td>
</tr>
<tr class="tbl-data">
<td class="data-td last font-weight-normal"><strong>Estee Lauder</strong></td>
<td class="data-td last font-weight-normal"><strong>EL</strong></td>
<td class="data-td data last text-right"><strong>2.8</strong></td>
</tr>
<tr class="tbl-data">
<td class="data-td last font-weight-normal"><strong>West Pharmaceutical</strong></td>
<td class="data-td last font-weight-normal"><strong>WST</strong></td>
<td class="data-td data last text-right"><strong>2.7</strong></td>
</tr>
<tr class="tbl-data">
<td class="data-td last font-weight-normal"><strong>Thermo Fisher Scientific</strong></td>
<td class="data-td last font-weight-normal"><strong>TMO</strong></td>
<td class="data-td data last text-right"><strong>2.7</strong></td>
</tr>
<tr class="tbl-data">
<td class="data-td last font-weight-normal"><strong>Agilent Technologies</strong></td>
<td class="data-td last font-weight-normal"><strong>A</strong></td>
<td class="data-td data last text-right"><strong>2.6</strong></td>
</tr>
<tr class="tbl-data">
<td class="data-td last font-weight-normal"><strong>NXP Semiconductors</strong></td>
<td class="data-td last font-weight-normal"><strong>NXPI</strong></td>
<td class="data-td data last text-right"><strong>2.5</strong></td>
</tr>
<tr class="tbl-data">
<td class="data-td last font-weight-normal"><strong>US Bancorp</strong></td>
<td class="data-td last font-weight-normal"><strong>USB</strong></td>
<td class="data-td data last text-right"><strong>2.5</strong></td>
</tr>
<tr class="tbl-data">
<td class="data-td last font-weight-normal"><strong>Merck &amp; Co</strong></td>
<td class="data-td last font-weight-normal"><strong>MRK</strong></td>
<td class="data-td data last text-right"><strong>2.5</strong></td>
</tr>
<tr class="tbl-data">
<td class="data-td last font-weight-normal"><strong>Nike Inc</strong></td>
<td class="data-td last font-weight-normal"><strong>NKE</strong></td>
<td class="data-td data last text-right"><strong>2.5</strong></td>
</tr>
</tbody>
</table>
</div>
</div>
</div>
<div class="row">
<div class="col-sm-12 col-md-6 col-lg-6 mb-4">
<div class="wrapped-div">
<table style="width: 100%;">
<tbody>
<tr class="tbl-data">
<td class="tbl-header last" colspan="3">Russell 1000 Growth Index</td>
</tr>
<tr class="tbl-data">
<td class="data-td last">Name</td>
<td class="data-td last">Ticker</td>
<td class="data-head last text-right">Weight</td>
</tr>
<tr class="tbl-data">
<td class="data-td last font-weight-normal">NVIDIA</td>
<td class="data-td last font-weight-normal">NVDA</td>
<td class="data-td data last text-right">13.1</td>
</tr>
<tr class="tbl-data">
<td class="data-td last font-weight-normal">Microsoft</td>
<td class="data-td last font-weight-normal">MSFT</td>
<td class="data-td data last text-right">11.5</td>
<td>&nbsp;</td>
</tr>
<tr class="tbl-data">
<td class="data-td last font-weight-normal">Apple</td>
<td class="data-td last font-weight-normal">AAPL</td>
<td class="data-td data last text-right">11.2</td>
</tr>
<tr class="tbl-data">
<td class="data-td last font-weight-normal">Broadcom</td>
<td class="data-td last font-weight-normal">AVGO</td>
<td class="data-td data last text-right">4.7</td>
</tr>
<tr class="tbl-data">
<td class="data-td last font-weight-normal">Amazon</td>
<td class="data-td last font-weight-normal">AMZN</td>
<td class="data-td data last text-right">4.2</td>
</tr>
<tr class="tbl-data">
<td class="data-td last font-weight-normal">Tesla</td>
<td class="data-td last font-weight-normal">TSLA</td>
<td class="data-td data last text-right">3.9</td>
</tr>
<tr class="tbl-data">
<td class="data-td last font-weight-normal">Meta</td>
<td class="data-td last font-weight-normal">META</td>
<td class="data-td data last text-right">3.8</td>
</tr>
<tr class="tbl-data">
<td class="data-td last font-weight-normal">Alphabet A</td>
<td class="data-td last font-weight-normal">GOOGL</td>
<td class="data-td data last text-right">2.8</td>
</tr>
<tr class="tbl-data">
<td class="data-td last font-weight-normal">Alphabet C</td>
<td class="data-td last font-weight-normal">GOOG</td>
<td class="data-td data last text-right">2.3</td>
</tr>
<tr class="tbl-data">
<td class="data-td last font-weight-normal">Eli Lilly</td>
<td class="data-td last font-weight-normal">LLY</td>
<td class="data-td data last text-right">2.0</td>
</tr>
</tbody>
</table>
</div>
</div>
<div class="col-sm-12 col-md-6 col-lg-6 mb-4">
<div class="wrapped-div">
<table style="width: 100%;">
<tbody>
<tr class="tbl-data">
<td class="tbl-header last" colspan="3">Nasdaq 100 Index</td>
</tr>
<tr class="tbl-data">
<td class="data-td last">Name</td>
<td class="data-td last">Ticker</td>
<td class="data-head last text-right">Weight</td>
</tr>
<tr class="tbl-data">
<td class="data-td last font-weight-normal">NVIDIA</td>
<td class="data-td last font-weight-normal">NVDA</td>
<td class="data-td data last text-right">9.9</td>
</tr>
<tr class="tbl-data">
<td class="data-td last font-weight-normal">Microsoft</td>
<td class="data-td last font-weight-normal">MSFT</td>
<td class="data-td data last text-right">8.4</td>
</tr>
<tr class="tbl-data">
<td class="data-td last font-weight-normal">Apple</td>
<td class="data-td last font-weight-normal">AAPL</td>
<td class="data-td data last text-right">8.2</td>
</tr>
<tr class="tbl-data">
<td class="data-td last font-weight-normal">Broadcom</td>
<td class="data-td last font-weight-normal">AVGO</td>
<td class="data-td data last text-right">5.6</td>
</tr>
<tr class="tbl-data">
<td class="data-td last font-weight-normal">Amazon</td>
<td class="data-td last font-weight-normal">AMZN</td>
<td class="data-td data last text-right">5.1</td>
</tr>
<tr class="tbl-data">
<td class="data-td last font-weight-normal">Tesla</td>
<td class="data-td last font-weight-normal">TSLA</td>
<td class="data-td data last text-right">3.5</td>
</tr>
<tr class="tbl-data">
<td class="data-td last font-weight-normal">Meta</td>
<td class="data-td last font-weight-normal">META</td>
<td class="data-td data last text-right">3.5</td>
</tr>
<tr class="tbl-data">
<td class="data-td last font-weight-normal">Alphabet A</td>
<td class="data-td last font-weight-normal">GOOGL</td>
<td class="data-td data last text-right">3.1</td>
</tr>
<tr class="tbl-data">
<td class="data-td last font-weight-normal">Alphabet C</td>
<td class="data-td last font-weight-normal">GOOG</td>
<td class="data-td data last text-right">2.9</td>
</tr>
<tr class="tbl-data">
<td class="data-td last font-weight-normal">Netflix</td>
<td class="data-td last font-weight-normal">NFLX</td>
<td class="data-td data last text-right">2.7</td>
</tr>
</tbody>
</table>
</div>
</div>
</div>
<div class="row">
<div class="col-sm-12 col-md-6 col-lg-6 mb-4">
<div class="wrapped-div">
<table style="width: 100%;">
<tbody>
<tr class="tbl-data">
<td class="tbl-header last" colspan="3">MSCI USA Sector Neutral Quality Index</td>
</tr>
<tr class="tbl-data">
<td class="data-td last">Name</td>
<td class="data-td last">Ticker</td>
<td class="data-head last text-right">Weight</td>
</tr>
<tr class="tbl-data">
<td class="data-td last font-weight-normal">NVIDIA</td>
<td class="data-td last font-weight-normal">NVDA</td>
<td class="data-td data last text-right">5.9</td>
</tr>
<tr class="tbl-data">
<td class="data-td last font-weight-normal">Apple</td>
<td class="data-td last font-weight-normal">AAPL</td>
<td class="data-td data last text-right">5.6</td>
</tr>
<tr class="tbl-data">
<td class="data-td last font-weight-normal">Microsoft</td>
<td class="data-td last font-weight-normal">MSFT</td>
<td class="data-td data last text-right">4.7</td>
</tr>
<tr class="tbl-data">
<td class="data-td last font-weight-normal">Visa</td>
<td class="data-td last font-weight-normal">V</td>
<td class="data-td data last text-right">4.0</td>
</tr>
<tr class="tbl-data">
<td class="data-td last font-weight-normal">Mastercard</td>
<td class="data-td last font-weight-normal">MA</td>
<td class="data-td data last text-right">4.1</td>
</tr>
<tr class="tbl-data">
<td class="data-td last font-weight-normal">Meta</td>
<td class="data-td last font-weight-normal">META</td>
<td class="data-td data last text-right">4.0</td>
</tr>
<tr class="tbl-data">
<td class="data-td last font-weight-normal">Eli Lilly</td>
<td class="data-td last font-weight-normal">LLY</td>
<td class="data-td data last text-right">4.0</td>
</tr>
<tr class="tbl-data">
<td class="data-td last font-weight-normal"><strong>TJX Companies</strong></td>
<td class="data-td last font-weight-normal"><strong>TJX</strong></td>
<td class="data-td data last text-right"><strong>2.8</strong></td>
</tr>
<tr class="tbl-data">
<td class="data-td last font-weight-normal">Netflix</td>
<td class="data-td last font-weight-normal">NFLX</td>
<td class="data-td data last text-right">2.5</td>
</tr>
<tr class="tbl-data">
<td class="data-td last font-weight-normal">Alphabet A</td>
<td class="data-td last font-weight-normal">GOOGL</td>
<td class="data-td data last text-right">2.3</td>
</tr>
</tbody>
</table>
</div>
</div>
<div class="col-sm-12 col-md-6 col-lg-6 mb-4">
<div class="wrapped-div">
<table style="width: 100%;">
<tbody>
<tr class="tbl-data">
<td class="tbl-header last" colspan="3">S&amp;P US Dividend Growers Index</td>
</tr>
<tr class="tbl-data">
<td class="data-td last">Name</td>
<td class="data-td last">Ticker</td>
<td class="data-head last text-right">Weight</td>
</tr>
<tr class="tbl-data">
<td class="data-td last font-weight-normal">Broadcom</td>
<td class="data-td last font-weight-normal">AVGO</td>
<td class="data-td data last text-right">6.0</td>
</tr>
<tr class="tbl-data">
<td class="data-td last font-weight-normal">Microsoft</td>
<td class="data-td last font-weight-normal">MSFT</td>
<td class="data-td data last text-right">4.8</td>
</tr>
<tr class="tbl-data">
<td class="data-td last font-weight-normal"><strong>JPMorgan Chase</strong></td>
<td class="data-td last font-weight-normal"><strong>JPM</strong></td>
<td class="data-td data last text-right"><strong>4.0</strong></td>
</tr>
<tr class="tbl-data">
<td class="data-td last font-weight-normal">Apple</td>
<td class="data-td last font-weight-normal">AAPL</td>
<td class="data-td data last text-right">3.7</td>
</tr>
<tr class="tbl-data">
<td class="data-td last font-weight-normal">Eli Lilly</td>
<td class="data-td last font-weight-normal">LLY</td>
<td class="data-td data last text-right">2.8</td>
</tr>
<tr class="tbl-data">
<td class="data-td last font-weight-normal">Visa</td>
<td class="data-td last font-weight-normal">V</td>
<td class="data-td data last text-right">2.7</td>
</tr>
<tr class="tbl-data">
<td class="data-td last font-weight-normal"><strong>Exxon Mobil</strong></td>
<td class="data-td last font-weight-normal"><strong>XOM</strong></td>
<td class="data-td data last text-right"><strong>2.4</strong></td>
</tr>
<tr class="tbl-data">
<td class="data-td last font-weight-normal">Mastercard</td>
<td class="data-td last font-weight-normal">MA</td>
<td class="data-td data last text-right">2.3</td>
</tr>
<tr class="tbl-data">
<td class="data-td last font-weight-normal"><strong>Oracle</strong></td>
<td class="data-td last font-weight-normal"><strong>ORCL</strong></td>
<td class="data-td data last text-right"><strong>2.0</strong></td>
</tr>
<tr class="tbl-data">
<td class="data-td last font-weight-normal"><strong>Walmart</strong></td>
<td class="data-td last font-weight-normal"><strong>WMT</strong></td>
<td class="data-td data last text-right"><strong>2.0</strong></td>
</tr>
</tbody>
</table>
</div>
</div>
</div>-->
<p class="chart-disclosure">Source: Morningstar. All data as of 9/30/2025 except for S&amp;P US Dividend Growers Index which is as of 8/31/20225. Past performance is not a guarantee of future results. Index performance is not illustrative of fund performance. It is not possible to invest in an index. Not intended as a recommendation to buy or to sell any of the securities mentioned herein.</p>

<h2>Stretched Valuations Have Led to Muted Returns</h2>
<p>The forward P/E ratio of the S&amp;P 500 Index sat at approximately 25 at the end of September. This implies that the index is trading at more than 25 times forward earnings estimates. Largely, investors have been happy to pay that multiple as many companies, particularly the Magnificent 7, have managed to notably expand profits in recent periods.</p>
<p>Stretched valuations and changing market dynamics are not necessarily reasons to shift a portfolio or underweight any given sector. In fact, many believe there is plenty of room to run from here. But they are certainly a good reason to consider diversification. Since 1991, high forward P/E ratios have preceded long-term S&amp;P 500 performance that was underwhelming at best, and in negative territory at worst.</p>
<h3>S&amp;P 500 Returns Have Been Underwhelming at Current Valuations</h3>
<p><strong>Forward P/E Ratios Relative to Future Annualized Return (8/1991 &ndash; 9/2015)</strong></p>
<p><img loading="lazy" class="img-responsive" alt="S&amp;P 500 Returns Have Been Underwhelming at Current Valuations" src="https://www.vaneck.com/contentassets/a0071bfc89554addab6dcf5ec6d363e9/6280_moat-diversification_chart-3_2025-10_v1_blog.svg" /></p>
<p class="chart-disclosure">Source: FactSet; Morningstar. Past performance is not a guarantee of future results. P/E represents the ratio of price to earnings. In this case, forward P/E represents index stock prices versus forecast earnings one year into the future. Index performance is not illustrative of fund performance. It is not possible to invest in an index. Not intended as a forecast or prediction of future results.</p>
<h2>Diversify Your Portfolio with Quality Companies at Attractive Valuations</h2>
<p><a href="/link/9e43dd198c5f4e419f13220685081895.aspx" title="MOAT - VanEck Morningstar Wide Moat ETF - Overview"><strong>VanEck Morningstar Wide Moat ETF (MOAT)</strong></a> seeks to replicate as closely as possible, before fees and expenses the price and yield performance of the Morningstar Wide Moat Focus Index. Its strategy targets high quality companies with durable competitive advantages that are also trading at attractive valuations.</p>
<p>Its focus on attractive valuations is what can give this systematic strategy its contrarian bias by leading it to out-of-favor stocks trading well below their intrinsic value. The strategy has long offered diversification benefits while historically providing a compelling risk/reward profile, in spite of its lack of exposure to mega-cap tech and other leading exposures in the S&amp;P 500 Index.</p>


<p>To receive more <a href="https://www.vaneck.com/us/en/insights/moat-investing" title="Moat Investing Insights"><strong>Moat Investing</strong></a> insights, <a href="https://www.vaneck.com/us/en/subscribe/" title="Subscription Center"><strong>sign up in our subscription center</strong></a>.</p>
]]></content:encoded>
</item><item rdf:about="https://www.vaneck.com/us/en/blogs/natural-resources/commodities-find-their-balance-strength-in-selectivity/">
  <title>Commodities Find Their Balance: Strength in Selectivity></title>
  <link>https://www.vaneck.com/us/en/blogs/natural-resources/commodities-find-their-balance-strength-in-selectivity/</link>
  <description><![CDATA[Commodities had mixed results as fundamentals and policy shifts took hold. Gold and copper strengthened, while energy and agriculture eased. Low-cost, disciplined producers led gains, and long-term trends remain supportive.]]></description>
  <dc:creator>Shawn Reynolds</dc:creator>
  <dc:date>10/14/2025 06:30:00</dc:date>
<content:encoded><![CDATA[

<p>Quarterly insights from Global Resources Portfolio Manager Shawn Reynolds, featuring his unique views on natural resources and commodities.</p>
<p><strong>Key Takeaways:</strong></p>
<ul class="content-list">
<li class="mt-2"><strong>Commodities mixed:</strong> Gold and copper gained; energy and agriculture softened.</li>
<li class="mt-2"><strong>Strong company focus:</strong> Low-cost, well-managed producers drove stronger results.</li>
<li class="mt-2"><strong>Positive outlook:</strong> Tight supply and electrification trends support long-term growth.</li>
</ul>

<h2 id="commodities-diverge" class="jump-link-nav anchored-block mt-4" data-jumplink-title="Commodities Diverge">Commodities Diverge as Fundamentals and Policy Drive Outcomes</h2>
<p>Commodity markets were mixed in the third quarter. Energy eased on apparent ample supply as OPEC+ continued to restore production cuts, while gold and precious metals benefited from safe-haven demand. Base metals diverged&mdash;copper held firm on supply tightness, whereas steel and aluminum were more swayed by economic and trade policy headlines. Agriculture was range-bound amid robust harvests and competitive exports, and paper/forest products reflected shifting trade measures and producer pricing actions. Renewables activity remained solid, though higher financing costs and policy uncertainty continued to weigh on sentiment.</p>
<p>For investors, resilience mattered: companies with low costs, healthy balance sheets, and disciplined capital allocation were better positioned against price swings and policy shifts.</p>
<h2 id="q3-recap" class="jump-link-nav anchored-block" data-jumplink-title="Sector Performance Recap">Sector Performance Recap</h2>
<ul class="content-list">
<li class="mt-2"><strong>Oil &amp; Gas</strong> &ndash; Crude drifted as OPEC+ signals remained in focus. Natural gas also moved lower but finished stronger, with LNG demand beginning to ramp up and supporting additional gas consumption. Discipline and low break-evens remained key advantages for producers and midstream.</li>
<li class="mt-2"><strong>Base &amp; Industrial Metals</strong> &ndash; Copper prices strengthened after supply disruptions at major mines highlighted the sector&rsquo;s fragile balance. Miners with visible production growth and clean balance sheets were rewarded, while smelter-heavy businesses felt the squeeze. By contrast, steel and aluminum were shaped more by trade policies and tariff developments, which added volatility without significantly improving fundamentals.</li>
<li class="mt-2"><strong>Gold &amp; Precious Metals</strong> &ndash; Gold rose to new highs, supported by investor demand amid expectations of lower interest rates and a softer U.S. dollar. Producers benefited from higher prices and continued to emphasize cost control and steady capital returns. The sector&rsquo;s strong cash generation kept attention on growth pipelines and balance-sheet discipline.</li>
<li class="mt-2"><strong>Agriculture</strong> &ndash; Ample grain supply and resilient South American exports kept a lid on prices. Fertilizer demand stabilized into fall applications, supporting potash and phosphate dynamics, while proteins and processors continued to adapt to shifting cost and consumption patterns.</li>
<li class="mt-2"><strong>Paper &amp; Forest Products</strong> &ndash; Lumber prices dropped early in the quarter due to oversupply but rebounded after new U.S. tariffs on wood products. Pulp markets strengthened as leading producers announced price increases, supporting sentiment in the sector. The combination of trade actions and producer discipline helped improve the outlook for North American and Latin American suppliers.</li>
<li class="mt-2"><strong>Renewables &amp; Alternative Energy</strong> &ndash; Installations progressed, with solar and storage remaining active, but equities were sensitive to incentive visibility and the cost of capital. Balance-sheet strength and execution remained the key differentiators.</li>
</ul>

<h2 id="portfolio-performance" class="jump-link-nav anchored-block" data-jumplink-title="Portfolio Performance">Portfolio Performance: Drivers and Detractors</h2>
<p>Global Resources Fund (Class A; excluding fees and expenses, the &ldquo;Fund&rdquo;) returned 12.74% in the third quarter of 2025, outperforming its benchmark, the S&amp;P Global Natural Resources Index (the &ldquo;Index&rdquo;), which returned 9.36%. Year-to-date, the Fund returned 27.78%, ahead of the Index&rsquo;s 20.76% return over the same period.</p>
<p>On an absolute basis, the top contributors to Fund performance were positions in Gold &amp; Precious Metals&mdash;particularly gold producers, which benefited from record bullion prices&mdash;and Base &amp; Industrial Metals, led by copper-related holdings. Integrated oil companies and refiners also added to returns amid steady product margins. Detractors included fertilizer producers and select oil and gas exploration companies that lagged on weaker commodity pricing.</p>
<p>Relative to the Index, the Fund benefited from strong security selection and overweight positioning within Gold &amp; Precious Metals, as well as a significant underweight in Paper &amp; Forest, where benchmark constituents declined. However, performance was hindered by overweight exposure and weaker selection in Agriculture, where fertilizer names underperformed despite stable volumes. Modest underweights in oilfield services also weighed slightly on relative results</p>
<h3>Average Annual Total Returns<sup>*</sup>&nbsp;(%) Quarter End as of 09/30/25</h3>
<div class="wrapped-div mb-3">
<table style="width: 100%;">
<tbody>
<tr class="tbl-data">
<td class="tbl-header last" colspan="9">VanEck Global Resources Fund: Class A</td>
</tr>
<tr class="tbl-data">
<td class="data-head data last text-right">&nbsp;</td>
<td class="data-head data last text-right">1 MO</td>
<td class="data-head data last text-right">3 MO</td>
<td class="data-head data last text-right">YTD</td>
<td class="data-head data last text-right">1 YR</td>
<td class="data-head data last text-right">3 YR</td>
<td class="data-head data last text-right">5 YR</td>
<td class="data-head data last text-right">10 YR</td>
<td class="data-head data last text-right">LIFE<br />(11/02/94)</td>
</tr>
<tr class="tbl-data">
<td class="data-td last text-left">At Net Asset Value</td>
<td class="data-td data last text-right">5.44</td>
<td class="data-td data last text-right">12.74</td>
<td class="data-td data last text-right">27.78</td>
<td class="data-td data last text-right">17.33</td>
<td class="data-td data last text-right">9.08</td>
<td class="data-td data last text-right">13.42</td>
<td class="data-td data last text-right">6.46</td>
<td class="data-td data last text-right">--</td>
</tr>
<tr class="tbl-data">
<td class="data-td last text-left">At Maximum 5.75% Sales Charge</td>
<td class="data-td data last text-right">-0.63</td>
<td class="data-td data last text-right">6.26</td>
<td class="data-td data last text-right">20.43</td>
<td class="data-td data last text-right">10.59</td>
<td class="data-td data last text-right">6.95</td>
<td class="data-td data last text-right">12.09</td>
<td class="data-td data last text-right">5.84</td>
<td class="data-td data last text-right">--</td>
</tr>
<tr class="tbl-data">
<td class="data-td last text-left">S&amp;P Global Natural Resources Net Total Return Index</td>
<td class="data-td data last text-right">1.93</td>
<td class="data-td data last text-right">9.36</td>
<td class="data-td data last text-right">20.76</td>
<td class="data-td data last text-right">6.39</td>
<td class="data-td data last text-right">10.03</td>
<td class="data-td data last text-right">13.56</td>
<td class="data-td data last text-right">9.71</td>
<td class="data-td data last text-right">--</td>
</tr>
<tr class="tbl-data">
<td class="data-td last text-left">S&amp;P North American Natural Resources Sector Index</td>
<td class="data-td data last text-right">2.95</td>
<td class="data-td data last text-right">11.72</td>
<td class="data-td data last text-right">17.38</td>
<td class="data-td data last text-right">14.63</td>
<td class="data-td data last text-right">15.87</td>
<td class="data-td data last text-right">24.03</td>
<td class="data-td data last text-right">9.21</td>
<td class="data-td data last text-right">--</td>
</tr>
</tbody>
</table>
</div>
<p class="chart-disclosure"><sup>*</sup>&nbsp;Returns less than one year are not annualized.</p>
<p class="chart-disclosure"><strong>The table presents past performance which is no guarantee of future results and which may be lower or higher than current performance. Returns reflect temporary contractual fee waivers and/or expense reimbursements. Had the Fund incurred all expenses and fees, investment returns would have been reduced. Expenses: Class A: Gross 1.49% and Net 1.38%. Expenses are capped contractually through 05/01/26 at 1.38% for Class A. Investment returns and Fund share values will fluctuate so that investors' shares, when redeemed, may be worth more or less than their original cost. Fund returns assume that dividends and capital gains distributions have been reinvested in the Fund at NAV. </strong></p>
<h2>Top Contributors/Detractors</h2>
<h3>Contributors:</h3>
<div class="wrapped-div mt-3">
<table style="width: 100%;">
<tbody>
<tr class="tbl-data">
<td class="tbl-header last">Company</td>
<td class="tbl-header last">Sector</td>
<td class="tbl-header last text-right">Weight (%)</td>
<td class="tbl-header last text-right">Estimated<br />Contribution (%)</td>
<td class="tbl-header last">Rationale</td>
</tr>
<tr class="tbl-data">
<td class="data-td data last">Kinross</td>
<td class="data-td data last">Gold &amp; Precious Metals</td>
<td class="data-td data last text-right">3.37</td>
<td class="data-td data last text-right">1.55</td>
<td class="data-td data last">Record gold, strong momentum, $500m buyback/dividend, and steady project progress at Great Bear, Tasiast, Paracatu.</td>
</tr>
<tr class="tbl-data">
<td class="data-td data last">Barrick</td>
<td class="data-td data last">Gold &amp; Precious Metals</td>
<td class="data-td data last text-right">2.93</td>
<td class="data-td data last text-right">1.25</td>
<td class="data-td data last">Record gold, portfolio upgrades, Hemlo sale, Fourmile progress, higher Q2 output, and stronger cash flow momentum.</td>
</tr>
<tr class="tbl-data">
<td class="data-td data last">Gold Fields</td>
<td class="data-td data last">Gold &amp; Precious Metals</td>
<td class="data-td data last text-right">2.19</td>
<td class="data-td data last text-right">1.13</td>
<td class="data-td data last">Record bullion, higher profits and dividend, Salares Norte ramp improving growth visibility and investor confidence.</td>
</tr>
</tbody>
</table>
<h3>Detractors:</h3>
<div class="wrapped-div mt-3">
<table style="width: 100%;">
<tbody>
<tr class="tbl-data">
<td class="tbl-header last">Company</td>
<td class="tbl-header last">Sector</td>
<td class="tbl-header last text-right">Weight (%)</td>
<td class="tbl-header last text-right">Estimated<br />Contribution (%)</td>
<td class="tbl-header last">Rationale</td>
</tr>
<tr class="tbl-data">
<td class="data-td data last">FMC Corp</td>
<td class="data-td data last">Agriculture</td>
<td class="data-td data last text-right">1.79</td>
<td class="data-td data last text-right">-0.46</td>
<td class="data-td data last">Lagged on channel destocking, weak LATAM demand, litigation, and soft 2025 guidance.</td>
</tr>
<tr class="tbl-data">
<td class="data-td data last">Kirby Corp</td>
<td class="data-td data last">Industrials &amp; Utilities</td>
<td class="data-td data last text-right">1.11</td>
<td class="data-td data last text-right">-0.36</td>
<td class="data-td data last">Weakened after downgrade, with low Mississippi levels raising costs, constraining barge traffic.</td>
</tr>
<tr class="tbl-data">
<td class="data-td data last">Freeport McMoRan</td>
<td class="data-td data last">Base &amp; Industrial Metals</td>
<td class="data-td data last text-right">2.79</td>
<td class="data-td data last text-right">-0.29</td>
<td class="data-td data last">Underperformed on Grasberg mudslide shutdown, force majeure, and reduced sales outlook.</td>
</tr>
</tbody>
</table>
</div>
</div>
<p class="chart-disclosure">Source: VanEck, FactSet. Data as of September 30, 2025.</p>
<h2 class="mt-4">Notable Portfolio Changes</h2>
<p>During the quarter, the team added to and exited some of its Base &amp; Industrial Metals exposure, while also exiting positions in Agriculture.&nbsp;</p>
<h3>Notable Adds:</h3>
<div class="wrapped-div mt-3">
<table style="width: 100%;">
<tbody>
<tr class="tbl-data">
<td class="tbl-header last">Company</td>
<td class="tbl-header last">Sector</td>
<td class="tbl-header last text-right">Weight (%)</td>
<td class="tbl-header last">Rationale</td>
</tr>
<tr class="tbl-data">
<td class="data-td data last">Northam Platinum</td>
<td class="data-td data last">Gold &amp; Precious Metals</td>
<td class="data-td data last text-right">0.91</td>
<td class="data-td data last">Rising platinum prices and operational turnaround offer leveraged exposure to tightening PGM market fundamentals.</td>
</tr>
<tr class="tbl-data">
<td class="data-td data last">Ivanhoe Electric</td>
<td class="data-td data last">Base &amp; Industrial Metals</td>
<td class="data-td data last text-right">0.67</td>
<td class="data-td data last">A U.S. copper developer rapidly de-risking its Santa Cruz project in Arizona, targeting 2028 production.</td>
</tr>
<tr class="tbl-data">
<td class="data-td data last">WaterBridge Infrastructure</td>
<td class="data-td data last">Industrials &amp; Utilities</td>
<td class="data-td data last text-right">0.71</td>
<td class="data-td data last">Expanding Delaware Basin water-midstream network under long-term contracts provides resilient, inflation-linked infrastructure cash flows.</td>
</tr>
</tbody>
</table>
<h3>Notable Exits:</h3>
<div class="wrapped-div mt-3">
<table style="width: 100%;">
<tbody>
<tr class="tbl-data">
<td class="tbl-header last">Company</td>
<td class="tbl-header last">Sector</td>
<td class="tbl-header last text-right">Weight (%)</td>
<td class="tbl-header last">Rationale</td>
</tr>
<tr class="tbl-data">
<td class="data-td data last">MP Materials</td>
<td class="data-td data last">Base &amp; Industrial Metals</td>
<td class="data-td data last">(not held)</td>
<td class="data-td data last">U.S. support for MP&mdash;loan, equity stake, premium offtake&mdash;drove valuation to unsustainable levels, prompting our exit.</td>
</tr>
<tr class="tbl-data">
<td class="data-td data last">Bunge</td>
<td class="data-td data last">Agriculture</td>
<td class="data-td data last">(not held)</td>
<td class="data-td data last">Exited before 2Q earnings, expecting weak crush margins and Viterra integration risks to pressure results.</td>
</tr>
<tr class="tbl-data">
<td class="data-td data last">BHP</td>
<td class="data-td data last">Base &amp; Industrial Metals</td>
<td class="data-td data last">(not held)</td>
<td class="data-td data last">Falling iron-ore margins and cost inflation eroded returns, prompting reallocation toward higher-growth resource exposures.</td>
</tr>
</tbody>
</table>
</div>
</div>
<p class="chart-disclosure">Source: VanEck, FactSet. Data as of September 30, 2025.</p>
<h2 id="supportive-fundamentals" class="jump-link-nav anchored-block mt-4" data-jumplink-title="Supportive Fundamentals">Tight Supply and Electrification Keep Fundamentals Supportive</h2>
<p>We remain constructive on resource equities given tight supply in select commodities, disciplined industry behavior, and secular demand tied to electrification, grid investment and data-center build-out. Three themes shape our view:</p>
<ul class="content-list">
<li class="mt-2">Secular load growth from AI/data centers, EVs and broader electrification is reshaping energy and metals demand; in the near term, natural gas continues to bridge power needs as grids adapt.</li>
<li class="mt-2">Security of supply and consolidation are front and center in mining and energy; scale and optionality can support re-ratings as companies optimize portfolios and capital returns.</li>
<li class="mt-2">Slow supply response, especially in copper and other &ldquo;transition&rdquo; metals, underpins medium-term fundamentals given multi-year project lead times and rising permitting hurdles.</li>
</ul>
<p>Risks we&rsquo;re watching include trade/tariff policy, power generation uptake, China&rsquo;s growth trajectory, rate paths and geopolitics&mdash;each capable of elevating volatility even in constructive setups. On balance, we see attractive valuations, robust cash generation and durable secular tailwinds that support a long-term allocation to resource equities.</p>
<p>To receive more <a href="/us/en/insights/natural-resources/" title="Natural Resources Insights"><strong>Natural Resources</strong></a> insights, <a href="https://www.vaneck.com/us/en/subscribe/" title="Subscription Center"><strong>sign up in our subscription center</strong></a>.</p>
]]></content:encoded>
</item><item rdf:about="https://www.vaneck.com/us/en/blogs/emerging-markets-bonds/its-a-new-era-of-emerging-market-exceptionalism/">
  <title>It’s a New Era of Emerging Market Exceptionalism></title>
  <link>https://www.vaneck.com/us/en/blogs/emerging-markets-bonds/its-a-new-era-of-emerging-market-exceptionalism/</link>
  <description><![CDATA[As emerging markets continue their fiscal dominance over their developed market counterparts, EM bonds are increasingly reaping the benefits.]]></description>
  <dc:creator>Eric Fine</dc:creator>
  <dc:date>10/13/2025 06:30:00</dc:date>
<content:encoded><![CDATA[

<p>The global balance has quietly inverted. Before 1998, emerging markets (EM) ran chronic external deficits and were the epicenter of 1990s crises. After 1998, developed markets (DM) took up that mantle&mdash;running large, persistent deficits and driving the major crises of the new millennium. The difference is policy. EMs generally have lower levels of government and/or total economy debt. This allows central banks independence to focus solely on inflation and not be constrained by concerns about undermining government financing. As they are independent, EM central banks can maintain high real policy rates that keep market rates attractive versus those of DM countries. In addition, we think DMs are generally facing headwinds from geopolitical developments, while many EMs are experiencing tailwinds from geopolitical developments.</p>
<p>In a recent webinar, VanEck&rsquo;s Eric Fine discusses this fiscal dominance of emerging market countries and explains why the emerging market debt asset class is the beneficiary of this new world order.</p>
<h2>Webinar Replay: It&rsquo;s a New Era of EM Exceptionalism</h2>
<p>Watch the replay of <em>A New Era of EM Exceptionalism </em>&mdash; insights into emerging market dynamics and opportunities. Access the recording with Passcode: aM96kgz&amp;</p>
<p>Key takeaways from the webinar include:</p>
<ul class="content-list">
<li class="mt-2"><strong>Fiscal dominance -</strong> Since the late 1990s, the roles of developed and emerging markets have flipped: EMs internalized hard lessons, tightened policy, and ran surpluses; DMs increasingly ran large deficits and engineered crisis responses that fused monetary and fiscal policy.</li>
<li class="mt-2"><strong>Geopolitics favor EM -</strong> Geopolitics and reserve diversification are pushing capital toward surplus-running EMs and higher-yielding EM local bonds, creating a structural tailwind for emerging market bonds.</li>
<li class="mt-2"><strong>Recent EM debt outperformance and the power of active management -</strong> While fundamentals increasingly favor emerging markets, the opportunities swing by country, currency, and cycle, which makes a blended active approach key.</li>
</ul>

<h2><strong>How to Invest</strong></h2>
<p>The <a href="/link/f447bf0c04f64108a3dcff3ca025af4a.aspx" title="EMBX - VanEck Emerging Markets Bond ETF - Overview"><strong> VanEck Emerging Markets Bond ETF</strong></a> was one of the first blended emerging markets bond strategies in the market. The strategy adopts a comprehensive approach, investing across the entire EM bond spectrum to maximize opportunity and manage risk in a complex global environment. Despite global disruptions such as the COVID pandemic, the war in Ukraine and economic troubles in China, the fund has historically outperformed both global and U.S. bond benchmarks. VanEck&rsquo;s active strategy, which focuses on fundamental value relative to bond risk premia, aims to capitalize on these shifts and avoid troubled issuers, making a compelling case for a diversified, actively managed EM bond allocation.</p>

<p>To receive more <a href="https://www.vaneck.com/us/en/insights/emerging-markets-bonds/" title="Emerging Markets Bonds Insights"><strong>Emerging Markets Bonds</strong></a> insights, <a href="/link/5f45412c2143400497908cea2897f7d3.aspx" title=" Subscription Center"><strong>sign up in our subscription center</strong></a>.</p>
]]></content:encoded>
</item><item rdf:about="https://www.vaneck.com/us/en/blogs/gold-investing/ima-casanova-golds-relentless-rally-fundamentals-and-renewed-investor-confidence/">
  <title>Gold’s Relentless Rally: Fundamentals and Renewed Investor Confidence></title>
  <link>https://www.vaneck.com/us/en/blogs/gold-investing/ima-casanova-golds-relentless-rally-fundamentals-and-renewed-investor-confidence/</link>
  <description><![CDATA[Gold rose to record highs near $3,859/oz in September as Fed rate cuts and central bank buying fueled demand. Miners rallied on strong cash flow, discipline, and renewed investor interest.]]></description>
  <dc:creator>Imaru Casanova</dc:creator>
  <dc:date>10/10/2025 06:30:00</dc:date>
<content:encoded><![CDATA[

<p><strong>Key Takeaways:</strong></p>
<ul class="content-list">
<li class="mt-2">Gold hit record highs near $3,859/oz in September, driven by the Fed&rsquo;s rate cut</li>
<li class="mt-2">Central banks sustained strong gold buying, supporting a global de-dollarization trend</li>
<li class="mt-2">Gold miners and junior producers rallied on record margins, improved capital access, and disciplined growth</li>
</ul>
<p>Monthly gold market and economic insights from <a href="/link/cfa7139e649944fea51aa2a740b2372e.aspx?p=1" title="Imaru Casanova - Portfolio Manager, Gold and Precious Metals"><strong>Imaru Casanova, Portfolio Manager</strong></a>, featuring her unique views on mining and gold&rsquo;s portfolio benefits.</p>

<h2 id="gold-at-record-highs" class="jump-link-nav anchored-block" data-jumplink-title="Gold at Record Highs">Gold Surges to Record Highs</h2>
<p>Gold&rsquo;s relentless rally kicked into a higher gear in September, closing at $3,858.96 per ounce on September 30&mdash;a gain of $411.02 per ounce (11.92%) for the month. After trading rangebound around the $3,300 per ounce level for about five months, from mid-April to mid-August, gold had refused to take a breather, setting new highs almost every week since.</p>
<h2>Fed Rate Cut Fuels Momentum</h2>
<p>The Federal Open Market Committee&rsquo;s (FOMC) decision to lower the federal funds rate by 25 basis points on September 17 came as no surprise. The move, however, provided support for gold both before and after the announcement. Historically, lower interest rates have been positive for gold prices.</p>
<p>This inverse relationship is more closely linked to investment demand, as investors are more likely to invest in gold when the opportunity cost of holding the metal decreases as real (inflation-adjusted) rates fall. Combined with headline PCE<sup>1</sup>&nbsp;accelerating in August (2.7% year-on-year vs 2.6% in July), the Federal Reserve (Fed) rate cut and a looming U.S. government shutdown, put gold back on the market&rsquo;s radar. This attracted flows into global gold bullion ETFs, which registered a 3.9% increase in holdings during the month, while remaining below record levels.</p>
<h2>Central Banks Sustain Historic Buying</h2>
<p>In contrast, central bank buying appears less sensitive to the interest rate and broader macro-economic environment. The official sector has been buying gold at record levels since 2022, emerging as a primary driver of the most recent gold bull market. While Western investors had been mostly reducing their gold exposure since April 2022, their return to the gold markets over the past year, coupled with continued strength in central bank buying, created the powerful combination behind gold&rsquo;s phenomenal price performance in 2025.</p>
<p>After pausing in July, central banks resumed gold purchases in August, adding a net 15 tonnes to global reserves, according to World Gold Council estimates. The National Bank of Kazakhstan led the buying for the month, followed by the National Bank of Bulgaria and the Central Reserve Bank of El Salvador. The National Bank of Poland&mdash;this year&rsquo;s largest buyer&mdash;reaffirmed its pro-gold stance by raising its target gold share within its international reserves from 20% to 30%, a level well above most peers.</p>
<p>The People's Bank of China reported its tenth consecutive monthly increase in gold reserves, bringing its gold holdings to more than 2,300 tonnes, though still accounting for only 7% of total international reserves. The Czech National Bank&rsquo;s total gold reserves increased to 65 tonnes, with a target to hold 100 tonnes of gold as part of its international reserves by the end of 2028.</p>
<p>These are indications that, despite recent moderation in purchases, central banks&rsquo; appetite for gold remains robust. In fact, we may be in the very early stages of a global de-dollarization movement where gold is likely to play a leading role.</p>
<p>The NYSE Arca Gold Miners Index (GDMNTR)<sup>2</sup>&nbsp;rose 21% in September, outperforming gold itself, while the mid-tier and small cap index, MVIS Global Junior Gold Miners (MVGDXJTR)<sup>3</sup>, gained 24.7%. This rather spectacular performance was the perfect backdrop for the sector&rsquo;s flagship events held in Colorado annually.</p>
<h2 id="conference-takeaways" class="jump-link-nav anchored-block" data-jumplink-title="Conference Takeaways">2025 Gold Forum Americas &amp; Precious Metals Summit Takeaways</h2>
<p>This year&rsquo;s conferences struck a confident but measured tone. Both the Gold Forum Americas and the Precious Metals Summit in Colorado drew record attendance &mdash; a mix of producers, juniors, institutional investors, banks, and corporate development teams. The mood was positive, but not exuberant, as companies emphasized strong free cash flow, record margins, and renewed growth plans, while remaining committed to cost control, capital discipline and delivering against their targets.</p>
<h2>Junior Producers &amp; Developers: Starved for Capital, Now Courted Again</h2>
<p>The Precious Metals Summit is an annual conference held in Colorado that focuses on junior (small/micro-cap) companies that develop gold, silver, and other metals. This year&rsquo;s gathering underscored renewed investor interest in the junior sector. Attendance hit new records, and our hosted session with 14 silver companies drew a standing-room-only audience&mdash;a stark contrast to the subdued turnout in past years. With gold at record levels, juniors that had been starved for capital in recent years are finally finding support to fund exploration, drilling, and property development. Some are newly formed companies acquiring assets positioned for this high gold price environment.</p>
<p>We held one-on-one meetings with 22 junior companies, with several already in our portfolio and others under evaluation. We see a subset of these advancing toward production in the near term &mdash; potential acquisition targets or future emerging producers. Others remain longer-term bets, where management quality, project potential, and permitting risk must be carefully weighed.</p>
<p>Despite renewed capital availability, share price performance of many developers has lagged as reserve/resource assumptions remain anchored at conservative gold prices (on average, around $1,500 per ounce), while producers reap direct free cash flow benefits at spot levels.</p>

<h2>Producers: Execution, Growth, and Capital Discipline</h2>
<p>At the Gold Forum Americas conference, we met with over 40 companies. For producers, the focus remains firmly on operational efficiency and disciplined growth. Many companies highlighted the advancement of organic projects, with expansions and life-of-mine extensions at or near existing operations and infrastructure still a preference, as compared to greenfield projects. At current gold prices, funding capital programs is no longer a constraint, and hedging is being phased out. Strong cash flow generation allows the producers to refocus on their project pipelines, increase their flexibility to redesign or rescope projects targeting improved profitability and returns, and expand their ability to make more impactful acquisitions. In addition, major producers such as Newmont (7.0% of Strategy net assets) and Barrick Mining (3.5% of Strategy net assets) have taken advantage of strong gold markets to divest non-core assets at attractive valuations, boosting their cash positions.</p>
<p>The message was consistent: balance sheets are healthy, but capital discipline remains a priority, with shareholders constantly reminding companies not to repeat mistakes of prior bull markets. With a focus on quality over quantity and de-risking, companies are targeting opportunities that enhance their portfolios (e.g., lower cost ounces, better mining jurisdictions, truly synergetic consolidations, and opportunistic equity investments), which is keeping M&amp;A activity far from frenzying levels. Debt repayment, increased dividends, and share buybacks are all being emphasized.</p>
<p>Notably, many producers are using gold price assumptions for estimating their reserves and resources that represent more than a 50% discount to the current spot gold price. This conservatism highlights the producers&rsquo; desire to stay prudent despite record margins, reassuring investors, who, in large part, still lack exposure to the sector.</p>
<p>Cost cutting initiatives, offset by relatively mild industry cost inflation (3-5% in 2025) appear to be keeping a lid on costs. Lower employee turnover was reported by several companies, but in some cases, this came with higher pay, leading to increased labor costs. In other cases, a slowdown in activity in other sectors has improved labor availability. Overall, the sector struggles to attract talent and find skilled labor locally. In response, companies are partnering with universities, increasing the number and type of training programs, moving people across operations globally, and ramping up their use of autonomous and remotely operated equipment.</p>
<h2 id="industry-developments" class="jump-link-nav anchored-block" data-jumplink-title="Industry Developments">Industry Developments and Policy Tailwinds</h2>
<p>The biggest industry news came from Barrick&rsquo;s preliminary economic assessment (PEA) of its Fourmile project (100% owned by Barrick) in Nevada. Pending significant further drilling, the PEA points to a potential 25-million-ounce high-grade gold resource&mdash;within the world&rsquo;s largest gold mining complex, Nevada Gold Mines (NGM), a joint venture between Barrick and Newmont, operated by Barrick. The announcement was well timed with a post-conference visit to NGM, which we attended. This sparked notable Barrick stock price outperformance &mdash; and was followed by the surprise departure of the company&rsquo;s CEO, announced on September 29. Interestingly, and apparently coincidentally, on that same day, Newmont also announced a rather expected leadership transition, appointing current Chief Operating Officer Natascha Viljoen as its new CEO, effective January 1, 2026.</p>
<p>Government policy was also featured in conversations. We met with the Mines Minister of British Columbia (BC), who highlighted streamlined permitting systems and stronger engagement with First Nations &mdash; positioning BC as a leader in responsible resource development. We see this as a new era of government awareness around the development of critical resources that bodes well for the North American mining industry.</p>
<h2>Outlook: Gold Equities Poised for Revaluation</h2>
<p>We believe the case for gold equities remains compelling. Strong fundamentals, resilient balance sheets, and historically low valuations create an attractive opportunity set, supported by a rising gold price outlook, particularly as broader investors begin to re-engage with the sector.</p>
<p>To receive more <strong><a href="https://www.vaneck.com/us/en/insights/gold-investing/" title="Gold Investing Insights">Gold Investing</a></strong> insights, <strong><a href="https://www.vaneck.com/us/en/subscribe/" title="Subscription Center">sign up in our subscription center</a></strong>.</p>
]]></content:encoded>
</item><item rdf:about="https://www.vaneck.com/us/en/blogs/model-portfolios/september-market-recap-the-ai-boom-meets-the-trust-trade/">
  <title>September Market Recap: The AI Boom Meets the Trust Trade></title>
  <link>https://www.vaneck.com/us/en/blogs/model-portfolios/september-market-recap-the-ai-boom-meets-the-trust-trade/</link>
  <description><![CDATA[Two forces are shaping the next market cycle. One is build&mdash;AI and the infrastructure powering it. The other is erosion&mdash;trust in money and institutions. Both are investable.]]></description>
  <dc:creator>David Schassler</dc:creator>
  <dc:date>10/10/2025 06:30:00</dc:date>
<content:encoded><![CDATA[

<p><strong>Key Takeaways</strong></p>
<ul class="content-list">
<li class="mt-2"><strong>AI Chain Reaction: </strong>Build &rarr; adopt &rarr; automate; winners progress from builders to operators to integrators.</li>
<li class="mt-2"><strong>Industrial Tailwind: </strong>Data centers need power, steel, copper, and concrete&mdash;energy and infrastructure are in a bull market.</li>
<li class="mt-2"><strong>Trust Shift: </strong>Rethink returns not just in dollars, but in units of scarcity&mdash;gold and Bitcoin are emerging as the true measures of value.</li>
<li class="mt-2"><strong>Portfolio Action: </strong>Diversify beyond 60/40&mdash;own AI builders and operators, the energy that powers them, and scarcity assets that preserve value.</li>
</ul>
<p><i>Investments in digital assets are subject to significant risk and are not suitable for all investors. It is possible to lose your entire principal investment. The views and opinions stated herein should not be construed as any call to action, are not recommendations to buy or sell any security or digital asset, or to adopt any investment strategy, are for illustrative purposes only, are subject to change without notice, and are those of the author(s) and not necessarily those of VanEck or its other employees. Past performance is no guarantee of future results.</i></p>

<h2>The AI Chain Reaction</h2>
<p><img loading="lazy" class="img-responsive w-100" alt="The AI Chain Reaction" src="https://www.vaneck.com/contentassets/6aa9fe26d9ef4371993c6a6769c53b6d/6271_models-monthly-september_image-1_2025-10_v1.jpg" /></p>
<p>AI is rolling through the economy in waves: build, adopt, and automate. In the first wave, own the builders&mdash;the chips, clouds, gear, and power keeping everything running. In the second, back the operators&mdash;the firms plugging agents into workflows and letting margins do the talking. In the third, scale with the integrators&mdash;AI plus robotics turning routine work into output. Not every industry or country moves together. Invest in whoever&rsquo;s advancing fastest.</p>
<p><img loading="lazy" class="img-responsive w-100" alt="3 Phases of AI Adoptions" src="https://www.vaneck.com/contentassets/6aa9fe26d9ef4371993c6a6769c53b6d/6271_models-monthly-september_table_2025-10_v1_blog.svg" /></p>
<p class="chart-disclosure">Source: VanEck.</p>
<p>AI&rsquo;s rise isn&rsquo;t just a tech story&mdash;it&rsquo;s an industrial one. Behind every model, data center, and robot is a surge in demand for electricity, materials, and infrastructure. The &ldquo;old-world&rdquo; assets that power and build things&mdash;energy, utilities, nuclear, and construction&mdash;are suddenly in a bull market. They&rsquo;re the backbone of the digital economy.</p>
<p>Here are the five-year annualized returns that demonstrate the bull market in the &ldquo;old-world&rdquo; assets behind the AI build:</p>
<h3>5-Year Returns of &ldquo;Old World&rdquo; Assets</h3>
<p><img loading="lazy" class="img-responsive w-100" alt="5-Year Returns of &ldquo;Old World&rdquo; Assets" src="https://www.vaneck.com/contentassets/6bd651abb1f84f88b71078306c54f198/6271_models-monthly-september_chart-01_2025-10_v1_blog.svg" /></p>
<p class="chart-disclosure">Source: Bloomberg. Data from 2020 to 2025. Past performance is no guarantee of future results.</p>
<p>This is the paradox of progress: the smarter the world gets, the more it needs steel, copper, concrete, and reliable power.</p>
<p>AI is driving a new industrial cycle&mdash;one where computing and energy rise together.</p>
<h2>The Parallel Theme: The Trust Trade</h2>
<p>While AI rebuilds productivity, another story is unfolding at the same time&mdash;one defined not by innovation, but by erosion. The erosion of trust.</p>
<h2>Losing Money in Gold Terms</h2>
<p>Since 2020, nearly every major asset class has posted gains in U.S. dollar terms&mdash;but losses in gold. That&rsquo;s the tell. Fiat returns look fine; scarcity says otherwise. When confidence in policy slips, capital moves to what can&rsquo;t be printed: gold, Bitcoin, and hard assets.</p>
<h3>Nearly Every Asset Class Has Posted Losses in Gold Terms</h3>
<p><img loading="lazy" class="img-responsive w-100" alt="Nearly Every Asset Class Has Posted Losses in Gold Terms" src="https://www.vaneck.com/contentassets/0ad54650caca4b7082424291c5b7bb93/6271_models-monthly-september_chart-02_2025-10_v1_blog.svg" /></p>
<p class="chart-disclosure">Source: Bloomberg. Data from 2020 to 2025. Past performance is no guarantee of future results. Index performance is not illustrative of fund or strategy performance. It is not possible to invest directly in an index. Please see index definitions at the end of this commentary.</p>
<p>When gold is up big year to date, the reflex is to ask, &ldquo;Should I sell?&rdquo; That question misses the point. We&rsquo;re in a new regime where the financial laws of gravity apply again&mdash;debt, spending, and deficits matter.</p>
<p>Gold (and Bitcoin) are the opt-out: assets that can&rsquo;t be printed to fund excess. In that setup, we believe that this bull has much more room to run. It won&rsquo;t be smooth&mdash;expect higher volatility and sharp corrections&mdash;but over the next few years, we believe the path is higher.</p>
<h2>The Shutdown: Why This Time Feels Different</h2>
<p><img loading="lazy" class="img-responsive w-100" alt="The Shutdown: Why This Time Feels Different" src="https://www.vaneck.com/contentassets/bf304e54879a4b8ea7160d6e1107a19c/6271_models-monthly-september_image-2_2025-10_v1.jpg" /></p>
<p>Government shutdowns used to be temporary noise. This time is a bit different.</p>
<ol class="content-list">
<li class="mt-2"><strong>Weaponized Policy</strong> &ndash; Past shutdowns paused spending. This one points toward a permanent downsizing of the federal workforce.</li>
<li class="mt-2"><strong>Dollar Context </strong>&ndash; It&rsquo;s happening during dollar weakness. Investors aren&rsquo;t treating the greenback as a safe-haven asset. Instead, they&rsquo;re moving to gold and Bitcoin.</li>
<li class="mt-2"><strong>Data Blackout </strong>&ndash; No September jobs report. Normally a footnote. But in an era of doubt about inflation and Fed independence, the lack of data compounds uncertainty.</li>
</ol>
<p>Shutdowns were once sideshows. Now they&rsquo;re symptoms. Each event&mdash;policy paralysis, political violence, fraying alliances&mdash;chips away at institutional trust. And when trust goes, capital doesn&rsquo;t disappear; it repositions&mdash;from promises to proof, from fiat to scarcity.</p>
<h2>Portfolio Action</h2>
<p>Two forces are shaping the next market cycle. One is build&mdash;AI and the infrastructure powering it. The other is erosion&mdash;trust in money and institutions. Both are investable.</p>
<p>The playbook is diversification beyond the traditional 60/40. Lean into the AI buildout&mdash;semiconductors, cloud, energy, and infrastructure. Own the operators using AI to expand productivity and margins. And balance it with scarcity&mdash;gold and Bitcoin&mdash;as anchors of value in an age of monetary uncertainty.</p>
<p>Progress and preservation aren&rsquo;t mutually exclusive. The strongest portfolios hold both: the engines of innovation and the assets that endure when confidence fades. That&rsquo;s how you stay positioned for what&rsquo;s next.</p>


<p>Today&rsquo;s predominant macro forces are driving the key themes and exposures in VanEck&rsquo;s models, including the core allocation of the <a href="https://www.vaneck.com/us/en/investments/wealth-builder-plus-portfolios/overview/" title="VanEck Wealth Builder Plus Portfolios"><strong>VanEck Wealth Builder Plus Portfolios</strong></a>. The allocations below are representative of the Moderate Portfolio.</p>
<p class="d-none d-lg-block"><img loading="lazy" class="img-responsive" src="https://www.vaneck.com/contentassets/63b52e9ec8bd4b05816da99da1ba8cdb/6271_models-monthly-september_chart-03_2025-10_v1_dekstop.svg" alt="Asset Allocation" /></p>
<p style="width: 345px;" class="d-lg-none"><img loading="lazy" class="img-responsive" src="https://www.vaneck.com/contentassets/63b52e9ec8bd4b05816da99da1ba8cdb/6271_models-monthly-september_chart-03_2025-10_v1_mobile.svg" alt="Asset Allocation" /></p>
<div class="flourish-embed flourish-table" data-src="visualisation/25571451?2429575"><script src="https://public.flourish.studio/resources/embed.js"></script><noscript><img loading="lazy" src="https://public.flourish.studio/visualisation/25571451/thumbnail" width="100%" alt="The Asset Allocation Breakdown" /></noscript></div>
<h3>Standardized Performance</h3>
<div class="wrapped-div blog-post content">
<table style="width: 100%;">
<tbody>
<tr class="tbl-data">
<td class="data-head last">&nbsp;</td>
<td class="data-head last text-right">Inception Date</td>
<td class="data-head last text-right">1M</td>
<td class="data-head last text-right">3M</td>
<td class="data-head last text-right">YTD</td>
<td class="data-head last text-right">1Y</td>
<td class="data-head last text-right">3Y</td>
<td class="data-head last text-right">5Y</td>
<td class="data-head last text-right">Since Inception</td>
</tr>
<tr class="tbl-data">
<td class="data-td data last text-left">Wealth Builder Plus Conservative Strategy</td>
<td class="data-td data last text-right">7/1/2024</td>
<td class="data-td data last text-right">&nbsp;</td>
</tr>
<tr class="tbl-data">
<td class="data-td data last text-left">Net</td>
<td class="data-td data last text-right">&nbsp;</td>
<td class="data-td data last text-right">2.00</td>
<td class="data-td data last text-right">3.70</td>
<td class="data-td data last text-right">9.08</td>
<td class="data-td data last text-right">7.16</td>
<td class="data-td data last text-right">--</td>
<td class="data-td data last text-right">10.02</td>
</tr>
<tr class="tbl-data">
<td class="data-td data last text-left">Gross</td>
<td class="data-td data last text-right">&nbsp;</td>
<td class="data-td data last text-right">2.00</td>
<td class="data-td data last text-right">3.70</td>
<td class="data-td data last text-right">9.08</td>
<td class="data-td data last text-right">7.16</td>
<td class="data-td data last text-right">--</td>
<td class="data-td data last text-right">10.02</td>
</tr>
<tr class="tbl-data">
<td class="data-td data last text-left">20% ACWI/80% ICE Broad Market Index</td>
<td class="data-td data last text-right">&nbsp;</td>
<td class="data-td data last text-right">1.56</td>
<td class="data-td data last text-right">3.10</td>
<td class="data-td data last text-right">8.39</td>
<td class="data-td data last text-right">5.49</td>
<td class="data-td data last text-right">--</td>
<td class="data-td data last text-right">8.85</td>
</tr>
<tr class="tbl-data">
<td class="data-td data last text-left">Wealth Builder Plus Moderate Strategy</td>
<td class="data-td data last text-right">7/1/2024</td>
<td class="data-td data last text-right">&nbsp;</td>
</tr>
<tr class="tbl-data">
<td class="data-td data last text-left">Net</td>
<td class="data-td data last text-right">&nbsp;</td>
<td class="data-td data last text-right">3.22</td>
<td class="data-td data last text-right">6.13</td>
<td class="data-td data last text-right">13.51</td>
<td class="data-td data last text-right">13.05</td>
<td class="data-td data last text-right">--</td>
<td class="data-td data last text-right">15.23</td>
</tr>
<tr class="tbl-data">
<td class="data-td data last text-left">Gross</td>
<td class="data-td data last text-right">&nbsp;</td>
<td class="data-td data last text-right">3.22</td>
<td class="data-td data last text-right">6.13</td>
<td class="data-td data last text-right">13.51</td>
<td class="data-td data last text-right">13.05</td>
<td class="data-td data last text-right">--</td>
<td class="data-td data last text-right">15.23</td>
</tr>
<tr class="tbl-data">
<td class="data-td data last text-left">60% ACWI/40% ICE Broad Market Index</td>
<td class="data-td data last text-right">&nbsp;</td>
<td class="data-td data last text-right">2.52</td>
<td class="data-td data last text-right">5.18</td>
<td class="data-td data last text-right">12.80</td>
<td class="data-td data last text-right">10.62</td>
<td class="data-td data last text-right">--</td>
<td class="data-td data last text-right">13.44</td>
</tr>
<tr class="tbl-data">
<td class="data-td data last text-left">Wealth Builder Plus Aggressive Strategy</td>
<td class="data-td data last text-right">7/1/2024</td>
<td class="data-td data last text-right">&nbsp;</td>
</tr>
<tr class="tbl-data">
<td class="data-td data last text-left">Net</td>
<td class="data-td data last text-right">&nbsp;</td>
<td class="data-td data last text-right">3.86</td>
<td class="data-td data last text-right">7.37</td>
<td class="data-td data last text-right">15.90</td>
<td class="data-td data last text-right">16.16</td>
<td class="data-td data last text-right">--</td>
<td class="data-td data last text-right">17.95</td>
</tr>
<tr class="tbl-data">
<td class="data-td data last text-left">Gross</td>
<td class="data-td data last text-right">&nbsp;</td>
<td class="data-td data last text-right">3.86</td>
<td class="data-td data last text-right">7.37</td>
<td class="data-td data last text-right">15.90</td>
<td class="data-td data last text-right">16.16</td>
<td class="data-td data last text-right">--</td>
<td class="data-td data last text-right">17.95</td>
</tr>
<tr class="tbl-data">
<td class="data-td data last text-left">80% ACWI/20% ICE Broad Market Index</td>
<td class="data-td data last text-right">&nbsp;</td>
<td class="data-td data last text-right">3.01</td>
<td class="data-td data last text-right">6.23</td>
<td class="data-td data last text-right">14.95</td>
<td class="data-td data last text-right">13.13</td>
<td class="data-td data last text-right">--</td>
<td class="data-td data last text-right">15.66</td>
</tr>
<tr class="tbl-data">
<td class="data-td data last text-left">Thematic Disruption Strategy</td>
<td class="data-td data last text-right">12/24/2021</td>
<td class="data-td data last text-right">&nbsp;</td>
</tr>
<tr class="tbl-data">
<td class="data-td data last text-left">Net</td>
<td class="data-td data last text-right">&nbsp;</td>
<td class="data-td data last text-right">7.67</td>
<td class="data-td data last text-right">11.59</td>
<td class="data-td data last text-right">24.16</td>
<td class="data-td data last text-right">32.70</td>
<td class="data-td data last text-right">25.39</td>
<td class="data-td data last text-right">--</td>
<td class="data-td data last text-right">6.60</td>
</tr>
<tr class="tbl-data">
<td class="data-td data last text-left">Gross</td>
<td class="data-td data last text-right">&nbsp;</td>
<td class="data-td data last text-right">7.68</td>
<td class="data-td data last text-right">11.62</td>
<td class="data-td data last text-right">24.25</td>
<td class="data-td data last text-right">32.83</td>
<td class="data-td data last text-right">25.73</td>
<td class="data-td data last text-right">--</td>
<td class="data-td data last text-right">6.94</td>
</tr>
<tr class="tbl-data">
<td class="data-td data last text-left">MSCI ACWI IMI Growth Index</td>
<td class="data-td data last text-right">&nbsp;</td>
<td class="data-td data last text-right">4.64</td>
<td class="data-td data last text-right">8.88</td>
<td class="data-td data last text-right">18.87</td>
<td class="data-td data last text-right">21.33</td>
<td class="data-td data last text-right">26.45</td>
<td class="data-td data last text-right">--</td>
<td class="data-td data last text-right">8.91</td>
</tr>
<tr class="tbl-data">
<td class="data-td data last text-left">Real Assets Strategy</td>
<td class="data-td data last text-right">8/16/2017</td>
<td class="data-td data last text-right">&nbsp;</td>
</tr>
<tr class="tbl-data">
<td class="data-td data last text-left">Net</td>
<td class="data-td data last text-right">&nbsp;</td>
<td class="data-td data last text-right">5.11</td>
<td class="data-td data last text-right">9.66</td>
<td class="data-td data last text-right">23.70</td>
<td class="data-td data last text-right">22.54</td>
<td class="data-td data last text-right">18.09</td>
<td class="data-td data last text-right">16.63</td>
<td class="data-td data last text-right">7.74</td>
</tr>
<tr class="tbl-data">
<td class="data-td data last text-left">Gross</td>
<td class="data-td data last text-right">&nbsp;</td>
<td class="data-td data last text-right">5.11</td>
<td class="data-td data last text-right">9.66</td>
<td class="data-td data last text-right">23.70</td>
<td class="data-td data last text-right">22.54</td>
<td class="data-td data last text-right">18.34</td>
<td class="data-td data last text-right">17.01</td>
<td class="data-td data last text-right">8.16</td>
</tr>
<tr class="tbl-data">
<td class="data-td data last text-left">Bloomberg Commodity Index</td>
<td class="data-td data last text-right">&nbsp;</td>
<td class="data-td data last text-right">2.15</td>
<td class="data-td data last text-right">3.65</td>
<td class="data-td data last text-right">9.38</td>
<td class="data-td data last text-right">8.88</td>
<td class="data-td data last text-right">2.76</td>
<td class="data-td data last text-right">11.53</td>
<td class="data-td data last text-right">5.59</td>
</tr>
<tr class="tbl-data">
<td class="data-td data last text-left">Select Opportunities Strategy</td>
<td class="data-td data last text-right">12/20/2024</td>
<td class="data-td data last text-right">&nbsp;</td>
</tr>
<tr class="tbl-data">
<td class="data-td data last text-left">Net</td>
<td class="data-td data last text-right">&nbsp;</td>
<td class="data-td data last text-right">7.37</td>
<td class="data-td data last text-right">11.69</td>
<td class="data-td data last text-right">24.80</td>
<td class="data-td data last text-right">--</td>
<td class="data-td data last text-right">23.68</td>
</tr>
<tr class="tbl-data">
<td class="data-td data last text-left">Gross</td>
<td class="data-td data last text-right">&nbsp;</td>
<td class="data-td data last text-right">7.37</td>
<td class="data-td data last text-right">11.69</td>
<td class="data-td data last text-right">24.80</td>
<td class="data-td data last text-right">--</td>
<td class="data-td data last text-right">23.68</td>
</tr>
<tr class="tbl-data">
<td class="data-td data last text-left">MSCI ACWI Index</td>
<td class="data-td data last text-right">&nbsp;</td>
<td class="data-td data last text-right">3.62</td>
<td class="data-td data last text-right">7.62</td>
<td class="data-td data last text-right">18.44</td>
<td class="data-td data last text-right">--</td>
<td class="data-td data last text-right">18.75</td>
</tr>
<tr class="tbl-data">
<td class="data-td data last text-left">Dynamic High Income Strategy</td>
<td class="data-td data last text-right">9/30/2021</td>
<td class="data-td data last text-right">&nbsp;</td>
</tr>
<tr class="tbl-data">
<td class="data-td data last text-left">Net</td>
<td class="data-td data last text-right">&nbsp;</td>
<td class="data-td data last text-right">0.72</td>
<td class="data-td data last text-right">2.77</td>
<td class="data-td data last text-right">6.84</td>
<td class="data-td data last text-right">7.11</td>
<td class="data-td data last text-right">11.30</td>
<td class="data-td data last text-right">--</td>
<td class="data-td data last text-right">3.24</td>
</tr>
<tr class="tbl-data">
<td class="data-td data last text-left">Gross</td>
<td class="data-td data last text-right">&nbsp;</td>
<td class="data-td data last text-right">0.72</td>
<td class="data-td data last text-right">2.77</td>
<td class="data-td data last text-right">6.84</td>
<td class="data-td data last text-right">7.11</td>
<td class="data-td data last text-right">11.37</td>
<td class="data-td data last text-right">--</td>
<td class="data-td data last text-right">3.31</td>
</tr>
<tr class="tbl-data">
<td class="data-td data last text-left">ICE BofA Global HY Corp. &amp; Sov. Index</td>
<td class="data-td data last text-right">&nbsp;</td>
<td class="data-td data last text-right">0.76</td>
<td class="data-td data last text-right">2.65</td>
<td class="data-td data last text-right">9.63</td>
<td class="data-td data last text-right">8.79</td>
<td class="data-td data last text-right">13.47</td>
<td class="data-td data last text-right">--</td>
<td class="data-td data last text-right">3.86</td>
</tr>
</tbody>
</table>
</div>
<p class="chart-disclosure"><strong>The performance data quoted represents past performance. Past performance is not a guarantee of future results. Performance may be lower or higher than performance data quoted. Please contact us at <a href="mailto:info@vaneck.com">info@vaneck.com</a> for additional information.</strong></p>
<p class="chart-disclosure">Returns greater than 1 year are annualized.</p>
<p class="chart-disclosure">Source: VanEck. As of 9/30/2025.</p>
<p>To receive more <strong><a href="https://www.vaneck.com/us/en/insights/guided-allocation/" title="Model Portfolio Insights">Model Portfolio</a></strong> insights, <strong><a href="https://www.vaneck.com/us/en/subscribe/" title="Subscription Center">sign up in our subscription center</a></strong>.</p>
]]></content:encoded>
</item><item rdf:about="https://www.vaneck.com/us/en/blogs/emerging-markets-equity/ai-demand-reforms-and-policy-support-power-em-momentum/">
  <title>AI Demand, Reforms, and Policy Support Power EM Momentum></title>
  <link>https://www.vaneck.com/us/en/blogs/emerging-markets-equity/ai-demand-reforms-and-policy-support-power-em-momentum/</link>
  <description><![CDATA[Emerging markets have rallied in 2025 as a weaker U.S. dollar, moderating inflation, and easy policy met reforms in Asia and the Gulf and cyclical support in LatAm, setting up a constructive year-end.]]></description>
  <dc:creator>Ola  El-Shawarby, CFA</dc:creator>
  <dc:date>10/09/2025 06:30:00</dc:date>
<content:encoded><![CDATA[

<p><strong>Key Takeaways:</strong></p>
<ul class="content-list">
<li class="mt-2">China&rsquo;s liquidity-led rally, AI investment surge, and gradual consumer recovery highlight a more pragmatic policy stance.</li>
<li class="mt-2">Taiwan and South Korea benefit from global AI demand, with semiconductors and memory chips driving equity gains.</li>
<li class="mt-2">Brazil, India, and GCC markets advance on easing rates, reform momentum, and strategic diversification, while Argentina lags on political risk.</li>
</ul>
<p id="market-overview" class="jump-link-nav anchored-block" data-jumplink-title="Market Overview">Emerging markets have delivered strong results in 2025, supported by a broad shift in global conditions. A weaker U.S. dollar, moderating inflation, and the end of tightening cycles across key EM central banks have combined with structural growth stories to draw renewed investor flows into the asset class. Equity performance has been underpinned by abundant liquidity in Asia, policy-driven reforms in markets such as India and the Gulf, and cyclical tailwinds in Latin America. While global growth remains uneven, the relative stability and improving fundamentals across many emerging economies have made them stand out in a year when developed markets have faced headwinds.</p>
<h2>China: Liquidity-Led Rally Meets Structural Reform</h2>
<p>China&rsquo;s equity market staged a strong, liquidity-driven rally in Q3 2025, moving ahead of underlying economic fundamentals. The Shanghai Composite Index rose approximately 25% from its April lows to a 10-year high, despite the broader economy remaining weighed down by the property sector and deflationary pressures. Abundant liquidity and limited returns in deposits or government bonds encouraged a shift of savings into equities. The rally has so far been led by institutions and sovereign investors rather than retail speculation, which provides some comfort regarding durability.</p>
<p>Investor sentiment has improved on signs that Beijing is adopting a more pragmatic policy stance both externally and domestically. Measures to tackle excess supply and suppress deflationary trends have been introduced, with concepts such as &ldquo;anti-involution&rdquo; gaining prominence in policy discussions. We welcome these supply-side reforms, as chronic overcapacity and cutthroat competition have long constrained corporate returns. That said, adjustments in areas like EVs may weigh on near-term growth sentiment. Implementation this time is also more complex than during the 2015&ndash;2016 cycle, when excess capacity was concentrated in commoditized, state-dominated industries more amenable to top-down directives. Nevertheless, we view these reforms as directionally healthy and ultimately supportive of more sustainable profitability.</p>
<p>At the same time, China&rsquo;s leading technology firms have announced substantial commitments to artificial intelligence. Alibaba (2.7% of Fund net assets*) has outlined plans to invest roughly $52 billion in AI and cloud infrastructure, with management signaling potential upward revisions, while Tencent (4.2% of Fund net assets*) also indicated higher AI-related spending. Domestic semiconductor capabilities continue to advance more quickly than anticipated, providing a stronger foundation for the ecosystem. We remain constructive on China&rsquo;s long-term AI growth potential, underpinned by abundant and relatively low-cost power as well as easing chip constraints. Against this backdrop, we have been steadily adding exposure to companies positioned to benefit from both AI infrastructure and applications. Encouragingly, these holdings have delivered meaningful outperformance while still trading at attractive valuations relative to global peers and their own history. Consumer-facing companies, particularly those centered on experiences, are showing encouraging signs of recovery. Travel demand continues to rebound, with Trip.com (1.2% of Fund net assets) delivering double-digit revenue growth, while leisure spending is fueling both Macau&rsquo;s gaming industry and online entertainment platforms such as NetEase (1.9% of Fund net assets*) and Tencent&mdash;trends that have reflected positively in our holdings. These dynamics point to a gradual normalization of household activity, adding a cyclical layer to China&rsquo;s growth profile.</p>
<p>Overall, while equities have rallied ahead of underlying fundamentals, we believe accommodative policy, accelerating AI-related investment, and a more constructive external backdrop could sustain near-term momentum, even as the broader economic recovery remains measured.</p>
<h2>Taiwan: Semiconductors at the Center of AI Growth</h2>
<p>Taiwan benefited from strong demand for advanced semiconductors and its central role in the global AI supply chain. Taiwan Semiconductor Manufacturing Company (TSMC) (9.5% of Fund net assets*) remains the primary beneficiary, with global cloud providers increasing their long-term infrastructure commitments, which implies substantial future chip demand. TSMC&rsquo;s shares appreciated significantly during the quarter, reflecting both order momentum and its dominance in advanced manufacturing.</p>
<p>The broader Taiwanese technology supply chain also stands to benefit, with contract manufacturers and component suppliers participating in the uplift from global AI investment. While geopolitical risks remain an overhang, cross-strait tensions were relatively subdued in Q3, allowing fundamentals to drive market performance.</p>
<h2>South Korea: Memory Cycle Revival and Governance Reforms</h2>
<p>South Korea&rsquo;s equity market delivered strong returns, supported by technology and incremental policy reforms. Semiconductor manufacturers led performance. SK Hynix (3.6% of Fund net assets*) benefited from strong demand for high-bandwidth memory chips used in AI servers, while Samsung Electronics (2.7% of Fund net assets*) gained on expectations it will also qualify as a supplier to leading AI chipmakers. The memory cycle has turned up faster than expected, easing earlier concerns of prolonged oversupply.</p>
<p>Policy initiatives under the government&rsquo;s &ldquo;Value-Up&rdquo; program, designed to improve corporate governance and shareholder returns, have contributed to rising investor interest. Tax incentives linked to dividend payments and measures to stimulate consumption provided further support. We also initiated a position in HD Hyundai Electric (0.9% of Fund net assets*), which is well positioned to benefit from structural demand for power infrastructure upgrades tied to global data center expansion.</p>
<h2>Brazil: Easing Rates Fuel Consumer-Led Momentum</h2>
<p>Brazil&rsquo;s market continued to improve as the interest rate cycle turned. The central bank ended its tightening phase, and markets anticipate rate cuts in late 2025 or early 2026. This has created a supportive backdrop for equities, particularly in consumption-oriented sectors.</p>
<p>The quarter included a short-lived disruption from U.S. tariff announcements. While headline tariffs appeared severe, exemptions covering major export categories such as iron ore, oil, and agribusiness significantly limited the impact. As a result, the effect on corporate earnings was less negative than initially feared.</p>
<p>We initiated a position in Multiplan (0.2% of Fund net assets*), a leading shopping mall operator, which we expect to benefit from stronger consumer demand and lower financing costs as rates decline. Overall, Brazil remains a core market in Latin America, supported by improving monetary conditions and more stable fiscal management.</p>
<h2>Argentina: Political Risk Forces a Strategic Exit</h2>
<p>We exited our Argentina position during the quarter following a deterioration in the political outlook. Earlier optimism around reforms gave way to renewed political risk after a major corruption scandal and poor results for the ruling party in provincial elections. These developments undermined confidence in the reform program and shifted the risk profile to a binary outcome dependent on politics. Given the volatility and uncertainty, we decided to close the position.</p>
<h2>Other Latin America: Peru and Mexico</h2>
<p>Peru performed well, supported by improving political stability and economic recovery. Our holding in Credicorp (0.7% of Fund net assets*) appreciated significantly, leading us to trim the position on valuation grounds. We continue to view the long-term opportunity favorably.</p>
<p>In Mexico, we are reviewing opportunities but made no major portfolio changes. The market remains supported by nearshoring trends, though valuations are less compelling. We are monitoring developments for more attractive entry points.</p>
<h2>India: Reforms and Domestic Demand Anchor Growth</h2>
<p>India contributed positively, with our overweight positions performing well. Indian equities lagged some peers but rebounded from earlier pullbacks. A key development was the rollout of a new goods and services tax (GST) reform, which simplified the tax structure and reduced rates on consumer goods. This measure should support consumption over time and has been well received by markets.</p>
<p>While sentiment was impacted by higher-than-expected tariff announcements as well as U.S. visa policy changes and occasional protectionist rhetoric, these issues have limited direct impact on our domestically focused holdings. We remain constructive on India&rsquo;s long-term outlook, supported by reforms, infrastructure spending, and favorable demographics and focus our exposure to domestic demand growth stories with solid returns and execution to capitalize on such trends.</p>
<h2>Middle East (GCC): Reform Momentum and Strategic Diversification</h2>
<p>The UAE continued to outperform, driven by reform momentum and investment in technology infrastructure. Abu Dhabi announced major projects in artificial intelligence and data centers, reinforcing the diversification strategy and supporting equity market performance. We initiated a position in one of the UAE&rsquo;s largest banks, with a particular focus on Abu Dhabi. The bank has been expanding faster than its peers and is well positioned to benefit from the region&rsquo;s anticipated large-scale investments across infrastructure, artificial intelligence, and other strategic sectors. Its strong balance sheet, solid capital base, and deep strategic relationships provide a competitive advantage that should enable it to capture these growth opportunities while maintaining resilience.</p>
<p>Saudi Arabia underperformed for much of the quarter due to softer oil prices and concerns around capital expenditure. However, late in the quarter the Capital Market Authority announced potential plans to lift foreign ownership limits on listed companies, a change that would significantly increase liquidity and index weightings. The market responded strongly, particularly in financials. We remain focused on Saudi domestic sectors, particularly banks, where reforms, non-oil growth investments and capital market development provide long-term support.</p>
<h2>Poland: Policy Risks Challenge Banking Strength</h2>
<p>Poland&rsquo;s economy benefited from EU alignment and expansionary policies, but equity performance was undermined by a potential new tax on banks. The Finance Ministry announced an increase in the corporate tax rate for banks from 19-30% starting in 2026, stepping down gradually in subsequent years. While the legal process has yet to be finalized, this move was unexpected and weighed heavily on bank valuations.</p>
<p>Despite the near-term earnings impact, Polish banks and our holding in PKO (0.7% of Fund net assets*) remain fundamentally sound, with solid balance sheets and ongoing credit growth. We continue to hold core positions but trimmed exposure to manage risk. We remain constructive on the broader Polish economy, supported by EU funds and regional trade and fiscal expansion dynamics.</p>
<h2>Portfolio Positioning and Outlook</h2>
<p>We took a proactive approach to portfolio positioning in Q3, adding new exposures in Asia&mdash;including China, Korea, and ASEAN&mdash;alongside the UAE and Brazil, while slightly trimming Peru and fully exiting Argentina. These moves sharpen our tilt toward markets where reform momentum, policy support, and long-term growth prospects are strongest, particularly in Asia and the Middle East.</p>
<p>Emerging markets enter the final quarter of 2025 with a supportive backdrop of moderating inflation, peaking policy rates, and ongoing reforms. While global growth remains subdued and risks persist, valuations across emerging markets remain reasonable, and earnings momentum is building in several key sectors. We will continue to balance tactical adjustments with a long-term focus on quality and structural growth opportunities.</p>
<h2 id="fund-performance" class="jump-link-nav anchored-block" data-jumplink-title="Fund Performance">Fund Performance</h2>
<p>The <a href="/link/eb4419e6f6394611b3f80c597020daa4.aspx" title="GBFAX - Emerging Markets Fund - Class A - Overview"><strong>VanEck Emerging Markets Fund</strong></a> (the &ldquo;Fund&rdquo;) underperformed the MSCI EM IMI Index on the quarter-to-date basis ending September 30, 2025 (+7.95% for the Fund; +9.88% for the Index). Positive relative performance for the quarter was driven by stock selection in South Korea and Greece. Negative relative performance was driven by stock selection in China and Brazil.</p>
<p>China and Taiwan were the Fund&rsquo;s top contributors for the quarter.</p>
<h3>Average Annual Total Returns (%) as of September 30, 2025</h3>
<div class="wrapped-div">
<table style="width: 100%;">
<tbody>
<tr class="tbl-data">
<td class="tbl-header last">&nbsp;</td>
<td class="tbl-header last text-center">3Q25<sup>&dagger;</sup></td>
<td class="tbl-header last text-center">YTD</td>
<td class="tbl-header last text-center">1YR</td>
<td class="tbl-header last text-center">3YR</td>
<td class="tbl-header last text-center">5YR</td>
<td class="tbl-header last text-center">10YR</td>
</tr>
<tr class="tbl-data">
<td class="data-td last text-left">Class A: NAV (Inception 12/20/93)</td>
<td class="data-td data last text-center">7.95</td>
<td class="data-td data last text-center">25.25</td>
<td class="data-td data last text-center">12.60</td>
<td class="data-td data last text-center">16.78</td>
<td class="data-td data last text-center">1.05</td>
<td class="data-td data last text-center">4.70</td>
</tr>
<tr class="tbl-data">
<td class="data-td last text-left">Class A: Maximum 5.75% Load</td>
<td class="data-td data last text-center">1.74</td>
<td class="data-td data last text-center">18.04</td>
<td class="data-td data last text-center">6.13</td>
<td class="data-td data last text-center">14.49</td>
<td class="data-td data last text-center">-0.14</td>
<td class="data-td data last text-center">4.08</td>
</tr>
<tr class="tbl-data">
<td class="data-td last text-left">Class I: NAV (Inception 12/31/07)</td>
<td class="data-td data last text-center">8.16</td>
<td class="data-td data last text-center">25.85</td>
<td class="data-td data last text-center">13.29</td>
<td class="data-td data last text-center">17.49</td>
<td class="data-td data last text-center">1.61</td>
<td class="data-td data last text-center">5.25</td>
</tr>
<tr class="tbl-data">
<td class="data-td last text-left">MSCI Emerging Markets Investable Markets Index (IMI)</td>
<td class="data-td data last text-center">9.88</td>
<td class="data-td data last text-center">25.95</td>
<td class="data-td data last text-center">16.01</td>
<td class="data-td data last text-center">18.15</td>
<td class="data-td data last text-center">7.63</td>
<td class="data-td data last text-center">8.03</td>
</tr>
<tr class="tbl-data">
<td class="data-td last text-left">MSCI Emerging Markets IMI Growth Index</td>
<td class="data-td data last text-center">11.48</td>
<td class="data-td data last text-center">28.19</td>
<td class="data-td data last text-center">19.42</td>
<td class="data-td data last text-center">18.34</td>
<td class="data-td data last text-center">5.03</td>
<td class="data-td data last text-center">8.51</td>
</tr>
</tbody>
</table>
</div>
<p class="chart-disclosure"><strong>The table presents past performance which is no guarantee of future results and which may be lower or higher than current performance. Returns reflect applicable fee waivers and/or expense reimbursements. Had the Fund incurred all expenses and fees, investment returns would have been reduced. Investment returns and Fund shares values will fluctuate so that investor's shares, when redeemed, may be worth more or less than their original cost. Fund returns assume that dividends and capital gains distributions have been reinvested in the Fund at net asset value (NAV). Index returns assume that dividends of the Index constituents in the Index have been reinvested. Performance information current to the most recent month end is available by calling 800.826.2333 or by visiting vaneck.com.</strong></p>
<p class="chart-disclosure"><strong>Expenses: Class A: Gross 1.59%; Net 1.59%; Class I: Gross 1.25%; Net 1.02%. Expenses are capped contractually until 5/1/26 at 1.60% for Class A and 1.00% for Class I. Caps exclude acquired fund fees and expenses, interest, trading, dividends, interest payments of securities sold short, taxes and extraordinary expenses.</strong></p>

<h2 id="fund-review" class="jump-link-nav anchored-block" data-jumplink-title="Fund Review">Fund Review</h2>
<p>On a sector level, Consumer Staples, Utilities, and Financials contributed to relative performance, while Real Estate, Materials, and Energy detracted. On a country level, South Korea, Greece and Saudi Arabia contributed to relative performance, while China, Brazil and Poland detracted.</p>
<h2>Top Contributors</h2>
<p>Top contributors to return on an absolute basis during the quarter:</p>
<ul class="content-list">
<li class="mt-2"><strong>Taiwan Semiconductor Manufacturing Co. (&ldquo;TSMC&rdquo;) (9.5% of Fund net assets*): </strong>TSMC is the world&rsquo;s leading semiconductor foundry, supplying advanced chips to the biggest names in global technology. It is also the largest position in the Fund&rsquo;s portfolio. TSMC&rsquo;s dominance has been built over two decades through customer focus, operational excellence, and technological leadership. We believe its exceptionally wide economic moat&mdash;supported by its singular manufacturing expertise and unmatched client base&mdash;will continue to reward long-term investors. While quarterly growth may vary, we see TSMC as a core holding with a justified place as the Fund&rsquo;s largest exposure.</li>
<li class="mt-2"><strong>Alibaba (2.7% of Fund net assets*):</strong> Alibaba, China&rsquo;s largest e-commerce and cloud platform operator, delivered solid results with revenue up ~8% year-over-year and adjusted EPS rising ~13%. Its &ldquo;AI + Cloud&rdquo; strategy is gaining traction, with cloud revenue growing ~11% (ex-subsidiaries) and AI-related products sustaining triple-digit growth. Core commerce remained healthy, supported by Taobao/Tmall user and order growth and the continued expansion of the 88VIP membership base. Restructuring efforts and refreshed leadership are driving greater strategic focus and agility. We see Alibaba emerging as a national leader in AI infrastructure, with management planning more than $50 billion in AI cloud CAPEX over the next three years. While competition in e-commerce and food delivery is intensifying, Alibaba&rsquo;s integrated model should allow it to capture synergies and monetize investments more effectively. Despite strong share price gains, we believe execution strength and rising conviction in strategy can support further rerating over the medium term.</li>
<li class="mt-2"><strong>Tencent Holdings (4.2% of Fund net assets*):</strong> Tencent, China&rsquo;s leading internet and technology platform, delivered a robust quarter with strength across gaming, advertising, and cloud. We are beginning to see meaningful AI-driven enhancements across its ecosystem, particularly in advertising, where improved targeting can continue to drive higher conversion rates and monetization without compromising user experience. Tencent also continues to expand its cloud capabilities and application suite, positioning itself to benefit from the next wave of AI adoption. With unmatched scale, a vast user base, and a highly diversified business model, Tencent is uniquely placed to capture secular growth opportunities while remaining resilient amid a challenging macro environment. We remain constructive on its medium-term outlook, supported by structural growth in AI, cloud, and platform monetization.</li>
</ul>
<h2>Top Detractors</h2>
<p>Top detractors to return on an absolute basis during the quarter:</p>
<ul class="content-list">
<li class="mt-2"><strong>Reliance Industries (2.9% of Fund net assets*): </strong>Reliance Industries, one of India&rsquo;s largest conglomerates, spans technology, retail, renewables, and petrochemicals. After a strong start to the year, the stock underperformed in Q3, with modest softness tied to U.S.&ndash;India tariff discussions. We maintain a large position given Reliance&rsquo;s embedded value, with the planned spin-off of its mobile and internet services&mdash;and the anticipated telecom IPO&mdash;serving as a key potential catalyst for further upside.</li>
<li class="mt-2"><strong>Oberoi Realty (1.5% of Fund net assets*):</strong> Oberoi Realty has seen several quarters of underperformance, following a remarkable 300&ndash;400% rally in prior years. The weakness is consistent with broader softness in Indian real estate equities over the past year. We continue to hold our position, as Oberoi remains well-positioned in its market and benefits from structural drivers such as urbanization, rising homeownership demand, and India&rsquo;s ongoing economic development&mdash;factors that support a constructive long-term outlook.</li>
<li class="mt-2"><strong>MercadoLibre (&ldquo;MELI&rdquo;) (2.4% of Fund net assets*): </strong>MELI is Latin America&rsquo;s leading e-commerce and fintech platform, with dominant scale in Brazil and across the region. Shares faced near-term pressure after Amazon waived seller fees through year-end, but sellers continue to favor MELI for its superior logistics, onboarding, and fintech integration. While Q3 margins will reflect higher shipping, marketing, and fulfillment costs, Gross Merchandise Value (GMV) growth, advertising momentum, and resilient credit performance should help offset pressures. We continue to view MELI as the structural winner in LatAm e-commerce, with any weakness creating a potential entry opportunity.</li>
</ul>
<h2 id="top-buys-and-sells" class="jump-link-nav anchored-block" data-jumplink-title="Top Buys &amp; Sells">Top Buys &amp; Sells</h2>
<p>During the period, we established new positions in the following:</p>
<ul class="content-list">
<li class="mt-2"><strong>Abu Dhabi Commercial Bank (&ldquo;ADCB&rdquo;) (0.5% of Fund net assets*): </strong>ADCB, the UAE&rsquo;s third-largest bank with over 2.4 million customers, has outpaced peers with more than 15% annual loan growth for two years and doubled net income from 2021&ndash;2024, reaching an 18% market share. Management targets ~20% earnings CAGR through 2029, supported by strong loan demand and Abu Dhabi&rsquo;s strategic spending on AI, technology, and infrastructure. We initiated a position given ADCB&rsquo;s compelling growth outlook, with mid-teens loan expansion expected over the next five years, driven by government-related entities and international growth, particularly in Saudi Arabia.</li>
<li class="mt-2"><strong>China Resources Mixc Lifestyle Services (0.8% of Fund net assets*): </strong>China Resources Mixc Lifestyle is China&rsquo;s leading premium shopping mall operator and the property management arm of CR Land. Unlike peers reliant on low-margin residential management, Mixc derives ~25% of revenue from high-end malls, which generate over 50% of gross profit with 72% gross margins. Supported by luxury tenants, a 57mn-member loyalty program, ~97% occupancy, and strong same-store sales, Mixc has built one of the most resilient retail platforms in China. We like Mixc for its robust growth pipeline from CR Land and third-party developers, continued expansion into luxury malls, and rising brand partnerships. With sector-leading margins, ~22% ROE, and a 100% payout ratio (~5% yield), Mixc offers both quality and income. We see it as a structural winner in China&rsquo;s retail property sector, with strong brand equity and a long runway for premium mall growth.</li>
<li class="mt-2"><strong>HY Hyundai Electric (0.9% of Fund net assets*): </strong>HDE is the largest manufacturer of large power transformers (LPTs) in the U.S., with more than a decade of experience serving utilities. The company is positioned to be a prime beneficiary of structural U.S. demand growth, underpinned by rising ASPs, strong new orders, and a persistent supply-demand imbalance given disciplined capacity expansion. Internationally, HDE is capturing accelerating transmission capex in the Middle East, now its second-largest market, with orders more than doubling since 2021. We like HDE for its revenue visibility supported by a robust backlog, strong ROE, and diversified global growth drivers.</li>
<li class="mt-2"><strong>Mao Geping Cosmetics (&ldquo;MGP&rdquo;) (0.4% of Fund net assets*): </strong>Maogeping is China&rsquo;s leading premium cosmetics brand, differentiated by its focus on high-end makeup (60% of revenue) and strong offline presence, where personalized services drive loyalty and repeat purchases. Leveraging Mao Geping&rsquo;s brand equity and unique customer engagement model, MGP competes directly with global luxury names like YSL and NARS, but at more accessible price points. With best-in-class gross margins (~84&ndash;86%), strong traction across offline and digital channels, and forecast EPS growth of ~26&ndash;28% CAGR through 2026, we see MGP as a structural winner in China&rsquo;s premium beauty market.</li>
<li class="mt-2"><strong>Multiplan Empreendimentos Imobiliarios SA (0.2% of Fund net assets*):</strong> Multiplan, one of Brazil&rsquo;s highest-quality real estate names, is well positioned to benefit from the coming monetary easing cycle. The company owns 20 premium malls in affluent, high-traffic areas, delivering resilient tenant sales, near-full occupancy, and net operating income (NOI) margins above 90%. Inflation-linked leases provide stability, while management has a strong track record of execution and disciplined capital allocation. Trading at attractive multiples, Multiplan offers both near-term upside from expected SELIC cuts in 2026 and long-term growth from structural retail demand, premium consumer exposure, and free cash flow expansion&mdash;making it a compelling addition to the portfolio.</li>
<li class="mt-2"><strong>P.N. Gadgil Jewellers Limited (&ldquo;PNG&rdquo;) (0.2% of Fund net assets*):</strong> PNG is a heritage jewelry brand with deep-rooted trust among Indian consumers, built over generations. Its customer-first model, which is anchored on personalized service, quality assurance, and transparent repurchase policies, has created a scalable moat that drives repeat business and sustainable growth. The company is well placed to capture structural tailwinds in India&rsquo;s jewelry sector, including the shift toward organized retail, rising consumer aspirations, and regulatory formalization. With a strong brand, proven scalability, and balanced presence across physical and digital channels, PNG is positioned to deliver long-term value as demand for authentic, premium jewelry expands.</li>
<li class="mt-2"><strong>Sea Limited Sponsored (&ldquo;SE&rdquo;) (0.5% of Fund net assets*): </strong>SE is a Singapore-based consumer internet company with three core businesses: Shopee (e-commerce), Garena (digital entertainment), and SeaMoney (digital financial services). Since 2024, EPS upgrades and multiple expansion have been supported by a more rational ASEAN market, sharper focus on profitability, and strong execution in Brazil. Sea has shifted from a turnaround story to a long-term compounder. Low e-commerce penetration in ASEAN and Brazil, rising take rates, and improving unit economics support sustained GMV growth, while SeaMoney&rsquo;s evolution into a standalone fintech platform offers additional long-term value.</li>
<li class="mt-2"><strong>Tencent Music Entertainment Group (&ldquo;TME&rdquo;) (0.5% of Fund net assets*): </strong>TME, often called the &ldquo;Spotify of China,&rdquo; operates a more innovative, fan-driven model that extends beyond streaming into concerts, karaoke, and merchandise&mdash;deepening engagement and driving higher ARPPU. Unlike global peers, TME enjoys structurally higher margins thanks to lower label costs and a growing library of self-produced content. Margins should expand further on the back of SVIP upgrades, ad monetization, and operating leverage. Trading at just 25x 2025 P/E versus Spotify&rsquo;s ~57x, TME offers a compelling blend of growth, profitability, and relative value.</li>
<li class="mt-2"><strong>Yum China Holdings, Inc. (&ldquo;YUMC&rdquo;) (0.5% of Fund net assets*): </strong>Yum China is the country&rsquo;s largest restaurant operator, with over 16,000 stores across KFC, Pizza Hut, and emerging formats such as K Coffee. The company is improving operations through its Fresh Eye (store efficiency) and Red Eye (supply chain) initiatives while expanding with smaller, capital-light formats. White-space growth in lower-tier cities and a greater tilt toward franchising provide a clear path to 20,000 stores by 2026 with improving returns on capital. We like YUMC for its combination of scale, profitability recovery, and shareholder returns. Margins are improving (1Q25 OPM 13.4%, +80bps YoY), Pizza Hut has turned more profitable, and buybacks are accelerating ($510m in 2H25). At just 17x forward P/E&mdash;below global peers&mdash;YUMC offers a compelling way to own China&rsquo;s dominant restaurant platform with both margin recovery and structural growth ahead.</li>
</ul>
<p>During the period, we exited the following positions:</p>
<ul class="content-list">
<li class="mt-2"><strong>Proya Cosmetics Co.:</strong> Proya, once a leading Chinese skincare brand, has seen growth slow to single digits as flagship products mature and new launches underperform. The brand is being squeezed between premium global players and cheaper domestic rivals like Kans and Comfy, which are rapidly gaining share via Douyin at lower price points. Execution risk has risen with multiple senior management departures, while recent festival sales significantly lagged peers. Although margins have held up, weakening top-line growth, eroding market share, and organizational instability led us to exit the position and reallocate capital to higher-conviction names such as Maogeping.</li>
<li class="mt-2"><strong>Arcos Dorados Holdings:</strong> Arcos Dorados, the largest McDonald&rsquo;s franchise in Latin America, was exited from the portfolio due to mounting macro headwinds and limited near-term visibility. Rising meat costs in Brazil, weak demand under high interest rates, and currency depreciation are pressuring margins and sales, while Argentina&rsquo;s normalization phase has weighed on consumer trends. With consensus pointing to declining EBITDA and stronger opportunities in other LatAm names, we see limited upside despite the stock&rsquo;s low valuation.</li>
<li class="mt-2"><strong>Tofas Turk Otomobil Fabrikasi A.S.:</strong> Tofaş, founded in 1968 as a joint venture between Ko&ccedil; Holding and Stellantis, is one of Turkey&rsquo;s leading auto manufacturers. Following its merger with Stellantis&rsquo; Turkey distribution assets, the company has become the country&rsquo;s largest light vehicle player with a 30% pro forma market share. However, model discontinuations drove capacity utilization down to 35% in 2024 from 60% the prior year, and margins now face pressure from lower utilization and a greater distribution mix. With limited near-term catalysts and rising competition&mdash;particularly from Chinese automakers&mdash;we exited the position and remain cautious on the longer-term outlook.</li>
<li class="mt-2"><strong>Grupo Financiero Galicia SA:</strong> Banco Galicia, one of Argentina&rsquo;s largest banks, was exited from the portfolio amid rising political risk, weakening macro conditions, and reduced earnings visibility. The electoral defeat in Buenos Aires bolstered the Peronist opposition, increasing the risk of legislative gridlock, while corruption scandals further undermined reform prospects. At the macro level, tight fiscal and monetary conditions have slowed loan growth, with little near-term visibility for recovery. Although Argentina&rsquo;s low credit penetration offers long-term potential, we see limited catalysts in the current environment and chose to close the position.</li>
<li class="mt-2"><strong>Meituan Class:</strong> Meituan remains China&rsquo;s market leader in food delivery but has been severely impacted by an escalating subsidy war. Unit economics fell from RMB 1.5 per order in March 2025 to RMB 0.8 in June and are expected to weaken further, as industry players collectively burned ~RMB 50bn in subsidies during Q3. While Meituan retains scale and superior delivery quality versus peers, profitability has become highly uncertain. We exited the stock as earnings visibility is weak and valuation depends on volatile assumptions around subsidies and unit economics. Despite its long-term leadership, structural headwinds from competition, regulation, and reliance on costly subsidies make the risk/reward unattractive. We believe capital is better deployed in higher-conviction opportunities.</li>
</ul>
<h2>Conclusion</h2>
<p>We remain grounded by our investment process and our positioning reflects our convictions from a bottom-up perspective. Our process has created some positioning differentials versus the benchmark. Brazil remains overweight to start the quarter (7.7% Fund weight versus 4.1% Index weight), as does Georgia (2.0% versus 0.0% Index weight).</p>
<p>Taiwan, South Africa, and South Korea remain underweight versus the benchmark.</p>
<p>The Fund&rsquo;s objective is to find long-term structural growth companies at fair prices (S-GARP). Investments are chosen based on individual company analysis, focusing on quality, governance, innovative business models and low disruption risk, with active management and detailed research guiding our selection process.</p>

<p>To receive more <a href="/us/en/insights/emerging-markets-equity/" title="Emerging Markets Equity Insights"><strong>Emerging Markets Equity</strong></a> insights, <a href="/us/en/subscribe/" title="Subscription Center"><strong>sign up in our subscription center</strong></a>.</p>
]]></content:encoded>
</item><item rdf:about="https://www.vaneck.com/us/en/blogs/emerging-markets-bonds/unlocking-growth-the-power-of-emerging-markets-debt/">
  <title>Unlocking Growth: The Power of Emerging Markets Debt></title>
  <link>https://www.vaneck.com/us/en/blogs/emerging-markets-bonds/unlocking-growth-the-power-of-emerging-markets-debt/</link>
  <description><![CDATA[Despite strong underlying fundamentals and historical performance, EMD is frequently overlooked and under-allocated as a fixed income asset.]]></description>
  <dc:creator>Eric Fine</dc:creator>
  <dc:date>10/09/2025 06:30:00</dc:date>
<content:encoded><![CDATA[

<h2>The Overlooked Benefits of EM Debt</h2>
<p>Many fixed income portfolios do not include an allocation to emerging markets (EM) bonds. Over the past 25 years, EM governments have gone from being in deficit to running up surpluses, while developed markets (DM) governments have been accruing deficits. This change has resulted in a shift in the origin of bond crises since the turn of the millennium. Fixed income portfolios have yet to reflect this new reality. We believe EM bonds are the future of fixed income.</p>
<h2>Emerging Markets Exhibit Stronger Fundamentals Than Developed Markets</h2>
<p>EMs generally have lower levels of government and/or total economy debt. This allows central banks independence to focus solely on inflation and not be constrained by concerns about undermining government financing. As they are independent, EM central banks can maintain high real policy rates that keep market rates attractive to those of DM countries. Further, we think DMs are generally facing headwinds from geopolitical developments, while many EMs are experiencing tailwinds from geopolitical developments.</p>
<p>The chart below shows EM central government debt levels, which are lower than those in DM. This is the result of decades of fiscal prudence and central bank independence, particularly in Asia, put in place after the 1997 Asia Crisis. It is also worth noting that EMs have lower total economy (i.e. private) debt than DMs. An important point is that the way in which governments treat private debt in their economies might also differ between key EM and DM. Since the GFC, DM central banks have taken risky assets onto their balance sheet, including high yield (HY) ETFs, as was the case with the U.S. This can stabilize markets, but the moral hazard is that it creates market distortions. Contrast this with China&rsquo;s recent property crisis, in which policymakers avoided taking these entities onto their balance sheet.</p>
<p>In comparing the U.S. and China&rsquo;s approaches, it is orthodox policy not to guarantee corporate risks, however much short-term pain this entails. That&rsquo;s the key point, EM, such as China, have shown great caution over debt levels, which protects their economies.</p>
<h3>EM Government Debt Is Lower than DM</h3>
<p><img loading="lazy" class="img-responsive" alt="EM Government Debt Is Lower than DM" src="https://www.vaneck.com/contentassets/22ae1ba5dc3f44fbb716e8032d44b118/6258_unlocking-growth_emb_chart-01_2025-10_v1_blog.svg" /></p>
<p class="chart-disclosure">Source: VanEck Research; International Monetary Fund; Bloomberg LP. Data as of June 2025. LATAM represents Latin America; G7 represents Canada, France, Germany, Italy, Japan, the United Kingdom, and the United States; EMEA represents Europe, the Middle East, and Africa; EM x-China represents Emerging Markets excluding China; Not intended as a prediction of future results. For illustrative purposes only. Past performance is no guarantee of future results.</p>
<p>The result is high real policy and market rates in EM. This initial condition of low debt levels allows central banks to focus primarily on inflation, as the maintenance of high real policy rates doesn&rsquo;t create financing risks for its country&rsquo;s government. This central bank independence is illustrated by the history of real policy rates in EM versus DM below. It shows what one would expect, consistently higher real interest rates than DM.</p>
<h3>Real Policy Rates in EM Exceed Those In DM</h3>
<p><img loading="lazy" class="img-responsive" alt="Real Policy Rates in EM Exceed Those In DM" src="https://www.vaneck.com/contentassets/f052ef4060e44eb6b01aa90360c92680/6258_unlocking-growth_emb_chart-02_2025-10_v2.svg" /></p>
<p class="chart-disclosure">Source: VanEck Research; Bloomberg LP. Data as of June 2025. EM represents Emerging Markets; DM represents Developed Markets. Past performance is not indicative of future results.</p>
<h2>Fiscal Dominance</h2>
<p>The shift away from DM to EM is observable and tectonic. The chart below compares EM versus DM current accounts over the past 30 years. Prior to 1998, EMs were running large and persistent deficits and were responsible for the global financial crises in the 1990s. Since 1998, however, it&rsquo;s the DMs that have been generating large and persistent deficits. DMs have also been responsible for the crises of the new millennium. We think this is due to &ldquo;fiscal dominance&rdquo;, a state in which monetary policy becomes subsumed to fiscal policy. Most generally, after the Latin American crises of the 80s and 90s, and the Asia and Russia&rsquo;s crises in 1997 and 1998, EMs, along with the IMF agreed on a &ldquo;Washington consensus&rdquo;. Exchange rates were floated, and if inflationary, the central bank had to step in with high real rates. If that was recessionary, the recession was allowed. Thailand and Indonesia experienced 50% declines in USD GDP. Fiscal policy was austere, not stimulative. And insolvent financial and industrial institutions were allowed to fail, i.e. were not put on the government&rsquo;s balance sheet. You can see the persistent surpluses generated due to these policies in the chart below. DM&rsquo;s response to the many crises of the past two and a half decades have been the exact opposite. Policies were implemented, resulting in monetary policy enabling fiscal policy, and coordination was celebrated, insolvent financial institutions were guaranteed, recessions were prevented at all costs.</p>
<h3>Almost 30 Years of EM Exceptionalism</h3>
<p><img loading="lazy" class="img-responsive" alt="Almost 30 Years of EM Exceptionalism" src="https://www.vaneck.com/contentassets/aaecf9e599634700ac22d768837c93ef/6258_unlocking-growth_emb_chart-03_2025-10_v1_blog.svg" /></p>
<p class="chart-disclosure">Source: VanEck Research; International Monetary Fund (IMF); Bloomberg LP. Data as of December 2024. EM represents Emerging Markets; DM represents Developed Markets Past performance is not indicative of future results.</p>

<h2>EM Debt Deserves a Place in a Strategic Asset Allocation</h2>
<p>In a world that is simultaneously worried about endless monetary experimentation and leverage in developed markets, but also looking for attractive yield, EMD has answers. Many emerging markets have strong fundamentals and bonds that pay high yields. DM debt, in many ways, is the opposite, with high leverage and limited compensation. This is why the 60/40 model is being re-evaluated&mdash;perhaps rightly so. But even if global debt deserves a lower allocation, we believe EMD deserves to be a bigger part of investors&rsquo; overall fixed income allocations.</p>
<h2>VanEck Emerging Markets Bond Strategy</h2>
<p>The <a href="/link/f447bf0c04f64108a3dcff3ca025af4a.aspx" title="EMBX - VanEck Emerging Markets Bond ETF - Overview"><strong>VanEck Emerging Markets Bond ETF</strong></a> was one of the first blended emerging markets bond strategies in the market. The Strategy adopts a comprehensive approach, investing across the entire EM bond spectrum to maximize opportunity and manage risk in a complex global environment. Despite global disruptions such as the COVID pandemic, the war in Ukraine and economic troubles in China, the fund has consistently outperformed both global and U.S. bond benchmarks. VanEck&rsquo;s active strategy, which focuses on fundamental value relative to bond risk premia, aims to capitalize on these shifts and avoid troubled issuers, making a compelling case for a diversified, actively managed EM bond allocation.</p>

<p>To receive more <a href="https://www.vaneck.com/us/en/insights/emerging-markets-bonds/" title="Emerging Markets Bonds Insights"><strong>Emerging Markets Bonds</strong></a> insights, <a href="/link/5f45412c2143400497908cea2897f7d3.aspx" title=" Subscription Center"><strong>sign up in our subscription center</strong></a>.</p>
]]></content:encoded>
</item><item rdf:about="https://www.vaneck.com/us/en/blogs/emerging-markets-bonds/how-to-prepare-for-fed-rate-cut/">
  <title>How a Fed Rate Cut Impacts Investors and How to Prepare></title>
  <link>https://www.vaneck.com/us/en/blogs/emerging-markets-bonds/how-to-prepare-for-fed-rate-cut/</link>
  <description><![CDATA[A Fed rate cut can impact stocks, bonds, and portfolio strategy. Learn how to prepare, with insights on fixed income, emerging markets (EMBX), and muni bonds (MLN).]]></description>
  <dc:creator> </dc:creator>
  <dc:date>10/08/2025 06:30:00</dc:date>
<content:encoded><![CDATA[

<p id="how-to-prepare" class="jump-link-nav anchored-block" data-jumplink-title="How to Prepare"><strong>Key Takeaways:</strong></p>
<ul class="content-list">
<li class="mt-2">Rate cuts fuel risk-on sentiment and support growth stocks, EM, and bonds.</li>
<li class="mt-2">MLN and EMBX could perform strongly as yields decline and income demand grows.</li>
<li class="mt-2">Focus on duration, sectors, and diversification when repositioning.</li>
</ul>
<h2>What the Fed Rate Cut Means for Investors and How You Can Prepare</h2>
<p>The Federal Reserve&rsquo;s interest rate decisions shape everything from borrowing costs to stock valuations. With markets closely watching the potential for Fed rate cuts, investors are asking the same question: What do Fed interest rate cuts really mean for my portfolio? In this blog, we&rsquo;ll explore the Fed&rsquo;s policy playbook, look at how markets have historically reacted to cuts, and outline practical steps investors can take today to prepare for a changing rate environment.</p>
<h2>Understanding the Federal Reserve&rsquo;s Interest Rate Policy</h2>
<p>When it comes to guiding the U.S. economy, few institutions are more influential than the Federal Reserve. The Fed&rsquo;s decision-making process on interest rates is driven by a mix of economic indicators&mdash;chief among them inflation trends, the strength of the labor market, and the GDP outlook.</p>
<p>At its core, the Fed follows a dual mandate: to promote maximum employment and to maintain stable prices. When inflation cools or economic growth slows, policymakers often consider cutting rates to stimulate borrowing, spending, and overall activity.</p>
<p>Examining the history of Fed interest rate cuts provides valuable context. For example:</p>
<ul class="content-list">
<li class="mt-2">In 2024, the Fed cut rates as inflation cooled and growth slowed, marking a shift toward easing after aggressive tightening in prior year.</li>
</ul>
<p>Markets tend to react swiftly to these moves, with volatility often spiking around Fed announcements as investors try to glean insights from the Fed&rsquo;s rationale behind their decisions on monetary policy. Former Federal Reserve Chairman Alan Greenspan once quipped, "Since becoming a central banker, I have learned to mumble with great incoherence. If I seem unduly clear to you, you must have misunderstood what I said."</p>
<h2 id="understanding-rate-cuts" class="jump-link-nav anchored-block" data-jumplink-title="Understanding Rate Cuts">What Happens When the Fed Cuts Rates?</h2>
<p>Many investors would like a &ldquo;one-size fits all&rdquo; answer to common questions like &ldquo;what happens when the Fed cuts rates&rdquo; or &ldquo;what does a rate cut do to the market.&rdquo; The short answer: a rate cut makes money cheaper to borrow and often increases liquidity in the financial system.</p>
<p>Lower rates can encourage businesses and consumers to spend more, boost corporate earnings, and support higher equity valuations. At the same time, they often drive a &ldquo;risk-on&rdquo; shift in investor appetite, with capital flowing toward equities, credit markets, and emerging asset classes.</p>
<p>The stock market&rsquo;s reaction can be both immediate and lagging:</p>
<ul>
<li>Immediate effect: a rally in interest-rate-sensitive assets like growth stocks and bonds.</li>
<li>Lagging effect: sector rotation as investors reposition for a new cycle of growth and liquidity.</li>
</ul>
<p>Historically, more cyclically sensitive technology and consumer discretionary stocks tend to benefit most, while financials can gain if steeper yield curves improve net interest margins. In global portfolios, emerging markets often see renewed inflows as investors search for higher yields. Recent data show that <a href="/us/en/blogs/emerging-markets-bonds/em-bonds-are-outperforming-is-anyone-paying-attention/" title="EM Bonds Are Outperforming&mdash;Is Anyone Paying Attention?"><strong>EM bonds have already been outperforming</strong></a>, even before rate cuts take full effect&mdash;raising questions about whether markets are underestimating this asset class. This is particularly true EM debt strategies that invest in local-currency denominated bonds, such as the <a href="/link/f447bf0c04f64108a3dcff3ca025af4a.aspx" title="EMBX - VanEck Emerging Markets Bond ETF - Overview"><strong>VanEck Emerging Markets Bond ETF (EMBX)</strong></a>, which may benefit from a weaker dollar and improved financing conditions during periods of U.S. rate cuts.</p>
<p><a href="/us/en/blogs/emerging-markets-bonds/the-quiet-outperformer-why-em-bonds-deserve-a-second-look/" title="The Quiet Outperformer: Why EM Bonds Deserve a Second Look"><strong>Despite this performance, EM bonds remain underappreciated by many investors</strong></a>. Their consistent track record in easing cycles, especially when backed by improving macro conditions and a stable dollar, suggests they deserve a more prominent role in diversified portfolios.</p>

<h2 id="market-themes-to-watch" class="jump-link-nav anchored-block" data-jumplink-title="Market Themes to Watch">Potential Market Themes to Watch in a Rate-Cut Environment</h2>
<p>Reinforce that investor responses to rate changes are highly individual and context-dependent, with portfolio construction decisions ideally grounded in long-term objectives and macro awareness.</p>
<p>When the Federal Reserve moves toward lower interest rates, markets often shift in ways that reflect both opportunity and caution. While past Fed interest rate cut cycles can provide useful guideposts, it&rsquo;s important to remember that every environment carries its own mix of macro drivers, fiscal conditions, and investor psychology.</p>
<h3>Fixed Income: Duration and credit dynamics.</h3>
<p>Lower policy rates may create a tailwind for Treasury and investment-grade bonds, to the extent inflation expectations remained anchored and long-term rates also decline. However, credit spreads can behave differently depending on the growth outlook: spreads often tighten in early recovery phases but can widen if rate cuts coincide with recessionary fears. The shape of the yield curve also matters&mdash;bear steepening, as seen in parts of 2025, can blunt some of the expected gains from longer-duration exposure.</p>
<h3>Cash and ultrashort duration: Shifting opportunity cost.</h3>
<p>When rates are high, cash and short-term instruments like money market funds can offer attractive yields with minimal risk. As the Fed cuts, those yields typically decline, making cash less competitive relative to equities and bonds. Investors focused heavily on cash-like assets may find themselves re-evaluating allocations if the opportunity cost of staying on the sidelines grows.</p>
<p>However, recent activity serves as reminder that markets don&rsquo;t always respond to Fed policy decisions as you expect them to. For example, even when the Fed has an easing bias, Treasury moves can defy expectations because dynamics like supply, liquidity, and term-premium can overwhelm the policy signal. Higher inflation expectations and concerns around fiscal policy and Fed independence may also drive longer term bond yields higher. These dynamics, as well as the elevated rate volatility, may make ultrashort fixed income solutions attractive within an income portfolio. Although coupons will decrease in line with the policy rates, additional spread can make up for that. Investment grade collateralized loan obligations are floating rate and provide a significant spread above base rates, with minimal default risk. At each rating category, CLOs have provided a significant and consistent spread pickup versus bonds with the same rating. The ability to invest throughout the investment grade capital structure provides investors the ability to benefit from yield opportunities outside of AAA rated CLOs, while insulating a portfolio from interest rate volatility. The <a href="/link/e090deaddc774ac699a04b959d9254c6.aspx" title="CLOI - VanEck CLO ETF -Holdings and Performance"><strong>VanEck CLO ETF (CLOI)</strong></a> provides exposure to investment grade CLOs.</p>
<p>The critical point is that investor responses to rate changes are highly individual and context dependent. A rate cut in a strong economy can fuel growth and lift risk assets, while a cut in the face of recession can trigger flight-to-quality dynamics. That&rsquo;s why portfolio construction in a rate-cut environment should remain anchored in long-term objectives, diversified rate exposure and&nbsp;macro awareness, rather than chasing short-term market moves.</p>

<h2 id="opportunities-and-risks" class="jump-link-nav anchored-block" data-jumplink-title="Opportunities and Risks">Fixed Income Implications: Opportunities and Risks</h2>
<p>For fixed income investors, a Fed rate cut is rarely a one-dimensional story. It can alter the balance between yield, duration, and credit in ways that create both opportunities and risks across the bond market.</p>
<p>For example, when the Fed cuts rates, Treasury yields typically fall, boosting the price of existing bonds. This dynamic tends to favor long-duration exposure, since price sensitivity to yield changes is greater on the long end of the curve. However, duration risk cuts both ways. If inflation remains sticky or Treasury supply pressures persist, long rates can stay elevated or even rise despite easier policy. That makes active management of curve positioning critical.</p>
<p>As far as corporate credit goes, historically, rate cuts have supported spread tightening in investment-grade and high-yield bonds, as liquidity improves and risk appetite strengthens. Yet the context matters: spreads often tighten most when cuts are viewed as pre-emptive or growth friendly. By contrast, if markets interpret cuts as a response to recessionary weakness, spreads can widen even as Treasury yields fall, leaving credit investors caught in a push-pull between carry and downside risk.</p>

<p>In past easing cycles, municipal bond strategies such as the <strong><a href="/link/1ec087c36ce04ebfaf0617b63e908818.aspx" title="MLN-VanEck Long Muni ETF-Overview">VanEck Long Muni ETF (MLN)</a></strong> have shown resilience and outperformance, driven by their relatively high tax-equivalent yields and strong demand from both retail and institutional investors. In a falling-rate environment, long-duration municipal bonds can offer enhanced after-tax income potential and play a stabilizing role in multi-asset portfolios. Meanwhile, emerging markets debt strategies like the <a href="/link/f447bf0c04f64108a3dcff3ca025af4a.aspx" title="EMBX - VanEck Emerging Markets Bond ETF - Overview"><strong>VanEck Emerging Markets Bond ETF (EMBX)</strong></a>&nbsp;can benefit from a decline in US rates and a weaker dollar, improving external financing conditions for sovereigns and corporates. Historically, EM hard-currency debt has shown outsized performance during periods of Fed easing, and EM bonds denominated in local currency may gain from currency appreciation against the US dollar.</p>
<p>Taken together, the message is clear: rate cuts expand the menu of opportunities in fixed income, but they also amplify the need for careful risk calibration. Successfully navigating monetary policy changes requires balanced duration exposure with credit discipline, while selectively leaning into sectors like municipals and <strong><a href="https://www.vaneck.com/us/en/webinar-registration/?id=92918754799&amp;utm_source=vaneck&amp;utm_medium=calendar" title="Outperforming in Plain Sight: Demystifying Emerging Market Bonds">EM debt where historical patterns suggest room for outperformance</a></strong>.</p>
<h2>How Investors Can Prepare for a Changing Rate Environment</h2>
<p>Preparing for a Fed rate cut requires more than reacting to headlines. Whether you are an institutional allocator or an individual investor, the key is to align portfolio strategy with both macro conditions and long-term objectives. These three steps can serve as a blueprint for preparing portfolios for changes in monetary policy:</p>
<ol>
<li class="mt-2"><strong>Reevaluate fixed income duration</strong>
<p>As rates decline, extending duration can capture price appreciation in Treasuries and investment-grade bonds. But duration adds volatility if inflation surprises to the upside. Investors may consider a barbell approach&mdash;balancing short-maturity bonds for liquidity with longer-dated securities for capital gains.</p>
</li>
<li class="mt-2"><strong>Assess equity exposure to rate-sensitive sectors</strong>
<p>Lower borrowing costs can lift growth stocks, real estate, and emerging markets. On the other hand, sectors like financials may benefit from a steeper yield curve but could lag if credit conditions tighten. Reassessing sector weights ensures exposure is intentional, not incidental.</p>
</li>
<li class="mt-2"><strong>Considering income-generating alternatives</strong>
<p>Rate cuts can compress yields on cash and traditional fixed income, pushing investors toward alternative income strategies (private credit, dividend-focused equities). These allocations can serve both as diversifiers and inflation hedges.</p>
</li>
</ol>
<p>Consider a balanced portfolio allocation of equities, fixed income, and alternatives. In anticipation of a cut, an investor may:</p>
<ul class="content-list">
<li class="mt-2">Shift from cash and short-duration bonds into longer Treasuries and municipal bonds such as those tracked by the <a href="https://www.vaneck.com/us/en/investments/long-muni-etf-mln/overview/" title="MLN - VanEck Long Muni ETF - Overview"><strong>VanEck Long Muni ETF (MLN)</strong></a> positioning for potential yield curve steepening and tax-efficient income.</li>
<li class="mt-2">Reallocate equities toward technology and emerging markets, and consider allocating fixed income exposure toward EM debt strategies such as the <a href="https://www.vaneck.com/us/en/investments/emerging-markets-bond-etf-embx/overview/" title="EMBX - VanEck Emerging Markets Bond ETF - Overview"><strong>VanEck Emerging Markets Bond ETF (EMBX)</strong></a>&nbsp;which may benefit from increased risk appetite and dollar softening in a Fed easing cycle.</li>
</ul>
<p>Of course, every investor faces unique constraints and goals. Before implementing allocation shifts, it&rsquo;s essential to consult with a financial advisor or internal portfolio team to assess the risk-return trade-offs of duration, sector tilts, or alternative allocations.</p>
<p>Ultimately, the goal is not to guess the exact path of Fed policy, but to ensure portfolios remain resilient and aligned with long-term investment objectives as conditions evolve.</p>
<h2>Final Thoughts</h2>
<p>The Federal Reserve&rsquo;s interest rate decisions ripple across every corner of the financial markets&mdash;but the key for investors is to focus on macro drivers, not headlines. History shows that while rate cuts can influence borrowing costs, liquidity, and risk appetite, the actual market response often depends on broader factors like fiscal policy, global growth, and investor sentiment.</p>
<p>In a changing rate environment, success rarely comes from chasing the market&rsquo;s knee-jerk reactions. Instead, investors are best served by combining long-term thinking with tactical flexibility, reassessing duration exposure, sector positioning, and alternative income sources without losing sight of overarching portfolio goals.</p>
<p>Above all, a risk-aware approach is critical. Rate cuts may create opportunity, but they also introduce new dynamics&mdash;from yield-curve shifts to credit spread volatility&mdash;that require thoughtful navigation. By staying grounded in fundamentals, consulting trusted advisors, and aligning strategy with long-term objectives, investors can position themselves to capture opportunities while mitigating risks in the next phase of the Fed cycle.</p>

<p>To receive more <a href="https://www.vaneck.com/us/en/insights/emerging-markets-bonds/" title="Emerging Markets Bonds Insights"><strong>Emerging Markets Bonds</strong></a> and <a href="https://www.vaneck.com/us/en/insights/municipal-bonds/" title="Municipal Bonds Insights"><strong>Municipal Bonds</strong></a> insights, <a href="/us/en/subscribe" title=" Subscription Center"><strong>sign up in our subscription&nbsp;center</strong></a>.</p>
]]></content:encoded>
</item><item rdf:about="https://www.vaneck.com/us/en/blogs/natural-resources/precious-metals-lead-today-diversification-wins-tomorrow/">
  <title>Precious Metals Lead Today, Diversification Wins Tomorrow></title>
  <link>https://www.vaneck.com/us/en/blogs/natural-resources/precious-metals-lead-today-diversification-wins-tomorrow/</link>
  <description><![CDATA[Precious metals led Q3 commodity gains, with gold and silver rallying on central bank buying and safe-haven demand. Broader diversification across sectors positions commodities for durable, long-term performance.]]></description>
  <dc:creator>Roland Morris</dc:creator>
  <dc:date>10/08/2025 06:30:00</dc:date>
<content:encoded><![CDATA[

<p><strong>Key Takeaways:</strong></p>
<ul class="content-list">
<li class="mt-3">Precious metals remained the key performance driver of commodities, with gold and silver delivering exceptional quarterly and yearly gains.</li>
<li class="mt-3">CMCITR&rsquo;s diversified structure delivered balanced returns across sectors and is built for resilience.</li>
<li class="mt-3">Growing demand from electrification and AI is expected to fuel long-term growth in industrial metals.</li>
</ul>
<h2>Steady Gains, Diverging Drivers</h2>
<p>Commodity index products delivered steady gains in the third quarter, extending what has been a positive year for the asset class. The UBS CM Commodity Index (CMCITR) advanced 2.82%, while the Bloomberg Commodity Index (BCOM) gained 3.65%. CMCITR underperformed BCOM both quarter-to-date and year-to-date. The difference comes down to precious metals, which carry a larger weight in BCOM&rsquo;s structure than in CMCITR&rsquo;s.</p>
<h2>Precious Metals Take Center Stage</h2>
<p>Gold and silver have been the standout performers of 2025. In Q3, gold rose 16% and is now up nearly 47% year-to-date. Silver gained 28% in the quarter and an extraordinary 64% year-to-date. Precious metals are therefore the best-performing asset class in the world this year. BCOM, with its heavier allocation to gold and silver, captured all of its Q3 gains from this sector. CMCITR, by contrast, generated more balanced gains across the commodity complex, apart from agriculture, underscoring its diversified design.</p>
<h3>BCOM&rsquo;s YTD gains are attributed to heavier allocation to the precious metals sector</h3>
<p><strong>Comparative Index Sector Weights</strong></p>
<p><img loading="lazy" class="img-responsive w-100" src="https://www.vaneck.com/contentassets/c0632059c76c4f45bf8e0d5fcfc7ccf3/6263_cmci-blog-chart_01_2025-10_v1_blog.svg" alt="BCOM&rsquo;s YTD gains are attributed to heavier allocation to the precious metals sector" /></p>
<p class="chart-disclosure"><strong>Source:</strong> VanEck, Bloomberg. Data as of September 2025.</p>
<p><strong>Estimated Q3 2025 Contribution to Return by Sector</strong></p>
<p><img loading="lazy" class="img-responsive w-100" src="https://www.vaneck.com/contentassets/d5b2e114b2be4b5fabb98876a814ffa4/6263_cmci-blog-chart_02_2025-10_v1_blog.svg" alt="Estimated Q3 2025 Contribution to Return by Sector" /></p>
<p class="chart-disclosure"><strong>Source:</strong> VanEck, Bloomberg. Data as of September 2025. Past performance is no guarantee of future results. Index performance is not illustrative of fund performance. It is not possible to invest directly in an index.</p>
<h2>Why Gold and Silver Are Rallying</h2>
<p>Several themes have fueled gold and silver&rsquo;s rally. Central banks continue to diversify away from U.S. dollar assets, steadily increasing their gold holdings. Gold has also benefited from its role as the world&rsquo;s ultimate safety asset amid geopolitical risks and fiscal concerns. More recently, Western investors have joined the trend, using gold to hedge against market volatility and U.S. policy uncertainty. Silver has moved in tandem, boosted by safe-haven demand but also by its industrial role in electrification, technology, and renewable energy. This dual demand has amplified silver&rsquo;s rise, sending it to multi-year highs.</p>
<h2>CMCITR&rsquo;s Strength Lies in Diversification</h2>
<p>While BCOM&rsquo;s concentration in precious metals has been a clear advantage this year, CMCITR&rsquo;s broader allocation is built for resilience. In the third quarter, its gains were more evenly spread across energy and industrial metals. That balance highlights the benefit of diversification when leadership shifts across sectors.</p>
<h2>Positioning for the Future: Balance Provides Clear Opportunities</h2>
<p>Looking ahead, CMCITR&rsquo;s emphasis on industrial metals provides a structural advantage. The global shift to cleaner energy, the buildout of electric power infrastructure, and the rapid growth of AI computing all rely heavily on copper, aluminum, nickel, and other critical inputs. These forces are only beginning to accelerate and are likely to drive strong demand in the years ahead. CMCITR&rsquo;s diversified exposure positions it to capture these opportunities, even if precious metals cool from their extraordinary run. Gold may be golden today, but over full cycles, balance wins. With its broader sector allocation and greater weight in industrial metals, CMCITR is well-positioned to deliver durable outperformance over the long term.</p>


<p>To receive more <a href="/us/en/insights/natural-resources/" title="Natural Resources Insights"><strong>Natural Resources</strong></a> insights, <a href="https://www.vaneck.com/us/en/subscribe/" title="Subscription Center"><strong>sign up in our subscription center</strong></a>.</p>
]]></content:encoded>
</item><item rdf:about="https://www.vaneck.com/us/en/blogs/moat-investing/wide-moat-stocks-defy-september-slump/">
  <title>Wide Moat Stocks Defy September Slump></title>
  <link>https://www.vaneck.com/us/en/blogs/moat-investing/wide-moat-stocks-defy-september-slump/</link>
  <description><![CDATA[Tech gains helped moat strategies navigate September&rsquo;s headwinds, with fresh picks from the quarterly Moat Index review keeping value opportunities in focus.]]></description>
  <dc:creator>Coulter Regal, CFA</dc:creator>
  <dc:date>10/08/2025 06:30:00</dc:date>
<content:encoded><![CDATA[

<p><strong>Key Takeaways:</strong></p>
<ul class="content-list">
<li class="mt-2">Moat Index gains in September, thanks to tech names offsetting weakness in defensive sectors like consumer staples.</li>
<li class="mt-2">Applied Materials and Oracle led Moat Index contributors.</li>
<li class="mt-2">SMID Moat Index slipped 1%, with consumer discretionary detracting, while tech and health care provided support.</li>
<li class="mt-2">Ionis Pharma and Marvell Technology were top SMID Moat Index contributors.</li>
</ul>
<p id="us-equity-market-review" class="jump-link-nav anchored-block" data-jumplink-title="U.S. Equity Market Review">In September, U.S. equities shrugged off the month&rsquo;s usual seasonal headwinds and pressed ahead with their rally, posting a fifth consecutive month of gains as the S&amp;P 500 advanced 3.7% to notch another record high. Market momentum was supported by the Federal Reserve's first rate cut in nearly a year as well as strong consumer spending data and GDP growth estimates that exceeded expectations. However, in a departure from last month&rsquo;s broad market breadth, where small- and mid-caps outperformed, leadership this month was more concentrated with mega-cap technology once again leading the way. The month ended with some concern around a possible government shutdown, as partisan gridlock in Congress led to a failed last-ditch funding bill and threats from the Trump administration to convert temporary furloughs into permanent mass layoffs, weighing on stocks and investor sentiment amid fears of broader fiscal disruptions.</p>
<p>The <a href="/link/9e43dd198c5f4e419f13220685081895.aspx" title=" MOAT - VanEck Morningstar Wide Moat ETF - Overview"><strong>Morningstar Wide Moat Focus Index</strong></a> (the &ldquo;Moat Index&rdquo;) also bucked September seasonality to advance during the month. However, the strategy faced some resistance due to its equal-weight methodology, resulting in lagging performance behind the top-heavy S&amp;P 500. This same dynamic was also evident in the equal-weight variant of the S&amp;P 500, which lagged by a similar degree.</p>
<p>Despite the supportive back drop of rate cuts, performance of smaller U.S. stocks was muted this month, with the broad small- and mid-cap benchmarks returning 1.0% and 0.5%, respectively. The <a href="/link/166321dbcfec440590fb51cf0ad629aa.aspx" title=" SMOT - VanEck Morningstar SMID Moat ETF - Overview"><strong>Morningstar US Small-Mid Cap Moat Focus Index</strong></a> (the &ldquo;SMID Moat Index&rdquo;) faced some additional pressure during the month due a handful of consumer discretionary names, but remains in line with benchmarks year-to-date.</p>
<h3>Stocks Buck Seasonal September Slump</h3>
<p><img loading="lazy" class="img-responsive" alt="Stocks Buck Seasonal September Slump" src="https://www.vaneck.com/contentassets/df2657b147a843af8672dd7148133023/6262_moat-monthly-october_chart-1_2025-10_v1_blog.svg" /></p>
<p class="chart-disclosure"><strong>Source: Morningstar. Data as of 9/30/2025.</strong> Past performance is no guarantee of future results. Index performance is not representative of fund performance. It is not possible to invest directly in an index. Please see index definitions and other important disclosures at the end of this content. Fund performance current to the most recent month end is available by visiting vaneck.com or by calling 800.826.2333.</p>

<h2 id="moat-highlights" class="jump-link-nav anchored-block" data-jumplink-title="Moat Highlights">Moat Index Keeps Value in Focus at Quarterly Review</h2>
<p>Both the Moat and SMID Moat Indexes underwent quarterly reviews on September 19, 2025. Each quarter they systematically target the most attractively priced, high quality U.S. companies within their respective universes. At the September review, the Moat strategies targeted valuation opportunities within the industrial and consumer staple sectors. See our <strong><a href="/us/en/blogs/moat-investing/moat-index-keeps-tech-in-check-value-in-focus/" title="Moat Index Keeps Tech in Check, Value in Focus">blog covering the recent review</a></strong> for more on these trends and other key insights. Full results of the quarterly reviews are also available here: <strong><a href="/link/9e43dd198c5f4e419f13220685081895.aspx" title=" MOAT - VanEck Morningstar Wide Moat ETF - Overview">Moat Index</a></strong> and <strong><a href="/link/166321dbcfec440590fb51cf0ad629aa.aspx" title="SMOT - VanEck Morningstar SMID Moat ETF - Overview">SMID Moat Index</a>.</strong></p>
<h2>Moat Index Highlights: AI &amp; Data Center Infrastructure Lead</h2>
<p>In September, the Moat Index faced headwinds caused by its equal-weighted approach and current overweight positioning in defensive sectors, particularly within consumer staples and health care. However, these were partly offset by security selection in a handful of technology names, as the cohort is heavily represented in the top contributors during the month.</p>
<p>Applied Materials (AMAT), a leading supplier of semiconductor wafer fabrication equipment, was the top contributor in September, surging more than 25%. The rally followed a reassessment of AI-driven capital spending across the semiconductor ecosystem, with Morningstar boosting its medium-term outlook for wafer fab equipment and advanced packaging. Morningstar highlights AMAT&rsquo;s wide moat, anchored by its unmatched breadth across deposition, etch, and process control, deep integration with customer workflows, and a market-leading $3 billion annual R&amp;D budget that reinforces sticky, long-dated relationships. Morningstar raised its fair value estimate to $200 per share, and while it now views AMAT as fairly valued after the move, it still prefers AMAT over peers given its leadership in advanced packaging and exposure to growing demand for advanced logic and memory tied to AI.<br /><br />Oracle (ORCL), a leader in enterprise software and cloud infrastructure, was also among September&rsquo;s top contributors, rallying sharply on a strong quarterly update. Morningstar notes that surging AI data center demand and deepening partnerships with leading model providers materially improved the company&rsquo;s multiyear outlook for Oracle Cloud Infrastructure (OCI). While the ramp requires heavy investment and may pressure near-term cash flows, Morningstar views OCI&rsquo;s switching costs and the broader shift toward multi-cloud as supportive of durable growth. Morningstar raised its fair value estimate to $330 and sees additional upside if Oracle successfully converts its sizable bookings into revenue.</p>
<p>Other top contributors within the Moat Index during the month include the supplier of automated test equipment for semiconductors, Teradyne Inc. (TER); semiconductor wafer fabrication equipment manufacturer, Lam Research Corp. (LRCX); and internet search and content giant, Alphabet Inc. (GOOGL).</p>
<p>Companies detracting the most in September included the spirits and Mexican beer importer, Constellation Brands Inc. (STZ); electronic design automation software provider, Synopsys Inc. (SNPS); athletic footwear and apparel brand, Nike Inc. (NKE); consumer health company, Kenvue Inc. (KVUE); and aerospace and defense firm, Boeing Co. (BA).</p>
<h2>Moat Index Top Contributors and Detractors - September 2025</h2>
<h3>Contributors</h3>
<div class="wrapped-div">
<table style="width: 100%;">
<tbody>
<tr class="tbl-data">
<td class="tbl-header last text-left">Company</td>
<td class="tbl-header last text-left">Ticker</td>
<td class="tbl-header last text-left">Sector</td>
<td class="tbl-header last text-right">Avg. Weight (%)</td>
<td class="tbl-header last text-right">Contribution (%)</td>
</tr>
<tr class="tbl-data">
<td class="data-td last text-left">Applied Materials Inc.</td>
<td class="data-td data last text-left">AMAT</td>
<td class="data-td data last text-left">Technology</td>
<td class="data-td data last text-right">2.29</td>
<td class="data-td data last text-right">0.63</td>
</tr>
<tr class="tbl-data">
<td class="data-td last text-left">Teradyne Inc.</td>
<td class="data-td data last text-left">TER</td>
<td class="data-td data last text-left">Technology</td>
<td class="data-td data last text-right">3.08</td>
<td class="data-td data last text-right">0.51</td>
</tr>
<tr class="tbl-data">
<td class="data-td last text-left">Lam Research Corp.</td>
<td class="data-td data last text-left">LRCX</td>
<td class="data-td data last text-left">Technology</td>
<td class="data-td data last text-right">1.42</td>
<td class="data-td data last text-right">0.48</td>
</tr>
<tr class="tbl-data">
<td class="data-td last text-left">Alphabet Inc.</td>
<td class="data-td data last text-left">GOOGL</td>
<td class="data-td data last text-left">Communication Services</td>
<td class="data-td data last text-right">2.81</td>
<td class="data-td data last text-right">0.40</td>
</tr>
<tr class="tbl-data">
<td class="data-td last text-left">Oracle Corp.</td>
<td class="data-td data last text-left">ORCL</td>
<td class="data-td data last text-left">Technology</td>
<td class="data-td data last text-right">1.63</td>
<td class="data-td data last text-right">0.40</td>
</tr>
</tbody>
</table>
</div>
<h3>Detractors</h3>
<div class="wrapped-div">
<table style="width: 100%;">
<tbody>
<tr class="tbl-data">
<td class="tbl-header last text-left">Company</td>
<td class="tbl-header last text-left">Ticker</td>
<td class="tbl-header last text-left">Sector</td>
<td class="tbl-header last text-right">Avg. Weight (%)</td>
<td class="tbl-header last text-right">Contribution (%)</td>
</tr>
<tr class="tbl-data">
<td class="data-td last text-left">Constellation Brands Inc.</td>
<td class="data-td data last text-left">STZ</td>
<td class="data-td data last text-left">Consumer Staples</td>
<td class="data-td data last text-right">2.09</td>
<td class="data-td data last text-right">-0.35</td>
</tr>
<tr class="tbl-data">
<td class="data-td last text-left">Synopsys Inc.</td>
<td class="data-td data last text-left">SNPS</td>
<td class="data-td data last text-left">Technology</td>
<td class="data-td data last text-right">1.52</td>
<td class="data-td data last text-right">-0.28</td>
</tr>
<tr class="tbl-data">
<td class="data-td last text-left">Nike Inc.</td>
<td class="data-td data last text-left">NKE</td>
<td class="data-td data last text-left">Consumer Discretionary</td>
<td class="data-td data last text-right">2.65</td>
<td class="data-td data last text-right">-0.25</td>
</tr>
<tr class="tbl-data">
<td class="data-td last text-left">Kenvue Inc.</td>
<td class="data-td data last text-left">KVUE</td>
<td class="data-td data last text-left">Consumer Staples</td>
<td class="data-td data last text-right">1.14</td>
<td class="data-td data last text-right">-0.25</td>
</tr>
<tr class="tbl-data">
<td class="data-td last text-left">Boeing Co.</td>
<td class="data-td data last text-left">BA</td>
<td class="data-td data last text-left">Industrials</td>
<td class="data-td data last text-right">2.86</td>
<td class="data-td data last text-right">-0.23</td>
</tr>
</tbody>
</table>
</div>
<p class="chart-disclosure"><strong>Source: Morningstar</strong>. Past performance is no guarantee of future results. Index performance is not illustrative of fund performance. Not intended as a recommendation to buy or to sell any of the securities mentioned herein.</p>

<h2 id="smid-highlights" class="jump-link-nav anchored-block" data-jumplink-title="SMID Moat Highlights">SMID Moat Index Highlights: Positive Pharma Trial and AI Build Out</h2>
<p>Smaller caps gained slightly during the month, but trailed their large-cap counterparts in a cooling from the strong price action seen in the small cap segment in August. The SMID Moat Index faced some additional headwinds from its overweight in consumer discretionary names, which underperformed in September. However, bright spots remained in technology and health care names.</p>
<p>Ionis Pharmaceuticals (IONS), a leader in RNA-targeted therapeutics, was one of those bright spots and the top contributor to the SMID Moat Index in September after a sharp 50% rally. The move followed positive phase 3 top-line results for Ionis&rsquo;s olezarsen in severe hypertriglyceridemia, which delivered meaningful efficacy on both primary and secondary outcomes and, in Morningstar&rsquo;s view, materially de-risks the program. Morningstar highlights Ionis&rsquo;s proprietary antisense platform, durable intellectual property, and a growing late-stage pipeline as key supports for its moat rating, with partnerships helping to share development risk. With regulatory filings planned and multiple potential launches ahead, Morningstar raised its fair value estimate to $74 and maintains a constructive long-term outlook on Ionis.</p>
<p>Marvell Technology (MRVL), a leading provider of data center networking and custom silicon, was also a notable contributor in September following upbeat commentary from management. Morningstar notes that the CEO reaffirmed confidence in Marvell&rsquo;s custom AI accelerator roadmap, easing concerns about potential share shifts and bringing market expectations closer to its thesis. The firm sees AI as the primary growth engine, with both accelerators and optical connectivity poised to benefit from sustained data center investment and a multisourcing dynamic among hyperscalers. Morningstar maintained its $90 fair value estimate and views shares as closer to fair value after the rally, with further upside if accelerator ramps and new customer programs progress as planned.</p>
<p>Other top contributors include Vertiv Holdings (VRT), a leading thermal and power management products within data centers; Monolithic Power Systems (MPWR), an analog and mixed-signal chipmaker specializing in power management solutions; and the supplier of automated test equipment for semiconductors, Teradyne Inc. (TER).</p>
<p>Companies detracting the most in September within the SMID Moat Index showed a clear tilt toward the consumer discretionary sector as four of the five laggards came from the segment. Names included online sports betting firm, DraftKing Inc. (DKNG); consumer vehicle retailer, CarMax Inc. (KMX); FanDuel online betting parent company, Flutter Entertainment (FLUT); cruise ship operator, Carnival Corp. (CCL); and consumer health firm, Kenvue (KVUE).</p>
<h2>SMID Moat Index Top Contributors and Detractors - September 2025</h2>
<h3>Contributors</h3>
<div class="wrapped-div">
<table style="width: 100%;">
<tbody>
<tr class="tbl-data">
<td class="tbl-header last text-left">Company</td>
<td class="tbl-header last text-left">Ticker</td>
<td class="tbl-header last text-left">Sector</td>
<td class="tbl-header last text-right">Avg. Weight (%)</td>
<td class="tbl-header last text-right">Contribution (%)</td>
</tr>
<tr class="tbl-data">
<td class="data-td last text-left">Ionis Pharmaceuticals Inc.</td>
<td class="data-td data last text-left">IONS</td>
<td class="data-td data last text-left">Health Care</td>
<td class="data-td data last text-right">0.73</td>
<td class="data-td data last text-right">0.39</td>
</tr>
<tr class="tbl-data">
<td class="data-td last text-left">Marvell Technology Inc.</td>
<td class="data-td data last text-left">MRVL</td>
<td class="data-td data last text-left">Technology</td>
<td class="data-td data last text-right">0.58</td>
<td class="data-td data last text-right">0.19</td>
</tr>
<tr class="tbl-data">
<td class="data-td last text-left">Vertiv Holdings Co.</td>
<td class="data-td data last text-left">VRT</td>
<td class="data-td data last text-left">Industrials</td>
<td class="data-td data last text-right">0.96</td>
<td class="data-td data last text-right">0.18</td>
</tr>
<tr class="tbl-data">
<td class="data-td last text-left">Monolithic Power Systems Inc</td>
<td class="data-td data last text-left">MPWR</td>
<td class="data-td data last text-left">Technology</td>
<td class="data-td data last text-right">1.62</td>
<td class="data-td data last text-right">0.17</td>
</tr>
<tr class="tbl-data">
<td class="data-td last text-left">Teradyne Inc.</td>
<td class="data-td data last text-left">TER</td>
<td class="data-td data last text-left">Technology</td>
<td class="data-td data last text-right">0.83</td>
<td class="data-td data last text-right">0.14</td>
</tr>
</tbody>
</table>
<h3>Detractors</h3>
<div class="wrapped-div">
<table style="width: 100%;">
<tbody>
<tr class="tbl-data">
<td class="tbl-header last text-left">Company</td>
<td class="tbl-header last text-left">Ticker</td>
<td class="tbl-header last text-left">Sector</td>
<td class="tbl-header last text-right">Avg. Weight (%)</td>
<td class="tbl-header last text-right">Contribution (%)</td>
</tr>
<tr class="tbl-data">
<td class="data-td last text-left">DraftKings Inc.</td>
<td class="data-td data last text-left">DKNG</td>
<td class="data-td data last text-left">Consumer Discretionary</td>
<td class="data-td data last text-right">1.60</td>
<td class="data-td data last text-right">-0.35</td>
</tr>
<tr class="tbl-data">
<td class="data-td last text-left">CarMax Inc.</td>
<td class="data-td data last text-left">KMX</td>
<td class="data-td data last text-left">Consumer Discretionary</td>
<td class="data-td data last text-right">1.09</td>
<td class="data-td data last text-right">-0.29</td>
</tr>
<tr class="tbl-data">
<td class="data-td last text-left">Flutter Entertainment</td>
<td class="data-td data last text-left">FLUT</td>
<td class="data-td data last text-left">Consumer Discretionary</td>
<td class="data-td data last text-right">1.51</td>
<td class="data-td data last text-right">-0.26</td>
</tr>
<tr class="tbl-data">
<td class="data-td last text-left">Carnival Corp.</td>
<td class="data-td data last text-left">CCL</td>
<td class="data-td data last text-left">Consumer Discretionary</td>
<td class="data-td data last text-right">1.86</td>
<td class="data-td data last text-right">-0.17</td>
</tr>
<tr class="tbl-data">
<td class="data-td last text-left">Kenvue Inc.</td>
<td class="data-td data last text-left">KVUE</td>
<td class="data-td data last text-left">Consumer Staples</td>
<td class="data-td data last text-right">0.62</td>
<td class="data-td data last text-right">-0.13</td>
</tr>
</tbody>
</table>
</div>
</div>
<p class="chart-disclosure"><strong>Source: Morningstar</strong>. Past performance is no guarantee of future results. Index performance is not illustrative of fund performance. Not intended as a recommendation to buy or to sell any of the securities mentioned herein.</p>

<h2 id="moat-strategies" class="jump-link-nav anchored-block" data-jumplink-title="Moat Strategies">Choose Your Moat Strategy</h2>
<p>VanEck&rsquo;s suite of <a href="/us/en/blogs/moat-investing/moat-investing-powered-by-morningstar/" title="Quality Companies at Attractive Prices"><strong>moat investing strategies</strong></a> is powered by Morningstar&rsquo;s equity research team, which seeks quality companies trading at attractive valuations. The below ETFs offer access to US moat companies:</p>
<p><a href="/link/9e43dd198c5f4e419f13220685081895.aspx" title="MOAT - VanEck Morningstar Wide Moat ETF - Overview"><strong>VanEck Morningstar Wide ETF (MOAT)</strong></a><span>:</span> companies with a wide moat rating, which means Morningstar believes the company is likely to sustain its competitive advantage for at least the next 20 years.</p>
<p><a href="/link/166321dbcfec440590fb51cf0ad629aa.aspx" title="SMOT - VanEck Morningstar SMID Moat ETF - Overview"><strong>VanEck Morningstar SMID Moat ETF (SMOT)</strong></a><span>:</span> small and mid-cap moat companies.</p>
<p><a href="/link/fd582da052ba46c79bfc112c078a6256.aspx" title="MVAL - VanEck Morningstar Wide Moat Value ETF - Overview"><strong>VanEck Morningstar Wide Moat Value ETF (MVAL)</strong></a><span>:</span> wide moat companies within Morningstar&rsquo;s value style category.</p>
<p>To receive more <a href="https://www.vaneck.com/us/en/insights/moat-investing" title="Moat Investing Insights"><strong>Moat Investing</strong></a> insights, <a href="https://www.vaneck.com/us/en/subscribe/" title="Subscription Center"><strong>sign up in our subscription center</strong></a>.</p>
]]></content:encoded>
</item><item rdf:about="https://www.vaneck.com/us/en/blogs/emerging-markets-bonds/em-bonds-shine-as-dm-bonds-struggle-with-fiscal-drift/">
  <title>EM Bonds Shine as DM Bonds Struggle with Fiscal Drift></title>
  <link>https://www.vaneck.com/us/en/blogs/emerging-markets-bonds/em-bonds-shine-as-dm-bonds-struggle-with-fiscal-drift/</link>
  <description><![CDATA[EM bonds continue to outperform on fiscal discipline and CNY strength, while indebted DMs struggle with weak policy and unpopular governments.]]></description>
  <dc:creator>Eric Fine</dc:creator>
  <dc:date>10/07/2025 06:30:00</dc:date>
<content:encoded><![CDATA[

<p id="performance-overview" class="jump-link-nav anchored-block" data-jumplink-title="Performance Review"><strong>Key Takeaways:</strong></p>
<ul class="content-list">
<li class="mt-2">Low-debt EMs with orthodox central banks are benefiting, while high-debt DMs face fiscal and political strains.</li>
<li class="mt-2">EM governments are popular and disciplined, contrasting with weak and unpopular DM leadership.</li>
<li class="mt-2">A steadily strengthening CNY is a key, overlooked driver of EM currency resilience.</li>
</ul>
<p>The <a href="/link/f447bf0c04f64108a3dcff3ca025af4a.aspx" title="EMBX - VanEck Emerging Markets Bond ETF - Overview"><strong>VanEck Emerging Markets Bond ETF</strong></a><sup>&dagger;</sup>&nbsp;was up 1.70% in September, compared to 1.59% for its benchmark, the 50% J.P. Morgan Government Bond Index - Emerging Markets Global Diversified (GBI-EM) and 50% J.P. Morgan Emerging Markets Bond Index (EMBI). Year to date, the ETF is up 15.41%, compared to 13.04% for its benchmark, and 8.12% and 6.96% for the Global Agg and 10-year Treasuries, respectively. Argentina was a big mover this month (and an outperformer for the ETF). We touch on it inside, though we caution that there is a significant global oversupply of opinions on Argentina. Here&rsquo;s ours: we didn&rsquo;t like Argentina because policy was way ahead of politics and there was a consensus overweight/bullish view in markets and among cab drivers globally. Then politics arose, bonds puked, and there was a chance of a fairly fast and easy bridge loan from the US (which then happened). So, when it crashed, we got bullish. It&rsquo;s a trade, we are still in a heavily game-theoretic stage. We remain very bullish on local currency, while somewhat cautious on USD duration especially with low spreads. The ETF has around 55.3% in curated local currency, the rest in mostly higher-yielding USD bonds. Carry is 6.4%, yield to worst (YTW) is 8.1%, and duration is 5.3. The maximum for local is 60% and our bias remains to be close to the maximum.</p>

<h3>Average Annual Total Returns<sup>*</sup>&nbsp;(%) (In USD)</h3>
<div class="wrapped-div">
<table style="width: 100%;">
<tbody>
<tr class="tbl-data">
<td class="data-head last text-left">as of 9/30/2025</td>
<td class="data-head last text-right">MTD</td>
<td class="data-head last text-right">3MO</td>
<td class="data-head last text-right">YTD</td>
<td class="data-head last text-right">1 Year</td>
<td class="data-head last text-right">3 Years</td>
<td class="data-head last text-right">5 Years</td>
<td class="data-head last text-right">10 Years</td>
<td class="data-head last text-right">Since Inception</td>
</tr>
<tr class="tbl-data">
<td class="data-td data last text-left">VanEck Emerging Markets Bond ETF</td>
<td class="data-td data last text-right">1.70</td>
<td class="data-td data last text-right">4.40</td>
<td class="data-td data last text-right">15.41</td>
<td class="data-td data last text-right">9.72</td>
<td class="data-td data last text-right">13.39</td>
<td class="data-td data last text-right">4.87</td>
<td class="data-td data last text-right">5.27</td>
<td class="data-td data last text-right">3.39</td>
</tr>
<tr class="tbl-data">
<td class="data-td data last text-left">50%JPM GBI-EM GD and 50%JPM EMBI GD</td>
<td class="data-td data last text-right">1.59</td>
<td class="data-td data last text-right">3.78</td>
<td class="data-td data last text-right">13.04</td>
<td class="data-td data last text-right">7.98</td>
<td class="data-td data last text-right">11.80</td>
<td class="data-td data last text-right">2.33</td>
<td class="data-td data last text-right">3.92</td>
<td class="data-td data last text-right">2.48</td>
</tr>
<tr class="tbl-data">
<td class="data-td data last text-left">ICE BofA Gbl Brd Mkt TR USD</td>
<td class="data-td data last text-right">0.78</td>
<td class="data-td data last text-right">0.75</td>
<td class="data-td data last text-right">8.12</td>
<td class="data-td data last text-right">2.36</td>
<td class="data-td data last text-right">5.24</td>
<td class="data-td data last text-right">-2.00</td>
<td class="data-td data last text-right">0.93</td>
<td class="data-td data last text-right">0.66</td>
</tr>
<tr class="tbl-data">
<td class="data-td data last text-left">ICE BofA Current 10-Y US Trsy TR USD</td>
<td class="data-td data last text-right">0.94</td>
<td class="data-td data last text-right">1.81</td>
<td class="data-td data last text-right">6.93</td>
<td class="data-td data last text-right">1.35</td>
<td class="data-td data last text-right">2.85</td>
<td class="data-td data last text-right">-3.08</td>
<td class="data-td data last text-right">0.53</td>
<td class="data-td data last text-right">0.74</td>
</tr>
</tbody>
</table>
</div>
<div class="chart-disclosure">
<p>Source: VanEck.&nbsp;<strong>EMBX Expense Ratio:</strong> Gross: 0.75% | Net: 0.75%</p>
<p>Van Eck Associates Corporation (the &ldquo;Adviser&rdquo;) will pay all expenses of the Fund, except for the fee payment under the investment management agreement, acquired fund fees and expenses, interest expense, offering costs, trading expenses, taxes and extraordinary expenses. Notwithstanding the foregoing, the Adviser has agreed to pay the offering costs until at least May 1, 2027. &ldquo;Other Expenses&rdquo; have been restated to reflect current fees.</p>
<p><strong>The performance data quoted represents past performance. Past performance is not a guarantee of future results. Investment return and principal value of an investment will fluctuate so that an investor's shares, when redeemed, may be worth more or less than their original cost. Performance may be lower or higher than performance data quoted. Please call 800.826.2333 or visit <a title="VanEck" href="http://vaneck.com">http://vaneck.com</a> for performance current to the most recent month ended.</strong></p>
<p>Prior to 10/06/2025, the Fund operated as the VanEck Emerging Markets Bond mutual fund; performance shown before that date is that fund&rsquo;s NAV performance (Class I, unadjusted for today&rsquo;s ETF expenses).</p>
</div>
<p id="macro-market-review" class="jump-link-nav anchored-block" data-jumplink-title="Macro Market Review"><strong>The big wheel turning remains &ldquo;fiscal dominance&rdquo;, in which low-indebted EMs with inflation-focused central banks win, and high-indebted DMs with arguably co-opted central banks lose.</strong> We got reminders of the bad &ndash; UK financing worries, a EU that looks <i>not</i> to be seizing the moment to issue mutualized debt when the market wants it, a new PM in France with immediate protests over fiscal policy&hellip;sigh. EM gave us more reminders of the good. Mexico&rsquo;s first budget under newly elected President Sheinbaum met market expectations of orthodoxy. Indonesia re-committed to its fiscal targets after a bout of political turmoil that saw its finance minister leave. (Now, on Indonesia, we must say that we have low confidence in this commitment, but our point is that the government rushed to reassure on orthodoxy; whether they are serious is a separate question.) South Africa is arguably in a goldilocks situation, with its always-excellent monetary policy now complemented by improved fiscal outcomes. China is chugging along smoothly, with the market hopefully realizing that weak growth outcomes will be met with fiscal stimulus (which will be reduced if strong growth outcomes materialize). And we have deepening reform in Ecuador under its IMF program, and surprising positive policy tilts in Zambia, just to mention some of the off-the-beaten-path names.</p>
<p><strong>&ldquo;Fiscal dominance&rdquo; also happens to map to social and political risk.</strong> A classic outcome is higher inflation, which reduces the real value of debt at the expense of social and political peace, as well as attempts to downplay inflation in nominal GDP narratives. A cursory look at DM headlines tells you we are at this stage. EM politics, on the other hand, are generally characterized by strength, popularity, and economic orthodoxy. Just look at Exhibit 1, which shows government popularity (defined as &ldquo;approval&rdquo; and using data sources chosen by Perplexity). We always like to remind investors that it is hard (and getting harder) to find relevant political parties in EMs that can get away with heterodoxy &ndash; voters aren&rsquo;t as susceptible to promises of fiscal profligacy or harnessing central banks to gin up growth. Mexico&rsquo;s supposedly left-wing government is economically orthodox and generated higher real incomes for Mexicans, for example &ndash; that is a typical and arguably growing formula inside EMs. Roughly half of consumption in many of our countries is food and energy, so voters have disciplined politicians over decades.</p>
<h3>Exhibit 1 &ndash; EMs Have Popular (and Orthodox) Governments, DMs Have Unpopular and Flailing Governments</h3>
<p><strong>Government Popularity</strong></p>
<p><img loading="lazy" class="img-responsive w-100" src="https://www.vaneck.com/contentassets/7e9aa90298a74919aa1b4bd05700c6ae/6257_embx-monthly-september_chart-1_2025-10_v1_blog.svg" alt="EMs Have Popular (and Orthodox) Governments, DMs Have Unpopular and Flailing Governments" /></p>
<p class="chart-disclosure">Source: VanEck, Perplexity; data as of September 2025.</p>
<p><strong>If &ldquo;fiscal dominance&rdquo; is the big wheel, CNY remains the driving wheel where actual asset-price stuff starts happening&hellip;and it keeps strengthening steadily.</strong> This remains one of the most important dynamics for all markets and remains incredibly overlooked. EMs trade more with China than with the US, so this is a huge tailwind to EM currencies (see Exhibit 2). And remember the start of the year or even last month? The consensus view was that tariffs would destroy EM currencies. The opposite has happened. We&rsquo;ve written extensively on this, including our piece &ldquo;<a href="/us/en/blogs/emerging-markets-bonds/the-curiously-unpopular-case-for-rmb-cny-appreciation/" title="The Curiously Unpopular Case for RMB/CNY Appreciation"><strong>The Curiously Unpopular Case for RMB/CNY Appreciation</strong></a>&rdquo;. Now, as we said in the piece, CNY itself is not the way to express this view. It will be tightly managed and the appreciation will be like watching paint dry. Lucky for us we can invest in bonds/currencies that are allowed to move more freely, see below for the big names. We should also point out that the ETF has no exposure to India local currency, which performed poorly in 2025, as we see it as broadly &ldquo;not ready for primetime&rdquo;. We are also cautious/underweight on Indonesia local, also a loser this year.</p>
<h3>Exhibit 2 &ndash; EM Currencies Keep Rallying; Every Possible Cause Cited Other Than CNY</h3>
<p><img loading="lazy" class="img-responsive w-100" src="https://www.vaneck.com/contentassets/ecd38ec1879d4ea2a189ec6a75480e7a/6257_embx-monthly-september_chart-2_2025-10_v1_blog.svg" alt="EM Currencies Keep Rallying; Every Possible Cause Cited Other Than CNY" /></p>
<p class="chart-disclosure">Source: Bloomberg. Data as of September 2025.</p>

<p><strong>A look at Argentina.</strong> The ratio of the number of opinions on Argentina relative to its importance is astronomical. For decades this has been the case. From cab drivers to heads of state &ndash; I&rsquo;m always getting asked about trivial Argentina and never about Indonesia, Brazil, South Africa, or Nigeria. It&rsquo;s incredible. Our opinion is actually pretty simple, and we&rsquo;re also intimating that the world doesn&rsquo;t need more opinions on Argentina&hellip;but here&rsquo;s ours.</p>
<p>We didn&rsquo;t like Argentina. Policy was way ahead of politics. Then it blew up in September and bond prices crashed. And, there was a chance of a fairly fast and easy bridge loan from the US. And, the market was consensus overweight, even the cab drivers. So, when it crashed, we got bullish. It&rsquo;s a trade, we are still in a heavily game-theoretic stage. But, the government can probably get through to midterm elections with protecting reserves and actually buying back short-dated USD debt (which we now own). We&rsquo;ll see what we think at that next decision node, the midterm elections.</p>
<h2 id="exposure-types-and-significant-changes" class="jump-link-nav anchored-block" data-jumplink-title="Exposure Types and Significant Changes">Exposure Types and Significant Changes</h2>
<p>The changes to our top positions are summarized below. Our largest positions in September were South Africa, Mexico, Poland, Thailand and Malaysia:</p>
<ul class="content-list">
<li class="mt-2">We increased our local currency exposure in South Africa and Poland. South Africa&rsquo;s &ldquo;sleeper&rdquo; fiscal story is not fully appreciated by the market, but the country&rsquo;s fiscal performance continues to improve, and the latest move &ndash; considering a formal fiscal rule &ndash; would be a major structural breakthrough. In terms of our investment process, this has strengthened South Africa&rsquo;s policy test score. Poland&rsquo;s fiscal situation looks more concerning, but this is unlikely to affect net bond issuance and slow fiscal consolidation (which in part reflects less inflationary defense spending) is mostly priced in. Poland&rsquo;s central bank remains credible, and the currency is a proxy for the Europe&rsquo;s revival theme, which improves the technical test score for the country.</li>
<li class="mt-2">We also increased our hard currency sovereign exposure in Argentina and the Republic of Congo. The level of political noise in Argentina will remain elevated in the run up to the mid-term elections, but the U.S. decision to provide a large-scale support package (which came after a major selloff) is likely to be a game-changer for the post-election period, strengthening the policy test score for the country. Congo&rsquo;s multi-billion dollar deal with China to boost oil production had a positive impact on the country&rsquo;s economic and policy test scores.</li>
<li class="mt-2">Finally, we increased our local currency exposure in Mexico and Chile. Mexico is a major winner in Trade War 2.0, with supportive domestic backdrop (gradual fiscal consolidation, disinflation, and credible rate cuts being the most relevant for local bonds). The global commodity/copper price backdrop remains beneficial for the Chilean currency, the central bank might deliver another rate cut, and the presidential election outcome is not expected to derail Chile&rsquo;s orthodox policy framework. In terms of our investment process, this improves the technical and policy test scores for the country.</li>
<li class="mt-2">We reduced our local currency exposure in Indonesia on the back of the constant flow of negative fiscal news, which reflect the government&rsquo;s increasingly pro-growth policy stance. An additional structural complication is an attempt to expand the central bank&rsquo;s mandate. Both factors worsened the country&rsquo;s policy test score. Further, Indonesia&rsquo;s economy will be negatively affected by the Grasberg mine incident &ndash; it lowered the economic test score for the country.</li>
<li class="mt-2">We also reduced our local currency exposure and hard currency corporate exposure in Brazil. The latter reflected corporate fraud allegations. Regarding local bonds, we took partial profits after the huge year-to-date rally, which dented the technical test score for the country. We are likely to take it back up.</li>
<li class="mt-2">Finally, we reduced our local currency exposure in China and hard currency sovereign exposure in Bosnia and Herzegovina. Bosnia and Herzegovina is making structural progress to access the EU funds (Growth Plan for the Western Balkans), but valuations are less attractive now, so we decided to employ the funds in more compelling opportunities. We also took partial profits in China, since the anti-involution policy push is expected to lead to higher domestic prices, and hence, higher local yields, worsening the policy test score for the country.</li>
</ul>
<p>To receive more <a href="https://www.vaneck.com/us/en/insights/emerging-markets-bonds/" title="Emerging Markets Bonds Insights"><strong>Emerging Markets Bonds</strong></a> insights, <a href="/link/5f45412c2143400497908cea2897f7d3.aspx" title=" Subscription Center"><strong>sign up in our subscription center</strong></a>.</p>
]]></content:encoded>
</item><item rdf:about="https://www.vaneck.com/us/en/blogs/emerging-markets-equity/vietnams-market-reform-wave-a-market-at-a-turning-point/">
  <title>Vietnam’s Market Reform Wave: A Market at a Turning Point></title>
  <link>https://www.vaneck.com/us/en/blogs/emerging-markets-equity/vietnams-market-reform-wave-a-market-at-a-turning-point/</link>
  <description><![CDATA[Vietnam is advancing ambitious market reforms and economic integration. These changes may accelerate its path to emerging market status and broaden global investor interest.]]></description>
  <dc:creator>Sunny  Bokhari</dc:creator>
  <dc:date>10/06/2025 06:30:00</dc:date>
<content:encoded><![CDATA[

<p><strong>Key Takeaways:</strong></p>
<ul class="content-list">
<li class="mt-2">Vietnam is modernizing its trading infrastructure and working to improve foreign investor access.</li>
<li class="mt-2">FTSE EM status may come in 2025, with MSCI inclusion targeted by 2030 as reforms accelerate.</li>
<li class="mt-2">Strong growth and policy momentum position Vietnam as a key market in Asia&rsquo;s evolving landscape.</li>
</ul>
<h2>Vietnam&rsquo;s Market Reforms: Why Investors Should Pay Attention</h2>
<p>Vietnam is one of Asia&rsquo;s most dynamic economies. Strong growth, ambitious reforms, and improvements to its capital markets are helping the country progress toward potential inclusion in global emerging market indices. For investors, this may be an opportune moment to consider exposure to Vietnamese equities.</p>
<h2 id="economic-growth" class="jump-link-nav anchored-block" data-jumplink-title="Economic Growth">Vietnam&rsquo;s Economic Growth</h2>
<p>Vietnam has delivered decades of consistent GDP growth, averaging approximately 6.4% annually since 1985.<sup>1</sup>&nbsp;This economic momentum is rooted in structural trends and driven by geopolitical influences that have propelled the country forward. Vietnam is home to a young, educated population with a median age of 33 years and a high literacy rate of about 96%. A sizeable working age population with growing incomes has led to rapid urbanization, supporting the country&rsquo;s economic growth trajectory.</p>
<p>Vietnam has proactively entered multiple free trade agreements to deepen its integration into global trade and reduce its export reliance on a single country. It intends to sign two new agreements with Mercosur<sup>2</sup>&nbsp;trading bloc and GCC<sup>2</sup>&nbsp;by year-end. Despite 20% U.S. tariffs, Vietnam's exports in the year to September 15th rose 15.8% from a year earlier to $325.3 billion.<sup>3</sup></p>
<h3>Free Trade Agreements</h3>
<p><img loading="lazy" class="img-responsive" alt="Free Trade Agreements" src="https://www.vaneck.com/contentassets/e9c7e1b7f03b404d9a08398dc56631ef/6237_vietnams-market-reform-wave_chart-1_2025-10_v1_blog.svg" /></p>
<p class="chart-disclosure"><strong>EVFTA</strong>: European Union &ndash; Vietnam Free Trade Agreement.<strong>VEUFTA</strong>: Vietnam Eurasian Economic Union Free Trade Agreement. <strong>CPTPP</strong>: Comprehensive and Progressive Agreement for Trans-Pacific Partnership. <strong>VJEPA</strong>: Vietnam &ndash; Japan Economic Partnership Agreement.<strong>RCEP</strong>: The Regional Comprehensive Economic Partnership. <strong>VKFTA</strong>: Vietnam &ndash; Korea Free Trade Agreement.<strong>ASEAN</strong>: Association of Southeast Asian Nations. <strong>AFTA</strong>: ASEAN Free Trade Agreement.<strong>AFTA &ndash; China</strong>: ASEAN &ndash; China Free Trade Agreement.<strong>UKFTA</strong>: The United Kingdom &ndash; Vietnam Free Trade Agreement.<strong>VCFTA</strong>: Vietnam- Chile Free Trade Agreement.</p>
<h2 id="market-reforms" class="jump-link-nav anchored-block" data-jumplink-title="Market Reforms">Market Reforms: Structural Changes to Unlock Foreign Capital</h2>
<p>In recent years, Vietnam has enacted a broad suite of reforms aimed at attracting institutional and foreign investors, aligning its capital markets with international best practices.</p>
<p><strong>Reforms Include:</strong></p>
<ul>
<li><strong>Removal of Company-Imposed Foreign Ownership Caps (Sept 2025):</strong><br />A newly enacted decree that went into effect on September 11, 2025, prevents public companies from arbitrarily setting their own lower foreign ownership limits (FOLs). It also requires companies to officially report their maximum foreign ownership limits within 12 months.The decree does not create a single new foreign ownership cap but instead corrects prior rules that allowed companies or their shareholders to impose stricter limits than required by law.Companies that previously implemented lower caps may now increase them, perhaps gradually, to align with legal ceilings. Similarly, companies that have not consistently disclosed their FOLs will be required to officially report their foreign ownership limits to the market. This reform is expected to improve foreign investors&rsquo; access and increase transparency on FOLs of publicly listed companies.</li>
<li><strong>Elimination of Pre-Funding Requirement (Nov 2024):</strong><br />Overseas investors no longer need to fully pre-fund equity trades, removing a long-standing obstacle for foreign inflows. Under Vietnam&rsquo;s old system, foreign investors had to fully transfer cash to a domestic account before trade execution. This tied up liquidity and created the risk of failed trades if orders were not matched.</li>
<li><strong>Launch of KRX Trading System (May 2025):</strong><br />Vietnam&rsquo;s new securities trading and post-trade system, KRX, developed in partnership with the Korea Exchange, replaces the country&rsquo;s legacy infrastructure. The modern platform can handle higher trading volumes and shorten trade settlement cycles. More importantly, it paves the way towards central counterparty clearing (CCP) that will allow Vietnam to meet global trade settlement standards.</li>
<li><strong>IPO Acceleration Reforms (Sep 2025):</strong><br />The Vietnamese government has streamlined the IPO and listing procedures, reducing the time for shares to debut on the exchange from 90 days to just 30 days. The government hopes this initiative will encourage major state-owned enterprises and large private companies to list their shares. This, in turn, will expand the market&rsquo;s size and make it more attractive to foreign investors.</li>
<li><strong>Ongoing English Disclosure Rollouts (Sep 2025):</strong><br />Regulations are being phased in, requiring all listed firms to publish financials and filings in English. These measures are aimed at boosting transparency and attracting more foreign investment to Vietnam&rsquo;s capital markets.</li>
</ul>

<h2 id="index-upgrades" class="jump-link-nav anchored-block" data-jumplink-title="Index Upgrades">Meeting FTSE&rsquo;s Criteria: Why an Upgrade to E.M. May Be on the Horizon</h2>
<p>Vietnam has been on FTSE Russell&rsquo;s watchlist for secondary emerging market status since 2018. Under FTSE Russell&rsquo;s system, Secondary Emerging market status is a classification between Frontier and Advanced Emerging. It applies to markets that meet requirements for quality (infrastructure, settlement, capital repatriation) and size, including sufficient eligible securities for the FTSE Emerging Index, but fall short of Advanced Emerging standards. As of mid-2025, analysts and investors widely expect the country to receive an upgrade in September 2025. The country&rsquo;s compliance with funding standards, enhancements in settlement and trading infrastructure along with meaningful progress on foreign investor access, makes it a strong contender for an upgrade.</p>
<p>FTSE estimates that reclassification could trigger up to $6 billion in capital inflows into Vietnamese equities.<sup>4</sup>&nbsp;In addition, The World Bank has estimated that an upgrade to emerging market status and inclusion in global indices could help Vietnam attract $25 billion in international capital inflows by 2030.<sup>5</sup></p>
<h2>What Vietnam Still Needs to Do for MSCI Emerging Market Status</h2>
<p>Vietnam's government has approved a comprehensive plan to meet MSCI's emerging market (EM) criteria by 2030. The roadmap involves a series of market and regulatory reforms designed to modernize the country's stock market, attract foreign investment, and increase liquidity.</p>
<p>While FTSE may upgrade Vietnam, MSCI Emerging Market inclusion remains a longer-term target for the country. As reforms accelerate, including the introduction of securities lending, a central clearing system, stronger disclosures, and greater regulatory consistency, Vietnam&rsquo;s market is positioning itself for broader global recognition. This creates a timely opportunity for investors to gain exposure ahead of a potential re-rating.</p>
<h2>Why This Is a Timely Moment to Own Vietnam</h2>
<p>Vietnam&rsquo;s benchmark VN Index has already surged approximately 30% year-to-date<sup>6</sup>, outpacing all major Southeast Asian peers. Investor enthusiasm in the market is being driven by a clear policy momentum, a wave of reclassification-fueled inflows and relatively attractive equity valuations compared to other EM/Asia peers.</p>
<p>Vietnam has emerged as a reform-driven, globally integrated, and fast-growing economy with a clear commitment to global best practices. Ongoing market reforms, index upgrades on the horizon, and strong economic fundamentals make a strong case to gain exposure to Vietnamese equities.</p>
<h2>How to Invest</h2>
<p><a href="/link/ee96cb0806fb4d03bc33aa404ce73c2b.aspx" title="VNM - VanEck Vietnam ETF - Overview"><strong>VanEck Vietnam ETF (VNM)</strong></a> provides access to the growth story of Vietnam and could be an appealing investment for investors seeking growth exposure outside of traditional emerging markets. <strong><a href="/link/ee96cb0806fb4d03bc33aa404ce73c2b.aspx" title="VNM - VanEck Vietnam ETF - Overview">VNM</a></strong>, the largest and most liquid<sup>7</sup>&nbsp;U.S.-listed Vietnam ETF, provides investors with one trade access to the Vietnamese&nbsp;market.</p>

<p>To receive more <a href="/us/en/insights/emerging-markets-equity/" title="Emerging Markets Equity Insights"><strong>Emerging Markets Equity</strong></a> insights, <a href="/us/en/subscribe/" title="Subscription Center"><strong>sign up in our subscription center</strong></a>.</p>
]]></content:encoded>
</item><item rdf:about="https://www.vaneck.com/us/en/blogs/emerging-markets-bonds/vaneck-emerging-markets-bond-strategy-question-and-answer/">
  <title>VanEck Emerging Markets Bond ETF: Question &amp; Answer></title>
  <link>https://www.vaneck.com/us/en/blogs/emerging-markets-bonds/vaneck-emerging-markets-bond-strategy-question-and-answer/</link>
  <description><![CDATA[Access emerging markets bonds with a flexible, actively managed strategy that invests across the full spectrum of EM debt.]]></description>
  <dc:creator> </dc:creator>
  <dc:date>10/05/2025 18:30:00</dc:date>
<content:encoded><![CDATA[

<script>
    //Temporary script
    $(function () {
        $(".popup-youtube, .popup-vimeo, .popup-gmaps").on("click", function (e) {
            e.preventDefault();
            var width = $(window).width();
            if (width > 768) {
                openSimpleIframeModalDialog($(this).attr('href'), "video-modal");
            } else if ($(this).is('.popup-youtube')) {
                var target = $(this).attr('data-video');
                self.location = target;
            }
        });
    });
</script>
<style>
    .modal.fade.video-modal div.modal-dialog {
        margin: 7% auto !important;
    }

    .modal-simple-iframe .close span {
        font-size: 35px;
        line-height: 1;
    }
</style>
<p>As one of the first <i>truly</i> blend <strong><a href="https://www.vaneck.com/us/en/blogs/emerging-markets-bonds/the-investment-case-for-emerging-markets-debt/" title="The Investment Case for Emerging Markets Debt">emerging markets bond strategies</a></strong> in the market, the <a href="/link/f447bf0c04f64108a3dcff3ca025af4a.aspx" title="EMBX - VanEck Emerging Markets Bond ETF - Overview"><strong>VanEck Emerging Markets Bond ETF (EMBX)</strong></a> is actively managed with the flexibility to invest in sovereign and corporate debt in hard- and local-currency. Here we answer commonly asked questions about the <a href="/link/f447bf0c04f64108a3dcff3ca025af4a.aspx" title="EMBX - VanEck Emerging Markets Bond ETF - Overview"><strong>VanEck Emerging Markets Bond ETF (EMBX)</strong></a>.</p>
<ul class="content-list">
<li><strong><a href="#point-one">Why invest in EM debt?</a></strong></li>
<li><strong><a href="#point-two">How does the VanEck Emerging Markets Bond ETF invest in EM debt?</a></strong></li>
<li><strong><a href="#point-three">Who is responsible for managing the ETF?</a></strong></li>
<li><strong><a href="#point-four">How does the Investment Team construct its portfolio(s)?</a></strong></li>
<li><strong><a href="#point-five">How does the Investment Team conduct research?</a></strong></li>
<li><strong><a href="#point-six">How can investors buy VanEck ETFs?</a></strong></li>
</ul>
<h2 id="point-one" class="anchored-block">Why invest in EM debt?</h2>
<p><strong>1. Emerging Markets Have Lower Debt</strong></p>
<p>Emerging markets (EM), in general, have had much lower debt levels due to consistently lower fiscal deficits compared to the U.S. and other developed markets (DM). For EM bonds, this means a powerful technical tailwind compared to DM &ndash; EM is issuing much less debt than DM, and some EMs are even issuing less debt than principal and interest coming due on their debt. Low debt also allows central bank monetary policy to have traction &ndash; it allows central banks to credibly hike rates to counter price inflation.</p>
<p><strong>2. EM Has Independent Central Banks</strong></p>
<p>The primary goal of EM central banks is to control inflation, which they do by maintaining high real interest rates and regulating banks. For EM bonds, the result has been higher real and nominal policy rates. This higher carry rewards investors in local-currency bonds directly.</p>
<p><strong>3. EM Benefits from the New Global Economic Structure (with a Boost from China&rsquo;s Reopening)</strong></p>
<p>Unlike developed markets, which experience higher commodity prices as a price shock, many emerging markets export more commodities than they import, which means they benefit from higher prices. This dynamic means emerging markets are good creditors in dollar terms and have dollars on hand to stabilize their local currency if needed. China&rsquo;s re-opening and the support this gives to its trading partners is clear in this regard.</p>
<p>Additionally, a new global financial structure dynamic is currently unfolding &ndash; EMs are opening trade and financing structures and using each other&rsquo;s currencies in trade. For example, China and India can now pay for Gulf oil with CNY and INR; this forces those Gulf central banks to use that cash to buy Chinese and Indian bonds. We don&rsquo;t happen to like the CNY nor INR bonds, but there are tons of great EM bond markets subject to this new dynamic.</p>
<p>We think EM bonds should be a key part of investors&rsquo; strategic allocations in 2025 and beyond. Learn more in <a href="https://www.vaneck.com/us/en/blogs/emerging-markets-bonds/the-investment-case-for-emerging-markets-debt/" title="The Investment Case for Emerging Markets Debt"><strong>The Investment Case for Emerging Markets Debt</strong></a>.</p>
<h2 id="point-two" class="anchored-block">How does the VanEck Emerging Markets Bond team invest in EM debt?</h2>
<p>The VanEck Emerging Markets Bond team first deploys a quantitative process that identifies the cheapest bonds in the EM debt universe. The team then screens the initially identified cheap bonds for non-systematic risks, eliminating those deemed too risky. The ETF is differentiated by investing across all components of EM debt (sovereign, corporate, hard-currency, local-currency), by being index-agnostic, and by its&rsquo; bottom-up approach. The benefit of this investment approach is potential portfolio outperformance vs the Index over a market cycle.</p>
<p>The <a href="/link/f447bf0c04f64108a3dcff3ca025af4a.aspx" title="EMBX - VanEck Emerging Markets Bond ETF - Overview"><strong>VanEck Emerging Markets Bond ETF (EMBX)</strong></a> is a high active share emerging market bond investment solution with the flexibility to navigate across sovereigns, corporates, USD and local currency bonds. It is managed by an established investment team that merges industry and personal experience to develop superior understanding of global markets and local policy. The team utilizes a quantitative and qualitative process to exploit significantly undervalued opportunities within a disciplined risk management framework.</p>
<h3>Flexibility to Invest across All Components of EM Debt</h3>
<p><strong>VanEck Emerging Markets Bond Allocations Over Time</strong></p>
<p><img loading="lazy" class="img-responsive w-100" src="https://www.vaneck.com/contentassets/d2d5b9d97e5445e9b66d600e37ec8ed0/6248-embx-chart_2025-10_v1.svg" alt="VanEck Emerging Markets Bond Strategy Allocation" /></p>
<p class="chart-disclosure">HC = Hard Currency; LC = Local Currency.</p>
<p class="chart-disclosure"><strong>Source: Bloomberg and FactSet. Data for the 10YR period ending September 30, 2025.</strong></p>
<p class="chart-disclosure">For illustrative purposes only. The information above is intended to demonstrate VanEck&rsquo;s investment process and strategies, and the types of investment opportunities VanEck may consider. During any given stage of the investment process the selection criteria may vary from those shown above. <strong>Information regarding investment opportunity selection criteria is intended as guidelines which are subject to change by VanEck at any time without notice. Any projections, forecasts or forward-looking statements do not reflect actual results, and are not intended as financial advice, a recommendation to buy or sell any securities, or any call to action.</strong></p>
<h2 id="point-three" class="anchored-block">Who is responsible for managing the ETF?</h2>
<p><a href="/link/db5971bd4f1b4eaab24e30c743613c84.aspx" title="Eric Fine &mdash; Portfolio Manager, Active Emerging Markets Debt"><strong>Eric Fine</strong></a> is the Portfolio Manager of the <a href="/link/f447bf0c04f64108a3dcff3ca025af4a.aspx" title="EMBX - VanEck Emerging Markets Bond ETF - Overview"><strong>VanEck Emerging Markets Bond ETF (EMBX)</strong></a>, with over 34 years of industry experience and 14 years at VanEck. Eric began his career working for Harvard University in Russia. After that, he held senior leadership positions at Morgan Stanley, including running EM Economics and Fixed Income Research, and founding and managing Morgan Stanley&rsquo;s Emerging Markets Proprietary Trading group. Eric advised numerous governments on economic policies and debt profiles; he also worked on restructuring sovereign debts in Russia, Turkey and the Dominican Republic. For additional detail on Eric&rsquo;s unique background and how it impacts his management of the Fund.</p>
<p>Eric is supported by Deputy Portfolio Manager David Austerweil, <a href="https://www.vaneck.com/us/en/news-and-insights/thought-leaders/natalia-gurushina/" title="Natalia Gurushina - Chief Economist, Emerging Markets Fixed Income"><strong>Chief Economist Natalia Gurushina</strong></a> and Senior Corporate Analyst Robert Schmieder. In addition, the team draws on the collective resources of VanEck&rsquo;s extensive emerging markets fixed income and equity platform, which comprises 16 portfolio managers and analysts.</p>
<p>VanEck has been investing in emerging markets for three decades, and manages $6.5B in emerging markets assets across active passive equity and debt investment solutions.</p>
<div class="epi-contentfragment">how-to-invest-insights-embx</div>
<br />
<h2 id="point-four" class="anchored-block">How does the investment team construct its portfolio(s)?</h2>
<p>The VanEck Emerging Markets Bond team adheres to a disciplined three-step investment process, as highlighted below.</p>
<p><strong><i>Step 1: Valuation</i></strong></p>
<p>This first step of the investment process is designed to identify the cheapest sovereigns and corporates, in hard and local currencies, with attractive risk/reward profiles compared to other investments with similar fundamentals. This step is 100% quantitative.</p>
<p><strong><i>Step 2: Screening</i></strong></p>
<p>The second step of the investment process is to screen the investments generated by Step 1 via three tests. Each test can get one of two passing or two failing grades, and strong failing grades eliminate the investment. This step is subjective, but quantitatively-informed and documented. ESG considerations are integrated into this step of the process.</p>
<div class="wrapped-div">
<table style="width: 100%;">
<tbody>
<tr class="tbl-data">
<td class="tbl-header last" style="text-align: left;">&nbsp;</td>
<td class="tbl-header last" style="text-align: left;">Issuer</td>
<td class="tbl-header last" style="text-align: right;">Initial Allocation</td>
<td class="tbl-header last" style="text-align: left;">Policy Test</td>
<td class="tbl-header last" style="text-align: left;">Economic Test</td>
<td class="tbl-header last" style="text-align: left;">Technical Test</td>
<td class="tbl-header last" style="text-align: left;">&nbsp;</td>
<td class="tbl-header last" style="text-align: right;">Adjusted Allocation</td>
</tr>
<tr class="tbl-data">
<td class="data-td last" style="text-align: left;">Local currency sovereign example</td>
<td class="data-td data last" style="text-align: left;">Country B</td>
<td class="data-td data last" style="text-align: right;">8.64%</td>
<td class="data-td data last" style="text-align: left;">STRONG PASS</td>
<td class="data-td data last" style="text-align: left;">WEAK FAIL</td>
<td class="data-td data last" style="text-align: right;">7.64%</td>
</tr>
<tr class="tbl-data">
<td class="data-td last" style="text-align: left;">Hard currency sovereign example</td>
<td class="data-td data last" style="text-align: left;">Country A</td>
<td class="data-td data last" style="text-align: right;">0.30%</td>
<td class="data-td data last" style="text-align: left;">STRONG PASS</td>
<td class="data-td data last" style="text-align: left;">WEAK PASS</td>
<td class="data-td data last" style="text-align: left;">&rarr;</td>
<td class="data-td data last" style="text-align: right;">7.64%</td>
</tr>
<tr class="tbl-data">
<td class="tbl-header last" style="text-align: left;">&nbsp;</td>
<td class="tbl-header last" style="text-align: left;">Issuer</td>
<td class="tbl-header last" style="text-align: right;">Initial Allocation</td>
<td class="tbl-header last" style="text-align: left;">Policy Test</td>
<td class="tbl-header last" style="text-align: left;">Economic Test</td>
<td class="tbl-header last" style="text-align: left;">Technical Test</td>
<td class="tbl-header last" style="text-align: left;">&nbsp;</td>
<td class="tbl-header last" style="text-align: right;">Adjusted Allocation</td>
</tr>
<tr class="tbl-data">
<td class="data-td last" style="text-align: left;">Corporate hard currency example</td>
<td class="data-td data last" style="text-align: left;">Corporate 1</td>
<td class="data-td data last" style="text-align: right;">1.00%</td>
<td class="data-td data last" style="text-align: left;">WEAK PASS</td>
<td class="data-td data last" style="text-align: left;">&rarr;</td>
<td class="data-td data last" style="text-align: right;">1.00%</td>
</tr>
</tbody>
</table>
</div>
<br />
<p class="chart-disclosure"><strong>Source: Bloomberg and VanEck.</strong> For illustrative purposes only. The information above is intended to demonstrate VanEck&rsquo;s investment process and strategies, and the types of investment opportunities that VanEck may consider. During any stage of the investment process, the selection criteria may vary from those shown above. Information regarding investment opportunity selection criteria is intended as guidelines which are subject to change by VanEck at any time without notice. Any projections, forecasts or forward-looking statements do not reflect actual results, and are not intended as financial advice, a recommendation to buy or sell any securities, or any call to action.</p>
<p><strong><i>Step 3: Portfolio construction and risk management</i></strong></p>
<p>Portfolios are constructed based on the investment process and the risk limits of the ETF.</p>
<h2 id="point-five" class="anchored-block">How does the investment team conduct research?</h2>
<p>The team conducts regular visits to key countries and their officials. These meetings include government officials (e.g., central bank, ministry of finance), private sector (e.g., banks, non-financial corporates), and independent bodies (e.g., media, official international organizations, opposition parties). In addition, the investment team has similar meetings in the U.S., and regularly attends conferences focused on risks and opportunities in the emerging markets bond space.</p>

<p class="d-none d-lg-block"><a href="mailto:askvaneck@vaneck.com" title="Have More Questions? - Ask VanEck" rel="noopener"><img loading="lazy" class="img-responsive" src="https://www.vaneck.com/globalassets/home/us/insights/blogs/bm-blog-images/cta-faq_desktop-02.svg" alt="Have More Questions? - Ask VanEck" /></a></p>
<p class="d-lg-none"><a href="mailto:askvaneck@vaneck.com" title="Have More Questions? - Ask VanEck" rel="noopener"><img loading="lazy" class="img-responsive" src="https://www.vaneck.com/globalassets/home/us/insights/blogs/bm-blog-images/cta-faq_mobile-01.svg" alt="Have More Questions? - Ask VanEck" /></a></p>
<p>To receive more <a href="/us/en/insights/emerging-markets-bonds/" title="Emerging Markets Bonds Insights"><strong>Emerging Markets Bonds</strong></a> insights, <a href="/us/en/subscribe/" title="Subscription Center"><strong>sign up in our subscription center</strong></a>.</p>
<style type="text/css">
 .wrapped-div {
 max-width: 100%;
 }

 @media (max-width: 768px) {
 .wrapped-div {
 overflow-x: scroll;
 }
 }

 .wrapped-div-sector {
 max-width: 100%;
 overflow-x: scroll;
 }
</style>
]]></content:encoded>
</item><item rdf:about="https://www.vaneck.com/us/en/blogs/digital-assets/matthew-sigel-vaneck-crypto-monthly-recap-for-september-2025/">
  <title>VanEck Crypto Monthly Recap for September 2025></title>
  <link>https://www.vaneck.com/us/en/blogs/digital-assets/matthew-sigel-vaneck-crypto-monthly-recap-for-september-2025/</link>
  <description><![CDATA[September brought familiar weakness across crypto markets with token declines, lower blockchain revenues from fading volatility, and renewed focus on Solana&rsquo;s Alpenglow upgrade, Ethereum&rsquo;s Fusaka milestone, and enterprise blockchain revival.]]></description>
  <dc:creator>Matthew  Sigel</dc:creator>
  <dc:date>10/03/2025 06:30:00</dc:date>
<content:encoded><![CDATA[

<p><strong>Please note that VanEck may have a position(s) in the digital asset(s) described below.</strong></p>
<p><strong>Three key takeaways for September:</strong></p>
<ul class="content-list">
<li class="mt-2"><strong>Crypto markets cool: </strong>Most tokens finished September lower, with <strong>23 </strong>of <strong>35</strong> major assets declining as late-month selloffs erased earlier gains. BTC held firm <strong>(+5%)</strong> while ETH slipped <strong>(-5%).</strong></li>
<li class="mt-2"><strong>DAT boom continues: </strong>Entities like Bitmine and MicroStrategy drive total DAT assets to approximately <strong>$135B</strong>, although sustainability depends on maintaining volatility-driven funding.</li>
<li class="mt-2"><strong>Perpetual DEXs surge: </strong>Aster and Hyperliquid captured nearly one-third <strong>(32%)</strong> of all blockchain fees as perpetual futures trading volumes jumped <strong>(+30%)</strong> MoM, powered by Aster&rsquo;s token launch and incentive farming..</li>
</ul>
<h3 id="price-returns" class="jump-link-nav anchored-block" data-jumplink-title="Price Returns">Price Returns</h3>
<div class="wrapped-div">
<table style="width: 100%;">
<tbody>
<tr class="tbl-data">
<td class="tbl-header last text-left">&nbsp;</td>
<td class="tbl-header last text-right">September (%)</td>
<td class="tbl-header last text-right">YTD (%)</td>
</tr>
<tr class="tbl-data">
<td class="data-td data last text-left">MarketVector Global Digital Assets Equity Index</td>
<td class="data-td data last text-right">21.77</td>
<td class="data-td data last text-right">50.04</td>
</tr>
<tr class="tbl-data">
<td class="data-td data last text-left">Coinbase</td>
<td class="data-td data last text-right">10.82</td>
<td class="data-td data last text-right">35.92</td>
</tr>
<tr class="tbl-data">
<td class="data-td data last text-left">Nasdaq Index</td>
<td class="data-td data last text-right">5.59</td>
<td class="data-td data last text-right">17.33</td>
</tr>
<tr class="tbl-data">
<td class="data-td data last text-left">Bitcoin</td>
<td class="data-td data last text-right">5.18</td>
<td class="data-td data last text-right">21.70</td>
</tr>
<tr class="tbl-data">
<td class="data-td data last text-left">S&amp;P 500 Index</td>
<td class="data-td data last text-right">3.51</td>
<td class="data-td data last text-right">13.70</td>
</tr>
<tr class="tbl-data">
<td class="data-td data last text-left">MarketVector Smart Contract Leaders Index</td>
<td class="data-td data last text-right">-0.34</td>
<td class="data-td data last text-right">1.69</td>
</tr>
<tr class="tbl-data">
<td class="data-td data last text-left">MarketVector Meme Coin Index</td>
<td class="data-td data last text-right">-0.88</td>
<td class="data-td data last text-right">-47.85</td>
</tr>
<tr class="tbl-data">
<td class="data-td data last text-left">MarketVector Infrastructure Application Leaders Index</td>
<td class="data-td data last text-right">-1.09</td>
<td class="data-td data last text-right">-38.15</td>
</tr>
<tr class="tbl-data">
<td class="data-td data last text-left">Ethereum</td>
<td class="data-td data last text-right">-4.94</td>
<td class="data-td data last text-right">23.49</td>
</tr>
<tr class="tbl-data">
<td class="data-td data last text-left">MarketVector Decentralized Finance Leaders Index</td>
<td class="data-td data last text-right">-12.43</td>
<td class="data-td data last text-right">-40.34</td>
</tr>
</tbody>
</table>
</div>
<br />
<p class="chart-disclosure">Source: Bloomberg as of 9/30/2025. <strong>Index performance is not representative of fund performance. It is not possible to invest directly in an index. Past performance is no guarantee of future results. Not intended as a recommendation to buy or sell any securities named herein.</strong></p>
<h3><a href="https://www.marketvector.com/indexes/digital-assets/marketvector-smart-contract-leaders" target="_blank" title="MVSCLE - MarketVector Smart Contract Leaders Index" rel="noopener">MarketVector Smart Contract Leaders Index (MVSCLE)</a> &mdash; 1-Year Performance</h3>
<p><img loading="lazy" class="img-responsive w-100" alt="MarketVector Smart Contract Leaders Index (MVSCLE) &mdash; 1-Year Performance" src="https://www.vaneck.com/contentassets/98a558263d204db2aa3da860cc99275d/6243_crypto-monthly-sep_chart-1_2025-10_v1_blog.svg" /></p>
<p class="chart-disclosure">Source: Bloomberg as of 9/29/2025.<strong> Index performance is not representative of fund performance. It is not possible to invest directly in an index. Past performance is no guarantee of future results. Not intended as a recommendation to buy or sell any securities named herein.</strong></p>
<p>September was a disappointing month for most cryptocurrencies as the selloff in the waning days of the month dragged most tokens underwater. Out of the <strong>35</strong> major native blockchain tokens we track, <strong>23</strong> of them experienced a decline in value in September. BTC was positive <strong>(+5%),</strong> ETH was down <strong>(-5%),</strong> and the performance of the alt-token complex was mixed, with <a href="https://www.marketvector.com/indexes/digital-assets/marketvector-smart-contract-leaders" target="_blank" title="MVSCLE - MarketVector Smart Contract Leaders Index" rel="noopener"><strong>the MarketVector Smart Contract Leaders Index (MVSCLE)</strong></a> flat <strong>(0%).</strong> Thematically, stablecoins once again seized the narrative with Plasma&rsquo;s (XPL) <strong>$10B</strong> chain launch that included a <strong>$1.25B+</strong> airdrop to users of the platform as well as Binance&rsquo;s BNB token stakers. This, alongside the emergence of Binance&rsquo;s Perps exchange, called Aster, contributed to BNB&rsquo;s <strong>(+16%)</strong> outperformance on the month.</p>
<p>The seasoned crypto investor is not surprised by September&rsquo;s weak performance. Since 2016, across the <strong>35</strong> tokens we track, September has delivered negative returns <strong>(62%)</strong> of the time. While both BTC and ETH recorded positive returns in September in each of the last <strong>two</strong> years, looking back further in history reveals a typical weakness. BTC posted negative results in six consecutive September&rsquo;s prior, while ETH was negative in <strong>five</strong> of the previous <strong>six</strong>. On average, since 2016, BTC has returned <strong>(&ndash;3%)</strong> in September, while ETH has lost (<strong>&ndash;7%</strong>)<strong>.</strong></p>
<p>Onchain, spot crypto decentralized exchange (DEX) volumes were roughly equal to those in August at approximately <strong>$365B</strong>. However, the trading volume of perpetual futures (perps) on DEXes was <strong>(+30%),</strong> and this surge was almost entirely due to the trading on BNB&rsquo;s Aster, which we cover later in this write-up. Absent the explosion in &ldquo;farming&rdquo; volumes on Aster, perp volumes were actually down <strong>(-15%)</strong> month-over-month.</p>
<h2>Blockchain Revenues Decline due to Reduced Volatility</h2>
<p>One of the most notable onchain developments in September was the broad decline in blockchain revenues, which fell<strong> (-16%) </strong>MoM. Among major networks, Ethereum&rsquo;s revenue decreased by <strong>(-6%),</strong> Solana&rsquo;s by <strong>(-11%),</strong> and Tron&rsquo;s by a striking <strong>(-37%).</strong> This contraction was largely driven by reduced crypto market volatility, evidenced by volatility declines of SOL <strong>(-16%),</strong> ETH <strong>(-40%),</strong> and BTC <strong>(-26%)</strong> MoM. With reduced volatility for digital assets, there are fewer arbitrage opportunities to compel traders to pay high priority fees. Tron&rsquo;s sharp drop, however, was more related to the onchain governance Proposal #104, which more than halved transaction fees.</p>
<h3>Volatility Decreases Across Most Projects</h3>
<p><img loading="lazy" class="img-responsive w-100" alt="Volatility Decreases Across Most Projects" src="https://www.vaneck.com/contentassets/98a558263d204db2aa3da860cc99275d/6243_crypto-monthly-sep_chart-2_2025-10_v1_blog.svg" /></p>
<p class="chart-disclosure">Source: Artemis XYZ as of 9/29/2025. <strong>Index performance is not representative of fund performance. It is not possible to invest directly in an index. Past performance is no guarantee of future results. Not intended as a recommendation to buy or sell any securities named herein.</strong></p>
<h2>Notable Performance Winners and Laggards for September</h2>
<p><strong>Winners</strong></p>
<ol class="content-list">
<li class="mt-2">Mantel (MNT): (+53%)</li>
<li class="mt-2">Avalanche (AVAX): (+24%)</li>
<li class="mt-2">Binance (BNB): (+16%)</li>
</ol>
<p><strong>Laggards </strong></p>
<ol class="content-list">
<li class="mt-2">Polygon (POL): (-19%)</li>
<li class="mt-2">Arbitrum (ARB): (-17%)</li>
<li class="mt-2">Toncoin (TON): (-14%)</li>
</ol>
<h2 id="dat-update" class="jump-link-nav anchored-block" data-jumplink-title="DAT Update">Digital Asset Treasury (DAT) Update</h2>
<p>Thematically, September 2025 was characterized by the continued growth of digital asset treasuries (DATs), which swelled to hold around <strong>~$135B</strong> in assets <strong>(~53%</strong> in MSTR). DATs are entities that utilize financialization to increase common share exposure to digital assets. Some DAT EVs currently trade at mNAV premiums to the value of their digital asset treasury holdings. We believe this is partly explained by the market assigning a premium to entities that have a credible long-term ability to increase per-share digital asset exposure. To purchase more digital assets, companies often sell securities whose valuations are linked to the underlying volatility of the company&rsquo;s stock.</p>
<p>In order to &ldquo;reap&rdquo; the benefits of the volatility of their common shares (and the underlying digital assets), these entities must price the volatility they are selling well below the implied volatility of options. This allows sophisticated market participants to buy relatively cheap volatility (through common shares, convertible debt, or warrant sales) and hedge against relatively expensive options portfolios. These savvy traders then expect the volatility of the two positions to converge over time, enabling a profit on the trade.</p>
<h3>BNMR Enjoys Almost Twice the Daily Turnover of Other DATs</h3>
<p><img loading="lazy" class="img-responsive w-100" alt="BNMR Enjoys Almost Twice the Daily Turnover of Other DATs" src="https://www.vaneck.com/contentassets/98a558263d204db2aa3da860cc99275d/6243_crypto-monthly-sep_chart-3_2025-10_v1_blog.svg" /></p>
<p class="chart-disclosure">Source: Bloomberg as of 9/29/2025. <strong>Past performance is no guarantee of future results. Not intended as a recommendation to buy or sell any securities named herein.</strong></p>
<p>One issue that many new DATs are encountering is the lack of deep and liquid markets for the secondary trading of their securities (particularly options). As a result, DATs without a developed options market must offer investors large discounts on volatility. Recently, Bitmine Immersion, the largest ETH DAT with <strong>&gt;$11B</strong> in ETH holdings, sold common shares priced at <strong>$70</strong> (when the stock was trading at <strong>$61.39</strong>). Alongside these common shares were two attached warrants to purchase additional shares at a higher price. Effectively, Bitmine sold investors common shares in BNMR with two free call options with a strike price of <strong>$87.50</strong>. Using options math, each of these warrants is worth about <strong>$20</strong> on its own. Combined, Bitmine sold a package worth <strong>$104.61</strong> ($61.39 + $21.61 + $21.61) for <strong>$70</strong>. This means BNMR is underpricing volatility by selling warrants at a steep discount, which is quite a caper for the trader who can manage the options risk.</p>
<p>Stepping back, BNMR is the most widely traded DAT by nearly a factor of two and still had to underprice its volatility by <strong>~75%</strong> to provide enough juice for speculators to buy its securities. Apt investors should take note that these &ldquo;volatility reactors,&rdquo; as Saylor calls DATs, necessitate continual volatility to enable further purchase of cryptocurrencies. For almost a decade, cryptocurrency volatility has declined, and if this trend persists, it threatens the ability of DATs to finance more crypto purchases. As speculative zest fades at the same time and more digital asset products become available, mNAV should therefore fade because investors can no longer count on most DATs to expand their treasuries consistently.</p>
<h3>BTC 30-Day Trailing Volatility Trending Lower Due to Adoption</h3>
<p><img loading="lazy" class="img-responsive w-100" alt="BTC 30-Day Trailing Volatility Trending Lower Due to Adoption" src="https://www.vaneck.com/contentassets/98a558263d204db2aa3da860cc99275d/6243_crypto-monthly-sep_chart-4_2025-10_v1_blog.svg" /></p>
<p class="chart-disclosure">Source: Artemis XYZ as of 9/29/2025. <strong>Past performance is no guarantee of future results. Not intended as a recommendation to buy or sell any securities named herein.</strong></p>
<p>Another developing narrative is that DATs may actively compress implied volatility by selling options (and by selling warrants) to generate income. Saylor recently confirmed at a conference that Strategy would pursue this approach under circumstances where he could not issue shares due to MSTR mNAV &lt;1. If BTC faces a prolonged and significant price pullback, mNAVs for other entities could also decline and those entities may begin to sell options to generate cashflow. This dynamic could reduce implied volatility across the sector and eventually leave the &ldquo;volatility well&rdquo; depleted, limiting the ability of DATs to purchase assets.</p>
<h2>Solana Update (+2%)</h2>
<p><strong>SOL/ETH Below 1-Year Trendline</strong></p>
<p><img loading="lazy" class="img-responsive w-100" alt="SOL/ETH Below 1-Year Trendline" src="https://www.vaneck.com/contentassets/98a558263d204db2aa3da860cc99275d/6243_crypto-monthly-sep_chart-5_2025-10_v1_blog.svg" /></p>
<p class="chart-disclosure">Source: Artemis XYZ as of 9/29/2025. <strong>Past performance is no guarantee of future results. Not intended as a recommendation to buy or sell any securities named herein.</strong></p>
<p>The SOL token had a relatively good, but deeply unsatisfying, end to the month after it punched above <strong>$250</strong> mid-month before falling below $200 in the span of a week. SOL&rsquo;s price action was mostly driven by ebullience surrounding the potential SOL ETP and the start of several new SOL-focused digital asset treasuries (DATs). In September, the two major DAT behemoths, Forward <strong>($1.5B</strong>) and Helius <strong>($500M),</strong> began operations, which translated into increased buying demand for SOL. At the time of writing, it is estimated that Solana DATs hold <strong>2.5% </strong>of the total SOL supply, and there are rumors that more SOL DATs may be forming.</p>
<p>From the technical development standpoint, Solana opened the month with its validators voting to pass the Alpenglow upgrade by a <strong>(98%)</strong> margin. Many believe this is the largest upgrade to Solana&rsquo;s consensus in its history, as it is the first step towards changing many core features of the Solana software. Some of the most monumental impacts include:</p>
<ul class="content-list">
<li class="mt-2">Faster finality time, dropping from 12s to 150ms</li>
<li class="mt-2">Offchain voting on blocks</li>
<li class="mt-2">Improved validator economics</li>
<li class="mt-2">Simpler, faster network communication mechanisms</li>
<li class="mt-2">Higher levels of consensus stability</li>
<li class="mt-2">Improved efficiency</li>
</ul>
<p>As a consequence of the Alpenglow upgrade, there have been calls by some developers to increase the capacity of each block on Solana. Each transaction on Solana is quantified by the computing power needed to process it. The measurement of computing power is called &ldquo;compute units,&rdquo; and there is a limit to how many compute units a transaction can demand. Additionally, there is a limit on how many compute units an entire block of transactions can contain. Effectively, Solana&rsquo;s transaction throughput is limited by the number of compute units that can be packed into each block. Already, Solana is on track to increase block capacity by <strong>25%</strong> by the end of the year, while Jump&rsquo;s Firedancer team recently proposed SIMD-0370 to remove Solana&rsquo;s fixed compute unit block limit entirely.</p>
<p>Another, deeper change to Solana&rsquo;s architecture comes from creating the &ldquo;P-token&rdquo; which is intended to replace the current token format called &ldquo;SPL token.&rdquo; The SPL tokens are inefficient because they consume a substantial number of compute units when they are transferred or traded. Around <strong>10%</strong> of all of Solana&rsquo;s blockspace (a rough synonym for compute unit capacity of each block) is utilized by SPL token compute units. The &ldquo;P-token&rdquo; will reduce the compute needs of tokens by <strong>95%.</strong> As a result, Solana can increase its transaction throughput by nearly <strong>10%.</strong></p>
<p>In terms of its offering for the current financial system, Solana has been winning market share for products like tokenized stocks. In the past few months, Solana has hosted 60% of the volume on its Chain. At the same time, Solana added <strong>$2B</strong> worth of stablecoins to its blockchain to bring its total to <strong>$14.3B.</strong></p>
<h3 id="enterprise-blockchains" class="jump-link-nav anchored-block" data-jumplink-title="Enterprise Blockchains">Enterprise Blockchains Re-Emerge</h3>
<p>Cryptocurrency is the nexus of cryptography, distributed systems, and economics to create a private money that competes with government-backed fiat. Once Bitcoin proved that decentralized networks could coordinate and transfer value, others began to experiment with building blockchains with fewer technical limitations. Amongst these actors were corporations and foundations dedicated to building chains that solved issues plaguing large companies. While blockchains presented a range of potential applications, the majority of corporate endeavors were exploratory in nature, motivated by a desire to align with perceived trends rather than by serious strategic intent.</p>
<p>For example, in 2016, JP Morgan forked Ethereum to create Quorum, a permissioned chain for use by financial institutions, that incorporated smart contracts to speed up asset settlement, enforce repo transactions, and reduce compliance checks in cross-border payments. By 2018, entities such as Walmart and Carrefour were utilizing blockchain to trace the origin of vegetables sold in their stores. Another interesting experiment was HSBC&rsquo;s Voltron digitizing letters of credit and MineHub, which placed a BHP iron-ore trade on a private blockchain in 2020. In the shipping sector, Tradelens, a collaboration of IBM and Maersk, used IBM&rsquo;s Fabric distributed ledger to document global shipping data and documentation.</p>
<p>The majority of these early projects delivered little more than PR buzz and tax breaks from R&amp;D spending. Most were proof-of-concepts that either lacked a real-world problem to solve or were blocked by regulatory constraints. Many collapsed altogether when their values failed to exceed the necessary moment to launch beyond the gravitational pull of stakeholders wedded to legacy systems. With the latest surge in token prices as well as the pending legislation on stablecoins and digital assets, corporations are once again exploring blockchain use. However, this time appears to be different because there is both legal clarity and encouragement for utilizing blockchain coming from Washington, DC. It appears that this is the &ldquo;crypto moment&rdquo; in the same way that 2009 was a &ldquo;green energy moment&rdquo; with the ascension of Barack Obama to the presidency.</p>
<p>Some of the most eye-catching &ldquo;enterprise&rdquo; blockchain projects include:</p>
<ol class="content-list">
<li class="mt-2"><strong>Figure Technologies</strong>
<ul class="content-list">
<li class="mt-2">Provenance is a Cosmos blockchain that is used as a ledger of record for HELOCs and, in the future, other asset-backed securities.</li>
</ul>
</li>
<li class="mt-2"><strong>SWIFT</strong>
<ul class="content-list">
<li class="mt-2">SWIFT is collaborating with 30 financial institutions to create a shared digital ledger that will be interoperable with existing blockchains.</li>
</ul>
</li>
<li class="mt-2"><strong>Societe Generale</strong>
<ul class="content-list">
<li class="mt-2">Forge is a fully regulated and compliant platform for tokenization and stablecoins, enabling connections to public blockchains and traditional market infrastructure.</li>
</ul>
</li>
<li class="mt-2"><strong>Stripe </strong>
<ul class="content-list">
<li class="mt-2">Tempo is an Ethereum based network that will become a neutral stablecoin payments network which can be used by agentic AI.</li>
</ul>
</li>
<li class="mt-2"><strong>Digital Asset</strong>
<ul class="content-list">
<li class="mt-2">Canton, a collaboration between DRW, Tradeweb, and GS, is a privacy-first, settlement network for securities trading and asset exchanges between financial institutions.</li>
</ul>
</li>
<li class="mt-2"><strong>Circle</strong>
<ul class="content-list">
<li class="mt-2">Arca, Circle&rsquo;s USDC-focused payments blockchain.</li>
</ul>
</li>
<li class="mt-2"><strong>OpenAI</strong>
<ul class="content-list">
<li class="mt-2">Worldchain is blockchain created to host the ID system that will distinguish human users from AI users on the internet.</li>
</ul>
</li>
<li class="mt-2"><strong>Coinbase</strong>
<ul class="content-list">
<li class="mt-2">Base is Coinbase&rsquo;s home for DeFi and crypto payments including the likely home of Cloudflare&rsquo;s AI agentic payment stablecoin NET.</li>
</ul>
</li>
<li class="mt-2"><strong>Ripple </strong>
<ul class="content-list">
<li class="mt-2">The Ripple network is creating a settlement system and payments financial entities like the major prime broker Hidden Road.</li>
</ul>
</li>
<li class="mt-2"><strong>JP Morgan </strong>
<ul class="content-list">
<li class="mt-2">Kinexys Digital Payments network to create programable, cross-chain payments 24/7.</li>
</ul>
</li>
</ol>
<h2>Ethereum Update (-5%)</h2>
<p>ETH traded down slightly<strong> (-5%) </strong>in September, underperforming BTC&rsquo;s <strong>(+5%)</strong> gain after two months of double-digit outperformance in July and August. Daily transactions fell <strong>(-8.7%)</strong> to <strong>47.2M</strong> from the all-time high of <strong>51.7M </strong>set in August but remained the second-highest month on record. Similarly, DEX trading volumes fell <strong>(-20.3%)</strong> to <strong>$111.9B</strong> from all-time highs of <strong>$140.5B</strong> set in August, the third-highest month on record behind the previous cycle highs of <strong>$118.1B</strong> set in June 2021. At <strong>$1.74T</strong>, stablecoin transfer volumes on Ethereum were also the second highest on record in September, down <strong>(-4%)</strong> from all-time highs of <strong>$1.80T</strong> in August, up <strong>(+105%)</strong> YTD.</p>
<h2>The Fusaka Upgrade</h2>
<p>Ethereum&rsquo;s scaling roadmap is entering its next phase with the planned Fusaka upgrade in December 2025, which will introduce Peer Data Availability Sampling (PeerDAS). PeerDAS helps improve Ethereum&rsquo;s Layer-2 (L2) blockchain scalability by reducing the data requirements needed by Ethereum validators to verify the L2s. As a result, Fusaka is designed to relieve one of the network&rsquo;s most pressing bottlenecks: data availability for rollups.</p>
<h3>Blob Count Reached New Target For The First Time Since The Dencun Upgrade</h3>
<p><img loading="lazy" class="img-responsive w-100" alt="Blob Count Reached New Target For The First Time Since The Dencun Upgrade" src="https://www.vaneck.com/contentassets/98a558263d204db2aa3da860cc99275d/6243_crypto-monthly-sep_chart-6_2025-10_v1_blog.svg" /></p>
<p class="chart-disclosure">Source: Dune Analytics <a href="https://x.com/hildobby/status/1970875271843872815" target="_blank" title="hildobby on X" rel="noopener"><strong>@hildobby</strong></a> as of 9/29/2025. <strong>Past performance is no guarantee of future results. Not intended as a recommendation to buy or sell any securities named herein.</strong></p>
<p>The chart above shows that average blob usage has reached the six-blob target for the first time since Dencun went live in March 2025. Dencun initially launched with a conservative cap of three blobs per block, but after developers confirmed network stability, the ceiling was raised to six in May. Since then, L2 rollups have increasingly filled this expanded blob space, demonstrating sustained demand for cheap data availability and marking another milestone in Ethereum&rsquo;s transition toward rollup-centric scaling. Currently, Coinbase&rsquo;s Base and Worldcoin&rsquo;s World Chain represent around <strong>60%</strong> of all data submitted by L2s to Ethereum.</p>
<p><strong>World Chain and Base Submit 60% of All L2 Data</strong></p>
<p><img loading="lazy" class="img-responsive w-100" alt="World Chain and Base Submit 60% of All L2 Data" src="https://www.vaneck.com/contentassets/98a558263d204db2aa3da860cc99275d/6243_crypto-monthly-sep_chart-7_2025-10_v1_blog.svg" /></p>
<p class="chart-disclosure">Source: Dune Analytics <a href="https://x.com/hildobby/status/1970875271843872815" target="_blank" title="hildobby on X" rel="noopener"><strong>@hildobby</strong></a> as of 9/30/2025. <strong>Past performance is no guarantee of future results. Not intended as a recommendation to buy or sell any securities named herein.</strong></p>
<p>Fusaka will allow Ethereum to raise blob capacity further by enabling nodes to validate blocks through probabilistic sampling rather than downloading full blob data. This approach reduces bandwidth and storage demands on validators, making higher blob throughput feasible without undermining security. The roadmap envisions incremental increases in blob targets through &ldquo;Blob Parameter Only&rdquo; (BPO) forks, with Fusaka providing the critical technical foundation. That said, PeerDAS introduces complexity, relying on erasure coding and statistical guarantees. Developers are intentionally conservative in their approach, rolling out capacity in phases to minimize the risk of bandwidth spikes or validator stress.</p>
<p>The implications of Fusaka are significant. By expanding blob capacity, the upgrade should lower costs for L2 rollups, translating into cheaper transactions for end users. All else equal, this should bring more onchain economic activity into Ethereum&rsquo;s orbit. While Fusaka may not materially restore L1 fee burns, since L2 adoption has historically cannibalized Ethereum&rsquo;s mainnet fee revenue, the upgrade reinforces ETH&rsquo;s role at the center of Ethereum&rsquo;s broader ecosystem.</p>
<p>The chart below highlights this dynamic, showing how declining L1 fee revenues have coincided with rising ETH dilution for non-stakers.</p>
<p><strong>Falling L1 Fees Are Driving Net ETH Dilution for Non-Stakers</strong></p>
<p><img loading="lazy" class="img-responsive w-100" alt="Falling L1 Fees Are Driving Net ETH Dilution for Non-Stakers" src="https://www.vaneck.com/contentassets/98a558263d204db2aa3da860cc99275d/6243_crypto-monthly-sep_chart-8_2025-10_v1_blog.svg" /></p>
<p class="chart-disclosure">Source: Artemis.xyz as of 9/29/2025. <strong>Past performance is no guarantee of future results. Not intended as a recommendation to buy or sell any securities named herein.</strong></p>
<p>As more economic activity takes place on L2s due to increased bandwidth and reduced fees, the economic security of Ethereum L1 settlements becomes increasingly important. This enhances ETH&rsquo;s importance as a store of value and monetary asset, even against the backdrop of a secular decline in L1 fee economics. In other words, investors should be aware that the case for ETH is trending away from its status as a fee-driven yield-bearing asset and instead towards a monetary one. Moreover, as institutional actors like DATs and ETPs continue to accumulate long-term ETH positions to stake for in-kind yield, investors holding unstaked ETH should be aware of their exposure to dilution.</p>
<h2 id="perp-dexs" class="jump-link-nav anchored-block" data-jumplink-title="Perp DEXs">The Battle of Perpetual Futures DEXs: Hyperliquid vs. Aster</h2>
<h3>Perpetual DEXs Surge: Aster and Hyperliquid Capture One-Third of Crypto Fee Revenues</h3>
<p><img loading="lazy" class="img-responsive w-100" alt="Perpetual DEXs Surge: Aster and Hyperliquid Capture One-Third of Crypto Fee Revenues" src="https://www.vaneck.com/contentassets/98a558263d204db2aa3da860cc99275d/6243_crypto-monthly-sep_chart-9_2025-10_v1_blog.svg" /></p>
<p>Source: Artemis.xyz as of 9/29/2025. <strong>Past performance is no guarantee of future results. Not intended as a recommendation to buy or sell any securities named herein.</strong></p>
<p>Perpetuals are becoming the fastest-growing corner of DeFi, and two names now dominate the conversation: Hyperliquid and Aster. Hyperliquid (HYPE) gained <strong>(+1.5%)</strong> this month, cooling off after being one of the Top 100 crypto&rsquo;s best performers YTD <strong>(+88%).</strong> Aster (ASTER), another decentralized exchange specializing in perpetual futures trading, stole the spotlight after launching its ASTER token in September, which is up <strong>(+1,667%)</strong> since it began trading on September 17th. Beyond price action, both protocols are now among the top fee generators in the crypto space, together accounting for nearly one-third <strong>(32%) </strong>of all blockchain fee revenues as of late September.</p>
<p><i>Perpetual futures (&ldquo;perps&rdquo;)</i> are derivatives that let traders speculate on the price of an asset with leverage but without expiry dates, making them the dominant product on centralized exchanges like Binance and OKX. Hyperliquid&rsquo;s success comes from transplanting this model onchain with a fully on-chain, high-performance order book deployed on its own Layer-1. Unlike earlier perp decentralized exchanges (&ldquo;DEXs&rdquo;) that relied on automated market makers (e.g., GMX&rsquo;s GLP pools) or hybrid off-chain order books (e.g., dYdX v3), Hyperliquid handles matching and risk management natively at the chain level.</p>
<p>This architecture enables it to provide instant user feedback on centralized exchanges while maintaining non-custodial settlement. Hyperliquid offers a superior user experience to legacy AMM-based DeFi applications that have been lauded by sophisticated and retail traders alike. The result has been strong adoption in perp trading volume and fee generation, with Hyperliquid now ranking among the top protocols in DeFi revenues.</p>
<p>Hyperliquid&rsquo;s native HYPE token is a fee-sharing token, allowing holders to earn a share of the protocol&rsquo;s fees when staking the asset. On a circulating basis, HYPE&rsquo;s <strong>$12.2B</strong> market cap against $976M in annualized revenues values the DEX at <strong>12.5x</strong> P/S, roughly in line with centralized exchange (&ldquo;CEX&rdquo;) comps such as Coinbase <strong>(11.5x)</strong> or Robinhood <strong>(23.7x).</strong> However, on a fully diluted basis, HYPE trades at <strong>45.7x</strong> revenues, a valuation more akin to high-growth SaaS than exchanges. We think this is a more appropriate valuation. There is ongoing uncertainty around how uncirculated HYPE tokens will be treated; a proposal to burn <strong>(45%)</strong> of HYPE&rsquo;s 1 billion supply cap was rejected in late September. It is also important to note that Hyperliquid&rsquo;s annualized revenues can be highly volatile and may not be sustainable in the long term. This is because substantial amounts of the application&rsquo;s trading activity is driven by HYPE token incentives.</p>
<p>Backed by CZ&rsquo;s family office YZi Labs, Aster leapt into the perps DEX conversation since launching its ASTER token on Binance&rsquo;s BNB Chain in mid-September. The platform <a href="https://medium.com/asterdex/aster-genesis-stage-2-trade-smarter-earn-better-07d121ee4841" title="Aster Genesis: Stage 2 &mdash; Trade Smarter &amp; Earn Better" target="_blank" rel="noopener"><strong>announced</strong></a> a points program that allocates <strong>(4%)</strong> of total supply, worth roughly <strong>$524M</strong> at a <strong>$13.1B</strong> FDV, to users based on their trading volumes, holding time, and other activities. While these incentives have driven sufficient volumes to reach the #1 position in crypto-native fees in late September, open interest suggests that this hasn&rsquo;t earned users&rsquo; long-term capital. Rather, much of Aster&rsquo;s fee generation appears to be wash trading by users &ldquo;farming&rdquo; the airdrop, as opposed to organic perp demand; at <strong>~$1.6B</strong>, Aster&rsquo;s open interest remains less than one-eighth that of Hyperliquid&rsquo;s.</p>
<h3>Hyperliquid's Open Interest Is &gt;8x Aster's</h3>
<p><img loading="lazy" class="img-responsive w-100" alt="Hyperliquid's Open Interest Is &gt;8x Aster's" src="https://www.vaneck.com/contentassets/98a558263d204db2aa3da860cc99275d/6243_crypto-monthly-sep_chart-10_2025-10_v1_blog.svg" /></p>
<p class="chart-disclosure">Source: DeFi Llama as of 9/30/2025. <strong>Past performance is no guarantee of future results. Not intended as a recommendation to buy or sell any securities named herein.</strong></p>
<p>ASTER&rsquo;s sharp price rally reflects the size of its airdrop carrot and corresponding market hype, but the real question is whether Aster&rsquo;s open interest can sustainably steal market share from Hyperliquid&rsquo;s more dominant liquidity after these incentives dry up. This remains uncertain because Aster has not made nearly the claim that Hyperliquid has beyond the ASTER token price pump. Additionally, Aster is an application wedded to Binance and may experience usability issues if Binance&rsquo;s blockchain becomes saturated with activity. On the other hand, Hyperliquid has demonstrated its functionality during extreme market events without serious degradation to the user's ability to trade.</p>
<p><strong>Links to third party websites are provided as a convenience and the inclusion of such links does not imply any endorsement, approval, investigation, verification or monitoring by us of any content or information contained within or accessible from the linked sites. By clicking on the link to a non-VanEck webpage, you acknowledge that you are entering a third-party website subject to its own terms and conditions. VanEck disclaims responsibility for content, legality of access or suitability of the third-party websites.</strong></p>
<p>To receive more <strong><a href="https://www.vaneck.com/us/en/insights/digital-assets/" title="Digital Assets Insights">Digital Assets</a></strong> insights, <strong><a href="https://www.vaneck.com/us/en/subscribe/" title="Subscription Center">sign up in our subscription center</a></strong>.</p>
]]></content:encoded>
</item><item rdf:about="https://www.vaneck.com/us/en/blogs/thematic-investing/resilient-retail-how-vanecks-rth-etf-stays-strong-amid-sector-shifts/">
  <title>Resilient Retail: How VanEck’s RTH ETF Stays Strong Amid Sector Shifts></title>
  <link>https://www.vaneck.com/us/en/blogs/thematic-investing/resilient-retail-how-vanecks-rth-etf-stays-strong-amid-sector-shifts/</link>
  <description><![CDATA[VanEck&rsquo;s RTH ETF remains resilient amid retail sector shifts by focusing on adaptable, high-performing companies like Amazon, Walmart, and Costco, while limiting exposure to underperformers.]]></description>
  <dc:creator> </dc:creator>
  <dc:date>10/02/2025 06:30:00</dc:date>
<content:encoded><![CDATA[

<p><strong>Key Takeaways:</strong></p>
<ul class="content-list">
<li>RTH continues to provide diversified retail exposure to leading retailers.</li>
<li>The ETF emphasizes adaptable leaders like Amazon, Walmart, and Costco that align with shifting consumer trends.</li>
<li>RTH helps reduce single-stock risk by balancing strong performers with limited exposure to struggling retailers.</li>
</ul>
<h2>Introduction</h2>
<p>The retail landscape is constantly evolving. Shifting consumer preferences and macroeconomic challenges force retailers to evolve or risk falling behind.</p>
<p>Even with these challenges, <strong><a href="/link/b638061645774dbeab416e78589cf25c.aspx" title="RTH - VanEck Retail ETF - Overview">VanEck&rsquo;s Retail ETF (RTH)</a></strong> continues to reflect a balanced approach to retail sector investing . In a market where some traditional stores are having a hard time, <a href="/link/b638061645774dbeab416e78589cf25c.aspx" title="RTH - VanEck Retail ETF - Overview"><strong>RTH</strong></a> gives a mix of investments. The methodology has allowed for companies that have demonstrated adaptability, while passively limiting exposure to those that have not.</p>
<h2>RTH ETF Diversification</h2>
<p><a href="/link/b638061645774dbeab416e78589cf25c.aspx" title="RTH - VanEck Retail ETF - Overview"><strong>VanEck&rsquo;s RTH ETF</strong></a> provides investors with targeted exposure to the leading U.S.-listed retailers across a variety of subsectors, from e-commerce giants to big-box stores and specialty chains.</p>
<p>A recent example is Target (TGT), which hit a 52-week low of $87.26, reflecting ongoing struggles with pricing, inventory, and adapting to evolving consumer expectations according to <a href="https://www.investing.com/news/company-news/target-stock-hits-52week-low-at-8726-usd-93CH-4249328" title="Target stock hits 52-week low at 87.26 USD" target="_blank" rel="noopener"><strong>Investing.com</strong></a>. Yet, despite Target&rsquo;s decline, <a href="/link/b638061645774dbeab416e78589cf25c.aspx" title="RTH - VanEck Retail ETF - Overview"><strong>RTH</strong></a> continues to provide diversified exposure to leading retailers, showcasing the ETF&rsquo;s ability to weather company-specific setbacks through strategic diversification.</p>
<h2>Consumer Preferences Are Shifting; Not All Retailers Are Ready</h2>
<p>Today&rsquo;s consumers are demanding more convenience, better digital experiences, and greater value. The pandemic accelerated these trends, and inflation has further changed shopping behavior. While some retailers have risen to the challenge, others are struggling to keep pace.</p>
<p><strong>We see three categories emerging:</strong></p>
<ul class="content-list">
<li><strong>Proactive Retailers</strong>: Companies that anticipated change and invested in digital infrastructure, customer data analytics, and fulfillment capabilities.</li>
<li><strong>Late Movers</strong>: Retailers that are adjusting, but slower than the market demands.</li>
<li><strong>Stagnant Players</strong>: Those failing to innovate or adapt, risking erosion of customer loyalty and market share.</li>
</ul>

<h2>Winners in Retail Transformation</h2>
<p>The top 3 holdings of <a href="/link/b638061645774dbeab416e78589cf25c.aspx" title="RTH - VanEck Retail ETF - Overview"><strong>RTH</strong></a><sup>*</sup>&nbsp;include companies that show agility and innovation in response to consumer trends.</p>
<ul class="content-list">
<li><strong>Amazon</strong> continues to dominate through its unmatched logistics network and Prime ecosystem.</li>
<li><strong>Costco</strong> has maintained strong loyalty through consistent value and operational efficiency.</li>
<li><strong>Walmart</strong> has strengthened its position by combining store scale with digital growth, driving convenience and everyday value.</li>
</ul>
<p>These companies are not only surviving, but they're also thriving by staying in tune with what modern consumers want.</p>
<h2>Retail Headwinds and Strategic Takeaways</h2>
<p>Target offers a valuable case study in the challenges large retailers face. While its brand and scale remain strong, recent hurdles around inventory management and pricing strategies illustrate how even established players must continuously adapt to evolving consumer behavior. The company's 52-week low reflects these operational pressures and underscores the importance of agility in today&rsquo;s dynamic retail environment.</p>
<p>For investors, these dynamics highlight the potential volatility of relying on individual retail names. The <a href="/link/b638061645774dbeab416e78589cf25c.aspx" title="RTH - VanEck Retail ETF - Overview"><strong>RTH ETF</strong></a> helps mitigate such risks by providing diversified exposure to both established retail leaders and emerging innovators.</p>
<h2>Why RTH Makes Strategic Sense</h2>
<p><strong><a href="/link/b638061645774dbeab416e78589cf25c.aspx" title="RTH - VanEck Retail ETF - Overview">The RTH ETF</a></strong> reflects the power of diversification. Instead of betting on any one company, investors gain exposure to a carefully curated group of highly performing retailers. This includes firms with strong digital capabilities, loyal customer bases, and forward-thinking strategies.</p>
<p>By tracking the performance of companies leading the charge, <a href="/link/b638061645774dbeab416e78589cf25c.aspx" title="RTH - VanEck Retail ETF - Overview"><strong>RTH</strong></a> captures retail sector upside while buffering against single-stock volatility. It offers a way to invest in retail's evolution without being dragged down by those resisting change.</p>

<h2>Conclusion</h2>
<p>In a time when the retail sector is anything but predictable, <a href="/link/b638061645774dbeab416e78589cf25c.aspx" title="RTH - VanEck Retail ETF - Overview"><strong>VanEck&rsquo;s RTH ETF</strong></a> stands out for its resilience. For investors seeking retail exposure without the baggage of struggling incumbents, <strong><a href="/link/b638061645774dbeab416e78589cf25c.aspx" title="RTH - VanEck Retail ETF - Overview">RTH</a></strong> provides a strategic, diversified solution for today&rsquo;s rapidly changing market.</p>
<p>As the industry evolves, one thing remains clear: adaptability is key. And with <a href="/link/b638061645774dbeab416e78589cf25c.aspx" title="RTH - VanEck Retail ETF - Overview"><strong>RTH</strong></a>, investors can align with the retailers that are ready for what's next.</p>
<p>To receive more <a href="https://www.vaneck.com/us/en/insights/thematic-investing/" title="Thematic Investing Insights"><strong>Thematic Investing</strong></a> insights, <a href="https://www.vaneck.com/us/en/subscribe/" title="Subscription Center"><strong>sign up in our subscription center</strong></a>.</p>
]]></content:encoded>
</item><item rdf:about="https://www.vaneck.com/us/en/blogs/income-investing/green-bond-market-resilience-in-2025/">
  <title>Green Bond Market Resilience in 2025></title>
  <link>https://www.vaneck.com/us/en/blogs/income-investing/green-bond-market-resilience-in-2025/</link>
  <description><![CDATA[The USD green bond market continues to evolve amid rate volatility, ideological pushbacks and climate challenges.]]></description>
  <dc:creator>Sunny  Bokhari</dc:creator>
  <dc:date>09/25/2025 06:30:00</dc:date>
<content:encoded><![CDATA[

<p><strong>Key Takeaways:</strong></p>
<ul class="content-list">
<li class="mt-2">Data centers have become a dominant theme in USD green bonds, fueled by AI&rsquo;s demand for energy-efficient infrastructure.</li>
<li class="mt-2">Leadership in the energy transition has shifted to China, while emerging markets increasingly drive USD issuance.</li>
<li class="mt-2">Despite slower 2025 issuance, corporates have accounted for two-thirds of USD green bond issuance YTD, up from 50% in 2020.</li>
</ul>
<p>2025 has been a challenging year for the global green bond market amid negative sentiment around sustainable investing and rollbacks in climate change policies in the U.S. and Europe. These factors have weighed on the market with global green bond issuance declining 32% YoY<sup>1</sup>. Cumulative global green bond issuance is approaching $4 trillion, falling well short of the $7.5 trillion needed per year by 2030 to achieve a net-zero future.<sup>1</sup></p>
<p>Despite headwinds within sustainable investing and a retrenchment from the climate politics seen in the 2010s, the energy transition has continued at a torrid pace. Christina Figueres, former head of the U.N. Framework Convention on Climate Change and instrumental in establishing the Paris Agreement, said, &ldquo;It&rsquo;s not about climate politics anymore, it&rsquo;s about climate economy.&rdquo; In 2024, for example, twice as much was invested in renewable energy than fossil fuels, and 93% of new power came from green sources<sup>2</sup>. We expect this to continue, and accordingly, there will be a vast amount of financing needed to fund the investment required. We believe green bonds can continue to play a large role in meeting this need.</p>
<h2 id="usd-green-bond-issuance-leading-up-to-2025" class="jump-link-nav anchored-block" data-jumplink-title="USD Green Bond Issuance Leading up to 2025">USD Green Bond Issuance Leading up to 2025</h2>
<p>USD-denominated green bonds are an important part of the global green bond market, accounting for 28% of all cumulative global issuance through July 2025. At $550 billion, U.S. issuers make up more than fifty percent of cumulative USD-denominated green bond issuance. U.S. corporations and government-backed entities account for the majority of that, in approximately equal amounts.</p>
<h3>USD-Denominated Green Bonds Form a Significant Part of the Global Market</h3>
<p><strong>Total Green Bond Issuance</strong></p>
<p><img loading="lazy" class="img-responsive" alt="Total Green Bond Issuance" src="https://www.vaneck.com/contentassets/b17672ede295486599d2e96e8e700386/6190_grnb-blog_chart-1_2025-9_v1_blog.svg" /></p>
<p class="chart-disclosure">Data: Climate Bonds Initiative, July 2025.</p>
<p>Over the past five years, USD-denominated green bond issuance has exhibited a mixed trend. Rising from $83.3 billion in 2020 to a record $156.3 billion in 2021 and stabilizing around $130 billion in 2023 and 2024. There has been a sharp decrease in YTD issuance, with only $60.6 billion issued as of July 2025 versus $99 billion over the same period last year. The decrease in USD bonds is in line with the overall decline in green-labelled bonds YTD amid the rollback of climate policies in the U.S. and Europe. Some issuers may be choosing to issue bonds without the green label to fund the same types of projects, while they wait for more clarity on climate policy or for market sentiment to shift.</p>
<h3>USD-Denominated Issuance Trends Over the Past Five years</h3>
<p><strong>5Yr US Green Bond Issuance</strong></p>
<p><img loading="lazy" class="img-responsive" alt="5Yr US Green Bond Issuance" src="https://www.vaneck.com/contentassets/54df8e86c17446e1baea5d6e9b0b0290/6190_grnb-blog_chart-2_2025-9_v1_blog.svg" /></p>
<p class="chart-disclosure">Data: Climate Bonds Initiative, July 2025.</p>

<p>In 2025, global green-labelled supply slowed, and U.S. corporations have become more selective with &ldquo;green&rdquo; branding amid political backlash. Despite slower 2025 issuance, corporates have accounted for two-thirds of USD green bond issuance YTD, up from 50% in 2020.<sup>3</sup></p>
<p>USD annual issuance shows an increase in asset-backed issuance (e.g., EV loan ABS, green mortgage-backed securities) and loan-market funding of green capex since 2022. The EUR-denominated market also saw a slight increase in green loans and ABS, although green bonds remain the preferred method of issuance.</p>
<h2 id="key-observations" class="jump-link-nav anchored-block" data-jumplink-title="Key Observations">Key Observations and Top 10 USD Green Bond Issues of 2025</h2>
<p>So far this year, $60.8 billion of dollar-denominated green bonds have been issued through July 2025, with 55% of them coming from U.S. corporations and government-backed entities. Issuers from China (10.7%), Ireland (5.9%), U.A.E. (4.4%), and South Korea (4.1%) have also issued USD-denominated green bonds this year. We believe non-U.S. issuance will continue to be a significant, and perhaps growing, part of the U.S. dollar green bond market. Although the U.S. has stepped away from taking a role in global climate leadership, its role has always been met with skepticism. China has moved in a completely different direction and is now the undisputed leader in green energy. In the 12-month period ending in June, for example, more solar power has been installed domestically in China than the United States has ever brought online.<sup>4</sup>&nbsp;Its role globally, particularly in other emerging markets, and its low-cost solar panels and electric vehicles now dominate the market. In other words, the green transition appears to be alive and well outside the U.S., and projects will continue to require financing. Given that much of this activity is in emerging markets, we expect a high share of this funding to be in U.S. dollars for the foreseeable future.</p>
<h3>Top 10 USD-Denominated Green Bond Issuers of 2025</h3>
<div class="wrapped-div">
<table style="width: 100%;">
<tbody>
<tr class="tbl-data">
<td class="tbl-header last">Issuer</td>
<td class="tbl-header text-left">USD Green Issuance (US$ bn)</td>
<td class="tbl-header last text-left">Entity Type</td>
<td class="tbl-header last text-left">Country</td>
</tr>
<tr class="tbl-data">
<td class="data-td last font-weight-normal">Vantage Data Centers LLC</td>
<td class="data-td data last text-left">5.0</td>
<td class="data-td data last text-left">Non-Financial Corporate</td>
<td class="data-td data last text-left">USA</td>
</tr>
<tr class="tbl-data">
<td class="data-td last font-weight-normal">Smurfit Kappa Treasury ULC</td>
<td class="data-td data last text-left">2.7</td>
<td class="data-td data last text-left">Non-Financial Corporate</td>
<td class="data-td data last text-left">Ireland</td>
</tr>
<tr class="tbl-data">
<td class="data-td last font-weight-normal">Fannie Mae</td>
<td class="data-td data last text-left">2.5</td>
<td class="data-td data last text-left">Government-Backed Entity</td>
<td class="data-td data last text-left">USA</td>
</tr>
<tr class="tbl-data">
<td class="data-td last font-weight-normal">SWCH Commercial Mortgage Trust 2025-DATA</td>
<td class="data-td data last text-left">2.4</td>
<td class="data-td data last text-left">Financial Corporate</td>
<td class="data-td data last text-left">USA</td>
</tr>
<tr class="tbl-data">
<td class="data-td last font-weight-normal">DayOne Data Centers Singapore Pte Ltd</td>
<td class="data-td data last text-left">1.7</td>
<td class="data-td data last text-left">Non-Financial Corporate</td>
<td class="data-td data last text-left">Singapore</td>
</tr>
<tr class="tbl-data">
<td class="data-td last font-weight-normal">Hapag-Lloyd AG</td>
<td class="data-td data last text-left">1.6</td>
<td class="data-td data last text-left">Non-Financial Corporate</td>
<td class="data-td data last text-left">Germany</td>
</tr>
<tr class="tbl-data">
<td class="data-td last font-weight-normal">California Community Choice Financing Authority</td>
<td class="data-td data last text-left">1.5</td>
<td class="data-td data last text-left">Government-Backed Entity</td>
<td class="data-td data last text-left">USA</td>
</tr>
<tr class="tbl-data">
<td class="data-td last font-weight-normal">Stack Infrastructure Inc</td>
<td class="data-td data last text-left">1.4</td>
<td class="data-td data last text-left">Non-Financial Corporate</td>
<td class="data-td data last text-left">USA</td>
</tr>
<tr class="tbl-data">
<td class="data-td last font-weight-normal">Industrial &amp; Commercial Bank of China Ltd</td>
<td class="data-td data last text-left">1.3</td>
<td class="data-td data last text-left">Financial Corporate</td>
<td class="data-td data last text-left">China</td>
</tr>
<tr class="tbl-data">
<td class="data-td last font-weight-normal">Saudi Electricity Sukuk Programme Co</td>
<td class="data-td data last text-left">1.2</td>
<td class="data-td data last text-left">Government-Backed Entity</td>
<td class="data-td data last text-left">Saudi Arabia</td>
</tr>
</tbody>
</table>
</div>
<p class="chart-disclosure">Data: Climate Bonds Initiative, July 2025.</p>
<p>So far this year, data center infrastructure has dominated USD-denominated green bond issuance, with Vantage, DayOne, and Stack Infrastructure collectively accounting for nearly $8 billion year-to-date. As artificial intelligence (AI) companies scale up the need for energy-efficient, large data centers are expected to grow, which could provide a tailwind for the issuance of green bonds to fund these upcoming projects. Five of the top ten issuers are U.S.-based, underscoring the country&rsquo;s significant presence in USD-labelled green finance despite headwinds, particularly across technology, housing, and community energy sectors. California&rsquo;s Community Choice Financing Authority illustrates the ongoing innovation in municipal-scale public finance, while corporates such as Smurfit Kappa and Hapag-Lloyd highlight strong industrial uses of green capital in packaging and shipping. At the same time, multinational issuers, including ICBC of China and Saudi Electricity, have further contributed to supply of USD green bonds this year.</p>
<h2 id="looking-ahead" class="jump-link-nav anchored-block" data-jumplink-title="Looking Ahead">Looking Ahead</h2>
<p>Over 60% of 2025 USD green bonds were benchmark-sized ($500M+), boosting liquidity and institutional appeal. Gulf Cooperative Council (GCC) has continued to support the USD green bond supply with 92% of all GCC-labelled green bonds being issued in USD.</p>
<p>Supranational bonds from the World Bank and European Investment Bank have helped USD green bonds maintain a considerable share of the market. USD-denominated green bonds are expected to be steady at about 25% of global green bond issuance.<sup>5</sup>&nbsp;Over the last five years, robust supranational, corporate, emerging market and sovereign-linked issuance underscores the geographic breadth of the USD green bond market.</p>

<p>Green bonds offer investors a way to build sustainable core fixed income portfolios without significantly affecting risk and return and leverage the size and diversity of the global bond markets to help achieve climate goals. <a href="/link/0f22371fe87042dd880bda58e6a65b73.aspx" title="GRNB - VanEck Green Bond ETF - Overview"><strong>VanEck Green Bond ETF (GRNB)</strong></a> provides access to a diverse group of issuers who are proactively investing in climate solutions, including renewable energy, green buildings, clean transportation and more. An investment of $1 million in GRNB yields annual impact equivalent to 872 MWh of renewable energy generated, 718 MT of CO<sub>2</sub> avoided, and 14 Hectares of land conserved or reforested.<sup>6</sup></p>
<p>To receive more <a href="/us/en/blogs/income-investing/" title="Income Investing Insights"><strong>Income Investing</strong></a> insights, <a href="/link/5f45412c2143400497908cea2897f7d3.aspx" title=" Subscription Center"><strong>sign up in our subscription center</strong></a>.</p>
]]></content:encoded>
</item><item rdf:about="https://www.vaneck.com/us/en/blogs/emerging-markets-bonds/the-investment-case-for-emerging-markets-debt/">
  <title>The Case for Emerging Markets Debt: Why Invest in EMD?></title>
  <link>https://www.vaneck.com/us/en/blogs/emerging-markets-bonds/the-investment-case-for-emerging-markets-debt/</link>
  <description><![CDATA[Emerging markets debt (EMD) offers a compelling case for investors. Learn why EMD deserves to play a bigger role in your portfolio in this white paper.]]></description>
  <dc:creator>Eric Fine</dc:creator>
  <dc:date>09/24/2025 06:30:00</dc:date>
<content:encoded><![CDATA[

<p><strong>Key Takeaways:</strong></p>
<ul class="content-list">
<li class="mt-2">Emerging markets have lower debt and higher yields than developed markets, strengthening the case for EMD.</li>
<li class="mt-2">EMD&rsquo;s liquidity, default, and recovery rates rival developed markets, challenging risk perceptions.</li>
<li class="mt-2">EMD remains under-allocated despite strong fundamentals and risk-adjusted returns.</li>
</ul>
<h2>The Investment Case for Emerging Markets Debt</h2>
<p>The investment case for emerging markets (EM) debt is compelling and straightforward. EM debt has generated annual returns of 3.68% while developed market (DM) sovereigns returned -0.02%. The past five years look even worse for DM sovereigns. As of now, DM sovereigns&rsquo; yield to maturity (YTM) is only 3.6%, while EM sovereigns yield between 5.93% and 6.89% in both local and hard currencies.</p>
<p>Despite strong underlying fundamentals and historical performance, EMD is frequently overlooked and under-allocated as a fixed income asset. Under current market conditions, we believe EMD deserves to play a bigger role in global portfolios.</p>
<h2>What positions EMD as such as strong fixed income investment?</h2>
<p>First, in a world rightly concerned about &ldquo;fiscal dominance&rdquo; - excessive debt that undermines central bank independence thus keeping yields too low - EM generally has low levels of government debt that pay higher yields.</p>
<p>Second, these longstanding EM strengths are gaining attention and becoming impossible to ignore with the advent of CNY sharing reserve currency status with the USD (an outcome of the &ldquo;dollar debasement&rdquo; trade). EM conducts more trade with China than with the US, so this is important to all EM currencies.</p>
<p>Third, two decades of outright and volatility-adjusted performance shows EM bonds to be too-small an allocation for most investors, and DM bonds to be too-large an allocation.</p>
<p>In &ldquo;The Investment Case for Emerging Markets Debt,&rdquo; we discuss why emerging markets have stronger fundamentals than developed markets, why the asset class should be considered now, and its outperformance relative to developed markets.</p>
<p>Topics in this white paper include:</p>
<ul class="content-list">
<li class="mt-2">Why emerging markets have stronger fundamentals than developed markets.</li>
<li class="mt-2">Why now? The rise of CNY as a Reserve Currency.</li>
<li class="mt-2">EM Bonds&rsquo; superior nominal and volatility-adjusted returns.</li>
</ul>
<p>Want to learn more before downloading the full white paper? Below, you&rsquo;ll find a summary of our core findings and why we believe investors should consider an allocation to EMD.</p>
<h2>1. Fiscal Dominance - Emerging Markets have Stronger Fundamentals Than Developed Markets</h2>
<p>The age-old debate between Emerging Markets and Developed Markets has taken an intriguing twist. Contrary to the historical norm, EMD showcases stronger fundamentals than the developed markets. Developed markets also grapple with significantly higher debt-to-GDP ratios than emerging markets. Emerging markets fundamentals look compelling relative to developed markets across a range of additional metrics, including fiscal deficits and current account deficits. Emerging market debt (EMD) also boasts higher yields ranging from 6.3% to 7.8%<sup>*</sup>&nbsp;and significantly outpacing developed markets. Asia, in particular, has &ldquo;graduated&rdquo;: years of orthodoxy pushed nominal borrowing costs down, yet real yields still sit above DM levels, so investors are paid for discipline. This shift underscores a pivotal narrative: In a world wary of escalating debt in developed markets, EMD is emerging as a beacon of fiscal responsibility.</p>
<h2>2. Why Now? The Rise of CNY as a Reserve Currency</h2>
<p>Central banks have been reducing the share of the US dollar and US treasuries and purchasing gold, and eventually, we believe that other reserve currencies such as CNY will be established. Using the real-effective-exchange-rate (REER) model, CNY screens undervalued by about 15% after a stretch of lower inflation relative to trading partners. Emerging market countries would also benefit as they trade more with China than with the US. Meanwhile, developed markets deal with a &ldquo;twin deficit&rdquo; problem (external financing and fiscal financing deficits), which should support emerging market currencies and/or duration. Lastly, emerging market local bonds have exhibited lower volatility than DM in the past few years, as CNY stability has anchored emerging market currencies and thus bond markets.</p>
<h2>3. EM bonds Have Superior Nominal and Volatility-Adjusted Returns Than DM Bonds</h2>
<p>Our thesis has seen evidence in the form of 150% cumulative outperformance relative to developed-market bonds over the last two decades. Additionally, the efficient frontier for global bonds concluded that the optimal allocation to EM bonds is far higher than most investors maintain. For a U.S. investor targeting a mid-range volatility of around 6.5, the optimal allocation to emerging market bonds would have been about one-quarter of the fixed income portfolio. Across most volatility scenarios, zero allocation to emerging market bonds is the wrong answer.</p>
<h2>The Future of Emerging Markets Bonds</h2>
<p>&ldquo;Fiscal dominance&rdquo; defines developed markets and is driving markets. Its absence in emerging markets points to a key winner in this current market state &ndash; emerging market bonds. Low debt and superior fiscal and structural policy in emerging markets have allowed independent central banks that pay high real rates, while collapsing their credit spreads. The opposite and problematic state for developed markets has led to UST&rsquo;s decreasing use in central bank reserves and growing discussions of USD &ldquo;debasement&rdquo;, accelerated by sanctions risks. We think the story about USD/treasuries loss of reserve status is overdone and the wrong framing. But what is correct framing is that CNY and other emerging markets will gradually share reserve status. And China matters arguably more to emerging markets. In fact, we think we are simply observing things well in-train, not speculating. As one can easily observe from two decades of asset performance. The return-to-volatility data points clearly to much higher allocations to emerging market debt.</p>
<p>To learn more about the investment opportunity in emerging market debt, read our full white paper.</p>
<p><a href="/us/en/investments/emerging-markets-bond-fund-embax/investment-case-for-emerging-markets-debt.pdf" title="Download White Paper - The Investment Case for Emerging Markets Debt" target="_blank" rel="noopener"><img loading="lazy" class="desktop-image img-responsive" src="https://www.vaneck.com/contentassets/f21bd9802f884f3091366b36b5a2a9b9/the-investment-case-for-emerging-markets-debt-desktop.svg" alt="Download White Paper - The Investment Case for Emerging Markets Debt" /></a></p>
<p><a href="/us/en/investments/emerging-markets-bond-fund-embax/investment-case-for-emerging-markets-debt.pdf" title="Download White Paper - The Investment Case for Emerging Markets Debt" target="_blank" rel="noopener"><img loading="lazy" class="mobile-image img-responsive" src="https://www.vaneck.com/contentassets/f21bd9802f884f3091366b36b5a2a9b9/the-investment-case-for-emerging-markets-debt-mobile.svg" alt="Download White Paper - The Investment Case for Emerging Markets Debt" /></a></p>
<style>

.widgetBody .desktop-image{display:block;}
.widgetBody .mobile-image{display:none;}
@media screen and (max-width: 425px){.widgetBody .desktop-image {display: none;}
.widgetBody .mobile-image {display: block;}}

</style>
<p>To receive more <a href="https://www.vaneck.com/us/en/insights/emerging-markets-bonds/" title="Emerging Markets Bonds Insights"><strong>Emerging Markets Bonds</strong></a> insights, <a href="https://www.vaneck.com/us/en/subscribe/" title="Subscription Center"><strong>sign up in our subscription center</strong></a>.</p>
]]></content:encoded>
</item><item rdf:about="https://www.vaneck.com/us/en/blogs/thematic-investing/buzz-investing-stocks-move-higher-on-fed-cut-hopes/">
  <title>BUZZ Investing: Stocks Move Higher on Fed Cut Hopes></title>
  <link>https://www.vaneck.com/us/en/blogs/thematic-investing/buzz-investing-stocks-move-higher-on-fed-cut-hopes/</link>
  <description><![CDATA[U.S. equities climbed with record highs in major indices, driven by strong tech earnings and AI optimism, while soft labor data and stable inflation bolstered expectations for Fed rate cuts, leading to falling yields and muted volatility.]]></description>
  <dc:creator> </dc:creator>
  <dc:date>09/24/2025 06:30:00</dc:date>
<content:encoded><![CDATA[

<p><strong>Key Takeaways:</strong></p>
<ul class="content-list">
<li class="mt-2"><strong>Institutional buying and AI momentum</strong> fueled BUZZ Index gains, with UnitedHealth and Nebius leading on strong earnings, contracts, and sentiment.</li>
<li class="mt-2"><strong>Competitive pressures weighed on select equities,</strong> with AST SpaceMobile, AMD, and Palantir detracting amid execution concerns and analyst downgrades.</li>
<li class="mt-2"><strong>Index rebalancing spotlight</strong> saw Oracle and EchoStar added, reflecting transformative AI cloud growth and spectrum deal momentum.</li>
</ul>
<p>U.S. equities advanced during the recent period between index selection dates (August 14, 2025 &ndash; September 11, 2025, the &ldquo;Period&rdquo;), with the S&amp;P 500 and Nasdaq Composite setting additional record highs. Volatility remained muted, with realized volatility across major indices holding near the lowest levels observed this year. Large-cap technology stocks continued to drive performance, supported by strong earnings and renewed enthusiasm around artificial intelligence. Broader markets also benefited from resilience in consumer spending and a policy backdrop that investors interpreted as incrementally more supportive.</p>
<p>Economic data released during the Period helped shape expectations for Federal Reserve policy. At the Jackson Hole Symposium on August 23, Chair Powell acknowledged that monetary policy is restrictive and noted emerging risks in the labor market, remarks that were widely viewed as opening the door to near-term easing. Those expectations gained momentum after the September 5 employment report, which came in weaker than expected, showing payrolls rising by only 22,000 and the unemployment rate increasing to 4.3%, its highest level in nearly four years. Treasury yields fell sharply following the release, with the 10-year moving toward 4.1% as investors priced in a high probability of a September rate cut. On September 10, the Bureau of Labor Statistics reported that August CPI rose 0.4% month-over-month and 2.9% year-over-year, while core CPI held at 3.1%. The figures were largely in line with expectations, suggesting that inflation pressures remain contained and helping to reinforce the case for rate cuts rather than challenge it. Overall, the Period was marked by continued equity gains, muted volatility, and a market increasingly focused on the likelihood of Fed easing amid a backdrop of softer labor data and steady inflation.</p>
<p>The BUZZ Index returned -0.31% during the month of August compared to a return of 2.03% for the S&amp;P 500 Index during the same period. Year-to-date, the BUZZ Index leads the S&amp;P 500 with returns of 29.49% and 10.79%, respectively, as of the end of August.</p>
<h2>UnitedHealth Leads BUZZ Performance; Nebius Soars on Multi-Billion AI Contract</h2>
<p>Shares of UnitedHealth Group (NYSE: UNH) rallied during the Period, leading contributors to BUZZ Index performance. The stock advanced after 13F filings revealed that Berkshire Hathaway, David Tepper, and several other large institutional investors had initiated or added to positions, a signal that may have reinforced the value thesis supporting the stock. UnitedHealth also reaffirmed its 2025 earnings outlook, offering reassurance after earlier concerns around cost pressures in its Medicare Advantage business. Further, the company disclosed that nearly 78% of its members will be enrolled in Medicare Advantage plans rated four stars or higher, alleviating investor worries around ratings risk and supporting the view that long-term fundamentals remain intact. While challenges tied to medical cost trends persist, renewed interest from high-profile investors and evidence of operating stability may have helped strengthen sentiment during the Period.</p>
<p>Nebius Group (NASDAQ: NBIS) was another top contributor, continuing its rapid ascent on the back of accelerating AI infrastructure demand. The company reported second-quarter revenue of approximately $105 million, representing growth of more than 600% year-over-year and exceeding expectations. Shares surged further after announcing a multi-year agreement with Microsoft, valued at up to $17.4 billion through 2031, which validated investor optimism around its GPU capacity and data center expansion. Management also raised its full-year annual recurring revenue guidance to a range of $900 million to $1.1 billion. These developments supported the view that Nebius is emerging as a key beneficiary of enterprise AI adoption, helping propel the stock to strong gains during the Period.</p>

<h3 id="top-contributors" class="jump-link-nav anchored-block" data-jumplink-title="Top Contributors">Top BUZZ Index Contributors: August 14, 2025 &ndash; September 11, 2025</h3>
<div class="wrapped-div">
<table width="100%">
<tbody>
<tr class="tbl-data">
<td class="tbl-header last text-left"><strong>Company</strong></td>
<td class="tbl-header last text-left"><strong>Ticker</strong></td>
<td class="tbl-header last text-right"><strong>Average Weight (%)</strong></td>
<td class="tbl-header last text-right"><strong>Return Contribution (%)</strong></td>
</tr>
<tr class="tbl-data">
<td class="data-td data last text-left">UnitedHealth Group Inc</td>
<td class="data-td data last text-left">UNH</td>
<td class="data-td data last text-right">3.33</td>
<td class="data-td data last text-right">0.87</td>
</tr>
<tr class="tbl-data">
<td class="data-td data last text-left">Nebius Group NV</td>
<td class="data-td data last text-left">NBIS</td>
<td class="data-td data last text-right">2.40</td>
<td class="data-td data last text-right">0.68</td>
</tr>
<tr class="tbl-data">
<td class="data-td data last text-left">Alphabet Inc</td>
<td class="data-td data last text-left">GOOGL</td>
<td class="data-td data last text-right">3.27</td>
<td class="data-td data last text-right">0.57</td>
</tr>
<tr class="tbl-data">
<td class="data-td data last text-left">Rocket Cos Inc</td>
<td class="data-td data last text-left">RKT</td>
<td class="data-td data last text-right">1.73</td>
<td class="data-td data last text-right">0.38</td>
</tr>
<tr class="tbl-data">
<td class="data-td data last text-left">SoFi Technologies Inc</td>
<td class="data-td data last text-left">SOFI</td>
<td class="data-td data last text-right">3.27</td>
<td class="data-td data last text-right">0.35</td>
</tr>
<tr class="tbl-data">
<td class="data-td data last text-left">Rocket Lab Corp</td>
<td class="data-td data last text-left">RKLB</td>
<td class="data-td data last text-right">3.06</td>
<td class="data-td data last text-right">0.35</td>
</tr>
<tr class="tbl-data">
<td class="data-td data last text-left">Hims &amp; Hers Health Inc</td>
<td class="data-td data last text-left">HIMS</td>
<td class="data-td data last text-right">2.82</td>
<td class="data-td data last text-right">0.33</td>
</tr>
<tr class="tbl-data">
<td class="data-td data last text-left">AppLovin Corp</td>
<td class="data-td data last text-left">APP</td>
<td class="data-td data last text-right">0.98</td>
<td class="data-td data last text-right">0.31</td>
</tr>
<tr class="tbl-data">
<td class="data-td data last text-left">Tesla Inc</td>
<td class="data-td data last text-left">TSLA</td>
<td class="data-td data last text-right">3.08</td>
<td class="data-td data last text-right">0.29</td>
</tr>
<tr class="tbl-data">
<td class="data-td data last text-left">GameStop Corp</td>
<td class="data-td data last text-left">GME</td>
<td class="data-td data last text-right">2.98</td>
<td class="data-td data last text-right">0.26</td>
</tr>
</tbody>
</table>
</div>
<p class="chart-disclosure"><i>Source: BUZZ Holdings ULC, Bloomberg. Past performance is no guarantee of future results. Index performance is not illustrative of fund performance. Not intended as a recommendation to buy or to sell any of the securities mentioned herein.</i></p>

<h2>AST SpaceMobile Leads BUZZ Detractors as Competitive Pressures Mount</h2>
<p>Shares of AST SpaceMobile (NASDAQ: ASTS) were among the leading detractors to BUZZ Index performance during the Period, pressured by rising competitive concerns and a high-profile analyst downgrade. On September 9, UBS cut its rating on the stock to neutral from buy, reducing its price target to $43 from $62. The downgrade followed news that SpaceX&rsquo;s Starlink had acquired key spectrum licenses from EchoStar, a move that analysts argued strengthens Starlink&rsquo;s position in the emerging space-to-cellular market and increases execution risk for AST. While UBS noted there is room for multiple players in the segment, the report highlighted how AST&rsquo;s smaller, nascent constellation may face challenges in scaling utilization at the same pace as its larger rival. The downgrade was compounded by downward revisions to long-term revenue and EBITDA estimates, reflecting a more cautious outlook on the company&rsquo;s growth trajectory. Although AST continues to benefit from carrier partnerships and differentiated technology, the combination of rising competitive pressure and tempered analyst expectations weighed heavily on the stock during the Period, leaving it as a notable detractor to Index performance.</p>
<h3 id="bottom-contributors" class="jump-link-nav anchored-block" data-jumplink-title="Bottom Contributors">Bottom BUZZ Index Contributors: August 14, 2025 &ndash; September 11, 2025</h3>
<div class="wrapped-div">
<table width="100%">
<tbody>
<tr class="tbl-data">
<td class="tbl-header last text-left"><strong>Company</strong></td>
<td class="tbl-header last text-left"><strong>Ticker</strong></td>
<td class="tbl-header last text-right"><strong>Average Weight (%)</strong></td>
<td class="tbl-header last text-right"><strong>Return Contribution (%)</strong></td>
</tr>
<tr class="tbl-data">
<td class="data-td data last text-left">AST SpaceMobile Inc</td>
<td class="data-td data last text-left">ASTS</td>
<td class="data-td data last text-right">2.90</td>
<td class="data-td data last text-right">-0.66</td>
</tr>
<tr class="tbl-data">
<td class="data-td data last text-left">Advanced Micro Devices Inc</td>
<td class="data-td data last text-left">AMD</td>
<td class="data-td data last text-right">2.90</td>
<td class="data-td data last text-right">-0.49</td>
</tr>
<tr class="tbl-data">
<td class="data-td data last text-left">Palantir Technologies Inc</td>
<td class="data-td data last text-left">PLTR</td>
<td class="data-td data last text-right">2.84</td>
<td class="data-td data last text-right">-0.38</td>
</tr>
<tr class="tbl-data">
<td class="data-td data last text-left">Strategy Inc</td>
<td class="data-td data last text-left">MSTR</td>
<td class="data-td data last text-right">2.66</td>
<td class="data-td data last text-right">-0.34</td>
</tr>
<tr class="tbl-data">
<td class="data-td data last text-left">Archer Aviation Inc</td>
<td class="data-td data last text-left">ACHR</td>
<td class="data-td data last text-right">1.61</td>
<td class="data-td data last text-right">-0.26</td>
</tr>
<tr class="tbl-data">
<td class="data-td data last text-left">Lucid Group Inc</td>
<td class="data-td data last text-left">LCID</td>
<td class="data-td data last text-right">1.71</td>
<td class="data-td data last text-right">-0.18</td>
</tr>
<tr class="tbl-data">
<td class="data-td data last text-left">Joby Aviation Inc</td>
<td class="data-td data last text-left">JOBY</td>
<td class="data-td data last text-right">0.80</td>
<td class="data-td data last text-right">-0.16</td>
</tr>
<tr class="tbl-data">
<td class="data-td data last text-left">Lululemon Athletica Inc</td>
<td class="data-td data last text-left">LULU</td>
<td class="data-td data last text-right">0.88</td>
<td class="data-td data last text-right">-0.13</td>
</tr>
<tr class="tbl-data">
<td class="data-td data last text-left">Marvell Technology Inc</td>
<td class="data-td data last text-left">MRVL</td>
<td class="data-td data last text-right">0.49</td>
<td class="data-td data last text-right">-0.10</td>
</tr>
<tr class="tbl-data">
<td class="data-td data last text-left">NVIDIA Corp</td>
<td class="data-td data last text-left">NVDA</td>
<td class="data-td data last text-right">2.97</td>
<td class="data-td data last text-right">-0.09</td>
</tr>
</tbody>
</table>
</div>
<p class="chart-disclosure"><i>Source: BUZZ Holdings ULC, Bloomberg. Past performance is no guarantee of future results. Index performance is not illustrative of fund performance. Not intended as a recommendation to buy or to sell any of the securities mentioned herein</i></p>
<h2>BUZZ Index September 2025 Rebalance Highlights</h2>
<p><strong>Oracle Corporation</strong></p>
<p>Shares of Oracle (NYSE: ORCL) surged following its September 9 earnings release, which, while broadly in line with expectations on revenue and profitability, was overshadowed by an outlook that stunned the market. Management projected its cloud infrastructure business will grow by at least 70% annually over the next four years, a forecast that investors viewed as a powerful endorsement of Oracle&rsquo;s positioning in the AI era. Shares spiked as much as 40% intraday, adding nearly $300 billion in market value in a single session, one of the largest one-day market cap increases in history. The extraordinary move also briefly vaulted founder Larry Ellison, who owns roughly 1.2 billion shares of Oracle, past Elon Musk as the world&rsquo;s wealthiest individual. Investors interpreted the announcement as a clear signal that Oracle may emerge as a leading beneficiary of AI-driven enterprise demand, dispelling prior concerns about its competitive relevance in the cloud. This month, Oracle joins the BUZZ Index with a 2.49% weight.</p>
<p><strong>EchoStar Corporation</strong></p>
<p>Shares of EchoStar (NASDAQ: SATS) soared during the Period following a pair of transformative spectrum transactions. On August 26, the company announced the sale of a portion of its wireless spectrum to AT&amp;T (NYSE: T) for approximately $23 billion, a deal that marked a pivot away from owning infrastructure toward strengthening its Boost Mobile network. Shares surged over 70% on the news. Two weeks later, EchoStar unveiled another landmark agreement, selling additional spectrum licenses to SpaceX for $17 billion. The deal provides Starlink satellites with direct-to-cell capability, significantly expanding SpaceX&rsquo;s mobile reach and reinforcing the strategic value of EchoStar&rsquo;s spectrum portfolio. SATS rallied another 20% on the announcement, as investors viewed the combined transactions as transformative to the company&rsquo;s financial profile. With materially improved liquidity, a stronger balance sheet, and reduced debt, EchoStar enters the BUZZ Index for the first time this month with a 0.51% weight.</p>

<p>To receive more <a href="https://www.vaneck.com/us/en/insights/thematic-investing/" title="Thematic Investing Insights"><strong>Thematic Investing</strong></a> insights, <a href="https://www.vaneck.com/us/en/subscribe/" title="Subscription Center"><strong>sign up in our subscription center</strong></a>.</p>
]]></content:encoded>
</item><item rdf:about="https://www.vaneck.com/us/en/blogs/moat-investing/moat-index-keeps-tech-in-check-value-in-focus/">
  <title>Moat Index Keeps Tech in Check, Value in Focus></title>
  <link>https://www.vaneck.com/us/en/blogs/moat-investing/moat-index-keeps-tech-in-check-value-in-focus/</link>
  <description><![CDATA[The September Moat Index review trimmed tech exposure, added new names and maintained a strong value tilt, highlighting its contrarian position in today&rsquo;s market.]]></description>
  <dc:creator>Brandon Rakszawski</dc:creator>
  <dc:date>09/24/2025 06:30:00</dc:date>
<content:encoded><![CDATA[

<p><strong>Key Takeaways</strong></p>
<ul class="content-list">
<li class="mt-2">Moat Index holds largest tech underweight vs. S&amp;P 500 since start of 2025.</li>
<li class="mt-2">17 companies moved in and out of the Index, including five brand-new names.</li>
<li class="mt-2">Contrarian positioning is reinforced by 18% discount to fair value, according to Morningstar&rsquo;s price to fair value ratio.</li>
</ul>
<p>The Morningstar<sup>&reg;</sup>&nbsp;Wide Moat Focus Index<sup>SM</sup>&nbsp;(the &ldquo;Moat Index&rdquo; or &ldquo;Index&rdquo;) underwent its quarterly review on September 19, 2025. The Index systematically targets attractively priced, high quality U.S. companies each quarter, as identified by Morningstar&rsquo;s equity research analysts. Below are a few highlights from the latest review. The full results are available here:</p>

<h2>Moat Index Review Highlights:</h2>
<ul class="content-list">
<li class="mt-2"><strong>Tech Weight Pared Following Strong Quarter for Software and Semis</strong>
<p>The Moat Index&rsquo;s tech sector weight dropped by about 8% and sits at a 13% underweight compared to the S&amp;P 500 Index. This is the largest underweight since the beginning of 2025. Additionally, the exposure within tech continues to differ from the broader market with a focus on undervalued application software and semiconductor companies. Beyond tech, Magnificent 7 company exposure continues to be significantly underweight at 4.3% versus 34.2% in the S&amp;P 500 Index.</p>
</li>
</ul>
<ul class="content-list">
<li class="mt-2"><strong>High Turnover Quarter Brings First-Time Entrants</strong>
<p>There were 17 total companies added and removed from the sub-portfolio under review this quarter. A few moat rating downgrades were added to the list of valuation-driven changes following a quarter of market volatility. Among the additions were five companies that are being added to the Moat Index for the first time: Airbnb, Broadridge, Copart, Entegris and Jack Henry &amp; Associates.</p>
</li>
</ul>
<ul class="content-list">
<li class="mt-2"><strong>Valuation Focus Offers Contrarian Exposure and Valuation Buffer</strong>
<p>The value style remains the notable overweight relative to the broad market. This trend has been in place for the better part of the last two years as U.S. equity markets have appreciated consistently, despite periods of short-term volatility. The Moat Index&rsquo;s price-to-fair value was reduced from about 0.87 to 0.82 following the review, implying an 18% discount to fair value. This stands in stark contrast to the S&amp;P 500 Index, which is currently 4% overvalued (1.04 price-to-fair-value ratio).</p>
</li>
</ul>
<h3>3Q 2025 Moat Index Review Results</h3>
<p><strong>Moat Index Sector Shifts Following 3Q 2025 Review</strong></p>
<p><img loading="lazy" class="img-responsive" alt="Moat Index Sector Shifts Following 3Q 2025 Review" src="https://www.vaneck.com/contentassets/105c7fa9189f4fcc8476eca1bb1e382e/6197_moat-index-rebalance_chart-1_2025-9_v1_blog.svg" /></p>
<p><strong>Moat Index Sector Exposure Relative to S&amp;P 500 Index</strong></p>
<p><img loading="lazy" class="img-responsive" alt="Moat Index Sector Exposure Relative to S&amp;P 500 Index" src="https://www.vaneck.com/contentassets/105c7fa9189f4fcc8476eca1bb1e382e/6197_moat-index-rebalance_chart-2_2025-9_v1_blog.svg" /></p>
<p><strong>Moat Index Style Exposure Relative to S&amp;P 500 Index: Value Bias Persists</strong></p>
<p><img loading="lazy" class="img-responsive" alt="Moat Index Style Exposure Relative to S&amp;P 500 Index: Value Bias Persists" src="https://www.vaneck.com/contentassets/105c7fa9189f4fcc8476eca1bb1e382e/6197_moat-index-rebalance_chart-3_2025-9_v2_blog.svg" /></p>
<p class="chart-disclosure">Source: Morningstar. As of 9/19/2025 unless otherwise noted.</p>

<h2>Access Quality Companies at Attractive Valuations</h2>
<p><a href="/link/9e43dd198c5f4e419f13220685081895.aspx" title="MOAT - VanEck Morningstar Wide Moat ETF - Overview"><strong>VanEck Morningstar Wide Moat ETF (MOAT)</strong></a> and <strong><a href="/link/ca0b4e316f1c4e1985e2d0b7d293f0e4.aspx" title="MWMZX - VanEck Morningstar Wide Moat Fund - Class Z">VanEck Morningstar Wide Moat Fund</a></strong> seek to replicate as closely as possible, before fees and expenses the price and yield performance of the Morningstar Wide Moat Focus Index.</p>

<p>To receive more <a href="https://www.vaneck.com/us/en/insights/moat-investing" title="Moat Investing Insights"><strong>Moat Investing</strong></a> insights, <a href="https://www.vaneck.com/us/en/subscribe/" title="Subscription Center"><strong>sign up in our subscription center</strong></a>.</p>
]]></content:encoded>
</item><item rdf:about="https://www.vaneck.com/us/en/blogs/digital-assets/matthew-sigel-vaneck-mid-september-2025-bitcoin-chaincheck/">
  <title>VanEck Mid-September 2025 Bitcoin ChainCheck></title>
  <link>https://www.vaneck.com/us/en/blogs/digital-assets/matthew-sigel-vaneck-mid-september-2025-bitcoin-chaincheck/</link>
  <description><![CDATA[Institutions continue to buy Bitcoin, AI-driven pivots lead to miner re-ratings, and wide valuation gaps suggest that small-caps and new pivoters could drive the next leg of miner growth.]]></description>
  <dc:creator>Nathan  Frankovitz</dc:creator>
  <dc:date>09/23/2025 06:30:00</dc:date>
<content:encoded><![CDATA[

<p><strong>Please note that VanEck has exposure to bitcoin.</strong></p>
<p><strong>Three key takeaways for mid-August &ndash; mid-September:</strong></p>
<ul>
<li class="mt-3"><strong>Institutions Scoop Up Bitcoin, But DATs Underperform: </strong>While ETPs and Digital Asset Treasuries (&ldquo;DATs&rdquo;) continue to add Bitcoin and other cryptocurrencies, other crypto equities are stealing the show.</li>
<li class="mt-3"><strong>Bitcoin Miners Receive AI Re-Ratings:</strong> Surging AI/HPC deals are de-risking Bitcoin miners&rsquo; pivots into AI/HPC hosting and cloud services, resulting in a dispersion in price performance and valuation multiples.</li>
<li class="mt-3"><strong>Not All Miners Are Equal: </strong>Wide gaps across power assets, BTC treasuries, and AI/HPC strategies suggest that small-caps and new pivoters could drive the next leg of miner growth.</li>
</ul>
<h2 id="chart-of-the-month" class="jump-link-nav anchored-block" data-jumplink-title="Chart of the Month">Chart of the Month</h2>
<h3>Corporate Treasuries Widen Their Lead as Bitcoin's Marginal Buyer As Maximum Supply Approaches</h3>
<p><img loading="lazy" class="img-responsive w-100" alt="Corporate Treasuries Widen Their Lead as Bitcoin's Marginal Buyer As Maximum Supply Approaches" src="https://www.vaneck.com/contentassets/102c9a94f5df455eae3fedb910f669d6/6191_bitcoin-chaincheck-mid-sept_chart-1_2025-9_v1_blog.svg" /></p>
<p class="chart-disclosure">Source: Glassnode as of 9/11/2025. <strong>Past performance is no guarantee of future results. Not intended as a recommendation to buy or sell any securities named herein.</strong></p>
<p>Over the past year, corporations have added over <strong>709K</strong> BTC <strong>(~$83bn)</strong>. In total, over 290 companies now own <strong>$163B+</strong> in Bitcoin. With only <strong>270K </strong>BTC mined over the same period, the current rate of corporate demand outpaces Bitcoin production by a factor of <strong>~4.3x</strong>. After including ETPs, other funds, and government holdings, total institutional demand outpaces production by a factor of <strong>~6.7x</strong>.</p>
<p>Institutions&rsquo; accelerating purchases suggests their growing appreciation of Bitcoin&rsquo;s disinflationary supply, which gives it its unique store-of-value property. Between now and the next halving expected in April 2028, only <strong>~0.43M</strong> bitcoin will be mined. That halving cycle (2028-2032) will yield a total of only <strong>~0.33M</strong> bitcoins. Thereafter, only a final <strong>~0.33M</strong> Bitcoins will ever be mined over the next 100+ years.</p>
<h3>Bitcoin ChainCheck Monthly Dashboard and Highlights</h3>
<div class="wrapped-div">
<table style="width: 100%;">
<tbody>
<tr class="tbl-data">
<td class="tbl-header last text-left">As of September 17th, 2025</td>
<td class="tbl-header last text-right">30-day avg</td>
<td class="tbl-header last text-right">30 day change (%)<sup>1</sup></td>
<td class="tbl-header last text-right">365 day change(%)</td>
<td class="tbl-header last text-right">Last 30 days Percentile vs<br />all-time history (%)</td>
</tr>
<tr class="tbl-data">
<td class="data-td data last text-left">Bitcoin Price</td>
<td class="data-td data last text-right">$112,700</td>
<td class="data-td data last text-right">-4</td>
<td class="data-td data last text-right">91</td>
<td class="data-td data last text-right">99</td>
</tr>
<tr class="tbl-data">
<td class="data-td data last text-left">Daily Active Addresses</td>
<td class="data-td data last text-right">705,353</td>
<td class="data-td data last text-right">-4</td>
<td class="data-td data last text-right">0</td>
<td class="data-td data last text-right">60</td>
</tr>
<tr class="tbl-data">
<td class="data-td data last text-left">Daily New Addresses</td>
<td class="data-td data last text-right">308,809</td>
<td class="data-td data last text-right">-5</td>
<td class="data-td data last text-right">1</td>
<td class="data-td data last text-right">56</td>
</tr>
<tr class="tbl-data">
<td class="data-td data last text-left">Daily Transactions</td>
<td class="data-td data last text-right">510,960</td>
<td class="data-td data last text-right">19</td>
<td class="data-td data last text-right">-22</td>
<td class="data-td data last text-right">75</td>
</tr>
<tr class="tbl-data">
<td class="data-td data last text-left">Daily Inscriptions</td>
<td class="data-td data last text-right">71,972</td>
<td class="data-td data last text-right">-37</td>
<td class="data-td data last text-right">81</td>
<td class="data-td data last text-right">42</td>
</tr>
<tr class="tbl-data">
<td class="data-td data last text-left">Total Transfer Volume (USD)</td>
<td class="data-td data last text-right">$70,694,940,093</td>
<td class="data-td data last text-right">-2</td>
<td class="data-td data last text-right">44</td>
<td class="data-td data last text-right">90</td>
</tr>
<tr class="tbl-data">
<td class="data-td data last text-left">% Supply Active, last 180 days</td>
<td class="data-td data last text-right">23</td>
<td class="data-td data last text-right">3</td>
<td class="data-td data last text-right">-1</td>
<td class="data-td data last text-right">42</td>
</tr>
<tr class="tbl-data">
<td class="data-td data last text-left">% Supply Dormant for 3+ Years</td>
<td class="data-td data last text-right">44</td>
<td class="data-td data last text-right">-1</td>
<td class="data-td data last text-right">-5</td>
<td class="data-td data last text-right">90</td>
</tr>
<tr class="tbl-data">
<td class="data-td data last text-left">Avg Fees (USD)</td>
<td class="data-td data last text-right">$101,210.54</td>
<td class="data-td data last text-right">-29</td>
<td class="data-td data last text-right">78</td>
<td class="data-td data last text-right">80</td>
</tr>
<tr class="tbl-data">
<td class="data-td data last text-left">Avg Fees (BTC)</td>
<td class="data-td data last text-right">0.89852</td>
<td class="data-td data last text-right">-26</td>
<td class="data-td data last text-right">-6</td>
<td class="data-td data last text-right">57</td>
</tr>
<tr class="tbl-data">
<td class="data-td data last text-left">Percent of BTC Addresses in profit</td>
<td class="data-td data last text-right">95</td>
<td class="data-td data last text-right">-3</td>
<td class="data-td data last text-right">13</td>
<td class="data-td data last text-right">83</td>
</tr>
<tr class="tbl-data">
<td class="data-td data last text-left">Unrealized profit/loss ratio</td>
<td class="data-td data last text-right">0.53</td>
<td class="data-td data last text-right">-5</td>
<td class="data-td data last text-right">14</td>
<td class="data-td data last text-right">74</td>
</tr>
<tr class="tbl-data">
<td class="data-td data last text-left">Global Power Consumption (TWh)</td>
<td class="data-td data last text-right">190</td>
<td class="data-td data last text-right">7</td>
<td class="data-td data last text-right">56</td>
<td class="data-td data last text-right">100</td>
</tr>
<tr class="tbl-data">
<td class="data-td data last text-left">Total Daily BTC Miner Revenues (USD)</td>
<td class="data-td data last text-right">$53,432,811</td>
<td class="data-td data last text-right">-1</td>
<td class="data-td data last text-right">95</td>
<td class="data-td data last text-right">97</td>
</tr>
<tr class="tbl-data">
<td class="data-td data last text-left">Total Crypto Equities' Market Cap<sup>*</sup>&nbsp;(USD) (MM)</td>
<td class="data-td data last text-right">$306,825</td>
<td class="data-td data last text-right">-6</td>
<td class="data-td data last text-right">142</td>
<td class="data-td data last text-right">93</td>
</tr>
<tr class="tbl-data">
<td class="data-td data last text-left">Transfer volume from Miners to Exchanges (USD)</td>
<td class="data-td data last text-right">$18,285,892</td>
<td class="data-td data last text-right">-16</td>
<td class="data-td data last text-right">197</td>
<td class="data-td data last text-right">96</td>
</tr>
<tr class="tbl-data">
<td class="data-td data last text-left">Bitcoin Dominance</td>
<td class="data-td data last text-right">58</td>
<td class="data-td data last text-right">-4</td>
<td class="data-td data last text-right">3</td>
<td class="data-td data last text-right">74</td>
</tr>
<tr class="tbl-data">
<td class="data-td data last text-left">Bitcoin Futures Annualized Basis</td>
<td class="data-td data last text-right">7</td>
<td class="data-td data last text-right">-10</td>
<td class="data-td data last text-right">0</td>
<td class="data-td data last text-right">49</td>
</tr>
<tr class="tbl-data">
<td class="data-td data last text-left">Mining Difficulty (T)</td>
<td class="data-td data last text-right">132</td>
<td class="data-td data last text-right">3</td>
<td class="data-td data last text-right">48</td>
<td class="data-td data last text-right">100</td>
</tr>
</tbody>
</table>
</div>
<p class="chart-disclosure mt-3"><sup>*</sup>&nbsp;DAPP market cap as a proxy, as of September 17th, 2025. "All-time" data as of 6.8.23, not since index inception.</p>
<p class="chart-disclosure"><sup>1</sup>&nbsp;30 day change &amp; 365 day change are relative to the 30-day avg, not absolute.</p>
<div class="wrapped-div">
<table style="width: 100%;">
<tbody>
<tr class="tbl-data">
<td class="tbl-header last text-left">Regional Trading ($)</td>
<td class="tbl-header last text-right">MoM Change (%)</td>
<td class="tbl-header last text-right">YoY Change (%)</td>
</tr>
<tr class="tbl-data">
<td class="data-td data last text-left">Asia Hours Price Change MoM</td>
<td class="data-td data last text-right">1</td>
<td class="data-td data last text-right">3</td>
</tr>
<tr class="tbl-data">
<td class="data-td data last text-left">US hours Price Change MoM</td>
<td class="data-td data last text-right">0</td>
<td class="data-td data last text-right">1</td>
</tr>
<tr class="tbl-data">
<td class="data-td data last text-left">EU hours Price Change MoM</td>
<td class="data-td data last text-right">-1</td>
<td class="data-td data last text-right">2</td>
</tr>
</tbody>
</table>
</div>
<br />
<p class="chart-disclosure">Source: Glassnode as of 9/17/2025. <strong>Past performance is no guarantee of future results. Not intended as a recommendation to buy or sell any securities named herein.</strong></p>
<h2 id="market-sentiment" class="jump-link-nav anchored-block" data-jumplink-title="Market Sentiment">Bitcoin Price &amp; Market Sentiment</h2>
<p>Bitcoin traded down <strong>4%</strong> this month as its 3-month annualized volatility fell to <strong>29%</strong>, the lowest level in over five years. Bitcoin dominance, a measure of Bitcoin&rsquo;s share of the total market cap of cryptocurrencies, also fell <strong>4%</strong> this month, reversing most of the metric&rsquo;s gains in 2025. Despite Digital Asset Treasuries&rsquo; (&ldquo;DATs&rdquo;) impressive YoY accumulation, they have slowed relative to newcomer DATs that are focused on other tokens like Ethereum and Solana.</p>
<h3>Rising Share of Supply Held in Digital Asset Treasuries</h3>
<p><img loading="lazy" class="img-responsive w-100" alt="Rising Share of Supply Held in Digital Asset Treasuries" src="https://www.vaneck.com/contentassets/102c9a94f5df455eae3fedb910f669d6/6191_bitcoin-chaincheck-mid-sept_chart-2_2025-9_v1_blog.svg" /></p>
<p class="chart-disclosure">Source: Artemis XYZ as of 9/17/2025. <strong>Past performance is no guarantee of future results. Not intended as a recommendation to buy or sell any securities named herein.</strong></p>
<p>While BTC DATs increased their share of BTC by <strong>2.5%</strong> over the past month, ETH and SOL DATs played catch-up. SOL DATs grew their share of SOL supply by <strong>18%</strong> MoM, while ETH DATs collectively added <strong>83%</strong>. These purchases helped drive up their tokens&rsquo; price ratios versus BTC, with ETH/BTC +<strong>2.3%</strong> and SOL/BTC +<strong>25.6%</strong>. Similarly, BTC ETPs saw net inflows of <strong>$2.2B</strong> over the past month, representing <strong>0.09%</strong> of its market cap, while ETH ETPs saw <strong>$853M</strong> of net inflows, representing <strong>0.16%</strong> of its market cap. As institutionalization plays an increasing role in crypto, we believe these trends are paving the way for so-called &ldquo;altcoin seasons&rdquo; to play out in public markets.</p>
<p><strong>Crypto Equities Market Cap</strong>: The 30-day moving average (30DMA) of <strong><a href="https://www.marketvector.com/indexes/sector/mvis-global-digital-assets-equity" target="_blank" title="MVDAPP - MVIS Global Digital Assets Equity Index" rel="noopener">MVIS<sup>&reg;</sup>&nbsp;Global Digital Assets Equity Index (MVDAPP)</a></strong> fell <strong>6%</strong> month-over-month as major Bitcoin &ldquo;pure-play&rdquo; components like MSTR and MARA fell following Bitcoin&rsquo;s late summer highs. However, the index has gone on to set new cycle highs over the past week. Crypto equities are showing market dispersion as the AI/HPC trade heats up, driving outperformance from a growing number of Bitcoin miners that are pivoting to AI while DATs and more pure-play miners lag.</p>
<h3>AI-Pivoting Miners Outperform as Pure-Play Miners and DATs Lag Bitcoin</h3>
<p><img loading="lazy" class="img-responsive w-100" alt="AI-Pivoting Miners Outperform as Pure-Play Miners and DATs Lag Bitcoin" src="https://www.vaneck.com/contentassets/102c9a94f5df455eae3fedb910f669d6/6191_bitcoin-chaincheck-mid-sept_chart-3_2025-9_v1_blog.svg" /></p>
<p class="chart-disclosure"><sup>*</sup>&nbsp;CORZ excluded due to pending stock-based merger with CRWV.</p>
<p class="chart-disclosure">Source: Company filings, FactSet as of 9/16/2025. <strong>Past performance is no guarantee of future results. Not intended as a recommendation to buy or sell any securities named herein.</strong></p>
<p>Over the past month, Bitcoin mining stocks with clear AI/HPC pivots gained an average of <strong>57%</strong>, adding <strong>~$16B</strong> to their collective market capitalization. Over the past three months, this cohort achieved a cumulative average gain of <strong>126%</strong>, outperforming Bitcoin <strong>(+9%)</strong>, pure-play miners <strong>(+4%)</strong>, and Bitcoin DATs <strong>(-38%)</strong>. The move marks an accelerating trend of miners being re-rated for the value of their scarce power assets, as AI-focused enterprises like Google, Microsoft, OpenAI, and AI neoclouds like CoreWeave escalate their capital expenditures to meet demand for AI capacity.</p>
<p>On September 9th, Nebius Group (NBIS) secured a landmark deal with Microsoft, adding <strong>$17.4-$19.4B</strong> in revenues over five years to provide Microsoft Azure with expanded infrastructure capacity to NVIDIA&rsquo;s latest AI hardware. Microsoft noted in its Q2 earnings call that its Intelligent Cloud segment showed the greatest growth, at <strong>26%</strong>, compared to <strong>16%</strong> growth from its Productivity and Business Processes segment and <strong>9%</strong> growth in Personal Computing. In total, Microsoft&rsquo;s capex grew <strong>~$24B (27%)</strong> year-over-year to support demand for its cloud and AI offerings. Chairman and CEO Satya Nadella stated that &ldquo;Cloud and AI is the driving force of business transformation across every industry and sector.&rdquo; Though NBIS is not a Bitcoin miner, by highlighting AI&rsquo;s power capacity bottleneck, the deal helped catalyze a cascade of re-ratings across the hybrid Bitcoin-miner-to-AI-data-center landscape. Underscoring the strategic importance of power, NBIS&rsquo;s Q2 2025 highlights the company&rsquo;s emphasis on growing capacity from <strong>220MW</strong> in 2025 to <strong>1&gt;GW</strong> in 2026. Announced on September 10th, OpenAI&rsquo;s <strong>$300B</strong>, 5-year computing power deal with Oracle further added fuel to the fire, one of the largest cloud contracts ever signed.</p>
<h3>Miners With Colocation Deals Have Already Pivoted Over Half Their MW Capacity</h3>
<p><img loading="lazy" class="img-responsive w-100" alt="Miners With Colocation Deals Have Already Pivoted Over Half Their MW Capacity" src="https://www.vaneck.com/contentassets/102c9a94f5df455eae3fedb910f669d6/6191_bitcoin-chaincheck-mid-sept_chart-4_2025-9_v1_blog.svg" /></p>
<p class="chart-disclosure"><sup>*</sup>&nbsp;Based on an est. average Power Usage Effectiveness (&ldquo;PUE&rdquo;) ratio of 1.25.</p>
<p class="chart-disclosure">Source: Company filings as of 9/16/2025. <strong>Past performance is no guarantee of future results. Not intended as a recommendation to buy or sell any securities named herein.</strong></p>
<p>Among the four Bitcoin miners with AI colocation deals, we estimate <strong>~61%</strong> of their capacity has already been pivoted to AI workloads. Most recently, Applied Digital announced on August 29th that it had finalized a new lease agreement for an additional <strong>150MW</strong> at its Polaris Forge 1 Campus in Ellendale, North Dakota, adding <strong>~$4B</strong> in contracted lease revenue over 15 years. In total, the deal brings APLD&rsquo;s total anticipated contracted lease revenue to approximately <strong>$11B</strong>. In August, TeraWulf contracted <strong>360+</strong> <strong>MW</strong> of critical IT load to AI cloud platform Fluidstack in a deal representing <strong>$6.7B</strong> in contracted revenue over the initial 10-year term, including two five-year extension options that, if exercised, would bring the total to <strong>$16B</strong>. As a strategic partner, Google is providing a <strong>$3.2B</strong> backstop in project-related debt financing and will receive warrants for <strong>32.5M</strong> shares of WULF, representing <strong>~14%</strong> pro forma equity ownership in TeraWulf. As competition over power assets continues to underscore their value, Two Seas Capital, which owns <strong>6.3%</strong> of Core Scientific, reiterated its opposition to the company&rsquo;s pending merger with CoreWeave in a proxy <a href="https://www.sec.gov/Archives/edgar/data/1823138/000090266425003969/p25-1953prec14a.htm" title="SCHEDULE 14A - Proxy Statement Pursuant to Section 14(a) - of the Securities Exchange Act of 1934 (Amendment No. )" target="_blank" rel="noopener"><strong>filing</strong></a> dated September 4th. Even as AI valuations surge, Two Seas argues that the all-stock deal structure undervalued Core Scientific from the start. The merger valued CORZ at <strong>$20.40</strong> per share <strong>(~$6.2B)</strong>, which was already a <strong>39%</strong> discount to the <strong>$10.2B</strong> of <i>pre-renewal</i> hosting contracts it held with CoreWeave. The situation worsened as CoreWeave&rsquo;s stock declined, dragging the implied value of CORZ below <strong>$12</strong> per share as of September 3. Two Seas calls this &ldquo;a take-under&rdquo; and deems it indefensible.</p>
<p>But Bitcoin miners are not being re-rated purely on their potential to provide colocation deals. Some miners are leaning into the more lucrative but capex-heavy business of owning and operating the GPUs themselves. In late August, IREN announced securing <strong>$102M</strong> in financing for a prior purchase of NVIDIA Blackwell B200 and B300 GPUs, structured as a 36-month lease for <strong>100%</strong> of the purchase price for an estimated <strong>9%</strong> interest rate. Days later, the company secured NVIDIA Preferred Partner status and receiving an additional <strong>$96M</strong> in financing to procure an additional <strong>1.2k</strong> air-cooled B300s and <strong>1.2k</strong> liquid-cooled GB300s for <strong>$168M</strong>, expanding its total GPU fleet to <strong>10.9k</strong> NVIDIA GPUs, a <strong>474%</strong> increase from the company&rsquo;s <strong>~1.9k</strong> operational GPUs in July. Similarly, HIVE&rsquo;s Buzz HPC struck a deal with Bell Canada, the country&rsquo;s largest telecommunications provider, to provide the NVIDIA GPU clusters to Bell&rsquo;s government and enterprise customers, though the terms of the deal remain undisclosed. BTDR, another miner with multi-GW capacity in search of colocation customers, also expanded its neocloud business to <strong>$8M</strong> ARR in July, with &ldquo;significant growth expected from Q4&rdquo; as compared to &ldquo;immaterial&rdquo; AI Cloud Service ARR as of its April annual filing. We believe that with capital markets now offering single-digit financing for GPUs, Bitcoin miners with proven expertise in operating their own cloud AI services can drive better margins by being more vertically integrated and thus having greater negotiating leverage with colocation tenants.</p>
<h3>WULF, CIFR, and RIOT Start to Trade Like AI Data Centers, While Other Pivoters Remain Overlooked</h3>
<p><img loading="lazy" class="img-responsive w-100" alt="WULF, CIFR, and RIOT Start to Trade Like AI Data Centers, While Other Pivoters Remain Overlooked" src="https://www.vaneck.com/contentassets/102c9a94f5df455eae3fedb910f669d6/6191_bitcoin-chaincheck-mid-sept_chart-5_2025-9_v1_blog.svg" /></p>
<p class="chart-disclosure">Source: Company filings, Bloomberg as of 9/17/2025. <strong>Past performance is no guarantee of future results. Not intended as a recommendation to buy or sell any securities named herein.</strong></p>
<p>Surveying the Bitcoin miner landscape, there is a clear valuation dispersion between miners that have been exploring AI/HPC for over a year and those who have remained mostly pure-plays. To more accurately measure each miners&rsquo; core operating businesses versus their 2026 EBITDA estimates, we calculate &ldquo;BTC-Adjusted EV&rdquo; by subtracting the value of each company&rsquo;s BTC holdings from EV. We <a href="/us/en/blogs/digital-assets/matthew-sigel-vaneck-mid-april-2025-bitcoin-chaincheck/" title="VanEck Mid-April 2025 Bitcoin Chaincheck"><strong>noted</strong></a> earlier this year that the value of BTC treasuries is not accounted for by most data providers like Bloomberg, a dynamic that disproportionately affects relatively BTC-heavy companies like MARA, CLSK, and RIOT.</p>
<p>With <strong>430MW</strong> in contracted power, WULF is the only miner in this list with a colocation deal, trading firmly within the AI/HPC data center EV/EBITDA multiple range at <strong>24.2x</strong>. CIFR, trading at <strong>19.9x</strong> hasn&rsquo;t closed a deal, but has <strong>300MW</strong> of interconnect capacity at its Barber Lake, TX site, with a signed MOU for an additional <strong>500MW</strong> data center at the same site. Earlier in September, CIFR&rsquo;s CEO <a href="https://x.com/McnallieM/status/1965071106609652114" title="McNallie Money on X" target="_blank" rel="noopener"><strong>stated</strong></a> at the H.C. Wainwright conference that he is confident the company will have at least one deal by the end of 2025. At <strong>15.6x, </strong>RIOT&rsquo;s valuation reflects its <strong>600MW</strong> of remaining capacity at Corsicana, a site in close proximity to Dallas, where they first began formally <a href="https://www.riotplatforms.com/riot-platforms-launches-formal-evaluation-of-potential-ai-hpc-uses-for-remaining-600-mw-of-power-capacity-at-corsicana-facility/" title="Riot Platforms Launches Formal Evaluation of Potential AI/HPC Uses for Remaining 600 MW of Power Capacity at Corsicana Facility" target="_blank" rel="noopener"><strong>evaluating</strong></a> potential AI/HPC colocation deals in January. Similarly, HUT, IREN, BITF, and BTDR have all explicitly announced that they are pursuing colocation deals with hundreds of megawatts each. While MARA and CLSK have historically led pure-play miners with their dominant hashrate and Bitcoin treasuries, and have been skeptics of the AI/HPC pivot, they have taken recent steps toward AI/HPC as well. CLSK saw an <strong>18% </strong>gain after its newly returned CEO Matt Schultz <a href="https://www.youtube.com/watch?v=HJT6ATDhDWM\" title="CleanSpark (CLSK) CEO on Data Center Outreach, Bitcoin's &quot;Shock Absorber&quot; Value" target="_blank" rel="noopener">messaged</a> on Schwab Network that they were well-positioned to pivot some of their <strong>1GW+</strong> of power assets into &ldquo;other types of compute to maximize profitability.&rdquo; In August, MARA signed an agreement with an option to acquire a <strong>64%-75%</strong> stake in Exaion, a developer and operator of HPC data centers and cloud AI infrastructure. Overall, we think that as global AI/HPC capex continues to climb, the growing success of miner pivots will de-risk the miner pivot trade, or even demand it for shareholder value. Thanks to the synergies between Bitcoin and AI, miners&rsquo; involvement in AI/HPC is turning from a binary &ldquo;yes&rdquo; or &ldquo;no&rdquo; to a question of &ldquo;how much&rdquo; power they are capable of monetizing, and how.</p>
<p>Through this lens, we think HIVE looks particularly undervalued. We conservatively assume that HIVE can earn <strong>40%</strong> EBITDA margins (IREN earns <strong>~60%</strong>) on its estimated <strong>$550M</strong> ARR from mining once it completes its EH/s expansion in Paraguay, slated for completion by Thanksgiving, for a total of <strong>$220M</strong> EBITDA. We further assume HIVE can earn <strong>70%</strong> EBITDA margins on their $<strong>100M</strong> ARR cloud HPC target for 2026, totaling <strong>$70M</strong> EBITDA. Thus, HIVE&rsquo;s <strong>$369M</strong> BTC-Adjusted EV / <strong>$290M</strong> EBITDA target implies <strong>1.3x</strong> EV/EBITDA, almost half the <strong>2.4x</strong> EV/EBITDA implied by the Bloomberg estimates we used for the BTC-Adjusted EV / EBITDA graph above. We partially attribute HIVE&rsquo;s potential undervaluation to its relatively small enterprise value and sizable BTC stack, which tends to be overlooked by traditional financial data providers.</p>
<p><img loading="lazy" class="img-responsive w-100" alt="Bitcoin Miners BTC/EV Comparison" src="https://www.vaneck.com/contentassets/102c9a94f5df455eae3fedb910f669d6/6191_bitcoin-chaincheck-mid-sept_table_2025-9_v1_blog.svg" /></p>
<p class="chart-disclosure">Source: Company filings, Bitcoin Treasuries, Bloomberg as of 9/17/2025. <strong>Past performance is no guarantee of future results.</strong></p>
<p><strong>Links to third party websites are provided as a convenience and the inclusion of such links does not imply any endorsement, approval, investigation, verification or monitoring by us of any content or information contained within or accessible from the linked sites. By clicking on the link to a non-VanEck webpage, you acknowledge that you are entering a third-party website subject to its own terms and conditions. VanEck disclaims responsibility for content, legality of access or suitability of the third-party websites.</strong></p>
<p>To receive more <strong><a href="https://www.vaneck.com/us/en/insights/digital-assets/" title="Digital Assets Insights">Digital Assets</a></strong> insights, <strong><a href="https://www.vaneck.com/us/en/subscribe/" title="Subscription Center">sign up in our subscription center</a></strong>.</p>
]]></content:encoded>
</item><item rdf:about="https://www.vaneck.com/us/en/blogs/municipal-bonds/investor-guide-to-municipal-bonds/">
  <title>An Investor&#39;s Guide to Municipal Bonds></title>
  <link>https://www.vaneck.com/us/en/blogs/municipal-bonds/investor-guide-to-municipal-bonds/</link>
  <description><![CDATA[Understand the pros and cons of muni bond investing with VanEck&rsquo;s comprehensive guide.]]></description>
  <dc:creator> </dc:creator>
  <dc:date>09/18/2025 06:30:00</dc:date>
<content:encoded><![CDATA[

<p><strong>Key Takeaways:</strong></p>
<ul class="content-list">
<li class="mt-2"><strong>Tax Efficiency</strong>: Municipal bond interest is often exempt from federal income tax, and if the investor resides in the state of issuance, it can also be exempt from state and local taxes.</li>
<li class="mt-2"><strong>Stable Income</strong>: Munis typically offer a fixed rate of return, providing a predictable income stream, which is particularly attractive in volatile markets.</li>
<li class="mt-2"><strong>Financing for Essential Projects</strong>: Investing in municipal bonds means contributing to the development and improvement of local infrastructure and public services.</li>
</ul>
<p>Municipal bonds, commonly referred to as "munis," are debt securities issued by states, cities, counties, and other state governmental entities to fund public projects. These bonds are a favorite among investors in high tax brackets seeking steady income with tax advantages, as they often provide tax-free interest at the federal and sometimes state and local levels. By investing in munis, investors provide financing for essential community projects such as schools, highways, and hospitals while receiving regular interest payments.</p>
<h2>What Are Municipal Bonds?</h2>
<p>Municipal bonds (also known as &ldquo;munis&rdquo;) are securities issued by local, or state governmental entities to finance public projects. By purchasing munis, investors lend money to the issuer in exchange for periodic interest payments and the return of the bond's face value upon maturity. <strong><a href="https://www.investopedia.com/terms/m/municipalbond.asp" target="_blank" rel="noopener" title="Municipal Bond: Definition, Types, Risks, and Tax Benefits">Municipal bonds act like loans, with bondholders becoming creditors</a></strong>.</p>
<h3>How Do Municipal Bonds Work?</h3>
<p>Municipal bonds are debt instruments through which local or state governments raise capital for public projects. Investors buy these bonds, effectively lending money to the issuing body, and in return, they receive periodic interest payments. Upon the bond's maturity, the principal amount is repaid. The appeal lies in the tax-exempt status of the interest income and the relative safety of the investment, as most are backed by government entities.</p>
<h3>Types of Municipal Bonds</h3>
<p>The two most popular municipal bonds are general obligation bonds and revenue bonds, each with distinct characteristics and risks. Other types of municipal bonds exist each having unique risk profiles.</p>
<h4>General Obligation Bond</h4>
<p>General obligation bonds are backed by the full faith and credit of the issuing municipality, which means they are secured by the issuer's ability to tax residents. Investors may consider these bonds lower risk because they are supported by the issuing government's taxing power. However, because of this lower risk, they typically offer lower yields compared to other types of bonds. They are best suited for investors looking for a stable investment with potentially lower default risk.</p>
<h4>Revenue Bond</h4>
<p>Revenue bonds are issued to fund income-producing projects and are secured by specific revenue sources, such as tolls or earnings from a public utility. These bonds typically offer higher yields due to their higher risk; if the project fails to generate the expected revenue, bondholders may not receive their expected interest payments or the bondholders may not be repaid at the bond&rsquo;s maturity date. Investors interested in these bonds should consider the project's potential to generate steady revenue.</p>
<h2>How to Invest in Municipal Bonds</h2>
<p>Investing in municipal bonds can be done directly through bond brokers or indirectly through mutual funds and exchange-traded funds (ETFs), each with unique advantages and considerations.</p>
<h3>Bond Brokers</h3>
<p>Bond brokers allow investors to purchase individual muni bonds directly. This method offers the ability to select specific bonds and tailor the investment to one's preferences and risk tolerance. The downside is that it requires a higher level of investment knowledge and can involve higher transaction fees.</p>
<h3>Mutual Funds</h3>
<p>Mutual funds that specialize in municipal bonds provide diversification and professional management. They are suitable for investors who want exposure to a variety of bonds without the need to manage individual securities. The trade-off includes management fees and less control over the specific bonds in the portfolio.</p>
<h3>Exchange Traded Funds (ETFs)</h3>
<p>Municipal bond ETFs offer the benefits of mutual funds&mdash;diversification and professional management&mdash;with the added advantage of real-time trading like stocks. They typically have lower fees than mutual funds but can be subject to market fluctuations. <strong><a href="https://www.vaneck.com/us/en/blogs/municipal-bonds/municipal-bond-etfs-expect-more-from-your-munis/" title="Municipal Bond ETFs &ndash; Expect More from Your Munis">VanEck&rsquo;s municipal income ETFs</a></strong> offer investors the ability to exercise control over their portfolio yield, duration, and credit exposure at different points in the interest rate cycle.</p>
<h3>Alternative Methods</h3>
<p>Other ways to invest in munis include direct investment programs from municipalities and closed-end funds. These methods can offer higher yields and investment in specific community projects. However, they may come with higher risks and less liquidity, and they may require more active management.</p>
<p>Each method of investing in municipal bonds has its own set of benefits and drawbacks, and the best choice depends on the investor's financial goals, risk tolerance, and desired level of involvement in managing the investment.</p>
<h2>Pros and Cons of Investing in Municipal Bonds</h2>
<p>Investing in municipal bonds carries a unique set of characteristics that appeal to a variety of investors. The allure of munis often lies in their tax-exempt status, as well as being considered a relatively safe investment. However, they may also be less attractive due to their typically lower yields compared to other taxable securities and potential liquidity issues. Overall, munis can be a strong investment for those seeking steady, tax-efficient income, but they are not without risks, such as interest rate fluctuations and the rare instances of default.</p>
<p>Let's delve into both the advantages and the inherent risks associated with municipal bonds.</p>
<h3>Advantages of Municipal Bonds for Investors</h3>
<p>Municipal bonds offer several compelling advantages that can make them an attractive component of an investment portfolio.</p>
<h4>Tax Exemption</h4>
<p>The most significant benefit of munis is the tax exemption on interest income they offer. For investors in high tax brackets, this can equate to a considerable advantage, often making the after-tax return on munis more favorable than that of taxable bonds.</p>
<h4>Low Default Risk</h4>
<p>Munis are known for being a relatively safe investment. Their default rates are historically low, especially for general obligation bonds, making them a potential choice for risk-averse investors.</p>
<h4>Diversification</h4>
<p>Investing in munis can provide a portfolio with diversification benefits. Historically, municipal bonds have demonstrated a low correlation with other asset classes, which can help reduce overall portfolio risk.</p>
<h3>Risks of Municipal Bonds for Investors</h3>
<p>Municipal bonds offer several benefits, but they are not without their risks. Understanding these risks is essential for investors looking to make informed decisions.</p>
<h4>Interest Rate Risk</h4>
<p>All bonds face interest rate risk; when rates go up, bond prices typically go down. To manage this risk, investors can construct a laddered bond portfolio, which staggers the maturity of bonds and allows for reinvestment at potentially higher rates over time. Another strategy is to focus on short to intermediate-term bonds, which are less sensitive to interest rate changes than long-term bonds.</p>
<h4>Call Risk</h4>
<p>The call risk associated with munis, where an issuer may retire a bond early, can be offset by investing in non-callable bonds or by being compensated with a higher yield for callable bonds. Understanding the call provisions and how they may impact investment returns is crucial before investing.</p>
<h4>Lower Yields</h4>
<p>Munis generally offer lower yields due to their tax-exempt status. Investors in higher tax brackets often find the tax-adjusted returns of munis to be competitive with higher-yielding taxable bonds. It&rsquo;s important for investors to calculate their tax-equivalent yield to compare the true return potential of munis with other investment options.</p>
<h2>When to Invest in Municipal Bonds</h2>
<p>The decision to invest in municipal bonds should align with an investor's financial goals, tax situation, and risk tolerance. They are particularly suitable for high-net-worth individuals in higher tax brackets looking for tax-free income. Additionally, periods of market volatility or low interest rates may present favorable opportunities for adding munis to one's portfolio.</p>
<h2>The Bottom Line</h2>
<p>Municipal bonds can be a staple in many investment strategies, prized for their tax advantages, relative safety, and role in portfolio diversification. However, they are not entirely risk-free and tend to offer lower yields. Investors should weigh the pros and cons in the context of their investment objectives and the current economic environment. As with any investment, due diligence and a clear understanding of munis' place within a broader financial plan are paramount.</p>
<p>Looking to enhance your portfolio with munis? Explore <strong><a href="https://www.vaneck.com/us/en/etf-mutual-fund-finder/etfs/income/municipal-bond/overview/?InvType=etf&amp;AssetClass=mb&amp;Funds=emf,esf,grf,iigf,mwmf,emlf,embf,ccif&amp;ShareClass=a,c,i,y,z&amp;tab=ov" title="Explore Our ETFs and Mutual Funds">VanEck&rsquo;s comprehensive suite of muni ETFs</a></strong>.</p>
<p>To receive more <strong><a href="https://www.vaneck.com/us/en/insights/municipal-bonds/" title="Municipal Bonds Insights">Municipal Bonds</a></strong> insights, <strong><a href="https://www.vaneck.com/us/en/subscribe/" title="Subscription Center">sign up in our subscription center</a></strong>.</p>
]]></content:encoded>
</item><item rdf:about="https://www.vaneck.com/us/en/blogs/digital-assets/three-reasons-active-management-matters-in-crypto/">
  <title>Three Reasons Active Management Matters in Crypto></title>
  <link>https://www.vaneck.com/us/en/blogs/digital-assets/three-reasons-active-management-matters-in-crypto/</link>
  <description><![CDATA[With shifting cycles, emerging opportunities, and rapid innovation, crypto is a market where adaptability matters. Active management provides the flexibility to harness upside potential while avoiding the pitfalls that passive strategies must endure.]]></description>
  <dc:creator> </dc:creator>
  <dc:date>09/18/2025 06:30:00</dc:date>
<content:encoded><![CDATA[

<p><strong>Key Takeaways:</strong></p>
<ul data-indent-level="1">
<li class="mt-2">Active management helps investors navigate crypto&rsquo;s boom-and-bust cycles by adjusting exposure as conditions change.</li>
<li class="mt-2">Active strategies can capture growth dynamics across miners, fintechs, and infrastructure&mdash;not just tokens.</li>
<li class="mt-2">Research-driven oversight aims to screen out weak players and seeks to avoid costly failures.</li>
</ul>
<h2>Introduction</h2>
<p>Crypto is one of the fastest-moving areas of global markets. Entire sectors can rise or fall within months, and the winners of one cycle often fade into obscurity by the next. For investors, this raises an important question: is simply buying and holding enough, or does crypto demand a more active approach? Here are three reasons why active management can make a meaningful difference in digital assets.</p>
<h2>1. The Cycle Challenge<sup>*</sup></h2>
<p>Crypto markets are cyclical, often moving in four-year waves tied to Bitcoin&rsquo;s halving events. During bull runs, digital asset prices and related equities can soar, while bear markets bring steep corrections. Bitcoin has experienced peak-to-trough drawdowns of 70% or more in past cycles, pulling down miners, exchanges, and related equities with it.</p>
<p><img loading="lazy" class="img-responsive w-100" alt="The Cycle Challenge" src="https://www.vaneck.com/contentassets/fe180c18a9e243f098ede9240c1e74e1/6171_node-blog_chart-1_2025-9_v1_blog.svg" /></p>
<p class="chart-disclosure">Source: Morningstar. Q3 2025.Data included in chart refers to S&amp;P 500 Total Return Index (S&amp;P 500 TR).60/40 Portfolio is 60% S&amp;P 500 TR and 40% Bloomberg U.S. Aggregate Bond Index.Bitcoin data refers to Bloomberg Bitcoin Index.Please see important disclosures and index definitions at the end of this content. <strong><i>Past performance and references to Bitcoin market cycles are based on historical data, neither of which guarantee future results.</i></strong></p>
<p>This chart makes clear that timing and adaptability matter: historically, while the volatility is extreme, so have been the recoveries. Even with those steep declines, Bitcoin&rsquo;s historical long-term performance remains among the strongest of any asset class. The key question for investors is whether active management can help keep the upside while dialing down the pain of the downside.</p>
<p>An active approach allows investors to adjust exposure as these cycles unfold rather than simply riding them up and down. This could mean leaning into higher-growth opportunities when conditions are favorable and becoming more cautious when signs of stress appear. The flexibility to make those shifts is one of the clearest advantages of active management in crypto.</p>
<h2>2. Beyond Just Tokens</h2>
<p>The onchain economy is broader than just cryptocurrencies. It includes miners powering both Bitcoin and AI data centers, fintech firms enabling digital payments, exchanges providing liquidity, and even energy infrastructure companies that keep this digital ecosystem running. These are businesses with revenues, cash flows, and real customers&mdash;not just speculative tokens.</p>
<p>One way to see this trend: companies are increasingly talking about blockchain in their regulatory disclosures. Mentions of terms related to digital assets in SEC filings climbed this past year, hitting their highest point last month. That steady rise suggests that adoption is moving beyond crypto-native firms and into a much wider range of industries.</p>
<h3>Blockchain-related Mentions in SEC Filings</h3>
<p><img loading="lazy" class="img-responsive" alt="Blockchain-related Mentions in SEC Filings" src="https://www.vaneck.com/contentassets/11902b29e62e4a128748b2fae4b3db34/6171_node-blog_chart-2_2025-9_v1_blog.svg" /></p>
<p class="chart-disclosure">Source: SEC Edgar Database. The Block. As of 9/9/25. Not intended as a recommendation to buy or sell any securities referenced herein or as any call to action.</p>
<p>Active management allows rotation between these categories to balance risk and reward. For example, during the AI boom of 2024, several Bitcoin miners repurposed data centers to service high-performance computing demand&mdash;creating growth opportunities outside of pure crypto cycles. Similarly, fintech leaders in Latin America and Asia have integrated crypto wallets into their payments platforms, broadening adoption and revenue streams. These types ofcross-sector opportunities highlight how diversified companies can benefit investors in ways that passive indexes tied strictly to tokens cannot.</p>
<h2>3. Filtering Risks &amp; Avoiding the Duds</h2>
<p>Not every company or token in the digital asset space is built to last. Some carry excessive leverage, weak governance, or business models tied to hype cycles. The past few years alone saw high-profile failures of both private and publicly traded firms that grew too aggressively and collapsed when liquidity dried up.</p>
<p>Active management brings research discipline&mdash;screening out fragile players while identifying firms with sustainable revenues, strong balance sheets, and strategic positioning in the onchain economy. Think of it as spotting cracks in a foundation: if you see them early enough, you can step aside before the building comes down. Passive strategies, on the other hand, are stuck holding everything in the index&mdash;even as it falls apart.</p>
<p>The public markets offer cautionary examples. Silvergate Capital, once trading above $200 a share, saw an 89% drawdown in late 2022 before announcing liquidation in March 2023 and filing for bankruptcy in 2024. Signature Bank, which peaked near $375 in early 2022, was seized by regulators in March 2023 after a deposit run, with shares now worth pennies on OTC markets. And Voyager Digital, a Canadian-listed crypto broker, lost over 99% of its value following exposure to Three Arrows Capital and filed for bankruptcy in July 2022. In each case, red flags like concentrated crypto deposits, weak liquidity, or risky lending appeared before the final collapse&mdash;warning signs that active managers could have acted on well before passive strategies were forced to ride them down.</p>
<h3>Silvergate Capital: From Growth to Voluntary Liquidation</h3>
<p><img loading="lazy" class="img-responsive" alt="Silvergate Capital: From Growth to Voluntary Liquidation" src="https://www.vaneck.com/contentassets/50e930c85f9f4a0daa7b1ca0b09d2d0d/6171_node-blog_chart-3_2025-9_v1_blog.svg" /></p>
<h3>Signature Bank: Regulatory Seizure Following Crypto Deposit Outflows</h3>
<p><img loading="lazy" class="img-responsive" alt="Signature Bank: Regulatory Seizure Following Crypto Deposit Outflows" src="https://www.vaneck.com/contentassets/50e930c85f9f4a0daa7b1ca0b09d2d0d/6171_node-blog_chart-4_2025-9_v1_blog.svg" /></p>
<h3>Voyager Digital: Bankruptcy Following Risky Lending and Crypto Exposures</h3>
<p><img loading="lazy" class="img-responsive" alt="Voyager Digital: Bankruptcy Following Risky Lending and Crypto Exposures" src="https://www.vaneck.com/contentassets/50e930c85f9f4a0daa7b1ca0b09d2d0d/6171_node-blog_chart-5_2025-9_v1_blog.svg" /></p>
<p class="chart-disclosure">Sources: Vested Finance, The Block, Morningstar. Past performance is no guarantee of future results. Not intended as a recommendation to buy or sell any securities referenced herein or as any call to action.</p>

<p>This ability to separate signals from noise is especially valuable in crypto, where the pace of innovation is matched by the frequency of failed experiments. Active oversight also enables selective use of tools like exchange-traded products or futures, adding tactical exposure during favorable environments and reducing it when conditions deteriorate&mdash;an advantage that passive strategies lack.</p>
<h2>Conclusion</h2>
<p>For investors, we believe the case for active management in crypto is clear: it provides the ability to adapt to cycles, diversify beyond tokens, and filter for quality. Taken together, these advantages can help navigate one of the most dynamic corners of today&rsquo;s markets.</p>
<p>For those looking for a practical way to access this approach, <strong><a href="/link/54b98110e4034531bd63d27f035b8bd9.aspx" title="NODE - VanEck Onchain Economy ETF - Overview">VanEck&rsquo;s Onchain Economy ETF (NODE)</a></strong> is one option designed to bring active management into the digital asset space.</p>
<p>To receive more <strong><a href="https://www.vaneck.com/us/en/insights/digital-assets/" title="Digital Assets Insights">Digital Assets</a></strong> insights, <strong><a href="https://www.vaneck.com/us/en/subscribe/" title="Subscription Center">sign up in our subscription center</a></strong>.</p>
]]></content:encoded>
</item><item rdf:about="https://www.vaneck.com/us/en/blogs/gold-investing/updated-analysis-ahead-of-gdx-index-change/">
  <title>Updated Analysis Ahead of GDX Index Change></title>
  <link>https://www.vaneck.com/us/en/blogs/gold-investing/updated-analysis-ahead-of-gdx-index-change/</link>
  <description><![CDATA[GDX will track a new index after markets close on September 19, 2025. We provide an updated look at expected differences between its current holdings and the pro forma portfolio.]]></description>
  <dc:creator> </dc:creator>
  <dc:date>09/17/2025 06:30:00</dc:date>
<content:encoded><![CDATA[

<p><a href="/link/0ef4cceba0a44fbe8de2f60e7952a27d.aspx" title="GDX - VanEck Gold Miners Equity ETF - Holdings and Performance "><strong>VanEck Gold Miners ETF (GDX)</strong></a> is set to begin tracking the MarketVector Global Gold Miners Index (MVGDXTR) after the close of markets on September 19, 2025. Following the initial announcement of this index change in early June 2025, we provided an <strong><a href="/us/en/blogs/gold-investing/what-to-know-about-gdxs-index-change/" title="What to Know About GDX&rsquo;s Index Change">analysis of the differences</a></strong> between GDX&rsquo;s holdings and its soon to be new index, MVGDXTR.</p>
<p>The June 2025 analysis was based on exposures at the time. MarketVector Indexes has now publicly announced the anticipated MVGDXTR quarterly reconstitution and rebalance effective at the time of the forthcoming index change. Below is an updated analysis of the anticipated differences between GDX&rsquo;s current exposure and the exposure expected from its new index, MVGDXTR, which it will begin tracking at the end of this week. The MVGDXTR data below is based on its &ldquo;pro forma&rdquo; portfolio effective after the close of markets on September 19, 2025.</p>
<h3>Comparison of GDX Holdings vs. MarketVector Global Gold Miners Index Pro Forma</h3>
<div class="wrapped-div">
<table style="width: 100%;">
<tbody>
<tr class="tbl-data">
<td class="data-head last">Company</td>
<td class="data-head last text-left">Ticker</td>
<td class="data-head last text-right">GDX Weight</td>
<td class="data-head last text-right">MVGDXTR Weight</td>
<td class="data-head last text-right">Difference</td>
</tr>
<tr class="tbl-data">
<td class="data-td last text-left">Newmont Corporation</td>
<td class="data-td data last text-left">NEM UN</td>
<td class="data-td data last text-right">12.99</td>
<td class="data-td data last text-right">6.95</td>
<td class="data-td data last text-right">-6.04</td>
</tr>
<tr class="tbl-data">
<td class="data-td last text-left">Agnico Eagle Mines Limited</td>
<td class="data-td data last text-left">AEM UN</td>
<td class="data-td data last text-right">11.41</td>
<td class="data-td data last text-right">8.05</td>
<td class="data-td data last text-right">-3.36</td>
</tr>
<tr class="tbl-data">
<td class="data-td last text-left">Barrick Mining Corporation</td>
<td class="data-td data last text-left">B UN</td>
<td class="data-td data last text-right">7.35</td>
<td class="data-td data last text-right">5.00</td>
<td class="data-td data last text-right">-2.35</td>
</tr>
<tr class="tbl-data">
<td class="data-td last text-left">Wheaton Precious Metals Corp</td>
<td class="data-td data last text-left">WPM UN</td>
<td class="data-td data last text-right">7.13</td>
<td class="data-td data last text-right">5.00</td>
<td class="data-td data last text-right">-2.13</td>
</tr>
<tr class="tbl-data">
<td class="data-td last text-left">Franco-Nevada Corporation</td>
<td class="data-td data last text-left">FNV UN</td>
<td class="data-td data last text-right">5.69</td>
<td class="data-td data last text-right">5.00</td>
<td class="data-td data last text-right">-0.69</td>
</tr>
<tr class="tbl-data">
<td class="data-td last text-left">Gold Fields Limited Sponsored ADR</td>
<td class="data-td data last text-left">GFI UN</td>
<td class="data-td data last text-right">4.96</td>
<td class="data-td data last text-right">5.00</td>
<td class="data-td data last text-right">0.04</td>
</tr>
<tr class="tbl-data">
<td class="data-td last text-left">Anglogold Ashanti PLC</td>
<td class="data-td data last text-left">AU UN</td>
<td class="data-td data last text-right">4.59</td>
<td class="data-td data last text-right">5.00</td>
<td class="data-td data last text-right">0.41</td>
</tr>
<tr class="tbl-data">
<td class="data-td last text-left">Kinross Gold Corporation</td>
<td class="data-td data last text-left">KGC UN</td>
<td class="data-td data last text-right">4.21</td>
<td class="data-td data last text-right">5.00</td>
<td class="data-td data last text-right">0.79</td>
</tr>
<tr class="tbl-data">
<td class="data-td last text-left">Zijin Mining Group Co., Ltd. Class H</td>
<td class="data-td data last text-left">2899 HK</td>
<td class="data-td data last text-right">3.38</td>
<td class="data-td data last text-right">--</td>
<td class="data-td data last text-right">-3.38</td>
</tr>
<tr class="tbl-data">
<td class="data-td last text-left">Northern Star Resources Ltd</td>
<td class="data-td data last text-left">NST AT</td>
<td class="data-td data last text-right">2.96</td>
<td class="data-td data last text-right">4.24</td>
<td class="data-td data last text-right">1.28</td>
</tr>
<tr class="tbl-data">
<td class="data-td last text-left">Pan American Silver Corp.</td>
<td class="data-td data last text-left">PAAS UN</td>
<td class="data-td data last text-right">2.29</td>
<td class="data-td data last text-right">4.03</td>
<td class="data-td data last text-right">1.74</td>
</tr>
<tr class="tbl-data">
<td class="data-td last text-left">Alamos Gold Inc.</td>
<td class="data-td data last text-left">AGI UN</td>
<td class="data-td data last text-right">2.04</td>
<td class="data-td data last text-right">3.70</td>
<td class="data-td data last text-right">1.66</td>
</tr>
<tr class="tbl-data">
<td class="data-td last text-left">Evolution Mining Limited</td>
<td class="data-td data last text-left">EVN AT</td>
<td class="data-td data last text-right">1.93</td>
<td class="data-td data last text-right">1.82</td>
<td class="data-td data last text-right">-0.11</td>
</tr>
<tr class="tbl-data">
<td class="data-td last text-left">Royal Gold, Inc.</td>
<td class="data-td data last text-left">RGLD UW</td>
<td class="data-td data last text-right">1.84</td>
<td class="data-td data last text-right">2.01</td>
<td class="data-td data last text-right">0.17</td>
</tr>
<tr class="tbl-data">
<td class="data-td last text-left">Zhaojin Mining Industry Co., Ltd. Class H</td>
<td class="data-td data last text-left">1818 HK</td>
<td class="data-td data last text-right">1.64</td>
<td class="data-td data last text-right">1.59</td>
<td class="data-td data last text-right">-0.04</td>
</tr>
<tr class="tbl-data">
<td class="data-td last text-left">Coeur Mining, Inc.</td>
<td class="data-td data last text-left">CDE UN</td>
<td class="data-td data last text-right">1.46</td>
<td class="data-td data last text-right">2.16</td>
<td class="data-td data last text-right">0.70</td>
</tr>
<tr class="tbl-data">
<td class="data-td last text-left">Harmony Gold Mining Co. Ltd. Sponsored ADR</td>
<td class="data-td data last text-left">HMY UN</td>
<td class="data-td data last text-right">1.40</td>
<td class="data-td data last text-right">1.75</td>
<td class="data-td data last text-right">0.35</td>
</tr>
<tr class="tbl-data">
<td class="data-td last text-left">Endeavour Mining PLC<sup>*</sup></td>
<td class="data-td data last text-left">EDV CA</td>
<td class="data-td data last text-right">1.37</td>
<td class="data-td data last text-right">--</td>
<td class="data-td data last text-right">-1.37</td>
</tr>
<tr class="tbl-data">
<td class="data-td last text-left">Equinox Gold Corp.</td>
<td class="data-td data last text-left">EQX UA</td>
<td class="data-td data last text-right">1.18</td>
<td class="data-td data last text-right">2.22</td>
<td class="data-td data last text-right">1.04</td>
</tr>
<tr class="tbl-data">
<td class="data-td last text-left">Hecla Mining Company</td>
<td class="data-td data last text-left">HL UN</td>
<td class="data-td data last text-right">1.04</td>
<td class="data-td data last text-right">1.59</td>
<td class="data-td data last text-right">0.55</td>
</tr>
<tr class="tbl-data">
<td class="data-td last text-left">OR Royalties Inc.</td>
<td class="data-td data last text-left">OR UN</td>
<td class="data-td data last text-right">0.99</td>
<td class="data-td data last text-right">1.41</td>
<td class="data-td data last text-right">0.41</td>
</tr>
<tr class="tbl-data">
<td class="data-td last text-left">IAMGOLD Corporation</td>
<td class="data-td data last text-left">IAG UN</td>
<td class="data-td data last text-right">0.95</td>
<td class="data-td data last text-right">1.60</td>
<td class="data-td data last text-right">0.65</td>
</tr>
<tr class="tbl-data">
<td class="data-td last text-left">B2Gold Corp.</td>
<td class="data-td data last text-left">BTG UA</td>
<td class="data-td data last text-right">0.87</td>
<td class="data-td data last text-right">1.39</td>
<td class="data-td data last text-right">0.52</td>
</tr>
<tr class="tbl-data">
<td class="data-td last text-left">Eldorado Gold Corporation</td>
<td class="data-td data last text-left">EGO UN</td>
<td class="data-td data last text-right">0.85</td>
<td class="data-td data last text-right">1.23</td>
<td class="data-td data last text-right">0.38</td>
</tr>
<tr class="tbl-data">
<td class="data-td last text-left">New Gold Inc.</td>
<td class="data-td data last text-left">NGD UA</td>
<td class="data-td data last text-right">0.76</td>
<td class="data-td data last text-right">1.38</td>
<td class="data-td data last text-right">0.62</td>
</tr>
<tr class="tbl-data">
<td class="data-td last text-left">First Majestic Silver Corp.</td>
<td class="data-td data last text-left">AG UN</td>
<td class="data-td data last text-right">0.75</td>
<td class="data-td data last text-right">1.13</td>
<td class="data-td data last text-right">0.38</td>
</tr>
<tr class="tbl-data">
<td class="data-td last text-left">Compania de Minas Buenaventura SAA Sponsored ADR</td>
<td class="data-td data last text-left">BVN UN</td>
<td class="data-td data last text-right">0.75</td>
<td class="data-td data last text-right">1.00</td>
<td class="data-td data last text-right">0.25</td>
</tr>
<tr class="tbl-data">
<td class="data-td last text-left">OceanaGold Corporation</td>
<td class="data-td data last text-left">OGC CT</td>
<td class="data-td data last text-right">0.70</td>
<td class="data-td data last text-right">1.17</td>
<td class="data-td data last text-right">0.47</td>
</tr>
<tr class="tbl-data">
<td class="data-td last text-left">SSR Mining Inc</td>
<td class="data-td data last text-left">SSRM UW</td>
<td class="data-td data last text-right">0.67</td>
<td class="data-td data last text-right">1.13</td>
<td class="data-td data last text-right">0.46</td>
</tr>
<tr class="tbl-data">
<td class="data-td last text-left">Genesis Minerals Limited</td>
<td class="data-td data last text-left">GMD AT</td>
<td class="data-td data last text-right">0.63</td>
<td class="data-td data last text-right">0.76</td>
<td class="data-td data last text-right">0.13</td>
</tr>
<tr class="tbl-data">
<td class="data-td last text-left">G Mining Ventures Corp</td>
<td class="data-td data last text-left">GMIN CA</td>
<td class="data-td data last text-right">0.58</td>
<td class="data-td data last text-right">--</td>
<td class="data-td data last text-right">-0.58</td>
</tr>
<tr class="tbl-data">
<td class="data-td last text-left">Perseus Mining Limited</td>
<td class="data-td data last text-left">PRU AT</td>
<td class="data-td data last text-right">0.58</td>
<td class="data-td data last text-right">0.81</td>
<td class="data-td data last text-right">0.23</td>
</tr>
<tr class="tbl-data">
<td class="data-td last text-left">Orla Mining Ltd.</td>
<td class="data-td data last text-left">ORLA US</td>
<td class="data-td data last text-right">0.56</td>
<td class="data-td data last text-right">--</td>
<td class="data-td data last text-right">-0.56</td>
</tr>
<tr class="tbl-data">
<td class="data-td last text-left">Dundee Precious Metals Inc.</td>
<td class="data-td data last text-left">DPM CA</td>
<td class="data-td data last text-right">0.54</td>
<td class="data-td data last text-right">--</td>
<td class="data-td data last text-right">-0.54</td>
</tr>
<tr class="tbl-data">
<td class="data-td last text-left">Capricorn Metals Ltd</td>
<td class="data-td data last text-left">CMM AT</td>
<td class="data-td data last text-right">0.52</td>
<td class="data-td data last text-right">0.66</td>
<td class="data-td data last text-right">0.14</td>
</tr>
<tr class="tbl-data">
<td class="data-td last text-left">Sandstorm Gold Ltd.</td>
<td class="data-td data last text-left">SAND UN</td>
<td class="data-td data last text-right">0.51</td>
<td class="data-td data last text-right">0.77</td>
<td class="data-td data last text-right">0.26</td>
</tr>
<tr class="tbl-data">
<td class="data-td last text-left">Torex Gold Resources Inc.</td>
<td class="data-td data last text-left">TXG CT</td>
<td class="data-td data last text-right">0.49</td>
<td class="data-td data last text-right">0.76</td>
<td class="data-td data last text-right">0.27</td>
</tr>
<tr class="tbl-data">
<td class="data-td last text-left">Vault Minerals Limited</td>
<td class="data-td data last text-left">VAU AU</td>
<td class="data-td data last text-right">0.44</td>
<td class="data-td data last text-right">--</td>
<td class="data-td data last text-right">-0.44</td>
</tr>
<tr class="tbl-data">
<td class="data-td last text-left">Regis Resources Limited</td>
<td class="data-td data last text-left">RRL AU</td>
<td class="data-td data last text-right">0.43</td>
<td class="data-td data last text-right">--</td>
<td class="data-td data last text-right">-0.43</td>
</tr>
<tr class="tbl-data">
<td class="data-td last text-left">Discovery Silver Corp</td>
<td class="data-td data last text-left">DSV CA</td>
<td class="data-td data last text-right">0.42</td>
<td class="data-td data last text-right">--</td>
<td class="data-td data last text-right">-0.42</td>
</tr>
<tr class="tbl-data">
<td class="data-td last text-left">K92 Mining, Inc.</td>
<td class="data-td data last text-left">KNT CT</td>
<td class="data-td data last text-right">0.42</td>
<td class="data-td data last text-right">0.66</td>
<td class="data-td data last text-right">0.24</td>
</tr>
<tr class="tbl-data">
<td class="data-td last text-left">Ramelius Resources Limited</td>
<td class="data-td data last text-left">RMS AT</td>
<td class="data-td data last text-right">0.41</td>
<td class="data-td data last text-right">1.18</td>
<td class="data-td data last text-right">0.77</td>
</tr>
<tr class="tbl-data">
<td class="data-td last text-left">Fortuna Mining Corp.</td>
<td class="data-td data last text-left">FSM UN</td>
<td class="data-td data last text-right">0.38</td>
<td class="data-td data last text-right">0.65</td>
<td class="data-td data last text-right">0.27</td>
</tr>
<tr class="tbl-data">
<td class="data-td last text-left">Cash/Other</td>
<td class="data-td data last text-left">-</td>
<td class="data-td data last text-right">0.37</td>
<td class="data-td data last text-right">--</td>
<td class="data-td data last text-right">-0.37</td>
</tr>
<tr class="tbl-data">
<td class="data-td last text-left">Gold Road Resources Ltd</td>
<td class="data-td data last text-left">GOR AU</td>
<td class="data-td data last text-right">0.37</td>
<td class="data-td data last text-right">--</td>
<td class="data-td data last text-right">-0.37</td>
</tr>
<tr class="tbl-data">
<td class="data-td last text-left">Westgold Resources Ltd</td>
<td class="data-td data last text-left">WGX AT</td>
<td class="data-td data last text-right">0.36</td>
<td class="data-td data last text-right">0.49</td>
<td class="data-td data last text-right">0.13</td>
</tr>
<tr class="tbl-data">
<td class="data-td last text-left">West African Resources Ltd</td>
<td class="data-td data last text-left">WAF AU</td>
<td class="data-td data last text-right">0.34</td>
<td class="data-td data last text-right">--</td>
<td class="data-td data last text-right">-0.34</td>
</tr>
<tr class="tbl-data">
<td class="data-td last text-left">Pan African Resources PLC</td>
<td class="data-td data last text-left">PAN ZA</td>
<td class="data-td data last text-right">0.31</td>
<td class="data-td data last text-right">--</td>
<td class="data-td data last text-right">-0.31</td>
</tr>
<tr class="tbl-data">
<td class="data-td last text-left">Wesdome Gold Mines Ltd.</td>
<td class="data-td data last text-left">WDO CT</td>
<td class="data-td data last text-right">0.31</td>
<td class="data-td data last text-right">0.56</td>
<td class="data-td data last text-right">0.25</td>
</tr>
<tr class="tbl-data">
<td class="data-td last text-left">DRDGOLD Ltd. Sponsored ADR</td>
<td class="data-td data last text-left">DRD US</td>
<td class="data-td data last text-right">0.29</td>
<td class="data-td data last text-right">--</td>
<td class="data-td data last text-right">-0.29</td>
</tr>
<tr class="tbl-data">
<td class="data-td last text-left">Centerra Gold Inc.</td>
<td class="data-td data last text-left">CG CA</td>
<td class="data-td data last text-right">0.28</td>
<td class="data-td data last text-right">--</td>
<td class="data-td data last text-right">-0.28</td>
</tr>
<tr class="tbl-data">
<td class="data-td last text-left">Emerald Resources NL</td>
<td class="data-td data last text-left">EMR AU</td>
<td class="data-td data last text-right">0.27</td>
<td class="data-td data last text-right">--</td>
<td class="data-td data last text-right">-0.27</td>
</tr>
<tr class="tbl-data">
<td class="data-td last text-left">Allied Gold Corporation</td>
<td class="data-td data last text-left">AAUC CA</td>
<td class="data-td data last text-right">0.26</td>
<td class="data-td data last text-right">--</td>
<td class="data-td data last text-right">-0.26</td>
</tr>
<tr class="tbl-data">
<td class="data-td last text-left">Endeavour Silver Corp.</td>
<td class="data-td data last text-left">EXK US</td>
<td class="data-td data last text-right">0.26</td>
<td class="data-td data last text-right">--</td>
<td class="data-td data last text-right">-0.26</td>
</tr>
<tr class="tbl-data">
<td class="data-td last text-left">Aris Mining Corp</td>
<td class="data-td data last text-left">ARMN US</td>
<td class="data-td data last text-right">0.26</td>
<td class="data-td data last text-right">--</td>
<td class="data-td data last text-right">-0.26</td>
</tr>
<tr class="tbl-data">
<td class="data-td last text-left">Aya Gold &amp; Silver Inc.</td>
<td class="data-td data last text-left">AYA CA</td>
<td class="data-td data last text-right">0.22</td>
<td class="data-td data last text-right">--</td>
<td class="data-td data last text-right">-0.22</td>
</tr>
<tr class="tbl-data">
<td class="data-td last text-left">Pantoro Gold Limited</td>
<td class="data-td data last text-left">PNR AU</td>
<td class="data-td data last text-right">0.21</td>
<td class="data-td data last text-right">--</td>
<td class="data-td data last text-right">-0.21</td>
</tr>
<tr class="tbl-data">
<td class="data-td last text-left">Catalyst Metals Limited</td>
<td class="data-td data last text-left">CYL AU</td>
<td class="data-td data last text-right">0.19</td>
<td class="data-td data last text-right">--</td>
<td class="data-td data last text-right">-0.19</td>
</tr>
<tr class="tbl-data">
<td class="data-td last text-left">Resolute Mining Limited</td>
<td class="data-td data last text-left">RSG AU</td>
<td class="data-td data last text-right">0.18</td>
<td class="data-td data last text-right">--</td>
<td class="data-td data last text-right">-0.18</td>
</tr>
<tr class="tbl-data">
<td class="data-td last text-left">Silvercorp Metals Inc.</td>
<td class="data-td data last text-left">SVM US</td>
<td class="data-td data last text-right">0.17</td>
<td class="data-td data last text-right">--</td>
<td class="data-td data last text-right">-0.17</td>
</tr>
<tr class="tbl-data">
<td class="data-td last text-left">Chifeng Jilong Gold Mining Co., Ltd. Class H</td>
<td class="data-td data last text-left">6693 HK</td>
<td class="data-td data last text-right">0.15</td>
<td class="data-td data last text-right">--</td>
<td class="data-td data last text-right">-0.15</td>
</tr>
<tr class="tbl-data">
<td class="data-td last text-left">Bellevue Gold Limited</td>
<td class="data-td data last text-left">BGL AU</td>
<td class="data-td data last text-right">0.14</td>
<td class="data-td data last text-right">--</td>
<td class="data-td data last text-right">-0.14</td>
</tr>
<tr class="tbl-data">
<td class="data-td last text-left">Artemis Gold Inc</td>
<td class="data-td data last text-left">ARTG CV</td>
<td class="data-td data last text-right">--</td>
<td class="data-td data last text-right">1.12</td>
</tr>
<tr class="tbl-data">
<td class="data-td last text-left">Endeavour Mining PLC*</td>
<td class="data-td data last text-left">EDV LN</td>
<td class="data-td data last text-right">--</td>
<td class="data-td data last text-right">1.65</td>
</tr>
<tr class="tbl-data">
<td class="data-td last text-left">Fresnillo PLC</td>
<td class="data-td data last text-left">FRES LN</td>
<td class="data-td data last text-right">--</td>
<td class="data-td data last text-right">1.59</td>
</tr>
<tr class="tbl-data">
<td class="data-td last text-left">Industrias Penoles SAB de CV</td>
<td class="data-td data last text-left">PE&amp;OLES MF</td>
<td class="data-td data last text-right">--</td>
<td class="data-td data last text-right">2.28</td>
</tr>
<tr class="tbl-data">
<td class="data-td last text-left">Lundin Gold Inc.</td>
<td class="data-td data last text-left">LUG CT</td>
<td class="data-td data last text-right">--</td>
<td class="data-td data last text-right">1.58</td>
</tr>
<tr class="tbl-data">
<td class="data-td last text-left">PT Amman Mineral Internasional Tbk</td>
<td class="data-td data last text-left">AMMN IJ</td>
<td class="data-td data last text-right">--</td>
<td class="data-td data last text-right">1.92</td>
</tr>
<tr class="tbl-data">
<td class="data-td last text-left">PT Bumi Resources Minerals Tbk Class A</td>
<td class="data-td data last text-left">BRMS IJ</td>
<td class="data-td data last text-right">--</td>
<td class="data-td data last text-right">0.61</td>
</tr>
<tr class="tbl-data">
<td class="data-td last text-left">Seabridge Gold Inc</td>
<td class="data-td data last text-left">SA UN</td>
<td class="data-td data last text-right">--</td>
<td class="data-td data last text-right">0.41</td>
</tr>
</tbody>
</table>
</div>
<br />
<p class="chart-disclosure"><sup>*</sup>&nbsp;This difference represents a listing difference. GDX currently holds the Canadian listing of Endeavour Mining while MVGDXTR will include the London listing.</p>
<p class="chart-disclosure">Source: VanEck, MarketVector Indexes GmbH. GDX holdings as of 9/12/2025. MVGDXTR holdings based on pro forma announcement on 9/12/2025 and effective after the close of markets on 9/19/2025. Index holdings are not representative of fund holdings. Fund holdings will vary. Visit vaneck.com/gdx for complete fund holdings information. Not intended as a recommendation to buy or sell any securities mentioned herein. All data subject to change.</p>

<h2>Anticipated Overlap with GDXJ, the VanEck Junior Gold Miners ETF</h2>
<p>Below are the anticipated common holdings and weights with the <strong><a href="/link/a89bf56fe3cd4ec69342e1472f50889b.aspx" title="GDXJ - VanEck Junior Gold Miners ETF - Holdings and Performance">VanEck Junior Gold Miners ETF (GDXJ)</a></strong> before and after the forthcoming index change. These figures are subject to change.</p>
<p>First we look at current ETF holdings.</p>
<h3>Common Holding: GDX vs. GDXJ as of 9/12/2025</h3>
<div class="wrapped-div">
<table style="width: 100%;">
<tbody>
<tr class="tbl-data">
<td class="data-head last text-right">&nbsp;</td>
<td class="data-head last text-right">Count</td>
<td class="data-head last text-right">Weight</td>
</tr>
<tr class="tbl-data">
<td class="data-td last text-left">GDX</td>
<td class="data-td data last text-right">46</td>
<td class="data-td data last text-right">32.32</td>
</tr>
<tr class="tbl-data">
<td class="data-td last text-left">GDXJ</td>
<td class="data-td data last text-right">46</td>
<td class="data-td data last text-right">79.47</td>
</tr>
</tbody>
</table>
</div>
<p class="chart-disclosure">Overlap includes three companies in which GDX holds a different issuer listing than GDXJ (Endeavour Mining, Centerra Gold, and Pan African Resources). Source: VanEck; FactSet. Index holdings are not representative of fund holdings. Fund holdings will vary. Visit vaneck.com/gdx or vaneck.com/gdxj for complete fund holdings information. Not intended as a recommendation to buy or sell any securities mentioned herein.</p>

<p>Next we look at the pro forma reconstitution files published by MarketVector for both MVGDXTR and GDXJ&rsquo;s underlying index, MVIS Global Gold Miners Index (MVGDXJTR). Both pro forma files are set to go into effect after the close of markets on September 19, 2025.</p>
<h3>Pro Formas: MVGDXTR vs. MVGDXJTR</h3>
<div class="wrapped-div">
<table style="width: 100%;">
<tbody>
<tr class="tbl-data">
<td class="data-head last text-right">&nbsp;</td>
<td class="data-head last text-right">Count</td>
<td class="data-head last text-right">Weight</td>
</tr>
<tr class="tbl-data">
<td class="data-td last text-left">MVGDXTR</td>
<td class="data-td data last text-right">34</td>
<td class="data-td data last text-right">47.25</td>
</tr>
<tr class="tbl-data">
<td class="data-td last text-left">MVGDXJTR</td>
<td class="data-td data last text-right">34</td>
<td class="data-td data last text-right">77.55</td>
</tr>
</tbody>
</table>
</div>
<p class="chart-disclosure">Source: MarketVector Indexes GmbH. Index holdings are not representative of fund holdings. Fund holdings will vary. Visit vaneck.com/gdxj for complete fund holdings information. Not intended as a recommendation to buy or sell any securities mentioned herein. Pro forma portfolios were announced on September 12, 2025 and are meant to indicated the reconstitutiona and rebalance of both indexes effective after the close of markets on Septebember 19, 2025. All data subject to change.</p>

<h2>How can investors assess the new MarketVector indexes?</h2>
<p>MarketVector publishes daily index constituents on its website, <a href="http://www.marketvector.com/" target="_blank" title=" MarketVector Indexes GmbH ('MarketVector')" rel="noopener"><strong>www.marketvector.com</strong></a>. The MVGDXTR index guide can be viewed here: <a href="https://www.marketvector.com/rulebooks/download/MVGDX_Index_Guide.pdf" target="_blank" title="MarketVector Global Gold Miners Index - Index Guide" rel="noopener"><strong>Index Methodology</strong></a>.</p>
<p>To receive more <strong><a href="https://www.vaneck.com/us/en/insights/gold-investing/" title="Gold Investing Insights">Gold Investing</a></strong> insights, <strong><a href="https://www.vaneck.com/us/en/subscribe/" title="Subscription Center">sign up in our subscription center</a></strong>.</p>
]]></content:encoded>
</item><item rdf:about="https://www.vaneck.com/us/en/blogs/income-investing/bdcs-an-alternative-way-to-access-the-benefits-of-private-credit/">
  <title>BDCs: An Alternative Way to Access the Benefits of Private Credit></title>
  <link>https://www.vaneck.com/us/en/blogs/income-investing/bdcs-an-alternative-way-to-access-the-benefits-of-private-credit/</link>
  <description><![CDATA[BDCs are a compelling option for investors seeking exposure to the potential benefits of private credit without sacrificing the ability to access their capital when necessary. &nbsp;]]></description>
  <dc:creator>Coulter Regal, CFA</dc:creator>
  <dc:date>09/15/2025 06:30:00</dc:date>
<content:encoded><![CDATA[

<p><strong>Key Takeaways:</strong></p>
<ul class="content-list">
<li class="mt-2">BDCs provide capital to small and mid-sized businesses while delivering high dividend income to investors.</li>
<li class="mt-2">BDCs offer liquid, accessible exposure to private markets, bridging the gap between banks and private equity.</li>
<li class="mt-2">Investors should assess NAV, dividend sustainability, and portfolio quality to avoid unnecessary risks.</li>
</ul>
<p>Demand for private credit is surging. The market size has nearly doubled since 2020, exceeding an estimated $1.5 trillion in 2024. This growth is expected to continue, with projections suggesting it could hit $3 trillion by 2028.<sup>1</sup></p>
<p>For investors, private credit offers the potential for higher yields and diversification. Meanwhile, corporate borrowers value the flexibility and speed offered by private lenders compared to traditional banks, many of which have pulled back lending in this space.</p>
<div class="row mb-3">
<div class="col-md-4 col-xs-12"><a href="https://www.youtube.com/embed/GsyuFWAV0Y4" data-video="https://youtu.be/GsyuFWAV0Y4" class="popup-youtube" title="Watch Video"><img loading="lazy" class="img-responsive" style="margin-right: 15px; margin-top: 0px;" src="https://www.vaneck.com/contentassets/ac7bbe4fcacc4b6e8a2c199928230fc6/5322_bizd-ticker-promo-video_thumbnail_2025-2_v1.jpg" alt="Watch Video" align="left" /></a></div>
<div class="col-md-8 col-xs-12"><br /><strong><a href="https://www.youtube.com/embed/GsyuFWAV0Y4" data-video=" https://youtu.be/GsyuFWAV0Y4" class="popup-youtube" title="Watch Video">Watch Video</a><br /></strong><a href="https://www.youtube.com/embed/GsyuFWAV0Y4" data-video="https://youtu.be/GsyuFWAV0Y4" class="popup-youtube" title="Watch Video" style="font-size: 16px; font-weight: bold; padding: 10px 0px 0px; margin-right: 20px; width: 202px;">The VanEck BDC Income ETF: The Liquid Alternative to Private Credit</a></div>
</div>
<h2>Private Credit Becomes More Entrenched as Banks Retreat from Middle Market Lending</h2>
<p>The 2023 regional banking crisis accelerated the pre-existing trend of banks retreating from lending to private companies that tend to be below investment grade or not rated. This void is being filled by private credit. Unlike banks, which are subject to stricter regulations and capital requirements, private lenders offer more flexibility and can tailor loan structures to meet the specific needs of borrowers. This flexibility, coupled with their increasing pool of capital positions private credit as a crucial source of financing, particularly for businesses that may not meet the stricter criteria of traditional banks.</p>
<h2>There&rsquo;s Just One Problem: Traditional Private Credit is Illiquid</h2>
<p>Traditional private credit investments, while offering the potential for attractive returns and yield, come with a drawback: illiquidity. Unlike publicly traded stocks or bonds, these investments often involve long lock-up periods, typically several years. This means your money is tied up for the duration, inaccessible for immediate needs or strategic portfolio adjustments. This inflexibility can be a major hurdle for investors who require more dynamic access to their capital, especially in a market rife with uncertainties. In an environment where liquidity is highly prized, Business Development Companies (BDCs) present a compelling, liquid alternative to traditional private credit strategies.</p>
<h2>BDCs: A Liquid Alternative in Private Credit</h2>
<p>BDCs bridge the gap between traditional private credit and publicly traded securities. BDCs offer the same benefits as traditional private credit strategies &ndash; the potential for higher yields and diversification away from traditional stocks and bonds &ndash; but in a much more liquid form.</p>
<h3>BDCs Offer Attractive Relative Yield</h3>
<div class="flourish-embed flourish-chart" data-src="visualisation/23202977?2429379"><script src="https://public.flourish.studio/resources/embed.js"></script><noscript><img loading="lazy" src="https://public.flourish.studio/visualisation/23202977/thumbnail" width="100%" alt="BDCs Offer Attractive Relative Yield" /></noscript></div>
<p class="chart-disclosure">Source: Factset as of 3/31/2025. Past performance is no guarantee of future results. BDCs represented by MVIS US Business Development Companies Index; U.S. HY Bonds represented by ICE BofA US High Yield Index; REITs represented by FTSE NAREIT Equity REITs Index; Utilities represented by Standard &amp; Poor&rsquo;s 500 Utilities Index; U.S. Stocks represented by Standard &amp; Poor&rsquo;s 500 Index; U.S. IG Bonds represented by Bloomberg Barclays US Aggregate Bond Index; U.S. 10 Yr Treasury represented by ICE BofA Current 10-Year US Treasury Index.</p>
<p>Since BDCs are publicly traded on exchanges, investors can buy and sell shares daily, providing the flexibility to adjust their holdings as needed. This makes BDCs a compelling option for investors seeking exposure to the private credit market without sacrificing the ability to access their capital when necessary. It is important to note though, that because of their daily liquidity, publicly traded BDCs can exhibit greater short-term volatility relative to traditional private credit funds which tend to have lower liquidity and lack price discovery.</p>

<h2>The Complexity of BDC Investments and the Role of BIZD</h2>
<p>Like the broader private credit space, the market capitalization of the public BDC universe has grown substantially over the past several years.</p>
<h3>Increasing Demand for BDCs</h3>
<p><img loading="lazy" class="img-responsive w-100" src="https://www.vaneck.com/contentassets/8ba3da99a7fc4e0faaf428e94150aafe/4371_bidz-blog_chart-2_2024-4_v2_blog.svg" alt="Increasing Demand for BDCs" /></p>
<p class="chart-disclosure">Source: FactSet as of 3/31/2025. BDCs represented by MVIS US Business Development Companies Index (MVBDCTRG); Index data prior to June 19, 2023 reflects that of the MVIS US Business Development Companies Index (MVBIZDTG). From June 19, 2023 forward, the index data reflects that of the MVIS US Business Development Companies Index (MVBDCTRG). Index history which includes periods prior to June 19, 2023 links the performance of MVBIZDTG and MVBDCTRG and is not intended for third party use. Past performance is no guarantee of future results.</p>
<p>Today, there are many publicly traded BDCs available, each with distinct risk profiles based on their asset structures, sector and credit exposures, financing terms and management quality. Investing in individual BDCs demands rigorous research to fully understand each entity.</p>
<p>This is where the <strong><a href="https://www.vaneck.com/us/en/investments/bdc-income-etf-bizd/overview/" title="BIZD - VanEck BDC Income ETF - Overview">VanEck BDC Income ETF (BIZD)</a></strong> comes in. BIZD offers broad market exposure to publicly traded U.S. business development companies and may be appealing for investors seeking a liquid alternative to private credit funds. BIZD seeks to replicate as closely as possible, before fees and expenses, the price and yield performance of the MVIS<sup>&reg;</sup>&nbsp;US Business Development Companies Index, which tracks the overall performance of publicly traded business development companies.</p>
<p>To receive more <strong><a href="https://www.vaneck.com/us/en/insights/income-investing/" title="Income Investing Insights">Income Investing</a></strong> insights, <strong><a href="https://www.vaneck.com/us/en/subscribe/" title="Subscription Center">sign up in our subscription center</a></strong>.</p>
<p><br /><br /></p>
]]></content:encoded>
</item><item rdf:about="https://www.vaneck.com/us/en/blogs/municipal-bonds/shyd-efficient-access-to-hard-to-access-hy-munis/">
  <title>SHYD: Efficient Access to Hard-to-Access HY Munis></title>
  <link>https://www.vaneck.com/us/en/blogs/municipal-bonds/shyd-efficient-access-to-hard-to-access-hy-munis/</link>
  <description><![CDATA[SHYD offers efficient access to scarce short-dated high-yield municipal bonds enabling investors to capture attractive yield with moderate duration risk.]]></description>
  <dc:creator>James Colby</dc:creator>
  <dc:date>09/15/2025 06:30:00</dc:date>
<content:encoded><![CDATA[

<p><strong>Key Takeaways:</strong></p>
<ul class="content-list">
<li class="mt-2">Most high-yield muni issuance is long-dated, making short maturities under 10 years rare. Limited supply and investors holding to maturity make them even harder to access.</li>
<li class="mt-2">Short HY munis currently deliver about 290 basis points of extra tax-equivalent yield over short IG munis. They provide higher income without meaningfully extending duration.</li>
<li class="mt-2">Short HY munis remain undervalued but rising demand could drive spread compression. The unusually steep muni 2s10s curve also presents a relative value opportunity in the 1-12 year segment.</li>
</ul>
<h2>SHYD: Efficient Access to Hard-to-Access HY Munis</h2>
<p>The municipal high-yield market is predominantly composed of long-dated bonds, with maturities often extending 20 years or more. This structure reflects the nature of the projects being financed-such as infrastructure, transportation, healthcare and development-which inherently require long-term funding. Given the speculative profile of high-yield issuers, locking in financing over extended horizons is generally preferred, making shorter-dated issuance far less common.</p>
<p>As a result, high-yield (HY) municipal bonds with maturities under 10 years remain scarce. Issuers rarely bring such deals to market, as longer amortization schedules better align with project cash flows and provide greater flexibility for refinancing or restructuring. In the secondary market, the limited supply is compounded by investor behavior: those who hold short-dated HY paper often keep it to maturity, as it offers attractive near-term yield without committing capital for decades. This dynamic restricts turnover and makes sourcing short HY bonds particularly challenging.</p>
<p>In this environment, the <a href="/link/1881686e84234b1b9ca2b6d56f2e25a0.aspx" title="SHYD - VanEck Short High Yield Muni ETF - Overview"><strong>VanEck Short High Yield Muni ETF (SHYD)</strong></a> stands out as an efficient vehicle for accessing a segment of the municipal market that is both scarce and difficult to source directly. By providing diversified exposure to over 220 unique obligors rated BBB+ or below, SHYD enables investors to capture the premium potential of municipal high yield while maintaining the benefits of a transparent, liquid, and passively managed ETF structure.</p>
<h2>Short HY Munis: Positioning Early in a Market Poised for Spread Compression</h2>
<p>Short HY municipal bonds present a particularly attractive investment opportunity in the current market environment. On a tax-equivalent basis, they offer close to 290 basis points of incremental yield compared with short investment-grade munis, and they do so without meaningfully extending duration. This makes them an efficient way to capture enhanced income while maintaining a conservative stance on interest-rate risk.</p>
<h3>Higher Yield without Extended Duration</h3>
<br />
<div class="wrapped-div">
<table style="width: 100%;">
<tbody>
<tr class="tbl-data">
<td class="data-head last">&nbsp;</td>
<td class="data-head last text-right">Duration</td>
<td class="data-head last text-right">YTW</td>
<td class="data-head last text-right">TEY @ 35%</td>
</tr>
<tr class="tbl-data">
<td class="data-td last text-left">Short HY Muni 1-12 Yr Maturity</td>
<td class="data-td data last text-right">4.35</td>
<td class="data-td data last text-right">4.79</td>
<td class="data-td data last text-right">7.37</td>
</tr>
<tr class="tbl-data">
<td class="data-td last text-left">Short IG Muni 1-10 Yr Maturity AAA-A</td>
<td class="data-td data last text-right">3.89</td>
<td class="data-td data last text-right">2.9</td>
<td class="data-td data last text-right">4.46</td>
</tr>
<tr class="tbl-data">
<td class="data-td last text-left">Broad HY Muni</td>
<td class="data-td data last text-right">8.48</td>
<td class="data-td data last text-right">5.43</td>
<td class="data-td data last text-right">8.35</td>
</tr>
<tr class="tbl-data">
<td class="data-td last text-left">Broad IG Muni</td>
<td class="data-td data last text-right">7.7</td>
<td class="data-td data last text-right">3.75</td>
<td class="data-td data last text-right">5.77</td>
</tr>
</tbody>
</table>
</div>
<p class="chart-disclosure">Source: ICE Data Services. As of 8/31/25.See important disclosures for definitions and additional information.</p>
<p><img loading="lazy" class="img-responsive" alt="Chart TEY @35% Tax Rate" src="https://www.vaneck.com/contentassets/02da9004f4414617812f21a8bbbdc4be/6166_muni-blog-shyd_chart-1_2025-9_v1_blog.svg" /></p>
<p class="chart-disclosure">Source: ICE Data Services. As of 8/31/25. See important disclosures for definitions and additional information.</p>
<p>Currently, short-dated HY paper on average still offers wider spreads relative to the long end of the curve. This dynamic exists because many high-yield muni investors traditionally prefer locking in rates through longer-term maturities, aligning with the 20+ year issuance profile of much of the sector. As a result, shorter-dated HY bonds have historically been under-owned and undervalued, leaving spread levels more elevated compared with their long-dated securities.</p>
<p>However, we are beginning to observe growing demand for shorter-dated HY paper in the secondary market. This development is important for investors, as increased buying interest could gradually lead to spread compression in the short HY segment. While this may reduce the current yield premium, it also highlights the advantage of positioning early to capture value before spreads tighten further. For now, short HY munis continue to offer a compelling balance of yield pickup, manageable duration, and defensive positioning, making them a valuable component for investors seeking income while carefully navigating rate risk.</p>
<h2>Opportunity in the Steep Muni 2s10s Curve: Positioning Ahead of Curve Convergence</h2>
<h3>Treasury VS. Muni 2s10 Spread</h3>
<p><img loading="lazy" class="img-responsive" alt="Treasury VS. Muni 2s10 Spread" src="https://www.vaneck.com/contentassets/8c543e9d64b74623ad3d2a1f26af135e/6166_muni-blog-shyd_chart-2_2025-9_v1_blog.svg" /></p>
<p class="chart-disclosure">Source: ICE Data Services and Bloomberg. As of 8/31/25. See important disclosures for additional information.</p>

<p>As of the end of August, the Muni AAA 2s10s spread had widened by nearly 70 basis points year-to-date, compared with only about 25 basis points of steepening in the Treasury 2s10s curve over the same period. The municipal 2s10s curve currently stands out as the steepest among major fixed income markets, diverging meaningfully from both U.S. Treasuries and high-grade corporates. Historically, the muni 2s10s spread has tended to track more closely with, or even remain tighter than, the Treasury curve. This unusual steepness highlights a relative value dislocation between munis and other high-quality fixed income markets.</p>

<p>SHYD provides targeted exposure to the 1-12 year segment of the municipal curve, an area where we see a compelling opportunity. With the muni curve unusually steep relative to other fixed income markets, investors will benefit from both attractive levels of tax-exempt income and the potential for improving relative value in the short-to-intermediate market.</p>
<p>To receive more <a href="https://www.vaneck.com/us/en/insights/municipal-bonds/" title="Municipal Bonds Insights"><strong>Municipal Bonds</strong></a> insights, <a href="/link/5f45412c2143400497908cea2897f7d3.aspx" title=" Subscription Center"><strong>sign up in our subscription center</strong></a>.</p>
]]></content:encoded>
</item><item rdf:about="https://www.vaneck.com/us/en/blogs/emerging-markets-bonds/cny-strength-and-dm-bond-weakness-drive-em-outperformance/">
  <title>CNY Strength and DM Bond Weakness Drive EM Outperformance></title>
  <link>https://www.vaneck.com/us/en/blogs/emerging-markets-bonds/cny-strength-and-dm-bond-weakness-drive-em-outperformance/</link>
  <description><![CDATA[Emerging markets bonds continue to outperform DM bonds as EM inflation eases and CNY strength lifts EMFX.]]></description>
  <dc:creator>Eric Fine</dc:creator>
  <dc:date>09/11/2025 06:30:00</dc:date>
<content:encoded><![CDATA[

<p id="performance-overview" class="jump-link-nav anchored-block" data-jumplink-title="Performance Overview"><strong>Key Takeaways:</strong></p>
<ul class="content-list">
<li class="mt-2">EM bonds are far outpacing DM bonds (again!) as G10 yields rise and CNY strengthens.</li>
<li class="mt-2">EM inflation has eased while DM inflation builds, with little reform risk.</li>
<li class="mt-2">CNY strength is, boosting broader EMFX as China trade links with EM are greater than the U.S.</li>
</ul>


<p>The VanEck Emerging Markets Bond Fund was up 2.78% in August, compared to up 1.89% for its benchmark. YTD, the fund is up 13.47%, compared to 11.28% for its benchmark, 50% J.P. Morgan GBI-EM Global Diversified Index/50% J.P. Morgan EMBI Global Diversified Index, and 7.26% and 5.92% for the Global Agg and 10-year treasuries, respectively.<sup>1</sup></p>
<p>During August we took a brief break from our extreme caution on USD duration as it had worked perhaps too quickly, making Saudi and Philippines big winners for the fund. We intend to reverse these soon. Our tiny exposure to very selected China corporates continues to crush it and leads the outperformers, and Brazil in local currency was a big winner. Another big winner was our severe underweight to India in both local and USD, which performed poorly in August.</p>
<p>We remain very bullish on local currency, while very cautious on USD duration (after a brief boost to our USD duration during August based largely on the low duration view having worked very well but also very quickly). The fund has around 60% in curated local currency, 40% in mostly higher-yielding USD bonds. Carry is 6.49%, yield to worst (YTW) is 7.9%, and duration is 3.9 (down from 4.8 in July).</p>

<h3>Average Annual Total Returns<sup>*</sup>&nbsp;(%) (In USD)</h3>
<div class="wrapped-div">
<table style="width: 100%;">
<tbody>
<tr class="tbl-data">
<td class="tbl-header last" colspan="10">As of August 31, 2025</td>
</tr>
<tr class="tbl-data">
<td class="data-head last text-right">&nbsp;</td>
<td class="data-head last text-right">1 Mo</td>
<td class="data-head last text-right">3 Mo</td>
<td class="data-head last text-right">YTD</td>
<td class="data-head last text-right">1 Yr</td>
<td class="data-head last text-right">3 Yrs</td>
<td class="data-head last text-right">5 Yrs</td>
<td class="data-head last text-right">10 Yrs</td>
</tr>
<tr class="tbl-data">
<td class="data-td last text-left">Class A: NAV (Inception 07/09/12)</td>
<td class="data-td data last text-right">2.56</td>
<td class="data-td data last text-right">6.20</td>
<td class="data-td data last text-right">13.16</td>
<td class="data-td data last text-right">10.88</td>
<td class="data-td data last text-right">9.97</td>
<td class="data-td data last text-right">3.75</td>
<td class="data-td data last text-right">4.36</td>
</tr>
<tr class="tbl-data">
<td class="data-td last text-left">Class A: Maximum 5.75% load</td>
<td class="data-td data last text-right">-3.34</td>
<td class="data-td data last text-right">0.09</td>
<td class="data-td data last text-right">6.66</td>
<td class="data-td data last text-right">4.50</td>
<td class="data-td data last text-right">7.82</td>
<td class="data-td data last text-right">2.53</td>
<td class="data-td data last text-right">3.75</td>
</tr>
<tr class="tbl-data">
<td class="data-td last text-left">Class I: NAV (Inception 07/09/12)</td>
<td class="data-td data last text-right">2.78</td>
<td class="data-td data last text-right">6.51</td>
<td class="data-td data last text-right">13.47</td>
<td class="data-td data last text-right">11.39</td>
<td class="data-td data last text-right">10.46</td>
<td class="data-td data last text-right">4.15</td>
<td class="data-td data last text-right">4.70</td>
</tr>
<tr class="tbl-data">
<td class="data-td last text-left">Class Y: NAV (Inception 07/09/12)</td>
<td class="data-td data last text-right">2.75</td>
<td class="data-td data last text-right">6.44</td>
<td class="data-td data last text-right">13.52</td>
<td class="data-td data last text-right">11.28</td>
<td class="data-td data last text-right">10.33</td>
<td class="data-td data last text-right">4.03</td>
<td class="data-td data last text-right">4.62</td>
</tr>
<tr class="tbl-data">
<td class="data-td last text-left">50% GBI-EM/50% EMBI</td>
<td class="data-td data last text-right">1.89</td>
<td class="data-td data last text-right">4.81</td>
<td class="data-td data last text-right">11.28</td>
<td class="data-td data last text-right">9.07</td>
<td class="data-td data last text-right">9.11</td>
<td class="data-td data last text-right">1.63</td>
<td class="data-td data last text-right">3.54</td>
</tr>
</tbody>
</table>
</div>
<br />
<div class="wrapped-div">
<table style="width: 100%;">
<tbody>
<tr class="tbl-data">
<td class="tbl-header last" colspan="10">As of June 30, 2025</td>
</tr>
<tr class="tbl-data">
<td class="data-head last text-right">&nbsp;</td>
<td class="data-head last text-right">1 Mo</td>
<td class="data-head last text-right">3 Mo</td>
<td class="data-head last text-right">YTD</td>
<td class="data-head last text-right">1 Yr</td>
<td class="data-head last text-right">3 Yrs</td>
<td class="data-head last text-right">5 Yrs</td>
<td class="data-head last text-right">10 Yrs</td>
</tr>
<tr class="tbl-data">
<td class="data-td last text-left">Class A: NAV (Inception 07/09/12)</td>
<td class="data-td data last text-right">3.71</td>
<td class="data-td data last text-right">6.87</td>
<td class="data-td data last text-right">10.51</td>
<td class="data-td data last text-right">13.04</td>
<td class="data-td data last text-right">10.68</td>
<td class="data-td data last text-right">4.77</td>
<td class="data-td data last text-right">3.35</td>
</tr>
<tr class="tbl-data">
<td class="data-td last text-left">Class A: Maximum 5.75% load</td>
<td class="data-td data last text-right">-2.25</td>
<td class="data-td data last text-right">0.73</td>
<td class="data-td data last text-right">4.16</td>
<td class="data-td data last text-right">6.54</td>
<td class="data-td data last text-right">8.51</td>
<td class="data-td data last text-right">3.54</td>
<td class="data-td data last text-right">2.74</td>
</tr>
<tr class="tbl-data">
<td class="data-td last text-left">Class I: NAV (Inception 07/09/12)</td>
<td class="data-td data last text-right">3.76</td>
<td class="data-td data last text-right">7.00</td>
<td class="data-td data last text-right">10.54</td>
<td class="data-td data last text-right">13.33</td>
<td class="data-td data last text-right">11.04</td>
<td class="data-td data last text-right">5.08</td>
<td class="data-td data last text-right">3.64</td>
</tr>
<tr class="tbl-data">
<td class="data-td last text-left">Class Y: NAV (Inception 07/09/12)</td>
<td class="data-td data last text-right">3.91</td>
<td class="data-td data last text-right">7.12</td>
<td class="data-td data last text-right">10.82</td>
<td class="data-td data last text-right">13.51</td>
<td class="data-td data last text-right">11.03</td>
<td class="data-td data last text-right">5.04</td>
<td class="data-td data last text-right">3.59</td>
</tr>
<tr class="tbl-data">
<td class="data-td last text-left">50% GBI-EM/50% EMBI</td>
<td class="data-td data last text-right">2.60</td>
<td class="data-td data last text-right">5.47</td>
<td class="data-td data last text-right">8.94</td>
<td class="data-td data last text-right">11.93</td>
<td class="data-td data last text-right">8.72</td>
<td class="data-td data last text-right">1.89</td>
<td class="data-td data last text-right">2.88</td>
</tr>
</tbody>
</table>
</div>
<div class="chart-disclosure">
<p><sup>*</sup>&nbsp;Returns less than one year are not annualized.</p>
<p><strong>Expenses: Class A: Gross 1.83%, Net 1.21%; Class I: Gross 1.37%, Net 0.86%; Class Y: Gross 1.33%, Net 0.96%. </strong>Expenses are capped contractually until 5/01/26 at 1.20% for Class A, 0.85% for Class I, 0.95% for Class Y. Caps exclude acquired fund fees and expenses, interest, trading, dividends, and interest payments of securities sold short, taxes, and extraordinary expenses.</p>
<p><strong>The performance data quoted represents past performance. Past performance is not a guarantee of future results. Investment return and principal value of an investment will fluctuate so that an investor&rsquo;s shares, when redeemed, may be worth more or less than their original cost. </strong></p>
<p>Performance may be lower or higher than performance data quoted. Please call 800.826.2333 or visit <strong><a href="/link/3e9e20bda0bc484a87e57444cafac36e.aspx" title="ETF and Mutual Fund Manager">vaneck.com</a></strong> for performance current to the most recent month ended.</p>
<p>The &ldquo;Net Asset Value&rdquo; (NAV) of a Fund is determined at the close of each business day , and represents the dollar value of one share of the fund; it is calculated by taking the total asset of the fund, subtracting total liabilities, and dividing by the total number of shares outstanding. The NAV is not necessarily the same of the ETF&rsquo;s intraday trading value. Investors should not expect to buy or sell shares at NAV.</p>
</div>
<p id="reason-why-em-bonds-are-outperforming" class="jump-link-nav anchored-block" data-jumplink-title="Reason Why EM Bonds Are Outperforming"><strong>We continue to see two major trends boosting EM bonds &ndash; the ongoing selloff of G-10 30y yields (from Japan to the UK and the US) combined with the related and ongoing rally of CNY.</strong> They are interrelated because the strength of EMFX reinforces their low inflation paths and actually supports duration on EM local currency bonds, while duration in DM bonds sells off. Both trends support EM bonds. This is why duration is not a monolith. Mexican 30-year yields are lower by over 100bp in 2025! Seemingly incredibly given its strong connection to the US, so we&rsquo;re picking the hardest comparable in EM by mentioning Mexico. We show the aggregate EM local currency paths in Trump 1 and Trump 2, and the market continues to struggle for an explanation. As we&rsquo;ve argued, the source of this exceptional behavior is the far superior fiscal positions of most EMs relative to over-indebted DMs. This has led Chinese and Asian EM inflation downward relative to the DMs, which continues to strengthen EM currencies. We note this to remind that the big wheel turning is fiscal and its monetary implications, namely that EM central banks are far more credible on their inflation focus. We tied this all together in <strong><a href="/us/en/blogs/emerging-markets-bonds/the-curiously-unpopular-case-for-rmb-cny-appreciation/" title="The Curiously Unpopular Case for RMB/CNY Appreciation">&ldquo;The Curiously Unpopular Case for RMB/CNY Appreciation&rdquo;</a></strong>.</p>
<h3>Exhibit 1 - Trump 1 Hurt EM, Trump 2 Helping...Why?</h3>
<p><img loading="lazy" class="img-responsive" alt="Trump 1 Hurt EM, Trump 2 Helping...Why" src="https://www.vaneck.com/contentassets/ee5756e17e8247f88f9c46994e4331a1/6146_emb-monthly-september-2025_chart-1_2025-9_blog.svg" /></p>
<p class="chart-disclosure">Source: VanEck Research, Bloomberg LP. as of August 2025. EM Corporate is represented by the J.P. Morgan CEMBI Broad Diversified Index which tracks the performance of US dollar-denominated bonds issued by emerging market corporate entities.; EM Local is represented by the J.P. Morgan GBI-EM Global Core which tracks local currency bonds issued by emerging markets governments. The index weighting methodology limits the weight of countries with larger debt stocks, with a maximum of 10% and a minimum of 1% to 3% depending on the amount of the country&rsquo;s eligible debt outstanding.; EM Sovereign is represented by the J.P. Morgan EMBI Global Diversified Index which is comprised of U.S. dollar-denominated Brady bonds, Eurobonds, and traded loans issued by emerging markets sovereign and quasi-sovereign entities. The index weighting methodology limits the weight of countries with larger debt stocks. Past performance is no guarantee of future results. Index performance is not representative of fund performance. It is not possible to invest directly in an index.</p>
<p><strong>The first trend, rising G-10 30y yields, is driven by the &ldquo;fiscal dominance&rdquo; thesis we&rsquo;ve been presenting for over a decade.</strong> High government indebtedness translates into a central bank less or unable to hike rates purely due to inflation. EM inflation has been declining and DM inflation rising as a result. The risk to this trend is fiscal austerity and/or structural reform in the over-indebted DMs, and we see very low odds of this. In fact, odds of the Fed, for example, suppressing interest rates using heterodox tools (like yield curve control) seem to be a serious scenario.</p>
<p><strong>This trend has its opposite, as obviously money is going somewhere.</strong> Although many focus on the USD&rsquo;s moves versus EUR, JPY, or GBP, we think that because they are all subject to the same &rdquo;fiscal dominance&rdquo; and are provably highly correlated with each other. They are all in the same &ldquo;overindebted G-10&rdquo; bucket so to speak. As a result, it is CNY&rsquo;s strength that is noteworthy. Most EM trades far more with China than with the US, so CNY revaluation is a real boost to other EM currencies as we&rsquo;ve seen in 2025. Given the strong net international investment position of China and many EMs, meaning a net long USD position, simple game-theory should tell you that the incentive to reshore (or bring to other non-US shores) assets to EMs is profound. The simplest example is Japan, a key funder of US Treasuries. Hedged into JPY, US Treasuries yield &frac14; of what a Japanese government bond (JGB) yields, or 100bp lower, due to FX hedging costs. This characterizes many key buyers of Treasuries. Exhibit 2 shows that EM bonds are now in a <u>lower</u> volatility regime than DM bonds. Not only is outright carry or yield or ex-post return superior, but actual volatility is lower. There really is no clearer signal for investors, who largely have avoided EM bonds for the past decade.</p>
<h3>Bonus Exhibit 2 - EM Local Bonds Less Volatile than DM Bonds</h3>
<p><strong>EM Local Bonds vs DM Sovereigns - 90-day Total Return Volatility (%)</strong></p>
<p><img loading="lazy" class="img-responsive" alt="EM Local Bonds vs DM Sovereigns - 90-day Total Return Volatility" src="https://www.vaneck.com/contentassets/d8e8846bc46b415eb437735c78e2358f/6146_emb-monthly-september-2025_chart-2_2025-9_blog.svg" /></p>
<p class="chart-disclosure">Source: VanEck Research, Bloomberg LP. Data as of July 2025.</p>

<p>During August we took a brief break from our extreme caution on USD duration as it had worked perhaps too quickly, making Saudi and Philippines big winners for the fund. We intend to reverse these soon. Our tiny exposure to very selected China corporates continues to crush it leading the outperformers, and Brazil in local currency was a big winner. Another big winner was our severe underweight to India in local and USD which performed poorly in August. We remain very bullish on local-currency while very cautious on USD duration (after a brief boost to our USD duration during August based largely on the low duration view having worked very well but also very quickly). The fund has around 60% in curated local currency, 40% in mostly higher-yielding USD bonds. Carry is 6.49%, YTW is 7.9%, and duration is 3.9 (down from 4.8 in July).</p>
<h2 id="exposure-types-and-significant-changes" class="jump-link-nav anchored-block" data-jumplink-title="Exposure Types and Significant Changes">Exposure Types and Significant Changes</h2>
<p>The changes to our top positions are summarized below. Our largest positions in August were Brazil, Mexico, South Africa, Thailand, and Malaysia:</p>
<ul class="content-list">
<li class="mt-2">We increased our local currency exposure in Mexico and Colombia. Mexico is a likely winner from solid growth in the U.S. and the next stage of the trade war 2.0, while the central bank is credibly reducing the policy rate (at a slower speed). These factors strengthened the country&rsquo;s technical and policy test scores. Colombia&rsquo;s central bank staying on hold (despite persistent political pressure from the government) and a prospect of a market-friendly political change after the presidential elections improved the policy/politics test score for the country.</li>
<li class="mt-2">We also increased our hard currency sovereign exposure in Bolivia, as the as the market started to price in a more pro-reform presidential election scenario, which got confirmed by the 1st round results. In terms of our investment process, this improved the country&rsquo;s policy/politics test score.</li>
<li class="mt-2">Finally, we increased our local currency exposure in Poland and Hungary. Poland&rsquo;s 2026 budget raised some concerns about the pace of fiscal consolidation, but the net borrowing needs are likely to be close to the 2025 level, which was revised lower, improving the technical test score for the country. Hungary&rsquo;s inflation is slowing, the market&rsquo;s expectations for this cycle&rsquo;s terminal rate might be too high, and the government is sticking to its 2025 and 2026 fiscal targets despite weaker growth, boosting Hungary&rsquo;s policy/politics and economic test scores.</li>
<li class="mt-2">We reduced our local currency exposure in Malaysia and Thailand, as both positions are popular longs which now started to look elevated worsening the technical test score for the countries. An additional consideration in Malaysia is that solid Q2 GDP growth is likely to support the central bank&rsquo;s decision to remain on hold for now.</li>
<li class="mt-2">We also reduced our hard currency sovereign exposure in Saudi Arabia on the back of concerns about global duration against the backdrop of Saudi Arabia&rsquo;s low spread-to-yield ratio, which worsened the technical test score for country.</li>
<li class="mt-2">Finally, we reduced our hard currency sovereign exposure in Argentina. Sovereign bonds were popular longs which makes them vulnerable to stronger political noise in the runup to the mid-term elections. The market is also not very happy about the authorities&rsquo; attempts to maintain stable/strong currency before the elections, which boost local interest rates and can slow (or even reverse) the reserve accumulation. In terms of our investment process, this worsened the technical and policy/politics test scores for Argentina.</li>
</ul>
<p>To receive more <a href="https://www.vaneck.com/us/en/insights/emerging-markets-bonds/" title="Emerging Markets Bonds Insights"><strong>Emerging Markets Bonds</strong></a> insights, <a href="/link/5f45412c2143400497908cea2897f7d3.aspx" title=" Subscription Center"><strong>sign up in our subscription center</strong></a>.</p>
]]></content:encoded>
</item><item rdf:about="https://www.vaneck.com/us/en/blogs/thematic-investing/nvidia-q3-earnings-shift-full-systems/">
  <title>Nvidia Earnings: Systems, Not Just GPUs></title>
  <link>https://www.vaneck.com/us/en/blogs/thematic-investing/nvidia-q3-earnings-shift-full-systems/</link>
  <description><![CDATA[Nvidia's Q3 results highlight its shift from GPUs to full systems, with networking driving growth. AI CapEx, fabless innovation, and industry concentration reinforce the semiconductor supercycle.]]></description>
  <dc:creator>Nick Frasse</dc:creator>
  <dc:date>09/11/2025 06:30:00</dc:date>
<content:encoded><![CDATA[

<p><strong>Key Takeaways:</strong></p>
<ul class="content-list">
<li class="mt-2">Nvidia is evolving into a full systems company, with networking as a major new growth driver.</li>
<li class="mt-2">Semiconductor cyclicality now stems from industry concentration, not traditional oversupply.</li>
<li class="mt-2">AI CapEx is becoming a structural baseline, with fabless innovators critical to scaling efficiency.</li>
</ul>
<h2>Nvidia Q3 Earnings and the Semiconductor Supercycle</h2>
<p><strong>Nvidia Earnings: Systems, Not Just GPUs</strong></p>
<p><strong><a href="https://www.vaneck.com/us/en/webinar-registration/?id=97005891050&amp;utm_source=vaneck&amp;utm_medium=calendar" title="Nvidia Earnings: The Market Signal for AI and Semiconductors">Nvidia</a></strong> once again posted strong results, beating expectations even in the absence of China sales. The company&rsquo;s guidance set a &ldquo;high floor with a flexible ceiling,&rdquo; reflecting rapid adoption of its Blackwell architecture. A key theme from the call: Nvidia is evolving from a pure GPU provider into a systems company. Networking stood out as the largest growth surprise, with entire racks of GPUs being connected as unified nodes, underscoring demand for high‑speed interconnects and power efficiency.</p>
<p>Despite skepticism around valuation, Nvidia still projects ~40% EPS growth over the next year<sup>1</sup>, extraordinary for a company of its scale. Analysts have begun raising out‑year forecasts, reinforcing confidence in the long‑term growth trajectory.</p>
<h2 id="point-thirteen" class="anchored-block">Webinar Replay: The Market Signal for AI and Semiconductors</h2>
<p>In this webinar we cover top takeaways from the Nvidia earnings call, AI-driven demand, hyperscaler strategies, and how supply dynamics are shaping the space.</p>
<h2>Cyclicality Has Shifted: From Oversupply to Concentration</h2>
<p>One of the broader takeaways from the quarterly call is that semiconductor &ldquo;cyclicality&rdquo; is no longer driven by demand but by competition. Historically, oversupply came from too many companies building the same products. Today, AI has pushed the industry into concentrated leadership, with Nvidia, Broadcom, TSMC, and a handful of others forming what has been described as an &ldquo;oligopoly stack.&rdquo; These dynamics bring greater capital discipline, tighter supply chains, and less volatility.</p>
<h3>Historical Semiconductor Cyclicality Based on Supply/Demand Imbalance</h3>
<p><img loading="lazy" class="img-responsive" alt="Historical Semiconductor Cyclicality Based on Supply/Demand Imbalance" src="https://www.vaneck.com/contentassets/9bb3bf87a3444de5a04466f0a2bc0517/6150_smhx-follow-nvidia-earning_chart-1_2025-9_v1_blog.svg" /></p>
<p class="chart-disclosure"><strong>Source:</strong> iFAST</p>
<h2>CapEx: A New Baseline for AI</h2>
<p>Capital expenditures from hyperscalers continue to be the backbone of AI infrastructure investment. Rather than being a temporary spike, CapEx is increasingly being viewed as a baseline operating cost. Companies are racing to future‑proof their infrastructure as token usage grows and applications broaden. Importantly, supply-side discipline is holding; TSMC and others are avoiding the trap of overbuilding, which keeps margins healthy.</p>
<h3>TSMC Gross Margins 2009-2025</h3>
<p><img loading="lazy" class="img-responsive" alt="TSMC Gross Margins 2009-2025" src="https://www.vaneck.com/contentassets/9bb3bf87a3444de5a04466f0a2bc0517/6150_smhx-follow-nvidia-earning_chart-2_2025-9_v1_blog.svg" /></p>
<p class="chart-disclosure"><strong>Source:</strong> Macrotrends.net, as of 06/2024. For illustrative purposes only. Past performance is no guarantee of future results</p>
<h2>The Role of Fabless Innovation</h2>
<p>Fabless semiconductor companies continue to play a critical role as optimizers rather than competitors to Nvidia. They address bottlenecks in power management, interconnectivity, and efficiency, enabling hyperscalers to scale data centers effectively. Examples include firms like Astera Labs, which builds high‑speed connectivity solutions integrated into hyperscaler and GPU ecosystems.;</p>
<p>This positioning highlights the complementary nature of<strong> <a href="/link/9b8fb1812bc74764bf11fc85767838f9.aspx?utm_source=google&amp;utm_medium=cpc&amp;utm_campaign=smh_search_us" title="SMHX - VanEck Fabless Semiconductor ETF - Performance and Holdings">VanEck&rsquo;s SMH</a></strong> and <strong><a href="/link/39c8d235748b4c26a5930c31d3ac0160.aspx" title="SMH - VanEck Semiconductor ETF - Performance and Holdings">SMHX ETFs</a></strong>: SMH captures the concentrated leaders across the stack, while SMHX emphasizes the fabless innovators solving the next layer of AI infrastructure challenges.</p>
<h2>Beyond Hyperscalers: Expanding Demand Drivers</h2>
<p>While hyperscaler CapEx remains the most visible demand engine, three additional demand layers are accelerating:</p>
<ul class="content-list">
<li class="mt-2"><strong>Internal demand: </strong>cloud providers improving their own businesses (e.g., Meta).</li>
<li class="mt-2"><strong>External demand: </strong>enterprises adopting cloud AI services (Google has highlighted under‑investment risks here).</li>
<li class="mt-2"><strong>Application demand: </strong>a new &ldquo;trust‑based&rdquo; layer of AI adoption in regulated fields like healthcare and law, requiring factual, reliable compute.</li>
</ul>
<h3>Nvidia Revenue by Geographic Region 2017-2025</h3>
<img loading="lazy" class="img-responsive" alt="Nvidia Revenue by Geographic Region 2017-2025" src="https://www.vaneck.com/contentassets/5334ea0fdf5e4e8a9097706ef91fa001/6150_smhx-follow-nvidia-earning_chart-3_2025-9_v1_blog.svg" />
<p class="chart-disclosure"><strong>Source:</strong> Nvidia, as of February 2025. Past performance is no guarantee of future results.</p>

<p>These expanding drivers reinforce that the AI supercycle is still in its early innings, with semiconductors as the backbone of growth.</p>
<h2>Final Takeaway: A Durable Innovation Flywheel</h2>
<p>The Q3 discussion reinforced that AI demand is not only persisting but also broadening across sovereigns, enterprises, and applications. Nvidia may lead headlines, but the story is one of diversified winners. For investors, pairing <strong> <a href="/link/39c8d235748b4c26a5930c31d3ac0160.aspx" title="SMH - VanEck Semiconductor ETF - Performance and Holdings">SMH</a></strong> with <strong><a href="/link/9b8fb1812bc74764bf11fc85767838f9.aspx?utm_source=google&amp;utm_medium=cpc&amp;utm_campaign=smh_search_us" title="SMHX - VanEck Fabless Semiconductor ETF - Performance and Holdings">SMHX</a></strong> offers exposure to both the market‑cap leaders anchoring the stack and the design‑driven innovators enabling efficiency and scale.</p>

<p>To receive more <a href="https://www.vaneck.com/us/en/insights/thematic-investing/" title="Thematic Investing Insights"><strong>Thematic Investing</strong></a> insights, <a href="https://www.vaneck.com/us/en/subscribe/" title="Subscription Center"><strong>sign up in our subscription center</strong></a>.</p>
]]></content:encoded>
</item><item rdf:about="https://www.vaneck.com/us/en/blogs/gold-investing/ima-casanova-miners-find-their-mojo-as-gold-consolidates/">
  <title>Miners Find Their Mojo as Gold Consolidates></title>
  <link>https://www.vaneck.com/us/en/blogs/gold-investing/ima-casanova-miners-find-their-mojo-as-gold-consolidates/</link>
  <description><![CDATA[Gold steadies near $3,300; miners soar on strong earnings, discipline, and rising margins, hinting at a potential re-rating and new bull cycle for gold equities.]]></description>
  <dc:creator>Imaru Casanova</dc:creator>
  <dc:date>09/10/2025 06:30:00</dc:date>
<content:encoded><![CDATA[

<p>Monthly gold market and economic insights from <strong><a href="/link/cfa7139e649944fea51aa2a740b2372e.aspx?p=1" title="Imaru Casanova &mdash; Portfolio Manager, Gold and Precious Metals">Imaru Casanova, Portfolio Manager</a></strong>, featuring her unique views on mining and gold&rsquo;s portfolio benefits.</p>
<p><strong>Key Takeaways:</strong></p>
<ul class="content-list">
<li class="mt-2">Gold range-bound near $3,300/oz, with catalysts like Fed turmoil and global risks boosting safe-haven demand</li>
<li class="mt-2">Gold miners surged in August on strong earnings and capital discipline</li>
<li class="mt-2">Signs of a sector re-rating suggest gold equities may be entering a new bull cycle</li>
</ul>

<h2>Policy Whiplash, Golden Calm</h2>
<p>Gold continues to be supported by heightened uncertainty and volatility stemming from persistent global geopolitical and trade tensions and mixed economic signals. In August, gold itself became entangled in the trade-tariff chaos when news reports suggested that the U.S. had imposed tariffs on 1-kilogram and 100-ounce bars of gold. The White House and President Trump later reassured markets that gold will not be subject to tariffs. TACO, indeed! The gold tariff fiasco exemplifies the confusing policy environment in the U.S., with markets trying to re-interpret and price in rapidly changing (and conflicting) information daily.</p>
<h2>Gold Holds the Line</h2>
<p>The gold price has been range-bound around the $3,300 per ounce level following its strong rally post &ldquo;liberation&rdquo; day in April. This sideways action does not surprise us. In recent years, after significant moves to new highs, the gold price tends to consolidate around a new, higher base before the next catalyst emerges that drives it to the next level. While there are plenty of potential catalysts at present, the timing is impossible to predict, but anything that threatens the stability of the global financial system would likely lead to a surge in safe-haven demand for gold.</p>
<h2>From Tariff Talk to Rally Walk</h2>
<p>We had a taste of what some of those catalysts may look like on August 20, when President Trump called for the resignation of &ndash; and days later announced he had fired &ndash; U.S. Federal Reserve (&ldquo;Fed&rdquo;) Governor Lisa Cook. This escalation in assaults on the Fed by the current administration raised fears that the Fed could lose its independence, threatening the stability and credibility of the world&rsquo;s most important central bank. Gold rallied in response, also supported by increased probabilities of a Fed cut in September and a weaker dollar, closing at $3,447.95 per ounce on August 29, a $158.02 (4.80%) gain for the month.</p>
<h2>Calm Metal, Hot Miners</h2>
<p>The NYSE Arca Gold Miners Index (GDMNTR)<sup>1</sup>&nbsp;(&ldquo;GDM&rdquo;) was up a whopping 21.73% during the month, while the mid-tier and small cap index, MVIS Global Junior Gold Miners (MVGDXJTR),<sup>2</sup>&nbsp;was up 23.35%. The gold price increase led to an amplified gain for the gold equities, as expected, reflecting their leverage to the metal price. However, the substantial outperformance suggests other factors, beyond the gold price, supported gold mining shares in August. We believe a key driver was a very strong Q2 2025 earnings season: companies generally reported financial and operating results that met or exceeded expectations, with many companies reporting record revenues and free cash flow. Most companies in our universe maintained their yearly guidance, and many larger players reiterated their commitment to higher shareholder returns via dividend payments and share buybacks. Investors were reassured that higher gold prices are indeed translating into higher margins, higher profitability, lower debt and enhanced growth prospects for the industry. And while August was not a bad month for broader equities, helped by mega-cap tech dominance and optimistic rate-cut speculation, monthly gains of approximately 2% for the S&amp;P 500<sup>&reg;</sup>&nbsp;Index<sup>3</sup>&nbsp;and the NASDAQ Composite<sup>4</sup>&nbsp;paled in comparison to the gold miners&rsquo; advance. Richly valued U.S. equities, concerns that growth of mega-cap stocks may be fading and high concentration in AI/tech stocks may also be driving portfolio diversification and rotation of capital that is benefiting gold stocks.</p>
<h2>Miners Find Their Mojo</h2>
<p>After almost two decades of persistent de-rating, could gold equities finally be getting their mojo back? Our data seems to suggest so. We have been tracking the relationship between gold bullion and gold equities (GDM) since 2001 (see chart below) and have identified six clear (strong) trends, indicating a significant and prolonged de-rating of the gold mining sector since 2007. A de-rating occurs when a trendline shifts to the right and/or downward. De-ratings in the past were the result of companies consistently disappointing investors. Examples include massively out-of-the- money hedge books in the 2000&rsquo;s; over indebtedness and low returns on capital in the 2010&rsquo;s; and missing production and cost targets in the early 2020&rsquo;s. Now investors are seeing expanding margins, low debt, capital-allocation discipline, and companies doing what they said they would do this year. While it is too early to tell if a new valuation trend is forming, August data is encouraging and may signal the beginning of a new bull cycle for gold mining stocks. For reference, the bull-market trend of 2001-2007 would imply a GDM value of approximately 6,000 at today&rsquo;s spot gold price, compared to its present value of around 1,800. A return of those historical sector multiples may seem unrealistic and it&rsquo;s not part of our outlook, but a significant re-rating of the sector is in the cards, in our view.</p>
<p><i>As mentioned above, the chart below maps gold prices against the GDM since 2001, highlighting the six trends&mdash;and a potential re-rating with a steeper &ldquo;new trend&rdquo; emerging since mid-August 2025.</i></p>

<h3>Gold vs NYSE Arca Gold Miners Index</h3>
<p><strong>2001 - 2025 Weekly Close</strong></p>
<p><img loading="lazy" class="img-responsive" alt="Gold vs NYSE Arca Gold Miners Index" src="https://www.vaneck.com/contentassets/6bdc9a9cb1fa43c1931fddcb256f138e/6148_gold-commentary-august-2025_chart-1_2025-9_v1_blog.svg" /></p>
<p class="chart-disclosure">Data as of September 4, 2025. Past performance is no guarantee of future results.</p>
<p>To receive more <strong><a href="https://www.vaneck.com/us/en/insights/gold-investing/" title="Gold Investing Insights">Gold Investing</a></strong> insights, <strong><a href="https://www.vaneck.com/us/en/subscribe/" title="Subscription Center">sign up in our subscription center</a></strong>.</p>
]]></content:encoded>
</item><item rdf:about="https://www.vaneck.com/us/en/blogs/investment-outlook/then-vs-now-a-consistent-philosophy-for-a-changing-world/">
  <title>Then vs. Now: A Consistent Philosophy for a Changing World></title>
  <link>https://www.vaneck.com/us/en/blogs/investment-outlook/then-vs-now-a-consistent-philosophy-for-a-changing-world/</link>
  <description><![CDATA[From typewriters and cramped conference rooms to bell ringings at NYSE, VanEck&rsquo;s 70-year journey shows how much has changed--and how its philosophy has endured.]]></description>
  <dc:creator> </dc:creator>
  <dc:date>09/10/2025 06:30:00</dc:date>
<content:encoded><![CDATA[

<p>When Russell Brennan, AVP, Accounting and Valuation Oversight, first joined the firm, he recalls the space being so cramped that there was a conference room with four desks squeezed into it. &ldquo;The oxygen plummeted if someone shut the door,&rdquo; he jokes. For Paul Weltchek, Senior Analyst, Security and Portfolio Analytics, who arrived when VanEck had fewer than 70 employees, those early years were defined by building processes and systems from scratch. Paralegal Alison Emanuel remembers transcribing board minutes on a typewriter and mailing heavy board books in binders. Today, they&rsquo;re delivered with a click.</p>
<p>From those modest beginnings, VanEck has grown into a global investment manager with teams across continents, a market-leading ETF platform, and strategies spanning active and passive, traditional and digital assets. But some things haven&rsquo;t changed. Since the firm&rsquo;s founding in 1955, the investment philosophy has remained the same: identify investment opportunities tied to impactful trends across economic, technological, political, and social dimensions, and deliver forward-looking solutions to investors.</p>
<p style="font-size: 1.16em;">&ldquo;Our investment philosophy is defined by a relentless determination to innovate on behalf of our clients. We focus on optimal access, whether by being first to market or by developing a more intelligent, efficient approach.&rdquo; &ndash; <strong>CEO <a href="/link/3bf292f28484410caabd0c2b9ad69e12.aspx" title="Jan van Eck, Chief Executive Officer">Jan van Eck</a></strong></p>
<p><img loading="lazy" class="img-responsive" alt="CEO Jan van Eck ringing the bell for the launch of GDX in 2006" src="https://www.vaneck.com/contentassets/f36878b32aa24767bbc02efb120d25a2/6137_70th-anniversary-then-now_image_2025-9_v2-option-2.jpg" /></p>
<p>Nadira Singh remembers the excitement in 2006 over the launch of VanEck&rsquo;s first ETF, the <strong><a href="/link/0ef4cceba0a44fbe8de2f60e7952a27d.aspx" title="GDX - VanEck Gold Miners ETF - Overview">VanEck Gold Miners ETF (GDX)</a></strong>, marked by the firm&rsquo;s first bell ringing at what was then the American Stock Exchange (now NYSE). VanEck&rsquo;s Senior Sales Management Support &amp; Client Services Manager Carmen Chartier Ryser recalls Jan&rsquo;s bold call to push into ETFs in Europe in 2012. &ldquo;Many didn&rsquo;t believe, but Jan had done the work. He saw what was coming. I was a believer then&mdash;and I still am.&rdquo;</p>
<p>Fast forward to today. VanEck recently commemorated its 70th anniversary with the ringing of the NYSE Closing Bell on August 27, 2025, a bookend that reflects how far we&rsquo;ve come and how strong our convictions remain.</p>
<p>Even as the team has expanded and the firm&rsquo;s product set has evolved, VanEck has stayed true to its guiding principle to provide investors early access to transformative opportunities that have the potential to reshape markets. Another demonstration of the firm&rsquo;s willingness to lead ahead of the curve came in 2017, when VanEck became the first established ETF issuer to file for a bitcoin-linked ETF.</p>
<p>Seventy years in, VanEck is still investing with a deep understanding of disruptive macroeconomic forces. Still thinking long term. And still building the kind of firm where culture and conviction endure.</p>
<p>To receive more <a href="https://www.vaneck.com/us/en/insights/investment-outlook/" title="Investment Outlook Insights"><strong>Investment Outlook</strong></a> insights, <a href="/link/5f45412c2143400497908cea2897f7d3.aspx" title=" Subscription Center"><strong>sign up in our subscription center</strong></a>.</p>
]]></content:encoded>
</item><item rdf:about="https://www.vaneck.com/us/en/blogs/income-investing/investors-guide-to-bdcs/">
  <title>BDC Investing: A Comprehensive Guide for Investors></title>
  <link>https://www.vaneck.com/us/en/blogs/income-investing/investors-guide-to-bdcs/</link>
  <description><![CDATA[Understand the essentials of BDCs, their role in a portfolio, and key considerations for BDC investing. Learn how BDC stocks could fit into your investment strategy.]]></description>
  <dc:creator> </dc:creator>
  <dc:date>09/09/2025 06:30:00</dc:date>
<content:encoded><![CDATA[

<p><strong>Key Takeaways:</strong></p>
<ul class="content-list">
<li class="mt-2">Dividend investing can offers growth, but success depends on avoiding unsustainable payouts and dividend traps.</li>
<li class="mt-2">Strong strategies focus on financial health, balance sheets, and fair valuations, not just yield.</li>
<li class="mt-2">Align your dividend plan with goals and risk tolerance while diversifying across quality companies.</li>
</ul>
<p>Business Development Companies (BDCs) are gaining traction as a compelling investment option, especially for income-focused investors seeking higher yields. These companies offer unique opportunities by providing much-needed capital to small and mid-sized businesses. For investors, BDCs represent a way to invest in the growth of these businesses while benefiting from the steady income streams they generate.</p>
<h2 id="what-is-bds" class="jump-link-nav anchored-block" data-jumplink-title="What is a BDC?">What is a BDC?</h2>
<p>A Business Development Company is a type of investment company established by the U.S. Congress in 1980 to support small and mid-sized enterprises. Operating under the Investment Company Act of 1940, BDCs provide capital to these businesses through debt or equity financing. In return, BDCs receive interest payments from loans or take ownership stakes in the companies, distributing these profits to shareholders in the form of dividends.</p>
<p>BDCs play a crucial role in bridging the gap between traditional banks and private equity firms. They offer small and mid-sized businesses access to capital that may not be available through banks, especially for companies that are not large enough to attract private equity investors. For individual investors, BDCs offer exposure to these private companies without the complexities or liquidity challenges associated with direct private equity investments.</p>
<p>To better understand BDCs, consider the example of a mid-sized manufacturing company that needs funds to expand its facilities or acquire another business. In this scenario, a BDC can step in to provide the necessary capital in exchange for interest payments on loans or an equity stake in the business.</p>
<p>For investors, this means they can indirectly participate in the success of these companies through regular dividend payments. These dividends are generated from the interest and returns the BDC earns from its portfolio of loans and investments. By investing in a BDC, investors can gain exposure to a diversified pool of small and mid-sized businesses that they wouldn't typically have access to through public markets.</p>
<p>In this way, BDCs offer a more liquid, accessible way for everyday investors to benefit from the growth potential of private companies while receiving the steady income that comes from dividend payments.</p>

<h2 id="how-bds-work" class="jump-link-nav anchored-block" data-jumplink-title="How BDCs Work">How BDCs Work: Structure and Function</h2>
<p>BDCs function similarly to closed-end investment funds. They raise capital from investors, which they use to invest in the debt or equity of small to mid-sized companies. BDCs generate income primarily from interest payments on loans, which is then distributed to shareholders as dividends.</p>
<p>BDCs are subject to specific regulations that govern their operations. For example, they are required to distribute at least 90% of their taxable income to shareholders, which makes them attractive to income-seeking investors. Additionally, BDCs must invest at least 70% of their assets in private or thinly traded public companies in the U.S.</p>
<p>Compared to other investment vehicles like REITs (Real Estate Investment Trusts) and private equity, BDCs offer a unique balance of income generation and capital appreciation. In addition, BDCs typically invest across a broader range of industries, offering a more diversified portfolio of private investments.</p>
<h2 id="bdc-vs-alternatives" class="jump-link-nav anchored-block" data-jumplink-title="BDCs vs. Common Alternatives">BDCs vs. Common Alternatives</h2>
<p>While Business Development Companies provide investors with exposure to small and mid-sized businesses, there are other alternative investment vehicles that serve different purposes and sectors. Investors looking for high-yielding investments might also consider options such as Real Estate Investment Trusts, Private Equity (PE), or Private Credit. Each of these investment types offers distinct opportunities, risk profiles, and focuses on different asset classes. In the following sections, we will compare BDCs with REITs, private equity, and private credit, highlight their key differences and explain scenarios where one might be more suitable than the other, depending on an investor's goals and risk tolerance.</p>
<p><strong>BDCs vs. REITs</strong></p>
<p>BDCs and <a href="https://www.vaneck.com/us/en/blogs/income-investing/investing-in-mortgage-reits/" title="Investing in Mortgage REITs"><strong>REITs</strong></a> both offer high dividend yields and are structured similarly in that they are required to distribute a significant portion of their income to shareholders. However, the key difference lies in their investment focus. While REITs invest primarily in income-generating real estate, BDCs provide capital to small and mid-sized businesses.</p>
<p>Investors seeking exposure to the real estate market may prefer REITs, while those interested in supporting business growth through private companies might opt for BDCs. Additionally, REITs are more sensitive to property market fluctuations, whereas BDCs are more affected by the performance of their underlying business investments.</p>
<p><strong>BDC vs. Private Equity</strong></p>
<p>Private equity investments are typically restricted to institutional investors and high-net-worth individuals due to high minimum investments and long holding periods. In contrast, BDCs offer a more accessible way for retail investors to gain exposure to private companies, often with lower investment minimums and greater liquidity.</p>
<p>BDCs also provide more frequent income in the form of dividends, whereas private equity investors often wait years for returns through capital appreciation or company exits. However, private equity may offer higher returns over the long term, making it more suitable for investors with a high-risk tolerance and a longer investment horizon.</p>
<p><strong>BDCs vs Private Credit</strong></p>
<p>BDCs and private credit investments both focus on providing loans to private companies. However, BDCs are typically more accessible to retail investors through publicly traded shares, while private credit investments are often limited to institutional or accredited investors.</p>
<p>Private credit tends to offer more tailored loan structures and can target specific industries, while BDCs generally invest across a broader range of businesses. For more details on the benefits of private credit through BDCs, you can explore this article: <a href="https://www.vaneck.com/us/en/blogs/income-investing/bdcs-an-alternative-way-to-access-the-benefits-of-private-credit/" title="BDCs: An Alternative Way to Access the Benefits of Private Credit"><strong>BDCs: An Alternative Way to Access the Benefits of Private Credit</strong></a>.</p>

<h2 id="bds-strategies" class="jump-link-nav anchored-block" data-jumplink-title="BDC strategies">BDC Investment Strategies</h2>
<p>When investing in BDCs, there are various strategies that investors can adopt, depending on their goals:</p>
<ul class="content-list">
<li class="mt-2">Income Generation: Many investors are drawn to BDCs for their high dividend yields, making them a good option for those seeking regular income.</li>
<li class="mt-2">Capital Appreciation: Some BDCs also offer potential for capital gains, especially if their portfolio companies perform well or go public.</li>
<li class="mt-2">Diversification: BDCs provide access to a broad portfolio of private companies, which can help diversify an investor's portfolio away from traditional stocks and bonds.</li>
</ul>
<p>When choosing BDCs, it&rsquo;s essential to consider factors like the management team's track record, portfolio composition, and historical performance. Additionally, BDCs can be sensitive to interest rate changes and economic downturns, so careful research is crucial.</p>
<h2>Analyzing BDC Stocks: Key Metrics to Consider</h2>
<p>Before investing in BDCs, there are several key metrics that investors should evaluate:</p>
<ul class="content-list">
<li class="mt-2">Net Asset Value (NAV): This represents the value of a BDC&rsquo;s assets minus its liabilities and is a critical metric for determining whether a BDC&rsquo;s stock is trading at a premium or a discount.</li>
<li class="mt-2">Dividend Yield: Investors should assess the sustainability of a BDC's dividend yield by reviewing its earnings and payout ratio.</li>
<li class="mt-2">Portfolio Quality: Understanding the creditworthiness of the companies in a BDC's portfolio is essential, as this will impact the stability of the dividend payouts.</li>
</ul>
<p>Conducting thorough research on these metrics will help investors make more informed decisions.</p>
<h2>Top Public BDC Companies in 2025</h2>
<p>Identifying the top Business Development Companies (BDCs) can be challenging given the diverse range of companies and sectors they cover. Investors should focus on key metrics such as dividend yield, portfolio quality, management expertise, and asset exposure when selecting individual BDCs to invest in. Investors often benefit from using a BDC-focused ETF like the <a title="BIZD - VanEck BDC Income ETF - Overview" href="https://www.vaneck.com/us/en/investments/bdc-income-etf-bizd/"><strong>VanEck BDC Income ETF (BIZD)</strong></a> for diversified exposure without needing to individually select companies. A few leading companies within BIZD include:</p>
<ul class="content-list">
<li class="mt-2"><strong>Ares Capital Corp. (ARCC): </strong>As the largest publicly traded BDC, Ares Capital offers investors stability through its extensive portfolio of diverse middle-market loans and strong historical dividend performance.</li>
<li class="mt-2"><strong>Blue Owl Capital Corp. (OBDC):</strong> Known for its disciplined underwriting and significant asset management scale, Blue Owl Capital delivers consistent income generation by investing primarily in senior secured loans.</li>
<li class="mt-2"><strong>Blackstone Secured Lending (BXSL):</strong> Managed by Blackstone, a global leader in alternative asset management, BXSL offers investors access to a portfolio of loans supported by Blackstone&rsquo;s scale, credit expertise, and disciplined risk management.</li>
</ul>
<h2>Pros and Cons of BDC Investing</h2>
<p>To understand how BDCs fit in a broader portfolio, it&rsquo;s important for investors to understand the pros and cons of an allocation to BDCs:</p>
<p><strong>Pros:</strong></p>
<ul class="content-list">
<li class="mt-2">High Dividend Yields: One of the main attractions of BDCs is their high dividend payouts, making them popular among income-focused investors.</li>
<li class="mt-2">Diversification: BDCs provide exposure to a wide range of private companies, offering diversification that can complement other investments.</li>
<li class="mt-2">Access to Private Companies: BDCs offer a relatively easy way for retail investors to gain exposure to private companies that would otherwise be difficult to access.</li>
</ul>
<p><strong>Cons:</strong></p>
<ul class="content-list">
<li class="mt-2">Market Volatility: BDCs can be more sensitive to economic conditions and market volatility, as their success depends on the performance of the companies they invest in.</li>
<li class="mt-2">Interest Rate Risk: BDCs that invest in debt securities are often sensitive to interest rate changes, which can affect the value of their investments and the income they generate.</li>
<li class="mt-2">Performance of Underlying Assets: BDCs are only as strong as the companies they lend to, and if these businesses underperform, it can hurt the BDC&rsquo;s returns.</li>
</ul>
<h2 id="how-to-invest-in-bdc" class="jump-link-nav anchored-block" data-jumplink-title="How to invest in BDCs">How to invest in BDCs</h2>
<p>Investors can mitigate potential risks through careful selection of BDCs, focusing on those with high-quality portfolios and experienced management teams. However, in the current environment, there are many publicly traded BDCs available, each with distinct risk profiles based on their asset structures, sector and credit exposures, financing terms and management quality. Investing in individual BDCs demands rigorous research to fully understand each entity.</p>
<h2>Understanding BDC ETFs</h2>
<p>Business Development Company ETFs provide a convenient and efficient way to invest in a diversified portfolio of publicly traded BDCs. These ETFs, like <strong><a title="BIZD - VanEck BDC Income ETF - Overview" href="https://www.vaneck.com/us/en/investments/bdc-income-etf-bizd/">VanEck&rsquo;s BDC Income ETF (BIZD)</a></strong>, track indices representing the overall performance of the BDC market, offering investors exposure without the need for extensive individual research and analysis. Investing through ETFs also enhances liquidity, provides broader sector exposure, and helps mitigate company-specific risks by spreading investments across multiple BDCs. Additionally, BDC ETFs simplify portfolio management and enable easier access to regular dividend payments derived from a variety of underlying private companies.</p>
<p>BIZD offers broad market exposure to publicly traded U.S. business development companies and may be appealing for investors seeking a liquid alternative to private credit funds. BIZD seeks to replicate as closely as possible, before fees and expenses, the price and yield performance of the MVIS&reg; US Business Development Companies Index, which tracks the overall performance of publicly traded business development companies.</p>
<h2>Learn more about BIZD</h2>
<p>VanEck BDC Income ETF Fund Profile</p>
<h2>Conclusion</h2>
<p>Business Development Companies are an attractive investment vehicle for those seeking exposure to private companies and a steady income stream through high dividend yields. By providing capital to small and mid-sized businesses, BDCs offer a unique opportunity to invest in sectors that are often out of reach for individual investors.</p>
<p>BDCs stand out by combining elements of private credit, debt financing, and public markets, offering liquidity that private equity lacks while maintaining the potential for high returns through dividend payouts. However, like any investment, BDCs come with risks such as market volatility, interest rate sensitivity, and reliance on the performance of underlying assets.</p>
<p>To manage these risks, investors should carefully evaluate BDCs based on metrics like Net Asset Value (NAV), dividend sustainability, and portfolio quality. For those seeking a more diversified approach, BDC ETFs, such as the <a href="https://www.vaneck.com/us/en/investments/bdc-income-etf-bizd/" title="VanEck BDC Income ETF (BIZD)"><strong>VanEck BDC Income ETF (BIZD)</strong></a>, provide broad market exposure to a range of BDCs, simplifying the investment process while maintaining the benefits of this asset class.</p>
<p>Ultimately, BDCs offer a compelling option for income-focused investors, but like any investment, it&rsquo;s crucial to perform due diligence and align your portfolio with your long-term financial goals.</p>
<p>To receive more <a href="/us/en/blogs/income-investing/" title="Income Investing Insights"><strong>Income Investing</strong></a> insights, <a href="/link/5f45412c2143400497908cea2897f7d3.aspx" title=" Subscription Center"><strong>sign up in our subscription center</strong></a>.</p>
]]></content:encoded>
</item><item rdf:about="https://www.vaneck.com/us/en/blogs/model-portfolios/august-market-recap-when-gold-speaks-markets-listen/">
  <title>August Market Recap: When Gold Speaks, Markets Listen></title>
  <link>https://www.vaneck.com/us/en/blogs/model-portfolios/august-market-recap-when-gold-speaks-markets-listen/</link>
  <description><![CDATA[Gold signals caution as deficits, debt, and geopolitics test confidence, while AI innovation is reshaping growth for the decade ahead.]]></description>
  <dc:creator>David Schassler</dc:creator>
  <dc:date>09/09/2025 06:30:00</dc:date>
<content:encoded><![CDATA[

<p><strong>Key Takeaways:</strong></p>
<ul class="content-list">
<li class="mt-2">Gold&rsquo;s surge signals eroding trust in money as deficits, debt, and geopolitics collide.</li>
<li class="mt-2">Fiscal excess vs. AI innovation: the forces set to define investing for the next decade.</li>
<li class="mt-2">Beyond 60/40: portfolios need gold, Bitcoin, AI, and energy to withstand transition.</li>
</ul>
<p><i>Nothing herein should be construed as investment advice or any call to action. Views expressed are for illustrative purposes only, which may include forward-looking statements or past performance, neither of which guarantee future results. Views are those of the author(s), and not necessarily those of VanEck or its other employees.</i></p>

<h2>Gold Doesn&rsquo;t Lie</h2>
<p>+35% for bullion. +90% for gold miners. Gold&rsquo;s message could not be louder: the world is changing. Gold is on track for its best calendar year since 1979 - the last time deficits, inflation, and geopolitics collided to test global confidence in money.</p>
<p>Two powerful forces are colliding, and they will define the next decade of investing. On one side is government financial excess: runaway deficits, unpayable debt, and mounting pressure on central banks. On the other is extraordinary innovation: artificial intelligence, a once-in-a-century technology that will drive productivity and growth. These forces pull in different directions, but they share one truth - investors can profit by aligning their portfolios with them.</p>
<h2>Gold&rsquo;s Timeless Value</h2>
<p>Gold doesn&rsquo;t need a central bank. It doesn&rsquo;t rely on fiscal promises. It doesn&rsquo;t default. It is money in its purest form.</p>
<p>Jarrod Dillian, in his monthly research note The Daily Dirtnap, recently highlighted a 1966 essay from Alan Greenspan that captured this truth perfectly: <i>&ldquo;Deficit spending is simply a scheme for the confiscation of wealth. Gold stands in the way of this insidious process. It stands as a protector of property rights. If one grasps this, one has no difficulty in understanding the statists&rsquo; antagonism toward the gold standard.&rdquo;</i></p>
<p>That was nearly 60 years ago - and it reads like it was written for today.</p>
<p>Central banks understand it. They&rsquo;re buying gold to diversify away from the dollar. For the first time since the mid-1990s, gold holdings exceed U.S. Treasuries as a percentage of foreign reserves.</p>
<p>Investors are following their lead. Over $25 billion has flowed into bullion ETFs this year, while the largest gold miner ETF, saw $264 million of inflows in a single day in August. Silver and platinum are surging to keep pace.</p>
<p>Gold isn&rsquo;t just protection. It&rsquo;s participation. It&rsquo;s the asset that turns government excess into investor opportunity.</p>
<h3>Foreign Central Banks Hold More Gold Than Treasuries</h3>
<p><strong>Central Banks' Gold vs. US Treasuries Holdings as a % of International Reserves</strong></p>
<p><img loading="lazy" class="img-responsive" alt="Central Banks' Gold vs. US Treasuries Holdings as a % of International Reserves" src="https://www.vaneck.com/contentassets/9d234f034f1046e9b529f4a1fd8ad4ee/6147_mas-monthly-september-2025_chart-1_2025-9_v1_blog.svg" /></p>
<p class="chart-disclosure">Source: Bloomberg, Tavis Costa, Crescat Capital. Chart as of 8/27/2025</p>
<h2>Innovation&rsquo;s Counterweight</h2>
<p>While fiscal excess undermines trust, AI is rewriting the growth outlook. Artificial intelligence is not a passing fad. It is a general-purpose technology - like electricity or the internet - that will reshape industries, unlock productivity, and drive global growth faster than most expect.</p>
<p>AI and blockchain are not separate stories - they are part of the same future. As AI takes on more decision-making and accelerates the pace of commerce, decentralized money and programmable financial systems will be the natural counterpart. Gold protects wealth in the physical world. Bitcoin protects it in the digital one. Together, they anchor portfolios for the era ahead.</p>
<h2>Beyond the 60/40 Illusion</h2>
<p>The 60/40 portfolio was built for a world that no longer exists. To thrive in the next decade, investors need assets that can withstand transition, not just stability. The allocations below are representative of our&nbsp;<a href="https://www.vaneck.com/us/en/investments/wealth-builder-core-portfolios/holdings/" title="Model Portfolios - VanEck Wealth Builder Core Portfolios - Holdings"><strong>Wealth Builder Plus Model Portfolio.</strong></a></p>
<p class="d-none d-lg-block"><img loading="lazy" class="img-responsive" src="https://www.vaneck.com/contentassets/999f8a23aebf43a6854886700c922f97/6147_mas-monthly-september-2025_chart-1_2025-9_v2_blog.svg" alt="Beyond the 60/40 Illusion" /></p>
<p style="width: 345px;" class="d-lg-none"><img loading="lazy" class="img-responsive" src="https://www.vaneck.com/contentassets/999f8a23aebf43a6854886700c922f97/6147_mas-monthly-september-2025_chart-1_2025-9_v3_mobile.svg" alt="Beyond the 60/40 Illusion" /></p>

<h2>The Bottom Line</h2>
<p>The clash between government excess and innovation will define this era. For investors, the message is not bearish - it is bullish for those who adapt. Own the stores of value that protect against financial excess. Own the innovations that will power the next wave of growth.</p>
<p>Gold doesn&rsquo;t lie - it tells us debt and deficits matter, and investors should listen.</p>
<p>To receive more <strong><a href="https://www.vaneck.com/us/en/insights/guided-allocation/" title="Model Portfolio Insights">Model Portfolio</a></strong> insights, <strong><a href="https://www.vaneck.com/us/en/subscribe/" title="Subscription Center">sign up in our subscription center</a></strong>.</p>
]]></content:encoded>
</item><item rdf:about="https://www.vaneck.com/us/en/blogs/moat-investing/smid-cap-moats-outpace-large-caps-in-august/">
  <title>SMID-Cap Moats Outpace Large-Caps in August></title>
  <link>https://www.vaneck.com/us/en/blogs/moat-investing/smid-cap-moats-outpace-large-caps-in-august/</link>
  <description><![CDATA[Small and mid-cap stocks took the spotlight in August, outpacing large-cap benchmarks as the U.S. equities rally broadened beyond mega-cap tech.]]></description>
  <dc:creator>Kendall Duncan </dc:creator>
  <dc:date>09/09/2025 06:30:00</dc:date>
<content:encoded><![CDATA[

<p><strong>Key Takeaways:</strong></p>
<ul class="content-list">
<li class="mt-2">Moat Index rose 1.7%, with semis &amp; healthcare offsetting energy headwinds.</li>
<li class="mt-2">Monolithic Power and Zimmer Biomet were top Moat Index contributors.</li>
<li class="mt-2">SMID Moat Index gained 3.1%, outpacing large-cap and equal-weight peers.</li>
<li class="mt-2">Wynn Resorts and Expedia led SMID Moat gains as consumer demand stayed strong.</li>
</ul>
<p id="us-equity-market-review" class="jump-link-nav anchored-block" data-jumplink-title="U.S. Equity Market Review">In August, U.S. equity markets extended their summer rally, posting a fourth consecutive month of gains as the S&amp;P 500 advanced 2.0% to notch another record high. Market momentum was supported by continued strength in corporate earnings, resilient consumer spending, and moderating inflation data. Investor optimism was tempered somewhat by ongoing trade negotiations and a mixed set of labor market readings, which revealed both steady job growth and further downward revisions to prior reports. Most sectors posted gains in August, with Materials and Healthcare leading the way. The Federal Reserve held interest rates steady for a third consecutive meeting, though expectations for potential cuts later this year grew stronger as inflation pressures eased. Additionally, small cap leadership signals a healthier, broader rally beyond mega-cap tech.</p>
<p>The <strong><a href="/link/9e43dd198c5f4e419f13220685081895.aspx" title="MOAT - VanEck Morningstar Wide Moat ETF - Overview">Morningstar Wide Moat Focus Index</a></strong> (the &ldquo;Moat Index&rdquo;) participated in the August rally along with the broader equity market, posting a gain of 1.7% for the month. The Moat Index lagged the S&amp;P 500 and equal weighted benchmarks slightly, which returned 2.0% and 2.7%, respectively. The strategy continues to provide differentiated exposure, which has become increasingly difficult for investors to find, amid historical levels of concentration in the U.S. equity markets.</p>
<p>Small cap stocks saw advances during the month, as comments by the Fed at the Jackson Hole symposium reignited hopes for rate cuts and boosted rate-sensitive small caps. The <strong><a href="/link/166321dbcfec440590fb51cf0ad629aa.aspx" title="SMOT - VanEck Morningstar SMID Moat ETF - Overview">Morningstar US Small-Mid Cap Moat Focus Index</a></strong> (the &ldquo;SMID Moat Index&rdquo;) posted a 3.1% gain in August, outpacing both large-cap and equal weighted benchmarks.</p>
<h3>Small Caps Lead the Pack in August</h3>
<img loading="lazy" class="img-responsive w-100" src="https://www.vaneck.com/contentassets/1e31d481fabd4de2856a325918362325/6142_moat-monthly-september-2025_chart-1_2025-9_v1_blog.svg" alt="Small Caps Lead the Pack in August" />
<p class="chart-disclosure"><strong>Source: Morningstar. Data as of 8/31/2025.</strong> Past performance is no guarantee of future results. Index performance is not representative of fund performance. It is not possible to invest directly in an index. Please see index definitions and other important disclosures at the end of this content. Fund performance current to the most recent month end is available by visiting vaneck.com or by calling 800.826.2333.</p>

<h2 id="moat-highlights" class="jump-link-nav anchored-block" data-jumplink-title="Moat Highlights">Moat Index August Highlights: Semiconductors and Joints Drive Gains</h2>
<p>In August, sector positioning, more than individual stock selection shaped the Moat Index&rsquo;s performance. Energy extended its rebound on higher oil prices and strong commodity demand, and the Moat Index has no exposure to this sector. However, positive stock selection within the health care segment as well as strong earnings from several moat companies helped offset sector exposure headwind.</p>
<p>Wide-moat semiconductor producer Monolithic Power Systems (MPWR) was the top contributor to the Moat Index in August, with second-quarter results beating guidance, and management provided a strong third-quarter outlook. Revenue rose 31% year over year and 4% sequentially to $665 million. The midpoint of third-quarter guidance implies 16% year-over-year and 8% sequential growth. Morningstar believes Monolithic Power Systems is a disruptor in the power management chip market, using its proprietary process technology to differentiate from larger competitors. With ramps of new products in data centers and autos, Morningstar raised its fair value estimate to $804 per share after raising their medium-term growth forecast.</p>
<p>Healthcare manufacturer Zimmer Biomet (ZBH) was also a key contributor to Moat Index performance in August, with shares gaining on the back of strong quarterly results and guidance. The firm continues to make steady progress in its core businesses, helped along by adoption of innovation in its hip and knee devices. As the undisputed king of large-joint reconstruction, Morningstar expects aging baby boomers and improving technology suitable for younger patients to fuel solid demand for large-joint replacement that should offset price declines. Morningstar maintains a $130 fair value estimate, as lower tariff burden and working capital improvements are largely offset by the higher cost of absorbing Paragon 28. Shares seem moderately undervalued.</p>
<p>Other top contributors within the Moat Index during the month include semiconductor testing company, Teradyne (TER), global technology leader, Alphabet (GOOGL), as well as chip maker, NXP Semiconductors (NXPI).</p>
<p>Companies detracting the most in August came from a mix of sectors, with technology and financials each accounting for two of the five names on the list. Notable detractors included Applied Materials (AMAT), software giant Oracle (ORCL), fixed-income trading platform MarketAxess (MKTX), credit reporting agency TransUnion (TRU), and International Flavors &amp; Fragrances. (IFF).</p>
<h2>Moat Index Top Contributors and Detractors - August 2025</h2>
<h3>Contributors</h3>
<div class="wrapped-div">
<table style="width: 100%;">
<tbody>
<tr class="tbl-data">
<td class="tbl-header last text-left">Company</td>
<td class="tbl-header last text-left">Ticker</td>
<td class="tbl-header last text-left">Sector</td>
<td class="tbl-header last text-right">Avg. Weight (%)</td>
<td class="tbl-header last text-right">Contribution (%)</td>
</tr>
<tr class="tbl-data">
<td class="data-td last text-left">Monolithic Power Systems Inc</td>
<td class="data-td data last text-left">MPWR</td>
<td class="data-td data last text-left">Technology</td>
<td class="data-td data last text-right">2.54</td>
<td class="data-td data last text-right">0.44</td>
</tr>
<tr class="tbl-data">
<td class="data-td last text-left">Zimmer Biomet Holdings Inc</td>
<td class="data-td data last text-left">ZBH</td>
<td class="data-td data last text-left">Healthcare</td>
<td class="data-td data last text-right">2.16</td>
<td class="data-td data last text-right">0.34</td>
</tr>
<tr class="tbl-data">
<td class="data-td last text-left">Teradyne Inc</td>
<td class="data-td data last text-left">TER</td>
<td class="data-td data last text-left">Technology</td>
<td class="data-td data last text-right">2.84</td>
<td class="data-td data last text-right">0.29</td>
</tr>
<tr class="tbl-data">
<td class="data-td last text-left">Alphabet Inc Class A</td>
<td class="data-td data last text-left">GOOGL</td>
<td class="data-td data last text-left">Communication Services</td>
<td class="data-td data last text-right">2.57</td>
<td class="data-td data last text-right">0.28</td>
</tr>
<tr class="tbl-data">
<td class="data-td last text-left">NXP Semiconductors NV</td>
<td class="data-td data last text-left">NXPI</td>
<td class="data-td data last text-left">Technology</td>
<td class="data-td data last text-right">2.34</td>
<td class="data-td data last text-right">0.23</td>
</tr>
</tbody>
</table>
</div>
<h3>Detractors</h3>
<div class="wrapped-div">
<table style="width: 100%;">
<tbody>
<tr class="tbl-data">
<td class="tbl-header last text-left">Company</td>
<td class="tbl-header last text-left">Ticker</td>
<td class="tbl-header last text-left">Sector</td>
<td class="tbl-header last text-right">Avg. Weight (%)</td>
<td class="tbl-header last text-right">Contribution (%)</td>
</tr>
<tr class="tbl-data">
<td class="data-td last text-left">Applied Materials Inc</td>
<td class="data-td data last text-left">AMAT</td>
<td class="data-td data last text-left">Technology</td>
<td class="data-td data last text-right">2.60</td>
<td class="data-td data last text-right">-0.27</td>
</tr>
<tr class="tbl-data">
<td class="data-td last text-left">MarketAxess Holdings Inc</td>
<td class="data-td data last text-left">MKTX</td>
<td class="data-td data last text-left">Financials</td>
<td class="data-td data last text-right">2.21</td>
<td class="data-td data last text-right">-0.23</td>
</tr>
<tr class="tbl-data">
<td class="data-td last text-left">Oracle Corp</td>
<td class="data-td data last text-left">ORCL</td>
<td class="data-td data last text-left">Technology</td>
<td class="data-td data last text-right">1.86</td>
<td class="data-td data last text-right">-0.20</td>
</tr>
<tr class="tbl-data">
<td class="data-td last text-left">TransUnion</td>
<td class="data-td data last text-left">TRU</td>
<td class="data-td data last text-left">Financials</td>
<td class="data-td data last text-right">2.57</td>
<td class="data-td data last text-right">-0.18</td>
</tr>
<tr class="tbl-data">
<td class="data-td last text-left">International Flavors &amp; Fragrances Inc</td>
<td class="data-td data last text-left">IFF</td>
<td class="data-td data last text-left">Basic Materials</td>
<td class="data-td data last text-right">2.07</td>
<td class="data-td data last text-right">-0.10</td>
</tr>
</tbody>
</table>
</div>
<p class="chart-disclosure"><strong>Source: Morningstar</strong>. Past performance is no guarantee of future results. Index performance is not illustrative of fund performance. Not intended as a recommendation to buy or to sell any of the securities mentioned herein.</p>

<h2 id="smid-highlights" class="jump-link-nav anchored-block" data-jumplink-title="SMID Moat Highlights">SMID Moat Index August Highlights: Gaming and Travel Lead the Way</h2>
<p>The SMID Moat Index performance in August was driven by strong stock selection across several parts of the portfolio. Consumer discretionary was the standout area, with four of the month&rsquo;s top five contributors coming from this sector. Amid the Federal Reserve drama and deluge of corporate earnings in August, one clear but overlooked trend emerged in U.S. equities: the rotation out of expensive tech stocks and into cheaper small caps, with a S&amp;P SmallCap 600 index monthly gain of 7.1%.</p>
<p>Wynn Resorts (WYNN) topped the SMID Moat Index in August, as the company continues to see resilient demand despite an uncertain economic landscape. Macao gaming revenue saw a 19% rise in July. Morningstar believes the company's focus on a premium offering continues to resonate with consumers. In Macao, demand continues to gradually recover, with Wynn's high-end iconic brand positioned to participate, leading to a low-teens percentage gross gaming revenue share in 2024. Morningstar raised its fair value estimate from $107 to $110 on improved 2025 Macao revenue.</p>
<p>Expedia Group (EXPE), the leading global online travel company, was also a top contributor to SMID Moat Index performance in August, with the catalyst being an announcement of a partnership with a leading cloud provider to enhance its booking platform&rsquo;s capabilities. Over the past two decades, Expedia has built a strong network of properties (the supply side of the network effect equation), which has driven strong end-user traffic and bookings (demand side of the network effect equation). After reviewing second-quarter results, Morningstar has increased their fair value estimate from $207 to $222 to reflect higher sales in 2025.</p>
<p>Companies detracting the most in August from the SMID Moat Index included two names from industrials, with CNH Industrial (CNH) and critical digital infrastructure provider Vertiv Holdings (VRT) weighing on performance during the month. Other notable laggards were semiconductor company Marvell Technology (MVRL), MarketAxess Holdings (MKTX), and real estate investment trust SBA Communications (SBAC).</p>
<h2>SMID Moat Index Top Contributors and Detractors - August 2025</h2>
<h3>Contributors</h3>
<div class="wrapped-div">
<table style="width: 100%;">
<tbody>
<tr class="tbl-data">
<td class="tbl-header last text-left">Company</td>
<td class="tbl-header last text-left">Ticker</td>
<td class="tbl-header last text-left">Sector</td>
<td class="tbl-header last text-right">Avg. Weight (%)</td>
<td class="tbl-header last text-right">Contribution (%)</td>
</tr>
<tr class="tbl-data">
<td class="data-td last text-left">Wynn Resorts Ltd</td>
<td class="data-td data last text-left">WYNN</td>
<td class="data-td data last text-left">Consumer Discretionary</td>
<td class="data-td data last text-right">1.64</td>
<td class="data-td data last text-right">0.27</td>
</tr>
<tr class="tbl-data">
<td class="data-td last text-left">Expedia Group Inc</td>
<td class="data-td data last text-left">EXPE</td>
<td class="data-td data last text-left">Consumer Discretionary</td>
<td class="data-td data last text-right">1.37</td>
<td class="data-td data last text-right">0.27</td>
</tr>
<tr class="tbl-data">
<td class="data-td last text-left">BorgWarner Inc</td>
<td class="data-td data last text-left">BWA</td>
<td class="data-td data last text-left">Consumer Discretionary</td>
<td class="data-td data last text-right">1.55</td>
<td class="data-td data last text-right">0.25</td>
</tr>
<tr class="tbl-data">
<td class="data-td last text-left">Monolithic Power Systems Inc</td>
<td class="data-td data last text-left">MPWR</td>
<td class="data-td data last text-left">Technology</td>
<td class="data-td data last text-right">1.42</td>
<td class="data-td data last text-right">0.25</td>
</tr>
<tr class="tbl-data">
<td class="data-td last text-left">Lithia Motors Inc Class A</td>
<td class="data-td data last text-left">LAD</td>
<td class="data-td data last text-left">Consumer Discretionary</td>
<td class="data-td data last text-right">1.19</td>
<td class="data-td data last text-right">0.20</td>
</tr>
</tbody>
</table>
<h3>Detractors</h3>
<div class="wrapped-div">
<table style="width: 100%;">
<tbody>
<tr class="tbl-data">
<td class="tbl-header last text-left">Company</td>
<td class="tbl-header last text-left">Ticker</td>
<td class="tbl-header last text-left">Sector</td>
<td class="tbl-header last text-right">Avg. Weight (%)</td>
<td class="tbl-header last text-right">Contribution (%)</td>
</tr>
<tr class="tbl-data">
<td class="data-td last text-left">Marvell Technology Inc</td>
<td class="data-td data last text-left">MVRL</td>
<td class="data-td data last text-left">Technology</td>
<td class="data-td data last text-right">0.76</td>
<td class="data-td data last text-right">-0.16</td>
</tr>
<tr class="tbl-data">
<td class="data-td last text-left">CNH Industrial NV</td>
<td class="data-td data last text-left">CNH</td>
<td class="data-td data last text-left">Industrials</td>
<td class="data-td data last text-right">1.30</td>
<td class="data-td data last text-right">-0.15</td>
</tr>
<tr class="tbl-data">
<td class="data-td last text-left">Vertiv Holdings Co Class A</td>
<td class="data-td data last text-left">VRT</td>
<td class="data-td data last text-left">Industrials</td>
<td class="data-td data last text-right">1.13</td>
<td class="data-td data last text-right">-0.14</td>
</tr>
<tr class="tbl-data">
<td class="data-td last text-left">MarketAxess Holdings Inc</td>
<td class="data-td data last text-left">MKTX</td>
<td class="data-td data last text-left">Financials</td>
<td class="data-td data last text-right">1.23</td>
<td class="data-td data last text-right">-0.13</td>
</tr>
<tr class="tbl-data">
<td class="data-td last text-left">SBA Communications Corp Class A</td>
<td class="data-td data last text-left">SBAC</td>
<td class="data-td data last text-left">Real Estate</td>
<td class="data-td data last text-right">1.32</td>
<td class="data-td data last text-right">-0.11</td>
</tr>
</tbody>
</table>
</div>
</div>
<p class="chart-disclosure"><strong>Source: Morningstar</strong>. Past performance is no guarantee of future results. Index performance is not illustrative of fund performance. Not intended as a recommendation to buy or to sell any of the securities mentioned herein.</p>
<h2 id="moat-strategies" class="jump-link-nav anchored-block" data-jumplink-title="Moat Strategies">Choose Your Moat Strategy</h2>
<p>VanEck&rsquo;s suite of <a href="/us/en/blogs/moat-investing/moat-investing-powered-by-morningstar/" title="Quality Companies at Attractive Prices"><strong>moat investing strategies</strong></a> is powered by Morningstar&rsquo;s equity research team, which seeks quality companies trading at attractive valuations. The below ETFs offer access to US moat companies:</p>
<div class="flourish-embed flourish-cards d-none d-md-block" data-src="visualisation/23047091?2429575"><script src="https://public.flourish.studio/resources/embed.js"></script><noscript><img loading="lazy" src="https://public.flourish.studio/visualisation/23047091/thumbnail" width="100%" alt="Choose Your Moat Strategy" /></noscript></div>
<div class="flourish-embed flourish-cards-mobile d-md-none" data-src="visualisation/23047086?2429575"><script src="https://public.flourish.studio/resources/embed.js"></script><noscript><img loading="lazy" src="https://public.flourish.studio/visualisation/23047086/thumbnail" width="100%" alt="Choose Your Moat Strategy" /></noscript></div>
<p>To receive more <a href="https://www.vaneck.com/us/en/insights/moat-investing" title="Moat Investing Insights"><strong>Moat Investing</strong></a> insights, <a href="https://www.vaneck.com/us/en/subscribe/" title="Subscription Center"><strong>sign up in our subscription center</strong></a>.</p>
]]></content:encoded>
</item><item rdf:about="https://www.vaneck.com/us/en/blogs/digital-assets/matthew-sigel-vaneck-crypto-monthly-recap-for-august-2025/">
  <title>VanEck Crypto Monthly Recap for August 2025></title>
  <link>https://www.vaneck.com/us/en/blogs/digital-assets/matthew-sigel-vaneck-crypto-monthly-recap-for-august-2025/</link>
  <description><![CDATA[August saw a sharp return of crypto volatility, with Ethereum inflows surging, Bitcoin dominance slipping, and CEX tokens like OKB and CRO leading market gains.]]></description>
  <dc:creator>Matthew  Sigel</dc:creator>
  <dc:date>09/04/2025 06:30:00</dc:date>
<content:encoded><![CDATA[

<p><strong>Please note that VanEck may have a position(s) in the digital asset(s) described below.</strong></p>
<p><strong>Three key takeaways for August:</strong></p>
<ul class="content-list">
<li class="mt-2"><strong>Crypto volatility returns: </strong>BTC and ETH vol spiked to multi-month highs, breaking the summer lull as markets traded in tighter correlation with equities.</li>
<li class="mt-2"><strong>Flows diverge: </strong>ETH ETPs pulled in $4B while BTC saw $600M in outflows, helping push BTC dominance down from 65% to 57%.</li>
<li class="mt-2"><strong>CEX tokens shine: </strong>OKB (+248%) and CRO (+112%) led August gains, far outpacing flat or negative returns in listed CEX equities like Coinbase and OSL Group.</li>
</ul>
<h3 id="price-returns" class="jump-link-nav anchored-block" data-jumplink-title="Price Returns">Price Returns</h3>
<div class="wrapped-div">
<table style="width: 100%;">
<tbody>
<tr class="tbl-data">
<td class="tbl-header last text-left">&nbsp;</td>
<td class="tbl-header last text-right">August (%)</td>
<td class="tbl-header last text-right">YTD (%)</td>
</tr>
<tr class="tbl-data">
<td class="data-td data last text-left">Ethereum</td>
<td class="data-td data last text-right">15.81</td>
<td class="data-td data last text-right">29.93</td>
</tr>
<tr class="tbl-data">
<td class="data-td data last text-left">MarketVector Smart Contract Leaders Index</td>
<td class="data-td data last text-right">9.47</td>
<td class="data-td data last text-right">4.20</td>
</tr>
<tr class="tbl-data">
<td class="data-td data last text-left">S&amp;P 500 Index</td>
<td class="data-td data last text-right">1.91</td>
<td class="data-td data last text-right">9.84</td>
</tr>
<tr class="tbl-data">
<td class="data-td data last text-left">MarketVector Decentralized Finance Leaders Index</td>
<td class="data-td data last text-right">1.75</td>
<td class="data-td data last text-right">-31.84</td>
</tr>
<tr class="tbl-data">
<td class="data-td data last text-left">Nasdaq Index</td>
<td class="data-td data last text-right">1.58</td>
<td class="data-td data last text-right">11.11</td>
</tr>
<tr class="tbl-data">
<td class="data-td data last text-left">MarketVector Infrastructure Application Leaders Index</td>
<td class="data-td data last text-right">0.65</td>
<td class="data-td data last text-right">-37.42</td>
</tr>
<tr class="tbl-data">
<td class="data-td data last text-left">Bitcoin</td>
<td class="data-td data last text-right">-7.42</td>
<td class="data-td data last text-right">15.71</td>
</tr>
<tr class="tbl-data">
<td class="data-td data last text-left">MarketVector Meme Coin Index</td>
<td class="data-td data last text-right">-7.82</td>
<td class="data-td data last text-right">-47.35</td>
</tr>
<tr class="tbl-data">
<td class="data-td data last text-left">Coinbase</td>
<td class="data-td data last text-right">-19.38</td>
<td class="data-td data last text-right">22.65</td>
</tr>
</tbody>
</table>
</div>
<br />
<p class="chart-disclosure">Source: Bloomberg as of 8/29/2025. <strong>Index performance is not representative of fund performance. It is not possible to invest directly in an index. Past performance is no guarantee of future results. Not intended as a recommendation to buy or sell any securities named herein.</strong></p>
<p>The crypto market in August sailed through a moderate chop as BTC and ETH 30-day volatilities broke their summer malaise, reaching <strong>40%</strong> and <strong>90%</strong>, respectively. While BTC volatility reached its highest volatility readings since May 2025, ETH&rsquo;s zoomed to elevated levels not attained since the aftermath of the Yen crash in September 2024. Prices rebounded unevenly, with (<strong>60%</strong>) of the assets we track showing gains in August. Some notable winners were our <a href="https://www.marketvector.com/indexes/digital-assets/marketvector-smart-contract-leaders" title="MVSCLE - MarketVector Smart Contract Leaders Index" target="_blank" rel="noopener"><strong>MarketVector Smart Contract Leaders Index (MVSCLE)</strong></a> (<strong>+9%</strong>), ETH (<strong>+18%</strong>), and SOL (<strong>+15%</strong>). Unfortunately, BTC (<strong>-7%</strong>), SUI (<strong>-10%</strong>) and TON (<strong>-10%</strong>) lagged during the dog days of summer. In August, cryptocurrencies traded closely in line with movements of the S&amp;P 500, as the correlation between the <a href="https://www.marketvector.com/indexes/digital-assets/marketvector-smart-contract-leaders" title="MVSCLE - MarketVector Smart Contract Leaders Index" target="_blank" rel="noopener"><strong>MarketVector Smart Contract Leaders Index (MVSCLE)</strong></a> and the S&amp;P 500 reached <strong>0.73,</strong> the largest since April 2025. The supply of stablecoins across all blockchains reached <strong>$276 billion</strong> in August, which is a (<strong>+36%</strong>) gain in 2025. Total Value Locked (TVL), a strong barometer of DeFi&rsquo;s success and the performance of alt-tokens, increased by <strong>11%</strong> month-over-month (M/M).</p>
<h3>Ethereum&rsquo;s Volatility Approach 1-Year Highs in August</h3>
<p><strong>In August 2025, Ethereum's Volatility Approached 1 Yr Highs</strong></p>
<p><img loading="lazy" class="img-responsive" alt="In August 2025, Ethereum's Volatility Approached 1 Yr Highs" src="https://www.vaneck.com/contentassets/b41644e3d2844e518c58bb40f421748e/6119_crypto-monthly-aug_chart-1_2025-9_v1_blog.svg" /></p>
<p class="chart-disclosure">Source: Artemis XYZ as of 8/28/2025. <strong>Past performance is no guarantee of future results. Not intended as a recommendation to buy or sell any securities named herein.</strong></p>
<p>BTC&rsquo;s dominance of total cryptocurrency market capitalization dropped from its 5-year high (<strong>65%</strong>) at the end of June and sagged to <strong>57%</strong> in August. A big driver of this move was the violent resurgence of ETH, gaining (<strong>+24%</strong>) in August, as the continuing narrative around stablecoins and digital asset treasury accumulation (DATs) drove ETH ETPs flows. In August, Ethereum recorded more than <strong>$4 billion in ETP inflows, while BTC ETPs lost $600 million due</strong> to outflows.</p>
<p>The unexpected surge in volatility in August, combined with the DAT activity, translated into daily DEX volumes increasing (<strong>+18%</strong>) month-over-month (M/M) to reach <strong>$16.7 billion</strong>. This figure is the second-highest level since January 2025 and the second-highest ever recorded. Likewise, DEX volume reached its second-highest ratio to centralized exchange volume (CEX) spot volume (<strong>17.1%</strong>). Daily average blockchain revenues increased by <strong>7%</strong> month-over-month (M/M), with Hyperliquid still leading the pack with an average of <strong>$3.7 million </strong>per day in August, up <strong>24%</strong> M/M.</p>
<h2 id="ethereum-updates" class="jump-link-nav anchored-block" data-jumplink-title="Ethereum Updates">Ethereum Updates</h2>
<h3>ETH ETPs Post $4.0B Inflows in August, Beating BTC by Record Margin; Now 3% of Network</h3>
<p><img loading="lazy" class="img-responsive" alt="ETH ETF Flows ($4.0bn) Outpaced BTC Flows (-$0.6bn) By Record Margin In August, Acquiring 3% Network Share Since Launch" src="https://www.vaneck.com/contentassets/b41644e3d2844e518c58bb40f421748e/6119_crypto-monthly-aug_chart-2_2025-9_v1_blog.svg" /></p>
<p class="chart-disclosure">Source: Artemis XYZ as of 8/26/2025.<strong> Past performance is no guarantee of future results. Not intended as a recommendation to buy or sell any securities named herein.</strong></p>
<p>Ethereum ETP inflows continued in August, building on the network&rsquo;s record-breaking institutional adoption in July. While dollar-denominated inflows declined from <strong>$5.5</strong> billion in July to <strong>$4.0</strong> billion in August, Ethereum still sharply diverged from Bitcoin, whose ETP inflows fell from <strong>$6.1</strong> billion in July to <strong>-$600 </strong>million in August.</p>
<p>The disparity between BTC and ETH ETP flows contributed to a rare divergence in the performance of both underlying assets: for the first time since 2021, BTC hit a &gt;(<strong>-10%)</strong> drawdown while ETH did not, a setup that occurred just <strong>52</strong> of <strong>1,927</strong> days (<strong>~2.7%</strong>). Historically, BTC has returned a median of (<strong>-2.8%)</strong> over the following <strong>7</strong> days and (<strong>-15.6%)</strong> over <strong>30</strong> days. On the other hand, while ETH initially gains <strong>6.4%</strong> over <strong>7</strong> days, it tends to follow a lower trend (<strong>-8.4%</strong>) over the next <strong>30</strong> days. Accordingly, we urge short-term caution: while ETH may offer a temporary cushion, both assets have historically rolled over after such divergences.</p>
<p>In August, Strategic ETH Reserve companies grew their share of ETH&rsquo;s supply by (+<strong>50%</strong>). This represents the addition of <strong>~1.4 million</strong> ETH to the DAT treasuries. The leaders in August&rsquo;s ETH DAT accumulation were Bitmine Immersion Technologies (<strong>+1.1M</strong> ETH), Sharplink Gaming (<strong>+300k</strong> ETH), and ETHZilla corporation (<strong>+102k</strong> ETH). Other noteworthy treasury companies that added ETH in August include FG Nexus (<strong>+41k</strong> ETH), The Ether Machine (<strong>+10.6k</strong> ETH) and Aave DAO (<strong>+573</strong> ETH). In total, ETH treasury strategies added (<strong>+1.13%)</strong> of ETH supply during the month, compared to (<strong>+0.24%)</strong> added to Bitcoin treasuries. While some believe that ETH DATs are simply catching up to BTC DATs, we remain open to the possibility that ETH is a <a href="/us/en/blogs/digital-assets/matthew-sigel-vaneck-crypto-monthly-recap-for-july-2025/?utm_source=veg-m&amp;utm_medium=email&amp;utm_campaign=US-Digital-Assets-2025-08-05&amp;cid=27111101/AKCU9SF&amp;sfveclid=003Nw00000B5eT7IAJ&amp;mkt_tok=NDEwLVhPUi02NzMAAAGcGswu02MIgFMGMpODdVVUOvUgI_1OW7haGb7ykrBmCqLHo5DPwTs4aoa1KqL3QdNMS0SZTsBYfv5o70BG-7dsb84L4EvZttr6fmKfWf6MeX-BBAkl" title="VanEck Crypto Monthly Recap for July 2025"><strong>better store of value than Bitcoin</strong></a>. And therefore, a better treasury asset.</p>
<p>As a result of ETH&rsquo;s exuberance, the ETH/BTC ratio rebounded to its highest level, <strong>0.043</strong>, since September 2024. The apex of the ETH/BTC move occurred on Sunday, August 24, when a BTC whale with over <strong>24k</strong> BTC rapidly dumped<strong> 8k</strong> BTC in the course of <strong>20</strong> minutes, sending the BTC price from ~<strong>$114k</strong> to <strong>$112k</strong>. Over the next twenty-four hours of trading, the whale sold the remaining <strong>16k</strong> of BTC in his wallet. Interestingly, this whale not only dumped its BTC but also swapped its position for ETH. For a long time, the communities of Ethereum and Bitcoin have been at odds, with many Bitcoin zealots looking acrimoniously at Ethereum&rsquo;s development. A large whale with over <strong>24k</strong> BTC dumping his BTC for ETH is a stunning development that approximates Babe Ruth leaving the Red Sox for the Yankees.</p>
<h3>Ethereum&rsquo;s Exit Queue Hits All-Time Highs in August</h3>
<p><img loading="lazy" class="img-responsive" alt="Ethereum&rsquo;s Exit Queue Hits All-Time Highs in August" src="https://www.vaneck.com/contentassets/b41644e3d2844e518c58bb40f421748e/6119_crypto-monthly-aug_chart-3_2025-9_v1_blog.svg?epiediEthereum&amp;rsquo;s Exit Queue Hits All-Time Highs in Augusttmode=False" /></p>
<p class="chart-disclosure">Source: Dune Analytics - @hashkey_cloud as of 8/26/2025. <strong>Past performance is no guarantee of future results. Not intended as a recommendation to buy or sell any securities named herein.</strong></p>
<p>Another interesting event in August was new all-time highs in Ethereum&rsquo;s validator exit queue, which reached <strong>993K</strong> ETH. This figure corresponds to around <strong>~31k</strong> validators or about (<strong>3%</strong>) of the entire network. Ethereum&rsquo;s exit queue exists to prevent a sudden mass validator exodus that may destabilize Ethereum&rsquo;s network. At a certain scale, the departure of ETH validators from the network may also pose a security concern. However, we view the current buildup as being driven by three factors. First, we believe validators are still consolidating operations following this spring&rsquo;s increase in the maximum validator ETH holdings, which rose from <strong>32</strong> ETH to <strong>2,048</strong> ETH. Second, we believe that many long-term holders are removing ETH from staking to participate in ETH DATs, which accept in-kind contributions. Third, we believe the long exit queue is partly explained by holders selling ETH as its price hovers near its all-time high of approximately <strong>$4,956</strong>.</p>
<p>Regarding the argument that validators are consolidating operations, the portion of the ETH supply staked has remained remarkably stable at <strong>29.5%</strong>, despite the mass exits of validators. If we consider the contention that many ETH holders are joining DATs, we need look no further than the massive inflow of ETH into DATs, which totaled <strong>+1.4 million</strong> ETH in August. Additionally, these DATs intend to stake ETH to generate additional yield and should be added to new validators. On the third count, ETH has rallied (<strong>+258%)</strong> from April lows to August highs, providing a good excuse for holders to reduce risk going into the typically tumultuous fall.</p>
<p>In the past, large exit queues have occurred without much incident for Ethereum&rsquo;s network or its price. For instance, in January 2024, the bankruptcy and restructuring of the crypto lending platform Celsius drove mass unstaking, but this behavior proved to be more operational than speculative. Soon after the event, ETH rallied in the ensuing month.</p>
<h3>Ethereum Ecosystem Share of DEX Volumes Approaches 50%</h3>
<p><img loading="lazy" class="img-responsive" alt="Ethereum Ecosystem Share of DEX Volumes Approaches 50%" src="https://www.vaneck.com/contentassets/b41644e3d2844e518c58bb40f421748e/6119_crypto-monthly-aug_chart-4_2025-9_v1_blog.svg" /></p>
<p class="chart-disclosure">Source: Artemis XYZ as of 8/28/2025. <strong>Past performance is no guarantee of future results. Not intended as a recommendation to buy or sell any securities named herein.</strong></p>
<p>Onchain, there was a triumphant return of DeFi activity to Ethereum as the project&rsquo;s share of total DEX volumes approached <strong>50%</strong> after hitting a low of <strong>31%</strong> in July 2025. Additionally, Ethereum onboarded <strong>$13.2 billion</strong> in stablecoins in August, bringing its total to just under <strong>$150 billion</strong> hosted on its chain. Ethereum&rsquo;s stablecoin ingestion represents around <strong>90%</strong> of all stablecoins brought onchain in August. August&rsquo;s increase in Ethereum activity drove daily average Ethereum transactions to an all-time high, with ~<strong>1.7 million,</strong> which compares to the next highest in May 2021, at ~<strong>1.5 million</strong>.</p>
<p>Despite this surge in onchain transactions, the average transaction fee is down (<strong>-45%</strong>) in ETH terms from the previous month and (<strong>-72%</strong>) since August 2024. We attribute this dramatic decline in costs to Ethereum sagaciously raising the gas limit from <strong>30M</strong> -&gt; <strong>36M</strong> -&gt; <strong>45M</strong> in two increases since January 2025. Effectively, this lowers prices for Ethereum users by increasing the amount of blockspace that can be packed with transactions. Going forward, Ethereum developers are currently working on a significant update to enhance Ethereum&rsquo;s processing capabilities substantially.</p>
<p>Ethereum Improvement Proposal 7928, proposed in March 2025 and currently in the testing and planning phase, will build the capability for parallel processing of transactions on Ethereum. This is a monumental development that, if implemented, will enable the Ethereum Virtual Machine (EVM) to increase its transaction capacity by at least <strong>2.6 times</strong>. This is accomplished through something called &ldquo;Access lists,&rdquo; which would inform which parts of Ethereum&rsquo;s ledger a transaction will change. As a result, transactions that touch different parts of Ethereum&rsquo;s ledger, ones that do not conflict, can be processed simultaneously.</p>
<p>High-speed competitors to Ethereum like Sui and Solana utilize this capability to increase their transaction throughput. Currently, Ethereum can only process one transaction at a time, even if the transactions alter separate parts of the Ethereum blockchain. If implemented, users sending payments on Ethereum and those trading on Uniswap will be able to have their transactions processed simultaneously.</p>
<h2 id="solana-updates" class="jump-link-nav anchored-block" data-jumplink-title="Solana Updates">Solana Updates</h2>
<h3>SOL/ETH Hovers Below 1 Yr Avg of 0.062</h3>
<p><img loading="lazy" class="img-responsive" alt="SOL/ETH Hovers Below 1 Yr Avg of 0.062" src="https://www.vaneck.com/contentassets/b41644e3d2844e518c58bb40f421748e/6119_crypto-monthly-aug_chart-5_2025-9_v1_blog.svg" /></p>
<p class="chart-disclosure">Source: Artemis XYZ As of 8/28/2025. <strong>Past performance is no guarantee of future results. Not intended as a recommendation to buy or sell any securities named herein.</strong></p>
<p>The price of SOL has significantly lagged behind that of ETH after reaching an all-time high ratio (SOL/ETH) of <strong>~0.087</strong> in April 2025. Currently, SOL/ETH sits around <strong>0.047</strong>, which compares to a year earlier when it was <strong>0.056</strong>. We attribute the majority of this decline in the ratio to renewed institutional interest in blockchain tokenization and stablecoins, as well as the perception that most deployments will occur within the Ethereum ecosystem. The continued lethargy of memecoin trading in spring/summer 2025 has also disproportionately affected Solana and contributed to its relative share of onchain trading dropping (<strong>-6%</strong>) in August 2025 vs August 2024. Likewise, the emergence of ETH DATs, combined with ETH ETPs gobbling up almost <strong>10%</strong> of the total ETH supply, has accelerated ETH&rsquo;s momentum. SOL, by contrast, has fewer, less capitalized DATs and awaits SEC approval of a Solana spot ETP.</p>
<p>At the time of writing, <strong>1.4%</strong> of SOL supply worth <strong>$1.7B</strong> is held by DATs as opposed to ETH DATs, which have <strong>$31B</strong> ETH, corresponding to <strong>5.6%</strong> of the ETH supply. Of course, we would also be remiss if we did not mention that competition for onchain trading has intensified with Hyperliquid offering a suite of enticing trading products. Hyperliquid&rsquo;s success, most notably in perpetual futures (perps) trading, has drawn away a vast number of speculators from Solana. Hyperliquid has been successful in churning users from Solana by offering a better platform for perpetual futures trading. The inferior user experience of perpetual exchanges on Solana is directly attributable to the chain&rsquo;s technical issues despite strong projects on Solana like Drift offering serviceable products.</p>
<p>Perpetual futures require fast, reliable execution to manage leveraged positions, avoid liquidations, and capitalize on short-term price movements. Even minor shortcomings in a perps DEX can greatly impact the bottom-line economics of traders. Solana&rsquo;s defects, compared to Hyperliquid, include:</p>
<ol class="content-list">
<li class="mt-2">Network jitter causing transaction delays and performance fluctuations
<ul class="content-list">
<li class="mt-2">Users are uncertain if their transactions will land</li>
<li class="mt-2">Market makers are unsure if their orders will be cancelled quickly enough</li>
</ul>
</li>
<li class="mt-2">High activity congesting the network during periods of peak volatility
<ul class="content-list">
<li class="mt-2">Market makers cannot quote spreads as tight as they can on Hyperliquid/CEXes</li>
<li class="mt-2">Oracle messages may not be able to update onchain prices quickly</li>
</ul>
</li>
<li class="mt-2">Transaction compute limitations constraining logic for running perps exchanges
<ul class="content-list">
<li class="mt-2">Perpetuals exchanges rely upon complex functions to operate effectively</li>
</ul>
</li>
</ol>
<p>Additionally, Solana has other complex idiosyncrasies that make exchanges run less smoothly than they do on centralized competitors and Hyperliquid. In August, Solana addressed some of its technical shortcomings by beginning the process of upgrading to a new software version called Alpenglow. Alpenglow comes after Solana increased its compute limit per block from <strong>60M</strong> to <strong>100M</strong> in July, enabling more logic to be processed with each block. Alpenglow will be implemented piecemeal, after the validators approve two separate Solana Improvement Documents (SIMD): 0326 and a yet-to-be-numbered SIMD.</p>
<p>One component of Alpenglow, called &ldquo;Votor,&rdquo; will allow validator voting to occur offchain through a single round of voting. The result is that Solana transaction feedback will sharply decrease from <strong>12.8s</strong> to <strong>150ms</strong>. Likewise, this change will increase the resiliency of Solana by enabling the network to function still even when (<strong>20%</strong>) of the validators are offline and (<strong>20%</strong>) of the validators are malicious, corresponding to (<strong>40%</strong>) of the network being down. Previously, Solana could not progress if &gt; than <strong>33.3%</strong> of the network was not cooperating.</p>
<p>Another interesting component of Alpenglow is that validators will no longer pay for their votes with transaction fees. Instead, they will pay <strong>1.6 SOL</strong> upfront at the start of each epoch for the right to validate the network. The entirety of this fee will be burned compared to (<strong>50%</strong>) of the voting fees being burned in the past. Therefore, in addition to making Solana faster, Alpenglow will enhance the token economics (tokenomics) of SOL.</p>
<p>The second portion of Alpenglow is a more optimized cadence for fanning out messages from the leader validator to the other validators. This is important because it paves the way for cutting-edge advancements on Solana, such as multiple concurrent leaders, while also further solidifying low latency and network stability. Additionally, August saw the Jito team release its BAM upgrade, which promises to improve trading economics by substantially cutting down onchain maximal extracted value (MEV). Reducing MEV is much coveted by traders because MEV can cause transaction fees to be as high as (<strong>10%</strong>) of the value of a transaction. This is due to trader bots manipulating token prices as speculators buy, especially during volatile periods, resulting in eye-watering execution slippage.</p>
<h3 id="cex-tokens-vs-equities" class="jump-link-nav anchored-block" data-jumplink-title="CEX Tokens vs. Equities">CEX Tokens (OKB, CRO) Rallied in August While CEX Equities Stayed Flat/Down</h3>
<p><img loading="lazy" class="img-responsive" alt="CEX Tokens Gained In August As CEX Equities Traded Flat/ Down" src="https://www.vaneck.com/contentassets/b41644e3d2844e518c58bb40f421748e/6119_crypto-monthly-aug_chart-6_2025-9_v1_blog.svg" /></p>
<p><img loading="lazy" class="img-responsive" alt="CEX Tokens (OKB, CRO) Rallied in August While CEX Equities Stayed Flat/Down" src="https://www.vaneck.com/contentassets/b41644e3d2844e518c58bb40f421748e/6155_scl-august_table_2025-09_v1.svg" /></p>
<p class="chart-disclosure">Source: Bloomberg as of 8/29/2025.&nbsp;<strong>Index performance is not representative of fund performance. It is not possible to invest directly in an index. Past performance is no guarantee of future results. Not intended as a recommendation to buy or sell any securities named herein.</strong></p>
<h3>MarketVector<sup>&trade;</sup>&nbsp;Centralized Exchanges Index (MVCEX) Components</h3>
<div class="wrapped-div">
<table style="width: 50%;">
<tbody>
<tr class="tbl-data">
<td class="tbl-header last text-left">Token</td>
<td class="tbl-header last text-right">Weight %</td>
</tr>
<tr class="tbl-data">
<td class="data-td data last text-left">Binance Coin</td>
<td class="data-td data last text-right">22.7</td>
</tr>
<tr class="tbl-data">
<td class="data-td data last text-left">OKB</td>
<td class="data-td data last text-right">22.3</td>
</tr>
<tr class="tbl-data">
<td class="data-td data last text-left">Cronos</td>
<td class="data-td data last text-right">21.9</td>
</tr>
<tr class="tbl-data">
<td class="data-td data last text-left">WhiteBIT Coin</td>
<td class="data-td data last text-right">14.3</td>
</tr>
<tr class="tbl-data">
<td class="data-td data last text-left">Bitget Token</td>
<td class="data-td data last text-right">12.4</td>
</tr>
<tr class="tbl-data">
<td class="data-td data last text-left">KuCoin Token</td>
<td class="data-td data last text-right">4.0</td>
</tr>
<tr class="tbl-data">
<td class="data-td data last text-left">NEXO</td>
<td class="data-td data last text-right">1.9</td>
</tr>
<tr class="tbl-data">
<td class="data-td data last text-left">WOO</td>
<td class="data-td data last text-right">0.3</td>
</tr>
<tr class="tbl-data">
<td class="data-td data last text-left">Bitmart Token</td>
<td class="data-td data last text-right">0.2</td>
</tr>
<tr class="tbl-data">
<td class="data-td data last text-left">Tokocrypto</td>
<td class="data-td data last text-right">0.1</td>
</tr>
</tbody>
</table>
</div>
<br />
<p class="chart-disclosure">Source: MarketVector as of 8/29/2025. <strong>Index performance is not representative of fund performance. It is not possible to invest directly in an index. Past performance is no guarantee of future results. Not intended as a recommendation to buy or sell any securities named herein.</strong></p>
<p>Exchange tokens OKB (OKB) <strong>(+248%)</strong> and Cronos (CRO) <strong>(+112%)</strong> were top performers in August, following a series of announcements on scaling and deepening their integrations with public blockchain ecosystems.</p>
<p>As the native cryptocurrency of the OKX ecosystem, holding the OKB token effectively rewards users with &ldquo;premium&rdquo; features on the exchange. Historically, OKB&rsquo;s utility has included trading fee discounts, boosted yield on OKX&rsquo;s Earn products, partnership integrations (e.g., discounts, payments), and privileged access to the platform&rsquo;s Initial Exchange Offering (&ldquo;IEO&rdquo;) service, OKX Jumpstart.</p>
<p>In mid-August, OKX announced overhauling both its L2 network, &ldquo;X Layer&rdquo;, and OKB&rsquo;s economic design. Following the upgrade, OKB became the exclusive native gas token of X Layer, meaning that all network transaction processing fees must be paid in OKB, just as the Ethereum network requires ETH for gas. A concurrent, one-time burn of <strong>~65.3M</strong> OKB tokens was announced alongside the upgrade, reducing OKB&rsquo;s circulating supply to a now fixed <strong>21.0M</strong>, mirroring Bitcoin&rsquo;s max supply. The burned supply was sourced from OKB&rsquo;s treasury reserves and historical repurchases.</p>
<p>OKB&rsquo;s X Layer upgrade hinges on adopting Polygon&rsquo;s Pessimistic Proof (PP) zero-knowledge proofs upgrade, which brings performance improvements such as increased throughput (<strong>~5,000</strong> transactions per second), reduced transaction fees, and enhanced security and interoperability with Ethereum&rsquo;s ecosystem. By integrating with OKX Wallet, Exchange, and Pay, the strategic move <strong><a href="https://x.com/star_okx/status/1955793263585321224" title="Star on X" target="_blank" rel="noopener">aims</a></strong> to capture a share of the growing DeFi, payments, and RWA market. As an offshore exchange, OKX&rsquo;s initiatives also benefit from the CFTC&rsquo;s August 28th <strong><a href="https://www.cftc.gov/PressRoom/PressReleases/9111-25" title="Commodity Futures Trading Commission" target="_blank" rel="noopener">announcement</a></strong>, which creates a path for non-U.S. entities to provide U.S. persons direct market access to their trading platforms.</p>
<p>Crypto.com&rsquo;s CRO also benefited from a DAT partnership with some important partners. A press release on August 26th announced that Trump Media &amp; Technology Group and Crypto.com agreed to a SPAC deal to accumulate CRO, making CRO the latest digital asset to join the DAT frenzy. Trump Media Group CRO Strategy will go public via a merger with Yorkville Acquisition Corp and listed on the Nasdaq under the ticker MCGA. However, the deal is not the first between TMTG and Crypto.com. In March of this year, TMTG <a href="https://www.reuters.com/technology/trump-media-teams-up-with-cryptocom-etfs-2025-03-24/" title="Reuters" target="_blank" rel="noopener"><strong>announced</strong></a> partnering with Crypto.com to launch ETFs and other digital assets and securities products with a &ldquo;Made in America focus&rdquo; through its Truth.Fi brand.</p>
<p>Launched in late 2021, Cronos is also an EVM-compatible chain targeting DeFi, payments, and RWAs. As OKB is for OKX&rsquo;s X Layer, CRO is the native gas token of Crypto.com&rsquo;s Cronos Chain, used for paying transactions, chain governance, and staking. On Crypto.com&rsquo;s CEX, CRO also offers holders lower trading fees, higher earning rates, and reduced margin borrowing rates.</p>
<h2>Benefits and Pitfalls of CEX Tokens</h2>
<p>In general, CEX tokens offer a unique hybrid product that marries conventional L2 token utilities with the kinds of premium features that only centralized exchanges can offer. While they can potentially expose users to the exchange&rsquo;s growth through as a quasi-equity-like instrument, they offer asymmetric risks as well. Exchange tokens often have hidden supply dynamics, and insiders with important, non-public information often control them.</p>
<p>The 2022 collapses of CEXs Celsius (CEL) (<strong>-99%</strong>), FTX (FTX) (<strong>-99%</strong>), and Voyager (VGX) (<strong>-100%</strong>) not only left their depositors empty-handed with a fraction of their crypto but also gave investors CEX tokens that lost effectively all their value. The attractive yields offered by these exchanges, boosted by holding CEX tokens, drew millions of unsophisticated investors. Despite offering sleek &ldquo;earn&rdquo; and &ldquo;savings&rdquo; products resembling traditional banks, these institutions were not (and still are not!) banks, and do not carry banking safeguards like the Federal Deposit Insurance Corporation (FDIC), which offers a standard maximum deposit insurance of $250k per depositor, per insured bank, for each account ownership category.</p>
<p>In response to the 2022 CEX collapses, regulators worldwide are advancing frameworks to protect users and stabilize the crypto ecosystem. The European Union&rsquo;s Markets in Crypto-Assets (MiCA) regulation, fully effective as of late 2024, mandates that centralized exchanges segregate client assets, maintain full reserves, and undergo regular audits to prevent the commingling and mismanagement seen in FTX and Celsius. MiCA also imposes strict transparency and anti-money laundering requirements, aiming to curb the risks of high-yield products that lured Voyager&rsquo;s users. In the U.S., proposed legislation like the CLARITY Act, building on FIT21, mandates protections such as CEX registration and segregation of customer funds to prevent their use for proprietary trading.</p>
<p>As of August 2025, the bill has passed the House and is advancing in the Senate, signaling progress toward robust oversight. Globally, the International Organization of Securities Commissions (IOSCO) is pushing for unified standards on CEX resilience. While these measures indicate progress, gaps in enforcement and jurisdictional disparities persist. Thus, while we are not opposed to CEX tokens in principle, we urge caution due to their historical volatility and the catastrophic losses from past exchange failures, pending more robust and globally consistent regulatory safeguards.</p>
<p><strong>Links to third party websites are provided as a convenience and the inclusion of such links does not imply any endorsement, approval, investigation, verification or monitoring by us of any content or information contained within or accessible from the linked sites. By clicking on the link to a non-VanEck webpage, you acknowledge that you are entering a third-party website subject to its own terms and conditions. VanEck disclaims responsibility for content, legality of access or suitability of the third-party websites.</strong></p>
<style>

    .data-td.data {
        padding-right: 5px !important;
    }
    
    .wrapped-div {
        max-width: 100%;
    }
    
    @media (max-width: 1240px) {
        .wrapped-div {
            overflow-x: scroll;
        }
    }
    
    .wrapped-div-sector {
        max-width: 100%;
        overflow-x: scroll;
    }
</style>
<p>To receive more <strong><a href="https://www.vaneck.com/us/en/insights/digital-assets/" title="Digital Assets Insights">Digital Assets</a></strong> insights, <strong><a href="https://www.vaneck.com/us/en/subscribe/" title="Subscription Center">sign up in our subscription center</a></strong>.</p>
]]></content:encoded>
</item><item rdf:about="https://www.vaneck.com/us/en/blogs/income-investing/a-guide-to-collateralized-loan-obligations-clos/">
  <title>A Guide to Collateralized Loan Obligations (CLOs)></title>
  <link>https://www.vaneck.com/us/en/blogs/income-investing/a-guide-to-collateralized-loan-obligations-clos/</link>
  <description><![CDATA[With higher relative yields, built-in risk protection, and historical outperformance in periods of rising rates, it&rsquo;s time to get to know CLOs and how they are structured.]]></description>
  <dc:creator>William Sokol</dc:creator>
  <dc:date>08/28/2025 06:30:00</dc:date>
<content:encoded><![CDATA[

<p><strong>Key Takeaways:</strong></p>
<ul class="content-list">
<li class="mt-2">CLOs are actively managed portfolios of secured loans with built-in protections and historically low default rates.</li>
<li class="mt-2">Floating-rate structure can help preserve value when interest rates rise.</li>
<li class="mt-2">CLOs combine income potential with diversification for fixed income portfolios.</li>
</ul>
<h2>What Is a Collateralized Loan Obligation (CLO)?</h2>
<p>A <a href="https://www.vaneck.com/us/en/blogs/income-investing/clos-question-and-answer/" title="CLOI: Question and Answer"><strong>collateralized loan obligation (CLO)</strong></a> is a portfolio of predominantly senior secured loans that is securitized and actively managed. Each CLO issues a series of floating rate bonds, along with a first-loss equity tranche. The tranches differ in terms of subordination and priority&mdash;and, thus, lowest to highest in order of riskiness. Major rating agencies, such as Moody&rsquo;s and S&amp;P Global Ratings, provide ratings on the investment risk of these individual tranches as they do within other areas of fixed income.</p>
<p>Cash flows from the underlying loans of a CLO are used to pay interest on the debt tranches, and get distributed based on a &ldquo;waterfall&rdquo; whereby cashflows are paid sequentially starting with the senior-most tranche until each tranche has been paid its full distribution. Equity-tranche holders receive the residual distributions, net of costs. Principal distributions are similarly applied first to the most senior tranches.</p>
<h3>How CLOs Are Structured</h3>
<p>CLOs issue multiple tranches of debt to finance the purchase of the underlying leveraged loans. The debt tranches typically account for about 90% of total CLO liabilities, which combined with approximately 10% of equity comprise the entire capital structure. The tranches are ranked highest to lowest in order of credit quality and priority to receive cashflows (both principal and interest)&mdash;and, thus, lowest to highest in order of riskiness.</p>
<p>Although leveraged loans themselves are rated below investment grade, most tranches are rated investment grade, benefiting from diversification, credit enhancements, and priority of cash flows.</p>
<p>CLOs are actively managed vehicles. In a typical CLO structure, there is a <a href="https://www.vaneck.com/us/en/blogs/income-investing/clos-question-and-answer/#point-one" title="What is a CLO?"><strong>reinvestment period</strong></a> (typically the first 5 years after the CLO is issued) during which the manager can buy and sell loans within the portfolio and reinvest within the parameters set forth by the governing documents. Managers can add value by reinvesting and positioning portfolios to increase returns in benign economic environments and protect against downside risk during weaker economic times.</p>
<p><img loading="lazy" class="img-responsive w-100" src="https://www.vaneck.com/contentassets/436d0852d2164301b3dbae8d03d9a6b4/cloi_chart-01_2022.07_v1_blog.svg" alt="Understanding the Structure of CLOs" /></p>
<p class="chart-disclosure"><strong>Source: PineBridge Investments.</strong> This is not an offer to buy or sell, or recommendation to buy or sell any of the securities mentioned herein.</p>
<h3>Who Manages CLOs?</h3>
<p>CLOs are generally issued and managed by asset managers that specialize in credit, and the CLO investor base is largely institutional, with banks, insurance companies and hedge funds often purchasing CLOs directly or through institutional separate accounts. Recently, however, the launch of CLO focused ETFs has opened up the market to all types of investors.</p>
<p>Assessing a CLO manager is one of the most critical steps of CLO tranche investing. CLO managers have their own unique investment process and style, resulting in different portfolios and risk/return characteristics. Accordingly, performance may vary greatly among managers, and successful managers share several key traits. Experience is the most important. Deep CLO management experience provides a combination of credit expertise, access to new deals, trading acumen, risk management, and understanding of the unique needs of CLO tranche and equity investor needs to generate strong returns. Experience managing CLOs through different market environments is crucial.</p>

<h3>Investing in CLOs</h3>
<p>An experienced CLO tranche portfolio manager performs rigorous due diligence on CLO managers to understand their capabilities and style, and then tier them accordingly. Each CLO is unique, even if managed by the same CLO manager, so CLO tranche portfolio managers must understand the loan collateral and structural features that drive returns. This involves cashflow modelling and access to underlying CLO portfolio information, as well as real time pricing information to identify potential value. Perhaps most importantly, the ability to &ldquo;look through &ldquo; the CLO collateral portfolio and perform loan-level analysis is crucial.</p>
<p>A CLO tranche portfolio manager must also take into account overall portfolio exposures in terms of vintage, manager, and underlying sector exposure and conduct ongoing monitoring to identify potential early warning signs in the portfolios. By identifying relative value across the CLO capital stack, CLO tranche portfolio managers can add value by allocating to more attractively valued segments while avoiding overpriced ones.</p>
<p>Also important is relative value analysis between primary and secondary market deals, and a CLO tranche portfolio manager must have both access and trading expertise to source attractive deals. From a risk management perspective, the CLO tranche portfolio manager must manage downgrade risk as well as liquidity, and have the ability to &ldquo;de-risk&rdquo; the portfolio in times of market stress. There is significant room to add value through an active approach that has flexibility to identify attractive value.</p>
<p>An overview of how Pinebridge Investments, sub-advisor for the <strong><a href="/link/e090deaddc774ac699a04b959d9254c6.aspx" title="CLOI - VanEck CLO ETF - Overview">VanEck CLO ETF (CLOI)</a></strong> and <a href="/link/d2f16468a9f14c1e807f6bb7fb597a3e.aspx" title="CLOB - VanEck AA-BB CLO ETF - Overview"><strong>VanEck AA-BB CLO ETF (CLOB)</strong></a>, selects and constructs a portfolio is outline below:</p>
<ol class="content-list">
<li><strong>CLO Manager Due Diligence:</strong> PineBridge classifies CLO managers, and focuses investments on those with an established process and team.</li>
<li><strong>Re-Underwrite CLO:</strong> PineBridge collects and analyzes fundamental loan-level data using its proprietary credit platform, which drives portfolio credit analysis, risk measurement and optimization. The team reviews each CLO&rsquo;s structure and documentation, which&mdash;combined with the collateral analysis and stress-test analysis&mdash;is the basis of the investment analysis.</li>
<li><strong>Construct Portfolio:</strong> Portfolios are constructed using both bottom-up deal selection from the re-underwriting process and a top-down overlay that incorporates the group&rsquo;s credit views.</li>
<li><strong>Risk Monitoring:</strong> There is ongoing compliance and risk monitoring, as well as regular reviews of the portfolio and CLO-specific metrics that can result in rebalancing. Various portfolio and performance metrics act as &ldquo;credit review triggers&rdquo; and form the basis of the sell discipline.</li>
</ol>
<h2>Benefits of Collateralized Loan Obligations (CLOs)</h2>
<h3>Built-in Risk Protection: The CLO Structure Is Built to Last</h3>
<p>The strong historical performance of the asset class is a testament to the built-in risk protections of CLOs, which starts with the strength of its underlying collateral, i.e. the likelihood the collateral pool will continue to generate sufficient cash flow over the life of a CLO. Leveraged loans (the underlying collateral of CLOs) are senior and secured, meaning they have the senior-most claim on all the issuer&rsquo;s assets in the event of a bankruptcy. Historically, leveraged loans&rsquo; senior secured status has consistently led to lower default rates and higher recoveries compared to unsecured high-yield bonds. CLOs further reduce risk by creating diverse portfolios of leveraged loans&mdash;typically 150&ndash;250 borrowers&mdash;and actively managing that portfolio.</p>
<p>In addition to the attractive risk profile and active management of its underlying collateral, the structure of CLOs helps mitigate risk. For example, coverage tests are a vital mechanism to detect and correct collateral deterioration, which directly affects the allocation of cash flows. All CLOs have covenants that require the manager to test the portfolio&rsquo;s ability to cover its interest payments monthly. Among the many such tests, the most common are the interest coverage and overcollateralization tests. Interest coverage dictates that the income generated by the underlying pool of loans must be greater than the interest due on the outstanding debt in the CLO, while overcollateralization requires the principal amount of the underlying pool of loans to be greater than the principal amount of outstanding CLO tranches. As shown below, if the tests come up short, cash flows are diverted from more junior tranches to pay off the most senior tranches first, until these failures are cured.</p>
<h3>CLOs Are Structured to Minimize Defaults</h3>
<p><img class="img-responsive w-100" src="https://www.vaneck.com/contentassets/fd364bb8d3d447c4bfb834ac0eadc762/cloi_chart-02_2022.07_v1_blog-new.svg" alt="CLOs Are Structured to Minimize Defaults" /></p>
<p class="chart-disclosure"><strong>Source: VanEck.</strong> This is not an offer to buy or sell, or recommendation to buy or sell any of the securities mentioned herein.</p>
<h3>CLOs Are Less Sensitive to Changes in Interest Rates</h3>
<p>In addition to their strong risk profiles, CLOs are floating rate instruments, reflective of the underlying floating-rate senior loans they hold. This means they have virtually no price sensitivity to changes in interest rates, and coupon payments increase as rates go up. As a result, CLOs have historically outperformed in periods of rising rates. In fact, investment-grade (IG) CLOs have historically provided a more attractive risk/return profile relative to other similarly rated areas of fixed income, such as IG corporate bonds and IG floating rate notes.</p>

<h2>Common Misperceptions about CLOs</h2>
<p>CLOs fall into the structured credit category, an asset class that includes collateralized debt obligations that held subprime mortgages, a market segment at the epicenter of the 2008 Global Financial Crisis. As a result, the perception exists among some investors that all structured credit is inherently riskier than more traditional fixed income. Historical evidence, however, tells a much different story, especially for CLOs.</p>
<p>CLOs have been tested through two major market crises. Through both the Global Financial Crisis and COVID-19 drawdown, the asset class ultimately experienced fewer defaults than corporate bonds of the same rating. For example, of the approximately $500B of U.S. CLOs issued from 1994-2009 and rated by S&amp;P, only 0.88% experienced defaults. In the higher rated AAA and AA CLO tranches, there have been zero defaults.<sup>1</sup></p>
<h2>CLOs Compared to Other Investments</h2>
<p>Historically, CLOs have offered attractive yields relative to other corporate debt categories, including bank loans, high yield bonds, and investment grade bonds within the same rating category. CLOs have been tested through two major market crises. Through both the Global Financial Crisis and COVID-19 drawdown, the asset class ultimately experienced fewer defaults than corporate bonds of the same rating. We believe this resilience combined with the potential for higher yields and spreads makes the asset class compelling for long-term investors.</p>
<p>CLOs have low sensitivity to changes in interest rates due to their floating rate coupons, a characteristic that is similar to leveraged loans but with additional risk protections due to the CLO structure. Further, CLOs trade similarly to bonds and are generally not subject to the extended settlement times associated with loan settlement. These characteristics can be advantageous to investors in diversified fixed income portfolios.</p>
<h2>Key Takeaways and Conclusion</h2>
<p>CLOs are securitized, actively managed portfolios of leveraged loans. They have historically offered a compelling combination of both an attractive yield and strong risk profiles. The strong historical performance of the asset class is a testament to the built-in risk protections resulting from how CLOs are structured. In addition, CLOs are floating rate instruments, which means their coupons reset each quarter along with prevailing interest rates, resulting in low price sensitivity to changes in interest rates. This has led to CLOs historically outperforming in periods of rising rates, like the environment we are in today.</p>
<p>Learn more about the <a href="/link/e090deaddc774ac699a04b959d9254c6.aspx" title="CLOI - VanEck CLO ETF - Overview"><strong>VanEck CLO ETF (CLOI)</strong></a> and <a href="/link/d2f16468a9f14c1e807f6bb7fb597a3e.aspx" title="CLOB - VanEck AA-BB CLO ETF - Overview"><strong>VanEck AA-BB CLO ETF (CLOB)</strong></a>.</p>
<p>To receive more <a href="/us/en/blogs/income-investing/" title="Income Investing Insights"><strong>Income Investing</strong></a> insights, <a href="/link/5f45412c2143400497908cea2897f7d3.aspx" title=" Subscription Center"><strong>sign up in our subscription center</strong></a>.</p>
]]></content:encoded>
</item><item rdf:about="https://www.vaneck.com/us/en/blogs/thematic-investing/etf-investing-strategy/">
  <title>Investing in ETFs: Investment Strategies></title>
  <link>https://www.vaneck.com/us/en/blogs/thematic-investing/etf-investing-strategy/</link>
  <description><![CDATA[Unlock the power of ETFs with VanEck. Discover the ins and outs of ETF investing, investing strategies &amp; more.]]></description>
  <dc:creator> </dc:creator>
  <dc:date>08/28/2025 06:30:00</dc:date>
<content:encoded><![CDATA[

<p><strong>Key Takeaways:</strong></p>
<ul class="content-list">
<li class="mt-2">ETFs offer diversification, cost-efficiency, and flexibility, making them suitable for a wide range of investment goals and experience levels.</li>
<li class="mt-2">Popular strategies like buy-and-hold, dollar-cost averaging, and sector rotation allow investors to align ETF investments with risk tolerance and market outlook.</li>
<li class="mt-2">A successful ETF strategy requires clear goals, regular portfolio reviews, and staying informed about market trends to adapt as conditions change.</li>
</ul>
<h2 id="introduction-to-investing-in-etfs" class="jump-link-nav anchored-block" data-jumplink-title="Intro to ETFs">Introduction to Investing in ETFs</h2>
<p>When it comes to investing, Exchange-Traded Funds (ETFs) have surged in popularity for their ease of access, diversity, and cost-efficiency. But what exactly are ETFs, and why are they becoming a go-to option for both novice and experienced investors alike? In this blog, we'll dive into the world of ETFs, shedding light on their definition, the reasons behind their growing appeal, and the advantages they hold over more traditional investment avenues.</p>
<p><strong>Understanding ETFs</strong></p>
<p>At its core, an ETF is a type of investment fund that's traded on stock exchanges, much like individual stocks. An ETF holds assets such as stocks, commodities, or bonds, and generally operates with an arbitrage mechanism designed to keep it trading close to its net asset value, although deviations can occasionally occur. ETFs offer exposure to a diverse collection of assets and typically track an index, sector, commodity, or other asset, but unlike mutual funds, shares in an ETF can be bought and sold throughout the trading day at market price. To learn more about ETF basics read our <a href="https://www.vaneck.com/us/en/blogs/thematic-investing/investing-in-etfs-beginners-guide/" title="Investing in ETFs: Beginner's Guide"><strong>ETF 101 blog</strong></a>.</p>
<p><strong>The Rising Popularity of ETFs</strong></p>
<p>ETFs have been growing in prominence within the investment landscape for several reasons. One of the primary factors is their accessibility. Investors can buy and sell ETFs just like stocks, through a brokerage account. This ease of trading, combined with the wide variety of ETFs available, means that investors can access almost any market or sector worldwide without having to own the individual assets directly.</p>
<p>Another reason for their popularity is the transparency of ETFs. Most ETFs are required to publish their holdings daily, giving investors the ability to see exactly what they own at any given time. This level of transparency is not always available with other types of funds, such as mutual funds, which typically only disclose their holdings quarterly.</p>
<p><strong>Advantages of Investing in ETFs</strong></p>
<p>ETFs offer several benefits over traditional investment options, such as mutual funds. Here are a few key advantages:</p>
<ul class="content-list">
<li>Diversification: With a single transaction, ETFs provide investors with exposure to a basket of securities. This can help to spread risk more effectively than purchasing individual stocks or bonds.</li>
<li>Cost Efficiency: ETFs often come with lower expense ratios compared to mutual funds. Additionally, because they are traded like stocks, investors can execute the same types of trades that they can with a stock, such as limit orders, stop-loss orders, and margin buying.</li>
<li>Tax Efficiency: ETFs are often more tax-efficient than mutual funds due to their unique structure and the way transactions within the fund are handled.</li>
<li>Flexibility: Investors can purchase as little as one share of an ETF, providing flexibility and accessibility to markets that might otherwise require a significant capital investment.</li>
</ul>
<h2 id="types-of-etfs">Types of ETFs</h2>
<p>Different types of ETFs cater to various investment strategies and goals. This section is crucial for understanding where each ETF fits within a broader investment portfolio and can serve as a roadmap for investors looking to tailor their investments to their specific preferences and values.</p>
<p><strong>Equity ETFs</strong></p>
<p>Equity ETFs are perhaps the most straightforward type of ETFs, designed to track the performance of a particular index, sector, or basket of stocks. These ETFs offer the chance to invest in a broad market index like the S&amp;P 500 or in niche sectors, providing a simple way to gain exposure to an entire segment of the economy. For those interested in specific market segments or industries, <a href="https://www.vaneck.com/us/en/etf-mutual-fund-finder/etfs/equity/strategic-equity/overview/?InvType=etf&amp;AssetClass=se&amp;Funds=emf,esf,grf,iigf,mwmf,emlf,embf,ccif&amp;ShareClass=a,c,i,y,z&amp;tab=ov&amp;Sort=name&amp;SortDesc=true" title="Explore Our ETFs and Mutual Funds"><strong>explore VanEck&rsquo;s Equity ETFs</strong></a> to find the ETF that best fits your investment objective.</p>
<p><strong>Income ETFs</strong></p>
<p>For investors whose primary goal is to generate regular income, Income ETFs are a suitable option. These typically invest in a collection of bonds or dividend-paying stocks and can provide a steady stream of income. They may focus on high-yield bonds, preferred stocks, or other income-generating assets. <a href="https://www.vaneck.com/us/en/etf-mutual-fund-finder/etfs/equity/strategic-equity/overview/?InvType=etf&amp;AssetClass=cb,ei,ib,mb,fr,ma&amp;Funds=emf,esf,grf,iigf,mwmf,emlf,embf,ccif&amp;ShareClass=a,c,i,y,z&amp;tab=ov&amp;Sort=name&amp;SortDesc=true" title="Explore Our ETFs and Mutual Funds"><strong>Learn more about VanEck&rsquo;s Income ETFs here</strong></a>.</p>
<p><strong>Digital Assets ETFs</strong></p>
<p>As the financial world embraces the digital revolution, Digital Assets ETFs have emerged, offering exposure to cryptocurrencies and blockchain technologies without the need for direct investment in the assets themselves. These ETFs can provide a diversified approach to this volatile and exciting sector. <a href="https://www.vaneck.com/us/en/etf-mutual-fund-finder/etfs/equity/strategic-equity/overview/?InvType=etf&amp;AssetClass=c-da&amp;Funds=emf,esf,grf,iigf,mwmf,emlf,embf,ccif&amp;ShareClass=a,c,i,y,z&amp;tab=ov&amp;Sort=name&amp;SortDesc=true" title="Explore Our ETFs and Mutual Funds"><strong>Explore VanEck&rsquo;s Digital Assets ETFs</strong></a> for solutions that provide innovative ways to invest in the future of finance.</p>
<p><strong>Hybrid / Alternative ETFs</strong></p>
<p>Hybrid or Alternative ETFs present a mix of asset classes or alternative investment strategies that might not fit into the traditional categories. These could include funds that use a blend of stocks and bonds, invest in commodities, or employ complex strategies like derivatives trading. For a curated list of innovative investment options, <a href="https://www.vaneck.com/us/en/etf-mutual-fund-finder/etfs/?InvType=etf&amp;AssetClass=c-ra,c-da,c-g&amp;Funds=emf,esf,grf,iigf,mwmf,emlf,embf,ccif&amp;ShareClass=a,c,i,y,z&amp;tab=ov&amp;Sort=name&amp;SortDesc=true" title="Explore Our ETFs and Mutual Funds"><strong>VanEck&rsquo;s Alternative ETFs</strong></a> are the perfect starting point.</p>
<p><strong>Commodity ETFs</strong></p>
<p>Commodity ETFs provide investors with exposure to the prices of raw materials used across various sectors of the economy. These ETFs can focus on a single commodity, such as gold, silver, or oil, or offer a diversified mix of many different commodities including energy, precious metals, agricultural goods, and more. This type of investment can serve as a hedge against inflation or a play on market demand for natural resources. <a href="https://www.vaneck.com/us/en/etf-mutual-fund-finder/etfs/equity/natural-resources/overview/?InvType=etf&amp;AssetClass=nr&amp;Funds=emf,esf,grf,iigf,mwmf,emlf,embf,ccif&amp;ShareClass=a,c,i,y,z&amp;tab=ov&amp;Sort=name&amp;SortDesc=true" title="Explore Our ETFs and Mutual Funds"><strong>In VanEck&rsquo;s Natural Resources ETFs</strong></a>, you will find a diverse range of ETFs that allow for investment in commodities without the complexities of direct trading in futures markets.</p>
<p>Each of these sections not only introduces you to the types of ETFs available but also connects you to our carefully selected priority ETFs in each category. By exploring these sections, you can find the ETFs that align with your investment objectives, whether you're seeking growth, income, diversification, or sustainability.</p>
<h2 id="factors-to-consider-before-investing-in-etfs" class="jump-link-nav anchored-block" data-jumplink-title="Consider Before Investing">Factors to Consider Before Investing in ETFs</h2>
<p>When venturing into the world of ETFs, it's important to align your investment choices with your financial goals and risk appetite. Here are key factors you should consider before adding ETFs to your investment portfolio:</p>
<p><strong>Assessing Risk Tolerance and Investment Goals</strong></p>
<p>The first step in ETF investing is a thorough self-assessment of your risk tolerance and investment goals. Are you looking for growth, income, or preservation of capital? How much market volatility can you stomach? ETFs come in various risk profiles, from broad-market index funds to niche sectors or geographies. Understanding your investment horizon and risk tolerance will help you select ETFs that align with your long-term financial objectives.</p>
<p><strong>Understanding Expense Ratios and Management Fees</strong></p>
<p>ETFs are known for their cost efficiency, but they do incur some charges in the form of expense ratios and management fees. These fees can vary widely and will impact your net returns. It's crucial to consider these costs when comparing ETFs, as even small differences can add up over time. Look for transparent ETF providers that offer competitive and reasonable fee structures.</p>
<p><strong>Liquidity and Trading Volume</strong></p>
<p>Liquidity is another important factor to consider. It refers to how easily shares of an ETF can be bought or sold in the market at a price close to the net asset value. A higher trading volume typically indicates better liquidity, which means lower transaction costs and easier entry and exit. Review the average trading volume of the ETFs you&rsquo;re considering to ensure they can be traded efficiently.</p>
<p><strong>Tracking Error and Performance Consistency</strong></p>
<p>Tracking error measures how closely an ETF follows the index or assets it aims to replicate. A lower tracking error means the ETF is more accurately mirroring the performance of its underlying index. Consistent performance over time is key, especially if you're investing in an ETF for its index-matching strategy. Examine the ETF's historical performance to assess its tracking efficiency, but it is important to remember that past performance does not guarantee future results.</p>
<p><strong>Tax Implications of ETF Investments</strong></p>
<p>Lastly, consider the tax implications of your ETF investments. ETFs are generally more tax-efficient than mutual funds due to their unique creation and redemption process, which can minimize capital gains distributions. However, some ETFs, particularly those that invest in commodities or use certain strategies, may have different tax considerations. It&rsquo;s advisable to consult with a tax professional to understand the potential tax liabilities associated with your ETF investments.</p>
<p>By taking these factors into account, you'll be better positioned to choose ETFs that not only fit your investment strategy but also complement your financial plan. As with any investment, due diligence is key to navigating the vast array of ETF options available in the market.</p>
<h2 id="popular-etf-investing-strategies" class="jump-link-nav anchored-block" data-jumplink-title="ETF Strategies">Popular ETF Investing Strategies</h2>
<p>Investing in ETFs can be approached from various angles, each with its own set of strategies, risks, and rewards. Here, we explore popular ETF investing strategies, weighing their pros and cons to help you make informed decisions.</p>
<h3>Long-term: Buy-and-Hold Strategy</h3>
<p><strong>Pros</strong>:</p>
<ul class="content-list">
<li>Simplicity: Easy to implement and manage over time.</li>
<li>Cost-Effective: Minimizes transaction fees and capital gains taxes.</li>
<li>Compounding: Allows for potential growth through the power of compounding interest.</li>
</ul>
<p><strong>Cons</strong>:</p>
<ul class="content-list">
<li>Opportunity Cost: May miss out on short-term gains from active trading.</li>
<li>Market Risk: Exposed to long-term market fluctuations and cycles.</li>
</ul>
<p><strong>Risks and Benefits</strong>: Risk is linked to market volatility over the long term, but the potential benefit is the historical trend of markets appreciating over extended periods, which can yield significant returns.</p>
<h3>Dollar-Cost Averaging (DCA)</h3>
<p><strong>Pros:</strong></p>
<ul class="content-list">
<li>Reduces Impact of Volatility: Spreads out purchases, reducing the impact of market dips.</li>
<li>Disciplined Investing: Encourages regular investing regardless of market conditions.</li>
</ul>
<p><strong>Cons:</strong></p>
<ul class="content-list">
<li>Lower Gains in Bull Markets: Periodic investments may miss out on larger gains during a consistently rising market.</li>
<li>Requires Patience and Time: May take a long time to see substantial growth.</li>
</ul>
<p><strong>Risks and Benefits: </strong>DCA mitigates timing risk but may lead to lower returns if the market consistently trends upward.</p>
<h3>Sector Rotation</h3>
<p><strong>Pros</strong>:</p>
<ul class="content-list">
<li>Capitalizes on Economic Cycles: Can generate returns by moving into sectors poised to benefit from economic shifts.</li>
<li>Active Management: Allows for adaptation to changing market conditions.</li>
</ul>
<p><strong>Cons</strong>:</p>
<ul class="content-list">
<li>Requires Market Knowledge: Success depends on accurately predicting economic trends.</li>
<li>Transaction Costs: Higher due to frequent buying and selling.</li>
</ul>
<p><strong>Risks and Benefits</strong>: Risk comes from misjudging market trends; the benefit is the potential to outperform the market by capturing growth in trending sectors.</p>
<h3>Swing Trading</h3>
<p><strong>Pros</strong>:</p>
<ul class="content-list">
<li>Potential for Quick Profits: Takes advantage of short-term price movements.</li>
<li>Active Approach: Can be rewarding for those who enjoy market engagement.</li>
</ul>
<p><strong>Cons</strong>:</p>
<ul class="content-list">
<li>Time-Consuming: Requires constant market monitoring.</li>
<li>High Stress: The need for quick decisions can be stressful and lead to errors.</li>
</ul>
<p><strong>Risks and Benefits</strong>: Risk involves market timing inaccuracies, while the benefit is the potential for rapid gains.</p>
<h3>Leveraging</h3>
<p><strong>Pros</strong>:</p>
<ul class="content-list">
<li>Amplified Returns: Offers the potential for magnified gains from market moves.</li>
<li>Capital Efficiency: Less capital required to achieve higher exposure.</li>
</ul>
<p><strong>Cons</strong>:</p>
<ul class="content-list">
<li>Amplified Losses: Just as gains are magnified, so are losses.</li>
<li>Risk of Margin Calls: Borrowed money can lead to margin calls if investments decline in value.</li>
</ul>
<p><strong>Risks and Benefits</strong>: High risk due to the use of borrowed funds, but with the benefit of potentially higher rewards.</p>
<h3>Short Selling</h3>
<p><strong>Pros</strong>:</p>
<ul class="content-list">
<li>Profit from Market Declines: Allows investors to benefit from downward market movements.</li>
<li>Hedging: Can be used to hedge against market downturns.</li>
</ul>
<p><strong>Cons</strong>:</p>
<ul class="content-list">
<li>Unlimited Losses: Potential losses are theoretically unlimited.</li>
<li>Margin Interest: Borrowing shares to short sell incurs interest costs.</li>
</ul>
<p><strong>Risks and Benefits</strong>: High risk due to the potential for unlimited losses, but benefits in the ability to hedge and profit from market declines.</p>
<h3>Hedging</h3>
<p><strong>Pros</strong>:</p>
<ul class="content-list">
<li>Risk Management: Helps protect against downturns in other investment holdings.</li>
<li>Diversification: Provides a counterbalance to a portfolio.</li>
</ul>
<p><strong>Cons</strong>:</p>
<ul class="content-list">
<li>Cost: There may be costs associated with implementing hedging strategies.</li>
<li>Limited Upside: Hedging can cap potential gains.</li>
</ul>
<p><strong>Risks and Benefits</strong>: Risk is reduced exposure to market downturns, with the benefit being protection of portfolio value.</p>
<h3>Asset Allocation/Model Portfolios</h3>
<p><strong>Pros</strong>:</p>
<ul class="content-list">
<li>Tailored Risk Profile: Aligns investments with individual goals and risk tolerance.</li>
<li>Strategic Diversification: Balances asset classes for optimal performance.</li>
</ul>
<p><strong>Cons</strong>:</p>
<ul class="content-list">
<li>Requires Rebalancing: Portfolios must be regularly reviewed and adjusted.</li>
<li>Complex: Involves a deeper understanding of asset behavior and correlation.</li>
</ul>
<p><strong>Risks and Benefits</strong>: Risk management is tailored to individual profiles, with benefits arising from a strategic mix of assets geared towards long-term objectives.</p>
<h2 id="what-makes-a-good-etf-strategy" class="jump-link-nav anchored-block" data-jumplink-title="Choosing the Right ETF">What Makes a Good ETF Strategy? Choosing the Right ETFs for Your Portfolio</h2>
<p>In crafting a sound ETF strategy, thorough research and careful consideration of various factors are key to aligning with your investment goals. Let's explore how to sift through the multitude of ETF options to select the right ones for your portfolio.</p>
<p><strong>Conducting In-Depth Research on ETFs and Their Underlying Assets</strong></p>
<p>Understanding the components that make up an ETF is vital. This includes knowing what assets the ETF holds, how it performs under different market conditions, and what factors influence its performance. Researching the underlying assets gives you insight into the ETF's potential volatility and how it may fit with your investment strategy.</p>
<p><strong>Evaluating Expense Ratios and Management Fees</strong></p>
<p>Cost is a crucial aspect of any investment, and ETFs are no exception. Comparing the expense ratios and management fees across different ETFs can help you choose funds that are cost-efficient and less likely to erode your returns over time. Look for ETFs with low expense ratios that don&rsquo;t compromise on performance or quality.</p>
<p><strong>Analyzing Historical Performance and Risk Metrics</strong></p>
<p>While past performance is not indicative of future results, historical data can provide a glimpse into how an ETF has navigated market highs and lows. Assessing risk metrics, such as standard deviation, Sharpe ratio, and beta, can also help you understand the ETF&rsquo;s performance relative to its risk level. This analysis can guide you to ETFs that have demonstrated resilience and consistent performance over time.</p>
<p><strong>Understanding ETF Prospectuses</strong></p>
<p>An ETF prospectus offers a wealth of information, from investment objectives and strategies to risks and costs. Reading and interpreting this document is essential for understanding the finer details of the ETF, including its investment approach, principal risks, performance, and distribution policy. A careful review of the prospectus can ensure that the ETF you're considering aligns with your investment strategy and expectations.</p>
<p>By integrating these practices into your selection process, you can develop a more effective and tailored ETF strategy. Remember, the goal is to choose ETFs that not only meet your financial objectives but also complements your risk tolerance, time horizon, and cost considerations.</p>
<h2 id="how-to-build-a-successful-etf-strategy" class="jump-link-nav anchored-block" data-jumplink-title="Build an ETF Strategy">How to Build a Successful ETF Strategy</h2>
<p>Building a successful ETF strategy is akin to constructing a well-designed building&mdash;it requires a strong foundation, regular maintenance, and the flexibility to adapt to changing conditions. Let's break down the components that can contribute to a robust ETF investment approach.</p>
<p><strong>Setting Clear Investment Objectives</strong></p>
<p>Your investment journey begins with a clear understanding of your destination. Establishing concrete investment objectives will serve as the guiding star for your ETF strategy. Whether you're focused on retirement, saving for a major purchase, or generating income, your goals should dictate the composition and risk level of your ETF portfolio.</p>
<p><strong>Regular Portfolio Review and Rebalancing</strong></p>
<p>A successful ETF strategy is not a &ldquo;set it and forget it&rdquo; proposition; it requires ongoing attention and maintenance. Regular reviews of your portfolio's performance allow you to make informed decisions about rebalancing. This means realigning your portfolio's weightings back to your target asset allocation to stay in line with your investment objectives and risk tolerance.</p>
<p><strong>Staying Updated with Market Trends and Economic Indicators</strong></p>
<p>The financial markets are dynamic, with trends and economic indicators constantly shifting. Keeping abreast of these changes is crucial for making proactive adjustments to your ETF strategy. By staying informed, you can better understand the forces that may impact your investments. For market analysis and commentary on significant investment trends, <a href="/link/6069d42ccdc24a1b878e52966b85cf0a.aspx" title="Insights"><strong>follow VanEck's insights</strong>.</a></p>
<h2 id="summary">Summary</h2>
<p>Throughout this blog, we've explored the multifaceted world of ETFs and the myriad benefits they offer to investors. ETFs stand out for their diversity, cost efficiency, and accessibility, making them a versatile tool in any investor's arsenal. From broad market exposure to targeted niche sectors, ETFs can accommodate a wide range of investment strategies and objectives.</p>
<p>As we've seen, a well-thought-out ETF strategy involves clear goal setting, ongoing review and rebalancing, and an awareness of market conditions. With these practices, investors can harness the full potential of ETFs to meet their financial goals.</p>
<p>Whether you're taking your first steps into the realm of ETFs or looking to refine your existing approach, now is an excellent time to leverage the advantages that ETFs have to offer. Begin your journey today, and take a proactive step towards building a resilient and successful investment portfolio with ETFs.</p>
<p>To receive more <a href="https://www.vaneck.com/us/en/insights/thematic-investing/" title="Thematic Investing Insights"><strong>Thematic Investing</strong></a> insights, <a href="https://www.vaneck.com/us/en/subscribe/" title="Subscription Center"><strong>sign up in our subscription center</strong></a>.</p>
]]></content:encoded>
</item><item rdf:about="https://www.vaneck.com/us/en/blogs/income-investing/why-invest-in-clos/">
  <title>Why Invest in CLOs?></title>
  <link>https://www.vaneck.com/us/en/blogs/income-investing/why-invest-in-clos/</link>
  <description><![CDATA[CLOs have historically offered a compelling combination of above-average yield, strong risk profiles, and the potential for strong upside appreciation.]]></description>
  <dc:creator> </dc:creator>
  <dc:date>08/27/2025 06:39:00</dc:date>
<content:encoded><![CDATA[

<p><strong>Key Takeaways:</strong></p>
<ul class="content-list">
<li class="mt-2">CLOs have historically delivered strong risk-adjusted returns, outperforming other corporate debt, especially at lower rating tiers, while maintaining low default rates even during major crises.</li>
<li class="mt-2">CLOs offer wider spreads and lower interest rate sensitivity compared to similarly rated fixed-rate bonds, making them attractive in rising rate environments.</li>
<li class="mt-2">Individual investors can now access the traditionally institutional CLO market more easily through vehicles that offer greater liquidity, transparency, and lower investment minimums.</li>
</ul>
<p>Over the long term, <strong><a href="https://www.vaneck.com/us/en/blogs/income-investing/demystifying-collateralized-loan-obligations/" title="Demystifying Collateralized Loan Obligations">collateralized loan obligation (CLO)</a></strong> tranches have historically performed well relative to other corporate debt categories, including leveraged loans, high yield bonds, and investment grade bonds, and have significantly outperformed at lower rating tiers. CLOs are <strong><a href="https://www.vaneck.com/us/en/blogs/income-investing/clos-question-and-answer/#point-three" title="CLOI: Question and Answer">structured to help mitigate risk</a></strong>, through the strength of their underlying collateral as well as built-in traits such as coverage tests to correct collateral deterioration. This has historically helped them experience significantly lower levels of principal loss when compared with corporate debt and other securitized products. This has resulted in a track record of strong risk-adjusted returns versus other fixed income asset classes.</p>
<h3>CLOs Track Record of Strong Risk-Adjusted Returns vs. Other Asset Classes</h3>
<p><strong>10 Years as of 7/31/2025</strong></p>
<p><img loading="lazy" class="img-responsive w-100" src="https://www.vaneck.com/contentassets/f00b957c8ac1456fb753803320b42d82/4841_clo_chart-7_2024-9_v2_blog.svg" alt="CLOs Track Record of Strong Risk-Adjusted Returns vs. Other Asset Classes" /></p>
<p class="chart-disclosure">Source: Morningstar. Broad CLOs represented by J.P. Morgan CLO Index, IG CLOs represented by J.P Morgan CLO IG Index, AA-BB CLOs represented by the J.P. Morgan CLOIE Balanced Mezzanine Index, AAA Rated CLOs represented by J.P. Morgan CLO AAA Index, AA Rated CLOs represented by J.P. Morgan CLO AA Index, A Rated CLOs represented by J.P. Morgan CLO A Index, BBB Rated CLOs represented by J.P. Morgan CLO BBB Index, BB Rated CLOs represented by J.P. Morgan CLO BB Index, US IG represented by ICE BofA US Corporate Index, US HY represented by ICE BofA US High Yield Index, Agg is represented by the ICE BofA US Broad Market, US IG FRNs represented by MVIS US Investment Grade Floating Rate Note Index, Leveraged Loans represented by Morningstar LSTA US Leveraged Loan 100 Index. See index descriptions at the end of this blog. Past performance is not indicative of future results. Index performance is not illustrative of fund performance. It is not possible to invest directly in an index.</p>
<h2>CLOs Have Been Tested Through Two Major Crises</h2>
<p>Through both the Global Financial Crisis and COVID-19 drawdown, the asset class ultimately experienced far fewer defaults than corporate bonds of the same rating. For example, among the nearly 20,000 U.S. CLOs issued from 1996-2021 and rated by S&amp;P, only 60 experienced defaults, primarily in non-investment grade rated tranches. And the performance is even better for investment grade CLOs. In the higher rated AAA and AA CLO tranches, there have been zero defaults. We believe this resilience combined with the potential for upside returns makes the asset class compelling for long-term minded investors.</p>

<h2>The Search for Income is Over</h2>
<p>In addition to this strong track record of risk-adjusted returns, CLO spreads have historically been significantly wider than those of other debt instruments.</p>
<h3>Consistent Spread Pickup by CLOs Compared to Similarly Rated Bonds</h3>
<p><strong>(In bps as of 7/31/2025)</strong></p>
<p><img loading="lazy" class="img-responsive w-100" alt="Consistent Spread Pickup by CLOs Compared to Similarly Rated Bonds" src="https://www.vaneck.com/EPiServer/CMS/Content/contentassets/f7bf67391f924e8298cb17febecd0410/4841_clo_chart-7_2024-9_v1_blog.svg,,293491/Download?epieditmode=False" /></p>
<p class="chart-disclosure">Source: JP Morgan and ICE Data Services. Using option-adjusted spread for corporate bonds and discount margins for CLOs. AAA Rated CLOs represented by J.P. Morgan CLO AAA Index, AA Rated CLOs represented by J.P. Morgan CLO AA Index, A Rated CLOs represented by J.P. Morgan CLO A Index, BBB Rated CLOs represented by J.P. Morgan CLO BBB Index, BB Rated CLOs represented by J.P. Morgan CLO BB Index, B Rated CLOs represented by J.P. Morgan CLO B Index AAA Rated Corps represented by the ICE BofA AAA US Corporate Index, AA Rated Corps represented by the ICE BofA AA US Corporate Index, A Rated Corps represented by the ICE BofA A US Corporate Index, BBB Rated Corps represented by the ICE BofA BBB US Corporate Index, BB Rated Corps represented by the ICE BofA BB US High Yield Index and B Rated Corps represented by the ICE BofA Single-B US High Yield Index. Index descriptions at the end of this blog. Past performance is not indicative of future results. Index performance is not illustrative of fund performance. It is not possible to invest directly in an index.</p>
<h2>CLOs Have Lower Sensitivity to Interest Rates</h2>
<p>CLOs are also floating-rate instruments, meaning they have low sensitivity to changes in interest rates. As interest rates rise or fall, CLO yields will move accordingly, and their prices have historically moved less than those of fixed-rate instruments. These characteristics may be advantageous to investors in diversified fixed income portfolios.</p>
<p>With higher relative yields, a history of strong risk-adjusted returns, and protection against rising rates, we believe there are several benefits to making a strategic allocation to investment grade CLOs within an income portfolio.</p>

<h2>How to Invest in CLOs</h2>
<p>The CLO market is largely institutional, with banks, insurance companies and hedge funds often purchasing CLOs directly or through institutional separate accounts that may carry minimums of $50M or more. This may make access difficult for many investors.</p>
<p>The <a href="/link/e090deaddc774ac699a04b959d9254c6.aspx" title="CLOI - VanEck CLO ETF - Overview"><strong>VanEck CLO ETF (CLOI)</strong></a> and <a href="/link/d2f16468a9f14c1e807f6bb7fb597a3e.aspx" title="CLOB - VanEck AA-BB CLO ETF - Overview"><strong>VanEck AA-BB CLO ETF (CLOB)</strong></a> may offer attractive ways for investors to efficiently access this market with the liquidity, transparency and low cost features of an ETF. CLOI and CLOB are actively managed ETFs, sub-advised by PineBridge Investments. CLOI provides access to investment grade CLOs, and CLOB invests primarily in mezzanine tranches of CLOs. Both ETFs benefit from PineBridge&rsquo;s decades of CLO market experience, both as a CLO manager and CLO tranche investor, and deep leveraged finance expertise.</p>
<p>To receive more <a href="/us/en/blogs/income-investing/" title="Income Investing Insights"><strong>Income Investing</strong></a> insights, <a href="/link/5f45412c2143400497908cea2897f7d3.aspx" title=" Subscription Center"><strong>sign up in our subscription center</strong></a>.</p>
]]></content:encoded>
</item><item rdf:about="https://www.vaneck.com/us/en/blogs/moat-investing/understanding-market-capitalization/">
  <title>Understanding Small Cap, Mid Cap &amp; Large Cap Stocks></title>
  <link>https://www.vaneck.com/us/en/blogs/moat-investing/understanding-market-capitalization/</link>
  <description><![CDATA[Discover the differences between small-cap, mid-cap, and large-cap stocks. Make informed investment decisions with VanEck's comprehensive guide.]]></description>
  <dc:creator> </dc:creator>
  <dc:date>08/27/2025 06:30:00</dc:date>
<content:encoded><![CDATA[

<h2>Small-Cap vs Mid-Cap vs Large-Cap: Market Capitalization Explained</h2>
<p><strong>Key Takeaways:</strong></p>
<ul class="content-list">
<li class="mt-2">Market cap defines a stock&rsquo;s risk and growth potential; small caps offer higher upside with more volatility, while large caps provide greater stability.</li>
<li class="mt-2">Diversifying across small, mid, and large-cap stocks helps balance risk and return in a portfolio.</li>
<li class="mt-2">Investment strategy matters. Growth, value, or blend approaches should align with your goals.</li>
</ul>
<h2>Introduction: What is Market Capitalization?</h2>
<p>Market capitalization, often referred to as "market cap," is a fundamental concept in investing. Market capitalization represents the total value of a company's outstanding shares of stock in the market. Market cap is calculated by multiplying the current share price of a company by the total number of shares outstanding. This figure gives investors an indication of a company's size and relative worth in the market.</p>
<p>Understanding market capitalization is crucial because it helps investors classify companies into different categories based on their size. This classification provides valuable insights into a company's risk profile, growth potential, and investment returns.</p>
<h2 id="small-cap-stocks" class="jump-link-nav anchored-block" data-jumplink-title="Small Cap Stocks">Understanding Small Cap Stocks</h2>
<p>Small-cap stocks refer to companies with a relatively small market capitalization. The definition of a small-cap stock varies across the industry, leading to differing interpretations based on market cap ranges or percentile allocations within the total market cap.</p>
<p>One approach to classifying small-cap stocks is to look at dollar-based market cap ranges. Companies with market capitalizations ranging from a few million dollars to a couple of billion dollars are generally considered small-cap. This definition is often influenced by the company's size relative to larger corporations and its growth potential.</p>
<p>However, another perspective, as exemplified by Morningstar's classification, involves percentile ranges. According to Morningstar's classification, the top 70% of the total U.S. market capitalization is categorized as large-cap, the next 20% is considered mid-cap, and the subsequent 7% falls under the small-cap category. This allocation method offers a dynamic view, considering the overall market landscape.</p>
<p>To further complicate matters, the remaining 3% of the market could be referred to as micro-cap stocks, representing companies with even smaller market capitalizations. These micro-cap stocks are often characterized by their potential for rapid growth but also heightened volatility.</p>
<p>Given these differences in defining small-cap stocks, investors should be aware of the methodology used by different financial institutions and investment platforms.</p>
<p>Examples of small-cap stocks include emerging tech startups and niche market players. Below are two specific examples of small-cap stocks:</p>
<p>Guided Software Inc. (Ticker: GWRE): Guidewire Software provides software solutions for property and casualty insurers through their flagship products: InsuranceSuite, ClaimCenter, PolicyCenter, BillingCenter, and InsuranceNow. Together these products create a modern software platform capable of disrupting an industry that has been underserved by legacy software vendors.</p>
<p>Cerus Corporation (Ticker: CERS): Cerus is a biomedical products company that specializes in blood safety. It focuses on providing solutions to prevent the transmission of infectious diseases through blood transfusions. As a small-cap stock, Cerus operates in a specialized niche within the healthcare sector.</p>
<p>Investing in small-cap stocks can offer significant advantages, such as the potential for substantial returns if the company succeeds. However, they also come with higher risk and volatility compared to larger, more established companies. Small-cap stocks can also be more sensitive to market fluctuations and economic downturns.</p>
<h2 id="mid-cap-stocks" class="jump-link-nav anchored-block" data-jumplink-title="Mid-Cap Stocks">Exploring Mid-Cap Stocks</h2>
<p>Mid-cap stocks fall between small-cap and large-cap stocks in terms of market capitalization. These companies are generally more established than small cap companies but may not have the same level of recognition as large-cap giants. Here are a couple of real examples of mid-cap stocks:</p>
<p>Zebra Technologies Corporation (Ticker: ZBRA): Zebra Technologies is a company that provides tracking and visibility solutions, including barcode printers, scanners, and RFID technology. As a mid-cap stock, Zebra has established itself as a leader in its industry and serves a wide range of sectors, including retail, healthcare, and manufacturing.</p>
<p>The Cooper Companies Inc. (Ticker: COO): The Cooper Companies is a global medical device company that specializes in products for contact lens wearers and women's health. With a mid-cap market capitalization, Cooper Companies has a strong presence in its niche markets and continues to innovate in its field.</p>
<p>Investing in mid-cap stocks can provide a balanced approach for investors seeking growth opportunities without the extreme volatility of small-cap stocks. While they offer good growth potential, mid-cap stocks may also be influenced by market shifts and economic conditions.</p>
<h2 id="large-cap-stocks" class="jump-link-nav anchored-block" data-jumplink-title="Large-Cap Stocks">Analyzing Large-Cap Stocks</h2>
<p>Large-cap stocks are well-established companies with a substantial market capitalization, often exceeding ten billion dollars. These companies are recognized globally and typically have a history of stable performance. Here are a couple of real examples of large-cap stocks:</p>
<p>Apple Inc. (Ticker: AAPL): Apple needs no introduction. As a large cap stock, it's one of the world's most valuable and recognizable technology companies. Apple's market capitalization reflects its massive global footprint, innovative products, and diverse revenue streams.</p>
<p>Johnson &amp; Johnson (Ticker: JNJ): Johnson &amp; Johnson is a large cap company in the healthcare sector, known for its wide range of pharmaceuticals, medical devices, and consumer health products.</p>
<p>Investing in large-cap stocks offers the benefit of stability and lower risk compared to smaller counterparts. However, large-cap stocks may have limited room for explosive growth compared to smaller companies. They are often considered core holdings in long-term investment portfolios.</p>
<h2 id="key-differences" class="jump-link-nav anchored-block" data-jumplink-title="Key Differences">Key Differences Between Small-Cap, Mid-Cap, and Large-Cap Stocks</h2>
<p>Each category of stocks comes with its own market capitalization thresholds, risk and volatility levels, and growth potential:</p>
<p><strong>Market Capitalization Thresholds</strong></p>
<p>The classification of stocks into small-, mid- and large-cap categories is primarily determined by their market capitalization. Small-cap stocks typically fall within a market capitalization range of a few million to a couple of billion dollars. Mid-cap stocks encompass a broader scope, ranging from a few billion to around ten billion dollars. Large-cap stocks extend beyond ten billion dollars in market capitalization. These thresholds provide a basis for understanding the scale and scope of companies within each category.</p>
<p><strong>Risk and Volatility Levels</strong></p>
<p>Small-cap stocks are often associated with heightened risk and volatility due to their relatively smaller size and sensitivity to market shifts. The potential for rapid growth is counterbalanced by increased susceptibility to market fluctuations. Mid-cap stocks present a middle ground, offering growth potential while possessing a level of stability that is intermediate between small and large-cap stocks. Large-cap stocks are renowned for their stability and lower risk compared to smaller counterparts. Their well-established presence and diversified operations contribute to a more predictable performance trajectory.</p>
<p><strong>Growth Potential and Investment Returns</strong></p>
<p>Small-cap stocks frequently exhibit significant growth potential as they operate in dynamic sectors with ample room for expansion and innovation. However, this growth potential is accompanied by greater uncertainty and potential downside. Mid-cap stocks offer a compromise between growth and stability, appealing to investors seeking opportunities without extreme volatility. Large-cap stocks, while providing stability and a potential source of dividends, may offer comparatively slower growth due to their size and market maturity.</p>
<h2>Factors to Consider When Choosing Between Small-Cap, Mid-Cap, and Large-Cap Stocks</h2>
<p>The decision to invest in small-cap, mid-cap, or large-cap stocks hinges on an investor's risk tolerance, investment objectives, and time horizon. Investors seeking aggressive growth may be drawn to small-cap stocks, acknowledging the higher level of risk involved. Those seeking a balanced approach might opt for mid cap stocks, while investors prioritizing stability and reliability could lean towards large cap stocks. By aligning investment choices with individual preferences, investors can construct diversified portfolios that reflect their financial goals and risk appetite.</p>
<h2 id="investing-strategies" class="jump-link-nav anchored-block" data-jumplink-title="Investing Strategies">Investing Strategies for Small-Cap, Mid-Cap, and Large-Cap Stocks</h2>
<p>When delving into the realm of small cap, mid cap, and large cap stocks, investors have a spectrum of strategies at their disposal. These strategies cater to different investment philosophies and risk appetites, allowing investors to align their approaches with their financial goals.</p>
<p><strong>Value Investing</strong></p>
<p>Value investing is a timeless strategy that transcends market capitalization categories. For small-cap stocks, value investing involves seeking out companies that are trading below their intrinsic value, often due to market pessimism or temporary setbacks. Investors employing this strategy look for opportunities to buy undervalued stocks, with the expectation that their true worth will eventually be recognized by the market. In mid-cap and large-cap categories, value investors similarly seek companies with strong fundamentals and sound financials that might be currently underappreciated.</p>
<p><strong>Growth Investing</strong></p>
<p>Growth investing revolves around identifying companies poised for significant expansion and capitalizing on their potential for rapid growth. In the context of small-cap stocks, growth investors focus on emerging companies in niche markets that have the capacity to disrupt industries. For mid-cap stocks, they target companies with proven track records of consistent growth. Even among large-cap stocks, growth investors seek corporations that demonstrate the ability to maintain above-average growth rates. This strategy entails accepting higher risk in exchange for the potential for substantial returns.</p>
<p><strong>Blend Investing</strong></p>
<p>Blend investing, often referred to as a "core and satellite" approach, combines elements of both value and growth investing. This strategy involves maintaining a diversified core portfolio of well-established, large-cap companies for stability, while allocating a portion of the portfolio to small- and mid-cap stocks for growth potential. The idea is to strike a balance between stability and higher risk-reward opportunities. Blend investors seek to capture the benefits of both value and growth strategies while managing overall portfolio risk.</p>
<p><strong>Choosing the Right Strategy</strong></p>
<p>The choice of strategy depends on an investor's risk tolerance, time horizon, and investment objectives. Investors with a higher appetite for risk and a longer investment horizon might be drawn to growth or blend strategies, as they aim for substantial returns over the long term. On the other hand, those seeking a more conservative approach could opt for value or blend strategies to mitigate potential volatility. Each strategy offers its own advantages and challenges, making it important for investors to conduct thorough research and consultation before implementing a specific approach.</p>
<h2>Market Capitalization and Portfolio Diversification</h2>
<p>Diversification is often hailed as one of the most effective tools in an investor's toolkit, and market capitalization serves as a crucial component of this diversification strategy. The concept behind diversification is simple: by spreading investments across different asset classes, industries, and market capitalization categories, investors can reduce risk and optimize their potential for returns. Market capitalization diversification, specifically, involves investing in a variety of small-cap, mid-cap, and large-cap stocks to strike a balance between growth potential and stability.</p>
<p><strong>Risk Mitigation through Diversification</strong></p>
<p>Investing solely in one market cap category exposes a portfolio to a higher degree of risk. Small-cap stocks, for instance, can experience heightened volatility due to their sensitivity to market shifts. However, by diversifying across various market capitalization tiers, investors can mitigate the impact of the volatility in one category with the stability of another. While small-cap stocks might introduce a level of risk, the presence of mid- and large-cap stocks helps to counterbalance that risk, providing a more consistent performance trajectory.</p>
<p><strong>Enhanced Return Potential</strong></p>
<p>Market capitalization diversification doesn't just aim to reduce risk&mdash;it also aims to enhance potential returns. Small-cap stocks often offer high growth potential, but their volatility can be a double-edged sword. By combining them with mid and large-cap stocks, investors can achieve a blend of growth and stability. Mid-cap stocks, in particular, can offer the advantage of growth while presenting a less erratic performance pattern than small-caps. Large-cap stocks contribute to portfolio stability and can also provide dividends, adding another layer of potential returns.</p>
<p><strong>Customizing for Individual Goals</strong></p>
<p>A well-balanced portfolio is not a one-size-fits-all concept. Investors have unique risk tolerances, investment horizons, and financial objectives. Market capitalization diversification allows for customization based on these individual factors. For instance, aggressive investors seeking rapid growth might allocate a larger portion to small-cap and mid-cap stocks, while more conservative investors might emphasize larger, well-established companies. By adjusting the allocation across market caps, investors can tailor their portfolios to their comfort levels and goals.</p>
<p><strong>Monitoring and Rebalancing</strong></p>
<p>It's important to note that portfolio diversification is not a one-time task. As market conditions, economic trends, and personal circumstances evolve, the balance of market cap allocations may shift. Regular monitoring and periodic rebalancing ensure that the portfolio remains aligned with an investor's objectives and risk tolerance. This process involves selling some assets that have appreciated and investing in others to maintain the desired diversification levels.</p>
<h2>Summary and Conclusions</h2>
<p>Market capitalization, a fundamental investing concept, is the total value of a company's outstanding shares and is calculated by multiplying the current share price by the total number of shares outstanding. This measurement assists in categorizing companies based on their size, thus influencing risk, growth potential, and investment returns.</p>
<p>Differentiating small-cap, mid-cap, and large-cap stocks is essential. Small-cap stocks have a market capitalization of a few million to a couple of billion dollars, often offering high growth potential coupled with higher risk. Mid-cap stocks, ranging from a few billion to around ten billion dollars, provide a balanced mix of growth and stability. Large-cap stocks, exceeding ten billion dollars, are renowned for their stability and lower risk, though with potentially slower growth. The choice between these categories depends on investors' risk tolerance, time horizon, and objectives.</p>
<p>Investment strategies vary across market caps. Value investing seeks undervalued stocks, growth investing targets high-growth companies, and blend investing combines both approaches. Diversifying across market capitalizations reduces risk and enhances potential returns. A well-balanced portfolio should include a mix of small-cap, mid-cap, and large-cap stocks based on individual risk appetite and goals. Regular monitoring and rebalancing ensure the portfolio remains aligned with changing market conditions and personal circumstances, reflecting the essence of effective portfolio management.</p>
<p>Many investors seeking smaller cap exposure look to a small- and mid-cap strategy, or &ldquo;SMID&rdquo; cap strategy which combines the two market cap exposures into one strategy that can serve as a compliment or completion portfolio in combination with their large cap exposure. Morningstar applies its time-tested economic moat and valuation equity research framework to assemble a portfolio of quality SMID cap stocks that are trading at attractive valuations. This approach takes the guesswork out of investing in SMID cap companies and take the form of the Morningstar U.S. Small-Mid Cap Moat Focus Index.</p>
<p><strong><a href="https://www.vaneck.com/us/en/investments/morningstar-smid-moat-etf-smot/overview/" title="SMOT - VanEck Morningstar SMID Moat ETF">VanEck Morningstar SMID Moat ETF (SMOT)</a></strong> seeks to track as closely as possible, before fees and expenses, the price and yield performance of the Morningstar US Small-Mid Cap Moat Focus Index.</p>
<p>To receive more <a href="https://www.vaneck.com/us/en/insights/moat-investing" title="Moat Investing Insights"><strong>Moat Investing</strong></a> insights, <a href="https://www.vaneck.com/us/en/subscribe/" title="Subscription Center"><strong>sign up in our subscription center</strong></a>.</p>
]]></content:encoded>
</item><item rdf:about="https://www.vaneck.com/us/en/blogs/thematic-investing/investing-in-semiconductors/">
  <title>Investing in Semiconductor ETFs &amp; Stocks></title>
  <link>https://www.vaneck.com/us/en/blogs/thematic-investing/investing-in-semiconductors/</link>
  <description><![CDATA[Explore investment opportunities with VanEck&rsquo;s semiconductor ETFs. Understand the sector's evolution, market dynamics, and future in our comprehensive semiconductor investing guide.]]></description>
  <dc:creator>Nick Frasse</dc:creator>
  <dc:date>08/26/2025 06:30:00</dc:date>
<content:encoded><![CDATA[

<p><strong>Key Takeaways:</strong></p>
<ul class="content-list">
<li class="mt-2">Semiconductors are essential to modern technology and economic growth, powering everything from smartphones to Al, and driving innovation across industries.</li>
<li class="mt-2">Semiconductor ETFs offer diversified, accessible exposure to the sector's long-term potential while helping manage risks tied to individual companies or supply chain disruptions.</li>
<li class="mt-2">AI is accelerating demand for advanced chips and driving innovation within the semiconductor industry, making semiconductors a key way to invest in the future of AI.</li>
</ul>
<h2 id="introduction-to-semiconductors" class="jump-link-nav anchored-block" data-jumplink-title="Intro to Semiconductors">Introduction to Semiconductors</h2>
<p>The semiconductor industry, a cornerstone of modern digital technology, is heavily reliant on semiconductor equipment manufacturing. These companies provide the machinery that enables the creation of integrated devices, often housed within fabrication facilities or &ldquo;fabs&rdquo;. The diverse range of equipment includes wafer manufacturing and processing, mask/reticle equipment, thermal processing equipment, inspection measurement, as well as assembly and packaging equipment.</p>
<p>At their core, semiconductors are materials, often made of silicon, that have the unique ability to conduct electricity under certain conditions, making them indispensable in the creation of electronic circuits. Their importance in modern technology cannot be overstated. From the smartphones in our pockets to the advanced computer systems driving our cars, and the vast servers powering the internet, semiconductors are truly ubiquitous. It's hard to imagine a world without them, given how intertwined they are with our daily lives and the gadgets and tools we rely on.</p>
<p>This prevalence in daily technology has had a cascading effect on the stock market. As the demand for advanced technology has surged, so has the semiconductor industry's growth. Reflecting this boom, which has increased the focus on semiconductor Exchange Traded Funds (ETFs), offering investors an opportunity to tap into this dynamic sector's potential. Over the years, these ETFs have seen significant appreciation, underscoring the critical role semiconductors play not just in our devices, but in the global economy.</p>
<h2 id="why-semiconductors-matter-in-investing" class="jump-link-nav anchored-block" data-jumplink-title="Why They Matter">Why Semiconductors Matter in Investing</h2>
<p>From an economic perspective, the semiconductor industry is a powerhouse. It has been instrumental in job creation, providing employment to millions globally. Additionally, the sector consistently ranks high in research and development (R&amp;D) investments, reflecting its commitment to innovation. This fervor for R&amp;D not only pushes the boundaries of what's technologically possible but also cements the industry's position in global trade, making it a critical player in global economic dynamics.</p>
<p>The continued adoption of digital technologies across various sectors, including healthcare, automotive, consumer electronics, and industrial automation, is expected to drive demand for semiconductors moving forward. These components are the foundation for digital systems, facilitating data processing, storage, and device communication. The emergence of technologies such as the Internet of Things (IoT), 5G, and edge computing, which necessitate high-performance and energy-efficient chips, also open up additional avenues for semiconductor industry growth. As these technologies become increasingly mainstream, the reliance on semiconductors deepens, thereby solidifying the industry's positive outlook.</p>
<p>As we continue to ride the wave of technological advancement, semiconductors, and artificial intelligence stand at the forefront of this evolution. Together, they drive each other's growth, propelling us into an unprecedented era of technological revolution. As these two domains deepen their relationship, they're heralding a new surge of innovation. The future of AI is anchored in the creation of new, AI-optimized semiconductor chips&mdash;a dynamic we believe is poised to fuel significant growth in the next half-decade.</p>
<h2 id="the-rise-of-semiconductor-eTFs" class="jump-link-nav anchored-block" data-jumplink-title="Rise of Semiconductors">The Rise of Semiconductor ETFs</h2>
<p>As the prominence of semiconductors in the global economy has grown, so has the attention of investors. One of the most intriguing investment avenues that has garnered significant interest is the Semiconductor ETF. But before we dive into the specifics, let's unpack what an ETF is and why it's become such a sought-after investment vehicle.</p>
<p>An Exchange Traded Fund, or ETF, is a type of security that tracks an index, sector, commodity, or other assets, which can be purchased or sold on a stock exchange, much like a regular stock. Its allure lies in its simplicity and versatility, making it a preferred choice for many investors.</p>
<p>Semiconductor ETFs primarily invest in stocks of companies involved in the semiconductor industry. These ETFs provide a snapshot of the sector's health and performance and provide several potential benefits for investors:</p>
<p><strong>Diversification:</strong> One of the primary benefits of semiconductor ETFs is the inherent diversification they offer. Instead of investing in a single company, investors spread their risk across multiple players in the semiconductor space. This diversified approach can help mitigate potential losses and ensure a more balanced portfolio.</p>
<p><strong>Accessibility:</strong> For retail investors, diving into the semiconductor sector might seem daunting. Semiconductor ETFs simplify this entry, offering an accessible route to tap into the industry's potential without needing intricate knowledge of each company within the sector.</p>
<p><strong>Liquidity:</strong> A standout feature of ETFs is their liquidity. Just like stocks, semiconductor ETFs can be traded throughout the trading day at market prices. This high liquidity ensures that investors can enter or exit their positions with ease, providing flexibility in investment strategies.</p>
<p>As the semiconductor industry continues its upward trajectory, semiconductor ETFs present a compelling opportunity. They encapsulate the sector's dynamism, while also offering the benefits of diversification, accessibility, and liquidity. For those keen on harnessing the growth of the semiconductor world, these ETFs might just be the perfect vehicle.</p>

<h2 id="investing-in-semiconductor-ETFs-things-to-consider" class="jump-link-nav anchored-block" data-jumplink-title="Things to Consider">Investing in Semiconductor ETFs: Things to Consider</h2>
<p>In recent years, the semiconductor industry has experienced a notable departure from its traditional cyclical patterns, embracing a more secular behavior that defies the ups and downs tied closely to economic cycles. This transformation can be attributed to a range of factors, including the ever-expanding presence of technology in our daily lives and the surging demand for semiconductors across diverse sectors.</p>
<p>That said, like any investment, semiconductors come with risks. For example, in 2020, the COVID-19 pandemic caused a big shake-up in the semiconductor industry. Car makers cut production costs and bought fewer chips as the virus spread. At the same time, there was a sudden increase in demand for semiconductors in areas like remote healthcare, virtual learning, and work-from-home setups. Because making semiconductors is a complex process, the industry couldn't quickly adjust to these changes. This led to a mismatch between the supply and demand of semiconductors that hasn't fully balanced out yet.</p>
<p>Another critical point is that many industries rely on the same type of semiconductors. This made the supply and demand issues worse during the pandemic. The semiconductor shortage hit the car industry the hardest. This was due to several reasons, including more semiconductors being used in electric cars, chip companies not wanting to invest in older car technology, and continued high demand from the consumer services sector. This mix of factors made the disruption in the semiconductor industry even more significant.</p>
<h3>Are Semiconductor ETFs a Good Investment?</h3>
<p>In our view, these potential risks reinforce the benefits of investing in semiconductors through an ETF. By opting for semiconductor ETFs, investors can harness the benefits of diversification. Rather than having their investments tied to the fate of a single company, they spread their stakes across various players in the industry. This diversified approach not only mitigates potential losses from unforeseen industry disruptions but also allows investors to capitalize on the broader sector's growth. Thus, for those seeking a balanced exposure to the semiconductor realm, ETFs emerge as a prudent and strategic choice.</p>
<h3>How to Invest in Semiconductors</h3>
<p>To access the semiconductor investment opportunity, investors can buy individual stocks or choose to invest in mutual funds and / or ETFs that target semiconductor companies. <a href="https://www.vaneck.com/us/en/investments/semiconductor-etf-smh/overview/#how-to-buy-etf&amp;utm=SMH-Blog" title="How to Invest in VanEck ETFs"><strong>Learn more about how to buy</strong></a>.</p>
<p><strong>VanEck&rsquo;s Semiconductor ETF</strong></p>
<p>Rather than attempting to pick individual stock winners in the ever-evolving semiconductor sector, the <a href="https://www.vaneck.com/us/en/investments/semiconductor-etf-smh/overview/" title="SMH - VanEck Semiconductor ETF - Overview"><strong>VanEck Semiconductor ETF (SMH)</strong></a> provides exposure to the top 25 most liquid U.S.-listed semiconductor companies, spanning the entire industry value chain from chip design and fabrication to manufacturing machinery. SMH has a global scope and invests in highly liquid companies that are considered industry leaders among semiconductors. <a href="https://www.vaneck.com/us/en/blogs/thematic-investing/smh-question-and-answer/" title="SMH ETF: Question and Answer"><strong>Learn more about SMH in the fund FAQ</strong></a>.</p>
<p><strong>VanEck&rsquo;s Fabless Semiconductor ETF</strong></p>
<p>The <a href="https://www.vaneck.com/us/en/investments/fabless-semiconductor-etf-smhx/overview/" title="SMHX - VanEck Fabless Semiconductor ETF - Overview"><strong>VanEck Fabless Semiconductor ETF (SMHX)</strong></a> offers investors targeted exposure to leading fabless semiconductor companies, mitigating individual stock risk while capturing the sector's growth potential. SMHX ETF provides a balanced investment in a dynamic and essential industry, poised for continued expansion and technological breakthroughs. <a href="https://www.vaneck.com/us/en/blogs/thematic-investing/smhx-etf-question-answer/" title="SMHX ETF: Question and Answer"><strong>Learn more about SMHX in the fund FAQ.</strong></a></p>
<h2 id="factors-influencing-the-semiconductor-sector" class="anchored-block">Factors Influencing the Semiconductor Sector</h2>
<p>Illustrating just how critical semiconductors have become for economic prosperity, the United States is pushing to become self-sufficient in semiconductors, aiming to curb dependence on foreign supply chains. This drive follows the Covid-19 pandemic exposing the vulnerabilities in supply. In fact, the typical semiconductor production process could involve steps in more than five countries and three or more shipments across the globe. Regional bottlenecks exist at nearly every step in the value chain because of industry consolidation, labor cost dynamics and technical complexity.</p>
<p>The CHIPS (Creating Helpful Incentives to Produce Semiconductors) Act in the United States and the proposed European Chips Act are landmark measures designed to stimulate domestic semiconductor production and lessen reliance on foreign suppliers.</p>
<p>The U.S. CHIPS Act provides a $39 billion incentive program to attract investment and boost domestic production, alongside an $11 billion initiative to foster a research and development ecosystem for the industry. It seeks to enhance supply chain resilience, increase U.S. semiconductor production, and promote safe, secure, domestically produced chips. It also encourages private sector investment and emphasizes technical feasibility, workforce development, and broader community impacts.</p>
<p>Meanwhile, the proposed European Chips Act aims to make Europe more self-reliant in semiconductors, particularly in producing advanced chips and systems. This will be achieved by boosting the EU's production capacity and strengthening technological sovereignty.</p>
<p>Both of these acts are expected to spur growth in the semiconductor industry through financial incentives and support for research and development, workforce development, and infrastructure expansion. They aim to mitigate risk by diversifying the supply chain, reinforcing domestic production, and enhancing technological competitiveness.</p>
<h2 id="how-ai-plays-into-the-future-outlook-of-semiconductor-investments" class="jump-link-nav anchored-block" data-jumplink-title="AI &amp; Semiconductors">How AI Plays into the Future Outlook of Semiconductor Investments</h2>
<p>Machine learning thrives on vast data sets for its training and operational processes. To be harnessed effectively, this data demands speedy and efficient processing and storage, a role filled perfectly by semiconductors. These chips are found in everything&mdash;from the smartphone in your pocket to sprawling data centers&mdash;and are vital for powering AI applications.</p>
<p>As the applications grow increasingly complex, the demand for advanced semiconductors escalates. This expanding need represents a golden opportunity for semiconductor companies. For example, graphic processing units (GPUs) are instrumental in powering companies like OpenAI and its applications, including ChatGPT. GPUs are also used in a variety of other AI applications, including:</p>
<ul class="content-list">
<li>Self-driving cars: GPUs are used to process the data from the car&rsquo;s sensors, such as cameras and radar, to help the car navigate safely.</li>
<li>Facial recognition: GPUs are used to identify people in images and videos. This technology is used in variety of applications, such as security and marketing.</li>
<li>Natural language processing: GPUs are used to understand human language. This technology is used in various applications, such as voice assistants, machine translation, and spam filtering.</li>
</ul>
<p>The GPUs&rsquo; ability to efficiently handle parallel tasks makes them perfect for the heavy-duty processing required in machine learning. These high-speed GPUs manage the large volumes of data needed to train AI models like GPT. By doing so, they enable quicker responses and better language understanding. Simply put, semiconductor technology is vital in smoothly operating applications such as ChatGPT.</p>
<p>AI is not just benefiting from semiconductor power; it has emerged as a significant driving force in the evolution of the semiconductor industry. AI is enhancing efficiency and profitability within the sector by redefining chip designs, identifying defects, optimizing processes, and predicting chip failures. And there&rsquo;s more to the story&mdash;AI is catalyzing the creation of a new lineage of chips tailor-made for AI&rsquo;s distinctive requirements and needs. These aren&rsquo;t your regular chips, but one&rsquo;s tailor-made for AI&rsquo;s unique demands. Think of Intel (NASDAQ: INTC) and its pioneering work crafting AI-optimized chips that excel in speed, efficiency, and power management.</p>
<p>We believe semiconductors are the &lsquo;picks and shovels&rsquo; way to play the AI landscape and present a compelling way to capitalize on the growing AI sector, particularly when direct access to private AI companies is limited for many investors. The VanEck Semiconductor ETF (SMH) provides a way to invest in the entire value chain of the semiconductor industry, from chip design and fabrication to the machinery used in the manufacturing process. As semiconductors are the essential components that power AI innovation, we believe they are poised to gain value amid the potential deflationary impact of AI&rsquo;s efficiency&mdash;they also provide a unique opportunity to ride the wave of AI&rsquo;s transformative impact.</p>
<h2 id="conclusion" class="anchored-block">Conclusion</h2>
<p>The semiconductor industry is integral to the digital age, supplying equipment essential for the creation of integrated devices. These devices are utilized in smartphones, computer systems, servers, and other digital gadgets, making semiconductors an indispensable aspect of modern technology. Their importance has also influenced the stock market.</p>
<p>From an economic standpoint, the semiconductor sector is a powerhouse, creating jobs for millions worldwide and heavily investing in research and development. This commitment to innovation has positioned the industry as a vital player in the global economy. The increasing adoption of digital tech across various sectors, such as healthcare and automotive, predicts a rising demand for semiconductors. Emerging technologies like the Internet of Things (IoT) and 5G also present new opportunities for the industry's growth. As technology continues to advance, semiconductors and artificial intelligence will be at the forefront, fueling each other's development and leading the way into a new age of technological innovation.</p>
<p>The growing demand for advanced technology has caused a surge in the semiconductor industry's growth. This has given rise to semiconductor ETFs, which provide investors a chance to benefit from this sector's expansion. We encourage you to explore the <a href="https://www.vaneck.com/us/en/investments/semiconductor-etf-smh/overview/" title="SMH - VanEck Semiconductor ETF - Overview"><strong>VanEck Semiconductor ETF (SMH)</strong></a> and the <a href="https://www.vaneck.com/us/en/investments/fabless-semiconductor-etf-smhx/overview/" title="SMHX - VanEck Fabless Semiconductor ETF - Overview"><strong>VanEck Fabless Semiconductor ETF (SMHX)</strong></a> to understand how these ETFs can be valuable additions to your portfolio.</p>
<p>To receive more <a href="https://www.vaneck.com/us/en/insights/thematic-investing/" title="Thematic Investing Insights"><strong>Thematic Investing</strong></a> insights, <a href="https://www.vaneck.com/us/en/subscribe/" title="Subscription Center"><strong>sign up in our subscription center</strong></a>.</p>
]]></content:encoded>
</item><item rdf:about="https://www.vaneck.com/us/en/blogs/natural-resources/the-race-to-secure-rare-earths/">
  <title>The Race to Secure Rare Earths></title>
  <link>https://www.vaneck.com/us/en/blogs/natural-resources/the-race-to-secure-rare-earths/</link>
  <description><![CDATA[Rare earths power clean energy, defense, and tech. VanEck&rsquo;s REMX offers pure-play exposure to these critical materials as nations work to secure supply chains.]]></description>
  <dc:creator>Andrew Musgraves</dc:creator>
  <dc:date>08/26/2025 06:30:00</dc:date>
<content:encoded><![CDATA[

<p>Rare earth elements and strategic metals may sound like niche materials reserved for scientists and engineers. In reality, they are the hidden backbone of modern technology&mdash;powering everything from the phone in your pocket to fighter jets, wind turbines, and electric vehicles. And as the geopolitical landscape shifts, so too does the investment opportunity.</p>
<p>In a <a href="/us/en/webinar-registration/?id=95854569834&amp;utm_source=vaneck&amp;utm_medium=calendar" title="How to Invest in Rare Earths and the U.S. Supply Chain Revival"><strong>recent webinar</strong></a>, VanEck&rsquo;s Andrew Musgraves and Kendall Duncan highlight growing public and private sector alignment to build a secure, U.S.-based rare earth supply chain.</p>
<p><strong>Key takeaways from the webinar include:</strong></p>
<ul class="content-list">
<li class="mt-2">Rare earths and strategic metals are vital to current and emerging technologies</li>
<li class="mt-2">Security of supply is a growing concern</li>
<li class="mt-2">Nations &ndash; predominately led by the U.S. &ndash; are focused on reviving their supply chains</li>
<li class="mt-2">VanEck offers liquid exposure to the opportunity set through the <a href="/link/71e51530eb0e4adbbd16a7847361abc7.aspx" title="REMX - VanEck Rare Earth and Strategic Metals ETF"><strong>VanEck Rare Earth and Strategic Metals ETF (REMX)</strong></a></li>
</ul>
<h2>Why Rare Earths Matter</h2>
<p>Rare earth elements possess unique properties like magnetic strength, heat resistance, and light transmission. These are not easily substituted, making them essential in sectors where performance is critical.</p>
<p>Strategic metals broaden the scope to include materials like lithium, cobalt, tungsten, and titanium, which are resources governments deem critical to economic stability and national security. Together, they are foundational to three fast-growing sectors:</p>
<ul class="content-list">
<li class="mt-2"><strong>Clean energy</strong>: Rare earth magnets power wind turbines, EV motors, grid-scale batteries, and even next-gen nuclear systems.</li>
<li class="mt-2"><strong>Defense</strong>: F-35 fighter jets, Navy destroyers, and submarines are examples of defense-related items that require large amounts of rare earth materials to produce. Without these metals, modern defense systems lose their edge.</li>
<li class="mt-2"><strong>Consumer tech and healthcare</strong>: Smartphones, headphones, flat-screen TVs, MRI machines, and precision surgical equipment all depend on rare earths.</li>
</ul>
<p>In short: without these materials, much of the 21st-century economy doesn&rsquo;t work.</p>
<h3>Rare Earths and Strategic Metals: Defined</h3>
<p><img loading="lazy" src="https://www.vaneck.com/contentassets/821e150698204aa682a011c7adf63eef/6074_remx-blog_chart-1_2025-8_v2_blog.svg" alt="Rare Earths and Strategic Metals: Defined" /></p>
<p class="chart-disclosure">Source as of May 2025: MarketVector Indexes GmbH</p>
<h2>The Supply Chain Challenge</h2>
<p>Extracting and refining rare earths is difficult, costly, and environmentally sensitive. Many rare earths and strategic metals are primarily produced and refined in China, posing <strong>a potential threat to supply security </strong>and prompting numerous countries to reassess their sourcing strategies and invest in domestic mining efforts. As the chart below highlights, China controls over <strong>90% of production and refining capacity</strong>, with a similar dominance in strategic metals like lithium and cobalt.</p>
<p><img loading="lazy" src="https://www.vaneck.com/contentassets/fee0585d98954e33b21eca374a9a12dd/6074_remx-blog_chart-2_2025-8_v1_blog.svg" alt="The Supply Chain Challenge" /></p>
<p class="chart-disclosure">Source: IEA. Data as of December 2024.</p>

<p>China&rsquo;s dominance was built through decades of centralized state strategy with the country consolidating mines, subsidizing refining, and allowing less stringent environmental standards. And China has shown a willingness to use its position strategically, tightening export restrictions when geopolitics heat up. Recent moves restricting certain exports in response to U.S. tariffs sent prices spiking and supply chains scrambling.</p>
<p>For the U.S. and its allies, access to these materials is no longer just an economic question. It&rsquo;s a matter of <strong>national security and energy independence</strong>.</p>
<h2>A U.S. and Global Revival</h2>
<p>Recognizing the stakes, governments are adapting. In the U.S., <strong>MP Materials</strong>&mdash;the operator of the Mountain Pass mine in California&mdash;has become a flagship project. With more than $500 million in funding and offtake agreements from both the Department of Defense and Apple, MP is scaling magnet production and downstream processing.</p>
<p>Other nations are following suit with governments and corporations mobilizing to build rare earth and strategic metals supply chains outside China. Several notable, recent announcements highlight the size, scope, and global coordination of that effort:</p>
<div class="wrapped-div">
<table width="100%">
<tbody>
<tr class="tbl-data">
<td class="tbl-header last text-left">Country</td>
<td class="tbl-header last text-left">Organization / Lead Entity</td>
<td class="tbl-header last text-left">2025 Headline Investment / Project Announcement</td>
</tr>
<tr class="tbl-data">
<td class="data-td data last text-left">U.S.</td>
<td class="data-td data last text-left">Department of Defense</td>
<td class="data-td data last text-left">US$400m preferred-equity investment in MP Materials to build rare earth supply</td>
</tr>
<tr class="tbl-data">
<td class="data-td data last text-left">U.S.</td>
<td class="data-td data last text-left">Apple</td>
<td class="data-td data last text-left">US$500m multi-year offtake commitment with MP Materials</td>
</tr>
<tr class="tbl-data">
<td class="data-td data last text-left">E.U.</td>
<td class="data-td data last text-left">European Commission</td>
<td class="data-td data last text-left">Expected &euro;22.5b covering 47 mining/refining projects across 13 member states</td>
</tr>
<tr class="tbl-data">
<td class="data-td data last text-left">Australia</td>
<td class="data-td data last text-left">National Reconstruction Fund</td>
<td class="data-td data last text-left">AU$200m equity stake in Arafura's Nolans rare earth mine and refinery</td>
</tr>
<tr class="tbl-data">
<td class="data-td data last text-left">India</td>
<td class="data-td data last text-left">National Critical Mineral Mission</td>
<td class="data-td data last text-left">State geological survey tasked with identifying 1,200 exploration projects</td>
</tr>
<tr class="tbl-data">
<td class="data-td data last text-left">Japan</td>
<td class="data-td data last text-left">JOGMEC</td>
<td class="data-td data last text-left">&euro;110m equity/debt for a rare earth refining facility in France</td>
</tr>
<tr class="tbl-data">
<td class="data-td data last text-left">U.K.</td>
<td class="data-td data last text-left">CirculaREEconomy</td>
<td class="data-td data last text-left">&pound;11m grant for building UK magnet-recycling chain</td>
</tr>
<tr class="tbl-data">
<td class="data-td data last text-left">South Korea</td>
<td class="data-td data last text-left">Supply Chain Stabilization Fund</td>
<td class="data-td data last text-left">₩50b per year fund for public-private overseas mine stakes and stockpiles</td>
</tr>
</tbody>
</table>
</div>
<style>
    .data-td.data {
        padding-right: 5px !important;
    }

    .data-head {
        padding-right: 5px !important;
    }

    .wrapped-div {
        max-width: 100%;
    }

    @media (max-width: 1240px) {
        .wrapped-div {
            overflow-x: scroll;
        }
    }

    .wrapped-div-full {
        overflow-x: scroll;
    }

    .wrapped-div-sector {
        max-width: 100%;
        overflow-x: scroll;
    }
</style>
<p class="chart-disclosure">Source: IEA, Reuters. Data as of August 2025</p>
<p>These projects will take years to scale, but the direction is clear: a coordinated effort to diversify supply away from China.</p>
<h2>How to Invest</h2>
<p>Directly purchasing rare earths isn&rsquo;t feasible for most investors&mdash;these materials are not traded on traditional commodity exchanges. That&rsquo;s where REMX comes in.</p>
<p>The <a href="/us/en/investments/rare-earth-strategic-metals-etf-remx/overview/" title="REMX - VanEck Rare Earth and Strategic Metals ETF"><strong>VanEck Rare Earth and Strategic Metals ETF (REMX)</strong></a> provides <strong>pure-play, comprehensive, global exposure</strong> with holdings generating at least 50% of revenues from rare earths and strategic metals.</p>
<p><span style="font-size: 14pt;"><strong>How to Buy REMX?</strong></span></p>
<p>Vaneck ETFs can be purchased the same way you would buy a stock, through a broker or with your advisor.</p>
<p>To receive more <a href="/us/en/insights/natural-resources/" title="Natural Resources Insights"><strong>Natural Resources</strong></a> insights, <a href="https://www.vaneck.com/us/en/subscribe/" title="Subscription Center"><strong>sign up in our subscription center</strong></a>.</p>
]]></content:encoded>
</item><item rdf:about="https://www.vaneck.com/us/en/blogs/thematic-investing/buzz-investing-stocks-push-higher-amid-low-volatility-and-policy-crosscurrents/">
  <title>BUZZ Investing: Stocks Push Higher Amid Low Volatility and Policy Crosscurrents></title>
  <link>https://www.vaneck.com/us/en/blogs/thematic-investing/buzz-investing-stocks-push-higher-amid-low-volatility-and-policy-crosscurrents/</link>
  <description><![CDATA[Amid stable macroeconomic conditions and signs of gradual cooling in the labor market, investor sentiment remained focused on AI-driven growth, commodity resurgence, and evolving expectations for Federal Reserve policy.]]></description>
  <dc:creator> </dc:creator>
  <dc:date>08/25/2025 06:30:00</dc:date>
<content:encoded><![CDATA[

<p><strong>Key Takeaways:</strong></p>
<ul class="content-list">
<li class="mt-2"><strong>AI and tech momentum</strong> fueled BUZZ Index gains, with standout performances from Palantir, Reddit, and AMD.</li>
<li class="mt-2"><strong>Crypto-related equities underperformed</strong> despite Bitcoin's strength, reflecting investor concerns over profitability, execution, and competition.</li>
<li class="mt-2"><strong>Investor sentiment shifts</strong> led to key index changes, including the addition of Barrick Mining and a rebound in UnitedHealth following major institutional buying.</li>
</ul>
<p>U.S. equities extended their advance during the recent period between index selection dates (July 10, 2025 &ndash; August 14, 2025, the &ldquo;Period&rdquo;), with the S&amp;P 500 and Nasdaq Composite reaching multiple new all-time highs. Volatility remained subdued, with 30-day realized volatility on major indices falling to some of the lowest levels observed over the past year. Large-cap technology stocks led the move higher, supported by a series of strong earnings reports that reinforced confidence in forward growth expectations. Broader market strength was aided by progress on trade policy, including a new U.S.&ndash;EU investment framework, and reduced political friction following the passage of the &ldquo;One Big, Beautiful Bill&rdquo; in Washington. The BUZZ NextGen AI US Sentiment Leaders Index ("BUZZ Index") returned 4.3% during the Period, compared to a gain of 3.1% for the S&amp;P 500. Year to date, the BUZZ Index has returned 30.7%, outperforming the S&amp;P 500&rsquo;s 10.8% gain.</p>
<p>Macroeconomic data released during the Period reflected continued strength alongside signs of gradual moderation. U.S. GDP grew at an annualized rate of 3.0% in the second quarter, reversing the decline in Q1 and reinforcing a steady near-term growth outlook. July inflation data remained contained, with headline CPI rising 2.7% year-over-year, broadly in line with expectations. Labor indicators pointed to some cooling, with a slight rise in unemployment claims and fewer job openings. The Federal Reserve held rates unchanged at its July meeting, while public comments from Fed officials suggested growing divergence on the timing and scope of potential policy easing. In fixed income, Treasury yields edged lower, with the 10-year falling to approximately 4.28% by mid-August. The U.S. dollar firmed modestly, while credit markets remained constructive, supported by healthy issuance and firm demand. Commodities were relatively stable, with crude oil and gold both trading in narrow ranges. Overall, the Period was marked by continued equity strength, supportive macro conditions, and a market increasingly focused on upcoming Fed communications, including the Jackson Hole symposium.</p>
<p>The BUZZ Index returned 6.41% during the month of July compared to a return of 2.24% for the S&amp;P 500 Index during the same period. Year-to-date, the BUZZ Index leads the S&amp;P 500 with returns of 29.90% and 8.59%, respectively, as of the end of July.</p>
<h2>Shares of Palantir pace BUZZ Index Gains</h2>
<p>Shares of Palantir Technologies (NYSE: PLTR) rallied sharply during the Period, leading contributors to BUZZ Index performance. The company reported its first-ever quarter with revenue above $1 billion, supported by 53% growth in U.S. government sales and a 93% surge in U.S. commercial revenue. Adjusted EPS of $0.16 beat expectations, while management raised full-year guidance to a range of $4.14&ndash;$4.15 billion. Investors responded positively to the accelerating adoption of Palantir&rsquo;s Artificial Intelligence Platform (AIP), which is being deployed across industries from financial services to manufacturing alongside large government contracts such as a $10 billion U.S. Army award. While valuation remains elevated, strong execution and repeated earnings beats have reinforced Palantir&rsquo;s position as a leading AI beneficiary.</p>
<p>Reddit (NYSE: RDDT) was another top contributor, gaining more than 70% during the Period. Shares surged after the company posted second-quarter revenue growth of 78% and a 21% year-over-year increase in daily active users, easing concerns over prior Google search-related traffic headwinds. Management highlighted growing adoption of AI-driven advertising tools and raised its outlook for the third quarter, projecting revenue well above consensus estimates. The results helped the stock recover from spring weakness and propelled it back to record highs, underscoring Reddit&rsquo;s positioning as both a key digital advertising platform and a valuable source of data for AI applications.</p>

<h3 id="top-contributors" class="jump-link-nav anchored-block" data-jumplink-title="Top Contributors">Top BUZZ Index Contributors: July 10, 2025 &ndash; August 14, 2025</h3>
<div class="wrapped-div">
<table width="100%">
<tbody>
<tr class="tbl-data">
<td class="tbl-header last text-left"><strong>Company</strong></td>
<td class="tbl-header last text-left"><strong>Ticker</strong></td>
<td class="tbl-header last text-right"><strong>Average Weight (%)</strong></td>
<td class="tbl-header last text-right"><strong>Return Contribution (%)</strong></td>
</tr>
<tr class="tbl-data">
<td class="data-td data last text-left">Palantir Technologies Inc</td>
<td class="data-td data last text-left">PLTR</td>
<td class="data-td data last text-right">3.27</td>
<td class="data-td data last text-right">0.80</td>
</tr>
<tr class="tbl-data">
<td class="data-td data last text-left">Advanced Micro Devices Inc</td>
<td class="data-td data last text-left">AMD</td>
<td class="data-td data last text-right">3.40</td>
<td class="data-td data last text-right">0.79</td>
</tr>
<tr class="tbl-data">
<td class="data-td data last text-left">Unity Software Inc</td>
<td class="data-td data last text-left">U</td>
<td class="data-td data last text-right">0.64</td>
<td class="data-td data last text-right">0.79</td>
</tr>
<tr class="tbl-data">
<td class="data-td data last text-left">Reddit Inc</td>
<td class="data-td data last text-left">RDDT</td>
<td class="data-td data last text-right">1.30</td>
<td class="data-td data last text-right">0.74</td>
</tr>
<tr class="tbl-data">
<td class="data-td data last text-left">Nebius Group NV</td>
<td class="data-td data last text-left">NBIS</td>
<td class="data-td data last text-right">1.65</td>
<td class="data-td data last text-right">0.56</td>
</tr>
<tr class="tbl-data">
<td class="data-td data last text-left">Rocket Lab Corp</td>
<td class="data-td data last text-left">RKLB</td>
<td class="data-td data last text-right">3.55</td>
<td class="data-td data last text-right">0.54</td>
</tr>
<tr class="tbl-data">
<td class="data-td data last text-left">Alphabet Inc</td>
<td class="data-td data last text-left">GOOGL</td>
<td class="data-td data last text-right">3.09</td>
<td class="data-td data last text-right">0.42</td>
</tr>
<tr class="tbl-data">
<td class="data-td data last text-left">Robinhood Markets Inc</td>
<td class="data-td data last text-left">HOOD</td>
<td class="data-td data last text-right">3.23</td>
<td class="data-td data last text-right">0.41</td>
</tr>
<tr class="tbl-data">
<td class="data-td data last text-left">AST SpaceMobile Inc</td>
<td class="data-td data last text-left">ASTS</td>
<td class="data-td data last text-right">3.51</td>
<td class="data-td data last text-right">0.37</td>
</tr>
<tr class="tbl-data">
<td class="data-td data last text-left">SoFi Technologies Inc</td>
<td class="data-td data last text-left">SOFI</td>
<td class="data-td data last text-right">3.18</td>
<td class="data-td data last text-right">0.37</td>
</tr>
</tbody>
</table>
</div>
<p class="chart-disclosure">Source: BUZZ Holdings ULC, Bloomberg. Past performance is no guarantee of future results. Index performance is not illustrative of fund performance. Not intended as a recommendation to buy or to sell any of the securities mentioned herein.</p>

<h2>Crypto Equities Weigh on the BUZZ Index</h2>
<p>Despite Bitcoin advancing during the Period, several high-profile crypto-linked equities were among the top detractors in the BUZZ Index. Marathon Digital (NASDAQ: MARA) declined as rising network difficulty and softer monthly production figures weighed on sentiment toward mining profitability. Coinbase Global (NASDAQ: COIN) also traded lower, giving back earlier gains as quarterly results modestly missed expectations and optimism around higher digital asset prices did not fully translate into trading activity or revenue momentum. MicroStrategy (NASDAQ: MSTR) underperformed as well, diverging from the strength in Bitcoin. While the company continues to emphasize its large Bitcoin holdings, investor attention may be shifting toward newer alternatives, including the growing popularity of institutional Bitcoin ETFs and the rise of corporate treasury-style offerings. These developments may be diminishing MicroStrategy&rsquo;s unique role as a listed proxy for direct Bitcoin exposure. Concerns around continued equity issuance and the reliance on leverage to expand its Bitcoin position may have also contributed to investor caution during the Period.</p>
<h3 id="bottom-contributors" class="jump-link-nav anchored-block" data-jumplink-title="Bottom Contributors">Bottom BUZZ Index Contributors: July 10, 2025 &ndash; August 14, 2025</h3>
<div class="wrapped-div">
<table width="100%">
<tbody>
<tr class="tbl-data">
<td class="tbl-header last text-left"><strong>Company</strong></td>
<td class="tbl-header last text-left"><strong>Ticker</strong></td>
<td class="tbl-header last text-right"><strong>Average Weight (%)</strong></td>
<td class="tbl-header last text-right"><strong>Return Contribution (%)</strong></td>
</tr>
<tr class="tbl-data">
<td class="data-td data last text-left">Archer Aviation Inc</td>
<td class="data-td data last text-left">ACHR</td>
<td class="data-td data last text-right">1.36</td>
<td class="data-td data last text-right">-0.55</td>
</tr>
<tr class="tbl-data">
<td class="data-td data last text-left">MARA Holdings Inc</td>
<td class="data-td data last text-left">MARA</td>
<td class="data-td data last text-right">1.44</td>
<td class="data-td data last text-right">-0.45</td>
</tr>
<tr class="tbl-data">
<td class="data-td data last text-left">Coinbase Global Inc</td>
<td class="data-td data last text-left">COIN</td>
<td class="data-td data last text-right">3.00</td>
<td class="data-td data last text-right">-0.42</td>
</tr>
<tr class="tbl-data">
<td class="data-td data last text-left">Strategy Inc</td>
<td class="data-td data last text-left">MSTR</td>
<td class="data-td data last text-right">2.84</td>
<td class="data-td data last text-right">-0.33</td>
</tr>
<tr class="tbl-data">
<td class="data-td data last text-left">Super Micro Computer Inc</td>
<td class="data-td data last text-left">SMCI</td>
<td class="data-td data last text-right">3.05</td>
<td class="data-td data last text-right">-0.29</td>
</tr>
<tr class="tbl-data">
<td class="data-td data last text-left">UnitedHealth Group Inc</td>
<td class="data-td data last text-left">UNH</td>
<td class="data-td data last text-right">2.55</td>
<td class="data-td data last text-right">-0.26</td>
</tr>
<tr class="tbl-data">
<td class="data-td data last text-left">Lululemon Athletica Inc</td>
<td class="data-td data last text-left">LULU</td>
<td class="data-td data last text-right">0.95</td>
<td class="data-td data last text-right">-0.21</td>
</tr>
<tr class="tbl-data">
<td class="data-td data last text-left">Hims &amp; Hers Health Inc</td>
<td class="data-td data last text-left">HIMS</td>
<td class="data-td data last text-right">3.02</td>
<td class="data-td data last text-right">-0.20</td>
</tr>
<tr class="tbl-data">
<td class="data-td data last text-left">Snap Inc</td>
<td class="data-td data last text-left">SNAP</td>
<td class="data-td data last text-right">0.65</td>
<td class="data-td data last text-right">-0.19</td>
</tr>
<tr class="tbl-data">
<td class="data-td data last text-left">Uber Technologies Inc</td>
<td class="data-td data last text-left">UBER</td>
<td class="data-td data last text-right">1.26</td>
<td class="data-td data last text-right">-0.17</td>
</tr>
</tbody>
</table>
</div>
<p class="chart-disclosure">Source: BUZZ Holdings ULC, Bloomberg. Past performance is no guarantee of future results. Index performance is not illustrative of fund performance. Not intended as a recommendation to buy or to sell any of the securities mentioned herein.</p>
<h2>BUZZ Index August 2025 Rebalance Highlights</h2>
<p><strong>Barrick Mining Corporation</strong></p>
<p>Gold staged a significant breakout last year after a prolonged period of consolidation, gaining nearly 70% since January 2024, and the rally has since extended to silver and copper, suggesting that investor interest in commodities may be broadening. Mining equities, long viewed skeptically after years of underperformance relative to the metals themselves, have begun to show renewed strength, with the VanEck Gold Miners ETF (NYSE ARCA: GDX) and the VanEck Junior Gold Miners ETF (NYSE ARCA: GDXJ) each posting significant gains year-to-date.. This shift may reflect a change in perception toward the sector, as investors appear increasingly open to the idea that miners could participate more meaningfully in the current commodity cycle. Within this backdrop, Barrick Mining Corporation (NYSE: B), the world&rsquo;s second-largest producer, enters the BUZZ Index in August as its largest new addition. Shares of Barrick are up more than 50% year-to-date and improving investor perception may indicate growing confidence that the sector is at the start of a more durable recovery. Barrick joins the BUZZ Index this month with 0.86% weight.</p>
<p><strong>UnitedHealth Group</strong></p>
<p>In May 2025, we highlighted the rebound in investor sentiment toward UnitedHealth Group (NYSE: UNH), even as the company continued to face negative headlines. At that time, UNH reached the Index&rsquo;s maximum 3% weight, reflecting the conviction some investors may have had in the emerging value thesis. Sentiment has continued to strengthen in recent months, even as the stock retested its May intraday low of $250. A potential inflection may have come on August 15, when 13F filings showed that Berkshire Hathaway, David Tepper, and several other large institutional managers had initiated or increased positions. The stock gained nearly 12% the following day, which may have reinforced the view that long-term investors see opportunity despite ongoing challenges. While the stock has rebounded from its lows, it continues to trade at roughly half of its all-time high, leaving scope for additional recovery if the value narrative persists. This month, UNH ranks among the top five sentiment leaders and remains at the Index&rsquo;s maximum 3% weight, highlighting how it may be viewed as one of the more notable large-cap recovery opportunities in the market.</p>

<p>To receive more <a href="https://www.vaneck.com/us/en/insights/thematic-investing/" title="Thematic Investing Insights"><strong>Thematic Investing</strong></a> insights, <a href="https://www.vaneck.com/us/en/subscribe/" title="Subscription Center"><strong>sign up in our subscription center</strong></a>.</p>
]]></content:encoded>
</item><item rdf:about="https://www.vaneck.com/us/en/blogs/emerging-markets-bonds/vaneck-emerging-markets-bond-mutual-fund-conversion-to-etf-questions-and-answers/">
  <title>VanEck Emerging Markets Bond Mutual Fund Conversion to ETF: Questions and Answers></title>
  <link>https://www.vaneck.com/us/en/blogs/emerging-markets-bonds/vaneck-emerging-markets-bond-mutual-fund-conversion-to-etf-questions-and-answers/</link>
  <description><![CDATA[We answer the frequently asked questions about the Emerging Markets Bond Mutual Fund Conversion to ETF.]]></description>
  <dc:creator> </dc:creator>
  <dc:date>08/22/2025 06:30:00</dc:date>
<content:encoded><![CDATA[

<p>On June 5, 2025, the Board of Trustees of VanEck Funds approved converting the VanEck Emerging Markets Bond Fund into an ETF by the reorganization of the Fund into a corresponding ETF, the VanEck Emerging Markets Bond ETF.</p>
<h2>Why did VanEck propose the conversion of my mutual fund to an ETF?</h2>
<p>VanEck believes that the Reorganization will provide multiple benefits for investors of the Fund, including lower expenses, additional trading flexibility, increased portfolio holdings transparency and the potential for enhanced tax efficiency.</p>
<h2>How does VanEck anticipate that the Fund be managed after the Reorganization?</h2>
<p>It is currently anticipated that the Acquiring ETF will be managed in substantially the same manner as the Fund, with minimal changes, if at all, to the Fund's investment process or the portfolio management team.</p>
<h2>What types of shareholder accounts can receive shares of an ETF as part of the Reorganization?</h2>
<p>If you hold your Fund shares in an account that permits you to purchase securities traded on U.S. stock exchanges, such as ETFs or other types of stocks, then you will be eligible to receive shares of the Acquiring ETF in the Reorganization. No further action is needed by you.</p>
<h2>What types of shareholder accounts cannot receive shares of an ETF as part of the Reorganization?</h2>
<p>The following account types cannot hold ETFs:</p>
<ul class="content-list">
<li>If you hold your Fund shares in an account with a financial intermediary that only allows you to hold shares of mutual funds in the account, you will need to contact your broker or financial intermediary to transfer your shares to an existing or new brokerage account that permits investment in ETF shares. <strong>If you do nothing, you will not receive shares of the ETF and your position will be liquidated and you will receive a cash distribution </strong>equal in value to the net asset value of your Fund shares <strong>less any fees and expenses your intermediary may charge. This event may be taxable. To prevent a taxable event, </strong>please contact your broker or financial intermediary to transfer your shares to an existing or new brokerage account.</li>
<li>If you hold your Fund shares through an IRA or group retirement plan whose plan sponsor does not have the ability to hold shares of ETFs on its platform, you may need to redeem your shares prior to the Reorganization, or your broker or intermediary may transfer your investment in the Fund to a different investment option prior to or at the time of the Reorganization.</li>
<li>If you are unsure about the ability of your account to accept shares of an ETF, please contact your broker or financial intermediary.</li>
</ul>
<h2>How do I transfer my Fund shares to a brokerage account that will accept ETF shares?</h2>
<p>The broker where you hold your Fund shares should be able to assist you in transferring your shares to a brokerage account that can accept shares of an ETF. <strong>The sooner you initiate the transfer, the better. </strong>If you don't have a brokerage account or a relationship with a brokerage firm, you will need to open an account with a brokerage firm.</p>
<h2>What if I do not want to own shares of an ETF?</h2>
<p>If you do not want to receive shares of the Acquiring ETF in connection with the Reorganization, you can exchange your Fund shares for shares of another VanEck mutual fund that is not participating in the Reorganization or redeem your Fund shares. Prior to doing so, however, you should consider the tax consequences associated with either action. Exchange or redemption of your Fund shares may be a taxable event if you hold your shares in a taxable account.</p>
<p>In connection with the Reorganization discussed herein, a prospectus/information statement included in a registration statement on Form N-14 will be filed with the Securities and Exchange Commission (the &ldquo;SEC&rdquo;). Investors are urged to read the materials and any other relevant documents when available because they will contain important information about the Reorganization. Free copies of the materials will be available on the SEC&rsquo;s website at <a href="http://www.sec.gov/" title="U.S. Securities and Exchange Commission" target="_blank" rel="noopener"><strong>www.sec.gov</strong></a>. A paper copy of the materials can be obtained at no charge by calling 1.800.826.2333. This communication is for informational purposes only and does not constitute an offer of any securities for sale. No offer of securities will be made except pursuant to a prospectus meeting the requirements of Section 10 of the Securities Act of 1933.</p>
<h2>Will the fees and expenses of the Acquiring Fund be lower than the fees and expenses of the Target Fund?</h2>
<p>Yes. The total expense ratio for the Acquiring Fund is lower than the expense ratios of each class of shares of the Target Fund. In addition, the Acquiring Fund will be subject to a unitary fee structure, which will require the Adviser to pay the Acquiring Fund&rsquo;s ordinary operating expenses (with limited exceptions as described below) without any increase in the Acquiring Fund&rsquo;s management fee, typically resulting in lower fees and expenses to shareholders. This obligation to bear fund expenses is part of the Acquiring Fund&rsquo;s investment management agreement and cannot be changed without the approval of shareholders.</p>
<p>The unitary management fee (the &ldquo;Unitary Fee&rdquo;) of the Acquiring Fund (0.75%) is lower than the management fee of the Target Fund (a non-unitary fee of 0.80% of the first $1.5 billion of average daily net assets of the Target Fund and (ii) 0.75% of average daily net assets in excess of $1.5 billion.). As noted above, the Acquiring Fund has a Unitary Fee, which means the Adviser is responsible for all expenses of the Acquiring Fund, including the costs of transfer agency, custody, fund administration, legal, audit and other services, except for the fee payment under the Investment Management Agreement, acquired fund fees and expenses, interest expense, offering costs, trading expenses, taxes and extraordinary expenses.<sup>1</sup></p>
<h2>What are some features of ETFs that differ from mutual funds?</h2>
<p>The following are some unique features of ETFs as compared to mutual funds:</p>
<p><i>Transparency.</i> The Acquiring Fund will be a transparent ETF that operates with full transparency of its portfolio holdings. Following the Reorganization, the Acquiring Fund, like other transparent ETFs, will make its portfolio holdings public each day. This holdings information, along with other information about the Acquiring Fund, will be found on the VanEck website.</p>
<p><i>Tax Efficiency.</i> In a mutual fund, when portfolio securities are sold, either to rebalance holdings or to raise cash for redemptions, the sale can create capital gains that impact all taxable shareholders of the mutual fund. In contrast, the mechanics of the creation and redemption process for ETFs allows ETFs to acquire securities in-kind and redeem securities in-kind generally reducing the realization of capital gains by the ETFs for the same processes. As a result, shareholders in an ETF are largely only subject to capital gains on their investment in the ETF after they sell their ETF shares.</p>
<p><i>Sales on an Exchange throughout the Day.</i> ETFs provide shareholders with the opportunity to purchase and sell shares throughout the day at market-determined prices, instead of being required to wait to make a purchase or a redemption at the next calculated NAV per share at the end of the trading day. This means that when a shareholder decides to purchase or sell shares of the ETF the shareholder can act on that decision immediately by contacting the shareholder&rsquo;s broker to execute the trade. The market price of the ETF may be higher or lower than the ETF&rsquo;s NAV per share, and might not be the same as the ETF&rsquo;s next calculated NAV at the close of the trading day.</p>
<p><i>Sales only through a Broker.</i> Unlike a mutual fund&rsquo;s shares, individual shares of ETFs, like the Acquiring Fund, are not purchased or sold at NAV directly with the Fund. Individual Acquiring Fund shares may only be purchased and sold through a broker at market prices. When buying and selling shares through a financial intermediary, a shareholder may incur brokerage or other charges determined by the financial intermediary, although ETFs trade with no transaction fees (NTF) on many platforms. In addition, a shareholder of an ETF, such as the Acquiring Fund, may incur costs attributable to the difference between the highest price a buyer is willing to pay to purchase shares(bid) and the lowest price a seller is willing to accept for shares (ask) when buying or selling shares in the secondary market (the &ldquo;bid-ask spread&rdquo;). Because ETF shares trade at market prices rather than at NAV, shares of an ETF, like the Acquiring Fund, may trade at a price less than (discount) or greater than (premium) the Fund&rsquo;s NAV. The trading prices of an ETF&rsquo;s shares in the secondary market will fluctuate continuously throughout trading hours based on the supply and demand for the ETF&rsquo;s shares and shares of the underlying securities held by the ETF, economic conditions and other factors, rather than an ETF&rsquo;s NAV, which is calculated at the end of each business day.</p>
<h2>When is the Reorganization expected to occur?</h2>
<p>VEAC is anticipating a Reorganization date on or around October 6, 2025. This date could be delayed because some administrative conditions must be satisfied to implement the Reorganization. The Target Fund will publicly disclose updates on material developments throughout the process.</p>
<h2>Will shareholders have to pay any sales load, commission or other similar fee in connection with the Reorganization?</h2>
<p>No. Shareholders will not pay any sales load, commission or other similar fee in connection with the receipt of ETF shares from the Reorganization.</p>
<h2>Can I purchase, redeem or exchange shares of the Target Fund before the Reorganizationtakes place?</h2>
<p>Yes. You can purchase or exchange Target Fund shares until September 29, 2025. You can redeem Target Fund shares until the business day before the Reorganization occurs. That means your redemption order must be received by October 3, 2025. Any shares not redeemed before this date will be exchanged for shares of the Acquiring Fund.</p>
<h2>What do I need to do to prepare for the Reorganization?</h2>
<p>It is important for you to determine that you hold your shares of the Target Fund in the type of account that can accommodate the receipt of the ETF shares that will be received in the Reorganization. If you hold your shares of the Target Fund in an account directly with the Fund at the Fund&rsquo;s transfer agent or in a brokerage account with a financial intermediary that only allows you to hold mutual fund shares, you will need to set up a brokerage account that allows investment in ETF shares. A separate Q&amp;A that immediately follows this Q&amp;A is provided to help you determine your account type and provide information about changing your type of account if necessary.</p>
<p>For shareholders who do not have a brokerage account that can accept ETF shares, if a brokerage account is not set up by October 3,2025, you will not receive shares of the Acquiring Fund as part of the Reorganization. Instead, your Target Fund investment will be liquidated on October 3, 2025 and you will receive cash equal in value to the NAV of your Target Fund shares. (subject to applicable federal or state laws concerning unclaimed property). The conversion of Target Fund shares to cash may be subject to fees and expenses and will likely be a taxable event.</p>
<h2>Whom do I contact for further information?</h2>
<p>You can contact your financial advisor or other financial intermediary for further information. If you do not have a financial intermediary, you also may contact VanEck at 800 826-2333.</p>
<h3>VanEck Emerging Markets Bond ETF Expense Information</h3>
<p><strong>Annual Fund Operating Expenses</strong></p>
<p>(expenses that you pay each year as a percentage of the value of your investment)</p>
<div class="wrapped-div">
<table style="width: 100%;">
<tbody>
<tr class="tbl-data">
<td class="data-td data last text-left">Management Fee</td>
<td class="data-td data last text-right">0.75%</td>
</tr>
<tr class="tbl-data">
<td class="data-td data last text-left">Other Expenses<sup>(b)</sup></td>
<td class="data-td data last text-right">0.01%</td>
</tr>
<tr class="tbl-data">
<td class="data-td last text-left">Total Annual Fund Operating Expenses<sup>(a)</sup></td>
<td class="data-td last text-right">0.76%</td>
</tr>
</tbody>
</table>
</div>
<br />
<p class="chart-disclosure"><sup>(a)</sup>&nbsp;Van Eck Associates Corporation (the &ldquo;Adviser&rdquo;) will pay all expenses of the Fund, except for the fee payment under the investment management agreement, acquired fund fees and expenses, interest expense, offering costs, trading expenses, taxes and extraordinary expenses. Notwithstanding the foregoing, the Adviser has agreed to pay the offering costs until at least May 1, 2027.</p>
<p class="chart-disclosure"><sup>(b)</sup>&nbsp;&ldquo;Other Expenses&rdquo; are based on estimated amounts for the current fiscal year.</p>
<h3>Emerging Markets Bond Fund Expense Information</h3>
<p><strong>Annual Fund Operating Expenses</strong></p>
<p>(expenses that you pay each year as a percentage of the value of your investment)</p>
<div class="wrapped-div">
<table style="width: 100%;">
<tbody>
<tr class="tbl-data">
<td class="tbl-header last">&nbsp;</td>
<td class="tbl-header last text-right">Class A %</td>
<td class="tbl-header last text-right">Class I %</td>
<td class="tbl-header last text-right">Class Y %</td>
</tr>
<tr class="tbl-data">
<td class="data-td data last text-left">Management Fees</td>
<td class="data-td data last text-right">0.80</td>
</tr>
<tr class="tbl-data">
<td class="data-td data last text-left">Distribution and/or Service (12b-1) Fees</td>
<td class="data-td data last text-right">0.25</td>
<td class="data-td data last text-right">0.00</td>
</tr>
<tr class="tbl-data">
<td class="data-td data last text-left">Other Expenses</td>
<td class="data-td data last text-right">0.78</td>
<td class="data-td data last text-right">0.57</td>
<td class="data-td data last text-right">0.53</td>
</tr>
<tr class="tbl-data">
<td class="data-td last text-left">Total Annual Fund Operating Expenses</td>
<td class="data-td last text-right">1.83</td>
<td class="data-td last text-right">1.37</td>
<td class="data-td last text-right">1.33</td>
</tr>
<tr class="tbl-data">
<td class="data-td data last text-left">Fee Waivers and/or Expense Reimbursements<sup>2</sup></td>
<td class="data-td data last text-right">-0.62</td>
<td class="data-td data last text-right">-0.51</td>
<td class="data-td data last text-right">-0.37</td>
</tr>
<tr class="tbl-data">
<td class="data-td last text-left">Total Annual Fund Operating Expenses After Fee Waivers and/or Expense Reimbursements</td>
<td class="data-td last text-right">1.21</td>
<td class="data-td last text-right">0.86</td>
<td class="data-td last text-right">0.96</td>
</tr>
</tbody>
</table>
</div>
<br />
<p class="chart-disclosure"><sup>1</sup>&nbsp;A contingent deferred sales charge for Class A shares of 1.00% for one year applies to redemptions of qualified commissionable shares purchased at or above the $1 million breakpoint level.</p>
<p class="chart-disclosure"><sup>2</sup>&nbsp;Van Eck Associates Corporation (the &ldquo;Adviser&rdquo;) has agreed to waive fees and/or pay Fund expenses to the extent necessary to prevent the operating expenses of the Fund (excluding acquired fund fees and expenses, interest expense, trading expenses, dividends and interest payments on securities sold short, taxes and extraordinary expenses) from exceeding 1.20% for Class A, 0.85% for Class I, and 0.95% for Class Y of the Fund&rsquo;s average daily net assets per year until May 1, 2026. During such time, the expense limitation is expected to continue until the Board of Trustees acts to discontinue all or a portion of such expense limitation.</p>
<style>
    .data-td.data {
        padding-right: 5px !important;
        padding-left: 5px !important;
    }

    .wrapped-div {
        max-width: 100%;
    }

    @media (max-width: 1240px) {
        .wrapped-div {
            overflow-x: scroll;
        }
    }

    .wrapped-div-sector {
        max-width: 100%;
        overflow-x: scroll;
    }
</style>
<p>To receive more <a href="https://www.vaneck.com/us/en/insights/emerging-markets-bonds/" title="Emerging Markets Bonds Insights"><strong>Emerging Markets Bonds</strong></a> insights, <a href="/link/5f45412c2143400497908cea2897f7d3.aspx" title=" Subscription Center"><strong>sign up in our subscription center</strong></a>.</p>
]]></content:encoded>
</item><item rdf:about="https://www.vaneck.com/us/en/blogs/digital-assets/how-younger-generations-are-redefining-wealth-through-crypto-and-collectibles/">
  <title>How Younger Generations Are Redefining Wealth Through Crypto and Collectibles></title>
  <link>https://www.vaneck.com/us/en/blogs/digital-assets/how-younger-generations-are-redefining-wealth-through-crypto-and-collectibles/</link>
  <description><![CDATA[As Millennials and Gen Z face barriers to traditional wealth building, they&rsquo;re embracing crypto and collectibles, finding value in scarcity, digital ownership, and cultural significance.]]></description>
  <dc:creator>Matthew Bartlett</dc:creator>
  <dc:date>08/22/2025 06:30:00</dc:date>
<content:encoded><![CDATA[

<p>We&rsquo;re watching a quiet shift unfold in the financial world. It&rsquo;s not driven by policy changes or institutional mandates, but by how younger generations are rethinking the role of money, ownership, and value.</p>
<p>Millennials and Gen Z are entering an economy where many of the traditional paths to building wealth don&rsquo;t feel as accessible as they once were. Real estate is out of reach for many. Public markets feel increasingly abstract or dominated by large institutions. And inflation, while rarely headline news anymore, continues to chip away at purchasing power in a way that&rsquo;s hard to ignore.</p>
<p>That doesn&rsquo;t mean this generation is disengaging from the markets. It just means they&rsquo;re looking for alternative options. Among the more interesting trends are two areas that might seem unrelated at first: crypto and collectibles. They share something important. Both rely on scarcity, carry strong cultural meaning, and offer a level of ownership that feels more direct and personal.</p>
<h2>Wealth on Their Own Terms</h2>
<p>It&rsquo;s not that younger investors are anti-finance. They&rsquo;re just playing a different game based on the hand they&rsquo;ve been dealt.</p>
<p>For many, wage growth hasn&rsquo;t kept up with asset prices. Buying a home, especially in major cities, has become far more difficult. Private investment opportunities are still limited to accredited investors. And even with index funds or ETFs, the market often feels distant or detached from real life.</p>
<p>So the shift we&rsquo;re seeing is practical. People are looking for assets that are easier to access, more transparent, and better aligned with how they live and operate day to day. That&rsquo;s what makes crypto and collectibles so appealing. They offer flexibility, portability, and, in many cases, they live in the same digital environments that these generations already spend most of their time in.</p>
<h2>Scarcity Continues to be a Signal of Value</h2>
<p>Scarcity has always been part of the investing story. It&rsquo;s what gives value to fine art, rare wine, or classic cars. What&rsquo;s different now is how younger investors are applying that same thinking to a broader mix of assets.</p>
<p>A limited-edition trading card, a pair of collectible sneakers, or a fixed-supply token offers something you can&rsquo;t easily replicate. It stands in contrast to a world that feels increasingly saturated &mdash; whether it&rsquo;s liquidity, data, or content.</p>
<p>Scarce assets bring focus. They also create a sense of permanence in an environment where everything else can feel volatile or uncertain.</p>
<h2>Blending Digital Scarcity and Physical Ownership</h2>
<p>Blockchain technology made something possible that didn&rsquo;t really exist before. For the first time, you could verify ownership of a digital item without needing a third party to vouch for it.</p>
<p>That simple shift opened the door to all kinds of possibilities. Suddenly, a digital item could be treated like a physical collectible, with transparent provenance, fixed supply, and access to global markets.</p>
<p>We&rsquo;ve seen this play out in multiple ways:</p>
<ul class="content-list">
<li class="mt-2"><strong>NFT IP Expansion</strong>: <em>Pudgy Penguins</em>, which began as a profile picture (PFP) NFT project, has grown into a full-fledged IP powerhouse &mdash; expanding into toys, licensing deals, and mainstream culture. It shows how digital-native communities can evolve into brands with staying power.</li>
</ul>
<p><img loading="lazy" src="https://www.vaneck.com/contentassets/31f328b452d645f9b3304f360bffb568/6060_collectibles-blog_image-1_2025-08_v1_option-1.jpg" alt="Luca Schnetzler, Pudgy Penguin CEO, speaking at VanEck's Web3 Takeover event" class="img-responsive w-100" /></p>
<p class="chart-disclosure">Luca Schnetzler, Pudgy Penguin CEO, speaking at VanEck&rsquo;s Web3 Takeover event.</p>
<ul class="content-list">
<li class="mt-2"><strong>&ldquo;Phygital&rdquo; Collectibles</strong>: Companies like <em>Orange Cap Games</em> have taken Pudgy IP as one example, a step further by creating a trading card game that bridges physical and digital. It&rsquo;s not just a product; it&rsquo;s a new kind of collectible experience, where ownership, gameplay, and blockchain verification all intersect.</li>
</ul>
<p><img loading="lazy" src="https://www.vaneck.com/contentassets/fbc40299c7d5490098f69f0464445e26/6060_collectibles-blog_image-2_2025-08_v1.jpg" alt="VanEck Promo Card from Orange Cap Games." class="img-resonsive w-100" /></p>
<p class="chart-disclosure">VanEck Promo Card from Orange Cap Games.</p>
<ul class="content-list">
<li class="mt-2"><strong>Tokenized Assets</strong>: Beyond IP, tokenized real-world assets now allow people to invest in trading cards, watches, or art without needing to physically custody them. NFTs tied to tangible goods provide built-in authenticity and ownership tracking.</li>
</ul>
<p>Digital scarcity doesn&rsquo;t replace physical ownership. It expands what&rsquo;s possible, creating hybrid experiences that are both cultural and investable.</p>
<h2>Assets Represent More Than Financial Value</h2>
<p>What&rsquo;s often overlooked in these conversations is that crypto and collectibles also carry cultural weight.</p>
<p>A rare card or a unique NFT can say something about who you are, what you value, or the communities you belong to. A wallet can function as both a portfolio and a social signal.</p>
<p>That might feel unusual from a traditional finance perspective, but it&rsquo;s second nature to people who grew up online. Value isn&rsquo;t only measured in return on capital. It&rsquo;s also about meaning, relevance, and participation.</p>
<h2>Acknowledging Risks, Yet Advancing Forward</h2>
<p>Like any nascent market, there are risks. Volatility, fraud, and speculation are all part of the landscape. Not all platforms are equal, and not every project is built to last. But that doesn&rsquo;t mean the space isn&rsquo;t evolving. We&rsquo;re seeing real progress in areas like custody, compliance, authentication, and regulation. Professional infrastructure is starting to support these markets in a more serious way.</p>
<p>It&rsquo;s easy to focus on the noise, but beneath it is a clear signal. There is genuine demand for assets that blend scarcity, utility, and cultural relevance. That demand is unlikely to fade anytime soon.</p>
<h2>Traditional Finance&rsquo;s Role in a Changing Market</h2>
<p>At VanEck, we see this trend as an opportunity, not a challenge. Potentially in the future, it could be interesting to help connect investors to the assets and strategies they care about, with the same level of trust and infrastructure they&rsquo;ve come to expect from traditional financial markets.</p>
<p>There&rsquo;s a generation coming up that wants access to scarce, verifiable, globally tradable assets. They want ownership models that reflect how they live, communicate, and build. They are not abandoning the financial system. They&rsquo;re just choosing to engage with it on their terms.</p>
<p>That&rsquo;s why we&rsquo;ve begun experimenting in this space ourselves:</p>
<ul class="content-list">
<li class="mt-2"><strong>SegMint:</strong> Originally launched as a collectibles marketplace, SegMint is now being developed into a backend infrastructure project designed to power the tokenization, authentication, and trading of real-world collectibles.</li>
<li class="mt-2"><strong>Social Collectibles App</strong> (coming early 2026): On the consumer side, we&rsquo;re building a social-first platform where collectors can scan, showcase, and trade their items more seamlessly &mdash; with digital binders, trade matching, and community features that make collecting more connected and rewarding.</li>
</ul>
<p>By building bridges between established frameworks and new asset classes, we can support a broader, more inclusive definition of investing &mdash; one that reflects the full spectrum of value in a changing world.</p>
<p>To receive more <strong><a href="https://www.vaneck.com/us/en/insights/digital-assets/" title="Digital Assets Insights">Digital Assets</a></strong> insights, <strong><a href="https://www.vaneck.com/us/en/subscribe/" title="Subscription Center">sign up in our subscription center</a></strong>.</p>
]]></content:encoded>
</item><item rdf:about="https://www.vaneck.com/us/en/blogs/income-investing/clos-vs-cdos-understanding-the-difference/">
  <title>CLOs vs. CDOs: Understanding the Difference></title>
  <link>https://www.vaneck.com/us/en/blogs/income-investing/clos-vs-cdos-understanding-the-difference/</link>
  <description><![CDATA[Don&rsquo;t mistake CLOs for CDOs&mdash;CLOs invest in senior secured loans and have built-in risk protections that have been tested through two major market crises.]]></description>
  <dc:creator>William Sokol</dc:creator>
  <dc:date>08/18/2025 06:30:00</dc:date>
<content:encoded><![CDATA[

<p><strong>Key Takeaways:</strong></p>
<ul class="content-list">
<li class="mt-2">Unlike CDOs, CLOs are backed by senior secured loans with lower historical credit risk.</li>
<li class="mt-2">Strong performance through 2008 and COVID shows CLOs resilience in stressed market environments.</li>
<li class="mt-2">Built-in safeguards like coverage tests and active management help reduce default risk.</li>
<li class="mt-2">Higher yields and transparency make CLOs a compelling option in fixed income investing.</li>
</ul>
<p>Collateralized loan obligations (CLOs) are not the same thing as collateralized debt obligations (CDOs). While they both securitized products that, on the surface, share many structural similarities, these similarities and the terminologies used can cause confusion among investors, who may end up conflating CLOs with some of the more notorious CDOs of the past. As a result, the perception exists among some investors that all structured credit is inherently riskier than more traditional fixed income. However, CLOs stand apart from other types of structured credit due to the types of assets they invest in and structural risk protections. This has resulted in stark performance differences historically, including during and after the 2008 Global Financial Crisis (GFC), in which CLO investors (particularly those in senior tranches) fared very well, while many CDO investors experienced severe losses.</p>
<p>In this blog, we dispel prevailing misconceptions around CLOs, and highlight their relative stability, even in periods of extreme stress like the 2008 Global Financial Crisis and the more recent COVID-19 market drawdown.</p>
<div class="row">
<div class="col-md-4 col-xs-12"><a href="https://www.youtube.com/embed/iR5G8XlMuO8" data-video="https://youtu.be/iR5G8XlMuO8" class="popup-youtube" title="Watch Video"><img loading="lazy" class="img-responsive" style="margin-right: 15px; margin-top: 0px;" src="https://www.vaneck.com/contentassets/b1b80969c63f4762aaa6d562484a5b20/4516_clo-vs-cdos_thumbnail_2024-8_v3.jpg" alt="Watch Video" align="left" /></a></div>
<div class="col-md-8 col-xs-12"><br /><strong><a href="https://www.youtube.com/embed/iR5G8XlMuO8" data-video=" https://youtu.be/iR5G8XlMuO8" class="popup-youtube" title="Watch Video">Watch Video</a><br /></strong><a href="https://www.youtube.com/embed/iR5G8XlMuO8" data-video="https://youtu.be/iR5G8XlMuO8" class="popup-youtube" title="Watch Video" style="font-size: 16px; font-weight: bold; padding: 10px 0px 0px; margin-right: 20px; width: 202px;">CLOs vs. CDOs: Understanding the Difference</a></div>
</div>
<br />
<p>As a generic term, CDO can refer to vehicles that hold a variety of debt instruments including bonds, mortgages (including subprime mortgages) or even other CDOs. CLO refers to vehicles that invest in leveraged loans. Ultimately, this is the most important differentiator between CLOs and CDOs, and it drives the vastly different risk and return profiles. Leveraged loans are a form of corporate debt, like high yield bonds, often issued by household names such as American Airlines, Staples and Charter Communications. However, leveraged loans rank senior to high yield bonds and have a first lien on the company&rsquo;s assets, resulting in higher recovery rates, and thus lower loss rates, historically compared to lower ranking and typically unsecured high yield bonds. Ultimately, this means lower credit risk, all else equal.</p>
<p>The focus of CLOs on corporate credit is worth emphasizing, particularly as concerns in the real estate market emerge. Although there is a type of CLO that invests in real estate loans (CRE CLOs), these are distinct from the $1 trillion CLO market that invests in broadly syndicated leveraged loans. In general, CLOs also have very low indirect real estate exposure as well (e.g. to regional banks or REITs).</p>
<p>A CLO typically holds 150-250 individual loans. CLOs are generally more transparent than CDOs, allowing investors to look through to the underlying loans. An experienced CLO tranche investor can therefore perform credit analysis on the underlying issuers to inform their buy or sell decisions. This is in contrast to CDOs that held subprime mortgages, which provided portfolio-level statistics of the underlying borrowers, but little detail on the thousands of underlying mortgages. The leverage loan market itself is regulated, in addition to the borrowers themselves being widely covered by credit analysts, whereas the subprime mortgages held in GFC-era CDOs were lightly regulated and were not subject to rigorous due diligence. These CDOs also did not benefit from a long history of corporate default and recovery data on which to base pricing and ratings assumptions, as the subprime mortgage and credit derivative market were relatively new and had not experienced a market environment anything like the GFC.</p>
<p>The underlying loans of a CLO are liquid and tradeable, which is not the case with other CDOs. CLOs are also actively managed, and for a period of time after issuance, the collateral manager can actively trade and reinvest within the loan portfolio. This active management is a key risk mitigator for CLOs, allowing CLO managers to maintain the overall credit quality of the portfolio by selecting loans with attractive characteristics, or reducing or avoiding issuers or sector exposures they are less comfortable with.</p>

<h2>CLOs Did Not Cause the 2008 Global Financial Crisis</h2>
<p>One common misperception is that CLOs are excessively risky and contributed significantly to the 2008 Global Financial Crisis. This confusion arises because of their similarity with CDOs in terms of structure and nomenclature, and the latter's notorious reputation for being a major contributor to the crisis. In fact, not only did CLOs have nothing to do with the Global Financial Crisis, the asset class thrived through the 2008 crisis relative to other fixed income asset classes.</p>
<p>Through both the Global Financial Crisis and COVID-19 drawdown, CLOs ultimately experienced fewer defaults than corporate bonds of the same rating. For example, of the approximately $500B of U.S. CLOs issued from 1994-2009 and rated by S&amp;P, only 0.88% experienced defaults. In the higher rated AAA and AA CLO tranches, there have been zero defaults.<sup>1</sup></p>
<h2>CLOs Are Built Different&mdash;With Built-In Risk Protection</h2>
<p>In addition to the attractive risk profile and active management of its underlying collateral, the structure of CLOs helps mitigate risk. For example, coverage tests are a vital mechanism to detect and correct collateral deterioration, which directly affects the allocation of cash flows. All CLOs have covenants that require the manager to test the portfolio&rsquo;s ability to cover its interest payments monthly. Among the many such tests, the most common are the interest coverage and overcollateralization tests. Interest coverage dictates that the income generated by the underlying pool of loans must be greater than the interest due on the outstanding debt in the CLO, while overcollateralization requires the principal amount of the underlying pool of loans to be greater than the principal amount of outstanding CLO tranches. As shown below, if the tests come up short, cash flows are diverted from more junior tranches to pay off the most senior tranches first, until these failures are cured.</p>
<div class="row">
<div class="col-md-4 col-xs-12"><a href="https://www.youtube.com/embed/JzQcAtCmMXY" data-video="https://youtu.be/JzQcAtCmMXY" class="popup-youtube" title="Watch Video"><img loading="lazy" class="img-responsive" style="margin-right: 15px; margin-top: 0px;" src="https://www.vaneck.com/EPiServer/CMS/Content/contentassets/en/cc0eb160ecc14030ae63575b66831a61/4516_clo-structuralprotections_thumbnail_2024-8_v2.jpg,,289802_23719031/Download?epieditmode=False" alt="Watch Video" align="left" /></a></div>
<div class="col-md-8 col-xs-12"><br /><strong><a href="https://www.youtube.com/embed/JzQcAtCmMXY" data-video=" https://youtu.be/JzQcAtCmMXY" class="popup-youtube" title="Watch Video">Watch Video</a><br /></strong><a href="https://www.youtube.com/embed/JzQcAtCmMXY" data-video="https://youtu.be/JzQcAtCmMXY" class="popup-youtube" title="Watch Video" style="font-size: 16px; font-weight: bold; padding: 10px 0px 0px; margin-right: 20px; width: 202px;">Structural Protections of CLOs</a></div>
</div>
<h3>CLOs Are Structured to Protect Debtholders</h3>
<p><img loading="lazy" class="img-responsive w-100" src="https://www.vaneck.com/contentassets/6647e9abb4724a2cace70b710974fe6d/cloi_chart-02_2022.07_v1_blog.svg" alt="CLOs Are Structured to Minimize Defaults" /></p>
<p class="chart-disclosure"><strong>Source: VanEck.</strong> This is not an offer to buy or sell, or recommendation to buy or sell any of the securities mentioned herein.</p>
<h2>The Reality of CLOs: Strong Historical Performance</h2>
<p>Don&rsquo;t let prevailing misconceptions about CLOs deter you from considering this asset class as part of a diversified portfolio. Understanding the intricacies of these securities can potentially uncover valuable investment opportunities often overshadowed by misunderstandings.</p>
<p>Over the long term, CLO tranches have performed well relative to other corporate debt categories, including leveraged loans, high yield bonds, and investment grade bonds, and have significantly outperformed at lower rating tiers. Because of CLOs&rsquo; <a href="https://www.vaneck.com/us/en/blogs/income-investing/clos-question-and-answer/#point-three" title="CLOI ETF: Question and Answer"><strong>built in risk protection</strong></a>&mdash;which comes from the strength of their underlying collateral as well as structural traits, such as coverage tests to correct collateral deterioration&mdash;they have historically experienced lower levels of principal loss when compared with corporate debt and other securitized products. This has resulted in a track record of strong risk-adjusted returns versus other fixed income asset classes.</p>
<h3>CLOs versus Other Asset Classes</h3>
<p><img loading="lazy" class="img-responsive w-100" src="https://www.vaneck.com/contentassets/6647e9abb4724a2cace70b710974fe6d/3188_cloi_chart_01_v1_2022_06_blog_2.svg" alt="CLOs versus Other Asset Classes" /></p>
<p class="chart-disclosure">Source: Morningstar. CLOs represented by J.P. Morgan CLO Index; AAA Rated CLOs represented by J.P. Morgan CLO AAA Index, AA Rated CLOs represented by J.P. Morgan CLO AA Index, A Rated CLOs represented by J.P. Morgan CLO A Index, BBB Rated CLOs represented by J.P. Morgan CLO BBB Index, BB Rated CLOs represented by J.P. Morgan CLO BB Index, US IG represented by ICE BofA US Corporate Index, US HY represented by ICE BofA US High Yield Index, Agg is represented by the ICE BofA US Broad Market, US IG FRNs represented by MVIS US Investment Grade Floating Rate Note Index, Leveraged Loans represented by Morningstar LSTA US Leveraged Loan 100 Index, AA-BB CLOs represented by JPM CLO Bal Mezz Index, IG CLOs represented by JPM CLO IG Index See index descriptions at the end of this presentation. Past performance is not indicative of future results. This is not an offer to buy or sell, or recommendation to buy or sell any of the securities mentioned herein.</p>
<p>With higher relative yields and a history of strong risk-adjusted returns, we believe CLOs should be a strategic allocation within an investor&rsquo;s portfolio.</p>

<p>The <a href="/link/e090deaddc774ac699a04b959d9254c6.aspx" title="CLOI - VanEck CLO ETF - Overview"><strong>VanEck CLO ETF (CLOI)</strong></a> and <a href="/link/d2f16468a9f14c1e807f6bb7fb597a3e.aspx" title="CLOB - VanEck AA-BB CLO ETF - Overview"><strong>VanEck AA-BB CLO ETF (CLOB)</strong></a> are actively managed ETFs, sub-advised by PineBridge Investments. CLOI provides access to investment grade CLOs, and CLOB invests primarily in mezzanine tranches of CLOs. Both ETFs benefit from PineBridge&rsquo;s decades of CLO market experience, both as a CLO manager and CLO tranche investor, and deep leveraged finance expertise.</p>
<p>To receive more <a href="https://www.vaneck.com/us/en/insights/income-investing/" title="Income Investing insights"><strong>Income Investing</strong></a> insights, <a href="/link/5f45412c2143400497908cea2897f7d3.aspx" title=" Subscription Center"><strong>sign up in our subscription center</strong></a>.</p>
]]></content:encoded>
</item><item rdf:about="https://www.vaneck.com/us/en/blogs/digital-assets/hodl-etf-question-and-answer/">
  <title>HODL ETF: Question &amp; Answer></title>
  <link>https://www.vaneck.com/us/en/blogs/digital-assets/hodl-etf-question-and-answer/</link>
  <description><![CDATA[We answer the frequently asked questions about the HODL ETF.]]></description>
  <dc:creator>Denis   Zinoviev</dc:creator>
  <dc:date>08/18/2025 06:30:00</dc:date>
<content:encoded><![CDATA[

<p><strong>An investment in the VanEck Bitcoin ETF (&ldquo;HODL,&rdquo; or the &ldquo;Trust&rdquo;) is subject to significant risk and may not be suitable for all investors. The value of Bitcoin is highly volatile, and you can lose your entire principal investment. HODL is not an investment company registered under the Investment Company Act of 1940 (the &ldquo;1940 Act&rdquo;) and therefore is not subject to the same protections as mutual funds or ETFs registered under the 1940 Act.</strong></p>
<p>HODL: <strong><a href="/link/e69729da605940c3a698168162105cc1.aspx" title="HODL Prospectus">Prospectus</a></strong></p>
<ul class="content-list">
<li class="mt-2"><a href="#point-1"><strong>Why should investors consider HODL?</strong></a></li>
<li class="mt-2"><a href="#point-2"><strong>Why should investors consider investing in Bitcoin now?</strong></a></li>
<li class="mt-2"><a href="#point-3"><strong>What is the investment strategy for HODL?</strong></a></li>
<li class="mt-2"><a href="#point-4"><strong>How does the VanEck Bitcoin ETF track the price of bitcoin?</strong></a></li>
<li class="mt-2"><a href="#point-5"><strong>How does HODL compare to direct bitcoin ownership?</strong></a></li>
<li class="mt-2"><a href="#point-6"><strong>What are the differences between HODL and other bitcoin investment options?</strong></a></li>
<li class="mt-2"><a href="#point-7"><strong>How does the fund's creation/redemption process work?</strong></a></li>
<li class="mt-2"><a href="#point-8"><strong>How does the fund buy and sell bitcoin?</strong></a></li>
<li class="mt-2"><a href="#point-9"><strong>What are the tax implications compared to direct bitcoin investment?</strong></a></li>
<li class="mt-2"><a href="#point-10"><strong>How is the bitcoin for HODL custodied?</strong></a></li>
<li class="mt-2"><a href="#point-11"><strong>What are the risks involved in buying HODL?</strong></a></li>
<li class="mt-2"><a href="#point-12"><strong>How does the Trust audit its bitcoin?</strong></a></li>
<li class="mt-2"><a href="#point-13"><strong>How can investors buy HODL? </strong></a></li>
<li class="mt-2"><a href="#point-14"><strong>Are there options available on HODL?</strong></a></li>
</ul>
<h2 id="point-1" class="anchored-block">Why should investors consider HODL?</h2>
<p><a href="/link/c754aca617ab4535a8e611ded6d5b13c.aspx" title="HODL - VanEck Bitcoin ETF - Overview"><strong>HODL</strong> </a>offers a convenient way to gain exposure to Bitcoin without the complexities of direct ownership. It&rsquo;s a cost-efficient method to obtain bitcoin exposure, managed by VanEck, a well-established ETF issuer with extensive experience in crypto-related products. <a href="/link/c754aca617ab4535a8e611ded6d5b13c.aspx" title="HODL - VanEck Bitcoin ETF - Overview"><strong>HODL</strong></a> also benefits from expert management and qualified custody of bitcoin. This product makes it easier and potentially more secure for investors to add bitcoin to their portfolios.</p>
<h2 id="point-2" class="anchored-block">Why should investors consider investing in Bitcoin now?</h2>
<p>Bitcoin is a scarce asset, with only 21 million bitcoins ever to exist, enhancing its appeal as a potential store of value. As a potential digital store of value and a potential hedge against inflation, Bitcoin offers portfolio diversification benefits. With over a decade of operating history and a growing network of users, Bitcoin's acceptance is increasing in the mainstream financial world.</p>
<ul class="content-list">
<li class="mt-2"><strong>Utility and Demand:</strong> Bitcoin is used as a decentralized digital currency, enabling peer-to-peer transactions without the need for intermediaries. Its utility as a store of value and medium of exchange drives continuous demand in various economic sectors.</li>
<li class="mt-2"><strong>Portfolio Diversification:</strong> Investing in Bitcoin can provide potential portfolio diversification benefits, as it operates independently from traditional financial assets. Its unique market dynamics can help balance risk and return in a diversified investment portfolio.</li>
<li class="mt-2"><strong>Adoption and Growth:</strong> With increasing mainstream acceptance and institutional interest, Bitcoin's role in the digital economy is expanding rapidly. Its robust and active community contributes to its growing adoption and continuous development, enhancing its potential as a global digital currency.</li>
</ul>
<h2 id="point-3" class="anchored-block">What is the investment strategy for HODL?</h2>
<p>The Trust&rsquo;s investment objective is to reflect the performance of the price of Bitcoin less the expenses of the Trust&rsquo;s operations. The Trust is a passive investment vehicle that does not seek to pursue any investment strategy beyond tracking the price of bitcoin.</p>
<h2 id="point-4" class="anchored-block">How does the VanEck Bitcoin ETF track the price of bitcoin?</h2>
<p>The product aims to closely track the price of the <strong><a href="https://www.marketvector.com/indexes/digital-assets/marketvector-bitcoin-benchmark-rate" target="_blank" rel="noopener">MarketVector Bitcoin Benchmark Rate (BBR)</a></strong>. The NAV (Net Asset Value) of the product is calculated based on the current market value of the bitcoin it holds, less any applicable fees and expenses.</p>
<h2 id="point-5" class="anchored-block">How does HODL compare to direct bitcoin ownership?</h2>
<p>Direct bitcoin ownership requires interacting with a crypto exchange, managing storage, and ensuring security, all of which can be complex. <a href="/link/c754aca617ab4535a8e611ded6d5b13c.aspx" title="HODL - VanEck Bitcoin ETF - Overview"><strong>HODL</strong></a> can be bought and sold on traditional stock exchanges, making it accessible through brokerage accounts, simplifying the process for investors.</p>

<h3 id="point-6" class="anchored-block">What are the differences between HODL and other bitcoin investment options?</h3>
<div class="wrapped-div mb-3">
<table style="width: 100%;">
<tbody>
<tr class="tbl-data">
<td class="tbl-header last text-left">Investment Option</td>
<td class="tbl-header last text-left">Pros</td>
<td class="tbl-header last text-left">Cons</td>
</tr>
<tr class="tbl-data">
<td class="data-td data last text-left">Direct bitcoin Investing</td>
<td class="data-td data last text-left">Full ownership, high control</td>
<td class="data-td data last text-left">Requires significant knowledge, complex storage, and security management</td>
</tr>
<tr class="tbl-data">
<td class="data-td data last text-left">Bitcoin ETNs/ETPs (e.g., HODL)</td>
<td class="data-td data last text-left">Easy trading, managed by experienced issuers</td>
<td class="data-td data last text-left">Management fees, dependent on ETP structure performance</td>
</tr>
<tr class="tbl-data">
<td class="data-td data last text-left">Crypto Hedge Funds</td>
<td class="data-td data last text-left">Professional management, potential for higher returns</td>
<td class="data-td data last text-left">High initial investment, lock-up periods, complex fee structures</td>
</tr>
</tbody>
</table>
</div>
<h2 id="point-7" class="anchored-block">How does the fund's creation/redemption process work?</h2>
<p><a href="/link/c754aca617ab4535a8e611ded6d5b13c.aspx" title="HODL - VanEck Bitcoin ETF - Overview"><strong>HODL</strong></a> has an all-cash creation and redemption process. For creations, the Sponsor receives cash from the Authorized Participant (AP) in exchange for shares of the Trust. For redemptions, the Sponsor receives shares of the Fund from the AP in exchange for cash. Following a creation or redemption order, the Trust utilizes liquidity providers and Gemini Clearing to execute and settle the underlying bitcoin. Any and all trading costs (as pertaining to the underlying bitcoin transactions) for each primary market order will be passed back to the Authorized Participant(s) placing the creation/redemption order(s). The Fund does not offer in-kind creations or redemptions.</p>
<h2 id="point-8" class="anchored-block">How does the fund buy and sell bitcoin?</h2>
<p>For creations, the Sponsor uses cash delivered by APs to purchase bitcoin from third-party liquidity providers. Once the purchase is made, the bitcoin is delivered to the Trust&rsquo;s custodian, Gemini Trust Company, LLC, ensuring secure storage. To satisfy redemptions, the Sponsor sells bitcoin to a third- party liquidity provider in exchange for cash.</p>
<h2 id="point-9" class="anchored-block">What are the tax implications compared to direct bitcoin investment?</h2>
<p>The VanEck Bitcoin ETF is a grantor trust for U.S. federal income tax purposes. As a result, the Trust itself is not subject to U.S. federal income tax. Instead, the Trust&rsquo;s income and expenses &ldquo;flow through&rdquo; to the Shareholders. Shareholders generally will be treated, for U.S. federal income tax purposes, as if they directly owned a pro rata share of the underlying assets held in the Trust. Shareholders also will be treated as if they directly received their respective pro rata shares of the Trust&rsquo;s income and proceeds, and directly incurred their pro rata share of the Trust&rsquo;s expenses. Most state and local tax authorities follow U.S. Income tax rules in this regard. However, Shareholders should contact their own tax advisors as to the tax consequences of ownership of <a href="/link/c754aca617ab4535a8e611ded6d5b13c.aspx" title="HODL - VanEck Bitcoin ETF - Overview"><strong>HODL</strong></a> shares.</p>
<h2>What kind of fees does HODL have?</h2>
<p><a href="/link/c754aca617ab4535a8e611ded6d5b13c.aspx" title="HODL - VanEck Bitcoin ETF - Overview"><strong>HODL</strong></a> charges an annual sponsor fee of 0.20%. During the period commencing on November 25, 2025 and ending on July 31, 2026, the Sponsor will waive the entire Sponsor Fee for the first $2.5 billion of the Trust&rsquo;s assets. If the Trust&rsquo;s assets exceed $2.5 billion prior to July 31, 2026, the Sponsor Fee charged on assets over $2.5 billion will be 0.20%. All investors will incur the same Sponsor Fee which is the weighted average of those fee rates. After July 31, 2026, the Sponsor Fee will be 0.20%. Brokerage fees and commissions may apply, so please check with your broker. This adjustment demonstrates VanEck's commitment to delivering enhanced value to investors through competitive pricing.</p>
<h2 id="point-10" class="anchored-block">How is the bitcoin for HODL custodied?</h2>
<p>The Trust&rsquo;s bitcoin is held by its crypto custodians (currently, Gemini Trust Company, LLC and Coinbase Custody Trust, LLC), which act as the bitcoin Custodian, responsible for securely storing all of the Trust&rsquo;s bitcoin related to its bitcoin Account and Clearing Account.</p>

<h2>Gemini Overview</h2>
<p><strong>Who is Gemini?</strong></p>
<p>Gemini is a leading cryptocurrency exchange and custodian known for its robust security measures and regulatory compliance:</p>
<ul class="content-list">
<li class="mt-2"><strong>Regulation: </strong>Full-reserve exchange and custodian, regulated by NYDFS (New York Department of Financial Services), licensed in all 50 US states, and holds multiple licenses globally.</li>
<li class="mt-2"><strong>Security: </strong>Includes multisignature technology, role-based governance protocols, physical security, multiple layers of biometric access controls, and $100M in digital asset insurance coverage. Completed SOC 1 Type II and SOC 2 Type II audits, and ISO 27001 certified (a global standard for information security management, ensuring organizations implement and maintain strong data protection and risk management controls).</li>
<li class="mt-2"><strong>Operational Standards: </strong>Ensures all customer funds are held 1:1 and are available for withdrawal, adheres to strict compliance and operational protocols to safeguard customer assets.</li>
</ul>
<p><strong>Storage Solutions:</strong></p>
<ul class="content-list">
<li class="mt-2"><strong>Cold Storage: </strong>Gemini is required to hold the Trust&rsquo;s bitcoin in cold storage, which involves storing private keys completely offline to protect against unauthorized access and cyber threats. Cold storage is used for long-term security.</li>
<li class="mt-2"><strong>Hot Storage: </strong>bitcoin that needs to be accessible temporarily for operations, such as creations, redemptions, or to pay the Sponsor Fee and extraordinary expenses, is held in hot wallets. These wallets are connected to the internet but are used only for short periods.</li>
</ul>
<p><strong>Custody Structure and Security:</strong></p>
<ul class="content-list">
<li class="mt-2">Gemini employs hardware security modules (HSMs) to generate, store, and manage private keys for both cold and hot storage.</li>
<li class="mt-2">Multi-signature technology and geographically diverse storage locations across the United States are used to enhance security and reduce risks.</li>
<li class="mt-2">All private keys are stored in air-gapped environments with multiple levels of physical security and monitoring controls.</li>
</ul>
<p><strong>Regulatory Compliance:</strong></p>
<ul class="content-list">
<li class="mt-2">As a fiduciary under Section 100 of the New York Banking Law, Gemini is held to stringent capital reserve requirements and banking compliance standards.</li>
<li class="mt-2">Gemini has undergone SOC 1 Type II and SOC 2 Type II audits, which are external assessments designed to verify the effectiveness of its security and operational procedures. These audits ensure that the systems Gemini uses to store and protect assets meet rigorous standards.</li>
</ul>
<p><strong>Insurance Coverage:</strong></p>
<ul class="content-list">
<li class="mt-2">Gemini maintains a $100 million policy covering fraud, theft, and cyber-security breaches, and a $25 million crime policy. This insurance applies to all digital assets held by Gemini, including those of the Trust.</li>
<li class="mt-2">It&rsquo;s important to note that this insurance does not cover any loss in the value of bitcoin and only applies in cases of specified events such as fraud or theft. Additionally, the insurance is not specific to the Trust, meaning it may not be sufficient to cover all potential losses for the Trust or its investors in such events. In some cases, the coverage may not be available or enough to protect the Trust from all possible losses.</li>
</ul>
<h2>Coinbase Overview</h2>
<p><strong>Who is Coinbase?</strong></p>
<p>Coinbase is a prominent cryptocurrency exchange and custodian acclaimed for its extensive security protocols and regulatory adherence:</p>
<ul class="content-list">
<li class="mt-2"><strong>Regulation: </strong>Operates as a licensed and regulated entity in the US and various jurisdictions worldwide. Engages in regular SOC 1 and SOC 2 Type II audits.</li>
<li class="mt-2"><strong>Security: </strong>Employs comprehensive security features including cold storage for the majority of assets, multisignature technology, encrypted private keys stored within high-security environments, and $320M in digital asset insurance coverage. Adheres to rigorous standards such as the SOC 1 Type II and Soc 2 Type II attestations.</li>
<li class="mt-2"><strong>Operational Standards: </strong>Ensures that customer assets are held in segregated or omnibus accounts with strict adherence to accounting controls. Maintains robust compliance and operational protocols to ensure the protection and integrity of customer assets.</li>
</ul>
<p><strong>Information Security Management Program: </strong></p>
<ul class="content-list">
<li class="mt-2">Led by the Chief Security Officer with independent SOC 1 (a report evaluating internal controls relevant to financial reporting) and SOC 2 Type II (a report assessing the effectiveness of security, availability, processing integrity, confidentiality and privacy controls over time) attestations.</li>
<li class="mt-2">Includes policies, procedures, and standards to manage information security risks.</li>
<li class="mt-2">Detailed Physical Security program with access control processes, emergency procedures, CCTV, and security systems governed by a board-approved policy.</li>
</ul>
<p><strong>Custody and Security of Assets:</strong></p>
<ul class="content-list">
<li class="mt-2"><strong>Vault wallet: </strong>Assets are secured within a cold storage environment with segregated wallets. Extensive key management technology, operations, and personnel ensure security.</li>
<li class="mt-2"><strong>Trading balance: </strong>The majority of assets are kept in cold storage, with some in hot wallets.</li>
</ul>
<p><strong>Secure Storage of Client Keys/Assets:</strong></p>
<ul class="content-list">
<li class="mt-2"><strong>Vault wallet: </strong>secure key generation, dual-encrypted private key material, and geographically redundant storage. Transactions require cryptographic consensus across multiple operators.</li>
<li class="mt-2"><strong>Trading wallet: </strong>private keys are stored within high-security online environments, encrypted at rest, and transactions are signed in protected environments.</li>
</ul>
<p><strong>Insurance Coverage</strong></p>
<ul class="content-list">
<li class="mt-2">Coinbase maintains a commercial crime insurance policy covering loss of client assets, including coverage for events such as employee collusion, theft, security breaches, and fraudulent transfers.</li>
<li class="mt-2">As with Gemini, this insurance does not cover any loss in the value of bitcoin and only applies to specific events such as fraud or theft. The policy is not exclusive to the Trust and may not be sufficient to cover all potential losses. Investors should be aware that coverage may be limited and not guaranteed to fully protect against all possible losses.</li>
</ul>
<h2 id="point-11" class="anchored-block">What are the risks involved in buying HODL?</h2>
<ul class="content-list">
<li class="mt-2"><strong>Bitcoin Market Risks: </strong>The value of bitcoin can be extremely volatile and unpredictable. Bitcoin has only been in existence for just over a decade, and its medium-to-long-term value is subject to numerous factors related to the development and capabilities of blockchain technologies. These factors, as well as the fundamental characteristics of digital assets, remain uncertain and difficult to evaluate, contributing to the volatility and risks of investing in bitcoin and <a href="/link/c754aca617ab4535a8e611ded6d5b13c.aspx" title="HODL - VanEck Bitcoin ETF - Overview"><strong>HODL</strong></a>.</li>
<li class="mt-2"><strong>Regulatory Risks: </strong>Changes in laws or regulations affecting Bitcoin or cryptocurrency markets may impact the value of the Trust&rsquo;s holdings. The regulatory environment for digital assets continues to evolve, and platforms that trade bitcoin may be subject to regulation in certain jurisdictions, but may not comply or be subject to limited oversight. This can introduce risks related to fraud, manipulation, security failures, or operational issues, all of which could adversely affect the value of bitcoin and, consequently, the value of <a href="/link/c754aca617ab4535a8e611ded6d5b13c.aspx" title="HODL - VanEck Bitcoin ETF - Overview"><strong>HODL</strong></a> shares.</li>
<li class="mt-2"><strong>Operational Risks</strong>: The Trust&rsquo;s bitcoin is stored with custodians in both hot and cold storage solutions to help mitigate risks. However, there can be no assurance that these security measures will function as intended or prove entirely effective. Custodians could experience technical failures, security breaches, or other operational problems that may result in losses or disruptions. Additionally, digital asset trading platforms, including those that may be used by the Trust&rsquo;s counterparties, can be vulnerable to hacking, fraud, and operational failures.</li>
<li class="mt-2"><strong>Market Trading Risks: </strong>There may be times when there is limited liquidity in the market for <a href="/link/c754aca617ab4535a8e611ded6d5b13c.aspx" title="HODL - VanEck Bitcoin ETF - Overview"><strong>HODL</strong></a> shares, which could affect their market price. In periods of high volatility or low trading volume, it may be difficult for investors to buy or sell shares at their desired price, potentially leading to significant deviations between the market price of the shares and the value of the Trust's underlying bitcoin.</li>
</ul>
<h2 id="point-12" class="anchored-block">How does the Trust audit its bitcoin?</h2>
<p>On a daily basis, the sponsor and the accounting agent reconcile the bitcoin position at Gemini and Coinbase. As part of the Trust's annual audit, auditors confirm the existence of bitcoin positions. Gemini and Coinbase have a SOC 1 Report produced by an independent auditor outlining controls around the safekeeping of assets.</p>
<h2 id="point-13" class="anchored-block">How can investors buy HODL?</h2>
<p>Investors can purchase <a href="/link/c754aca617ab4535a8e611ded6d5b13c.aspx" title="HODL - VanEck Bitcoin ETF - Overview"><strong>HODL</strong></a> shares through their existing brokerage or stock trading accounts, making it a straightforward addition to any investment portfolio.</p>
<h2 id="point-14" class="anchored-block">Are there options available on HODL?</h2>
<p>Yes. Options on the VanEck Bitcoin ETF (<a href="/link/c754aca617ab4535a8e611ded6d5b13c.aspx" title="HODL - VanEck Bitcoin ETF - Overview"><strong>HODL</strong></a>) are available.</p>
<p><i>VanEck has no influence or decision-making authority regarding options on its ETFs. We do not sponsor, write, influence, or have control over option contracts issued on its ETFs. Options trading is subject to the rules and regulations of the exchange(s) on which such options trade.</i></p>
<p>Source of all information: VanEck Research, July 2025.</p>
<p><span style="font-size: 14pt;"><strong>How to buy HODL?</strong></span></p>
<p>VanEck ETFs can be purchased the same way you would buy a stock, through a broker or with your advisor.</p>
<p class="d-none d-lg-block"><a href="mailto:askvaneck@vaneck.com" title="Have More Questions? - Ask VanEck" rel="noopener"><img loading="lazy" class="img-responsive" src="https://www.vaneck.com/globalassets/home/us/insights/blogs/bm-blog-images/cta-faq_desktop-02.svg" alt="Have More Questions? - Ask VanEck" /></a></p>
<p class="d-lg-none"><a href="mailto:askvaneck@vaneck.com" title="Have More Questions? - Ask VanEck" rel="noopener"><img loading="lazy" class="img-responsive" src="https://www.vaneck.com/globalassets/home/us/insights/blogs/bm-blog-images/cta-faq_mobile-01.svg" alt="Have More Questions? - Ask VanEck" /></a></p>
<p>To receive more <strong><a href="https://www.vaneck.com/us/en/insights/digital-assets/" title="Digital Assets Insights">Digital Assets</a></strong> insights, <strong><a href="https://www.vaneck.com/us/en/subscribe/" title="Subscription Center">sign up in our subscription center</a></strong>.</p>
]]></content:encoded>
</item><item rdf:about="https://www.vaneck.com/us/en/blogs/digital-assets/matthew-sigel-vaneck-mid-august-2025-bitcoin-chaincheck/">
  <title>VanEck Mid-August 2025 Bitcoin ChainCheck></title>
  <link>https://www.vaneck.com/us/en/blogs/digital-assets/matthew-sigel-vaneck-mid-august-2025-bitcoin-chaincheck/</link>
  <description><![CDATA[Bitcoin hit all‑time highs in August despite an early‑month dip; deepening mining consolidation and miner AI‑hosting pivots underscore structural shifts even as volatility stays suppressed.]]></description>
  <dc:creator>Patrick Bush</dc:creator>
  <dc:date>08/18/2025 06:30:00</dc:date>
<content:encoded><![CDATA[

<p><strong>Please note that VanEck has exposure to bitcoin and may have positions in bitcoin mining stocks mentioned.</strong></p>
<p><strong>Three key takeaways for mid-July &ndash; mid-August:</strong></p>
<ul class="content-list">
<li class="mt-2"><strong>Bitcoin (BTC) Hit All-Time Highs:</strong> Rebounded to <strong>$124K</strong> as CME basis hit yearly highs; we maintain our <strong>$180K</strong> year-end BTC target.</li>
<li class="mt-2"><strong>Bitcoin Miners Split:</strong> APLD jumped; most lagged even as U.S. miners&rsquo; share of global hashrate hit <strong>31.5%.</strong></li>
<li class="mt-2"><strong>Digital Asset Treasuries (DATs) mNAVs Fall:</strong> Low volatility curbed financing and growth.</li>
</ul>
<h2 id="market-performance" class="jump-link-nav anchored-block" data-jumplink-title="Market Performance">1. Market Performance</h2>
<p>In early August, bitcoin (BTC) slid to <strong>$112K</strong> with <strong>92%</strong> of onchain holdings still in profit, before rebounding to <strong>$124K</strong> on August 13 to notch a new all-time high above July&rsquo;s <strong>$123,838</strong>. CME basis funding rates surged to <strong>9%</strong>, the highest since February 2025, reflecting renewed speculative appetite. Exchange-traded products (ETPs) and Digital Asset Treasuries (DATs) purchases added <strong>+54K BTC</strong> and +<strong>72K BTC,</strong> respectively, in July.</p>
<h3>CME Bitcoin Futures: Annualized 3-Month Rolling Basis</h3>
<p><img loading="lazy" class="img-responsive" alt="CME Bitcoin Futures: Annualized 3-Month Rolling Basis" src="https://www.vaneck.com/contentassets/5ca8bb9197164b6faa4969589636c914/6053_bitcoin-chaincheck-mid-august_chart-1_2025-8_v1_blog.svg" /></p>
<p class="chart-disclosure">Source: Glassnode as of 8/13/2025. <strong>Past performance is no guarantee of future results. Not intended as a recommendation to buy or sell any securities named herein.</strong></p>
<h2>2. Onchain Metrics and Dominance</h2>
<p>BTC dominance fell from <strong>64.5%</strong> in early July to <strong>59.7% </strong>by mid-August as Ethereum gained market share. Network transactions increased <strong>26%</strong> MoM to <strong>12.9M</strong> &mdash; the highest since November 2024 &mdash; while median fees fell <strong>13%</strong> to <strong>421</strong> sats, the lowest since September 2024. This drop was partly due to a reduction in ordinal inscription activity, which hit its second-lowest level since August 2024.</p>
<p><img loading="lazy" class="img-responsive" alt="Onchain Metrics and Dominance" src="https://www.vaneck.com/contentassets/5ca8bb9197164b6faa4969589636c914/6053_bitcoin-chaincheck-mid-august_table_2025-8_v1_blog.svg" /></p>
<p class="chart-disclosure"><sup>1</sup>&nbsp;30 day change &amp; 365 day change are relative to the 30-day avg, not absolute.</p>
<p class="chart-disclosure">Source: Glassnode as of 8/11/2025. <strong>Past performance is no guarantee of future results. Not intended as a recommendation to buy or sell any securities named herein.</strong></p>
<h2>3. Derivatives and Volatility Trends</h2>
<p>Options markets reflected strong bullish positioning. The call/put ratio rose to <strong>3.21x</strong>, the highest since June 2024, with <strong>$792M</strong> spent on call premiums <strong>(+37% MoM)</strong>. Implied volatility fell to just <strong>32%,</strong> well below the <strong>50%</strong> one-year average, compressing option prices. A <strong>+25%</strong> OTM 1-year call now costs ~<strong>6%</strong> of spot, compared to <strong>18%</strong> in late 2024. Total option premiums reached <strong>$1.1B</strong> over the past 30 days, raising the prospect of a sharp volatility spike as investors return from summer.</p>
<h3>BTC Volatility Reaches Lowest Levels Since Fall 2023</h3>
<p><img loading="lazy" class="img-responsive" alt="BTC Volatility Reaches Lowest Levels Since Fall 2023" src="https://www.vaneck.com/contentassets/5ca8bb9197164b6faa4969589636c914/6053_bitcoin-chaincheck-mid-august_chart-2_2025-8_v1_blog.svg" /></p>
<p class="chart-disclosure">Source: Glassnode as of 8/12/2025. <strong>Past performance is no guarantee of future results. Not intended as a recommendation to buy or sell any securities named herein.</strong></p>
<h2 id="mining-landscape" class="jump-link-nav anchored-block" data-jumplink-title="Mining Landscape">4. Mining Landscape</h2>
<p>Hashrate reached a record 902 EH/s in August, up <strong>47%</strong> YoY. Revenue per EH/s rose to <strong>$59.4K</strong>, the highest since December 2024. Key updates: Hive Digital reached 14 EH/s, Cleanspark exceeded 50 EH/s with over 1GW contracted power, and CIFR&rsquo;s Black Pearl hit 3.4 EH/s. Equity performance was mixed &mdash; APLD surged <strong>~54%</strong> on strong earnings and a CoreWeave expansion, while CIFR dropped <strong>~22%</strong> amid cost and AI/HPC uncertainties. Excluding APLD, the 13-miner equity index we track declined <strong>~4%</strong>, even as BTC and the S&amp;P 500 rose <strong>~2%.</strong></p>
<p>A notable structural pivot: TeraWulf (WULF) secured a deal to host 200 MW of AI load with Fluidstack, backed by Google, which will take an <strong>8%</strong> stake via warrants. Phase one (40 MW) is set for H1 2026; full buildout by year-end, anchoring WULF as a leader in AI-linked mining infrastructure.</p>
<p>Moreover, U.S.-listed miners now command <strong>31.5%</strong> of the global Bitcoin hashrate, up from <strong>~29%</strong> earlier this year, marking a record high and showcasing accelerating consolidation and scale advantages.</p>
<h3>Mixed Month for Bitcoin Miners: Avg. ~0%, BTC +2.5%</h3>
<p><img loading="lazy" class="img-responsive" alt="Mixed Month for Bitcoin Miners: Avg. ~0%, BTC +2.5%" src="https://www.vaneck.com/contentassets/5ca8bb9197164b6faa4969589636c914/6053_bitcoin-chaincheck-mid-august_chart-3_2025-8_v1_blog.svg" /></p>
<p class="chart-disclosure">Source: Bloomberg as of 8/12/2025. <strong>Past performance is no guarantee of future results. Not intended as a recommendation to buy or sell any securities named herein.</strong></p>
<h2 id="dat-flows" class="jump-link-nav anchored-block" data-jumplink-title="DAT Flows">5. Institutional Flows and Digital Asset Treasuries (DATs)</h2>
<p>Public BTC treasuries now hold <strong>951K</strong> BTC. MSTR, trading at <strong>1.63x</strong> the value of its BTC holdings, has inspired a new wave of DAT entrants aiming to replicate its equity premium. <em>However</em>, mNAVs for MSTR <strong>(-16%),</strong> MTPLF <strong>(-62%),</strong> and SMLR <strong>(-12%)</strong> fell in July. DAT financing depends heavily on BTC volatility, which fuels convertible debt and equity issuance. With volatility muted, issuance capacity &mdash; and therefore mNAV growth &mdash; may remain under pressure. The chart below illustrates this mNAV compression, highlighting Metaplanet&rsquo;s higher mNAV from tax, regulatory, and financial advantages, and how valuations have shifted since June.</p>
<p>For a deeper look at MSTR and the mechanics of Digital Asset Treasuries, <a href="/link/ede07c697c474b56bcf4999bfdc0f307.aspx" title="Deconstructing Strategy (MSTR): Premium, Leverage, and Capital Structure"><strong>see our prior analysis</strong></a>.</p>
<h3>mNAV Compression in Digital Asset Treasuries (DATs) &ndash; Metaplanet vs. Peers</h3>
<p><strong>Metaplanet Averaged Higher mNAV due to Tax, Regulatory and Financial Advantages</strong></p>
<p><img loading="lazy" class="img-responsive" alt="Metaplanet Averaged Higher mNAV due to Tax, Regulatory and Financial Advantages" src="https://www.vaneck.com/contentassets/5ca8bb9197164b6faa4969589636c914/6053_bitcoin-chaincheck-mid-august_chart-4_2025-8_v1_blog.svg" /></p>
<p class="chart-disclosure">Source: Bloomberg as of 8/12/2025. <strong>Past performance is no guarantee of future results. Not intended as a recommendation to buy or sell any securities named herein.</strong></p>
<div class="wrapped-div">
<table style="width: 100%;">
<tbody>
<tr class="tbl-data">
<td class="data-head last text-left">&nbsp;</td>
<td class="data-head last text-right">MSTR</td>
<td class="data-head last text-right">MTPLF</td>
<td class="data-head last text-right">SMLR</td>
</tr>
<tr class="tbl-data">
<td class="data-td last text-left">mNAV Change From June</td>
<td class="data-td data last text-right">-16%</td>
<td class="data-td data last text-right">-62%</td>
<td class="data-td data last text-right">-12%</td>
</tr>
</tbody>
</table>
</div>
<br />
<p class="chart-disclosure">Source: Bloomberg as of 8/13/2025. <strong>Past performance is no guarantee of future results. Not intended as a recommendation to buy or sell any securities named herein.</strong></p>
<h2>6. Forward Risks &amp; Watchpoints</h2>
<p>As autumn approaches, several intertwined risks and opportunities emerge. Large outstanding options positions increase the chance that even modest volatility could trigger amplified price swings via dealer hedging. For DATs, a prolonged low-volatility regime may limit capital-raising ability, driving further mNAV compression. In mining, operational execution and integration of AI/HPC workloads will likely drive performance dispersion. Macroeconomic developments and seasonal investor re-engagement could either extend Bitcoin&rsquo;s momentum or prompt profit-taking. <i>Still, we stick with our <strong>$180K</strong> BTC price target by year-end.</i></p>
<p><strong>Links to third party websites are provided as a convenience and the inclusion of such links does not imply any endorsement, approval, investigation, verification or monitoring by us of any content or information contained within or accessible from the linked sites. By clicking on the link to a non-VanEck webpage, you acknowledge that you are entering a third-party website subject to its own terms and conditions. VanEck disclaims responsibility for content, legality of access or suitability of the third-party websites.</strong></p>
<style>
    .data-td.data {
        padding-right: 5px !important;
        padding-left: 5px !important;
    }

    .wrapped-div {
        max-width: 100%;
    }

    @media (max-width: 1240px) {
        .wrapped-div {
            overflow-x: scroll;
        }
    }

    .wrapped-div-sector {
        max-width: 100%;
        overflow-x: scroll;
    }
</style>
<p>To receive more <strong><a href="https://www.vaneck.com/us/en/insights/digital-assets/" title="Digital Assets Insights">Digital Assets</a></strong> insights, <strong><a href="https://www.vaneck.com/us/en/subscribe/" title="Subscription Center">sign up in our subscription center</a></strong>.</p>
]]></content:encoded>
</item><item rdf:about="https://www.vaneck.com/us/en/blogs/economic-trends/markets-in-motion-credit-crypto-em-trends-shaping-h2-outlook/">
  <title>Markets in Motion: Credit, Crypto &amp; EM Trends Shaping H2 Outlook></title>
  <link>https://www.vaneck.com/us/en/blogs/economic-trends/markets-in-motion-credit-crypto-em-trends-shaping-h2-outlook/</link>
  <description><![CDATA[After a turbulent Q2, trends in credit, crypto, and EM&mdash;from CLO spread shifts to high-yield surprises&mdash;are shaping our H2 outlook on risk and opportunity.]]></description>
  <dc:creator> </dc:creator>
  <dc:date>08/15/2025 15:31:16</dc:date>
<content:encoded><![CDATA[

<p>As we turn the page on a turbulent second quarter, key trends across credit, crypto and emerging markets are shaping how we think about risk and opportunity in the second half of the year. From tightening CLO spreads and high yield surprises to overlooked strength in emerging markets and crypto sector shakeups, we break down the moves that mattered and what they signal going forward.</p>
<p>After a volatile start to Q2, CLO spreads tightened meaningfully, fueling a broad rally across the capital stack and setting the stage for stronger performance across risk assets. As summarized in <a href="/link/9d831378d6104cd3b982f0eb2422282c.aspx" title="CLOs: Positioning for Resilience into the Second Half of the Year"><strong>CLOs: Positioning for Resilience into the Second Half of the Year</strong></a>, we believe returns will be driven primarily by yield amid ongoing trade uncertainty and evolving credit conditions. Security selection and flexibility will be critical as we move into the second half of the year, with volatility expected to persist.</p>
<p>Q2 brought sharp swings for high-yield investors, as spreads surged following April&rsquo;s tariff announcements but closed the quarter tighter. Interest rates also swung sharply, driven by inflation and fiscal concerns. Despite the volatility, <strong><a href="/link/94582b1825ac4884a5f2aa2d25660079.aspx" title="Volatile Quarter, But Fallen Angels Still on Top YTD">fallen angels outperformed the broad high yield market in the first half of the year</a></strong>. Whirlpool joined the Index in Q2; Constellation Insurance and Royal Caribbean exited.</p>
<p><a href="/link/eee0f6b5cca941948fa9acec3760c763.aspx" title="EM Bonds Are Outperforming-Is Anyone Paying Attention?"><strong>Emerging markets bonds continue to outperform, but is anyone paying attention?</strong></a> Emerging markets maintain high real rates, low debt, and policy independence, positioning them as strongholds amid global uncertainty and shifting inflation dynamics.</p>
<p>Bitcoin surged past $123K in July on dollar weakness, institutional buying, and pro-crypto House bills&mdash;just as flagged in our <a href="/link/6b7e8bd6999d4f7eaef686dcb5650cbf.aspx" title="VanEck Mid-July 2025 Bitcoin ChainCheck"><strong>Mid-July Bitcoin ChainCheck</strong></a>. But Ethereum stole the show during &ldquo;Crypto Week,&rdquo; with $2.2B in ETH ETP inflows denting Bitcoin&rsquo;s dominance. Meanwhile, miners are being reevaluated as the CoreWeave&ndash;Core Scientific deal highlights diverging AI/HPC strategies.</p>
<p>VanEck has been at the forefront of crypto within traditional finance since 2017, and we&rsquo;d love to serve as your go-to resource for in-depth research&mdash;whether you're exploring institutional adoption, regulatory developments, portfolio construction and sizing, or tailored crypto market access based on your balance sheet needs. Please visit our <strong><a href="https://www.vaneck.com/us/en/insights/digital-assets/?p=1" title="Digital Assets Insights">Digital Assets Insights</a></strong> page for more information.</p>
]]></content:encoded>
</item><item rdf:about="https://www.vaneck.com/us/en/blogs/emerging-markets-bonds/em-bonds-thrive-in-a-changing-world/">
  <title>EM Bonds Thrive in a Changing World></title>
  <link>https://www.vaneck.com/us/en/blogs/emerging-markets-bonds/em-bonds-thrive-in-a-changing-world/</link>
  <description><![CDATA[EM bonds show continued strength and greater than usual outperformance over DMs. Local trade ties and currency fundamentals matter more than broad dollar moves, supporting strength in local currency and high-yield EM debt.]]></description>
  <dc:creator>Eric Fine</dc:creator>
  <dc:date>08/14/2025 06:30:00</dc:date>
<content:encoded><![CDATA[

<p id="performance-recap" class="jump-link-nav anchored-block" data-jumplink-title="Performance Recap">The <a href="/link/dbb866e8704049c784a0bdf9299143ea.aspx" title="EMBAX - Emerging Markets Bond Fund - Class A - Overview"><strong>VanEck Emerging Markets Bond Fund</strong></a> returned -0.13% in July, compared to 0.26% for its benchmark, the 50% J.P. Morgan Government Bond Index - Emerging Markets Global Diversified (GBI-EM) and 50% J.P. Morgan Emerging Markets Bond Index (EMBI). Year-to-date, the Fund is up 10.4%, compared to 5.7% and 4.3% for the Global Agg and 10-year Treasuries, respectively. In July, local currency exposure in Brazil and the avoidance of local currency positions in India drove outperformance. The Fund has approximately 59% in local currency and 41% in mostly higher-yielding US dollar-denominated bonds. Carry is 6.7%, yield to worst is 7.9% and duration is 5.3.</p>

<h3>Average Annual Total Returns<sup>*</sup>&nbsp;(%) (In USD)</h3>
<div class="wrapped-div">
<table style="width: 100%;">
<tbody>
<tr class="tbl-data">
<td class="tbl-header last" colspan="10">As of July 31, 2025</td>
</tr>
<tr class="tbl-data">
<td class="data-head last text-right">&nbsp;</td>
<td class="data-head last text-right">1 Mo</td>
<td class="data-head last text-right">3 Mo</td>
<td class="data-head last text-right">YTD</td>
<td class="data-head last text-right">1 Yr</td>
<td class="data-head last text-right">3 Yrs</td>
<td class="data-head last text-right">5 Yrs</td>
<td class="data-head last text-right">10 Yrs</td>
</tr>
<tr class="tbl-data">
<td class="data-td last text-left">Class A: NAV (Inception 07/09/12)</td>
<td class="data-td data last text-right">-0.15</td>
<td class="data-td data last text-right">5.40</td>
<td class="data-td data last text-right">10.34</td>
<td class="data-td data last text-right">10.82</td>
<td class="data-td data last text-right">9.58</td>
<td class="data-td data last text-right">3.75</td>
<td class="data-td data last text-right">3.68</td>
</tr>
<tr class="tbl-data">
<td class="data-td last text-left">Class A: Maximum 5.75% load</td>
<td class="data-td data last text-right">-5.89</td>
<td class="data-td data last text-right">-0.66</td>
<td class="data-td data last text-right">4.00</td>
<td class="data-td data last text-right">4.45</td>
<td class="data-td data last text-right">7.44</td>
<td class="data-td data last text-right">2.53</td>
<td class="data-td data last text-right">3.07</td>
</tr>
<tr class="tbl-data">
<td class="data-td last text-left">Class I: NAV (Inception 07/09/12)</td>
<td class="data-td data last text-right">-0.13</td>
<td class="data-td data last text-right">5.52</td>
<td class="data-td data last text-right">10.40</td>
<td class="data-td data last text-right">11.12</td>
<td class="data-td data last text-right">9.94</td>
<td class="data-td data last text-right">4.07</td>
<td class="data-td data last text-right">3.99</td>
</tr>
<tr class="tbl-data">
<td class="data-td last text-left">Class Y: NAV (Inception 07/09/12)</td>
<td class="data-td data last text-right">-0.31</td>
<td class="data-td data last text-right">5.45</td>
<td class="data-td data last text-right">10.47</td>
<td class="data-td data last text-right">10.96</td>
<td class="data-td data last text-right">9.87</td>
<td class="data-td data last text-right">3.98</td>
<td class="data-td data last text-right">3.92</td>
</tr>
<tr class="tbl-data">
<td class="data-td last text-left">50% GBI-EM/50% EMBI</td>
<td class="data-td data last text-right">0.26</td>
<td class="data-td data last text-right">4.17</td>
<td class="data-td data last text-right">9.21</td>
<td class="data-td data last text-right">9.93</td>
<td class="data-td data last text-right">8.24</td>
<td class="data-td data last text-right">1.26</td>
<td class="data-td data last text-right">3.01</td>
</tr>
</tbody>
</table>
</div>
<br />
<div class="wrapped-div">
<table style="width: 100%;">
<tbody>
<tr class="tbl-data">
<td class="tbl-header last" colspan="10">As of June 30, 2025</td>
</tr>
<tr class="tbl-data">
<td class="data-head last text-right">&nbsp;</td>
<td class="data-head last text-right">1 Mo</td>
<td class="data-head last text-right">3 Mo</td>
<td class="data-head last text-right">YTD</td>
<td class="data-head last text-right">1 Yr</td>
<td class="data-head last text-right">3 Yrs</td>
<td class="data-head last text-right">5 Yrs</td>
<td class="data-head last text-right">10 Yrs</td>
</tr>
<tr class="tbl-data">
<td class="data-td last text-left">Class A: NAV (Inception 07/09/12)</td>
<td class="data-td data last text-right">3.71</td>
<td class="data-td data last text-right">6.87</td>
<td class="data-td data last text-right">10.51</td>
<td class="data-td data last text-right">13.04</td>
<td class="data-td data last text-right">10.68</td>
<td class="data-td data last text-right">4.77</td>
<td class="data-td data last text-right">3.35</td>
</tr>
<tr class="tbl-data">
<td class="data-td last text-left">Class A: Maximum 5.75% load</td>
<td class="data-td data last text-right">-2.25</td>
<td class="data-td data last text-right">0.73</td>
<td class="data-td data last text-right">4.16</td>
<td class="data-td data last text-right">6.54</td>
<td class="data-td data last text-right">8.51</td>
<td class="data-td data last text-right">3.54</td>
<td class="data-td data last text-right">2.74</td>
</tr>
<tr class="tbl-data">
<td class="data-td last text-left">Class I: NAV (Inception 07/09/12)</td>
<td class="data-td data last text-right">3.76</td>
<td class="data-td data last text-right">7.00</td>
<td class="data-td data last text-right">10.54</td>
<td class="data-td data last text-right">13.33</td>
<td class="data-td data last text-right">11.04</td>
<td class="data-td data last text-right">5.08</td>
<td class="data-td data last text-right">3.64</td>
</tr>
<tr class="tbl-data">
<td class="data-td last text-left">Class Y: NAV (Inception 07/09/12)</td>
<td class="data-td data last text-right">3.91</td>
<td class="data-td data last text-right">7.12</td>
<td class="data-td data last text-right">10.82</td>
<td class="data-td data last text-right">13.51</td>
<td class="data-td data last text-right">11.03</td>
<td class="data-td data last text-right">5.04</td>
<td class="data-td data last text-right">3.59</td>
</tr>
<tr class="tbl-data">
<td class="data-td last text-left">50% GBI-EM/50% EMBI</td>
<td class="data-td data last text-right">2.60</td>
<td class="data-td data last text-right">5.47</td>
<td class="data-td data last text-right">8.94</td>
<td class="data-td data last text-right">11.93</td>
<td class="data-td data last text-right">8.72</td>
<td class="data-td data last text-right">1.89</td>
<td class="data-td data last text-right">2.88</td>
</tr>
</tbody>
</table>
</div>
<div class="chart-disclosure">
<p><sup>*</sup>&nbsp;Returns less than one year are not annualized.</p>
<p><strong>Expenses: Class A: Gross 1.83%, Net 1.21%; Class I: Gross 1.37%, Net 0.86%; Class Y: Gross 1.33%, Net 0.96%. </strong>Expenses are capped contractually until 5/01/26 at 1.20% for Class A, 0.85% for Class I, 0.95% for Class Y. Caps exclude acquired fund fees and expenses, interest, trading, dividends, and interest payments of securities sold short, taxes, and extraordinary expenses.</p>
<p><strong>The performance data quoted represents past performance. Past performance is not a guarantee of future results. Investment return and principal value of an investment will fluctuate so that an investor&rsquo;s shares, when redeemed, may be worth more or less than their original cost. </strong></p>
<p>Performance may be lower or higher than performance data quoted. Please call 800.826.2333 or visit <strong><a href="http://www.vaneck.com/us/en/" title="ETF and Mutual Fund Manager">vaneck.com</a></strong> for performance current to the most recent month ended.</p>
<p>The &ldquo;Net Asset Value&rdquo; (NAV) of a Fund is determined at the close of each business day , and represents the dollar value of one share of the fund; it is calculated by taking the total asset of the fund, subtracting total liabilities, and dividing by the total number of shares outstanding. The NAV is not necessarily the same of the ETF&rsquo;s intraday trading value. Investors should not expect to buy or sell shares at NAV.</p>
</div>

<p><strong>We maintain our core views</strong>. EM debt&rsquo;s resilience and continued outperformance of DM bonds is based on superior fiscal and monetary policies; crudely, low debts and deficits and high real interest rates on the part of the EMs &ndash; the opposite on the part of the DMs. The fact that UK Gilts (bonds issued by the UK government to finance public spending) are yet again facing fiscally related turmoil is another reminder, as is EM bonds&rsquo; even greater than usual outperformance of DM bonds in a tumultuous 2025. Asset price implications are upside risks to EM bonds, particularly local currency bonds and high yield sovereign bonds, and that remains our core view and positioning.</p>
<p><strong>USD depreciation is the &ldquo;hook&rdquo; for many investors&rsquo; interest in EM bonds; we believe that is wrong, but we&rsquo;ll take it.</strong> &ldquo;The dollar&rdquo; is primarily measured against EUR and JPY (via DXY, for example), which happen to also be very low-yielding currencies. We don&rsquo;t look at &ldquo;the dollar&rdquo;, rather we look at every individual currency cross (like BRL) and the currency&rsquo;s yields (mid-teens for Brazil). Moreover, most EMs trade far more with China than with the U.S., so CNY is arguably more important than USD. In fact, we just published a piece on this topic titled <a href="/us/en/blogs/emerging-markets-bonds/the-curiously-unpopular-case-for-rmb-cny-appreciation/" title="The Curiously Unpopular Case for RMB/CNY Appreciation"><strong>&ldquo;The Curiously Unpopular Case for RMB Appreciation&rdquo;</strong></a>.</p>
<p>Is the Trump U.S. Federal Reserve (Fed) already here? Frankly, we were a bit worried about an August reversal of EM&rsquo;s strong 2025 performance. But the greater likelihood of Fed easing following the Trump administration&rsquo;s greater power (the popular media have followed these developments ranging from retirements to a pre-naming of Chairman Powell&rsquo;s successor), takes a big risk out of the way. We are not saying that the new Fed is good or bad, we are saying that non-resolution would have meant much tighter interest rate policy. The clearest winner from this is EM currencies, not duration, in our view. This is due to ongoing fiscal and sanctions concerns from the U.S. Also, as we noted in earlier publications, FX hedging costs for major financers of U.S. debt (such as Japan and China) greatly discourage the purchase, or even ownership of, FX-hedged U.S. Treasuries, greatly favoring ownership of their unhedged local treasuries in their own currencies.</p>
<h2 id="exposure-types-and-significant-changes" class="jump-link-nav anchored-block" data-jumplink-title="Exposure Types and Significant Changes">Exposure Types and Significant Changes</h2>
<p>The changes to our top positions are summarized below. Our largest positions in July were Brazil, Malaysia, South Africa, Thailand and Indonesia.</p>
<ul class="content-list">
<li class="mt-2">We increased our local currency exposure in Chile and Uganda. The Chilean peso underperformed vs. peers, and the country&rsquo;s assets should benefit from a more market-friendly outcome of the 2026 presidential elections. These developments improve Chile&rsquo;s technical and policy test scores. Uganda&rsquo;s economy and the fiscal performance are benefitting from higher commodity prices (gold, coffee), whereas a potential loan from the IMF should give a boost to its external position. In terms of our investment process, this improves the technical and policy test scores for the country.</li>
<li class="mt-2">We increased our hard currency sovereign exposure in Saudi Arabia, Egypt, Bolivia, Guatemala, Nigeria and Bosnia and Herzegovina. Regarding Bosnia and Herzegovina, this was an attractively priced new issue (against the backdrop of solid fundamentals and policies). Guatemala&rsquo;s bond was also a new issue, and while there are some concerns about political risks, the macro backdrop is solid and improving. Nigeria is expected to benefit from higher oil and gas receipts, which improved the country&rsquo;s economic test score. Bolivia&rsquo;s improving political outlook supports its repayment capacity and has also boosted its policy and politics test score. Egypt&rsquo;s sovereign bonds have attractive valuations, and the country might benefit from the easing regional geopolitical tensions, which should strengthen its politics test score. Saudi Arabia&rsquo;s tight spread vs. U.S. Treasuries puts it in a good position to benefit from a rally in duration if the U.S. growth disappoints and the Fed turns dovish. In terms of our investment process, this improves the technical test score for the country.</li>
<li class="mt-2">We also increased our hard currency sovereign exposure in Argentina and hard currency corporate exposure in Argentina and Singapore, as well as our quasi-sovereign exposure in Peru. Argentina&rsquo;s corporate bond was an attractively priced new issue, while Argentina&rsquo;s sovereign bonds were expected to benefit from a successful IMF review, which unlocked access to USD2bn, improving the policy test score for the country. With regard to the corporate bond in Singapore, we picked up a low-dollar price asset from a company with a good liquidity position and a debt-reduction trajectory. A major driver in Peru was a debt reprofiling plan, which is expected to ease the company&rsquo;s debt burden.</li>
<li class="mt-2">We reduced our local currency exposure in Poland and Hungary on the back of concerns about a stronger momentum in the U.S. dollar &ndash; driven in part by the widening growth differential between the U.S. and Europe &ndash; against the backdrop of tighter end-of-summer liquidity, which worsened the technical test score for both countries. In addition, we now have greater concern about Poland&rsquo;s fiscal trajectory, which can weaken the policy test score for the country.</li>
<li class="mt-2">We also reduced our hard currency sovereign exposure in Romania after the post-presidential election relief rally. The election outcome significantly lowered risks associated with the disbursement of the EU funds, but additional positive catalysts for this asset class might be limited right now. In terms of our investment process, this lowered Romania&rsquo;s policy/politics test score.</li>
<li class="mt-2">Finally, we reduced our local currency exposure in Zambia. We don&rsquo;t believe that positive macro catalysts behind the original trade are fully exhausted, but we opted to take profits after a very sizable rally in the Zambian kwacha, which weakened the technical test score for the country.</li>
</ul>

<p>To receive more <a href="https://www.vaneck.com/us/en/insights/emerging-markets-bonds/" title="Emerging Markets Bonds Insights"><strong>Emerging Markets Bonds</strong></a> insights, <a href="/link/5f45412c2143400497908cea2897f7d3.aspx" title=" Subscription Center"><strong>sign up in our subscription center</strong></a>.</p>
]]></content:encoded>
</item><item rdf:about="https://www.vaneck.com/us/en/blogs/emerging-markets-bonds/the-curiously-unpopular-case-for-rmb-cny-appreciation/">
  <title>The Curiously Unpopular Case for RMB/CNY Appreciation></title>
  <link>https://www.vaneck.com/us/en/blogs/emerging-markets-bonds/the-curiously-unpopular-case-for-rmb-cny-appreciation/</link>
  <description><![CDATA[Instead of devaluing, China let the CNY strengthen in 2025&mdash;defying expectations. Undervaluation, low inflation, reserve shifts, and rising EM trade ties all point to a new FX dynamic centered on RMB strength.]]></description>
  <dc:creator>Eric Fine</dc:creator>
  <dc:date>08/12/2025 06:30:00</dc:date>
<content:encoded><![CDATA[


<p id="overview" class="jump-link-nav anchored-block" data-jumplink-title="Overview">Remember the consensus view for 2025 that tariffs would force China (and other emerging markets) to devalue their currencies? The opposite happened, spectacularly so, with the Chinese Yuan (CNY) at its strongest level since November 2024 and EM local currency debt up around 12% as of 7/30/25. Why did this happen and what does it mean? CNY strength is a key component (among others). For China&rsquo;s authorities, a stable or strong CNY is consistent with their goal of renminbi (RMB) internationalization. It supports consumers&rsquo; real incomes and wealth. It anchors inflation and expectations. Therefore, it addresses key imbalances and arguably makes a case for fiscal stimulus. It further contains trade war risks that would clearly arise should China simply devalue to compensate for tariffs. For many EMs, it means a new landscape of upward pressure on their currencies. We lay out the ongoing and surprisingly unpopular case for RMB appreciation below.</p>
<p id="the-case-for-rmb-appreciation" class="jump-link-nav anchored-block" data-jumplink-title="The Case for RMB Appreciation"><strong>1. CNY is already cheap.</strong> Using the BIS real effective exchange rate model (which simply measures value incorporating inflation differentials with trading partners), Exhibit 1 shows more specifically that CNY is almost 30% undervalued on this basis. (The dollar is overvalued on this basis, and if we took the chart back farther you&rsquo;d see it&rsquo;s near record-high over-valuation on the BIS model.)</p>
<h3>Exhibit 1 &ndash; CNY REER Cheap, USD Not</h3>
<p><strong>Real Effective Exchange Rates - USD and CNY</strong></p>
<p><img loading="lazy" class="img-responsive" alt="Real Effective Exchange Rates - USD and CNY" src="https://www.vaneck.com/contentassets/c0f566b3d3be4678a90f6a0dc3cc2959/6019_emb-cny_chart-1_2025-8_v1_blog.svg" /></p>
<p class="chart-disclosure">Source: BIS via Bloomberg LP. Data as of June 2025.</p>
<p><strong>2. The roots of this CNY undervaluation &ndash; low Chinese inflation relative to US inflation &ndash; look set to continue.</strong> Exhibit 2 shows the evolution of the IMF&rsquo;s Chinese and US inflation forecasts &ndash; China&rsquo;s has been downward-revised and US&rsquo;s has been upward-revised. This should have and has led to USD weakness against CNY. We should add that the CNY&rsquo;s strength and stability this year should reinforce China&rsquo;s de-/dis-inflation dynamic, and USD weakness and volatility this year could reinforce or reignite the United States&rsquo; inflationary dynamic.</p>
<h3>Exhibit 2 &ndash; US Inflation Forecast Rising, China&rsquo;s Declining</h3>
<p><strong>Evolution of 2025 Inflation Forecasts<br />(Median, percent, year over year)</strong></p>
<p><img loading="lazy" class="img-responsive" alt="Evolution of 2025 Inflation Forecasts" src="https://www.vaneck.com/contentassets/1ad033d3739b4b51a2eaed5da0d49bf2/6019_emb-cny_chart-2_2025-8_v1_blog.svg" /></p>
<p class="chart-disclosure">Source: IMF via Bloomberg LP. Data as of April 2025.</p>
<p><strong>3. China has significant net asset surpluses with the US (and the world), meaning it owns more USD assets than the US owns of CNY assets.</strong> The net international investment position is a popular way to measure this, now significant, imbalance. This is a balance sheet or stock measure, not a flow measure. We make this distinction because the primary response from economists was to analyze China&rsquo;s balance of payments statistics to &ldquo;solve&rdquo; for the &ldquo;flow&rdquo; of Chinese exports. If that&rsquo;s your framing, of course further CNY <u>de</u>valuation should have happened in order to boost exports and make imports dearer, because the economist is solving that problem. But, due to China&rsquo;s NIIP it can manage the currency stronger, an option it didn&rsquo;t previously have &ndash; it does not <em>have to </em>devalue and it has not been devaluing, in fact the daily foreign exchange (FX) fixes have been regularly <em>stronger</em> for CNY than the bank-predicted levels in 2025. So, what was/is the right economic analysis this time? We continue to think that the correct framework is that the stock of USD assets owned by China are what is being activated. China&rsquo;s (and others&rsquo;) USD assets are being sold and reshored to China or to other non-US shores. This is an opinion, as the data will speak more clearly later, but it seems to be the only explanation for what to many has been surprising strength in CNY this year. (Speaking of external balance sheet strength, China and many EMs are net creditors in USD as well &ndash; they have more USD in reserves than government debt in USD, underlining credit quality in dollars.)</p>
<h3>Exhibit 3 &ndash; China Owns More of US Than Vice Versa</h3>
<p><strong>Net International Investment Position - U.S. and China (bn USD)</strong></p>
<p><img loading="lazy" class="img-responsive" alt="Net International Investment Position - U.S. and China" src="https://www.vaneck.com/contentassets/c7faf554f78843b2b300587b54c1fa3e/6019_emb-cny_chart-3_2025-8_v1_blog.svg" /></p>
<p class="chart-disclosure">Source: IMF via Bloomberg LP. Data as of June 2025.</p>
<p><strong>4. PBOC is using fewer US Treasuries in reserves, and there&rsquo;s more to go, arguably.</strong> You see the data and trend below. We would strongly observe that unlike global central bank&rsquo;s as surveyed by the IMF, China&rsquo;s reserves are still nearly four times their lowest levels, while global central bank holdings of US Treasuries are hovering <em>at</em> their lowest levels. This points to further downside risk in Chinese ownership of US Treasuries and thus upward pressure on US yields and/or downward pressure on the USD. Conversely, we should add that Chinese Government Bonds (CGBs) are increasingly demanded as reserve assets, but that process is intentionally opaque and will only be clear when it is established. We should also acknowledge that state bank holdings are reasonably looked at as part of the Venn diagram capturing central bank holdings, but we don&rsquo;t think that&rsquo;s worth delving into here. Also, when we are country economists, we do not take reporting of gold reserves too trustingly, but the true (higher) amounts likely reinforce our point. A final reference should be made to US sanctions risks which have clearly changed the attractiveness of US Treasuries to reserve managers, and which is especially alive in countries that could move to a more adversarial relationship.</p>
<h3>Exhibit 4 &ndash; China Is Already Reducing US Treasury Exposure</h3>
<p><strong>China's UST Holdings, bn USD</strong></p>
<p><img loading="lazy" class="img-responsive" alt="China's UST Holdings" src="https://www.vaneck.com/contentassets/d8a0bc0622c0444db946d70e0c04885b/6019_emb-cny_chart-4_2025-8_v1_blog.svg" /></p>
<p class="chart-disclosure">Source: Bloomberg LP. Data as of June 2025.</p>

<p><strong>5. The rubber hits the road on our NIIP framing because US dependence on fiscal financing (remember, the US borrows from China and Japan) should be reflected in a different risk/reward profile for onshore Chinese or Japanese Treasury buyers.</strong> One way of measuring this precisely is cross-currency swap spreads. An onshore Chinese or Japanese buyer will typically hedge any US Treasuries into CNY or JPY. But, given FX hedging costs, the hedge treasury in Japan pays around &frac14; of the yield of a simple unhedged JGB. We&rsquo;ve shown this in other publications. Another way to look at it is to use the NIIP framework to see how much higher US yields &ldquo;should&rdquo; be to incorporate this fact. We show this below, and it points to USD over-valuation/US Treasury over-valuation (yields too low).</p>
<h3>Exhibit 5 &ndash; What US NIIP Might Mean For US Rates/USD</h3>
<p><strong>A simple NIIP framework implies more USD weakness needed unless US yields rise more than peers</strong></p>
<p><img loading="lazy" class="img-responsive" alt="What US NIIP Might Mean For US Rates/USD" src="https://www.vaneck.com/contentassets/5267f254928547319012928fe2b23f8b/6019_emb-cny_chart-5_2025-8_v1_blog.svg" /></p>
<p class="chart-disclosure">Source: Deutsche Bank, Bloomberg LP, Haver Analytics. Data as of June 2025.</p>
<p><strong>6. Tariff game theory supports RMB appreciation.</strong> Let&rsquo;s get a history lesson out of the way. If you expect official statements on currency arrangements, don&rsquo;t hold your breath and don&rsquo;t trade bonds or currencies. Given that many say we are in Nixonian times, we&rsquo;ll refer to the Smithsonian Agreement of December 1971. This was negotiated for months prior to its announcement. Official references to currencies remain highly controlled if allowed at all, in all countries. So, the idea that the market will &ldquo;know&rdquo; with official clarity about currency arrangements is a non-starter, in our view. What&rsquo;s our understanding? The simplest version is that key trading partners are being told that if they devalue after a trade deal (to be humorously extreme about it) would be a deal-killer. Reread that &ndash; you can&rsquo;t weaken your currency and maybe you have to strengthen it if you don&rsquo;t want another round of tariff trouble. We aren&rsquo;t getting into the nature of the agreements which can be vague and weak or specific and strong&hellip;because they cannot be known, only surmised. But now further remember your pile of USD assets we noted in the NIIP above. So, you&rsquo;re sitting on a net pile of USD and you know USD has to go <em>down</em> versus your own shore&rsquo;s/currency&rsquo;s assets. What will you do? Exhibit 6 has the answer: you bring your USD onshore or to other non-US shores). EM assets are reacting positively to Trump Tariffs v.2, and the market continues to scramble for an explanation.</p>
<h3>Exhibit 6 &ndash; Trump 1 Hurt EM, Trump 2 Helping&hellip;Why?</h3>
<p><img loading="lazy" class="img-responsive" alt="Trump 1 Hurt EM, Trump 2 Helping&hellip;Why?" src="https://www.vaneck.com/contentassets/bb8722f67a984e2ebdf189e96a336b5e/6019_emb-cny_chart-6_2025-8_v1_blog.svg" /></p>
<p class="chart-disclosure">Source: VanEck Research, Bloomberg LP.</p>
<p id="implications-for-em" class="jump-link-nav anchored-block" data-jumplink-title="Implications for EM"><strong>7. This has significant positive implications for EM.</strong> There&rsquo;s not just one currency cross anymore, CNY is more important to many EMs than USD. Exhibit 7 shows a couple versions of this. On the left you see the China/EM trade balance rising secularly against the China/DM trade balance. On the right you see trade volume between China/EM surging above the volume of China/DM trade. There are obviously big country variations (Mexico is uniquely very exposed to the US, for example, whereas Chile and Brazil are much less so), which we discuss in our other publications.</p>
<h3>Exhibit 7 - CNY Is More Important than USD to Many EMs</h3>
<p><img loading="lazy" class="img-responsive" alt="CNY Is More Important than USD to Many EMs" src="https://www.vaneck.com/contentassets/dab52da7e77043289e831fe434742af9/6019_emb-cny_chart-7_2025-8_v1_blog.svg" /></p>
<p class="chart-disclosure">Source: VanEck Research; Bloomberg LP. Data as of June 2025.</p>
<p><strong>8. So you think China&rsquo;s currency is risky; EM currencies, too?</strong> Well, if you think volatility is a measure of risk, Exhibit 8 shows the remarkable stability of CNY compared to JPY and USD. It&rsquo;s not the scope for this note, but we&rsquo;ve written elsewhere about &ldquo;fiscal dominance&rdquo; characterizing many DMs &ndash; government debt is so high that monetary policy loses meaning and traction, which we see as underneath this volatility in DM currencies. We add a bonus Exhibit 9 showing how all of EM local bond market volatility appears to be in a similar regime now relative to higher DM bond volatility. This underlines the centrality of CNY for EMs more broadly. Note that currency stability supports Chinese authorities&rsquo; objective of internationalizing the RMB, increases consumers&rsquo; real income and wealth, and anchors inflation and inflation expectations. It also, to our conjecture, prevents upsetting a US that would surely retaliate if the currency was simply devalued to compensate for tariffs.</p>
<h3>Exhibit 8 &ndash; CNY Stable Versus USD and JPY</h3>
<p><strong>Exchange Rate volatility Trends (CNY vs JPY)</strong></p>
<p><img loading="lazy" class="img-responsive" alt="Trends (CNY vs JPY)&lt;/strong&gt;&lt;/p&gt;" src="https://www.vaneck.com/contentassets/34af09e8bee34dee8960d80261776128/6019_emb-cny_chart-8_2025-8_v1_blog.svg" /></p>
<p class="chart-disclosure">Source: Bloomberg LP. Data as of July 2025.</p>
<h3>Bonus Exhibit 9 &ndash; EM Local Bonds Less Volatile Than DM Bonds</h3>
<p><strong>EM Local Bonds vs DM Sovereigns - 90-day Total Return Volatility (%)</strong></p>
<p><img loading="lazy" class="img-responsive" alt="EM Local Bonds vs DM Sovereigns - 90-day Total Return Volatility" src="https://www.vaneck.com/contentassets/3d8743878b48470eba968bf9d2aab339/6019_emb-cny_chart-9_2025-8_v1_blog.svg" /></p>
<p class="chart-disclosure">Source: VanEck Research, Bloomberg LP. Data as of July 2025.</p>
<p id="conclusion" class="jump-link-nav anchored-block" data-jumplink-title="Conclusion">The evidence for Chinese currency appreciation in 2025 is building. A structurally undervalued CNY, persistent inflation divergence with the U.S., and China&rsquo;s strong external balance sheet all support a stronger currency. Meanwhile, de-risking from U.S. Treasuries and growing trade ties between China and EMs are redefining global FX dynamics. In this context, CNY stability is not only consistent with China&rsquo;s policy goals&mdash;it may be central to a new era of EM financial strength.</p>
<p>To receive more <a href="https://www.vaneck.com/us/en/insights/emerging-markets-bonds/" title="Emerging Markets Bonds Insights"><strong>Emerging Markets Bonds</strong></a> insights, <a href="/link/5f45412c2143400497908cea2897f7d3.aspx" title=" Subscription Center"><strong>sign up in our subscription center</strong></a>.</p>
]]></content:encoded>
</item><item rdf:about="https://www.vaneck.com/us/en/blogs/thematic-investing/the-401k-opening-alternative-asset-managers-have-been-waiting-for/">
  <title>The 401(k) Opening Alternative Asset Managers Have Been Waiting For></title>
  <link>https://www.vaneck.com/us/en/blogs/thematic-investing/the-401k-opening-alternative-asset-managers-have-been-waiting-for/</link>
  <description><![CDATA[A new executive order could bring alternative assets to 401(k)s, creating potential growth opportunities for alternative asset managers. Here&rsquo;s what this shift could mean for investors.]]></description>
  <dc:creator>Brandon Rakszawski</dc:creator>
  <dc:date>08/12/2025 06:30:00</dc:date>
<content:encoded><![CDATA[

<ul class="content-list">
<li class="mt-2">401(k) investment menus may soon include private equity, credit, real estate, infrastructure and more.</li>
<li class="mt-2">Expanded access may open a new distribution channel for alternative asset managers such as Blackstone, KKR, Apollo and Brookfield.</li>
<li class="mt-2">With institutional allocations to private markets nearing limits, retirement plans may be the next big source of inflows.</li>
<li class="mt-2"><a href="/link/018811e6db344b7691fd273a97737194.aspx" title="GPZ - VanEck Alternative Asset Manager ETF - Overview"><strong>GPZ</strong></a> offers exposure to publicly traded alternative asset managers well-positioned for the potential adoption of private market strategies in retirement plans.</li>
</ul>
<p>On August 7, 2025, President Trump signed an executive order titled &ldquo;Democratizing Access to Alternative Assets for 401(k) Investors,&rdquo; aiming to broaden retirement investors&rsquo; access to alternative asset classes, such as private equity and credit, real estate, digital assets, commodities, infrastructure and lifetime income strategies.</p>
<p>This directive mandates a 180‑day review by the Department of Labor to reexamine and potentially soften guidance under ERISA (Employee Retirement Income Security Act) that has historically discouraged fiduciaries from offering alternative-investment options in defined‑contribution retirement plans. In parallel, the Securities and Exchange Commission is asked to consider revising rules around accredited and qualified investor status to facilitate broader participation by individual retirement savers.</p>

<h2>A 401(k) Opening for Alternative Asset Managers Growth</h2>
<p>This executive order may prove to be a structural driver of growth for alternative asset managers that specialize in managing private equity, venture capital, private credit, infrastructure and real estate managers.</p>
<p>As 401(k) plans potentially expand their menus to include private market-based strategies, alternative asset managers like Blackstone, KKR, Apollo, and Brookfield&mdash;among the <strong><a href="/link/018811e6db344b7691fd273a97737194.aspx" title="GPZ - VanEck Alternative Asset Manager ETF - Overview">VanEck Alternative Asset Manager ETF&rsquo;s (GPZ&rsquo;s)</a></strong> potential holdings<sup>1</sup>&nbsp;&mdash;could be looking at a significant new source of inflows. These firms have benefited from the adoption of private market exposure across several major investor types, and the retirement segment would be yet another opportunity.</p>
<p>For years, institutions have increased their exposure to private markets investments. With a subdued &ldquo;exit&rdquo; market (e.g., fewer private market portfolio companies going public or being acquired) and institutional private market allocations pushing up against maximum allowable exposure, fundraising has been more competitive in that channel. This has led to significant efforts among alternative asset managers to penetrate the wealth management market, and 401(k) plans would present another opportunity.</p>
<p><a href="/link/018811e6db344b7691fd273a97737194.aspx" title="GPZ - VanEck Alternative Asset Manager ETF - Overview"><strong>GPZ</strong></a> provides investors with a way to tap into the growth of private markets through public equities, offering diversification and alignment with the unfolding regulatory shift, and is well-positioned to benefit from potential rises in retirement-plan adoption of such strategies.</p>
<h2>From Policy to Practice: What&rsquo;s Next?</h2>
<p>The executive order explicitly opens the door to private market investments in 401(k)s, although actual implementation depends on forthcoming guidance from the Department of Labor and SEC. There is a lot to learn as new guidance is released from all parties involved, but industry participants have already begun efforts to capitalize on the opportunity.</p>
<p>Some managers are working on target‑date retirement funds that will include an allocation to private investments, and plan sponsors are considering how and when to allow for private market exposure on their platforms. Once more clarity is available, developments could happen far more rapidly.</p>
<p>Many questions do remain unanswered, particularly related to suitability of these investments in light of the typically elevated cost associated, transparency considerations, and operational implementation timelines. However, many expect the market to innovate around these hurdles and tap into the incredible potential that lay ahead.</p>

<h2>Tapping the Private Market Growth Opportunity</h2>
<p>The executive order marks a watershed moment and signals a potential paradigm shift in 401(k) design. Given its focus on the largest publicly listed alternative asset managers, <a href="/link/018811e6db344b7691fd273a97737194.aspx" title="GPZ - VanEck Alternative Asset Manager ETF - Overview"><strong>GPZ</strong></a> stands at the intersection of this structural change. The next 6 to 12 months will be pivotal in uncovering whether this regulatory signal translates into real flows&mdash;and whether <a href="/link/018811e6db344b7691fd273a97737194.aspx" title="GPZ - VanEck Alternative Asset Manager ETF - Overview"><strong>GPZ</strong></a> can ride the surge.</p>
<p>To receive more <a href="https://www.vaneck.com/us/en/insights/thematic-investing/" title="Thematic Investing Insights"><strong>Thematic Investing</strong></a> insights, <a href="https://www.vaneck.com/us/en/subscribe/" title="Subscription Center"><strong>sign up in our subscription center</strong></a>.</p>
]]></content:encoded>
</item><item rdf:about="https://www.vaneck.com/us/en/blogs/gold-investing/ima-casanova-gold-stays-strong-m-a-and-earnings-take-spotlight/">
  <title>Gold Stays Strong; M&amp;A and Earnings Take Spotlight></title>
  <link>https://www.vaneck.com/us/en/blogs/gold-investing/ima-casanova-gold-stays-strong-m-a-and-earnings-take-spotlight/</link>
  <description><![CDATA[Gold traded near record highs in July as ETF inflows surged and earnings season kicked off strong. Robust free cash flow is fueling M&amp;A, with royalty firms gaining investor attention.]]></description>
  <dc:creator>Imaru Casanova</dc:creator>
  <dc:date>08/11/2025 06:30:00</dc:date>
<content:encoded><![CDATA[

<p>Monthly gold market and economic insights from <strong><a href="/link/cfa7139e649944fea51aa2a740b2372e.aspx?p=1" title="Imaru Casanova - Portfolio Manager, Gold and Precious Metals">Imaru Casanova, Portfolio Manager</a></strong>, featuring her unique views on mining and gold&rsquo;s portfolio benefits.</p>

<h2 id="july-recap" class="jump-link-nav anchored-block" data-jumplink-title="July Recap">Gold Steadies Near Highs as Investment Demand Accelerates</h2>
<p>With major equity indices reaching new highs, it is not surprising that the gold price closed July nearly unchanged at $3,289.93 per ounce (-0.40% for the month). However, it traded near record levels, reaching a high of $3,439 on July 22 ― an indication that investors, while perhaps more optimistic about the economic outlook, still see plenty of reasons to own gold.</p>
<p>In fact, total gold bullion ETF holdings &mdash; our proxy for investment demand &mdash; increased by more than 615,000 ounces during July, a 0.68% month-on-month rise, contributing to a 10% gain so far in 2025. The World Gold Council&rsquo;s <i>Gold Demand Trends</i> report for Q2 2025, highlighted significant investment in gold-backed ETFs as the main driver behind a 3% year-on-year increase in gold demand, reaching 1,249 tonnes for the quarter. In value terms, a record-high quarterly gold price average of $3,280 per ounce supported a 45% year-on-year jump in total gold demand gain to $132 billion.</p>
<h3>H1 Gold Demand Volume Holds Firm, While Value Rockets</h3>
<p><strong>Total H1 Demand by Sector in Tonnes, and Value (US$Bn)<sup>*</sup></strong></p>
<p><img loading="lazy" class="img-responsive" alt="Total H1 Demand by Sector in Tonnes, and Value" src="https://www.vaneck.com/contentassets/432ea60a437e4f098e9097b201a1d387/6016_gold-commentary-july-2025_chart-1_2025-8_v1_blog.svg" /></p>
<p class="chart-disclosure"><sup>*</sup>&nbsp;Data to 30 June 2025.</p>
<p class="chart-disclosure">Source: Metals Focus, Refinitiv GFMS, World Gold Council.</p>

<p>The gold miners, as represented by the NYSE Arca Gold Miners Index (GDMNTR)<sup>1</sup>, held up fairly well despite the slightly lower gold price, declining only 0.58% for the month. However, the mid-tier and small-cap index, MVIS Global Junior Gold Miners (MVGDXJTR)<sup>2</sup>, underperformed, ending the month down 4.69%.</p>
<h2 id="Q2-earnings-season" class="jump-link-nav anchored-block" data-jumplink-title="Q2 Earnings Season">Q2 Earnings Season Begins on a Strong Note</h2>
<p>During July, gold companies began reporting their Q2 2025 results. On July 24, Newmont (7.5% of Strategy net assets) kicked off the earnings season with strong operational performance that led to better-than-expected earnings and record free cash flow generation. During the quarter, the company continued to reduce debt, returned $1.0 billion to shareholders in the form of dividends and share buybacks, and approved an additional $3.0 billion share repurchase program, bringing total authorization to $6.0 billion ($2.8 billion executed to date). Newmont also reaffirmed that it is on track to meet its 2025 guidance of 5.6 million ounces of gold at all-in sustaining costs of $1,620 per ounce. These results are precisely what gold equity investors want to see during a period of record gold prices. Newmont shares responded positively, rising nearly 7% on July 25. The company also provided gold price sensitivities, noting that every $100 per ounce increase translates into more than $500 million in additional revenue. Newmont set a constructive tone for the reporting season, with senior producers and top fund holdings, Agnico Eagle Mines (9.9% of Strategy net assets), Kinross Gold (6.2% of Strategy net assets), and AngloGold Ashanti (5.2% of Strategy net assets), also posting strong results and reaffirming their 2025 targets.</p>
<h2 id="m-and-a-activity" class="jump-link-nav anchored-block" data-jumplink-title="M&amp;A Activity">M&amp;A Activity Heats Up on Strong Cash Flows</h2>
<p>The gold mining sector&rsquo;s record margins are translating into record levels of free cash flow. This abundance of cash is enabling companies to refocus on their growth strategies, fueling an increase in M&amp;A activity for the industry. Producers need to replace the ounces they mine each year, and while organic growth projects are the preferred option, the ounces associated with those projects are simply not enough to offset depletion. Acquisitions usually come at a significantly higher price tag, but with gold shares trading higher this year and plenty of cash and debt capacity in most balance sheets, companies can more aggressively pursue M&amp;A. Our hope is that they continue to do so with discipline &mdash; protecting margins and seeking value creation. Bigger is not always better in the gold sector, so management teams need to be very selective.</p>
<h2>Torex Gold Resources and Royal Gold Announce Strategic Acquisitions</h2>
<p>In July, Torex Gold Resources (&ldquo;Torex&rdquo;)(2.0% of Strategy net assets) announced its proposed acquisition of Prime Mining (not held in Strategy). If completed as expected, the deal will give Torex full ownership of the multi-million ounce Los Reyes gold-silver project in Mexico &mdash; a jurisdiction where Torex has successfully worked since 2010. It&rsquo;s experience in Mexican operations, project development, permitting, community and labor relations, procurement and supply chain management and stakeholder engagement, gives it a clear competitive advantage in unlocking value and delivering synergies.</p>
<p>Also, in July, Royal Gold (0.9% of Strategy net assets) announced its proposed acquisition of Sandstorm Gold (not held in Strategy) and Horizon Copper (not held in Strategy). The transaction is expected to deliver immediate meaningful revenue growth, strengthen Royal Gold&rsquo;s precious metals focus, and expand its long-term growth pipeline. It also improves investor appeal by increasing scale and liquidity, while unlocking value through the simplification of complex inter-company structures.</p>
<h2 id="royalty-and-streaming-companies" class="jump-link-nav anchored-block" data-jumplink-title="Royalty &amp; Streaming Companies">The Compelling Case for Royalty and Streaming Companies</h2>
<p>Royalty and streaming companies offer a unique and compelling investment profile within the gold mining sector. Unlike producers, they do not own or operate mines. Instead, they hold contractual rights to a portion of the production (either through royalties or streams) from mines operated by others. This model provides substantial benefits: reduced exposure to cost inflation, broad asset diversification, and limited operational risk.</p>
<p>Functioning as financiers to mine developers, these companies effectively participate in the upside of mining operations without taking on many of the associated downside risks. Moreover, their business model offers the opportunity for "zero-cost growth" as they often benefit from mine life extensions or production expansions without needing to invest additional capital. This combination of growth potential and a lower-risk profile makes them a strategic &ldquo;happy medium&rdquo; between gold bullion and traditional producers, offering safety during downturns and exposure to upside in growth cycles.</p>
<h2>Growth Efficiency versus Gold Price Leverage</h2>
<p>The drawback is that royalty and streamers offer lower leverage to the gold price &mdash; a reason often offered to explain underweight positioning in this gold equity subsector during a gold bull market. However, this perceived limitation may be offset by their more attractive growth profiles and lower risk exposure. This dynamic likely explains why they tend to trade at premium valuations relative to producers.</p>
<p>The acquisition of Sandstorm Gold and Horizon Copper by Royal Gold exemplifies the value-adding potential of M&amp;A within the streaming and royalty space. Unlike producer-led M&amp;A, which often comes with integration challenges, geopolitical and operational risk, and the dilution of management focus, streaming companies can pursue acquisitions that are relatively risk-free from an execution standpoint.</p>
<p>In this case, the transaction is NAV accretive by most estimates, enhances Royal Gold&rsquo;s growth pipeline, and expands its already diversified portfolio to nearly 400 assets&mdash;80 of which are in production. The deal also improves scale and liquidity, elevating Royal Gold&rsquo;s profile among generalist investors and better positioning it to compete with the largest players in the sector. Notably, no single asset is expected to represent more than 13% of the company&rsquo;s valuation post-transaction, reinforcing the company&rsquo;s risk-mitigated structure.</p>
<p><i>Royal Gold&rsquo;s proposed acquisition of Sandstorm gives the company one of the largest, most diversified mining asset portfolios. The proposed acquisition increases the company&rsquo;s scale&mdash;however, it is still small enough to show growth potential.</i></p>
<h3>Royal Gold - Less Concentrated Post-Acquisition</h3>
<div class="wrapped-div">
<table style="width: 100%;">
<tbody>
<tr class="tbl-data">
<td class="tbl-header last">Principal Asset</td>
<td class="tbl-header last text-right" style="font-weight: strong;">Mt Milligan</td>
<td class="tbl-header last text-right" style="font-weight: strong;">Pueblo Viejo</td>
<td class="tbl-header last text-right" style="font-weight: strong;">Cortez</td>
<td class="tbl-header last text-right" style="font-weight: strong;">Andacollo</td>
<td class="tbl-header last text-right" style="font-weight: strong;">Khoemacau</td>
<td class="tbl-header last text-right" style="font-weight: strong;">Hod Maden</td>
<td class="tbl-header last text-right" style="font-weight: strong;">Wassa</td>
<td class="tbl-header last text-right" style="font-weight: strong;">Platreef</td>
<td class="tbl-header last text-right" style="font-weight: strong;">Antamina</td>
<td class="tbl-header last text-right" style="font-weight: strong;">MARA</td>
</tr>
<tr class="tbl-data">
<td class="data-td last">% of NAV</td>
<td class="data-td data last text-right">13</td>
<td class="data-td data last text-right">10</td>
<td class="data-td data last text-right">8</td>
<td class="data-td data last text-right">7</td>
<td class="data-td data last text-right">6</td>
<td class="data-td data last text-right">5</td>
<td class="data-td data last text-right">3</td>
</tr>
</tbody>
</table>
</div>
<br />
<p class="chart-disclosure">Top 10 assets comprise ~60% of total asset NAV.</p>
<h3>Increased Size, Scale, Liquidity (Market Cap, $B)</h3>
<p><img loading="lazy" class="img-responsive" alt="Increased Size, Scale, Liquidity" src="https://www.vaneck.com/contentassets/5e5f60b624314378876d023dd4551975/6016_gold-commentary-july-2025_chart-2_2025-8_v1_blog.svg" /></p>
<p class="chart-disclosure">Source: Royal Gold. Data as of June 30, 2025.</p>
<p>In sum, this acquisition not only strengthens Royal Gold&rsquo;s organic growth trajectory but demonstrates the superior scalability and efficiency of the royalty and streaming model.</p>
<h2>Positioning for a Dynamic Gold Market</h2>
<p>We believe royalty companies possess meaningful advantages &mdash; both in terms of organic growth and growth through acquisitions &mdash; and when combined with their lower-risk profile, they are positioned well to effectively compete with gold producers, even in a rising gold price environment.</p>
<style>

    .data-td.data {
        padding-right: 5px !important;
    }
    
    .wrapped-div {
        max-width: 100%;
    }
    
    @media (max-width: 1240px) {
        .wrapped-div {
            overflow-x: scroll;
        }
    }
    
    .wrapped-div-sector {
        max-width: 100%;
        overflow-x: scroll;
    }
</style>
<p>To receive more <strong><a href="https://www.vaneck.com/us/en/insights/gold-investing/" title="Gold Investing Insights">Gold Investing</a></strong> insights, <strong><a href="https://www.vaneck.com/us/en/subscribe/" title="Subscription Center">sign up in our subscription center</a></strong>.</p>
]]></content:encoded>
</item><item rdf:about="https://www.vaneck.com/us/en/blogs/model-portfolios/july-market-recap-positioning-for-ai-demand-and-policy-uncertainty/">
  <title>July Market Recap: Positioning for AI Demand and Policy Uncertainty></title>
  <link>https://www.vaneck.com/us/en/blogs/model-portfolios/july-market-recap-positioning-for-ai-demand-and-policy-uncertainty/</link>
  <description><![CDATA[Amid accelerating AI demand and policy uncertainty, we&rsquo;re focused on long-term themes&mdash;investing in U.S. tech, nuclear energy, and holding gold and bitcoin as trust gradually erodes.]]></description>
  <dc:creator>David Schassler</dc:creator>
  <dc:date>08/11/2025 06:30:00</dc:date>
<content:encoded><![CDATA[

<h2>Overview</h2>
<p>July wasn&rsquo;t quiet. Markets moved. Institutions wobbled. Innovation advanced.</p>
<p>None of this is new. But it&rsquo;s gaining speed.</p>
<p>We continue to track the same primary themes as last month and our positioning reflects those: driven by AI, long U.S. technology and nuclear innovation with exposure to gold and bitcoin as potential offsets lingering policy uncertainty. In summary, our framework focuses on where structural shifts are creating lasting opportunity, not on short-term market movements.</p>
<h2>Key Market Themes</h2>
<p>Three themes continue to shape our view:</p>
<ul class="content-list">
<li class="mt-3">AI is reshaping global productivity.</li>
<li class="mt-3">Energy systems must scale to support that shift.</li>
<li class="mt-3">Policy credibility is under pressure - from both monetary and fiscal sides.</li>
</ul>
<h2>AI&rsquo;s Consolidation and Market Leadership</h2>
<p>AI is more than a theme - it&rsquo;s the infrastructure of the next cycle.</p>
<p>Microsoft surpassed $4 trillion in market cap. Nvidia continues to dominate the compute layer. These companies are powering platforms that will define productivity for decades.</p>
<p>The policy environment is increasingly supportive. The Trump administration has made clear moves to support U.S. leadership in AI and digital assets - through infrastructure investment, energy policy, and crypto regulation. That&rsquo;s a real tailwind.</p>
<p><strong>The message from markets is clear: innovation remains the structural engine of growth. We stay aligned. </strong></p>
<h2>Cracks in Policy Credibility</h2>
<p>July also exposed growing pressure on institutional trust.</p>
<p>President Trump fired Bureau of Labor Statistics Commissioner Erika McEntarfer after weak jobs data and downward revisions, citing data manipulation. Whether the numbers were flawed or politically inconvenient, the signal to investors was the same: trust is fraying.</p>
<p>He also publicly challenged Fed Chair Powell on live television over the cost of the Federal Reserve&rsquo;s building renovation, while floating major leadership changes. Meanwhile, the U.S. dollar is down 8.6% YTD - a material move for the world&rsquo;s reserve currency.</p>
<p><strong>In this environment, bitcoin and gold aren&rsquo;t speculative. In our view, they&rsquo;re becoming essential. </strong></p>
<h2>Nuclear Energy: The Next Investment Frontier</h2>
<p>AI is always on. That means power demand is rising - and reliability matters.</p>
<p>Small modular reactors (SMRs) are gaining real momentum. X-energy and Amazon are working to deploy gigawatts of capacity. Trump&rsquo;s executive order calls for a fourfold increase in U.S. nuclear generation. Private capital is already moving.</p>
<p><strong>Nuclear is no longer a long-term conversation, it&rsquo;s a medium-term solution. Fossil fuels remain the immediate bridge. </strong></p>
<h2>Portfolio Activity: Recent Moves</h2>
<p>We made targeted adjustments in July to better align with our themes and upgrade the growth profile of our portfolios.</p>
<p><strong>New and increased positions included: </strong></p>
<ul class="content-list">
<li class="mt-3"><strong>Invesco QQQ (QQQ): </strong>Large-cap AI platform leadership</li>
<li class="mt-3"><strong><a href="/link/d41cc1b7916f46e5bb3ee751f311c4f2.aspx" title="ESPO - VanEck Video Gaming and eSports ETF - Holdings and Performance">VanEck Video Gaming &amp; eSports (ESPO)</a>: </strong>Immersive digital content and engagement</li>
<li class="mt-3"><strong>GlobalX Infrastructure Development (PAVE): </strong>Physical buildout behind AI and energy scale</li>
<li class="mt-3"><strong>Defiance Quantum (QTUM): </strong>Advanced computing, AI acceleration, and quantum potential</li>
<li class="mt-3"><strong><a href="/link/018811e6db344b7691fd273a97737194.aspx" title="GPZ - VanEck Alternative Asset Manager ETF - Holdings and Performance">VanEck Alternative Asset Manager (GPZ)</a>: </strong>New position. Firms like Blackstone, KKR, and Apollo are financing the infrastructure powering AI, cybersecurity, energy transition, and digital health</li>
</ul>
<p>Each position improves thematic precision and portfolio adaptability.</p>

<h2>Market Review</h2>
<p><strong>Equities: </strong></p>
<p>U.S. stocks (S&amp;P 500) rose +2.24% in July and are up +8.59% year-to-date, supported by strong tech earnings and steady consumer strength.</p>
<p>Developed international markets fell -1.40%, held back by weakness in Europe. Manufacturing PMIs across the Eurozone remained in contraction territory, especially in Germany and France. Eurozone GDP growth came in flat, and consumer confidence remained subdued pointing to a lack of momentum across the region.</p>
<p>Emerging markets gained +1.95%, bringing YTD performance to +17.51%. Commodity-linked and tech-driven economies continued to lead, even as China&rsquo;s ongoing softness weighed on sentiment.</p>
<p><strong>Fixed Income: </strong></p>
<p>The Bloomberg U.S. Aggregate Bond Index declined -0.26% in July, up +3.75% YTD.</p>
<p>Weaker-than-expected job growth pushed yields lower, reinforcing expectations that the Fed may cut rates later this year.</p>
<p><strong>Real Assets: </strong></p>
<p>Copper dominated headlines. It surged 13.3%, the largest one-day gain on record - after a proposed 50% tariff on imports. Weeks later, it plunged 22% when the final policy excluded raw materials and scrap. This whiplash reinforced copper&rsquo;s role as both a strategic input and a proxy for policy risk.</p>
<p>The <a href="/link/fae5e7a97c094c9b924c6ee6aec199fd.aspx" title="PIT - VanEck Commodity Strategy ETF - Holdings and Performance"><strong>VanEck Commodity Strategy ETF (PIT)</strong></a>, which started July overweight copper, reduced exposure following the announcement. That decision was well-timed. PIT is a core position in our <a href="/link/5ce91a58002841728be4456829de5cbb.aspx" title="VanEck Real Assets Portfolio"><strong>Real Asset Model</strong></a> and is also held through <a href="/link/310be2aebcad4c5cb5a89a82fd128841.aspx" title="RAAX - VanEck Real Assets ETF - Holdings and Performance"><strong>RAAX</strong></a> in the <strong><a href="/link/39fe1617e2e94666bb799654d182e126.aspx" title="VanEck Model Portfolios">Wealth Builders</a></strong> and <a href="/link/ec88c90a3dbe4ea7918f988bd51b43c3.aspx" title="VanEck Select Opportunities Portfolio"><strong>Select Opportunities Models</strong></a>.</p>
<p>Gold, while less volatile, continues to deliver. It dipped -0.61% in July but remains up +25.00% YTD. We see the recent consolidation as an opportunity to add exposure at more favorable pricing. Gold remains a key hedge against monetary excess and institutional instability.</p>
<p><strong>Digital Assets: </strong></p>
<p>Bitcoin rose +8.43% in July and is also up +25.00% YTD.</p>
<p>Its price strength continues to reflect investor demand for non-sovereign, policy-agnostic stores of value.</p>
<p>July&rsquo;s divergence from gold was a reminder: while both serve similar purposes, they behave differently. Bitcoin remains a core allocation in our digital asset framework.</p>
<h2>Positioning Going Forward</h2>
<p>Here&rsquo;s where we remain focused:</p>
<ol class="content-list">
<li class="mt-3">AI and compute platforms - the foundation of productivity going forward</li>
<li class="mt-3">Energy infrastructure - especially nuclear, where digital demand meets physical constraint</li>
<li class="mt-3">Gold and bitcoin - potential stores of value when trust is in question</li>
<li class="mt-3">U.S. tech leadership - where innovation lives, and where we stay overweight</li>
</ol>
<p>The market is evolving. So are we. Our focus: stay aligned with where the world is going - and act with clarity and conviction.</p>
<p>To receive more <strong><a href="https://www.vaneck.com/us/en/insights/guided-allocation/" title="Model Portfolio Insights">Model Portfolio</a></strong> insights, <strong><a href="https://www.vaneck.com/us/en/subscribe/" title="Subscription Center">sign up in our subscription center</a></strong>.</p>
]]></content:encoded>
</item><item rdf:about="https://www.vaneck.com/us/en/blogs/natural-resources/catalysts-powering-the-nuclear-comeback-in-2025/">
  <title>Catalysts Powering the Nuclear Comeback in 2025></title>
  <link>https://www.vaneck.com/us/en/blogs/natural-resources/catalysts-powering-the-nuclear-comeback-in-2025/</link>
  <description><![CDATA[2025 marks a nuclear shift as global energy needs and tech trends fuel market opportunities.]]></description>
  <dc:creator>Brandon Rakszawski</dc:creator>
  <dc:date>08/11/2025 06:30:00</dc:date>
<content:encoded><![CDATA[

<p><strong>Key Takeaways</strong></p>
<ul class="content-list">
<li class="mt-3">U.S. nuclear policy is accelerating, with 2025 Executive Orders targeting a 4x increase in capacity by 2050 and streamlining the regulatory process.</li>
<li class="mt-3">Big Tech is doubling down on nuclear, with Meta and Amazon signing new long-term power purchase agreements to support data center operations and carbon offsets.</li>
<li class="mt-3">Small Modular Reactors (SMRs) gain military backing, as Oklo secures a key contract for deployment at Eielson Air Force Base.</li>
<li class="mt-3">AI-driven electricity demand remains strong and hyperscalers maintain or increase capex despite market volatility.</li>
<li class="mt-3">VanEck&rsquo;s <strong><a href="/link/49acb0d4174146e9a0269c9cb81c02bb.aspx" title="NLR - VanEck Uranium and Nuclear ETF - Holdings and Performance">NLR</a></strong> ETF provides diversified exposure to the full nuclear value chain, from uranium miners to advanced reactor firms and utilities.</li>
</ul>
<h2 id="point-thirteen" class="anchored-block">Webinar Replay: The AI Energy Trade Is Nuclear</h2>
<p>Our most-watched webinar reveals how this growth story could reshape portfolios. See why investors tuned in.</p>
<h2>2025: The Year of Nuclear</h2>
<p>Nuclear energy is no longer an afterthought. In just two to three short years, our national nuclear energy conversation has evolved from (1) decommissioning our aging reactor fleet to (2) extending its regulatory life to (3) recommissioning shuttered reactors, and now we&rsquo;re (4) talking about building new reactors. With aggressive global policy goals and tech company attention, the focus is sure to stay on nuclear energy as the U.S. and other countries seek to meet their&nbsp; ever-increasing need for electricity.</p>
<h2>Key 2025 Nuclear Energy Catalysts</h2>
<p><strong><i>1. U.S. Federal Executive Orders</i></strong></p>
<p>In May 2025, the Trump Administration issued a series of executive orders aimed at quadrupling U.S. nuclear capacity to 400 GW by 2050 from approximately 100 GW today. His executive orders also focused on expediting nuclear licensing by placing time limits on the Nuclear Regulatory Commission&rsquo;s licensing review process. Additionally, his orders also seek to address America&rsquo;s lack of domestic uranium enrichment and processing capability. The U.S. and much of the world have become increasingly dependent on a select few countries, namely Russia, for enriched uranium.</p>
<p>These executive orders supported the nuclear energy ecosystem, providing investor confidence across the supply chain and raising the prospects of increased investment in nuclear capacity across the board.</p>
<p><strong><i>2. Tech Giants Continued Commitment to Nuclear Power</i></strong></p>
<p>2023 and 2024 were marked by numerous announcements from hyperscalers, including commitments to nuclear power purchase agreements and direct equity investments in nuclear start-ups. Microsoft made headlines in late 2023 when it posted a job listing seeking a nuclear engineer to help coordinate the adoption of small modular reactors (SMRs) to power its data centers. 2025 has been clear cut continuation of this trend.</p>
<p><u>Meta/Constellation PPA Announcement &ndash; June 2025</u></p>
<p>On June 3, 2025, Meta Platforms (META) and nuclear utility Constellation Energy (CEG) announced a 20-year power purchase agreement (PPA) for nuclear power output from the Clinton Clean Energy Center in Clinton, IL. The agreement was unique in that Meta will not use the power it is purchasing. Instead it will offset the tech firm&rsquo;s less green electricity usage. The investment will help cover the costs of relicensing, upgrades, and maintenance of the facility effectively, extending its life, which was otherwise in doubt before to the announcement.</p>
<p><u>Amazon and Talen Energy PPA Announcement &ndash; June 2025</u></p>
<p>Shortly after the Meta/Constellation announcement, Amazon (AMZN) and Talen Energy (TLN) announced an expansion of an existing relationship forged in prior years. A new PPA aims to supply electricity to Amazon for operations that support AI and other cloud technologies at a data center campus near Talen&rsquo;s Susquehanna nuclear power plant in Pennsylvania. The agreement runs through 2042 and also includes commitments to explore the building of SMRs throughout Talen&rsquo;s Pennsylvania footprint.</p>
<p><strong><i>3. SMR Projects at Military Outposts</i></strong></p>
<p>Among the Trump executive orders was a notable provision for the deployment and use of advanced nuclear reactor technologies at military installations. Shortly after the executive order signing, Oklo (OKLO) saw its share price advance rapidly as speculation circulated that it would be selected to supply its Aurora powerhouse SMR for the Eielson Air Force Base in Alaska. Later, the &ldquo;Notice of Intent to Award&rdquo; from the Department of Defense was confirmed justifying the hype around Oklo and other advanced reactor companies. As other military branches look to implement the executive order, the market is patiently waiting to see which SMR companies, both private and public, will win contracts and benefit.</p>
<p><strong><i>4. Continued AI Capex Growth</i></strong></p>
<p>One of the most significant risks facing the nuclear energy renaissance is a slowdown in infrastructure investment. The most acute example of this was the DeepSeek news that sent tech stocks and nuclear companies spiraling in late January 2025. Based on the relative cost-efficiency of DeepSeek&rsquo;s model, markets reflected the doubts that the massive AI arms race spending was sustainable or even necessary. However, major hyperscalers have not pulled back their capital expenditure commitments, and US electricity demand remains above last year as well as above levels before the global pandemic market disruptions. These companies have not only maintained capex levels, but in many cases have upped commitments.</p>

<h3>Big Tech 2025 Annual Capex Outlooks</h3>
<p><img loading="lazy" src="https://www.vaneck.com/contentassets/5dc886d60fe84cc5aa5eb89f791aca0c/6026_nlr-blog_image_2025-8_v1_blog.svg" class="w-100 img-responsive" alt="Big Tech 2025 Annual Capex Outlooks" /></p>
<p class="chart-disclosure">Source: CNBC; company reports. For illustrative purposes only.</p>
<h2>Diverse Opportunity Set, Broad Implications</h2>
<p>The nuclear energy ecosystem is broad and complex. Upstream uranium miners and processors can behave quite differently from advanced reactor companies and downstream utilities that are producing power for industrial, commercial, and residential clients. Each of the nuclear segments may react differently to the various catalysts discussed herein and will likely respond differently to future catalysts, both positive and negative. Therefore, gaining diversified exposure to the nuclear opportunity set can be essential to spread risk, increase broad participation, and prevent the tall task of picking winners and losers of this rapidly evolving trend.</p>
<p><a href="/link/49acb0d4174146e9a0269c9cb81c02bb.aspx" title="NLR - VanEck Uranium and Nuclear ETF - Holdings and Performance"><strong>The VanEck Uranium and Nuclear ETF (NLR)</strong></a> offers investors broad exposure to the entire ecosystem, including uranium miners, construction and engineering firms, advanced reactor companies, and nuclear utilities.</p>

<p>To receive more <a href="/us/en/insights/natural-resources/" title="Natural Resources Insights"><strong>Natural Resources</strong></a> insights, <a href="https://www.vaneck.com/us/en/subscribe/" title="Subscription Center"><strong>sign up in our subscription center</strong></a>.</p>
]]></content:encoded>
</item><item rdf:about="https://www.vaneck.com/us/en/blogs/moat-investing/differentiation-matters-as-moat-stocks-lead-in-july/">
  <title>Differentiation Matters as Moat Stocks Lead in July></title>
  <link>https://www.vaneck.com/us/en/blogs/moat-investing/differentiation-matters-as-moat-stocks-lead-in-july/</link>
  <description><![CDATA[In a market dominated by mega-cap momentum, July showcased the strength of the Moat Index&rsquo;s stock selection and structural discipline.]]></description>
  <dc:creator>Coulter Regal, CFA</dc:creator>
  <dc:date>08/07/2025 06:30:00</dc:date>
<content:encoded><![CDATA[

<p><strong>Key Takeaways</strong></p>
<ul class="content-list">
<li class="mt-2">Solid earnings, tax cut extensions and AI momentum lifted U.S. equity markets for a third consecutive month of gains in July.</li>
<li class="mt-2">The Moat Index&rsquo;s differentiated exposure led to outperformance against the broad market.</li>
<li class="mt-2">Strong stock selection in consumer staples and industrials, led by Teradyne and Huntington Ingalls, offset the Moat Index&rsquo;s underweight to mega-cap tech.</li>
<li class="mt-2">SMID Moat Index topped small- and mid-cap benchmarks, led by Norwegian Cruise Line and Chart Industries.</li>
</ul>
<p id="us-equity-market-review" class="jump-link-nav anchored-block" data-jumplink-title="U.S. Equity Market Review">In July, U.S. equity markets continued their summer advance, marking the third straight month of gains as the S&amp;P 500 rose 2.2% and set a fresh new record high. The Nasdaq Composite gained 3.7%, while the Dow Jones Industrial Average ended the month largely flat. Investor sentiment was bolstered by strong corporate earnings, positive GDP data, and the passage of the One Big Beautiful Bill, which enacted new tax legislation extending previous cuts. However, renewed tariff discussions with multiple countries and a softer-than-expected jobs report toward month's end introduced volatility. The Technology sector remained at the forefront, propelled by AI developments, even as the Federal Reserve once again kept interest rates unchanged. Continued large downward revisions in jobs data did, however, boost market expectations for possible rate reductions later in the year.</p>
<p>The <strong><a href="/link/9e43dd198c5f4e419f13220685081895.aspx" title=" MOAT - VanEck Morningstar Wide Moat ETF - Overview">Morningstar Wide Moat Focus Index</a></strong> (the &ldquo;Moat Index&rdquo;) gained more than 3% in July, outpacing both the broad market S&amp;P 500 as well as the equal-weighted variant. The outperformance came despite the Moat Index&rsquo;s structural underweight to top mega-cap technology names. Strong stock selection during the month, particularly within the consumer staples and industrial sectors, more than offset sector allocations. The strategy continues to provide <a href="/link/2fda9d99c78b436cb2960bb0b469eee9.aspx" title="A Wide Moat Focus Provides Differentiation"><strong>differentiated exposure</strong></a>, which has become increasingly difficult for investors to find, amid <a href="/link/fee68d3b0b134bca95513e885392ace0.aspx" title="Market Leadership Is Narrow. Your Portfolio Shouldn&rsquo;t Be"><strong>historical levels of concentration</strong></a> in the U.S. equity markets.</p>
<p>Smaller stocks also saw advances during the month, but like much of the year so far, the cohort&rsquo;s performance lagged relative to large-caps. The <strong><a href="/link/166321dbcfec440590fb51cf0ad629aa.aspx" title=" SMOT - VanEck Morningstar SMID Moat ETF - Overview">Morningstar US Small-Mid Cap Moat Focus Index</a></strong> (the &ldquo;SMID Moat Index&rdquo;) posted a 1.9% gain in July, outpacing both the broad small- and mid-cap benchmarks which returned 0.9% and 1.6%, respectively. Despite their muted performance, many are keeping a close eye on small- and mid-caps as the segment&rsquo;s prospects could improve with a dovish pivot by the Fed.</p>
<h3>Moat Stocks Lead the Pack in July</h3>
<div class="flourish-embed flourish-chart" data-src="visualisation/24580980?2429575"><script src="https://public.flourish.studio/resources/embed.js"></script><noscript><img loading="lazy" src="https://public.flourish.studio/visualisation/24580980/thumbnail" width="100%" alt="Moat Stocks Lead the Pack in July" /></noscript></div>
<p class="chart-disclosure"><strong>Source: Morningstar. Data as of 7/31/2025.</strong> Past performance is no guarantee of future results. Index performance is not representative of fund performance. It is not possible to invest directly in an index. Please see index definitions and other important disclosures at the end of this content. Fund performance current to the most recent month end is available by visiting vaneck.com or by calling 800.826.2333.</p>

<h2 id="moat-highlights" class="jump-link-nav anchored-block" data-jumplink-title="Moat Highlights">Moat Index July Highlights: Chips and Ships Steer Gains</h2>
<p>In July, the <strong><a href="/link/9e43dd198c5f4e419f13220685081895.aspx" title=" MOAT - VanEck Morningstar Wide Moat ETF - Overview">Moat Index</a></strong> benefited from strong stock selection, as several companies delivered solid earnings results that prompted the market to revalue their shares more in line with Morningstar&rsquo;s fair value estimates. This earnings-driven rerating more than offset headwinds from the Index&rsquo;s equal-weighted construction in the current mega-cap driven market. As a result, the Index outpaced the broader, tech-heavy market while continuing to provide differentiated exposure.</p>
<p>Wide-moat semiconductor testing leader Teradyne (TER) was the top contributor to the <strong><a href="/link/9e43dd198c5f4e419f13220685081895.aspx" title=" MOAT - VanEck Morningstar Wide Moat ETF - Overview">Moat Index</a></strong> in July, with shares rising nearly 20% following second-quarter earnings and positive forward commentary. While sales declined year over year, management&rsquo;s guidance pointed to a return to growth in the second half of 2025, and upbeat messaging around demand for AI chip testing and robotics drove a sharp rerating. Morningstar believes Teradyne is well positioned to benefit from growing complexity in semiconductors, particularly in high-bandwidth memory and custom AI accelerators, and sees a recent robotics design win as a meaningful growth driver heading into 2026. With its leading market share, sticky customer relationships, and a robust R&amp;D pipeline, Morningstar maintains a $115 fair value estimate, suggesting there may still be additional upside ahead.</p>
<p>Defense contractor Huntington Ingalls (HII) was also a key contributor to <strong><a href="/link/9e43dd198c5f4e419f13220685081895.aspx" title=" MOAT - VanEck Morningstar Wide Moat ETF - Overview">Moat Index</a></strong> performance in July, with shares gaining on the back of strong quarterly results and guidance. While quarterly profit declined due to temporary shipbuilding delays, revenue rose modestly, and management highlighted the arrival of key components that should allow construction to accelerate in the second half of the year. Morningstar expects gradual margin improvement over the coming years, driven by more efficient throughput and higher-margin contracts, particularly in submarine programs. With the U.S. Navy continuing to invest in shipyard capacity and submarine production, Morningstar sees durable long-term demand for Huntington Ingalls&rsquo; uniquely positioned shipbuilding operations. Following the update, Morningstar raised its fair value estimate to $324 per share, suggesting shares remain attractively priced.</p>
<p>Other top contributors within the <strong><a href="/link/9e43dd198c5f4e419f13220685081895.aspx" title=" MOAT - VanEck Morningstar Wide Moat ETF - Overview">Moat Index</a></strong> during the month include global prestige beauty market leader, Estee Lauder (EL), security products and solutions company, Allegion (ALLE), as well as semiconductor design software provider, Synopsys (SNPS).</p>
<p>Companies detracting the most in July came from a mix of sectors, with industrials accounting for two of the five names on the list: United Parcel Service (UPS) and fluidics equipment manufacturer IDEX Corp. (IEX). Other notable detractors included fixed-income trading platform MarketAxess (MKTX), software and analytics giant Adobe Inc. (ADBE), and enterprise cloud leader Salesforce Inc. (CRM).</p>
<h2>Moat Index Top Contributors and Detractors - July 2025</h2>
<h3>Contributors</h3>
<div class="wrapped-div">
<table style="width: 100%;">
<tbody>
<tr class="tbl-data">
<td class="tbl-header last text-left">Company</td>
<td class="tbl-header last text-left">Ticker</td>
<td class="tbl-header last text-left">Sector</td>
<td class="tbl-header last text-right">Avg. Weight (%)</td>
<td class="tbl-header last text-right">Contribution (%)</td>
</tr>
<tr class="tbl-data">
<td class="data-td last text-left">Teradyne Inc.</td>
<td class="data-td data last text-left">TER</td>
<td class="data-td data last text-left">Technology</td>
<td class="data-td data last text-right">2.46</td>
<td class="data-td data last text-right">0.48</td>
</tr>
<tr class="tbl-data">
<td class="data-td last text-left">The Estee Lauder</td>
<td class="data-td data last text-left">EL</td>
<td class="data-td data last text-left">Consumer Staples</td>
<td class="data-td data last text-right">2.84</td>
<td class="data-td data last text-right">0.44</td>
</tr>
<tr class="tbl-data">
<td class="data-td last text-left">Huntington Ingalls</td>
<td class="data-td data last text-left">HII</td>
<td class="data-td data last text-left">Industrials</td>
<td class="data-td data last text-right">2.75</td>
<td class="data-td data last text-right">0.43</td>
</tr>
<tr class="tbl-data">
<td class="data-td last text-left">Allegion</td>
<td class="data-td data last text-left">ALLE</td>
<td class="data-td data last text-left">Industrials</td>
<td class="data-td data last text-right">2.62</td>
<td class="data-td data last text-right">0.40</td>
</tr>
<tr class="tbl-data">
<td class="data-td last text-left">Synopsys Inc.</td>
<td class="data-td data last text-left">SNPS</td>
<td class="data-td data last text-left">Technology</td>
<td class="data-td data last text-right">1.35</td>
<td class="data-td data last text-right">0.32</td>
</tr>
</tbody>
</table>
</div>
<h3>Detractors</h3>
<div class="wrapped-div">
<table style="width: 100%;">
<tbody>
<tr class="tbl-data">
<td class="tbl-header last text-left">Company</td>
<td class="tbl-header last text-left">Ticker</td>
<td class="tbl-header last text-left">Sector</td>
<td class="tbl-header last text-right">Avg. Weight (%)</td>
<td class="tbl-header last text-right">Contribution (%)</td>
</tr>
<tr class="tbl-data">
<td class="data-td last text-left">United Parcel Service</td>
<td class="data-td data last text-left">UPS</td>
<td class="data-td data last text-left">Industrials</td>
<td class="data-td data last text-right">2.26</td>
<td class="data-td data last text-right">-0.33</td>
</tr>
<tr class="tbl-data">
<td class="data-td last text-left">MarketAxess Inc.</td>
<td class="data-td data last text-left">MKTX</td>
<td class="data-td data last text-left">Financials</td>
<td class="data-td data last text-right">2.48</td>
<td class="data-td data last text-right">-0.20</td>
</tr>
<tr class="tbl-data">
<td class="data-td last text-left">Adobe Inc.</td>
<td class="data-td data last text-left">ADBE</td>
<td class="data-td data last text-left">Technology</td>
<td class="data-td data last text-right">2.17</td>
<td class="data-td data last text-right">-0.16</td>
</tr>
<tr class="tbl-data">
<td class="data-td last text-left">IDEX Corp.</td>
<td class="data-td data last text-left">IEX</td>
<td class="data-td data last text-left">Industrials</td>
<td class="data-td data last text-right">2.30</td>
<td class="data-td data last text-right">-0.15</td>
</tr>
<tr class="tbl-data">
<td class="data-td last text-left">Salesforce Inc.</td>
<td class="data-td data last text-left">CRM</td>
<td class="data-td data last text-left">Technology</td>
<td class="data-td data last text-right">2.35</td>
<td class="data-td data last text-right">-0.12</td>
</tr>
</tbody>
</table>
</div>
<p class="chart-disclosure"><strong>Source: Morningstar</strong>. Past performance is no guarantee of future results. Index performance is not illustrative of fund performance. Not intended as a recommendation to buy or to sell any of the securities mentioned herein.</p>

<h2 id="smid-highlights" class="jump-link-nav anchored-block" data-jumplink-title="SMID Moat Highlights">SMID Moat Index July Highlights: Travel Strength and M&amp;A Activity Shine</h2>
<p>The <strong><a href="/link/166321dbcfec440590fb51cf0ad629aa.aspx" title=" SMOT - VanEck Morningstar SMID Moat ETF - Overview">SMID Moat Index</a></strong> outpaced both the small-cap and mid-cap benchmarks in July, driven by strong stock selection across several parts of the portfolio. Industrials and consumer discretionary were standout areas, with four of the month&rsquo;s top five contributors coming from these two sectors.</p>
<p>Norwegian Cruise Line Holdings (NCLH) topped the <strong><a href="/link/166321dbcfec440590fb51cf0ad629aa.aspx" title=" SMOT - VanEck Morningstar SMID Moat ETF - Overview">SMID Moat Index</a></strong> in July, marking its second consecutive month as a leading contributor. Shares rallied 26% as investor confidence grew around the company&rsquo;s consistent pricing strength, robust travel demand, and expanding onboard spend. Morningstar believes Norwegian remains well positioned to deliver improving returns on invested capital, supported by <a href="/link/215ebc2024af47a696d86d339d1c6fd9.aspx" title="Efficient Scale: Moats with Natural Monopoly"><strong>efficient scale</strong></a>, <a href="/link/5cacf7dfe2854733b5bd5b1736600fec.aspx" title="Cost Leadership Provides Market Control"><strong>cost advantages</strong></a> and brand loyalty across its portfolio. The company&rsquo;s younger fleet and pipeline of new ships provide ongoing pricing power, while cost initiatives and scale benefits continue to support margin expansion. Morningstar maintains its fair value estimate of $31.50 per share, suggesting shares may still have room to run.</p>
<p>Chart Industries (GTLS), a provider of cryogenic equipment and specialty solutions used across LNG, hydrogen, and industrial gas markets, was also a top contributor to <strong><a href="/link/166321dbcfec440590fb51cf0ad629aa.aspx" title=" SMOT - VanEck Morningstar SMID Moat ETF - Overview">SMID Moat Index</a></strong> performance in July, with shares jumping 20% following news that the company had entered into a definitive agreement to be acquired by Baker Hughes. The all-cash deal, valued at $13.6 billion or $210 per share, marked a premium over Chart&rsquo;s prior trading levels and sent the stock sharply higher. Morningstar views the offer price as aligned with its fair value estimate and sees the acquisition as a positive outcome for Chart shareholders, offering greater certainty than a prior bid from Flowserve. Despite softer second-quarter sales, the company&rsquo;s aftermarket service business remains a key strength, and Morningstar continues to believe Chart&rsquo;s specialty products and repair-driven revenue model support its economic moat.</p>
<p>Companies detracting the most in July within the <strong><a href="/link/166321dbcfec440590fb51cf0ad629aa.aspx" title=" SMOT - VanEck Morningstar SMID Moat ETF - Overview">SMID Moat Index</a></strong> included two names from the auto industry, with auto retailers Lithia Motors (LAD) and CarMax (KMX) weighing on performance during the month. Other notable laggards were toy manufacturer Mattel (MAT), health care supplier Baxter International (BAX), and communications provider Charter Communications (CHTR).</p>
<h2>SMID Moat Index Top Contributors and Detractors - July 2025</h2>
<h3>Contributors</h3>
<div class="wrapped-div">
<table style="width: 100%;">
<tbody>
<tr class="tbl-data">
<td class="tbl-header last text-left">Company</td>
<td class="tbl-header last text-left">Ticker</td>
<td class="tbl-header last text-left">Sector</td>
<td class="tbl-header last text-right">Avg. Weight (%)</td>
<td class="tbl-header last text-right">Contribution (%)</td>
</tr>
<tr class="tbl-data">
<td class="data-td last text-left">Norwegian Cruise Line</td>
<td class="data-td data last text-left">NCLH</td>
<td class="data-td data last text-left">Consumer Discretionary</td>
<td class="data-td data last text-right">1.36</td>
<td class="data-td data last text-right">0.36</td>
</tr>
<tr class="tbl-data">
<td class="data-td last text-left">Chart Industries Inc.</td>
<td class="data-td data last text-left">GTLS</td>
<td class="data-td data last text-left">Industrials</td>
<td class="data-td data last text-right">1.45</td>
<td class="data-td data last text-right">0.31</td>
</tr>
<tr class="tbl-data">
<td class="data-td last text-left">The Carlyle Group Inc.</td>
<td class="data-td data last text-left">CG</td>
<td class="data-td data last text-left">Financials</td>
<td class="data-td data last text-right">1.50</td>
<td class="data-td data last text-right">0.27</td>
</tr>
<tr class="tbl-data">
<td class="data-td last text-left">Generac Holdings Inc.</td>
<td class="data-td data last text-left">GNRC</td>
<td class="data-td data last text-left">Industrials</td>
<td class="data-td data last text-right">0.73</td>
<td class="data-td data last text-right">0.27</td>
</tr>
<tr class="tbl-data">
<td class="data-td last text-left">Wynn Resorts Ltd.</td>
<td class="data-td data last text-left">WYNN</td>
<td class="data-td data last text-left">Consumer Discretionary</td>
<td class="data-td data last text-right">1.41</td>
<td class="data-td data last text-right">0.24</td>
</tr>
</tbody>
</table>
<h3>Detractors</h3>
<div class="wrapped-div">
<table style="width: 100%;">
<tbody>
<tr class="tbl-data">
<td class="tbl-header last text-left">Company</td>
<td class="tbl-header last text-left">Ticker</td>
<td class="tbl-header last text-left">Sector</td>
<td class="tbl-header last text-right">Avg. Weight (%)</td>
<td class="tbl-header last text-right">Contribution (%)</td>
</tr>
<tr class="tbl-data">
<td class="data-td last text-left">Charter Communications</td>
<td class="data-td data last text-left">CHTR</td>
<td class="data-td data last text-left">Communication Services</td>
<td class="data-td data last text-right">1.43</td>
<td class="data-td data last text-right">-0.50</td>
</tr>
<tr class="tbl-data">
<td class="data-td last text-left">Baxter International Inc</td>
<td class="data-td data last text-left">BAX</td>
<td class="data-td data last text-left">Health Care</td>
<td class="data-td data last text-right">1.20</td>
<td class="data-td data last text-right">-0.34</td>
</tr>
<tr class="tbl-data">
<td class="data-td last text-left">Lithia Motors Inc</td>
<td class="data-td data last text-left">LAD</td>
<td class="data-td data last text-left">Consumer Discretionary</td>
<td class="data-td data last text-right">1.40</td>
<td class="data-td data last text-right">-0.21</td>
</tr>
<tr class="tbl-data">
<td class="data-td last text-left">CarMax Inc</td>
<td class="data-td data last text-left">KMX</td>
<td class="data-td data last text-left">Consumer Discretionary</td>
<td class="data-td data last text-right">1.23</td>
<td class="data-td data last text-right">-0.20</td>
</tr>
<tr class="tbl-data">
<td class="data-td last text-left">Mattel Inc</td>
<td class="data-td data last text-left">MAT</td>
<td class="data-td data last text-left">Consumer Discretionary</td>
<td class="data-td data last text-right">1.29</td>
<td class="data-td data last text-right">-0.18</td>
</tr>
</tbody>
</table>
</div>
</div>
<p class="chart-disclosure"><strong>Source: Morningstar</strong>. Past performance is no guarantee of future results. Index performance is not illustrative of fund performance. Not intended as a recommendation to buy or to sell any of the securities mentioned herein.</p>

<h2 id="moat-strategies" class="jump-link-nav anchored-block" data-jumplink-title="Moat Strategies">Choose Your Moat Strategy</h2>
<p>VanEck&rsquo;s suite of <a href="/us/en/blogs/moat-investing/moat-investing-powered-by-morningstar/" title="Quality Companies at Attractive Prices"><strong>moat investing strategies</strong></a> is powered by Morningstar&rsquo;s equity research team, which seeks quality companies trading at attractive valuations. The below ETFs offer access to US moat companies:</p>
<p><a href="/link/9e43dd198c5f4e419f13220685081895.aspx" title="MOAT - VanEck Morningstar Wide Moat ETF - Overview"><strong>VanEck Morningstar Wide ETF (MOAT)</strong></a>: companies with a wide moat rating, which means Morningstar believes the company is likely to sustain its competitive advantage for at least the next 20 years.</p>
<p><a href="/link/166321dbcfec440590fb51cf0ad629aa.aspx" title="SMOT - VanEck Morningstar SMID Moat ETF - Overview"><strong>VanEck Morningstar SMID Moat ETF (SMOT)</strong></a>: small and mid-cap moat companies.&nbsp;</p>

<p>To receive more <a href="https://www.vaneck.com/us/en/insights/moat-investing" title="Moat Investing Insights"><strong>Moat Investing</strong></a> insights, <a href="https://www.vaneck.com/us/en/subscribe/" title="Subscription Center"><strong>sign up in our subscription center</strong></a>.</p>
]]></content:encoded>
</item><item rdf:about="https://www.vaneck.com/us/en/blogs/thematic-investing/turning-online-buzz-into-an-investable-strategy-with-ai/">
  <title>Turning Online Buzz into an Investable Strategy with AI></title>
  <link>https://www.vaneck.com/us/en/blogs/thematic-investing/turning-online-buzz-into-an-investable-strategy-with-ai/</link>
  <description><![CDATA[BUZZ Index uses AI to track online investor sentiment, turning millions of conversations into a dynamic, rules-based strategy that has outperformed the S&amp;P 500.]]></description>
  <dc:creator> </dc:creator>
  <dc:date>08/05/2025 06:30:00</dc:date>
<content:encoded><![CDATA[

<p><a><strong>Key Takeaways</strong></a></p>
<ul class="content-list">
<li class="mt-2">Investor sentiment is now a quantifiable factor, with <strong><a href="/link/459289f4c5ea4648bd9dfcf70d847cd7.aspx" title="BUZZ - VanEck Social Sentiment ETF - Holdings and Performance">BUZZ</a></strong> using real-time online data to build a transparent, investable index.</li>
<li class="mt-2"><strong><a href="/link/459289f4c5ea4648bd9dfcf70d847cd7.aspx" title="BUZZ - VanEck Social Sentiment ETF - Holdings and Performance">BUZZ</a></strong> leverages collective intelligence, identifying the 75 most positively discussed large-cap U.S. stocks through AI-driven analysis.</li>
<li class="mt-2">The index adapts to market trends faster than traditional ETFs, offering early exposure to emerging themes like AI, space tech, and healthcare innovation.</li>
</ul>
<p class="chart-disclosure">Past Performance is no guarantee of future results. Index performance is not illustrative of fund performance. Not intended as a recommendation to buy or sell any of the securities mentioned herein.</p>
<h3>BUZZ Average Annual Total Returns<sup>*</sup>&nbsp;(%) as of June 30, 2025</h3>
<div class="wrapped-div">
<table width="100%">
<tbody>
<tr class="tbl-data">
<td class="tbl-header last text-left">&nbsp;</td>
<td class="tbl-header last text-right">1 MO</td>
<td class="tbl-header last text-right">3 MO</td>
<td class="tbl-header last text-right">YTD</td>
<td class="tbl-header last text-right">1 YR</td>
<td class="tbl-header last text-right">3 YR</td>
<td class="tbl-header last text-right">5 YR</td>
<td class="tbl-header last text-right">10 YR</td>
<td class="tbl-header last text-right">LIFE<br />03/02/21</td>
</tr>
<tr class="tbl-data">
<td class="data-td data last text-left">BUZZ (NAV)</td>
<td class="data-td data last text-right">12.64</td>
<td class="data-td data last text-right">35.66</td>
<td class="data-td data last text-right">21.74</td>
<td class="data-td data last text-right">43.20</td>
<td class="data-td data last text-right">33.46</td>
<td class="data-td data last text-right">--</td>
<td class="data-td data last text-right">4.86</td>
</tr>
<tr class="tbl-data">
<td class="data-td data last text-left">BUZZ (Share Price)</td>
<td class="data-td data last text-right">12.77</td>
<td class="data-td data last text-right">35.56</td>
<td class="data-td data last text-right">21.73</td>
<td class="data-td data last text-right">43.38</td>
<td class="data-td data last text-right">33.45</td>
<td class="data-td data last text-right">--</td>
<td class="data-td data last text-right">4.86</td>
</tr>
<tr class="tbl-data">
<td class="data-td data last text-left">BUZZTR (Index)</td>
<td class="data-td data last text-right">12.68</td>
<td class="data-td data last text-right">35.83</td>
<td class="data-td data last text-right">22.08</td>
<td class="data-td data last text-right">44.05</td>
<td class="data-td data last text-right">33.79</td>
<td class="data-td data last text-right">15.89</td>
<td class="data-td data last text-right">--</td>
<td class="data-td data last text-right">5.18</td>
</tr>
<tr class="tbl-data">
<td class="data-td data last text-left">Performance Differential (NAV - Index)</td>
<td class="data-td data last text-right">-0.04</td>
<td class="data-td data last text-right">-0.17</td>
<td class="data-td data last text-right">-0.34</td>
<td class="data-td data last text-right">-0.85</td>
<td class="data-td data last text-right">-0.33</td>
<td class="data-td data last text-right">--</td>
<td class="data-td data last text-right">-0.32</td>
</tr>
<tr class="tbl-data">
<td class="data-td data last text-left">S&amp;P 500 Index</td>
<td class="data-td data last text-right">5.09</td>
<td class="data-td data last text-right">10.94</td>
<td class="data-td data last text-right">6.20</td>
<td class="data-td data last text-right">15.16</td>
<td class="data-td data last text-right">19.71</td>
<td class="data-td data last text-right">16.64</td>
<td class="data-td data last text-right">13.65</td>
<td class="data-td data last text-right">13.21</td>
</tr>
</tbody>
</table>
</div>
<br />
<p class="chart-disclosure"><sup>*</sup>Returns less than one year are not annualized.</p>
<p class="chart-disclosure">Index inception date: 12/18/2015.</p>
<p class="chart-disclosure"><strong>The performance data quoted represents past performance. Past performance is not a guarantee of future results. Investment return and principal value of an investment will fluctuate so that an investor's shares, when redeemed, may be worth more or less than their original cost. Performance may be lower or higher than performance data quoted. Please call 800.826.2333 or visit vaneck.com for performance current to the most recent month ended.</strong></p>
<p class="chart-disclosure">BUZZ ETF Total Expense Ratio: 0.76%: Van Eck Associates Corporation (the &ldquo;Adviser&rdquo;) will pay all expenses of the Fund, except for the fee payment under the investment management agreement, acquired fund fees and expenses, interest expense, offering costs, trading expenses, taxes and extraordinary expenses. Notwithstanding the foregoing, the Adviser has agreed to pay the offering costs until at least February 1, 2026.</p>

<p><strong>What if you could turn millions of online conversations into a successful investment strategy?</strong> That&rsquo;s exactly what the <strong><a href="/link/459289f4c5ea4648bd9dfcf70d847cd7.aspx" title="BUZZ - VanEck Social Sentiment ETF - Holdings and Performance">VanEck Social Sentiment ETF (BUZZ)</a></strong> sets out to do. By tracking the stocks that individual investors are consistently talking about online, through forums, social media, and blogs, BUZZ Index uses artificial intelligence to distill that chatter into investable insights.</p>
<p>In a <a href="https://www.vaneck.com/us/en/webinar-registration/?id=94920452499" title="Turning Online Sentiment Into Market Performance"><strong>recent webinar</strong></a>, VanEck&rsquo;s Coulter Regal,&nbsp;CFA and Jamie Wise, CEO of Buzz Indexes, explored how this innovative strategy works and why investor sentiment may be one of the most overlooked forces in the market today. We outlined the main takeaways from the webinar exploring sentiment-driven investing.</p>
<h2>Investor Sentiment Is a Legitimate Market Factor</h2>
<p>For decades, sentiment was viewed as a contrarian or vaguely defined concept. But thanks to the rise of online investing communities, there is now a measurable, real-time stream of investor sentiment happening across the internet. <strong><a href="/link/459289f4c5ea4648bd9dfcf70d847cd7.aspx" title="BUZZ - VanEck Social Sentiment ETF - Holdings and Performance">BUZZ</a></strong> aims to quantify that sentiment and turn it into an actionable index.</p>
<p>Sentiment is no longer just a gut feeling, it&rsquo;s a measurable factor like value or momentum, and now there are tools to track it.</p>
<h2>The Power of the Crowd: Collective Intelligence Over Individual Experts</h2>
<p><strong><a href="/link/459289f4c5ea4648bd9dfcf70d847cd7.aspx" title="BUZZ - VanEck Social Sentiment ETF - Holdings and Performance">BUZZ</a></strong> doesn&rsquo;t try to guess which influencer is right. It treats every online investor voice equally, focusing instead on the <i>collective signal</i> that emerges from broad, sustained discussions. The result? An index composed of the 75 U.S. large-cap stocks with the highest positive sentiment each month, measured objectively with no human bias, and no hero stock pickers.</p>
<h2>How the Index Works: AI + Natural Language Processing</h2>
<p>The Buzz Index uses sophisticated natural language processing (NLP) to scan millions of posts from verified online platforms. These tools categorize posts as positive, neutral, or negative based solely on investment-oriented commentary. Stocks are then scored and weighted based on the intensity and consistency of positive sentiment.</p>
<p>Importantly, only large-cap stocks ($5B+ market cap) with consistent online discussion qualify. This filter reduces the risk of spam or manipulation and helps ensure that sentiment is organic and meaningful.</p>
<h2>Dynamic Exposure to Emerging Themes</h2>
<p>Because <strong><a href="/link/459289f4c5ea4648bd9dfcf70d847cd7.aspx" title="BUZZ - VanEck Social Sentiment ETF - Holdings and Performance">BUZZ</a></strong> rebalances monthly, it adapts quickly to market shifts. New themes, like AI, space tech, or healthcare disruptions, can appear in the index long before they show up in traditional ETFs. In fact, many trending stocks first showed up in <strong><a href="/link/459289f4c5ea4648bd9dfcf70d847cd7.aspx" title="BUZZ - VanEck Social Sentiment ETF - Holdings and Performance">BUZZ</a></strong> before becoming household names.</p>
<h2>Sentiment is Broader than Just Momentum</h2>
<p>While some might confuse <strong><a href="/link/459289f4c5ea4648bd9dfcf70d847cd7.aspx" title="BUZZ - VanEck Social Sentiment ETF - Holdings and Performance">BUZZ</a></strong> with momentum investing, the two are not the same. Momentum typically reflects price trends. Sentiment can reflect value, recovery potential, and conviction, even in beaten-down names.</p>
<h2>Why It Matters Now</h2>
<p>The rise of self-directed investors, mobile trading apps, and real-time forums has permanently changed the investing landscape. Retail investors are no longer on the sidelines, they&rsquo;re shaping the market narrative. And with more financial conversations happening online than ever before, tapping into those voices isn&rsquo;t just novel, it may be necessary.</p>
<p>The price of a stock is simply the collective opinion of investors. If you can measure those opinions directly, you gain a new lens on the market.</p>
<h2>How to Invest</h2>
<p>The <strong><a href="/link/459289f4c5ea4648bd9dfcf70d847cd7.aspx" title="BUZZ - VanEck Social Sentiment ETF - Holdings and Performance">VanEck Social Sentiment ETF (BUZZ)</a></strong> offers a transparent, rules-based way to gain exposure to this sentiment factor. It tracks the <strong>BUZZ NextGen AI US Sentiment Leaders Index</strong>, which is updated monthly using proprietary AI models to surface the most talked-about&mdash;and positively viewed&mdash;stocks online.</p>
<p>To explore the index and monthly rebalances, visit <strong><a href="http://vaneck.com/" title="ETF and Mutual Fund Manager">VanEck.com</a></strong> or <strong><a href="https://www.buzzindexes.com/" title="It&rsquo;s a New Era of Investing. Welcome to BUZZ. - BUZZ Indexes" target="_new">BuzzIndexes.com </a>.</strong></p>

<p>To receive more <a href="https://www.vaneck.com/us/en/insights/thematic-investing/" title="Thematic Investing Insights"><strong>Thematic Investing</strong></a> insights, <a href="https://www.vaneck.com/us/en/subscribe/" title="Subscription Center"><strong>sign up in our subscription center</strong></a>.</p>
]]></content:encoded>
</item><item rdf:about="https://www.vaneck.com/us/en/blogs/natural-resources/barrons-stocks-powering-the-nuclear-resurgence/">
  <title>Barron’s: Stocks Powering the Nuclear Resurgence></title>
  <link>https://www.vaneck.com/us/en/blogs/natural-resources/barrons-stocks-powering-the-nuclear-resurgence/</link>
  <description><![CDATA[From next-gen reactors to grid-stable utilities, Barron&rsquo;s examines the nuclear revival and the stocks contributing to its rise.]]></description>
  <dc:creator> </dc:creator>
  <dc:date>08/05/2025 06:30:00</dc:date>
<content:encoded><![CDATA[

<p>Nuclear energy is stepping into the spotlight as the global push for low-carbon energy accelerates. It&rsquo;s earning the backing of some of the world&rsquo;s most prominent tech companies, including Amazon, Alphabet and Meta, as a reliable and scalable energy source.</p>
<p>A recent Barron&rsquo;s article, <em>Nuclear Power Is Going Mainstream. These Stocks Stand to Benefit</em>, highlights how this shift is driving performance in nuclear-related stocks and offers a closer look at several names building momentum thus far in 2025.</p>
<h2>Nuclear Stock Highlights</h2>
<ul class="content-list">
<li class="mt-3"><strong>Oklo </strong>(4.30% of NLR assets) is developing advanced nuclear reactors designed to be smaller, faster to deploy and highly efficient. It has surged over 250% this year.</li>
<li class="mt-3"><strong>BWX Technologies </strong>(6.03% of NLR assets), a U.S.-based nuclear tech and defense firm, recently hit a record high.</li>
<li class="mt-3"><strong>Public Service Enterprise Group </strong>(5.84% of NLR assets), a New Jersey utility operating three nuclear plants, offers a more conservative angle, combining growth potential with a 3% dividend yield.</li>
</ul>
<h2>How to Find Diversified Nuclear Energy Exposure</h2>
<p>For investors looking to tap into this trend, Barron&rsquo;s focuses on the <strong><a href="https://www.vaneck.com/us/en/investments/uranium-nuclear-energy-etf-nlr/overview/" title="NLR - VanEck Uranium and Nuclear ETF - Holdings and Performance">VanEck Uranium and Nuclear Energy ETF (NLR)</a></strong>. The fund includes a balanced mix of holdings, from emerging players like Oklo to utilities and technology leaders.</p>

<p>To receive more <a href="/us/en/insights/natural-resources/" title="Natural Resources Insights"><strong>Natural Resources</strong></a> insights, <a href="https://www.vaneck.com/us/en/subscribe/" title="Subscription Center"><strong>sign up in our subscription center</strong></a>.</p>
]]></content:encoded>
</item><item rdf:about="https://www.vaneck.com/us/en/blogs/digital-assets/matthew-sigel-vaneck-crypto-monthly-recap-for-july-2025/">
  <title>VanEck Crypto Monthly Recap for July 2025></title>
  <link>https://www.vaneck.com/us/en/blogs/digital-assets/matthew-sigel-vaneck-crypto-monthly-recap-for-july-2025/</link>
  <description><![CDATA[Crypto markets rebounded in July as regulatory momentum in Washington accelerated, Ethereum surged on tokenization and stablecoin demand, and exchanges filed for broad new crypto ETP approvals.]]></description>
  <dc:creator>Matthew  Sigel</dc:creator>
  <dc:date>08/05/2025 06:30:00</dc:date>
<content:encoded><![CDATA[

<p><strong>Please note that VanEck may have a position(s) in the digital asset(s) described below.</strong></p>
<p><strong>Three key takeaways July:</strong></p>
<ul class="content-list">
<li class="mt-2"><strong>Regulatory momentum accelerates</strong>: A wave of U.S. policy moves including the GENIUS and CLARITY Acts, SEC&rsquo;s &ldquo;Project Crypto&rdquo; and new ETP approvals signals Washington&rsquo;s pivot toward a clearer, more innovation‑friendly framework for digital assets.</li>
<li class="mt-2"><strong>Ethereum rebounds and gains ground</strong>: ETH rallied 50% in July, buoyed by $4.7B in ETP inflows and rising adoption of tokenization and stablecoin projects on its network, narrowing its gap with Bitcoin as a potential store of value asset.</li>
<li class="mt-2"><strong>Real‑world assets move onchain</strong>: Major brokerages and exchanges piloted tokenized equities and funds on Ethereum and Arbitrum, signaling a shift from crypto‑native trading to mainstream financial products on public blockchains.</li>
</ul>
<p>Regulatory momentum in Washington accelerated in July, with a string of major crypto announcements this week following the earlier passage of the GENIUS and CLARITY Acts.</p>
<p><strong>Major Crypto Announcements This Past Week</strong></p>
<ul class="content-list">
<li class="mt-2"><a href="https://www.sec.gov/newsroom/press-releases/2025-101-sec-permits-kind-creations-redemptions-crypto-etps" title="SEC Permits In-Kind Creations and Redemptions for Crypto ETPs" target="_blank" rel="noopener"><strong><strong>July 29, 2025</strong> &ndash; SEC clears in‑kind ETP transactions</strong></a>: Spot bitcoin and ether funds can now issue and redeem shares directly in crypto rather than cash, a shift expected to boost liquidity and align them with commodity ETFs.</li>
<li class="mt-2"><a href="https://www.whitehouse.gov/fact-sheets/2025/07/fact-sheet-the-presidents-working-group-on-digital-asset-markets-releases-recommendations-to-strengthen-american-leadership-in-digital-financial-technology/" title="Fact Sheet: The President&rsquo;s Working Group on Digital Asset Markets Releases Recommendations to Strengthen American Leadership in Digital Financial Technology" target="_blank" rel="noopener"><strong>July 30, 2025 &ndash; White House publishes 160‑page digital‑asset report</strong></a>: The President&rsquo;s Working Group outlined a unified regulatory framework, signaling federal support for innovation alongside new guardrails.</li>
<li class="mt-2"><a href="https://www.sec.gov/files/rules/sro/cboebzx/2025/34-103594.pdf" title="Notice of Filing of a Proposed" target="_blank" rel="noopener"><strong>July 30, 2025 &ndash; Cboe, Nasdaq, NYSE seek generic ETP standards</strong></a>: The exchanges proposed rules allowing faster approval of crypto funds without case‑by‑case SEC sign‑offs, potentially opening the door to dozens of new products.</li>
<li class="mt-2"><a href="https://www.sec.gov/newsroom/speeches-statements/atkins-digital-finance-revolution-073125" title="American Leadership in the Digital Finance Revolution" target="_blank" rel="noopener"><strong>July 31, 2025 &ndash; SEC unveils &ldquo;Project Crypto&rdquo;</strong></a>: Chair Paul Atkins proposed a broad overhaul of U.S. crypto oversight aimed at enabling tokenization of traditional assets and integrating on‑chain markets into existing financial rules.</li>
</ul>
<p>Collectively, these steps mark a shift toward institutionalization, with U.S. policymakers laying the groundwork for a more mature and accessible digital‑asset market.</p>
<h3 id="price-returns" class="jump-link-nav anchored-block" data-jumplink-title="Price Returns">Price Returns</h3>
<div class="wrapped-div">
<table style="width: 100%; height: 246.211px;">
<tbody>
<tr class="tbl-data">
<td class="tbl-header last text-left">&nbsp;</td>
<td class="tbl-header last text-right">July (%)</td>
<td class="tbl-header last text-right">YTD (%)</td>
</tr>
<tr class="tbl-data">
<td class="data-td data last text-left">Ethereum</td>
<td class="data-td data last text-right">49.83</td>
<td class="data-td data last text-right">12.19</td>
</tr>
<tr class="tbl-data">
<td class="data-td data last text-left">MarketVector Smart Contract Leaders Index</td>
<td class="data-td data last text-right">28.48</td>
<td class="data-td data last text-right">-6.80</td>
</tr>
<tr class="tbl-data">
<td class="data-td data last text-left">MarketVector Decentralized Finance Leaders Index</td>
<td class="data-td data last text-right">28.26</td>
<td class="data-td data last text-right">-35.01</td>
</tr>
<tr class="tbl-data">
<td class="data-td data last text-left">MarketVector Meme Coin Index</td>
<td class="data-td data last text-right">21.95</td>
<td class="data-td data last text-right">-43.30</td>
</tr>
<tr class="tbl-data">
<td class="data-td data last text-left">MarketVector Infrastructure Application Leaders Index</td>
<td class="data-td data last text-right">13.57</td>
<td class="data-td data last text-right">-39.41</td>
</tr>
<tr class="tbl-data">
<td class="data-td data last text-left">Bitcoin</td>
<td class="data-td data last text-right">8.99</td>
<td class="data-td data last text-right">24.98</td>
</tr>
<tr class="tbl-data">
<td class="data-td data last text-left">Coinbase</td>
<td class="data-td data last text-right">7.78</td>
<td class="data-td data last text-right">52.14</td>
</tr>
<tr class="tbl-data">
<td class="data-td data last text-left">MarketVector Global Digital Assets Equity Index</td>
<td class="data-td data last text-right">5.74</td>
<td class="data-td data last text-right">21.78</td>
</tr>
<tr class="tbl-data">
<td class="data-td data last text-left">Nasdaq Index</td>
<td class="data-td data last text-right">3.70</td>
<td class="data-td data last text-right">9.38</td>
</tr>
<tr class="tbl-data">
<td class="data-td data last text-left">S&amp;P 500 Index</td>
<td class="data-td data last text-right">2.17</td>
<td class="data-td data last text-right">7.79</td>
</tr>
</tbody>
</table>
</div>
<p class="chart-disclosure mt-2">Source: Bloomberg as of 7/31/2025. <strong>Index performance is not representative of fund performance. It is not possible to invest directly in an index. Past performance is no guarantee of future results. Not intended as a recommendation to buy or sell any securities named herein.</strong></p>
<h3>ETH/BTC Falls Below 5-YR Lows, Rebounds +38% in July</h3>
<p><img loading="lazy" alt="ETH/BTC Falls Below 5-YR Lows, Rebounds +38% in July" src="https://www.vaneck.com/contentassets/e05ed4b50d844c7d829d05f20d1e10b3/5997_crypto-monthly-july_chart-1_2025-7_v1_blog.svg" class="img-responsive w-100" /></p>
<p class="chart-disclosure">Source: Artemis XYZ as of 7/29/2025. <strong>Past performance is no guarantee of future results. Not intended as a recommendation to buy or sell any securities named herein.</strong></p>
<p>July was a strong month for crypto with BTC <strong>(+9%)</strong> and many altcoins exceeding BTC&rsquo;s returns as exemplified by MVSCLE&rsquo;s <strong>(+28%)</strong> performance in July. While XRP <strong>(+38%)</strong>, ADA <strong>(+33%)</strong>, and Sui <strong>(+35%)</strong> were big winners, the most notable performer was ETH <strong>(+50%)</strong>. After many agonizing months of ETH&rsquo;s weakness relative to BTC and ETH/BTC breaking 5 yr lows, ETH rallied <strong>(+50%)</strong> in dollar terms in July and <strong>(+38%)</strong> relative to BTC. Besides the technical rebound, ETH&rsquo;s price performance was catalyzed by strong ETP inflows. In July, spot ETH ETP net flows were <strong>$4.7B</strong> which is just over half all-time, cumulative inflows of <strong>$9.2B</strong>. Bitcoin net inflows remained strong with <strong>$5.9B</strong> in total, helping support positive BTC price action. On a relative basis, ETH inflows absorbed <strong>1%</strong> of total ETH spot market capitalization while BTC&rsquo;s were only <strong>25bps</strong>.</p>
<h3>BTC ETPs Hold More Supply The ETH&rsquo;s, But ETH ETPs Accelerated in July</h3>
<p><img loading="lazy" alt="BTC ETPs Hold More Supply The ETH&rsquo;s, But ETH ETPs Accelerated in July" src="https://www.vaneck.com/contentassets/e05ed4b50d844c7d829d05f20d1e10b3/5997_crypto-monthly-july_chart-2_2025-7_v1_blog.svg" class="img-responsive w-100" /></p>
<p class="chart-disclosure">Source: Glassnode as of 7/29/2025. <strong>Past performance is no guarantee of future results. Not intended as a recommendation to buy or sell any securities named herein.</strong></p>
<p>What has been driving ETH price action? We believe it is the combination of tokenization and stablecoins interacting with ETH price ascension, to drive buying activity. Many who have missed out on BTC&rsquo;s run are drawn to ETH&rsquo;s positive price action, noticing that it is below its all-time highs as BTC establishes new peak prices. Others are encouraged by the monstrous returns offered by CRCL, <strong>(+500%)</strong>, since its IPO in June. In July, news emerged that several important financial institutions were taking an active interest in stablecoins and tokenization in the Ethereum ecosystem. These included Robinhood launching <strong>200+</strong> tokenized stocks and ETFs on an Arbitrum L2, eToro&rsquo;s announcing the upcoming rollout of <strong>100</strong> U.S.-listed stocks and ETFs on Ethereum L1, and Kraken unveiling 24/5 tokenized equity trading. Some of this jubilance spilled over into ETH&rsquo;s price action. As Ethereum ecosystem is responsible for <strong>62%</strong> of all stablecoin value transfer thus far in 2025 and holds <strong>71%</strong> of all assets locked in DeFi, it appears to be the target blockchain for the tokenization and stablecoin efforts of major financial institutions. Ethereum&rsquo;s revenue also had a strong July (<strong>+23%</strong> <strong>MtM</strong>) as DEX Volumes climbed (<strong>+8%</strong> <strong>MtM)</strong> and TVL jumped (<strong>+39% MtM</strong>). As a consequence, Ethereum overtook Solana to jump into third place amongst the top revenue producing blockchains.</p>
<h3 id="top-blockhains-by-avg" class="jump-link-nav anchored-block" data-jumplink-title="Blockchains by Revenue">Top 5 Blockchains by Average Daily Revenue</h3>
<div class="wrapped-div">
<table style="width: 100%;">
<tbody>
<tr class="tbl-data">
<td class="tbl-header last text-left">Top Chains This Month</td>
<td class="tbl-header last text-right">TRX</td>
<td class="tbl-header last text-right">&nbsp;</td>
<td class="tbl-header last text-right">SOL</td>
<td class="tbl-header last text-right">BNB</td>
</tr>
<tr class="tbl-data">
<td class="data-td data last text-left">Avg Daily Revenue</td>
<td class="data-td data last text-right">$1,960,040</td>
<td class="data-td data last text-right">&nbsp;</td>
<td class="data-td data last text-right">$1,398,636</td>
<td class="data-td data last text-right">$355,868</td>
</tr>
<tr class="tbl-data">
<td class="tbl-header last text-left">3 Months Ago</td>
<td class="tbl-header last text-right">TRX</td>
<td class="tbl-header last text-right">&nbsp;</td>
<td class="tbl-header last text-right">SOL</td>
<td class="tbl-header last text-right">BTC</td>
</tr>
<tr class="tbl-data">
<td class="data-td data last text-left">Avg Daily Revenue</td>
<td class="data-td data last text-right">$1,676,844</td>
<td class="data-td data last text-right">&nbsp;</td>
<td class="data-td data last text-right">$1,341,198</td>
<td class="data-td data last text-right">$526,049</td>
</tr>
<tr class="tbl-data">
<td class="tbl-header last text-left">6 Months Ago</td>
<td class="tbl-header last text-right">SOL</td>
<td class="tbl-header last text-right">&nbsp;</td>
<td class="tbl-header last text-right">TRX</td>
<td class="tbl-header last text-right">BTC</td>
</tr>
<tr class="tbl-data">
<td class="data-td data last text-left">Avg Daily Revenue</td>
<td class="data-td data last text-right">$8,335,649</td>
<td class="data-td data last text-right">&nbsp;</td>
<td class="data-td data last text-right">$1,824,358</td>
<td class="data-td data last text-right">$659,445</td>
</tr>
<tr class="tbl-data">
<td class="tbl-header last text-left">9 Months Ago</td>
<td class="tbl-header last text-right">ETH</td>
<td class="tbl-header last text-right">&nbsp;</td>
<td class="tbl-header last text-right">BTC</td>
<td class="tbl-header last text-right">BNB</td>
</tr>
<tr class="tbl-data">
<td class="data-td data last text-left">Avg Daily Revenue</td>
<td class="data-td data last text-right">$4,474,905</td>
<td class="data-td data last text-right">&nbsp;</td>
<td class="data-td data last text-right">$1,569,310</td>
<td class="data-td data last text-right">$342,183</td>
</tr>
<tr class="tbl-data">
<td class="tbl-header last text-left">12 Months Ago</td>
<td class="tbl-header last text-right">ETH</td>
<td class="tbl-header last text-right">&nbsp;</td>
<td class="tbl-header last text-right">TRX</td>
<td class="tbl-header last text-right">BNB</td>
</tr>
<tr class="tbl-data">
<td class="data-td data last text-left">Avg Daily Revenue</td>
<td class="data-td data last text-right">$3,044,133</td>
<td class="data-td data last text-right">&nbsp;</td>
<td class="data-td data last text-right">$1,345,962</td>
<td class="data-td data last text-right">$359,367</td>
</tr>
</tbody>
</table>
</div>
<p class="chart-disclosure mt-2">Source: Artemis XYZ as of 7/31/2025. <strong>Past performance is no guarantee of future results. Not intended as a recommendation to buy or sell any securities named herein.</strong></p>
<h2>Institutional Bitcoin, Ethereum, and Solana Holdings vs. Token Supply</h2>
<h3>Institutional Crypto Holdings vs. Supply</h3>
<div class="wrapped-div">
<table style="width: 100%;">
<tbody>
<tr class="tbl-data">
<td class="tbl-header last text-left">Metric</td>
<td class="tbl-header last text-right">Bitcoin</td>
<td class="tbl-header last text-right">Ethereum</td>
<td class="tbl-header last text-right">Solana</td>
</tr>
<tr class="tbl-data">
<td class="data-td data last text-left">Total Supply</td>
<td class="data-td data last text-right">19,899,396</td>
<td class="data-td data last text-right">120,710,562</td>
<td class="data-td data last text-right">606,327,009</td>
</tr>
<tr class="tbl-data">
<td class="data-td data last text-left">Total Institutional Holdings</td>
<td class="data-td data last text-right">3,096,459</td>
<td class="data-td data last text-right">8,164,604</td>
<td class="data-td data last text-right">5,209,195</td>
</tr>
<tr class="tbl-data">
<td class="data-td data last text-left pl-1">Treasury Holdings</td>
<td class="data-td data last text-right">1,742,781</td>
<td class="data-td data last text-right">2,329,611</td>
<td class="data-td data last text-right">3,440,000</td>
</tr>
<tr class="tbl-data">
<td class="data-td data last text-left pl-1">ETP Holdings</td>
<td class="data-td data last text-right">1,353,678</td>
<td class="data-td data last text-right">5,834,993</td>
<td class="data-td data last text-right">1,769,195</td>
</tr>
<tr class="tbl-data">
<td class="data-td data last text-left">Total Institutional Holdings (% of Total Supply)</td>
<td class="data-td data last text-right">15.6%</td>
<td class="data-td data last text-right">6.8%</td>
<td class="data-td data last text-right">0.9%</td>
</tr>
<tr class="tbl-data">
<td class="data-td data last text-left pl-1">Treasury Holdings</td>
<td class="data-td data last text-right">8.8%</td>
<td class="data-td data last text-right">1.9%</td>
<td class="data-td data last text-right">0.6%</td>
</tr>
<tr class="tbl-data">
<td class="data-td data last text-left pl-1">ETP Holdings</td>
<td class="data-td data last text-right">6.8%</td>
<td class="data-td data last text-right">4.9%</td>
<td class="data-td data last text-right">0.3%</td>
</tr>
<tr class="tbl-data">
<td class="data-td data last text-left">Total Institutional Holdings ($000s)</td>
<td class="data-td data last text-right">$364,208,562</td>
<td class="data-td data last text-right">$30,779,823</td>
<td class="data-td data last text-right">$925,986</td>
</tr>
<tr class="tbl-data">
<td class="data-td data last text-left pl-1">Treasury Holdings</td>
<td class="data-td data last text-right">$204,987,644</td>
<td class="data-td data last text-right">$8,782,424</td>
<td class="data-td data last text-right">$611,494</td>
</tr>
<tr class="tbl-data">
<td class="data-td data last text-left pl-1">ETP Holdings</td>
<td class="data-td data last text-right">$159,220,918</td>
<td class="data-td data last text-right">$21,997,399</td>
<td class="data-td data last text-right">$314,492</td>
</tr>
</tbody>
</table>
</div>
<h3>Investment Needed for ETH, SOL to Reach Institutional Supply Share Parity with BTC Holdings</h3>
<div class="wrapped-div">
<table style="width: 100%;">
<tbody>
<tr class="tbl-data">
<td class="tbl-header last text-left">Metric</td>
<td class="tbl-header last text-right">Bitcoin</td>
<td class="tbl-header last text-right">Ethereum</td>
<td class="tbl-header last text-right">Solana</td>
</tr>
<tr class="tbl-data">
<td class="data-td data last text-left">Multiple Needed to Match Institutional Share of Bitcoin Supply<sup>*</sup></td>
<td class="data-td data last text-right">1.0</td>
<td class="data-td data last text-right">2.3</td>
<td class="data-td data last text-right">18.1</td>
</tr>
<tr class="tbl-data">
<td class="data-td data last text-left pl-1">Treasury Parity Multiple</td>
<td class="data-td data last text-right">1.0</td>
<td class="data-td data last text-right">4.5</td>
<td class="data-td data last text-right">15.4</td>
</tr>
<tr class="tbl-data">
<td class="data-td data last text-left pl-1">ETP Parity Multiple</td>
<td class="data-td data last text-right">1.0</td>
<td class="data-td data last text-right">1.4</td>
<td class="data-td data last text-right">23.4</td>
</tr>
<tr class="tbl-data">
<td class="data-td data last text-left">Investment Needed to Match Institutional Share of Bitcoin Supply ($000s)*</td>
<td class="data-td data last text-right">$0</td>
<td class="data-td data last text-right">$40,031,326</td>
<td class="data-td data last text-right">$16,159,791</td>
</tr>
<tr class="tbl-data">
<td class="data-td data last text-left pl-1">Investment Needed for Treasury Parity</td>
<td class="data-td data last text-right">$0</td>
<td class="data-td data last text-right">$31,072,242</td>
<td class="data-td data last text-right">$8,827,894</td>
</tr>
<tr class="tbl-data">
<td class="data-td data last text-left pl-1">Investment Needed for ETP Parity</td>
<td class="data-td data last text-right">$0</td>
<td class="data-td data last text-right">$8,959,024</td>
<td class="data-td data last text-right">$7,331,896</td>
</tr>
</tbody>
</table>
</div>
<p class="chart-disclosure mt-2">Source: Glassnode, Artemis.xyz, Bitcoin Treasuries, The Block, StrategicETHReserve.xyz as of 7/29/2025. <strong>Past performance is no guarantee of future results. Not intended as a recommendation to buy or sell any securities named herein.</strong></p>
<p>Currently, we track eight significant ETH Digital Asset Treasuries (DATs) that hold roughly <strong>1.46M </strong>ETH. The largest, Bitmine Immersion Technologies, owns <strong>625K</strong> ETH valued at about $<strong>2.4B</strong>, almost half the DAT total. When corporates that simply keep ETH on their balance sheets are added, institutional treasury reserves reach <strong>2.3M</strong> ETH. Combining DATs, treasuries, and exchange‑traded products (ETPs), institutions control <strong>8.2</strong><strong>M</strong> ETH, or <strong>6.8%</strong> of circulating supply. By contrast, Bitcoin&rsquo;s institutional share is <strong>15.6%</strong> and to match it, ETH treasuries would have to expand <strong>4.5</strong><strong>x</strong> and ETH ETPs <strong>1.4</strong><strong>x</strong>. For Solana, treasuries and ETPs hold <strong>&lt;1%</strong> of SOL&rsquo;s supply, leaving ample upside if SOL ETPs gain approval.</p>
<p>Despite the positive price action for ETH as ETH DATs multiply and mature, several potentially bearish catalysts materialized on Ethereum&rsquo;s blockchain in July. Over the past few weeks, the exit queue for validators has <strong>24x</strong>&rsquo;d its normal amount to reach <strong>24.2k</strong> validators holding <strong>774k</strong> in ETH. This is the largest figure in the history of Ethereum and has created a backlog that will last just under <strong>12</strong> days. Realistically, this exit line represents a small portion of total staked ETH, just <strong>2%</strong>, but has coincided with other interesting on-chain developments. The Ethereum whale, Justin Sun, also withdrew about <strong>$600M</strong> worth of ETH from AAVE which corresponds to <strong>~5%</strong> of supply and caused ETH borrow rates to spike to above <strong>9% </strong>several times.</p>
<h2 id="institutional-crypto-integrations" class="anchored-block">Institutional Crypto Integrations</h2>
<h3>Major Financial Institutions Announced Crypto Integrations This Month</h3>
<div class="wrapped-div">
<table style="width: 100%;">
<tbody>
<tr class="tbl-data">
<td class="tbl-header last text-left">Date</td>
<td class="tbl-header last text-left">Firm(s)</td>
<td class="tbl-header last text-left">Announcement</td>
</tr>
<tr class="tbl-data">
<td class="data-td data last text-left">7/2/2025</td>
<td class="data-td data last text-left">AllUnity<br />(JV Between DWS Group, Flow Traders, &amp; Galaxy Digital)</td>
<td class="data-td data last text-left">Secures a German Federal Financial Supervisory Authority (BaFin) E-Money Insitution (EMI) License to Launch MiCAR-Compliant Euro Stablecoin.</td>
</tr>
<tr class="tbl-data">
<td class="data-td data last text-left">7/15/2025</td>
<td class="data-td data last text-left">JPMorgan</td>
<td class="data-td data last text-left">CEO says JPM will engage with both deposit coin and stablecoins, building upon JPM client-only stablecoins announced last month.</td>
</tr>
<tr class="tbl-data">
<td class="data-td data last text-left">7/15/2025</td>
<td class="data-td data last text-left">Citigroup</td>
<td class="data-td data last text-left">CEO says Citi is exploring a stablecoin and focused on tokenized deposits, custody, and reserve management.</td>
</tr>
<tr class="tbl-data">
<td class="data-td data last text-left">7/16/2025</td>
<td class="data-td data last text-left">Bank of America</td>
<td class="data-td data last text-left">On the company's Q2 earnings call, CEO Brian Moynihan states the bank is working on launching a stablecoin and that investors can expect BofA to move forward with it.</td>
</tr>
<tr class="tbl-data">
<td class="data-td data last text-left">7/23/2025</td>
<td class="data-td data last text-left">BNY Mellon, Goldman Sachs</td>
<td class="data-td data last text-left">Announce blockchain-based system to track Money Market Fund (MMF) ownership and improve MMF share transferability.</td>
</tr>
<tr class="tbl-data">
<td class="data-td data last text-left">7/24/2025</td>
<td class="data-td data last text-left">Franklin Templeton</td>
<td class="data-td data last text-left">Expands BENJI platform to VeChain for enterprise US gov&rsquo;t money fund access; Bitgo and Keyrock join as partners.</td>
</tr>
<tr class="tbl-data">
<td class="data-td data last text-left">7/25/2025</td>
<td class="data-td data last text-left">SoFi</td>
<td class="data-td data last text-left">Will launch global crypto remittances and reintroduce crypto investing with plans for stablecoins, staking, and more.</td>
</tr>
<tr class="tbl-data">
<td class="data-td data last text-left">7/28/2025</td>
<td class="data-td data last text-left">Interactive Brokers</td>
<td class="data-td data last text-left">Exploring its own stablecoin for 24/7 brokerage funding; may also integrate trusted third-party stablecoins and other crypto asset transfers.</td>
</tr>
<tr class="tbl-data">
<td class="data-td data last text-left">7/28/2025</td>
<td class="data-td data last text-left">FIS, Circle</td>
<td class="data-td data last text-left">FIS integrates Circle&rsquo;s USDC into Money Movement Hub to enable domestic and cross-border stablecoin payments.</td>
</tr>
<tr class="tbl-data">
<td class="data-td data last text-left">7/31/2025</td>
<td class="data-td data last text-left">Visa</td>
<td class="data-td data last text-left">Adds USDC, PYUSD, EURC support; expands settlement to Stellar and Avalanche to serve fintech and stablecoin netorks, citing demand for stablecoin-linked cards and the company's vision for comprehensive blockchain &amp; token services.</td>
</tr>
</tbody>
</table>
</div>
<p class="chart-disclosure mt-2">Source: Various News Reports as of 7/31/2025. <strong>Not intended as a recommendation to buy or sell any securities named herein.</strong></p>
<p>While some suppose the validator unwind presages sell pressure, many contend that those unwinding their validators may not be selling their ETH positions. Instead, many validator companies may be reducing their validator count to consolidate operations and reduce overhead expenses. The catalyst for this consolidation can be traced to Ethereum&rsquo;s Pectra upgrade in May which increased the maximum ETH per validator from <strong>32</strong> ETH to <strong>2048 </strong>ETH. Additionally, the outflow of staked ETH is somewhat offset by an inflow of <strong>390K</strong> ETH that backs validators seeking to join the Ethereum network. In fact, as of July 14, just before the mass withdrawals of ETH, staked ETH reached a record <strong>36.4M</strong> ETH.</p>
<p>Going forward, we see positive developments persisting for Ethereum as the community appears aligned in increasing Ethereum&rsquo;s throughput. For example, in July, <strong>47%</strong> of the validators backed a proposal to increase Ethereum&rsquo;s gas limit from <strong>36M</strong> to <strong>45M</strong> which increases transaction capacity by <strong>25%</strong>. Even with the increase in throughput, Ethereum&rsquo;s average transaction price, in USD, was (<strong>+14%</strong>) higher than it was in May and reached the highest average, <strong>$1.04</strong>, since February 2025.</p>
<h3>ETH Volatility at its Lowest Levels Since Fall 2024</h3>
<p><img loading="lazy" alt="ETH Volatility at its Lowest Levels Since Fall 2024" src="https://www.vaneck.com/contentassets/e05ed4b50d844c7d829d05f20d1e10b3/5997_crypto-monthly-july_chart-3_2025-7_v1_blog.svg" class="img-responsive w-100" /></p>
<p class="chart-disclosure">Source: Artemis XYZ as of 7/31/2029.<strong>Past performance is no guarantee of future results. Not intended as a recommendation to buy or sell any securities named herein.</strong></p>
<p>BTC volatility dropped to <strong>33%</strong>, the lowest since summer 2024. This was partly seasonal but also reflects structural demand: ETPs bought <strong>42K</strong> BTC in June and BTC treasury firms added another <strong>68K</strong>, more than offsetting June&rsquo;s <strong>13.5K</strong> BTC mined. This steady absorption suppresses volatility by providing a consistent bid.</p>
<p>July&rsquo;s positive crypto price action has sucked the wind out of volatility&rsquo;s sails. While a summer decline in volatility is typical across all risk assets, July is noteworthy for the persistence of BTC&rsquo;s volatility drop. BTC and ETH dropped to their lowest volatility levels since fall 2024. In fact, BTC&rsquo;s volatility has been hovering near its lowest reading ever. We attribute this development to the net buying from both ETPs and Digital Asset Treasuries (DATs) buying both BTC and ETH. However, we believe this volatility vacation is short-lived and believe the fall will bring greater levels of uncertainty which will translate into price variance. Over the medium term, we suspect that the DATs have the potential to add substantial volatility if there is a sustained digital asset sell off.</p>
<h2 id="hedera-momentum" class="anchored-block">HBAR Rallies on Momentum</h2>
<p>HBAR climbed <strong>+70%</strong> in July on a wave of partnerships, network growth, and broadening institutional legitimization.</p>
<p>The Reserve Bank of Australia and the Digital Finance Cooperative Research Centre chose Hedera for Project Acacia, a six‑month pilot that tests how tokenized assets and a wholesale CBDC could settle on distributed ledgers. Nineteen live pilots and five proofs of concept will cover assets such as fixed income, carbon credits, and private‑market securities. Hedera&rsquo;s new private‑network product, HashSphere, lets institutions trial tokenization, AI, and digital‑asset workflows in a compliant environment while staying interoperable with the public chain.</p>
<p>At the same time, Hedera became core infrastructure in EQTY Lab&rsquo;s secure‑AI initiative with NVIDIA, SCAN UK, and Accenture Public Sector. The project uses NVIDIA Blackwell confidential‑computing to govern autonomous AI agents; Hedera records cryptographic proofs of agent actions and verifies compliance with legal and geographic policies.</p>
<p>Institutional tokenization activity is also emerging. In late July, Archax created Hedera token contracts named after BlackRock, Fidelity ILF, State Street, Aberdeen Investments, and LGIM. Archax&rsquo;s CEO confirmed these represent money‑market funds that could soon transact in HBAR, signaling early but still pre‑launch interest in real‑world‑asset tokenization on the network.</p>
<h2>Network Activity and DeFi Growth</h2>
<p>Hedera&rsquo;s onchain activity was strong as Hedera&rsquo;s transactions surged as did the supply of stablecoins on its blockchain.</p>
<h3>The Supply of Stablecoins on Hedera Reached All-Time Highs in July</h3>
<p><img loading="lazy" alt="The Supply of Stablecoins on Hedera Reached All-Time Highs in July" src="https://www.vaneck.com/contentassets/e05ed4b50d844c7d829d05f20d1e10b3/5997_crypto-monthly-july_chart-4_2025-7_v1_blog.svg" class="img-responsive" /></p>
<p class="chart-disclosure">Source: DeFiLlama as of 8/1/2025. <strong>Past performance is no guarantee of future results. Not intended as a recommendation to buy or sell any securities named herein.</strong></p>
<ul class="content-list">
<li class="mt-2"><strong>Rising Transactions &amp; Usage:</strong> Hedera continued to handle high throughput (up to 10,000 TPS capacity) as new use cases went live. Notably, network utilization spiked during key announcements.</li>
<li class="mt-2"><strong>DeFi TVL and Stablecoins Up:</strong> The total value locked in Hedera DeFi protocols jumped <strong>~50%</strong> in July, reaching ~<strong>$146</strong> <strong>million, +82%</strong> MoM. Stablecoin circulation on Hedera also hit new highs over <strong>$208 million</strong>, <strong>~99.9% </strong>of which is USDC.</li>
<li class="mt-2"><strong>Ecosystem Expansion:</strong> Developers and startups continue to build on Hedera. July saw the launch of the <strong>Hello Future: Origins</strong> global hackathon, a three-part saga offering a total of $550,000 in prizes to Hedera builders. The first stage in late July attracted participants worldwide to innovate on Hedera for $150,000 in prizes.</li>
</ul>
<p><strong>Expanding Access and Legitimacy</strong></p>
<ul class="content-list">
<li class="mt-2"><strong>Grayscale Inclusion:</strong> In early July, Grayscale added HBAR to its Smart Contract Platform Select Fund, assigning it <strong>a 5.8%</strong> weight.</li>
<li class="mt-2"><strong>Robinhood U.S. Listing:</strong> HBAR gained broader retail access when Robinhood enabled trading for U.S. users in late July (following its earlier EU listing).</li>
<li class="mt-2"><strong>ETP Speculation:</strong> A Bloomberg Intelligence graphic shared by ETF analyst Eric Balchunas estimated an <strong>~85%</strong> chance of a spot HBAR ETP approval in 2025.</li>
<li class="mt-2"><strong>White House Recognition:</strong> A July 30 White House report, <em>&ldquo;American Leadership in Financial Technology,&rdquo;</em> referenced Hedera&rsquo;s report <em>&ldquo;DeFi Stack: Getting a Grip on the DeFi Ecosystem&rdquo;</em> in a section covering DeFi infrastructure.</li>
</ul>
<h3>Hyperliquid Earned 35% of All Blockchain Revenue in July 2025</h3>
<p><img loading="lazy" alt="Hyperliquid Earned 35% of All Blockchain Revenue in July 2025" src="https://www.vaneck.com/contentassets/e05ed4b50d844c7d829d05f20d1e10b3/5997_crypto-monthly-july_chart-5_2025-7_v1_blog.svg" class="img-responsive" /></p>
<p class="chart-disclosure">Source: Artemis XYZ as of 7/31/2029. <strong>Past performance is no guarantee of future results. Not intended as a recommendation to buy or sell any securities named herein.</strong></p>
<h2 id="solana" class="jump-link-nav anchored-block" data-jumplink-title="Solana Updates">Solana&rsquo;s Outperformed Bitcoin in July, But Awaits Catalysts</h2>
<p>In January 2025 SOL price spiked to an all-time high of <strong>$262.50</strong> as memecoin speculation blossomed and many considered Solana the epicenter of on-chain trading. In January 2025, despite being a &ldquo;low-cost blockchain,&rdquo; Solana was producing more revenue from transactions fees than the next four largest blockchains combined. If we count MEV, or maximal extracted value, Solana was likely producing at least <strong>4x</strong> the total revenue of all other chains put together. However, since it&rsquo;s the start of the year, SOL (<strong>-8%</strong>) has underperformed BTC (<strong>+26%</strong>), ETH (<strong>+13%</strong>), XRP (<strong>+48%</strong>) and even XLM (<strong>+23%)</strong>. While this is partly due to SOL price reliance on expectations of unsustainable levels of memecoin trading, Solana&rsquo;s status as the king of on-chain trading has been usurped by Hyperliquid.</p>
<p>Hyperliquid was able to capture much of Solana&rsquo;s momentum, and likely Solana&rsquo;s market capitalization, because it offers a simple, highly functional product. Thus, Hyperliquid has poached high value users from Solana and has retained them. For a long time, the bull case on Solana was that it boasted a strong ecosystem of builders who could utilize Solana&rsquo;s best in class transaction processing capabilities. As a result, trading would continue to thrive on Solana. However, Solana has not delivered meaningful improvements to boost its user experience, specifically in perpetual futures trading (perps), and Hyperliquid stepped up with a better product.</p>
<p>The Firedancer developer team, tasked with making revolutionary improvements in Solana&rsquo;s capabilities, could not meet production deadlines for upgrades to Solana&rsquo;s core software. Firedancer was not only supposed to expand Solana&rsquo;s throughput, but also make it provably reliable. Neither goal has been accomplished. At the same time, some of the most important developers left Firedancer and disputes over the quality of Firedancer&rsquo;s codebase boiled over into public disputes. Some would even argue that the team chosen to improve Solana&rsquo;s architecture, crack software engineers from the HFT hegemon Jump Trading, were ill-suited to improve Solana. While the Anza team has picked up the slack, the failure of Firedancer has manifested a market poltergeist who is suppressing SOL&rsquo;s price.</p>
<p>Solana&rsquo;s key differentiating factor compared to Ethereum is its ability to handle more transaction bandwidth. But this advantage only matters if Solana can capture the activity driving current excitement around blockchain. This enthusiasm revolves around financial institutions deploying to blockchain, but many are hesitant to deploy to Solana due to its reliability issues. Thus far, Solana has not been able to make a strong case that it will be important to either the businesses with blockchain plans or to investors who want to profit from the blockchain revolution.</p>
<p>Luckily, nothing is set in stone, but we are rapidly approaching the event horizon point for blockchain deployment decisions. Most major financial players still refer to blockchain in the abstract and committed their efforts to one blockchain ecosystem. It is generally assumed that there will be a mix of private ledgers and public ledgers operating in unison. The Ethereum community believes that by default, these banks will choose Ethereum for public exchange of value and L2s for internal remittances. Since this issue is not settled, Solana has a chance to make its case for why it should be the preferred chain of choice. To accomplish this, its community and development team should focus on messaging not only around its capabilities, but also its long-term stability.</p>
<h2 id="ethereum" class="jump-link-nav anchored-block" data-jumplink-title="Ethereum Updates">Ethereum Could Still Emerge as a Better Store of Value Than Bitcoin</h2>
<p>Alternative digital asset treasuries are growing rapidly, and the most common assets chosen are BTC and ETH. Initially, entities opted to choose BTC because of its strong store of value properties created through its ossified economic policies. The lynchpin of this policy structure is BTC&rsquo;s predictable issuance that results in a finite total supply. More recently, DATs have emerged that focus on Ethereum. These upstart DATs believe ETH is a better asset for running a digital treasury because savvy firms can engage in exotic financial activities to accumulate ETH at a faster rate than they could BTC.</p>
<p>While BTC treasuries can increase their BTC holdings by financing additional purchases, conducting sophisticated options strategies, or lending out their BTC, ETH treasuries have greater flexibility. ETH DATs can replicate BTC DAT financial strategies and also stake their Ethereum to receive Ethereum network revenues and inflationary issuance. Additionally, they can participate in DeFi to achieve additional income. Lost in the discussion, however, are the basic principles that govern Ethereum vs Bitcoin. Paradoxically, Ethereum may arrive at an economic system that favors its tokenholders more than Bitcoin&rsquo;s.</p>
<p>Ethereum, who turned <strong>10</strong> years old on July 30th, 2025, began with much higher inflation than BTC&rsquo;s, <strong>14.4%</strong> vs. <strong>9.3%</strong>. However, Ethereum made two major economic policy changes that set it upon the path towards a lower inflation rate than that of Bitcoin. The first adjustment was EIP 1559 which was instituted in August 2021 and created the &ldquo;burn&rdquo; of ETH base transaction fees. The consequence of this change is that increases in Ethereum activity cause the total amount of ETH supply to decrease.</p>
<p>The second, substantial policy change was the transition of Ethereum from Proof of Work (PoW) to Proof of Stake (PoS). Called &ldquo;the Merge,&rdquo; the transition occurred in September 2022. The Merge allowed Ethereum to reduce its inflation issuance from <strong>~13,000</strong> ETH/day to <strong>~1,700 </strong>ETH/day because it no longer needed to compensate the miners who secured its network. The result was that by March 8,2023, Ethereum&rsquo;s inflation rate dropped below that of BTC&rsquo;s. Since that date, ETH&rsquo;s supply has grown only (<strong>+0.2%</strong>) while BTC&rsquo;s has grown (<strong>+3%</strong>). In fact, the combination of these two monetary upgrades led to temporary reductions in Ethereum&rsquo;s ETH supply.</p>
<p>Total supply of ETH fell between October 7th, 2022, and April 4th, 2024, moving from <strong>~120.6M</strong> on to a low of <strong>~120.1M</strong> on, achieving an annualized (<strong>-0.25%</strong>) inflation rate over the period. Since that time, ETH burn has been reduced due to the increase in Ethereum transaction throughput, and the network has accrued (<strong>+0.5%</strong>) in additional supply. Regardless, over that same period, BTC supply has increased (<strong>+1.1%</strong>).</p>
<h3>ETH Inflation Dropped Below BTC's on March 8, 2023</h3>
<p><img loading="lazy" alt="ETH Inflation Dropped Below BTC's on March 8, 2023" src="https://www.vaneck.com/contentassets/e05ed4b50d844c7d829d05f20d1e10b3/5997_crypto-monthly-july_chart-6_2025-7_v1_blog.svg" class="img-responsive w-100" /></p>
<p class="chart-disclosure">Source: Glassnode as of 7/31/2025. <strong>Past performance is no guarantee of future results. Not intended as a recommendation to buy or sell any securities named herein.</strong></p>
<p>However, the superiority of ETH&rsquo;s inflationary policy may be short lived. Bitcoin&rsquo;s halving in April 2024 predictably dropped its inflation rate by (<strong>-50%</strong>). Currently, ETH&rsquo;s annual inflation over the last year is (<strong>+0.38%</strong>) vs BTC&rsquo;s at (<strong>+0.84%</strong>). Over the course of the next few halvings, BTC&rsquo;s inflation rate will approach (+<strong>0%)</strong>. Conversely, Ethereum&rsquo;s rate is hard to predict and may be as high as (<strong>+0.5%</strong>) or it may be negative. Even if ETH&rsquo;s current inflationary trajectory remains unchanged, BTC&rsquo;s will not be lower until 2028.</p>
<p>One very underappreciated dynamic is the issue of the Bitcoin&rsquo;s security budget. Bitcoin maintains inflationary issuance as an incentive to miners and without it, would have to rely upon network transaction fees. In the last year, miners made <strong>$278M</strong> from transaction fees and <strong>$14.64B</strong> in network inflation. Clearly, the economics of miners would have to radically adjust if they had to rely upon transaction fees alone. As the halvings occur, BTC&rsquo;s price must increase to make up for the difference of reduced network inflation to keep miners economically viable. If this price trajectory does not occur, the network&rsquo;s security may have to adopt a different economic model. There are many potential solutions to this problem and any change will not have a terminal impact on Bitcoin. But the economic policy adjustment will have winners and losers.</p>
<p>For example, one option to traverse the security budget dilemma would be for Bitcoin to introduce inflation through a hard fork. Regardless of its implementation, it would undercut one of its community&rsquo;s core critiques of Ethereum which is that Ethereum&rsquo;s economic policy is too malleable. More importantly, it would subject BTC holders to a taxation that would favor miners. These political-economic decisions are not zero-sum games and Bitcoin&rsquo;s system centered around miners favors their interests over token holders. In proof-of-stake systems like Ethereum, token ownership dictates which fork the validators will follow because stake will migrate to validators who choose the preferred forks. By contrast, Bitcoin&rsquo;s fork choice rule is ultimately decided by the miners and nodes who secure the network. By identity, there is a substantial conflict of interest which favors people whose interest lies in selling BTC to fund their operations. Ethereum, under PoS, lacks this dynamic.</p>
<p>While there are inherent economic tradeoffs with each system, ETH&rsquo;s set of tradeoffs favor the holders of ETH because they ultimately decide network direction. Though BTC holders do have sway on Bitcoin&rsquo;s network, their ability to influence the progression of the network is far limited compared to ETH holders&rsquo; domestic sway. As such, ETH may yet prove to be a better asset than BTC.</p>
<p><strong>Links to third party websites are provided as a convenience and the inclusion of such links does not imply any endorsement, approval, investigation, verification or monitoring by us of any content or information contained within or accessible from the linked sites. By clicking on the link to a non-VanEck webpage, you acknowledge that you are entering a third-party website subject to its own terms and conditions. VanEck disclaims responsibility for content, legality of access or suitability of the third-party websites.</strong></p>
<style>

    .data-td.data {
        padding-right: 5px !important;
    }
    
    .wrapped-div {
        max-width: 100%;
    }
    
    @media (max-width: 1240px) {
        .wrapped-div {
            overflow-x: scroll;
        }
    }
    
    .wrapped-div-sector {
        max-width: 100%;
        overflow-x: scroll;
    }
</style>
<p>To receive more <strong><a href="https://www.vaneck.com/us/en/insights/digital-assets/" title="Digital Assets Insights">Digital Assets</a></strong> insights, <strong><a href="https://www.vaneck.com/us/en/subscribe/" title="Subscription Center">sign up in our subscription center</a></strong>.</p>
]]></content:encoded>
</item><item rdf:about="https://www.vaneck.com/us/en/blogs/natural-resources/how-to-invest-in-natural-resources-diversify-your-portfolio-from-the-ground-up/">
  <title>How to Invest in Natural Resources: Diversify Your Portfolio from the Ground Up></title>
  <link>https://www.vaneck.com/us/en/blogs/natural-resources/how-to-invest-in-natural-resources-diversify-your-portfolio-from-the-ground-up/</link>
  <description><![CDATA[Natural resources offer a rare combination of inflation protection, portfolio diversification, and the opportunity to tap into global growth and key secular trends.]]></description>
  <dc:creator> </dc:creator>
  <dc:date>08/04/2025 06:30:00</dc:date>
<content:encoded><![CDATA[

<h2>Natural Resources Come in Many Different Forms</h2>
<p>Natural resources include traditional commodities like oil and gas, base and precious metals, as well as technologies and materials supporting the multi-decade transition to renewables. This expansive boundary offers a far-ranging opportunity set stretching well beyond traditional commodity markets.</p>
<p>From an investment perspective, VanEck classifies global natural resources into the following categories: renewables &amp; alternatives, base &amp; industrial metals, gold &amp; precious metals, oil &amp; gas, agriculture, paper &amp; forest, and industrials &amp; utilities.</p>
<h2 id="investment-benefits" class="jump-link-nav anchored-block" data-jumplink-title="Investment Benefits">Investment Benefits of Natural Resources: Inflation Protection, Diversification and Access to Global Growth</h2>
<p>Historically, global resources and commodity investments have been an excellent way to diversify broader stock and fixed income portfolios, hedge against inflation and gain access to the key secular trends powering global economic growth.</p>
<ul class="content-list">
<li class="mt-2"><i>Inflation hedge:</i> On average, resource equities have outperformed traditional asset classes &ndash; such as U.S. stocks and bonds &ndash; in even modest inflationary periods (2-6%).</li>
<li class="mt-2"><i>Diversification benefits</i>: Natural resources offer strong diversification benefits due to their low correlation with traditional assets like stocks and bonds. When the stock market is volatile or economic conditions change, commodities often behave differently, providing a stabilizing effect on your portfolio. For instance, during economic downturns, while stock prices may plummet, commodity prices like gold can remain stable or even increase, offering a cushion against market shocks.</li>
<li class="mt-2"><i>Global growth:</i> Natural resources&rsquo; critical role in powering growth&mdash;whether through traditional and renewable energy, emerging markets, or the AI-driven demand for electricity&mdash;positions them as key beneficiaries of global expansion.</li>
</ul>
<h2>Resource Equities Have Outperformed in Inflationary Periods</h2>
<p>With unsustainable government spending and rising deficits, the potential for inflationary pressures remains high. Historically, on average, once inflation has breached 5%, it has taken 18 years to get back to 2% or lower. Commodities and real assets have served as effective inflation hedges during previous inflationary periods, outperforming traditional equities and bonds.</p>
<p><img loading="lazy" class="img-responsive w-100" alt="Frequency of Inflation Regime" src="https://www.vaneck.com/EPiServer/CMS/Content/contentassets/bc623561ab8b42118d9544e755d3ddf2/6728_natural-resources_chart-1_2026-01_v1_blog.svg,,360066/Download?epieditmode=False" /></p>
<p class="chart-disclosure"><strong>Source: VanEck, Bloomberg, CRSP, FactSet, World Bank. Data as of December 2025. &ldquo;Diversified Miners&rdquo;</strong> represented MSCI ACWI Select Metals &amp; Mining Producers ex. Gold &amp; Silver Index <strong>&ldquo;Energy Producers&rdquo;</strong> represented by MSCI ACWI Select Energy Producers Index <strong>&ldquo;Gold Miners&rdquo;</strong> represented by NYSE Arca Gold Miners Index <strong>&ldquo;REITs&rdquo;</strong> represented by FTSE NAREIT All Equity REITs Index <strong>&ldquo;U.S. Bonds&rdquo;</strong> Bloomberg U.S. Aggregate Bond Index <strong>&ldquo;U.S. Equities&rdquo;</strong> represented by S&amp;P 500 Index. Past performance is no indication of future results. Index performance is not representative of fund performance. It is not possible to invest directly in an index. Index descriptions included at the end of this presentation.</p>
<h2>Natural Resources Offer Diversification Amid Heavily Concentrated Equity Indexes</h2>
<p>While the U.S. stock market has many things going for it&mdash;profit growth, a strong economy, low unemployment&mdash;valuations are high and recent performance has been dominated by a handful of mega-cap technology companies, i.e., the so-called &ldquo;Magnificent Seven.&rdquo; Commodities, particularly precious metals like gold, have historically exhibited a low correlation with stocks and bonds, offering portfolio resilience during market downturns. In addition, unlike the concentrated technology-heavy equity markets, natural resource investments provide exposure to tangible, real assets, which can enhance diversification.</p>
<h2 id="global-growth" class="jump-link-nav anchored-block" data-jumplink-title="Global Growth">Tapping into Global Growth</h2>
<p>From traditional commodities like oil and gas to the ongoing transition to renewables, global resources represent the foundation of economic activity.</p>
<p><strong>Emerging Markets and Industrialization</strong></p>
<p>Emerging markets, particularly in Asia, are experiencing significant economic growth, driving the demand for natural resources. As these countries continue to industrialize and urbanize, the need for infrastructure development, manufacturing, and energy increases. This surge in demand is particularly evident in:</p>
<ul class="content-list">
<li class="mt-2">Metals: Iron ore, copper, and aluminum are crucial for construction, electronics, and transportation industries. China's infrastructure projects, including railways, highways, and urban developments, have significantly increased the demand for these metals.</li>
<li class="mt-2">Energy: Traditional energy resources like oil and natural gas remain vital for powering industries and transportation. India's expanding economy has led to a higher consumption of fossil fuels to meet its growing energy needs.</li>
<li class="mt-2">Agricultural Products: As populations grow and incomes rise, dietary patterns change, increasing the demand for diverse agricultural products. For instance, China's rising middle class has led to higher consumption of meat, driving up the demand for feed grains like soybeans and corn.</li>
</ul>
<p><strong>U.S. Energy Demand &amp; AI Boom</strong></p>
<p>The rise of artificial intelligence and data centers is driving demand for natural gas, renewables and nuclear energy as reliable power sources. As AI computing expands, so will the need for stable, large-scale energy solutions. In fact, markets may be underestimating the significant power requirements commanded by AI technologies (and the resources required to sustain that growth).</p>
<p>The chart below illustrates four potential paths for global data center electricity consumption, based on varying assumptions about the pace of AI adoption and infrastructure development. The &ldquo;Lift-Off&rdquo; scenario assumes rapid AI deployment and a swift buildout of computing infrastructure, resulting in a dramatic surge in power demand. The &ldquo;Base&rdquo; case reflects more moderate, trend-based growth, while the &ldquo;High Efficiency&rdquo; scenario assumes meaningful advances in AI hardware and software that temper energy use per unit of compute. The most conservative forecast (&ldquo;Headwinds&rdquo;) assumes delayed adoption and slower infrastructure rollout. Yet even in this downside case, power demand from data centers is expected to rise substantially, underscoring the structural role that AI-driven computing will play in shaping future energy needs.</p>
<h3>Global Data Center Electricity Use Is Set to Rise&mdash;Even with Efficiency Gains</h3>
<p><strong>Global Data Center Electricity Consumption by Sensitivity Case (2020 - 2035)</strong></p>
<p><img loading="lazy" class="img-responsive w-100" alt="Power Demand Needs Are Growing Due to AI" src="https://www.vaneck.com/contentassets/5f974a70436341cb9cfc6cd1be4565fd/5364_nr-feb_chart-2_2025-2_v1_blog.svg" /></p>
<p class="chart-disclosure">Source: IEA. Data as of April 2025. &ldquo;Lift-Off&rdquo; assumes strong AI uptake and fast infrastructure buildout; &ldquo;Base&rdquo; reflects current trends with moderate growth; &ldquo;High Efficiency&rdquo; models rapid efficiency gains in AI hardware/software; and &ldquo;Headwinds&rdquo; includes slower AI adoption and infrastructure delays. For illustrative purposes only.</p>
<p>Below is an expanded view of the &ldquo;Base&rdquo; case scenario that breaks down the rising power demand from data centers by fuel type. As shown, natural gas remains the dominant source of electricity generation, reflecting its role as a flexible and reliable option to meet round-the-clock computing needs. Renewables see significant growth as well, while nuclear energy provides additional baseload capacity. Even coal, though representing a smaller share, remains part of the mix. Together, these trends highlight the scale and diversity of resources required to support the data center buildout&mdash;further underscoring the broad energy sector implications of accelerating AI-driven demand.</p>
<h3>Meeting Data Center Demand Requires a Broad Energy Mix</h3>
<p><strong>U.S. Data Center Electricity Generation by Fuel ("Base" Case)</strong></p>
<div class="flourish-embed flourish-chart" data-src="visualisation/24473520?2429379"><script src="https://public.flourish.studio/resources/embed.js"></script><noscript><img loading="lazy" src="https://public.flourish.studio/visualisation/24473520/thumbnail" width="100%" alt="Meeting Data Center Demand Requires a Broad Energy Mix" /></noscript></div>
<p class="chart-disclosure">Source: IEA. Data as of April 2025. &ldquo;Base&rdquo; reflects current trends with moderate growth. For illustrative purposes only.</p>
<h2>Resources Transition: Inevitable, but a Long Way to Go</h2>
<p>The global shift towards renewable energy and sustainable technologies is another critical factor driving the demand for specific natural resources. Electrified transport (including electric vehicles) and energy storage, among others, are likely to contend as major drivers of the resources transition alongside renewables, in our view.</p>
<h3>Global Investment in Resource Transition is Increasing ($ Billion)</h3>
<p><img loading="lazy" class="img-responsive w-100" alt="Global Investment in Resource Transition is Increasing ($ Billion)" src="https://www.vaneck.com/contentassets/d4c357b2393b4680b37bb4ba97dd9593/6728_natural-resources_chart-2_2026-01_v1_blog.svg" /></p>
<p class="chart-disclosure"><strong>Source: BNEF; IRENA. Data as of December 2025.</strong> Note: start years differ by sector, but all sectors are present from 2020 onwards.<sup>*</sup>IRENA projected investment needed to keep rising global temperatures to well below 2 degree Celsius (&deg;C) and towards 1.5&deg;C during this century.</p>

<h2>Supply Constraints and Investment Opportunities</h2>
<p>While the demand for natural resources continues to grow, supply constraints pose challenges and create investment opportunities. Key supply-side factors include:</p>
<ul class="content-list">
<li class="mt-2">Mining Challenges: Extracting minerals and metals from the earth is becoming increasingly difficult and costly. Deeper mines, lower ore grades, and stricter environmental regulations are some of the factors contributing to these challenges. Investors can capitalize on companies that innovate in mining technologies or hold high-quality resource deposits.</li>
<li class="mt-2">Agricultural Disruptions: Climate change, extreme weather events, and diseases can significantly impact agricultural production. These disruptions can lead to supply shortages and higher prices for agricultural commodities. Investing in agricultural technologies, such as drought-resistant crops or precision farming, can provide exposure to potential gains from these challenges.</li>
</ul>
<h2>Risk Considerations</h2>
<p>Investing in natural resources comes with a unique set of risks. Commodities tend to be more volatile than other asset classes due to factors like weather conditions, geopolitical tensions, and changes in supply and demand. For example, political instability in oil-producing regions can lead to sharp spikes in oil prices. Additionally, commodities markets can be less liquid than stock markets, making it harder to buy and sell assets quickly without affecting their prices. Understanding these risks is crucial before adding natural resources to your portfolio.</p>
<h2 id="ways-to-invest" class="jump-link-nav anchored-block" data-jumplink-title="Ways to Invest">Ways to Invest</h2>
<p>There are several ways to invest in natural resources:</p>
<ul class="content-list">
<li class="mt-2">Buy Physical Commodities: This involves purchasing the actual commodity, such as gold bars or agricultural products. While it offers direct exposure, storage and security can be challenging.</li>
<li class="mt-2">Invest in Companies: Buying stocks of companies involved in the extraction, production, and distribution of natural resources, such as mining firms or oil companies, provides indirect exposure to commodity prices.</li>
<li class="mt-2">Futures Contracts: These financial instruments allow you to agree to buy or sell a commodity at a future date and price, providing leverage and potentially higher returns, but also higher risk.</li>
<li class="mt-2">ETFs and Mutual Funds: These funds pool investor money to buy a diversified portfolio of commodities or commodity-related companies, offering a more manageable way to gain exposure to natural resources with professional management.</li>
</ul>
<p>Incorporating natural resources into your investment portfolio can offer significant benefits, including diversification, inflation protection, and the potential to capitalize on global growth trends. However, it is essential to be aware of the risks involved and to choose the appropriate investment method based on your risk tolerance and investment goals. By carefully considering these factors, you can effectively leverage natural resources to enhance and diversify your investment portfolio.</p>
<h2>VanEck Natural Resources and Commodities Solutions</h2>
<p>VanEck has a history of investing in natural resources and commodities for over 50 years, offering investors actively and passively managed strategies, from physical commodities to natural resource equities. We offer specialized exposure to individual sectors and diversified solutions with broad exposure across sectors and industries.</p>
<div class="wrapped-div">
<table>
<tbody>
<tr class="tbl-data">
<td class="tbl-header last">Symbol</td>
<td class="tbl-header last">Name</td>
<td class="tbl-header last">Agriculture /<br />Agri-Food Technology</td>
<td class="tbl-header last">Gold/<br />Precious<br />Metals</td>
<td class="tbl-header last">Base/<br />Industrial<br />Metals</td>
<td class="tbl-header last">Strategic/<br />Rare Earth<br />Metals</td>
<td class="tbl-header last">Renewable/<br />Alternative<br />Energy</td>
<td class="tbl-header last">Traditional<br />Energy<br />(Oil &amp; Gas)</td>
<td class="tbl-header last">Energy<br />MLPs</td>
<td class="tbl-header last">Infrastructure</td>
<td class="tbl-header last">REITs</td>
</tr>
<tr class="tbl-data">
<td class="data-td data last text-left"><strong><a href="/link/2ed6209aa9674070b56e86addc947db6.aspx" title="GHAAX - Global Resources Fund - Class A - Overview">GHAAX</a>/ <a href="/link/347c450348f34db2a523260dcbb909ce.aspx" title="GHAIX - Global Resources Fund - Class I - Overview">GHAIX</a></strong></td>
<td class="data-td last"><strong><a href="/link/2ed6209aa9674070b56e86addc947db6.aspx" title="GHAAX - Global Resources Fund - Class A - Overview">Global Resources Fund</a></strong></td>
<td class="data-td data last">■</td>
<td class="data-td data last">&nbsp;</td>
</tr>
<tr class="tbl-data">
<td class="data-td data last text-left"><strong><a href="/link/9cc454bdc12d49638c0a22783d5a26cf.aspx" title="CMCAX - CM Commodity Index Fund - Class A - Overview">CMCAX</a>/ <a href="/link/58aef3e5401749e99ccd267956e2242f.aspx" title="COMIX - CM Commodity Index Fund - Class I - Overview">COMIX</a></strong></td>
<td class="data-td last"><strong><a href="/link/9cc454bdc12d49638c0a22783d5a26cf.aspx" title="CMCAX - CM Commodity Index Fund - Class A - Overview">CM Commodity Index Fund</a></strong></td>
<td class="data-td data last">■</td>
<td class="data-td data last">&nbsp;</td>
<td class="data-td data last">■</td>
<td class="data-td data last">&nbsp;</td>
</tr>
<tr class="tbl-data">
<td class="data-td data last text-left"><strong><a href="/link/b517b8245a934e7bb2908053bfd688db.aspx" title="CMCI - VanEck CMC - Commodity Strategy ETF| Overview  ">CMCI</a></strong></td>
<td class="data-td last"><strong><a href="/link/b517b8245a934e7bb2908053bfd688db.aspx" title="CMCI - VanEck CMCI Commodity Strategy ETF - Overview ">CMCI Commodity Strategy ETF</a></strong></td>
<td class="data-td data last">■</td>
<td class="data-td data last">&nbsp;</td>
<td class="data-td data last">■</td>
<td class="data-td data last">&nbsp;</td>
</tr>
<tr class="tbl-data">
<td class="data-td data last text-left"><strong><a href="/link/44f7b473b01d474080286ad9f3ade614.aspx" title="INIVX - International Investors Gold Fund - Class I - Overview">INIVX</a>/ <a href="/link/00484e4fdc7d407ab219db93d3fd8f95.aspx" title="INIIX - International Investors Gold Fund - Class I - Overview">INIIX</a></strong></td>
<td class="data-td last"><strong><a href="/link/44f7b473b01d474080286ad9f3ade614.aspx" title="INIVX - International Investors Gold Fund - Class A - Overview">International Investors Gold Fund</a></strong></td>
<td class="data-td data last">&nbsp;</td>
<td class="data-td data last">■</td>
<td class="data-td data last">&nbsp;</td>
</tr>
<tr class="tbl-data">
<td class="data-td data last text-left"><strong><a href="/link/e74398db6cef4ef6ba1af75cd64aec32.aspx" title="CRAK -  VanEck Oil Refiners ETF - Overview">CRAK</a></strong></td>
<td class="data-td last"><strong><a href="/link/e74398db6cef4ef6ba1af75cd64aec32.aspx" title="CRAK -  VanEck Oil Refiners ETF - Overview">Oil Refiners ETF</a></strong></td>
<td class="data-td data last">&nbsp;</td>
<td class="data-td data last">■</td>
<td class="data-td data last">&nbsp;</td>
</tr>
<tr class="tbl-data">
<td class="data-td data last text-left"><strong><a href="/link/170aabbf18f648849d853d9254eb4173.aspx" title="EINC - VanEck Energy Income ETF - Overview">EINC</a></strong></td>
<td class="data-td last"><strong><a href="/link/170aabbf18f648849d853d9254eb4173.aspx" title="EINC - VanEck Energy Income ETF - Overview">Energy Income ETF</a></strong></td>
<td class="data-td data last">&nbsp;</td>
<td class="data-td data last">■</td>
<td class="data-td data last">&nbsp;</td>
</tr>
<tr class="tbl-data">
<td class="data-td data last text-left"><strong><a href="/link/cc9d35e48255460e9d1a48baf803333e.aspx" title="GDX - VanEck Gold Miners ETF - Overview">GDX</a></strong></td>
<td class="data-td last"><strong><a href="/link/cc9d35e48255460e9d1a48baf803333e.aspx" title="GDX - VanEck Gold Miners ETF - Overview">Gold Miners ETF</a></strong></td>
<td class="data-td data last">&nbsp;</td>
<td class="data-td data last">■</td>
<td class="data-td data last">&nbsp;</td>
</tr>
<tr class="tbl-data">
<td class="data-td data last text-left"><strong><a href="/link/8e4cfe6abfde493a98e46e398f66d364.aspx" title="GDXJ - VanEck Junior Gold Miners ETF - Overview">GDXJ</a></strong></td>
<td class="data-td last"><strong><a href="/link/8e4cfe6abfde493a98e46e398f66d364.aspx" title="GDXJ - VanEck Junior Gold Miners ETF - Overview">Junior Gold Miners ETF</a></strong></td>
<td class="data-td data last">&nbsp;</td>
<td class="data-td data last">■</td>
<td class="data-td data last">&nbsp;</td>
</tr>
<tr class="tbl-data">
<td class="data-td data last text-left"><strong><a href="/link/3f62ce8a611f419890a9c9c75dc5c4d1.aspx" title="EMET - VanEck Copper and Green Metals ETF - Overview">EMET</a></strong></td>
<td class="data-td last"><strong><a href="/link/3f62ce8a611f419890a9c9c75dc5c4d1.aspx" title="EMET - VanEck Copper and Green Metals ETF - Overview">Copper and Green Metals ETF </a></strong></td>
<td class="data-td data last">&nbsp;</td>
<td class="data-td data last">■</td>
<td class="data-td data last">&nbsp;</td>
<td class="data-td data last">■</td>
<td class="data-td data last">&nbsp;</td>
</tr>
<tr class="tbl-data">
<td class="data-td data last text-left"><strong><a href="/link/3f543637b8194acbaf623bf10aff8300.aspx" title="HAP - VanEck Natural Resources ETF - Overview">HAP</a></strong></td>
<td class="data-td last"><strong><a href="/link/3f543637b8194acbaf623bf10aff8300.aspx" title="HAP - VanEck Natural Resources ETF - Overview">Natural Resources ETF</a></strong></td>
<td class="data-td data last">■</td>
<td class="data-td data last">&nbsp;</td>
</tr>
<tr class="tbl-data">
<td class="data-td data last text-left"><strong><a href="/link/e5fc174dfb2d4bdc8fcb535ffad93759.aspx" title="MOO - VanEck Agribusiness ETF - Overview">MOO</a></strong></td>
<td class="data-td last"><strong><a href="/link/e5fc174dfb2d4bdc8fcb535ffad93759.aspx" title="MOO - VanEck Agribusiness ETF - Overview">Agribusiness ETF</a></strong></td>
<td class="data-td data last">■</td>
<td class="data-td data last">&nbsp;</td>
</tr>
<tr class="tbl-data">
<td class="data-td data last text-left"><strong><a href="/link/3f0f63188e34417eb5f99cc5d6f4e999.aspx" title="NLR - VanEck Uranium and Nuclear ETF - Overview">NLR</a></strong></td>
<td class="data-td last"><strong><a href="/link/3f0f63188e34417eb5f99cc5d6f4e999.aspx" title="NLR - VanEck Uranium and Nuclear ETF - Overview">Uranium and Nuclear ETF</a></strong></td>
<td class="data-td da ta last">&nbsp;</td>
<td class="data-td data last">&nbsp;</td>
<td class="data-td data last">■</td>
<td class="data-td data last">&nbsp;</td>
</tr>
<tr class="tbl-data">
<td class="data-td data last text-left"><strong><a href="/link/d9d0c169b9e6488b8ba2ca940208e4f1.aspx" title="OIH - VanEck Oil Services ETF - Overview">OIH</a></strong></td>
<td class="data-td last"><strong><a href="/link/d9d0c169b9e6488b8ba2ca940208e4f1.aspx" title="OIH - VanEck Oil Services ETF - Overview">Oil Services ETF</a></strong></td>
<td class="data-td data last">&nbsp;</td>
<td class="data-td data last">■</td>
<td class="data-td data last">&nbsp;</td>
</tr>
<tr class="tbl-data">
<td class="data-td data last text-left"><strong><a href="/link/7870ff5f9864408f86a28549f1b2dfbb.aspx" title="OUNZ - VanEck Merk Gold ETF - Overview">OUNZ<sup>1</sup></a></strong></td>
<td class="data-td last"><strong><a href="/link/7870ff5f9864408f86a28549f1b2dfbb.aspx" title="OUNZ - VanEck Merk Gold ETF - Overview">VanEck Merk Gold ETF</a></strong></td>
<td class="data-td data last">&nbsp;</td>
<td class="data-td data last">■</td>
<td class="data-td data last">&nbsp;</td>
</tr>
<tr class="tbl-data">
<td class="data-td data last text-left"><strong><a href="/link/464b5a544f084a50815b7f92ec61b208.aspx" title="PIT - VanEck Commodity Strategy ETF - Overview">PIT</a></strong></td>
<td class="data-td last"><strong><a href="/link/464b5a544f084a50815b7f92ec61b208.aspx" title="PIT - VanEck Commodity Strategy ETF - Overview">VanEck Commodity Strategy ETF</a></strong></td>
<td class="data-td data last">■</td>
<td class="data-td data last">&nbsp;</td>
<td class="data-td data last">■</td>
<td class="data-td data last">&nbsp;</td>
</tr>
<tr class="tbl-data">
<td class="data-td data last text-left"><strong><a href="/link/6e91eff51c6042ef9f1d5943ffa90a0e.aspx" title="RAAX - VanEck Real Assets ETF - Overview">RAAX</a></strong></td>
<td class="data-td last"><strong><a href="/link/6e91eff51c6042ef9f1d5943ffa90a0e.aspx" title="RAAX - VanEck Real Assets ETF - Overview">Real Assets ETF</a></strong></td>
<td class="data-td data last">■</td>
</tr>
<tr class="tbl-data">
<td class="data-td data last text-left"><strong><a href="/link/3652dffb8cb14a8b9c7290cb32decb87.aspx" title="REMX - VanEck Rare Earth and Strategic Metals ETF - Overview">REMX</a></strong></td>
<td class="data-td last"><strong><a href="/link/3652dffb8cb14a8b9c7290cb32decb87.aspx" title="REMX - VanEck Rare Earth and Strategic Metals ETF - Overview">Rare Earth and Strategic Metals ETF</a></strong></td>
<td class="data-td data last">&nbsp;</td>
<td class="data-td data last">■</td>
<td class="data-td data last">&nbsp;</td>
</tr>
<tr class="tbl-data">
<td class="data-td data last text-left"><strong><a href="/link/410bd48b10ab49819386dfd0080e7210.aspx" title="SLX - VanEck Steel ETF - Overview">SLX</a></strong></td>
<td class="data-td last"><strong><a href="/link/410bd48b10ab49819386dfd0080e7210.aspx" title="SLX - VanEck Steel ETF - Overview">Steel ETF</a></strong></td>
<td class="data-td data last">&nbsp;</td>
<td class="data-td data last">■</td>
<td class="data-td data last">&nbsp;</td>
</tr>
<tr class="tbl-data">
<td class="data-td data last text-left"><strong><a href="/link/8bf7f7f5f3594a4eae2799c077aaed42.aspx" title="SMOG - VanEck Low Carbon Energy ETF - Overview">SMOG</a></strong></td>
<td class="data-td last"><strong><a href="/link/8bf7f7f5f3594a4eae2799c077aaed42.aspx" title="SMOG - VanEck Low Carbon Energy ETF - Overview">Low Carbon Energy ETF</a></strong></td>
<td class="data-td data last">&nbsp;</td>
<td class="data-td data last">■</td>
<td class="data-td data last">&nbsp;</td>
</tr>
</tbody>
</table>
</div>
<p class="chart-disclosure"><strong><sup>1</sup>&nbsp;VanEck Merk Gold ETF ("OUNZ," or the "Trust"): This material must be preceded or accompanied by a prospectus: (OUNZ: <a href="/us/en/investments/merk-gold-trust-etf-ounz/ounz-prospectus.pdf" title="VanEck Merk Gold ETF"><strong>Prospectus</strong></a>).</strong></p>
<p class="chart-disclosure"><strong>Investing in the Trust is subject to significant risk and may not be suitable for all investors. The Trust is not investment company registered under the Investment Company Act of 1940 (&ldquo;1940 Act&rdquo;) or commodity pools for the purposes of the Commodity Exchange Act (&ldquo;CEA&rdquo;). Shares of the Trusts are not subject to the same regulatory requirements as mutual funds. As a result, shareholders of the Trusts do not have the protections associated with ownership of shares in an investment company registered under the 1940 Act or the protections afforded by the CEA.</strong></p>
<p>More information, including recent performance and current holdings, can be found by clicking the fund names below:</p>
<p><a href="/link/166837347eb349dc81ff131cd1514f52.aspx" title="GHAAX - Global Resources Fund - Class A - Overview"><strong>Global Resources Fund:</strong></a> Actively-managed approach to companies with unique competitive advantages associated with traditional commodities and those leading the development of emerging resource applications and technologies.</p>
<p><a href="/link/305237df17384439b28745fea31dded1.aspx" title="INIVX - International Investors Gold Fund - Class A - Overview"><strong>International Investors Gold Fund:</strong></a> Proven fundamental, bottom-up process emphasizes stock selection based on industry experience to access opportunities across the gold mining sector.</p>
<p><a href="/link/218468eae2b54f8989eda6f3f557770d.aspx" title="CMCAX - CM Commodity Index Fund - Class A - Overview"><strong>CM Commodity Index Fund:</strong></a> A passively managed fund that offers diversified commodities exposure by spreading its exposure across multiple maturities and maintaining a constant maturity per commodity to mitigate the impact of negative roll yield.</p>
<p><a href="/link/b517b8245a934e7bb2908053bfd688db.aspx" title="CMCI - VanEck CMCI Commodity Strategy ETF - Overview"><strong>CMCI Commodity Strategy ETF:</strong></a> A passively managed ETF that spreads its exposure across multiple maturities to offer diversified exposure and mitigates the impact of negative roll yield by maintaining a constant maturity per commodity.</p>
<p><a href="/link/a7dbc67770ac4eb8a7c25f4c0afe1bd3.aspx" title="CRAK -  VanEck Oil Refiners ETF - Overview"><strong>VanEck Oil Refiners ETF (CRAK):</strong></a> Provides exposure to an industry that may generally benefit from lower oil prices, a segment that has historically interacted differently with oil prices and market dynamics than other energy segments.</p>
<p><a href="/link/5f7e90d690b947acabb6e7a0cc30e35c.aspx" title="EINC - VanEck Energy Income ETF - Overview"><strong>VanEck Energy Income ETF (EINC):</strong></a> Offers exposure to MLPs and energy infrastructure companies that have historically exhibited attractive yield characteristics without burdensome K-1 tax reporting.</p>
<p><a href="/link/0ef4cceba0a44fbe8de2f60e7952a27d.aspx" title="GDX - VanEck Gold Miners ETF - Overview"><strong>VanEck Gold Miners ETF (GDX):</strong></a> The nation's first ETF that offers direct exposure to the gold mining industry, which may provide leverage to rising gold prices.</p>
<p><a href="/link/a89bf56fe3cd4ec69342e1472f50889b.aspx" title="GDXJ - VanEck Junior Gold Miners ETF - Overview"><strong>VanEck Junior Gold Miners ETF (GDXJ):</strong></a> Access to junior gold miners, including smaller exploratory or early development phase companies that are responsible for many gold reserve discoveries worldwide.</p>
<p><a href="/link/87d6a3678ec445ee9f240584921cba00.aspx" title="GMET - VanEck Green Metals ETF - Overview"><strong>Copper and Green Metals ETF (EMET):</strong></a> Capture companies involved in the production of the metals that enable the energy transition from fossil fuels to cleaner energy sources and technologies.</p>
<p><a href="/link/8035c2a4153d4a16bd871a6b15c949b3.aspx" title="HAP - VanEck Natural Resources ETF - Overview"><strong>VanEck Natural Resources ETF (HAP):</strong></a> Offers exposure to global companies involved in six natural resources segments (including agriculture, energy, metals and renewable energy).</p>
<p><a href="/link/63b1b78621384fa2a809fb2131edd706.aspx" title="MOO - VanEck Agribusiness ETF - Overview"><strong>VanEck Agribusiness ETF (MOO):</strong></a> Positioned to meet growing demand as global population growth is driving increasing food demand and the need for efficient agricultural solutions.</p>
<p><a href="/link/49acb0d4174146e9a0269c9cb81c02bb.aspx" title="NLR - VanEck Uranium and Nuclear ETF - Overview"><strong>VanEck Uranium and Nuclear ETF (NLR):</strong></a> Access to an important segment of the nuclear energy market, which is a significant clean energy source at an inflection point from increasing demand.</p>
<p><a href="/link/8339ad0b563143d98a7d2e61afbc5425.aspx" title="OIH - VanEck Oil Services ETF - Overview"><strong>VanEck Oil Services ETF (OIH):</strong></a> Invests in highly liquid companies in oil services industry, including both domestic and U.S. listed foreign companies, allowing for enhanced industry representation.</p>
<p><a href="/link/982ab5546e32473b85c7b266bc6b2be6.aspx" title="OUNZ - VanEck Merk Gold ETF - Overview"><strong>VanEck Merk Gold ETF (OUNZ)<sup>1</sup>:</strong></a>&nbsp;Provides investors with a convenient and cost-efficient way to invest in gold through shares with the option to take physical delivery.</p>
<p><a href="/link/310be2aebcad4c5cb5a89a82fd128841.aspx" title="RAAX - VanEck Real Assets ETF - Overview"><strong>VanEck Real Assets ETF (RAAX):</strong></a> Comprehensive allocation strategy that invests across real assets and seeks to reduce volatility by responding to changing market environments.</p>
<p><a href="/link/71e51530eb0e4adbbd16a7847361abc7.aspx" title="REMX - VanEck Rare Earth and Strategic Metals ETF - Overview"><strong>VanEck Rare Earth and Strategic Metals ETF (REMX):</strong></a> Provides access to the rare earth or strategic metals industry, which supplies key inputs to many of the world&rsquo;s most advanced technologies.</p>
<p><a href="/link/18d42b75c35647aaae623a51ed85ce34.aspx" title="SLX - VanEck Steel ETF - Overview"><strong>VanEck Steel ETF (SLX):</strong></a> Access to the steel industry, an industry supporting global industrialization and economic expansion.</p>
<p><a href="/link/4b0f56133b4b4a38abc4b8db775983b6.aspx" title="SMOG - VanEck Low Carbon Energy ETF - Overview"><strong>VanEck Low Carbon Energy ETF (SMOG):</strong></a> Exposure to low carbon energy that includes not only solar, wind and hydro companies, but also in more recently developing areas of the market such as electric vehicles, battery tech, hydrogen and fuel cells.</p>
<p><a href="/link/fae5e7a97c094c9b924c6ee6aec199fd.aspx" title="PIT - VanEck Commodity Strategy ETF - Overview"><strong>VanEck Commodity Strategy ETF (PIT):</strong></a> Actively managed exposure to a broad basket of commodity futures.</p>
<style type="text/css">
    .wrapped-div {
        max-width: 100%;
    }

    @media (max-width: 1240px) {
        .wrapped-div {
            overflow-x: scroll;
        }
    }

    .wrapped-div-sector {
        max-width: 100%;
        overflow-x: scroll;
    }
</style>
<p>To receive more <a href="/us/en/insights/natural-resources/" title="Natural Resources Insights"><strong>Natural Resources</strong></a> insights, <a href="https://www.vaneck.com/us/en/subscribe/" title="Subscription Center"><strong>sign up in our subscription center</strong></a>.</p>
]]></content:encoded>
</item><item rdf:about="https://www.vaneck.com/us/en/blogs/thematic-investing/esports-investing-roblox-stock-gains-momentum-as-ai-transforms-gaming/">
  <title>Esports Investing: Roblox Stock Gains Momentum as AI Transforms Gaming></title>
  <link>https://www.vaneck.com/us/en/blogs/thematic-investing/esports-investing-roblox-stock-gains-momentum-as-ai-transforms-gaming/</link>
  <description><![CDATA[Roblox leads gaming&rsquo;s AI evolution, boosting user creation, engagement, and revenue. ESPO investors may benefit as AI tools drive growth, scale, and platform dominance.]]></description>
  <dc:creator>Nick Frasse</dc:creator>
  <dc:date>08/04/2025 06:30:00</dc:date>
<content:encoded><![CDATA[

<p><strong>Key Takeaways</strong></p>
<ul class="content-list">
<li class="mt-2">Roblox leverages AI to accelerate game development, automate asset creation, and scale personalized user experiences.</li>
<li class="mt-2">AI tools like Cube 3D and Roblox Assistant help creators build faster, increasing platform activity and bookings.</li>
<li class="mt-2">Roblox runs over 250 AI systems weekly, managing 4B chat completions and 70B queries to improve engagement and safety.</li>
<li class="mt-2">With Roblox as its top holding, the <strong><a href="/link/d41cc1b7916f46e5bb3ee751f311c4f2.aspx" title="ESPO - VanEck Video Gaming and eSports ETF - Holdings and Performance ">VanEck Video Gaming &amp; eSports ETF (ESPO)</a></strong> is positioned to capture Roblox&rsquo;s AI-driven growth.</li>
</ul>
<h2>Roblox Stock Gains Momentum as AI Transforms Gaming</h2>
<p>Roblox is not a single video game. It is a platform that hosts millions of user-created games and virtual experiences, all built by independent developers using Roblox&rsquo;s proprietary engine and tools. Players create an avatar, explore 3D worlds, and interact socially through games, events, and virtual items.</p>
<p>The core of Roblox&rsquo;s strategy lies in its user-generated content (UGC) model. Instead of developing its own games, Roblox provides the infrastructure, including a game engine, discovery platform, and monetization tools. This enables creators to build and publish their own games and virtual goods.</p>
<p><strong>Roblox Revenue Streams:</strong></p>
<p><i>Virtual Currency (Robux) Purchases</i></p>
<ul class="content-list">
<li class="mt-2">Players purchase Robux, a digital currency, to buy virtual goods like avatar outfits, power-ups, or access to premium content.</li>
<li class="mt-2">Roblox takes a platform fee while developers earn a share of Robux spent in their games.</li>
</ul>
<p><i>Developer Exchange (DevEx) Program</i></p>
<ul class="content-list">
<li class="mt-2">Developers who accumulate Robux can convert them into real-world currency through Roblox&rsquo;s DevEx. In 2024, Roblox paid out over $740 million to creators.<sup>*</sup></li>
<li class="mt-2">This incentivizes high-quality game development and helps retain top talent on the platform.</li>
</ul>
<p><i>Advertising and Brand Partnerships</i></p>
<ul class="content-list">
<li class="mt-2">Roblox partners with major brands like Nike, Netflix, and the NFL to create branded experiences, sponsored events, and in-game items that drive engagement and monetization.</li>
<li class="mt-2">These activations are often immersive, including virtual concerts, scavenger hunts, or product launches inside Roblox worlds.</li>
</ul>
<h2>Unlocking Growth Through AI Creation Tools</h2>
<p>Roblox&rsquo;s revenue model is tightly linked to developer success. The more immersive, diverse, and engaging the user-generated content, the more time and money users spend on the platform. This is where AI is creating real financial leverage.</p>
<p>In March 2025, Roblox open-sourced Cube 3D, a 1.8 billion-parameter foundation model<sup>*</sup>&nbsp;that allows developers to generate 3D assets from a simple text prompt. Paired with Mesh Generation APIs, creators can now accelerate asset production dramatically, reducing development cycles and costs.</p>
<p>On the coding side, Roblox Assistant, an AI-powered code-completion and debugging tool, has moved beyond beta. It now includes real-time prompt editing, undo and redo functionality, script recommendations, and diff review. Developers no longer need to be full-time engineers to publish complex, multiplayer-ready games.</p>
<p>These tools directly impact platform velocity. More creators producing high-quality games leads to more daily active users (DAUs), more virtual currency transactions, and ultimately higher bookings. AI is powering a scalable content engine at minimal incremental cost.</p>

<h2>AI at Scale, Behind the Scenes of the Roblox Platform</h2>
<p>It&rsquo;s easy to think of AI in games as something flashy, like chatbots or voice assistants, but much of Roblox&rsquo;s AI power sits behind the scenes, quietly improving the user experience at scale.</p>
<p>Over the past year, Roblox has built a massive AI backbone to support its global platform. By late 2024, the company had over 250 different AI systems<sup>*</sup>&nbsp;running simultaneously, helping with everything from personalized game recommendations to moderating content and powering developer tools. These systems run across thousands of high-powered computers in data centers and the cloud.</p>
<p>Every week, Roblox&rsquo;s AI infrastructure handles<sup>*</sup>:</p>
<ul class="content-list">
<li class="mt-2">4 billion AI-generated text completions, used for in-game chat, code suggestions, and content filtering.</li>
<li class="mt-2">1 billion personalized experiences, including game suggestions, avatar customization, and social recommendations.</li>
<li class="mt-2">70 billion daily smart queries, helping the system understand player behavior and serve up relevant content.</li>
</ul>
<p>This scale allows Roblox to offer each user a tailored experience, and gives developers the tools they need to reach the right audience.</p>
<p>Building AI tools is one thing, but running them at this scale for nearly 100 million daily users is something few companies in the world can do. It gives Roblox a real edge, enabling faster, smarter, and safer platform experiences that keep users engaged and spending. It also creates a significant barrier to entry. Without comparable infrastructure and data, it is incredibly difficult for competitors to match what Roblox delivers, especially as AI becomes central to discovery, creation, and moderation.</p>
<h2>Safety, Moderation, and Platform Trust</h2>
<p>Roblox&rsquo;s user base includes millions of minors, making trust and safety absolutely essential. In July 2025, the company announced that its AI moderation system now processes 6.1 billion chat messages per day across 25 languages<sup>*</sup>. It uses transformer-based AI models running on GPUs to filter harmful content in real time. Its voice moderation system has improved message detection accuracy by 92% over the prior version.</p>
<p>These tools are critical, especially as Roblox expands into older age groups and adds more real-time communication to its platform.</p>
<p>Strong moderation supports user retention, ensures compliance with global regulations, and helps Roblox maintain its reputation with parents, educators, and advertisers. That trust supports the long-term health of the platform and its revenue model.</p>
<h2>Roblox Performance Speaks for Itself</h2>
<p>Roblox&rsquo;s business performance clearly reflects the impact of its AI investments. In Q1 2025, the company reported<sup>*</sup>:</p>
<ul class="content-list">
<li class="mt-2">Bookings of $1.21 billion, up +31% YoY.</li>
<li class="mt-2">97.8 million DAUs, up +22% YoY.</li>
<li class="mt-2">$4.5 billion in cash on hand, enabling continued investment in tools, infrastructure, and safety.</li>
</ul>
<p>Management directly credited this growth to AI innovations and the expansion of its developer ecosystem.</p>
<p>This is a real-world case of AI creating measurable business value. Roblox is using AI to improve productivity, reduce friction, scale up services, and convert user engagement into higher revenue.</p>

<h2>What It Means for ESPO Investors</h2>
<p>The <strong><a href="/link/d41cc1b7916f46e5bb3ee751f311c4f2.aspx" title="ESPO - VanEck Video Gaming and eSports ETF - Holdings and Performance ">VanEck Video Gaming &amp; eSports ETF (ESPO)</a></strong> is built to provide targeted, high-conviction exposure to the most influential companies in gaming and interactive entertainment. Unlike broader tech ETFs, ESPO focuses on pure-play companies that derive at least 50% of their revenue from video games or esports.</p>
<p>With Roblox as the largest holding,&nbsp;<strong><a href="/link/c558cd12dafb4701be59d594db3eb9a6.aspx" title="Esports Investing: How 5G, AI &amp; Cloud Gaming Are Driving Growth">ESPO is well-positioned to capture the upside from the company&rsquo;s AI-driven growth</a></strong>. The ETF&rsquo;s market-cap weighted design allows leaders like Roblox to drive performance when they execute &mdash; and Roblox is executing.</p>
<p>For Roblox, AI is not a future bet or side feature. It is a core operating strategy, transforming how games are built, how players interact, and how the business scales. As long as Roblox continues to integrate AI into every layer of its ecosystem, it remains a key growth engine for the platform and a compelling contributor to ESPO&rsquo;s long-term investment case.</p>
<p>To receive more <a href="https://www.vaneck.com/us/en/insights/thematic-investing/" title="Thematic Investing Insights"><strong>Thematic Investing</strong></a> insights, <a href="https://www.vaneck.com/us/en/subscribe/" title="Subscription Center"><strong>sign up in our subscription center</strong></a>.</p>
]]></content:encoded>
</item><item rdf:about="https://www.vaneck.com/us/en/blogs/thematic-investing/smh-question-and-answer/">
  <title>SMH ETF: Question &amp; Answer></title>
  <link>https://www.vaneck.com/us/en/blogs/thematic-investing/smh-question-and-answer/</link>
  <description><![CDATA[Semiconductors power our digital world, from AI to EVs. The industry is rapidly evolving, driven by innovation, efficiency, and growing demand.]]></description>
  <dc:creator>Nick Frasse</dc:creator>
  <dc:date>08/01/2025 06:30:00</dc:date>
<content:encoded><![CDATA[

<p>Semiconductors, the crucial components driving artificial intelligence (AI), electric cars, and cloud computing, are becoming increasingly valuable in this digital age. Rather than attempting to pick individual stock winners in this ever-evolving sector, the <a href="/link/39c8d235748b4c26a5930c31d3ac0160.aspx" title="SMH - VanEck Semiconductor ETF - Holdings and Performance"><strong>VanEck Semiconductor ETF (SMH)</strong></a> provides exposure to the top 25 most liquid U.S.-listed semiconductor companies, spanning the entire industry value chain from chip design and fabrication to manufacturing machinery. Additionally, the <a href="https://www.vaneck.com/us/en/investments/fabless-semiconductor-etf-smhx/overview/" title="SMHX - VanEck Fabless Semiconductor ETF - Holdings and Performance"><strong>VanEck Fabless Semiconductor ETF (SMHX)</strong></a> offers targeted exposure to leading fabless chip designers.</p>
<ul class="content-list">
<li><a href="#point-one"><strong>Why Invest in Semiconductors and Why Choose VanEck&rsquo;s Semiconductor ETFs?</strong></a></li>
<li><a href="#point-two"><strong>What is the Long-Term Outlook for Semiconductors?</strong></a></li>
<li><a href="#point-three"><strong>Are Semiconductors Still a Cyclical Industry?</strong></a></li>
<li><a href="#point-four"><strong>Semiconductors and AI: How Do They Work Together?</strong></a></li>
<li><a href="#point-five"><strong>What Will Drive Semiconductors Over the Next Decade?</strong></a></li>
<li><a href="#point-six"><strong>Who are the Main Participants of the Semiconductor Industry?</strong></a></li>
<li><a href="#point-seven"><strong>How to buy VanEck ETFs?</strong></a></li>
</ul>
<h2 id="point-one" class="anchored-block">Why Invest in Semiconductors and Why Choose VanEck&rsquo;s Semiconductor ETFs?</h2>
<p>Semiconductors are the foundational components powering our increasingly digital world. From cloud computing and electric vehicles to smartphones and AI, these tiny chips enable the infrastructure of modern technology. As industries digitize and artificial intelligence proliferates, demand for semiconductors continues to rise.</p>
<p>Investing in the <a href="/link/39c8d235748b4c26a5930c31d3ac0160.aspx" title="SMH - VanEck Semiconductor ETF - Overview"><strong>VanEck Semiconductor ETF (SMH)</strong></a> is a way to gain exposure to this crucial sector. <a href="/link/39c8d235748b4c26a5930c31d3ac0160.aspx" title="SMH - VanEck Semiconductor ETF - Overview"><strong>SMH</strong></a> offers broad access to the top 25 most liquid U.S.-listed semiconductor companies, spanning the entire value chain from design and fabrication to manufacturing machinery. For more targeted exposure, the <a href="/link/9b8fb1812bc74764bf11fc85767838f9.aspx" title="SMHX - VanEck Fabless Semiconductor ETF - Overview"><strong>VanEck Fabless Semiconductor ETF (SMHX)</strong></a> focuses on companies that design and develop chips but outsource the manufacturing, often resulting in higher R&amp;D investment and operational agility.</p>
<h2 id="point-two" class="anchored-block">What is the Long-term Outlook for Semiconductors?</h2>
<p>The long-term growth outlook for semiconductors remains strong. Digital transformation across industries from automotive to industrial automation continues to expand the demand for processing, storage, and connectivity. Emerging technologies such as 5G, Internet of Things (IoT), edge computing, and AI all rely heavily on increasingly advanced and energy-efficient chips.</p>
<p>Graphics Processing Units (GPUs), once primarily used for gaming, are now pivotal in artificial intelligence and machine learning applications due to their high parallel processing capabilities. As AI becomes more embedded in everything from enterprise software to healthcare diagnostics, the importance of semiconductors and their diversity is only growing.</p>
<p>Policy support, such as the U.S. CHIPS Act and similar initiatives abroad, continues to boost domestic production and R&amp;D, helping diversify supply chains and support long-term innovation.</p>

<h2 id="point-three" class="anchored-block">Are Semiconductors Still a Cyclical Industry?</h2>
<p>Historically, semiconductors were considered a cyclical industry, prone to dramatic booms and busts driven by PC and smartphone upgrade cycles. But that dynamic is rapidly changing.</p>
<p>The rise of AI data centers, enterprise cloud infrastructure, industrial automation, and automotive semiconductors has diversified the demand profile for chips. These segments are driven by sustained capital investment and long-term deployment, not short-term consumer behavior.</p>
<p>As a result, the industry is becoming structurally less cyclical. This evolution points to more consistent, multi-year demand growth across a broader customer base and a wider set of end markets. Investors are now viewing semiconductors as long-term infrastructure plays rather than short-term tech trades.</p>

<h2 id="point-four" class="anchored-block">Semiconductors and AI: How Do They Work Together?</h2>
<p><a href="/us/en/blogs/thematic-investing/if-you-are-reading-this-semiconductors-and-ai-are-taking-over/" title="If You&rsquo;re Reading This Semiconductors &amp; AI Are Taking Over"><strong>Artificial Intelligence (AI) and semiconductors share a symbiotic relationship</strong></a>. GPUs power AI workloads by executing many simultaneous computations required for training complex models. As AI continues to expand into areas like autonomous driving, robotics, and finance, the need for performance-optimized chips grows.</p>
<p>Simultaneously, AI is revolutionizing how chips are designed. AI-assisted design tools are enabling breakthroughs beyond traditional Moore's Law scaling, creating more application-specific architectures that maximize performance and efficiency. In short, AI depends on semiconductors to function, and semiconductors are evolving faster thanks to AI.</p>
<p>AI infrastructure also benefits the broader semiconductor ecosystem including memory, power management, networking, and packaging underscoring the comprehensive impact of this trend across the value chain.</p>
<h2 id="point-five" class="anchored-block">What Will Drive Semiconductors Over the Next Decade?</h2>
<p>If there's one force set to define the next decade for semiconductors, it's the relentless rise of compute demand.</p>
<p>Across every industry from finance and biotech to entertainment and national defense the need for faster, smarter, and more efficient computing is intensifying. The AI revolution has only accelerated this trend, creating a flywheel effect of model complexity, data growth, and infrastructure expansion.</p>
<p>To meet this insatiable appetite for compute, modern systems require an entire ecosystem of semiconductors working in harmony. This includes:</p>
<ul class="content-list">
<li>High Bandwidth Memory (HBM): Feeding massive datasets into accelerators</li>
<li>Networking &amp; Interconnect Chips: Moving data swiftly between nodes in AI clusters</li>
<li>Power Management &amp; Analog ICs: Optimizing energy usage at scale</li>
<li>Advanced Packaging &amp; Back-End Equipment: Pushing physical limits for performance and density</li>
</ul>
<p>What makes this trend so compelling is its durability. Compute demand is not tied to one product cycle or hype phase. It's a foundational requirement for digital transformation in nearly every domain. Whether training trillion-parameter AI models, simulating protein folding, or delivering real-time cloud services, the need for semiconductors is only deepening.</p>
<p>Investors in <a href="/link/39c8d235748b4c26a5930c31d3ac0160.aspx" title="SMH - VanEck Semiconductor ETF - Overview"><strong>SMH</strong></a> gain access to the companies powering this megatrend&mdash;not just the designers of leading-edge chips, but also the enablers of memory, infrastructure, and fabrication. As compute becomes the oil of the 21st century, semiconductors are poised to be the picks and shovels.</p>
<h2 id="point-six" class="anchored-block">Who are&nbsp;the Main Participants of the Semiconductor Industry?</h2>
<p>The semiconductor industry is made up of several key players:</p>
<ol class="content-list">
<li>Foundry Operators (e.g., TSMC) - Manufacture chips to client specifications</li>
<li>Integrated Device Manufacturers (IDMs) (e.g., Intel) - Handle design, manufacturing, and packaging in-house</li>
<li>Fabless Companies (e.g., NVIDIA, AMD) - Focus solely on design, outsourcing fabrication</li>
<li>Equipment Manufacturers (e.g., ASML) - Supply the tools and machinery for chip production</li>
</ol>
<p>Each of these segments contributes to the industry&rsquo;s advancement and offers unique exposure within ETFs like <a href="/link/39c8d235748b4c26a5930c31d3ac0160.aspx" title="SMH - VanEck Semiconductor ETF - Overview"><strong>SMH</strong></a> and <a href="/link/9b8fb1812bc74764bf11fc85767838f9.aspx" title="SMHX - VanEck Fabless Semiconductor ETF - Overview"><strong>SMHX</strong></a>.</p>
<h2 id="point-seven" class="anchored-block">How to buy VanEck ETFs?</h2>
<p><strong><a href="/link/39c8d235748b4c26a5930c31d3ac0160.aspx#how-to-buy-etf&amp;utm=SMH-Blog" title="How to buy VanEck ETFs?"> Learn more here.</a></strong></p>
<p class="d-none d-lg-block"><a href="mailto:askvaneck@vaneck.com" title="Have More Questions? - Ask VanEck" rel="noopener"><img loading="lazy" class="img-responsive" src="https://www.vaneck.com/globalassets/home/us/insights/blogs/bm-blog-images/cta-faq_desktop-02.svg" alt="Have More Questions? - Ask VanEck" /></a></p>
<p class="d-lg-none"><a href="mailto:askvaneck@vaneck.com" title="Have More Questions? - Ask VanEck" rel="noopener"><img loading="lazy" class="img-responsive" src="https://www.vaneck.com/globalassets/home/us/insights/blogs/bm-blog-images/cta-faq_mobile-01.svg" alt="Have More Questions? - Ask VanEck" /></a></p>
<p>To receive more <a href="https://www.vaneck.com/us/en/insights/thematic-investing/" title="Thematic Investing Insights"><strong>Thematic Investing</strong></a> insights, <a href="https://www.vaneck.com/us/en/subscribe/" title="Subscription Center"><strong>sign up in our subscription&nbsp;center</strong></a>.</p>
<style type="text/css">
    .wrapped-div {
        max-width: 100%;
    }

    @media (max-width: 768px) {
        .wrapped-div {
            overflow-x: scroll;
        }
    }

    .wrapped-div-sector {
        max-width: 100%;
        overflow-x: scroll;
    }
</style>
]]></content:encoded>
</item><item rdf:about="https://www.vaneck.com/us/en/blogs/income-investing/why-everyone-is-talking-about-private-credit-in-2025/">
  <title>Why Everyone&#39;s Talking About Private Credit in 2025></title>
  <link>https://www.vaneck.com/us/en/blogs/income-investing/why-everyone-is-talking-about-private-credit-in-2025/</link>
  <description><![CDATA[As markets adjust to new tariff policies, private credit is gaining traction. VanEck shares insights on why this asset class is in sharp focus.]]></description>
  <dc:creator>Coulter Regal, CFA</dc:creator>
  <dc:date>08/01/2025 06:30:00</dc:date>
<content:encoded><![CDATA[

<p><strong>Key Takeaways</strong></p>
<ul class="content-list">
<li class="mt-2">Private credit surges in 2025 as banks retreat from lending and investors seek higher, less correlated yields. Projections suggest it could hit $2.8 trillion by 2028.</li>
<li class="mt-2">Middle-market companies and sectors like healthcare and tech are turning to private lenders for flexible financing.</li>
<li class="mt-2">ETFs, like VanEck&rsquo;s BIZD and GPZ, are expanding retail access to private credit strategies with daily liquidity and diversified exposure.</li>
<li class="mt-2">The combination of structural growth drivers, macro tailwinds and new access pathways are paving the the way for private credit to evolve into a mainstream income allocation for both institutions and individual investors.</li>
<li class="mt-2">In the second half of 2025, focus is shifting to refinancing needs ahead of the 2026&ndash;2027 maturity wall in high-yield bonds and leveraged loans.</li>
</ul>
<p id="private-credit-demand" class="jump-link-nav anchored-block" data-jumplink-title="Private Credit Demand">Demand for private credit continues to surge, with projections suggesting it could hit $2.8 trillion by 2028.<sup>1</sup>&nbsp;Private credit has stepped into the spotlight in 2025, and it&rsquo;s not hard to see why. Amid volatile markets, evolving trade dynamics, and investors&rsquo; growing appetite for alternative income, private credit offers something rare: the potential for attractive risk-adjusted returns and yield. Here&rsquo;s what&rsquo;s fueling the boom and why more investors are adding it to their portfolios.</p>
<div class="row mb-3">
<div class="col-md-4 col-xs-12"><a href="https://www.youtube.com/embed/UOYy1wZiawM" data-video="https://youtu.be/UOYy1wZiawM" class="popup-youtube" title="Watch Video"><img loading="lazy" class="img-responsive" style="margin-right: 15px; margin-top: 0px;" src="https://www.vaneck.com/EPiServer/CMS/Content/contentassets/ad4378454ce74234b29d98edf2c4bd1a/5998_private_credit_video_gpz-bizd_thumbnail_2025-8_v1.jpg,,344899/Download?epieditmode=False" alt="Watch Video" align="left" /></a></div>
<div class="col-md-8 col-xs-12"><br /><strong><a href="https://www.youtube.com/embed/UOYy1wZiawM" data-video=" https://youtu.be/UOYy1wZiawM" class="popup-youtube" title="Watch Video">Watch Video</a><br /></strong><a href="https://www.youtube.com/embed/UOYy1wZiawM" data-video="https://youtu.be/UOYy1wZiawM" class="popup-youtube" title="Watch Video" style="font-size: 16px; font-weight: bold; padding: 10px 0px 0px; margin-right: 20px; width: 202px;">What&rsquo;s Driving the Private Credit Boom?</a></div>
</div>
<h2>What&rsquo;s Driving the Private Credit Boom?</h2>
<p>The 2023 regional banking crisis accelerated the pre-existing trend of banks retreating from lending to private companies that tend to be below investment grade or not rated. This void is being filled by private credit. Unlike banks, which are subject to stricter regulations and capital requirements, private lenders offer more flexibility and can tailor loan structures to meet the specific needs of borrowers. This flexibility, coupled with their increasing pool of capital positions private credit as a crucial source of financing, particularly for businesses that may not meet the stricter criteria of traditional banks.</p>
<p>More recently, the macro backdrop of 2025 has been a perfect catalyst for private credit&rsquo;s rise. Volatility across traditional stocks and bonds has prompted investors to seek for assets less tied to public market swings. At the same time, geopolitical tensions and new tariff policies are reshaping global trade, tightening corporate borrowing conditions, and creating demand for non-bank lending alternatives.</p>

<h2 id="outlook" class="jump-link-nav anchored-block" data-jumplink-title="Outlook">Private Credit End of Year 2025 Outlook</h2>
<p>The momentum behind private credit isn&rsquo;t expected to slow. In 2025, specifically, there are several tailwinds for private credit:</p>
<ul class="content-class">
<li class="mt-2">Middle-market companies often underserved by traditional banks are increasingly turning to private lenders to finance growth, acquisitions, and recapitalizations.</li>
<li class="mt-2">Sector-specific opportunities in industries like healthcare, technology, and infrastructure are expanding.</li>
<li class="mt-2">Institutional allocations continue to grow, with pension funds and insurers viewing private credit as a core income strategy rather than a niche alternative.</li>
</ul>
<p>However, investors should also be mindful of risks: tighter financial conditions could pressure weaker borrowers, and while the market is expanding, manager selection will remain critical.</p>
<h2>Why Investors Are Paying Attention to Private Credit</h2>
<p>A sustained spread premium continues to exist between public and private markets, allowing investors to earn higher yields for lending privately. This spread advantage, combined with the evolving debt landscape, has created a rich opportunity set for private credit lenders.</p>
<p>Recent years have seen a major shift: instead of relying on traditional syndicated loan markets, many companies have turned to private credit for refinancing needs. Looking ahead, attention is shifting toward a looming maturity wall, as a significant portion of high-yield bonds and leveraged loans are set to come due in 2026 and 2027. In contrast to past cycles, this maturing debt could see even greater private market participation as companies seek flexible financing solutions outside of traditional bank lending.</p>
<p>At the heart of private credit&rsquo;s appeal are three core benefits:</p>
<ul class="content-class">
<li class="mt-2"><strong>Attractive yields</strong>: Private loans often offer higher income than comparable public bonds, a compelling advantage in a higher-rate world.</li>
<li class="mt-2"><strong>Reduced correlation to traditional stocks and bonds:</strong> Private credit tends to be less sensitive to day-to-day market swings, helping diversify portfolios.</li>
<li class="mt-2"><strong>Potential inflation protection</strong>: Many private credit deals feature floating-rate structures that adjust with rising rates.</li>
</ul>
<p>Access to private credit is expanding. Historically reserved for large institutions, private credit is now increasingly available to individual investors through new vehicles, such as ETFs. This democratization is reshaping the landscape, but with it comes the need for careful attention to credit quality, illiquidity risks, and manager expertise.</p>

<h2 id="role-of-private-credit" class="jump-link-nav anchored-block" data-jumplink-title="Role of Private Credit">The Role of Private Credit in a Diversified Portfolio</h2>
<p><strong>Is private credit here to stay? All signs point to yes.</strong> The rise of private credit is part of a broader rethinking of portfolio construction. As traditional fixed income struggles to deliver the same returns and diversification benefits it once did, investors are seeking alternative income sources. Private credit fits the bill, offering a differentiated return stream while complementing traditional assets and investment strategies.</p>
<p>Institutions are leading the way, often carving out dedicated allocations to private credit within their multi-asset portfolios. Retail investors are following suit, thanks to more accessible vehicles. VanEck believes that private credit will play a strategic role in diversified portfolios moving forward. However, investors should carefully weigh liquidity needs, risk tolerance, and manager quality when making allocation decisions.</p>
<h2>Accessing the Market: Private Credit ETFs and BDCs</h2>
<p>Traditional private credit investments, while offering the potential for attractive returns and yield, come with a drawback: illiquidity. Unlike publicly traded stocks or bonds, these investments often involve long lock-up periods, typically several years. This means your money is tied up for the duration, inaccessible for immediate needs or strategic portfolio adjustments. This inflexibility can be a major hurdle for investors who require more dynamic access to their capital, especially in a market rife with uncertainties. In an environment where liquidity is highly prized, Business Development Companies (BDCs) present a compelling, liquid alternative to traditional private credit strategies.</p>
<p>BDCs bridge the gap between traditional private credit and publicly traded securities. BDCs offer the same benefits as traditional private credit strategies &ndash; the potential for higher yields and diversification away from traditional stocks and bonds, but in a much more liquid form.</p>
<p>ETFs like the <a href="/link/459289f4c5ea4648bd9dfcf70d847cd7.aspx" title="BIZD - VanEck BDC Income ETF - Overview"><strong>VanEck BDC Income ETF (BIZD)</strong></a> offer diversified exposure to leading BDCs, which in turn invest across a wide range of private loans. For investors seeking access to private credit opportunities without the barriers of direct lending, including capital commitments, illiquidity, and operational complexity, <strong><a href="/link/459289f4c5ea4648bd9dfcf70d847cd7.aspx" title="BIZD - VanEck BDC Income ETF - Overview">BIZD</a></strong> provides a streamlined alternative.</p>
<p>Importantly, these vehicles allow investors to participate in private credit&rsquo;s growth potential while maintaining daily liquidity, transparency, and simplicity.</p>
<h2 id="how-to-invest" class="jump-link-nav anchored-block" data-jumplink-title="How to Invest">Investing in the Firms Powering Private Markets</h2>
<p>Another way to tap into the growth of private credit is by investing in the companies that operate and manage the funds behind it. These are alternative asset managers, firms that provide financing through private credit while also overseeing capital across private equity, real estate, infrastructure, and venture capital. As the organizations sourcing deals, structuring loans, and allocating private capital, they are positioned to benefit directly from the increasing demand for private market solutions.</p>
<p>While investors have long been able to buy shares of publicly listed alternative asset managers, the role these firms play in portfolios is evolving. As demand for private credit and other private market strategies grows, these companies are expanding their business models. Many are reaching beyond institutional capital and into wealth management and retirement channels, broadening their investor base and solidifying their importance in today&rsquo;s investment landscape. With access to long-term capital and resilient fee structures, they are well positioned to benefit from the continued shift toward private markets.</p>
<p>To help investors access this opportunity, VanEck has introduced the <a href="https://www.vaneck.com/us/en/investments/alternative-asset-manager-etf-gpz/overview/" title="GPZ - VanEck Alternative Asset Manager ETF - Overview"><strong>Alternative Asset Manager ETF (GPZ)</strong></a>. This ETF seeks to track as closely as possible, before fees and expenses, the price and yield performance of the <strong><a href="/link/d52df9865d4344169ef628a966527697.aspx" title="Prices &amp; Returns">MarketVector Alternative Asset Managers Index (MVAALTTR)</a></strong>, which is intended to track the overall performance of alternative asset managers across private equity, venture capital, private credit, private real estate, and private infrastructure.</p>
<p>Unlike direct private investments, <a href="https://www.vaneck.com/us/en/investments/alternative-asset-manager-etf-gpz/overview/" title="GPZ - VanEck Alternative Asset Manager ETF - Overview"><strong>GPZ</strong></a> offers diversified exposure to the firms driving the expansion of private markets. As private markets reshape global capital flows, alternative asset managers have become central to this transformation. <a href="https://www.vaneck.com/us/en/investments/alternative-asset-manager-etf-gpz/overview/" title="GPZ - VanEck Alternative Asset Manager ETF - Overview"><strong>GPZ</strong></a> gives investors a way to participate in that growth through a single, liquid, and transparent ETF.</p>

<h2 id="whats-next" class="jump-link-nav anchored-block" data-jumplink-title="What&rsquo;s Next">What Comes Next for Private Credit?</h2>
<p>As the private credit market matures, several themes are likely to shape its future:</p>
<ul class="content-class">
<li class="mt-2"><strong>Regulation</strong>: Increased attention from regulators may lead to more oversight, especially around risk management and disclosure.</li>
<li class="mt-2"><strong>Growing demand</strong>: New entrants, from large asset managers to fintech platforms, are making private credit more competitive and innovative.</li>
<li class="mt-2"><strong>Portfolio integration</strong>: Private credit is becoming a core portfolio allocation, not just a niche play.</li>
</ul>
<p>Looking ahead, VanEck sees private credit evolving into a mainstream income strategy for both institutions and individual investors. The combination of structural growth drivers, macro tailwinds, and new access pathways positions private credit as a critical part of the investing conversation &mdash; not just in 2025 but well beyond.</p>
<p>To receive more <a href="/us/en/blogs/income-investing/" title="Income Investing Insights"><strong>Income Investing</strong></a> and <a href="https://www.vaneck.com/us/en/insights/thematic-investing/" title="Thematic Investing Insights"><strong>Thematic Investing</strong></a> insights, <a href="/link/5f45412c2143400497908cea2897f7d3.aspx" title=" Subscription Center"><strong>sign up in our subscription center</strong></a>.</p>
]]></content:encoded>
</item><item rdf:about="https://www.vaneck.com/us/en/blogs/thematic-investing/private-market-access-without-the-hassle/">
  <title>Private Market Access Without the Hassle></title>
  <link>https://www.vaneck.com/us/en/blogs/thematic-investing/private-market-access-without-the-hassle/</link>
  <description><![CDATA[Private markets have surged to $15T, but access remains complex. We explore two ways to gain exposure to private credit and asset managers without traditional hurdles.]]></description>
  <dc:creator>Coulter Regal, CFA</dc:creator>
  <dc:date>08/01/2025 06:30:00</dc:date>
<content:encoded><![CDATA[

<p><strong>Key Takeaways</strong></p>
<ul class="content-list">
<li class="mt-2">Private market growth has quadrupled in the last ten years as investors look beyond traditional markets in search of high income. Private credit with a focus on direct lending to middle market companies underserved by traditional banks is leading this trend.</li>
<li class="mt-2">Historically, investors have faced obstacles when trying to access the private credit space, but ETFs such as BIZD and GPZ can offer convenient exposure without the hassle allowing retail investors access to the space.</li>
<li class="mt-2">The VanEck BDC ETF BIZD, offers liquid access to middle‑market private credit, letting retail investors tap into higher‑yield income opportunities without the typical complexity, lock‑ups, or direct lending arrangements.</li>
<li class="mt-2">The VanEck Alternative Asset Manager ETF GPZ provides exposure to leading public alternative asset managers, allowing investors access to the growth of firms that structure and manage private market capital across equity, credit, infrastructure, and real estate.</li>
</ul>
<p>Private markets are growing rapidly. Just ten years ago, they represented around $4 trillion in assets. Today that number has grown to about $15 trillion and industry estimates maintain that pace of growth into the next decade.<sup>1</sup>&nbsp;This expansion reflects a major shift in how investors are seeking returns, as many look beyond traditional public markets in search of better income, diversification, and long-term growth.</p>
<p>But while private markets offer attractive opportunities, they are not always easy to access. High investment minimums, long lockup periods, and complex structures often stand in the way. However, at VanEck we have aimed to change that with ETF offerings that provide simple and liquid exposure to two important parts of the private market landscape.</p>
<h2>Private Credit Exposure Made Simple</h2>
<p>One of the fastest growing corners of private markets is private credit, particularly direct lending to middle market companies. These firms often fall outside the scope of traditional bank lending but still require capital for growth, acquisitions, and operational improvements. Historically, investors have faced various obstacles when trying to access this space directly, from minimum investment requirements to complex fund structures with limited transparency and liquidity.</p>
<p><a href="/link/c48bed1be12e47c88f01e1bdbfa51ed2.aspx" title="BIZD - VanEck BDC Income ETF - Holdings and Performance"><strong>VanEck&rsquo;s BDC Income ETF (BIZD) </strong></a>offers simple and efficient access to this market by investing in a portfolio of publicly traded business development companies (BDCs). BDCs are specialized investment companies that provide loans directly to middle market businesses. By investing in BDCs, BIZD delivers diversified exposure to the underlying loan portfolios of these development companies, but with daily liquidity, transparency, and ease of access typically associated with ETFs. This diversified approach also helps reduce the impact of performance differences among individual BDCs, which can vary based on their asset mix, sector exposure, financing terms, and management quality.</p>

<p>One of the primary benefits of private credit is its income potential, and BIZD offers investors a way to tap into that. Loans originated by BDCs often carry higher yields than traditional fixed income investments, helping enhance portfolio income generation.</p>
<h3>BDCs Offer High Income Potential | As of June 30, 2025</h3>
<p><img loading="lazy" class="img-responsive w-100" alt="BDCs Offer High Income Potential - As of June 30, 2025" src="https://www.vaneck.com/contentassets/604ca6f1a0e143de93d2fbd8e5718c1e/charts-gpz-bizd-exposures-blog-july-2025_blog-bar.svg" /></p>
<p class="chart-disclosure">Source: FactSet. BDCs represented by MVIS US Business Development Companies Index; U.S. HY Bonds represented by ICE BofAML US High Yield Index; REITs represented by FTSE NAREIT Equity REITs Index; Utilities represented by Standard &amp; Poor&rsquo;s 500 Utilities Index; U.S. Stocks represented by Standard &amp; Poor&rsquo;s 500 Index; U.S. IG Bonds represented by Bloomberg Barclays Capital US Aggregate Bond Index; U.S. 10 Yr Treasury represented by ICE BofAML Current 10-Year US Treasury Index.</p>
<p>Most BDC loans are also floating rate, allowing them to adjust with interest rate movements and remain attractive in a higher-for-longer rate environment. This floating rate structure also provides diversification benefits when paired with traditional core bond holdings, which typically have fixed coupons and greater duration risk.</p>
<p>Overall, BIZD serves as an effective tool for investors looking to participate in the income opportunities associated with private credit without the barriers to entry of traditional direct private credit investments.</p>
<h2>Investing in the Firms Powering Private Markets</h2>
<p>Another way to tap into the growth of private markets is by investing in the companies that operate and manage the funds behind it. These are alternative asset managers, firms that oversee capital across private credit, private equity, real estate, infrastructure, and venture capital. As the organizations sourcing deals, structuring loans, and allocating private capital, they are positioned to benefit directly from the increasing demand for private market solutions.</p>

<p>While alternative asset managers have been around for a while, the role these firms play in the market is evolving. As demand for private credit and other private market strategies grows, these companies are expanding their business models. Many are reaching beyond institutional capital and into wealth management and retirement channels, broadening their investor base and solidifying their importance in today&rsquo;s investment landscape. With access to long-term capital and resilient fee structures, they are well positioned to benefit from the continued shift toward private markets.</p>
<p>To help investors access this opportunity, VanEck introduced the <strong><a href="/link/018811e6db344b7691fd273a97737194.aspx" title="GPZ - VanEck Alternative Asset Manager ETF - Holdings and Performance">Alternative Asset Manager ETF (GPZ)</a></strong>, designed to offer access to the public equities of leading private asset managers like Blackstone, KKR and others. Through these firms, GPZ captures a broad spectrum of alternative asset management businesses, providing exposure to the growth taking place across the various private market categories.</p>
<h3>Asset Exposure of Underlying Management Firm AUM | As of June 30, 2025</h3>
<p><img loading="lazy" class="img-responsive w-100" alt="Asset Exposure of Underlying Management Firm AUM - As of June 30, 2025" src="https://www.vaneck.com/contentassets/c4b551803207401b9c8469f3412b71e4/charts-gpz-bizd-exposures-blog-july-2025_blog-pie.svg" /></p>
<p class="chart-disclosure">Source: Individual company filings and reports. Alternative management firm asset exposure is based on an aggregate weighted average calculation of constituents in the MarketVector Alternative Asset Managers Index.</p>

<p>With GPZ, investors can efficiently invest in the equity of firms driving growth across the private market ecosystem, gaining diversified exposure in a single, convenient ETF.</p>
<h2>Exposure Made Practical</h2>
<p>The appeal of private market investments has traditionally come with significant hurdles and complexity. BIZD and GPZ address these challenges, offering investors straightforward access to two distinct yet complementary areas of the alternative investment universe: middle market private credit and the asset managers leading the industry.</p>
<p>In an era where private markets are increasingly becoming part of investor portfolios, VanEck&rsquo;s BIZD and GPZ ETFs present investors with access to the opportunity and benefits of these markets without the traditional hassles.</p>
<p>To receive more <a href="https://www.vaneck.com/us/en/insights/thematic-investing/" title="Thematic Investing Insights"><strong>Thematic Investing</strong></a> insights, <a href="https://www.vaneck.com/us/en/subscribe/" title="Subscription Center"><strong>sign up in our subscription center</strong></a>.</p>
]]></content:encoded>
</item><item rdf:about="https://www.vaneck.com/us/en/blogs/investment-outlook/vaneck-turns-70-staying-ahead-in-a-world-that-never-stands-still/">
  <title>VanEck Turns 70: Staying Ahead in a World That Never Stands Still></title>
  <link>https://www.vaneck.com/us/en/blogs/investment-outlook/vaneck-turns-70-staying-ahead-in-a-world-that-never-stands-still/</link>
  <description><![CDATA[VanEck celebrates its 70th anniversary, honoring its rich history while continuing to lead with purpose, culture and forward-thinking investment ideas.]]></description>
  <dc:creator> </dc:creator>
  <dc:date>08/01/2025 06:30:00</dc:date>
<content:encoded><![CDATA[

<h2>Conviction Over Convention: The Founding DNA of VanEck</h2>
<p>In the fall of 2007, <a href="/link/b4a5d9b143604891a05a0afa1b81f120.aspx#kris-capuano" title="Kristen Capuano, Chief Marketing Officer, co-Chief Operating Officer (Active)"><strong>Kristen Capuano</strong></a> walked into VanEck&rsquo;s office in Midtown Manhattan for a four-hour interview that would ultimately shape the course of her life. The marketing team at the time was a lean group of five or six people, all laser-focused on something called &ldquo;ETFs&rdquo;&mdash;a concept still foreign to most. Kristen didn&rsquo;t know much about ETFs at the time, but she knew enough about mutual funds, marketing and basic economics to take a chance. Two weeks later, she joined the firm.</p>
<p><strong>VanEck's Past, Present and the Next 70 Years </strong></p>
<p>Step into the story of VanEck with CEO Jan van Eck as he shares how his father founded the firm in 1955, the bold steps into gold investing, and how that same spirit drives the firm today.</p>
<p>That spirit of stepping into the unknown, and choosing conviction over convention, wasn&rsquo;t unusual at VanEck. In fact, it echoed a philosophy that stretches back to the firm&rsquo;s founding in 1955. Born from <a href="/link/b4a5d9b143604891a05a0afa1b81f120.aspx#john-van-eck" title="John C. van Eck, Founder"><strong>John C. van Eck</strong></a>&rsquo;s vision to give U.S. investors access to international markets in the aftermath of WWII, the firm&rsquo;s early moves were bold. Launching the first U.S. mutual fund focused on gold equities in the 1960s was nearly unthinkable, but it was prescient. Gold would soar in the subsequent decade, and so, too, would VanEck&rsquo;s reputation for foresight.</p>
<p>As we as a firm mark our 70th anniversary, we do so with a clear-eyed view of the future: one where innovation, integrity and independence remain the cornerstones of how we do business.</p>
<h2>Innovation with Intention: Investing in What Matters</h2>
<p>VanEck&rsquo;s enduring investment philosophy is to identify transformative themes before they go mainstream and give investors access to opportunities that can reshape markets and portfolios.</p>
<p>This mindset came into sharp focus in 1968. Most saw gold as a stable commodity, while VanEck saw signs of inflation, upheaval and a coming inflection point. At a time when gold was pegged to the dollar at $35/oz, VanEck launched the <a href="/us/en/blogs/gold-investing/raising-the-bar-on-gold-investing/" title="VanEck Gold Investments - Gold ETFs, Funds &amp; Trusts"><strong>first U.S. fund dedicated to gold equities</strong></a>. A few years later, the U.S. abandoned the gold standard, sending gold up to over $800/oz in the 1970s. Today, gold is over $3,000/oz. This move exemplified the firm&rsquo;s focus on identifying impactful trends early and acting with conviction to give investors meaningful access to compelling opportunities. &ldquo;My father believed that investors deserved more than what the mainstream was offering,&rdquo; says <strong><a href="/link/3bf292f28484410caabd0c2b9ad69e12.aspx" title="Jan van Eck, Chief Executive Officer">Jan van Eck</a></strong>, who joined the firm in 1991 and became CEO in 2010. &ldquo;He built this firm on the idea that the world is constantly changing, and that by understanding those shifts early, you could create real opportunity for clients. That belief still guides us today.&rdquo;</p>
<p style="font-size: 1.16em;">&ldquo; built this firm on the idea that the world is constantly changing, and that by understanding those shifts early, you could create real opportunity for clients. That belief still guides us today.&rdquo; &ndash; <strong>CEO <a href="/link/3bf292f28484410caabd0c2b9ad69e12.aspx" title="Jan van Eck, Chief Executive Officer">Jan van Eck</a> on Founder John van Eck</strong></p>
<p>That long-term lens has carried the firm through decades of monetary shifts, inflation cycles, geopolitical disruption, and, most recently, a digital revolution in finance. In 2017, VanEck became the first established ETF issuer to file for a bitcoin-linked ETF, once again showing that VanEck moves early and with purpose.</p>
<p>To paraphrase Wayne Gretzky, the firm goes to where the puck is going and not where it is, noted <a href="/link/db5971bd4f1b4eaab24e30c743613c84.aspx" title="Eric Fine, Portfolio Manager, Active Emerging Markets Debt"><strong>Eric Fine</strong></a>, Portfolio Manager. &ldquo;That is impossible to teach, but whether it&rsquo;s gold in the 70s, ETFs in the 90s, crypto today, bonds&mdash;that is very much a trait that exists at VanEck,&rdquo; says Eric.</p>
<p><a href="/link/ea4377f66b48462aad6f1a8f2ea4aca2.aspx" title="Shawn Reynolds, Portfolio Manager, Global Resources"><strong>Shawn Reynolds</strong></a>, Portfolio Manager, likes to describe the firm&rsquo;s posture as &ldquo;conservatively innovative&rdquo;: a willingness to explore the cutting edge, paired with the discipline to ensure it delivers long-term value. &ldquo;I think that culture permeates this institution and is fairly unique,&rdquo; adds Shawn.</p>

<h2>Built by People, Sustained by Culture</h2>
<p>&ldquo;There&rsquo;s no way this company would be here without the contributions of the team and the individuals,&rdquo; says Jan. &ldquo;It really takes a team.&rdquo;</p>
<p>Kristen, now co-COO and CMO, reflects on the firm&rsquo;s journey with the warmth of someone who grew up there. &ldquo;My adult life was shaped at VanEck,&rdquo; she says. &ldquo;I met my husband here. I learned to be patient and to listen. I learned that you get more out of people not just when there&rsquo;s a shared mission, but when people care about each other, too.&rdquo;</p>
<p>That sentiment isn&rsquo;t hers alone. <a href="/link/8a941682150144598010e2784c931836.aspx#adamphillips" title="Adam Phillips"><strong>Adam Phillips</strong></a>, who has been with the firm for nearly two decades and is currently COO of the ETF business, recalls the 90-minute lunch with the firm&rsquo;s founder on his first day with VanEck. &ldquo;He was fully engaged, asked all about me and my family. We talked about history in the markets and where VanEck could go,&rdquo; Adam says. &ldquo;I still think about that today. I might have been one of the last people to experience that.&rdquo;</p>
<p>For <a href="/link/8a941682150144598010e2784c931836.aspx#gregorykrenzer,-cfa" title="Gregory Krenzer, CFA"><strong>Greg Krenzer</strong></a>, who joined in 1994, when VanEck had fewer than 50 employees, that atmosphere was just as vivid. As Jan and his brother, Derek, were stepping into leadership roles, their father remained a visible, and formative, presence. Greg recalls Mr. van Eck being in the office every day, literally plotting gold prices by hand on graph paper. &ldquo;A very collegial atmosphere has always been a trait here at VanEck, and Mr. van Eck was instrumental in that influence,&rdquo; he adds.</p>
<p>&ldquo;I joined VanEck in 2008 as employee number 99,&rdquo; recalls Laura Martinez, now VP, Associate General Counsel. In her first interview, instead of discussing legal precedent, she and the firm&rsquo;s former General Counsel talked about movies and hobbies. &ldquo;It was the most un-law-like interview ever&mdash;and it set the tone. VanEck has always felt more like family than firm.&rdquo;</p>
<p>Kristen remembers impromptu wine tastings that led to finding and washing 80 glasses before an advisor meeting, a last-minute photo shoot in Central Park for Barron&rsquo;s and a surreal trip to the Great Wall of China as part of a new business initiative. And now? &ldquo;We host global sales and marketing meetings with nearly 200 people,&rdquo; she says. &ldquo;But that same spirit&mdash;that sense of family&mdash;remains.&rdquo;</p>
<p>Culture, after all, is core. &ldquo;People really care, and you can see it and feel it every day,&rdquo; says Adam. &ldquo;If you walk around the halls, you&rsquo;ll hear &lsquo;we&rsquo; way more than you hear &lsquo;I.&rsquo; That makes a difference.&rdquo;</p>
<p>Patty Ye joined VanEck in 1989 and played a pivotal role in its Asia expansion. She started as a Corporate Accountant and ultimately went on to open the firm&rsquo;s Shanghai office in 2011, an experience that deepened her sense of VanEck as her &ldquo;professional home&rdquo;.</p>
<p>&ldquo;What sets this firm apart, in my view, is its unwavering commitment to innovation&mdash;always looking ahead, seeking opportunities for our clients, and embracing bold steps into new territory,&rdquo; Patty says. &ldquo;One of the unique privileges and honor of my time at VanEck has been working for two generations of the van Eck family, experiencing firsthand the continuity of vision and values that make this firm so special.&rdquo;</p>
<p>For Arian Neiron, CEO &amp; Managing Director of VanEck Asia Pacific, that culture is anchored in independence. &ldquo;Remaining family-owned and independent gives us the unique advantage of agility and authenticity,&rdquo; he says. &ldquo;We&rsquo;re not bound by short-termism. We can think generationally. And that is exactly how we plan to operate: with the courage to lead, the humility to listen and the clarity to invest in what truly matters.&rdquo;</p>
<p style="font-size: 1.16em;">"We can think generationally. And that is exactly how we plan to operate: with the courage to lead, the humility to listen and the clarity to invest in what truly matters.&rdquo; &ndash;&nbsp;<strong>VanEck Asia Pacific CEO Arian Neiron</strong></p>
<p>That culture isn&rsquo;t just inherited. It&rsquo;s chosen. For <a href="/link/8a941682150144598010e2784c931836.aspx#angusshillington" title="Angus Shillington"><strong>Angus Shillington</strong></a>, who joined as Deputy Portfolio Manager after the global financial crisis, VanEck was a deliberate pivot away from investment banking. &ldquo;I wanted something smaller, more collegial, with more room to think, collaborate and build,&rdquo; he says. &ldquo;And I found that here.&rdquo;</p>
<p>His choice has paid off, not just professionally, but also philosophically. &ldquo;Jan&rsquo;s grit and determination&mdash;not only to move the firm forward, but to do it in a way that stayed true to principle&mdash;speaks volumes about VanEck&rsquo;s DNA. The firm has navigated many market crises, and it&rsquo;s never been about just surviving for survival&rsquo;s sake. It&rsquo;s always conviction-led and kinetic, and as the market changes and evolves, we get stronger,&rdquo; he says.</p>
<h2>Leading with Purpose: The Next Era</h2>
<p>Under Jan&rsquo;s leadership since 2010, the firm has evolved into a global asset manager, offering ETFs, mutual funds, institutional strategies, model portfolios, UCITS funds, and more. The firm manages $132.9 billion as of June 30, 2025. Beneath this growth, the firm&rsquo;s mission hasn&rsquo;t changed: to deliver forward-thinking investment ideas that help investors navigate change by staying one step ahead of it.</p>
<p>&ldquo;I think the spirit of the firm was always to try different investment ideas&mdash;try to identify trends, not chase fads,&rdquo; says Jan. That guiding philosophy has shaped the growth and evolution of the firm, and that willingness to lead with a clear purpose continues to this day. &ldquo;The world changes. Technology changes. And there will be changes in the financial services industry. VanEck has to pivot when necessary, but always with curiosity and discipline,&rdquo; adds Jan.</p>
<p>"Celebrating our 70th anniversary is not just about honoring our history and longevity, but also about the people who have carried our philosophy forward and continue to do so today,&rdquo; says Jan. &ldquo;From our early days of hand drawing gold charts to the rise of digital assets, our team has always brought thoughtfulness and a willingness to adapt. That&rsquo;s what will carry us into the future.&rdquo;</p>
]]></content:encoded>
</item><item rdf:about="https://www.vaneck.com/us/en/blogs/thematic-investing/buzz-investing-market-gains-broaden/">
  <title>BUZZ Investing: &quot;Meme Stocks&quot; Lead Market Gains></title>
  <link>https://www.vaneck.com/us/en/blogs/thematic-investing/buzz-investing-market-gains-broaden/</link>
  <description><![CDATA[Equity markets advanced amid strong AI enthusiasm, resilient macro data, stable commodities, and growing Fed rate cut expectations.]]></description>
  <dc:creator> </dc:creator>
  <dc:date>07/31/2025 06:30:00</dc:date>
<content:encoded><![CDATA[

<p><strong>Key Takeaways</strong></p>
<ul class="content-list">
<li class="mt-2">Strong performance of the BUZZ index shows a market that is heavily driven by sentiment and attention with a renewed focus on "meme stocks".</li>
<li class="mt-2">Top contributors are Coinbase, Rocket Lab and SoFi, reflecting investor enthusiast for digitally native and social media favored companies.</li>
<li class="mt-2">Optimism around generative AI and signals from the Federal Reserve about potential rate cuts have fueled continued market gains and risk-on sentiment. However, the rally is showing signs of fatigue as market leadership narrows.</li>
</ul>
<p class="chart-disclosure">Past performance is no guarantee of future results. Index performance is not illustrative of fund performance. Not intended as a recommendation to buy or to sell any of the securities mentioned herein.</p>
<p>Equity markets advanced during the recent period between index selection dates (June 12, 2025 &ndash; July 10, 2025, the &ldquo;Period&rdquo;), extending gains from earlier in the quarter and pushing major U.S. indices further into record territory. The BUZZ NextGen AI US Sentiment Leaders Index ("BUZZ Index") returned 11.5% during the Period, compared to a gain of 4.0% for the S&amp;P 500. Year to date, the BUZZ Index has returned 25.4%, outperforming/underperforming the S&amp;P 500&rsquo;s 7.5% gain. Enthusiasm around generative AI remained a dominant force, with large-cap technology continuing to lead, though signs of rally fatigue emerged as breadth narrowed. Economic data released during the Period offered a mixed picture: while the labor market showed further signs of softening, including a modest rise in unemployment claims and slower payroll growth, consumer spending remained firm and forward inflation indicators were largely stable. The Federal Reserve kept rates on hold at its June meeting and signaled a cautious but growing willingness to consider cuts later in the year, though internal divisions remain over the pace and trigger points for policy easing.</p>
<p>Geopolitical developments continued to influence market sentiment. The U.S. maintained a heightened military presence in the Middle East following June&rsquo;s targeted strikes in Iran, though tensions appeared to stabilize as diplomatic channels reopened. In commodities, both crude oil and gold were little changed during the Period. For crude, easing geopolitical tensions offset prior supply concerns, while steady inventory data reinforced a more balanced outlook. Gold traded in a narrow range, as stable real yields and waning immediate macro risks tempered investor demand for traditional hedges. In terms of fixed income, Treasury yields edged lower, particularly at the front end, as markets priced in higher odds of a rate cut before year-end. Credit conditions remained supportive, with spreads holding firm and issuance levels consistent with seasonal norms.</p>
<p>Overall, the Period was characterized by persistent equity strength, resilient macro data, and a market increasingly focused on signals from the Fed and developments across key geopolitical flashpoints. The BUZZ Index returned 12.68% during the month of June compared to a return of 5.09% for the S&amp;P 500 Index during the same period. Year-to-date, the BUZZ Index leads the S&amp;P 500 with returns of 22.08% and 6.20%, respectively, as of the end of June.</p>
<h2>Shares of crypto, space, and fintech leaders pace BUZZ Index Gains</h2>
<p>Shares of Coinbase Global (NASDAQ: COIN) surged 61.4% during the Period, leading gains within the BUZZ Index. The move followed renewed optimism across the digital asset space, driven by a combination of rising crypto prices, increased ETF inflows, and growing retail engagement. Regulatory sentiment also appeared to improve modestly after a key SEC enforcement case was delayed, a development some investors viewed as a potential tailwind for the broader ecosystem. Rocket Lab USA (NASDAQ: RKLB) gained 48.1%, supported by a return to launch activity and bullish sentiment around the company&rsquo;s competitive positioning in the small-launch segment. Rocket Lab successfully completed its seventh mission of the year, a milestone that may have reinforced confidence in its ability to scale operations and secure government and commercial contracts. SoFi Technologies (NASDAQ: SOFI) rose 40.7% as investors responded positively to continued growth in its lending and financial services business. While some of the move may reflect short covering, improved guidance and higher visibility into profitability targets appeared to support the rally, positioning SOFI as a standout within the fintech space during the Period.</p>

<h3 id="top-contributors" class="jump-link-nav anchored-block" data-jumplink-title="Top Contributors">Top BUZZ Index Contributors: June 12, 2025 &ndash; July 10, 2025</h3>
<div class="wrapped-div">
<table width="100%">
<tbody>
<tr class="tbl-data">
<td class="tbl-header last text-left">Company</td>
<td class="tbl-header last text-left">Ticker</td>
<td class="tbl-header last text-right">Average Weight (%)</td>
<td class="tbl-header last text-right">Return Contribution (%)</td>
</tr>
<tr class="tbl-data">
<td class="data-td data last text-left">Coinbase Global Inc</td>
<td class="data-td data last text-left">COIN</td>
<td class="data-td data last text-right">3.58</td>
<td class="data-td data last text-right">1.67</td>
</tr>
<tr class="tbl-data">
<td class="data-td data last text-left">Rocket Lab Corp</td>
<td class="data-td data last text-left">RKLB</td>
<td class="data-td data last text-right">3.10</td>
<td class="data-td data last text-right">1.32</td>
</tr>
<tr class="tbl-data">
<td class="data-td data last text-left">SoFi Technologies Inc</td>
<td class="data-td data last text-left">SOFI</td>
<td class="data-td data last text-right">3.22</td>
<td class="data-td data last text-right">1.20</td>
</tr>
<tr class="tbl-data">
<td class="data-td data last text-left">Robinhood Markets Inc</td>
<td class="data-td data last text-left">HOOD</td>
<td class="data-td data last text-right">3.44</td>
<td class="data-td data last text-right">1.05</td>
</tr>
<tr class="tbl-data">
<td class="data-td data last text-left">AST SpaceMobile Inc</td>
<td class="data-td data last text-left">ASTS</td>
<td class="data-td data last text-right">3.76</td>
<td class="data-td data last text-right">0.84</td>
</tr>
<tr class="tbl-data">
<td class="data-td data last text-left">Advanced Micro Devices Inc</td>
<td class="data-td data last text-left">AMD</td>
<td class="data-td data last text-right">3.25</td>
<td class="data-td data last text-right">0.67</td>
</tr>
<tr class="tbl-data">
<td class="data-td data last text-left">Unity Software Inc</td>
<td class="data-td data last text-left">U</td>
<td class="data-td data last text-right">2.65</td>
<td class="data-td data last text-right">0.51</td>
</tr>
<tr class="tbl-data">
<td class="data-td data last text-left">Super Micro Computer Inc</td>
<td class="data-td data last text-left">SMCI</td>
<td class="data-td data last text-right">3.19</td>
<td class="data-td data last text-right">0.49</td>
</tr>
<tr class="tbl-data">
<td class="data-td data last text-left">Uber Technologies Inc</td>
<td class="data-td data last text-left">UBER</td>
<td class="data-td data last text-right">2.53</td>
<td class="data-td data last text-right">0.41</td>
</tr>
<tr class="tbl-data">
<td class="data-td data last text-left">NVIDIA Corp</td>
<td class="data-td data last text-left">NVDA</td>
<td class="data-td data last text-right">3.07</td>
<td class="data-td data last text-right">0.39</td>
</tr>
</tbody>
</table>
</div>
<p class="chart-disclosure">Source: BUZZ Holdings ULC, Bloomberg. Past performance is no guarantee of future results. Index performance is not illustrative of fund performance. Not intended as a recommendation to buy or to sell any of the securities mentioned herein.</p>

<h2>Shares of HIMS and UNH among declining stocks in the BUZZ Index</h2>
<p>Shares of Hims &amp; Hers Health (NASDAQ: HIMS) declined approximately 12% during the Period, primarily driven by the sudden termination of its partnership with Novo Nordisk. Novo alleged that Hims was improperly marketing and distributing compounded versions of Wegovy, which Hims denies. The development triggered a sharp selloff in late June and was followed by investor lawsuits alleging misleading disclosures. While some investors view the decline as overdone given the company&rsquo;s broader telehealth momentum, concerns around regulatory scrutiny and brand reputation placed meaningful pressure on the stock. UnitedHealth Group (NYSE: UNH) fell 6.0% during the Period, as continued headwinds in its Medicare Advantage business weighed on investor sentiment. Elevated medical costs, management turnover, and an ongoing Department of Justice investigation into billing practices have challenged near-term visibility. While the company&rsquo;s diversified platform may support a longer-term recovery, recent performance reflects growing concern about margin compression and the potential for further downside revisions.</p>
<h3 id="bottom-contributors" class="jump-link-nav anchored-block" data-jumplink-title="Bottom Contributors">Bottom BUZZ Index Contributors: June 12, 2025 &ndash; July 10, 2025</h3>
<div class="wrapped-div">
<table width="100%">
<tbody>
<tr class="tbl-data">
<td class="tbl-header last text-left">Company</td>
<td class="tbl-header last text-left">Ticker</td>
<td class="tbl-header last text-right">Average Weight (%)</td>
<td class="tbl-header last text-right">Return Contribution (%)</td>
</tr>
<tr class="tbl-data">
<td class="data-td data last text-left">Hims &amp; Hers Health Inc</td>
<td class="data-td data last text-left">HIMS</td>
<td class="data-td data last text-right">2.58</td>
<td class="data-td data last text-right">-0.39</td>
</tr>
<tr class="tbl-data">
<td class="data-td data last text-left">UnitedHealth Group Inc</td>
<td class="data-td data last text-left">UNH</td>
<td class="data-td data last text-right">2.58</td>
<td class="data-td data last text-right">-0.14</td>
</tr>
<tr class="tbl-data">
<td class="data-td data last text-left">AppLovin Corp</td>
<td class="data-td data last text-left">APP</td>
<td class="data-td data last text-right">0.62</td>
<td class="data-td data last text-right">-0.09</td>
</tr>
<tr class="tbl-data">
<td class="data-td data last text-left">Tesla Inc</td>
<td class="data-td data last text-left">TSLA</td>
<td class="data-td data last text-right">2.86</td>
<td class="data-td data last text-right">-0.08</td>
</tr>
<tr class="tbl-data">
<td class="data-td data last text-left">Rivian Automotive Inc</td>
<td class="data-td data last text-left">RIVN</td>
<td class="data-td data last text-right">1.03</td>
<td class="data-td data last text-right">-0.05</td>
</tr>
<tr class="tbl-data">
<td class="data-td data last text-left">ServiceNow Inc</td>
<td class="data-td data last text-left">NOW</td>
<td class="data-td data last text-right">0.35</td>
<td class="data-td data last text-right">-0.04</td>
</tr>
<tr class="tbl-data">
<td class="data-td data last text-left">TG Therapeutics Inc</td>
<td class="data-td data last text-left">TGTX</td>
<td class="data-td data last text-right">0.53</td>
<td class="data-td data last text-right">-0.03</td>
</tr>
<tr class="tbl-data">
<td class="data-td data last text-left">Enphase Energy Inc</td>
<td class="data-td data last text-left">ENPH</td>
<td class="data-td data last text-right">0.28</td>
<td class="data-td data last text-right">-0.03</td>
</tr>
<tr class="tbl-data">
<td class="data-td data last text-left">Eli Lilly &amp; Co</td>
<td class="data-td data last text-left">LLY</td>
<td class="data-td data last text-right">0.54</td>
<td class="data-td data last text-right">-0.03</td>
</tr>
<tr class="tbl-data">
<td class="data-td data last text-left">Target Corp</td>
<td class="data-td data last text-left">TGT</td>
<td class="data-td data last text-right">0.14</td>
<td class="data-td data last text-right">-0.03</td>
</tr>
</tbody>
</table>
</div>
<p class="chart-disclosure">Source: BUZZ Holdings ULC, Bloomberg. Past performance is no guarantee of future results. Index performance is not illustrative of fund performance. Not intended as a recommendation to buy or to sell any of the securities mentioned herein.</p>
<h2>BUZZ Index July 2025 Rebalance Highlights</h2>
<p><strong>eVTOL Sector</strong></p>
<p>The eVTOL sector has gained renewed momentum this year, drawing investor interest back to several names that went public through SPAC mergers during the 2021 wave. Joby Aviation (NYSE: JOBY) and Archer Aviation (NYSE: ACHR), two of the more prominent entrants from that period, saw their shares decline sharply in 2022 alongside broader market weakness. Both stocks bottomed in December 2022, with JOBY trading at $3.35 and Archer at $1.80. Since then, performance has been strong. Joby closed the Period at $12.33, while Archer finished at $10.78. Operational milestones may have supported the rally. Both companies have secured partnerships with major airports, conducted successful test flights, and are moving closer to the commercial rollout of air taxi services. While the long-term adoption of eVTOL remains uncertain, investor sentiment has clearly improved. Joby returns to the BUZZ Index this month at a weight of 0.48%, while Archer makes its first appearance, entering with a weight of 1.77%.</p>
<p><strong>AI-Related Stocks</strong></p>
<p>AI has undeniably transformed the global tech landscape, building on decades of hardware and software innovation to enable a new wave of intelligent applications. As adoption accelerates, a growing number of new companies are being formed to support the expanding infrastructure needs, ranging from energy and storage to data transmission. One example is Nebius Group (NASDAQ: NBIS), which aims to provide a comprehensive AI pipeline to a broad range of users. Although the company originally IPO&rsquo;d in 2011, trading in its shares was suspended in 2022 due to its relationships with Russian entities following the invasion of Ukraine. Its AI business was subsequently spun out, and the stock resumed trading in October 2024. At the same time, AI is being integrated into specialized use cases across a wide range of industries. One notable example is healthcare, where AI helps reduce human error in diagnostics and data analysis. Tempus AI (NASDAQ: TEM) has become a recognized name in this space. Following its IPO in May 2024, the stock quickly gained traction among online investors. Over the past two years, it has traded in a volatile range between $30 and $90, though sentiment has continued to strengthen in recent months. This month, both NBIS and TEM make their first appearances in the BUZZ Index, with weights of 1.73% and 0.41%, respectively.</p>

<p>To receive more <a href="https://www.vaneck.com/us/en/insights/thematic-investing/" title="Thematic Investing Insights"><strong>Thematic Investing</strong></a> insights, <a href="https://www.vaneck.com/us/en/subscribe/" title="Subscription Center"><strong>sign up in our subscription center</strong></a>.</p>
]]></content:encoded>
</item><item rdf:about="https://www.vaneck.com/us/en/blogs/emerging-markets-equity/inside-chinas-pivot-smarter-growth-sharper-investing/">
  <title>Inside China’s Pivot: Smarter Growth, Sharper Investing></title>
  <link>https://www.vaneck.com/us/en/blogs/emerging-markets-equity/inside-chinas-pivot-smarter-growth-sharper-investing/</link>
  <description><![CDATA[Portfolio Manager Ola El Shawarby shares firsthand insights from her multi-city China trip, exploring innovation, shifting consumer trends, and the forces reshaping China&rsquo;s economy.]]></description>
  <dc:creator>Ola  El-Shawarby, CFA</dc:creator>
  <dc:date>07/31/2025 06:30:00</dc:date>
<content:encoded><![CDATA[

<ul class="content-list">
<li class="mt-2">Economic activity has likely bottomed out, but the recovery remains uneven, with a clear shift in consumer demand toward new consumption trends focused on experiences, emotions, and value, rather than big-ticket spending.</li>
<li class="mt-2">Policy is shifting to a strategic approach, with targeted support for innovation and quality growth over broad stimulus.</li>
<li class="mt-2">AI and technology are scaling rapidly, driven by government prioritization and significant capital investment.</li>
<li class="mt-2">Competition is intense, especially in EVs and e-commerce, but policy is starting to push back on margin-eroding price wars.</li>
<li class="mt-2">As sentiment improves, selectivity is key, focused on companies with pricing power, capital discipline, and alignment with policy and structural growth trends.</li>
</ul>
<h2>Boots on the Ground in China: Firsthand Insights from a Transforming Economy</h2>
<p>Investor sentiment toward China has been cautious in recent years, shaped by regulatory overhang and global tensions. But after two weeks on the ground across five cities&mdash;meeting company leaders, walking factory floors, and observing evolving consumer behavior &mdash; we came away with a more nuanced, forward-looking view. While macro recovery remains slow and uneven, innovation is moving fast, and selective policy support is clearly guiding capital, talent, and attention into strategic growth areas.</p>
<p>For investors, this means opportunity&mdash;but not necessarily broad exposure. It&rsquo;s about being focused and aligned with the direction of change.</p>
<h2>Economic Landscape: Stabilization with Strategic Focus</h2>
<p>China&rsquo;s recovery is advancing, though still gradual and uneven. Activity has likely bottomed out. Green shoots are emerging across sectors, but challenges remain&mdash;from deflationary pressures to lingering overcapacity in sectors like property, EVs, manufacturing, and more recently in some e-commerce segments.</p>
<p>The government remains committed to a ~5% GDP growth target in 2025, favoring a measured approach.<sup>1</sup>&nbsp;Premier Li Qiang continues to stress &ldquo;high-quality development,&rdquo; with policy support aimed at boosting domestic demand and accelerating innovation in areas such as AI, automation, and clean energy&mdash;rather than deploying blunt, broad-based stimulus.<sup>2</sup></p>
<p>Ongoing trade tensions with the U.S. have added pressure on China&rsquo;s export sector, but Beijing has responded with measured pragmatism. The central bank stands ready to inject liquidity and adjust rates if needed.<sup>3</sup>&nbsp;Notably, policymakers have begun publicly addressing the issue of &ldquo;involution&rdquo;&mdash;China&rsquo;s race-to-the-bottom price wars, especially pronounced in EVs and e-commerce. The emerging push toward more rational growth, profitability, and quality-focused business models marks a positive shift for long-term investors.</p>
<p>That said, the path ahead may be more complex than in past reform cycles. Unlike the 2015&ndash;2016 supply-side reforms&mdash;where overcapacity was concentrated in SOEs and commodity-linked sectors&mdash;today&rsquo;s challenges cut across a broader range of industries, particularly in the private sector. With demand still tepid, the adjustment will likely be gradual. Nonetheless, the policy direction is clear&mdash;and welcome: steering the economy toward healthier, more sustainable growth.</p>
<p>Taken together, these signals point to a steady, pragmatic macro approach&mdash;one that balances near-term support with long-term strategic alignment. For investors, this underscores the need for focus: identifying companies with pricing power, capital discipline, and alignment with the sectors where policy, innovation, and demand intersect.</p>
<h2>On the Ground Observations by Themes</h2>
<p id="technology-ai" class="jump-link-nav anchored-block" data-jumplink-title="Technology &amp; AI"><strong>1. Technology and Artificial Intelligence</strong></p>
<p><strong><i>China&rsquo;s AI Push: Progress with Pragmatic Challenges</i></strong></p>
<p>China&rsquo;s ambition to become a global AI leader is more than aspirational&mdash;it&rsquo;s backed by substantial capital and national commitment. In 2025 alone, the government allocated over $50 billion to AI development, signaling its strategic priority within China&rsquo;s broader economic transition.<sup>4</sup></p>
<p>Technology giants like Alibaba<sup>*</sup>&nbsp;and Tencent<sup>*</sup>&nbsp;are playing central roles. Alibaba is rapidly expanding its cloud and compute infrastructure for external use, while Tencent is embedding AI into internal workflows&mdash;with early gains seen in areas like targeted advertising and digital operations.4 Both firms have pivoted toward supporting national tech priorities, and in doing so, appear to have regained policy favor.</p>
<p>These moves are helping build out China&rsquo;s domestic AI ecosystem, but key constraints remain&mdash;chief among them, access to advanced chips. U.S. firms like Nvidia continue to dominate the high-end GPU market, creating a structural bottleneck for model training and scalability. In response, local players such as Huawei and others are accelerating R&amp;D. The partial easing of U.S. export controls, allowing Nvidia to resume shipments of chips like the H20 and RTX Pro, signals not only geopolitical pragmatism but also the depth of China&rsquo;s demand&mdash;even for second-tier hardware.</p>
<p>On the infrastructure side, China enjoys a cost and capacity advantage. Abundant electricity and excess industrial space make it relatively easier to scale data centers. Buildout is progressing rapidly&mdash;but near-term challenges persist: overcapacity in lower-tier regions, high capital intensity, and delayed monetization. That said, we expect utilization rates to improve by 2026, especially across Tier-1 city clusters where AI adoption is accelerating and policy support is concentrated.</p>
<p>A notable catalyst has been the so-called "Deepseek moment"&mdash;a breakthrough that reframed the importance of AI inferencing over brute-force training. This has sparked a shift toward practical, scalable applications of AI, with greater emphasis on edge deployment and commercial use cases rather than just foundational model horsepower.</p>
<p>In sum, China&rsquo;s AI ambitions are moving quickly and deliberately, even as they navigate external constraints. For investors, this is not a story of broad thematic exposure&mdash;it&rsquo;s about precision. The opportunity lies in identifying companies that combine technological depth, policy alignment, and capital discipline&mdash;those positioned to lead as China builds its own distinct AI architecture for the decade ahead.</p>
<p id="robotics" class="jump-link-nav anchored-block" data-jumplink-title="Robotics"><strong>2. Advanced Manufacturing and Robotics</strong></p>
<p>China&rsquo;s automation and systems integration capabilities are rapidly setting a global benchmark. Across EVs and electronics supply chains, &ldquo;lights-out&rdquo; factories&mdash;run by engineers rather than laborers&mdash;are becoming the norm, signaling a decisive shift toward high-efficiency, high-tech production.</p>
<p>Companies like Shenzhen Inovance<sup>*</sup>&nbsp;are well-positioned to benefit from the accelerating adoption of factory automation. At the same time, the humanoid robotics supply chain is expanding, with more Chinese firms&mdash;including component makers and integrators&mdash;being tapped to support initiatives like Tesla&rsquo;s Optimus robot.</p>
<p>The integration of robotics into real-world manufacturing is no longer conceptual. Partnerships like UBTech and BYD<sup>*</sup>&nbsp;deploying humanoid robots on production lines to automate repetitive tasks, reduce labor costs, and improve operational precision. The technological progress is striking&mdash;but ultimately, capital discipline and execution will determine which companies emerge as long-term winners in this fast-evolving space.</p>
<p><img loading="lazy" class="img-responsive w-100" alt="An automated EV components factory floor" src="https://www.vaneck.com/contentassets/683e6e2fe0e343a7ad1760aa97cf6db2/5967_china-eme_image-1_2025-7_v1.jpg" /></p>
<p class="chart-disclosure">An automated EV components factory floor and Ola at a robotic exhibition.</p>
<p id="electric-vehicles" class="jump-link-nav anchored-block" data-jumplink-title="Electric Vehicles"><strong>3. Electric Vehicles (EVs) and Autonomous Driving</strong></p>
<p>China continues to make strong headway in Advanced Driver Assistance Systems (ADAS), with adoption rising quickly&mdash;especially in Level 2+ systems that offer partial automation with human oversight. While Nvidia chips still power much of the underlying compute, domestic players like Huawei and Horizon Robotics are gaining momentum, driven by national priorities and increasing OEM demand.</p>
<p>A test ride in a Pony.ai robotaxi in Shenzhen demonstrated Level 4 autonomy already functioning in real-world conditions&mdash;clear evidence that the technology is advancing rapidly. However, widespread L4 rollout in passenger vehicles will take time, as challenges remain around cost, safety validation, and user experience. Crucially, the regulatory framework for fully autonomous driving is still under development, and will be key to enabling scaled commercial deployment.</p>
<p>The pace of innovation is encouraging, but a mature ecosystem&mdash;combining regulation, infrastructure, and consumer readiness&mdash;will be essential for the next stage of autonomy to take hold.</p>
<p><img loading="lazy" class="img-responsive w-100" alt="BYD&rsquo;s latest EV lineup on-site" src="https://www.vaneck.com/contentassets/d525133ba18142529b4344dd09b93728/5967_china-eme_image-3_2025-7_v1.jpg" /></p>
<p class="chart-disclosure">BYD&rsquo;s latest EV lineup on-site.</p>
<p id="consumption-trends" class="jump-link-nav anchored-block" data-jumplink-title="Consumption Trends"><strong>4. New Consumption Trends</strong></p>
<p>Chinese consumers are not simply pulling back &mdash; they are reprioritizing. While overall sentiment remains cautious, spending patterns are shifting in more emotionally driven and experience-oriented directions. A rising trend known as &ldquo;dopamine consumption&rdquo;&mdash;small indulgences that deliver immediate joy or gratification&mdash;is fueling demand across categories like bubble tea, travel, branded gold, outdoor gear, and IP-based collectibles also known as pop toys.</p>
<p>One standout example is the viral craze surrounding Labububmonster figurines&mdash;collectible toys sold in &ldquo;blind boxes&rdquo; that conceal the character inside. Young adults eagerly line up to buy them, drawn not just by the product but by the experience: the thrill of surprise, the joy of sharing with friends, and the social ritual of trading figures&mdash;sometimes at significant resale premiums. Here, it&rsquo;s not about price&mdash;it&rsquo;s about novelty, identity, and emotional gratification.</p>
<p>This trend is more than a short-term reaction and reflects a structural shift, led by younger generations, toward value, identity, and utility over traditional brand status or big-ticket goods. Emotional consumption has grown at an average annual rate of 12% since 2013 and is projected to surpass $270 billion in 2025.<sup>5</sup></p>
<p>Companies that tap into these evolving preferences by delivering affordability, creativity, and cultural relevance are outperforming. Companies like Pop Mart and Laopu Gold, which align closely with these emotional consumption trends, have delivered standout equity performance this year. Within our portfolio, we see similar positioning strength in names such as Miniso<sup>*</sup>, ANTA Sports<sup>*</sup>, Trip.com<sup>*</sup>, and gaming leaders like Netease* and Tencent*&mdash;all well poised to capture this next wave of experience-driven consumer growth.</p>
<p><img loading="lazy" class="img-responsive w-100" alt="Labubu dolls on display in a Chinese shop" src="https://www.vaneck.com/contentassets/27dcc942a8a0489ba7aedf9984f2d7d1/5967_china-eme_image-4_2025-7_v1.jpg" /></p>
<p class="chart-disclosure">Labubu dolls on display in a Chinese shop.</p>
<p><img loading="lazy" class="img-responsive w-100" alt="Miniso&rsquo;s new &ldquo;Pink&rdquo; flagship store in Shanghai" src="https://www.vaneck.com/contentassets/ca8fbbb80fd94c28b513391198f302a7/5967_china-eme_image-5_2025-7_v1.jpg" /></p>
<p class="chart-disclosure">Miniso&rsquo;s new &ldquo;Pink&rdquo; flagship store in Shanghai.</p>

<h2>Positioning for What&rsquo;s Next</h2>
<p>The China opportunity remains real, but it&rsquo;s no longer about broad beta. It&rsquo;s about depth over breadth. Innovation is moving fast. Policy is becoming more pragmatic. And the consumer is evolving.</p>
<p>At VanEck, the focus remains on companies with pricing power, capital discipline, and alignment with structural growth themes&mdash;particularly in AI infrastructure, advanced manufacturing, electric mobility, and emerging consumer behavior.</p>
<p>Valuations are compelling, and sentiment is turning a corner. For investors with a discerning lens and on-the-ground insight, the next leg of China&rsquo;s transformation appears increasingly attractive.</p>
<h3>Investing in China with VanEck</h3>
<p><img loading="lazy" class="img-responsive w-100" alt="Investing in China with VanEck" src="https://www.vaneck.com/contentassets/34884fe87ad1440597d5c09bb9b0cead/5967_china-eme_chart-1_2025-7_v1_blog.svg" /></p>
<p class="chart-disclosure"><strong><a href="/link/eb4419e6f6394611b3f80c597020daa4.aspx" title="GBFAX - Emerging Markets Fund - Class A - Overview">VanEck Emerging Markets Fund</a></strong> offers exposure to high quality, structural growth companies at a reasonable price poised to represent future development and growth of emerging markets.</p>
<p class="chart-disclosure"><sup>*</sup>&nbsp;Data as of 6/30/2025. Portfolio weight: Alibaba(1.62%), Tencent (2.46%), Shenzhen Inovance (0.79%), BYD Company Ltd. (1.68%), Xiaomi Corporation Ltd. (0.33%), ANTA Sports Products Ltd. (0.70%), Trip.com Group Ltd. (1.02%).</p>
<p>To receive more <a href="/us/en/insights/emerging-markets-equity/" title="Emerging Markets Equity Insights"><strong>Emerging Markets Equity</strong></a> insights, <a href="/us/en/subscribe/" title="Subscription Center"><strong>sign up in our subscription center</strong></a>.</p>
]]></content:encoded>
</item><item rdf:about="https://www.vaneck.com/us/en/blogs/thematic-investing/semiconductor-industry-new-update/">
  <title>Semiconductor Industry Updates: Hyperscalers Go Vertical and Policy Clouds Linger></title>
  <link>https://www.vaneck.com/us/en/blogs/thematic-investing/semiconductor-industry-new-update/</link>
  <description><![CDATA[Hyperscalers double down on AI chips, memory surges on HBM demand, and M&amp;A talk rises amid labor and export policy clouds in a fast-evolving semiconductor landscape.]]></description>
  <dc:creator>Nick Frasse</dc:creator>
  <dc:date>07/30/2025 06:30:00</dc:date>
<content:encoded><![CDATA[

<h2 id="june-july-updates" class="mb-3 jump-link-nav anchored-block" data-jumplink-title="June-July Updates">3 Key Takeaways This Month</h2>
<ul class="content-list">
<li class="mt-2"><strong>AI Buildout Accelerates Across Sectors:</strong> From hyperscalers to automakers, AI infrastructure spend continues to ramp. Meta and Amazon unveiled new AI chip strategies while traditional players like Marvell and Micron are seeing momentum in HBM and connectivity.</li>
<li class="mt-2"><strong>Policy Moves Remain a Wildcard:</strong> As CHIPS Act disbursements pick up, labor shortages and Investment Accelerator bottlenecks persist. Meanwhile, export restrictions on advanced lithography tools tighten.</li>
<li class="mt-2"><strong>Ecosystem Consolidation Picks Up:</strong> M&amp;A chatter intensifies across the fabless and equipment space, with investors eyeing design efficiency and vertical integration as key to next-phase gains.</li>
</ul>
<h2>Semiconductor Industry Snapshot</h2>
<p><strong>June-July Highlights</strong></p>
<ul class="content-list">
<li class="mt-2"><strong>Meta&rsquo;s In-House Chip Strategy Unveiled:</strong> Meta formally introduced its in-house inference chip &ldquo;Artemis,&rdquo; part of a broader effort to optimize LLM performance and reduce reliance on NVIDIA. The chip will support the company&rsquo;s Llama 3 and upcoming Llama 4 deployments.</li>
<li class="mt-2"><strong>Amazon Doubles Down on Custom AI Stack:</strong> Amazon confirmed the internal rollout of Trainium2 and Inferentia3, both designed to handle model training and inference at AWS scale. Rumors suggest the company is also evaluating Arm-based server CPUs to replace x86 in key workloads.</li>
<li class="mt-2"><strong>Micron Reports HBM3E Ramp:</strong> Micron announced volume production of HBM3E for NVIDIA&rsquo;s Blackwell platform. With demand surging from both hyperscalers and AI startups, Micron&rsquo;s memory capacity expansion is ahead of schedule.</li>
<li class="mt-2"><strong>ASML Hit by New Restrictions:</strong> The Dutch government moved to further limit ASML&rsquo;s exports of advanced EUV tools to China, following U.S. lobbying. This creates potential revenue uncertainty for ASML but reinforces nearshoring demand in allied regions.</li>
<li class="mt-2"><strong>Marvell Gains on AI Networking:</strong> Marvell&rsquo;s earnings call highlighted record growth in AI-related connectivity, with particular strength in custom interconnects for hyperscaler data centers. The company noted expanding design wins in 800G switching and custom ASICs.</li>
</ul>
<h2>Top Semiconductor Stories</h2>
<p><strong>Meta Enters AI Silicon Arena</strong></p>
<p>Meta&rsquo;s launch of &ldquo;Artemis,&rdquo; its in-house AI inference chip, signals a new phase in hyperscaler silicon independence. The chip&mdash;developed over two years&mdash;will serve both training and inference for internal LLMs. Meta joins Google, Amazon, and Microsoft in the push to reduce reliance on NVIDIA, although initial benchmarks suggest Artemis will be deployed in targeted workloads, rather than general-purpose computing.</p>
<p><strong>CHIPS Act Progress Shadowed by Labor Crunch</strong></p>
<p>CHIPS Act funding has now surpassed $40 billion in approvals, with significant projects in Arizona, Texas, and New York entering the build-out phase. However, execution delays persist due to labor shortages in engineering. The U.S. Investment Accelerator has faced criticism for its opaque approval processes and unclear benchmarks, which have stalled timelines for key fabs, including Samsung Austin and TSMC Phase 2.</p>
<p><strong>Semiconductor M&amp;A Rumblings</strong></p>
<p>Industry observers have noted an increase in chatter around consolidation in the fabless design and IP space. Companies with a strong AI adjacency (e.g., IP vendors, RF specialists) are reportedly exploring strategic options amid the rising costs of next-gen node development. While no major deals have closed, investor attention has shifted to capital efficiency and platform scale.</p>
<h2>Sector Headwinds &amp; Tailwinds</h2>
<p><strong>What&rsquo;s Working:</strong></p>
<ul class="content-list">
<li class="mt-2"><strong>Micron:</strong> Capitalizing on the HBM3E ramp for NVIDIA and AI data center demand. Positive pricing trends in DRAM and NAND also support margins.</li>
<li class="mt-2"><strong>Marvell:</strong> Benefiting from rising demand for high-speed connectivity and custom ASIC design services in AI cloud deployments.</li>
<li class="mt-2"><strong>AMD:</strong> Momentum continues after Microsoft&rsquo;s MI325X adoption, with reports of additional wins at Meta and Oracle.</li>
</ul>
<p><strong>What&rsquo;s Challenged:</strong></p>
<ul class="content-list">
<li class="mt-2"><strong>NVIDIA:</strong> While demand remains high, growing hyperscaler self-reliance and China export restrictions are creating long-term questions about volume visibility.</li>
<li class="mt-2"><strong>ASML:</strong> Regulatory hurdles continue to cast a shadow over revenue<span> exposed to China</span>. Meanwhile, nearshoring may delay tool deployments beyond 2026.</li>
<li class="mt-2"><strong>GlobalFoundries:</strong> Lags peers in high-end AI logic manufacturing and faces elevated fixed costs as U.S. fab buildouts proceed without major AI design wins.</li>
</ul>
<h2>Looking Ahead</h2>
<p>Expect continued investment in custom AI silicon strategies as LLM workloads diversify. Meta, Amazon, and Microsoft are all expected to detail second-gen roadmaps by fall. Meanwhile, the CHIPS Act&rsquo;s effectiveness will hinge on resolving labor bottlenecks and clarifying funding approvals. Keep an eye on potential M&amp;A in the fabless design space as firms seek scale and IP depth to remain competitive at 3nm and below.</p>

<p class="mt-5"><strong>Catch Up on Last Month&rsquo;s Updates Below</strong></p>
<h1 id="may-updates" class="mb-3 jump-link-nav anchored-block" data-jumplink-title="May Updates">Tightening Tariffs and CHIPS Act Changes</h1>
<h2>3 Key Takeaways in May</h2>
<ul class="content-list">
<li class="mt-2"><strong>Tariff Pause Signals Temporary Relief:</strong> The Trump administration paused new Section 301 tariffs on Chinese semiconductors amid negotiations. This provides short-term breathing room for supply chains but leaves long-term policy friction unresolved.</li>
<li class="mt-2"><strong>Google I/O Spotlights Custom AI Chips:</strong> Google&rsquo;s unveiling of its TPU v6 and Gemini 2.5 platform underscores the hyperscaler shift toward in-house AI silicon boosting demand for advanced memory, packaging, and compute innovations.</li>
<li class="mt-2"><strong>Hyperscalers Intensify AI Silicon Race:</strong> From Microsoft&rsquo;s AMD-powered builds to Amazon&rsquo;s acceleration of Trainium2, hyperscalers are shaping next-gen silicon strategy, transforming the competitive landscape for semiconductor players.</li>
</ul>
<h2>Semiconductor Industry Snapshot</h2>
<p><strong>April Recap Highlights</strong></p>
<ul class="content-list">
<li class="mt-2">The U.S. paused the rollout of expanded Section 301 semiconductor tariffs as part of renewed negotiations with China. This signals a potential opening in trade tensions but continues to fuel uncertainty around long-term supply chain stability.</li>
<li class="mt-2">Google I/O 2025 introduced TPU v6 chips, co-developed with Broadcom, delivering major improvements in training and inference for large models like Gemini 2.5. The emphasis on in-house silicon aligns with ongoing hyperscaler trends toward vertical integration.</li>
<li class="mt-2">Microsoft announced a major AI infrastructure buildout using both AMD&rsquo;s new MI325X GPUs and NVIDIA&rsquo;s Blackwell Ultra chips, confirming robust demand for advanced compute silicon.</li>
<li class="mt-2">Amazon is reportedly fast-tracking Trainium2 and Inferentia3 development as part of a broader strategy to reduce dependence on external GPU vendors.</li>
<li class="mt-2">On the geopolitical front, labor and investment concerns persist. While CHIPS Act projects continue to advance, the U.S. Investment Accelerator's oversight remains a wildcard for timelines and execution confidence.</li>
</ul>
<h2>Top Semiconductor Stories</h2>
<p><strong>Tariff Pause Reflects Strategic De-escalation</strong></p>
<p>In a notable shift, the U.S. Trade Representative announced a temporary halt to new Section 301 tariffs on Chinese semiconductor imports. The move is intended to allow more constructive negotiations with Beijing and avoid immediate supply chain disruption. Semiconductor players with heavy China exposure, such as Qorvo and ON Semiconductor, are seeing short-term relief. However, the long-term policy direction remains uncertain, especially amid ongoing congressional scrutiny.</p>
<p><strong>Hyperscalers Expand Custom Silicon Ambitions</strong></p>
<p>At Google I/O, the release of TPU v6 built for Gemini 2.5 and future LLMs highlights how hyperscalers are increasingly designing their own silicon. Co-development with Broadcom signals rising interest in semi-custom models. Microsoft&rsquo;s AI stack, now incorporating AMD&rsquo;s MI325X alongside NVIDIA's Blackwell GPUs, shows a multi-vendor approach to compute. Meanwhile, Amazon is accelerating development of Trainium2 and Inferentia3. These moves reinforce demand for HBM memory, advanced packaging, and fabless logic expertise.</p>
<p><strong>CHIPS Act Oversight Looms Over Execution</strong></p>
<p>While more than $30 billion in CHIPS Act funding has been earmarked, the U.S. Investment Accelerator&rsquo;s new review authority is already creating friction. Industry insiders warn that delays may affect critical fabs, particularly TSMC Arizona and Samsung Texas. Though aimed at improving project efficiency, the lack of clarity on approval processes is affecting private-sector confidence and timeline visibility.</p>
<h2>Sector Headwinds &amp; Tailwinds</h2>
<p><strong>What&rsquo;s Working:</strong></p>
<ul class="content-list">
<li class="mt-2"><strong>Micron:</strong> Continuing to benefit from HBM demand driven by AI growth, with additional momentum from IoT and edge memory segments.</li>
<li class="mt-2"><strong>Broadcom:</strong> Strengthening position as a custom silicon partner to hyperscalers.</li>
<li class="mt-2"><strong>AMD:</strong> Riding strong sentiment following Microsoft&rsquo;s endorsement of the MI325X for AI infrastructure builds.</li>
</ul>
<p><strong>What&rsquo;s Challenged:</strong></p>
<ul class="content-list">
<li class="mt-2"><strong>NVIDIA:</strong> Hyperscalers developing their own silicon in partnership with companies like Broadcom leaves a lot of unknowns with Nvidia&rsquo;s near term revenues.</li>
<li class="mt-2"><strong>Qorvo &amp; ON Semiconductor:</strong> Despite tariff pause, long-term China exposure remains a risk variable.</li>
<li class="mt-2"><strong>Labor Shortages:</strong> With many CHIPS Act projects now in the execution phase, the talent bottleneck, especially for 4-year technical roles, remains a concern.</li>
</ul>
<h2>Looking Ahead</h2>
<p>The next phase of the semiconductor cycle will be shaped by how three forces converge: policy, hyperscaler strategy, and supply chain resilience. Stay tuned for updates on U.S.-China tariff negotiations, formal AI chip roadmaps from Amazon and Meta, and clarification from the U.S. Investment Accelerator on project approvals.</p>
<p>To receive more <a href="https://www.vaneck.com/us/en/insights/thematic-investing/" title="Thematic Investing Insights"><strong>Thematic Investing</strong></a> insights, <a href="https://www.vaneck.com/us/en/subscribe/" title="Subscription Center"><strong>sign up in our subscription center</strong></a>.</p>
]]></content:encoded>
</item><item rdf:about="https://www.vaneck.com/us/en/blogs/emerging-markets-bonds/actively-managed-em-bonds-the-edge-investors-need/">
  <title>Actively Managed EM Bonds: The Edge Investors Need></title>
  <link>https://www.vaneck.com/us/en/blogs/emerging-markets-bonds/actively-managed-em-bonds-the-edge-investors-need/</link>
  <description><![CDATA[A blended, actively managed EM bond strategy taps into the full EM debt universe, aiming to boost flexibility, manage risk and deliver stronger long-term returns for investors.]]></description>
  <dc:creator>Eric Fine</dc:creator>
  <dc:date>07/30/2025 06:30:00</dc:date>
<content:encoded><![CDATA[

Many fixed income portfolios have historically overlooked emerging markets (EM) bonds, despite significant shifts in global fiscal dynamics. Over the past 25 years, EM governments have transitioned from fiscal deficits to surpluses, while developed market (DM) governments have increasingly accumulated debt. This reversal has altered the geography of bond crises, with EM demonstrating growing fiscal stability. However, fixed income allocations have not yet fully adapted to this evolution. As discussed in <a href="/us/en/blogs/emerging-markets-bonds/actively-managed-em-bonds-the-edge-investors-need-whitepaper.pdf" title="Unlocking Actively Managed EM bonds Potential" target="_blank" rel="noopener"><strong>our new whitepaper</strong></a>, we contend that EM bonds represent the future of fixed income and that due to the diverse nature of EM countries and bond types, ranging from hard-currency sovereign to local-currency corporate bonds, an active management strategy, such as that employed by the <a href="/link/f447bf0c04f64108a3dcff3ca025af4a.aspx" title="EMBX - VanEck Emerging Markets Bond ETF - Overview"><strong>VanEck Emerging Markets Bond ETF</strong></a>, is the most effective way for investors to access this underutilized asset class.
<h3>VanEck Emerging Markets Bond ETF&rsquo;s 5-Year Outperformance vs. Fixed Income Benchmarks</h3>
<div class="flourish-embed flourish-chart" data-src="visualisation/24462215?2428759"><script src="https://public.flourish.studio/resources/embed.js"></script><noscript><img loading="lazy" src="https://public.flourish.studio/visualisation/24462215/thumbnail" width="100%" alt="VanEck Emerging Market Bond Fund&rsquo;s 5-Year Outperformance vs. Fixed Income Benchmarks" /></noscript></div>
<p class="chart-disclosure">Source: VanEck, Bloomberg. Data as of June 2025. Returns are annualized. VanEck Emerging Markets Bond Fund is represented by Class I of the Fund. Returns reflect temporary contractual fee waivers and/or expense reimbursements. Had the Fund incurred all expenses and fees, investment returns would have been reduced. Expenses: Class I: Gross 1.37% and Net 0.86%. Expenses are capped contractually through 05/01/26 at 0.85% for Class I. Investment returns and Fund share values will fluctuate so that investors' shares, when redeemed, may be worth more or less than their original cost. Fund returns assume that dividends and capital gains distributions have been reinvested in the Fund at NAV. EM corporate bonds are represented by the J.P. Morgan CEMBI Broad Diversified Index. Local currency bonds are represented by the J.P. Morgan Government Bond-Emerging Market Index Global Diversified. 50:50 benchmark is represented by the 50% J.P. Morgan Emerging Market Bond Index Global Diversified and 50% J.P. Morgan Government Bond-Emerging Market Index Global Diversified, US Broad Market is represented by the ICE BofA US Broad Market, Global broad market is represented by the ICE BofA Global Broad Market. USD EM Bonds are represented by the J.P. Morgan Emerging Market Bond Index Global Diversified. Performance is calculated net of management fees. DM Bonds are represented by the ICE BofA Developed Markets Sovereign Bond Index.</p>
<p class="chart-disclosure"><strong>The performance data quoted represents past performance. Past performance is not a guarantee of future results. Investment return and principal value of an investment will fluctuate so that an investor's shares, when redeemed, may be worth more or less than their original cost. Performance may be lower or higher than performance data quoted. Please call 800.826.2333 or visit&nbsp;<a href="https://www.vaneck.com/us/en/" title="ETF and Mutual Fund Manager">vaneck.com</a> for performance current to the most recent month ended.</strong></p>
<p class="chart-disclosure">Prior to 10/06/2025, the Fund operated as the VanEck Emerging Markets Bond mutual fund; performance shown before that date is that fund&rsquo;s NAV performance (Class I, unadjusted for today&rsquo;s ETF expenses).</p>

<p>The <a href="/link/dbb866e8704049c784a0bdf9299143ea.aspx" title="EMBX - VanEck Emerging Markets Bond ETF - Overview"><strong>VanEck Emerging Markets Bond ETF</strong></a> adopts a comprehensive approach, investing across the entire EM bond spectrum to maximize opportunity and manage risk in a complex global environment. Despite global disruptions such as the COVID pandemic, the war in Ukraine and economic troubles in China, the fund has consistently outperformed both global and U.S. bond benchmarks, earning top-quartile rankings from Morningstar over the past five years. This outperformance, both absolute and risk-adjusted, is also evident when compared to the fund&rsquo;s benchmark, which includes the same EM bonds but without active management. VanEck&rsquo;s active strategy, which focuses on fundamental value relative to bond risk premia, aims to capitalize on these shifts and avoid troubled issuers, making a compelling case for a diversified, actively managed EM bond allocation.</p>

<h3>Average Annual Total Returns<sup>*</sup>&nbsp;(%)</h3>
<div class="wrapped-div">
<table style="width: 100%;">
<tbody>
<tr class="tbl-data">
<td class="data-head last text-left">Month End as of 11/30/2025</td>
<td class="data-head last text-right">1 MO</td>
<td class="data-head last text-right">3 MO</td>
<td class="data-head last text-right">YTD</td>
<td class="data-head last text-right">1 YR</td>
<td class="data-head last text-right">3 YR</td>
<td class="data-head last text-right">5 YR</td>
<td class="data-head last text-right">10 YR</td>
</tr>
<tr class="tbl-data">
<td class="data-td last text-left">EMBX (NAV)</td>
<td class="data-td data last text-right">0.79</td>
<td class="data-td data last text-right">3.44</td>
<td class="data-td data last text-right">17.38</td>
<td class="data-td data last text-right">15.48</td>
<td class="data-td data last text-right">11.39</td>
<td class="data-td data last text-right">4.26</td>
<td class="data-td data last text-right">5.13</td>
</tr>
<tr class="tbl-data">
<td class="data-td last text-left">EMBX (Share Price)</td>
<td class="data-td data last text-right">0.99</td>
<td class="data-td data last text-right">3.63</td>
<td class="data-td data last text-right">17.60</td>
<td class="data-td data last text-right">15.69</td>
<td class="data-td data last text-right">11.46</td>
<td class="data-td data last text-right">4.29</td>
<td class="data-td data last text-right">5.15</td>
</tr>
<tr class="tbl-data">
<td class="data-td last text-left">50% GBI-EM/50% EMBI</td>
<td class="data-td data last text-right">0.83</td>
<td class="data-td data last text-right">3.76</td>
<td class="data-td data last text-right">15.47</td>
<td class="data-td data last text-right">13.55</td>
<td class="data-td data last text-right">10.11</td>
<td class="data-td data last text-right">1.80</td>
<td class="data-td data last text-right">3.89</td>
</tr>
</tbody>
</table>
</div>
<br />
<div class="wrapped-div">
<table style="width: 100%;">
<tbody>
<tr class="tbl-data">
<td class="data-head last text-left">Quarter End as of 09/30/2025</td>
<td class="data-head last text-right">1 MO</td>
<td class="data-head last text-right">3 MO</td>
<td class="data-head last text-right">YTD</td>
<td class="data-head last text-right">1 YR</td>
<td class="data-head last text-right">3 YR</td>
<td class="data-head last text-right">5 YR</td>
<td class="data-head last text-right">10 YR</td>
</tr>
<tr class="tbl-data">
<td class="data-td last text-left">EMBX (NAV)</td>
<td class="data-td data last text-right">1.70</td>
<td class="data-td data last text-right">4.40</td>
<td class="data-td data last text-right">15.41</td>
<td class="data-td data last text-right">9.72</td>
<td class="data-td data last text-right">13.39</td>
<td class="data-td data last text-right">4.87</td>
<td class="data-td data last text-right">5.27</td>
</tr>
<tr class="tbl-data">
<td class="data-td last text-left">EMBX (Share Price)</td>
<td class="data-td data last text-right">1.70</td>
<td class="data-td data last text-right">4.40</td>
<td class="data-td data last text-right">15.41</td>
<td class="data-td data last text-right">9.72</td>
<td class="data-td data last text-right">13.39</td>
<td class="data-td data last text-right">4.87</td>
<td class="data-td data last text-right">5.27</td>
</tr>
<tr class="tbl-data">
<td class="data-td last text-left">50% GBI-EM/50% EMBI</td>
<td class="data-td data last text-right">1.59</td>
<td class="data-td data last text-right">3.78</td>
<td class="data-td data last text-right">13.05</td>
<td class="data-td data last text-right">7.98</td>
<td class="data-td data last text-right">11.82</td>
<td class="data-td data last text-right">2.34</td>
<td class="data-td data last text-right">3.93</td>
</tr>
</tbody>
</table>
</div>
<p class="chart-disclosure"><sup>*</sup>&nbsp;Returns less than one year are not annualized.</p>
<p class="chart-disclosure"><strong>The performance data quoted represents past performance. Past performance is not a guarantee of future results. Investment return and principal value of an investment will fluctuate so that an investor's shares, when redeemed, may be worth more or less than their original cost. Performance may be lower or higher than performance data quoted. Please call 800.826.2333 or visit <a href="https://www.vaneck.com/us/en/" title="ETF and Mutual Fund Manager">vaneck.com</a> for performance current to the most recent month ended.</strong></p>
<p class="chart-disclosure">Prior to 10/06/2025, the Fund operated as the VanEck Emerging Markets Bond mutual fund; performance shown before that date is that fund&rsquo;s NAV performance (Class I, unadjusted for today&rsquo;s ETF expenses).</p>

<p>To receive more <a href="https://www.vaneck.com/us/en/insights/emerging-markets-bonds/" title="Emerging Markets Bonds Insights"><strong>Emerging Markets Bonds</strong></a> insights, <a href="/link/5f45412c2143400497908cea2897f7d3.aspx" title=" Subscription Center"><strong>sign up in our subscription center</strong></a>.</p>
]]></content:encoded>
</item><item rdf:about="https://www.vaneck.com/us/en/blogs/digital-assets/matthew-sigel-vaneck-mid-july-2025-bitcoin-chaincheck/">
  <title>VanEck Mid-July 2025 Bitcoin ChainCheck></title>
  <link>https://www.vaneck.com/us/en/blogs/digital-assets/matthew-sigel-vaneck-mid-july-2025-bitcoin-chaincheck/</link>
  <description><![CDATA[Bitcoin hits new ATHs amid macro tailwinds. Miners rerate on AI pivot validation, but not equally. ETH ETPs drive rotation, pulling record $2.2B during &lsquo;Crypto Week&rsquo; and denting BTC dominance.]]></description>
  <dc:creator>Nathan  Frankovitz</dc:creator>
  <dc:date>07/24/2025 06:30:00</dc:date>
<content:encoded><![CDATA[

<p><strong>Please note that VanEck has exposure to bitcoin and may have positions in bitcoin mining stocks mentioned.</strong></p>
<p><strong>Three key takeaways for mid-June &ndash; mid-July:</strong></p>
<ol class="content-list">
<li class="mt-2"><strong>Inflation, Inflation, Inflation: </strong>BTC surged to new all-time highs above $123K, fueled by dollar weakness, rising fiscal pressures, and the House&rsquo;s passage of pro-crypto bills during July&rsquo;s &ldquo;Crypto Week.&rdquo;</li>
<li class="mt-2"><strong>Bitcoin Miners Are Being Rerated, But Not Equally: </strong>The Core Scientific-CoreWeave deal validated AI infrastructure pivots, but shareholder dilution and strategic absorption sent a warning: execution matters.</li>
<li class="mt-2"><strong>ETP Inflows Roar Back, Driving ETH Rotation: </strong>ETH ETPs pulled in $2.2B during Crypto Week&mdash;nearly 30% of their all-time flows&mdash;triggering ETH/BTC outperformance and the sharpest BTC Dominance drop of the year.</li>
</ol>
<h3 id="monthly-dashboard" class="jump-link-nav anchored-block" data-jumplink-title="Bitcoin Monthly Dashboard">Bitcoin ChainCheck Monthly Dashboard and Highlights</h3>
<div class="wrapped-div">
<table style="width: 100%;">
<tbody>
<tr class="tbl-data">
<td class="tbl-header last text-left">As of July 21st, 2025</td>
<td class="tbl-header last text-right">30-day avg</td>
<td class="tbl-header last text-right">30 day change (%)<sup>1</sup></td>
<td class="tbl-header last text-right">365 day change (%)</td>
<td class="tbl-header last text-right">Last 30 days Percentile vs<br />all-time history (%)</td>
</tr>
<tr class="tbl-data">
<td class="data-td data last text-left">Bitcoin Price</td>
<td class="data-td data last text-right">$111,197</td>
<td class="data-td data last text-right">5</td>
<td class="data-td data last text-right">82</td>
<td class="data-td data last text-right">100</td>
</tr>
<tr class="tbl-data">
<td class="data-td data last text-left">Daily Active Addresses</td>
<td class="data-td data last text-right">721,874</td>
<td class="data-td data last text-right">-2</td>
<td class="data-td data last text-right">1</td>
<td class="data-td data last text-right">64</td>
</tr>
<tr class="tbl-data">
<td class="data-td data last text-left">Daily New Addresses</td>
<td class="data-td data last text-right">307,623</td>
<td class="data-td data last text-right">1</td>
<td class="data-td data last text-right">9</td>
<td class="data-td data last text-right">56</td>
</tr>
<tr class="tbl-data">
<td class="data-td data last text-left">Daily Transactions</td>
<td class="data-td data last text-right">388,116</td>
<td class="data-td data last text-right">9</td>
<td class="data-td data last text-right">-34</td>
<td class="data-td data last text-right">75</td>
</tr>
<tr class="tbl-data">
<td class="data-td data last text-left">Daily Inscriptions</td>
<td class="data-td data last text-right">98,557</td>
<td class="data-td data last text-right">146</td>
<td class="data-td data last text-right">261</td>
<td class="data-td data last text-right">55</td>
</tr>
<tr class="tbl-data">
<td class="data-td data last text-left">Total Transfer Volume (USD)</td>
<td class="data-td data last text-right">$68,526,433,925</td>
<td class="data-td data last text-right">13</td>
<td class="data-td data last text-right">59</td>
<td class="data-td data last text-right">90</td>
</tr>
<tr class="tbl-data">
<td class="data-td data last text-left">% Supply Active, last 180 days</td>
<td class="data-td data last text-right">21%</td>
<td class="data-td data last text-right">-10</td>
<td class="data-td data last text-right">-16</td>
<td class="data-td data last text-right">55</td>
</tr>
<tr class="tbl-data">
<td class="data-td data last text-left">% Supply Dormant for 3+ Years</td>
<td class="data-td data last text-right">45%</td>
<td class="data-td data last text-right">0</td>
<td class="data-td data last text-right">-3</td>
<td class="data-td data last text-right">92</td>
</tr>
<tr class="tbl-data">
<td class="data-td data last text-left">Avg Fees (USD)</td>
<td class="data-td data last text-right">$143,252.42</td>
<td class="data-td data last text-right">-7</td>
<td class="data-td data last text-right">44</td>
<td class="data-td data last text-right">86</td>
</tr>
<tr class="tbl-data">
<td class="data-td data last text-left">Avg Fees (BTC)</td>
<td class="data-td data last text-right">1.28809</td>
<td class="data-td data last text-right">-11</td>
<td class="data-td data last text-right">-21</td>
<td class="data-td data last text-right">65</td>
</tr>
<tr class="tbl-data">
<td class="data-td data last text-left">Percent of BTC Addresses in profit</td>
<td class="data-td data last text-right">99%</td>
<td class="data-td data last text-right">1</td>
<td class="data-td data last text-right">13</td>
<td class="data-td data last text-right">97</td>
</tr>
<tr class="tbl-data">
<td class="data-td data last text-left">Unrealized profit/loss ratio</td>
<td class="data-td data last text-right">0.56</td>
<td class="data-td data last text-right">1</td>
<td class="data-td data last text-right">13</td>
<td class="data-td data last text-right">80</td>
</tr>
<tr class="tbl-data">
<td class="data-td data last text-left">Global Power Consumption (TWh)</td>
<td class="data-td data last text-right">169</td>
<td class="data-td data last text-right">-3</td>
<td class="data-td data last text-right">45</td>
<td class="data-td data last text-right">99</td>
</tr>
<tr class="tbl-data">
<td class="data-td data last text-left">Total Daily BTC Miner Revenues (USD)</td>
<td class="data-td data last text-right">$50,662,629</td>
<td class="data-td data last text-right">4</td>
<td class="data-td data last text-right">78</td>
<td class="data-td data last text-right">97</td>
</tr>
<tr class="tbl-data">
<td class="data-td data last text-left">Total Crypto Equities' Market Cap<sup>*</sup>&nbsp;(USD) (MM)</td>
<td class="data-td data last text-right">$306,825</td>
<td class="data-td data last text-right">35</td>
<td class="data-td data last text-right">133</td>
<td class="data-td data last text-right">100</td>
</tr>
<tr class="tbl-data">
<td class="data-td data last text-left">Transfer volume from Miners to Exchanges (USD)</td>
<td class="data-td data last text-right">$15,504,275</td>
<td class="data-td data last text-right">11</td>
<td class="data-td data last text-right">130</td>
<td class="data-td data last text-right">95</td>
</tr>
<tr class="tbl-data">
<td class="data-td data last text-left">Bitcoin Dominance</td>
<td class="data-td data last text-right">64%</td>
<td class="data-td data last text-right">1</td>
<td class="data-td data last text-right">19</td>
<td class="data-td data last text-right">96</td>
</tr>
<tr class="tbl-data">
<td class="data-td data last text-left">Bitcoin Futures Annualized Basis</td>
<td class="data-td data last text-right">6%</td>
<td class="data-td data last text-right">-16</td>
<td class="data-td data last text-right">-44</td>
<td class="data-td data last text-right">37</td>
</tr>
<tr class="tbl-data">
<td class="data-td data last text-left">Mining Difficulty (T)</td>
<td class="data-td data last text-right">122</td>
<td class="data-td data last text-right">-3</td>
<td class="data-td data last text-right">50</td>
<td class="data-td data last text-right">99</td>
</tr>
</tbody>
</table>
</div>
<p class="chart-disclosure mt-3"><sup>*</sup>&nbsp;DAPP market cap as a proxy, as of June 19th, 2025.</p>
<p class="chart-disclosure"><sup>1</sup>&nbsp;30 day change &amp; 365 day change are relative to the 30-day avg, not absolute.</p>
<div class="wrapped-div">
<table style="width: 100%;">
<tbody>
<tr class="tbl-data">
<td class="tbl-header last text-left">Regional Trading ($)</td>
<td class="tbl-header last text-right">MoM Change (%)</td>
<td class="tbl-header last text-right">YoY Change (%)</td>
</tr>
<tr class="tbl-data">
<td class="data-td data last text-left">Asia Hours Price Change MoM</td>
<td class="data-td data last text-right">0</td>
<td class="data-td data last text-right">3</td>
</tr>
<tr class="tbl-data">
<td class="data-td data last text-left">US hours Price Change MoM</td>
<td class="data-td data last text-right">3</td>
<td class="data-td data last text-right">1</td>
</tr>
<tr class="tbl-data">
<td class="data-td data last text-left">EU hours Price Change MoM</td>
<td class="data-td data last text-right">0</td>
<td class="data-td data last text-right">2</td>
</tr>
</tbody>
</table>
</div>
<p class="chart-disclosure mt-3"><strong>Source: Glassnode as of 7/21/2025. Past performance is no guarantee of future results. Not intended as a recommendation to buy or sell any securities named herein.</strong></p>
<p><strong>Bitcoin Price: </strong>Bitcoin punched to new highs&mdash;at least in U.S. Dollar terms&mdash;above <strong>$123K</strong> this month. However, the move coincided with the U.S. Dollar Index (DXY) falling to its lowest level since February 2022. We reiterate our <a href="/us/en/blogs/digital-assets/matthew-sigel-vaneck-mid-september-2024-bitcoin-chaincheck-1-year-review-edition/" title="VanEck Mid-September 2024 Bitcoin ChainCheck: 1-Year Review Edition"><strong>previous</strong></a> research showing that Bitcoin&rsquo;s negative correlation with USD strength remains one of its most persistent and defining macro relationships.</p>
<p>The One Big Beautiful Bill Act (&ldquo;BBB&rdquo;), passed on Independence Day, raised the U.S. debt ceiling by <strong>$5 trillion</strong>, fueling inflation fears and boosting Bitcoin&rsquo;s appeal as a hedge. While crypto-specific amendments (e.g., tax exemptions, staking rules) were excluded from the OBBBA due to partisan gridlock and time constraints, the Trump administration&rsquo;s pro-crypto stance spurred optimism. During &ldquo;Crypto Week&rdquo; in July, the House advanced the GENIUS Act (regulating stablecoins, which the Senate had previously passed), the CLARITY Act (enhancing SEC/CFTC oversight), and the Anti-CBDC Surveillance State Act, reinforcing a positive outlook for cryptocurrencies. Institutional ETP inflows further supported Bitcoin&rsquo;s rally, discussed below.</p>
<p><strong>Bitcoin Futures Annualized Basis: </strong>The basis trade is a popular delta-neutral strategy among institutions in the Bitcoin market, where they hold spot BTC while selling BTC futures contracts, capturing the premium paid by bullish traders who believe Bitcoin&rsquo;s price will increase. The annualized rate of return from this strategy, or the premium traders pay, serves as a proxy for bullish sentiment. Despite record-high prices, this medium-term signal is down <strong>16%</strong> month-over-month, potentially signaling de-risking from June&rsquo;s elevated rates. After Bitcoin&rsquo;s <strong>54%</strong> run-up from lows around <strong>$76K</strong> on April 8th to <strong>$117K</strong> on July 20th, we read this as healthy for Bitcoin&rsquo;s medium-term outlook.</p>
<p>However, we note that BTC&rsquo;s perpetual futures borrowing rates are elevated versus last month&rsquo;s. Serving as a better indicator of shorter-term sentiment, we believe this signals a potentially overheated market due for correction. We also note that with the emergence of treasury companies like MSTR this market cycle, much of the leverage in Bitcoin markets is nested in corporate balance sheets. All else equal, we warn that basis trade premiums may not reach as high as the peak of this market cycle as they did during the last market cycle.</p>
<p><strong>Bitcoin Dominance: </strong>While Bitcoin Dominance&rsquo;s (BTCD) 30-day moving average is flat month-over-month, it may finally be inflecting. At the time of writing, on July 21st, BTCD is at <strong>60.6%</strong>, presently in free fall from a peak of <strong>66.0%</strong> on June 27th. While BTC prices have retraced slightly since peaking July 14th, the decline in BTCD is more so due to surging altcoin prices, particularly Ethereum. On July 18th, the total market value of cryptoassets crossed <strong>$4 trillion</strong> for the first time.</p>
<h3>ETH ETPs Recorded Record Flows on July 16th, Driving Price Outperformance vs. BTC ETPs</h3>
<div class="flourish-embed flourish-chart" data-src="visualisation/24350369?2429379"><script src="https://public.flourish.studio/resources/embed.js"></script><noscript><img loading="lazy" src="https://public.flourish.studio/visualisation/24350369/thumbnail" width="100%" alt="ETH ETPs Recorded Record Flows on July 16th, Driving Price Outperformance vs. BTC ETPs" /></noscript></div>
<p class="chart-disclosure">Source: Farside Investors, Artemis, as of 7/21/2025. <strong>Past performance is no guarantee of future results. Not intended as a recommendation to buy or sell any securities named herein.</strong></p>
<p>Ethereum ETPs posted back-to-back record flows on July 16th and 17th, adding <strong>$727 million</strong> and <strong>$602 million</strong>, respectively. In total, <strong>29%</strong> of the all-time flows into ETH ETPs were added during &ldquo;crypto week&rdquo; alone.</p>
<p>Fortunately for Bitcoin, this isn&rsquo;t a zero-sum game: in July, BTC ETPs saw two days of <strong>$1 billion</strong> net inflows, on track for the biggest month since November 2024.</p>
<p><strong>Daily Inscriptions: </strong>After reaching lows not seen since November, Ordinals transactions picked back up again in July as Bitcoin&rsquo;s rally renewed traders&rsquo; speculative enthusiasm. Per Cryptoslam.io data, daily Ordinals volume averaged <strong>$1.9</strong> <strong>million </strong>in June versus <strong>$2.6 million</strong> so far in July <strong>(+37%)</strong>, with <strong>$11.6 million</strong> of volume on July 13th marking the highest daily volume since December 2024. Despite the turnaround, Ordinals activity remains niche, lagging behind Ethereum NFTs&rsquo; average of <strong>$3.3 million </strong>of trading volume in June, versus <strong>$6.7</strong> <strong>million (+102%)</strong> so far in July.</p>
<p><strong>Mining Difficulty: </strong>On June 29th, Bitcoin&rsquo;s network difficulty dropped <strong>~7.5%</strong>, from <strong>126T </strong>to <strong>117T</strong>, following widespread miner curtailments across Texas amid extreme heat. From peak to trough, Bitcoin&rsquo;s hashrate fell from <strong>1,006 EH/s</strong> on June 11th to <strong>649 EH/s</strong> on June 24th, marking one of the sharpest difficulty drops <strong>(-3% MoM)</strong> since the 2021 China mining ban. Texas&rsquo;s independent ERCOT grid, which has long been favored by miners for its cheap and abundant wind and solar electricity, can mandate shutdowns during peak demand events. Miners participating in these programs are compensated through energy credits or grid payments, effectively reducing their all-in power costs.</p>
<p>Meanwhile, several large-scale miners, including CORZ, IREN, and BITF, have paused upgrades or begun downsizing their mining fleets to pursue AI data center opportunities. Because Bitcoin&rsquo;s issuance is fixed, miners who remain operational during curtailment or HPC pivot cycles benefit from improved economics, all else equal.</p>
<p><strong>Crypto Equities Market Cap: </strong>With its 30-day moving average up <strong>35% </strong>month-over-month, <strong>133%</strong> year-over-year, the&nbsp;<a href="https://www.marketvector.com/indexes/sector/mvis-global-digital-assets-equity" title="MVDAPP - MVIS&nbsp;Global Digital Assets Equity Index" target="_blank" rel="noopener"><strong>MVIS<sup>&reg;</sup>&nbsp;Global Digital Assets Equity Index (MVDAPP)</strong></a>reached new all-time highs this July, delivering significant alpha versus Bitcoin (more below).</p>
<h3 id="chart-of-the-month" class="jump-link-nav anchored-block" data-jumplink-title="Chart of the Month">Chart of the Month: Bitcoin Miner Rally Lifts MVIS<sup>&reg;</sup>&nbsp;Global Digital Assets Equity Index (MVDAPP) 59% from June to Mid-July, Outpacing Bitcoin&rsquo;s 15% Gain</h3>
<p><img loading="lazy" class="img-responsive w-100" alt="Chart of the Month: Bitcoin Miner Rally Lifts MVIS&lt;sup&gt;&reg;&lt;/sup&gt;&nbsp;Global Digital Assets Equity Index (MVDAPP) 59% from June to Mid-July, Outpacing Bitcoin&rsquo;s 15% Gain" src="https://www.vaneck.com/contentassets/18345ce50dc94641bd186ccf24324ba0/5948_bitcoin-chaincheck-for-mid-july-2025_chart-2_2025-7_v1_blog.svg" /></p>
<p class="chart-disclosure">Source: Glassnode, MarketVector as of 7/21/2025. <strong>Past performance is no guarantee of future results. The MVIS<sup>&reg;</sup>&nbsp;Global Digital Assets Equity Index (MVDAPP) tracks the performance of the largest and most liquid companies in the digital assets industry. Index performance is not representative of strategy performance. Past performance is no guarantee of future results. Not intended as a recommendation to buy or sell any securities named herein.</strong></p>
<p>MVDAPP returned <strong>+59%</strong> since May, driven by surging values in Bitcoin mining and treasury stocks including IREN, MARA, and MTPLF, marking the Digital Assets Equity Index&rsquo;s best outperformance of Bitcoin so far this market cycle.</p>
<p>The move comes amid a wave of renewed interest in Bitcoin miners&rsquo; AI/HPC potential, driving outsized returns from miners with plausible capacity for neocloud tenants. In late June, The Wall Street Journal <a href="https://www.wsj.com/business/deals/coreweave-in-talks-to-buy-core-scientific-ed821c09?gaa_at=eafs&amp;gaa_n=ASWzDAidd7gXh0kX1SQhQ_CndjMmWHOoh6P8QD1oItXY5pWSPmF0xnFiOg7j2VTQKrc%3D&amp;gaa_ts=68714b66&amp;gaa_sig=1tAS3uAqtiQDazhcustHb-ehLhFS8mH_G53XOPEAz8COAyGIDnL9rX60YqA_z9u6ldXRy3T1Jv5WefgzqE3sMw%3D%3D" title="CoreWeave in Talks to Buy Core Scientific" target="_blank" rel="noopener"><strong>reported</strong></a> that Core Scientific&mdash;the Bitcoin mining company with the gold-standard hosting contract worth <strong>approximately $ 9 billion</strong>&mdash;was in talks to be acquired by its tenant, CoreWeave. This spurred investment activity in the sector and more recently developed into a formal deal announcement (discussed below).</p>
<p>We see clear signs that the Bitcoin mining sector is undergoing a rerating as a result. However, we also think this is a stock-picker&rsquo;s market; nearly one year after we first <a href="/us/en/blogs/digital-assets/matthew-sigel-bitcoin-miners-ai-arbitrage-play-to-boost-revenue/" title="Bitcoin Miners' AI Arbitrage Play to Boost Revenue"><strong>noted</strong></a> their opportunity in AI, we see a Bitcoin mining market with increasingly dispersed strategies.</p>
<h2 id="miners" class="jump-link-nav anchored-block" data-jumplink-title="Bitcoin Miners">Bitcoin Miners: AI Gets Validated, Value Remains Stratified</h2>
<p>To evaluate and compare Bitcoin miners, we begin with their hash rate. Measured in exahash per second (EH/s), this figure represents a miner&rsquo;s total computational capacity and reflects both the scale and efficiency of its operations. Scale is determined by how much power (in megawatts) the miner has energized, while efficiency reflects the quality and age of its mining rigs. When benchmarked against enterprise value (equity + debt &ndash; cash), EH/s becomes a useful lens through which to assess a miner&rsquo;s two core competencies: 1) acquiring energy at scale, and 2) converting that energy into computational work as cost-effectively as possible.</p>
<p>As the chart below shows, adjusting for bitcoin holdings reveals stark differences in how the market is valuing miners&rsquo; core operating businesses.</p>
<h3>BTC-Adjusted EV per EH/s: Market Valuations Reflect Diverging Strategies</h3>
<p><img loading="lazy" alt="After Stripping Out BTC Holdings, HIVE and CANG's Operating Businesses are Priced Near or Below $0 per EH/s" class="img-responsive w-100" src="https://www.vaneck.com/contentassets/18345ce50dc94641bd186ccf24324ba0/5948_bitcoin-chaincheck-for-mid-july-2025_chart-3_2025-7_v1_blog.svg" /></p>
<p><img loading="lazy" class="img-responsive w-100" alt="Bitcoin Miners: Hash Rate, Bitcoin Holdings, and Enterprise Value" src="https://www.vaneck.com/contentassets/18345ce50dc94641bd186ccf24324ba0/5948_bitcoin-chaincheck-for-mid-july-2025_table-1_2025-07_v1_blog.svg" /></p>
<p class="chart-disclosure">Source: Bloomberg, Company Filings, VanEck Research as of 7/21/2025. <strong>Past performance is no guarantee of future results. Not intended as a recommendation to buy or sell any securities named herein.</strong></p>
<ul class="content-list">
<li class="mt-2">CORZ, WULF, and BTDR carry the highest EV/EH/s multiples, reflecting investor belief in AI monetization. In BTDR&rsquo;s case, its emerging ASIC business is likely also a significant component of its valuation.</li>
<li class="mt-2">IREN and RIOT valuations are modest despite their scale and AI/HPC potential, suggesting execution risk or AI skepticism.</li>
<li class="mt-2">CLSK stands out as the cleanest pure-play benchmark with no AI premium baked in.</li>
<li class="mt-2">Despite AI/HPC initiatives, BITF and HIVE valuations are lower than CLSK, suggesting even deeper execution risk and AI skepticism.</li>
<li class="mt-2">CANG trades below cash/BTC, implying the market assigns negative value to their ops.</li>
</ul>
<p>This wide dispersion in valuations reflects a sector in transition, where some miners are being rewarded for AI/HPC exposure, while others are still priced closer to pure-play Bitcoin operators.</p>
<h2>Successful AI/HPC Pivoters</h2>
<p>At the top of the BTC-adjusted EV/EH/s chart are Core Scientific (CORZ) and TeraWulf (WULF), both of which have executed major deals with neoclouds that validate their pivot toward AI/HPC hosting infrastructure. CORZ, in particular, signed a gold-standard agreement with CoreWeave, which has since evolved into a full acquisition. The all-stock deal values CORZ at <strong>~$9 billion</strong>, less than the projected <strong>$10 billion</strong> in lease savings CoreWeave expects to realize from the transaction. CORZ shareholders will own less than <strong>10%</strong> of the combined entity, receive no cash, and are subject to a fixed exchange ratio. With no premium paid for the mining business and no retained control, the market appears to value CORZ&rsquo;s remaining <strong>~500 MW</strong> of gross BTC mining infrastructure at effectively <strong>$0</strong>. CORZ shares fell <strong>~31%</strong> in the week following the <a href="https://investors.corescientific.com/news-events/press-releases/detail/119/coreweave-to-acquire-core-scientific" title="CoreWeave to Acquire Core Scientific" target="_blank" rel="noopener"><strong>announcement</strong></a> on Monday, July 7th, dragged down by CRWV, which declined <strong>24%</strong> over the same period. This deal resembles a strategic acquisition of a critical infrastructure vendor, rather than a growth-driven acquisition that rewards CORZ shareholders with a premium.</p>
<p>For these reasons, CRWV may ultimately need to increase its offer before CORZ shareholders approve the merger, which is currently expected to close in Q4 2025. However, under definitive terms, the deal already has CORZ management&rsquo;s approval, limiting the likelihood of a higher bid.</p>
<p>While the all-stock deal has dampened some expectations for miners&rsquo; opportunities in AI/HPC, it nevertheless validates their potential. As reflected in MVDAPP&rsquo;s performance, miners pursuing AI/HPC pivots have rallied since the CORZ deal: at the time of writing on July 21st, RIOT, IREN, CIFR, and HUT are up <strong>24%</strong>, <strong>11%</strong>, <strong>10%</strong>, and <strong>2%</strong>, respectively, since the CORZ and CRWV deal was announced on July 7th.</p>
<h2>Aspirational Pivoters with Potential Optionality</h2>
<p>Clustered in the middle of the chart are Hut 8 (HUT), Cipher Mining (CIFR), Iris Energy (IREN), and Riot Platf toward AI or HPC, but remain early in the execution phase. For example, HUT&rsquo;s newly <a href="https://hut8.com/2025/06/30/hut-8-energizes-vega-data-center/" title="Hut 8 Energizes Vega Data Center" target="_blank" rel="noopener"><strong>energized</strong></a> <strong>205 MW</strong> Vega site is designed for potential AI optionality: it uses proprietary rack-based architecture to house its Bitcoin mining ASICs, emulating the form factor used by traditional AI/HPC data centers, and can support up to <strong>180 kW per rack</strong>, exceeding the requirements of existing NVIDIA Blackwell GPUs. Through this approach, Bitcoin mining serves as Hut 8&rsquo;s &ldquo;anchor tenant&rdquo;, so to speak, enabling the company to finance infrastructure capable of more than doubling the company&rsquo;s hashrate while preserving the site&rsquo;s potential for future upgrades supporting more advanced AI/HPC use cases.</p>
<p>Similarly, in January, RIOT <a href="https://www.riotplatforms.com/riot-platforms-launches-formal-evaluation-of-potential-ai-hpc-uses-for-remaining-600-mw-of-power-capacity-at-corsicana-facility/" title="Riot Platforms Launches Formal Evaluation of Potential AI/HPC Uses for Remaining 600 MW of Power Capacity at Corsicana Facility" target="_blank" rel="noopener"><strong>announced</strong></a> that it would pause its Phase II mining expansion at its <strong>1 GW</strong> Corsicana facility to launch an AI/HPC feasibility study for the site&rsquo;s remaining <strong>600 MW</strong> of power capacity. Along with Hut 8&rsquo;s site in Vega, we toured Corsicana and spoke to RIOT&rsquo;s management in June, who told us that they are not only hopeful to secure a deal and break ground for an on-site AI/HPC data center within a year, but even to evaluate retrofitting the existing <strong>400 MW</strong> of Bitcoin mining for AI use cases. While that decision is several years off, the existing ASIC &ldquo;anchor tenants&rdquo; will pay an estimated additional <strong>10,000-15,000 BTC</strong> before the next halving, pointing to the value of mining power capacity and its potential repurposing. Like Corsicana&rsquo;s proximity to Dallas/Fort Worth, RIOT&rsquo;s other major site, Rockdale, is <strong>~50 miles</strong> from Austin, placing it in an attractive market to meet AI inference demand and draw talent. With <strong>700 MW</strong>, this mining site&mdash;North America&rsquo;s largest by developed capacity&mdash;is another contender for an AI/HPC retrofit deal.</p>
<p>Like RIOT, CIFR has two large-scale Texas sites, Black Pearl and Barber Lake. Black Pearl&rsquo;s <strong>300 MW</strong> power capacity is split into two <strong>150 MW</strong> phases: Phase I is dedicated to air-cooled Bitcoin mining, slated to add <strong>9.6 EH/s</strong> by Q3&rsquo;25, and is <a href="https://investors.ciphermining.com/news-releases/news-release-details/cipher-mining-surpasses-hashrate-growth-forecasts-black-pearl" title="Cipher Mining Surpasses Hashrate Growth Forecasts at Black Pearl and Announces June 2025 Operational Update" target="_blank" rel="noopener"><strong>ahead</strong></a> of schedule as of early July; Phase II, meanwhile, remains in the process of evaluating its potential for HPC. Also on the HPC front, in early May, CIFR <a href="https://investors.ciphermining.com/static-files/7300be48-81d0-499c-9914-32c9ac57938b" title="Cipher Mining - Presentation for Business Update" target="_blank" rel="noopener"><strong>announced</strong></a> signing Fortress Credit Advisors as a JV financing partner for its Barber Lake site, which features <strong>300 MW</strong> of approved ERCOT interconnection agreements, a newly constructed substation, and a signed MOU for an additional <strong>500 MW</strong> data center. Multiple HPC tenants are under NDA as they perform due diligence on the site. In a positive outcome, CEO Tyler Page <a href="https://www.investing.com/news/transcripts/earnings-call-transcript-cipher-mining-q1-2025-posts-unexpected-earnings-beat-93CH-4025129" title="Earnings call transcript: Cipher Mining Q1 2025 posts unexpected earnings beat" target="_blank" rel="noopener"><strong>anticipates</strong></a> retaining <strong>40%</strong> of the economics by contributing the site&rsquo;s land, substation, and interconnect (no cash)&mdash;implying significant upside potential for the development of a <strong>$3.2 billion</strong> (<strong>$ 10.7 million/MW</strong>) data center.</p>
<p>IREN, the best-performing miner in our coverage YTD (<strong>+60%</strong>), has stood out both for its rapid <strong>50 EH/s</strong> buildout and for the potential AI/HPC optionality that comes with it. Between June 2024 and June 2025, IREN's production reports show that its hashrate grew from<strong> 10</strong> <strong>to</strong> <strong>50 EH/s</strong>, thanks to the rapid buildout of its five-phase Childress site, now totaling <strong>650 MW</strong> of operating Bitcoin mining data centers. The site is on target to energize its first AI-dedicated building, Horizon 1, by Q4&rsquo;25, delivering up to <strong>50MW</strong> of IT load with <strong>200kW</strong> rack densities and setting the stage for further on-site buildouts with Horizon 2 and beyond. Whereas older mining sites were typically built without alternative use cases in mind, IREN&rsquo;s newer, modular Bitcoin mining data centers are ostensibly designed to be more suited for AI/HPC-capable retrofits. And, while IREN paused its hashrate growth after hitting <strong>50 EH/s</strong> in June, its Sweetwater 1 and 2 sites targeting energization in April 2026 and late 2027, respectively, give the company a sizable growth pipeline with the potential to develop one of the world&rsquo;s largest Bitcoin mining or AI/HPC data centers. Like most other miners, however, IREN&rsquo;s potential AI/HPC far capacity exceeds its ability to purchase and operate its own GPUs. To fully realize its potentially multi-GW AI/HPC capacity, it needs a customer like CoreWeave.</p>
<p>On a much smaller scale, IREN has developed its own AI Cloud since August 2023, reaching <strong>1.9K</strong> NVIDIA GPUs as of its Q1 2025 update. This month, IREN more than doubled its GPU fleet, spending <strong>$130 million</strong> to add <strong>~2.4k</strong> NVIDIA GPUs (plus fit-out costs incl. servers, storage, and ancillary equipment) to its Prince George, BC campus. At <strong>50MW</strong>, Prince George can host over <strong>20K</strong> Blackwell GPUs, implying <strong>~$1.1 billion +</strong> in GPUs costs for each of its <strong>50MW</strong> data centers.</p>
<h2>Pure-Play Bitcoin Miners and Overlooked Outliers</h2>
<p>Toward the lower end of the EV/EH/s spectrum lie more pure-play Bitcoin firms like Marathon (MARA), CleanSpark (CLSK), Bitfarms (BITF), Hive Digital Technologies (HIVE), and Canaan (CANG).</p>
<p>CLSK serves as a particularly useful benchmark for a pure-play miner without other product lines or AI exposure. While primarily a Bitcoin-only operation, too, MARA may benefit from a premium thanks to holding the largest public equity BTC treasury aside from Strategy (MSTR).</p>
<p>While BITF is also pursuing the HPC hosting pivot, it appears to be the most doubted. Nevertheless, the company has no plans to make large miner purchases in 2025 and 2026, focusing entirely on developing U.S. energy &amp; HPC infrastructure. In April, the company entered a private debt facility with Macquarie Group for up to <strong>$300 million</strong> to fund the initial development of its HPC project at Panther Creek, one of the PJM (Pennsylvania-New Jersey-Maryland Interconnection) sites it acquired from HIVE in March. The company has ambitious plans: they want to save <strong>$2-4mn</strong> <strong>(20-40%!)</strong> of the <strong>~$10mn/MW</strong> in capex it takes to build an AI/HPC data center by eliminating the need for traditional redundancy equipment (e.g., diesel generators). As CEO Ben Gagnon <a href="https://www.youtube.com/watch?v=jvtIav7geGA" title="Bitfarms Q4 &amp; FY Earnings | Latest Bitcoin Mining Stock News | Ben Gagnon CEO Q&amp;A | BITF Stock" target="_blank" rel="noopener"><strong>explains</strong></a>, the company plans to leverage its on-site power plants and treat its Bitcoin miners as a battery, shutting the miners down temporarily to redirect electricity to the AI/HPC data center in the rare event of a primary power failure. While this hasn&rsquo;t been applied to AI/HPC data centers before, it is effectively the same concept as Bitcoin miners curtailing their power during times of peak grid demand. Such demand response programs have enabled Texas&rsquo;s ERCOT grid to <a href="https://www.mara.com/posts/bitcoin-mining-the-key-to-solving-renewable-energy-intermittency?utm_source=chatgpt.com" title="Bitcoin Mining" target="_blank" rel="noopener"><strong>achieve</strong></a> better stability, pricing, and increased investment in renewables. In the case of BITF, the company wants to internalize those curtailment benefits to cheapen its HPC data center buildout while earning Bitcoin, replacing idle redundancy infrastructure with revenue-generating ASICs. It remains to be seen, however, whether Macquarie&rsquo;s development milestones and BITF&rsquo;s prospective AI/HPC customers will tolerate this approach, and that is if the engineering even proves feasible. We also note that BITF&rsquo;s stock has suffered as a result of RIOT&rsquo;s sales following RIOT&rsquo;s attempted takeover. In September 2024, RIOT held as much as <strong>19.9%</strong> of BITF&rsquo;s outstanding common shares. In more recent months, RIOT&rsquo;s share of BITF has fallen from <strong>14.3%</strong> ownership on June 10th to <strong>10.3%</strong> ownership on July 14th. With financing, engineering, and RIOT&rsquo;s overhanging shares all presenting risk, we view BITF as an underdog.</p>
<p>Until the recent rally, HIVE&rsquo;s operating business was trading below <strong>$0</strong> after stripping out its relatively sizable Bitcoin holdings. Considering its rapid EH/s growth in Paraguay and growing cloud AI business, we think HIVE looks cheap. With BTBT spinning out its WhiteFiber HPC business and <a href="https://bit-digital.com/press-releases/bit-digital-inc-announces-strategic-shift-to-ethereum-treasury-and-staking-operations/" title="Bit Digital Inc. Announces Strategic Shift to Ethereum Treasury and Staking Operations" target="_blank" rel="noopener"><strong>pivoting</strong></a> fully to ETH in June, HIVE (along with BTDR, discussed below) is one of the only two other miners in our coverage with a GPU Cloud service, Buzz HPC. As of HIVE&rsquo;s Q1'25 <a href="https://www.hivedigitaltechnologies.com/medias/uploads/HIVE_Earnings_Q4_F2025.pdf" title="Hive - Q4 F2025 Results Webcast" target="_blank" rel="noopener"><strong>presentation</strong></a>, the company has <strong>4,000</strong> NVIDIA A-Series GPUs and <strong>848</strong> H-Series GPUs, achieving a <strong>$20M ARR</strong>. While HIVE&rsquo;s smaller scale and pipeline make it incapable of achieving the hyperscaler deals that IREN is pursuing, achieving predictable AI cashflows should help both companies unlock new financing pathways, differentiating them from other miners.</p>
<p>It reasons that CANG&mdash;which has no power infrastructure and thus pays a premium for its 100% hosted capacity&mdash;places last on an EV/EH/s basis, as it is singularly focused on BTC accumulation but has not formally launched a &ldquo;value-additive&rdquo; treasury strategy like MSTR&rsquo;s.</p>
<h2>Vertically Integrated and Idiosyncratic: Bitdeer (BTDR)</h2>
<p>By developing its own brand of Bitcoin mining machines, the SEALMINER series, Bitdeer occupies a unique position amongst this peer group. As of this month&rsquo;s production <a href="https://ir.bitdeer.com/news-releases/news-release-details/bitdeer-announces-june-2025-production-and-operations-update" title="Bitdeer Announces June 2025 Production and Operations Update" target="_blank" rel="noopener"><strong>update</strong></a>, BTDR has manufactured <strong>14.9 EH/s</strong> of the planned <strong>16.0 EH/s</strong> of its second-generation miner, the SEALMINER A2, shipping <strong>5.3 EH/s</strong> to customers and retaining <strong>9.6 EH/s</strong> for its use. Like HUT, BTDR&rsquo;s rapid hashrate growth trajectory potentially explains its high EV/EH/s, as the company expects to more than double its hashrate from <strong>16.5 EH/s</strong> to <strong>40.0 EH/s</strong> by the end of October 2025.</p>
<p>It is encouraging to see BTDR eating its own cooking with the SEALMINER A2, which yields a power efficiency of <strong>14.9 J/TH</strong>. If the A2&rsquo;s performance holds up in the field, and the next-generation SEALMINER A3 &amp; A4 ASICs can match the <strong>11-12 J/TH</strong> and <strong>5.5-6.0 J/TH</strong> power efficiencies <a href="https://www.bitdeer.com/sealminer/roadmap" title="SEALMINER Technology Roadmap" target="_blank" rel="noopener"><strong>advertised</strong></a> on their roadmap, it could spell an enormous win for the company. Bitmain currently <a href="https://www.jbs.cam.ac.uk/wp-content/uploads/2025/04/2025-04-cambridge-digital-mining-industry-report.pdf" title="Cambridge Digital Mining Industry Report" target="_blank" rel="noopener"><strong>dominates</strong></a> the ASIC market with an estimated <strong>82%</strong> share. Its most efficient next-generation model, the S23 Hyd&mdash;scheduled to ship in January 2026&mdash;is expected to deliver <strong>9.5 J/TH</strong> in power efficiency. That&rsquo;s more than 50% less efficient than the <strong>5.5&ndash;6.0 J/TH</strong> target range advertised for Bitdeer&rsquo;s SEALMINER A4. As other miners are pursuing AI/HPC, if BTDR can &ldquo;sell picks and shovels&rdquo; to diversify its revenues away from the fundamentally flawed business of pure-play Bitcoin mining, it could help the company finance more value-accretive opportunities in AI/HPC hosting infrastructure or even its own GPU fleet.</p>
<p>Still, SEALMINER's success is far from guaranteed. It must not only match or exceed Bitmain&rsquo;s performance claims in the field, but also overcome the broader moat Bitmain enjoys via its financing partners, resale network, and entrenched miner loyalty. Without equivalent ecosystem trust or liquidity, even a technically superior chip may struggle to gain commercial traction, especially if deployment is delayed or yields underwhelm.</p>
<p>BTDR also has potential in the AI/HPC landscape. Last year, BTDR engaged TLM Group for feasibility assessments of its <strong>2.5 GW</strong> power portfolio, which <a href="https://ir.bitdeer.com/news-releases/news-release-details/bitdeer-announces-september-2024-production-and-operations" title="Bitdeer Announces September 2024 Production and Operations Update" target="_blank" rel="noopener"><strong>yielded</strong></a> &ldquo;largely positive&rdquo; results for the company&rsquo;s two Ohio sites. This May, the company <a href="https://ir.bitdeer.com/news-releases/news-release-details/bitdeer-announces-april-2025-production-and-operations-update" title="Bitdeer Announces April 2025 Production and Operations Update" target="_blank" rel="noopener"><strong>reported</strong></a> pausing mining-related construction at its <strong>570 MW</strong> Clarington, Ohio site due to advancing HPC/AI discussions. Apparently, it resumed the site&rsquo;s mining-related construction &ldquo;with full optionality to reassess and repurpose for HPC at a later date.&rdquo; Setting the mixed signals on BTDR&rsquo;s AI/HPC hosting potential aside, like IREN and HIVE, the company has invested in its own cloud GPU services through Bitdeer AI, which offers AI model training and deployment. While Bitdeer has not disclosed the exact size of its GPU Cloud business, its Bitdeer AI division <a href="https://www.bitdeer.ai/en/blog/bitdeer-ai-wins-2025-ai-breakthrough-award-for-mlops-innovation/" title="Bitdeer AI Wins 2025 AI Breakthrough Award for MLOps Innovation" target="_blank" rel="noopener"><strong>operates</strong></a> NVIDIA H100-, H200-, and upcoming GB200-powered clusters across at least seven countries, including the U.S., Canada, Singapore, and the Netherlands. The platform offers a full-stack MLOps suite comparable to other emerging GPU clouds, indicating significant infrastructure investment and a maturing product portfolio.</p>
<h2 id="self-custody-vs-exchange-rate" class="jump-link-nav anchored-block" data-jumplink-title="Self-Custody vs. Exchange Usage">Where Are the Buyers? Self-Custody Slows as Exchanges Scale</h2>
<h3>Wallet Use Drops to 23% as Exchanges Dominate</h3>
<p><img loading="lazy" alt="Wallet Use Drops to 23% as Exchanges Dominate" class="img-responsive w-100" src="https://www.vaneck.com/contentassets/18345ce50dc94641bd186ccf24324ba0/5948_bitcoin-chaincheck-for-mid-july-2025_chart-4_2025-7_v1_blog.svg" /></p>
<p class="chart-disclosure">Source: Sensor Tower as of 7/9/2025. <strong>Past performance is no guarantee of future results.</strong></p>
<p>As the old saying goes, &ldquo;Not your keys, not your crypto.&rdquo; Between the infamous collapses of crypto institutions like Mt. Gox, Celsius, and FTX, self-custody hardliners have repeated this mantra, warning users about the dangers of outsourcing their crypto wallet&rsquo;s security. Yet if you ask any crypto native how they store their private keys &mdash; to the extent that they&rsquo;ll even tell you &mdash; it will likely sound risky, contrived, or downright precarious. Whether scribbled on paper, stashed in a password manager, or split across seed vaults, these practices reveal an uncomfortable truth: self-custody, while philosophically pure, remains operationally brittle for most users.</p>
<p>Whether self-custody is &ldquo;better&rdquo; is a personal decision hinging on factors such as one&rsquo;s location, lifestyle, risk tolerance, technical knowledge, free time, and trust in institutions. However, the market tells a clearer story: users are voting with their thumbs, and they&rsquo;re increasingly choosing custodial exchanges over non-custodial wallets. Monthly active users (MAUs) for exchange apps, such as Binance, Robinhood, and Coinbase have remained resilient, even as overall crypto app usage has softened. By contrast, many self-custody wallets, such as MetaMask, Trust Wallet, and Tonkeeper have experienced declines in users across nearly every time frame. In aggregate, the exchanges in our analysis gained <strong>~4 million MAUs (3%)</strong> year-over-year, while the wallets collectively lost <strong>~14 million MAUs (28%)</strong> over the same time frame. Put differently, wallets&rsquo; share of users has dropped from <strong>30%</strong> to <strong>23%</strong> over the past year, a trend indicating a broader preference for ease of use and custodial safety nets among new users, even if it means ceding control of private keys. Notably, however, this data doesn&rsquo;t include the growing popularity of ETPs or crypto treasury equities, which arguably offer the benefits of accessibility and third-party custody even more effectively than exchanges.</p>
<h3>Top 24 Crypto Apps by Monthly Active Users (millions), Growth (%)</h3>
<p><img loading="lazy" alt="Top 24 Crypto Apps by Monthly Active Users (millions), Growth (%)" class="img-responsive w-100" src="https://www.vaneck.com/contentassets/18345ce50dc94641bd186ccf24324ba0/5948_bitcoin-chaincheck-for-mid-july-2025_table-2_2025-07_v2.svg" /></p>
<p class="chart-disclosure">Source: Sensor Tower as of 7/9/2025. <strong>Past performance is no guarantee of future results. Not intended as a recommendation to buy or sell any securities named herein.</strong></p>
<p>However, we do not want to ascribe exchange&rsquo;s recent success over wallets purely to their custodial services. Many crypto-savvy users may be on exchanges <i>despite</i> the custodial risks associated with them. Take, for example, Robinhood, Bitget, and Kraken, which offer trading products beyond cryptocurrency, such as equities, spot, futures, and FX trading. For active traders, the ability to unify their crypto liquidity with these other markets may be the driving factor in their decision&mdash;even if they remain self-custody purists ideologically, or with other less actively managed parts of their portfolio.</p>
<p>To the extent that this is the case, we caution against interpreting this trend as fundamentally bearish for self-custody. Advancements in real-world asset tokenization, such as Robinhood&rsquo;s recent xTokens launch, pave the way for a world where the programmability and interoperability of on-chain DeFi ecosystems offer more features than any centralized exchange.</p>
<p><strong>Links to third party websites are provided as a convenience and the inclusion of such links does not imply any endorsement, approval, investigation, verification or monitoring by us of any content or information contained within or accessible from the linked sites. By clicking on the link to a non-VanEck webpage, you acknowledge that you are entering a third-party website subject to its own terms and conditions. VanEck disclaims responsibility for content, legality of access or suitability of the third-party websites.</strong></p>
<p>To receive more <strong><a href="https://www.vaneck.com/us/en/insights/digital-assets/" title="Digital Assets Insights">Digital Assets</a></strong> insights, <strong><a href="https://www.vaneck.com/us/en/subscribe/" title="Subscription Center">sign up in our subscription center</a></strong>.</p>
]]></content:encoded>
</item><item rdf:about="https://www.vaneck.com/us/en/blogs/thematic-investing/technology-and-esports/">
  <title>Esports Investing: How 5G, AI &amp; Cloud Gaming Are Driving Growth></title>
  <link>https://www.vaneck.com/us/en/blogs/thematic-investing/technology-and-esports/</link>
  <description><![CDATA[With innovations like AI and cloud gaming reshaping the esports ecosystem, investors have new opportunities tied to audience growth and tech-fueled monetization. Read more.]]></description>
  <dc:creator>Nick Frasse</dc:creator>
  <dc:date>07/24/2025 06:30:00</dc:date>
<content:encoded><![CDATA[

<p>Tech like 5G, AI, and cloud gaming is redefining eSports by lowering entry barriers, increasing engagement, and accelerating industry growth.</p>
<ul class="content-list">
<li class="mt-2">5G is powering mobile eSports growth, enabling low-latency play and access in emerging markets.</li>
<li class="mt-2">Cloud gaming removes hardware barriers, expanding access and accelerating monetization via subscriptions.</li>
<li class="mt-2">AI boosts efficiency and engagement, from faster game development to personalized, fair gameplay.</li>
<li class="mt-2"><a href="/link/d41cc1b7916f46e5bb3ee751f311c4f2.aspx" title="ESPO - VanEck Video Gaming and eSports ETF - Overview"><strong>ESPO</strong></a> offers targeted exposure to the gaming ecosystem driving global eSports expansion.</li>
</ul>
<h2>Tech Catalysts Powering the Next Wave of Video Game Expansion</h2>
<p>The future of eSports and video games isn&rsquo;t just about better graphics or faster reflexes; it&rsquo;s about how emerging technologies like 5G, cloud gaming, and artificial intelligence (AI) are reshaping the very infrastructure and monetization models of the industry. These shifts are more than speculative; they&rsquo;re actively changing how games are played, distributed, and monetized, paving the way for significant expansion in both reach and revenue.</p>
<p>For investors, understanding these tech tailwinds is key to evaluating where growth will come from and who stands to benefit.</p>
<h2>The eSports Backdrop, Scale Meets Structural Change</h2>
<p>The core eSports audience is expected to surpass 318 million global fans by 2025, up nearly 13% year-over-year. But perhaps more important than fanbase size is the changing nature of how people play and pay.</p>
<p>Grand View Research forecasts the global eSports market to grow at a 23% CAGR through 2030, reaching over $7.5 billion in annual revenue. Unlike traditional entertainment, this market is shaped not only by content, but also by the infrastructure and platforms that enable new ways to play.</p>
<h2>Catalyst #1: 5G &ndash; Enabling the Mobile eSports Economy</h2>
<p>5G isn&rsquo;t just about faster downloads; it&rsquo;s about low latency, edge processing, and consistent performance across mobile networks. These capabilities unlock:</p>
<ul class="content-list">
<li class="mt-2">Mobile-first competitive play: Games like <em>Honor of Kings</em> and <em>PUBG Mobile</em> are already headlining eSports tournaments. Sub-30ms ping on 5G makes that possible.</li>
<li class="mt-2">Access in underserved regions: Southeast Asia and Latin America are rapidly adopting mobile eSports, leapfrogging the need for consoles or high-end PCs.</li>
<li class="mt-2">XR/AR venues and real-time experiences: 5G powers cloud-rendered immersive experiences that were previously limited by bandwidth and jitter.</li>
</ul>
<h3>5G Mobile Subscriptions Globally 2019-2030<sup>*</sup></h3>
<p><img loading="lazy" class="img-responsive w-100" alt="5G Mobile Subscriptions Globally 2019-2030" src="https://www.vaneck.com/contentassets/a26160ff9d8245619a2c4466298bb071/5952_seo-espo_chart-1_2025-7_v1_blog.svg" /></p>
<p class="chart-disclosure">Source: Ericsson, as of 11/2024. For illustrative purposes only. Not intended as a forecast or prediction of future results.&nbsp;<sup>*</sup>Projected estimates.</p>
<h2>Catalyst #2: Cloud Gaming &ndash; Lowering the Barrier to Entry</h2>
<p>Cloud gaming is removing hardware constraints from high-end gaming. Players can now access AAA titles on low-spec devices via mobile gaming platforms. Forecasts suggest the cloud gaming market will grow from $2.3 billion in 2024 to over $21 billion by 2030, a nearly 10x expansion.</p>
<p>What this means:</p>
<ul class="content-list">
<li class="mt-2">Casual gamers become active participants.</li>
<li class="mt-2">Subscription models replace single-game sales.</li>
<li class="mt-2">Publishers recoup development costs faster with broader day-one access.</li>
</ul>
<h3>Subscriber Count of Leading Cloud Gaming and Gaming Subscription Services in 2025</h3>
<p><img loading="lazy" class="img-responsive w-100" alt="Subscriber Count of Leading Cloud Gaming and Gaming Subscription Services in 2025" src="https://www.vaneck.com/contentassets/02a18d8bacc44701bc16f8bea04f5529/5952_seo-espo_chart-2_2025-7_v1_blog.svg" /></p>
<p class="chart-disclosure">Source: Sony, Nintendo, Microsoft, Electronic Arts, PC Magazine, Statista, as of 06/2025. For illustrative purposes only.</p>

<p><a href="/link/d41cc1b7916f46e5bb3ee751f311c4f2.aspx" title="ESPO - VanEck Video Gaming and eSports ETF - Overview"><strong>ESPO</strong></a> provides exposure to key cloud gaming enablers including game publishers, infrastructure providers, and monetization platforms all positioned to benefit from the accessibility and recurring revenue models cloud gaming enables.</p>
<h2>Catalyst #3: AI &ndash; Unlocking Monetization &amp; Efficiency</h2>
<p>AI is transforming the development, personalization, and competitive integrity of games. Game studios are increasingly using generative AI tools to accelerate asset creation and dialogue writing, cutting development cycles and costs. AI-powered assistants are being embedded directly into games to offer real-time coaching, gameplay analysis, and difficulty adjustments that keep players engaged. On the competitive side, advanced anti-cheat systems powered by machine learning are preserving the fairness and integrity of eSports tournaments a critical factor in attracting sponsors and media partners.</p>
<h3>Gen AI Tool Usage in Select Areas of Game Development in 2025</h3>
<p><img loading="lazy" class="img-responsive w-100" alt="Gen AI Tool Usage in Select Areas of Game Development in 2025" src="https://www.vaneck.com/contentassets/f16f17f4293b444a97c2fe49bc0fd1fe/5952_seo-espo_chart-3_2025-7_v1_blog.svg" /></p>
<p class="chart-disclosure">Source: Konvoy, Statista, as of 03/2025. For illustrative purposes only.</p>
<p>Companies included in <a href="/link/d41cc1b7916f46e5bb3ee751f311c4f2.aspx" title="ESPO - VanEck Video Gaming and eSports ETF - Overview"><strong>ESPO</strong></a> integrate AI across content creation, player personalization, and integrity tools, enabling both cost efficiencies and new monetization paths within the gaming ecosystem.</p>
<h2>The Investment Case for Video Gaming and eSports</h2>
<p>With structural catalysts in motion, the question becomes how to invest in this transformation.</p>
<p>VanEck&rsquo;s Video Gaming and eSports ETF (<a href="/link/d41cc1b7916f46e5bb3ee751f311c4f2.aspx" title="ESPO - VanEck Video Gaming and eSports ETF - Overview"><strong>ESPO</strong></a>) offers:</p>
<ul class="content-list">
<li class="mt-2">Pure-play exposure to companies deriving &gt;50% of revenue from video gaming and eSports.</li>
<li class="mt-2">Focused diversification across 25&ndash;30 companies, reducing single-name risk.</li>
<li class="mt-2">Direct participation in technologies driving growth across mobile, cloud, and AI.</li>
</ul>
<p>The portfolio includes leading game developers, platform operators, and infrastructure providers, all positioned to benefit from a broader player base, recurring revenue models, and more efficient content creation.</p>
<h2>Don&rsquo;t Bet on One Platform, Own the Ecosystem</h2>
<p>As 5G, cloud gaming, and AI reshape the gaming landscape, investors don&rsquo;t need to guess which title will be the next <i>Fortnite</i> or which platform will win the cloud gaming wars.</p>
<p>Instead, the opportunity lies in owning the ecosystem: the publishers, platforms, and monetization engines behind this evolution.</p>
<p>eSports is no longer niche; it&rsquo;s a technology-powered media format with global scale, sticky user engagement, and expanding monetization paths. <a href="/link/d41cc1b7916f46e5bb3ee751f311c4f2.aspx" title="ESPO - VanEck Video Gaming and eSports ETF - Overview"><strong>ESPO</strong></a> offers a focused exposure into that growth.</p>

<p>To receive more <a href="https://www.vaneck.com/us/en/insights/thematic-investing/" title="Thematic Investing Insights"><strong>Thematic Investing</strong></a> insights, <a href="https://www.vaneck.com/us/en/subscribe/" title="Subscription Center"><strong>sign up in our subscription center</strong></a>.</p>
]]></content:encoded>
</item><item rdf:about="https://www.vaneck.com/us/en/blogs/income-investing/clos-positioning-for-resilience-into-the-second-half-of-the-year/">
  <title>CLOs: Positioning for Resilience into the Second Half of the Year></title>
  <link>https://www.vaneck.com/us/en/blogs/income-investing/clos-positioning-for-resilience-into-the-second-half-of-the-year/</link>
  <description><![CDATA[CLO spreads tightened in Q2 after early volatility, fueling a broad rally. With tight valuations and trade uncertainty, we favor higher-quality tranches and yield-driven strategies going forward.]]></description>
  <dc:creator> </dc:creator>
  <dc:date>07/17/2025 06:30:00</dc:date>
<content:encoded><![CDATA[

<p id="overview" class="jump-link-nav anchored-block" data-jumplink-title="Overview">CLO spreads widened early in the quarter after &ldquo;Liberation Day&rdquo; but ended the quarter tighter than where they started. This tightening marked the beginning of a sustained rally across risk assets, setting the stage for stronger CLO performance, especially in the bottom tranches. During the quarter, CLOI slightly underperformed its benchmark by 13 basis points (bps) (1.57% vs 1.70%) and was approximately in line on a year-to-date (YTD) basis (2.76% vs 2.81%). In the second quarter, the <a href="/link/e090deaddc774ac699a04b959d9254c6.aspx" title="CLOI - VanEck CLO ETF"><strong>VanEck CLO ETF (CLOI)</strong></a> changed its primary performance benchmark to the J.P. Morgan CLO IG Index from the J.P. Morgan CLO Index, which we believe is a better reflection of its investment grade strategy. The <a href="/link/d2f16468a9f14c1e807f6bb7fb597a3e.aspx" title="CLOB - VanEck AA-BB CLO ETF"><strong>VanEck AA-BB CLO ETF (CLOB)</strong></a> underperformed its benchmark in the quarter, the J.P. Morgan CLOIE Balanced Mezzanine Index, by 26bps (2.13% vs 2.39%), and slightly underperformed YTD by 15bps. As markets weigh the path of monetary policy against ongoing trade uncertainty and evolving credit conditions, CLO valuations and investor sentiment are likely to be shaped by shifting risk dynamics. We believe returns will be primarily driven by yield going forward, and we think CLOs have attractive total return potential relative to other equivalently rated fixed income assets under these conditions. However, given tight valuations we currently maintain an up-in-quality bias, focusing purchases higher in the capital stack where there is value and select short spread-duration purchases lower in the capital stack. With volatility expected to persist, security selection and a nimble approach will be critical in the second half of the year.</p>
<h3>CLOI Average Annual Total Returns<sup>*</sup>&nbsp;(%)</h3>
<div class="wrapped-div">
<table style="width: 100%;">
<tbody>
<tr class="tbl-data">
<td class="tbl-header last" colspan="9">As of June 30, 2025</td>
</tr>
<tr class="tbl-data">
<td class="data-head last text-right">&nbsp;</td>
<td class="data-head last text-right">1 MO</td>
<td class="data-head last text-right">3 MO</td>
<td class="data-head last text-right">YTD</td>
<td class="data-head last text-right">1 YR</td>
<td class="data-head last text-right">3 YR</td>
<td class="data-head last text-right">5 YR</td>
<td class="data-head last text-right">10 YR</td>
<td class="data-head last text-right">LIFE<br />06/21/22</td>
</tr>
<tr class="tbl-data">
<td class="data-td last text-left">CLOI (NAV)</td>
<td class="data-td data last text-right">0.47</td>
<td class="data-td data last text-right">1.57</td>
<td class="data-td data last text-right">2.76</td>
<td class="data-td data last text-right">6.48</td>
<td class="data-td data last text-right">7.84</td>
<td class="data-td data last text-right">--</td>
<td class="data-td data last text-right">7.80</td>
</tr>
<tr class="tbl-data">
<td class="data-td last text-left">CLOI (Share Price)</td>
<td class="data-td data last text-right">0.46</td>
<td class="data-td data last text-right">1.67</td>
<td class="data-td data last text-right">2.73</td>
<td class="data-td data last text-right">6.50</td>
<td class="data-td data last text-right">7.69</td>
<td class="data-td data last text-right">--</td>
<td class="data-td data last text-right">7.78</td>
</tr>
<tr class="tbl-data">
<td class="data-td last text-left">J.P. Morgan CLO IG Index</td>
<td class="data-td data last text-right">0.56</td>
<td class="data-td data last text-right">1.70</td>
<td class="data-td data last text-right">2.81</td>
<td class="data-td data last text-right">6.42</td>
<td class="data-td data last text-right">7.78</td>
<td class="data-td data last text-right">--</td>
<td class="data-td data last text-right">7.65</td>
</tr>
<tr class="tbl-data">
<td class="data-td last text-left">J.P. Morgan Collateralized Loan Obligation Index</td>
<td class="data-td data last text-right">0.58</td>
<td class="data-td data last text-right">1.80</td>
<td class="data-td data last text-right">2.89</td>
<td class="data-td data last text-right">6.70</td>
<td class="data-td data last text-right">8.23</td>
<td class="data-td data last text-right">--</td>
<td class="data-td data last text-right">8.08</td>
</tr>
</tbody>
</table>
</div>
<p class="chart-disclosure"><strong><sup>*</sup>&nbsp;Returns less than one year are not annualized. Effective May 1, 2025, the J.P. Morgan CLO IG Index replaced the J.P. Collateralized Loan Obligation Index as the Fund's benchmark</strong></p>
<p class="chart-disclosure"><strong>The performance data quoted represents past performance. Past performance is not a guarantee of future results. Investment return and principal value of an investment will fluctuate so that an investor's shares, when redeemed, may be worth more or less than their original cost. Performance may be lower or higher than performance data quoted. Please call 800.826.2333 or visit vaneck.com for performance current to the most recent month ended.</strong></p>
<p class="chart-disclosure">CLOI&rsquo;s gross expense ratio is 0.40% and the total expense ratio is 0.40%. Van Eck Associates Corporation (the &ldquo;Adviser&rdquo;) will pay all expenses of the Fund, except for the fee payment under the investment management agreement, acquired fund fees and expenses, interest expense, offering costs, trading expenses, taxes and extraordinary expenses. Notwithstanding the foregoing, the Adviser has agreed to pay the offering costs until at least May 1, 2025. &ldquo;Other Expenses&rdquo; have been restated to reflect current fees.</p>
<h3>CLOB Average Annual Total Returns<sup>*</sup>&nbsp;(%)</h3>
<div class="wrapped-div">
<table style="width: 100%;">
<tbody>
<tr class="tbl-data">
<td class="tbl-header last" colspan="9">As of June 30, 2025</td>
</tr>
<tr class="tbl-data">
<td class="data-head last text-right">&nbsp;</td>
<td class="data-head last text-right">1 MO</td>
<td class="data-head last text-right">3 MO</td>
<td class="data-head last text-right">YTD</td>
<td class="data-head last text-right">1 YR</td>
<td class="data-head last text-right">3 YR</td>
<td class="data-head last text-right">5 YR</td>
<td class="data-head last text-right">10 YR</td>
<td class="data-head last text-right">LIFE<br />06/21/22</td>
</tr>
<tr class="tbl-data">
<td class="data-td last text-left">CLOB (NAV)</td>
<td class="data-td data last text-right">0.73</td>
<td class="data-td data last text-right">2.13</td>
<td class="data-td data last text-right">3.28</td>
<td class="data-td data last text-right">--</td>
<td class="data-td data last text-right">6.25</td>
</tr>
<tr class="tbl-data">
<td class="data-td last text-left">CLOB (Share Price)</td>
<td class="data-td data last text-right">0.75</td>
<td class="data-td data last text-right">2.00</td>
<td class="data-td data last text-right">3.10</td>
<td class="data-td data last text-right">--</td>
<td class="data-td data last text-right">6.09</td>
</tr>
<tr class="tbl-data">
<td class="data-td last text-left">J.P. Morgan CLOIE Balanced Mezzanine Index</td>
<td class="data-td data last text-right">0.68</td>
<td class="data-td data last text-right">2.39</td>
<td class="data-td data last text-right">3.43</td>
<td class="data-td data last text-right">--</td>
<td class="data-td data last text-right">6.38</td>
</tr>
</tbody>
</table>
</div>
<p class="chart-disclosure"><strong><sup>*</sup>&nbsp;Returns less than one year are not annualized. Effective May 1, 2025, the J.P. Morgan CLO IG Index replaced the J.P. Collateralized Loan Obligation Index as the Fund's benchmark</strong></p>
<p class="chart-disclosure"><strong>The performance data quoted represents past performance. Past performance is not a guarantee of future results. Investment return and principal value of an investment will fluctuate so that an investor's shares, when redeemed, may be worth more or less than their original cost. Performance may be lower or higher than performance data quoted. Please call 800.826.2333 or visit vaneck.com for performance current to the most recent month ended.</strong></p>
<p class="chart-disclosure">CLOB&rsquo;s gross expense ratio is 0.45% and the total expense ratio is 0.45%. Van Eck Associates Corporation (the &ldquo;Adviser&rdquo;) will pay all expenses of the Fund, except for the fee payment under the investment management agreement, acquired fund fees and expenses, interest expense, offering costs, trading expenses, taxes and extraordinary expenses. Notwithstanding the foregoing, the Adviser has agreed to pay the offering costs until at least May 1, 2026. &ldquo;Other Expenses&rdquo; have been restated to reflect current fees.</p>
<h2 id="market-update" class="jump-link-nav anchored-block" data-jumplink-title="Market Update">Market Update</h2>
<p>June proved to be a strong month for risk assets. CLOs benefited from a broader market rally and generated positive returns across the capital stack. Improved investor sentiment was supported by the Federal Reserve's (the Fed&rsquo;s) dovish rhetoric, easing geopolitical tensions, and positive developments on the trade tariff front. The Fed kept policy rates unchanged, as anticipated, but markets expect potential easing later in the year, with OIS forwards pricing in ~65bps of cuts by the end of 2025. The asset class also benefitted from continued strong investor inflows, as CLO ETFs saw $1.2bn of inflows following $1bn of inflows in May. In June, 5- and 10-year Treasury rates traded 16 and 17bps lower, respectively.</p>
<p>Floating rate CLOs and bank loans underperformed high yield bonds given the rally in intermediate-term Treasury rates.</p>
<div class="wrapped-div">
<table width="100%">
<tbody>
<tr class="tbl-data">
<td class="tbl-header last text-left">Asset class</td>
<td class="tbl-header last text-right">Q2 2025 Return (%)</td>
<td class="tbl-header last text-right">YTD 2025 Return (%)</td>
<td class="tbl-header last text-right">Yield to Worst (%)</td>
<td class="tbl-header last text-right">Spreads (bps)</td>
</tr>
<tr class="tbl-data">
<td class="data-td last font-weight-normal text-left">CLOs</td>
<td class="data-td data last text-right">1.80</td>
<td class="data-td data last text-right">2.89</td>
<td class="data-td data last text-right">5.46</td>
<td class="data-td data last text-right">154</td>
</tr>
<tr class="tbl-data">
<td class="data-td last font-weight-normal text-left">CLOs IG</td>
<td class="data-td data last text-right">1.70</td>
<td class="data-td data last text-right">2.81</td>
<td class="data-td data last text-right">5.20</td>
<td class="data-td data last text-right">128</td>
</tr>
<tr class="tbl-data">
<td class="data-td last font-weight-normal text-left">CLOs Mezz</td>
<td class="data-td data last text-right">2.39</td>
<td class="data-td data last text-right">3.43</td>
<td class="data-td data last text-right">7.10</td>
<td class="data-td data last text-right">319</td>
</tr>
<tr class="tbl-data">
<td class="data-td last font-weight-normal text-left">AAA</td>
<td class="data-td data last text-right">1.60</td>
<td class="data-td data last text-right">2.70</td>
<td class="data-td data last text-right">4.96</td>
<td class="data-td data last text-right">106</td>
</tr>
<tr class="tbl-data">
<td class="data-td last font-weight-normal text-left">AA</td>
<td class="data-td data last text-right">1.84</td>
<td class="data-td data last text-right">2.92</td>
<td class="data-td data last text-right">5.34</td>
<td class="data-td data last text-right">137</td>
</tr>
<tr class="tbl-data">
<td class="data-td last font-weight-normal text-left">A</td>
<td class="data-td data last text-right">2.00</td>
<td class="data-td data last text-right">3.18</td>
<td class="data-td data last text-right">5.56</td>
<td class="data-td data last text-right">159</td>
</tr>
<tr class="tbl-data">
<td class="data-td last font-weight-normal text-left">BBB</td>
<td class="data-td data last text-right">2.08</td>
<td class="data-td data last text-right">3.20</td>
<td class="data-td data last text-right">6.77</td>
<td class="data-td data last text-right">285</td>
</tr>
<tr class="tbl-data">
<td class="data-td last font-weight-normal text-left">BB</td>
<td class="data-td data last text-right">3.62</td>
<td class="data-td data last text-right">4.40</td>
<td class="data-td data last text-right">10.43</td>
<td class="data-td data last text-right">661</td>
</tr>
<tr class="tbl-data">
<td class="data-td last font-weight-normal text-left">U.S. Agg</td>
<td class="data-td data last text-right">1.17</td>
<td class="data-td data last text-right">3.99</td>
<td class="data-td data last text-right">4.55</td>
<td class="data-td data last text-right">36</td>
</tr>
<tr class="tbl-data">
<td class="data-td last font-weight-normal text-left">Investment Grade Corporates</td>
<td class="data-td data last text-right">1.79</td>
<td class="data-td data last text-right">4.20</td>
<td class="data-td data last text-right">5.01</td>
<td class="data-td data last text-right">86</td>
</tr>
<tr class="tbl-data">
<td class="data-td last font-weight-normal text-left">High Yield Bonds</td>
<td class="data-td data last text-right">3.57</td>
<td class="data-td data last text-right">4.55</td>
<td class="data-td data last text-right">7.06</td>
<td class="data-td data last text-right">296</td>
</tr>
<tr class="tbl-data">
<td class="data-td last font-weight-normal text-left">Leveraged Loans</td>
<td class="data-td data last text-right">2.36</td>
<td class="data-td data last text-right">2.85</td>
<td class="data-td data last text-right">7.82</td>
<td class="data-td data last text-right">351</td>
</tr>
</tbody>
</table>
</div>
<p class="chart-disclosure">Source: JP Morgan and ICE Data Indices as of 6/30/2025. CLOs represented by J.P. Morgan Collateralized Loan Obligation Index, CLOs IG represented by J.P. Morgan Collateralized Loan Obligation IG Index, CLOs Mezz represented by J.P. Morgan Collateralized Loan Obligation Balanced Mezzanine Index, AAA Rated CLOs represented by J.P. Morgan CLO AAA Index, AA Rated CLOs represented by J.P. Morgan CLO AA Index, A Rated CLOs represented by J.P. Morgan CLO A Index, BBB Rated CLOs represented by J.P. Morgan CLO BBB Index, BB Rated CLOs represented by J.P. Morgan CLO BB Index, US Agg is represented by the ICE BofA US Broad Market, Investment Grade Corporates represented by ICE BofA US Corporate Index, High Yield Bonds represented by ICE BofA US High Yield Index and Leveraged Loans represented by JP Morgan Leveraged Loan Index.</p>

<p>CLO new issue supply decreased month-over-month, with $15.4bn pricing in June, compared to $20.5bn in May. Year-to-date new issue volume of $96.4bn was just slightly behind last year&rsquo;s record-setting pace. Refinancing and reset activity increased materially during the month, following depressed levels in April and May, with $29.0bn pricing, after $14.3bn in May. Total issuance (including refinancing/reset transactions) of $255.6bn is the largest volume to start a year on record. Year-to-date refinancing/reset activity of $159.2bn was at a record pace following last year&rsquo;s record volume.</p>
<p>In the secondary market, TRACE supply decreased month-over-month, with $17.9bn of volume in June compared to $25.7bn in May. Investment grade volumes decreased to $13.5bn from $19.0bn, while below investment grade volumes decreased to $4.4bn from $6.7bn. Meanwhile, total BWIC volume decreased to $3.6bn from $5.9bn in May.</p>
<p>In June, gross institutional loan issuance was $44.1bn, following $28.0bn in May. Institutional loan supply increased across all types of issuance, albeit from low levels. Opportunistic transactions including repricings picked up as the broad rally for loans expanded the share of the loan market trading at par or above, while M&amp;A and LBO activity also increased. Demand for loans slowed in June versus the prior month but still outpaced net loan supply. Retail loan funds saw net inflows of $0.3bn, versus $1.2bn in May.</p>
<p>The trailing twelve-month default rate within the Morningstar US Leveraged Loan Index increased 37bp month-over-month to 1.11%. As measured by JP Morgan, the default rate including distressed exchanges, increased 17bp to 3.79%. Activity has been elevated as borrowers with unsustainable capital structures endeavored to manage their liabilities and avoid the bankruptcy process through liability management exercises, keeping the &ldquo;official&rdquo; default rate lower than otherwise. We anticipate the default rate to remain below historical averages in the near-term for the leveraged loan market as a result. None-the-less, our expectations are that defaults, including distressed exchanges, will remain above the long-term historical average of ~3%, with the path for the default rate uncertain given rapidly changing trade policy.</p>
<p>US CLO secondary spreads tightened across most of the capital stack in the quarter. The AAA tranche tightened 17bp, the AA tranche tightened 37bp; single-A&rsquo;s, 33bp; BBB&rsquo;s, 11bp; BB&rsquo;s, 64bp; and single-B&rsquo;s widened 11bp. Meanwhile, Investment Grade Corporate tightened by 11bp, High Yield Bonds 59bp, and Leveraged Loans 49bp.</p>
<h2 id="portfolio-strategy" class="jump-link-nav anchored-block" data-jumplink-title="Portfolio Strategy">Portfolio Strategy</h2>
<p>The borrowing rate for leveraged loan companies remains high following rate increases from central banks in 2022 and 2023. While the Fed initiated a series of rate cuts starting in September 2024, inflation remains above the Fed&rsquo;s target and the labor market remains robust. The Fed has paused further action as they await more information on the path of inflation and employment, which may result from the implementation of tariffs and more robust immigration policies. The market is expecting two rate cuts in 2025. However, the Fed has signaled a wait and see approach leaving the path of policy changes an outstanding question. The Fed remains in a very tricky position as US trade policy changes rapidly and hard economic data post the imposition of tariffs has yet to come through. Cuts, should they come, will ultimately provide relief for more stressed borrowers, but the path and timing of more cuts is highly uncertain.</p>
<p>The market has stabilized since the tariff escalation and de-escalation back and forth in April, with spreads tightening materially off the wides and prices rallying back to levels seen in mid-March, where most of the market was pricing above par. Notwithstanding the more recent de-escalation of tensions, given signs of economic weakening in the US and the continued prospects of a global trade war, we prefer tranche purchases higher in the capital stack, with selective purchases of shorter spread-duration assets for lower rated credits. We believe current AAA spreads are tight, so given our up in quality bias, we believe adding AA and A rated securities make the most sense. We expect there to be additional bouts of volatility throughout the year and would like to maintain the ability to shift further into lower rated tranches during future periods of market weakness. Given the rally over the last six weeks, buying in the secondary market has become less attractive, and we now prefer purchases in the primary market, even when taking an increase in spread duration into account.</p>
<h3>CLOI Total Return and Credit Allocation</h3>
<div class="flourish-embed flourish-chart" data-src="visualisation/24286984?2429379"><script src="https://public.flourish.studio/resources/embed.js"></script><noscript><img loading="lazy" src="https://public.flourish.studio/visualisation/24286984/thumbnail" width="100%" alt="CLOI Total Return and Credit Allocation" /></noscript></div>
<p class="chart-disclosure">Source: <strong>FactSet, J.P. Morgan, VanEck</strong>, as of June 30, 2025. Index performance is not representative of Fund performance. It is not possible to invest directly in an index.</p>
<h3>CLOB Total Return and Credit Allocation</h3>
<p><img loading="lazy" class="img-responsive w-100" alt="CLOB Total Return and Credit Allocation" src="https://www.vaneck.com/contentassets/4279135e76504923a9c087d94dcaa9a2/5930_cloi-quarterly-july-2025_chart-2_2025-7_v1_blog.svg" /></p>
<p class="chart-disclosure">Source: <strong>FactSet, J.P. Morgan, VanEck</strong>, as of June 30, 2025. Index performance is not representative of Fund performance. It is not possible to invest directly in an index.</p>
<h2 id="outlook" class="jump-link-nav anchored-block" data-jumplink-title="Outlook">Outlook</h2>
<p>On the policy front, the post-April 9th trend has continued into June with a large majority of administration policy announcements viewed favorably from a macro perspective, and the recession fears of early April continue to fade. The market is much more focused on sectors and issuers that will be on the wrong side of policy and fiscal changes than the macroeconomic outlook. Fundamentals for leveraged finance issuers remain robust. More companies are beating than missing earnings estimates, with help from a supportive pre-tariff stocking trend. However, more companies are guiding down than guiding up, which is consistent with heightened trade uncertainty.</p>
<p>While the team does not expect significant spread compression from here, it believes returns will be driven by yield going forward, and we think CLOs have attractive total return potential relative to other equivalently rated fixed income assets under these conditions. That said, the roller coaster trade dynamics and other currents will keep markets fluid, and we expect to see both positive shocks, in the form of deal announcements or teases, and negative ones, such as more aggressive policies or deal disappointments. Despite likely headline-driven volatility both ways in the coming months, we believe the risk is balanced. However, tight valuations tilt incrementally toward a more defensive portfolio bias.</p>
<p>In a world where interest rates will be higher for longer, floating rate assets continue to be attractive. We continue to see spreads and yields attractive under most market scenarios over the next twelve months. That said, we believe having a nimble approach is of paramount importance given the pace of news flow which is rapidly shifting consumer and business sentiment. In addition, a robust bottoms-up approach to security selection remains key given the significant tail risks to the fundamental backdrop and a market bifurcated between vintages and, relatedly, between deals in and out of their reinvestment periods. Given the dispersion seen in the loan market, certain CLO portfolios holding weaker credits may eventually experience impairments to the lowest rated debt tranches. As a result, vintage, portfolio, and manager selection remains key.</p>

<p>To receive more <a href="/us/en/blogs/income-investing/" title="Income Investing Insights"><strong>Income Investing</strong></a> insights, <a href="/link/5f45412c2143400497908cea2897f7d3.aspx" title=" Subscription Center"><strong>sign up in our subscription center</strong></a>.</p>
]]></content:encoded>
</item><item rdf:about="https://www.vaneck.com/us/en/blogs/municipal-bonds/municipals-back-in-business-tax-clarity-sparks-opportunity/">
  <title>Municipals Back in Business: Tax Clarity Sparks Opportunity></title>
  <link>https://www.vaneck.com/us/en/blogs/municipal-bonds/municipals-back-in-business-tax-clarity-sparks-opportunity/</link>
  <description><![CDATA[With municipal bonds&rsquo; tax-exempt status reaffirmed, now is the time for investors to adjust their exposures and position portfolios for income and resilience.]]></description>
  <dc:creator>James Colby</dc:creator>
  <dc:date>07/16/2025 06:30:00</dc:date>
<content:encoded><![CDATA[

<p>The municipal bond market just received a shot of adrenaline. With the passage of the One Big Beautiful Bill Act, tax-exempt income remains untouched - a significant victory for investors and the muni ecosystem. Coupled with an expanded SALT deduction (up to $40,000), this renewed clarity in tax policy reinforces the strategic value of municipal bonds in both income generation and portfolio construction.</p>
<p>Now, with the fog of legislative uncertainty lifting, it&rsquo;s time for investors and advisors to recalibrate their approach. Let&rsquo;s walk through where the opportunities lie and why VanEck&rsquo;s muni ETF suite is built for this moment.</p>
<h2>Investment Grade: Sweet Spot in the Steepness</h2>
<p>At the heart of VanEck&rsquo;s municipal ETF platform is customization of interest rate risk, from short to long duration. While 2024 saw a preference for cash equivalents and ultra-short strategies, the market tide is shifting toward intermediate-term munis, such as the <strong><a href="/link/34b93d6c4ba74006913a58769f7e7e77.aspx" title="ITM - VanEck Intermediate Muni ETF - Holdings &amp; Performance">VanEck Intermediate Muni ETF (ITM)</a></strong>. Why? Because the steepness of the muni yield curve between 6 to 12 years has been a consistent generator of alpha. SMAs and advisors alike have leaned into this segment, taking advantage of its performance resiliency amid fluctuating rate expectations. Inflows into intermediate-duration strategies continue to climb, and ITM has been a core beneficiary.</p>
<p>Meanwhile, long-duration strategies haven&rsquo;t enjoyed the same popularity&mdash;yet. With persistent uncertainties over fiscal and monetary policy, investors have been cautious about extending out the curve. However, there&rsquo;s a case to be made for revisiting long munis.</p>
<h2>Don&rsquo;t Sleep on MLN</h2>
<p><a href="/link/1ec087c36ce04ebfaf0617b63e908818.aspx" title="MLN - VanEck Long Muni ETF - Holdings &amp; Performance"><strong>VanEck&rsquo;s Long Muni ETF (MLN)</strong></a>, focused on long-dated investment-grade munis, presents a compelling taxable-equivalent yield opportunity. As the long end of the curve has steepened, the reward for duration risk has become increasingly attractive. For investors with longer time horizons or those seeking to barbell their muni exposure, MLN offers a unique entry point, especially if rate cuts materialize faster than consensus expects.</p>

<h2>Municipal High Yield: Tight but Attractive</h2>
<p>On the opposite end of the credit spectrum sits municipal high yield. The <a href="/link/63e99d0ce68b47e79eae26e1c163fd09.aspx" title="HYD - VanEck High Yield Muni ETF - Holdings &amp; Performance"><strong>VanEck High Yield Muni ETF (HYD)</strong></a> continues to hold its own despite tight spreads.</p>
<p>As of early July, HYD boasts a taxable-equivalent yield to worst of 8.52% (with a 30-Day SEC Yield of 4.68%. <em>Please see below for HYD standardized performance.</em>), outpacing U.S. corporate high yield, which sits at 7.16%, based on the ICE BofA US High Yield Index (H0A0). While the spread differential is modest, HYD's edge comes from its tax advantage and muni high yield&rsquo;s relatively low default rates compared to corporate high yield.</p>
<p>The primary constraint? Supply. Unlike the investment-grade muni space, high yield issuance remains light. This supply/demand imbalance has kept spreads narrow, but secondary market liquidity remains healthy. Investors are still able to access yield without sacrificing credit quality, provided they&rsquo;re selective.</p>
<h3>Municipal 2s30s Spread Reaches 5-Year High: Curve Steepening Accelerates</h3>
<p><img loading="lazy" class="img-responsive w-100" alt="Municipal 2s30s Spread Reaches 5-Year High: Curve Steepening Accelerates" src="https://www.vaneck.com/contentassets/90c18ef5b4ac442f9c4a2c031d18aa0c/5921_muni-blog-july_chart-1_2025-7_v1.svg" /></p>
<h3>30-Year Muni Yields Hover Near 5%: Long-Term Rates at Multi-Year Highs</h3>
<p><img loading="lazy" class="img-responsive w-100" alt="30-Year Muni Yields Hover Near 5%: Long-Term Rates at Multi-Year Highs" src="https://www.vaneck.com/contentassets/90c18ef5b4ac442f9c4a2c031d18aa0c/5921_muni-blog-july_chart-2_2025-7_v1.svg" /></p>
<p class="chart-disclosure">Source: Municipal Market Analytics. As of July 8, 2025. <strong>Past performance is no guarantee of future results. Not representative of fund performance.</strong></p>
<h2>The Supply Surge: A Tailwind for the Remainder of 2025</h2>
<p>With the OBBBA now codified, municipalities are expected to accelerate issuance plans, particularly in the investment-grade segment. Infrastructure and essential services funding, once in limbo, may now be fast-tracked. For investors, this means greater access to new credits and potentially more attractive valuations.</p>
<p>As the year unfolds, we anticipate that new issuance will be the dominant force driving muni market dynamics, especially in investment grade. Conversely, limited high yield supply may continue to support an upward pressure on prices and compress yields, but for now, we believe HYD continues to deliver.</p>
<h2>Final Thoughts: Recalibrate with Purpose</h2>
<p>Municipals are back in the spotlight, and for good reason. Whether it&rsquo;s through targeted exposure to intermediate duration, tactical long allocations, or high-yield yield enhancement, <a href="/us/en/blogs/municipal-bonds/municipal-bond-etfs-expect-more-from-your-munis/" title="Municipal Bond ETFs &ndash; Expect More from Your Munis"><strong>VanEck&rsquo;s municipal ETF suite</strong></a> offers tools to meet the moment.</p>

<p>As always, tax-free income isn&rsquo;t just a benefit; it&rsquo;s a portfolio strategy. With new clarity from Capitol Hill, investors may want to consider using this window to adjust their muni exposures and position portfolios for both income and resilience going forward.</p>
<p>To receive more <a href="https://www.vaneck.com/us/en/insights/municipal-bonds/" title="Municipal Bonds Insights"><strong>Municipal Bonds</strong></a> insights, <a href="/link/5f45412c2143400497908cea2897f7d3.aspx" title=" Subscription Center"><strong>sign up in our subscription center</strong></a>.</p>
]]></content:encoded>
</item><item rdf:about="https://www.vaneck.com/us/en/blogs/natural-resources/staying-the-course-navigating-a-volatile-q2-in-commodities/">
  <title>Staying the Course: Navigating a Volatile Q2 in Commodities></title>
  <link>https://www.vaneck.com/us/en/blogs/natural-resources/staying-the-course-navigating-a-volatile-q2-in-commodities/</link>
  <description><![CDATA[Commodities remained resilient in Q2 2025; oil was volatile, gold rose, metals fell. Resource equities were mixed but showed strong fundamentals despite macro uncertainty.]]></description>
  <dc:creator>Shawn Reynolds</dc:creator>
  <dc:date>07/16/2025 06:30:00</dc:date>
<content:encoded><![CDATA[

<p>Quarterly insights from Global Resources Portfolio Manager Shawn Reynolds, featuring his unique views on natural resources and commodities.</p>

<h2 id="q2-recap" class="jump-link-nav anchored-block" data-jumplink-title="Q2 Recap">Q2 2025 Commodities &amp; Resource Equities: Resilience Through Uncertainty</h2>
<p>Commodities and resource equities remained resilient in Q2 2025, navigating a complex macroeconomic and geopolitical backdrop. Oil markets experienced pronounced volatility, driven by evolving OPEC+ supply dynamics and heightened geopolitical risk. Gold outperformed, reaffirming its status as a safe-haven asset amid global uncertainty. Industrial metals, however, came under pressure due to softer demand trends&mdash;particularly from China&rsquo;s industrial sector.</p>
<p>Resource equities delivered a mixed performance, though the broader sector continued to reflect key investment strengths: robust operational execution, disciplined capital allocation, and an ongoing commitment to shareholder returns. While investor sentiment remained cautious&mdash;shaped by persistent macro and policy uncertainty&mdash;the underlying fundamentals and long-term value drivers in the space remain intact.</p>
<h2 id="sector-performance-recap" class="jump-link-nav anchored-block" data-jumplink-title="Sector Performance Recap">Sector Performance Recap</h2>
<ul class="content-list">
<li class="mt-3"><strong>Oil &amp; Gas</strong> &ndash; Oil markets experienced significant volatility in Q2. Crude prices fell to four-year lows in early May but rebounded sharply following the strikes against Iran&rsquo;s nuclear infrastructure. These gains were short-lived, however, as the subsequent de-escalation redirected market focus to weakening global demand and OPEC+&rsquo;s gradual rollback of voluntary production cuts. U.S. shale producers maintained a conservative approach to capital expenditures amid margin compression and elevated input costs driven by new tariffs. In contrast, U.S. refiners outperformed thanks to robust shareholder return strategies and firm capital discipline.</li>
<li class="mt-3"><strong>Base &amp; Industrial Metals</strong> &ndash; Base metal prices delivered mixed results. Copper traded near multi-month highs, supported by ongoing supply constraints and relatively stable demand from China. U.S. exchange inventories fell to their lowest levels in nearly two-year, driven by pre-tariff stockpiling and persistent mining disruptions. Supply remains tight due to project delays at major developments, while Chinese smelters face margin compression from historically low treatment and refining charges. In the iron ore market, resilient steel production and declining Chinese port inventories offered bullish signals, but broader macroeconomic concerns&mdash;including trade and property sector instability&mdash;kept prices under pressure.</li>
<li class="mt-3"><strong>Gold &amp; Precious Metals</strong> &ndash; Gold prices remained robust, briefly dipping below $3,000/oz in April amid a risk-on rally before swiftly recovering. Gold equities generally outperformed the metal, supported by stable all-in sustaining costs (AISC) and strong free cash flow generation. Producers capitalized on favorable price conditions to strengthen balance sheets&mdash;reduce debt, enhance dividend payouts, and pursue strategic M&amp;A activity. Recent consolidation trends have created opportunities for operational synergies and reserve replacement.</li>
<li class="mt-3"><strong>Renewables &amp; Alternatives</strong> &ndash; The renewable energy sector continued to demonstrate modest growth in Q2 2025, though emerging policy and macroeconomic headwinds have raised new uncertainties. China remained the global leader, installing a record 60 GW of solar capacity, while the U.S. added 10 GW of battery storage in Q1 alone. However, proposed U.S. federal policy changes&mdash;such as potential reductions to production and investment tax credits, and the introduction of excise taxes on solar and wind&mdash;pose risks to project costs and development pipelines. Elevated interest rates and capital costs continue to challenge equipment manufacturers and independent power producers.</li>
<li class="mt-3"><strong>Agriculture/Paper &amp; Forest Products </strong>&ndash; The agricultural sector presented a mixed outlook. Grain markets remained under pressure, with corn and soybean prices falling below breakeven levels for many U.S. farmers, despite generally favorable growing conditions. Margins continued to be compressed by rising input costs and ongoing trade policy uncertainty. Fertilizer prices surged, driven by supply disruption in the Middle East. Conversely, protein markets showed relative strength as tight supplies of cattle, hogs and chickens supported higher prices across beef, pork and poultry. Nonetheless, packaged food producers faced pressure from elevated production costs, tariff-induced input inflation, and subdued consumer demand.</li>
</ul>

<h2 id="portfolio-performance" class="jump-link-nav anchored-block" data-jumplink-title="Portfolio Performance">Portfolio Performance: Drivers and Detractors</h2>
<p>The Global Resources Fund (Class A; excluding fees and expenses, the &ldquo;Fund&rdquo;) returned 5.47% in the second quarter of 2025, outperforming its benchmark, the S&amp;P Global Natural Resources Index (the &ldquo;Index&rdquo;), which returned 3.26%. Year-to-date, the Fund has returned 13.34%, also ahead of the Index&rsquo;s 10.42% return over the same period.</p>
<p>On an absolute basis, the top contributors to Fund performance were positions in Base &amp; Industrial Metals&mdash;notably copper producers and diversified miners&mdash;as well as Gold &amp; Precious Metals producers. Fertilizer companies within Agriculture also added to returns. Detractors included Oil &amp; Gas and Paper &amp; Forest positions, with integrated oil and gas producers accounting for the largest declines.</p>
<p>Relative to the Index, the Fund benefited from strong security selection within Base &amp; Industrial Metals, an underweight allocation and effective selection in Oil &amp; Gas, and an overweight in Renewables &amp; Alternatives. However, performance was negatively impacted by selection and interaction effects in Agriculture.</p>
<h3>Average Annual Total Returns<sup>*</sup>&nbsp;(%) Quarter End as of 06/30/25</h3>
<div class="wrapped-div mb-3">
<table style="width: 100%;">
<tbody>
<tr class="tbl-data">
<td class="tbl-header last" colspan="9">VanEck Global Resources Fund: Class A</td>
</tr>
<tr class="tbl-data">
<td class="data-head data last text-right">&nbsp;</td>
<td class="data-head data last text-right">1 MO</td>
<td class="data-head data last text-right">3 MO</td>
<td class="data-head data last text-right">YTD</td>
<td class="data-head data last text-right">1 YR</td>
<td class="data-head data last text-right">3 YR</td>
<td class="data-head data last text-right">5 YR</td>
<td class="data-head data last text-right">10 YR</td>
<td class="data-head data last text-right">LIFE<br />(11/02/94)</td>
</tr>
<tr class="tbl-data">
<td class="data-td last text-left">At Net Asset Value</td>
<td class="data-td data last text-right">5.36</td>
<td class="data-td data last text-right">5.47</td>
<td class="data-td data last text-right">13.34</td>
<td class="data-td data last text-right">5.39</td>
<td class="data-td data last text-right">4.75</td>
<td class="data-td data last text-right">14.90</td>
<td class="data-td data last text-right">1.90</td>
<td class="data-td data last text-right">--</td>
</tr>
<tr class="tbl-data">
<td class="data-td last text-left">At Maximum 5.75% Sales Charge</td>
<td class="data-td data last text-right">-0.70</td>
<td class="data-td data last text-right">-0.60</td>
<td class="data-td data last text-right">6.82</td>
<td class="data-td data last text-right">-0.67</td>
<td class="data-td data last text-right">2.71</td>
<td class="data-td data last text-right">13.55</td>
<td class="data-td data last text-right">1.30</td>
<td class="data-td data last text-right">--</td>
</tr>
<tr class="tbl-data">
<td class="data-td last text-left">S&amp;P Global Natural Resources Net Total Return Index</td>
<td class="data-td data last text-right">3.50</td>
<td class="data-td data last text-right">3.26</td>
<td class="data-td data last text-right">10.42</td>
<td class="data-td data last text-right">0.60</td>
<td class="data-td data last text-right">5.08</td>
<td class="data-td data last text-right">11.98</td>
<td class="data-td data last text-right">5.98</td>
<td class="data-td data last text-right">--</td>
</tr>
<tr class="tbl-data">
<td class="data-td last text-left">S&amp;P North American Natural Resources Sector Index</td>
<td class="data-td data last text-right">4.33</td>
<td class="data-td data last text-right">-1.93</td>
<td class="data-td data last text-right">5.07</td>
<td class="data-td data last text-right">3.64</td>
<td class="data-td data last text-right">10.86</td>
<td class="data-td data last text-right">19.42</td>
<td class="data-td data last text-right">5.69</td>
<td class="data-td data last text-right">--</td>
</tr>
</tbody>
</table>
</div>
<p class="chart-disclosure"><sup>*</sup>&nbsp;Returns less than one year are not annualized.</p>
<p class="chart-disclosure"><strong>The table presents past performance which is no guarantee of future results and which may be lower or higher than current performance. Returns reflect temporary contractual fee waivers and/or expense reimbursements. Had the Fund incurred all expenses and fees, investment returns would have been reduced. Expenses: Class A: Gross 1.49% and Net 1.38%. Expenses are capped contractually through 05/01/26 at 1.38% for Class A. Investment returns and Fund share values will fluctuate so that investors' shares, when redeemed, may be worth more or less than their original cost. Fund returns assume that dividends and capital gains distributions have been reinvested in the Fund at NAV.</strong></p>
<h2>Top Contributors/Detractors</h2>
<h3>Contributors</h3>
<div class="wrapped-div mt-3">
<table style="width: 100%;">
<tbody>
<tr class="tbl-data">
<td class="tbl-header last">Company</td>
<td class="tbl-header last">Sector</td>
<td class="tbl-header last text-right">Weight</td>
<td class="tbl-header last text-right">Estimated<br />Contribution</td>
<td class="tbl-header last">Rationale</td>
</tr>
<tr class="tbl-data">
<td class="data-td data last">Kinross</td>
<td class="data-td data last">Gold &amp; Prec. Metals.</td>
<td class="data-td data last text-right">2.77%</td>
<td class="data-td data last text-right">0.68%</td>
<td class="data-td data last">Benefited from strong gold prices, improving earnings outlook</td>
</tr>
<tr class="tbl-data">
<td class="data-td data last">Corteva</td>
<td class="data-td data last">Agriculture</td>
<td class="data-td data last text-right">3.15%</td>
<td class="data-td data last text-right">0.56%</td>
<td class="data-td data last">Operational efficiency and favorable commodity pricing</td>
</tr>
<tr class="tbl-data">
<td class="data-td data last">Nutrien</td>
<td class="data-td data last">Agriculture</td>
<td class="data-td data last text-right">3.00%</td>
<td class="data-td data last text-right">0.53%</td>
<td class="data-td data last">Margin expansion from rising fertilizer prices</td>
</tr>
</tbody>
</table>
</div>
<p class="chart-disclosure">Source: VanEck, FactSet. Data as of June 30, 2025.</p>
<h3>Detractors</h3>
<div class="wrapped-div mt-3">
<table style="width: 100%;">
<tbody>
<tr class="tbl-data">
<td class="tbl-header last">Company</td>
<td class="tbl-header last">Sector</td>
<td class="tbl-header last text-right">Weight</td>
<td class="tbl-header last text-right">Estimated<br />Contribution</td>
<td class="tbl-header last">Rationale</td>
</tr>
<tr class="tbl-data">
<td class="data-td data last">Exxon Mobil</td>
<td class="data-td data last">Oil &amp; Gas</td>
<td class="data-td data last text-right">4.31%</td>
<td class="data-td data last text-right">-0.53%</td>
<td class="data-td data last">Impacted by weaker refining margins and lower oil prices</td>
</tr>
<tr class="tbl-data">
<td class="data-td data last">Chevron</td>
<td class="data-td data last">Oil &amp; Gas</td>
<td class="data-td data last text-right">2.17%</td>
<td class="data-td data last text-right">-0.45%</td>
<td class="data-td data last">Earnings declined due to falling crude prices</td>
</tr>
<tr class="tbl-data">
<td class="data-td data last">Tyson Foods</td>
<td class="data-td data last">Agriculture</td>
<td class="data-td data last text-right">1.86%</td>
<td class="data-td data last text-right">-0.30%</td>
<td class="data-td data last">Losses in beef segment and legal settlement expenses</td>
</tr>
</tbody>
</table>
</div>
<p class="chart-disclosure">Source: VanEck, FactSet. Data as of June 30, 2025.</p>
<h2 class="mt-4">Notable Portfolio Changes</h2>
<p>During the quarter, the team added to and exited some of its Base &amp; Industrial Metals exposure, while also exiting positions in Agriculture.</p>
<h3>Adds</h3>
<div class="wrapped-div mt-3">
<table style="width: 100%;">
<tbody>
<tr class="tbl-data">
<td class="tbl-header last">Company</td>
<td class="tbl-header last">Sector</td>
<td class="tbl-header last text-right">Weight</td>
<td class="tbl-header last">Rationale</td>
</tr>
<tr class="tbl-data">
<td class="data-td data last">JSW Steel</td>
<td class="data-td data last">Base &amp; Indus. Metals</td>
<td class="data-td data last text-right">0.76%</td>
<td class="data-td data last">One of India&rsquo;s largest private steel producers, JSW posted strong results with EBITDA growth driven by rising volumes. We expect Indian steel capacity to double over the next decade, positioning JSW for long-term growth.</td>
</tr>
<tr class="tbl-data">
<td class="data-td data last">Cameco</td>
<td class="data-td data last">Base &amp; Indus. Metals</td>
<td class="data-td data last text-right">0.83%</td>
<td class="data-td data last">As the world&rsquo;s second-largest uranium producer, Cameco holds key downstream assets&mdash;such as refining and fuel manufacturing&mdash;where supply tightness is concentrated. These assets are a major valuation driver.</td>
</tr>
<tr class="tbl-data">
<td class="data-td data last">Antofagasta</td>
<td class="data-td data last">Base &amp; Indus. Metals</td>
<td class="data-td data last text-right">0.30%</td>
<td class="data-td data last">Chilean copper producer with four mines. Growth is expected from the Zaldivar mine. Barrick (2.07% of Fund assets) is considering selling its stake, potentially leading to strategic repositioning and optimization.</td>
</tr>
</tbody>
</table>
</div>
<p class="chart-disclosure">Source: VanEck, FactSet. Data as of June 30, 2025. Not a recommendation to buy or sell any securities referenced herein. Estimated contributions are sourced from FactSet and are not intended as a predictor or guarantee of future results and are for illustrative purposes only. Portfolio compositions are subject to change at any time.</p>
<h3>Exits</h3>
<div class="wrapped-div mt-3">
<table style="width: 100%;">
<tbody>
<tr class="tbl-data">
<td class="tbl-header last">Company</td>
<td class="tbl-header last">Sector</td>
<td class="tbl-header last text-right">Weight</td>
<td class="tbl-header last">Rationale</td>
</tr>
<tr class="tbl-data">
<td class="data-td data last">US Steel</td>
<td class="data-td data last">Base &amp; Indus. Metals</td>
<td class="data-td data last text-right">(exited)</td>
<td class="data-td data last">Exited following the Nippon Steel acquisition offer ($55/share) and perceived limited additional upside after meeting our price target.</td>
</tr>
<tr class="tbl-data">
<td class="data-td data last">Nucor</td>
<td class="data-td data last">Base &amp; Indus. Metals</td>
<td class="data-td data last text-right">(exited)</td>
<td class="data-td data last">After benefiting from domestic policy tailwinds, we rotated out in favor of European opportunities, which now offer more compelling upside.</td>
</tr>
<tr class="tbl-data">
<td class="data-td data last">Ingredion</td>
<td class="data-td data last">Agriculture</td>
<td class="data-td data last text-right">(exited)</td>
<td class="data-td data last">Exited due to margin pressures from rising corn prices (+6% y/y) and potential demand headwinds from RFK&rsquo;s proposed SNAP reforms impacting sugar-laden food sales.</td>
</tr>
</tbody>
</table>
</div>
<p class="chart-disclosure">Source: VanEck, FactSet. Data as of June 30, 2025. Not a recommendation to buy or sell any securities referenced herein. Estimated contributions are sourced from FactSet and are not intended as a predictor or guarantee of future results and are for illustrative purposes only. Portfolio compositions are subject to change at any time.</p>
<h2 id="h2-2025" class="jump-link-nav anchored-block mt-4" data-jumplink-title="2H 2025">From Policy Shifts to Price Signals: Key Market Drivers and Sector Impacts for the Second Half</h2>
<p>The U.S. dollar is expected to remain under pressure, with downside driven by renewed tariff threats and growing concerns over fiscal sustainability. The passage of Trump&rsquo;s "Big Beautiful Bill" could further widen budget deficits. Historically, a weaker dollar has supported higher commodity prices&mdash;a dynamic we expect to persist into the second half of 2025.</p>
<p>Geopolitical risk remains elevated, particularly in the Middle East. Although a ceasefire with Iran is currently in place, its long-term viability is uncertain. We believe a 5%&ndash;10% risk premium is currently warranted for oil prices until a lasting resolution is achieved or market fundamentals regain control. Importantly, the distinction between oil at $60&ndash;$65 versus $55 is critical for high-cost producers and exploration-intensive firms. The current environment favors well-capitalized oil and gas companies with low break-even points, healthy balance sheets, robust profitability, and attractive shareholder return profiles via dividends and buybacks.</p>
<p>In the metals space, companies are benefiting from improved operational efficiency and resilient commodity prices. Meanwhile, volatility continues to plague the renewables sector as clarity around tax credits, other fiscal incentives and enforcement rules remain unclear. In agriculture, low crop prices should bolster the margins of protein players who will benefit from subdued animal feed costs. Conversely, subdued crop prices present challenges for fertilizers and agrochemical producers. Finally, the macroeconomic environment remains unfavorable for paper and forest products companies, where demand softness and cost pressures continue to weigh on performance.</p>
<p>To receive more <a href="/us/en/insights/natural-resources/" title="Natural Resources Insights"><strong>Natural Resources</strong></a> insights, <a href="https://www.vaneck.com/us/en/subscribe/" title="Subscription Center"><strong>sign up in our subscription center</strong></a>.</p>
]]></content:encoded>
</item><item rdf:about="https://www.vaneck.com/us/en/blogs/model-portfolios/june-market-recap-policy-shifts-themes-endure/">
  <title>June Market Recap: Policy Shifts. Themes Endure.></title>
  <link>https://www.vaneck.com/us/en/blogs/model-portfolios/june-market-recap-policy-shifts-themes-endure/</link>
  <description><![CDATA[Donald Trump is once again dominating market headlines, marking a period of aggressive policy moves and elevated volatility. Stocks sit at all-time highs&mdash;but with rising vulnerability.]]></description>
  <dc:creator>David Schassler</dc:creator>
  <dc:date>07/14/2025 06:30:00</dc:date>
<content:encoded><![CDATA[

<h2>Trump Drives Headlines and Volatility</h2>
<p>Donald Trump is once again dominating market headlines. This week alone, headlines included Bloomberg&rsquo;s Trump&rsquo;s 50% Levy on Brazil Shows World Nothing Is Off Limits and WSJ&rsquo;s Dow Futures Slip After Trump Unveils 50% Brazil Tariff.</p>
<p>The message is clear: we&rsquo;re in a period defined by aggressive policy moves and elevated volatility. The market has rallied more than 25% off the lows sparked by &ldquo;Liberation Day.&rdquo; Stocks are now at all-time highs, but also increasingly vulnerable. The next market catalyst may not come from earnings or inflation - it may come from a microphone in Washington.</p>

<h2>Our Approach: Focused Themes, Real Diversification</h2>
<p>We allocate risk through a clear framework: stay prepared for the unknown through diversification, and lean into long-term themes we believe will drive returns.</p>
<p>And let&rsquo;s be clear - unlike beauty, diversification is not in the eye of the beholder. When we use the term, we mean holding fundamentally differentiated asset classes - stocks, bonds, real assets, and digital assets - in allocations large enough to matter.</p>
<h2>Three Core Investment Themes</h2>
<p>Our portfolio remains anchored around three structural themes.</p>
<p>First, <strong>de-dollarization</strong>. Ongoing fiscal excess and rising debt levels are fueling demand for decentralized store-of-value assets like gold and bitcoin.</p>
<p>Second, <strong>artificial intelligence</strong>. AI is not a sector - it&rsquo;s an infrastructure shift. It&rsquo;s reshaping productivity, industries, and global competition.</p>
<p>Third, <strong>energy security</strong>. Reliable, scalable energy is back in focus. That includes fossil fuels, nuclear, and infrastructure modernization.</p>
<h2>Policy Tailwinds: The &ldquo;Big Beautiful Bill&rdquo;</h2>
<p>Trump&rsquo;s recently passed &ldquo;Big Beautiful Bill&rdquo; accelerates all three of our core themes. The Congressional Budget Office estimates the bill will add $3.3 trillion to the federal deficit over the next decade. It directs capital toward domestic chip production, military AI systems, and energy-related AI research. And on energy, the bill prioritizes proven sources - specifically fossil fuels and nuclear - over intermittent alternatives.</p>
<h2>Portfolio Activity: Recent Moves</h2>
<p>We&rsquo;ve been active in managing risk and taking advantage of market moves. Recent positioning updates include:</p>
<ul class="content-list">
<li>On June 3, we repositioned along the U.S. Treasury curve to increase our exposure to a steepening yield curve. <em>(<strong><a href="/link/6e9d9147570e4f1f93468eee6ea2af7a.aspx" title="VanEck Wealth Builder Plus Portfolios">Wealth Builder</a></strong>) </em></li>
<li class="mt-2">On June 13, we sold oil at $73 after buying in May at $57. A straightforward profit-taking trade. <em>(Traded within a key holding in the <strong><a href="/link/310be2aebcad4c5cb5a89a82fd128841.aspx" title="RAAX - VanEck Real Assets ETF">VanEck Real Assets ETF</a></strong> which is managed by the MAS team and held in <strong><a href="/link/ec88c90a3dbe4ea7918f988bd51b43c3.aspx" title="VanEck Select Opportunities Portfolio">Select Opportunities</a></strong>, <strong><a href="/link/6e9d9147570e4f1f93468eee6ea2af7a.aspx" title="VanEck Wealth Builder Plus Portfolios">Wealth Builder</a></strong> and <a href="/link/5ce91a58002841728be4456829de5cbb.aspx" title="VanEck Real Assets Portfolio"><strong>Real Assets</strong></a>) </em></li>
<li class="mt-2">On June 17, we trimmed our nuclear energy exposure after a 30% YTD gain. We remain bullish on the long-term theme but saw an opportunity to lock in gains. <em>(<strong><a href="/link/ec88c90a3dbe4ea7918f988bd51b43c3.aspx" title="VanEck Select Opportunities Portfolio">Custom Select Opportunities Models</a></strong>) </em></li>
<li class="mt-2">On July 8 and 10, we reduced copper holdings after Trump&rsquo;s 50% copper tariff sent prices to all-time highs. A price spike of this magnitude, driven by policy, created an attractive exit point. <em>(Traded within a key holding in the VanEck Real Assets ETF which is managed by the MAS team and held in <strong><a href="/link/ec88c90a3dbe4ea7918f988bd51b43c3.aspx" title="VanEck Select Opportunities Portfolio">Select Opportunities</a></strong>, <strong><a href="/link/6e9d9147570e4f1f93468eee6ea2af7a.aspx" title="VanEck Wealth Builder Plus Portfolios">Wealth Builder</a></strong> and <a href="/link/5ce91a58002841728be4456829de5cbb.aspx" title="VanEck Real Assets Portfolio"><strong>Real Assets</strong></a>) </em></li>
<li class="mt-2">On July 9, we increased our AI exposure through targeted allocations to eSports, video gaming, and broader tech, funded by reductions in value and broad-based equity. <em>(<strong><a href="/link/6e9d9147570e4f1f93468eee6ea2af7a.aspx" title="VanEck Wealth Builder Plus Portfolios">Wealth Builder</a></strong>)</em></li>
</ul>

<h2>Market Review</h2>
<p><strong>Equities:</strong></p>
<p>U.S. stocks are up more than 25% from April lows and at record highs. That said, they lag international peers YTD: the S&amp;P 500 is up 7%, MSCI EAFE up 21%, and MSCI Emerging Markets up 17%. The primary driver of this divergence is currency - the U.S. dollar has fallen nearly 10% versus a basket of developed market currencies.</p>
<p><strong>Fixed Income:</strong></p>
<p>In fixed income, the 10-year Treasury yield is hovering near 4.35%. Investor appetite for long-dated Treasuries has become a hot topic as the financial outlook for the U.S. continues to decline. Markets are pricing in 50 basis points of Fed rate cuts in the second half of 2025. Credit spreads remain tight, reflecting a broadly stable credit environment.</p>
<p><strong>Real Assets:</strong></p>
<p>In real assets, oil fell to $57 in May and rebounded to $75 in June, driven by geopolitical risk, particularly threats to shipping through the Strait of Hormuz. Copper surged to record levels after Trump&rsquo;s tariff announcement. Gold remains steady between $3,200 and $3,400 after a strong rally from $2,600 earlier this year. Silver and platinum have followed suit. Nuclear stocks, up 30% YTD, continue to benefit from policy momentum and investor flows.</p>
<p><strong>Digital Assets:</strong></p>
<p>Bitcoin has broken out to new all-time highs above $118,000. It continues to benefit from risk-on sentiment, institutional adoption, and rising concern about fiscal sustainability.</p>
<h2>Final Thoughts</h2>
<p>We are in a new investment regime. Policy swings are large, volatility is elevated, and long-term themes are gaining strength.</p>
<p>We are long innovation through U.S. technology and AI. We are hedging fiat debasement and a declining U.S. dollar through gold and bitcoin. We are diversified across asset classes to stay flexible in the face of uncertainty. And we look to take advantage of volatility at extremes - using dislocations as opportunities to buy and sell with discipline.</p>
<p>We don&rsquo;t react to headlines - we position around fundamentals, themes, and price.</p>
<p>To receive more <strong><a href="https://www.vaneck.com/us/en/insights/guided-allocation/" title="Model Portfolio Insights">Model Portfolio</a></strong> insights, <strong><a href="https://www.vaneck.com/us/en/subscribe/" title="Subscription Center">sign up in our subscription center</a></strong>.</p>
]]></content:encoded>
</item><item rdf:about="https://www.vaneck.com/us/en/blogs/income-investing/volatile-quarter-but-fallen-angels-still-on-top-ytd/">
  <title>Volatile Quarter, But Fallen Angels Still on Top YTD></title>
  <link>https://www.vaneck.com/us/en/blogs/income-investing/volatile-quarter-but-fallen-angels-still-on-top-ytd/</link>
  <description><![CDATA[Fallen angels outperformed the broad high yield market in H1. Whirlpool joined the Index during Q2; Constellation Insurance and Royal Caribbean exited.]]></description>
  <dc:creator>Nicolas  Fonseca, CFA</dc:creator>
  <dc:date>07/14/2025 06:30:00</dc:date>
<content:encoded><![CDATA[

<p id="q2-2025-update" class="jump-link-nav anchored-block" data-jumplink-title="Q2 2025 Update">Fallen angels (as represented by the ICE US Fallen Angel High Yield 10% Constrained Index, &ldquo;H0CF&rdquo;) finished the first half of the year outperforming the broad high yield market (as represented by the ICE BofA US High Yield Index, &ldquo;H0A0&rdquo;) by 0.16% (4.71% vs. 4.55%), despite underperforming by 0.46% in Q2.</p>
<p>Q2 was marked by significant volatility for high yield investors, beginning with the tariff announcements on April 2 (credit spreads had already been widening since February in anticipation of policy shifts). The April tariff announcement accelerated this trend, causing spreads to widen by over 100bps and peak nearly 200bps above their tightest levels of the year. However, this widening was short lived. The &ldquo;Liberation Day&rdquo; selloff fully reversed by mid-May, and high yield spreads finished the quarter nearly 60bps tighter than where they started.</p>
<p>Interest rates were also volatile during the quarter. Long-term bond yields initially declined but later rose sharply due to mounting concerns over inflation and fiscal sustainability.</p>
<p>Fallen angels underperformed in April by 1.25% but rebounded in May and June with outperformance of 0.22% and 0.61%, respectively. The 2.47% return in June was the strongest monthly performance since late 2023, following a solid 1.90% return in May. The asset class benefited from a 17bps decline in the 10Y yield, as well as signs of easing geopolitical tensions and improving trade conditions.</p>
<p>Overall, BB rated bonds continue to lead performance, while CCC &amp; lower rated bonds recovered swiftly following the "Liberation Day" event.</p>
<h3>BB Outperformed, but Lower Quality Trying to Catch Up</h3>
<p><img loading="lazy" class="img-responsive" alt="BB - Rated Bonds Continue to Outperform" src="https://www.vaneck.com/contentassets/57d96fc752a34e279a1f373d5e0c8264/5916_angl-july_chart-1_2025-7_v1_blog.svg" /></p>
<p class="chart-disclosure">Source: ICE Data Services as of 6/30/2025, VanEck. BB represented by ICE BofA BB US High Yield Index; B represented by ICE BofA Single-B US High Yield Index; CCC and below represented by ICE BofA CCC &amp; Lower US High Yield Index. ICE BofA BB US High Yield Index is a subset of ICE BofA US High Yield Index including all securities rated BB1 through BB3, inclusive. ICE BofA Single-B US High Yield Index is a subset of ICE BofA US High Yield Index including all securities rated B1 through B3, inclusive. ICE BofA CCC &amp; Lower US High Yield Index is a subset of ICE BofA US High Yield Index including all securities rated CCC1 and below.</p>
<p>Rate dynamics were further influenced at the end of Q2 by the passage of President Trump&rsquo;s tax bill, which is projected to add approximately $3 trillion to the national debt. This contributed to the ongoing steepening of the yield curve, a trend that has persisted over the past two years.</p>
<p>Despite this, corporate fundamentals remain notably strong. As a result, we expect inflationary pressures, elevated interest rates, and slowing economic growth to impact fallen angels primarily through idiosyncratic events rather than through a broad-based downgrade cycle, barring a major economic shock.</p>
<p>A clear example of this is Whirlpool Corporation, the only company to enter the fallen angels index during the quarter. Whirlpool&rsquo;s bonds entered the index with a significant weight of 4.2%, following a downgrade of approximately $3.3 billion in outstanding debt. The downgrade was driven by a combination of high leverage, shareholder friendly capital allocation, and sluggish sales performance. Consistent with historical trends, the bonds experienced a price decline of nearly 10% prior to the downgrade, entering the index at a discounted level.</p>
<h3>Whirlpool Corporation Bond Average Cumulative Price Return 6m Before Index Inclusion</h3>
<p><img loading="lazy" class="img-responsive" alt="Whirlpool Corporation Bond Average Cumulative Price Return 6m Before Index Inclusion" src="https://www.vaneck.com/contentassets/b6e9778fe1a54a6990e1b69154306293/5916_angl-july_chart-2_2025-7_v1_blog.svg" /></p>
<p class="chart-disclosure">Source: ICE Data Services as of 6/30/2025, VanEck.</p>
<p>Despite being one of the largest downgrades in the high yield space, Warner Brothers Discovery ultimately did not enter the fallen angels segment. The company was downgraded to high yield in early June, with approximately $31 billion in debt, which would have potentially made it one of the top five largest fallen angels in index history. The downgrade came amid a corporate restructuring intended to split the company into two separate entities.</p>
<p>However, following the initial downgrade by Moody&rsquo;s, Warner Brothers Discovery undertook a novel liability management exercise, rarely seen in the investment grade market. The company initiated a debt exchange that effectively compelled bondholders to accept new terms. As a result, while the original bonds technically qualified as fallen angels, their outstanding size was significantly reduced due to a tender offer, disqualifying most from index inclusion.</p>
<p>Additionally, because the debt exchange and tender process were ongoing at the end of June, ICE Data Indices elected to exclude Warner Brothers Discovery bonds from all of its high yield indices until July. The newly issued debt, in conjunction with the transaction, does not qualify as fallen angels, as these are considered newly issued securities.</p>
<p id="overall-statistics" class="jump-link-nav anchored-block" data-jumplink-title="Overall Statistics"><strong>Fallen Angels Overall Statistics:</strong> Fallen angels and broad high yield spreads were notably volatile during the second quarter. Fallen angels spreads began the quarter at 257bps, widened sharply to 357bps in early April, and then steadily declined to end the quarter at 237bps. Broad high yield spreads followed a similar pattern, widening by 115bps from 342 to 457bps in early April before tightening to finish the quarter just below 300bps. This tightening was a key driver of broad high yield&rsquo;s relative outperformance in Q2. Yields for both indices remained elevated relative to their 10Y averages, though they ended the quarter at their lowest levels year-to-date. This reflects both the decline in spreads and movement in underlying interest rates. Fallen angels duration increased during Q2, particularly in June, driven by the removal of several bonds, most notably an issue from Walgreens, with less than 12 months to maturity. In contrast, broad high yield duration continued to shorten, reaching an all-time low of 2.89 years. This ongoing divergence in duration highlights the increasing role of interest rate sensitivity in differentiating returns between fallen angels and the broader high yield market. From a pricing perspective, broad high yield has experienced a continued increase, with prices now exceeding their 10Y average by approximately $1. Fallen angels prices have risen moderately and remain below their 10Y average, which could signal continued potential for outperformance, as has been the case year-to-date.</p>
<div class="wrapped-div">
<table style="width: 100%;">
<tbody>
<tr class="tbl-data">
<td class="tbl-header last text-center">&nbsp;</td>
<td class="tbl-header last text-center" style="border-right: outset;" colspan="3">Fallen Angels</td>
<td class="tbl-header last text-center" colspan="3">Broad HY</td>
</tr>
<tr class="tbl-data">
<td class="data-head last text-right">&nbsp;</td>
<td class="data-head last text-right">12/31/2024</td>
<td class="data-head last text-right">3/31/2025</td>
<td class="data-head last text-right" style="border-right: outset;">6/30/2025</td>
<td class="data-head last text-right">12/31/2024</td>
<td class="data-head last text-right">3/31/2025</td>
<td class="data-head last text-right">6/30/2025</td>
</tr>
<tr class="tbl-data">
<td class="data-td last">Yield to Worst</td>
<td class="data-td data last text-right">7.00</td>
<td class="data-td data last text-right">6.72</td>
<td class="data-td data last text-right" style="border-right: outset;">6.43</td>
<td class="data-td data last text-right">7.47</td>
<td class="data-td data last text-right">7.73</td>
<td class="data-td data last text-right">7.06</td>
</tr>
<tr class="tbl-data">
<td class="data-td last">Par Weighted Price</td>
<td class="data-td data last text-right">91.52</td>
<td class="data-td data last text-right">93.11</td>
<td class="data-td data last text-right" style="border-right: outset;">93.70</td>
<td class="data-td data last text-right">95.48</td>
<td class="data-td data last text-right">94.97</td>
<td class="data-td data last text-right">97.12</td>
</tr>
<tr class="tbl-data">
<td class="data-td last">Effective Duration</td>
<td class="data-td data last text-right">4.89</td>
<td class="data-td data last text-right">4.56</td>
<td class="data-td data last text-right" style="border-right: outset;">4.88</td>
<td class="data-td data last text-right">3.22</td>
<td class="data-td data last text-right">3.19</td>
<td class="data-td data last text-right">2.89</td>
</tr>
<tr class="tbl-data">
<td class="data-td last">Full Market Value ($mn)</td>
<td class="data-td data last text-right">53,393</td>
<td class="data-td data last text-right">67,566</td>
<td class="data-td data last text-right" style="border-right: outset;">63,035</td>
<td class="data-td data last text-right">1,338,887</td>
<td class="data-td data last text-right">1,357,142</td>
<td class="data-td data last text-right">1,375,495</td>
</tr>
<tr class="tbl-data">
<td class="data-td last">OAS</td>
<td class="data-td data last text-right">249</td>
<td class="data-td data last text-right">257</td>
<td class="data-td data last text-right" style="border-right: outset;">237</td>
<td class="data-td data last text-right">292</td>
<td class="data-td data last text-right">355</td>
<td class="data-td data last text-right">296</td>
</tr>
<tr class="tbl-data">
<td class="data-td last">No. of Issues</td>
<td class="data-td data last text-right">122</td>
<td class="data-td data last text-right">134</td>
<td class="data-td data last text-right" style="border-right: outset;">126</td>
<td class="data-td data last text-right">1,879</td>
<td class="data-td data last text-right">1,902</td>
<td class="data-td data last text-right">1,868</td>
</tr>
</tbody>
</table>
</div>
<p class="chart-disclosure">Source: ICE Data Services, VanEck. Fallen Angels: ICE US Fallen Angel High Yield 10% Constrained Index. Broad HY: ICE BofA US High Yield Index. OAS refers to &ldquo;option-adjusted spread.&rdquo; Please see definition for this and other terms referenced herein in the disclosures and definitions portion of this blog. Past performance is no guarantee of future results. Index performance is not representative of strategy performance. It is not possible to invest in an index.</p>

<p><strong>Fallen Angels:</strong> Fallen angels continued to exhibit an idiosyncratic profile in Q2. Whirlpool Corporation entered the index in May after being downgraded by all three major rating agencies. The downgrades cited weakening consumer demand, a slow U.S. housing market, elevated leverage, and anticipated impacts from tariffs. Whirlpool joined the index at 4.23% weight, which rose to 4.75% in June. The bonds carried a duration exceeding seven years and had experienced a notable price deterioration of nearly 6% over the six months prior to index inclusion. However, a partial price recovery occurred in June, with the bonds closing the month at $88.54, reflecting a 3.5% gain over their entry price. This rebound made Whirlpool one of the top three contributors to fallen angels outperformance during the month, trailing only Hudson Pacific Properties (a January 2024 fallen angel) and Celanese (a February 2025 fallen angel).</p>
<p>JP Morgan recently updated its forecast for the fallen angels pipeline, estimating approximately $12 billion of index eligible debt could be downgraded over the remainder of the year. However, they also highlight a broader pool of $65 billion in debt from issuers currently holding one high yield rating and a negative outlook. Given persistent economic uncertainty, JP Morgan expects the trend of more downgrades than upgrades to continue in the coming quarters.</p>
<div class="wrapped-div">
<table style="width: 100%;">
<tbody>
<tr class="tbl-data">
<td class="tbl-header last">Month-end Addition</td>
<td class="tbl-header last">Name</td>
<td class="tbl-header last">Rating</td>
<td class="tbl-header last">Sector</td>
<td class="tbl-header last">Industry</td>
<td class="tbl-header last text-right">% Mkt Value</td>
<td class="tbl-header last text-right">Price</td>
</tr>
<tr class="tbl-data">
<td class="data-td last font-weight-normal">January</td>
<td class="data-td data last text-left">Aptiv PLC / Aptiv Global Financing DAC</td>
<td class="data-td data last text-left">BB1</td>
<td class="data-td data last text-left">Automotive</td>
<td class="data-td data last text-left">Auto Parts &amp; Equipment</td>
<td class="data-td data last text-right">0.95</td>
<td class="data-td data last text-right">99.71</td>
</tr>
<tr class="tbl-data">
<td class="data-td last font-weight-normal">February</td>
<td class="data-td data last text-left">Celanese US Holdings Llc</td>
<td class="data-td data last text-left">BB1</td>
<td class="data-td data last text-left">Basic Industry</td>
<td class="data-td data last text-left">Chemicals</td>
<td class="data-td data last text-right">10.06</td>
<td class="data-td data last text-right">103.69</td>
</tr>
<tr class="tbl-data">
<td class="data-td last font-weight-normal">February</td>
<td class="data-td data last text-left">Nissan Motor Acceptance Co LLC</td>
<td class="data-td data last text-left">BB1</td>
<td class="data-td data last text-left">Automotive</td>
<td class="data-td data last text-left">Auto Loans</td>
<td class="data-td data last text-right">4.82</td>
<td class="data-td data last text-right">97.64</td>
</tr>
<tr class="tbl-data">
<td class="data-td last font-weight-normal">February</td>
<td class="data-td data last text-left">Nissan Motor Co Ltd.</td>
<td class="data-td data last text-left">BB1</td>
<td class="data-td data last text-left">Automotive</td>
<td class="data-td data last text-left">Automakers</td>
<td class="data-td data last text-right">5.41</td>
<td class="data-td data last text-right">97.26</td>
</tr>
<tr class="tbl-data">
<td class="data-td last font-weight-normal">May</td>
<td class="data-td data last text-left">Whirlpool Corp.</td>
<td class="data-td data last text-left">BB1</td>
<td class="data-td data last text-left">Consumer Goods</td>
<td class="data-td data last text-left">Personal &amp; Household Products</td>
<td class="data-td data last text-right">4.23</td>
<td class="data-td data last text-right">85.52</td>
</tr>
</tbody>
</table>
</div>
<p class="chart-disclosure">Source: ICE Data Services, VanEck. Fallen Angels: ICE US Fallen Angel High Yield 10% Constrained Index. Past performance is no guarantee of future results. Not a recommendation to buy or sell any of the names/securities mentioned herein. Index performance is not representative of strategy performance. It is not possible to invest in an index.</p>
<p><strong>Rising Stars:</strong> In May, Constellation Insurance and Royal Caribbean became the second and third rising stars of the year. Constellation Insurance was upgraded Fitch while Royal Caribbean was upgraded by S&amp;P and Moody&rsquo;s. Fitch&rsquo;s upgrade of Constellation Insurance was based on the agency&rsquo;s view that the company had enhanced its business profile by expanding operations and focusing on lower volatility insurance products. These strategic shifts were seen as strengthening financial stability and reducing overall business risk. Constellation had originally entered the fallen angels index in July 2022 at a price of $99.87, resulting in a negative total price return of approximately 4% over its time in the index. Royal Caribbean, a notable "COVID" fallen angel from April 2020, was upgraded by both S&amp;P and Moody&rsquo;s. The upgrade reflected the company's strong financial performance, improved leverage metrics, and a positive operating outlook. Royal Caribbean entered the index at $70.29, and over five years, delivered a 42% price return.</p>
<div class="wrapped-div">
<table style="width: 100%;">
<tbody>
<tr class="tbl-data">
<td class="tbl-header last">Month-end Exit</td>
<td class="tbl-header last">Name</td>
<td class="tbl-header last">Rating</td>
<td class="tbl-header last">Sector</td>
<td class="tbl-header last">Industry</td>
<td class="tbl-header last text-right">% Mkt Value</td>
<td class="tbl-header last text-right">Price</td>
</tr>
<tr class="tbl-data">
<td class="data-td last font-weight-normal">February</td>
<td class="data-td data last text-left">Western Alliance Bancorp</td>
<td class="data-td data last text-left">BB1</td>
<td class="data-td data last text-left">Banking</td>
<td class="data-td data last text-right">1.05</td>
<td class="data-td data last text-right">93.75</td>
</tr>
<tr class="tbl-data">
<td class="data-td last font-weight-normal">May</td>
<td class="data-td data last text-left">Constellation Insurance Inc.</td>
<td class="data-td data last text-left">BB1</td>
<td class="data-td data last text-left">Insurance</td>
<td class="data-td data last text-left">Life Insurance</td>
<td class="data-td data last text-right">1.04</td>
<td class="data-td data last text-right">95.74</td>
</tr>
<tr class="tbl-data">
<td class="data-td last font-weight-normal">May</td>
<td class="data-td data last text-left">Royal Caribbean Group</td>
<td class="data-td data last text-left">BB1</td>
<td class="data-td data last text-left">Leisure</td>
<td class="data-td data last text-left">Recreation &amp; Travel</td>
<td class="data-td data last text-right">1.27</td>
<td class="data-td data last text-right">99.78</td>
</tr>
</tbody>
</table>
</div>
<p class="chart-disclosure">Source: ICE Data Services, VanEck. Fallen Angels: ICE US Fallen Angel High Yield 10% Constrained Index. Past performance is no guarantee of future results. Not a recommendation to buy or sell any of the names/securities mentioned herein. Index performance is not representative of strategy performance. It is not possible to invest in an index.</p>
<p><strong>Fallen Angels Performance by Sector:</strong> There were changes to sector composition during the quarter, as Whirlpool entered the index, adding approximately 3% to the Consumer Good Sector while Tech and Retail saw their exposures decrease by approximately 2% each, due to Seagate and a Walgreens issue being removed from the index in June. Real Estate spreads tightened during the quarter by close to 150bps while its price increase the most, making it the top performer in the quarter and YTD. Real Estate, Retail, and Telecom were the top contributors relative to performance vs broad high yield during the quarter, while Media, Healthcare, and Services detracted the most from relative performance.</p>
<div class="wrapped-div-full">
<table style="width: 100%;">
<tbody>
<tr class="tbl-data">
<td class="tbl-header last text-center">&nbsp;</td>
<td class="tbl-header last text-center" style="border-right: outset;" colspan="3">Wgt (%)</td>
<td class="tbl-header last text-center" style="border-right: outset;" colspan="3">OAS</td>
<td class="tbl-header last text-center" style="border-right: outset;" colspan="3">Price</td>
<td class="tbl-header last text-right" colspan="2">Total Return</td>
</tr>
<tr class="tbl-data">
<td class="data-head data last text-right">&nbsp;</td>
<td class="data-head data last text-right">12/31/2024</td>
<td class="data-head data last text-right">3/31/2025</td>
<td class="data-head data last text-right" style="border-right: outset;">6/30/2025</td>
<td class="data-head data last text-right">12/31/2024</td>
<td class="data-head data last text-right">3/31/2025</td>
<td class="data-head data last text-right" style="border-right: outset;">6/30/2025</td>
<td class="data-head data last text-right">12/31/2024</td>
<td class="data-head data last text-right">3/31/2025</td>
<td class="data-head data last text-right" style="border-right: outset;">6/30/2025</td>
<td class="data-head data last text-right">QTD</td>
<td class="data-head data last text-right">YTD</td>
</tr>
<tr class="tbl-data">
<td class="data-td last">Automotive<sup>*</sup></td>
<td class="data-td data last text-right">&nbsp;</td>
<td class="data-td data last text-right">10.80</td>
<td class="data-td data last text-right" style="border-right: outset;">10.78</td>
<td class="data-td data last text-right">&nbsp;</td>
<td class="data-td data last text-right">182</td>
<td class="data-td data last text-right" style="border-right: outset;">253</td>
<td class="data-td data last text-right">&nbsp;</td>
<td class="data-td data last text-right">96.58</td>
<td class="data-td data last text-right" style="border-right: outset;">95.34</td>
<td class="data-td data last text-right">-0.15</td>
<td class="data-td data last text-right">-1.51</td>
</tr>
<tr class="tbl-data">
<td class="data-td last">Banking</td>
<td class="data-td data last text-right">4.94</td>
<td class="data-td data last text-right">3.92</td>
<td class="data-td data last text-right" style="border-right: outset;">3.19</td>
<td class="data-td data last text-right">181</td>
<td class="data-td data last text-right">176</td>
<td class="data-td data last text-right" style="border-right: outset;">142</td>
<td class="data-td data last text-right">96.00</td>
<td class="data-td data last text-right">103.69</td>
<td class="data-td data last text-right" style="border-right: outset;">107.29</td>
<td class="data-td data last text-right">-0.41</td>
<td class="data-td data last text-right">1.07</td>
</tr>
<tr class="tbl-data">
<td class="data-td last">Basic Industry</td>
<td class="data-td data last text-right">4.94</td>
<td class="data-td data last text-right">14.03</td>
<td class="data-td data last text-right" style="border-right: outset;">14.55</td>
<td class="data-td data last text-right">181</td>
<td class="data-td data last text-right">188</td>
<td class="data-td data last text-right" style="border-right: outset;">148</td>
<td class="data-td data last text-right">96.00</td>
<td class="data-td data last text-right">100.89</td>
<td class="data-td data last text-right" style="border-right: outset;">102.86</td>
<td class="data-td data last text-right">3.52</td>
<td class="data-td data last text-right">5.85</td>
</tr>
<tr class="tbl-data">
<td class="data-td last">Capital Goods</td>
<td class="data-td data last text-right">5.55</td>
<td class="data-td data last text-right">4.52</td>
<td class="data-td data last text-right" style="border-right: outset;">4.56</td>
<td class="data-td data last text-right">179</td>
<td class="data-td data last text-right">209</td>
<td class="data-td data last text-right" style="border-right: outset;">157</td>
<td class="data-td data last text-right">96.48</td>
<td class="data-td data last text-right">95.90</td>
<td class="data-td data last text-right" style="border-right: outset;">97.92</td>
<td class="data-td data last text-right">3.54</td>
</tr>
<tr class="tbl-data">
<td class="data-td last">Consumer Goods</td>
<td class="data-td data last text-right">4.37</td>
<td class="data-td data last text-right">3.41</td>
<td class="data-td data last text-right" style="border-right: outset;">6.41</td>
<td class="data-td data last text-right">184</td>
<td class="data-td data last text-right">243</td>
<td class="data-td data last text-right" style="border-right: outset;">220</td>
<td class="data-td data last text-right">98.89</td>
<td class="data-td data last text-right">95.87</td>
<td class="data-td data last text-right" style="border-right: outset;">88.78</td>
<td class="data-td data last text-right">4.76</td>
<td class="data-td data last text-right">3.24</td>
</tr>
<tr class="tbl-data">
<td class="data-td last">Energy</td>
<td class="data-td data last text-right">9.16</td>
<td class="data-td data last text-right">7.53</td>
<td class="data-td data last text-right" style="border-right: outset;">8.18</td>
<td class="data-td data last text-right">273</td>
<td class="data-td data last text-right">305</td>
<td class="data-td data last text-right" style="border-right: outset;">301</td>
<td class="data-td data last text-right">91.72</td>
<td class="data-td data last text-right">91.82</td>
<td class="data-td data last text-right" style="border-right: outset;">91.21</td>
<td class="data-td data last text-right">0.98</td>
<td class="data-td data last text-right">2.65</td>
</tr>
<tr class="tbl-data">
<td class="data-td last">Financial Services</td>
<td class="data-td data last text-right">3.22</td>
<td class="data-td data last text-right">2.05</td>
<td class="data-td data last text-right" style="border-right: outset;">2.35</td>
<td class="data-td data last text-right">282</td>
<td class="data-td data last text-right">357</td>
<td class="data-td data last text-right" style="border-right: outset;">261</td>
<td class="data-td data last text-right">91.46</td>
<td class="data-td data last text-right">89.83</td>
<td class="data-td data last text-right" style="border-right: outset;">93.67</td>
<td class="data-td data last text-right">5.49</td>
<td class="data-td data last text-right">6.16</td>
</tr>
<tr class="tbl-data">
<td class="data-td last">Healthcare</td>
<td class="data-td data last text-right">4.10</td>
<td class="data-td data last text-right">3.45</td>
<td class="data-td data last text-right" style="border-right: outset;">3.83</td>
<td class="data-td data last text-right">195</td>
<td class="data-td data last text-right">214</td>
<td class="data-td data last text-right" style="border-right: outset;">173</td>
<td class="data-td data last text-right">90.40</td>
<td class="data-td data last text-right">91.71</td>
<td class="data-td data last text-right" style="border-right: outset;">94.14</td>
<td class="data-td data last text-right">4.08</td>
<td class="data-td data last text-right">7.12</td>
</tr>
<tr class="tbl-data">
<td class="data-td last">Insurance</td>
<td class="data-td data last text-right">2.49</td>
<td class="data-td data last text-right">1.67</td>
<td class="data-td data last text-right" style="border-right: outset;">0.68</td>
<td class="data-td data last text-right">193</td>
<td class="data-td data last text-right">214</td>
<td class="data-td data last text-right" style="border-right: outset;">208</td>
<td class="data-td data last text-right">98.34</td>
<td class="data-td data last text-right">99.12</td>
<td class="data-td data last text-right" style="border-right: outset;">100.04</td>
<td class="data-td data last text-right">-0.66</td>
<td class="data-td data last text-right">1.25</td>
</tr>
<tr class="tbl-data">
<td class="data-td last">Leisure</td>
<td class="data-td data last text-right">4.53</td>
<td class="data-td data last text-right">3.70</td>
<td class="data-td data last text-right" style="border-right: outset;">2.68</td>
<td class="data-td data last text-right">220</td>
<td class="data-td data last text-right">280</td>
<td class="data-td data last text-right" style="border-right: outset;">374</td>
<td class="data-td data last text-right">93.65</td>
<td class="data-td data last text-right">93.18</td>
<td class="data-td data last text-right" style="border-right: outset;">90.10</td>
<td class="data-td data last text-right">1.62</td>
<td class="data-td data last text-right">2.45</td>
</tr>
<tr class="tbl-data">
<td class="data-td last">Real Estate</td>
<td class="data-td data last text-right">10.71</td>
<td class="data-td data last text-right">8.30</td>
<td class="data-td data last text-right" style="border-right: outset;">9.10</td>
<td class="data-td data last text-right">450</td>
<td class="data-td data last text-right">448</td>
<td class="data-td data last text-right" style="border-right: outset;">229</td>
<td class="data-td data last text-right">86.94</td>
<td class="data-td data last text-right">87.85</td>
<td class="data-td data last text-right" style="border-right: outset;">93.17</td>
<td class="data-td data last text-right">7.60</td>
<td class="data-td data last text-right">10.69</td>
</tr>
<tr class="tbl-data">
<td class="data-td last">Retail</td>
<td class="data-td data last text-right">22.15</td>
<td class="data-td data last text-right">18.18</td>
<td class="data-td data last text-right" style="border-right: outset;">16.72</td>
<td class="data-td data last text-right">219</td>
<td class="data-td data last text-right">221</td>
<td class="data-td data last text-right" style="border-right: outset;">225</td>
<td class="data-td data last text-right">86.26</td>
<td class="data-td data last text-right">88.43</td>
<td class="data-td data last text-right" style="border-right: outset;">87.64</td>
<td class="data-td data last text-right">2.16</td>
<td class="data-td data last text-right">6.30</td>
</tr>
<tr class="tbl-data">
<td class="data-td last">Services</td>
<td class="data-td data last text-right">0.83</td>
<td class="data-td data last text-right">0.67</td>
<td class="data-td data last text-right" style="border-right: outset;">0.77</td>
<td class="data-td data last text-right">189</td>
<td class="data-td data last text-right">234</td>
<td class="data-td data last text-right" style="border-right: outset;">145</td>
<td class="data-td data last text-right">95.97</td>
<td class="data-td data last text-right">96.12</td>
<td class="data-td data last text-right" style="border-right: outset;">99.63</td>
<td class="data-td data last text-right">4.91</td>
<td class="data-td data last text-right">6.45</td>
</tr>
<tr class="tbl-data">
<td class="data-td last">Technology &amp; Electronics</td>
<td class="data-td data last text-right">6.78</td>
<td class="data-td data last text-right">5.45</td>
<td class="data-td data last text-right" style="border-right: outset;">3.26</td>
<td class="data-td data last text-right">208</td>
<td class="data-td data last text-right">262</td>
<td class="data-td data last text-right" style="border-right: outset;">269</td>
<td class="data-td data last text-right">90.50</td>
<td class="data-td data last text-right">88.87</td>
<td class="data-td data last text-right" style="border-right: outset;">87.07</td>
<td class="data-td data last text-right">4.66</td>
<td class="data-td data last text-right">4.22</td>
</tr>
<tr class="tbl-data">
<td class="data-td last">Telecommunications</td>
<td class="data-td data last text-right">12.56</td>
<td class="data-td data last text-right">10.07</td>
<td class="data-td data last text-right" style="border-right: outset;">10.40</td>
<td class="data-td data last text-right">311</td>
<td class="data-td data last text-right">366</td>
<td class="data-td data last text-right" style="border-right: outset;">326</td>
<td class="data-td data last text-right">92.24</td>
<td class="data-td data last text-right">89.80</td>
<td class="data-td data last text-right" style="border-right: outset;">92.06</td>
<td class="data-td data last text-right">5.46</td>
<td class="data-td data last text-right">4.63</td>
</tr>
<tr class="tbl-data">
<td class="data-td last">Transportation</td>
<td class="data-td data last text-right">0.59</td>
<td class="data-td data last text-right">0.48</td>
<td class="data-td data last text-right" style="border-right: outset;">0.54</td>
<td class="data-td data last text-right">156</td>
<td class="data-td data last text-right">217</td>
<td class="data-td data last text-right" style="border-right: outset;">174</td>
<td class="data-td data last text-right">104.16</td>
<td class="data-td data last text-right">102.60</td>
<td class="data-td data last text-right" style="border-right: outset;">105.77</td>
<td class="data-td data last text-right">4.76</td>
<td class="data-td data last text-right">4.87</td>
</tr>
<tr class="tbl-data">
<td class="data-td last">Utility</td>
<td class="data-td data last text-right">2.22</td>
<td class="data-td data last text-right">1.78</td>
<td class="data-td data last text-right" style="border-right: outset;">1.99</td>
<td class="data-td data last text-right">173</td>
<td class="data-td data last text-right">217</td>
<td class="data-td data last text-right" style="border-right: outset;">191</td>
<td class="data-td data last text-right">96.71</td>
<td class="data-td data last text-right">95.53</td>
<td class="data-td data last text-right" style="border-right: outset;">97.28</td>
<td class="data-td data last text-right">3.26</td>
<td class="data-td data last text-right">3.45</td>
</tr>
<tr class="tbl-data">
<td class="data-td last">Grand Total</td>
<td class="data-td data last text-right">100</td>
<td class="data-td data last text-right" style="border-right: outset;">100</td>
<td class="data-td data last text-right">249</td>
<td class="data-td data last text-right">257</td>
<td class="data-td data last text-right" style="border-right: outset;">237</td>
<td class="data-td data last text-right">91.52</td>
<td class="data-td data last text-right">93.11</td>
<td class="data-td data last text-right" style="border-right: outset;">93.70</td>
<td class="data-td data last text-right">3.11</td>
<td class="data-td data last text-right">4.71</td>
</tr>
</tbody>
</table>
</div>
<p class="chart-disclosure">Source: ICE Data Services, VanEck.&nbsp;<sup>*</sup>Returns are based on partial period data. Fallen Angels: ICE US Fallen Angel High Yield 10% Constrained Index. Not intended as a recommendation to invest or divest in any of the sectors mentioned herein. Index performance is not representative of strategy performance. It is not possible to invest in an index.</p>
<p><strong>Fallen Angels Performance by Rating:</strong> There were no major change in overall rating composition during the quarter, with BB rated bonds still being the highest exposure within the fallen angels index. In terms of performance, CCC &amp; Lower rated bonds outperformed higher quality bonds in the second quarter as these quickly recovered following &ldquo;Liberation Day&rdquo;.</p>
<div class="wrapped-div">
<table style="width: 100%;">
<tbody>
<tr class="tbl-data">
<td class="tbl-header last text-center">&nbsp;</td>
<td class="tbl-header last text-center" style="border-right: outset;" colspan="3">Wgt (%)</td>
<td class="tbl-header last text-center" style="border-right: outset;" colspan="3">OAS</td>
<td class="tbl-header last text-center" style="border-right: outset;" colspan="3">Price</td>
<td class="tbl-header last text-right" colspan="2">Total Return</td>
</tr>
<tr class="tbl-data">
<td class="data-head data last text-right">&nbsp;</td>
<td class="data-head data last text-right">12/31/2024</td>
<td class="data-head data last text-right">3/31/2025</td>
<td class="data-head data last text-right" style="border-right: outset;">6/30/2025</td>
<td class="data-head data last text-right">12/31/2024</td>
<td class="data-head data last text-right">3/31/2025</td>
<td class="data-head data last text-right" style="border-right: outset;">6/30/2025</td>
<td class="data-head data last text-right">12/31/2024</td>
<td class="data-head data last text-right">3/31/2025</td>
<td class="data-head data last text-right" style="border-right: outset;">6/30/2025</td>
<td class="data-head data last text-right">QTD</td>
<td class="data-head data last text-right">YTD</td>
</tr>
<tr class="tbl-data">
<td class="data-td last">BB</td>
<td class="data-td data last text-right">83.93</td>
<td class="data-td data last text-right">82.22</td>
<td class="data-td data last text-right" style="border-right: outset;">79.91</td>
<td class="data-td data last text-right">197</td>
<td class="data-td data last text-right">220</td>
<td class="data-td data last text-right" style="border-right: outset;">197</td>
<td class="data-td data last text-right">93.33</td>
<td class="data-td data last text-right">95.43</td>
<td class="data-td data last text-right" style="border-right: outset;">96.30</td>
<td class="data-td data last text-right">2.29</td>
<td class="data-td data last text-right">3.51</td>
</tr>
<tr class="tbl-data">
<td class="data-td last">B</td>
<td class="data-td data last text-right">10.09</td>
<td class="data-td data last text-right">13.22</td>
<td class="data-td data last text-right" style="border-right: outset;">14.98</td>
<td class="data-td data last text-right">474</td>
<td class="data-td data last text-right">322</td>
<td class="data-td data last text-right" style="border-right: outset;">294</td>
<td class="data-td data last text-right">86.36</td>
<td class="data-td data last text-right">88.45</td>
<td class="data-td data last text-right" style="border-right: outset;">88.79</td>
<td class="data-td data last text-right">6.63</td>
<td class="data-td data last text-right">14.31</td>
</tr>
<tr class="tbl-data">
<td class="data-td last">CCC</td>
<td class="data-td data last text-right">4.72</td>
<td class="data-td data last text-right">3.78</td>
<td class="data-td data last text-right" style="border-right: outset;">4.16</td>
<td class="data-td data last text-right">425</td>
<td class="data-td data last text-right">496</td>
<td class="data-td data last text-right" style="border-right: outset;">477</td>
<td class="data-td data last text-right">88.24</td>
<td class="data-td data last text-right">86.54</td>
<td class="data-td data last text-right" style="border-right: outset;">86.63</td>
<td class="data-td data last text-right">1.88</td>
<td class="data-td data last text-right">1.67</td>
</tr>
<tr class="tbl-data">
<td class="data-td last">CC</td>
<td class="data-td data last text-right">1.26</td>
<td class="data-td data last text-right">0.78</td>
<td class="data-td data last text-right" style="border-right: outset;">0.95</td>
<td class="data-td data last text-right">1262</td>
<td class="data-td data last text-right">1955</td>
<td class="data-td data last text-right" style="border-right: outset;">1651</td>
<td class="data-td data last text-right">54.65</td>
<td class="data-td data last text-right">39.08</td>
<td class="data-td data last text-right" style="border-right: outset;">45.75</td>
<td class="data-td data last text-right">20.60</td>
<td class="data-td data last text-right">-9.00</td>
</tr>
<tr class="tbl-data">
<td class="data-td last">Total</td>
<td class="data-td data last text-right">100.00</td>
<td class="data-td data last text-right" style="border-right: outset;">100.00</td>
<td class="data-td data last text-right">249</td>
<td class="data-td data last text-right">257</td>
<td class="data-td data last text-right" style="border-right: outset;">237</td>
<td class="data-td data last text-right">91.52</td>
<td class="data-td data last text-right">93.11</td>
<td class="data-td data last text-right" style="border-right: outset;">93.70</td>
<td class="data-td data last text-right">3.11</td>
<td class="data-td data last text-right">4.71</td>
</tr>
</tbody>
</table>
</div>
<p class="chart-disclosure">Source: ICE Data Services, VanEck. Fallen Angels: ICE US Fallen Angel High Yield 10% Constrained Index. Not intended as a recommendation to invest or divest in any of the sectors mentioned herein. Index performance is not representative of strategy performance. It is not possible to invest in an index. BB index: ICE BofA BB US High Yield Index; Single-B index: ICE BofA Single-B US High Yield Index; CCC &amp; Lower rated index ICE BofA CCC &amp; Lower US High Yield Index.</p>

<p>To receive more <a href="/us/en/blogs/income-investing/" title="Income Investing Insights"><strong>Income Investing</strong></a> insights, <a href="/link/5f45412c2143400497908cea2897f7d3.aspx" title=" Subscription Center"><strong>sign up in our subscription center</strong></a>.</p>
]]></content:encoded>
</item><item rdf:about="https://www.vaneck.com/us/en/blogs/gold-investing/ima-casanova-gold-holds-firm-as-junior-miners-regain-momentum/">
  <title>Gold Holds Firm as Junior Miners Regain Momentum></title>
  <link>https://www.vaneck.com/us/en/blogs/gold-investing/ima-casanova-gold-holds-firm-as-junior-miners-regain-momentum/</link>
  <description><![CDATA[Gold&rsquo;s strength, solid cash flow and rising valuations are fueling M&amp;A activity. Well-positioned firms aim to grow, with junior miners likely to benefit most in this bullish gold cycle.]]></description>
  <dc:creator>Imaru Casanova</dc:creator>
  <dc:date>07/11/2025 06:30:00</dc:date>
<content:encoded><![CDATA[

<p>Monthly gold market and economic insights from <strong><a href="/link/cfa7139e649944fea51aa2a740b2372e.aspx?p=1" title="Imaru Casanova - Portfolio Manager, Gold and Precious Metals">Imaru Casanova, Portfolio Manager</a></strong>, featuring her unique views on mining and gold&rsquo;s portfolio benefits.</p>

<h2>Flight to Safety Drives Gold to New Highs</h2>
<p>Investors once again sought shelter in gold during turbulent times. On June 13, gold prices climbed to a new all-time high, $3,432.34 per ounce, driven by escalating geopolitical tensions following Israeli strikes on Iranian nuclear sites.</p>
<p>As tensions around the conflict eased and U.S. trade negotiations evolved throughout the month, equity markets rebounded, supported by strong corporate earnings that bolstered investor confidence. The S&amp;P 500,<sup>1</sup>&nbsp;Nasdaq Composite<sup>2</sup>&nbsp;and Dow Jones Industrial Average<sup>3</sup>&nbsp;indices all closed at record highs on June 30. While gold was pressured by this shift in sentiment, it remained resilient, closing at $3,303.14 per ounce on June 30, a modest monthly gain of $13.89 per ounce (0.42%).</p>
<h2>Gold Stocks Outperform Despite Flat Metal Prices</h2>
<p>Gold mining equities, as represented by the NYSE Arca Gold Miners Index (GDMNTR),<sup>4</sup>&nbsp;once again managed to post a gain (up 3.03% in June), despite gold&rsquo;s flat performance and the broader equities&rsquo; strong recovery. In both 2023 and 2024, whenever gold prices drifted sideways without much momentum, gold equities tended to experience sharp declines (see charts below). This downturn also corresponded with declining investor interest in gold, as evidenced by outflows out of the gold bullion ETFs.</p>
<p><img loading="lazy" class="img-responsive w-100" alt="Gold Stocks Outperform Despite Flat Metal Prices" src="https://www.vaneck.com/contentassets/a3e4929301b34b78aba13b6508c5a239/5897_june-2025-gold_chart-1_2025-7_v1.svg" /></p>
<p class="chart-disclosure">Source: Bloomberg. Past performance is no guarantee of future results. Index performance is not representative of strategy performance. It is not possible to invest in an index.</p>

<p><img loading="lazy" class="img-responsive w-100" alt="Gold Stocks Outperform Despite Flat Metal Prices" src="https://www.vaneck.com/contentassets/ba4d27b25f9a4330befd83ba9975ee9e/5897_june-2025-gold_chart-2_2025-7_v1.svg" /></p>
<p class="chart-disclosure">Source: Bloomberg. Past performance is no guarantee of future results. Index performance is not representative of strategy performance. It is not possible to invest in an index.</p>
<p>It is encouraging to see gold equities outperforming the metal since mid-April, despite relatively flat gold prices over the same period.</p>
<p><img loading="lazy" class="img-responsive w-100" alt="Gold Stocks Outperform Despite Flat Metal Prices" src="https://www.vaneck.com/contentassets/bb84113d32f2409eab43a88de39bae2d/5897_june-2025-gold_chart-3_2025-7_v2.svg" /></p>
<p class="chart-disclosure">Source: Bloomberg. Past performance is no guarantee of future results. Index performance is not representative of strategy performance. It is not possible to invest in an index.</p>
<h2>Why Gold Equities Are Gaining Momentum</h2>
<p>Gold equities&rsquo; outperformance makes sense to us. Gold companies are realizing record margins at current gold prices &ndash; they don&rsquo;t require higher gold prices to continue to deliver strong free cash flow, and with average all-in sustaining costs for the sector at around $1,600 per ounce, they can in fact stay profitable at a gold price much lower than the spot price today.</p>
<p>We believe another factor providing support for gold equities this year is western investment demand once again acting as an important driver of gold prices&mdash;unlike in 2023 and 2024 when central bank demand acted as the main driver. Central banks and Asian investors don&rsquo;t typically buy gold equities, but western investors do; their return to the gold markets should continue to support a re-rating of the gold mining sector.</p>
<p>Despite their strong performance so far this year, gold equities are still trading at historically low valuations. Scotiabank estimates that for their universe of senior gold producers, current stock prices, on average, reflect a 30% discount to spot gold prices. Thus, continued outperformance of gold stocks relative to the metal, even in a flat gold price environment, is justified in our view. Meanwhile, the small-cap or junior gold mining companies, which have lagged gold and the larger companies in recent years, appear to be staging a comeback.</p>
<h2>Our Approach to Investing Across the Gold Spectrum</h2>
<p>We invest across the full spectrum of gold companies, seeking quality properties and capable management teams. Our top positions consistently execute well on their operations and growth strategies. However, there is also significant value to be found in companies that rarely show up in our top holdings. Junior developers, companies in early stages of development ranging from early drilling to detailed engineering, don&rsquo;t have any mines in production or generate revenues. There are hundreds of such companies listed mainly on Canadian and Australian stock exchanges with projects scattered around the world. They are credited with 60% to 70% of all significant gold discoveries globally.</p>
<p>A junior developer becomes investable for us when it demonstrates the potential to either:</p>
<ul class="content-list">
<li class="mt-2">Become an attractive acquisition for a mid- to large-cap producer, or</li>
<li class="mt-2">Develop a mine that forms the core of a newly emerging producer.</li>
</ul>
<p>We prefer companies with at least two-million ounces of mineable gold and favorable geology, metallurgy and engineering characteristics, as well as a sound geopolitical setting. We maintain smaller portfolio positions in these companies because they are not as liquid and are more speculative than their larger producing peers.</p>
<h2>Valuation and M&amp;A Tailwinds for Junior Developers</h2>
<p>Currently, there are 25 junior developers that meet our investment criteria. While we have frequently commented on the attractive valuations of the producers, it is noteworthy that the developers look even cheaper. One metric we use in our evaluation of these companies is Total Acquisition Cost (TAC) which is calculated as the sum of the estimated construction capital, life-of-mine operating and sustaining costs and market cap per ounce of mineable resource. We estimate that the companies in our junior developer universe carry an average TAC of $1,608 per ounce. Once built, they will make money at gold prices above $2,000 per ounce and become cash machines at current prices north of $3,000.</p>
<h3>Total Acquisition Cost/Ounce</h3>
<p><img loading="lazy" class="img-responsive w-100" alt="Total Acquisition Cost/Ounce" src="https://www.vaneck.com/contentassets/32c704a6446c41629808388ae2412b13/5897_june-2025-gold_chart-4_2025-7_v1.svg" /></p>
<p class="chart-disclosure">Source: VanEck, June 2025.</p>
<p>Whether we hold such companies in our portfolio depends on their relative valuations and how they rank on a number of factors, with their development timeline increasingly becoming more important for our selection. Investors and acquirors today appear to have little patience for the long permitting times that, unfortunately, have become common across the mining industry. The stocks seem to perform best early when drilling new ounces and later when reaching permitting/ financing/construction milestones.</p>
<p>Notably, sentiment seems to be shifting. From 2021 to 2023, junior developers underperformed the GDMNTR by 3.2% annually, with only one or two acquisitions per year. In 2024, there were four acquisitions at premiums ranging from 29% to 67% and the group of 25 outperformed by 36%. So far in 2025, they are up 14%, with two acquisitions already completed.</p>
<p>This momentum, combined with plenty of free cash flow and higher valuations, should support increased M&amp;A activity in the gold mining industry as companies are much better equipped to advance their growth strategies. Junior companies could be the main beneficiaries in the current gold cycle.</p>
<p>To receive more <strong><a href="https://www.vaneck.com/us/en/insights/gold-investing/" title="Gold Investing Insights">Gold Investing</a></strong> insights, <strong><a href="https://www.vaneck.com/us/en/subscribe/" title="Subscription Center">sign up in our subscription center</a></strong>.</p>
]]></content:encoded>
</item><item rdf:about="https://www.vaneck.com/us/en/blogs/digital-assets/matthew-sigel-investors-push-back-on-bitcoin-miner-exec-pay/">
  <title>Investors Push Back on Bitcoin Miner Exec Pay></title>
  <link>https://www.vaneck.com/us/en/blogs/digital-assets/matthew-sigel-investors-push-back-on-bitcoin-miner-exec-pay/</link>
  <description><![CDATA[In the 2025 proxy season, shareholders of bitcoin mining companies are pushing back on executive compensation, citing concerns about pay practices and investor alignment.]]></description>
  <dc:creator>Matthew  Sigel</dc:creator>
  <dc:date>07/10/2025 06:30:00</dc:date>
<content:encoded><![CDATA[

<p><strong>Please note that VanEck has exposure to Bitcoin and may have positions in Bitcoin mining stocks mentioned. </strong></p>
<p>Nearly <strong>99%</strong> of executive pay proposals passed in the 2024 proxy season, and early 2025 filings show S&amp;P 500 CEO pay rising nearly <strong>10%</strong> year-over-year. Across corporate America, shareholder support for compensation remains strong, even as the numbers climb.</p>
<p>Bitcoin miners are the exception. Despite aggressive compensation packages, their shareholders are balking. In our latest review of eight U.S.-listed miners, average support for executive pay proposals came in at just <strong>64%</strong>, far below the S&amp;P 500 and Russell 3000 averages of <strong>90%</strong> and <strong>91%.</strong></p>
<p>That skepticism appears well-founded. Mining executives continue to grant themselves oversized equity awards that dilute shareholders without reliably linking pay to long-term value creation. It&rsquo;s a striking contradiction: in an industry built on Bitcoin&rsquo;s 21-million hard cap, there are few such limits on how much stock insiders can issue themselves.</p>
<h2 id="methodology" class="jump-link-nav anchored-block" data-jumplink-title="Methodology">Scope and Methodology</h2>
<p>Building on our 2022 analysis, we reviewed executive compensation across eight U.S.-listed Bitcoin miners: BTBT, CIFR, CLSK, CORZ, HUT, MARA, RIOT, and WULF. We excluded foreign issuers like IREN, HIVE, and GLXY, whose proxy disclosures lack the granularity required for consistent comparison.</p>
<p>Using data from Gallagher benchmarking reports and DEF 14A filings, we compared total direct compensation (base salary, bonuses, and equity awards) against benchmarks from the energy and IT sectors, as well as the broader Russell 3000.</p>
<h2>Bitcoin Miners Outpay Peers, Driven by Equity-Heavy Packages</h2>
<p>The results were clear: Bitcoin miners&rsquo; pay is significantly higher than in comparable industries, driven by a greater reliance on equity. In some cases, this reliance is well-aligned with shareholder interests, but in many cases it appears excessive. In 2023, base salaries for miner NEOs averaged <strong>$474,000</strong>, which is roughly in line with Energy at <strong>$505,000</strong>, IT at <strong>$472,000</strong>, and the broader market at <strong>$535,000</strong>. However, equity and long-term awards made up <strong>79 percent</strong> of total miner compensation that year, and that weighting increased to <strong>89 percent</strong> in 2024 based on early proxy filings. While full peer data for 2024 is not yet available, the equity-heavy design continued to push total compensation significantly higher.</p>
<p>Miner NEOs earned an average of <strong>$6.6 million</strong> in total direct compensation in 2023. This far exceeded the averages for Energy at <strong>$3.0 million</strong>, the Russell 3000 at <strong>$3.1 million</strong>, and even the tech sector at <strong>$4.5 million</strong>. In 2024, that figure nearly doubled to <strong>$14.4 million </strong>for the Bitcoin miners. To be sure, equity compensation likely rose across many sectors amid a broader bull market, but miners appear to have outpaced even that elevated baseline.</p>
<p>Cash bonuses were elevated as well. In 2023, miner NEOs took home an average of <strong>$836,000</strong> in bonuses, <strong>more than double</strong> the levels seen in IT and Energy. This suggests that even short-term incentives in the mining sector are generously structured compared to performance norms in adjacent industries.</p>
<h2 id="average-compensations" class="jump-link-nav anchored-block" data-jumplink-title="Average Compensation">Average NEO (Named Executive Officer) Compensation by Factor (2023-2024)</h2>
<h3>Equity and Long-Term Awards Drive Average NEO Compensation Higher in Bitcoin Mining Than Adjacent Industries</h3>
<p><img loading="lazy" src="https://www.vaneck.com/contentassets/07183f6fc4f3428fb59707e9b7246179/5813_bitcoin-mining-ceo_chart-1_2025-1_v2_blog.svg" alt="Equity and Long-Term Awards Drive Average NEO Compensation Higher in Bitcoin Mining Than Adjacent Industries" class="img-responsive w-100" /></p>
<p class="chart-disclosure"><strong>Sources: Gallagher, DEF14As (2023 &amp; 2024) as of 6/10/2025.</strong> The mean compensation factors for NEOs for Bitcoin miners and their peers compared to the energy and IT industries and the Russell 3000.<br />*excluding CORZ, which was in Chapter 11 bankruptcy throughout 2023</p>
<p><img loading="lazy" src="https://www.vaneck.com/contentassets/07183f6fc4f3428fb59707e9b7246179/5813_bitcoin-mining-ceo_table-1_2025-1_v1_blog.svg" alt="Average NEO Compensation by Factor" class="img-responsive w-100" /></p>
<p class="chart-disclosure"><strong>Sources: Gallagher, DEF14As (2023 &amp; 2024) as of 6/10/2025.</strong> The mean compensation factors for NEOs for Bitcoin miners and their peers compared to the energy and IT industries and the Russell 3000.<br />*excluding CORZ, which was in Chapter 11 bankruptcy throughout 2023</p>
<h2>Equity Award Structure: Short-Term Bias Remains, but Performance Gating Expands</h2>
<p>Patterns in our latest findings reinforce the concerns raised in our 2022 report: that miner executive pay practices remain aggressive, equity-heavy, and often weakly aligned with shareholder outcomes. The structure of these awards plays a key role, with most miners historically emphasizing short- to medium-term vesting schedules. While &ldquo;as-achieved&rdquo; performance grants remain uncommon, the trend is beginning to shift toward multi-year, performance-gated equity.</p>
<p>As of their 2025 DEF 14A filings, <strong>six of the eight miners</strong> in our sample (Riot, Core Scientific, Hut 8, Cipher Mining, TeraWulf, and Marathon) report expanded use of performance stock units (PSUs). These awards typically vest over multiple years based on share price targets or relative total shareholder return (TSR), often paired with continued service requirements.</p>
<p>Notably, Marathon transitioned fully to PSUs in 2025, while Cipher introduced a 50/50 mix of RSUs and PSUs. Core Scientific, following its reorganization, relaunched its long-term incentive program with PSU awards tied to cumulative stock performance. These changes mark a meaningful shift toward long-term alignment.</p>
<p>Still, gaps remain. CleanSpark is the only miner in our dataset that has not adopted PSUs. Bit Digital&rsquo;s 2025 plan authorizes them, but there&rsquo;s no evidence of issuance in its filings. Both firms emphasize performance in principle, but neither discloses milestone-based vesting or gating criteria, elements now widely viewed as baseline governance practice.</p>
<p>Taken together, the sector is showing early signs of reform. Most leading miners now incorporate multi-year vesting, relative benchmarks, and defined performance thresholds into their equity plans. While implementation varies, the departure from short-term-heavy designs is clear. As shareholder scrutiny builds, further improvements will likely be expected.</p>
<h2>Value Delivered? Not Always</h2>
<p><strong>In 2024, NEO (Named Executive Officer) Compensation Equaled ~73% of RIOT's Market Cap Growth; WULF &amp; CORZ, ~2%</strong></p>
<p>For all the structural shifts underway, a central question remains: are these pay packages aligned with shareholder value creation?</p>
<p>Our analysis compared total NEO compensation to each company&rsquo;s 2024 market-cap growth&mdash;a direct test of pay-for-performance alignment. The results were stark. While WULF and CORZ generated billions in new shareholder value, their NEOs took home just <strong>~2%</strong> of that growth in compensation. By contrast, RIOT paid its NEOs <strong>$230 million</strong>, equivalent to <strong>73%</strong> of its 2024 market-cap increase. MARA&rsquo;s ratio came in at <strong>18%</strong>.</p>
<p>These disparities echo concerns we first raised in our <a href="/link/b03ebb5111e64453b31fba8c7e7a8197.aspx" title="Bitcoin Miners' Excessive Comp Prompts Shareholder Concern"><strong>2022</strong> </a>report, when RIOT&rsquo;s shareholders rejected the company&rsquo;s say-on-pay proposal after disclosing <strong>$21.9 million</strong> in CEO compensation. That same proxy also included a proposal to expand RIOT&rsquo;s equity compensation plan by <strong>10 million</strong> shares, fueling investor concern over dilution, weak performance thresholds, and short-vesting equity. While RIOT has since adopted relative TSR-based PSUs, total pay still routinely outpaces shareholder returns.</p>
<h3>In 2024, NEO Compensation Equaled ~73% of RIOT's Market Cap Growth; WULF &amp; CORZ, ~2%</h3>
<p><img loading="lazy" src="https://www.vaneck.com/contentassets/07183f6fc4f3428fb59707e9b7246179/5813_bitcoin-mining-ceo_chart-2_2025-1_v1_blog.svg" alt="In 2024, NEO Compensation Equaled ~73% of RIOT's Market Cap Growth; WULF &amp; CORZ, ~2%" class="img-responsive w-100" /></p>
<p><img loading="lazy" src="https://www.vaneck.com/contentassets/07183f6fc4f3428fb59707e9b7246179/5813_bitcoin-mining-ceo_table-2_2025-1_v1_blog.svg" alt="Bitcoin Miner Neo Compensation vs. Market Cap Growth ($M)" class="img-responsive w-100" /></p>
<p class="chart-disclosure"><sup>*</sup>&nbsp;Using data from its opening day on Jan 24th, 2024, for the 2023 EOY Market Cap, due to prior Chapter 11 bankruptcy.<br />Source: FactSet, Company Filings as of 6/10/2025. <strong>Past performance is no guarantee of future results.</strong></p>
<h3>Equity Grants Remain Outsized, Even as Structures Evolve</h3>
<div class="wrapped-div">
<table style="width: 100%;">
<tbody>
<tr class="tbl-data">
<td class="tbl-header last text-left">Company</td>
<td class="tbl-header last text-right">CEO 2024 <br />Equity Grant ($M)</td>
<td class="tbl-header last text-left">Vesting Type</td>
<td class="tbl-header last text-left">Vesting Detail</td>
<td class="tbl-header last text-left">Special Equity Award?</td>
</tr>
<tr class="tbl-data">
<td class="data-td data last text-left">RIOT</td>
<td class="data-td data last text-right">79.3</td>
<td class="data-td data last text-left text-nowrap">Performance-Gated</td>
<td class="data-td data last text-left">RSAs/PRSAs over <strong>3 years</strong>.<br />PRSAs tied to relative TSR vs index.</td>
<td class="data-td data last text-left">None</td>
</tr>
<tr class="tbl-data">
<td class="data-td data last text-left">MARA</td>
<td class="data-td data last text-right">40.1</td>
<td class="data-td data last text-left">Time-Based</td>
<td class="data-td data last text-left"><strong>3 years;</strong> 25% upfront, then linear quarterly vesting</td>
<td class="data-td data last text-left">None</td>
</tr>
<tr class="tbl-data">
<td class="data-td data last text-left">CORZ</td>
<td class="data-td data last text-right">39.5</td>
<td class="data-td data last text-left">Performance-Gated</td>
<td class="data-td data last text-left">RSUs: <strong>4 years;</strong> PSUs: <strong>3 years</strong>, stock-price hurdles.</td>
<td class="data-td data last text-left">None</td>
</tr>
<tr class="tbl-data">
<td class="data-td data last text-left">CIFR</td>
<td class="data-td data last text-right">14.9</td>
<td class="data-td data last text-left">Time-Based</td>
<td class="data-td data last text-left"><strong>3 years;</strong> equal annual installments</td>
<td class="data-td data last text-left">None</td>
</tr>
<tr class="tbl-data">
<td class="data-td data last text-left">HUT</td>
<td class="data-td data last text-right">8.6</td>
<td class="data-td data last text-left">Performance-Gated</td>
<td class="data-td data last text-left"><strong>3-year</strong> cliff if 2-year price targets met.</td>
<td class="data-td data last text-left">None</td>
</tr>
<tr class="tbl-data">
<td class="data-td data last text-left">CLSK</td>
<td class="data-td data last text-right">5.0</td>
<td class="data-td data last text-left">As-Achieved</td>
<td class="data-td data last text-left">Stock-price based.<br /><strong>3 years;</strong> 40% upfront, then linear quarterly vesting.</td>
<td class="data-td data last text-left">None</td>
</tr>
<tr class="tbl-data">
<td class="data-td data last text-left">WULF</td>
<td class="data-td data last text-right">4.4</td>
<td class="data-td data last text-left">Performance-Gated</td>
<td class="data-td data last text-left">RSUs: <strong>1 year</strong> (50%/50% over two six-month anniversaries);<br />PSUs: <strong>3 years</strong>, stock-price hurdles.</td>
<td class="data-td data last text-left">None</td>
</tr>
<tr class="tbl-data">
<td class="data-td data last text-left">BTBT</td>
<td class="data-td data last text-right">3.2</td>
<td class="data-td data last text-left">Time-Based</td>
<td class="data-td data last text-left"><strong>3 years</strong> (assumed; not disclosed)</td>
<td class="data-td data last text-left">None</td>
</tr>
</tbody>
</table>
</div>
<p class="chart-disclosure mt-3">Source: Company Filings as of 6/10/2025. <strong>Past performance is no guarantee of future results.</strong></p>
<p>While several miners have begun adopting longer vesting timelines and performance-linked awards, the absolute scale of 2024 equity grants remains a red flag. RIOT&rsquo;s CEO received <strong>a $79.3 million</strong> equity award, the largest in the group, nearly double that of MARA and a multiple of its peers&rsquo; average.</p>
<p>None of the companies in our sample issued special, one-time equity awards in 2024, suggesting a welcome move toward more standardized and predictable incentive cycles. But the size of regular-cycle grants alone continues to raise questions. Even with relative TSR gating in place, RIOT&rsquo;s equity package reinforces concerns first raised in 2022: that total compensation remains out of step with shareholder value creation.</p>
<h2 id="shareholder-proposals" class="jump-link-nav anchored-block" data-jumplink-title="Shareholder Proposals">Shareholder Pushback Intensifies</h2>
<h3>Bitcoin Miner Executive Comp Shareholder Proposals</h3>
<div class="wrapped-div">
<table style="width: 100%;">
<tbody>
<tr class="tbl-data">
<td class="tbl-header last text-left">Company</td>
<td class="tbl-header last text-left">Proposal #</td>
<td class="tbl-header last text-left">Description</td>
<td class="tbl-header last text-left">Status</td>
<td class="tbl-header last text-right">Shareholder Meeting Date</td>
</tr>
<tr class="tbl-data">
<td class="data-td data last text-left">CLSK</td>
<td class="data-td data last text-left">#2 - Say-on-Pay</td>
<td class="data-td data last text-left">Standard note to approve 2024 NEO comp.</td>
<td class="data-td data last text-left">✅ 76% For</td>
<td class="data-td data last text-right">3/3/2025</td>
</tr>
<tr class="tbl-data">
<td class="data-td data last text-left" rowspan="2">WULF</td>
<td class="data-td data last text-left">#3 - Say-on-Pay</td>
<td class="data-td data last text-left">Standard note to approve 2024 NEO comp.</td>
<td class="data-td data last text-left">✅ 99% For</td>
<td class="data-td data last text-right" rowspan="2">5/5/2025</td>
</tr>
<tr class="tbl-data">
<td class="data-td data last text-left">#4 - Omnibus Equity Compensation Plan</td>
<td class="data-td data last text-left">Increases 2021 Plan share authorization by 45M <strong>(~10.5% dilution)</strong> to 54.1M total.</td>
<td class="data-td data last text-left">✅ 87% For</td>
</tr>
<tr class="tbl-data">
<td class="data-td data last text-left" rowspan="3">CORZ</td>
<td class="data-td data last text-left">#2 - Say-on-Pay</td>
<td class="data-td data last text-left">Standard note to approve 2024 NEO comp.</td>
<td class="data-td data last text-left">❌ 62% Against</td>
<td class="data-td data last text-right" rowspan="3">5/12/2025</td>
</tr>
<tr class="tbl-data">
<td class="data-td data last text-left">#3 - Say-on-Frequency</td>
<td class="data-td data last text-left">Proposes say-on-pay <strong>every 1 year</strong>.</td>
<td class="data-td data last text-left">✅ 1 Year (99%)</td>
</tr>
<tr class="tbl-data">
<td class="data-td data last text-left">#7 - Omnibus Equity Compensation Plan</td>
<td class="data-td data last text-left">Seeks approval of 32.4M new shares <strong>(~9.8% dilution)</strong> under amended 2024 plan. CORZ projects 4 years of usage and cites prior 3-year average dilution below 1%.</td>
<td class="data-td data last text-left">✅ 90% For</td>
</tr>
<tr class="tbl-data">
<td class="data-td data last text-left" rowspan="3">BTBT</td>
<td class="data-td data last text-left">#2 - Omnibus Equity Incentive Plan</td>
<td class="data-td data last text-left">Proposes adoption of new 2025 Omnibus Equity Incentive Plan authorizing 8M shares <strong>(~3.8% dilution)</strong> for future equity grants.</td>
<td class="data-td data last text-left">✅ 98% For</td>
<td class="data-td data last text-right" rowspan="3">5/20/2025</td>
</tr>
<tr class="tbl-data">
<td class="data-td data last text-left">#4 - Say-on-Pay</td>
<td class="data-td data last text-left">Standard note to approve 2024 NEO comp.</td>
<td class="data-td data last text-left">✅ 72% For</td>
</tr>
<tr class="tbl-data">
<td class="data-td data last text-left">#5 - Say-on-Frequency</td>
<td class="data-td data last text-left">Proposes say-on-pay <strong>every 3 years</strong>.</td>
<td class="data-td data last text-left text-nowrap">✅ 3 Years (65%)<br /><br />❌ 1 Year (35%)</td>
</tr>
<tr class="tbl-data">
<td class="data-td data last text-left" rowspan="2">CIFR</td>
<td class="data-td data last text-left">#3 - Say-on-Pay</td>
<td class="data-td data last text-left">Standard note to approve 2024 NEO comp.</td>
<td class="data-td data last text-left">✅ 72% For</td>
<td class="data-td data last text-right" rowspan="2">6/3/2025</td>
</tr>
<tr class="tbl-data">
<td class="data-td data last text-left">#4 - Say-on-Frequency</td>
<td class="data-td data last text-left">Proposes say-on-pay <strong>every 1 year</strong>.</td>
<td class="data-td data last text-left">✅ 1 Year (96%)</td>
</tr>
<tr class="tbl-data">
<td class="data-td data last text-left" rowspan="2">RIOT</td>
<td class="data-td data last text-left">#3 - Say-on-Pay</td>
<td class="data-td data last text-left">Standard note to approve 2024 NEO comp.</td>
<td class="data-td data last text-left">❌ 68% Against</td>
<td class="data-td data last text-right" rowspan="2">6/10/2025</td>
</tr>
<tr class="tbl-data">
<td class="data-td data last text-left">#4 - Say-on-Frequency</td>
<td class="data-td data last text-left">Proposes say-on-pay <strong>every 1 year</strong>.</td>
<td class="data-td data last text-left">✅ 1 Year (95%)</td>
</tr>
<tr class="tbl-data">
<td class="data-td data last text-left" rowspan="3">HUT</td>
<td class="data-td data last text-left">#2 - Say-on-Pay</td>
<td class="data-td data last text-left">Standard note to approve 2024 NEO comp.</td>
<td class="data-td data last text-left">✅ 99% For</td>
<td class="data-td data last text-right" rowspan="3">6/18/2025</td>
</tr>
<tr class="tbl-data">
<td class="data-td data last text-left">#3 - Say-on-Frequency</td>
<td class="data-td data last text-left">Proposes say-on-pay <strong>every 1 year</strong>.</td>
<td class="data-td data last text-left">✅ 1 Year (91%)</td>
</tr>
<tr class="tbl-data">
<td class="data-td data last text-left">#5 - Omnibus Equity Compensation Plan</td>
<td class="data-td data last text-left">Amends 2023 plan to double share reserve to 10.5M (5.25M shares = <strong>~4.8% dilution</strong>) and removes evergreen clause (annual 6.85% increases), reducing future dilution risk.</td>
<td class="data-td data last text-left">✅ 94% For</td>
</tr>
<tr class="tbl-data">
<td class="data-td data last text-left" rowspan="2">MARA</td>
<td class="data-td data last text-left">#3 - Say-on-Pay</td>
<td class="data-td data last text-left">Standard note to approve 2024 NEO comp.</td>
<td class="data-td data last text-left">❌ 78% Against</td>
<td class="data-td data last text-right" rowspan="2">6/26/2025</td>
</tr>
<tr class="tbl-data">
<td class="data-td data last text-left">#4 - Equity Plan Amendment</td>
<td class="data-td data last text-left">Amend 2018 Equity Incentive Plan to add 18M new shares <strong>(~4.9% dilution)</strong>, bringing total to 63M (from 45M).</td>
<td class="data-td data last text-left">✅ 86% For</td>
</tr>
</tbody>
</table>
<p class="chart-disclosure mt-3">Source: Company Filings as of 6/10/2025. <strong>Past performance is no guarantee of future results.</strong></p>
<p>Shareholders are taking notice. In 2025,<strong> 3</strong> of the <strong>8</strong> miners we analyzed (CORZ, RIOT, and MARA) faced striking rebukes on their executive pay proposals. Only <strong>38%</strong> of CORZ investors approved its plan, followed by <strong>32%</strong> for RIOT and just <strong>22%</strong> for MARA.</p>
<p>As discussed earlier, these reactions appear grounded in substance. CORZ&rsquo;s <strong>$62 million</strong> NEO pay package amounted to just <strong>2.2%</strong> of the firm&rsquo;s market-cap growth: high in absolute terms, but modest compared to MARA&rsquo;s <strong>18%</strong> and RIOT&rsquo;s <strong>73%</strong>. Timing may have been CORZ&rsquo;s undoing: the awards were issued only months after the company emerged from Chapter 11. In RIOT&rsquo;s case, shareholder rejection is more straightforward and consistent with concerns flagged in 2021 and 2022. MARA&rsquo;s even steeper disapproval likely reflects frustration with its dilutive Bitcoin accumulation strategy and a perceived lack of progress toward AI and HPC opportunities.</p>
<p>Importantly, say-on-pay votes are advisory, but they send a clear message. Proxy advisors like ISS flag any proposal receiving less than <strong>70%</strong> support as &ldquo;low support,&rdquo; while Glass Lewis applies an even stricter <strong>80%</strong> threshold. Both expect boards -- especially compensation committees -- to respond and disclose corrective actions in the following year&rsquo;s proxy. Votes under <strong>50%</strong>, like those seen at CORZ, RIOT, and MARA, warrant what ISS calls &ldquo;the highest degree of responsiveness.&rdquo;</p>
<p>Viewed through that lens, the Bitcoin mining sector stands out. Only two of the eight companies we assessed surpassed both the <strong>70%</strong> and <strong>80%</strong> thresholds in 2025, a <strong>75% failure rate</strong>. By comparison, just <strong>4.3%</strong> of Russell 3000 and <strong>4.1%</strong> of S&amp;P 500 companies fell below <strong>70%</strong> in 2023, with even lower failure rates so far in 2024.</p>
<h2>Governance Reforms are Gaining Traction</h2>
<p>In response to growing scrutiny, several miners are adjusting how they engage shareholders on compensation. The most notable change is the adoption of &ldquo;say-on-frequency&rdquo; proposals, which determine how often investors vote on executive pay. In a sector known for rapid equity issuance and inconsistent performance alignment, annual votes provide a much-needed mechanism for accountability.</p>
<p>Most miners in our analysis now support annual say-on-pay votes. CORZ, CIFR, RIOT, and HUT all received strong approval for this approach, with support ranging from <strong>91% to 99%</strong>. BTBT was the only outlier, proposing to maintain a triennial vote. That proposal received just <strong>65%</strong> support, signaling that investors prefer more frequent oversight.</p>
<p>Several companies also sought approval to expand their equity or incentive plans. WULF and CORZ each proposed authorizing new grants equal to roughly <strong>10% of shares outstanding</strong>. BTBT, HUT, and MARA requested approvals in the range of <strong>4% to 5%</strong>. While all five proposals passed with solid majorities above <strong>86%</strong>, the broader context is important. Two of these companies, CORZ and MARA, failed their say-on-pay votes outright, and one&mdash;BTBT&mdash;narrowly avoided the same outcome.</p>
<p>This gap underscores a central concern. While shareholders may approve equity plans on procedural grounds, particularly when they apply company-wide, they remain deeply skeptical about how executive awards are structured and justified. As the sector evolves, we expect investor attention to shift toward award design, dilution levels, and the degree to which pay reflects long-term value creation.</p>
<h2>How Miners Can Rebuild Alignment</h2>
<p>As Bitcoin miners mature into large-scale infrastructure operators, their executive compensation programs must evolve as well. Recent proxy votes make clear that investors are no longer comfortable with oversized equity awards that lack meaningful ties to performance.</p>
<p>Boards and compensation committees should focus on three priorities:</p>
<p><strong>1. Incentivize cost-efficiency</strong></p>
<p>Bonuses and equity grants should be tied to cost-per-coin-mined. This metric captures the key drivers of profitability, including power pricing, fleet optimization, and SG&amp;A control. It encourages operational discipline and better protects margins during Bitcoin price cycles.</p>
<p><strong>2. Reinforce capital discipline</strong></p>
<p>Boards should incorporate measures like return on invested capital or capex efficiency into long-term incentive frameworks. These metrics help align compensation with how effectively management deploys shareholder capital, especially when growth depends on continued equity issuance.</p>
<p><strong>3. Strengthen performance gating on equity awards</strong></p>
<p>Equity should vest over multiple years and include performance thresholds, not just service requirements. Relative total shareholder return remains a viable benchmark, but awards should include caps and minimums to ensure they reflect company-specific execution rather than general market trends.</p>
<p>These changes won&rsquo;t eliminate scrutiny, but they would move miner compensation closer to governance best practice and restore credibility to pay programs that have drawn justified criticism. Focusing on execution, efficiency, and capital discipline would send a clearer signal that boards are committed to long-term alignment.</p>
<p><strong>Links to third party websites are provided as a convenience and the inclusion of such links does not imply any endorsement, approval, investigation, verification or monitoring by us of any content or information contained within or accessible from the linked sites. By clicking on the link to a non-VanEck webpage, you acknowledge that you are entering a third-party website subject to its own terms and conditions. VanEck disclaims responsibility for content, legality of access or suitability of the third-party websites.</strong></p>
</div>
<style>
    .data-td.data {
        padding-right: 5px !important;
        padding-left: 5px !important;
    }

    .wrapped-div {
        max-width: 100%;
    }

    @media (max-width: 1240px) {
        .wrapped-div {
            overflow-x: scroll;
        }
    }

    .wrapped-div-sector {
        max-width: 100%;
        overflow-x: scroll;
    }
</style>
<p>To receive more <strong><a href="https://www.vaneck.com/us/en/insights/digital-assets/" title="Digital Assets Insights">Digital Assets</a></strong> insights, <strong><a href="https://www.vaneck.com/us/en/subscribe/" title="Subscription Center">sign up in our subscription center</a></strong>.</p>
]]></content:encoded>
</item><item rdf:about="https://www.vaneck.com/us/en/blogs/natural-resources/safe-haven-demand-strengthens-commodities/">
  <title>Safe-Haven Demand Strengthens Commodities></title>
  <link>https://www.vaneck.com/us/en/blogs/natural-resources/safe-haven-demand-strengthens-commodities/</link>
  <description><![CDATA[Commodities faced mixed Q2 returns but remain supported by dollar weakness and rising geopolitical risk. Precious metals led performance amid inflation fears and global uncertainty.]]></description>
  <dc:creator>Roland Morris</dc:creator>
  <dc:date>07/10/2025 06:30:00</dc:date>
<content:encoded><![CDATA[

<h2>Macroeconomic Pressures Driving Market Sentiment</h2>
<p>The global macroeconomic environment continues to shape the trajectory of commodity markets in 2025. The U.S. dollar has been in a steady decline, pressured by growing concerns over expanding budget deficits and aggressive tariff posturing. President Trump&rsquo;s ongoing tariff threats have intensified trade tensions while his &ldquo;Big Beautiful Bill&rdquo;&mdash;expected to pass later this year&mdash;is likely to contribute significantly to projected U.S. fiscal deficits. These concerns have led investors to reduce dollar exposure, favoring alternative assets such as gold.</p>
<p>Simultaneously, geopolitical risk remains high. The fragile ceasefire in the Middle East raises the prospect of renewed disruption to global oil supplies. Meanwhile, the Russia-Ukraine conflict has intensified, with Russia advancing further into eastern Ukraine. Diplomatic efforts have stalled, and Ukraine&rsquo;s recent battlefield setbacks appear to have strengthened Russia&rsquo;s strategic posture. These global tensions are contributing to a growing demand for safe-haven and inflation-hedging assets.</p>
<h2>Precious Metals Shine Amid Uncertainty</h2>
<p>Gold and silver have emerged as the top-performing sectors in the commodity complex this year, largely benefiting from the macroeconomic and geopolitical backdrop. Gold has gained traction as both a reserve currency alternative and a hedge against potential inflation stemming from tariff-driven cost increases. While the bulk of these gains occurred in the first quarter, precious metals continue to play a pivotal role in year-to-date commodity performance.</p>
<h2>Index Performance: Divergence Driven by Allocation</h2>
<p>In the second quarter, the UBS Constant Maturity Commodity Index (CMCITR) posted a modest decline of approximately 1.76%, while the Bloomberg Commodity Index (BCOM) fell more sharply by 3.08%. This was driven by CMCI&rsquo;s lower exposure to natural gas&mdash;a weaker segment in the quarter&mdash;and a comparatively higher allocation to industrial metals, which showed greater resilience.</p>
<p>However, BCOM stronger year-to-date return of 5.53%, compared to CMCITR&rsquo;s 3.27% was largely attributable to BCOM&rsquo;s higher allocation to the precious metals sector, which has more than offset relative weaknesses in other areas. These differences underscore how sector weights and index design continue to drive divergence in performance.</p>
<h3>Comparative Index Sector Weights</h3>
<div class="flourish-embed flourish-chart" data-src="visualisation/24153932?2429575"><script src="https://public.flourish.studio/resources/embed.js"></script><noscript><img loading="lazy" src="https://public.flourish.studio/visualisation/24153932/thumbnail" width="100%" alt="Comparative Index Sector Weights" /></noscript></div>
<p class="chart-disclosure"><strong>Source: </strong>VanEck, Bloomberg. Data as of June 2025.</p>

<h2>Outlook: A Constructive Setup for Commodities</h2>
<p>If current macro trends persist&mdash;particularly U.S. dollar weakness and rising geopolitical risk&mdash;commodities may benefit in the second half of 2025. Inflation fears tied to tariff escalation, coupled with fiscal uncertainty, could provide further tailwinds to both industrial and precious metals, while energy markets remain sensitive to global supply shocks. Against this backdrop, investor interest in commodities as both tactical plays and strategic hedges is likely to remain strong.</p>
<p>Learn more about the <a href="/link/218468eae2b54f8989eda6f3f557770d.aspx" title="CMCAX - CM Commodity Index Fund - Class A - Overview"><strong>VanEck CM Commodity Index Fund</strong></a> and the <a href="/link/b517b8245a934e7bb2908053bfd688db.aspx" title="CMCI - VanEck CMCI Commodity Strategy ETF - Overview"><strong>VanEck CMCI Commodity Strategy ETF (CMCI)</strong></a>, which seek to track, before fees and expenses, the CMCITR.</p>

<p>To receive more <a href="/us/en/insights/natural-resources/" title="Natural Resources Insights"><strong>Natural Resources</strong></a> insights, <a href="https://www.vaneck.com/us/en/subscribe/" title="Subscription Center"><strong>sign up in our subscription center</strong></a>.</p>
]]></content:encoded>
</item><item rdf:about="https://www.vaneck.com/us/en/blogs/moat-investing/moat-stocks-advance-in-summer-rally/">
  <title>Moat Stocks Advance in Summer Rally></title>
  <link>https://www.vaneck.com/us/en/blogs/moat-investing/moat-stocks-advance-in-summer-rally/</link>
  <description><![CDATA[Moat stocks rose in June driven by strong tech stock performance, easing trade tensions, and solid earnings.]]></description>
  <dc:creator>Brandon Rakszawski</dc:creator>
  <dc:date>07/09/2025 06:30:00</dc:date>
<content:encoded><![CDATA[

<p id="us-equity-market-review" class="jump-link-nav anchored-block" data-jumplink-title="U.S. Equity Market Review">In June, U.S. equity markets sustained their May momentum, delivering an impressive summer rally as the S&amp;P 500 and Nasdaq Composite soared to record highs, climbing 5.1% and 6.6% respectively during the month. A ceasefire between Israel and Iran alleviated geopolitical tensions, while progress in U.S.-China trade negotiations eased tariff fears, boosting investor confidence. Strong corporate earnings and robust employment data further propelled optimism, pushing the S&amp;P 500 above 6,000 for the first time since February. Technology stocks spearheaded the gains again this month, despite the Federal Reserve maintaining elevated interest rates, as investors found some assurance in updated policy rate projections that left the door open for rate cuts to begin in the second half of the year.</p>
<p>The <strong><a href="/link/9e43dd198c5f4e419f13220685081895.aspx" title=" MOAT - VanEck Morningstar Wide Moat ETF - Overview">Morningstar Wide Moat Focus Index</a> </strong>(the &ldquo;Moat Index&rdquo;) participated in the June rally along with the broader equity market, posting a gain of 4.7% for the month. The strategy benefited from strong stock selection, allowing it to outperform the equal-weight S&amp;P 500 and keep pace with the traditional market-weight benchmark while also providing differentiated exposure amid a market environment that continues to be dominated by mega-cap technology.</p>
<p>Smaller U.S. stocks also advanced during the month, but to a lesser extent relative to large-caps, as the cohort remains laggards on the year, pressured by the persistent elevated interest rate backdrop. The <strong><a href="/link/166321dbcfec440590fb51cf0ad629aa.aspx" title=" SMOT - VanEck Morningstar SMID Moat ETF - Overview">Morningstar US Small-Mid Cap Moat Focus Index</a></strong> (the &ldquo;SMID Moat Index&rdquo;) posted a 4.2% gain in June, outpacing both the broad small- and mid-cap benchmarks, which returned 4% and 3.6%, respectively.</p>
<h3>Summer Rally Takes Stocks to Record Highs</h3>
<div class="flourish-embed flourish-chart" data-src="visualisation/24134531?2429379"><script src="https://public.flourish.studio/resources/embed.js"></script><noscript><img loading="lazy" src="https://public.flourish.studio/visualisation/24134531/thumbnail" width="100%" alt="Summer Rally Takes Stocks to Record Highs" /></noscript></div>
<p class="chart-disclosure"><strong>Source: Morningstar. Data as of 6/30/2025.</strong> Past performance is no guarantee of future results. Index performance is not representative of fund performance. It is not possible to invest directly in an index. Please see index definitions and other important disclosures at the end of this content. Fund performance current to the most recent month end is available by visiting vaneck.com or by calling 800.826.2333.</p>

<h2>Moat Index Sees Tech Uptick at Quarterly Review</h2>
<p>Both the Moat and SMID Moat Indexes underwent quarterly reviews on June 20, 2025. Each quarter, they systematically target the most attractively priced, high-quality U.S. companies within their respective universes. At the June review, the Moat strategies targeted valuation opportunities within technology, consumer goods and industrials. See our <strong><a href="/us/en/blogs/moat-investing/moat-index-sees-tech-uptick-and-consumer-goods-opportunities/" title="Moat Index Sees Tech Uptick and Consumer Goods Opportunities">blog covering the recent review</a></strong> for more on these trends and other key insights. Full results of the quarterly reviews are also available here: <strong><a href="https://www.vaneck.com/us/en/investments/morningstar-wide-moat-etf-moat/moat-reconstitution.pdf" title="MOAT - VanEck Morningstar Wide Moat ETF" target="_blank" rel="noopener">Moat Index</a></strong> and <strong><a href="https://www.vaneck.com/us/en/investments/morningstar-smid-moat-etf-smot/smot-reconstitution.pdf" title="SMOT - VanEck Morningstar SMID Moat ETF" target="_blank" rel="noopener">SMID Moat Index</a></strong>.</p>
<p>Additionally, in our moat investing webinar, we go even more in-depth on the quarterly review, current positioning, as well as recent performance. We also host members of Morningstar&rsquo;s equity research team to share their perspectives on market trends and companies within the strategies. View the webinar here: <strong><a href="https://www.vaneck.com/us/en/webinar-registration/?id=97872041518&amp;utm_source=vaneck&amp;utm_medium=calendar" title="U.S. Equity Overload: Time to Rethink Core Diversification ">U.S. Equity Overload: Time to Rethink Core Diversification</a></strong>.</p>
<h2 id="moat-highlights" class="jump-link-nav anchored-block" data-jumplink-title="Moat Highlights">Moat Index June Highlights: Tailwinds from Tech Selection</h2>
<p>In June, the Moat Index benefited from strong stock selection, which largely offset headwinds caused by its equal-weighted approach and current overweight positioning in defensive sectors. This enabled the Index to keep pace with the broader, tech-heavy market. Stock selection was particularly effective within the Technology sector, despite an underweight position, as highlighted by the presence of three technology names among the top five contributors.</p>
<p>The largest contributor, for the second consecutive month, was wide-moat semiconductor company Microchip Technology (MCHP). Microchip shares soared in May following strong earnings, and that momentum continued in June as shares gained another 20% on analyst upgrades and market optimism. The two-month rally moved MCHP shares from $45 at the beginning of May to over $70 per share by end of June, exceeding Morningstar&rsquo;s fair value estimate of $63 and leading to a trimming of the position at the recent June reconstitution in favor of other more attractive valuation opportunities.</p>
<p>Est&eacute;e Lauder (EL), a leader in premium beauty products, was also among the top contributors in June, gaining 20%. Shares had previously faced pressure due to uncertainty around tariffs, reflecting the company&rsquo;s significant global exposure, particularly in China. However, investor sentiment improved notably in June amid encouraging progress in U.S. trade negotiations, easing concerns around international market disruptions. Morningstar believes Est&eacute;e Lauder remains well-positioned to benefit from consumer premiumization trends and their strategic investments aimed at expanding its presence across key emerging markets. Morningstar believes EL remains undervalued and could continue its rebound given its fair value estimate of $120 per share.</p>
<p>Other top contributors within the Moat Index during the month include the cloud enterprise application and infrastructure company, Oracle Corp. (ORCL), global footwear and apparel brand, Nike Inc. (NKE), and automotive semiconductor supplier, NXP Semiconductors (NXPI).</p>
<p>Companies detracting the most in June are notably from the Consumer Staples sector with four names from the segment making the list including the premium distilled spirits manufacturer, Brown-Forman (BF.B), packaged-food giant, Campbell&rsquo;s (CPB), the spirits and Mexican beer importer, Constellation Brands (STZ), and consumer health company, Kenvue Inc. (KVUE). Outside of Consumer Staples is the document management and digital marketing software firm, Adobe Inc. (ADBE).</p>
<h2>Moat Index Top Contributors and Detractors - June 2025</h2>
<h3>Contributors</h3>
<div class="wrapped-div">
<table style="width: 100%;">
<tbody>
<tr class="tbl-data">
<td class="tbl-header last text-left">Company</td>
<td class="tbl-header last text-left">Ticker</td>
<td class="tbl-header last text-left">Sector</td>
<td class="tbl-header last text-right">Avg. Weight (%)</td>
<td class="tbl-header last text-right">Contribution (%)</td>
</tr>
<tr class="tbl-data">
<td class="data-td last text-left">Microchip Technology Inc.</td>
<td class="data-td data last text-left">MCHP</td>
<td class="data-td data last text-left">Technology</td>
<td class="data-td data last text-right">2.65</td>
<td class="data-td data last text-right">0.56</td>
</tr>
<tr class="tbl-data">
<td class="data-td last text-left">Estee Lauder</td>
<td class="data-td data last text-left">EL</td>
<td class="data-td data last text-left">Consumer Staples</td>
<td class="data-td data last text-right">2.39</td>
<td class="data-td data last text-right">0.50</td>
</tr>
<tr class="tbl-data">
<td class="data-td last text-left">Oracle Corp.</td>
<td class="data-td data last text-left">ORCL</td>
<td class="data-td data last text-left">Technology</td>
<td class="data-td data last text-right">1.35</td>
<td class="data-td data last text-right">0.43</td>
</tr>
<tr class="tbl-data">
<td class="data-td last text-left">Nike Inc.</td>
<td class="data-td data last text-left">NKE</td>
<td class="data-td data last text-left">Consumer Discretionary</td>
<td class="data-td data last text-right">2.05</td>
<td class="data-td data last text-right">0.37</td>
</tr>
<tr class="tbl-data">
<td class="data-td last text-left">NXP Semiconductors</td>
<td class="data-td data last text-left">NXPI</td>
<td class="data-td data last text-left">Technology</td>
<td class="data-td data last text-right">2.32</td>
<td class="data-td data last text-right">0.34</td>
</tr>
</tbody>
</table>
</div>
<h3>Detractors</h3>
<div class="wrapped-div">
<table style="width: 100%;">
<tbody>
<tr class="tbl-data">
<td class="tbl-header last text-left">Company</td>
<td class="tbl-header last text-left">Ticker</td>
<td class="tbl-header last text-left">Sector</td>
<td class="tbl-header last text-right">Avg. Weight (%)</td>
<td class="tbl-header last text-right">Contribution (%)</td>
</tr>
<tr class="tbl-data">
<td class="data-td last text-left">Brown-Forman Corp.</td>
<td class="data-td data last text-left">BF.B</td>
<td class="data-td data last text-left">Consumer Staples</td>
<td class="data-td data last text-right">2.24</td>
<td class="data-td data last text-right">-0.42</td>
</tr>
<tr class="tbl-data">
<td class="data-td last text-left">The Campbell's Co.</td>
<td class="data-td data last text-left">CPB</td>
<td class="data-td data last text-left">Consumer Staples</td>
<td class="data-td data last text-right">2.18</td>
<td class="data-td data last text-right">-0.22</td>
</tr>
<tr class="tbl-data">
<td class="data-td last text-left">Constellation Brands Inc.</td>
<td class="data-td data last text-left">STZ</td>
<td class="data-td data last text-left">Consumer Staples</td>
<td class="data-td data last text-right">2.19</td>
<td class="data-td data last text-right">-0.19</td>
</tr>
<tr class="tbl-data">
<td class="data-td last text-left">Kenvue Inc.</td>
<td class="data-td data last text-left">KVUE</td>
<td class="data-td data last text-left">Consumer Staples</td>
<td class="data-td data last text-right">1.47</td>
<td class="data-td data last text-right">-0.18</td>
</tr>
<tr class="tbl-data">
<td class="data-td last text-left">Adobe Inc.</td>
<td class="data-td data last text-left">ADBE</td>
<td class="data-td data last text-left">Technology</td>
<td class="data-td data last text-right">2.16</td>
<td class="data-td data last text-right">-0.15</td>
</tr>
</tbody>
</table>
</div>
<p class="chart-disclosure"><strong>Source: Morningstar, June 2025.</strong> Past performance is no guarantee of future results. Index performance is not illustrative of fund performance. Not intended as a recommendation to buy or to sell any of the securities mentioned herein.</p>

<h2 id="smid-highlights" class="jump-link-nav anchored-block" data-jumplink-title="SMID Moat Highlights">SMID Moat Index May Highlights: Cruise Line Momentum Continues</h2>
<p>The <a href="/link/d52df9865d4344169ef628a966527697.aspx" title="Equity ETF Indices"><strong>SMID Moat Index</strong></a> outperformed both the small-cap and mid-cap benchmarks in June, supported by strong stock selection across key areas of the portfolio. Standout performance within the Consumer Discretionary and Health Care sectors led the way, helping to offset a more neutral contribution from sector positioning overall.</p>
<p>For the second straight month, Carnival Corp. (CCL) topped the <a href="/link/d52df9865d4344169ef628a966527697.aspx" title="Equity ETF Indices"><strong>SMID Moat Index</strong></a>, with shares rising 21 percent in June. The cruise operator extended its rally after posting another quarter of impressive results, surpassing yield and cost expectations thanks to strong onboard spending and resilient late-booking demand. Management raised its 2025 net yield growth target and highlighted a booking curve that now stretches further out than ever before. With record customer deposits, a string of successful refinancing efforts, and credit-rating upgrades from S&amp;P and Fitch, investor optimism remained strong. Morningstar lifted its fair value estimate per share for Carnival to $33 from $31 to reflect the cruise operator&rsquo;s improved fundamentals and pricing strength.</p>
<p>Also powering Index performance was Norwegian Cruise Line Holdings (NCLH), which saw shares climb nearly 15 percent in June as the cruise rebound broadened. Norwegian continues to benefit from firm pricing trends and steady demand across its brands, supported by attractive itineraries, bundled offerings like the More at Sea program, and data-driven marketing. With ships sailing at full occupancy and returns on invested capital expected to reach meaningful levels in 2025, Morningstar sees the company on solid footing. Even after the strong month, Morningstar believes Norwegian shares have further upside based on their $31 fair value estimate.</p>
<p>Companies detracting the most in June within the <a href="/link/d52df9865d4344169ef628a966527697.aspx" title="Equity ETF Indices"><strong>SMID Moat Index</strong></a> also showed a clear tilt toward the Consumer Staples sector, echoing the trend seen earlier in the Moat Index. Three of the five laggards came from the segment, including packaged-food maker Campbell&rsquo;s (CPB), consumer health firm Kenvue (KVUE), and household goods manufacturer Kimberly-Clark (KMB). Rounding out the list were money-transfer provider Western Union (WU) and video conferencing software company Zoom Communications (ZM).</p>
<h2>SMID Moat Index Top Contributors and Detractors - June 2025</h2>
<h3>Contributors</h3>
<div class="wrapped-div">
<table style="width: 100%;">
<tbody>
<tr class="tbl-data">
<td class="tbl-header last text-left">Company</td>
<td class="tbl-header last text-left">Ticker</td>
<td class="tbl-header last text-left">Sector</td>
<td class="tbl-header last text-right">Avg. Weight (%)</td>
<td class="tbl-header last text-right">Contribution (%)</td>
</tr>
<tr class="tbl-data">
<td class="data-td data last text-left">Carnival Corp.</td>
<td class="data-td data last text-left">CCL</td>
<td class="data-td data last text-left">Consumer Discretionary</td>
<td class="data-td data last text-right">1.41</td>
<td class="data-td data last text-right">0.30</td>
</tr>
<tr class="tbl-data">
<td class="data-td data last text-left">DraftKings Inc.</td>
<td class="data-td data last text-left">DKNG</td>
<td class="data-td data last text-left">Consumer Discretionary</td>
<td class="data-td data last text-right">1.24</td>
<td class="data-td data last text-right">0.24</td>
</tr>
<tr class="tbl-data">
<td class="data-td data last text-left">The Carlyle Group Inc.</td>
<td class="data-td data last text-left">CG</td>
<td class="data-td data last text-left">Financials</td>
<td class="data-td data last text-right">1.30</td>
<td class="data-td data last text-right">0.18</td>
</tr>
<tr class="tbl-data">
<td class="data-td data last text-left">Monolithic Power Systems</td>
<td class="data-td data last text-left">MPWR</td>
<td class="data-td data last text-left">Technology</td>
<td class="data-td data last text-right">1.51</td>
<td class="data-td data last text-right">0.16</td>
</tr>
<tr class="tbl-data">
<td class="data-td data last text-left">Norwegian Cruise Line</td>
<td class="data-td data last text-left">NCLH</td>
<td class="data-td data last text-left">Consumer Discretionary</td>
<td class="data-td data last text-right">1.08</td>
<td class="data-td data last text-right">0.16</td>
</tr>
</tbody>
</table>
</div>
<h3>Detractors</h3>
<div class="wrapped-div">
<table style="width: 100%;">
<tbody>
<tr class="tbl-data">
<td class="tbl-header last text-left">Company</td>
<td class="tbl-header last text-left">Ticker</td>
<td class="tbl-header last text-left">Sector</td>
<td class="tbl-header last text-right">Avg. Weight (%)</td>
<td class="tbl-header last text-right">Contribution (%)</td>
</tr>
<tr class="tbl-data">
<td class="data-td data last text-left">The Campbell's Co.</td>
<td class="data-td data last text-left">CPB</td>
<td class="data-td data last text-left">Consumer Staples</td>
<td class="data-td data last text-right">1.18</td>
<td class="data-td data last text-right">-0.12</td>
</tr>
<tr class="tbl-data">
<td class="data-td data last text-left">Kenvue Inc.</td>
<td class="data-td data last text-left">KVUE</td>
<td class="data-td data last text-left">Consumer Staples</td>
<td class="data-td data last text-right">0.80</td>
<td class="data-td data last text-right">-0.10</td>
</tr>
<tr class="tbl-data">
<td class="data-td data last text-left">The Western Union Co.</td>
<td class="data-td data last text-left">WU</td>
<td class="data-td data last text-left">Financials</td>
<td class="data-td data last text-right">1.22</td>
<td class="data-td data last text-right">-0.08</td>
</tr>
<tr class="tbl-data">
<td class="data-td data last text-left">Kimberly-Clark Corp.</td>
<td class="data-td data last text-left">KMB</td>
<td class="data-td data last text-left">Consumer Staples</td>
<td class="data-td data last text-right">0.83</td>
<td class="data-td data last text-right">-0.08</td>
</tr>
<tr class="tbl-data">
<td class="data-td data last text-left">Zoom Communications Inc.</td>
<td class="data-td data last text-left">ZM</td>
<td class="data-td data last text-left">Technology</td>
<td class="data-td data last text-right">1.41</td>
<td class="data-td data last text-right">-0.06</td>
</tr>
</tbody>
</table>
</div>
<p class="chart-disclosure"><strong>Source: Morningstar, June 2025.</strong> Past performance is no guarantee of future results. Index performance is not illustrative of fund performance. Not intended as a recommendation to buy or to sell any of the securities mentioned herein.</p>

<h2 id="moat-strategy" class="jump-link-nav anchored-block" data-jumplink-title="Moat Strategies">Choose Your Moat Strategy</h2>
<p>VanEck&rsquo;s suite of <a href="https://www.vaneck.com/us/en/blogs/moat-investing/moat-investing-powered-by-morningstar/" title="Quality Companies at Attractive Prices"><strong>moat investing strategies</strong></a> is powered by Morningstar&rsquo;s equity research team, which seeks quality companies trading at attractive valuations. The below ETFs offer access to U.S. moat companies:</p>
<div class="flourish-embed flourish-cards d-none d-md-block" data-src="visualisation/23047091?2429575"><script src="https://public.flourish.studio/resources/embed.js"></script><noscript><img loading="lazy" src="https://public.flourish.studio/visualisation/23047091/thumbnail" width="100%" alt="Choose Your Moat Strategy" /></noscript></div>
<div class="flourish-embed flourish-cards-mobile d-md-none" data-src="visualisation/23047086?2429575"><script src="https://public.flourish.studio/resources/embed.js"></script><noscript><img loading="lazy" src="https://public.flourish.studio/visualisation/23047086/thumbnail" width="100%" alt="Choose Your Moat Strategy" /></noscript></div>
<p>To receive more <a href="https://www.vaneck.com/us/en/insights/moat-investing" title="Moat Investing Insights"><strong>Moat Investing</strong></a> insights, <a href="https://www.vaneck.com/us/en/subscribe/" title="Subscription Center"><strong>sign up in our subscription center</strong></a>.</p>
]]></content:encoded>
</item><item rdf:about="https://www.vaneck.com/us/en/blogs/emerging-markets-equity/turning-tides-em-equities-are-surging-in-2025/">
  <title>Turning Tides: EM Equities Are Surging in 2025></title>
  <link>https://www.vaneck.com/us/en/blogs/emerging-markets-equity/turning-tides-em-equities-are-surging-in-2025/</link>
  <description><![CDATA[Emerging markets are entering a more favorable phase, supported by a weakening U.S. dollar, fading U.S. exceptionalism, and renewed investor interest in undervalued, under-owned regions.]]></description>
  <dc:creator>Ola  El-Shawarby, CFA</dc:creator>
  <dc:date>07/07/2025 06:30:00</dc:date>
<content:encoded><![CDATA[

<p>Emerging markets equities delivered solid returns in Q2 2025, driven by policy shifts and region-specific initiatives. The MSCI Emerging Markets IMI Index rose approximately 12.7% in the quarter, outperforming the MSCI World (+11.5%) and the S&amp;P 500 (+10.9%). Emerging markets equities are handily outperforming developed markets and U.S. equities year to date. Investors responded positively to signs of stabilization in China, easing inflation in key countries, and select policy changes in India and Brazil. Emerging markets are outperforming both developed and U.S. equities this year, marking a notable reversal of recent relative weakness. Nonetheless, markets remain uneven, with differentiation and stock selection more important than ever.</p>
<h2 id="region-review" class="jump-link-nav anchored-block" data-jumplink-title="Region Review">China: Competition Heats Up, but Stability Returns</h2>
<p>The MSCI China Index rose 2.0% in Q2, bringing year-to-date performance to +17.3%. Stock selection within China, primarily in the consumer sector, where competitive dynamics evolved rapidly over the quarter, detracted from the Emerging Markets Fund&rsquo;s (the portfolio) performance. We observed new entrants and strategic pivots by existing players that intensified price competition and disrupted previously stable industry structures. These shifts weighed on sentiment and reduced earnings visibility for several of our holdings. While such volatility is not uncommon in China&rsquo;s fast-moving consumer landscape, it reinforces the importance of maintaining a forward-looking perspective and staying agile in our assessment of business model resilience and strategic positioning.</p>
<p>During a recent trip across five Chinese cities, we observed that innovation, especially in AI, robotics, and EV supply chains, is moving full steam ahead. Factory automation is impressive, with engineer-led production and fewer manual tasks, but aggressive pricing and overcapacity are eroding near-term returns.</p>
<p>Technology remains a national priority. The breakthrough of &ldquo;Deepseek&rdquo; has catalyzed AI adoption across industries and accelerated investment in underlying infrastructure. Platform companies like Tencent and Alibaba are increasingly being treated as strategic national champions, with growing clarity around their roles in building out AI infrastructure and monetizing AI applications.</p>
<p>Economically, China appears to be in a stabilization phase. Activity is gradually bottoming out, although the recovery remains steady rather than strong. Policymakers remain committed to achieving the government&rsquo;s 5% GDP growth target, but are doing so through measured, tactical support rather than broad-based stimulus. The property sector remains a pressure point but could serve as a policy lever if growth momentum weakens further.</p>
<p>Externally, the tone has also become more constructive. The recent round of tariff negotiations and a tentative trade deal provided some relief to earlier concerns that peaked in April. While the external environment is still uncertain and long-term tensions persist, the relatively more pragmatic and engagement-oriented stance from both sides has been better than feared and has helped stabilize investor sentiment.</p>
<p>On the ground, we encountered signs of improving corporate confidence and greater openness among management teams. Investor sentiment is also showing signs of life, with increased engagement from global allocators and the return of international tourism. While deflationary pressures and muted consumer demand continue to pose challenges, we believe China's equity market remains attractively valued. The combination of low valuations, excess household savings, and cautious optimism among domestic investors gives us reason to believe the market has further room to re-rate.</p>
<p>Consumer trends continue to evolve as well. Despite an uneven recovery, pockets of consumption are healthy. We are seeing a notable rise in demand for &ldquo;dopamine consumption&rdquo;&mdash;a term describing spending on small luxuries and instant-gratification experiences, such as branded jewelry, collectibles, and &ldquo;feel good&rdquo; beverage items like bubble tea. These trends are partially driven by a younger generation of consumers influenced by both regional and global culture, including the rising popularity of &ldquo;K-pop&rdquo; and adjacent aesthetics. Some companies positioned in this segment have performed well, and we continue to evaluate whether these demand shifts represent enduring, defensible growth opportunities.</p>
<p>While this quarter&rsquo;s underperformance in China was disappointing, we are actively incorporating our on-the-ground learnings into the portfolio. We remain disciplined in our approach and are taking proactive steps to refine our exposure, focusing on structural winners with pricing power, capital discipline, and alignment with long-term policy priorities. At the same time, we are selectively positioning in areas where competitive dynamics are more stable and visibility on shareholder returns is stronger. Despite near-term volatility and ongoing policy and geopolitical complexity, we remain constructive on the long-term opportunity and continue to sharpen our process to stay aligned with our quality-growth investment philosophy.</p>
<h2>India: A Well-Timed Turn in the Cycle</h2>
<p>The MSCI India Index surged 9.2% in Q2, bringing its year-to-date return to approximately +6.0%. Our positioning and disciplined stock selection in Q1 proved effective, particularly in financials, where we had been adding with conviction ahead of the RBI&rsquo;s (India&rsquo;s central bank) surprise 100 basis point (bps) rate cut&mdash;double market expectations&mdash;which provided a meaningful liquidity boost.</p>
<p>We&rsquo;ve long viewed India as a compelling structural growth story, underpinned by rising urban consumption, accelerating digitization, and government-backed manufacturing initiatives. Importantly, India&rsquo;s economy is largely domestically driven, making it relatively less exposed to global trade tensions and tariff risks&mdash;an attribute that adds resilience in a more fragmented external environment.</p>
<p>While high valuations had previously tempered our pace of adding, the market pullback in late 2024 to early 2025&mdash;sparked by election-related growth concerns&mdash;created a window to increase exposure. We used that dislocation to selectively add to existing high-conviction names and initiate new positions with stronger valuation support.</p>
<p>We remain constructive on India&rsquo;s long-term outlook and believe our increased exposure positions us well to benefit from the country&rsquo;s enduring structural tailwinds and continued capital inflows.</p>
<h2>Brazil: Inflation Eases, Value Remains</h2>
<p>The MSCI Brazil Index rose approximately 13.3% in Q2, extending its strong year-to-date performance to around +30%. This rebound follows a volatile second half of 2024, when rising inflation and fiscal concerns spooked investors and prompted Brazil&rsquo;s central bank to reverse course&mdash;shifting from a rate-cutting cycle into hikes. This pivot pressured equities, triggered a reallocation into fixed income, and drove valuations down to multi-year lows.</p>
<p>As we entered 2025, with valuations at attractive levels and signs that the rate cycle was nearing its peak, sentiment began to turn. The most recent 25bp hike in June likely marks the end of the tightening phase. With inflation gradually easing, there is growing optimism that rate cuts could begin later this year or in early 2026&mdash;providing a supportive backdrop for equities. Fiscal fears have also moderated, as the government has demonstrated more restraint and discipline than markets initially feared.</p>
<p>Brazil further benefits from favorable external dynamics. The country was among the relative winners of the U.S. tariff adjustments announced in April, facing only a 10% rate compared to steeper hikes for other exporters. Meanwhile, as the "U.S. exceptionalism" narrative loses steam, investor appetite for emerging markets has begun to recover, with Brazil a notable beneficiary.</p>
<p>Against this backdrop, domestically oriented growth companies&mdash;particularly in sectors tied to consumption, services, and financials&mdash;stand to benefit most. These businesses are poised to thrive in an environment of easing rates, improving consumer sentiment, and ongoing earnings momentum. While we remain mindful of the approaching 2026 presidential election, the political news flow has been benign to date. Overall, we maintain a constructive view on Brazilian equities, especially where bottom-up fundamentals align with supportive macro and capital flow dynamics.</p>
<h2>Middle East: Resilience Amid Geopolitical Noise</h2>
<p>Regional EM exposure delivered mixed results compared to the broad MSCI EM IMI Index. We remain constructive on our current allocations to the Gulf economies, where structural reform, domestic resilience, and deepening global partnerships continue to underpin a favorable investment outlook.</p>
<p>While geopolitical risks remain elevated, markets across the GCC&mdash;particularly the UAE&mdash;have proven remarkably resilient. These economies are increasingly underpinned by diversification and reform-driven growth, making them less vulnerable to external shocks. Barring a significant escalation into a broader regional conflict, the UAE and Dubai specifically have continued to benefit from their positioning as stable, business-friendly safe havens&mdash;attracting capital, talent, and global companies seeking both security and opportunity.</p>
<p>Saudi Arabia has underperformed, largely due to investor concerns around oil prices. However, we believe this overlooks the strength and momentum in the non-oil economy, driven by sustained social and economic reforms. While lower oil revenues may lead to reprioritization of some megaprojects, the Kingdom remains committed to its transformation agenda. Access to global funding and hard deadlines for flagship events&mdash;such as the Asian Winter Games in 2029, Expo 2030, and the FIFA World Cup 2034&mdash;support a steady pipeline of infrastructure and service-sector investment, helping to sustain credit growth and non-oil GDP expansion.</p>
<p>In parallel, the region is seeing a new wave of strategic relevance emerge through the lens of technology and digital infrastructure. Strengthening ties between the U.S. and GCC&mdash;particularly through high-level economic and technology cooperation&mdash;have opened the door for the Gulf to become a regional hub for AI development. The availability of low-cost power, abundant land, and recent agreements with U.S. companies like Nvidia to provide access to cutting-edge GPUs position countries such as the UAE and Saudi Arabia as increasingly attractive destinations for AI infrastructure investment. This evolving dynamic introduces a new layer of growth and diversification potential, which we are actively monitoring.</p>
<p>We have used recent market overreactions to geopolitical events as selective buying opportunities in both the UAE and Saudi Arabia. Our focus remains on high-conviction names supported by long-term policy alignment, attractive valuations, and robust earnings visibility. As the region balances traditional strengths with new economic frontiers, we believe it offers a differentiated and resilient investment proposition.</p>
<h2>Latin America (ex-Brazil): Selective Re-engagement on Structural Shifts</h2>
<p>MSCI Peru rose approximately +18.8% in Q2, supported by improving political stability and a more favorable economic backdrop. We see scope for earnings momentum to accelerate from here, particularly in the financial sector. In that context, we have been adding to our position in Credicorp, Peru&rsquo;s leading bank, which also operates the country&rsquo;s dominant digital banking platform. With strengthening macro fundamentals and a more constructive policy environment, we believe the setup supports both top-line growth and continued leadership in digital financial services.</p>
<p>MSCI Argentina fell around -6.4% in Q2, extending its run of underperformance. The country has long been underinvested, with one of the lowest levels of banking penetration in Latin America. This creates a significant runway for structural growth&mdash;provided the reform agenda maintains momentum and macro execution remains credible. We re-initiated exposure for the first time in years, adding to Grupo Financiero Galicia SA, based on increased conviction in the sustainability and effectiveness of President Milei&rsquo;s economic reforms.</p>
<p>Early signs of macro stabilization and fiscal discipline are encouraging, and we are also seeing positive signals from portfolio companies like MercadoLibre, whose exposure to Argentina through both e-commerce and fintech arms reflects a nascent but exciting growth opportunity. Pent-up demand, improving sentiment, and low baseline formal financial adoption suggest that, if reforms stay on track, Argentina could offer compelling upside over a multi-year horizon. While risks remain, we believe the market is entering a new chapter and we are positioning accordingly.</p>
<h2>Macro Outlook</h2>
<p>Emerging markets are entering a more favorable phase, supported by a weakening U.S. dollar, fading U.S. exceptionalism, and renewed investor interest in undervalued, under-owned regions. Policy cycles are turning&mdash;India has already begun easing, Brazil appears to be at the end of its tightening path, and inflation is broadly moderating, creating a more supportive backdrop for EM equity flows and risk appetite.</p>
<p>China&rsquo;s economic activity appears to be bottoming, with gradual signs of improving sentiment and renewed investor engagement. Trade tensions have eased, and recent tariff negotiations reflect a more pragmatic external posture. Domestically driven economies like India and the GCC remain resilient, while reform-led stories in Saudi Arabia and Argentina offer underappreciated structural potential. Meanwhile, fiscal expansion in Europe is helping to stabilize global demand, with Eastern Europe particularly well-positioned to benefit via trade and investment linkages. With momentum building around AI infrastructure, digital consumption, and financial inclusion&mdash;and valuations still attractive&mdash;we see a growing case for selective, fundamentals-driven exposure to EM equities in a recalibrating global landscape.</p>
<h2 id="fund-performance" class="jump-link-nav anchored-block" data-jumplink-title="Fund Performance">Fund Performance</h2>
<p>The <strong><a href="/link/eb4419e6f6394611b3f80c597020daa4.aspx" title="GBFAX- Emerging Markets Fund - Class A">VanEck Emerging Markets Fund</a></strong> (the &ldquo;Fund&rdquo;) outperformed the MSCI EM IMI Index on the quarter-to-date basis ending June 30, 2025 (+13.79% for the Fund; +12.71% for the Index). Positive relative performance for the quarter was driven by stock selection in Brazil and India. Negative relative performance was driven by stock selection in China and allocation (weighting) to Kazakhstan.</p>
<p>India and Taiwan were the Fund&rsquo;s top contributors for the quarter.</p>
<h3>Average Annual Total Returns (%) as of June 30, 2025</h3>
<div class="wrapped-div">
<table style="width: 100%;">
<tbody>
<tr class="tbl-data">
<td class="tbl-header last text-left">&nbsp;</td>
<td class="tbl-header last text-right">2Q25<sup>&dagger;</sup></td>
<td class="tbl-header last text-right">YTD</td>
<td class="tbl-header last text-right">1YR</td>
<td class="tbl-header last text-right">3YR</td>
<td class="tbl-header last text-right">5YR</td>
<td class="tbl-header last text-right">10YR</td>
</tr>
<tr class="tbl-data">
<td class="data-td last text-left">Class A: NAV (Inception 12/20/93)</td>
<td class="data-td data last text-right">13.79</td>
<td class="data-td data last text-right">16.02</td>
<td class="data-td data last text-right">7.20</td>
<td class="data-td data last text-right">10.38</td>
<td class="data-td data last text-right">1.10</td>
<td class="data-td data last text-right">1.93</td>
</tr>
<tr class="tbl-data">
<td class="data-td last text-left">Class A: Maximum 5.75% Load</td>
<td class="data-td data last text-right">7.25</td>
<td class="data-td data last text-right">9.35</td>
<td class="data-td data last text-right">1.03</td>
<td class="data-td data last text-right">8.22</td>
<td class="data-td data last text-right">-0.09</td>
<td class="data-td data last text-right">1.33</td>
</tr>
<tr class="tbl-data">
<td class="data-td last text-left">Class I: NAV (Inception 12/31/07)</td>
<td class="data-td data last text-right">13.94</td>
<td class="data-td data last text-right">16.36</td>
<td class="data-td data last text-right">7.86</td>
<td class="data-td data last text-right">11.03</td>
<td class="data-td data last text-right">1.64</td>
<td class="data-td data last text-right">2.45</td>
</tr>
<tr class="tbl-data">
<td class="data-td last text-left">MSCI Emerging Markets Investable Markets Index (IMI)</td>
<td class="data-td data last text-right">12.71</td>
<td class="data-td data last text-right">14.62</td>
<td class="data-td data last text-right">14.28</td>
<td class="data-td data last text-right">10.22</td>
<td class="data-td data last text-right">7.61</td>
<td class="data-td data last text-right">4.95</td>
</tr>
<tr class="tbl-data">
<td class="data-td last text-left">MSCI Emerging Markets IMI Growth Index</td>
<td class="data-td data last text-right">14.56</td>
<td class="data-td data last text-right">14.99</td>
<td class="data-td data last text-right">16.39</td>
<td class="data-td data last text-right">9.63</td>
<td class="data-td data last text-right">5.52</td>
<td class="data-td data last text-right">5.40</td>
</tr>
</tbody>
</table>
</div>
<p class="chart-disclosure"><strong>The table presents past performance which is no guarantee of future results and which may be lower or higher than current performance. Returns reflect applicable fee waivers and/or expense reimbursements. Had the Fund incurred all expenses and fees, investment returns would have been reduced. Investment returns and Fund shares values will fluctuate so that investor's shares, when redeemed, may be worth more or less than their original cost. Fund returns assume that dividends and capital gains distributions have been reinvested in the Fund at net asset value (NAV). Index returns assume that dividends of the Index constituents in the Index have been reinvested. Performance information current to the most recent month end is available by calling 800.826.2333 or by visiting vaneck.com.</strong></p>
<p class="chart-disclosure"><strong>Expenses: Class A: Gross 1.59%; Net 1.59%; Class I: Gross 1.25%; Net 1.02%. Expenses are capped contractually until 5/1/26 at 1.60% for Class A and 1.00% for Class I. Caps exclude acquired fund fees and expenses, interest, trading, dividends, interest payments of securities sold short, taxes and extraordinary expenses.</strong></p>

<h2>Fund Review</h2>
<p>On a sector level, Information Technology, Financials and Energy contributed to relative performance, while Industrials and Real Estate detracted. On a country level, Brazil, India and Georgia contributed to relative performance, while China, Kazakhstan and South Korea detracted.</p>
<h3>Top Contributors</h3>
<p>Top contributors to return on an absolute basis during the quarter:</p>
<ul class="content-list">
<li class="mt-2"><strong>Taiwan Semiconductor Manufacturing Co. (&ldquo;TSMC&rdquo;) (8.6% of Fund net assets<sup>*</sup>): </strong>TSMC delivered solid performance in Q2 2025, supported by continued investment in Chip-on-Wafer-Substrate (CoWoS) advanced packaging, a key technology for high-performance AI chips. While expansion is progressing steadily&mdash;with capacity expected to reach 115,000 units per month by 2026&mdash;the pace may moderate slightly, in line with expectations. Notably, TSMC is advancing its U.S. localization efforts, with plans to shift its AP9 and AP10 packaging facilities from Taiwan to Arizona, marking a strategic move in high-value process steps. Despite these shifts, the company remains on track, and we believe guidance is likely to trend higher through FY25.</li>
<li class="mt-2"><strong>SK hynix (3.9% of Fund net assets<sup>*</sup>):</strong> SK Hynix continues to be a strong performer, particularly as demand for AI-related memory accelerates and supports the broader semiconductor cycle. As the anchor asset of SK Square, accounting for approximately 80% of its net asset value, Hynix provides a solid foundation of earnings, dividends, and long-term structural exposure to advanced semiconductor technologies. SK Square, which was spun off from SK Telecom to better unlock the value of its portfolio, is now actively refining its strategy with a focused shift toward semiconductor-related investments. The company is streamlining legacy holdings and has maintained a net cash position, allowing flexibility to deploy capital into high-quality assets aligned with AI infrastructure. With ongoing share buybacks, a growing dividend stream from Hynix, and a clearer thematic orientation emerging, SK Square is positioning itself to deliver long-term value as Korea&rsquo;s broader market reforms take shape.</li>
<li class="mt-2"><strong>MercadoLibre (&ldquo;MELI&rdquo;) (3.8% of Fund net assets<sup>*</sup>):</strong> MercadoLibre delivered strong Q2 results, beating expectations across all major metrics. Revenue grew 37% year over year, led by 32% growth in commerce and 43% in fintech. Ad revenue rose 50%, with room for further penetration. Active users increased 30% to 67 million, the fastest growth since early 2021. The credit portfolio grew 75%, with delinquency at record lows in Brazil and steady improvements in margins and risk metrics. Argentina was a standout, with over 100% revenue growth and improved profitability, helping offset increased investment in Brazil and Mexico. Despite expectations for margin pressure, MELI posted margin expansion, driven by operating leverage and disciplined cost control. Management remains positive on Argentina, highlighting continued GMV growth and strong credit momentum. These results should support upward earnings revisions and reinforce our positive long-term view.</li>
</ul>
<h3>Top Detractors</h3>
<p>Top detractors to return on an absolute basis during the quarter:</p>
<ul class="content-list">
<li class="mt-2"><strong>Meituan (1.0% of Fund net assets<sup>*</sup>) and JD.com (0.7% of Fund net assets<sup>*</sup>):</strong> Meituan is China&rsquo;s leading food delivery and local services platform, and it now faces new competition as JD.com begins expanding into the food delivery space through its JD Daojia service. JD&rsquo;s entry into food delivery in Q2 disrupted industry dynamics and added pressure to sector profitability, leading us to reduce exposure in the near term. The push has been heavily subsidy-driven, and while it gained share quickly, the sustainability of this approach remains to be seen. We believe consumption trends have likely bottomed, and JD&rsquo;s broader strategy&mdash;including efforts in local services and OTA&mdash;reflects a proactive move to increase user engagement and build out its ecosystem. Over time, we&rsquo;re watching for more durable cross-selling opportunities that could emerge as competitive intensity normalizes. Meituan has remained resilient, with stable food delivery volumes and quick commerce momentum despite the heightened competition. Its international expansion is progressing, and we continue to expect Meituan to remain a structural leader in food delivery, supported by logistics scale and ecosystem depth.</li>
<li class="mt-2"><strong>PDD Holdings (1.0% of Fund net assets<sup>*</sup>):</strong> PDD Holdings is a Chinese e-commerce company that operates Pinduoduo in China and Temu globally, focusing on value-driven online retail through deep discounts and social buying. PDD&rsquo;s Q1 revenue miss was driven by lower commission rates as it prioritized merchant support and long-term engagement over near-term monetization. Ad trends remain healthy, and user activity continues to grow. We see signs that consumption has stabilized. Temu&rsquo;s global growth strategy is being recalibrated amid external headwinds, but PDD&rsquo;s growth remains well above average. With a compelling valuation and improving monetization potential, we see room for upside as strategic execution progresses.</li>
<li class="mt-2"><strong>Kaspi.kz (&ldquo;KASPI&rdquo;) (1.9% of Fund net assets<sup>*</sup>):</strong> Kaspi.kz JSC is Kazakhstan's leading payments, marketplace, and fintech platform, engaging with over 90 % of the country's adult population on a monthly basis. Kaspi's business model is highly profitable, driven by a well-integrated ecosystem that supports growth across its three core segments. Since going public, first in London and more recently in the U.S., Kaspi has consistently exceeded market expectations, demonstrating its ability to leverage scale and its ecosystem to expand into new areas such as online grocery and travel services. The company&rsquo;s share price has come under some pressure following first-quarter results that missed consensus estimates, due to a combination of softer discretionary spending, higher interest rates raising funding costs and credit loss provisions, and new regulations negatively affecting smartphone demand, which accounts for nearly 18 % of e-commerce GMV. That said, underlying operational metrics including monthly active users, new merchant additions, and transactions per active user continue to rise. We remain confident in Kaspi&rsquo;s strong growth and earnings potential.</li>
</ul>
<h3>Top Buys &amp; Sells</h3>
<p>During the period, we established new positions in the following:</p>
<ul class="content-list">
<li class="mt-2"><strong>Aditya Birla Capital Ltd (&ldquo;AB Capital&rdquo;) (1.6% of Fund net assets<sup>*</sup>): </strong>AB Capital is a distinctive player in the Indian financial services landscape, benefiting from its position within the Aditya Birla Group and its strong relationships with a large base of small and medium-sized enterprises across the country. Our investment thesis centers on a turnaround opportunity. Nearly two years ago, the group signaled its commitment to improving the quality and performance of AB Capital by appointing a new management team, well known to us through their previous leadership roles. We followed the company closely for over a year, engaging regularly with the new leadership to assess their strategy for enhancing returns and strengthening the business. We initiated a position once we observed clear and tangible progress in the turnaround, and the recent market weakness in India provided an attractive entry point into what we believe is a high potential, improving financial services platform.</li>
<li class="mt-2"><strong>Emaar Properties (0.8% of Fund net assets<sup>*</sup>): </strong>Emaar is the largest real estate developer in the UAE, with a broad portfolio that includes residential and commercial projects, malls, hospitality, and entertainment assets. With over 90 % of its revenue generated in Dubai, Emaar is a direct beneficiary of the city&rsquo;s strong population and tourism growth, driven by the Emirate&rsquo;s Master Plan 2040, which aims to increase the population by 75% through long-term visa reforms and strategic infrastructure investments. Emaar&rsquo;s scale, strong execution, and market leadership position it well to capture these secular trends across both property sales and recurring income streams. We initiated a position in the company due to its compelling combination of earnings visibility, rising recurring revenue, and operating leverage. Trading at a discount to regional peers, Emaar offers an attractive way to participate in Dubai&rsquo;s demographic and economic transformation, with additional downside protection from its stable earnings base and shareholder-friendly capital return policy.</li>
<li class="mt-2"><strong>Grab Holdings (0.8% of Fund net assets<sup>*</sup>):</strong> Grab Holdings is a Southeast Asian technology company that operates a super app offering services including ride-hailing, food delivery, digital payments, and financial services across multiple countries in the region. Since its SPAC listing in 2021, Grab&rsquo;s stock has underperformed due to concerns about profitability and its dependence on subsidies. However, 2024 marked a meaningful turning point, as the company delivered $313 million in adjusted EBITDA, implemented stronger cost discipline, and improved transparency through a revamped segment reporting structure. Management has adopted a more credible and conservative communication approach, while shifting the business away from subsidies toward monetization through tiered pricing, ecosystem synergies, and a growing advertising segment. Industry consolidation is supporting better unit economics, and AI is driving faster product development and personalization. With potential upside from a possible GoTo acquisition, Grab is positioning itself as a more durable, margin-accretive platform.</li>
<li class="mt-2"><strong>Grupo Financiero Galicia (0.9% of Fund net assets<sup>*</sup>): </strong>Grupo Galicia is the most compelling name in Argentina&rsquo;s banking sector, offering a diversified, high-growth platform that is well positioned to benefit from the country&rsquo;s macroeconomic turnaround. Under President Milei, inflation is falling, credit demand is rebounding, and structural reforms are advancing, supported by the recent IMF deal and easing of capital controls. Galicia stands out for its strong capital base, cleaner earnings, and exposure to insurance and other financial services, providing broader revenue stability. With upcoming elections, continued reform, and sector consolidation ahead, Galicia offers a compelling mix of growth and re-rating potential.</li>
<li class="mt-2"><strong>Larsen &amp; Toubro (&ldquo;L&amp;T&rdquo;) (0.9% of Fund assets<sup>*</sup>): </strong>L&amp;T is India&rsquo;s largest construction and engineering firm, with a strong legacy and an expanding international footprint, particularly in the Middle East. What differentiates L&amp;T is its unmatched scale and consistent execution, which have become increasingly valuable as both public and private infrastructure stakeholders shift focus from lowest-cost bids to reliable, on-time delivery. This change is improving pricing power for high-quality operators like L&amp;T. The company is also capturing strong momentum in the Middle East, benefiting from rising public and private capital expenditure. We initiated a position during the market weakness in the first half of FY25, viewing L&amp;T as a high-quality, long-term structural growth opportunity.</li>
<li class="mt-2"><strong>Xiaomi Corporation (0.3% of Fund assets<sup>*</sup>): </strong>Xiaomi is a Chinese technology company that designs and manufactures smartphones, smart home devices, Internet of Things (IoT) products, and consumer electronics, while also expanding into electric vehicles and other smart hardware. Xiaomi has transformed from a value-focused smartphone maker into a premium technology brand, with the 2024 launch of its SU7 EV serving as a turning point that lifted demand across its smartphone, IoT, and home appliance segments. While much of the 2025 earnings potential may already be priced in, the market underestimates Xiaomi&rsquo;s long-term upside, particularly from IoT monetization and global expansion. Stronger-than-expected momentum in IoT and improved EV scale could drive both revenue and margin surprises. If execution stays on track, Xiaomi has the potential to become a durable tech compounder, offering attractive risk-reward for long-term investors.</li>
</ul>
<p>During the period, we exited the following positions:</p>
<ul class="content-list">
<li class="mt-2"><strong>Bloomberry Resorts Corporation:</strong> Bloomberry is facing structurally deteriorating fundamentals, reflected in recent earnings disappointment and sustained share price weakness. Key headwinds include market share erosion to online gaming platforms, heightened competitive pressure from peers in Metro Manila, and regulatory uncertainty surrounding a potential POGO ban. These challenges suggest ongoing pressure on both revenue growth and profitability, reinforcing a bearish view on the stock.</li>
<li class="mt-2"><strong>Shenzhou International Group Holdings Limited:</strong> We exited our position in Shenzhou to reduce exposure to export-oriented names amid rising trade tensions. As an industry leader with strong bargaining power, Shenzhou is well-positioned to pass on most (if not all)of the tariff increases to its customers. However, our greater concern lies with potential weakness in U.S. demand, as higher tariffs may exacerbate inflationary pressures and weigh on consumer spending.</li>
<li class="mt-2"><strong>Delivery Hero SE: </strong>During the quarter, we exited our position and consolidated our food delivery exposure through our existing holdings in Prosus and Talabat, which offer more targeted access to the sector&rsquo;s long-term growth. We believe Delivery Hero faces ongoing margin pressure and growing competitive risks, particularly in South Korea, where local players are gaining share, and in Saudi Arabia, where new entrants like Meituan-backed Keeta are adding uncertainty to the earnings outlook.</li>
</ul>
<h2 id="positioning-and-outlook" class="jump-link-nav anchored-block" data-jumplink-title="Positioning and Outlook">Fund Positioning and Outlook</h2>
<p>We remain grounded by our investment process and our positioning reflects our convictions from a bottom-up perspective. Our process has created some positioning differentials versus the benchmark. Brazil remains overweight to start the quarter (8.6% Fund weight versus 4.2% Index weight), as does Georgia (2.4% versus 0.0% Index weight).</p>
<p>Taiwan and South Korea remain underweight versus the benchmark.</p>
<p>The Fund&rsquo;s objective is to find long-term structural growth companies at fair prices (S-GARP). Investments are chosen based on individual company analysis, focusing on quality, governance, innovative business models and low disruption risk, with active management and detailed research guiding our selection process.</p>

<p>To receive more <a href="/us/en/insights/emerging-markets-equity/" title="Emerging Markets Equity Insights"><strong>Emerging Markets Equity</strong></a> insights, <a href="/us/en/subscribe/" title="Subscription Center"><strong>sign up in our subscription center</strong></a>.</p>
]]></content:encoded>
</item><item rdf:about="https://www.vaneck.com/us/en/blogs/emerging-markets-bonds/em-bonds-are-outperforming-is-anyone-paying-attention/">
  <title>EM Bonds Are Outperforming—Is Anyone Paying Attention?></title>
  <link>https://www.vaneck.com/us/en/blogs/emerging-markets-bonds/em-bonds-are-outperforming-is-anyone-paying-attention/</link>
  <description><![CDATA[Emerging markets bonds continue to outperform, but is anyone paying attention? Emerging markets maintain high real rates, low debt, and policy independence, positioning them as strongholds amid global uncertainty and shifting inflation dynamics.]]></description>
  <dc:creator>Eric Fine</dc:creator>
  <dc:date>07/07/2025 06:30:00</dc:date>
<content:encoded><![CDATA[

<p id="performance-recap" class="jump-link-nav anchored-block" data-jumplink-title="Performance Recap">The <a href="/link/dbb866e8704049c784a0bdf9299143ea.aspx" title="EMBAX - Emerging Markets Bond Fund - Class A"><strong>VanEck Emerging Markets Bond Fund</strong></a> gained 3.76% in June, compared 2.60% for its benchmark, the 50% J.P. Morgan Government Bond Index-Emerging Markets Global Diversified (GBI-EM) and 50% J.P. Morgan Emerging Markets Bond Index (EMBI). Year to -date , the Fund is up 10.5%, compared to 7.3% and 5.0% for the Global Agg and 10-year Treasuries, respectively. During June, Zambia local currency and Ecuador in hard currency or US dollar led outperformers. We remain very bullish on local currency, while very cautious on US dollar duration. The Fund has around 60% in curated local currency, 40% in mostly higher-yielding US dollar-denominated bonds. Carry is 7.1%, yield to worst is 8.3%, and duration is 5.0.</p>
<h3>Average Annual Total Returns<sup>*</sup>&nbsp;(%) (In USD)</h3>
<div class="wrapped-div">
<table style="width: 100%;">
<tbody>
<tr class="tbl-data">
<td class="tbl-header last" colspan="10">As of June 30, 2025</td>
</tr>
<tr class="tbl-data">
<td class="data-head last text-right">&nbsp;</td>
<td class="data-head last text-right">1 Mo</td>
<td class="data-head last text-right">3 Mo</td>
<td class="data-head last text-right">YTD</td>
<td class="data-head last text-right">1 Yr</td>
<td class="data-head last text-right">3 Yrs</td>
<td class="data-head last text-right">5 Yrs</td>
<td class="data-head last text-right">10 Yrs</td>
</tr>
<tr class="tbl-data">
<td class="data-td last text-left">Class A: NAV (Inception 07/09/12)</td>
<td class="data-td data last text-right">3.71</td>
<td class="data-td data last text-right">6.87</td>
<td class="data-td data last text-right">10.51</td>
<td class="data-td data last text-right">13.04</td>
<td class="data-td data last text-right">10.68</td>
<td class="data-td data last text-right">4.77</td>
<td class="data-td data last text-right">3.35</td>
</tr>
<tr class="tbl-data">
<td class="data-td last text-left">Class A: Maximum 5.75% load</td>
<td class="data-td data last text-right">-2.25</td>
<td class="data-td data last text-right">0.73</td>
<td class="data-td data last text-right">4.16</td>
<td class="data-td data last text-right">6.54</td>
<td class="data-td data last text-right">8.51</td>
<td class="data-td data last text-right">3.54</td>
<td class="data-td data last text-right">2.74</td>
</tr>
<tr class="tbl-data">
<td class="data-td last text-left">Class I: NAV (Inception 07/09/12)</td>
<td class="data-td data last text-right">3.76</td>
<td class="data-td data last text-right">7.00</td>
<td class="data-td data last text-right">10.54</td>
<td class="data-td data last text-right">13.33</td>
<td class="data-td data last text-right">11.04</td>
<td class="data-td data last text-right">5.08</td>
<td class="data-td data last text-right">3.64</td>
</tr>
<tr class="tbl-data">
<td class="data-td last text-left">Class Y: NAV (Inception 07/09/12)</td>
<td class="data-td data last text-right">3.91</td>
<td class="data-td data last text-right">7.12</td>
<td class="data-td data last text-right">10.82</td>
<td class="data-td data last text-right">13.51</td>
<td class="data-td data last text-right">11.03</td>
<td class="data-td data last text-right">5.04</td>
<td class="data-td data last text-right">3.59</td>
</tr>
<tr class="tbl-data">
<td class="data-td last text-left">50% GBI-EM/50% EMBI</td>
<td class="data-td data last text-right">2.60</td>
<td class="data-td data last text-right">5.47</td>
<td class="data-td data last text-right">8.94</td>
<td class="data-td data last text-right">11.93</td>
<td class="data-td data last text-right">8.72</td>
<td class="data-td data last text-right">1.89</td>
<td class="data-td data last text-right">2.88</td>
</tr>
</tbody>
</table>
</div>
<p class="chart-disclosure"><sup>*</sup>&nbsp;Returns less than one year are not annualized.</p>
<p class="chart-disclosure">Expenses: Class A: Gross 1.83%, Net 1.21%; Class I: Gross 1.37%, Net 0.86%; Class Y: Gross 1.33%, Net 0.96%. Expenses are capped contractually until 05/01/26 at 1.20% for Class A, 0.85% for Class I, 0.95% for Class Y. Caps exclude acquired fund fees and expenses, interest, trading, dividends, and interest payments of securities sold short, taxes, and extraordinary expenses.</p>
<p class="chart-disclosure">The performance data quoted represents past performance. Past performance is not a guarantee of future results. Investment return and principal value of an investment will fluctuate so that an investor&rsquo;s shares, when redeemed, may be worth more or less than their original cost. Performance may be lower or higher than performance data quoted. Please call 800.826.2333 or visit <strong><a href="https://www.vaneck.com/us/en/" title="ETF and Mutual Fund Manager">vaneck.com</a></strong> for performance current to the most recent month ended.</p>
<p class="chart-disclosure">The &ldquo;Net Asset Value&rdquo; (NAV) of a Fund is determined at the close of each business day, and represents the dollar value of one share of the fund; it is calculated by taking the total assets of the fund, subtracting total liabilities, and dividing by the total number of shares outstanding. The NAV is not necessarily the same as the ETF&rsquo;s intraday trading value. Investors should not expect to buy or sell shares at NAV.</p>
<p id="emfx-tariffs-and-more" class="jump-link-nav anchored-block" data-jumplink-title="EMFX, Tariffs, and More"><strong>We&rsquo;ve been saying the same thing for 10 years.</strong> Namely, that emerging markets (EM) have low government debt, allowing independent central banks that pay high real interest rates, while developed markets (DM) such as the U.S. have high government debt and thus co-opted central banks that suppress interest rates. This story continues to unfold, but now it&rsquo;s getting noticed. Developed markets in 2025 are further increasing the fiscal impulse (Europe on defense, theoretically, and the U.S. at least according to the CBO) at high levels of government debt, labile inflation concerns, and full employment. <i>These are observations, not predictions</i>. We&rsquo;ve shown you the charts on record-low central bank allocations to US Treasuries. We&rsquo;ve shown you the rising evolution of the inflation forecast for the US and the declining evolution of forecast for China (IMF). We&rsquo;ve even written white papers <a href="/link/4088f0636d114e54ba014be36be890b6.aspx" title="Fiscal Dominance: The Clarifying Lens for EM (and DM) Bonds"><strong>showing the risk-adjusted returns of EM bonds compared to global bond categories</strong></a>, showing that simple backward-looking (over 20 years) optimizations say much higher allocations to EM bonds are merited. And year to date, EM bond returns are not just outperforming DM bonds, their performance is accelerating.</p>
<h3>Exhibit 1 &ndash; EMFX Rallying YTD Despite &ldquo;The Risks&rdquo;</h3>
<p><img loading="lazy" alt="EMFX Rallying YTD Despite The Risks" src="https://www.vaneck.com/contentassets/6cc495e1394f4ee38f313784f15b61f9/5888_emb-july_chart-1_2025-7_v1_blog.svg" class="img-responsive w-100" /></p>
<p class="chart-disclosure">Source: VanEck Research, Bloomberg LP. Data as of June 2025.</p>
<p><strong>US &ldquo;tariff&rdquo; discussions are about much more than &ldquo;tariffs&rdquo;. Most important to us, there is a currency chapter to the discussions &ndash; trade partners are not being allowed to devalue their way out of tariffs.</strong> This remains a bafflingly unique and outlier contrarian view of ours &ndash; that CNY and other currencies will revalue slowly over the next several years, supporting all EMFX. CNY has largely been fixed stronger in its daily fixings than the market-predicted level, since Donald Trump was elected President. Virtually all EMFX has rallied YTD, anchoring their inflation expectations and interest rates. And, EM central banks have kept rates much higher in real terms than their DM counterparts (which we&rsquo;ve also charted), meaning the advent of Fed rate cuts should also accelerate rate rallies in EM. This has been going on for almost three decades now, initially to the great benefit of EM USD-denominated bonds whose spreads were high and where the inflow of dollars was impossible to ignore. The past six years, this reward for consistent orthodox policy spread to Asian local markets, whose yields collapsed as per the chart we use regularly, below. Many EMs such as China and most of Asia have lower inflation than DMs, making the EMFX appreciation argument straightforward, before invoking secret tariff chapters in negotiations or the status of the dollar <a href="/link/f4cc8891f79343e2a229d866e15b7419.aspx" title="IMF 2025 Spring Takeaways: The Era of EM Exceptionalism"><strong>(see our latest IMF takeaways for a full discussion)</strong></a>.</p>
<h3>Exhibit 2 &ndash; EM Asian Local Currency Bonds Rallied to Yields Lower than US</h3>
<p><img loading="lazy" alt="EM Asian Local Currency Bonds Rallied to Yields Lower than US" src="https://www.vaneck.com/contentassets/c7f6608579c842cd8e874e8711abf8e7/5888_emb-july_chart-2_2025-7_v1_blog.svg" class="img-responsive w-100" /></p>
<p class="chart-disclosure">Source: VanEck Research, Bloomberg LP. Data as of June 2025.</p>
<p>CNH&rsquo;s consistent outperformance (despite low interest rate differentials with the US) this year remains un-remarked upon. We remark on it, as it&rsquo;s consistent with our view that there is re-valuation risk in CNY. This would reprice Asian and EMFX further, which is somewhat what the market is pricing. But to relatively no notice or fanfare. Go figure.</p>
<h3>Exhibit 3 &ndash; CNH Rallies To Everyone&rsquo;s Surprise and Nobody is Commenting</h3>
<p><img loading="lazy" alt="CNH Rallies To Everyone's Surprise and Nobody is Commenting" src="https://www.vaneck.com/contentassets/5b27551a84e642d0b58d0d910e6a4955/5888_emb-july_chart-3_2025-7_v1_blog.svg" class="img-responsive w-100" /></p>
<p class="chart-disclosure">Source: VanEck Research, Bloomberg LP. Data as of June 2025.</p>
<p><strong>EM bonds continue to outperform, the question is does anybody notice or care?</strong> In the past 5 years, our fund has returned +5.0% per year, the benchmark returned +1.8%, while the Global Agg returned -3.4% per year and Treasuries returned -1.7% per year. The table below tells the story neatly. This observed performance stands in strong contrast to the neutral net flow EM bonds have experienced over the past 10 years. To our eye, this strengthens the case for EM bonds. It also explains why so few are saying EMFX could be revalued upward, led by CNY &ndash; there&rsquo;s great nervousness over taking market views, and a preference for index-tracking and AUM preservation. Nobody is invested in EM bonds. Whereas everyone is invested in US investment grade, Treasuries, the Global Agg, etc. We really don&rsquo;t know what more to say.</p>
<h3>Exhibit 4 &ndash; EM Bonds Outperform All Fixed Income For 5 years</h3>
<div class="wrapped-div">
<table style="width: 100%;">
<tbody>
<tr class="tbl-data">
<td class="tbl-header last">As of 6/30/2025</td>
<td class="tbl-header last last text-right">MTD</td>
<td class="tbl-header last last text-right">YTD</td>
<td class="tbl-header last last text-right">2024</td>
<td class="tbl-header last last text-right">2023</td>
<td class="tbl-header last last text-right">2022</td>
<td class="tbl-header last last text-right">2021</td>
<td class="tbl-header last last text-right">2020</td>
<td class="tbl-header last last text-right">5 Years</td>
</tr>
<tr class="tbl-data">
<td class="data-td last">VanEck Emerging Markets Bond Fund I</td>
<td class="data-td data last text-right">3.76</td>
<td class="data-td data last text-right">10.54</td>
<td class="data-td data last text-right">3.09</td>
<td class="data-td data last text-right">10.97</td>
<td class="data-td data last text-right">-7.22</td>
<td class="data-td data last text-right">-4.30</td>
<td class="data-td data last text-right">11.60</td>
<td class="data-td data last text-right">5.08</td>
</tr>
<tr class="tbl-data">
<td class="data-td last">50%JPM GBI-EM GD and 50%JPM EMBI GD</td>
<td class="data-td data last text-right">2.60</td>
<td class="data-td data last text-right">8.93</td>
<td class="data-td data last text-right">2.01</td>
<td class="data-td data last text-right">11.92</td>
<td class="data-td data last text-right">-14.75</td>
<td class="data-td data last text-right">-5.32</td>
<td class="data-td data last text-right">4.02</td>
<td class="data-td data last text-right">1.87</td>
</tr>
<tr class="tbl-data">
<td class="data-td last">ICE BofA Gbl Brd Mkt TR USD</td>
<td class="data-td data last text-right">1.94</td>
<td class="data-td data last text-right">7.31</td>
<td class="data-td data last text-right">-2.08</td>
<td class="data-td data last text-right">5.56</td>
<td class="data-td data last text-right">-16.87</td>
<td class="data-td data last text-right">-5.24</td>
<td class="data-td data last text-right">8.94</td>
<td class="data-td data last text-right">-1.66</td>
</tr>
<tr class="tbl-data">
<td class="data-td last">FTSE Treasury Benchmark 10 Yr USD</td>
<td class="data-td data last text-right">1.63</td>
<td class="data-td data last text-right">4.98</td>
<td class="data-td data last text-right">-1.67</td>
<td class="data-td data last text-right">3.54</td>
<td class="data-td data last text-right">-16.65</td>
<td class="data-td data last text-right">-3.51</td>
<td class="data-td data last text-right">10.37</td>
<td class="data-td data last text-right">-3.35</td>
</tr>
</tbody>
</table>
</div>
<p class="chart-disclosure">Source: VanEck Research, Morningstar. Data as of June 30 2025.</p>

<h2 id="exposure-types-and-significant-changes" class="jump-link-nav anchored-block" data-jumplink-title="Exposure Types and Significant Changes">Exposure Types and Significant Changes</h2>
<p>The changes to our top positions are summarized below. Our largest positions in June were Brazil, Malaysia, Thailand, South Africa, and China:</p>
<ul class="content-list">
<li class="mt-2">We increased our local currency exposure in South Africa, Peru, and Chile. South Africa&rsquo;s 2025 budget process is chugging along, despite occasional political hiccups, while inflation risks are to the downside. The latter leaves the central bank room to ease a bit more, but the board&rsquo;s main focus now is on adopting a lower inflation target. In terms of our investment process, this improved the policy test score for the country. Chile and Peru are key beneficiaries of higher copper prices, which improves their technical test score. Pre-election noise in both countries is a potential complication, but Peru&rsquo;s election are still far away, while Chile&rsquo;s right and center-right can benefit from the left&rsquo;s fragmentation.</li>
<li class="mt-2">We also increased our hard currency sovereign exposure in Romania and Oman, and hard currency corporate exposure in Hong Kong. Romania&rsquo;s political and policy risks subsided after the market-friendly presidential candidate won the presidential election, improving the policy test score for the country. Among the Gulf countries, Oman is the least exposed to potential Strait of Hormuz disruptions, which improves its technical and economic test scores. Regarding the corporate bond in Hong Kong, we sold a higher-price bond and bought a lower-priced security after the company failed to pay a coupon.</li>
<li class="mt-2">Finally, we increased our hard currency sovereign exposure in Cote d&rsquo;Ivoire, Angola, and Ghana. High oil prices should strengthen Angola&rsquo;s technical and economic test scores. As regards Cote d&rsquo;Ivoire, we are now less pessimistic about the election outcome as domestic political tensions are subsiding, improving the policy/politics test score for the country. Ghana&rsquo;s staff-level agreement with the IMF and strong foreign trade results support the currency, improving the country&rsquo;s debt/GDP metrics.</li>
<li class="mt-2">We reduced our local currency exposure in Turkey and Kazakhstan. Turkey&rsquo;s political noise is persistent, and the central bank is eager to start policy easing in a situation when regional geopolitical tensions are rising and might require more caution. In terms of our investment process, this worsened the policy/politics test score for the country. Kazakhstan is exposed to the on-going uncertainty about the resolution of the Russia-Ukraine conflict, which worsens the technical test score for the country.</li>
<li class="mt-2">We also reduced our hard currency sovereign exposure in Nigeria and Senegal and hard currency corporate exposure in Israel. The latter reflected the recent spike in the Middle East geopolitical tensions, which worsened the politics and technical test scores for Israel. In Nigeria, most policy improvements are priced in &ndash; worsening the technical test score and making it difficult to find a fresh positive catalyst for a major rally. Senegal&rsquo;s fiscal and debt struggles &ndash; including a surprising increase in the government&rsquo;s debt/GDP ratio - complicate talks with the IMF, worsening the country&rsquo;s policy test score.</li>
<li class="mt-2">Finally, we reduced our hard currency sovereign exposure in Argentina and Ukraine. Argentina&rsquo;s political backdrop is set to become noisier, and its external account (trade and current account) might deteriorate as the economy is recovering. This worsens the policy and economic test scores for the country. Ukraine&rsquo;s ceasefire and a peace deal remain elusive, with the situation on the ground deteriorating in the past weeks together with the country&rsquo;s politics test score.</li>
</ul>

<p>To receive more <a href="https://www.vaneck.com/us/en/insights/emerging-markets-bonds/" title="Emerging Markets Bonds Insights"><strong>Emerging Markets Bonds</strong></a> insights, <a href="/link/5f45412c2143400497908cea2897f7d3.aspx" title=" Subscription Center"><strong>sign up in our subscription center</strong></a>.</p>
]]></content:encoded>
</item><item rdf:about="https://www.vaneck.com/us/en/blogs/investment-outlook/jan-van-eck-the-middle-of-a-fiscal-reckoning-revisited-focus-on-what-we-can-see/">
  <title>The Middle of a Fiscal Reckoning Revisited: Focus on What We Can See></title>
  <link>https://www.vaneck.com/us/en/blogs/investment-outlook/jan-van-eck-the-middle-of-a-fiscal-reckoning-revisited-focus-on-what-we-can-see/</link>
  <description><![CDATA[As there are no major policy shifts, Jan van Eck&rsquo;s latest outlook focuses on investable trends in gold, AI, India, and the Middle East.]]></description>
  <dc:creator>Jan van Eck</dc:creator>
  <dc:date>07/07/2025 06:30:00</dc:date>
<content:encoded><![CDATA[

<a href="/us/en/blogs/investment-outlook/jan-van-eck-q2-2026-outlook-the-reset-is-your-entry-point/" title="Jan van Eck's Latest Outlook"><strong>Looking for the latest outlook? Read the Q2 2026 Outlook.</strong></a>
<h2>Watch Video: Thoughtful Money with Jan van Eck</h2>
<p>Jan joins Adam Taggart to discuss the market&rsquo;s conflicting macro signals and his outlook for 3Q25.</p>
<p>Since there are no major policy shifts coming out of the budget bill, despite the&nbsp;<a href="/link/4b5f91a3bd4946e5bef748c223adc92a.aspx" title="Q2 2025 Outlook: In the Middle of the 3% Reckoning"><strong>3% reckoning in the U.S.</strong></a>, investors should focus on these three investment themes:</p>
<ul class="content-list">
<li class="mt-2"><strong>Protection against deficits and debt:</strong> Assets like gold and crypto were big winners in the first half of 2025, but remain powerful portfolio diversifiers despite their run-up.</li>
<li class="mt-2"><strong>AI continues to astound:</strong> The AI boom is driving corporate profitability potential and demand for energy, infrastructure, and next-gen computing.</li>
<li class="mt-2"><strong>Opportunities in India and Middle East:</strong> India&rsquo;s digital adoption and scale are accelerating its rise as a global growth engine, while Middle East energy and infrastructure stand to benefit from the AI power surge.</li>
</ul>


<h2>Murky Waters: No Strong Fiscal or Monetary Policy Changes</h2>
<p>Despite being in the middle of a period of fiscal overspending, we are not seeing a sharp shift in policy. In addition:</p>
<ul class="content-list">
<li class="mt-2"><strong>Deficit math is not precise:</strong> Not all details are known, assumptions are important, and some items, like tariff revenue, aren&rsquo;t even part of deficit calculations.</li>
<li class="mt-2"><strong>Labor market signals are muddled by structural shifts:</strong> AI is softening demand for white-collar jobs, while immigration reform could tighten supply&mdash;leaving overall employment data difficult to interpret.</li>
<li class="mt-2"><strong>Inflation is a mixed bag:</strong> Goods prices are falling, but services inflation remains sticky. Add in rising tariffs, and investors again face a noisy inflation picture.</li>
<li class="mt-2"><strong>Growth looks slower, but profits don&rsquo;t:</strong> While GDP and consumer data suggest economic deceleration, earnings remain resilient&mdash;driven by margin expansion and tech-led efficiency. The result is a widening disconnect between macro signals and market performance.</li>
</ul>
<p>Taken together, these crosscurrents make the current macro environment unusually noisy. For investors, this reinforces the importance of higher-conviction themes.</p>
<p><strong>How to Invest:</strong></p>
<ul class="content-list">
<li class="mt-2">Hold gold and crypto as &ldquo;hedges&rdquo; against de-dollarization</li>
<li class="mt-2">Consider India and Middle East digitization winners as those regions lean into technology</li>
<li class="mt-2">Consider emerging markets debt - fiscal and monetary discipline in EM contrasts with deteriorating developed markets fundamentals.</li>
</ul>
<h2>AI Continues to Astound</h2>
<p>The first phase of the AI trade was dominated by a handful of mega-cap tech giants. Companies like NVIDIA captured outsized gains as foundational model training became the market&rsquo;s biggest arms race. But now, with infrastructure largely in place and foundational models deployed, the focus is shifting to real-world applications&mdash;and to the physical systems required to power them.</p>
<p>The training and deployment of AI models, particularly in high-density data centers, is also consuming exponentially more electricity. This is creating knock-on demand for energy infrastructure: natural gas as a transitional fuel, nuclear as a long-term solution, and power transmission upgrades across the grid.</p>
<h3>ChatGPT Downloads Far Outpace All Other Social Platforms</h3>
<p><strong>App Store downloads: ChatGPT vs. leading social apps</strong></p>
<p><img loading="lazy" class="img-responsive w-100" alt="ChatGPT Downloads Far Outpace All Other Social Platforms" src="https://www.vaneck.com/contentassets/dc0ecf5effb0436a8308c8994f5d459c/5894_jan-outlook-q3-2025_chart-2_2025-07_v1_blog.svg" /></p>
<p class="chart-disclosure"><strong>Source: Similarweb.</strong> Data as of June 24, 2025. Any projections, forecasts and other forward-looking statements are not indicative of actual results, are for illustrative purposes only, are valid as of the date of this communication, and are subject to change without notice.</p>
<p><strong>How to Invest:</strong></p>
<ul class="content-list">
<li class="mt-2"><strong>Semiconductors: Still Room to Run.</strong> Despite a 55%+ surge since April, we believe there&rsquo;s more upside ahead as demand drivers remain strong.</li>
<li class="mt-2"><strong>Nuclear Energy: Stay Invested.</strong> With AI accelerating global electricity needs, nuclear remains a compelling long-term solution.</li>
</ul>
<h2>International is Back, Major Developments</h2>
<p>While the last decade was a &ldquo;lost decade&rdquo; for emerging markets in terms of performance, we continue to like the new winners--India and the Middle East. India is not only home to the most people in the world, it also has the largest percentage of ChatGPT users in the world. This underscores the country&rsquo;s rapid digitization, thriving equity market and demographic trends that are creating compelling investment opportunities that we believe investors should be exploring. While India&rsquo;s economic reforms were implemented years ago, they played out in Q2. Another often-overlooked region is the Middle East. As the AI boom accelerates, the region&rsquo;s energy resources and infrastructure are well positioned to benefit from the surge in power demand driven by artificial intelligence. The region also struck major AI deals in 2025, despite political conflict.</p>
<h3>India++ Share of GDP Will Pass the EU in 10 Years</h3>
<p><img loading="lazy" class="img-responsive w-100" alt="India++ Share of GDP Will Pass the EU in 10 Years" src="https://www.vaneck.com/contentassets/371e23e2b94e4072921aec09e277ad48/5894_jan-outlook-q3-2025_chart-1_2025-07_v1_blog.svg" /></p>
<p class="chart-disclosure"><strong>Source: VanEck Research; IMF; Bloomberg as of 6/30/2023.</strong> Past performance is no guarantee of future results. Any projections, forecasts and other forward-looking statements are not indicative of actual results, are for illustrative purposes only, are valid as of the date of this communication, and are subject to change without notice.</p>
<p><strong>How to Invest:</strong></p>
<ul class="content-list">
<li class="mt-2"><strong>India: Long-Term Opportunity Remains Strong.</strong> While India lagged other emerging markets in the first half of 2025, it remains one of the most compelling long-term investments. Key government reforms are complete, and strong infrastructure is already in place to support continued growth.</li>
</ul>
<h2>Key Takeaways</h2>
<ul class="content-list">
<li class="mt-2"><strong>Uncertain U.S. debt and deficit solutions call for macro hedges.</strong> With risks of fiscal overspending, gold and crypto should be kept as buffers against volatility despite tremendous gains already this year.</li>
<li class="mt-2"><strong>AI expansion creates new winners beyond megacap tech.</strong> As foundational models give way to real-world deployment, opportunities are emerging in energy, infrastructure, and the broader AI ecosystem&mdash;making this a prime time to reengage with select growth and next-gen tech enablers.</li>
<li class="mt-2"><strong>International is back. India and the Middle East stand out.</strong> India&rsquo;s digital leap and favorable demographics position it as a future economic powerhouse, while rising AI-driven energy demand boosts the investment case for Middle East infrastructure.</li>
</ul>
<p>To receive more <a href="https://www.vaneck.com/us/en/insights/investment-outlook/" title="Investment Outlook Insights"><strong>Investment Outlook</strong></a> insights, <a href="/link/5f45412c2143400497908cea2897f7d3.aspx" title=" Subscription Center"><strong>sign up in our subscription center</strong></a>.</p>
]]></content:encoded>
</item><item rdf:about="https://www.vaneck.com/us/en/blogs/digital-assets/matthew-sigel-vaneck-crypto-monthly-recap-for-june-2025/">
  <title>VanEck Crypto Monthly Recap for June 2025></title>
  <link>https://www.vaneck.com/us/en/blogs/digital-assets/matthew-sigel-vaneck-crypto-monthly-recap-for-june-2025/</link>
  <description><![CDATA[Bitcoin climbed 3% on strong ETP inflows while altcoins slumped, deepening a divergence that underscores both growing institutional BTC demand and fragility across the broader crypto landscape.]]></description>
  <dc:creator>Matthew  Sigel</dc:creator>
  <dc:date>07/03/2025 06:30:00</dc:date>
<content:encoded><![CDATA[

<p><strong>Please note that VanEck may have a position(s) in the digital asset(s) described below.</strong></p>
<p>June was a quiet month for crypto, with most tokens drifting lower amid declining volatility. Bitcoin (BTC) was the standout, rising <strong>+3%</strong> for the month on steady ETP inflows totaling <strong>$4.5B</strong>. The divergence between BTC and altcoins continued to widen. The <a href="https://www.marketvector.com/indexes/digital-assets/marketvector-smart-contract-leaders" title="MarketVector Smart Contract Leaders Index" target="_blank" rel="noopener"><strong>MarketVector Smart Contract Leaders Index (MVSCLE)</strong></a> fell <strong>(-5%)</strong> in June, highlighting the continued underperformance of altcoins over the past 18 months.</p>
<ul class="content-list">
<li class="mt-3"><a href="#price-returns"><strong>Price Returns</strong></a></li>
<li class="mt-3"><a href="#exchange-volumes-btc"><strong>Exchange Volumes and BTC Volatility</strong></a></li>
<li class="mt-3"><a href="#crypto-treasury-companies"><strong>Crypto Treasury Companies</strong></a></li>
<li class="mt-3"><a href="#solana-updates"><strong>Solana Updates</strong></a></li>
<li class="mt-3"><a href="#ethereum-updates"><strong>Ethereum Updates</strong></a></li>
</ul>
<h3 id="price-returns" class="jump-link-nav anchored-block" data-jumplink-title="Price Returns">Price Returns</h3>
<div class="wrapped-div mb-3">
<table style="width: 600px;">
<tbody>
<tr class="tbl-data">
<td class="tbl-header last text-right">&nbsp;</td>
<td class="tbl-header last text-right">June</td>
<td class="tbl-header last text-right">YTD</td>
</tr>
<tr class="tbl-data">
<td class="data-td last">Coinbase</td>
<td class="data-td data last text-right">42.12%</td>
<td class="data-td data last text-right">41.16%</td>
</tr>
<tr class="tbl-data">
<td class="data-td last">MarketVector Global Digital Assets Equity Index</td>
<td class="data-td data last text-right">29.20%</td>
<td class="data-td data last text-right">15.17%</td>
</tr>
<tr class="tbl-data">
<td class="data-td last">Nasdaq Index</td>
<td class="data-td data last text-right">6.57%</td>
<td class="data-td data last text-right">5.48%</td>
</tr>
<tr class="tbl-data">
<td class="data-td last">S&amp;P 500 Index</td>
<td class="data-td data last text-right">4.96%</td>
<td class="data-td data last text-right">5.50%</td>
</tr>
<tr class="tbl-data">
<td class="data-td last">MarketVector Decentralized Finance Leaders Index</td>
<td class="data-td data last text-right">4.19%</td>
<td class="data-td data last text-right">-48.35%</td>
</tr>
<tr class="tbl-data">
<td class="data-td last">Bitcoin</td>
<td class="data-td data last text-right">2.62%</td>
<td class="data-td data last text-right">14.70%</td>
</tr>
<tr class="tbl-data">
<td class="data-td last">Ethereum</td>
<td class="data-td data last text-right">-2.79%</td>
<td class="data-td data last text-right">-25.09%</td>
</tr>
<tr class="tbl-data">
<td class="data-td last">MarketVector Smart Contract Leaders Index</td>
<td class="data-td data last text-right">-3.68%</td>
<td class="data-td data last text-right">-26.83%</td>
</tr>
<tr class="tbl-data">
<td class="data-td last">MarketVector Infrastructure Application Leaders Index</td>
<td class="data-td data last text-right">-13.11%</td>
<td class="data-td data last text-right">-45.92%</td>
</tr>
<tr class="tbl-data">
<td class="data-td last">MarketVector Meme Coin Index</td>
<td class="data-td data last text-right">-17.18%</td>
<td class="data-td data last text-right">-52.30%</td>
</tr>
</tbody>
</table>
</div>
<p class="chart-disclosure">Source: Bloomberg as of 6/30/2025. <strong>Index performance is not representative of fund performance. It is not possible to invest directly in an index. Past performance is no guarantee of future results. Not intended as a recommendation to buy or sell any securities named herein.</strong></p>
<h3>The MarketVector Smart Contract Leaders Index (MVSCLE) Fell 4% in June, Reflecting Broader Altcoin Weakness</h3>
<div class="flourish-embed flourish-chart" data-src="visualisation/24042517?2429379"><script src="https://public.flourish.studio/resources/embed.js"></script><noscript><img loading="lazy" class="img-responsive w-100" src="https://public.flourish.studio/visualisation/24042517/thumbnail" width="100%" alt="The MarketVector Smart Contract Leaders Index (MVSCLE) Fell 4% in June, Reflecting Broader Altcoin Weakness" /></noscript></div>
<p class="chart-disclosure">Source: Artemis XYZ as of 6/30/2025. The MarketVector Smart Contract Leaders Index (MVSCLE) is designed to track the performance of the largest and most liquid smart contract assets. Index performance is not representative of strategy performance.<strong> Past performance is no guarantee of future results. Not intended as a recommendation to buy or sell any securities named herein.</strong></p>
<p>Since January 2024, only <strong>36%</strong> of the top <strong>300 </strong>tokens are up. <strong>25%</strong> more tokens have dropped over <strong>50%</strong> than gained that much, and in 2025 alone, <strong>7.5x</strong> more tokens declined over <strong>50% </strong>than appreciated similarly. Just <strong>12%</strong> are up YTD, underscoring the increasingly skewed, Pareto-like nature of the crypto market.</p>
<p><strong>June Leaders:</strong></p>
<ul class="content-list">
<li class="mt-3">Arbitrum&rsquo;s ARB: <strong>+6%</strong></li>
<li class="mt-3">Tron&rsquo;s TRX: <strong>+4%</strong></li>
</ul>
<p><strong>June&rsquo;s Laggards:</strong></p>
<ul class="content-list">
<li class="mt-3">Cardano&rsquo;s ADA: <strong>-18%</strong></li>
<li class="mt-3">Sui&rsquo;s SUI: <strong>-15%</strong></li>
</ul>
<p>ARB rebounded from an early-June drawdown to end the month up <strong>6%</strong>. This move followed Robinhood&rsquo;s announcement to list up to 200 tokenized equities on Arbitrum for EU investors starting June 30. Long term, Robinhood aims to migrate this to its own blockchain, developed by Arbitrum creator Offchain Labs. While the news is positive, it&rsquo;s unlikely to drive material fee growth or value accrual to the ARB token. The commercial arrangement compensates Offchain Labs, not ARB holders.</p>
<h2 id="exchange-volumes-btc" class="jump-link-nav anchored-block" data-jumplink-title="Exchange Volumes and BTC Volatility">Exchange Volumes and BTC Volatility</h2>
<p>Trading volumes dropped <strong>29%</strong> across centralized exchanges (CEXes) and were flat YoY. Spot volumes in BTC and ETH fell to multi-year lows relative to futures (BTC: <strong>19%</strong>, ETH: <strong>13%</strong>). DEX volumes hit <strong>$332B</strong> in June, setting a new DEX/CEX ratio high of <strong>28%</strong>, up from <strong>21%</strong> in May.</p>
<h3>Return Profiles of Top 300 Non-Stable Tokens - Most Returns Negative Over All Time Periods</h3>
<p><img loading="lazy" class="img-responsive w-100" src="https://www.vaneck.com/contentassets/aa847a12f42c45b1938a8a1e2b24d21d/5885_crypto-monthly-june_chart-2_2025-7_blog.svg" alt="Return Profiles of Top 300 Non-Stable Tokens - Most Returns Negative Over All Time Periods" /></p>
<p class="chart-disclosure">Source: Artemis XYZ as of 6/30/2025. <strong>Past performance is no guarantee of future results. Not intended as a recommendation to buy or sell any securities named herein. </strong></p>
<p>BTC volatility dropped to <strong>33%</strong>, the lowest since summer 2024. This was partly seasonal but also reflects structural demand: ETPs bought <strong>42K</strong> BTC in June and BTC treasury firms added another <strong>68K</strong>, more than offsetting June&rsquo;s <strong>13.5K</strong> BTC mined. This steady absorption suppresses volatility by providing a consistent bid.</p>
<h2 id="crypto-treasury-companies" class="jump-link-nav anchored-block" data-jumplink-title="Crypto Treasury Companies">Crypto Treasury Companies</h2>
<p>An additional volatility dampener comes from the emergence of BTC treasury companies. Twenty-one new entities adopted the MicroStrategy-style strategy in June. These firms use debt issuance and equity to accumulate BTC, often trading at premiums to their holdings based on bullish BTC assumptions and easy capital access.</p>
<p>These firms often trade at premiums to their BTC holdings, but the model carries major downside risk. A BTC drawdown <strong>&gt;25%</strong> could crash their mNAVs, as seen with MSTR in 2022. In extreme cases, forced BTC sales could trigger recursive declines. While innovative, these firms are high-risk, option-like plays on BTC.</p>
<p>In May we <a href="https://www.vaneck.com/us/en/blogs/digital-assets/matthew-sigel-deconstructing-strategy-mstr-premium-leverage-and-capital-structure/" title="Deconstructing Strategy (MSTR): Premium, Leverage, and Capital Structure"><strong>wrote</strong></a> about how MicroStrategy, the pioneer of BTC Treasury Strategies, employs financialization to gradually increase BTC exposure for common shareholders. Currently, these entities are benefitting from a positive market environment buoyed by BTC price appreciation. With BTC going up in value, these companies can more easily finance additional BTC exposure by issuing securities receptive capital markets. If we assume that the market is rationally valuing these companies based upon terminal BTC holdings and a terminal BTC price in the future, this valuation will increase during market upswings. This is because BTC price projections will become more bullish and each company&rsquo;s ability to finance new BTC purchases will also increase. The result is a higher terminal valuation for each BTC treasury company. As such, many of these companies are trading a premium to their holdings of BTC based upon a rosy outlook for Bitcoin and the financing market for Bitcoin treasury companies.</p>
<p>However, things can turn grim very quickly for these Bitcoin companies if BTC experiences one of its typical, large drawdowns of (&gt;<strong>-25%</strong>). MSTR demonstrated this negative dynamic during the summer of 2022 when its mNAV fell as low as <strong>0.7</strong>. If BTC price collapses, the downside will translate into mNAV degradation for many of these BTC companies. And, if these businesses are unable to fund operations or make debt repayments, market participants may begin to sense these BTC companies may be forced to liquidate their BTC holdings. This may cause recursive price depreciation for both the treasury companies and BTC. As a result, while we see some of these vehicles as interesting financial experiments to give holders option-like exposure to BTC, we recognize the massive risks posed to investors in these companies.</p>
<h2 id="solana-updates" class="jump-link-nav anchored-block" data-jumplink-title="Solana Updates">Solana Updates</h2>
<h3>Solana Has the 2nd Highest "Blockchain GDP"</h3>
<p><img loading="lazy" class="img-responsive w-100" src="https://www.vaneck.com/contentassets/aa847a12f42c45b1938a8a1e2b24d21d/5885_crypto-monthly-june_chart-3_2025-7_blog.svg" alt="Solana Has the 2nd Highest &quot;Blockchain GDP&quot;" /></p>
<p class="chart-disclosure">Source: Token Terminal as of 6/30/2025. <strong>Past performance is no guarantee of future results. Not intended as a recommendation to buy or sell any securities named herein. </strong></p>
<p>With an ETH ETP approved last July, anticipation was high for a SOL ETP in 2025. That milestone materialized on July 2 with the launch of the REX-Osprey Solana + Staking ETF (SSK), which traded an impressive ~$40M on its first day. However, SSK is not a spot-based ETP in the traditional sense. Instead, it functions as a fund-of-funds, holding a Cayman subsidiary that invests in SOL and participates in staking via providers like Jito. The structure sidesteps direct SEC approval of spot SOL custody by leveraging the 1940 Act and a C-corp wrapper. While a major step forward, SSK comes at a cost, charging a 1.4% expense ratio, and leaves room for future products with purer exposure. As the first spot SOL ETP filer, we remain optimistic that a more direct, staking-enabled structure could be approved, offering lower fees, improved redemption mechanics, and greater transparency at launch.</p>
<p>We believe Solana is well-positioned to underpin the emerging 'Internet Capital Markets', a digital environment for real-time financial exchange.</p>
<p>Its strengths include:</p>
<ul class="content-list">
<li class="mt-3">Latency: Solana confirms transactions in 400ms with 5s finality which is vastly quicker than BTC (1 hour) or ETH (13 min), critical for real-time commerce.</li>
<li class="mt-3">Throughput: Solana averages 1.5K TPS with bursts &gt;10K TPS, enabling cheap, sub-cent microtransactions for mass-scale applications.</li>
<li class="mt-3">Ongoing Innovation: With teams like Anza and Firedancer, Solana aims for 100K TPS within a year, 1M TPS in three and this aggressive roadmap is unique among blockchains.</li>
<li class="mt-3">Developer Base: Solana hosts <strong>~6,400</strong> active developers (<strong>~25% </strong>of all crypto devs), driven by its rich tooling and performance.</li>
</ul>
<p>Solana's application layer continues to grow across verticals, including trading, liquid staking, consumer tokens, and anti-bot infrastructure. Key contributors to Solana GDP in June included:</p>
<h3>Most Top Solana Apps are in Trading or Stablecoins</h3>
<p><img loading="lazy" class="img-responsive w-100" src="https://www.vaneck.com/contentassets/aa847a12f42c45b1938a8a1e2b24d21d/5885_crypto-monthly-june_chart-4_2025-7_blog.svg" alt="Most Top Solana Apps are in Trading or Stablecoins" /></p>
<p class="chart-disclosure">Source: Token Terminal as of 6/30/2025. <strong>Past performance is no guarantee of future results. Not intended as a recommendation to buy or sell any securities named herein. </strong></p>
<h3>Raydium Dominates Activity - 2x Other 9 Apps Combined</h3>
<p><img loading="lazy" class="img-responsive w-100" src="https://www.vaneck.com/contentassets/aa847a12f42c45b1938a8a1e2b24d21d/5885_crypto-monthly-june_chart-5_2025-07_v1.svg" alt="Raydium Dominates Activity - 2x Other 9 Apps Combined" /></p>
<p class="chart-disclosure">Source: Token Terminal as of 6/30/2025. <strong>Past performance is no guarantee of future results. Not intended as a recommendation to buy or sell any securities named herein. </strong></p>
<h3>Solana Trading Volumes Cluster Around a Few Top Apps</h3>
<p><img loading="lazy" class="img-responsive w-100" src="https://www.vaneck.com/contentassets/aa847a12f42c45b1938a8a1e2b24d21d/5885_crypto-monthly-june_chart-6_2025-07_v1.svg" alt="Solana Trading Volumes Cluster Around a Few Top Apps" /></p>
<p class="chart-disclosure">Source: Dune @Ally as of 6/30/2025. <strong><em>Past performance is no guarantee of future results. Not intended as a recommendation to buy or sell any securities named herein. </em></strong></p>
<p><strong>Jito:</strong> Solana liquid-staking protocol that issues JitoSOL and shares validator MEV earnings with stakers. This application derives value from all DEX activity by means of earning MEV revenues.</p>
<p><strong>Raydium:</strong> The top Automated Market Maker on Solana whose liquidity pools plug into a central on-chain order book for combined AMM and limit-order depth. Adds revenues through trading activity.</p>
<p><strong>pump.fun:</strong> No-code Solana launchpad for new tokens that provides novel assets that drive new trading volumes. The tokens launched on Pump were responsible for as much as 90% of Solana trading volumes in January 2025.</p>
<p><strong>Meteora:</strong> A novel AMM whose pools adjust fees and token balances algorithmically to reflect market conditions. Meteora&rsquo;s volumes are up <strong>272%</strong> YoY.</p>
<p><strong>Orca</strong>: Solana AMM supporting concentrated-liquidity &ldquo;Whirlpool&rdquo; pools for capital-efficient swaps. Orca was once a more dominant DEX but has lost market share to competitors who focused on memecoins falling from <strong>31%</strong> market share in 1Q2024 to <strong>15%</strong> market share by 1Q2025.</p>
<p><strong>Axiom Trade:</strong> Axiom is a recent creation to prevent Solana users from being front run by trading bots. Trading volume has grown <strong>40x</strong> since Jan 2025 to June 2025, <strong>$8M</strong> -&gt; <strong>$3.2B</strong>.</p>
<p><strong>Trojan: </strong>A trading application that simplifies trading by using Telegram as a wallet and to execute trades. This provides a more &ldquo;social trading&rdquo; experience. The app has grown from 160K monthly active users in Jan 2025 to <strong>350K</strong> monthly active users in June 2025.</p>
<p><strong>Photon</strong>: A competing telegram trading application to Trojan that earned <strong>$6.9M</strong> in revenue over the past month.</p>
<p><strong>BullX:</strong> A platform that combines complex trading features to enable more sophisticated trading strategies. The application averages <strong>260K</strong> monthly active users in June 2025 and generated <strong>$2.6M</strong> in revenues.</p>
<h2>SOL ETP and Staking Considerations</h2>
<p>A key feature for a successful SOL ETP will be staking integration. Without it, investors could lose out on <strong>7&ndash;10%</strong> annual yield and suffer dilution, as roughly half of SOL&rsquo;s yield derives from inflationary issuance. However, including staking introduces multiple challenges:</p>
<ul>
<li class="mt-3">Operational risks: These include validator slashing, key management failures, or governance misalignment.</li>
<li class="mt-3">Tax uncertainty: There is limited IRS guidance on staking income treatment.</li>
<li class="mt-3">Principal-agent issues: Validators may profit from opaque activities (e.g. MEV) not passed through to ETP holders.</li>
<li class="mt-3">Redemption constraints: While ETP shares must redeem T+1, unstaking SOL can take ~2 days (and longer for ETH). Market makers must hedge this gap at a cost (~9bps/day at a <strong>40%</strong> cost of capital).</li>
</ul>
<p>Some solutions for redemptions have been presented, but none of these are ideal. One idea is to let market makers charge investors for early access to unstaked tokens, but that model assumes liquid and cheaply priced withdrawal markets. During bouts of volatility, the cost of capital soars and the exit fee does too. Another idea is to hold a liquid staking token (LST), yet regulators in several jurisdictions treat these tokens as unregistered securities. Additionally, they are prone to de-pegging under stress. In the summer of 2022, Lido&rsquo;s stETH traded at (<strong>88%</strong>) percent of its net asset value. LSTs also introduce additional smart-contract risks that are hard for typical ETF investors to evaluate.</p>
<p>We are working with validators to model these tradeoffs and remain optimistic about a path forward. With transparency, coordination, and thoughtful structuring, a staking-enabled SOL ETP is achievable.</p>
<h2 id="ethereum-updates" class="jump-link-nav anchored-block" data-jumplink-title="Ethereum Updates">Ethereum Updates</h2>
<h3>Spot ETH ETPs See Largest Monthly Inflows of 2025</h3>
<p><img loading="lazy" class="img-responsive w-100" src="https://www.vaneck.com/contentassets/aa847a12f42c45b1938a8a1e2b24d21d/5885_crypto-monthly-june_chart-7_2025-07_v1.svg" alt="Spot ETH ETPs See Largest Monthly Inflows of 2025" /></p>
<p class="chart-disclosure">Source: Glassnode, Yahoo Finance as of 6/29/2025. <strong>Past performance is no guarantee of future results. Not intended as a recommendation to buy or sell any securities named herein. </strong></p>
<p>Investors poured <strong>~$1.1B </strong>into Ethereum ETPs in June, the second-largest month since their launch in 2024. Actual institutional demand for ETH may be even higher, as this figure coincides with a renewed interest in using ETH as a treasury asset. We first <a href="https://www.vaneck.com/us/en/blogs/digital-assets/matthew-sigel-vaneck-crypto-monthly-recap-for-may-2025/" title="VanEck Crypto Monthly Recap for May 2025"><strong>noted</strong></a> this trend in May, when several public companies began emulating the treasury strategy popularized by Strategy (MSTR), but using ETH instead. While both ETH ETPs and ETH treasury strategies are bullish for the asset, they compete for similar pools of capital.</p>
<p><img loading="lazy" class="img-responsive w-100" src="https://www.vaneck.com/contentassets/aa847a12f42c45b1938a8a1e2b24d21d/5885_crypto-monthly-june_table_2025-07_v1.svg" alt="ETH, SOL Treasury Announcements &amp; Stock Performances" /></p>
<p class="chart-disclosure">Source: Yahoo Finance, Company Press Releases as of 6/30/2025. <strong><em>Past performance is no guarantee of future results. Not intended as a recommendation to buy or sell any securities named herein. </em></strong></p>
<p>On June 25th, Bitcoin miner Bit Digital (BTBT) <a href="https://bit-digital.com/press-releases/bit-digital-inc-announces-strategic-shift-to-ethereum-treasury-and-staking-operations/" title="Bit Digital Inc. Announces Strategic Shift to Ethereum Treasury and Staking Operations" target="_blank" rel="noopener"><strong>announced</strong></a> its transition into a pure-play Ethereum staking and treasury company, initiating the wind-down of its Bitcoin mining operations and beginning a gradual conversion of its BTC holdings into ETH. However, the stock opened down (-<strong>17%</strong>) the following morning, raising questions about market appetite for ETH treasury-focused firms. In contrast, on June 30th, newly uplisted BitMine Immersion Technologies (BMNR) announced a <strong>$250M</strong> private placement, selling 55,555,556 shares of common stock for <strong>$4.50</strong> per share, with plans to use the proceeds to acquire ETH for its treasury operations. We suspect this divergent performance reflects BMNR&rsquo;s smaller size, prominent backers, and relatively large fundraise, which could make it a more compelling and straightforward pure-play ETH treasury play in the eyes of investors.</p>
<p>Ethereum&rsquo;s blockchain itself also saw meaningful inflows in June, adding <strong>~$5.1B</strong> in net digital assets. Nearly all of these new assets (<strong>~$5.0B</strong>) originated from Coinbase&rsquo;s Base L2, even as Base&rsquo;s monthly DEX volumes declined (<strong>-13%</strong>). The fading AI-driven activity (e.g., VIRTUAL <strong>-26%</strong>) likely drove this decline.</p>
<h3>34% of Ethereum Transactions Involved Stablecoins in June, Driving Network Activity Near All-Time Highs</h3>
<p><img loading="lazy" class="img-responsive w-100" src="https://www.vaneck.com/contentassets/aa847a12f42c45b1938a8a1e2b24d21d/5885_crypto-monthly-june_chart-8_2025-07_v1.svg" alt="34% of Ethereum Transactions Involved Stablecoins in June, Driving Network Activity Near All-Time Highs" /></p>
<p class="chart-disclosure">Source: Glassnode as of 6/30/2025. <strong>Past performance is no guarantee of future results. Not intended as a recommendation to buy or sell any securities named herein. </strong></p>
<p>While perhaps defensive by crypto standards, this rotation into the L1 may not be bearish. Instead, it suggests that on-chain traders, primarily retail, are aligning with institutional investors&rsquo; renewed interest in Ethereum&rsquo;s base layer. In June, stablecoins experienced a breakout moment following Circle&rsquo;s IPO and the GENIUS Act&rsquo;s advancement towards the House, with daily transactions rising <strong>(+7%)</strong> month-over-month and <strong>(+27%)</strong> year-over-year. Of the <strong>$125B</strong> in total stablecoin supply, Ethereum L1 hosts the majority <strong>(51%)</strong> and settles over (<strong>58%)</strong> of all stablecoin transaction volume (<strong>29%</strong> on ETH L1, <strong>25% </strong>on Base, and <strong>4%</strong> across Arbitrum, Mantle, and OP Mainnet).</p>
<p>Meanwhile, Ethereum-native DeFi tokens such as Maple Finance (SYRUP <strong>+61%</strong>), Sky (SKY <strong>+22%</strong>), Uniswap (UNI <strong>+17</strong>%), and Aave (AAVE <strong>+9%</strong>) were among June&rsquo;s top-performing tokens, underscoring how Ethereum&rsquo;s legacy protocols are benefitting from real-world, stablecoin-driven financial applications. Accordingly, we believe the all-time high in NFT transfers on Ethereum is being driven not by JPEG art speculation, but by emergent use cases like tokenized real-world assets, digital identifiers, and on-chain debt instruments.</p>
<p><strong>Links to third party websites are provided as a convenience and the inclusion of such links does not imply any endorsement, approval, investigation, verification or monitoring by us of any content or information contained within or accessible from the linked sites. By clicking on the link to a non-VanEck webpage, you acknowledge that you are entering a third-party website subject to its own terms and conditions. VanEck disclaims responsibility for content, legality of access or suitability of the third-party websites.</strong></p>
<p>To receive more <strong><a href="https://www.vaneck.com/us/en/insights/digital-assets/" title="Digital Assets Insights">Digital Assets</a></strong> insights, <strong><a href="https://www.vaneck.com/us/en/subscribe/" title="Subscription Center">sign up in our subscription center</a></strong>.</p>
]]></content:encoded>
</item><item rdf:about="https://www.vaneck.com/us/en/blogs/income-investing/floating-rate-ideas-shine-in-a-higher-for-longer-world/">
  <title>Floating Rate Ideas Shine in a Higher-for-Longer World></title>
  <link>https://www.vaneck.com/us/en/blogs/income-investing/floating-rate-ideas-shine-in-a-higher-for-longer-world/</link>
  <description><![CDATA[With persistent rate volatility and uncertain inflation dynamics, floating rate instruments like FRNs and CLOs offer a compelling way to earn income while staying insulated from rate risk.]]></description>
  <dc:creator>William Sokol</dc:creator>
  <dc:date>07/02/2025 06:30:00</dc:date>
<content:encoded><![CDATA[

<p>Even as rate hikes appear to be behind us, the &ldquo;all-clear&rdquo; signal for long-duration fixed income hasn&rsquo;t arrived. With inflation proving sticky and the front end of the curve still offering high yields, investors are remaining cautious about adding duration risk.</p>
<p>In this environment, floating rate instruments continue to offer a rare combination of yield, resilience, and diversification, making them a powerful strategic allocation within a broader fixed income portfolio.</p>
<p>Here&rsquo;s why:</p>
<ul class="content-list">
<li class="mt-2"><strong>Front-end yields remain elevated</strong>, offering attractive income opportunities without the need to stretch for credit or duration risk.</li>
<li class="mt-2"><strong>Interest rate volatility is still high</strong>, reinforcing the case for rate-insulated assets.</li>
<li class="mt-2"><strong>Duration-sensitive sectors remain vulnerable</strong> to policy shifts and shifting inflation expectations.</li>
</ul>
<h2>Floating Rate Notes: High-Quality Yield, Low Duration</h2>
<p>Investment-grade <a href="/us/en/blogs/income-investing/fltr-question-and-answer/#point-one"><strong>floating rate notes (FRNs)</strong></a>, which reset their coupons based on short-term rates like SOFR, offer a compelling value proposition in today&rsquo;s market. They allow investors to earn competitive income while preserving downside protection if rates rise again.</p>
<p>Importantly, FRNs typically carry investment grade ratings, making them a good choice for investors who want yield without chasing lower-quality credit risk&mdash;a contrast to leveraged loans or high yield bonds. With their low correlation to rate-sensitive assets, FRNs can fulfill the twin objectives of fixed income: income and diversification.</p>

<h2>CLOs: Income, Resilience, and Structural Strength</h2>
<p>Investment-grade collateralized loan obligations (CLOs) offer another way to take advantage of the floating rate environment while also accessing historically attractive risk-adjusted returns.</p>
<p>Unlike traditional corporate debt, CLOs are structured vehicles backed by pools of senior secured loans. These structures include <a href="/us/en/blogs/income-investing/clos-question-and-answer#point-three"><strong>built-in protections</strong></a> like subordination tests, collateral coverage requirements, and active management. Over time, these features have helped CLOs deliver strong returns with lower historical default rates than similarly rated corporate bonds.</p>
<p>Notably, CLOs aren&rsquo;t just a play on rising rates. Even <a href="/us/en/blogs/income-investing/why-clos-still-make-sense-when-the-fed-cuts-rates/"><strong>if the Fed begins cutting</strong></a>, certain tranches&mdash;especially mezzanine CLOs&mdash;can still offer strong total return potential thanks to their embedded credit spreads. In a scenario where rate cuts are more aggressive than expected, spread widening may more than offset the lower base rates, providing the opportunity to continue generating high absolute yields. The benefits of lower rated CLO tranches are especially compelling when compared to unsecured high yield bonds, which lack the structural protections that have helped the CLO asset class outperform other parts of the credit spectrum during times of stress. The key is to have flexibility to take advantage of market moves, while also being able to sidestep volatility. We believe an active strategy that is not constrained to single rating provides the opportunity to allocate to the most attractive parts of the CLO market while managing risk effectively.</p>
<h2>VanEck Floating Rate Fixed Income Solutions</h2>
<p>At VanEck, we offer targeted ETFs designed to give investors efficient access to the benefits of floating rate fixed income exposure:</p>
<ul class="content-list">
<li class="mt-2"><a href="/us/en/investments/clo-etf-cloi/overview/"><strong>VanEck CLO ETF (CLOI)</strong></a> and <a href="/us/en/investments/aa-bb-clo-etf-clob/overview/"><strong>VanEck AA-BB CLO ETF (CLOB)</strong></a> offer exposure to investment grade CLOs, with CLOI investing across investment grade tranches and CLOB focusing on mezzanine tranches. Both <a href="/us/en/blogs/income-investing/clos-question-and-answer"><strong>CLOI and CLOB</strong></a> are actively managed by PineBridge Investments, the funds&rsquo; sub-adviser, and are managed to provide an enhanced return by identifying the most attractive segments of the CLO market, while avoiding downgrades and default losses.</li>
<li class="mt-2"><a href="/us/en/investments/ig-floating-rate-etf-fltr/overview/"><strong>VanEck IG Floating Rate ETF (FLTR)</strong></a> delivers access to investment grade corporate floating rate notes. FLTR&rsquo;s underlying index has a bias towards longer-maturity notes, which tend to have greater yield without an increase in interest rate risk.</li>
</ul>
<p>To receive more <a href="/us/en/blogs/income-investing/" title="Income Investing Insights"><strong>Income Investing</strong></a> insights, <a href="/link/5f45412c2143400497908cea2897f7d3.aspx" title=" Subscription Center"><strong>sign up in our subscription center</strong></a>.</p>
]]></content:encoded>
</item><item rdf:about="https://www.vaneck.com/us/en/blogs/income-investing/whats-next-for-clos/">
  <title>What’s Next for CLOs?></title>
  <link>https://www.vaneck.com/us/en/blogs/income-investing/whats-next-for-clos/</link>
  <description><![CDATA[VanEck and PineBridge unpack the risks and opportunities for CLOs amid economic uncertainty, inflation and heightened geopolitical risk.]]></description>
  <dc:creator> </dc:creator>
  <dc:date>06/30/2025 06:30:00</dc:date>
<content:encoded><![CDATA[

<p>The <a href="/link/e090deaddc774ac699a04b959d9254c6.aspx" title="CLOI - VanEck CLO ETF - Holdings &amp; Performance"><strong>VanEck CLO ETF (CLOI)</strong></a> is celebrating its three-year anniversary. We recently held a client event with the ETF&rsquo;s sub-advisor, PineBridge Investments, to discuss their outlook, CLO market trends and how they are positioned for uncertainty ahead. This Q&amp;A summarizes their discussion.</p>
<ul class="content-list">
<li class="mt-2"><a href="#point-one"><strong>How is your economic outlook impacting portfolio positioning?</strong></a></li>
<li class="mt-2"><a href="#point-two"><strong>How would lower interest rates impact CLOs?</strong></a></li>
<li class="mt-2"><a href="#point-three"><strong>What are the long-term default rates of CLOs?</strong></a></li>
<li class="mt-2"><a href="#point-four"><strong>What is PineBridge&rsquo;s process for selecting CLOs?</strong></a></li>
<li class="mt-2"><a href="#point-five"><strong>How is sector exposure managed in a CLO tranche portfolio?</strong></a></li>
<li class="mt-2"><a href="#point-six"><strong>What role does the equity tranche play in CLOI or CLOB?</strong></a></li>
<li class="mt-2"><a href="#point-seven"><strong>How many defaults in the CLO portfolio does it take to impair a CLO debt tranche?</strong></a></li>
<li class="mt-2"><a href="#point-eight"><strong>What has recent CLO issuance been like?</strong></a></li>
<li class="mt-2"><a href="#point-nine"><strong>Do CLO ETFs face capacity constraints?</strong></a></li>
<li class="mt-2"><a href="#point-ten"><strong>How are advisors using CLOs in portfolios?</strong></a></li>
<li class="mt-2"><a href="#point-eleven"><strong>What is the impact of loans being called on CLOs?</strong></a></li>
<li class="mt-2"><a href="#point-twelve"><strong>Have CLO ETFs impacted the overall CLO market?</strong></a></li>
<li class="mt-2"><a href="#point-thirteen"><strong>Have credit cycles changed versus history?</strong></a></li>
<li class="mt-2"><a href="#point-fourteen"><strong>How have CLOs evolved since the GFC?</strong></a></li>
</ul>
<h2 id="point-one" class="jump-link-nav anchored-block" data-jumplink-title="Outlook">How is your economic outlook impacting portfolio positioning?</h2>
<p>Based on current economic data, our base case scenario is for a slowdown but no recession. Issuer fundamentals remain strong. Earnings are moderating but aren&rsquo;t falling off a cliff, so corporate balance sheets are well positioned to withstand a moderate downturn. However, markets have rallied back since the turbulence in April and valuations for a lot of credit assets have tightened back to February/early March levels.</p>
<p>That said, we believe this optimistic backdrop is discounting several downside risks:</p>
<ul class="content-list">
<li class="mt-2"><strong>Uncertainty around tariffs and trade policy</strong>: This is still very fluid between varying rulings in the courts and pivots from the administration during trade deal negotiations. If things get more combative, we could see renewed pressure on prices and if tariffs were sustained at higher levels, we could ultimately see deterioration in credit metrics.</li>
<li class="mt-2"><strong>Inflation</strong>: This seems poised to move higher in coming quarters as the impact from the trade policies that are already enacted come into effect. Inflation is still above the Fed target and our expectation is that we see an increase over the coming quarters.</li>
<li class="mt-2"><strong>Higher for longer rates: </strong>Higher inflation would lead to the third potential downside risk for the economy, which is that rates stay higher for longer. With trade policy and the ultimate impact on inflation still a question mark, we believe the Fed is inclined to wait and see what the data shows before acting. Weaker loan borrowers that couldn&rsquo;t refinance over the last two years may experience adverse outcomes, something we&rsquo;ve already seen a bit of given elevated default rates (including distressed exchanges) in the leveraged loan index. However, it is important to note this is a mixed bag as higher base rates means higher coupons for floating rate debt investors. From a CLO debt investors perspective, if rates stay higher without causing a massive spike in defaults, this could be a good outcome overall.</li>
<li class="mt-2"><strong>Eroding consumer sentiment:</strong> Although the consumer has remained resilient, consumer sentiment data has been relatively weak, and projections for an increase in unemployment could further erode confidence and ultimately lead to a decrease in spending.</li>
<li class="mt-2"><strong>Fiscal policy uncertainty:</strong> Fiscal developments in the U.S. may push long end rates higher and increase the cost of long-term capital.</li>
</ul>
<p>For now, these risks are primarily on the horizon, so until we see any of the impacts play out, we are constructive on credit metrics overall in the short term. However, given tight valuations and multiple downside risks, we believe the backdrop is tilted toward widening rather than significant tightening in the medium term.</p>
<p>Notwithstanding the more recent de-escalation of trade tensions, we prefer higher-quality tranches and are selectively purchasing shorter spread duration assets for lower rated credits. This is due to signs of economic weakening in the U.S. and the continued prospects of a global trade war. We believe current AAA spreads are tight, so given our quality bias, we believe adding AA and A rated securities makes the most sense. We expect additional bouts of volatility throughout the year and would like to maintain the ability to shift further into lower rated tranches during future periods of market weakness.</p>
<h2 id="point-two" class="anchored-block">How would lower interest rates impact CLOs?</h2>
<p>CLO yields, as floating rate assets, adjust quickly to Fed policy rate changes. While a lower rate environment reduces yields, CLOs still offer relative advantages like higher Sharpe Ratios, superior yield-to-risk and a higher spread compared to similarly rated corporate bonds. This spread and yield advantage has been maintained across credit cycles and interest rate regimes, and we expect that to continue going forward.</p>
<p>We believe CLOs can help income investors benefit a diversified income stream from their portfolios which provides an attractive return relative to the degree of risk taken. We also note that inflationary pressures will likely keep rates high for the foreseeable future, in our opinion. If rates were to be cut more aggressively, that would likely be reflective of a more adverse economic environment than the market is currently expecting, which would likely be accompanied by significant spread widening, which would offset the impact of rate cuts. Such an environment can provide opportunities for a flexible investment strategy to add risk after a selloff and continue to provide attractive absolute yield levels.</p>
<h2 id="point-three" class="anchored-block">What are the long-term default rates of CLOs?</h2>
<p>Default rates for CLOs and corporate debt diverge significantly by rating. Over a 10-year horizon, CLOs rated BB have cumulative impairment rates of about 3.1%, while similarly rated corporates average 15.4%.</p>
<p>More broadly, speculative-grade (SG) corporate bonds exhibit 30.3% default rates over 10 years. This underscores the historical resilience of CLOs, especially in the investment-grade range, which has shown near-zero impairments over multi-year horizons. We note that no Aaa or Aa rated has ever had an impairment, and since the global financial crisis, no investment grade tranche has ever defaulted&mdash;this is due to the more robust structures of CLOs (more on this later).</p>
<h3>Default Rates for CLOs vs. Other Forms of Corporate Credit, 1983 - 2023</h3>
<p><strong>CLOs</strong></p>
<div class="wrapped-div">
<table style="width: 100%;">
<tbody>
<tr class="tbl-data">
<td class="tbl-header last">&nbsp;</td>
<td class="tbl-header last text-center" colspan="10">Horizon year</td>
</tr>
<tr class="tbl-data">
<td class="data-head last text-right">&nbsp;</td>
<td class="data-head last text-right">1</td>
<td class="data-head last text-right">2</td>
<td class="data-head last text-right">3</td>
<td class="data-head last text-right">4</td>
<td class="data-head last text-right">5</td>
<td class="data-head last text-right">6</td>
<td class="data-head last text-right">7</td>
<td class="data-head last text-right">8</td>
<td class="data-head last text-right">9</td>
<td class="data-head last text-right">10</td>
</tr>
<tr class="tbl-data">
<td class="data-td last text-left">Aaa (%)</td>
<td class="data-td data last text-right">0.00</td>
</tr>
<tr class="tbl-data">
<td class="data-td last text-left">Aa (%)</td>
<td class="data-td data last text-right">0.00</td>
</tr>
<tr class="tbl-data">
<td class="data-td last text-left">A (%)</td>
<td class="data-td data last text-right">0.00</td>
<td class="data-td data last text-right">0.04</td>
</tr>
<tr class="tbl-data">
<td class="data-td last text-left">Baa (%)</td>
<td class="data-td data last text-right">0.03</td>
<td class="data-td data last text-right">0.07</td>
<td class="data-td data last text-right">0.19</td>
<td class="data-td data last text-right">0.31</td>
<td class="data-td data last text-right">0.48</td>
<td class="data-td data last text-right">0.76</td>
<td class="data-td data last text-right">0.93</td>
</tr>
<tr class="tbl-data">
<td class="data-td last text-left">Ba (%)</td>
<td class="data-td data last text-right">0.00</td>
<td class="data-td data last text-right">0.07</td>
<td class="data-td data last text-right">0.28</td>
<td class="data-td data last text-right">0.51</td>
<td class="data-td data last text-right">0.76</td>
<td class="data-td data last text-right">1.18</td>
<td class="data-td data last text-right">1.33</td>
<td class="data-td data last text-right">1.95</td>
<td class="data-td data last text-right">2.35</td>
<td class="data-td data last text-right">3.10</td>
</tr>
<tr class="tbl-data">
<td class="data-td last text-left">B (%)</td>
<td class="data-td data last text-right">0.09</td>
<td class="data-td data last text-right">0.20</td>
<td class="data-td data last text-right">0.52</td>
<td class="data-td data last text-right">1.24</td>
<td class="data-td data last text-right">2.88</td>
<td class="data-td data last text-right">4.07</td>
<td class="data-td data last text-right">4.44</td>
</tr>
<tr class="tbl-data">
<td class="data-td last text-left">Caa (%)</td>
<td class="data-td data last text-right">&nbsp;</td>
</tr>
<tr class="tbl-data">
<td class="data-td last text-left">IG (%)</td>
<td class="data-td data last text-right">0.01</td>
<td class="data-td data last text-right">0.02</td>
<td class="data-td data last text-right">0.04</td>
<td class="data-td data last text-right">0.07</td>
<td class="data-td data last text-right">0.10</td>
<td class="data-td data last text-right">0.16</td>
<td class="data-td data last text-right">0.19</td>
</tr>
<tr class="tbl-data">
<td class="data-td last text-left">SG (%)</td>
<td class="data-td data last text-right">0.03</td>
<td class="data-td data last text-right">0.11</td>
<td class="data-td data last text-right">0.35</td>
<td class="data-td data last text-right">0.52</td>
<td class="data-td data last text-right">0.88</td>
<td class="data-td data last text-right">1.60</td>
<td class="data-td data last text-right">1.96</td>
<td class="data-td data last text-right">2.53</td>
<td class="data-td data last text-right">2.86</td>
<td class="data-td data last text-right">3.55</td>
</tr>
<tr class="tbl-data">
<td class="data-td last text-left">All (%)</td>
<td class="data-td data last text-right">0.01</td>
<td class="data-td data last text-right">0.02</td>
<td class="data-td data last text-right">0.08</td>
<td class="data-td data last text-right">0.13</td>
<td class="data-td data last text-right">0.21</td>
<td class="data-td data last text-right">0.33</td>
<td class="data-td data last text-right">0.42</td>
<td class="data-td data last text-right">0.56</td>
<td class="data-td data last text-right">0.64</td>
<td class="data-td data last text-right">0.74</td>
</tr>
</tbody>
</table>
</div>
<p class="chart-disclosure">Source: Moody's Ratings.</p>
<h3>Average cumulative issuer-weighted global corporate default rates by letter rating</h3>
<div class="wrapped-div">
<table style="width: 100%;">
<tbody>
<tr class="tbl-data">
<td class="data-head last text-left">Rating\Year</td>
<td class="data-head last text-right">1</td>
<td class="data-head last text-right">2</td>
<td class="data-head last text-right">3</td>
<td class="data-head last text-right">4</td>
<td class="data-head last text-right">5</td>
<td class="data-head last text-right">6</td>
<td class="data-head last text-right">7</td>
<td class="data-head last text-right">8</td>
<td class="data-head last text-right">9</td>
<td class="data-head last text-right">10</td>
</tr>
<tr class="tbl-data">
<td class="data-td last text-left">Aaa (%)</td>
<td class="data-td data last text-right">0.0</td>
<td class="data-td data last text-right">0.1</td>
</tr>
<tr class="tbl-data">
<td class="data-td last text-left">Aa (%)</td>
<td class="data-td data last text-right">0.0</td>
<td class="data-td data last text-right">0.1</td>
<td class="data-td data last text-right">0.2</td>
<td class="data-td data last text-right">0.3</td>
<td class="data-td data last text-right">0.4</td>
<td class="data-td data last text-right">0.5</td>
<td class="data-td data last text-right">0.6</td>
<td class="data-td data last text-right">0.7</td>
</tr>
<tr class="tbl-data">
<td class="data-td last text-left">A (%)</td>
<td class="data-td data last text-right">0.1</td>
<td class="data-td data last text-right">0.2</td>
<td class="data-td data last text-right">0.3</td>
<td class="data-td data last text-right">0.5</td>
<td class="data-td data last text-right">0.7</td>
<td class="data-td data last text-right">0.9</td>
<td class="data-td data last text-right">1.2</td>
<td class="data-td data last text-right">1.4</td>
<td class="data-td data last text-right">1.7</td>
<td class="data-td data last text-right">1.9</td>
</tr>
<tr class="tbl-data">
<td class="data-td last text-left">Baa (%)</td>
<td class="data-td data last text-right">0.2</td>
<td class="data-td data last text-right">0.4</td>
<td class="data-td data last text-right">0.7</td>
<td class="data-td data last text-right">1.1</td>
<td class="data-td data last text-right">1.4</td>
<td class="data-td data last text-right">1.8</td>
<td class="data-td data last text-right">2.1</td>
<td class="data-td data last text-right">2.5</td>
<td class="data-td data last text-right">2.9</td>
<td class="data-td data last text-right">3.3</td>
</tr>
<tr class="tbl-data">
<td class="data-td last text-left">Ba (%)</td>
<td class="data-td data last text-right">0.9</td>
<td class="data-td data last text-right">2.5</td>
<td class="data-td data last text-right">4.3</td>
<td class="data-td data last text-right">6.2</td>
<td class="data-td data last text-right">8.0</td>
<td class="data-td data last text-right">9.6</td>
<td class="data-td data last text-right">11.1</td>
<td class="data-td data last text-right">12.6</td>
<td class="data-td data last text-right">13.9</td>
<td class="data-td data last text-right">15.4</td>
</tr>
<tr class="tbl-data">
<td class="data-td last text-left">B (%)</td>
<td class="data-td data last text-right">3.1</td>
<td class="data-td data last text-right">7.5</td>
<td class="data-td data last text-right">12.1</td>
<td class="data-td data last text-right">16.3</td>
<td class="data-td data last text-right">20.2</td>
<td class="data-td data last text-right">23.6</td>
<td class="data-td data last text-right">26.7</td>
<td class="data-td data last text-right">29.4</td>
<td class="data-td data last text-right">31.9</td>
<td class="data-td data last text-right">34.0</td>
</tr>
<tr class="tbl-data">
<td class="data-td last text-left">Caa-C (%)</td>
<td class="data-td data last text-right">8.9</td>
<td class="data-td data last text-right">16.1</td>
<td class="data-td data last text-right">22.4</td>
<td class="data-td data last text-right">27.9</td>
<td class="data-td data last text-right">32.6</td>
<td class="data-td data last text-right">36.6</td>
<td class="data-td data last text-right">39.9</td>
<td class="data-td data last text-right">42.8</td>
<td class="data-td data last text-right">45.5</td>
<td class="data-td data last text-right">47.7</td>
</tr>
<tr class="tbl-data">
<td class="data-td last text-left">IG (%)</td>
<td class="data-td data last text-right">0.1</td>
<td class="data-td data last text-right">0.2</td>
<td class="data-td data last text-right">0.4</td>
<td class="data-td data last text-right">0.6</td>
<td class="data-td data last text-right">0.9</td>
<td class="data-td data last text-right">1.1</td>
<td class="data-td data last text-right">1.4</td>
<td class="data-td data last text-right">1.6</td>
<td class="data-td data last text-right">1.9</td>
<td class="data-td data last text-right">2.1</td>
</tr>
<tr class="tbl-data">
<td class="data-td last text-left">SG (%)</td>
<td class="data-td data last text-right">4.2</td>
<td class="data-td data last text-right">8.4</td>
<td class="data-td data last text-right">12.5</td>
<td class="data-td data last text-right">16.1</td>
<td class="data-td data last text-right">19.3</td>
<td class="data-td data last text-right">22.1</td>
<td class="data-td data last text-right">24.5</td>
<td class="data-td data last text-right">26.6</td>
<td class="data-td data last text-right">28.6</td>
<td class="data-td data last text-right">30.3</td>
</tr>
<tr class="tbl-data">
<td class="data-td last text-left">All (%)</td>
<td class="data-td data last text-right">1.7</td>
<td class="data-td data last text-right">3.4</td>
<td class="data-td data last text-right">4.9</td>
<td class="data-td data last text-right">6.3</td>
<td class="data-td data last text-right">7.4</td>
<td class="data-td data last text-right">8.4</td>
<td class="data-td data last text-right">9.2</td>
<td class="data-td data last text-right">10.0</td>
<td class="data-td data last text-right">10.6</td>
<td class="data-td data last text-right">11.2</td>
</tr>
</tbody>
</table>
</div>
<p class="chart-disclosure">Source: Moody's Ratings.</p>

<h2 id="point-four" class="jump-link-nav anchored-block" data-jumplink-title="Process">What is PineBridge&rsquo;s process for selecting CLOs?</h2>
<p>PineBridge applies a highly analytical and multi-layered investment process when selecting CLOs, focusing on four primary factors: manager quality, deal structure, documentation, and underlying loan credit quality. At the core of the process is a deep evaluation of the CLO manager, where only managers with proven, disciplined credit processes and strong risk oversight are considered. PineBridge avoids managers with weak performance histories, unstable platforms, high default or low recovery rates, or no long-term equity placement plans.</p>
<p>The investment team conducts in-depth structural and documentation analysis and utilizes its proprietary credit platform to map every underlying loan to its internal credit ratings and research. This enables a granular understanding of each CLO&rsquo;s risk profile. Further scrutiny is applied via tools that allow us to model default/loss simulations, rate sensitivity, reinvestment dynamics, and spread/maturity stress testing&mdash;especially critical for mezzanine and equity tranches.</p>
<p>Ultimately, every potential investment is re-underwritten and summarized in a CLO Tranche Investment Report, which guides security selection. This is complemented by PineBridge&rsquo;s experience managing 41 CLOs globally, offering an &ldquo;insider&rdquo; view into best practices when managing CLOs. Each potential tranche investment opportunity is then reviewed by the CLO Credit Committee, to determine our degree of comfort within the CLO.</p>
<p>Additionally, PineBridge also avoids CLOs where the manager has exhibited poor credit selection, the portfolio has had heavy losses, market pricing appears overvalued or if we believe the tranche has a high probability of being downgraded.</p>
<h2 id="point-five" class="anchored-block">How is sector exposure managed in a CLO tranche portfolio?</h2>
<p>CLOs benefit from sector/industry limitations within the transaction, so there are no further limitations within the CLO Tranche portfolio. Industry exposure typically reflects the overall loan index of each vintage (after accounting for these limits), and active management allows the CLO manager to avoid riskier issuers or those that do not offer attractive value. In addition, PineBridge overlays its strategic views on issuers and industries on the CLOs that are considered for investment or are in existing portfolios.</p>
<h3>Current CLO Holdings by Moody's Industry</h3>
<p><img loading="lazy" class="img-responsive w-100" alt="Current CLO Holdings by Moody's Industry" src="https://www.vaneck.com/contentassets/adb6a049a45f485babb389170e4fd27b/5857_cloi-qa-blog_chart-1_2025-6_v1_blog.svg" /></p>
<h3>Change in CLO Holdings Over Time</h3>
<p><img loading="lazy" class="img-responsive w-100" alt="Change in CLO Holdings Over Time" src="https://www.vaneck.com/contentassets/adb6a049a45f485babb389170e4fd27b/5857_cloi-qa-blog_chart-2_2025-6_v1_blog.svg" /></p>
<p class="chart-disclosure">Source: Kanerai, Intex, Markit, Barclays as of May 31, 2025. Diversification does not ensure against market loss. For illustrative purposes only.</p>

<h2 id="point-six" class="anchored-block">What role does the equity tranche play in CLOI or CLOB?</h2>
<p><a href="/link/e090deaddc774ac699a04b959d9254c6.aspx" title="CLOI - VanEck CLO ETF - Holdings &amp; Performance"><strong>VanEck CLO ETF (CLOI)</strong></a> and <a href="/link/d2f16468a9f14c1e807f6bb7fb597a3e.aspx" title="CLOB - VanEck AA-BB CLO ETF - Holdings &amp; Performance"><strong>VanEck AA-BB CLO ETF (CLOB)</strong></a> do not invest in equity tranches. However, historical performance of the equity tranche is a key factor in our manager due diligence and ranking process. Metrics like equity NAV inform manager assessments and purchase evaluations, and also provide an indicator of the portfolio quality of existing holdings.</p>
<h2 id="point-seven" class="anchored-block">How many defaults in the CLO portfolio does it take to impair a CLO debt tranche?</h2>
<p>Breakeven annual default rates to impair holdings range from ~52% for AAA to ~6% for BB-rated tranches. These default rates would need to be maintained for several consecutive years to experience the first dollar of loss. Despite a recent rise in default-related activity to about 4%, default risks remain well below the breakeven levels for most investment-grade tranches. Stress testing incorporates conservative assumptions including lower recoveries, increased CCC exposures, and a recovery lag.</p>
<h3>Stressed Default Rates to Incur Loss, by Credit Rating</h3>
<p><img loading="lazy" class="img-responsive w-100" alt="Stressed Default Rates to Incur Loss, by Credit Rating" src="https://www.vaneck.com/contentassets/fe2802b76393414488d7281c3737ba76/5857_cloi-qa-blog_chart-3_2025-6_v1_blog.svg" /></p>
<p class="chart-disclosure">PineBridge Investments analysis as of 1/31/2025 and J.P. Morgan for Leveraged Loan Annual Default Rate (2001-2024). Based on PineBridge CLO Tranche Strategy Holdings. Any views represent the opinion of the investment manager, are valid as of the date indicated and are subject to change. Past performance is not indicative of future results. This is not an offer to buy or sell, or recommendation to buy or sell any of the securities mentioned herein.</p>
<h2 id="point-eight" class="anchored-block">What has recent CLO issuance been like?</h2>
<p>CLO issuance rebounded in May following April volatility tied to tariff announcements. Spreads widened temporarily but didn&rsquo;t get anywhere near the widest of other historical market shocks given that they were starting from low levels. Since this period of widening, they have retraced. With the market whipsawing, we saw the primary market cool as investors were waiting for volatility to die down and have greater visibility on clearing levels. Ultimately, issuance has remained strong&mdash;second only to last year&rsquo;s record. However, refi/reset activity slowed, as in-the-money deals became less attractive, and paydown activity has been elevated leading to flat net AAA supply. That said, the percentage of CLOs out of their reinvestment period has declined, so paydown could start to ebb compared to the prior few quarters.</p>
<h2 id="point-nine" class="anchored-block">Do CLO ETFs face capacity constraints?</h2>
<p>There are no current capacity concerns for CLO ETFs like CLOI or CLOB. The available investable universe, especially when targeting the top 25% of deals, remains vast, with over $983 billion in U.S. and &euro;265 billion in European CLOs outstanding, leaving ample room for asset growth.</p>
<h2 id="point-ten" class="jump-link-nav anchored-block" data-jumplink-title="CLOs in Portfolios">How are advisors using CLOs in portfolios?</h2>
<p>Total assets in CLO ETFs have grown from zero to nearly $30 billion in five years. Although the CLO market itself has been around since the 1990&rsquo;s, most advisors were not able to access CLOs until these ETFs were launched. The liquidity and transparency benefits of the ETF structure make CLO ETFs useful tools in the portfolio construction process, allowing advisors to take advantage of the benefits that CLOs can provide - something that institutional investors have been doing for many years. Accordingly, we have seen most advisors using CLOs as a strategic allocation in their fixed income portfolios. In general, we have seen advisors primarily using CLOI within their core bond portfolios to enhance yield and provide diversification, while maintaining a high credit quality. CLOB is an attractive complement to a high yield portfolio, or as a higher quality alternative to a leveraged loan investment.</p>
<h2 id="point-eleven" class="anchored-block">What is the impact of loans being called on CLOs?</h2>
<p>Loans getting called has pros and cons for CLOs depending on where you invest in the capital stack. For AAA and senior tranche investors, increased call activity results in a faster deleveraging of the structure, especially for CLOs that are outside their reinvestment period. Investors get their capital back faster, reducing the overall spread duration of their investment. However, for junior tranches and equity investors, a loan prepayment/refi wave could potentially lead to adverse selection and subsequently higher tail risk in a CLO that is outside of the reinvestment period. Also, the excess weighted average spread that helps provide indirect subordination to CLO debt tranches tends to shrink when capital markets allow elevated levels of loan refi/prepayment activity.</p>
<h2 id="point-twelve" class="anchored-block">Have CLO ETFs impacted the overall CLO market?</h2>
<p>While the CLO ETF market has grown significantly, it still represents only ~3% of the U.S. CLO market overall, limiting their market impact. Past volatility hasn't indicated any ETF-driven systematic spread volatility, but as ETF presence grows, it is possible that their market impact could rise. CLO ETFs went through their first significant period of market stress in April following the &ldquo;Liberation Day&rdquo; tariff announcements and experienced meaningful outflows for the first time since these products have been around. We believe that CLO ETFs performed as expected and, and we did not observe any issues satisfying redemptions or disruption to the underlying CLO market.</p>
<p>Outside of market volatility events like we saw in April, we do believe the marginal demand from CLO ETFs can have incremental impacts on relative value across the CLO capital stack. This is due to large, ratings-constrained ETFs that are limited to buying (or selling) CLOs with a single rating. For example, following significant inflows in 2024 and into 2025 into AAA CLO ETFs (and strong demand generally), that rating category appeared rich, in our opinion. For this reason, we believe that for most investors, an active approach that has flexibility to invest more broadly throughout the CLO capital structure can provide better outcomes.</p>
<p>In general, we believe the growth of CLO ETFs has been a positive catalyst for the CLO market. CLOs have historically been restricted to institutional investors, so the creation of CLO ETFs opens the market to a swath of new potential investors, such as smaller institutional investors that didn&rsquo;t have the assets for a separately managed account and retail investors. Further, CLO ETFs enhance liquidity and price discovery in the market. Other areas of fixed income like high yield and municipal bonds, among others, experienced this change over the past two decades as ETFs became meaningful participants in those markets, and we believe we are seeing the same evolution in CLOs.</p>
<h2 id="point-thirteen" class="jump-link-nav anchored-block" data-jumplink-title="Credit Cycles">Have credit cycles changed versus history?</h2>
<p>While credit cycles haven&rsquo;t fundamentally changed, their pace has quickened, requiring more agility. PineBridge&rsquo;s flexible ETF strategies and ability to invest across the capital stack offer an edge in rapidly shifting environments, enabling quicker positioning based on evolving sentiment and news. In addition, we believe flexibility offered to invest in different parts of the capital stack gives us an advantage in this environment as we are able to quickly adjust our positioning as market conditions change.</p>
<h2 id="point-fourteen" class="anchored-block">How have CLOs evolved since the GFC?</h2>
<p>CLOs originated in the late 1980s (similar to other types of securitizations) as a way for banks to package leveraged loans together to provide investors with an investment vehicle with varied degrees of risk and return to best suit their investment objectives. Following the Global Financial Crisis (GFC), CLOs evolved significantly to enhance structural resilience and investor protection. The pre-crisis "CLO 1.0" vintage often included high yield bonds and had looser reinvestment and credit standards. Post-2010, CLO 2.0 emerged with stronger credit support and shorter reinvestment periods, responding directly to the weaknesses exposed during the crisis.</p>
<p>In 2014, CLO 3.0 introduced further safeguards, such as stricter adherence to the Volcker Rule, removal (or strict limits) on high-yield bonds, and increased subordination levels to protect debt investors. Although the Volcker Rule was amended in 2020 to allow limited high-yield exposure, most modern CLOs cap this at 5&ndash;10%, maintaining stronger protections. These structural shifts have made CLOs more transparent, resilient, and investor-friendly post-GFC.</p>
<h3>Pre-Crisis vs. Post-Crisis</h3>
<p><strong>CLO Capital Structure<sup>1</sup></strong></p>
<p><img loading="lazy" class="img-responsive w-100" alt="Pre-Crisis vs. Post-Crisis" src="https://www.vaneck.com/contentassets/d9edbb9dc1664b26be6a8614bac84e1b/5857_cloi-qa-blog_chart-4_2025-6_v1_blog.svg" /></p>
<p class="chart-disclosure">Sources: Citibank, as of 30 September 2021.</p>
<p class="chart-disclosure">Note: All data is median of Q4 2020 vintage deals, thus tranche thickness does not add to 100%. Any views represent the opinion of the manager and are subject to change. Diversification does not ensure against loss. For illustrative purposes only.</p>

<p>To receive more <a href="/us/en/blogs/income-investing/" title="Income Investing Insights"><strong>Income Investing</strong></a> insights, <a href="/link/5f45412c2143400497908cea2897f7d3.aspx" title=" Subscription Center"><strong>sign up in our subscription center</strong></a>.</p>
]]></content:encoded>
</item><item rdf:about="https://www.vaneck.com/us/en/blogs/thematic-investing/buzz-index-leads-amid-rising-geopolitical-tensions/">
  <title>BUZZ Index Leads Amid Rising Geopolitical Tensions></title>
  <link>https://www.vaneck.com/us/en/blogs/thematic-investing/buzz-index-leads-amid-rising-geopolitical-tensions/</link>
  <description><![CDATA[Equity markets continued to advance, supported by strong earnings and persistent leadership from large-cap technology and AI-related names.]]></description>
  <dc:creator> </dc:creator>
  <dc:date>06/26/2025 06:30:00</dc:date>
<content:encoded><![CDATA[

<p>Equity markets continued to advance during the recent period between index selection dates (May 8, 2025 &ndash; June 12, 2025, the &ldquo;Period&rdquo;), supported by strong earnings, stabilizing inflation trends, and persistent leadership from large-cap technology and AI-related names. The BUZZ NextGen AI US Sentiment Leaders Index ("BUZZ Index")returned 12.2%, outperforming the S&amp;P 500 and Nasdaq Composite, which gained 6.9% and 9.8%, respectively. Breadth improved as the rally extended beyond mega-cap tech into consumer discretionary and select industrials. Inflation data released during the Period pointed to continued moderation, keeping expectations for Federal Reserve policy easing intact, although the timing remains highly data-dependent. Meanwhile, trade policy re-entered focus following a federal trade court&rsquo;s decision to block the reinstatement of broad Trump-era tariffs. That ruling was quickly paused by a federal appeals court, temporarily allowing the tariffs to stand. The sequence introduced legal uncertainty around future trade enforcement and added a layer of complexity to the evolving cross-border policy outlook.</p>
<p>In fixed income, Treasury yields drifted modestly lower as markets interpreted softening labor data and cooler inflation prints as supportive of a less restrictive policy path. Credit markets remained constructive, with spreads tightening slightly. Commodity markets reflected rising geopolitical tensions. WTI crude oil prices rose more than 14% during the Period, driven in part by escalating unrest in the Middle East and renewed concerns about supply disruption. Gold held steady as investors maintained exposure to perceived hedges amid lingering macro and political risks. Overall, the Period was characterized by strong equity performance, a constructive macro backdrop, and a market increasingly attuned to shifting policy signals across monetary, trade, and geopolitical dimensions.</p>
<p>The BUZZ Index returned 13.50% during the month of May compared to a return of 6.29% for the S&amp;P 500 Index during the same period. Year-to-date, the BUZZ Index leads the S&amp;P 500 with returns of 8.33% and 1.06%, respectively, as of the end of May.</p>
<h2>Shares of AST SpaceMobile pace BUZZ Index Gains</h2>
<p>Shares of AST SpaceMobile (NASDAQ: ASTS) gained 46% during the Period, driven in part by renewed investor focus following a highly publicized dispute between President Trump and Elon Musk. In our view, the escalating tension&mdash;culminating in Trump threatening to cancel federal contracts with Musk&rsquo;s companies&mdash;may have shifted market attention toward alternative players in the satellite communications space. ASTS, often seen as a challenger to Musk&rsquo;s Starlink, appeared to benefit from the perception that a breakdown in the Trump&ndash;Musk alliance could rebalance competitive dynamics. This political backdrop coincided with a series of company-specific positives, including a $43 million contract with the U.S. Space Development Agency and growing expectations around the commercialization of its satellite-to-cell service later this year. While some portion of the move may reflect speculation, the combination of policy headlines, strategic milestones, and a rising profile within the space-based connectivity theme helped position ASTS as a top performer in the BUZZ Index this month.</p>

<h3>Top BUZZ Index Contributors: May 8, 2025 &ndash; June 12, 2025</h3>
<div class="wrapped-div">
<table style="width: 100%;">
<tbody>
<tr class="tbl-data">
<td class="tbl-header last">Company</td>
<td class="tbl-header last">Ticker</td>
<td class="tbl-header last text-right">Average Weight (%)</td>
<td class="tbl-header last text-right">Return Contribution (%)</td>
</tr>
<tr class="tbl-data">
<td class="data-td data last text-left">AST SpaceMobile Inc</td>
<td class="data-td data last text-left">ASTS</td>
<td class="data-td data last text-right">2.94</td>
<td class="data-td data last text-right">1.34</td>
</tr>
<tr class="tbl-data">
<td class="data-td data last text-left">Robinhood Markets Inc</td>
<td class="data-td data last text-left">HOOD</td>
<td class="data-td data last text-right">3.48</td>
<td class="data-td data last text-right">1.15</td>
</tr>
<tr class="tbl-data">
<td class="data-td data last text-left">Super Micro Computer Inc</td>
<td class="data-td data last text-left">SMCI</td>
<td class="data-td data last text-right">3.46</td>
<td class="data-td data last text-right">0.84</td>
</tr>
<tr class="tbl-data">
<td class="data-td data last text-left">NVIDIA Corp</td>
<td class="data-td data last text-left">NVDA</td>
<td class="data-td data last text-right">3.17</td>
<td class="data-td data last text-right">0.67</td>
</tr>
<tr class="tbl-data">
<td class="data-td data last text-left">Hims &amp; Hers Health Inc</td>
<td class="data-td data last text-left">HIMS</td>
<td class="data-td data last text-right">3.48</td>
<td class="data-td data last text-right">0.63</td>
</tr>
<tr class="tbl-data">
<td class="data-td data last text-left">Coinbase Global Inc</td>
<td class="data-td data last text-left">COIN</td>
<td class="data-td data last text-right">2.47</td>
<td class="data-td data last text-right">0.51</td>
</tr>
<tr class="tbl-data">
<td class="data-td data last text-left">Advanced Micro Devices Inc</td>
<td class="data-td data last text-left">AMD</td>
<td class="data-td data last text-right">3.12</td>
<td class="data-td data last text-right">0.49</td>
</tr>
<tr class="tbl-data">
<td class="data-td data last text-left">Meta Platforms Inc</td>
<td class="data-td data last text-left">META</td>
<td class="data-td data last text-right">3.02</td>
<td class="data-td data last text-right">0.47</td>
</tr>
<tr class="tbl-data">
<td class="data-td data last text-left">Palantir Technologies Inc</td>
<td class="data-td data last text-left">PLTR</td>
<td class="data-td data last text-right">3.06</td>
<td class="data-td data last text-right">0.43</td>
</tr>
<tr class="tbl-data">
<td class="data-td data last text-left">Alphabet Inc</td>
<td class="data-td data last text-left">GOOGL</td>
<td class="data-td data last text-right">2.96</td>
<td class="data-td data last text-right">0.39</td>
</tr>
</tbody>
</table>
</div>
<p class="chart-disclosure">Source: BUZZ Holdings ULC, Bloomberg. Past performance is no guarantee of future results. Index performance is not illustrative of fund performance. Not intended as a recommendation to buy or to sell any of the securities mentioned herein.</p>

<h2>Shares of GameStop Corporation among declining stocks in the BUZZ Index</h2>
<p>Shares of GameStop Corporation (GME) declined 17% during the Period, with the move largely driven by investor reaction to the company&rsquo;s second zero-coupon convertible note offering in just three months. On June 11, GameStop announced a $1.75 billion private offering of 0.00% convertible senior notes due 2032, following a similar $1.3 billion raise in March. In our view, the offering raised renewed concerns around future dilution and the company&rsquo;s evolving financial strategy, particularly given that proceeds may be used for additional Bitcoin purchases, in line with its revised treasury policy. Although GameStop reported a return to profitability in Q1, a 17% year-over-year revenue decline and the speculative nature of its crypto-oriented investments may have weighed on investor confidence. The Period&rsquo;s performance reflects the tension between GameStop&rsquo;s strategic pivot and uncertainty around long-term execution in a highly volatile segment of the market.</p>
<h3>Bottom BUZZ Index Contributors: May 8, 2025 &ndash; June 12, 2025</h3>
<div class="wrapped-div">
<table style="width: 100%;">
<tbody>
<tr class="tbl-data">
<td class="tbl-header last">Company</td>
<td class="tbl-header last">Ticker</td>
<td class="tbl-header last text-right">Average Weight (%)</td>
<td class="tbl-header last text-right">Return Contribution (%)</td>
</tr>
<tr class="tbl-data">
<td class="data-td data last text-left">GameStop Corp</td>
<td class="data-td data last text-left">GME</td>
<td class="data-td data last text-right">3.06</td>
<td class="data-td data last text-right">-0.48</td>
</tr>
<tr class="tbl-data">
<td class="data-td data last text-left">MicroStrategy Inc</td>
<td class="data-td data last text-left">MSTR</td>
<td class="data-td data last text-right">2.82</td>
<td class="data-td data last text-right">-0.29</td>
</tr>
<tr class="tbl-data">
<td class="data-td data last text-left">First Solar Inc</td>
<td class="data-td data last text-left">FSLR</td>
<td class="data-td data last text-right">0.34</td>
<td class="data-td data last text-right">-0.05</td>
</tr>
<tr class="tbl-data">
<td class="data-td data last text-left">Enphase Energy Inc</td>
<td class="data-td data last text-left">ENPH</td>
<td class="data-td data last text-right">0.30</td>
<td class="data-td data last text-right">-0.05</td>
</tr>
<tr class="tbl-data">
<td class="data-td data last text-left">ServiceNow Inc</td>
<td class="data-td data last text-left">NOW</td>
<td class="data-td data last text-right">1.17</td>
<td class="data-td data last text-right">-0.04</td>
</tr>
<tr class="tbl-data">
<td class="data-td data last text-left">Intel Corp</td>
<td class="data-td data last text-left">INTC</td>
<td class="data-td data last text-right">2.72</td>
<td class="data-td data last text-right">-0.03</td>
</tr>
<tr class="tbl-data">
<td class="data-td data last text-left">Affirm Holdings Inc</td>
<td class="data-td data last text-left">AFRM</td>
<td class="data-td data last text-right">0.07</td>
<td class="data-td data last text-right">-0.02</td>
</tr>
<tr class="tbl-data">
<td class="data-td data last text-left">NU Holdings Ltd/Cayman Islands</td>
<td class="data-td data last text-left">NU</td>
<td class="data-td data last text-right">0.36</td>
<td class="data-td data last text-right">-0.02</td>
</tr>
<tr class="tbl-data">
<td class="data-td data last text-left">MercadoLibre Inc</td>
<td class="data-td data last text-left">MELI</td>
<td class="data-td data last text-right">0.38</td>
<td class="data-td data last text-right">-0.02</td>
</tr>
<tr class="tbl-data">
<td class="data-td data last text-left">Grab Holdings Ltd</td>
<td class="data-td data last text-left">GRAB</td>
<td class="data-td data last text-right">0.34</td>
<td class="data-td data last text-right">-0.02</td>
</tr>
</tbody>
</table>
</div>
<p class="chart-disclosure">Source: BUZZ Holdings ULC, Bloomberg. Past performance is no guarantee of future results. Index performance is not illustrative of fund performance. Not intended as a recommendation to buy or to sell any of the securities mentioned herein.</p>
<h2>BUZZ Index June 2025 Rebalance Highlights</h2>
<p><strong>Unity Software Inc.</strong></p>
<p>Unity Software Inc. (NYSE: U) has spent the past year navigating the fallout from a highly criticized overhaul of its game engine monetization model, which strained relations with its core developer base. In the months since, the company has taken visible steps to rebuild credibility, and those efforts appear to be gaining traction. While controversy initially dominated online discourse, the narrative has shifted, with recent discussion framing Unity as a potential value opportunity. Some investors have even drawn parallels to GameStop&rsquo;s pre-2021 setup, fueled in part by a cryptic January post from Keith Gill, better known as &ldquo;Roaring Kitty&rdquo;, that included a subtle nod to a track titled &ldquo;Unity.&rdquo; Though the stock has traded relatively flat over the past year, engagement and visibility across social platforms have steadily climbed. This renewed focus elevates Unity to a maximum 3% weighting in the BUZZ Index this month, reflecting its growing presence in investor conversations.</p>
<p><strong>Lululemon Athletica Inc.</strong></p>
<p>On June 5, Lululemon Athletica Inc. (NASDAQ: LULU) reported first-quarter results that topped expectations on both revenue and global sales growth. However, the company cut its full-year guidance, citing persistent tariff uncertainty and mounting macroeconomic headwinds. CEO Calvin McDonald flagged signs of a slowing U.S. economy and more cautious consumer behavior, particularly in discretionary spending. The market&rsquo;s reaction was swift and decisive as LULU shares fell 20% the following day, the steepest single-session drop since 2020. Year-to-date, the stock is now down over 35%, diverging sharply from the broader market, with the S&amp;P 500 up more than 3% over the same period. Despite the drawdown, investor interest has turned more constructive in recent weeks, with some framing LULU as a potential value opportunity, especially as trade-related concerns appear to be easing. This month, LULU re-enters in the BUZZ Index with a 0.96% weight, reflecting renewed attention from the online investor community.</p>

<p>To receive more <a href="https://www.vaneck.com/us/en/insights/thematic-investing/" title="Thematic Investing Insights"><strong>Thematic Investing</strong></a> insights, <a href="https://www.vaneck.com/us/en/subscribe/" title="Subscription Center"><strong>sign up in our subscription center</strong></a>.</p>
]]></content:encoded>
</item><item rdf:about="https://www.vaneck.com/us/en/blogs/emerging-markets-bonds/the-global-reset-three-shifts-investors-cant-ignore/">
  <title>The Global Reset: Three Shifts Investors Can&#39;t Ignore></title>
  <link>https://www.vaneck.com/us/en/blogs/emerging-markets-bonds/the-global-reset-three-shifts-investors-cant-ignore/</link>
  <description><![CDATA[Stagflation risks, rising recession odds, and shifting global power dynamics are reshaping the investment landscape&mdash;forcing investors to rethink where safety and opportunity truly lie.]]></description>
  <dc:creator>Eric Fine</dc:creator>
  <dc:date>06/26/2025 06:30:00</dc:date>
<content:encoded><![CDATA[

<p><a href="https://www.vaneck.com/us/en/news-and-insights/thought-leaders/eric-fine/?p=1" title="Eric Fine - Portfolio Manager, Active Emerging Markets Debt"><strong>Eric Fine</strong></a> recently joined <i>ABC News In-depth</i> to discuss the current outlook for the global economy and the impact from the escalating conflict in the Middle East. The full interview can be accessed <strong><a href="https://www.youtube.com/watch?v=0X-eQ73UPj8&amp;t=206s" title="Investors sell as threat of higher oil prices stoke stagflation fears | Close of Business | ABC NEWS" target="_blank" rel="noopener">here</a></strong>. Highlights include:</p>
<h2>Stagflation Risk Is Back on the Table (4:03)</h2>
<p>The U.S. economy is facing a growing risk of stagflation&mdash;a toxic mix of slowing growth and stubborn inflation. Long-term inflation expectations have begun to creep higher, fueled by persistent wage pressures, geopolitical fragmentation, and structurally higher energy costs. At the same time, the re-emergence of tariffs as a policy tool introduces an unpredictable new inflationary force. Unlike past cycles, this inflation isn't just cyclical&mdash;it's structural. And it&rsquo;s colliding with a late-cycle slowdown, increasing the risk of stagflationary conditions that are notoriously difficult to manage.</p>
<p>In this environment, the likelihood of a recession in the U.S. is increasing and investors should look to diversify away from credit spreads and U.S. assets.</p>
<h2>U.S. Exceptionalism Is Fading&mdash;Emerging Markets Are Rising (7:05)</h2>
<p>For decades, the U.S. enjoyed a unique combination of economic dominance, policy credibility, and reserve currency strength. But that aura of exceptionalism is being tested by rising policy uncertainty at home. Meanwhile, emerging markets&mdash;once dismissed as volatile and unpredictable&mdash;are increasingly seen as anchors of global growth. Countries like India are benefiting from demographic tailwinds, pro-growth reforms, and a more multipolar energy and trade landscape. The dollar and U.S. Treasuries will retain their central role, but their monopoly on global safe-haven status may be over.</p>
<h2>Middle East Tensions Reshape the Energy Map (8:09)</h2>
<p>Escalating conflict in the Middle East remains a wild card for global markets. While the U.S. economy is exposed to higher oil prices through inflation and consumer sensitivity, many oil-exporting nations are set to benefit. At the same time, large emerging markets like India are quietly insulating themselves by securing discounted Russian crude&mdash;locking in favorable energy terms and enhancing their competitive position. The result: greater divergence between winners and losers in a bifurcated energy market.</p>

<p>To receive more <a href="https://www.vaneck.com/us/en/insights/emerging-markets-bonds/" title="Emerging Markets Bonds Insights"><strong>Emerging Markets Bonds</strong></a> insights, <a href="/link/5f45412c2143400497908cea2897f7d3.aspx" title=" Subscription Center"><strong>sign up in our subscription center</strong></a>.</p>
]]></content:encoded>
</item><item rdf:about="https://www.vaneck.com/us/en/blogs/emerging-markets-equity/brazil-a-rare-bright-spot-in-a-turbulent-global-market/">
  <title>Brazil: A Rare Bright Spot in a Turbulent Global Market></title>
  <link>https://www.vaneck.com/us/en/blogs/emerging-markets-equity/brazil-a-rare-bright-spot-in-a-turbulent-global-market/</link>
  <description><![CDATA[Amid global uncertainty, Brazil stands out for its macro resilience and strong domestic sectors, offering attractive opportunities for selective investors despite ongoing risks.]]></description>
  <dc:creator>Patricia Gonzalez</dc:creator>
  <dc:date>06/26/2025 06:30:00</dc:date>
<content:encoded><![CDATA[

<p>As global markets navigate heightened uncertainty from trade wars to shifting monetary cycles, Brazil stands out as an emerging market that shows promise. While no country is immune to external shocks, Brazil offers a compelling investment case underpinned by macro resilience, improving relative competitiveness, and strong sector-specific opportunities.</p>
<h2 id="brazils-emerging-market-edge" class="jump-link-nav anchored-block" data-jumplink-title="Brazil&rsquo;s Emerging Market Edge">Insulated from Trade Turmoil</h2>
<p>Brazil&rsquo;s trade exposure to the U.S. is limited at only approximately 12%<sup>1</sup>&nbsp;of its exports, unlike more export-reliant economies in Asia. Brazil&rsquo;s baseline tariff of 10% is comparatively more favorable than the broad new U.S. tariffs imposed on countries such as China and Vietnam and Its energy exports, including oil and oil derivatives, are largely exempt from U.S. tariffs.</p>
<p>Brazil may be a dual beneficiary from the U.S. &ndash; China trade spat. It could gain manufacturing and export market share as global supply chains shift away from high-tariff regions; and as a key global player in oil, soybeans, iron ore and meat, Brazil is also likely to benefit from demand for its exports from both U.S. and China.</p>
<h2>Resilient Domestic Economy</h2>
<p>Despite global headwinds, Brazil's economy is holding up well with 2025 GDP forecasted to grow at +2.3%.<sup>2</sup>&nbsp;Credit and fiscal expansion have softened the expected slowdown, and private consumption remains strong due to a tight labor market. Disinflation is gradual, but Brazil is benefiting from being a domestic focused economy that is relatively shielded from global trade volatility.</p>
<p>That said, Brazil&rsquo;s fiscal dynamics remain a key consideration. The country continues to run a high public debt burden, and structural rigidities in government spending limits flexibility. As the country heads into 2026 general elections, any indication of a shift towards a reformist fiscal policy could improve investor sentiment on Brazil.</p>
<h2>Rotation Back to Equities</h2>
<p>Brazil&rsquo;s inflation is currently elevated from its central bank&rsquo;s target inflation rate, but is expected to decline from 5.6% in 2025 to 4.4% in 2026.<sup>3</sup>&nbsp;Many strategists are now expecting interest rate cuts by Q1 2026.<sup>3</sup>&nbsp;Moreover, Brazil is likely to be the only major global central bank to start cutting rates. Rate cuts could have major implications for the country&rsquo;s economic growth as approximately 60% of its debt (mostly corporate) is linked to the Selic, the central bank&rsquo;s policy rate. An ease in monetary policy could spur growth in the corporate sector, consequently lifting the economy. We believe this has the potential to drive a large stock market rotation into equities and investors have barely begun to price in the upcoming rate cuts.</p>
<h2 id="attractive-valuations" class="jump-link-nav anchored-block" data-jumplink-title="Attractive Valuations">Attractive Valuation and Low Correlation to U.S. Assets</h2>
<p>The interest rate and election cycle are typically top of mind for most investors. These investors may be overlooking Brazil&rsquo;s double valuation discount on both the equity market and currency. We see valuation and FX as the two major positive drivers of the stock market this year in a reversal of last year&rsquo;s trend.</p>
<h3>FX &amp; Valuation Driving Returns This Year</h3>
<p><img loading="lazy" class="img-responsive w-100" alt="FX and Valuation Driving Returns This Year" src="https://www.vaneck.com/contentassets/b45160269af84de18c162b3735f38338/5835_eme-brazil-blog_chart-1_2025-6_v1_blog.svg" /></p>
<p class="chart-disclosure">Source: Bradesco BBI Research. Data as of 5/7/2025. Past performance is no guarantee of future results.</p>
<p class="chart-disclosure">PE: Price to Earnings Ratio, FX: Foreign exchange rate, EPS: earnings per share, USD: U.S. Dollar.</p>
<p>Given Brazil&rsquo;s market history of high inflation and real interest rates, value has typically been the best performing investment style over the long run. The local Ibovespa index is under 9x P/E, hovering near 10-year lows to its historical valuation band and may offer an attractive entry point.<sup>4</sup></p>
<h3>IBOV 10-Yr P/E</h3>
<p><img loading="lazy" alt="IBOV 10-Yr P/E" src="https://www.vaneck.com/contentassets/3de5d75778224a47a7ef17e87cc1e0b6/5835_eme-brazil-blog_chart-2_2025-6_v1_blog.svg" /></p>
<p class="chart-disclosure">Source: VanEck. Data as of 5/31/2025.</p>
<p class="chart-disclosure">IBOV: IboveSpa, is the benchmark of Brasil Sao Paulo Stock Exchange.</p>
<p class="chart-disclosure">P/E: Price to earnings ratio.</p>
<h3>BRL vs Peers<sup>*</sup>&nbsp;and USD</h3>
<p><img loading="lazy" alt="BRL vs Peers and USD" src="https://www.vaneck.com/contentassets/36aaf6ad17ff482baed3a696e8ca2296/5835_eme-brazil-blog_chart-3_2025-6_v1_blog.svg" /></p>
<p class="chart-disclosure">Source: Bradesco BBI as of 5/7/2025.&nbsp;<sup>*</sup>Peers: AUD, CLP, COP, MXN, ZAR.</p>
<p class="chart-disclosure">BRL: Brazilian Real, AUD: Australian Dollar, CLP: Chilean Peso, COP: Colombian Peso, Mexican Peso, ZAR: South African Rand, DXY: U.S. Dollar Index.</p>
<p>Similarly, the Brazilian Real (BRL) appears undervalued at these levels. BRL is one of the cheapest of major emerging markets currencies and at a discount to its long-term average real equilibrium exchange rate,<sup>5</sup>&nbsp;which incorporates economic fundamentals such as inflation, productivity, and trade flows. In addition, currently high BRL yields and potential upside has made Brazilian assets more attractive to global investors.</p>
<p>The correlation of the Brazilian stock market from the S&amp;P 500 to U.S. Treasury yields and the U.S. dollar is very low and has been becoming less significant over time. This reflects the independent nature of the Brazilian macroeconomic outlook. At these levels, Brazilian equities provide attractive value for investors looking to diversify their U.S. exposure.</p>
<h3>10 Year Correlation Ibovespa to U.S. Assets</h3>
<p><strong>5/31/2015 &ndash; 5/31/2025</strong></p>
<div class="wrapped-div">
<table style="width: 100%;">
<tbody>
<tr class="tbl-data">
<td class="tbl-header last">&nbsp;</td>
<td class="tbl-header last text-right">Ibovespa IBOV TR BRL</td>
<td class="tbl-header last text-right">S&amp;P 500 TR USD</td>
<td class="tbl-header last text-right">Bloomberg US Treasury Yld USD</td>
<td class="tbl-header last text-right">US Dollar</td>
</tr>
<tr class="tbl-data">
<td class="data-td last text-left">Ibovespa IBOV TR BRL</td>
<td class="data-td data last text-right">1.00</td>
<td class="data-td data last text-right">&nbsp;</td>
</tr>
<tr class="tbl-data">
<td class="data-td last text-left">S&amp;P 500 TR USD</td>
<td class="data-td data last text-right">0.45</td>
<td class="data-td data last text-right">1.00</td>
<td class="data-td data last text-right">&nbsp;</td>
</tr>
<tr class="tbl-data">
<td class="data-td last text-left">Bloomberg US Treasury Yld USD</td>
<td class="data-td data last text-right">-0.02</td>
<td class="data-td data last text-right">-0.03</td>
<td class="data-td data last text-right">1.00</td>
<td class="data-td data last text-right">&nbsp;</td>
</tr>
<tr class="tbl-data">
<td class="data-td last text-left">US Dollar</td>
<td class="data-td data last text-right">-0.45</td>
<td class="data-td data last text-right">-0.33</td>
<td class="data-td data last text-right">0.00</td>
<td class="data-td data last text-right">1.00</td>
</tr>
</tbody>
</table>
</div>
<p class="chart-disclosure">Source: Morningstar Direct. Data as of 5/31/2025.</p>
<h2 id="sectors-likely-to-benefit" class="jump-link-nav anchored-block" data-jumplink-title="Sectors Likely to Benefit">Sectors Likely to Benefit</h2>
<p>Ibovespa has rallied 13.9% YTD,<sup>6</sup>&nbsp;with financials leading the market recovery led by banks such as Itau Unibanco Holding.<sup>*</sup>&nbsp;Itau has posted strong earnings and high ROE as it benefits from high net interest margins. Exempt from tariffs, the Energy sector also enjoys strong USD-based earnings and looks poised for upside too. Trade rerouting tailwinds could also lift Agricultural and Materials sectors. In our opinion, domestic focused growth names with solid fundamentals within the Consumer Discretionary and I.T. sectors remain top picks.</p>
<p>JSL S.A.,<sup>*</sup>&nbsp;the largest logistics company in Brazil with a leading market share across 16 industries, is likely to benefit from consumer demand pickup as interest rate cut expectations grow. Another domestic name, Rede D&rsquo;Or Sao Luiz SA, Brazil&rsquo;s largest hospital operator and health insurance provider stands out with its strong balance sheet and a healthy growth trajectory. LATAM&rsquo;s leading fitness chain, Smartfit<sup>*</sup>&nbsp;also appears attractive at current levels. Smartfit&rsquo;s minimal trade exposure and positive operating leverage make it a good pick.</p>
<p>Companies operating in consumer and technology sectors overlap and are likely to benefit from a bullish sentiment on Brazil. MercadoLibre,<sup>*</sup>&nbsp;a standout in the Latin American technology sector, has demonstrated strong growth in e-commerce, fintech, and logistics, remains our favorite. We are also positive on Nubank,<sup>*</sup>&nbsp;one of the fastest-growing digital banks in the region. Nubank has a scalable platform and an opportunity to expand market share in a large underbanked market.</p>
<h3>VanEck Emerging Markets Fund Portfolio Positioning</h3>
<div class="wrapped-div">
<table style="width: 100%;">
<tbody>
<tr class="tbl-data">
<td class="tbl-header last">Company Name</td>
<td class="tbl-header last text-right">Ptf. Wt. (%)</td>
<td class="tbl-header last text-right">YTD Return (%)</td>
<td class="tbl-header last text-left">Trade Impact</td>
<td class="tbl-header last text-left">Interest Rate Sensitive</td>
<td class="tbl-header last text-left">Investment Rationale</td>
</tr>
<tr class="tbl-data">
<td class="data-td last text-left">MercadoLibre, Inc.</td>
<td class="data-td data last text-right">4.04</td>
<td class="data-td data last text-right">50.74</td>
<td class="data-td data last text-left">No</td>
<td class="data-td data last text-left">Neutral</td>
<td class="data-td data last text-left">Strong growth in e-commerce, fintech, and logistics</td>
</tr>
<tr class="tbl-data">
<td class="data-td last text-left">Rede D'Or Sao Luiz SA</td>
<td class="data-td data last text-right">1.51</td>
<td class="data-td data last text-right">61.19</td>
<td class="data-td data last text-left">No</td>
<td class="data-td data last text-left">Yes</td>
<td class="data-td data last text-left">Market leader in health care, strong management team and growth track record</td>
</tr>
<tr class="tbl-data">
<td class="data-td last text-left">Itau Unibanco Holding SA Pfd</td>
<td class="data-td data last text-right">1.15</td>
<td class="data-td data last text-right">50.40</td>
<td class="data-td data last text-left">No</td>
<td class="data-td data last text-left">Yes</td>
<td class="data-td data last text-left">Market leader in banking benefitng from high net interest margins</td>
</tr>
<tr class="tbl-data">
<td class="data-td last text-left">Smartfit Escola de Ginastica e Danca SA</td>
<td class="data-td data last text-right">1.00</td>
<td class="data-td data last text-right">23.91</td>
<td class="data-td data last text-left">No</td>
<td class="data-td data last text-left">Neutral</td>
<td class="data-td data last text-left">Leading fitness chain minimal trade exposure and strong operational execution</td>
</tr>
<tr class="tbl-data">
<td class="data-td last text-left">JSL S.A.</td>
<td class="data-td data last text-right">0.73</td>
<td class="data-td data last text-right">53.07</td>
<td class="data-td data last text-left">No</td>
<td class="data-td data last text-left">Yes</td>
<td class="data-td data last text-left">Market leader in logistics, attractively valued, strong growth track record</td>
</tr>
<tr class="tbl-data">
<td class="data-td last text-left">Nu Holdings Ltd. Class A</td>
<td class="data-td data last text-right">0.49</td>
<td class="data-td data last text-right">15.93</td>
<td class="data-td data last text-left">No</td>
<td class="data-td data last text-left">Neutral</td>
<td class="data-td data last text-left">One of the fastest-growing digital banks in the region, with a scalable platform</td>
</tr>
</tbody>
</table>
</div>
<p class="chart-disclosure">Source: VanEck Research. Past performance is no guarantee of future results. The reader should not assume that an investment in the securities identified was or will be profitable. Not a recommendation to buy or sell a security.</p>

<h2>Strategic Exposure to Brazil Looks Timely</h2>
<p>While fiscal fragility, political uncertainty, and inflation volatility remain key concerns for investors in Brazil, we believe the risk-reward skew in Brazil is increasingly attractive. Compared to other EMs, Brazil has better relative positioning in global trade and a strong domestic focused economy. While selectivity remains key, investors seeking exposure to high-quality, undervalued, and structurally sound companies should not overlook Brazil equities.</p>
<p>To receive more <a href="/us/en/insights/emerging-markets-equity/" title="Emerging Markets Equity Insights"><strong>Emerging Markets Equity</strong></a> insights, <a href="/us/en/subscribe/" title="Subscription Center"><strong>sign up in our subscription center</strong></a>.</p>
]]></content:encoded>
</item><item rdf:about="https://www.vaneck.com/us/en/blogs/digital-assets/matthew-sigel-vaneck-mid-june-bitcoin-chaincheck/">
  <title>VanEck Mid-June Bitcoin ChainCheck></title>
  <link>https://www.vaneck.com/us/en/blogs/digital-assets/matthew-sigel-vaneck-mid-june-bitcoin-chaincheck/</link>
  <description><![CDATA[Bitcoin sets new highs and holds strong above $100K as Ordinals fade and onchain activity slows. Equity markets reward treasury-heavy BTC proxies over operational miners.]]></description>
  <dc:creator>Nathan  Frankovitz</dc:creator>
  <dc:date>06/25/2025 06:30:00</dc:date>
<content:encoded><![CDATA[

<p><strong>Please note that VanEck has exposure to bitcoin.</strong></p>
<p><strong>Three key takeaways for mid-May to mid-June:</strong></p>
<ol class="content-list">
<li class="mt-2"><strong>Price Resilience in a Volatile Macro Backdrop: </strong>Bitcoin set new all-time highs above <strong>$110K</strong>, though geopolitical tension briefly pushed BTC as low as <strong>$98K</strong> on June 22nd, marking a six-week low.</li>
<li class="mt-2"><strong>Onchain Activity Slows: </strong>Transaction volume and fee revenue declined, with Ordinals volumes hitting year-to-date lows, highlighting Bitcoin&rsquo;s growing reliance on off-chain adoption.</li>
<li class="mt-2"><strong>Treasury Plays Outperform&hellip;for Now: </strong>Metaplanet&rsquo;s <strong>+125%</strong> rally highlights recent investor preference for balance sheet BTC exposure over operational mining models, though leadership could shift with some valuations looking stretched.</li>
</ol>
<ul class="content-list">
<li class="mt-2"><a href="#bitcoin-dashboard"><strong>Bitcoin Monthly Dashboard</strong></a></li>
<li class="mt-2"><a href="#price-action"><strong>Bitcoin&rsquo;s Price Action </strong></a></li>
<li class="mt-2"><a href="#pure-play-stocks"><strong>Bitcoin Pure-Play Stocks</strong></a></li>
</ul>
<h3 id="bitcoin-dashboard" class="jump-link-nav anchored-block" data-jumplink-title="Bitcoin Monthly Dashboard">Bitcoin ChainCheck Monthly Dashboard</h3>
<div class="wrapped-div">
<table style="width: 100%;">
<tbody>
<tr class="tbl-data">
<td class="tbl-header last text-left">As of June 19th, 2025</td>
<td class="tbl-header last text-right">30-day avg</td>
<td class="tbl-header last text-right">30 day change (%)<sup>1</sup></td>
<td class="tbl-header last text-right">365 day change (%)</td>
<td class="tbl-header last text-right">Last 30 days Percentile vs<br />all-time history (%)</td>
</tr>
<tr class="tbl-data">
<td class="data-td last text-left">Bitcoin Price</td>
<td class="data-td data last text-right">$106,612</td>
<td class="data-td data last text-right">7</td>
<td class="data-td data last text-right">57</td>
<td class="data-td data last text-right">100</td>
</tr>
<tr class="tbl-data">
<td class="data-td last text-left">Daily Active Addresses</td>
<td class="data-td data last text-right">743,777</td>
<td class="data-td data last text-right">-2</td>
<td class="data-td data last text-right">14</td>
<td class="data-td data last text-right">67</td>
</tr>
<tr class="tbl-data">
<td class="data-td last text-left">Daily New Addresses</td>
<td class="data-td data last text-right">307,442</td>
<td class="data-td data last text-right">-1</td>
<td class="data-td data last text-right">18</td>
<td class="data-td data last text-right">56</td>
</tr>
<tr class="tbl-data">
<td class="data-td last text-left">Daily Transactions</td>
<td class="data-td data last text-right">364,471</td>
<td class="data-td data last text-right">-8</td>
<td class="data-td data last text-right">-42</td>
<td class="data-td data last text-right">76</td>
</tr>
<tr class="tbl-data">
<td class="data-td last text-left">Daily Inscriptions</td>
<td class="data-td data last text-right">42,864</td>
<td class="data-td data last text-right">-39</td>
<td class="data-td data last text-right">63</td>
<td class="data-td data last text-right">33</td>
</tr>
<tr class="tbl-data">
<td class="data-td last text-left">Total Transfer Volume (USD)</td>
<td class="data-td data last text-right">$64,418,735,945</td>
<td class="data-td data last text-right">-2</td>
<td class="data-td data last text-right">40</td>
<td class="data-td data last text-right">64</td>
</tr>
<tr class="tbl-data">
<td class="data-td last text-left">% Supply Active, last 180 days</td>
<td class="data-td data last text-right">24%</td>
<td class="data-td data last text-right">-10</td>
<td class="data-td data last text-right">-6</td>
<td class="data-td data last text-right">33</td>
</tr>
<tr class="tbl-data">
<td class="data-td last text-left">% Supply Dormant for 3+ Years</td>
<td class="data-td data last text-right">45%</td>
<td class="data-td data last text-right">-1</td>
<td class="data-td data last text-right">-3</td>
<td class="data-td data last text-right">92</td>
</tr>
<tr class="tbl-data">
<td class="data-td last text-left">Avg Fees (USD)</td>
<td class="data-td data last text-right">$159,028.01</td>
<td class="data-td data last text-right">-7</td>
<td class="data-td data last text-right">-70</td>
<td class="data-td data last text-right">87</td>
</tr>
<tr class="tbl-data">
<td class="data-td last text-left">Avg Fees (BTC)</td>
<td class="data-td data last text-right">1.49090</td>
<td class="data-td data last text-right">-12</td>
<td class="data-td data last text-right">-80</td>
<td class="data-td data last text-right">69</td>
</tr>
<tr class="tbl-data">
<td class="data-td last text-left">Percent of BTC Addresses in profit</td>
<td class="data-td data last text-right">98%</td>
<td class="data-td data last text-right">2</td>
<td class="data-td data last text-right">3</td>
<td class="data-td data last text-right">95</td>
</tr>
<tr class="tbl-data">
<td class="data-td last text-left">Unrealized profit/loss ratio</td>
<td class="data-td data last text-right">0.56</td>
<td class="data-td data last text-right">2</td>
<td class="data-td data last text-right">1</td>
<td class="data-td data last text-right">79</td>
</tr>
<tr class="tbl-data">
<td class="data-td last text-left">Global Power Consumption (TWh)</td>
<td class="data-td data last text-right">175</td>
<td class="data-td data last text-right">5</td>
<td class="data-td data last text-right">50</td>
<td class="data-td data last text-right">100</td>
</tr>
<tr class="tbl-data">
<td class="data-td last text-left">Total Daily BTC Miner Revenues (USD)</td>
<td class="data-td data last text-right">$48,728,898</td>
<td class="data-td data last text-right">7</td>
<td class="data-td data last text-right">42</td>
<td class="data-td data last text-right">96</td>
</tr>
<tr class="tbl-data">
<td class="data-td last text-left">Total Crypto Equities' Market Cap<sup>*</sup>&nbsp;(USD) (MM)</td>
<td class="data-td data last text-right">$232,311</td>
<td class="data-td data last text-right">15</td>
<td class="data-td data last text-right">76</td>
<td class="data-td data last text-right">97</td>
</tr>
<tr class="tbl-data">
<td class="data-td last text-left">Transfer volume from Miners to Exchanges (USD)</td>
<td class="data-td data last text-right">$12,819,409</td>
<td class="data-td data last text-right">6</td>
<td class="data-td data last text-right">0</td>
<td class="data-td data last text-right">92</td>
</tr>
<tr class="tbl-data">
<td class="data-td last text-left">Bitcoin Dominance</td>
<td class="data-td data last text-right">63%</td>
<td class="data-td data last text-right">1</td>
<td class="data-td data last text-right">19</td>
<td class="data-td data last text-right">96</td>
</tr>
<tr class="tbl-data">
<td class="data-td last text-left">Bitcoin Futures Annualized Basis</td>
<td class="data-td data last text-right">7%</td>
<td class="data-td data last text-right">9</td>
<td class="data-td data last text-right">-42</td>
<td class="data-td data last text-right">47</td>
</tr>
<tr class="tbl-data">
<td class="data-td last text-left">Mining Difficulty (T)</td>
<td class="data-td data last text-right">125</td>
<td class="data-td data last text-right">3</td>
<td class="data-td data last text-right">49</td>
<td class="data-td data last text-right">100</td>
</tr>
</tbody>
</table>
</div>
<p class="chart-disclosure mt-3"><sup>*</sup>&nbsp;DAPP market cap as a proxy, as of June 19th, 2025</p>
<p class="chart-disclosure"><sup>1</sup>&nbsp;30 day change &amp; 365 day change are relative to the 30-day avg, not absolute</p>
<div class="wrapped-div">
<table style="width: 100%;">
<tbody>
<tr class="tbl-data">
<td class="tbl-header last text-left">Regional Trading ($)</td>
<td class="tbl-header last text-right">MoM Change (%)</td>
<td class="tbl-header last text-right">YoY Change (%)</td>
</tr>
<tr class="tbl-data">
<td class="data-td data last text-left">Asia Hours Price Change MoM</td>
<td class="data-td data last text-right">2</td>
<td class="data-td data last text-right">3</td>
</tr>
<tr class="tbl-data">
<td class="data-td data last text-left">US hours Price Change MoM</td>
<td class="data-td data last text-right">9</td>
<td class="data-td data last text-right">0</td>
</tr>
<tr class="tbl-data">
<td class="data-td data last text-left">EU hours Price Change MoM</td>
<td class="data-td data last text-right">4</td>
<td class="data-td data last text-right">3</td>
</tr>
</tbody>
</table>
</div>
<p class="chart-disclosure mt-3">Source: Glassnode as of 6/19/2025. <strong>Past performance is no guarantee of future results. Not intended as a recommendation to buy or sell any securities named herein.</strong></p>
<h2 id="price-action" class="jump-link-nav anchored-block" data-jumplink-title="Bitcoin&rsquo;s Price Action">Bitcoin&rsquo;s Price Action</h2>
<h3>Bitcoin (BTC) Borrowing Rates are Near YTD Lows Despite All-Time High Prices</h3>
<p><img loading="lazy" src="https://www.vaneck.com/contentassets/efbce7fa96674778af0385fc5e0252cc/5843_bitcoin-chaincheck-for-mid-june-2025_chart-1_2025-6_v1.svg" alt="Bitcoin (BTC) Borrowing Rates are Near YTD Lows Despite All-Time High Prices" class="img-responsive w-100" /></p>
<p class="chart-disclosure">Source: Glassnode as of 6/19/2025. <strong>Past performance is no guarantee of future results. Not intended as a recommendation to buy or sell any securities named herein.</strong></p>
<p>Bitcoin quietly carved new all-time highs this month, reaching nearly <strong>$112K</strong> on May 22 and trading above <strong>$110K</strong> again on June 9. Yet, in the wake of escalating U.S.-Iran tensions over the weekend, BTC briefly fell to <strong>~$98K</strong>, its lowest level in over a month, before stabilizing back above <strong>$100K</strong>.</p>
<p>Despite this volatility, 30-day moving averages remain elevated at ~$<strong>107K</strong>. Interestingly, borrowing rates have cooled to <strong>7%, </strong>about <strong>50%</strong> lower than at the start of 2025, indicating neutral market sentiment and increased stability.</p>
<p>While future conditions remain uncertain, Bitcoin&rsquo;s evolving role as both a high-beta tech proxy and a macro hedge may allow it to benefit across multiple scenarios. In peace, improved risk appetite could favor high-growth assets like BTC. In conflict, rising fiscal deficits and currency concerns may bolster the asset&rsquo;s appeal among reserve-seeking investors.</p>
<h3>Bitcoin&rsquo;s Market Cap Dominance Hit Multi-Year Highs in June</h3>
<p><img loading="lazy" src="https://www.vaneck.com/contentassets/efbce7fa96674778af0385fc5e0252cc/5843_bitcoin-chaincheck-for-mid-june-2025_chart-2_2025-6_v1.svg" alt="Bitcoin&rsquo;s Market Cap Dominance Hit Multi-Year Highs in June" class="img-responsive w-100" /></p>
<p class="chart-disclosure">Source: Glassnode as of 6/19/2025. <strong>Past performance is no guarantee of future results. Not intended as a recommendation to buy or sell any securities named herein.</strong></p>
<h2>Bitcoin Dominance and Institutional Flows</h2>
<p>Bitcoin&rsquo;s market dominance rose another <strong>1%</strong> in June, setting a new 30-day moving average high for this cycle. This continued rise reflects Bitcoin&rsquo;s strengthening role as the preferred crypto asset among institutional investors, even as altcoins remain largely trapped in speculative, retail-driven narratives.</p>
<p>Since the 2021&ndash;2022 altcoin cycle, Bitcoin has reclaimed nearly all market share gains made by other crypto assets. The momentum in dominance supports the view that Bitcoin has matured into a digital store-of-value -- functionally &ldquo;digital gold&rdquo;-- for both public and private institutions.</p>
<p>Unlike prior cycles, investors today can access leveraged BTC exposure through public equities. Strategy (MSTR), for example, offers deep liquidity and capital efficiency, while smaller entrants like Semler Scientific (SMLR) provide high-volatility trading opportunities. These structures appear to absorb speculative demand that might have previously flowed into altcoins.</p>
<p>While ETH and SOL treasury strategies show early promise, Bitcoin continues to command the lion&rsquo;s share of institutional flows, supported by its dominant liquidity, simple narrative, and macro positioning. Altcoins, by contrast, have struggled to attract sustained inflows, with market activity largely rotational and retail-driven. As a result, Bitcoin appears to be pulling in net new capital, while altcoins operate in a more insular environment, reinforcing BTC&rsquo;s status as the foundation of institutional crypto exposure.</p>
<h2>Onchain Performance: Activity Slows as Offchain Adoption Grows</h2>
<h3>Daily Bitcoin Transactions and Fees Hovered Near YTD Lows in June</h3>
<p><img loading="lazy" src="https://www.vaneck.com/contentassets/efbce7fa96674778af0385fc5e0252cc/5843_bitcoin-chaincheck-for-mid-june-2025_chart-3_2025-6_v1.svg" alt="Daily Bitcoin Transactions and Fees Hovered Near YTD Lows in June" class="img-responsive w-100" /></p>
<p class="chart-disclosure">Source: Glassnode as of 6/19/2025. <strong>Past performance is no guarantee of future results. Not intended as a recommendation to buy or sell any securities named herein.</strong></p>
<p>While market-facing indicators such as price action, futures, flows, and institutional positioning remain supportive, Bitcoin&rsquo;s on-chain metrics point to softening activity. Over the past 30 days:</p>
<ul class="content-list">
<li class="mt-2">The Bitcoin network processed an average of <strong>364,000</strong> transactions per day, down <strong>8%</strong> month-over-month and <strong>42%</strong> year-over-year.</li>
<li class="mt-2">Daily fee revenue averaged <strong>$641K</strong>, down <strong>57%</strong> year-to-date.</li>
<li class="mt-2">In contrast, block rewards earned by miners remain elevated at approximately <strong>$45M</strong> per day, assuming 144 blocks/day at <strong>$100K</strong> per BTC.</li>
<li class="mt-2">This means that, on an annualized basis, transaction fees account for just <strong>1.4%</strong> of the estimated <strong>$16.4B</strong> in yearly block rewards, a stark mismatch between network usage and price performance.</li>
</ul>
<p>This disconnect may persist, especially as Bitcoin adoption increasingly occurs offchain through financial products like ETPs and corporate treasuries, rather than through native blockchain activity. Looking ahead, the scheduled block reward halvings in 2028 and 2032 will further reduce miner revenue, raising structural questions about the long-term sustainability of security incentives if fee generation doesn&rsquo;t materially recover.</p>
<h3>Ordinals ("Bitcoin NFTs") Activity Fell To 2025 Lows in June</h3>
<p><img loading="lazy" alt="Ordinals ('Bitcoin NFTs') Activity Fell To 2025 Lows in June" src="https://www.vaneck.com/contentassets/efbce7fa96674778af0385fc5e0252cc/5843_bitcoin-chaincheck-for-mid-june-2025_chart-4_2025-6_v1.svg" class="img-responsive w-100" /></p>
<p class="chart-disclosure">Source: Glassnode as of 6/19/2025. <strong>Past performance is no guarantee of future results. Not intended as a recommendation to buy or sell any securities named herein.</strong></p>
<h2>Ordinals Cool Off</h2>
<p>A major factor behind Bitcoin&rsquo;s weaker on-chain metrics is the collapse in activity related to Ordinals, which allowed users to inscribe digital content onto individual satoshis&mdash;effectively enabling Bitcoin-native NFTs.</p>
<p>After launching in early 2023, Ordinals briefly revitalized Bitcoin&rsquo;s base layer, bringing in unprecedented retail demand. Transaction volumes surged, fees spiked, and Bitcoin&mdash;which historically lacked the smart contract capabilities of chains like Ethereum and Solana&mdash;saw renewed relevance as an application layer.</p>
<p>From late 2023 through early 2024, Ordinals helped narrow the perceived gap between Bitcoin and more expressive chains by enabling digital collectibles, meme assets, and experimental DeFi primitives on BTC. But in June, activity collapsed: transaction volumes fell 39% month-over-month, marking new 2025 lows and the weakest performance since the latest wave of interest began in late 2024.</p>
<p>The decline reflects both cooling speculative interest and structural challenges in sustaining high-fee on-chain activity. While the protocol was an important moment for Bitcoin&rsquo;s cultural evolution, its volatility underscores the difficulty of building persistent user demand on a chain not optimized for programmability.</p>
<h2 id="pure-play-stocks" class="jump-link-nav anchored-block" data-jumplink-title="Bitcoin Pure-Play Stocks">Bitcoin Pure-Play Stocks</h2>
<p><img loading="lazy" alt="Bitcoin Pure-Play Stocks" src="https://www.vaneck.com/contentassets/efbce7fa96674778af0385fc5e0252cc/5843_bitcoin-chaincheck-for-mid-june-2025_table-1_2025-6_v1.svg" class="img-responsive w-100" /></p>
<p class="chart-disclosure mt-3">Source: FactSet as of 6/19/2025. <strong>Past performance is no guarantee of future results. Not intended as a recommendation to buy or sell any securities named herein.</strong></p>
<h3>Metaplanet (+125%)</h3>
<p>Metaplanet stood out as a top performer among Bitcoin pure-plays this month, up <strong>125%</strong> MoM. The company announced three purchases of Bitcoin: On May 19th, June 2nd, and June 16th, Metaplanet acquired <strong>1,004</strong>, <strong>1,088</strong>, and <strong>1,112</strong> Bitcoin, respectively, bringing its total holdings to <strong>10,000 BTC</strong>. The company also <a target="_blank" href="https://contents.xj-storage.jp/xcontents/33500/438bcb7c/15db/4afe/94c4/e4d32d1a2293/140120250605582519.pdf" title="Metaplanet - 2025-2027 Bitcoin Plan" rel="noopener"><strong>announced</strong></a> its 2025-2027 Bitcoin Plan, targeting <strong>210,000</strong> BTC by 2027. While we flag that Metaplanet&rsquo;s NAV Premium to basic shares (<strong>~7.1x</strong>) remains elevated compared to Strategy&rsquo;s (<strong>~1.8x</strong>) and Semler Scientific&rsquo;s <strong>(~1.1x</strong>), we recognize the company&rsquo;s dominance as a Bitcoin treasury company in the Japanese and broader Asian markets, in addition to certain tax and regulatory advantages it offers over spot Bitcoin.</p>
<h3>Strategy (-11%)</h3>
<p>In late May, Strategy <a target="_blank" href="https://www.strategy.com/press/strategy-acquires-4020-btc-now-holds-580250-btc_05-26-2025" title="Strategy Acquires 4,020 BTC and Now Holds 580,250 BTC" rel="noopener"><strong>announced</strong></a> its latest Bitcoin acquisition, adding 4,020 to bring its total to <strong>580,250 BTC</strong>. On June 6th, Strategy priced a <strong>$980M</strong> public offering of <strong>10.00%</strong> Series A Perpetual Preferred Stock ('STRD'), with proceeds earmarked for further Bitcoin acquisitions and general corporate purposes. The non-cumulative preferred shares, structured to pay quarterly cash dividends when declared, represent Strategy&rsquo;s latest innovation in capital structure to scale BTC exposure without issuing common equity. While MSTR&rsquo;s 1M performance was negative, we note that its YTD <strong>(+28%)</strong> performance still largely outpaces Bitcoin&rsquo;s <strong>(+7%),</strong> and that its NAV premium suggests more downside protection than Metaplanet&rsquo;s.</p>
<h3>CleanSpark (-7%)</h3>
<p>CleanSpark doubled its BTC treasury year-over-year, now holding <strong>12,502 BTC</strong>. In May, it produced <strong>694 BTC</strong>, selling only <strong>293.5</strong>. While CleanSpark holds more BTC than Metaplanet, its market cap is only one-third as large, suggesting either a steep discount on miners or a premium on treasuries.</p>
<p>Notably, CleanSpark has avoided equity dilution since November 2024, a rare feat in the mining space, and continues to scale through localized energy strategies. Still, the market&rsquo;s broader view on mining economics remains skeptical.</p>
<h3>Marathon Digital (-12%)</h3>
<p>Despite having the highest energized hash rate (58.3 EH/s) and the second-largest BTC treasury (<strong>49,179 BTC</strong>), Marathon fell <strong>12%</strong> MoM, underperforming other pure-plays. While the company has begun building out its own infrastructure, about <strong>45%</strong> of its operational hashrate still comes from hosted arrangements, which can limit margins and strategic flexibility, especially when compared to fully integrated miners. Marathon&rsquo;s past reliance on third-party hosting and its history of equity dilution continue to weigh on investor sentiment. That overhang could persist unless the company transitions more fully to a self-operated model or demonstrates progress in diversifying its revenue base beyond core mining.</p>
<p><strong>Links to third party websites are provided as a convenience and the inclusion of such links does not imply any endorsement, approval, investigation, verification or monitoring by us of any content or information contained within or accessible from the linked sites. By clicking on the link to a non-VanEck webpage, you acknowledge that you are entering a third-party website subject to its own terms and conditions. VanEck disclaims responsibility for content, legality of access or suitability of the third-party websites.</strong></p>
<p>To receive more <strong><a href="https://www.vaneck.com/us/en/insights/digital-assets/" title="Digital Assets Insights">Digital Assets</a></strong> insights, <strong><a href="https://www.vaneck.com/us/en/subscribe/" title="Subscription Center">sign up in our subscription center</a></strong>.</p>
]]></content:encoded>
</item><item rdf:about="https://www.vaneck.com/us/en/blogs/moat-investing/moat-index-sees-tech-uptick-and-consumer-goods-opportunities/">
  <title>Moat Index Sees Tech Uptick and Consumer Goods Opportunities></title>
  <link>https://www.vaneck.com/us/en/blogs/moat-investing/moat-index-sees-tech-uptick-and-consumer-goods-opportunities/</link>
  <description><![CDATA[The Moat Index&rsquo;s June rebalance featured tech and consumer goods additions, demonstrating how market turbulence can uncover attractively priced, high quality companies.]]></description>
  <dc:creator>Brandon Rakszawski</dc:creator>
  <dc:date>06/25/2025 06:30:00</dc:date>
<content:encoded><![CDATA[

<p>The Morningstar<sup>&reg;</sup>&nbsp;Wide Moat Focus Index<sup>SM</sup>&nbsp;(the &ldquo;Moat Index&rdquo; or &ldquo;Index&rdquo;) underwent its quarterly review on June 20, 2025. The Index systematically targets attractively priced, high quality U.S. companies each quarter, as identified by Morningstar&rsquo;s equity research analysts. Below are a few highlights from the latest review. The full results are available here:</p>

<h2>Moat Index Review Takeaways:</h2>
<ul class="content-list">
<li class="mt-2"><strong>Tech Weight Increases, Despite Removals</strong>
<p>The Moat Index locked in gains from several strong performing tech names over the quarter including Microchip Technologies. However, several additions to the sub-portfolio under review (Applied Materials, Salesforce, and Workday) paired with deletions across other sectors resulted in a modest increase in the Index&rsquo;s tech sector weight. At approximately 5% underweight compared to the S&amp;P 500 Index, the tech sector is now at the lowest underweight in some time. The exposure within tech does vary from the broader market, with a focus on undervalued application software and semiconductor companies.</p>
</li>
</ul>
<ul class="content-list">
<li class="mt-2"><strong>Consumer Goods Enter</strong>
<p>A handful of consumer goods companies were added to the sub-portfolio under review following a choppy quarter. Global tariff uncertainty and macro headwinds put pressure on several wide moat companies, presenting a potential opportunity amidst the uncertainty. Additions in June include PepsiCo, Clorox Company, and The Hershey Company.</p>
</li>
</ul>
<ul class="content-list">
<li class="mt-2"><strong>Valuation Focus Drives Value Posture</strong>
<p>Despite the tech additions discussed above, value remains the notable overweight relative to the broad market. Growth accounts for the majority of underweight, with modest underweight to core/blend stocks. This trend has been in place for the better part of the last year and a half as U.S. equity markets have appreciated consistently, despite periods of short-term volatility. The Moat Index&rsquo;s price-to-fair value was reduced modestly to 0.80 following the review, implying a 20% discount to fair value. This stands in stark contrast to the S&amp;P 500 Index which is currently fairly value (1.0).</p>
</li>
</ul>

<h3>2Q 2025 Moat Index Review Results</h3>
<p><strong>Moat Index Sector Shifts Following 2Q 2025 Review</strong></p>
<div class="flourish-embed flourish-chart" data-src="visualisation/23910999?2429379"><script src="https://public.flourish.studio/resources/embed.js"></script><noscript><img loading="lazy" src="https://public.flourish.studio/visualisation/23910999/thumbnail" width="100%" alt="chart visualization" /></noscript></div>
<p><strong>Moat Index Sector Exposure Relative to S&amp;P 500 Index</strong></p>
<p><img loading="lazy" class="img-responsive w-100" alt="Moat Index Sector Exposure Relative to S&amp;P 500 Index" src="https://www.vaneck.com/contentassets/c6cdc2376ae1445d86a2447b9fdf3681/5845_moat_chart-2_2025-3_v1.svg" /></p>
<p><strong>Moat Index Style Exposure Relative to S&amp;P 500 Index: Value Bias Persists</strong></p>
<p><img loading="lazy" class="img-responsive w-100" alt="Moat Index Style Exposure Relative to S&amp;P 500 Index: Value Bias Persists" src="https://www.vaneck.com/contentassets/c6cdc2376ae1445d86a2447b9fdf3681/5845_moat_chart-3_2025-3_v1.svg" /></p>
<p class="chart-disclosure">Source: Morningstar. As of 6/20/2025 unless otherwise noted.</p>

<p>To receive more <a href="https://www.vaneck.com/us/en/insights/moat-investing" title="Moat Investing Insights"><strong>Moat Investing</strong></a> insights, <a href="https://www.vaneck.com/us/en/subscribe/" title="Subscription Center"><strong>sign up in our subscription center</strong></a>.</p>
]]></content:encoded>
</item><item rdf:about="https://www.vaneck.com/us/en/blogs/emerging-markets-bonds/the-quiet-outperformer-why-em-bonds-deserve-a-second-look/">
  <title>The Quiet Outperformer: Why EM Bonds Deserve a Second Look></title>
  <link>https://www.vaneck.com/us/en/blogs/emerging-markets-bonds/the-quiet-outperformer-why-em-bonds-deserve-a-second-look/</link>
  <description><![CDATA[Emerging markets bonds have been quietly outperforming U.S. and global broad markets over the past decade, offering high yields, strong fundamentals, and diversification amid global risks.]]></description>
  <dc:creator>William Sokol</dc:creator>
  <dc:date>06/25/2025 06:30:00</dc:date>
<content:encoded><![CDATA[

<p>The fundamental case for investing in emerging markets (EM) bonds has been building for some time, but investors have shown little interest in the asset class over the past several years. However, we believe that is changing. Ongoing tariff drama has served as a catalyst, but the long-term drivers of this shift are not new, and we believe are set to continue. Recent and longer-term returns reflect this. Emerging markets bonds have strongly outperformed U.S. and global aggregate bonds this year, as well as investment grade and high yield U.S. credit. Longer term, emerging markets bonds have been quietly outperforming the U.S. and global broad markets over the past decade, and in particular since 2022.</p>
<h3>EM Bonds Have Outperformed Global and U.S. Markets Over the Last Decade</h3>
<p><img loading="lazy" src="https://www.vaneck.com/contentassets/6425a9d574ee48ab9f05f9c32ba03ac9/5840_emb-why-deserve-a-second-look_chart-1_2025-6_v1.svg" alt="EM Bonds Have Outperformed Global and U.S. Markets Over the Last Decade" class="img-responsive w-100" /></p>
<p class="chart-disclosure">Source: Morningstar as of 5/31/2025. EM Bonds is represented by the 50% J.P. Morgan EMBI Global Diversified Index/50% J.P. Morgan GBI-EM Global Diversified Index; Global Broad Market is represented by the ICE BofA Global Broad Market Index; U.S. Broad Market is represented by the ICE BofA US Broad Market Index. Past performance is no guarantee of future results. Index performance is not representative of fund performance. It is not possible to invest directly in an index.</p>
<h2>Performance Is Speaking Loudly</h2>
<p>A key driver in this outperformance is the higher yield. As of May 31, 2025 EM bonds yielded 7.5%, a 2.8% increase over the broad U.S. bond market and more than 3% above the 10-year U.S. Treasury bond yield. In addition to these high nominal yields, real yields in emerging markets have been significantly higher than those in developed markets, favoring the case for local currency bonds in particular. Central banks have demonstrated a strong focus on keeping inflation under control, by hiking rates far before most developed markets and keeping real rates high. High real rates support emerging markets foreign exchange (EMFX) rates, providing central banks flexibility to ease rates if needed to support economic growth. Further, fundamental metrics, such as debt-to-GDP ratios, fiscal deficits, and current account balances compare favorably to developed markets.</p>
<h2>Developed Markets: Growing Risk, Diminishing Reward</h2>
<p>In addition to the long-term fundamental strength we see in emerging markets, we also see increasing risk in developed markets. Ongoing political dysfunction and the inability to address increasing debt levels means that investors may not be adequately compensated for the risk they are taking. These dynamics, as well as continued inflationary pressures, put pressure on developed markets rates, which could drive underperformance. The dollar&rsquo;s ongoing role globally has started to be questioned, and recent behavior of U.S. rates and the U.S. dollar has not followed historical patterns. Heightened geopolitical risk may keep commodity prices high, stoking inflation and pushing yields higher in the U.S. while putting further pressure on the U.S. dollar &ndash; while benefiting emerging markets.</p>
<h2>Why Now? Diversification and Dollar Dynamics</h2>
<p>Altogether, we see a strong case for diversifying a U.S.-centric fixed income portfolio towards emerging markets bonds, given low to moderate correlation with other fixed income asset classes and strong negative correlation to the U.S. dollar (particularly local currency denominated bonds). Many investors are underinvested in EM bonds, and we believe now is the time to consider higher exposure to the asset class. With risks growing in developed markets, stronger fundamentals in EM and more attractive EM bond yields we believe outperformance can continue.</p>

<h2>VanEck Solutions</h2>
<p>VanEck offers active and passive investment solutions for investors to access the benefits of emerging markets bonds in their income portfolios:</p>
<p>The <a href="/link/dbb866e8704049c784a0bdf9299143ea.aspx" title="EMBAX - Emerging Markets Bond Fund - Class A - Overview"><strong>VanEck Emerging Markets Bond Fund</strong></a> was one of the first blended emerging markets bond strategies in the market. The Fund is actively managed with the flexibility to invest in sovereign and corporate debt in hard and local-currency. The Fund&rsquo;s broad universe and bottom-up, high active share approach drives the opportunity to potentially outperform the benchmark over a market cycle.</p>
<p>The <a href="/link/98c7fd49bdbc456294a1eb859ad166f7.aspx" title="EMLC - VanEck J.P. Morgan EM Local Currency Bond ETF - Overview"><strong>VanEck J.P. Morgan EM Local Currency Bond ETF</strong></a> provides exposure to local currency bonds issued by emerging market sovereign issuers. It seeks to track the J.P. Morgan GBI-EM Global Core Index, part of the most widely followed local currency benchmarks globally due to the design around liquidity and investability.</p>
<p>For investors seeking the higher yields available through EM corporate bonds, the <a href="/link/b572cc2d2799458eb526924e28c41513.aspx" title="HYEM - VanEck Emerging Markets High Yield Bond ETF - Overview"><strong>VanEck Emerging Markets High Yield Bond ETF</strong></a> provides exposure to non-sovereign EM issuers rated below investment grade.</p>
<p>To receive more <a href="https://www.vaneck.com/us/en/insights/emerging-markets-bonds/" title="Emerging Markets Bonds Insights"><strong>Emerging Markets Bonds</strong></a> insights, <a href="/link/5f45412c2143400497908cea2897f7d3.aspx" title=" Subscription Center"><strong>sign up in our subscription center</strong></a>.</p>
]]></content:encoded>
</item><item rdf:about="https://www.vaneck.com/us/en/blogs/gold-investing/ima-casanova-the-cost-of-leverage-gold-miners-margins-matter/">
  <title>The Cost of Leverage: Gold Miners&#39; Margins Matter></title>
  <link>https://www.vaneck.com/us/en/blogs/gold-investing/ima-casanova-the-cost-of-leverage-gold-miners-margins-matter/</link>
  <description><![CDATA[Gold held steady in May near $3,200/oz despite strong equity markets, while gold miners gained 3%, aided by solid Q1 results&mdash;even as rising gold prices added to production costs.]]></description>
  <dc:creator>Imaru Casanova</dc:creator>
  <dc:date>06/11/2025 06:30:00</dc:date>
<content:encoded><![CDATA[

<p>Monthly gold market and economic insights from <a href="/link/cfa7139e649944fea51aa2a740b2372e.aspx" title="Imaru Casanova &mdash; Portfolio Manager, Gold and Precious Metals"><strong>Imaru Casanova, Portfolio Manager</strong></a>, featuring her unique views on mining and gold&rsquo;s portfolio benefits.</p>

<h2 id="market-snapshot" class="jump-link-nav anchored-block" data-jumplink-title="Market Snapshot">Market Snapshot: Gold&rsquo;s Resilience Defies Risk-On Rally</h2>
<p>In May 2025, gold demonstrated notable resilience, holding firm around the $3,200 per ounce range despite a broad rebound in global equity markets and the resurgence of the &ldquo;risk-on&rdquo; trade. Market optimism was primarily driven by a temporary easing of trade tensions and signals that trade negotiations could be moving in the right direction. The S&amp;P 500<sup>1</sup>&nbsp;and NASDAQ<sup>2</sup>&nbsp;jumped 6% and 10% respectively in May, while the Nikkei,<sup>3</sup>&nbsp;FTSE 100<sup>4</sup>&nbsp;and Hang Seng<sup>5</sup>&nbsp;all posted gains above 4%. Yet gold managed to close the month unchanged from the end of April.</p>
<p>Gold&rsquo;s ability to maintain its value in the face of rising stock indexes and improving investor sentiment reflects lingering concerns over macroeconomic instability, including unresolved trade tensions, high sovereign debt levels and geopolitical flashpoints. Gold&rsquo;s resilience was particularly impressive considering investment demand, as tracked by the holdings of global gold bullion ETFs, declined in May, down 0.77%. This reaffirms our view that other centers of demand, most notably global central banks, continue to provide support for the gold price in the current environment.</p>
<p>Unlike investor interest, which seems to surge and fade depending on evolving financial market conditions and global macro-economic developments, the official sector&rsquo;s gold buying appears anchored to a long-term commitment to diversify its reserves and is supported by gold&rsquo;s role as an inflation hedge and strong performance in times of crisis. Gold closed as high as $3,431 on May 6, and as low as $3,177 on May 14, ending the month at $3,289.35 per ounce&mdash;effectively unchanged from April&rsquo;s close of $3,288.71.</p>
<h2>Earnings Season Highlights Operational Discipline in Gold Miners</h2>
<p>The gold miners, as represented by the NYSE Arca Gold Miners Index (GDMNTR).<sup>6</sup>&nbsp;delivered a respectable performance in May, rising 3.02%. This gain came despite gold&rsquo;s flat performance and a strong rebound in broader equity markets. May marked the peak of the Q1 reporting season for gold miners, with operating and financial results that generally exceeded expectations across the sector&mdash;likely contributing to the equity&rsquo;s relatively strong performance.</p>
<p>The market is very focused on gold miners&rsquo; ability to meet their targets, particularly around production costs. Positively, among the group of companies we track, more than 75% reported all-in sustaining costs of production that were in line with, or better than, expected. Consistently meeting or beating production and costs targets should continue to improve investor sentiment toward gold mining stocks and support a re-rating of the sector, lifting valuation metrics to levels more in line with historical multiples.</p>

<h2 id="margin-pressures" class="jump-link-nav anchored-block" data-jumplink-title="Margin Pressures">Margin Pressures: Unpacking the Drivers of Rising Mining Costs</h2>
<p>The market&rsquo;s obsession with costs is justifiable. Investors own gold stocks to benefit from their leverage to the gold price in a rising gold price environment, but, if at the same time, costs were also to increase, margin expansion would be compromised. During a recent podcast, <a href="https://www.vaneck.com/us/en/offsite-disclaimer/?id=329968&amp;button=no&amp;url=https://awealthofcommonsense.com/2025/05/talk-your-book-investing-in-goldminers/" title="Talk Your Book: Investing in Goldminers" target="_blank" rel="noopener"><strong>Animal Spirits Talk Your Book</strong></a>, we were asked an important question: why do production costs tend to increase when the gold price is increasing? Let&rsquo;s examine some of the main reasons.</p>
<ol class="content-list">
<li class="mt-2"><strong>Royalties</strong> &ndash; Gold mines across the world are subject to royalties. Most governments collect a portion of the profits of a gold mine that operates in their country in the form of royalties. In some cases, these royalties operate on a sliding scale, so that the higher the gold price, the higher the royalty rate. In addition, royalties can be the result of financing arrangements or a legacy from previous ownership structures. In any case, as the gold price increases, companies face larger royalty expenses, which are included in the cost of production.</li>
<li class="mt-2"><strong>Profit sharing</strong> &ndash; Gold mining operations around the world have also established profit sharing agreements with their employees. The higher the gold price, the more profits generated, and the larger the profit-sharing costs to the company.</li>
<li class="mt-2"><strong>Inflation</strong> &ndash; Higher gold prices can coincide with higher levels of inflation. This inflation can be widespread, affecting all sectors of the economy, and likely contributing to demand for gold. Or it can be sector specific inflation, caused by a higher commodity price environment which leads to increased demand and competition among miners for labor, equipment, consumables, energy and services as industry activity picks up. In either case, inflationary pressures contribute to higher costs of production.</li>
<li class="mt-2"><strong>Foreign currency appreciation</strong> &ndash; A higher gold price can contribute to the appreciation of the currencies of countries that produce it, especially if gold production is a significant part of their economy. Stronger local currencies result in higher U.S. dollar costs for gold miners, as a large portion of production costs is denominated in the local currency.</li>
<li class="mt-2"><strong>Lower grade</strong> &ndash; As the gold price increases, companies may decide to mine and process lower grade (i.e., lower concentration of gold per tonne of rock) portions of the gold deposit. Production of lower grade material may become economic at higher gold prices, and companies may choose to extract this material and maximize production and revenues over the life of the mine. Although more gold will be mined, it is more costly to produce gold from lower grade material, so unit costs of production will also go up in that scenario.</li>
<li class="mt-2"><strong>Higher sustaining and exploration expenditures</strong> &ndash; Higher free cash flow because of higher gold prices allows companies to spend more in maintaining and expanding their operations. Exploration activities may pick up, and sustaining capital expenditures may be accelerated or forced to play catch up after previous years&rsquo; deferrals.</li>
</ol>
<h2 id="outlook" class="jump-link-nav anchored-block" data-jumplink-title="Outlook">Outlook: Rising Gold Prices, Stable Costs, Stronger Valuations</h2>
<p>Gold companies are currently producing gold at an average all-in sustaining cost (AISC) of approximately $1,600 per ounce, translating into an average margin of more than $1,600 per ounce at today&rsquo;s gold spot prices, a record for this industry.</p>
<p>Take Alamos Gold (6.1% of Strategy net assets), a top holding in our active gold strategy. While gold prices have more than doubled since 2014, the company&rsquo;s AISC have remained relatively stable&mdash;supporting record margins today.</p>
<h3>Gold Price vs. Alamos Gold AISC: A Decade of Expanding Margins</h3>
<p><img loading="lazy" class="img-responsive w-100" alt="Gold Price vs. Alamos Gold AISC: A Decade of Expanding Margins" src="https://www.vaneck.com/contentassets/28bba5170c3e4e9cad4043dda859dd39/5798_may-2025-gold-commentary_chart-1_2025-6_v1_blog.svg" /></p>
<p class="chart-disclosure">Source: Bloomberg, Datastream, ICE Benchmark Administration, World Gold Council, and Alamos Gold (2025E value is based on guidance for 2025, which is between $1,250 and $1,300/oz). Average Gold Price is represented by LBMA Gold Price PM and priced per troy ounce. Total consolidated all-in sustaining costs include corporate and administrative and share based compensation expenses.</p>
<p>While costs will likely continue to increase going forward, we don&rsquo;t expect costs to explode to the point where margin erosion is of significant concern. Although companies cannot control cost increases coming from factors such as those listed in the first four points above, they can continue to look for ways to optimize their operations and increase productivity to offset some of those cost pressures and help contain costs. Our positive outlook for gold is accompanied by our projection that gold miners&rsquo; margins will continue to expand in a rising gold price environment, supporting higher valuations for the gold equity space.</p>
<p>To receive more <strong><a href="https://www.vaneck.com/us/en/insights/gold-investing/" title="Gold Investing Insights">Gold Investing</a></strong> insights, <strong><a href="https://www.vaneck.com/us/en/subscribe/" title="Subscription Center">sign up in our subscription center</a></strong>.</p>
]]></content:encoded>
</item><item rdf:about="https://www.vaneck.com/us/en/blogs/emerging-markets-bonds/em-bonds-extend-gains-as-the-dollar-faces-mounting-pressure/">
  <title>EM Bonds Extend Gains As The Dollar Faces Mounting Pressure></title>
  <link>https://www.vaneck.com/us/en/blogs/emerging-markets-bonds/em-bonds-extend-gains-as-the-dollar-faces-mounting-pressure/</link>
  <description><![CDATA[U.S. inflation remains higher than in many EMs, weakening the dollar&rsquo;s appeal. Rising hedging costs make Treasuries less attractive, while EMFX strength signals deeper disinflation momentum.]]></description>
  <dc:creator>Eric Fine</dc:creator>
  <dc:date>06/10/2025 06:30:00</dc:date>
<content:encoded><![CDATA[

<p id="performance-recap" class="jump-link-nav anchored-block" data-jumplink-title="Performance Recap">The <a href="/link/cae21763b8c742f0952c4e4e3234dab9.aspx" title="EMBUX - Emerging Markets Bond Fund - Class I - Overview"><strong>VanEck Emerging Markets Bond Fund</strong></a> was up 1.83% in May, compared to up 1.27% for its benchmark, the 50% J.P. Morgan Government Bond Index-Emerging Markets Global Diversified (GBI-EM) and 50% J.P. Morgan Emerging Markets Bond Index (EMBI). Year-to-date (YTD), the fund is up 6.54%, compared to 5.26% and 3.30% for the Global Agg and 10-year treasuries, respectively. During May, South Africa and Zambia local currency led outperformers. An underweight in Brazil hard-currency bonds led underperformers. We remain very bullish on local currency, cautious on USD duration, and USD spread duration. The fund has around 60% in curated local currency, 40% in USD bonds, with a noteworthy underweight to Brazil and South Africa in local currency. Carry is 7.2%, YTW is 8.9%, and duration is 4.9.</p>
<div class="row mb-3">
<div class="col-md-4 col-xs-12"><a href="https://www.youtube.com/embed/hxU6s2lDM6E" data-video="https://youtu.be/hxU6s2lDM6E" class="popup-youtube" title="Watch Video"><img loading="lazy" class="img-responsive" style="margin-right: 15px; margin-top: 0px;" src="https://www.vaneck.com/EPiServer/CMS/Content/contentassets/en/fe0da1f358e1457c9b9ab17a30a03f9f/5746_imf-may-2025-takeaways_thumbnail_2025-6_v1.jpg,,327498/Download?epieditmode=False" alt="Watch Video" align="left" /></a></div>
<div class="col-md-8 col-xs-12"><br /><strong><a href="https://www.youtube.com/embed/hxU6s2lDM6E" data-video=" https://youtu.be/hxU6s2lDM6E" class="popup-youtube" title="Watch Video">Watch Video</a><br /></strong><a href="https://www.youtube.com/embed/hxU6s2lDM6E" data-video="https://youtu.be/hxU6s2lDM6E" class="popup-youtube" title="Watch Video" style="font-size: 16px; font-weight: bold; padding: 10px 0px 0px; margin-right: 20px; width: 202px;">IMF Recap: EM Rising, Dollar Drifting</a></div>
</div>

<h3>Average Annual Total Returns<sup>*</sup>&nbsp;(%) (In USD)</h3>
<div class="wrapped-div">
<table style="width: 100%;">
<tbody>
<tr class="tbl-data">
<td class="tbl-header last" colspan="10">As of May 31, 2025</td>
</tr>
<tr class="tbl-data">
<td class="data-head last text-right">&nbsp;</td>
<td class="data-head last text-right">1 Mo</td>
<td class="data-head last text-right">3 Mo</td>
<td class="data-head last text-right">YTD</td>
<td class="data-head last text-right">1 Yr</td>
<td class="data-head last text-right">3 Yrs</td>
<td class="data-head last text-right">5 Yrs</td>
<td class="data-head last text-right">10 Yrs</td>
</tr>
<tr class="tbl-data">
<td class="data-td last text-left">Class A: NAV (Inception 07/09/12)</td>
<td class="data-td data last text-right">1.79</td>
<td class="data-td data last text-right">2.74</td>
<td class="data-td data last text-right">6.56</td>
<td class="data-td data last text-right">9.28</td>
<td class="data-td data last text-right">6.89</td>
<td class="data-td data last text-right">5.41</td>
<td class="data-td data last text-right">2.73</td>
</tr>
<tr class="tbl-data">
<td class="data-td last text-left">Class A: Maximum 5.75% load</td>
<td class="data-td data last text-right">-4.07</td>
<td class="data-td data last text-right">-3.17</td>
<td class="data-td data last text-right">0.43</td>
<td class="data-td data last text-right">3.00</td>
<td class="data-td data last text-right">4.80</td>
<td class="data-td data last text-right">4.17</td>
<td class="data-td data last text-right">2.13</td>
</tr>
<tr class="tbl-data">
<td class="data-td last text-left">Class I: NAV (Inception 07/09/12)</td>
<td class="data-td data last text-right">1.83</td>
<td class="data-td data last text-right">2.84</td>
<td class="data-td data last text-right">6.54</td>
<td class="data-td data last text-right">9.70</td>
<td class="data-td data last text-right">7.28</td>
<td class="data-td data last text-right">5.73</td>
<td class="data-td data last text-right">3.04</td>
</tr>
<tr class="tbl-data">
<td class="data-td last text-left">Class Y: NAV (Inception 07/09/12)</td>
<td class="data-td data last text-right">1.80</td>
<td class="data-td data last text-right">2.80</td>
<td class="data-td data last text-right">6.65</td>
<td class="data-td data last text-right">9.46</td>
<td class="data-td data last text-right">7.12</td>
<td class="data-td data last text-right">5.63</td>
<td class="data-td data last text-right">2.97</td>
</tr>
<tr class="tbl-data">
<td class="data-td last text-left">50% GBI-EM/50% EMBI</td>
<td class="data-td data last text-right">1.27</td>
<td class="data-td data last text-right">3.20</td>
<td class="data-td data last text-right">6.17</td>
<td class="data-td data last text-right">8.84</td>
<td class="data-td data last text-right">5.84</td>
<td class="data-td data last text-right">1.76</td>
<td class="data-td data last text-right">2.47</td>
</tr>
</tbody>
</table>
</div>
<br />
<div class="wrapped-div">
<table style="width: 100%;">
<tbody>
<tr class="tbl-data">
<td class="tbl-header last" colspan="10">As of March 31, 2025</td>
</tr>
<tr class="tbl-data">
<td class="data-head last text-right">&nbsp;</td>
<td class="data-head last text-right">1 Mo</td>
<td class="data-head last text-right">3 Mo</td>
<td class="data-head last text-right">YTD</td>
<td class="data-head last text-right">1 Yr</td>
<td class="data-head last text-right">3 Yrs</td>
<td class="data-head last text-right">5 Yrs</td>
<td class="data-head last text-right">10 Yrs</td>
</tr>
<tr class="tbl-data">
<td class="data-td last text-left">Class A: NAV (Inception 07/09/12)</td>
<td class="data-td data last text-right">-0.30</td>
<td class="data-td data last text-right">3.40</td>
<td class="data-td data last text-right">6.32</td>
<td class="data-td data last text-right">4.18</td>
<td class="data-td data last text-right">7.60</td>
<td class="data-td data last text-right">2.34</td>
</tr>
<tr class="tbl-data">
<td class="data-td last text-left">Class A: Maximum 5.75% load</td>
<td class="data-td data last text-right">-6.03</td>
<td class="data-td data last text-right">-2.54</td>
<td class="data-td data last text-right">0.21</td>
<td class="data-td data last text-right">2.15</td>
<td class="data-td data last text-right">6.33</td>
<td class="data-td data last text-right">1.73</td>
</tr>
<tr class="tbl-data">
<td class="data-td last text-left">Class I: NAV (Inception 07/09/12)</td>
<td class="data-td data last text-right">-0.27</td>
<td class="data-td data last text-right">3.31</td>
<td class="data-td data last text-right">6.53</td>
<td class="data-td data last text-right">4.54</td>
<td class="data-td data last text-right">7.92</td>
<td class="data-td data last text-right">2.64</td>
</tr>
<tr class="tbl-data">
<td class="data-td last text-left">Class Y: NAV (Inception 07/09/12)</td>
<td class="data-td data last text-right">-0.28</td>
<td class="data-td data last text-right">3.46</td>
<td class="data-td data last text-right">6.45</td>
<td class="data-td data last text-right">4.42</td>
<td class="data-td data last text-right">7.84</td>
<td class="data-td data last text-right">2.57</td>
</tr>
<tr class="tbl-data">
<td class="data-td last text-left">50% GBI-EM/50% EMBI</td>
<td class="data-td data last text-right">0.39</td>
<td class="data-td data last text-right">3.28</td>
<td class="data-td data last text-right">5.42</td>
<td class="data-td data last text-right">3.11</td>
<td class="data-td data last text-right">2.94</td>
<td class="data-td data last text-right">2.27</td>
</tr>
</tbody>
</table>
</div>
<p class="chart-disclosure"><sup>*</sup>&nbsp;Returns less than one year are not annualized.</p>
<p class="chart-disclosure"><strong>Expenses: Class A: Gross 1.83%, Net 1.21%; Class I: Gross 1.37%, Net 0.86%; Class Y: Gross 1.33%, Net 0.96%.</strong> Expenses are capped contractually until 05/01/26 at 1.20% for Class A, 0.85% for Class I, 0.95% for Class Y. Caps exclude acquired fund fees and expenses, interest, trading, dividends, and interest payments of securities sold short, taxes, and extraordinary expenses.</p>
<p class="chart-disclosure"><strong>The performance data quoted represents past performance. Past performance is not a guarantee of future results. Investment return and principal value of an investment will fluctuate so that an investor&rsquo;s shares, when redeemed, may be worth more or less than their original cost. Performance may be lower or higher than performance data quoted. Please call 800.826.2333 or visit <a href="https://www.vaneck.com/us/en/" title="ETF &amp; Mutual Fund Manager | VanEck">vaneck.com</a> for performance current to the most recent month ended.</strong></p>
<p class="chart-disclosure">The &ldquo;Net Asset Value&rdquo; (NAV) of a Fund is determined at the close of each business day, and represents the dollar value of one share of the fund; it is calculated by taking the total assets of the fund, subtracting total liabilities, and dividing by the total number of shares outstanding. The NAV is not necessarily the same as the ETF&rsquo;s intraday trading value. Investors should not expect to buy or sell shares at NAV.</p>

<p id="dollar-treasuries-china" class="jump-link-nav anchored-block" data-jumplink-title="Dollar, Treasuries, China"><strong>Dollar down remains an asset-price see-through, while most market participants lament a lack of direction and clarity &ndash; not sure what they&rsquo;re talking about. </strong>U.S. inflation is higher than China and many EMs, which alone is a USD depreciation argument, before invoking the now-fashionable &ldquo;USD/treasury loss of status&rdquo; argument. We continue to see reserve status for the dollar as continuing but also see it sharing that status with other deserving currencies in EM over time.</p>
<p><strong>Eyes still on treasuries. </strong>The 30y is near 5%, and JBG 30y broke above 3%. G-10 rates are normally highly correlated, which is risky enough. But FX hedging costs have changed significantly, making FX-hedged US treasury yields way too low compared to Japanese (or Chinese) government bonds onshore. Why should they buy treasuries? We show how this looks to a Japanese investor (meaning a p/l in JPY), and a Chinese investor (meaning a p/l in CNY) below. Hard to see why normally core buyers such as Japan or China see value in treasuries given that USD hedging costs make their own onshore JPY or CNY bonds more attractive. This is an invisible dynamic to many but it&rsquo;s real and real powerful. And just getting started.</p>
<h3>Exhibit 1 &ndash; Why Would a Japanese Investor Buy Treasuries As Opposed to JGBs?</h3>
<p><strong>JPY-Hedged 10Y Treasury Yields Too Low</strong></p>
<p><img loading="lazy" class="img-responsive w-100" src="https://www.vaneck.com/contentassets/5d0527dcfeab47b5b515a971eeae84d2/5796_emb-june_chart-1_2025-6_v1_blog.svg" alt="Exhibit 1 &ndash; Why Would a Japanese Investor Buy Treasuries As Opposed to JGBs?" /></p>
<p class="chart-disclosure">Source: VanEck Research, Bloomberg, LP. Data as of June 2025.</p>
<h3>Exhibit 2 - Why Would a Chinese Investor Buy Treasuries As Opposed to JGBs or CGBs?</h3>
<p><strong>CNY-Hedged Treasury Yields Too Low</strong></p>
<p><img loading="lazy" class="img-responsive w-100" src="https://www.vaneck.com/contentassets/e49a0ebb2f094850a3eab7182ac82ef3/5796_emb-june_chart-2_2025-6_v1_blog.svg" alt="Exhibit 2 - Why Would a Chinese Investor Buy Treasuries As Opposed to JGBs or CGBs?" /></p>
<p class="chart-disclosure">Source: VanEck Research, Bloomberg, LP. Data as of June 2025.</p>
<p><strong>China, trade policy, and fiscal policy still generating narratives</strong>. Policy uncertainty can hit growth; we get and accept that that&rsquo;s a risk. But inflation is surprising on the downside, compensating for this risk via greater odds of cuts. But every day, CNY is stable and EMFX are stronger, pointing to far greater disinflation trends in EM. And the Fed is tight and can ease - what do you think will happen to the dollar on Fed easing? EMFX&rsquo;s rally would likely accelerate, as would rallies in their yield curves as a result of lower inflation and inflation expectations. Rates are generally higher in real terms in EM than in DM.</p>

<h2 id="exposure-types-and-significant-changes" class="jump-link-nav anchored-block" data-jumplink-title="Exposure Types and Significant Changes">Exposure Types and Significant Changes</h2>
<p>The changes to our top positions are summarized below. Our largest positions in May were Malaysia, Thailand, Brazil, China and South Africa.</p>
<ul class="content-list">
<li class="mt-2">We increased our local currency exposure in China and Indonesia. China&rsquo;s bonds benefitted from additional policy easing, as well as a 90-day tariff reprieve. Further, China&rsquo;s central bank adopted a cautious and patient currency stance, guiding the renminbi daily fix a touch stronger. In terms of our investment process, this improved the policy test score for China. The tariff pause was a boon for Indonesia as well &ndash; it allowed the central bank to resume the easing cycle (against the backdrop of very low inflation) without jeopardizing the currency&rsquo;s stability. These developments improved Indonesia&rsquo;s technical test score.</li>
<li class="mt-2">We also increased our local currency exposure in South Korea, Thailand, Malaysia, and Singapore. These countries can benefit from China&rsquo;s growth upside, the tariff truce, as well as the renminbi&rsquo;s strength/stability. In addition, the region is going through some major soul-searching as regards to the role of U.S. Dollar-based assets in local portfolios. In terms of our investment process, this improved the technical test scores for these countries.</li>
<li class="mt-2">Finally, we increased our hard currency sovereign exposure in Ghana and Costa Rica and local currency exposure in Paraguay. Ghana secured a staff-level agreement with the IMF, while strong trade and the cedi&rsquo;s resulting appreciation improved the country&rsquo;s debt metric. These factors strengthened Ghana&rsquo;s economic and policy test scores. Costa Rica&rsquo;s policy and technical test scores should benefit from a lack of new issuance and President&rsquo;s high approval ratings, which signal policy continuity after the 2026 elections.</li>
<li class="mt-2">We reduced our local currency exposure in Peru and Colombia. Peru&rsquo;s policy rate is quite low now, whereas yet another government reshuffle slows down reforms, worsening the policy test score for the country. Colombia&rsquo;s Flexible Credit Line with the IMF got suspended on the back of fiscal and policy concerns, and the policy rate cut might have been premature under these circumstances. In terms of our investment process, this has worsened the policy test score for the country.</li>
<li class="mt-2">We also reduced our hard currency corporate exposure and hard currency sovereign exposure in Brazil, and local currency exposure in Mexico. Brazil&rsquo;s tightening cycle is coming to an end and inflation expectations are peaking, supporting the country&rsquo;s economic and policy test scores. Hence there is no need to continue hiding in hard currency debt. Mexico&rsquo;s local duration has the highest correlation to the U.S. duration in the region, in addition to the central bank&rsquo;s maintaining the pace of rate cuts and negative growth spillovers from the U.S. These factors worsened Mexico&rsquo;s policy and technical test scores.</li>
<li class="mt-2">Finally, we reduced our hard currency sovereign exposure in Sri Lanka and Pakistan, and local currency exposure in Kazakhstan. We took profits on Sri Lanka&rsquo;s bonds after a nice rally. The latest military conflict between India and Pakistan has worsened the latter&rsquo;s policy test score. Kazakhstan is likely to be affected by lower oil prices and the greater uncertainty about the Russia-Ukraine war, which worsened the technical test scores for the country.</li>
</ul>
<p>To receive more <a href="https://www.vaneck.com/us/en/insights/emerging-markets-bonds/" title="Emerging Markets Bonds Insights"><strong>Emerging Markets Bonds</strong></a> insights, <a href="/link/5f45412c2143400497908cea2897f7d3.aspx" title=" Subscription Center"><strong>sign up in our subscription center</strong></a>.</p>
]]></content:encoded>
</item><item rdf:about="https://www.vaneck.com/us/en/blogs/moat-investing/moat-stocks-rebound-on-earnings-surprises/">
  <title>Moat Stocks Rebound on Earnings Surprises></title>
  <link>https://www.vaneck.com/us/en/blogs/moat-investing/moat-stocks-rebound-on-earnings-surprises/</link>
  <description><![CDATA[Moat stocks gained ground in May as strong earnings, signs of easing inflation, and a tech rally lifted markets.]]></description>
  <dc:creator>Coulter Regal, CFA</dc:creator>
  <dc:date>06/09/2025 06:30:00</dc:date>
<content:encoded><![CDATA[

<p id="us-equity-market-review" class="jump-link-nav anchored-block" data-jumplink-title="U.S. Equity Market Review">After a bruising April, U.S. equities defied the old &ldquo;Sell in May and go away&rdquo; adage by roaring back to life during the month. The Nasdaq Composite rallied nearly 10 percent, the S&amp;P 500 added 6.3 percent, and the Dow Jones Industrial Average returned 4 percent as investors embraced a stronger than expected earnings season and a lull in tariff saber-rattling. A low Consumer Price Index release mid-month further soothed nerves, reinforcing hopes that inflation remains on a downward path. Technology shares led the advance, buoyed by upbeat artificial-intelligence commentary and a strong report from NVIDIA, even with lingering concerns over export restrictions to China. History shows that a strong May often sets a constructive tone for the following year, and sentiment grew steadily more optimistic as the month unfolded.</p>
<p>The <a href="/link/d52df9865d4344169ef628a966527697.aspx" title="VanEck Morningstar Wide ETF - MOAT"><strong>Morningstar Wide Moat Focus Index</strong></a> (the &ldquo;Moat Index&rdquo;) rose 4.2 percent, capturing much of the market upswing while holding fast to its emphasis on competitive advantages and valuations. Its equally weighted structure left it with a smaller stake in the mega-cap technology cohort that led May&rsquo;s charge, yet strong earnings from holdings such as Microchip Technology and Disney provided a solid boost. The Index&rsquo;s larger health care position did temper the headline return amid ongoing drug-tariff chatter, leading to a finish behind the tech-concentrated S&amp;P 500 but in line with the equal-weighted variant of the benchmark.</p>
<p>The <a href="/link/d52df9865d4344169ef628a966527697.aspx" title="VanEck Morningstar SMID Moat ETF - SMOT"><strong>Morningstar US Small-Mid Cap Moat Focus Index</strong></a> (the &ldquo;SMID Moat Index&rdquo;) advanced 5.4 percent, effectively matching the mid-cap benchmark and outpacing broad small-caps. Notable contributions from consumer-oriented names reflected both healthy stock selection and upbeat earnings across the portfolio. The Index&rsquo;s moat investing philosophy and blended size profile helped it stay ahead of both small-caps and mid-caps on a year-to-date basis.</p>
<h3>Markets Regain Their Footing in May</h3>
<div class="flourish-embed flourish-chart" data-src="visualisation/23609654?2429379"><script src="https://public.flourish.studio/resources/embed.js"></script><noscript><img loading="lazy" src="https://public.flourish.studio/visualisation/23609654/thumbnail" width="100%" alt="Markets Regain Their Footing in May" /></noscript></div>
<p class="chart-disclosure"><strong>Source: Morningstar. Data as of 5/31/2025.</strong> Past performance is no guarantee of future results. Index performance is not representative of fund performance. It is not possible to invest directly in an index. Please see index definitions and other important disclosures at the end of this content. Fund performance current to the most recent month end is available by visiting vaneck.com or by calling 800.826.2333.</p>

<h2 id="moat-highlights" class="jump-link-nav anchored-block" data-jumplink-title="Moat Highlights">Moat Index May Highlights: Chipmakers Climb, Disney Dazzles</h2>
<p>Sector positioning, more than individual stock choices, shaped the <a href="/link/d52df9865d4344169ef628a966527697.aspx" title="Equity ETF Indices"><strong>Moat Index&rsquo;s performance</strong></a> relative to the S&amp;P 500 in May. An underweight in technology during a large-cap growth rally and an overweight in health care, where pharmaceutical-tariff concerns persisted, both dragged on returns. However, positive stock selection within the health care segment as well as strong earnings from several moat companies helped offset the sector exposure headwind.</p>
<p>Wide-moat chipmaker Microchip Technology (MCHP) claimed the <a href="/link/d52df9865d4344169ef628a966527697.aspx" title="Equity ETF Indices"><strong>Moat Index&rsquo;s</strong></a> top spot in May after its shares surged over 25 percent during the month on an upbeat earnings release. Reported revenue was down year over year, though the market celebrated a figure that came in above expectations as well as April chip orders that were the strongest of any month in the prior quarter. Looking ahead, the company expects next quarter revenue to climb about 8 percent sequentially and reiterated a long-term gross-margin target of 65 percent, a signal that the semiconductor downturn may have reached bottom. Morningstar maintained its $63 fair-value estimate, pointing to sticky microcontroller design wins and high <a href="/link/343b704b35c64cb882ee290bd1280603.aspx" title="An Investor's Guide to Switching Costs"><strong>switching costs</strong></a> that anchor the firm&rsquo;s wide economic moat.</p>
<p>Close behind was The Walt Disney Company (DIS), which rallied over 20 percent in May after what Morningstar called a spectacular quarterly report. Disney saw revenue and operating income improve year over year, with domestic park bookings mid-single-digits ahead of last year, and a streaming media portfolio that continued on a path toward sustained profitability. Management now expects operating income to finish at the top end of its prior growth target, and the upbeat outlook lifted the shares more than 10 percent on the day of the release. Morningstar increased its fair-value estimate to $120, crediting Disney&rsquo;s timeless franchises and world-class theme parks for the company&rsquo;s durable competitive edge.</p>
<p>Other top contributors within the <a href="/link/d52df9865d4344169ef628a966527697.aspx" title="Equity ETF Indices"><strong>Moat Index</strong></a> during the month include the well-known aerospace and defense giant Boeing Co. (BA), agricultural inputs and crop protection leader Corteva (CTVA), and the life sciences software solutions company Veeva Systems (VEEV).</p>
<p>Detracting most, for the second consecutive month, were companies within the tariff threatened health care sector, including orthopedic implants provider Zimmer Biomet (ZBH), pharmaceutical&nbsp;developer Merk &amp; Co. (MRK), and biotech, diagnostics, and life sciences company Danaher (DHR). Two Consumer Staples names, Campbell&rsquo;s Co. (CPB) and Constellation Brands (STZ), were also primary detractors this month.</p>
<h2>Moat Index Top Contributors and Detractors - May 2025</h2>
<h3>Contributors</h3>
<div class="wrapped-div">
<table style="width: 100%;">
<tbody>
<tr class="tbl-data">
<td class="tbl-header last text-left">Company</td>
<td class="tbl-header last text-left">Ticker</td>
<td class="tbl-header last text-left">Sector</td>
<td class="tbl-header last text-right">Avg. Weight (%)</td>
<td class="tbl-header last text-right">Contribution (%)</td>
</tr>
<tr class="tbl-data">
<td class="data-td last text-left">Microchip Technology Inc.</td>
<td class="data-td data last text-left">MCHP</td>
<td class="data-td data last text-left">Technology</td>
<td class="data-td data last text-right">2.18</td>
<td class="data-td data last text-right">0.59</td>
</tr>
<tr class="tbl-data">
<td class="data-td last text-left">The Walt Disney Co.</td>
<td class="data-td data last text-left">DIS</td>
<td class="data-td data last text-left">Communication Services</td>
<td class="data-td data last text-right">2.27</td>
<td class="data-td data last text-right">0.55</td>
</tr>
<tr class="tbl-data">
<td class="data-td last text-left">Veeva Systems Inc.</td>
<td class="data-td data last text-left">VEEV</td>
<td class="data-td data last text-left">Health Care</td>
<td class="data-td data last text-right">2.66</td>
<td class="data-td data last text-right">0.52</td>
</tr>
<tr class="tbl-data">
<td class="data-td last text-left">Corteva Inc.</td>
<td class="data-td data last text-left">CTVA</td>
<td class="data-td data last text-left">Materials</td>
<td class="data-td data last text-right">2.81</td>
<td class="data-td data last text-right">0.40</td>
</tr>
<tr class="tbl-data">
<td class="data-td last text-left">Boeing Co.</td>
<td class="data-td data last text-left">BA</td>
<td class="data-td data last text-left">Industrials</td>
<td class="data-td data last text-right">2.97</td>
<td class="data-td data last text-right">0.39</td>
</tr>
</tbody>
</table>
</div>
<h3>Detractors</h3>
<div class="wrapped-div">
<table style="width: 100%;">
<tbody>
<tr class="tbl-data">
<td class="tbl-header last text-left">Company</td>
<td class="tbl-header last text-left">Ticker</td>
<td class="tbl-header last text-left">Sector</td>
<td class="tbl-header last text-right">Avg. Weight (%)</td>
<td class="tbl-header last text-right">Contribution (%)</td>
</tr>
<tr class="tbl-data">
<td class="data-td last text-left">Zimmer Biomet</td>
<td class="data-td data last text-left">ZBH</td>
<td class="data-td data last text-left">Health Care</td>
<td class="data-td data last text-right">2.65</td>
<td class="data-td data last text-right">-0.28</td>
</tr>
<tr class="tbl-data">
<td class="data-td last text-left">The Campbell's Co.</td>
<td class="data-td data last text-left">CPB</td>
<td class="data-td data last text-left">Consumer Staples</td>
<td class="data-td data last text-right">2.43</td>
<td class="data-td data last text-right">-0.16</td>
</tr>
<tr class="tbl-data">
<td class="data-td last text-left">Merck &amp; Co. Inc.</td>
<td class="data-td data last text-left">MRK</td>
<td class="data-td data last text-left">Health Care</td>
<td class="data-td data last text-right">1.21</td>
<td class="data-td data last text-right">-0.07</td>
</tr>
<tr class="tbl-data">
<td class="data-td last text-left">Constellation Brands Inc.</td>
<td class="data-td data last text-left">STZ</td>
<td class="data-td data last text-left">Consumer Staples</td>
<td class="data-td data last text-right">2.40</td>
<td class="data-td data last text-right">-0.12</td>
</tr>
<tr class="tbl-data">
<td class="data-td last text-left">Danaher Corp.</td>
<td class="data-td data last text-left">DHR</td>
<td class="data-td data last text-left">Health Care</td>
<td class="data-td data last text-right">2.43</td>
<td class="data-td data last text-right">-0.10</td>
</tr>
</tbody>
</table>
</div>
<p class="chart-disclosure"><strong>Source: Morningstar, May 2025</strong>. Past performance is no guarantee of future results. Index performance is not illustrative of fund performance. Not intended as a recommendation to buy or to sell any of the securities mentioned herein.</p>

<h2 id="smid-highlights" class="jump-link-nav anchored-block" data-jumplink-title="SMID Moat Highlights">SMID Moat Index May Highlights: Carnival Cruise Makes Waves</h2>
<p>The <a href="/link/d52df9865d4344169ef628a966527697.aspx" title="Equity ETF Indices"><strong>SMID Moat Index</strong></a> benefited from strong stock selection in May, particularly within the Consumer Discretionary and Health Care segments of the market. Sector positioning pulled in the opposite direction, though, offsetting much of that advantage and leaving the Index to finish roughly in step with the broader small and mid-cap benchmarks.</p>
<p>Carnival Corp. (CCL) cruised to the top of the <a href="/link/d52df9865d4344169ef628a966527697.aspx" title="Equity ETF Indices"><strong>SMID Moat Index</strong></a> in May, its shares jumping 26 percent after the company posted a record-setting first quarter and raised its full year outlook. Revenue reached new highs and operating profit almost doubled from last year as pent-up travel demand and healthy onboard spending packed its ships. Management capitalized on the momentum by refinancing a large slice of debt, cutting future interest costs, and highlighted that advance bookings and prices for sailings through 2026 are tracking at record levels. With those tailwinds, Carnival now expects earnings to grow meaningfully faster than it projected just a few months ago, reinforcing investor confidence that the cruise giant&rsquo;s post-pandemic comeback still has plenty of open water ahead. Even after May&rsquo;s impressive rally, Morningstar&rsquo;s fair-value estimate of $31 suggests Carnival&rsquo;s shares still have more room to run.</p>
<p>Shifting from the high seas to high finance, moat company LPL Financial Holdings (LPLA) landed just behind Carnival as the number two performer in May, climbing 21 percent. The advance followed a solid first-quarter report that featured strong organic asset inflows and news of a planned purchase of Commonwealth Financial Network, which would be the largest deal in LPL&rsquo;s history. The acquisition could add roughly $260 billion in client assets and more than 2,500 advisors, expanding LPL&rsquo;s platform by about 15 percent.</p>
<p>The biggest laggards were packaged-food stalwart Campbell&rsquo;s (CPB), money-transfer specialist Western Union (WU), orthopedic implant maker Zimmer Biomet (ZBH), collaboration-software provider Atlassian (TEAM), and advertising agency network Interpublic Group (IPG).</p>
<h2>SMID Moat Index Top Contributors and Detractors - May 2025</h2>
<h3>Contributors</h3>
<div class="wrapped-div">
<table style="width: 100%;">
<tbody>
<tr class="tbl-data">
<td class="tbl-header last text-left">Company</td>
<td class="tbl-header last text-left">Ticker</td>
<td class="tbl-header last text-left">Sector</td>
<td class="tbl-header last text-right">Avg. Weight (%)</td>
<td class="tbl-header last text-right">Contribution (%)</td>
</tr>
<tr class="tbl-data">
<td class="data-td data last text-left">Carnival Corp.</td>
<td class="data-td data last text-left">CCL</td>
<td class="data-td data last text-left">Consumer Discretionary</td>
<td class="data-td data last text-right">1.16</td>
<td class="data-td data last text-right">0.31</td>
</tr>
<tr class="tbl-data">
<td class="data-td data last text-left">LPL Financial Holdings Inc.</td>
<td class="data-td data last text-left">LPLA</td>
<td class="data-td data last text-left">Financials</td>
<td class="data-td data last text-right">1.42</td>
<td class="data-td data last text-right">0.30</td>
</tr>
<tr class="tbl-data">
<td class="data-td data last text-left">Veeva Systems Inc.</td>
<td class="data-td data last text-left">VEEV</td>
<td class="data-td data last text-left">Health Care</td>
<td class="data-td data last text-right">1.45</td>
<td class="data-td data last text-right">0.29</td>
</tr>
<tr class="tbl-data">
<td class="data-td data last text-left">BorgWarner Inc.</td>
<td class="data-td data last text-left">BWA</td>
<td class="data-td data last text-left">Consumer Discretionary</td>
<td class="data-td data last text-right">1.32</td>
<td class="data-td data last text-right">0.22</td>
</tr>
<tr class="tbl-data">
<td class="data-td data last text-left">Corteva Inc.</td>
<td class="data-td data last text-left">CTVA</td>
<td class="data-td data last text-left">Materials</td>
<td class="data-td data last text-right">1.53</td>
<td class="data-td data last text-right">0.22</td>
</tr>
</tbody>
</table>
</div>
<h3>Detractors</h3>
<div class="wrapped-div">
<table style="width: 100%;">
<tbody>
<tr class="tbl-data">
<td class="tbl-header last text-left">Company</td>
<td class="tbl-header last text-left">Ticker</td>
<td class="tbl-header last text-left">Sector</td>
<td class="tbl-header last text-right">Avg. Weight (%)</td>
<td class="tbl-header last text-right">Contribution (%)</td>
</tr>
<tr class="tbl-data">
<td class="data-td data last text-left">The Campbell's Co.</td>
<td class="data-td data last text-left">CPB</td>
<td class="data-td data last text-left">Consumer Staples</td>
<td class="data-td data last text-right">1.32</td>
<td class="data-td data last text-right">-0.09</td>
</tr>
<tr class="tbl-data">
<td class="data-td data last text-left">The Western Union Co.</td>
<td class="data-td data last text-left">WU</td>
<td class="data-td data last text-left">Financials</td>
<td class="data-td data last text-right">1.36</td>
<td class="data-td data last text-right">-0.09</td>
</tr>
<tr class="tbl-data">
<td class="data-td data last text-left">Zimmer Biomet Inc.</td>
<td class="data-td data last text-left">ZBH</td>
<td class="data-td data last text-left">Health Care</td>
<td class="data-td data last text-right">0.68</td>
<td class="data-td data last text-right">-0.07</td>
</tr>
<tr class="tbl-data">
<td class="data-td data last text-left">Atlassian Corp.</td>
<td class="data-td data last text-left">TEAM</td>
<td class="data-td data last text-left">Technology</td>
<td class="data-td data last text-right">0.70</td>
<td class="data-td data last text-right">-0.06</td>
</tr>
<tr class="tbl-data">
<td class="data-td data last text-left">The Interpublic Group of Companies Inc.</td>
<td class="data-td data last text-left">IPG</td>
<td class="data-td data last text-left">Communication Services</td>
<td class="data-td data last text-right">1.32</td>
<td class="data-td data last text-right">-0.06</td>
</tr>
</tbody>
</table>
</div>
<p class="chart-disclosure"><strong>Source: Morningstar, May 2025</strong>. Past performance is no guarantee of future results. Index performance is not illustrative of fund performance. Not intended as a recommendation to buy or to sell any of the securities mentioned herein.</p>

<h2 id="moat-strategy" class="jump-link-nav anchored-block" data-jumplink-title="Moat Strategies">Choose Your Moat Strategy</h2>
<p>VanEck&rsquo;s suite of <a href="https://www.vaneck.com/us/en/blogs/moat-investing/moat-investing-powered-by-morningstar/" title="Quality Companies at Attractive Prices
"><strong>moat investing strategies</strong></a> is powered by Morningstar&rsquo;s equity research team, which seeks quality companies trading at attractive valuations. The below ETFs offer access to moat companies across market segments:</p>
<div class="flourish-embed flourish-cards d-none d-md-block" data-src="visualisation/23047091?2429575"><script src="https://public.flourish.studio/resources/embed.js"></script><noscript><img loading="lazy" src="https://public.flourish.studio/visualisation/23047091/thumbnail" width="100%" alt="Choose Your Moat Strategy" /></noscript></div>
<div class="flourish-embed flourish-cards-mobile d-md-none" data-src="visualisation/23047086?2429575"><script src="https://public.flourish.studio/resources/embed.js"></script><noscript><img loading="lazy" src="https://public.flourish.studio/visualisation/23047086/thumbnail" width="100%" alt="Choose Your Moat Strategy" /></noscript></div>
<p>To receive more <a href="https://www.vaneck.com/us/en/insights/moat-investing" title="Moat Investing Insights"><strong>Moat Investing</strong></a> insights, <a href="https://www.vaneck.com/us/en/subscribe/" title="Subscription Center"><strong>sign up in our subscription center</strong></a>.</p>
]]></content:encoded>
</item><item rdf:about="https://www.vaneck.com/us/en/blogs/thematic-investing/the-future-of-fandom-why-esports-and-gaming-are-outpacing-traditional-sports/">
  <title>The Future of Fandom: Why Esports and Gaming Are Outpacing Traditional Sports></title>
  <link>https://www.vaneck.com/us/en/blogs/thematic-investing/the-future-of-fandom-why-esports-and-gaming-are-outpacing-traditional-sports/</link>
  <description><![CDATA[Traditional sports face declining interest as younger viewers embrace the interactive and digital-first experiences offered by esports and gaming, driving global fan engagement and growth.]]></description>
  <dc:creator>Nick Frasse</dc:creator>
  <dc:date>06/09/2025 06:30:00</dc:date>
<content:encoded><![CDATA[

<h2>Traditional Sports Are Losing Their Grip on the Next Generation</h2>
<p>For more than a century, leagues like Major League Baseball (MLB) and the National Basketball Association (NBA) have served as cultural cornerstones in American sports. But in 2024 and beyond, signs of structural decline are becoming more evident, particularly when it comes to younger viewers.</p>
<p>MLB is struggling to connect with Gen Z. According to a 2024 CivicScience study, baseball ranks lowest in interest among Gen Z fans compared to other major leagues. Rule changes aimed at shortening games and making the sport more accessible have yet to produce meaningful gains in youth engagement. On the business side, the financial strains are becoming more public. ESPN opted out of a decades-long partnership with MLB, citing that it was paying roughly $550 million in rights fees annually for content that generated just $150 million in advertising revenue. That&rsquo;s not a sustainable equation.</p>
<p>The NBA, often thought of as a digitally savvy and youth-oriented league, is also encountering headwinds. Viewership on ESPN was down 28 percent as of late 2024, and opening night ratings dropped 42 percent compared to the prior year. While the NBA excels in short-form, highlight-driven social media content, it&rsquo;s increasingly clear that Gen Z and younger Millennials are seeking more authenticity and depth - qualities not always present in the NBA&rsquo;s broadcast product. In response, ESPN has reportedly cut back on long-form analytical coverage in favor of viral clips, a move that may actually be driving fans away.</p>
<h2>Esports and Gaming Offer What Modern Audiences Actually Want</h2>
<p>While traditional sports are struggling to reinvent themselves for a digital-first world, eSports and gaming are meeting young audiences where they are on digital platforms, with interactive content, and in spaces that prioritize community and participation.</p>
<p>The eSports audience surpassed 570 million in 2024 and is projected to grow to over 640 million by 2025. Nearly half of this global audience falls under the age of 35, positioning eSports squarely within the demographic traditional leagues are losing. The broader gaming industry is even more impressive, on track to reach $321 billion in global revenue by 2026.</p>
<h3>Esports Revenues Worldwide in Billions</h3>
<p><img loading="lazy" class="img-responsive w-100" alt="Esports Revenues Worldwide in Billions" src="https://www.vaneck.com/contentassets/5f353a84b9194f77b3d23a6ac602b856/5784_espo-blog_chart-2_2025-6_v1_blog.svg" /></p>
<p class="chart-disclosure">Source: Statista as of 2024. For illustrative purposes only. Not a projection of future results. Past performance is no guarantee of future results.</p>
<p>What sets eSports apart is its inherent interactivity. Unlike passive broadcast formats, eSports events often take place on platforms like Twitch or YouTube, where fans can engage directly with streamers, teams, and each other. Viewers can participate in real-time chats, vote on in-game decisions, and even contribute financially to their favorite content creators. This type of two-way engagement is absent in traditional sports and helps build strong, sticky relationships between fans and franchises.</p>
<p>Esports also integrates seamlessly into the larger entertainment ecosystem. Events frequently feature musical performances, influencer crossovers, and community-generated content. This blend of gaming, pop culture, and real-time interaction has created an entirely new kind of fan experience, one that aligns perfectly with the expectations of Gen Z and Gen Alpha.</p>
<h2>Key Differences Between Esports and Traditional Sports</h2>
<p>The structural differences between traditional sports and eSports go beyond format. Esports and gaming have a fundamentally more scalable, globally accessible, and digitally monetizable model. This table highlights several of the most important contrasts:</p>
<div class="wrapped-div">
<table style="width: 100%;">
<tbody>
<tr class="tbl-data">
<td class="tbl-header last text-left">Category</td>
<td class="tbl-header last text-left">Traditional Sports</td>
<td class="tbl-header last text-left">Esports and Gaming</td>
</tr>
<tr class="tbl-data">
<td class="data-td last text-left">Digital Revenue Share</td>
<td class="data-td data last text-left">Approximately 30&ndash;40%</td>
<td class="data-td data last text-left">More than 80%</td>
</tr>
<tr class="tbl-data">
<td class="data-td last text-left">Capital Expenditure (CapEx)</td>
<td class="data-td data last text-left">Stadiums, teams, logistics</td>
<td class="data-td data last text-left">Low &ndash; Software and cloud infra</td>
</tr>
<tr class="tbl-data">
<td class="data-td last text-left">Fan Age Demographic</td>
<td class="data-td data last text-left">35&ndash;54 (aging)</td>
<td class="data-td data last text-left">16&ndash;34 (growing)</td>
</tr>
<tr class="tbl-data">
<td class="data-td last text-left">Content Format</td>
<td class="data-td data last text-left">Broadcast, passive</td>
<td class="data-td data last text-left">Interactive, always-on</td>
</tr>
<tr class="tbl-data">
<td class="data-td last text-left">Global Scalability</td>
<td class="data-td data last text-left">Limited by geography and licenses</td>
<td class="data-td data last text-left">Digital, borderless, instantly scalable</td>
</tr>
<tr class="tbl-data">
<td class="data-td last text-left">Recurring Revenue</td>
<td class="data-td data last text-left">Seasonal ticketing and media deals</td>
<td class="data-td data last text-left">Continual in-game purchases and subscriptions</td>
</tr>
</tbody>
</table>
</div>
<p class="chart-disclosure">Source: VanEck as of 2025</p>

<h2>Scalability and Fan Interactivity Are the Real Growth Drivers</h2>
<p>Perhaps the biggest strategic advantage eSports holds over traditional sports is scalability. Traditional leagues must rely on physical venues, geographic markets, and linear broadcasting contracts to grow. Esports, on the other hand, is global by design. A tournament in Seoul can be streamed live to millions across the U.S., Europe, and South America simultaneously with minimal infrastructure investment.</p>
<p>Additionally, eSports generates recurring revenue through game-as-a-service models. Titles like League of Legends and Fortnite monetize through battle passes, in-game cosmetics, and seasonal events. Fans aren't just watching, they're participating. Many eSports fans actively play the games they follow, further reinforcing brand loyalty and deepening engagement. Traditional sports struggle to replicate this level of ecosystem stickiness.</p>
<p>That engagement also translates into revenue frequency. A baseball fan might attend a few games a year. A gamer may log in daily, spending money frequently and participating in a digital economy that is always evolving.</p>
<h2>Investment Implications: Embracing the Digital Shift with ESPO</h2>
<p>For investors seeking exposure to the growing eSports and gaming sector, the <a href="/link/d41cc1b7916f46e5bb3ee751f311c4f2.aspx" title="ESPO - VanEck Video Gaming and eSports ETF - Overview"><strong>VanEck Video Gaming and eSports ETF (ESPO)</strong></a> offers a compelling thematic opportunity. <a href="/link/d41cc1b7916f46e5bb3ee751f311c4f2.aspx" title="ESPO - VanEck Video Gaming and eSports ETF - Overview"><strong>ESPO</strong></a> tracks the <a href="/link/d52df9865d4344169ef628a966527697.aspx" title="Equity ETF Indices"><strong>MVIS Global Video Gaming and eSports Index</strong></a>, which includes companies that derive at least 50% of their revenues from video gaming and/or eSports.</p>
<p>As of April 2025, <a href="/link/d41cc1b7916f46e5bb3ee751f311c4f2.aspx?epsremainingpath=holdings" title="ESPO - VanEck Video Gaming and eSports ETF - Holdings"><strong>ESPO&rsquo;s top holdings</strong></a> include leading global publishers and platforms such as Nintendo, Applovin, Tencent, Roblox, and Netease, each playing a significant role in the evolution of the digital entertainment landscape.</p>
<p>These companies exemplify the structural growth potential in gaming, from mobile distribution and immersive game development to social gaming ecosystems and global content delivery.</p>
<h3>ESPO Index Outperforms Broad Indices Over the Last Twelve Months</h3>
<p><img loading="lazy" class="img-responsive w-100" alt="ESPO Index Outperforms Broad Indices Over the Last Twelve Months" src="https://www.vaneck.com/contentassets/5ec9ce3cb18f40c38deb8d51eda8a482/5784_espo-blog_chart-1_2025-6_v1_blog.svg" /></p>
<p class="chart-disclosure">Source: Morningstar as of 6/3/2025. Past performance is no guarantee of future results. Index performance is not representative of fund performance. It is not possible to invest directly in an index.</p>
<h2>Key Takeaways</h2>
<p>The sports world is evolving quickly. What was once dominated by stadiums, cable networks, and passive viewing is being replaced by interactive platforms, global audiences, and deeply participatory ecosystems. Traditional leagues like MLB and the NBA may not vanish, but their cultural and financial dominance is clearly eroding.</p>
<p>Esports and gaming aren't just a niche alternative, they are the new mainstream. And for those looking to invest in the future of fandom, the time to act is now.</p>

<p>To receive more <a href="https://www.vaneck.com/us/en/insights/thematic-investing/" title="Thematic Investing Insights"><strong>Thematic Investing</strong></a> insights, <a href="https://www.vaneck.com/us/en/subscribe/" title="Subscription Center"><strong>sign up in our subscription center</strong></a>.</p>
]]></content:encoded>
</item><item rdf:about="https://www.vaneck.com/us/en/blogs/model-portfolios/may-market-recap-gold-bitcoin-nuclear-chaos-is-here-so-is-the-playbook/">
  <title>May Market Recap: Gold, Bitcoin, Nuclear – Chaos Is Here, So Is the Playbook></title>
  <link>https://www.vaneck.com/us/en/blogs/model-portfolios/may-market-recap-gold-bitcoin-nuclear-chaos-is-here-so-is-the-playbook/</link>
  <description><![CDATA[Gold, Bitcoin, and nuclear energy can help hedge against debt, inflation, and energy risk, offering diversification amid fiscal chaos, fiat decay, and rising power demand.]]></description>
  <dc:creator>David Schassler</dc:creator>
  <dc:date>06/09/2025 06:30:00</dc:date>
<content:encoded><![CDATA[

<h2>Fiscal Insanity: Borrow, Spend, Deny</h2>
<p>Let&rsquo;s break down Washington&rsquo;s strategy:</p>
<ol class="content-list">
<li class="mt-2">Borrow into oblivion.</li>
<li class="mt-2">Offer no plan to pay it back.</li>
<li class="mt-2">Pass a &ldquo;Big Beautiful Bill&rdquo; that leans into the chaos.</li>
</ol>
<p>The CBO says it adds $2.4 trillion to the deficit over 10 years.&nbsp;Elon Musk said it best:</p>
<p><img loading="lazy" alt="Twitter Screenshot" class="img-responsive w-100" src="https://www.vaneck.com/contentassets/b8440cc098d64d879e8fbe3aa84c69a8/5793_models-monthly-may-2025_2025-6_v1.jpg" /></p>

<h2>Nuclear Is Back:</h2>
<p>Trump&rsquo;s executive orders mark the biggest U.S. energy shift in 40 years - finally embracing nuclear as a clean, reliable, science-first solution.&nbsp;What&rsquo;s changing:</p>
<ul class="content-list">
<li class="mt-2">Fast-tracking next-gen reactors</li>
<li class="mt-2">Reviving uranium mining</li>
<li class="mt-2">Unlocking federal land</li>
<li class="mt-2">Cutting the red tape</li>
</ul>
<p>This isn&rsquo;t politics. It&rsquo;s physics. Nuclear is the only energy source that&rsquo;s clean, scalable, and always-on. AI-driven power demand is surging. Datacenters don&rsquo;t run on dreams. They run on nuclear. This shift is overdue - and investable.</p>
<h2>Trade War Interrupted:</h2>
<p>Trump&rsquo;s tariff strategy hit a wall: a U.S. trade court ruled key tariffs exceeded presidential authority.</p>
<p>The legal blow is less important than the signal: America&rsquo;s trade policy isn&rsquo;t cohesive. Markets hate that.</p>
<p>Some say TACO - Trump Always Chickens Out. But Trump doesn&rsquo;t pull back. He escalates. And bruised ego is hard to price in. Policy can be modeled. Pride can&rsquo;t.</p>
<h2>Where to Go From Here:</h2>
<ul class="content-list">
<li class="mt-2"><strong>Diversify Beyond the Dollar: </strong> Being long the dollar used to mean stability. Now it means exposure to dysfunction and debt. Don&rsquo;t ditch it - but hedge it.</li>
<li class="mt-2"><strong>Own Gold and Bitcoin: </strong> Both are decentralized store of value assets that protect against fiat decay.</li>
<li class="mt-2"><strong>Go Long Nuclear: </strong>Look for investments that provide exposure to miners, processors, reactor developers, and utilities.</li>
</ul>
<h3>Models Favor Gold, Nuclear, and Bitcoin</h3>
<div class="flourish-embed flourish-number-ticker" data-src="visualisation/23660433?2429379"><script src="https://public.flourish.studio/resources/embed.js"></script><noscript><img loading="lazy" src="https://public.flourish.studio/visualisation/23660433/thumbnail" width="100%" alt="number-ticker visualization" /></noscript></div>

<h2>Market Review</h2>
<p><strong>Equities: </strong></p>
<ul class="content-list">
<li class="mt-2">AI leadership is back. Nvidia passed Microsoft in market cap.</li>
<li class="mt-2">May surged: S&amp;P 500 +6.3%, Nasdaq 100 +9.2%</li>
<li class="mt-2">International/EM lagged in May, but leads YTD</li>
<li class="mt-2">Watch FX tailwinds if the dollar weakens</li>
</ul>
<p><strong>Fixed Income: </strong></p>
<ul class="content-list">
<li class="mt-2">The curve is steepening - we&rsquo;re positioned for it</li>
<li class="mt-2">Long-end yields rising on fiscal concerns</li>
<li class="mt-2">Unpopular view: The Fed may eventually step in to cap long-term yields via asset purchases</li>
</ul>
<p><strong>Real Assets: </strong></p>
<ul class="content-list">
<li class="mt-2">Nuclear stocks rallied 50% off April lows, +25% in May, driven by Trump&rsquo;s orders and Meta&rsquo;s 20-year nuclear deal with Constellation</li>
<li class="mt-2">We are bullish on gold, but it may trade sideways near term</li>
</ul>
<p><strong>Digital Assets: </strong></p>
<ul class="content-list">
<li class="mt-2">Bitcoin rallied to $111K from $77K. We think it goes much higher.</li>
</ul>
<h2>Final Word</h2>
<p>I write it every month and say it every day. I&rsquo;m not going to miss the chance to say it again now: <strong>Buy gold</strong>. Not because it&rsquo;s shiny - but because it protects. From reckless spending. From rising debt. From the slow, steady erosion of fiat.</p>
<p><strong>Buy Bitcoin</strong>, too. Same goal, different design - decentralized, portable, digital.</p>
<p>And <strong>own nuclear</strong>. It&rsquo;s the only scalable, reliable, carbon-free energy source - and demand is accelerating.</p>
<p>These are differentiated assets solving different problems. That&rsquo;s real diversification.</p>
<p>To receive more <strong><a href="https://www.vaneck.com/us/en/insights/guided-allocation/" title="Model Portfolio Insights">Model Portfolio</a></strong> insights, <strong><a href="https://www.vaneck.com/us/en/subscribe/" title="Subscription Center">sign up in our subscription center</a></strong>.</p>
]]></content:encoded>
</item><item rdf:about="https://www.vaneck.com/us/en/blogs/thematic-investing/nvidia-back-in-focus-and-ai-infrastructure-acceleration/">
  <title>Nvidia Back in Focus and AI Infrastructure Acceleration></title>
  <link>https://www.vaneck.com/us/en/blogs/thematic-investing/nvidia-back-in-focus-and-ai-infrastructure-acceleration/</link>
  <description><![CDATA[We distill the major insights from Nvidia&rsquo;s earnings, exploring what&rsquo;s changed in the dynamic semiconductor industry, what&rsquo;s accelerating, and what it might mean for investors.]]></description>
  <dc:creator>Angus Shillington</dc:creator>
  <dc:date>06/06/2025 06:30:00</dc:date>
<content:encoded><![CDATA[

<p>Each quarter, we break down the evolving world of semiconductors through the lens of Nvidia&rsquo;s earnings and the broader AI investment landscape. This latest call came at a pivotal moment, with demand surging, CapEx accelerating, and the semiconductor ecosystem transforming faster than most expected.</p>
<div class="row mb-3">
<div class="col-md-4 col-xs-12"><a href="https://www.youtube.com/embed/cJr4iWlNiqs" data-video="https://youtu.be/cJr4iWlNiqs" class="popup-youtube" title="Watch Video"><img loading="lazy" class="img-responsive" style="margin-right: 15px; margin-top: 0px;" src="https://www.vaneck.com/EPiServer/CMS/Content/contentassets/en/6ff1ac47f2a14004922dda450509ff74/5754_2025-q2-semis-nvidia-video_thumbnail_2025-5_v1.jpg,,325208/Download?epieditmode=False" alt="Watch Video" align="left" /></a></div>
<div class="col-md-8 col-xs-12"><br /><strong><a href="https://www.youtube.com/embed/cJr4iWlNiqs" data-video=" https://youtu.be/cJr4iWlNiqs" class="popup-youtube" title="Watch Video">Watch Video</a><br /></strong><a href="https://www.youtube.com/embed/cJr4iWlNiqs" data-video="https://youtu.be/cJr4iWlNiqs" class="popup-youtube" title="Beyond Nvidia Earnings: AI CapEx Surge, Competition, and the Future of Semiconductors" style="font-size: 16px; font-weight: bold; padding: 10px 0px 0px; margin-right: 20px; width: 202px;">Beyond Nvidia Earnings: AI CapEx Surge, Competition, and the Future of Semiconductors</a></div>
</div>
<h2>Nvidia is &ldquo;Back in the Game,&rdquo; But It's Not Alone</h2>
<p>While Nvidia remains the headline act, the semiconductor narrative is no longer a one-player story. After spending some time &ldquo;on the bench,&rdquo; Nvidia has returned to the spotlight, thanks to renewed demand, sovereign AI expansion, and robust margins on next-gen products. But the real story lies in the entire stack&mdash;from foundational GPU builders like Nvidia and Broadcom to the less visible but crucial chip designers in the fabless space.</p>
<p>What&rsquo;s changed? For one, the pace. From model development to chip deployment, the speed of innovation and adoption, particularly across hyperscalers and enterprise infrastructure, has exceeded expectations. This confirms a core view we&rsquo;ve held that diversified exposure, particularly through vehicles like the <a href="/link/39c8d235748b4c26a5930c31d3ac0160.aspx" title="SMH - VanEck Semiconductor ETF - Overview"><strong>VanEck Semiconductor ETF (SMH)</strong></a> and the <a href="/link/9b8fb1812bc74764bf11fc85767838f9.aspx" title="SMHX - VanEck Fabless Semiconductor ETF - Overview"><strong>VanEck Fabless Semiconductor ETF (SMHX)</strong></a>, is critical in capturing this sector&rsquo;s momentum without betting on a single name.</p>
<h3>1-Year Performance Snapshot: Nvidia Returns, but Broadcom Leads</h3>
<div class="flourish-embed flourish-chart" data-src="visualisation/23631731?2428759"><script src="https://public.flourish.studio/resources/embed.js"></script><noscript><img loading="lazy" src="https://public.flourish.studio/visualisation/23631731/thumbnail" width="100%" alt="1-Year Performance Snapshot: Nvidia Returns, but Broadcom Leads" /></noscript></div>
<p class="chart-disclosure">Source: Morningstar, as of 6/2/2025 Past performance is no guarantee of future results. Index performance is not representative of fund performance. It is not possible to invest directly in an index. This is not an offer to buy or sell, or a solicitation of any offer to buy or sell any of the securities mentioned herein. Fund holdings will vary.</p>
<h2>CapEx: Not a Bubble, But a Baseline</h2>
<p>A key theme this quarter was capital expenditure&mdash;its scale, sustainability, and strategic importance. Nvidia&rsquo;s call emphasized sovereign AI deals (notably in the Middle East), rising enterprise demand, and hyperscalers racing to future-proof infrastructure. CapEx tied to AI infrastructure isn&rsquo;t showing signs of topping; if anything, forecasts may still be too conservative.</p>
<p>Why it matters: Token usage, a proxy for how heavily AI tools are being used, is doubling every six months. That translates directly to more compute, which requires more chips, more power efficiency, and more architectural innovation. In short, the rails are down, and the trains are speeding up.</p>
<h3>CapEx Surge as Hyperscalers Ramp Spending into 2025</h3>
<p><img loading="lazy" alt="CapEx Surge as Hyperscalers Ramp Spending into 2025" src="https://www.vaneck.com/contentassets/2236f1e409a24385bb64d3ffe054f0c6/5776_nvidia_chart-2_2025-6_v1_blog.svg" /></p>
<p class="chart-disclosure">Source: Amazon, Microsoft, Alphabet, Meta as of 4/30/2025.&nbsp;<sup>*</sup>Past performance is no guarantee of future results. This is not an offer to buy or sell, or a solicitation of any offer to buy or sell any of the securities mentioned herein. Fund holdings will vary.</p>

<h2>Beyond General-Purpose Compute: The Rise of Custom Silicon</h2>
<p>The architecture of AI is shifting. Specialized chips&mdash;ASICs from names like Broadcom, Google (TPUs), and Amazon (Tranium)&mdash;are no longer secondary players; they&rsquo;re core to how hyperscalers are optimizing cost and performance. This has implications up and down the stack. Nvidia&rsquo;s pivot toward more tailored inference solutions is part of this evolution.</p>
<p>Meanwhile, fabless semiconductor designers, often behind the scenes, are developing chips that improve bandwidth, reduce power consumption, and unlock efficiency across the AI workflow. These innovators may not be household names yet, but their impact on AI deployment is foundational. It&rsquo;s why we see SMHX as a space with significant long-term potential&mdash;it captures the "brains" behind the operation, not just the brawn.</p>
<h2>Final Thoughts: AI Is the Story and Semiconductors Are the Backbone</h2>
<p>If there&rsquo;s one takeaway from this quarter&rsquo;s discussion, it&rsquo;s this: AI adoption isn&rsquo;t slowing. It&rsquo;s broadening. From sovereign initiatives to data centers to consumer internet, the demand for compute is feeding a flywheel of innovation, and semiconductors are at its center. Whether it's the industry giants or the rising specialists, this ecosystem is dynamic, diversified, and far from peaking.</p>
<p>We&rsquo;ll continue to monitor the landscape closely each quarter. For now, it&rsquo;s clear: AI and semis are inextricably linked, and the runway ahead is long.</p>
<p>To receive more <a href="https://www.vaneck.com/us/en/insights/thematic-investing/" title="Thematic Investing Insights"><strong>Thematic Investing</strong></a> insights, <a href="https://www.vaneck.com/us/en/subscribe/" title="Subscription Center"><strong>sign up in our subscription center</strong></a>.</p>
]]></content:encoded>
</item><item rdf:about="https://www.vaneck.com/us/en/blogs/thematic-investing/gpz-etf-question-answer/">
  <title>GPZ ETF: Question &amp; Answer></title>
  <link>https://www.vaneck.com/us/en/blogs/thematic-investing/gpz-etf-question-answer/</link>
  <description><![CDATA[The VanEck Alternative Asset Manager ETF (GPZ) targets asset managers involved in private equity, private credit, venture capital, buyouts, private infrastructure, and private real estate.]]></description>
  <dc:creator> </dc:creator>
  <dc:date>06/05/2025 06:30:00</dc:date>
<content:encoded><![CDATA[

<p>The structural growth of private markets has emerged as one of the most significant finance and investing developments in recent years. This is driving growing interest among investors and wealth managers and demand for exposure to these opportunities. The <strong><a href="/us/en/investments/alternative-asset-manager-etf-gpz/overview" title="VanEck Alternative Asset Manager ETF (GPZ)">VanEck Alternative Asset Manager ETF (GPZ)</a></strong> provides investors with a way to participate in the growth of private markets by offering access to asset managers involved in private equity, private credit, venture capital, buyouts, private infrastructure, and private real estate.</p>
<p>This blog is intended to address frequently asked questions about investing in alternative asset managers and specifically, <a href="/us/en/investments/alternative-asset-manager-etf-gpz/overview" title="VanEck Alternative Asset Manager ETF (GPZ)"><strong>GPZ</strong></a>.</p>
<ul class="content-list">
<li class="mt-2"><strong><a href="#point-one">What are alternative asset managers?</a></strong></li>
<li class="mt-2"><strong><a href="#point-two">Why have alternative asset managers gained attention as potential investment opportunities?</a></strong></li>
<li class="mt-2"><strong><a href="#point-three">What are GPZ&rsquo;s holdings and how is its portfolio determined?</a></strong></li>
<li class="mt-2"><strong><a href="#point-four">Do alternative asset managers pay notable dividends?</a></strong></li>
<li class="mt-2"><strong><a href="#point-five">What risks are associated with alternative asset managers?</a></strong></li>
<li class="mt-2"><strong><a href="#point-six">How can GPZ fit within a portfolio?</a></strong></li>
</ul>
<h2 id="point-one" class="anchored-block">What are alternative asset managers?</h2>
<p>These are firms that specialize in managing alternative investments, which encompass a range of non-traditional assets that fall outside of traditional stocks, bonds and cash. This includes assets like private equity, venture capital, direct lending, infrastructure, and real estate. Prominent firms in this space include Brookfield, Blackstone, KKR and Apollo.</p>
<h2 id="point-two" class="anchored-block">Why have alternative asset managers gained attention as potential investment opportunities?</h2>
<p>Alternative asset managers have strong fundraising capabilities and are strategically positioned in fast-growing sectors with long-term tailwinds. They are continuously innovating and scaling to deliver growth, while also benefiting from the long-term capital commitments associated with many of their investment vehicles.</p>
<p>Private assets also offer differentiated risk-return profiles compared to traditional stocks and bonds, providing diversification benefits and potential for higher returns. Additionally, alternative investments can offer unique exposure to transformative secular themes such as AI, healthcare innovation, and power infrastructure. Demand for these exposures has resulted in increased assets under management for alternative asset managers.</p>

<h2 id="point-three" class="anchored-block">What are GPZ&rsquo;s holdings and how is its portfolio determined?</h2>
<p><a href="/us/en/investments/alternative-asset-manager-etf-gpz/overview" title="VanEck Alternative Asset Manager ETF (GPZ)"><strong>GPZ</strong></a>&rsquo;s underlying index is the MarketVector<sup>TM</sup>&nbsp;Alternative Asset Managers Index. This is a rules-based, modified capitalization weighted, float adjusted index comprised of equity securities of publicly traded U.S., Canadian and developed European alternative asset management companies. To be initially eligible for the Index, companies must derive at least 75% of their revenues or operating assets from alternative asset investing. Alternative asset investing comprises private equity, private credit, venture capital, buy-outs, private real estate, and private infrastructure. View GPZ&rsquo;s holdings here: <a href="/us/en/investments/alternative-asset-manager-etf-gpz/holdings" title="VanEck Alternative Asset Manager ETF - Holdings"><strong>VanEck Alternative Asset Manager ETF holdings</strong></a>.</p>
<h2 id="point-four" class="anchored-block">Do alternative asset managers pay notable dividends?</h2>
<p>While many of the investment vehicles managed by alternative asset managers tend to offer high yield, particularly in private credit, the yield profile of the managers themselves can vary significantly from company to company. <a href="/us/en/investments/alternative-asset-manager-etf-gpz/overview" title="VanEck Alternative Asset Manager ETF (GPZ)"><strong>GPZ</strong></a> is not expected to be a high-yielding ETF, but the underlying companies have tended, on average, to yield slightly higher than the broad U.S. equity markets historically.</p>
<h2 id="point-five" class="anchored-block">What are the risks of investing in alternative asset managers?</h2>
<p>Alternative asset managers have benefited from a great deal of market demand for the investment services they offer. However, they are not without risk. Alternative asset managers are subject to pressure associated with adverse market conditions. In periods of slowing economic growth, fundraising may slow and opportunities to realize value through portfolio exits may be impeded. Alternative asset managers are also likely to see increasing competition, which may result in less, or lower quality investment opportunities as well as fee compression.</p>
<h2 id="point-six" class="anchored-block">How can GPZ fit within a portfolio?</h2>
<p><a href="/us/en/investments/alternative-asset-manager-etf-gpz/overview" title="VanEck Alternative Asset Manager ETF (GPZ)"><strong>GPZ</strong></a> can be integrated into an investment portfolio as a long-term strategic allocation providing both diversification benefits and access to potential growth opportunity amidst the push towards alternative assets and private equity. Additionally, because of its targeted exposure, <a href="/us/en/investments/alternative-asset-manager-etf-gpz/overview" title="VanEck Alternative Asset Manager ETF (GPZ)"><strong>GPZ</strong></a> can be used more tactically by investors to express a shorter-term view of private markets in an efficient and low-cost way.</p>
<p><span style="font-size: 14pt;"><strong>How to buy GPZ?</strong></span></p>
<p>VanEck ETFs can be purchased the same way you would buy a stock, through a broker or with your advisor.</p>
<p class="d-none d-lg-block"><a href="mailto:askvaneck@vaneck.com" title="Have More Questions? - Ask VanEck" rel="noopener"><img loading="lazy" class="img-responsive" src="https://www.vaneck.com/globalassets/home/us/insights/blogs/bm-blog-images/cta-faq_desktop-02.svg" alt="Have More Questions? - Ask VanEck" /></a></p>
<p class="d-lg-none"><a href="mailto:askvaneck@vaneck.com" title="Have More Questions? - Ask VanEck" rel="noopener"><img loading="lazy" class="img-responsive" src="https://www.vaneck.com/globalassets/home/us/insights/blogs/bm-blog-images/cta-faq_mobile-01.svg" alt="Have More Questions? - Ask VanEck" /></a></p>
<p>To receive more <a href="https://www.vaneck.com/us/en/insights/thematic-investing/" title="Thematic Investing Insights"><strong>Thematic Investing</strong></a> insights, <a href="https://www.vaneck.com/us/en/subscribe/" title="Subscription Center"><strong>sign up in our subscription center</strong></a>.</p>
]]></content:encoded>
</item><item rdf:about="https://www.vaneck.com/us/en/blogs/digital-assets/matthew-sigel-vaneck-crypto-monthly-recap-for-may-2025/">
  <title>VanEck Crypto Monthly Recap for May 2025></title>
  <link>https://www.vaneck.com/us/en/blogs/digital-assets/matthew-sigel-vaneck-crypto-monthly-recap-for-may-2025/</link>
  <description><![CDATA[Ethereum rebounded in May on key upgrades, Solana gained momentum from institutional treasury moves and protocol changes, while Hyperliquid cemented its dominance in DeFi trading.]]></description>
  <dc:creator>Matthew  Sigel</dc:creator>
  <dc:date>06/05/2025 06:30:00</dc:date>
<content:encoded><![CDATA[

<p><strong>Please note that VanEck may have a position(s) in the digital asset(s) described below.</strong></p>
<p>Digital assets, especially digital asset equities, outperformed in May as equity capital markets funded <strong>12+</strong> &ldquo;crypto treasury companies&rdquo; via SPAC, reverse takeover, IPO, or Secondary. Many of these companies then bought Bitcoin or other digital assets, leading to reflexive upside. For the month, the <strong><a href="https://www.marketvector.com/indexes/sector/mvis-global-digital-assets-equity" title="MVIS Global Digital Assets Equity Index I MVDAPP" target="_blank" rel="noopener">MarketVector Global Digital Assets Equity Index (MVDAPP) </a></strong>rose <strong>24%</strong>. The <strong><a href="https://www.marketvector.com/indexes/digital-assets/marketvector-smart-contract-leaders" title="MarketVector Smart Contract Leaders Index I MVSCLE" target="_blank" rel="noopener">MarketVector Smart Contract Leaders Index (MVSCLE),</a></strong> which tracks the largest and most liquid digital assets, is up <strong>18%</strong>. Bitcoin <strong>+11%</strong> to a record high of <strong>$111.8K</strong>, vs. the Nasdaq <strong>+10%</strong> and S&amp;P 500 <strong>+6%</strong>.</p>
<ul class="content-list">
<li class="mt-2"><a href="#price-returns"><strong>Price Returns</strong></a></li>
<li class="mt-2"><a href="#scp-fundamentals"><strong>SCP Fundamentals</strong></a></li>
<li class="mt-2"><a href="#ethereum-reawakens"><strong>Ethereum Reawakens</strong></a></li>
<li class="mt-2"><a href="#solanas-protocol-overhaul"><strong>Solana&rsquo;s Protocol Overhaul</strong></a></li>
<li class="mt-2"><a href="#notable-performer"><strong>May&rsquo;s Notable Performer</strong></a></li>
</ul>
<h3 id="price-returns" class="jump-link-nav anchored-block" data-jumplink-title="Price Returns">Price Returns</h3>
<div class="wrapped-div">
<table style="width: 600px;">
<tbody>
<tr class="tbl-data">
<td class="tbl-header last text-center">&nbsp;</td>
<td class="tbl-header last text-right">May (%)</td>
<td class="tbl-header last text-right">YTD (%)</td>
</tr>
<tr class="tbl-data">
<td class="data-td last">Ethereum</td>
<td class="data-td data last text-right">45</td>
<td class="data-td data last text-right">-23</td>
</tr>
<tr class="tbl-data">
<td class="data-td last">MarketVector Global Digital Assets Equity Index</td>
<td class="data-td data last text-right">24</td>
<td class="data-td data last text-right">-11</td>
</tr>
<tr class="tbl-data">
<td class="data-td last">Coinbase</td>
<td class="data-td data last text-right">22</td>
<td class="data-td data last text-right">-1</td>
</tr>
<tr class="tbl-data">
<td class="data-td last">MarketVector Decentralized Finance Leaders Index</td>
<td class="data-td data last text-right">20</td>
<td class="data-td data last text-right">-49</td>
</tr>
<tr class="tbl-data">
<td class="data-td last">MarketVector Smart Contract Leaders Index</td>
<td class="data-td data last text-right">18</td>
<td class="data-td data last text-right">-21</td>
</tr>
<tr class="tbl-data">
<td class="data-td last">MarketVector Meme Coin Index</td>
<td class="data-td data last text-right">12</td>
<td class="data-td data last text-right">-43</td>
</tr>
<tr class="tbl-data">
<td class="data-td last">Bitcoin</td>
<td class="data-td data last text-right">11</td>
<td class="data-td data last text-right">12</td>
</tr>
<tr class="tbl-data">
<td class="data-td last">Nasdaq Index</td>
<td class="data-td data last text-right">10</td>
<td class="data-td data last text-right">-1</td>
</tr>
<tr class="tbl-data">
<td class="data-td last">S&amp;P 500 Index</td>
<td class="data-td data last text-right">6</td>
<td class="data-td data last text-right">1</td>
</tr>
<tr class="tbl-data">
<td class="data-td last">MarketVector Infrastructure Application Leaders Index</td>
<td class="data-td data last text-right">1</td>
<td class="data-td data last text-right">-37</td>
</tr>
</tbody>
</table>
</div>
<p class="chart-disclosure mt-3">Source: Bloomberg as of 5/31/2025. <strong>Index performance is not representative of fund performance. It is not possible to invest directly in an index. Past performance is no guarantee of future results. Not intended as a recommendation to buy or sell any securities named herein.</strong></p>
<p>Though BTC punched to a new all-time high, within the Layer 1 ecosystem we track closely, only <strong>14</strong> of the <strong>35</strong> tokens gained in the month. Altcoins were paced by a reanimated Ethereum <strong>(+45%)</strong>, which re-established a credible narrative for value capture and an improved user experience. ETH&rsquo;s outperformance resulted in a substantial <strong>(+27%)</strong> BTC/ETH ratio retracement as it moved from <strong>0.019</strong> to <strong>0.024</strong> over May. Despite this tremendous pullback, ETH/BTC returned to roughly the same levels it traded in mid-March.</p>
<h3>ETH/BTC Finally Rallies: +27% in May</h3>
<p><img loading="lazy" class="img-responsive w-100" src="https://www.vaneck.com/EPiServer/CMS/Content/contentassets/en/36b7395470c64e539946d23d326561ab/5771_crypto-monthly_chart-1_2025-6_v1_blog.svg,,326028/Download?epieditmode=False" alt="ETH/BTC Finally Rallies: +27% in May" /></p>
<p class="chart-disclosure">Source: Artemis XYZ as of 6/2/2025. <strong>Past performance is no guarantee of future results. Not intended as a recommendation to buy or sell any securities named herein.</strong></p>
<p>Zooming out, ETH/BTC has been in a downward trend since September 2022 after peaking amid the implementation of EIP-1559, which instilled faith in ETH as a monetary competitor to BTC due to its introduction of deflationary mechanisms. Since that apex in sentiment, however, migration to L2s reduced demand for ETH, causing the asset to become net inflationary. However, May saw a return to the &ldquo;ETH is money&rdquo; narrative, this time from institutional treasuries instead of retail podcasters, bringing new credibility and demand. More on Ethereum&rsquo;s comeback below.</p>
<h2 id="scp-fundamentals" class="anchored-block">Smart Contract Platform (SCP) Fundamentals</h2>
<p><strong>The <a href="https://www.marketvector.com/indexes/digital-assets/marketvector-smart-contract-leaders" title="MarketVector Smart Contract Leaders Index I MVSCLE" target="_blank" rel="noopener">MarketVector Smart Contract Leaders Index (MVSCLE)</a> Gained 18% in May but Lagged behind Majors as Long-Tail Altcoins Struggle</strong></p>
<h3>Despite Gaining 18% In May, MVSCLE Is Outpaced by Majors as Long-Tail Altcoins Underperform</h3>
<p><img loading="lazy" class="img-responsive w-100" src="https://www.vaneck.com/EPiServer/CMS/Content/contentassets/en/36b7395470c64e539946d23d326561ab/5771_crypto-monthly_chart-2_2025-6_v1_blog.svg,,326029/Download?epieditmode=False" alt="Despite Gaining 17% In May, MVSCLE Is Outpaced by Majors as Long-Tail Altcoins Underperform" /></p>
<p class="chart-disclosure">Source: MarketVector as of 5/31/2025. The MarketVector Smart Contract Leaders Index (MVSCLE) is designed to track the performance of the largest and most liquid smart contract assets. Index performance is not representative of strategy performance. <strong>Past performance is no guarantee of future results. Not intended as a recommendation to buy or sell any securities named herein.</strong></p>
<p>Daily average DEX Volumes returned in a big way in May and were up <strong>(+111%)</strong> across all SCPs compared to April&rsquo;s figures, totaling <strong>$502B</strong> in May vs <strong>$238B</strong> in April. The largest contributor to the surge in on-chain trading activity was BNB Chain, which took the top spot from Solana with an average trading volume of <strong>$6.4B</strong> per day in the month of May. BNB Chain&rsquo;s total was more than double that of the next best, Solana&rsquo;s, at <strong>$3.0B</strong> per day.</p>
<p>The large surge in trading activity contributed to the increase of onchain revenues by <strong>(+36%)</strong> month-to-month. Amongst all SCPs, Hyperliquid seized the top spot and generated more than <strong>$2.3M</strong> in average daily revenue. Hyperliquid&rsquo;s topline success in May, with revenues up <strong>(+65%)</strong>, has been reinforced by a series of new trading products and features launched in May, detailed further below.</p>
<h2 id="ethereum-reawakens" class="jump-link-nav anchored-block" data-jumplink-title="Ethereum Reawakens">Ethereum Reawakens and Gains Corporate Treasury Adoption</h2>
<p>ETH&rsquo;s performance versus BTC in May came amid the implementation of Ethereum&rsquo;s long-awaited Pectra upgrade, ecosystem-wide security initiatives, and newfound interest in Ethereum as a treasury asset.</p>
<p>The Pectra upgrade, launched on May 7, 2025, marked Ethereum&rsquo;s largest protocol update since the Merge, incorporating 11 EIPs to boost usability, scalability, and institutional staking. Account abstraction (EIP-7702) allows Externally Owned Accounts to execute smart contract logic, enabling gasless transactions, ERC-20 fee payments, transaction batching, social recovery, and single-step token approvals, simplifying DeFi interactions, cutting gas costs, and easing onboarding by removing the need to hold ETH for gas. Expanded validator limits (EIP-7251) raise the maximum effective balance to 2,048 ETH, reducing institutional staking costs by up to <strong>98%</strong> through fewer nodes. Enhanced blob throughput (EIP-7691) and dynamic blob capacity (EIP-7742) increase Layer 2 (L2) scalability by expanding blob capacity, improving data availability, and lowering L2 transaction fees. These upgrades align Ethereum with the needs of complex applications and professional validators. Ethereum&rsquo;s roadmap now focuses on execution layer improvements, like transaction parallelism and security, to further enhance throughput and DeFi scalability.</p>
<p>On May 14, the Ethereum Foundation announced the <strong><a href="https://blog.ethereum.org/2025/05/14/trillion-dollar-security" title="Announcing the Trillion Dollar Security Initiative | Ethereum Foundation Blog" target="_blank" rel="noopener"><em>Trillion Dollar Security Initiative</em></a></strong>, a multi-pronged effort to elevate Ethereum&rsquo;s security posture across the stack: UX, wallet security, smart contract security, cloud infrastructure, consensus and protocol security, and more. The initiative aims to build trust at a &ldquo;civilization-scale,&rdquo; envisioning billions of individuals comfortably storing <strong>$1,000+</strong> onchain, plus public and private institutions storing <strong>$1T</strong>+ inside a single smart contract or application. Its launch reinforces Ethereum&rsquo;s push to become the credible infrastructure for institutional and sovereign adoption, supported by the <strong>$32.6M</strong> in ecosystem grants <strong><a href="https://blog.ethereum.org/2025/05/08/allocation-q1-25" title="Allocation Update - Q1 2025 | Ethereum Foundation Blog" target="_blank" rel="noopener">awarded</a></strong> in Q1.</p>
<p>This revitalized infrastructure narrative coincided with a wave of institutional interest in ETH, not just as a utility token, but increasingly as a strategic reserve asset. Most striking was Sharplink Gaming (NASDAQ: SBET), which on May 27th <a href="https://www.globenewswire.com/news-release/2025/05/27/3088575/0/en/SharpLink-Gaming-Announces-425-000-000-Private-Placement-to-Initiate-Ethereum-Treasury-Strategy.html" title="SharpLink Gaming Announces $425,000,000 Private Placement" target="_blank" rel="noopener"><strong>announced</strong></a> an expected $<strong>425M</strong> in private placement proceeds and named Ethereum co-founder Joseph Lubin as Chairman of the Board (pending closing of the offering), formally adopting ETH as its core reserve asset and pledging to operate validator infrastructure. The stock surged over <strong>400%</strong> on the news. Earlier in the month, on May 15<sup>th</sup>, French real estate search engine Entreparticuliers.com (Euronext: ALENT) <strong><a href="https://ebs.publicnow.com/view/A8CD593C709F4888751D2A83E9D14742C8C12C4F" title="Strategic Announcement : Ethereum Treasury Company" target="_blank" rel="noopener">declared</a></strong> its transformation into an &ldquo;Ethereum Treasury Company&rdquo;, citing ETH&rsquo;s commodity status, staking yield, foundational role in DeFi, and institutional adoption. After shifting towards DeFi and RWA tokenization in April, the move further anchored the French company&rsquo;s corporate strategy in ETH, its stock rallying more than <strong>800%</strong> in the days following the announcement. Both Sharplink and Entreparticuliers.com follow BioNexus Gene Lab Corp (NASDAQ: BGLC), a small Malaysia-based biotech whose March <strong><a href="https://www.globenewswire.com/news-release/2025/03/05/3037582/0/en/BioNexus-Gene-Lab-Corp-Announces-Board-Approval-of-Ethereum-Treasury-Strategy-and-Release-of-Strategic-Whitepaper.html" title="BioNexus Gene Lab Corp. Announces Board Approval of Ethereum Treasury Strategy and Release of Strategic Whitepaper" target="_blank" rel="noopener">announcement</a></strong> made it the first Nasdaq-listed company to commit to an exclusively ETH treasury strategy publicly. After <strong><a href="https://www.btcs.com/news-media/market-dislocations/" title="Market Dislocations &ndash; BTCS Inc. - Advanced Blockchain Operations" target="_blank" rel="noopener">calling</a></strong> a cyclical bottom expanding its Ethereum holdings in April, on May 14<sup>th</sup>, Ethereum infrastructure company BTCS <strong><a href="https://www.btcs.com/news-media/convertible-note/" title="Convertible Note - BTCS Inc. - Advanced Blockchain Operations" target="_blank" rel="noopener">announced</a></strong> agreements to issue up to <strong>$57.8M</strong> in convertible notes exclusively for ETH purchases, officially adopting an Ethereum treasury strategy likened to MicroStrategy&rsquo;s Bitcoin treasury strategy. While still nascent compared to BTC or even SOL treasury adoption, the market&rsquo;s response to these moves may reflect early signs that ETH&rsquo;s monetary premium is being recognized again by equity markets.</p>
<h3>Public Companies Added Over $1.1 Billion in Cumulative Market Cap Since Announcing SOL &amp; ETH Treasury Strategies</h3>
<div class="flourish-embed flourish-chart" data-src="visualisation/23587115?2429575"><script src="https://public.flourish.studio/resources/embed.js"></script><noscript><img loading="lazy" src="https://public.flourish.studio/visualisation/23587115/thumbnail" width="100%" alt="chart visualization" /></noscript></div>
<p><img loading="lazy" class="img-responsive w-100 mt-3" src="https://www.vaneck.com/EPiServer/CMS/Content/contentassets/en/36b7395470c64e539946d23d326561ab/5771_crypto-monthly-may_table_2025-06_v2.svg,,326045/Download?epieditmode=False" alt="Public Companies" /></p>
<p class="chart-disclosure"><sup>*</sup>&nbsp;Share Prices in EUR.</p>
<p class="chart-disclosure"><sup>**</sup>&nbsp;Share Prices in CAD.</p>
<p class="chart-disclosure">Sources: FactSet, Yahoo Finance as of 5/31/2025. <strong>Past performance is no guarantee of future results. Not intended as a recommendation to buy or sell any securities named herein.</strong></p>
<h2 id="solanas-protocol-overhaul" class="anchored-block mt-2">Solana&rsquo;s MicroStrategy Moment and Protocol Overhaul</h2>
<p>Solana&rsquo;s SOL token had an admirable month, gaining <strong>(+6%)</strong> as trading activity returned to the chain. DEX Volumes increased <strong>(+41%)</strong> from <strong>$66.5B</strong> to <strong>$93.7B</strong> as memecoins like WIF <strong>(+34%)</strong> and SPX <strong>(+70%)</strong> climbed back to prices not seen since January, possibly reflecting trader optimism for a return to a speculator&rsquo;s market on the heels of Bitcoin all-time highs.</p>
<p>As we noted in April, the first shoots of a &ldquo;MicroStrategy-for-Solana&rdquo; movement began to sprout, with several companies publicly declaring SOL as a strategic treasury reserve asset. This early interest grew into a broader trend in May, with DeFi Development Corp expanding its holdings to over <strong>609K</strong> SOL <strong>(~$107M)</strong>, while Upexi surpassed <strong>$100M</strong> in total exposure by accumulating both spot and locked tokens. DeFi Development Corp also invested part of its SOL treasury into dfdvSOL, a liquid staking token (&ldquo;LST&rdquo;) delegated to the company&rsquo;s own validators. Mirroring other LSTs on Solana and Ethereum enables the company to earn staking rewards while maintaining liquidity. On May 1st, Classover Holdings (KIDZ) became the latest publicly traded company to adopt a Solana treasury strategy, announcing a $400 million equity facility to fund the long-term purchase, staking, and validator operation of SOL tokens as part of its core balance sheet strategy.</p>
<p>Meanwhile, SOL Strategies (CYFRF), previously Cypherpunk Holdings, <strong><a href="https://solstrategies.io/sol-strategies-provides-update-on-sol-purchases-2/" title="SOL Strategies Provides Update on SOL Purchases" target="_blank" rel="noopener">bought</a></strong> $18M of Solana tokens with the first tranche of the $500M note announced in April. The company also filed a $1 billion base shelf prospectus in May, signaling its intent to become the most capitalized Solana-native public vehicle to date. This move underscores how equity markets are opening up to SOL exposure in ways that mirror the early Bitcoin treasury era.</p>
<p>Solana&rsquo;s performance in May was also driven by significant protocol upgrades and ecosystem growth, reinforcing its capabilities as a high-performance monolithic blockchain and ambitions for greater institutional applications. The <strong>Alpenglow consensus overhaul</strong>, <strong><a href="https://www.anza.xyz/blog/alpenglow-a-new-consensus-for-solana" title="Alpenglow: A New Consensus for Solana - Anza" target="_blank" rel="noopener">proposed</a></strong> on May 19<sup>th</sup>&nbsp;by Solana-focused research &amp; development studio Anza, would replace Solana&rsquo;s legacy consensus mechanisms, Proof of History and Tower BFT, with Votor and Rotor, slashing deterministic finality from 12.8 seconds to 100&ndash;150 ms, a ~100x improvement. Such improvements in latency de-risk high-value applications like trading and payments on Solana, underscoring Solana&rsquo;s ambition to compete for institutional-grade financial services.</p>
<p>Echoing Solana&rsquo;s institutional focus, on May 23, the Solana Attestation Service (SAS) <a href="https://solana.com/news/solana-attestation-service" title="Introducing Solana Attestation Service" target="_blank" rel="noopener"><strong>launched</strong></a>, offering verifiable credentials (e.g., KYC, accreditation) at the wallet level. This identification framework enables sophisticated compliance, access control, reputation systems, and identity-based applications to be programmed without revealing sensitive data onchain. On the consumer front, the Solana Seeker smartphone, Solana&rsquo;s second mobile device, <strong><a href="https://x.com/solanamobile/status/1925168003840114823" title="Seeker | Solana Mobile" target="_blank" rel="noopener">announced</a></strong> shipping in August. The launch introduces the SKR token and TEEPIN (Trusted Execution Environment Platform Infrastructure Network) framework for decentralized app distribution. SKR will power Solana Mobile&rsquo;s economy, indicating an effort to compete with Helium&rsquo;s recent success in the mobile network space. Separately, TEEPIN aims to provide decentralized authentication of hardware, software, and network layer integrity so that mobile users can access blockchain-based apps without traditional gatekeepers and fees, such as the Apple App Store&rsquo;s 30% fees.</p>
<p>Solana also became the first non-EVM chain to <a href="https://www.prnewswire.com/news-releases/chainlink-ccip-is-officially-live-on-solana-supercharging-the-growth-of-solana-defi-by-unlocking-access-to-19b-of-assets-302458899.html" title="Chainlink CCIP Is Officially Live on Solana, Supercharging the Growth of Solana DeFi by Unlocking Access to $19B+ of Assets " target="_blank" rel="noopener"><strong>integrate</strong></a> Chainlink&rsquo;s CCIP v.16 this month, tapping into simplified cross-chain DeFi applications for $19B+ of eligible cross-chain assets.</p>
<h2>Sui Rocked by $223M Cetus Exploit</h2>
<h3>Sui's TVL Reached New All-Time Highs Just Before the Cetus Hack</h3>
<p><img loading="lazy" class="img-responsive w-100" src="https://www.vaneck.com/EPiServer/CMS/Content/contentassets/en/36b7395470c64e539946d23d326561ab/5771_crypto-monthly_chart-4_2025-6_v1_blog.svg,,326044/Download?epieditmode=False" alt="Sui's TVL Reached New All-Time Highs Just Before the Cetus Hack" /></p>
<p class="chart-disclosure">Source: Artemis.xyz as of 5/29/2025. <strong>Past performance is no guarantee of future results. Not intended as a recommendation to buy or sell any securities named herein.</strong></p>
<p>On May 22nd, Sui&rsquo;s largest decentralized exchange, Cetus, suffered a <strong>$223M</strong> exploit after an attacker used fake tokens to exploit flaws in the Cetus&rsquo; smart contracts, draining its liquidity pools. Having just reached an all-time high above <strong>$2.1B</strong>, Sui&rsquo;s total value locked (TVL) dropped <strong>$590M</strong> overnight as users rushed to withdraw capital from the ecosystem. The attacker was able to launder approximately <strong>$60M</strong>, but Cetus successfully <strong><a href="https://x.com/CetusProtocol/status/1925567348586815622" title="Cetus on X: ANNOUNCEMENT" target="_blank" rel="noopener">froze</a> $162M</strong> of stolen funds by halting the affected smart contracts. These funds remain immobilized on-chain as the protocol works with the Sui Foundation and blockchain security firm OtterSec on a recovery plan.</p>
<p>To recover the funds, a Sui governance vote initiated on May 27<sup>th</sup>&nbsp;<strong><a href="https://sui.scan.space/vote" title="Sui Explorer" target="_blank" rel="noopener">proposed</a></strong> a one-time protocol upgrade to forcibly transfer the frozen assets from the attacker&rsquo;s wallets to a multi-signature wallet co-managed by Cetus, the Sui Foundation, and OtterSec. It would mark one of the largest &ldquo;hack-the-hacker&rdquo; interventions in DeFi history if passed. However, the vote has reignited debates around decentralization and governance-based reversibility, reminiscent of Ethereum&rsquo;s 2016 DAO hack response. In that case, a vulnerability in the DAO smart contract allowed an attacker to siphon <strong>3.6M</strong> ETH, prompting Ethereum developers to initiate a contentious hard fork that reversed the exploit. This act ultimately split the community and gave rise to Ethereum Classic.</p>
<p>As in the case of Ethereum versus Ethereum Classic, it appears that the side of the white hat hackers will win. At the time of writing, <strong>90.6%</strong> of SUI-denominated votes favor the governance proposal, with most other votes abstaining. Interestingly, Stakefish, a provider of staking services since 2018, voted no on the proposal, drawing <strong><a href="https://x.com/search?q=stakefish&amp;src=typed_query&amp;f=live" title="Stakefish" target="_blank" rel="noopener">criticism</a></strong> on X.</p>
<p>At the time of writing, SUI&rsquo;s price is trading at <strong>$3.54</strong>, down <strong>15%</strong> from its high of <strong>$4.16</strong> on the day of the hack. Sui has recovered <strong>~$225M (15%)</strong> of TVL from its post-hack low of ~<strong>$1.5B.</strong></p>
<h2 id="notable-performer" class="jump-link-nav anchored-block" data-jumplink-title="Notable Performer">May&rsquo;s Notable Performer: HYPE (+87%)</h2>
<h3>Hyperliquid Achieved 86% of Perps Volume in May; Up from 16% One Year Earlier</h3>
<p><img loading="lazy" class="img-responsive w-100" src="https://www.vaneck.com/EPiServer/CMS/Content/contentassets/en/36b7395470c64e539946d23d326561ab/5771_crypto-monthly_chart-5_2025-6_v1_blog.svg,,326046/Download?epieditmode=False" alt="Hyperliquid Achieved 86% of Perps Volume in May; Up from 16% One Year Earlier" /></p>
<p class="chart-disclosure">Source: Artemis XYZ. <strong>Past performance is no guarantee of future results. Not intended as a recommendation to buy or sell any securities named herein.</strong></p>
<p>The biggest winner in May amongst SCP tokens was Hyperliquid&rsquo;s HYPE (+65%). We discussed Hyperliquid&rsquo;s potential in <strong><a href="/us/en/blogs/digital-assets/matthew-sigel-vaneck-crypto-monthly-recap-for-december-2024/#notable-performers" title="VanEck Crypto Monthly Recap for December 2024">our December monthly</a></strong> amid HYPE&rsquo;s startling price performance of <strong>(+154%)</strong> in the last month of 2024. Hyperliquid&rsquo;s journey from a perpetual futures decentralized exchange to a more general-purpose financial chain has been noteworthy for its strong execution. Hyperliquid has been able to translate the high value of its airdrop, now worth &gt;$10B, into a highly successful ecosystem.</p>
<p>As liquidity begets liquidity, Hyperliquid&rsquo;s performance can partially be attributed to its ability to respond to community feedback to drive trading volumes. Hyperliquid added LAUNCHCOIN, a token central to the Believe ecosystem, on May 14th, enabling up to 3x leverage long &amp; short perpetuals on the viral creator token launchpad. Due to popular demand, Hyperliquid also increased leverage limits to 5x on SOPH and NXPC. These new perpetuals markets helped drive Hyperliquid&rsquo;s record-breaking metrics in the month, with the protocol achieving a <strong><a href="https://x.com/HyperliquidX/status/1925417760710152675" title="Hyperliquid on X" target="_blank" rel="noopener">record</a> $5.4M</strong> in 24h trading fees on May 22nd and all-time high open interest of <strong>$8.9B</strong>. Perp trading volume on Hyperliquid reached <strong>~$261B</strong> in May, an increase of <strong>896%</strong> year-over-year from May 2024, driving the platform&rsquo;s share of perps volume from <strong>16%</strong> to <strong>86%</strong> over the same period. The <strong><a href="https://x.com/HyperliquidX/status/1922305320325357895" title="Hyperliquid on X" target="_blank" rel="noopener">addition</a></strong> of native SOL &amp; FARTCOIN deposits, withdrawals, and spot trading further increased the platform&rsquo;s gravity amongst leading L1 &amp; memecoin assets. The HIP-3 improvement proposal went live on Hyperliquid&rsquo;s testnet to further grow its ecosystem's reach. By incentivizing the platform&rsquo;s decentralized userbase to add additional perp trading pairs, the initiative could further advance Hyperliquid&rsquo;s growth into new markets.</p>
<p>Hyperliquid ended the month with the launch of Hyperdrive, a stablecoin money market tailored for its blockchain. Hyperdrive allows users to lend or borrow stablecoins and stake $HYPE, unlocking up to 3x leverage for the yield-bearing HLP tokens, which represent deposits in Hyperliquid&rsquo;s market-making and liquidation vault, earning a share of the platform&rsquo;s trading fees.</p>
<p>On the regulatory front, Hyperliquid Labs <strong><a href="https://hyperfnd.medium.com/defi-as-a-more-open-transparent-and-efficient-financial-system-c2c9e9fa2081" title="Defi as a more open, transparent, and efficient financial system" target="_blank" rel="noopener">responded</a></strong> to the CFTC&rsquo;s requests for comment on perpetuals and 24/7 trading. Hyperliquid argues that its L1&rsquo;s 24/7 trading operations demonstrate DeFi&rsquo;s well-suitedness to crucial aspects of market operation, and that perpetual derivatives offer valuable use cases when implemented onchain for reasons including their transparency, programmability, and self-custody. As a leading decentralized exchange, Hyperliquid is well-positioned to gain further market share against centralized incumbents like Coinbase if favorable DeFi regulations emerge.</p>
<p><strong>Links to third party websites are provided as a convenience and the inclusion of such links does not imply any endorsement, approval, investigation, verification or monitoring by us of any content or information contained within or accessible from the linked sites. By clicking on the link to a non-VanEck webpage, you acknowledge that you are entering a third-party website subject to its own terms and conditions. VanEck disclaims responsibility for content, legality of access or suitability of the third-party websites.</strong></p>
<p>To receive more <strong><a href="https://www.vaneck.com/us/en/insights/digital-assets/" title="Digital Assets Insights">Digital Assets</a></strong> insights, <strong><a href="https://www.vaneck.com/us/en/subscribe/" title="Subscription Center">sign up in our subscription center</a></strong>.</p>
]]></content:encoded>
</item><item rdf:about="https://www.vaneck.com/us/en/blogs/thematic-investing/invest-where-private-market-growth-begins/">
  <title>Invest Where Private Market Growth Begins></title>
  <link>https://www.vaneck.com/us/en/blogs/thematic-investing/invest-where-private-market-growth-begins/</link>
  <description><![CDATA[Private markets are growing, and the firms managing that capital are at the center of this growth. We make the case for why these firms present an opportunity investors shouldn&rsquo;t overlook.]]></description>
  <dc:creator>Brandon Rakszawski</dc:creator>
  <dc:date>06/05/2025 06:30:00</dc:date>
<content:encoded><![CDATA[

<p>What was once the domain of institutions has been opening up to everyday investors, as private equity, credit, real estate, and infrastructure become more accessible. Alternative asset managers, the firms that source, analyze, and allocate to these markets, are expanding beyond pensions and endowments and pushing into wealth management and even retirement accounts. As this shift accelerates, new opportunities are emerging for investors to tap into this rapidly growing space.</p>
<h2>Forces Powering the Rise of Alternative Asset Managers</h2>
<p>Private assets under management have ballooned at a rapid pace as institutional investors have sought uncorrelated exposure and attractive yield in their long-term portfolio mix. These alternative asset managers advise larger pools of capital, often captive assets with long-term lockups. Their push into new channels such as wealth management and retirement are helping to fuel this growth and also open doors to potential future growth.</p>
<h3>Global Alternative Assets Under Management as of 6/30/2024</h3>
<p><img loading="lazy" class="img-responsive w-100" alt="Global Alternative Assets Under Management" src="https://www.vaneck.com/contentassets/c2af960185854e6eaba93df16a93d3b0/5772_gpz-launch_chart-1_2025-6_v1_blog.svg" /></p>
<p class="chart-disclosure">Source: HFR, Preqin, J.P. Morgan Asset Management. Assets under management is defined as managed assets in private closed-end funds, which includes the latest available valuation of investments (including unrealized value), as well as committed capital available for investment by fund managers. 2024 figures are as of June 30, 2024, the latest data available.</p>
<h2>A Spotlight on Private Credit</h2>
<p>Private credit has been a recent standout within private markets. As traditional lenders pull back, alternative managers have stepped in to fill the void, offering customized lending solutions to businesses of all sizes. This trend has shown no signs of slowing.</p>
<h3>Global Private Credit AUM ($ trillions) / Projections as of January 2025</h3>
<p><img loading="lazy" class="img-responsive w-100" alt="Global Private Credit AUM ($ trillions) / Projections as of January 2025" src="https://www.vaneck.com/contentassets/fa866204fe2440a9a25387b0158ae0e5/5772_gpz-launch_chart-2_2025-6_v1_blog.svg" /></p>
<p class="chart-disclosure">Source: Preqin, Moody&rsquo;s Ratings. Moody&rsquo;s estimate uses Preqin's historical private debt fund AUM figures, which are not inclusive of all private credit AUM. Data does not include asset-based financing, real estate and infrastructure PC assets, assets in non-fund structures and leverage on these funds. Past or projected data does not guarantee future results and is for illustrative purposes only.</p>

<h2>Why Companies Are Staying Private Longer</h2>
<p>Meanwhile, more companies are choosing to stay private longer. The number of publicly listed companies in the U.S. has dropped since the late 1990s, even as market capitalizations have risen. A concentrated group of mega-cap tech names now dominates public markets, leaving many high-growth companies in private hands.</p>
<p>This shift has elevated the role of alternative asset managers as gatekeepers to some of the most dynamic segments of the economy.</p>
<h3>Median Age of VC-Backed Companies (Years)</h3>
<p><img loading="lazy" class="img-responsive w-100" alt="Median Age of VC-Backed Companies" src="https://www.vaneck.com/contentassets/187f8f682d4843afaa3472f855e7ce7f/5772_gpz-launch_chart-3_2025-6_v1_blog.svg" /></p>
<p class="chart-disclosure">Source: PitchBook. Past performance is no guarantee of future results.</p>
<h3>IPOs Rare Among Recent VC Exits / Share of Total Value in 2024</h3>
<p><img loading="lazy" class="img-responsive w-100" alt="IPOs Rare Among Recent VC Exits / Share of Total Value in 2024" src="https://www.vaneck.com/contentassets/ab81eb6df3e841b09edcd88eb9193b9d/5772_gpz-launch_chart-4_2025-6_v1_blog.svg" /></p>
<p class="chart-disclosure">Source: Fortune, Theory Ventures, PitchBook, Goldman Sachs. Past performance is no guarantee of future results.</p>
<h2>The Advantage of Captive Capital</h2>
<p>One of the more compelling aspects of alternative asset managers is their access to long-term capital. Unlike traditional managers who rely on daily liquidity structures like mutual funds or ETFs, these firms typically operate investment vehicles with multi-year lockups or limited liquidity.</p>
<p>These include:</p>
<ul class="content-list">
<li class="mt-2"><strong>Private funds</strong> (LPs, SPVs, etc.)</li>
<li class="mt-2"><strong>Separately managed accounts</strong></li>
<li class="mt-2"><strong>Semi-liquid vehicles</strong> (interval funds, tender offer funds, BDCs, and REITs)</li>
</ul>
<p>These structures allow managers to take a long-term view, supporting more stable fee revenues and enabling them to navigate economic cycles.</p>
<h2>A Full Spectrum of Private Market Opportunity</h2>
<p>Investing in publicly traded alternative asset managers offers exposure across the entire private markets spectrum.</p>
<h3>Private Markets Spectrum</h3>
<div class="wrapped-div">
<table style="width: 100%;">
<tbody>
<tr class="tbl-data">
<td class="tbl-header last">Private Equity / Venture Capital</td>
<td class="tbl-header last text-left">Private Credit</td>
<td class="tbl-header last text-left">Private Infrastructure</td>
<td class="tbl-header last text-left">Private Real Estate</td>
</tr>
<tr class="tbl-data">
<td class="data-td last font-weight-normal">Investment in private companies or buyouts of public companies, with goal of increasing value before exiting through a sale or IPO; or exposure to early-stage companies with the goal of outsized returns if a company is successful.</td>
<td class="data-td data last text-left">Non-bank lending to companies, often in the form of direct loans. Offers investors attractive yields and borrowers customized financing unavailable through traditional lenders.</td>
<td class="data-td data last text-left">Long-term investments in physical assets like transportation, energy, utilities, and digital infrastructure. These assets often provide stable, inflation-linked cash flows.</td>
<td class="data-td data last text-left">Direct investment in commercial or residential property, often through private funds. Focuses on income from rents and capital appreciation from asset management and development.</td>
</tr>
</tbody>
</table>
</div>
<br />
<h2>How to Invest in Private Market Managers</h2>
<p>The <a href="https://www.vaneck.com/us/en/investments/alternative-asset-manager-etf-gpz/holdings/" title="GPZ - VanEck Alternative Asset Manager ETF - Holdings"><strong>VanEck Alternative Asset Manager ETF (GPZ)</strong></a> offers investors targeted exposure to major companies across the private markets spectrum. Holdings include leading firms like Blackstone, Apollo, and KKR, among other major players in private equity, credit, real estate, infrastructure, and venture capital. GPZ is designed to track the performance of the MarketVector Alternative Asset Managers Index, an ultra pure-play index focused on firms whose core business is managing and growing private capital.</p>
<p>Private markets are transforming global capital flows, and alternative asset managers are at the center of that evolution. With GPZ, investors can now gain exposure to this momentum through a liquid and transparent ETF.</p>
<p><a href="https://www.vaneck.com/us/en/investments/alternative-asset-manager-etf-gpz/holdings/" title="GPZ - VanEck Alternative Asset Manager ETF - Holdings"><strong>Learn how GPZ can help you access this fast-growing area of the market</strong></a>.</p>
<p>To receive more <a href="https://www.vaneck.com/us/en/insights/thematic-investing/" title="Thematic Investing Insights"><strong>Thematic Investing</strong></a> insights, <a href="https://www.vaneck.com/us/en/subscribe/" title="Subscription Center"><strong>sign up in our subscription center</strong></a>.</p>
]]></content:encoded>
</item><item rdf:about="https://www.vaneck.com/us/en/blogs/thematic-investing/gpz-delivers-unmatched-access-to-alternative-asset-managers/">
  <title>GPZ Delivers Unmatched Access to Alternative Asset Managers></title>
  <link>https://www.vaneck.com/us/en/blogs/thematic-investing/gpz-delivers-unmatched-access-to-alternative-asset-managers/</link>
  <description><![CDATA[GPZ fills a key gap in the market as the first broad, pure-play ETF providing exposure to leading alternative asset managers from across the private market spectrum.]]></description>
  <dc:creator>Brandon Rakszawski</dc:creator>
  <dc:date>06/05/2025 06:30:00</dc:date>
<content:encoded><![CDATA[

<p>Alternative investing isn't new. For years, institutional and sophisticated investors have allocated capital to private markets, seeking attractive return potential and relatively muted volatility, thanks to the long-term nature of these investments.</p>
<p>As traditional lenders such as banks reduce their exposure to private and middle-market lending, alternative asset managers have stepped in. Private credit has delivered compelling yields and experienced strong growth, making it a standout segment in the private investment landscape. But this growth isn&rsquo;t isolated to private credit. Equity, real estate, and infrastructure have all experienced growth in the private markets.</p>
<h2>Barriers to Participating in Private Market Growth</h2>
<p>Newer structures like business development companies (BDCs), listed closed-end funds, interval funds, and tender offer funds have made private assets more accessible. However, these vehicles often come with trade-offs in the form of higher volatility or less liquidity compared to traditional mutual funds and ETFs.</p>
<p>Investors seeking to capitalize on the growth of the alternative asset management industry itself, rather than just its underlying investments, have had limited options. While it&rsquo;s possible to buy stock in individual firms, there hasn't been a diversified, pure-play ETF that focuses solely on leading alternative asset managers&mdash;until now.</p>
<h2>Why Alternative Asset Managers Now? Structural Shifts Made This Possible</h2>
<p>Historically, many top alternative asset managers were structured as partnerships, which posed tax challenges for ETFs. But over the past several years, many of these firms have converted to corporations, removing key barriers to ETF inclusion.</p>
<p>Additionally, existing ETFs in this space launched years ago were often focused narrowly on private equity and included investment vehicles (like BDCs) managed by these firms. These approaches don&rsquo;t reflect the breadth of today&rsquo;s private market asset managers or include many of the newer, fast-growing managers.</p>
<h2>GPZ: A Targeted Approach to an Evolving Market</h2>
<p>The <strong><a href="/link/018811e6db344b7691fd273a97737194.aspx" title=" GPZ - VanEck Alternative Asset Manager ETF - Overview">VanEck Alternative Asset Manager ETF (GPZ)</a></strong>, listed on June 5, 2025, addresses these gaps. GPZ seeks to track the MarketVector Alternative Asset Managers Index, providing exposure to asset managers primarily engaged in private equity (including venture capital and buyout), private credit, private real estate, and private infrastructure.</p>
<p>Unlike legacy indices, GPZ&rsquo;s index does not include the investment vehicles managed by these firms. That means no BDCs or closed-end funds, just exposure to the asset managers themselves. While this may come with higher short-term volatility than the managers&rsquo; underlying investment vehicles, it offers a purer way to invest in the industry's structural growth.</p>
<div class="flourish-embed flourish-chart" data-src="visualisation/22436488?2429575"><script src="https://public.flourish.studio/resources/embed.js"></script><noscript><img loading="lazy" src="https://public.flourish.studio/visualisation/22436488/thumbnail" width="100%" alt="Targeted Exposure and Legacy Exposure" /></noscript></div>
<p class="chart-disclosure">Source: Morningstar classifications; VanEck research. Figures are as of May 31, 2025. For illustrative purposes only. Indices are unmanaged and are not securities in which investments can be made.</p>

<h3>Top Ten Holdings: MarketVector Alternative Asset Managers Index / As of May 31, 2025</h3>
<div class="wrapped-div">
<table style="width: 100%;">
<tbody>
<tr class="tbl-data">
<td class="tbl-header last">Company</td>
<td class="tbl-header last">Ticker</td>
<td class="tbl-header last text-right">Weight (%)</td>
</tr>
<tr class="tbl-data">
<td class="data-td data last text-left">Brookfield Corp</td>
<td class="data-td data last text-left">BN</td>
<td class="data-td data last text-right">12.59</td>
</tr>
<tr class="tbl-data">
<td class="data-td data last text-left">Blackstone Inc</td>
<td class="data-td data last text-left">BX</td>
<td class="data-td data last text-right">11.16</td>
</tr>
<tr class="tbl-data">
<td class="data-td data last text-left">KKR &amp; Co Inc</td>
<td class="data-td data last text-left">KKR</td>
<td class="data-td data last text-right">10.27</td>
</tr>
<tr class="tbl-data">
<td class="data-td data last text-left">Brookfield Asset Management Ltd</td>
<td class="data-td data last text-left">BAM</td>
<td class="data-td data last text-right">9.03</td>
</tr>
<tr class="tbl-data">
<td class="data-td data last text-left">Apollo Global Management Inc</td>
<td class="data-td data last text-left">APO</td>
<td class="data-td data last text-right">6.98</td>
</tr>
<tr class="tbl-data">
<td class="data-td data last text-left">Ares Management Corp</td>
<td class="data-td data last text-left">ARES</td>
<td class="data-td data last text-right">4.87</td>
</tr>
<tr class="tbl-data">
<td class="data-td data last text-left">Hamilton Lane Inc</td>
<td class="data-td data last text-left">HLNE</td>
<td class="data-td data last text-right">4.83</td>
</tr>
<tr class="tbl-data">
<td class="data-td data last text-left">Intermediate Capital Group PLC</td>
<td class="data-td data last text-left">IGC</td>
<td class="data-td data last text-right">4.43</td>
</tr>
<tr class="tbl-data">
<td class="data-td data last text-left">EQT AB</td>
<td class="data-td data last text-left">EQT</td>
<td class="data-td data last text-right">4.26</td>
</tr>
<tr class="tbl-data">
<td class="data-td data last text-left">Blue Owl Capital Inc.</td>
<td class="data-td data last text-left">OWL</td>
<td class="data-td data last text-right">4.23</td>
</tr>
</tbody>
</table>
</div>
<p class="chart-disclosure">This is not an offer to buy or sell, or recommendation to buy or sell any of the securities mentioned herein. Past performance is no indication of future results.</p>
<h2>Ready to Access the Next Generation of Private Market Exposure?</h2>
<p>GPZ offers a unique, diversified way to gain exposure to the firms fueling the growth of private markets across the full spectrum from private equity and credit to infrastructure and real estate.</p>
<p><a href="/link/018811e6db344b7691fd273a97737194.aspx" title="GPZ - VanEck Alternative Asset Manager ETF - Overview"><strong>Learn how GPZ can help you invest in this structural growth story.</strong></a></p>
<p>To receive more <a href="https://www.vaneck.com/us/en/insights/thematic-investing/" title="Thematic Investing Insights"><strong>Thematic Investing</strong></a> insights, <a href="https://www.vaneck.com/us/en/subscribe/" title="Subscription Center"><strong>sign up in our subscription center</strong></a>.</p>
]]></content:encoded>
</item><item rdf:about="https://www.vaneck.com/us/en/blogs/gold-investing/what-to-know-about-gdxs-index-change/">
  <title>What to Know About GDX’s Index Change></title>
  <link>https://www.vaneck.com/us/en/blogs/gold-investing/what-to-know-about-gdxs-index-change/</link>
  <description><![CDATA[GDX is set to track a new index starting September 19, 2025. Here's a look at how the transition to the MarketVector Global Gold Miners Index may change its portfolio.]]></description>
  <dc:creator> </dc:creator>
  <dc:date>06/05/2025 06:30:00</dc:date>
<content:encoded><![CDATA[

<p><a href="/link/4fc383b5906846ad89213f8f64f0bbe9.aspx" title="Updated Analysis Ahead of GDX Index Change"><strong>View an updated analysis here.</strong></a></p>
<p>Later this year, the <strong><a href="/link/0ef4cceba0a44fbe8de2f60e7952a27d.aspx" title="GDX - VanEck Gold Miners ETF - Overview">VanEck Gold Miners ETF (GDX)</a></strong> will begin tracking a new index. Since its inception, GDX has tracked the NYSE Arca Gold Miners Index. After the market closes on September 19, 2025, GDX will transition to the MarketVector Global Gold Miners Index (MVGDXTR).</p>
<h2>How will GDX holdings change following the index transition?</h2>
<p>The use of free-float market capitalization and other methodology features such as listing exchange eligibility in the MarketVector Global Gold Miners Index mean there may be changes to GDX&rsquo;s portfolio in September. The changes are scheduled to coincide with GDX&rsquo;s regular index reconstitution and rebalance cycle. While the final list of changes will be available closer to the September transition, and the makeup of GDX and the new index are likely to change over the next several months, the table below offers a preliminary look at the key differences between the current and new index methodologies. The majority of the changes noted below are related to the new index&rsquo;s market capitalization considerations.</p>
<h3>Comparison of GDX Holdings vs. MarketVector Global Gold Miners Index as of 6/3/2025</h3>
<div class="wrapped-div mb-3">
<table style="width: 100%; height: 1487.76px;">
<tbody>
<tr class="tbl-data" style="height: 22.3906px;">
<td class="tbl-header last text-right" style="height: 22.3906px;">&nbsp;</td>
<td class="tbl-header last" style="height: 22.3906px;">Ticker</td>
<td class="tbl-header last text-right" style="height: 22.3906px;">GDX Weight</td>
<td class="tbl-header last text-right" style="height: 22.3906px;">MVGDXTR Weight</td>
<td class="tbl-header last text-right" style="height: 22.3906px;">Difference</td>
</tr>
<tr class="tbl-data" style="height: 22.3906px;">
<td class="data-td last" style="height: 22.3906px;">Newmont Corporation</td>
<td class="data-td data last text-left" style="height: 22.3906px;">NEM US</td>
<td class="data-td data last text-right" style="height: 22.3906px;">11.52</td>
<td class="data-td data last text-right" style="height: 22.3906px;">8.95</td>
<td class="data-td data last text-right" style="height: 22.3906px;">-2.57</td>
</tr>
<tr class="tbl-data" style="height: 22.3906px;">
<td class="data-td last" style="height: 22.3906px;">Agnico Eagle Mines Limited</td>
<td class="data-td data last text-left" style="height: 22.3906px;">AEM US</td>
<td class="data-td data last text-right" style="height: 22.3906px;">11.39</td>
<td class="data-td data last text-right" style="height: 22.3906px;">11.48</td>
<td class="data-td data last text-right" style="height: 22.3906px;">0.10</td>
</tr>
<tr class="tbl-data" style="height: 22.3906px;">
<td class="data-td last" style="height: 22.3906px;">Wheaton Precious Metals Corp.</td>
<td class="data-td data last text-left" style="height: 22.3906px;">WPM US</td>
<td class="data-td data last text-right" style="height: 22.3906px;">7.69</td>
<td class="data-td data last text-right" style="height: 22.3906px;">6.05</td>
<td class="data-td data last text-right" style="height: 22.3906px;">-1.64</td>
</tr>
<tr class="tbl-data" style="height: 22.3906px;">
<td class="data-td last" style="height: 22.3906px;">Barrick Mining Corporation</td>
<td class="data-td data last text-left" style="height: 22.3906px;">B US</td>
<td class="data-td data last text-right" style="height: 22.3906px;">6.41</td>
<td class="data-td data last text-right" style="height: 22.3906px;">6.47</td>
<td class="data-td data last text-right" style="height: 22.3906px;">0.06</td>
</tr>
<tr class="tbl-data" style="height: 22.3906px;">
<td class="data-td last" style="height: 22.3906px;">Franco-Nevada Corporation</td>
<td class="data-td data last text-left" style="height: 22.3906px;">FNV US</td>
<td class="data-td data last text-right" style="height: 22.3906px;">6.28</td>
<td class="data-td data last text-right" style="height: 22.3906px;">5.25</td>
<td class="data-td data last text-right" style="height: 22.3906px;">-1.02</td>
</tr>
<tr class="tbl-data" style="height: 22.3906px;">
<td class="data-td last" style="height: 22.3906px;">Anglogold Ashanti PLC</td>
<td class="data-td data last text-left" style="height: 22.3906px;">AU US</td>
<td class="data-td data last text-right" style="height: 22.3906px;">4.90</td>
<td class="data-td data last text-right" style="height: 22.3906px;">5.20</td>
<td class="data-td data last text-right" style="height: 22.3906px;">0.30</td>
</tr>
<tr class="tbl-data" style="height: 22.3906px;">
<td class="data-td last" style="height: 22.3906px;">Gold Fields Limited Sponsored ADR</td>
<td class="data-td data last text-left" style="height: 22.3906px;">GFI US</td>
<td class="data-td data last text-right" style="height: 22.3906px;">4.54</td>
<td class="data-td data last text-right" style="height: 22.3906px;">4.85</td>
<td class="data-td data last text-right" style="height: 22.3906px;">0.31</td>
</tr>
<tr class="tbl-data" style="height: 22.3906px;">
<td class="data-td last" style="height: 22.3906px;">Kinross Gold Corporation</td>
<td class="data-td data last text-left" style="height: 22.3906px;">KGC US</td>
<td class="data-td data last text-right" style="height: 22.3906px;">4.00</td>
<td class="data-td data last text-right" style="height: 22.3906px;">4.94</td>
<td class="data-td data last text-right" style="height: 22.3906px;">0.95</td>
</tr>
<tr class="tbl-data" style="height: 22.3906px;">
<td class="data-td last" style="height: 22.3906px;">Northern Star Resources Ltd</td>
<td class="data-td data last text-left" style="height: 22.3906px;">NST AU</td>
<td class="data-td data last text-right" style="height: 22.3906px;">3.30</td>
<td class="data-td data last text-right" style="height: 22.3906px;">5.20</td>
<td class="data-td data last text-right" style="height: 22.3906px;">1.90</td>
</tr>
<tr class="tbl-data" style="height: 22.3906px;">
<td class="data-td last" style="height: 22.3906px;">Zijin Mining Group Co., Ltd. Class H</td>
<td class="data-td data last text-left" style="height: 22.3906px;">2899 HK</td>
<td class="data-td data last text-right" style="height: 22.3906px;">2.90</td>
<td class="data-td data last text-right" style="height: 22.3906px;">--</td>
<td class="data-td data last text-right" style="height: 22.3906px;">-2.90</td>
</tr>
<tr class="tbl-data" style="height: 22.3906px;">
<td class="data-td last" style="height: 22.3906px;">Evolution Mining Limited</td>
<td class="data-td data last text-left" style="height: 22.3906px;">EVN AU</td>
<td class="data-td data last text-right" style="height: 22.3906px;">2.56</td>
<td class="data-td data last text-right" style="height: 22.3906px;">2.58</td>
<td class="data-td data last text-right" style="height: 22.3906px;">0.01</td>
</tr>
<tr class="tbl-data" style="height: 22.3906px;">
<td class="data-td last" style="height: 22.3906px;">Royal Gold, Inc.</td>
<td class="data-td data last text-left" style="height: 22.3906px;">RGLD US</td>
<td class="data-td data last text-right" style="height: 22.3906px;">2.55</td>
<td class="data-td data last text-right" style="height: 22.3906px;">2.26</td>
<td class="data-td data last text-right" style="height: 22.3906px;">-0.29</td>
</tr>
<tr class="tbl-data" style="height: 22.3906px;">
<td class="data-td last" style="height: 22.3906px;">Alamos Gold Inc.</td>
<td class="data-td data last text-left" style="height: 22.3906px;">AGI US</td>
<td class="data-td data last text-right" style="height: 22.3906px;">2.37</td>
<td class="data-td data last text-right" style="height: 22.3906px;">3.48</td>
<td class="data-td data last text-right" style="height: 22.3906px;">1.11</td>
</tr>
<tr class="tbl-data" style="height: 22.3906px;">
<td class="data-td last" style="height: 22.3906px;">Pan American Silver Corp.</td>
<td class="data-td data last text-left" style="height: 22.3906px;">PAAS US</td>
<td class="data-td data last text-right" style="height: 22.3906px;">1.99</td>
<td class="data-td data last text-right" style="height: 22.3906px;">3.14</td>
<td class="data-td data last text-right" style="height: 22.3906px;">1.15</td>
</tr>
<tr class="tbl-data" style="height: 22.3906px;">
<td class="data-td last" style="height: 22.3906px;">Harmony Gold Mining Co. Ltd. Sponsored ADR</td>
<td class="data-td data last text-left" style="height: 22.3906px;">HMY US</td>
<td class="data-td data last text-right" style="height: 22.3906px;">1.97</td>
<td class="data-td data last text-right" style="height: 22.3906px;">2.13</td>
<td class="data-td data last text-right" style="height: 22.3906px;">0.15</td>
</tr>
<tr class="tbl-data" style="height: 25.7188px;">
<td class="data-td last" style="height: 25.7188px;">Endeavour Mining PLC</td>
<td class="data-td data last text-left" style="height: 25.7188px;">EDV CN</td>
<td class="data-td data last text-right" style="height: 25.7188px;">1.63</td>
<td class="data-td data last text-right" style="height: 25.7188px;">--</td>
<td class="data-td data last text-right" style="height: 25.7188px;">-1.63<sup>*</sup></td>
</tr>
<tr class="tbl-data" style="height: 22.3906px;">
<td class="data-td last" style="height: 22.3906px;">Zhaojin Mining Industry Co., Ltd.</td>
<td class="data-td data last text-left" style="height: 22.3906px;">1818 HK</td>
<td class="data-td data last text-right" style="height: 22.3906px;">1.51</td>
<td class="data-td data last text-right" style="height: 22.3906px;">1.23</td>
<td class="data-td data last text-right" style="height: 22.3906px;">-0.27</td>
</tr>
<tr class="tbl-data" style="height: 22.3906px;">
<td class="data-td last" style="height: 22.3906px;">Coeur Mining, Inc.</td>
<td class="data-td data last text-left" style="height: 22.3906px;">CDE US</td>
<td class="data-td data last text-right" style="height: 22.3906px;">1.18</td>
<td class="data-td data last text-right" style="height: 22.3906px;">1.52</td>
<td class="data-td data last text-right" style="height: 22.3906px;">0.34</td>
</tr>
<tr class="tbl-data" style="height: 22.3906px;">
<td class="data-td last" style="height: 22.3906px;">OR Royalties Inc.</td>
<td class="data-td data last text-left" style="height: 22.3906px;">OR US</td>
<td class="data-td data last text-right" style="height: 22.3906px;">1.05</td>
<td class="data-td data last text-right" style="height: 22.3906px;">1.32</td>
<td class="data-td data last text-right" style="height: 22.3906px;">0.27</td>
</tr>
<tr class="tbl-data" style="height: 22.3906px;">
<td class="data-td last" style="height: 22.3906px;">B2Gold Corp.</td>
<td class="data-td data last text-left" style="height: 22.3906px;">BTG US</td>
<td class="data-td data last text-right" style="height: 22.3906px;">0.99</td>
<td class="data-td data last text-right" style="height: 22.3906px;">1.42</td>
<td class="data-td data last text-right" style="height: 22.3906px;">0.43</td>
</tr>
<tr class="tbl-data" style="height: 22.3906px;">
<td class="data-td last" style="height: 22.3906px;">IAMGOLD Corporation</td>
<td class="data-td data last text-left" style="height: 22.3906px;">IAG US</td>
<td class="data-td data last text-right" style="height: 22.3906px;">0.90</td>
<td class="data-td data last text-right" style="height: 22.3906px;">1.36</td>
<td class="data-td data last text-right" style="height: 22.3906px;">0.45</td>
</tr>
<tr class="tbl-data" style="height: 22.3906px;">
<td class="data-td last" style="height: 22.3906px;">Eldorado Gold Corporation</td>
<td class="data-td data last text-left" style="height: 22.3906px;">EGO US</td>
<td class="data-td data last text-right" style="height: 22.3906px;">0.90</td>
<td class="data-td data last text-right" style="height: 22.3906px;">1.02</td>
<td class="data-td data last text-right" style="height: 22.3906px;">0.12</td>
</tr>
<tr class="tbl-data" style="height: 22.3906px;">
<td class="data-td last" style="height: 22.3906px;">Compania de Minas Buenaventura SAA Sponsored ADR</td>
<td class="data-td data last text-left" style="height: 22.3906px;">BVN US</td>
<td class="data-td data last text-right" style="height: 22.3906px;">0.85</td>
<td class="data-td data last text-right" style="height: 22.3906px;">0.93</td>
<td class="data-td data last text-right" style="height: 22.3906px;">0.08</td>
</tr>
<tr class="tbl-data" style="height: 22.3906px;">
<td class="data-td last" style="height: 22.3906px;">New Gold Inc.</td>
<td class="data-td data last text-left" style="height: 22.3906px;">NGD US</td>
<td class="data-td data last text-right" style="height: 22.3906px;">0.77</td>
<td class="data-td data last text-right" style="height: 22.3906px;">1.12</td>
<td class="data-td data last text-right" style="height: 22.3906px;">0.35</td>
</tr>
<tr class="tbl-data" style="height: 22.3906px;">
<td class="data-td last" style="height: 22.3906px;">Genesis Minerals Limited</td>
<td class="data-td data last text-left" style="height: 22.3906px;">GMD AU</td>
<td class="data-td data last text-right" style="height: 22.3906px;">0.76</td>
<td class="data-td data last text-right" style="height: 22.3906px;">--</td>
<td class="data-td data last text-right" style="height: 22.3906px;">-0.76</td>
</tr>
<tr class="tbl-data" style="height: 22.3906px;">
<td class="data-td last" style="height: 22.3906px;">Hecla Mining Company</td>
<td class="data-td data last text-left" style="height: 22.3906px;">HL US</td>
<td class="data-td data last text-right" style="height: 22.3906px;">0.76</td>
<td class="data-td data last text-right" style="height: 22.3906px;">1.00</td>
<td class="data-td data last text-right" style="height: 22.3906px;">0.24</td>
</tr>
<tr class="tbl-data" style="height: 22.3906px;">
<td class="data-td last" style="height: 22.3906px;">G Mining Ventures Corp.</td>
<td class="data-td data last text-left" style="height: 22.3906px;">GMIN CN</td>
<td class="data-td data last text-right" style="height: 22.3906px;">0.75</td>
<td class="data-td data last text-right" style="height: 22.3906px;">--</td>
<td class="data-td data last text-right" style="height: 22.3906px;">-0.75</td>
</tr>
<tr class="tbl-data" style="height: 22.3906px;">
<td class="data-td last" style="height: 22.3906px;">Perseus Mining Limited</td>
<td class="data-td data last text-left" style="height: 22.3906px;">PRU AU</td>
<td class="data-td data last text-right" style="height: 22.3906px;">0.74</td>
<td class="data-td data last text-right" style="height: 22.3906px;">0.91</td>
<td class="data-td data last text-right" style="height: 22.3906px;">0.16</td>
</tr>
<tr class="tbl-data" style="height: 22.3906px;">
<td class="data-td last" style="height: 22.3906px;">First Majestic Silver Corp.</td>
<td class="data-td data last text-left" style="height: 22.3906px;">AG US</td>
<td class="data-td data last text-right" style="height: 22.3906px;">0.72</td>
<td class="data-td data last text-right" style="height: 22.3906px;">1.03</td>
<td class="data-td data last text-right" style="height: 22.3906px;">0.32</td>
</tr>
<tr class="tbl-data" style="height: 22.3906px;">
<td class="data-td last" style="height: 22.3906px;">OceanaGold Corporation</td>
<td class="data-td data last text-left" style="height: 22.3906px;">OGC CN</td>
<td class="data-td data last text-right" style="height: 22.3906px;">0.69</td>
<td class="data-td data last text-right" style="height: 22.3906px;">1.11</td>
<td class="data-td data last text-right" style="height: 22.3906px;">0.42</td>
</tr>
<tr class="tbl-data" style="height: 22.3906px;">
<td class="data-td last" style="height: 22.3906px;">Equinox Gold Corp.</td>
<td class="data-td data last text-left" style="height: 22.3906px;">EQX US</td>
<td class="data-td data last text-right" style="height: 22.3906px;">0.66</td>
<td class="data-td data last text-right" style="height: 22.3906px;">0.99</td>
<td class="data-td data last text-right" style="height: 22.3906px;">0.33</td>
</tr>
<tr class="tbl-data" style="height: 22.3906px;">
<td class="data-td last" style="height: 22.3906px;">Torex Gold Resources Inc.</td>
<td class="data-td data last text-left" style="height: 22.3906px;">TXG CN</td>
<td class="data-td data last text-right" style="height: 22.3906px;">0.61</td>
<td class="data-td data last text-right" style="height: 22.3906px;">0.82</td>
<td class="data-td data last text-right" style="height: 22.3906px;">0.21</td>
</tr>
<tr class="tbl-data" style="height: 22.3906px;">
<td class="data-td last" style="height: 22.3906px;">Dundee Precious Metals Inc.</td>
<td class="data-td data last text-left" style="height: 22.3906px;">DPM CN</td>
<td class="data-td data last text-right" style="height: 22.3906px;">0.59</td>
<td class="data-td data last text-right" style="height: 22.3906px;">--</td>
<td class="data-td data last text-right" style="height: 22.3906px;">-0.59</td>
</tr>
<tr class="tbl-data" style="height: 22.3906px;">
<td class="data-td last" style="height: 22.3906px;">Sandstorm Gold Ltd.</td>
<td class="data-td data last text-left" style="height: 22.3906px;">SAND US</td>
<td class="data-td data last text-right" style="height: 22.3906px;">0.58</td>
<td class="data-td data last text-right" style="height: 22.3906px;">0.69</td>
<td class="data-td data last text-right" style="height: 22.3906px;">0.11</td>
</tr>
<tr class="tbl-data" style="height: 22.3906px;">
<td class="data-td last" style="height: 22.3906px;">Capricorn Metals Ltd</td>
<td class="data-td data last text-left" style="height: 22.3906px;">CMM AU</td>
<td class="data-td data last text-right" style="height: 22.3906px;">0.55</td>
<td class="data-td data last text-right" style="height: 22.3906px;">--</td>
<td class="data-td data last text-right" style="height: 22.3906px;">-0.55</td>
</tr>
<tr class="tbl-data" style="height: 22.3906px;">
<td class="data-td last" style="height: 22.3906px;">K92 Mining, Inc.</td>
<td class="data-td data last text-left" style="height: 22.3906px;">KNT CN</td>
<td class="data-td data last text-right" style="height: 22.3906px;">0.55</td>
<td class="data-td data last text-right" style="height: 22.3906px;">0.71</td>
<td class="data-td data last text-right" style="height: 22.3906px;">0.17</td>
</tr>
<tr class="tbl-data" style="height: 22.3906px;">
<td class="data-td last" style="height: 22.3906px;">Regis Resources Limited</td>
<td class="data-td data last text-left" style="height: 22.3906px;">RRL AU</td>
<td class="data-td data last text-right" style="height: 22.3906px;">0.55</td>
<td class="data-td data last text-right" style="height: 22.3906px;">--</td>
<td class="data-td data last text-right" style="height: 22.3906px;">-0.55</td>
</tr>
<tr class="tbl-data" style="height: 22.3906px;">
<td class="data-td last" style="height: 22.3906px;">SSR Mining Inc</td>
<td class="data-td data last text-left" style="height: 22.3906px;">SSRM US</td>
<td class="data-td data last text-right" style="height: 22.3906px;">0.53</td>
<td class="data-td data last text-right" style="height: 22.3906px;">0.75</td>
<td class="data-td data last text-right" style="height: 22.3906px;">0.22</td>
</tr>
<tr class="tbl-data" style="height: 22.3906px;">
<td class="data-td last" style="height: 22.3906px;">Gold Road Resources Ltd</td>
<td class="data-td data last text-left" style="height: 22.3906px;">GOR AU</td>
<td class="data-td data last text-right" style="height: 22.3906px;">0.50</td>
<td class="data-td data last text-right" style="height: 22.3906px;">--</td>
<td class="data-td data last text-right" style="height: 22.3906px;">-0.50</td>
</tr>
<tr class="tbl-data" style="height: 22.3906px;">
<td class="data-td last" style="height: 22.3906px;">Ramelius Resources Limited</td>
<td class="data-td data last text-left" style="height: 22.3906px;">RMS AU</td>
<td class="data-td data last text-right" style="height: 22.3906px;">0.46</td>
<td class="data-td data last text-right" style="height: 22.3906px;">--</td>
<td class="data-td data last text-right" style="height: 22.3906px;">-0.46</td>
</tr>
<tr class="tbl-data" style="height: 22.3906px;">
<td class="data-td last" style="height: 22.3906px;">Wesdome Gold Mines Ltd.</td>
<td class="data-td data last text-left" style="height: 22.3906px;">WDO CN</td>
<td class="data-td data last text-right" style="height: 22.3906px;">0.44</td>
<td class="data-td data last text-right" style="height: 22.3906px;">0.60</td>
<td class="data-td data last text-right" style="height: 22.3906px;">0.16</td>
</tr>
<tr class="tbl-data" style="height: 22.3906px;">
<td class="data-td last" style="height: 22.3906px;">West African Resources Ltd</td>
<td class="data-td data last text-left" style="height: 22.3906px;">WAF AU</td>
<td class="data-td data last text-right" style="height: 22.3906px;">0.44</td>
<td class="data-td data last text-right" style="height: 22.3906px;">--</td>
<td class="data-td data last text-right" style="height: 22.3906px;">-0.44</td>
</tr>
<tr class="tbl-data" style="height: 22.3906px;">
<td class="data-td last" style="height: 22.3906px;">Emerald Resources NL</td>
<td class="data-td data last text-left" style="height: 22.3906px;">EMR AU</td>
<td class="data-td data last text-right" style="height: 22.3906px;">0.44</td>
<td class="data-td data last text-right" style="height: 22.3906px;">--</td>
<td class="data-td data last text-right" style="height: 22.3906px;">-0.44</td>
</tr>
<tr class="tbl-data" style="height: 22.3906px;">
<td class="data-td last" style="height: 22.3906px;">MAG Silver Corp.</td>
<td class="data-td data last text-left" style="height: 22.3906px;">MAG US</td>
<td class="data-td data last text-right" style="height: 22.3906px;">0.43</td>
<td class="data-td data last text-right" style="height: 22.3906px;">0.50</td>
<td class="data-td data last text-right" style="height: 22.3906px;">0.07</td>
</tr>
<tr class="tbl-data" style="height: 22.3906px;">
<td class="data-td last" style="height: 22.3906px;">Calibre Mining Corp.</td>
<td class="data-td data last text-left" style="height: 22.3906px;">CXB CN</td>
<td class="data-td data last text-right" style="height: 22.3906px;">0.43</td>
<td class="data-td data last text-right" style="height: 22.3906px;">--</td>
<td class="data-td data last text-right" style="height: 22.3906px;">-0.43</td>
</tr>
<tr class="tbl-data" style="height: 22.3906px;">
<td class="data-td last" style="height: 22.3906px;">Fortuna Mining Corp.</td>
<td class="data-td data last text-left" style="height: 22.3906px;">FSM US</td>
<td class="data-td data last text-right" style="height: 22.3906px;">0.43</td>
<td class="data-td data last text-right" style="height: 22.3906px;">0.65</td>
<td class="data-td data last text-right" style="height: 22.3906px;">0.22</td>
</tr>
<tr class="tbl-data" style="height: 22.3906px;">
<td class="data-td last" style="height: 22.3906px;">Vault Minerals Limited</td>
<td class="data-td data last text-left" style="height: 22.3906px;">VAU AU</td>
<td class="data-td data last text-right" style="height: 22.3906px;">0.42</td>
<td class="data-td data last text-right" style="height: 22.3906px;">--</td>
<td class="data-td data last text-right" style="height: 22.3906px;">-0.42</td>
</tr>
<tr class="tbl-data" style="height: 22.3906px;">
<td class="data-td last" style="height: 22.3906px;">Westgold Resources Ltd</td>
<td class="data-td data last text-left" style="height: 22.3906px;">WGX AU</td>
<td class="data-td data last text-right" style="height: 22.3906px;">0.41</td>
<td class="data-td data last text-right" style="height: 22.3906px;">0.53</td>
<td class="data-td data last text-right" style="height: 22.3906px;">0.13</td>
</tr>
<tr class="tbl-data" style="height: 22.3906px;">
<td class="data-td last" style="height: 22.3906px;">Centerra Gold Inc.</td>
<td class="data-td data last text-left" style="height: 22.3906px;">CG CN</td>
<td class="data-td data last text-right" style="height: 22.3906px;">0.33</td>
<td class="data-td data last text-right" style="height: 22.3906px;">--</td>
<td class="data-td data last text-right" style="height: 22.3906px;">-0.33</td>
</tr>
<tr class="tbl-data" style="height: 22.3906px;">
<td class="data-td last" style="height: 22.3906px;">DRDGOLD Ltd. Sponsored ADR</td>
<td class="data-td data last text-left" style="height: 22.3906px;">DRD US</td>
<td class="data-td data last text-right" style="height: 22.3906px;">0.29</td>
<td class="data-td data last text-right" style="height: 22.3906px;">--</td>
<td class="data-td data last text-right" style="height: 22.3906px;">-0.29</td>
</tr>
<tr class="tbl-data" style="height: 22.3906px;">
<td class="data-td last" style="height: 22.3906px;">Pan African Resources PLC</td>
<td class="data-td data last text-left" style="height: 22.3906px;">PAN SJ</td>
<td class="data-td data last text-right" style="height: 22.3906px;">0.28</td>
<td class="data-td data last text-right" style="height: 22.3906px;">--</td>
<td class="data-td data last text-right" style="height: 22.3906px;">-0.28</td>
</tr>
<tr class="tbl-data" style="height: 22.3906px;">
<td class="data-td last" style="height: 22.3906px;">Aya Gold &amp; Silver Inc.</td>
<td class="data-td data last text-left" style="height: 22.3906px;">AYA CN</td>
<td class="data-td data last text-right" style="height: 22.3906px;">0.26</td>
<td class="data-td data last text-right" style="height: 22.3906px;">--</td>
<td class="data-td data last text-right" style="height: 22.3906px;">-0.26</td>
</tr>
<tr class="tbl-data" style="height: 22.3906px;">
<td class="data-td last" style="height: 22.3906px;">Aris Mining Corp.</td>
<td class="data-td data last text-left" style="height: 22.3906px;">ARMN US</td>
<td class="data-td data last text-right" style="height: 22.3906px;">0.25</td>
<td class="data-td data last text-right" style="height: 22.3906px;">--</td>
<td class="data-td data last text-right" style="height: 22.3906px;">-0.25</td>
</tr>
<tr class="tbl-data" style="height: 22.3906px;">
<td class="data-td last" style="height: 22.3906px;">U.S. Dollar</td>
<td class="data-td data last text-left" style="height: 22.3906px;">-</td>
<td class="data-td data last text-right" style="height: 22.3906px;">0.24</td>
<td class="data-td data last text-right" style="height: 22.3906px;">--</td>
<td class="data-td data last text-right" style="height: 22.3906px;">-0.24</td>
</tr>
<tr class="tbl-data" style="height: 22.3906px;">
<td class="data-td last" style="height: 22.3906px;">Endeavour Silver Corp.</td>
<td class="data-td data last text-left" style="height: 22.3906px;">EXK US</td>
<td class="data-td data last text-right" style="height: 22.3906px;">0.22</td>
<td class="data-td data last text-right" style="height: 22.3906px;">--</td>
<td class="data-td data last text-right" style="height: 22.3906px;">-0.22</td>
</tr>
<tr class="tbl-data" style="height: 22.3906px;">
<td class="data-td last" style="height: 22.3906px;">Silvercorp Metals Inc.</td>
<td class="data-td data last text-left" style="height: 22.3906px;">SVM US</td>
<td class="data-td data last text-right" style="height: 22.3906px;">0.19</td>
<td class="data-td data last text-right" style="height: 22.3906px;">--</td>
<td class="data-td data last text-right" style="height: 22.3906px;">-0.19</td>
</tr>
<tr class="tbl-data" style="height: 22.3906px;">
<td class="data-td last" style="height: 22.3906px;">Resolute Mining Limited</td>
<td class="data-td data last text-left" style="height: 22.3906px;">RSG AU</td>
<td class="data-td data last text-right" style="height: 22.3906px;">0.18</td>
<td class="data-td data last text-right" style="height: 22.3906px;">--</td>
<td class="data-td data last text-right" style="height: 22.3906px;">-0.18</td>
</tr>
<tr class="tbl-data" style="height: 22.3906px;">
<td class="data-td last" style="height: 22.3906px;">Bellevue Gold Limited</td>
<td class="data-td data last text-left" style="height: 22.3906px;">BGL AU</td>
<td class="data-td data last text-right" style="height: 22.3906px;">0.17</td>
<td class="data-td data last text-right" style="height: 22.3906px;">--</td>
<td class="data-td data last text-right" style="height: 22.3906px;">-0.17</td>
</tr>
<tr class="tbl-data" style="height: 22.3906px;">
<td class="data-td last" style="height: 22.3906px;">Artemis Gold Inc</td>
<td class="data-td data last text-left" style="height: 22.3906px;">ARTG CV</td>
<td class="data-td data last text-right" style="height: 22.3906px;">--</td>
<td class="data-td data last text-right" style="height: 22.3906px;">1.06</td>
</tr>
<tr class="tbl-data" style="height: 25.7188px;">
<td class="data-td last" style="height: 25.7188px;">Endeavour Mining PLC</td>
<td class="data-td data last text-left" style="height: 25.7188px;">EDV LN</td>
<td class="data-td data last text-right" style="height: 25.7188px;">--</td>
<td class="data-td data last text-right" style="height: 25.7188px;">1.48</td>
<td class="data-td data last text-right" style="height: 25.7188px;">1.48<sup>*</sup></td>
</tr>
<tr class="tbl-data" style="height: 22.3906px;">
<td class="data-td last" style="height: 22.3906px;">Fresnillo PLC</td>
<td class="data-td data last text-left" style="height: 22.3906px;">FRES LN</td>
<td class="data-td data last text-right" style="height: 22.3906px;">--</td>
<td class="data-td data last text-right" style="height: 22.3906px;">1.14</td>
</tr>
<tr class="tbl-data" style="height: 25.7188px;">
<td class="data-td last" style="height: 25.7188px;">Industrias Penoles SAB de CV</td>
<td class="data-td data last text-left" style="height: 25.7188px;">PE&amp;OLES<sup>*</sup>MF</td>
<td class="data-td data last text-right" style="height: 25.7188px;">--</td>
<td class="data-td data last text-right" style="height: 25.7188px;">1.55</td>
</tr>
<tr class="tbl-data" style="height: 22.3906px;">
<td class="data-td last" style="height: 22.3906px;">Lundin Gold Inc.</td>
<td class="data-td data last text-left" style="height: 22.3906px;">LUG CT</td>
<td class="data-td data last text-right" style="height: 22.3906px;">--</td>
<td class="data-td data last text-right" style="height: 22.3906px;">1.58</td>
</tr>
<tr class="tbl-data" style="height: 22.3906px;">
<td class="data-td last" style="height: 22.3906px;">PT Bumi Resources Minerals Tbk</td>
<td class="data-td data last text-left" style="height: 22.3906px;">BRMS IJ</td>
<td class="data-td data last text-right" style="height: 22.3906px;">--</td>
<td class="data-td data last text-right" style="height: 22.3906px;">0.65</td>
</tr>
<tr class="tbl-data" style="height: 22.3906px;">
<td class="data-td last" style="height: 22.3906px;">Seabridge Gold Inc</td>
<td class="data-td data last text-left" style="height: 22.3906px;">SA UN</td>
<td class="data-td data last text-right" style="height: 22.3906px;">--</td>
<td class="data-td data last text-right" style="height: 22.3906px;">0.35</td>
</tr>
</tbody>
</table>
</div>
<p class="chart-disclosure"><sup>*</sup>&nbsp;This difference represents a listing difference. GDX currently holds the Canadian listing of Endeavour Mining while MVGDXTR includes the London listing.</p>
<p class="chart-disclosure">Source: MarketVector Indexes GmbH; FactSet. Index holdings are not representative of fund holdings. Fund holdings will vary. Visit vaneck.com/gdx for complete fund holdings information. Not intended as a recommendation to buy or sell any securities mentioned herein.</p>

<h2>How does the GDX index change impact the overlap between GDX and GDXJ, the VanEck Junior Gold Miners ETF?</h2>
<p>Below is a preliminary view of the common holdings and weight, which may change as we approach the September transition date.</p>
<h3>Common Holdings: GDX vs GDXJ as of 6/3/2025</h3>
<div class="wrapped-div mb-3">
<table style="width: 100%;">
<tbody>
<tr class="tbl-data">
<td class="tbl-header last text-right">&nbsp;</td>
<td class="tbl-header last text-right">Count</td>
<td class="tbl-header last text-right">Weight (%)</td>
</tr>
<tr class="tbl-data">
<td class="data-td last">GDX</td>
<td class="data-td data last text-right">46</td>
<td class="data-td data last text-right">34.29</td>
</tr>
<tr class="tbl-data">
<td class="data-td last">GDXJ</td>
<td class="data-td data last text-right">46</td>
<td class="data-td data last text-right">78.84</td>
</tr>
</tbody>
</table>
</div>
<p class="chart-disclosure">Overlap includes three companies in which GDX holds a different issuer listing than GDXJ (Endeavour Mining, Centerra Gold, and Pan African Resources). Source: MarketVector Indexes GmbH; FactSet. Index holdings are not representative of fund holdings. Fund holdings will vary. Visit vaneck.com/gdx or vaneck.com/gdxj for complete fund holdings information. Not intended as a recommendation to buy or sell any securities mentioned herein.</p>
<h3>Common Holdings: MVGDXTR vs GDXJ as of 6/3/2025</h3>
<div class="wrapped-div mb-3">
<table style="width: 100%;">
<tbody>
<tr class="tbl-data">
<td class="tbl-header last text-right">&nbsp;</td>
<td class="tbl-header last text-right">Count</td>
<td class="tbl-header last text-right">Weight (%)</td>
</tr>
<tr class="tbl-data">
<td class="data-td last">MVGDXTR</td>
<td class="data-td data last text-right">32</td>
<td class="data-td data last text-right">39.05</td>
</tr>
<tr class="tbl-data">
<td class="data-td last">GDXJ</td>
<td class="data-td data last text-right">32</td>
<td class="data-td data last text-right">72.72</td>
</tr>
</tbody>
</table>
</div>
<p class="chart-disclosure">Source: MarketVector Indexes GmbH; FactSet. Index holdings are not representative of fund holdings. Fund holdings will vary. Visit vaneck.com/gdxj for complete fund holdings information. Not intended as a recommendation to buy or sell any securities mentioned herein.</p>
<h2>What are the key features of the MarketVector Global Gold Miners Index?</h2>
<p>The MarketVector Global Gold Miners Index tracks the performance of companies involved in the gold and silver mining industry. To be initially eligible for the Index, companies must generate at least 50% of their revenues from gold and/or silver mining/royalties/streaming or have at least 50% of their mineral resources related to gold and/or silver.</p>
<p>Learn more about the changes in GDX&rsquo;s regulatory update: <a href="https://vaneck.onlineprospectus.net/vaneck/GDX/index.php?ctype=summary" title="GDX Summary Prospectus" target="_blank" rel="noopener"><strong>Summary Prospectus</strong></a>.</p>
<h2>How can investors assess the new MarketVector indexes?</h2>
<p>MarketVector publishes daily index constituents on its website, <a href="http://www.marketvector.com/" title="MarketVector Indexes" target="_blank" rel="noopener"><strong>www.marketvector.com</strong></a>. The MVGDXTR index guide can be viewed here: <a href="https://www.marketvector.com/rulebooks/download/MVGDX_Index_Guide.pdf" title="MarketVector&trade; Global Gold Miners Index - Index Guide" target="_blank" rel="noopener"><strong>Index Methodology</strong></a>.</p>
<p>To receive more <strong><a href="https://www.vaneck.com/us/en/insights/gold-investing/" title="Gold Investing Insights">Gold Investing</a></strong> insights, <strong><a href="https://www.vaneck.com/us/en/subscribe/" title="Subscription Center">sign up in our subscription center</a></strong>.</p>
]]></content:encoded>
</item><item rdf:about="https://www.vaneck.com/us/en/blogs/municipal-bonds/tourism-and-tax-revenues-an-overlooked-link-to-municipal-bonds/">
  <title>Tourism and Tax Revenues: An Overlooked Link to Municipal Bonds></title>
  <link>https://www.vaneck.com/us/en/blogs/municipal-bonds/tourism-and-tax-revenues-an-overlooked-link-to-municipal-bonds/</link>
  <description><![CDATA[International travel plays a key role in the stability of the municipal bond market. Explore how a slowdown in tourism can impact revenue bonds, local budgets, and investor sentiment.]]></description>
  <dc:creator>Michael Cohick</dc:creator>
  <dc:date>06/02/2025 11:30:00</dc:date>
<content:encoded><![CDATA[

<p>As investors in the municipal bond space, we spend much of our time tracking rate movements, credit trends and fiscal policy. But one external force that could quietly reshape state and local government finances, and in turn, the municipal bond market, is a slowdown in international tourism to the United States. For many municipalities, foreign visitors represent a critical stream of tax revenue. When that revenue disappears or declines meaningfully, the impact can cascade from local budgets to bond markets, particularly for investors exposed to certain kinds of revenue-backed debt.</p>
<h2>Why International Tourism Trends Matter for the Municipal Bond Market</h2>
<p>International travelers aren&rsquo;t just sightseeing, they&rsquo;re spending. And that spending translates into real dollars for states and cities through sales taxes, hotel and occupancy taxes, and transportation-related levies. Places like Florida, New York, Nevada, and California depend heavily on this activity to fund essential services.</p>
<p>In Florida, for example, state sales tax collections topped $36 billion in fiscal year 2023, equal to more than 70% of the state&rsquo;s general revenue according to the Florida Department of Revenue. Similarly, hotel taxes are a core revenue source in cities like Las Vegas and New Orleans &mdash; revenue that declines in lockstep with falling occupancy rates. Add to this the transportation-related taxes from rental cars and ride-hailing services in tourist-heavy metros like San Francisco or Los Angeles, and you begin to see just how embedded tourism is in municipal fiscal health.</p>
<h2>Economic Ripple Effects Beyond Direct Tax Losses</h2>
<p>When international tourism declines, the direct hit to tax collections is only the first domino. Local economies dependent on visitors often experience job losses in hospitality and retail, reduced business profits, and, ultimately, softer income and corporate tax receipts. Hawaii stands out as a high-risk example where tourism accounts for a significant share of the state&rsquo;s GDP, making it especially vulnerable to global travel trends.</p>
<p>While domestic travel can help partially offset these losses, U.S.-based tourists tend to spend less and stay for shorter periods. International travelers, by contrast, often book longer, more expensive trips, making their absence more economically painful.</p>
<h3>Changes in Passengers at Major U.S. Airports</h3>
<p><strong>Rolling 30-day vs. same 30-days a year prior at Orlando, NYC, LA, Atlanta, Denver, Dallas, Houston and DC airports (ORD, JFK, LAX, ATL, DEN, DFW, IAH, IAD).</strong></p>
<p><img loading="lazy" src="https://www.vaneck.com/contentassets/6cf9dd2b107644a8aadd735f6b98be84/5763_muni-blog---may-2025_chart-1_2025-6.svg" class="img-responsive w-100" alt="Changes in Passengers at Major U.S. Airports" /></p>
<p class="chart-disclosure">Source: U.S. Travel Association as of April 2025.</p>

<h2>The Munis Connection: Revenue Bonds Under Pressure</h2>
<p>For muni investors, the key question is how this tourism drag could affect the performance and creditworthiness of municipal bonds. The most immediate concern is revenue bonds. These instruments are directly tied to specific cash flows, many of which rely on tourism-driven activities. Bonds issued to finance airports, convention centers, transit systems, and sports venues in major tourist cities could face cash flow stress if visitor-related revenues fall short.</p>
<p>During the pandemic, we saw how airport revenue bonds lost value when travel came to a halt. A slower, more structural drop in international tourism could lead to similar weakness in other corners of the revenue bond market.</p>
<p>Even general obligation (GO) bonds could be exposed indirectly. If municipalities need to adjust budgets by cutting services, raising taxes, or delaying capital investments, their broader credit profile may weaken. That, in turn, could potentially lead to rating downgrades and higher borrowing costs down the line.</p>
<h2>Investor Sentiment and Market Volatility</h2>
<p>Beyond fundamentals, the bond market is sensitive to sentiment. If international visitor numbers continue to fall, and particularly if recession concerns rise globally, investors may demand a higher risk premium for bonds issued by tourism-reliant issuers. This could drive widening spreads and create volatility in portfolios concentrated in these regions.</p>
<p>Municipalities that are highly dependent on tourism revenues but lack deep fiscal reserves or diversified economies may also face refinancing challenges if bond values decline or borrowing costs rise.</p>
<h2>The Case for National Diversification</h2>
<p>This evolving dynamic makes one thing clear: municipal investors should think carefully about geographic and sector concentrations. Relying heavily on one region or one type of bond structure can expose portfolios to risks that aren't always obvious on the surface, such as changes in international tourism patterns.</p>
<p>This is why investing in the municipal asset class through a nationally diversified strategy, like VanEck&rsquo;s <a href="http://vaneck.com/us/en/blogs/municipal-bonds/municipal-bond-etfs-expect-more-from-your-munis/" title="Municipal Bond ETFs &ndash; Expect More from Your Munis"><strong>municipal bond ETFs</strong></a>, may provide meaningful risk mitigation. By spreading exposure across states, sectors, and credit types, these ETFs are designed to absorb regional shocks while preserving tax income potential and tax-exempt advantages.</p>
<p>Diversification doesn&rsquo;t eliminate risk, but it does help ensure that a slowdown in one part of the country or one sector of the economy doesn&rsquo;t derail an investor&rsquo;s broader income strategy. In a market shaped not just by interest rates but by everything from global travel patterns to local tax receipts, that kind of flexibility is becoming more important than ever.</p>
<p>To receive more <a href="https://www.vaneck.com/us/en/insights/municipal-bonds/" title="Municipal Bonds Insights"><strong>Municipal Bonds</strong></a> insights, <a href="/link/5f45412c2143400497908cea2897f7d3.aspx" title=" Subscription Center"><strong>sign up in our subscription center</strong></a>.</p>
]]></content:encoded>
</item><item rdf:about="https://www.vaneck.com/us/en/blogs/gold-investing/gold-in-a-storm-how-gold-holds-up-during-market-crises/">
  <title>Gold in a Storm: How Gold Holds Up During Market Crises></title>
  <link>https://www.vaneck.com/us/en/blogs/gold-investing/gold-in-a-storm-how-gold-holds-up-during-market-crises/</link>
  <description><![CDATA[Gold proves its worth in crises, outperforming stocks and bonds with resilience and low correlation during market turmoil.]]></description>
  <dc:creator> </dc:creator>
  <dc:date>05/27/2025 06:30:00</dc:date>
<content:encoded><![CDATA[

<p><strong>Key Takeaways</strong></p>
<ul class="content-list">
<li class="mt-2">Historical data shows gold often holds or gains value during severe equity drawdowns and systemic shocks, reinforcing its long-standing role as a crisis hedge in diversified portfolios.</li>
<li class="mt-2">Over more than 50 years, gold has demonstrated minimal correlation with traditional asset classes, helping smooth portfolio returns when markets behave unpredictably.</li>
<li class="mt-2">Thoughtfully sized exposure to gold, can reduce drawdowns and support overall resilience through periods of heightened uncertainty.</li>
</ul>
<p>In times of market stress, investors often search for assets that can preserve value and diversify risk. Gold is once again proving its worth surging more than 25% amid recent global uncertainty, reinforcing that its current breakout is no fluke. This rally is consistent with gold&rsquo;s long-standing reputation as a safe haven. Over the last 50 years, gold has repeatedly earned its place as a crisis hedge. To prove it, we examined how gold performed during some of the most severe U.S. market downturns.</p>
<p>Before we take a look at the crises, let&rsquo;s level set and see how gold holds up versus bonds, stocks, and commodities over the past 50+ years. As you can see in the below chart, gold is a top-performing asset over short-, medium- and long-term windows:</p>
<h3 id="gold-performance-vs-other-asset-classes" class="anchored-block">Gold performance versus other asset classes (1972 to 2025)</h3>
<p><img loading="lazy" class="img-responsive" alt="Gold performance versus other asset classes (1972 to 2025)" src="https://www.vaneck.com/contentassets/4eb498b0935e46dfa61a4d3fef9b7d47/5721_gold-in-a-storm_chart-1_2025-05_v1_blog.svg" /></p>
<p class="chart-disclosure">Source: VanEck, FactSet. Data as of March 2025. &ldquo;U.S. Stocks&rdquo; represented by the S&amp;P 500 Index. &ldquo;U.S. Bonds&rdquo; represented by U.S. Treasury Bond (10-Year Estimate)&mdash;calculated using a constant average duration of 8.105 and the daily yield from U.S. 10-year treasuries to infer a daily return series. &ldquo;Commodities&rdquo; represented by Bloomberg Commodity Index. Past performance is not indicative of future results.</p>
<p>Not only does gold outperform, it outperforms independently. The chart below demonstrates that gold is uncorrelated to stocks and bonds:</p>
<h3>Gold correlation with U.S. stocks and bonds (1972 to 2025)</h3>
<div class="wrapped-div">
<table width="100%">
<tbody>
<tr class="tbl-data">
<td class="tbl-header last text-center">&nbsp;</td>
<td class="tbl-header last text-right">U.S. Stocks</td>
<td class="tbl-header last text-right">U.S. Bonds</td>
<td class="tbl-header last text-right">Gold ($/oz)</td>
</tr>
<tr class="tbl-data">
<td class="data-td last">U.S. Stocks</td>
<td class="data-td data last text-right">1.00</td>
<td class="data-td data last text-right">&nbsp;</td>
</tr>
<tr class="tbl-data">
<td class="data-td last">U.S. Bonds</td>
<td class="data-td data last text-right">0.11</td>
<td class="data-td data last text-right">1.00</td>
<td class="data-td data last text-right">&nbsp;</td>
</tr>
<tr class="tbl-data">
<td class="data-td last">Gold ($/oz)</td>
<td class="data-td data last text-right">0.01</td>
<td class="data-td data last text-right">0.06</td>
<td class="data-td data last text-right">1.00</td>
</tr>
</tbody>
</table>
</div>
<p class="chart-disclosure">Source: VanEck, FactSet. Data as of March 2025. &ldquo;U.S. Stocks&rdquo; represented by the S&amp;P 500 Index. &ldquo;U.S. Bonds&rdquo; represented by U.S. Treasury Bond (10-Year Estimate). Past performance is not indicative of future results.</p>

<h2>Performance of Gold, Stocks, and Bonds in Major Crises</h2>
<h3 id="hover-on-each-period-for-details" class="anchored-block"><strong>HOVER ON EACH PERIOD FOR DETAILS</strong></h3>
<div class="flourish-embed flourish-chart" data-src="visualisation/23457106?2429575"><script src="https://public.flourish.studio/resources/embed.js"></script><noscript><img loading="lazy" src="https://public.flourish.studio/visualisation/23457106/thumbnail" width="100%" alt="Performance of Gold, Stocks, and Bonds in Major Crises" /></noscript></div>
<p class="chart-disclosure"><strong>Source: VanEck, World Gold Council. Data as of December 31, 2024.</strong> Dates utilized: Dot-com bubble = Mar 2000 to Mar 2001; 9/11 = Sep 2001; Global Financial Crisis = Aug 2007 to Mar 2009; Sovereign Debt Crisis = Jan 2010 to Jun 2010; Brexit = June 2016; COVID 19 = Jan 2020 to Mar 2020; Russia/Ukraine = Jan 2022 to Dec 2022; Regional Bank Crisis = Mar 2023; October 7th Attacks = Oct 2023; &ldquo;Global Stocks&rdquo; represented by MSCI World Index. &ldquo;Global Bonds&rdquo; represented by Bloomberg Global Aggregate Bond Index. Past performance is not indicative of future results. Index descriptions included at the end of this presentation.</p>
<h2>Why Gold Matters in a Diversified Portfolio</h2>
<p>As the chart above shows, gold often outperformed when it mattered most, during deep equity drawdowns or systemic shocks. It doesn&rsquo;t always beat stocks or bonds, but in extreme uncertainty, it has historically held or gained value when other asset classes fell.</p>
<p>Advisors and investors looking for robust portfolio construction should consider a strategic allocation to gold (5%&ndash;10%) to reduce drawdowns and improve resilience. In times of crisis, gold doesn&rsquo;t just protect value, it buys time and confidence.</p>
<p>To receive more <strong><a href="https://www.vaneck.com/us/en/insights/gold-investing/" title="Gold Investing Insights">Gold Investing</a></strong> insights, <strong><a href="https://www.vaneck.com/us/en/subscribe/" title="Subscription Center">sign up in our subscription center</a></strong>.</p>
]]></content:encoded>
</item><item rdf:about="https://www.vaneck.com/us/en/blogs/model-portfolios/how-to-protect-portfolio-from-geopolitical-shocks/">
  <title>How to Protect Your Portfolio from Geopolitical Shocks></title>
  <link>https://www.vaneck.com/us/en/blogs/model-portfolios/how-to-protect-portfolio-from-geopolitical-shocks/</link>
  <description><![CDATA[Geopolitical risk has moved to the center stage. From escalating trade tensions and military conflicts to shifting fiscal policies, the global landscape demands a proactive and informed approach.]]></description>
  <dc:creator>Dylan  Desai, CFA </dc:creator>
  <dc:date>05/23/2025 06:30:00</dc:date>
<content:encoded><![CDATA[

<h2>Geopolitical Risk: From Background Noise to Foreground Signal</h2>
<p>Geopolitical risk encompasses events such as armed conflicts, government sanctions, regime changes, and diplomatic standoffs that can disrupt global markets. Historically considered background noise, these risks now sit front and center in investment decision-making.</p>
<p>As we move through the <a href="https://www.vaneck.com/us/en/blogs/investment-outlook/jan-van-eck-2025-outlook-at-the-doorstep-of-the-reckoning/" title="2025 Outlook: At the Doorstep of the Reckoning"><strong>fiscal reckoning</strong></a> in the U.S., investors face a shifting macro environment shaped by spending cuts, tariffs, and recessionary pressures. Following years of stimulus and deficit spending, the U.S. is transitioning from a "two feet on the gas" economy to a more austere fiscal policy. The implications may be recessionary, with a potential rise in unemployment and pressure on corporate earnings. We're starting to see this reflected in forward guidance, or lack thereof, coming out in the Q2 earnings season.</p>
<div class="row mb-3">
<div class="col-md-4 col-xs-12"><a href="https://www.youtube.com/embed/ER6pigk6w5I" data-video="https://youtu.be/ER6pigk6w5I" class="popup-youtube" title="Watch Video"><img loading="lazy" class="img-responsive" style="margin-right: 15px; margin-top: 0px;" src="https://www.vaneck.com/contentassets/d9016f5ef48a4f4b85f2456f57385e71/5704_geopolitical-risk_video_thumbnail_2025-6_v1.jpg" alt="Watch Video" align="left" /></a></div>
<div class="col-md-8 col-xs-12"><br /><strong><a href="https://www.youtube.com/embed/ER6pigk6w5I" data-video=" https://youtu.be/ER6pigk6w5I" class="popup-youtube" title="Watch Video">Watch Video</a><br /></strong><a href="https://www.youtube.com/embed/ER6pigk6w5I" data-video="https://youtu.be/ER6pigk6w5I" class="popup-youtube" title="Watch Video" style="font-size: 16px; font-weight: bold; padding: 10px 0px 0px; margin-right: 20px; width: 202px;">Positioning Portfolios for Resilience from Geopolitical Risk</a></div>
</div>
<h2>The Top Geopolitical Risks Shaping Markets</h2>
<p><strong>The top geopolitical risks of 2025</strong> are redefining investment playbooks:</p>
<ul class="content-list">
<li class="mt-2"><strong>Escalating Global Conflicts and Instability:</strong> Armed conflicts across the mid-east and Eurasia have disrupted energy markets and initiated renewed pressure on global inflation.</li>
<li class="mt-2"><strong>Rising Nationalism and Protectionism:</strong> The trend towards protectionist trade policies includes increasing trade barriers, tariffs, and disruptions to global trade. While U.S. tariffs may have de-escalated recently, expect materially higher tariff policies than the market has been accustomed to.</li>
<li class="mt-2"><strong>Capital Flows and Currency Volatility:</strong> Significant shifts in capital flows with some investors potentially moving away from U.S. dollar-denominated assets, including those that have historically been considered safe havens during market turmoil. Capital seems to be flowing towards currencies and markets where policy may be more predictable per se.</li>
</ul>
<p><strong>How Geopolitical Risk Impacts Investment Performance</strong></p>
<p>Geopolitical shocks can lead to immediate &amp; intense market volatility swings and long-term economic shifts. For instance:</p>
<ul class="content-list">
<li class="mt-2">Russia's invasion of Ukraine triggered a global energy realignment and commodity rally.</li>
<li class="mt-2">Brexit reshaped Europe's financial services landscape.</li>
<li class="mt-2">U.S.-China tariffs in 2018-2019 disrupted supply chains and forced revaluations across sectors.</li>
</ul>
<p>Such events often result in capital flight, increased funding costs, and shifts in corporate investment strategies.</p>
<p>So, does geopolitical risk matter for corporate investment? Absolutely. It alters incentives, narrows planning horizons, and redirects capital towards jurisdictions that are perceived as safer or more stable.</p>
<p>And how does political risk affect foreign investment? It often causes institutional investors to reduce exposure, increase cash allocations, or reweight portfolios toward hard assets and geopolitically insulated markets.</p>
<p>The market activity we saw in early April exemplifies how this volatility rattles investors. U.S. equity markets saw extreme volatility triggered by newly announced tariffs under emergency economic powers. The sweeping policy changes led to a rapid selloff, driven by fears of global retaliation, supply chain disruptions, and economic fallout. Markets briefly stabilized after the White House paused most of the tariffs, leading to a dramatic rebound. However, investor sentiment remained fragile, with ongoing concerns about inflation, corporate earnings, and geopolitical uncertainty highlighting how quickly market mood can shift in response to policy developments.</p>

<h2>Strategies to Protect and Diversify Your Portfolio</h2>
<p>While predicting every crisis is impossible, investors can adopt strategies to enhance portfolio resilience:</p>
<ul class="content-list">
<li class="mt-2"><strong>Go Beyond the Conventional 60/40 Allocation:</strong> Investments in real assets, including gold and other commodities, often retain value or appreciate during global instability.
<ul class="content-list">
<li class="mt-2"><a href="/link/80e68be8744143d88e29ef67f8b7151c.aspx" title="David Schassler &mdash; Head of Multi-Asset Solutions"><strong>David Schassler</strong></a> offers investors a guidebook of how to implement these strategies within a comprehensive asset allocation via the <strong><a href="/link/6e9d9147570e4f1f93468eee6ea2af7a.aspx" title="VanEck Wealth Builder Plus Portfolios">VanEck Wealth Builder Plus</a></strong> and <a href="/link/66b1175c2973436da185f1eb7be4c319.aspx" title="VanEck Wealth Builder Core Portfolios"><strong>Wealth Builder Core</strong></a> Portfolios.</li>
<li class="mt-2">Investors looking to exclusively add real assets to their portfolio may also be intrigued by the <a href="/link/310be2aebcad4c5cb5a89a82fd128841.aspx" title="RAAX - VanEck Real Assets ETF - Overview"><strong>VanEck Real Assets ETF (RAAX)</strong></a>.</li>
</ul>
</li>
<li class="mt-2"><strong>Hedge with Scarce Assets</strong>: Gold's store-of-value properties allow it to remain a reliable hedge against geopolitical shocks. Bitcoin, while more volatile, is increasingly viewed as a potential store of value.
<ul class="content-list">
<li class="mt-2">The <a href="/link/982ab5546e32473b85c7b266bc6b2be6.aspx" title="OUNZ - VanEck Merk Gold ETF - Overview"><strong>VanEck Merk Gold ETF (OUNZ)</strong></a> offers investors exposure to the spot price of gold and the unique option to take physical delivery of that exposure.</li>
<li class="mt-2">The <a href="/link/c754aca617ab4535a8e611ded6d5b13c.aspx" title="HODL - VanEck Bitcoin ETF - Overview"><strong>VanEck Bitcoin ETF (HODL)</strong></a> the most cost-effective product that offers exposure to the spot price of Bitcoin since VanEck has waved the entirety of the fee<sup>*</sup>.</li>
</ul>
</li>
<li class="mt-2"><strong>Diversify Geographically</strong>: Spread investments across multiple countries and regions to reduce centralized exposure to any single geopolitical event.
<ul class="content-list">
<li class="mt-2">VanEck emphasizes the importance of geographic diversification and has highlighted opportunities in markets like India for some time now due to the robust structural growth potential and macro tailwinds. To gain access, consider the <a href="/link/979eec17b7274fcb9dd954ab832450cc.aspx" title="DGIN - VanEck Digital India ETF - Overview"><strong>VanEck Digital India ETF (DGIN)</strong></a> and <a href="/link/6eb23584c31940ce96a2427607da5914.aspx" title="GLIN - VanEck India Growth Leaders ETF - Overview"><strong>VanEck India Growth Leaders ETF (GLIN)</strong></a>.</li>
</ul>
</li>
</ul>
<p>At the top of the year, <a href="/link/3bf292f28484410caabd0c2b9ad69e12.aspx" title="Jan van Eck &mdash; Chief Executive Officer"><strong>Jan van Eck</strong></a> urged investors to diversify their equity exposure and seek hedges for looming inflation risk. That guidance was reiterated in his <a href="https://www.vaneck.com/us/en/blogs/investment-outlook/jan-van-eck-q2-2025-outlook-in-the-middle-of-the-3-reckoning/" title="Q2 2025 Outlook: In the Middle of the 3% Reckoning"><strong>Q2 outlook</strong></a>. The remainder of 2025 may bring additional volatility, potentially creating attractive entry or re-entry points for buyers of U.S. equities; however, even the best investors may find market timing challenging.</p>
<p>In the recent past, U.S. stocks have been the only place to outperform&mdash;largely attributed to the overweight large-cap tech stocks that have delivered tremendous returns and resilience. Is this the case going forward? If mean reversion tells us anything, probably not. This sentiment underscores the importance of global diversification.</p>
<h2>How Smart Investors Stay Grounded During Geopolitical Shocks</h2>
<p>Emotional responses to geopolitical events can lead to suboptimal investment decisions. History shows that investors who maintain discipline during turbulent times often achieve better long-term results. Periods of elevated uncertainty and market dislocation can create compelling entry points for long-term investors. Resisting the urge to react impulsively and remaining invested through cycles is one of the most effective ways to build long-term wealth.</p>
<p>One of my favorite quotes articulates that time in the market beats timing the market.</p>
<i>Kenneth Fisher</i>
<h2>Conclusion: Preparing Your Portfolio for Volatility</h2>
<p>Geopolitical risk is nothing new, but the convergence of trade disputes, military tensions, and pivotal elections in 2025 is testing investor resolve. Navigating these challenges requires a balanced perspective: protecting against downside risk while staying open to the opportunities volatility can bring. As <a href="/link/3bf292f28484410caabd0c2b9ad69e12.aspx" title="Jan van Eck &mdash; Chief Executive Officer"><strong>Jan van Eck</strong></a> noted in his <a href="https://www.vaneck.com/us/en/blogs/investment-outlook/jan-van-eck-q2-2025-outlook-in-the-middle-of-the-3-reckoning/" title="Q2 2025 Outlook: In the Middle of the 3% Reckoning"><strong>recent outlook</strong></a>,</p>
<i>Jan van Eck</i>
<p>To receive more <strong><a href="https://www.vaneck.com/us/en/insights/guided-allocation/" title="Model Portfolio Insights">Model Portfolio</a></strong> insights, <strong><a href="https://www.vaneck.com/us/en/subscribe/" title="Subscription Center">sign up in our subscription center</a></strong>.</p>
]]></content:encoded>
</item><item rdf:about="https://www.vaneck.com/us/en/blogs/digital-assets/matthew-sigel-deconstructing-strategy-mstr-premium-leverage-and-capital-structure/">
  <title>Deconstructing Strategy (MSTR): Premium, Leverage, and Capital Structure></title>
  <link>https://www.vaneck.com/us/en/blogs/digital-assets/matthew-sigel-deconstructing-strategy-mstr-premium-leverage-and-capital-structure/</link>
  <description><![CDATA[We analyze Strategy (MSTR) as a structurally leveraged Bitcoin vehicle, examining its NAV premium, regulatory positioning, and capital structure optionality driving both opportunity and risk.]]></description>
  <dc:creator>Patrick Bush</dc:creator>
  <dc:date>05/22/2025 06:30:00</dc:date>
<content:encoded><![CDATA[

<p><strong>Please note that VanEck has positions in Bitcoin, MSTR, STRK, and STRF.</strong></p>
<h2>Four key takeaways:</h2>
<ul class="content-list">
<li class="mt-2"><strong>MSTR Stock is a Leveraged Bitcoin (BTC) Proxy: </strong>MSTR&rsquo;s stock behaves like a call option on Bitcoin due to its recursive strategy of issuing equity and debt to acquire more BTC as its price rises. This structure provides asymmetric upside and high sensitivity to BTC movements, making MSTR a popular alternative to holding Bitcoin directly.</li>
<li class="mt-2"><strong>MSTR Trades at a Significant Premium to Net Asset Value (NAV): </strong>We calculate a <strong>+112%</strong> premium to the combined fair value of MSTR&rsquo;s BTC and core software business, driven by expectations of future BTC accumulation, regulatory advantages, and speculative positioning.</li>
<li class="mt-2"><strong>MSTR&rsquo;s Premium is a meta-stable &ldquo;Crypto Reactor&rdquo; the powers MSTR: </strong>The Premium fuels its MSTR&rsquo;s equity value through a recursive loop where volatility and Bitcoin exposure attract investor capital, enabling further BTC accumulation that amplifies the Premium.</li>
<li class="mt-2"><strong>Convertible Securities Add Optionality but Heighten Risk: </strong>Strategy&rsquo;s convertibles and preferreds (especially STRK and STRF) offer different levels of yield and BTC exposure, but come with complexity, downside asymmetry, and sensitivity to volatility. The 3/15/2030 convert has the most MSTR exposure, but even these instruments are heavily tied to BTC and the persistence of the Premium.</li>
</ul>
<ul class="content-list">
<li class="mt-2"><a href="#strategy"><strong>What is Strategy?</strong></a></li>
<li class="mt-2"><a href="#sources-mstr"><strong>Sources of MSTR&rsquo;s Equity &ldquo;Premium&rdquo;</strong></a></li>
<li class="mt-2"><a href="#funding-bitcoin"><strong>Funding the Bitcoin Treasury Strategy</strong></a></li>
<li class="mt-2"><a href="#evaluating-strategy"><strong>Evaluating Strategy&rsquo;s Financing Sustainability</strong></a></li>
<li class="mt-2"><a href="#mstr-capital-strategy"><strong>MSTR&rsquo;s Capital Strategy and Bitcoin Yield</strong></a></li>
<li class="mt-2"><a href="#assessing-strategy"><strong>Assessing Strategy&rsquo;s Convertible Bonds</strong></a></li>
<li class="mt-2"><a href="#strk-overview"><strong>STRK Overview and Analysis</strong></a></li>
<li class="mt-2"><a href="#strf-overview"><strong>STRF Overview and Analysis</strong></a></li>
<li class="mt-2"><a href="#conclusion"><strong>Conclusion on Strategy&rsquo;s Capital Stack</strong></a></li>
<li class="mt-2"><a href="#recommendations"><strong>Recommendations for Bitcoin Treasury Strategy Firms</strong></a></li>
<li class="mt-2"><a href="#key-risks"><strong>Key Risks to Strategy&rsquo;s Bitcoin-Financing Model</strong></a></li>
</ul>
<p>Strategy (MSTR) accounts for nearly one-third of the pure-play equity-to-crypto market capitalization and represents 10% of the <a href="https://www.marketvector.com/indexes/sector/mvis-global-digital-assets-equity" title="Market Vector Global Digital Assets Equity Index" target="_blank" rel="noopener"><strong>Market Vector Global Digital Assets Equity Index</strong></a> (MVDAPP) Index. As a result, the decision to include it in a portfolio is a key consideration for investment managers aiming to convert the digital asset transformation into alpha.</p>
<p>There is ongoing debate around the merits of exposure to MSTR versus Bitcoin (BTC) or even leveraged BTC, driven by the complexities of Strategy&rsquo;s capital structure. This calculus is further complicated by Strategy&rsquo;s issuance of convertible bonds and equity instruments, including high-yielding convertible preferred shares (STRK) and even higher-yielding non-convertible preferred shares (STRF).</p>
<p>In this note, we assess the structure and evaluate the benefits and drawbacks of taking positions within Strategy&rsquo;s equity or debt stack. We find MSTR common stock to be the superior investment decision compared to the other options offered by Strategy. We assert this view based on the following reasons:</p>
<ol class="content-list">
<li class="mt-2">Greatest exposure to BTC</li>
<li class="mt-2">Simplicity of investment strategy</li>
<li class="mt-2">Strongest risk/return profile</li>
</ol>
<h2 id="strategy" class="jump-link-nav anchored-block" data-jumplink-title="What is Strategy?">What is Strategy?</h2>
<p>Strategy (formerly MicroStrategy) is a provider of enterprise analytics software that pioneered the concept of a corporate &ldquo;Bitcoin Treasury.&rdquo; In August 2020, Strategy calculated that the significant cash reserves on its balance sheet were vulnerable to inflation in the then-low-interest rate environment. Strategy&rsquo;s opening move of its Bitcoin Treasury Strategy was to employ <strong>$250M</strong> of its balance sheet&rsquo;s cash to buy<strong> 21,454 BTC</strong>.</p>
<p>In December 2020, Strategy issued <strong>$650M</strong> in convertible notes and committed its purpose to buying BTC through financial alchemy. Thereafter, Strategy transformed itself into a levered Bitcoin financial vehicle rather than a straightforward enterprise software business. Using leverage and issuing various forms of equity, Strategy has grown to hold <strong>2.7%</strong> of Bitcoin&rsquo;s total supply, corresponding to <strong>$61B at the time of writing.</strong></p>
<p>Strategy&rsquo;s stated aim is to maximize the price of MSTR by increasing the BTC &ldquo;backing&rdquo; of each common share. By issuing debt or equity, Strategy accretes the amount of BTC per share and terms this dynamic as &ldquo;Bitcoin Yield.&rdquo; Leverage and additional equity issuance are added opportunistically when investor appetite is high during periods of Bitcoin price appreciation. As a result, Strategy&rsquo;s BTC exposure and leverage are recursive in nature because it is expected to grow over time. As BTC appreciates, the value of Strategy&rsquo;s BTC stack appreciates so it can re-lever itself by issuing debt to buy more BTC. On the equity side, bull markets in BTC drive favorable capital markets for MSTR common stock, which enables the Strategy to sell equity for additional Bitcoin. The result is that MSTR stock offers accelerating exposure to BTC that advances in tandem with BTC price appreciation. Therefore, the price dynamics of MSTR somewhat resemble a call option on BTC.</p>
<h2 id="sources-mstr" class="jump-link-nav anchored-block" data-jumplink-title="MSTR Premium">Understanding the Sources of MSTR&rsquo;s Equity &ldquo;Premium&rdquo;</h2>
<p>MSTR&rsquo;s common equity currently trades at a premium (&ldquo;The Premium&rdquo;) to the combined value of its BTC NAV and Strategy&rsquo;s underlying software business. At the time of writing, MSTR common equity trades at (+<strong>112%</strong>) to the fair value of its cache of underlying assets (BTC Holdings + Core Business). Mathematically, we define this as:</p>
<p><img loading="lazy" class="img-responsive w-100" src="https://www.vaneck.com/contentassets/f50e318c68c34d45b447e216fcf8bae1/5702_mtsr-blog_infog-1_2025-5_v3.svg" alt="Understanding the Sources of MSTR&rsquo;s Equity &ldquo;Premium&rdquo;" /></p>
<p class="chart-disclosure">Source: VanEck Research as of 3/25/2025</p>
<p>Many debate the causes of MSTR&rsquo;s Premium, but we believe it is driven by four components:</p>
<ol class="content-list">
<li class="mt-2">Expectations of Strategy&rsquo;s future BTC holdings</li>
<li class="mt-2">Limited investor options for BTC exposure</li>
<li class="mt-2">Leverage to BTC and the advantages of Strategy&rsquo;s leverage</li>
<li class="mt-2">Speculation</li>
</ol>
<p>The <strong>first</strong> component of MSTR&rsquo;s Premium is market expectations around Strategy&rsquo;s future Bitcoin holdings. The expected future value of Strategy&rsquo;s Bitcoin holdings can be estimated using three key factors: the &ldquo;terminal&rdquo; number of Bitcoins held, the projected future price of Bitcoin, and the discount rate applied to those holdings. A significant portion of the Premium on MSTR stock comes from market recognition that the company will likely continue purchasing more Bitcoin over time. A positive Premium suggests that each BTC will also grow in value and therefore reflects the discounted future price of BTC.</p>
<p>The <strong>second</strong> component, which can be described as a "regulatory premium," stems from structural limitations in the investment landscape. Many institutional and individual investors are restricted from directly purchasing Bitcoin due to regulatory constraints, investment mandates, distribution bottlenecks, or the lack of secure custody solutions. Since many investors cannot access capital-efficient, leveraged exposure to Bitcoin, they invest in MSTR. Numerous jurisdictions treat Bitcoin unfavorably for tax treatment and capital holding requirements, which causes investors to favor a publicly traded equity vehicle like MSTR. Because it is a common stock, MSTR also offers financial advantages as a collateral asset. These investor limitations render MSTR an attractive proxy for Bitcoin exposure, particularly for investors otherwise excluded from the asset class.</p>
<p>The <strong>third</strong> component of MSTR&rsquo;s Premium is the market's recognition of Michael Saylor&rsquo;s ability to use financial leverage in ways that most investors cannot. Saylor has demonstrated the capacity to raise large amounts of capital at low interest rates, and his corporate structure provides resilience during Bitcoin market drawdowns. Unlike typical margin traders, who are often forced to liquidate in downturns, Saylor can sustain losses and maintain long-term positions. During parts of 2022 and 2023, even as Strategy&rsquo;s equity deficit reached hundreds of millions of dollars, MSTR's market capitalization remained in the billions, reflecting investor confidence in the long-term leverage structure offered by Strategy.</p>
<p>MSTR&rsquo;s unique dynamics turbocharge its 30-day historical volatility to an astronomical ~<strong>113%</strong> compared to BTC&rsquo;s at <strong>~55%</strong>. In summary, MSTR equity gives investors convenient access to a levered BTC vehicle that trades on public equity venues. The Premium contributes the bulk of the volatility and performance of MSTR&rsquo;s stock. We find these figures by deconstructing the weights, correlations, and volatilities in the portfolio that is MSTR (BTC + Business + Premium). The total contribution to returns is <strong><em>96.5%,</em></strong> while its volatility contribution is around <strong><em>87.5%</em></strong>.</p>
<div class="wrapped-div">
<table style="width: 100%;">
<tbody>
<tr class="tbl-data">
<td class="tbl-header last">1/2/2025-3/25/2025</td>
<td class="tbl-header last text-right">Premium (%)</td>
<td class="tbl-header last text-right">Business (QQQ) (%)</td>
<td class="tbl-header last text-right">BTC (%)</td>
</tr>
<tr class="tbl-data">
<td class="data-td last">Weight</td>
<td class="data-td data last text-right">49.45</td>
<td class="data-td data last text-right">1.12</td>
<td class="data-td data last text-right">49.44</td>
</tr>
<tr class="tbl-data">
<td class="data-td last">Return</td>
<td class="data-td data last text-right">30.85</td>
<td class="data-td data last text-right">0.00</td>
<td class="data-td data last text-right">2.21</td>
</tr>
<tr class="tbl-data">
<td class="data-td last">Volatility</td>
<td class="data-td data last text-right">192.17</td>
<td class="data-td data last text-right">20.94</td>
<td class="data-td data last text-right">43.21</td>
</tr>
<tr class="tbl-data">
<td class="data-td last">Return Contribution</td>
<td class="data-td data last text-right">96.56</td>
<td class="data-td data last text-right">0.00</td>
<td class="data-td data last text-right">6.92</td>
</tr>
<tr class="tbl-data">
<td class="data-td last">Volatility Contribution</td>
<td class="data-td data last text-right">87.48</td>
<td class="data-td data last text-right">0.14</td>
<td class="data-td data last text-right">12.39</td>
</tr>
</tbody>
</table>
</div>
<br />
<div class="wrapped-div">
<table style="width: 100%;">
<tbody>
<tr class="tbl-data">
<td class="tbl-header last">Correlations</td>
<td class="tbl-header last text-right">Premium (%)</td>
<td class="tbl-header last text-right">Business (QQQ) (%)</td>
<td class="tbl-header last text-right">BTC (%)</td>
</tr>
<tr class="tbl-data">
<td class="data-td last">Premium</td>
<td class="data-td data last text-right">1.00</td>
<td class="data-td data last text-right">0.54</td>
<td class="data-td data last text-right">0.47</td>
</tr>
<tr class="tbl-data">
<td class="data-td last">Business (QQQ)</td>
<td class="data-td data last text-right">0.54</td>
<td class="data-td data last text-right">1.00</td>
<td class="data-td data last text-right">0.48</td>
</tr>
<tr class="tbl-data">
<td class="data-td last">BTC</td>
<td class="data-td data last text-right">0.47</td>
<td class="data-td data last text-right">0.48</td>
<td class="data-td data last text-right">1.00</td>
</tr>
</tbody>
</table>
</div>
<p class="chart-disclosure mt-3">We use QQQ (Invesco&rsquo;s NASDAQ-100 ETF) as a proxy for tech sector exposure, particularly large-cap software and cloud companies, to represent the characteristics of MSTR&rsquo;s core business.</p>
<p class="chart-disclosure">Source: VanEck Research as of 3/26/2025. <strong>Past performance is no guarantee of future results. The information, valuation scenarios, and price targets in this blog are not intended as financial advice or any call to action, a recommendation to buy or sell, or as a projection of how bitcoin will perform in the future. Actual future performance of bitcoin is unknown, and may differ significantly from the hypothetical results depicted here. There may be risks or other factors not accounted for in the scenarios presented that may impede the performance. These are solely the results of a simulation based on our research and are for illustrative purposes only. Please conduct your own research and draw your own conclusions.</strong></p>
<p>The <strong>fourth </strong>component of MSTR&rsquo;s Premium stems from speculative trading dynamics tied to MSTR&rsquo;s volatility and capital structure. Since the Premium contributes heavily to MSTR&rsquo;s returns and volatility, any disruption in the core drivers of the Premium would be very detrimental to MSTR&rsquo;s share price. This is because Saylor harvests MSTR volatility to fund purchases of BTC. As we expand upon below, Saylor&rsquo;s preferred method of financing BTC purchases is, in order, preferred equity, convertible preferred equity, convertible debt, and common equity. This order is based on the &ldquo;BTC Gains&rdquo; afforded to common shareholders, which are driven by the BTC attributable to each common share. Selling preferred equity, for example, adds share dilution, and the proceeds are cycled directly into BTC gains for common shareholders.</p>
<p>These securities that Strategy markets are popular with investors because MSTR&rsquo;s high volatility translates into numerous trading opportunities across Strategy&rsquo;s capital stack and options on MSTR. In fact, Strategy is able to maintain low interest costs on its convertible debt because MSTR&rsquo;s volatility makes the convertible debt&rsquo;s option component very valuable. Arguably, Strategy prices this option value cheaply to appeal to relative value trading entities. These sophisticated arbitrageurs make relative value volatility trades between the various slivers of Strategy&rsquo;s securities.</p>
<p>The result is a circular relationship between Strategy&rsquo;s Premium and its ability to finance more BTC purchases. The Premium provides the bulk of MSTR&rsquo;s volatility. However, the Premium is largely a function of the ability of Strategy to finance BTC buys. The market is only willing to buy Strategy&rsquo;s securities because its capital stack is volatile, and Strategy arguably sells this volatility cheaply. On the 1Q2025 earnings call, Saylor calls this reinforcing dynamic a &ldquo;crypto reactor that can run for a long, long period of time.&rdquo;</p>
<p>The Premium shows a clear positive relationship with the price of Bitcoin. Over the past year, it has maintained a correlation of <strong>0.52</strong> to BTC (<strong>T-Stat = 9</strong>) and an approximate beta of <strong>1.77</strong> to BTC. This indicates that as Bitcoin&rsquo;s price increases, the Premium tends to expand, further enhancing MSTR&rsquo;s stock performance. The link between BTC price, speculation, financing ability, and MSTR&rsquo;s valuation forms a self-reinforcing cycle that is central to the company&rsquo;s strategy.</p>
<h3>Correlation of MSTR&rsquo;s Premium to Bitcoin (BTC) Price</h3>
<p><img loading="lazy" class="img-responsive w-100" src="https://www.vaneck.com/contentassets/f50e318c68c34d45b447e216fcf8bae1/5702_mstr-blog_chart-1_2025-05.svg" alt="Correlation of MSTR&rsquo;s Premium to Bitcoin (BTC) Price" /></p>
<p class="chart-disclosure">Source: VanEck Research as of 3/26/2025. <strong>Past performance is no guarantee of future results. Not intended as a recommendation to buy or sell any securities named herein.</strong></p>
<h2 id="funding-bitcoin" class="anchored-block">Funding the Bitcoin Treasury Strategy</h2>
<p>In October 2024, Strategy announced the ambitious 21/21 capital plan to buy BTC with <strong>$42B</strong> raised by selling <strong>$21B</strong> of MSTR equity and <strong>$21B</strong> of fixed income securities by 2027. In the original plan, Strategy would sell <strong>$5B</strong> of equity in 2025, <strong>$7B</strong> in 2026, and <strong>$9B</strong> in 2027. Meanwhile, it would sell fixed income securities at a similar pace of <strong>$5B</strong>, <strong>$7B,</strong> and <strong>$9B</strong> in 2025, 2026, and 2027. These debt issuances targeted a leverage ratio between <strong>20-30%.</strong> Strategy leader Michael Saylor calls this &ldquo;intelligent leverage,&rdquo; not for speculation, but to strategically acquire a &ldquo;dominant digital asset.&rdquo;</p>
<p>Thanks to an unprecedented crypto bull market following the start of the 21/21 plan, By May 2025, it sold all <strong>$21B </strong>worth of MSTR stock offered in its At-The-Market (ATM) program. In his fixed-income bucket, Saylor has sold <strong>$5B</strong> in convertible notes, <strong>$875M </strong>in STRK convertible preferred stock, and <strong>$850M</strong> in non-convertible preferred stock. During Strategy&rsquo;s earnings call on May 1, 2025, the firm announced it would be expanding the financing program to <strong>$84B, </strong>including a new <strong>$21B</strong> MSTR ATM program, the existing <strong>$21B</strong> STRK ATM, and an additional <strong>$14B </strong>in new convertible debt offerings.</p>
<h3>42/42 Capital Raising Plan - 32% Complete</h3>
<p><img loading="lazy" src="https://www.vaneck.com/contentassets/f50e318c68c34d45b447e216fcf8bae1/5702_mtsr-blog_infog-2_2025-5_v2.svg" class="img-responsive w-100" alt="42/42 Capital Raising Plan - 32% Complete" /></p>
<p class="chart-disclosure">Source: <a href="https://assets.contentstack.io/v3/assets/bltf8d808d9b8cebd37/bltf134a12423806bf1/6813e074987681ffa36e35e0/q1-2025-strategy-earnings-presentation.pdf" title="Strategy₿ - Q1 2025 Financial Results" target="_blank" rel="noopener"><strong>Strategy</strong></a> as of 5/7/2025. <strong>Past performance is no guarantee of future results. Not intended as a recommendation to buy or sell any securities named herein.</strong></p>
<p>With BTC trading at ~<strong>$95k</strong> and Strategy&rsquo;s holding at<strong> 555,450 BTC</strong>, we calculate Saylor&rsquo;s leverage ratio ((Debt + Pref)/(Market Cap)) to <a href="https://www.strategy.com/" title="Strategy₿;" target="_blank" rel="noopener"><strong>be 9%</strong></a>. This figure represents the lowest leverage ratio that the Strategy has undertaken since 2020. Given Saylor&rsquo;s lower-than-average leverage ratio and his stated desire for debt that is &ldquo;convertible, unsecured and non-recourse,&rdquo; it is reasonable to expect more capital will be raised through convertible debt in the very near future.</p>
<h3>Funding BTC Purchases by Harvesting Volatility</h3>
<div class="wrapped-div">
<table style="width: 100%;">
<tbody>
<tr class="tbl-data">
<td class="tbl-header last text-left">Issuance Name</td>
<td class="tbl-header last text-right">Issuance Amount</td>
<td class="tbl-header last text-right pl-5">Potential Dilutive Shares</td>
<td class="tbl-header last text-right pl-5">Interest Rate (%)</td>
<td class="tbl-header last text-left pl-5">Status</td>
<td class="tbl-header last text-left pl-5">Maturity</td>
<td class="tbl-header last text-right pl-5">Strike Price ($)</td>
</tr>
<tr class="tbl-data">
<td class="data-td last text-left">2030 Convertible Notes A</td>
<td class="data-td data last text-right">800</td>
<td class="data-td data last text-right pl-5">5.34</td>
<td class="data-td data last text-right pl-5">0.000</td>
<td class="data-td data last text-left pl-5">ITM</td>
<td class="data-td data last text-left pl-5">Mar-2030</td>
<td class="data-td data last text-right pl-5">149.80</td>
</tr>
<tr class="tbl-data">
<td class="data-td last text-left">2031 Convertible Notes</td>
<td class="data-td data last text-right">604</td>
<td class="data-td data last text-right pl-5">2.60</td>
<td class="data-td data last text-right pl-5">0.875</td>
<td class="data-td data last text-left pl-5">ITM</td>
<td class="data-td data last text-left pl-5">Mar-2031</td>
<td class="data-td data last text-right pl-5">232.70</td>
</tr>
<tr class="tbl-data">
<td class="data-td last text-left">2032 Convertible Notes</td>
<td class="data-td data last text-right">800</td>
<td class="data-td data last text-right pl-5">3.92</td>
<td class="data-td data last text-right pl-5">2.250</td>
<td class="data-td data last text-left pl-5">ITM</td>
<td class="data-td data last text-left pl-5">Jun-2032</td>
<td class="data-td data last text-right pl-5">204.30</td>
</tr>
<tr class="tbl-data">
<td class="data-td last text-left">2028 Convertible Notes</td>
<td class="data-td data last text-right">1010</td>
<td class="data-td data last text-right pl-5">5.51</td>
<td class="data-td data last text-right pl-5">0.625</td>
<td class="data-td data last text-left pl-5">ITM</td>
<td class="data-td data last text-left pl-5">Sep-2028</td>
<td class="data-td data last text-right pl-5">183.20</td>
</tr>
<tr class="tbl-data">
<td class="data-td last text-left">2029 Convertible Notes</td>
<td class="data-td data last text-right">3000</td>
<td class="data-td data last text-right pl-5">4.46</td>
<td class="data-td data last text-right pl-5">0.000</td>
<td class="data-td data last text-left pl-5">ITM</td>
<td class="data-td data last text-left pl-5">Dec-2029</td>
<td class="data-td data last text-right pl-5">672.40</td>
</tr>
<tr class="tbl-data">
<td class="data-td last text-left">2030 Convertible Notes B</td>
<td class="data-td data last text-right">2000</td>
<td class="data-td data last text-right pl-5">4.61</td>
<td class="data-td data last text-right pl-5">0.625</td>
<td class="data-td data last text-left pl-5">ITM</td>
<td class="data-td data last text-left pl-5">Mar-2030</td>
<td class="data-td data last text-right pl-5">433.40</td>
</tr>
<tr class="tbl-data">
<td class="data-td last text-left">STRK Convertible Preferred Stock</td>
<td class="data-td data last text-right">744</td>
<td class="data-td data last text-right pl-5">0.00</td>
<td class="data-td data last text-right pl-5">8.000</td>
<td class="data-td data last text-left pl-5">ITM</td>
<td class="data-td data last text-left pl-5">Perpetual</td>
<td class="data-td data last text-right pl-5">1,000</td>
</tr>
<tr class="tbl-data">
<td class="data-td last text-left">STRF Perpetual Preferred</td>
<td class="data-td data last text-right">711</td>
<td class="data-td data last text-right pl-5">N/A</td>
<td class="data-td data last text-right pl-5">10.000</td>
<td class="data-td data last text-left pl-5">N/A</td>
<td class="data-td data last text-left pl-5">Perpetual</td>
<td class="data-td data last text-right pl-5">N/A</td>
</tr>
</tbody>
</table>
</div>
<p class="chart-disclosure mt-3">Source: <a href="https://assets.contentstack.io/v3/assets/bltf8d808d9b8cebd37/bltf134a12423806bf1/6813e074987681ffa36e35e0/q1-2025-strategy-earnings-presentation.pdf" title="Strategy₿ - Q1 2025 Financial Results" target="_blank" rel="noopener"><strong>Strategy</strong></a> 2025 as of 3/25/2025. <strong>Past performance is no guarantee of future results. Not intended as a recommendation to buy or sell any securities named herein.</strong></p>
<p>MSTR stock is highly volatile because it is leveraged to BTC, and that leverage is likely to increase as Strategy finances more BTC purchases. Most investors view taking additional leverage to purchase volatile assets like BTC unfavorably and would, therefore, demand a high interest rate. Strategy addresses this by issuing convertible bonds and convertible preferred stock, which derive much of their value from the embedded option features within these securities.</p>
<p>Sophisticated investors prefer these issuances because they allow them to engage in activities like convertible stock arbitrage. In this risky and complex trading strategy, experienced investors buy convertible bonds against shorting MSTR stock and/or MSTR options to profit from differences in realized volatility, implied volatility, and other components of option pricing models.</p>
<p>This trading dynamic helps Strategy solve the cash flow issues by ensuring lower interest payments on its debt. Because there is great demand for highly volatile convertible securities, Strategy can promise investors very low future interest rate payments. A complex dance occurs between Strategy&rsquo;s capital markets strategy and the market appetite of potential investors.</p>
<h3>Strategy ATM (At-the-Market) Offering Program Updates</h3>
<div class="wrapped-div">
<table style="width: 100%;">
<tbody>
<tr class="tbl-data">
<td class="tbl-header last">&nbsp;</td>
<td class="tbl-header last text-center" colspan="2">During Period<br />April 28, 2025 to May 4, 2025</td>
<td class="tbl-header last text-center">As of May 4, 2025</td>
</tr>
<tr class="tbl-data">
<td class="tbl-header last text-left">ATM Program Summary</td>
<td class="tbl-header last text-left">Shares Sold</td>
<td class="tbl-header last text-right pl-5 text-nowrap">Net Proceeds<sup>(1)</sup><br />($ million)</td>
<td class="tbl-header last text-left pl-5">Available for Issuance and Sale</td>
</tr>
<tr class="tbl-data">
<td class="data-td last text-left">2025 Common ATM</td>
<td class="data-td data last text-left">-</td>
<td class="data-td data last text-right pl-5">-</td>
<td class="data-td data last text-left pl-5">$21 billion of MSTR Shares</td>
</tr>
<tr class="tbl-data">
<td class="data-td data last text-left pl-4"><em>Securities Offered:</em> Class A Common Stock. $0.001 par value per share<br />("MSTR Shares")<br />Size: $21 billion<br />Established: May 1, 2025</td>
<td class="data-td data last text-left">&nbsp;</td>
<td class="data-td data last text-right pl-5">&nbsp;</td>
<td class="data-td data last text-left pl-5">&nbsp;</td>
</tr>
<tr class="tbl-data">
<td class="data-td last text-left">2024 Common ATM<sup>(2)</sup></td>
<td class="data-td data last text-left">353,825 MSTR Shares</td>
<td class="data-td data last text-right pl-5">128.5</td>
<td class="data-td data last text-left pl-5">-</td>
</tr>
<tr class="tbl-data">
<td class="data-td data last text-left pl-4"><em>Securities Offered:</em> MSTR Shares<br />Size: $21 billion<br />Established: October 30, 2024</td>
<td class="data-td data last text-left">&nbsp;</td>
<td class="data-td data last text-right pl-5">&nbsp;</td>
<td class="data-td data last text-left pl-5">&nbsp;</td>
</tr>
<tr class="tbl-data">
<td class="data-td last text-left">STRK ATM</td>
<td class="data-td data last text-left">575,392 STRK Shares</td>
<td class="data-td data last text-right pl-5">51.8</td>
<td class="data-td data last text-left pl-5">$20.87 billion of STRK Shares</td>
</tr>
<tr class="tbl-data">
<td class="data-td data last text-left pl-4"><em>Securities Offered:</em> 8.00% series A perpetual strike preferred stock,<br />$0.001 par value per share ("STRK Shares")<br />Size: $21 billion<br />Established: March 10, 2025</td>
<td class="data-td data last text-left">&nbsp;</td>
<td class="data-td data last text-right pl-5">&nbsp;</td>
<td class="data-td data last text-left pl-5">&nbsp;</td>
</tr>
<tr class="tbl-data">
<td class="data-td last text-left ">Total</td>
<td class="data-td data last text-left">&nbsp;</td>
<td class="data-td data last text-right pl-5">180.3</td>
<td class="data-td data last text-left pl-5">&nbsp;</td>
</tr>
</tbody>
</table>
</div>
<p class="chart-disclosure mt-3">Source: <a href="https://assets.contentstack.io/v3/assets/bltf8d808d9b8cebd37/bltf134a12423806bf1/6813e074987681ffa36e35e0/q1-2025-strategy-earnings-presentation.pdf" title="Strategy₿ - Q1 2025 Financial Results" target="_blank" rel="noopener"><strong>Strategy</strong></a> as of 5/05/2025. <strong>Past performance is no guarantee of future results. Not intended as a recommendation to buy or sell any securities named herein.</strong></p>
<ol class="content-list">
<li class="mt-2">Net proceeds are presented net of sales commission.</li>
<li class="mt-2">The 2024 Common ATM has been substantially depleted and the sales agreement for this program has been terminated by its terms.</li>
</ol>
<p>This involves Strategy pricing the implied volatility, setting a strike price, and adding a redemption price to maximize the tradability of each issuance. For example, a somewhat near-the-market redemption price allows Strategy to place a ceiling on the upside on the option component of its bond. The result is that the derivative behaves more like a &ldquo;capped call,&rdquo; which can exhibit a lower delta than vanilla call options. Choosing strike prices far out of the money on the converts can also lower the value of the option component and thus the delta. Lowering the delta means reducing the number of shares of MSTR stock (or options) needed to hedge the option within the convert. Many convertible arbitrage players favor lower delta issuances because these are less capital-intensive for trading balance sheets.</p>
<h2 id="evaluating-strategy" class="anchored-block">Evaluating Strategy&rsquo;s Financing Sustainability</h2>
<p>While Strategy&rsquo;s core business generates some operational income, its BTC purchases using financing will bring significant cash demands. Based on Strategy&rsquo;s documents and statements, we project total debt to reach <strong>$13B</strong> by the end of 2025 (up from ~<strong>$8B</strong> in April 2025) and <strong>$19B</strong> by the end of 2026. We also expect preferred equity to grow to <strong>$7.5B</strong> in 2025 and <strong>$15.5B</strong> in 2026.</p>
<p>By year-end 2025, we forecast annual interest payments to reach <strong>$48M</strong> and rise to <strong>$87M</strong> by 2026. Meanwhile, preferred stock (STRK) dividend payments are expected to rise from <strong>$217M</strong> in 2025 to <strong>$904M</strong> in 2026. We estimate these figures based on anticipated market demands for MSTR&rsquo;s debt coupon and preferred dividend figures. While Strategy retains the option to pay STRK preference dividends in common shares, doing so would dilute existing MSTR holders by reducing BTC per share.</p>
<p>With a projected revenue of <strong>$475M</strong> in 2025, Strategy depends on financing to cover its fixed income obligations. Of course, the ability to raise new capital is contingent upon the price of Bitcoin. If Bitcoin&rsquo;s price continues on an upward trajectory, securing new capital will prove easy. Between August 2024 and May 2025, Strategy grew its holdings from <strong>226,000 BTC</strong> to <strong>555,450 BTC</strong> by obtaining <strong>$28.7B </strong>in financing. On the other hand, during a crypto downturn between June 2022 and December 2022, Strategy was only able to raise <strong>$49M </strong>and <strong>$11M </strong>from equity and debt sales, respectively. With increased cash outlays materializing due to new fixed income securities offerings, a bear market could prove challenging for Strategy.</p>
<h2>MSTR is a convexity bet on BTC price</h2>
<p>Investing in MSTR is somewhat akin to investing in call options on BTC due to MSTR&rsquo;s leveraged sensitivity (or &lsquo;torque&rsquo;) to BTC price movements. However, it is actually much more similar to trying to dynamically replicate a call option on BTC by adding leveraged exposure as the price increases. Strategy&rsquo;s gambit is to increase its BTC position as financing becomes available, and this typically occurs when the price of BTC is on an upswing. The risk of this strategy is not just prices dropping, but also the contraction of the Premium based upon the collapse of financing BTC purchases. Additionally, this strategy deploys capital at arguably inopportune times, i.e., when BTC reaches highs.</p>
<h3>Net Gains from &lsquo;Na&iuml;ve&rsquo; Buying Beat Strategy's Buys</h3>
<p><img loading="lazy" src="https://www.vaneck.com/contentassets/f50e318c68c34d45b447e216fcf8bae1/5702_mstr-blog_chart-2_2025-05.svg" class="img-responsive w-100" alt="Net Gains from &lsquo;Na&iuml;ve&rsquo; Buying Beat Strategy's Buys" /></p>
<div class="wrapped-div">
<table style="width: 100%;">
<tbody>
<tr class="tbl-data">
<td class="tbl-header last">&nbsp;</td>
<td class="tbl-header last text-right">Strategy</td>
<td class="tbl-header last text-right">Na&iuml;ve Strategy A</td>
<td class="tbl-header last text-right">Na&iuml;ve Strategy B</td>
</tr>
<tr class="tbl-data">
<td class="data-td last">Avg Cost Basis</td>
<td class="data-td data last text-right">$67,458</td>
<td class="data-td data last text-right">$43,043</td>
<td class="data-td data last text-right">$31,877</td>
</tr>
<tr class="tbl-data">
<td class="data-td last">BTC Held</td>
<td class="data-td data last text-right">528,185</td>
<td class="data-td data last text-right">1,117,408</td>
</tr>
<tr class="tbl-data">
<td class="data-td last">Net Gains</td>
<td class="data-td data last text-right">$8,130,619,920</td>
<td class="data-td data last text-right">$43,750,619,920</td>
<td class="data-td data last text-right">$56,937,136,807</td>
</tr>
<tr class="tbl-data">
<td class="data-td last">Notes</td>
<td class="data-td data last text-right">Buys when financing available</td>
<td class="data-td data last text-right">Spreads BTC total of Saylor's purchases<br />evenly across time</td>
<td class="data-td data last text-right">Spreads dollar value of Saylor's purchases<br />evenly across time</td>
</tr>
</tbody>
</table>
</div>
<p class="chart-disclosure mt-3">Source: VanEck Research, <a href="https://assets.contentstack.io/v3/assets/bltf8d808d9b8cebd37/bltf134a12423806bf1/6813e074987681ffa36e35e0/q1-2025-strategy-earnings-presentation.pdf" title="Strategy₿ - Q1 2025 Financial Results" target="_blank" rel="noopener"><strong>Strategy</strong></a> as of 3/26/2025. <strong>Past performance is no guarantee of future results. Not intended as a recommendation to buy or sell any securities named herein.</strong></p>
<p>Strategy&rsquo;s local top buys accrue &ldquo;losses&rdquo; compared to other strategies because they skew higher the average price of Strategy&rsquo;s BTC buys than if BTC is bought randomly. Whether or not Strategy buying is the reason for the local &ldquo;highs and lows&rdquo; is another question. Regardless, this buying strategy at local tops comes at the expense of shareholders as compared to a na&iuml;ve, randomly implemented BTC buying strategy. However, the flip side is that MSTR provides recursive upside to BTC price because of its &ldquo;positive convexity,&rdquo; where BTC price changes cause increasingly higher dollar value of BTC per share, and new financing causes the amount of BTC held per share to also increase. Thus, an investor is exposed to an increasing BTC position as the price of BTC increases.</p>
<p>Replicating Saylor&rsquo;s strategy as an individual investor without a corporate &ldquo;wrapper&rdquo; for the strategy is nearly impossible. While an investor buying BTC futures can see their margin balance grow as BTC rises, enabling more BTC buying, they cannot hold that leverage "patiently" during downturns in price. Futures contracts are marked to market daily, meaning gains and losses are settled regularly, and margin calls must be met immediately in the event of a drawdown. A margin trader will be liquidated if BTC retraces past their margin balance.</p>
<p>So, while a savvy trader might mimic Saylor&rsquo;s strategy and scale into BTC as it appreciates, even a modest pullback could trigger forced liquidations, wiping out this trader&rsquo;s position. This daily margin requirement makes it extremely difficult for individual investors to replicate the Strategy&rsquo;s long-term accumulation strategy using futures. Therefore, Strategy has a substantial financial advantage, enabling it to run a leveraged BTC strategy more effectively.</p>
<h2 id="mstr-capital-strategy" class="anchored-block">MSTR&rsquo;s Capital Strategy and Bitcoin Yield</h2>
<p>Strategy&rsquo;s financial engineering has added substantial debt and shares to its balance sheet to gain more BTC exposure for each common share. This is because Strategy&rsquo;s core goal is to increase the exposure of common shares to the BTC price. Saylor calls the increasing amount of BTC per share <em>&ldquo;BTC Yield.&rdquo; </em>This key performance indicator (KPI) for Strategy is calculated by comparing BTC holdings per common share over time. As of May 2025, the YTD BTC yield is approximately <strong>14% </strong>using issued common shares and around <strong>13% </strong>on a fully diluted basis. Strategy&rsquo;s minimum target for BTC yield in 2025 is <a href="https://assets.contentstack.io/v3/assets/bltf8d808d9b8cebd37/bltf134a12423806bf1/681427785f6726700cbfa9a4/q1-2025-strategy-earnings-presentation.pdf" title="Strategy₿ - Q1 2025 Financial Results" target="_blank" rel="noopener"><strong>25%</strong></a><strong>. </strong>This would correspond to increasing the amount of BTC per <strong>1,000</strong> MSTR shares from ~<strong>1.79</strong> <strong>BTC</strong>, its ratio as of 5/8/2025, to ~<strong>1.99 BTC </strong>by the end of the year.</p>
<h3>Strategy's Bitcoin (BTC) Yield Faces Tough Forward Comps</h3>
<p><img loading="lazy" src="https://www.vaneck.com/contentassets/f50e318c68c34d45b447e216fcf8bae1/5702_mstr-blog_chart-3_2025-05.svg" class="img-responsive w-100" alt="Strategy's Bitcoin (BTC) Yield Faces Tough Forward Comps" /></p>
<p class="chart-disclosure">Source: VanEck Research as of 5/8/2025. <strong>Past performance is no guarantee of future results. Not intended as a recommendation to buy or sell any securities named herein.</strong></p>
<p>The management team of Strategy has many options for creating BTC yield. They can sell various financial products to acquire BTC to increase the numerator or buy common shares to reduce the denominator. Since MSTR trades at a Premium, it is more logical to sell &ldquo;expensive shares&rdquo; or issue debt to acquire BTC. Selling common shares through an ATM to buy BTC may be the simplest method, but it is also the most dilutionary and involves buying the most BTC. Saylor mentions this dynamic on the 1Q2025 Earnings Call, noting they prefer to acquire BTC using sales of perpetual, non-convertible equity stock.</p>
<h3>BTC KPIs Illustration for $100M Insurance of Different Securities</h3>
<p><img loading="lazy" class="img-responsive w-100" src="https://www.vaneck.com/contentassets/f50e318c68c34d45b447e216fcf8bae1/5702_mtsr-blog_infog-3_2025-5_v2.svg" alt="BTC KPIs Illustration for $100M Insurance of Different Securities" /></p>
<p class="chart-disclosure">Source: <strong><a href="https://assets.contentstack.io/v3/assets/bltf8d808d9b8cebd37/bltf134a12423806bf1/6813e074987681ffa36e35e0/q1-2025-strategy-earnings-presentation.pdf" title="Strategy₿ - Q1 2025 Financial Results" target="_blank" rel="noopener">Strategy</a></strong> As of 5/8/2025. <strong>Past performance is no guarantee of future results. Not intended as a recommendation to buy or sell any securities named herein.</strong></p>
<p>If Saylor were to add no additional common shares to achieve Strategy&rsquo;s yield targets, he would have to buy <strong>58,312 BTC,</strong> which would be around <strong>$5.9B at current prices</strong>. On the other hand, if Saylor were to add the exposure using only common stock, he would need to issue ~<strong>25.8M</strong> shares to buy <strong>106,305 BTC</strong> worth <strong>$10.8B</strong> at today&rsquo;s BTC prices. Given the capital markets&rsquo; voracious appetite for Strategy&rsquo;s capital stack, it would seem likely that Strategy will easily achieve a <strong>25%</strong> yield for 2025.</p>
<h2>High BTC Yield is Unsustainable</h2>
<h3>Dollars ($M) required to increase MSTR Yield by 1 Basis Point (90-Day Moving Average)</h3>
<p><img loading="lazy" class="img-responsive w-100" src="https://www.vaneck.com/contentassets/f50e318c68c34d45b447e216fcf8bae1/5702_mstr-blog_chart-4_2025-05.svg" alt="Dollars ($M) required to increase MSTR Yield by 1 Basis Point (90-Day Moving Average)" /></p>
<p class="chart-disclosure">Source: VanEck Research as of 4/11/2025. <strong>Past performance is no guarantee of future results. Not intended as a recommendation to buy or sell any securities named herein.</strong></p>
<p>The reality of Saylor&rsquo;s Bitcoin gambit is that high Bitcoin yields are unsustainable due to decreasing returns to scale. As Strategy accumulates more BTC, generating meaningful additional Bitcoin yield becomes significantly harder. This is because the amount of BTC required to produce each incremental basis point of yield increases disproportionately as the total stack of BTC grows.</p>
<p>For instance, in August 2021, MicroStrategy needed just <strong>2.6 BTC</strong> to generate one basis point of Bitcoin yield. By May 2025, that figure had ballooned to <strong>58 BTC</strong>. Measured in dollar terms, the capital needed rose from approximately <strong>$126k</strong> to <strong>$5.5M </strong>for the same unit of yield. This reflects a fundamental mathematical reality: as the Bitcoin base of Strategy grows, each new BTC contributes less marginal yield, and the capital required to generate yield increases exponentially. This compounding inefficiency creates a declining ceiling on sustainable yield.</p>
<h3 id="assessing-strategy" class="jump-link-nav anchored-block" data-jumplink-title="Convertibles Assessment">Assessing Strategy&rsquo;s Convertible Bonds</h3>
<div class="wrapped-div">
<table style="width: 100%;">
<tbody>
<tr class="tbl-data">
<td class="tbl-header last text-left">&nbsp;</td>
<td class="tbl-header last text-right">STRK</td>
<td class="tbl-header last text-right">9/14/2028</td>
<td class="tbl-header last text-right">12/1/2029</td>
<td class="tbl-header last text-right">3/1/2030</td>
<td class="tbl-header last text-right">3/15/2030</td>
<td class="tbl-header last text-right">3/15/2031</td>
<td class="tbl-header last text-right">6/15/2032</td>
</tr>
<tr class="tbl-data">
<td class="data-td last text-left">Strike Price (Conversion Price)</td>
<td class="data-td data last text-right">$1000.00</td>
<td class="data-td data last text-right">$183.19</td>
<td class="data-td data last text-right">$672.40</td>
<td class="data-td data last text-right">$433.43</td>
<td class="data-td data last text-right">$149.77</td>
<td class="data-td data last text-right">$232.72</td>
<td class="data-td data last text-right">$204.33</td>
</tr>
<tr class="tbl-data">
<td class="data-td last text-left">Conversion Ratio</td>
<td class="data-td data last text-right">0.10</td>
<td class="data-td data last text-right">5.46</td>
<td class="data-td data last text-right">1.49</td>
<td class="data-td data last text-right">2.31</td>
<td class="data-td data last text-right">6.68</td>
<td class="data-td data last text-right">4.30</td>
<td class="data-td data last text-right">4.89</td>
</tr>
<tr class="tbl-data">
<td class="data-td last text-left">Option Value</td>
<td class="data-td data last text-right">$28.96</td>
<td class="data-td data last text-right">$111.83</td>
<td class="data-td data last text-right">$21.97</td>
<td class="data-td data last text-right">$41.32</td>
<td class="data-td data last text-right">$156.03</td>
<td class="data-td data last text-right">$96.85</td>
<td class="data-td data last text-right">$118.57</td>
</tr>
<tr class="tbl-data">
<td class="data-td last text-left">Bond Value</td>
<td class="data-td data last text-right">$55.62</td>
<td class="data-td data last text-right">$72.02</td>
<td class="data-td data last text-right">$59.59</td>
<td class="data-td data last text-right">54.86</td>
<td class="data-td data last text-right">$54.41</td>
<td class="data-td data last text-right">$49.25</td>
<td class="data-td data last text-right">$48.73</td>
</tr>
<tr class="tbl-data">
<td class="data-td last text-left">Model Convertible Bond Value</td>
<td class="data-td data last text-right">$84.58</td>
<td class="data-td data last text-right">$183.85</td>
<td class="data-td data last text-right">$81.56</td>
<td class="data-td data last text-right">$96.19</td>
<td class="data-td data last text-right">$210.44</td>
<td class="data-td data last text-right">$146.10</td>
<td class="data-td data last text-right">$167.30</td>
</tr>
<tr class="tbl-data">
<td class="data-td last text-left">Option Share</td>
<td class="data-td data last text-right">34.24%</td>
<td class="data-td data last text-right">60.83%</td>
<td class="data-td data last text-right">26.94%</td>
<td class="data-td data last text-right">42.96%</td>
<td class="data-td data last text-right">74.15%</td>
<td class="data-td data last text-right">66.29%</td>
<td class="data-td data last text-right">70.87%</td>
</tr>
<tr class="tbl-data">
<td class="data-td last text-left">Bond Share</td>
<td class="data-td data last text-right">65.64%</td>
<td class="data-td data last text-right">39.17%</td>
<td class="data-td data last text-right">73.06%</td>
<td class="data-td data last text-right">57.04%</td>
<td class="data-td data last text-right">25.85%</td>
<td class="data-td data last text-right">33.71%</td>
<td class="data-td data last text-right">29.13%</td>
</tr>
<tr class="tbl-data">
<td class="data-td last text-left">Coupon</td>
<td class="data-td data last text-right">8%</td>
<td class="data-td data last text-right">0.625%</td>
<td class="data-td data last text-right">0%</td>
<td class="data-td data last text-right">0.625%</td>
<td class="data-td data last text-right">0.875%</td>
<td class="data-td data last text-right">2.25%</td>
</tr>
<tr class="tbl-data">
<td class="data-td last text-left">Holder Redemption Clause</td>
<td class="data-td data last text-right">No</td>
<td class="data-td data last text-right">Yes</td>
<td class="data-td data last text-right">Depends</td>
<td class="data-td data last text-right">Yes</td>
</tr>
<tr class="tbl-data">
<td class="data-td last text-left">Strategy Redemption Price (Ceiling)</td>
<td class="data-td data last text-right">N/A</td>
<td class="data-td data last text-right">$238.14</td>
<td class="data-td data last text-right">$874.12</td>
<td class="data-td data last text-right">$563.46</td>
<td class="data-td data last text-right">$194.70</td>
<td class="data-td data last text-right">$302.56</td>
<td class="data-td data last text-right">$265.63</td>
</tr>
<tr class="tbl-data">
<td class="data-td last text-left" colspan="8"><strong>*Convertible Security Option Share of Value: MSTR = 300, VOL = 80</strong></td>
</tr>
</tbody>
</table>
</div>
<p class="chart-disclosure mt-3">Source: VanEck Research, <a href="https://assets.contentstack.io/v3/assets/bltf8d808d9b8cebd37/bltf134a12423806bf1/6813e074987681ffa36e35e0/q1-2025-strategy-earnings-presentation.pdf" title="Strategy₿ - Q1 2025 Financial Results" target="_blank" rel="noopener"><strong>Strategy</strong></a>&nbsp;as of 4/2/2025. <strong>Past performance is no guarantee of future results. The information, valuation scenarios, and price targets in this blog are not intended as financial advice or any call to action, a recommendation to buy or sell, or as a projection of how bitcoin will perform in the future. Actual future performance of bitcoin is unknown, and may differ significantly from the hypothetical results depicted here. There may be risks or other factors not accounted for in the scenarios presented that may impede the performance. These are solely the results of a simulation based on our research and are for illustrative purposes only. Please conduct your own research and draw your own conclusions.</strong></p>
<p>Convertible bonds are hybrid securities that combine the characteristics of fixed income with the upside potential of equity. Specifically, they consist of a traditional bond and an embedded call option that allows holders to convert the bond into MSTR common stock under certain conditions. The total value of a convertible bond equals the value of the bond plus the value of the conversion option. Thus, investors who buy a convertible bond are allocating part of their principal to a corporate bond and part of the principal to a call option. As a result, the prices of convertibles are sensitive to option pricing variables like underlying price, delta, gamma, etc., as well as bond pricing factors like interest rates and credit spreads.</p>
<p>Strategy&rsquo;s convertible notes have added special provisions that cap upside from the attached option and also allow investors some protection on principal. Strategy embeds &ldquo;redemption options&rdquo; which permit the company to buy back the notes at face value plus unpaid accrued interest after the redemption date. The most common provision across Strategy&rsquo;s converts allows the company to redeem the bonds if MSTR is trading at <strong>130%</strong> of the strike price of the convertible bond. This stipulation caps upside on the option value of the bond once the redemption date passes. Strategy also gives its convert holders, except for the 3/1/2030 issue, the ability to sell back their bonds at face value to Strategy for cash past the holder redemption date. This can be considered a bond price floor if Strategy runs into financial trouble.</p>
<h3>The Mar 15, 2030 Convert Has Most Leverage to MSTR Price Due to Its Large Option Component</h3>
<p><img loading="lazy" src="https://www.vaneck.com/contentassets/f50e318c68c34d45b447e216fcf8bae1/5702_mstr-blog_chart-5_2025-05.svg" class="img-responsive w-100" alt="The Mar 15, 2030 Convert Has Most Leverage to MSTR Price Due to Its Large Option Component" /></p>
<p class="chart-disclosure">Source: VanEck Research as of 4/2/2025. <strong>Past performance is no guarantee of future results. Not intended as a recommendation to buy or sell any securities named herein.</strong></p>
<p>Due to the underlying equity&rsquo;s extreme volatility, MicroStrategy&rsquo;s convertible bonds carry substantial embedded option value. Depending on the issuance, the share of a bond&rsquo;s total value attributable to the option can be as high as <strong><em>74%</em></strong>. The higher this proportion, the more exposure the investor has to MSTR stock price movements. This exposure changes materially as MSTR&rsquo;s volatility oscillates and as the options move in or out of the money.</p>
<p>Among the outstanding convertibles, the March 2030 B notes have the risk profile most closely aligned with MSTR&rsquo;s stock. In high-volatility scenarios (e.g., MSTR<strong> VOL &gt; 80</strong>), whether the stock moves up or down, this issue exhibits the most sensitivity to MSTR&rsquo;s price. Conversely, the December 2029 bonds exhibit the least sensitivity, as their embedded option is the furthest out of the money. This results in the option contributing a smaller portion to the overall value of the security, reducing its impact on the bond's price movements.</p>
<h3>Implied Credit Spreads vs. BTC-Adjusted Credit Estimates for Strategy&rsquo;s Convertible Bonds</h3>
<div class="wrapped-div">
<table style="width: 100%;">
<tbody>
<tr class="tbl-data">
<td class="tbl-header last">&nbsp;</td>
<td class="tbl-header last text-right">STRK</td>
<td class="tbl-header last text-right">9/14/2028</td>
<td class="tbl-header last text-right">12/1/2029</td>
<td class="tbl-header last text-right">3/1/2030</td>
<td class="tbl-header last text-right">3/15/2030</td>
<td class="tbl-header last text-right">3/15/2031</td>
<td class="tbl-header last text-right">6/15/2032</td>
</tr>
<tr class="tbl-data">
<td class="data-td last text-left">Current Implied Credit Spread</td>
<td class="data-td data last text-right">700 bps</td>
<td class="data-td data last text-right">500 bps</td>
<td class="data-td data last text-right">975 bps</td>
<td class="data-td data last text-right">1,075 bps</td>
<td class="data-td data last text-right">900 bps</td>
<td class="data-td data last text-right">1,100 bps</td>
<td class="data-td data last text-right">1,250 bps</td>
</tr>
<tr class="tbl-data">
<td class="data-td last text-left">&ldquo;BTC Rating&rdquo;</td>
<td class="data-td data last text-right">5.3x</td>
<td class="data-td data last text-right">52.1x</td>
<td class="data-td data last text-right">13.1x</td>
<td class="data-td data last text-right">10.9x</td>
<td class="data-td data last text-right">7.7x</td>
<td class="data-td data last text-right">7.1x</td>
<td class="data-td data last text-right">6.4x</td>
</tr>
<tr class="tbl-data">
<td class="data-td last text-left">&ldquo;BTC Credit&rdquo; $95k, BTC Vol 50, 0% AR return</td>
<td class="data-td data last text-right">513 bps</td>
<td class="data-td data last text-right">0 bps</td>
<td class="data-td data last text-right">21 bps</td>
<td class="data-td data last text-right">48 bps</td>
<td class="data-td data last text-right">80 bps</td>
<td class="data-td data last text-right">143 bps</td>
<td class="data-td data last text-right">238 bps</td>
</tr>
<tr class="tbl-data">
<td class="data-td last text-left">&ldquo;BTC Credit&rdquo; $95k, BTC Vol 50, 10% AR return</td>
<td class="data-td data last text-right">201 bps</td>
<td class="data-td data last text-right">0 bps</td>
<td class="data-td data last text-right">7 bps</td>
<td class="data-td data last text-right">18 bps</td>
<td class="data-td data last text-right">34 bps</td>
<td class="data-td data last text-right">62 bps</td>
<td class="data-td data last text-right">104 bps</td>
</tr>
<tr class="tbl-data">
<td class="data-td last text-left">&ldquo;BTC Credit&rdquo; $95k, BTC Vol 50, 10% AR return</td>
<td class="data-td data last text-right">60 bps</td>
<td class="data-td data last text-right">0 bps</td>
<td class="data-td data last text-right">2 bps</td>
<td class="data-td data last text-right">6 bps</td>
<td class="data-td data last text-right">13 bps</td>
<td class="data-td data last text-right">24 bps</td>
<td class="data-td data last text-right">40 bps</td>
</tr>
<tr class="tbl-data">
<td class="data-td last text-left">&ldquo;BTC Credit&rdquo; $95k, BTC Vol 50, 30% ARR return</td>
<td class="data-td data last text-right">13 bps</td>
<td class="data-td data last text-right">0 bps</td>
<td class="data-td data last text-right">1 bps</td>
<td class="data-td data last text-right">2 bps</td>
<td class="data-td data last text-right">5 bps</td>
<td class="data-td data last text-right">8 bps</td>
<td class="data-td data last text-right">14 bps</td>
</tr>
</tbody>
</table>
</div>
<p class="chart-disclosure mt-3">Source: VanEck Research, <a href="https://assets.contentstack.io/v3/assets/bltf8d808d9b8cebd37/bltf134a12423806bf1/6813e074987681ffa36e35e0/q1-2025-strategy-earnings-presentation.pdf" title="Strategy₿ - Q1 2025 Financial Results" target="_blank" rel="noopener"><strong>Strategy</strong></a> as of 5/7/2025. <strong>Past performance is no guarantee of future results. Not intended as a recommendation to buy or sell any securities named herein.</strong></p>
<p>The bond component of Strategy&rsquo;s convertible debt is a point of contention due to the high credit spread priced in each of the bonds. The wide credit spreads reflect the market&rsquo;s risk assessment of Saylor&rsquo;s bonds and thus price the bonds &ldquo;cheaply.&rdquo; As Saylor notes on his 1Q2025 earnings call, Strategy&rsquo;s fixed income securities have credit spreads that range between <strong>500 bps</strong> and <strong>1,250 bps</strong>. This places Strategy&rsquo;s bonds in the same credit spread category as &ldquo;double or triple junk bond credit spreads.&rdquo;</p>
<p>Saylor contends these credit spreads are so immense because the market does not properly evaluate the value of the BTC collateral backing them. Because credit agencies do not adequately assess Strategy&rsquo;s bonds, Saylor claims, many long-term investors do not purchase the bonds due to the perceived risk. This lowers their market price and contributes to the wide credit spreads.</p>
<p>Saylor uses option pricing models to create his own analysis of Strategy&rsquo;s converts to make his case that the bonds are underpriced due to incomplete collateral consideration. Saylor creates the concepts of &ldquo;BTC Rating&rdquo; and &ldquo;BTC Risk&rdquo; to describe the potential risk of Strategy&rsquo;s debt. BTC Rating is the multiple of a bond&rsquo;s par value backed by Bitcoin holdings at current BTC market prices. This metric is applied across all bonds and adjusted for seniority preference in the event of a liquidation of Strategy&rsquo;s BTC holdings. For example, the 9/14/2028 bond&rsquo;s BTC Rating is <strong>52.1x</strong> because the value of Strategy&rsquo;s BTC, at current BTC prices and according to the bond&rsquo;s seniority, is <strong>52.1x</strong> the par value of the bond.</p>
<p>Saylor employs a &ldquo;BTC Rating&rdquo; in tandem with an options pricing model, using the current BTC price and volatility to determine the probability that BTC would trade below the BTC liquidation price, making each bondholder whole. He calls this calculated probability &ldquo;BTC Risk,&rdquo; which he then inputs into a bond pricing model to generate a new &ldquo;Credit Spread,&rdquo; which he terms &ldquo;BTC Credit.&rdquo; As the table above demonstrates, Saylor believes the market is wildly overpricing Strategy&rsquo;s probability of default on each bond, causing the bonds to trade cheaper than if the bonds were &ldquo;properly&rdquo; assessed.</p>
<h3>Implied Yield on Bond Component of MSTR Convertibles</h3>
<p><img loading="lazy" src="https://www.vaneck.com/contentassets/f50e318c68c34d45b447e216fcf8bae1/5702_mstr-blog_chart-6_2025-05.svg" class="img-responsive w-100" alt="Implied Yield on Bond Component of MSTR Convertibles" /></p>
<p class="chart-disclosure">Source: VanEck Research as of 4/7/2025. <strong>Past performance is no guarantee of future results. Not intended as a recommendation to buy or sell any securities named herein. Any projections shown are those of VanEck and based on the firm&rsquo;s own research, are for illustrative purposes only, are valid as of the posting date of this content and are subject to change without notice.</strong></p>
<p>A key concern with Strategy&rsquo;s convertible notes is the outsized influence of the embedded option components on their pricing. As a result, many issuances currently trade well above their par value, which acts as a downside backstop. This means that significant portions of the bonds&rsquo; values can decline if the option premium erodes. For instance, the 2028 Convertible Note is priced at <strong>$227.15</strong> as of 5/7/2025. If MSTR's stock falls below the bond&rsquo;s conversion price of <strong>$183.19</strong> at maturity, the bond would be worth only $100, assuming all other factors remain constant. This reflects the substantial option premium embedded in these instruments.</p>
<p>Another notable risk associated with the embedded option is sensitivity to changes in volatility, among other factors in option pricing. We estimate that if volatility declines from <strong>85</strong> to <strong>50</strong>, the bonds will fall in value by approximately (<strong>-13%</strong>) on average. A further drop in volatility from <strong>85</strong> to <strong>30</strong> would lead to an average price decline of around (<strong>-20%</strong>).</p>
<p>MSTR&rsquo;s stock performance is heavily influenced by its Premium, which accounts for <strong>87%</strong> of the stock&rsquo;s volatility and <strong>96%</strong> of its total return. In our view, this suggests that investors in MSTR convertibles are not just purchasing an option on the stock itself. They are effectively buying an option on the continued existence of the Premium. This Premium is largely driven by the price of Bitcoin. As Bitcoin rises, the company gains greater ability to finance additional purchases, which in turn inflates the projected value of its holdings and supports speculation in MSTR&rsquo;s stock.</p>
<p>If Bitcoin's value declined, the Premium would also likely fall. We estimate the relationship has a beta of approximately <strong>1.77x</strong>, meaning the premium's value could drop significantly relative to Bitcoin. This decline would erode the value of the convertible&rsquo;s option component.</p>
<p>The fixed income portion of the convertible bonds is also at risk due to the same factor: the premium. The straight bond&rsquo;s value depends in part on the company&rsquo;s ability to raise future financing. Strategy does not generate sufficient revenues to service its fixed income obligations, let alone repay principal at maturity. A decline in the Premium would weaken Strategy&rsquo;s financing capacity and likely result in wider credit spreads. This would reduce the value of the corporate bond portions of the convertibles. The precipitating cause of the attrition of the Premium would likely be a fall in BTC price. This decline in Bitcoin also aggravates the value of Strategy&rsquo;s converts because of the lowered probability of full recovery value in the event of a BTC liquidation.</p>
<p>This downside scenario is not presented as inevitable, but rather to highlight that both components of the convertible bond, the option and the bond itself, are tied to the same underlying drivers: the price of Bitcoin and the MSTR Premium. While some investors may be able to hedge these risks, many will struggle to understand them, let alone manage them effectively. MSTR convertibles may appeal to investors seeking yield with potential upside, but they involve many risks. These instruments may be suitable for sophisticated investors capable of executing dynamic hedging strategies and analyzing the behavior of equity-linked debt.</p>
<h3>Convert Value Upside from Credit Risk Tightening</h3>
<p><img loading="lazy" src="https://www.vaneck.com/contentassets/f50e318c68c34d45b447e216fcf8bae1/5702_mstr-blog_chart-7_2025-05.svg" class="img-responsive w-100" alt="Convert Value Upside from Credit Risk Tightening" /></p>
<div class="wrapped-div">
<table style="width: 100%;">
<tbody>
<tr class="tbl-data">
<td class="tbl-header last">&nbsp;</td>
<td class="tbl-header last text-right">9/14/2028</td>
<td class="tbl-header last text-right">12/1/2029</td>
<td class="tbl-header last text-right">3/1/2030</td>
<td class="tbl-header last text-right">3/15/2030</td>
<td class="tbl-header last text-right">3/15/2031</td>
<td class="tbl-header last text-right">6/15/2032</td>
</tr>
<tr class="tbl-data">
<td class="data-td last text-left">Current Implied Credit Spread</td>
<td class="data-td data last text-right">500 bps</td>
<td class="data-td data last text-right">975 bps</td>
<td class="data-td data last text-right">1,075 bps</td>
<td class="data-td data last text-right">900 bps</td>
<td class="data-td data last text-right">1,100 bps</td>
<td class="data-td data last text-right">1,250 bps</td>
</tr>
<tr class="tbl-data">
<td class="data-td last text-left">&ldquo;BTC Credit&rdquo; $95k, BTC Vol 50, 0% AR return</td>
<td class="data-td data last text-right">0 bps</td>
<td class="data-td data last text-right">21 bps</td>
<td class="data-td data last text-right">48 bps</td>
<td class="data-td data last text-right">80 bps</td>
<td class="data-td data last text-right">143 bps</td>
<td class="data-td data last text-right">238 bps</td>
</tr>
</tbody>
</table>
</div>
<p class="chart-disclosure mt-3">Source: VanEck Research as of 5/7/2025. <strong>Any projections shown are those of VanEck and based on the firm&rsquo;s own research, are for illustrative purposes only, are valid as of the posting date of this content and are subject to change without notice.</strong></p>
<p>However, Strategy&rsquo;s converts provide an exciting vehicle for speculating on the advancement of crypto accounting practices. If credit rating agencies take a more favorable view of Bitcoin as collateral for debt, this could cause the credit spread to tighten dramatically. This should increase the value of Strategy&rsquo;s converts significantly by increasing the bond portions. If Strategy&rsquo;s bonds reach even Saylor&rsquo;s least sanguine estimations of their &ldquo;true&rdquo; credit spreads, we calculate the median increase in convert value to be (<strong>+16%</strong>). In fact, the converts with a greater portion of bond value will see their prices increase the most.</p>
<p>The two most appealing targets would be the 12/1/2029 (<strong>+31% upside</strong>) and the 3/1/2030 (<strong>+26% upside</strong>). Given that the 3/1/2030 is nearer to being in-the-money on its option, the combination of upside from the conversion of its credit spread to Saylor&rsquo;s &ldquo;BTC Credit&rdquo; and its high option value may prove attractive to the intrepid speculator. However, for traditional long-only investors, these bonds present a bundle of risk exposures that may be too challenging to manage. On a relative basis, we believe they are less attractive than other parts of MSTR&rsquo;s capital structure.</p>
<h3>MSTR Price Simulation (BTC +/- 80% @ MSTR Vol = 80)</h3>
<p><img loading="lazy" src="https://www.vaneck.com/contentassets/f50e318c68c34d45b447e216fcf8bae1/5702_mstr-blog_chart-8_2025-05.svg" class="img-responsive w-100" alt="MSTR Price Simulation (BTC +/- 80% @ MSTR Vol = 80)" /></p>
<p class="chart-disclosure mt-3">Simulation assumes MSTR Vol = 80, BTC falls 80% in 3 months.</p>
<p class="chart-disclosure">Source: VanEck Research as of 4/2/2025. <strong>Any projections shown are those of VanEck and based on the firm&rsquo;s own research, are for illustrative purposes only, are valid as of the posting date of this content and are subject to change without notice. Not intended as a recommendation to buy or sell any securities named herein.</strong></p>
<h2 id="strk-overview" class="jump-link-nav anchored-block" data-jumplink-title="STRK Overview">STRK Overview and Analysis</h2>
<p>STRK is called a &ldquo;preferred perpetual convertible equity,&rdquo; with several concepts rolled into one security. It provides a perpetual dividend at <strong>8%</strong> of face value, and this dividend is payable in cash or common shares. However, there are restrictions on remitting common shares instead of dividends. These include capping the total number of shares that can be paid to satisfy the dividends, such as if MSTR&rsquo;s value falls below <strong>35%</strong> of its 1/27/2025 price of <strong>$347.92</strong>. STRK also provides an option on MSTR shares with no maturity date (no theta decay to option component value) and liquidation rights typically associated with preferred equity. Like a convertible bond, but lower in seniority, it is a fixed income security with an attached call option that is deeply out of the money with a strike price at <strong>$1000,</strong> which is <strong>2.5x</strong> higher than the price where MSTR currently trades (as of 5/7/2025).</p>
<p>At the time of writing, we calculate that <strong>36%</strong> of STRK&rsquo;s price is derived from the call option, giving holders upside exposure to MSTR. Because MSTR&rsquo;s volatility is so high and the option is perpetual in duration, STRK&rsquo;s option on MSTR already trades at a delta near 1 despite it being deeply out-of-the-money. This means that the price fluctuations of STRK already closely mirror those of MSTR (in the option component of STRK).</p>
<p>Until MSTR&rsquo;s equity price approaches the conversion strike, we expect STRK to exhibit asymmetric sensitivity to changes in volatility skewed heavily to the downside. For example, if implied volatility increases from approximately <strong>80%</strong> to <strong>120%</strong>, we estimate STRK would appreciate less than (<strong>+0.01%</strong>). However, if volatility declines from <strong>80%</strong> to <strong>40%</strong>, we project STRK&rsquo;s price would fall by (<strong>-3%</strong>), and a further decline in volatility to <strong>20%</strong> would result in a loss of approximately (<strong>-19%</strong>).</p>
<p>This asymmetry arises because the embedded call option in STRK is currently far out of the money and perpetual in nature. In such cases, increases in volatility beyond a certain point do little to increase the option&rsquo;s probability of finishing in the money, which flattens the upside response. Conversely, reductions in MSTR&rsquo;s current volatility can sharply reduce the probability of finishing in the money, leading to disproportionately large price declines. This convex volatility exposure, limited upside, and substantial downside are key features of STRK&rsquo;s risk profile. Stepping back, it is interesting to consider STRK as a security that pays you to be long a call option, but that upside is capped compared to even simply buying MSTR.</p>
<h3>STRK Value Falls Assymetrically Lower with Volatility Declines</h3>
<p><img loading="lazy" src="https://www.vaneck.com/contentassets/f50e318c68c34d45b447e216fcf8bae1/5702_mstr-blog_chart-9_2025-05.svg" class="img-responsive w-100" alt="STRK Value Falls Assymetrically Lower with Volatility Declines" /></p>
<p class="chart-disclosure">Source: VanEck Research as of 4/7/2025. <strong>Any projections shown are those of VanEck and based on the firm&rsquo;s own research, are for illustrative purposes only, are valid as of the posting date of this content and are subject to change without notice. Not intended as a recommendation to buy or sell any securities named herein.</strong></p>
<p>From a pricing standpoint, we expect STRK&rsquo;s price movements to be significantly muted relative to changes in MSTR&rsquo;s equity price, both on the upside and the downside. For instance, we compute that a (<strong>+100%</strong>) increase in MSTR&rsquo;s stock price would, all else equal, result in approximately a (<strong>+37%</strong>) increase in STRK&rsquo;s price. Conversely, a (<strong>-50%</strong>) decline in MSTR&rsquo;s stock would lead to an estimated (<strong>-17%</strong>) drop in STRK&rsquo;s value.</p>
<p>However, in downside scenarios, it is likely that STRK&rsquo;s credit spread will also widen, which is an important factor that impacts the value of its preferred equity component. For example, if the credit spread increases by <strong>500 basis points</strong>, rising from <strong>700 bps</strong> to <strong>1,200 bps</strong>, alongside a (<strong>-50%</strong>) decline in MSTR&rsquo;s equity price, the combined effect could drive STRK&rsquo;s price down by approximately (<strong>-30%</strong>). We believe this occurrence is likely because Strategy&rsquo;s credit spread direction tends to follow MSTR price. Interestingly, STRK&rsquo;s implied credit spread is closer to Saylor&rsquo;s BTC-based estimation than Strategy&rsquo;s converts. This implies there is less upside from STRK&rsquo;s credit spread converging to Saylor&rsquo;s calculations.</p>
<h3>Strategy Liabilities and Capital Structure</h3>
<p><strong>Assuming $95,000 BTC Price , 50% BTC Volatility, and 0% BTC ARR ("Skeptic")</strong></p>
<div class="wrapped-div">
<table style="width: 100%;">
<tbody>
<tr class="tbl-data">
<td class="tbl-header last text-left">&nbsp;</td>
<td class="tbl-header last text-right">Notional ($M)</td>
<td class="tbl-header last text-right">Cum. Notional ($M)</td>
<td class="tbl-header last text-right">Duration (Yrs)<sup>1</sup></td>
<td class="tbl-header last text-right">BTC Rating</td>
<td class="tbl-header last text-right">BTC Risk<sup>2</sup></td>
<td class="tbl-header last text-right">BTC Credit<sup>3</sup></td>
<td class="tbl-header last text-right">Market Credit Spread<sup>4</sup></td>
<td class="tbl-header last text-right">Spread Premium</td>
</tr>
<tr class="tbl-data">
<td class="data-td last">Debt:</td>
</tr>
<tr class="tbl-data">
<td class="data-td last">Convertible 2028</td>
<td class="data-td data last text-right">1,010</td>
<td class="data-td data last text-right">2.4</td>
<td class="data-td data last text-right">52.1x</td>
<td class="data-td data last text-right">0%</td>
<td class="data-td data last text-right">0 bps</td>
<td class="data-td data last text-right">500 bps</td>
</tr>
<tr class="tbl-data">
<td class="data-td last">Convertible 2029</td>
<td class="data-td data last text-right">3,000</td>
<td class="data-td data last text-right">4,010</td>
<td class="data-td data last text-right">3.1</td>
<td class="data-td data last text-right">13.1x</td>
<td class="data-td data last text-right">1%</td>
<td class="data-td data last text-right">21 bps</td>
<td class="data-td data last text-right">975 bps</td>
<td class="data-td data last text-right">954 bps</td>
</tr>
<tr class="tbl-data">
<td class="data-td last">Convertible 2030 (0.625%)</td>
<td class="data-td data last text-right">800</td>
<td class="data-td data last text-right">4,810</td>
<td class="data-td data last text-right">3.4</td>
<td class="data-td data last text-right">10.9x</td>
<td class="data-td data last text-right">2%</td>
<td class="data-td data last text-right">48 bps</td>
<td class="data-td data last text-right">1075 bps</td>
<td class="data-td data last text-right">1,027 bps</td>
</tr>
<tr class="tbl-data">
<td class="data-td last">Convertible 2030 (0.000%)</td>
<td class="data-td data last text-right">2,000</td>
<td class="data-td data last text-right">6,810</td>
<td class="data-td data last text-right">2.8</td>
<td class="data-td data last text-right">7.7x</td>
<td class="data-td data last text-right">2%</td>
<td class="data-td data last text-right">80 bps</td>
<td class="data-td data last text-right">900 bps</td>
<td class="data-td data last text-right">820 bps</td>
</tr>
<tr class="tbl-data">
<td class="data-td last">Convertible 2031</td>
<td class="data-td data last text-right">604</td>
<td class="data-td data last text-right">7,414</td>
<td class="data-td data last text-right">3.4</td>
<td class="data-td data last text-right">7.1x</td>
<td class="data-td data last text-right">5%</td>
<td class="data-td data last text-right">143 bps</td>
<td class="data-td data last text-right">1100 bps</td>
<td class="data-td data last text-right">957 bps</td>
</tr>
<tr class="tbl-data">
<td class="data-td last">Convertible 2032</td>
<td class="data-td data last text-right">800</td>
<td class="data-td data last text-right">8,214</td>
<td class="data-td data last text-right">4.1</td>
<td class="data-td data last text-right">6.4x</td>
<td class="data-td data last text-right">9%</td>
<td class="data-td data last text-right">238 bps</td>
<td class="data-td data last text-right">1250 bps</td>
<td class="data-td data last text-right">1,012 bps</td>
</tr>
<tr class="tbl-data">
<td class="data-td last">Total Debt</td>
<td class="data-td data last text-right">8,214</td>
<td class="data-td data last text-right">6.4x</td>
<td class="data-td data last">&nbsp;</td>
</tr>
<tr class="tbl-data">
<td class="data-td last">Preferred Stock:</td>
</tr>
<tr class="tbl-data">
<td class="data-td last">STRF</td>
<td class="data-td data last text-right">850</td>
<td class="data-td data last text-right">9,064</td>
<td class="data-td data last text-right">10.1</td>
<td class="data-td data last text-right">5.8x</td>
<td class="data-td data last text-right">38%</td>
<td class="data-td data last text-right">470 bps</td>
<td class="data-td data last text-right">675 bps</td>
<td class="data-td data last text-right">205 bps</td>
</tr>
<tr class="tbl-data">
<td class="data-td last">STRK</td>
<td class="data-td data last text-right">818</td>
<td class="data-td data last text-right">9,882</td>
<td class="data-td data last text-right">11.8</td>
<td class="data-td data last text-right">5.3x</td>
<td class="data-td data last text-right">46%</td>
<td class="data-td data last text-right">514 bps</td>
<td class="data-td data last text-right">700 bps</td>
<td class="data-td data last text-right">186 bps</td>
</tr>
<tr class="tbl-data">
<td class="data-td last">Total Preferred Stock</td>
<td class="data-td data last text-right">1,668</td>
<td class="data-td data last text-right">9,882</td>
<td class="data-td data last text-right">5.3x</td>
</tr>
<tr class="tbl-data">
<td class="data-td last">Total Debt &amp; Pref. Stock</td>
<td class="data-td data last text-right">9,882</td>
<td class="data-td data last text-right">5.3x</td>
<td class="data-td data last">&nbsp;</td>
</tr>
</tbody>
</table>
</div>
<p class="chart-disclosure mt-3">Source: FactSet, Strategy as of 5/7/2025.<strong> Not intended as a recommendation to buy or sell any securities named herein.</strong></p>
<p class="chart-disclosure"><sup>1</sup>&nbsp;Duration calculated until put date for converts. Duration calculated as Macaulay duration for preferred equity.</p>
<p class="chart-disclosure"><sup>2</sup>&nbsp;Calculated as the probability that BTC Rating falls below 1x at the end of the given Duration, using a lognormal model adjusted for BTC ARR and BTC Volatility.</p>
<p class="chart-disclosure"><sup>3</sup>&nbsp;Calculated by annualizing BTC Risk assuming the same risk each year and no recovery if collateral falls short. BTC Credit = (-ln(1 - BTC Risk) &divide; Duration).</p>
<p class="chart-disclosure"><sup>4</sup>&nbsp;Source: Bloomberg, Kynex. Assuming 0.50% borrow cost and 60% vol to calculate credit spread for convertible notes. Assuming 200 bps embedded call option value in STRK.</p>
<p>As noted above, Strategy intends to sell approximately <strong>$20B</strong> of additional STRK. These future issuances would further increase claims on the dividends generated by Strategy and thus its risk profile. Even without additional STRK sales, Strategy&rsquo;s capacity to pay existing dividends in cash appears constrained. STRK is even further down the capital stack than Strategy&rsquo;s suite of convertible notes, and the result is that Saylor classifies STRK&rsquo;s BTC Risk for STRK to be much higher than the converts. In Strategy&rsquo;s baseline assessment (not BTC price appreciation), there is a <strong>46%</strong> chance that the value of Strategy&rsquo;s BTC holdings will fall below the implied backing of STRK within a year.</p>
<p>In our view, several structural elements of STRK present considerable downside risk without commensurate upside potential. These include weak BTC backing, the ability to suspend dividends, and the small option component of the bonds. Additionally, there is little opportunity to see price appreciation from credit spread re-rating.</p>
<p>As a result, we believe the risk-reward profile of STRK is suboptimal for long-term investors, particularly when compared to the profile offered by MSTR equity. However, very active investors with a strong aptitude for hedging out STRK&rsquo;s risk may find the volatility and dividend profile enticing. Income-oriented, active investors who would still like some upside from MSTR equity may be very enticed by STRK. Furthermore, very bullish long-term investors on Strategy may find STRK more interesting because its option component gives a delta of near 1 while also providing an attractive yield.</p>
<h2 id="strf-overview" class="jump-link-nav anchored-block" data-jumplink-title="STRF Overview">STRF Overview and Analysis</h2>
<p>STRF is a plain-vanilla preferred equity instrument that pays a fixed <strong>10%</strong> annual cash coupon. Unlike STRK, it does not have the flexibility to pay dividends in common shares. Currently, STRF trades at <strong>$94.30,</strong> so its effective annual yield is around <strong>10.6%</strong>.</p>
<p>Its valuation is primarily driven by prevailing interest rates and Strategy&rsquo;s credit spread. Under the terms of the agreement between Strategy and STRF holders, each missed dividend payment results in a 100 basis point increase in the coupon rate, up to a maximum of <strong>18%</strong>. If four consecutive payments, or eight in total, are missed, STRF holders gain the right to elect a director on the Strategy&rsquo;s board. This right is revoked once all missed dividends are repaid. STRF ranks higher in the capital structure than both STRK and MSTR common equity, giving it stronger claims in the event of liquidation. However, that claim is weak as its BTC Rating is <strong>5.8x</strong> compared to STRK&rsquo;s at <strong>5.3x.</strong></p>
<p>These protections are meaningful given that MSTR has not generated meaningful cash flow since 2021, but are still rather weak given BTC&rsquo;s volatility. If MSTR&rsquo;s core business deteriorates further or the company loses access to capital markets, it may suspend dividend payments. In such a case, STRF begins to resemble a long-duration, subordinated bond with significant credit risk but no equity upside. If this event happens concurrently with the decline in BTC, which is a likely scenario, the value of STRF will be materially affected.</p>
<p>The largest challenge with STRF is that it will not benefit from the upside of Bitcoin while exposed to sharp BTC price declines. Since lower Bitcoin prices can impair Strategy&rsquo;s ability to meet its cash obligations, it will increase its credit spreads. This view is backed up empirically because STRF is correlated <strong>50%</strong> with MSTR and <strong>55%</strong> with BTC. We calculate STRF credit spreads to be ~<strong>6.1% based on current market prices. </strong>If this credit spread approaches even the median of those of the convertible bonds, <strong>10.25%</strong>, this would decrease the value of STRF by (<strong>-28%</strong>). Like STRK, STRF is heavily exposed to the price of BTC and the MSTR Premium.</p>
<p>In our view, <em>STRF presents a risk profile that does not make an ideal investment for a long-only investor</em> because it is exposed to factors that are difficult to underwrite given STRF&rsquo;s upside ceiling. However, the risk profile of STRF may be ideal for a very advanced investor who can apply the STRF dividends towards buying options for some BTC upside exposure or downside protection.</p>
<h2 id="conclusion" class="anchored-block">Conclusion on Strategy&rsquo;s Capital Stack</h2>
<p>The entire structure of Strategy&rsquo;s capital stack is highly related to:</p>
<ol class="content-list">
<li class="mt-2">BTC&rsquo;s Price</li>
<li class="mt-2">Strategy&rsquo;s ability to raise more funds to buy BTC</li>
<li class="mt-2">BTC&rsquo;s and MSTR&rsquo;s Price Volatilities</li>
</ol>
<p>MSTR offers an asymmetric investment profile that combines leveraged BTC exposure, regulatory accessibility, and public market liquidity. While the capital structure is complex and carries material risks, MSTR&rsquo;s design gives investors a unique vehicle to participate in Bitcoin&rsquo;s upside through difficult-to-replicate leverage and strategic optionality. For those unable or unwilling to hold Bitcoin directly or manage futures strategies, MSTR serves as a more practical and effective alternative. Continued investor confidence, stable access to capital markets, and disciplined execution remain essential to maintaining this investment thesis.</p>
<h2 id="recommendations" class="anchored-block">Recommendations for Firms Considering a Bitcoin Treasury Strategy</h2>
<p>From a strategic standpoint, Strategy offers several key lessons for firms considering implementing a Bitcoin treasury strategy.</p>
<p>First, there must be a clearly defined objective behind adopting a Bitcoin treasury. Strategy exemplifies this through its singular focus on increasing BTC holdings per share, rather than adhering to traditional financial metrics such as dilution or enterprise value in fiat terms. Under Michael Saylor&rsquo;s leadership, the firm has reoriented its valuation framework around Bitcoin itself. Saylor views success not in terms of dollar-based returns, but in the amount of Bitcoin each MSTR share represents. This clarity of purpose has enabled consistent, long-term decision-making, even amid market volatility.</p>
<p>Second, a company must develop a well-structured financing strategy that leverages market dynamics to support BTC accumulation. Strategy accomplishes this aim by tapping into investor appetite for volatility and embedded optionality. Saylor has built a financial ecosystem that attracts retail investors and active traders through a mix of convertible bonds, preferred equity, and common stock issuances. The volatility of BTC feeds into MSTR&rsquo;s volatility, which in turn sustains demand for its securities. For example, the open interest in MSTR&rsquo;s equity options, which are used to trade against MSTR&rsquo;s capital stack, is greater than GOOG&rsquo;s and AMZN&rsquo;s (<strong>$95B</strong> vs <strong>$80B and $84B</strong>). This dynamic exists despite GOOG&rsquo;s market capitalization being <strong>15x</strong> that of MSTR&rsquo;s. This flywheel effect has allowed Strategy to finance its Bitcoin purchases at favorable terms, with low cash obligations, and without relying solely on traditional debt or equity issuance.</p>
<p>Finally, firms pursuing similar strategies must recognize that market demand for BTC-linked securities will not materialize automatically. Investor engagement, innovative structuring, and transparent communication will be critical. Whether through traditional issuance, structured products, or digital asset integration, companies must craft financial instruments that provide both yield and/or substantial upside to attract capital. Because implementing the Bitcoin Treasury strategy will contradict most planks of financial theory, HOLDers must build an ironclad investment narrative that supports a Bitcoin strategy. Michael Saylor&rsquo;s outsized public profile is no accident and demonstrates implicit recognition <strong><em>that the market needs to believe in the Bitcoin Treasury strategy to succeed.</em></strong></p>
<h2 id="key-risks" class="anchored-block">Key Risks to Strategy&rsquo;s Bitcoin-Financing Model</h2>
<p>A range of macro, structural, and execution risks could impair Strategy&rsquo;s ability to sustain its Bitcoin accumulation strategy and support MSTR&rsquo;s valuation.</p>
<ol class="content-list">
<li class="mt-2"><strong>Decline in bitcoin price</strong>
<ol class="content-list" style="list-style-type: lower-alpha;">
<li class="mt-2">Strategy&rsquo;s business model is predicated on BTC appreciation. A sustained drop in BTC price could undermine both the value of existing holdings and the viability of future financing.</li>
</ol>
</li>
<li class="mt-2"><strong>Reduced volatility in BTC or MSTR</strong>
<ol class="content-list" style="list-style-type: lower-alpha;">
<li class="mt-2">Lower volatility diminishes investor interest in MSTR&rsquo;s convertible bonds and preferred shares, which rely on optionality to attract capital.</li>
</ol>
</li>
<li class="mt-2"><strong>Collapse of MSTR&rsquo;s Premium to NAV</strong>
<ol class="content-list" style="list-style-type: lower-alpha;">
<li class="mt-2">The market premium above NAV fuels much of MSTR&rsquo;s upside and its ability to issue accretive equity. A sharp contraction would impair capital-raising capacity and shareholder returns.</li>
</ol>
</li>
<li class="mt-2"><strong>Deterioration of core business operations</strong>
<ol class="content-list" style="list-style-type: lower-alpha;">
<li class="mt-2">Though increasingly de-emphasized, Strategy&rsquo;s software business still contributes to cash flow. Further erosion could limit financial flexibility during market downturns.</li>
</ol>
</li>
<li class="mt-2"><strong>Regulatory changes enabling leveraged BTC products</strong>
<ol class="content-list" style="list-style-type: lower-alpha;">
<li class="mt-2">New ETFs or structured products offering leveraged BTC exposure could reduce demand for MSTR as a proxy vehicle.</li>
</ol>
</li>
<li class="mt-2"><strong>Emerging competition from copycat strategies</strong>
<ol class="content-list" style="list-style-type: lower-alpha;">
<li class="mt-2">New firms adopting similar BTC treasury models may fragment investor interest and saturate capital markets seeking BTC exposure through leverage.</li>
<li class="mt-2">New competitive upstarts can achieve higher BTC Yield and BTC per share than Strategy with less capital because they are smaller in size relative to Strategy</li>
</ol>
</li>
<li class="mt-2"><strong>Forced liquidations to meet debt obligations</strong>
<ol class="content-list" style="list-style-type: lower-alpha;">
<li class="mt-2">In the event of severe drawdowns or financing shortfalls, Strategy could be compelled to sell BTC holdings to service debt, negatively impacting BTC per share.</li>
</ol>
</li>
<li class="mt-2"><strong>Weakened demand for Strategy&rsquo;s securities</strong>
<ol class="content-list" style="list-style-type: lower-alpha;">
<li class="mt-2">Strategy intends to raise over $22 billion to continue its BTC purchases. A drop in investor demand would compromise its ability to execute this plan.</li>
</ol>
</li>
<li class="mt-2"><strong>Dilution of BTC per share holdings</strong>
<ol class="content-list" style="list-style-type: lower-alpha;">
<li class="mt-2">Actions such as issuing new shares to meet dividend or financing obligations could reduce BTC per share, undermining Strategy&rsquo;s core KPI: Bitcoin yield.</li>
</ol>
</li>
<li class="mt-2"><strong>Capital market instability</strong>
<ol class="content-list" style="list-style-type: lower-alpha;">
<li class="mt-2">MSTR&rsquo;s business model depends on continuous access to functioning, liquid capital markets. Disruptions could threaten both operations and treasury expansion.</li>
</ol>
</li>
<li class="mt-2"><strong>Rising interest rates</strong>
<ol class="content-list" style="list-style-type: lower-alpha;">
<li class="mt-2">Higher rates increase the cost of debt issuance and reduce investor appetite for low-yield convertibles, limiting Strategy&rsquo;s ability to fund BTC acquisitions.</li>
</ol>
</li>
</ol>
<p><strong>Links to third party websites are provided as a convenience and the inclusion of such links does not imply any endorsement, approval, investigation, verification or monitoring by us of any content or information contained within or accessible from the linked sites. By clicking on the link to a non-VanEck webpage, you acknowledge that you are entering a third-party website subject to its own terms and conditions. VanEck disclaims responsibility for content, legality of access or suitability of the third-party websites.</strong></p>
<style>
    .data-td.data {
        padding-right: 5px !important;
    }
   
    
    .wrapped-div {
        max-width: 100%;
    }
    
    @media (max-width: 1240px) {
        .wrapped-div {
            overflow-x: scroll;
        }
    }
    
    .wrapped-div-sector {
        max-width: 100%;
        overflow-x: scroll;
    }
</style>
<p>To receive more <strong><a href="https://www.vaneck.com/us/en/insights/digital-assets/" title="Digital Assets Insights">Digital Assets</a></strong> insights, <strong><a href="https://www.vaneck.com/us/en/subscribe/" title="Subscription Center">sign up in our subscription center</a></strong>.</p>
]]></content:encoded>
</item><item rdf:about="https://www.vaneck.com/us/en/blogs/thematic-investing/buzz-investing-tariff-chaos-drive-historic-market-swings/">
  <title>BUZZ Investing: Tariff Chaos Drive Historic Market Swings></title>
  <link>https://www.vaneck.com/us/en/blogs/thematic-investing/buzz-investing-tariff-chaos-drive-historic-market-swings/</link>
  <description><![CDATA[Financial markets grappled with a storm of political maneuvering around trade, taxes, and regulation, stoking some investor unease.]]></description>
  <dc:creator> </dc:creator>
  <dc:date>05/21/2025 06:30:00</dc:date>
<content:encoded><![CDATA[

<p>Following the sharp policy-driven volatility in early April, U.S. equity markets staged a robust and, to many, unexpected recovery. During the recent period between index selection dates (April 10, 2025 &ndash; May 8 ,2025, the &ldquo;Period&rdquo;), the S&amp;P 500 rose 7.6% and the Nasdaq gained 9.4%, erasing earlier losses and lifting major indices back near year-to-date highs. The BUZZ NextGen AI US Sentiment Leaders Index ("BUZZ Index") outperformed, advancing 15.6%. In our view, the rally was fueled by a combination of easing trade concerns following the temporary suspension of most tariffs, and better-than-feared earnings results, particularly from large-cap technology and consumer-facing companies. The sharp reversal may have also triggered a mechanical bid from short covering and re-risking flows, while systematic strategies could have re-engaged as volatility subsided and momentum signals turned more constructive.</p>
<p>Beneath the surface, market leadership rotated. While mega-cap tech regained footing, the rally broadened into cyclicals and select high-beta areas, reflecting a sentiment rebound more than a uniform improvement in fundamentals. In our view, the pace and magnitude of the recovery may point to a market still prone to abrupt shifts in narrative, particularly as policy remains the dominant macro driver and positioning remains cautious. While recent strength has offered some reassurance, the interplay between trade developments, political headlines, and monetary policy continues to inject a high degree of uncertainty. As such, the Period highlights how sentiment-driven rallies can coexist with fragile underlying confidence, and why adaptability may remain a core requirement for navigating today&rsquo;s environment.</p>
<p>The BUZZ Index returned 6.20% during the month of April compared to a return of -0.68% for the S&amp;P 500 Index during the same period. Year-to-date, the BUZZ Index leads the S&amp;P 500 with returns of -4.55% and -4.92%, respectively, as of the end of April.</p>
<h2>Shares of Hims &amp; Hers pace BUZZ Index Gains</h2>
<p>Hims &amp; Hers (NYSE: HIMS) was the top contributor to BUZZ Index performance, with shares rising over 90% during the Period. The company&rsquo;s Q1 earnings beat on both revenue and EBITDA, but it was the April 29 announcement of a distribution agreement with Novo Nordisk for branded Wegovy that appeared to drive the most significant upside. In our view, this deal may have reassured investors about the company&rsquo;s long-term role in the competitive GLP-1 market, even as compounded semaglutide faces tighter regulatory constraints. HIMS also announced the hiring of a former Amazon Pharmacy executive as COO, which could further support its expansion ambitions. While second-quarter guidance came in slightly below consensus and questions remain around margin durability, the stock&rsquo;s performance reflects investor appetite for scalable, consumer-facing healthcare platforms&mdash;particularly those with exposure to high-demand therapeutic area.</p>

<h3>Top BUZZ Index Contributors: April 10, 2025 &ndash; May 8, 2025</h3>
<div class="wrapped-div">
<table style="width: 100%;">
<tbody>
<tr class="tbl-data">
<td class="tbl-header last">Company</td>
<td class="tbl-header last">Ticker</td>
<td class="tbl-header last text-right">Average Weight (%)</td>
<td class="tbl-header last text-right">Return Contribution (%)</td>
</tr>
<tr class="tbl-data">
<td class="data-td data last text-left">Hims &amp; Hers Health Inc</td>
<td class="data-td data last text-left">HIMS</td>
<td class="data-td data last text-right">3.24</td>
<td class="data-td data last text-right">2.63</td>
</tr>
<tr class="tbl-data">
<td class="data-td data last text-left">MicroStrategy Inc</td>
<td class="data-td data last text-left">MSTR</td>
<td class="data-td data last text-right">3.63</td>
<td class="data-td data last text-right">1.62</td>
</tr>
<tr class="tbl-data">
<td class="data-td data last text-left">Palantir Technologies Inc</td>
<td class="data-td data last text-left">PLTR</td>
<td class="data-td data last text-right">3.43</td>
<td class="data-td data last text-right">1.06</td>
</tr>
<tr class="tbl-data">
<td class="data-td data last text-left">Robinhood Markets Inc</td>
<td class="data-td data last text-left">HOOD</td>
<td class="data-td data last text-right">3.29</td>
<td class="data-td data last text-right">1.01</td>
</tr>
<tr class="tbl-data">
<td class="data-td data last text-left">SoFi Technologies Inc</td>
<td class="data-td data last text-left">SOFI</td>
<td class="data-td data last text-right">3.12</td>
<td class="data-td data last text-right">0.79</td>
</tr>
<tr class="tbl-data">
<td class="data-td data last text-left">Coinbase Global Inc</td>
<td class="data-td data last text-left">COIN</td>
<td class="data-td data last text-right">2.97</td>
<td class="data-td data last text-right">0.64</td>
</tr>
<tr class="tbl-data">
<td class="data-td data last text-left">Advanced Micro Devices Inc</td>
<td class="data-td data last text-left">AMD</td>
<td class="data-td data last text-right">2.90</td>
<td class="data-td data last text-right">0.43</td>
</tr>
<tr class="tbl-data">
<td class="data-td data last text-left">Rocket Lab USA Inc</td>
<td class="data-td data last text-left">RKLB</td>
<td class="data-td data last text-right">2.47</td>
<td class="data-td data last text-right">0.38</td>
</tr>
<tr class="tbl-data">
<td class="data-td data last text-left">Micron Technology Inc</td>
<td class="data-td data last text-left">MU</td>
<td class="data-td data last text-right">1.27</td>
<td class="data-td data last text-right">0.37</td>
</tr>
<tr class="tbl-data">
<td class="data-td data last text-left">Tesla Inc</td>
<td class="data-td data last text-left">TSLA</td>
<td class="data-td data last text-right">2.99</td>
<td class="data-td data last text-right">0.37</td>
</tr>
</tbody>
</table>
</div>
<p class="chart-disclosure">Source: BUZZ Holdings ULC, Bloomberg. Past performance is no guarantee of future results. Index performance is not illustrative of fund performance. Not intended as a recommendation to buy or to sell any of the securities mentioned herein.</p>

<h2>Shares of Lucid Group among declining stocks in the BUZZ Index</h2>
<p>Despite broad strength in the BUZZ Index during the Period, a small group of names detracted modestly from overall performance. In aggregate, the ten lowest-contributing stocks reduced total return by just 74 basis points, with nearly two-thirds of that impact driven by two positions. Notably, five of the ten detractors each reduced index performance by just 1 basis point, reflecting either modest price moves or limited weighting within the portfolio. Overall, the limited drag from underperformers underscores the strength and breadth of this Period&rsquo;s rally.</p>
<h3>Bottom BUZZ Index Contributors: April 10, 2025 &ndash; May 8, 2025</h3>
<div class="wrapped-div">
<table style="width: 100%;">
<tbody>
<tr class="tbl-data">
<td class="tbl-header last">Company</td>
<td class="tbl-header last">Ticker</td>
<td class="tbl-header last text-right">Average Weight (%)</td>
<td class="tbl-header last text-right">Return Contribution (%)</td>
</tr>
<tr class="tbl-data">
<td class="data-td data last text-left">UnitedHealth Group Inc</td>
<td class="data-td data last text-left">UNH</td>
<td class="data-td data last text-right">0.30</td>
<td class="data-td data last text-right">-0.27</td>
</tr>
<tr class="tbl-data">
<td class="data-td data last text-left">Lucid Group Inc</td>
<td class="data-td data last text-left">LCID</td>
<td class="data-td data last text-right">2.01</td>
<td class="data-td data last text-right">-0.20</td>
</tr>
<tr class="tbl-data">
<td class="data-td data last text-left">Super Micro Computer Inc</td>
<td class="data-td data last text-left">SMCI</td>
<td class="data-td data last text-right">2.67</td>
<td class="data-td data last text-right">-0.11</td>
</tr>
<tr class="tbl-data">
<td class="data-td data last text-left">TG Therapeutics Inc</td>
<td class="data-td data last text-left">TGTX</td>
<td class="data-td data last text-right">0.58</td>
<td class="data-td data last text-right">-0.09</td>
</tr>
<tr class="tbl-data">
<td class="data-td data last text-left">Starbucks Corp</td>
<td class="data-td data last text-left">SBUX</td>
<td class="data-td data last text-right">0.34</td>
<td class="data-td data last text-right">-0.02</td>
</tr>
<tr class="tbl-data">
<td class="data-td data last text-left">Cava Group Inc</td>
<td class="data-td data last text-left">CAVA</td>
<td class="data-td data last text-right">0.12</td>
<td class="data-td data last text-right">-0.01</td>
</tr>
<tr class="tbl-data">
<td class="data-td data last text-left">Dollar General Corp</td>
<td class="data-td data last text-left">DG</td>
<td class="data-td data last text-right">0.64</td>
<td class="data-td data last text-right">-0.01</td>
</tr>
<tr class="tbl-data">
<td class="data-td data last text-left">Datadog Inc</td>
<td class="data-td data last text-left">DDOG</td>
<td class="data-td data last text-right">0.11</td>
<td class="data-td data last text-right">-0.01</td>
</tr>
<tr class="tbl-data">
<td class="data-td data last text-left">Snowflake Inc</td>
<td class="data-td data last text-left">SNOW</td>
<td class="data-td data last text-right">0.23</td>
<td class="data-td data last text-right">-0.01</td>
</tr>
<tr class="tbl-data">
<td class="data-td data last text-left">DraftKings Inc</td>
<td class="data-td data last text-left">DKNG</td>
<td class="data-td data last text-right">0.70</td>
<td class="data-td data last text-right">-0.01</td>
</tr>
</tbody>
</table>
</div>
<p class="chart-disclosure">Source: BUZZ Holdings ULC, Bloomberg. Past performance is no guarantee of future results. Index performance is not illustrative of fund performance. Not intended as a recommendation to buy or to sell any of the securities mentioned herein.</p>
<h2>BUZZ Index May 2025 Rebalance Highlights</h2>
<p><strong>UnitedHealth Group Inc.</strong></p>
<p>On December 4th, 2024, UnitedHealth Group (NYSE: UNH) was thrust into the spotlight following the tragic shooting and death of then-CEO Brian Thompson. The incident brought renewed attention to mounting frustration over the company&rsquo;s high claim denial rates and intensified scrutiny across the healthcare sector. UNH shares initially sold off but recovered over the following weeks. However, Q1 earnings released on April 17th fell well short of expectations, with revenue and profit misses and a weak 2025 outlook. Shares dropped over 20% on the report and continued to decline in the weeks that followed. On May 13th, UnitedHealth suspended its full-year guidance and announced the resignation of current CEO Andrew Witty, triggering another 18% decline. From early April highs, the stock has now fallen nearly 50%. Still, investor sentiment has shown signs of improvement, suggesting that many may believe the bulk of the downside risk may now be priced in. UNH returns to the BUZZ Index this month at the maximum 3% weight.</p>
<p><strong>First Solar, Inc.</strong></p>
<p>Equity markets have rebounded strongly following the initial turmoil sparked by President Trump&rsquo;s &ldquo;Liberation Day&rdquo; tariff announcement, as worst-case trade fears gave way to renewed optimism. Technology stocks led the recovery, with some of the most heavily sold subsectors, particularly solar, posting the strongest gains. The Invesco Solar ETF (NYSE: TAN) has risen sharply off its lows, driven in part by a rally in First Solar (NASDAQ: FSLR), which surged after initially falling 8% following its April 29th earnings release. Favorable developments shortly thereafter helped shift sentiment. Signs of progress in U.S.-China trade talks helped ease investor concerns, and proposed revisions to the GOP&rsquo;s budget reconciliation bill left solar tax credits untouched. This policy clarity represents an important support for FSLR&rsquo;s long-term economics. With both regulatory clarity and policy momentum at its back, FSLR enters the BUZZ Index this month with a 0.38% weight.</p>

<p>To receive more <a href="https://www.vaneck.com/us/en/insights/thematic-investing/" title="Thematic Investing Insights"><strong>Thematic Investing</strong></a> insights, <a href="https://www.vaneck.com/us/en/subscribe/" title="Subscription Center"><strong>sign up in our subscription center</strong></a>.</p>
]]></content:encoded>
</item><item rdf:about="https://www.vaneck.com/us/en/blogs/emerging-markets-bonds/em-local-currency-bonds-shine-as-u.s.-dollar-and-rates-wobble">
  <title>EM Local Currency Bonds Shine as U.S. Dollar and Rates Wobble></title>
  <link>https://www.vaneck.com/us/en/blogs/emerging-markets-bonds/em-local-currency-bonds-shine-as-u.s.-dollar-and-rates-wobble</link>
  <description><![CDATA[EM local bonds are outperforming in 2025, offering high yield, diversification, and strong fundamentals amid U.S. market weakness.]]></description>
  <dc:creator>Fran Rodilosso</dc:creator>
  <dc:date>05/16/2025 06:30:00</dc:date>
<content:encoded><![CDATA[

<p>Emerging markets (EM) local currency sovereign bonds have strongly outperformed other major global fixed income asset classes this year. The U.S. dollar has been notably weak year to date through May 13, 2025, declining approximately 7% versus a basket of developed markets trading partners. However, the strength of emerging markets currencies, which have gained approximately 4% year to date, only explains about half of the return this year of the JP Morgan GBE EM Core Index. The remainder of the return this year is explained by local interest rates and bond price movements, with a yield of over 7% generating significant income return.</p>
<h3>EM Local Currency Bonds Have Strongly Outpaced Most Of Their Peers</h3>
<div class="flourish-embed flourish-chart" data-src="visualisation/23220026?2429575"><script src="https://public.flourish.studio/resources/embed.js"></script><noscript><img loading="lazy" src="https://public.flourish.studio/visualisation/23220026/thumbnail" width="100%" alt="EM Local Currency Bonds Have Strongly Outpaced Most Of Their Peers" /></noscript></div>
<p class="chart-disclosure">Source: J.P. Morgan and ICE Data Indices as of 5/13/2025. EM Local Sov represented by J.P. Morgan GBI-EM Global Core Index; Global Broad Market represented by ICE BofA Global Broad Market Index; EM USD Sov represented by J.P. Morgan EMBI Global Diversified Index; Global DM Sov represented by ICE BofA Developed Markets Sovereign Bond Index; US HY Corp represented by ICE BofA US High Yield Index; US Broad Market represented by ICE BofA US Broad Market Index; US IG Corp represented by ICE BofA US Corporate Index.</p>

<p>EM local bonds lagged most other fixed income in the first five years of the past decade. However since then, they have outperformed all of the segments shown above, other than U.S. high yield corporates and U.S. dollar-denominated EM sovereign bonds. However recent performance of EM local bonds stands out, particularly following the U.S. tariff announcement on April 2, 2025, or &ldquo;Liberation Day,&rdquo; when U.S. rates increased sharply while the U.S. dollar also depreciated. Several possible explanations for the weakness in U.S. fixed income (and U.S dollar assets generally) have been put forth including a decline of confidence in U.S. institutions and doubts around the U.S. dollar&rsquo;s role as a reserve currency, unwinds of leveraged basis trades and selling of U.S. Treasuries by foreign central banks. It is possible that a combination of these or other factors explain what has been observed. In any case, we believe the case for diversification outside of U.S. rates and the U.S. dollar has become stronger, and EM local currency bonds are an attractive way to achieve this within a fixed income portfolio.</p>
<p>In addition to diversification benefits, we believe EM fundamentals also justify an allocation to EM local bonds. Developed markets economies are characterized by very high debt-to-GDP ratios, fiscal deficits, and increasing political dysfunction. In addition to lower debt levels and more disciplined fiscal policy, emerging markets have benefited from independent central banks that have prioritized keeping inflation under control. For example, most EM central banks hiked policy rates swiftly and decisively soon after the COVID pandemic started, getting ahead of inflation. The results have been both high real and nominal interest rates. Sticky inflation and geopolitical conflict may also keep commodity prices elevated, benefiting the currencies of commodity exporting countries such as Brazil, Indonesia, and South Africa.</p>
<p>EM bond mutual fund and ETF flows have been significantly negative over the past several years<sup>1</sup>, indicating that many investors remain underallocated to the asset class. As a result, renewed interest may set up a favorable technical backdrop. Along with favorable fundamentals, the ability to diversify away from U.S. rate and dollar risk, and achieve a yield of over 7%, we believe it&rsquo;s time to take another look at EM local currency bonds.</p>
<p>To receive more <a href="https://www.vaneck.com/us/en/insights/emerging-markets-bonds/" title="Emerging Markets Bonds Insights"><strong>Emerging Markets Bonds</strong></a> insights, <a href="/link/5f45412c2143400497908cea2897f7d3.aspx" title=" Subscription Center"><strong>sign up in our subscription center</strong></a>.</p>
]]></content:encoded>
</item><item rdf:about="https://www.vaneck.com/us/en/blogs/emerging-markets-bonds/em-bond-performance-remains-solid-in-2025/">
  <title>EM Bond Performance Remains Solid in 2025></title>
  <link>https://www.vaneck.com/us/en/blogs/emerging-markets-bonds/em-bond-performance-remains-solid-in-2025/</link>
  <description><![CDATA[EM Bonds continue to gain ground in 2025, despite many external risks.]]></description>
  <dc:creator>Eric Fine</dc:creator>
  <dc:date>05/15/2025 06:30:00</dc:date>
<content:encoded><![CDATA[

<p>The <strong><a href="/link/cae21763b8c742f0952c4e4e3234dab9.aspx" title="EMBUX - Emerging Markets Bond Fund - Class I - Overview">VanEck Emerging Markets Bond Fund</a></strong> was up 1.39% in April, compared to up 1.51% for its benchmark. Year-to-date, the fund is up 5.94%, compared to 4.84% for its benchmark. During April, China led outperformers; the team continues to see the worst of the Chinese property crisis as behind us. Underweights in Czechia and Malaysia led underperformers. We remain cautious on US dollar (USD) duration, USD spread duration, but open on local-currency duration. The fund has around 60% in curated local currency, 40% in USD bonds, with a noteworthy underweight to Brazil and South Africa in local currency. Carry is 8.2%, YTW is 9.9%, and duration is 5.3.</p>

<p>Last month we attended the IMF Spring Meetings. <a href="/us/en/blogs/emerging-markets-bonds/imf-2025-spring-takeaways-the-era-of-em-exceptionalism/" title="IMF 2025 Spring Takeaways: The Era of EM Exceptionalism"><strong>Read our key takeaways here.</strong></a></p>
<h3>Average Annual Total Returns<sup>*</sup>&nbsp;(%) (In USD)</h3>
<div class="wrapped-div">
<table style="width: 100%;">
<tbody>
<tr class="tbl-data">
<td class="tbl-header last" colspan="10">As of April 30, 2025</td>
</tr>
<tr class="tbl-data">
<td class="data-head last text-right">&nbsp;</td>
<td class="data-head last text-right">1 Mo</td>
<td class="data-head last text-right">3 Mo</td>
<td class="data-head last text-right">YTD</td>
<td class="data-head last text-right">1 Yr</td>
<td class="data-head last text-right">3 Yrs</td>
<td class="data-head last text-right">5 Yrs</td>
<td class="data-head last text-right">10 Yrs</td>
</tr>
<tr class="tbl-data">
<td class="data-td last text-left">Class A: NAV (Inception 07/09/12)</td>
<td class="data-td data last text-right">1.24</td>
<td class="data-td data last text-right">2.39</td>
<td class="data-td data last text-right">4.69</td>
<td class="data-td data last text-right">9.20</td>
<td class="data-td data last text-right">6.42</td>
<td class="data-td data last text-right">7.11</td>
<td class="data-td data last text-right">2.34</td>
</tr>
<tr class="tbl-data">
<td class="data-td last text-left">Class A: Maximum 5.75% load</td>
<td class="data-td data last text-right">-4.58</td>
<td class="data-td data last text-right">-3.50</td>
<td class="data-td data last text-right">-1.33</td>
<td class="data-td data last text-right">2.92</td>
<td class="data-td data last text-right">4.34</td>
<td class="data-td data last text-right">5.85</td>
<td class="data-td data last text-right">1.73</td>
</tr>
<tr class="tbl-data">
<td class="data-td last text-left">Class I: NAV (Inception 07/09/12)</td>
<td class="data-td data last text-right">1.28</td>
<td class="data-td data last text-right">2.48</td>
<td class="data-td data last text-right">4.63</td>
<td class="data-td data last text-right">9.51</td>
<td class="data-td data last text-right">6.75</td>
<td class="data-td data last text-right">7.45</td>
<td class="data-td data last text-right">2.64</td>
</tr>
<tr class="tbl-data">
<td class="data-td last text-left">Class Y: NAV (Inception 07/09/12)</td>
<td class="data-td data last text-right">1.23</td>
<td class="data-td data last text-right">2.44</td>
<td class="data-td data last text-right">4.76</td>
<td class="data-td data last text-right">9.44</td>
<td class="data-td data last text-right">6.65</td>
<td class="data-td data last text-right">7.36</td>
<td class="data-td data last text-right">2.57</td>
</tr>
<tr class="tbl-data">
<td class="data-td last text-left">50% GBI-EM/50% EMBI</td>
<td class="data-td data last text-right">1.51</td>
<td class="data-td data last text-right">3.04</td>
<td class="data-td data last text-right">4.84</td>
<td class="data-td data last text-right">9.31</td>
<td class="data-td data last text-right">5.71</td>
<td class="data-td data last text-right">2.62</td>
<td class="data-td data last text-right">2.19</td>
</tr>
</tbody>
</table>
</div>
<br />
<div class="wrapped-div">
<table style="width: 100%;">
<tbody>
<tr class="tbl-data">
<td class="tbl-header last" colspan="10">As of March 31, 2025</td>
</tr>
<tr class="tbl-data">
<td class="data-head last text-right">&nbsp;</td>
<td class="data-head last text-right">1 Mo</td>
<td class="data-head last text-right">3 Mo</td>
<td class="data-head last text-right">YTD</td>
<td class="data-head last text-right">1 Yr</td>
<td class="data-head last text-right">3 Yrs</td>
<td class="data-head last text-right">5 Yrs</td>
<td class="data-head last text-right">10 Yrs</td>
</tr>
<tr class="tbl-data">
<td class="data-td last text-left">Class A: NAV (Inception 07/09/12)</td>
<td class="data-td data last text-right">-0.30</td>
<td class="data-td data last text-right">3.40</td>
<td class="data-td data last text-right">6.32</td>
<td class="data-td data last text-right">4.18</td>
<td class="data-td data last text-right">7.60</td>
<td class="data-td data last text-right">2.34</td>
</tr>
<tr class="tbl-data">
<td class="data-td last text-left">Class A: Maximum 5.75% load</td>
<td class="data-td data last text-right">-6.03</td>
<td class="data-td data last text-right">-2.54</td>
<td class="data-td data last text-right">0.21</td>
<td class="data-td data last text-right">2.15</td>
<td class="data-td data last text-right">6.33</td>
<td class="data-td data last text-right">1.73</td>
</tr>
<tr class="tbl-data">
<td class="data-td last text-left">Class I: NAV (Inception 07/09/12)</td>
<td class="data-td data last text-right">-0.27</td>
<td class="data-td data last text-right">3.31</td>
<td class="data-td data last text-right">6.53</td>
<td class="data-td data last text-right">4.54</td>
<td class="data-td data last text-right">7.92</td>
<td class="data-td data last text-right">2.64</td>
</tr>
<tr class="tbl-data">
<td class="data-td last text-left">Class Y: NAV (Inception 07/09/12)</td>
<td class="data-td data last text-right">-0.28</td>
<td class="data-td data last text-right">3.46</td>
<td class="data-td data last text-right">6.45</td>
<td class="data-td data last text-right">4.42</td>
<td class="data-td data last text-right">7.84</td>
<td class="data-td data last text-right">2.57</td>
</tr>
<tr class="tbl-data">
<td class="data-td last text-left">50% GBI-EM/50% EMBI</td>
<td class="data-td data last text-right">0.39</td>
<td class="data-td data last text-right">3.28</td>
<td class="data-td data last text-right">5.42</td>
<td class="data-td data last text-right">3.11</td>
<td class="data-td data last text-right">2.94</td>
<td class="data-td data last text-right">2.27</td>
</tr>
</tbody>
</table>
</div>
<p class="chart-disclosure"><sup>*</sup>&nbsp;Returns less than one year are not annualized.</p>
<p class="chart-disclosure"><strong>Expenses: Class A: Gross 1.83%, Net 1.21%; Class I: Gross 1.37%, Net 0.86%; Class Y: Gross 1.33%, Net 0.96%.</strong> Expenses are capped contractually until 05/01/26 at 1.20% for Class A, 0.85% for Class I, 0.95% for Class Y. Caps exclude acquired fund fees and expenses, interest, trading, dividends, and interest payments of securities sold short, taxes, and extraordinary expenses.</p>
<p class="chart-disclosure"><strong>The performance data quoted represents past performance. Past performance is not a guarantee of future results. Investment return and principal value of an investment will fluctuate so that an investor&rsquo;s shares, when redeemed, may be worth more or less than their original cost. Performance may be lower or higher than performance data quoted. Please call 800.826.2333 or visit <a href="https://www.vaneck.com/us/en/" title="ETF &amp; Mutual Fund Manager | VanEck">vaneck.com</a> for performance current to the most recent month ended.</strong></p>
<p class="chart-disclosure">The &ldquo;Net Asset Value&rdquo; (NAV) of a Fund is determined at the close of each business day, and represents the dollar value of one share of the fund; it is calculated by taking the total assets of the fund, subtracting total liabilities, and dividing by the total number of shares outstanding. The NAV is not necessarily the same as the ETF&rsquo;s intraday trading value. Investors should not expect to buy or sell shares at NAV.</p>

<h2>Exposure Types and Significant Changes</h2>
<p>The changes to our top positions are summarized below. Our largest positions in April were Mexico, Brazil, Thailand, South Africa, and Poland.</p>
<ul class="content-list">
<li class="mt-2">We increased our local currency exposure in Brazil, Thailand, and South Africa. Brazil shows signs of tentative fiscal improvement, its direct trade exposure to the U.S. is limited, inflation expectations had peaked bringing us closer to the end of the tightening cycle. These factors improved the policy and technical test scores for the country. Thailand is a higher-yielding beneficiary of China&rsquo;s restrained approach to the trade war, which improves its technical test score. South Africa&rsquo;s budget debates are not over yet, but the main coalition partners confirmed that the government of national unity remains in place, improving the policy test score for the country.</li>
<li class="mt-2">We also increased our hard currency sovereign exposure in Ecuador, Argentina, and Nigeria. In Ecuador, the incumbent&rsquo;s victory in the presidential elections should strengthen the reform mandate and the country&rsquo;s policy test score. Argentina just got a new IMF program, which was conditional on a major overhaul of the country&rsquo;s exchange rate regime with a freer floating currency and no FX intervention within the currency band. This boosted Argentina&rsquo;s policy test score. We continue to see more green shoots in the Nigerian economy, and 80% of Nigeria&rsquo;s exports is oil, which is exempt from the tariffs, which strengthens the economic and technical test scores for the country.</li>
<li class="mt-2">Finally, we increased our hard currency sovereign exposure in Gabon, Senegal, and Pakistan. In Gabon, we now have more certainty on the policy front after the former transitional president Nguema comfortably won the presidential election, improving the policy test score for the country.
<p>In Senegal, the IMF signaled that it is ready to move on a new program after the country addressed some data misreporting issues. This should strengthen the policy test score for Senegal. Pakistan&rsquo;s valuations look better now, and the country&rsquo;s direct exposure to the U.S. tariffs is limited. The U.S. is expected to keep Pakistan in its orbit for political reasons, and the IMF funding is expected to get unlocked after the board&rsquo;s approval. In terms of our investment process, this improved the policy and technical test scores for the country.</p>
</li>
<li class="mt-2">We reduced our local currency exposure in Indonesia, Chile, Mexico, and Turkey. The Indonesian government has a communication problem, especially as regards its fiscal plans against the backdrop of downside growth risks. The central bank&rsquo;s focus on currency stability may limit room for rate cuts. In terms of our investment process, this weakens the policy test score for the country. The softening growth outlook in Chile&rsquo;s main trade partners and its potential impact on demand for copper worsen the economic and technical test scores for the country. Mexico&rsquo;s growth prospects can be also adversely affected by a rising risk of recession in the U.S. Turkey might be well positioned to deal with the trade war challenges, but its domestic political scene remains noisy, worsening the policy test score for the country.</li>
<li class="mt-2">We also reduced our hard currency corporate exposure in China, Hong Kong, and Singapore. The main reasons are the negative and more direct impact of higher tariffs, and the non-zero risk of the renminbi&rsquo;s devaluation to regain competitiveness.</li>
<li class="mt-2">Finally, we reduced our hard currency sovereign exposure in Saudi Arabia, Bahrain, Bahamas, the Philippines, Cote d&rsquo;Ivoire, and Papua New Guinea. The key concern in Saudi Arabia, Bahrain and the Philippines was the impact of the U.S. tariffs on inflation expectations and duration. The tariffs&rsquo; negative impact on lower-income fragile economies was the main consideration in Cote d&rsquo;Ivoire and Papua New Guinea. In terms of our investment process, this has worsened the technical test score for these countries.</li>
</ul>
<p>To receive more <a href="https://www.vaneck.com/us/en/insights/emerging-markets-bonds/" title="Emerging Markets Bonds Insights"><strong>Emerging Markets Bonds</strong></a> insights, <a href="/link/5f45412c2143400497908cea2897f7d3.aspx" title=" Subscription Center"><strong>sign up in our subscription center</strong></a>.</p>
]]></content:encoded>
</item><item rdf:about="https://www.vaneck.com/us/en/blogs/digital-assets/matthew-sigel-the-investment-case-for-the-onchain-economy/">
  <title>The Investment Case for the Onchain Economy></title>
  <link>https://www.vaneck.com/us/en/blogs/digital-assets/matthew-sigel-the-investment-case-for-the-onchain-economy/</link>
  <description><![CDATA[<strong><a href="/link/54b98110e4034531bd63d27f035b8bd9.aspx" title="NODE - VanEck Onchain Economy ETF - Holdings and performance">NODE</a></strong> provides access to the leading public companies and investment vehicles shaping the digital asset economy, guided by a hands-on approach that adapts to market shifts.]]></description>
  <dc:creator>Matthew  Sigel</dc:creator>
  <dc:date>05/14/2025 06:30:00</dc:date>
<content:encoded><![CDATA[

<p><i>The Fund may invest most or all of its net assets in Digital Transformation Companies and/or Digital Asset Instruments but does not invest directly in digital assets or commodities. Digital asset instruments may involve risks from investing in digital asset ETPs, including extreme market volatility and limited investor protections, as these ETPs are not registered under the Investment Company Act of 1940 or the Commodity Exchange Act and do not offer the investor protections provided under those Acts.</i></p>
<h2>Investing in the Infrastructure of the Onchain Future</h2>
<p>The global economy is shifting toward a new digital foundation. Blockchain technology is maturing, and the adoption of digital assets is extending well beyond retail speculation. Today, the companies integrating, enabling, and building on digital asset infrastructure are increasingly relevant to broader capital markets.</p>
<p>The <a href="/link/54b98110e4034531bd63d27f035b8bd9.aspx" title="NODE - VanEck Onchain Economy ETF - Holdings and performance"><strong>VanEck Onchain Economy ETF (Ticker: NODE)</strong></a> is an actively managed strategy designed to provide diversified equity exposure to these companies&mdash;those operating at the intersection of blockchain, traditional finance, infrastructure, and computing.</p>

<h2>The Case for the Onchain Economy</h2>
<p>Digital asset adoption continues to grow at a rapid pace. As of early 2025, <strong>global crypto ownership reached 660 million</strong>, up from 106 million in 2021&mdash;a <strong>four-year compound annual growth rate (CAGR) of nearly 60%</strong>.</p>
<p>Institutions are also getting more involved. Since early 2020, the value of <strong>bitcoin held by public companies has skyrocketed</strong> from under $400 million to more than $56 billion. This does not even include exchange-traded products (ETPs) and crypto-focused funds, representing another growing trend toward regulated exposure.</p>
<p>Governments are also participating. Some are integrating Bitcoin into treasury management or payment systems, and others are launching government-run mining operations. The onchain economy is expanding across industries, countries, and political systems.</p>
<h2>A Broader, Equity-Based Approach</h2>
<p><strong><a href="/link/54b98110e4034531bd63d27f035b8bd9.aspx" title="NODE - VanEck Onchain Economy ETF - Holdings and performance">NODE</a></strong> invests in companies involved in the digital asset space, not the tokens themselves. Instead, it provides access to a wide array of companies operating in the digital asset economy, spanning ten categories that include:</p>
<ul class="content-list">
<li class="mt-2"><strong>Crypto-native businesses</strong> (e.g., exchanges, miners, asset managers)</li>
<li class="mt-2"><strong>&ldquo;Holders&rdquo;, </strong>companies where bitcoin or other digital asset holdings comprise a meaningful share of enterprise value</li>
<li class="mt-2"><strong>Data center operators</strong> increasingly servicing AI and blockchain demand</li>
<li class="mt-2"><strong>Energy and infrastructure providers</strong> enabling digital industry growth</li>
<li class="mt-2"><strong>Consumer platforms and fintech</strong> embedding blockchain in financial services</li>
<li class="mt-2"><strong>Semiconductor and hardware manufacturers</strong> supplying critical inputs</li>
</ul>
<p>This diversified approach allows <strong><a href="/link/54b98110e4034531bd63d27f035b8bd9.aspx" title="NODE - VanEck Onchain Economy ETF - Holdings and performance">NODE</a></strong> to target the economic impact of blockchain technology through the equity markets, where business models, governance, and financial disclosures are familiar to institutional investors.</p>
<h2>Active Management Informed by Market Cycles<sup>*</sup></h2>
<p><strong><a href="/link/54b98110e4034531bd63d27f035b8bd9.aspx" title="NODE - VanEck Onchain Economy ETF - Holdings and performance">NODE</a></strong> integrates a systematic view of bitcoin&rsquo;s market cycle into its portfolio construction. These cycles have historically influenced market sentiment and price behavior, especially the &lsquo;halving cycle&rsquo; where bitcoin mining rewards are reduced by half. Instead of reacting to price swings, <strong><a href="/link/54b98110e4034531bd63d27f035b8bd9.aspx" title="NODE - VanEck Onchain Economy ETF - Holdings and performance">NODE</a></strong> uses consistent signals to guide its investments. These signals include:</p>
<ul class="content-list">
<li class="mt-2">Net unrealized profits (NUP)</li>
<li class="mt-2">Funding rates in derivatives markets</li>
<li class="mt-2">Retail engagement (e.g., app store rankings for crypto platforms)</li>
<li class="mt-2"><a>Bitcoin cycle</a></li>
</ul>
<p>These indicators inform category-level weightings and risk exposure.</p>
<ul class="content-list">
<li class="mt-2"><strong>Anticipating bull markets</strong>, <strong><a href="/link/54b98110e4034531bd63d27f035b8bd9.aspx" title="NODE - VanEck Onchain Economy ETF - Holdings and performance">NODE</a></strong> leans into higher-sensitivity sectors such as miners, exchanges, and crypto-linked asset managers.</li>
<li class="mt-2"><strong>Positioning for downcycles</strong>, the fund tilts toward more stable areas, including infrastructure, semiconductors, and consumer platforms with diversified revenue streams.</li>
</ul>
<p><strong>Active management ensures monthly category and position-level updates</strong>, with a full quarterly portfolio review.</p>

<h2>Exposure to the Bedrock: Bitcoin</h2>
<p>While <strong><a href="/link/54b98110e4034531bd63d27f035b8bd9.aspx" title="NODE - VanEck Onchain Economy ETF - Holdings and performance">NODE</a></strong> is an equity strategy, it can allocate up to <strong>25% of assets to regulated digital asset instruments</strong>, such as exchange-traded products (ETPs), via a wholly owned subsidiary.</p>
<p>This allows the fund to maintain targeted exposure to <strong>Bitcoin, the bedrock of the onchain economy</strong>, within a regulated wrapper.</p>
<p>The equity portfolio may be more volatile than broader indices like the S&amp;P 500, so Bitcoin exposure can serve as a structural complement. When cycle indicators are favorable, Bitcoin can offer additional upside without materially increasing risk, based on historical return profiles.</p>
<h2>A Focused, Research-Driven Portfolio</h2>
<p><a href="/link/54b98110e4034531bd63d27f035b8bd9.aspx" title="NODE - VanEck Onchain Economy ETF - Holdings and performance"><strong>NODE</strong></a> typically holds <strong>30 to 60 high-conviction positions</strong>, selected from a universe of <strong>~100+</strong> actively monitored companies. All holdings must play a clear role in the onchain economy&mdash;whether by generating revenue from digital assets, enabling digital infrastructure, or integrating blockchain into core business operations.</p>
<p>The strategy emphasizes:</p>
<ul class="content-list">
<li class="mt-2">Transparent digital asset exposure</li>
<li class="mt-2">Disciplined capital allocation and governance</li>
<li class="mt-2">Financial strength and long-term strategic alignment</li>
</ul>
<h2>Why VanEck?</h2>
<p>VanEck has been building in the digital asset space since 2017, launching some of the earliest regulated crypto equity, futures, and spot products. That experience has taught us that <strong>active management is essential</strong> in this fast-evolving sector to find growth and avoid excessive leverage, overhyped narratives, and drawdowns exceeding 90%.</p>
<p>We&rsquo;ve seen firsthand how quickly this space can shift&mdash;technologically, politically, and structurally. A passive approach may capture the theme, but <strong>only an active lens can navigate its risks</strong>.</p>
<p>With over $116 billion in assets under management and a dedicated digital assets research team, VanEck brings institutional infrastructure to an emerging asset class.</p>
<h2>Conclusion</h2>
<p>The onchain economy is more than a trend&mdash;it&rsquo;s a transformation. <strong><a href="/link/54b98110e4034531bd63d27f035b8bd9.aspx" title="NODE - VanEck Onchain Economy ETF - Holdings and performance">NODE</a></strong> is designed to help investors participate in that transformation through a diversified, actively managed equity portfolio focused on the real businesses powering the shift.</p>
<p>As digital assets reshape the financial and computing landscape, <strong><a href="/link/54b98110e4034531bd63d27f035b8bd9.aspx" title="NODE - VanEck Onchain Economy ETF - Holdings and performance">NODE</a></strong> offers a thoughtful way to allocate funds to public companies building their foundation.</p>
<p>To receive more <strong><a href="https://www.vaneck.com/us/en/insights/digital-assets/" title="Digital Assets Insights">Digital Assets</a></strong> insights, <strong><a href="https://www.vaneck.com/us/en/subscribe/" title="Subscription Center">sign up in our subscription center</a></strong>.</p>
]]></content:encoded>
</item><item rdf:about="https://www.vaneck.com/us/en/blogs/digital-assets/node-etf-question-and-answer/">
  <title>NODE ETF: Question &amp; Answer></title>
  <link>https://www.vaneck.com/us/en/blogs/digital-assets/node-etf-question-and-answer/</link>
  <description><![CDATA[We answer the frequently asked questions about the NODE ETF.]]></description>
  <dc:creator>Drew  Anderson</dc:creator>
  <dc:date>05/14/2025 06:30:00</dc:date>
<content:encoded><![CDATA[

<p><a href="/link/54b98110e4034531bd63d27f035b8bd9.aspx" title="NODE - VanEck Onchain Economy ETF - Overview"><strong>NODE</strong></a> is built on a simple thesis: the onchain economy is real, accelerating, and increasingly investable. What began as a fringe financial experiment has become a catalyst for transformation across energy, computing, finance, and consumer tech.</p>
<p>As digital assets go mainstream &mdash; from ETF approvals to enterprise adoption and sovereign integration &mdash; <a href="/link/54b98110e4034531bd63d27f035b8bd9.aspx" title="NODE - VanEck Onchain Economy ETF - Overview"><strong>NODE</strong></a> aims to offer investors a smart, risk-aware way to participate in this long-term shift.</p>
<ul class="content-list">
<li class="mt-2"><a href="#point-one"><strong>What is the VanEck Onchain Economy ETF (NODE)?</strong></a></li>
<li class="mt-2"><a href="#point-two"><strong>What is the &ldquo;onchain economy&rdquo;?</strong></a></li>
<li class="mt-2"><a href="#point-three"><strong>What types of companies does NODE invest in?</strong></a></li>
<li class="mt-2"><a href="#point-four"><strong>What is NODE&rsquo;s investment approach?</strong></a></li>
<li class="mt-2"><a href="#point-five"><strong>How does the Bitcoin cycle influence NODE&rsquo;s positioning?</strong></a></li>
<li class="mt-2"><a href="#point-six"><strong>Why active management in this space?</strong></a></li>
<li class="mt-2"><a href="#point-seven"><strong>Is NODE just about crypto or something broader?</strong></a></li>
<li class="mt-2"><a href="#point-eight"><strong>How concentrated is NODE&rsquo;s portfolio?</strong></a></li>
<li class="mt-2"><a href="#point-nine"><strong>How can investors buy VanEck ETFs?</strong></a></li>
</ul>
<h2 id="point-one" class="anchored-block">What is the VanEck Onchain Economy ETF (NODE)?</h2>
<p>The<strong><a title="NODE - VanEck Onchain Economy ETF - Overview" href="/link/54b98110e4034531bd63d27f035b8bd9.aspx"> VanEck Onchain Economy ETF (NODE)</a> </strong>is an actively managed equity ETF that seeks to capture the transformative growth of blockchain and digital assets. <a href="/link/54b98110e4034531bd63d27f035b8bd9.aspx" title="NODE - VanEck Onchain Economy ETF - Overview"><strong>NODE</strong></a> invests in companies across a broad set of categories &mdash; from crypto infrastructure to adjacent enablers like semiconductors and data centers &mdash; all of which contribute to or benefit from the onchain economy.</p>

<h2 id="point-two" class="anchored-block">What is the &ldquo;onchain economy&rdquo;?</h2>
<p>The onchain economy refers to the expanding network of businesses, technologies, and infrastructure tied to public blockchains like Bitcoin and Ethereum. It includes crypto-native firms like miners and exchanges and companies in traditional finance, energy, semiconductors, and software actively integrating blockchain into their operations.</p>
<p>These businesses are helping build a new era of value transfer, decentralized computing, and financial infrastructure &mdash; and <a href="/link/54b98110e4034531bd63d27f035b8bd9.aspx" title="NODE - VanEck Onchain Economy ETF - Overview"><strong>NODE</strong></a> aims to provide investors with diversified, equity-based access to that shift.</p>
<h2 id="point-three" class="anchored-block">What types of companies does NODE invest in?</h2>
<p><a href="/link/54b98110e4034531bd63d27f035b8bd9.aspx" title="NODE - VanEck Onchain Economy ETF - Overview"><strong>NODE</strong></a>&rsquo;s portfolio spans 10 categories within the onchain economy:</p>
<ol class="content-list">
<li class="mt-2">Crypto ETPs</li>
<li class="mt-2">Mining</li>
<li class="mt-2">Exchanges</li>
<li class="mt-2">Asset Managers</li>
<li class="mt-2">Corporate Bitcoin Holders (companies with large bitcoin (BTC) holdings)</li>
<li class="mt-2">Data Centers</li>
<li class="mt-2">Energy Infrastructure</li>
<li class="mt-2">Traditional finance (TradFi) Enablers</li>
<li class="mt-2">Semiconductors/Hardware</li>
<li class="mt-2">Consumer/Gaming</li>
</ol>
<p>Each category represents a different stage of blockchain adoption or enablement. The Fund dynamically adjusts exposure based on category beta, market conditions, and where we believe we are in the Bitcoin cycle (based on historical data).</p>
<h2 id="point-four" class="anchored-block">What is NODE&rsquo;s investment approach?</h2>
<p><a href="/link/54b98110e4034531bd63d27f035b8bd9.aspx" title="NODE - VanEck Onchain Economy ETF - Overview"><strong>NODE</strong></a> is an actively managed ETF designed to adapt to one of the fastest-evolving areas of the global economy. Rather than track an index, <a href="/link/54b98110e4034531bd63d27f035b8bd9.aspx" title="NODE - VanEck Onchain Economy ETF - Overview"><strong>NODE</strong></a>&rsquo;s portfolio management team:</p>
<ul class="content-list">
<li class="mt-2">Chooses 30&ndash;60 high-conviction names from a universe of ~100 global stocks</li>
<li class="mt-2">Monitors fundamental, macro, and crypto-native signals</li>
<li class="mt-2">Allocates dynamically across categories based on opportunity and risk</li>
</ul>
<p><a href="/link/54b98110e4034531bd63d27f035b8bd9.aspx" title="NODE - VanEck Onchain Economy ETF - Overview"><strong>NODE</strong></a> avoids direct cryptocurrency exposure. Instead, it uses equities and regulated instruments (such as crypto ETPs and futures) to gain targeted digital asset exposure via a Cayman subsidiary structure.</p>

<h2 id="point-five" class="anchored-block">How does the Bitcoin cycle influence NODE&rsquo;s positioning?</h2>
<p>The historical patterns of the Bitcoin halving cycle has tended to drive changes in crypto sentiment and price behavior. The Fund optimizes exposure by overweighting higher-beta categories during periods of positive sentiment and focusing on more defensive categories when volatility rises or risk appetite declines.</p>
<p><strong>Beta (BTC Beta):</strong> A measure of how an asset moves in relation to Bitcoin&rsquo;s price fluctuations. Higher beta (&gt;1.0) means the asset moves more than BTC, while lower beta (&lt;1.0) means it moves less.</p>
<h2 id="point-six" class="anchored-block">Why active management in this space?</h2>
<p>The onchain economy moves fast &mdash; driven by innovation, policy shifts, and crypto market volatility. Passive or index-based strategies may lag behind major developments or overexpose investors to stale themes.</p>
<p>Active management gives <a href="/link/54b98110e4034531bd63d27f035b8bd9.aspx" title="NODE - VanEck Onchain Economy ETF - Overview"><strong>NODE</strong></a> the flexibility to:</p>
<ul class="content-list">
<li class="mt-2">Respond to emerging narratives or market disruptions</li>
<li class="mt-2">Adjust allocations as categories evolve or correlations change</li>
<li class="mt-2">Manage risk proactively during periods of volatility or drawdowns</li>
</ul>
<p>This agility is particularly important in a space with asymmetric upside and cyclical behavior.</p>
<h2 id="point-seven" class="anchored-block">Is NODE just about crypto or something broader?</h2>
<p><a href="/link/54b98110e4034531bd63d27f035b8bd9.aspx" title="NODE - VanEck Onchain Economy ETF - Overview"><strong>NODE</strong></a> is crypto-forward, but not crypto-only. While many of the Fund&rsquo;s holdings have exposure to bitcoin or digital assets, <a href="/link/54b98110e4034531bd63d27f035b8bd9.aspx" title="NODE - VanEck Onchain Economy ETF - Overview"><strong>NODE</strong></a> also includes companies enabling the broader digital transformation &mdash; from AI-powered data centers and power-hungry GPU manufacturers to payment platforms exporting blockchain-based services to emerging markets.</p>
<p>The goal is to capture value across the entire digital asset stack: infrastructure, applications, and adjacencies.</p>
<h2 id="point-eight" class="anchored-block">How concentrated is NODE&rsquo;s portfolio?</h2>
<p><a href="/link/54b98110e4034531bd63d27f035b8bd9.aspx" title="NODE - VanEck Onchain Economy ETF - Overview"><strong>NODE</strong></a> targets 30&ndash;60 securities selected from a broader universe of ~100 names. This allows:</p>
<ul class="content-list">
<li class="mt-2">Diversification across categories, regions, and risk profiles</li>
<li class="mt-2">Flexibility to express high-conviction views</li>
<li class="mt-2">Tactical rotation when opportunities or risks emerge</li>
</ul>
<p>The Fund&rsquo;s portfolio construction is designed to balance upside participation with risk awareness &mdash; particularly during volatile crypto phases.</p>
<h2>What role could NODE play in a portfolio?</h2>
<p><a href="/link/54b98110e4034531bd63d27f035b8bd9.aspx" title="NODE - VanEck Onchain Economy ETF - Overview"><strong>NODE</strong></a> may fit within the following allocation sleeves:</p>
<ul class="content-list">
<li class="mt-2">Thematic Growth: For investors seeking exposure to disruptive trends</li>
<li class="mt-2">Alternative Equity: As a differentiated equity sleeve with potential crypto correlation</li>
<li class="mt-2">Core-Satellite: As a satellite position complementing core index exposure</li>
</ul>
<p>Because it spans multiple categories with distinct risk/return profiles, <a href="/link/54b98110e4034531bd63d27f035b8bd9.aspx" title="NODE - VanEck Onchain Economy ETF - Overview"><strong>NODE</strong></a> can act as a flexible tool for expressing a long-term view of blockchain&rsquo;s impact on the global economy.</p>
<h2 id="point-nine" class="anchored-block">How can investors buy VanEck ETFs?</h2>
<p>Learn more here: <strong><a title="How to buy VanEck ETFs?" href="https://www.vaneck.com/us/en/investments/onchain-economy-etf-node/overview/#how-to-buy-etf&amp;utm=NODE-Blog">VanEck Onchain Economy ETF </a></strong></p>
<p class="d-none d-lg-block"><a href="mailto:askvaneck@vaneck.com" title="Have More Questions? - Ask VanEck" rel="noopener"><img loading="lazy" class="img-responsive" src="https://www.vaneck.com/globalassets/home/us/insights/blogs/bm-blog-images/cta-faq_desktop-02.svg" alt="Have More Questions? - Ask VanEck" /></a></p>
<p class="d-lg-none"><a href="mailto:askvaneck@vaneck.com" title="Have More Questions? - Ask VanEck" rel="noopener"><img loading="lazy" class="img-responsive" src="https://www.vaneck.com/globalassets/home/us/insights/blogs/bm-blog-images/cta-faq_mobile-01.svg" alt="Have More Questions? - Ask VanEck" /></a></p>
<p>To receive more <strong><a href="https://www.vaneck.com/us/en/insights/digital-assets/" title="Digital Assets Insights">Digital Assets</a></strong> insights, <strong><a href="https://www.vaneck.com/us/en/subscribe/" title="Subscription Center">sign up in our subscription center</a></strong>.</p>
]]></content:encoded>
</item><item rdf:about="https://www.vaneck.com/us/en/blogs/emerging-markets-equity/india-building-on-economic-momentum/">
  <title>India: Building on Economic Momentum></title>
  <link>https://www.vaneck.com/us/en/blogs/emerging-markets-equity/india-building-on-economic-momentum/</link>
  <description><![CDATA[India is accelerating in 2025&mdash;soaring consumption, fintech disruption, and record infrastructure spending are turning it into the hottest emerging market.]]></description>
  <dc:creator>Ola  El-Shawarby, CFA</dc:creator>
  <dc:date>05/14/2025 06:30:00</dc:date>
<content:encoded><![CDATA[

<p id="overview" class="jump-link-nav anchored-block" data-jumplink-title="Overview">India&rsquo;s economy is gaining investor attention as the nation builds on strong macroeconomic fundamentals and structural reforms. Despite falling short of expectations, India&rsquo;s FY&rsquo;24 GDP growth of 6.6%<sup>1</sup>&nbsp;is relatively attractive to growth rates of other emerging markets countries. India&rsquo;s growth is supported by strong domestic consumption, services sector, and high-value manufacturing exports​.<sup>2</sup>&nbsp;Indian equities soared for most of 2024, but experienced a short-term pull back following softer-than-expected GDP data in the fourth quarter.</p>
<p>Emerging markets equities are facing pricing pressures due to uncertainty over U.S. tariffs. However, Indian equities have been mostly immune to tariff-related volatility as the country&rsquo;s growth is mainly a factor of domestic consumption and infrastructure spending. If anything, India stands to benefit from supply chain shifts out of China and Vietnam. We remain focused on the long-term structural growth of India as it marches on to become the world&rsquo;s third-largest economy​.<sup>3</sup>&nbsp;</p>
<h3>Indian Stocks Are Outpacing Their Emerging Markets Peers</h3>
<p><a><img loading="lazy" src="https://www.vaneck.com/contentassets/5d21065accf84ca0950b1c99a80bf0b9/5675_india-building-economic-momentum_chart-1_2025-5_v1.svg" class="img-responsive w-100" width="100%" alt="Indian Stocks Are Outpacing Their Emerging Markets Peers" /></a></p>
<p class="chart-disclosure">Source: Morningstar Direct. Data as of March 31, 2025</p>
<p class="chart-disclosure">Past performance is no guarantee of future results. Index performance is not representative of fund performance. It is not possible to invest directly in an index.</p>
<h2 id="the-case-for-india" class="jump-link-nav anchored-block" data-jumplink-title="The Case for India">Monetary and Fiscal Policy Support</h2>
<p>India&rsquo;s GDP expansion of roughly 6% &ndash;7% outpaces peers, providing a tailwind for corporate earnings. Even as growth takes off, inflation has been brought under control, dipping to 3.6% in February which is within the central bank&rsquo;s 4% target​ ceiling,<sup>4</sup>&nbsp;giving the Reserve Bank of India (RBI) room to cut rates and support growth​.<sup>3</sup>&nbsp;</p>
<p>The government has orchestrated a delicate balance of fiscal prudence and growth-focused spending. After the pandemic, India embarked on fiscal consolidation &ndash; cutting the fiscal deficit from 9%+ of GDP to 5.9% in FY2023-24<sup>5</sup>&ndash; while sharply increasing capital investments. Notably, the FY23/24 budget hiked public capital expenditure by 33% to about $122 billion,<sup>6</sup>&nbsp;an all-time high of ~3.3% of GDP. This hefty outlay, directed at infrastructure, housing, and manufacturing signals a shift from subsidies to long-term asset creation. By spending almost one-fifth of its budget on development projects, the government aims to crowd into private investment and sustain high growth​.<sup>7</sup>&nbsp;Meanwhile, healthy tax revenues from the growing economy have kept public finances on a sustainable path, allowing India to invest in growth without jeopardizing stability.</p>
<p>Beyond supportive macro factors, multiple high-growth sectors are driving India&rsquo;s economic momentum. Structural trends&ndash;from a burgeoning middle class to digital innovation and policy reforms&ndash;are propelling these industries and creating new investment opportunities.</p>
<h2>Consumer Boom and Premiumization</h2>
<p>India is undergoing a consumer boom, particularly in the premium segment. Rising incomes and urbanization have unleashed a new wave of discretionary spending. By 2030, India is projected to quadruple consumer spending from about $1.5 trillion to $6 trillion​ with domestic consumption doubling in size forecasted to reach 5 trillion​.<sup>6</sup></p>
<p>The narrative is clear: an aspirational middle class is &ldquo;trading up,&rdquo; eager to spend on quality products and experiences. This trend bodes well for consumer-facing companies&ndash;from retailers and mall operators to auto makers and real estate developers catering to the upscale market. As India&rsquo;s consumption story shifts from basic needs to premium indulgences, investors have a chance to ride a powerful wave of domestic demand growth.</p>
<p>Luxury real estate sales surged 50%+ in 2024,<sup>8</sup>&nbsp;benefiting developers like Oberoi Realty.* Housing demand is now heavily tilted toward the luxury segment, with affluent buyers in major cities opting for premium housing, a trend that directly benefits Oberoi&rsquo;s portfolio of upscale projects.<sup>9</sup>&nbsp;</p>
<p>Similarly, rising discretionary spending with global brands eager to cater to Indian consumers, is likely to benefit Phoenix Mills Ltd.* The company is India&rsquo;s top mall developer and owns a portfolio of marquee shopping malls in major cities across the country. Phoenix&rsquo;s high-end malls (often destinations for shopping, dining, and entertainment) are experiencing strong leasing demand and rental growth. Investors in Phoenix Mills gain from both steady rental income and the capital appreciation of prime retail real estate.</p>

<h2>Digital Finance and Credit Access Expansion</h2>
<p>The fintech revolution in India is in full swing, transforming how Indians save, borrow, pay, and invest. Over the past decade, the government&rsquo;s &ldquo;Digital India&rdquo; initiative has dramatically expanded internet access<sup>10</sup>&nbsp;and lowered e-KYC costs for financial institutions.<sup>11</sup>&nbsp;With almost 900 million internet users and cheap mobile data, India is now the world&rsquo;s largest open market for digital services.<sup>12</sup>&nbsp;As a result, a vibrant ecosystem of digital platforms has emerged, offering everything from peer-to-peer payments and online lending to robo-advisory and insure-tech.</p>
<p>Expanded access to financial services is unlocking credit for underbanked segments, such as small merchants and rural entrepreneurs​. Cholamandalam Investment &amp; Finance Company<sup>*</sup>&nbsp;(CIFC) has been growing its loan book at a rapid pace, targeting 20%&ndash;25% annual growth in assets under management (AUM) as it finances vehicle purchases, home loans, and small business expansion​.<sup>13</sup>&nbsp;With one of the widest branch networks among non-bank lenders, CIFC is poised to gain from rising consumption and underpenetrated credit in rural areas. Its asset quality remains healthy and capital position strong, positioning the firm to continue expanding credit access to India&rsquo;s aspiring middle class.</p>
<p>Even traditional banks such as HDFC Bank Ltd (HDFC)<sup>*</sup>&nbsp;are partnering with fintechs to co-create digital products.<sup>14</sup>&nbsp;India&rsquo;s largest private sector bank, HDFC, is a bellwether for the nation&rsquo;s financial services and consumer economy. The bank continues to post solid growth even at scale &ndash; for the quarter ending December 2024, retail loans grew ~10% year-on-year and commercial/rural loans by ~11.5%​.<sup>15</sup>&nbsp;With the recent merger of its parent HDFC Ltd (a housing finance giant), HDFC Bank has bolstered its balance sheet and product suite, especially in mortgages. This one-stop financial conglomerate is positioned to harness India&rsquo;s rising income levels. For investors, HDFC Bank represents a stable, blue-chip exposure to India&rsquo;s banking growth, known for its consistent execution, high asset quality, and steady profit growth.</p>
<p>Jio Financial Services Ltd.<sup>*</sup>&nbsp;was demerged from Reliance Industries in 2023, leveraging the immense reach of Reliance&rsquo;s telecom arm (Jio) to offer digital finance solutions. Jio Financial and BlackRock have agreed to a 50:50 joint venture with $300 million in initial investment to launch asset management services in India​.<sup>16</sup>&nbsp;This venture will create a new platform for mutual funds and investment products targeting India&rsquo;s growing retail investor base.</p>
<p>Beyond investments, the firm is expected to roll out consumer lending, insurance, and payments solutions integrated with Jio&rsquo;s digital ecosystem (smartphone apps used by hundreds of millions). In essence, Jio Financial is building a fintech powerhouse that could disrupt traditional banks by offering low-cost, tech-enabled financial services to the masses.</p>
<h2>Infrastructure and Urban Development Upswing</h2>
<p>India is undergoing an infrastructure renaissance, pouring resources into highways, railways, ports, and urban development at an unprecedented scale. The government&rsquo;s push is evident in budget allocations &ndash; capital investment outlays have hit record highs at $11.6 billion in FY24 (a 33% jump) to build the backbone of a modern economy​.<sup>17</sup>&nbsp;Landmark projects like the Delhi-Mumbai Industrial Corridor, new freight rail corridors, and dozens of new airports are under execution, which will reduce logistics costs and spur industrial growth.</p>
<p>The infrastructure boom is not only adding to GDP directly but also enabling other industries (like e-commerce, logistics, manufacturing) to flourish on the back of improved facilities. This virtuous cycle of building and growth makes India&rsquo;s infrastructure an attractive long-term investment theme. India&rsquo;s largest integrated logistics and e-commerce fulfillment company, Delhivery Ltd<sup>*</sup>&nbsp;is likely to benefit from India&rsquo;s infrastructure and consumption boom. Delhivery provides parcel transportation, warehousing, and supply chain services to e-commerce players and merchants nationwide. The company&rsquo;s volume and revenue are climbing steadily with its nationwide network and technology platform, Delhivery is positioned to capitalize on India&rsquo;s e-commerce logistics market growth as more retailers outsource their logistics.<sup>18</sup>&nbsp;</p>
<p>India&rsquo;s cables and wires sector is thriving on the back of strong domestic demand in real estate and infrastructure. As a manufacturer of cables &amp; electrical wires, KEI Industries Ltd<sup>*</sup>&nbsp;is benefiting from India&rsquo;s infrastructure and power development projects. The company is witnessing high domestic and export demand, prompting a massive capacity expansion. KEI has planned a ₹18&ndash;19 billion ($210.5M - $222.2M) capital expenditure for a greenfield expansion that will boost its cable manufacturing capacity by 137%​.<sup>19</sup>&nbsp;</p>
<h2>Green Energy and Manufacturing</h2>
<p>India is spearheading one of the largest green energy and manufacturing transformations globally. The government aims to reach 500 GW of renewable energy capacity by 2030 (up from 125 GW today), with ambitious investments in solar, wind, battery storage, and green hydrogen. Manufacturing is also on a growth trajectory, with the &ldquo;Make in India&rdquo; initiative accelerating production in electronics, semiconductors, automotive, and specialty chemicals.</p>
<p>With a committed capital investment of $10 billion in clean energy, Reliance Industries<sup>*</sup>&nbsp;stands at the crossroads of both megatrends. Reliance is building a 5,000-acre Green Energy Giga Complex to manufacture solar panels, energy storage, and hydrogen fuel technology. It plans to establish 100 GW of renewable capacity by 2030,<sup>20</sup>&nbsp;positioning itself as a leader in India&rsquo;s energy transition. It plans to start manufacturing solar wafers inhouse by December 2025 and develop a local supply chain.</p>
<p>With government-backed incentives and massive industrial investments, India&rsquo;s shift toward clean energy and advanced manufacturing presents a multi-decade investment opportunity. Reliance Industries possesses the scale and strategic positioning to capitalize on these opportunities.</p>
<p>India&rsquo;s rapid expansion across consumer, fintech, infrastructure, and green energy sectors presents a compelling investment case. Companies positioned in these high-growth areas are set to benefit as India moves toward a $7.5T economy by 2031. Now is the time for investors to capitalize on India&rsquo;s unfolding economic transformation.<sup>21</sup>&nbsp;</p>

<p>To receive more <a href="/us/en/insights/emerging-markets-equity/" title="Emerging Markets Equity Insights"><strong>Emerging Markets Equity</strong></a> insights, <a href="/us/en/subscribe/" title="Subscription Center"><strong>sign up in our subscription center</strong></a>.</p>
]]></content:encoded>
</item><item rdf:about="https://www.vaneck.com/us/en/blogs/municipal-bonds/why-munis-still-make-sense-compelling-yields-in-a-changing-landscape/">
  <title>Why Munis Still Make Sense: Compelling Yields in a Changing Landscape></title>
  <link>https://www.vaneck.com/us/en/blogs/municipal-bonds/why-munis-still-make-sense-compelling-yields-in-a-changing-landscape/</link>
  <description><![CDATA[Despite policy uncertainty, municipal bonds continue to offer compelling yields and experience strong investor demand, making them an attractive tax-advantaged income option in today&rsquo;s market.&nbsp;]]></description>
  <dc:creator>James Colby</dc:creator>
  <dc:date>05/14/2025 06:30:00</dc:date>
<content:encoded><![CDATA[

<p>Back in March, we <strong><a title="Muni Market&rsquo;s Moment of Truth: Tax-Exemption in Question" href="/us/en/blogs/municipal-bonds/muni-markets-moment-of-truth-tax-exemption-in-question/">wrote</a></strong> that the tax-exemption status of municipal bonds faced growing uncertainty as policymakers weighed major tax changes. While risks loomed, the case for munis remained grounded in one thing: compelling yields.</p>
<p>As of early May, the theme is unchanged&mdash;but the backdrop has evolved.</p>
<h2>Flows Affirm Investor Appetite</h2>
<p>Despite some yield compression in recent weeks, investors continue to take advantage of attractive municipal bond valuations. Net flows remain solid: municipal bond ETFs saw $2.7 billion in inflows in April alone. The market may not be flashing bargain-bin yields like a month ago, but relative value persists&mdash;particularly for those seeking income without overcommitting to duration or credit risk.</p>
<h3>Largest April on Record for Muni ETF Flows (2011-2025)</h3>
<p><img loading="lazy" src="https://www.vaneck.com/contentassets/397fe45ffb0c41cbbe6a3ee50259668c/5674_muni-blog-may-2025_chart-1_2025-5.svg" class="img-responsive w-100" alt="Largest April on Record for Muni ETF Flows" /></p>
<p class="chart-disclosure">Source: Morningstar as of 4/30/25.</p>

<h2>Supply Swells, Demand Grows Stronger</h2>
<p>New issuance is robust. According to CreditSights, supply in April ran 58% above the 52-week average, and the May calendar suggests this pace will continue. But importantly, demand is rising to meet it. May alone brings an estimated $38 billion of reinvestment cash from maturities, calls, and coupons. After subtracting new supply, this nets to roughly $16 billion in positive technicals for the month.</p>
<h2>History and Policy May Align for Munis</h2>
<p>Longer term, the market may find tailwinds from the macro landscape. Municipal Market Analytics (MMA) notes that since 1966, a year of negative municipal returns (like 2024) is historically followed by a positive 10-year total return. If a slowing economy or trade pressures prompt the Fed to cut rates, bonds&mdash;especially tax-exempt&mdash;stand to benefit.</p>
<h2>Compelling Yields Amid Policy Overhang</h2>
<p>We return to where we began: the theme is unchanged. Yields remain attractive. A 10-year AAA muni yielding 3.25% offers a taxable-equivalent yield (TEY) of 5% for those in the top tax bracket. A 30-year AAA at 4.37% equates to 7.38% TEY. Even as discussions around tax exemption continue in Washington, the current muni landscape offers meaningful income opportunities, especially for investors navigating uncertainty.</p>
<h3>Yields Attractive Amid Policy Uncertainty</h3>
<div class="flourish-embed flourish-chart" data-src="visualisation/23165607?2428759"><script src="https://public.flourish.studio/resources/embed.js"></script><noscript><img loading="lazy" src="https://public.flourish.studio/visualisation/23165607/thumbnail" width="100%" alt="Yields Attractive Amid Policy Uncertainty" /></noscript></div>
<p class="chart-disclosure">Source: Bloomberg as of 5/8/2025. Municipal (AAA): BVAL Municipal AAA Yield Curve (Callable) - The curve is populated with high quality US municipal bonds with an average rating of AAA from Moody's and S&amp;P. Municipal (A): US General Obligation A+ A A- Muni BVAL Yield Curve - The BVAL curve is populated with pricing from uninsured A+, A, and A rated General Obligation bonds. Both are calculated using *Taxable equivalent yield @ 40.8% tax rate.</p>
<p>To receive more <a href="https://www.vaneck.com/us/en/insights/municipal-bonds/" title="Municipal Bonds Insights"><strong>Municipal Bonds</strong></a> insights, <a href="/link/5f45412c2143400497908cea2897f7d3.aspx" title=" Subscription Center"><strong>sign up in our subscription center</strong></a>.</p>
]]></content:encoded>
</item><item rdf:about="https://www.vaneck.com/us/en/blogs/model-portfolios/april-market-recap-a-new-world-order-built-on-tariffs-trust-issues-and-gold/">
  <title>April Market Recap: A New World Order—Built on Tariffs, Trust Issues, and Gold></title>
  <link>https://www.vaneck.com/us/en/blogs/model-portfolios/april-market-recap-a-new-world-order-built-on-tariffs-trust-issues-and-gold/</link>
  <description><![CDATA[Trump is reshaping global trade&mdash;prioritizing U.S. strength, pressuring allies, challenging China, and forcing a shift from dollar dominance. <strong>In this blog we examine how recent events affect our model portfolio outlook.</strong>]]></description>
  <dc:creator>David Schassler</dc:creator>
  <dc:date>05/14/2025 06:30:00</dc:date>
<content:encoded><![CDATA[

<p>Trump isn&rsquo;t bluffing. He&rsquo;s rewriting the rules of global engagement&mdash;putting <strong>America first</strong>, demanding <strong>fair trade</strong>, and prioritizing <strong>national strength over global cooperation for its own sake</strong>.</p>
<ul class="content-list">
<li class="mt-2"><strong>Tariffs are tools&mdash;not threats.</strong> Imports from China and others face heavy costs unless they play fair. The goal? Level the playing field.</li>
<li class="mt-2"><strong>Globalization isn&rsquo;t dead&mdash;but it&rsquo;s conditional.</strong> Trump wants trade. But not at any cost. It must be <strong>balanced, reciprocal, and in America&rsquo;s interest</strong>.</li>
<li class="mt-2"><strong>Even allies face pressure.</strong> Long-standing partners are being pushed to deliver better terms&mdash;not out of hostility, but fairness.</li>
<li class="mt-2"><strong>Strategic industries are the new front lines.</strong> Tech, energy, semiconductors&mdash;these aren&rsquo;t just markets anymore. They&rsquo;re national assets.</li>
</ul>
<p>For decades, the world earned dollars through trade and recycled them into U.S. Treasuries. That system is breaking. Countries are now <strong>diversifying reserves</strong>, buying <strong>gold</strong>, and acquiring <strong>real assets</strong> instead of lending to governments they no longer fully trust.</p>
<p><strong>The shift is real and accelerating:</strong></p>
<ul class="content-list">
<li class="mt-2">Falling demand for U.S. debt</li>
<li class="mt-2">A weaker U.S. dollar</li>
<li class="mt-2">Soaring interest in hard assets</li>
</ul>
<p>Nations are reducing their reliance on the U.S.&mdash;its economy, its institutions, and its currency.</p>
<h3>Models Favor Gold, India and Bitcoin</h3>
<div class="flourish-embed flourish-number-ticker" data-src="visualisation/23184284?2429379"><script src="https://public.flourish.studio/resources/embed.js"></script><noscript><img loading="lazy" src="https://public.flourish.studio/visualisation/23184284/thumbnail" width="100%" alt="Sentiment Favors Gold, India and Bitcoin" /></noscript></div>

<h2>Markets Are Rallying. That Doesn&rsquo;t Mean It&rsquo;s Safe.</h2>
<p>Yes, the S&amp;P 500 is once again trading near all-time highs. Yes, gold cooled slightly after topping $3,400. But <strong>don&rsquo;t confuse a bounce with a bottom</strong>.</p>
<p>If your portfolio struggled in the last drop, the market just gave you a gift: <strong>a second chance to diversify</strong>.</p>
<h2>Gold Isn&rsquo;t a Trade. It&rsquo;s a Trend.</h2>
<p>Forget the &ldquo;Did I miss it?&rdquo; narrative. Here&rsquo;s what matters:</p>
<ul class="content-list">
<li class="mt-2">Gold hit an all-time high of $3,400 in early May.</li>
<li class="mt-2">It&rsquo;s up nearly <strong>30% this year</strong> and <strong>45% over the past 12 months.</strong></li>
<li class="mt-2">Supply is stable. Demand is rising.</li>
<li class="mt-2">Global de-dollarization is accelerating.</li>
</ul>
<p><strong>Gold is a core asset in a world questioning the value of fiat.</strong></p>
<h2>Oil Sold Off. We Bought.</h2>
<p>Oil prices plunged&mdash;WTI hit $57 on May 5&mdash;as markets priced in recession fears and OPEC+ began easing production cuts.</p>
<p>Saudi Arabia is playing a strategic game: enforce discipline inside OPEC, slow U.S. production gains, and maintain influence.</p>
<p>We used the sell-off to increase oil exposure&mdash;positioning for upside as supply-demand dynamics reset.</p>
<h2>The U.S. is Pricey. The Opportunity is Abroad.</h2>
<p>U.S. equities have bounced, and <strong>valuations are stretched</strong>&mdash;especially in a world flirting with recession.</p>
<p>Meanwhile, the rest of the world is catching a bid:</p>
<ul class="content-list">
<li class="mt-2"><strong>Developed international stocks</strong>: +15% YTD</li>
<li class="mt-2"><strong>Emerging markets</strong>: +7% YTD</li>
<li class="mt-2"><strong>U.S. equities</strong>: flat to slightly down</li>
</ul>
<p>Why?</p>
<ul class="content-list">
<li class="mt-2">Cheaper valuations</li>
<li class="mt-2">Rising fiscal stimulus</li>
<li class="mt-2">Weaker dollar tailwinds</li>
<li class="mt-2">More independent growth stories</li>
</ul>
<p>We're entering a <strong>multi-polar economy</strong>. Global growth is no longer just about what happens in Washington or at the Fed. Investors need to look beyond U.S. borders.</p>
<p><strong>We&rsquo;ve been steadily increasing our allocation to international equities all year&mdash;and we plan to continue.</strong> The setup is strong, the valuations are attractive, and the diversification benefits are real.</p>

<h2>Bitcoin Pulled Back. Here&rsquo;s Why.</h2>
<p>Bitcoin fell from a high of $107,000 to a low of $77,000 in just a few weeks.</p>
<ul class="content-list">
<li class="mt-2">Dormant wallets sold into strength</li>
<li class="mt-2">Institutions rotated out amid macro uncertainty</li>
<li class="mt-2">The Bybit hack ($1.5B) spooked sentiment</li>
<li class="mt-2">Broader risk-off environment weighed on crypto</li>
</ul>
<p>But let&rsquo;s be clear: this is a <strong>pullback</strong>, not a breakdown. Bitcoin&rsquo;s long-term thesis remains intact&mdash;this kind of volatility is a feature, not a flaw.</p>
<h2>Fixed Income: Signals Worth Watching</h2>
<p>The bond market is sending quiet but important signals.</p>
<ul class="content-list">
<li class="mt-2">Between December and February, foreign central banks sold <strong>$86 billion</strong> of U.S. bonds</li>
<li class="mt-2">During April&rsquo;s equity correction, <strong>Treasuries sold off too</strong>&mdash;a sign that traditional safe havens aren&rsquo;t acting like they used to</li>
</ul>
<p>The risk now isn&rsquo;t just about credit&mdash;it&rsquo;s about duration. <strong>If the yield curve continues to steepen, long-duration bonds could face renewed pressure.</strong> Rising term premiums and global sellers add fuel to that risk.</p>
<p>In this environment, fixed income strategy must shift:</p>
<ul class="content-list">
<li class="mt-2"><strong>Favor quality over yield</strong></li>
<li class="mt-2"><strong>Be cautious of long-duration exposure</strong></li>
<li class="mt-2"><strong>Avoid complacency&mdash;rate volatility is back</strong></li>
</ul>
<h2>What Worked Won&rsquo;t Work Forever</h2>
<p>This market rally feels good&mdash;but it could be setting a trap.</p>
<ul class="content-list">
<li class="mt-2">The dollar is weakening</li>
<li class="mt-2">Gold is outperforming</li>
<li class="mt-2">Credit markets are flashing stress</li>
<li class="mt-2">Global leadership is decentralizing</li>
</ul>
<p>We&rsquo;re in a transition from monetary dominance to fiscal muscle, from globalization to regional blocs, from U.S. hegemony to economic self-determination.</p>
<h2>Our View</h2>
<ul class="content-list">
<li class="mt-2"><strong>Gold deserves a seat at the table&mdash;5% or more</strong></li>
<li class="mt-2"><strong>International equities are undervalued and under-owned</strong></li>
<li class="mt-2"><strong>In fixed income, stay conservative&mdash;favor capital preservation over reach</strong></li>
</ul>
<p>The old system isn&rsquo;t just evolving&mdash;it&rsquo;s unraveling. A new one is taking shape. <strong>Now is the time to manage risk and diversify with intent.</strong></p>

<p>To receive more <strong><a href="https://www.vaneck.com/us/en/insights/guided-allocation/" title="Model Portfolio Insights">Model Portfolio</a></strong> insights, <strong><a href="https://www.vaneck.com/us/en/subscribe/" title="Subscription Center">sign up in our subscription center</a></strong>.</p>
]]></content:encoded>
</item><item rdf:about="https://www.vaneck.com/us/en/blogs/emerging-markets-bonds/imf-2025-spring-takeaways-the-era-of-em-exceptionalism/">
  <title>IMF 2025 Spring Takeaways: The Era of EM Exceptionalism></title>
  <link>https://www.vaneck.com/us/en/blogs/emerging-markets-bonds/imf-2025-spring-takeaways-the-era-of-em-exceptionalism/</link>
  <description><![CDATA[At the Spring IMF Meetings, Eric Fine and our Emerging Markets Debt team observed various tailwinds supporting EM bonds, including a weaker U.S. dollar, stable inflation in EM nations, and growing confidence in emerging market currencies (EMFX).]]></description>
  <dc:creator>Eric Fine</dc:creator>
  <dc:date>05/12/2025 06:30:00</dc:date>
<content:encoded><![CDATA[

<p><em>The team just returned from the IMF Spring meetings, meeting with finance, central bank, and other officials from around the world, along with other market participants. Your authors have been going to these meetings for three decades, so there will be some meta-observations as well.</em></p>

<h2>Key Takeaways</h2>
<ul class="content-list">
<li class="mt-2">Dollar depreciation &ndash; the U.S. is generating uncertainty, economic weakness, <em>and </em>inflation. EM inflation, on the other hand, remains relatively stable in the majority of EM (and deflationary in China). The obvious conclusion arrived at during meetings was that this was very positive for the major currencies and for EMFX, against the USD.</li>
<li class="mt-2">USD and Treasuries&rsquo; reserve status is no longer a taboo topic. This is a completely different topic than USD depreciation, we must emphasize. Up until these Spring 2025 meetings, this topic of reserve status was fringe or taboo. We&rsquo;ve been <a href="/us/en/blogs/emerging-markets-bonds/fiscal-dominance-the-clarifying-lens-for-em-and-dm-bonds/"><strong>publishing on the topic</strong></a> for over a decade, using the orthodox lens of &ldquo;fiscal dominance&rdquo;. Now that the topic is being discussed, we see it as over-hyped. Our view remains that the USD reserve status will remain and that the proper framing is to see the dollar slowly sharing reserve status with other deserving currencies over time. We do a deep dive later!</li>
<li class="mt-2">IMF cannot please any of its stakeholders and is defensive. It is seen as unfair to private creditors, which is correct to us. And it has presided over a massive imbalance between mercantilist China and other economies and the big consumers. The IMF will be forced to change, so keep an eye on this space.</li>
<li class="mt-2">Any U.S. isolationism is a great opportunity for Europe. Euro is a market winner, representing a great tailwind if greater financial integration is an objective. German fiscal expansion is the great hope. And of course, Euro strength is a tailwind for ECB easing. Will Europe grab this opportunity was the open question.</li>
<li class="mt-2">&ldquo;Tariffs&rdquo; transmit uncertainty which maps to recession risk. That&rsquo;s the big focus and framing. However, the inflationary impact from tariffs is temporary while the ultimate impact is recessionary, so some in the market are trying to see through any inflation risks and to a new Fed chair in May 2026. We also discuss the U.S. stance a bit in this blog.</li>
<li class="mt-2">Fed independence was a big topic of conversation. It spiced up the now-acceptable discussion on the dollar&rsquo;s reserve status, obviously. There was a good amount of ideology disguised as economics, pointing to what a long intellectual slog this could be. Sooner or later, the Fed will become dovish.</li>
<li class="mt-2">The era of EM Exceptionalism. Overall, we feel even stronger following IMF meetings that many EMs could experience upward pressure on their currencies. This would be due to the dollar&rsquo;s selloff against the major currencies, typically, but there is now obviously &ldquo;pressure&rdquo; from the Trump administration to keep EM currencies stable or arguably stronger as part of &ldquo;trade&rdquo; negotiations. A country that devalues its currency to compensate for these negotiations increases risks dramatically, and we are struck that so few meeting participants see a scenario of CNY <u>re-</u>valuation (CNY stronger). This is disinflationary for many EMs. EMs generally have higher real rates, making their currencies both attractive and giving their duration upside potentially even before the Fed inaugurates a new cutting cycle.</li>
</ul>

<p>To receive more <a href="https://www.vaneck.com/us/en/insights/emerging-markets-bonds/" title="Emerging Markets Bonds Insights"><strong>Emerging Markets Bonds</strong></a> insights, <a href="/link/5f45412c2143400497908cea2897f7d3.aspx" title=" Subscription Center"><strong>sign up in our subscription center</strong></a>.</p>
]]></content:encoded>
</item><item rdf:about="https://www.vaneck.com/us/en/blogs/digital-assets/what-is-the-onchain-economy/">
  <title>What Is the Onchain Economy?></title>
  <link>https://www.vaneck.com/us/en/blogs/digital-assets/what-is-the-onchain-economy/</link>
  <description><![CDATA[The onchain economy represents the next phase of digital transformation built on blockchain and automation, quietly reshaping sectors far beyond crypto.]]></description>
  <dc:creator>Drew  Anderson</dc:creator>
  <dc:date>05/09/2025 06:30:00</dc:date>
<content:encoded><![CDATA[

<h2>Understanding the Next Phase of Digital Transformation</h2>
<p>Global commerce is undergoing a significant overhaul. New digital infrastructure that is decentralized (no single entity controls it) and programmable (it can be customized and automated) is replacing outdated legacy systems. This transition is unfolding alongside broader macro shifts: rising interest in alternatives to the U.S. dollar, de-globalization, and a growing focus on domestic energy and infrastructure.</p>
<p>The onchain economy is emerging as the connective tissue across these trends, where financial services, computing, and monetary systems are being reimagined from the ground up.</p>
<p>This blog defines the onchain economy, breaks down the categories that make it up, and explores its positioning to benefit from a world increasingly influenced by Bitcoin and the digital asset ecosystem.</p>
<h2>From Online to Onchain</h2>
<p>The <strong>onchain economy</strong> describes economic activity enabled by blockchain-based infrastructure, where transactions, data, and assets are managed directly, transparently, and efficiently, reducing reliance on traditional middlemen and intermediaries.</p>
<p>Over the past 25 years, most of the global economy has digitized, but not all of it has been truly transformed.</p>
<p>Despite decades of innovation, much of today&rsquo;s digital economy still relies on outdated systems: slow payment networks, siloed databases, and frustrating intermediaries &mdash; think the Department of Motor Vehicles (DMV)&rsquo;s online portal. Systems like these often feel sluggish, clunky, and frustrating &mdash; a far cry from the seamless experience users expect today. The onchain economy is <i>different.</i> It&rsquo;s a shift in how industries handle trust, value, and coordination &mdash; using code instead of paper, automation instead of middlemen, and transparency instead of opacity.</p>
<p>It&rsquo;s also emerging when confidence in legacy institutions is fading. Governments are exploring alternative reserve assets. Consumers are looking for digital-first stores of value. Corporations are integrating bitcoin into their balance sheets or treasury strategies. The onchain economy is the infrastructure layer enabling this evolution.</p>

<h2>Mapping the Onchain Economy</h2>
<p>The onchain economy isn't one industry; it's a set of connected pieces working together. Here's what it looks like in practice:</p>
<div class="wrapped-div">
<table style="width: 100%;">
<tbody>
<tr class="tbl-data">
<td class="tbl-header last text-left">Category</td>
<td class="tbl-header last text-left">What It Is</td>
<td class="tbl-header last text-left">What It Might Include</td>
<td class="tbl-header last text-left">Example Company</td>
</tr>
<tr class="tbl-data">
<td class="data-td data last text-left">Mining</td>
<td class="data-td data last text-left">Companies that validate blockchain transactions using energy-intensive computing.</td>
<td class="data-td data last text-left">Specialized mining operations, including hybrid AI/crypto compute.</td>
<td class="data-td data last text-left">CleanSpark, Riot Platforms</td>
</tr>
<tr class="tbl-data">
<td class="data-td data last text-left">Exchanges</td>
<td class="data-td data last text-left">Platforms that allow users to buy, sell, and store digital assets.</td>
<td class="data-td data last text-left">Centralized trading platforms, token swap services, crypto-native brokers.</td>
<td class="data-td data last text-left">Coinbase</td>
</tr>
<tr class="tbl-data">
<td class="data-td data last text-left">Holders</td>
<td class="data-td data last text-left">Entities holding a material amount of digital assets as a strategic or treasury reserve.</td>
<td class="data-td data last text-left">Public companies with significant Bitcoin on balance sheets.</td>
<td class="data-td data last text-left">Strategy, Block</td>
</tr>
<tr class="tbl-data">
<td class="data-td data last text-left">Asset Managers</td>
<td class="data-td data last text-left">Firms that create and manage crypto-focused portfolios for investors.</td>
<td class="data-td data last text-left">Crypto ETP sponsors, actively managed crypto strategies, fund-of-fund offerings.</td>
<td class="data-td data last text-left">CoinShares</td>
</tr>
<tr class="tbl-data">
<td class="data-td data last text-left">Data Centers</td>
<td class="data-td data last text-left">Physical infrastructure operators supporting blockchain and AI workloads.</td>
<td class="data-td data last text-left">High-performance computing centers, converted mining facilities.</td>
<td class="data-td data last text-left">Equinix, Digital Realty</td>
</tr>
<tr class="tbl-data">
<td class="data-td data last text-left">Energy Infrastructure</td>
<td class="data-td data last text-left">Providers of power and grid services for energy-intensive technologies.</td>
<td class="data-td data last text-left">Utilities, nuclear, and renewable energy firms supporting blockchain</td>
<td class="data-td data last text-left">Constellation Energy, Nextera Energy</td>
</tr>
<tr class="tbl-data">
<td class="data-td data last text-left">Traditional Finance (TradFi) Enablers</td>
<td class="data-td data last text-left">Traditional finance companies adopting blockchain for greater speed, transparency, or cost-efficiency.</td>
<td class="data-td data last text-left">Fintech apps, payment networks, digital ID</td>
<td class="data-td data last text-left">PayPal, Robinhood</td>
</tr>
<tr class="tbl-data">
<td class="data-td data last text-left">Semiconductors/Hardware</td>
<td class="data-td data last text-left">Hardware manufacturers building chips for mining, AI, and edge computing.</td>
<td class="data-td data last text-left">Designers and fabricators of ASICs, GPUs, and HPC chips.</td>
<td class="data-td data last text-left">Nvidia, AMD</td>
</tr>
<tr class="tbl-data">
<td class="data-td data last text-left">Consumer &amp; Gaming</td>
<td class="data-td data last text-left">Applications using tokens, NFTs, or smart contracts to deliver new digital experiences.</td>
<td class="data-td data last text-left">Blockchain games, digital wallets, token-powered consumer apps.</td>
<td class="data-td data last text-left">MercadoLibre, Shopify</td>
</tr>
<tr class="tbl-data">
<td class="data-td data last text-left">Crypto ETPs</td>
<td class="data-td data last text-left">Exchange-traded products that provide exposure to digital assets through public markets.</td>
<td class="data-td data last text-left">Spot Bitcoin products, Ether trackers, diversified crypto index notes.</td>
<td class="data-td data last text-left">n/a</td>
</tr>
</tbody>
</table>
</div>
<br />
<p>Each category reflects a different angle on how increased Bitcoin and blockchain adoption drive real economic activity, whether it's miners scaling energy usage, holders securing treasuries, or energy and data providers capturing digital infrastructure demand. Take <strong>MercadoLibre</strong>, the Amazon of Latin America, which has integrated crypto payments to help millions gain exposure to digital assets through everyday transactions. This integration allows unbanked and underbanked people to transact securely and efficiently. Or consider <strong>CleanSpark</strong>, a Bitcoin mining company that contributes to grid stability by managing high-load computing infrastructure, a key component of how blockchain intersects with energy strategy. CleanSpark shows how blockchain-linked businesses can deliver real-world infrastructure benefits. These examples highlight how the onchain economy is already reshaping industries. Key parts of finance, energy, and computing are being rebuilt to meet the needs of a more decentralized global landscape.</p>
<h2>Why It Matters: Building a Better System</h2>
<p>Bitcoin adoption is accelerating among corporations, governments, and consumers, not just as an asset, but as a monetary alternative in an increasingly fragmented world. In 2024 alone, bitcoin ETPs <strong>saw $35 billion</strong> in inflows (CoinMarketCap), while stablecoins processed over <strong>$11 trillion</strong> in value, outpacing some major card networks. This is driving demand for infrastructure that supports this adoption: miners scaling energy capacity, data centers shifting workloads, and asset managers designing new ways to access the ecosystem.</p>
<p>Meanwhile, trends like de-dollarization, the onshoring of energy and compute infrastructure, and the rethinking of global trade flows align with onchain investment themes. From power producers and semiconductor manufacturers to public companies holding bitcoin in treasury, the onchain economy is where monetary evolution meets real-world infrastructure.</p>
<p>It's not just a story of blockchain efficiency&mdash;it's a broader economic shift that reflects how the next generation of financial and industrial systems is being shaped.</p>
<h2>The Economy Is Going Onchain</h2>
<p>The systems that power the economy are becoming more digital, more connected, and more automated. Blockchain and related technologies are starting to reshape how money moves, data is stored, and services are delivered.</p>
<p>This defines the onchain economy&mdash;not just crypto but an entire stack of infrastructure, starting with everything from sovereign asset strategy to domestic energy production.</p>
<p>This shift is still early, but it's quietly laying the foundation for the next generation of financial and industrial systems. The economy isn&rsquo;t just going digital&mdash;<i>it&rsquo;s going onchain</i>.</p>
<p>To receive more <strong><a href="https://www.vaneck.com/us/en/insights/digital-assets/" title="Digital Assets Insights">Digital Assets</a></strong> insights, <strong><a href="https://www.vaneck.com/us/en/subscribe/" title="Subscription Center">sign up in our subscription center</a></strong>.</p>
]]></content:encoded>
</item><item rdf:about="https://www.vaneck.com/us/en/blogs/moat-investing/moat-index-finds-strength-in-submarines-and-semiconductors/">
  <title>Moat Index Finds Strength in Submarines and Semiconductors></title>
  <link>https://www.vaneck.com/us/en/blogs/moat-investing/moat-index-finds-strength-in-submarines-and-semiconductors/</link>
  <description><![CDATA[Despite April&rsquo;s market volatility, the Moat Index found support from strong performers in defense and tech, showcasing the resilience of wide moat stocks amid trade tensions and recession fears.]]></description>
  <dc:creator>Coulter Regal, CFA</dc:creator>
  <dc:date>05/07/2025 06:30:00</dc:date>
<content:encoded><![CDATA[

<p>In April, volatility in U.S. equity markets intensified, as the cautious investor sentiment and trade war fears that gripped March surged to new heights following President Trump&rsquo;s &ldquo;Liberation Day&rdquo; on April 2, which unleashed sweeping tariffs and triggered sharp retaliatory measures, sending shockwaves through global markets and deepening economic uncertainty. Equities reacted violently to the disruption, with the S&amp;P 500 plummeting more than 10% in the days following the tariff announcement, marking its worst week since the 2020 Covid crash. Pressures eventually eased after Trump announced a 90-day tariff pause on most nations, except China, providing relief to a market under severe strain. However, even with a notable rebound off intra-month lows, U.S. equities finished lower in April as investors continued to digest volatile trade tensions, renewed inflation uncertainty, and the increased threat of a potential recession.</p>
<p>The <strong><a href="https://www.vaneck.com/us/en/investments/morningstar-wide-moat-etf-moat/index/" title=" MOAT - VanEck Morningstar Wide Moat ETF - Overview">Morningstar Wide Moat Focus Index</a></strong> (the &ldquo;Moat Index&rdquo;) slipped 2.09% in April, trailing the cap-weighted S&amp;P 500&rsquo;s 0.68% decline yet edging ahead of the S&amp;P 500 Equal-Weighted Index&rsquo;s 2.29% loss. The Moat Index&rsquo;s equally weighted construction, which spreads exposure more evenly and therefore reduces concentration in the market&rsquo;s largest mega-cap names, proved a headwind this month. An overweight health care position, once a tailwind earlier in the year, also worked against the Index as fresh tariff threats on pharmaceutical imports pressured the sector. Together, these factors left the Moat Index behind the broad market for the month despite beneficial exposure from other market segments.</p>
<p>Down market-cap, the <a href="https://www.vaneck.com/us/en/investments/morningstar-smid-moat-etf-smot/index/" title=" SMOT - VanEck Morningstar SMID Moat ETF - Overview"><strong>Morningstar US Small-Mid Cap Moat Focus Index</strong></a> (the &ldquo;SMID Moat Index&rdquo;) retreated 3.29% during the month, falling between the small-cap benchmark&rsquo;s 4.19% drop and the mid-cap benchmark&rsquo;s 2.25% decline, mirroring its blended size exposure. Smaller companies were hit harder as tariff threats heightened concerns that trade tensions could drag on domestic GDP growth, a dynamic to which they are naturally more sensitive than larger multinationals. Even with the setback, the SMID Moat Index still leads both the small- and mid-cap benchmarks on a year-to-date basis.</p>
<h3>Stocks Slide in April on Volatile Trade Tension</h3>
<p><img loading="lazy" class="img-responsive" alt="Stocks Slide in April on Volatile Trade Tension" src="https://www.vaneck.com/contentassets/6d8ba0c64c5a4245b514ebc1a21c2f63/5658_moat-monthly_chart-1_2025-5_v2.svg" /></p>
<p class="chart-disclosure"><strong>Source: Morningstar. Data as of 4/30/2025.</strong> Past performance is no guarantee of future results. Index performance is not representative of fund performance. It is not possible to invest directly in an index. Please see index definitions and other important disclosures at the end of this content. Fund performance current to the most recent month end is available by visiting vaneck.com or by calling 800.826.2333.</p>
<h2>Moat Index April Highlights: Ships and Chips Sail Ahead</h2>
<p>Sector positioning played a primary role in the Moat Index&rsquo;s relative showing against the S&amp;P 500 in April. A complete absence of energy stocks, a group that suffered the month&rsquo;s steepest losses, added a tailwind, and a larger-than-benchmark stake in consumer staples and industrial names also helped. These benefits were, unfortunately, more than offset, however, by the Index&rsquo;s heavier weight in health care, where threats of targeted tariffs, specifically toward pharmaceutical imports, dragged on the sector.</p>
<p>For the second straight month, wide-moat military shipbuilder Huntington Ingalls Industries (HII) held the performance crown. After sidestepping March&rsquo;s market turbulence, the stock steamed ahead in April on the strength of a solid first-quarter earnings beat. Momentum built further when management announced a new U.S. Navy contract for two Virginia-class submarines, coupled with fresh congressional funding to boost shipbuilding productivity. That powerful combination catapulted HII shares into double-digit gains and prompted Morningstar analyst Nicolas Owens to raise his fair-value estimate to $316 and reiterate his view that Huntington remains undervalued.</p>
<p>Also within the top contributors list for April is the newcomer semiconductor company Cadence Design Systems (CDNS), which just recently made its debut in the Moat Index at the March reconstitution. Cadence provides leading-edge electronic design automation tools and IP critical to the semiconductor chip design process. It benefits from switching costs and intangible assets and was upgraded to a wide moat rating from narrow in December 2024. It historically traded well above fair value until just earlier this year, allowing it to make the cut for the Moat Index. Shares of Cadence rallied 17 percent in April following positive earnings results and a steady growth trajectory amid macroeconomic uncertainty.</p>
<p>Other top contributors within the Moat Index during the month include the well-known aerospace and defense giant Boeing Co. (BA), global security products and solutions company Allegion (ALLE), and the semiconductor design software provider Synopsys (SNPS).</p>
<p>Detracting most this month were companies particularly impacted by tariff uncertainty, several belonging to the health care sector, including leading medical technology firm GE HealthCare Technologies (GEHC), orthopedic implants provider Zimmer Biomet (ZBH), and drug manufacturer Bristol Myers Squibb (BMY). Footwear and apparel brand Nike (NKE) and the world's largest parcel delivery company, United Parcel Service (UPS), both heavily influenced by tariffs, were also notable detractors.</p>
<h2>Moat Index Top Contributors and Detractors - April 2025</h2>
<h3>Contributors</h3>
<div class="wrapped-div">
<table style="width: 100%;">
<tbody>
<tr class="tbl-data">
<td class="tbl-header last text-left">Company</td>
<td class="tbl-header last text-left">Ticker</td>
<td class="tbl-header last text-left">Sector</td>
<td class="tbl-header last text-right">Avg. Weight (%)</td>
<td class="tbl-header last text-right">Contribution (%)</td>
</tr>
<tr class="tbl-data">
<td class="data-td last text-left">Huntington Ingalls Industries Inc.</td>
<td class="data-td data last text-left">HII</td>
<td class="data-td data last text-left">Industrials</td>
<td class="data-td data last text-right">2.81</td>
<td class="data-td data last text-right">0.36</td>
</tr>
<tr class="tbl-data">
<td class="data-td last text-left">Cadence Design Systems Inc.</td>
<td class="data-td data last text-left">CDNS</td>
<td class="data-td data last text-left">Technology</td>
<td class="data-td data last text-right">1.33</td>
<td class="data-td data last text-right">0.23</td>
</tr>
<tr class="tbl-data">
<td class="data-td last text-left">Boeing Co.</td>
<td class="data-td data last text-left">BA</td>
<td class="data-td data last text-left">Industrials</td>
<td class="data-td data last text-right">2.70</td>
<td class="data-td data last text-right">0.20</td>
</tr>
<tr class="tbl-data">
<td class="data-td last text-left">Allegion</td>
<td class="data-td data last text-left">ALLE</td>
<td class="data-td data last text-left">Industrials</td>
<td class="data-td data last text-right">2.60</td>
<td class="data-td data last text-right">0.17</td>
</tr>
<tr class="tbl-data">
<td class="data-td last text-left">Synopsys Inc.</td>
<td class="data-td data last text-left">SNPS</td>
<td class="data-td data last text-left">Technology</td>
<td class="data-td data last text-right">1.24</td>
<td class="data-td data last text-right">0.09</td>
</tr>
</tbody>
</table>
<h3>Detractors</h3>
<div class="wrapped-div">
<table style="width: 100%;">
<tbody>
<tr class="tbl-data">
<td class="tbl-header last text-left">Company</td>
<td class="tbl-header last text-left">Ticker</td>
<td class="tbl-header last text-left">Sector</td>
<td class="tbl-header last text-right">Avg. Weight (%)</td>
<td class="tbl-header last text-right">Contribution (%)</td>
</tr>
<tr class="tbl-data">
<td class="data-td last text-left">GE HealthCare Technologies</td>
<td class="data-td data last text-left">GEHC</td>
<td class="data-td data last text-left">Health Care</td>
<td class="data-td data last text-right">2.56</td>
<td class="data-td data last text-right">-0.33</td>
</tr>
<tr class="tbl-data">
<td class="data-td last text-left">United Parcel Service</td>
<td class="data-td data last text-left">UPS</td>
<td class="data-td data last text-left">Industrials</td>
<td class="data-td data last text-right">2.37</td>
<td class="data-td data last text-right">-0.32</td>
</tr>
<tr class="tbl-data">
<td class="data-td last text-left">Zimmer Biomet Holdings</td>
<td class="data-td data last text-left">ZBH</td>
<td class="data-td data last text-left">Health Care</td>
<td class="data-td data last text-right">2.85</td>
<td class="data-td data last text-right">-0.26</td>
</tr>
<tr class="tbl-data">
<td class="data-td last text-left">Bristol-Myers Squibb</td>
<td class="data-td data last text-left">BMY</td>
<td class="data-td data last text-left">Health Care</td>
<td class="data-td data last text-right">1.51</td>
<td class="data-td data last text-right">-0.25</td>
</tr>
<tr class="tbl-data">
<td class="data-td last text-left">Nike Inc.</td>
<td class="data-td data last text-left">NKE</td>
<td class="data-td data last text-left">Consumer Discretionary</td>
<td class="data-td data last text-right">2.18</td>
<td class="data-td data last text-right">-0.24</td>
</tr>
</tbody>
</table>
</div>
</div>
<p class="chart-disclosure"><strong>Source: Morningstar, April 2025.</strong> Past performance is no guarantee of future results. Index performance is not illustrative of fund performance. Not intended as a recommendation to buy or to sell any of the securities mentioned herein.</p>
<h2>SMID Moat Index April Highlights: Data Centers Keep Their Cool</h2>
<p>The SMID Moat Index&rsquo;s April performance benefited from favorable sector positioning relative to the mid-cap benchmark, with underweights in financials and real estate, two of the weaker-performing sectors, alongside a higher allocation to technology stocks, which provided a modest lift. However, those advantages were offset by stock-specific weakness, stemming from names that were disproportionately affected by the heightened tariff uncertainty.</p>
<p>Vertiv Holdings Co. (VRT) defied April&rsquo;s market volatility, gaining 18 percent only weeks after joining the SMID Moat Index in the March reconstitution. The surge followed a standout first-quarter report that delivered 25 percent year-over-year organic revenue growth and nearly 50 percent earnings-per-share expansion. Management also lifted full-year sales guidance by approximately three percentage points. The robust results reinforced investor confidence in Vertiv&rsquo;s key role in supplying critical infrastructure equipment, primarily power management and cooling systems, to data centers increasingly focused on cloud computing and AI-driven workloads.</p>
<p>Morningstar assigns Vertiv a narrow economic moat, reflecting the durability of its Liebert brand, which maintains leading market positions in thermal management and power equipment, as well as customer relationships that frequently span more than two decades. Analyst Nicholas Lieb, CFA, maintains a $103 fair-value estimate, citing Vertiv&rsquo;s pricing power and the essential nature of its products as valuable safeguards against potential tariff-related cost pressures arising from its manufacturing facilities in Mexico and component sourcing from China.</p>
<p>Other notable gainers in April included the automobile retailer AutoNation (AN), cloud-native cybersecurity software provider Zscaler (ZS), global security products and solutions company Allegion (ALLE), as well as respiratory care and medical device developer ResMed (RMD).</p>
<p>The biggest laggards were independent oil and gas producer Hess Corp. (HES), the largest domestic used-vehicle retailer CarMax (KMX), cruise line operator and travel service provider Norwegian Cruise Line (NCLH), medical technology firm GE HealthCare Technologies (GEHC), and protein sciences market leader Bio-Techne Corp. (TECH).</p>
<h2>SMID Moat Index Top Contributors and Detractors - April 2025</h2>
<h3>Contributors</h3>
<div class="wrapped-div">
<table style="width: 100%;">
<tbody>
<tr class="tbl-data">
<td class="tbl-header last text-left">Company</td>
<td class="tbl-header last text-left">Ticker</td>
<td class="tbl-header last text-left">Sector</td>
<td class="tbl-header last text-right">Avg. Weight (%)</td>
<td class="tbl-header last text-right">Contribution (%)</td>
</tr>
<tr class="tbl-data">
<td class="data-td last text-left">Vertiv Holdings Co.</td>
<td class="data-td data last text-left">VRT</td>
<td class="data-td data last text-left">Industrials</td>
<td class="data-td data last text-right">0.56</td>
<td class="data-td data last text-right">0.10</td>
</tr>
<tr class="tbl-data">
<td class="data-td last text-left">AutoNation Inc.</td>
<td class="data-td data last text-left">AN</td>
<td class="data-td data last text-left">Consumer Discretionary</td>
<td class="data-td data last text-right">1.33</td>
<td class="data-td data last text-right">0.10</td>
</tr>
<tr class="tbl-data">
<td class="data-td last text-left">Zscaler Inc.</td>
<td class="data-td data last text-left">ZS</td>
<td class="data-td data last text-left">Technology</td>
<td class="data-td data last text-right">0.71</td>
<td class="data-td data last text-right">0.10</td>
</tr>
<tr class="tbl-data">
<td class="data-td last text-left">Allegion</td>
<td class="data-td data last text-left">ALLE</td>
<td class="data-td data last text-left">Industrials</td>
<td class="data-td data last text-right">1.40</td>
<td class="data-td data last text-right">0.09</td>
</tr>
<tr class="tbl-data">
<td class="data-td last text-left">ResMed Inc.</td>
<td class="data-td data last text-left">RMD</td>
<td class="data-td data last text-left">Health Care</td>
<td class="data-td data last text-right">1.37</td>
<td class="data-td data last text-right">0.08</td>
</tr>
</tbody>
</table>
<h3>Detractors</h3>
<div class="wrapped-div">
<table style="width: 100%;">
<tbody>
<tr class="tbl-data">
<td class="tbl-header last text-left">Company</td>
<td class="tbl-header last text-left">Ticker</td>
<td class="tbl-header last text-left">Sector</td>
<td class="tbl-header last text-right">Avg. Weight (%)</td>
<td class="tbl-header last text-right">Contribution (%)</td>
</tr>
<tr class="tbl-data">
<td class="data-td last text-left">Hess Corp.</td>
<td class="data-td data last text-left">HES</td>
<td class="data-td data last text-left">Energy</td>
<td class="data-td data last text-right">1.57</td>
<td class="data-td data last text-right">-0.30</td>
</tr>
<tr class="tbl-data">
<td class="data-td last text-left">CarMax Inc.</td>
<td class="data-td data last text-left">KMX</td>
<td class="data-td data last text-left">Consumer Discretionary</td>
<td class="data-td data last text-right">1.38</td>
<td class="data-td data last text-right">-0.23</td>
</tr>
<tr class="tbl-data">
<td class="data-td last text-left">Norwegian Cruise Line</td>
<td class="data-td data last text-left">NCLH</td>
<td class="data-td data last text-left">Consumer Discretionary</td>
<td class="data-td data last text-right">1.17</td>
<td class="data-td data last text-right">-0.18</td>
</tr>
<tr class="tbl-data">
<td class="data-td last text-left">GE HealthCare Technologies</td>
<td class="data-td data last text-left">GEHC</td>
<td class="data-td data last text-left">Health Care</td>
<td class="data-td data last text-right">1.38</td>
<td class="data-td data last text-right">-0.18</td>
</tr>
<tr class="tbl-data">
<td class="data-td last text-left">Bio-Techne Corp.</td>
<td class="data-td data last text-left">TECH</td>
<td class="data-td data last text-left">Health Care</td>
<td class="data-td data last text-right">1.20</td>
<td class="data-td data last text-right">-0.17</td>
</tr>
</tbody>
</table>
</div>
</div>
<p class="chart-disclosure"><strong>Source: Morningstar, April 2025.</strong> Past performance is no guarantee of future results. Index performance is not illustrative of fund performance. Not intended as a recommendation to buy or to sell any of the securities mentioned herein.</p>

<h2>Choose Your Moat Strategy</h2>
<p>VanEck&rsquo;s suite of <strong><a href="https://www.vaneck.com/us/en/blogs/moat-investing/moat-investing-powered-by-morningstar/" title="Quality Companies at Attractive Prices">moat investing strategies</a></strong> is powered by Morningstar&rsquo;s equity research team, which seeks quality companies trading at attractive valuations. The below ETFs offer access to moat companies across market segments:</p>
<div class="flourish-embed flourish-cards d-none d-md-block" data-src="visualisation/23047091?2429575"><script src="https://public.flourish.studio/resources/embed.js"></script><noscript><img loading="lazy" src="https://public.flourish.studio/visualisation/23047091/thumbnail" width="100%" alt="Choose Your Moat Strategy" /></noscript></div>
<div class="flourish-embed flourish-cards-mobile d-md-none" data-src="visualisation/23047086?2429575"><script src="https://public.flourish.studio/resources/embed.js"></script><noscript><img loading="lazy" src="https://public.flourish.studio/visualisation/23047086/thumbnail" width="100%" alt="Choose Your Moat Strategy" /></noscript></div>
<p>To receive more <a href="https://www.vaneck.com/us/en/insights/moat-investing" title="Moat Investing Insights"><strong>Moat Investing</strong></a> insights, <a href="https://www.vaneck.com/us/en/subscribe/" title="Subscription Center"><strong>sign up in our subscription center</strong></a>.</p>
]]></content:encoded>
</item><item rdf:about="https://www.vaneck.com/us/en/blogs/gold-investing/ima-casanova-still-on-the-sidelines-why-gold-belongs-in-your-portfolio-today/">
  <title>Still on the Sidelines? Why Gold Belongs in Your Portfolio Today></title>
  <link>https://www.vaneck.com/us/en/blogs/gold-investing/ima-casanova-still-on-the-sidelines-why-gold-belongs-in-your-portfolio-today/</link>
  <description><![CDATA[April&rsquo;s tariff chaos and market swings reinforced gold&rsquo;s role as a safe haven. If you&rsquo;re worried you missed the rally, don&rsquo;t be&mdash;we explore why gold still has room to run and how much to own.]]></description>
  <dc:creator>Imaru Casanova</dc:creator>
  <dc:date>05/06/2025 06:30:00</dc:date>
<content:encoded><![CDATA[

<p>Monthly gold market and economic insights from <a href="https://www.vaneck.com/us/en/news-and-insights/thought-leaders/imaru-casanova/?p=1" title="Imaru Casanova &mdash; Portfolio Manager, Gold and Precious Metals"><strong>Imaru Casanova, Portfolio Manager</strong></a>, featuring her unique views on mining and gold&rsquo;s portfolio benefits.</p>

<h2>Tariff Turbulence: April&rsquo;s Policy Whiplash Shakes Markets</h2>
<p>It&rsquo;s fair to say that most market participants were left disoriented after April&rsquo;s economic rollercoaster. The month began with the announcement of a 10% &ldquo;universal&rdquo; tariff on April 2&mdash;an announcement that proved to be anything but universal. Canada and Mexico were excluded, certain sectors and products were exempt, and over 50 countries were instead hit with additional &ldquo;reciprocal&rdquo; tariffs ranging from 11% to 50%.</p>
<p>Just days later, confusion deepened when those same reciprocal tariffs were suspended&mdash;except for China, where cumulative tariffs reached an effective rate of 145%. Countries across the world scrambled to craft retaliation measures while financial markets struggled to price in the flurry of conflicting announcements on an hour-by-hour basis.</p>
<h2>Gold: From Panic to Safe Haven</h2>
<p>Gold and gold stocks were swept up in the turmoil during the first volatile week of April. Margin calls, investor panic, broad selling pressure, and a rush to raise cash pushed gold below the $3,000 mark, hitting a monthly low of $2,983.27 on April 8.</p>
<p>However, gold&rsquo;s safe haven status was soon reaffirmed, rising to new highs throughout the month and trading intraday as high as $3,500 per ounce on April 22.</p>


<p>By comparison, the S&amp;P 500<sup>1</sup>&nbsp;fell 0.68%, the U.S. dollar declined 4.55%, and the Nasdaq<sup>2</sup>&nbsp;eked out a modest (but notable) 0.88% gain. Even U.S. Treasuries experienced early selling pressure, with the 10-year yield briefly spiking to 4.5% on April 11 before settling at 4.2% by month-end. Gold ultimately closed April at $3,288.71 per ounce.</p>
<h2>Gold Miners: A Tale of Two Halves</h2>
<p>Gold miners, as represented by the NYSE Arca Gold Miners Index (GDMNTR)<sup>3</sup>, performed exceptionally well in the first half of the month, outpacing both the metal and broader asset classes. As equity markets rebounded in the latter half, however, investor enthusiasm for gold cooled, and miners lagged.</p>
<p>The month also highlighted the strong correlation between western investment flows and gold pricing. Inflows into global gold bullion ETFs early in April coincided with gold&rsquo;s rally, while outflows during the final seven trading days contributed to downward price pressure. Still, gold equities&mdash;up 6.94% in April&mdash;achieved their goal of outperforming bullion and offered effective protection during April&rsquo;s turbulence.</p>
<h2>A Missed Opportunity for Most Investors</h2>
<p>With only about 1% of global assets under management currently allocated to the gold sector, it&rsquo;s clear that the vast majority of investors have missed out on gold&rsquo;s exceptional performance this year. When we speak with those who are now starting to pay attention, our conversations typically revolve around two key questions:</p>
<ul class="content-list">
<li class="mt-2"><strong>Am I too late?</strong></li>
<li class="mt-2"><strong>How much gold should I own in my portfolio?</strong></li>
</ul>
<p>On the first point, many investors see gold&rsquo;s 25% surge this year&mdash;on top of a 27% gain in 2024&mdash;and assume the rally must be nearing its end. Interestingly, these same investors have been actively participating in equity markets that have risen nearly every year for the past 16 years.</p>
<h2>Why Gold Still Has Room to Run</h2>
<p>The S&amp;P 500 has posted annual gains nearly every year since the 2008 financial crisis&mdash;except for 2015, 2018, and 2022&mdash;and is up 53% just since the start of 2022. Yet even after the market turmoil of April and an increasingly uncertain outlook, most investors remain hesitant to reduce their equity exposure or reallocate capital.</p>
<p>Gold, by contrast, has seen far less participation. Investment demand remains well below prior peaks. Given the strength of gold&rsquo;s recent rally, a short-term pullback is neither unexpected nor concerning. In fact, we believe gold is in the process of forming a new, higher base&mdash;likely around $3,000 per ounce.</p>
<p>When investors return to gold in a meaningful way&mdash;and we believe the case for doing so is growing&mdash;the combined force of renewed investment flows and continued strong central bank buying could drive prices significantly higher. Based on historical correlations between ETF holdings and the gold price, a return to 2020 peak ETF levels could translate to an additional $600 per ounce increase.</p>
<p>In our view, it&rsquo;s not too late to begin building or adding to a position in gold or gold equities.</p>

<p>In today&rsquo;s environment, having zero allocation to gold is increasingly difficult to justify.</p>
<h2>How Much Gold Should You Own?</h2>
<p>On the second point&mdash;how much gold exposure should I have?&mdash;we believe gold should be treated as a core, long-term component of a well-diversified portfolio. A strategic allocation of around 5% is a reasonable starting point for most investors. We do not recommend trading in and out of this core position.</p>
<p>A more tactical approach to complement a core allocation could involve adjusting the size of the position based on macroeconomic trends, as well as determining the appropriate mix between gold bullion and gold miners.</p>
<p>While initial interest in gold often leads investors to start with bullion, we believe gold equities also deserve consideration. Their risk profile may lead to different allocation choices depending on the investor, but they offer leveraged exposure to the gold price&mdash;an opportunity every investor should evaluate.</p>
<p>Finally, we recommend taking a basket approach when investing in gold equities. Consistently picking the top performers year after year is difficult, which makes diversification essential in this sector.</p>
<p>To receive more <strong><a href="https://www.vaneck.com/us/en/insights/gold-investing/" title="Gold Investing Insights">Gold Investing</a></strong> insights, <strong><a href="https://www.vaneck.com/us/en/subscribe/" title="Subscription Center">sign up in our subscription center</a></strong>.</p>
]]></content:encoded>
</item><item rdf:about="https://www.vaneck.com/us/en/blogs/digital-assets/matthew-sigel-vaneck-crypto-monthly-recap-for-april-2025/">
  <title>VanEck Crypto Monthly Recap for April 2025></title>
  <link>https://www.vaneck.com/us/en/blogs/digital-assets/matthew-sigel-vaneck-crypto-monthly-recap-for-april-2025/</link>
  <description><![CDATA[Crypto markets stumbled early in April, but Bitcoin held strong amid rising institutional interest and shifting macro trends, while token unlocks and speculative fatigue dragged on some alts.]]></description>
  <dc:creator>Patrick Bush</dc:creator>
  <dc:date>05/05/2025 06:30:00</dc:date>
<content:encoded><![CDATA[

<p><strong>Please note that VanEck may have a position(s) in the digital asset(s) described below.</strong></p>
<h3>Layer 1s (L1s) Have Fallen (-34%) Year-to-Date</h3>
<p><img loading="lazy" class="img-responsive w-100" src="https://www.vaneck.com/contentassets/3854a13e9d414a3c84a6dc47d3f8ea2f/5645_crypto-april_chart-1_2025-5_v2.svg" alt="Layer 1s (L1s) Have Fallen (-34%) Year-to-Date" /></p>
<p class="chart-disclosure">Source: Market Vectors as of 4/30/2025. The MarketVector<sup>&trade;</sup>&nbsp;Smart Contract Leaders Index (MVSCLE) is designed to track the performance of the largest and most liquid smart contract assets. Index performance is not representative of strategy performance. It is not possible to invest directly in an index. <strong>Past performance is no guarantee of future results. Not intended as a recommendation to buy or sell any securities named herein.</strong></p>
<p>April opened with an unexpected chill in the crypto markets. BTC initially sank as low as <strong>$74.5K</strong> (<strong>-32%</strong> from January 2025 all-time-high) while Altcoins fared worse. SOL dipped below <strong>$95 </strong>(<strong>-68% </strong>from January 2025 all-time-high), Sui touched <strong>$1.70</strong> (-<strong>68%</strong> from January 2025 all-time-high), and ETH plunged under <strong>$1400 (-66%</strong> from 4-year highs). The <a target="_blank" href="https://www.marketvector.com/indexes/digital-assets/marketvector-smart-contract-leaders" title="MVSCLE MarketVector&trade; Smart Contract Leaders Index" rel="noopener"><strong>MarketVector Smart Contract Leaders Index</strong></a> (MVSCLE) slipped to <strong>91</strong> (<strong>-59% </strong>from its December 2024 high of <strong>220</strong>). The broader crypto market took on water alongside a sharp global sell-off in risk assets, sparked by a deepening trade dispute.</p>
<ul class="content-list">
<li class="mt-2"><a href="#price-returns"><strong>Price Returns</strong></a></li>
<li class="mt-2"><a href="#bitcoin-correlation"><strong>Bitcoin&rsquo;s Correlation to Stocks</strong></a></li>
<li class="mt-2"><a href="#top-five-blockchains"><strong>Top 5 Blockchains by Average Daily Revenue</strong></a></li>
<li class="mt-2"><a href="#saylors-strategy"><strong>More Firms Replicate Saylor&rsquo;s Strategy</strong></a></li>
<li class="mt-2"><a href="#notable-performers"><strong>April&rsquo;s Notable Performers </strong></a></li>
<li class="mt-2"><a href="#notable-laggards"><strong>April&rsquo;s Notable Laggards</strong></a></li>
</ul>
<h3 id="price-returns" class="jump-link-nav anchored-block" data-jumplink-title="Price Returns">Price Returns</h3>
<div class="wrapped-div">
<table style="width: 600px;">
<tbody>
<tr class="tbl-data">
<td class="tbl-header last text-center">&nbsp;</td>
<td class="tbl-header last text-right">April (%)</td>
<td class="tbl-header last text-right">YTD (%)</td>
</tr>
<tr class="tbl-data">
<td class="data-td last">MarketVector Infrastructure Application Leaders Index</td>
<td class="data-td data last text-right">26</td>
<td class="data-td data last text-right">-37</td>
</tr>
<tr class="tbl-data">
<td class="data-td last">Coinbase</td>
<td class="data-td data last text-right">18</td>
<td class="data-td data last text-right">-18</td>
</tr>
<tr class="tbl-data">
<td class="data-td last">MarketVector Meme Coin Index</td>
<td class="data-td data last text-right">16</td>
<td class="data-td data last text-right">-48</td>
</tr>
<tr class="tbl-data">
<td class="data-td last">MarketVector Global Digital Assets Equity Index</td>
<td class="data-td data last text-right">15</td>
<td class="data-td data last text-right">-28</td>
</tr>
<tr class="tbl-data">
<td class="data-td last">Bitcoin</td>
<td class="data-td data last text-right">13</td>
<td class="data-td data last text-right">0</td>
</tr>
<tr class="tbl-data">
<td class="data-td last">MarketVector Smart Contract Leaders Index</td>
<td class="data-td data last text-right">5</td>
<td class="data-td data last text-right">-34</td>
</tr>
<tr class="tbl-data">
<td class="data-td last">Nasdaq Index</td>
<td class="data-td data last text-right">1</td>
<td class="data-td data last text-right">-10</td>
</tr>
<tr class="tbl-data">
<td class="data-td last">S&amp;P 500 Index</td>
<td class="data-td data last text-right">-1</td>
<td class="data-td data last text-right">-5</td>
</tr>
<tr class="tbl-data">
<td class="data-td last">MarketVector Decentralized Finance Leaders Index</td>
<td class="data-td data last text-right">-1</td>
<td class="data-td data last text-right">-57</td>
</tr>
<tr class="tbl-data">
<td class="data-td last">Ethereum</td>
<td class="data-td data last text-right">-3</td>
<td class="data-td data last text-right">-47</td>
</tr>
</tbody>
</table>
</div>
<p class="chart-disclosure mt-3"><strong>Source: Bloomberg as of 4/30/2025. Index performance is not representative of strategy performance. It is not possible to invest directly in an index. Past performance is no guarantee of future results. Not intended as a recommendation to buy or sell any securities named herein.</strong></p>
<p>Even before April, sentiment had already begun to list. Crypto investors absorbed concurrent broadsides from the decline in the DeFi AI, AI Agents, and DeSci sectors, which lost (<strong>-91%</strong>), (<strong>-81%</strong>), and (<strong>-75%</strong>) YTD, respectively. Memecoins also added to the damage as trading volumes dropped (<strong>-93%</strong>) between January and March 2025, while <a target="_blank" href="https://www.marketvector.com/indexes/digital-assets/marketvector-meme-coin" title="MEMECOIN MarketVector&trade; Meme Coin Index" rel="noopener"><strong>MarketVector&rsquo;s Memecoin Index</strong></a> showed a loss of (<strong>-55%</strong>) YTD. Crypto investors also struggled to stay afloat under the barrage of relentless token unlocks, with <strong>$7.2B</strong> hitting the market in January alone and <strong>$28B</strong> expected by the end of June.</p>
<p>When tariffs were announced on April 7, crypto looked ready to sink to Davy Jones&rsquo; Locker. BTC fell <strong>-500bps </strong>relative to stocks that day. But from there, BTC began to show signs of life. On a daily return basis, it outperformed stocks more often than not (<strong>10 </strong>out of <strong>17</strong> sessions) and posted strong gains on up days amid heavy BTC buying. By month-end, BTC was treading water in the mid-<strong>$90k</strong> range, having retraced over half its January ATH losses.</p>
<p>BTC&rsquo;s buoyancy appears tied to the strengthening sovereign asset narrative, continued expansion of BTC investment products, and renewed risk appetite following pauses in tariff escalation. We also note meaningful corporate accumulation: MSTR (<strong>+25.4K BTC</strong>), XXI (<strong>+31.5K</strong>), Metaplanet (<strong>+954 BTC</strong>), and SMLR (<strong>+275 BTC</strong>), as well as ETF and fund buying (<strong>+29K BTC</strong>). Altcoins, lacking similar helping currents, struggled to recover amid the implosion of speculative zest. The <a target="_blank" href="https://www.marketvector.com/indexes/digital-assets/marketvector-smart-contract-leaders" title="MVSCLE MarketVector&trade; Smart Contract Leaders Index" rel="noopener"><strong>MarketVector Smart Contract Leaders Index</strong></a> recovered just <strong>19%</strong> of their December-to-April losses while ETH clawed back only <strong>16.5%</strong> of its drawdown over the same period.</p>
<p>Amid the carnage, a few ships avoided the onslaught and gained significant steam. Sui (<strong>+52%</strong>) surged ahead of its annual Base Camp conference. STX (<strong>+22%</strong>) gained on BitGo&rsquo;s endorsement of its sBTC initiative and its ties to BTC price appreciation. SOL (<strong>+16%</strong>) found support as multiple firms announced plans for Solana-based treasury strategies, and its community put its heads down to improve the network<strong>.</strong></p>
<h2 id="bitcoin-correlation" class="anchored-block">Bitcoin&rsquo;s Correlation to Stocks Shows Little Change</h2>
<h3>Crypto Correlation to S&amp;P 500 Index is Still High</h3>
<p><img loading="lazy" class="img-responsive w-100" src="https://www.vaneck.com/contentassets/3854a13e9d414a3c84a6dc47d3f8ea2f/5645_crypto-april_chart-2_2025-5_v3.svg" alt="Crypto Correlation to S&amp;P 500 Index is Still High" /></p>
<p class="chart-disclosure">Source: VanEck Research, Artemis XYZ as of 4/28/2025.<strong> Index performance is not representative of strategy performance. It is not possible to invest directly in an index. Past performance is no guarantee of future results. Not intended as a recommendation to buy or sell any securities named herein.</strong></p>
<p>In April, many in the crypto community celebrated BTC&rsquo;s apparent decoupling from broader risk assets, but the data <em>does not fully support this case</em>. Though the <strong>30-day</strong> MA of BTC/S&amp;P 500 correlation fell below <strong>0.25</strong> briefly in early April, it quickly regained a correlation of around <strong>0.55</strong> by the end of the month. However, this brief lapse in covariance between BTC and equities did translate into a better BTC return profile than equities. BTC returned (<strong>+13%</strong>) in April while the Nasdaq Composite and S&amp;P 500 returned (<strong>-1%</strong>) and (<strong>+1%</strong>) respectively. More interestingly, the tariff melee caused the volatility of the S&amp;P 500 and Nasdaq to each double over the course of April, while BTC&rsquo;s volatility actually fell (<strong>-4%</strong>).</p>
<p>Going forward, we expect the relationship between equities and BTC to dissolve further as individual investors, corporations, and central banks recognize Bitcoin as a sovereign, uncorrelated store-of-value asset. Countries like <a target="_blank" href="https://siliconangle.com/2024/12/25/russias-finance-minister-reveals-bitcoin-used-conduct-foreign-trade/#:~:text=Russia's%20finance%20minister%20reveals%20bitcoin%20is%20being%20used%20to%20conduct%20foreign%20trade,-by%20Mike%20Wheatley&amp;text=Russia's%20finance%20minister%20has%20revealed,a%20mechanism%20for%20international%20payments." title="Russia&rsquo;s finance minister reveals bitcoin is being used to conduct foreign trade" rel="noopener"><strong>Russia</strong></a> and <a target="_blank" href="https://www.reuters.com/business/finance/venezuela-accelerate-cryptocurrency-shift-oil-sanctions-return-2024-04-22/" rel="noopener"><strong>Venezuela</strong></a> have already acknowledged BTC&rsquo;s developing role in international trade. We believe that many nations will transition some international trade to BTC as a result of Western nations' overuse of sanctions, the desire to hedge away dollar risk, and the lack of trustworthy alternative currencies.</p>
<h3 id="top-five-blockchains" class="anchored-block">Top 5 Blockchains by Average Daily Revenue</h3>
<div class="wrapped-div">
<table style="width: 600px;">
<tbody>
<tr class="tbl-data">
<td class="tbl-header last">Top Chains This Month</td>
<td class="tbl-header last text-right">TRX ($)</td>
<td class="tbl-header last text-right">HYPE ($)</td>
<td class="tbl-header last text-right">SOL ($)</td>
<td class="tbl-header last text-right">ETH ($)</td>
<td class="tbl-header last text-right">BTC ($)</td>
</tr>
<tr class="tbl-data">
<td class="data-td last">Avg Daily Revenue</td>
<td class="data-td data last text-right">1,704,424</td>
<td class="data-td data last text-right">1,455,743</td>
<td class="data-td data last text-right">1,210,862</td>
<td class="data-td data last text-right">710,386</td>
<td class="data-td data last text-right">533,430</td>
</tr>
<tr class="tbl-data">
<td class="tbl-header last">3 Months Ago</td>
<td class="tbl-header last text-right">SOL ($)</td>
<td class="tbl-header last text-right">ETH ($)</td>
<td class="tbl-header last text-right">TRX ($)</td>
<td class="tbl-header last text-right">HYPE ($)</td>
<td class="tbl-header last text-right">BTC ($)</td>
</tr>
<tr class="tbl-data">
<td class="data-td last">Avg Daily Revenue</td>
<td class="data-td data last text-right">8,184,682</td>
<td class="data-td data last text-right">4,832,461</td>
<td class="data-td data last text-right">1,820,250</td>
<td class="data-td data last text-right">1,722,981</td>
<td class="data-td data last text-right">663,422</td>
</tr>
<tr class="tbl-data">
<td class="tbl-header last">6 Months Ago</td>
<td class="tbl-header last text-right">ETH ($)</td>
<td class="tbl-header last text-right">SOL ($)</td>
<td class="tbl-header last text-right">BTC ($)</td>
<td class="tbl-header last text-right">TRX ($)</td>
<td class="tbl-header last text-right">BNB ($)</td>
</tr>
<tr class="tbl-data">
<td class="data-td last">Avg Daily Revenue</td>
<td class="data-td data last text-right">4,512,295</td>
<td class="data-td data last text-right">2,453,933</td>
<td class="data-td data last text-right">1,570,891</td>
<td class="data-td data last text-right">1,566,830</td>
<td class="data-td data last text-right">343,967</td>
</tr>
<tr class="tbl-data">
<td class="tbl-header last">9 Months Ago</td>
<td class="tbl-header last text-right">ETH ($)</td>
<td class="tbl-header last text-right">SOL ($)</td>
<td class="tbl-header last text-right">TRX ($)</td>
<td class="tbl-header last text-right">BTC ($)</td>
<td class="tbl-header last text-right">BNB ($)</td>
</tr>
<tr class="tbl-data">
<td class="data-td last">Avg Daily Revenue</td>
<td class="data-td data last text-right">3,099,851</td>
<td class="data-td data last text-right">1,752,622</td>
<td class="data-td data last text-right">1,349,523</td>
<td class="data-td data last text-right">777,232</td>
<td class="data-td data last text-right">360,772</td>
</tr>
<tr class="tbl-data">
<td class="tbl-header last">12 Months Ago</td>
<td class="tbl-header last text-right">BTC ($)</td>
<td class="tbl-header last text-right">ETH ($)</td>
<td class="tbl-header last text-right">SOL ($)</td>
<td class="tbl-header last text-right">TRX ($)</td>
<td class="tbl-header last text-right">BNB ($)</td>
</tr>
<tr class="tbl-data">
<td class="data-td last">Avg Daily Revenue</td>
<td class="data-td data last text-right">9,382,056</td>
<td class="data-td data last text-right">7,352,098</td>
<td class="data-td data last text-right">1,694,517</td>
<td class="data-td data last text-right">1,327,356</td>
<td class="data-td data last text-right">708,056</td>
</tr>
</tbody>
</table>
</div>
<p class="chart-disclosure mt-3">Source: VanEck Research as of 4/29/2025. <strong>Past performance is no guarantee of future results. Not intended as a recommendation to buy or sell any securities named herein.</strong></p>
<p>Remarkably, onchain activity measured by blockchain revenues, stablecoin transfer volume, and DEX volumes was robust despite the token price drawdowns. Compared to March 2025&rsquo;s figures, total blockchain revenue was (+<strong>0.5%</strong>)<strong>,</strong> stablecoin transfer volume was (<strong>+11%</strong>)<strong>,</strong> and DEX volume was (<strong>+5%</strong>) compared to April&rsquo;s values. Tron, a general purpose blockchain who derives most of its activity from stablecoin transfers, and Hyperliquid, a blockchain focused on trading applications, respectively earned the first and second most revenue amongst smart contract platforms (SCPs) in April. This marks the second consecutive month where Tron and Hyperliquid earned more onchain revenue than Solana earned. Another notable event in April was Ethereum's reversal in asset movement trends. After previously ranking among the blockchains with the most outflows, it became the top recipient of asset inflows from other blockchains. Ethereum received most of its inflows from its L2s, chiefly Arbitrum and Optimism, while Ethereum&rsquo;s assets left Mainnet for Base and Sonic.</p>
<h2 id="saylors-strategy" class="anchored-block">More Firms Replicate Saylor&rsquo;s Strategy</h2>
<h3>BTC Price Tends to Drive MSTR Premium</h3>
<p><img loading="lazy" class="img-responsive w-100" src="https://www.vaneck.com/contentassets/3854a13e9d414a3c84a6dc47d3f8ea2f/5645_crypto-april_chart-3_2025-5_v2.svg" alt="BTC Price Tends to Drive MSTR Premium" /></p>
<p class="chart-disclosure">Source: VanEck Research, Strategy as of 4/28/2025. <strong>Past performance is no guarantee of future results. Not intended as a recommendation to buy or sell any securities named herein.</strong></p>
<p>A crypto narrative that flowered amid the downpour of negativity in April was the sprouting of new firms replicating Saylor&rsquo;s BTC Treasury Strategy. Until Michael Saylor launched the Bitcoin (BTC) treasury strategy in 2020, most corporate BTC holders were crypto-native firms such as miners, trading companies, and exchanges. That changed when companies like Block (<strong>8.48K</strong> BTC) and Tesla (<strong>11.5K </strong>BTC) began accumulating BTC as a core treasury asset. Most recently, GameStop (GME) announced plans to allocate part of its <strong>$1.5B</strong> capital raise to BTC purchases. Currently, total corporate BTC treasury holdings stand at approximately <strong>1.05</strong> million BTC.</p>
<p>We trace the renewed interest in Saylor&rsquo;s strategy to the persistent premium embedded in Strategy (MSTR) stock. MSTR trades at a <strong>119%</strong> premium to the combined value of its BTC holdings and enterprise software business. This phenomenon has attracted other firms such as Metaplanet (Japan, <strong>5K</strong> BTC) and Semler Scientific (USA, <strong>3.3K</strong> BTC) to engage in Bitcoin strategies. Semler trades at approximately <strong>1.07 </strong>times its BTC NAV, while Metaplanet trades around <strong>2.25</strong> times.</p>
<p>In April, Softbank, Tether, and Cantor Fitzgerald launched a joint venture called XXI, with initial holdings of <strong>31.5K</strong> BTC. Companies have also expanded beyond BTC to accumulate other tokens. DeFi Development Corp (formerly Janover) increased its SOL holdings to <strong>317K</strong> tokens valued at <strong>$47M</strong> and announced plans to raise to <strong>$1B</strong> more in SOL. Upexi, another Nasdaq-listed firm, said it would raise <strong>$100M</strong>, largely for SOL accumulation. In Canada, SOL Strategies announced a <strong>$500M</strong> note facility to purchase SOL to back its shares.</p>
<p>While this financialization trend reflects growing institutional interest in digital assets, we cautiously approach its broad adoption. As more firms seek exposure through capital markets, it may introduce added volatility to BTC and other crypto assets. We will explore this dynamic further in an upcoming blog post on MicroStrategy.</p>
<div class="wrapped-div">
<table style="width: 500px;">
<tbody>
<tr class="tbl-data">
<td class="tbl-header">Name</td>
<td class="tbl-header text-right">Bitcoin (₿)</td>
</tr>
<tr class="tbl-data">
<td class="data-td">Microstrategy, Inc.</td>
<td class="data-td data text-right">553,555</td>
</tr>
<tr class="tbl-data">
<td class="data-td">MARA Holdings, Inc.</td>
<td class="data-td data text-right">47,600</td>
</tr>
<tr class="tbl-data">
<td class="data-td">XXI</td>
<td class="data-td data text-right">31,500</td>
</tr>
<tr class="tbl-data">
<td class="data-td">Riot Platforms, Inc.</td>
<td class="data-td data text-right">19,223</td>
</tr>
<tr class="tbl-data">
<td class="data-td">Galaxy Digital Holdings Ltd</td>
<td class="data-td data text-right">13,704</td>
</tr>
<tr class="tbl-data">
<td class="data-td">CleanSpark, Inc.</td>
<td class="data-td data text-right">11,869</td>
</tr>
<tr class="tbl-data">
<td class="data-td">Tesla, Inc.</td>
<td class="data-td data text-right">11,509</td>
</tr>
<tr class="tbl-data">
<td class="data-td">Hut 8 Mining Corp</td>
<td class="data-td data text-right">10,273</td>
</tr>
<tr class="tbl-data">
<td class="data-td">Coinbase Global, Inc.</td>
<td class="data-td data text-right">9,480</td>
</tr>
<tr class="tbl-data">
<td class="data-td last">Block, Inc.</td>
<td class="data-td data last text-right">8,485</td>
</tr>
</tbody>
</table>
</div>
<p class="chart-disclosure mt-3">Source: BitcoinTreasuries.Net as of 4/28/2025. <strong>Past performance is no guarantee of future results.Not intended as a recommendation to buy or sell any securities named herein.</strong></p>
<h2 id="notable-performers" class="jump-link-nav anchored-block" data-jumplink-title="Notable Performers">April&rsquo;s Notable Performers - Solana (SOL) (+16%) and SUI (+52%)</h2>
<h2>Solana spends April building</h2>
<h3>Solana Decentralized Exchange (DEX) Volume is Driven by Memecoins</h3>
<div class="flourish-embed flourish-chart" data-src="visualisation/22960874?2429575"><script src="https://public.flourish.studio/resources/embed.js"></script><noscript><img loading="lazy" src="https://public.flourish.studio/visualisation/22960874/thumbnail" width="100%" alt="Solana Decentralized Exchange (DEX) Volume is Driven by Memecoins" /></noscript></div>
<p class="chart-disclosure">Source: Artemis XYZ as of 4/28/2025. <strong>Past performance is no guarantee of future results. Not intended as a recommendation to buy or sell any securities named herein.</strong></p>
<p>April was a quieter month for Solana, focused on core improvements aligned with its &ldquo;Increasing Bandwidth, Reducing Latency&rdquo; (IBRL) roadmap. The chain released SIMD-0207, raising the block compute limit to <strong>50M</strong>, up from <strong>48M</strong>, a (<strong>+4%</strong>) increase. This enables higher transaction throughput and sets the stage for SIMD-0256, which could raise the limit to <strong>60M</strong>. In effect, a higher compute limit expands block size and network capacity.</p>
<p>The Solana Foundation also reassessed its validator delegation program, which allocates over <strong>70M</strong> SOL, roughly <strong>18%</strong> of total staked SOL. Some community members have raised concerns about centralization and possible favoritism. In response, Solana will begin removing validators with less than <strong>1,000</strong> SOL in external stake who have relied on Foundation support for more than 18 months. Three underperforming validators will be phased out for every new validator onboarded to the Solana Foundation delegation program.</p>
<p>The program aims to encourage validators to deliver services beyond basic validation. Many already offer tools like blockchain scanners that serve the community at no cost. These contributions raise a validator&rsquo;s profile and help attract stake. In short, the Foundation is rewarding those who add value to the ecosystem and phasing out those who do not.</p>
<p>Meanwhile, memecoins remain the primary driver of onchain revenues. In January 2025, they accounted for <strong>44%</strong> of decentralized exchange trading volume, and <strong>35%</strong> in April 2025. If we exclude stablecoins, SOL, and SOL liquid staking tokens, often on the other side of trades, memecoins represent <strong>99%</strong> of Solana trading activity in January and <strong>95%</strong> in April. While some question the sustainability of this trend, Solana has proven its unmatched ability to process large volumes of decentralized trading. This positions Solana as the most likely home for the next breakout trading application.</p>
<h2>SUI&rsquo;s near-term velocity is impressive</h2>
<h3>Average Daily Decentralized Exchange (DEX) Volume for April 2025</h3>
<p><img loading="lazy" class="img-responsive w-100" src="https://www.vaneck.com/contentassets/3854a13e9d414a3c84a6dc47d3f8ea2f/5645_crypto-april_chart-5_2025-5_v1.svg" alt="Average Daily Decentralized Exchange (DEX) Volume for April 2025" /></p>
<p class="chart-disclosure">Source: Artemis XYZ as of 4/30/2025. <strong>Past performance is no guarantee of future results. Not intended as a recommendation to buy or sell any securities named herein.</strong></p>
<p>We have extensively covered the potential of Sui&rsquo;s blockchain and find it compelling based on its rockstar leadership team, novel high-performance architecture, and continued output of interesting products. Blockchains are extremely competitive businesses, and one of the only moats is a project&rsquo;s ability to ship new, useful features. Sui continues to deliver with tools like Walrus, a decentralized storage protocol; Deepbook, a chain-wide liquidity pool for all assets; Seal, a data access control tool; and Nautilus, an off-chain computation verifier.</p>
<p>Even the most avid crypto user may find the value of these tools hard to assess, but each was created to solve specific developer problems based on user feedback. In our discussions with teams building on Sui, many point to the responsiveness of Mysten Labs, the core developers behind the network. This drive to make things that matter to developers is one of the key features differentiating Sui from other SCPs.</p>
<p>Sui&rsquo;s fundamentals in April reflect its price momentum. DEX volumes jumped (<strong>+45.5%</strong>) to a daily average of <strong>$374M</strong>, up from March, making Sui the 6th highest trading blockchain. On the revenue front, Sui ranked <strong>9th</strong>among SCPs, generating an average of <strong>$44K</strong> per day. Its stablecoin supply remains relatively small at <strong>$885M</strong>, placing it <strong>12th</strong> by onchain stablecoin value. Still, Sui ranks <strong>1st</strong> in stablecoin turnover ratio at <strong>716%</strong> (stablecoin transfer volume/stablecoin market cap), just ahead of Base at <strong>602%</strong>.</p>
<h2 id="notable-laggards" class="jump-link-nav anchored-block" data-jumplink-title="Notable Laggards">April&rsquo;s Notable Laggards - Ethereum (ETH) (-3%) and XRP (+5%)</h2>
<h3>ETH + L2s Share of Fees Hit Multi-Year Lows in April</h3>
<p><img loading="lazy" class="img-responsive w-100" src="https://www.vaneck.com/contentassets/3854a13e9d414a3c84a6dc47d3f8ea2f/5645_crypto-april_chart-6_2025-5_v2.svg" alt="ETH + L2s Share of Fees Hit Multi-Year Lows in April" /></p>
<p class="chart-disclosure">Source: Artemis as of 4/30/2025. <strong>Past performance is no guarantee of future results. Not intended as a recommendation to buy or sell any securities named herein.</strong></p>
<p>Ethereum&rsquo;s ETH (<strong>-3%</strong>) continued to lag this month as faster chains like Solana (<strong>+16%</strong>) and Sui (<strong>+52%</strong>) gained market share during the latest rally. Unfortunately for Ethereum, this marks a continuation of a grim, longer-term trend: its share of blockchain transaction fees dropped from (<strong>-74.1%</strong>) two years ago to just <strong>13.7%</strong> of all smart contract platform (SCP) revenues.</p>
<p>In our opinion, the market is sending a clear signal: users, applications, and fees are migrating to faster, cheaper chains. In response, Ethereum developers are advancing several initiatives to scale the network and simplify its execution layer dramatically.</p>
<h2>Ethereum L1 Developments</h2>
<ol class="content-list">
<li class="mt-2"><strong>Vitalik Buterin&rsquo;s RISC-V Proposal: </strong>Vitalik Buterin has proposed replacing Ethereum&rsquo;s Virtual Machine (EVM) with the RISC-V architecture. This move to RISC-V could simplify Ethereum&rsquo;s execution layer, boost transaction speeds, and dramatically improve zero-knowledge proof (ZKP) efficiency. Today, proving a single Ethereum block takes around 4.7 minutes; with RISC-V, researchers hope to cut this down by up to 100x, unlocking sub-5-second proving times critical for scaling ZK rollups. The proposal also aims to enhance competition among block producers while maintaining Solidity and Vyper compatibility. However, implementing RISC-V would require rebuilding major sections of Ethereum&rsquo;s core code and could take years.</li>
<li class="mt-2"><strong>EIP-9698: 100x Gas Limit Increase: </strong>Ethereum researcher Dankrad Feist proposed EIP-9698, which would increase the gas limit by 100x over four years. This change could raise throughput from today&rsquo;s 15&ndash;20 transactions per second (TPS) to around 2,000 TPS by 2029. Instead of a hard fork, the upgrade would use a deterministic, exponential schedule baked into Ethereum client defaults, allowing validators to upgrade hardware gradually. If approved, the changes could start on June 1.</li>
<li class="mt-2"><strong>Access Lists for Parallelization: </strong>EIP-9580 introduces block-level access lists to enable parallel transaction processing. By predefining which accounts and storage slots are accessed, Ethereum could dramatically cut validation times, allowing for simultaneous disk reads and EVM execution. This is similar to how Solana works under the hood. This would improve performance, especially under network congestion.</li>
</ol>
<p>These L1 initiatives reflect a growing focus on reasserting control over the Ethereum ecosystem&rsquo;s economics. As the Ethereum ecosystem&rsquo;s Layer 2s have scaled, they have increasingly taken user activity and transaction fees from the L1, even though Ethereum continues to provide core security and data availability infrastructure. Recently, Flashblocks&rsquo; launch on OP Superchain networks like Base, Unichain, and Optimism reduced confirmation times to 200ms down from 2s. Additionally, Arbitrum upgraded its blockchain to enable gas to be paid in tokens other than Ethereum. Taken together, these moves embody the tension between Ethereum and its L2s. Flashbots will arguably draw more activity away from Ethereum&rsquo;s Mainnet, while Arbitrum&rsquo;s new proposal may reduce the importance of ETH in the L2s that are built using Arbitrum&rsquo;s tech stack.</p>
<p>With ETH prices continuing to lag other major cryptocurrencies, the market increasingly recognizes L2s as economically parasitic to L1. This tension has led to the urgency in the Ethereum Foundation&rsquo;s efforts to reclaim fee share and reinforce ETH&rsquo;s value proposition as an asset. At the same time, many L2s are pursuing their own priorities, setting the stage for a growing divergence in strategy. We applaud Ethereum&rsquo;s effort and scaling of its blockchain, but we urge it to make more rapid changes. The competition, such as Solana and Sui, responds quickly to user needs with tight feedback loops that can be measured in weeks or months. Ethereum must consider the threats these new chains pose as terminal and match the cadence of its competitors.</p>
<h2>XRP barely budges despite Ripple&rsquo;s shift</h2>
<h3>Driven by DeFi Demand on Ethereum, RLUSD Supply Crossed 300M in April</h3>
<img loading="lazy" class="img-responsive w-100" src="https://www.vaneck.com/contentassets/3854a13e9d414a3c84a6dc47d3f8ea2f/5645_crypto-april_chart-7_2025-5_v1.svg" alt="XRP barely budges despite Ripple&rsquo;s shift" />
<p class="chart-disclosure mt-3">Source: Ripple as of 5/2/2025. <strong>Past performance is no guarantee of future results. Not intended as a recommendation to buy or sell any securities named herein.</strong></p>
<p>April saw XRP underperform despite Ripple&rsquo;s efforts to reposition its network through several key moves. For years, many dismissed Ripple as a speculative asset with little real usage. Recently, however, it has shifted toward smart contracts, a dollar-pegged stablecoin, and major acquisitions to drive activity on its chain.</p>
<p>Ripple began April by integrating RLUSD, its enterprise-grade stablecoin, into Ripple Payments, a platform offering institutions fast, low-cost, blockchain-assisted cross-border transactions. According to data from Ripple, RLUSD supply crossed <strong>$300M</strong> by month-end, growing 30% month-over-month. However, with roughly <strong>79% </strong>of RLUSD issued on Ethereum, it's unclear how much of this growth stems from DeFi activity versus enterprise usage. Issued by a NYDFS-regulated limited-purpose trust company, RLUSD arguably offers stronger compliance oversight than USDT or even USDC.</p>
<p>Just one week after RLUSD&rsquo;s integration, Ripple announced a <strong>$1.25B</strong> acquisition of Hidden Road, one of the largest deals in digital assets to date. Hidden Road plans to use RLUSD for cross-margining between traditional and digital assets, a key utility for prime brokers who move trillions in collateral daily. Ripple also intends to migrate Hidden Road&rsquo;s post-trade activity onto the XRP Ledger, positioning XRPL as a foundational layer for institutional finance.</p>
<p>In a joint report released the same week, Ripple and Boston Consulting Group projected the tokenized real-world asset market could grow from <strong>$600B</strong> today to <strong>$18.9T</strong> by 2033, a <strong>+53% compound annual growth rate (CAGR)</strong>. Ripple&rsquo;s actions show a clear conviction in this thesis and its intent to benefit if it plays out.</p>
<p>If successful, Ripple may become a case study in transforming a speculative token into a world-class business. With over <strong>40%</strong> of XRP&rsquo;s supply, Ripple holds a war chest worth <strong>$100B</strong> to fund future acquisitions. As April closed, rumors surfaced that Ripple offered <strong>$4&ndash;5B</strong> to acquire Circle, ahead of Circle&rsquo;s expected IPO.</p>
<p>Though XRP underperformed this month, it remains a standout long-term performer, up (<strong>+340%</strong>) YoY, compared to an (<strong>-8% </strong>) decline in the <a target="_blank" href="https://www.marketvector.com/indexes/digital-assets/marketvector-smart-contract-leaders" title="MVSCLE MarketVector&trade; Smart Contract Leaders Index" rel="noopener"><strong>MarketVector Smart Contract Leaders Index</strong></a>. In the competitive world of crypto, Ripple has succeeded where technically superior blockchains have failed. Its durability comes from a consistent narrative, strong leadership, and an unmatched community of XRP holders.</p>
<p><strong>Links to third party websites are provided as a convenience and the inclusion of such links does not imply any endorsement, approval, investigation, verification or monitoring by us of any content or information contained within or accessible from the linked sites. By clicking on the link to a non-VanEck webpage, you acknowledge that you are entering a third-party website subject to its own terms and conditions. VanEck disclaims responsibility for content, legality of access or suitability of the third-party websites.</strong></p>
<style>
    .data-td.data {
        padding-right: 5px !important;
    }
    
    .wrapped-div {
        max-width: 100%;
    }
    
    @media (max-width: 1240px) {
        .wrapped-div {
            overflow-x: scroll;
        }
    }
    
    .wrapped-div-sector {
        max-width: 100%;
        overflow-x: scroll;
    }
</style>
<p>To receive more <strong><a href="https://www.vaneck.com/us/en/insights/digital-assets/" title="Digital Assets Insights">Digital Assets</a></strong> insights, <strong><a href="https://www.vaneck.com/us/en/subscribe/" title="Subscription Center">sign up in our subscription center</a></strong>.</p>
]]></content:encoded>
</item><item rdf:about="https://www.vaneck.com/us/en/blogs/digital-assets/matthew-sigel-vaneck-mid-april-2025-bitcoin-chaincheck/">
  <title>VanEck Mid-April 2025 Bitcoin Chaincheck></title>
  <link>https://www.vaneck.com/us/en/blogs/digital-assets/matthew-sigel-vaneck-mid-april-2025-bitcoin-chaincheck/</link>
  <description><![CDATA[Bitcoin volatility hits cycle lows as gold rallies and balance sheets get redefined. Our latest analysis shows why treating BTC like cash and actively managing portfolios matters more than ever.]]></description>
  <dc:creator>Nathan  Frankovitz</dc:creator>
  <dc:date>04/25/2025 06:30:00</dc:date>
<content:encoded><![CDATA[

<p><strong>Please note that VanEck has exposure to bitcoin.</strong></p>
<p><strong>Three key takeaways for mid-March &ndash; mid-April:</strong></p>
<ol class="content-list">
<li class="mt-2"><strong>Volatility Falls, Allocation Case Builds: </strong>Bitcoin's relative volatility versus equities is testing multi-year lows, reinforcing its case as a maturing, lower-beta asset and potential hedge amid rising macro uncertainty.</li>
<li class="mt-2"><strong>From Treasuries to Gold to Bitcoin as Reserve Assets:</strong> As de-dollarization accelerates, central banks move from Treasuries to gold. Rising corporate adoption suggests Bitcoin may be next, offering a programmable, censorship-resistant alternative for treasuries.</li>
<li class="mt-2"><strong>Bitcoin Treasury Adoption Demands Better Data and Management:</strong> Most financial data still ignore Bitcoin holdings, distorting how miner solvency and risk are assessed. Active management is essential, as balance sheets shift quickly across BTC, energy, and AI.</li>
</ol>
<ul class="content-list">
<li class="mt-2"><a href="#chart-of-the-month"><strong>Chart of The Month</strong></a></li>
<li class="mt-2"><a href="#bitcoin-monthly-dashboard"><strong>Bitcoin Monthly Dashboard</strong></a></li>
<li class="mt-2"><a href="#bitcoin-miners-coverage-analysis"><strong>Bitcoin Miners Coverage Analysis</strong></a></li>
</ul>
<h3 id="chart-of-the-month" class="jump-link-nav anchored-block" data-jumplink-title="Chart of the Month">Chart of the Month: Bitcoin's Volatility vs. NASDAQ's Near-Historic Lows</h3>
<p><strong>Bitcoin Stabilizes: Relative Volatility Nears Cycle Lows vs. Nasdaq</strong></p>
<p><img loading="lazy" class="img-responsive w-100" alt="Bitcoin's Volatility vs. NASDAQ's Near-Historic Lows" src="https://www.vaneck.com/contentassets/5c1bb31c7d32449cbed3e7d139e197a8/5602_bitcoin-chaincheck-apr_chart-1_2025-4_v1_blog.svg" /></p>
<p class="chart-disclosure">Source: Glassnode as of 4/15/2025. <strong>Past performance is no guarantee of future results.</strong></p>
<p>Bitcoin's volatility relative to the NASDAQ has compressed towards levels not seen since before the 2017 bull run. Despite heightened equity market swings, with S&amp;P 500 volatility near <strong>3-year </strong>highs, Bitcoin's realized volatility remains subdued and is down nearly <strong>50%</strong> from its 2022 peaks. This divergence supports a compelling narrative: Bitcoin is increasingly behaving less like a speculative tech asset and more like a macro-neutral commodity.</p>
<p>Low volatility and low correlation enhance Bitcoin's potential as a true portfolio hedge. As allocators navigate renewed turbulence in traditional risk assets, Bitcoin's differentiated price dynamics could justify larger strategic allocations, particularly in multi-asset portfolios.</p>
<p>This structural shift may also reflect Bitcoin's evolving use cases. As trade and financial infrastructure are increasingly weaponized in geopolitical conflicts, some progressive sovereigns are taking greater interest in neutral settlement rails like Bitcoin. At the same time, both public and private institutions are beginning to subsidize AI compute with Bitcoin mining activity, reinforcing its status as a strategic commodity. In this context, Bitcoin's relatively calm price action may not indicate disinterest but growing maturity.</p>
<h3 id="bitcoin-monthly-dashboard" class="jump-link-nav anchored-block" data-jumplink-title="Dashboard">Bitcoin Monthly Dashboard and Highlights</h3>
<div class="wrapped-div">
<table style="width: 100%;">
<tbody>
<tr class="tbl-data">
<td class="tbl-header last text-left">As of April 14th, 2025</td>
<td class="tbl-header last text-right">30-day avg</td>
<td class="tbl-header last text-right">30 day change (%)<sup>1</sup></td>
<td class="tbl-header last text-right">365 day change (%)</td>
<td class="tbl-header last text-right">Last 30 days Percentile vs<br />all-time history (%)</td>
</tr>
<tr class="tbl-data">
<td class="data-td last">Bitcoin Price</td>
<td class="data-td data last text-right">$83,560</td>
<td class="data-td data last text-right">-7</td>
<td class="data-td data last text-right">23</td>
<td class="data-td data last text-right">98</td>
</tr>
<tr class="tbl-data">
<td class="data-td last">Daily Active Addresses</td>
<td class="data-td data last text-right">735,356</td>
<td class="data-td data last text-right">-2</td>
<td class="data-td data last text-right">-18</td>
<td class="data-td data last text-right">66</td>
</tr>
<tr class="tbl-data">
<td class="data-td last">Daily New Addresses</td>
<td class="data-td data last text-right">309,801</td>
<td class="data-td data last text-right">-1</td>
<td class="data-td data last text-right">-18</td>
<td class="data-td data last text-right">56</td>
</tr>
<tr class="tbl-data">
<td class="data-td last">Daily Transactions</td>
<td class="data-td data last text-right">390,823</td>
<td class="data-td data last text-right">0</td>
<td class="data-td data last text-right">-1</td>
<td class="data-td data last text-right">90</td>
</tr>
<tr class="tbl-data">
<td class="data-td last">Daily Inscriptions</td>
<td class="data-td data last text-right">119,088</td>
<td class="data-td data last text-right">-9</td>
<td class="data-td data last text-right">-11</td>
<td class="data-td data last text-right">52</td>
</tr>
<tr class="tbl-data">
<td class="data-td last">Total Transfer Volume (USD)</td>
<td class="data-td data last text-right">$45,628,150,430</td>
<td class="data-td data last text-right">-30</td>
<td class="data-td data last text-right">-22</td>
<td class="data-td data last text-right">82</td>
</tr>
<tr class="tbl-data">
<td class="data-td last">Supply Active, last 180 days</td>
<td class="data-td data last text-right">26%</td>
<td class="data-td data last text-right">1</td>
<td class="data-td data last text-right">25</td>
<td class="data-td data last text-right">47</td>
</tr>
<tr class="tbl-data">
<td class="data-td last">% Supply Dormant for 3+ Years</td>
<td class="data-td data last text-right">45%</td>
<td class="data-td data last text-right">0</td>
<td class="data-td data last text-right">1</td>
<td class="data-td data last text-right">63</td>
</tr>
<tr class="tbl-data">
<td class="data-td last">Avg Fees (USD)</td>
<td class="data-td data last text-right">$1.24</td>
<td class="data-td data last text-right">-14</td>
<td class="data-td data last text-right">-82</td>
<td class="data-td data last text-right">62</td>
</tr>
<tr class="tbl-data">
<td class="data-td last">Avg Fees (BTC)</td>
<td class="data-td data last text-right">0.00001</td>
<td class="data-td data last text-right">-8</td>
<td class="data-td data last text-right">-85</td>
<td class="data-td data last text-right">4</td>
</tr>
<tr class="tbl-data">
<td class="data-td last">Percent of BTC Addresses in profit</td>
<td class="data-td data last text-right">88%</td>
<td class="data-td data last text-right">-2</td>
<td class="data-td data last text-right">-9</td>
<td class="data-td data last text-right">71</td>
</tr>
<tr class="tbl-data">
<td class="data-td last">Unrealized profit/loss ratio</td>
<td class="data-td data last text-right">0.48</td>
<td class="data-td data last text-right">-7</td>
<td class="data-td data last text-right">-20</td>
<td class="data-td data last text-right">64</td>
</tr>
<tr class="tbl-data">
<td class="data-td last">Global Power Consumption (TWh)</td>
<td class="data-td data last text-right">164</td>
<td class="data-td data last text-right">6</td>
<td class="data-td data last text-right">40</td>
<td class="data-td data last text-right">100</td>
</tr>
<tr class="tbl-data">
<td class="data-td last">Total Daily BTC Miner Revenues (USD)</td>
<td class="data-td data last text-right">$39,420,584</td>
<td class="data-td data last text-right">-4</td>
<td class="data-td data last text-right">-39</td>
<td class="data-td data last text-right">88</td>
</tr>
<tr class="tbl-data">
<td class="data-td last">Total Crypto Equities' Market Cap<sup>*</sup>&nbsp;(USD) (MM)</td>
<td class="data-td data last text-right">$167,340</td>
<td class="data-td data last text-right">-8</td>
<td class="data-td data last text-right">21</td>
<td class="data-td data last text-right">78</td>
</tr>
<tr class="tbl-data">
<td class="data-td last">Transfer volume from Miners to Exchanges (USD)</td>
<td class="data-td data last text-right">$5,518,130</td>
<td class="data-td data last text-right">9</td>
<td class="data-td data last text-right">18</td>
<td class="data-td data last text-right">86</td>
</tr>
<tr class="tbl-data">
<td class="data-td last">Bitcoin Dominance</td>
<td class="data-td data last text-right">61%</td>
<td class="data-td data last text-right">2</td>
<td class="data-td data last text-right">18</td>
<td class="data-td data last text-right">93</td>
</tr>
<tr class="tbl-data">
<td class="data-td last">Bitcoin Futures Annualized Basis</td>
<td class="data-td data last text-right">6%</td>
<td class="data-td data last text-right">-27</td>
<td class="data-td data last text-right">-75</td>
<td class="data-td data last text-right">36</td>
</tr>
<tr class="tbl-data">
<td class="data-td last">Mining Difficulty (T)</td>
<td class="data-td data last text-right">116</td>
<td class="data-td data last text-right">4</td>
<td class="data-td data last text-right">38</td>
<td class="data-td data last text-right">100</td>
</tr>
</tbody>
</table>
</div>
<br />
<p class="chart-disclosure"><sup>*</sup>DAPP market cap as a proxy, as of April 15th, 2025.</p>
<p class="chart-disclosure"><sup>1</sup>&nbsp;30 day change &amp; 365 day change are relative to the 30-day avg, not absolute.</p>
<div class="wrapped-div">
<table style="width: 100%;">
<tbody>
<tr class="tbl-data">
<td class="tbl-header last text-left">Regional Trading</td>
<td class="tbl-header last text-right">MoM Change (%)</td>
<td class="tbl-header last text-right">YoY Change (%)</td>
</tr>
<tr class="tbl-data">
<td class="data-td data last text-left">Asia Hours Price Change MoM ($)</td>
<td class="data-td data last text-right">-1</td>
<td class="data-td data last text-right">2</td>
</tr>
<tr class="tbl-data">
<td class="data-td data last text-left">US hours Price Change MoM ($)</td>
<td class="data-td data last text-right">-6</td>
<td class="data-td data last text-right">2</td>
</tr>
<tr class="tbl-data">
<td class="data-td data last text-left">EU hours Price Change MoM ($)</td>
<td class="data-td data last text-right">-4</td>
<td class="data-td data last text-right">1</td>
</tr>
</tbody>
</table>
</div>
<br />
<p class="chart-disclosure">Source: Glassnode, VanEck research as of 04/14/25. <strong>Past performance is no guarantee of future results. Not intended as a recommendation to buy or sell any securities named herein. </strong></p>
<p><strong>Total Transfer Volume (USD): </strong>Bitcoin's USD-denominated transfer volume is down <strong>30% </strong>MoM and <strong>22%</strong> YoY from a 2024 local peak. At <strong>~$45.6</strong> billion per day, volume sits in the<strong> 82nd</strong> percentile of all-time activity, though still <strong>~83%</strong> below the November 2021 high of <strong>~$272</strong> billion. While increased use of custodial solutions may be suppressing on-chain volume among retail users, early signs of international settlement use could drive a future rebound.</p>
<p><strong>Bitcoin Futures Annualized Basis: </strong>The <strong>30-day</strong> moving average of Bitcoin futures' annualized basis <strong>fell 27%</strong> month-over-month, indicating a continuation of last month's collapse in speculative trading. Our research has demonstrated that the best time to consider buying is when funding rates are low, as they have been over the last month.</p>
<p><strong>Global Power Consumption &amp; Mining Difficulty:</strong> Bitcoin's global power consumption increased <strong>6%</strong> this month, while difficulty (<strong>+4% MoM</strong>) once again set new all-time highs. The Bitcoin network's global hashrate crossed <strong>1 Zetahash per second (ZH/s)</strong> for the first time ever as Bitcoin miners completed fleet upgrades, a landmark in the strength of Bitcoin's global network.</p>
<p><strong>Total Crypto Equities Market Cap: </strong>Crypto equities' <strong>30-day</strong> avg. fell <strong>8%</strong> MoM, demonstrating downside beta to Bitcoin <strong>(-7%</strong> MoM) but in line with Nasdaq, also <strong>-8%</strong> MoM.</p>
<h2 id="market-sentiment" class="jump-link-nav anchored-block" data-jumplink-title="Market Sentiment">Bitcoin Market Sentiment</h2>
<p><strong>Short-Term Price Action</strong></p>
<p>Bitcoin's selloff continued this month, with <strong>30-day</strong> moving average (30-DMA) prices <strong>down 7% MoM</strong>, a slower decline than last month's <strong>12% drop</strong>. Bitcoin continued to outperform the broader crypto market, with Bitcoin dominance reaching the highest levels since February 2021 with a <strong>30-DMA of 61%</strong>. Since March 14th, Bitcoin ETPs have seen <strong>$187 million </strong>in net inflows, potentially marking an end to the record <strong>$6.4 billion </strong>of net outflows we reported last month.</p>
<p>This modest rebound in flows follows a turbulent February and March. DeepSeek's surprise disclosures catalyzed a broad risk-off move across AI infrastructure, data centers, crypto mining, and other risk assets like crypto more broadly. The selloff has recently been compounded by investor uncertainty over U.S. tariff policy and its implications for globally exposed tech and compute-intensive industries.</p>
<p>Against this backdrop of risk repricing and macro uncertainty, investor attention has increasingly turned to assets outside the traditional financial system, particularly gold and Bitcoin, as potential neutral reserves.</p>
<h2>De-Dollarization and the Rise of Neutral Reserves</h2>
<h3>Asian Trading Hours Drove Stronger Average Gold (AXU) Gains in Recent Weeks</h3>
<p><img loading="lazy" class="img-responsive w-100" alt="Asian Trading Hours Drove Stronger Average Gold (AXU) Gains in Recent Weeks" src="https://www.vaneck.com/contentassets/5c1bb31c7d32449cbed3e7d139e197a8/5602_bitcoin-chaincheck-apr_chart-2_2025-4_v1_blog.svg" /></p>
<p class="chart-disclosure">Source: Glassnode, VanEck research as of 04/15/25. <strong>Past performance is no guarantee of future results. Not intended as a recommendation to buy or sell any securities named herein.</strong></p>
<p>Gold's recent performance may signal what's ahead for Bitcoin. Like gold, Bitcoin has seen widening cumulative gains during Asian trading hours, a trend that has accelerated alongside gold's breakout to new highs.</p>
<p>Recent IMF Official Foreign Exchange Reserves (COFER) data show that USD FX reserves are at <strong>30-year</strong> lows, as central banks have replaced USD exposure with gold and non-traditional currencies. Foreign holdings of U.S. Treasuries languish near <strong>25-year</strong> lows of <strong>33%,</strong> down from a peak of <strong>54%</strong> in 2007, <strong>44%</strong> in 2017. Meanwhile, the Chinese CNY's SWIFT usage is at an all-time high, growing from <strong>1.85%</strong> in February 2019 to <strong>4.33%</strong> in February 2025. Grim GDP trends in the UK, EU, and Japan also predict major losses for their currencies&mdash;GBP/EUR/JPY, respectively.</p>
<h3>The Share of USD in FX Reserves as Reported by IMF's COFER Data</h3>
<p><img loading="lazy" class="img-responsive w-100" alt="The Share of USD in FX Reserves as Reported by IMF's COFER Data" src="https://www.vaneck.com/contentassets/5c1bb31c7d32449cbed3e7d139e197a8/5602_bitcoin-chaincheck-apr_chart-3_2025-4_v1_blog.svg" /></p>
<p class="chart-disclosure">Source: IMF as of 04/08/25. Past performance is no guarantee of future results.</p>
<p>While currencies like China's CNY, India's INR, and Turkey's TRY may absorb some demand displaced by weakening Western FX, neutral assets like gold and Bitcoin may increasingly claim a larger share of global reserves. White House Chief Economist Steve Miran stated earlier in April, &ldquo;&hellip;the reserve function of the dollar has caused persistent currency distortions and contributed, along with other countries' unfair barriers to trade, to unsustainable trade deficits.&rdquo; In context with Trump's broader pro-crypto initiatives, we believe the U.S. has more to gain from continued performance from Gold and Bitcoin than from the continued adoption of other nations' currencies.</p>
<p>As these reserve allocation shifts accelerate, Bitcoin may increasingly be seen by some as &ldquo;digital gold&rdquo; with settlement utility, offering neutral value storage, censorship resistance, and programmable transferability. That positions it as a credible alternative reserve asset, especially in regions where capital controls or geopolitical tensions reduce trust in traditional FX rails. For example, a small but growing part of Russia's oil trade has <a href="https://www.reuters.com/business/energy/russia-leans-cryptocurrencies-oil-trade-sources-say-2025-03-14/" title="Russia leans on cryptocurrencies for oil trade, sources say" target="_blank" rel="noopener"><strong>reportedly</strong></a> been conducted via Bitcoin, Ether, and stablecoins, smoothing the conversion of Chinese yuan and Indian rupees to Russian roubles while circumventing Western sanctions. However, such adoption trends are not steady. Just days after Russia's majority state-owned energy corporation Gazprom disclosed its exit from the country, Bolivia's state-owned YPFB reversed its March 2025 decree to use cryptocurrency to pay for energy imports amid fuel and foreign reserve shortages.</p>
<h3>Corporate Treasuries Surpass ETPs as the New Marginal Buyer in 2025</h3>
<p><img loading="lazy" class="img-responsive w-100" alt="Corporate Treasuries Surpass ETPs as the New Marginal Buyer in 2025" src="https://www.vaneck.com/contentassets/5c1bb31c7d32449cbed3e7d139e197a8/5602_bitcoin-chaincheck-apr_chart-4_2025-4_v1_blog.svg" /></p>
<p class="chart-disclosure">Source: BitcoinTreasuries, VanEck research as of 04/03/25. Past performance is no guarantee of future results.<br /><sup>*</sup>&nbsp;Estimates include only U.S., China, U.K., North Korea, Bhutan, El Salvador, &amp; Germany</p>
<p>Recent changes in Bitcoin's holder base lend credence to Bitcoin's status as a treasury asset. While the newly launched Bitcoin ETPs unlocked significant demand (over <strong>200,000</strong> BTC!) in just the first few months after launching in early 2024, net flows have slowed more recently amid market volatility. Meanwhile, corporations have more than doubled the rate of their Bitcoin purchases. Of these three major cohorts, only governments have decreased their aggregate Bitcoin holdings over the past year, driven primarily by Germany's sale of all ~<strong>50,000</strong> of its seized Bitcoin and the U.S.'s cumulative liquidation of ~<strong>27,000</strong> <strong>BTC</strong>.</p>
<p>The accelerating pace of corporate Bitcoin adoption signals that forward-looking governments may increasingly consider its potential to strengthen reserves and <strong><a href="/link/8e3a4ef560ff4027a21236849804d8d2.aspx" title="Bitcoin Strategic Reserve Calculator">offset</a></strong> long-term debt burdens. At the same time, we urge the need for measured, data-driven approaches to adopting Bitcoin as a reserve asset.</p>
<h2 id="bitcoin-miners-coverage-analysis" class="jump-link-nav anchored-block" data-jumplink-title="Bitcoin Miners">Bitcoin Miners Coverage Analysis</h2>
<p>As we gear up to become <strong><a href="https://x.com/matthew_sigel/status/1912585992822804505" title="Tweet of Matthew Sigel" target="_blank" rel="noopener">more active equity investors in the space</a></strong>, we have been analyzing Bitcoin miners' use of Bitcoin in their corporate treasuries to assess their liquidity and solvency risks. Below is one case study for how BTC-backed balance sheets might behave under market stress.</p>
<p><img loading="lazy" class="img-responsive w-100" alt="BTC &amp; Cash Treasuries (USD 000's)" src="https://www.vaneck.com/contentassets/5c1bb31c7d32449cbed3e7d139e197a8/5602_bitcoin-chaincheck-apr_table_2025-04_v1.svg" /></p>
<p class="chart-disclosure"><sup>*</sup>&nbsp;Assumes de minimis (zero) BTC held based on historical patterns.</p>
<p class="chart-disclosure"><sup>1</sup>&nbsp;&lsquo;BTC Held' includes BTBT's &lsquo;BTC equivalent' ETH holdings as of January 31, 2025; BTC holdings are 769.</p>
<p class="chart-disclosure">Sources: Company Filings as of 4/22/2025. <strong>Past performance is no guarantee of future results. Not intended as a recommendation to buy or sell any securities named herein. </strong></p>
<p>We begin with a simple recap of each miners' liquid assets: the combination of BTC (and ETH, in BTBT's case) and cash. BTC held is as of the latest available monthly production report: March 31st figures for all BTC-holding miners except BTBT, which last reported in January. We note that IREN and WULF have typically sold all BTC mined in recent quarters, leading to our assumption that they hold no BTC, though they may retain negligible amounts.</p>
<p>Miners like <strong>MARA</strong> <strong>($4.25B</strong>), <strong>CLSK</strong> <strong>($1.06B</strong>), and <strong>RIOT</strong> <strong>($1.72B</strong>) continue to hold the largest BTC treasuries, highlighting their dominant positions as &ldquo;HOLDers&rdquo; exposed to BTC&mdash;though <strong>RIOT</strong> has recently left <strong>MARA</strong> and <strong>CLSK</strong> behind as the last two &ldquo;pure play&rdquo; miners by <a href="https://www.riotplatforms.com/riot-platforms-launches-formal-evaluation-of-potential-ai-hpc-uses-for-remaining-600-mw-of-power-capacity-at-corsicana-facility/" title="Riot Platforms Launches Formal Evaluation of Potential AI/HPC Uses for Remaining 600 MW of Power Capacity at Corsicana Facility" target="_blank" rel="noopener"><strong>initiating</strong></a> AI/HPC feasibility studies of <strong>600 MW</strong> at its Corsicana site in Q1.</p>
<p>As a percentage of their cash + BTC treasuries, however, <strong>HIVE</strong> (<strong>95%)</strong> and <strong>CIFR</strong> <strong>(94%)</strong> show even greater exposure to BTC than <strong>MARA</strong> <strong>(92%),</strong> <strong>RIOT</strong> (<strong>86%),</strong> and <strong>CLSK</strong> <strong>(79%).</strong> Miners with the greatest emphasis on AI/HPC pivots, such as <strong>IREN</strong> <strong>(0%),</strong> <strong>WULF</strong> <strong>(0%),</strong> and <strong>CORZ</strong> <strong>(9%),</strong> show the least BTC treasury exposure, likely due to steep capex costs. Interestingly, we note that despite reporting zero BTC holdings in its Q3 earnings and only <strong>256 BTC</strong> as of Dec 31st 2024, a review of its 2025 monthly production reports (which no longer cite any Bitcoin sold) and onchain <a href="https://intel.arkm.com/explorer/entity/core-scientific" title="Core Scientific" target="_blank" rel="noopener"><strong>analytics</strong></a> suggests that <strong>CORZ</strong> has held almost all its self-mined Bitcoin this year.</p>
<h3>Debt, Bitcoin &amp; Market Caps (000's)</h3>
<div class="wrapped-div">
<table style="width: 100%;">
<tbody>
<tr class="tbl-data">
<td class="tbl-header last text-left">Ticker</td>
<td class="tbl-header last text-right">Total Debt ($)</td>
<td class="tbl-header last text-right">Net Debt (excl. BTC) ($)</td>
<td class="tbl-header last text-right">Net Debt (incl. BTC) ($)</td>
<td class="tbl-header last text-right">Market Cap($)</td>
</tr>
<tr class="tbl-data">
<td class="data-td last">MARA</td>
<td class="data-td data last text-right">2,450,455</td>
<td class="data-td data last text-right">2,058,684</td>
<td class="data-td data last text-right">-2,191,348</td>
<td class="data-td data last text-right">4,610,000</td>
</tr>
<tr class="tbl-data">
<td class="data-td last">CORZ</td>
<td class="data-td data last text-right">1,111,296</td>
<td class="data-td data last text-right">275,096</td>
<td class="data-td data last text-right">188,005</td>
<td class="data-td data last text-right">2,020,000</td>
</tr>
<tr class="tbl-data">
<td class="data-td last">CLSK</td>
<td class="data-td data last text-right">649,648</td>
<td class="data-td data last text-right">373,049</td>
<td class="data-td data last text-right">-688,230</td>
<td class="data-td data last text-right">2,390,000</td>
</tr>
<tr class="tbl-data">
<td class="data-td last">RIOT</td>
<td class="data-td data last text-right">584,625</td>
<td class="data-td data last text-right">306,765</td>
<td class="data-td data last text-right">-1,412,079</td>
<td class="data-td data last text-right">2,450,000</td>
</tr>
<tr class="tbl-data">
<td class="data-td last">WULF</td>
<td class="data-td data last text-right">487,796</td>
<td class="data-td data last text-right">213,731</td>
<td class="data-td data last text-right">987,820</td>
</tr>
<tr class="tbl-data">
<td class="data-td last">HUT</td>
<td class="data-td data last text-right">324,285</td>
<td class="data-td data last text-right">239,241</td>
<td class="data-td data last text-right">-678,525</td>
<td class="data-td data last text-right">1,210,000</td>
</tr>
<tr class="tbl-data">
<td class="data-td last">BTDR</td>
<td class="data-td data last text-right">286,260</td>
<td class="data-td data last text-right">-190,040</td>
<td class="data-td data last text-right">-293,405</td>
<td class="data-td data last text-right">1,670,000</td>
</tr>
<tr class="tbl-data">
<td class="data-td last">CIFR</td>
<td class="data-td data last text-right">43,459</td>
<td class="data-td data last text-right">37,874</td>
<td class="data-td data last text-right">-54,582</td>
<td class="data-td data last text-right">999,560</td>
</tr>
<tr class="tbl-data">
<td class="data-td last">HIVE</td>
<td class="data-td data last text-right">25,194</td>
<td class="data-td data last text-right">15,349</td>
<td class="data-td data last text-right">-181,456</td>
<td class="data-td data last text-right">269,748</td>
</tr>
<tr class="tbl-data">
<td class="data-td last">BITF</td>
<td class="data-td data last text-right">23,415</td>
<td class="data-td data last text-right">-36,127</td>
<td class="data-td data last text-right">-138,061</td>
<td class="data-td data last text-right">496,678</td>
</tr>
<tr class="tbl-data">
<td class="data-td last">IREN</td>
<td class="data-td data last text-right">1,655</td>
<td class="data-td data last text-right">-425,645</td>
<td class="data-td data last text-right">1,350,000</td>
</tr>
<tr class="tbl-data">
<td class="data-td last">BTBT</td>
<td class="data-td data last text-right">0</td>
<td class="data-td data last text-right">-95,201</td>
<td class="data-td data last text-right">-289,170</td>
<td class="data-td data last text-right">343,590</td>
</tr>
</tbody>
</table>
</div>
<br />
<p class="chart-disclosure">Source: Company Filings, Google Finance as of 4/22/2025. <strong>Past performance is no guarantee of future results. Not intended as a recommendation to buy or sell any securities named herein.</strong></p>
<p>Next, we assessed each company's debt loads based on their most recent earnings reports. Total debt includes short-term debt, long-term borrowings, finance leases, and convertible notes. Net debt is each company's combined cash plus BTC treasury minus total debt.</p>
<p>Importantly, we now present <strong>Net Debt both excluding and including BTC</strong>, to reflect how <strong>traditional data providers like Bloomberg often ignore BTC holdings</strong>, which can lead to significantly distorted perceptions of miners' financial health. We believe this is because Bitcoin (a commodity) technically does not fall under &ldquo;marketable securities&rdquo;, a component often included alongside cash &amp; cash equivalents. We believe this &ldquo;TradFi&rdquo; oversight reflects the nascency of corporate Bitcoin treasuries and suggests Wall Street's potential underestimation of companies with crypto-heavy balance sheets.</p>
<p>For example, <strong>MARA</strong> appears to have <strong>~$2.1B</strong> in net debt excluding BTC, a sizable load. But once BTC holdings are accounted for, MARA's net debt flips to <strong>&ndash;$2.2B</strong>, signaling an almost equal and opposite <strong>net &ldquo;cash&rdquo; position </strong>(&ldquo;cash&rdquo; being used liberally to include the market value of Bitcoin). This stark contrast illustrates the extent to which miners' BTC holdings act as de facto reserves; a nuance increasingly relevant in the context of Bitcoin's emergence as a balance sheet asset.</p>
<p>This accounting divergence also highlights how early we are in the mainstream recognition of BTC as a strategic treasury asset. Miners like <strong>CLSK, RIOT, HUT, and BTBT</strong> all flip from modest net debt positions to net cash once BTC is considered! Conversely, <strong>WULF</strong> and <strong>CORZ</strong> remain net debtors even after accounting for BTC, reflecting balance sheet structures more aligned with traditional data center financing, where capital markets are currently more comfortable underwriting AI and HPC infrastructure than Bitcoin mining.</p>
<h3>Coverage &amp; Leverage Ratios</h3>
<div class="wrapped-div">
<table style="width: 100%;">
<tbody>
<tr class="tbl-data">
<td class="tbl-header last text-left">Ticker</td>
<td class="tbl-header last text-right">(Cash + BTC) / Debt (%)</td>
<td class="tbl-header last text-right">Net Debt (excl. BTC) / Shareholders' Equity (%)</td>
<td class="tbl-header last text-right">Net Debt (incl. BTC) /&nbsp;Shareholders' Equity (%)&nbsp;</td>
</tr>
<tr class="tbl-data">
<td class="data-td last">BTDR<sup>1</sup></td>
<td class="data-td data last text-right">202</td>
<td class="data-td data last text-right">-69</td>
<td class="data-td data last text-right">-106</td>
</tr>
<tr class="tbl-data">
<td class="data-td last">HUT</td>
<td class="data-td data last text-right">309</td>
<td class="data-td data last text-right">24</td>
<td class="data-td data last text-right">-69</td>
</tr>
<tr class="tbl-data">
<td class="data-td last">BTBT</td>
<td class="data-td data last text-right">(no debt)</td>
<td class="data-td data last text-right">-21</td>
<td class="data-td data last text-right">-62</td>
</tr>
<tr class="tbl-data">
<td class="data-td last">MARA</td>
<td class="data-td data last text-right">189</td>
<td class="data-td data last text-right">50</td>
<td class="data-td data last text-right">-53</td>
</tr>
<tr class="tbl-data">
<td class="data-td last">RIOT</td>
<td class="data-td data last text-right">342</td>
<td class="data-td data last text-right">10</td>
<td class="data-td data last text-right">-45</td>
</tr>
<tr class="tbl-data">
<td class="data-td last">HIVE</td>
<td class="data-td data last text-right">820</td>
<td class="data-td data last text-right">4</td>
<td class="data-td data last text-right">-42</td>
</tr>
<tr class="tbl-data">
<td class="data-td last">IREN</td>
<td class="data-td data last text-right">25819</td>
<td class="data-td data last text-right">-39</td>
</tr>
<tr class="tbl-data">
<td class="data-td last">CLSK</td>
<td class="data-td data last text-right">206</td>
<td class="data-td data last text-right">18</td>
<td class="data-td data last text-right">-34</td>
</tr>
<tr class="tbl-data">
<td class="data-td last">BITF</td>
<td class="data-td data last text-right">690</td>
<td class="data-td data last text-right">-6</td>
<td class="data-td data last text-right">-23</td>
</tr>
<tr class="tbl-data">
<td class="data-td last">CIFR</td>
<td class="data-td data last text-right">226</td>
<td class="data-td data last text-right">6</td>
<td class="data-td data last text-right">-8</td>
</tr>
<tr class="tbl-data">
<td class="data-td last">WULF</td>
<td class="data-td data last text-right">56</td>
<td class="data-td data last text-right">87</td>
</tr>
<tr class="tbl-data">
<td class="data-td last">CORZ</td>
<td class="data-td data last text-right">83</td>
<td class="data-td data last text-right">n/a</td>
</tr>
</tbody>
</table>
</div>
<br />
<p class="chart-disclosure">Source: Company Filings as of 4/22/2025. <strong>Past performance is no guarantee of future results. Not intended as a recommendation to buy or sell any securities named herein.</strong></p>
<p class="chart-disclosure"><sup>1</sup>&nbsp;BTDR is not adjusted for the dilution of one of their in-the-money converts.</p>
<p>This table offers a direct view of each miner's financial resilience, presenting a traditional <strong>debt coverage ratio</strong> (with BTC included) and <strong>Net Debt to Equity </strong>ratios, both with and without Bitcoin included. Together, these metrics illustrate how Bitcoin holdings shape leverage and solvency across the sector.</p>
<p>The first column measures how fully a miner's liquid assets could cover its outstanding debt. Ratios above 100% indicate full coverage, with additional flexibility to fund operations or expansion. Miners like <strong>HIVE (820%)</strong>, <strong>BITF (690%)</strong>, <strong>RIOT (342%)</strong>, and <strong>HUT (309%)</strong> exhibit exceptionally strong coverage of debt, indicating that liquid assets far exceed debt obligations. These figures reflect healthy net cash positions relative to book value, a sign of financial flexibility and reduced reliance on capital markets. With very little debt, IREN's coverage <strong>(25,819%)</strong> is a clear outlier. <strong>WULF</strong> (<strong>56%)</strong> &amp; <strong>CORZ</strong> (<strong>83%)</strong> once again stand out, demonstrating more stretched resources as they invest in AI/HPC pivots and tap the credit markets.</p>
<p>The next two columns&mdash;<strong>Net Debt / Equity</strong>, both excluding and including BTC&mdash;provide a complementary lens, showing how levered each company is relative to shareholder capital, and how much that picture shifts when Bitcoin is treated as a treasury asset. For instance, <strong>MARA flips from 50% to &ndash;53%</strong>, <strong>CLSK from 18% to &ndash;34%</strong>, and <strong>BTDR from &ndash;69% to &ndash;106%</strong>&mdash;demonstrating how deeply embedded BTC is in their financial flexibility. By contrast, <strong>WULF</strong> (<strong>87%)</strong> remains highly levered regardless of BTC adjustments due to its lack of crypto reserves.</p>
<p><strong>CORZ</strong> is a unique case: it has significant cash and growing Bitcoin holdings, but its equity value remains negative due to substantial debt, flipping its ratio negative. To avoid misinterpretation, we've removed its Net Debt / Equity metrics from the table. While its debt coverage ratio <strong>(83%)</strong> is respectable, it reflects a tightly managed balance sheet. That said, CORZ is one of only several miners now backed by long-term AI hosting contracts. Its <strong>12-year, $8.7 billion</strong> agreement with CoreWeave, with related capex costs fully funded by the client, covers <strong>500 MW of critical IT load</strong> and provides dollar-denominated revenue that positions CORZ to de-lever and potentially transform its financial profile. WULF has secured a similar <strong>10-year, $1+ billion</strong> agreement with Core42, a subsidiary of UAE-based G42, to host <strong>over 70 MW</strong> of AI infrastructure at its Lake Mariner facility. With <strong>two five-year renewal options</strong>, the deal offers a long-term, high-margin revenue stream. Galaxy Digital (GLXY), while excluded from our coverage analysis for not being a pure-play miner/data center, has expanded its partnership with CoreWeave through CoreWeave&rsquo;s exercise of a Phase II option, nearly tripling the original <strong>15-year, $4.5 billion</strong> agreement and bringing total AI and HPC capacity at the Helios site to <strong>393 MW</strong> of critical IT load. Though these deals vary in structure, each reflects a growing shift toward contracted AI revenues that may help offset debt burdens and reduce dependence on Bitcoin mining cycles.</p>
<div class="wrapped-div">
<table style="width: 600px;">
<tbody>
<tr class="tbl-data">
<td class="tbl-header last text-left">Ticker</td>
<td class="tbl-header last text-right">Bitcoin Breakven Coverage Price ($)</td>
</tr>
<tr class="tbl-data">
<td class="data-td last">MARA</td>
<td class="data-td data last text-right">43,312</td>
</tr>
<tr class="tbl-data">
<td class="data-td last">CIFR</td>
<td class="data-td data last text-right">36,629</td>
</tr>
<tr class="tbl-data">
<td class="data-td last">CLSK</td>
<td class="data-td data last text-right">31,431</td>
</tr>
<tr class="tbl-data">
<td class="data-td last">HUT</td>
<td class="data-td data last text-right">23,309</td>
</tr>
<tr class="tbl-data">
<td class="data-td last">RIOT</td>
<td class="data-td data last text-right">15,958</td>
</tr>
<tr class="tbl-data">
<td class="data-td last">HIVE</td>
<td class="data-td data last text-right">6,974</td>
</tr>
</tbody>
</table>
</div>
<br />
<p class="chart-disclosure">Source: VanEck Research as of 4/14/2025. <strong><em>Past performance is no guarantee of future results.</em></strong></p>
<p>The final stress test we apply is the <strong>BTC Insolvency Price</strong>: the Bitcoin price at which a miner's combined BTC and cash reserves would just cover its total debt. This metric highlights the downside threshold at which a miner's current treasury no longer offers full protection from debt exposure.</p>
<p>We include only miners with <strong>positive</strong> <strong>net debt (excluding BTC) </strong>and for whom <strong>BTC comprises more than 50% of liquid assets</strong>; in other words, companies whose solvency meaningfully depends on BTC's market value. This metric offers a simple, BTC-denominated lens on balance sheet risk: how far could Bitcoin fall before a miner might need to raise capital, restructure, or sell assets?</p>
<p>Among this group, <strong>MARA</strong>, <strong>CIFR</strong>, and <strong>CLSK</strong> show relatively high insolvency thresholds of <strong>~$43K</strong>, <strong>~37K</strong>, and <strong>~$31K</strong>, respectively, reflecting large, debt-offset BTC holdings. They also have similar solvency ratios ((cash + BTC) / total debt) around <strong>200%.</strong> However, this <strong>does not imply equal risk</strong> in a BTC drawdown. Here's why:</p>
<ul class="content-list">
<li class="mt-2"><strong>Absolute Debt Matters:</strong><br />MARA has <strong>~$2.5 billion</strong> in total debt, while CLSK's debt is <strong>~$650 million</strong>, and CIFR's is just <strong>$43 million</strong>. Even if their relative coverage is the same, MARA must navigate a far larger liability stack, meaning it faces greater pressure to refinance, dilute, or restructure if Bitcoin declines.</li>
<li class="mt-2"><strong>Cost to Mine = Operating Resilience:</strong><br />CLSK's lower breakeven cost per BTC gives it a distinct advantage during downturns. It can remain profitable at lower BTC prices, potentially self-funding operations even in bear markets. This self-reliance reduces the likelihood of cash burn or emergency capital raises. MARA, by contrast, could be more exposed to dilution risk if market conditions deteriorate.</li>
</ul>
<p><strong>HUT</strong> and <strong>RIOT</strong> screen stronger, with thresholds of <strong>~$24K</strong> and <strong>~$16K</strong>, respectively. Despite its liquid assets being <strong>95% BTC</strong>, <strong>HIVE</strong> stands out with a notably low insolvency price of just <strong>~$7K</strong>, implying robust balance sheet strength relative to its modest debt load.</p>
<h2>Conclusion</h2>
<p>This analysis highlights a growing disconnect. While Bitcoin is too volatile to be treated exactly like cash, ignoring it entirely, as many data providers still do, is equally flawed. Macro forces like diminishing USD FX reserves, persistent fiat inflation, and uncontrolled national deficits are driving corporations and sovereign nations into hard assets like gold and Bitcoin. Due to Bitcoin's superior returns and transactability, we think corporations will continue to front-run nations' accelerating Bitcoin adoption, underscoring the need for improved Bitcoin balance sheet data and analytics.</p>
<p>Because this trend is still emerging and is unfolding alongside rapid changes in FX, energy, and AI infrastructure, balance sheets can shift quickly. In our view, this underscores the importance of active management, guided by sector-specific expertise spanning energy, crypto, AI, and more, to reassess fundamentals as both market conditions and corporate strategies evolve.</p>
<p><strong>Links to third party websites are provided as a convenience and the inclusion of such links does not imply any endorsement, approval, investigation, verification or monitoring by us of any content or information contained within or accessible from the linked sites. By clicking on the link to a non-VanEck webpage, you acknowledge that you are entering a third-party website subject to its own terms and conditions. VanEck disclaims responsibility for content, legality of access or suitability of the third-party websites.</strong></p>
<p>To receive more <strong><a href="https://www.vaneck.com/us/en/insights/digital-assets/" title="Digital Assets Insights">Digital Assets</a></strong> insights, <strong><a href="https://www.vaneck.com/us/en/subscribe/" title="Subscription Center">sign up in our subscription center</a></strong>.</p>
]]></content:encoded>
</item><item rdf:about="https://www.vaneck.com/us/en/blogs/thematic-investing/buzz-investing-tariff-chaos-shakes-us-equities/">
  <title>BUZZ Investing: Tariff Chaos Shakes U.S. Equities></title>
  <link>https://www.vaneck.com/us/en/blogs/thematic-investing/buzz-investing-tariff-chaos-shakes-us-equities/</link>
  <description><![CDATA[Financial markets grappled with a storm of political maneuvering around trade, taxes, and regulation, stoking some investor unease.]]></description>
  <dc:creator> </dc:creator>
  <dc:date>04/22/2025 06:30:00</dc:date>
<content:encoded><![CDATA[

<p>During the recent period between index selection dates (March 13, 2025 &ndash; April 10, 2025, the &ldquo;Period&rdquo;), U.S. equity markets experienced severe volatility as escalating trade tensions drove a sharp repricing of risk assets. The S&amp;P 500 fell approximately 4.5%, while the Nasdaq Composite dropped 5.2%, reflecting mounting investor anxiety following President Trump&rsquo;s April 2nd &ldquo;Liberation Day&rdquo; announcement. The policy, enacted under emergency economic powers, imposed a 10% tariff on nearly all U.S. imports and sharply higher &ldquo;reciprocal&rdquo; tariffs on over 60 countries&mdash;ranging from 24% on Japan to an eventual 145% on China. The sweeping nature of the tariffs, coupled with fears of retaliatory action and supply chain disruption, triggered a historic selloff. The S&amp;P 500 posted its fifth biggest two-day decline in the index since 1950 on April 3rd and 4th, declining 4.9% and 6.0% respectively, while the Nasdaq entered bear market territory. The VIX surged above 50&mdash;its highest level since the 2020 pandemic&mdash;amid a flight from risk assets and growing warnings from corporate leaders and global trade bodies about the economic consequences.</p>
<p>Yet just as panic peaked, markets staged a dramatic turnaround. On April 9th, Trump unexpectedly paused the implementation of most tariffs for 90 days&mdash;excluding those targeting China&mdash;and lowered rates on several key trade partners, citing &ldquo;constructive dialogue&rdquo; and market feedback. The move sparked a record-breaking relief rally: the S&amp;P 500 surged 9.5%, its third-largest single-day gain since 1940, and the Nasdaq jumped 12.2%, as investors rushed back into beaten-down names. While the rebound recaptured a portion of earlier losses, the broader tone remained cautious. Earnings guidance from multinationals flagged continued supply disruptions, and sticky inflation in services kept the Fed on hold at its March meeting. With geopolitical headlines driving sharp market swings and election rhetoric heating up, the Period underscored the market&rsquo;s sensitivity to policy risk&mdash;and the speed at which sentiment can shift.</p>
<p>The BUZZ NextGen AI US Sentiment Leaders Index ("BUZZ Index") returned -9.07% during the month of March compared to a return of -5.63% for the S&amp;P 500 Index during the same period. Year-to-date, the BUZZ Index lags the S&amp;P 500 with returns of -10.13% and -4.27%, respectively, as of the end of March.</p>
<h2 id="celsius-gains" class="jump-link-nav anchored-block" data-jumplink-title="Celsius Buzz Index Gains">Shares of Celsius Holdings pace BUZZ Index Gains</h2>
<p>Shares of Celsius Holdings (NASDAQ: CELH) extended their momentum and led gains in the BUZZ Index for a second consecutive Period, as investors appeared to respond positively to a series of strategic developments. The completion of the company&rsquo;s $1.8 billion acquisition of Alani Nutrition on April 1, which includes $150 million in tax assets and potential cost synergies of $50 million over two years, may have reinforced optimism around Celsius&rsquo; efforts to broaden its health-focused product portfolio and appeal to new consumer demographics. The appointment of former PepsiCo executive Eric Hanson as President and COO in late March was also viewed by some analysts as a signal of the company&rsquo;s intent to accelerate global expansion, supported by new distribution partnerships in Europe. Taken together, these developments contributed to renewed enthusiasm around Celsius&rsquo; long-term growth strategy, helping the stock outperform broader markets despite ongoing concerns about the consumer discretionary backdrop.</p>

<h3>Top BUZZ Index Contributors: March 13, 2025 &ndash; April 10, 2025</h3>
<div class="wrapped-div">
<table style="width: 100%;">
<tbody>
<tr class="tbl-data">
<td class="tbl-header last">Company</td>
<td class="tbl-header last">Ticker</td>
<td class="tbl-header last text-right">Average Weight (%)</td>
<td class="tbl-header last text-right">Return Contribution (%)</td>
</tr>
<tr class="tbl-data">
<td class="data-td data last text-left">Celsius Holdings Inc</td>
<td class="data-td data last text-left">CELH</td>
<td class="data-td data last text-right">3.40</td>
<td class="data-td data last text-right">0.86</td>
</tr>
<tr class="tbl-data">
<td class="data-td data last text-left">GameStop Corp</td>
<td class="data-td data last text-left">GME</td>
<td class="data-td data last text-right">3.15</td>
<td class="data-td data last text-right">0.44</td>
</tr>
<tr class="tbl-data">
<td class="data-td data last text-left">Lucid Group Inc</td>
<td class="data-td data last text-left">LCID</td>
<td class="data-td data last text-right">1.98</td>
<td class="data-td data last text-right">0.35</td>
</tr>
<tr class="tbl-data">
<td class="data-td data last text-left">Palantir Technologies Inc</td>
<td class="data-td data last text-left">PLTR</td>
<td class="data-td data last text-right">3.02</td>
<td class="data-td data last text-right">0.28</td>
</tr>
<tr class="tbl-data">
<td class="data-td data last text-left">Rocket Lab USA Inc</td>
<td class="data-td data last text-left">RKLB</td>
<td class="data-td data last text-right">2.56</td>
<td class="data-td data last text-right">0.27</td>
</tr>
<tr class="tbl-data">
<td class="data-td data last text-left">IonQ Inc</td>
<td class="data-td data last text-left">IONQ</td>
<td class="data-td data last text-right">1.05</td>
<td class="data-td data last text-right">0.20</td>
</tr>
<tr class="tbl-data">
<td class="data-td data last text-left">UnitedHealth Group Inc</td>
<td class="data-td data last text-left">UNH</td>
<td class="data-td data last text-right">0.83</td>
<td class="data-td data last text-right">0.18</td>
</tr>
<tr class="tbl-data">
<td class="data-td data last text-left">Carvana Co</td>
<td class="data-td data last text-left">CVNA</td>
<td class="data-td data last text-right">1.06</td>
<td class="data-td data last text-right">0.18</td>
</tr>
<tr class="tbl-data">
<td class="data-td data last text-left">Netflix Inc</td>
<td class="data-td data last text-left">NFLX</td>
<td class="data-td data last text-right">0.93</td>
<td class="data-td data last text-right">0.11</td>
</tr>
<tr class="tbl-data">
<td class="data-td data last text-left">Tesla Inc</td>
<td class="data-td data last text-left">TSLA</td>
<td class="data-td data last text-right">2.99</td>
<td class="data-td data last text-right">0.10</td>
</tr>
</tbody>
</table>
</div>
<p class="chart-disclosure">Source: BUZZ Holdings ULC, Bloomberg. Past performance is no guarantee of future results. Index performance is not illustrative of fund performance. Not intended as a recommendation to buy or to sell any of the securities mentioned herein.</p>
<h2>Shares of Intel Corp among declining stocks in the BUZZ Index</h2>
<p>During the recent Period, Shares of Intel Corporation (NASDAQ: INTC) led declining stocks in the BUZZ Index, as investors reacted to a combination of geopolitical shocks and company-specific headwinds. The drop was catalyzed by heightened trade tensions following President Trump&rsquo;s &ldquo;Liberation Day&rdquo; tariffs on April 2, which included a 10% baseline tariff on imports and sharply higher rates on countries such as China&mdash;where Intel derives over $15 billion in annual revenue. China&rsquo;s retaliatory 34% tariffs on U.S. goods amplified concerns about global supply chain disruptions and margin compression across the semiconductor sector. Beyond macro pressures, ongoing losses in Intel&rsquo;s foundry business and uncertainty surrounding its competitive positioning in the AI chip space have continued to weigh on the stock.</p>
<h3>Bottom BUZZ Index Contributors: March 13, 2025 &ndash; April 10, 2025</h3>
<div class="wrapped-div">
<table style="width: 100%;">
<tbody>
<tr class="tbl-data">
<td class="tbl-header last">Company</td>
<td class="tbl-header last">Ticker</td>
<td class="tbl-header last text-right">Average Weight (%)</td>
<td class="tbl-header last text-right">Return Contribution (%)</td>
</tr>
<tr class="tbl-data">
<td class="data-td data last text-left">Intel Corp</td>
<td class="data-td data last text-left">INTC</td>
<td class="data-td data last text-right">3.02</td>
<td class="data-td data last text-right">-0.48</td>
</tr>
<tr class="tbl-data">
<td class="data-td data last text-left">Hims &amp; Hers Health Inc</td>
<td class="data-td data last text-left">HIMS</td>
<td class="data-td data last text-right">2.73</td>
<td class="data-td data last text-right">-0.45</td>
</tr>
<tr class="tbl-data">
<td class="data-td data last text-left">NIKE Inc</td>
<td class="data-td data last text-left">NKE</td>
<td class="data-td data last text-right">1.26</td>
<td class="data-td data last text-right">-0.37</td>
</tr>
<tr class="tbl-data">
<td class="data-td data last text-left">Super Micro Computer Inc</td>
<td class="data-td data last text-left">SMCI</td>
<td class="data-td data last text-right">2.89</td>
<td class="data-td data last text-right">-0.35</td>
</tr>
<tr class="tbl-data">
<td class="data-td data last text-left">AST SpaceMobile Inc</td>
<td class="data-td data last text-left">ASTS</td>
<td class="data-td data last text-right">2.85</td>
<td class="data-td data last text-right">-0.34</td>
</tr>
<tr class="tbl-data">
<td class="data-td data last text-left">Apple Inc</td>
<td class="data-td data last text-left">AAPL</td>
<td class="data-td data last text-right">2.98</td>
<td class="data-td data last text-right">-0.29</td>
</tr>
<tr class="tbl-data">
<td class="data-td data last text-left">Advanced Micro Devices Inc</td>
<td class="data-td data last text-left">AMD</td>
<td class="data-td data last text-right">3.04</td>
<td class="data-td data last text-right">-0.29</td>
</tr>
<tr class="tbl-data">
<td class="data-td data last text-left">Robinhood Markets Inc</td>
<td class="data-td data last text-left">HOOD</td>
<td class="data-td data last text-right">2.54</td>
<td class="data-td data last text-right">-0.25</td>
</tr>
<tr class="tbl-data">
<td class="data-td data last text-left">SoFi Technologies Inc</td>
<td class="data-td data last text-left">SOFI</td>
<td class="data-td data last text-right">2.97</td>
<td class="data-td data last text-right">-0.25</td>
</tr>
<tr class="tbl-data">
<td class="data-td data last text-left">Grab Holdings Ltd</td>
<td class="data-td data last text-left">GRAB</td>
<td class="data-td data last text-right">1.47</td>
<td class="data-td data last text-right">-0.24</td>
</tr>
</tbody>
</table>
</div>
<p class="chart-disclosure">Source: BUZZ Holdings ULC, Bloomberg. Past performance is no guarantee of future results. Index performance is not illustrative of fund performance. Not intended as a recommendation to buy or to sell any of the securities mentioned herein.</p>
<h2 id="rebalance-highlights" class="jump-link-nav anchored-block" data-jumplink-title="Rebalance Highlights">BUZZ Index April 2025 Rebalance Highlights</h2>
<p><strong>NIKE, Inc.</strong></p>
<p>It has been a challenging four years for shares of Nike (NYSE: NKE). Since peaking near $180 in late 2021, the stock has declined by more than 70%, a stunning reversal for a company long regarded as a dominant force in the sports apparel industry. Once synonymous with innovation, Nike has seen its product momentum stall, ceding market share to emerging brands like On and Hoka. Execution missteps ultimately led to the departure of CEO John Donahoe, as the company struggled to adapt to shifting consumer preferences and competitive pressures. More recently, escalating tariff threats under President Trump have introduced a fresh layer of uncertainty. With much of Nike&rsquo;s manufacturing base located in Asia, the potential for increased import costs poses a significant risk to margins. Despite these headwinds, sentiment appears to be stabilizing, with investors betting that the worst may be priced in. A resolution on the trade front could provide a much-needed catalyst, and the recent increase in Nike&rsquo;s weight in the BUZZ Index to the maximum 3% level may reflect a resurgence in buy-the-dip optimism.</p>
<p><strong>Dollar General Corporation</strong></p>
<p>Amid ongoing tariff uncertainty, the consumer staples sector has shown resilience relative to other retail segments. Anticipated price increases because of tariff policies have made consumers more cost-conscious, shifting spending toward essential goods. Discount retailers like Dollar General (NYSE: DG) and Dollar Tree (NASDAQ: DLTR) may be well-positioned to benefit from this trend. Dollar General&rsquo;s limited exposure to tariffs because of its predominantly domestic supply chain has boosted its popularity amongst investors. While the S&amp;P 500 has fallen 4.5% during the recent Period, shares of DG have surged nearly 10%, and investor sentiment has been on the rise. This month, Dollar General is a new addition to the BUZZ Index with a 0.92% weight.</p>

<p>To receive more <a href="https://www.vaneck.com/us/en/insights/thematic-investing/" title="Thematic Investing Insights"><strong>Thematic Investing</strong></a> insights, <a href="https://www.vaneck.com/us/en/subscribe/" title="Subscription Center"><strong>sign up in our subscription center</strong></a>.</p>
]]></content:encoded>
</item><item rdf:about="https://www.vaneck.com/us/en/blogs/model-portfolios/gold-bitcoin-and-emerging-markets-our-market-playbook/">
  <title>Gold, Bitcoin, and Emerging Markets: Our Market Playbook></title>
  <link>https://www.vaneck.com/us/en/blogs/model-portfolios/gold-bitcoin-and-emerging-markets-our-market-playbook/</link>
  <description><![CDATA[We explore the roles of gold, bitcoin, and emerging markets amid market turmoil. Gold thrives, bitcoin&rsquo;s strong performance continues, and India and semiconductors offer growth opportunities.]]></description>
  <dc:creator>David Schassler</dc:creator>
  <dc:date>04/17/2025 06:30:00</dc:date>
<content:encoded><![CDATA[

<p>Markets are moving fast and keeping up with what this means for your portfolio can be tough. VanEck&rsquo;s Asset Allocation Committee recently gave an update on market trends and shared how these factors are shaping our core allocation models, the <a href="/link/39fe1617e2e94666bb799654d182e126.aspx" title="VanEck Model Portfolios"><strong>VanEck Wealth Builder Portfolios</strong></a>.</p>

<h2>Key Highlights</h2>
<ul class="content-list">
<li class="mt-2">Gold typically outperforms during the second half of the inflation regime as investors seek protection from social, geopolitical, and financial instability.</li>
<li class="mt-2">Bitcoin has been the best performing asset class in 8 out of the past 11 years and we strongly believe it deserves a place in investors&rsquo; strategic asset allocation.</li>
<li class="mt-2">Semiconductor valuations have reset: It may be time to reengage after a major repricing since last summer.</li>
<li class="mt-2">India is one of the most compelling structural growth stories in the market, and the recent India correction is a buying opportunity.</li>
</ul>
<h2>Gold is the Second Half Team (9:33)</h2>
<p>Government spending accounts for a whopping one-third of U.S. GDP. Deep spending cuts will likely trigger a recession &ndash; which would increase U.S. deficits and cause more inflation. And the risk isn&rsquo;t just inflation&mdash;it&rsquo;s fragmentation. These cuts are happening amid a trade war, which makes everything more expensive, more uncertain, and more fragile.</p>
<p>This market backdrop, characterized by inflation, war, uncertainty and growing financial instability, is built for gold. Historical data shows that commodities outperform during the first half of the inflation regime, while gold typically outperforms during the second half of the inflation regime as investors seek protection from social, geopolitical and financial instability.</p>
<h3>Dividing the Bull Market into Two Halves</h3>
<div class="row">
<div class="col-md-6">
<div class="flourish-embed flourish-chart" data-src="visualisation/22701838?2429575"><script src="https://public.flourish.studio/resources/embed.js"></script><noscript>
        <img loading="lazy" src="https://public.flourish.studio/visualisation/22701838/thumbnail" width="100%" alt="chart visualization" />
      </noscript></div>
</div>
<div class="col-md-6">
<div class="flourish-embed flourish-chart" data-src="visualisation/22701994?2429575"><script src="https://public.flourish.studio/resources/embed.js"></script><noscript>
        <img loading="lazy" src="https://public.flourish.studio/visualisation/22701994/thumbnail" width="100%" alt="chart visualization" />
      </noscript></div>
</div>
</div>
<p class="chart-disclosure"><strong>Source: Bloomberg, VanEck.</strong> &ldquo;Commodities&rdquo; represented by the Bloomberg Commodity Index. Past performance is no guarantee of future results. Any projections, forecasts and other forward-looking statements are not indicative of actual results, are for illustrative purposes only, are valid as of the date of this communication, and are subject to change without notice.</p>

<h2>Bitcoin Deserves to be Owned (12:47)</h2>
<p>Unlike traditional assets, Bitcoin is decentralized&mdash;not controlled by any single government or central bank. It is much more volatile than gold and should not be confused as a risk-off asset. Expect prices to remain under pressure in the near term. However, Bitcoin is well-positioned to rally in the future and continue its strong run of performance.</p>
<h3>Bitcoin Has Been the Best Performing Asset Class in 8 Out of the Past 11 Years</h3>
<div class="flourish-embed flourish-table" data-src="visualisation/22659977?2429575"><script src="https://public.flourish.studio/resources/embed.js"></script><noscript><img loading="lazy" src="https://public.flourish.studio/visualisation/22659977/thumbnail" width="100%" alt="table visualization" /></noscript></div>
<p class="chart-disclosure"><strong>Source: Morningstar. As of March 2025.</strong> &ldquo;Bitcoin&rdquo; represented by MVIS CryptoCompare Bitcoin Index; &ldquo;US Equities&rdquo; represented by S&amp;P 500 Index; &ldquo;Gold&rdquo; represented by S&amp;P GSCI Gold Spot; &ldquo;EM Equity&rdquo; represented by Fidelity Emerging Markets Index; &ldquo;Real Estate&rdquo; represented by the NASDAQ Global Real Estate Index; &ldquo;US Bonds&rdquo; represented by Bloomberg US Aggregate Bond USD; &ldquo;Treasuries&rdquo; represented by Bloomberg Aggregate Bond Treasury Index; &ldquo;Commodities&rdquo; represented by Bloomberg Commodity Index. Index definitions included at the end of this presentation. Digital assets are subject to significant risk and are not suitable for all investors. Not intended as an offer or recommendation to buy or sell any assets referenced herein. Past performance is not indicative of future results.</p>
<h2>Finding Opportunity in the Chaos: Semiconductors and India (13:34)</h2>
<p>Market volatility often triggers a flight to safety, but for astute investors, it can also open the door to compelling opportunities. When asset prices move sharply in response to fear, uncertainty, or liquidity pressures, dislocations can emerge&mdash;creating mispricings that don&rsquo;t reflect underlying fundamentals. Two of our favorite areas are in semiconductors related to AI and India&mdash;as the U.S. economy slows, global stimulus efforts are accelerating elsewhere, and India remains a top conviction idea.</p>
<h2>Comprehensive Model Portfolio Solutions: From Core to Thematic (17:32)</h2>
<p>VanEck&rsquo;s model portfolio solutions span from comprehensive asset allocation to thematic offerings. Our <strong><a href="/link/39fe1617e2e94666bb799654d182e126.aspx" title="VanEck Model Portfolios">Wealth Builder Plus Portfolios</a></strong> provide core exposure to equities and fixed income with a strategic allocation to real and digital assets. Security selection, which marries the elements of both active and passive strategies, allows the portfolio to adapt to changing markets. Its systematic investment approach focuses on maximizing diversification and monitoring risk to optimize performance over the long term.</p>
<p>To learn more about market trends and portfolio positioning, listen to the full discussion <a href="https://www.youtube.com/watch?v=lt1DKI3KnhY" title="Aligning Allocations with Uncertain Markets" target="_blank" rel="noopener"><strong>here</strong></a>.</p>
<p>To receive more <strong><a href="https://www.vaneck.com/us/en/insights/guided-allocation/" title="Model Portfolio Insights">Model Portfolio</a></strong> insights, <strong><a href="https://www.vaneck.com/us/en/subscribe/" title="Subscription Center">sign up in our subscription center</a></strong>.</p>
]]></content:encoded>
</item><item rdf:about="https://www.vaneck.com/us/en/blogs/income-investing/clos-staying-nimble-amid-tariff-driven-volatility/">
  <title>CLOs: Staying Nimble Amid Tariff Driven Volatility></title>
  <link>https://www.vaneck.com/us/en/blogs/income-investing/clos-staying-nimble-amid-tariff-driven-volatility/</link>
  <description><![CDATA[CLOs posted positive Q1 total returns as spreads widened and market volatility grew. Amid trade tensions and signs of economic slowdown, we prefer tranches higher in the capital stack.]]></description>
  <dc:creator> </dc:creator>
  <dc:date>04/17/2025 06:30:00</dc:date>
<content:encoded><![CDATA[

<p>In the first quarter, the <a title="CLOI - VanEck CLO ETF - Overview" href="/link/e090deaddc774ac699a04b959d9254c6.aspx"><strong>VanEck CLO ETF (CLOI)</strong></a> outperformed its benchmark, the J.P. Morgan CLO Index, by 11bps (1.18% vs 1.07%), and the <a title="CLOB - VanEck AA-BB CLO ETF - Overview" href="/link/d2f16468a9f14c1e807f6bb7fb597a3e.aspx"><strong>VanEck AA-BB CLO ETF (CLOB)</strong></a> outperformed its benchmark, the J.P. Morgan CLOIE Balanced Mezzanine Index by 10bps (1.12% vs 1.02%).</p>
<p>CLO spreads widened through the quarter, and &ldquo;Liberation Day&rdquo; has added significant uncertainty to the outlook. Given signs of economic weakening in the US and the prospects of a global trade war, we prefer tranche purchases higher in the capital stack, with selective purchases of shorter spread-duration assets for lower-rated credits. However, wider spreads may begin to offer opportunities for long-term investors, and we maintain the ability to shift further into lower-rated tranches given our overall portfolio positioning higher up the capital stack. A robust bottom-up approach to security selection that looks beyond a tranche credit rating remains key, given the significant tail risks to the fundamental backdrop and increased dispersion in performance among vintages.</p>
<h2 id="market-update" class="jump-link-nav anchored-block" data-jumplink-title="Market Update">Market Update</h2>
<p>In March, CLOs generated marginally positive total returns as the impact of carry outweighed negative price returns. This month marked the 24th consecutive month of positive total returns. However, it was the lowest total return since March 2023 as BBB to B-rated tranches generated negative total returns. All tranches posted positive returns for the quarter. Investor sentiment has grown more cautious amid a backdrop of an escalating trade war with the potential risks of an economic slowdown and stubbornly sticky inflation. During the month, all eyes were on April 2, when the Trump administration was expected to unveil the next steps of their tariff regime. Ultimately, the administration announced &ldquo;reciprocal tariffs&rdquo; on more than 180 countries and territories to varying degrees, including a 20% tariff on the EU and 34% on China. The narrative coming out of the Federal Reserve following its March meeting was mixed, as it downgraded economic growth to 1.7% from 2.1% and increased core inflation expectations to 2.8% from 2.5%. Despite that, the Fed signaled a somewhat dovish tone, as the dot plot still indicated two rate cuts this year while it is reducing tapering its balance sheet. However, the dot plot showed that four members now see no change in rates, up from just one member in January. The 5-year Treasury rate traded 7 bps lower, and the 10-year Treasury rate was unchanged during the month.</p>
<p>CLOs outperformed bank loans and high yield corporates but underperformed investment grade corporates and the agg as longer duration exposure contributed positively.</p>
<div class="wrapped-div">
<table style="width: 100%;">
<tbody>
<tr class="tbl-data">
<td class="tbl-header last">Asset Class</td>
<td class="tbl-header last text-right">Q1 2025 Return (%)</td>
<td class="tbl-header last text-right">Yield to Worst (%)</td>
<td class="tbl-header last text-right">Spreads (bps)</td>
</tr>
<tr class="tbl-data">
<td class="data-td last font-weight-normal">CLOs</td>
<td class="data-td data last text-right">1.07</td>
<td class="data-td data last text-right">5.73</td>
<td class="data-td data last text-right">177</td>
</tr>
<tr class="tbl-data">
<td class="data-td last font-weight-normal">CLOs IG</td>
<td class="data-td data last text-right">1.09</td>
<td class="data-td data last text-right">5.44</td>
<td class="data-td data last text-right">148</td>
</tr>
<tr class="tbl-data">
<td class="data-td last font-weight-normal">CLOs Mezz</td>
<td class="data-td data last text-right">1.02</td>
<td class="data-td data last text-right">7.48</td>
<td class="data-td data last text-right">347</td>
</tr>
<tr class="tbl-data">
<td class="data-td last font-weight-normal pl-4">AAA</td>
<td class="data-td data last text-right">1.08</td>
<td class="data-td data last text-right">5.17</td>
<td class="data-td data last text-right">123</td>
</tr>
<tr class="tbl-data">
<td class="data-td last font-weight-normal pl-4">AA</td>
<td class="data-td data last text-right">1.06</td>
<td class="data-td data last text-right">5.69</td>
<td class="data-td data last text-right">174</td>
</tr>
<tr class="tbl-data">
<td class="data-td last font-weight-normal pl-4">A</td>
<td class="data-td data last text-right">1.16</td>
<td class="data-td data last text-right">5.92</td>
<td class="data-td data last text-right">192</td>
</tr>
<tr class="tbl-data">
<td class="data-td last font-weight-normal pl-4">BBB</td>
<td class="data-td data last text-right">1.10</td>
<td class="data-td data last text-right">6.98</td>
<td class="data-td data last text-right">296</td>
</tr>
<tr class="tbl-data">
<td class="data-td last font-weight-normal pl-4">BB</td>
<td class="data-td data last text-right">0.75</td>
<td class="data-td data last text-right">11.35</td>
<td class="data-td data last text-right">725</td>
</tr>
<tr class="tbl-data">
<td class="data-td last font-weight-normal">U.S. Agg</td>
<td class="data-td data last text-right">2.79</td>
<td class="data-td data last text-right">4.64</td>
<td class="data-td data last text-right">41</td>
</tr>
<tr class="tbl-data">
<td class="data-td last font-weight-normal">Investment Grade Corporates</td>
<td class="data-td data last text-right">2.36</td>
<td class="data-td data last text-right">5.16</td>
<td class="data-td data last text-right">97</td>
</tr>
<tr class="tbl-data">
<td class="data-td last font-weight-normal">High Yield Bonds</td>
<td class="data-td data last text-right">0.94</td>
<td class="data-td data last text-right">7.73</td>
<td class="data-td data last text-right">355</td>
</tr>
<tr class="tbl-data">
<td class="data-td last font-weight-normal">Leveraged Loans</td>
<td class="data-td data last text-right">0.48</td>
<td class="data-td data last text-right">8.30</td>
<td class="data-td data last text-right">399</td>
</tr>
</tbody>
</table>
</div>
<p class="chart-disclosure">Source: JP Morgan and ICE Data Indices as of 3/31/2025. CLOs represented by J.P. Morgan Collateralized Loan Obligation Index, CLOs IG represented by J.P. Morgan Collateralized Loan Obligation IG Index, CLOs Mezz represented by J.P. Morgan Collateralized Loan Obligation Balanced Mezzanine Index, AAA Rated CLOs represented by J.P. Morgan CLO AAA Index, AA Rated CLOs represented by J.P. Morgan CLO AA Index, A Rated CLOs represented by J.P. Morgan CLO A Index, BBB Rated CLOs represented by J.P. Morgan CLO BBB Index, BB Rated CLOs represented by J.P. Morgan CLO BB Index, US Agg is represented by the ICE BofA US Broad Market, Investment Grade Corporates represented by ICE BofA US Corporate Index, High Yield Bonds represented by ICE BofA US High Yield Index and Leveraged Loans represented by JP Morgan Leveraged Loan Index. Past performance is no guarantee of future results. Index performance is not representative of fund performance. It is not possible to invest directly in an index.</p>

<p>CLO new issue supply decreased month-over-month with $16.8bn pricing, compared to $18.4bn in February. Refinancing and reset activity slowed but continued at a rapid pace in March with $35.4bn pricing, after $37.7bn in February. First quarter total issuance of $150.2bn is the fastest issuance to start a year on record and the second largest quarterly issuance in CLO 2.0 history behind 4Q 2024.</p>
<p>In the secondary market, TRACE supply increased month-over-month, with $22.7bn of volume in March compared to $13.6bn in February. Investment grade volumes increased to $18.5bn from $10.1bn and below investment grade volumes increased to $4.2bn from $3.5bn. Meanwhile, total BWIC volume increased to $7.7bn from $5.1bn in February and was the highest since March 2020.</p>
<p>In March, gross institutional loan issuance was $35.7bn, following $44.2bn in February. The primary market continued to cool in March amid rising volatility and softening investor sentiment. Opportunistic transactions declined as the number of loans trading at or above par, typical candidates for repricings and refinancings, fell further. One bright spot was LBO and M&amp;A transactions, which totaled $20 billion for the month and contributed to a more balanced technical environment. Retail loan funds saw net outflows of $6.2bn. The average bid of the Morningstar LSTA Leveraged Loan Index decreased 84bp to end the month at 96.31, the largest monthly decline since September 2022. The percentage of loans pricing at par or above decreased to 10.3% from 35.8%; the percentage of loans pricing between 95 and par increased to 73.9% from 51.5%; the percentage of loans pricing below 90 increased to 9.0% from 7.1% and loans pricing below 80 increased to 3.2% from 3.1%.</p>
<p>The trailing twelve-month default rate within the Morningstar US Leveraged Loan Index increased 1bp month-over-month to 0.82%. As measured by JP Morgan, the default rate including distressed exchanges decreased 7bp, but remains elevated at 3.86%. Activity has been elevated as borrowers with unsustainable capital structures endeavored to manage their liabilities and avoid the bankruptcy process through liability management exercises, keeping the &ldquo;official&rdquo; default rate lower than otherwise. We anticipate the default rate to remain below historical averages in the near term for the leveraged loan market as a result. Nonetheless, our expectations are that defaults, including distressed exchanges, will remain above the long-term historical average of ~3%, with the path for the default rate uncertain given rapidly changing trade policy and US CLO spreads widened across the capital stack.</p>
<h2 id="portfolio-strategy" class="jump-link-nav anchored-block" data-jumplink-title="Portfolio Strategy">Portfolio Strategy</h2>
<p>Despite rate cuts in 2024, the borrowing rate for leveraged loan companies remains high following rate increases from central banks in 2022 and 2023. While the Fed initiated a series of rate cuts starting in September 2024, inflation remains above the Fed&rsquo;s target and the labor market remains robust, although signs of slowing growth are starting to creep up. The Fed has paused further action as they await more information on the path of inflation and employment, which may result from the implementation of tariffs and more robust immigration policies. Market expectations with respect to Fed cuts moved slightly higher in March, with the market now expecting three to four rate cuts in 2025. However, the Fed appears to be in a very tenuous position, having to balance both sides of their dual mandate of maximum employment and stable prices during a period where stagflation is looking ever more likely. Cuts will ultimately provide relief for more stressed borrowers, but the path and timing of more cuts are highly uncertain.</p>
<p>The rally in CLO prices we&rsquo;ve seen since the lows in 4Q 2022 has cracked, with prices declining across the capital stack in March and throughout the beginning of April. The average price across all tranches is now below par for the first time since January 2024. We have also begun selling out of positions higher in the capital stack to raise cash as wider spreads lower in the capital stack are starting to look more attractive for longer-term investors. If spreads were to widen further, we maintain the ability to shift further into lower rated tranches, given our overall portfolio positioning higher up the capital stack.</p>
<p>As markets have sold off in recent weeks, buying in the secondary market has become much more attractive. That said, buying in the primary market also remains attractive, even when taking spread duration into account. CLO equity arbitrage in 2024 was supported by continued liability spread tightening. While recent volatility has driven CLO debt spreads wider, average loan prices have declined materially from the highs in late January, making CLO creation more attractive. Despite that, high levels of amortization and call volumes resulted in marginally negative net AAA supply for 2024 and flat net supply through 1Q 2025.</p>
<h3>CLOI Total Return and Credit Allocation</h3>
<div class="flourish-embed flourish-chart" data-src="visualisation/22701686?2429379"><script src="https://public.flourish.studio/resources/embed.js"></script><noscript><img loading="lazy" src="https://public.flourish.studio/visualisation/22701686/thumbnail" width="100%" alt="chart visualization" /></noscript></div>
<p class="chart-disclosure">Source: <strong>FactSet, J.P. Morgan, VanEck</strong>, as of March 31, 2025. Index performance is not representative of Fund performance. It is not possible to invest directly in an index.</p>
<h3>Average Annual Total Returns<sup>*</sup>&nbsp;(%)</h3>
<div class="wrapped-div">
<table style="width: 100%;">
<tbody>
<tr class="tbl-data">
<td class="tbl-header last" colspan="9">As of March 31, 2025</td>
</tr>
<tr class="tbl-data">
<td class="data-head last text-right">&nbsp;</td>
<td class="data-head last text-right">1 MO</td>
<td class="data-head last text-right">3 MO</td>
<td class="data-head last text-right">YTD</td>
<td class="data-head last text-right">1 YR</td>
<td class="data-head last text-right">3 YR</td>
<td class="data-head last text-right">5 YR</td>
<td class="data-head last text-right">10 YR</td>
<td class="data-head last text-right">LIFE<br />06/21/22</td>
</tr>
<tr class="tbl-data">
<td class="data-td last text-left">CLOI (NAV)</td>
<td class="data-td data last text-right">0.08</td>
<td class="data-td data last text-right">1.18</td>
<td class="data-td data last text-right">6.98</td>
<td class="data-td data last text-right">-</td>
<td class="data-td data last text-right">7.92</td>
</tr>
<tr class="tbl-data">
<td class="data-td last text-left">CLOI (Share Price)</td>
<td class="data-td data last text-right">-0.12</td>
<td class="data-td data last text-right">1.04</td>
<td class="data-td data last text-right">6.72</td>
<td class="data-td data last text-right">-</td>
<td class="data-td data last text-right">7.86</td>
</tr>
<tr class="tbl-data">
<td class="data-td last text-left">J.P. Morgan Collateralized Loan Obligation Index</td>
<td class="data-td data last text-right">0.05</td>
<td class="data-td data last text-right">1.07</td>
<td class="data-td data last text-right">7.00</td>
<td class="data-td data last text-right">-</td>
<td class="data-td data last text-right">8.14</td>
</tr>
</tbody>
</table>
</div>
<p class="chart-disclosure"><sup>*</sup>&nbsp;Returns less than one year are not annualized.</p>
<p class="chart-disclosure"><strong>The performance data quoted represents past performance. Past performance is not a guarantee of future results. Investment return and principal value of an investment will fluctuate so that an investor's shares, when redeemed, may be worth more or less than their original cost. Performance may be lower or higher than performance data quoted. Please call 800.826.2333 or visit vaneck.com for performance current to the most recent month ended.</strong></p>
<p class="chart-disclosure">CLOI&rsquo;s gross expense ratio is 0.40% and the total expense ratio is 0.40%. Van Eck Associates Corporation (the &ldquo;Adviser&rdquo;) will pay all expenses of the Fund, except for the fee payment under the investment management agreement, acquired fund fees and expenses, interest expense, offering costs, trading expenses, taxes and extraordinary expenses. Notwithstanding the foregoing, the Adviser has agreed to pay the offering costs until at least May 1, 2025. &ldquo;Other Expenses&rdquo; have been restated to reflect current fees.</p>

<h3>CLOB Total Return and Credit Allocation</h3>
<div class="flourish-embed flourish-chart" data-src="visualisation/22702192?2429379"><script src="https://public.flourish.studio/resources/embed.js"></script><noscript><img loading="lazy" src="https://public.flourish.studio/visualisation/22702192/thumbnail" width="100%" alt="CLOB Total Return and Credit Allocation" /></noscript></div>
<p class="chart-disclosure">Source: <strong>FactSet, J.P. Morgan, VanEck</strong>, as of March 31, 2025. Index performance is not representative of Fund performance. It is not possible to invest directly in an index.</p>
<h3>Average Annual Total Returns<sup>*</sup>&nbsp;(%)</h3>
<div class="wrapped-div">
<table style="width: 100%;">
<tbody>
<tr class="tbl-data">
<td class="tbl-header last" colspan="9">As of March 31, 2025</td>
</tr>
<tr class="tbl-data">
<td class="data-head last text-right">&nbsp;</td>
<td class="data-head last text-right">1 MO</td>
<td class="data-head last text-right">3 MO</td>
<td class="data-head last text-right">YTD</td>
<td class="data-head last text-right">1 YR</td>
<td class="data-head last text-right">3 YR</td>
<td class="data-head last text-right">5 YR</td>
<td class="data-head last text-right">10 YR</td>
<td class="data-head last text-right">LIFE<br />09/24/24</td>
</tr>
<tr class="tbl-data">
<td class="data-td last text-left">CLOB (NAV)</td>
<td class="data-td data last text-right">-0.23</td>
<td class="data-td data last text-right">1.12</td>
<td class="data-td data last text-right">-</td>
<td class="data-td data last text-right">4.04</td>
</tr>
<tr class="tbl-data">
<td class="data-td last text-left">CLOB (Share Price)</td>
<td class="data-td data last text-right">-0.28</td>
<td class="data-td data last text-right">1.08</td>
<td class="data-td data last text-right">-</td>
<td class="data-td data last text-right">4.01</td>
</tr>
<tr class="tbl-data">
<td class="data-td last text-left">J.P. Morgan CLOIE Balanced Mezzanine Index</td>
<td class="data-td data last text-right">-0.36</td>
<td class="data-td data last text-right">1.02</td>
<td class="data-td data last text-right">-</td>
<td class="data-td data last text-right">3.90</td>
</tr>
</tbody>
</table>
</div>
<p class="chart-disclosure"><sup>*</sup>&nbsp;Returns less than one year are not annualized.</p>
<p class="chart-disclosure"><strong>The performance data quoted represents past performance. Past performance is not a guarantee of future results. Investment return and principal value of an investment will fluctuate so that an investor's shares, when redeemed, may be worth more or less than their original cost. Performance may be lower or higher than performance data quoted. Please call 800.826.2333 or visit vaneck.com for performance current to the most recent month ended.</strong></p>
<p class="chart-disclosure">CLOB&rsquo;s gross expense ratio is 0.45% and the total expense ratio is 0.45%. Van Eck Associates Corporation (the &ldquo;Adviser&rdquo;) will pay all expenses of the Fund, except for the fee payment under the investment management agreement, acquired fund fees and expenses, interest expense, offering costs, trading expenses, taxes and extraordinary expenses. Notwithstanding the foregoing, the Adviser has agreed to pay the offering costs until at least May 1, 2026. &ldquo;Other Expenses&rdquo; have been restated to reflect current fees.</p>

<h2 id="outlook" class="jump-link-nav anchored-block" data-jumplink-title="Outlook">Outlook</h2>
<p>Clearly the ground has shifted coming out of &ldquo;Liberation Day,&rdquo; with the implications and the ultimate impact to the economy still uncertain. Many questions remain related to the impacts on employment and sentiment; if and when the Fed will react and how large of an impact any actions to support the economy will have; and, ultimately, how other countries around the world will react and/or retaliate. Looking ahead, we see continued geopolitical uncertainty and market volatility as tariff negotiations continue over the next few weeks and months.</p>
<p>Through just the first nine days of April, we have seen the Trump administration announce &ldquo;reciprocal tariffs&rdquo; on more than 180 countries and territories to varying degrees, including a 20% tariff on the EU and 34% on China, China retaliating with 84% tariffs of its own, followed by the administration &ldquo;immediately&rdquo; raising U.S. tariffs on Chinese imports to 145% while simultaneously pausing increased tariff rates above 10% for other countries for 90 days. While the path of trade policy is highly uncertain, what is highly likely is that even a minimum increase of 10% in tariffs will increase inflation and lead to a significant economic slowdown, or more likely, a recession in the United States and the rest of the world. Unemployment will also increase &ndash; the only question is when and to what level. In addition, given the increased prospects of a stagflationary environment, we do not expect the Fed to come to the rescue. At present, our view is that given expectations of sticky or higher inflation, the Fed will most likely only start to lower rates when unemployment increases above 5%.</p>
<p>In a world where interest rates will be higher for longer and credit spreads wider, floating rate assets continue to be attractive. We are looking to rotate down from AAA/AA tranches to A/BBB and opportunistically adding some BB-rated tranches where allowed. Historically, BBB-, BB- and B-rated CLOs outperform in the years following significant fixed income underperformance, and we expect them to be among the top performing fixed income asset classes.</p>
<p>That said, we see spreads and yields attractive under most market scenarios over the next twelve months. Notwithstanding the shorter-term tailwinds, we believe wider spreads are beginning to offer attractive entry points for longer term investors. However, a robust bottom-up approach to security selection remains key given the significant tail risks to the fundamental backdrop and a market bifurcated between vintages and, relatedly, between deals in and out of their reinvestment periods. Given the dispersion seen in the loan market, certain CLO portfolios holding weaker credits may eventually experience impairments to the lowest-rated debt tranches. As a result, vintage, portfolio, and manager selection remain key.</p>
<p>To receive more <a href="/us/en/blogs/income-investing/" title="Income Investing Insights"><strong>Income Investing</strong></a> insights, <a href="/link/5f45412c2143400497908cea2897f7d3.aspx" title=" Subscription Center"><strong>sign up in our subscription center</strong></a>.</p>
]]></content:encoded>
</item><item rdf:about="https://www.vaneck.com/us/en/blogs/natural-resources/mixed-results-clear-signals-navigating-resource-equities-in-a-shifting-macro-landscape/">
  <title>Mixed Results, Clear Signals: Navigating Resource Equities in a Shifting Macro Landscape></title>
  <link>https://www.vaneck.com/us/en/blogs/natural-resources/mixed-results-clear-signals-navigating-resource-equities-in-a-shifting-macro-landscape/</link>
  <description><![CDATA[Commodity markets face uncertainty from tariffs, global growth risks and geopolitics, but may show resilience. Tight supply and global stimulus support a constructive long-term outlook.]]></description>
  <dc:creator>Shawn Reynolds</dc:creator>
  <dc:date>04/10/2025 06:30:00</dc:date>
<content:encoded><![CDATA[

<p>Quarterly insights from Global Resources Portfolio Manager Shawn Reynolds, featuring his unique views on natural resources and commodities.</p>

<p>Despite outperforming broad U.S. equities, resource equities delivered mixed results in the first quarter of 2025. Base metals, precious metals and natural gas producers led the way, supported by strong underlying commodity prices&mdash;most notably copper, gold and natural gas. In contrast, most oil producers struggled as crude prices retreated below $70/bbl.</p>
<p>The dominant macro themes during the quarter included the potential downstream impact of the Trump Administration&rsquo;s tariffs on commodity markets and resource equities, as well as an increasingly uncertain global growth outlook.</p>
<h2>Sector Performance Recap</h2>
<ul class="content-list">
<li class="mt-2"><strong>Gold &ndash; </strong>Gold&nbsp;and gold mining stocks were the top performers during the quarter. Gold prices advanced above $3,100 per ounce, driven by sustained central bank buying, a resurgence in gold ETF demand and heightened geopolitical risk. Gold miners benefited from record margin expansion, supported by elevated gold prices and relatively stable operating costs.</li>
<li class="mt-2"><strong>Base Metals &ndash; </strong>Copper led the strength in base metals, rallying approximately 25% during the quarter. Most base metal miners saw share price gains in response. Trade policy dominated headlines, as the Trump Administration implemented 25% tariffs on imported aluminum and steel, while also floating the possibility of similar duties on copper. Ongoing skepticism around China&rsquo;s ability to reinvigorate its economy remained a headwind for the sector overall.</li>
<li class="mt-2"><strong>Oil &amp; Gas &ndash; </strong>Oil prices faced significant pressure during the quarter, falling below $70/bbl after OPEC+ signaled its intentions to ease production caps that had been in place for over two years. Further weighing on the sector was a deteriorating global growth outlook, with the International Energy Agency downgrading its oil demand forecasts. Natural gas producers fared better, buoyed by modest price gains and growing optimism around gas&rsquo; role in meeting incremental electricity demand.</li>
<li class="mt-2"><strong>Agriculture &ndash; </strong>Agricultural commodities and equities posted modest gains during the quarter. Supportive fertilizer prices and resilient crop prices underpinned performance. Agricultural machinery stocks also fared well, defying headwinds from "higher for longer" interest rates and the potential drag from upcoming trade tariffs.</li>
</ul>

<h2>Looking Ahead: Navigating an Evolving Landscape</h2>
<p>Our outlook, written before the April 2 announcement of new tariffs by the Trump Administration, anticipates continued challenges and uncertainty in commodity markets driven by trade policies, geopolitical tensions and broader macroeconomic trends. While tariffs remain a significant concern, their broader impact on global economic growth is the more pressing issue for commodities. As we assess the landscape, we see resilience in key commodities, despite the ongoing risks.</p>
<p>The uncertainty introduced by tariffs influences both global economic activity and commodity demand. If tariffs slow economic growth, they could weigh on demand for key raw materials. However, commodities have endured similar cycles before, and market participants are prepared to adjust as needed.</p>
<p>Steel and aluminum remain focal points in the tariff discussion. U.S. steel producers have already responded by increasing prices, benefiting from the anticipated trade barriers. However, outside the U.S.&mdash;particularly in Canada, Mexico and Europe&mdash;producers could face headwinds. Energy markets have also absorbed some of the uncertainty. A 10% tariff on Canadian and Mexican energy imports is not expected to be a major disruptor, as price adjustments have already taken place. However, crude oil has struggled relative to other commodities, reflecting broader geopolitical uncertainties and shifts in global supply and demand. Meanwhile, natural gas has emerged as a more attractive opportunity, particularly within the U.S.</p>
<p>Beyond tariffs, a series of external risks continue to challenge commodities. Geopolitical tensions&mdash;ranging from conflicts in Ukraine and the Middle East to instability in Venezuela and OPEC+ production decisions&mdash;create a difficult operating environment. These factors have combined to form one of the most complex commodity landscapes in recent memory. Despite these risks, the resilience of commodity markets has been notable. China and Europe continue to roll out stimulus measures, helping to support demand even in the face of economic slowdowns. Whether global growth weakens significantly or stabilizes remains to be seen, but for now, many commodities are holding firm.</p>
<p>Despite the macroeconomic pressures, several commodities remain strong. Gold has reached record highs, underscoring its role as a safe-haven asset amid market uncertainty. Copper prices are also robust, reflecting tight supply conditions and long-term demand tied to electrification trends. Even agricultural commodities, which face potential challenges from Chinese retaliatory tariffs, have remained reasonably stable. In contrast, crude oil continues to lag behind, likely due to geopolitical uncertainty and shifting supply dynamics. This divergence has led to strategic shifts in positioning, with some investors reducing oil exposure in favor of U.S. natural gas, which presents a more favorable outlook. Additionally, selective steel exposure has been added, recognizing both tactical opportunities and long-term structural trends.</p>
<p>While commodity markets face considerable uncertainty, their resilience in the face of multiple headwinds is noteworthy. The interplay between tariffs, economic growth, and geopolitical risks will continue to shape the market, requiring investors to remain flexible. With supply conditions tight across several key commodities and demand supported by global stimulus efforts, the longer-term outlook remains constructive despite near-term challenges.</p>
<p>To receive more <a href="/us/en/insights/natural-resources/" title="Natural Resources Insights"><strong>Natural Resources</strong></a> insights, <a href="https://www.vaneck.com/us/en/subscribe/" title="Subscription Center"><strong>sign up in our subscription center</strong></a>.</p>
]]></content:encoded>
</item><item rdf:about="https://www.vaneck.com/us/en/blogs/income-investing/angl-higher-quality-outperforms-amid-volatility-and-spike-in-downgrades/">
  <title>ANGL: Higher Quality Outperforms Amid Volatility and Spike in Downgrades></title>
  <link>https://www.vaneck.com/us/en/blogs/income-investing/angl-higher-quality-outperforms-amid-volatility-and-spike-in-downgrades/</link>
  <description><![CDATA[Fallen angels ended Q1 strong, outpacing rising stars with a 21% market value gain and driving a notable shift in market composition.]]></description>
  <dc:creator>Nicolas  Fonseca, CFA</dc:creator>
  <dc:date>04/10/2025 06:30:00</dc:date>
<content:encoded><![CDATA[

<p>Fallen angels (as represented by the ICE US Fallen Angel High Yield 10% Constrained Index, &ldquo;H0CF&rdquo;) finished Q1 on a strong note, outperforming the broad high-yield market (as represented by the ICE BofA US High Yield Index, &ldquo;H0A0&rdquo;) by 0.60% (1.55% vs. 0.95%). Increasing concern around U.S. trade policy and the expected negative impacts on economic growth and inflation drove high yield credit spreads to their highest levels since August 2024. Spreads have continued to widen in the first few days of April, very close to the October 2023 levels (high yield spreads ~450bps). Higher quality credit outperformed in this more uncertain environment, benefitting fallen angels relative to the broad market given their approximately 26% overweight to BB rated bonds and 6% underweight to CCC and below rated bonds. CCCs are now down -0.67% YTD after also underperforming in February, while higher quality, BB-rated bonds outperformed each month in the quarter at 1.29%, 0.72% and -0.56% respectively. Despite strong balance sheets and fundamentals overall, spread levels remain historically tight even after this recent widening, making high yield (especially lower rated bonds) vulnerable to continued price declines as the market digests the impact of tariffs and amid generally increased uncertainty. The 10-year U.S. Treasury yield fluctuated during the period and ended the quarter at 4.21%, a decline of 0.32%. The yield curve steepened in March, with a higher degree of rate cuts being reflected in the 2-year rate, but 2yr/10yr ended the quarter approximately where it began, and overall longer duration exposure outperformed.</p>
<h3>BB- Rated Bonds Continue to Outperform</h3>
<div class="flourish-embed flourish-chart" data-src="visualisation/22555679?2429575"><script src="https://public.flourish.studio/resources/embed.js"></script><noscript><img loading="lazy" src="https://public.flourish.studio/visualisation/22555679/thumbnail" width="100%" alt="BB- Rated Bonds Continue to Outperform" /></noscript></div>
<p class="chart-disclosure">Source: ICE Data Indices as of 4/3/2025. BB represented by ICE BofA BB US High Yield Index; B represented by ICE BofA Single-B US High Yield Index; CCC and below represented by ICE BofA CCC &amp; Lower US High Yield Index. ICE BofA BB US High Yield Index is a subset of ICE BofA US High Yield Index including all securities rated BB1 through BB3, inclusive. ICE BofA Single-B US High Yield Index is a subset of ICE BofA US High Yield Index including all securities rated B1 through B3, inclusive.ICE BofA CCC &amp; Lower US High Yield Index is a subset of ICE BofA US High Yield Index including all securities rated CCC1 and below.</p>
<p><strong>Fallen Angels Overall Statistics:</strong> Fallen angels and broad high yield spreads widened in the first quarter of the year by 8bps and 63bps, respectively, as lower rated bonds exhibited wider spreads, particularly in March, with CCC &amp; below rated bonds widening by 168bps. The widening reflects an escalating trade war and policy uncertainty, along with increased odds of a U.S. economic slowdown and higher inflation. Yields remained relatively high for both indices, although fallen angels finished the quarter slightly lower than the beginning of the year. Broad high yield, on the other hand, ended the quarter with wider spreads offsetting a decline in risk free yields, due to a 45% exposure to single-B or below-rated bonds. Fallen angel stats were impacted by the addition of new fallen angels equating to approximately 20% of added index weight. The new entrants (Nissan Motor Acceptance, Nissan Motor and Celanese US Holding) entered with lower yields and spreads relative to the overall index.</p>
<div class="wrapped-div">
<table style="width: 100%;">
<tbody>
<tr class="tbl-data">
<td class="tbl-header last text-center">&nbsp;</td>
<td class="tbl-header last text-center" style="border-right: outset;" colspan="4">Fallen Angels</td>
<td class="tbl-header last text-center" colspan="4">Broad HY</td>
</tr>
<tr class="tbl-data">
<td class="data-head last text-right">&nbsp;</td>
<td class="data-head last text-right">12/31/2024</td>
<td class="data-head last text-right">1/31/2025</td>
<td class="data-head last text-right">2/28/2025</td>
<td class="data-head last text-right" style="border-right: outset;">3/31/2025</td>
<td class="data-head last text-right">12/31/2024</td>
<td class="data-head last text-right">1/31/2025</td>
<td class="data-head last text-right">2/28/2025</td>
<td class="data-head last text-right">3/31/2025</td>
</tr>
<tr class="tbl-data">
<td class="data-td last">Yield to Worst</td>
<td class="data-td data last text-right">7.00</td>
<td class="data-td data last text-right">6.76</td>
<td class="data-td data last text-right">6.52</td>
<td class="data-td data last text-right" style="border-right: outset;">6.72</td>
<td class="data-td data last text-right">7.47</td>
<td class="data-td data last text-right">7.17</td>
<td class="data-td data last text-right">7.73</td>
</tr>
<tr class="tbl-data">
<td class="data-td last">Par Weighted Price</td>
<td class="data-td data last text-right">91.52</td>
<td class="data-td data last text-right">92.48</td>
<td class="data-td data last text-right">93.90</td>
<td class="data-td data last text-right" style="border-right: outset;">93.11</td>
<td class="data-td data last text-right">95.48</td>
<td class="data-td data last text-right">96.34</td>
<td class="data-td data last text-right">96.52</td>
<td class="data-td data last text-right">94.97</td>
</tr>
<tr class="tbl-data">
<td class="data-td last">Effective Duration</td>
<td class="data-td data last text-right">4.89</td>
<td class="data-td data last text-right">4.85</td>
<td class="data-td data last text-right">4.54</td>
<td class="data-td data last text-right" style="border-right: outset;">4.56</td>
<td class="data-td data last text-right">3.22</td>
<td class="data-td data last text-right">3.09</td>
<td class="data-td data last text-right">3.06</td>
<td class="data-td data last text-right">3.19</td>
</tr>
<tr class="tbl-data">
<td class="data-td last">Full Market Value ($mn)</td>
<td class="data-td data last text-right">53,393</td>
<td class="data-td data last text-right">53,847</td>
<td class="data-td data last text-right">69,904</td>
<td class="data-td data last text-right" style="border-right: outset;">67,556</td>
<td class="data-td data last text-right">1,338,887</td>
<td class="data-td data last text-right">1,347,313</td>
<td class="data-td data last text-right">1,378,239</td>
<td class="data-td data last text-right">1,357,142</td>
</tr>
<tr class="tbl-data">
<td class="data-td last">OAS</td>
<td class="data-td data last text-right">249</td>
<td class="data-td data last text-right">229</td>
<td class="data-td data last text-right">233</td>
<td class="data-td data last text-right" style="border-right: outset;">257</td>
<td class="data-td data last text-right">292</td>
<td class="data-td data last text-right">268</td>
<td class="data-td data last text-right">287</td>
<td class="data-td data last text-right">355</td>
</tr>
<tr class="tbl-data">
<td class="data-td last">No. of Issues</td>
<td class="data-td data last text-right">122</td>
<td class="data-td data last text-right">121</td>
<td class="data-td data last text-right">136</td>
<td class="data-td data last text-right" style="border-right: outset;">134</td>
<td class="data-td data last text-right">1,879</td>
<td class="data-td data last text-right">1,874</td>
<td class="data-td data last text-right">1,897</td>
<td class="data-td data last text-right">1,902</td>
</tr>
</tbody>
</table>
</div>
<p class="chart-disclosure">Source: ICE Data Services, VanEck. Fallen Angels: ICE US Fallen Angel High Yield 10% Constrained Index. Broad HY: ICE BofA US High Yield Index. OAS refers to &ldquo;option-adjusted spread.&rdquo; Please see definition for this and other terms referenced herein in the disclosures and definitions portion of this blog. Past performance is no guarantee of future results. Index performance is not representative of strategy performance. It is not possible to invest in an index.</p>
<p><strong>Fallen Angels:</strong> Aptiv PLC junior subordinated debt was downgraded by Fitch to BB+ from BBB- in January, as the company is planning to spin off its electrical distribution systems business into a separate company. Fitch stated that the downgrade aligns more closely with other similarly junior subordinated debt from other issuers. Over the last six months, the junior subordinated debt price decreased to $99.71 from $101.05. Within the Auto sector, S&amp;P affirmed Ford&rsquo;s BBB- rating in early February but revised their outlook to negative as its expansion over the next couple of years appears to be limited due to slower-than-expected progress on cost reduction, high labor costs and increasing pricing pressure. S&amp;P stated that the negative outlook also reflects an increase in the risk of downgrade over the next 12-24 months, which could make Ford a fallen angel again, all else equal, as Moody&rsquo;s credit rating is Ba1 while Fitch is BBB-. In February, Celanese U.S. Holdings was downgraded by Moody&rsquo;s to Ba1 from Baa3, with a negative outlook, following the downgrade by S&amp;P in November to BB+. The downgrade by Moody&rsquo;s was due to concerns over the company's increased debt levels and potential challenges in maintaining strong cash flow amid market uncertainties and reflects apprehensions about Celanese's ability to reduce leverage while navigating fluctuating demand and pricing pressures in the chemical industry. Moody's and Fitch also downgraded Nissan to high yield with a negative outlook in February, due to declining profitability linked to weakening demand for its older vehicle lineup, especially in markets such as the U.S. and China. Moody&rsquo;s also raised concerns about Nissan's ability to effectively execute its restructuring strategy, including workforce reductions and production cuts, amid ongoing global economic uncertainty while Fitch stated that persistently low profitability and a recovery trajectory that has been slower than anticipated.</p>
<p>Despite the concentration in Autos over the past few months, fallen angels have generally been idiosyncratic in nature. We are keeping an eye on signs for increased systemic downgrade activity, given the increased macro uncertainty following the recent tariff announcement.</p>
<div class="wrapped-div">
<table style="width: 100%;">
<tbody>
<tr class="tbl-data">
<td class="tbl-header last">Month-end Addition</td>
<td class="tbl-header last">Name</td>
<td class="tbl-header last">Rating</td>
<td class="tbl-header last">Sector</td>
<td class="tbl-header last">Industry</td>
<td class="tbl-header last text-right">% Mkt Value</td>
<td class="tbl-header last text-right">Price</td>
</tr>
<tr class="tbl-data">
<td class="data-td last font-weight-normal">January</td>
<td class="data-td data last text-left">Aptiv PLC / Aptiv Global Financing DAC</td>
<td class="data-td data last text-left">BB1</td>
<td class="data-td data last text-left">Automotive</td>
<td class="data-td data last text-left">Auto Parts &amp; Equipment</td>
<td class="data-td data last text-right">0.95</td>
<td class="data-td data last text-right">99.71</td>
</tr>
<tr class="tbl-data">
<td class="data-td last font-weight-normal">February</td>
<td class="data-td data last text-left">Celanese US Holdings Llc</td>
<td class="data-td data last text-left">BB1</td>
<td class="data-td data last text-left">Basic Industry</td>
<td class="data-td data last text-left">Chemicals</td>
<td class="data-td data last text-right">10.06</td>
<td class="data-td data last text-right">103.69</td>
</tr>
<tr class="tbl-data">
<td class="data-td last font-weight-normal">February</td>
<td class="data-td data last text-left">Nissan Motor Acceptance Co LLC</td>
<td class="data-td data last text-left">BB1</td>
<td class="data-td data last text-left">Automotive</td>
<td class="data-td data last text-left">Auto Loans</td>
<td class="data-td data last text-right">4.82</td>
<td class="data-td data last text-right">97.64</td>
</tr>
<tr class="tbl-data">
<td class="data-td last font-weight-normal">February</td>
<td class="data-td data last text-left">Nissan Motor Co Ltd.</td>
<td class="data-td data last text-left">BB1</td>
<td class="data-td data last text-left">Automotive</td>
<td class="data-td data last text-left">Automakers</td>
<td class="data-td data last text-right">5.41</td>
<td class="data-td data last text-right">97.26</td>
</tr>
</tbody>
</table>
</div>
<p class="chart-disclosure">Source: ICE Data Services, VanEck. Fallen Angels: ICE US Fallen Angel High Yield 10% Constrained Index. Past performance is no guarantee of future results. Not a recommendation to buy or sell any of the names/securities mentioned herein. Index performance is not representative of strategy performance. It is not possible to invest in an index.</p>

<p><strong>Rising Stars:</strong> Western Alliance Bancorp, a fallen angel from the regional banking crisis in early 2023, exited the index in February as Moody&rsquo;s upgraded it back to investment grade, recognizing the company&rsquo;s stronger capital position and improved risk management practices. The upgrade reflects increased resilience to potential financial stress and a more robust ability to navigate economic uncertainties. Back in April 2023, Western Alliance joined the fallen angel index with a price of $76.39 and now leaves at $93.75, providing an approximate 23% return over its time in the fallen angel index.</p>
<div class="wrapped-div">
<table style="width: 100%;">
<tbody>
<tr class="tbl-data">
<td class="tbl-header last">Month-end Exit</td>
<td class="tbl-header last">Name</td>
<td class="tbl-header last">Rating</td>
<td class="tbl-header last">Sector</td>
<td class="tbl-header last">Industry</td>
<td class="tbl-header last text-right">% Mkt Value</td>
<td class="tbl-header last text-right">Price</td>
</tr>
<tr class="tbl-data">
<td class="data-td last font-weight-normal">February</td>
<td class="data-td data last text-left">Western Alliance Bancorp</td>
<td class="data-td data last text-left">BB1</td>
<td class="data-td data last text-left">Banking</td>
<td class="data-td data last text-right">1.05</td>
<td class="data-td data last text-right">93.75</td>
</tr>
</tbody>
</table>
</div>
<p class="chart-disclosure">Source: ICE Data Services, VanEck. Fallen Angels: ICE US Fallen Angel High Yield 10% Constrained Index. Past performance is no guarantee of future results. Not a recommendation to buy or sell any of the names/securities mentioned herein. Index performance is not representative of strategy performance. It is not possible to invest in an index.</p>
<p><strong>Fallen Angels Performance by Sector</strong>: There were major changes to sector composition during the quarter. With Aptiv PLC and Nissan entering the index this past quarter, the Auto sector is again represented in the fallen angel index, following the exit of Ford in November 2023. Retail remains the highest sector weight, but the quarter saw significantly higher weights in the Autos and Basic Industry sectors, which are now greater than than 10% each. Real Estate continues to be the sector with wider spreads, and the only one above 400, and has continued to provide upside as the third best returning sector YTD, behind Retail and Healthcare. Retail and Real Estate, the largest sector overweights, were the top contributors to relative outperformance versus broad high yield during the quarter; Media and Telecommunications exposure detracted the most from relative performance.</p>
<div class="wrapped-div-full">
<table style="width: 100%;">
<tbody>
<tr class="tbl-data">
<td class="tbl-header last text-center">&nbsp;</td>
<td class="tbl-header last text-center" style="border-right: outset;" colspan="4">Wgt (%)</td>
<td class="tbl-header last text-center" style="border-right: outset;" colspan="4">OAS</td>
<td class="tbl-header last text-center" style="border-right: outset;" colspan="4">Price</td>
<td class="tbl-header last text-right">Total Return</td>
</tr>
<tr class="tbl-data">
<td class="data-head data last text-right">&nbsp;</td>
<td class="data-head data last text-right">12/31/2024</td>
<td class="data-head data last text-right">1/31/2025</td>
<td class="data-head data last text-right">2/28/2025</td>
<td class="data-head data last text-right" style="border-right: outset;">3/31/2025</td>
<td class="data-head data last text-right">12/31/2024</td>
<td class="data-head data last text-right">1/31/2025</td>
<td class="data-head data last text-right">2/28/2025</td>
<td class="data-head data last text-right" style="border-right: outset;">3/31/2025</td>
<td class="data-head data last text-right">12/31/2024</td>
<td class="data-head data last text-right">1/31/2025</td>
<td class="data-head data last text-right">2/28/2025</td>
<td class="data-head data last text-right" style="border-right: outset;">3/31/2025</td>
<td class="data-head data last text-right">YTD</td>
</tr>
<tr class="tbl-data">
<td class="data-td last">Automotive<sup>*</sup></td>
<td class="data-td data last text-right">&nbsp;</td>
<td class="data-td data last text-right">0.95</td>
<td class="data-td data last text-right">11.00</td>
<td class="data-td data last text-right" style="border-right: outset;">10.80</td>
<td class="data-td data last text-right">&nbsp;</td>
<td class="data-td data last text-right">276</td>
<td class="data-td data last text-right">134</td>
<td class="data-td data last text-right" style="border-right: outset;">182</td>
<td class="data-td data last text-right">&nbsp;</td>
<td class="data-td data last text-right">99.71</td>
<td class="data-td data last text-right">97.55</td>
<td class="data-td data last text-right" style="border-right: outset;">96.58</td>
<td class="data-td data last text-right">-1.36</td>
</tr>
<tr class="tbl-data">
<td class="data-td last">Banking</td>
<td class="data-td data last text-right">4.94</td>
<td class="data-td data last text-right">5.78</td>
<td class="data-td data last text-right">3.84</td>
<td class="data-td data last text-right" style="border-right: outset;">3.92</td>
<td class="data-td data last text-right">181</td>
<td class="data-td data last text-right">156</td>
<td class="data-td data last text-right">169</td>
<td class="data-td data last text-right" style="border-right: outset;">176</td>
<td class="data-td data last text-right">96.00</td>
<td class="data-td data last text-right">102.02</td>
<td class="data-td data last text-right">103.94</td>
<td class="data-td data last text-right" style="border-right: outset;">103.69</td>
<td class="data-td data last text-right">1.49</td>
</tr>
<tr class="tbl-data">
<td class="data-td last">Basic Industry</td>
<td class="data-td data last text-right">4.94</td>
<td class="data-td data last text-right">5.00</td>
<td class="data-td data last text-right">14.11</td>
<td class="data-td data last text-right" style="border-right: outset;">14.03</td>
<td class="data-td data last text-right">181</td>
<td class="data-td data last text-right">158</td>
<td class="data-td data last text-right" style="border-right: outset;">188</td>
<td class="data-td data last text-right">96.00</td>
<td class="data-td data last text-right">97.55</td>
<td class="data-td data last text-right">101.98</td>
<td class="data-td data last text-right" style="border-right: outset;">100.89</td>
<td class="data-td data last text-right">2.26</td>
</tr>
<tr class="tbl-data">
<td class="data-td last">Capital Goods</td>
<td class="data-td data last text-right">5.55</td>
<td class="data-td data last text-right">5.51</td>
<td class="data-td data last text-right">4.48</td>
<td class="data-td data last text-right" style="border-right: outset;">4.52</td>
<td class="data-td data last text-right">179</td>
<td class="data-td data last text-right">163</td>
<td class="data-td data last text-right">188</td>
<td class="data-td data last text-right" style="border-right: outset;">209</td>
<td class="data-td data last text-right">96.48</td>
<td class="data-td data last text-right">96.72</td>
<td class="data-td data last text-right">96.79</td>
<td class="data-td data last text-right" style="border-right: outset;">95.90</td>
<td class="data-td data last text-right">0.85</td>
</tr>
<tr class="tbl-data">
<td class="data-td last">Consumer Goods</td>
<td class="data-td data last text-right">4.37</td>
<td class="data-td data last text-right">4.38</td>
<td class="data-td data last text-right">3.48</td>
<td class="data-td data last text-right" style="border-right: outset;">3.41</td>
<td class="data-td data last text-right">184</td>
<td class="data-td data last text-right">161</td>
<td class="data-td data last text-right">223</td>
<td class="data-td data last text-right" style="border-right: outset;">243</td>
<td class="data-td data last text-right">98.89</td>
<td class="data-td data last text-right">99.57</td>
<td class="data-td data last text-right">97.16</td>
<td class="data-td data last text-right" style="border-right: outset;">95.87</td>
<td class="data-td data last text-right">-1.45</td>
</tr>
<tr class="tbl-data">
<td class="data-td last">Energy</td>
<td class="data-td data last text-right">9.16</td>
<td class="data-td data last text-right">9.15</td>
<td class="data-td data last text-right">7.42</td>
<td class="data-td data last text-right" style="border-right: outset;">7.53</td>
<td class="data-td data last text-right">273</td>
<td class="data-td data last text-right">258</td>
<td class="data-td data last text-right">295</td>
<td class="data-td data last text-right" style="border-right: outset;">305</td>
<td class="data-td data last text-right">91.72</td>
<td class="data-td data last text-right">92.57</td>
<td class="data-td data last text-right">92.34</td>
<td class="data-td data last text-right" style="border-right: outset;">91.82</td>
<td class="data-td data last text-right">1.66</td>
</tr>
<tr class="tbl-data">
<td class="data-td last">Financial Services</td>
<td class="data-td data last text-right">3.22</td>
<td class="data-td data last text-right">2.50</td>
<td class="data-td data last text-right">2.05</td>
<td class="data-td data last text-right" style="border-right: outset;">2.05</td>
<td class="data-td data last text-right">282</td>
<td class="data-td data last text-right">265</td>
<td class="data-td data last text-right">281</td>
<td class="data-td data last text-right" style="border-right: outset;">357</td>
<td class="data-td data last text-right">91.46</td>
<td class="data-td data last text-right">91.37</td>
<td class="data-td data last text-right">91.99</td>
<td class="data-td data last text-right" style="border-right: outset;">89.83</td>
<td class="data-td data last text-right">0.63</td>
</tr>
<tr class="tbl-data">
<td class="data-td last">Healthcare</td>
<td class="data-td data last text-right">4.10</td>
<td class="data-td data last text-right">3.37</td>
<td class="data-td data last text-right" style="border-right: outset;">3.45</td>
<td class="data-td data last text-right">195</td>
<td class="data-td data last text-right">215</td>
<td class="data-td data last text-right" style="border-right: outset;">214</td>
<td class="data-td data last text-right">90.40</td>
<td class="data-td data last text-right">90.79</td>
<td class="data-td data last text-right">91.80</td>
<td class="data-td data last text-right" style="border-right: outset;">91.71</td>
<td class="data-td data last text-right">2.92</td>
</tr>
<tr class="tbl-data">
<td class="data-td last">Insurance</td>
<td class="data-td data last text-right">2.49</td>
<td class="data-td data last text-right">1.99</td>
<td class="data-td data last text-right">1.63</td>
<td class="data-td data last text-right" style="border-right: outset;">1.67</td>
<td class="data-td data last text-right">193</td>
<td class="data-td data last text-right">181</td>
<td class="data-td data last text-right">196</td>
<td class="data-td data last text-right" style="border-right: outset;">214</td>
<td class="data-td data last text-right">98.34</td>
<td class="data-td data last text-right">98.87</td>
<td class="data-td data last text-right">99.60</td>
<td class="data-td data last text-right" style="border-right: outset;">99.12</td>
<td class="data-td data last text-right">1.92</td>
</tr>
<tr class="tbl-data">
<td class="data-td last">Leisure</td>
<td class="data-td data last text-right">4.53</td>
<td class="data-td data last text-right">4.51</td>
<td class="data-td data last text-right">3.69</td>
<td class="data-td data last text-right" style="border-right: outset;">3.70</td>
<td class="data-td data last text-right">220</td>
<td class="data-td data last text-right">222</td>
<td class="data-td data last text-right">231</td>
<td class="data-td data last text-right" style="border-right: outset;">280</td>
<td class="data-td data last text-right">93.65</td>
<td class="data-td data last text-right">93.59</td>
<td class="data-td data last text-right">94.43</td>
<td class="data-td data last text-right" style="border-right: outset;">93.18</td>
<td class="data-td data last text-right">0.81</td>
</tr>
<tr class="tbl-data">
<td class="data-td last">Real Estate</td>
<td class="data-td data last text-right">10.71</td>
<td class="data-td data last text-right">10.95</td>
<td class="data-td data last text-right">8.31</td>
<td class="data-td data last text-right" style="border-right: outset;">8.30</td>
<td class="data-td data last text-right">450</td>
<td class="data-td data last text-right">362</td>
<td class="data-td data last text-right">389</td>
<td class="data-td data last text-right" style="border-right: outset;">448</td>
<td class="data-td data last text-right">86.94</td>
<td class="data-td data last text-right">89.59</td>
<td class="data-td data last text-right">89.16</td>
<td class="data-td data last text-right" style="border-right: outset;">87.85</td>
<td class="data-td data last text-right">2.88</td>
</tr>
<tr class="tbl-data">
<td class="data-td last">Retail</td>
<td class="data-td data last text-right">22.15</td>
<td class="data-td data last text-right">22.20</td>
<td class="data-td data last text-right">18.11</td>
<td class="data-td data last text-right" style="border-right: outset;">18.18</td>
<td class="data-td data last text-right">219</td>
<td class="data-td data last text-right">200</td>
<td class="data-td data last text-right">224</td>
<td class="data-td data last text-right" style="border-right: outset;">221</td>
<td class="data-td data last text-right">86.26</td>
<td class="data-td data last text-right">87.28</td>
<td class="data-td data last text-right">87.80</td>
<td class="data-td data last text-right" style="border-right: outset;">88.43</td>
<td class="data-td data last text-right">4.05</td>
</tr>
<tr class="tbl-data">
<td class="data-td last">Services</td>
<td class="data-td data last text-right">0.83</td>
<td class="data-td data last text-right">0.81</td>
<td class="data-td data last text-right">0.66</td>
<td class="data-td data last text-right" style="border-right: outset;">0.67</td>
<td class="data-td data last text-right">189</td>
<td class="data-td data last text-right">185</td>
<td class="data-td data last text-right">199</td>
<td class="data-td data last text-right" style="border-right: outset;">234</td>
<td class="data-td data last text-right">95.97</td>
<td class="data-td data last text-right">96.39</td>
<td class="data-td data last text-right">96.92</td>
<td class="data-td data last text-right" style="border-right: outset;">96.12</td>
<td class="data-td data last text-right">1.46</td>
</tr>
<tr class="tbl-data">
<td class="data-td last">Technology &amp; Electronics</td>
<td class="data-td data last text-right">6.78</td>
<td class="data-td data last text-right">6.81</td>
<td class="data-td data last text-right">5.50</td>
<td class="data-td data last text-right" style="border-right: outset;">5.45</td>
<td class="data-td data last text-right">208</td>
<td class="data-td data last text-right">197</td>
<td class="data-td data last text-right">227</td>
<td class="data-td data last text-right" style="border-right: outset;">262</td>
<td class="data-td data last text-right">90.50</td>
<td class="data-td data last text-right">91.40</td>
<td class="data-td data last text-right">91.03</td>
<td class="data-td data last text-right" style="border-right: outset;">88.87</td>
<td class="data-td data last text-right">-0.42</td>
</tr>
<tr class="tbl-data">
<td class="data-td last">Telecommunications</td>
<td class="data-td data last text-right">12.56</td>
<td class="data-td data last text-right">12.57</td>
<td class="data-td data last text-right">10.09</td>
<td class="data-td data last text-right" style="border-right: outset;">10.07</td>
<td class="data-td data last text-right">311</td>
<td class="data-td data last text-right">296</td>
<td class="data-td data last text-right">345</td>
<td class="data-td data last text-right" style="border-right: outset;">366</td>
<td class="data-td data last text-right">92.24</td>
<td class="data-td data last text-right">92.98</td>
<td class="data-td data last text-right">91.67</td>
<td class="data-td data last text-right" style="border-right: outset;">89.80</td>
<td class="data-td data last text-right">-0.78</td>
</tr>
<tr class="tbl-data">
<td class="data-td last">Transportation</td>
<td class="data-td data last text-right">0.59</td>
<td class="data-td data last text-right">0.58</td>
<td class="data-td data last text-right">0.47</td>
<td class="data-td data last text-right" style="border-right: outset;">0.48</td>
<td class="data-td data last text-right">156</td>
<td class="data-td data last text-right">173</td>
<td class="data-td data last text-right">210</td>
<td class="data-td data last text-right" style="border-right: outset;">217</td>
<td class="data-td data last text-right">104.16</td>
<td class="data-td data last text-right">103.24</td>
<td class="data-td data last text-right">103.06</td>
<td class="data-td data last text-right" style="border-right: outset;">102.60</td>
<td class="data-td data last text-right">0.11</td>
</tr>
<tr class="tbl-data">
<td class="data-td last">Utility</td>
<td class="data-td data last text-right">2.22</td>
<td class="data-td data last text-right">2.20</td>
<td class="data-td data last text-right">1.78</td>
<td class="data-td data last text-right" style="border-right: outset;">1.78</td>
<td class="data-td data last text-right">173</td>
<td class="data-td data last text-right">184</td>
<td class="data-td data last text-right">216</td>
<td class="data-td data last text-right" style="border-right: outset;">217</td>
<td class="data-td data last text-right">96.71</td>
<td class="data-td data last text-right">96.18</td>
<td class="data-td data last text-right">95.95</td>
<td class="data-td data last text-right" style="border-right: outset;">95.53</td>
<td class="data-td data last text-right">0.18</td>
</tr>
<tr class="tbl-data">
<td class="data-td last">Grand Total</td>
<td class="data-td data last text-right">100</td>
<td class="data-td data last text-right" style="border-right: outset;">100</td>
<td class="data-td data last text-right">249</td>
<td class="data-td data last text-right">229</td>
<td class="data-td data last text-right">233</td>
<td class="data-td data last text-right" style="border-right: outset;">257</td>
<td class="data-td data last text-right">91.52</td>
<td class="data-td data last text-right">92.48</td>
<td class="data-td data last text-right">93.90</td>
<td class="data-td data last text-right" style="border-right: outset;">93.11</td>
<td class="data-td data last text-right">1.55</td>
</tr>
</tbody>
</table>
</div>
<p class="chart-disclosure">Source: ICE Data Services, VanEck. *Returns are based on partial period data. Fallen Angels: ICE US Fallen Angel High Yield 10% Constrained Index. Not intended as a recommendation to invest or divest in any of the sectors mentioned herein. Index performance is not representative of strategy performance. It is not possible to invest in an index.</p>
<p><strong>Fallen Angels Performance by Rating:</strong> There were no major changes in overall rating composition during the quarter with BB-rated bonds still the highest exposure within the fallen angels index. In terms of performance, Single-B rated bonds outperformed higher and lower quality bonds and was the only rating category to see tighter spreads. Security selection within and an overweight to BB bonds contributed to relative performance versus broad high yield, while selection within CC rated bonds detracted.</p>
<div class="wrapped-div">
<table style="width: 100%;">
<tbody>
<tr class="tbl-data">
<td class="tbl-header last text-center">&nbsp;</td>
<td class="tbl-header last text-center" style="border-right: outset;" colspan="4">Wgt (%)</td>
<td class="tbl-header last text-center" style="border-right: outset;" colspan="4">OAS</td>
<td class="tbl-header last text-center" style="border-right: outset;" colspan="4">Price</td>
<td class="tbl-header last text-right">Total Return</td>
</tr>
<tr class="tbl-data">
<td class="data-head data last text-right">&nbsp;</td>
<td class="data-head data last text-right">12/31/2024</td>
<td class="data-head data last text-right">1/31/2025</td>
<td class="data-head data last text-right">2/28/2025</td>
<td class="data-head data last text-right" style="border-right: outset;">3/31/2025</td>
<td class="data-head data last text-right">12/31/2024</td>
<td class="data-head data last text-right">1/31/2025</td>
<td class="data-head data last text-right">2/28/2025</td>
<td class="data-head data last text-right" style="border-right: outset;">3/31/2025</td>
<td class="data-head data last text-right">12/31/2024</td>
<td class="data-head data last text-right">1/31/2025</td>
<td class="data-head data last text-right">2/28/2025</td>
<td class="data-head data last text-right" style="border-right: outset;">3/31/2025</td>
<td class="data-head data last text-right">YTD</td>
</tr>
<tr class="tbl-data">
<td class="data-td last">BB</td>
<td class="data-td data last text-right">83.93</td>
<td class="data-td data last text-right">77.66</td>
<td class="data-td data last text-right">82.57</td>
<td class="data-td data last text-right" style="border-right: outset;">82.22</td>
<td class="data-td data last text-right">197</td>
<td class="data-td data last text-right">183</td>
<td class="data-td data last text-right">192</td>
<td class="data-td data last text-right" style="border-right: outset;">220</td>
<td class="data-td data last text-right">93.33</td>
<td class="data-td data last text-right">95.06</td>
<td class="data-td data last text-right">96.42</td>
<td class="data-td data last text-right" style="border-right: outset;">95.43</td>
<td class="data-td data last text-right">1.19</td>
</tr>
<tr class="tbl-data">
<td class="data-td last">B</td>
<td class="data-td data last text-right">10.09</td>
<td class="data-td data last text-right">16.29</td>
<td class="data-td data last text-right">12.70</td>
<td class="data-td data last text-right" style="border-right: outset;">13.22</td>
<td class="data-td data last text-right">474</td>
<td class="data-td data last text-right">317</td>
<td class="data-td data last text-right">338</td>
<td class="data-td data last text-right" style="border-right: outset;">322</td>
<td class="data-td data last text-right">86.36</td>
<td class="data-td data last text-right">86.62</td>
<td class="data-td data last text-right">86.66</td>
<td class="data-td data last text-right" style="border-right: outset;">88.45</td>
<td class="data-td data last text-right">7.20</td>
</tr>
<tr class="tbl-data">
<td class="data-td last">CCC</td>
<td class="data-td data last text-right">4.72</td>
<td class="data-td data last text-right">4.76</td>
<td class="data-td data last text-right">3.80</td>
<td class="data-td data last text-right" style="border-right: outset;">3.78</td>
<td class="data-td data last text-right">425</td>
<td class="data-td data last text-right">400</td>
<td class="data-td data last text-right">448</td>
<td class="data-td data last text-right" style="border-right: outset;">496</td>
<td class="data-td data last text-right">88.24</td>
<td class="data-td data last text-right">89.14</td>
<td class="data-td data last text-right">87.91</td>
<td class="data-td data last text-right" style="border-right: outset;">86.54</td>
<td class="data-td data last text-right">-0.21</td>
</tr>
<tr class="tbl-data">
<td class="data-td last">CC</td>
<td class="data-td data last text-right">1.26</td>
<td class="data-td data last text-right">1.29</td>
<td class="data-td data last text-right">0.93</td>
<td class="data-td data last text-right" style="border-right: outset;">0.78</td>
<td class="data-td data last text-right">1262</td>
<td class="data-td data last text-right">1227</td>
<td class="data-td data last text-right">1510</td>
<td class="data-td data last text-right" style="border-right: outset;">1955</td>
<td class="data-td data last text-right">54.65</td>
<td class="data-td data last text-right">56.00</td>
<td class="data-td data last text-right">48.79</td>
<td class="data-td data last text-right" style="border-right: outset;">39.08</td>
<td class="data-td data last text-right">-24.55</td>
</tr>
<tr class="tbl-data">
<td class="data-td last">Total</td>
<td class="data-td data last text-right">100.00</td>
<td class="data-td data last text-right" style="border-right: outset;">100.00</td>
<td class="data-td data last text-right">249</td>
<td class="data-td data last text-right">229</td>
<td class="data-td data last text-right">233</td>
<td class="data-td data last text-right" style="border-right: outset;">257</td>
<td class="data-td data last text-right">91.52</td>
<td class="data-td data last text-right">92.48</td>
<td class="data-td data last text-right">93.90</td>
<td class="data-td data last text-right" style="border-right: outset;">93.11</td>
<td class="data-td data last text-right">1.55</td>
</tr>
</tbody>
</table>
</div>
<p class="chart-disclosure">Source: ICE Data Services, VanEck. Fallen Angels: ICE US Fallen Angel High Yield 10% Constrained Index. Not intended as a recommendation to invest or divest in any of the sectors mentioned herein. Index performance is not representative of strategy performance. It is not possible to invest in an index. BB index: ICE BofA BB US High Yield Index; Single-B index: ICE BofA Single-B US High Yield Index; CCC &amp; Lower rated index ICE BofA CCC &amp; Lower US High Yield Index.</p>

<p>To receive more <a href="/us/en/blogs/income-investing/" title="Income Investing Insights"><strong>Income Investing</strong></a> insights, <a href="/link/5f45412c2143400497908cea2897f7d3.aspx" title=" Subscription Center"><strong>sign up in our subscription center</strong></a>.</p>
]]></content:encoded>
</item><item rdf:about="https://www.vaneck.com/us/en/blogs/investment-outlook/jan-van-eck-q2-2025-outlook-in-the-middle-of-the-3-reckoning/">
  <title>Q2 2025 Outlook: In the Middle of the 3% Reckoning></title>
  <link>https://www.vaneck.com/us/en/blogs/investment-outlook/jan-van-eck-q2-2025-outlook-in-the-middle-of-the-3-reckoning/</link>
  <description><![CDATA[Spending cuts, tariffs and recession risk&mdash;Jan van Eck&rsquo;s latest outlook breaks down what to watch and why he&rsquo;s focused on gold, bitcoin, semiconductors and India.]]></description>
  <dc:creator>Jan van Eck</dc:creator>
  <dc:date>04/10/2025 06:30:00</dc:date>
<content:encoded><![CDATA[

<a href="/us/en/blogs/investment-outlook/jan-van-eck-q2-2026-outlook-the-reset-is-your-entry-point/" title="Jan van Eck's Latest Outlook"><strong>Looking for the latest outlook? Read the Q2 2026 Outlook.</strong></a>
<h2>Watch Video: Thoughtful Money with Jan van Eck</h2>
<p>Jan joins Adam Taggart to discuss the changing macro environment and his top convictions.</p>
<p>As we move through the middle of a <a href="https://www.vaneck.com/us/en/blogs/investment-outlook/jan-van-eck-2025-outlook-at-the-doorstep-of-the-reckoning/"><strong>fiscal reckoning</strong></a> in the U.S., investors face a shifting macro environment shaped by spending cuts, tariffs and recessionary pressures. In my latest quarterly outlook, I discuss where we are in the cycle, what markets may still be underestimating, and where I&rsquo;m seeing both risk and opportunity.</p>
<ul class="content-list">
<li class="mt-2"><strong>Fiscal reckoning is here:</strong> The U.S. is enacting spending cuts and tariffs that may reduce the deficit by 3% of GDP&mdash;roughly $1 trillion&mdash;leading to recessionary pressure.</li>
<li class="mt-2"><strong>Gold and bitcoin remain in bull markets:</strong> They continue to benefit from de-dollarization, stimulated by defense uncertainty in Europe and tariff unpredictability.</li>
<li class="mt-2"><strong>Tech valuations have reset:</strong> Semiconductors and growth stocks look more attractive after a major repricing since last summer. Nvidia is now trading around 20x forward earnings.</li>
<li class="mt-2"><strong>India and international equities are gaining momentum:</strong> As the U.S. economy slows, global stimulus efforts are accelerating elsewhere, and India remains a top conviction idea.</li>
</ul>


<h2 id="fiscal-reckoning" class="jump-link-nav anchored-block" data-jumplink-title="Fiscal Reckoning">A Fiscal Turning Point: How We Cut $1T</h2>
<p>We&rsquo;re now in the midst of what I&rsquo;ve been calling a fiscal reckoning. Following years of stimulus and deficit spending, the U.S. is transitioning from a &ldquo;two feet on the gas&rdquo; economy to a more austere fiscal policy. Last year, the deficit stood at 6.4% of GDP. My base case is that this shrinks by 3% of GDP, or about $1 trillion, through a combination of spending cuts, tax increases and tariffs. Some assumptions and estimates that help us get there:</p>
<ul class="content-list">
<li class="mt-2">2 million job losses (400,000 federal workers, 1.6 million contractors): $125 billion</li>
<li class="mt-2">Waste, fraud, and abuse savings: $100 billion</li>
<li class="mt-2">Tariff revenue increases: $250 billion (conservative compared to estimates of $600&ndash;800 billion)</li>
<li class="mt-2">Policy rollbacks like ending the Inflation Reduction Act ($65B), reversing Medicaid expansion ($200B), cutting 10% of Pentagon spending ($80B), and modest corporate tax hikes ($55B)</li>
</ul>
<p>The implications are recessionary, with a potential rise in unemployment to 4.5&ndash;5% and pressure on corporate earnings. We&rsquo;ll start seeing this reflected in forward guidance coming out in the Q2 earnings season, and this lower growth will lower inflation. This gives the Fed room to cut rates, and my expectation is for cuts of up to 200 basis points in 2025.</p>
<p><strong>How to Invest:</strong></p>
<ul class="content-list">
<li class="mt-2">Stay invested, but diversified&mdash;this is a process, not a moment.</li>
<li class="mt-2">While a slowdown will likely hit in the second half of 2025, buying should probably start in Q2.</li>
</ul>
<h2 id="gold-bitcoin" class="jump-link-nav anchored-block" data-jumplink-title="Gold and Bitcoin">Gold and Bitcoin: Long-Term Bull Markets, Short-Term Caution</h2>
<p>Both gold and bitcoin continue to perform well in this environment. Gold has moved above $3,000 and has been the best-performing major asset over the past year. Bitcoin is hovering around $80,000, despite a 10-15% pullback YTD.</p>
<h3>Gold and Bitcoin Shine as Top Performers</h3>
<p><strong>1-Year Return of Various Asset Classes</strong></p>
<div class="flourish-embed flourish-chart" data-src="visualisation/22586866?2428759"><script src="https://public.flourish.studio/resources/embed.js"></script><noscript><img loading="lazy" src="https://public.flourish.studio/visualisation/22586866/thumbnail" width="100%" alt="Gold and Bitcoin Shine as Top Performers" /></noscript></div>
<p class="chart-disclosure"><strong>Source: VanEck, FactSet. Data as of April 7, 2025. </strong>&ldquo;Gold Stocks&rdquo; represented by NYSE Arca Gold Miners Index. &ldquo;U.S. Stocks&rdquo; represented by the S&amp;P 500 Index. &ldquo;REITs&rdquo; represented by FTSE NAREIT All REITs Index. &ldquo;EM Stocks&rdquo; represented by MSCI Emerging Markets Index. &ldquo;International Stocks&rdquo; represented by MSCI AC World ex USA Index. &ldquo;U.S. TIPS&rdquo; represented by Bloomberg U.S. TIPS (1-3 Year) Index. &ldquo;U.S. Bonds&rdquo; represented by Bloomberg U.S. Aggregate Bond Index. &ldquo;International Bonds&rdquo; represented by Bloomberg Global Aggregate ex US Index. &ldquo;Commodities&rdquo; represented by Bloomberg Commodity Index. Past performance is not indicative of future results. It is not possible to directly invest in an index. Index descriptions included at the end of this presentation. <strong>Digital assets are subject to significant risk and are not suitable for all investors. It is possible to lose your entire principal investment. </strong>Not intended as an offer or recommendation to buy or sell any assets referenced herein.</p>
<p>Gold continues to benefit from de-dollarization. Central bank accumulation, defense uncertainty in Europe and tariff policy volatility are driving demand for an alternative to the U.S. dollar. That said, I wouldn&rsquo;t add too much to gold at these levels. It&rsquo;s above its 200-day moving average, so while I remain long-term bullish, I wouldn&rsquo;t be surprised to see a bit of correction.</p>
<p>Bitcoin also remains a high-conviction holding in my view, despite its increased correlation with the Nasdaq in the post-COVID era. That makes the diversification case trickier, though not invalid. What&rsquo;s notable is that bitcoin now outperforms the Nasdaq over nearly every time period, despite recent volatility.</p>
<p><strong>How to Invest:</strong></p>
<ul class="content-list">
<li class="mt-2">Hold gold, but be ready for a pullback.</li>
<li class="mt-2">Maintain long-term exposure to bitcoin; adoption continues to grow for store of value and diversification.</li>
</ul>
<h2 id="semiconductors" class="jump-link-nav anchored-block" data-jumplink-title="Semiconductors">Semiconductors Attractively Valued After a Hard Reset</h2>
<p>Last summer, we warned that growth stocks&mdash;especially in tech&mdash;were extremely overvalued, and I called for reduced exposure. That view played out. Since then, growth has underperformed, and the market has begun to normalize.</p>
<p>Nvidia&rsquo;s forward P/E has dropped to around 20x, and after about a 30% correction, it now looks far more reasonable relative to its earnings trajectory.</p>
<h3>NVIDIA Valuations Now Reasonable</h3>
<div class="flourish-embed flourish-chart" data-src="visualisation/22586973?2428759"><script src="https://public.flourish.studio/resources/embed.js"></script><noscript><img loading="lazy" src="https://public.flourish.studio/visualisation/22586973/thumbnail" width="100%" alt="NVIDIA Valuations Now Reasonable" /></noscript></div>
<p class="chart-disclosure"><strong>Source: Bloomberg. </strong>Data as of April 4, 2025. The price-to-earnings ratio compares a company's share price with its earnings per share and is used to determine the relative value of a company's shares in side-by-side comparisons. Any projections, forecasts and other forward-looking statements are not indicative of actual results, are for illustrative purposes only, are valid as of the date of this communication, and are subject to change without notice. Please see important disclosures and definitions at the end of the presentation.</p>
<p><strong>How to Invest:</strong></p>
<ul class="content-list">
<li class="mt-2">Revisit semiconductors, which offer attractive value.</li>
<li class="mt-2">Seek exposure to AI Phase 2 infrastructure plays, including utilities and energy assets.</li>
</ul>
<h2 id="india" class="jump-link-nav anchored-block" data-jumplink-title="India">India: A Structural Growth Story with Stronger Momentum</h2>
<p>The global growth baton is being passed. As the U.S. tightens, Europe is adding fiscal stimulus and China is also stimulating. I believe India remains the most compelling, long-term macro growth story. Following a market correction in late 2024, I believe it&rsquo;s a good time to increase exposure.</p>
<p>India recently outperformed the S&amp;P 500, and while valuations are high, the P/E-to-growth ratio remains attractive. The Indian economy is not dependent on U.S. exports, and in fact, imports more than it exports. Its growth trajectory is powered by a rising middle class, a strong equity culture and its serving as a technology and services base for global corporations.</p>
<p><strong>How to Invest:</strong></p>
<ul class="content-list">
<li class="mt-2">Increase exposure to India. Its macro story remains intact following its Q4 2024 correction.</li>
<li class="mt-2">We favor exposure to growth sectors and digital innovation.</li>
</ul>
<h2>Key Takeaways</h2>
<ul class="content-list">
<li class="mt-2"><strong>Fiscal reckoning and recession risk:</strong> Stay diversified as markets adjust to a $1 trillion spending cut. Avoid concentrated U.S. equity bets and prepare for continued volatility.</li>
<li class="mt-2"><strong>Cautiously bullish gold and bitcoin:</strong> Maintain long-term positions in gold and bitcoin. Both remain key hedges amid fiscal instability and shifting global currency dynamics.</li>
<li class="mt-2"><strong>Semiconductors valuations normalize:</strong> Reengage selectively with growth and semiconductor stocks as prices reset. Consider energy and infrastructure as phase-two AI beneficiaries.</li>
<li class="mt-2"><strong>India attractive following correction:</strong> Increase exposure to India as a core, long-term allocation. The country&rsquo;s growth is domestically driven and less tied to U.S. economic cycles.</li>
</ul>
<p>To receive more <a href="https://www.vaneck.com/us/en/insights/investment-outlook/" title="Investment Outlook Insights"><strong>Investment Outlook</strong></a> insights, <a href="/link/5f45412c2143400497908cea2897f7d3.aspx" title=" Subscription Center"><strong>sign up in our subscription center</strong></a>.</p>
]]></content:encoded>
</item><item rdf:about="https://www.vaneck.com/us/en/blogs/income-investing/corporate-bonds-vs-municipal-bonds/">
  <title>Corporate vs. Municipal Bonds: Key Differences Every Investor Should Know></title>
  <link>https://www.vaneck.com/us/en/blogs/income-investing/corporate-bonds-vs-municipal-bonds/</link>
  <description><![CDATA[Compare corporate and municipal bonds, including risks, returns, and tax benefits. Learn which bond type fits your investment goals.]]></description>
  <dc:creator> </dc:creator>
  <dc:date>04/09/2025 06:30:00</dc:date>
<content:encoded><![CDATA[

<p id="corp-bonds-vs-munis" class="jump-link-nav anchored-block" data-jumplink-title="Corp Bonds vs. Munis">For financial advisors, institutional investors, and high-net-worth individuals, selecting the right fixed-income investments is critical for achieving income goals, managing risk, and optimizing tax efficiency. Corporate and municipal bonds are two of the most widely used bond types, each offering distinct advantages and trade-offs. While corporate bonds provide higher yields to compensate for credit risk, municipal bonds stand out for their tax-exempt status, making them particularly attractive to investors in higher tax brackets.</p>
<p>Corporate bonds are issued by companies to fund operations, expansions, or refinancing, with interest payments dependent on the issuer&rsquo;s financial health. Municipal bonds, on the other hand, are issued by state and local governments to finance public projects such as roads, schools, and utilities, often carrying lower credit risk due to government backing.</p>
<p>This article provides a side-by-side comparison of corporate and municipal bonds, helping investors make informed decisions based on their financial objectives, risk tolerance, and tax considerations.</p>
<h2>What Are Corporate Bonds?</h2>
<p>Corporate bonds are debt securities issued by companies to raise capital for various business needs, such as funding expansions, financing operations, or refinancing existing debt. These bonds are backed by the issuing company's ability to generate revenue and maintain financial stability. The creditworthiness of corporate bonds depends on the issuer&rsquo;s financial health, business performance, and credit rating.</p>
<p>Key Features of Corporate Bonds:</p>
<ul class="content-list">
<li class="mt-2"><strong>Higher Yields:</strong> Corporate bonds generally offer higher yields compared to municipal bonds to compensate for the additional credit risk. Yield levels vary depending on the issuer&rsquo;s credit rating, with investment-grade corporate bonds offering lower yields than high-yield (or "junk") bonds.</li>
<li class="mt-2"><strong>Credit and Default Risk:</strong> The biggest risk with corporate bonds is the possibility of the issuing company defaulting on its debt obligations. Bonds with lower credit ratings have a higher probability of default but offer more attractive yields.</li>
<li class="mt-2"><strong>Interest Rate Sensitivity:</strong> Like all fixed-income securities, corporate bonds are affected by interest rate fluctuations. Rising rates can negatively impact bond prices, while falling rates can boost their value.</li>
<li class="mt-2"><strong>Taxation:</strong> Unlike municipal bonds, interest income from corporate bonds is fully taxable at both federal and state levels, making them potentially less attractive to high-tax-bracket investors.</li>
</ul>
<h2>What Are Municipal Bonds?</h2>
<p>Municipal bonds (munis) are debt securities issued by state and local governments to finance public projects such as highways, schools, and utilities. These bonds provide investors with a way to earn steady income while supporting infrastructure development.</p>
<p>Types of Municipal Bonds:</p>
<ul class="content-list">
<li class="mt-2"><strong>General Obligation (GO) Bonds:</strong> Backed by the full faith and credit of the issuing government, these bonds are typically repaid through taxation.</li>
<li class="mt-2"><strong>Revenue Bonds:</strong> Secured by the revenue generated from a specific project, such as toll roads or public utilities, rather than general tax revenues.</li>
</ul>
<p>Key Features of Municipal Bonds:</p>
<ul class="content-list">
<li class="mt-2"><strong>Lower Default Risk:</strong> High-grade municipal bonds, especially GO bonds, tend to have lower default rates than corporate bonds due to their government backing.</li>
<li class="mt-2"><strong>Tax Advantages:</strong> Most municipal bond interest income is federally tax-exempt and, in many cases, state-tax-free if the investor resides in the issuing state. This tax-exempt status can make them particularly attractive to investors in high-income tax brackets.</li>
<li class="mt-2"><strong>Lower Yields:</strong> Because of their tax benefits, municipal bonds typically offer lower yields than corporate bonds. However, their tax-equivalent yield may be competitive for certain investors.</li>
</ul>

<h3 id="key-differences" class="jump-link-nav anchored-block" data-jumplink-title="Key differences">Key Differences Between Corporate and Municipal Bonds</h3>
<div class="wrapped-div">
<table style="width: 100%;">
<tbody>
<tr class="tbl-data">
<td class="tbl-header last">Feature</td>
<td class="tbl-header last">Corporate Bonds</td>
<td class="tbl-header last">Municipal Bonds</td>
</tr>
<tr class="tbl-data">
<td class="data-td data last text-left">Issuer</td>
<td class="data-td data last text-left">Corporations</td>
<td class="data-td data last text-left">State &amp; local governments</td>
</tr>
<tr class="tbl-data">
<td class="data-td data last text-left">Credit Risk</td>
<td class="data-td data last text-left">Higher (depends on issuer)</td>
<td class="data-td data last text-left">Lower (especially GO bonds)</td>
</tr>
<tr class="tbl-data">
<td class="data-td data last text-left">Interest Rates</td>
<td class="data-td data last text-left">Higher to compensate for credit risk</td>
<td class="data-td data last text-left">Lower due to tax advantages</td>
</tr>
<tr class="tbl-data">
<td class="data-td data last text-left">Tax Treatment</td>
<td class="data-td data last text-left">Fully taxable</td>
<td class="data-td data last text-left">Often tax-exempt (federal and state)</td>
</tr>
<tr class="tbl-data">
<td class="data-td data last text-left">Investor Suitability</td>
<td class="data-td data last text-left">Investors seeking higher returns</td>
<td class="data-td data last text-left">Investors in high tax brackets seeking tax efficiency</td>
</tr>
</tbody>
</table>
</div>
<br />
<p>While corporate bonds typically offer higher returns, municipal bonds can be a more tax-efficient choice for certain investors. Understanding these differences can help investors tailor their fixed-income strategies to their financial goals and tax situations.</p>
<h2 id="taxes" class="jump-link-nav anchored-block" data-jumplink-title="Taxes">Tax Considerations</h2>
<p>One of the most important distinctions between corporate and municipal bonds is taxation. Corporate bond interest is subject to both federal and state taxes, while most municipal bond interest is exempt from federal taxes and may also be state-tax-free for residents of the issuing state.</p>
<p>Example:</p>
<ul class="content-list">
<li class="mt-2">A corporate bond with a 5% yield provides a fully taxable return.</li>
<li class="mt-2">A municipal bond with a 3.5% tax-free yield may provide a higher after-tax return for an investor in a high tax bracket.</li>
</ul>
<p>For high-tax-bracket investors, municipal bonds can be particularly appealing, as their after-tax returns may outperform those of corporate bonds with higher stated yields. However, corporate bonds may still be preferable for investors seeking higher overall income or those in lower tax brackets.</p>
<h2 id="risk-and-returns" class="jump-link-nav anchored-block" data-jumplink-title="Risk and Returns">Risk and Return Trade-Offs</h2>
<p><strong>Corporate Bonds</strong></p>
<p>Corporate bonds offer higher potential returns than municipal bonds but carry greater credit and default risk, especially in the high-yield segment. The creditworthiness of corporate bonds depends on the financial health of the issuing company, making them more vulnerable to economic downturns, industry disruptions, and company-specific challenges.</p>
<ul class="content-list">
<li class="mt-2"><strong>Investment-grade corporate bonds</strong> (rated BBB- or higher) provide a balance of yield and stability, making them a suitable option for income-focused investors with moderate risk tolerance.</li>
<li class="mt-2"><strong>High-yield corporate bonds</strong> (rated BB+ or lower) offer significantly higher interest rates but come with an increased risk of default. These bonds are more speculative and tend to perform well when economic growth is strong but may suffer during recessions.</li>
<li class="mt-2"><strong>Sensitivity to economic conditions:</strong> Corporate bonds are directly influenced by corporate earnings, economic growth, and interest rate changes. A strong economy generally supports corporate profitability, reducing default risk, while economic contractions can lead to higher corporate defaults and wider credit spreads.</li>
</ul>
<p><strong>Municipal Bonds</strong></p>
<p>Municipal bonds are generally considered more stable than corporate bonds, particularly during times of economic uncertainty. Since they are issued by state and local governments, they often benefit from predictable tax revenue streams, reducing default risk compared to corporate issuers.</p>
<ul class="content-list">
<li class="mt-2"><strong>Lower default rates:</strong> Historically, municipal bonds&mdash;especially investment-grade general obligation (GO) bonds&mdash;have had lower default rates than corporate bonds. GO bonds are backed by the taxing authority of the issuing government, making them particularly secure. Revenue bonds, which are supported by specific project revenues (such as toll roads or utilities), carry slightly more risk but still tend to be more stable than corporate debt.</li>
<li class="mt-2"><strong>Tax advantages:</strong> The primary appeal of municipal bonds is their tax-exempt status. Many municipal bonds are exempt from federal taxes and, in some cases, state and local taxes. This makes them particularly attractive to high-income investors in higher tax brackets.</li>
<li class="mt-2"><strong>Resilience during market downturns:</strong> Municipal bonds tend to hold up well during recessions, as government issuers can often adjust tax policies or receive federal support to meet their debt obligations. They are less tied to corporate earnings, making them a safer option for conservative investors seeking steady income.</li>
</ul>
<p>While corporate bonds may provide higher yields, municipal bonds offer tax efficiency and lower volatility, making them a strong choice for risk-averse investors or those in higher tax brackets looking to optimize after-tax income.</p>
<h2 id="what-works-best-for-you" class="jump-link-nav anchored-block" data-jumplink-title="What works best for you?">Who Should Invest in Corporate vs. Municipal Bonds?</h2>
<p>Corporate Bonds are ideal for:</p>
<ul class="content-list">
<li class="mt-2">Investors seeking higher yields and are comfortable with taking on more credit risk.</li>
<li class="mt-2">Those in lower tax brackets where the tax impact is less significant.</li>
<li class="mt-2">Investors looking for corporate exposure to diversify their fixed-income holdings.</li>
</ul>
<p>Municipal Bonds are ideal for:</p>
<ul class="content-list">
<li class="mt-2">High-net-worth individuals and investors in high tax brackets looking for tax-free income.</li>
<li class="mt-2">Conservative investors seeking stable, lower-risk fixed-income investments.</li>
<li class="mt-2">Those interested in supporting public infrastructure projects.</li>
</ul>
<p>A well-balanced portfolio can include both corporate and municipal bonds to optimize returns while managing risk and tax efficiency.</p>
<h2>Choosing the Right Bonds for Your Portfolio</h2>
<p>Investors must evaluate their financial goals, risk tolerance, and tax situation when deciding between corporate and municipal bonds. There is no universally superior option&mdash;the right choice depends on individual needs.</p>
<p>Key Takeaways:</p>
<ul class="content-list">
<li class="mt-2">Corporate bonds typically offer higher yields but come with more credit risk and are fully taxable.</li>
<li class="mt-2">Municipal bonds provide tax-exempt income and lower risk but generally offer lower yields.</li>
<li class="mt-2">When constructing a fixed-income portfolio, investors should assess their tax brackets, income goals, and risk appetite.</li>
</ul>
<p>For those looking to explore investment options in corporate or municipal bonds, VanEck offers a range of solutions designed to provide diversified exposure to both markets. Learn more about <a href="https://www.vaneck.com/us/en/etf-mutual-fund-finder/etfs/income/corporate-bond/overview/" title="ETF and Mutual Fund Finder"><strong>VanEck&rsquo;s corporate bond strategies</strong></a> and <a href="https://www.vaneck.com/us/en/etf-mutual-fund-finder/etfs/income/municipal-bond/overview/" title="ETF and Mutual Fund Finder"><strong>municipal bond ETFs</strong></a> to find the right fit for your investment strategy.</p>
<h3>VanEck Corporate and Municipal Bond ETFs</h3>
<div class="wrapped-div">
<table style="width: 100%;">
<tbody>
<tr class="tbl-data">
<td class="tbl-header last">&nbsp;</td>
<td class="tbl-header last">Name</td>
<td class="tbl-header last">Symbol</td>
<td class="tbl-header last">Exposure</td>
</tr>
<tr class="tbl-data">
<td class="tbl-header last" style="border-top: 1px solid #b2b3b2;" rowspan="7">Corporate Bond</td>
<td class="data-td data last" style="text-align: left;"><a href="https://www.vaneck.com/us/en/investments/bdc-income-etf-bizd/overview/" title="BIZD - VanEck BDC Income ETF - Holdings and Performance"><strong>BDC Income ETF</strong></a></td>
<td class="data-td data last" style="text-align: left;"><strong><a href="https://www.vaneck.com/us/en/investments/bdc-income-etf-bizd/overview/" title="BIZD - VanEck BDC Income ETF - Holdings and Performance">BIZD</a></strong></td>
<td class="data-td data last" style="text-align: left;">Publicly traded business development companies.</td>
</tr>
<tr class="tbl-data">
<td class="data-td data last" style="text-align: left;"><a href="https://www.vaneck.com/us/en/investments/clo-etf-cloi/overview/" title="CLOI - VanEck CLO ETF - Holdings and Performance"><strong>CLO ETF</strong></a></td>
<td class="data-td data last" style="text-align: left;"><strong><a href="https://www.vaneck.com/us/en/investments/clo-etf-cloi/overview/" title="CLOI - VanEck CLO ETF - Holdings and Performance">CLOI</a></strong></td>
<td class="data-td data last" style="text-align: left;">Investment grade-rated tranches of CLOs of any maturity.</td>
</tr>
<tr class="tbl-data">
<td class="data-td data last" style="text-align: left;"><a href="https://www.vaneck.com/us/en/investments/aa-bb-clo-etf-clob/overview/" title="CLOB - VanEck AA-BB CLO ETF - Holdings and Performance"><strong>AA-BB CLO ETF</strong></a></td>
<td class="data-td data last" style="text-align: left;"><strong><a href="https://www.vaneck.com/us/en/investments/aa-bb-clo-etf-clob/overview/" title="CLOB - VanEck AA-BB CLO ETF - Holdings and Performance">CLOB</a></strong></td>
<td class="data-td data last" style="text-align: left;">AA to BB rated tranches of CLOs of any maturity.</td>
</tr>
<tr class="tbl-data">
<td class="data-td data last" style="text-align: left;"><strong><a href="https://www.vaneck.com/us/en/investments/ig-floating-rate-etf-fltr/overview/" title="FLTR - VanEck IG Floating Rate ETF - Holdings and Performance">IG Floating Rate ETF</a></strong></td>
<td class="data-td data last" style="text-align: left;"><strong><a href="https://www.vaneck.com/us/en/investments/ig-floating-rate-etf-fltr/overview/" title="FLTR - VanEck IG Floating Rate ETF - Holdings and Performance">FLTR</a></strong></td>
<td class="data-td data last" style="text-align: left;">U.S. dollar denominated floating rate notes issued by corporate issuers and rated investment grade.</td>
</tr>
<tr class="tbl-data">
<td class="data-td data last" style="text-align: left;"><strong><a href="https://www.vaneck.com/us/en/investments/angel-high-yield-bond-etf-angl/overview/" title="ANGL - VanEck Fallen Angel High Yield Bond ETF - Holdings and Performance">Fallen Angel High Yield Bond ETF</a></strong></td>
<td class="data-td data last" style="text-align: left;"><strong><a href="https://www.vaneck.com/us/en/investments/angel-high-yield-bond-etf-angl/overview/" title="ANGL - VanEck Fallen Angel High Yield Bond ETF - Holdings and Performance">ANGL</a></strong></td>
<td class="data-td data last" style="text-align: left;">Below investment grade corporate bonds denominated in U.S. dollars, issued in the U.S. domestic market and that were rated investment grade at the time of issuance.</td>
</tr>
<tr class="tbl-data">
<td class="data-td data last" style="text-align: left;"><strong><a href="https://www.vaneck.com/us/en/investments/moodys-analytics-bbb-corporate-bond-etf-mbbb/overview/" title="MBBB - VanEck Moody&rsquo;s Analytics BBB Corporate Bond ETF - Holdings and Performance">Moody&rsquo;s Analytics BBB Corporate Bond ETF</a></strong></td>
<td class="data-td data last" style="text-align: left;"><strong><a href="https://www.vaneck.com/us/en/investments/moodys-analytics-bbb-corporate-bond-etf-mbbb/overview/" title="MBBB - VanEck Moody&rsquo;s Analytics BBB Corporate Bond ETF - Holdings and Performance">MBBB</a></strong></td>
<td class="data-td data last" style="text-align: left;">BBB rated corporate bonds that have attractive valuations and a lower probability of being downgraded to high yield compared to other BBB rated bonds.</td>
</tr>
<tr class="tbl-data">
<td class="data-td data last" style="text-align: left;"><strong><a href="https://www.vaneck.com/us/en/investments/moodys-analytics-ig-corporate-bond-etf-mig/overview/" title="MIG - VanEck Moody&rsquo;s Analytics IG Corporate Bond ETF - Holdings and Performance">Moody&rsquo;s Analytics IG Corporate Bond ETF</a></strong></td>
<td class="data-td data last" style="text-align: left;"><strong><a href="https://www.vaneck.com/us/en/investments/moodys-analytics-ig-corporate-bond-etf-mig/overview/" title="MIG - VanEck Moody&rsquo;s Analytics IG Corporate Bond ETF - Holdings and Performance">MIG</a></strong></td>
<td class="data-td data last" style="text-align: left;">Investment grade corporate bonds that have attractive valuations and a lower probability of being downgraded to high yield compared to other investment grade bonds.</td>
</tr>
<tr class="tbl-data">
<td class="tbl-header last" style="border-top: 1px solid #b2b3b2;" rowspan="6">Municipal Bond</td>
<td class="data-td data last" style="text-align: left;"><strong><a href="https://www.vaneck.com/us/en/investments/cef-municipal-income-etf-xmpt/overview/" title="XMPT - VanEck CEF Muni Income ETF - Holdings and Performance">CEF Muni Income ETF</a></strong></td>
<td class="data-td data last" style="text-align: left;"><strong><a href="https://www.vaneck.com/us/en/investments/cef-municipal-income-etf-xmpt/overview/" title="XMPT - VanEck CEF Muni Income ETF - Holdings and Performance">XMPT</a></strong></td>
<td class="data-td data last" style="text-align: left;">U.S.-listed closed-end funds that invest in U.S. dollar denominated tax-exempt market.</td>
</tr>
<tr class="tbl-data">
<td class="data-td data last" style="text-align: left;"><strong><a href="https://www.vaneck.com/us/en/investments/high-yield-muni-etf-hyd/overview/" title="HYD - VanEck High Yield Muni ETF - Holdings and Performance">High Yield Muni ETF</a></strong></td>
<td class="data-td data last" style="text-align: left;"><strong><a href="https://www.vaneck.com/us/en/investments/high-yield-muni-etf-hyd/overview/" title="HYD - VanEck High Yield Muni ETF - Holdings and Performance">HYD</a></strong></td>
<td class="data-td data last" style="text-align: left;">U.S. dollar denominated high yield long-term tax-exempt bond market.</td>
</tr>
<tr class="tbl-data">
<td class="data-td data last" style="text-align: left;"><strong><a href="https://www.vaneck.com/us/en/investments/intermediate-muni-etf-itm/overview/" title="ITM - VanEck Intermediate Muni ETF - Holdings and Performance">Intermediate Muni ETF</a></strong></td>
<td class="data-td data last" style="text-align: left;"><strong><a href="https://www.vaneck.com/us/en/investments/intermediate-muni-etf-itm/overview/" title="ITM - VanEck Intermediate Muni ETF - Holdings and Performance">ITM</a></strong></td>
<td class="data-td data last" style="text-align: left;">U.S. dollar denominated intermediate-term tax-exempt bond market.</td>
</tr>
<tr class="tbl-data">
<td class="data-td data last" style="text-align: left;"><strong><a href="https://www.vaneck.com/us/en/investments/long-muni-etf-mln/overview/" title="MLN - VanEck Long Muni ETF - Holdings and Performance">Long Muni ETF</a></strong></td>
<td class="data-td data last" style="text-align: left;"><strong><a href="https://www.vaneck.com/us/en/investments/long-muni-etf-mln/overview/" title="MLN - VanEck Long Muni ETF - Holdings and Performance">MLN</a></strong></td>
<td class="data-td data last" style="text-align: left;">U.S. dollar denominated long-term tax-exempt bond market.</td>
</tr>
<tr class="tbl-data">
<td class="data-td data last" style="text-align: left;"><strong><a href="https://www.vaneck.com/us/en/investments/short-high-yield-muni-etf-shyd/overview/" title="SHYD - VanEck Short High Yield Muni ETF - Holdings and Performance">Short High Yield Muni ETF</a></strong></td>
<td class="data-td data last" style="text-align: left;"><strong><a href="https://www.vaneck.com/us/en/investments/short-high-yield-muni-etf-shyd/overview/" title="SHYD - VanEck Short High Yield Muni ETF - Holdings and Performance">SHYD</a></strong></td>
<td class="data-td data last" style="text-align: left;">U.S. dollar denominated high yield short-term tax-exempt bond market.</td>
</tr>
<tr class="tbl-data">
<td class="data-td data last" style="text-align: left;"><a href="https://www.vaneck.com/us/en/investments/short-muni-etf-smb/overview/" title="SMB - VanEck Short Muni ETF - Holdings and Performance"><strong>Short Muni ETF</strong></a></td>
<td class="data-td data last" style="text-align: left;"><strong><a href="https://www.vaneck.com/us/en/investments/short-muni-etf-smb/overview/" title="SMB - VanEck Short Muni ETF - Holdings and Performance">SMB</a></strong></td>
<td class="data-td data last" style="text-align: left;">U.S. dollar denominated short-term tax-exempt bond market.</td>
</tr>
</tbody>
</table>
</div>
<p>To receive more <a href="/us/en/blogs/income-investing/" title="Income Investing Insights"><strong>Income Investing</strong></a> insights, <a href="/link/5f45412c2143400497908cea2897f7d3.aspx" title=" Subscription Center"><strong>sign up in our subscription center</strong></a>.</p>
]]></content:encoded>
</item><item rdf:about="https://www.vaneck.com/us/en/blogs/income-investing/corporate-bond-market-trends-and-insights-a-2025-investors-guide/">
  <title>Corporate Bond Market Trends and Insights: A 2025 Investor’s Guide></title>
  <link>https://www.vaneck.com/us/en/blogs/income-investing/corporate-bond-market-trends-and-insights-a-2025-investors-guide/</link>
  <description><![CDATA[Stay ahead in 2025 with VanEck's comprehensive analysis of corporate bond market trends, rates, and investment strategies tailored for institutional investors, financial advisors, and economists.]]></description>
  <dc:creator> </dc:creator>
  <dc:date>04/09/2025 06:30:00</dc:date>
<content:encoded><![CDATA[

<h2>Corporate Bond Market Trends and Insights: A 2025 Investor&rsquo;s Guide</h2>
<p>The corporate bond market is entering 2025 amid a backdrop of economic and policy uncertainty, shifting investor sentiment, and significant issuance trends.</p>
<p>With 2024 in the rearview mirror, it is evident that the past year unfolded differently than many market participants had anticipated. At the start of 2024, recession risks loomed large, and consensus forecasts predicted weaker equity performance alongside wider credit spreads. However, the U.S. economy demonstrated resilience, defying expectations with continued expansion and strong risk asset performance. The S&amp;P 500 Index surged, delivering impressive returns, while investment-grade and high-yield spreads tightened to multi-year lows.</p>
<p>In this outlook, we examine the key trends shaping corporate bonds in 2025, including interest rate movements, investor sentiment, and strategies for navigating the evolving market landscape.</p>
<h2 id="overview" class="jump-link-nav anchored-block" data-jumplink-title="Overview">Overview of the 2025 Corporate Bond Market</h2>
<p>With 2025 well underway, credit spreads remained relatively tight, only widening over the last few weeks given the macro uncertainty and consumer sentiment. In addition, the underlying fundamentals and technical conditions in credit markets continue to support valuations. That said, as the market has recently witnessed, potential shifts in fiscal and monetary policy, along with evolving macroeconomic conditions, are likely to create periods of sharp volatility as the year progresses.</p>
<p>Issuance is expected to remain strong in 2025, following a banner year in 2024 in which investment-grade bond issuers garnered around $1.5 trillion, up nearly 24% from 2023, according to the Securities Industry and Financial Markets Association (SIFMA). Meanwhile, sales of high-yield notes lured $302 billion, well above $183.6 billion in total issuance in the prior year.<sup>1</sup></p>
<h2 id="key-trends" class="jump-link-nav anchored-block" data-jumplink-title="Key Trends">Key Trends Shaping the Corporate Bond Market in 2025</h2>
<p>Several pivotal trends are influencing the corporate bond market in 2025. Investors must stay informed on these developments to make well-calibrated decisions.</p>
<p><strong>Attractive All-In Yields: Corporate Bonds Offer More Than Cash</strong></p>
<p>One of the defining features of the 2025 corporate bond market is its attractive all-in yields. With corporate bond yields surpassing the yields of cash and money market instruments, investors are finding a compelling case to deploy cash into floating rate instruments with very limited duration and/or take some risk by adding duration to their portfolios. The current environment provides an opportunity to lock in yields at historically high levels while balancing duration risk with appropriate credit exposure.</p>
<p><strong>Tight Spread Environment</strong></p>
<p>Despite economic uncertainties, corporate bond spreads remain relatively tight, indicating strong investor demand and confidence in corporate credit quality. Investment-grade and high-yield spreads have compressed, reflecting both the resilience of corporate balance sheets and limited concerns about widespread defaults. This low-spread environment presents a favorable climate for issuers but requires investors to be selective, as tighter spreads reduce the buffer for risk-adjusted returns.</p>
<p><strong>Interest Rate Volatility and Yield Curve Normalization</strong></p>
<p>The Federal Reserve's policy stance continues to influence corporate bond market dynamics, with expectations of "higher for longer" interest rates keeping investors cautious. Rate volatility remains a key theme, impacting bond valuations and portfolio positioning. While parts of the yield curve have started to normalize, the market remains sensitive to inflation data and central bank guidance. Investors must navigate these shifts by balancing duration exposure and diversifying across credit qualities and maturities.</p>

<h2 id="investment-strategies" class="jump-link-nav anchored-block" data-jumplink-title="Investment Strategies">Investment Strategies for Corporate Bonds in 2025</h2>
<p><strong>Should Investors Favor Investment-Grade or High-Yield Bonds?</strong></p>
<p>Investment-grade (IG) and high-yield (HY) bonds serve different roles in a portfolio, with distinct risk-return profiles. IG bonds are issued by companies with strong credit ratings (BBB- or higher by S&amp;P and Baa3 or higher by Moody&rsquo;s), offering lower yields but greater stability and lower default risk. These bonds are favored by conservative investors seeking predictable income and capital preservation, particularly in uncertain economic environments.</p>
<p>In contrast, HY bonds&mdash;often referred to as &ldquo;junk bonds&rdquo;&mdash;are issued by companies with lower credit ratings (BB+ or lower by S&amp;P and Ba1 or lower by Moody&rsquo;s). They offer higher yields to compensate for increased credit risk, making them attractive to investors willing to take on more risk in pursuit of greater returns. HY bonds can outperform in strong economic conditions but are more vulnerable during downturns.</p>
<p>Investors must weigh credit risk, interest rate trends, and economic conditions when deciding between IG and HY bonds, with a balanced approach often providing diversification benefits.</p>
<h2 id="top-funds" class="jump-link-nav anchored-block" data-jumplink-title="Top Funds">Top-Rated Corporate Bond Funds for 2025</h2>
<p>The <a href="https://www.vaneck.com/us/en/investments/moodys-analytics-ig-corporate-bond-etf-mig/overview/" title="MIG - VanEck Moody's Analytics IG Corporate Bond ETF - Overview"><strong>VanEck Moody&rsquo;s Analytics IG Corporate Bond ETF (MIG)</strong></a> seeks to track, as closely as possible, before fees and expenses, the price and yield performance of the MVIS<sup>&reg;</sup>&nbsp;Moody&rsquo;s Analytics<sup>&reg;</sup>&nbsp;US Investment Grade Corporate Bond Index while the <a href="https://www.vaneck.com/us/en/investments/moodys-analytics-bbb-corporate-bond-etf-mbbb/overview/" title="MBBB - VanEck Moody's Analytics BBB Corporate Bond ETF - Overview"><strong>VanEck Moody&rsquo;s Analytics BBB Corporate Bond ETF (MBBB)</strong></a> seeks to track, as closely as possible, before fees and expenses, the price and yield performance of the MVIS<sup>&reg;</sup>&nbsp;Moody&rsquo;s Analytics<sup>&reg;</sup>&nbsp;US BBB Corporate Bond Index.</p>
<p>These indices identify the most attractively valued bonds based on their market spread relative to their fair value, a metric calculated by Moody&rsquo;s Analytics. There is a significant dispersion of credit risk pricing within the corporate bond market, which offers the ability to build diversified portfolios with alpha potential, and Moody&rsquo;s Analytics is the industry leader in credit risk modeling. Their models have won numerous industry awards, and over 1,000 of the world&rsquo;s largest institutional investors (including banks, insurance companies, government institutions, and asset managers) use their models to power credit risk and portfolio management decision-making.</p>
<p>A model is only as good as its inputs and the assumptions that underlie it, and we believe that the quality and coverage of Moody&rsquo;s Analytics data and the extensive research capabilities and resources dedicated to supporting the model have contributed to Moody&rsquo;s Analytics industry-leading role.</p>
<p>For investors seeking an allocation to high-yield bonds, the <strong><a href="https://www.vaneck.com/us/en/investments/angel-high-yield-bond-etf-angl/overview/" title="ANGL - VanEck Fallen Angel High Yield Bond ETF - Overview">VanEck<sup>&reg;</sup>&nbsp;Fallen Angel High Yield Bond ETF (ANGL<sup>&reg;</sup>)</a></strong> offers exposure to &ldquo;fallen angels,&rdquo; which are bonds that were originally issued with investment-grade ratings but later downgraded to non-investment grade or high yield. They are part of the overall high-yield universe, but unique in that they were not originally issued with high-yield ratings, which is the case for approximately 87% of the overall market.<sup>2</sup>&nbsp;The unique value proposition of fallen angel bonds originates from the crossover between two distinct markets: the investment grade market and the high yield market. These markets have two different investor bases with unique objectives, risk constraints, and investment policy statements. As a result, the crossover from investment grade to high yield can have an impact on a bond's value since investment grade investors who cannot or will not, hold a high yield bond must sell it in the marketplace.</p>
<p><strong><a href="https://www.vaneck.com/us/en/investments/ig-floating-rate-etf-fltr/overview/" title="FLTR - VanEck IG Floating Rate ETF - Overview">VanEck IG Floating Rate ETF (FLTR<sup>&reg;</sup>)</a></strong> is ideal for investors who are looking for protection from interest rate uncertainty that floating rate notes can provide. FLTR offers exposure to U.S. dollar-denominated, investment-grade floating rate notes issued by corporate entities. These securities have variable interest payments that adjust periodically based on prevailing short-term interest rates, making them less sensitive to interest rate fluctuations compared to fixed-rate bonds. The ETF primarily invests in investment-grade securities, with a significant portion rated 'A'. This focus on higher-quality bonds aims to reduce credit risk. FLTR may be suitable for investors seeking to mitigate interest rate risk while earning income from investment-grade corporate bonds.</p>
<h2 id="risks-and-challenges" class="jump-link-nav anchored-block" data-jumplink-title="Risks and Challenges">Risks and Challenges in the Corporate Bond Market</h2>
<p>While corporate bonds remain an attractive asset class, investors must navigate key risks that could impact performance in 2025.</p>
<ol class="content-list">
<li class="mt-2"><strong>Challenging Market for Alpha Generation</strong>
<p>The corporate bond market is vast and highly liquid, making it difficult for investors to consistently generate alpha. With thousands of issuers across various sectors and credit qualities, selecting the right mix of bonds that can outperform the broader market is a challenge. Passive investment strategies may provide broad exposure but limit return potential, while active managers must rely on deep credit research and tactical positioning to differentiate their portfolios.</p>
</li>
<li class="mt-2"><strong>Risk of Spread Widening</strong>
<p>Despite the current low-spread environment, there is always the potential for spread widening due to macroeconomic shocks, deteriorating corporate fundamentals, or a shift in investor sentiment. If spreads widen significantly, bond prices could decline, leading to mark-to-market losses for investors. High-yield bonds, in particular, are more vulnerable to spread movements, as risk premiums can rise sharply in periods of uncertainty. Investors need to be mindful of credit selection and ensure their portfolios are resilient to spread volatility.</p>
</li>
</ol>
<h2>Final Insights</h2>
<p>As 2025 unfolds, corporate bonds continue to play a critical role in investor portfolios, offering compelling yields, diversification benefits, and a balance between risk and return. The market remains supported by strong technical and fundamental factors, with tight credit spreads reflecting robust demand. However, investors must be prepared for potential volatility, particularly in response to macroeconomic shifts, interest rate policy changes, and geopolitical developments.</p>
<p>Key themes such as attractive all-in yields, the low-spread environment, and interest rate normalization will shape investment opportunities this year. While investment-grade bonds provide stability and steady income, high-yield bonds offer higher return potential for those willing to take on greater risk. Careful credit selection and portfolio diversification will be crucial in managing the challenge of spread widening and maintaining resilience in a complex market.</p>
<p>Looking ahead, active risk management, strategic asset allocation, and a focus on high-quality corporate debt can help investors capitalize on opportunities while mitigating downside risks. By staying informed and adapting to evolving market conditions, institutional investors and financial advisors can position themselves for success in 2025&rsquo;s dynamic corporate bond landscape.</p>
<h3>VanEck Corporate and Floating Rate ETFs</h3>
<div class="wrapped-div">
<table style="width: 100%;">
<tbody>
<tr class="tbl-data">
<td class="tbl-header last">&nbsp;</td>
<td class="tbl-header last">Name</td>
<td class="tbl-header last">Symbol</td>
<td class="tbl-header last">Exposure</td>
</tr>
<tr class="tbl-data">
<td class="tbl-header last" style="border-top: 1px solid #b2b3b2;" rowspan="4">Floating Rate</td>
<td class="data-td data last" style="text-align: left;"><a href="https://www.vaneck.com/us/en/investments/bdc-income-etf-bizd/overview/" title="BIZD - VanEck BDC Income ETF - Overview"><strong>BDC Income ETF</strong></a></td>
<td class="data-td data last" style="text-align: left;"><strong><a href="https://www.vaneck.com/us/en/investments/bdc-income-etf-bizd/overview/" title="BIZD - VanEck BDC Income ETF - Overview">BIZD</a></strong></td>
<td class="data-td data last" style="text-align: left;">Publicly traded business development companies.</td>
</tr>
<tr class="tbl-data">
<td class="data-td data last" style="text-align: left;"><a href="https://www.vaneck.com/us/en/investments/clo-etf-cloi/overview/" title="CLOI - VanEck CLO ETF - Overview"><strong>CLO ETF</strong></a></td>
<td class="data-td data last" style="text-align: left;"><strong><a href="https://www.vaneck.com/us/en/investments/clo-etf-cloi/overview/" title="CLOI - VanEck CLO ETF - Overview">CLOI</a></strong></td>
<td class="data-td data last" style="text-align: left;">Investment grade-rated tranches of CLOs of any maturity.</td>
</tr>
<tr class="tbl-data">
<td class="data-td data last" style="text-align: left;"><a href="https://www.vaneck.com/us/en/investments/aa-bb-clo-etf-clob/overview/" title="CLOB - VanEck AA-BB CLO ETF - Overview"><strong>AA-BB CLO ETF</strong></a></td>
<td class="data-td data last" style="text-align: left;"><strong><a href="https://www.vaneck.com/us/en/investments/aa-bb-clo-etf-clob/overview/" title="CLOB - VanEck AA-BB CLO ETF - Overview">CLOB</a></strong></td>
<td class="data-td data last" style="text-align: left;">AA to BB rated tranches of CLOs of any maturity.</td>
</tr>
<tr class="tbl-data">
<td class="data-td data last" style="text-align: left;"><strong><a href="https://www.vaneck.com/us/en/investments/ig-floating-rate-etf-fltr/overview/" title="FLTR - VanEck IG Floating Rate ETF - Overview">IG Floating Rate ETF</a></strong></td>
<td class="data-td data last" style="text-align: left;"><strong><a href="https://www.vaneck.com/us/en/investments/ig-floating-rate-etf-fltr/overview/" title="FLTR - VanEck IG Floating Rate ETF - Overview">FLTR</a></strong></td>
<td class="data-td data last" style="text-align: left;">U.S. dollar denominated floating rate notes issued by corporate issuers and rated investment grade.</td>
</tr>
<tr class="tbl-data">
<td class="tbl-header last" style="border-top: 1px solid #b2b3b2;" rowspan="3">Corporate Bond</td>
<td class="data-td data last" style="text-align: left;"><strong><a href="https://www.vaneck.com/us/en/investments/angel-high-yield-bond-etf-angl/overview/" title="ANGL - VanEck Fallen Angel High Yield Bond ETF - Overview">Fallen Angel High Yield Bond ETF</a></strong></td>
<td class="data-td data last" style="text-align: left;"><strong><a href="https://www.vaneck.com/us/en/investments/angel-high-yield-bond-etf-angl/overview/" title="ANGL - VanEck Fallen Angel High Yield Bond ETF - Overview">ANGL</a></strong></td>
<td class="data-td data last" style="text-align: left;">Below investment grade corporate bonds denominated in U.S. dollars, issued in the U.S. domestic market and that were rated investment grade at the time of issuance.</td>
</tr>
<tr class="tbl-data">
<td class="data-td data last" style="text-align: left;"><strong><a href="https://www.vaneck.com/us/en/investments/moodys-analytics-bbb-corporate-bond-etf-mbbb/overview/" title="MBBB - VanEck Moody&rsquo;s Analytics BBB Corporate Bond ETF - Overview">Moody&rsquo;s Analytics BBB Corporate Bond ETF</a></strong></td>
<td class="data-td data last" style="text-align: left;"><strong><a href="https://www.vaneck.com/us/en/investments/moodys-analytics-bbb-corporate-bond-etf-mbbb/overview/" title="MBBB - VanEck Moody&rsquo;s Analytics BBB Corporate Bond ETF - Overview">MBBB</a></strong></td>
<td class="data-td data last" style="text-align: left;">BBB rated corporate bonds that have attractive valuations and a lower probability of being downgraded to high yield compared to other BBB rated bonds.</td>
</tr>
<tr class="tbl-data">
<td class="data-td data last" style="text-align: left;"><strong><a href="https://www.vaneck.com/us/en/investments/moodys-analytics-ig-corporate-bond-etf-mig/overview/" title="MIG - VanEck Moody&rsquo;s Analytics IG Corporate Bond ETF - Overview">Moody&rsquo;s Analytics IG Corporate Bond ETF</a></strong></td>
<td class="data-td data last" style="text-align: left;"><strong><a href="https://www.vaneck.com/us/en/investments/moodys-analytics-ig-corporate-bond-etf-mig/overview/" title="MIG - VanEck Moody&rsquo;s Analytics IG Corporate Bond ETF - Overview">MIG</a></strong></td>
<td class="data-td data last" style="text-align: left;">Investment grade corporate bonds that have attractive valuations and a lower probability of being downgraded to high yield compared to other investment grade bonds.</td>
</tr>
</tbody>
</table>
</div>
<p>To receive more <a href="/us/en/blogs/income-investing/" title="Income Investing Insights"><strong>Income Investing</strong></a> insights, <a href="/link/5f45412c2143400497908cea2897f7d3.aspx" title=" Subscription Center"><strong>sign up in our subscription center</strong></a>.</p>
]]></content:encoded>
</item><item rdf:about="https://www.vaneck.com/us/en/blogs/natural-resources/commodities-powerful-start-amid-global-shifts/">
  <title>Commodities’ Powerful Start Amid Global Shifts></title>
  <link>https://www.vaneck.com/us/en/blogs/natural-resources/commodities-powerful-start-amid-global-shifts/</link>
  <description><![CDATA[Commodities delivered strong gains in Q1, fueled by a weaker U.S. dollar and global tensions. All major sectors advanced, signifying commodities are well-positioned for ongoing volatility.]]></description>
  <dc:creator>Roland Morris</dc:creator>
  <dc:date>04/08/2025 06:30:00</dc:date>
<content:encoded><![CDATA[

<h2>Market Overview: a Strong Start for Commodities</h2>
<p>Commodity markets posted strong gains in the first quarter of 2025, supported by a declining U.S. dollar, persistent geopolitical tensions, and shifting trade policies. The Trump Administration&rsquo;s emphasis on reciprocal tariffs has introduced new uncertainty to global trade, prompting some market participants to stockpile commodities in anticipation of future supply disruptions.</p>
<p>All major commodity sectors advanced during the quarter, with precious metals as the top performer. Industrial metals and energy also saw meaningful gains, benefiting from both supply concerns and policy-driven demand.</p>
<h2>Index Performance: Benchmark Divergence</h2>
<p>The UBS Constant Maturity Commodity Index (CMCITR) rose 5.1% in Q1, underperforming the Bloomberg Commodity Index (BCOM), which gained 8.8%. This divergence was primarily driven by differences in sector allocation.</p>
<p>CMCITR maintains a lower weighting in both precious metals and U.S. natural gas, which were two of the quarter&rsquo;s strongest areas. Gold and silver each gained 18%, while U.S. natural gas surged 27% during the period.</p>
<p>CMCITR takes a disciplined approach by rebalancing monthly to maintain its target weightings, whereas BCOM allows its top-performing sectors to run without rebalancing. While this can lead to short-term outperformance for BCOM during strong market trends, CMCITR&rsquo;s structured approach has historically supported stronger relative performance over the long term. In addition, CMCITR&rsquo;s unique roll methodology, applied throughout the year, further enhances its performance relative to BCOM by optimizing how it handles futures contracts.</p>
<h2>Sector Drivers and Strategic Takeaways</h2>
<p><strong>Precious Metals: Strong Demand in a Flight to Safety (+18.2%)</strong></p>
<p>Gold and silver both surged 18% in Q1 2025, making the precious metals sector the top performer for the quarter. Ongoing global uncertainty &mdash; from geopolitical tensions to shifting trade alliances &mdash; has renewed investor interest in traditional safe-haven assets. Global central banks continued to increase their gold holdings, looking to diversify away from U.S. dollar assets. At the same time, Western investors began moving into gold and silver as a hedge against volatility and broader macro risks.</p>
<p><strong>Industrial Metals: Policy-driven Rally Led by Copper (+7.5%)</strong></p>
<p>The industrial metals sector posted solid gains, rising 7.5% for the quarter, supported largely by policy-driven market behavior. The Trump Administration&rsquo;s tariffs on steel and aluminum, coupled with expectations of reciprocal measures from global trading partners, led to a wave of stockpiling across key markets. Copper stood out, rallying 25% and reaching new all-time highs, as investors anticipated tighter supply conditions and steady demand growth.</p>
<p><strong>Energy: Geopolitical Pressures and Cold Weather Lift Prices (+4.4%)</strong></p>
<p>The energy sector climbed 4.4% in Q1 as geopolitical conflicts and seasonal demand drove prices higher. Ongoing wars in the Middle East and Ukraine maintained a risk premium in oil markets, even as OPEC announced plans to boost production. In the final weeks of the quarter, President Trump&rsquo;s threat of additional tariffs on buyers of Russian oil added further upward pressure to crude prices. Meanwhile, an unusually cold winter across the U.S. fueled a 27% spike in natural gas prices.</p>
<p><strong>Agriculture: Mixed Results Weigh on Overall Performance (+1.2%)</strong></p>
<p>Agricultural commodities had a muted quarter, ending up 1.2%, with mixed performance across subsectors. Coffee prices saw a sharp rally, rising 25% on supply concerns, but these gains were largely offset by a 23% decline in cocoa. U.S. grain prices also softened modestly, reflecting stable supply expectations and a lack of weather-driven catalysts.</p>
<p><strong>Livestock: Steady Gains Driven by Cattle Prices (+4.3%)</strong></p>
<p>The livestock sector delivered a solid return of 4.3% in Q1. Live cattle prices led the way, rising 7.8% on tighter supply and strong domestic demand. However, the sector&rsquo;s overall gains were partially held back by a 2.3% decline in lean hog prices.</p>
<p>The chart below highlights the sector weight differences between CMCITR and BCOM.</p>
<h3>CMCITR Rebalances Monthly to Fixed Annual Targets, While BCOM&rsquo;s Weights Adjust With Market Movements.</h3>
<p><strong>Comparative Index Sector Weights</strong></p>
<div class="flourish-embed flourish-chart" data-src="visualisation/22472750?2429575"><script src="https://public.flourish.studio/resources/embed.js"></script><noscript><img loading="lazy" src="https://public.flourish.studio/visualisation/22472750/thumbnail" width="100%" alt="CMCITR rebalances monthly to fixed annual targets, while BCOM&rsquo;s weights adjust with market movements" /></noscript></div>
<p class="chart-disclosure">Source: VanEck, Bloomberg. Data as of March 2025.</p>

<h2>Outlook: Commodities Positioned for an Active Year Ahead</h2>
<p>With a strong start to 2025, the commodity market enters the second quarter with several tailwinds still in place. Geopolitical risks, shifting trade dynamics, and a weaker U.S. dollar continue to support demand for real assets&mdash;particularly in sectors such as precious metals and energy. At the same time, supply disruptions, policy-driven market shifts, and variable weather patterns are likely to keep volatility elevated across key segments, presenting both risks and opportunities.</p>
<p>In this environment, a diversified and disciplined strategy&mdash;like that of the CMCITR &mdash;may prove especially valuable. Its monthly rebalancing and dynamic roll methodology help manage exposure through changing market conditions, positioning it to navigate uncertainty while capturing long-term trends.</p>
<p>As investors look to hedge against inflation and broader market volatility, commodities remain a relevant and potentially rewarding component of a well-balanced portfolio. The remainder of 2025 may offer a compelling backdrop for selective, active allocation within the asset class.</p>
<p>Learn more about the <strong><a href="https://www.vaneck.com/us/en/investments/cm-commodity-index-fund-cmcax/overview/" title="CMCAX - CM Commodity Index Fund - Class A - Overview">VanEck CM Commodity Index Fund</a></strong> and the <strong><a href="https://www.vaneck.com/us/en/investments/cmci-commodity-strategy-etf-cmci/overview/" title="CMCI - VanEck CMCI Commodity Strategy ETF - Overview">VanEck CMCI Commodity Strategy ETF (CMCI)</a></strong>, which seek to track, before fees and expenses, the CMCITR.</p>
<p>To receive more <a href="/us/en/insights/natural-resources/" title="Natural Resources Insights"><strong>Natural Resources</strong></a> insights, <a href="https://www.vaneck.com/us/en/subscribe/" title="Subscription Center"><strong>sign up in our subscription center</strong></a>.</p>
]]></content:encoded>
</item><item rdf:about="https://www.vaneck.com/us/en/blogs/moat-investing/moat-stocks-weather-tariff-tumble/">
  <title>Moat Stocks Weather Tariff Tumble></title>
  <link>https://www.vaneck.com/us/en/blogs/moat-investing/moat-stocks-weather-tariff-tumble/</link>
  <description><![CDATA[Market turbulence in March weighed on stocks, but moat strategies held up better&mdash;thanks in part to defensive sector resilience and underweight exposure to mega-caps.]]></description>
  <dc:creator>Coulter Regal, CFA</dc:creator>
  <dc:date>04/08/2025 06:30:00</dc:date>
<content:encoded><![CDATA[

<p id="us-equity-market-review" class="jump-link-nav anchored-block" data-jumplink-title="US Equity Market Review">In March, U.S. equity markets extended the turbulence and cautious shift in investor sentiment that began in February, driven by ongoing trade tensions from steep U.S. tariffs on Mexico, Canada, and other global trade partners that intensified trade war fears and disrupted market stability. This uncertainty continued to pressure markets, particularly within mega-caps and technology, as they faced sustained declines. The U.S. Federal Reserve&rsquo;s March meeting added to the unease, projecting slower growth and higher core inflation for 2025, further dampening optimism. The broader market struggled to stabilize amid these challenges, reflecting a persistent retreat from risk as President Trump&rsquo;s tariff policy continues to unfold.</p>
<p>The <a href="/us/en/investments/morningstar-wide-moat-etf-moat/index/" title="MOAT - VanEck Morningstar Wide Moat ETF - Overview"><strong>Morningstar Wide Moat Focus Index</strong></a> (the &ldquo;Moat Index&rdquo;) was not immune to the market turmoil, as it declined along with the broad U.S. equity market ending the month down 4.2%. However, the Moat Index showed resilience relative to both the S&amp;P 500 and the tech-heavy Nasdaq Composite, which declined 5.6% and 8.1%, respectively. The outperformance was the result of positioning in high quality companies within defensive sectors, like health care and consumer staples, and underweight exposure to the richly valued mega-caps that were the most significantly pressured.</p>
<p>Smaller U.S. stocks were also impacted by global trade tensions and economic growth concerns with the broad small- and mid-cap benchmarks falling 6.1% and 5.5%, respectively, during the month. After outperforming during the first two months of the year, the <a href="/us/en/investments/morningstar-smid-moat-etf-smot/index/" title="SMOT - VanEck Morningstar SMID Moat ETF - Overview"><strong>Morningstar US Small-Mid Cap Moat Focus Index</strong></a> (the &ldquo;SMID Moat Index&rdquo;) gave up some of its lead in March, declining 7.4%. However, year-to-date, the SMID Moat Index remains ahead of the broader small- and mid-cap markets.</p>
<h3>U.S. Stocks Tariff Tumble Continued in March</h3>
<div class="flourish-embed flourish-chart" data-src="visualisation/22512739?2429575"><script src="https://public.flourish.studio/resources/embed.js"></script><noscript><img loading="lazy" src="https://public.flourish.studio/visualisation/22512739/thumbnail" width="100%" alt="U.S. Stocks Tariff Tumble Continued in March" /></noscript></div>
<p class="chart-disclosure"><strong>Source: Morningstar. Data as of 3/31/2025.</strong> Past performance is no guarantee of future results. Index performance is not representative of fund performance. It is not possible to invest directly in an index. Please see index definitions and other important disclosures at the end of this content. Fund performance current to the most recent month end is available by visiting vaneck.com or by calling 800.826.2333.</p>

<h2 id="moat-highlights" class="jump-link-nav anchored-block" data-jumplink-title="Moat Highlights">Moat Strategies Target Tech at Quarterly Review</h2>
<p>Both the Moat and SMID Moat Indexes underwent quarterly reviews on March 21, 2025. Each quarter they systematically target the most attractively priced, high quality U.S. companies within their respective universes. Notably, at the March review, the Moat strategies took advantage of recent market volatility by targeting valuation opportunities within the beaten down technology sector. See our <a href="/blogs/moat-investing/moat-index-adds-tech-as-volatility-reveals-value/" title="Moat Index Adds Tech as Volatility Reveals Value"><strong>recent blog covering the March review</strong></a> for more on this trend and other key insights. Full results of the quarterly reviews are also available here: <a href="/investments/morningstar-wide-moat-etf-moat/moat-reconstitution.pdf" title="Morningstar Wide Moat Focus Index Reconstitution" target="_blank" rel="noopener"><strong>Moat Index</strong></a> and <a href="/investments/morningstar-smid-moat-etf-smot/smot-reconstitution.pdf" title="Morningstar SMID Moat ETF Index Reconstitution" target="_blank" rel="noopener"><strong>SMID Moat Index</strong></a>.</p>
<p>Additionally, in our moat investing webinar, we go even more in-depth on the quarterly review, current positioning, as well as recent performance. We also host members of Morningstar&rsquo;s equity research team to share their perspectives on market trends and the companies they cover. View the webinar here: <a href="/webinar-registration/?id=98813847564&amp;utm_source=vaneck&amp;utm_medium=calendar" title="Market Wake-Up Call: Diversify Your Core Equity Exposure"><strong>Market Wake-Up Call: Diversify Your Core Equity Exposure</strong></a></p>
<h2>Moat Index March Highlights: Battleships Weathered Rough Seas</h2>
<p>Sector allocations within the Moat Index were the primary drivers of outperformance versus the S&amp;P 500 in March. A defensive posture with overweights in health care and consumer staples, as well as strong stock selection within these sectors, helped mitigate market turmoil. Avoidance of expensive mega-cap tech, one of the worst performing cohorts this month, also proved beneficial.</p>
<p>In the top slot of the contributors table this month is the wide moat industrial defense company, Huntington Ingalls (HII). Huntington is the largest independent military shipbuilder domestically and is responsible for supplying the U.S. Navy with destroyers and nuclear submarines. HII also operates a business segment focused on development of autonomous uncrewed sea vessels and other technology services that U.S. government agencies depend on. Given that Huntington is one of only two major shipbuilders for the U.S. Navy, Morningstar believes HII benefits from the U.S.&rsquo;s vested interest in maintaining the financial viability of the company. Shares of HII bounced in March, rebuking market turbulence to gain more than 15% during the month. Despite the rise, shares remain well below Morningstar&rsquo;s current $312 estimate of fair value.</p>
<p>Other top contributors within the Moat Index during the month include the consumer staple and leading cigarette brand parent firm Altria (MO), electronic bond trading platform operator MarketAxess (MKTX), orthopedic implant and medical device company Zimmer Biomet (ZBH), and the industrial aerospace and defense company Northrop Grumman (NOC).</p>
<p>On the opposite end, companies detracting the most in March include a few semiconductor and technology names with Teradyne Inc. (TER), Microchip Technology (MCHP) and NXP Semiconductors (NXPI) all landing in the leading detractors table. Global footwear and apparel brand Nike (NKE) and entertainment, sports, and experiences stalwart Walt Disney Co. (DIS) also detracted during the month.</p>
<h2>Moat Index Top Contributors and Detractors - March 2025</h2>
<h3>Contributors</h3>
<div class="wrapped-div">
<table style="width: 100%;">
<tbody>
<tr class="tbl-data">
<td class="tbl-header last text-left">Company</td>
<td class="tbl-header last text-left">Ticker</td>
<td class="tbl-header last text-left">Sector</td>
<td class="tbl-header last text-right">Avg. Weight (%)</td>
<td class="tbl-header last text-right">Contribution (%)</td>
</tr>
<tr class="tbl-data">
<td class="data-td last text-left">Huntington Ingalls Industries Inc.</td>
<td class="data-td data last text-left">HII</td>
<td class="data-td data last text-left">Industrials</td>
<td class="data-td data last text-right">2.07</td>
<td class="data-td data last text-right">0.33</td>
</tr>
<tr class="tbl-data">
<td class="data-td last text-left">Altria Group Inc.</td>
<td class="data-td data last text-left">MO</td>
<td class="data-td data last text-left">Consumer Staples</td>
<td class="data-td data last text-right">2.69</td>
<td class="data-td data last text-right">0.25</td>
</tr>
<tr class="tbl-data">
<td class="data-td last text-left">MarketAxess Inc.</td>
<td class="data-td data last text-left">MKTX</td>
<td class="data-td data last text-left">Financials</td>
<td class="data-td data last text-right">2.05</td>
<td class="data-td data last text-right">0.25</td>
</tr>
<tr class="tbl-data">
<td class="data-td last text-left">Zimmer Biomet Inc.</td>
<td class="data-td data last text-left">ZBH</td>
<td class="data-td data last text-left">Health Care</td>
<td class="data-td data last text-right">2.55</td>
<td class="data-td data last text-right">0.22</td>
</tr>
<tr class="tbl-data">
<td class="data-td last text-left">Northrop Grumman Corp.</td>
<td class="data-td data last text-left">NOC</td>
<td class="data-td data last text-left">Industrials</td>
<td class="data-td data last text-right">1.28</td>
<td class="data-td data last text-right">0.15</td>
</tr>
</tbody>
</table>
<h3>Detractors</h3>
<div class="wrapped-div">
<table style="width: 100%;">
<tbody>
<tr class="tbl-data">
<td class="tbl-header last text-left">Company</td>
<td class="tbl-header last text-left">Ticker</td>
<td class="tbl-header last text-left">Sector</td>
<td class="tbl-header last text-right">Avg. Weight (%)</td>
<td class="tbl-header last text-right">Contribution (%)</td>
</tr>
<tr class="tbl-data">
<td class="data-td last text-left">Teradyne Inc.</td>
<td class="data-td data last text-left">TER</td>
<td class="data-td data last text-left">Technology</td>
<td class="data-td data last text-right">2.23</td>
<td class="data-td data last text-right">-0.55</td>
</tr>
<tr class="tbl-data">
<td class="data-td last text-left">Nike Inc.</td>
<td class="data-td data last text-left">NKE</td>
<td class="data-td data last text-left">Consumer Discretionary</td>
<td class="data-td data last text-right">2.57</td>
<td class="data-td data last text-right">-0.51</td>
</tr>
<tr class="tbl-data">
<td class="data-td last text-left">Microchip Technology Inc.</td>
<td class="data-td data last text-left">MCHP</td>
<td class="data-td data last text-left">Technology</td>
<td class="data-td data last text-right">2.23</td>
<td class="data-td data last text-right">-0.40</td>
</tr>
<tr class="tbl-data">
<td class="data-td last text-left">The Walt Disney Co.</td>
<td class="data-td data last text-left">DIS</td>
<td class="data-td data last text-left">Communication Services</td>
<td class="data-td data last text-right">2.93</td>
<td class="data-td data last text-right">-0.39</td>
</tr>
<tr class="tbl-data">
<td class="data-td last text-left">NXP Semiconductors</td>
<td class="data-td data last text-left">NXPI</td>
<td class="data-td data last text-left">Technology</td>
<td class="data-td data last text-right">2.46</td>
<td class="data-td data last text-right">-0.28</td>
</tr>
</tbody>
</table>
</div>
</div>
<p class="chart-disclosure"><strong>Source: Morningstar, March 2025</strong>. Past performance is no guarantee of future results. Index performance is not illustrative of fund performance. Not intended as a recommendation to buy or to sell any of the securities mentioned herein.</p>

<h2 id="smid-moat-highlights" class="jump-link-nav anchored-block" data-jumplink-title="SMID Moat Highlights">SMID Moat Index March Highlights: Electric Bonds Buck Turmoil</h2>
<p>The SMID Moat Index&rsquo;s March underperformance, relative to small- and mid-cap broad benchmarks, was driven by a combination of stock selection and exposure to more cyclical segments of the market as consumer discretionary names were well-represented within the top detractors table this month.</p>
<p>Despite the sharp selloff this month, several companies within the SMID Moat Index managed to buck the trend and post positive returns. MarketAxess Inc. (MKTX), a leading electronic fixed-income trading platform, lands as the top example. MarketAxess has built a dominant position in the section of the bond market that is electronically traded, and the firm has benefited significantly from the ongoing transition in fixed-income markets toward electronic trading and away from voice negotiated trades. This secular trend has provided MarketAxess with steady growth as the implicit and explicit trade cost reductions offered through its electronic trading protocols pulls more clients and trading volume to its platform. Shares of MKTX gained more than 12% in March, but Morningstar continues to view shares as attractive compared to their $260 fair value assessment.</p>
<p>Other top contributors that broke rank in the down market include pure-play global agriculture and crop protection company FMC Corp. (FMC), the above-mentioned military shipbuilder Huntington Ingalls Industries Inc. (HII), wireless cell tower and fiber communication infrastructure operator Crown Castle Inc. (CCI), and orthopedic implant and medical device company Zimmer Biomet (ZBH).</p>
<p>Names that detracted most from the SMID Moat Index performance during the month include luxury fashion and accessory brands company Tapestry (TPR), online sports and casino gambling innovator DraftKings Inc. (DKNG), semiconductor testing equipment manufacturer Teradyne Inc. (TER), cruise line operator and travel service provider Carnival Corp. (CCL), and regional automobile dealership group owner Asbury Automotive Group Inc. (ABG).</p>
<h2>SMID Moat Index Top Contributors and Detractors - March 2025</h2>
<h3>Contributors</h3>
<div class="wrapped-div">
<table style="width: 100%;">
<tbody>
<tr class="tbl-data">
<td class="tbl-header last text-left">Company</td>
<td class="tbl-header last text-left">Ticker</td>
<td class="tbl-header last text-left">Sector</td>
<td class="tbl-header last text-right">Avg. Weight (%)</td>
<td class="tbl-header last text-right">Contribution (%)</td>
</tr>
<tr class="tbl-data">
<td class="data-td data last text-left">MarketAxess Inc.</td>
<td class="data-td data last text-left">MKTX</td>
<td class="data-td data last text-left">Financials</td>
<td class="data-td data last text-right">1.05</td>
<td class="data-td data last text-right">0.13</td>
</tr>
<tr class="tbl-data">
<td class="data-td data last text-left">FMC Corp.</td>
<td class="data-td data last text-left">FMC</td>
<td class="data-td data last text-left">Materials</td>
<td class="data-td data last text-right">0.45</td>
<td class="data-td data last text-right">0.07</td>
</tr>
<tr class="tbl-data">
<td class="data-td data last text-left">Huntington Ingalls Industries Inc.</td>
<td class="data-td data last text-left">HII</td>
<td class="data-td data last text-left">Industrials</td>
<td class="data-td data last text-right">0.43</td>
<td class="data-td data last text-right">0.07</td>
</tr>
<tr class="tbl-data">
<td class="data-td data last text-left">Crown Castle Inc.</td>
<td class="data-td data last text-left">CCI</td>
<td class="data-td data last text-left">Real Estate</td>
<td class="data-td data last text-right">0.50</td>
<td class="data-td data last text-right">0.06</td>
</tr>
<tr class="tbl-data">
<td class="data-td data last text-left">Zimmer Biomet Inc.</td>
<td class="data-td data last text-left">ZBH</td>
<td class="data-td data last text-left">Health Care</td>
<td class="data-td data last text-right">0.63</td>
<td class="data-td data last text-right">0.06</td>
</tr>
</tbody>
</table>
<h3>Detractors</h3>
<div class="wrapped-div">
<table style="width: 100%;">
<tbody>
<tr class="tbl-data">
<td class="tbl-header last text-left">Company</td>
<td class="tbl-header last text-left">Ticker</td>
<td class="tbl-header last text-left">Sector</td>
<td class="tbl-header last text-right">Avg. Weight (%)</td>
<td class="tbl-header last text-right">Contribution (%)</td>
</tr>
<tr class="tbl-data">
<td class="data-td data last text-left">Tapestry Inc.</td>
<td class="data-td data last text-left">TPR</td>
<td class="data-td data last text-left">Consumer Discretionary</td>
<td class="data-td data last text-right">2.22</td>
<td class="data-td data last text-right">-0.38</td>
</tr>
<tr class="tbl-data">
<td class="data-td data last text-left">DraftKings Inc.</td>
<td class="data-td data last text-left">DKNG</td>
<td class="data-td data last text-left">Consumer Discretionary</td>
<td class="data-td data last text-right">1.45</td>
<td class="data-td data last text-right">-0.35</td>
</tr>
<tr class="tbl-data">
<td class="data-td data last text-left">Teradyne Inc.</td>
<td class="data-td data last text-left">TER</td>
<td class="data-td data last text-left">Technology</td>
<td class="data-td data last text-right">1.14</td>
<td class="data-td data last text-right">-0.28</td>
</tr>
<tr class="tbl-data">
<td class="data-td data last text-left">Carnival Corp.</td>
<td class="data-td data last text-left">CCL</td>
<td class="data-td data last text-left">Consumer Discretionary</td>
<td class="data-td data last text-right">1.51</td>
<td class="data-td data last text-right">-0.28</td>
</tr>
<tr class="tbl-data">
<td class="data-td data last text-left">Asbury Automotive Group Inc.</td>
<td class="data-td data last text-left">ABG</td>
<td class="data-td data last text-left">Consumer Discretionary</td>
<td class="data-td data last text-right">1.52</td>
<td class="data-td data last text-right">-0.27</td>
</tr>
</tbody>
</table>
</div>
</div>
<p class="chart-disclosure"><strong>Source: Morningstar, March 2025</strong>. Past performance is no guarantee of future results. Index performance is not illustrative of fund performance. Not intended as a recommendation to buy or to sell any of the securities mentioned herein.</p>

<h2 id="moat-strategies" class="jump-link-nav anchored-block" data-jumplink-title="Moat Strategies">Choose Your Moat Strategy</h2>
<p>VanEck&rsquo;s suite of <a href="https://www.vaneck.com/us/en/blogs/moat-investing/moat-investing-powered-by-morningstar/" title="Quality Companies at Attractive Prices"><strong>moat investing strategies</strong></a> is powered by Morningstar&rsquo;s equity research team, which seeks quality companies trading at attractive valuations. The below ETFs offer access to US moat companies:</p>
<div class="flourish-embed flourish-cards d-none d-md-block" data-src="visualisation/22052290?2429575"><script src="https://public.flourish.studio/resources/embed.js"></script><noscript><img loading="lazy" src="https://public.flourish.studio/visualisation/22052290/thumbnail" width="100%" alt="Choose Your Moat Strategy" /></noscript></div>
<div class="flourish-embed flourish-cards-mobile d-md-none" data-src="visualisation/22109199?2429575"><script src="https://public.flourish.studio/resources/embed.js"></script><noscript><img loading="lazy" src="https://public.flourish.studio/visualisation/22109199/thumbnail" width="100%" alt="Choose Your Moat Strategy" /></noscript></div>
<p>To receive more <a href="https://www.vaneck.com/us/en/insights/moat-investing" title="Moat Investing Insights"><strong>Moat Investing</strong></a> insights, <a href="https://www.vaneck.com/us/en/subscribe/" title="Subscription Center"><strong>sign up in our subscription center</strong></a>.</p>
]]></content:encoded>
</item><item rdf:about="https://www.vaneck.com/us/en/blogs/emerging-markets-bonds/em-debt-its-not-me-em-its-you-dm/">
  <title>EM Debt: It’s Not Me (EM), It’s You (DM)></title>
  <link>https://www.vaneck.com/us/en/blogs/emerging-markets-bonds/em-debt-its-not-me-em-its-you-dm/</link>
  <description><![CDATA[In a March risk-off environment, it was developed markets, not emerging markets, driving risks for investors.]]></description>
  <dc:creator>Eric Fine</dc:creator>
  <dc:date>04/08/2025 06:30:00</dc:date>
<content:encoded><![CDATA[

<p id="market-review" class="jump-link-nav anchored-block" data-jumplink-title="Market Review">The <a href="https://www.vaneck.com/us/en/investments/emerging-markets-bond-fund-embux/overview/" title="EMBUX - Emerging Markets Bond Fund - Class I - Overview"><strong>VanEck Emerging Markets Bond Fund</strong></a> was down -0.27% in March, compared to up 0.36% for its benchmark, the 50% J.P. Morgan Government Bond Index-Emerging Markets Global Diversified (GBI-EM) and 50% J.P. Morgan Emerging Markets Bond Index (EMBI). Year to date (YTD), the fund is up 3.31%, compared to 3.28% for its benchmark. The Global Agg and 10-year Treasuries were up YTD by 2.92% and 3.94%, respectively. Emerging markets (EM) local currency is up 4.31% YTD! During March, Zambia (local) led the outperformers followed by &ldquo;peace trade&rdquo; Poland (local), Hungary (local), and a zero weight in weakening Ukraine bonds. Underperformers for the month were Turkey, India, Romania, and Saudi. We reduced portfolio duration significantly, but the reductions were focused on spread duration, not risk-free duration (i.e., local-currency yield curves). We like local currency but are cautious on spread duration (not something for a bumper-sticker, sorry). The fund has around 57% in curated local currency, 41% in USD bonds, with a noteworthy underweight to Brazil and South Africa in local currency. Carry is 8.3%, yield to worst (YTW) is 9.5%, and duration is 6.1.</p>

<h3>Average Annual Total Returns<sup>*</sup>(%) (In USD)</h3>
<div class="wrapped-div">
<table style="width: 100%;">
<tbody>
<tr class="tbl-data">
<td class="tbl-header last" colspan="10">As of March 31, 2025</td>
</tr>
<tr class="tbl-data">
<td class="data-head last text-right">&nbsp;</td>
<td class="data-head last text-right">1 Mo</td>
<td class="data-head last text-right">3 Mo</td>
<td class="data-head last text-right">YTD</td>
<td class="data-head last text-right">1 Yr</td>
<td class="data-head last text-right">3 Yrs</td>
<td class="data-head last text-right">5 Yrs</td>
<td class="data-head last text-right">10 Yrs</td>
</tr>
<tr class="tbl-data">
<td class="data-td last text-left">Class A: NAV (Inception 07/09/12)</td>
<td class="data-td data last text-right">-0.30</td>
<td class="data-td data last text-right">3.40</td>
<td class="data-td data last text-right">6.32</td>
<td class="data-td data last text-right">4.18</td>
<td class="data-td data last text-right">7.60</td>
<td class="data-td data last text-right">2.34</td>
</tr>
<tr class="tbl-data">
<td class="data-td last text-left">Class A: Maximum 5.75% load</td>
<td class="data-td data last text-right">-6.03</td>
<td class="data-td data last text-right">-2.54</td>
<td class="data-td data last text-right">0.21</td>
<td class="data-td data last text-right">2.15</td>
<td class="data-td data last text-right">6.33</td>
<td class="data-td data last text-right">1.73</td>
</tr>
<tr class="tbl-data">
<td class="data-td last text-left">Class I: NAV (Inception 07/09/12)</td>
<td class="data-td data last text-right">-0.27</td>
<td class="data-td data last text-right">3.31</td>
<td class="data-td data last text-right">6.53</td>
<td class="data-td data last text-right">4.54</td>
<td class="data-td data last text-right">7.92</td>
<td class="data-td data last text-right">2.64</td>
</tr>
<tr class="tbl-data">
<td class="data-td last text-left">Class Y: NAV (Inception 07/09/12)</td>
<td class="data-td data last text-right">-0.28</td>
<td class="data-td data last text-right">3.46</td>
<td class="data-td data last text-right">6.45</td>
<td class="data-td data last text-right">4.42</td>
<td class="data-td data last text-right">7.84</td>
<td class="data-td data last text-right">2.57</td>
</tr>
<tr class="tbl-data">
<td class="data-td last text-left">50% GBI-EM/50% EMBI</td>
<td class="data-td data last text-right">0.39</td>
<td class="data-td data last text-right">3.28</td>
<td class="data-td data last text-right">5.42</td>
<td class="data-td data last text-right">3.11</td>
<td class="data-td data last text-right">2.94</td>
<td class="data-td data last text-right">2.27</td>
</tr>
</tbody>
</table>
</div>
<p class="chart-disclosure"><sup>*</sup>&nbsp;Returns less than one year are not annualized.</p>
<p class="chart-disclosure"><strong>Expenses: Class A: Gross 2.08%, Net 1.21%; Class I: Gross 1.34%, Net 0.86%;</strong> Class Y: Gross 1.35%, Net 0.96%. Expenses are capped contractually until 05/01/25 at 1.20% for Class A, 0.85% for Class I, 0.95% for Class Y. Caps excluding acquired fund fees and expenses, interest, trading, dividends, and interest payments of securities sold short, taxes, and extraordinary expenses.</p>
<p class="chart-disclosure"><strong>The performance data quoted represents past performance. Past performance is not a guarantee of future results. Investment return and principal value of an investment will fluctuate so that an investor&rsquo;s shares, when redeemed, may be worth more or less than their original cost. Performance may be lower or higher than performance data quoted. Please call 800.826.2333 or visit vaneck.com for performance current to the most recent month ended.</strong></p>
<p class="chart-disclosure">The &ldquo;Net Asset Value&rdquo; (NAV) of a Fund is determined at the close of each business day, and represents the dollar value of one share of the fund; it is calculated by taking the total assets of the fund, subtracting total liabilities, and dividing by the total number of shares outstanding. The NAV is not necessarily the same as the ETF&rsquo;s intraday trading value. Investors should not expect to buy or sell shares at NAV.</p>
<p id="tarriff-and-recession-risks" class="jump-link-nav anchored-block" data-jumplink-title="Tarriff and Recession Risks"><strong>It&rsquo;s not EM generating risk, it&rsquo;s DM. </strong>Yet again. The starting themes for 2025 are &ldquo;bonds over stocks and international over US&rdquo;. You don&rsquo;t need a Venn diagram to know that EM bonds are smack in the middle! The table below makes two important points. First, US stocks were down (-4.90%) <i>and</i> US Treasuries were up (+3.53%) for the first time since the first quarter of 2020! That will get attention, and obviously improves the backward-looking risk/return statistics of Treasuries in the standard 60/40 model. By attention, we mean inflows into bonds generally. Second, international stocks (+6.54%) beat US stocks (-4.90%) in the first quarter. Look at the bottom two rows of the chart below and you&rsquo;ll see this <i>almost</i> never happened in the last five years. That will also get attention too, we think, meaning inflows into international, outflows from US. Those two being the dominant themes of the year could impact EM bonds positively via flows.</p>
<h3>Exhibit 1 &ndash; Treasuries and&nbsp;International Stocks&nbsp;Beat US Stocks</h3>
<div class="wrapped-div">
<table style="width: 100%;">
<tbody>
<tr class="tbl-data">
<td class="data-td last text-left">as of 3/31/2025</td>
<td class="data-td last text-right">VanEck Emerging Markets Bond Fund I</td>
<td class="data-td last text-right">50%JPM GBI-EM GD and 50%JPM EMBI GD</td>
<td class="data-td last text-right">JPM GBI-EM Global Diversified TR USD</td>
<td class="data-td last text-right">JPM EMBI Global Diversified TR USD</td>
<td class="data-td last text-right">FTSE Treasury Benchmark 10 Yr USD</td>
<td class="data-td last text-right" style="border-right: outset;">ICE BofA Gbl Brd Mkt TR USD</td>
<td class="data-td last text-right">MSCI ACWI Ex USA IMI NR USD</td>
<td class="data-td last text-right">S&amp;P 500 NR USD</td>
</tr>
<tr class="tbl-data">
<td class="data-td last text-left">Q1'20</td>
<td class="data-td data last text-right">-19.98</td>
<td class="data-td data last text-right">-14.28</td>
<td class="data-td data last text-right">-15.21</td>
<td class="data-td data last text-right">-13.38</td>
<td class="data-td data last text-right">11.69</td>
<td class="data-td data last text-right" style="border-right: outset;">0.28</td>
<td class="data-td data last text-right">-24.11</td>
<td class="data-td data last text-right">-19.72</td>
</tr>
<tr class="tbl-data">
<td class="data-td last text-left">Q2'20</td>
<td class="data-td data last text-right">22.27</td>
<td class="data-td data last text-right">11.05</td>
<td class="data-td data last text-right">9.82</td>
<td class="data-td data last text-right">12.26</td>
<td class="data-td data last text-right">0.70</td>
<td class="data-td data last text-right" style="border-right: outset;">3.20</td>
<td class="data-td data last text-right">16.96</td>
<td class="data-td data last text-right">20.37</td>
</tr>
<tr class="tbl-data">
<td class="data-td last text-left">Q3'20</td>
<td class="data-td data last text-right">5.43</td>
<td class="data-td data last text-right">1.46</td>
<td class="data-td data last text-right">0.61</td>
<td class="data-td data last text-right">2.32</td>
<td class="data-td data last text-right">0.05</td>
<td class="data-td data last text-right" style="border-right: outset;">2.53</td>
<td class="data-td data last text-right">6.80</td>
<td class="data-td data last text-right">8.79</td>
</tr>
<tr class="tbl-data">
<td class="data-td last text-left">Q4'20</td>
<td class="data-td data last text-right">8.20</td>
<td class="data-td data last text-right">7.70</td>
<td class="data-td data last text-right">9.62</td>
<td class="data-td data last text-right">5.80</td>
<td class="data-td data last text-right">-1.91</td>
<td class="data-td data last text-right" style="border-right: outset;">2.68</td>
<td class="data-td data last text-right">17.22</td>
<td class="data-td data last text-right">12.01</td>
</tr>
<tr class="tbl-data">
<td class="data-td last text-left">Q1'21</td>
<td class="data-td data last text-right">-3.51</td>
<td class="data-td data last text-right">-5.61</td>
<td class="data-td data last text-right">-6.68</td>
<td class="data-td data last text-right">-4.54</td>
<td class="data-td data last text-right">-7.09</td>
<td class="data-td data last text-right" style="border-right: outset;">-4.77</td>
<td class="data-td data last text-right">3.77</td>
<td class="data-td data last text-right">6.05</td>
</tr>
<tr class="tbl-data">
<td class="data-td last text-left">Q2'21</td>
<td class="data-td data last text-right">3.94</td>
<td class="data-td data last text-right">3.81</td>
<td class="data-td data last text-right">3.54</td>
<td class="data-td data last text-right">4.06</td>
<td class="data-td data last text-right">3.35</td>
<td class="data-td data last text-right" style="border-right: outset;">1.31</td>
<td class="data-td data last text-right">5.60</td>
<td class="data-td data last text-right">8.44</td>
</tr>
<tr class="tbl-data">
<td class="data-td last text-left">Q3'21</td>
<td class="data-td data last text-right">-2.70</td>
<td class="data-td data last text-right">-1.91</td>
<td class="data-td data last text-right">-3.10</td>
<td class="data-td data last text-right">-0.70</td>
<td class="data-td data last text-right">-0.28</td>
<td class="data-td data last text-right" style="border-right: outset;">-0.99</td>
<td class="data-td data last text-right">-2.56</td>
<td class="data-td data last text-right">0.48</td>
</tr>
<tr class="tbl-data">
<td class="data-td last text-left">Q4'21</td>
<td class="data-td data last text-right">-1.93</td>
<td class="data-td data last text-right">-1.49</td>
<td class="data-td data last text-right">-2.53</td>
<td class="data-td data last text-right">-0.44</td>
<td class="data-td data last text-right">0.77</td>
<td class="data-td data last text-right" style="border-right: outset;">-0.80</td>
<td class="data-td data last text-right">1.64</td>
<td class="data-td data last text-right">10.91</td>
</tr>
<tr class="tbl-data">
<td class="data-td last text-left">Q1'22</td>
<td class="data-td data last text-right">-4.01</td>
<td class="data-td data last text-right">-8.25</td>
<td class="data-td data last text-right">-6.46</td>
<td class="data-td data last text-right">-10.02</td>
<td class="data-td data last text-right">-6.82</td>
<td class="data-td data last text-right" style="border-right: outset;">-6.58</td>
<td class="data-td data last text-right">-5.60</td>
<td class="data-td data last text-right">-4.70</td>
</tr>
<tr class="tbl-data">
<td class="data-td last text-left">Q2'22</td>
<td class="data-td data last text-right">-10.73</td>
<td class="data-td data last text-right">-10.03</td>
<td class="data-td data last text-right">-8.63</td>
<td class="data-td data last text-right">-11.43</td>
<td class="data-td data last text-right">-4.94</td>
<td class="data-td data last text-right" style="border-right: outset;">-8.16</td>
<td class="data-td data last text-right">-14.28</td>
<td class="data-td data last text-right">-16.20</td>
</tr>
<tr class="tbl-data">
<td class="data-td last text-left">Q3'22</td>
<td class="data-td data last text-right">-1.96</td>
<td class="data-td data last text-right">-4.63</td>
<td class="data-td data last text-right">-4.73</td>
<td class="data-td data last text-right">-4.57</td>
<td class="data-td data last text-right">-6.12</td>
<td class="data-td data last text-right" style="border-right: outset;">-7.11</td>
<td class="data-td data last text-right">-9.69</td>
<td class="data-td data last text-right">-5.00</td>
</tr>
<tr class="tbl-data">
<td class="data-td last text-left">Q4'22</td>
<td class="data-td data last text-right">10.43</td>
<td class="data-td data last text-right">8.29</td>
<td class="data-td data last text-right">8.45</td>
<td class="data-td data last text-right">8.11</td>
<td class="data-td data last text-right">0.24</td>
<td class="data-td data last text-right" style="border-right: outset;">4.31</td>
<td class="data-td data last text-right">14.15</td>
<td class="data-td data last text-right">7.42</td>
</tr>
<tr class="tbl-data">
<td class="data-td last text-left">Q1'23</td>
<td class="data-td data last text-right">3.42</td>
<td class="data-td data last text-right">3.51</td>
<td class="data-td data last text-right">5.16</td>
<td class="data-td data last text-right">1.86</td>
<td class="data-td data last text-right">4.16</td>
<td class="data-td data last text-right" style="border-right: outset;">2.98</td>
<td class="data-td data last text-right">6.56</td>
<td class="data-td data last text-right">7.36</td>
</tr>
<tr class="tbl-data">
<td class="data-td last text-left">Q2'23</td>
<td class="data-td data last text-right">2.51</td>
<td class="data-td data last text-right">2.35</td>
<td class="data-td data last text-right">2.51</td>
<td class="data-td data last text-right">2.19</td>
<td class="data-td data last text-right">-1.90</td>
<td class="data-td data last text-right" style="border-right: outset;">-1.37</td>
<td class="data-td data last text-right">2.38</td>
<td class="data-td data last text-right">8.61</td>
</tr>
<tr class="tbl-data">
<td class="data-td last text-left">Q3'23</td>
<td class="data-td data last text-right">-3.46</td>
<td class="data-td data last text-right">-2.74</td>
<td class="data-td data last text-right">-3.26</td>
<td class="data-td data last text-right">-2.23</td>
<td class="data-td data last text-right">-5.12</td>
<td class="data-td data last text-right" style="border-right: outset;">-3.92</td>
<td class="data-td data last text-right">-3.49</td>
<td class="data-td data last text-right">-3.39</td>
</tr>
<tr class="tbl-data">
<td class="data-td last text-left">Q4'23</td>
<td class="data-td data last text-right">8.43</td>
<td class="data-td data last text-right">8.62</td>
<td class="data-td data last text-right">8.07</td>
<td class="data-td data last text-right">9.16</td>
<td class="data-td data last text-right">6.79</td>
<td class="data-td data last text-right" style="border-right: outset;">8.17</td>
<td class="data-td data last text-right">9.81</td>
<td class="data-td data last text-right">11.55</td>
</tr>
<tr class="tbl-data">
<td class="data-td last text-left">Q1'24</td>
<td class="data-td data last text-right">-0.03</td>
<td class="data-td data last text-right">-0.05</td>
<td class="data-td data last text-right">-2.12</td>
<td class="data-td data last text-right">2.04</td>
<td class="data-td data last text-right">-1.72</td>
<td class="data-td data last text-right" style="border-right: outset;">-2.15</td>
<td class="data-td data last text-right">4.33</td>
<td class="data-td data last text-right">10.44</td>
</tr>
<tr class="tbl-data">
<td class="data-td last text-left">Q2'24</td>
<td class="data-td data last text-right">0.58</td>
<td class="data-td data last text-right">-0.67</td>
<td class="data-td data last text-right">-1.63</td>
<td class="data-td data last text-right">0.30</td>
<td class="data-td data last text-right">-0.27</td>
<td class="data-td data last text-right" style="border-right: outset;">-1.19</td>
<td class="data-td data last text-right">0.92</td>
<td class="data-td data last text-right">4.18</td>
</tr>
<tr class="tbl-data">
<td class="data-td last text-left">Q3'24</td>
<td class="data-td data last text-right">7.84</td>
<td class="data-td data last text-right">7.57</td>
<td class="data-td data last text-right">8.99</td>
<td class="data-td data last text-right">6.15</td>
<td class="data-td data last text-right">5.75</td>
<td class="data-td data last text-right" style="border-right: outset;">6.98</td>
<td class="data-td data last text-right">8.18</td>
<td class="data-td data last text-right">5.78</td>
</tr>
<tr class="tbl-data">
<td class="data-td last text-left">Q4'24</td>
<td class="data-td data last text-right">-4.93</td>
<td class="data-td data last text-right">-4.48</td>
<td class="data-td data last text-right">-6.98</td>
<td class="data-td data last text-right">-1.94</td>
<td class="data-td data last text-right">-5.13</td>
<td class="data-td data last text-right" style="border-right: outset;">-5.33</td>
<td class="data-td data last text-right">-7.61</td>
<td class="data-td data last text-right">2.31</td>
</tr>
<tr class="tbl-data">
<td class="data-td last text-left">Q1'25</td>
<td class="data-td data last text-right">3.31</td>
<td class="data-td data last text-right">3.28</td>
<td class="data-td data last text-right">4.31</td>
<td class="data-td data last text-right">2.24</td>
<td class="data-td data last text-right">3.94</td>
<td class="data-td data last text-right" style="border-right: outset;">2.92</td>
<td class="data-td data last text-right">6.54</td>
<td class="data-td data last text-right">-4.90</td>
</tr>
<tr class="tbl-data">
<td class="data-td last text-left">5 Years</td>
<td class="data-td data last text-right">8.26</td>
<td class="data-td data last text-right">3.26</td>
<td class="data-td data last text-right">2.65</td>
<td class="data-td data last text-right">3.81</td>
<td class="data-td data last text-right">-3.33</td>
<td class="data-td data last text-right" style="border-right: outset;">-1.84</td>
<td class="data-td data last text-right">11.83</td>
<td class="data-td data last text-right">19.21</td>
</tr>
</tbody>
</table>
</div>
<p class="chart-disclosure"><strong>Source: Morningstar. Data as of March 2025. Past performance is no guarantee of future results. Index performance is not representative of fund performance. It is not possible to invest directly in an index. Fund performance current to the most recent month end is available by visiting vaneck.com or by calling 800.826.2333.</strong></p>

<p><strong>March was all about pricing tariff and related recession risks (yet again). </strong>US equities were down&hellip;and Treasuries were actually up, as we noted above, but our point now is that we view this as a classic recession trade. But, supposed-to-be riskier and higher-beta EM local currency performed better than Treasuries! It&rsquo;s kind-of weird to many that the riskiest EM bonds are rallying in a big risk-off month. Not to us. Chalk it up to two drivers: First, contained/rallying US 2-year rates. Exhibit 2 shows the different paths of US 2-year Treasury yields and US 10-year Treasury yields recently. What strikes us is the tighter range with capped upside of 2-year rates, which are also setting a cycle low. Compare this to the uncapped sell-off in 10-year rates and notice that they are not (yet) setting a cycle low. So what? 2-year rates drive currency moves, 10-year rates do not. So, this is very supportive of EM currencies. (This is another layer, but stronger EM currencies can support rallies along their risk-free yield curves &ndash; this explains our acceptance of duration in local currency compared to our aversion in USD/spread bonds.) We won&rsquo;t chart it this month, but almost all EMFX is up YTD, led by local currency as we noted.</p>
<h3>Exhibit 2 &ndash; FX Cares More About Capped 2-Year Treasury Yields Than Uncapped 10-Year Yields<sup>*</sup></h3>
<div class="flourish-embed" data-src="story/3027111?2429575"><script src="https://public.flourish.studio/resources/embed.js"></script><noscript><img loading="lazy" src="https://public.flourish.studio/story/3027111/thumbnail" width="100%" alt="FX Cares More About Capped 2-Year" /></noscript></div>
<div class="flourish-embed" data-src="story/3027123?2429575"><script src="https://public.flourish.studio/resources/embed.js"></script><noscript><img loading="lazy" src="https://public.flourish.studio/story/3027123/thumbnail" width="100%" alt="Treasury Yields Than Uncapped 10-Year Yields" /></noscript></div>
<p class="chart-disclosure">Source: Bloomberg. Data as of March 2025. Past performance is no guarantee of future results. *Short-term rates (2-year) are falling and seem limited in how high they can bounce back &mdash; they&rsquo;ve hit a new low for this cycle. Long-term rates (10-year) are also falling, but more freely &mdash; and they <strong>haven&rsquo;t</strong> hit new lows <strong>yet</strong>.</p>
<p><strong>Reason two is more EM Exceptionalism<sup>TM</sup>. </strong>This is our old mantra &ndash; EMs have low debt, higher real rates, and often win from geopolitics, in a world worried about (and exposed to) DM debt levels, co-opted central banks, and geopolitics mostly hurting DM. We&rsquo;ll stop pounding this theme when it&rsquo;s on the front pages. But we&rsquo;ll note yet again that CNY remains very stable in the face of tariff noise. This is still an important anchor for EM currencies, even though we don&rsquo;t mention it every single month. And this EMFX stability is occurring with rising recession risk, consistent with our unusual view that the bulk of China&rsquo;s property crisis is over (which we wrote about in previous monthlies). Put differently, if global demand (relative to the US) and commodity price stability maintain, <em>and</em> you have US front-end rates rallying, you are in a real sweet-spot for EMFX obviously, as the currencies can remain stable or strong while their risk-free bond curves <i>also</i> rally.</p>
<h2 id="exposure-types-and-significant-changes" class="jump-link-nav anchored-block" data-jumplink-title="Exposure Types and Significant Changes">Exposure Types and Significant Changes</h2>
<p>The changes to our top positions are summarized below. Our largest positions in March were Mexico, Indonesia, Colombia, Poland and Malaysia:</p>
<ul class="content-list">
<li class="mt-2">We increased our local currency exposure in Indonesia and Mexico. Indonesia is among higher-yielding countries in EM Asia, and local yields are correlated with U.S. Treasuries, which might be re-pricing the probability of a recession. Even though domestic fiscal noise is persistent, in practice, fiscal risks are contained. In terms of our investment process, this improves the technical test score for the country. Mexican local yields also follow U.S. Treasuries quite closely. Further, President Sheinbaum is playing the tariff game smartly, and her latest domestic political moves (including the appointment of the new minister of finance) look prudent, improving the policy test score for the country.</li>
<li class="mt-2">We also increased our local currency exposure in Chile, Uganda, and Kazakhstan. Chile&rsquo;s presidential race is shaping up well for the right/center-right parties, which should improve the policy trajectory. Chile might be vulnerable to sustained drops in the price of copper, but the growth outlook is getting better, and the central bank is not in a hurry to extend its easing cycle. These factors improve the policy test score for the country. Uganda&rsquo;s valuations look attractive, albeit we keep an eye on the pace of fiscal consolidation. The Kazakh currency can benefit from a potential ceasefire in Ukraine, the central bank remains hawkish, tightening more than expected to lower inflation pressures. In terms of our investment process, this strengthened the policy and technical test scores for Kazakhstan.</li>
<li class="mt-2">Finally, we increased our hard currency sovereign exposure in Cote d&rsquo;Ivoire and Gabon. Cote d&rsquo;Ivoire&rsquo;s new Eurobond was in line with the government&rsquo;s earlier guidance, and it was attractively priced vs. the existing bonds, as well as against the improving macroeconomic backdrop and the on-going reform effort, which improved the technical and policy test scores for the country. Gabon is in the middle of the election cycle, but the transitional president maintains communications with the IMF (supporting the country&rsquo;s policy test score) and the country&rsquo;s near-term external financing needs are covered.</li>
<li class="mt-2">We reduced our hard currency exposure in the United Arab Emirates and Qatar. Both countries have tight spreads vs. U.S. Treasuries, which can be a disadvantage during risk-off periods. In terms of our investment process, the latest developments worsened the technical test scores for the United Arab Emirates and Qatar.</li>
<li class="mt-2">We also reduced our local currency exposure in South Africa. South Africa&rsquo;s Q2 could be quite noisy. The budget approval timeline (which looks bumpier than usual under the coalition government - a new political arrangement with very steep learning curves for all coalition partners), a risk of financial sanctions against individuals, and the ANC&rsquo;s annual congress can overshadow numerous structural improvements that should strengthen South Africa&rsquo;s growth outlook. In terms of our investment process, this weakened the economic and policy test scores for the country.</li>
<li class="mt-2">Finally, we reduced our hard currency exposure in Nigeria and Angola. In Nigeria, sovereign bond valuations no longer fully reflect global risks and uncertainties (including the price of oil), which worsened the technical test score for the country. In the similar vein, Angola&rsquo;s spread duration risks are underappreciated by the market, lower oil prices can affect both the budget and the external balance &ndash; in addition to the impact of global uncertainties on more vulnerable frontier credits like Angola. In terms of our investment process, this worsened the technical test score for the country.</li>
</ul>
<p>To receive more <a href="https://www.vaneck.com/us/en/insights/emerging-markets-bonds/" title="Emerging Markets Bonds Insights"><strong>Emerging Markets Bonds</strong></a> insights, <a href="/link/5f45412c2143400497908cea2897f7d3.aspx" title=" Subscription Center"><strong>sign up in our subscription center</strong></a>.</p>
]]></content:encoded>
</item><item rdf:about="https://www.vaneck.com/us/en/blogs/investment-outlook/our-portfolio-managers-weigh-impact-of-trumps-tariffs/">
  <title>Our Portfolio Managers Weigh Impact of Trump’s Tariffs></title>
  <link>https://www.vaneck.com/us/en/blogs/investment-outlook/our-portfolio-managers-weigh-impact-of-trumps-tariffs/</link>
  <description><![CDATA[As markets react to sweeping new tariffs, our portfolio managers weigh in on what this means for their respective asset classes and strategies.]]></description>
  <dc:creator> </dc:creator>
  <dc:date>04/08/2025 06:30:00</dc:date>
<content:encoded><![CDATA[

<p>Markets were already on edge, and sweeping new tariffs from President Trump have added another level of complexity. To help investors make sense of the implications, we asked our portfolio managers two key questions:</p>
<ol class="content-list">
<li class="mt-2">How do the new tariffs impact your asset class?</li>
<li class="mt-2">What indicators should investors be watching?</li>
</ol>
<p>Their answers offer timely perspective on this shifting environment and provide valuable context to help investors cut through the noise. As the situation evolves, we&rsquo;ll keep this blog updated with fresh insights from our portfolio managers.</p>
<ul class="content-list">
<li class="mt-2"><a href="#digital-assets-bitcoin"><strong>Digital Assets: De-dollarization Shifts Bitcoin Towards Monetary Role </strong></a></li>
<li class="mt-2"><a href="#gold"><strong>Gold: Safe Haven Demand Rises and Miners&rsquo; Margins Are Key</strong></a></li>
<li class="mt-2"><a href="#natural-resources"><strong>Natural Resources: Sector Readies Response Playbook</strong></a></li>
<li class="mt-2"><a href="#commodities"><strong>Commodities: Weaker Dollar May Shift Tides After Demand Shock</strong></a></li>
<li class="mt-2"><a href="#emb"><strong>Emerging Markets Bonds: Spreads Pressured, EM Currencies Steady</strong></a></li>
<li class="mt-2"><a href="#eme"><strong>Emerging Markets Equity: Short-Term Challenges May Accelerate Structural Trends</strong></a></li>
<li class="mt-2"><a href="#fixed-income"><strong>Fixed Income: Spreads Widen as Confidence Indicators Flash</strong></a></li>
<li class="mt-2"><a href="#municipal-bonds"><strong>Municipal Bonds: As Costs Pressure Projects, Timing and Pricing Matter</strong></a></li>
</ul>
<h2 id="digital-assets-bitcoin" class="jump-link-nav anchored-block" data-jumplink-title="Digital Assets">Digital Assets: De-dollarization Moves Bitcoin Towards Monetary Role</h2>
<div class="d-flex justify-content-between align-items-center row my-3">
<div class="col-md-12">
<div class="byline__author">
<div class="porthole porthole--lg byline__author-image no-print mr-3" style="background-image: url('https://www.vaneck.com/globalassets/home/us/insights/thought-leaders/img-tl-matthew-sigel-645px.jpg');"><img loading="lazy" alt="David Schassler Head of Multi-Asset Solutions" class="porthole__image" src="https://www.vaneck.com/globalassets/home/us/insights/thought-leaders/img-tl-matthew-sigel-645px.jpg" /></div>
<div style="position: relative;" class="byline__author-content"><a data-ve-gtm="blog-author" class="byline__author-name-link" href="/link/b2b937a9c48a476890a9e6e7ad308413.aspx" title="Matthew Sigel &mdash; Head of Digital Assets Research">
<h3 class="byline__author-name mt-0">Matthew Sigel</h3>
</a>
<div class="byline__author-title">Head of Digital Assets Research</div>
</div>
</div>
</div>
</div>
<!-- -->
<p><strong>Impact</strong></p>
<p>The Trump administration&rsquo;s April 2 tariff package&mdash;targeting imports from China and the EU&mdash;has reignited global trade tensions and increased the risk of monetary and geopolitical fragmentation. Bitcoin initially dipped from $85k to the $81K range after the announcement and sold off further over the weekend, but has still outperformed the Nasdaq across every major timeframe&mdash;1 week, 1 month, YTD, and over the past 1, 2, 3, 5, and 10 years. While slower growth alone isn&rsquo;t bullish for Bitcoin, the policy response might be: if tariffs weigh on GDP without triggering a fresh inflation spike, the Fed may have scope to cut rates&mdash;reintroducing the liquidity conditions under which Bitcoin has historically excelled. At the same time, the weaponization of trade and financial infrastructure continues to drive interest in neutral settlement rails.</p>
<p>That interest is no longer theoretical. China and Russia have reportedly begun settling some energy transactions in Bitcoin and other digital assets. Bolivia has announced plans to import electricity using crypto. And French energy utility EDF is exploring whether it can mine Bitcoin with surplus electricity currently exported to Germany. These are early signs that Bitcoin is evolving from a speculative asset into a functional monetary tool&mdash;particularly in economies looking to bypass the dollar and reduce exposure to U.S.-led financial systems.</p>
<p><strong>Indicators to Watch</strong></p>
<p>Investors should watch the evolving path of Fed policy: dovish shifts in rate expectations and rising liquidity are historically positive for Bitcoin. The U.S. Dollar Index (DXY) remains a key signal&mdash;any sustained dollar weakness may bolster the Bitcoin-as-hedge narrative, particularly in an environment of geopolitical fragmentation. Importantly, while 10-year Treasury yields surged on Monday, Bitcoin&rsquo;s reaction was notably subdued. Unlike in 2022, rising yields did not trigger a wave of forced liquidations or volatility in crypto markets, suggesting that BTC may be decoupling from old macro sensitivities. Bitcoin ETP flows and on-chain activity also matter: despite recent volatility, U.S.-listed spot Bitcoin ETPs are still net positive by ~$600 million year-to-date, with renewed inflows in late March. Finally, watch for retaliatory moves from China or the EU&mdash;especially those aimed at bypassing dollar-based systems&mdash;which could accelerate adoption of crypto as an alternative settlement layer.</p>
<p><a href="https://www.vaneck.com/us/en/insights/digital-assets/"><strong>Explore more Digital Assets Insights.</strong></a></p>
<h2 id="gold" class="jump-link-nav anchored-block" data-jumplink-title="Gold">Gold: Safe Haven Demand Rises and Miners&rsquo; Margins Are Key</h2>
<div class="d-flex justify-content-between align-items-center row my-3">
<div class="col-md-12">
<div class="row align-items-center">
<div class="col-md-12">
<div class="byline__author">
<div class="porthole porthole--lg byline__author-image no-print mr-3" style="background-image: url('https://www.vaneck.com/globalassets/home/corp/our-firm/investment-professionals/imaru-casanova.jpg');"><img loading="lazy" alt="Imaru Casanova Portfolio Manager, Gold and Precious Metals" class="porthole__image" src="https://www.vaneck.com/globalassets/home/corp/our-firm/investment-professionals/imaru-casanova.jpg" /></div>
<div style="position: relative;" class="byline__author-content"><a data-ve-gtm="blog-author" class="byline__author-name-link" href="/us/en/news-and-insights/thought-leaders/imaru-casanova/">
<h3 class="byline__author-name mt-0">Imaru Casanova</h3>
</a>
<div class="byline__author-title">Portfolio Manager, Gold and Precious Metals</div>
</div>
</div>
</div>
</div>
</div>
</div>
<!-- -->
<p><strong>Impact</strong></p>
<p>Gold and gold stocks should ultimately benefit from the heightened level of risk across the global economy and global financial system. The unpredictability of economic policies and heightened market volatility should boost gold's appeal as the preferred safe-haven asset during times of global uncertainty. This should support a shift in investor sentiment towards gold and related equities.</p>
<p>Gold stocks&rsquo; leverage to the gold price, combined with their attractive valuations relative to the broader equity markets, and their low correlation with most other asset classes, should lead to a re-rating of the sector as investors look for a safer place to rotate capital to and as they look to diversify their portfolios.</p>
<p><strong>Indicators to Watch</strong></p>
<p>For the gold miners, investors should be focused on margins, assessing the impact of the ongoing trade war on global currencies and inflation trends for the sector. A weaker local currency leads to lower USD costs and improves margins for the miners. Gold miners were estimating cost inflation would average about 3-5% in 2025, prior to the recent tariff related developments.</p>
<p><a href="https://www.vaneck.com/us/en/insights/gold-investing/"><strong>Explore more Gold Insights.</strong></a></p>
<h2 id="natural-resources" class="jump-link-nav anchored-block" data-jumplink-title="Natural Resources">Natural Resources: Sector Readies Response Playbook</h2>
<div class="d-flex justify-content-between align-items-center row my-3">
<div class="col-md-12">
<div class="row align-items-center">
<div class="col-md-6">
<div class="byline__author">
<div class="porthole porthole--lg byline__author-image no-print mr-3" style="background-image: url('https://www.vaneck.com/globalassets/home/corp/our-firm/investment-professionals/shawn-reynolds.jpg');"><img loading="lazy" alt="Shawn Reynolds Portfolio Manager, Global Resources" class="porthole__image" src="https://www.vaneck.com/globalassets/home/corp/our-firm/investment-professionals/shawn-reynolds.jpg" /></div>
<div style="position: relative;" class="byline__author-content"><a data-ve-gtm="blog-author" class="byline__author-name-link" href="/us/en/news-and-insights/thought-leaders/shawn-reynolds/">
<h3 class="byline__author-name mt-0">Shawn Reynolds</h3>
</a>
<div>
<div class="byline__author-title">Portfolio Manager, Global Resources</div>
</div>
</div>
</div>
</div>
</div>
</div>
</div>
<!-- -->
<p><strong>Impact</strong></p>
<p>Needless to say, the current tariff landscape is highly variable, complex and far from certain. Threats of further steps against China and their response ratchet up the intensity. Nevertheless, there is more clarity today than during February and March, even if it is still a blurry sight and worse than feared. However, given the severe reaction of global markets to tariff risks, we feel a large portion of the downside has been priced.</p>
<p>Undoubtedly, the biggest factor facing the entire natural resource sector is the current sentiment that a trade war will lead to a prolonged and deep global recession. In particular, the U.S. relationship with China has escalated and an off-ramp may take time and appear difficult to construct. Under that scenario, commodity demand of all of the main sectors covered by our Global Resources Strategy&mdash;energy (traditional and transitional), metals and mining and agriculture/paper/forest products&mdash;would suffer.</p>
<p>However, we believe the reality of application of &ldquo;reciprocal&rdquo; tariffs, as well as &ldquo;retaliatory&rdquo; tariffs will not be as disruptive as the worst fears. The broad-based 10% tariff influences the price of most commodities well within their recent ranges and is something to which the global economy historically has had a rather benign reaction relative to current perceptions. Additionally, geopolitical events over the last several years have reoriented and made supple commodity supply chains. The energy, metals and agricultural industries have adapted adroitly, and we believe these ecosystems will continuously evolve to newly optimal patterns. A good example of this is the 34% tit-for-tat tariffs on energy (mostly liquefied natural gas (LNG)) between China and the U.S. In our view, global LNG trade will adapt. We view that the delivery patterns of Russian, Iranian and Venezuelan crude oil has comfortably adjusted. In sum, most commodity producers have seen a version of this movie before and have a playbook for how to react.</p>
<p>Nevertheless, the net impact of recessionary fears have overwhelmed any moderation in the tangible impact of tariffs and uncertainty has spiked.</p>
<p><strong>Indicators to Watch</strong></p>
<p>As suggested above, the key factor to watch for our industries is how demand evolves&mdash;particularly in China. Most economists are now predicting a recession that should lead to an erosion of demand. But we would also watch several other macro factors including:</p>
<ul class="content-list">
<li class="mt-2">How credit markets ultimately react to this.</li>
<li class="mt-2">How quickly (or if) negotiations of tariffs settle and with whom.</li>
<li class="mt-2">Stimulus measures announced by major economies such as China or the EU.</li>
<li class="mt-2">The announcement of supportive positives for the U.S., including deregulation, tax relief, Federal Reserve easing and revamped fiscal spending.</li>
</ul>
<p><a href="https://www.vaneck.com/us/en/insights/natural-resources/"><strong>Explore more Natural Resources Insights.</strong></a></p>
<h2 id="commodities" class="jump-link-nav anchored-block" data-jumplink-title="Commodities">Commodities: Weaker Dollar May Shift Tides After Demand Shock</h2>
<div class="d-flex justify-content-between align-items-center row my-3">
<div class="col-md-12">
<div class="byline__author">
<div class="porthole porthole--lg byline__author-image no-print mr-3" style="background-image: url('/EPiServer/CMS/Content/globalassets/en/home/us/blogs/bm-blog-images/roland-morris_100x100px.jpg,,78179?epieditmode=false;');"><img loading="lazy" alt="Roland Morris Portfolio Manager, Commodity Index Strategy" class="porthole__image" src="https://www.vaneck.com/globalassets/home/us/blogs/bm-blog-images/roland-morris_100x100px.jpg" /></div>
<div style="position: relative;" class="byline__author-content"><a data-ve-gtm="blog-author" class="byline__author-name-link" href="/link/8a941682150144598010e2784c931836.aspx#commodities">
<h3 class="byline__author-name mt-0">Roland Morris</h3>
</a>
<div class="byline__author-title">Portfolio Manager, Commodity Index Strategy</div>
</div>
</div>
</div>
</div>
<!-- -->
<p><strong>Impact</strong></p>
<p>Very simple, commodities fell sharply because demand expectations collapsed. Most commodity indexes were close to all-time highs on April 2. The UBS Constant Maturity Commodity Total Return Index fell 6% in the following two days, a large move for a broad-based index. Copper, the commodity with a &ldquo;PhD in economics&rdquo;, declined 14% in two days after making new all-time highs in late March.</p>
<p>These tariffs are much higher and worse than expected. The outlook for global growth has collapsed. Gold has held up better than most commodity sectors but has pulled back about 4% from the new all-time highs reached on April 2. I believe that Trump&rsquo;s global tariff war is very bullish gold.</p>
<p><strong>Indicators to Watch</strong></p>
<p>The dollar. I think that this trade war is very bearish the dollar in the longer term. If I am correct, commodities should be supported and could resume a bullish trend.</p>
<p><a href="https://www.vaneck.com/us/en/insights/natural-resources/"><strong>Explore more Commodities Insights.</strong></a></p>
<h2 id="emb" class="jump-link-nav anchored-block" data-jumplink-title="Emerging Markets">Emerging Markets Bonds: Spreads Pressured, EM Currencies Steady</h2>
<div class="d-flex justify-content-between align-items-center row my-3">
<div class="col-md-12">
<div class="byline__author">
<div class="porthole porthole--lg byline__author-image no-print mr-3" style="background-image: url('https://www.vaneck.com/globalassets/home/corp/our-firm/investment-professionals/eric-fine.jpg');"><img loading="lazy" alt="Eric Fine Portfolio Manager, Head of Active Emerging Markets Debt" class="porthole__image" src="https://www.vaneck.com/globalassets/home/corp/our-firm/investment-professionals/eric-fine.jpg" /></div>
<div style="position: relative;" class="byline__author-content"><a data-ve-gtm="blog-author" class="byline__author-name-link" href="/us/en/news-and-insights/thought-leaders/eric-fine">
<h3 class="byline__author-name mt-0">Eric Fine</h3>
</a>
<div class="byline__author-title">Portfolio Manager, Head of Active Emerging Markets Debt</div>
</div>
</div>
</div>
</div>
<!-- -->
<p><strong>Impact</strong></p>
<p>Tariffs and their associated recession risks are having three main effects on emerging market bonds.</p>
<ol class="content-list">
<li class="mt-2">The &ldquo;easy&rdquo; one: spreads should widen on dollar-denominated bonds. Credit spreads are extremely correlated in risk-off moments like this, and long credit (from investment grade to high yield) has been the most consensus view, for arguably decades. We&rsquo;d also note that corporate bonds can get incredibly illiquid and that this risk is almost always un-priced, further pressuring spreads higher.</li>
<li class="mt-2">Risk-free yield curves should rally. This means Treasuries, as well as the risk-free yield curves of emerging market local-currency bonds (which were actually up on the year until April 4).</li>
<li class="mt-2">Emerging market currencies have been resilient, only cracking recently when U.S. stocks deepened their declines. EM local currency is incredibly under-owned, which explains their strength this year (despite the selloff in recent days). They also have higher real rates and are often net creditors in dollars, so have FX intervention power. Also CNY has been kept unchanged by the Chinese authorities, anchoring EM currencies.</li>
</ol>
<p><strong>Indicators to Watch</strong></p>
<p>CNY: watch the daily fix. If it stays largely unchanged (versus the daily model predictions), China is remaining a stabilizing force for emerging markets.</p>
<p>China stimulus: it&rsquo;s the logical pressure on China, which was already moving in that direction.</p>
<p>The U.S. Federal Reserve: a dovish tilt could mark a turn in trend.</p>
<p>Also, watch the big asset prices combos for the U.S. In particular, if U.S. stocks are down and Treasuries are down, that&rsquo;s very bad, as that indicates an exit from anything other than cash. If U.S. stocks are down and Treasuries are down and the USD is down, that&rsquo;s very, very bad, as that is an exit even from cash and the U.S. system.</p>
<p><a href="https://www.vaneck.com/us/en/insights/emerging-markets-bonds/"><strong>Explore more Emerging Markets Bonds Insights.</strong></a></p>

<h2 id="eme" class="anchored-block">Emerging Markets Equity: Short-Term Challenges May Accelerate Structural Trends</h2>
<div class="d-flex justify-content-between align-items-center row my-3">
<div class="col-md-12">
<div class="row align-items-center">
<div class="col-md-6">
<div class="byline__author">
<div class="porthole porthole--lg byline__author-image no-print mr-3" style="background-image: url('https://www.vaneck.com/globalassets/home/corp/our-firm/investment-professionals/ola-el-shawarby_2022.06_v1.jpg');"><img loading="lazy" alt="Ola  El-Shawarby, CFA Portfolio Manager, Emerging Markets Equity" class="porthole__image" src="https://www.vaneck.com/globalassets/home/corp/our-firm/investment-professionals/ola-el-shawarby_2022.06_v1.jpg" /></div>
<div style="position: relative;" class="byline__author-content"><a data-ve-gtm="blog-author" class="byline__author-name-link" href="/link/f98f0ec11c0043b3803f14238bacfd2d.aspx">
<h3 class="byline__author-name mt-0">Ola El-Shawarby, CFA</h3>
</a>
<div class="byline__author-title">Portfolio Manager, Emerging Markets Equity</div>
</div>
</div>
</div>
</div>
</div>
</div>
<!-- -->
<p><strong>Impact</strong></p>
<p>The U.S. administration&rsquo;s proposed reciprocal tariff framework adds a new layer of complexity to the global trade outlook, particularly for export-oriented economies. However, rather than derailing momentum, it may accelerate structural trends already reshaping emerging markets&mdash;such as the shift toward domestic demand, innovation-led growth and supply chain diversification.</p>
<p>While tariffs pose short-term challenges for China, they reinforce the country&rsquo;s strategic pivot toward consumption, high-value manufacturing and technological innovation&mdash;including advances in AI and next-generation industries&mdash;supported by targeted policy measures. India remains relatively insulated, with growth anchored by robust internal demand and ongoing reform. In Europe, the risk of trade disruption is being met with growing support for coordinated fiscal expansion.</p>
<p>With U.S. exceptionalism increasingly in question, the potential for a weaker dollar and lower rates reduces external pressures on emerging markets. That said, equity market volatility is likely to persist amid uncertain global growth and shifting policy dynamics. In this environment, selectivity is key&mdash;we remain focused on resilient, domestically driven businesses with strong fundamentals and clear exposure to long-term structural tailwinds.</p>
<p><strong>Indicators to Watch</strong></p>
<p>Several macro forces are shaping the outlook for emerging markets, and investors should stay focused on a few key areas:</p>
<ul>
<li>Trade and policy dynamics: The broadening scope of U.S. tariffs raises the risk of retaliatory measures and further supply chain disruption, which could weigh on global trade and sentiment.</li>
<li>Inflation and interest rates: Trade-driven cost pressures may complicate the inflation outlook. However, a more dovish U.S. Federal Reserve&mdash;having paused its tightening cycle&mdash;supports the case for rate cuts, improving liquidity and easing pressure on EM currencies.</li>
<li>U.S. dollar trajectory: A weaker dollar would provide a meaningful tailwind for EMs by reducing external funding costs and supporting commodity-linked revenues.</li>
<li>Structural shifts: Ongoing trends such as nearshoring, supply chain diversification, and rising investment in domestic capacity remain central to EM growth stories.</li>
<li>Country-level fundamentals: In a more volatile and uncertain global environment, markets with sound external balances, credible policy frameworks, and scope for targeted stimulus are best positioned to navigate near-term risks and sustain long-term outperformance.</li>
</ul>
<p>While short-term volatility is likely to persist, these indicators offer a useful lens through which to assess both risks and opportunities across the EM landscape.</p>
<p><a href="/us/en/insights/emerging-markets-equity/"><strong>Explore more Emerging Markets Equity Insights.</strong></a></p>
<h2 id="fixed-income" class="jump-link-nav anchored-block" data-jumplink-title="Fixed Income">Fixed Income: Spreads Widen as Confidence Indicators Flash</h2>
<div class="d-flex justify-content-between align-items-center row my-3">
<div class="col-md-12">
<div class="byline__author">
<div class="porthole porthole--lg byline__author-image no-print mr-3" style="background-image: url('https://www.vaneck.com/globalassets/home/corp/our-firm/investment-professionals/fran-rodilosso.jpg');"><img loading="lazy" alt="Fran Rodilosso Head of Fixed Income ETF Portfolio Management" class="porthole__image" src="https://www.vaneck.com/globalassets/home/corp/our-firm/investment-professionals/fran-rodilosso.jpg" /></div>
<div style="position: relative;" class="byline__author-content"><a data-ve-gtm="blog-author" class="byline__author-name-link" href="/us/en/news-and-insights/thought-leaders/fran-rodilosso/" title="Fran Rodilosso - Head of Fixed Income ETF Portfolio Management">
<h3 class="byline__author-name mt-0">Fran Rodilosso</h3>
</a>
<div>
<div class="byline__author-title">Head of Fixed Income ETF Portfolio Management</div>
</div>
</div>
</div>
</div>
</div>
<!-- -->
<p><strong>Impact</strong></p>
<p>The newly introduced tariff regime equates to lower growth expectations, at best, and a higher risk of recession both in the U.S. and abroad as a bad, but not even worst, case. Slower growth and/or greater recession odds lead to higher credit spreads, and this impact is being felt across all risky debt markets, including investment grade credit, high yield, loans, CLOs and emerging markets debt.</p>
<p>There were many other market reactions in the couple of days following &ldquo;liberation day&rdquo; that are consistent with the rapid move wider in credit spreads, such as the rally in risk-free rates, the fall in commodity prices and, of course, equities entering bear market territory. We find all of these moves consistent with slower growth, lower earnings and&mdash;if there is not a rapid reversal in the tariff policies&mdash;multiple contraction. What is extremely interesting, and should be of some additional concern, however, is the bond market selloff on Monday, April 7. A correlated selloff with equities may show additional loss of confidence in the U.S. administration&rsquo;s overall economic plan and its ability to manage through the multiple challenges of elevated prices, high and rapidly growing debt and economic uncertainty that the administration itself has created.</p>
<p><strong>Indicators to Watch</strong></p>
<p>In the credit space, we will be watching a variety of indicators:</p>
<ul>
<li>The new issue market as an indicator of the health of capital markets.</li>
<li>Fund flows as a sign of investor sentiment and market technical.</li>
<li>Default rates in the high yield bond and leveraged loan markets as an indicator of financial stress, although these will take longer to develop.</li>
<li>Lastly, of course, the performance of the U.S. dollar and Treasuries as indicators of market confidence in the U.S. economy and U.S. institutions.</li>
</ul>
<p>As always, we are looking for other signs of stress that could potentially lead to credit market dislocations, such as funding market disruptions and wholesale unwinding of leveraged positioning. So far, we have seen no such cracks emerge.</p>
<p><a href="/us/en/insights/income-investing/"><strong>Explore more Income Investing Insights.</strong></a></p>
<h2 id="municipal-bonds" class="anchored-block">Municipal Bonds: As Costs Pressure Projects, Timing and Pricing Matter</h2>
<div class="d-flex justify-content-between align-items-center row my-3">
<div class="col-md-12">
<div class="row align-items-center">
<div class="col-md-6">
<div class="byline__author">
<div class="porthole porthole--lg byline__author-image no-print mr-3" style="background-image: url('https://www.vaneck.com/globalassets/home/us/insights/thought-leaders/tamara-lowin_2022.06_v1.jpg');"><img loading="lazy" alt="Tamara  Lowin Senior Municipal Credit Analyst" class="porthole__image" src="https://www.vaneck.com/globalassets/home/us/insights/thought-leaders/tamara-lowin_2022.06_v1.jpg" /></div>
<div style="position: relative;" class="byline__author-content"><a data-ve-gtm="blog-author" class="byline__author-name-link" href="/link/9217c92d0f9a407e8b869d637f8a9cce.aspx">
<h3 class="byline__author-name mt-0">Tamara Lowin</h3>
</a>
<div>
<div class="byline__author-title">Senior Municipal Credit Analyst</div>
</div>
</div>
</div>
</div>
</div>
</div>
</div>
<!-- -->
<p><strong>Impact</strong></p>
<p>The cost of construction projects across all sectors will increase as tariffs raise the price of materials sourced internationally. Some projects will be shelved, but we expect to see a combination of strained financials as projects are completed over budget and increased revenue streams to close funding gaps&mdash;whether higher tolls, tuition costs, rent, healthcare services and/or other fees. Replacing aging infrastructure, from bridges to potholed roads, will be fiscally more difficult to justify. Expansion projects will also likely be stalled without increases in revenue streams, and areas could find themselves with insufficient resources, such as hospital beds and transit.</p>
<p>Public borrowers without expansion or replacement plans will also feel additional strain due to operational supplies and employee costs. Healthcare providers especially have already seen an increase in general supply costs, many sourced from overseas, and in addition, have attempted to address the U.S. shortage of nursing staff with international hiring, which will become more difficult, further squeezing margins and closing more beds.</p>
<p>Sales and use tax revenues are likely to remain within range due to increasing base prices balanced by lower anticipated tourism and domestic demand. Entities directly involved in international trade&mdash;such as ports, airports, energy and the state and local governments that depend on the revenue, economic activity and jobs from those facilities&mdash;will see strain from higher unemployment (lower income taxes and high unemployment costs) and lower revenue.</p>
<p><strong>Indicators to Watch</strong></p>
<p>Understanding the timing and any guaranteed pricing for existing construction projects as well as realistic pricing projections for future plans will be important to evaluate the feasibility of their success. The liquidity cushion of borrowers as well as revenue elasticity will also be a necessary factor to understand their pricing power. The economic drivers of local and state governments, both their industries (e.g. healthcare, construction, finance and tourism), and their revenue streams such as sales tax or income tax will give us color on the timing and magnitude of declines in revenue and feasibility of current operation and capital plans.</p>
<p><a href="https://www.vaneck.com/us/en/insights/municipal-bonds/"><strong>Explore more Municipal Bonds Insights.</strong></a></p>
<p>To receive more <a href="https://www.vaneck.com/us/en/insights/investment-outlook/" title="Investment Outlook Insights"><strong>Investment Outlook</strong></a> insights, <a href="/link/5f45412c2143400497908cea2897f7d3.aspx" title=" Subscription Center"><strong>sign up in our subscription center</strong></a>.</p>
]]></content:encoded>
</item><item rdf:about="https://www.vaneck.com/us/en/blogs/emerging-markets-equity/emerging-markets-policy-uncertainty-tempers-a-strong-start-to-2025/">
  <title>Emerging Markets: Policy Uncertainty Tempers a Strong Start to 2025></title>
  <link>https://www.vaneck.com/us/en/blogs/emerging-markets-equity/emerging-markets-policy-uncertainty-tempers-a-strong-start-to-2025/</link>
  <description><![CDATA[Emerging markets stocks have outperformed developed markets to start 2025, led by a surge in China tech and Brazilian commodities. Macro shifts, AI innovation, and policy support shape the outlook across regions.]]></description>
  <dc:creator>Ola  El-Shawarby, CFA</dc:creator>
  <dc:date>04/07/2025 06:30:00</dc:date>
<content:encoded><![CDATA[

<p id="market-review" class="jump-link-nav anchored-block" data-jumplink-title="Market Review">Emerging market equities are off to a strong relative start in 2025, with the MSCI Emerging Markets IMI Index rising approximately 1.7% during the first quarter, outperforming developed markets after years of lagging. This performance has been largely led by a rebound in China&rsquo;s equity markets, particularly in the technology sector. In contrast, India has seen moderate declines amid profit-taking and softening economic data. Brazil and parts of the CEEMEA region have also delivered solid gains, supported by improved macro conditions and investor sentiment. Global trade policy shifts, evolving interest rate expectations, geopolitical developments, and currency dynamics continue to shape the environment for emerging markets.</p>
<p>At the onset of the second quarter, the U.S. administration&rsquo;s proposed reciprocal tariff framework introduced an additional layer of complexity into the global trade and growth equation. While the scope of the proposed measures is significant&mdash;particularly for export-oriented economies in Asia and Europe&mdash;it may also serve to reinforce important structural shifts already in motion. Chinese exports to the U.S. now face significant additional cumulative tariffs, presenting short-term challenges but also strengthening the case for continued domestic stimulus and a strategic pivot toward innovation and consumption. India, while targeted in the proposal, remains anchored by robust internal demand drivers supported by demographic, digitization, and policy reform tailwinds. In Europe, potential trade frictions come alongside a renewed emphasis on coordinated fiscal expansion. While the near-term landscape remains fluid and we need to continue to monitor developments closely, we believe these developments ultimately support our focus on selectively identifying resilient, domestically oriented growth opportunities across emerging markets.</p>

<h2 id="em-countries" class="jump-link-nav anchored-block" data-jumplink-title="EM Countries &amp; Themes">China: Rebound Driven by Tech &amp; Policy Support</h2>
<p>Chinese equities have surged approximately 15% in the first quarter of 2025, driven by renewed fiscal stimulus, improving investor sentiment, and a notable recovery in large-cap technology stocks. Beijing&rsquo;s pro-growth policy pivot has been central, with measures to support domestic consumption, stabilize the property market, and encourage capital market activity. The government&rsquo;s efforts to restore confidence in the internet sector, highlighted by regulatory easing and supportive rhetoric, have also played a key role. At the same time, breakthroughs like Deepseek&rsquo;s recent AI advancement underscore the sector&rsquo;s ongoing innovation and global competitiveness. However, challenges persist. Consumer demand remains uneven, and tensions with the U.S., including hefty proposed tariffs and ongoing export controls on semiconductors, present potential headwinds. While policy execution remains a focus, China&rsquo;s long-term outlook is underpinned by its push into strategic industries like AI and advanced manufacturing, as well as still-attractive equity valuations following several difficult years.</p>
<h2>India: Near-Term Pullback Amid Strong Long-Term Fundamentals</h2>
<p>India&rsquo;s markets have pulled back modestly in early 2025, with the MSCI India Index declining approximately 4% during the first quarter. After a strong multi-year run, elevated valuations, weaker-than-expected GDP growth, and muted corporate earnings prompted foreign investors to trim exposure. Contributing factors include persistent inflation, regulatory tightening, and a slowdown in infrastructure spending ahead of elections. Despite these near-term headwinds, the team&rsquo;s multiple visits to India in recent months reinforce our conviction in the country&rsquo;s structural story. Growth drivers such as rising domestic consumption, manufacturing tailwinds from the &ldquo;Make in India&rdquo; initiative, and a globally competitive technology services sector remain firmly in place. In our view, the recent correction presents an opportunity to add to high-quality names at more reasonable valuations, with long-term fundamentals intact.</p>
<h2>Brazil: Strong Start Amid Commodity &amp; Policy Tailwinds</h2>
<p>Brazilian equities have been among the top performers in emerging markets this year, with the MSCI Brazil Index up approximately 15% in U.S. dollar terms. Improving fiscal signals from the government, along with a supportive commodity backdrop, have helped restore investor confidence. Markets have responded positively to more disciplined rhetoric around government spending and tax reform, while rising demand for exports such as iron ore and soybeans&mdash;especially from China&mdash;has supported earnings. However, the outlook remains sensitive to inflation dynamics, central bank policy, and political developments. The Brazilian real has shown signs of stabilization following sharp depreciation last year, but remains a watchpoint. Despite these risks, Brazil&rsquo;s diversified economy, attractive equity valuations, and exposure to structural trends in agriculture and financial technology position it well for long-term growth particularly as the country nears the end of its rate hiking cycle.</p>
<h2>Technology: EM Tech Stocks Fueling the Rally</h2>
<p>The technology sector has been a key contributor to emerging markets&rsquo; performance year to date. Gains have been led by Chinese internet firms with optimism around Deepseek, along with easing regulatory risks, driving an acceleration of AI investments and innovation in China. Select semiconductor manufacturers in Taiwan and South Korea are also set to benefit from accelerating demand tied to artificial intelligence. However, risks remain, particularly around U.S.&ndash;China technology tensions and export controls that could disrupt key supply chains. Still, the long-term growth trajectory for EM tech remains compelling. Structural themes such as digital transformation, e-commerce penetration, and government-led innovation initiatives are expected to drive sustained investment opportunities across the region.</p>
<h2>CEEMEA: Policy Stability &amp; Geopolitical Rebalancing</h2>
<p>CEEMEA equities delivered a mixed performance year to date, shaped by a range of idiosyncratic and macro factors across the region. Turkey began the year on a strong footing, with the return to orthodox macroeconomic policy boosting investor confidence. However, the recent arrest of a key opposition figure weighed on sentiment, serving as a reminder of the persistent political risk premium. Central Europe performed well, with Hungary and Poland both seeing gains in equities and currencies. Optimism around the potential for a ceasefire in Ukraine, combined with expansionary fiscal policy in Europe &mdash; particularly Germany&rsquo;s push for growth-oriented spending &mdash; supported risk appetite in the region. While potential U.S. tariffs could pressure Europe&rsquo;s export sectors, fiscal stimulus and domestic investment are creating opportunities for selective bottom-up ideas.</p>
<p>In the Middle East, performance was more muted, but our recent on-the-ground meetings in Saudi Arabia and the UAE leave us constructive on the outlook. Continued structural reforms, government-led investments, and pro-growth agendas are supporting business sentiment and medium-term growth expectations. That said, oil prices and evolving geopolitical dynamics remain key watchpoints for the region.</p>
<h2>Macro Landscape</h2>
<p>Several global macro trends are shaping the outlook for emerging markets. The proposed expansion of U.S. tariffs&mdash;now targeting a broader set of trade partners across Asia and Europe&mdash;adds to global uncertainty and raises risks of retaliatory measures. These dynamics could disrupt supply chains and place upward pressure on inflation, complicating the outlook for interest rates. At the same time, they may accelerate structural shifts already underway, including nearshoring, supply chain diversification, and increased focus on domestic demand. Emerging markets continue to benefit from a more dovish U.S. Federal Reserve, which has paused its tightening cycle and signaled potential rate cuts&mdash;supporting capital flows and easing currency pressures. A weaker U.S. dollar has further improved debt-servicing capacity and commodity-linked revenues. While volatility in rates and FX remains a risk&mdash;particularly for countries with external imbalances&mdash;those with sound fundamentals, credible policy frameworks, and room for targeted stimulus are well-positioned to navigate this environment and potentially outperform.</p>
<h2 id="fund-performance" class="jump-link-nav anchored-block" data-jumplink-title="Fund Performance">Fund Performance</h2>
<p>The VanEck <a href="/us/en/investments/emerging-markets-fund-gbfax/overview" title="GBFAX - Emerging Markets Fund - Class A"><strong>Emerging Markets Fund</strong></a> (the &ldquo;Fund&rdquo;) performed in line with the MSCI EM IMI Index on the quarter-to-date basis ending March 31, 2025 (+1.97% for the Fund; +1.70% for the Index). Positive relative performance for the quarter was driven by allocation and stock selection in Brazil, as well as allocation towards Georgia. Negative relative performance was driven by stock selection in China.</p>
<p>China and Brazil were the Fund&rsquo;s top contributors for the quarter.</p>
<h3>Average Annual Total Returns (%) as of March 31, 2025</h3>
<div class="wrapped-div">
<table style="width: 100%;">
<tbody>
<tr class="tbl-data">
<td class="tbl-header last">&nbsp;</td>
<td class="tbl-header last text-right">1Q25<sup>&dagger;</sup></td>
<td class="tbl-header last text-right">YTD</td>
<td class="tbl-header last text-right">1YR</td>
<td class="tbl-header last text-right">3YR</td>
<td class="tbl-header last text-right">5YR</td>
<td class="tbl-header last text-right">10YR</td>
</tr>
<tr class="tbl-data">
<td class="data-td last text-left">Class A: NAV (Inception 12/20/93)</td>
<td class="data-td data last text-right">1.97</td>
<td class="data-td data last text-right">-2.48</td>
<td class="data-td data last text-right">1.10</td>
<td class="data-td data last text-right">3.03</td>
<td class="data-td data last text-right">0.93</td>
</tr>
<tr class="tbl-data">
<td class="data-td last text-left">Class A: Maximum 5.75% Load</td>
<td class="data-td data last text-right">-3.90</td>
<td class="data-td data last text-right">-8.09</td>
<td class="data-td data last text-right">-0.87</td>
<td class="data-td data last text-right">1.81</td>
<td class="data-td data last text-right">0.33</td>
</tr>
<tr class="tbl-data">
<td class="data-td last text-left">Class I: NAV (Inception 12/31/07)</td>
<td class="data-td data last text-right">2.12</td>
<td class="data-td data last text-right">-1.91</td>
<td class="data-td data last text-right">1.68</td>
<td class="data-td data last text-right">3.57</td>
<td class="data-td data last text-right">1.45</td>
</tr>
<tr class="tbl-data">
<td class="data-td last text-left">MSCI Emerging Markets Investable Markets Index (IMI)</td>
<td class="data-td data last text-right">1.70</td>
<td class="data-td data last text-right">6.60</td>
<td class="data-td data last text-right">1.46</td>
<td class="data-td data last text-right">8.77</td>
<td class="data-td data last text-right">3.82</td>
</tr>
<tr class="tbl-data">
<td class="data-td last text-left">MSCI Emerging Markets IMI Growth Index</td>
<td class="data-td data last text-right">0.37</td>
<td class="data-td data last text-right">6.67</td>
<td class="data-td data last text-right">0.09</td>
<td class="data-td data last text-right">6.99</td>
<td class="data-td data last text-right">4.01</td>
</tr>
</tbody>
</table>
</div>
<style>
    .data-td.data {
        padding-right: 5px !important;
        padding-left: 5px !important;
    }

    .wrapped-div {
        max-width: 100%;
    }

    @media (max-width: 1240px) {
        .wrapped-div {
            overflow-x: scroll;
        }
    }

    .wrapped-div-sector {
        max-width: 100%;
        overflow-x: scroll;
    }
</style>
<p class="chart-disclosure">MSCI Emerging Markets IMI Growth Index captures large, mid and small cap exhibiting overall growth style characteristics across Emerging Markets countries.</p>
<p class="chart-disclosure">The table presents past performance which is no guarantee of future results and which may be lower or higher than current performance. Returns reflect applicable fee waivers and/or expense reimbursements. Had the Fund incurred all expenses and fees, investment returns would have been reduced. Investment returns and Fund shares values will fluctuate so that investor's shares, when redeemed, may be worth more or less than their original cost. Fund returns assume that dividends and capital gains distributions have been reinvested in the Fund at net asset value (NAV). Index returns assume that dividends of the Index constituents in the Index have been reinvested. Performance information current to the most recent month end is available by calling 800.826.2333 or by visiting vaneck.com.</p>
<p class="chart-disclosure">Expenses: Class A: Gross 1.54%; Net 1.54%; Class I: Gross 1.19%; Net 1.01%. Expenses are capped contractually until 5/1/25 at 1.60% for Class A and 1.00% for Class I. Caps exclude acquired fund fees and expenses, interest, trading, dividends, interest payments of securities sold short, taxes and extraordinary expenses.</p>

<h2 id="fund-review" class="jump-link-nav anchored-block" data-jumplink-title="Fund Review">Fund Review</h2>
<p>On a sector level, Consumer Discretionary, Financials, and Information Technology contributed to relative performance, while Industrials, Real Estate, and Communication Services detracted. On a country level, Brazil, Georgia, and Greece contributed to relative performance, while China, Turkey, and Poland detracted.</p>
<h2>Top Contributors</h2>
<p>Top contributors to return on an absolute basis during the quarter:</p>
<ul class="content-list">
<li class="mt-2"><strong>MercadoLibre (&ldquo;MELI&rdquo;) (4.6% of Fund net assets<sup>*</sup>):</strong> The company continues to post strong results, with Gross Merchandise Value (GMV) up 56% year-over-year&mdash;driven by 32% growth in Brazil and 28% in Mexico&mdash;and solid progress on monetization. Fintech growth remains robust, supported by rising loan originations and improving asset quality. While NIMAL (Net Interest Margin After Losses) remains under pressure, it&rsquo;s expected to improve as the portfolio matures. Management is confident in asset quality, and its upmarket shift and increased cross-selling within the ecosystem should help offset broader market risks. Argentina could also be a tailwind, given MELI&rsquo;s strong market share and higher margins, with normalization supporting take rate and margin expansion. We remain positive on MELI, backed by favorable structural trends, a strong track record, a complete ecosystem, and continued momentum in Mercado Pago. While competition is rising, MELI is investing to maintain its leadership.</li>
<li class="mt-2"><strong>Prosus N.V. (3.5% of Fund net assets<sup>*</sup>):</strong> Prosus N.V. Class N holds a diverse portfolio of leading internet assets across Asia, emerging Europe, MENA, and Latin America, including significant stakes in Tencent Holdings (24%) and Delivery Hero (28%). The company is strategically invested in high-growth e-commerce verticals&mdash;online food delivery, online classifieds, and fintech&mdash;which have recently seen broad-based profitability improvements. Tencent&rsquo;s improving profitability, combined with a more positive outlook for the Chinese economy and equity markets&mdash;driven by stronger-than-expected stimulus measures and AI innovation breakthroughs&mdash;has improved sentiment and enhanced the outlook for Prosus' stake in Tencent. Additionally, the recent appointment of a new CEO with strong operational expertise, particularly in food delivery, and complementary skills to the Group President &amp; CIO, reflects a sharpened focus on profitability, value creation, and disciplined capital allocation. With a strong cash position, Prosus is well-positioned to act as a sector consolidator, as evidenced by a recent uptick in M&amp;A activity.</li>
<li class="mt-2"><strong>BYD Company (&ldquo;BYD&rdquo;) (2.0% of Fund net assets<sup>*</sup>):</strong> BYD has delivered strong growth and increasing profit per vehicle, despite operating in a highly competitive Chinese EV market that has faced over two years of price wars. The company has aggressively gained market share from both internal combustion engine (ICE) vehicles and other EV players, driven by competitive pricing and advanced technology. Profitability per car has been supported by a favorable shift in the sales mix toward higher-margin overseas volumes and premium models, along with scale efficiencies. Overseas expansion continues to be a key growth driver, with South America&mdash;particularly Brazil&mdash;emerging as a standout market thanks to BYD&rsquo;s strong local partnerships. Southeast Asia and Europe also remain important markets. The company&rsquo;s international growth strategy and the development of high-end brands are expected to sustain profitability going forward. Despite the stock more than doubling over the past year, its valuation remains attractive.</li>
</ul>
<h2>Top Detractors</h2>
<p>Top detractors to return on an absolute basis during the quarter:</p>
<ul class="content-list">
<li class="mt-2"><strong>Taiwan Semiconductor Manufacturing Company (&ldquo;TSMC&rdquo;) (7.6% of Fund net assets<sup>*</sup>):</strong> TSMC, the world&rsquo;s leading contract chip manufacturer, is our portfolio&rsquo;s largest holding and has delivered exceptional performance over the years&mdash;particularly in 2024. Operating primarily on a foundry model, TSMC is insulated from short-term semiconductor price swings and has effectively secured a monopoly in advanced chip fabrication, serving top-tier clients such as Nvidia and Broadcom. We see minimal earnings risk outside of a prolonged global recession and continue to view TSMC as a long-term outperformer. Our primary concern lies in the valuation multiple, which has expanded alongside improving margins and rising expectations tied to AI-driven demand&mdash;factors that have made the stock more sensitive to shifts in sector sentiment, especially as U.S. large-cap semiconductor names have come under pressure. Despite this, we believe efforts to time the market or react to short-term volatility risk missing the substantial long-term upside in this high-quality business.</li>
<li class="mt-2"><strong>Oberoi Realty Limited (1.9% of Fund net assets<sup>*</sup>):</strong> Oberoi Realty, a premier developer of ultra-high-end residential properties and malls in India, has been a consistent top performer in our portfolio for many years. Its strong track record reflects outstanding management, disciplined capital allocation, and a trusted brand. Despite its success, Oberoi is often used as a source of liquidity during broader market selloffs&mdash;such as the one following India&rsquo;s mid-2024 elections&mdash;due to its rich valuation and strong long-term performance. In a recent meeting with the CEO in Mumbai, we reaffirmed our conviction in Oberoi&rsquo;s long-term prospects, even as the stock faced short-term pressure, and remain confident in its ability to deliver sustained growth through a clear and well-executed strategic vision.</li>
<li class="mt-2"><strong>Chroma Ate Inc. (1.3% of Fund net assets<sup>*</sup>):</strong> Chroma Ate, a specialist in designing and manufacturing test and packaging equipment, has faced challenges similar to those experienced by TSMC last quarter, with its share price declining alongside the broader global semiconductor sector. As semiconductor complexity increases, Chroma Ate&rsquo;s role becomes more critical&mdash;particularly for customers like Nvidia, whose cutting-edge chips require more intensive testing to ensure post-delivery reliability. Given its market position and technical expertise, Chroma Ate deserves a valuation premium relative to peers. However, this premium remains vulnerable to short-term contractions during bouts of volatility in the global semiconductor industry, as recently observed.</li>
</ul>
<h2>Top Buys &amp; Sells</h2>
<p>During the period, we established new positions in the following:</p>
<ul class="content-list">
<li class="mt-2"><strong>United International Transportation Co. Ltd. (&ldquo;Budget Saudi&rdquo;) (0.3% of Fund net assets<sup>*</sup>):</strong> Budget Saudi, officially known as United International Transportation Company, is a leading vehicle rental and leasing provider in Saudi Arabia, operating under the Budget Rent a Car brand. The company offers a full range of services, including short-term rentals, long-term leasing, and used car sales. The Saudi car rental and leasing sector is poised to benefit from structural tailwinds, including the government&rsquo;s Vision 2030 initiative and its push to grow tourism and strengthen logistics and transportation infrastructure&mdash;trends that are expected to drive increased demand across both short- and long-term segments. We initiated a position in Budget Saudi, as we believe it is best positioned to capitalize on this growth due to its market leadership and healthier balance sheet, with lower leverage compared to peers. The stock is trading at an attractive valuation&mdash;approximately a 15% discount to other listed Saudi consumer discretionary names&mdash;while offering higher medium-term EPS growth potential and more direct exposure to the structural transformation of the Saudi economy.</li>
<li class="mt-2"><strong>PKO Bank Polski SA (0.5% of Fund net assets<sup>*</sup>):</strong> PKO BP, the largest bank in Poland, is well positioned to benefit from the country&rsquo;s solid economic outlook, with growth in 2025&ndash;26 expected to be driven by exports, EU funding, infrastructure investment, and energy modernization. Political stability and renewed EU integration further support a positive medium-term outlook. The bank is highly capitalized, profitable (ROE of 22%), and prepared to support credit expansion despite expected rate cuts and modest margin pressure. While the stock has already performed well, we see further upside driven by stronger loan growth tied to Poland&rsquo;s investment cycle, Germany&rsquo;s fiscal stimulus spillover, and the potential for a Russia-Ukraine ceasefire to unlock trade and investment across the region. We also see room for earnings revisions, making the risk-reward attractive.</li>
<li class="mt-2"><strong>Diagnostyka S.A. (0.5% of Fund net assets<sup>*</sup>):</strong> Diagnostyka is the largest diagnostic company in Poland&mdash;a fast-growing and resilient economy&mdash;with a 50% market share. In operation for 27 years, the company serves 20 million patients annually through 1,100 collection points and processes 140 million tests each year. Established through a merger in 2011, it has delivered a 24% CAGR from 2011 to 2023, supported by a solid business model and strong secular growth drivers. The company completed its IPO in January, and we participated in the deal, attracted by its compelling growth prospects and valuation discount relative to regional peers, despite stronger profitability and momentum.</li>
<li class="mt-2"><strong>ANTA Sports Products Ltd. (0.6% of Fund net assets<sup>*</sup>):</strong> Anta is a leading Chinese sportswear company that designs, manufactures, and sells athletic apparel, footwear, and accessories across a portfolio of brands including Anta, Fila, Descente, and Kolon. We added Anta to our portfolio as we believe it is well positioned to benefit from the recovery of offline consumption in China, with an attractive valuation supporting the investment case. The company is innovating with new retail formats&mdash;such as Super Anta stores&mdash;to drive foot traffic and engagement. While growth at Fila, acquired in 2009, slowed in the second half of 2024, a newly appointed CEO is expected to introduce fresh strategies to reinvigorate the brand. At the same time, Anta&rsquo;s high-end sportswear brands, Descente and Kolon, are outperforming expectations, providing additional upside to the group&rsquo;s growth outlook.</li>
<li class="mt-2"><strong>TAL Education Group (&ldquo;TAL&rdquo;) (0.6% of Fund net assets<sup>*</sup>):</strong> TAL is a K-12 after-school tutoring company in China that has shifted its focus to AI-powered learning tablets and digital education following the 2021 regulatory crackdown on the tutoring sector. Leveraging the open-sourced DeepSeek model, TAL is incorporating advanced AI capabilities into its products, with upcoming tablet models expected to feature even more sophisticated functionality. As government policy has recently become more supportive&mdash;driven by a focus on improving graduate employment&mdash;TAL has expanded its school network over the past year. Despite demographic concerns, a significant decline in the K-12 population is not expected within the next five years, supporting a stable demand outlook.</li>
<li class="mt-2"><strong>Lemon Tree Hotels Ltd. (0.7% of Fund net assets<sup>*</sup>):</strong> Lemon Tree Hotels is India&rsquo;s leading mid- and budget-segment hotel chain, catering to both business and leisure travelers through its owned Lemon Tree brand and franchised Keys brand. The Fund has previously invested in the company, whose business model and management team are well known to us. A prior exit at the pandemic bottom, driven by valuation concerns from a former portfolio manager, proved premature. Recent market weakness in India created an opportunity to re-enter the position at attractive levels. We see considerable upside from a combination of increasing domestic travel demand and improved cash returns to shareholders.</li>
<li class="mt-2"><strong>Alibaba Group (1.5% of Fund net assets<sup>*</sup>):</strong> Alibaba is a leading Chinese technology company operating in e-commerce, cloud computing, logistics, and digital media. We added Alibaba to our portfolio as we see it as a long-term beneficiary of China&rsquo;s AI advancements, with the recent launch of DeepSeek helping shift investor focus from macroeconomic concerns to the country&rsquo;s technological potential. As China&rsquo;s top cloud provider, it is well-positioned to benefit from rising demand for AI inference, with cloud computing emerging as a key profit driver in the era of artificial general intelligence. The company has announced a strategic focus on two core areas&mdash;e-commerce and AI+Cloud&mdash;and plans to significantly boost capital expenditures over the next three years, aiming to triple its average annual capex from the past decade to support this transformation.</li>
</ul>
<p>During the period, we exited the following positions:</p>
<ul class="content-list">
<li class="mt-2"><strong>Cleopatra Hospital Company:</strong> Cleopatra Hospital Group is a leading private healthcare provider in Egypt, operating a network of hospitals and polyclinics that serve the growing demand for high-quality medical services amid a national shortage of well-equipped facilities. While we continue to believe in the long-term structural growth opportunity for the group, recent currency depreciation and inflationary pressures have negatively impacted customer affordability and operational costs, while also affecting stock liquidity. Given these headwinds, we decided to exit the position and will continue to monitor for a more favorable re-entry point in the future.</li>
<li class="mt-2"><strong>Fleury SA:</strong> Fleury is the largest diagnostic company in Brazil, but we decided to exit the position as the company has shown signs of growth deceleration over the past few quarters, raising concerns about future trends. Additionally, an increase in claim denials has begun to weigh on profitability. While Fleury has maintained healthy cash flow, we believe its growth outlook has weakened, prompting us to reallocate capital to a company with stronger visibility and more compelling growth prospects.</li>
<li class="mt-2"><strong>PT Bank Rakyat Indonesia (Persero) Tbk Class B:</strong> Bank Rakyat Indonesia (BRI) faces ongoing asset quality challenges, particularly related to non-performing loan recognition&mdash;a known issue the bank is working to address. However, the greater uncertainty lies in its growth trajectory once these credit issues are resolved. Under the new president&rsquo;s policy direction, BRI is seen as the highest-risk among state-owned banks due to its exposure to mass-market lending and its position as the most well-capitalized institution. Investor concerns center around potential pressure to contribute dividends to Danareksa and the bank&rsquo;s significant expected involvement in the government's ambitious 3 million housing program, both of which could strain capital adequacy and lead to higher provisioning charges.</li>
<li class="mt-2"><strong>Sok Marketler Ticaret AS (&ldquo;Sok&rdquo;):</strong> Sok is a leading discount grocery retailer in Turkey, operating over 10,000 stores nationwide. Despite its scale, we have been disappointed with management&rsquo;s execution on growth and profitability targets in recent quarters and remain unconvinced about the company&rsquo;s path to operational recovery amid rising competitive pressures. As a result, we chose to reallocate capital to opportunities with greater visibility and stronger near-term outlooks.</li>
<li class="mt-2"><strong>Sterling And Wilson Renewable Energy Limited:</strong> Sterling &amp; Wilson is a global solar engineering, procurement, and construction (EPC) company based in India. We recently met the company&rsquo;s new CFO during a trip to India, following a period of weak share price performance that we had been closely monitoring. In that meeting, it became apparent that there had been a shift in the company&rsquo;s working relationship with its largest shareholders. Given this development, we grew concerned that the risk profile and alignment with the company&rsquo;s structural growth trajectory may be compromised, and we therefore decided to exit the position.</li>
<li class="mt-2"><strong>Sungrow Power Supply Co., Ltd. Class A:</strong> We decided to sell Sungrow following a significant policy change in February 2025, when China&rsquo;s NDRC removed the requirement for new renewable projects to include matching energy storage capacity&mdash;a regulation that had driven much of China&rsquo;s energy storage growth since 2022. With China representing 40% of Sungrow&rsquo;s energy storage system sales in 2024, this shift is expected to materially reduce domestic demand. At the same time, Sungrow is facing heightened competition in the Middle East from BYD and CATL, who manufacture batteries in-house and can offer more pricing flexibility. While the U.S. remains Sungrow&rsquo;s most profitable market, ongoing uncertainty around tariffs adds further risk to the outlook.</li>
<li class="mt-2"><strong>Yifeng Pharmacy Chain Co Ltd Class A:</strong> Yifeng Pharmacy Chain Co., Ltd. is a leading pharmaceutical retail chain in China, offering a wide range of products including Western and Chinese medicines, health supplements, and medical devices. In 2024, the pharmacy industry faced challenges as the Medical Insurance Bureau conducted inspections to identify potential misuse or fraud involving government medical insurance funds. These inspections negatively impacted sales, as stores were unable to run promotions during the review process, which typically lasts 2&ndash;3 weeks per store. Given the shortfall in China&rsquo;s medical insurance funding and the ongoing trend of downgraded consumption, we remain pessimistic about the outlook for the pharmacy sector.</li>
</ul>
<h2 id="fund-positioning" class="jump-link-nav anchored-block" data-jumplink-title="Fund Positioning and Outlook">Fund Positioning and Outlook</h2>
<p>We remain grounded by our investment process and our positioning reflects our convictions from a bottom-up perspective. Our process has created some positioning differentials versus the benchmark. Brazil remains overweight to start the quarter (8.7% Fund weight versus 4.2% Index weight), as does Kazakhstan (3.3% Fund weight versus 0.0% Index weight).</p>
<p>Taiwan and South Korea remain underweight versus the benchmark.</p>
<p>The Fund&rsquo;s objective is to find long-term structural growth companies at fair prices (S-GARP). Investments are chosen based on individual company analysis, focusing on quality, governance, innovative business models and low disruption risk, with active management and detailed research guiding our selection process.</p>

<p>To receive more <a href="/us/en/insights/emerging-markets-equity/" title="Emerging Markets Equity Insights"><strong>Emerging Markets Equity</strong></a> insights, <a href="/us/en/subscribe/" title="Subscription Center"><strong>sign up in our subscription center</strong></a>.</p>
]]></content:encoded>
</item><item rdf:about="https://www.vaneck.com/us/en/blogs/model-portfolios/gold-positioning-pays-off-during-trade-turbulence/">
  <title>March Market Recap: Gold Positioning Pays Off During Trade Turbulence></title>
  <link>https://www.vaneck.com/us/en/blogs/model-portfolios/gold-positioning-pays-off-during-trade-turbulence/</link>
  <description><![CDATA[Trump&rsquo;s tariffs spark trade war fears, fueling market volatility, inflation risk, and recession threats. With global retaliation likely, near-term growth is clearly at risk.]]></description>
  <dc:creator>David Schassler</dc:creator>
  <dc:date>04/07/2025 06:30:00</dc:date>
<content:encoded><![CDATA[

<p>Donald Trump&rsquo;s tariffs were rolled out with patriotic fanfare, but most are not celebrating. Markets are falling fast. Investors see these sweeping tariffs not as a moment of strength, but as a signal of escalating risk. Let&rsquo;s be honest: tariffs are taxes. And this tax&mdash;slapped on imports across the board&mdash;is a blunt instrument with serious consequences. As much as the rhetoric feels defiant, the economics are shaky. Isolation is not strength. Turning inward while the rest of the world turns against you is not a path to prosperity. Trump&rsquo;s tariffs aim to rebuild the industrial base&mdash;primarily blue-collar, low-to-mid skill manufacturing jobs. But it&rsquo;s unclear if enough American workers want those jobs, and if they do, whether they&rsquo;re willing to perform them at a wage that makes economic sense. That reluctance isn&rsquo;t a failure&mdash;it&rsquo;s generational progress. It reflects a society that has invested in education, moved up the value chain, and aspires to higher standards of living.</p>

<p>The best solution for all participants is no tariffs and free trade. From a game theory perspective, if you are faced with tariffs, the optimal strategy is to retaliate&mdash;raising tariffs in response to pressure your trading partner to drop theirs. The goal isn't escalation; it&rsquo;s mutual de-escalation. In that sense, Trump may be on to something.</p>
<p>Ultimately, this is a giant game of chicken. It&rsquo;s dangerous&mdash;for everyone. While I remain optimistic that the U.S. ultimately comes out ahead on trade, it won&rsquo;t be without scars. These actions risk undermining America&rsquo;s trustworthiness as the world&rsquo;s economic leader. And in a global system, everyone is replaceable. If this drags on, the economic fallout won&rsquo;t be limited to one nation. It will be global. No one wins a prolonged trade war. Everyone bleeds.</p>
<p>The risk isn&rsquo;t just inflation&mdash;it&rsquo;s fragmentation. Trade wars make everything more expensive, more uncertain, and more fragile. There&rsquo;s a reason markets are on edge.</p>
<p>The U.S. dollar, historically a safe haven, has weakened nearly 8% this year. That&rsquo;s not typical during global stress&mdash;and it&rsquo;s not just a signal of market volatility, it&rsquo;s a signal of fading trust. This environment pushes the world closer to de-dollarization. As confidence erodes, capital flows increasingly into decentralized assets like gold and Bitcoin&mdash;stores of value that don&rsquo;t rely on any single government&rsquo;s credibility. Gold is breaking out&mdash;up over 16% and trading above $3,100 an ounce&mdash;doing exactly what it&rsquo;s supposed to do: protect against policy missteps, economic instability, and loss of confidence.</p>
<p>Investors face real, structural risks:</p>
<ul class="content-list">
<li class="mt-2"><strong>Geopolitical Tensions:</strong> War, trade conflict, and sanctions are multiplying.</li>
<li class="mt-2"><strong>Unsustainable Public Debt:</strong> Debt is spiraling with no credible plan to repay it.</li>
<li class="mt-2"><strong>Fiscal Irresponsibility:</strong> Deficits are growing, and interest costs are ballooning.</li>
<li class="mt-2"><strong>Persistent Inflation + Slowing Growth:</strong> A dangerous mix that can choke real returns.</li>
</ul>
<p>It&rsquo;s not all gloom and doom; we are in a clear innovation cycle that will eventually drive productivity gains and long-term economic growth. A new wave of technological advancement&mdash;led by artificial intelligence&mdash;is changing the landscape across industries. Innovation is real, and it is compounding. But let&rsquo;s not confuse the long term with the short term. We are dangerously close to a recession, and that risk is real. Near-term growth estimates are vulnerable, and the immediate risk is clearly to the downside.</p>
<p>As with every major correction, these periods of stress create opportunity. This time will not be different. But how you go about it makes all the difference.</p>
<h2>Stocks</h2>
<ul class="content-list">
<li class="mt-2">The S&amp;P 500 Index is down nearly 15% from highs, but stocks are not yet cheap.</li>
<li class="mt-2">Valuations (P/E ~24 vs. 10-year avg. of 22) remain elevated given recession risk.</li>
<li class="mt-2">A downturn could reset prices further&mdash;real buying opportunities are likely ahead, but they are not here yet.</li>
</ul>
<h2>Bonds</h2>
<ul class="content-list">
<li class="mt-2">Yields have fallen fast. The 10-year U.S. Treasury yield has fallen from 4.79% to below 4%&mdash;a clear recession signal.</li>
<li class="mt-2">Credit spreads are widening, a growing risk to fixed income portfolios.</li>
<li class="mt-2">Stay cautious. Duration and quality matter more than ever.</li>
</ul>
<h2>Real Assets</h2>
<ul class="content-list">
<li class="mt-2">Gold is working&mdash;expect that to continue.</li>
<li class="mt-2">Commodities started the year strong, up nearly 10%. However, that strength is fading quickly. Recessions are not good for commodities, and that risk is now being aggressively priced in.</li>
<li class="mt-2">OPEC+ shocked markets with a massive supply hike to discipline members&mdash;and possibly to align with U.S. political pressure.</li>
</ul>
<h2>Bitcoin</h2>
<ul class="content-list">
<li class="mt-2">Bitcoin corrected from a near-term overbought situation, pulling back to ~$80K from earlier highs over $107K.</li>
<li class="mt-2">Unlike traditional assets, Bitcoin is decentralized&mdash;uncontrolled by any single government or central bank. It is much more volatile than gold and should not be confused as a risk-off asset. Expect prices to remain under pressure in the near term. However, because of its decentralized store-of-value attributes, Bitcoin is well-positioned to rally hard in the future.</li>
</ul>

<h2>Bottom Line</h2>
<p>Having managed money through many corrections, we&rsquo;ve learned that the strategy for success doesn&rsquo;t change. (1) Be diversified. (2) Opportunistically purchase good assets with a plan. Our plan is simple: we came into this mess diversified, and we plan to use this volatility to buy quality assets at a discount.</p>
<p>Tariffs aren&rsquo;t a traditional growth policy, but they can be a strategic one. From a game theory perspective, retaliation may be necessary to encourage all sides to drop barriers and return to free trade. The goal isn&rsquo;t protectionism&mdash;it&rsquo;s leverage. Used effectively, tariffs can be a means to a better end. But this situation has already escalated. China has responded with retaliatory tariffs at the same levels on all American goods. Others will likely follow. This is no longer a warning shot&mdash;it&rsquo;s a trade war. And trade wars rarely end without economic casualties.</p>
<p>But beneath the noise, the future is still being built. Gold is doing its job. Stocks are repricing. Innovation is real and ongoing. This is a moment for focus, not fear.</p>
<p>Diversify. Accumulate. Position for what&rsquo;s next.</p>
<p>Happy Liberation Day.</p>
<p>To receive more <strong><a href="https://www.vaneck.com/us/en/insights/guided-allocation/" title="Model Portfolio Insights">Model Portfolio</a></strong> insights, <strong><a href="https://www.vaneck.com/us/en/subscribe/" title="Subscription Center">sign up in our subscription center</a></strong>.</p>
]]></content:encoded>
</item><item rdf:about="https://www.vaneck.com/us/en/blogs/gold-investing/ima-casanova-riding-the-gold-wave-record-prices-strategic-mergers-and-miners-resilience/">
  <title>Riding the Gold Wave: Record Prices, Strategic Mergers and Miners&#39; Resilience></title>
  <link>https://www.vaneck.com/us/en/blogs/gold-investing/ima-casanova-riding-the-gold-wave-record-prices-strategic-mergers-and-miners-resilience/</link>
  <description><![CDATA[Gold miners substantially outperformed in March as surging prices sparked M&amp;A activity and drove the largest monthly inflows in over a year, reversing a long trend of outflows.]]></description>
  <dc:creator>Imaru Casanova</dc:creator>
  <dc:date>04/04/2025 06:30:00</dc:date>
<content:encoded><![CDATA[

<p>Monthly gold market and economic insights from <a href="https://www.vaneck.com/us/en/news-and-insights/thought-leaders/imaru-casanova/?p=1" title="Imaru Casanova &mdash; Portfolio Manager, Gold and Precious Metals"><strong>Imaru Casanova, Portfolio Manager</strong></a>, featuring her unique views on mining and gold&rsquo;s portfolio benefits.</p>

<h2 id="equity-turbulence" class="jump-link-nav anchored-block" data-jumplink-title="Equity Turbulence Boosts Gold&rsquo;s Shine">Equity Turbulence Boosts Gold&rsquo;s Shine</h2>
<p>U.S. equity markets experienced significant declines during the month of March. Driven by concerns over new tariff implementations and their potential impact on the global economy, both the S&amp;P 500<sup>1</sup>&nbsp;and the Nasdaq Composite<sup>2</sup>&nbsp;entered correction territory on March 13, after dropping more than 10% from their February 19 peak. The unpredictability of economic policies and heightened market volatility bolstered gold's appeal, reaffirming its role as the preferred safe-haven asset during times of global uncertainty. The spot gold price recorded new all-time highs during the month, surpassing the $3,000 per ounce mark on March 14 and closing at a record price of $3123.57 on March 31, a 9.30% ($265.73) monthly gain.</p>
<h2>Gold Miners Outperform Amid Market Weakness</h2>
<p>The gold miners, as represented by the NYSE Arca Gold Miners Index (GDMNTR)<sup>3</sup>, outperformed significantly (up 15.51% during the month), showcasing not only their leverage to the gold price, but also their attractive valuations relative to the broader equity markets, and their role as an effective portfolio diversifier due to their low correlation with most other asset classes. The S&amp;P 500 and the NASDAQ composite ended the month down 5.63% and 8.14%, respectively.</p>
<h2 id="investment-demand-signals-sentiment-shift" class="jump-link-nav anchored-block" data-jumplink-title="Investment Demand Signals Sentiment Shift">Investment Demand Signals Sentiment Shift</h2>
<p>The contrasting performances highlight a shift in investor sentiment towards gold and related equities. Increasing investment demand for gold translated into another month of strong inflows for the gold bullion backed ETFs, with holdings up 2.82% during the month. More importantly, according to LSEG Lipper data, this surge in investor interest in the gold sector led to the largest monthly net inflows in more than a year for funds that invest in gold miners, reversing a trend of persistent net outflows over the last couple of years. Funds investing in physical gold and gold derivatives attracted net $17.8 billion in 2024, the highest in five years, while funds investing in gold miners lost net $4.6 billion, the most in a decade.</p>
<h3>Chasing the Vein: Fund Flows into Gold Miners</h3>
<div class="flourish-embed flourish-chart" data-src="visualisation/22435013?2429575"><script src="https://public.flourish.studio/resources/embed.js"></script><noscript><img loading="lazy" src="https://public.flourish.studio/visualisation/22435013/thumbnail" width="100%" alt="Chasing the Vein: Fund Flows into Gold Miners" /></noscript></div>
<p class="chart-disclosure">Source: Mining.com. Data as of March 21, 2025. Note&mdash;data covers 493 funds with combined assets under management of $62 billion.</p>

<p>Surging gold prices are driving record cash flow for gold producers, and when paired with rising stock valuations, are creating a more favorable climate for mergers and acquisitions (M&amp;A) within the sector. Gold miners led the way in metals and mining M&amp;A in 2024, according to research from S&amp;P Global Market Intelligence, which revealed that gold deals made up 70% of the total transaction value. The report highlighted 62 gold-focused transactions during the year&mdash;representing a 32% increase from 47 deals in 2023.</p>
<h2 id="m-and-a-momentum" class="jump-link-nav anchored-block" data-jumplink-title="M&amp;A Momentum: Gold Sector Takes the Lead">M&amp;A Momentum: Gold Sector Takes the Lead</h2>
<p>We believe one of the key factors supporting a re-rating of the gold equity sector is a balanced approach to capital allocation. Investors&rsquo; desire for dividends and share buybacks must be satisfied, but to remain competitive and attract business, companies must deliver growth. That growth doesn&rsquo;t necessarily have to be annual production growth, to be clear. We are looking for companies that can grow the life of their existing assets, their reserves, their margins, their per share metrics and their rates of return. Growth can be achieved organically&mdash;through the drill bit, optimizations, efficiencies and expansions&mdash;and is certainly our preferred approach. However, growth can also be acquired through M&amp;A. While not as economically attractive as organic growth, it remains an important&mdash;if not essential&mdash;component of any mid-tier or large gold producer&rsquo;s growth strategy.</p>
<h2>Diverging Deals: A Critical Look at Recent Mergers</h2>
<p>Recently announced/proposed M&amp;A transactions include the acquisition of De Grey Mining (1.9% of Strategy net assets) by Northern Star Resources (1.6% of Strategy net assets); the merger of Equinox Gold (not held) and Calibre Mining (0.3% of Strategy net assets); the acquisition of Spartan Resources (1.8% of Strategy net assets) by Ramelius Resources (not held); and a public offer by Gold Fields (3.8% of Strategy net assets) to acquire Gold Road Resources (not held), which has been rejected by the board of Gold Road Resources.</p>
<p>We are not supportive of the friendly, at-the-market merger between Equinox Gold and Calibre Resources, announced on February 23, 2025. The implied market capitalization of the combined company was estimated at around CAD$7.7 billion. We don&rsquo;t see any synergies between any of the companies&rsquo; operations. Both operate in the Americas, but in vastly different locations. Calibre is ramping up its Valentine Gold Mine in Newfoundland, Canada. This is a transformational asset that will vault the company to mid-tier status. Construction is progressing as planned and we expected Calibre shares to have a positive re-rate once it achieves commercial production later in 2025. The terms of the proposed combination, which is subject to shareholder approval, do not include a takeover premium for Calibre shareholders. In our view, a premium would be necessary to justify Calibre shareholders walking away from the share price appreciation they were likely to realize as the company transformed itself into a multi-asset producer with a flagship asset in Canada.</p>
<p>In contrast, the other three transactions we are highlighting here (all coincidently involving the acquisition of assets in Australia) offer obvious regional and operational synergies, along with significant takeover premiums.</p>
<h2>Strategic Consolidations in Australia</h2>
<p>On December 2, 2024, Australian major Northern Star Resources, announced an AUD$5 billion friendly acquisition of De Grey Mining at a 37.1% premium to the prior day&rsquo;s close. The deal is expected to close in the second quarter of this year. Northern Star is probably the company that is best suited to develop De Grey&rsquo;s Hemi gold project. The company is established in Western Australia and has seen a tremendous growth trajectory over the past decade from scrappy junior to established mid-tier and now an emerging major. Their growth has come primarily from smart acquisitions, through which they have constantly created more value than expected through operational efficiencies and exploration. While Northern Star Resources is paying a generous premium for De Grey Mining, the land package offers upside from an additional five-million-ounce resource with exploration potential likely to extend the project&rsquo;s life. Hemi also presents technical challenges due to metallurgically complex ores&mdash;challenges Northern Star Resources is well-equipped to handle. This project firmly establishes Northern Star Resources among the ranks of the world&rsquo;s leading gold majors.</p>
<p>The Dalgaranga low-grade open pit operation in Western Australia opened in 2018, but by 2021, the junior company that owned it was failing due to poor planning and execution. Management was replaced, and in early 2022, new geologic ideas led to the discovery of the high-grade Never Never lode deposit beneath the pit. The unprofitable open pit was shut down, and in 2023 the company was recapitalized and renamed Spartan Resources. On March 17, 2025, Australian junior Ramelius Resources announced the friendly AUD$2.4 billion acquisition of Spartan at a 27.5% premium to the 30-day volume weighted average price. There are considerable synergies between the Dalgaranga properties and Ramelius Resources&rsquo; nearby Mt. Magnet operation that justify this premium. The merger will also transform Ramelius into a mid-tier producing a half-million ounces per year once Never Never is developed.</p>
<p>On March 25, 2025, senior gold producer Gold Fields made public an offer to acquire Gold Road Resources for a cash consideration that valued Gold Road Resources at AUD$3.3 billion, representing a 28% premium to its closing share price on March 21. Gold Fields already owns a 50% interest in and is the operator of the Gruyere mine in Western Australia. Gold Road holds the other 50% non-operating interest in the Gruyere joint venture, which is its only producing asset. The rationale is clear: consolidating ownership of the asset would allow Gold Fields to unlock the full potential of the Gruyere mine by eliminating dis-synergies stemming from the current joint venture structure. Gold Road Resources&rsquo; shareholders would have the opportunity to monetize their investment at a nice premium. It is now up to them to decide whether this is a good deal.</p>
<p>To receive more <strong><a href="https://www.vaneck.com/us/en/insights/gold-investing/" title="Gold Investing Insights">Gold Investing</a></strong> insights, <strong><a href="https://www.vaneck.com/us/en/subscribe/" title="Subscription Center">sign up in our subscription center</a></strong>.</p>
]]></content:encoded>
</item><item rdf:about="https://www.vaneck.com/us/en/blogs/digital-assets/matthew-sigel-vaneck-crypto-monthly-recap-for-march-2025/">
  <title>VanEck Crypto Monthly Recap for March 2025></title>
  <link>https://www.vaneck.com/us/en/blogs/digital-assets/matthew-sigel-vaneck-crypto-monthly-recap-for-march-2025/</link>
  <description><![CDATA[March brought sharp volatility and broad declines across crypto markets, offset somewhat by substantial regulatory progress and increased interest in tokenized treasury funds.]]></description>
  <dc:creator>Matthew  Sigel</dc:creator>
  <dc:date>04/03/2025 06:30:00</dc:date>
<content:encoded><![CDATA[

<p><strong>Please note that VanEck may have a position(s) in the digital asset(s) described below.</strong></p>
<p>March was a turbulent month, with 30-day average daily volatility surging to its highest level since August 2024: <strong>72%</strong> for BTC, <strong>95%</strong> for ETH, and <strong>137%</strong> for SOL. The MarketVector<sup>&trade;</sup>&nbsp;Smart Contract Leaders Index (MVSCLE) fell<strong> (-11%)</strong> while BTC declined <strong>(-1%), </strong>outperforming the Nasdaq Composite Index (<strong>-8%) </strong> as investors grappled with tariff uncertainty, inflation concerns, and fiscal question marks.</p>
<h3>Layer 1 Performance in March (-11%)</h3>
<p><img loading="lazy" class="img-responsive w-100" alt="" /></p>
<div class="flourish-embed flourish-chart" data-src="visualisation/22434326?2429379"><script src="https://public.flourish.studio/resources/embed.js"></script><noscript><img loading="lazy" src="https://public.flourish.studio/visualisation/22434326/thumbnail" width="100%" alt="Layer 1 Performance in March (-11%)" /></noscript></div>
<p class="chart-disclosure">Source: MarketVectors of 3/31/2025. The MarketVector<sup>&trade;</sup>&nbsp;Smart Contract Leaders Index (MVSCLE) is designed to track the performance of the largest and most liquid smart contract assets. Index performance is not representative of strategy performance. It is not possible to invest directly in an index. <strong>Past performance is no guarantee of future results. Not intended as a recommendation to buy or sell any securities named herein.</strong></p>
<h3 id="price-returns" class="jump-link-nav anchored-block" data-jumplink-title="Price Returns">Price Returns</h3>
<div class="wrapped-div">
<table style="width: 600px;">
<tbody>
<tr class="tbl-data">
<td class="tbl-header last text-center">&nbsp;</td>
<td class="tbl-header last text-right">March (%)</td>
<td class="tbl-header last text-right">1-year (%)</td>
</tr>
<tr class="tbl-data">
<td class="data-td last">Bitcoin</td>
<td class="data-td data last text-right">-2</td>
<td class="data-td data last text-right">16</td>
</tr>
<tr class="tbl-data">
<td class="data-td last">S&amp;P 500 Index</td>
<td class="data-td data last text-right">-6</td>
<td class="data-td data last text-right">7</td>
</tr>
<tr class="tbl-data">
<td class="data-td last">Nasdaq Index</td>
<td class="data-td data last text-right">-8</td>
<td class="data-td data last text-right">5</td>
</tr>
<tr class="tbl-data">
<td class="data-td last">MarketVector Smart Contract Leaders Index (MVSCLE)</td>
<td class="data-td data last text-right">-11</td>
<td class="data-td data last text-right">-38</td>
</tr>
<tr class="tbl-data">
<td class="data-td last">MarketVector Meme Coin Index</td>
<td class="data-td data last text-right">-13</td>
<td class="data-td data last text-right">-50</td>
</tr>
<tr class="tbl-data">
<td class="data-td last">MarketVector Infrastructure Application Leaders Index</td>
<td class="data-td data last text-right">-17</td>
<td class="data-td data last text-right">-65</td>
</tr>
<tr class="tbl-data">
<td class="data-td last">Ethereum</td>
<td class="data-td data last text-right">-18</td>
<td class="data-td data last text-right">-50</td>
</tr>
<tr class="tbl-data">
<td class="data-td last">Coinbase</td>
<td class="data-td data last text-right">-20</td>
<td class="data-td data last text-right">-32</td>
</tr>
<tr class="tbl-data">
<td class="data-td last">MarketVector Global Digital Assets Equity Index</td>
<td class="data-td data last text-right">-21</td>
<td class="data-td data last text-right">-14</td>
</tr>
<tr class="tbl-data">
<td class="data-td last">MarketVector Decentralized Finance Leaders Index</td>
<td class="data-td data last text-right">-22</td>
<td class="data-td data last text-right">-64</td>
</tr>
</tbody>
</table>
</div>
<br />
<p class="chart-disclosure"><strong>Source: Bloomberg as of 3/31/2025. Index performance is not representative of fund performance. It is not possible to invest directly in an index. Past performance is no guarantee of future results. Not intended as a recommendation to buy or sell any securities named herein.</strong></p>
<ul class="content-list">
<li class="mt-2"><a href="#notable-laggard-solana"><strong>Notable Laggard: Solana</strong></a></li>
<li class="mt-2"><a href="#notable-laggard-ethereum"><strong>Notable Laggard: Ethereum </strong></a></li>
<li class="mt-2"><a href="#treasury-fund-search"><strong>Tokenized Treasury Funds Surge</strong></a></li>
</ul>
<p>Offsetting the macroeconomic drag were several substantial crypto policy victories, including:</p>
<ol class="content-list">
<li class="mt-2"><strong>Legislative/Executive</strong>
<ol class="content-list" style="list-style-type: lower-alpha;">
<li class="mt-2">White House establishment of a Strategic Bitcoin Reserve</li>
<li class="mt-2">FDIC rescinded its prior approval requirement for crypto activity</li>
<li class="mt-2">Stablecoin legislation (GENIUS Act) advanced in the U.S. House</li>
<li class="mt-2">State legislatures are acting to establish BTC reserves and crypto rights</li>
<li class="mt-2">U.S. Senate voted to repeal the IRS&rsquo;s expanded crypto broker rule, easing DeFi reporting burdens</li>
<li class="mt-2">US Treasury lifted sanctions on Tornado Cash</li>
</ol>
</li>
<li class="mt-2"><strong>Judicial</strong>
<ol class="content-list" style="list-style-type: lower-alpha;">
<li class="mt-2">SEC dropped the lawsuit against Ripple</li>
<li class="mt-2">Criminal suits against HEX and Kraken were dismissed</li>
<li class="mt-2">Galaxy Digital settled with the SEC</li>
</ol>
</li>
</ol>
<p>As is typical during macro-driven risk sell-offs, the 30-day correlation between BTC and NASDAQ rose from <strong>0.19</strong> on March 4 to<strong> 0.60</strong> by March 28. Meanwhile, spot volumes collapsed to six-month lows of <strong>$1.34T</strong>, or $43B/day, down <strong>(-24%)</strong> from February 2025 and a <strong>(-55%)</strong> drop from highs in January 2025. Inflation came in lower than expected&mdash;<strong>2.8%</strong> vs. <strong>3.0%</strong>&mdash;which helped soften the Fed&rsquo;s tone in its March rate decision. Despite negative price action, U.S.-listed ETFs net purchased 246 BTC, while Saylor&rsquo;s strategy acquired <strong>29,000 BTC</strong>. New entrants to crypto treasury strategies included BioNexus (ETH) and GameStop (BTC), the latter having sold a <strong>$1.3B</strong> convertible bond with plans to allocate proceeds to Bitcoin.</p>
<h2>Smart Contract Platform (SCP) Fundamentals Sag, Stablecoins in a Bull Market</h2>
<p>Only <strong>5 </strong>of the <strong>34 </strong>major tokens we track ended March in the green among smart contract platforms (SCPs). The top performers were TON <strong>(+17%),</strong> MNT (<strong>+9%</strong>), and BNB (<strong>+1%</strong>). SCP fundamentals broadly sagged, with Revenues (<strong>-36%</strong>), DEX Volumes (<strong>-40%</strong>), and Stablecoin Transfer Volume (<strong>-5%</strong>) all down on the month&mdash;typical in an environment of declining risk appetite.</p>
<p><i>Yields tell the story:</i> average returns on stablecoins have fallen sharply, now ranging from just above Treasury yields (<strong>4.9%</strong> 30-day average on Kamino/Solana) to significantly below (<strong>3.1%</strong> on Aave/Arbitrum). On Jan 1, 2025, those figures were <strong>10%</strong> and <strong>9%,</strong> respectively.</p>
<p>Yet even as yields fall, demand for stablecoins is growing. The total supply on-chain rose from <strong>$225B</strong> in February to <strong>$234B</strong> at month-end. Stablecoins are in a bull market of their own, with issuers ranging from VanEck and Trump&rsquo;s Liberty Financial to Fidelity all launching or preparing new offerings. Earning yield on someone else&rsquo;s idle capital remains a powerful business model.</p>
<h2 id="notable-laggard-solana" class="jump-link-nav anchored-block" data-jumplink-title="Solana">March&rsquo;s Notable Laggard &ndash; Solana (SOL) (-14%)</h2>
<h3>Solana loses DEX (Decentralized Exchange) Trading to Ethereum&rsquo;s Ecosystem</h3>
<div class="flourish-embed flourish-chart" data-src="visualisation/22434487?2429379"><script src="https://public.flourish.studio/resources/embed.js"></script><noscript><img loading="lazy" src="https://public.flourish.studio/visualisation/22434487/thumbnail" width="100%" alt="Blockchain Share of Daily Fees" /></noscript></div>
<p class="chart-disclosure">Source: Artemis XYZ as of 3/31/2025. <strong>Past performance is no guarantee of future results. Not intended as a recommendation to buy or sell any securities named herein. </strong></p>
<p>In March, Solana&rsquo;s onchain activity declined sharply as speculative animal spirits retreated to the sidelines. Daily average fees dropped <strong>(-66%)</strong>, Stablecoin Transfer Volume <strong>(-34%), </strong>and DEX Volumes plunged <strong>(-53%)</strong>. After briefly overtaking Ethereum&rsquo;s entire ecosystem in January, Solana&rsquo;s share of smart contract platform (SCP) DEX volume fell to levels not seen since October 2024. The primary driver of this contraction was the collapse in memecoin trading. We estimate that daily memecoin volumes on Solana peaked at <strong>~$12B</strong> in January during the height of the &ldquo;season&rdquo; but fell to <strong>~$720M</strong> per day in March. Memecoins, excluding stablecoins and SOL, accounted for <strong>92%</strong> of Solana&rsquo;s remaining trading volume in March&mdash;highlighting their enormous impact on network revenues.</p>
<h3>Memecoins Dominate Solan DEX (Decentralized Exchange) Trading</h3>
<div class="flourish-embed flourish-chart" data-src="visualisation/22436435?2429379"><script src="https://public.flourish.studio/resources/embed.js"></script><noscript><img loading="lazy" src="https://public.flourish.studio/visualisation/22436435/thumbnail" width="100%" alt="Memecoins Dominate Solan DEX (Decentralized Exchange) Trading" /></noscript></div>
<p class="chart-disclosure">Source: Dune @ally as of 3/31/2025. <strong>Past performance is no guarantee of future results. Not intended as a recommendation to buy or sell any securities named herein. </strong></p>
<h2>Solana Keeps Inflation Levels</h2>
<p>March also saw the debate over a proposal to reform Solana&rsquo;s inflation model to make it more market-based. The current inflation rate is <strong>4.6%</strong>, declining by <strong>~15%</strong> annually on a predictable schedule. The proposed change&mdash;<strong>SIMD-0228</strong>&mdash;sought to lower inflation to <strong>~1%</strong> and introduce a mechanism where inflation would rise and fall inversely with the percentage of SOL staked. This would mirror Ethereum&rsquo;s model and incentivize what proponents called an &ldquo;optimal&rdquo; staking ratio.</p>
<p>SIMD-0228 aimed to reduce inflationary issuance and the resulting sell pressure, which we estimate could amount to <strong>$500M&mdash;$1B</strong> annually at March prices. However, critics warned that the change would render smaller validators uneconomical, potentially reducing the validator count from <strong>1,312 </strong>to <strong>~800</strong>. Others expressed concern that a variable inflation regime would hurt financial products like ETFs and undermine investor confidence due to increased unpredictability.</p>
<p>Ultimately, the Solana community voted down SIMD-0228. Inflation remains unchanged for now. Supporters of the proposal still argue for reform but acknowledge it should be paired with cost-reduction measures for validators. One promising suggestion is to eliminate transaction fees for consensus voting&mdash;a cost currently estimated at <strong>1&ndash;2</strong> SOL per day, disproportionately affecting smaller validators.</p>
<h2>Solana Progresses Under New Regulatory Clarity</h2>
<p>Despite declining on-chain activity, Solana achieved significant milestones off-chain. On March 18, the CME launched long-anticipated SOL futures contracts. Two days later, the first SOL futures ETF began trading. These developments pave the way for a spot SOL ETPs in the U.S.</p>
<p>The SEC, which will ultimately decide SOL's regulatory classification, may begin hearings on its non-security status as early as late spring or early summer.</p>
<h2 id="notable-laggard-ethereum" class="jump-link-nav anchored-block" data-jumplink-title="Ethereum">March&rsquo;s Notable Laggard &ndash; Ethereum (ETH) (-18%)</h2>
<h3>Layer 2 (L2s) DEX Volume Share Dips Amid Selloff, but Long-Term Trend Remains Intact</h3>
<p><img loading="lazy" class="img-responsive w-100" alt="" /></p>
<div class="flourish-embed flourish-chart" data-src="visualisation/22453705?2429379"><script src="https://public.flourish.studio/resources/embed.js"></script><noscript><img loading="lazy" src="https://public.flourish.studio/visualisation/22453705/thumbnail" width="100%" alt="Layer 2 (L2s) DEX Volume Share Dips Amid Selloff, but Long-Term Trend Remains Intact" /></noscript></div>
<p class="chart-disclosure">Source: Artemis as of 3.25.2025. <strong>Past performance is no guarantee of future results. Not intended as a recommendation to buy or sell any securities named herein. </strong></p>
<p>Ethereum made meaningful technical progress in March as the long-awaited Pectra upgrade moved closer to deployment. Combining the Prague and Electra proposals, Pectra introduces several UX-enhancing features: transaction batching, ERC-20 fee payments, and sponsored transactions. These upgrades aim to streamline onboarding and reduce friction. For example:</p>
<ul class="content-list">
<li class="mt-2"><strong>Transaction batching</strong> lets users combine multiple DeFi steps into one action.</li>
<li class="mt-2"><strong>ERC-20 fee payments,</strong> and <strong>sponsored transactions</strong> allow users to pay gas without first acquiring ETH.</li>
</ul>
<p>Pectra also enables native smart wallet functionality, including gasless transactions, one-click upgrades from EOAs (externally owned accounts) to programmable smart contract wallets, and single-step token approvals. Together, these changes significantly boost usability and security&mdash;key steps toward mainstream adoption.</p>
<p>After delays on earlier testnets, developers launched the "Hoodi" testnet on March 17. If testing goes smoothly, Pectra could activate on mainnet by late April.</p>
<p>Ethereum&rsquo;s base-layer performance also improved modestly following a <strong>gas limit increase from ~30M to 36M</strong> in February&mdash;the first such change since the Merge in September 2022. With over 50% validator support, the new limit has helped ease congestion, with <strong>average gas fees dropping below 1 gwei</strong> during off-peak hours.</p>
<p>According to Glassnode, Ethereum&rsquo;s <strong>7-day average transaction fee</strong> has fallen to <strong>$0.41</strong>, down <strong>(-96%)</strong> from $9.23 year-over-year. Meanwhile, daily transactions have held steady at <strong>1.19M</strong>, down just (-5.1%) from March 2024. Holding transaction counts constant, these improvements save users an estimated <strong>$11.1M daily</strong>.</p>
<p>Many developers now support <strong>further gas limit increases, which</strong> Vitalik Buterin argues is vital for censorship resistance and long-term scalability&mdash;especially in an L2-centric roadmap. Higher L1 throughput could also help Ethereum reclaim lost DEX share from L2s and bolster ETH&rsquo;s yield, improving its inflation profile.</p>
<p>Despite technical momentum, Ethereum&rsquo;s economic model remains under pressure. Standard Chartered cut its 2025 ETH price target in March from <strong>$10,000</strong> to $<strong>4,000</strong>, citing structural issues with fee capture. L2s&mdash;especially Coinbase&rsquo;s Base&mdash;are pulling value away from the L1. Base alone has diverted over $50B in market cap and substantial transaction fees.</p>
<p>This dynamic has prompted fears that Ethereum is "commoditizing itself" within its scaling architecture. Some in the community have floated ideas like L2 taxation to re-align incentives&mdash;where rollups would pay back to L1&mdash;but such proposals face steep political and technical hurdles. Enforcing them would require centralized intervention or protocol-level mandates, which clash with Ethereum&rsquo;s ethos of neutrality, modularity, and permissionlessness.</p>
<p>Amid these growing pains, the Ethereum Foundation moved to strengthen internal leadership. In March, it appointed Hsiao-Wei Wang and Tomasz Stańczak as Co-Executive Directors, reaffirming its commitment to steward Ethereum's evolution&mdash;from a grassroots experiment to a censorship-resistant, modular base layer for global finance and software.</p>
<h2>Layer 1 Updates</h2>
<h3>March Recap: MarketVector<sup>&trade;</sup>&nbsp;Smart Contract Leaders Index</h3>
<div class="flourish-embed flourish-table" data-src="visualisation/22439026?2429379"><script src="https://public.flourish.studio/resources/embed.js"></script><noscript><img loading="lazy" src="https://public.flourish.studio/visualisation/22439026/thumbnail" width="100%" alt="Layer 1 Updates" /></noscript></div>
<p class="chart-disclosure">Source: MarketVectors of 3/31/2025. The MarketVector<sup>&trade;</sup>&nbsp;Smart Contract Leaders Index (MVSCLE) is designed to track the performance of the largest and most liquid smart contract assets. Index performance is not representative of strategy performance. It is not possible to invest directly in an index. <strong>Past performance is no guarantee of future results. Not intended as a recommendation to buy or sell any securities named herein.</strong></p>
<h3 id="treasury-fund-search" class="jump-link-nav anchored-block" data-jumplink-title="Tokenized Treasury Funds">Tokenized Treasury Funds Break $5B as Regulation Pushes Yield Onchain</h3>
<div class="flourish-embed flourish-chart" data-src="visualisation/22439488?2429379"><script src="https://public.flourish.studio/resources/embed.js"></script><noscript><img loading="lazy" src="https://public.flourish.studio/visualisation/22439488/thumbnail" width="100%" alt="Tokenized Treasury Funds Break $5B as Regulation Pushes Yield Onchain" /></noscript></div>
<p class="chart-disclosure">Source: rwa.xyz as of: 3.31.2025. <strong>Past performance is no guarantee of future results. Not intended as a recommendation to buy or sell any securities named herein. </strong></p>
<p>In March, tokenized U.S. Treasury funds, a key segment of real-world assets (RWAs), surpassed <strong>$5B </strong>in total issuance, a <strong>(+26%)</strong> jump from February. This surge reflects an accelerating institutional adoption race fueled by blockchain&rsquo;s efficiency and regulatory shifts favoring compliant yield options. Demand for safe, digital-native assets drives this growth as investors seek alternatives to low-yield stablecoins and volatile cryptocurrencies.</p>
<p>Joining this trend, Fidelity Investments <a href="https://www.sec.gov/Archives/edgar/data/917286/000113322825002995/ftdf-efp15119_485apos.htm#useof" title="Use of Blockchain" target="_blank" rel="noopener"><strong>filed</strong></a> with the U.S. Securities and Exchange Commission to introduce an &lsquo;Onchain&rsquo; share class for its Fidelity Treasury Digital Fund (FYHXX). This fully regulated money market fund leverages a public blockchain to mirror share ownership and transaction history. Unlike leading issuers such as Franklin Templeton, BlackRock, and Ondo Finance, whose funds are typically fully tokenized and settled natively across multiple blockchains, Fidelity&rsquo;s conservative approach uses the blockchain as a secondary ledger: official recordkeeping remains with its traditional transfer agent, offering a regulatory-first model to broaden institutional adoption without replacing existing structures.</p>
<p>This month&rsquo;s surge in tokenized treasury funds also coincided with key U.S. legislative developments. In late March, the House released the <a href="https://steil.house.gov/sites/evo-subsites/steil.house.gov/files/evo-media-document/stable-act-final-bill.pdf" title="STABLE Act" target="_blank" rel="noopener"><strong>STABLE Act</strong></a>, which explicitly prohibits yield-bearing payment stablecoins, i.e., dollar-pegged digital assets offering interest or returns from their underlying collateral. The <a href="https://www.hagerty.senate.gov/wp-content/uploads/2025/02/GENIUS-Act.pdf" title="GENIUS Act" target="_blank" rel="noopener"><strong>GENIUS Act</strong></a> advanced earlier in Congress, takes a similar stance: its latest version, passed by the Senate Banking Committee in March 2025, defines &lsquo;payment stablecoins&rsquo; to exclude yield-bearing variants. This marks a shift from earlier drafts&rsquo; light-touch approach, which appeared more permissive and all-encompassing, now deliberately tightened in scope.</p>
<p>By clearly separating &lsquo;digital cash&rsquo; from yield-generating assets, both acts may unintentionally bolster the value proposition of tokenized treasury funds by positioning them as the compliant, modular pathway for onchain exposure to government debt yields. Both the STABLE Act and the GENIUS Act permit banks and non-bank entities to issue stablecoins, fostering a private-sector alternative to CBDC risks while expanding the tokenized treasury fund space&rsquo;s compliant issuers.</p>
<p><strong>Links to third party websites are provided as a convenience and the inclusion of such links does not imply any endorsement, approval, investigation, verification or monitoring by us of any content or information contained within or accessible from the linked sites. By clicking on the link to a non-VanEck webpage, you acknowledge that you are entering a third-party website subject to its own terms and conditions. VanEck disclaims responsibility for content, legality of access or suitability of the third-party websites.</strong></p>
<style>
    .data-td.data {
        padding-right: 5px !important;
    }
    
    .wrapped-div {
        max-width: 100%;
    }
    
    @media (max-width: 1240px) {
        .wrapped-div {
            overflow-x: scroll;
        }
    }
    
    .wrapped-div-sector {
        max-width: 100%;
        overflow-x: scroll;
    }
    .flourish-credit {
        display: none !important;
    }
</style>
<p>To receive more <strong><a href="https://www.vaneck.com/us/en/insights/digital-assets/" title="Digital Assets Insights">Digital Assets</a></strong> insights, <strong><a href="https://www.vaneck.com/us/en/subscribe/" title="Subscription Center">sign up in our subscription center</a></strong>.</p>
]]></content:encoded>
</item><item rdf:about="https://www.vaneck.com/us/en/blogs/thematic-investing/top-semiconductor-companies/">
  <title>Top Semiconductor Companies to Watch in 2025></title>
  <link>https://www.vaneck.com/us/en/blogs/thematic-investing/top-semiconductor-companies/</link>
  <description><![CDATA[From AI to data centers, the semiconductor industry is at the core of technological innovation. Here&rsquo;s a look at the top semiconductor companies shaping the market in 2025.]]></description>
  <dc:creator>Nick Frasse</dc:creator>
  <dc:date>04/02/2025 06:30:00</dc:date>
<content:encoded><![CDATA[

<p>The semiconductor industry remains a critical pillar of technological innovation, powering everything from AI to high-performance computing. While Nvidia dominates headlines, we aim to highlight lesser-known names that are making significant contributions to the semiconductor space. Investors looking for exposure to this sector can consider two key semiconductor ETFs: <a href="https://www.vaneck.com/us/en/investments/semiconductor-etf-smh/overview/" title="SMH - VanEck Semiconductor ETF - Overview"><strong>VanEck Semiconductor ETF (SMH)</strong></a> and <a href="https://www.vaneck.com/us/en/investments/fabless-semiconductor-etf-smhx/overview/" title="SMHX - VanEck Fabless Semiconductor ETF - Overview"><strong>VanEck Fabless Semiconductor ETF (SMHX)</strong></a>. Below, we explore SMH's top holdings (excluding Nvidia) and highlight three unique holdings in <strong><a href="https://www.vaneck.com/us/en/investments/fabless-semiconductor-etf-smhx/holdings/" title="SMHX - VanEck Fabless Semiconductor ETF - Holdings">SMHX</a> </strong>to watch in 2025.</p>
<div class="row mb-3">
<div class="col-md-4 col-xs-12"><a href="https://www.youtube.com/embed/P570yO4GzNU" data-video="https://youtu.be/P570yO4GzNU" class="popup-youtube" title="Watch Video"><img loading="lazy" class="img-responsive" style="margin-right: 15px; margin-top: 0px;" src="https://www.vaneck.com/EPiServer/CMS/Content/contentassets/en/c67a394728364cae956c237d9c661e7c/5436_smh-top-companies_thumbnail_2025-4_v1.jpg,,317020/Download?epieditmode=False" alt="Watch Video" align="left" /></a></div>
<div class="col-md-8 col-xs-12"><br /><strong><a href="https://www.youtube.com/embed/P570yO4GzNU" data-video=" https://youtu.be/P570yO4GzNU" class="popup-youtube" title="Watch Video">Watch Video</a><br /></strong><a href="https://www.youtube.com/embed/P570yO4GzNU" data-video="https://youtu.be/P570yO4GzNU" class="popup-youtube" title="Watch Video" style="font-size: 16px; font-weight: bold; padding: 10px 0px 0px; margin-right: 20px; width: 202px;">Top Semiconductor Companies to Watch in 2025</a></div>
</div>
<h2>Why Chips Are a Critical Sector for Investors in 2025</h2>
<ul class="content-list">
<li class="mt-2"><strong>AI &amp; Cloud Computing</strong>: Demand for advanced semiconductors will continue growing as AI workloads expand across industries.</li>
<li class="mt-2"><strong>Geopolitical &amp; Supply Chain Shifts</strong>: U.S.-China trade tensions and government incentives (e.g., CHIPS Act) are influencing semiconductor production strategies.</li>
<li class="mt-2"><strong>Market Demand &amp; Innovation</strong>: With increased reliance on data centers, autonomous vehicles, and high-performance computing, leading semiconductor firms are poised for strong revenue growth.</li>
<li class="mt-2"><strong>ASIC Growth</strong>: Application-Specific Integrated Circuits (ASICs) are becoming increasingly important in AI, crypto mining, and high-speed networking, driving innovation across the sector.</li>
</ul>
<h2>Top 5 Semiconductor Companies to Watch in SMH This Year<sup>*</sup></h2>
<ol class="content-list">
<li class="mt-2"><strong>Taiwan Semiconductor Manufacturing Co. (TSMC) &ndash; 12.73%</strong></li>
<ul class="content-list">
<li class="mt-2"><strong>What They Do</strong>: The world's largest contract chip manufacturer, producing semiconductors for major companies like Apple and AMD.</li>
<li class="mt-2"><strong>Outlook for 2025</strong>: With AI and high-performance computing demand soaring, TSMC is well-positioned to benefit from increased chip complexity and production volume. TSMC's leadership in advanced process nodes and continued investment in cutting-edge manufacturing technologies will solidify its competitive edge amid rising global semiconductor demand.</li>
</ul>
<li class="mt-2"><strong>Broadcom Inc. &ndash; 9.93%</strong></li>
<ul class="content-list">
<li class="mt-2"><strong>What They Do</strong>: Designs and develops semiconductor solutions, including chips for networking, broadband, and wireless communications.</li>
<li class="mt-2"><strong>Outlook for 2025</strong>: Broadcom is expected to benefit from AI-driven networking demand and its diversified revenue across infrastructure and software. Its leadership in custom ASICs, network switching, and silicon photonics further positions the company for expansion, especially in data center and AI-related infrastructure deployments.</li>
</ul>
<li class="mt-2"><strong>Qualcomm Inc. &ndash; 4.74%</strong></li>
<ul class="content-list">
<li class="mt-2"><strong>What They Do</strong>: Develops wireless technologies, including mobile processors, 5G chips, and automotive solutions.</li>
<li class="mt-2"><strong>Outlook for 2025</strong>: With strong positioning in 5G and edge AI, Qualcomm should sustain growth as mobile and IoT applications expand. Moreover, Qualcomm's advancements in AI-driven on-device processing and automotive semiconductors position it well for next-generation smart devices, autonomous vehicles, and industrial automation applications.</li>
</ul>
<li class="mt-2"><strong>Advanced Micro Devices (AMD) &ndash; 4.17%</strong></li>
<ul class="content-list">
<li class="mt-2"><strong>What They Do</strong>: Compete with Intel in CPUs and GPUs, with a growing presence in AI and data center chips.</li>
<li class="mt-2"><strong>Outlook for 2025</strong>: AMD's focus on AI accelerators and high-performance computing should drive continued growth. The company's EPYC server processors continue to gain traction in cloud and enterprise markets, while its investments in AI and adaptive computing through acquisitions like Xilinx enhance its ability to meet the evolving needs of AI workloads.</li>
</ul>
<li class="mt-2"><strong>Texas Instruments (TXN) &ndash; 4.16% </strong></li>
<ul class="content-list">
<li class="mt-2"><strong>What They Do</strong>: Designs and manufactures analog and embedded processing chips, serving industries from automotive to industrial automation.</li>
<li class="mt-2"><strong>Outlook for 2025</strong>: Strong demand in industrial and automotive applications should sustain steady revenue growth. Texas Instruments' strategic focus on in-house manufacturing and expanding its 300mm wafer production capabilities will enable cost efficiencies and supply chain resilience, ensuring it remains a key player in the analog semiconductor market.</li>
</ul>
</ol>

<h2>Top Unique Holdings in SMHX (Not in SMH)</h2>
<ol class="content-list">
<li class="mt-2"><strong>Arm Holdings Plc (5.00%)</strong></li>
<ul class="content-list">
<li class="mt-2"><strong>What They Do</strong>: Designs energy-efficient microprocessors used in smartphones, data centers, and AI applications.</li>
<li class="mt-2"><strong>Outlook for 2025</strong>: With increasing AI workloads and a growing need for power-efficient chips, Arm is expected to benefit from rising demand in mobile, cloud, and edge computing.</li>
<li class="mt-2"><strong>ASIC Focus</strong>: Arm's custom chip architectures play a significant role in AI and IoT-driven ASIC development.</li>
</ul>
<li class="mt-2"><strong>Astera Labs Inc (3.75%)</strong></li>
<ul class="content-list">
<li class="mt-2"><strong>What They Do</strong>: Develop connectivity solutions for cloud computing and AI workloads, focusing on reducing bottlenecks in data-intensive applications.</li>
<li class="mt-2"><strong>Outlook for 2025</strong>: As AI and cloud computing demand grow, Astera Labs is well-positioned to support the industry's transition to high-speed connectivity and low-latency systems.</li>
</ul>
<li class="mt-2"><strong>Rambus Inc (3.74%)</strong></li>
<ul class="content-list">
<li class="mt-2"><strong>What They Do</strong>: Specialize in memory and security chip solutions, playing a crucial role in high-performance computing.</li>
<li class="mt-2"><strong>Outlook for 2025</strong>: The push for AI-driven workloads and increasing cybersecurity concerns will likely drive demand for Rambus' memory and cryptographic solutions.</li>
<li class="mt-2"><strong>ASIC Focus</strong>: Rambus' cryptographic security ASICs are increasingly vital in securing AI-driven and financial applications.</li>
</ul>
</ol>
<h2>Accessing the Opportunities in The Semi Space</h2>
<p>Investing in semiconductors requires an understanding of the market's cyclical nature and key industry drivers. Whether you're looking for broad exposure or a more targeted approach, ETFs can offer an efficient way to access the sector.</p>
<h2>Key Takeaways for Accessing the Semiconductor Space:</h2>
<ul class="content-list">
<li class="mt-2"><strong>Diversification Matters</strong>: Investing in individual semiconductor stocks can be volatile. ETFs like <a href="https://www.vaneck.com/us/en/investments/semiconductor-etf-smh/overview/" title="SMH - VanEck Semiconductor ETF - Overview"><strong>VanEck Semiconductor ETF (SMH)</strong></a> and <a href="https://www.vaneck.com/us/en/investments/fabless-semiconductor-etf-smhx/overview/" title="SMHX - VanEck Fabless Semiconductor ETF - Overview"><strong>VanEck Fabless Semiconductor ETF (SMHX)</strong></a> provide diversified exposure to leading companies in the industry.</li>
<li class="mt-2"><strong>AI, Data Centers, and Connectivity</strong>: As AI workloads, cloud computing, and 5G expansion accelerate, semiconductor demand will remain strong. Investors should consider exposure to companies driving these innovations.</li>
<li class="mt-2"><strong>Understanding Fabless vs. Foundry</strong>: SMH provides exposure to both chip designers and manufacturers, while SMHX focuses exclusively on <strong>fabless</strong> semiconductor companies, which design chips but outsource manufacturing, offering a different risk/reward profile.</li>
<li class="mt-2"><strong>Long-Term Growth Potential</strong>: With government support through initiatives like the CHIPS Act and increasing global semiconductor reliance, this sector remains a crucial long-term investment opportunity.</li>
</ul>
<h2>How to Invest in Semiconductors</h2>
<p>For investors seeking broad exposure to the semiconductor industry, <a href="https://www.vaneck.com/us/en/investments/semiconductor-etf-smh/overview/" title="SMH - VanEck Semiconductor ETF - Overview"><strong>VanEck Semiconductor ETF (SMH)</strong></a> provides a diversified portfolio that includes both semiconductor designers and manufacturers, making it an attractive option for those looking to capture the industry's growth potential. Meanwhile, <a href="https://www.vaneck.com/us/en/investments/fabless-semiconductor-etf-smhx/overview/" title="SMHX - VanEck Fabless Semiconductor ETF - Overview"><strong>VanEck Fabless Semiconductor ETF (SMHX)</strong></a> focuses exclusively on <strong>fabless semiconductor</strong> companies, which benefit from high-margin chip design and innovation while avoiding the capital-intensive nature of manufacturing. By investing in these funds, investors can gain access to the evolving semiconductor landscape and capitalize on advancements in AI, IoT, and high-performance computing.</p>

<p>Both funds allow investors to participate in the semiconductor growth story while spreading risk across multiple companies. As AI, IoT, and high-performance computing drive semiconductor demand, these ETFs provide structured exposure to one of the market's most innovative industries.</p>
<p>To receive more <a href="https://www.vaneck.com/us/en/insights/thematic-investing/" title="Thematic Investing Insights"><strong>Thematic Investing</strong></a> insights, <a href="https://www.vaneck.com/us/en/subscribe/" title="Subscription Center"><strong>sign up in our subscription center</strong></a>.</p>
]]></content:encoded>
</item><item rdf:about="https://www.vaneck.com/us/en/blogs/thematic-investing/top-robotics-companies/">
  <title>Top Robotics Companies Transforming the Industry in 2025></title>
  <link>https://www.vaneck.com/us/en/blogs/thematic-investing/top-robotics-companies/</link>
  <description><![CDATA[This blog explores the top robotics companies revolutionizing the sector, the industries being impacted, and key investment trends shaping the future of robotics.]]></description>
  <dc:creator> </dc:creator>
  <dc:date>03/31/2025 06:30:00</dc:date>
<content:encoded><![CDATA[

<p>The robotics industry is experiencing an unprecedented transformation driven by advancements in artificial intelligence, automation, and machine learning. As we move into 2025, several companies are leading the charge by reshaping industries and enhancing efficiency through cutting-edge robotic solutions.</p>
<div class="row mb-3">
<div class="col-md-4 col-xs-12"><a href="https://www.youtube.com/embed/sZHmY4yJUIA" data-video="https://youtu.be/sZHmY4yJUIA" class="popup-youtube" title="Watch Video"><img loading="lazy" class="img-responsive" style="margin-right: 15px; margin-top: 0px;" src="https://www.vaneck.com/EPiServer/CMS/Content/contentassets/en/c6a9cb2940154839a00b5fd06ec9c321/5437_ibot-top-companies-video-thumbnail_2025-3_v1.jpg,,316447/Download?epieditmode=False" alt="Watch Video" align="left" /></a></div>
<div class="col-md-8 col-xs-12"><br /><strong><a href="https://www.youtube.com/embed/sZHmY4yJUIA" data-video=" https://youtu.be/sZHmY4yJUIA" class="popup-youtube" title="Watch Video">Watch Video</a><br /></strong><a href="https://www.youtube.com/embed/sZHmY4yJUIA" data-video="https://youtu.be/sZHmY4yJUIA" class="popup-youtube" title="Watch Video" style="font-size: 16px; font-weight: bold; padding: 10px 0px 0px; margin-right: 20px; width: 202px;">Top Robotics Companies Transforming the Industry in 2025</a></div>
</div>
<h2 id="top-10-companies" class="jump-link-nav anchored-block" data-jumplink-title="Top 10 Companies">The Top 10 Robotics Companies in 2025</h2>
<p>Robotics technology is no longer a futuristic concept&mdash;it is here and rapidly evolving. The following ten companies are at the forefront of this revolution, leading in manufacturing, automation, and machine learning applications.</p>
<ol class="content-list">
<li class="mt-2"><strong>ABB Ltd.</strong></li>
<ul class="content-list">
<li class="mt-2"><strong>Focus:</strong> Robots and Manufacturing/Industrial Automation Systems</li>
<li class="mt-2"><strong>Known For:</strong> ABB has installed over 400,000 industrial robots worldwide, solidifying its position as a leader in automation solutions.<sup>1</sup></li>
<li class="mt-2"><strong>Why It Matters:</strong> ABB's automation solutions are streamlining industries by reducing human error, increasing productivity, and optimizing operational efficiency across various sectors.</li>
</ul>
<li class="mt-2"><strong>Fanuc Corporation</strong></li>
<ul class="content-list">
<li class="mt-2"><strong>Focus:</strong> Robots and Manufacturing/Industrial Automation Systems</li>
<li class="mt-2"><strong>Known For:</strong> Fanuc has captured a significant share of the global industrial robotics market, with strong contributions in manufacturing and electronics.</li>
<li class="mt-2"><strong>Why It Matters:</strong> With a strong foothold in the manufacturing sector, Fanuc's robots are critical in enhancing precision and efficiency, particularly in electronics production.</li>
</ul>
<li class="mt-2"><strong>KUKA AG</strong></li>
<ul class="content-list">
<li class="mt-2"><strong>Focus:</strong> Robots and Manufacturing/Industrial Automation Systems</li>
<li class="mt-2"><strong>Known For:</strong> KUKA is a pioneer in developing robotics for manufacturing, particularly in automotive assembly and material handling. It deployed over 60,000 robots in recent years.<sup>2</sup></li>
<li class="mt-2"><strong>Why It Matters:</strong> Automotive giants rely on KUKA's innovations to automate assembly lines, reducing costs and improving product consistency.</li>
</ul>
<li class="mt-2"><strong>Yaskawa Electric Corporation</strong></li>
<ul class="content-list">
<li class="mt-2"><strong>Focus:</strong> Robots and Manufacturing/Industrial Automation Systems</li>
<li class="mt-2"><strong>Known For:</strong> Yaskawa has installed over 500,000 robots globally, demonstrating its dominance in industrial automation.<sup>3</sup></li>
<li class="mt-2"><strong>Why It Matters:</strong> The company's automation systems contribute significantly to efficiency in production lines worldwide.</li>
</ul>
<li class="mt-2"><strong>Keyence Corporation</strong></li>
<ul class="content-list">
<li class="mt-2"><strong>Focus:</strong> Machine Vision</li>
<li class="mt-2"><strong>Known For:</strong> Keyence is a global leader in machine vision technology, supporting automation with innovative sensors and imaging solutions.</li>
<li class="mt-2"><strong>Why It Matters:</strong> Keyence's innovations are enabling next-generation robotic applications, enhancing quality control and precision manufacturing.</li>
</ul>
<li class="mt-2"><strong>Teradyne</strong></li>
<ul class="content-list">
<li class="mt-2"><strong>Focus:</strong> Robots and Manufacturing/Industrial Automation Systems</li>
<li class="mt-2"><strong>Known For:</strong> Universal Robots, a subsidiary of Teradyne, leads the collaborative robot (cobot) market, with over 50,000 cobots sold globally.<sup>4</sup></li>
<li class="mt-2"><strong>Why It Matters:</strong> The rise of cobots is making automation more accessible to small and medium-sized businesses.</li>
</ul>
<li class="mt-2"><strong>Intuitive Surgical</strong></li>
<ul class="content-list">
<li class="mt-2"><strong>Focus:</strong> Robotic Surgical Systems</li>
<li class="mt-2"><strong>Known For:</strong> Performing over 10 million surgeries globally using Intuitive Surgical's da Vinci robotic systems.<sup>5</sup></li>
<li class="mt-2"><strong>Why It Matters:</strong> Intuitive Surgical is at the forefront of medical robotics, revolutionizing healthcare by enhancing precision and reducing recovery times for patients.</li>
</ul>
<li class="mt-2"><strong>Boston Dynamics</strong></li>
<ul>
<li class="mt-2"><strong>Focus:</strong> Robots and Manufacturing/Industrial Automation Systems</li>
<li class="mt-2"><strong>Known For:</strong> Boston Dynamics' Spot robot is used in over 35 countries for tasks such as inspection, surveillance, and construction.<sup>6</sup></li>
<li class="mt-2"><strong>Why It Matters:</strong> The company's advanced robotics technology is expanding the capabilities of robots in industries such as security, logistics, and disaster response.</li>
</ul>
<li class="mt-2"><strong>Universal Robots</strong></li>
<ul class="content-list">
<li class="mt-2"><strong>Focus:</strong> Robots and Manufacturing/Industrial Automation Systems</li>
<li class="mt-2"><strong>Known For:</strong> Universal Robots commands over 50% of the global collaborative robot market, making automation accessible for small and medium-sized enterprises.<sup>7</sup></li>
<li class="mt-2"><strong>Why It Matters:</strong> The company's innovative cobot solutions are transforming factory operations reducing manual labor dependence.</li>
</ul>
<li class="mt-2"><strong>Zebra Technologies</strong></li>
<ul class="content-list">
<li class="mt-2"><strong>Focus:</strong> Machine Vision</li>
<li class="mt-2"><strong>Known For:</strong> Zebra offers a comprehensive suite of automation solutions designed to enhance efficiency and accuracy in logistics operations, increasing productivity by 30% for major clients.<sup>8</sup></li>
<li class="mt-2"><strong>Why It Matters:</strong> The company is at the heart of warehouse automation, optimizing supply chain efficiency.</li>
</ul>
</ol>

<h2 id="things-to-know" class="jump-link-nav anchored-block" data-jumplink-title="Things to Know">What You Should Know When Investing in Robotic</h2>
<p>Robotics is a transformative force across industries, driving innovation and efficiency in ways previously unimaginable. As an investor, understanding the key sectors impacted and the broader economic trends shaping robotics adoption can provide a comprehensive view of the opportunities within this rapidly evolving market.</p>
<h2 id="industries-impacted" class="jump-link-nav anchored-block" data-jumplink-title="Industries Impacted">Key Industries Impacted by Robotics</h2>
<p><strong>Manufacturing</strong></p>
<ul class="content-list">
<li class="mt-2">Robotics is revolutionizing the manufacturing sector, particularly in assembly lines, logistics, and precision welding. Automated solutions are now the backbone of smart factories, helping to reduce labor costs, minimize errors, and improve productivity.</li>
</ul>
<p><strong>Healthcare</strong></p>
<ul class="content-list">
<li class="mt-2">Robotic-assisted surgeries and automation in diagnostics are reshaping patient care. Technologies like robotic surgical systems and AI-driven diagnostic tools are increasing precision, improving outcomes, and enhancing accessibility in healthcare. For instance, robotic arms are being widely adopted for minimally invasive surgeries, reducing recovery times for patients.</li>
</ul>
<p><strong>Logistics and E-Commerce</strong></p>
<ul class="content-list">
<li class="mt-2">Warehouse automation and delivery robots are streamlining operations, enhancing order fulfillment, and reducing costs. Companies like Amazon and Walmart are pioneering the use of robotics in automated warehouses, ensuring faster delivery and more efficient inventory management.</li>
</ul>
<p><strong>Agriculture</strong></p>
<ul class="content-list">
<li class="mt-2">Precision farming technologies are optimizing crop yields and addressing labor shortages in the agricultural sector. Robotic systems for planting, harvesting, and monitoring are helping to improve productivity and sustainability in food production.</li>
</ul>
<h2 id="economictrends" class="jump-link-nav anchored-block" data-jumplink-title="Economic Trends">Economic Trends Driving Robotics Adoption</h2>
<p><strong>Labor Shortages</strong></p>
<ul class="content-list">
<li class="mt-2">Demographic shifts, such as aging populations and changing workforce preferences, are creating labor gaps in many countries. Nations like Japan and Germany are investing heavily in robotic automation to address these shortages, with robots increasingly performing tasks in elderly care, factory assembly, and beyond.</li>
</ul>
<p><strong>AI Integration</strong></p>
<ul class="content-list">
<li class="mt-2">Artificial intelligence is revolutionizing robotics by making machines smarter, more adaptive, and capable of handling complex tasks. AI-driven robots are being deployed across industries to improve predictive maintenance, optimize workflows, and expand the scope of automation. For example, AI-enhanced logistics robots can use real-time data to adjust operations dynamically, reducing downtime and boosting efficiency.</li>
</ul>
<p><strong>Government Support</strong></p>
<ul class="content-list">
<li class="mt-2">Governments around the world are incentivizing the adoption of robotics through subsidies, policies, and funding initiatives. Programs like Germany's Industry 4.0 and China's <i>Made in China 2025</i> are promoting the digitalization of manufacturing and advancing robotics innovation. These initiatives aim to boost economic competitiveness, reducing reliance on imports, and fostering leadership in high-tech industries.</li>
</ul>
<h2 id="key-risks" class="jump-link-nav anchored-block" data-jumplink-title="Key Risks">Key Risks to Consider for Robotics Investing</h2>
<ul class="content-list">
<li class="mt-2"><strong>High R&amp;D Costs:</strong> Robotics development requires significant investment in research and development, impacting profitability.</li>
<li class="mt-2"><strong>Regulatory Challenges:</strong> Robotics used in healthcare and autonomous systems face stringent regulatory approvals.</li>
<li class="mt-2"><strong>Technological Obsolescence and Competition:</strong> Rapid innovation cycles mean companies must continuously evolve to remain competitive.</li>
</ul>
<p>By staying informed about these industry applications and economic drivers, businesses and investors can strategically position themselves to capitalize on the growth and innovation in the robotics sector. Understanding these dynamics is essential for navigating the opportunities and challenges in this transformative market.</p>
<h2>Why Choose IBOT for Robotics Investing?</h2>
<p>The <strong><a href="https://www.vaneck.com/us/en/investments/robotics-etf-ibot/overview/" title="IBOT - VanEck Robotics ETF - Overview">VanEck Robotics ETF (IBOT) </a></strong> invests in companies that are involved in robotics, targeting companies that derive at least 50% of their revenues from one or more of seven subthemes. These themes include robots and manufacturing/industrial automation systems, robotic surgical systems, 3D printing, robotics or manufacturing computer-aided design or other software, semiconductor manufacturing systems, machine vision, and embedded machine learning chips. Coverage includes global companies in developed markets, providing exposure to the world's largest markets, including China, the world's leader in industrial robotics demand.</p>

<h2>Conclusion</h2>
<p>The robotics industry is undergoing a transformative era, with advancements in AI, automation, and machine learning driving its rapid evolution. From manufacturing and healthcare to logistics, e-commerce, and agriculture, robotics is revolutionizing industries while addressing challenges like labor shortages and operational inefficiencies. Leading companies such as ABB, Fanuc, and Intuitive Surgical are at the forefront, spearheading innovation across seven key subthemes like: industrial automation, machine vision, and robotic surgical systems. Understanding these subthemes and the economic trends driving robotics adoption is essential for investors to capitalize on this transformative market while navigating its associated risks.</p>
<p>To receive more <a href="https://www.vaneck.com/us/en/insights/thematic-investing/" title="Thematic Investing Insights"><strong>Thematic Investing</strong></a> insights, <a href="https://www.vaneck.com/us/en/subscribe/" title="Subscription Center"><strong>sign up in our subscription center</strong></a>.</p>
]]></content:encoded>
</item><item rdf:about="https://www.vaneck.com/us/en/blogs/moat-investing/moat-index-adds-tech-as-volatility-reveals-value/">
  <title>Moat Index Adds Tech as Volatility Reveals Value></title>
  <link>https://www.vaneck.com/us/en/blogs/moat-investing/moat-index-adds-tech-as-volatility-reveals-value/</link>
  <description><![CDATA[Tech headlined the Moat Index&rsquo;s March review, as six of the nine additions came from the sector, showcasing how volatility can create opportunities to find misvalued, high quality companies.]]></description>
  <dc:creator>Brandon Rakszawski</dc:creator>
  <dc:date>03/26/2025 06:30:00</dc:date>
<content:encoded><![CDATA[

<p>The Morningstar<sup>&reg;</sup>&nbsp;Wide Moat Focus Index<sup>SM</sup>&nbsp;(the &ldquo;Moat Index&rdquo; or &ldquo;Index&rdquo;) underwent its quarterly review on March 21, 2025. The Index systematically targets attractively priced, high quality U.S. companies each quarter, as identified by Morningstar&rsquo;s equity research analysts. Below are a few highlights from the latest review. The full results are available here:</p>

<h2>Moat Index Review Takeaways:</h2>
<ul class="content-list">
<li class="mt-2"><strong>Volatility Brings Tech Opportunities to Surface</strong>
<p>The Moat Index picked up several tech companies during the quarterly review as semiconductor and software companies (largely semiconductor-related software companies) found themselves in undervalued territory. Tech, which has been a significant underweight and headwind to relative Moat Index performance, may now present an opportunity. As markets sell off and become less efficient, that dynamic has historically offered the Moat Index&rsquo;s systematic allocation process a chance to capitalize on companies unfairly punished by broader momentum in the market.</p>
</li>
</ul>
<ul class="content-list">
<li class="mt-2"><strong>Growth Exposure Increases, Value Remains Largest Overweight</strong>
<p>Despite the pullback in U.S. equity markets, mega caps continue to dominate the S&amp;P 500 Index&rsquo;s makeup. The Moat Index&rsquo;s contrarian nature has resulted in a value bias relative to the headline large cap index and allows investors to meaningfully participate in the U.S. equity market with the added benefit of portfolio diversification. The Index&rsquo;s methodology also allows it to target attractive valuation opportunities regardless of a company&rsquo;s &ldquo;style.&rdquo; This quarter, the Moat Index&rsquo;s growth exposure increased slightly while its value exposure decreased.</p>
</li>
</ul>
<ul class="content-list">
<li class="mt-2"><strong>Semiconductor Innovation Propels Moat Index Newcomers</strong>
<p>There were two companies that were added to the Moat Index for the first time in its over 17-year history. Morningstar believes that as long as the semiconductor industry exists and is innovating, these two companies will be a necessary part of that innovation and earn excess returns on invested capital:</p>
<p><strong>Cadence Design Systems (CDNS):</strong> Cadence provides leading-edge electronic design automation tools and IP critical to the semiconductor chip design process. It benefits from switching costs and intangible assets and was upgraded to a wide moat rating from narrow in December 2024. It historically traded well above fair value until February of this year.</p>
<p><strong>Synopsys (SNPS):</strong> Like Cadence, Synopsys specializes in electronic design automation software used by engineers in the chip design and build phases. SNPS benefits from switching costs and intangible assets. Its moat rating was also upgraded from narrow to wide in December 2024.</p>
</li>
</ul>
<h3>1Q 2025 Moat Index Review Results</h3>
<p><strong>Moat Index Sector Shifts Following 1Q 2025 Review</strong></p>
<div class="flourish-embed flourish-chart" data-src="visualisation/22290125?2429379"><script src="https://public.flourish.studio/resources/embed.js"></script><noscript><img loading="lazy" src="https://public.flourish.studio/visualisation/22290125/thumbnail" width="100%" alt="chart visualization" /></noscript></div>
<p><strong>Moat Index Sector Exposure Relative to S&amp;P 500 Index</strong></p>
<div class="flourish-embed flourish-chart" data-src="visualisation/22290212?2429379"><script src="https://public.flourish.studio/resources/embed.js"></script><noscript><img loading="lazy" src="https://public.flourish.studio/visualisation/22290212/thumbnail" width="100%" alt="chart visualization" /></noscript></div>
<p><strong>Moat Index Style Exposure Relative to S&amp;P 500 Index: Value Bias Persists</strong></p>
<div class="flourish-embed flourish-chart" data-src="visualisation/22290271?2429379"><script src="https://public.flourish.studio/resources/embed.js"></script><noscript><img loading="lazy" src="https://public.flourish.studio/visualisation/22290271/thumbnail" width="100%" alt="chart visualization" /></noscript></div>
<p class="chart-disclosure">Source: Morningstar. As of 3/21/2025 unless otherwise noted.</p>

<h2>Access Quality Companies and Attractive Valuations</h2>
<p><a href="https://www.vaneck.com/us/en/investments/morningstar-wide-moat-etf-moat/index/" title="MOAT - VanEck Morningstar Wide Moat ETF - Overview"><strong>VanEck Morningstar Wide Moat ETF (MOAT)</strong></a> and <strong><a href="https://www.vaneck.com/us/en/investments/morningstar-wide-moat-fund-mwmzx/overview/" title="MWMZX - VanEck Morningstar Wide Moat Fund - Class Z">VanEck Morningstar Wide Moat Fund</a></strong> seek to replicate as closely as possible, before fees and expenses the price and yield performance of the Morningstar Wide Moat Focus Index.</p>

<p>To receive more <a href="https://www.vaneck.com/us/en/insights/moat-investing" title="Moat Investing Insights"><strong>Moat Investing</strong></a> insights, <a href="https://www.vaneck.com/us/en/subscribe/" title="Subscription Center"><strong>sign up in our subscription center</strong></a>.</p>
]]></content:encoded>
</item><item rdf:about="https://www.vaneck.com/us/en/blogs/municipal-bonds/muni-markets-moment-of-truth-tax-exemption-in-question/">
  <title>Muni Market’s Moment of Truth: Tax-Exemption in Question></title>
  <link>https://www.vaneck.com/us/en/blogs/municipal-bonds/muni-markets-moment-of-truth-tax-exemption-in-question/</link>
  <description><![CDATA[The tax-exemption status of municipal bonds faces growing uncertainty as policymakers consider major tax changes. While risks loom, attractive yields offer strategic opportunities for investors.]]></description>
  <dc:creator>James Colby</dc:creator>
  <dc:date>03/25/2025 06:30:00</dc:date>
<content:encoded><![CDATA[

<p>Fixed income markets are no fan of indecision or uncertainty. And here we are, mid-March, mired in a sea of uncertainty. Specifically, in the view of municipal investors, there are more reasons for concern now than in any other major market sector. The existential threat to the future of tax-exempt finance has heightened this uncertainty, making municipal bonds a focal point for policymakers and investors alike.</p>
<h2>The Future of the Tax-Exemption Unanswered</h2>
<p>Municipal investors are watching closely as discussions unfold in Washington, where both the House and Senate finance committees are weighing significant changes that could reshape tax-exempt finance. Some of the key questions on the table include:</p>
<ul class="content-list">
<li class="mt-2">Will the benefit of the federal exemption be capped at 28% or eliminated entirely?</li>
<li class="mt-2">Will the potential cap apply to all outstanding bonds or only those issued after a certain date?</li>
<li class="mt-2">Could tax exemption for municipal bonds be legislated out of existence altogether?</li>
</ul>
<p>At this moment, the outcome remains highly uncertain. However, the potential for an adverse resolution appears more serious than ever before. Advocacy efforts are already underway in Washington, with advisory groups representing both state and local bond issuers working to educate lawmakers on the costly implications of such legislative changes.</p>
<h2>Market Uncertainty Presents a Unique Opportunity</h2>
<p>While these uncertainties create challenges, they also present compelling opportunities for entities currently holding cash or equivalents. Recent shifts in the municipal bond market have resulted in more attractive yields, particularly in the 10- and 30-year segments.</p>
<p>According to Bank of America, these yields have now approached their most compelling levels in years. Despite concerns over potential federal taxation of municipal bond interest, several bank strategists highlight that the taxable-equivalent yield from municipal high-yield bonds currently offers a pickup of 30-40 basis points over various corporate high-yield alternatives.</p>
<h3>High-Yield Munis Are Now at Their Most Compelling Levels</h3>
<div class="flourish-embed flourish-chart" data-src="visualisation/22270864?2429575"><script src="https://public.flourish.studio/resources/embed.js"></script><noscript><img loading="lazy" src="https://public.flourish.studio/visualisation/22270864/thumbnail" width="100%" alt="High-Yield Munis Are Now at Their Most Compelling Levels" /></noscript></div>
<p class="chart-disclosure">Source: ICE Data Service, March 2025. Past performance is no guarantee of future results. Index performance is not illustrative of fund performance. It is not possible to invest directly in an index.</p>
<h3>Superior Tax-Equivalent Yields vs. Corporate High-Yield Bonds</h3>
<div class="flourish-embed flourish-chart" data-src="visualisation/22270976?2429575"><script src="https://public.flourish.studio/resources/embed.js"></script><noscript><img loading="lazy" src="https://public.flourish.studio/visualisation/22270976/thumbnail" width="100%" alt="Superior Tax-Equivalent Yields vs. Corporate High-Yield Bonds" /></noscript></div>
<p class="chart-disclosure">Source: ICE Data Service, March 2025. Past performance is no guarantee of future results. Index performance is not illustrative of fund performance. It is not possible to invest directly in an index. The indices are unmanaged and are not securities in which an investment can be made. The chart displays the yield of the ICE Municipal Bond index on a tax-equivalent yield basis. ICE Core High Yield &amp; Unrated Municipal Index (High Yield Munis), ICE BofA US High Yield Index (US High Yield), ICE BofA Euro High Yield Index (Euro High Yield), ICE BofA High Yield Emerging Markets Corporate Plus Index (Emerging Markets High Yield), ICE BofA Global High Yield Index (Global High Yield). See index descriptions at the end.</p>

<h2>Why Now is the Time to Consider Municipals</h2>
<p>Given the current market landscape, now may be an opportune time for allocations to municipal bonds&mdash;both in high-yield and investment-grade categories. The combination of higher ratios, strong taxable-equivalent yields, and the long-term stability of munis makes them a viable option for investors looking to optimize their portfolios in uncertain times.</p>
<p>While the fate of tax-exempt finance remains unclear, one thing is certain: those who navigate this period strategically could find themselves in a position of strength when the dust settles.</p>
<p>To receive more <a href="https://www.vaneck.com/us/en/insights/municipal-bonds/" title="Municipal Bonds Insights"><strong>Municipal Bonds</strong></a> insights, <a href="/link/5f45412c2143400497908cea2897f7d3.aspx" title=" Subscription Center"><strong>sign up in our subscription center</strong></a>.</p>
]]></content:encoded>
</item><item rdf:about="https://www.vaneck.com/us/en/blogs/thematic-investing/buzz-investing-feds-glimmer-of-hope-amid-market-corrections/">
  <title>BUZZ Investing: Fed’s Glimmer of Hope Amid Market Corrections></title>
  <link>https://www.vaneck.com/us/en/blogs/thematic-investing/buzz-investing-feds-glimmer-of-hope-amid-market-corrections/</link>
  <description><![CDATA[Markets faced turbulence following concerns about tariffs and an economic slowdown. Celsius surged while tech stocks and Trump Media struggled.]]></description>
  <dc:creator> </dc:creator>
  <dc:date>03/21/2025 06:30:00</dc:date>
<content:encoded><![CDATA[

<p>During the recent period between index selection dates (February 12, 2025 &ndash; March 13, 2025, the &ldquo;Period&rdquo;), U.S. stock markets faced a steep decline, with the S&amp;P 500 falling 8.6% and the Nasdaq Composite dropping 11.9%, signaling a shift from the turbulence of February into a more pronounced downturn. The escalation came as the Trump administration&rsquo;s tariff policies began to take shape, targeting major trading partners like Canada, Mexico, and China, unsettling investors with the prospect of higher costs, supply chain strains, and retaliatory trade measures. At the same time, economic indicators painted a gloomier picture, with softening job growth, rising unemployment, and persistent concerns about consumer spending amplifying fears of a slowdown. The tech sector, a key driver of earlier gains, took a significant hit as investor sentiment soured, particularly around high-profile names tied to AI and electric vehicles, where weakening demand and regulatory pressures added to the woes. Amid this uncertainty, a flight to safety boosted demand for U.S. government bonds, pushing Treasury yields lower as equities struggled to regain traction.</p>
<p>The broader market mood during this period was shaped by a mix of policy uncertainty and macroeconomic challenges, overshadowing fleeting moments of relief. While a slightly lower-than-expected inflation reading offered a brief glimmer of hope for potential Federal Reserve rate adjustments, the overriding concerns about tariffs and economic health quickly erased any gains, with the Nasdaq hitting correction territory on March 6 and the S&amp;P 500 entering correction territory, defined as a decline of more than 10% from its recent peak, on March 13. Defensive sectors, such as utilities and consumer staples, showed relative resilience as investors pivoted away from riskier assets amid the deepening sell-off. Corporate earnings reports further highlighted vulnerabilities, with consumer-facing companies signaling caution amid signs of weakening demand, contrasting with earlier optimism tied to technological innovation. Analysts adjusted their outlooks downward, reflecting a market increasingly weighed down by external pressures and a reassessment of the post-election rally, marking a stark departure from the buoyancy seen earlier in the year.</p>
<p>The BUZZ NextGen AI U.S. Sentiment Leaders Index ("BUZZ Index") returned -3.73% during the month of February compared to a return of -1.30% for the S&amp;P 500 Index during the same period. Year-to-date, the BUZZ Index lags the S&amp;P 500 with returns of -1.17% and 1.44%, respectively, as of the end of February.</p>
<h2 id="celsius-gains" class="jump-link-nav anchored-block" data-jumplink-title="Celsius Buzz Index Gains">Shares of Celsius Holdings Pace BUZZ Index Gains</h2>
<p>Shares of Celsius Holdings (NASDAQ: CELH) emerged as standout in the BUZZ Index during the recent Period, climbing approximately 25%, fueled by a combination of strong quarterly results and a strategic acquisition. The energy drink maker reported earnings and sales that surpassed Wall Street forecasts, boosting investor confidence at a time when the stock had been under pressure from slowing growth and distribution challenges. The announcement of its $1.8 billion acquisition of Alani Nu, a fast-growing rival with a strong social-media-driven following, further energized the stock, potentially positioning Celsius to bolster its market share and tap into new consumer segments. This surge may reflect renewed optimism about the company&rsquo;s ability to navigate a competitive landscape and reignite its growth trajectory despite broader concerns about consumer spending and intensifying rivalry in the energy drink sector.</p>

<h3>Top BUZZ Index Contributors: February 12, 2025 &ndash; March 13, 2025</h3>
<div class="wrapped-div">
<table style="width: 100%;">
<tbody>
<tr class="tbl-data">
<td class="tbl-header last">Company</td>
<td class="tbl-header last">Ticker</td>
<td class="tbl-header last text-right">Average Weight (%)</td>
<td class="tbl-header last text-right">Return Contribution (%)</td>
</tr>
<tr class="tbl-data">
<td class="data-td data last text-left">Micron Technology Inc</td>
<td class="data-td data last text-left">MU</td>
<td class="data-td data last text-right">1.43</td>
<td class="data-td data last text-right">0.20</td>
</tr>
<tr class="tbl-data">
<td class="data-td data last text-left">Celsius Holdings Inc</td>
<td class="data-td data last text-left">CELH</td>
<td class="data-td data last text-right">1.54</td>
<td class="data-td data last text-right">0.19</td>
</tr>
<tr class="tbl-data">
<td class="data-td data last text-left">Walgreens Boots Alliance Inc</td>
<td class="data-td data last text-left">WBA</td>
<td class="data-td data last text-right">0.95</td>
<td class="data-td data last text-right">0.12</td>
</tr>
<tr class="tbl-data">
<td class="data-td data last text-left">Intel Corp</td>
<td class="data-td data last text-left">INTC</td>
<td class="data-td data last text-right">3.12</td>
<td class="data-td data last text-right">0.12</td>
</tr>
<tr class="tbl-data">
<td class="data-td data last text-left">Lockheed Martin Corp</td>
<td class="data-td data last text-left">LMT</td>
<td class="data-td data last text-right">0.81</td>
<td class="data-td data last text-right">0.06</td>
</tr>
<tr class="tbl-data">
<td class="data-td data last text-left">Unity Software Inc</td>
<td class="data-td data last text-left">U</td>
<td class="data-td data last text-right">0.87</td>
<td class="data-td data last text-right">0.05</td>
</tr>
<tr class="tbl-data">
<td class="data-td data last text-left">Vertex Pharmaceuticals Inc</td>
<td class="data-td data last text-left">VRTX</td>
<td class="data-td data last text-right">0.69</td>
<td class="data-td data last text-right">0.04</td>
</tr>
<tr class="tbl-data">
<td class="data-td data last text-left">Super Micro Computer Inc</td>
<td class="data-td data last text-left">SMCI</td>
<td class="data-td data last text-right">3.74</td>
<td class="data-td data last text-right">0.04</td>
</tr>
<tr class="tbl-data">
<td class="data-td data last text-left">Moderna Inc</td>
<td class="data-td data last text-left">MRNA</td>
<td class="data-td data last text-right">0.68</td>
<td class="data-td data last text-right">0.04</td>
</tr>
<tr class="tbl-data">
<td class="data-td data last text-left">Dollar General Corp</td>
<td class="data-td data last text-left">DG</td>
<td class="data-td data last text-right">0.35</td>
<td class="data-td data last text-right">0.02</td>
</tr>
</tbody>
</table>
</div>
<p class="chart-disclosure">Source: BUZZ Holdings ULC, Bloomberg. Past performance is no guarantee of future results. Index performance is not illustrative of fund performance. Not intended as a recommendation to buy or to sell any of the securities mentioned herein.</p>

<h2>Shares of Trump Media &amp; Technology Among Declining Stocks in the BUZZ Index</h2>
<p>During the recent period, shares of Palantir Technologies (NASDAQ: PLTR), Trump Media &amp; Technology Group (NASDAQ: DJT), and Hims &amp; Hers Health (NYSE: HIMS) saw substantial declines of 32.2%, 37.0%, and 31.9%, respectively, negatively impacting BUZZ Index performance amidst a broader market downturn fueled by tariff uncertainties and economic slowdown concerns. Palantir&rsquo;s drop may have been influenced by worries over its heavy reliance on government contracts, which account for a significant portion of its revenue, as reports surfaced of potential Pentagon budget cuts under the Trump administration, alongside a lofty valuation that left little room for error. DJT faced turbulence as its stock, closely tied to political sentiment, wavered with shifting perceptions of the administration&rsquo;s policy direction, compounded by skepticism about its long-term business viability after a volatile run. Hims &amp; Hers Health stumbled as signs of softening consumer spending hit the telehealth and wellness sector, with additional pressure from competitive pricing moves by rivals eroding confidence in its growth prospects.</p>
<h3>Bottom BUZZ Index Contributors: February 12, 2025 &ndash; March 13, 2025</h3>
<div class="wrapped-div">
<table style="width: 100%;">
<tbody>
<tr class="tbl-data">
<td class="tbl-header last">Company</td>
<td class="tbl-header last">Ticker</td>
<td class="tbl-header last text-right">Average Weight (%)</td>
<td class="tbl-header last text-right">Return Contribution (%)</td>
</tr>
<tr class="tbl-data">
<td class="data-td data last text-left">Palantir Technologies Inc</td>
<td class="data-td data last text-left">PLTR</td>
<td class="data-td data last text-right">3.08</td>
<td class="data-td data last text-right">-1.05</td>
</tr>
<tr class="tbl-data">
<td class="data-td data last text-left">Trump Media &amp; Tech Group</td>
<td class="data-td data last text-left">DJT</td>
<td class="data-td data last text-right">2.46</td>
<td class="data-td data last text-right">-1.04</td>
</tr>
<tr class="tbl-data">
<td class="data-td data last text-left">Hims &amp; Hers Health Inc</td>
<td class="data-td data last text-left">HIMS</td>
<td class="data-td data last text-right">2.89</td>
<td class="data-td data last text-right">-0.98</td>
</tr>
<tr class="tbl-data">
<td class="data-td data last text-left">Tesla Inc</td>
<td class="data-td data last text-left">TSLA</td>
<td class="data-td data last text-right">2.66</td>
<td class="data-td data last text-right">-0.88</td>
</tr>
<tr class="tbl-data">
<td class="data-td data last text-left">Coinbase Global Inc</td>
<td class="data-td data last text-left">COIN</td>
<td class="data-td data last text-right">1.72</td>
<td class="data-td data last text-right">-0.81</td>
</tr>
<tr class="tbl-data">
<td class="data-td data last text-left">Rocket Lab USA Inc</td>
<td class="data-td data last text-left">RKLB</td>
<td class="data-td data last text-right">1.74</td>
<td class="data-td data last text-right">-0.73</td>
</tr>
<tr class="tbl-data">
<td class="data-td data last text-left">MARA Holdings Inc</td>
<td class="data-td data last text-left">MARA</td>
<td class="data-td data last text-right">2.68</td>
<td class="data-td data last text-right">-0.72</td>
</tr>
<tr class="tbl-data">
<td class="data-td data last text-left">SoFi Technologies Inc</td>
<td class="data-td data last text-left">SOFI</td>
<td class="data-td data last text-right">2.97</td>
<td class="data-td data last text-right">-0.70</td>
</tr>
<tr class="tbl-data">
<td class="data-td data last text-left">IonQ Inc</td>
<td class="data-td data last text-left">IONQ</td>
<td class="data-td data last text-right">1.35</td>
<td class="data-td data last text-right">-0.69</td>
</tr>
<tr class="tbl-data">
<td class="data-td data last text-left">SoundHound AI Inc</td>
<td class="data-td data last text-left">SOUN</td>
<td class="data-td data last text-right">1.31</td>
<td class="data-td data last text-right">-0.67</td>
</tr>
</tbody>
</table>
</div>
<p class="chart-disclosure">Source: BUZZ Holdings ULC, Bloomberg. Past performance is no guarantee of future results. Index performance is not illustrative of fund performance. Not intended as a recommendation to buy or to sell any of the securities mentioned herein.</p>
<h2 id="rebalance-highlights" class="jump-link-nav anchored-block" data-jumplink-title="Rebalance Highlights">BUZZ Index March 2025 Rebalance Highlights</h2>
<p><strong>Marvell Technology Inc.</strong></p>
<p>The stock market has encountered broad selling pressure, with momentum stocks among those experiencing significant declines. The &ldquo;Magnificent Seven&rdquo; tech leaders have seen notable pullbacks since mid-February, potentially driven by concerns over looming tariffs, geopolitical uncertainties, and possible liquidations from large investors. Many of last year&rsquo;s highflyers have slipped into correction territory and face further challenges reporting earnings in this difficult environment. Marvell Technology (NASDAQ: MRVL) may exemplify this trend, as the company reported earnings in early March that appeared to meet expectations, yet its stock still fell sharply, possibly reflecting broader worries about softening semiconductor demand in data centers and automotive sectors, alongside ongoing supply chain issues. Despite this, a &ldquo;buy-the-dip&rdquo; attitude seems to be gaining traction among some investors, and this month, MRVL has secured a 0.51% weighting in the BUZZ Index, suggesting cautious optimism may be present amidst the market&rsquo;s challenges.</p>
<p><strong>The Trade Desk, Inc.</strong></p>
<p>The Trade Desk (NASDAQ: TTD) is the latest high-growth stock to come under pressure following a weaker-than-expected earnings report. In early February, the company&rsquo;s Q4 revenue fell short of Wall Street estimates, largely due to a slower-than-anticipated rollout of its Kokai advertising platform. As a leader in digital marketing automation, The Trade Desk has seen substantial appreciation since its 2016 IPO, making this revenue miss a rare event&mdash;only the second in its history as a public company. Over the past month, TTD shares have faced considerable declines, driven not only by company-specific factors but also by broader market dynamics, as investors shift away from high-growth names and reassess valuations. However, signs of stabilization within the investor sentiment suggest that some may now view the pullback as a buying opportunity. Reflecting this, TTD re-enters the BUZZ Index this month with a 1.72% weighting.</p>

<p>To receive more <a href="https://www.vaneck.com/us/en/insights/thematic-investing/" title="Thematic Investing Insights"><strong>Thematic Investing</strong></a> insights, <a href="https://www.vaneck.com/us/en/subscribe/" title="Subscription Center"><strong>sign up in our subscription center</strong></a>.</p>
]]></content:encoded>
</item><item rdf:about="https://www.vaneck.com/us/en/blogs/income-investing/clos-now-a-core-necessity/">
  <title>CLOs Now a Core Necessity></title>
  <link>https://www.vaneck.com/us/en/blogs/income-investing/clos-now-a-core-necessity/</link>
  <description><![CDATA[Despite their lack of inclusion in broad &ldquo;agg&rdquo; indices, CLOs have proven they belong in investors&rsquo; core bond portfolios.]]></description>
  <dc:creator>William Sokol</dc:creator>
  <dc:date>03/20/2025 06:30:00</dc:date>
<content:encoded><![CDATA[

<p>Bond investors typically look to their core bond portfolios to provide a ballast against market volatility. However, core fixed income asset classes continue to feel the impact of &ldquo;higher for longer&rdquo; and continued economic and policy uncertainty this year, as sticky inflation and long-term debt and borrowing dynamics in the U.S. continue to drive interest rate volatility. From the end of November last year through mid-January 2025, the 10-year U.S. Treasury yield rose sharply, only to completely re-trace this rise through the end of February. We don&rsquo;t know if long-term bond yields will continue rising or decline from here, but we do expect rate volatility to remain elevated.</p>
<p>This recent volatility is yet another reminder that core bond returns, even U.S. Treasuries, are heavily impacted by interest rate duration. Collateralized loan obligations (&ldquo;CLOs&rdquo;) are generally not included in &ldquo;agg&rdquo;-type indices that most core bond managers benchmark to, and therefore allocations tend to be relatively small or non-existent. However, CLOs provide the attributes that investors look for in their core bond portfolios: attractive yield, safety, and diversification, and have continued to outperform core fixed income through this most recent volatility. As a result, an allocation to CLOs in a core bond portfolio has provided better outcomes over the past year.</p>

<h3>CLOs Have Outperformed</h3>
<div class="flourish-embed flourish-chart" data-src="visualisation/22191214?2429575"><script src="https://public.flourish.studio/resources/embed.js"></script><noscript><img loading="lazy" src="https://public.flourish.studio/visualisation/22191214/thumbnail" width="100%" alt="CLOs Have Outperformed" /></noscript></div>
<p class="chart-disclosure">Source: J.P. Morgan and ICE Data Indices as of February 28, 2025. CLOs represented by J.P. Morgan CLO Index; AAA CLOs represented by the AAA subset of the J.P. Morgan CLO Index; Core Bonds represented by the ICE BofA US Broad Market Index. Past performance is no guarantee of future results. Index performance is not representative of fund performance. It is not possible to invest directly in an index.</p>
<p>In fact, <a href="https://www.vaneck.com/us/en/blogs/income-investing/clos-too-good-to-be-true/" title="CLOs: Too Good to Be True?"><strong>CLOs have provided the best risk-adjusted returns versus</strong></a> other fixed income asset classes over the past decade, through various rate and credit cycles. CLO returns benefit from high yields and spreads versus similarly rated bonds, structural protections that have resulted in extremely low default risk, and rate insensitivity. More recently, strong technical and fundamentals have provided a tailwind to credit spreads.</p>
<p>For investors looking to add CLO exposure, we believe a broad investment grade exposure provides better opportunities <a href="https://www.vaneck.com/us/en/blogs/income-investing/looking-beyond-aaa-rated-clos-pays-off/" title="Looking Beyond AAA Rated CLOs Pays Off"><strong>versus one that is constrained to AAA CLOs</strong></a>. Today&rsquo;s currently benign credit environment favors capturing higher carry outside of AAAs, while remaining cautious due to tighter valuations in CLOs rated BBB and below. The ability to take advantage of higher yields in lower-rated tranches also provides the opportunity to earn attractive absolute yield levels even in a declining environment. Looking forward, any weakening in the credit environment could create attractive total return opportunities for CLO tranche managers that can opportunistically add risk when value is pushed further into lower-rated tranches. Constraining a CLO investment strategy to only one rating category significantly reduces these opportunities.</p>
<p>An actively managed approach, in both top-down portfolio construction as well as rigorous bottom-up security selection, can add significant value in CLO investing. Right now such an approach, we believe, falls into a sweet spot of high carry with relative safety and stability &ndash; the attributes most investors look for in their core bond portfolio.</p>
<p>VanEck has partnered with PineBridge Investments on the <a href="https://www.vaneck.com/us/en/investments/clo-etf-cloi/overview" title="CLOI - VanEck CLO ETF - Overview"><strong>VanEck CLO ETF (CLOI)</strong></a>, which provides access to investment grade floating-rate CLOs. CLOI benefits from PineBridge&rsquo;s decades of CLO market experience, both as a CLO manager and CLO tranche investor, and deep leveraged finance expertise.</p>
<p>To receive more <a href="/us/en/blogs/income-investing/" title="Income Investing Insights"><strong>Income Investing</strong></a> insights, <a href="/link/5f45412c2143400497908cea2897f7d3.aspx" title=" Subscription Center"><strong>sign up in our subscription center</strong></a>.</p>
]]></content:encoded>
</item><item rdf:about="https://www.vaneck.com/us/en/blogs/digital-assets/matthew-sigel-vaneck-mid-march-2025-bitcoin-chaincheck/">
  <title>VanEck Mid-March 2025 Bitcoin ChainCheck></title>
  <link>https://www.vaneck.com/us/en/blogs/digital-assets/matthew-sigel-vaneck-mid-march-2025-bitcoin-chaincheck/</link>
  <description><![CDATA[Bitcoin sees its second-largest retracement this cycle amid ETP outflows and weak risk appetite, as corporate treasury yield strategies emerge and Texas energy bills reshape mining.]]></description>
  <dc:creator>Nathan  Frankovitz</dc:creator>
  <dc:date>03/20/2025 06:30:00</dc:date>
<content:encoded><![CDATA[

<p><strong>Please note that VanEck has exposure to bitcoin.</strong></p>
<p><strong>Three key takeaways for mid-February &ndash; mid-March:</strong></p>
<ol class="content-list">
<li class="mt-2"><strong>Key Data Threatens Bull Market: </strong>Bitcoin&rsquo;s <strong>30%</strong> retracement coincides with historically low futures funding rates and the longest ETF outflow streak since inception. Altcoins remain weak while Bitcoin (BTC) dominance holds steady, reflecting abnormally weak bull market demand for speculative blockchain use cases.</li>
<li class="mt-2"><strong>Corporate Bitcoin Yield Strategies Scale</strong>: MSTR, Metaplanet, and SMLR continue expanding BTC-backed financial engineering, with MSTR acquiring <strong>20,356 BTC ($1.99 billion)</strong> and launching a <strong>$2 billion</strong> convertible note. The new REX Shares Bitcoin Convertible Bond ETF highlights the growing institutional interest in BTC treasuries.</li>
<li class="mt-2"><strong>Texas Energy Bills Could Reshape Mining Economics</strong>: SB6 could raise interconnection costs and delays for large miners, while SB1942 would fast-track ERCOT approvals for flexible loads, creating a competitive edge for miners that generate their own power on-site. SB388&rsquo;s <strong>50%</strong> dispatchable energy mandate may drive up long-term mining costs by shifting Texas&rsquo; power mix toward fossil fuels.</li>
</ol>
<ul class="content-list">
<li class="mt-2"><a href="#chart-of-the-month"><strong>Chart of The Month</strong></a></li>
<li class="mt-2"><a href="#monthly-dashboard"><strong>Monthly Dashboard</strong></a></li>
<li class="mt-2"><a href="#bitcoin-network-activity"><strong>Bitcoin&rsquo;s Network Activity, Adoption, and Fees</strong></a></li>
<li class="mt-2"><a href="#regulatory-and-geopolitics"><strong>Regulatory and Geopolitical Developments</strong></a></li>
<li class="mt-2"><a href="#bitcoin-and-balance-sheets"><strong>Bitcoin on Balance Sheets and Enterprise Value Analysis</strong></a></li>
</ul>
<h3 id="chart-of-the-month" class="jump-link-nav anchored-block" data-jumplink-title="Chart of the Month">Chart of the Month: A Collapse in Animal Spirits?</h3>
<p><strong>3-Month Futures Roll Yield Hits Multi-Year Lows as Hedge Funds Exit Basis Trade</strong></p>
<div class="flourish-embed flourish-chart" data-src="visualisation/22170119?2429575"><script src="https://public.flourish.studio/resources/embed.js"></script><noscript><img loading="lazy" src="https://public.flourish.studio/visualisation/22170119/thumbnail" width="100%" alt="3-Month Futures Roll Yield Hits Multi-Year Lows as Hedge Funds Exit Basis Trade" /></noscript></div>
<p class="chart-disclosure">Source: Glassnode as of 3/13/202. <strong>Past performance is no guarantee of future results.</strong></p>
<p>One of the most striking market sentiment indicators this month is the sharp decline in Bitcoin's funding rate, which has reached its lowest level since October 2023. The funding rate reflects the cost of borrowing to go long BTC in perpetual futures contracts. When it falls to such lows, it signals a cooling of speculative enthusiasm&mdash;what some might call a lack of &ldquo;animal spirits&rdquo; in the market.</p>
<p>This decline suggests that hedge funds have largely closed out the basis trade, a common strategy where traders arbitrage the spread between spot and futures prices. While some of this may be attributed to tighter futures spreads following the U.S. spot Bitcoin ETF launch, broader macro uncertainty and risk management adjustments could also play a role. With lower borrowing costs, this is the lowest speculative positioning in over a year, reminiscent of the pre-ETF environment when investors were still waiting on a catalyst for renewed bullish momentum.</p>
<p>However, while speculative fervor has clearly waned, this is far from the capitulation levels seen in the bear market depths. While the funding rate remains low, it has not flipped negative, which would indicate rare bearish periods of aggressive shorting. Instead, the market appears to be resetting expectations after the Trump trade as investors await a new catalyst to rekindle risk appetite.</p>
<h3 id="monthly-dashboard" class="jump-link-nav anchored-block" data-jumplink-title="Monthly Dashboard">Bitcoin Monthly Dashboard</h3>
<div class="wrapped-div">
<table style="width: 100%;">
<tbody>
<tr class="tbl-data">
<td class="tbl-header last text-left">As of March 17th, 2025</td>
<td class="tbl-header last text-right">30-day avg</td>
<td class="tbl-header last text-right">30 day change (%)<sup>1</sup></td>
<td class="tbl-header last text-right">365 day change (%)</td>
<td class="tbl-header last text-right">Last 30 days Percentile vs<br />all-time history (%)</td>
</tr>
<tr class="tbl-data">
<td class="data-td last">Bitcoin Price</td>
<td class="data-td data last text-right">$88,967</td>
<td class="data-td data last text-right">-12</td>
<td class="data-td data last text-right">46</td>
<td class="data-td data last text-right">98</td>
</tr>
<tr class="tbl-data">
<td class="data-td last">Daily Active Addresses</td>
<td class="data-td data last text-right">741,594</td>
<td class="data-td data last text-right">-3</td>
<td class="data-td data last text-right">-21</td>
<td class="data-td data last text-right">67</td>
</tr>
<tr class="tbl-data">
<td class="data-td last">Daily New Addresses</td>
<td class="data-td data last text-right">309,731</td>
<td class="data-td data last text-right">-3</td>
<td class="data-td data last text-right">-25</td>
<td class="data-td data last text-right">56</td>
</tr>
<tr class="tbl-data">
<td class="data-td last">Daily Transactions</td>
<td class="data-td data last text-right">399,582</td>
<td class="data-td data last text-right">9</td>
<td class="data-td data last text-right">7</td>
<td class="data-td data last text-right">91</td>
</tr>
<tr class="tbl-data">
<td class="data-td last">Daily Inscriptions</td>
<td class="data-td data last text-right">140,976</td>
<td class="data-td data last text-right">62</td>
<td class="data-td data last text-right">13</td>
<td class="data-td data last text-right">53</td>
</tr>
<tr class="tbl-data">
<td class="data-td last">Total Transfer Volume (USD)</td>
<td class="data-td data last text-right">$63,167,619,258</td>
<td class="data-td data last text-right">-5</td>
<td class="data-td data last text-right">-1</td>
<td class="data-td data last text-right">87</td>
</tr>
<tr class="tbl-data">
<td class="data-td last">Supply Active, last 180 days</td>
<td class="data-td data last text-right">26%</td>
<td class="data-td data last text-right">2</td>
<td class="data-td data last text-right">46</td>
<td class="data-td data last text-right">45</td>
</tr>
<tr class="tbl-data">
<td class="data-td last">% Supply Dormant for 3+ Years</td>
<td class="data-td data last text-right">45%</td>
<td class="data-td data last text-right">0</td>
<td class="data-td data last text-right">1</td>
<td class="data-td data last text-right">64</td>
</tr>
<tr class="tbl-data">
<td class="data-td last">Avg Fees (USD)</td>
<td class="data-td data last text-right">$1.42</td>
<td class="data-td data last text-right">-14</td>
<td class="data-td data last text-right">-80</td>
<td class="data-td data last text-right">64</td>
</tr>
<tr class="tbl-data">
<td class="data-td last">Avg Fees (BTC)</td>
<td class="data-td data last text-right">0.00002</td>
<td class="data-td data last text-right">-2</td>
<td class="data-td data last text-right">-86</td>
<td class="data-td data last text-right">4</td>
</tr>
<tr class="tbl-data">
<td class="data-td last">Percent of BTC Addresses in profit</td>
<td class="data-td data last text-right">90%</td>
<td class="data-td data last text-right">-7</td>
<td class="data-td data last text-right">74</td>
</tr>
<tr class="tbl-data">
<td class="data-td last">Unrealized profit/loss ratio</td>
<td class="data-td data last text-right">0.51</td>
<td class="data-td data last text-right">-11</td>
<td class="data-td data last text-right">-15</td>
<td class="data-td data last text-right">70</td>
</tr>
<tr class="tbl-data">
<td class="data-td last">Global Power Consumption (TWh)</td>
<td class="data-td data last text-right">155</td>
<td class="data-td data last text-right">1</td>
<td class="data-td data last text-right">40</td>
<td class="data-td data last text-right">100</td>
</tr>
<tr class="tbl-data">
<td class="data-td last">Total Daily BTC Miner Revenues (USD)</td>
<td class="data-td data last text-right">$40,538,898</td>
<td class="data-td data last text-right">-20</td>
<td class="data-td data last text-right">-30</td>
<td class="data-td data last text-right">90</td>
</tr>
<tr class="tbl-data">
<td class="data-td last">Total Crypto Equities' Market Cap<sup>*</sup>&nbsp;(USD) (MM)</td>
<td class="data-td data last text-right">$181,909</td>
<td class="data-td data last text-right">-19</td>
<td class="data-td data last text-right">52</td>
<td class="data-td data last text-right">81</td>
</tr>
<tr class="tbl-data">
<td class="data-td last">Transfer volume from Miners to Exchanges (USD)</td>
<td class="data-td data last text-right">$5,034,007</td>
<td class="data-td data last text-right">-16</td>
<td class="data-td data last text-right">-42</td>
<td class="data-td data last text-right">84</td>
</tr>
<tr class="tbl-data">
<td class="data-td last">Bitcoin Dominance</td>
<td class="data-td data last text-right">60%</td>
<td class="data-td data last text-right">3</td>
<td class="data-td data last text-right">16</td>
<td class="data-td data last text-right">90</td>
</tr>
<tr class="tbl-data">
<td class="data-td last">Bitcoin Futures Annualized Basis</td>
<td class="data-td data last text-right">7%</td>
<td class="data-td data last text-right">-38</td>
<td class="data-td data last text-right">-50</td>
<td class="data-td data last text-right">3</td>
</tr>
<tr class="tbl-data">
<td class="data-td last">Mining Difficulty (T)</td>
<td class="data-td data last text-right">111</td>
<td class="data-td data last text-right">1</td>
<td class="data-td data last text-right">37</td>
<td class="data-td data last text-right">100</td>
</tr>
</tbody>
</table>
</div>
<br />
<p class="chart-disclosure"><sup>*</sup>&nbsp;DAPP market cap as a proxy, as of March 14th, 2025.</p>
<p class="chart-disclosure"><sup>1</sup>&nbsp;30 day change &amp; 365 day change are relative to the 30-day avg, not absolute.</p>
<div class="wrapped-div">
<table style="width: 100%;">
<tbody>
<tr class="tbl-data">
<td class="tbl-header last text-left">Regional Trading</td>
<td class="tbl-header last text-right">MoM Change (%)</td>
<td class="tbl-header last text-right">YoY Change (%)</td>
</tr>
<tr class="tbl-data">
<td class="data-td data last text-left">Asia Hours Price Change MoM ($)</td>
<td class="data-td data last text-right">1</td>
<td class="data-td data last text-right">2</td>
</tr>
<tr class="tbl-data">
<td class="data-td data last text-left">US hours Price Change MoM ($)</td>
<td class="data-td data last text-right">-6</td>
<td class="data-td data last text-right">1</td>
</tr>
<tr class="tbl-data">
<td class="data-td data last text-left">EU hours Price Change MoM ($)</td>
<td class="data-td data last text-right">0</td>
<td class="data-td data last text-right">3</td>
</tr>
</tbody>
</table>
</div>
<br />
<p class="chart-disclosure">Source: Glassnode, VanEck research as of 03/17/25. Past performance is no guarantee of future results.</p>
<h2>Bitcoin&rsquo;s Price Action</h2>
<h2>Market Sentiment</h2>
<p>Bitcoin has just experienced its second-largest correction so far this cycle, dropping <strong>~30%</strong> peak-to-trough from <strong>$109K</strong> in January to <strong>$76.5K</strong> on March 11th, exceed only by a <strong>~33%</strong> drop from March 2024 from ~<strong>$74K</strong> to ~<strong>$49K</strong> in August 2024. While Bitcoin bull markets have historically seen multiple retracements of similar or greater magnitude, this latest decline stands out for contrasting with favorable regulatory developments. Bitcoin ETFs faced their longest outflow streak since inception, losing <strong>$6.4 billion</strong> over five weeks to Trump&rsquo;s tariff policies.</p>
<p>Further, broader crypto market sentiment is unusually poor, even for a <strong>30%</strong> bull market retracement. Unlike Bitcoin, altcoins have failed to sustain an altcoin bull market, with many already retouching their 2022-2023 bear market lows. This is evident in Bitcoin dominance, which remains mostly unchanged at <strong>~60%</strong> this month&mdash;a sign that capital is not rotating as aggressively into other crypto assets this cycle as it did in previous cycles.</p>
<h2 id="bitcoin-network-activity" class="jump-link-nav anchored-block" data-jumplink-title="Bitcoin&rsquo;s Network">Bitcoin&rsquo;s Network Activity, Adoption, and Fees</h2>
<p><strong>Transfer Volumes from Miners to Exchanges:</strong> With transfers to exchanges <strong>down 16%</strong> month-over-month, miners are holding onto their BTC treasuries, signaling confidence in Bitcoin&rsquo;s longer-term outlook.</p>
<p><strong>Daily Inscriptions: </strong>Bitcoin inscriptions (mostly &ldquo;Ordinals&rdquo;) have <strong>grown 62%</strong> month-over-month, showing signs of life after an extended cooling off period in Q3 &amp; Q4 of 2024. The Bitcoin NFT ecosystem is showing enthusiasm as Taproot Wizards announced their upcoming mint. The project aims to &ldquo;make Bitcoin magical again&rdquo; through initiatives surrounding Bitcoin software developments like OP_CAT, which could bring Ethereum-like smart contract functionality to Bitcoin&rsquo;s blockchain. Following its $7.5M seed round in November 2023, the project raised $30M in Series A funding this February to build an ecosystem of applications using the OP_CAT Bitcoin improvement proposal.</p>
<p><strong>Bitcoin Futures Annualized Basis: </strong>As highlighted in the chart of the month, Bitcoin futures borrowing rates are at their historical <strong>3rd percentile</strong>, demonstrating the extent of relative bearishness among traders.</p>
<p><strong>Daily Transactions: </strong>Daily transactions grew<strong> 9%</strong> month-over-month, currently at the <strong>91st percentile </strong>of the network&rsquo;s history.</p>
<p><strong>Total Transfer Volume: </strong>Down <strong>5%</strong> month-over-month, USD-denominated transfer volumes remain at a healthy 87th percentile of the network&rsquo;s history. This sustained volume may reflect Bitcoin&rsquo;s expanding role in international trade settlements, as discussed in &lsquo;Global Trade&rsquo;.</p>
<p><strong>Average Transaction Fees: </strong>Transaction fees remain low in both USD <strong>(-14%)</strong> and BTC<strong> (-2%)</strong> terms, indicating that on-chain activity like Ordinals still have not driven sufficient activity to drive up costs.</p>
<p><strong>Global Power Consumption &amp; Mining Difficulty:</strong> Bitcoin&rsquo;s steadily growing global power consumption ticked up <strong>1%</strong> this month, remaining at the <strong>100th percentile</strong> of the metric&rsquo;s history as miners continue to energize new capacity.</p>
<p><strong>Total Crypto Equities Market Cap:</strong> Demonstrating high beta to Bitcoin, crypto equities dropped <strong>19%</strong> this month as markets responded to tariffs and crypto selloffs.</p>
<h2 id="regulatory-and-geopolitics" class="anchored-block">Regulatory and Geopolitical Developments</h2>
<p>Despite this month&rsquo;s price correction, Bitcoin&rsquo;s macro narrative continues to strengthen, with governments, institutions, and emerging markets making strategic moves into digital assets. Key developments across U.S. regulation, international trade, and corporate adoption suggest that Bitcoin&rsquo;s role in global markets is expanding.</p>
<h2>Washington&rsquo;s Crypto Reset</h2>
<p>In a landmark policy move on March 6th, Donald Trump officially <strong><a target="_blank" title="Fact Sheet: President Donald J.
        Trump Establishes the Strategic Bitcoin Reserve and U.S. Digital Asset Stockpile" href="https://www.whitehouse.gov/fact-sheets/2025/03/fact-sheet-president-donald-j-trump-establishes-the-strategic-bitcoin-reserve-and-u-s-digital-asset-stockpile/" rel="noopener">established</a></strong> the <strong>Strategic Bitcoin Reserve</strong> <strong>and U.S. Digital Asset Stockpile</strong>, using Bitcoin and other digital assets previously obtained from criminal and civil asset forfeiture proceedings. The administration&rsquo;s decision to hold, rather than auction, seized Bitcoin signals a fundamental shift in how the U.S. government views BTC&mdash;as a strategic asset rather than just confiscated property. While the government has historically liquidated seized BTC through public auctions, this policy pivot suggests that the U.S. recognizes Bitcoin&rsquo;s role as a reserve asset alongside gold and foreign currency reserves.</p>
<p>The White House is weighing further Bitcoin accumulation for the Reserve.<strong> <a target="_blank" title="White House seeks to acquire as much Bitcoin as possible" href="https://www.binance.com/en/square/post/21518324401545" rel="noopener">Reports</a></strong> from a closed-door roundtable hosted by the Bitcoin Policy Institute suggest that the White House is considering direct Bitcoin accumulation as part of a broader Strategic Bitcoin Reserve and U.S. Digital Asset Stockpile initiative. According to multiple attendees, Bo Hines, Executive Director of the Presidential Working Group on Digital Assets, stated that any such purchases would be made in a &ldquo;budget-neutral way that doesn&rsquo;t cost taxpayers a dime.&rdquo; This would mark a major shift in U.S. policy if confirmed, solidifying Bitcoin&rsquo;s position as a government store of value and adding to its list of similarities to gold.</p>
<p>Echoing the Bitcoin Policy Institute&rsquo;s roundtable, Senator Cynthia Lummis <strong><a target="_blank" title="Lummis introduces bill to create bitcoin strategic reserve" href="https://thehill.com/policy/technology/5188458-lummis-introduces-bill-to-create-bitcoin-strategic-reserve/" rel="noopener">reintroduced</a></strong> legislation aimed at establishing a <strong>Strategic Bitcoin Reserve</strong>, which would rely on diversifying existing funds from reserve banks and the Fed&rsquo;s gold certificates. Separately, the Senate Banking Committee<strong> <a target="_blank" title="GENIUS Act Clears Senate Banking Committee: What It Means For Stablecoins" href="https://www.forbes.com/sites/tonyaevans/2025/03/13/genius-act-clears-senate-banking-committee-what-it-means-for-stablecoins/" rel="noopener">advanced</a></strong> the <strong>GENIUS Act</strong>&mdash;a bill with bipartisan support that would create a regulatory framework for stablecoins&mdash;as a potential precursor to broader digital asset legislation.</p>
<p>On the enforcement front, the SEC has officially dropped charges against major crypto exchanges including Coinbase, Cumberland DRW, and Robinhood, signaling the end of its aggressive enforcement campaign against the industry. This regulatory shift and the emergence of Bitcoin-focused policy initiatives suggest that Washington&rsquo;s "war on crypto" is over for now.</p>

<h2>Global Trade</h2>
<p>Russia has begun using Bitcoin and other cryptocurrencies to settle oil trade transactions with China and India to bypass Western sanctions. While Russia has explored alternative payment rails since being cut off from SWIFT, this move signals an increasing reliance on digital assets to facilitate cross-border commerce.</p>
<p>Separately, the Bank of Russia has proposed a new regulatory framework allowing qualified investors to conduct crypto transactions within a special three-year experimental regime. While Russia remains officially skeptical of Bitcoin as legal tender, this framework suggests a growing recognition of its utility in international trade, as we predicted in our long-term <strong><a title="Bitcoin 2050 Valuation Scenarios: Global Medium of Exchange and Reserve Asset" href="https://www.vaneck.com/us/en/blogs/digital-assets/matthew-sigel-bitcoin-2050-valuation-scenarios-global-medium-of-exchange-and-reserve-asset/">2050 Bitcoin Outlook</a></strong>.</p>
<p>In Argentina, the securities regulator has approved a new framework for virtual asset service providers (VASPs), allowing licensed firms to operate legally within the country. Notably, Coinbase has secured a license, strengthening its presence in Latin America&rsquo;s fastest-growing Bitcoin economy.</p>
<h2>Institutional Adoption</h2>
<p>Traditional financial institutions are continuing to expand their digital asset services in Europe. Germany&rsquo;s Deutsche B&ouml;rse announced it will offer Bitcoin and Ether custody and settlement services for institutional clients beginning in April 2025. Similarly, Spanish bank BBVA received approval from Spain&rsquo;s securities regulator to offer Bitcoin and Ether trading services.</p>
<p>Abu Dhabi&rsquo;s MGX fund has announced a <strong>$2 billion</strong> investment in Binance, reinforcing the UAE&rsquo;s position as a major crypto hub. MGX already backs G42, an AI firm that received a <strong>$1.5 billion</strong> investment from Microsoft, which in turn leases data center space from WULF, a U.S.-listed Bitcoin miner. This highlights the growing intersection between Bitcoin mining, AI infrastructure, and sovereign capital investments that we have increasingly <strong><a title="Bitcoin Miners' AI Arbitrage Play to Boost Revenue" href="https://www.vaneck.com/us/en/blogs/digital-assets/matthew-sigel-bitcoin-miners-ai-arbitrage-play-to-boost-revenue/">covered over the past year</a></strong>.</p>
<h2>Bitcoin Treasury Corporate Adoption</h2>
<p>The trend of corporate treasury allocations to Bitcoin continues to accelerate, with multiple firms announcing new BTC holdings:</p>
<ul class="content-list">
<li class="mt-2">Rumble (RUM) <strong><a title="Bitcoin Miners' AI Arbitrage Play to Boost Revenue" href="https://www.globenewswire.com/news-release/2025/03/12/3041366/0/en/Rumble-Announces-Purchases-of-17-1-Million-in-Bitcoin-in-Accordance-with-Previously-Announced-Bitcoin-Treasury-Strategy.html">completed</a></strong> its first <strong>$17.1 million</strong> Bitcoin purchase, officially marking its entry into its new BTC treasury strategy.</li>
<li class="mt-2">Brazilian cashback business Meliuz <strong><a target="_blank" title="Brazilian Meliuz Invests Over $4 Million in Bitcoin Following Strategy's Playbook" href="https://news.bitcoin.com/brazilian-meliuz-invests-over-4-million-in-bitcoin-following-strategys-playbook/" rel="noopener">allocated</a></strong> <strong>10%</strong> of its free cash flow <strong>(over</strong> <strong>$4M)</strong> to Bitcoin, becoming the first Brazilian company to adopt the Bitcoin treasury strategy pioneered by MicroStrategy.</li>
<li class="mt-2">MSTR acquired <strong>20,356</strong> additional BTC for <strong>$1.99</strong> billion, boosting its holdings <strong>to 499,096 BTC</strong> as of February 23rd. To continue financing its Bitcoin yield strategy&mdash;a strategy wherein the company aims to maximize Bitcoin per share through aggressive capital raises and acquisitions, targeting a &lsquo;BTC Yield&rsquo; metric of <strong>6-15%</strong> annually&mdash;the company announced two offerings: a <strong>$2 billion</strong> 0% convertible senior note offering due 2029, finalized in February, and a <strong>$21 billion</strong> At-The-Market (ATM) program for its <strong>8%</strong> Series A Perpetual Strike Preferred Stock (STRK), launched March 10, to fund further Bitcoin purchases and general corporate purposes.</li>
</ul>
<p>A VanEck strategy began acquiring MicroStrategy&rsquo;s STRK on February 28th, initiating a <strong>1.2%</strong> weight. Since inception, STRK has gained <strong>6.59%,</strong> while MSTR common equity is down <strong>15.22%,</strong> reflecting STRK&rsquo;s relative resilience due to its fixed <strong>8%</strong> dividend and lower direct exposure to Bitcoin price volatility compared to MSTR&rsquo;s BTC-levered common stock.</p>
<p>The <a href="https://www.coindesk.com/markets/2025/03/14/bitcoin-related-convertible-bond-etf-comes-to-market" title="Bitcoin-Related Convertible Bond ETF Comes to Market" target="_blank" rel="noopener"><strong>launch</strong></a> of the first Bitcoin-related convertible bond ETF&mdash;the REX Shares Bitcoin Corporate Treasury Convertible Bond ETF&mdash;illustrates the momentum that the Bitcoin treasury strategy is gaining. The ETF holds convertible debt issued by MicroStrategy and other Bitcoin-heavy firms, providing investors with exposure to BTC treasury strategies via structured debt securities. This product delivers the &ldquo;Bitcoin yield&rdquo; earned by the growing number of corporations adopting this strategy in an institutionally friendly package, paving the way for Bitcoin treasuries to further scale into traditional market structures. However, as <strong><a target="_blank" title="Bitcoin-Related Convertible Bond ETF Comes to Market" href="https://x.com/ColeMacro/status/1900561224108032233" rel="noopener">noted</a></strong> by Strive&rsquo;s Matt Cole, this fund is not advantageous from a tax perspective, as its structure as a C-Corp subjects it to double taxation&mdash;once at the fund level and again at the shareholder level. This tax burden can significantly reduce returns compared to alternatives like direct Bitcoin ownership, owning the convertible bonds directly, or investing in MicroStrategy (MSTR), potentially undermining the investment case for the ETF&rsquo;s purported risk-adjusted returns.</p>
<p>With corporate Bitcoin holdings expanding and financial markets evolving to support BTC-based debt instruments, the next logical step is to analyze how companies are structuring their Bitcoin treasuries&mdash;a topic we explore in the next section.</p>
<h3 id="bitcoin-and-balance-sheets" class="anchored-block">Corporate Bitcoin Yield Strategies</h3>
<p><img loading="lazy" src="https://www.vaneck.com/contentassets/fa5c360c755d4b45b6932603f5ed13dd/5465_bitcoin-chaincheck-feb-march_table_2025-03_v1.svg" width="100%" alt="Corporate Bitcoin Yield Strategies" /></p>
<p class="chart-disclosure">Source: FactSet, Company Filings as of 3/13/2025. <strong>Past performance is no guarantee of future results.</strong></p>
<p>As more corporations integrate Bitcoin into their balance sheets, we are building a database of corporate Bitcoin treasuries to analyze the impact of this emerging treasury management strategy. The summary table above covers the top nine Bitcoin-only digital asset treasuries, highlighting the growing portion of enterprise value (EV) derived from Bitcoin holdings. This strategy aims to grow the value of BTC holdings faster than the cost of capital through debt or equity issuance. In other words, these companies are wagering that they can enhance their enterprise value by borrowing low-cost, inflationary fiat and converting it into deflationary cryptocurrency.</p>
<h3>Metaplanet's BTC-Attributed Enterprise Value Spiked to New Highs in Q1</h3>
<div class="flourish-embed flourish-chart" data-src="visualisation/22171248?2429575"><script src="https://public.flourish.studio/resources/embed.js"></script><noscript><img loading="lazy" src="https://public.flourish.studio/visualisation/22171248/thumbnail" width="100%" alt="Metaplanet's BTC-Attributed Enterprise Value Spiked to New Highs in Q1" /></noscript></div>
<p class="chart-disclosure">Source: FactSet, Company Filings as of 3/13/202. <strong>Past performance is no guarantee of future results.</strong></p>
<p>As of March 12th, Metaplanet's BTC yield for the year 2025 stands at <strong>53.2%,</strong> indicating a significant increase in the company's Bitcoin holdings relative to its share count. This metric highlights the potential benefits of strategies that leverage equity or debt issuance to acquire additional Bitcoin. Since Q2 2024 earnings when Metaplanet and Semler Scientific first reported Bitcoin on their balance, the average BTC as a % of EV has surged from <strong>21%</strong> to <strong>49%</strong> among leading Bitcoin yield strategists: MicroStrategy, MARA Holdings, Riot Platforms, Metaplanet, and Semler Scientific (highlighted orange in the table above). To better understand how the market values these Bitcoin-heavy firms, we invert this ratio by dividing enterprise value by the underlying Bitcoin treasury market value to calculate the <em>Bitcoin Premium Multiple</em>.</p>
<h2>Interpreting the Bitcoin Premium Multiple</h2>
<ul class="content-list">
<li class="mt-2">The Bitcoin Premium Multiple naturally compresses toward <strong>1.0</strong> as Bitcoin becomes a larger share of EV.</li>
<li class="mt-2">A high multiple suggests that the market is assigning additional value beyond just BTC holdings due to speculation or the presence of other valuable business segments.</li>
<li class="mt-2">A high multiple in cases where BTC dominates EV suggests that investors either believe strongly in the company&rsquo;s other business assets or are speculating heavily on BTC exposure.
<p>Conversely, a low multiple suggests the market views the company primarily as a proxy for BTC, with minimal confidence in its additional business activities.</p>
</li>
</ul>
<p>For companies like Tesla (TSLA) and Block (SQ), the Bitcoin Premium Multiple is relatively meaningless because they maintain profitable core businesses that are the primary drivers of valuation. However, firms like Semler Scientific, Metaplanet, and MicroStrategy are increasingly valued based on their Bitcoin holdings as they structure their financial strategies to amplify BTC exposure.</p>
<h2>Why Some Firms Command a Higher Bitcoin Premium Multiple</h2>
<ol class="content-list">
<li class="mt-2"><strong>MicroStrategy&rsquo;s First-Mover Advantage &amp; Hedge Fund Liquidity</strong><br />MicroStrategy (MSTR) enjoys a unique valuation premium due to its first-mover advantage in corporate Bitcoin treasuries. Unlike smaller firms, MSTR has become a trading vehicle for hedge funds seeking high liquidity and volatility to execute structured financial strategies. Because of its deep access to capital markets and convertible bond issuances, institutional investors frequently use MSTR for basis trades, volatility arbitrage, and convertible debt hedging. This additional financial structuring creates an inflated valuation relative to its BTC holdings; investors aren&rsquo;t just buying exposure to Bitcoin. They&rsquo;re trading MSTR as a Bitcoin-adjacent financial instrument.</li>
<li class="mt-2"><strong>Smaller Bitcoin Treasuries Lack This Liquidity &amp; Institutional Demand</strong><br />Conversely, smaller Bitcoin treasury firms like Semler Scientific (SMLR) and Metaplanet (MAPL) do not benefit from this dynamic. Their relatively low liquidity and lack of convertible debt issuance mean they attract far less hedge fund participation, and thus do not enjoy MicroStrategy&rsquo;s hedge fund financial structuring premium. <br /><br />With Bitcoin premium multiples of <strong>1.66</strong> and <strong>7.36</strong>, respectively, SMLR looks cheap compared to MAPL, which appears overvalued relative to the other Bitcoin yield plays.</li>
<li class="mt-2"><strong>Core Business Profitability Still Matters</strong><br />Beyond financial engineering, core business profitability and debt capacity both play crucial roles in determining the Bitcoin Premium Multiple. If a company has a profitable non-BTC business, investors may assign a higher multiple if they expect those earnings to be reinvested into further Bitcoin accumulation. However, a firm&rsquo;s existing debt burden is just as critical. Companies with lower debt loads have greater flexibility to raise capital or reinvest earnings without immediate financial constraints, allowing them to pursue aggressive BTC accumulation strategies. In contrast, firms already carrying high leverage may struggle to expand their Bitcoin holdings unless they can secure new financing at favorable terms. MicroStrategy&rsquo;s ability to sustain its strategy stems from structured debt issuance, but smaller firms with limited debt capacity may lack the same flexibility to scale BTC purchases at the same rate. This dynamic between profitability, leverage, and Bitcoin treasury expansion is essential in evaluating a firm&rsquo;s long-term ability to maintain its BTC accumulation model.</li>
</ol>
<h2>Evaluating "Un-squeezed Juice" in Bitcoin-Focused Firms</h2>
<p>Another way to assess potentially mispriced Bitcoin treasuries is to look at their core business earnings power. If a company has a separate business segment&mdash;such as MicroStrategy&rsquo;s software, Metaplanet&rsquo;s hotel business, or Semler Scientific&rsquo;s medical devices&mdash;we can estimate how much BTC they <em>could</em> acquire with future profits.</p>
<p>For instance:</p>
<ul class="content-list">
<li class="mt-2">Applying a <strong>10-15x P/E</strong> multiple to a company&rsquo;s operating income gives a rough estimate of how much capital could be redirected into BTC.</li>
<li class="mt-2">If a company&rsquo;s Bitcoin Premium Multiple is low, but its core business remains profitable and committed to BTC accumulation, it could indicate an undervalued BTC exposure opportunity.</li>
</ul>
<p>By combining traditional valuation methods with Bitcoin-specific metrics, investors can identify outliers where the market may be underpricing Bitcoin-heavy firms. Companies with low Bitcoin Premium Multiples and strong underlying businesses could be poised for further BTC accumulation, increasing their valuation premium over time.</p>
<h2>Texas Legislative Updates: Barriers and Opportunities for Bitcoin Miners</h2>
<p>Texas, the leading U.S. hub for Bitcoin mining, faces new legislation that could either accelerate or hinder miners' access to ERCOT's grid. Three bills&mdash;SB6, SB1942, and SB388&mdash;represent a policy shift that balances energy reliability with industrial growth. Senate Bill 1942 aims to expedite interconnections for large-scale miners, Senate Bill 6 introduces new compliance burdens, and Senate Bill 388 prioritizes dispatchable energy, potentially affecting power costs. These developments highlight Texas&rsquo;s balancing act between grid reliability and supporting BTC mining growth, a key theme in Bitcoin&rsquo;s evolving regulatory narrative.</p>
<div class="wrapped-div">
<table>
<tbody>
<tr class="tbl-data">
<td class="tbl-header last text-left">Bill</td>
<td class="tbl-header last text-left">Key Provisions</td>
<td class="tbl-header last text-left">Impact on BTC Miners</td>
<td class="tbl-header last text-left">Likelihood of Passing</td>
</tr>
<tr class="tbl-data">
<td class="data-td data last text-left">SB6</td>
<td class="data-td data last text-left">Requires ERCOT oversight for large loads (&gt;75MW), mandating backup generator disclosure, remote disconnect equipment, and a $100,000 transmission study fee. Increases compliance costs and interconnection delays without expanding power supply.</td>
<td class="data-td data last text-left">Delays large AI &amp; BTC mining interconnections (&gt;75MW) due to added fees and oversight, raises upfront costs (e.g., $100,000 fee, remote disconnect equipment), reducing NPV via extended timelines and risks (e.g., stranded assets).</td>
<td class="data-td data last text-left">
<p><strong>Moderate: </strong>Backed by grid reliability advocates but opposed by industry.</p>
</td>
</tr>
<tr class="tbl-data">
<td class="data-td data last text-left">SB1942</td>
<td class="data-td data last text-left">Fast-tracks ERCOT interconnection for large flexible loads (&gt;75MW) with behind-the-meter (BTM) generation. Participants gain queue priority if they can curtail during peak demand or export power, unlocking gigawatt-scale capacity with minimal new infrastructure.</td>
<td class="data-td data last text-left">Unlocks grid capacity (potentially GW-scale) for BTC mining by leveraging BTM generation during peaks, enabling faster ERCOT approvals, higher IRR, and better site valuations via queue priority.</td>
<td class="data-td data last text-left">
<p><strong>High: </strong>Growing support from energy developers and industrial consumers.</p>
</td>
</tr>
<tr class="tbl-data">
<td class="data-td data last text-left">SB388</td>
<td class="data-td data last text-left">Requires 50% of new ERCOT power capacity (post-2026) to be dispatchable (e.g., natural gas, nuclear). Enforces compliance via a dispatchable generation credit system (activated if &lt;55% dispatchable capacity). Battery storage is explicitly excluded.</td>
<td class="data-td data last text-left">May reduce reliance on low-cost renewables, potentially raising mining costs if gas prices rise. ERCOT grid supply impact is uncertain until the 2027 credits program activates.</td>
<td class="data-td data last text-left">
<p><strong>Moderate:</strong> Backed by fossil fuel interests but facing resistance from renewable advocates.</p>
</td>
</tr>
</tbody>
</table>
</div>
<br />
<p>For Bitcoin miners, SB1942 presents a competitive advantage by fast-tracking grid access for operations with backup power, unlocking expansion potential. SB6, however, imposes new compliance hurdles and interconnection delays, raising upfront costs. SB388&rsquo;s dispatchable energy mandate could shift Texas&rsquo; power mix away from cheap renewables, potentially increasing mining electricity costs over time. With Texas at the center of the BTC mining industry, miners must navigate these policies strategically to maximize profitability.</p>
<p><strong>Links to third party websites are provided as a convenience and the inclusion of such links does not imply any endorsement, approval, investigation, verification or monitoring by us of any content or information contained within or accessible from the linked sites. By clicking on the link to a non-VanEck webpage, you acknowledge that you are entering a third-party website subject to its own terms and conditions. VanEck disclaims responsibility for content, legality of access or suitability of the third-party websites.</strong></p>
<p>To receive more <strong><a href="https://www.vaneck.com/us/en/insights/digital-assets/" title="Digital Assets Insights">Digital Assets</a></strong> insights, <strong><a href="https://www.vaneck.com/us/en/subscribe/" title="Subscription Center">sign up in our subscription center</a></strong>.</p>
]]></content:encoded>
</item><item rdf:about="https://www.vaneck.com/us/en/blogs/thematic-investing/price-tag-politics-retailers-vs-tariffs/">
  <title>Price Tag Politics: Retailers vs. Tariffs></title>
  <link>https://www.vaneck.com/us/en/blogs/thematic-investing/price-tag-politics-retailers-vs-tariffs/</link>
  <description><![CDATA[Tariffs may raise costs for retailers, impact consumers&rsquo; purchasing behavior, and drive market volatility. Understanding how retailers adapt can help investors navigate this environment.]]></description>
  <dc:creator>Michael Cohick</dc:creator>
  <dc:date>03/20/2025 06:30:00</dc:date>
<content:encoded><![CDATA[

<p>The retail sector faces renewed uncertainty as the U.S. administration considers tariffs as part of its trade policy strategy. While tariffs are often discussed in the context of manufacturing, retail businesses, especially those reliant on imported goods&mdash;are also highly sensitive to trade policy changes. With consumer prices already a focal point for policymakers, the potential for higher costs is raising questions about how retail companies will adapt.</p>
<h2>The Trump Administration&rsquo;s Tariff Strategy</h2>
<p>The potential return of tariffs under the Trump administration reflects a shift in trade policy that goes beyond previous uses of tariffs as a bargaining tool.</p>
<ol class="content-list">
<li class="mt-2"><strong>Revenue Generation</strong> &ndash; Unlike past administrations that have used tariffs primarily as leverage in trade negotiations, Trump has indicated that tariffs could serve as a major revenue source for the federal government. If implemented as proposed, this would mark the first time in over a century that tariffs are used to meaningfully fund the government rather than as a short-term economic tool.</li>
<li class="mt-2"><strong>Rebalancing Global Trade</strong> &ndash; The administration&rsquo;s broader goal is to reduce trade deficits and create a more balanced economic relationship between the U.S. and key trading partners. While tariffs can create short-term disruptions, a more balanced trade environment could, in theory, lead to stronger long-term economic stability for U.S. industries by reducing dependency on foreign supply chains and encouraging domestic investment.</li>
<li class="mt-2"><strong>Driving Market Volatility to Lower Interest Rates</strong> &ndash; A less conventional but increasingly discussed theory is that the administration may be using the threat of tariffs to create volatility in equity markets, prompting a "flight to safety" into U.S. Treasury bonds. This influx of capital into bonds could push yields lower, easing financial conditions and reducing interest rates without direct intervention from the Federal Reserve.</li>
<li class="mt-2"><strong>The Federal Reserve&rsquo;s Role and Debt Refinancing Considerations</strong> &ndash; With trillions in U.S. debt set to be refinanced in the coming years, lower interest rates are critical for managing the cost of government borrowing. The Federal Reserve has signaled that rate cuts may come more slowly than some had anticipated, making alternative strategies&mdash;such as leveraging trade policy to create rate-reducing market movements&mdash;a potential consideration for policymakers.</li>
</ol>
<h3>Tariff Induced Volatility and Impact on 10 Yr Treasuries</h3>
<div class="flourish-embed flourish-chart" data-src="visualisation/22196686?2429575"><script src="https://public.flourish.studio/resources/embed.js"></script><noscript><img loading="lazy" src="https://public.flourish.studio/visualisation/22196686/thumbnail" width="100%" alt="Tariff Induced Volatility and Impact on 10 Yr Treasuries" /></noscript></div>
<p class="chart-disclosure">Source: Morningstar &amp; FRED Economic Data as of 3/14/2025. Past performance is no guarantee of future results.</p>
<h2>How Tariffs Impact Retail Prices</h2>
<p>For retailers, tariffs increase the cost of goods before they even reach store shelves. This can create challenges in pricing, supply chain management, and profitability.</p>
<ul class="content-list">
<li class="mt-2"><strong>Higher procurement costs:</strong> Many retailers source a significant portion of their inventory from overseas. Tariffs function as an additional cost, which may affect margins or retail pricing.</li>
<li class="mt-2"><strong>Potential consumer price inflation:</strong> If retailers adjust pricing to reflect tariff-related costs, consumers may see higher prices, which could influence purchasing behavior.</li>
<li class="mt-2"><strong>Supply chain adjustments:</strong> Some retailers may shift sourcing to alternative regions with lower tariff exposure, though this process can take time and involve logistical complexities.</li>
<li class="mt-2"><strong>Market volatility:</strong> Trade uncertainty has historically contributed to fluctuations in retail stock prices as investors react to potential cost pressures and changes in economic conditions.</li>
</ul>
<h2>Which Retailers Will Be Most Impacted?</h2>
<p>Retailers have different levels of pricing power, which influences their ability to manage tariff-related costs. Some companies operate in categories with strong brand recognition, membership-based models, or necessity-driven purchases, which may allow for greater flexibility in pricing decisions, creating high pricing power. Others compete in highly price-sensitive segments, where cost increases may be more challenging to absorb or pass through, reflecting lower pricing power.</p>

<h3>Pricing Power Assessment of Retail Companies</h3>
<div class="wrapped-div">
<table style="width: 100%;">
<tbody>
<tr class="tbl-data">
<td class="tbl-header last">Company</td>
<td class="tbl-header last">Category</td>
<td class="tbl-header last">Pricing Power</td>
<td class="tbl-header last">Rationale</td>
</tr>
<tr class="tbl-data">
<td class="data-td data last text-left">Amazon</td>
<td class="data-td data last text-left">E-commerce &amp; cloud</td>
<td class="data-td data last text-left">High</td>
<td class="data-td data last text-left">The company operates at scale and has multiple revenue streams, influencing its ability to manage cost fluctuations.</td>
</tr>
<tr class="tbl-data">
<td class="data-td data last text-left">Walmart</td>
<td class="data-td data last text-left">Discount retail</td>
<td class="data-td data last text-left">Moderate to High</td>
<td class="data-td data last text-left">Large-scale operations and supplier relationships may provide flexibility in cost management, though pricing remains competitive.</td>
</tr>
<tr class="tbl-data">
<td class="data-td data last text-left">Home Depot</td>
<td class="data-td data last text-left">Home improvement</td>
<td class="data-td data last text-left">High</td>
<td class="data-td data last text-left">Home improvement projects are often planned purchases, which may provide stability in pricing strategies.</td>
</tr>
<tr class="tbl-data">
<td class="data-td data last text-left">Costco</td>
<td class="data-td data last text-left">Wholesale retail</td>
<td class="data-td data last text-left">High</td>
<td class="data-td data last text-left">The membership model and bulk purchasing structure affect pricing dynamics.</td>
</tr>
<tr class="tbl-data">
<td class="data-td data last text-left">Target</td>
<td class="data-td data last text-left">General merchandise</td>
<td class="data-td data last text-left">Moderate</td>
<td class="data-td data last text-left">A mix of essential and discretionary goods results in varying levels of pricing flexibility across product categories.</td>
</tr>
<tr class="tbl-data">
<td class="data-td data last text-left">Lowe&rsquo;s</td>
<td class="data-td data last text-left">Home improvement</td>
<td class="data-td data last text-left">High</td>
<td class="data-td data last text-left">Similar to Home Depot, the company operates in a segment where purchases are often necessity-driven.</td>
</tr>
<tr class="tbl-data">
<td class="data-td data last text-left">TJX</td>
<td class="data-td data last text-left">Off-price retail</td>
<td class="data-td data last text-left">Moderate</td>
<td class="data-td data last text-left">The ability to source inventory opportunistically may help manage costs, though the focus on discount pricing is a factor.</td>
</tr>
<tr class="tbl-data">
<td class="data-td data last text-left">Walgreens</td>
<td class="data-td data last text-left">Pharmacy</td>
<td class="data-td data last text-left">Low to Moderate</td>
<td class="data-td data last text-left">Prescription pricing is influenced by reimbursement structures, and retail sales are subject to broader consumer trends.</td>
</tr>
<tr class="tbl-data">
<td class="data-td data last text-left">AutoZone</td>
<td class="data-td data last text-left">Auto parts</td>
<td class="data-td data last text-left">High</td>
<td class="data-td data last text-left">Demand for replacement auto parts tends to be inelastic, potentially allowing for cost adjustments.</td>
</tr>
<tr class="tbl-data">
<td class="data-td data last text-left">Ross Stores</td>
<td class="data-td data last text-left">Off-price apparel</td>
<td class="data-td data last text-left">Moderate</td>
<td class="data-td data last text-left">The ability to source discounted goods provides some flexibility, though pricing remains a competitive factor.</td>
</tr>
</tbody>
</table>
</div>
<br />
<h2>The Investment Case for Retail Amid Tariff Uncertainty</h2>
<p>The <a href="/link/b638061645774dbeab416e78589cf25c.aspx" title="RTH - VanEck Retail ETF - Overview"><strong>VanEck Retail ETF (RTH)</strong></a> provides exposure to a broad set of retailers, outlined in the table above, reflecting a mix of companies with varying levels of pricing power and cost management strategies.</p>
<ul class="content-list">
<li class="mt-2"><strong>Broad exposure:</strong> The fund includes a mix of retail segments, capturing both essential and discretionary spending categories.</li>
<li class="mt-2"><strong>Market leaders:</strong> Holdings include well-established retailers with significant market presence and supply chain capabilities.</li>
<li class="mt-2"><strong>Valuation considerations:</strong> If tariff concerns lead to short-term stock price pressure, investors may find opportunities to gain exposure at adjusted valuations.</li>
</ul>
<p>The potential for tariffs introduces a layer of complexity for retailers. However, companies with pricing power, supply chain flexibility, and established consumer demand may be better positioned to navigate these changes. Investors evaluating the retail sector may consider these factors when assessing how different retailers respond to cost pressures and competitive dynamics.</p>
<p>For those looking to gain exposure to the retail industry in a diversified way, RTH provides a structured approach to tracking the sector&rsquo;s performance.</p>

<p>To receive more <a href="https://www.vaneck.com/us/en/insights/thematic-investing/" title="Thematic Investing Insights"><strong>Thematic Investing</strong></a> insights, <a href="https://www.vaneck.com/us/en/subscribe/" title="Subscription Center"><strong>sign up in our subscription center</strong></a>.</p>
]]></content:encoded>
</item><item rdf:about="https://www.vaneck.com/us/en/blogs/moat-investing/tariffs-pressure-mega-caps-moat-stocks-show-resilience/">
  <title>Tariffs Pressure Mega-Caps: Moat Stocks Show Resilience></title>
  <link>https://www.vaneck.com/us/en/blogs/moat-investing/tariffs-pressure-mega-caps-moat-stocks-show-resilience/</link>
  <description><![CDATA[Tariff tensions rattled markets in February, hitting mega-caps hardest. Moat stocks held up better, highlighting the risks of market concentration amid ongoing volatility.]]></description>
  <dc:creator>Coulter Regal, CFA</dc:creator>
  <dc:date>03/11/2025 06:30:00</dc:date>
<content:encoded><![CDATA[

<p id="us-equity-market-review" class="jump-link-nav anchored-block" data-jumplink-title="US Equity Market Review">In February, U.S. equity markets navigated a turbulent month, marked by a noticeable shift in investor risk appetite that gained momentum starting around mid-month. The catalyst was the steep U.S. <strong><a title="Markets in Motion: Tariffs, Tech and Treasure" href="https://www.vaneck.com/us/en/blogs/model-portfolios/markets-in-motion-tariffs-tech-and-treasure/">tariffs on Mexico, Canada and China</a></strong>, prompting concerns of a trade war and retaliatory measures from all three nations. This escalating trade tension rattled markets, amplifying uncertainty and triggering a pullback, particularly in mega-cap tech stocks, which had been the linchpin of market returns for more than a year.</p>
<p>Tech giants like <strong><a title="Managing Nvidia&rsquo;s Single-Stock Risk through Diversified Semiconductor Exposure" href="https://www.vaneck.com/us/en/blogs/thematic-investing/nvidia-single-stock-risk/">Nvidia</a></strong> faltered under the pressure, as investors grew wary of their outsized exposure amid uncertain geo-politics and the resulting economic impact. The broader market struggled to regain footing, reflecting a growing preference for caution over risk. This shift underscored the fragility of a market heavily concentrated in a handful of mega-cap tech names, hinting that diversification might be a prudent consideration as the year unfolds.</p>
<p>The <strong><a title="MOAT - VanEck Morningstar Wide Moat ETF - Overview" href="https://www.vaneck.com/us/en/investments/morningstar-wide-moat-etf-moat/overview/">Morningstar Wide Moat Focus Index</a></strong> (the &ldquo;Moat Index&rdquo;) retreated along with the broad U.S. equity market in February, declining 3.8%, for the month. While its equal-weighted methodology and sector positioning was a relative strength compared to the S&amp;P 500, earnings-driven volatility offset these advantages and ultimately resulted in a tough close on the month. Notably though, the Moat Index&rsquo;s differentiated exposure led to resilience during the volatile second half of the month and beginning of March, which saw abrupt broad market declines, particularly in mega-caps.</p>
<h3>Moat Stocks Show Mettle Versus Mega-Caps in Tariff Volatility</h3>
<div class="flourish-embed flourish-chart" data-src="visualisation/22022312?2429575"><script src="https://public.flourish.studio/resources/embed.js"></script><noscript><img loading="lazy" src="https://public.flourish.studio/visualisation/22022312/thumbnail" width="100%" alt="Moat Stocks Show Mettle Versus Mega-Caps in Tariff Volatility" /></noscript></div>
<p class="chart-disclosure"><strong>Source: Morningstar; S&amp;P Global.</strong> Time period: February 17th &ndash; March 4th. The S&amp;P 500 Top 10 Index consists of 10 of the largest companies from the S&amp;P 500. Index constituents are weighted by float-adjusted market capitalization. Past performance is no guarantee of future results. Index performance is not representative of fund performance. It is not possible to invest directly in an index. Fund performance current to the most recent month end is available by visiting vaneck.com or by calling 800.826.2333.</p>
<p>Tariff concerns also weighed on smaller-cap stocks, contributing to a sharp decline in the segment amid February&rsquo;s volatility. Broad small- and mid-cap benchmarks fell 5.7% and 4.4%, respectively, during the month. However, the <strong><a title="SMOT - VanEck Morningstar SMID Moat ETF - Overview" href="https://www.vaneck.com/us/en/investments/morningstar-smid-moat-etf-smot/overview/">Morningstar US Small-Mid Cap Moat Focus Index</a></strong> (the &ldquo;SMID Moat Index&rdquo;) fared better, declining only 2.6%, as its emphasis on companies with durable economic moats provided a degree of stability. Despite the broader market downturn, the SMID Moat Index remained positive through the first two months of the year, while its comparative benchmarks slipped into negative territory.</p>
<h3>Market Volatility Shakes Up Smaller Stocks</h3>
<div class="flourish-embed flourish-chart" data-src="visualisation/22022472?2429575"><script src="https://public.flourish.studio/resources/embed.js"></script><noscript><img loading="lazy" src="https://public.flourish.studio/visualisation/22022472/thumbnail" width="100%" alt="Market Volatility Shakes Up Smaller Stocks" /></noscript></div>
<p class="chart-disclosure"><strong>Source: Morningstar. Data as of 2/28/2025.</strong> Past performance is no guarantee of future results. Index performance is not representative of fund performance. It is not possible to invest directly in an index. Fund performance current to the most recent month end is available by visiting vaneck.com or by calling 800.826.2333.</p>

<h2 id="moat-highlights" class="jump-link-nav anchored-block" data-jumplink-title="Moat Highlights">Moat Index Highlights: Therapeutics Thrive</h2>
<p>Sector positioning within the Moat Index was a positive driver of relative performance versus the S&amp;P 500 in February. Overweights in health care and consumer defensive, as well as underweight exposure to consumer cyclicals proved beneficial amid the market shift. However, earnings-related volatility offset the positive sector positioning, resulting in underperformance during the month.</p>
<p>Not all earnings news was bad though, as wide-moat rated Gilead Sciences (GILD) surprised to the upside and was the top contributor to performance during the month. Gilead develops and markets therapies for life-threatening infectious diseases, primarily focusing on HIV and hepatitis B and C, but has also grown its presence in the oncology market as well. Gilead announced strong top- and bottom-line quarterly performance beating expectations and gave forward guidance that was ahead of estimates. Following the release Morningstar increased its fair value estimate citing solid underlying demand growth and margin strength. Shares of Gilead soared on the earnings beat, finishing the month up over 17%.</p>
<p>Also announcing strong earnings during the month was Kenvue (KVUE). Formerly a part of Johnson &amp; Johnson, Kenvue spun off and went public in May 2023. It operates in a variety of silos within consumer health, such as cough, cold and allergy care, pain management, face and body care, and oral care, as well as women&rsquo;s health. Its portfolio has some of the most well-known brands in the space, including Tylenol, Listerine, Johnson&rsquo;s, Aveeno, and Neutrogena. Following the earnings beat, shares of KVUE surged and ended February up nearly 12%.</p>
<p>Other top contributors include semiconductor company Microchip Technology (MCHP), leading cigarette and smokeless tobacco brand parent firm Altria (MO), and top grocery and snack confectioner Mondelez International (MDLZ).</p>
<p>Top detractors in February include medical device company Bio-Rad Laboratories (BIO), well-known technology giant Alphabet (GOOGL), medical instruments supplier West Pharmaceutical Services (WST), life science and diagnostic firm Agilent Technologies (A), and global beauty products company Estee Lauder (EL).</p>
<h2>Top Contributors and Detractors from Moat Index - February 2025</h2>
<h3>Contributors</h3>
<div class="wrapped-div">
<table style="width: 100%;">
<tbody>
<tr class="tbl-data">
<td class="tbl-header last text-left">Company</td>
<td class="tbl-header last text-left">Ticker</td>
<td class="tbl-header last text-left">Sector</td>
<td class="tbl-header last text-right">Avg. Weight (%)</td>
<td class="tbl-header last text-right">Contribution (%)</td>
</tr>
<tr class="tbl-data">
<td class="data-td data last text-left">Gilead Sciences Inc.</td>
<td class="data-td data last text-left">GILD</td>
<td class="data-td data last text-left">Health Care</td>
<td class="data-td data last text-right">2.78</td>
<td class="data-td data last text-right">0.49</td>
</tr>
<tr class="tbl-data">
<td class="data-td data last text-left">Kenvue Inc.</td>
<td class="data-td data last text-left">KVUE</td>
<td class="data-td data last text-left">Consumer Staples</td>
<td class="data-td data last text-right">2.36</td>
<td class="data-td data last text-right">0.28</td>
</tr>
<tr class="tbl-data">
<td class="data-td data last text-left">Microchip Technology Inc.</td>
<td class="data-td data last text-left">MCHP</td>
<td class="data-td data last text-left">Technology</td>
<td class="data-td data last text-right">1.97</td>
<td class="data-td data last text-right">0.18</td>
</tr>
<tr class="tbl-data">
<td class="data-td data last text-left">Altria Group Inc.</td>
<td class="data-td data last text-left">MO</td>
<td class="data-td data last text-left">Consumer Discretionary</td>
<td class="data-td data last text-right">2.42</td>
<td class="data-td data last text-right">0.17</td>
</tr>
<tr class="tbl-data">
<td class="data-td data last text-left">Mondelez International Inc.</td>
<td class="data-td data last text-left">MDLZ</td>
<td class="data-td data last text-left">Consumer Staples</td>
<td class="data-td data last text-right">1.17</td>
<td class="data-td data last text-right">0.13</td>
</tr>
</tbody>
</table>
</div>
<h3>Detractors</h3>
<div class="wrapped-div">
<table style="width: 100%;">
<tbody>
<tr class="tbl-data">
<td class="tbl-header last text-left">Company</td>
<td class="tbl-header last text-left">Ticker</td>
<td class="tbl-header last text-left">Sector</td>
<td class="tbl-header last text-right">Avg. Weight (%)</td>
<td class="tbl-header last text-right">Contribution (%)</td>
</tr>
<tr class="tbl-data">
<td class="data-td data last text-left">Bio-Rad Laboratories Inc.</td>
<td class="data-td data last text-left">BIO</td>
<td class="data-td data last text-left">Health Care</td>
<td class="data-td data last text-right">2.70</td>
<td class="data-td data last text-right">-0.72</td>
</tr>
<tr class="tbl-data">
<td class="data-td data last text-left">Alphabet Inc.</td>
<td class="data-td data last text-left">GOOGL</td>
<td class="data-td data last text-left">Communication Services</td>
<td class="data-td data last text-right">2.87</td>
<td class="data-td data last text-right">-0.47</td>
</tr>
<tr class="tbl-data">
<td class="data-td data last text-left">West Pharmaceutical Services Inc.</td>
<td class="data-td data last text-left">WST</td>
<td class="data-td data last text-left">Health Care</td>
<td class="data-td data last text-right">1.36</td>
<td class="data-td data last text-right">-0.44</td>
</tr>
<tr class="tbl-data">
<td class="data-td data last text-left">Agilent Technologies Inc.</td>
<td class="data-td data last text-left">A</td>
<td class="data-td data last text-left">Health Care</td>
<td class="data-td data last text-right">2.69</td>
<td class="data-td data last text-right">-0.42</td>
</tr>
<tr class="tbl-data">
<td class="data-td data last text-left">The Estee Lauder Companies Inc.</td>
<td class="data-td data last text-left">EL</td>
<td class="data-td data last text-left">Consumer Staples</td>
<td class="data-td data last text-right">2.52</td>
<td class="data-td data last text-right">-0.34</td>
</tr>
</tbody>
</table>
</div>
<p class="chart-disclosure"><strong>Source: Morningstar, February 2025</strong>. Past performance is no guarantee of future results. Index performance is not illustrative of fund performance. Not intended as a recommendation to buy or to sell any of the securities mentioned herein.</p>

<h2 id="smid-moat-highlights" class="jump-link-nav anchored-block" data-jumplink-title="SMID Moat Highlights">SMID Moat Index Highlights: Fashion and Travel in Trend</h2>
<p>The SMID Moat Index's outperformance relative to small- and mid-cap broad benchmarks in February was primarily driven by strong stock selection, rather than sector overweights or underweights, which had little overall impact during the month.</p>
<p>The luxury fashion and accessory brands parent, Tapestry Inc. (TPR), topped the list of leading contributors after the company delivered strong quarterly earnings with sales and profitability surpassing expectations. Tapestry&rsquo;s top brand, Coach, posted double-digit percentage sales growth in North America and outperformed the industry in Europe and China, as well. Management also announced increased outlook for 2025, sending shares of TPR up 17% during the month following the news.</p>
<p>Another name helping drive performance this month, also off the back of a positive earnings release, was the travel services company, Expedia Group (EXPE). Expedia shares rose 15% in February, as investors cheered fourth-quarter bookings growth acceleration and strong EBITDA margin expansion. Morningstar raised its fair value estimate from $191 to $210 to reflect revenue and profitability strength in the quarter and higher future gross margins expectations.</p>
<p>Names that detracted most from performance during the month include luxury cruise liner operators Norwegian Cruise Line (NCLH) and Carnival Corp. (CCL), merchant payment service provider Block Inc. (XYZ), global crop protection materials company FMC Crop. (FMC), as well as video and chat communications company Zoom (ZM).</p>
<h2>Top Contributors and Detractors from SMID Moat Index - February 2025</h2>
<h3>Contributors</h3>
<div class="wrapped-div">
<table style="width: 100%;">
<tbody>
<tr class="tbl-data">
<td class="tbl-header last text-left">Company</td>
<td class="tbl-header last text-left">Ticker</td>
<td class="tbl-header last text-left">Sector</td>
<td class="tbl-header last text-right">Avg. Weight (%)</td>
<td class="tbl-header last text-right">Contribution (%)</td>
</tr>
<tr class="tbl-data">
<td class="data-td data last text-left">Tapestry Inc.</td>
<td class="data-td data last text-left">TPR</td>
<td class="data-td data last text-left">Consumer Discretionary</td>
<td class="data-td data last text-right">1.84</td>
<td class="data-td data last text-right">0.31</td>
</tr>
<tr class="tbl-data">
<td class="data-td data last text-left">Expedia Group Inc.</td>
<td class="data-td data last text-left">EXPE</td>
<td class="data-td data last text-left">Consumer Discretionary</td>
<td class="data-td data last text-right">1.40</td>
<td class="data-td data last text-right">0.22</td>
</tr>
<tr class="tbl-data">
<td class="data-td data last text-left">Kenvue Inc.</td>
<td class="data-td data last text-left">KVUE</td>
<td class="data-td data last text-left">Consumer Staples</td>
<td class="data-td data last text-right">1.22</td>
<td class="data-td data last text-right">0.15</td>
</tr>
<tr class="tbl-data">
<td class="data-td data last text-left">Hasbro Inc.</td>
<td class="data-td data last text-left">HAS</td>
<td class="data-td data last text-left">Consumer Discretionary</td>
<td class="data-td data last text-right">1.14</td>
<td class="data-td data last text-right">0.14</td>
</tr>
<tr class="tbl-data">
<td class="data-td data last text-left">SS&amp;C Technologies Holdings Inc.</td>
<td class="data-td data last text-left">SSNC</td>
<td class="data-td data last text-left">Industrials</td>
<td class="data-td data last text-right">1.38</td>
<td class="data-td data last text-right">0.14</td>
</tr>
</tbody>
</table>
</div>
<h3>Detractors</h3>
<div class="wrapped-div">
<table style="width: 100%;">
<tbody>
<tr class="tbl-data">
<td class="tbl-header last text-left">Company</td>
<td class="tbl-header last text-left">Ticker</td>
<td class="tbl-header last text-left">Sector</td>
<td class="tbl-header last text-right">Avg. Weight (%)</td>
<td class="tbl-header last text-right">Contribution (%)</td>
</tr>
<tr class="tbl-data">
<td class="data-td data last text-left">Norwegian Cruise Line</td>
<td class="data-td data last text-left">NCLH</td>
<td class="data-td data last text-left">Consumer Discretionary</td>
<td class="data-td data last text-right">1.58</td>
<td class="data-td data last text-right">-0.31</td>
</tr>
<tr class="tbl-data">
<td class="data-td data last text-left">Block Inc.</td>
<td class="data-td data last text-left">XYZ</td>
<td class="data-td data last text-left">Financials</td>
<td class="data-td data last text-right">0.84</td>
<td class="data-td data last text-right">-0.24</td>
</tr>
<tr class="tbl-data">
<td class="data-td data last text-left">Carnival Corp.</td>
<td class="data-td data last text-left">CCL</td>
<td class="data-td data last text-left">Consumer Discretionary</td>
<td class="data-td data last text-right">1.69</td>
<td class="data-td data last text-right">-0.23</td>
</tr>
<tr class="tbl-data">
<td class="data-td data last text-left">FMC Corp.</td>
<td class="data-td data last text-left">FMC</td>
<td class="data-td data last text-left">Materials</td>
<td class="data-td data last text-right">0.66</td>
<td class="data-td data last text-right">-0.22</td>
</tr>
<tr class="tbl-data">
<td class="data-td data last text-left">Zoom Communications Inc.</td>
<td class="data-td data last text-left">ZM</td>
<td class="data-td data last text-left">Technology</td>
<td class="data-td data last text-right">1.44</td>
<td class="data-td data last text-right">-0.22</td>
</tr>
</tbody>
</table>
</div>
<p class="chart-disclosure"><strong>Source: Morningstar, February 2025.</strong> Past performance is no guarantee of future results. Index performance is not illustrative of fund performance. Not intended as a recommendation to buy or to sell any of the securities mentioned herein.</p>

<h2 id="moat-strategies" class="jump-link-nav anchored-block" data-jumplink-title="Moat Strategies">Choose Your Moat Strategy</h2>
<div class="flourish-embed flourish-cards d-none d-md-block" data-src="visualisation/22052290?2429575"><script src="https://public.flourish.studio/resources/embed.js"></script><noscript><img loading="lazy" src="https://public.flourish.studio/visualisation/22052290/thumbnail" width="100%" alt="Choose Your Moat Strategy" /></noscript></div>
<div class="flourish-embed flourish-cards-mobile d-md-none" data-src="visualisation/22109199?2429575"><script src="https://public.flourish.studio/resources/embed.js"></script><noscript><img loading="lazy" src="https://public.flourish.studio/visualisation/22109199/thumbnail" width="100%" alt="Choose Your Moat Strategy" /></noscript></div>
<p>To receive more <a href="https://www.vaneck.com/us/en/insights/moat-investing" title="Moat Investing Insights"><strong>Moat Investing</strong></a> insights, <a href="https://www.vaneck.com/us/en/subscribe/" title="Subscription Center"><strong>sign up in our subscription center</strong></a>.</p>
]]></content:encoded>
</item><item rdf:about="https://www.vaneck.com/us/en/blogs/emerging-markets-bonds/riding-the-em-debt-bull/">
  <title>Riding the EM Debt Bull></title>
  <link>https://www.vaneck.com/us/en/blogs/emerging-markets-bonds/riding-the-em-debt-bull/</link>
  <description><![CDATA[EM debt is thriving despite risks, with stronger currencies and U.S. rate rallies boosting returns. High carry, priced-in tariff concerns, and high real rates support its outperformance.]]></description>
  <dc:creator>Eric Fine</dc:creator>
  <dc:date>03/07/2025 06:30:00</dc:date>
<content:encoded><![CDATA[

<p id="performance-overview" class="jump-link-nav anchored-block" data-jumplink-title="Performance Overview">The <strong><a href="/link/cae21763b8c742f0952c4e4e3234dab9.aspx" title="EMBUX - Emerging Markets Bond Fund - Class I - Overview">VanEck Emerging Markets Bond Fund</a></strong> was up 1.47% in February, compared to 1.11% for its benchmark. YTD, the fund is up 3.59%, compared to 2.88% for its benchmark, 50% J.P. Morgan GBI-EM Global Diversified Index/50% J.P. Morgan EMBI Global Diversified Index. The Global Agg and 10-year treasuries were up YTD by 2.29% and 3.8%, respectively.<sup>1</sup>&nbsp;During February, China (corporates), Chile (local currency), and Tunisia led outperformers. Ecuador led underperformance. Country-specific views will remain more important than top-down <em>anything</em>. We increased duration yet again, as telegraphed, and remain happy with an overweight relative to our benchmark. HY sovereigns remain our hunting ground in USD, but IG Sovereigns in the Gulf have allowed the fund to capture U.S. rate rallies. The fund had around 50% in curated local currency, with a noteworthy underweight to Brazil in local currency. Carry is 7.7%, YTW is 9.0%, and duration is 6.6.</p>
<p id="performance-overview" class="jump-link-nav anchored-block" data-jumplink-title="Performance Overview">The <strong><a href="/link/cae21763b8c742f0952c4e4e3234dab9.aspx" title="EMB - Emerging Markets
    Bond - Overview">VanEck Emerging Markets Bond Fund</a></strong> was up 1.47% in February, compared to 1.11% for its benchmark. YTD, the fund is up 3.59%, compared to 2.88% for its benchmark, 50% J.P. Morgan GBI-EM Global Diversified Index/50% J.P. Morgan EMBI Global Diversified Index. The Global Agg and 10-year treasuries were up YTD by 2.29% and 3.8%, respectively.<sup>1</sup>During February, China (corporates), Chile (local currency), and Tunisia led outperformers. Ecuador led underperformance. Country-specific views will remain more important than top-down <em>anything</em>. We increased duration yet again, as telegraphed, and remain happy with an overweight relative to our benchmark. HY sovereigns remain our hunting ground in USD, but IG Sovereigns in the Gulf have allowed the fund to capture US rate rallies. The fund had around 50% in curated local currency, with a noteworthy underweight to Brazil in local currency. Carry is 7.7%, YTW is 9.0%, and duration is 6.6.</p>
<h3>Average Annual Total Returns* (%) (In USD)</h3>
<div class="wrapped-div">
<table style="width: 100%;">
<tbody>
<tr class="tbl-data">
<td class="tbl-header last" colspan="10">As of February 28, 2025</td>
</tr>
<tr class="tbl-data">
<td class="data-head last text-right">&nbsp;</td>
<td class="data-head last text-right">1 Mo</td>
<td class="data-head last text-right">3 Mo</td>
<td class="data-head last text-right">YTD</td>
<td class="data-head last text-right">1 Yr</td>
<td class="data-head last text-right">3 Yrs</td>
<td class="data-head last text-right">5 Yrs</td>
<td class="data-head last text-right">10 Yrs</td>
</tr>
<tr class="tbl-data">
<td class="data-td last text-left">Class A: NAV (Inception 07/09/12)</td>
<td class="data-td data last text-right">1.43</td>
<td class="data-td data last text-right">1.82</td>
<td class="data-td data last text-right">3.72</td>
<td class="data-td data last text-right">7.36</td>
<td class="data-td data last text-right">4.03</td>
<td class="data-td data last text-right">2.99</td>
<td class="data-td data last text-right">2.20</td>
</tr>
<tr class="tbl-data">
<td class="data-td last text-left">Class A: Maximum 5.75% load</td>
<td class="data-td data last text-right">-4.40</td>
<td class="data-td data last text-right">-4.04</td>
<td class="data-td data last text-right">-2.25</td>
<td class="data-td data last text-right">1.19</td>
<td class="data-td data last text-right">2.00</td>
<td class="data-td data last text-right">1.78</td>
<td class="data-td data last text-right">1.60</td>
</tr>
<tr class="tbl-data">
<td class="data-td last text-left">Class I: NAV (Inception 07/09/12)</td>
<td class="data-td data last text-right">1.47</td>
<td class="data-td data last text-right">1.91</td>
<td class="data-td data last text-right">3.59</td>
<td class="data-td data last text-right">7.63</td>
<td class="data-td data last text-right">4.34</td>
<td class="data-td data last text-right">3.29</td>
<td class="data-td data last text-right">2.50</td>
</tr>
<tr class="tbl-data">
<td class="data-td last text-left">Class Y: NAV (Inception 07/09/12)</td>
<td class="data-td data last text-right">1.45</td>
<td class="data-td data last text-right">1.87</td>
<td class="data-td data last text-right">3.75</td>
<td class="data-td data last text-right">7.53</td>
<td class="data-td data last text-right">4.21</td>
<td class="data-td data last text-right">3.22</td>
<td class="data-td data last text-right">2.43</td>
</tr>
<tr class="tbl-data">
<td class="data-td last text-left">50% GBI-EM/50% EMBI</td>
<td class="data-td data last text-right">1.11</td>
<td class="data-td data last text-right">1.17</td>
<td class="data-td data last text-right">2.88</td>
<td class="data-td data last text-right">6.09</td>
<td class="data-td data last text-right">2.56</td>
<td class="data-td data last text-right">0.16</td>
<td class="data-td data last text-right">2.09</td>
</tr>
</tbody>
</table>
</div>
<br />
<div class="wrapped-div">
<table style="width: 100%;">
<tbody>
<tr class="tbl-data">
<td class="tbl-header last" colspan="10">As of December 31, 2024</td>
</tr>
<tr class="tbl-data">
<td class="data-head last text-right">&nbsp;</td>
<td class="data-head last text-right">1 Mo</td>
<td class="data-head last text-right">3 Mo</td>
<td class="data-head last text-right">YTD</td>
<td class="data-head last text-right">1 Yr</td>
<td class="data-head last text-right">3 Yrs</td>
<td class="data-head last text-right">5 Yrs</td>
<td class="data-head last text-right">10 Yrs</td>
</tr>
<tr class="tbl-data">
<td class="data-td last text-left">Class A: NAV (Inception 07/09/12)</td>
<td class="data-td data last text-right">-1.83</td>
<td class="data-td data last text-right">-5.05</td>
<td class="data-td data last text-right">2.52</td>
<td class="data-td data last text-right">1.61</td>
<td class="data-td data last text-right">2.21</td>
<td class="data-td data last text-right">1.87</td>
</tr>
<tr class="tbl-data">
<td class="data-td last text-left">Class A: Maximum 5.75% load</td>
<td class="data-td data last text-right">-7.48</td>
<td class="data-td data last text-right">-10.51</td>
<td class="data-td data last text-right">-3.38</td>
<td class="data-td data last text-right">-0.37</td>
<td class="data-td data last text-right">1.00</td>
<td class="data-td data last text-right">1.27</td>
</tr>
<tr class="tbl-data">
<td class="data-td last text-left">Class I: NAV (Inception 07/09/12)</td>
<td class="data-td data last text-right">-1.62</td>
<td class="data-td data last text-right">-4.93</td>
<td class="data-td data last text-right">3.09</td>
<td class="data-td data last text-right">2.01</td>
<td class="data-td data last text-right">2.54</td>
<td class="data-td data last text-right">2.20</td>
</tr>
<tr class="tbl-data">
<td class="data-td last text-left">Class Y: NAV (Inception 07/09/12)</td>
<td class="data-td data last text-right">-1.81</td>
<td class="data-td data last text-right">-5.14</td>
<td class="data-td data last text-right">2.84</td>
<td class="data-td data last text-right">1.86</td>
<td class="data-td data last text-right">2.44</td>
<td class="data-td data last text-right">2.11</td>
</tr>
<tr class="tbl-data">
<td class="data-td last text-left">50% GBI-EM/50% EMBI</td>
<td class="data-td data last text-right">-1.66</td>
<td class="data-td data last text-right">-4.48</td>
<td class="data-td data last text-right">2.01</td>
<td class="data-td data last text-right">-0.88</td>
<td class="data-td data last text-right">-0.83</td>
<td class="data-td data last text-right">1.84</td>
</tr>
</tbody>
</table>
</div>
<p class="chart-disclosure"><sup>*</sup>&nbsp;Returns less than one year are not annualized.</p>
<p class="chart-disclosure"><strong>Expenses: Class A: Gross 2.08%, Net 1.21%; Class I: Gross 1.34%, Net 0.86%;</strong> Class Y: Gross 1.35%, Net 0.96%. Expenses are capped contractually until 05/01/25 at 1.20% for Class A, 0.85% for Class I, 0.95% for Class Y. Caps excluding acquired fund fees and expenses, interest, trading, dividends, and interest payments of securities sold short, taxes, and extraordinary expenses.</p>
<p class="chart-disclosure"><strong>The performance data quoted represents past performance. Past performance is not a guarantee of future results. Investment return and principal value of an investment will fluctuate so that an investor&rsquo;s shares, when redeemed, may be worth more or less than their original cost. Performance may be lower or higher than performance data quoted. Please call 800.826.2333 or visit vaneck.com for performance current to the most recent month ended.</strong></p>
<p class="chart-disclosure">The &ldquo;Net Asset Value&rdquo; (NAV) of a Fund is determined at the close of each business day, and represents the dollar value of one share of the fund; it is calculated by taking the total assets of the fund, subtracting total liabilities, and dividing by the total number of shares outstanding. The NAV is not necessarily the same as the ETF&rsquo;s intraday trading value. Investors should not expect to buy or sell shares at NAV.</p>
<p><strong>It&rsquo;s all bullish for EM debt! </strong>Despite tariff fears, U.S. policy uncertainty, geopolitical risk, and weak equity markets, EM debt is doing great. Our benchmark is up over 3% YTD, better than the Global Agg (once again). If you like themes, there have been three boosting EM bonds &ndash; a) the U.S. rates rally, b) tariff fatigue, and c) &ldquo;Ukraine&rdquo;. The U.S. rates rally speaks for itself and seems sustainable. Our rationale for liking duration appears intact, with our original rationale (now actual causes, at this stage) including a big short rates &ldquo;hedge&rdquo;, progress from DOGE despite persistent skepticism, growth risks from migration and tariff policy, and an independent Fed. Let&rsquo;s add to that last point &ndash; we find it striking and noteworthy that the new Trump administration has left the Fed out of its rhetorical targeting. In fact, the administration&rsquo;s focus on the 10y yield and <em>lack</em> of Fed criticism are boosting Fed independence and thus anchoring the 30-year, in our opinion. The U.S. rates rally obviously boosted all bonds. USD bonds thus led outperformance in EM in February. The second theme is that tariffs may be priced - interestingly, high beta EMFX is the winner <em>within</em> local currency, with the Colombian peso, Brazilian real, and Chilean peso as the leaders. It&rsquo;s hardly a sign of turmoil that bonds are rallying <em>and </em>currencies are rallying, led by the riskiest! The final theme is &ldquo;Ukraine&rdquo;, with the Russian rouble, Polish zloty, and Hungarian forint as other YTD FX winners. These three themes are consistent with the following in our existing outlook &ndash; they show that EM can be uncorrelated, even when directly subject to risks such as tariffs. The &ldquo;blob&rdquo; called EM has many winners, but the country components must be curated by a consistent investment process.</p>
<h3>Exhibit 1 &ndash; EMFX Strong YTD</h3>
<div class="flourish-embed flourish-chart" data-src="visualisation/21977044?2429575"><script src="https://public.flourish.studio/resources/embed.js"></script><noscript><img loading="lazy" src="https://public.flourish.studio/visualisation/21977044/thumbnail" width="100%" alt="Exhibit 1 &ndash; EMFX Strong YTD" /></noscript></div>
<p class="chart-disclosure">Source: Bloomberg as of 3/3/25. Past performance is no guarantee of future results.</p>
<h3>Exhibit 2 &ndash; Treasuries Strong YTD</h3>
<p><img loading="lazy" title="Exhibit 2 &ndash; Treasuries Strong YTD" src="https://www.vaneck.com/contentassets/4b8b30de4bcf4830b13ed82d02f4f3e7/5433_emb-february-2025_chart-2_2025-03_blog.svg" /></p>
<p class="chart-disclosure">Source: Bloomberg as of 3/3/25. Past performance is no guarantee of future results.</p>

<p><strong>EM outperformance makes sense to us. </strong>Generally, in EM, carry is higher, tariff concerns are priced, and real rates are high (cushioning growth concerns). Specifically in EM, call us when China adjusts its currency, and until then, we see it as an anchor for EMFX stability. Is there any better example of our &ldquo;fiscal dominance&rdquo; thesis in DM than in the past few weeks? Political and policy uncertainty emanating from a highly indebted U.S. is challenging EMs. EMs are responding from positions of low indebtedness, high real rates, independent central banks, and political authorities are doing their best. No important EMs need major structural reforms (maybe India is an exception), they just need to absorb the impact with their existing structures. The most important EM, China, continues to fix its currency (at the daily fix) unchanged and better than predicted, as we&rsquo;ve been harping on. This is an anchor for <em>all</em> EMFX. We will also reiterate that the Trump administration continues to hint at the need for a currency accord that keeps the dollar from strengthening and thus offsetting any perceived gains from tariffs. Support for this thesis (or attitude) is in the strong performance of EMFX so far in 2025.</p>
<p id="tariff-risks" class="jump-link-nav anchored-block" data-jumplink-title="Tariff Risks"><strong>Tariff risks remain. </strong>Tariffs are a risk to most conventional economists, as they are a tax that normally leads to less-optimal trade. Moreover, with open capital accounts, currencies can simply adjust weaker, so nothing is accomplished other than uncertainty, plus higher costs/lower margins. This is behind our prediction that the U.S. will attempt to reach an accord with key trading partners to keep currencies stable despite tariffs &ndash; China, for sure, but Japan also gets mentioned. Treasury Secretary Bessent has alluded to this. A precedent would obviously be the 1987 Plaza Accord. This held for only under two years, if that (a subsequent Louvre Accord was required) &mdash; but it was a development one <em>absolutely had </em>to anticipate. There are more prosaic risks from tariffs, too. It&rsquo;s possible the market is simply not pricing tariffs until tariffs are actually in place, meaning risks lie ahead and the recent rally is to be faded. We&rsquo;ve all heard the popular interpretation that tariff announcements have had a tactical negotiation objective (bluster, not reality). It&rsquo;s further possible that tariffs take on an anti-China flavor (i.e., some version of being off the hook if you duplicate U.S. tariffs with China), which could transmit costs and risks through global supply chains. But, gauging the market reactions to tariff headlines (we are writing this on March 4, following Chinese, Mexican, Canadian reciprocal tariffs on the U.S.), it appears a lot of this is priced. Exhibit 1 above should be acknowledged. In fact, our strategy in 2024 was largely to get here &ndash; the post-tariff world (whatever it is). For example, the fund was overweight local currency in 2024, and even though local currency did poorly overall, curation (in particular, our severe underweight in Mexico) allowed us to maintain our strategy and outperform. We remain bullish, though open-minded and nimble.</p>
<h2 id="exposure-types" class="jump-link-nav anchored-block" data-jumplink-title="Exposure Types and Significant Changes">Exposure Types and Significant Changes</h2>
<p>The changes to our top positions are summarized below. Our largest positions in February were Mexico, Colombia, Indonesia, Brazil, and Turkey.</p>
<ul class="content-list">
<li class="mt-2">We increased our local currency exposure in Poland. The country is expected to benefit from a potential ceasefire in Ukraine, like the rest of the region. One thing that sets Poland apart though &ndash; especially with regards to local debt &ndash; is that this is the only European economy where higher defense spending is already the reality, and it is fully reflected in the country&rsquo;s credit metric. The latest data also point to the improving growth outlook, which should reduce pressure on the central bank to lower interest rates. In terms of our investment process, this improves the economic and policy test scores for Poland.</li>
<li class="mt-2">We also increased our local currency exposure in Mexico and Kazakhstan. Mexico was motivated by the respite in the tariff war with the U.S., which improved the policy test score for the country. Our decision in Kazakhstan was in part due to better prospects of resolving the Russia-Ukraine conflict, which strengthens the country&rsquo;s policy test score. Another important development on the structural front is tax reform/fiscal consolidation, which is now in the works and which is expected to boost revenue collection by a significant amount.</li>
<li class="mt-2">Finally, we increased our hard currency sovereign exposure in the United Arab Emirates. We were driven mostly by duration considerations here, which improved the technical test scores for the country. Negative market positioning provided additional technical support, and the economy can also benefit if additional tariffs lift oil prices higher.</li>
<li class="mt-2">We reduced our local currency exposure in South Africa and Brazil. South Africa is affected by (somewhat surprising) negative spillovers from President Trump&rsquo;s comments linking the land expropriation law with tariffs. And it is not entirely clear what South Africa can do to reduce this pressure. In terms of our investment process, this worsened the country&rsquo;s policy test score. Brazil is also affected by the trade war uncertainty, as well as by the accumulation of longs in January. However, Brazil&rsquo;s drivers are mostly domestic &ndash; specifically, the ongoing increase in inflation expectations (which requires continuing policy tightening) and the government&rsquo;s inability to clarify its fiscal consolidation plans for 2025 and beyond. The latter worsened Brazil&rsquo;s policy test score.</li>
<li class="mt-2">We also reduced our hard currency corporate exposure in Ecuador. The decision was driven by the incumbent&rsquo;s (President Noboa) surprisingly weak performance in the first round of the presidential elections and stronger than expected results of the leftist candidate, whose second-round chances were boosted by potential support from other political parties. This worsened the political test score for Ecuador.</li>
<li class="mt-2">Finally, we reduced our hard currency exposure in Kuwait and Saudi Arabia. Even though we think that duration can benefit from concerns about the U.S. global outlook, there are better ways (in terms of valuations) to express this view. This factor worsened the technical test score for both countries.</li>
</ul>

<p>To receive more <a href="https://www.vaneck.com/us/en/insights/emerging-markets-bonds/" title="Emerging Markets Bonds Insights"><strong>Emerging Markets Bonds</strong></a> insights, <a href="/link/5f45412c2143400497908cea2897f7d3.aspx" title=" Subscription Center"><strong>sign up in our subscription center</strong></a>.</p>
]]></content:encoded>
</item><item rdf:about="https://www.vaneck.com/us/en/blogs/model-portfolios/markets-in-motion-tariffs-tech-and-treasure/">
  <title>February Market Recap: Markets in Motion—Tariffs, Tech, and Treasure></title>
  <link>https://www.vaneck.com/us/en/blogs/model-portfolios/markets-in-motion-tariffs-tech-and-treasure/</link>
  <description><![CDATA[<p>Trump&rsquo;s tariffs, AI&rsquo;s next phase, and a potential U.S. gold revaluation could shake markets&mdash;investors who stay ahead of these transitions will be best positioned.</p>]]></description>
  <dc:creator>David Schassler</dc:creator>
  <dc:date>03/06/2025 06:30:00</dc:date>
<content:encoded><![CDATA[

<h2>The Three Big Ideas Everyone&rsquo;s Talking About</h2>
<p>Over the past few weeks, I&rsquo;ve been meeting with some of the sharpest investors across the globe. The conversations?</p>
<p>Disruptive ideas, market-moving insights, and scenarios that could shake up portfolios.</p>
<p>Three themes keep coming up, again and again:</p>
<ol class="content-list">
<li class="mt-2">Will Trump&rsquo;s tariffs reshape global trade?</li>
<li class="mt-2">Is tech&rsquo;s recent pullback a warning sign&mdash;or simply the next phase of the AI-driven super-cycle?</li>
<li class="mt-2">Could a U.S. gold revaluation unlock a $750 billion windfall?</li>
</ol>
<p>These aren&rsquo;t just theoretical debates. If any of them play out, the impact could be significant. Let&rsquo;s dig in.</p>

<h2>Trump Tariff Plan: A New Trade Playbook?</h2>
<p>The U.S. has officially enacted 25% tariffs on imports from Mexico and Canada, triggering swift retaliation. Canada plans to impose equivalent tariffs on nearly $100 billion of U.S. goods, while Mexico is preparing its own countermeasures.</p>
<p>Meanwhile, the U.S. has also increased tariffs on Chinese imports, layering an additional 10% duty overnight. China responded by targeting U.S. agricultural products, introducing restrictions on American companies, and filing a complaint with the World Trade Organization.</p>
<p>Markets reacted sharply. U.S. equities dropped, gold rallied, and volatility spiked as investors assessed the fallout. Despite initial currency stability in Canada and Mexico, the broader concern is the economic impact. Businesses facing higher costs are expected to pass them to consumers, likely driving up prices on goods such as food and automobiles.</p>
<p>The key question remains: Are these tariffs a short-term pressure tactic or a long-term shift in trade policy? Either way, they are reshaping global supply chains, creating new risks and opportunities for investors.</p>
<h2>AI&rsquo;s Next Phase: Moving Beyond Infrastructure</h2>
<p>Tech stocks have pulled back, but this isn&rsquo;t the end of the AI rally&mdash;it&rsquo;s the natural transition to the next phase of the AI-driven super-cycle.</p>
<p>AI adoption is rolling out in three stages:</p>
<ul class="content-list">
<li class="mt-2"><strong>Phase 1: AI Arms Dealers &ndash;</strong> The infrastructure builders (chips, cloud, and compute power) fueled the first wave of returns.</li>
<li class="mt-2"><strong>Phase 2: AI Power Users &ndash; </strong>Companies embedding AI into their operations, gaining efficiency, automation, and product advantages.</li>
<li class="mt-2"><strong>Phase 3: AI for Everyone &ndash; </strong>Mass adoption drives broad-based productivity gains, benefiting companies across all sectors.</li>
</ul>
<p>We are now transitioning from Phase 1 to Phase 2. AI is moving beyond hardware and into real-world applications, where businesses investing in AI will start separating from those that aren&rsquo;t. The transition brings new winners, but AI&rsquo;s role in reshaping the economy remains just as strong.</p>

<h2>Gold Revaluation: A Thought Experiment</h2>
<p>The idea of a U.S. gold revaluation is making the rounds, though it&rsquo;s far from a base case. The U.S. Treasury holds 261.5 million ounces of gold but still values them at $42.22 per ounce&mdash;a relic from the early 1970s. With gold trading near $2,950 per ounce, that&rsquo;s a multi-hundred-billion-dollar windfall sitting on the books.</p>
<p>A revaluation would allow the Treasury to boost its balance sheet without printing new money or issuing debt. There&rsquo;s precedent:</p>
<ul class="content-list">
<li class="mt-2">1934 &ndash; The Gold Reserve Act: FDR raised gold&rsquo;s price to strengthen the Treasury&rsquo;s war chest.</li>
<li class="mt-2">1971 &ndash; Nixon Ends the Gold Standard: Cutting dollar convertibility enabled massive monetary expansion.</li>
</ul>
<p>If it happens, expect:</p>
<ul class="content-list">
<li class="mt-2">Gold prices to surge in anticipation.</li>
<li class="mt-2">A weaker dollar if markets see it as monetary expansion.</li>
<li class="mt-2">Big upside for gold miners and hard assets.</li>
</ul>
<p>Again, this isn&rsquo;t our base case, but given the debt backdrop, it&rsquo;s worth watching.</p>
<h2>Market Review</h2>
<p><strong>Equities: Rotation in Full Swing </strong></p>
<p>The shifts in market leadership are real and accelerating:</p>
<ul class="content-list">
<li class="mt-2">Tech is adjusting as AI moves into its next phase.</li>
<li class="mt-2">Traditional economy sectors&mdash;energy, materials, real estate, and healthcare&mdash;are seeing inflows.</li>
<li class="mt-2">Markets are adjusting to policy-driven headwinds&mdash;trade, inflation, and fiscal concerns.</li>
</ul>
<p><strong>Fixed Income: Volatility Returns</strong> Bonds have had a wild ride, and the narrative is shifting fast:</p>
<ul class="content-list">
<li class="mt-2">The 10-Year Treasury yield dropped from 4.79% to 4.2%, reflecting recession fears.</li>
<li class="mt-2">Inflation data came in hotter than expected, forcing a higher-for-longer stance on rates.</li>
<li class="mt-2">Now, growth concerns have the market asking for rate cuts. Now is not the time to take excess risk. Credit spreads are tight, but if volatility spikes, they could widen fast.</li>
</ul>
<p><strong>Real Assets: The Bull Market Marches</strong></p>
<p>The bull market in real assets is alive and well, fueled by:</p>
<ul class="content-list">
<li class="mt-2">Persistent inflation.</li>
<li class="mt-2">Geopolitical chaos.</li>
<li class="mt-2">Tighter supply chains. Gold and gold equities are leading the way, followed by commodities, natural resource equities, and REITs.</li>
</ul>
<p><strong>Digital Assets: Bitcoin&rsquo;s Wild Ride </strong></p>
<p>Bitcoin hit $107K before falling back below $80K&mdash;a classic high-volatility shakeout.</p>
<ul class="content-list">
<li class="mt-2">Bitcoin is trading like a risk asset, moving with big tech.</li>
<li class="mt-2">Will it go lower? Probably.</li>
<li class="mt-2">Will we buy more if it does? Absolutely. Timing bottoms is impossible. The real question: If I buy today, will I look smart in 6, 12, or 18 months? We think the answer is yes.</li>
</ul>
<h2>Final Thought</h2>
<p>Market risk is elevated, and with rotation underway, this is a time for broad diversification&mdash;across asset classes, within asset classes, and with exposure to traditional risk-off assets like Treasuries and gold&mdash;not a time for taking outsized risks.</p>
<p>To receive more <strong><a href="https://www.vaneck.com/us/en/insights/guided-allocation/" title="Model Portfolio Insights">Model Portfolio</a></strong> insights, <strong><a href="https://www.vaneck.com/us/en/subscribe/" title="Subscription Center">sign up in our subscription center</a></strong>.</p>
]]></content:encoded>
</item><item rdf:about="https://www.vaneck.com/us/en/blogs/gold-investing/ima-casanova-dollars-trouble-could-be-golds-triumph/">
  <title>Dollar’s Trouble Could Be Gold’s Triumph></title>
  <link>https://www.vaneck.com/us/en/blogs/gold-investing/ima-casanova-dollars-trouble-could-be-golds-triumph/</link>
  <description><![CDATA[Gold continued to make new highs in February; a crisis of confidence in the U.S. dollar may drive gold prices higher than expected.]]></description>
  <dc:creator>Imaru Casanova</dc:creator>
  <dc:date>03/06/2025 06:30:00</dc:date>
<content:encoded><![CDATA[

<p>Monthly gold market and economic insights from <a href="https://www.vaneck.com/us/en/news-and-insights/thought-leaders/imaru-casanova/?p=1" title="Imaru Casanova &mdash; Portfolio Manager, Gold and Precious Metals"><strong>Imaru Casanova, Portfolio Manager</strong></a>, featuring her unique views on mining and gold&rsquo;s portfolio benefits.</p>

<h2>Gold&rsquo;s Record Highs and Market Drivers</h2>
<p>Gold continued its upward trajectory in February, reaching a record high of $2,951.73 per ounce on February 24, driven by safe-haven demand amid concerns over U.S. trade policy. The Trump administration&rsquo;s policy induced uncertainty, combined with rising inflation expectations and diminished consumer confidence, weighed on major stock indexes, further boosting gold&rsquo;s appeal as an alternative investment and portfolio diversifier.</p>
<p>A key factor behind gold&rsquo;s latest rally was a surge in the holdings of gold bullion backed ETFs. Total known ETF holdings of gold increased by 2.49% in February, marking the largest monthly inflow since March 2022. However, profit-taking and a strengthening U.S. dollar in the final week of February triggered a pullback, pushing gold down by approximately $100 from its peak. Despite this decline, gold closed at $2,857.83 per ounce on February 28, securing a monthly gain of $59.42, or 2.12%.</p>
<h2>Performance and Investor Sentiment</h2>
<p>The NYSE Arca Gold Miners Index (GDMNTR)<sup>1</sup>gained 2.01% in February, performing significantly better than the broader equity markets, but ultimately falling short of matching the metal&rsquo;s gains. However, year to date, gold equities have demonstrated relatively strong leverage to gold prices, rising 17.22% compared to bullion&rsquo;s 8.89% gain.</p>
<p>This mixed performance was a key topic at the annual BMO Metals and Mining conference in Florida this past month. Optimism about the sector was met with frustration, as rising cash balances, improved liquidity, lower debt ratios, higher dividends and significant buyback programs have failed to spark investor interest in the past years. That trend may be set to change in 2025, as growing investment demand for gold, evidenced by inflows into the bullion ETFs, should also lead to increased demand for gold equities. Anecdotally, companies at the conference reported an increased number of meetings with general investors eager to increase their near-zero exposure to gold.</p>
<h2>Resilience Amid Global Tariffs</h2>
<p>The gold industry remains largely isolated from the negative impact of global tariffs. In fact, many gold producers could benefit from foreign currency depreciations triggered by these tariffs, as a significant portion of their cost base is denominated in local currencies. For example, Alamos Gold (approximately 7% of Strategy net assets), estimates that about 90-95% of its Canadian operational costs are Canadian dollar denominated, while about 40-45% of its Mexican mine expenses are denominated in pesos.&nbsp; While industry cost inflation is widely reported around the 3-5% range for 2025, the potential benefit of weaker local currencies and a rising gold price should more than offset inflationary pressures for the sector. This dynamic is expected to continue to drive margin expansion to new record levels.</p>
<h2>The Evolving Role of the U.S. Dollar and Emerging Trends</h2>
<p>For more than a century, the U.S. dollar has been the cornerstone of the global financial system. Most trade is financed in U.S. dollars, commodities are priced in U.S. dollars and the U.S. dollar has been used, coveted and hoarded by people and nations around the world. However, this is changing.</p>
<p>The U.S. dollar&rsquo;s strength against other currencies has traditionally been supported by the robustness of the U.S. economy and its reputation as one of the safest jurisdictions in which to invest.</p>
<p>The chart below highlights a steady long-term upward trend of the U.S. Dollar Index (DXY)<sup>2</sup>&nbsp;amid fluctuations in recent years.</p>
<h3>U.S. Dollar Strength, 2008 to 2025</h3>
<p><img loading="lazy" class="img-responsive w-100" alt="U.S. Dollar Strength, 2008 to 2025" src="https://www.vaneck.com/contentassets/a4a98ec2e83b426fa0898c1324e0a6c8/5427_gold-commentary_chart-1_2025-3_v1_blog.svg" /></p>
<p class="chart-disclosure">Source: FactSet. Data as of February 12, 2025. Past performance is no guarantee of future results. Index performance is not representative of strategy performance. It is not possible to invest in an index.</p>

<p>Despite its strength, the dollar has been devaluing relative to gold&mdash;an unprecedented trend that few view as a threat to the currency or sign of a precipitated crisis.</p>
<p>Historically, gold bull markets have been driven by three things:</p>
<ol class="content-list">
<li class="mt-2">Runaway inflation &ndash; gold surged 1500% in the 1970s</li>
<li class="mt-2">A failing dollar &ndash; gold climbed 302% from 2001 to 2008</li>
<li class="mt-2">Financial crises &ndash; gold increased 134% from 2008 to 2011</li>
</ol>
<p>The current gold bull market, which began in 2016, is remarkable because it is not accompanied by U.S. dollar weakness or a global financial crisis. While the pandemic was a crisis, its financial impact was short-lived, thanks to massive government intervention.</p>
<h2>Erosion of Confidence in the Dollar</h2>
<p>Another driver has emerged: people and nations that have long used, coveted and hoarded the U.S. dollar are now losing faith and trust in the currency as a store of wealth. This shift began in 2008 when the global financial crisis led many to question the efficacy of the banking system and western economic hegemony. It escalated with sanctions and freezing of assets imposed on Russia by the U.S. Other countries fear that similar retribution or &ldquo;weaponization of the dollar&rdquo; is possible for lesser infractions than the hostile invasion of another country. Now tariffs have been weaponized. Gold has gained 275% since Lehman Brothers failed in 2008 and 50% since Russia invaded Ukraine in 2022. Additionally, irresponsible fiscal policies and political chaos in the U.S. suggest that one or more of the traditional drivers of gold may reemerge. As a result, the world is slowly and methodically moving away from the dollar, a shift most evident in changes to currency reserves and increased central bank gold purchases.</p>
<p>China has been exiting U.S. Treasuries while increasing its gold:</p>
<h3>China's US Treasury Holdings vs. Gold Reserves (2013-2014)</h3>
<div class="flourish-embed flourish-chart" data-src="visualisation/21939136?2429575"><script src="https://public.flourish.studio/resources/embed.js"></script><noscript><img loading="lazy" src="https://public.flourish.studio/visualisation/21939136/thumbnail" width="100%" alt="China's US Treasury Holdings vs. Gold Reserves (2013-2014)" /></noscript></div>
<p class="chart-disclosure">Source: Bloomberg. Data as of December 2024.</p>
<p>Central bank net purchases of gold began in earnest after the financial crisis and accelerated after the Ukraine invasion:</p>
<h3>Central Banks Have Been Net Buyers for 15 Years&hellip;</h3>
<p><strong>Annual Central Bank Net Purchases, in Tonnes</strong></p>
<div class="flourish-embed flourish-chart" data-src="visualisation/21938911?2429575"><script src="https://public.flourish.studio/resources/embed.js"></script><noscript><img loading="lazy" src="https://public.flourish.studio/visualisation/21938911/thumbnail" width="100%" alt="Central Banks Have Been Net Buyers for 15 Years&hellip;" /></noscript></div>
<p class="chart-disclosure">Source: Metals Focus, LSEG Data &amp; Analytics (formerly Refinitiv), ICE Benchmark Administration, and World Gold Council. Data as of December 2024.</p>
<p>We believe this marks the start of longer-term trends that will become recognized as a crisis of confidence in the U.S. dollar, potentially driving gold prices much higher than many expect. If a digital asset like Bitcoin, created and residing within servers, can be valued at $100,000, then surely an ounce of a tangible, reliable safe-haven asset like gold could reach a small fraction of that value.</p>
<p>To receive more <strong><a href="https://www.vaneck.com/us/en/insights/gold-investing/" title="Gold Investing Insights">Gold Investing</a></strong> insights, <strong><a href="https://www.vaneck.com/us/en/subscribe/" title="Subscription Center">sign up in our subscription center</a></strong>.</p>
]]></content:encoded>
</item><item rdf:about="https://www.vaneck.com/us/en/blogs/digital-assets/matthew-sigel-vaneck-crypto-monthly-recap-for-february-2025/">
  <title>VanEck Crypto Monthly Recap for February 2025></title>
  <link>https://www.vaneck.com/us/en/blogs/digital-assets/matthew-sigel-vaneck-crypto-monthly-recap-for-february-2025/</link>
  <description><![CDATA[February saw a brutal crypto selloff, driven by macro fears and a bitcoin carry trade collapse, but institutional interest and regulatory shifts hint at resilience.]]></description>
  <dc:creator>Matthew  Sigel</dc:creator>
  <dc:date>03/05/2025 06:30:00</dc:date>
<content:encoded><![CDATA[

<p><strong>Please note that VanEck may have a position(s) in the digital asset(s) described below.</strong></p>
<p>Brutal month. Bitcoin tanked <strong>(-28%) </strong>from its January peak of <strong>$109K</strong>, bottoming at <strong>$78.2K</strong> before bouncing to <strong>$84K</strong> (<strong>-17.5% MTD</strong>). Ethereum <strong>(-33%)</strong> and other alts fared much worse. Nasdaq slid (-<strong>4%</strong>), it&rsquo;s worst month since April 2024. Despite the improving <strong><a target="_blank" title="SEC Drops Robinhood Crypto Case, Mirroring Coinbase Outcome" href="https://www.ccn.com/news/crypto/sec-drops-robinhood-crypto-case/" rel="noopener">regulatory</a></strong> backdrop in the US and a <strong><a target="_blank" title="SEC Drops Robinhood Crypto Case, Mirroring Coinbase Outcome" href="https://www.ccn.com/news/crypto/sec-drops-robinhood-crypto-case/" rel="noopener">positive</a></strong> sentiment<strong> <a title="JPMorgan Survey Finds 29% of Institutional Traders Will Trade Crypto This Year" href="https://thedefiant.io/news/tradfi-and-fintech/jpmorgan-survey-finds-29-of-institutional-traders-will-trade-crypto-this-year?utm_source=newsletter2.thedefiant.io&amp;utm_medium=referral&amp;utm_campaign=weekly-recap-trade-war-uncertainty-roils-crypto-markets" target="_blank" rel="noopener">shift</a></strong> amongst investment institutions, the MarketVector Smart Contract Leaders Index (MVSCLE) was down a painful (<strong>-34%) </strong>since the last day of January. Some of the biggest losing smart contract platform (SCP) tokens on the month include Starknet&rsquo;s STRK <strong>(-39%),</strong> Solana&rsquo;s SOL <strong>(-37%),</strong> and Avalanche&rsquo;s AVAX <strong>(- 36%).</strong> On the other end, some of the tokens that held the line against the price rinse include Sonic&rsquo; S <strong>(+21%),</strong> Tron&rsquo;s <strong>TRX (-9%),</strong> and Binance&rsquo;s BNB <strong>(-13%).</strong> The worst performing sector for tokens was Memecoins <strong>(-41%)</strong> followed closely by Oracles <strong>(-36%)</strong> and Gaming <strong>(-35%).</strong></p>
<ul class="content-list">
<li class="mt-2"><a href="#crypto-Fundamentals"><strong>Crypto Fundamental&rsquo;s Sour</strong></a></li>
<li class="mt-2"><a href="#ethereum"><strong>Ethereum Update</strong></a></li>
<li class="mt-2"><a href="#solana"><strong>Solana Update</strong></a></li>
<li class="mt-2"><a href="#bybit-hack"><strong>Bybit Hack</strong></a></li>
<li class="mt-2"><a href="#notable-performer"><strong>Notable Performer: Sonic</strong></a></li>
</ul>
<p>Bitcoin corrections in bull markets aren&rsquo;t new. 2017 saw multiple <strong>(-30-40%)</strong> dips. Even in 2021, BTC cratered <strong>55%</strong> before ripping to all-time highs. This selloff fits the pattern.</p>
<h2 id="what-happened" class="jump-link-nav anchored-block" data-jumplink-title="What Happened">What happened?</h2>
<ul class="content-list">
<li class="mt-2"><strong>Macro: </strong>Trump&rsquo;s proposed <strong>25%</strong> tariffs on Canada, Mexico, China, and the EU spooked markets. Consumer confidence slumped near multi-decade lows. The services sector (ISM) contracted for the first time in over two years.</li>
<li class="mt-2"><strong>Carry trade collapse:</strong> The annualized next-month BTC futures premium hit 52-week lows as leverage unwound. Bitcoin ETPs had their worst week of net outflows ever, totaling <strong>$3.3B</strong>, as hedge funds closed Bitcoin trades, and many went short.</li>
<li class="mt-2">
<p><strong>Crypto-specific: </strong>Bybit hacked for <strong>$1.5B</strong> in ETH, shaking trust in CEXs and smart contract platforms.</p>
<p>Bitcoin reserve bills flopped. Four U.S. states failed to pass Bitcoin reserve legislation. Key Oklahoma vote coming soon.</p>
<p>Stablecoin legislation gets a revamp. A new House draft bill removes many federal restrictions from last year&rsquo;s version, restoring state rights and cutting bureaucracy&mdash;a major win for stablecoin issuers.</p>
<p>VanEck-backed Agora stablecoin surpassed <strong>$100M</strong> in AUM after launching on Solana, its 6th chain, making $AUSD one of the fastest-growing dollar stablecoins.</p>
<p>Figure launched the first retail yield-bearing stablecoin, bringing traditional financial yield mechanisms into crypto-native dollars.</p>
</li>
<li class="mt-2"><strong>Regulatory U-turn: </strong>SEC abruptly dropped cases against Coinbase, Uniswap, Robinhood, Binance, and others. Two years of &ldquo;war on crypto&rdquo; suddenly vanished.</li>
<li class="mt-2">
<p><strong>Institutional money still moving in: </strong>BlackRock raises the ante. The world&rsquo;s biggest asset manager added <strong>1-2%</strong> Bitcoin exposure to its <strong>$150B</strong> model portfolios, putting BTC in front of thousands of RIAs and wealth managers.</p>
<p>MicroStrategy broke into the preferred equity stack. MSTR sold <strong>$700M</strong> of <strong>8% </strong>perpetual preferred stock, managed by Morgan Stanley, Citi, and Goldman Sachs, at <strong>80 cents</strong> on the dollar. The issue rallied to <strong>99 cents</strong> before ending the month at <strong>92.4</strong> cents.</p>
<p>In-kind Bitcoin ETP redemptions coming? Nasdaq filed a rule change on Jan 24, 2025, to enable in-kind creations/redemptions for BlackRock&rsquo;s bitcoin ETP. The SEC has a 45-day review window, meaning approval could come as soon as March 10, 2025. This would allow U.S. broker-dealers to handle Bitcoin directly&mdash;a game changer for market structure.</p>
<p>VanEck-backed SegMint became the #2 NFT project by volume on Abstract blockchain as utility expanded thanks to an innovative real-world quest the team launched alongside Portals.</p>
</li>
<li class="mt-2">
<p><strong>Governments making moves: </strong>Abu Dhabi&rsquo;s Mubadala sovereign fund took a <strong>$436.9M</strong> stake in BlackRock&rsquo;s Bitcoin ETP&mdash;first known SWF allocation to BTC.</p>
<p>Czech central bank governor pushed to evaluate Bitcoin as a reserve asset, possibly allocating up to <strong>5%</strong> of its <strong>&euro;140B</strong> reserves to BTC.</p>
<p>Wisconsin doubles down on Bitcoin ETP. The State of Wisconsin Investment Board increased its Bitcoin ETP holdings to over <strong>6M</strong> shares (~<strong>$321M</strong> position).</p>
<p>U.S. signals Bitcoin policy shift. As we went to print, Donald Trump posted on social media that he will establish a U.S. Crypto Strategic Reserve, promising to include BTC, ETH, XRP, ADA, and SOL, signaling a dramatic shift in U.S. digital asset policy.</p>
</li>
<li class="mt-2"><strong>Bitcoin&rsquo;s correlation with the Nasdaq:</strong> The correlation ratio has drifted lower to <strong>0.27</strong> from its 2022 peak of <strong>0.8</strong>, suggesting that Bitcoin&rsquo;s price action is increasingly moving to its own rhythm rather than being dictated by traditional equities.</li>
</ul>
<p>February was ugly, but if history is any guide, deep corrections in bull markets shake out weak hands before the next leg up.</p>
<h3 id="price-returns" class="jump-link-nav anchored-block" data-jumplink-title="Price Returns">Price Returns</h3>
<div class="wrapped-div">
<table style="width: 100%;">
<tbody>
<tr class="tbl-data">
<td class="data-header last">&nbsp;</td>
<td class="data-head last text-right">February (%)</td>
<td class="data-head last text-right">1-year (%)</td>
</tr>
<tr class="tbl-data">
<td class="data-td data last text-left">S&amp;P 500 Index</td>
<td class="data-td data last text-right">-2</td>
<td class="data-td data last text-right">16</td>
</tr>
<tr class="tbl-data">
<td class="data-td data last text-left">Nasdaq Index</td>
<td class="data-td data last text-right">-4</td>
<td class="data-td data last text-right">18</td>
</tr>
<tr class="tbl-data">
<td class="data-td data last text-left">Bitcoin</td>
<td class="data-td data last text-right">-18</td>
<td class="data-td data last text-right">47</td>
</tr>
<tr class="tbl-data">
<td class="data-td data last text-left">MarketVector Global Digital Assets Equity Index</td>
<td class="data-td data last text-right">-23</td>
<td class="data-td data last text-right">18</td>
</tr>
<tr class="tbl-data">
<td class="data-td data last text-left">Coinbase</td>
<td class="data-td data last text-right">-27</td>
<td class="data-td data last text-right">4</td>
</tr>
<tr class="tbl-data">
<td class="data-td data last text-left">Ethereum</td>
<td class="data-td data last text-right">-33</td>
<td class="data-td data last text-right">-32</td>
</tr>
<tr class="tbl-data">
<td class="data-td data last text-left">MarketVector Smart Contract Leaders Index</td>
<td class="data-td data last text-right">-34</td>
<td class="data-td data last text-right">-18</td>
</tr>
<tr class="tbl-data">
<td class="data-td data last text-left">MarketVector Infrastructure Application Leaders Index</td>
<td class="data-td data last text-right">-39</td>
<td class="data-td data last text-right">54</td>
</tr>
<tr class="tbl-data">
<td class="data-td data last text-left">MarketVector Meme Coin Index</td>
<td class="data-td data last text-right">-40</td>
<td class="data-td data last text-right">NA</td>
</tr>
<tr class="tbl-data">
<td class="data-td data last text-left">MarketVector Decentralized Finance Leaders Index</td>
<td class="data-td data last text-right">-40</td>
<td class="data-td data last text-right">-43</td>
</tr>
</tbody>
</table>
</div>
<br />
<p class="chart-disclosure">Source: Bloomberg as of 2/28/2025. Index performance is not representative of strategy performance. It is not possible to invest directly in an index. <strong>Past performance is no guarantee of future results. Not intended as a recommendation to buy or sell any securities named herein.</strong></p>
<h2 id="crypto-Fundamentals" class="anchored-block">Crypto Fundamental&rsquo;s Sour</h2>
<p>The cryptocurrency market saw a sharp decline in Smart Contract Platform (SCP) activity as memecoin trading collapsed <strong>(-80%</strong> month-to-month), driven by accusations of insider trading and fraud. January saw controversial launches of $TRUMP and $MELANIA, followed by February&rsquo;s launch of $LIBRA, a token likely linked to Argentinian President Javier Milei. $LIBRA briefly reached a <strong>$4B</strong> valuation before crashing over <strong>98%,</strong> with insiders profiting heavily. This has fueled concerns that memecoin markets are manipulated by influencers and traders engaging in pump-and-dump schemes. Onchain gas usage for memecoin trading dropped significantly, down <strong>(-73%)</strong> on Ethereum and <strong>(-65%)</strong> on Solana month-to-month.</p>
<h3>MarketVector Smart Contract Leaders Index (MVSCLE) Below Pre-Election Levels</h3>
<div class="flourish-embed flourish-chart" data-src="visualisation/21916289?2428759"><script src="https://public.flourish.studio/resources/embed.js"></script><noscript><img loading="lazy" src="https://public.flourish.studio/visualisation/21916289/thumbnail" width="100%" alt="MarketVector Smart Contract Leaders Index (MVSCLE) Below Pre-Election Levels" /></noscript></div>
<p class="chart-disclosure">Source: Market Vectors as of 2/28/2025. <strong>Past performance is no guarantee of future results. Not intended as a recommendation to buy or sell any securities named herein. The MarketVector Smart Contract Leaders Index (MVSCLE) is designed to track the performance of the largest and most liquid smart contract assets, and is an investable subset of MarketVector Smart Contract Index.</strong></p>
<p>Just as investors were moving past memecoin losses, the market took another hit with the partial hack of Bybit, the third-largest crypto exchange by volume. The attack, the largest in crypto history, resulted in the theft of <strong>$1.5B</strong> in ETH or about <strong>6%</strong> of Bybit&rsquo;s assets. Authorities have linked the hack to the Lazarus Group, a North Korean state-sponsored cybercriminal organization. The attack&rsquo;s sophistication, along with concerns about security vulnerabilities in Gnosis&rsquo; crypto safeguarding software, has left the industry on high alert.</p>
<h3>Stablecoin Volume Increased (+63%) for Base in February</h3>
<div class="flourish-embed flourish-chart" data-src="visualisation/21916983?2428759"><script src="https://public.flourish.studio/resources/embed.js"></script><noscript><img loading="lazy" src="https://public.flourish.studio/visualisation/21916983/thumbnail" width="100%" alt="Stablecoin Volume Increased (+63%) for Base in February" /></noscript></div>
<p class="chart-disclosure">Source: Artemis XYZ as of 2/28/2025. <strong>Past performance is no guarantee of future results. Not intended as a recommendation to buy or sell any securities named herein.</strong></p>
<p>Across all blockchains, key metrics of economic activity were down in February including daily averages in Revenue <strong>(-48%),</strong> DEX Volume <strong>(-27%),</strong> Stablecoin Transfer Volume <strong>(-16%),</strong> and Active Addresses <strong>(-7%).</strong> In fact, if we remove Base from our calculation of Stablecoin Transfer Volumes, who has shown some recent aberrant surges in stablecoin activity, transfer volumes are down <strong>(-42%)</strong> month-to-month. Additionally, the relative share of crypto trading that occurs on blockchain DEXes versus centralized exchanges fell from its all-time high of <strong>20.2% </strong>in January to <strong>19.2%</strong> in February. Activity in some sectors of the on-chain economy declined more than others, as measured by blockchain revenues generated. For example, revenues from DeFi activity on Ethereum slumped <strong>(-80%)</strong> and Solana DeFi activity dropped by <strong>(-65%). </strong></p>
<h2 id="ethereum" class="jump-link-nav anchored-block" data-jumplink-title="Ethereum">Ethereum-Tectonics</h2>
<h3>Average Gas Price in Gwei (1-9 ETH) is down (-88%) YoY</h3>
<div class="flourish-embed flourish-chart" data-src="visualisation/21919290?2428759"><script src="https://public.flourish.studio/resources/embed.js"></script><noscript><img loading="lazy" src="https://public.flourish.studio/visualisation/21919290/thumbnail" width="100%" alt="Average Gas Price in Gwei (1-9 ETH) is down (-88%) YoY" /></noscript></div>
<p class="chart-disclosure">Source: Etherscan as of 2/28/2025.<strong> Past performance is no guarantee of future results. Not intended as a recommendation to buy or sell any securities named herein. </strong></p>
<p>Ethereum has struggled in the current crypto cycle, both in terms of usage and asset valuation. This decline is largely due to the erosion of the core factors that once made Ethereum valuable. Most significantly, Ethereum is no longer the central hub for onchain crypto trading or related revenue-generating activities like trading finance and wallet-to-wallet transfers.</p>
<p>One major reason for this shift is Ethereum&rsquo;s own strategy of encouraging users to move off its Mainnet to Layer 2 (L2) blockchains by expanding and lowering the cost of available blockspace. Additionally, other blockchains have emerged as more efficient and cost-effective alternatives. Due to the mechanics of EIP-1559, a linear decline in Ethereum&rsquo;s usage leads to an exponential drop in gas prices. With demand shifting to L2s and competing blockchains, Ethereum&rsquo;s gas prices have fallen <strong>(-88%),</strong> and its revenue has dropped <strong>(-93%)</strong> over the past year. Currently, the cost of Ethereum blockspace, measured in ETH per gas unit, is at its lowest since mid-2024 in both ETH and dollar terms.</p>
<p>A direct consequence of this reduced demand is that ETH is no longer deflationary. Since ETH is burned as part of transaction fees, lower usage means less ETH is being burned. With crypto activity moving elsewhere, Ethereum's valuation has declined due to reduced expectations for its economic future. Ethereum&rsquo;s share of blockchain revenue has dropped from <strong>55%</strong> in February 2024 to <strong>24%</strong> in February 2025. Furthermore, because Ethereum cannot handle high transaction volumes efficiently, major projects are moving to their own blockchains. These include Uniswap, which accounted for <strong>11%</strong> of Ethereum&rsquo;s revenue, Ondo, an RWA platform managing <strong>~$1B</strong> in assets, and Ethereum Name Service. Ethereum now faces competition from more advanced blockchains with significantly greater processing power and substantial financial and intellectual resources. Without lowering transaction costs, Ethereum&rsquo;s previous fee structure may have accelerated its decline due to the rise of low-cost alternatives.</p>
<p>Another issue is Ethereum&rsquo;s divided vision. It aims to maximize decentralization, serve as a financial infrastructure, and establish ETH as a store-of-value asset. However, many argue that these goals conflict with each other both technically and philosophically. Competing blockchains tend to focus on just one goal: Solana prioritizes transaction execution while Bitcoin focuses on store-of-value. Many argue that this singularity of vision contributed to outperformance against Ethereum. While Ethereum is widely considered the most decentralized blockchain, it is unclear whether this alone justifies ETH&rsquo;s <strong>~$300B</strong> valuation. Recent decisions, such as increasing the gas limit and reducing the validator count in the upcoming Pectra upgrade, suggest Ethereum is already compromising on its decentralization goals.</p>
<h3>Ethereum Mainnet Share of Decentralized Exchange (DEX) Volumes</h3>
<div class="flourish-embed flourish-chart" data-src="visualisation/21920017?2428759"><script src="https://public.flourish.studio/resources/embed.js"></script><noscript><img loading="lazy" src="https://public.flourish.studio/visualisation/21920017/thumbnail" width="100%" alt="Ethereum Mainnet Share of Decentralized Exchange (DEX) Volumes" /></noscript></div>
<p class="chart-disclosure">Source: Artemis XYZ as of 2/28/2025.<strong> Past performance is no guarantee of future results. Not intended as a recommendation to buy or sell any securities named herein. </strong></p>
<p>Despite ETH&rsquo;s anemic price action and economic activity clustering on other blockchains, Ethereum&rsquo;s community has been slow to acknowledge its challenges and even more lethargic in adequately addressing them. This has divided the Ethereum community, leading to infighting and even exodus by some disgruntled members. However, Ethereum&rsquo;s community is shifting focus to address its challenges and the most impactful has been changing Ethereum&rsquo;s execution layer to recapture lost economic activity. In early February, Ethereum&rsquo;s validators increased their capacities to process Ethereum transactions. Ethereum throughput was increased in February by validators who increased gas limits <strong>(+20%)</strong> moving from <strong>30M -&gt; 36M</strong>. Recognizing that this raise is competitively inadequate against current blockchains (Max Recorded TPS: Ethereum <strong>~63</strong> vs Solana <strong>~4,000</strong>) and future chains (TPS: Solana w/Firedancer <strong>100,000+),</strong> Ethereum&rsquo;s leader Vitalik Buterin has called for further <strong>10x</strong><strong> <a target="_blank" title="Vitalik Buterin Argues for 10x Gas Limit Hike on Ethereum" href="https://thedefiant.io/news/blockchains/vitalik-buterin-argues-for-10x-gas-limit-hike-on-ethereum" rel="noopener">increase</a></strong> in gas capacity. Increases in gas capacity arguably make Ethereum less decentralized because of the additional resources needed to run Ethereum&rsquo;s software, due to the gas increase, effectively. For Ethereum to remain competitive going forward, it may need to compromise more on decentralization to favor scaling its Mainnet.</p>
<h3>Even with L2s, Ethereum Throughput Lags Others</h3>
<div class="flourish-embed flourish-chart" data-src="visualisation/21920221?2428759"><script src="https://public.flourish.studio/resources/embed.js"></script><noscript><img loading="lazy" src="https://public.flourish.studio/visualisation/21920221/thumbnail" width="100%" alt="Even with L2s, Ethereum Throughput Lags Others" /></noscript></div>
<p class="chart-disclosure">Source: Chainspect as of 2/28/2025. <strong>Past performance is no guarantee of future results. Not intended as a recommendation to buy or sell any securities named herein.</strong></p>
<p>Ethereum is improving its own blockchain and enhancing the environment for its Layer 2 (L2) blockchains, which act as low-cost extensions that utilize Ethereum&rsquo;s blockspace. In February, the Ethereum Foundation introduced a software upgrade called &ldquo;Intents,&rdquo; designed to improve how L2s interact with each other. This upgrade will provide a smoother transaction experience for users when bridging and making transactions across multiple Ethereum L2 chains.</p>
<p>One of the biggest criticisms of Ethereum is its reliance on bridges, which users must use to move assets between chains. Bridges are often slow, expensive, and have been responsible for billions of dollars in security breaches. They charge high fees and require long wait times, sometimes minutes or hours, for asset transfers. With the introduction of Intents, users may no longer need to rely on bridges, reducing both security risks and transaction delays.</p>
<p>Many Ethereum users anticipate the upcoming "Pectra" upgrade, which is set to launch in March. Pectra is a major update that will bring significant improvements to Ethereum and promises to accomplish the following:</p>
<ol class="content-list">
<li class="mt-2">Increase Ethereum&rsquo;s L2 blob capacity from 3/6 -&gt; 6/12 (EIP-7742)</li>
<li class="mt-2">Increase the Maximum Validator Stake Size from 32 =&gt; 2,048 ETH (EIP-7251)</li>
<li class="mt-2">Improve the Staking Experience (EIP-6110, EIP-7002)</li>
<li class="mt-2">Debut Account Abstraction (EIP-7702)</li>
</ol>
<p>The most significant upgrade in Pectra is the increase in blob space, which will improve Ethereum&rsquo;s Layer 2 (L2) transaction processing capacity. Ethereum L2s operate on their own chains but submit compressed data, called "Blobs," to Ethereum for validation. These Blobs are stored in Ethereum&rsquo;s dedicated "Blob Space." Currently, Ethereum targets <strong>3</strong> and can process up to <strong>6 blobs</strong> <strong>(each 125KB)</strong> every <strong>12 seconds</strong>. With Pectra (EIP-7742), this capacity will double to <strong>6-12</strong> Blobs per cycle, allowing L2s to submit more transactions. This expansion could lower transaction costs for users as increased throughput eases congestion.</p>
<p>Another key upgrade is the increase in the maximum validator stake from <strong>32 ETH</strong> to <strong>2,048 ETH</strong> (EIP-7251). This change will enable large validator entities to consolidate stakes, reducing the total number of validators. Fewer validators mean lower messaging overhead, which could allow Ethereum to process larger blocks of transactions. Additionally, Ethereum could further increase transaction capacity by reducing the time between blocks (blocktime). For example, if blocktime is reduced from <strong>12 seconds</strong> to <strong>6 seconds</strong>, Ethereum could process twice as many transactions.</p>
<p>Other updates in Pectra focus on improving staking security and efficiency. Currently, validator deposits are managed through a bridge between Ethereum&rsquo;s consensus and execution layers, requiring validators to vote on deposit data, which can cause delays and potential failures. Pectra (EIP-6110) will move these deposits directly to the execution layer, cutting processing times from <strong>12 hours</strong> to <strong>13 minutes</strong> while improving security. Additionally, smart contracts will gain the ability to handle validator withdrawals (EIP-7002), giving staking pool operators like Lido more flexibility and allowing users to withdraw their funds without relying solely on the staking operators.</p>
<p>Finally, Pectra will introduce account abstraction (EIP-7702), which enhances how Ethereum handles user accounts and smart contract interactions. This feature aims to make Ethereum transactions more flexible and user-friendly by improving the efficiency of smart contract-based wallets.</p>
<h2 id="solana" class="jump-link-nav anchored-block" data-jumplink-title="Solana">More Solana Drama</h2>
<h3>Solana Decentralized Exchange (DEX) Volumes briefly exceeded Ethereum Ecosystem's</h3>
<div class="flourish-embed flourish-chart" data-src="visualisation/21920523?2428759"><script src="https://public.flourish.studio/resources/embed.js"></script><noscript><img loading="lazy" src="https://public.flourish.studio/visualisation/21920523/thumbnail" width="100%" alt="Solana Decentralized Exchange (DEX) Volumes briefly exceeded Ethereum Ecosystem's" /></noscript></div>
<p class="chart-disclosure">Source: Artemis XYZ as of 2/28/2025. <strong>Past performance is no guarantee of future results. Not intended as a recommendation to buy or sell any securities named herein.</strong></p>
<p>Solana has been the standout performer in the current crypto market cycle, with its token price rising <strong>(+191%),</strong> on-chain revenues (excluding MEV) surging <strong>(+700%),</strong> and stablecoin supply increasing <strong>(+291%)</strong> in 2024. This success is largely due to Solana&rsquo;s low transaction costs (Solana Avg <strong>~$0.05</strong> vs Ethereum Avg <strong>$1.27</strong>) and its ability to handle a high volume of trades. As a result, Solana has become a key hub for on-chain trading, attracting major crypto projects to build on its network.</p>
<p>One of the biggest drivers of Solana&rsquo;s growth has been memecoin trading, which accounts for approximately <strong>80%</strong> of its revenues. The most successful platform for memecoin launches, Pump.fun, operates on Solana. Pump.fun allows users to quickly and cheaply create and trade memecoins, charging a <strong>1%</strong> fee on trading volume. Pump.fun has generated more than <strong>$577M in</strong> fees in just over a year, making it one of the most profitable applications in crypto history. However, memecoin trading is controversial due to concerns over insider manipulation. Some insiders create and market memecoins solely to drive up prices before dumping them on retail investors. Additionally, <em>sophisticated automated traders</em> often <em>&ldquo;snipe&rdquo;</em> well-anticipated memecoin launches, buying tokens before retail traders have a chance. This is similar to the high-frequency trading issues highlighted in Michael Lewis&rsquo;s book *Flash Boys*.</p>
<p>In February, Solana suffered significant losses due to a collapse in memecoin trading. The impact was severe, with stablecoin transfers&mdash;the backbone of on-chain trading&mdash;plummeting <strong>(-80%) </strong>from January levels. Solana&rsquo;s price decline reflected this drop in fundamental activity. Key trading metrics also saw sharp declines: DEX volumes fell <strong>(-55%),</strong> fees collected dropped <strong>(-63%), </strong>and MEV activity decreased <strong>(-63%).</strong></p>
<p>Despite this downturn, Solana has several upcoming protocol upgrades, known as SIMDs, to improve its technical capabilities and economic framework. These changes could help stabilize and enhance Solana&rsquo;s position in the crypto ecosystem moving forward.</p>
<h3>Priority Fees are the Highest Share of Solana Revenues</h3>
<div class="flourish-embed flourish-chart" data-src="visualisation/21920754?2428759"><script src="https://public.flourish.studio/resources/embed.js"></script><noscript><img loading="lazy" src="https://public.flourish.studio/visualisation/21920754/thumbnail" width="100%" alt="Priority Fees are the Highest Share of Solana Revenues" /></noscript></div>
<p class="chart-disclosure">Source: Blockworks as of 3/3/2025. <strong>Past performance is no guarantee of future results. Not intended as a recommendation to buy or sell any securities named herein.</strong></p>
<p>Solana recently implemented <strong>SIMD 096</strong> on February 12, which changed its fee burn policy to direct <strong>100%</strong> of priority fees to validators. Previously, <strong>50%</strong> of these fees were burned, while the other half was shared between validators and their stakers. This change benefits stakers by increasing their rewards while discouraging offchain deals between traders and validators. Previously, validators were incentivized to engage in private trading agreements to bypass on-chain fees. With all priority fees now going to validators, they have a stronger economic reason to ensure trading occurs on-chain.</p>
<p>Another proposal, <strong>SIMD 0123</strong>, is awaiting a vote and would create an in-protocol mechanism to distribute Solana&rsquo;s priority fees to validator stakers. Currently, validators must share voting rewards and MEV fees with stakers, but they are not required to remit priority fees, which account for <strong>40%</strong> of all Solana fees. In practice, some validators send a portion of priority fees to stakers, but most keep the majority. If <strong>SIMD 0123</strong> passes, validators will have to distribute these fees to stakers based on an onchain verifiable commission rate. This would shift more revenue to stakers while reducing validator earnings.</p>
<p>The most impactful proposal under consideration is <strong>SIMD 0228</strong>, which aims to adjust Solana&rsquo;s inflation rate based on the percentage of SOL staked. Currently, <strong>about 63.4%</strong> of the total SOL supply is staked, and Solana's inflation rate stands at <strong>4.7%</strong>, decreasing <strong>15% annually</strong> until it reaches a floor of <strong>1.5%</strong>.</p>
<p>Under SIMD 0228, inflation would decrease as staking participation increases, reducing dilution and lowering selling pressure from stakers who treat staking rewards as income. Conversely, if staking participation drops, inflation would rise to incentivize more staking and maintain network security.<br />For example:</p>
<ul class="content-list">
<li class="mt-2">If <strong>63% of SOL is staked</strong>, inflation would adjust to <strong>0.93%</strong>.</li>
<li class="mt-2">If <strong>65% of SOL is staked</strong>, inflation would be approximately <strong>0.87%</strong>.</li>
<li class="mt-2">If <strong>50% of SOL is staked</strong>, inflation would be approximately <strong>1.32%</strong>.</li>
</ul>
<p>This mechanism aims to balance token issuance with staking demand, helping to sustain network security while minimizing unnecessary dilution. <strong>The vote on SIMD 0228 is scheduled for epoch 753, starting on March 6, 2025</strong>.</p>
<p>These three proposals have generated significant controversy due to their expected impact on validator revenues. Some estimates suggest validator earnings could decrease by as much as <strong>95%,</strong> making operations unsustainable for smaller validators. Running a Solana validator requires covering fixed costs, including voting fees of approximately <strong>1.1 SOL</strong> per day <strong>($58,000 per year</strong>) and hardware expenses of about <strong>$6,000</strong> per year. Currently, Solana has <strong>1,323</strong> validators, but only <strong>458 </strong>have enough stake (more than <strong>100,000 SOL</strong>) to surpass the basic profitability threshold. If smaller validators shut down, the network may become more centralized around large institutional entities such as Coinbase and Binance. Some community members propose reducing the cost of voting as a potential solution to help validators remain financially viable. But foundationally, it is difficult to assess what the correct number of validators is to sustain a decentralized network, and we leave such decisions to the market.</p>
<p>While these changes may reduce staking rewards, we believe lowering inflation is a worthy goal that strengthens Solana&rsquo;s long-term sustainability. Maintaining a predictable and low inflation rate can support SOL&rsquo;s value by reducing dilution and sell pressure. We support the team&rsquo;s willingness to experiment with different economic models and adjust course if necessary to balance incentives and network health over time.</p>
<h2 id="bybit-hack" class="jump-link-nav anchored-block" data-jumplink-title="Bybit Hack">Bybit Hack</h2>
<h3>Largest Hack Ever: Bybit Losses Are &gt;2x Previous Record Heists</h3>
<div class="flourish-embed" data-src="story/2947845?2429379"><script src="https://public.flourish.studio/resources/embed.js"></script><noscript><img loading="lazy" src="https://public.flourish.studio/story/2947845/thumbnail" width="100%" alt="visualization" /></noscript></div>
<p class="chart-disclosure">Source: DeFiLlama, Elliptic as of 2/25/2025. <strong>Past performance is no guarantee of future results. Not intended as a recommendation to buy or sell any securities named herein.</strong></p>
<h2>Backstory</h2>
<p>On February 21, 2025, Dubai-based cryptocurrency exchange Bybit suffered a massive security breach, resulting in the largest crypto heist in history. Approximately <strong>401,000 ETH</strong> was stolen, valued at over <strong>$1.4B</strong>. Initial investigations suggest a combination of social engineering and infrastructure compromise enabled the exploit, not technical vulnerabilities in the software, which differs from some crypto attacks that exploit coding flaws.</p>
<p>The culprit? On-chain analytics from Chainalysis reveal that laundered proceeds have been consolidated into addresses linked to previous attacks by North Korea&rsquo;s Lazarus Group, an entity commonly believed to be state-sponsored by the DPRK government. Chainalysis reports Lazarus Group stole <strong>$660.5M</strong> across 20 incidents in 2023 and <strong>$1.34B</strong> across 47 incidents in 2024, with the Bybit heist alone surpassing the 2024 total.</p>
<h2>How it Happened</h2>
<p>Bybit stored some of its funds in a widely used crypto security tool called Safe(Wallet), which requires multiple approvals (multi-signature) to move funds. This is similar to banks requiring multiple authorizations for large transactions. Hackers exploited a weakness in Safe (Wallet)&rsquo;s backend infrastructure, allowing them to secretly alter transactions as they were being processed.</p>
<p>Instead of directly hacking Bybit&rsquo;s wallets, the attackers gained access to Safe{Wallet}&rsquo;s cloud storage system (AWS S3), where important software files were stored. According to Safe itself, this was accomplished by compromising a Safe employee&rsquo;s computer. Using the hacked computer, the attackers modified a critical script that processed transactions, inserting hidden code that changed transaction details in real-time. This allowed them to replace Bybit&rsquo;s legitimate security checks with a fraudulent version, making it appear as if the transactions were approved normally.</p>
<p>Because the fraudulent code was embedded in Safe (Wallet)&rsquo;s legitimate website, Bybit&rsquo;s security team and signers unknowingly approved legitimate-looking transactions that had been secretly altered on the backend. The attack was designed to activate only for specific accounts, such as Bybit&rsquo;s, allowing the hackers to divert funds without triggering alarms.</p>
<p>It is crucial to understand how blind signing contributed to this exploit. During the attack, Bybit&rsquo;s signers used Safe(Wallet)&rsquo;s web interface, which falsely displayed the intended transaction addresses and URL but masked the true, signing details to hide the malicious changes. This reliance on the web frontend led to blind signing&mdash;approving transactions without seeing their real content&mdash;because hardware wallets like Ledger couldn&rsquo;t fully display Safe (Wallet)&rsquo;s transaction details, forcing signers to depend on the compromised interface instead of secure devices. This vulnerability bypassed a key security benefit of hardware wallets: their air-gapped design, which keeps them offline and immune to online hacking, ultimately enabling the hackers&rsquo; deception.</p>
<p><img loading="lazy" src="https://www.vaneck.com/contentassets/cd8e0c5ad47b49e5bf93d4dfbc73efeb/how-it-happened.png" class="img-responsive w-100" alt="How it Happened" /></p>
<p class="chart-disclosure">Source: Ledger as of 02/26/2025.<strong> Not intended as a recommendation to buy or sell any securities named herein.</strong></p>
<p>Had the signers been able to verify human-readable transaction details on their Ledger devices, instead of blindly approving hexadecimal data, this exploit likely would have been prevented.</p>
<h2>Execution and Fallout</h2>
<p>Once the malicious contract was approved, the attackers leveraged hidden backdoor functions, specifically sweepETH and sweepERC20, to drain Bybit&rsquo;s cold wallet. The stolen assets were then distributed across multiple wallets, a tactic associated with sophisticated threat actors such as North Korea&rsquo;s Lazarus Group.</p>
<p>Following the hack, Bybit temporarily halted certain wallet operations, including suspending Safe{Wallet} smart wallet functions to ensure platform security, as confirmed by the exchange. This led to significant operational disruptions, with users withdrawing approximately <strong>$5.5B</strong> in a single day, primarily from institutional accounts, causing delays in fund transfers. Bybit quickly replenished its reserves, securing nearly <strong>447,000 ETH</strong> through emergency loans and large deposits from firms like Galaxy Digital and Wintermute, and maintained withdrawals open, but the incident rattled investor confidence, prompting a sharp drop in Ethereum and broader crypto market prices.</p>
<p>To restore trust, Bybit accelerated plans to enhance its security infrastructure, moving the majority of funds out of Safe (Wallet) cold wallets and evaluating alternative custody solutions, such as potentially requiring secure devices for transaction verification. Regulatory scrutiny has intensified, with the Singapore government and the U.S. FBI taking the issue seriously, investigating North Korea&rsquo;s Lazarus Group&rsquo;s role. The hack has also spurred a market-wide sell-off, with Bitcoin and Ethereum prices falling significantly, and some users shifting funds to self-custody, reflecting heightened concerns about centralized exchanges&rsquo; security.</p>
<p>However, Bybit has since engaged forensic investigators and has assured customers that funds remain secure, implying that the losses were from corporate reserves rather than user funds.<br />Further analysis found that the malicious JavaScript modifications were timestamped February 19, 2025, indicating that the attackers had infiltrated Safe(Wallet)&rsquo;s infrastructure days before executing the attack.</p>
<p>This breach highlights the risks of multi-signature wallets that depend on third-party systems and reinforces concerns among crypto advocates about centralized exchanges like Bybit. It also strengthens the case for safeguards such as local multisig applications (instead of Safe{Wallet}&rsquo;s web interface) and adopting open-source tools like pcaversaccio&rsquo;s <em>safe-tx-hash-util </em><strong><a target="_blank" title="github repository - pcaversaccio" href="https://github.com/pcaversaccio/safe-tx-hashes-util" rel="noopener">script</a></strong>. By leveraging<strong> <a target="_blank" title="EIP-712: Typed structured data hashing and signing" href="https://eips.ethereum.org/EIPS/eip-712" rel="noopener">ERC-712</a></strong> standards, such tools enable users to verify transaction details, reducing the risk of relying on blind signing.</p>
<h2 id="notable-performer" class="anchored-block">February&rsquo;s Notable Performer &ndash; Sonic (S) (+21%)</h2>
<h3>Sonic &amp; Berachain Led Trading Volumes Among Sub-$5B L1s in February</h3>
<div class="flourish-embed flourish-chart" data-src="visualisation/21921093?2428759"><script src="https://public.flourish.studio/resources/embed.js"></script><noscript><img loading="lazy" src="https://public.flourish.studio/visualisation/21921093/thumbnail" width="100%" alt="Sonic &amp; Berachain Led Trading Volumes Among Sub-$5B L1s in February" /></noscript></div>
<p class="chart-disclosure">Source: DeFiLlama as of 02/2/2025. <strong>Past performance is no guarantee of future results. Not intended as a recommendation to buy or sell any securities named herein.</strong></p>
<p>Sonic (S), the rebranded evolution of Fantom, outperformed the broader altcoin market in February, gaining <strong>21%</strong> MoM after experiencing a <strong>~70% </strong>peak-to-trough drawdown in January from its December highs. The token&rsquo;s decline in December and January was driven by investor uncertainty following its transition from Fantom (FTM) to Sonic (S), such as Binance&rsquo;s delisting of FTM. However, February saw a recovery in sentiment, supported by rising DEX volumes, increasing onchain activity, and renewed investor interest&mdash;driven particularly, in our view, by an airdrop scheduled for June.</p>
<h2>Fantom vs. Sonic</h2>
<p>As Fantom, the network saw significant adoption during the 2021-2022 bull market, reaching over <strong>$10B in</strong> Total Value Locked (TVL) by October 2021. It&rsquo;s Opera network, capable of 200 transactions per second (TPS) and sub-600ms finality, provided an early advantage over Ethereum&rsquo;s <strong>12</strong> TPS and ~60-second finality at the time. Much of this growth was attributed to Andre Cronje, the founder of Yearn Finance, whose departure in February 2022&mdash;later linked to SEC-related pressures&mdash;marked a shift in momentum. Cronje&rsquo;s exit marked a turning point for Fantom, as it lost a key figurehead and a leader known for driving the project's vision and innovation. As bear market conditions worsened, Layer-1 alternatives such as Solana and Avalanche and Ethereum&rsquo;s Layer-2 ecosystem further challenged the network&rsquo;s position, eroding its mindshare as a high-throughput ecosystem.</p>
<p>Sonic&rsquo;s migration, completed in January 2025, was intended to reestablish its competitive standing. The upgrade introduced a new Layer-1 blockchain with increased scalability&mdash;which claims <strong>10,000 TPS</strong> and sub-1-second finality&mdash;alongside a 1:1 token swap from FTM to S.</p>
<h2>Sonic&rsquo;s Differentiation in 2025</h2>
<p>February&rsquo;s rally signals renewed confidence in Sonic&rsquo;s ecosystem expansion. TVL surpassed <strong>$1B</strong> on February 20<sup>th</sup>, increasing ~<strong>413%</strong> from <strong>$195M</strong> just one month prior. Similarly, weekly DEX trading volumes grew <strong>459%</strong>, from <strong>$152M</strong> in mid-January to <strong>$850M</strong> in mid-February, stealing market share from other alt-L1s like Mantle and competing with the highly anticipated Berachain launch, which has seen similar DEX volumes.</p>
<p>Sonic&rsquo;s unique developer incentives have likely contributed to this momentum. Its Fee Monetization (FeeM) program allows approved applications to earn up to <strong>90%</strong> of their users' transaction fees, creating a new revenue model for developers​. Unlike traditional Layer-1 fee structures that primarily reward validators, Sonic&rsquo;s FeeM model is inspired by Web2 ad-revenue systems (e.g., YouTube), enabling app developers to more directly share in the upside from the network adoption they bring</p>
<p>To attract retail demand, Sonic is conducting a <strong>190.5M</strong> S token airdrop (~<strong>$132M</strong> at current prices), driving increased participation. Anticipation of free tokens has likely fueled February&rsquo;s buying pressure as users position for eligibility. To discourage short-term speculation, only <strong>25%</strong> of the airdrop is immediately claimable to discourage short-term speculation, while the remaining <strong>75%</strong> vests over 270 days. Early claims incur steep, linearly decreasing penalties&mdash;<strong>90%</strong> after 30 days, <strong>80%</strong> after 60 days, tapering to <strong>0%</strong> at full vesting.</p>
<p><strong>Links to third party websites are provided as a convenience and the inclusion of such links does not imply any endorsement, approval, investigation, verification or monitoring by us of any content or information contained within or accessible from the linked sites. By clicking on the link to a non-VanEck webpage, you acknowledge that you are entering a third-party website subject to its own terms and conditions. VanEck disclaims responsibility for content, legality of access or suitability of the third-party websites.</strong></p>
<p>To receive more <strong><a href="https://www.vaneck.com/us/en/insights/digital-assets/" title="Digital Assets Insights">Digital Assets</a></strong> insights, <strong><a href="https://www.vaneck.com/us/en/subscribe/" title="Subscription Center">sign up in our subscription center</a></strong>.</p>
]]></content:encoded>
</item><item rdf:about="https://www.vaneck.com/us/en/blogs/thematic-investing/ai-driven-semiconductor-growth/">
  <title>AI-Driven Semiconductor Growth></title>
  <link>https://www.vaneck.com/us/en/blogs/thematic-investing/ai-driven-semiconductor-growth/</link>
  <description><![CDATA[Following Nvidia&rsquo;s recent earnings report, we discuss the rapid evolution of AI-driven semiconductor demand and the broader implications for the semiconductor industry and investors.]]></description>
  <dc:creator>Nick Frasse</dc:creator>
  <dc:date>03/04/2025 06:30:00</dc:date>
<content:encoded><![CDATA[

<p>In our latest semiconductor outlook discussion, we broke down the latest shifts in AI-driven semiconductor demand, Nvidia&rsquo;s evolving role, and what these trends mean for investors. Here are our top three takeaways:</p>
<ol class="content-list">
<li class="mt-2"><strong>AI model development is moving faster than expected:</strong> AI model specialization and monetization are accelerating, reshaping semiconductor demand.</li>
<li class="mt-2"><strong>Hyperscalers are restructuring AI infrastructure:</strong> Major players like AWS, Meta, and Microsoft are rapidly optimizing their AI compute strategies, influencing semiconductor investment and CAPEX allocation.</li>
<li class="mt-2"><strong>The semiconductor opportunity continues to broaden:</strong> Nvidia remains dominant, but the evolving AI landscape is creating new demand across GPUs, ASICs, and custom silicon, benefiting a wider range of semiconductor players.</li>
</ol>
<div class="row mb-3">
<div class="col-md-4 col-xs-12"><a href="https://www.youtube.com/embed/XQPuYssQvcc" data-video="https://youtu.be/XQPuYssQvcc" class="popup-youtube" title="Watch Video"><img loading="lazy" class="img-responsive" style="margin-right: 15px; margin-top: 0px;" src="https://www.vaneck.com/EPiServer/CMS/Content/contentassets/en/d205c5b71bf14b24bc659698b3e4e3d9/5407_2025-q1-semis-nvidia-video_thumbnail_2025-2_v1.jpg,,312244/Download?epieditmode=False" alt="Watch Video" align="left" /></a></div>
<div class="col-md-8 col-xs-12"><br /><strong><a href="https://www.youtube.com/embed/XQPuYssQvcc" data-video=" https://youtu.be/XQPuYssQvcc" class="popup-youtube" title="Watch Video">Watch Video</a><br /></strong><a href="https://www.youtube.com/embed/XQPuYssQvcc" data-video="https://youtu.be/XQPuYssQvcc" class="popup-youtube" title="Watch Video" style="font-size: 16px; font-weight: bold; padding: 10px 0px 0px; margin-right: 20px; width: 202px;">Nvidia Earnings Breakdown and the Next Phase of Semiconductor Growth</a></div>
</div>
<h2>1. AI Models Are Scaling and Optimizing at the Same Time</h2>
<p>The conversation started with the recent AI breakthroughs from DeepSeek and X AI/Grok. Initially, DeepSeek&rsquo;s efficiency gains sparked concerns that AI compute scaling might slow. However, Nvidia&rsquo;s latest results reaffirm that scaling laws are still intact, particularly for US-based operators. The key takeaway? AI still requires significant semiconductor hardware, whether through scaling (GPUs) or optimization (custom silicon and ASICs).</p>
<h2>2. Hyperscalers Are Monetizing AI Faster Than Expected</h2>
<p>AI monetization has moved beyond expectations, with Meta exceeding forecasts and OpenAI, Microsoft, and AWS carving out distinct AI business models. Rather than competing for the same customers, each is building its own lane, reinforcing demand for different semiconductor solutions. Faster monetization likely translates to higher overall CAPEX spending, benefiting the semiconductor supply chain.</p>
<h2>3. Reevaluating Nvidia&rsquo;s Position in a Broader Semi Landscape</h2>
<p>Nvidia remains the dominant AI chip provider, but the discussion highlighted how AI infrastructure is being unbundled. Hyperscalers are ramping up custom silicon efforts (Amazon&rsquo;s Tranium, Google&rsquo;s TPU, Meta&rsquo;s in-house chips), and market share definitions are shifting as AI compute needs fragment. While Nvidia remains a major player, the broader semiconductor ecosystem is expanding, creating more opportunities across different chip architectures. The <a href="/link/39c8d235748b4c26a5930c31d3ac0160.aspx" title="SMH - VanEck Semiconductor ETF - Overview"><strong>VanEck Semiconductor ETF (SMH)</strong></a> and the <a href="/link/9b8fb1812bc74764bf11fc85767838f9.aspx" title="SMHX - VanEck Fabless Semiconductor ETF - Overview"><strong>VanEck Fabless Semiconductor ETF (SMHX)</strong></a> both offer a diversified ETF approach to capture opportunities across the entire industry.</p>

<h2>4. Case Study: ARM and the Acceleration of AI at the Edge</h2>
<p>One of the biggest surprises of the quarter was how quickly AI is being integrated into mobile devices. ARM&rsquo;s licensing revenue has surged as companies like Apple, Qualcomm, and MediaTek adopt its ARMv9 architecture to power AI workloads at the edge. This rapid adoption suggests AI compute is moving beyond just data centers, creating a new growth driver for semiconductors outside traditional GPU markets.</p>
<h2>5. The Geopolitical Factor: Intel, TSMC, and US-China Dynamics</h2>
<p>The discussion also touched on Intel&rsquo;s struggles, TSMC&rsquo;s strategic position, and the long-term implications of US semiconductor policy. With China accelerating its domestic semiconductor efforts and the US relying heavily on Taiwan-based manufacturing, the semiconductor supply chain remains a key area of geopolitical focus.</p>
<h2>Final Thoughts from the Past Quarter</h2>
<p>The pace of AI innovation continues to exceed expectations, reinforcing demand across various segments of the semiconductor industry. While Nvidia remains a leader, the broader opportunity in AI-driven semiconductors is expanding beyond just GPUs, creating new investment considerations.</p>
<p>As always, our focus remains on mapping these industry shifts as they happen&mdash;understanding not just where the market is today but how it is reflexively evolving.</p>
<p>Stay tuned for our next update as we continue to track these developments.</p>

<p>To receive more <a href="https://www.vaneck.com/us/en/insights/thematic-investing/" title="Thematic Investing Insights"><strong>Thematic Investing</strong></a> insights, <a href="https://www.vaneck.com/us/en/subscribe/" title="Subscription Center"><strong>sign up in our subscription center</strong></a>.</p>
]]></content:encoded>
</item><item rdf:about="https://www.vaneck.com/us/en/blogs/moat-investing/a-wide-moat-focus-provides-differentiation/">
  <title>A Wide Moat Focus Provides Differentiation></title>
  <link>https://www.vaneck.com/us/en/blogs/moat-investing/a-wide-moat-focus-provides-differentiation/</link>
  <description><![CDATA[Many investors may be unknowingly doubling down on mega-cap stocks, but the Moat Index&rsquo;s approach may offer performance and diversification benefits relative to major U.S. equity indexes.]]></description>
  <dc:creator> </dc:creator>
  <dc:date>03/03/2025 06:30:00</dc:date>
<content:encoded><![CDATA[

<p>With the proliferation of mega-cap exposure across investor portfolios, the Morningstar Wide Moat Focus Index (the &ldquo;Moat Index&rdquo;) provides important diversification relative to major U.S. equity indexes. This differentiation is driven by its focus on high quality, attractively valued companies and its equally weighted approach.</p>
<p>The Moat Index philosophy has provided attractive exposures while also providing compelling long-term results that have come without doubling down on the largest companies by market cap, such as the &ldquo;Magnificent 7&rdquo;. Over the long-term, the combination of strong performance and diversification benefits has made the strategy appealing to many.</p>
<p>This Morningstar report highlights how common wide moat-rated companies are within popular U.S. large cap equity indexes and examines the Moat Index&rsquo;s appeal as a complement to broad market exposure. The Moat Index&rsquo;s focus on attractive valuations is what can give this systematic strategy its contrarian bias, by leading it to out-of-favor moat stocks trading well below their intrinsic value. The strategy has long offered diversification benefits while historically providing a compelling risk/reward profile, in spite of its lack of exposure to mega cap tech and other leading exposures in the S&amp;P 500 Index.</p>

<p>Access this strategy with the <a href="/link/9e43dd198c5f4e419f13220685081895.aspx" title="MOAT - VanEck Morningstar Wide Moat ETF"><strong>VanEck Morningstar Wide Moat ETF (MOAT)</strong></a> and <a href="/link/ca0b4e316f1c4e1985e2d0b7d293f0e4.aspx" title="VanEck Morningstar Wide Moat Fund - Class Z"><strong>VanEck Morningstar Wide Moat Fund</strong></a>, which seek to replicate as closely as possible, before fees and expenses, the price and yield performance of the Morningstar Wide Moat Focus&nbsp;Index.</p>

<p>To receive more <a href="https://www.vaneck.com/us/en/insights/moat-investing" title="Moat Investing Insights"><strong>Moat Investing</strong></a> insights, <a href="https://www.vaneck.com/us/en/subscribe/" title="Subscription Center"><strong>sign up in our subscription center</strong></a>.</p>
]]></content:encoded>
</item><item rdf:about="https://www.vaneck.com/us/en/blogs/thematic-investing/nvidia-single-stock-risk/">
  <title>Managing Nvidia’s Single-Stock Risk through Diversified Semiconductor Exposure></title>
  <link>https://www.vaneck.com/us/en/blogs/thematic-investing/nvidia-single-stock-risk/</link>
  <description><![CDATA[The semiconductor industry is quickly evolving, and spreading exposure across multiple players helps navigate volatility and competitive shifts while capturing long-term growth opportunities.]]></description>
  <dc:creator>Nick Frasse</dc:creator>
  <dc:date>02/27/2025 06:30:00</dc:date>
<content:encoded><![CDATA[

<p>Semiconductors are at the core of global innovation, powering advancements in artificial intelligence, cloud computing, autonomous vehicles, and more. As demand for these technologies accelerates, the semiconductor industry is expected to remain a key driver of economic and technological growth.</p>
<p>Nvidia has played a crucial role in AI and high-performance computing, with its GPUs widely used for AI model training and data center applications. Nvidia&rsquo;s leadership in the AI-driven economy has fueled strong performance, attracting significant investor interest. While Nvidia remains a dominant force, history has shown that even the most successful companies can experience volatility, competitive shifts, and extended periods of underperformance.</p>

<h2>DeepSeek Revealed Single-Stock Risk in Semiconductors</h2>
<p>Recent developments in AI, including the release of DeepSeek&rsquo;s new model, have highlighted how quickly the landscape can evolve. The semiconductor sector is complex, with innovation coming from multiple companies across chip design, manufacturing, and AI acceleration. While Nvidia continues to be a major player, other companies are shaping the future of semiconductors, and competitive dynamics will likely continue to shift.</p>
<p>We have seen similar scenarios with past market leaders that defined their industries but eventually faced volatility and shifting market dynamics. During the dot-com boom, Cisco was at the forefront of the internet revolution, much like Nvidia is leading the AI movement today. Cisco played a critical role in data center infrastructure, just as Nvidia&rsquo;s GPUs are essential for AI computing. However, after a massive run-up, Cisco&rsquo;s stock struggled to maintain momentum, and those who diversified into broader tech exposure saw better long-term outcomes.</p>
<p>More recently, Moderna experienced a sharp rise during the COVID-19 pandemic as its mRNA vaccine technology became a game-changer in biotech. While the company remains relevant, its stock faced a significant pullback once vaccine demand normalized. In both cases, investors who locked in gains and rotated into diversified sector ETFs captured continued growth without the risks of single-stock concentration.</p>
<h3>Risk Reward of SMH vs. NVDA</h3>
<img loading="lazy" alt="Risk Reward of SMH vs. NVDA" class="img-responsive w-100" src="https://www.vaneck.com/contentassets/c1f44600f88a4e689082fc2f93af8aee/5397_smhx-diversification_chart-1_2025-3_v4_blog_new_blog.svg" />
<p class="chart-disclosure">Source: Morningstar as of 2/21/2025. Past performance is no guarantee of future results.</p>
<h3>Average Annual Total Returns<sup>*</sup>&nbsp;(%)</h3>
<div class="wrapped-div">
<table style="width: 100%;">
<tbody>
<tr class="tbl-data">
<td class="tbl-header last" colspan="9">As of 12/31/2024</td>
</tr>
<tr class="tbl-data">
<td class="data-head last text-left">&nbsp;</td>
<td class="data-head last text-right">1 MO</td>
<td class="data-head last text-right">3 MO</td>
<td class="data-head last text-right">YTD</td>
<td class="data-head last text-right">1 YR</td>
<td class="data-head last text-right">3 YR</td>
<td class="data-head last text-right">5 YR</td>
<td class="data-head last text-right">10 YR</td>
<td class="data-head last text-right">LIFE<br />12/20/11</td>
</tr>
<tr class="tbl-data">
<td class="data-td last text-left">SMH (NAV)</td>
<td class="data-td data last text-right">0.44</td>
<td class="data-td data last text-right">-0.89</td>
<td class="data-td data last text-right">39.10</td>
<td class="data-td data last text-right">17.04</td>
<td class="data-td data last text-right">28.77</td>
<td class="data-td data last text-right">25.78</td>
<td class="data-td data last text-right">25.33</td>
</tr>
<tr class="tbl-data">
<td class="data-td last text-left">SMH (Share Price)</td>
<td class="data-td data last text-right">0.44</td>
<td class="data-td data last text-right">-0.92</td>
<td class="data-td data last text-right">39.08</td>
<td class="data-td data last text-right">17.04</td>
<td class="data-td data last text-right">28.79</td>
<td class="data-td data last text-right">25.77</td>
<td class="data-td data last text-right">25.30</td>
</tr>
<tr class="tbl-data">
<td class="data-td last text-left">MVSMHTR (Index)</td>
<td class="data-td data last text-right">0.46</td>
<td class="data-td data last text-right">-0.83</td>
<td class="data-td data last text-right">39.41</td>
<td class="data-td data last text-right">17.19</td>
<td class="data-td data last text-right">28.91</td>
<td class="data-td data last text-right">25.86</td>
<td class="data-td data last text-right">25.34</td>
</tr>
<tr class="tbl-data">
<td class="data-td last text-left">Performance Differential (NAV - Index)</td>
<td class="data-td data last text-right">-0.02</td>
<td class="data-td data last text-right">-0.06</td>
<td class="data-td data last text-right">-0.31</td>
<td class="data-td data last text-right">-0.15</td>
<td class="data-td data last text-right">-0.14</td>
<td class="data-td data last text-right">-0.08</td>
<td class="data-td data last text-right">-0.01</td>
</tr>
</tbody>
</table>
</div>
<p class="chart-disclosure"><sup>*</sup>Returns less than one year are not annualized.</p>
<p class="chart-disclosure"><strong>The performance data quoted represents past performance. Past performance is not a guarantee of future results. Investment return and principal value of an investment will fluctuate so that an investor's shares, when redeemed, may be worth more or less than their original cost. Performance may be lower or higher than performance data quoted. Please call 800.826.2333 or visit vaneck.com for performance current to the most recent month ended.</strong></p>
<p class="chart-disclosure">SMH Gross and Net Expense Ratio is 0.35%. Van Eck Associates Corporation (the &ldquo;Adviser&rdquo;) will pay all expenses of the Fund, except for the fee payment under the investment management agreement, acquired fund fees and expenses, interest expense, offering costs, trading expenses, taxes and extraordinary expenses. Notwithstanding the foregoing, the Adviser has agreed to pay the offering costs until at least February 1, 2026.</p>
<h2>The Case for a Diversified Approach to Semiconductors</h2>
<p>For investors focused on the long-term potential of semiconductors, broadening exposure may provide a more balanced way to participate in the industry&rsquo;s continued growth rather than relying on a single stock. Semiconductors extend beyond any one company&mdash;while Nvidia is a leader, companies such as AMD, ARM, TSMC, Broadcom, and Qualcomm are also advancing the sector.</p>
<p>Additionally, 15 out of 25 holdings in the <a href="/link/39c8d235748b4c26a5930c31d3ac0160.aspx" title="SMH - VanEck Semiconductor ETF - Holdings and Performance"><strong>VanEck Semiconductor ETF (SMH)</strong></a> are Wide Moat companies, representing nearly 30% of the fund, reinforcing exposure to industry leaders. Meanwhile, the <a href="/link/9b8fb1812bc74764bf11fc85767838f9.aspx" title="SMHX - VanEck Fabless Semiconductor ETF - Holdings and Performance"><strong>VanEck Fabless Semiconductor ETF (SMHX)</strong></a> provides a blend of both Wide and Narrow Moat companies, with 50% of its holdings classified as such (6 Wide Moat, 5 Narrow Moat) as defined by Morningstar, ensuring investors are not only diversified but also invested in the strongest players in the space.</p>
<p>Semiconductor technology is evolving rapidly, with new developments and competitors emerging. A broader strategy may help capture the next generation of industry leaders. Even the strongest companies can experience significant price swings due to market cycles, changing demand, and external pressures. Spreading exposure across multiple companies may help reduce the impact of individual stock volatility.</p>
<h3>SMH &amp; SMHX Top 10 Holdings and Weight</h3>
<div class="wrapped-div">
<table style="width: 100%;">
<tbody>
<tr class="tbl-data">
<td class="tbl-header last" colspan="3">SMH</td>
<td class="tbl-header last">&nbsp;</td>
<td class="tbl-header last" colspan="3">SMHX</td>
</tr>
<tr class="tbl-data">
<td class="data-head last text-left">Name</td>
<td class="data-head last text-left">Ticker</td>
<td class="data-head last text-right">Weight (%)</td>
<td class="data-head last text-left">&nbsp;</td>
<td class="data-head last text-left">Name</td>
<td class="data-head last text-left">Ticker</td>
<td class="data-head last text-right">Weight (%)</td>
</tr>
<tr class="tbl-data">
<td class="data-td data last text-left">NVIDIA Corp</td>
<td class="data-td data last text-left">NVDA</td>
<td class="data-td data last text-right">19.14</td>
<td class="data-td data last text-left">&nbsp;</td>
<td class="data-td data last text-left">NVIDIA Corp</td>
<td class="data-td data last text-left">NVDA</td>
<td class="data-td data last text-right">19.80</td>
</tr>
<tr class="tbl-data">
<td class="data-td data last text-left">Taiwan Semiconductor Manufacturing Co</td>
<td class="data-td data last text-left">TSM</td>
<td class="data-td data last text-right">11.87</td>
<td class="data-td data last text-left">&nbsp;</td>
<td class="data-td data last text-left">Broadcom Inc</td>
<td class="data-td data last text-left">AVGO</td>
<td class="data-td data last text-right">18.27</td>
</tr>
<tr class="tbl-data">
<td class="data-td data last text-left">Broadcom Inc</td>
<td class="data-td data last text-left">AVGO</td>
<td class="data-td data last text-right">9.27</td>
<td class="data-td data last text-left">&nbsp;</td>
<td class="data-td data last text-left">Qualcomm Inc</td>
<td class="data-td data last text-left">QCOM</td>
<td class="data-td data last text-right">5.35</td>
</tr>
<tr class="tbl-data">
<td class="data-td data last text-left">ASML Holding NV</td>
<td class="data-td data last text-left">ASML</td>
<td class="data-td data last text-right">4.95</td>
<td class="data-td data last text-left">&nbsp;</td>
<td class="data-td data last text-left">Monolithic Power Systems Inc</td>
<td class="data-td data last text-left">MPWR</td>
<td class="data-td data last text-right">4.91</td>
</tr>
<tr class="tbl-data">
<td class="data-td data last text-left">Qualcomm Inc</td>
<td class="data-td data last text-left">QCOM</td>
<td class="data-td data last text-right">4.65</td>
<td class="data-td data last text-left">&nbsp;</td>
<td class="data-td data last text-left">ARM Holdings PLC</td>
<td class="data-td data last text-left">ARM</td>
<td class="data-td data last text-right">4.67</td>
</tr>
<tr class="tbl-data">
<td class="data-td data last text-left">Texas Instruments Inc</td>
<td class="data-td data last text-left">TXN</td>
<td class="data-td data last text-right">4.56</td>
<td class="data-td data last text-left">&nbsp;</td>
<td class="data-td data last text-left">Marvell Technology Inc</td>
<td class="data-td data last text-left">MRVL</td>
<td class="data-td data last text-right">4.32</td>
</tr>
<tr class="tbl-data">
<td class="data-td data last text-left">Applied Materials Inc</td>
<td class="data-td data last text-left">AMAT</td>
<td class="data-td data last text-right">4.40</td>
<td class="data-td data last text-left">&nbsp;</td>
<td class="data-td data last text-left">Advanced Micro Devices Inc</td>
<td class="data-td data last text-left">AMD</td>
<td class="data-td data last text-right">4.32</td>
</tr>
<tr class="tbl-data">
<td class="data-td data last text-left">Analog Devices Inc</td>
<td class="data-td data last text-left">ADI</td>
<td class="data-td data last text-right">4.33</td>
<td class="data-td data last text-left">&nbsp;</td>
<td class="data-td data last text-left">Cadence Design Systems Inc</td>
<td class="data-td data last text-left">CDNS</td>
<td class="data-td data last text-right">4.30</td>
</tr>
<tr class="tbl-data">
<td class="data-td data last text-left">Lam Research Corp</td>
<td class="data-td data last text-left">LRCX</td>
<td class="data-td data last text-right">4.31</td>
<td class="data-td data last text-left">&nbsp;</td>
<td class="data-td data last text-left">Synopsys Inc</td>
<td class="data-td data last text-left">SNPS</td>
<td class="data-td data last text-right">4.27</td>
</tr>
<tr class="tbl-data">
<td class="data-td data last text-left">Intel Corp</td>
<td class="data-td data last text-left">INTC</td>
<td class="data-td data last text-right">4.28</td>
<td class="data-td data last text-left">&nbsp;</td>
<td class="data-td data last text-left">Rambus Inc</td>
<td class="data-td data last text-left">RMBS</td>
<td class="data-td data last text-right">3.59</td>
</tr>
</tbody>
</table>
</div>
<p class="chart-disclosure">Source: Morningstar as of 2/21/2025. Not intended as a recommendation to buy or sell any names referenced herein. Fund holdings will vary. Visit vaneck.com/smh or vaneck.com/smhx for a complete list of fund holdings.</p>
<h2>SMH &amp; SMHX: Diversified Exposure to the Semiconductor Industry</h2>
<p>For investors looking to stay positioned in the semiconductor space while managing risk, a diversified ETF approach can offer exposure to both today&rsquo;s leaders and tomorrow&rsquo;s innovators. <strong><a href="/link/39c8d235748b4c26a5930c31d3ac0160.aspx" title="SMH - VanEck Semiconductor ETF - Holdings and Performance">SMH</a></strong> provides access to the industry&rsquo;s largest and most established semiconductor companies, including Nvidia, ensuring participation in major market trends. <strong><a href="/link/9b8fb1812bc74764bf11fc85767838f9.aspx" title="SMHX - VanEck Fabless Semiconductor ETF - Holdings and Performance">SMHX</a></strong> offers a more focused exposure to fabless semiconductor designers, including Nvidia and other pivotal players in semiconductor design, which are driving innovation in AI, data centers, and high-performance computing.</p>
<p>While Nvidia remains a key player in AI and semiconductors, history has shown that a diversified approach may help investors navigate market cycles and capture opportunities across the entire industry.</p>

<p>To receive more <a href="https://www.vaneck.com/us/en/insights/thematic-investing/" title="Thematic Investing Insights"><strong>Thematic Investing</strong></a> insights, <a href="https://www.vaneck.com/us/en/subscribe/" title="Subscription Center"><strong>sign up in our subscription center</strong></a>.</p>
]]></content:encoded>
</item><item rdf:about="https://www.vaneck.com/us/en/blogs/emerging-markets-equity/invest-in-israel-cutting-edge-innovation-and-lasting-opportunities/">
  <title>Invest in Israel: Cutting-Edge Innovation and Lasting Opportunities></title>
  <link>https://www.vaneck.com/us/en/blogs/emerging-markets-equity/invest-in-israel-cutting-edge-innovation-and-lasting-opportunities/</link>
  <description><![CDATA[Israel, the &ldquo;Startup Nation&rdquo;, is a global innovation leader, driven by top R&amp;D spending, a thriving startup ecosystem, and strong government support for business growth and investment.]]></description>
  <dc:creator>John Patrick Lee, CFA</dc:creator>
  <dc:date>02/27/2025 06:30:00</dc:date>
<content:encoded><![CDATA[

<p>Israel stands as a global leader in innovation, driven by its unparalleled research and development (R&amp;D) spending and thriving startup ecosystem across key sectors like technology, healthcare, and clean energy. Israel&rsquo;s economic success is not just a product of its entrepreneurial spirit&mdash;it is actively reinforced by strategic government policies.</p>
<h2>Innovation and Global Leadership</h2>
<p>Israel has firmly established itself as a world leader in innovation, boasting the highest R&amp;D spending as a percentage of GDP among developed markets. Frequently referred to as the "Startup Nation," Israel consistently ranks among the top countries for producing high-growth startups and unicorns.</p>
<h3>Major Publicly Traded Companies Founded in Israel</h3>
<img loading="lazy" alt="Major Publicly Traded Companies Founded in Israel" src="https://www.vaneck.com/contentassets/f48f440c9520430eafff0526d3beb6be/5396_isra-blog-feb_table_2025-02-v1.svg" />
<p class="chart-disclosure">Source: Factset as of 2/20/2025</p>
<p class="chart-disclosure">Not intended as a recommendation to buy or sell any names referenced herein.</p>
<h2>Robust Exit Deal Ecosystem</h2>
<p>Exit deals, whether through IPOs or mergers and acquisitions (M&amp;A), are a key indicator of economic health, as they reflect investor confidence, market maturity, and the ability of private companies to scale successfully. Israel has consistently maintained a high volume of significant exit deals, demonstrating the strength of its start-up ecosystem and its capacity to attract global capital. A steady flow of exits signals a thriving innovation cycle, where successful companies reinvest in new ventures, driving sustained economic growth. In 2024, Israeli tech exits (M&amp;As and IPOs) grew to $13.4 billion,<sup>1</sup>&nbsp;and 67% of those exits were valued at or above $100 million.<sup>2</sup></p>
<h3>Annual Number of Tech Exit Deals in Israel</h3>
<div class="flourish-embed flourish-chart" data-src="visualisation/21813038?2429575"><script src="https://public.flourish.studio/resources/embed.js"></script><noscript><img loading="lazy" src="https://public.flourish.studio/visualisation/21813038/thumbnail" width="100%" alt="Annual Number of Tech Exit Deals in Israel" /></noscript></div>
<p class="chart-disclosure">Source: Statista as of 2024</p>

<h2>Proactive Government Policy Support</h2>
<p>Through regulatory reforms, international trade agreements, and targeted investment incentives, the Israeli government plays a crucial role in fostering business growth. Initiatives such as the Abraham Accords, innovation grants, and infrastructure investments are designed to strengthen the economy, support local industries, and integrate Israel further into global markets. These policies provide a stable foundation for businesses to thrive, attracting both domestic entrepreneurs and international investors.</p>
Two examples of this support include:
<ul class="contentt-list">
<li class="mt-2">Israel Innovation Authority (IIA) &ndash; Provides funding, grants, and policy support to foster R&amp;D and high-tech growth, ensuring Israel remains a global innovation leader. This drives job creation, attracts foreign investment, and strengthens the country&rsquo;s competitive edge.</li>
<li class="mt-2">Abraham Accords &ndash; Facilitates trade, investment, and economic collaboration between Israel and several Arab nations, unlocking new markets and business opportunities. This enhances regional stability, boosts exports, and fosters economic diversification.</li>
</ul>
<h2>Gain Exposure to Israel&rsquo;s Vibrant Economy with ISRA</h2>
<p>An allocation to Israeli equities via the <a href="https://www.vaneck.com/us/en/investments/israel-etf-isra/overview/" title="ISRA - VanEck Israel ETF - Overview"><strong>VanEck Israel ETF (ISRA<sup>TM</sup>)</strong></a> offers investors the opportunity to benefit from Israel&rsquo;s leading position in global innovation, its resilient economy, and its dynamic industries. <a href="/link/2f39037ec8bc41c6a993f1c730b2cc55.aspx" title="ISRA - VanEck Israel ETF - Overview"><strong>ISRA</strong></a> tracks the BlueStar Israel Global Index (BIGI), a benchmark with over two decades of history that reflects the performance of Israeli companies listed globally.</p>
<p><a href="/link/2f39037ec8bc41c6a993f1c730b2cc55.aspx"><strong>ISRA</strong></a> provides investors with the opportunity to capitalize on the strength of Israel&rsquo;s economy and current equity market conditions. <a href="/link/2f39037ec8bc41c6a993f1c730b2cc55.aspx" title="ISRA - VanEck Israel ETF - Overview"><strong>ISRA</strong></a> offers diversified exposure to a wide range of sectors, including finance, technology, healthcare, and defense. Investing in Israeli companies today is not just a bet on recovery from short-term challenges but also a long-term investment in the country&rsquo;s sustained leadership in cutting-edge innovation.</p>

<p>To receive more <a href="/us/en/insights/emerging-markets-equity/" title="Emerging Markets Equity Insights"><strong>Emerging Markets Equity</strong></a> insights, <a href="/us/en/subscribe/" title="Subscription Center"><strong>sign up in our subscription center</strong></a>.</p>
]]></content:encoded>
</item><item rdf:about="https://www.vaneck.com/us/en/blogs/thematic-investing/buzz-investing-markets-navigate-policy-shifts/">
  <title>BUZZ Investing: Markets Navigate Policy Shifts></title>
  <link>https://www.vaneck.com/us/en/blogs/thematic-investing/buzz-investing-markets-navigate-policy-shifts/</link>
  <description><![CDATA[Financial markets grappled with a storm of political maneuvering around trade, taxes, and regulation, stoking some investor unease.]]></description>
  <dc:creator> </dc:creator>
  <dc:date>02/26/2025 06:30:00</dc:date>
<content:encoded><![CDATA[

<p>During the recent period between index selection dates (January 8, 2025 &ndash; February 12, 2025, the &ldquo;Period&rdquo;), financial markets were shaped by political developments, central bank policy, and significant disruption in the technology sector. President Donald Trump&rsquo;s inauguration marked the beginning of an active policy agenda, with a series of executive orders and legislative initiatives focused on trade, corporate taxation, tariffs, and regulatory changes. While these actions provided some clarity on economic priorities, investors continued to assess their broader implications. Meanwhile, the Federal Reserve, in its January 29 meeting, maintained its benchmark interest rate at 4.25%&ndash;4.50%, emphasizing a patient, data-driven approach. Fed Chair Jerome Powell reinforced the central bank&rsquo;s commitment to inflation management while acknowledging risks to economic growth, setting the stage for potential policy friction with the new administration. Market volatility remained elevated as investors weighed these factors alongside inflation concerns and the evolving interest rate outlook.</p>
<p>A defining event in the technology sector was the emergence of DeepSeek, a Chinese artificial intelligence firm, which introduced a suite of large language models (LLMs) that rivaled those of leading U.S. companies at significantly lower costs. The announcement triggered a sharp repricing in the sector, with Nvidia declining 17% and the Nasdaq Composite falling nearly 3% in a single session as investors reassessed AI leadership and competitive pressures. Meanwhile, geopolitical tensions, particularly in Ukraine, drove gold prices to record highs, reinforcing a risk-off sentiment in certain market segments. The &ldquo;Magnificent Seven&rdquo; tech stocks struggled, with most underperforming except for Meta, which surged nearly 19% during the Period. Despite challenges in the tech sector, the S&amp;P 500 remained near its all-time high, buoyed by resilience in other sectors. While the Nasdaq initially suffered from AI-related disruptions, both it and the broader equity indices finished the Period higher, supported by international market strength and ongoing confidence in the economic outlook.</p>
<p>The BUZZ NextGen AI US Sentiment Leaders Index ("BUZZ Index") returned 2.66% during the month of January compared to a return of 2.78% for the S&amp;P 500 Index during the same period.</p>
<h2 id="palantir-gains" class="jump-link-nav anchored-block" data-jumplink-title="Palantir Gains">Shares of Palantir Technologies pace BUZZ Index Gains</h2>
<p>Palantir Technologies&rsquo; (NASDAQ: PLTR) stock surged 72% during the recent period, driven by strong earnings, upbeat guidance, and growing demand for its AI and defense analytics solutions. The company&rsquo;s results exceeded expectations, highlighting robust commercial growth and reinforcing confidence in its long-term trajectory. Unlike AI hardware firms that faced volatility after China&rsquo;s DeepSeek AI announcement, Palantir remained resilient. While DeepSeek raised concerns about AI commoditization, Palantir&rsquo;s pricing model and focus on operational AI insulated it from price pressures. The company positioned itself as a strategic AI partner, emphasizing integration and decision-making over raw model capabilities. Palantir&rsquo;s deep government ties, particularly its work with the Department of Defense, also bolstered investor optimism amid rising federal defense spending. Wall Street analysts raised price targets, citing its strong positioning in AI-driven decision-making. Broader enthusiasm for AI, including the Oracle-OpenAI-SoftBank-backed &lsquo;Stargate&rsquo; initiative, further fueled momentum, solidifying Palantir&rsquo;s role as a leader in applied AI.</p>

<h3>Top BUZZ Index Contributors: January 8, 2025 &ndash; February 12, 2025</h3>
<div class="wrapped-div">
<table style="width: 100%;">
<tbody>
<tr class="tbl-data">
<td class="tbl-header last text-left">Company</td>
<td class="tbl-header last text-left">Ticker</td>
<td class="tbl-header last text-right">Average Weight (%)</td>
<td class="tbl-header last text-right">Return Contribution (%)</td>
</tr>
<tr class="tbl-data">
<td class="data-td last font-weight-normal text-left">Palantir Technologies Inc</td>
<td class="data-td data last text-left">PLTR</td>
<td class="data-td data last text-right">3.51</td>
<td class="data-td data last text-right">2.13</td>
</tr>
<tr class="tbl-data">
<td class="data-td last font-weight-normal text-left">Hims &amp; Hers Health Inc</td>
<td class="data-td data last text-left">HIMS</td>
<td class="data-td data last text-right">1.56</td>
<td class="data-td data last text-right">1.11</td>
</tr>
<tr class="tbl-data">
<td class="data-td last font-weight-normal text-left">Robinhood Markets Inc</td>
<td class="data-td data last text-left">HOOD</td>
<td class="data-td data last text-right">2.75</td>
<td class="data-td data last text-right">0.94</td>
</tr>
<tr class="tbl-data">
<td class="data-td last font-weight-normal text-left">Super Micro Computer Inc</td>
<td class="data-td data last text-left">SMCI</td>
<td class="data-td data last text-right">2.78</td>
<td class="data-td data last text-right">0.63</td>
</tr>
<tr class="tbl-data">
<td class="data-td last font-weight-normal text-left">Meta Platforms Inc</td>
<td class="data-td data last text-left">META</td>
<td class="data-td data last text-right">3.14</td>
<td class="data-td data last text-right">0.56</td>
</tr>
<tr class="tbl-data">
<td class="data-td last font-weight-normal text-left">AST SpaceMobile Inc</td>
<td class="data-td data last text-left">ASTS</td>
<td class="data-td data last text-right">2.57</td>
<td class="data-td data last text-right">0.53</td>
</tr>
<tr class="tbl-data">
<td class="data-td last font-weight-normal text-left">Uber Technologies Inc</td>
<td class="data-td data last text-left">UBER</td>
<td class="data-td data last text-right">2.09</td>
<td class="data-td data last text-right">0.44</td>
</tr>
<tr class="tbl-data">
<td class="data-td last font-weight-normal text-left">Carvana Co</td>
<td class="data-td data last text-left">CVNA</td>
<td class="data-td data last text-right">1.89</td>
<td class="data-td data last text-right">0.42</td>
</tr>
<tr class="tbl-data">
<td class="data-td last font-weight-normal text-left">Intel Corp</td>
<td class="data-td data last text-left">INTC</td>
<td class="data-td data last text-right">2.58</td>
<td class="data-td data last text-right">0.31</td>
</tr>
<tr class="tbl-data">
<td class="data-td last font-weight-normal text-left">Coinbase Global Inc</td>
<td class="data-td data last text-left">COIN</td>
<td class="data-td data last text-right">0.63</td>
<td class="data-td data last text-right">0.22</td>
</tr>
</tbody>
</table>
</div>
<p class="chart-disclosure">Source: BUZZ Holdings ULC, Bloomberg. Past performance is no guarantee of future results. Index performance is not illustrative of fund performance. Not intended as a recommendation to buy or to sell any of the securities mentioned herein.</p>

<h2 id="trump-media-declines" class="jump-link-nav anchored-block" data-jumplink-title="Trump Media Declines">Shares of Trump Media &amp; Technology among declining stocks in the BUZZ Index</h2>
<p>Shares of Trump Media &amp; Technology Group (NASDAQ: DJT) fell during the recent Period, dropping nearly 12% as post-election enthusiasm waned and investor concerns over fundamentals resurfaced. The stock had surged following Trump&rsquo;s victory, driven by speculative buying, but the rally lost steam after his inauguration as investors took profits amid renewed skepticism about the company&rsquo;s long-term viability. Adding to the pressure, Trump&rsquo;s launch of the $TRUMP cryptocurrency token raised ethical concerns and potential regulatory scrutiny. The token&rsquo;s 48% decline over the past week further dampened confidence, fueling uncertainty around its implications for Trump's broader business ventures. While some investors see long-term potential in Trump&rsquo;s continued use of Truth Social as a direct communication platform, DJT&rsquo;s stock remains highly volatile. Its future will likely be shaped by political developments, regulatory factors, and market confidence in the company&rsquo;s ability to sustain growth beyond Trump&rsquo;s presidency.</p>
<h3>Bottom BUZZ Index Contributors: January 8, 2025 &ndash; February 12, 2025</h3>
<div class="wrapped-div">
<table style="width: 100%;">
<tbody>
<tr class="tbl-data">
<td class="tbl-header last text-left">Company</td>
<td class="tbl-header last text-left">Ticker</td>
<td class="tbl-header last text-right">Average Weight (%)</td>
<td class="tbl-header last text-right">Return Contribution (%)</td>
</tr>
<tr class="tbl-data">
<td class="data-td last font-weight-normal text-left">Trump Media &amp; Tech Group</td>
<td class="data-td data last text-left">DJT</td>
<td class="data-td data last text-right">2.11</td>
<td class="data-td data last text-right">-0.90</td>
</tr>
<tr class="tbl-data">
<td class="data-td last font-weight-normal text-left">GameStop Corp</td>
<td class="data-td data last text-left">GME</td>
<td class="data-td data last text-right">2.61</td>
<td class="data-td data last text-right">-0.75</td>
</tr>
<tr class="tbl-data">
<td class="data-td last font-weight-normal text-left">Tesla Inc</td>
<td class="data-td data last text-left">TSLA</td>
<td class="data-td data last text-right">2.92</td>
<td class="data-td data last text-right">-0.42</td>
</tr>
<tr class="tbl-data">
<td class="data-td last font-weight-normal text-left">Celsius Holdings Inc</td>
<td class="data-td data last text-left">CELH</td>
<td class="data-td data last text-right">1.16</td>
<td class="data-td data last text-right">-0.35</td>
</tr>
<tr class="tbl-data">
<td class="data-td last font-weight-normal text-left">MARA Holdings Inc</td>
<td class="data-td data last text-left">MARA</td>
<td class="data-td data last text-right">2.21</td>
<td class="data-td data last text-right">-0.33</td>
</tr>
<tr class="tbl-data">
<td class="data-td last font-weight-normal text-left">Micron Technology Inc</td>
<td class="data-td data last text-left">MU</td>
<td class="data-td data last text-right">2.17</td>
<td class="data-td data last text-right">-0.28</td>
</tr>
<tr class="tbl-data">
<td class="data-td last font-weight-normal text-left">Rivian Automotive Inc</td>
<td class="data-td data last text-left">RIVN</td>
<td class="data-td data last text-right">1.89</td>
<td class="data-td data last text-right">-0.25</td>
</tr>
<tr class="tbl-data">
<td class="data-td last font-weight-normal text-left">Advanced Micro Devices Inc</td>
<td class="data-td data last text-left">AMD</td>
<td class="data-td data last text-right">2.80</td>
<td class="data-td data last text-right">-0.25</td>
</tr>
<tr class="tbl-data">
<td class="data-td last font-weight-normal text-left">Viking Therapeutics Inc</td>
<td class="data-td data last text-left">VKTX</td>
<td class="data-td data last text-right">0.24</td>
<td class="data-td data last text-right">-0.22</td>
</tr>
<tr class="tbl-data">
<td class="data-td last font-weight-normal text-left">IonQ Inc</td>
<td class="data-td data last text-left">IONQ</td>
<td class="data-td data last text-right">1.90</td>
<td class="data-td data last text-right">-0.22</td>
</tr>
</tbody>
</table>
</div>
<p class="chart-disclosure">Source: BUZZ Holdings ULC, Bloomberg. Past performance is no guarantee of future results. Index performance is not illustrative of fund performance. Not intended as a recommendation to buy or to sell any of the securities mentioned herein.</p>
<h2 id="rebalance-highlights" class="jump-link-nav anchored-block" data-jumplink-title="Rebalance Highlights">BUZZ Index February 2025 Rebalance Highlights</h2>
<p><strong>Hims &amp; Hers Health Inc.</strong></p>
<p>The rise of telehealth has transformed the healthcare industry, with companies rapidly adopting digital-first solutions to meet growing consumer demand. Hims &amp; Hers Health (NYSE: HIMS) has been at the forefront of this shift, leveraging its direct-to-consumer model to expand access to personalized treatments for weight management, mental health, hair regrowth, and sexual wellness. The company has particularly benefited from the growing acceptance of prescription weight-loss medications, fueled by the widespread popularity of GLP-1 drugs like Ozempic. Investor enthusiasm for HIMS has surged alongside its business momentum, with shares climbing more than fivefold since 2024, including doubling in the first two months of this year. The company further capitalized on its visibility with a high-profile Super Bowl commercial, which drove a spike in consumer engagement. This rising traction has also translated into increased recognition among online investors, with HIMS' weighting in the BUZZ Index climbing from 1.57% in January 2025 to 2.79% this month, reflecting its growing influence in the telehealth space.</p>
<p><strong>IonQ Inc.</strong></p>
<p>Since the turn of the millennium, the world has experienced two major technological revolutions: the explosion of the internet and the rise of artificial intelligence. With AI reaching mainstream adoption just two years ago following the launch of ChatGPT, the next breakthrough may already be taking shape&mdash;this time in quantum computing. For decades, quantum mechanics was purely theoretical, but recent scientific advancements have brought practical applications closer to reality. If fully realized, quantum computers could process information millions of times faster than today&rsquo;s most advanced supercomputers. While widespread adoption remains years away, groundbreaking progress by Google and NASA has fueled a surge of interest in the space, driving investor enthusiasm toward companies like IonQ, Inc. (NYSE: IONQ). Founded in 2015, IonQ went public in 2021 through a SPAC merger with dMY Technology Group III. After an initial wave of excitement, the stock struggled to gain momentum, with interest fading as quantum computing remained in its early stages. However, recent breakthroughs have reignited enthusiasm, propelling shares more than 16 times higher from their post-merger lows. This month, IonQ ranks within the top 25 names in the BUZZ Index, holding a 1.47% weight, as investor confidence in quantum computing continues to grow.</p>

<p>To receive more <a href="https://www.vaneck.com/us/en/insights/thematic-investing/" title="Thematic Investing Insights"><strong>Thematic Investing</strong></a> insights, <a href="https://www.vaneck.com/us/en/subscribe/" title="Subscription Center"><strong>sign up in our subscription center</strong></a>.</p>
]]></content:encoded>
</item><item rdf:about="https://www.vaneck.com/us/en/blogs/natural-resources/recent-cpi-data-reinforces-need-for-inflation-fighting-assets/">
  <title>Recent CPI Data Reinforces Need for Inflation-Fighting Assets></title>
  <link>https://www.vaneck.com/us/en/blogs/natural-resources/recent-cpi-data-reinforces-need-for-inflation-fighting-assets/</link>
  <description><![CDATA[Persistent inflation, driven by high energy prices and market uncertainty from potential tariffs and global tensions, positions natural resources equities as a strong hedge.]]></description>
  <dc:creator>Alicia  Barkley</dc:creator>
  <dc:date>02/26/2025 06:30:00</dc:date>
<content:encoded><![CDATA[

<p>The latest U.S. Consumer Price Index (CPI) report for January 2025 revealed a higher-than-expected inflation rate of 3.0% annually, with a sharp monthly increase of 0.5%. This persistent inflationary pressure was heavily influenced by energy prices. The energy index rose by 1.1% in January, with gasoline prices climbing by 1.8%. Higher fuel costs impact many industries across the economy, leading to increased prices for consumers. Additionally, geopolitical tensions and fluctuating oil supplies are adding to the uncertainty in energy markets.</p>
<h3>Persistent Inflation Influencing Markets</h3>
<p><strong>Year-Over-Year % Change</strong></p>
<div class="flourish-embed flourish-chart" data-src="visualisation/21802973?2429575"><script src="https://public.flourish.studio/resources/embed.js"></script><noscript><img loading="lazy" src="https://public.flourish.studio/visualisation/21802973/thumbnail" width="100%" alt="Persistent Inflation Influencing Markets" /></noscript></div>
<p class="chart-disclosure">Source: U.S. Bureau of Labor Statistics via FRED&reg; as of 2/12/2025.</p>
<p>Inflation is also creating price swings in key commodities. Precious metals like gold and silver are gaining as investors seek inflation hedges. Industrial metals such as copper and aluminum are also seeing price increases due to high demand and supply constraints. In agriculture, rising costs for fuel and fertilizers are pushing food prices higher, further burdening consumers.</p>
<p>New tariff policies are another factor driving up costs for industries that rely on imported raw materials. While some domestic businesses benefit from these protections, supply chain disruptions and increased production expenses could add to inflation over time. This uncertainty makes it harder for businesses to plan and for investors to predict long-term market trends.</p>
<h2>Natural Resources Equities Can Serve as an Inflation Hedge</h2>
<p>Natural resources companies are well positioned to act as a hedge against inflation, outperforming U.S. stocks and bonds. Even in periods of modest inflation (2-6%), global resources have outperformed U.S. stocks broadly.</p>
<h3>Average 12-Month Return in Varying Inflation Regimes</h3>
<p><img loading="lazy" class="img-responsive w-100" alt="Average 12-Month Return in Varying Inflation Regimes" src="https://www.vaneck.com/contentassets/54da0a130a894dcda03d4291dae52ef4/5387_hap-inflation-blog_chart-2_2025-2_v1_blog.svg" /></p>
<p class="chart-disclosure"><strong>Diversified Miners&rdquo;</strong> represented MSCI ACWI Select Metals &amp; Mining Producers ex. Gold &amp; Silver Index from Sep-2001 to present, EMIX Global Mining ex. Gold &amp; Energy Index from Jan-1986 to Aug-2001, and CRSP - 48 Industry Portfolios (Mines, Average Value Weighted) returns from Jan-1970 to Dec-1985. <strong>&ldquo;Energy Producers&rdquo;</strong> represented by MSCI ACWI Select Energy Producers Index from Sep-2001 to present, EMIX Global Energy Index from Jan-1986 to Aug-2001, and CRSP - 10 Industry Portfolios (Energy, Average Value Weighted) returns from Jan-1970 to Dec-1985. <strong>&ldquo;Gold Miners&rdquo;</strong> represented by NYSE Arca Gold Miners Index from Oct-1993 to present and CRSP&rsquo;s - 48 Industry Portfolios (Gold, Average Value Weighted) returns from Jan-1970 to Sep-1993. <strong>&ldquo;REITs&rdquo;</strong> represented by FTSE NAREIT All Equity REITs Index (note: index inception is Jan-1972). <strong>&ldquo;U.S. Bonds&rdquo;</strong> Bloomberg U.S. Aggregate Bond Index from Jan-1976 to present, Bloomberg U.S. Aggregate Government/Credit Index from Jan-1973 to Dec-1976 and a blend of Ibbotson's SBBI U.S. 1 Year Treasury Index, U.S. Intermediate-Term Government Bond Index, U.S. Long-Term Government Bond Index, and U.S. Long-Term Corporate Bond Index series from Jan 1970 to Dec-1971. <strong>&ldquo;U.S. Equities&rdquo;</strong> represented by S&amp;P 500 Index.</p>
<p class="chart-disclosure"><strong>Source: VanEck, Bloomberg, CRSP, FactSet, World Bank. Data as of December 2024.</strong> Past performance is no indication of future results. Please see additional definitions and index descriptions at the end of this presentation.</p>

<h2>VanEck Inflation-Fighting Investment Opportunities</h2>
<p><strong>Comprehensive Index-Based Exposure</strong></p>
<p><a href="https://www.vaneck.com/us/en/investments/natural-resources-etf-hap/overview/" title="HAP - VanEck Natural Resources ETF - Overview"><strong>VanEck Natural Resources Fund (HAP)</strong></a> offers diversified exposure to companies engaged in energy, metals, and agriculture, providing investors with a hedge against inflation while benefiting from global demand for essential commodities. Additionally, HAP's diversified portfolio helps mitigate risks from individual commodity price fluctuations, making it a compelling option for investors seeking low-cost exposure to global natural resources.</p>
<p><strong>Actively Managed, Broad-Based Exposure from Proven Team</strong></p>
<p><a href="https://www.vaneck.com/us/en/investments/global-resources-fund-ghaax/overview/" title="GHAAX - Global Resources Fund - Class A - Overview"><strong>VanEck Global Resources Fund (GHAAX)</strong></a> provides investors with broad exposure to energy, metals, agriculture, alternative energy, and other resources, supported by a deep bench of portfolio managers and investment analysts with real-world engineering and geological experience backed by a research-driven, risk-managed investment approach.</p>
<p><strong>Broad Real Assets Exposure that Takes Care of the Allocation Decisions for You</strong></p>
<p><a href="https://www.vaneck.com/us/en/investments/real-assets-etf-raax/overview/" title="RAAX - VanEck Real Assets ETF - Overview"><strong>VanEck Real Assets ETF (RAAX)</strong></a> provides exposure to key inflation-fighting investments, adapting to different inflation levels and changing risks. RAAX invests across real assets including natural resources equities, commodities and income assets such as real estate, infrastructure and MLPs.</p>
<p>To receive more <a href="/us/en/insights/natural-resources/" title="Natural Resources Insights"><strong>Natural Resources</strong></a> insights, <a href="https://www.vaneck.com/us/en/subscribe/" title="Subscription Center"><strong>sign up in our subscription center</strong></a>.</p>
]]></content:encoded>
</item><item rdf:about="https://www.vaneck.com/us/en/blogs/gold-investing/ima-casanova-turbocharge-your-gold-investing/">
  <title>Forbes:  Turbocharge Your Gold Investing></title>
  <link>https://www.vaneck.com/us/en/blogs/gold-investing/ima-casanova-turbocharge-your-gold-investing/</link>
  <description><![CDATA[Learn how VanEck&rsquo;s Imaru Casanova leverages her engineering and resource investing expertise to navigate the high-risk, high-reward world of gold mining stocks.]]></description>
  <dc:creator> </dc:creator>
  <dc:date>02/21/2025 06:30:00</dc:date>
<content:encoded><![CDATA[

<p>Gold has long been a safe-haven asset, but for investors looking to enhance their exposure, mining stocks offer a potentially more lucrative&mdash;though riskier&mdash;alternative to holding bullion. Mining stocks may provide amplified returns compared to physical gold, but also require careful selection to navigate the sector&rsquo;s volatility. VanEck portfolio manager <strong><a href="/link/cfa7139e649944fea51aa2a740b2372e.aspx">Imaru Casanova</a></strong> understands these risks and rewards better than most, combining her engineering background with deep expertise in resource investing, and she shares her experience and insights <a href="https://www.vaneck.com/us/en/offsite-disclaimer/?id=346374&amp;button=no&amp;url=https://www.forbes.com/sites/baldwin/2025/02/01/how-to-turbocharge-your-gold-investing/" title="How To Turbocharge Your Gold Investing" target="_blank" rel="noopener"><strong>in a recent Forbes article</strong></a>.</p>
<p><a href="/link/775af929d69741efa7729872dda2bfa5.aspx"><strong>Casanova&rsquo;s journey</strong></a> into gold investing started far from Wall Street. Born in Venezuela, she won a foreign studies scholarship as a teenager and arrived in the U.S. with little knowledge of English. She went on to earn a degree in mechanical engineering and began her career in the oil industry, working on offshore rigs and learning firsthand how to assess reserves, extraction costs and operational risks. That experience gave her a unique perspective when she transitioned into finance, first covering oil and gas and later specializing in gold mining.</p>
<p>Today, she manages VanEck&rsquo;s <a href="https://www.vaneck.com/us/en/investments/international-investors-gold-fund-iniix/overview/" title="INIVX - International Investors Gold Fund - Class A - Overview"><strong>International Investors Gold Fund (INIIX)</strong></a>, which invests in miners that trade at historically low valuations relative to their production. Mining stocks provide built-in leverage: when gold prices rise, miner profits can multiply&mdash;but when prices fall, losses can be steep. Casanova actively seeks companies with strong balance sheets and sustainable operations, aiming to mitigate some of the risks inherent in the sector.</p>
<p>For those seeking a hedge against inflation and monetary uncertainty, gold remains a compelling option. But as the market for both physical gold and mining stocks evolves, understanding the nuances of each approach is crucial. Read the full Forbes article to explore how Casanova approaches this complex market and where she sees the biggest opportunities today.</p>
<p>Follow Imaru Casanova deep underground with shares in mining companies. They&rsquo;re a leveraged bet, so they&rsquo;re riskier than gold bars.</p>
<p>To receive more <strong><a href="https://www.vaneck.com/us/en/insights/gold-investing/" title="Gold Investing Insights">Gold Investing</a></strong> insights, <strong><a href="https://www.vaneck.com/us/en/subscribe/" title="Subscription Center">sign up in our subscription center</a></strong>.</p>
]]></content:encoded>
</item><item rdf:about="https://www.vaneck.com/us/en/blogs/digital-assets/matthew-sigel-vaneck-mid-february-2025-bitcoin-chaincheck/">
  <title>VanEck Mid-February 2025 Bitcoin ChainCheck></title>
  <link>https://www.vaneck.com/us/en/blogs/digital-assets/matthew-sigel-vaneck-mid-february-2025-bitcoin-chaincheck/</link>
  <description><![CDATA[Bitcoin policy momentum builds as Washington reverses course. States push for BTC reserves, and miners accelerate AI/HPC expansion. We break down key market, on-chain, and macro trends.]]></description>
  <dc:creator>Nathan  Frankovitz</dc:creator>
  <dc:date>02/20/2025 06:30:00</dc:date>
<content:encoded><![CDATA[

<p><strong><u>Please note that VanEck has exposure to bitcoin.</u></strong></p>
<p><strong><u>Three key takeaways for mid-January &ndash; mid-February:</u></strong></p>
<ol class="content-list">
<li class="mt-2"><strong>Washington Reverse Course on Crypto:</strong> The U.S. government is pivoting toward a more pro-crypto stance, with new legislative efforts, SEC regulatory shifts, and Bitcoin reserve discussions at the White House reinforcing Bitcoin&rsquo;s legitimacy.</li>
<li class="mt-2"><strong>State Bitcoin Treasuries Gain Momentum, 'Frontrunning&rsquo; the Fed:</strong> State legislators are rapidly proposing strategic Bitcoin reserves, positioning themselves ahead of federal discussions on a Strategic Bitcoin Reserve (SBR). To quantify the potential impact, we published the Bitcoin Reserve Tool, which helps model Bitcoin&rsquo;s potential role in U.S. monetary policy.</li>
<li class="mt-2"><strong>Miners Expand Capacity, Accelerate AI/HPC Pivot:</strong> The <strong>13</strong> miners we cover are on track for a <strong>42%</strong> CAGR in energized capacity, with increasing commitments to AI/HPC expansion. As AI energy demand surges, large-scale miners are positioning themselves as emerging AI/HPC infrastructure providers.</li>
</ol>
<ul class="content-list">
<li class="mt-2"><a href="#price-action"><strong>Bitcoin Price Action</strong></a></li>
<li class="mt-2"><a href="#treasury-adoption"><strong>Bitcoin Treasury Adoption</strong></a></li>
<li class="mt-2"><a href="#miners"><strong>Bitcoin Miners</strong></a></li>
<li class="mt-2"><a href="#btc-network-activity"><strong>Bitcoin&rsquo;s Network Activity, Adoption, and Fees</strong></a></li>
<li class="mt-2"><a href="#monthly-dashboard"><strong>Bitcoin ChainCheck Monthly Dashboard</strong></a></li>
</ul>
<h3>Chart of the Month</h3>
<p><strong>Relative Unrealized Profit (RUP) Indicators Have Cooled In 2025, Suggesting an Accumulation Opportunity</strong></p>
<div class="flourish-embed flourish-chart" data-src="visualisation/21696855?2428759"><script src="https://public.flourish.studio/resources/embed.js"></script><noscript><img loading="lazy" src="https://public.flourish.studio/visualisation/21696855/thumbnail" width="100%" alt="Relative Unrealized Profit (RUP) Indicators Have Cooled In 2025, Suggesting an Accumulation Opportunity" /></noscript></div>
<p class="chart-disclosure">Source: Glassnode as of 02/18/2025. Not intended as a recommendation to buy or sell any securities mentioned herein. <strong>Past performance is no guarantee of future results.</strong></p>
<p><strong>Context: </strong>In our <a href="https://www.vaneck.com/us/en/blogs/digital-assets/matthew-sigel-vaneck-mid-november-bitcoin-chaincheck/" title="VanEck Mid-November Bitcoin ChainCheck"><strong>November ChainCheck</strong></a>, we analyzed the relationship between Bitcoin&rsquo;s Relative Unrealized Profits (RUP) and forward-looking returns. RUP measures the proportion of Bitcoin&rsquo;s market cap represented by unrealized gains&mdash;profits that exist on paper but have not yet been realized through selling.</p>
<p><strong>Insight: </strong>Historically, Bitcoin&rsquo;s strongest short- to medium-term returns (7-day to 180-day) have occurred when RUP&rsquo;s 30-day moving average (30 DMA) ranged between <strong>0.60 and 0.70</strong>&mdash;high but not yet overheated. Today, RUP sits at <strong>~0.55</strong>, having never exceeded <strong>0.62</strong> since November. Given the short-lived duration of this indicator so far this cycle, we believe today&rsquo;s reading suggests another accumulation opportunity before a potential market cycle top.</p>
<h2 id="price-action" class="jump-link-nav anchored-block" data-jumplink-title="Price Action">Bitcoin&rsquo;s Price Action</h2>
<p><strong>Market sentiment: </strong>Bitcoin is once again in a period of low volatility, with price trading sideways <strong>(-2 %)</strong> month-over-month. Despite Bitcoin&rsquo;s price trading sideways, Bitcoin dominance is up<strong> 6%</strong> month-over-month as altcoins continue to bleed, firmly negating the budding alt season we <a href="https://www.vaneck.com/us/en/blogs/digital-assets/matthew-sigel-vaneck-mid-december-bitcoin-chaincheck/" title="VanEck Mid-December Bitcoin ChainCheck"><strong>highlighted</strong></a> in December. This disconnect between Bitcoin and altcoins has led to a dismal market sentiment; while the bullish U.S. regulatory backdrop has allowed Bitcoin to sustain its prices near all-time highs, altcoins have suffered from continued dispersion, most notably as meme coin mania continues. The most recent escalation of this &ldquo;memecoin&rdquo; carnage was through the fake Argentine cryptocurrency LIBRA, which was falsely touted by President Javier Milei&rsquo;s social media.</p>
<p>While damaging, we believe this sort of rampant market behavior invariably highlights Bitcoin&rsquo;s distinguished position among cryptocurrencies.</p>
<p>Like our <a href="https://www.vaneck.com/us/en/blogs/digital-assets/matthew-sigel-vaneck-mid-september-2024-bitcoin-chaincheck-1-year-review-edition/" title="VanEck Mid-September 2024 Bitcoin ChainCheck: 1-Year Review Edition"><strong>call</strong></a> in September, we believe this period of low volatility will end with a Bitcoin breakout to the upside. We also expect altcoin season to resume, reversing Bitcoin&rsquo;s recent dominance uptrend. However, this will be a token-picker&rsquo;s market. With far more altcoins available in 2025 than in prior cycles (2016&ndash;2017, 2020&ndash;2021), we do not expect a rising tide to lift all boats equally.</p>
<p>In anticipation of an upside catalyst, we examine the latest policy developments.</p>
<p><strong>Policy Updates: </strong>President Trump appears determined to fulfill his campaign promise to make the U.S. &ldquo;the Crypto Capital of the World,&rdquo; taking aggressive steps to reverse the federal government&rsquo;s prior anti-crypto stance. This is playing out across several legislative, judicial, and executive actions. The House Committee on Financial Services recently held a hearing on "Operation Choke Point 2.0: The Biden Administration&rsquo;s Efforts to Put Crypto in the Crosshairs," investigating allegations that crypto businesses and individuals were systematically debanked starting in 2021. If confirmed, these actions may have contributed to the collapse of crypto-friendly banks such as Signature Bank and Silvergate.</p>
<p>In late January, SEC Acting Chairman Mark Uyeda announced the formation of a Crypto Task Force to establish a clear regulatory framework for digital assets. Led by SEC Commissioner Hester Peirce, the Task Force signals a shift away from enforcement-first regulation. Its key objectives include defining the security status of digital assets, establishing temporary relief for token issuers, and addressing custody, clearing, and cross-border crypto regulation. As part of this shift, over 50 SEC lawyers and staff have reportedly been reassigned from crypto enforcement actions.</p>
<p>&lsquo;Stargate&rsquo;, a <strong>$500 billion</strong> AI infrastructure initiative, was also <a href="https://openai.com/index/announcing-the-stargate-project/" title="Announcing The Stargate Project" target="_blank" rel="noopener"><strong>announced</strong></a> in late January. Stargate is led by Softbank&rsquo;s Chairman Masayoshi Son&mdash;who previously pledged <strong>$100 billion</strong> in AI investment&mdash;and has doubled down under Trump&rsquo;s deregulatory, pro-energy, pro-crypto, pro-AI administration. SoftBank is joined by OpenAI, Oracle, and MGX in the initiative. While not directly tied to digital assets, our research suggests Stargate could provide Bitcoin miners with capital to expand into AI and HPC. Given Bitcoin miners' expertise in securing large-scale power agreements, they could emerge as key players in this AI-driven energy expansion.</p>
<p>SoftBank seems to think so. Later that month, it invested <strong>$50 million</strong> in Cipher Mining (CIFR), acquiring <strong>10.4 million</strong> shares to support CIFR&rsquo;s HPC data center expansion. This move reinforces the growing recognition of Bitcoin miners as emerging AI/HPC infrastructure providers.</p>
<p>On February 4, White House &lsquo;Crypto Czar&rsquo; David Sacks held a joint press conference with congressional leaders, outlining a bipartisan roadmap for digital asset legislation. Congress is advancing several key bills:</p>
<ol class="content-list">
<li class="mt-2"><strong>Stablecoins</strong>: The GENIUS Act (Guiding and Establishing National Innovation in U.S. Stablecoins Act), introduced by Senator Hagerty, defines stablecoins as USD-pegged digital assets, establishes issuance procedures, licensing, and reserve requirements, and designates the Federal Reserve and OCC as primary regulators. Meanwhile, Rep. French Hill's draft Stablecoin Tethering and Bank Licensing Enforcement (STABLE) Act is even more bullish. It permits state-qualified issuers without imposing a market cap limit, allowing for broader competition in the U.S. stablecoin market.</li>
<li class="mt-2"><strong>Market Structure</strong>: Lawmakers plan to reintroduce FIT21, which would clarify the CFTC&rsquo;s jurisdiction over digital commodities and grant the SEC oversight of blockchain-based securities.</li>
</ol>
<p>During the press conference, Sacks stated, <i>&ldquo; Bitcoin reserve will be one of the first things we are going to look at.&rdquo;</i></p>
<p>As the federal government pivots toward a more crypto-friendly stance, individual U.S. states are also accelerating their own Bitcoin strategies. A growing number are moving ahead of Washington by introducing legislation to treat Bitcoin as a Strategic Reserve Asset&mdash;a trend we explore next.</p>
<h2 id="treasury-adoption" class="anchored-block">Bitcoin Treasury Adoption Updates</h2>
<h3>State-Level Initiatives</h3>
<div class="wrapped-div">
<table style="width: 100%;">
<tbody>
<tr class="tbl-data">
<td class="tbl-header last" colspan="10">U.S. State Bitcoin &amp; Digital Asset Reserves</td>
</tr>
<tr class="tbl-data">
<td class="data-td last">&nbsp;</td>
<td class="data-head last text-left">Title</td>
<td class="data-head last text-left">Introduced</td>
<td class="data-head last text-left">Type</td>
<td class="data-head last text-left">Status</td>
<td class="data-head last text-left">Funding Source(s)</td>
<td class="data-head last text-right">Est. Funding Source Size ($)</td>
<td class="data-head last text-right">Potential Investment (%)</td>
<td class="data-head last text-right">Est. Potential Investment ($)</td>
<td class="data-head last text-right">Est. # Bitcoin</td>
</tr>
<tr class="tbl-data">
<td class="data-td last">Arizona</td>
<td class="data-td data last text-left">Senate Bill 1025, 'Arizona Strategic Bitcoin Reserve<br />24 Act'</td>
<td class="data-td data last text-left">16-Dec-24</td>
<td class="data-td data last text-left">Both Reserve &amp; Pension</td>
<td class="data-td data last text-left">Chamber 1</td>
<td class="data-td data last text-left">State Treasurer Public Fund, Retirement System</td>
<td class="data-td data last text-right">87,394,974,218</td>
<td class="data-td data last text-right">10</td>
<td class="data-td data last text-right">8,739,497,422</td>
<td class="data-td data last text-right">91,657</td>
</tr>
<tr class="tbl-data">
<td class="data-td last">Florida</td>
<td class="data-td data last text-left">Strategic Bitcoin Reserve</td>
<td class="data-td data last text-left">3-Dec-24</td>
<td class="data-td data last text-left">Both Reserve &amp; Pension</td>
<td class="data-td data last text-left">Introduced</td>
<td class="data-td data last text-left">Pension Fund, Budget Surplus</td>
<td class="data-td data last text-right">302,200,000,000</td>
<td class="data-td data last text-right">1</td>
<td class="data-td data last text-right">3,022,000,000</td>
<td class="data-td data last text-right">31,694</td>
</tr>
<tr class="tbl-data">
<td class="data-td last">Pennsylvania</td>
<td class="data-td data last text-left">House Bill No. 2664</td>
<td class="data-td data last text-left">19-Nov-24</td>
<td class="data-td data last text-left">Reserve</td>
<td class="data-td data last text-left">Failed/Dead</td>
<td class="data-td data last text-left">Unexpended, unencumbered, or uncommitted funds in the General Fund, Budget Stabilization Reserve Fund, Any other investment fund managed directly by State Treasurer</td>
<td class="data-td data last text-right">23,586,024,543</td>
<td class="data-td data last text-right">10</td>
<td class="data-td data last text-right">2,358,602,454</td>
<td class="data-td data last text-right">24,736</td>
</tr>
<tr class="tbl-data">
<td class="data-td last">Oklahoma</td>
<td class="data-td data last text-left">House Bill 1203 (HB 1203)</td>
<td class="data-td data last text-left">15-Jan-25</td>
<td class="data-td data last text-left">Both Reserve &amp; Pension</td>
<td class="data-td data last text-left">Committee 1</td>
<td class="data-td data last text-left">State General Fund, Revenue Stabilization Fund, Constitutional Reserve (Rainy Day) Fund</td>
<td class="data-td data last text-right">14,664,000,000</td>
<td class="data-td data last text-right">10</td>
<td class="data-td data last text-right">1,466,400,000</td>
<td class="data-td data last text-right">15,379</td>
</tr>
<tr class="tbl-data">
<td class="data-td last">Massachusetts</td>
<td class="data-td data last text-left">Senate Docket, No. 422</td>
<td class="data-td data last text-left">Jan-25</td>
<td class="data-td data last text-left">Reserve</td>
<td class="data-td data last text-left">Introduced</td>
<td class="data-td data last text-left">Commonwealth Stabilization ("Rainy Day") Fund</td>
<td class="data-td data last text-right">8,831,000,000</td>
<td class="data-td data last text-right">10</td>
<td class="data-td data last text-right">883,100,000</td>
<td class="data-td data last text-right">9,262</td>
</tr>
<tr class="tbl-data">
<td class="data-td last">Wyoming</td>
<td class="data-td data last text-left">House Bill 201 (HB 201)</td>
<td class="data-td data last text-left">17-Jan-25</td>
<td class="data-td data last text-left">Reserve</td>
<td class="data-td data last text-left">Failed/Dead</td>
<td class="data-td data last text-left">General Fund and Permanent Wyoming Mineral Trust Fund</td>
<td class="data-td data last text-right">27,100,000,000</td>
<td class="data-td data last text-right">3</td>
<td class="data-td data last text-right">813,000,000</td>
<td class="data-td data last text-right">8,526</td>
</tr>
<tr class="tbl-data">
<td class="data-td last">Ohio</td>
<td class="data-td data last text-left">House Bill No. 18</td>
<td class="data-td data last text-left">23-Jan-25</td>
<td class="data-td data last text-left">Reserve</td>
<td class="data-td data last text-left">Committee 1</td>
<td class="data-td data last text-left">General Revenue Fund Interim Funds, Budget Stabilization Fund, Deferred Prizes Trust Fund</td>
<td class="data-td data last text-right">4,590,000,000</td>
<td class="data-td data last text-right">10</td>
<td class="data-td data last text-right">459,000,000</td>
<td class="data-td data last text-right">4,814</td>
</tr>
<tr class="tbl-data">
<td class="data-td last">Ohio</td>
<td class="data-td data last text-left">Senate Bill No. 57</td>
<td class="data-td data last text-left">29-Jan-25</td>
<td class="data-td data last text-left">Reserve</td>
<td class="data-td data last text-left">Committee 1</td>
<td class="data-td data last text-left">State entities' Bitcoin payments, donations, criminal forfeitures, interim funds</td>
<td class="data-td data last text-right">n/a</td>
</tr>
<tr class="tbl-data">
<td class="data-td last">New Hampshire</td>
<td class="data-td data last text-left">HB 302</td>
<td class="data-td data last text-left">10-Jan-25</td>
<td class="data-td data last text-left">Reserve</td>
<td class="data-td data last text-left">Committee&nbsp;1</td>
<td class="data-td data last text-left">General Fund, Revenue Stabilization Funds, others as authorized by legislature</td>
<td class="data-td data last text-right">2,116,317,421</td>
<td class="data-td data last text-right">10</td>
<td class="data-td data last text-right">211,631,742</td>
<td class="data-td data last text-right">2,220</td>
</tr>
<tr class="tbl-data">
<td class="data-td last">Utah</td>
<td class="data-td data last text-left">House Bill 230</td>
<td class="data-td data last text-left">15-Jan-25</td>
<td class="data-td data last text-left">Reserve</td>
<td class="data-td data last text-left">Committee 2</td>
<td class="data-td data last text-left">State Disaster Recovery Restricted Account, General Fund Budget Reserve Account, Income Tax Fund Budget Reserve Account, Medicaid Growth Reduction and Budget Stabilization Account</td>
<td class="data-td data last text-right">1,401,800,000</td>
<td class="data-td data last text-right">10</td>
<td class="data-td data last text-right">140,180,000</td>
<td class="data-td data last text-right">1,470</td>
</tr>
<tr class="tbl-data">
<td class="data-td last">Texas</td>
<td class="data-td data last text-left">Senate Bill 778 (SB 778)</td>
<td class="data-td data last text-left">16-Jan-25</td>
<td class="data-td data last text-left">Reserve</td>
<td class="data-td data last text-left">Committee 1</td>
<td class="data-td data last text-left">Unencumbered and unobligated GRF blance per biennium</td>
<td class="data-td data last text-right">18,290,000,000</td>
<td class="data-td data last text-right">1</td>
<td class="data-td data last text-right">182,900,000</td>
<td class="data-td data last text-right">1,918</td>
</tr>
<tr class="tbl-data">
<td class="data-td last">North Dakota</td>
<td class="data-td data last text-left">House Concurrent Resolution No. 3001</td>
<td class="data-td data last text-left">14-Jan-25</td>
<td class="data-td data last text-left">Reserve</td>
<td class="data-td data last text-left">Introduced</td>
<td class="data-td data last text-left">State General Fund, Budget Stabilization Fund, Legacy Fund</td>
<td class="data-td data last text-right">18,557,625,832</td>
<td class="data-td data last text-right">unspecified</td>
<td class="data-td data last text-right">-</td>
</tr>
<tr class="tbl-data">
<td class="data-td last">North Dakota</td>
<td class="data-td data last text-left">HB1184</td>
<td class="data-td data last text-left">7-Jan-25</td>
<td class="data-td data last text-left">Reserve</td>
<td class="data-td data last text-left">Failed/Dead</td>
<td class="data-td data last text-left">Certain State Funds</td>
<td class="data-td data last text-right">n/a</td>
</tr>
<tr class="tbl-data">
<td class="data-td last">Iowa</td>
<td class="data-td data last text-left">Inflation Protection Act</td>
<td class="data-td data last text-left">6-Feb-25</td>
<td class="data-td data last text-left">Reserve</td>
<td class="data-td data last text-left">Introduced</td>
<td class="data-td data last text-left">General Fund, Cash Reserve Fund, Economic Emergency Fund</td>
<td class="data-td data last text-right">5,472,000,000</td>
<td class="data-td data last text-right">5</td>
<td class="data-td data last text-right">273,600,000</td>
<td class="data-td data last text-right">2,869</td>
</tr>
<tr class="tbl-data">
<td class="data-td last">Illinois</td>
<td class="data-td data last text-left">Strategic Bitcoin Reserve Act</td>
<td class="data-td data last text-left">29-Jan-25</td>
<td class="data-td data last text-left">Reserve</td>
<td class="data-td data last text-left">Committee 1</td>
<td class="data-td data last text-left">Gifts, Grants, Donations</td>
<td class="data-td data last text-right">n/a</td>
</tr>
<tr class="tbl-data">
<td class="data-td last">Kentucky</td>
<td class="data-td data last text-left">HB 376</td>
<td class="data-td data last text-left">6-Feb-25</td>
<td class="data-td data last text-left">Reserve</td>
<td class="data-td data last text-left">Committee 1</td>
<td class="data-td data last text-left">Excess State Treasury Cash</td>
<td class="data-td data last text-right">unclear</td>
<td class="data-td data last text-right">10%</td>
<td class="data-td data last text-right">-</td>
</tr>
<tr class="tbl-data">
<td class="data-td last">Missouri</td>
<td class="data-td data last text-left">HB 1217 Bitcoin Strategic Reserve Fund</td>
<td class="data-td data last text-left">6-Feb-25</td>
<td class="data-td data last text-left">Reserve</td>
<td class="data-td data last text-left">Introduced</td>
<td class="data-td data last text-left">Gifts, Grants, Donations</td>
<td class="data-td data last text-right">n/a</td>
</tr>
<tr class="tbl-data">
<td class="data-td last">Missouri</td>
<td class="data-td data last text-left">SB614 - Treasurer Investment Provisions</td>
<td class="data-td data last text-left">23-Jan-25</td>
<td class="data-td data last text-left">Reserve</td>
<td class="data-td data last text-left">Introduced</td>
<td class="data-td data last text-left">State Treasurer</td>
<td class="data-td data last text-right">17,082,467,808</td>
<td class="data-td data last text-right">10</td>
<td class="data-td data last text-right">1,708,246,781</td>
<td class="data-td data last text-right">17,916</td>
</tr>
<tr class="tbl-data">
<td class="data-td last">Maryland</td>
<td class="data-td data last text-left">HB1389 - Strategic Bitcoin Reserve Act of Maryland</td>
<td class="data-td data last text-left">21-Jan-25</td>
<td class="data-td data last text-left">Reserve</td>
<td class="data-td data last text-left">Committee 1</td>
<td class="data-td data last text-left">Seized gambling-related money, state budget fund appropriations, donations, grants</td>
<td class="data-td data last text-right">n/a</td>
</tr>
<tr class="tbl-data">
<td class="data-td last">New Mexico</td>
<td class="data-td data last text-left">Strategic Bitcoin Reserve Act (SB 275)</td>
<td class="data-td data last text-left">4-Feb-25</td>
<td class="data-td data last text-left">Reserve</td>
<td class="data-td data last text-left">Committee 1</td>
<td class="data-td data last text-left">Land Grant Permanent Fund, Severance Tax Permanent Fund, Tobacoo Settlement Permanent Fund, other state funds deemed appropriate by investment council</td>
<td class="data-td data last text-right">42,098,000,000</td>
<td class="data-td data last text-right">5</td>
<td class="data-td data last text-right">2,104,900,000</td>
<td class="data-td data last text-right">22,076</td>
</tr>
<tr class="tbl-data">
<td class="data-td last">South Dakota</td>
<td class="data-td data last text-left">House Bill 1202</td>
<td class="data-td data last text-left">30-Jan-25</td>
<td class="data-td data last text-left">Both Reserve &amp; Pension</td>
<td class="data-td data last text-left">Committee 1</td>
<td class="data-td data last text-left">State public funds approved by the State Investment Council</td>
<td class="data-td data last text-right">16,678,800,000</td>
<td class="data-td data last text-right">10</td>
<td class="data-td data last text-right">1,667,880,000</td>
<td class="data-td data last text-right">17,492</td>
</tr>
<tr class="tbl-data">
<td class="data-td last">Montana</td>
<td class="data-td data last text-left">House Bill No. 429 - "Inflation Protection Act of 2025"</td>
<td class="data-td data last text-left">8-Feb-25</td>
<td class="data-td data last text-left">Reserve</td>
<td class="data-td data last text-left">Committee 1</td>
<td class="data-td data last text-left">Montana General Fund - up to $50 million initially,</td>
<td class="data-td data last text-right">4,176,970,000</td>
<td class="data-td data last text-right">n/a</td>
<td class="data-td data last text-right">50,000,000</td>
<td class="data-td data last text-right">524</td>
</tr>
<tr class="tbl-data">
<td class="data-td last">North Carolina</td>
<td class="data-td data last text-left">HB 92 - NC Digital Assets Investments Act</td>
<td class="data-td data last text-left">10-Feb-25</td>
<td class="data-td data last text-left">Both Reserve &amp; Pension</td>
<td class="data-td data last text-left">Introduced</td>
<td class="data-td data last text-left">General Fund, Highway Fund, Teachers' and Sate Employees' Retirement System, other special state funds</td>
<td class="data-td data last text-right">26,291,046,000</td>
<td class="data-td data last text-right">10</td>
<td class="data-td data last text-right">2,629,104,600</td>
<td class="data-td data last text-right">27,573</td>
</tr>
<tr class="tbl-data">
<td class="data-td last">West Virginia</td>
<td class="data-td data last text-left">Senate Bill 465</td>
<td class="data-td data last text-left">14-Feb-25</td>
<td class="data-td data last text-left">Both Reserve &amp; Pension</td>
<td class="data-td data last text-left">Introduced</td>
<td class="data-td data last text-left">Public Funds Overseen by Board of Treasury Investments</td>
<td class="data-td data last text-right">11,000,000,000</td>
<td class="data-td data last text-right">10</td>
<td class="data-td data last text-right">1,100,000,000</td>
<td class="data-td data last text-right">11,536</td>
</tr>
<tr class="tbl-data">
<td class="data-td last">Michigan</td>
<td class="data-td data last text-left">HB4087</td>
<td class="data-td data last text-left">13-Feb-25</td>
<td class="data-td data last text-left">Reserve</td>
<td class="data-td data last text-left">Committee 1</td>
<td class="data-td data last text-left">The General Fund, The Countercyclical Budget and Economic Stabilization Fund</td>
<td class="data-td data last text-right">3,982,618,000</td>
<td class="data-td data last text-right">10</td>
<td class="data-td data last text-right">398,261,800</td>
<td class="data-td data last text-right">4,147</td>
</tr>
<tr class="tbl-data">
<td class="data-td data last" colspan="7">&nbsp;</td>
<td class="data-td data last text-left">Total:</td>
<td class="data-td data last text-right">25,036,702,345</td>
<td class="data-td data last text-right">262,547</td>
</tr>
</tbody>
</table>
</div>
<br />
<p class="chart-disclosure">Source: State Legislatures, Bitcoinlaws.io as of 02/17/2025. Not intended as a recommendation to buy or sell any securities mentioned herein. <strong>Past performance is no guarantee of future results. Please see important disclosures regarding hypothetical performance at the end of this blog. </strong></p>
<p>This month, we published a summary table of our database tracking the U.S. States&rsquo; legislative initiatives to invest in Bitcoin and other digital assets. After reading each piece of legislation, we identified the sources of funding and estimated their sizes by looking up their most recently available financials. Based on the legislation&rsquo;s limitations (e.g., up to <strong>10%</strong> of the General Fund), we estimated the potential investment size in U.S. dollars, which we then converted to Bitcoin. For simplicity, we excluded other cryptocurrencies, though several bills theoretically allow for investment in other digital assets contingent on certain factors such as market cap.</p>
<p>At current market prices of ~<strong>$95,350 </strong>per Bitcoin, we estimated that currently the pending legislative initiatives could see these U.S. states purchase a total for <strong>262,577</strong> BTC, worth ~<strong>$25 billion</strong>. This figure is both optimistic and conservative. The probability of each of these proposals passing is low, as three bills from Pennsylvania, Wyoming, and North Dakota have already failed. Further, our estimates are based on the upper bounds of each bill, which means purchasing as much Bitcoin as each bill allows. On the other hand, however, several bills do not provide clear guidance to estimate the amount of Bitcoin they could acquire. Thus, we allocated zero Bitcoin purchases to them. We also emphasize that while some of these bills include allocations to Bitcoin in certain state retirement funds, this list excludes pension-only allocations already made in states like Michigan and Wisconsin.</p>
<p>Regardless of the near-term likelihood of these bills passing and making significant allocations towards the digital asset class, this exercise illustrates the shift in sentiment between U.S. public policy and digital assets. These developments were previously unthinkable under prior administrations, given their hostility towards crypto entrepreneurs, banks, etc., as demonstrated by the systemic debanking now being uncovered in the Operation Chokepoint 2.0 investigations. As of February 17th, <strong>32</strong> pieces of state Bitcoin &amp; digital asset legislation have been <a href="https://bitcoinlaws.io/" title="Bitcoin Laws" target="_blank" rel="noopener"><strong>submitted</strong></a>&mdash;<strong>24</strong> of them strategic reserves&mdash;suggesting the urgency of this matter perceived by state lawmakers.</p>
<h3>At The Federal Level: A U.S. Strategic Bitcoin Reserve Could Help Offset National Debt</h3>
<!-- <p><strong>How a U.S. Bitcoin Reserve Could Offset National Debt Over Time</strong></p> -->
<p><img loading="lazy" src="https://www.vaneck.com/contentassets/66b9cbb6f33f42d684f47ca273432398/5358_bitcoin-chaincheck_february-2025_chart-4_v2.jpg" class="img-responsive w-100" alt="How a U.S. Bitcoin Reserve Could Offset National Debt Over Time" /></p>
<p class="chart-disclosure">Source: VanEck Research as of 02/17/2025. <strong>The information, valuation scenarios, and price targets presented on any Bitcoin in this blog are not intended as financial advice, a recommendation to buy or sell Bitcoin, or any call to action. There may be risks or other factors not accounted for in these scenarios that may impede the performance of Bitcoin scenarios or projections/forecasts herein. Any projections, forecasts or forward-looking statements included herein are the results of a simulation based on our research, are valid as of the date of this communication and subject to change without notice and are for illustrative purposes only. Please conduct your own research and draw your own conclusions.</strong></p>
<p>As states move ahead with Bitcoin reserves, they are effectively &lsquo;frontrunning&rsquo; the federal government's emerging policy signals for a Strategic Bitcoin Reserve (SBR). While no formal U.S. Treasury initiative exists yet, the debate is gaining momentum.</p>
<p>To explore this further, we&rsquo;ve developed the <a href="/link/8e3a4ef560ff4027a21236849804d8d2.aspx" title="A U.S. Strategic Bitcoin Reserve Could Help Offset National Debt"><strong>U.S. Debt to Bitcoin Reserve Tool</strong></a>, which is now available on our website. This interactive model lets users adjust U.S. debt growth rates, Bitcoin acquisition prices, BTC price growth, and reserve size to visualize how a national Bitcoin reserve could impact U.S. debt.</p>
<p>With state adoption accelerating, this tool offers a data-driven framework for evaluating Bitcoin&rsquo;s potential role in U.S. monetary policy. This idea, once speculative, is now increasingly entering the policy debate.</p>
<h2 id="miners" class="jump-link-nav anchored-block" data-jumplink-title="Miners">Bitcoin Miners</h2>
<h3>Publicly Traded Bitcoin Miners Will Energize an Estimated 4+ GW Per Year Through 2027</h3>
<div class="flourish-embed flourish-chart" data-src="visualisation/21697461?2428759"><script src="https://public.flourish.studio/resources/embed.js"></script><noscript><img loading="lazy" src="https://public.flourish.studio/visualisation/21697461/thumbnail" width="100%" alt="Publicly Traded Bitcoin Miners Will Energize An Estimated 4+ GW Per Year Through 2027" /></noscript></div>
<p class="chart-disclosure">Source: Company Public Filings as of 02/14/2025. Not intended as a recommendation to buy or sell any securities mentioned herein. <strong>Past performance is no guarantee of future results.</strong></p>
<h2>Scaling Electrical Capacity</h2>
<p>We conducted a comprehensive mapping of the <strong>13</strong> public Bitcoin miners in our coverage: BITF, BTBT, BTDR, CIFR, CLSK, CORZ, GLXY, HIVE, HUT, IREN, MARA, RIOT, and WULF. We estimate that these miners collectively operate <strong>7.1GW</strong> of energized capacity, with plans to expand to <strong>11.7GW</strong> by the end of 2025, <strong>15.9GW</strong> by 2026, and <strong>20.4GW</strong> by 2027. This projection represents a <strong>42%</strong> compound annual growth rate over three years. Beyond 2028, they have an additional <strong>7.3GW</strong> pipeline, which we view as a conservative estimate, given the competitive nature of power procurement in Bitcoin mining and the more secretive nature of long-term growth pipelines.</p>
<p>Assuming the expansion through 2027 would require a modernized (<strong>15 J/TH efficiency</strong>) fleet of Bitmain Antminer S21 Pros at <strong>$5,000</strong> each and <strong>$450,000 </strong>per MW of supporting infrastructure, we estimate the total cost of this growth would be <strong>$24.8 billion</strong> in capex.</p>
<p>However, we think miners are unlikely to commit all this capacity to Bitcoin. Securing new electrical capacity is a core competency for miners&mdash;one that is becoming even more valuable in the era of power-intensive AI computing. According to Goldman Sachs, AI currently consumes <strong>~7.7GW</strong> of global data center power usage (<strong>14%</strong>), a figure expected to grow to <strong>~22.7GW (27%)</strong> by 2027. Similarly, based on our review of their site pipelines, we think the Bitcoin miners we cover will pivot at least <strong>20%-30% </strong>of their electrical capacity to supporting AI/HPC workloads.</p>
<h2>Miners' AI/HPC Pivot Accelerates</h2>
<p>The shift toward AI and high-performance computing (HPC) is gaining momentum among Bitcoin miners. Following CoreWeave&rsquo;s <strong>700MW AI/HPC</strong> deal in 2024, multiple miners are now actively exploring AI-driven revenue streams:</p>
<ul class="content-list">
<li class="mt-2"><strong>Bitfarms (BITF):</strong> <a href="https://investor.bitfarms.com/news-events/press-releases/detail/287/bitfarms-engages-strategic-partners-to-develop-hpcai/" title="Bitfarms Engages Strategic Partners to Develop HPC/AI Business" target="_blank" rel="noopener"><strong>Engaged</strong></a> two AI/HPC consultants to assess feasibility across all North American sites.</li>
<li class="mt-2"><strong>Bitdeer (BTDR):</strong> Following <a href="https://ir.bitdeer.com/static-files/51ea4deb-2f46-4b36-b234-0e798b09e73a" title="A leading tech company for the blockchain &amp; accelerated compute communities" target="_blank" rel="noopener"><strong>completion</strong></a> of its AI/HPC datacenter consulting engagement, <a href="https://ir.bitdeer.com/news-releases/news-release-details/bitdeer-announces-january-2025-production-and-operations-update" title="Bitdeer Announces January 2025 Production and Operations Update" target="_blank" rel="noopener"><strong>cited</strong></a> ongoing discussions with AI/HPC development partners.</li>
<li class="mt-2"><strong>Cipher Mining (CIFR):</strong> In late January, SoftBank <a href="https://www.globenewswire.com/news-release/2025/01/30/3018432/0/en/Cipher-Mining-Announces-50-Million-PIPE-Investment-from-SoftBank-Group.html#:~:text=Cipher%20is%20focused%20on%20the,the%20world's%20largest%20HPC%20companies" title="Cipher Mining Announces $50 Million PIPE Investment from SoftBank Group" target="_blank" rel="noopener"><strong>invested</strong></a> <strong>$50 million </strong>in Cipher Mining, acquiring <strong>10.4 million</strong> shares to support HPC data center expansion.</li>
<li class="mt-2"><strong>Riot (RIOT):</strong> <a href="https://www.riotplatforms.com/riot-platforms-announces-changes-to-its-board-of-directors-and-provides-update-on-formal-evaluation-of-ai-hpc-uses/" title="Riot Platforms Announces Changes to Its Board of Directors and Provides Update on Formal Evaluation of AI/HPC Uses" target="_blank" rel="noopener"><strong>Announced</strong></a> additions to its Board of Directors bringing AI/HPC conversion, data center, and real estate expertise, in addition to retaining AI/HPC investment banking expertise.</li>
<li class="mt-2"><strong>HIVE Digital Technologies (HIVE):</strong> <a href="https://hivedigitaltechnologies.com/news/hive-digital-technologies-welcomes-craig-tavares-as-president-and-chief-operating-officer-of-buzz-hpc-to-lead-growth-in-hpc-and-gpu-cloud-services/" title="HIVE Digital Technologies Welcomes Craig Tavares as President and Chief Operating Officer of Buzz HPC to Lead Growth in HPC and GPU Cloud Services" target="_blank" rel="noopener"><strong>Appointed</strong></a> Craig Tavares as President and COO of Buzz HPC to lead the company&rsquo;s growth in HPC and GPU cloud services.</li>
<li class="mt-2"><strong>Iris Energy (IREN):</strong> <a href="https://irisenergy.gcs-web.com/static-files/a18dd174-516f-4896-bb2e-51254cff7d84" title="Q2 FY25 Results Presentation" target="_blank" rel="noopener"><strong>Announced</strong></a> a <strong>75MW</strong> liquid-cooled AI/HPC data center in Childress, TX (H2 2025) and an additional<strong> 600MW </strong>expansion at Sweetwater, bringing total site capacity to <strong>2GW</strong>&mdash;potentially making it one of the largest sites in North America that may become AI/HPC-eligible.</li>
</ul>
<p>One industry expert explained the scarcity of such large-scale sites like IREN&rsquo;s, stating, "<i>I can count on two hands the number of people who have <strong>1,000MW</strong>  today." Such campuses are ideal for AI training, providing the dense compute clusters needed for cutting-edge model development, faster iteration, and sustained workloads at scale. This underscores the strategic advantage of miners with large portfolios of scalable energy assets as AI demand surges.</i></p>
<h2>Implications for Bitcoin Miners</h2>
<h3>Bitcoin Network Transaction Fees Have Failed to Keep Pace with Price</h3>
<div class="flourish-embed flourish-chart" data-src="visualisation/21697839?2428759"><script src="https://public.flourish.studio/resources/embed.js"></script><noscript><img loading="lazy" src="https://public.flourish.studio/visualisation/21697839/thumbnail" width="100%" alt="Bitcoin Network Transaction Fees Have Failed to Keep Pace with Price" /></noscript></div>
<p class="chart-disclosure">Source: Company Public Filings as of 02/15/2025.</p>
<p>The pivot toward AI/HPC is increasingly critical as Bitcoin&rsquo;s fee revenue model remains unreliable. While network congestion associated with speculative markets can drive temporary spikes in transaction fees, sustained on-chain revenue growth remains elusive. Meanwhile, the rise of off-chain solutions (ETFs, futures markets, L2s, centralized exchanges) could further reduce miners' long-term fee income.</p>
<p>With Bitcoin&rsquo;s block rewards halving every four years, BTC&rsquo;s price must double just for miners to maintain their revenues. This structural challenge further highlights why AI/HPC is an attractive diversification play.</p>
<p>We believe the most successful Bitcoin miners will be those that:</p>
<ol class="content-list">
<li class="mt-2">Use mining to subsidize grid expansion in remote and overlooked energy markets.</li>
<li class="mt-2">Diversify into AI/HPC by leveraging their existing power portfolios and pipelines for higher-margin services, unlocking new financing vehicles.</li>
<li class="mt-2">Monetize operational expertise through innovations such as liquid cooling systems, chip design, and mining co-location technologies.</li>
</ol>
<h2 id="btc-network-activity" class="jump-link-nav anchored-block" data-jumplink-title="Network">Bitcoin&rsquo;s Network Activity, Adoption, and Fees</h2>
<p><strong>Daily Transactions: </strong>Transaction activity declined modestly, <strong>down 10%</strong> MoM.</p>
<p><strong>Ordinals Inscriptions: </strong>Ordinals transactions are <strong>down</strong> <strong>6% </strong>month-over-month (MoM), losing momentum after the Q4 surge in activity. Like NFTs on other blockchains, we view Ordinals as on-chain collectibles&mdash;essentially luxury or Veblen goods&mdash;whose demand tends to rise and fall with Bitcoin&rsquo;s price performance. This cyclical pattern suggests that while inscriptions may cool during periods of consolidation, they could reaccelerate in the next bull phase, particularly with continued advances in marketplace and gallery user experiences.</p>
<p><strong>Total Transfer Volume: </strong>Transfer volume is <strong>down</strong> <strong>28%</strong> MoM; we believe low volatility is once again the culprit. One month ago, transfer volumes were high as Bitcoin prices bounced off a low of <strong>$89k</strong> on January 13th and rapidly approached new highs above <strong>$109k</strong> by January 20th.</p>
<p><strong>Average Transaction Fees: </strong>Costing an average of <strong>$1.40</strong>, Bitcoin fees are <strong>down</strong> <strong>23%</strong> MoM, reflecting the reduced demand from transactions, transfer volume, and ordinals activity.</p>
<p><strong>Global Power Consumption &amp; Mining Difficulty:</strong> Global power consumption <strong>grew 3%</strong> to reach <strong>157 </strong>TWh, and mining difficulty <strong>rose 8%</strong> MoM to <strong>114</strong> terahashes (T), both hitting all-time highs. This reflects a robust and growing network as miners scale operations to meet rising Bitcoin demand.</p>
<p><strong>Total Crypto Equities Market Cap:</strong> <strong>Down 1%</strong> MoM, crypto equities mirrored Bitcoin&rsquo;s low volatility and minimal price changes MoM.</p>
<p><strong>Transfer Volume from Miners to Exchanges:</strong> Miners are transferring <strong>~$7.4M</strong> per day to exchanges, <strong>up 35%</strong> MoM. These levels reflect the 94th percentile of all-time history, though they are still less than half of the levels seen throughout most of H1&rsquo;21. We think that transfer volumes from miners to exchanges are a good proxy for Bitcoin&rsquo;s adoption as a monetary asset, as higher levels reflect a market capable of absorbing new, higher-cost supply as mining difficulty increases.</p>
<p><strong>Futures Sentiment: </strong>Annualized Bitcoin futures <strong>declined</strong> <strong>30%</strong> MoM, reflecting a shift from last month&rsquo;s bullish sentiment to a more neutral. At the 51st percentile of historical levels, funding rates suggest market indecision rather than outright bearishness.</p>
<h2 id="monthly-dashboard" class="anchored-block">Bitcoin Monthly Dashboard</h2>
<div class="wrapped-div">
<table style="width: 100%;">
<tbody>
<tr class="tbl-data">
<td class="tbl-header last text-left">As of February 17th, 2025</td>
<td class="tbl-header last text-right">7-day avg</td>
<td class="tbl-header last text-right">30 day change<sup>1</sup>&nbsp;(%)</td>
<td class="tbl-header last text-right">365 day change (%)</td>
<td class="tbl-header last text-right">Last 7 days Percentile vs all-time history(%)</td>
</tr>
<tr class="tbl-data">
<td class="data-td last font-weight-normal text-left">Bitcoin Price</td>
<td class="data-td data last text-right">$ 96,789</td>
<td class="data-td data last text-right">-2</td>
<td class="data-td data last text-right">88</td>
<td class="data-td data last text-right">99</td>
</tr>
<tr class="tbl-data">
<td class="data-td last font-weight-normal text-left">Daily Active Addresses</td>
<td class="data-td data last text-right">712,597</td>
<td class="data-td data last text-right">-8</td>
<td class="data-td data last text-right">-17</td>
<td class="data-td data last text-right">63</td>
</tr>
<tr class="tbl-data">
<td class="data-td last font-weight-normal text-left">Daily New Addresses</td>
<td class="data-td data last text-right">295,924</td>
<td class="data-td data last text-right">-9</td>
<td class="data-td data last text-right">-20</td>
<td class="data-td data last text-right">53</td>
</tr>
<tr class="tbl-data">
<td class="data-td last font-weight-normal text-left">Daily Transactions</td>
<td class="data-td data last text-right">341,131</td>
<td class="data-td data last text-right">-10</td>
<td class="data-td data last text-right">4</td>
<td class="data-td data last text-right">87</td>
</tr>
<tr class="tbl-data">
<td class="data-td last font-weight-normal text-left">Daily Inscriptions</td>
<td class="data-td data last text-right">84,506</td>
<td class="data-td data last text-right">-6</td>
<td class="data-td data last text-right">4</td>
<td class="data-td data last text-right">52</td>
</tr>
<tr class="tbl-data">
<td class="data-td last font-weight-normal text-left">Total Transfer Volume (USD)</td>
<td class="data-td data last text-right">$ 54,314,005,476</td>
<td class="data-td data last text-right">-28</td>
<td class="data-td data last text-right">18</td>
<td class="data-td data last text-right">85</td>
</tr>
<tr class="tbl-data">
<td class="data-td last font-weight-normal text-left">% Supply Active, last 180 days</td>
<td class="data-td data last text-right">26%</td>
<td class="data-td data last text-right">4</td>
<td class="data-td data last text-right">49</td>
<td class="data-td data last text-right">46</td>
</tr>
<tr class="tbl-data">
<td class="data-td last font-weight-normal text-left">% Supply Dormant for 3+ Years</td>
<td class="data-td data last text-right">45%</td>
<td class="data-td data last text-right">0</td>
<td class="data-td data last text-right">3</td>
<td class="data-td data last text-right">95</td>
</tr>
<tr class="tbl-data">
<td class="data-td last font-weight-normal text-left">Avg Fees (USD)</td>
<td class="data-td data last text-right">$ 1.40</td>
<td class="data-td data last text-right">-23</td>
<td class="data-td data last text-right">-78</td>
<td class="data-td data last text-right">66</td>
</tr>
<tr class="tbl-data">
<td class="data-td last font-weight-normal text-left">Avg Fees (BTC)</td>
<td class="data-td data last text-right">0.00001</td>
<td class="data-td data last text-right">-22</td>
<td class="data-td data last text-right">-89</td>
<td class="data-td data last text-right">9</td>
</tr>
<tr class="tbl-data">
<td class="data-td last font-weight-normal text-left">Percent of BTC Addresses in profit</td>
<td class="data-td data last text-right">93%</td>
<td class="data-td data last text-right">-4</td>
<td class="data-td data last text-right">-1</td>
<td class="data-td data last text-right">79</td>
</tr>
<tr class="tbl-data">
<td class="data-td last font-weight-normal text-left">Unrealized profit/loss ratio</td>
<td class="data-td data last text-right">0.55</td>
<td class="data-td data last text-right">-5</td>
<td class="data-td data last text-right">-1</td>
<td class="data-td data last text-right">76</td>
</tr>
<tr class="tbl-data">
<td class="data-td last font-weight-normal text-left">Global Power Consumption (TWh)</td>
<td class="data-td data last text-right">157</td>
<td class="data-td data last text-right">3</td>
<td class="data-td data last text-right">38</td>
<td class="data-td data last text-right">100</td>
</tr>
<tr class="tbl-data">
<td class="data-td last font-weight-normal text-left">Total Daily BTC Miner Revenues (USD)</td>
<td class="data-td data last text-right">$ 44,388,508</td>
<td class="data-td data last text-right">0</td>
<td class="data-td data last text-right">-8</td>
<td class="data-td data last text-right">92</td>
</tr>
<tr class="tbl-data">
<td class="data-td last font-weight-normal text-left">Total Crypto Equities' Market Cap* (USD) (MM)</td>
<td class="data-td data last text-right">$ 218,393</td>
<td class="data-td data last text-right">-1</td>
<td class="data-td data last text-right">122</td>
<td class="data-td data last text-right">89</td>
</tr>
<tr class="tbl-data">
<td class="data-td last font-weight-normal text-left">Transfer volume from Miners to Exchanges (USD)</td>
<td class="data-td data last text-right">$ 7,448,714</td>
<td class="data-td data last text-right">35</td>
<td class="data-td data last text-right">0</td>
<td class="data-td data last text-right">94</td>
</tr>
<tr class="tbl-data">
<td class="data-td last font-weight-normal text-left">Bitcoin Dominance</td>
<td class="data-td data last text-right">57%</td>
<td class="data-td data last text-right">6</td>
<td class="data-td data last text-right">15</td>
<td class="data-td data last text-right">89</td>
</tr>
<tr class="tbl-data">
<td class="data-td last font-weight-normal text-left">Bitcoin Futures Annualized Basis</td>
<td class="data-td data last text-right">8%</td>
<td class="data-td data last text-right">-30</td>
<td class="data-td data last text-right">-36</td>
<td class="data-td data last text-right">51</td>
</tr>
<tr class="tbl-data">
<td class="data-td last font-weight-normal text-left">Mining Difficulty (T)</td>
<td class="data-td data last text-right">114</td>
<td class="data-td data last text-right">3</td>
<td class="data-td data last text-right">40</td>
<td class="data-td data last text-right">100</td>
</tr>
</tbody>
</table>
</div>
<i><i><br /></i></i>
<p class="chart-disclosure"><sup>*</sup>&nbsp;DAPP market cap as a proxy, as of Feb 17th, 2025<br /><sup>1</sup>&nbsp;30 day change &amp; 365 day change are relative to the 7-day avg, not absolute</p>
<div class="wrapped-div">
<table style="width: 500px;">
<tbody>
<tr class="tbl-data">
<td class="tbl-header last text-left">Regional Trading</td>
<td class="tbl-header last text-right">MoM Change (%)</td>
<td class="tbl-header last text-right">YoY Change (%)</td>
</tr>
<tr class="tbl-data">
<td class="data-td last font-weight-normal text-left">Asia Hours Price Change MoM ($)</td>
<td class="data-td data last text-right">3</td>
<td class="data-td data last text-right">2</td>
</tr>
<tr class="tbl-data">
<td class="data-td last font-weight-normal text-left">US hours Price Change MoM ($)</td>
<td class="data-td data last text-right">-3</td>
<td class="data-td data last text-right">3</td>
</tr>
<tr class="tbl-data">
<td class="data-td last font-weight-normal text-left">EU hours Price Change MoM ($)</td>
<td class="data-td data last text-right">4</td>
<td class="data-td data last text-right">3</td>
</tr>
</tbody>
</table>
</div>
<i><i><br /></i></i>
<p class="chart-disclosure">Source: Glassnode, VanEck research as of 02/17/25. Past performance is no guarantee of future results.</p>
<p><strong>Links to third party websites are provided as a convenience and the inclusion of such links does not imply any endorsement, approval, investigation, verification or monitoring by us of any content or information contained within or accessible from the linked sites. By clicking on the link to a non-VanEck webpage, you acknowledge that you are entering a third-party website subject to its own terms and conditions. VanEck disclaims responsibility for content, legality of access or suitability of the third-party websites.</strong></p>
<style>
    .data-td.data {
        padding-right: 5px !important;
    }

    .data-head {
        padding-right: 5px !important;
    }

    .wrapped-div {
        max-width: 100%;
    }

    @media (max-width: 1240px) {
        .wrapped-div {
            overflow-x: scroll;
        }
    }

    .wrapped-div-sector {
        max-width: 100%;
        overflow-x: scroll;
    }
</style>
<p>To receive more <strong><a href="https://www.vaneck.com/us/en/insights/digital-assets/" title="Digital Assets Insights">Digital Assets</a></strong> insights, <strong><a href="https://www.vaneck.com/us/en/subscribe/" title="Subscription Center">sign up in our subscription center</a></strong>.</p>
]]></content:encoded>
</item><item rdf:about="https://www.vaneck.com/us/en/blogs/model-portfolios/monthly-market-recap-hold-my-beer-the-world-just-flipped-again/">
  <title>January Market Recap: Hold My Beer; The World Just Flipped (Again)></title>
  <link>https://www.vaneck.com/us/en/blogs/model-portfolios/monthly-market-recap-hold-my-beer-the-world-just-flipped-again/</link>
  <description><![CDATA[China's AI breakthrough, persistent inflation, gold&rsquo;s outperformance, and rising energy demand underscore a shifting investment landscape.]]></description>
  <dc:creator>David Schassler</dc:creator>
  <dc:date>02/20/2025 06:30:00</dc:date>
<content:encoded><![CDATA[

<p>Some asked if a monthly commentary could stay interesting. My answer? <em>At this rate, I could write a daily letter and still be redrafting it as the next shockwave hits.</em> Trump, Musk, AI (artificial intelligence), and global chaos have ensured that the world never stops moving.</p>

<h2>DeepSeek: China&rsquo;s AI &ldquo;Sputnik Moment&rdquo; Just Happened</h2>
<p>The media called DeepSeek-V2 China&rsquo;s &ldquo;Sputnik Moment&rdquo; for AI. Dramatic? Maybe. Accurate? Absolutely.</p>
<p>While Western AI labs spend billions on energy-hungry supercomputers, China&rsquo;s DeepSeek-V2 just developed a GPT-4-level model that&rsquo;s leaner, faster, and fully open-source&mdash;all while running on Nvidia chips that China supposedly couldn&rsquo;t get.</p>
<p>This isn&rsquo;t just about catching up&mdash;it&rsquo;s about rewriting the AI arms race. The real shock? Efficiency is the new nuclear weapon. If China can push AI further with fewer resources, U.S. tech dominance isn&rsquo;t as secure as it seems.</p>
<h2>Inflation: Still Here, Still a Problem</h2>
<p>Inflation isn&rsquo;t going anywhere. We&rsquo;re in an extended period of above-target inflation&mdash;think years, not months.</p>
<p>The January CPI came in hot: +0.5% vs. the expected +0.3 %. That&rsquo;s direct confirmation that inflation is still burning. The Fed cut rates by 100 bps in late 2024, and now prices are rising again&mdash; a surprise.</p>
<h3>Consumer-Price Index, Change from a Year Earlier</h3>
<div class="flourish-embed flourish-chart" data-src="visualisation/21706459?2429575"><script src="https://public.flourish.studio/resources/embed.js"></script><noscript><img loading="lazy" src="https://public.flourish.studio/visualisation/21706459/thumbnail" width="100%" alt="Consumer-Price Index, Change from a Year Earlier" /></noscript></div>
<p class="chart-disclosure"><strong>Source:</strong> Labor Department as of January 2025.</p>
<p>Now, the independence of the Fed is in focus because Trump wants lower rates.</p>
<p>&ldquo;I&rsquo;ll demand that interest rates drop immediately.&rdquo; &mdash; Trump, January 2025</p>
<p>Powell is focused on fighting inflation and will hold his ground&mdash;for now. But his term ends in May 2026, and that&rsquo;s when things get interesting.</p>
<p>This isn&rsquo;t new. Politicians forcing central banks into bad decisions never ends well:</p>
<ul class="content-list">
<li class="mt-2">Nixon pressured the Fed in 1972 &rarr; won reelection &rarr; runaway inflation.</li>
<li class="mt-2">Erdoğan strong-armed Turkey&rsquo;s central bank &rarr; lira collapsed; inflation exploded.</li>
<li class="mt-2">Argentina printed money to fund spending &rarr; hyperinflation, default, disaster.</li>
</ul>
<p>When politicians mess with central banks, markets pay the price.</p>
<h2>Gold is Laughing at Everyone</h2>
<p>One asset class hedge against inflation, government overspending, and currency devaluation. Yet, few investors own it.</p>
<p>It&rsquo;s gold.</p>
<p>In the past 12 months alone, gold has nearly doubled the S&amp;P's returns.</p>
<h3>Gold has outperformed the S&amp;P 500 over the past 1, 2, and 3 years</h3>
<div class="flourish-embed flourish-chart" data-src="visualisation/21706794?2429575"><script src="https://public.flourish.studio/resources/embed.js"></script><noscript><img loading="lazy" src="https://public.flourish.studio/visualisation/21706794/thumbnail" width="100%" alt="Gold vs. S&amp;P 500 Index" /></noscript></div>
<p class="chart-disclosure"><strong>Source: </strong>State Street Global Advisors and Bloomberg as of 2/12/2025. This chart is for illustrative purposes only.<strong> Past performance is no guarantee of future results.</strong> Not intended as a recommendation to buy or to sell any of the securities mentioned herein.</p>
<p>At $2,900/oz, people are asking when gold will break $3,000. My reaction? Who cares. Talk to me when it hits $5,000.</p>
<h2>2025 Investment Themes: Nothing Changes, Everything Changes</h2>
<p>So, what does all this mean for investors?</p>
<ul class="content-list">
<li class="mt-2">AI is more powerful and accessible than ever.</li>
<li class="mt-2">Inflation isn&rsquo;t going away&mdash;government spending ensures that.</li>
<li class="mt-2">Energy demand will keep rising, no matter how efficient AI gets.</li>
</ul>
<p>The playbook stays the same&mdash;own equities, real assets, and digital assets. The world is changing fast, but the right investments don&rsquo;t.</p>
<h2>Asset Class Breakdown</h2>
<p><strong>Equities</strong></p>
<ul>
<li class="mt-2">Nvidia suffered its worst single-day loss ever. China&rsquo;s DeepSeek trained a top-tier model for $5.58M using just 2,000 Nvidia GPUs, a fraction of what U.S. firms spend.</li>
<li class="mt-2">Investors panicked. Nvidia dropped 17%, wiping out $589B in market value.</li>
<li class="mt-2">That said, Big Tech (Amazon, Google, Microsoft) is still investing billions in AI, so Nvidia&rsquo;s long-term story isn&rsquo;t over yet.</li>
</ul>
<p><strong>Fixed Income</strong></p>
<ul>
<li class="mt-2">Rates are rising again. The 10-year Treasury yield hit 4.8%, dropped to 4.5%, and is now climbing back up after the latest CPI report.</li>
<li class="mt-2">Credit markets remain calm&mdash;BBB corporate spreads over Treasuries are at just 1.08%.</li>
</ul>
<p><strong>Real Assets</strong></p>
<ul class="content-list">
<li class="mt-2">Real assets are winning in 2025 because:
<ol class="content-list">
<li class="mt-2">Governments won&rsquo;t stop spending</li>
<li class="mt-2">The world won&rsquo;t stop breaking (geopolitical risk)</li>
<li class="mt-2">AI won&rsquo;t stop devouring resources</li>
</ol>
</li>
<li class="mt-2">As of February 12:
<ol>
<li class="mt-2">Gold is up +10.65%</li>
<li class="mt-2">Bloomberg Commodity Index is up +7.38%</li>
<li class="mt-2">Global Natural Resources stocks are outperforming</li>
</ol>
</li>
</ul>
<p><strong>Digital Assets</strong></p>
<ul class="content-list">
<li class="mt-2">Bitcoin is range-bound at ~$100K. Fed policy and regulation limit upside, while government spending and institutional adoption provide a strong floor.</li>
<li class="mt-2">BTC is maturing into a macro asset&mdash;less wild speculation, more tied to liquidity cycles and real adoption.</li>
</ul>
<h2>Final Thought: Own the Future</h2>
<p>The world is changing fast, but the playbook stays the same. AI is here, inflation is sticky, energy demand is rising, and governments won&rsquo;t stop spending.</p>
<p>The right moves? Stay long growth equities, real assets, and digital assets.</p>
<p>Bet on the future&mdash;or get left behind.</p>
<p>To receive more <strong><a href="https://www.vaneck.com/us/en/insights/guided-allocation/" title="Model Portfolio Insights">Model Portfolio</a></strong> insights, <strong><a href="https://www.vaneck.com/us/en/subscribe/" title="Subscription Center">sign up in our subscription center</a></strong>.</p>
]]></content:encoded>
</item><item rdf:about="https://www.vaneck.com/us/en/blogs/emerging-markets-bonds/tarrified-navigating-em-bonds-in-2025/">
  <title>Tarrified? Navigating EM Bonds in 2025></title>
  <link>https://www.vaneck.com/us/en/blogs/emerging-markets-bonds/tarrified-navigating-em-bonds-in-2025/</link>
  <description><![CDATA[Tariff risks are being priced differently across countries, with Mexico facing one-off shocks and China in a tit-for-tat cycle.]]></description>
  <dc:creator>Eric Fine</dc:creator>
  <dc:date>02/14/2025 06:30:00</dc:date>
<content:encoded><![CDATA[

<p id="market-overview" class="jump-link-nav anchored-block" data-jumplink-title="Market Overview ">The <strong><a href="/link/cae21763b8c742f0952c4e4e3234dab9.aspx" title="EMBUX - Emerging Markets Bond Fund - Class I - Overview">VanEck Emerging Markets Bond Fund</a></strong> was up 2.09% in January, compared to 1.74% for its benchmark. The Global Agg and 10-year Treasuries were up in January by only 0.54% and 0.59%, respectively. The decades-old story of emerging market (EM) bonds outperforming developed markets (DM) continues in 2025!</p>
<p>During January, Turkey and Ecuador local currency were winners. Importantly, <i>not</i> owning Mexico in 2024 was a big winner for the fund, but owning Mexico in 2025 has <i>also</i> been a winner for the fund. Country-specific views will remain more important than top-down <i>anything</i>. We increased duration further, as telegraphed, and remain happy with an overweight relative to our benchmark.High yield sovereigns remain our hunting ground in USD, but we added some investment grade sovereigns in the Gulf to capture U.S rate rallies.</p>
<p>A nimble approach to Mexico and Colombia are the high-betas we are attracted to in local currency. Carry is 7.7%, yield to worst is 9.0%, duration is 6.6, and local makes up around 47% of exposure. (The fund was nimble into the end of January, taking profit in many high-flyers in local currency, with the intention of re-establishing early in February. Expect local to increase. This is not regular behavior for the fund, but simply reflects nimble incorporation of recent market conditions.)</p>

<h3>Average Annual Total Returns<sup>*</sup>&nbsp;(%) (In USD)</h3>
<div class="wrapped-div">
<table style="width: 100%;">
<tbody>
<tr class="tbl-data">
<td class="tbl-header last" colspan="10">As of January 31, 2025</td>
</tr>
<tr class="tbl-data">
<td class="data-head last text-right">&nbsp;</td>
<td class="data-head last text-right">1 Mth</td>
<td class="data-head last text-right">3 Mth</td>
<td class="data-head last text-right">YTD</td>
<td class="data-head last text-right">1 Yr</td>
<td class="data-head last text-right">3 Yrs</td>
<td class="data-head last text-right">5 Yrs</td>
<td class="data-head last text-right">10 Yrs</td>
</tr>
<tr class="tbl-data">
<td class="data-td last text-left">Class A: NAV (Inception 07/09/12)</td>
<td class="data-td data last text-right">2.25</td>
<td class="data-td data last text-right">-0.32</td>
<td class="data-td data last text-right">2.25</td>
<td class="data-td data last text-right">5.92</td>
<td class="data-td data last text-right">2.85</td>
<td class="data-td data last text-right">2.53</td>
<td class="data-td data last text-right">1.95</td>
</tr>
<tr class="tbl-data">
<td class="data-td last text-left">Class A: Maximum 5.75% load</td>
<td class="data-td data last text-right">-3.63</td>
<td class="data-td data last text-right">-6.05</td>
<td class="data-td data last text-right">-3.63</td>
<td class="data-td data last text-right">-0.17</td>
<td class="data-td data last text-right">0.84</td>
<td class="data-td data last text-right">1.32</td>
<td class="data-td data last text-right">1.34</td>
</tr>
<tr class="tbl-data">
<td class="data-td last text-left">Class I: NAV (Inception 07/09/12)</td>
<td class="data-td data last text-right">2.09</td>
<td class="data-td data last text-right">-0.29</td>
<td class="data-td data last text-right">2.09</td>
<td class="data-td data last text-right">6.14</td>
<td class="data-td data last text-right">3.17</td>
<td class="data-td data last text-right">2.86</td>
<td class="data-td data last text-right">2.25</td>
</tr>
<tr class="tbl-data">
<td class="data-td last text-left">Class Y: NAV (Inception 07/09/12)</td>
<td class="data-td data last text-right">2.27</td>
<td class="data-td data last text-right">-0.25</td>
<td class="data-td data last text-right">2.27</td>
<td class="data-td data last text-right">6.26</td>
<td class="data-td data last text-right">3.09</td>
<td class="data-td data last text-right">2.77</td>
<td class="data-td data last text-right">2.19</td>
</tr>
<tr class="tbl-data">
<td class="data-td last text-left">50% GBI-EM/50% EMBI</td>
<td class="data-td data last text-right">1.75</td>
<td class="data-td data last text-right">0.37</td>
<td class="data-td data last text-right">1.75</td>
<td class="data-td data last text-right">5.13</td>
<td class="data-td data last text-right">0.17</td>
<td class="data-td data last text-right">-0.50</td>
<td class="data-td data last text-right">1.95</td>
</tr>
</tbody>
</table>
</div>
<br />
<div class="wrapped-div">
<table style="width: 100%;">
<tbody>
<tr class="tbl-data">
<td class="tbl-header last" colspan="10">As of December 31, 2024</td>
</tr>
<tr class="tbl-data">
<td class="data-head last text-right">&nbsp;</td>
<td class="data-head last text-right">1 Mth</td>
<td class="data-head last text-right">3 Mth</td>
<td class="data-head last text-right">YTD</td>
<td class="data-head last text-right">1 Yr</td>
<td class="data-head last text-right">3 Yrs</td>
<td class="data-head last text-right">5 Yrs</td>
<td class="data-head last text-right">10 Yrs</td>
</tr>
<tr class="tbl-data">
<td class="data-td last text-left">Class A: NAV (Inception 07/09/12)</td>
<td class="data-td data last text-right">-1.83</td>
<td class="data-td data last text-right">-5.05</td>
<td class="data-td data last text-right">2.52</td>
<td class="data-td data last text-right">1.61</td>
<td class="data-td data last text-right">2.21</td>
<td class="data-td data last text-right">1.87</td>
</tr>
<tr class="tbl-data">
<td class="data-td last text-left">Class A: Maximum 5.75% load</td>
<td class="data-td data last text-right">-7.48</td>
<td class="data-td data last text-right">-10.51</td>
<td class="data-td data last text-right">-3.38</td>
<td class="data-td data last text-right">-0.37</td>
<td class="data-td data last text-right">1.00</td>
<td class="data-td data last text-right">1.27</td>
</tr>
<tr class="tbl-data">
<td class="data-td last text-left">Class I: NAV (Inception 07/09/12)</td>
<td class="data-td data last text-right">-1.62</td>
<td class="data-td data last text-right">-4.93</td>
<td class="data-td data last text-right">3.09</td>
<td class="data-td data last text-right">2.01</td>
<td class="data-td data last text-right">2.54</td>
<td class="data-td data last text-right">2.20</td>
</tr>
<tr class="tbl-data">
<td class="data-td last text-left">Class Y: NAV (Inception 07/09/12)</td>
<td class="data-td data last text-right">-1.81</td>
<td class="data-td data last text-right">-5.14</td>
<td class="data-td data last text-right">2.84</td>
<td class="data-td data last text-right">1.86</td>
<td class="data-td data last text-right">2.44</td>
<td class="data-td data last text-right">2.11</td>
</tr>
<tr class="tbl-data">
<td class="data-td last text-left">50% GBI-EM/50% EMBI</td>
<td class="data-td data last text-right">-1.66</td>
<td class="data-td data last text-right">-4.48</td>
<td class="data-td data last text-right">2.01</td>
<td class="data-td data last text-right">-0.88</td>
<td class="data-td data last text-right">-0.83</td>
<td class="data-td data last text-right">1.84</td>
</tr>
</tbody>
</table>
</div>
<p class="chart-disclosure"><sup>*</sup>&nbsp;Returns less than one year are not annualized.</p>
<p class="chart-disclosure"><strong> Expenses: Class A: Gross 2.08%, Net 1.21%; Class I: Gross 1.34%, Net 0.86%;</strong> Class Y: Gross 1.35%, Net 0.96%. Expenses are capped contractually until 05/01/25 at 1.20% for Class A, 0.85% for Class I, 0.95% for Class Y. Caps excluding acquired fund fees and expenses, interest, trading, dividends, and interest payments of securities sold short, taxes, and extraordinary expenses.</p>
<p class="chart-disclosure"><strong> The performance data quoted represents past performance. Past performance is not a guarantee of future results. Investment return and principal value of an investment will fluctuate so that an investor&rsquo;s shares, when redeemed, may be worth more or less than their original cost. Performance may be lower or higher than performance data quoted. Please call 800.826.2333 or visit vaneck.com for performance current to the most recent month ended.</strong></p>
<p class="chart-disclosure">The &ldquo;Net Asset Value&rdquo; (NAV) of a Fund is determined at the close of each business day, and represents the dollar value of one share of the fund; it is calculated by taking the total assets of the fund, subtracting total liabilities, and dividing by the total number of shares outstanding. The NAV is not necessarily the same as the ETF&rsquo;s intraday trading value. Investors should not expect to buy or sell shares at NAV.</p>

<p id="us-tarrifs-impact" class="jump-link-nav anchored-block" data-jumplink-title="U.S Tariffs Impact"><strong>U.S tariff risks are not monolithic and may even be priced.</strong> Some countries &ndash; Mexico and Colombia, for example - seem to have been subject to one-off massively asymmetric games of chicken. Emphasis on <u>one-off</u>. Other countries, such as China, appear subject to multi-round games of Tit-for-Tat. The tariff trade is getting priced one country at a time, not monolithically. Even so, we ultimately see an agreement with China that keeps CNY stable, which is key to EM and the world. On the games of chicken, their power asymmetry (for example U.S. versus Mexico, over a third of whose economy is U.S exports?) is very consistent with these being close to &ldquo;one-off&rdquo;. Barring knowledge or other such failures. This is important, game-theoretically, obviously, because it could be over already. All we&rsquo;ll say is MXN and Mbonos in particular have been a strong package since tariffs were both announced <u>and</u> delayed by a month! Even in China, though there was a targeted tariff reaction, it was targeted and excluded contentious soybeans. Most importantly, the big message from the government was via CNY and was consistently one of stability! As we&rsquo;ve reported, and it can&rsquo;t be re-emphasized enough, the daily CNY fixes have remained stronger than the bank-predicted fixes (which are based on imputed models of CNY&rsquo;s currency basket). We don&rsquo;t bore you with those charts this month. Instead, just look at the two charts below. Two very simple points. First, since we&rsquo;re talking about China, can you even find CNY in the charts? Exactly &ndash; in a massively bearish EMFX world of 2024 it was basically unchanged, and ditto in the massively bullish EMFX world of January 2025. You&rsquo;d almost think China was an anchor&hellip;which is our view (Of course, investing around a view is more complicated). Second, there&rsquo;s a narrative &ndash; not more, but our job is to survive the twists &ndash; that has 2024 already pricing in a lot of tariff uncertainty. We&rsquo;ll stick to our portfolio as explained herein, but it&rsquo;s a narrative that could gain adherents and so is worth noting.</p>
<h3>Exhibit 1 &ndash; 2025 Sees EMFX &ldquo;Over&rdquo; Tariffs, After 2024 Saw Big EMFX Selloff&hellip;CNY Stable Throughout</h3>
<div class="flourish-embed flourish-chart" data-src="visualisation/21607834?2429575"><script src="https://public.flourish.studio/resources/embed.js"></script><noscript><img loading="lazy" src="https://public.flourish.studio/visualisation/21607834/thumbnail" width="100%" alt="Exhibit 1 &ndash; 2025 Sees EMFX &ldquo;Over&rdquo; Tariffs, After 2024 Saw Big EMFX Selloff&hellip;CNY Stable Throughout - chart1" /></noscript></div>
<div class="flourish-embed flourish-chart" data-src="visualisation/21607882?2429575"><script src="https://public.flourish.studio/resources/embed.js"></script><noscript><img loading="lazy" src="https://public.flourish.studio/visualisation/21607882/thumbnail" width="100%" alt="Exhibit 1 &ndash; 2025 Sees EMFX &ldquo;Over&rdquo; Tariffs, After 2024 Saw Big EMFX Selloff&hellip;CNY Stable Throughout - chart2" /></noscript></div>
<p class="chart-disclosure">Source: Bloomberg, LP. Data as of February 2025.</p>
<p><strong>Getting through tariff uncertainty is important, because the path afterwards is looking more attractive. The U.S is stimulating its economy. China is doing the same <i>and</i> we believe the worst of the major property sector problems are behind us!</strong> EM interest rates are high in nominal and real terms, and though the carry is good enough for us, there&rsquo;s even real risk of a U.S rate rally. Tariff obsession will end, and we want our eyes on the prizes. Unfortunately for our China allocations, there seem to be fewer prizes in Chinese corporate bonds&hellip;because they have largely repriced! We are keeping our remaining allocations until targets are hit, but our point is that the majors &ndash; from Longfor to Vanke to even Hong Kong-based New World &ndash; could be sorted. They&rsquo;ve done a combination of terming out debt, borrowing against unsecured assets, asset sales, etc., and seem to be survivors, meaning they are trusted enough to be selling new developments. We don&rsquo;t think this is reflected in broader markets, which continue to obsess about the day a &ldquo;fiscal bazooka&rdquo; will be fired. On U.S stimulus, tax cuts and de-regulation are clear positives (growth up, inflation down), but economists seem more comfortable projecting their overall political stances than actually quantifying the positive economic outcomes. This was true during President Trump&rsquo;s 2016 term. Anyway, there&rsquo;s a lot of premium in the long end for ventilations over long-term fiscal outcomes that seems very premature to us. This could have an impact on Fed thinking, over time, tilting it dovish. If data doesn&rsquo;t do that first.</p>
<p id="rates-impact" class="jump-link-nav anchored-block" data-jumplink-title="Rates Impact on EMFX"><strong>Rates lower, EMFX more selective.</strong> Rates lower is the clearest implication, to us. Short rates is the big &ldquo;hedge&rdquo; and fiscal developments or data could easily trigger big rallies in the long end. The long end also appeared fairly anchored in the face of early-year front-end selloffs. Let&rsquo;s dig in to the Fed a bit. This current Fed&rsquo;s latest hit was &ldquo;transitory inflation&rdquo; during an explicit fiscal expansion during low unemployment. Which was roundly predicted to be inflationary by many. And the Fed was able to convince itself to keep monetary policy easy&hellip;right until the Trump administration arrives! Those are bad optics, but easily manipulated by the new U.S administration, which seems to be the plan. Treasury Secretary Bessent&rsquo;s emphasis on getting market yields (as opposed to policy rates) lower is both a gentlemanly avoidance of direct conflict with the Fed, but also a set-up for a classic trade. Look at our structural reforms and fiscal rectitude and be an orthodox central bank and reward it with lower rates. Please. It&rsquo;s profoundly orthodox. EM currencies will be case-by-case, and more directly affected by ongoing tariff uncertainty. Even in weak MXN, though, the rates rally is more than compensating. And with Banxico now tilting dovish, Mbono rates look set to fall further, and MXN did not react terribly to the dovishness. Colombia clearly trades better, and we remain attracted to it. Perhaps the trade there is to slowly discount the eventual departure of near-disastrous Presidente Gustavo Petro. Anyway, it trades very well and is not broadly held. Our problem children could be Brazil and South Africa. Lula is just a bad juxtaposition to Trump, in the midst of a brewing fiscal brouhaha (or worse). China can easily dump Brazilian soybean purchases in favor of the U.S, as another headline and challenge. Anyway, hardly an obvious case of quick resolution like Mexico (which as we note is subjected to massively asymmetric power relative to the U.S). South Africa&rsquo;s Ramaphosa, too, is also a bad juxtaposition to Trump. The land expropriation issue is one we&rsquo;ve followed for decades and is much grayer than the black/white versions you&rsquo;ve heard. But, the good vs. evil theatrics are dominating, with both President Trump and Elon Musk commenting on the topic, culminating so far in the end of direct U.S financial assistance (which is small, at around half a billion USD, but is nonetheless symbolic). Anyway, hard to predict risks that could have significant adverse consequences, so we are nimble and cautious here, too.</p>
<h2 id="exposure-types" class="jump-link-nav anchored-block" data-jumplink-title="Exposure Types And Significant Changes">Exposure Types And Significant Changes</h2>
<p>The changes to our top positions are summarized below. Our largest positions in January were South Africa, Mexico, Colombia, Indonesia, and Malaysia</p>
<ul class="content-list">
<li class="mt-2">We increased our hard currency sovereign exposure in Saudi Arabia, the United Arab Emirates, Qatar, and Kuwait. We were driven mostly by duration considerations here, which improved the technical test scores for these countries. Specific factors included very negative market positioning, a non-zero probability that President Trump&rsquo;s fiscal consolidation push might succeed at least partially. This group of countries can also benefit if additional tariffs lift oil prices higher. Finally, this is also defensive exposure, following a significant rally in EM in January.</li>
<li class="mt-2">We also increased our hard currency sovereign exposure in Peru and Romania. Our reasoning regarding duration was very similar to the countries above. We also liked the fact that Romania&rsquo;s fiscal and election woes are now largely priced in (Romania also continues to receive significant funds from the EU). Peru benefits from relative policy and political stability in the region plagued by tariff and fiscal concerns, which boosts its policy test score.</li>
<li class="mt-2">Finally, we increased our hard currency sovereign exposure in Ecuador and Paraguay, and local currency exposure in Colombia. In Colombia, the market over-reacted to the &ldquo;tariff war&rdquo; story, which was resolved in a matter of hours. Ecuador&rsquo;s policy and economic outlook &ndash; and the policy test score - should benefit a great deal if the incumbent candidate wins the forthcoming presidential elections (polls are tight, but he has a good chance). As regards Paraguay, we sold this bond when it became too rich, and then covered our underweight when it cheapened (improving the technical test score along the way).</li>
<li class="mt-2">We reduced our local currency exposure in Mexico and Thailand. The price action in Mexico is likely to remain volatile until there is more clarity on the U.S. tariffs &ndash; rollercoaster-like headlines worsened the country&rsquo;s policy test score. Thailand can get affected by spillover effects from the U.S. policy uncertainty about China - as well as the stimulus uncertainty in China. The Thai baht is highly correlated with the Chinese renminbi, which weakened during Donald Trump&rsquo;s first trade war in response to higher tariffs. These factors worsened Thailand&rsquo;s technical test score.</li>
<li class="mt-2">We also reduced our hard currency corporate exposure in China and Hong Kong on the back of concerns about weak domestic demand, no major progress in real estate, and the fact that the next comprehensive stimulus announcement might need to wait until the end of March. President Trump 2.0 policy jitters and the tariffs uncertainty also weakened the policy test score for China.</li>
<li class="mt-2">Finally, we reduced our local currency exposure in Poland and Kazakhstan, and hard currency sovereign exposure in Barbados. Poland&rsquo;s fiscal concerns keep multiplying (a combination of election promises and higher defense spending), worsening the country&rsquo;s policy test score. Geopolitical considerations lowered the policy test score for Kazakhstan. As regards Barbados, we saw limited positive catalysts there and used the proceeds for more compelling opportunities.</li>
</ul>
<p>To receive more <a href="https://www.vaneck.com/us/en/insights/emerging-markets-bonds/" title="Emerging Markets Bonds Insights"><strong>Emerging Markets Bonds</strong></a> insights, <a href="/link/5f45412c2143400497908cea2897f7d3.aspx" title=" Subscription Center"><strong>sign up in our subscription center</strong></a>.</p>
]]></content:encoded>
</item><item rdf:about="https://www.vaneck.com/us/en/blogs/income-investing/fallen-angels-take-flight-a-strong-start-to-2025/">
  <title>Fallen Angels Take Flight: A Strong Start to 2025></title>
  <link>https://www.vaneck.com/us/en/blogs/income-investing/fallen-angels-take-flight-a-strong-start-to-2025/</link>
  <description><![CDATA[Fallen angels outperformed high yield in January as lower rates/tighter spreads drove gains. Aptiv joined the index, boosting Auto exposure, while Ford&rsquo;s outlook may signal broader sector headwinds.]]></description>
  <dc:creator>Nicolas  Fonseca, CFA</dc:creator>
  <dc:date>02/14/2025 06:30:00</dc:date>
<content:encoded><![CDATA[

<p>Fallen angels (as represented by the ICE US Fallen Angel High Yield 10% Constrained Index, &ldquo;H0CF&rdquo;) began 2025 on a positive note, outperforming the broad high-yield market (as represented by the ICE BofA US High Yield Index, &ldquo;H0A0&rdquo;) by 0.10% (1.48% vs. 1.38%). The outperformance was driven by declining interest rates and tightening credit spreads, particularly in the Real Estate sector, which is the second largest overweight versus broad high yield, behind Retail. The 10-year U.S. Treasury yield fluctuated throughout the month, peaking at 4.79% before settling at 4.52%. The U.S. Federal Reserve (Fed) held interest rates steady in January and is expected to maintain this stance until the summer, although we anticipate that expectations will continue to adjust based on new data points. Lower-rated bonds continued last year&rsquo;s trend of leading performance, with the CCC &amp; below index returning 1.64%, compared to 1.42% for single-B rated bonds and 1.29% for BB-rated bonds.</p>
<p>Fallen angels are off to a strong start this year. We believe interest rates will remain a key driver of returns in 2025, as they currently account for approximately 65% of total yield. Additionally, credit spreads can remain tight for extended periods, as corporate fundamentals take time to shift. Since 2003, there have been 6 periods&mdash;lasting between 0.4 and 3.9 years&mdash;where high-yield spreads remained below their historical average and fallen angels outperformed by approximately 3%. Fallen angels have underperformed by 2% during the current period, which has now reached 2.5 years. This makes it an outlier compared to historical trends. However, the current tight spread period is not over, and wider spreads would likely reflect a changing credit environment in which fallen angels could benefit, for example due to a higher volume of new fallen angels, higher quality or evolving sector themes.</p>
<div class="wrapped-div">
<table style="width: 100%;">
<tbody>
<tr class="tbl-data">
<td class="tbl-header last text-center">&nbsp;</td>
<td class="tbl-header last text-center" colspan="2">Cumulative Total Return</td>
<td class="tbl-header last text-center">&nbsp;</td>
</tr>
<tr class="tbl-data">
<td class="data-td last">Beg Date</td>
<td class="data-td last">End Date</td>
<td class="data-head last text-right"># Years</td>
<td class="data-head last text-right">Fallen Angel</td>
<td class="data-head last text-right">Broad HY</td>
<td class="data-head last text-right">Over/underperformance</td>
</tr>
<tr class="tbl-data">
<td class="data-td last font-weight-normal">12/31/2003</td>
<td class="data-td last font-weight-normal">11/12/2007</td>
<td class="data-td data last text-right">3.87</td>
<td class="data-td data last text-right">33.25</td>
<td class="data-td data last text-right">30.86</td>
<td class="data-td data last text-right">2.39</td>
</tr>
<tr class="tbl-data">
<td class="data-td last font-weight-normal">1/14/2011</td>
<td class="data-td last font-weight-normal">5/31/2011</td>
<td class="data-td data last text-right">0.38</td>
<td class="data-td data last text-right">6.69</td>
<td class="data-td data last text-right">4.60</td>
<td class="data-td data last text-right">2.09</td>
</tr>
<tr class="tbl-data">
<td class="data-td last font-weight-normal">1/3/2013</td>
<td class="data-td last font-weight-normal">12/8/2014</td>
<td class="data-td data last text-right">1.93</td>
<td class="data-td data last text-right">16.91</td>
<td class="data-td data last text-right">9.67</td>
<td class="data-td data last text-right">7.24</td>
</tr>
<tr class="tbl-data">
<td class="data-td last font-weight-normal">2/5/2015</td>
<td class="data-td last font-weight-normal">7/3/2015</td>
<td class="data-td data last text-right">0.41</td>
<td class="data-td data last text-right">1.42</td>
<td class="data-td data last text-right">1.37</td>
<td class="data-td data last text-right">0.04</td>
</tr>
<tr class="tbl-data">
<td class="data-td last font-weight-normal">9/30/2016</td>
<td class="data-td last font-weight-normal">2/27/2020</td>
<td class="data-td data last text-right">3.41</td>
<td class="data-td data last text-right">26.65</td>
<td class="data-td data last text-right">21.39</td>
<td class="data-td data last text-right">5.27</td>
</tr>
<tr class="tbl-data">
<td class="data-td last font-weight-normal">10/7/2020</td>
<td class="data-td last font-weight-normal">6/15/2022</td>
<td class="data-td data last text-right">1.69</td>
<td class="data-td data last text-right">-1.16</td>
<td class="data-td data last text-right">-2.44</td>
<td class="data-td data last text-right">1.28</td>
</tr>
<tr class="tbl-data">
<td class="data-td last">&nbsp;</td>
<td class="data-td last font-weight-normal">Average -&gt;</td>
<td class="data-td data last text-right">1.95</td>
<td class="data-td data last text-right">&nbsp;</td>
<td class="data-td data last text-right">3.05</td>
</tr>
</tbody>
</table>
</div>
<p class="chart-disclosure">Source: ICE Data Services, VanEck. Fallen Angels: ICE US Fallen Angel High Yield 10% Constrained Index. Broad HY: ICE BofA US High Yield Index. OAS refers to &ldquo;option-adjusted spread.&rdquo; Please see definition for this and other terms referenced herein in the disclosures and definitions portion of this blog. Past performance is no guarantee of future results. Index performance is not representative of strategy performance. It is not possible to invest in an index.</p>
<p><strong>Fallen Angels Overall Statistics:</strong> Fallen angels and broad high yield spreads continue tightening, with broad high yield reaching its post global financial crisis (GFC) low of 259bps in late January, although it finished the monthly slightly higher. Yields remained relatively high for both indices, albeit slightly lower than at the beginning of the year.</p>
<div class="wrapped-div">
<table style="width: 100%;">
<tbody>
<tr class="tbl-data">
<td class="tbl-header last text-center">&nbsp;</td>
<td class="tbl-header last text-center" style="border-right: outset;" colspan="2">Fallen Angels</td>
<td class="tbl-header last text-center" colspan="2">Broad HY</td>
</tr>
<tr class="tbl-data">
<td class="data-head last text-right">&nbsp;</td>
<td class="data-head last text-right">12/31/2024</td>
<td class="data-head last text-right" style="border-right: outset;">1/31/2025</td>
<td class="data-head last text-right">12/31/2024</td>
<td class="data-head last text-right">1/31/2025</td>
</tr>
<tr class="tbl-data">
<td class="data-td last">Yield to Worst</td>
<td class="data-td data last text-right">7.00</td>
<td class="data-td data last text-right" style="border-right: outset;">6.76</td>
<td class="data-td data last text-right">7.47</td>
<td class="data-td data last text-right">7.17</td>
</tr>
<tr class="tbl-data">
<td class="data-td last">Par Weighted Price</td>
<td class="data-td data last text-right">91.52</td>
<td class="data-td data last text-right" style="border-right: outset;">92.48</td>
<td class="data-td data last text-right">95.48</td>
<td class="data-td data last text-right">96.34</td>
</tr>
<tr class="tbl-data">
<td class="data-td last">Effective Duration</td>
<td class="data-td data last text-right">4.89</td>
<td class="data-td data last text-right" style="border-right: outset;">4.85</td>
<td class="data-td data last text-right">3.22</td>
<td class="data-td data last text-right">3.09</td>
</tr>
<tr class="tbl-data">
<td class="data-td last">Full Market Value ($mn)</td>
<td class="data-td data last text-right">53,393</td>
<td class="data-td data last text-right" style="border-right: outset;">53,847</td>
<td class="data-td data last text-right">1,338,887</td>
<td class="data-td data last text-right">1,347,313</td>
</tr>
<tr class="tbl-data">
<td class="data-td last">OAS</td>
<td class="data-td data last text-right">249</td>
<td class="data-td data last text-right" style="border-right: outset;">229</td>
<td class="data-td data last text-right">292</td>
<td class="data-td data last text-right">268</td>
</tr>
<tr class="tbl-data">
<td class="data-td last">No. of Issues</td>
<td class="data-td data last text-right">122</td>
<td class="data-td data last text-right" style="border-right: outset;">121</td>
<td class="data-td data last text-right">1,879</td>
<td class="data-td data last text-right">1,874</td>
</tr>
</tbody>
</table>
</div>
<p class="chart-disclosure">Source: ICE Data Services, VanEck. Fallen Angels: ICE US Fallen Angel High Yield 10% Constrained Index. Broad HY: ICE BofA US High Yield Index. OAS refers to &ldquo;option-adjusted spread.&rdquo; Please see definition for this and other terms referenced herein in the disclosures and definitions portion of this blog. Past performance is no guarantee of future results. Index performance is not representative of strategy performance. It is not possible to invest in an index.</p>
<p><strong>Fallen Angels:</strong> Aptiv PLC junior subordinated debt was downgraded by Fitch to BB+ from BBB-, as the company is planning to spin off its electrical distribution systems business into a separate company. Fitch states that the downgrade aligns more closely with other similarly junior subordinated debt from other issuers. Over the last six months, the junior subordinated debt price decreased to $99.71 from $101.05. Within the Auto sector, S&amp;P affirmed Ford&rsquo;s BBB- rating in early February but revised its outlook to negative, as Ford&rsquo;s expansion over the next couple of years appears to be limited due to slower-than-expected progress on cost reduction, high labor costs and increasing pricing pressure. S&amp;P stated that the negative outlook also reflects an increase in the risk of downgrade over the next 12-24 months, which could make Ford a fallen angel again, all else equal, as Moody&rsquo;s credit rating is Ba1 while Fitch is BBB-.</p>
<div class="wrapped-div">
<table style="width: 100%;">
<tbody>
<tr class="tbl-data">
<td class="tbl-header last">Month-end Addition</td>
<td class="tbl-header last">Name</td>
<td class="tbl-header last">Rating</td>
<td class="tbl-header last">Sector</td>
<td class="tbl-header last">Industry</td>
<td class="tbl-header last text-right">% Mkt Value</td>
<td class="tbl-header last text-right">Price</td>
</tr>
<tr class="tbl-data">
<td class="data-td last font-weight-normal">January</td>
<td class="data-td data last text-left">Aptiv PLC / Aptiv Global Financing DAC</td>
<td class="data-td data last text-left">BB1</td>
<td class="data-td data last text-left">Automotive</td>
<td class="data-td data last text-left">Auto Parts &amp; Equipment</td>
<td class="data-td data last text-right">0.95</td>
<td class="data-td data last text-right">99.71</td>
</tr>
</tbody>
</table>
</div>
<p class="chart-disclosure">Source: ICE Data Services, VanEck. Fallen Angels: ICE US Fallen Angel High Yield 10% Constrained Index. Past performance is no guarantee of future results. Not a recommendation to buy or sell any of the names/securities mentioned herein. Index performance is not representative of strategy performance. It is not possible to invest in an index.</p>

<p><strong>Rising Stars:</strong> None in January.</p>
<p><strong>Fallen Angels Performance by Sector:</strong> With Aptiv PLC entering the index this past month, the Auto sector is back on the fallen angel index since the exit of Ford in November 2023. There were no major changes to sector composition, with Retail, Telecom and Real Estate still accounting for approximately 50% exposure, in aggregate, of the index. In January, all but two sectors registered positive returns, with Real Estate taking the lead with a 3.42% total return as its spreads tightened by 88bps. Real Estate is still the only sector with spreads above the 300 level, which may continue to provide upside if spreads continue to grind tighter. The worst performing sector in January was Transportation, although it is represented by only one issuer/bond (XPO Inc). In terms of sector attribution vs broad high yield, Real Estate and Retail were the top contributors to relative outperformance while the lack of Media exposure continued to hurt the fallen angel index.</p>
<div class="wrapped-div">
<table style="width: 100%;">
<tbody>
<tr class="tbl-data">
<td class="tbl-header last text-center">&nbsp;</td>
<td class="tbl-header last text-center" style="border-right: outset;" colspan="2">Wgt (%)</td>
<td class="tbl-header last text-center" style="border-right: outset;" colspan="2">OAS</td>
<td class="tbl-header last text-center" style="border-right: outset;" colspan="2">Price</td>
<td class="tbl-header last text-right">Total Return</td>
</tr>
<tr class="tbl-data">
<td class="data-head data last text-right">&nbsp;</td>
<td class="data-head data last text-right">12/31/2024</td>
<td class="data-head data last text-right" style="border-right: outset;">1/31/2025</td>
<td class="data-head data last text-right">12/31/2024</td>
<td class="data-head data last text-right" style="border-right: outset;">1/31/2025</td>
<td class="data-head data last text-right">12/31/2024</td>
<td class="data-head data last text-right" style="border-right: outset;">1/31/2025</td>
<td class="data-head data last text-right">MTD</td>
</tr>
<tr class="tbl-data">
<td class="data-td last">Automotive</td>
<td class="data-td data last text-right">&nbsp;</td>
<td class="data-td data last text-right" style="border-right: outset;">0.95</td>
<td class="data-td data last text-right">&nbsp;</td>
<td class="data-td data last text-right" style="border-right: outset;">276</td>
<td class="data-td data last text-right">&nbsp;</td>
<td class="data-td data last text-right" style="border-right: outset;">99.71</td>
<td class="data-td data last text-right">&nbsp;</td>
</tr>
<tr class="tbl-data">
<td class="data-td last">Banking</td>
<td class="data-td data last text-right">4.94</td>
<td class="data-td data last text-right" style="border-right: outset;">5.78</td>
<td class="data-td data last text-right">181</td>
<td class="data-td data last text-right" style="border-right: outset;">156</td>
<td class="data-td data last text-right">96.00</td>
<td class="data-td data last text-right" style="border-right: outset;">102.02</td>
<td class="data-td data last text-right">0.84</td>
</tr>
<tr class="tbl-data">
<td class="data-td last">Basic Industry</td>
<td class="data-td data last text-right">4.94</td>
<td class="data-td data last text-right" style="border-right: outset;">5.00</td>
<td class="data-td data last text-right">181</td>
<td class="data-td data last text-right" style="border-right: outset;">158</td>
<td class="data-td data last text-right">96.00</td>
<td class="data-td data last text-right" style="border-right: outset;">97.55</td>
<td class="data-td data last text-right">2.06</td>
</tr>
<tr class="tbl-data">
<td class="data-td last">Capital Goods</td>
<td class="data-td data last text-right">5.55</td>
<td class="data-td data last text-right" style="border-right: outset;">5.51</td>
<td class="data-td data last text-right">179</td>
<td class="data-td data last text-right" style="border-right: outset;">163</td>
<td class="data-td data last text-right">96.48</td>
<td class="data-td data last text-right" style="border-right: outset;">96.72</td>
<td class="data-td data last text-right">0.72</td>
</tr>
<tr class="tbl-data">
<td class="data-td last">Consumer Goods</td>
<td class="data-td data last text-right">4.37</td>
<td class="data-td data last text-right" style="border-right: outset;">4.38</td>
<td class="data-td data last text-right">184</td>
<td class="data-td data last text-right" style="border-right: outset;">161</td>
<td class="data-td data last text-right">98.89</td>
<td class="data-td data last text-right" style="border-right: outset;">99.57</td>
<td class="data-td data last text-right">1.19</td>
</tr>
<tr class="tbl-data">
<td class="data-td last">Energy</td>
<td class="data-td data last text-right">9.16</td>
<td class="data-td data last text-right" style="border-right: outset;">9.15</td>
<td class="data-td data last text-right">273</td>
<td class="data-td data last text-right" style="border-right: outset;">258</td>
<td class="data-td data last text-right">91.72</td>
<td class="data-td data last text-right" style="border-right: outset;">92.57</td>
<td class="data-td data last text-right">1.43</td>
</tr>
<tr class="tbl-data">
<td class="data-td last">Financial Services</td>
<td class="data-td data last text-right">3.22</td>
<td class="data-td data last text-right" style="border-right: outset;">2.50</td>
<td class="data-td data last text-right">282</td>
<td class="data-td data last text-right" style="border-right: outset;">265</td>
<td class="data-td data last text-right">91.46</td>
<td class="data-td data last text-right" style="border-right: outset;">91.37</td>
<td class="data-td data last text-right">1.50</td>
</tr>
<tr class="tbl-data">
<td class="data-td last">Healthcare</td>
<td class="data-td data last text-right">4.10</td>
<td class="data-td data last text-right" style="border-right: outset;">4.10</td>
<td class="data-td data last text-right">195</td>
<td class="data-td data last text-right" style="border-right: outset;">195</td>
<td class="data-td data last text-right">90.40</td>
<td class="data-td data last text-right" style="border-right: outset;">90.79</td>
<td class="data-td data last text-right">0.91</td>
</tr>
<tr class="tbl-data">
<td class="data-td last">Insurance</td>
<td class="data-td data last text-right">2.49</td>
<td class="data-td data last text-right" style="border-right: outset;">1.99</td>
<td class="data-td data last text-right">193</td>
<td class="data-td data last text-right" style="border-right: outset;">181</td>
<td class="data-td data last text-right">98.34</td>
<td class="data-td data last text-right" style="border-right: outset;">98.87</td>
<td class="data-td data last text-right">0.59</td>
</tr>
<tr class="tbl-data">
<td class="data-td last">Leisure</td>
<td class="data-td data last text-right">4.53</td>
<td class="data-td data last text-right" style="border-right: outset;">4.51</td>
<td class="data-td data last text-right">220</td>
<td class="data-td data last text-right" style="border-right: outset;">222</td>
<td class="data-td data last text-right">93.65</td>
<td class="data-td data last text-right" style="border-right: outset;">93.59</td>
<td class="data-td data last text-right">0.37</td>
</tr>
<tr class="tbl-data">
<td class="data-td last">Real Estate</td>
<td class="data-td data last text-right">10.71</td>
<td class="data-td data last text-right" style="border-right: outset;">10.95</td>
<td class="data-td data last text-right">450</td>
<td class="data-td data last text-right" style="border-right: outset;">362</td>
<td class="data-td data last text-right">86.94</td>
<td class="data-td data last text-right" style="border-right: outset;">89.59</td>
<td class="data-td data last text-right">3.42</td>
</tr>
<tr class="tbl-data">
<td class="data-td last">Retail</td>
<td class="data-td data last text-right">22.15</td>
<td class="data-td data last text-right" style="border-right: outset;">22.20</td>
<td class="data-td data last text-right">219</td>
<td class="data-td data last text-right" style="border-right: outset;">200</td>
<td class="data-td data last text-right">86.26</td>
<td class="data-td data last text-right" style="border-right: outset;">87.28</td>
<td class="data-td data last text-right">1.59</td>
</tr>
<tr class="tbl-data">
<td class="data-td last">Services</td>
<td class="data-td data last text-right">0.83</td>
<td class="data-td data last text-right" style="border-right: outset;">0.81</td>
<td class="data-td data last text-right">189</td>
<td class="data-td data last text-right" style="border-right: outset;">185</td>
<td class="data-td data last text-right">95.97</td>
<td class="data-td data last text-right" style="border-right: outset;">96.39</td>
<td class="data-td data last text-right">0.85</td>
</tr>
<tr class="tbl-data">
<td class="data-td last">Technology &amp; Electronics</td>
<td class="data-td data last text-right">6.78</td>
<td class="data-td data last text-right" style="border-right: outset;">6.81</td>
<td class="data-td data last text-right">208</td>
<td class="data-td data last text-right" style="border-right: outset;">197</td>
<td class="data-td data last text-right">90.50</td>
<td class="data-td data last text-right" style="border-right: outset;">91.40</td>
<td class="data-td data last text-right">1.42</td>
</tr>
<tr class="tbl-data">
<td class="data-td last">Telecommunications</td>
<td class="data-td data last text-right">12.56</td>
<td class="data-td data last text-right" style="border-right: outset;">12.57</td>
<td class="data-td data last text-right">311</td>
<td class="data-td data last text-right" style="border-right: outset;">296</td>
<td class="data-td data last text-right">92.24</td>
<td class="data-td data last text-right" style="border-right: outset;">92.98</td>
<td class="data-td data last text-right">1.40</td>
</tr>
<tr class="tbl-data">
<td class="data-td last">Transportation</td>
<td class="data-td data last text-right">0.59</td>
<td class="data-td data last text-right" style="border-right: outset;">0.58</td>
<td class="data-td data last text-right">156</td>
<td class="data-td data last text-right" style="border-right: outset;">173</td>
<td class="data-td data last text-right">104.16</td>
<td class="data-td data last text-right" style="border-right: outset;">103.24</td>
<td class="data-td data last text-right">-0.35</td>
</tr>
<tr class="tbl-data">
<td class="data-td last">Utility</td>
<td class="data-td data last text-right">2.22</td>
<td class="data-td data last text-right" style="border-right: outset;">2.20</td>
<td class="data-td data last text-right">173</td>
<td class="data-td data last text-right" style="border-right: outset;">184</td>
<td class="data-td data last text-right">96.71</td>
<td class="data-td data last text-right" style="border-right: outset;">96.18</td>
<td class="data-td data last text-right">-0.08</td>
</tr>
<tr class="tbl-data">
<td class="data-td last">Grand Total</td>
<td class="data-td data last text-right">100</td>
<td class="data-td data last text-right" style="border-right: outset;">100</td>
<td class="data-td data last text-right">249</td>
<td class="data-td data last text-right" style="border-right: outset;">229</td>
<td class="data-td data last text-right">91.52</td>
<td class="data-td data last text-right" style="border-right: outset;">92.48</td>
<td class="data-td data last text-right">1.48</td>
</tr>
</tbody>
</table>
</div>
<p class="chart-disclosure">Source: ICE Data Services, VanEck. Returns are based on partial period data. Fallen Angels: ICE US Fallen Angel High Yield 10% Constrained Index. Not intended as a recommendation to invest or divest in any of the sectors mentioned herein. Index performance is not representative of strategy performance. It is not possible to invest in an index.</p>
<p><strong>Fallen Angels Performance by Rating:</strong> Walgreens Boots Alliance was downgraded to B1 from BB3, dropping the fallen angel BB-rated exposure from the mid-to-low 80s into the high 70s, something that has not occurred since January 2020. Relative to the broad high yield market, BB-rated fallen angels contributed the most.</p>
<div class="wrapped-div">
<table style="width: 100%;">
<tbody>
<tr class="tbl-data">
<td class="tbl-header last text-center">&nbsp;</td>
<td class="tbl-header last text-center" style="border-right: outset;" colspan="2">Wgt (%)</td>
<td class="tbl-header last text-center" style="border-right: outset;" colspan="2">OAS</td>
<td class="tbl-header last text-center" style="border-right: outset;" colspan="2">Price</td>
<td class="tbl-header last text-right">Total Return</td>
</tr>
<tr class="tbl-data">
<td class="data-head data last text-right">&nbsp;</td>
<td class="data-head data last text-right">12/31/2024</td>
<td class="data-head data last text-right" style="border-right: outset;">1/31/2025</td>
<td class="data-head data last text-right">12/31/2024</td>
<td class="data-head data last text-right" style="border-right: outset;">1/31/2025</td>
<td class="data-head data last text-right">12/31/2024</td>
<td class="data-head data last text-right" style="border-right: outset;">1/31/2025</td>
<td class="data-head data last text-right">MTD</td>
</tr>
<tr class="tbl-data">
<td class="data-td last">BB</td>
<td class="data-td data last text-right">83.93</td>
<td class="data-td data last text-right" style="border-right: outset;">77.66</td>
<td class="data-td data last text-right">197</td>
<td class="data-td data last text-right" style="border-right: outset;">183</td>
<td class="data-td data last text-right">93.33</td>
<td class="data-td data last text-right" style="border-right: outset;">95.06</td>
<td class="data-td data last text-right">1.19</td>
</tr>
<tr class="tbl-data">
<td class="data-td last">B</td>
<td class="data-td data last text-right">10.09</td>
<td class="data-td data last text-right" style="border-right: outset;">16.29</td>
<td class="data-td data last text-right">474</td>
<td class="data-td data last text-right" style="border-right: outset;">317</td>
<td class="data-td data last text-right">86.36</td>
<td class="data-td data last text-right" style="border-right: outset;">86.62</td>
<td class="data-td data last text-right">3.58</td>
</tr>
<tr class="tbl-data">
<td class="data-td last">CCC</td>
<td class="data-td data last text-right">4.72</td>
<td class="data-td data last text-right" style="border-right: outset;">4.76</td>
<td class="data-td data last text-right">425</td>
<td class="data-td data last text-right" style="border-right: outset;">400</td>
<td class="data-td data last text-right">88.24</td>
<td class="data-td data last text-right" style="border-right: outset;">89.14</td>
<td class="data-td data last text-right">1.57</td>
</tr>
<tr class="tbl-data">
<td class="data-td last">CC</td>
<td class="data-td data last text-right">1.26</td>
<td class="data-td data last text-right" style="border-right: outset;">1.29</td>
<td class="data-td data last text-right">1262</td>
<td class="data-td data last text-right" style="border-right: outset;">1227</td>
<td class="data-td data last text-right">54.65</td>
<td class="data-td data last text-right" style="border-right: outset;">56.00</td>
<td class="data-td data last text-right">3.63</td>
</tr>
<tr class="tbl-data">
<td class="data-td last">Total</td>
<td class="data-td data last text-right">100.00</td>
<td class="data-td data last text-right" style="border-right: outset;">100.00</td>
<td class="data-td data last text-right">249</td>
<td class="data-td data last text-right" style="border-right: outset;">229</td>
<td class="data-td data last text-right">91.52</td>
<td class="data-td data last text-right" style="border-right: outset;">92.48</td>
<td class="data-td data last text-right">1.48</td>
</tr>
</tbody>
</table>
</div>
<p class="chart-disclosure">Source: ICE Data Services, VanEck. Fallen Angels: ICE US Fallen Angel High Yield 10% Constrained Index. Not intended as a recommendation to invest or divest in any of the sectors mentioned herein. Index performance is not representative of strategy performance. It is not possible to invest in an index. BB index: ICE BofA BB US High Yield Index; Single-B index: ICE BofA Single-B US High Yield Index; CCC &amp; Lower rated index ICE BofA CCC &amp; Lower US High Yield Index.</p>

<p>To receive more <a href="/us/en/blogs/income-investing/" title="Income Investing Insights"><strong>Income Investing</strong></a> insights, <a href="/link/5f45412c2143400497908cea2897f7d3.aspx" title=" Subscription Center"><strong>sign up in our subscription center</strong></a>.</p>
]]></content:encoded>
</item><item rdf:about="https://www.vaneck.com/us/en/blogs/gold-investing/ima-casanova-market-chaos-ignites-golds-surge-are-you-in/">
  <title>Market Chaos Ignites Gold’s Surge– Are You In?></title>
  <link>https://www.vaneck.com/us/en/blogs/gold-investing/ima-casanova-market-chaos-ignites-golds-surge-are-you-in/</link>
  <description><![CDATA[In January, gold miners outperformed as investor interest spiked. With low correlation to most assets, gold and miners offer strong diversification, making them an attractive choice today.]]></description>
  <dc:creator>Imaru Casanova</dc:creator>
  <dc:date>02/13/2025 06:30:00</dc:date>
<content:encoded><![CDATA[

<p>Monthly gold market and economic insights from <a href="https://www.vaneck.com/us/en/news-and-insights/thought-leaders/imaru-casanova/?p=1" title="Imaru Casanova &mdash; Portfolio Manager, Gold and Precious Metals"><strong>Imaru Casanova, Portfolio Manager</strong></a>, featuring her unique views on mining and gold&rsquo;s portfolio benefits.</p>

<h2>GOT GOLD?</h2>
<p>If the answer is yes, you are one of the lucky winners so far in 2025. If the answer is no, take January as another great example of why you should want some gold exposure in your portfolio. A perfect storm of events&mdash;DeepSeek&rsquo;s release, a tech stock sell-off, an unpredictable U.S. administration issuing a wave of executive orders, escalating tariffs and trade tensions and rising inflation concerns&mdash;shook global financial markets.</p>
<p>Historically, gold has served as the ultimate safe haven, as a hedge against market uncertainty and volatility, geopolitical risk and inflation, and as a place to hide when there is a heightened level of risk and fear. Yet, investor sentiment toward gold has been exceptionally weak for many years. However, in January, the market's focus shifted to many of the risks that have long supported gold. Defending its status as the ultimate market hedge and as an effective diversifier, gold performed exactly as history would predict&mdash;surging to a new all-time high of $2,798.41 per ounce on January 31, marking a monthly gain of $173.91 per ounce, or 6.63%.</p>
<h2>Gold Rush 2.0: Western Investors Fuel the Comeback</h2>
<p>Gold has had an impressive start to the year, potentially signaling the long-awaited return of Western investors. As the urgency to diversify portfolios grows, interest in gold is accelerating, evidenced by a 0.70% increase in gold bullion-backed ETF holdings. Gold is quite literally making its way west&mdash;to New York, to be exact. Trump&rsquo;s tariff threats have ignited a physical gold rush, with investors and traders scrambling to secure bullion before potential price hikes. This has disrupted markets, widened price spreads between London and New York and drained London&rsquo;s reserves, further tightening supply.</p>
<p>Typically, gold trades in contango (i.e., longer-dated futures contracts are priced higher than near-term contracts or the current spot price). However, it is now experiencing instances of backwardation, where the spot price exceeds futures prices. Gold&rsquo;s 1-month lease rates jumped to as high as 4% recently, reflecting the crunch. Not bad for a non-yielding asset!</p>

<h2>The Power Players Behind Gold&rsquo;s Record-Breaking Surge</h2>
<p>While market tightness puts upward pressure on gold prices, the real drivers of its strength are central banks and investors. The World Gold Council 2024 <i>Gold Demand Trends</i> report estimates total gold demand reached record levels last year, both in tonnage (4,974 tonnes) and USD value ($382 billion).</p>
<p>For the third consecutive year, central banks were net purchasers of more than 1,000 tonnes of gold&mdash; more than twice their average annual purchases from 2010 to 2021. By the end of Q3 2024, they had added 712 tonnes, leading many to believe they would fall short of the 1,000-tonne mark. However, they picked up the pace significantly in Q4 purchasing 333 tonnes, finishing just 6 tonnes below the 2023 total. This sustained central bank buying remains a strong pillar of demand, with the trend expected to continue in the long term.</p>
<p>Investment demand rose 25%, but this increase was the result of a slowdown in ETF outflows rather than fresh inflows. While India and China saw significant increases in physical gold demand, global bar and coin demand remained flat year-over-year. In other words, investment demand increased because outflows from the gold bullion backed ETFs slowed down significantly (-6.8 tonnes in 2024 vs -244.2 tonnes in 2023), rather than due to increased buying. A slowdown of outflows in 2024, followed by inflows into the global gold bullion ETFs in early 2025, could signal renewed Western investor interest in gold and potential for higher prices ahead.</p>
<h3>2024 Gold Demand Trends</h3>
<p><img loading="lazy" class="img-responsive w-100" alt="2024 Gold Demand Trends" src="https://www.vaneck.com/contentassets/bed7330514d9425bb9f8d8c4cb97b038/5326_january-gold-commentary-chart-1_2025-2_v1_blog.svg" /></p>
<p class="chart-disclosure">Source: Metals Focus, Refinitiv GFMS, ICE Benchmark Administration, World Gold Council. <a href="https://www.gold.org/goldhub/research/gold-demand-trends/gold-demand-trends-full-year-2024" title="Gold Demand Trends: Full Year 2024" target="_blank" rel="noopener"><strong>https://www.gold.org/goldhub/research/gold-demand-trends/gold-demand-trends-full-year-2024</strong></a></p>
<h2>Gold Miners Shine: A Breakout Start to 2025</h2>
<p>The most exciting gold news in January was the strong performance of gold equities. As investor interest in gold grows, gold miners are delivering the expected outperformance relative to the metal. The NYSE Arca Gold Miners Index (GDMNTR)<sup>1</sup>&nbsp;rose 14.91%, while the small/mid-cap MVIS Global Juniors Gold Miners Index (MVGDXJTR)<sup>2</sup>&nbsp;gained 13.69% during the month.</p>
<p>Earnings season for the sector kicks off in mid-February. This is a crucial reporting period, as companies will release full-year 2024 results and provide 2025 guidance. Markets will focus on operating cost guidance, assessing margin expansion and free cash flow generation. Companies that meet or exceed 2024 targets and 2025 expectations may be rewarded, while those that miss could see their share prices decline.</p>
<p>Project updates will also be key, with investors closely watching timelines for permitting and production, as well as any capital cost revisions. Additionally, announcements on dividends and share buyback programs will be in focus.</p>
<p>For gold equities to be revalued from their historically low levels, high gold prices and renewed investor interest must be supported by strong performance from gold miners. The low correlation of gold and gold equities with most asset classes also enhances their diversification benefits, making them an attractive option for investors today.</p>
<h3>Low Correlation of Gold and Gold Equities with Most Asset Classes, December 2004 - December 2024</h3>
<p><img loading="lazy" class="img-responsive w-100" alt="Gold FactSet" src="https://www.vaneck.com/contentassets/d37064a915534ec081eecfaa3a5913d0/5326_january-gold-commentary-chart-2_2025-2_v1_blog.svg" /></p>
<p class="chart-disclosure"><strong>Source: FactSet, VanEck. Data as of December 31, 2024</strong>. &ldquo;Gold Stocks&rdquo; represented by NYSE Arca Gold Miners Index. &ldquo;International (Int&rsquo;l) Bonds&rdquo; represented by Bloomberg Global Aggregate ex U.S. Index. &ldquo;U.S. TIPS&rdquo; represented by Bloomberg U.S. Treasury Inflation Protected Notes (TIPS) Index. &ldquo;Commodities&rdquo; represented by Bloomberg Commodity Index. &ldquo;U.S. Bonds&rdquo; represented by Bloomberg U.S. Aggregate Bond Index. &ldquo;Emerging Markets (EM) Stocks&rdquo; represented by MSCI Emerging Markets Index. &ldquo;International (Int&rsquo;l) Stocks&rdquo; represented by MSCI World ex USA Index. &ldquo;REITs&rdquo; represented by FTSE NAREIT All Equity REITs Index. &ldquo;U.S. Stocks&rdquo; represented by the S&amp;P 500 Index. Past performance is not indicative of future results. Index descriptions included at the end of this presentation.</p>
<p>To receive more <strong><a href="https://www.vaneck.com/us/en/insights/gold-investing/" title="Gold Investing Insights">Gold Investing</a></strong> insights, <strong><a href="https://www.vaneck.com/us/en/subscribe/" title="Subscription Center">sign up in our subscription center</a></strong>.</p>
]]></content:encoded>
</item><item rdf:about="https://www.vaneck.com/us/en/blogs/emerging-markets-equity/beyond-the-hype-why-indias-market-is-still-a-compelling-bet-in-2025/">
  <title>Beyond the Hype: Why India is Still a Compelling Bet in 2025></title>
  <link>https://www.vaneck.com/us/en/blogs/emerging-markets-equity/beyond-the-hype-why-indias-market-is-still-a-compelling-bet-in-2025/</link>
  <description><![CDATA[India's strong growth, digital boom, and economic resilience create compelling investment opportunities in 2025. &nbsp;]]></description>
  <dc:creator>John Patrick Lee, CFA</dc:creator>
  <dc:date>02/12/2025 06:30:00</dc:date>
<content:encoded><![CDATA[

<p>Indian stocks have outperformed broad emerging markets for four consecutive years, reflecting the country's strong economic growth, structural reforms, and digital transformation. In 2024, India continued its trend of outperformance versus emerging markets, but specialized indexes like the MarketGrader India All-Cap Growth Leaders Index and the MVIS Digital India Index outpaced the broader Indian market.</p>
<p>In the fourth quarter of 2024, emerging markets sold off broadly due to a stronger U.S. dollar, trade tension and uneven growth across emerging markets economies, with India underperforming the broad market. Despite this, growth at a reasonable price (GARP) and digital-sector stocks proved more resilient, declining less than the broad Indian market. Digital sector stocks performed particularly well in Q4 due to a combination of sustained global demand for IT services, increased domestic digital adoption, and strategic investor interest. However, weakness extended into early 2025, with India continuing to lag even as emerging markets saw signs of recovery. Growth stocks, including GARP and digital sector stocks, underperformed the broader Indian market in January.</p>
<div class="wrapped-div">
<table style="width: 600px;">
<tbody>
<tr class="tbl-data">
<td class="tbl-header last">&nbsp;</td>
<td class="tbl-header last text-right">2024</td>
<td class="tbl-header last text-right">Q4 2024</td>
<td class="tbl-header last text-right">Jan-25</td>
</tr>
<tr class="tbl-data">
<td class="data-td last text-left">MarketGrader India All-Cap Growth Leaders Index</td>
<td class="data-td data last text-right">17.71</td>
<td class="data-td data last text-right">-7.66</td>
<td class="data-td data last text-right">-8.58</td>
</tr>
<tr class="tbl-data">
<td class="data-td last text-left">MVIS Digital India Index</td>
<td class="data-td data last text-right">29.63</td>
<td class="data-td data last text-right">-0.44</td>
<td class="data-td data last text-right">-7.40</td>
</tr>
<tr class="tbl-data">
<td class="data-td last text-left">MSCI India Index</td>
<td class="data-td data last text-right">11.22</td>
<td class="data-td data last text-right">-11.32</td>
<td class="data-td data last text-right">-3.56</td>
</tr>
<tr class="tbl-data">
<td class="data-td last text-left">MSCI Emerging Markets Index</td>
<td class="data-td data last text-right">7.50</td>
<td class="data-td data last text-right">-8.01</td>
<td class="data-td data last text-right">1.79</td>
</tr>
</tbody>
</table>
</div>
<style>
    .data-td.data {
        padding-right: 5px !important;
        padding-left: 5px !important;
    }

    .wrapped-div {
        max-width: 100%;
    }

    @media (max-width: 1240px) {
        .wrapped-div {
            overflow-x: scroll;
        }
    }

    .wrapped-div-sector {
        max-width: 100%;
        overflow-x: scroll;
    }
</style>
<p class="chart-disclosure">Source: Morningstar as of 1/31/25 Past performance is no guarantee of future results. Index performance is not representative of fund performance. It is not possible to invest directly in an index.</p>

<h2>India 2025 Outlook &ndash; More of the Same</h2>
<p>As outlined in our blog, <a href="https://www.vaneck.com/us/en/blogs/emerging-markets-equity/indias-economic-rise-demands-investor-attention/" title="India&rsquo;s Economic Rise Demands Investor Attention"><strong>India&rsquo;s Economic Rise Deserves Investor Attention</strong></a>, India's rapid economic ascent is capturing significant investor interest, driven by several key factors. The nation is experiencing robust GDP growth, bolstered by forward-looking government policies that create a conducive business environment. A significant contributor to this expansion is the digital sector, which is flourishing due to widespread smartphone adoption and initiatives promoting financial inclusion and fintech innovation. Additionally, India's young, English-proficient workforce provides a competitive edge, attracting multinational corporations and fostering a thriving equity market that has recently surpassed China's in performance. These dynamics underscore India's unique position in the global investment landscape, presenting compelling opportunities for investors seeking growth in emerging markets.</p>
<p>Going forward, we expect:</p>
<ul class="content-list">
<li class="mt-2"><strong>Sustained GDP Growth:</strong> India&rsquo;s economy is expected to expand at 6-8% annually, driven by domestic consumption, structural reforms, and a growing digital economy.</li>
<li class="mt-2"><strong>Infrastructure Expansion on Track:</strong> Government-led investments in renewables, logistics, and soft infrastructure will have second- and third-order effects on real estate, inflation trends, and DTC business models.</li>
<li class="mt-2"><strong>Economic Resilience:</strong> Low trade deficits and a diversified economy make India less vulnerable to global shocks, with digitization and financial formalization strengthening long-term stability.</li>
<li class="mt-2"><strong>Justified Valuations:</strong> India&rsquo;s high P/E ratios reflect productivity gains, economic formalization, and superior growth rates compared to similarly valued markets like the U.S. and Taiwan. Sector-specific opportunities outweigh broad valuation concerns.</li>
</ul>
<h2>Ongoing Risks</h2>
<p>We see the below ongoing risks for Indian equity investors:</p>
<ul class="content-list">
<li class="mt-2"><strong>Domestic Political Uncertainty:</strong> Despite securing a third term in the 2024 elections, India's political landscape remains uncertain as the majority party now relies on coalition partners, which could impact policy execution and reform momentum. Upcoming state elections and governance challenges may introduce further volatility. Additionally, concerns over media restrictions and civil liberties could affect investor confidence and India's global standing.</li>
<li class="mt-2"><strong>Global Market Downturn:</strong> India is not immune to external shocks. A global economic slowdown, recession in key trading partners, or tightening financial conditions could lead to capital outflows and currency depreciation. Rising U.S. interest rates, geopolitical conflicts, or a slowdown in global trade could impact India&rsquo;s exports and foreign direct investment (FDI). Additionally, risk-off sentiment in global markets could lead to short-term corrections in Indian equities, particularly in foreign-investment-heavy sectors like technology and financials.</li>
</ul>
<h2>Now Is the Time to Invest in India</h2>
<p>India is rapidly transforming into a powerhouse investment hub. Its booming digital sector, combined with a strong equity market, is drawing global attention. Additionally, the government's committed push for financial inclusion and fintech innovation is further fueling this interest. When compared to China, India's demographic advantage amplifies its allure. Simply put, we believe India's strong economic foundations and massive market potential make it an irresistible destination for investments.</p>

<p>To receive more <a href="/us/en/insights/emerging-markets-equity/" title="Emerging Markets Equity Insights"><strong>Emerging Markets Equity</strong></a> insights, <a href="/us/en/subscribe/" title="Subscription Center"><strong>sign up in our subscription center</strong></a>.</p>
]]></content:encoded>
</item><item rdf:about="https://www.vaneck.com/us/en/blogs/moat-investing/moat-stocks-outperform-amid-ai-turmoil/">
  <title>Moat Stocks Outperform Amid AI Turmoil></title>
  <link>https://www.vaneck.com/us/en/blogs/moat-investing/moat-stocks-outperform-amid-ai-turmoil/</link>
  <description><![CDATA[Moat stocks thrived in January, dodging AI-driven tech turmoil with gains in health care and mid-cap standouts.]]></description>
  <dc:creator>Brandon Rakszawski</dc:creator>
  <dc:date>02/07/2025 06:30:00</dc:date>
<content:encoded><![CDATA[

<p id="us-equity-market-review" class="jump-link-nav anchored-block" data-jumplink-title="US Equity Market Review">In January, U.S. equity markets opened the year with a generally positive outlook, spurred by optimism about the new administration's policy directions. However, the month was not without its challenges as the emergence of China's DeepSeek artificial intelligence (AI) model led to significant volatility, particularly affecting tech giants like Nvidia, whose stock saw notable declines. This event, coupled with uncertainty around potential new tariffs and trade war narratives, introduced additional market fluctuations. Despite these concerns, the markets managed to recover, with broad gains across the major stock benchmarks. Positive labor indicators and relatively neutral commentary from the Federal Reserve helped stabilize investor sentiment, setting a cautiously optimistic tone for the year as policy direction and the economic landscape continued to evolve.</p>
<p>The <a href="/link/9e43dd198c5f4e419f13220685081895.aspx" title="MOAT - VanEck Morningstar Wide Moat ETF - Overview"><strong>Morningstar Wide Moat Focus Index</strong></a> (the &ldquo;Moat Index&rdquo;) outpaced the broader U.S. equity market in January gaining 3.1% during the month versus the 2.8% return for the S&amp;P 500. The Moat Index&rsquo;s underweight to mega-cap technology, namely Nvidia, proved beneficial during the month as the market rerated companies linked to AI &nbsp;off the news surrounding cheap and competitive AI models out of China. Overweights in more value-oriented sectors like health care and industrials also contributed positively to the Moat Index&rsquo;s relative performance in January.</p>
<p>Smaller U.S. stocks, particularly mid-caps, were also supported by the broadening in market performance that saw gains in areas beyond just large-cap technology. The <a href="/link/166321dbcfec440590fb51cf0ad629aa.aspx" title="SMOT - VanEck Morningstar SMID Moat ETF - Overview"><strong>Morningstar US Small-Mid Cap Moat Focus Index</strong></a> (the &ldquo;SMID Moat Index&rdquo;) posted a notably strong return during month, gaining 5.6%, and outpacing the broad small- and mid-cap benchmarks which returned 2.9% and 3.9%, respectively. The SMID Moat Index&rsquo;s outperformance stemmed from strong stock selection rather than sector over or underweights during the month.</p>
<h3>Moat Stocks Outperform in January Amid AI Turmoil</h3>
<div class="flourish-embed flourish-chart" data-src="visualisation/21512351?2429575"><script src="https://public.flourish.studio/resources/embed.js"></script><noscript><img loading="lazy" src="https://public.flourish.studio/visualisation/21512351/thumbnail" width="100%" alt="Moat Stocks Outperform in January Amid AI Turmoil" /></noscript></div>
<p class="chart-disclosure"><strong>Source: Morningstar. Data as of 1/31/2025.</strong> Past performance is no guarantee of future results. Index performance is not representative of fund performance. It is not possible to invest directly in an index. Fund performance current to the most recent month end is available by visiting vaneck.com or by calling 800.826.2333.</p>

<h2 id="moat-highlights" class="jump-link-nav anchored-block" data-jumplink-title="Moat Highlights">Moat Index Highlights: Crops and Clinics Sprout Success</h2>
<p>Sector allocations within the Moat Index were the primary drivers of outperformance versus the S&amp;P 500 in January with an underweight in technology having the largest relative impact. Overweight exposure in health care was also a leading contributor to performance with three companies from the sector landing in the top contributors table for the month.</p>
<p>Topping the list of January contributors was the agriculture materials company, Corteva (CTVA). Spun out from DowDuPont in 2019, Corteva is a global leader in the premium seed and crop protection markets that has built a wide economic moat thanks to its portfolio of patented biotech seeds and crop chemicals. Corteva&rsquo;s proprietary seeds make crops resistant to damaging insects while also allowing farmers to spray more-effective chemicals to control weeds, ultimately driving improved crop yields and customer retention. Shares of Corteva gained nearly 15% during the month off the back of positive analyst ratings and price target increases by several research groups including Citigroup, Wells Fargo, and UBS. Morningstar currently places a $70 fair value estimate on Corteva shares and expects growing seed profits and a recovery in crop protection to be catalysts for the stock in 2025.</p>
<p>Also landing in the top contributors list and helping drive performance were several health care companies including leading life science diagnostic and research firm Agilent Technologies (A), medical imaging and ultrasound giant GE HealthCare Technologies (GEHC), as well as health information software provider Veeva Systems (VEEV). All three companies posted double digit price gains in January as the health care sector started off the new year strong following underperformance in 2024.</p>
<p>Companies detracting the most in January include us-based manufacturer of premium distilled spirits, Brown-Forman (BF), the well-known global parcel delivery company United Parcel Service (UPS), beer, wine, and spirits producer Constellation Brands (STZ), semiconductor equipment and materials company Teradyne (TER), and packaged food producer Campbell&rsquo;s (CPB).</p>
<h2>Top Contributors and Detractors from Moat Index - January 2025</h2>
<h3>Contributors</h3>
<div class="wrapped-div">
<table style="width: 100%;">
<tbody>
<tr class="tbl-data">
<td class="tbl-header last text-left">Company</td>
<td class="tbl-header last text-left">Ticker</td>
<td class="tbl-header last text-left">Sector</td>
<td class="tbl-header last text-right">Avg. Weight (%)</td>
<td class="tbl-header last text-right">Contribution (%)</td>
</tr>
<tr class="tbl-data">
<td class="data-td data last text-left">Corteva Inc.</td>
<td class="data-td data last text-left">CTVA</td>
<td class="data-td data last text-left">Materials</td>
<td class="data-td data last text-right">2.52</td>
<td class="data-td data last text-right">0.37</td>
</tr>
<tr class="tbl-data">
<td class="data-td data last text-left">Agilent Technologies Inc.</td>
<td class="data-td data last text-left">A</td>
<td class="data-td data last text-left">Health Care</td>
<td class="data-td data last text-right">2.45</td>
<td class="data-td data last text-right">0.31</td>
</tr>
<tr class="tbl-data">
<td class="data-td data last text-left">GE HealthCare Technologies Inc.</td>
<td class="data-td data last text-left">GEHC</td>
<td class="data-td data last text-left">Health Care</td>
<td class="data-td data last text-right">2.35</td>
<td class="data-td data last text-right">0.30</td>
</tr>
<tr class="tbl-data">
<td class="data-td data last text-left">Veeva Systems Inc.</td>
<td class="data-td data last text-left">VEEV</td>
<td class="data-td data last text-left">Health Care</td>
<td class="data-td data last text-right">2.40</td>
<td class="data-td data last text-right">0.26</td>
</tr>
<tr class="tbl-data">
<td class="data-td data last text-left">The Estee Lauder Companies Inc.</td>
<td class="data-td data last text-left">EL</td>
<td class="data-td data last text-left">Consumer Staples</td>
<td class="data-td data last text-right">2.33</td>
<td class="data-td data last text-right">0.26</td>
</tr>
</tbody>
</table>
<h3>Detractors</h3>
<div class="wrapped-div">
<table style="width: 100%;">
<tbody>
<tr class="tbl-data">
<td class="tbl-header last text-left">Company</td>
<td class="tbl-header last text-left">Ticker</td>
<td class="tbl-header last text-left">Sector</td>
<td class="tbl-header last text-right">Avg. Weight (%)</td>
<td class="tbl-header last text-right">Contribution (%)</td>
</tr>
<tr class="tbl-data">
<td class="data-td data last text-left">Brown-Forman Corp.</td>
<td class="data-td data last text-left">BF</td>
<td class="data-td data last text-left">Consumer Staples</td>
<td class="data-td data last text-right">2.15</td>
<td class="data-td data last text-right">-0.28</td>
</tr>
<tr class="tbl-data">
<td class="data-td data last text-left">United Parcel Service Inc.</td>
<td class="data-td data last text-left">UPS</td>
<td class="data-td data last text-left">Industrials</td>
<td class="data-td data last text-right">2.51</td>
<td class="data-td data last text-right">-0.24</td>
</tr>
<tr class="tbl-data">
<td class="data-td data last text-left">Constellation Brands Inc.</td>
<td class="data-td data last text-left">STZ</td>
<td class="data-td data last text-left">Consumer Staples</td>
<td class="data-td data last text-right">1.20</td>
<td class="data-td data last text-right">-0.22</td>
</tr>
<tr class="tbl-data">
<td class="data-td data last text-left">Teradyne Inc.</td>
<td class="data-td data last text-left">TER</td>
<td class="data-td data last text-left">Technology</td>
<td class="data-td data last text-right">2.53</td>
<td class="data-td data last text-right">-0.20</td>
</tr>
<tr class="tbl-data">
<td class="data-td data last text-left">The Campbell`s Co.</td>
<td class="data-td data last text-left">CPB</td>
<td class="data-td data last text-left">Consumer Staples</td>
<td class="data-td data last text-right">2.35</td>
<td class="data-td data last text-right">-0.15</td>
</tr>
</tbody>
</table>
</div>
</div>
<p class="chart-disclosure"><strong>Source: Morningstar, January 2025</strong>. Past performance is no guarantee of future results. Index performance is not illustrative of fund performance. Not intended as a recommendation to buy or to sell any of the securities mentioned herein.</p>

<h2 id="smid-moat-highlights" class="jump-link-nav anchored-block" data-jumplink-title="SMID Moat Highlights">SMID Moat Index Highlights: Asbury Auto Drives Gains</h2>
<p>The SMID Moat Index&rsquo;s outperformance over small- and mid-cap broad benchmarks in January was the product of strong stock selection rather than sector over or underweights which in aggregate had minimal impact during the month.</p>
<p>The top contributor to performance in January for the SMID Moat Index was the small-cap Asbury Automotive Group (ABG). As its name implies, Asbury Automotive is a regional collection of U.S. automobile dealerships, operating in 15 states (mostly Texas, the West, the Mid-Atlantic, and the Southeast regions), with more than 150 new vehicle stores and dozens of collision and repair centers. Asbury&rsquo;s moat rating stems from its larger size, relative to other dealers, which provides economies of scale and working capital efficiencies that drive pricing power versus smaller independent garages. Asbury shares were up over 20% during the month with most of those gains following its earnings release which posted record fourth-quarter revenue and earnings that surpassed analyst consensus estimates.</p>
<p>Other top January contributors include network security software company Cloudflare (NET), independent broker dealer and investment advisory services firm LPL Financial (LPLA), luxury fashion brand owner Tapestry (TPR), and the above discussed agriculture materials company, Corteva (CTVA).</p>
<p>Names that detracted most from performance during the month include travel services company Expedia Group (EXPE), automotive parts manufacturer Gentex (GNTX), semiconductor equipment and materials company Teradyne (TER), packaged food producer Campbell&rsquo;s (CPB), as well as the resort and casino operator Las Vegas Sands (LVS).</p>
<h2>Top Contributors and Detractors from SMID Moat Index - January 2025</h2>
<h3>Contributors</h3>
<div class="wrapped-div">
<table style="width: 100%;">
<tbody>
<tr class="tbl-data">
<td class="tbl-header last text-left">Company</td>
<td class="tbl-header last text-left">Ticker</td>
<td class="tbl-header last text-left">Sector</td>
<td class="tbl-header last text-right">Avg. Weight (%)</td>
<td class="tbl-header last text-right">Contribution (%)</td>
</tr>
<tr class="tbl-data">
<td class="data-td data last text-left">Asbury Automotive Group Inc.</td>
<td class="data-td data last text-left">ABG</td>
<td class="data-td data last text-left">Consumer Discretionary</td>
<td class="data-td data last text-right">1.40</td>
<td class="data-td data last text-right">0.31</td>
</tr>
<tr class="tbl-data">
<td class="data-td data last text-left">Cloudflare Inc.</td>
<td class="data-td data last text-left">NET</td>
<td class="data-td data last text-left">Technology</td>
<td class="data-td data last text-right">0.85</td>
<td class="data-td data last text-right">0.25</td>
</tr>
<tr class="tbl-data">
<td class="data-td data last text-left">LPL Financial Holdings Inc.</td>
<td class="data-td data last text-left">LPLA</td>
<td class="data-td data last text-left">Financials</td>
<td class="data-td data last text-right">1.68</td>
<td class="data-td data last text-right">0.21</td>
</tr>
<tr class="tbl-data">
<td class="data-td data last text-left">Tapestry Inc.</td>
<td class="data-td data last text-left">TPR</td>
<td class="data-td data last text-left">Consumer Discretionary</td>
<td class="data-td data last text-right">1.73</td>
<td class="data-td data last text-right">0.20</td>
</tr>
<tr class="tbl-data">
<td class="data-td data last text-left">Corteva Inc.</td>
<td class="data-td data last text-left">CTVA</td>
<td class="data-td data last text-left">Materials</td>
<td class="data-td data last text-right">1.33</td>
<td class="data-td data last text-right">0.20</td>
</tr>
</tbody>
</table>
<h3>Detractors</h3>
<div class="wrapped-div">
<table style="width: 100%;">
<tbody>
<tr class="tbl-data">
<td class="tbl-header last text-left">Company</td>
<td class="tbl-header last text-left">Ticker</td>
<td class="tbl-header last text-left">Sector</td>
<td class="tbl-header last text-right">Avg. Weight (%)</td>
<td class="tbl-header last text-right">Contribution (%)</td>
</tr>
<tr class="tbl-data">
<td class="data-td data last text-left">Expedia Group Inc.</td>
<td class="data-td data last text-left">EXPE</td>
<td class="data-td data last text-left">Consumer Discretionary</td>
<td class="data-td data last text-right">1.60</td>
<td class="data-td data last text-right">-0.13</td>
</tr>
<tr class="tbl-data">
<td class="data-td data last text-left">Gentex Corp.</td>
<td class="data-td data last text-left">GNTX</td>
<td class="data-td data last text-left">Consumer Discretionary</td>
<td class="data-td data last text-right">1.29</td>
<td class="data-td data last text-right">-0.12</td>
</tr>
<tr class="tbl-data">
<td class="data-td data last text-left">Teradyne Inc.</td>
<td class="data-td data last text-left">TER</td>
<td class="data-td data last text-left">Technology</td>
<td class="data-td data last text-right">1.34</td>
<td class="data-td data last text-right">-0.11</td>
</tr>
<tr class="tbl-data">
<td class="data-td data last text-left">The Campbell`s Co.</td>
<td class="data-td data last text-left">CPB</td>
<td class="data-td data last text-left">Consumer Staples</td>
<td class="data-td data last text-right">1.24</td>
<td class="data-td data last text-right">-0.08</td>
</tr>
<tr class="tbl-data">
<td class="data-td data last text-left">Las Vegas Sands Corp.</td>
<td class="data-td data last text-left">LVS</td>
<td class="data-td data last text-left">Consumer Discretionary</td>
<td class="data-td data last text-right">0.66</td>
<td class="data-td data last text-right">-0.07</td>
</tr>
</tbody>
</table>
</div>
</div>
<p class="chart-disclosure"><strong>Source: Morningstar, January 2025</strong>. Past performance is no guarantee of future results. Index performance is not illustrative of fund performance. Not intended as a recommendation to buy or to sell any of the securities mentioned herein.</p>

<h2 id="moat-strategies" class="jump-link-nav anchored-block" data-jumplink-title="Moat Strategies">Choose Your Moat Strategy</h2>
<p>VanEck&rsquo;s suite of <a href="/us/en/blogs/moat-investing/moat-investing-powered-by-morningstar/" title="Quality Companies at Attractive Prices"><strong>moat investing strategies</strong></a> is powered by Morningstar&rsquo;s equity research team, which seeks quality companies trading at attractive valuations. The below ETFs offer access to US moat companies:</p>
<p><a href="/link/9e43dd198c5f4e419f13220685081895.aspx" title="MOAT - VanEck Morningstar Wide Moat ETF - Overview"><strong>VanEck Morningstar Wide ETF (MOAT)</strong></a>: companies with a wide moat rating, which means Morningstar believes the company is likely to sustain its competitive advantage for at least the next 20 years.</p>
<p><a href="/link/166321dbcfec440590fb51cf0ad629aa.aspx" title="SMOT - VanEck Morningstar SMID Moat ETF - Overview"><strong>VanEck Morningstar SMID Moat ETF (SMOT)</strong></a>: small and mid-cap moat companies.</p>
<p>To receive more <a href="https://www.vaneck.com/us/en/insights/moat-investing" title="Moat Investing Insights"><strong>Moat Investing</strong></a> insights, <a href="https://www.vaneck.com/us/en/subscribe/" title="Subscription Center"><strong>sign up in our subscription center</strong></a>.</p>
]]></content:encoded>
</item><item rdf:about="https://www.vaneck.com/us/en/blogs/income-investing/looking-beyond-aaa-rated-clos-pays-off/">
  <title>Looking Beyond AAA Rated CLOs Pays Off></title>
  <link>https://www.vaneck.com/us/en/blogs/income-investing/looking-beyond-aaa-rated-clos-pays-off/</link>
  <description><![CDATA[Investors new to CLOs often stick with AAAs, but we argue investors should consider looking at lower rated tranches.]]></description>
  <dc:creator>William Sokol</dc:creator>
  <dc:date>02/05/2025 06:30:00</dc:date>
<content:encoded><![CDATA[

<p>Investors new to collateralized loan obligations (CLOs) may choose to constrain themselves to AAAs, <a href="https://www.vaneck.com/us/en/blogs/income-investing/clos-uncover-opportunity-beyond-aaas/" title="CLOs: Uncover Opportunity Beyond AAAs"><strong>but we believe this is misguided</strong></a>. Although volatility may increase as you move down in quality, the yield and return potential offered by investment grade tranches outside of AAAs is far greater and doesn&rsquo;t require taking significantly more credit risk.</p>
<p>Consider that:</p>
<ol class="content-list">
<li class="mt-2">The aggregate CLO market, which represents the entire capital structure and is approximately 68% AAA CLOs, outperformed the AAA-only subset by 73 basis points (bps) per year over the past five years.</li>
<li class="mt-2">Single A CLOs outperformed AAA CLOs by 142 bps per year over the past decade, with volatility that was lower than IG corporate bonds.</li>
<li class="mt-2">BBB CLOs provide a yield pickup over AAA CLOs of 147bps, and pay a significantly higher coupon than high yield bonds, with much higher credit quality.</li>
<li class="mt-2">Defaults have historically been extremely rare in investment grade CLOs, with only a 0.3% cumulative default rate, all which occurred prior to the GFC in CLOs with less robust structural protections than what is found today.<sup>*</sup></li>
</ol>

<h3 id="higher-yield" class="anchored-block">Higher Yields Can be Found Within Investment Grade</h3>
<div class="flourish-embed flourish-chart" data-src="visualisation/21476347?2429575"><script src="https://public.flourish.studio/resources/embed.js"></script><noscript><img loading="lazy" src="https://public.flourish.studio/visualisation/21476347/thumbnail" width="100%" alt="chart visualization" /></noscript></div>
<p class="chart-disclosure">Source: ICE Data Indices, J.P. Morgan. CLOs represented by J.P. Morgan CLO Index or the ratings subset of the J.P. Morgan CLO Index. Index performance is not illustrative of fund performance. It is not possible to invest directly in an index.</p>
<p>We note that the CLO yields in the chart already assume an expected decline in short-term rates, as market convention in the asset class is to use the current forward interest rate curve. Further, CLO yields assume a certain loss rate in the calculation, so default assumptions are already reflected. This may provide additional comfort to those who are wary of investing outside of AAA tranches. Corporate bond yields do not make similar adjustments for potential defaults.</p>
<p>The ability to move into higher yielding investment grade tranches outside of AAA, which have yields that are driven more by credit spreads versus short-term risk-free rates, may allow investors to continue earning high absolute levels of income even in an environment of declining interest rates. For example, in a risk off environment, even if the Fed cut rates aggressively it is likely that overall yields could increase due to spread widening, particularly in single A and BBB rated tranches, dispelling the notion that CLOs are only attractive in rising rate environments. In a more benign environment such as we are in currently, moving further down the CLO capital stack can provide the opportunity for higher carry compared to AAA CLOs, while remaining well insulated from underlying loan defaults and volatility.</p>
<p>Further, the ability to invest broadly within investment grade and move within the full CLO capital structure can provide attractive total return opportunities as the rate and credit environments shift compared to an AAA only portfolio, while avoiding the significant volatility and drawdown potential of a strategy focused on CLOs rated BBB and below. Highly rated CLOs may provide insulation against a risk-off environment, but the ability to capture higher value in mezzanine tranches after a sell-off can allow significant upside potential as prices recover.</p>
<p>Navigating the CLO capital stack is where the value of active tranche management shines. An active approach provides both alpha potential and additional risk protections: through bottom-up analysis of underlying exposures, identifying/avoiding mispriced deals (and in some cases, avoiding lower rated tranches altogether) and active liquidity management. The ability to understand the various drivers of CLO risk is key in assessing the relative value of a tranche. PineBridge has decades of expertise in the CLO market and takes an active, high-conviction approach to investing in CLO tranches.</p>
<p><a href="https://www.vaneck.com/us/en/investments/clo-etf-cloi/overview/" title="CLOI - VanEck CLO ETF - Overview"><strong>The VanEck CLO ETF (CLOI)</strong></a> invests primarily in investment grade tranches of CLOs. CLOI is actively managed and based on a strategy that PineBridge has managed for years for its institutional clients, and is now available to all investors with the transparency, liquidity and cost benefits of an ETF.</p>
<p>To receive more <strong><a href="https://www.vaneck.com/us/en/insights/income-investing/" title="Income Investing Insights">Income Investing</a></strong> insights, <strong><a href="https://www.vaneck.com/us/en/subscribe/" title="Subscription Center">sign up in our subscription center</a></strong>.</p>
]]></content:encoded>
</item><item rdf:about="https://www.vaneck.com/us/en/blogs/digital-assets/matthew-sigel-vaneck-crypto-monthly-recap-for-january-2025/">
  <title>VanEck Crypto Monthly Recap for January 2025></title>
  <link>https://www.vaneck.com/us/en/blogs/digital-assets/matthew-sigel-vaneck-crypto-monthly-recap-for-january-2025/</link>
  <description><![CDATA[Bitcoin outperformed despite AI-driven volatility. Solana led key smart contract platform metrics, Ethereum readies Pectra, and Virtuals expands to Solana amid competition and declining revenue.]]></description>
  <dc:creator>Matthew  Sigel</dc:creator>
  <dc:date>02/05/2025 06:30:00</dc:date>
<content:encoded><![CDATA[

<p><strong>Please note that VanEck may have a position(s) in the digital asset(s) described below.</strong></p>
<p>Bitcoin led all major asset classes again with a <strong>9%</strong> increase in January, despite AI-induced volatility that saw the Nasdaq <strong>(+1.6%)</strong> lag behind the S&amp;P 500 <strong>(+2.7%)</strong>&mdash;a rare dynamic in recent months. Innovations like those proposed by DeepSeek, which promise to significantly lower AI training costs and energy demands, could reshape market expectations for computational efficiency. This aligns with the Trump Administration&rsquo;s pro-growth energy policies, which, if successfully executed, could ensure more abundant and affordable energy&mdash;a cornerstone of productive societies&mdash;benefiting Bitcoin, Bitcoin miners, Big Tech, data center operators, and consumers alike.</p>
<ul class="content-list">
<li class="mt-2"><strong><a href="#revenue-comparison">Revenue Comparison</a></strong></li>
<li class="mt-2"><strong><a href="#notable-performer">Notable Performer: Solana</a></strong></li>
<li class="mt-2"><strong><a href="#ethereum-update">Ethereum Update</a></strong></li>
<li class="mt-2"><strong><a href="#virtuals-protocol">Virtuals Protocol</a></strong></li>
</ul>
<p>Still, uncertainty looms over the future energy demands of both AI and Bitcoin, especially given the rapid pace of innovation and the substantial capital required for electrical infrastructure. For data center operators, diversifying their high-energy clientele is becoming a prudent strategy&mdash;not just as a hedge against fluctuating energy policies and prices, but also to keep pace with evolving technological needs. As if to punctuate this point, Masayoshi Son&rsquo;s Softbank acquired a <strong>3%</strong> stake in leading Bitcoin miner Cipher (CIFR, market cap <strong>$2B</strong>) on January 31st.</p>
<p>Masa&rsquo;s decision underscores a sophisticated understanding of the natural hedge provided by integrating Bitcoin mining with AI high-performance computing (HPC). His strategic bets, though occasionally mistimed, have largely paid off over more than four decades, demonstrating a keen sense of emerging market trends. By enhancing CIFR&rsquo;s computing capabilities and leveraging its energy infrastructure, this investment sets a precedent that other mega-cap tech CEOs may follow, recognizing the advantages of combining Bitcoin and AI.</p>
<p>Such strategic integration could unlock significant economic efficiencies, benefiting Bitcoin, Bitcoin miners, and the entire AI value chain. More importantly, it further establishes Bitcoin as a key benchmark hurdle rate for innovators&mdash;where capital allocators must weigh its scarcity and resilience against alternative investments in the evolving digital economy.</p>
<h3 id="price-returns" class="jump-link-nav anchored-block" data-jumplink-title="Price Returns">Price Returns</h3>
<div class="wrapped-div">
<table style="width: 600px;">
<tbody>
<tr class="tbl-data">
<td class="tbl-header last text-center">&nbsp;</td>
<td class="tbl-header last text-right">January (%)</td>
<td class="tbl-header last text-right">1-year (%)</td>
</tr>
<tr class="tbl-data">
<td class="data-td last">Coinbase</td>
<td class="data-td data last text-right">17</td>
<td class="data-td data last text-right">126</td>
</tr>
<tr class="tbl-data">
<td class="data-td last">Bitcoin</td>
<td class="data-td data last text-right">9</td>
<td class="data-td data last text-right">123</td>
</tr>
<tr class="tbl-data">
<td class="data-td last">MarketVector Smart Contract Leaders Index</td>
<td class="data-td data last text-right">6</td>
<td class="data-td data last text-right">59</td>
</tr>
<tr class="tbl-data">
<td class="data-td last">MV Global Digital Assets Equity Index</td>
<td class="data-td data last text-right">6</td>
<td class="data-td data last text-right">97</td>
</tr>
<tr class="tbl-data">
<td class="data-td last">S&amp;P 500 Index</td>
<td class="data-td data last text-right">3</td>
<td class="data-td data last text-right">24</td>
</tr>
<tr class="tbl-data">
<td class="data-td last">Nasdaq Index</td>
<td class="data-td data last text-right">2</td>
<td class="data-td data last text-right">29</td>
</tr>
<tr class="tbl-data">
<td class="data-td last">Ethereum</td>
<td class="data-td data last text-right">-1</td>
<td class="data-td data last text-right">44</td>
</tr>
<tr class="tbl-data">
<td class="data-td last">MarketVector Infrastructure Application Leaders Index</td>
<td class="data-td data last text-right">-4</td>
<td class="data-td data last text-right">11</td>
</tr>
<tr class="tbl-data">
<td class="data-td last">MarketVector Decentralized Finance Leaders Index</td>
<td class="data-td data last text-right">-11</td>
<td class="data-td data last text-right">28</td>
</tr>
<tr class="tbl-data">
<td class="data-td last">MarketVector Meme Coin Index</td>
<td class="data-td data last text-right">-17</td>
<td class="data-td data last text-right">NA</td>
</tr>
</tbody>
</table>
</div>
<br />
<p class="chart-disclosure">Source: Bloomberg as of 1/31/2025. <strong>Index performance is not representative of fund performance. It is not possible to invest directly in an index. Past performance is no guarantee of future results. Not intended as a recommendation to buy or sell any securities named herein.</strong></p>
<p>January was a mixed bag for smart contract platform tokens (SCPs). The MVSCLE index of layer 1s we track gained <strong>+6%</strong>, but most tokens finished the month in the red. Excluding BTC, only four of the top 15 L1s posted gains&mdash;SOL <strong>(+18%),</strong> HBAR <strong>(+14%),</strong> ALGO <strong>(+13%),</strong> and ADA <strong>(+12%)</strong>&mdash;while Scroll <strong>(SCR -32%)</strong> and Starknet (<strong>STRK -25%)</strong> were the biggest laggards. Volatility remains the norm, but with fundamentals increasingly driving performance, dispersion among L1s is only getting more pronounced.</p>
<h3>The Market Share of Top SCP Projects is Increasing</h3>
<p><img loading="lazy" src="https://www.vaneck.com/contentassets/aebefdcaf22b4bfaa9a48facd8f146ea/5296_crypto-monthly_january-2025_chart-1_2025-1_v1.svg" class="img-responsive w-100" alt="The Market Share of Top SCP Projects is Increasing" /></p>
<p class="chart-disclosure">Source: Artemis as of 1/29/2025.<strong> Past performance is no guarantee of future results. Not intended as a recommendation to buy or sell any securities named herein.</strong></p>
<h2>Fewer Tokens Are Outperforming</h2>
<p>Expanding the view to the top 100 crypto tokens by market cap, 57 finished January in the red despite BTC <strong>(+9%)</strong> and XRP <strong>(+43%)</strong> posting strong gains. Among the 30 smart contract platforms (L1s, including BTC) we track, only six have gained market share over the past year, and just 13 have grown their market cap in absolute terms since January 2024.</p>
<p>BTC, BNB, SOL, TRX, TON, and SUI led in market share dominance, increasing their slice of the SCP market cap (including BTC) from <strong>71%</strong> to <strong>82%</strong>. However, excluding BTC, the top five SCPs saw a more modest rise&mdash;from <strong>10.5%</strong> to <strong>12%</strong>. Notably, only SUI and TON have outperformed BTC over the past year among L1s and L2s.</p>
<h2>Blockchain Tokens with Strong Fundamentals are Outperforming</h2>
<p>Investor liquidity is increasingly concentrating on established winners among non-BTC tokens, signaling a shift toward projects with robust fundamentals. While BTC remains dominant&mdash;bolstered by its mindshare and <strong>$39.5B</strong> in ETF inflows since early last year&mdash;select smart contract platforms (SCPs) are standing out.</p>
<p>Outside of BTC, the top five relative performers also lead in fundamental metrics. SOL, TRX, SUI, and TON have all gained a larger share of total SCP revenue in the past year. SOL, TRX, and SUI have increased their share of total DEX volume, while SOL, TON, and SUI have grown their market share of daily active crypto wallets&mdash;despite the metric&rsquo;s flaws. This suggests that improving fundamentals are increasingly driving long-term token performance.</p>
<p>For years, many sophisticated crypto market participants have dismissed fundamentals, assuming that hype and liquidity flows drive prices. This skepticism stems from the rapid migration of users to new platforms, short-term metric manipulation by low-quality projects, and the difficulty of detecting fraudulent data. However, as crypto matures, the ability to fake traction is diminishing. Investors are increasingly scrutinizing project founders, making it harder for weak projects to sustain inflated metrics.</p>
<h3 id="revenue-comparison" class="jump-link-nav anchored-block" data-jumplink-title="Revenue Comparison">Solana Revenue Was Greater than the Total of the Next Four Chains in Jan 2025</h3>
<div class="flourish-embed flourish-chart" data-src="visualisation/21445578?2428759"><script src="https://public.flourish.studio/resources/embed.js"></script><noscript><img loading="lazy" src="https://public.flourish.studio/visualisation/21445578/thumbnail" width="100%" alt="Solana Revenue was Greater than the Total of the Next Four Chains in Jan 2025" /></noscript></div>
<p class="chart-disclosure">Source: Artemis as of 1/29/2025. Note: Exclusive of MEV. <strong>Past performance is no guarantee of future results. Not intended as a recommendation to buy or sell any securities named herein. </strong></p>
<h2 id="notable-performer" class="jump-link-nav anchored-block" data-jumplink-title="Solana">Solana (+19%) Has Become the L1 Leader</h2>
<p>Solana continues to dominate among layer 1s across key fundamental metrics. In January, it led in DEX volumes (<strong>45%</strong> market share), chain revenues <strong>(45%),</strong> and daily active wallets <strong>(33%)</strong>. As expected, Solana has become the focal point for on-chain crypto trading, driven by a strong developer community and a design optimized for high user activity. If January&rsquo;s figures are extrapolated, Solana is generating revenue at an annualized rate of <strong>$6B</strong>.</p>
<p>A blockchain&rsquo;s revenue typically comes from three sources:</p>
<ol class="content-list">
<li class="mt-2">Base Fee &ndash; The minimum cost to use the network (<strong>1%</strong> of Solana&rsquo;s January revenue).</li>
<li class="mt-2">Priority Fee &ndash; The additional tip users pay to ensure faster transaction inclusion <strong>(43%).</strong></li>
<li class="mt-2">MEV (Maximal Extractable Value) &ndash; Fees earned by block builders for optimizing transaction order and execution <strong>(56%).</strong></li>
</ol>
<p>Solana&rsquo;s revenue mix highlights its growing transaction demand, with priority fees and MEV extraction playing an outsized role.</p>
<h2>Solana Has a Clear Path to Organic Revenue Growth &ndash; Better Monetization of MEV</h2>
<p>Right now, the majority of Solana&rsquo;s revenue comes from Maximal Extractable Value (MEV)&mdash;a controversial source of profit since it often benefits sophisticated traders at the expense of everyday users. This occurs because Solana&rsquo;s low-latency design enables block builders to influence trade execution, capturing value that might otherwise go to users. MEV exists on all blockchains, but some manage it more efficiently than others.</p>
<p>Ethereum mitigates MEV extraction through Flashbots, a software add-on that allows open bidding on block-building rights. Every 12 seconds, a new block is auctioned off in ETH, and validators retain <strong>95%</strong> of the MEV revenue while block builders keep just <strong>5%</strong>. Since bids are priced in ETH, this process supports Ethereum&rsquo;s revenue and demand for ETH.</p>
<p>Solana has a similar system called Jito, which auctions block-building rights in SOL. However, due to Solana&rsquo;s architecture and ultra-low latency, block builders capture an estimated <strong>60%</strong> of MEV value, while validators keep just <strong>40%</strong>. This means that while Solana&rsquo;s total MEV pie is estimated at <strong>$8.4B</strong>, only <strong>$3.4B</strong> goes to validators and their stakers.</p>
<p>If Solana validators were able to capture <strong>80%</strong> of MEV&mdash;closer to Ethereum&rsquo;s model&mdash;MEV-derived revenue for validators would surge from <strong>$3.4B</strong> to <strong>$6.8B</strong>, representing a <strong>56%</strong> revenue boost for SOL. This shift could be facilitated by Jito upgrades, Solana protocol improvements, and the rollout of Firedancer, potentially increasing SOL&rsquo;s intrinsic value.</p>
<h3>Solana 2024 Revenue Would Increase $950M (+49%) if MEV Take Rate 40% &rarr; 80%</h3>
<div class="flourish-embed flourish-chart" data-src="visualisation/21445716?2428759"><script src="https://public.flourish.studio/resources/embed.js"></script><noscript><img loading="lazy" src="https://public.flourish.studio/visualisation/21445716/thumbnail" width="100%" alt="Solana 2024 Revenue would Increase $950M (+49%) if MEV Take Rate 40% &rarr; 80%" /></noscript></div>
<p class="chart-disclosure">Source: Blockworks as of 1/31/2025. <strong>Past performance is no guarantee of future results. Not intended as a recommendation to buy or sell any securities named herein.</strong></p>
<h2>Solana&rsquo;s Obstacles to Gaining More MEV</h2>
<p>Despite this opportunity, Solana&rsquo;s MEV ecosystem has structural inefficiencies that reduce revenue potential:</p>
<ul class="content-list">
<li class="mt-2"><strong>Private Mempools and Insider Advantage:</strong> <strong>92%</strong> of Solana validators run Jito&rsquo;s MEV auction software, yet many also participate in private mempools, where pending transactions are pooled before execution. Block builders with access to these mempools have an unfair edge, as they can better predict which trades will be executed and bid less aggressively in Jito auctions. This lowers block auction prices and reduces demand for SOL to pay for those auctions.</li>
<li class="mt-2"><strong>Bundled Trades and Arbitrage Extraction: </strong>Sophisticated traders use private mempools to bundle trades that capture arbitrage opportunities, sending these pre-packaged bundles directly to validators.</li>
</ul>
<p>By contrast, Ethereum&rsquo;s MEV data is largely public, preventing the same level of insider advantage. If Solana could reduce the influence of private mempools and bundled trades, more MEV revenue could be captured at the protocol level, increasing SOL demand.</p>
<h2>Solutions to Improve Solana&rsquo;s MEV Capture</h2>
<p>Near-term fixes include:</p>
<ul class="content-list">
<li class="mt-2">Validator whitelists to prevent collusion.</li>
<li class="mt-2">Application-level MEV protections to limit front-running.</li>
<li class="mt-2">RFQ (Request-for-Quote) systems to improve pricing transparency on DEXs.</li>
<li class="mt-2">Software patches that mitigate known attack vectors.</li>
</ul>
<p>Longer-term, Solana researchers are exploring a multi-leader model, where multiple validators propose blocks simultaneously, reducing the influence of dominant block builders and increasing revenue capture for SOL validators.</p>
<p>If these improvements succeed, Solana could significantly increase MEV-derived revenue, driving greater demand for SOL while reducing the advantage of insider traders.</p>
<h3>Solana Applications Are Thriving</h3>
<p><strong>Solana App Revenues in 2H2024 Were 52% of Market</strong></p>
<div class="flourish-embed flourish-chart" data-src="visualisation/21445842?2428759"><script src="https://public.flourish.studio/resources/embed.js"></script><noscript><img loading="lazy" src="https://public.flourish.studio/visualisation/21445842/thumbnail" width="100%" alt="Solana App Revenues in 2H2024 were 52% of Market" /></noscript></div>
<p class="chart-disclosure">Source: Blockworks as of 1/31/2025. <strong>Past performance is no guarantee of future results. Not intended as a recommendation to buy or sell any securities named herein.</strong></p>
<p>A key driver of an SCP&rsquo;s success is the profitability of its applications. By some estimates, Solana has overtaken Ethereum in this area. In 2022, Ethereum apps generated <strong>84%</strong> of all application revenue, while Solana apps accounted for just <strong>0.26%.</strong> By 2024, that gap reversed&mdash;Ethereum&rsquo;s share fell to <strong>32%</strong>, while Solana&rsquo;s surged to <strong>42%</strong>.</p>
<p>In absolute terms, Ethereum app revenue declined <strong>27%</strong> (from <strong>$1.3B</strong> in 2022 to <strong>$950M</strong> in 2024), while Solana&rsquo;s app revenue skyrocketed <strong>318x</strong>, from <strong>$4M</strong> to <strong>$1.25B</strong>.</p>
<p>This growth is attracting developers. Electric Capital ranked Solana as the top destination for new crypto developers in 2024, adding <strong>7,625</strong> new devs&mdash;surpassing Ethereum&rsquo;s <strong>6,456</strong>, despite ETH&rsquo;s FDV being nearly <strong>4x</strong> larger.</p>
<h3>Updated Valuation on Solana</h3>
<p><strong>Solana May Grow from 15% to &sim;22% of SCP Market Cap</strong></p>
<div class="flourish-embed flourish-chart" data-src="visualisation/21445973?2428759"><script src="https://public.flourish.studio/resources/embed.js"></script><noscript><img loading="lazy" src="https://public.flourish.studio/visualisation/21445973/thumbnail" width="100%" alt="Solana may Grow from 15% to &sim;22% of SCP Market Cap" /></noscript></div>
<p class="chart-disclosure">Forecast of Blockchain Market Shares</p>
<p class="chart-disclosure">Source: VanEck Research as of 1/31/2025. <strong>Past performance is no guarantee of future results. Not intended as a recommendation to buy or sell any securities named herein.</strong></p>
<p>We value Solana (SOL) based on its projected year-end market share within the smart contract platform (SCP) market. Our SCP market cap forecast is derived from U.S. M2 money supply growth, given its strong historical correlation with crypto market capitalization.</p>
<p>We project M2 to reach <strong>$22.3T</strong> by the end of 2025, maintaining its <strong>3.2%</strong> annualized growth rate since its last trough in October 2023. Using regression analysis, we estimate total SCP market capitalization will grow <strong>43%</strong> to <strong>$1.1T</strong> by year-end 2025 (vs. <strong>$770B</strong> today), surpassing its 2021 peak of <strong>$989B</strong>. Historical data shows a strong correlation between M2 and SCP market cap, with a 12-month moving average R&sup2; of 0.36 and a t-statistic of 5.7 (p &lt; 0.0001).</p>
<p>Currently, Solana holds <strong>15%</strong> of SCP market cap, but we forecast its share to rise to <strong>22%</strong> by EOY 2025. This projection is supported by Solana&rsquo;s developer dominance, increasing market share in DEX volumes, revenues, and active users. Using an autoregressive (AR) forecast model, we estimate Solana&rsquo;s market cap will reach <strong>~$250B</strong>, implying a SOL price of<strong> $520</strong> based on <strong>~486M</strong> floating tokens.</p>
<h2 id="ethereum-update" class="jump-link-nav anchored-block" data-jumplink-title="Ethereum">Ethereum (-1%)</h2>
<h3>Solana and Sui Are Receiving Increasing Share of Ethereum's Outflows</h3>
<div class="flourish-embed flourish-chart" data-src="visualisation/21448711?2428759"><script src="https://public.flourish.studio/resources/embed.js"></script><noscript><img loading="lazy" src="https://public.flourish.studio/visualisation/21448711/thumbnail" width="100%" alt="Solana and Sui are Receiving Increasing Share of Ethereum's Outflows" /></noscript></div>
<p class="chart-disclosure">Source: Artemis as of 1/30/2025.<strong> Past performance is no guarantee of future results. Not intended as a recommendation to buy or sell any securities named herein. </strong></p>
<h2>Market Sentiment</h2>
<p>Despite declining <strong>1%</strong> this month and outperforming most L1s aside from SOL, Ethereum (ETH) sentiment remains weak. At its peak in December 2021, 1 ETH was worth <strong>8.8%</strong> of 1 BTC&mdash;but since then, ETH/BTC has continued to slide, even amid a broader crypto bull market. This month, the ratio hit a new cycle low of <strong>~3.0%,</strong> marking a <strong>66%</strong> drawdown from its previous peak.</p>
<p>One key reason for ETH&rsquo;s underperformance is capital outflows from its ecosystem to alternative Layer-1s like Solana and Sui (red-shaded TVL). Ethereum&rsquo;s Total Value Locked (TVL) includes not just assets on its base layer but also those on Layer-2s like Arbitrum, Optimism, and Base (blue-shaded TVL)&mdash;yet capital is increasingly shifting to cheaper, faster chains.</p>
<p>Solana and Sui attract users with superior speed, cost-efficiency, and accessibility, making them prime hubs for DePIN, trading, and retail activity. However, these alt-L1s lack Ethereum&rsquo;s deep liquidity, established application codebase, and network effects.</p>
<p>To stay competitive, Ethereum core developers are pushing upgrades to blend high-performance UX with L1 security and decentralization. The next major upgrade, Pectra, is slated for March, aiming to improve Ethereum&rsquo;s user experience and maintain its dominance.</p>
<h2>The Upcoming Pectra Upgrade: A Key Step Toward L2 Scalability</h2>
<p>Ethereum&rsquo;s Pectra upgrade aims to enhance Layer-2 (L2) scalability, reduce costs, and improve interoperability, making Ethereum more competitive with alternative Layer-1s.</p>
<h2>Key Upgrades in Pectra</h2>
<p><strong>EIP-7691:</strong> Doubles the number of &ldquo;blobs&rdquo; available on Ethereum, expanding L2 capacity by allowing more transactions to offload data to Ethereum L1. Introduced in Dencun (March 2024), blobs have already driven down L2 transaction costs, enabling a surge in transaction volume as seen in the chart below.</p>
<p><strong>EIP-7702:</strong> Implements account abstraction, simplifying wallet setups and transactions, eliminating the friction of Ethereum&rsquo;s legacy Solidity design.</p>
<p><strong>EIP-7251:</strong> Increases the validator staking limit from <strong>32 ETH</strong> to <strong>2048 ETH</strong>, reducing overhead costs and enhancing Layer-1 efficiency.</p>
<h3>L2 Transaction Costs Declined 84% While Volume Grew 364% YoY</h3>
<p><img loading="lazy" src="https://www.vaneck.com/contentassets/aebefdcaf22b4bfaa9a48facd8f146ea/5296_crypto-monthly_january-2025_chart-7_2025-1_v1.svg" class="img-responsive w-100" alt="L2 Transactions Costs Declined 84% while Volum Grew 365% YoY" /></p>
<p class="chart-disclosure">Source: Artemis as of 1/30/2025. <strong>Past performance is no guarantee of future results. Not intended as a recommendation to buy or sell any securities named herein. </strong></p>
<p>With these upgrades, Ethereum aims to improve user experience and scalability while maintaining its L1 security advantages.</p>
<h2>What to Watch Post-Pectra</h2>
<p><strong>Smart Contract-Based Wallets:</strong> Account abstraction will enable more flexible, user-friendly wallets, rivaling Solana&rsquo;s Phantom. Expect innovations like customizable gas payments, recovery mechanisms, and transaction automation to improve Ethereum&rsquo;s UX.</p>
<p><strong>New Application Growth:</strong> Lower fees will unlock cost-prohibitive use cases in trading, betting, social media, and NFT platforms, increasing Ethereum&rsquo;s appeal to retail users.</p>
<p><strong>DeFi &amp; Financial Services Expansion:</strong> Cheaper transactions will enhance DeFi accessibility, micropayments, and cross-border payments, positioning Ethereum to challenge traditional payment networks that charge 1.5%-3.5% per transaction.</p>
<h2>Bottom Line</h2>
<p>Pectra is a further evolution of Ethereum&rsquo;s L2-first scaling strategy, aiming to improve efficiency without sacrificing decentralization. With better UX, lower fees, and stronger DeFi infrastructure, Ethereum bulls hope the Pectra fork will catalyze the next wave of adoption.</p>
<h2 id="virtuals-protocol" class="jump-link-nav anchored-block" data-jumplink-title="Virtuals">Virtuals (-46%)</h2>
<h3>Virtuals Protocol Revenue Has Fallen &sim;78% since Dec 31</h3>
<div class="flourish-embed flourish-chart" data-src="visualisation/21450943?2428759"><script src="https://public.flourish.studio/resources/embed.js"></script><noscript><img loading="lazy" src="https://public.flourish.studio/visualisation/21450943/thumbnail" width="100%" alt="Virtuals Protocol Revenue have Fallen &sim;78% since Dec 31" /></noscript></div>
<p class="chart-disclosure">Source: Dune Analytics &ndash; jdhyper as of: 1/31/2025.</p>
<p>Virtuals Protocol (VIRTUAL) fell <strong>~46%</strong> month-over-month, shedding nearly <strong>$2B</strong> in market cap. Despite this, it remains a top performer this cycle, with its token still up <strong>500%</strong> from <strong>$0.34</strong> to <strong>$2.04</strong> over the past three months. We take a deeper look below:</p>
<h2>What is Virtuals Protocol?</h2>
<p>Virtuals Protocol is a blockchain-based platform for AI-powered agents, split into:</p>
<ul class="content-list">
<li class="mt-2"><strong>IP Agents</strong> &ndash; Entertainment-focused AI personalities, often engaging on social platforms.</li>
<li class="mt-2"><strong>Functional Agents</strong> &ndash; Task-oriented AI tools.</li>
</ul>
<p>Each AI agent has a unique token, creating a speculative market. $VIRTUAL serves as the base currency, used for trading agent tokens, inference payments, and liquidity pools.</p>
<p>This raises two key questions:</p>
<ul class="content-list">
<li class="mt-2">What is the utility of individual agent tokens?</li>
<li class="mt-2">How does this impact the broader VIRTUAL token?</li>
</ul>
<p>Critics argue agent tokens are mere speculative wrappers with little fundamental value. Proponents claim they represent a new asset class, offering governance, revenue-sharing, and potential future utilities, fostering a community-driven AI economy.</p>
<h2>The Role of $VIRTUAL</h2>
<p>Unlike agent tokens, $VIRTUAL&rsquo;s value depends on the entire ecosystem. Its key functions:</p>
<ul class="content-list">
<li class="mt-2"><strong>Agent Creation:</strong> Requires VIRTUAL, locking liquidity and exerting deflationary pressure.</li>
<li class="mt-2"><strong>Trading &amp; Liquidity:</strong> Agent tokens are paired with VIRTUAL in liquidity pools, ensuring demand.</li>
<li class="mt-2"><strong>Inference Payments:</strong> Users pay for agent interactions in VIRTUAL, which is burned, reducing supply.</li>
<li class="mt-2"><strong>Swap Fees:</strong> A <strong>1%</strong> fee on trades, distributed to agent creators, affiliates, and subDAOs.</li>
</ul>
<h2>What to Watch Next</h2>
<p>Virtuals&rsquo; daily revenue has dropped <strong>78%</strong> since December 31, driven by declining trading volume and a <strong>91%</strong> drop in protocol revenue since its December 2 peak. Investor confidence was further impacted by a now-patched security flaw in early January.</p>
<p>Additionally, capital flowed into the official TRUMP meme coin, which reached a <strong>$76B</strong> valuation in two days, pulling liquidity from other crypto markets&mdash;including Virtuals.</p>
<h2>Key Developments in January</h2>
<ul class="content-list">
<li class="mt-2"><strong>Solana Expansion</strong> &ndash; Virtuals is prioritizing Solana over Base.</li>
<li class="mt-2"><strong>Multi-Framework Support</strong> &ndash; Now supports AI models like ELIZA and RIG, improving flexibility for developers.</li>
<li class="mt-2"><strong>New Competitors</strong> &ndash; Cluster Protocol and Empyreal are emerging rivals on Base.</li>
<li class="mt-2"><strong>Swap Fee Changes</strong> &ndash; Trading fees are now denominated in cbBTC instead of VIRTUAL, while inference payments remain in VIRTUAL and are burned.</li>
<li class="mt-2"><strong>Revised Fee Allocation</strong> &ndash; <strong>50%</strong> of swap fees now go to Agent subDAOs, up from <strong>40%</strong>, reducing the cut for affiliates.</li>
</ul>
<h2>Bottom Line</h2>
<p>Virtuals Protocol faces declining revenue, increased competition, and shifting liquidity dynamics. However, its expansion to Solana, AI model flexibility, and continued deflationary mechanics could provide long-term upside should animal spirits return to the sector.</p>
<p><strong>Links to third party websites are provided as a convenience and the inclusion of such links does not imply any endorsement, approval, investigation, verification or monitoring by us of any content or information contained within or accessible from the linked sites. By clicking on the link to a non-VanEck webpage, you acknowledge that you are entering a third-party website subject to its own terms and conditions. VanEck disclaims responsibility for content, legality of access or suitability of the third-party websites.</strong></p>
<style>
    .data-td.data {
        padding-right: 5px !important;
    }
    
    .wrapped-div {
        max-width: 100%;
    }
    
    @media (max-width: 1240px) {
        .wrapped-div {
            overflow-x: scroll;
        }
    }
    
    .wrapped-div-sector {
        max-width: 100%;
        overflow-x: scroll;
    }
    .flourish-credit {
        display: none !important;
    }
</style>
<p>To receive more <strong><a href="https://www.vaneck.com/us/en/insights/digital-assets/" title="Digital Assets Insights">Digital Assets</a></strong> insights, <strong><a href="https://www.vaneck.com/us/en/subscribe/" title="Subscription Center">sign up in our subscription center</a></strong>.</p>
]]></content:encoded>
</item><item rdf:about="https://www.vaneck.com/us/en/blogs/municipal-bonds/no-department-of-education-what-it-means-for-municipal-bonds/">
  <title>No Department of Education? What It Means for Municipal Bonds></title>
  <link>https://www.vaneck.com/us/en/blogs/municipal-bonds/no-department-of-education-what-it-means-for-municipal-bonds/</link>
  <description><![CDATA[Eliminating the DOE will have little impact on municipal bonds, as schools rely mostly on state and local funding, though short-term disruptions in grants and student loans are possible.]]></description>
  <dc:creator>Tamara  Lowin</dc:creator>
  <dc:date>02/05/2025 06:30:00</dc:date>
<content:encoded><![CDATA[

<p>We believe the elimination of the federal Department of Education (DOE) will have a muted impact on the municipal market.</p>
<p>Public school districts, charter schools, private schools, colleges, universities, and community colleges borrow money in the municipal market. The bonds pay for facility improvements and are repaid through revenues &ndash; almost none of which originate from the federal government. If the federal Department of Education is eliminated, the closure will not impact these borrowers&rsquo; long-term credit quality.</p>
<p>Elementary and secondary (K-12) education funding is the responsibility of states, and on average, state funds account for about half of a school&rsquo;s budget. An additional 40% of school budgets are funded by local governments, usually from property taxes. The typical K-12 school in the United States receives less than 10% of its funding from the federal government<sup>1</sup>. And much of that 10% isn&rsquo;t from the Department of Education. The USDA, for example, administers the National School Lunch Program, which provides free to reduced meals for students living near the poverty level. Head Start is funded through the Department of Health and Human Services.</p>
<p>The Department of Education does administer grants for K-12 schools, most notably through the Title I and IDEA programs. A school qualifies for Title I funding if a large percentage of students come from low-income homes. IDEA (Individuals with Disabilities Education Act) funds and related programs provide money for special education funding. Each program has a total budget of $18 billion and $15 billion, respectively, in 2023<sup>2</sup>. There are other grant programs as well, but these are the two largest. In all, about $80 billion in grants were awarded in 2023 by the Department of Education to K-12 programs.</p>

<p>The elimination of the Department of Education doesn&rsquo;t eliminate funding for these programs, which would be a blow to the most vulnerable populations. We already see that funding for the public school system can come from multiple federal agencies. These programs can also be administered through other state agencies, like the Department of the Treasury.</p>
<p>The Department of Treasury would likely also take over the Department of Education&rsquo;s largest responsibility as well: the federal student loan program. The transition of the K-12 grant and loan programs to other agencies poses near-term credit concerns as the likelihood of funding delays, slower processing times, and errors are more likely as new teams get up to speed. For K-12 schools, delays are unlikely to result in bond defaults due to the small amount of the total budget these funds make up. Most school district debt is paid directly from property taxes as well.</p>
<p>Changes to the federal student loan program, Pell Grants, and federal student aid could significantly impact colleges and universities &ndash; whether the programs are administered in the Department of Education or the Department of Treasury. Delays will require colleges to rely upon their own liquidity, but the confusion from the transfer to another department will not have a long-term impact and should resolve in the near term. However, changes to the programs themselves could significantly impact institutions of higher education.</p>
<p>The student loan program ensures inexpensive funds are available for students to borrow to attend almost any higher education institution in the country. Beyond more expensive borrowing, a greater reliance on the private loan market means more discerning lenders with fewer dollars to lend. We do not know what changes, if any, will be considered, but we will continue to watch as events unfold.</p>
<p>To receive more <a href="https://www.vaneck.com/us/en/insights/municipal-bonds/" title="Municipal Bonds Insights"><strong>Municipal Bonds</strong></a> insights, <a href="/link/5f45412c2143400497908cea2897f7d3.aspx" title=" Subscription Center"><strong>sign up in our subscription center</strong></a>.</p>
]]></content:encoded>
</item><item rdf:about="https://www.vaneck.com/us/en/blogs/municipal-bonds/california-wildfires-impact-on-the-municipal-bond-market/">
  <title>California Wildfires’ Impact on the Municipal Bond Market></title>
  <link>https://www.vaneck.com/us/en/blogs/municipal-bonds/california-wildfires-impact-on-the-municipal-bond-market/</link>
  <description><![CDATA[Despite California's wildfires, municipal bonds remain resilient due to diverse tax bases, strong payment incentives, and federal aid, though smaller issuers need monitoring.]]></description>
  <dc:creator>Tamara  Lowin</dc:creator>
  <dc:date>01/31/2025 06:30:00</dc:date>
<content:encoded><![CDATA[

<p>For three weeks, California was ravaged by devastating wildfires, leaving a trail of destruction across the state. Thousands have been displaced, homes and businesses reduced to ash, and lives forever changed. Amidst this turmoil, an unexpected beacon of resilience has emerged: municipal bonds. Despite the catastrophic damage, the financial systems underpinning local governments and utilities appear remarkably stable. But how long can this stability hold?</p>
<h2>The Exposure of Municipal Debt</h2>
<p>Approximately $70 billion of municipal debt is currently exposed to the wildfires. Half of that is concentrated in the Los Angeles Department of Water and Power (LA DWP), which holds $20 billion of debt; the LA Unified School District, with $12 billion; and the LA County Metropolitan Transportation Authority, with $5 billion. Smaller borrowers, such as the Altadena Library District, which has $20 million of municipal debt outstanding, are also affected.</p>
<p>Despite these substantial amounts, the inherent resilience of municipal bonds reduces the likelihood of long-term defaults.</p>
<h2>The Resilience of Municipal Bonds</h2>
<p>Broad revenue streams secure the majority of affected municipal debt, shielding bonds from default. Southern California's diverse and robust tax base allows borrowers reliant on sales, income, and ad valorem property taxes to maintain debt service payments. Similarly, due to the scale and diversity of local transportation systems&mdash;including toll roads, highways, public transportation, and airports&mdash;local transportation bonds are not expected to suffer long-term credit quality reductions.</p>
<p>Even municipal utilities are insulated. For example, LA DWP is the nation&rsquo;s largest public utility, of its kind, serving 700,000 water connections and 1.6 million electric connections in the City of Los Angeles. Currently, only 0.5%, or 8,000 accounts, are out of service&mdash;a minor revenue disruption. The city-owned power company also transfers approximately $250 million annually to Los Angeles. The probability of repaying municipal bonds remains strong even if a utility incurs wildfire-related liabilities.</p>

<h2>Spotlight: Altadena Library District</h2>
<p>The Altadena Library District is one of the smallest bond issuers impacted by the fires, with $20 million of debt issued in 2022. These bonds are secured by a &ldquo;special tax&rdquo; collected and general property taxes. The special tax applies to over 13,000 parcels within an eight-square-mile area, 95% of which are residential properties.</p>
<p>Unlike traditional property taxes, the special tax is a fixed fee unaffected by property value fluctuations. Non-payment leads to a lien on the property and eventual foreclosure, creating strong incentives for property owners and banks to ensure taxes are paid. Banks holding mortgaged properties typically pay delinquent taxes to maintain control over the foreclosure process, yielding higher recovery amounts than a county auction. In foreclosure scenarios, delinquent taxes are prioritized for repayment over mortgage repayment to the banks.</p>
<p>This illustrates the fundamental strengths of property-tax-backed municipal bonds: a diverse tax base, strong payment incentives for stakeholders, and a predictable billing process. While many issuers maintain reserves for such scenarios, the Altadena Library District does not. We will monitor this situation closely to see if payments are disrupted.</p>
<h2>Natural Disasters and Federal Aid</h2>
<p>Despite the inherent strength of municipal bonds, financial humanitarian aid plays a vital role in stabilizing affected areas. On a federal level, former President Biden declared the wildfires a disaster eligible for FEMA relief funding, pledging to cover 100% of cleanup and firefighting costs for six months. Negotiations regarding additional federal assistance are ongoing.</p>
<p>On January 23rd, the California Legislature passed a set of bills allocating $2.5 billion in bridge funding to support state and local agencies&rsquo; relief efforts. This funding represents the first of many steps required to aid recovery and rebuild communities devastated by the fires.</p>
<h2>A Testament to Resilience</h2>
<p>Although the California wildfires have wreaked havoc on communities and infrastructure, the financial systems supporting municipal bonds remain steadfast. With diverse tax bases, strong payment incentives, and federal and state aid, the likelihood of long-term bond defaults is low. However, smaller issuers like the Altadena Library District highlight the need for vigilant monitoring and preparedness. As California navigates the path to recovery, its municipal bonds continue to reflect the resilience of its communities.</p>
<p>To receive more <a href="https://www.vaneck.com/us/en/insights/municipal-bonds/" title="Municipal Bonds Insights"><strong>Municipal Bonds</strong></a> insights, <a href="/link/5f45412c2143400497908cea2897f7d3.aspx" title=" Subscription Center"><strong>sign up in our subscription center</strong></a>.</p>
]]></content:encoded>
</item><item rdf:about="https://www.vaneck.com/us/en/blogs/digital-assets/sui-vs-aptos-competitive-analysis-and-price-prediction/">
  <title>Sui vs. Aptos: Competitive Analysis and Price Prediction></title>
  <link>https://www.vaneck.com/us/en/blogs/digital-assets/sui-vs-aptos-competitive-analysis-and-price-prediction/</link>
  <description><![CDATA[We compare Sui and Aptos across blockchain performance, scalability, ecosystems, and trading advantages while projecting SUI to hit $16 and APT $22 by the end of 2025.]]></description>
  <dc:creator>Patrick Bush</dc:creator>
  <dc:date>01/29/2025 06:30:00</dc:date>
<content:encoded><![CDATA[

<p><strong>Please note that VanEck has positions in Sui (SUI) and Aptos (APT)</strong></p>
<h2 id="top-origin_overview" class="jump-link-nav anchored-block" data-jumplink-title="Overview">Sui and Aptos: Origins and Overview</h2>
<p>Previously, we discussed the potential of <a href="https://www.vaneck.com/us/en/blogs/digital-assets/matthew-sigel-eth-2030-price-target/" title="ETH 2030 Price Target and Optimal Portfolio Allocations"><strong>Ethereum</strong></a> and <a href="https://www.vaneck.com/us/en/blogs/digital-assets/matthew-sigel-vanecks-base-bear-bull-case-solana-valuation-by-2030/" title="VanEck&rsquo;s Base, Bear, Bull Case: Solana Valuation by 2030"><strong>Solana</strong></a> to onboard billions of users to crypto. While both ecosystems are compelling, they represent earlier generations of blockchain technology. Since their inception, newer blockchains have emerged to address the limitations of these systems. Among these are Aptos and Sui, two related blockchains founded by the diaspora of Facebook&rsquo;s blockchain project, Diem. Diem aimed to create a stablecoin payment system for Facebook&rsquo;s social media platform but was shelved due to regulatory pressure. However, its experiments spurred significant advancements in blockchain technology.</p>
<p>One of the most important outputs of Diem was the Move smart contract programming language. Move is based off the popular (<strong><em>+4.3M </em><a href="https://www.slashdata.co/post/27-4m-developers-use-javascript-ai-chatbots-are-used-by-45-of-developers-for-problem-solving" title="27.4M developers use JavaScript &amp; AI chatbots are used by 45% of developers for problem-solving" target="_blank" rel="noopener"><em>developers worldwide</em></a></strong><em>, <strong>3rd</strong> fastest growing language) </em>Rust language and was optimized to solve issues with earlier smart contract languages like Ethereum&rsquo;s Solidity and Cardano&rsquo;s Haskell. Both Aptos and Sui leverage Move to create a quicker, safer, and more intuitive development environment for software engineers to build applications out of smart contracts. Move also helps the underlying engine of both Aptos and Sui, called &ldquo;the virtual machine&rdquo; (VM), process transactions faster (how quickly a user receives a confirmation) and with more throughput (how many transactions the system can process per time period). Move's potential is so high that the value of all Move-based blockchains has surged from <strong>~$5B</strong> to <strong>~$22B</strong> in just one year.</p>
<ul class="content-list">
<li class="mt-2"><strong><a href="#top-origin_overview" title="Sui and Aptos: Origins and Overview">Sui and Aptos: Origins and Overview</a> </strong></li>
<li class="mt-2"><strong><a href="#top-blockchain_performance" title="Sui vs. Aptos: Blockchain Performance and Scalability">Sui vs. Aptos: Blockchain Performance and Scalability</a> </strong></li>
<li class="mt-2"><strong><a href="#top-ecosystems" title="Sui vs. Aptos: Ecosystems">Sui vs. Aptos: Ecosystems</a> </strong></li>
<li class="mt-2"><strong><a href="#top-trading_experience" title="Sui vs. Aptos: Trading Experience">Sui vs. Aptos: Trading Experience</a> </strong></li>
<li class="mt-2"><strong><a href="#top-tokeconomics" title="Sui vs. Aptos: Tokenomics">Sui vs. Aptos: Tokenomics</a> </strong></li>
<li class="mt-2"><strong><a href="#top-valuation" title="Sui vs. Aptos: Our Valuation">Sui vs. Aptos: Our Valuation</a> </strong></li>
<li class="mt-2"><strong><a href="#top-price_prediction" title="Sui and Aptos: Price Prediction for 2025">Sui and Aptos: Price Prediction for 2025</a> </strong></li>
<li class="mt-2"><strong><a href="#top-risks" title="Sui and Aptos: Conclusion and Investment Risks">Sui and Aptos: Conclusion and Investment Risks</a> </strong></li>
</ul>
<h3>Crypto has 1/1000th the Developer Community of JavaScript</h3>
<div class="flourish-embed flourish-chart" data-src="visualisation/21301801?2429575"><script src="https://public.flourish.studio/resources/embed.js"></script><noscript><img loading="lazy" src="https://public.flourish.studio/visualisation/21301801/thumbnail" width="100%" alt="Crypto has 1/1000th the Developer Community of JavaScript" /></noscript></div>
<p class="chart-disclosure">Source: Electric Capital, Slash Data as of 12/19/2024.</p>
<p>Move is important because it offers a better entry point for incoming developers. The number of crypto developers is very small, and a popular quip is that there are more full-time developers at Meta (Facebook) than there are in all of crypto. By offering a more approachable and efficient language, Move has the potential to attract a broader developer base, fostering experimentation and innovation. This is vital for uncovering the next groundbreaking application that could drive mass adoption. We view blockchains as a platform for innovation and experimentation, with high valuations of SCPs driven by their capacity to enable groundbreaking applications that can engage hundreds of millions of users. Because no one knows what that application may be, it is important to have as many people experimenting as possible.</p>
<p>Both Sui and Aptos pair their Move VMs with advanced consensus mechanisms that ensure each network efficiently validates transactions and updates. This combination of cutting-edge virtual machines and consensus protocols forms the foundation of their technology, delivering superior performance compared to previous blockchain systems. Until innovations like Solana&rsquo;s Firedancer prove otherwise, Sui and Aptos stand as the <em>pinnacle of blockchain technology.</em></p>
<h3>Aptos Achieved 326M or 13.3K Transactions Per Second (TPS) on 10/18/2024</h3>
<div class="flourish-embed flourish-chart" data-src="visualisation/21296871?2429575"><script src="https://public.flourish.studio/resources/embed.js"></script><noscript><img loading="lazy" src="https://public.flourish.studio/visualisation/21296871/thumbnail" width="100%" alt="Aptos Achieved 326M or 13.3K Transactions Per Second (TPS) on 10/18/2024" /></noscript></div>
<p class="chart-disclosure">Peak daily transactions of different blockchains. Source: Artemis XYZ as of 12/19/2024.</p>
<p>Sui and Aptos offer important blockchain technology capable of serving hundreds of millions of users. Aptos and Sui bring blockchain scaling alongside simplicity and safety for builders. This contrasts Solana, which offers scaling at the cost of complexity, and Ethereum, which provides a richer ecosystem at the tradeoffs of governance through a rigid technocracy and inferior technology. Tactically, Sui and Aptos offer a better user experience for crypto&rsquo;s current use case &ndash; speculation and value transfer. Strategically, they lay the groundwork for future non-speculative applications like AI agents, social media, cloud services, and marketing. While the future blockbuster crypto applications are uncertain, Sui and Aptos stand out as strong contenders for attracting the blockchain users of tomorrow.</p>
<p>But what makes these systems exceptional, and <em>which is better</em>?</p>
<h2 id="top-blockchain_performance" class="anchored-block">Sui vs. Aptos: Blockchain Performance and Scalability</h2>
<p>While Sui and Aptos both utilize the Move programming language, their blockchains are architected with distinct design philosophies. Each network employs its own version of Move, optimized for different tradeoffs that influence how transactions are processed.</p>
<p>When a transaction is sent to a blockchain, it contains information that tells the blockchain&rsquo;s software what parts of the blockchain&rsquo;s database (called <em>state) </em>it wants to change. Blockchain engineers call these database updates &ldquo;state changes.&rdquo; Most blockchains operate in a hierarchy where one validator acts as the &ldquo;leader&rdquo; for a set period of time before a new one is selected. During a validator&rsquo;s leadership span, it ingests incoming transactions, determines their validity (ensuring authorization, correct signatures, and no double-spending), orders them, executes the changes, and then updates the blockchain&rsquo;s state. The resulting block of transactions (the block in the blockchain) is broadcast to the other validators in the network. These validators also verify, execute, and synchronize their copies of the state with other validators. Once a supermajority (66%) of validators agree that the state update is valid, the blockchain progresses to the next block of transactions.</p>
<p>A blockchain's architecture can be segmented into two primary components:</p>
<ol class="content-list">
<li class="mt-2"><strong>Processing transactions and building blocks of transactions</strong>
<ol class="content-list" style="list-style-type: lower-alpha;">
<li class="mt-2">Verifying transaction authenticity</li>
<li class="mt-2">Ensuring sufficient account balances</li>
<li class="mt-2">Executing smart contracts</li>
<li class="mt-2">Updating the blockchain&rsquo;s ledger</li>
</ol>
</li>
<li class="mt-2"><strong>Communicating block across the network </strong>
<ol class="content-list" style="list-style-type: lower-alpha;">
<li class="mt-2">Broadcasting the block of transactions across the network</li>
<li class="mt-2">Synchronizing the changes made to the blockchain&rsquo;s ledger so all validators hold the exact copy of the state</li>
<li class="mt-2">Handling conflicts that arise during ledger reconciliation for all validators</li>
</ol>
</li>
</ol>
<p>To improve transaction throughput, blockchains must either increase the volume of data transmitted across the network (enabling larger transaction blocks) or optimize the efficiency of data processing and communication (enhancing the message exchange process). Sui and Aptos tackle these challenges differently by leveraging their unique adaptations of Move to push the boundaries of blockchain technology to increase the efficiency and volume of data each processes.</p>
<h2><em>Blockchain Transaction Throughput = Block Size x Block Processing Speed</em></h2>
<p>Both Aptos and Sui optimize methods to increase the size of the data that can be processed and how quickly the network disseminates that data. This analysis examines their approaches to the first step, &ldquo;Processing transactions and building blocks of transactions,&rdquo; to highlight each chain's unique advantages and tradeoffs.</p>
<p><img loading="lazy" class="img-responsive w-100" src="https://www.vaneck.com/contentassets/3aae13c2f9424b3e8cfaabd599c4004b/5258_sui-and-aptos-blogemail_infographic-1_2025-01_v2_blog.svg" alt="Blockchain Transaction Throughput = Block Size x Block Processing Speed" /></p>
<p class="chart-disclosure">Source: VanEck Research as of 12/19/2024.</p>
<p>To simplify the technology behind Aptos and Sui, imagine blockchains as restaurants:</p>
<ol class="content-list">
<li class="mt-2"><strong>The blockchain is the restaurant </strong>
<ol class="content-list" style="list-style-type: lower-alpha;">
<li class="mt-2">It provides the infrastructure and environment where the entire process takes place.</li>
</ol>
</li>
<li class="mt-2"><strong>The blockchain users are the customers</strong>
<ol class="content-list" style="list-style-type: lower-alpha;">
<li class="mt-2">They interact with the restaurant by placing orders, just as users interact with the blockchain through transactions.</li>
</ol>
</li>
<li class="mt-2"><strong>User transactions are restaurant orders</strong>
<ol class="content-list" style="list-style-type: lower-alpha;">
<li class="mt-2">These are specific requests made by customers that require processing and fulfillment.</li>
</ol>
</li>
<li class="mt-2"><strong>The onchain applications are the waiters</strong>
<ol class="content-list" style="list-style-type: lower-alpha;">
<li class="mt-2">Waiters act as intermediaries, taking customer orders (transactions) and delivering them to the kitchen (validator) for processing. They also return the completed orders (state changes) to the customers.</li>
</ol>
</li>
<li class="mt-2"><strong>The Leader Validator is the kitchen</strong>
<ol class="content-list" style="list-style-type: lower-alpha;">
<li class="mt-2">The kitchen is responsible for processing orders (validating and executing transactions) and preparing the output (state changes).</li>
</ol>
</li>
<li class="mt-2"><strong>The state change is the food delivered to the customer </strong>
<ol class="content-list" style="list-style-type: lower-alpha;">
<li class="mt-2">The final product, representing the processed transaction or updated blockchain state, is served to the customer.</li>
</ol>
</li>
</ol>
<p>In this analogy, improvements in blockchain technology introduced by Aptos and Sui can be likened to optimizing the restaurant&rsquo;s operations. This includes making the kitchen faster and the waiters more efficient and ensuring orders are processed and delivered to customers quickly and accurately.</p>
<h2>Ethereum is a <em>slow restaurant</em></h2>
<p>Ethereum is software that processes one state update at a time, and this happens only after transactions are accumulated in a list over a relatively lengthy period. Each block of transactions is small and can handle only a limited number of operations. Additionally, transactions are processed sequentially rather than in parallel, meaning each one must be executed one after the other. Even if transactions touch different parts of the blockchain&rsquo;s state, they must wait for other transactions to be processed. This combination of small block sizes, infrequent updates, and sequential execution leads to low throughput and creates significant scalability challenges.</p>
<p>To make things more clear, imagine Ethereum as a restaurant with many waiters taking orders from tables but only one cook in the kitchen. Meals are prepared by that chef, one at a time. At the Ethereum Restaurant, customers give their food orders to their waiters, and these waiters come together to build the orders into a giant list. The list size is very limited; if a customer does not buy an expensive enough item, his order is bumped off the list (and he still owes money for his order). Once a period of time passes, roughly <strong>12 seconds</strong>, the list of customer orders is sent to the Chef, and he arranges the batch as he sees fit.</p>
<p>At the &lsquo;Ethereum Restaurant,&rsquo; the Chef is very &ldquo;entrepreneurial,&rdquo; so he accepts &ldquo;tips&rdquo; to process orders first so that customers can receive their food sooner. Once the Chef has decided on the order sequence, he prepares the food according to the customer's preferred meal. This almost always means the Chef cooks food first for patrons who give the largest tips.</p>
<p>Since the &lsquo;Ethereum Restaurant&rsquo; has only one person making food, many tables placing orders at once will result in a long queue of orders. While many consider the food at the &lsquo;Ethereum Restaurant&rsquo; to be very good, it has proven far too popular and cannot scale up to customer demand. Patrons of &lsquo;Ethereum&rsquo;s Restaurant&rsquo; are annoyed by the long wait times and the high costs of &ldquo;tipping&rdquo; the head waiter to get a timely meal. They particularly despise the experience of paying a lot of money and not receiving food.</p>
<h3>At the &lsquo;Ethereum Restaurant,&rsquo; Orders are Processed One at a Time (Even if They Don&rsquo;t Conflict)</h3>
<p><img loading="lazy" class="img-responsive w-100" src="https://www.vaneck.com/contentassets/3aae13c2f9424b3e8cfaabd599c4004b/5258_sui-and-aptos-blogemail_infographic-2_2025-01_v2_blog.svg" alt="At the &lsquo;Ethereum Restaurant,&rsquo; Orders are Processed One at a Time (Even if They Don&rsquo;t Conflict)" /></p>
<p class="chart-disclosure">Source: VanEck Research as of 12/19/2024.</p>
<h2>Sui and Aptos apply parallelization to make their restaurants faster</h2>
<p>Blockchains like Sui and Aptos have made a big improvement by allowing transactions to be parallelized. This is accomplished by allowing transactions that do not conflict to occur simultaneously. In practice, this means that transactions using different applications or simple payments can be processed together. Other blockchains, like Solana and Monad, can parallel processing, but Sui and Aptos currently offer the most advanced designs.</p>
<p>In the example of a restaurant, this capability of parallel processing would be equivalent to the restaurant adding many cooks to the kitchen. At the Sui/Aptos restaurants, the expanded staff can prepare many meals at once to fulfill customer orders much faster. However, how each blockchain achieves parallelization is very different and comes with tradeoffs. While there are now more chefs to process orders, each restaurant&rsquo;s kitchen is still limited by the amount of equipment it possesses.</p>
<p>If six tables order pizza at the same time, limited space in the pizza oven means that some pizzas must be cooked before the others. On blockchain, this would be like two traders competing to get the best price on the same DEX on the same coin. These &ldquo;conflicts&rdquo; must be resolved, and Sui and Aptos have different methods of doing this. In fact, the pros and cons of each blockchain&rsquo;s processing scheme have important implications for application developers and each&rsquo;s ability to scale.</p>
<h3>At &lsquo;Casa Sui&rsquo; and &lsquo;Le Maison de Aptos&rsquo;, Orders That Do Not Conflict with Others and Can Be Processed Simultaneously to Increase Throughput</h3>
<p><img loading="lazy" class="img-responsive w-100" src="https://www.vaneck.com/contentassets/3aae13c2f9424b3e8cfaabd599c4004b/5258_sui-and-aptos-blogemail_infographic-3_2025-01_v2_blog.svg" alt="At &lsquo;Casa Sui&rsquo; and &lsquo;Le Maison de Aptos&rsquo;, Orders That Do Not Conflict with Others and Can Be Processed Simultaneously to Increase Throughput" /></p>
<p class="chart-disclosure">Source: VanEck Research as of 12/19/2024.</p>
<h2>Fine dining at &lsquo;Casa Sui&rsquo;</h2>
<p>Sui employs a method to parallelize orders called &ldquo;static parallelism,&rdquo; which is similar to Solana&rsquo;s process. This means that transactions on Sui must explicitly specify the parts of the blockchain&rsquo;s ledger they want to read and write. Because Sui then knows what parts of the blockchain a transaction wants to touch, it can then allow other transactions that touch different parts to be processed at the same time. In the case where two transactions try to write to the same part of the blockchain simultaneously, Sui recognizes the conflict before the transactions are processed. To resolve the conflict, Sui determines which transaction comes first based on ordering criteria like fees paid, when the transaction was received, etc.</p>
<p>Returning to the restaurant example, we can better understand what this looks like in practice. At the Sui restaurant &ldquo;Casa Sui,&rdquo; when a table orders, the waiter takes the order and mentally breaks down the order to determine which parts of the kitchen will be used during preparation. If a hamburger and french fries are ordered, the waiter tells the kitchen to use the grill and the fryer. In turn, one of Sui&rsquo;s many chefs &ldquo;locks&rdquo; the area of the kitchen he needs to prepare the meal. During this &ldquo;lock,&rdquo; no other orders can be processed using that same kitchen equipment. However, items that use other parts of the kitchen can be cooked at the same time.</p>
<p>If two waiters simultaneously try to call on the same parts of the kitchen, &lsquo;Casa Sui&rsquo;s&rsquo; ordering system recognizes the &ldquo;conflict&rdquo; before the cooking begins. In that conflict scenario, one order is selected to be cooked first and the other to come afterward.</p>
<p>Let&rsquo;s assume three orders are placed simultaneously:</p>
<ol class="content-list">
<li class="mt-2">Table A orders <strong>white pizza</strong></li>
<li class="mt-2">Table B orders <strong>black pizza (the house specialty at &lsquo;Casa Sui&rsquo;)</strong></li>
<li class="mt-2">Table C orders <strong>salmon </strong></li>
</ol>
<p>In the case above, Table A&rsquo;s and Table B&rsquo;s orders conflict because they both use the pizza oven. However, Sui&rsquo;s waiters both determine this dependency upfront and determine the best ordering. So, &lsquo;Casa Sui&rsquo; selects Table B&rsquo;s order to go first and Table A&rsquo;s to go after. Meanwhile, the salmon is processed without any hold-up because it was known in advance that the grill station would be free.</p>
<h3>At &lsquo;Casa Sui,&rsquo; Waiters Call Out the Kitchen Equipment to be Used, and Ordering is Finalized After</h3>
<p><img loading="lazy" class="img-responsive w-100" src="https://www.vaneck.com/contentassets/3aae13c2f9424b3e8cfaabd599c4004b/5258_sui-and-aptos-blogemail_infographic-4_2025-01_v2_blog.svg" alt="At &lsquo;Casa Sui,&rsquo; Waiters Call Out the Kitchen Equipment to be Used, and Ordering is Finalized After" /></p>
<p class="chart-disclosure">Source: VanEck Research as of 12/19/2024.</p>
<h2>Haute Cuisine by &lsquo;Le Maison De Aptos&rsquo;</h2>
<p>At &lsquo;Le Maison de Aptos&rsquo;, the setup is very similar. There are ample waiters taking orders and many chefs cooking, but a limited supply of culinary equipment. However, Aptos does not worry about kitchen conflicts occurring. Aptos makes that tradeoff by assuming that conflicts in the kitchen are rare and can be quickly resolved. As such, Aptos uses what is called &ldquo;dynamic&rdquo; parallelism, which is similar to what Monad employs. In this model, transactions do not specify what parts of the state they touch. Instead, orders are &ldquo;optimistically&rdquo; processed, assuming they do not conflict.</p>
<p>On Aptos, an algorithm called the &ldquo;Scheduler&rdquo; processes transactions based on maximizing the output of transactions over the shortest period of time. However, it only finds conflicting transactions when it actually goes to write the change in the blockchain&rsquo;s state. In the event there is a conflict, the conflicting transactions and any dependent transactions are sent back to the scheduler, who must sift through the conflicts and resolve them. Thereafter, once the issues are settled, the set of transactions is processed to completion.</p>
<p>On Aptos, the waiters do not have to assess which parts of the kitchen must be touched. Instead, they simply pass the orders to the kitchen. Once the orders reach the kitchen, the &ldquo;Kitchen Head&rdquo; (The Scheduler) receives them and determines the most efficient cooking process. When orders come in, the Kitchen Head assumes there are no conflicts and orders the cooks to begin cooking food. If there is a conflict, it is only discovered once the cooks start cooking. In the event of a dispute, the cooks must stop cooking, throw away the partially completed meal, and ask the Kitchen Head to resolve the dispute. After scheduling the meal components, the orders are processed. While the process of &ldquo;throwing away the whole meal&rdquo; sounds like a waste and would slow down &lsquo;Le Maison de Aptos&rsquo;, under most circumstances, it does not impact the output very much. This is because Aptos&rsquo;s kitchen is very, very fast.</p>
<h3>At &lsquo;Le Maison de Aptos&rsquo;, the Scheduler Tries to Cook All Items Immediately. If a Conflict Occurs, the Chef Sends Back the Conflicting Requests to be Ordered</h3>
<p><img loading="lazy" class="img-responsive w-100" src="https://www.vaneck.com/contentassets/3aae13c2f9424b3e8cfaabd599c4004b/5258_sui-and-aptos-blogemail_infographic-5_2025-01_v2_blog.svg" alt="At &lsquo;Le Maison de Aptos&rsquo;, the Scheduler Tries to Cook All Items Immediately. If a Conflict Occurs, the Chef Sends Back the Conflicting Requests to be Ordered" /></p>
<p class="chart-disclosure">Source: VanEck Research as of 12/23/2024.</p>
<p><em>But what are the implications of each model?</em></p>
<h2>Aptos is more manageable for developers</h2>
<p>Aptos is considered by many to be a more flexible system because it does not force transactions to specify the parts of the state they touch upfront. This is important for developers because when they build applications, they must work through all the necessary dependencies and write the code to describe them. In the example of the restaurant, where the developers are waiters, processing customer orders on Aptos is much easier than it is on Sui because the waiters do not have to think about what parts of the kitchen are used for an order. From the standpoint of attracting builders to an ecosystem, some consider this development annoyance to be frustrating enough to opt for Aptos over Sui. This is because writing out extra code takes time, and dependencies may need to be changed often. As a result of Aptos design, development is more straightforward for its application creators.</p>
<p>Additionally, many dependencies are difficult to know upfront for both users and developers. While developers want optionality in application design, users may want many different transaction pathways that they will not know in advance. Due to the preference for optionality of both developers and users, in a system like Sui, transactions may &ldquo;lock&rdquo; part of the state that they do not need, which causes other transactions to be held up.</p>
<p>If a business relies upon lots of shared resources to operate, it will be challenging for it to reserve all resources at once using Sui&rsquo;s format. In some cases, a business on Sui may even lock parts of the blockchain it does not need, preventing others from using those areas. In the example of the restaurant at &lsquo;Maison de Aptos&rsquo;, a patron can tell the waiter he desires &ldquo;chicken&rdquo; and that he wants whichever type is made fastest (open kitchen spot) between fried, baked, or grilled. Meanwhile, at Casa Sui, the customer must tell the waiter which kind of chicken he wants upfront, and the customer cannot embed contingencies.</p>
<h2>Sui is more efficient</h2>
<p>Sui resolves conflicts between competing transactions upfront, allowing it to establish an order at the outset. This approach reduces the need for computational resources to handle conflicts during execution, freeing up the capacity to process additional transactions. This design is advantageous in scenarios with heavy decentralized exchange (DEX) activity, often called &ldquo;contentious state writes,&rdquo; such as traders competing for arbitrage opportunities.</p>
<p>Aptos, by contrast, detects and resolves conflicts dynamically during transaction processing. Under normal conditions, the difference in performance between the two chains is minimal, as Aptos's conflict resolution takes only a few milliseconds. This is because Aptos transactions being processed into a block reside &ldquo;in memory,&rdquo; the processor's cache, enabling very fast processing. However, the Aptos transaction scheduler can become a bottleneck during extreme trading scenarios. High levels of contention require repeated detection, rollback, reordering, and re-execution of conflicting transactions, which can significantly slow down transaction processing.</p>
<p><a href="https://en.wikipedia.org/wiki/Kingman%27s_formula" title="Kingman's formula" target="_blank" rel="noopener"><strong>Kingman&rsquo;s Formula</strong></a> from operations management illustrates that as system utilization approaches its maximum capacity, small increases in load, like conflicting transactions per second, will result in exponentially longer wait times. For Aptos, heavy trading activity can overwhelm its scheduler and significantly degrade performance. While such scenarios have not yet occurred on Aptos, they remain a potential risk, particularly during events with significant trading contention.</p>
<p>Notably, blockchain transaction throughput (TPS) benchmarks often focus on simple wallet transfers rather than real-world trading scenarios. This discrepancy means chains boasting high TPS may struggle under contentious trading conditions, where conflict resolution is critical.</p>
<p><strong>Restaurant Analogy:</strong> Sui is like a restaurant kitchen that pre-sorts orders to prevent clashes over limited kitchen space. Even during busy periods, kitchen space at &lsquo;Casa Sui&rsquo; is more efficiently allocated. Aptos, however, resolves conflicts dynamically, which usually works well but can create chaos during peak times. Imagine a Friday night at &lsquo;Maison de Aptos,&rsquo; with multiple diners competing for the popular Dover sole. The kitchen staff must re-check, re-cook, and re-serve orders amid the rush, resembling Lucy and Ethel struggling to keep up at the chocolate factory. This can lead to delays and inefficiencies under high demand, highlighting the potential drawbacks of Aptos's dynamic scheduler.</p>
<h3>A Blockchain Burdened by Too Many DEX Transactions (Colorized)</h3>
<p><img loading="lazy" class="img-responsive w-100" alt="A Blockchain Burdened by Too Many DEX Transactions (Colorized)" src="https://www.vaneck.com/contentassets/3aae13c2f9424b3e8cfaabd599c4004b/i-love-lucy-choclate-factory.webp" /></p>
<p class="chart-disclosure">Source: <a href="https://www.youtube.com/watch?v=K3axU2b0dDk" title="I Love Lucy" target="_blank" rel="noopener"><strong>I Love Lucy</strong></a> as of 12/17/2024.</p>
<p>Of course, Sui has its own bottlenecks and challenges due to the use of "write-locks." Transactions in Sui can reserve sections of the blockchain during processing, but some may fail to utilize the reserved resources effectively. This inefficiency can lead to certain parts of the blockchain being "boxed out," preventing other transactions from accessing them until the write-lock is released. Such scenarios could reduce overall system efficiency, especially under heavy transaction loads or when write-lock contention is high.</p>
<h2>Sui enables &ldquo;Local Fee Markets&rdquo;</h2>
<p>Sui&rsquo;s approach to resolving state writes upfront introduces a unique advantage called &ldquo;local fee markets.&rdquo; This feature allows Sui to manage transaction costs more efficiently by segmenting fees based on the specific parts of its blockchain being accessed. In practice, this means that the cost of interacting with a heavily used application on Sui can increase without affecting fees for other applications.</p>
<p>For example, if there is high demand for trading in the SUI/USDC pool on the Sui-based DEX Aftermath Finance, the blockchain can raise transaction fees specifically for that pool. However, users accessing other applications or parts of the blockchain will not face increased fees. This localized pricing model contrasts with blockchains like Aptos and Ethereum, which operate global fee markets. On these platforms, a surge in demand for one application, such as during a popular NFT minting event, raises transaction fees for all users. This makes the entire blockchain more expensive and difficult to use.</p>
<p><strong>Restaurant Analogy:</strong> At the &lsquo;Casa Sui&rsquo;, cooking stations can each set prices for usage relative to demand. For instance, if there&rsquo;s a rush for sea urchin ravioli, the pasta station can raise its prices, but the cost of triple-stuffed steak quesadillas from the grill station remains unaffected. Conversely, all kitchen resources share a single pricing mechanism at &lsquo;Maison de Aptos&rsquo;. If demand for ceviche ice cream spikes, the fees for unrelated items like red snapper pizza will also rise, even if the pizza oven is underutilized.</p>
<h2>Sui unlocks Service-Level Agreements (SLAs)</h2>
<p>Sui&rsquo;s design also enables service-level agreements (SLAs) on its blockchain. Validators on Sui can make binding commitments to applications regarding transaction latency and pricing on a per-day basis. This guarantees specific performance levels, ensuring businesses building on Sui do not have to worry about being crowded out by high activity elsewhere on the blockchain. For example, a business running an e-commerce platform on Sui can lock in agreements for low transaction fees and quick processing times. Sui's architecture ensures that operations remain unaffected even during high demand on unrelated applications, such as DEX trading.</p>
<p>This capability gives businesses a level of predictability and reliability that is unavailable on most other blockchains. For developers and enterprises, this creates a compelling reason to choose Sui as a platform, as it allows them to focus on growth and operations without worrying about network congestion or fluctuating fees.</p>
<h2>Sui&rsquo;s blockchain is faster while enabling new scaling</h2>
<h3>Time to Finality Favors Sui</h3>
<img loading="lazy" alt="Time to Finality Favors Sui" class="img-responsive w-100" src="https://www.vaneck.com/contentassets/869dc59efb854b01baea0477f51ef24b/5258_sui-and-aptos-blogemail_chart-3_2025-1_v1_blog.svg" />
<p class="chart-disclosure">Source: Circle, Project Docs as of 12/19/2024. <strong>Past performance is no guarantee of future results. Not intended as a recommendation to buy or sell any securities namedherein.</strong></p>
<p>For simple transactions like payments, Sui has two mechanisms that surpass other blockchains in terms of latency (user feedback time) and throughput (TPS). Sui calls these &ldquo;Fast Path&rdquo; and &ldquo;Pilot Fish.&rdquo; Fast Path allows simple payment transactions to bypass consensus, resulting in transaction latencies as low as <strong>300ms</strong>. Meanwhile, Pilot Fish demonstrates that Sui can be scaled nearly infinitely by allowing validators to add additional servers to process more transactions seamlessly.</p>
<p>Sui&rsquo;s unique scaling capabilities stem from the interaction between its transaction processing model, its version of the Move smart contract language, and its consensus mechanism. A key distinction of Sui is its state architecture, which is composed of flexible, modular units called objects. This differs from the more rigid account-based structure found on blockchains like Ethereum.</p>
<p>On Ethereum, accounts do not directly "hold" a balance of USDC. Instead, balances are tracked within the Ethereum-based USDC smart contract, which acts as a ledger for all USDC owners. When a user sends USDC to someone else, they must interact with the USDC smart contract. This process involves calling the contract to deduct the sender&rsquo;s balance and credit the recipient&rsquo;s balance. Every USDC transfer requires an interaction with the smart contract, which can introduce inefficiencies.</p>
<p><img loading="lazy" class="img-responsive w-100" src="https://www.vaneck.com/contentassets/3aae13c2f9424b3e8cfaabd599c4004b/5258_sui-and-aptos-blogemail_infographic-6_2025-01_v2_blog.svg" alt="State Update on Sui" />When Patrick sends Greg USDC on Sui, it deletes the $1,000 object to create two new $500 objects; one is sent to Greg.</p>
<p class="chart-disclosure">Source: VanEck Research as of 12/23/2024.</p>
<p>In contrast, Sui uses a more fluid object-based model. Balances of USDC on Sui are not centralized as ledger entries within a single contract. Instead, USDC exists as an object that individual user accounts own directly. Each USDC object is defined by:</p>
<ul class="content-list">
<li class="mt-2">Ownership: The account controlling the object</li>
<li class="mt-2">Type: The token type (ex: USDC)</li>
<li class="mt-2">Metadata: Additional details such as the amount of USDC</li>
</ul>
<p>When users transfer USDC on Sui, they transfer ownership of the USDC object itself. For example, if I send USDC to another account, I create a new USDC object representing the transferred balance, and ownership of that object is assigned to the recipient&rsquo;s account. This eliminates the need to repeatedly call a central contract for every transaction, significantly improving efficiency.</p>
<p>By allowing accounts to own and manage token objects directly, Sui achieves a more decentralized and scalable design. This object-based approach reduces bottlenecks caused by interactions with centralized smart contracts and provides a flexible framework for state management. This design significantly impacts blockchain parallelization. For example, suppose two entities send USDC simultaneously on Solana or Aptos. Their transactions must be ordered in that case because both will interact with the USDC smart contract and touch the same part of the Solana/Aptos state. In contrast, Sui&rsquo;s accounts own USDC as individual objects. When two entities send USDC, the transactions only modify the ownership of their respective token objects. As a result, these transactions can be processed in parallel, enabling higher throughput and efficiency. However, transactions involving the same object must still be serialized to maintain consistency.</p>
<div class="wrapped-div">
<table class="w-100">
<tbody>
<tr class="tbl-data">
<td class="tbl-header last text-left">Sui Latencies</td>
<td class="tbl-header last text-left">Exclusively owned by one account</td>
<td class="tbl-header last text-left">Accessible and modifiable by multiple accounts</td>
</tr>
<tr class="tbl-data">
<td class="data-td last">Consensus Requirement</td>
<td class="data-td data last text-left">No (local validators can process)</td>
<td class="data-td data last text-left">Yes (all validators must agree)</td>
</tr>
<tr class="tbl-data">
<td class="data-td last">Execution Path</td>
<td class="data-td data last text-left">Single validator validates, executes, and signs</td>
<td class="data-td data last text-left">Validators execute after consensus</td>
</tr>
<tr class="tbl-data">
<td class="data-td last">Round Trip Times (RTT)</td>
<td class="data-td data last text-left">2xRTT @ 150ms per RTT</td>
<td class="data-td data last text-left">4xRTT @ 200ms per RTT</td>
</tr>
<tr class="tbl-data">
<td class="data-td last">Latency</td>
<td class="data-td data last text-left">~300ms</td>
<td class="data-td data last text-left">~800ms</td>
</tr>
<tr class="tbl-data">
<td class="data-td last">Conflict Potential</td>
<td class="data-td data last text-left">None (exclusive ownership guarantees safety)</td>
<td class="data-td data last text-left">Potential conflicts require resolution</td>
</tr>
</tbody>
</table>
</div>
<br />
<p class="chart-disclosure">Source: VanEck Research as of 12/17/2024.</p>
<p>Sui introduces a unique property where simple object transfers, such as payments, <strong><em>do not require consensus</em></strong>. This is possible because these object transfers can only be initiated by the owner and do not need to be globally ordered. All that is required is a signature verification and an update to the state by the validators to reflect the transfer. By contrast, in Ethereum, Solana, and Aptos, calling a smart contract (like the USDC contract) must go through consensus, as transactions must be globally ordered.</p>
<p>Consensus is one of the most time-consuming aspects of blockchain transaction processing, often accounting for <strong>70%</strong> or more of the total processing time in high-throughput blockchains like Solana. This is because validators worldwide must exchange messages to agree on the transaction order. The time taken is measured in "RTTs" (round trips of messaging), where each RTT can take <strong>150ms&ndash;250ms</strong>, depending on the validators' geographic locations. By bypassing consensus for simple transfers, Sui eliminates this delay, shaving up to <strong>500ms</strong> off transaction processing time.</p>
<p><strong>Restaurant Analogy:</strong> This would be similar to &lsquo;Casa Sui,&rsquo; offering diners the option of a pre-cooked meal. This significantly reduces service time and expands the number of diners who can be served. In contrast, at other blockchain "restaurants," all orders must go through the kitchen, regardless of complexity.</p>
<h2>Sui&rsquo;s unique pathway to &ldquo;infinite&rdquo; TPS: Pilot Fish</h2>
<p>Sui&rsquo;s object-based structure enables near-unlimited scaling through a mechanism called Pilot Fish. Most blockchains scale by optimizing software to run efficiently within the constraints of a single server per validator. Sui&rsquo;s design, however, allows validators to scale horizontally by using multiple servers. This means a validator facing resource constraints (e.g., memory, bandwidth, or computational power) can add servers to handle more transactions.</p>
<p>While "hot" (high demand) areas of the blockchain still require ordered transaction processing, the ability to distribute processing across multiple servers prevents bottlenecks in other parts of the blockchain.</p>
<p><strong>Restaurant Analogy:</strong> If &lsquo;Casa Sui's&rsquo; main kitchen becomes overwhelmed, additional kitchens with specialized equipment can be contracted to handle the load. While patrons ordering popular dishes may face wait times, others can enjoy meals prepared in less busy stations.</p>
<h2>Aptos&rsquo;s response: Quorum Store</h2>
<p>Aptos has developed a scaling mechanism called Quorum Store that optimizes blockchain speed by focusing on the consensus process (the second part of blockchain processing) to increase throughput and reduce latency. It allows more validators to participate in the initial transaction processing than just the leader. Traditionally, blockchains rely on a leader-validator system, where one validator at a time ingests transactions, creates blocks, and updates the blockchain&rsquo;s state. Leadership rotates periodically, usually based on the amount of stake held.</p>
<p>Quorum Store disrupts this model by allowing any validator to disseminate transactions across the network, not just the leader. This frees up the leader to focus on proposing the blocks and disseminating those blocks. This speeds up the time needed to process transactions and enables other validators to do some of the leader&rsquo;s workload.</p>
<p>However, Quorum Store may exacerbate Aptos's scheduler challenges under high-conflict scenarios, such as when many transactions compete for the same trade. In these cases, multiple validators proposing conflicting blocks can slow Aptos&rsquo;s ability to resolve dependencies and conflicts. Nevertheless, in most scenarios, Quorum Store improves transaction efficiency.</p>
<h2>Aptos is more robust than Sui</h2>
<p>In blockchain design, as in life, &ldquo;there is no such thing as a free lunch,&rdquo; and Sui&rsquo;s design introduces new problems alongside its unique capabilities. One key decision is to skip a process called DAG certification, which serves as an additional check on transaction authenticity. This decision reduces the number of RTTs (round trips of messaging) required during consensus, resulting in faster transaction processing.</p>
<p>However, bypassing DAG certification comes with trade-offs. By skipping this step, Sui&rsquo;s network may not be as robust as Aptos&rsquo;s under <a href="https://blog.movementlabs.xyz/article/dag-sequencing-decentralized-sequencer-blockchain" title="All you need is DAG* (for Sequencing)" target="_blank" rel="noopener"><strong>certain conditions</strong></a>. For instance, packet loss, a common phenomenon in internet communication, can impact Sui more severely than other blockchains. Some <a href="https://x.com/SashaSpiegelman/status/1866970629083430936" title="Tweet of Alexander Spiegelman" target="_blank" rel="noopener"><strong>researchers</strong></a> claim that a minor packet drop, such as a 1% loss affecting 5 of Sui&rsquo;s 100 validators, could significantly degrade the network&rsquo;s performance. While these claims should be interpreted cautiously due to a lack of transparent methodology, they highlight a potential vulnerability in Sui&rsquo;s design. Under specific scenarios, Sui could experience transaction latency issues that more robust designs like Aptos might avoid.</p>
<p>Another consideration is the potential for malicious behavior by validators. Without DAG certification, Sui&rsquo;s network may allow validators to exploit vulnerabilities. For example, malicious validators could disrupt network operations more easily than Aptos, which has stronger safeguards through its consensus processes. While substantial <strong><a href="https://decentralizedthoughts.github.io/2024-06-12-shoalpp/" title="Shoal++: High Throughput DAG-BFT Can Be Fast" target="_blank" rel="noopener">attacks</a></strong> on proof-of-stake (PoS) systems remain rare, and these vulnerabilities are still largely theoretical, Sui&rsquo;s broader attack surface could pose a greater risk as the ecosystem matures.</p>
<h2>Sui has more traction, but this lead could be fleeting</h2>
<p>Both Move blockchains are less than a few years old; their usership is in its early innings. Despite immense potential, Sui and Aptos&rsquo;s ecosystems are relatively small. Sui is currently leading Aptos based on the most fundamental metrics of usership. Though Sui and Aptos have roughly the same number of monthly active addresses, <strong>8.6M</strong> for Sui and <strong>11.5M </strong>for Aptos, Sui excels in economic statistics. Note: <em>Active Addresses may not be a reliable measure of user activity due to the simplicity of one user controlling multiples addresses.</em> From the standpoint of fee revenues, Sui has captured <strong>6x</strong> of the fee revenue of Aptos in the past year <strong>($10.4M vs $1.7M).</strong> Sui has also transacted <strong>3.5x</strong> the DEX volume of Aptos <strong>($38.3B vs $10.8B)</strong>. When looking at DeFi TVL, Sui has <strong>$1.6B</strong> vs Aptos with <strong>$930M.</strong> However, Aptos <strong>($750M) </strong>has more stablecoins on the chain than Sui <strong>($476M).</strong></p>
<h3>Total Spot Decentralized Exchange (DEX) Volumes, Last 100-Days ($M)</h3>
<div class="flourish-embed flourish-chart" data-src="visualisation/21297004?2429575"><script src="https://public.flourish.studio/resources/embed.js"></script><noscript><img loading="lazy" src="https://public.flourish.studio/visualisation/21297004/thumbnail" width="100%" alt="Total Spot Decentralized Exchange (DEX) Volumes, Last 100-Days ($M)" /></noscript></div>
<p class="chart-disclosure">Source: Artemis XYZ as of 1/21/2025. <strong>Past performance is no guarantee of future results. Not intended as a recommendation to buy or sell any securities namedherein.</strong></p>
<p>Drilling down further into each ecosystem&rsquo;s constituents, both have most of the core components needed to facilitate speculation-focused use cases of crypto. Each ecosystem has ample applications in DEX, Borrow/Lend, and Perp Futures categories. Early as we are, Sui has stronger entities within the Borrow/Lend category in Suilend and Navi, each boasting <strong>over $450M</strong> in TVL. By comparison, the largest app on Aptos holds <strong>$300M</strong>. Sui has a deeper perpetual futures trading market, mostly centered around an application called BlueFin. Bluefin averages around <strong>$250M</strong> in trading volume and ranks <strong>7th</strong> in all crypto. However, Aptos has a more successful decentralized stablecoin project, called Thala <strong>($135M TVL</strong>), than Sui&rsquo;s, called Bucket Protocol <strong>($73M TVL</strong>).</p>
<h2 id="top-ecosystems" class="jump-link-nav anchored-block" data-jumplink-title="Ecosystems">Sui vs. Aptos: Ecosystems Have Grown Remarkably But Are Still Nascent</h2>
<p>The go-to market for attracting developers for Sui and Aptos has been to offer substantial incentives for builders to come to each chain. For example, on <strong><a href="https://x.com/SuiNetwork/status/1712906176730746981" title="Tweet of SuiNetwork" target="_blank" rel="noopener">October 13, 2023</a></strong>, Sui pledged <strong>157M</strong> SUI tokens to incentivize the growth of its ecosystem. In practical terms, this has been utilized to bootstrap its DeFI by rewarding those who trade, borrow, and lend. We estimate that the collective impact of Sui&rsquo;s incentives resulted in rewards that have added <strong><em>5.2%-10%</em></strong> in annualized yields since June 2024. We estimate that Sui has awarded more than<strong> 70M</strong> Sui in incentives in 2024 alone, worth <strong>~$300M</strong> today.</p>
<p>Following a similar pathway to attracting DeFI TVL and usership as Sui, Aptos currently adds <a href="https://app.ariesmarkets.xyz/lending" title="Assets information table" target="_blank" rel="noopener"><strong>~6.5% in APT</strong></a> rewards to borrow/lend deposited USDC/USDT while adding 8%-12% to deposited BTC. It also adds <a href="https://aptos.pancakeswap.finance/farms" title="PancakeSwap Page" target="_blank" rel="noopener"><strong>~15%-20% APT</strong></a> rewards to DEX pools to encourage liquidity. We estimate that Aptos spent over 10M APT worth around <strong>$100M</strong> to incentivize its DeFI ecosystem. While Sui has spent more than Aptos in dollar terms, we estimate Aptos has allocated slightly more of its token supply than Sui <strong>(0.9% vs. 0.7%).</strong></p>
<p>The result has been that both Sui and Aptos bootstrapped very important components of each ecosystem very quickly. However, this has also led to substantial &ldquo;mercenary capital&rdquo; (users only there to extract rewards) deploying to each chain. Similar to a federal government providing subsidies for an industry, the Sui and Aptos incentive campaigns have created a massive ecosystem. Still, it is yet to be seen if it is sustainable.</p>
<h2>Sui community is further along than Aptos&rsquo;s</h2>
<p>Sui and Aptos have focused on creating their respective communities by asserting each chain&rsquo;s technical supremacy. Though many developers herald the advantage of the Move programming language and some have fallen into the camps of Sui or Aptos, there is currently no material depth to either chain&rsquo;s culture compared to legacy blockchains. We assert this based upon Google search interest in each&rsquo;s memecoins and the total number of developers tracked in public repositories. While Sui averaged <strong>280</strong> weekly active developers in 1H2024, Aptos recorded <strong>272</strong>. These figures compare to Ethereum, which had <strong>3,300,</strong> and Solana, which had <strong>1,200</strong>. Together, Sui and Aptos builders represent less than <strong>4%</strong> of all active developers in crypto. From the standpoint of retail interest in each&rsquo;s community, Sui is ahead of Aptos by a factor of nearly <strong>9x</strong> when examining Google Trends (Aptos: <strong>2</strong> vs. Sui: <strong>9</strong>). In fact, in the last <strong>90 days</strong>, global search interest for Sui was higher than it was for Solana on <strong>17 days</strong> and higher than Ethereum on <strong>16 days</strong>.</p>
<p>The consequence of the relatively anemic development community of Aptos and Sui is that neither can boast of a truly differentiated, successful application. Though Sui has a few interesting applications like &ldquo;FanTV&rdquo; and &ldquo;Birds,&rdquo; neither application has attracted significant usage. Another current disappointment of Sui and Aptos is that neither has an application leveraging the unique technical capabilities of either chain. For example, the most important perpetual exchange on Sui, called Bluefin, has its entire trading engine deployed on Bluefin&rsquo;s private server and not on Sui&rsquo;s blockchain.</p>
<h3>Sui Outpaces Aptos in Google Searches Over the Last 90 Days</h3>
<div class="flourish-embed flourish-chart" data-src="visualisation/21300791?2429575"><script src="https://public.flourish.studio/resources/embed.js"></script><noscript><img loading="lazy" src="https://public.flourish.studio/visualisation/21300791/thumbnail" width="100%" alt="Sui Outpaces Aptos in Google Searches Over the Last 90 Days" /></noscript></div>
<p class="chart-disclosure">Source: Google Trends as of 1/21/2025.</p>
<h3>Sui&rsquo;s Top Decentralized Apps (dApps) are DeFi and Infrastructure</h3>
<div class="flourish-embed flourish-chart" data-src="visualisation/21300909?2429575"><script src="https://public.flourish.studio/resources/embed.js"></script><noscript><img loading="lazy" src="https://public.flourish.studio/visualisation/21300909/thumbnail" width="100%" alt="Sui&rsquo;s Top Decentralized Apps (dApps) are DeFi and Infrastructure" /></noscript></div>
<p class="chart-disclosure">Source: Artemis XYZ as of 1/21/2025.</p>
<h2 id="top-trading_experience" class="anchored-block">Sui vs. Aptos: Trading Experience</h2>
<p><strong>Sui&rsquo;s system is <em>currently</em> better for traders than Aptos</strong></p>
<p>Sui has created a better system for traders, which should translate into better prices for Sui DEXes. We base this upon the following components:</p>
<ol class="content-list">
<li class="mt-2">Programmable Transaction Blocks (PTB)</li>
<li class="mt-2">Predictable Gas Pricing</li>
<li class="mt-2">Advantageous Fee Structure for Large Transactions</li>
<li class="mt-2">Local Fee Markets</li>
<li class="mt-2">DeepBook</li>
</ol>
<p>Sui has poured tremendous thought into building a system optimized for onchain trading through built-in components of Sui&rsquo;s code and innovations created by Sui&rsquo;s team. The first is the concept of programmable transaction blocks (PTB), which enable a single transaction to dynamically interact with multiple parts of the blockchain state, executing up to <strong>1024</strong> commands. Unlike other blockchains, such as Ethereum or Aptos, where transactions call a pre-defined function, Sui&rsquo;s PTBs allow transactions to dynamically decide which calls to make and which parts of the state to touch. This dynamism enables real-time decision-making based on both onchain and offchain data, providing unprecedented flexibility.</p>
<p>This capability is particularly significant for applications requiring high performance, such as decentralized exchange (DEX) aggregators. On Sui, these aggregators can leverage offchain compute (like ASICS/GPUs) to determine optimal trading routes, incorporating both onchain liquidity and external pricing data. Due to their rigid transaction structures, this level of sophistication is challenging or impossible on Ethereum or Aptos. Furthermore, Sui&rsquo;s design surpasses Solana in practical applications. While Solana theoretically allows similar functionality, its stringent limits on the number of input accounts <strong>(64)</strong> and maximum transaction instructions significantly restrict its usability. For example, a complex Sui transaction that interacts with more than<strong> 100</strong> objects would be unfeasible on Solana. This makes Sui a more robust platform for advanced trading applications.</p>
<p>Both Sui and Aptos set their transaction prices based on the complexity of a transaction measured in network resources used (gas). Gas is the cost, in native tokens, that each network charges for some unit of resource utilization. Aptos gas prices function by having governance set a minimum gas price at an indeterminate interval and then allowing gas prices to float above this minimum based on transaction demand. Aptos does not have a priority tip separate from the gas price; instead, priority is achieved by setting the gas (cost per unit of network resource used) higher. Sui&rsquo;s validators set a &ldquo;reference price&rdquo; that bonds validators to process all transactions that pay this reference price. To gain a higher spot in the processing queue, a transactor on Sui can attach a priority fee to their transaction. As explained previously, Aptos has a global gas price that does not charge larger fees for higher-demand pieces of Aptos blockchain (like a DEX with lots of trading). In comparison, Sui enables more in-demand parts of the state to charge higher fees than lower-priority parts of the state.</p>
<p>These seemingly minuscule differences are important because they affect the economics of traders in meaningful ways. Particularly important traders called &ldquo;market makers&rdquo; often place and cancel (updating) thousands (or more) of orders per second. This is done to bid/offer advantageous prices relative to newly developing information. With PTBs that change many parts of the state simultaneously, a market maker can update their book of bids/asks with fewer transactions. This alone makes operating on Sui cheaper than other chains like Aptos.</p>
<p>Finally, Sui has an interesting component of architecture embedded in its blockchain called &ldquo;DeepBook,&rdquo; which is a global centralized limit order book (CLOB) on Sui for wholesale liquidity. This liquidity layer allows DEXes and DEX aggregators (entities that access all DEXes in their selection set) to tap into global liquidity across Sui. This centralized order book aggregates liquidity across Sui into one unified pool and enables deeper liquidity for traders operating on Sui. Since any app can tap into their liquidity layer, it reduces the advantages of applications with lots of liquidity thus leveling the playing field and lowering the prices that DEXes can charge users.</p>
<h2 id="top-tokeconomics" class="anchored-block">Sui vs. Aptos: Similar Tokenomics</h2>
<h3>Sui Earned 24% More Revenue in November Than Aptos Has in the Past Year</h3>
<div class="flourish-embed flourish-chart" data-src="visualisation/21301078?2429575"><script src="https://public.flourish.studio/resources/embed.js"></script><noscript><img loading="lazy" src="https://public.flourish.studio/visualisation/21301078/thumbnail" width="100%" alt="Sui Earned 24% More Revenue in November Than Aptos Has in the Past Year" /></noscript></div>
<p class="chart-disclosure">Source: Artemis XYZ as of 1/15/2025.</p>
<p>Sui and Aptos have both designed their systems so that high usage of each respective blockchain will accrue value to each respective token. If either gets many users, its token&rsquo;s value will likely appreciate in price. In fact, both blockchains&rsquo; chief token use cases are very similar:</p>
<ol class="content-list">
<li class="mt-2">Payment for Gas Fees</li>
<li class="mt-2">Deposit for Storage Fees</li>
<li class="mt-2">Validator Staking</li>
<li class="mt-2">Network Governance</li>
</ol>
<p>One key difference between SUI vs. APT tokens is that SUI has a capped supply of tokens while APT tokens have no maximum supply. Aptos inflation currently rests at <strong>6.7%</strong> per annum and decreases each year by <strong>1.5%.</strong> However, this endless supply of APT due to persistent inflation is offset by the fact that transaction fees on Aptos result in a token burn. Sui, by contrast, does not burn fees on its transactions. The consequence is that more activity on Sui will benefit those staking tokens over those not staking tokens. This is because those who stake validators on Sui will receive the transaction fees. On Aptos, since the token is burned, an increase in transaction fees benefits everyone equally. However, it must be noted that while Aptos can achieve a deflationary token system through substantial activity, Sui has it baked in by means of its storage system. More below.</p>
<p>An interesting feature of Sui and Aptos is their approach to addressing the long-term challenges associated with storing crypto data onchain. Blockchains continuously grow in storage size, measured in gigabytes and terabytes, which must be maintained by validators and nodes. This poses a problem because the increasing storage demands drive up costs and place additional strain on blockchain networks. Ideally, blockchains would charge for data storage, but most do not. Instead, they primarily charge transaction fees based on the consumption of network resources like bandwidth, compute power, and RAM. However, these costs are transient as they account only for the resources consumed at the moment of the transaction.</p>
<p>Most blockchains fail to charge fees for persistent resources, such as the ongoing cost of storing a user's account data and transaction history on the blockchain. Sui and Aptos address this issue by incorporating the cost of data creation into transaction fees. In other words, they price new data storage directly within the transaction, ensuring that users contribute to the long-term costs of maintaining the blockchain's storage.</p>
<p>On Aptos, storage fees in APT are locked behind the data that is created. If someone modifies the data to be smaller or deletes the data entirely, a portion or all of that locked APT is remitted to whoever deleted that data. On Sui, the process of removing data from Sui&rsquo;s storage also allows for a refund of stored SUI. However, while most of the SUI can be returned <strong>(up to 99%),</strong> the rest remains in the fund, creating a permanent &ldquo;token sink&rdquo; of SUI. This storage fund earns rewards from the network (newly minted SUI allocated from the original <strong>10B </strong>total supply). This fund then remits SUI rewards to the Sui network validators to help them pay the long-term costs of storing SUI&rsquo;s blockchain ledger.</p>
<p>Both Sui and Aptos face <em>significant amounts of token unlocks</em> that will occur in the next few years. The current floating supply of Aptos is greater than that of Sui <strong>(39.9% vs. 30.9%).</strong> Over the next year, both protocols will add significant amounts to the token supply as investor unlocks occur. While Aptos will have <a href="https://cryptorank.io/price/aptos/vesting" title="Unlocking APT Tokens" target="_blank" rel="noopener"><strong>11.9%</strong></a> of its total supply <strong>($1.2B</strong> at current prices) unlock over the next year, Sui will emit <a href="https://cryptorank.io/price/sui/vesting" title="Unlocking SUI Tokens" target="_blank" rel="noopener"><strong>7.6%</strong></a> of its total supply <strong>($3.65B</strong> at current prices).</p>
<h2 id="top-valuation" class="jump-link-nav anchored-block" data-jumplink-title="Valuation">Sui vs. Aptos: Our Valuation</h2>
<p>We base our valuation of Sui and Aptos on their projected year-end market share within the total smart contract platform (SCP) market capitalization. Our forecast for SCP market capitalization is derived from the estimated growth of the United States M2 money supply, reflecting their historical correlation. We project M2 to reach approximately <strong>$22.3</strong> <strong>trillion</strong> by the end of 2025, continuing its annualized growth rate of <strong>3.2%</strong> since its last trough in October 2023.</p>
<p>Using regression analysis, we estimate the total SCP market value to reach <strong>$1.1 trillion</strong> by the end of 2025, a <strong>43%</strong> increase from today&rsquo;s capitalization of <strong>$770 billion</strong>. This compares to an all-time peak valuation for SCPs of <strong>$989 billion</strong> in November 2021. Historical analysis of M2 changes versus SCP market cap changes shows a strong statistical relationship. The 12-month moving average of SCP market cap changes correlated positively with monthly M2 changes, exhibiting an R&sup2; value of <strong>0.36</strong> and a t-statistic of <strong>5.7 (p &lt; 0.0001)</strong>.</p>
<h3>Market Capitalization of Smart Contract Platforms (SCPs) Peaked in November 2024</h3>
<div class="flourish-embed flourish-chart" data-src="visualisation/21301342?2429575"><script src="https://public.flourish.studio/resources/embed.js"></script><noscript><img loading="lazy" src="https://public.flourish.studio/visualisation/21301342/thumbnail" width="100%" alt="Market Capitalization of Smart Contract Platforms (SCPs) Peaked in November 2024" /></noscript></div>
<p class="chart-disclosure">Source: Artemis XYZ as of 1/05/2024.</p>
<p>Currently, Move-based blockchains hold a combined market share of approximately <strong>2.7%</strong> of the SCP market, split between Aptos <strong>(0.7%)</strong> and Sui <strong>(2%). </strong>We forecast this share to rise to <strong>6.5%,</strong> using an AR model demonstrating the lowest AIC among comparable forecasting models. This model also predicts the individual shares for Aptos and Sui.</p>
<h2 id="top-price_prediction" class="jump-link-nav anchored-block" data-jumplink-title="Price Prediction">Sui and Aptos: Price Prediction Estimate by the End of 2025</h2>
<p><a><strong>Sui (SUI):</strong> <strong>5.5%</strong> of the SCP market, corresponding to a market capitalization of <strong>$61 billion</strong>. With <strong>3 billion </strong>tokens unlocked by January 2025, this equates to a token price of <strong>~$16</strong>. This represents a <strong>326%</strong> gain from today&rsquo;s price of <strong>$3.75.</strong></a></p>
<p><strong>Aptos (APT): 1%</strong> of the SCP market, corresponding to a market capitalization of <strong>$11 billion</strong>. With <strong>50.5%</strong> of its token supply <strong>(507 million tokens)</strong> unlocked, this equates to a token price of <strong>~$22</strong> and is a <strong>201%</strong> gain from today&rsquo;s price of <strong>$7.30.</strong></p>
<p>These projections highlight the strong growth potential for both chains. We believe Sui and Aptos are poised to capture a larger share of the expanding SCP market as other chains lose their relative status.</p>
<p><strong><em>Past performance is no guarantee of future results. The information, valuation scenarios, and price targets in this blog are not intended as financial advice or any call to action, a recommendation to buy or sell, or as a projection of how Sui (SUI) and Aptos (APT) will perform in the future. Actual future performance of Sui (SUI) and Aptos (APT) is unknown, and may differ significantly from the hypothetical results depicted here. There may be risks or other factors not accounted for in the scenarios presented that may impede the performance. These are solely the results of a simulation based on our research, and are for illustrative purposes only. Please conduct your own research and draw your ownconclusions.</em></strong></p>
<h2 id="top-risks" class="jump-link-nav anchored-block" data-jumplink-title="Conclusion &amp; Risks">Sui vs. Aptos: Our Conclusion</h2>
<p>We believe the evidence supports Sui over Aptos due to its performance advantages and scaling potential. We find that It currently offers capabilities that are not replicated in Aptos. Among these are Local Fee Markets, Pilot Fish, and Fast Path. Additionally, Sui may offer a set of technical capabilities and economics that prove more attractive to market markers, resulting in a better-priced DeFi ecosystem. From a marketing standpoint, Sui has formed its technical capabilities into powerful memetic narratives that have attracted token investors and application builders. This has translated into better token performance and a more vibrant ecosystem of applications.</p>
<p>However, we believe that Aptos&rsquo;s edge in designed flexibility and arguably more robust chain architecture may prove to be competitive advantages. While Sui has a substantial lead in many economic metrics, including TVL, DEX volumes, and transaction fees, this dynamic can quickly shift.</p>
<p>The long-term winner will depend on which platform can sustain innovation while translating it into ecosystem expansion, including novel applications of crypto technology.</p>
<h2>Sui and Aptos Investment Risks</h2>
<ol class="content-list">
<li class="mt-2"><strong>Business Development </strong>
<p>The greatest challenge facing both Aptos and Sui is achieving effective business development. While both projects have invested significant resources to incentivize ecosystem growth and emphasize their technical advantages, neither has yet developed a cohesive strategy that integrates technical development with ecosystem expansion.</p>
<p>Both blockchains represent state-of-the-art distributed systems design driven by teams at the forefront of technological innovation. However, business success requires more than technological breakthroughs. For token prices to thrive, Aptos and Sui must attract and cultivate differentiated projects while using feedback to inform technical direction.</p>
<p>Building the best system is admirable, but it is crucial to strike a balance between advancements that address current usability challenges and those designed to enable future use cases. While both chains have successfully onboarding projects, their ecosystems must attract applications that leverage their unique capabilities to create innovative use cases. A unified approach, where business development collaborates closely with technical development, is essential to build technology that solves problems users care about. Without this alignment and differentiation, these systems risk failing to achieve their potential.</p>
</li>
<li class="mt-2"><strong>Technology </strong>
<p>Sui and Aptos feature novel blockchain designs that have yet to be fully stress-tested in high-demand or adversarial environments. Although both have experienced surges in transaction volume, most were simple transactions rather than Solana-esque levels of DEX trading activity. This leaves uncertainty about how the systems would handle the intense trading conditions that have previously stressed many chains.</p>
<p>Additionally, while the innovative features of these blockchains (Pilot Fish, Quorum Store, Fast Path) are engineering marvels, they might require adjustments if significant performance issues arise under extreme scenarios. These changes could potentially compromise some of their high-level capabilities, making it critical for the teams to continuously refine their systems without losing their edge.</p>
</li>
<li class="mt-2"><strong>Competition </strong>
<p>As second-generation high throughput blockchains, Aptos and Sui face competition from established ecosystems like Ethereum and Solana. While these older chains may lack the technical sophistication of Aptos and Sui, they benefit from larger developer bases and broader distribution backed by users with substantial financial resources.</p>
<p>Emerging competitors like Monad and Berachain further intensify the landscape. Monad combines strong technology with a dedicated community, while Berachain has gained momentum by tapping into the crypto community's speculative animal spirits. Additionally, Solana's upcoming Firedancer upgrade, expected in 2025, promises to boost its performance, potentially surpassing Aptos and Sui in speed and throughput.</p>
<p>The trend seen with Aptos and Sui, investors backing the narrative of better technology, is not new but inherently fleeting. Blockchain teams must consistently deliver and implement new innovations quickly to maintain relevance. History is filled with high-performance blockchains that lost their edge and token valuations to newer, more advanced competitors. Given the enormous economic incentives in the blockchain space, many of the world&rsquo;s brightest minds may pursue degrees in distributed systems engineering. These developing entrants will continue to the cadence of technological advancement, ensuring the competitive landscape remains dynamic.</p>
</li>
<li class="mt-2"><strong>Macroeconomics </strong>
<p>Like all financial instruments, blockchain tokens are subject to broader economic cycles. As alternative forms of money and financial systems, they compete with traditional monetary frameworks. While political and economic reform seems unlikely in most nations, unexpected shifts in fiscal policy or financial prudence could impact crypto markets.</p>
<p>Crypto markets also exhibit high sensitivity to financial policy cycles. Our analysis reveals a strong correlation between the supply of M2 and the value of smart contract platforms, reinforcing the importance of macroeconomic trends in shaping blockchain token valuations.</p>
</li>
<li class="mt-2"><strong>Regulatory </strong>
<p>The recent rise in crypto prices reflects optimism about regulatory clarity under the new Trump administration. Although the administration&rsquo;s stance on crypto appears favorable, opposition to the industry remains strong and well-funded. While the executive branch&rsquo;s administrative "deep state" (SEC, FDIC, CFTC, etc) may no longer actively undermine crypto, challenges will materialize.</p>
<p>One concern is the FIT 21 bill, which introduces criteria for determining whether a cryptocurrency qualifies as a commodity rather than a security. While this framework provides much-needed clarity, there is a risk that existing crypto incumbents and their allies may influence the bill&rsquo;s language to impose stringent decentralization requirements. Such requirements could disqualify chains like Solana, Sui, and Aptos, making their tokens marketable only to qualified investors and limiting broader adoption.</p>
</li>
</ol>
<style>
        .data-td.data {
            padding-right: 5px !important;
        }
        
        .wrapped-div {
            max-width: 100%;
        }
        
        @media (max-width: 1240px) {
            .wrapped-div {
                overflow-x: scroll;
            }
        }
        
        .wrapped-div-sector {
            max-width: 100%;
            overflow-x: scroll;
        }
        
        .flourish-credit {
            display: none !important;
        }
    </style>
<p>To receive more <strong><a href="https://www.vaneck.com/us/en/insights/digital-assets/" title="Digital Assets Insights">Digital Assets</a></strong> insights, <strong><a href="https://www.vaneck.com/us/en/subscribe/" title="Subscription Center">sign up in our subscription center</a></strong>.</p>
]]></content:encoded>
</item><item rdf:about="https://www.vaneck.com/us/en/blogs/digital-assets/dapp-invest-in-the-digital-assets-transformation/">
  <title>Invest in the Digital Assets Transformation></title>
  <link>https://www.vaneck.com/us/en/blogs/digital-assets/dapp-invest-in-the-digital-assets-transformation/</link>
  <description><![CDATA[The digital transformation is underway. Companies involved in the digital transformation of the global economy represents a long-term structural growth opportunity, in our view.]]></description>
  <dc:creator>John Patrick Lee, CFA</dc:creator>
  <dc:date>01/28/2025 06:30:00</dc:date>
<content:encoded><![CDATA[

<p><strong>Please note that VanEck has positions in MicroStrategy and Block Inc.</strong></p>
<p>The digital transformation is underway. In recent years, digital assets have started to mature, evidenced by increased global adoption by both retail and institutional investors. Against this backdrop, we believe that companies involved in the digital transformation of the global economy represents a long-term structural growth opportunity that is becoming more and more accessible to investors.</p>
<h2>What Are Digital Assets?</h2>
<p>The term &ldquo;digital assets&rdquo; encompasses a broad range of technology and applications, commonly referred to as blockchain or distributed ledger technology. Digital assets can take a variety of forms, and are not just limited to cryptocurrencies.</p>
<img loading="lazy" class="img-responsive" src="https://www.vaneck.com/contentassets/a99c41c189324d8991f955f1b13cac78/digitalassets.svg" alt="What Are Digital Assets?" />
<h2>Companies at the Forefront of the Digital Asset Transformation</h2>
<p>The companies involved in the digital transformation are distinctly different from digital assets themselves. Digital transformation companies may range from digital asset mining to hardware to exchanges that facilitate the trading of digital assets.</p>
<img loading="lazy" class="img-responsive" src="https://www.vaneck.com/contentassets/4f18d2cf16e648b3ab3b7f44fdfe5b86/segments.svg" alt="Digital Asset Companies at the Forefront of the Digital Transformation" />
<p>Digital transformation companies may engage in only one of these business lines, or they may engage in multiple, depending on their goals, capabilities and focus within the broader digital transformation space. Below are two quick examples to illustrate how different companies are generating digital transformation-related revenues.</p>
<p><strong>MicroStrategy<sup>*</sup></strong>&nbsp;(MSTR), a business intelligence software firm, has strategically invested in Bitcoin to enhance its treasury holdings. As of January 13, 2025, the company holds approximately 450,000 bitcoins, acquired for $27.533 billion at an average price of $62,691 per bitcoin.<sup>1</sup></p>
<p><strong>Block Inc.<sup>*</sup></strong>&nbsp;(XYZ), the top weighted payment gateway company in the MVIS Global Digital Assets Equity Index, helps sellers start, run and grow their businesses. Investors and consumers can purchase cryptocurrency on Block&rsquo;s popular CashApp. In 2020, that amounted to $2.43 billion in bitcoin-related revenues.<sup>2</sup></p>
<h2>Digital Transformation Companies Reflect a Structural Growth Opportunity</h2>
<p>The opportunity set of publicly traded, pure-play digital transformation companies is still young, but has grown in both size and revenues over the last few years. Despite underlying volatility in digital assets themselves, many publicly traded companies are investing heavily in new business lines to position themselves favorably as digital asset usage and adoption continues to accelerate.</p>
<h3>The Growth of Publicly Traded Digital Transformation Companies (2012 &ndash; 2023)</h3>
<div class="flourish-embed flourish-chart" data-src="visualisation/21333315?2429575"><script src="https://public.flourish.studio/resources/embed.js"></script><noscript><img loading="lazy" src="https://public.flourish.studio/visualisation/21333315/thumbnail" width="100%" alt="chart visualization" /></noscript></div>
<p class="chart-disclosure">Source: VanEck. Revenues and market caps reflect pure-play digital asset companies as defined by MVIS and included in the composition of the MVIS Global Digital Assets Equity Index on 12/31/2023. See important disclosures and index descriptions at end.</p>
<p>The digital transformation opportunity set currently has fewer listed companies compared to more mature industries. However, we believe that as digital assets use cases and adoption grow over time, these early-mover companies may benefit, and that more digital transformation companies will go public.</p>
<style>
.digital-assets-related-videos, .digital-assets-related-blogs {
display: none;
}
</style>
<p>To receive more <strong><a href="https://www.vaneck.com/us/en/insights/digital-assets/" title="Digital Assets Insights">Digital Assets</a></strong> insights, <strong><a href="https://www.vaneck.com/us/en/subscribe/" title="Subscription Center">sign up in our subscription center</a></strong>.</p>
]]></content:encoded>
</item><item rdf:about="https://www.vaneck.com/us/en/blogs/thematic-investing/deepseek-impact-on-nvidia/">
  <title>DeepSeek’s Disruption: The Impact on Nvidia and the Semiconductor Industry></title>
  <link>https://www.vaneck.com/us/en/blogs/thematic-investing/deepseek-impact-on-nvidia/</link>
  <description><![CDATA[As DeepSeek&rsquo;s breakthrough AI news disrupts the semiconductor industry, understand the shift from training to inference and the impacts on dominant players like Nvidia.]]></description>
  <dc:creator>Nick Frasse</dc:creator>
  <dc:date>01/28/2025 06:30:00</dc:date>
<content:encoded><![CDATA[

<p><strong>Please note that VanEck may have positions in the firms referenced herein. </strong></p>
<p>DeepSeek&rsquo;s recent claim of high-end results at a fraction of typical costs has rattled investors and raised questions about Nvidia&rsquo;s dominance. However, it&rsquo;s important to see the forest through the trees: hyperscalers and enterprises could now shift focus on leveraging existing AI infrastructure for inference, where Nvidia still holds significant advantages with its software ecosystem and next-gen products. Meanwhile, the broader semiconductor market is ripe for diversification, with specialized ASICs and other chipmakers poised to capture demand. As a result, a balanced investment approach across the semiconductor landscape remains the most prudent strategy.</p>
<ul class="content-list">
<li class="mt-2"><a href="#breakthrough"><strong>The Breakthrough Claim: DeepSeek&rsquo;s R1 Model</strong></a></li>
<li class="mt-2"><a href="#hyperscalers"><strong>The Hyperscalers&rsquo; Massive CapEx on AI Training</strong></a></li>
<li class="mt-2"><a href="#training-vs-inference"><strong>Training vs. Inference in the Semiconductor Industry</strong></a></li>
<li class="mt-2"><a href="#disruption"><strong>DeepSeek&rsquo;s Disruption: Concerns for Nvidia and Other Chipmakers </strong></a></li>
<li class="mt-2"><a href="#story"><strong>Two Ways to Interpret the DeepSeek Story (and the Case for Diversification)</strong></a></li>
<li class="mt-2"><a href="#nvidia-continued-stengths"><strong>Nvidia&rsquo;s Continued Strengths and the Move to Inference</strong></a></li>
<li class="mt-2"><a href="#why-we-favor"><strong>Why We Favor a Diversified Approach</strong></a></li>
</ul>
<h2 id="breakthrough" class="anchored-block">The Breakthrough Claim: DeepSeek&rsquo;s R1 Model</h2>
<ul class="content-list">
<li class="mt-2">DeepSeek&rsquo;s R1 supposedly delivers near state-of-the-art reasoning performance at a fraction of the cost.</li>
<li class="mt-2">Compared with OpenAI and other leading AI labs, DeepSeek says they used inferior chips yet still achieved impressive results at a significantly lower training cost.</li>
<li class="mt-2">This prompts a key industry question: <i>If new models can be trained so cheaply, do hyperscalers still need more massive GPU investments to achieve top performance?</i></li>
</ul>

<h2 id="hyperscalers" class="anchored-block">The Hyperscalers&rsquo; Massive CapEx on AI Training</h2>
<ul class="content-list">
<li class="mt-2">Over the past two years, major cloud providers (AWS, Azure, Google Cloud, etc.) have poured billions into data centers outfitted with Nvidia GPUs to handle AI training at scale.</li>
<li class="mt-2">The open question has been how these hyperscalers plan to monetize that infrastructure.</li>
<li class="mt-2">AI researchers&rsquo; commentary now suggests that performance gains from ever-bigger models may be reaching diminishing returns, nudging the market from investing in bigger clusters toward monetizing existing models.</li>
<li class="mt-2">The GPU power dynamic has started to shift from Nvidia&rsquo;s ownership of the market to the hyperscalers&rsquo; increased purchasing power.</li>
</ul>
<p>Note: Each hyperscaler has different paths to monetization&mdash;through cloud subscriptions, consumer apps, enterprise services, etc.&mdash;which reduces the likelihood that open-source alone will displace them.</p>
<h2 id="training-vs-inference" class="anchored-block">Training vs. Inference in the Semiconductor Industry</h2>
<ul class="content-list">
<li class="mt-2">The industry is moving from a training-dominated focus to the inference phase, where real-world applications and monetization happen.</li>
<li class="mt-2">Tesla offers a perfect illustration:
<ul style="list-style-type: circle;">
<li class="mt-2">They train their Full Self-Driving (FSD) models in big data centers.</li>
<li class="mt-2">Inference happens in each car (edge computing)&mdash;with the car running the model locally without constant round trips to the cloud.</li>
<li class="mt-2">This edge-based inference is monetized through subscription fees (e.g., $99/month for FSD).</li>
</ul>
</li>
</ul>
<h2 id="disruption" class="anchored-block">DeepSeek&rsquo;s Disruption: Concerns for Nvidia and Other Chipmakers</h2>
<ul class="content-list">
<li class="mt-2">DeepSeek&rsquo;s announcement&mdash;training a high-performance model on cheaper hardware&mdash;caused market jitters about future GPU demand.</li>
<li class="mt-2">Previous assumptions around scaling laws could be disproven with this model. R1 did more with less computing.</li>
<li class="mt-2">The concern: if hyperscalers can achieve state-of-the-art results with less costly or alternative hardware, Nvidia&rsquo;s growth in data center GPUs specifically could slow. This sentiment contributed to recent stock price drops across AI chipmakers.</li>
</ul>
<h2 id="story" class="anchored-block">Two Ways to Interpret the DeepSeek Story (and the Case for Diversification)</h2>
<p>Despite the negative headlines, two main perspectives point to the wisdom of diversifying semiconductor investments&mdash;for example, through ETFs like the&nbsp;<a href="/link/39c8d235748b4c26a5930c31d3ac0160.aspx" title="SMH - VanEck Semiconductor ETF - Overview"><strong>VanEck Semiconductor ETF (SMH)</strong></a>&nbsp;and the&nbsp;<a href="/link/9b8fb1812bc74764bf11fc85767838f9.aspx" title="SMHX - VanEck Fabless Semiconductor ETF - Overview"><strong>VanEck Fabless Semiconductor ETF (SMHX)</strong></a>.</p>
<p><strong>If DeepSeek&rsquo;s Claims Are Fully True&hellip;</strong></p>
<ul class="content-list">
<li class="mt-2">DeepSeek&rsquo;s R1 shows that you can train top-tier models with cheaper hardware.</li>
<li class="mt-2">This doesn&rsquo;t eliminate Nvidia, but it accelerates a timeline where Nvidia&rsquo;s near-total dominance in AI training normalizes.</li>
<li class="mt-2">As training hardware demand broadens, other chip designers (e.g., ASIC makers, Broadcom, Intel, AMD, specialized startups) can gain footholds&mdash;especially in inference, where purpose-built chips are cost- and power-efficient.</li>
<li class="mt-2"><strong>Takeaway:</strong> Even if GPU training demand levels out, there is still significant opportunity across the diverse semiconductor ecosystem (i.e. fabless).</li>
</ul>
<p><strong>If DeepSeek&rsquo;s Claims Are Overstated&hellip;</strong></p>
<ul class="content-list">
<li class="mt-2">Perhaps DeepSeek&rsquo;s achievement isn&rsquo;t as groundbreaking as it seems, or there are undisclosed constraints.</li>
<li class="mt-2">Still, the long-term AI cycle naturally shifts to monetizing models via inference.</li>
<li class="mt-2">That inference stage often favors specialized ASICs, smaller GPU instances, and other accelerators (including CPU enhancements), broadening competition with Nvidia&rsquo;s high-end GPUs.</li>
<li class="mt-2"><strong>Takeaway:</strong> Nvidia may continue leading in training, but, as AI matures, more players will compete for different parts of the AI hardware stack. A diversified semis strategy remains prudent.</li>
</ul>

<h2 id="nvidia-continued-stengths" class="anchored-block">Nvidia&rsquo;s Continued Strengths and the Move to Inference</h2>
<ul class="content-list">
<li class="mt-2">Nvidia remains a highly innovative leader in AI hardware and software.</li>
<li class="mt-2">They have announced new products designed for inference workloads&mdash;like next-gen GPU architectures (e.g., Hopper) and specialized platforms that bridge training and inference.</li>
<li class="mt-2">As the market transitions, Nvidia&rsquo;s data center GPU business will likely see more normalized growth&mdash;but their comprehensive ecosystem (hardware, CUDA software, enterprise partnerships) still positions them as a key player.</li>
<li class="mt-2">In parallel, other chipmakers are ramping up, and a broader selection of ASICs and CPUs is emerging, enabling a variety of cost-effective inference solutions.</li>
</ul>
<h2 id="why-we-favor" class="anchored-block">Why We Favor a Diversified Approach</h2>
<ol>
<li class="mt-2"><strong>Training vs. Inference:</strong> Industry focus is shifting from massive training (where Nvidia dominated) to inference (where more players will have competitive offerings).</li>
<li class="mt-2"><strong>Monetization</strong>: AI is moving into real-world deployments and subscriptions (e.g., Tesla&rsquo;s FSD), highlighting the importance of efficient inference hardware and networks.</li>
<li class="mt-2"><strong>Nvidia&rsquo;s Role:</strong> Nvidia is still well-positioned with leading GPU and software solutions, plus new products targeting inference. However, the days of unbounded data center GPU demand may be giving way to a more balanced, multi-vendor market.</li>
<li class="mt-2"><strong>Investment Strategy:</strong> In this environment, diversifying across the semiconductor sector (e.g., via ETFs like SMH and SMHX) can hedge against potential shifts in market leadership&mdash;from Nvidia&rsquo;s GPUs to specialized ASICs, fabless designers, and other hardware innovators.</li>
</ol>
<p>Ultimately, the AI hardware landscape remains dynamic. While Nvidia is poised to remain a major force, Deepseek&rsquo;s story&mdash;and the broader shift to inference&mdash;underscore the value of broad exposure to the entire semiconductor value chain.</p>

<p>To receive more <a href="https://www.vaneck.com/us/en/insights/thematic-investing/" title="Thematic Investing Insights"><strong>Thematic Investing</strong></a> insights, <a href="https://www.vaneck.com/us/en/subscribe/" title="Subscription Center"><strong>sign up in our subscription center</strong></a>.</p>
]]></content:encoded>
</item><item rdf:about="https://www.vaneck.com/us/en/blogs/thematic-investing/2025-semiconductor-outlook-investor-roadmap/">
  <title>2025 Semiconductor Outlook: Investor Roadmap></title>
  <link>https://www.vaneck.com/us/en/blogs/thematic-investing/2025-semiconductor-outlook-investor-roadmap/</link>
  <description><![CDATA[We unpack where we believe the semiconductor industry is headed, including the rise of hyperscalers, sectors poised to rebound, undervalued opportunities, and potential competitor pressures.]]></description>
  <dc:creator>Angus Shillington</dc:creator>
  <dc:date>01/27/2025 06:30:00</dc:date>
<content:encoded><![CDATA[

<p>The semiconductor industry is poised for another transformative year in 2025. Following a year of record-breaking growth in AI-related semiconductors and notable struggles in legacy sectors, the landscape is set for both challenges and opportunities. For investors and financial advisors, understanding these dynamics is crucial to navigating the road ahead.</p>
<h3>The VanEck Semiconductor ETF (SMH) Holds Nvidia, Broadcom, TSMC, and Other Key Players</h3>
<p><img loading="lazy" alt="The VanEck Semiconductor ETF (SMH) Holds Nvidia, Broadcom, TSMC, and Other Key Players" class="img-responsive w-100" src="https://www.vaneck.com/contentassets/2a6fba65df8c4a4baabef7d0e660ddb3/webus-893_smh_infographic_2025-1_v1_option-1.png" /></p>
<p class="chart-disclosure">Source: VanEck. Not intended as a recommendation to buy or to sell any of the securities mentioned herein.</p>

<h2>AI Continues to Lead the Way</h2>
<p>Artificial intelligence remains the driving force behind the semiconductor market. Companies like Nvidia, Broadcom, TSMC, and Marvell continue to dominate, benefiting from AI&rsquo;s seemingly insatiable demand. Nvidia has cemented its role as the gold standard for AI semiconductors, though growth rates may moderate compared to its exceptional performance in 2023 and 2024. Meanwhile, Marvell&rsquo;s positions it as a major beneficiary in this space, particularly as it aligns its solutions with AI-driven trends and hyperscaler demand.</p>
<h3>Strong AI Chip Market Revenues Expected to Continue in 2025 (2023-2025)</h3>
<div class="flourish-embed flourish-chart" data-src="visualisation/21278414?2429575"><script src="https://public.flourish.studio/resources/embed.js"></script><noscript><img loading="lazy" src="https://public.flourish.studio/visualisation/21278414/thumbnail" width="100%" alt="Strong AI Chip Market Revenues Expected to Continue in 2025" /></noscript></div>
<p class="chart-disclosure">Source: Gartner as of 2024. For illustrative purposes only. Past performance is no guarantee of future results. Not intended as a forecast or prediction of future results.<sup>*</sup>&nbsp;Projected numbers.</p>
<p>The rise of hyperscalers like Amazon and Google developing their own AI solutions (e.g., Tranium and Tensor chips) marks a shift in the competitive landscape. Broadcom and AMD are also playing significant roles as this unbundling introduces viable alternatives that could reshape the market. While Nvidia&rsquo;s solutions remain vital for specialist workloads, this diversification highlights a growing ecosystem of players vying for AI market share. Additionally, TSMC&rsquo;s dominant position as the leading-edge fab player ensures it remains a critical component of AI&rsquo;s continued expansion into 2025 and beyond.</p>

<h2>Challenges and Opportunities for Legacy Sectors</h2>
<p>Not all segments shared AI&rsquo;s meteoric rise. Automotive, analog, and smartphone chips faced significant hurdles in 2024 with oversupply impacting profitability and growth. However, 2025 brings the potential for recovery as these sectors stabilize and benefit from cyclical rebounds. Automotive chips are poised to gain traction as the electric vehicle (EV) market grows and demand for advanced driver-assistance systems (ADAS) accelerates.</p>
<p>Analog and IoT-focused semiconductors also present recovery potential, with stabilization in key end markets driving renewed investor interest. Companies like Texas Instruments and Analog Devices may see improvement as market dynamics in these areas recover. For smartphones, the recovery may be slower, but the rollout of next-generation devices and a focus on efficiency improvements could create selective opportunities.</p>
<h3>Various Sectors are Poised to Gain Traction from Semiconductor Growth</h3>
<p><strong>Semiconductor Market Revenue Worldwide 2020-2025, by Segment</strong></p>
<div class="flourish-embed flourish-chart" data-src="visualisation/21278272?2429575"><script src="https://public.flourish.studio/resources/embed.js"></script><noscript><img loading="lazy" src="https://public.flourish.studio/visualisation/21278272/thumbnail" width="100%" alt="Semiconductor Market Revenue Worldwide 2020-2025, by Segment" /></noscript></div>
<p class="chart-disclosure">Source: Statista as of 2024. For illustrative purposes only. Past performance is no guarantee of future results. For illustrative purposes only. Not intended as a forecast or prediction of future results.<sup>*</sup>&nbsp;Projected numbers.</p>
<h2>Undervalued Players Emerging</h2>
<p>While market leaders grab headlines, undervalued players in memory chips and semiconductor equipment offer attractive opportunities for strategic positioning. Companies like SK Hynix and Micron are poised for growth as the memory market stabilizes, driven by stronger customer relationships and a shift toward contract-based demand. SK Hynix is positioned to benefit from demand for high-bandwidth memory (HBM), which is increasingly vital for AI applications. Western Digital, though less concentrated in HBM, also offers a potential upside as the market stabilizes.</p>
<p>On the equipment side, Applied Materials and Lam Research stand out as key beneficiaries of industry demand cycles, offering compelling value. With improving fundamentals and strategic alignment with future technology trends, these companies represent critical enablers of the semiconductor ecosystem. Emerging players like Onto Innovation and ACMR Technologies also present intriguing growth stories as their innovative solutions gain traction in the broader market.</p>

<h2>The Balancing Act: Optimism and Caution</h2>
<p>While the trajectory for AI semiconductors remains positive, history reminds us that this is a cyclical industry. Inventory builds and extended growth cycles could introduce volatility. Companies that successfully manage AI&rsquo;s high fixed and marginal costs will likely emerge as long-term leaders. Additionally, as hyperscalers continue to explore alternatives to Nvidia&rsquo;s dominance, the AI ecosystem may experience further fragmentation, with Broadcom and AMD increasingly shaping the competitive dynamics.</p>
<p>For investors, balancing exposure to high-growth areas with diversification across undervalued sectors is key. Semiconductors are integral to nearly every aspect of modern technology, making thoughtful portfolio allocation critical in capturing long-term value.</p>
<h2>Key Takeaways for the Semiconductor Market in 2025</h2>
<ul class="content-list">
<li class="mt-2"><strong>Stay Aligned with AI:</strong> Market leaders like Nvidia, Marvell, and TSMC are set to remain at the forefront of AI growth. Keep an eye on developments in hyperscaler-driven chip alternatives, including Broadcom and AMD.</li>
<li class="mt-2"><strong>Watch for Recovery:</strong> Automotive, IoT, and analog sectors may rebound, offering potential upside for diversified portfolios. Companies like Texas Instruments and Analog Devices could see improvement in these segments.</li>
<li class="mt-2"><strong>Explore Hidden Value:</strong> Memory chips (SK Hynix, Micron, Western Digital) and semiconductor equipment (Applied Materials, Lam Research, Onto Innovation) represent undervalued opportunities.</li>
<li class="mt-2"><strong>Monitor Fragmentation Risks</strong>: The increasing diversity in AI solutions could create competitive pressures but also open doors for new players and technologies.</li>
<li class="mt-2"><strong>Stay Vigilant: </strong>Inventory challenges and cyclical risks require careful monitoring, even as growth prospects remain strong.</li>
</ul>
<h2>A Roadmap for Semiconductor Investors</h2>
<p>For those investing in the semiconductor space, 2025 is a year to remain forward-looking yet cautious. The industry&rsquo;s evolution, driven by AI and emerging technologies, creates a fertile ground for growth while demanding strategic positioning. ETFs like the <a href="/link/39c8d235748b4c26a5930c31d3ac0160.aspx" title="SMH - VanEck Semiconductor ETF - Overview"><strong>VanEck Semiconductor ETF (SMH)</strong></a> and the <a href="/link/9b8fb1812bc74764bf11fc85767838f9.aspx" title="SMHX - VanEck Fabless Semiconductor ETF - Overview"><strong>VanEck Fabless Semiconductor ETF (SMHX)</strong></a> offer diversified exposure to both leading innovators and emerging players, making them valuable tools for navigating this dynamic sector.</p>
<p>As we move through 2025, staying informed and adaptable will be key to capitalizing on the opportunities this pivotal industry presents. The semiconductor story is far from over&mdash;and this year may be one of its most exciting chapters yet.</p>
<p>To receive more <a href="https://www.vaneck.com/us/en/insights/thematic-investing/" title="Thematic Investing Insights"><strong>Thematic Investing</strong></a> insights, <a href="https://www.vaneck.com/us/en/subscribe/" title="Subscription Center"><strong>sign up in our subscription center</strong></a>.</p>
]]></content:encoded>
</item><item rdf:about="https://www.vaneck.com/us/en/blogs/income-investing/clos-continue-to-thrive-amid-high-yields-and-rate-volatility/">
  <title>CLOs Continue To Thrive Amid High Yields and Rate Volatility></title>
  <link>https://www.vaneck.com/us/en/blogs/income-investing/clos-continue-to-thrive-amid-high-yields-and-rate-volatility/</link>
  <description><![CDATA[CLOs continue to see strong demand given high all-in yields, which we expect to remain the case into 2025.]]></description>
  <dc:creator> </dc:creator>
  <dc:date>01/24/2025 06:30:00</dc:date>
<content:encoded><![CDATA[

<p>The <strong><a href="/link/e090deaddc774ac699a04b959d9254c6.aspx" title="CLOI - VanEck CLO ETF - Overview">VanEck CLO ETF (CLOI)</a></strong> performed approximately in line with its benchmark, the J.P. Morgan CLO Index, over the quarter and slightly underperformed over the calendar year as lower rated tranches, which have a higher weight in the benchmark, outperformed. However, CLOI significantly outperformed the broad investment grade CLO benchmark. Early in the quarter, CLOI selectively purchased shorter spread-duration across the cap stack, and particularly in lower rated credits, increasing exposure to lower rated investment grade tranches (A/BBB) from the low 20% into the low-to-mid 30%s while limiting spread risk. Total return was driven by high base rates, even as the Federal Reserve began cutting rates in September, and spread tightening driven by a supportive technical and fundamental backdrop.</p>
<p>The <strong><a href="/link/d2f16468a9f14c1e807f6bb7fb597a3e.aspx" title="CLOB - VanEck AA-BB CLO ETF - Overview">VanEck AA-BB CLO ETF (CLOB)</a></strong> launched September 2024, actively allocating into the most attractive opportunities in lower rated mezzanine CLOs. CLOB performed approximately in line with its benchmark, the JP Morgan CLOIE Balanced Mezzanine Index which tracks broadly syndicated, arbitrage US CLO debt rated AA to BB, comprised of 25% of each rating category.</p>
<h2 id="market-update" class="jump-link-nav anchored-block" data-jumplink-title="Market Update">Market Update</h2>
<p>CLOs generated positive total returns across the capital stack in December, capping off a full calendar year of positive returns across all ratings categories and the 21st consecutive month of positive returns at the overall index level. As has been the case throughout the year, carry was the primary driver of returns given higher base rates. In a widely anticipated move, the Federal Reserve cut rates by 25 bps, its third consecutive meeting with a cut, bringing the Federal Funds rate to a target range of 4.25%-4.5%. However, the cut came alongside a hawkish tone, as inflation has held firm above the Fed&rsquo;s target level and growth remained solid. Specifically Core CPI increased 0.3% in November, rising by the same stubbornly high margin for the fourth consecutive month. Following the announcement, many risk assets sold off sharply and Treasury yields rose dramatically. With 3Q earnings season coming to a close, issuer fundamentals have modestly deteriorated but remain strong overall.</p>
<p>Treasury rates increased in December, with 5- and 10-year Treasury rates trading 33bp and 40bp higher, respectively. As rates moved higher, floating rate CLOs and bank loans outperformed more duration sensitive investment grade credit and high yield bonds.</p>
<div class="wrapped-div">
<table style="width: 100%;">
<tbody>
<tr class="tbl-data">
<td class="tbl-header last">Asset class</td>
<td class="tbl-header last text-right">Q4 2024 Return (%)</td>
<td class="tbl-header last text-right">2024 Return (%)</td>
<td class="tbl-header last text-right">Yield to Worst (%)</td>
<td class="tbl-header last text-right">Spreads (bps)</td>
</tr>
<tr class="tbl-data">
<td class="data-td last font-weight-normal">CLOs</td>
<td class="data-td data last text-right">1.83</td>
<td class="data-td data last text-right">8.31</td>
<td class="data-td data last text-right">5.71</td>
<td class="data-td data last text-right">142</td>
</tr>
<tr class="tbl-data">
<td class="data-td last font-weight-normal">CLOs IG</td>
<td class="data-td data last text-right">1.69</td>
<td class="data-td data last text-right">7.72</td>
<td class="data-td data last text-right">5.46</td>
<td class="data-td data last text-right">117</td>
</tr>
<tr class="tbl-data">
<td class="data-td last font-weight-normal pl-4">CLOs Mezz</td>
<td class="data-td data last text-right">2.58</td>
<td class="data-td data last text-right">12.03</td>
<td class="data-td data last text-right">7.13</td>
<td class="data-td data last text-right">280</td>
</tr>
<tr class="tbl-data">
<td class="data-td last font-weight-normal pl-4">AAA</td>
<td class="data-td data last text-right">1.59</td>
<td class="data-td data last text-right">7.06</td>
<td class="data-td data last text-right">5.25</td>
<td class="data-td data last text-right">97</td>
</tr>
<tr class="tbl-data">
<td class="data-td last font-weight-normal pl-4">AA</td>
<td class="data-td data last text-right">1.69</td>
<td class="data-td data last text-right">8.18</td>
<td class="data-td data last text-right">5.61</td>
<td class="data-td data last text-right">129</td>
</tr>
<tr class="tbl-data">
<td class="data-td last font-weight-normal pl-4">A</td>
<td class="data-td data last text-right">1.83</td>
<td class="data-td data last text-right">9.25</td>
<td class="data-td data last text-right">5.90</td>
<td class="data-td data last text-right">158</td>
</tr>
<tr class="tbl-data">
<td class="data-td last font-weight-normal pl-4">BBB</td>
<td class="data-td data last text-right">2.53</td>
<td class="data-td data last text-right">11.79</td>
<td class="data-td data last text-right">6.72</td>
<td class="data-td data last text-right">242</td>
</tr>
<tr class="tbl-data">
<td class="data-td last font-weight-normal pl-4">BB</td>
<td class="data-td data last text-right">4.31</td>
<td class="data-td data last text-right">19.16</td>
<td class="data-td data last text-right">10.27</td>
<td class="data-td data last text-right">589</td>
</tr>
<tr class="tbl-data">
<td class="data-td last font-weight-normal">U.S. Agg</td>
<td class="data-td data last text-right">-3.06</td>
<td class="data-td data last text-right">1.47</td>
<td class="data-td data last text-right">4.93</td>
<td class="data-td data last text-right">36</td>
</tr>
<tr class="tbl-data">
<td class="data-td last font-weight-normal">Investment Grade Corporates</td>
<td class="data-td data last text-right">-2.84</td>
<td class="data-td data last text-right">2.76</td>
<td class="data-td data last text-right">5.36</td>
<td class="data-td data last text-right">82</td>
</tr>
<tr class="tbl-data">
<td class="data-td last font-weight-normal">High Yield Bonds</td>
<td class="data-td data last text-right">0.16</td>
<td class="data-td data last text-right">8.20</td>
<td class="data-td data last text-right">7.47</td>
<td class="data-td data last text-right">292</td>
</tr>
<tr class="tbl-data">
<td class="data-td last font-weight-normal">Leveraged Loans</td>
<td class="data-td data last text-right">2.41</td>
<td class="data-td data last text-right">9.33</td>
<td class="data-td data last text-right">8.33</td>
<td class="data-td data last text-right">400</td>
</tr>
</tbody>
</table>
</div>
<p class="chart-disclosure">Source: JP Morgan and ICE Data Indices as of 12/31/2024. CLOs represented by J.P. Morgan Collateralized Loan Obligation Index, CLOs IG represented by J.P. Morgan Collateralized Loan Obligation IG Index, CLOs Mezz represented by J.P. Morgan Collateralized Loan Obligation Balanced Mezzanine Index, AAA Rated CLOs represented by J.P. Morgan CLO AAA Index, AA Rated CLOs represented by J.P. Morgan CLO AA Index, A Rated CLOs represented by J.P. Morgan CLO A Index, BBB Rated CLOs represented by J.P. Morgan CLO BBB Index, BB Rated CLOs represented by J.P. Morgan CLO BB Index, Investment Grade Corporates represented by ICE BofA US Corporate Index, US Agg is represented by the ICE BofA US Broad Market, Leveraged Loans represented by JP Morgan Leveraged Loan Index and High Yield Bonds represented by ICE BofA US High Yield Index. Past performance is no guarantee of future results. Index performance is not representative of fund performance. It is not possible to invest directly in an index.</p>

<p>CLO new issue supply decreased month-over-month, with $10.8bn pricing during the month, compared to $25.5bn in November, which was the highest volume month of the year and just trailed record issuance from November 2021. 2024 new issuance volume of $199.8bn ($163.6bn BSL, $36.2bn MM) set a new annual record, surpassing 2021 issuance, and was 72% higher than 2023. Refinancing and reset activity continued at a rapid pace in December and was the second highest level of the year, with $34.6bn pricing, after $34.3bn in November. Refinancing and reset activity for the year was $309.1bn ($279.6bn BSL, $29.6bn MM) compared to just $24.1bn in 2023 and is a new record. Total issuance of $508.9bn ($443.1bn BSL, $65.7bn MM) was 263% higher than 2023 levels.</p>
<p>In the secondary market, TRACE supply was roughly unchanged month-over-month at $13.0bn in December from $13.1bn in November. Investment grade volumes declined to $8.6bn from $8.9bn, while below investment grade volumes increased to $4.4bn from $4.2bn. Meanwhile, total BWIC volume decreased to $3.8bn from $4.6bn, as activity slowed during the holiday season.</p>
<p>Gross institutional loan issuance was $27.9bn in December, following $30.2bn in November. Retail loan funds saw net inflows of $1.8bn, the 14th inflow in the last 16 months. The average bid of the Morningstar LSTA Leveraged Loan Index increased 8bp to end the month at 97.33, the highest average bid price since April 2022. The percentage of loans pricing at par or above decreased to 62.6% from 65.3%; the percentage of loans pricing between 95 and par increased to 26.0% from 23.4%; the percentage of loans pricing below 90 increased to 7.4% from 6.4% and loans pricing below 80 decreased to 3.0% from 3.2%.</p>
<p>The trailing twelve-month default rate within the Morningstar US Leveraged Loan Index decreased 3bp month-over-month to 0.91%. In contrast, as measured by JP Morgan, the default rate including distressed exchanges increased to 4.49%. Activity has been elevated as borrowers with unsustainable capital structures endeavored to manage their liabilities and avoid the bankruptcy process through <a href="https://www.vaneck.com/us/en/blogs/income-investing/lender-on-lender-violence-should-clo-investors-be-concerned/" title="Lender-on-Lender Violence: Should CLO Investors be Concerned?"><strong>liability management exercises</strong></a>, keeping the &ldquo;official&rdquo; default rate lower than otherwise. We anticipate the default rate to remain below historical averages in the near term for the leveraged loan market as a result. Nonetheless, our expectations are that defaults, including distressed exchanges, will remain above the long-term historical average of 3%, but will be trending down from the current level of 4.49%.</p>
<p>CLO fundamentals were mixed month-over-month. US CLO spreads were wider at the top of the capital stack and tighter for lower rated securities.</p>
<p id="portfolio-strategy" class="jump-link-nav anchored-block" data-jumplink-title="Portfolio Strategy">Despite rate cuts in 2024, the borrowing rate for leveraged loan companies remains high following rate increases from central banks in 2022 and 2023. Following the end of summer 2024, the Fed initiated the current rate-cutting cycle with a 50bp cut in September and another two 25bp cuts in November and December, as inflation approached the Federal Reserve&rsquo;s target and the labor market remained resilient. However, following the release of economic data in December and January, demonstrating that inflation remains above the Fed&rsquo;s target and growth remaining strong, the Fed has adopted a more hawkish tone increasing uncertainty around future rate cuts. Market expectations with respect to Fed easing have moved significantly lower, with the market now not expecting another rate cut until September 2025. Cuts will ultimately provide relief for more stressed borrowers, but the path and timing of more cuts remains an outstanding question.</p>
<p>CLO prices remain elevated following the significant rally in 2024 with the basis between higher and lower rated tranches continuing to tighten. The average AAA-BBB price ended December above par, as has been the case for most of the second half of the year, and BBs are trading above 97 for the first time since early December 2018. Against this backdrop, we continue to selectively purchase shorter spread-duration across the cap stack, but especially so for lower rated credits. If spreads were to widen, we maintain the ability to shift further into lower rated tranches given our overall portfolio positioning higher up the cap stack.</p>
<p>Primary and secondary spreads tightened throughout the year, with secondary AAA and AA spreads ended the year at the tightest levels since January 2022. However, buying in the primary market continues to allow for wider spreads on a relative basis, even when taking spread duration into account. CLO issuance has become more attractive as the arbitrage improved with lower liability costs, leading to the largest volume of BSL CLO primary issuance on record in 2024. Despite that, with high levels of amortization and call volumes this year, 2024 net AAA supply actually ended marginally negative.</p>
<h3>CLOI Total Return and Credit Allocation</h3>
<div class="flourish-embed flourish-chart" data-src="visualisation/21277891?2429575"><script src="https://public.flourish.studio/resources/embed.js"></script><noscript><img loading="lazy" src="https://public.flourish.studio/visualisation/21277891/thumbnail" width="100%" alt="CLOI Total Return and Credit Allocation" /></noscript></div>
<p class="chart-disclosure">Source: <strong>FactSet, J.P. Morgan, VanEck</strong>, as of December 31, 2024. Index performance is not representative of Fund performance. It is not possible to invest directly in an index.</p>
<h3>Average Annual Total Returns<sup>*</sup>&nbsp;(%)</h3>
<div class="wrapped-div">
<table style="width: 100%;">
<tbody>
<tr class="tbl-data">
<td class="tbl-header last" colspan="9">As of December 31, 2024</td>
</tr>
<tr class="tbl-data">
<td class="data-head last text-right">&nbsp;</td>
<td class="data-head last text-right">1 MO</td>
<td class="data-head last text-right">3 MO</td>
<td class="data-head last text-right">YTD</td>
<td class="data-head last text-right">1 YR</td>
<td class="data-head last text-right">3 YR</td>
<td class="data-head last text-right">5 YR</td>
<td class="data-head last text-right">10 YR</td>
<td class="data-head last text-right">LIFE<br />06/21/22</td>
</tr>
<tr class="tbl-data">
<td class="data-td last text-left">CLOI (NAV)</td>
<td class="data-td data last text-right">0.55</td>
<td class="data-td data last text-right">1.76</td>
<td class="data-td data last text-right">8.14</td>
<td class="data-td data last text-right">-</td>
<td class="data-td data last text-right">8.22</td>
</tr>
<tr class="tbl-data">
<td class="data-td last text-left">CLOI (Share Price)</td>
<td class="data-td data last text-right">0.51</td>
<td class="data-td data last text-right">1.72</td>
<td class="data-td data last text-right">8.25</td>
<td class="data-td data last text-right">-</td>
<td class="data-td data last text-right">8.22</td>
</tr>
<tr class="tbl-data">
<td class="data-td last text-left">J.P. Morgan Collateralized Loan Obligation Index</td>
<td class="data-td data last text-right">0.57</td>
<td class="data-td data last text-right">1.83</td>
<td class="data-td data last text-right">8.31</td>
<td class="data-td data last text-right">-</td>
<td class="data-td data last text-right">8.51</td>
</tr>
</tbody>
</table>
</div>
<p class="chart-disclosure"><sup>*</sup>&nbsp;Returns less than one year are not annualized.<br /><strong>The performance data quoted represents past performance. Past performance is not a guarantee of future results. Investment return and principal value of an investment will fluctuate so that an investor's shares, when redeemed, may be worth more or less than their original cost. Performance may be lower or higher than performance data quoted. Please call 800.826.2333 or visit vaneck.com for performance current to the most recent month ended.</strong> <br />CLOI&rsquo;s gross expense ratio is 0.40% and the total expense ratio is 0.40%. Van Eck Associates Corporation (the &ldquo;Adviser&rdquo;) will pay all expenses of the Fund, except for the fee payment under the investment management agreement, acquired fund fees and expenses, interest expense, offering costs, trading expenses, taxes and extraordinary expenses. Notwithstanding the foregoing, the Adviser has agreed to pay the offering costs until at least May 1, 2025. &ldquo;Other Expenses&rdquo; have been restated to reflect current fees.</p>

<h3>CLOB Total Return and Credit Allocation</h3>
<div class="flourish-embed flourish-chart" data-src="visualisation/21278114?2429575"><script src="https://public.flourish.studio/resources/embed.js"></script><noscript><img loading="lazy" src="https://public.flourish.studio/visualisation/21278114/thumbnail" width="100%" alt="CLOB Total Return and Credit Allocation" /></noscript></div>
<p class="chart-disclosure">Source: <strong>FactSet, J.P. Morgan, VanEck</strong>, as of December 31, 2024. Index performance is not representative of Fund performance. It is not possible to invest directly in an index.</p>
<h3>Average Annual Total Returns<sup>*</sup>&nbsp;(%)</h3>
<div class="wrapped-div">
<table style="width: 100%;">
<tbody>
<tr class="tbl-data">
<td class="tbl-header last" colspan="9">As of December 31, 2024</td>
</tr>
<tr class="tbl-data">
<td class="data-head last text-right">&nbsp;</td>
<td class="data-head last text-right">1 MO</td>
<td class="data-head last text-right">3 MO</td>
<td class="data-head last text-right">YTD</td>
<td class="data-head last text-right">1 YR</td>
<td class="data-head last text-right">3 YR</td>
<td class="data-head last text-right">5 YR</td>
<td class="data-head last text-right">10 YR</td>
<td class="data-head last text-right">LIFE<br />09/24/24</td>
</tr>
<tr class="tbl-data">
<td class="data-td last text-left">CLOB (NAV)</td>
<td class="data-td data last text-right">0.81</td>
<td class="data-td data last text-right">2.56</td>
<td class="data-td data last text-right">-</td>
<td class="data-td data last text-right">2.88</td>
</tr>
<tr class="tbl-data">
<td class="data-td last text-left">CLOB (Share Price)</td>
<td class="data-td data last text-right">0.88</td>
<td class="data-td data last text-right">2.52</td>
<td class="data-td data last text-right">-</td>
<td class="data-td data last text-right">2.91</td>
</tr>
<tr class="tbl-data">
<td class="data-td last text-left">J.P. Morgan CLOIE Balanced Mezzanine Index</td>
<td class="data-td data last text-right">0.78</td>
<td class="data-td data last text-right">2.59</td>
<td class="data-td data last text-right">-</td>
<td class="data-td data last text-right">2.85</td>
</tr>
</tbody>
</table>
</div>
<p class="chart-disclosure"><sup>*</sup>&nbsp;Returns less than one year are not annualized.<br /><strong>The performance data quoted represents past performance. Past performance is not a guarantee of future results. Investment return and principal value of an investment will fluctuate so that an investor's shares, when redeemed, may be worth more or less than their original cost. Performance may be lower or higher than performance data quoted. Please call 800.826.2333 or visit vaneck.com for performance current to the most recent month ended.</strong> <br />CLOB&rsquo;s gross expense ratio is 0.45% and the total expense ratio is 0.45%. Van Eck Associates Corporation (the &ldquo;Adviser&rdquo;) will pay all expenses of the Fund, except for the fee payment under the investment management agreement, acquired fund fees and expenses, interest expense, offering costs, trading expenses, taxes and extraordinary expenses. Notwithstanding the foregoing, the Adviser has agreed to pay the offering costs until at least May 1, 2026. &ldquo;Other Expenses&rdquo; have been restated to reflect current fees.</p>

<h2 id="outlook" class="jump-link-nav anchored-block" data-jumplink-title="Outlook">Outlook</h2>
<p>Our base case has been that we are entering a rare non-recessionary rate-cutting cycle that should support credit performance in 2025. The US election&rsquo;s outcome is expected to add to pro-growth policies and further support risk assets from a fundamental perspective, while introducing potential headwinds outside the US amid more restrictive trade policies. With a second Trump administration forthcoming, concerns have turned toward how aggressively Trump will advance his campaign promises on immigration and trade. On immigration, it seems highly likely that Trump would quickly end the asylum programs established during the Biden administration. Over time, this could bring job growth back to pre-pandemic levels of about 100,000 jobs per month, which is expected to have a minimal inflationary impact. While large-scale deportations are a possibility, they would likely happen further down the road. The bigger uncertainty revolves around how swiftly and forcefully Trump will implement trade restrictions, including significantly higher tariffs on China. In the first Trump presidency, higher import prices led to only a modest rise in consumer prices and slightly slower economic growth. A looser regulatory environment may somewhat offset these concerns, leaving the overall growth outlook for next year relatively unchanged despite the shifting variables. Jobs data suggest that the base-case economic scenario is still leaning toward a soft landing.</p>
<p>We continue to believe that loan defaults will remain relatively stable. Fundamental strength in credit metrics appears to have peaked, but started at a high level and should remain strong. Solid growth and the potential for inflationary pressures in the United States could result in a less accommodative Fed tone. By contrast, the weaker economic outlook for Europe will allow the ECB to cut rates at a steady pace. The net outcome should be a stronger US dollar. Offsetting positive fundamentals are extremely tight valuations, which fully reflect hyper-bullish sentiment.</p>
<p>Despite limited net loan issuance, CLO new issuance reached a new annual record as managers take advantage of tighter liability spreads. We expect strong issuance again heading into 2025 as spreads remain at very tight levels. However, the pace from 2024 may be unsustainable moving forward unless M&amp;A and LBO activity picks up. The election of Donald Trump and expectations around his policy agenda have given some hope that there will be increased activity moving forward. CLOs continue to see strong demand given high all-in yields, which we expect to remain the case into 2025. Despite the commencement of the Fed&rsquo;s rate cutting cycle, recent comments from the central bank have led many to expect a pause through the first half of the year. While CLO valuations are tight, corporate valuations are tighter, which should be an additional boon for CLO demand in the short term. In addition to the traditional investor base of insurers, banks, and money managers (among others) &ndash; which have been a consistent source of demand given CLOs&rsquo; strong performance since the Covid period &ndash; the CLO market has also benefited from the growing presence of CLO exchange-traded funds. CLO ETFs experienced $16bn of inflows in 2024, a trend that has continued into early January, with CLO ETF AUM now 2-3% of the total CLO market. Refinancing and reset activity also set a new record in 2024 as portfolios constructed with purchases in the secondary market take advantage of higher loan prices and tighter CLO spreads, a trend we expect to continue coming into the new year. This has also bolstered demand for new paper and led to tighter spreads as investors put proceeds back to work. Should the loan and CLO markets continue to rally, we would expect to see more portfolios benefit from the significant redemption optionality in CLOs.</p>
<p>Amid the supportive technical environment, we anticipate CLO spreads to grind tighter. That said, we see spreads and yields attractive under most market scenarios over the next twelve months. Notwithstanding the shorter-term technical tailwinds, we believe expensive valuations and a fundamental picture bifurcated between vintages and, relatedly, between deals in and out of their reinvestment periods, calls for a robust bottom-up approach to security selection for long-term investors. Given the dispersion seen in the loan market and a moderation in Fed rate cut expectations, certain CLO portfolios holding weaker credits may eventually experience impairments to the lowest rated debt tranches. As a result, vintage, portfolio, and manager selection remains key.</p>
<p>To receive more <a href="/us/en/blogs/income-investing/" title="Income Investing Insights"><strong>Income Investing</strong></a> insights, <a href="/link/5f45412c2143400497908cea2897f7d3.aspx" title=" Subscription Center"><strong>sign up in our subscription center</strong></a>.</p>
]]></content:encoded>
</item><item rdf:about="https://www.vaneck.com/us/en/blogs/emerging-markets-equity/emerging-markets-navigating-q4-volatility-and-challenges/">
  <title>Emerging Markets: Navigating Q4 Volatility and Challenges></title>
  <link>https://www.vaneck.com/us/en/blogs/emerging-markets-equity/emerging-markets-navigating-q4-volatility-and-challenges/</link>
  <description><![CDATA[EM equities faced a volatile Q4 2024 amid macroeconomic and geopolitical pressures, with China's rally fading and India and Brazil grappling with growth, fiscal and interest rate challenges.]]></description>
  <dc:creator>Ola  El-Shawarby, CFA</dc:creator>
  <dc:date>01/23/2025 06:30:00</dc:date>
<content:encoded><![CDATA[

<p>Quarterly insights from Emerging Markets Equity Portfolio Manager Ola El-Shawarby, featuring her unique views on emerging markets.</p>

<p>Emerging markets equities faced a turbulent Q4 2024, with the MSCI Emerging Markets IMI Index declining by 7.9% amid heightened macroeconomic and geopolitical pressures. Significant volatility characterized the quarter across major markets. In China, a policy pivot at the end of Q3 fueled early optimism and a sharp rally, but profit-taking driven by uncertainties around stimulus implementation, U.S. trade policy, and weak economic data led to heightened volatility. Indian equities faced challenges from slower economic growth, weaker-than-expected government capital expenditures (CAPEX), softer corporate earnings, foreign fund outflows and election-related disruptions. Meanwhile, in Brazil, fiscal uncertainties and the prospect of prolonged higher interest rates reversed earlier gains. A strong U.S. dollar and global trade tensions further underscored the complexity of the quarter for emerging markets, presenting a particularly challenging environment.</p>
<h2 id="market-review" class="jump-link-nav anchored-block" data-jumplink-title="Market Review">Market Review</h2>
<p>Emerging markets equities are entering 2025 with a dynamic mix of opportunities and challenges, reflecting the complexities of the global economic landscape. Attractive valuations, persistent under-allocation by global investors and robust long-term growth drivers highlight the potential for compelling returns, despite near-term risks.</p>
<p>Key risks include the potential for heightened trade tensions, particularly between the U.S. and China, and uncertainties in U.S.-Mexico relations. Inflationary pressures stemming from U.S. policy decisions could delay anticipated rate cuts and strengthen the U.S. dollar, creating headwinds for some markets. These challenges underscore the importance of focusing on markets and sectors less vulnerable to such pressures.</p>
<p>On the positive side, China&rsquo;s pro-growth stimulus measures have helped stabilize its domestic economy and broader emerging markets sentiment, though further forceful actions are needed to sustain momentum. India continues to stand out with its structural growth story, driven by domestic consumption, reforms and expanding opportunities in manufacturing and technology. Additionally, enduring trends in digital transformation, financial inclusion, renewable energy and formalized consumption further bolster the case for a selective and focused investment approach in emerging markets. With these factors in mind, we remain optimistic about the long-term prospects while navigating near-term uncertainties with discipline and precision.</p>
<p id="em-countries" class="jump-link-nav anchored-block" data-jumplink-title="EM Countries &amp; Themes"><strong>Here is a brief overview of some of the largest emerging markets countries and themes, and how we view them:</strong></p>
<p><strong>China:</strong> China&rsquo;s equity markets experienced a rollercoaster year in 2024, ending with their first positive annual performance since 2020 but marked by significant Q4 volatility. The policy pivot at the end of Q3, signaling a focus on economic, property and market stabilization, sparked an early rally driven by light positioning and short covering. However, uncertainties around fiscal stimulus implementation, weak economic data and U.S. trade policy following the leadership transition contributed to profit-taking and heightened volatility.</p>
<p>Consumption recovery remains the cornerstone of China&rsquo;s long-term growth strategy, with government efforts increasingly focused on restoring consumer confidence to drive sustainable economic momentum. In this challenging environment, we are refining our approach, reallocating capital from lower-conviction names into high-quality companies and sectors&mdash;such as consumption and real estate recovery&mdash;that are better positioned to benefit from structural tailwinds.</p>
<p>While near-term challenges persist, we continue to leverage a disciplined, process-driven approach to optimize positioning. With greater clarity on fiscal measures and tariff adjustments expected after the March Two Sessions conference, we maintain a constructive outlook on China&rsquo;s long-term potential. Encouragingly, the regulatory environment is more supportive, and companies are prioritizing profitability, capital returns and shareholder value, bolstering confidence in select opportunities.</p>
<p><strong>India:</strong> India&rsquo;s equity markets faced headwinds in Q4 2024, with quarterly declines driven by slowing corporate earnings growth, weak GDP data, and foreign fund outflows. Additional pressures included tight liquidity from regulatory measures, a slowdown in government CAPEX ahead of elections and rural demand softness due to elevated food inflation. Despite these challenges, India ended the year with positive annual performance, underscoring its robust structural growth potential.</p>
<p>Our on-the-ground visit in Q4 reinforced confidence in long-term drivers such as urban consumption premiumization, the &lsquo;Make in India&rsquo; initiative, green energy transitions and infrastructure development. While market volatility persists, we see opportunities to reposition selectively at more reasonable valuation levels. By diversifying the portfolio and selectively increasing exposure to high-quality names in resilient sectors such as infrastructure, consumption and renewables, we aim to balance short-term risks with India&rsquo;s long-term growth trajectory, supported by ongoing reforms and structural shifts.</p>
<p><strong>Brazil:</strong> Brazil&rsquo;s equity markets faced heightened uncertainty in Q4 2024, driven by fiscal concerns and shifting economic dynamics. Debates around spending and tax reforms, alongside underwhelming government spending cuts, created a challenging environment. The central bank&rsquo;s decision to initiate an interest rate hiking cycle in September added to market volatility.</p>
<p>Our on-the-ground visit to Brazil at the start of Q4 confirmed the longer-term structural growth potential at attractive valuations. However, given the near-term uncertainty and fiscal dominance debates, we have been reducing overall risk by trimming exposure and reallocating toward high-quality, resilient names with lower sensitivity to interest rate fluctuations. This disciplined approach reflects our focus on managing risk while identifying enduring opportunities in Brazil&rsquo;s evolving market.</p>
<p><strong>Mexico:</strong> Strong domestic consumption and robust manufacturing activity, supported by nearshoring trends, helped mitigate pressures from inflation and rising interest rates. Mexico continues to solidify its role in global supply chains, leveraging its proximity to the U.S. and shifts in global trade dynamics. However, domestic policy uncertainty tied to the leadership transition in both Mexico and the U.S. and potential U.S.-Mexico trade tensions remain key risks.</p>
<p>We have adopted a more defensive stance while selectively seeking resilient opportunities in sectors linked to domestic demand and industrial growth. By focusing on companies with strong fundamentals that can adapt to evolving macroeconomic and policy landscapes, we aim to navigate near-term uncertainties while positioning for Mexico&rsquo;s long-term growth potential.</p>
<p><strong>Technology:</strong> We continue to maintain an overweight position in companies poised to benefit from the transformative adoption of artificial intelligence. As AI-driven innovation accelerates demand for semiconductors, we have rebalanced our exposure to align with long-term structural trends. This includes increasing exposure to Taiwan Semiconductor Manufacturing Company Limited, the global leader in advanced chip manufacturing, while reducing exposure to Samsung due to execution challenges moderating our conviction in the name. This rebalancing reflects our disciplined approach to managing risk and optimizing the portfolio to capture the transformative potential of AI.</p>
<p><strong>Central &amp; Eastern Europe, Middle East and Africa (CEEMEA)</strong></p>
<p>The CEEMEA region showcased its diversity in Q4 2024, with our portfolio performing well in Turkey, Georgia and Poland. Looking ahead to 2025, we are cautiously optimistic, with potential moderating geopolitical risks providing a more constructive backdrop for the region.</p>
<p>In the Middle East, we have selectively added to the UAE and Saudi Arabia, leveraging strong economic and consumption trends alongside resilience to U.S. dollar strength. Across Central and Eastern Europe, we maintain high conviction in long-term holdings in Kazakhstan, Georgia, Poland and Hungary, where improved geopolitical conditions could reduce risk premia. In Turkey, the return to orthodox macroeconomic policies has begun to show results, with inflation easing and interest rates declining, creating new investment opportunities.</p>
<p>Our strategy remains disciplined and selective, balancing near-term risks with the region&rsquo;s broad long-term potential as we position for 2025.</p>
<h2 id="fund-performance" class="jump-link-nav anchored-block" data-jumplink-title="Fund Performance">Fund Performance</h2>
<p>The VanEck <a href="/us/en/investments/emerging-markets-fund-gbfax/overview" title="GBFAX - Emerging Markets Fund - Class A"><strong>Emerging Markets Fund</strong></a> (the &ldquo;Fund&rdquo;) underperformed the MSCI EM IMI on the quarter-to-date basis ending December 31, 2024 (-10.10% for the Fund; -7.89% for the Index). Negative relative performance for the quarter was driven by stock selection and an overweight in Brazil and the Philippines.</p>
<p>Georgia and South Korea were the Fund&rsquo;s top contributors for the quarter.</p>
<h3>Average Annual Total Returns (%) as of December 31, 2024</h3>
<div class="wrapped-div">
<table style="width: 100%;">
<tbody>
<tr class="tbl-data">
<td class="tbl-header last">&nbsp;</td>
<td class="tbl-header last text-right">4Q24<sup>&dagger;</sup></td>
<td class="tbl-header last text-right">YTD</td>
<td class="tbl-header last text-right">1YR</td>
<td class="tbl-header last text-right">3YR</td>
<td class="tbl-header last text-right">5YR</td>
<td class="tbl-header last text-right">10YR</td>
</tr>
<tr class="tbl-data">
<td class="data-td last text-left">Class A: NAV (Inception 12/20/93)</td>
<td class="data-td data last text-right">-10.10</td>
<td class="data-td data last text-right">-0.29</td>
<td class="data-td data last text-right">-6.22</td>
<td class="data-td data last text-right">-3.34</td>
<td class="data-td data last text-right">0.85</td>
</tr>
<tr class="tbl-data">
<td class="data-td last text-left">Class A: Maximum 5.75% Load</td>
<td class="data-td data last text-right">-15.26</td>
<td class="data-td data last text-right">-6.03</td>
<td class="data-td data last text-right">-8.05</td>
<td class="data-td data last text-right">-4.48</td>
<td class="data-td data last text-right">0.25</td>
</tr>
<tr class="tbl-data">
<td class="data-td last text-left">Class I: NAV (Inception 12/31/07)</td>
<td class="data-td data last text-right">-9.98</td>
<td class="data-td data last text-right">0.28</td>
<td class="data-td data last text-right">-5.69</td>
<td class="data-td data last text-right">-2.84</td>
<td class="data-td data last text-right">1.36</td>
</tr>
<tr class="tbl-data">
<td class="data-td last text-left">MSCI Emerging Markets Investable Markets Index (IMI)</td>
<td class="data-td data last text-right">-7.89</td>
<td class="data-td data last text-right">7.09</td>
<td class="data-td data last text-right">-1.39</td>
<td class="data-td data last text-right">2.51</td>
<td class="data-td data last text-right">3.90</td>
</tr>
<tr class="tbl-data">
<td class="data-td last text-left">MSCI Emerging Markets Index</td>
<td class="data-td data last text-right">-8.01</td>
<td class="data-td data last text-right">7.50</td>
<td class="data-td data last text-right">-1.92</td>
<td class="data-td data last text-right">1.70</td>
<td class="data-td data last text-right">3.64</td>
</tr>
</tbody>
</table>
</div>
<style>
    .data-td.data {
        padding-right: 5px !important;
        padding-left: 5px !important;
    }

    .wrapped-div {
        max-width: 100%;
    }

    @media (max-width: 1240px) {
        .wrapped-div {
            overflow-x: scroll;
        }
    }

    .wrapped-div-sector {
        max-width: 100%;
        overflow-x: scroll;
    }
</style>
<p class="chart-disclosure">The table presents past performance which is no guarantee of future results and which may be lower or higher than current performance. Returns reflect applicable fee waivers and/or expense reimbursements. Had the Fund incurred all expenses and fees, investment returns would have been reduced. Investment returns and Fund shares values will fluctuate so that investor's shares, when redeemed, may be worth more or less than their original cost. Fund returns assume that dividends and capital gains distributions have been reinvested in the Fund at net asset value (NAV). Index returns assume that dividends of the Index constituents in the Index have been reinvested. Performance information current to the most recent month end is available by calling 800.826.2333 or by visiting vaneck.com.</p>
<p class="chart-disclosure">Expenses: Class A: Gross 1.54%; Net 1.54%; Class I: Gross 1.19%; Net 1.01%. Expenses are capped contractually until 5/1/25 at 1.60% for Class A and 1.00% for Class I. Caps exclude acquired fund fees and expenses, interest, trading, dividends, interest payments of securities sold short, taxes and extraordinary expenses.</p>

<h2 id="fund-review" class="jump-link-nav anchored-block" data-jumplink-title="Fund Review">Fund Review</h2>
<p>On a sector level, Materials, Health Care and Utilities contributed to relative performance, while Information Technology, Consumer Discretionary and Industrials detracted. On a country level, Georgia, South Korea and Turkey contributed to relative performance, while Brazil, Philippines and China detracted.</p>
<h2>Top Contributors</h2>
<p>Top contributors to return on an absolute basis during the quarter:</p>
<ul class="content-list">
<li class="mt-2"><strong>Taiwan Semiconductor Manufacturing Company Limited (TSMC) (9.58% of Fund net assets<sup><strong>*</strong></sup>):</strong> TSMC ended the year with a strong quarter, supported by improving expectations for its FY 2026 performance. As the leader in advanced semiconductor manufacturing and the preferred fabrication partner for AI chip designers, TSMC is well-positioned to benefit from these trends over the long term, maintaining its margins at cyclically high levels. Its near-monopoly status has elevated the valuation of its shares, which, while currently justified, requires careful monitoring.</li>
<li class="mt-2"><strong>Bank of Georgia Group (3.09% of Fund net assets<sup><strong>*</strong></sup>): </strong> Bank of Georgia Group Plc is one of the two largest banks in Georgia, holding over 33% of the market share in the country&rsquo;s banking sector. During the quarter, the bank delivered strong performance, supported by solid earnings in the first nine months of 2024, building on an already strong foundation from 2023. Its return on equity remained well above 25%. We remain optimistic about Bank of Georgia&rsquo;s acquisition of Ameriabank in Armenia, which presents an appealing opportunity to replicate its growth and profitability success in new markets.</li>
<li class="mt-2"><strong>MINISO Group Holding Ltd. Sponsored: (1.06% of Fund net assets<sup><strong>*</strong></sup>): </strong> Miniso's acquisition of Sun Art in late September was rejected by shareholders, creating a low baseline for its strong Q4 performance. The company reported robust results last quarter. Management highlighted an improved same-store sales growth (SSSG) rate in Q4 2024 and expressed optimism about 2025. While domestic SSSG was slightly below expectations, overseas performance reached the high end of guidance. Additionally, domestic store openings exceeded guidance, positioning the company for stronger growth in 2025. The recent tariff increase poses minimal concern for Miniso, as the company can shift up to 80% of its U.S. procurement from China to other countries within three to six months.</li>
</ul>
<h2>Top Detractors</h2>
<p>Top detractors to return on an absolute basis during the quarter:</p>
<ul class="content-list">
<li class="mt-2"><strong>MercadoLibre (MELI) (5.59% of Fund net assets<sup><strong>*</strong></sup>): </strong> MELI&rsquo;s underperformance was driven by continued logistics investments, which pressured margins, and higher credit portfolio growth, resulting in elevated upfront provisions. These impacts should ease as logistics investments stabilize with strong growth momentum and credit cohorts mature, reducing the lag effect from upfront provisioning. Despite near-term profitability challenges, operating KPIs remain strong, with expected improvement next quarter. MELI&rsquo;s focus on long-term growth over short-term profits mirrors past strategies, such as free shipping in Brazil (2016), Mercado Pago (2017) and logistics investments (2023), which initially pressured margins but led to exceeding returns and strong stock recoveries. This trend is expected to repeat.</li>
<li class="mt-2"><strong>Reliance Industries Limited (4.15% of Fund net assets<sup><strong>*</strong></sup>): </strong> Reliance shares experienced a pause this year due to several factors, though our analysis shows the business continued to create value for shareholders. The underperformance in 2024 was primarily due to multiple compression, setting the stage for improved returns in 2025. The stock was out of favor as the company is in the midst of significant investments, with benefits yet to fully materialize. Additionally, challenges in two key verticals&mdash;petrochemicals and retail&mdash;contributed to the weaker performance but are expected to ease in 2025.</li>
<li class="mt-2"><strong>Samsung Electronics (2.25% of Fund net assets<sup><strong>*</strong></sup>):</strong> Samsung Electronics shares underperformed in 2024, in line with other global semiconductor companies not directly benefiting from the AI boom. The company also faced challenges from a weak Korean won, compounded by increased political turbulence in South Korea during the second half of the year. Looking ahead to 2025, the political environment in South Korea appears more stable, and Samsung is poised to benefit from the anticipated widespread adoption of AI-focused semiconductor solutions in the first half of the year. These developments are expected to reignite investor interest and positively impact the share price.</li>
</ul>
<h2>Top Buys &amp; Sells</h2>
<p>During the period, we established new positions in the following:</p>
<ul class="content-list">
<li class="mt-2"><strong>Talabat Holding PLC (1.29% of Fund net assets</strong><sup><strong>*</strong></sup><strong>):</strong> A subsidiary of Delivery Hero, Talabat is the leading food delivery and quick-commerce platform in the Gulf Cooperation Council (GCC), outperforming competitors by 3&ndash;10x in key markets like the UAE, Kuwait and Qatar. With industry-leading profitability and strong growth prospects, Talabat is well-positioned to benefit from structural growth drivers such as low online penetration in food delivery and groceries, along with favorable demographics. High order frequency, large ticket sizes and low delivery costs in the region support a uniquely profitable and scalable business model.</li>
<li class="mt-2"><strong>JD.com (0.64% of Fund net assets</strong><sup><strong>*</strong></sup><strong>):</strong> The strategy initiated a small position in JD during 4Q as part of a strategic rebalancing in China. JD was selected for its quality and direct exposure to policy measures aimed at combating deflation and restoring consumer confidence. We anticipate these policies will intensify gradually, including initiatives like home appliance trade-in programs. Such measures are expected to directly benefit JD, a highly efficient online retailer well-positioned to capitalize on revenue growth driven by targeted efforts to strengthen consumer sentiment in China.</li>
<li class="mt-2"><strong>Itau Unibanco Holding SA (0.50% of Fund net assets</strong><sup><strong>*</strong></sup><strong>):</strong> Itau is a high-quality Brazilian bank known for its strong balance sheet, robust operating trends and sustainable ROE above 20%. The bank is well-positioned defensively in a scenario of fiscal uncertainty, with significant excess capital (Common Equity Tier 1 at 13.7%) and excess provisions, despite high capital distributions. Itau remains the most profitable large-cap bank in Brazil, with attractive valuation compared to historical levels and improving earnings momentum. The bank is expected to outperform under current conditions in Brazil, while any positive macroeconomic catalyst could ease pressure on interest rates, further benefiting the sector.</li>
<li class="mt-2"><strong>Saudi National Bank (0.38% of Fund net assets</strong><sup><strong>*</strong></sup><strong>):</strong> As the largest bank in Saudi Arabia with approximately 25% asset market share and a 37% government stake via the Public Investment Fund (PIF), SNB is well-positioned to benefit from Vision 2030 economic reforms and Saudization initiatives. Its strong balance sheet, robust capital and diversified business model support medium-term ROE growth. Additionally, the recent CEO change brings confidence in a refined strategic direction, given his proven track record at other Saudi banks. Despite these strengths, SNB shares are attractively valued, presenting a compelling entry opportunity.</li>
</ul>
<p>During the period, we exited the following positions:</p>
<ul class="content-list">
<li class="mt-2"><strong>China Education Group Holdings (CEG):</strong> After a call with the CEO of China Education in September, we decided to exit our position due to concerns over rising CAPEX commitments and the potential introduction of legislation in Australia to limit foreign student enrollment quotas. On November 12, China Education issued a profit warning, announcing a one-off, non-cash impairment of RMB 1.7 billion. This prompted us to expedite the sale of our position in CEG.</li>
<li class="mt-2"><strong>Vamos Locacao de Caminhoes Maq:</strong> 2024 was a challenging year for Vamos, primarily due to a tougher macroeconomic environment that led the company to shift its focus from accelerating fleet allocation to being more selective in granting contracts. While growth will continue, it is expected to be at a slower pace, falling below expectations. Additionally, the dealership division performed poorly throughout the year. Although the decision to carve out the dealership division and link it to the agricultural business is a positive step that reduces volatility, the remaining core business remains weak. Furthermore, while Vamos has concentrated on renting its grounding fleet, increased competition in the truck rental market from emerging players could intensify pressure during contract renewals. Given the company&rsquo;s high sensitivity to economic conditions, the current scenario remains unfavorable for its prospects.</li>
<li class="mt-2"><strong>Americana Restaurants International:</strong> We exited our position in Americana Restaurants, the master franchisee for Yum Brands in the Middle East, due to near-term challenges such as geopolitical conflicts affecting consumer brand preferences, weak sales and competitive pressure on yields in key markets like Saudi Arabia and Egypt. Although we see long-term growth potential, recent underperformance and limited visibility in the near term prompted us to reallocate capital.</li>
<li class="mt-2"><strong>Movida Participacoes SA:</strong> Movida shares declined last year due to fiscal concerns in Brazil and uncertainties surrounding the seminovos (used car sales) business, particularly trends in used car prices and their impact on depreciation. In recent months, prices have fallen, driven by lower steel and commodity costs, the entry of Chinese carmakers like BYD into the Brazilian market and reduced credit availability. While seminovos car prices have shown some stability, we remain concerned that the recent macroeconomic deterioration, including lower economic activity and higher interest rates, may not yet be fully reflected in car prices, posing downside risks. Additionally, the company&rsquo;s high sensitivity to interest rates makes the current environment unfavorable.</li>
<li class="mt-2"><strong>Shanghai Baosight Software Co (Baosight):</strong> We held a small position in Baosight, an industrial IoT software provider serving China&rsquo;s steel plants and sectors like metallurgy, transportation and electric power generation. With over half of its revenue tied to its parent company, Baosteel, and given China&rsquo;s weak economic outlook, we decided to exit this position due to its limited significance within the portfolio.</li>
<li class="mt-2"><strong>Baidu Inc:</strong> Baidu&rsquo;s rollout of artificial intelligence-generated content (AIGC) is expected to temporarily impact revenue and profit, as the company has chosen not to monetize content generated by Ernie (Baidu&rsquo;s AI chatbot service) to prioritize a positive user experience during the transition. Furthermore, management provided a cautious outlook for the second half of the year, citing challenges from the macroeconomic environment and the ongoing AIGC transition.</li>
</ul>
<h2 id="fund-positioning" class="jump-link-nav anchored-block" data-jumplink-title="Fund Positioning and Outlook">Fund Positioning and Outlook</h2>
<p>We remain grounded by our investment process and our positioning reflects our convictions from a bottom-up basis. Our process has created some positioning differentials versus the benchmark. Brazil remains overweight to start the quarter (10.2% Strategy weight versus 3.9% Index weight), as does the Philippines (4.4% versus 0.6% Index weight).</p>
<p>Taiwan and India remain underweight versus the benchmark.</p>
<p>The Strategy&rsquo;s objective is to find long-term structural growth companies at fair prices (S-GARP). Investments are chosen based on individual company analysis, focusing on quality, governance, innovative business models and low disruption risk, with active management and detailed research guiding our selection process.</p>

<p>To receive more <a href="/us/en/insights/emerging-markets-equity/" title="Emerging Markets Equity Insights"><strong>Emerging Markets Equity</strong></a> insights, <a href="/us/en/subscribe/" title="Subscription Center"><strong>sign up in our subscription center</strong></a>.</p>
]]></content:encoded>
</item><item rdf:about="https://www.vaneck.com/us/en/blogs/digital-assets/matthew-sigel-vaneck-mid-january-bitcoin-chaincheck/">
  <title>VanEck Mid-January Bitcoin ChainCheck></title>
  <link>https://www.vaneck.com/us/en/blogs/digital-assets/matthew-sigel-vaneck-mid-january-bitcoin-chaincheck/</link>
  <description><![CDATA[Bitcoin hit new highs post-Trump inauguration. This month, we review policy shifts, adoption trends, and miner strategies to shape the next phase of the market under the new administration.]]></description>
  <dc:creator>Nathan  Frankovitz</dc:creator>
  <dc:date>01/23/2025 06:30:00</dc:date>
<content:encoded><![CDATA[

<p><strong><u>Please note that VanEck has exposure to bitcoin.</u></strong></p>
<p><strong><u>Three key takeaways for mid-December &ndash; mid-January:</u></strong></p>
<ol class="content-list">
<li class="mt-2"><strong>All Eyes on Trump&rsquo;s First 100 Days:</strong> Bitcoin&rsquo;s choppy price action, driven by betting market odds for a Strategic Bitcoin Reserve, highlights the market&rsquo;s focus on this binary catalyst. Despite bullish policy signals, the tumultuous launch of Trump&rsquo;s memecoins and the White House&rsquo;s early executive orders, which excluded crypto, have left the market recalibrating expectations.</li>
<li class="mt-2"><strong>Bitcoin Miner Stratification:</strong> As VanEck prepares to become even more active managers of digital transformation stocks, our research shows how Bitcoin miners&rsquo; sensitivity to BTC prices varies by strategies like treasury holdings and AI/HPC pivots, offering distinct opportunities for investors.</li>
<li class="mt-2"><strong>Mining Difficulty Is &ldquo;Up Only&rdquo;</strong>: Miners upgraded their hashrate despite sideways prices, pushing mining difficulty higher and signaling optimism. Their Bitcoin stockpiling underscores bullish sentiment and confidence in long-term network growth."</li>
</ol>
<ul class="content-list">
<li class="mt-2"><a href="#price-action" title="Bitcoin Price Action"><strong>Bitcoin Price Action</strong></a></li>
<li class="mt-2"><a href="#treasury-adoption" title="Bitcoin Treasury Adoption"><strong>Bitcoin Treasury Adoption</strong></a></li>
<li class="mt-2"><a href="#miners" title="Bitcoin Miners"><strong>Bitcoin Miners</strong></a></li>
<li class="mt-2"><a href="#monthly-dashboard" title="Bitcoin Monthly Dashboard"><strong>Bitcoin Monthly Dashboard</strong></a></li>
<li class="mt-2"><a href="#btc-network-activity" title="Bitcoin&rsquo;s Network Activity, Adoption, and Fees"><strong>Bitcoin&rsquo;s Network Activity, Adoption, and Fees</strong></a></li>
</ul>
<h2>Chart of the Month</h2>
<h3>Mining Difficulty Continues to Climb, Reflecting Positive Network Sentiment</h3>
<div class="flourish-embed flourish-chart" data-src="visualisation/21261660?2133146"><script src="https://public.flourish.studio/resources/embed.js"></script><noscript><img loading="lazy" src="https://public.flourish.studio/visualisation/21261660/thumbnail" width="100%" alt="Mining Difficulty Continues to Climb, Reflecting Positive Sentiment by Network Participants" /></noscript></div>
<p class="chart-disclosure">Source: Glassnode as of 01/13/2025.</p>
<p><strong>Context:</strong> Bitcoin&rsquo;s mining difficulty, measured in Terahashes <em>(T = 1 trillion hashes), </em>reflects the computational effort required to solve a block and earn rewards. It adjusts every <strong>2,016</strong> blocks (<strong>~2</strong> weeks) to maintain a <strong>10-minute</strong> block time.</p>
<p><strong>Insight: </strong>Mining difficulty is up <strong>~57%</strong> year over year (YoY), driven by rising miner competition, market optimism, and enhanced network security. This aligns with reports of Russian Bitcoin mining equipment demand tripling in Q4 2024 as BRICS nations adopt Bitcoin to counter U.S. monetary dominance.</p>
<h2 id="price-action" class="jump-link-nav anchored-block" data-jumplink-title="Price Action">Bitcoin&rsquo;s Price Action</h2>
<p><strong>Market sentiment: </strong>Bitcoin prices rebounded after choppy selloffs from mid-December to mid-January, retracing from <strong>~$108K</strong> on December 17th to <strong>~$89K</strong> <strong>(-18%)</strong> on January 13th. The market remains focused on Trump&rsquo;s second term, particularly his proposed &lsquo;Strategic Bitcoin Reserve,&rsquo; which was first announced at the Bitcoin 2024 conference. BTC prices have consistently spiked alongside Polymarket odds for 'Will Trump create Bitcoin reserve in first 100 days?' on key dates, including November 21st, December 16th, January 6th, January 15th, and January 20th, underscoring the market&rsquo;s sensitivity to this potential catalyst. In our view, Bitcoin&rsquo;s sharp climb from <strong>$69k</strong> to $<strong>100k</strong> after Trump&rsquo;s election likely priced in his victory, while the subsequent sideways action highlights the looming SBR decision as a binary driver.</p>
<p>Reception to Trump&rsquo;s inauguration has been mixed. Bitcoin hit new all-time highs above <strong>$109k</strong> on inauguration day, driven by anticipation of pro-crypto day-one executive orders. However, none materialized. Speculation had centered on sweeping measures like a Strategic Bitcoin Reserve (SBR), repealing SAB 121 to let banks hold Bitcoin, halting federal crypto litigation, and pardoning Silk Road founder Ross Ulbricht. Their absence prompted markets to recalibrate expectations, sending Bitcoin back into a rangebound pattern.</p>
<p>Further complicating the post-inauguration narrative, Trump quietly launched his own &lsquo;Official Trump Meme&rsquo; coin on Solana during the first-ever Crypto Ball in Washington, D.C. The sudden debut of the &lsquo;$TRUMP&rsquo; coin sparked a speculative frenzy, dominating crypto headlines over the weekend. Within hours, the coin&rsquo;s fully diluted valuation surpassed <strong>$75 billion</strong>, marking one of the digital assets' fastest wealth-creation events. However, the launch faced significant criticism from industry insiders, who saw it as a self-serving money grab rather than advancing crypto&rsquo;s decentralized ethos. These critiques exacerbated the absence of expected day-one executive orders, deepening frustrations over Trump&rsquo;s pro-crypto policy commitments.</p>
<p>Together, these developments underscore the mixed reception to Trump&rsquo;s inauguration. Market optimism for pro-crypto policies collided with disappointment over the absence of key executive orders. Meanwhile, state and corporate actors have continued to adopt Bitcoin, reinforcing its role as a strategic financial asset amid policy uncertainty.</p>
<h2 id="treasury-adoption" class="anchored-block">Bitcoin Treasury Adoption</h2>
<p>Building on last month&rsquo;s review of <strong><a href="/us/en/blogs/digital-assets/matthew-sigel-vaneck-mid-december-bitcoin-chaincheck/#treasury-adoption" title="VanEck Mid-December Bitcoin ChainCheck">emerging corporate, national, and state-level Bitcoin treasury developments</a>,</strong> these actors have joined the chorus:</p>
<ul class="content-list">
<li class="mt-2"><strong>Czech</strong>: On January 6th, Czech National Bank Governor Ale&scaron; Michl said the Bank is considering investing in Bitcoin as a reserve asset.</li>
<li class="mt-2"><strong>Meta: </strong>On January 10th, Meta shareholders proposed allocating part of the company&rsquo;s <strong>$72 billion</strong> in cash and equivalents to Bitcoin, citing its potential as a hedge against inflation and low bond yields. The proposal highlighted Meta CEO Mark Zuckerberg&rsquo;s and board member Marc Andreessen&rsquo;s personal connections to Bitcoin, as well as BlackRock&rsquo;s (#2 shareholder) broader recommendation for a <strong>2%</strong> allocation.</li>
<li class="mt-2"><strong>Florida</strong>: On January 14th, Samuel Armes, Founder of the Florida Blockchain Business Association (FBBA), announced that Florida&rsquo;s strategic Bitcoin reserve initiative is moving forward, sharing an update on social media: 'Deal sealed. It&rsquo;s happening.' This follows his December statement that there was a 'very good chance' of the initiative being established in 2025.</li>
<li class="mt-2"><strong>Intesa Sanpaolo</strong>: On January 14th, Italy&rsquo;s biggest bank made its first proprietary Bitcoin trade, purchasing <strong>&euro;1,000,000</strong> as a &ldquo;test&rdquo;.</li>
<li class="mt-2"><strong>Oklahoma</strong>: On January 15th, Representative Cody Maynard introduced the Strategic Bitcoin Reserve Act, enabling Oklahoma&rsquo;s state savings accounts and pension funds to invest in Bitcoin and other cryptocurrencies.</li>
<li class="mt-2"><strong>Texas</strong>: Also on January 15th, Texas Senator Charles Schwertner filed SB 778, which would formally establish a Strategic Bitcoin Reserve. The bill emphasizes the secure storage of Bitcoin as a state asset and restricts the sale or transfer of Bitcoin without legislative approval or in emergencies.</li>
<li class="mt-2"><strong>Massachusetts: </strong>On January 17th, Senator Peter Durant introduced Bill SD.422, calling for a &lsquo;Commonwealth Bitcoin Strategic Reserve&rsquo;. Notably, this makes Massachusetts the first &ldquo;deep blue&rdquo; state to make such a proposal, underscoring crypto&rsquo;s historical record for bipartisan support.</li>
<li class="mt-2"><strong>Utah: </strong>On January 20th, it was announced that Utah State Representative Jordan Teuscher introduced the &lsquo;Blockchain and Digital Innovation Amendments&rsquo; bill. This bill would give the state treasurer the authority to invest up to <strong>10%</strong> of public funds in qualifying digital assets such as Bitcoin and stablecoins.</li>
<li class="mt-2"><strong>Rumble:</strong> On January 20th, Rumble CEO Chris Pavlovski announced that the company had made its first purchase of Bitcoin for its treasury strategy, stating, &ldquo;It  won&rsquo;t be the last.&rdquo;</li>
</ul>
<h2 id="miners" class="jump-link-nav anchored-block" data-jumplink-title="Miners">Bitcoin Miners</h2>
<p><img loading="lazy" class="img-responsive w-100" alt="Bitcoin Miners" src="https://www.vaneck.com/contentassets/b3493783146949428bf1fcb9edb04a2f/5249_bitcoin-chaincheck-for-january_table_2025-01.svg" /></p>
<p class="chart-disclosure">Beta, Vol, and Returns calculated from Bloomberg and FactSet data as of 1.10.2025.<br />Price / Book and Debt / Assets from Bloomberg as of 1.13.2025, reflecting latest quarterly data.<br /><sup>*</sup>&nbsp;As of 1.21.2025, RIOT has signaled a potentially significant 600 MW AI/HPC pivot at its Corsicana Facility, which is not reflected in this analysis.</p>
<div class="wrapped-div">
<table style="width: 100%;">
<tbody>
<tr class="tbl-data">
<td class="tbl-header last" colspan="10">U.S. State Bitcoin &amp; Digital Asset Reserves</td>
</tr>
<tr class="tbl-data">
<td class="data-td last">&nbsp;</td>
<td class="data-head last text-left">Title</td>
<td class="data-head last text-left">Introduced</td>
<td class="data-head last text-left">Type</td>
<td class="data-head last text-left">Status</td>
<td class="data-head last text-left">Funding Source(s)</td>
<td class="data-head last text-right">Est. Funding Source Size</td>
<td class="data-head last text-right">Potential Investment (%)</td>
<td class="data-head last text-right">Est. Potential Investment ($)</td>
<td class="data-head last text-right">Est. # Bitcoin</td>
</tr>
<tr class="tbl-data">
<td class="data-td last">Arizona</td>
<td class="data-td data last text-left">Senate Bill 1025, 'Arizona Strategic Bitcoin Reserve<br />24 Act'</td>
<td class="data-td data last text-left">16-Dec-24</td>
<td class="data-td data last text-left">Both Reserve &amp; Pension</td>
<td class="data-td data last text-left">Chamber 1</td>
<td class="data-td data last text-left">State Treasurer Public Fund, Retirement System</td>
<td class="data-td data last text-right">$87,394,974,218</td>
<td class="data-td data last text-right">10%</td>
<td class="data-td data last text-right">$8,739,497,422</td>
<td class="data-td data last text-right">91,657</td>
</tr>
<tr class="tbl-data">
<td class="data-td last">Florida</td>
<td class="data-td data last text-left">Strategic Bitcoin Reserve</td>
<td class="data-td data last text-left">3-Dec-24</td>
<td class="data-td data last text-left">Both Reserve &amp; Pension</td>
<td class="data-td data last text-left">Introduced</td>
<td class="data-td data last text-left">Pension Fund, Budget Surplus</td>
<td class="data-td data last text-right">$302,200,000,000</td>
<td class="data-td data last text-right">1%</td>
<td class="data-td data last text-right">$3,022,000,000</td>
<td class="data-td data last text-right">31,694</td>
</tr>
<tr class="tbl-data">
<td class="data-td last">Pennsylvania</td>
<td class="data-td data last text-left">House Bill No. 2664</td>
<td class="data-td data last text-left">19-Nov-24</td>
<td class="data-td data last text-left">Reserve</td>
<td class="data-td data last text-left">Failed/Dead</td>
<td class="data-td data last text-left">Unexpended, unencumbered, or uncommitted funds in the General Fund, Budget Stabilization Reserve Fund, Any other investment fund managed directly by State Treasurer</td>
<td class="data-td data last text-right">$23,586,024,543</td>
<td class="data-td data last text-right">10%</td>
<td class="data-td data last text-right">$2,358,602,454</td>
<td class="data-td data last text-right">24,736</td>
</tr>
<tr class="tbl-data">
<td class="data-td last">Oklahoma</td>
<td class="data-td data last text-left">House Bill 1203 (HB 1203)</td>
<td class="data-td data last text-left">15-Jan-25</td>
<td class="data-td data last text-left">Both Reserve &amp; Pension</td>
<td class="data-td data last text-left">Committee 1</td>
<td class="data-td data last text-left">State General Fund, Revenue Stabilization Fund, Constitutional Reserve (Rainy Day) Fund</td>
<td class="data-td data last text-right">$14,664,000,000</td>
<td class="data-td data last text-right">10%</td>
<td class="data-td data last text-right">$1,466,400,000</td>
<td class="data-td data last text-right">15,379</td>
</tr>
<tr class="tbl-data">
<td class="data-td last">Massachusetts</td>
<td class="data-td data last text-left">Senate Docket, No. 422</td>
<td class="data-td data last text-left">Jan-25</td>
<td class="data-td data last text-left">Reserve</td>
<td class="data-td data last text-left">Introduced</td>
<td class="data-td data last text-left">Commonwealth Stabilization ("Rainy Day") Fund</td>
<td class="data-td data last text-right">$8,831,000,000</td>
<td class="data-td data last text-right">10%</td>
<td class="data-td data last text-right">$883,100,000</td>
<td class="data-td data last text-right">9,262</td>
</tr>
<tr class="tbl-data">
<td class="data-td last">Wyoming</td>
<td class="data-td data last text-left">House Bill 201 (HB 201)</td>
<td class="data-td data last text-left">17-Jan-25</td>
<td class="data-td data last text-left">Reserve</td>
<td class="data-td data last text-left">Failed/Dead</td>
<td class="data-td data last text-left">General Fund and Permanent Wyoming Mineral Trust Fund</td>
<td class="data-td data last text-right">$27,100,000,000</td>
<td class="data-td data last text-right">3%</td>
<td class="data-td data last text-right">$813,000,000</td>
<td class="data-td data last text-right">8,526</td>
</tr>
<tr class="tbl-data">
<td class="data-td last">Ohio</td>
<td class="data-td data last text-left">House Bill No. 18</td>
<td class="data-td data last text-left">23-Jan-25</td>
<td class="data-td data last text-left">Reserve</td>
<td class="data-td data last text-left">Committee 1</td>
<td class="data-td data last text-left">General Revenue Fund Interim Funds, Budget Stabilization Fund, Deferred Prizes Trust Fund</td>
<td class="data-td data last text-right">$4,590,000,000</td>
<td class="data-td data last text-right">10%</td>
<td class="data-td data last text-right">$459,000,000</td>
<td class="data-td data last text-right">4,814</td>
</tr>
<tr class="tbl-data">
<td class="data-td last">Ohio</td>
<td class="data-td data last text-left">Senate Bill No. 57</td>
<td class="data-td data last text-left">29-Jan-25</td>
<td class="data-td data last text-left">Reserve</td>
<td class="data-td data last text-left">Committee 1</td>
<td class="data-td data last text-left">State entities' Bitcoin payments, donations, criminal forfeitures, interim funds</td>
<td class="data-td data last text-right">n/a</td>
</tr>
<tr class="tbl-data">
<td class="data-td last">New Hampshire</td>
<td class="data-td data last text-left">HB 302</td>
<td class="data-td data last text-left">10-Jan-25</td>
<td class="data-td data last text-left">Reserve</td>
<td class="data-td data last text-left">Committee 1</td>
<td class="data-td data last text-left">General Fund, Revenue Stabilization Funds, others as authorized by legislature</td>
<td class="data-td data last text-right">$2,116,317,421</td>
<td class="data-td data last text-right">10%</td>
<td class="data-td data last text-right">$211,631,742</td>
<td class="data-td data last text-right">2,220</td>
</tr>
<tr class="tbl-data">
<td class="data-td last">Utah</td>
<td class="data-td data last text-left">House Bill 230</td>
<td class="data-td data last text-left">15-Jan-25</td>
<td class="data-td data last text-left">Reserve</td>
<td class="data-td data last text-left">Committee 2</td>
<td class="data-td data last text-left">State Disaster Recovery Restricted Account, General Fund Budget Reserve Account, Income Tax Fund Budget Reserve Account, Medicaid Growth Reduction and Budget Stabilization Account</td>
<td class="data-td data last text-right">$1,401,800,000</td>
<td class="data-td data last text-right">10%</td>
<td class="data-td data last text-right">$140,180,000</td>
<td class="data-td data last text-right">1,470</td>
</tr>
<tr class="tbl-data">
<td class="data-td last">Texas</td>
<td class="data-td data last text-left">Senate Bill 778 (SB 778)</td>
<td class="data-td data last text-left">16-Jan-25</td>
<td class="data-td data last text-left">Reserve</td>
<td class="data-td data last text-left">Committee 1</td>
<td class="data-td data last text-left">Unencumbered and unobligated GRF blance per biennium</td>
<td class="data-td data last text-right">$18,290,000,000</td>
<td class="data-td data last text-right">1%</td>
<td class="data-td data last text-right">$182,900,000</td>
<td class="data-td data last text-right">1,918</td>
</tr>
<tr class="tbl-data">
<td class="data-td last">North Dakota</td>
<td class="data-td data last text-left">House Concurrent Resolution No. 3001</td>
<td class="data-td data last text-left">14-Jan-25</td>
<td class="data-td data last text-left">Reserve</td>
<td class="data-td data last text-left">Introduced</td>
<td class="data-td data last text-left">State General Fund, Budget Stabilization Fund, Legacy Fund</td>
<td class="data-td data last text-right">$18,557,625,832</td>
<td class="data-td data last text-right">unspecified</td>
<td class="data-td data last text-right">-</td>
</tr>
<tr class="tbl-data">
<td class="data-td last">North Dakota</td>
<td class="data-td data last text-left">HB1184</td>
<td class="data-td data last text-left">7-Jan-25</td>
<td class="data-td data last text-left">Reserve</td>
<td class="data-td data last text-left">Failed/Dead</td>
<td class="data-td data last text-left">Certain State Funds</td>
<td class="data-td data last text-right">n/a</td>
</tr>
<tr class="tbl-data">
<td class="data-td last">Iowa</td>
<td class="data-td data last text-left">Inflation Protection Act</td>
<td class="data-td data last text-left">6-Feb-25</td>
<td class="data-td data last text-left">Reserve</td>
<td class="data-td data last text-left">Introduced</td>
<td class="data-td data last text-left">General Fund, Cash Reserve Fund, Economic Emergency Fund</td>
<td class="data-td data last text-right">$5,472,000,000</td>
<td class="data-td data last text-right">5%</td>
<td class="data-td data last text-right">$273,600,000</td>
<td class="data-td data last text-right">2,869</td>
</tr>
<tr class="tbl-data">
<td class="data-td last">Illinois</td>
<td class="data-td data last text-left">Strategic Bitcoin Reserve Act</td>
<td class="data-td data last text-left">29-Jan-25</td>
<td class="data-td data last text-left">Reserve</td>
<td class="data-td data last text-left">Committee 1</td>
<td class="data-td data last text-left">Gifts, Grants, Donations</td>
<td class="data-td data last text-right">n/a</td>
</tr>
<tr class="tbl-data">
<td class="data-td last">Kentucky</td>
<td class="data-td data last text-left">HB 376</td>
<td class="data-td data last text-left">6-Feb-25</td>
<td class="data-td data last text-left">Reserve</td>
<td class="data-td data last text-left">Committee 1</td>
<td class="data-td data last text-left">Excess State Treasury Cash</td>
<td class="data-td data last text-right">unclear</td>
<td class="data-td data last text-right">10%</td>
<td class="data-td data last text-right">-</td>
</tr>
<tr class="tbl-data">
<td class="data-td last">Missouri</td>
<td class="data-td data last text-left">HB 1217 Bitcoin Strategic Reserve Fund</td>
<td class="data-td data last text-left">6-Feb-25</td>
<td class="data-td data last text-left">Reserve</td>
<td class="data-td data last text-left">Introduced</td>
<td class="data-td data last text-left">Gifts, Grants, Donations</td>
<td class="data-td data last text-right">n/a</td>
</tr>
<tr class="tbl-data">
<td class="data-td last">Missouri</td>
<td class="data-td data last text-left">SB614 - Treasurer Investment Provisions</td>
<td class="data-td data last text-left">23-Jan-25</td>
<td class="data-td data last text-left">Reserve</td>
<td class="data-td data last text-left">Introduced</td>
<td class="data-td data last text-left">State Treasurer</td>
<td class="data-td data last text-right">$17,082,467,808</td>
<td class="data-td data last text-right">10%</td>
<td class="data-td data last text-right">$1,708,246,781</td>
<td class="data-td data last text-right">17,916</td>
</tr>
<tr class="tbl-data">
<td class="data-td last">Maryland</td>
<td class="data-td data last text-left">HB1389 - Strategic Bitcoin Reserve Act of Maryland</td>
<td class="data-td data last text-left">21-Jan-25</td>
<td class="data-td data last text-left">Reserve</td>
<td class="data-td data last text-left">Committee 1</td>
<td class="data-td data last text-left">Seized gambling-related money, state budget fund appropriations, donations, grants</td>
<td class="data-td data last text-right">n/a</td>
</tr>
<tr class="tbl-data">
<td class="data-td last">New Mexico</td>
<td class="data-td data last text-left">Strategic Bitcoin Reserve Act (SB 275)</td>
<td class="data-td data last text-left">4-Feb-25</td>
<td class="data-td data last text-left">Reserve</td>
<td class="data-td data last text-left">Committee 1</td>
<td class="data-td data last text-left">Land Grant Permanent Fund, Severance Tax Permanent Fund, Tobacoo Settlement Permanent Fund, other state funds deemed appropriate by investment council</td>
<td class="data-td data last text-right">$42,098,000,000</td>
<td class="data-td data last text-right">5%</td>
<td class="data-td data last text-right">$2,104,900,000</td>
<td class="data-td data last text-right">22,076</td>
</tr>
<tr class="tbl-data">
<td class="data-td last">South Dakota</td>
<td class="data-td data last text-left">House Bill 1202</td>
<td class="data-td data last text-left">30-Jan-25</td>
<td class="data-td data last text-left">Both Reserve &amp; Pension</td>
<td class="data-td data last text-left">Committee 1</td>
<td class="data-td data last text-left">State public funds approved by the State Investment Council</td>
<td class="data-td data last text-right">$16,678,800,000</td>
<td class="data-td data last text-right">10%</td>
<td class="data-td data last text-right">$1,667,880,000</td>
<td class="data-td data last text-right">17,492</td>
</tr>
<tr class="tbl-data">
<td class="data-td last">Montana</td>
<td class="data-td data last text-left">House Bill No. 429 - "Inflation Protection Act of 2025"</td>
<td class="data-td data last text-left">8-Feb-25</td>
<td class="data-td data last text-left">Reserve</td>
<td class="data-td data last text-left">Committee 1</td>
<td class="data-td data last text-left">Montana General Fund - up to $50 million initially,</td>
<td class="data-td data last text-right">$4,176,970,000</td>
<td class="data-td data last text-right">n/a</td>
<td class="data-td data last text-right">$50,000,000</td>
<td class="data-td data last text-right">524</td>
</tr>
<tr class="tbl-data">
<td class="data-td last">North Carolina</td>
<td class="data-td data last text-left">HB 92 - NC Digital Assets Investments Act</td>
<td class="data-td data last text-left">10-Feb-25</td>
<td class="data-td data last text-left">Both Reserve &amp; Pension</td>
<td class="data-td data last text-left">Introduced</td>
<td class="data-td data last text-left">General Fund, Highway Fund, Teachers' and Sate Employees' Retirement System, other special state funds</td>
<td class="data-td data last text-right">$26,291,046,000</td>
<td class="data-td data last text-right">10%</td>
<td class="data-td data last text-right">$2,629,104,600</td>
<td class="data-td data last text-right">27,573</td>
</tr>
<tr class="tbl-data">
<td class="data-td last">West Virginia</td>
<td class="data-td data last text-left">Senate Bill 465</td>
<td class="data-td data last text-left">14-Feb-25</td>
<td class="data-td data last text-left">Both Reserve &amp; Pension</td>
<td class="data-td data last text-left">Introduced</td>
<td class="data-td data last text-left">Public Funds Overseen by Board of Treasury Investments</td>
<td class="data-td data last text-right">$11,000,000,000</td>
<td class="data-td data last text-right">10%</td>
<td class="data-td data last text-right">$1,100,000,000</td>
<td class="data-td data last text-right">11,536</td>
</tr>
<tr class="tbl-data">
<td class="data-td last">Michigan</td>
<td class="data-td data last text-left">HB4087</td>
<td class="data-td data last text-left">13-Feb-25</td>
<td class="data-td data last text-left">Reserve</td>
<td class="data-td data last text-left">Committee 1</td>
<td class="data-td data last text-left">The General Fund, The Countercyclical Budget and Economic Stabilization Fund</td>
<td class="data-td data last text-right">$3,982,618,000</td>
<td class="data-td data last text-right">10%</td>
<td class="data-td data last text-right">$398,261,800</td>
<td class="data-td data last text-right">4,147</td>
</tr>
<tr class="tbl-data">
<td class="data-td data last" colspan="7">&nbsp;</td>
<td class="data-td data last text-left">Total:</td>
<td class="data-td data last text-right">$ 25,036,702,345</td>
<td class="data-td data last text-right">262,547</td>
</tr>
</tbody>
</table>
</div>
<p class="chart-disclosure"># BTC Held &amp; EV from Bitcoin Treasuries &amp; Yahoo Finance as of 1.13.2025<br /><sup>*</sup>&nbsp;CORZ's 1Y performance calculated from 1/25/2024</p>
<p class="chart-disclosure">Sources: FactSet, Bloomberg, Bitcoin Treasuries, Yahoo Finance as of 01/13/2025. Not intended as a recommendation to buy or sell any securities mentioned herein. <strong>Past performance is no guarantee of future results. Please see important disclosures regarding hypothetical performance at the end of this blog. </strong></p>
<p>Our confidence in 'digital transformation' assets continues to grow, driven by the synergies between AI, cryptocurrency, and energy infrastructure. As a result, we are deepening our research into Bitcoin mining and data centers, with plans to increase our investments in this space over the coming quarters. The outlook is strong, with JPM describing data centers as "the most ferocious investment inflection in decades." JPM projects a <strong>25%</strong> Compound Annual Growth Rate (CAGR) in total data center MW additions from 2023 to 2026 and estimates hyperscalers will spend <strong>$237 billion</strong> on data center CapEx in 2025, a <strong>27%</strong> year-over-year increase. Given Bitcoin miners&rsquo; expertise in converting electricity into computational power within specialized data centers, we reiterate our view that they are well-positioned to benefit from this trend by continuing to repurpose energy capacity from Bitcoin mining to AI/high-performance computing (HPC) compute.</p>
<p>To instruct our data-driven approach to the sector, we calculated the Bitcoin beta for each miner over the past 30 and 360 days, reflecting their stock prices&rsquo; sensitivities to Bitcoin&rsquo;s price changes. Based on our categorization of the sector, high-beta miners, such as Cleanspark and Marathon Digital, tend to be BTC pure-plays (miners who have not signaled an AI/HPC pivot) and &lsquo;HOLDers&rsquo; (miners whose BTC holdings comprise <strong>20%+</strong> of their enterprise value), as their revenues are closely tied to Bitcoin's market value. On the other end of the BTC beta spectrum, miners like CORZ have invested heavily in providing AI/HPC infrastructure to capitalize on AI&rsquo;s growing energy demand, reducing their exposure to BTC price fluctuations. Due to their substantial Bitcoin treasuries, outliers like HUT and HIVE maintain higher BTC betas despite significant investments in GPU-as-a-Service initiatives, taking on hybrid Pivoter/HOLDer strategies. Similarly, despite being late in signaling an AI/HPC pivot, Bitfarms has shown relatively low sensitivity to Bitcoin prices. We believe the market may be overlooking BITF due to its smaller scale than other pure-play miners, limited BTC treasury, and lack of a clear AI/HPC strategy. However, these factors may present an opportunity for investors who see the stock as undervalued. Our <em>Enterprise Value Attribution Analysis (see below)</em> suggests that both BITF&rsquo;s and HIVE&rsquo;s AI/HPC potential remain almost entirely ignored in their current market valuations.</p>
<h3>Bitcoin Mining Stock Performance Averages by Category</h3>
<div class="wrapped-div">
<table style="width: 500px;">
<tbody>
<tr class="tbl-data">
<td class="tbl-header last text-left">Time Horizon</td>
<td class="tbl-header last text-right">BTC Pure Plays (%)</td>
<td class="tbl-header last text-right">Pivoters<sup>*</sup>&nbsp;(%)</td>
<td class="tbl-header last text-right">HOLDers (%)</td>
<td class="tbl-header last text-right">BTC (%)</td>
</tr>
<tr class="tbl-data">
<td class="data-td last font-weight-normal text-left">1M</td>
<td class="data-td data last text-right">-15.2</td>
<td class="data-td data last text-right">-19.2</td>
<td class="data-td data last text-right">-16.3</td>
<td class="data-td data last text-right">-5.3</td>
</tr>
<tr class="tbl-data">
<td class="data-td last font-weight-normal text-left">3M</td>
<td class="data-td data last text-right">18.0</td>
<td class="data-td data last text-right">52.6</td>
<td class="data-td data last text-right">31.5</td>
<td class="data-td data last text-right">6.7</td>
</tr>
<tr class="tbl-data">
<td class="data-td last font-weight-normal text-left">6M</td>
<td class="data-td data last text-right">-4.6</td>
<td class="data-td data last text-right">27.9</td>
<td class="data-td data last text-right">8.9</td>
<td class="data-td data last text-right">65.1</td>
</tr>
<tr class="tbl-data">
<td class="data-td last font-weight-normal text-left">1Y</td>
<td class="data-td data last text-right">-16.7</td>
<td class="data-td data last text-right">70.9</td>
<td class="data-td data last text-right">7.0</td>
<td class="data-td data last text-right">103.2</td>
</tr>
</tbody>
</table>
</div>
<br />
<p class="chart-disclosure"><sup>*</sup>&nbsp;CORZ's 1Y performance calculated from 1/25/2024</p>
<p class="chart-disclosure">Source: FactSet, VanEck Research as of 01/10/2025. Not intended as a recommendation to buy or sell any securities mentioned herein. <strong>Past performance is no guarantee of future results.</strong></p>
<p>Despite Bitcoin&rsquo;s strong 1Y performance <strong>(+103%),</strong> high-beta names like CLSK, MARA, and RIOT&mdash;the &lsquo;BTC Pure-Plays&rsquo;&mdash;have generally underperformed lower-beta names like CORZ, WULF, BTDR, BTBT, CIFR, and HUT. We categorize these miners as &lsquo;Pivoters,&rsquo; given their allocation of Bitcoin mining capacity toward AI/ high-performance computing (HPC) workloads. However, most Pivoters are still in the early stages of AI/HPC pilot programs and feasibility studies, underscoring the speculative nature of this trend. This dynamic is reflected in this month&rsquo;s performance and BTC beta data: Pivoters like BTBT and WULF showed the largest increases in 30-day BTC beta versus 360-day BTC beta (<strong>+2.77</strong> and <strong>+2.41</strong>, respectively), while pure-plays like CLSK and MARA exhibited the smallest changes <strong>(+0.92</strong> and <strong>+0.94</strong>, respectively). These findings suggest that while the market is gradually pricing the potential long-term upside for AI/HPC Pivoters, their sensitivity to Bitcoin&rsquo;s downside remains significant, as most of their anticipated AI/HPC revenues are not yet realized. In other words, in the near term, they will still be primarily involved in the mining of Bitcoin.</p>
<h3>After Standardizing For Bitcoin Mining (EH/s) Valuations, Market Expectations for AI/HPC Contribution Are Highest For CORZ &amp; BTDR, Lowest For BITF &amp; HIVE</h3>
<div class="flourish-embed flourish-chart" data-src="visualisation/21262189?2133146"><script src="https://public.flourish.studio/resources/embed.js"></script><noscript><img loading="lazy" src="https://public.flourish.studio/visualisation/21262189/thumbnail" width="100%" alt="After Standardizing For Bitcoin Mining (EH/s) Valuations, Market Expectations for AI/HPC Contribution Are Highest For CORZ &amp; BTDR, Lowest For BITF &amp; HIVE" /></noscript></div>
<p class="chart-disclosure">Sources: FactSet, Bloomberg, Bitcoin Treasuries, Yahoo Finance as of 01/13/2025. Not intended as a recommendation to buy or sell any securities mentioned herein. <strong>Past performance is no guarantee of future results. Please see important disclosures regarding hypothetical performance at the end of this blog. </strong></p>
<p>We performed an <em>Enterprise Value (EV) Attribution Analysis</em> to understand better how the market values each miner&rsquo;s AI/HPC efforts. This analysis aims to isolate the enterprise value contributed by each miners&rsquo; Bitcoin holdings, mining capacity, and AI/HPC pivot. First, we subtracted the market value of Bitcoin holdings from each miner's total EV. Using December production reports, we estimated each miner's operational Bitcoin mining capacity (exahash per second, or &ldquo;EH/s&rdquo;). Next, we calculated a standardized EV per EH/s of <strong>~$54.2M</strong> by averaging data from three major pure-play miners&mdash;Marathon Digital (MARA), Riot Platforms (RIOT), and CleanSpark (CLSK)&mdash;after excluding the value of their Bitcoin holdings. We applied this standardized EV/EH/s figure to each miner&rsquo;s operational hashrate to estimate the EV attributable to their Bitcoin mining operations. After accounting for Bitcoin holdings and mining capacity, the remaining EV gives us the implied enterprise value for their remaining efforts, primarily in AI/HPC. In the case of BTDR, however, this approach likely overestimates EV from AI/HPC by omitting an EV carveout specific to their growing &lsquo;SEALMINER&rsquo; ASIC business.</p>
<p>While we believe that averaging the leading pure-play Bitcoin miners (MARA, RIOT, and CLSK) provides a reliable benchmark EV/EH/s that reflects priced-in growth trajectories, this analysis does not account for the unique growth, profitability, or risk profiles of individual miners, nor does it assign additional value to stronger operators. Instead, it assumes that all mining stocks eventually converge to the same valuation over time. While this convergence is unlikely in the short term, the framework offers a useful starting point for evaluating AI/HPC opportunities. These opportunities currently deliver significantly higher margins compared to Bitcoin mining, where the difficulty algorithm relentlessly compresses profits through automated adjustments. Ultimately, we think Bitcoin mining&rsquo;s compressed margins could lead to the commoditization of electricity used for Bitcoin mining, forcing all miners to become multi-purpose energy infrastructure businesses like pivoters. While this may sound bearish, we interpret pivoters&rsquo; early success as validation of Bitcoin&rsquo;s unique ability to provide free-market, geographically agnostic subsidy for any energy-intensive enterprise, such as remote sustainable energy production, electrical grid management, and industrial production.</p>
<p>Examining HIVE and BITF through this standardized EV/EH/s framework suggests that both miners&rsquo; valuations are cheap relative to their peers. According to research from Bernstein, CIFR and HIVE lead in Bitcoin mining efficiency at <strong>~17 BTC/EH</strong>, followed closely by CLSK, IREN, BTDR, MARA, and RIOT. While BITF&rsquo;s efficiency trails these miners modestly at ~<strong>16 BTC/EH</strong>, we do not think it is enough to justify applying a lower enough EV/EH/s multiple to offset the negative EV of their AI/HPC potential implied by our analysis. Given their <strong>1.6 GW </strong>of multi-year development pipeline capacity, <strong>1,075 MW</strong> of which is in the coveted PJM market with strong AI/HPC properties, we think BITF is well-positioned to strike an AI/HPC deal in the coming years.</p>
<h3>Bitcoin Miners' Beta to Bitcoin Varies Widely By Strategy</h3>
<div class="flourish-embed flourish-chart" data-src="visualisation/21262440?2133146"><script src="https://public.flourish.studio/resources/embed.js"></script><noscript><img loading="lazy" src="https://public.flourish.studio/visualisation/21262440/thumbnail" width="100%" alt="Bitcoin Miners' Beta to Bitcoin Varies Widely By Strategy" /></noscript></div>
<p class="chart-disclosure">Sources: Bloomberg, FactSet, VanEck Research as of 01/13/2025. <strong>Past performance is no guarantee of future results.</strong></p>
<p>Building on our EV analysis, visualizing 360-day Bitcoin beta data provides further insight into how miners&rsquo; AI/HPC pivots are reshaping their sensitivity to Bitcoin prices. On average, AI/HPC pivoters have less Bitcoin beta <strong>(0.69)</strong> than Bitcoin pure-plays <strong>(1.06)</strong> and Bitcoin HOLDers <strong>(1.00). </strong>As both Pivoters and HOLDers, HUT and HIVE combine elements of Bitcoin pure-plays and data center pure-plays. Thanks to their industry-leading AI/HPC partnership with CoreWeave, CORZ&rsquo;s 360-day Bitcoin beta closely resembles that of typical pure-play data centers, which we have averaged from a blend of companies including Hyperscale Data, Digital Realty, and Equinix.</p>
<p>WULF exhibits BTC beta even lower than the average Data Center in our data set, reflecting the significant implied EV contributed by its AI/HPC business and its aggressive pivot toward AI/HPC workloads. This shift is exemplified by WULF&rsquo;s recently announced partnership to provide <strong>70 MW</strong> of turn-key data center infrastructure for Core42&rsquo;s GPU clusters at its Lake Mariner site, which is the second-largest Bitcoin miner-to-AI/HPC deal after CORZ&rsquo;s agreement with CoreWeave. In contrast, BTDR&rsquo;s higher beta likely stems from its sizable Bitcoin mining operations and its unique position as a vertically integrated chip producer, supported by its growing SEALMINER ASIC business line. However, as BTDR has made early progress in identifying AI/HPC sites through TLM Group&rsquo;s feasibility studies, we anticipate its BTC beta to decline over time as a potentially large-scale AI/HPC pivoter. More broadly, we anticipate the universe of publicly traded miners will continue differentiating their businesses through a combination of Bitcoin mining scale, AI/HPC pivots, and additional strategies such as BTC treasuries and ASIC production. This differentiation will increasingly stratify their exposure to BTC prices, carrying significant implications for investors seeking diversified exposure to the asset class across price cycles.</p>
<h2 id="monthly-dashboard" class="anchored-block">Bitcoin Monthly Dashboard</h2>
<div class="wrapped-div">
<table style="width: 100%;">
<tbody>
<tr class="tbl-data">
<td class="tbl-header last text-left">As of January 20th, 2024</td>
<td class="tbl-header last text-right">7-day avg</td>
<td class="tbl-header last text-right">30-day change<sup>&sup1;</sup>&nbsp;(%)</td>
<td class="tbl-header last text-right">365-day change (%)</td>
<td class="tbl-header last text-right">Last 7-days percentile<br />vs all-time history (%)</td>
</tr>
<tr class="tbl-data">
<td class="data-td last font-weight-normal text-left">Bitcoin Price</td>
<td class="data-td data last text-right">$ 101,298</td>
<td class="data-td data last text-right">0</td>
<td class="data-td data last text-right">141</td>
<td class="data-td data last text-right">100</td>
</tr>
<tr class="tbl-data">
<td class="data-td last font-weight-normal text-left">Daily Active Addresses</td>
<td class="data-td data last text-right">797,416</td>
<td class="data-td data last text-right">-6</td>
<td class="data-td data last text-right">-2</td>
<td class="data-td data last text-right">71</td>
</tr>
<tr class="tbl-data">
<td class="data-td last font-weight-normal text-left">Daily New Addresses</td>
<td class="data-td data last text-right">341,121</td>
<td class="data-td data last text-right">-3</td>
<td class="data-td data last text-right">-20</td>
<td class="data-td data last text-right">62</td>
</tr>
<tr class="tbl-data">
<td class="data-td last font-weight-normal text-left">Daily Transactions</td>
<td class="data-td data last text-right">372,167</td>
<td class="data-td data last text-right">-7</td>
<td class="data-td data last text-right">-24</td>
<td class="data-td data last text-right">90</td>
</tr>
<tr class="tbl-data">
<td class="data-td last font-weight-normal text-left">Daily Inscriptions</td>
<td class="data-td data last text-right">65,424</td>
<td class="data-td data last text-right">-8</td>
<td class="data-td data last text-right">-66</td>
<td class="data-td data last text-right">49</td>
</tr>
<tr class="tbl-data">
<td class="data-td last font-weight-normal text-left">Total Transfer Volume (USD)</td>
<td class="data-td data last text-right">$ 85,570,894,091</td>
<td class="data-td data last text-right">7</td>
<td class="data-td data last text-right">136</td>
<td class="data-td data last text-right">92</td>
</tr>
<tr class="tbl-data">
<td class="data-td last font-weight-normal text-left">% Supply Active, last 180 days</td>
<td class="data-td data last text-right">25%</td>
<td class="data-td data last text-right">11</td>
<td class="data-td data last text-right">48</td>
<td class="data-td data last text-right">40</td>
</tr>
<tr class="tbl-data">
<td class="data-td last font-weight-normal text-left">% Supply Dormant for 3+ Years</td>
<td class="data-td data last text-right">45%</td>
<td class="data-td data last text-right">-1</td>
<td class="data-td data last text-right">3</td>
<td class="data-td data last text-right">95</td>
</tr>
<tr class="tbl-data">
<td class="data-td last font-weight-normal text-left">Avg Fees (USD)</td>
<td class="data-td data last text-right">$ 2.17</td>
<td class="data-td data last text-right">-37</td>
<td class="data-td data last text-right">-75</td>
<td class="data-td data last text-right">75</td>
</tr>
<tr class="tbl-data">
<td class="data-td last font-weight-normal text-left">Avg Fees (BTC)</td>
<td class="data-td data last text-right">0.00002</td>
<td class="data-td data last text-right">-38</td>
<td class="data-td data last text-right">-90</td>
<td class="data-td data last text-right">10</td>
</tr>
<tr class="tbl-data">
<td class="data-td last font-weight-normal text-left">Percent of BTC Addresses in profit</td>
<td class="data-td data last text-right">98%</td>
<td class="data-td data last text-right">0</td>
<td class="data-td data last text-right">20</td>
<td class="data-td data last text-right">92</td>
</tr>
<tr class="tbl-data">
<td class="data-td last font-weight-normal text-left">Unrealized profit/loss ratio</td>
<td class="data-td data last text-right">0.59</td>
<td class="data-td data last text-right">-3</td>
<td class="data-td data last text-right">24</td>
<td class="data-td data last text-right">82</td>
</tr>
<tr class="tbl-data">
<td class="data-td last font-weight-normal text-left">Global Power Consumption (TWh)</td>
<td class="data-td data last text-right">152</td>
<td class="data-td data last text-right">1</td>
<td class="data-td data last text-right">51</td>
<td class="data-td data last text-right">100</td>
</tr>
<tr class="tbl-data">
<td class="data-td last font-weight-normal text-left">Total Daily BTC Miner Revenues (USD)</td>
<td class="data-td data last text-right">$ 46,157,777</td>
<td class="data-td data last text-right">-2</td>
<td class="data-td data last text-right">19</td>
<td class="data-td data last text-right">94</td>
</tr>
<tr class="tbl-data">
<td class="data-td last font-weight-normal text-left">Total Crypto Equities' Market Cap<sup>*</sup>&nbsp;(USD) (MM)</td>
<td class="data-td data last text-right">$ 224,766</td>
<td class="data-td data last text-right">-5</td>
<td class="data-td data last text-right">166</td>
<td class="data-td data last text-right">94</td>
</tr>
<tr class="tbl-data">
<td class="data-td last font-weight-normal text-left">Transfer volume from Miners to Exchanges (USD)</td>
<td class="data-td data last text-right">$ 5,607,255</td>
<td class="data-td data last text-right">-46</td>
<td class="data-td data last text-right">-14</td>
<td class="data-td data last text-right">89</td>
</tr>
<tr class="tbl-data">
<td class="data-td last font-weight-normal text-left">Bitcoin Dominance</td>
<td class="data-td data last text-right">57%</td>
<td class="data-td data last text-right">0</td>
<td class="data-td data last text-right">14</td>
<td class="data-td data last text-right">80</td>
</tr>
<tr class="tbl-data">
<td class="data-td last font-weight-normal text-left">Bitcoin Futures Annualized Basis</td>
<td class="data-td data last text-right">13%</td>
<td class="data-td data last text-right">-11</td>
<td class="data-td data last text-right">31</td>
<td class="data-td data last text-right">78</td>
</tr>
<tr class="tbl-data">
<td class="data-td last font-weight-normal text-left">Mining Difficulty (T)</td>
<td class="data-td data last text-right">110</td>
<td class="data-td data last text-right">6</td>
<td class="data-td data last text-right">53</td>
<td class="data-td data last text-right">100</td>
</tr>
</tbody>
</table>
</div>
<br />
<p class="chart-disclosure"><sup>*</sup>&nbsp;DAPP market cap as a proxy, as of Jan 20th, 2024<br /><sup>1</sup>&nbsp;30 day change &amp; 365 day change are relative to the 7-day avg, not absolute</p>
<div class="wrapped-div">
<table style="width: 500px;">
<tbody>
<tr class="tbl-data">
<td class="tbl-header last text-left">Regional Trading</td>
<td class="tbl-header last text-right">MoM Change (%)</td>
<td class="tbl-header last text-right">YoY Change (%)</td>
</tr>
<tr class="tbl-data">
<td class="data-td last font-weight-normal text-left">Asia Hours Price Change MoM ($)</td>
<td class="data-td data last text-right">-1</td>
<td class="data-td data last text-right">4</td>
</tr>
<tr class="tbl-data">
<td class="data-td last font-weight-normal text-left">US hours Price Change MoM ($)</td>
<td class="data-td data last text-right">-1</td>
<td class="data-td data last text-right">4</td>
</tr>
<tr class="tbl-data">
<td class="data-td last font-weight-normal text-left">EU hours Price Change MoM ($)</td>
<td class="data-td data last text-right">0</td>
<td class="data-td data last text-right">5</td>
</tr>
</tbody>
</table>
</div>
<br />
<p class="chart-disclosure">Source: Glassnode, VanEck research as of 1/20/25.<strong> Past performance is no guarantee of future results.</strong></p>
<h2 id="btc-network-activity" class="jump-link-nav anchored-block" data-jumplink-title="Bitcoin's Network">Bitcoin&rsquo;s Network Activity, Adoption, and Fees</h2>
<p><strong>Daily transactions: </strong>With daily transactions numbering a 7-day average of <strong>~372K</strong> <strong>(-7% MoM),</strong> the trend of fewer transactions being offset by larger payloads (transaction volumes) continued this month. We think the <strong>-24% YoY</strong> decline in onchain transaction count is due to increased usage of custodial solutions like centralized exchanges and wrapped BTC, which enable users to make BTC-denominated transactions with fewer transactions on Bitcoin&rsquo;s L1 blockchain.</p>
<p><strong>Ordinals inscriptions: </strong>Ordinals transactions incurred a modest <strong>(-8%)</strong> decline this month, retaining most of December&rsquo;s growth after the Bitcoin NFT asset class flatlined from May &ndash; November last year.</p>
<p><strong>Total transfer volume: </strong>Bitcoin blockchain transfer volumes grew <strong>7%</strong> month-over-month, with the 7-day moving average reaching <strong>~$85.6B</strong>. This is in the 92<sup>nd</sup>&nbsp;percentile of all-time readings and just below this market cycle&rsquo;s peak of <strong>$93.4B</strong> in November. However, it remains significantly lower than the second half of 2021, when 7-day averages often exceeded <strong>$100B</strong> and occasionally surpassed <strong>$300B</strong> between September and November. We believe this indicates that the market has not yet reached the euphoric levels of onchain activity typically associated with a market cycle peak.</p>
<p><strong>Transaction fees: </strong>Average transaction fees declined <strong>~38%</strong> month over month in both USD and BTC terms, extending a significant year-over-year decrease. This decline follows January 2024&rsquo;s heightened Ordinals and Inscriptions activity&mdash;Bitcoin&rsquo;s equivalent of NFTs&mdash;which temporarily drove fees higher.</p>
<h2>Bitcoin Market Health and Profitability</h2>
<p><strong>Percent of addresses in profit: </strong>With Bitcoin prices once again trading at all-time highs, <strong>~98%</strong> of all Bitcoin addresses are currently profitable.</p>
<p><strong>Bitcoin Dominance: </strong>Bitcoin dominance is flat month over month, curtailing last month&rsquo;s altcoin season momentum amid risk-off sentiment. If the market breaks to the upside after digesting Trump&rsquo;s volatile inauguration weekend, we expect dominance to decline and altcoin season to resume.</p>
<p><strong>Net unrealized profit/loss: </strong>Net Unrealized Profit/Loss (NUPL) is at <strong>0.59</strong>, down <strong>3%</strong> MoM. This decline indicates that some traders have taken profits recently. However, this level is relatively neutral for a bull market, suggesting that this month&rsquo;s cooling-off phase has primed BTC for its next significant move.</p>
<h2>Bitcoin Miners &amp; Total Crypto Equities&rsquo; Market Cap</h2>
<p><strong>Total Daily BTC Miner Revenues: </strong>Down just <strong>2%</strong> MoM, mining revenues have held onto most of last month&rsquo;s <strong>20%</strong> growth despite a 6% increase in mining difficulty and declining transaction fees. This resilience reflects Bitcoin price growth and miners&rsquo; fleet upgrades.</p>
<p><strong>Transfer Volume from Miners to Exchanges:</strong> As transfers to exchanges have dropped <strong>46% MoM</strong>, it appears that miners are stockpiling their newly mined coins, paralleling the growth in corporate and state Bitcoin reserves. We believe this indicates that miners have a bullish sentiment as we head into Trump&rsquo;s first 100 days.</p>
<p><strong>Total Crypto Equities&rsquo; Market Cap: </strong>The total market cap for crypto equities has fallen<strong> 5% </strong>MoM since last month&rsquo;s all-time highs. Due to the new administration&rsquo;s generally positive and deregulatory stances towards blockchain, energy, and AI, we believe this category will likely continue its strong performance. However, we remain cautious of crypto equities&rsquo; downside exposure to a broader crypto market cycle top.</p>
<p><strong>Links to third party websites are provided as a convenience and the inclusion of such links does not imply any endorsement, approval, investigation, verification or monitoring by us of any content or information contained within or accessible from the linked sites. By clicking on the link to a non-VanEck webpage, you acknowledge that you are entering a third-party website subject to its own terms and conditions. VanEck disclaims responsibility for content, legality of access or suitability of the third-party websites.</strong></p>
<style>
    .data-td.data {
        padding-right: 5px !important;
    }
    
    .data-head { 
    padding-right: 5px !important;
    }

    .wrapped-div {
        max-width: 100%;
    }

    @media (max-width: 1240px) {
        .wrapped-div {
            overflow-x: scroll;
        }
    }

    .wrapped-div-sector {
        max-width: 100%;
        overflow-x: scroll;
    }
</style>
<p>To receive more <strong><a href="https://www.vaneck.com/us/en/insights/digital-assets/" title="Digital Assets Insights">Digital Assets</a></strong> insights, <strong><a href="https://www.vaneck.com/us/en/subscribe/" title="Subscription Center">sign up in our subscription center</a></strong>.</p>
]]></content:encoded>
</item><item rdf:about="https://www.vaneck.com/us/en/blogs/income-investing/elevated-yields-spark-fallen-angels-appeal/">
  <title>Elevated Yields Spark Fallen Angels&#39; Appeal></title>
  <link>https://www.vaneck.com/us/en/blogs/income-investing/elevated-yields-spark-fallen-angels-appeal/</link>
  <description><![CDATA[A BDC downgrade last month may be the beginning of a new sector theme, though downgrades in 2025 are largely expected to be idiosyncratic.]]></description>
  <dc:creator>Nicolas  Fonseca, CFA</dc:creator>
  <dc:date>01/22/2025 06:30:00</dc:date>
<content:encoded><![CDATA[

<p id="december-update" class="jump-link-nav anchored-block" data-jumplink-title="December Update">Fallen angels (as represented by the ICE US Fallen Angel High Yield 10% Constrained Index, &ldquo;H0CF&rdquo;) underperformed the broad high yield market (as represented by the ICE BofA US High Yield Index, &ldquo;H0A0&rdquo;) by 0.56% (-0.40% vs 0.16%) in Q4 and by 2.44% in 2024 (5.76% vs 8.20%) as lower duration and lower quality outperformed. The 10Y US Treasury experienced significant volatility in 2024, beginning the year at 3.88%, rising to 4.70% in late May, declining to 3.63% in early September then spiking in Q4 to finish the year at 4.58%. Early 2025 trends suggest yields moving closer to 5%, driven by persistent inflation and a strong labor market. Despite their underperformance, fallen angels continued to present a compelling long-term opportunity due to their oversold and undervalued nature.</p>
<h3>Success Rates Matter: Fallen Angels vs Broad High Yield</h3>
<div class="flourish-embed flourish-chart" data-src="visualisation/21200987?2429575"><script src="https://public.flourish.studio/resources/embed.js"></script><noscript><img loading="lazy" src="https://public.flourish.studio/visualisation/21200987/thumbnail" width="100%" alt="Success Rates Matter: Fallen Angels vs Broad High Yield" /></noscript></div>
<p class="chart-disclosure">Source: Morningstar, January 2004 &ndash; December 2024. Batting Average is measured by dividing the number of periods a portfolio or investment strategy outperforms a benchmark by the total number of periods.</p>
<h2 id="in-review-2024" class="jump-link-nav anchored-block" data-jumplink-title="2024 in Review">2024 in Review</h2>
<p>Rising stars outpaced fallen angels in 2024, but at a much lower pace than 2023. The fallen angel index had 5 fallen angels, adding approximately $6.4bn, while the 7 rising stars impacted approximately $9.7bn in market value. As expected, these figures were significantly lower than 2023, when they were approximately $19.9bn in fallen angels and $40bn in rising stars, but not in line with what was expected of more fallen angels than rising stars in 2024.</p>
<p>The Retail sector was most impacted by fallen angels, as Advance Auto Parts and VF Corp added approximate $3.4bn and Marks &amp; Spencer&rsquo;s upgrade removed about $315mn. Meanwhile, the upgrade of FirstEnergy reduced $3.8 billion from the Utility sector bringing the sectors&rsquo; weight to 2.22% versus 3.36% in the broad high yield index. The fallen angel index ended 2024 with Retail the largest exposure (22.15% vs 6.20%), followed by Telecom (12.56% vs 6.29%) and Real Estate (10.71% vs 4.36%).</p>
<p>Investors closely monitored inflation, labor market indicators and other economic growth indicators, as well as the potential policy impacts of the new administration, and continued to adjust expectations around U.S. Federal Reserve (Fed) policy. This has resulted in volatility in longer term bond yields, with the 10-year yield ending the year higher than where it started. Shorter-duration, lower rated credit outperformed due to limited duration risk and the risk-on sentiment that persisted through the year. Accordingly, certain structural characteristics of fallen angels (longer duration and higher quality) dampened relative performance compared to broader high-yield markets.</p>
<p>Credit spreads, which were thought to have limited room for tightening, trended downward throughout the year except for the short-lived whiplash in early August. Broad high-yield spreads tightened to post-GFC lows of 260bps in mid-November before ending the year at 292bps, below their 5-year and 10-year averages.</p>
<h2 id="expectations-2025" class="jump-link-nav anchored-block" data-jumplink-title="2025 Expectations">2025 Expectations</h2>
<p>We expect the yield curve to continue to normalize, as long terms yields have risen while the market attempts to assess the potential impacts of tariffs, government spending and deregulatory agenda of the new administration, against a continued robust economic and employment backdrop. Policy rates will likely end 2025 somewhat lower, but the market is now only pricing in one 0.25% rate cut through the end of the year versus prior expectations of 250bps of cuts as recently as mid-September 2024.</p>
<p>Normalization of the yield curve could make bonds more attractive due to improved risk-return dynamics; as such, we will watch for changes in intermediate to long-term rates. Historically, fallen angels have offered better risk adjusted returns than the broad high yield market and overall yields continue to be incredibly attractive relative to historical levels. Fallen angels&rsquo; yield of 7.00%, is above the 1y, 3y, 5y and 10y averages, offering much higher quality than over the past 10 years.</p>
<p>There have been headlines about default rates and bankruptcies increasing, however, the majority of corporate balance sheets are still strong, especially in higher rated segments of the market. Much focus has been given to liability management exercises in the leveraged finance space, which is more relevant in the leveraged loan space than high yield corporates.</p>
<p>In terms of rating migrations, 2025 is expected to remain idiosyncratic, with no single sector at risk of widespread downgrades. However, policy uncertainty could introduce variability. JP Morgan Research stated that at the end of 2024, there was $699bn of BBB- rated debt, with 28% one rating notch from falling into high yield (Boeing and Warner Brothers, particularly). Bloomberg Intelligence writes that the majority of potential fallen angels are within Capital Goods (mostly Boeing) and Financials, in which they mentioned BDCs such as FS KKR Capital, BlackRok TCP and Oaktree Speciality Lending having a higher probability of downgrade.</p>
<p id="fallen-angel-statistics" class="jump-link-nav anchored-block" data-jumplink-title="Fallen Angel Statistics"><strong><u>Fallen Angels Overall Statistics:</u></strong> In 2024, fallen angels spreads tightened by 36bps, although, spreads were volatile reaching 310bps in August, but then tightening to 222bps by mid-November. The index spread remains approximately 200bps below the long-term average (commencing December 2003). The average yield of the fallen angel index finished the year relatively flat from the beginning of the year, while the yield of the broad market declined modestly. The market value of the fallen angel index decreased throughout the year, as there were more rising stars than fallen angels, but heavy issuance increased the broad high yield index market value. There were no fallen angels issuer defaults in 2024, while broad high yield had 6 issuers default, for a combined $4,144m in par value.</p>
<div class="wrapped-div">
<table style="width: 100%;">
<tbody>
<tr class="tbl-data">
<td class="tbl-header last text-center">&nbsp;</td>
<td class="tbl-header last text-center" style="border-right: outset;" colspan="5">Fallen Angels</td>
<td class="tbl-header last text-center" colspan="5">Broad HY</td>
</tr>
<tr class="tbl-data">
<td class="data-td last">&nbsp;</td>
<td class="data-head last text-right">12/31/2023</td>
<td class="data-head last text-right">3/31/2024</td>
<td class="data-head last text-right">6/30/2024</td>
<td class="data-head last text-right">9/30/2024</td>
<td class="data-head last text-right" style="border-right: outset;">12/31/2024</td>
<td class="data-head last text-right">12/31/2023</td>
<td class="data-head last text-right">3/31/2024</td>
<td class="data-head last text-right">6/30/2024</td>
<td class="data-head last text-right">9/30/2024</td>
<td class="data-head last text-right">12/31/2024</td>
</tr>
<tr class="tbl-data">
<td class="data-td last">Yield to Worst</td>
<td class="data-td data last text-right">6.99</td>
<td class="data-td data last text-right">6.92</td>
<td class="data-td data last text-right">7.10</td>
<td class="data-td data last text-right">6.43</td>
<td class="data-td data last text-right" style="border-right: outset;">7.00</td>
<td class="data-td data last text-right">7.69</td>
<td class="data-td data last text-right">7.75</td>
<td class="data-td data last text-right">7.94</td>
<td class="data-td data last text-right">6.98</td>
<td class="data-td data last text-right">7.47</td>
</tr>
<tr class="tbl-data">
<td class="data-td last">Par Weighted Price</td>
<td class="data-td data last text-right">91.20</td>
<td class="data-td data last text-right">91.22</td>
<td class="data-td data last text-right">90.32</td>
<td class="data-td data last text-right">93.69</td>
<td class="data-td data last text-right" style="border-right: outset;">91.52</td>
<td class="data-td data last text-right">91.86</td>
<td class="data-td data last text-right">93.18</td>
<td class="data-td data last text-right">92.98</td>
<td class="data-td data last text-right">96.72</td>
<td class="data-td data last text-right">95.48</td>
</tr>
<tr class="tbl-data">
<td class="data-td last">Effective Duration</td>
<td class="data-td data last text-right">5.41</td>
<td class="data-td data last text-right">5.32</td>
<td class="data-td data last text-right">5.08</td>
<td class="data-td data last text-right">5.04</td>
<td class="data-td data last text-right" style="border-right: outset;">4.89</td>
<td class="data-td data last text-right">3.31</td>
<td class="data-td data last text-right">3.28</td>
<td class="data-td data last text-right">3.26</td>
<td class="data-td data last text-right">3.04</td>
<td class="data-td data last text-right">3.22</td>
</tr>
<tr class="tbl-data">
<td class="data-td last">Full Market Value ($mn)</td>
<td class="data-td data last text-right">67,821</td>
<td class="data-td data last text-right">64,657</td>
<td class="data-td data last text-right">55,371</td>
<td class="data-td data last text-right">57,236</td>
<td class="data-td data last text-right" style="border-right: outset;">53,393</td>
<td class="data-td data last text-right">1,237,721</td>
<td class="data-td data last text-right">1,260,542</td>
<td class="data-td data last text-right">1,266,993</td>
<td class="data-td data last text-right">1,336,160</td>
<td class="data-td data last text-right">1,338,887</td>
</tr>
<tr class="tbl-data">
<td class="data-td last">OAS</td>
<td class="data-td data last text-right">285</td>
<td class="data-td data last text-right">247</td>
<td class="data-td data last text-right">252</td>
<td class="data-td data last text-right">261</td>
<td class="data-td data last text-right" style="border-right: outset;">249</td>
<td class="data-td data last text-right">339</td>
<td class="data-td data last text-right">315</td>
<td class="data-td data last text-right">321</td>
<td class="data-td data last text-right">303</td>
<td class="data-td data last text-right">292</td>
</tr>
<tr class="tbl-data">
<td class="data-td last">No. of Issues</td>
<td class="data-td data last text-right">143</td>
<td class="data-td data last text-right">138</td>
<td class="data-td data last text-right">126</td>
<td class="data-td data last text-right">124</td>
<td class="data-td data last text-right" style="border-right: outset;">122</td>
<td class="data-td data last text-right">1,837</td>
<td class="data-td data last text-right">1,864</td>
<td class="data-td data last text-right">1,863</td>
<td class="data-td data last text-right">1,873</td>
<td class="data-td data last text-right">1,879</td>
</tr>
</tbody>
</table>
</div>
<p class="chart-disclosure">Source: ICE Data Services, VanEck. Fallen Angels: ICE US Fallen Angel High Yield 10% Constrained Index. Broad HY: ICE BofA US High Yield Index. OAS refers to &ldquo;option-adjusted spread.&rdquo; Please see definition for this and other terms referenced herein in the disclosures and definitions portion of this blog. Past performance is no guarantee of future results. Index performance is not representative of strategy performance. It is not possible to invest in an index.</p>
<p><strong><u>Fallen Angels:</u></strong> Prospect Capital Corp, a publicly traded BDC, was downgraded by S&amp;P to BB+ from BBB- as it reported losses on its investment portfolio and cut its dividend. With Prospect Capital&rsquo;s downgrade, there were a total of 5 fallen angels in 2024, adding 11% to the market value.</p>
<div class="wrapped-div">
<table style="width: 100%;">
<tbody>
<tr class="tbl-data">
<td class="tbl-header last">Month-end Addition</td>
<td class="tbl-header last text-left">Name</td>
<td class="tbl-header last text-left">Rating</td>
<td class="tbl-header last text-left">Sector</td>
<td class="tbl-header last text-left">Industry</td>
<td class="tbl-header last text-right">% Mkt Value</td>
<td class="tbl-header last text-right">Price</td>
</tr>
<tr class="tbl-data">
<td class="data-td last font-weight-normal">January</td>
<td class="data-td data last text-left">Hudson Pacific Properties LP</td>
<td class="data-td data last text-left">BB1</td>
<td class="data-td data last text-left">Real Estate</td>
<td class="data-td data last text-left">REITs</td>
<td class="data-td data last text-right">2.18</td>
<td class="data-td data last text-right">88.05</td>
</tr>
<tr class="tbl-data">
<td class="data-td last font-weight-normal">February</td>
<td class="data-td data last text-left">Advance Auto Parts Inc.</td>
<td class="data-td data last text-left">BB1</td>
<td class="data-td data last text-left">Retail</td>
<td class="data-td data last text-left">Specialty Retail</td>
<td class="data-td data last text-right">2.52</td>
<td class="data-td data last text-right">91.20</td>
</tr>
<tr class="tbl-data">
<td class="data-td last font-weight-normal">September</td>
<td class="data-td data last text-left">OCI NV</td>
<td class="data-td data last text-left">BB1</td>
<td class="data-td data last text-left">Basic Industry</td>
<td class="data-td data last text-left">Chemicals</td>
<td class="data-td data last text-right">1.10</td>
<td class="data-td data last text-right">104.79</td>
</tr>
<tr class="tbl-data">
<td class="data-td last font-weight-normal">September</td>
<td class="data-td data last text-left">V.F. Corp</td>
<td class="data-td data last text-left">BB1</td>
<td class="data-td data last text-left">Retail</td>
<td class="data-td data last text-left">Specialty Retail</td>
<td class="data-td data last text-right">3.04</td>
<td class="data-td data last text-right">94.08</td>
</tr>
<tr class="tbl-data">
<td class="data-td last font-weight-normal">December</td>
<td class="data-td data last text-left">Prospect Capital Corp.</td>
<td class="data-td data last text-left">BB1</td>
<td class="data-td data last text-left">Financial Services</td>
<td class="data-td data last text-left">Investments &amp; Misc Financial Services</td>
<td class="data-td data last text-right">1.71</td>
<td class="data-td data last text-right">92.47</td>
</tr>
</tbody>
</table>
</div>
<p class="chart-disclosure">Source: ICE Data Services, VanEck. Fallen Angels: ICE US Fallen Angel High Yield 10% Constrained Index. Past performance is no guarantee of future results. Not a recommendation to buy or sell any of the names/securities mentioned herein. Index performance is not representative of strategy performance. It is not possible to invest in an index.</p>

<p><strong><u>Rising Stars:</u></strong> There were no rising stars in December, but there were 7 issuers upgraded to investment grade from high yield over the course of the year, removing approximately 16% of market value.</p>
<div class="wrapped-div">
<table style="width: 100%;">
<tbody>
<tr class="tbl-data">
<td class="tbl-header last">Month-end Exit</td>
<td class="tbl-header last text-left">Name</td>
<td class="tbl-header last text-left">Rating</td>
<td class="tbl-header last text-left">Sector</td>
<td class="tbl-header last text-left">Industry</td>
<td class="tbl-header last text-right">% Mkt Value</td>
<td class="tbl-header last text-right">Price</td>
</tr>
<tr class="tbl-data">
<td class="data-td last font-weight-normal">February</td>
<td class="data-td data last text-left">Las Vegas Sands Corp</td>
<td class="data-td data last text-left">BB1</td>
<td class="data-td data last text-left">Leisure</td>
<td class="data-td data last text-left">Gaming</td>
<td class="data-td data last text-right">3.12</td>
<td class="data-td data last text-right">93.19</td>
</tr>
<tr class="tbl-data">
<td class="data-td last font-weight-normal">March</td>
<td class="data-td data last text-left">Enlink Midstream Partners LP</td>
<td class="data-td data last text-left">BB1</td>
<td class="data-td data last text-left">Energy</td>
<td class="data-td data last text-left">Gas Distribution</td>
<td class="data-td data last text-right">2.30</td>
<td class="data-td data last text-right">88.92</td>
</tr>
<tr class="tbl-data">
<td class="data-td last font-weight-normal">April</td>
<td class="data-td data last text-left">FirstEnergy Corp.</td>
<td class="data-td data last text-left">BB1</td>
<td class="data-td data last text-left">Utility</td>
<td class="data-td data last text-left">Electric-Integrated</td>
<td class="data-td data last text-right">6.62</td>
<td class="data-td data last text-right">87.10</td>
</tr>
<tr class="tbl-data">
<td class="data-td last font-weight-normal">April</td>
<td class="data-td data last text-left">Rolls-Royce PLC</td>
<td class="data-td data last text-left">BB1</td>
<td class="data-td data last text-left">Capital Goods</td>
<td class="data-td data last text-left">Aerospace/Defense</td>
<td class="data-td data last text-right">1.51</td>
<td class="data-td data last text-right">96.00</td>
</tr>
<tr class="tbl-data">
<td class="data-td last font-weight-normal">July</td>
<td class="data-td data last text-left">Delta Air Lines Inc.</td>
<td class="data-td data last text-left">BB1</td>
<td class="data-td data last text-left">Transportation</td>
<td class="data-td data last text-left">Air Transportation</td>
<td class="data-td data last text-right">1.50</td>
<td class="data-td data last text-right">94.59</td>
</tr>
<tr class="tbl-data">
<td class="data-td last font-weight-normal">September</td>
<td class="data-td data last text-left">Port of Newcastle Investments Financing Pty Limited</td>
<td class="data-td data last text-left">BB1</td>
<td class="data-td data last text-left">Transportation</td>
<td class="data-td data last text-left">Transport Infrastructure/Services</td>
<td class="data-td data last text-right">0.52</td>
<td class="data-td data last text-right">95.59</td>
</tr>
<tr class="tbl-data">
<td class="data-td last font-weight-normal">November</td>
<td class="data-td data last text-left">Marks and Spencer PLC</td>
<td class="data-td data last text-left">BB1</td>
<td class="data-td data last text-left">Retail</td>
<td class="data-td data last text-left">Food &amp; Drug Retailers</td>
<td class="data-td data last text-right">0.57</td>
<td class="data-td data last text-right">107.07</td>
</tr>
</tbody>
</table>
</div>
<p class="chart-disclosure">Source: ICE Data Services, VanEck. Fallen Angels: ICE US Fallen Angel High Yield 10% Constrained Index. Past performance is no guarantee of future results. Not a recommendation to buy or sell any of the names/securities mentioned herein. Index performance is not representative of strategy performance. It is not possible to invest in an index.</p>
<p><strong><u>Fallen Angels Performance by Sector</u></strong>: All sectors registered positive returns for the year, with Consumer Goods taking the lead at 11.83%, while Tech/Electronics had the lowest return at 2.04%. Throughout the year, the Retail sector saw an increased in exposure with the downgrades of Advance Auto Parts and V.F. Corp, while Utility and Energy sectors saw their exposures decrease. In terms of sector attribution vs broad high yield, Telecom, Banking and Consumer Goods contributed positively while all other sectors detracted from performance, with the lack of Media having the largest impact. Real Estate continues to be the only sector with a notably wide spread (at 450bps), demonstrating that concerns in the commercial real estate are still ongoing.</p>
<div class="wrapped-div-full">
<table style="width: 100%;">
<tbody>
<tr class="tbl-data">
<td class="tbl-header last text-center">&nbsp;</td>
<td class="tbl-header last text-center" style="border-right: outset;" colspan="5">Wgt (%)</td>
<td class="tbl-header last text-center" style="border-right: outset;" colspan="5">OAS</td>
<td class="tbl-header last text-center" style="border-right: outset;" colspan="5">Price</td>
<td class="tbl-header last text-right" colspan="2">Total Return</td>
</tr>
<tr class="tbl-data">
<td class="data-head last text-right">&nbsp;</td>
<td class="data-head last text-right">12/31/23</td>
<td class="data-head last text-right">3/31/24</td>
<td class="data-head last text-right">6/30/24</td>
<td class="data-head last text-right">9/30/24</td>
<td class="data-head last text-right" style="border-right: outset;">12/31/24</td>
<td class="data-head last text-right">12/31/23</td>
<td class="data-head last text-right">3/31/24</td>
<td class="data-head last text-right">6/30/24</td>
<td class="data-head last text-right">9/30/24</td>
<td class="data-head last text-right" style="border-right: outset;">12/31/24</td>
<td class="data-head last text-right">12/31/23</td>
<td class="data-head last text-right">3/31/24</td>
<td class="data-head last text-right">6/30/24</td>
<td class="data-head last text-right">9/30/24</td>
<td class="data-head last text-right" style="border-right: outset;">12/31/24</td>
<td class="data-head last text-right">MTD</td>
<td class="data-head last text-right">YTD</td>
</tr>
<tr class="tbl-data">
<td class="data-td last">Banking</td>
<td class="data-td data last text-right">4.79</td>
<td class="data-td data last text-right">4.62</td>
<td class="data-td data last text-right">5.38</td>
<td class="data-td data last text-right">5.45</td>
<td class="data-td data last text-right" style="border-right: outset;">5.82</td>
<td class="data-td data last text-right">231</td>
<td class="data-td data last text-right">235</td>
<td class="data-td data last text-right">220</td>
<td class="data-td data last text-right">210</td>
<td class="data-td data last text-right" style="border-right: outset;">159</td>
<td class="data-td data last text-right">97.91</td>
<td class="data-td data last text-right">97.11</td>
<td class="data-td data last text-right">97.36</td>
<td class="data-td data last text-right">101.29</td>
<td class="data-td data last text-right" style="border-right: outset;">101.63</td>
<td class="data-td data last text-right">0.98</td>
<td class="data-td data last text-right">9.53</td>
</tr>
<tr class="tbl-data">
<td class="data-td last">Basic Industry</td>
<td class="data-td data last text-right">1.70</td>
<td class="data-td data last text-right">3.20</td>
<td class="data-td data last text-right">3.73</td>
<td class="data-td data last text-right">4.78</td>
<td class="data-td data last text-right" style="border-right: outset;">4.94</td>
<td class="data-td data last text-right">171</td>
<td class="data-td data last text-right">186</td>
<td class="data-td data last text-right">156</td>
<td class="data-td data last text-right">190</td>
<td class="data-td data last text-right" style="border-right: outset;">181</td>
<td class="data-td data last text-right">97.24</td>
<td class="data-td data last text-right">94.37</td>
<td class="data-td data last text-right">95.03</td>
<td class="data-td data last text-right">99.25</td>
<td class="data-td data last text-right" style="border-right: outset;">96.00</td>
<td class="data-td data last text-right">-1.22</td>
<td class="data-td data last text-right">4.62</td>
</tr>
<tr class="tbl-data">
<td class="data-td last">Capital Goods</td>
<td class="data-td data last text-right">5.85</td>
<td class="data-td data last text-right">6.17</td>
<td class="data-td data last text-right">5.41</td>
<td class="data-td data last text-right">5.31</td>
<td class="data-td data last text-right" style="border-right: outset;">5.55</td>
<td class="data-td data last text-right">200</td>
<td class="data-td data last text-right">153</td>
<td class="data-td data last text-right">161</td>
<td class="data-td data last text-right">198</td>
<td class="data-td data last text-right" style="border-right: outset;">179</td>
<td class="data-td data last text-right">97.34</td>
<td class="data-td data last text-right">97.38</td>
<td class="data-td data last text-right">97.51</td>
<td class="data-td data last text-right">98.72</td>
<td class="data-td data last text-right" style="border-right: outset;">96.48</td>
<td class="data-td data last text-right">-0.87</td>
<td class="data-td data last text-right">4.71</td>
</tr>
<tr class="tbl-data">
<td class="data-td last">Consumer Goods</td>
<td class="data-td data last text-right">4.33</td>
<td class="data-td data last text-right">4.42</td>
<td class="data-td data last text-right">5.28</td>
<td class="data-td data last text-right">5.22</td>
<td class="data-td data last text-right" style="border-right: outset;">4.37</td>
<td class="data-td data last text-right">230</td>
<td class="data-td data last text-right">223</td>
<td class="data-td data last text-right">240</td>
<td class="data-td data last text-right">231</td>
<td class="data-td data last text-right" style="border-right: outset;">184</td>
<td class="data-td data last text-right">94.29</td>
<td class="data-td data last text-right">93.07</td>
<td class="data-td data last text-right">93.64</td>
<td class="data-td data last text-right">97.25</td>
<td class="data-td data last text-right" style="border-right: outset;">98.89</td>
<td class="data-td data last text-right">0.08</td>
<td class="data-td data last text-right">11.83</td>
</tr>
<tr class="tbl-data">
<td class="data-td last">Energy</td>
<td class="data-td data last text-right">14.75</td>
<td class="data-td data last text-right">11.17</td>
<td class="data-td data last text-right">12.27</td>
<td class="data-td data last text-right">12.13</td>
<td class="data-td data last text-right" style="border-right: outset;">9.16</td>
<td class="data-td data last text-right">259</td>
<td class="data-td data last text-right">235</td>
<td class="data-td data last text-right">239</td>
<td class="data-td data last text-right">267</td>
<td class="data-td data last text-right" style="border-right: outset;">273</td>
<td class="data-td data last text-right">92.49</td>
<td class="data-td data last text-right">93.95</td>
<td class="data-td data last text-right">93.44</td>
<td class="data-td data last text-right">95.40</td>
<td class="data-td data last text-right" style="border-right: outset;">91.72</td>
<td class="data-td data last text-right">-1.70</td>
<td class="data-td data last text-right">6.70</td>
</tr>
<tr class="tbl-data">
<td class="data-td last">Financial Services</td>
<td class="data-td data last text-right">1.14</td>
<td class="data-td data last text-right">1.18</td>
<td class="data-td data last text-right">1.37</td>
<td class="data-td data last text-right">1.40</td>
<td class="data-td data last text-right" style="border-right: outset;">3.22</td>
<td class="data-td data last text-right">378</td>
<td class="data-td data last text-right">336</td>
<td class="data-td data last text-right">376</td>
<td class="data-td data last text-right">324</td>
<td class="data-td data last text-right" style="border-right: outset;">282</td>
<td class="data-td data last text-right">86.41</td>
<td class="data-td data last text-right">87.09</td>
<td class="data-td data last text-right">84.87</td>
<td class="data-td data last text-right">91.57</td>
<td class="data-td data last text-right" style="border-right: outset;">91.46</td>
<td class="data-td data last text-right">-1.45</td>
<td class="data-td data last text-right">10.93</td>
</tr>
<tr class="tbl-data">
<td class="data-td last">Healthcare</td>
<td class="data-td data last text-right">4.10</td>
<td class="data-td data last text-right">4.44</td>
<td class="data-td data last text-right">5.15</td>
<td class="data-td data last text-right">5.29</td>
<td class="data-td data last text-right" style="border-right: outset;">4.10</td>
<td class="data-td data last text-right">270</td>
<td class="data-td data last text-right">210</td>
<td class="data-td data last text-right">207</td>
<td class="data-td data last text-right">157</td>
<td class="data-td data last text-right" style="border-right: outset;">195</td>
<td class="data-td data last text-right">88.73</td>
<td class="data-td data last text-right">90.80</td>
<td class="data-td data last text-right">91.12</td>
<td class="data-td data last text-right">95.88</td>
<td class="data-td data last text-right" style="border-right: outset;">90.40</td>
<td class="data-td data last text-right">-2.11</td>
<td class="data-td data last text-right">9.65</td>
</tr>
<tr class="tbl-data">
<td class="data-td last">Insurance</td>
<td class="data-td data last text-right">1.32</td>
<td class="data-td data last text-right">1.43</td>
<td class="data-td data last text-right">1.65</td>
<td class="data-td data last text-right">1.67</td>
<td class="data-td data last text-right" style="border-right: outset;">2.49</td>
<td class="data-td data last text-right">323</td>
<td class="data-td data last text-right">244</td>
<td class="data-td data last text-right">238</td>
<td class="data-td data last text-right">237</td>
<td class="data-td data last text-right" style="border-right: outset;">193</td>
<td class="data-td data last text-right">94.10</td>
<td class="data-td data last text-right">96.82</td>
<td class="data-td data last text-right">96.11</td>
<td class="data-td data last text-right">100.34</td>
<td class="data-td data last text-right" style="border-right: outset;">98.34</td>
<td class="data-td data last text-right">-0.91</td>
<td class="data-td data last text-right">10.77</td>
</tr>
<tr class="tbl-data">
<td class="data-td last">Leisure</td>
<td class="data-td data last text-right">7.90</td>
<td class="data-td data last text-right">5.10</td>
<td class="data-td data last text-right">5.92</td>
<td class="data-td data last text-right">4.90</td>
<td class="data-td data last text-right" style="border-right: outset;">4.53</td>
<td class="data-td data last text-right">228</td>
<td class="data-td data last text-right">170</td>
<td class="data-td data last text-right">180</td>
<td class="data-td data last text-right">234</td>
<td class="data-td data last text-right" style="border-right: outset;">220</td>
<td class="data-td data last text-right">93.21</td>
<td class="data-td data last text-right">95.08</td>
<td class="data-td data last text-right">94.48</td>
<td class="data-td data last text-right">95.41</td>
<td class="data-td data last text-right" style="border-right: outset;">93.65</td>
<td class="data-td data last text-right">0.10</td>
<td class="data-td data last text-right">6.72</td>
</tr>
<tr class="tbl-data">
<td class="data-td last">Real Estate</td>
<td class="data-td data last text-right">9.07</td>
<td class="data-td data last text-right">9.60</td>
<td class="data-td data last text-right">10.07</td>
<td class="data-td data last text-right">10.23</td>
<td class="data-td data last text-right" style="border-right: outset;">10.71</td>
<td class="data-td data last text-right">675</td>
<td class="data-td data last text-right">527</td>
<td class="data-td data last text-right">450</td>
<td class="data-td data last text-right">389</td>
<td class="data-td data last text-right" style="border-right: outset;">450</td>
<td class="data-td data last text-right">82.72</td>
<td class="data-td data last text-right">81.84</td>
<td class="data-td data last text-right">84.76</td>
<td class="data-td data last text-right">89.79</td>
<td class="data-td data last text-right" style="border-right: outset;">86.94</td>
<td class="data-td data last text-right">-1.84</td>
<td class="data-td data last text-right">3.69</td>
</tr>
<tr class="tbl-data">
<td class="data-td last">Retail</td>
<td class="data-td data last text-right">14.38</td>
<td class="data-td data last text-right">18.02</td>
<td class="data-td data last text-right">20.45</td>
<td class="data-td data last text-right">21.67</td>
<td class="data-td data last text-right" style="border-right: outset;">22.15</td>
<td class="data-td data last text-right">242</td>
<td class="data-td data last text-right">179</td>
<td class="data-td data last text-right">196</td>
<td class="data-td data last text-right">252</td>
<td class="data-td data last text-right" style="border-right: outset;">219</td>
<td class="data-td data last text-right">86.39</td>
<td class="data-td data last text-right">89.54</td>
<td class="data-td data last text-right">88.19</td>
<td class="data-td data last text-right">88.38</td>
<td class="data-td data last text-right" style="border-right: outset;">86.26</td>
<td class="data-td data last text-right">-0.78</td>
<td class="data-td data last text-right">3.23</td>
</tr>
<tr class="tbl-data">
<td class="data-td last">Services</td>
<td class="data-td data last text-right">0.64</td>
<td class="data-td data last text-right">0.66</td>
<td class="data-td data last text-right">0.79</td>
<td class="data-td data last text-right">0.78</td>
<td class="data-td data last text-right" style="border-right: outset;">0.83</td>
<td class="data-td data last text-right">243</td>
<td class="data-td data last text-right">217</td>
<td class="data-td data last text-right">206</td>
<td class="data-td data last text-right">202</td>
<td class="data-td data last text-right" style="border-right: outset;">189</td>
<td class="data-td data last text-right">94.78</td>
<td class="data-td data last text-right">94.51</td>
<td class="data-td data last text-right">94.67</td>
<td class="data-td data last text-right">98.11</td>
<td class="data-td data last text-right" style="border-right: outset;">95.97</td>
<td class="data-td data last text-right">-0.84</td>
<td class="data-td data last text-right">6.61</td>
</tr>
<tr class="tbl-data">
<td class="data-td last">Technology &amp; Electronics</td>
<td class="data-td data last text-right">6.22</td>
<td class="data-td data last text-right">5.81</td>
<td class="data-td data last text-right">6.67</td>
<td class="data-td data last text-right">6.66</td>
<td class="data-td data last text-right" style="border-right: outset;">6.78</td>
<td class="data-td data last text-right">194</td>
<td class="data-td data last text-right">188</td>
<td class="data-td data last text-right">184</td>
<td class="data-td data last text-right">206</td>
<td class="data-td data last text-right" style="border-right: outset;">208</td>
<td class="data-td data last text-right">94.14</td>
<td class="data-td data last text-right">92.99</td>
<td class="data-td data last text-right">92.27</td>
<td class="data-td data last text-right">94.38</td>
<td class="data-td data last text-right" style="border-right: outset;">90.50</td>
<td class="data-td data last text-right">-0.94</td>
<td class="data-td data last text-right">2.04</td>
</tr>
<tr class="tbl-data">
<td class="data-td last">Telecommunications</td>
<td class="data-td data last text-right">13.00</td>
<td class="data-td data last text-right">13.39</td>
<td class="data-td data last text-right">11.10</td>
<td class="data-td data last text-right">11.82</td>
<td class="data-td data last text-right" style="border-right: outset;">12.56</td>
<td class="data-td data last text-right">366</td>
<td class="data-td data last text-right">368</td>
<td class="data-td data last text-right">413</td>
<td class="data-td data last text-right">351</td>
<td class="data-td data last text-right" style="border-right: outset;">311</td>
<td class="data-td data last text-right">92.22</td>
<td class="data-td data last text-right">90.01</td>
<td class="data-td data last text-right">81.48</td>
<td class="data-td data last text-right">92.33</td>
<td class="data-td data last text-right" style="border-right: outset;">92.24</td>
<td class="data-td data last text-right">-0.04</td>
<td class="data-td data last text-right">9.66</td>
</tr>
<tr class="tbl-data">
<td class="data-td last">Transportation</td>
<td class="data-td data last text-right">2.09</td>
<td class="data-td data last text-right">2.23</td>
<td class="data-td data last text-right">2.60</td>
<td class="data-td data last text-right">0.57</td>
<td class="data-td data last text-right" style="border-right: outset;">0.59</td>
<td class="data-td data last text-right">209</td>
<td class="data-td data last text-right">170</td>
<td class="data-td data last text-right">150</td>
<td class="data-td data last text-right">210</td>
<td class="data-td data last text-right" style="border-right: outset;">156</td>
<td class="data-td data last text-right">94.92</td>
<td class="data-td data last text-right">95.37</td>
<td class="data-td data last text-right">96.07</td>
<td class="data-td data last text-right">106.22</td>
<td class="data-td data last text-right" style="border-right: outset;">104.16</td>
<td class="data-td data last text-right">-1.25</td>
<td class="data-td data last text-right">7.07</td>
</tr>
<tr class="tbl-data">
<td class="data-td last">Utility</td>
<td class="data-td data last text-right">8.71</td>
<td class="data-td data last text-right">8.54</td>
<td class="data-td data last text-right">2.17</td>
<td class="data-td data last text-right">2.11</td>
<td class="data-td data last text-right" style="border-right: outset;">2.22</td>
<td class="data-td data last text-right">139</td>
<td class="data-td data last text-right">122</td>
<td class="data-td data last text-right">185</td>
<td class="data-td data last text-right">203</td>
<td class="data-td data last text-right" style="border-right: outset;">173</td>
<td class="data-td data last text-right">92.18</td>
<td class="data-td data last text-right">91.13</td>
<td class="data-td data last text-right">96.23</td>
<td class="data-td data last text-right">99.44</td>
<td class="data-td data last text-right" style="border-right: outset;">96.71</td>
<td class="data-td data last text-right">-1.39</td>
<td class="data-td data last text-right">2.81</td>
</tr>
<tr class="tbl-data">
<td class="data-td last">Total</td>
<td class="data-td data last text-right">100</td>
<td class="data-td data last text-right" style="border-right: outset;">100</td>
<td class="data-td data last text-right">285</td>
<td class="data-td data last text-right">247</td>
<td class="data-td data last text-right">252</td>
<td class="data-td data last text-right">261</td>
<td class="data-td data last text-right" style="border-right: outset;">249</td>
<td class="data-td data last text-right">91.20</td>
<td class="data-td data last text-right">91.22</td>
<td class="data-td data last text-right">90.32</td>
<td class="data-td data last text-right">93.69</td>
<td class="data-td data last text-right" style="border-right: outset;">91.52</td>
<td class="data-td data last text-right">-0.86</td>
<td class="data-td data last text-right">5.76</td>
</tr>
</tbody>
</table>
</div>
<p class="chart-disclosure">Source: ICE Data Services, VanEck. Returns are based on partial period data. Fallen Angels: ICE US Fallen Angel High Yield 10% Constrained Index. Not intended as a recommendation to invest or divest in any of the sectors mentioned herein. Index performance is not representative of strategy performance. It is not possible to invest in an index.</p>
<p><u><strong>Fallen Angels Performance by Rating</strong>:</u> There were no significant changes in the fallen angels rating allocation throughout the year. Relative to the broad high yield market, BB-rated fallen angels outperformed its peers in the broad high yield market, but the below-BB rated issuers (Single-B and CCC and lower rated) detracted. The Single-B Index posted 7.55% and the CCC &amp; Lower rated index posted an impressive 18.18% calendar year return vs flat and -1.86% return for the fallen angels in their respective rating buckets.</p>
<div class="wrapped-div-full">
<table style="width: 100%;">
<tbody>
<tr class="tbl-data">
<td class="tbl-header last text-center">&nbsp;</td>
<td class="tbl-header last text-center" style="border-right: outset;" colspan="5">Wgt (%)</td>
<td class="tbl-header last text-center" style="border-right: outset;" colspan="5">OAS</td>
<td class="tbl-header last text-center" style="border-right: outset;" colspan="5">Price</td>
<td class="tbl-header last text-right" colspan="2">Total Return</td>
</tr>
<tr class="tbl-data">
<td class="data-td last">&nbsp;</td>
<td class="data-td data last text-right">12/31/23</td>
<td class="data-td data last text-right">3/31/24</td>
<td class="data-td data last text-right">6/30/24</td>
<td class="data-td data last text-right">9/30/24</td>
<td class="data-td data last text-right" style="border-right: outset;">12/31/24</td>
<td class="data-td data last text-right">MTD</td>
<td class="data-td data last text-right">YTD</td>
</tr>
<tr class="tbl-data">
<td class="data-td last">BB</td>
<td class="data-td data last text-right">80.55</td>
<td class="data-td data last text-right">81.63</td>
<td class="data-td data last text-right">87.62</td>
<td class="data-td data last text-right">87.30</td>
<td class="data-td data last text-right" style="border-right: outset;">83.93</td>
<td class="data-td data last text-right">219</td>
<td class="data-td data last text-right">190</td>
<td class="data-td data last text-right">210</td>
<td class="data-td data last text-right">223</td>
<td class="data-td data last text-right" style="border-right: outset;">197</td>
<td class="data-td data last text-right">92.44</td>
<td class="data-td data last text-right">92.85</td>
<td class="data-td data last text-right">92.62</td>
<td class="data-td data last text-right">95.29</td>
<td class="data-td data last text-right" style="border-right: outset;">93.33</td>
<td class="data-td data last text-right">-0.88</td>
<td class="data-td data last text-right">5.97</td>
</tr>
<tr class="tbl-data">
<td class="data-td last">B</td>
<td class="data-td data last text-right">13.43</td>
<td class="data-td data last text-right">12.87</td>
<td class="data-td data last text-right">7.89</td>
<td class="data-td data last text-right">7.32</td>
<td class="data-td data last text-right" style="border-right: outset;">10.09</td>
<td class="data-td data last text-right">317</td>
<td class="data-td data last text-right">330</td>
<td class="data-td data last text-right">371</td>
<td class="data-td data last text-right">382</td>
<td class="data-td data last text-right" style="border-right: outset;">474</td>
<td class="data-td data last text-right">96.46</td>
<td class="data-td data last text-right">93.99</td>
<td class="data-td data last text-right">90.73</td>
<td class="data-td data last text-right">92.36</td>
<td class="data-td data last text-right" style="border-right: outset;">86.36</td>
<td class="data-td data last text-right">-2.27</td>
<td class="data-td data last text-right">0.08</td>
</tr>
<tr class="tbl-data">
<td class="data-td last">CCC</td>
<td class="data-td data last text-right">5.44</td>
<td class="data-td data last text-right">5.51</td>
<td class="data-td data last text-right">4.19</td>
<td class="data-td data last text-right">4.38</td>
<td class="data-td data last text-right" style="border-right: outset;">4.72</td>
<td class="data-td data last text-right">1,130</td>
<td class="data-td data last text-right">893</td>
<td class="data-td data last text-right">505</td>
<td class="data-td data last text-right">468</td>
<td class="data-td data last text-right" style="border-right: outset;">425</td>
<td class="data-td data last text-right">69.40</td>
<td class="data-td data last text-right">68.48</td>
<td class="data-td data last text-right">80.90</td>
<td class="data-td data last text-right">87.61</td>
<td class="data-td data last text-right" style="border-right: outset;">88.24</td>
<td class="data-td data last text-right">-0.57</td>
<td class="data-td data last text-right">-1.86</td>
</tr>
<tr class="tbl-data">
<td class="data-td last">CC*</td>
<td class="data-td data last text-right">&nbsp;</td>
<td class="data-td data last text-right">0.30</td>
<td class="data-td data last text-right">1.00</td>
<td class="data-td data last text-right" style="border-right: outset;">1.26</td>
<td class="data-td data last text-right">&nbsp;</td>
<td class="data-td data last text-right">5,719</td>
<td class="data-td data last text-right">1,703</td>
<td class="data-td data last text-right" style="border-right: outset;">1,262</td>
<td class="data-td data last text-right">&nbsp;</td>
<td class="data-td data last text-right">13.00</td>
<td class="data-td data last text-right">44.51</td>
<td class="data-td data last text-right" style="border-right: outset;">54.65</td>
<td class="data-td data last text-right">11.98</td>
<td class="data-td data last text-right">348.07</td>
</tr>
<tr class="tbl-data">
<td class="data-td last">Total</td>
<td class="data-td data last text-right">100</td>
<td class="data-td data last text-right" style="border-right: outset;">100.00</td>
<td class="data-td data last text-right">285</td>
<td class="data-td data last text-right">247</td>
<td class="data-td data last text-right">252</td>
<td class="data-td data last text-right">261</td>
<td class="data-td data last text-right" style="border-right: outset;">249</td>
<td class="data-td data last text-right">91.20</td>
<td class="data-td data last text-right">91.22</td>
<td class="data-td data last text-right">90.32</td>
<td class="data-td data last text-right">93.69</td>
<td class="data-td data last text-right" style="border-right: outset;">91.52</td>
<td class="data-td data last text-right">-0.86</td>
<td class="data-td data last text-right">5.76</td>
</tr>
</tbody>
</table>
</div>
<p class="chart-disclosure">Source: ICE Data Services, VanEck. Fallen Angels: ICE US Fallen Angel High Yield 10% Constrained Index. Not intended as a recommendation to invest or divest in any of the sectors mentioned herein. Index performance is not representative of strategy performance. It is not possible to invest in an index. BB index: ICE BofA BB US High Yield Index; Single-B index: ICE BofA Single-B US High Yield Index; CCC &amp; Lower rated index ICE BofA CCC &amp; Lower US High Yield Index. *Doesn&rsquo;t have securities for all months of selective periods. Returns are based on partial period data.</p>

<p>To receive more <a href="/us/en/blogs/income-investing/" title="Income Investing Insights"><strong>Income Investing</strong></a> insights, <a href="/link/5f45412c2143400497908cea2897f7d3.aspx" title=" Subscription Center"><strong>sign up in our subscription center</strong></a>.</p>
]]></content:encoded>
</item><item rdf:about="https://www.vaneck.com/us/en/blogs/economic-trends/building-a-2025-portfolio-inflation-hedges-and-ai-plays/">
  <title>Building a 2025 Portfolio: Inflation Hedges and AI Plays></title>
  <link>https://www.vaneck.com/us/en/blogs/economic-trends/building-a-2025-portfolio-inflation-hedges-and-ai-plays/</link>
  <description><![CDATA[This blog explores practical strategies to align your portfolio with the key macroeconomic trends outlined in CEO Jan van Eck&rsquo;s 2025 outlook.]]></description>
  <dc:creator>Patrick Schramm</dc:creator>
  <dc:date>01/21/2025 06:30:00</dc:date>
<content:encoded><![CDATA[

<p><strong>An investment in the VanEck Bitcoin ETF (&ldquo;HODL&rdquo;) and VanEck Merk Gold ETF (&ldquo;OUNZ&rdquo;) (collectively, the &ldquo;Trusts&rdquo;) involves significant risk and may not be suitable for all investors. </strong></p>
<p><strong>The Trusts are not investment companies registered under the Investment Company Act of 1940 (&ldquo;1940 Act&rdquo;) and therefore are not subject to the same protections as mutual funds or ETFs registered under the 1940 Act.</strong></p>
<p>Starting conditions matter, so let&rsquo;s level set current conditions that will set the tone for investors in 2025.</p>
<ul class="content-list">
<li class="mt-2"><strong>Economic growth and corporate health:</strong> The US economy is healthy and growing above trend near 3%, while corporate profits remain healthy and are accelerating. However, S&amp;P 500 valuations are priced for perfection, trading at a premium relative to historical averages.</li>
<li class="mt-2"><strong>Sticky inflation and Fed policy:</strong> Inflation has come down, but remains sticky above the US Federal Reserve&rsquo;s (Fed&rsquo;s) long-term 2% target. Meanwhile, the Fed has entered an easing cycle, contributing to already easy financial conditions.</li>
<li class="mt-2"><strong>Fiscal challenges:</strong> US federal debt and deficit have reached unprecedented levels, reducing foreign demand for US Treasuries and prompting calls for drastic reform to debt issuance and deficit spending.</li>
<li class="mt-2"><strong>Policy shifts</strong> <strong>under a new administration:</strong> The Trump Administration&rsquo;s &ldquo;America first&rdquo; platform&mdash;which focuses on tariffs, reshoring, immigration reform, tax cuts and a reduced government spending&mdash;may introduce implicit inflationary pressures.</li>
<li class="mt-2"><strong>Asset performance and tight spreads:</strong> Real assets such as gold, silver and bitcoin are among the best performing assets globally, while corporate fixed rate bond spreads across high yield and investment grade are near historically tight levels.</li>
</ul>
<p>TLDR: GDP and corporate profit growth are healthy, but markets are priced for it. Inflation remains sticky, while the new administration is focused on implicitly inflationary policies and we have an unsustainable debt and deficit situation.</p>
<p>You can read CEO Jan van Eck&rsquo;s 2025 outlook focusing on the key macroeconomic trends&mdash;US fiscal reckoning, inflation, the next phase of AI and India&rsquo;s growth&mdash;that investors should keep in mind here:<strong> <a href="https://www.vaneck.com/us/en/blogs/investment-outlook/jan-van-eck-2025-outlook-at-the-doorstep-of-the-reckoning/" title="2025 Outlook: At the Doorstep of the Reckoning">2025 Outlook: At the Doorstep of the Reckoning</a></strong>.</p>
<p>Below I share actionable ideas for incorporating these pivotal themes in an investment portfolio.</p>
<h2 id="fiscal-reckoning" class="jump-link-nav anchored-block" data-jumplink-title="Fiscal Reckoning"></h2>
<h2>Theme 1 - The U.S. faces a fiscal reckoning as government spending cuts and inflation risks dominate the outlook.</h2>
<p>Concerns of the fiscal, monetary, debt and deficit variety tend to drive investors toward safe havens, including non-financial real assets. For equity investors it is important to consider ways to diversify risks and consider concentration at the index and factor level, which all lean heavily in favor of technology and growth. Risk off and higher volatility periods tend to disproportionately impact corners of the market that have performed the best and/or are trading at the richest multiples.</p>
<p><strong><a href="/link/0131edd6521341ca902ec7dbb5b40ebb.aspx" title="Choose Your Moat">VanEck&rsquo;s suite of moat investing ETFs</a></strong> offers investors a number of compelling options to diversify their portfolios and capture relative value.</p>
<p>The<strong> <a href="/link/9e43dd198c5f4e419f13220685081895.aspx" title="MOAT - VanEck Morningstar Wide Moat ETF - Holdings and Performance">VanEck Morningstar Wide Moat ETF (MOAT)</a></strong> is anchored on quality and relative value metrics. MOAT is currently tilted towards more cyclical sectors and near the bottom of the large cap spectrum, away from the richly valued top of the market.</p>
<p>The <strong><a href="/link/166321dbcfec440590fb51cf0ad629aa.aspx" title="SMOT - VanEck Morningstar SMID Moat ETF - Holdings and Performance">VanEck Morningstar SMID Moat ETF (SMOT)</a></strong> is based on the same quality and relative value approach and applies it to small and mid cap companies, with a tilt towards mid caps, which potentially have less sensitivity to interest rates and superior earnings growth profiles.</p>
<p>International equities have been out of favor given the growth and earnings power of US technology companies&mdash;in particular coupled with a stronger US dollar. Interest rates drive the cost of capital and command valuations. The US interest rate picture is far from clear with two to three cuts of 25 basis points each priced into 2025 projections. However, with the potentially inflationary policy mix of the incoming administration, some are even forecasting rate hikes from the Fed this year.</p>
<p>The European Central Bank (ECB) has a much clearer picture on growth and inflation and is forecasted to cut rates seven times in 2025. Lower rates create a lower hurdle for earnings multiples, allow for cheaper access to capital and are economically stimulative. We look for a narrowing gap between US and international equities in 2025 on the combination of better policy clarity, cheaper valuations and a potentially weakening US dollar in the second half of 2025.</p>
<p>The <strong><a href="/link/f178b77e7fb54bb88cd5377ffe6bcd94.aspx" title="MOTI - VanEck Morningstar International Moat ETF - Holdings and Performance">VanEck Morningstar International Moat ETF (MOTI)</a></strong> is a way to capture this trend through high quality companies trading at attractive valuations.</p>
<h2 id="inflation" class="jump-link-nav anchored-block" data-jumplink-title="Inflation">Theme 2 &ndash; Bull markets in gold and bitcoin are supported by inflationary pressures, fiscal uncertainty and de-dollarization trends</h2>
<p>Despite a stronger dollar and rising real rates (both historically bad for gold) the yellow metal has performed remarkably well in the past year. The combination of a strong bid from global central banks looking to de risk and diversify US dollar based reserves, geopolitical risk and the overall health of the gold mining industry have been notable drivers.</p>
<p>These tailwinds remain in place, and <strong><a href="/us/en/blogs/gold-investing/golden-rule-gold-belongs-in-every-investors-portfolio" title="Golden Rule: Gold Belongs in Every Investor&rsquo;s Portfolio">gold remains a trusted risk off asset</a></strong> during periods of geopolitical conflict and recession risk. We think it remains prudent to maintain an allocation to gold in 2025.</p>
<p>The <strong><a href="/us/en/investments/merk-gold-etf-ounz" title="OUNZ - VanEck Merk Gold ETF - Holdings and Performance">VanEck Merk Gold ETF</a></strong> offers investors a simple way to buy and hold gold through an exchange traded product, with the option to take physical delivery of gold if and when desired.</p>
<p>The fundamentals in the gold mining sector remain extremely healthy with attractive P/CF and all in sustaining costs at historically attractive levels. Moderate and growth oriented investors should also consider owning <strong><a href="https://www.vaneck.com/us/en/blogs/gold-investing/ima-casanova-gold-vs-gold-equities-post-election-pressures/" title="Gold vs. Gold Equities: The Disconnect Won&rsquo;t Last">gold mining equities</a></strong> for additional leverage to the potential upside of the gold price.</p>
<p>For gold miners exposure, VanEck provides several options: <strong><a href="/link/305237df17384439b28745fea31dded1.aspx" title="INIVX - International Investors Gold Fund - Class A - Holdings and Performance">International Investors gold Fund</a></strong>, <strong><a href="/link/0ef4cceba0a44fbe8de2f60e7952a27d.aspx" title="GDX - VanEck Gold Miners ETF - Holdings and Performance">VanEck Gold Miners ETF (GDX)</a></strong> and <strong><a href="/link/a89bf56fe3cd4ec69342e1472f50889b.aspx" title="GDXJ - VanEck Junior Gold Miners ETF - Holdings and Performance">VanEck Junior Gold Miners ETF (GDXJ)</a></strong>.</p>
<p>In <strong><a href="/us/en/blogs/investment-outlook/jan-van-eck-top-investment-picks-for-2024-india-and-bitcoin/" title="Top Investment Picks for 2024: India and Bitcoin">last year&rsquo;s outlook</a></strong>, we wrote about Bitcoin getting a seat at the grownup&rsquo;s table in 2024 and it certainly has. The launch of <strong><a href="/link/c754aca617ab4535a8e611ded6d5b13c.aspx" title="HODL - VanEck Bitcoin ETF - Holdings and Performance">spot Bitcoin ETFs</a></strong> and an incoming, more pro crypto administration have been supporting the price of Bitcoin.</p>
<p>Underneath the surface Bitcoin is also benefiting from the same factors that are benefiting gold. Bitcoin offers investors a potential store of value that lives outside of the modern financial apparatus. With its transparent and fixed supply, exponential demand curve and ease of transfer, Bitcoin stands out as a compelling option. We believe <strong><a href="/us/en/blogs/digital-assets/matthew-sigel-vanecks-10-crypto-predictions-for-2025/#prediction-1" title="VanEck&rsquo;s 10 Crypto Predictions for 2025">Bitcoin has more room to run</a></strong> this cycle.</p>
<p>The <strong><a href="/link/c754aca617ab4535a8e611ded6d5b13c.aspx" title="HODL - VanEck Bitcoin ETF - Holdings and Performance">VanEck Bitcoin ETF (HODL)</a></strong> offers liquid and efficient exposure to bitcoin with a full fee waiver in place until the fund reaches $2.5B in AUM or January 10, 2026, whichever occurs first. After January 10, 2026, the Sponsor Fee will be 0.20%. <em>Brokerage fees and commissions may apply. Please check with your broker.</em></p>
<h2 id="ai-phase-2" class="jump-link-nav anchored-block" data-jumplink-title="AI Phase Two">Theme 3 - The next phase of AI is driving broader market benefits, while soaring electricity demand underscores the importance of nuclear and natural gas.</h2>
<p>Powerful macroeconomic tailwinds are in place supporting infrastructure spending, coming from both the public and private sectors. New sources of demand from artificial intelligence and the clean energy transition are colliding with the need to upgrade existing, aging infrastructure. Meeting the projected demand from US data centers alone will require new power capacity equivalent to that of six New York Cities by 2030.</p>
<p>We believe a key component to meeting this demand will come from the<strong> <a href="/us/en/blogs/natural-resources/three-forces-powering-the-nuclear-energy-surge/" title="Three Forces Powering the Nuclear Energy Surge">nuclear energy sector</a></strong>. We are not alone in this view as companies such as Microsoft, Amazon, Google and Nvidia have pledged billions of dollars of fresh investment capital to the sector.<strong> <a href="https://www.vaneck.com/us/en/blogs/natural-resources/smr-investing/" title="Investment Opportunities in SMRs: The Future of Nuclear Power">Small modular reactors (SMRs)</a></strong> are a key component of this buildout, as they offer a safer, more portable and scalable solution compared to the capital and time intensive development of traditional nuclear facilities.</p>
<p>The<strong> <a href="/link/49acb0d4174146e9a0269c9cb81c02bb.aspx" title="NLR - VanEck Uranium and Nuclear ETF - Holdings and Performance">VanEck Nuclear and Uranium ETF (NLR)</a></strong> offers comprehensive pure play exposure to this theme. NLR provides exposure to the entire nuclear power value chain, including utilities, uranium miners and service providers that contribute to the production, management, development and maintenance of the nuclear energy sector.</p>
<h2 id="india" class="jump-link-nav anchored-block" data-jumplink-title="India">Theme 4 - India&rsquo;s rapid growth and relative value present compelling opportunities.</h2>
<p>Although US-based investors have had a hard time allocating capital outside of their home country, we continue to highlight the <strong><a href="/us/en/blogs/emerging-markets-equity/indias-economic-rise-demands-investor-attention/" title="India&rsquo;s Economic Rise Demands Investor Attention">opportunity in the Indian equity market</a></strong> in particular, which has actually kept pace with the US in the past 20 years.</p>
<p>While the developed world grapples with high debt and deficits, bloated government and aging infrastructure, India benefits from a young, educated and digitally native demographic. Government reforms in capital markets and taxation have opened up the opportunity to invest in infrastrucure and technology. India is also home to more tech unicorns than any other country offering, an exciting pipeline of new and innovative companies potentially entering the market in the coming years.</p>
<p>We believe investors should continue to ride the strong<strong> <a href="/us/en/blogs/emerging-markets-equity/india-is-the-most-promising-emerging-market/" title="India Is the Most Promising Emerging Market - Holdings and Performance">economic momentum of the Indian economy</a></strong>. The difficulty for index-based EM allocators is the under-representation of India in broader benchmarks, which is why we highlight two unique approaches to capturing this exciting growth opportunity.</p>
<p>The <strong><a href="/link/6eb23584c31940ce96a2427607da5914.aspx" title="GLIN - VanEck India Growth Leaders ETF - Holdings and Performance">VanEck India Growth Leaders ETF (GLIN)</a></strong> is built on an approach that combines growth, quality and value characteristics to rate and score Indian companies, resulting in holdings that consist of fundamentally sound Indian companies with attractive growth potential at a reasonable price. With any high growth opportunity, it is important to consider balance sheet quality and relative value, which is all embedded in GLIN&rsquo;s process.</p>
<p>The<strong> <a href="/link/979eec17b7274fcb9dd954ab832450cc.aspx" title="DGIN - VanEck Digital India ETF - Holdings and Performance">VanEck Digital India ETF (DGIN)</a></strong> offers more focused access to the technological and consumer enablement themes that are at the center of India&rsquo;s growth story.</p>
<p>For more value-oriented investors, we think it is an interesting time to consider adding exposure to China. China has been going through a structural rebalancing of their economy towards a more consumer driven model. They have had a painfully slow recovery from the COVID-19 pandemic, a crippled property sector and weak consumer sentiment. The good news is that these factors are all known by investors as well as policy makers and are reflected in prices.</p>
<p>China recently announced a series of stimulus measures aimed at shoring up capital flows and reigniting some of the stalled parts of their economy. While there is more to do, particularly on the fiscal side of the ledger, China remains at the forefront of technological innovation and have made major strides in key sectors, such as automotive, where they are the global leader in EV sales.</p>
<p>We think it makes sense to take advantage of both the relative value and depressed sentiment opportunity through exposure to some of the less economically sensitive growth sectors in the technology and consumer enablement areas of the economy in particular. The <strong><a href="/link/3e02ab55f09e40faa6a8897fa593015e.aspx" title="CNXT - VanEck ChiNext ETF - Holdings and Performance">VanEck ChiNext ETF (CNXT)</a></strong> offers exposure to these unique corners of the market through a &ldquo;Nasdaq of China&rdquo; type approach, providing access to the 100 largest and most liquid stocks trading on the ChiNext market, which focuses on companies in innovative, high-growth sectors.</p>
<p>To receive more <a href="https://www.vaneck.com/us/en/insights/investment-outlook/" title="VanEck News &amp; Insights"><strong>VanEck News &amp; Insights</strong></a>, <a href="/link/5f45412c2143400497908cea2897f7d3.aspx" title=" Subscription Center"><strong>sign up in our subscription center</strong></a>.</p>
]]></content:encoded>
</item><item rdf:about="https://www.vaneck.com/us/en/blogs/digital-assets/trump-and-bitcoin/">
  <title>What Trump&#39;s Presidency Will Mean for Bitcoin></title>
  <link>https://www.vaneck.com/us/en/blogs/digital-assets/trump-and-bitcoin/</link>
  <description><![CDATA[Trump's presidency could redefine Bitcoin's future with policies on mining, regulation, and a federal reserve. Learn what this means for investors.]]></description>
  <dc:creator>Denis   Zinoviev</dc:creator>
  <dc:date>01/17/2025 07:30:00</dc:date>
<content:encoded><![CDATA[

<p>The reelection of Donald Trump as President of the United States marks a pivotal moment for the cryptocurrency landscape, particularly Bitcoin. With Trump's administration signaling shifts in regulatory priorities, market sentiment, and economic strategies, investors and enthusiasts are bracing for what could be a transformative period. Below, we explore the implications of Trump's presidency for Bitcoin.</p>
<h2 id="trumps-bitcoin-stance" class="jump-link-nav anchored-block" data-jumplink-title="Trump's Bitcoin Stance">Trump's Evolving Stance on Bitcoin</h2>
<p>Historically, Trump's views on Bitcoin have ranged from skepticism to cautious optimism. While he once called Bitcoin a threat to the U.S. dollar, recent statements indicate a more nuanced perspective. At the Nashville Bitcoin Conference, Trump floated the idea of creating a federal Bitcoin reserve&mdash;a policy that could legitimize Bitcoin's role as a global asset. His administration's pro-business ethos suggests a potential reduction in regulatory friction, fostering a more favorable environment for cryptocurrency innovation.</p>
<p>This shift aligns with recent market movements, where Trump's reelection triggered a surge in memecoins in November 2024, reflecting renewed investor confidence. His pro-crypto cabinet appointments have further fueled optimism about Bitcoin's future in a regulatory-friendly environment.</p>
<h2 id="expected-crypto-directives" class="jump-link-nav anchored-block" data-jumplink-title="Expected Crypto Directives">Regulatory Clarity: A Double-Edged Sword</h2>
<p>Trump's presidency could bring significant regulatory changes. Key appointments, such as the newly appointed SEC Chair Paul Atkins, known for his deregulatory stance, may end the "regulation by enforcement" era<strong>.</strong> This shift could benefit Bitcoin by increasing clarity for institutional investors. However, with greater adoption and legitimization may come heightened scrutiny. Proposed tax reforms and updated reporting requirements for crypto transactions could add complexity for individual investors.</p>
<p>Several ongoing judicial and legislative developments may support mainstream crypto adoption. The U.S. Appeals Court's ruling to overturn Tornado Cash's OFAC sanctions sets a legal precedent for how immutable smart contracts are treated, distinguishing them as non-ownable, uncontrollable, and not considered "property" under OFAC's definitions. On the legislative side, policies like SAB 121&mdash;which restricts banks from holding crypto assets off-balance-sheet&mdash;are likely to be repealed within a quarter. Furthermore, reworked stablecoin regulations under Sen. Hagerty's Clarity for Payment Stablecoins Act could pave the way for more privacy-friendly versions, enabling state-chartered banks to issue stablecoins without requiring Federal Reserve approval.</p>
<p>In addition, the executive branch's pro-crypto stance under Trump's leadership brings opportunities for growth. Key figures such as Secretary of the Treasury Scott Bessent have publicly stated that "everything is on the table with Bitcoin," while other prominent cabinet members actively hold crypto assets, signaling alignment with the industry's growth potential. Regulatory developments supporting Ethereum and Solana ETPs in 2025 could also enhance liquidity and attract institutional capital to decentralized applications.</p>
<p>Furthermore, the Trump administration could issue crypto-related executive orders as early as his first day in office. These orders are expected to include directives to:</p>
<ul class="content-list">
<li class="mt-2">Establish a clear national framework for cryptocurrency regulation, creating consistency across federal and state jurisdictions.</li>
<li class="mt-2">Provide tax incentives for blockchain-based businesses and mining operations to encourage innovation and domestic growth.</li>
<li class="mt-2">Mandate a review of current SEC and CFTC oversight structures to streamline approvals for cryptocurrency-based financial products, such as ETPs.</li>
<li class="mt-2">Launch public-private partnerships to accelerate blockchain research and development, with a focus on enhancing U.S. competitiveness in the global digital economy.</li>
</ul>
<p>By issuing these executive orders, Trump's administration aims to position the United States as a global leader in cryptocurrency and blockchain innovation, sending a strong signal to both institutional investors and industry stakeholders.</p>
<h2>Economic Policies and Bitcoin&rsquo;s Market Dynamics</h2>
<p>Trump's economic strategies&mdash;characterized by fiscal stimulus and trade realignments&mdash;could indirectly influence Bitcoin's trajectory. As government spending rises, concerns about inflation and dollar devaluation may push investors toward Bitcoin as a hedge. Historical trends reveal Bitcoin's correlation with political and economic uncertainty, suggesting a potential price surge in the face of these dynamics.</p>
<p>Moreover, Trump's support for domestic energy production aligns with the interests of Bitcoin miners. By encouraging fossil fuel and nuclear energy use, his administration could lower operational costs for U.S.-based mining operations, solidifying America's position as a global mining leader. Additionally, the possibility of regulatory clarity boosting institutional interest may propel Bitcoin adoption even further.</p>
<h2 id="federal-bitcoin-reserve" class="jump-link-nav anchored-block" data-jumplink-title="Federal Bitcoin Reserve">The Vision of a Federal Bitcoin Reserve</h2>
<p>One of the most intriguing possibilities under Trump's presidency is establishing a federal Bitcoin reserve. Proposed by influential figures like Senator Cynthia Lummis, this policy envisions the U.S. Treasury acquiring Bitcoin to bolster its balance sheet. Advocates argue that this move could solidify Bitcoin's role as a strategic reserve asset, similar to gold. While ambitious, such a plan would face logistical and political challenges, including global market reactions and potential accusations of dollar manipulation.</p>
<p>We highlight that the potential for a U.S. Bitcoin reserve may offset national debt significantly. According to projections, if the U.S. acquires 1 million BTC by 2029 and Bitcoin grows at a compound annual growth rate (CAGR) of 25%, Bitcoin could represent 35.5% of the national debt by 2049. This strategy assumes Bitcoin acquisition at $200,000 per coin and a deceleration of debt growth from its recent CAGR of 7% to 5%. Emphasizing this assumption ensures transparency in the calculation methodology.</p>
<p>In a more optimistic scenario, with Bitcoin's value reaching $42 million per coin by 2049, a U.S. Bitcoin reserve could represent 36% of the projected $119 trillion national debt. Such a reserve would also comprise 18% of global financial assets, demonstrating Bitcoin's increasing importance in global finance. The accompanying graph highlights the trajectory of the U.S. national debt versus Bitcoin's reserve value, underscoring the substantial fiscal benefits this strategy could offer.</p>
<h3>Bitcoin Reserve Value Vs. U.S. National Debt in 2049</h3>
<p><img loading="lazy" alt="Bitcoin Reserve Value Vs. U.S. National Debt in 2049" class="img-responsive w-100" src="https://www.vaneck.com/contentassets/2e727af6e80f4df28ffa7de1e308aaf7/5242_seo-blog-trump-bitcoin_table-1_2025-1_v1.svg" /></p>
<h3>Est. U.S. Debt vs BTC Reserve Growth</h3>
<p><img loading="lazy" alt="Est. U.S. Debt vs BTC Reserve Growth" class="img-responsive w-100" src="https://www.vaneck.com/contentassets/2e727af6e80f4df28ffa7de1e308aaf7/5242_seo-blog-trump-bitcoin_chart-1_2025-1_v1_blog.svg" /></p>
<p class="chart-disclosure">Source: VanEck research as of December 2024. <strong>Past performance is no guarantee of future results. Any information, valuation scenarios, or price targets/projections presented on Bitcoin are not intended as financial advice, a recommendation to buy or sell Bitcoin, or any call to action. There may be risks or other factors not accounted for in these scenarios that may impede the performance of Bitcoin; actual future performance is unknown and may differ significantly from the projections herein. Any projections, forecasts or forward-looking statements included herein are the results of a simulation based on our research, are valid as of the date of this communication and subject to change without notice, are for illustrative purposes only, and are those of the author(s), but not necessarily those of VanEck or its other employees. Please conduct your own research and draw your own conclusions.</strong></p>
<h2 id="investment-strategies" class="jump-link-nav anchored-block" data-jumplink-title="Investment Strategies">Investor Strategies in the Trump Era</h2>
<p>For Bitcoin investors, Trump's presidency presents both opportunities and risks. Key strategies to consider include:</p>
<ol class="content-list">
<li class="mt-2"><strong>Hedging Against Volatility</strong>: As Bitcoin reacts to macroeconomic shifts, maintaining a diversified portfolio with measured Bitcoin exposure can mitigate risks.</li>
<li class="mt-2"><strong>Mining Investments</strong>: Investors may explore opportunities in Bitcoin mining operations, particularly in regions benefiting from favorable energy policies.</li>
<li class="mt-2"><strong>Monitoring Regulatory Developments</strong>: Staying informed about changes in crypto tax laws and reporting requirements will be crucial for compliance and optimization.</li>
<li class="mt-2"><strong>Tracking Market Sentiment</strong>: As we highlighted in our <a href="/us/en/blogs/digital-assets/matthew-sigel-vanecks-10-crypto-predictions-for-2025" title="VanEck&rsquo;s 10 Crypto Predictions for 2025"><strong>2025 crypto predictions piece</strong></a>, monitoring metrics like search trends, app rankings, and institutional flows can provide critical insights into market dynamics.</li>
</ol>
<h2 id="outlook" class="jump-link-nav anchored-block" data-jumplink-title="Outlook">A Balanced Outlook</h2>
<p>Trump&rsquo;s presidency introduces a complex mix of potential catalysts and headwinds for Bitcoin. While pro-business policies and regulatory clarity could drive adoption, the associated risks of centralization and overregulation remain. Bitcoin&rsquo;s decentralized ethos will continue to be tested as it navigates this new political era.</p>
<p>The Trump administration may prioritize U.S. leadership in blockchain technology, potentially leveraging public-private partnerships to accelerate innovation in the sector.</p>
<p>For investors, the key lies in balancing optimism with caution. By understanding the broader implications of Trump&rsquo;s policies, preparing for market volatility, and leveraging insights from industry leaders, Bitcoin holders can position themselves to thrive in this evolving landscape.</p>
<p><strong>Links to third party websites are provided as a convenience and the inclusion of such links does not imply any endorsement, approval, investigation, verification or monitoring by us of any content or information contained within or accessible from the linked sites. By clicking on the link to a non-VanEck webpage, you acknowledge that you are entering a third-party website subject to its own terms and conditions. VanEck disclaims responsibility for content, legality of access or suitability of the third-party websites.</strong></p>
<p>To receive more <strong><a href="https://www.vaneck.com/us/en/insights/digital-assets/" title="Digital Assets Insights">Digital Assets</a></strong> insights, <strong><a href="https://www.vaneck.com/us/en/subscribe/" title="Subscription Center">sign up in our subscription center</a></strong>.</p>
]]></content:encoded>
</item><item rdf:about="https://www.vaneck.com/us/en/blogs/natural-resources/cautious-optimism-for-commodities-in-2025/">
  <title>Cautious Optimism for Commodities in 2025></title>
  <link>https://www.vaneck.com/us/en/blogs/natural-resources/cautious-optimism-for-commodities-in-2025/</link>
  <description><![CDATA[Commodity index returns were flat in Q4 with energy and livestock gains offset by declines in metals and agriculture. Easing monetary policies and continued energy demand are supportive for 2025.]]></description>
  <dc:creator>Roland Morris</dc:creator>
  <dc:date>01/17/2025 06:30:00</dc:date>
<content:encoded><![CDATA[

<h2>Navigating Headwinds and Outperformance</h2>
<p>Commodity index returns remained relatively flat during the fourth quarter, as a stronger U.S. dollar and rising interest rates provided support, despite subdued demand for gold toward the quarter's end and heightened volatility in oil markets. The Federal Reserve's 25 basis point rate cut in December 2024 added complexity to the landscape, offering limited relief to commodities. Markets also reacted to the geopolitical and economic implications of Donald Trump&rsquo;s election victory in early November. Meanwhile, China's slowing economy and underwhelming monetary and fiscal policy responses further weighed on global commodity demand, presenting a significant headwind for the sector.</p>
<p>The UBS Constant Maturity Commodity Index (CMCITR) returned -0.29% for the fourth quarter and +5.93% for the year, outperforming the Bloomberg Commodity Index (BCOM), which posted returns of -0.45% for the fourth quarter and +5.38% for the year. The CMCITR&rsquo;s relative outperformance can be attributed to its lower exposure to the precious metals sector which faced headwinds during the quarter.</p>
<h2>Sector Review: Energy Gains, Resilient Livestock, and Opportunities Amid Challenges</h2>
<p>The energy sector rose approximately 5% in Q4, driven by a similar increase of around 5% in crude oil and crude product prices. Natural gas, however, remained relatively flat for the quarter. The long-term outlook for U.S. natural gas has improved following Trump&rsquo;s election victory as anticipated deregulation and expanded U.S. LNG (liquid natural gas) export capacity are expected to bolster growth prospects for the domestic natural gas industry.</p>
<p>The livestock sector also rallied in the fourth quarter as both hog and cattle prices rose. However, in December, the outbreak of avian flu began to impact livestock, particularly cattle, adding to market volatility. The virus' spread fueled concerns about supply shortages and potential culling, driving up cattle prices. Stricter biosecurity measures and higher operational costs further strained livestock producers, impacting market dynamics.</p>
<p>The agriculture sector was unchanged in the quarter. Cocoa, a key component of the CMCITR, delivered exceptional returns, with London Cocoa surging approximately +88% and regular cocoa up around +77%. Coffee also posted strong gains, with returns of around +20%. However, these impressive performances were offset by losses in grains and sugar, which diminished the overall gains in the sector.</p>
<p>Precious metals declined during the quarter, driven primarily by losses in silver. Gold prices experienced a modest decline of about 1% toward the end of the quarter, driven by a stronger U.S. dollar and investors cashing out gains. The impact of gold on the CMCITR was minimal, given its modest allocation of approximately 5%, compared to BCOMTR&rsquo;s higher allocation of around 17%. Silver posted a return of about -7%, but its 1% weighting in the CMCITR had a negligible effect on the index's overall performance.</p>
<p>Industrial metals weakened during Q4, with copper prices dropping approximately 10% and nickel prices falling 12%. Persistent concerns over China&rsquo;s sluggish economic growth and the absence of robust policy measures prompted investors to reduce their exposure to the sector.</p>
<p>The charts below highlight the impact of sector weights on performance.</p>
<h3>CMCITR&rsquo;s lighter allocation in precious metals mitigated potential performance challenges.</h3>
<p><strong>Comparative Index Sector Weights</strong></p>
<div class="flourish-embed flourish-chart" data-src="visualisation/21185136?2429575"><script src="https://public.flourish.studio/resources/embed.js"></script><noscript><img loading="lazy" src="https://public.flourish.studio/visualisation/21185136/thumbnail" width="100%" alt="CMCITR&rsquo;s lighter allocation in precious metals mitigated potential performance challenges" /></noscript></div>
<p class="chart-disclosure"><strong>Source: </strong>VanEck, Bloomberg. Data as of December 2024.</p>

<p>CMCITR&rsquo;s strategic focus, with a lighter allocation in precious metals and stronger emphasis in agriculture, when compared to BCOM, played a key role in mitigating potential performance challenges.</p>
<h3>CMCITR outperforms BCOM in livestock and industrial metals, highlighting its strength in sector allocations.</h3>
<p><strong>Estimated Q4 2024 Total Return by Sector</strong></p>
<div class="flourish-embed flourish-chart" data-src="visualisation/21184942?2429575"><script src="https://public.flourish.studio/resources/embed.js"></script><noscript><img loading="lazy" src="https://public.flourish.studio/visualisation/21184942/thumbnail" width="100%" alt="CMCITR outperforms BCOM in livestock and industrial metals, highlighting its strength in sector allocations" /></noscript></div>
<p class="chart-disclosure"><strong>Source: </strong>VanEck, Bloomberg. Data as of December 2024.</p>
<h2>Optimistic Outlook for 2025</h2>
<p>The outlook for commodities in 2025 remains cautiously optimistic, with potential support from easing monetary policies, continued demand for energy and industrial metals, and opportunities in agriculture, though risks from geopolitical uncertainties and global economic slowdown persist.</p>

<p>To receive more <a href="/us/en/insights/natural-resources/" title="Natural Resources Insights"><strong>Natural Resources</strong></a> insights, <a href="https://www.vaneck.com/us/en/subscribe/" title="Subscription Center"><strong>sign up in our subscription center</strong></a>.</p>
]]></content:encoded>
</item><item rdf:about="https://www.vaneck.com/us/en/blogs/thematic-investing/buzz-investing-markets-react-to-fed-rate-cut-as-renewed-inflation-risks-emerge/">
  <title>BUZZ Investing: Markets React to Fed Rate Cut as Renewed Inflation Risks Emerge></title>
  <link>https://www.vaneck.com/us/en/blogs/thematic-investing/buzz-investing-markets-react-to-fed-rate-cut-as-renewed-inflation-risks-emerge/</link>
  <description><![CDATA[Markets recently faced volatility driven by Fed cuts, resilient economic data, and persistent inflation concerns, leading to subdued sentiment and rising Treasury yields.]]></description>
  <dc:creator> </dc:creator>
  <dc:date>01/17/2025 06:30:00</dc:date>
<content:encoded><![CDATA[

<p>During the recent period between index selection dates (December 12, 2024 &ndash; January 8, 2025), financial markets navigated a complex environment shaped by Federal Reserve policy adjustments and resilient economic data. The Federal Reserve&rsquo;s decision to lower interest rates by 25 basis points on December 18 aimed to balance growth objectives against moderating inflation trends. However, this action was accompanied by cautious projections for future rate cuts, triggering sharp declines in equity markets. The S&amp;P 500 and Nasdaq recorded their steepest one-day losses in months, reflecting heightened investor sensitivity to evolving monetary policy signals. Furthermore, the absence of the traditional "Santa Claus rally" during the final days of December and early January suggested a more subdued market sentiment than historical patterns.</p>
<p>Economic indicators during the Period highlighted robust activity across key sectors, renewing concerns about inflation&rsquo;s persistence and its impact on the Federal Reserve&rsquo;s timeline for easing policy. Strong labor market data and accelerating growth in the services sector underscored the economy&rsquo;s resilience and pointed to inflationary pressures, particularly as input prices reached multi-year highs. These developments introduced additional market volatility, with investors reevaluating the outlook for policy adjustments. Meanwhile, the benchmark 10-year Treasury yield closed the Period at its highest level since April 2024, signaling a cautious market stance amid ongoing inflation concerns and the potential for extended monetary policy tightening.</p>
<p>The BUZZ NextGen AI US Sentiment Leaders Index ("BUZZ Index") returned -1.64% during the month of December compared to a return of -2.38% for the S&amp;P 500 Index during the same period. Year-to-date, the BUZZ Index leads the S&amp;P 500 with returns of 33.87% and 25.02%, respectively, as of the end of December.</p>
<h2>Edge Computing Market Value Worldwide</h2>
<p>GameStop's gains during the recent Period may have been influenced by a cryptic post from Keith Gill, known online as "Roaring Kitty," who remains a prominent figure in the stock's retail investor narrative. On December 25, Gill shared an image of a gift on his X (formerly Twitter) account without comment, sparking renewed interest in the stock among his followers. This led to a spike in trading activity, with GameStop shares rising intraday to their highest level since June, reflecting the ongoing impact of social media-driven sentiment on its stock performance. Lucid Group saw gains, supported by reports of increased production targets and expanding partnerships in the electric vehicle market. The beginning of deliveries for its new Gravity SUV, highlighted by a convoy of the first customers departing from its Arizona facility, also added to the attention around the company during the Period.</p>

<h3>Top BUZZ Index Contributors: December 12, 2024 &ndash; January 8, 2025</h3>
<div class="wrapped-div">
<table style="width: 100%;">
<tbody>
<tr class="tbl-data">
<td class="tbl-header last text-left">Company</td>
<td class="tbl-header last text-left">Ticker</td>
<td class="tbl-header last text-right">Average Weight (%)</td>
<td class="tbl-header last text-right">Return Contribution (%)</td>
</tr>
<tr class="tbl-data">
<td class="data-td last font-weight-normal text-left">GameStop Corp</td>
<td class="data-td data last text-left">GME</td>
<td class="data-td data last text-right">3.25</td>
<td class="data-td data last text-right">0.43</td>
</tr>
<tr class="tbl-data">
<td class="data-td last font-weight-normal text-left">Lucid Group Inc</td>
<td class="data-td data last text-left">LCID</td>
<td class="data-td data last text-right">2.80</td>
<td class="data-td data last text-right">0.40</td>
</tr>
<tr class="tbl-data">
<td class="data-td last font-weight-normal text-left">Broadcom Inc</td>
<td class="data-td data last text-left">LCID</td>
<td class="data-td data last text-right">1.57</td>
<td class="data-td data last text-right">0.17</td>
</tr>
<tr class="tbl-data">
<td class="data-td last font-weight-normal text-left">Boeing Co/The</td>
<td class="data-td data last text-left">BA</td>
<td class="data-td data last text-right">1.92</td>
<td class="data-td data last text-right">0.14</td>
</tr>
<tr class="tbl-data">
<td class="data-td last font-weight-normal text-left">UnitedHealth Group Inc</td>
<td class="data-td data last text-left">UNH</td>
<td class="data-td data last text-right">1.20</td>
<td class="data-td data last text-right">0.11</td>
</tr>
<tr class="tbl-data">
<td class="data-td last font-weight-normal text-left">Robinhood Markets Inc</td>
<td class="data-td data last text-left">HOOD</td>
<td class="data-td data last text-right">3.15</td>
<td class="data-td data last text-right">0.10</td>
</tr>
<tr class="tbl-data">
<td class="data-td last font-weight-normal text-left">NVIDIA Corp</td>
<td class="data-td data last text-left">NVDA</td>
<td class="data-td data last text-right">2.94</td>
<td class="data-td data last text-right">0.09</td>
</tr>
<tr class="tbl-data">
<td class="data-td last font-weight-normal text-left">Uber Technologies Inc</td>
<td class="data-td data last text-left">UBER</td>
<td class="data-td data last text-right">1.16</td>
<td class="data-td data last text-right">0.09</td>
</tr>
<tr class="tbl-data">
<td class="data-td last font-weight-normal text-left">Target Corp</td>
<td class="data-td data last text-left">TGT</td>
<td class="data-td data last text-right">1.00</td>
<td class="data-td data last text-right">0.08</td>
</tr>
<tr class="tbl-data">
<td class="data-td last font-weight-normal text-left">Chewy Inc</td>
<td class="data-td data last text-left">CHWY</td>
<td class="data-td data last text-right">0.44</td>
<td class="data-td data last text-right">0.05</td>
</tr>
</tbody>
</table>
</div>
<p class="chart-disclosure">Source: BUZZ Holdings ULC, Bloomberg. Past performance is no guarantee of future results. Index performance is not illustrative of fund performance. Not intended as a recommendation to buy or to sell any of the securities mentioned herein.</p>

<h2>Shares of Super Micro Computer among declining stocks in the BUZZ Index</h2>
<p>Super Micro Computer (SMCI) faced declines during the recent Period, as a mix of factors continued to weigh on investor sentiment. Following the resignation of Ernst &amp; Young as its auditor in October, concerns over the company&rsquo;s accounting practices and delayed financial reporting have persisted. The company also received a compliance warning from Nasdaq for failing to file its reports in a timely manner, raising questions about potential delisting risks. Additionally, the stock&rsquo;s heightened volatility and sensitivity to broader interest rate developments left it particularly exposed to shifts in market sentiment. These factors, coupled with year-end flows and portfolio rebalancing activities, may have combined to create a challenging environment for SMCI during the Period.</p>
<h3>Bottom BUZZ Index Contributors: December 12, 2024 &ndash; January 8, 2025</h3>
<div class="wrapped-div">
<table style="width: 100%;">
<tbody>
<tr class="tbl-data">
<td class="tbl-header last text-left">Company</td>
<td class="tbl-header last text-left">Ticker</td>
<td class="tbl-header last text-right">Average Weight (%)</td>
<td class="tbl-header last text-right">Return Contribution (%)</td>
</tr>
<tr class="tbl-data">
<td class="data-td last font-weight-normal text-left">Super Micro Computer Inc</td>
<td class="data-td data last text-left">SMCI</td>
<td class="data-td data last text-right">3.32</td>
<td class="data-td data last text-right">-0.89</td>
</tr>
<tr class="tbl-data">
<td class="data-td last font-weight-normal text-left">Coinbase Global Inc</td>
<td class="data-td data last text-left">COIN</td>
<td class="data-td data last text-right">2.73</td>
<td class="data-td data last text-right">-0.51</td>
</tr>
<tr class="tbl-data">
<td class="data-td last font-weight-normal text-left">Unity Software Inc</td>
<td class="data-td data last text-left">U</td>
<td class="data-td data last text-right">1.58</td>
<td class="data-td data last text-right">-0.40</td>
</tr>
<tr class="tbl-data">
<td class="data-td last font-weight-normal text-left">SoFi Technologies Inc</td>
<td class="data-td data last text-left">SOFI</td>
<td class="data-td data last text-right">3.07</td>
<td class="data-td data last text-right">-0.28</td>
</tr>
<tr class="tbl-data">
<td class="data-td last font-weight-normal text-left">Viking Therapeutics Inc</td>
<td class="data-td data last text-left">VKTX</td>
<td class="data-td data last text-right">1.27</td>
<td class="data-td data last text-right">-0.27</td>
</tr>
<tr class="tbl-data">
<td class="data-td last font-weight-normal text-left">Palantir Technologies Inc</td>
<td class="data-td data last text-left">PLTR</td>
<td class="data-td data last text-right">3.31</td>
<td class="data-td data last text-right">-0.19</td>
</tr>
<tr class="tbl-data">
<td class="data-td last font-weight-normal text-left">Celsius Holdings Inc</td>
<td class="data-td data last text-left">CELH</td>
<td class="data-td data last text-right">1.56</td>
<td class="data-td data last text-right">-0.18</td>
</tr>
<tr class="tbl-data">
<td class="data-td last font-weight-normal text-left">Carvana Co</td>
<td class="data-td data last text-left">CVNA</td>
<td class="data-td data last text-right">0.60</td>
<td class="data-td data last text-right">-0.16</td>
</tr>
<tr class="tbl-data">
<td class="data-td last font-weight-normal text-left">Advanced Micro Devices Inc</td>
<td class="data-td data last text-left">AMD</td>
<td class="data-td data last text-right">2.80</td>
<td class="data-td data last text-right">-0.16</td>
</tr>
<tr class="tbl-data">
<td class="data-td last font-weight-normal text-left">Tesla Inc</td>
<td class="data-td data last text-left">TSLA</td>
<td class="data-td data last text-right">3.32</td>
<td class="data-td data last text-right">-0.16</td>
</tr>
</tbody>
</table>
</div>
<p class="chart-disclosure">Source: BUZZ Holdings ULC, Bloomberg. Past performance is no guarantee of future results. Index performance is not illustrative of fund performance. Not intended as a recommendation to buy or to sell any of the securities mentioned herein.</p>
<h2>BUZZ Index January 2025 Rebalance Highlights</h2>
<p><strong>Rocket Lab USA, Inc.</strong><br />Over the past decade, advancements in spaceflight technology have accelerated, with SpaceX leading the industry, conducting more orbital launches in 2024 than the rest of the world combined. Rocket Lab USA (NASDAQ: RKLB), another key player, has made considerable strides since its founding in New Zealand in 2006. After relocating to the United States in 2013, the company developed its Electron small-payload rocket and Photon satellite, securing contracts with U.S. investors and space agencies. Last year, Rocket Lab announced plans to recover and reuse its rockets, aligning with SpaceX&rsquo;s cost-saving and scalability efforts. Following its IPO in 2021 via a merger with SPAC Vector Acquisition Corp, RKLB&rsquo;s stock traded around $5 for several years before breaking out last September. This surge was driven by significant revenue growth, a record backlog, contracts for its new large-payload rocket, and heightened investor enthusiasm for the space industry. By January, the stock reached an intra-day high of over $30 per share, underscoring the company&rsquo;s rising profile. This month, Rocket Lab joins the BUZZ Index for the first time, with a 1.87% weight.</p>
<p><strong>SoundHound AI, Inc.</strong><br />SoundHound AI (NASDAQ: SOUN), originally launched as Midomi in 2005, gained early recognition for its ability to identify songs from playback or humming, amassing 100 million users by 2012. Over the years, it expanded into voice-enabled AI, with integrations in industries like automotive through partnerships with Hyundai, Mercedes-Benz, Honda, and Lucid Motors. After going public via a SPAC merger in 2022, SoundHound&rsquo;s stock declined to below $1.00 per share but then surged in 2024, reaching nearly $25 per share in December, driven by strategic acquisitions and plans to enter new sectors like hospitality, retail, and financial services. However, the stock has faced a quick 50% drop from its all-time highs to start 2025, reflecting broader challenges in the sector, including increased competition from larger players and economic conditions that have made it harder for growth-oriented companies to attract investor support. Despite these headwinds, positive investor sentiment remains robust and SoundHound debuts in the BUZZ Index this month with a 3% weight, reflecting continued optimism around its potential in the evolving AI landscape.</p>
<p>To receive more <a href="https://www.vaneck.com/us/en/insights/thematic-investing/" title="Thematic Investing Insights"><strong>Thematic Investing</strong></a> insights, <a href="https://www.vaneck.com/us/en/subscribe/" title="Subscription Center"><strong>sign up in our subscription center</strong></a>.</p>
]]></content:encoded>
</item><item rdf:about="https://www.vaneck.com/us/en/blogs/model-portfolios/monthly-market-recap-2025-is-the-year-of-the-axe-or-maybe-just-a-butter-knife/">
  <title>December Market Recap: 2025 is The Year of the Axe (or Maybe Just a Butter Knife)></title>
  <link>https://www.vaneck.com/us/en/blogs/model-portfolios/monthly-market-recap-2025-is-the-year-of-the-axe-or-maybe-just-a-butter-knife/</link>
  <description><![CDATA[In 2025, navigating turbulence means balancing tech innovation, inflation hedges, energy shifts, and risks from spending cuts and inflation.]]></description>
  <dc:creator>David Schassler</dc:creator>
  <dc:date>01/16/2025 06:30:00</dc:date>
<content:encoded><![CDATA[

<p>Buckle up. Making money in 2025 will be trickier than in 2024. Expect turbulence. And at the center of this brewing storm is one of the most polarizing government initiatives in years: the Department of Government Efficiency Commission (DOGE), spearheaded by none other than Elon Musk and Vivek Ramaswamy. Yes, DOGE isn&rsquo;t just a meme coin anymore&mdash;it&rsquo;s a federal task force with a $2 trillion axe aimed squarely at government bloat. In theory, I love it.</p>
<p>This DOGE post on X is a masterclass in highlighting just how absurd government spending can get:</p>
<p><img loading="lazy" class="img-responsive w-100" alt="How the U.S. Government Spent your Tax Dollars in 2024" src="https://www.vaneck.com/contentassets/8bf1a29f1c3747b5a969eb728287a848/5227_monthly-market-recap_infographic_2025-01_v2_blog.jpg" /></p>
<p class="chart-disclosure">Source: <strong><a href="https://x.com/DOGE/status/1871397453720695148" target="_blank" title="Twitter - Department of Government Efficiency" rel="noopener">Twitter/X</a></strong>.</p>

<p>It's catchy, but here&rsquo;s the rub: $2 trillion is about 25% of the federal budget. Cutting that much government spending isn&rsquo;t just trimming fat&mdash;it&rsquo;s amputating a limb from an economy reliant on government support.</p>
<p>Government spending accounts for a whopping one-third of U.S. GDP. If Department of Government Efficiency (DOGE) goes full Paul Bunyan on the budget, the economy could plunge into a deep recession. And here&rsquo;s the kicker: recessions increase deficits because Uncle Sam loves printing money during hard times, which worsens inflation. It&rsquo;s a vicious cycle, folks. This chart sums it up:</p>
<h3>Recession Periods and Increase in the Deficit</h3>
<div class="wrapped-div">
<table style="width: 450px;">
<tbody>
<tr class="tbl-data">
<td class="tbl-header last text-left">Recession Start</td>
<td class="tbl-header last text-right">Increase in Deficit (%)</td>
</tr>
<tr class="tbl-data">
<td class="data-td last font-weight-normal">March 2001</td>
<td class="data-td data last text-right">6.20</td>
</tr>
<tr class="tbl-data">
<td class="data-td last font-weight-normal">December 2007</td>
<td class="data-td data last text-right">8.80</td>
</tr>
<tr class="tbl-data">
<td class="data-td last font-weight-normal">February 2020</td>
<td class="data-td data last text-right">13.20</td>
</tr>
<tr class="tbl-data">
<td class="data-td last font-weight-normal">Average</td>
<td class="data-td data last text-right">9.40</td>
</tr>
</tbody>
</table>
</div>
<p class="chart-disclosure">Source: VanEck, Federal Reserve Bank of St. Louis as of August 2024.</p>
<p>Sure, there&rsquo;s plenty of waste to trim, but meaningful cuts would require political courage&mdash;a trait in chronically short supply in a system built on avoiding hard decisions. Unless President Trump decides to take one for the team and willingly spark a recession (spoiler: he won&rsquo;t), these cuts are more bark than bite.</p>
<h2>Market Review of December 2024</h2>
<ul class="content-list">
<li class="mt-2"><strong>Equities:</strong> Markets ended 2024 on a sour note. Rising 10-year Treasury yields, up from 4.17% to 4.57% in December, weighed on sentiment, leading the S&amp;P 500 to decline 2.39%. Growth stocks were a bright spot, gaining 1.77%, while value stocks struggled, falling 6.57%. Small caps had an especially tough month, with the Russell 2000 dropping 8.26% as higher interest rates hit smaller businesses the hardest.</li>
<li class="mt-2"><strong>Fixed Income:</strong> Higher rates battered bonds, with long-duration Treasuries plunging 6.16%. Credit spreads held steady, and high-yield bonds declined a mere 0.49%. Fixed income is expected to remain challenging space in 2025, offering income and diversification but requiring selectivity in a volatile environment.</li>
<li class="mt-2"><strong>Real Assets:</strong> Real assets faced headwinds as oil prices fell amid easing geopolitical tensions and weakening Chinese demand. Gold dropped 1.40%, pressured by higher rates and a strong U.S. dollar. Rate-sensitive assets like REITs and infrastructure also struggled.</li>
<li class="mt-2"><strong>Digital Assets:</strong> Bitcoin surged past $100k mid-month before settling at $93k, caught in a broader risk-off rotation as the Federal Reserve signaled fewer rate cuts.</li>
</ul>
<h2>Themes for 2025</h2>
<p><strong>1. Inflation&rsquo;s Second Act:</strong></p>
<ul class="content-list">
<li class="mt-2">Inflation isn&rsquo;t going anywhere&mdash;it&rsquo;s entrenched, quietly reshaping the economy while policymakers argue over who left the door open.</li>
<li class="mt-2">Rising yields will squeeze the economy, while excessive government debt keeps the inflation train chugging along.</li>
<li class="mt-2">Any serious attempt to rein in spending? Forget it. The U.S. economy isn&rsquo;t just living on fiscal support&mdash;it&rsquo;s built an entire lifestyle around it.</li>
<li class="mt-2">Expect another crisis within five years, followed by the Federal Reserve&rsquo;s classic &ldquo;print-and-pray&rdquo; strategy, which will kick off another inflation wave.</li>
</ul>
<p><strong>2. Compounding Technological Advancements:</strong></p>
<ul class="content-list">
<li class="mt-2">We&rsquo;re in a tech supercycle. Innovations like AI and machine learning are fueling productivity gains, and quantum computing potentially waiting in the wings.</li>
<li class="mt-2">AI adoption will trickle down to small and medium businesses, boosting efficiency while creating volatility as Wall Street wrestles with reality versus hype. These swings will be buying opportunities for the bold.</li>
</ul>
<p><strong>3. Gradual Growth in Energy Demand:</strong></p>
<ul class="content-list">
<li class="mt-2">Energy demand is poised for steady growth, driven by the expansion of AI, machine learning, and a rising global middle class.</li>
<li class="mt-2">Traditional energy sources like natural gas remain vital in the near term. They offer reliability, scalability, and lower emissions than coal.</li>
<li class="mt-2">Over the medium to long term, nuclear power emerges as a compelling solution. With high energy output, zero emissions, and next-generation technology advancements, it offers economic stability and energy independence.</li>
<li class="mt-2">However, the pace of nuclear adoption may frustrate investors in the short term, creating periodic volatility&mdash;but these periods could present attractive entry points for long-term investors.</li>
</ul>
<h2>Playbook in Action for 2025</h2>
<p>Navigating 2025 requires a balanced and thoughtful approach across asset classes:</p>
<ul class="content-list">
<li class="mt-2"><strong>Equities</strong> provide growth opportunities through innovation, particularly in AI. While market volatility is expected, it offers disciplined investors the chance to capitalize on disruption-led growth.</li>
<li class="mt-2"><strong>Real Assets</strong> are essential for stability and inflation protection. Gold stands out as both an inflation hedge and a volatility dampener, while natural gas and other traditional energy sources remain critical in meeting immediate energy demands. These assets bridge the gap as investments in nuclear energy&mdash;a long-term solution for reliable, zero-emission power&mdash;gain momentum.</li>
<li class="mt-2"><strong>Digital Assets</strong> like Bitcoin complement traditional real assets, offering a modern hedge against monetary instability and diversification in an increasingly digitized economy. While volatile, Bitcoin&rsquo;s growing acceptance and institutional adoption reinforce its role in forward-thinking portfolios.</li>
<li class="mt-2"><strong>Fixed Income</strong> provides limited excitement in 2025. While nominal yields are attractive, real yields are modest, and a rising rate environment creates challenges. Bonds remain valuable for income generation and diversification in a volatile market.</li>
</ul>
<h2>Final Thoughts</h2>
<p>The 2025 investment landscape is defined by innovation, inflation, and energy transitions. Success will depend on allocating capital across these themes to capture growth, preserve value, and build resilience for the future.</p>
<p>To receive more <strong><a href="https://www.vaneck.com/us/en/insights/guided-allocation/" title="Model Portfolio Insights">Model Portfolio</a></strong> insights, <strong><a href="https://www.vaneck.com/us/en/subscribe/" title="Subscription Center">sign up in our subscription center</a></strong>.</p>
]]></content:encoded>
</item><item rdf:about="https://www.vaneck.com/us/en/blogs/emerging-markets-bonds/navigating-the-wtf-risks-war-tariffs-and-the-feds-impact-on-emerging-markets-in-2025/">
  <title>Navigating the WTF Risks: War, Tariffs, and the Fed&#39;s Impact on Emerging Markets in 2025></title>
  <link>https://www.vaneck.com/us/en/blogs/emerging-markets-bonds/navigating-the-wtf-risks-war-tariffs-and-the-feds-impact-on-emerging-markets-in-2025/</link>
  <description><![CDATA[Emerging markets debt outperformed developed markets yet again in 2024. In 2025, war, tariffs, and Fed risks are top of mind to start the year.]]></description>
  <dc:creator>Eric Fine</dc:creator>
  <dc:date>01/16/2025 06:30:00</dc:date>
<content:encoded><![CDATA[

<p id="overview" class="jump-link-nav anchored-block" data-jumplink-title="Performance Overview">The <strong> <a href="/link/cae21763b8c742f0952c4e4e3234dab9.aspx" title="EMBUX - Emerging Markets Bond Fund - Class I - Overview">VanEck Emerging Markets Fund</a></strong> declined 1.62% in December, compared to -1.66% for its benchmark, the 50% J.P. Morgan Government Bond Index-Emerging Markets Global Diversified (GBI-EM) and 50% J.P. Morgan Emerging Markets Bond Index (EMBI). For the year, the fund gained 3.09%, compared to 2.01% for its benchmark (and compared to -2.08% and -1.67% for the Global Agg and 10-year Treasuries, respectively). For the trailing 5-year period, the Fund&rsquo;s cumulative return is 13.4%, compared to -4.1% for its benchmark (and -11.3% and -9.6% for the Agg and Treasuries, respectively). The decades-old story of emerging markets (EM) bonds outperforming developed markets (DM) continues.</p>
<p>During December, the winners were Sri Lanka and Brazil (an underweight during a big selloff). Ecuador, a long-held position for the fund, way by far the biggest loser. December&rsquo;s markets were very thin and volatile, and this hit Ecuador excessively to our eye. We are poised to increase some exposure to high-beta EM currencies (EMFX) such as the Mexican peso and Brazilian real, both of which had devastating losses last year (down around 20%). Many market participants got beaten up in the peso and real, and our assessment is that both markets might have exhausted selling.</p>
<p>We have covered our underweight in duration into the selloff in bonds and are looking to increase duration further. High yield sovereigns remain our hunting ground in USD, but we added some investment grade sovereigns on the selloff in yields as well. Carry is 7.8%, yield to worst is 9.8%, duration is 5.8, and local makes up around 56% of exposure.</p>

<h3>Average Annual Total Returns<sup>*</sup>&nbsp;(%) (In USD)</h3>
<div class="wrapped-div">
<table style="width: 100%;">
<tbody>
<tr class="tbl-data">
<td class="tbl-header last" colspan="10">As of December 31, 2024</td>
</tr>
<tr class="tbl-data">
<td class="data-head last text-right">&nbsp;</td>
<td class="data-head last text-right">1 Mth</td>
<td class="data-head last text-right">3 Mth</td>
<td class="data-head last text-right">YTD</td>
<td class="data-head last text-right">1 Yr</td>
<td class="data-head last text-right">3 Yrs</td>
<td class="data-head last text-right">5 Yrs</td>
<td class="data-head last text-right">10 Yrs</td>
</tr>
<tr class="tbl-data">
<td class="data-td last text-left">Class A: NAV (Inception 07/09/12)</td>
<td class="data-td data last text-right">-1.83</td>
<td class="data-td data last text-right">-5.05</td>
<td class="data-td data last text-right">2.52</td>
<td class="data-td data last text-right">1.61</td>
<td class="data-td data last text-right">2.21</td>
<td class="data-td data last text-right">1.87</td>
</tr>
<tr class="tbl-data">
<td class="data-td last text-left">Class A: Maximum 5.75% load</td>
<td class="data-td data last text-right">-7.48</td>
<td class="data-td data last text-right">-10.51</td>
<td class="data-td data last text-right">-3.38</td>
<td class="data-td data last text-right">-0.37</td>
<td class="data-td data last text-right">1.00</td>
<td class="data-td data last text-right">1.27</td>
</tr>
<tr class="tbl-data">
<td class="data-td last text-left">Class I: NAV (Inception 07/09/12)</td>
<td class="data-td data last text-right">-1.62</td>
<td class="data-td data last text-right">-4.93</td>
<td class="data-td data last text-right">3.09</td>
<td class="data-td data last text-right">2.01</td>
<td class="data-td data last text-right">2.54</td>
<td class="data-td data last text-right">2.20</td>
</tr>
<tr class="tbl-data">
<td class="data-td last text-left">Class Y: NAV (Inception 07/09/12)</td>
<td class="data-td data last text-right">-1.81</td>
<td class="data-td data last text-right">-5.14</td>
<td class="data-td data last text-right">2.84</td>
<td class="data-td data last text-right">1.86</td>
<td class="data-td data last text-right">2.44</td>
<td class="data-td data last text-right">2.11</td>
</tr>
<tr class="tbl-data">
<td class="data-td last text-left">50% GBI-EM/50% EMBI</td>
<td class="data-td data last text-right">-1.66</td>
<td class="data-td data last text-right">-4.48</td>
<td class="data-td data last text-right">2.01</td>
<td class="data-td data last text-right">-0.88</td>
<td class="data-td data last text-right">-0.83</td>
<td class="data-td data last text-right">1.84</td>
</tr>
</tbody>
</table>
</div>
<p class="chart-disclosure"><sup>*</sup>&nbsp;Returns less than one year are not annualized.</p>
<p class="chart-disclosure"><strong>Expenses: Class A: Gross 2.08%, Net 1.21%; Class I: Gross 1.34%, Net 0.86%; Class Y: Gross 1.35%, Net 0.96%.</strong> Expenses are capped contractually until 05/01/25 at 1.20% for Class A, 0.85% for Class I, 0.95% for Class Y. Caps excluding acquired fund fees and expenses, interest, trading, dividends, and interest payments of securities sold short, taxes, and extraordinary expenses.</p>
<p class="chart-disclosure"><strong>The performance data quoted represents past performance. Past performance is not a guarantee of future results. Investment return and principal value of an investment will fluctuate so that an investor&rsquo;s shares, when redeemed, may be worth more or less than their original cost. Performance may be lower or higher than performance data quoted. Please call 800.826.2333 or visit vaneck.com for performance current to the most recent month ended.</strong></p>
<p class="chart-disclosure">The &ldquo;Net Asset Value&rdquo; (NAV) of a Fund is determined at the close of each business day, and represents the dollar value of one share of the fund; it is calculated by taking the total assets of the fund, subtracting total liabilities, and dividing by the total number of shares outstanding. The NAV is not necessarily the same as the ETF&rsquo;s intraday trading value. Investors should not expect to buy or sell shares at NAV.</p>
<p id="war-tariffs-fed-risks" class="jump-link-nav anchored-block" data-jumplink-title="War, Tariffs, Fed Risks"><strong>Markets spent December trying to price eventual Trump administration policy, and markets are still at it in January. </strong>Tariff policy is obviously the proximate concern, but war and the Fed also loom uncertainly. War, tariffs, and the Fed -- we&rsquo;ll call these the &ldquo;WTF&rdquo; risks. These issues, by themselves, are obviously determinant. War is inflationary, boosts commodities prices, and places a layer of geopolitical risks onto markets. Tariffs are generally viewed by economists as a risky distortion, though we must note that this seems to be misreading Ricardo who was opining about trade with a <i>closed</i> capital account&hellip;open capital accounts are a challenge to the frameworks many economists seem to be using (money doesn&rsquo;t need to cross borders just for goods trade, it can invest to balance trade flows). We should reiterate that the Fed staff have consistently viewed tariffs as <u>hits to demand</u> which should be met with appropriately responsive (i.e., loose) monetary policy. So if our spin on tariff theories is correct, it&rsquo;s really about the magnitude and targeting &ndash; are they so big they cover &ldquo;everything&rdquo; or so punishing to China they create CNY devaluation risks? <i>That</i> would be important and nice to know, but we don&rsquo;t yet. Our point is that the theorizing isn&rsquo;t that productive, the details would be. On to the F in WTF, there is great uncertainty &ndash; will cuts return, is a long pause in store, is growth enough that hikes are coming? And, if you knew the direction of rates for the year, would that even be helpful? 2024 saw many seasons in Treasuries and catching those seasons were <i>way</i> more important than the year trend, practically speaking. Therefore, our strongly preferred stance remains to focus on economic data (is the market pricing Fed policy with too much expected strength or weakness?) or moments when markets seem to deviate significantly from policy moves. This latter case may hold now. Treasuries yields pushed over 90 basis points (bps) higher following the Fed&rsquo;s latest cutting cycle. This is one of the most perverse reactions in the history of modern Fed cutting cycles. Anyway, our point is that <u>that</u> seems to be an observable fact, which has now pushed us to higher duration.</p>
<p><strong>The best argument addressing these WTF risks is <i>not</i> that they are immaterial, but that they may <i>already</i> be priced. </strong>Some EMFX, particularly the Mexican peso, sold off already in 2024 on tariff risks. Look at the chart below to get a sense. It&rsquo;s fairly amazing to us that we had an overweight in local currency throughout 2024 and still outperformed the benchmark. The fund&rsquo;s biggest winner for the year was not owning the Mexican peso (and there&rsquo;s always a bottom-answer with us), but it perhaps gives you a sense of how comfortable we are with some of these risks at the start of 2025. Putting aside the WTF risks, the facts we are left with are a U.S. that is stimulating and a China that is stimulating, which are very supportive of EM.</p>
<h3>Exhibit 1: EMFX Sold Off in 2024</h3>
<div class="flourish-embed flourish-chart" data-src="visualisation/21174294?2429379"><script src="https://public.flourish.studio/resources/embed.js"></script><noscript><img loading="lazy" src="https://public.flourish.studio/visualisation/21174294/thumbnail" width="100%" alt="Exhibit 1: EMFX Sold Off in 2024" /></noscript></div>
<p class="chart-disclosure">Source: Bloomberg LP, Data as of December 2024</p>

<p><strong>While we await US policy clarity, China appears to be steadily moving toward increased spending, perhaps aggressively in the event of harsher U.S. tariffs</strong>. Importantly, the Chinese currency has been stable in the face of WTF risks, and this is despite a record-low yield differential with the U.S.. This stability has been an anchor for many EMs, underlining the idea that tariffs remain a serious risk until clarified, the only pushback is how anticipated they are. So, what&rsquo;s up with CNY now? Well, to our eye, it remains stable. One trigger for concern recently was that a basket of currencies managed against CNY is saw a small reduction of USD and EUR in the basket. But, this basket is changed regularly based on trailing trade data, so we think the regular change in the basket in December says most about the market reaction and little about the basket change itself; the market speculated that a devaluation was likelier and we disagree that this was the intention. Moreover, and most important, the daily fixes of the currency have remained remarkably stable around 6.2, it&rsquo;s market pricing of concern after the fixes that remains an issue. And, the market will take its cues from actual developments. China stimulus should be bullish for CNY, for example. US tariffs may be a more negotiated compromise or even be harsh, and we could still see CNY fixes remain stable. We should note that China&rsquo;s reserves and continued external surpluses make this a sustainable and defensible stance. We should further note that with domestic government bond rates around 1%, this does not strike us as a capital flight situation. Now, pressure still exists on the currency (as measured between the difference between the onshore and offshore exchange rates, CNY and CNH), and the currency could weaken. Perhaps currency weakness would be in reaction to policy moves by the U.S. But, our point is that any currency weakness is likely to be smooth and managed, and could even mark a catharsis of the tariff concern. We have a view, but are watching.</p>

<h2 id="exposure-types-and-significant-changes" class="jump-link-nav anchored-block" data-jumplink-title="Exposure Types and Significant Changes">Exposure Types And Significant Changes</h2>
<p>The changes to our top positions are summarized below. Our largest positions in December were Mexico, South Africa, China, Thailand and Indonesia, with the overall country allocations looking as they do below:</p>
<h3>Country Breakdown (%)</h3>
<div class="row">
<div class="col-lg-3">
<div class="wrapped-div">
<table style="width: 100%;">
<tbody>
<tr class="tbl-data">
<td class="tbl-header last text-left">Country Risk</td>
<td class="tbl-header last text-right">Weight</td>
</tr>
<tr class="tbl-data">
<td class="data-td last font-weight-normal">Mexico</td>
<td class="data-td data last text-right">8.0</td>
</tr>
<tr class="tbl-data">
<td class="data-td last font-weight-normal">South Africa</td>
<td class="data-td data last text-right">6.8</td>
</tr>
<tr class="tbl-data">
<td class="data-td last font-weight-normal">China</td>
<td class="data-td data last text-right">6.4</td>
</tr>
<tr class="tbl-data">
<td class="data-td last font-weight-normal">Thailand</td>
<td class="data-td data last text-right">5.0</td>
</tr>
<tr class="tbl-data">
<td class="data-td last font-weight-normal">Indonesia</td>
<td class="data-td data last text-right">4.6</td>
</tr>
<tr class="tbl-data">
<td class="data-td last font-weight-normal">Malaysia</td>
<td class="data-td data last text-right">4.4</td>
</tr>
<tr class="tbl-data">
<td class="data-td last font-weight-normal">Chile</td>
<td class="data-td data last text-right">4.0</td>
</tr>
<tr class="tbl-data">
<td class="data-td last font-weight-normal">Brazil</td>
<td class="data-td data last text-right">3.9</td>
</tr>
<tr class="tbl-data">
<td class="data-td last font-weight-normal">Colombia</td>
<td class="data-td data last text-right">3.5</td>
</tr>
<tr class="tbl-data">
<td class="data-td last font-weight-normal">Czech Republic</td>
<td class="data-td data last text-right">3.2</td>
</tr>
<tr class="tbl-data">
<td class="data-td last font-weight-normal">Poland</td>
<td class="data-td data last text-right">3.0</td>
</tr>
<tr class="tbl-data">
<td class="data-td last font-weight-normal">Hungary</td>
<td class="data-td data last text-right">2.7</td>
</tr>
<tr class="tbl-data">
<td class="data-td last font-weight-normal">Sri Lanka</td>
<td class="data-td data last text-right">2.6</td>
</tr>
<tr class="tbl-data">
<td class="data-td last font-weight-normal">Turkey</td>
<td class="data-td data last text-right">2.4</td>
</tr>
<tr class="tbl-data">
<td class="data-td last font-weight-normal">Zambia</td>
<td class="data-td data last text-right">2.1</td>
</tr>
<tr class="tbl-data">
<td class="data-td last font-weight-normal">Philippines</td>
<td class="data-td data last text-right">2.0</td>
</tr>
<tr class="tbl-data">
<td class="data-td last font-weight-normal">Congo</td>
<td class="data-td data last text-right">1.8</td>
</tr>
<tr class="tbl-data">
<td class="data-td last font-weight-normal">Ecuador</td>
<td class="data-td data last text-right">1.7</td>
</tr>
<tr class="tbl-data">
<td class="data-td last font-weight-normal">Nigeria</td>
<td class="data-td data last text-right">1.6</td>
</tr>
<tr class="tbl-data">
<td class="data-td last font-weight-normal">Luxembourg</td>
<td class="data-td data last text-right">1.6</td>
</tr>
<tr class="tbl-data">
<td class="data-td last font-weight-normal">Saudi Arabia</td>
<td class="data-td data last text-right">1.5</td>
</tr>
<tr class="tbl-data">
<td class="data-td last font-weight-normal">United Arab Emirates</td>
<td class="data-td data last text-right">1.5</td>
</tr>
<tr class="tbl-data">
<td class="data-td last font-weight-normal">Other (&lt;1.5%)</td>
<td class="data-td data last text-right">20.2</td>
</tr>
</tbody>
</table>
</div>
</div>
<div class="col-lg-8 mt-3">
<div class="flourish-embed flourish-chart" data-src="visualisation/21196622?2133146"><script src="https://public.flourish.studio/resources/embed.js"></script><noscript><img loading="lazy" src="https://public.flourish.studio/visualisation/21196622/thumbnail" width="100%" alt="chart visualization" /></noscript></div>
</div>
</div>
<p class="chart-disclosure">Source: VanEck Research, as of December 2024.</p>
<ul class="content-list">
<li class="mt-2">We increased our local currency exposure in Poland and Chile. Poland can benefit from potential changes in the regional geopolitical landscape (a ceasefire in Ukraine). The currency can also track the euro if the U.S. Fed ends up cutting more than currently expected (only 1 full rate cut in H1-25). These factors improve the policy and technical test scores for Poland. Chile is at the end of the easing cycle, and the economy can potentially benefit from China&rsquo;s eventual response to policy stimulus, which should improve Chile&rsquo;s technical and economic test scores.</li>
<li class="mt-2">We also increased our local currency exposure in Thailand and Malaysia. Thailand&rsquo;s tax reform proposals look encouraging, while solid tourism inflows should support the currency. In terms of our investment process, this improves the policy and economic test scores for the country. Malaysia&rsquo;s local currency bonds are considered a higher-yielding proxy for China&rsquo;s government bonds, and China&rsquo;s rates are expected to continue rallying on the back of additional policy easing (including rate cuts). This strengthens Malaysia&rsquo;s technical test score.</li>
<li class="mt-2">Finally, we increased our hard currency sovereign exposure in Qatar. The decision was motivated by more dovish comments from the U.S. Fed and lower prices paid pressures in some surveys/indices for the U.S. The outlook for the Fed is highly uncertain, but the market prices in a very shallow easing cycle in the U.S. this time around.</li>
<li class="mt-2">We reduced our local currency exposure in Brazil, Uruguay, Mexico, and Indonesia. The Brazilian government and the central bank to do not see eye to eye, reinforcing the negative feedback loop and sending local rates higher and the currency weaker. Despite the recent progress on spending cuts, the mechanism of how these risks can be communicated to the authorities is not always working, which worsens the country&rsquo;s policy test score. Concerns about fiscal slippages under Uruguay&rsquo;s new administration had a similar (negative) impact on the country&rsquo;s policy test score. Some EM local curves are getting flatter after the 5-year segment &ndash; Mexico and Indonesia including &ndash; not justifying taking duration risks in turbulent markets with thin liquidity. In terms of our investment process, this worsened the technical test scores for both countries.</li>
<li class="mt-2">We also reduced our hard currency sovereign exposure in Israel and Ecuador. We took partial profits in Ecuador in order manage potential risks associated with the pre-election political noise, which worsened the country&rsquo;s policy test score. Israel&rsquo;s geopolitical and domestic political pressures limit improvements in the policy test score, even though we are likely to see more initiatives to come under Trump 2.0 administration.</li>
<li class="mt-2">Finally, we reduced our hard currency corporate exposure in China and hard currency sovereign exposure in Ghana and Benin. China&rsquo;s &ldquo;glacial&rdquo; stimulus pace keeps disappointing investors, with the year-end liquidity issues amplifying price moves and worsening the technical test score. Benin&rsquo;s valuations are getting very expensive (the lowest initial valuation bucket), worsening the technical test score, while the opposition&rsquo;s victory in Ghana&rsquo;s presidential elections raised questions about fiscal slippages and the IMF program&rsquo;s renegotiations. These factors worsened the country&rsquo;s policy test score.</li>
</ul>
<p>To receive more <a href="https://www.vaneck.com/us/en/insights/emerging-markets-bonds/" title="Emerging Markets Bonds Insights"><strong>Emerging Markets Bonds</strong></a> insights, <a href="/link/5f45412c2143400497908cea2897f7d3.aspx" title=" Subscription Center"><strong>sign up in our subscription center</strong></a>.</p>
]]></content:encoded>
</item><item rdf:about="https://www.vaneck.com/us/en/blogs/natural-resources/from-resilience-to-revival-commodities-optimistic-outlook-for-2025/">
  <title>From Resilience to Revival: Commodities&#39; Optimistic Outlook for 2025></title>
  <link>https://www.vaneck.com/us/en/blogs/natural-resources/from-resilience-to-revival-commodities-optimistic-outlook-for-2025/</link>
  <description><![CDATA[The natural resource sector and commodities showed resilience in 2024 despite challenges. Looking ahead to 2025, optimism grows as the market prepares for growth amid improving global dynamics.]]></description>
  <dc:creator>Shawn Reynolds</dc:creator>
  <dc:date>01/16/2025 06:30:00</dc:date>
<content:encoded><![CDATA[

<p>Quarterly insights from Global Resources Portfolio Manager Shawn Reynolds, featuring his unique views on natural resources and commodities.</p>

<h2 id="q4-2024-recap" class="jump-link-nav anchored-block" data-jumplink-title="Q4 2024 Recap">Market Volatility Dampens Commodities, but Natural Gas Rallies</h2>
<p>Resource equities and commodities experienced significant pullbacks as the outlook for global economic growth moderated during the quarter. The anticipated pause in the U.S. Federal Reserve&rsquo;s (Fed&rsquo;s) interest rate-cutting cycle, coupled with the incoming U.S. Administration&rsquo;s tariff threats, strengthened the U.S. dollar, leading to a decline in most commodity prices. Base and industrial metals suffered the largest losses, with copper and nickel recording double-digit losses. Despite the overall market volatility, natural gas prices rallied at the end of the year, bolstering the performance of U.S. gas producers.</p>
<h2>Sector Insights: Navigating Energy, Metals, and Agriculture Amid Market Shifts</h2>
<div class="row pt-3 pb-3 align-items-center">
<div class="col-md-3 col-xs-12 col-lg-2"><img loading="lazy" class="img-responsive w-100 center-image" src="https://www.vaneck.com/contentassets/8443fbe34613472c91e40e7b2a0faf8d/oil_icon.svg" alt="Oil &amp; Gas" /></div>
<div class="col-md-9 col-xs-12 col-lg-10">
<p><strong>Oil &amp; Gas</strong></p>
<p>Oil prices trended sideways during the 4th quarter, despite OPEC+&rsquo;s announced plan to extend its production cuts. Natural gas markets, on the other hand, saw a notable recovery from October lows, supported by strong seasonal demand, tighter balances and structural support from the continued buildout of A.I. (artificial intelligence) data centers. Overall, the industry continued to be marked by consolidation and ongoing capital discipline efforts.</p>
</div>
</div>
<hr style="border: 1px solid #E6E7E8;" />
<div class="row pt-3 pb-3 align-items-center">
<div class="col-md-3 col-xs-12 col-lg-2"><img loading="lazy" class="img-responsive w-100 center-image" src="https://www.vaneck.com/contentassets/8443fbe34613472c91e40e7b2a0faf8d/industrial-metals_icon.svg" alt="Economic Moat Rating" /></div>
<div class="col-md-9 col-xs-12 col-lg-10">
<p><strong>Base &amp; Industrial Metals</strong></p>
<p>Metals markets faced challenges in the 4th quarter, with copper prices declining toward $4 per pound amid China&rsquo;s economic malaise, rising global trade tensions and a potential slowdown in global manufacturing, driven by looming tariffs under the incoming U.S. Administration. In Europe, the copper market remained weak, particularly in Germany, Europe&rsquo;s largest consumer. Iron ore prices were weighed down by weak Chinese steel production and increased scrap utilization, while supply surpluses persisted.</p>
</div>
</div>
<hr style="border: 1px solid #E6E7E8;" />
<div class="row pt-3 pb-3 align-items-center">
<div class="col-md-3 col-xs-12 col-lg-2"><img loading="lazy" class="img-responsive w-100 center-image" src="https://www.vaneck.com/contentassets/8443fbe34613472c91e40e7b2a0faf8d/gold-precious-metals_icon.svg" alt="Gold &amp; Precious Metals" /></div>
<div class="col-md-9 col-xs-12 col-lg-10">
<p><strong>Gold &amp; Precious Metals</strong></p>
<p>Gold hit record highs of $2,787 per ounce in October 2024, driven by geopolitical tensions, Fed rate cuts and central bank purchases, before correcting in November due to stronger U.S. Treasury yields and equity market gains. Despite high prices, gold miners faced operational challenges and investor skepticism, with some companies like Agnico Eagle achieving margin expansion and growth. M&amp;A activity and shareholder-focused strategies remained central themes for the sector.</p>
</div>
</div>
<hr style="border: 1px solid #E6E7E8;" />
<div class="row pt-3 pb-3 align-items-center">
<div class="col-md-3 col-xs-12 col-lg-2"><img loading="lazy" class="img-responsive w-100 center-image" src="https://www.vaneck.com/contentassets/8443fbe34613472c91e40e7b2a0faf8d/agriculture_icon.svg" alt="Agriculture" /></div>
<div class="col-md-9 col-xs-12 col-lg-10">
<p><strong>Agriculture</strong></p>
<p>In the 4th quarter, the agricultural markets faced mixed dynamics. While the Fed&rsquo;s monetary easing boosted economic prospects, farm incomes declined due to low crop prices and rising input costs. Crop yields were robust, with record-breaking corn and soybean production, though export demand remained weak. Overall, the sector showed resilience despite challenges in input costs and policy uncertainties.</p>
</div>
</div>
<hr style="border: 1px solid #E6E7E8;" />
<div class="row pt-3 pb-3 align-items-center">
<div class="col-md-3 col-xs-12 col-lg-2"><img loading="lazy" class="img-responsive w-100 center-image" src="https://www.vaneck.com/contentassets/8443fbe34613472c91e40e7b2a0faf8d/renewable-alternatives_icon.svg" alt="Renewables &amp; Alternatives" /></div>
<div class="col-md-9 col-xs-12 col-lg-10">
<p><strong>Renewables &amp; Alternatives</strong></p>
<p>Renewable energy underperformed due to pricing pressures, oversupply and concerns about the potential lack of supportive policies under the incoming administration. Higher interest rates have increased the cost of debt for many renewable projects, posing challenges for emerging developers. Moreover, the reduced likelihood of significant interest rate cuts in 2025 has further dampened the sector&rsquo;s outlook. Lastly, under the previous Trump Administration, the focus on 'energy dominance' prioritized expanding domestic fossil fuel production and rolling back clean energy policy and regulations.</p>
</div>
</div>

<h2 id="outlook-2025" class="jump-link-nav anchored-block" data-jumplink-title="2025 Outlook">Resilient Commodities and Natural Resource Equities: A Sanguine Outlook for 2025</h2>
<p>Resilient is the word we have consistently used throughout 2024 when discussing the natural resource sector and global commodity prices. With headwinds from high interest rates, sticky global inflation and, most importantly, a Chinese economy (the largest consumer of commodities in the world) that was extremely anemic at best, demand vectors for many commodities pointed downward. Similar headwinds were felt by the supply picture with the overhang from OPEC+ excess supply and green-field production being brought on stream by a broad spectrum of commodities. But in the face of these headwinds, commodity prices and resource companies fared relatively well, with several commodities hitting price levels near or at all-time highs. Even those that were down in the year were coming off highs in 2023 and/or were only off by small amounts. In summary, following a year like 2024, our outlook for 2025 remains unequivocally sanguine. Throughout the last 12 months we felt that if rates were on a downward path, China and other economies began to rebound and if geopolitical risks continued to balance oversupply risks, the direction of travel for the supply/demand balance of most commodities would reverse direction and begin pointing upwards. That environment very much feels like a reasonably healthy 2025 commodity market.</p>
<p>Resilient is also a word we use when describing many, if not most, of the natural resource companies in the sector. Following a decade when growth at any cost was the mantra, the post-COVID period is marked by prudence, discipline, capital allocation and returns focus. This has meant more consistent and predictable value accretion with a reduction in the normal volatility associated with commodity prices. In our view, that should eventually lead to higher valuations. Combined with lower global interest rates, record stimulus measures in China and, unfortunately, a never-ending stream of geopolitical risks, natural resource equities feel poised to outperform their 2024 results, in our view, and fully justify an allocation to long-term, diversified oriented portfolios. We have consistently said that natural resource equities do what they are supposed to do when they are supposed to do it, i.e., outperform during periods of global economic growth and associated inflation. This has proven true over 20 years and over the last 5 years, with the difference being over those two time periods the discipline and resilience now characterized by the sector.</p>
<p>On a more granular basis, however, we would rank relative outlooks for the different sub-sectors of the natural resources industry as follows:</p>
<div class="row pt-3 pb-3 align-items-center">
<div class="col-md-3 col-xs-12 col-lg-2"><img loading="lazy" class="img-responsive w-100 center-image" src="https://www.vaneck.com/contentassets/d6ed82613e3f4835acc1a5f8c0696dbd/industrial-metals-copper_icon.svg" alt="Base &amp; Industrial Metals" /></div>
<div class="col-md-9 col-xs-12 col-lg-10">
<p><strong>Base &amp; Industrial Metals</strong></p>
<p>Whether it is copper, industrial, precious or green metals, the supply situation is relatively easier to predict for meaningful step-changes given the lengthy lead times required for the development of any significant mine. The year 2025 should certainly have its share of new, world class mines coming on stream but these are well known, likely already incorporated into the market, and tend to be pushed to the right. Critically, after the start-up of these new sources in 2025/2026, there are virtually no new projects scheduled post 2026. This explains the consolidation fad that has gripped the market. Growth will not come from new mines but from acquired resources. It will not be surprising if this incorporates some of the largest players. Additionally, we see some of the mid-cap producers being likely M&amp;A targets for both major companies and peers. The main exception to this is lithium, where new geographies and evolving technologies point to a reasonable over supply for some time. When it comes to the demand picture, it is really summed up by two trends &ndash; China and &ldquo;Electrification of Everything&rdquo; (&ldquo;EoE&rdquo;). With the massive stimulus measures announced and promised, if needed, it appears highly likely that demand in China during 2025 will be higher than in 2024. The drive towards on-shoring and friend-shoring combined with EoE trends, from A.I. to EV&rsquo;s (electronic vehicles), suggest an inflection in demand for many metals.</p>
</div>
</div>
<hr style="border: 1px solid #E6E7E8;" />
<div class="row pt-3 pb-3 align-items-center">
<div class="col-md-3 col-xs-12 col-lg-2"><img loading="lazy" class="img-responsive w-100 center-image" src="https://www.vaneck.com/contentassets/d6ed82613e3f4835acc1a5f8c0696dbd/gas_icon.svg" alt="Oil &amp; Gas" /></div>
<div class="col-md-9 col-xs-12 col-lg-10">
<p><strong>Oil &amp; Gas</strong></p>
<p>The oil and gas sectors can be looked at somewhat separately. While the OPEC+ overhang remains and there are additional global increments of crude supply from North America, offshore Guyana and Brazil, this is somewhat similar to 2024. The year 2025 may carry more risk from the potential end of OPEC+ production cuts, but we anticipate this being offset by reduced output from new sources and an increased likelihood of stricter enforcement of sanctions on Iranian (and perhaps Russian) exports. Demand may once again turn to China for a renewed contribution to achieving record levels of global consumption. Natural gas, in our view, is facing a structural change in both demand and supply. Certainly, strength in new production from the U.S. and the Middle East is part of the equation. However, new and continuing worries regarding Russian flows of natural gas into Europe and the call on LNG (liquefied natural gas) appear to require meaningful growth. We see demand growth, however, being driven by the EoE and seemingly insatiable energy demand by A.I. data centers. There is little doubt in our minds that natural gas will end up being the main source of power for these intensive users. Access, reliability, affordability and speed to market all point to natural gas.</p>
</div>
</div>
<hr style="border: 1px solid #E6E7E8;" />
<div class="row pt-3 pb-3 align-items-center">
<div class="col-md-3 col-xs-12 col-lg-2"><img loading="lazy" class="img-responsive w-100 center-image" src="https://www.vaneck.com/contentassets/d6ed82613e3f4835acc1a5f8c0696dbd/forest_icon.svg" alt="Agriculture/Paper &amp; Forest" /></div>
<div class="col-md-9 col-xs-12 col-lg-10">
<p><strong>Agriculture/Paper &amp; Forest</strong></p>
<p>Good harvests, growing inventories and decent weather have led to moderating grain prices and less need for fertilizer and crop chemicals. This outlook, on the other hand, benefits the processing and protein companies. Poor weather has impacted several soft commodities and has led to extremely high prices &ndash; such as cocoa, coffee, orange juice and sugar. The year 2025 may be impacted by this and will likely reflect a similar path. During 2024, Paper &amp; Forest (including paper packaging) was completely dominated by actual and potential M&amp;A activity. 2025 looks to be a strengthening period, where most companies focus on internal strategies and self-help opportunities to drive value.</p>
</div>
</div>
<hr style="border: 1px solid #E6E7E8;" />
<div class="row pt-3 pb-3 align-items-center">
<div class="col-md-3 col-xs-12 col-lg-2"><img loading="lazy" class="img-responsive w-100 center-image" src="https://www.vaneck.com/contentassets/d6ed82613e3f4835acc1a5f8c0696dbd/renewable-resources_icon.svg" alt="Renewable Resources" /></div>
<div class="col-md-9 col-xs-12 col-lg-10">
<p><strong>Renewable Resources</strong></p>
<p>There has been a clear abatement in sentiment around transitional resources, not just in the U.S. but even being felt in Europe. However, while the growth rate has slowed, absolute expansion continues at an impactful cadence. Technologies and business models that have proven their capability and sustainability (through the cycle) will continue to thrive in 2025, in our view. Importantly, this is despite a clear intention from the new U.S. Administration to address the Inflation Reduction Act (IRA). From our perspective, it is likely that the IRA is adjusted and refined rather than wholesale cancellation. We see the incentives for EV&rsquo;s, EV charging and large, undesignated Department of Energy (DOE) Loan Program Office guarantees/grants being eliminated. Production Tax Credits (PTC) and Investment Tax Credits (ITC) will likely be maintained but may be altered. However, much of the IRA has bi-partisan support and is likely kept intact. This, in turn, could mean that support services, raw material and goods companies, and infrastructure construction firms will be able to continue to benefit from a steady backlog of downstream transitional resource projects.</p>
</div>
</div>
<p>To receive more <a href="/us/en/insights/natural-resources/" title="Natural Resources Insights"><strong>Natural Resources</strong></a> insights, <a href="https://www.vaneck.com/us/en/subscribe/" title="Subscription Center"><strong>sign up in our subscription center</strong></a>.</p>
]]></content:encoded>
</item><item rdf:about="https://www.vaneck.com/us/en/blogs/gold-investing/ima-casanova-gold-stocks-seek-to-reconnect-with-gold-in-2025/">
  <title>Gold Stocks Seek to Reconnect with Gold in 2025></title>
  <link>https://www.vaneck.com/us/en/blogs/gold-investing/ima-casanova-gold-stocks-seek-to-reconnect-with-gold-in-2025/</link>
  <description><![CDATA[Gold bullion closed 2024 with a 27.22% gain, marking its best performance in 14 years. 2025 investor demand may narrow the disconnect between gold equities and gold bullion prices.]]></description>
  <dc:creator>Imaru Casanova</dc:creator>
  <dc:date>01/14/2025 06:30:00</dc:date>
<content:encoded><![CDATA[

<p>Monthly gold market and economic insights from Imaru Casanova, Portfolio Manager, featuring her unique views on mining and gold&rsquo;s portfolio benefits.</p>

<h2>Gold Performance Amid Economic Shifts and Market Dynamics</h2>
<p>Higher U.S. Treasury rates and a stronger U.S. dollar (DXY index<sup>1</sup>; up 2.60% during the month) continued to pressure gold in December, though less significantly than in November. Gold declined by 0.71% during the final month of the year, outperforming the S&amp;P 500<sup>2</sup>&nbsp;(down 2.38%), but lagging the NASDAQ Composite<sup>3</sup>&nbsp;(up 0.56%). On December 18, the U.S. Federal Open Market Committee (FOMC) cut the federal funds rate by 25 basis points, which helped gold rebound from its monthly lows. However, the committee signaled fewer rate cuts in 2025, reducing the market&rsquo;s implied probability of additional easing. After reaching an all-time high of $2,787 per ounce at the close on October 30, gold consolidated around the $2,600 level, averaging $2,644 per ounce during November and December. Gold closed the year at $2,624.50 per ounce on December 31, achieving a yearly gain of $561.52 per ounce, or 27.22%.</p>
<p>Gold&rsquo;s exceptional performance in 2024 marked its best annual gain in 14 years. Looking back over the past 25 years, gold only performed better in 2007 (+30.94%) and 2010 (+29.57%). This achievement is remarkable given the strong performance of the U.S. equity markets and the U.S. dollar in 2024, with the NASDAQ Composite up 29.57%, the S&amp;P 500 up 25.02%, and the DXY index rising 7.06%, respectively. We believe this gold price action reflects a significant shift in the dynamics of the gold markets over the past two years. Central banks worldwide have emerged as a major driver of gold demand and gold prices, buying record amounts of gold bullion since 2022. Importantly, we think this new gold market reality also helps explain the significant (and to us perplexing) underperformance of gold equities relative to the metal itself.</p>
<h2>Central Banks&rsquo; Strategic Shift Toward Gold Reserves</h2>
<p>Global central banks have been buying gold bullion as part of their reserves management, driven by a variety of factors that have gained greater relevance beginning in 2022.<sup>i</sup>&nbsp;Factors include concerns about systemic financial risks, gold&rsquo;s role as an effective portfolio diversifier, its liquidity, its performance as an inflation hedge and its resilience during times of crisis. Additionally, gold serves as a geopolitical diversifier, a safeguard against sanctions and a component of de-dollarization policies. As a group, central banks&rsquo; recent impetus to increase gold reserves appears independent of the strength of the U.S. economy, the performance of the U.S. equity markets or fluctuations in the U.S. dollar and treasury rates. It is also worth emphasizing that central banks exclusively purchase gold bullion, not gold equities.</p>
<h2>Shifting Gold Dynamics: Central Banks vs. Investors</h2>
<p>Prior to this record level of gold buying by central banks over the past three years, the primary driver of gold prices historically was western investment demand, which has mostly declined since 2020. We gauge investment demand by tracking the flows into and out of global gold bullion ETFs. Investors who are buying gold bullion ETFs are often the same ones who purchase gold mining equities as a leveraged play on gold, aiming to broaden their exposure to gold as an asset class. However, these investors have been mostly absent during the recent gold rally, contributing to the widening valuation gap between gold and gold equities. While central banks have been actively buying gold, many investors have been enjoying the benefits of a relentless broader equity bull market, reducing the perceived need to own gold or gold equities.</p>

<h2>Gold ETFs and Prices: A Growing Disconnect</h2>
<p>We have highlighted the breakdown of the long-standing correlation between gold bullion ETF holdings and the gold price, with the gold price increasing even as investment demand declined. From April 2022 to the end of 2024, gold bullion ETF holdings fell by 22%, while the spot gold price increased by 36%. This disconnect is largely attributed to significant gold buying by the official sector in recent years.</p>
<p>In contrast, a strong correlation persists between gold bullion ETF holdings and the performance of gold equities relative to gold. From April 2022 to the end of 2024, the GDMNTR<sup>4</sup>&nbsp;has declined by 1.7%, underperforming gold by nearly 38 percentage points in a rising gold price environment. This underperformance reflects investors mostly abandoning gold as an asset class, even as central banks and non-Western investors drove gold prices higher. However, during brief periods over the past two years when global gold bullion ETF holdings increased, indicating a temporary return of Western investors, gold equities outperformed gold as expected.</p>
<p>The chart below illustrates the performance of gold bullion, gold bullion ETFs and gold miners across key periods from 2021 to 2024, highlighting the disconnect between gold prices, ETF flows, and miner returns during different market phases.</p>
<h3>Gold Miner Outperformance (vs. Bullion) may depend on the level of investment demand (Gold Bullion ETF flows)</h3>
<div class="flourish-embed flourish-chart" data-src="visualisation/21137517?2133146"><script src="https://public.flourish.studio/resources/embed.js"></script><noscript><img loading="lazy" src="https://public.flourish.studio/visualisation/21137517/thumbnail" width="100%" alt="Gold Miner Outperformance (vs. Bullion) may depend on the level of investment demand (Gold Bullion ETF flows)" /></noscript></div>
<p class="chart-disclosure">Source: Bloomberg, VanEck. Data as of December 2024. "Gold Miners" represented by NYSE Arca Gold Miners Index (NTR). Past performance is not indicative of future results.</p>
<h2>The Performance Gap in 2024 between Gold and Gold Equities</h2>
<p>As we look back at the performance of gold and gold equities in 2024, the most resounding question will be: &ldquo;Why did gold stocks fail to keep pace with gold, with a 10.64% gain (GDMNTR) compared to the metal&rsquo;s 27.22% increase?&rdquo;.&nbsp; While the gold mining industry fundamentals most certainly played a role, our best answer to this question is, &ldquo;Because central banks don&rsquo;t buy gold stocks&rdquo;.</p>
<p>Gold equities remain approximately 40% below their 2011 peaks, even as gold prices have risen roughly 40% since then. When investors decide it&rsquo;s time to add gold to their portfolio, for many of the same reasons central banks have been buying&mdash;market participants may no longer be able to ignore the very compelling case for owning gold equities.</p>
<p>To receive more <strong><a href="https://www.vaneck.com/us/en/insights/gold-investing/" title="Gold Investing Insights">Gold Investing</a></strong> insights, <strong><a href="https://www.vaneck.com/us/en/subscribe/" title="Subscription Center">sign up in our subscription center</a></strong>.</p>
]]></content:encoded>
</item><item rdf:about="https://www.vaneck.com/us/en/blogs/municipal-bonds/municipal-bond-outlook-for-2025/">
  <title>Municipal Bond Outlook for 2025></title>
  <link>https://www.vaneck.com/us/en/blogs/municipal-bonds/municipal-bond-outlook-for-2025/</link>
  <description><![CDATA[We believe munis are expected to shine in 2025 due to low real interest rates, potential tax policy changes, and their attractive taxable-equivalent yields relative to other asset classes.]]></description>
  <dc:creator>James Colby</dc:creator>
  <dc:date>01/08/2025 06:30:00</dc:date>
<content:encoded><![CDATA[

<p>The Federal Reserve&rsquo;s (Fed) measured actions throughout the year are expected to sustain a trend of lower real interest rates. Headlines like <em>"Blockbuster Good News for Inflation"</em> suggest a favorable capital market environment for bond issuers. With issuers eager to secure funding for long-overdue public infrastructure projects, 2025 may well rival the record levels of bond issuance observed in the departing year 2024.</p>
<p>However, the federal tax exemption for municipal bonds remains an uncertain factor. If the incoming administration seeks to curtail or eliminate this exemption, we could witness a dual effect: a surge in new issuances aiming to lock in the current low cost of capital and a significant rise in valuations for the $4 trillion in outstanding bonds that would likely be grandfathered under such legislation. These developments are poised to drive strong performance in the municipal bond market.</p>
<p>Potential changes to individual or corporate tax rates will be a focal point of early policy debates under the new administration. Any reductions in tax rates could exert downward pressure on municipal bond prices and upward pressure on yields for outstanding issues. Nevertheless, such adjustments would further amplify the comparative advantage of municipals, particularly their high taxable-equivalent yields.</p>
<p>The accompanying chart illustrates municipal bonds' current taxable-equivalent yield advantage relative to other asset classes. As noted, prospective tax reforms would likely enhance this differential advantage, solidifying municipal bonds' position as a highly attractive option. Investors and advisors should prioritize this critical comparative element, elevating municipal bonds to the forefront of portfolio allocations in 2025.</p>
<h3>Current Taxable-Equivalent Yield Comparison: Municipal Bonds vs. Fixed Income Asset Classes</h3>
<div class="flourish-embed flourish-chart" data-src="visualisation/21068546?2133146"><script src="https://public.flourish.studio/resources/embed.js"></script><noscript><img loading="lazy" src="https://public.flourish.studio/visualisation/21068546/thumbnail" width="100%" alt="Current Taxable-Equivalent Yield Comparison: Municipal Bonds vs. Fixed Income Asset Classes" /></noscript></div>
<p class="chart-disclosure">Source: ICE Data Service as of 12/31/2024. For illustrative purposes only. Taxable-equivalent yield represents the yield a taxable bond must earn to match&ndash;after federal taxes&ndash;the yield available on a tax-exempt municipal bond (excluding AMT). Municipal bonds may be subject to state and local taxes and federal taxes on gains and may be subject to alternative minimum taxes. The chart displays the yield of the ICE Municipal Bond indices on a tax-equivalent yield basis. It compares such yield to other asset classes as represented by the indexes described at the end of this presentation. Fixed income investments have interest rate risk, which is the risk that bond prices generally fall as interest rates rise and vice versa. U.S. government bonds are guaranteed by the full faith and credit of the United States government. Municipal, corporate, agency, and mortgage-backed bonds are not guaranteed by the full faith and credit of the United States and carry the issuer's credit risk. Municipal bonds are exempt from federal taxes and often state and local taxes. U.S. Treasuries are exempt from state and local taxes but subject to federal taxes. Other securities listed are subject to federal, state, and local taxes. Prices of equity securities change in response to many factors, including the historical and prospective earnings of the issuer, the value of its assets, general economic conditions, interest rates, investor perceptions, and market liquidity. Prices of bonds change in response to factors such as interest rates and the issuer&rsquo;s creditworthiness, among others. Investing in smaller companies involves risks not associated with investing in more established companies, such as business risk, stock price fluctuations, and illiquidity. Past performance is no guarantee of future results. The indices are unmanaged and are not securities in which an investment can be made. See index descriptions at the end of this presentation.</p>

<p>We believe 2025 may present a unique convergence of market conditions, tax policy considerations, and investor opportunities that position municipal bonds as a standout asset class. With their compelling taxable-equivalent yields and potential for strong performance amid shifting economic dynamics, municipals are poised to be a cornerstone of successful investment strategies in the year ahead. Investors recognizing and acting on this opportunity will be well-positioned to capitalize on its benefits.</p>
<h2>Choose Your Municipal Bond ETF</h2>
<p>VanEck&rsquo;s suite of municipal bond investing strategies offers investors flexibility to choose and fine tune their exposures:</p>
<p><a href="/link/af71e9a11e4441edbea8e95251ef5747.aspx" title="SMB - VanEck Short Muni ETF - Holdings and Performance"><strong>VanEck Short Muni ETF (SMB)</strong></a>: Investment grade bonds with maturities from 1 month to 6 years.</p>
<p><a href="/link/34b93d6c4ba74006913a58769f7e7e77.aspx" title="ITM - VanEck Intermediate Muni ETF - Holdings and Performance"><strong>VanEck Intermediate Muni ETF (ITM)</strong></a>: Investment grade bonds with maturities from 6 to 17 years.</p>
<p><a href="/link/1ec087c36ce04ebfaf0617b63e908818.aspx" title="MLN - VanEck Long Muni ETF - Holdings and Performance"><strong>VanEck Long Muni ETF (MLN)</strong></a>: Investment grade bonds with maturities from 17 to 30 years.</p>
<p><a href="/link/1881686e84234b1b9ca2b6d56f2e25a0.aspx" title="SHYD - VanEck Short High Yield Muni ETF - Holdings and Performance"><strong>VanEck Short High Yield Muni ETF (SHYD)</strong></a>: Predominately high-yield bonds with maturities from 1 year to 12 years.</p>
<p><a href="/link/63e99d0ce68b47e79eae26e1c163fd09.aspx" title="HYD - VanEck High Yield Muni ETF - Holdings and Performance"><strong>VanEck High Yield Muni ETF (HYD)</strong></a>: Predominately high-yield bonds with maturities from 1 year to 30 years.</p>
<p><a href="/link/fc018123f20d4f45aaf6b338189ae326.aspx" title="XMPT - VanEck CEF Muni Income ETF - Holdings and Performance"><strong>VanEck CEF Muni Income ETF (XMPT)</strong></a>: Municipal bond closed-end funds with the potential for high income through many of the world&rsquo;s top active asset managers.</p>
<p>To receive more <a href="https://www.vaneck.com/us/en/insights/municipal-bonds/" title="Municipal Bonds Insights"><strong>Municipal Bonds</strong></a> insights, <a href="/link/5f45412c2143400497908cea2897f7d3.aspx" title=" Subscription Center"><strong>sign up in our subscription center</strong></a>.</p>
]]></content:encoded>
</item><item rdf:about="https://www.vaneck.com/us/en/blogs/moat-investing/moat-strategies-reposition-for-2025-amid-december-dip/">
  <title>Moat Strategies Reposition for 2025 Amid December Dip></title>
  <link>https://www.vaneck.com/us/en/blogs/moat-investing/moat-strategies-reposition-for-2025-amid-december-dip/</link>
  <description><![CDATA[The end of 2024 brought mixed results for U.S. equities, as rate concerns offset tech resilience. Moat strategies outperformed equal-weight peers, while small caps revealed new opportunities.]]></description>
  <dc:creator>Coulter Regal, CFA</dc:creator>
  <dc:date>01/08/2025 06:30:00</dc:date>
<content:encoded><![CDATA[

<p>In December, U.S. equity markets ended the year on a mixed note, with the S&amp;P 500 Index declining by 2.4%. The Federal Reserve's (Fed&rsquo;s) more hawkish tone on rate cuts and an upward revision in inflation expectations led to investor apprehension about monetary policy going forward. Despite this downturn, the Nasdaq Composite bucked the trend, gaining about half a percent on the month, driven by continued resilience in the technology sector. The Dow Jones Industrial Average saw a steeper decrease of 5%, signaling broader market jitters over higher interest rates persisting into 2025. Nonetheless, optimism heading into the new year remained, given expected policy changes under the new administration, setting the stage for a more positive outlook to start 2025.</p>
<p>The <strong><a href="https://www.vaneck.com/us/en/investments/morningstar-wide-moat-etf-moat/overview/" title="MOAT - VanEck Morningstar Wide Moat ETF - Overview">Morningstar Wide Moat Focus Index</a></strong> (the &ldquo;Moat Index&rdquo;) retreated along with the broad U.S. equity market in December, falling 4.5% during the month versus the 2.4% decline for the S&amp;P 500. Like much of the year, the Moat Index&rsquo;s equal-weight and valuation conscious methodology proved a headwind in a market environment dominated by the narrow leadership of a few mega-cap tech names. However, when compared versus the equal-weight variant of the S&amp;P 500, which fell by more than 6% in December, the Moat Index found areas of comparative strength leading to outperformance during the month.</p>
<p>After posting their best month of the year in November, smaller U.S. stocks declined considerably in December following the Fed&rsquo;s hawkish statements on policy, suggesting a slower pace for rate cuts in 2025 than previously anticipated. The broad small- and mid-cap benchmarks fell between 7% and 8% during the month while the <strong><a href="https://www.vaneck.com/us/en/investments/morningstar-smid-moat-etf-smot/overview/" title="SMOT - VanEck Morningstar SMID Moat ETF - Overview">Morningstar US Small-Mid Cap Moat Focus Index</a></strong> (the &ldquo;SMID Moat Index&rdquo;) faired a bit better, declining roughly 6%. On the year, performance dispersion between large- and small-caps remains notable, offering compelling valuation opportunities for long-term investors looking to rotate capital in the new year.</p>
<h3>Stocks Close Strong Year with a December Dip</h3>
<div class="flourish-embed flourish-chart" data-src="visualisation/21070584?2133146"><script src="https://public.flourish.studio/resources/embed.js"></script><noscript><img loading="lazy" src="https://public.flourish.studio/visualisation/21070584/thumbnail" width="100%" alt="Stocks Close Strong Year with a December Dip" /></noscript></div>
<p class="chart-disclosure"><strong>Source: Morningstar. Data as of 12/31/2024.</strong> Past performance is no guarantee of future results. Index performance is not representative of fund performance. It is not possible to invest directly in an index. Fund performance current to the most recent month end is available by visiting vaneck.com or by calling 800.826.2333.</p>
<h2>Moat Strategies Positioning for 2025</h2>
<p>Both the Moat and SMID Moat Indexes underwent quarterly reviews on December 20, 2024. Each quarter they systematically target the most attractively priced, high quality U.S. companies within their respective universes. Key takeaways from the December review and how the Moat Index is positioned to start the new year can be found in our <strong><a href="https://www.vaneck.com/us/en/blogs/moat-investing/keepin-it-contrarian-moat-index-adds-health-care-reduces-tech/" title="Keepin' it Contrarian: Moat Index Adds Health Care, Reduces Tech">recent blog covering the review</a></strong>. Full results of the quarterly reviews are also available here: <strong><a href="https://www.vaneck.com/us/en/investments/morningstar-wide-moat-etf-moat/moat-reconstitution.pdf" title="MOAT - VanEck Morningstar Wide Moat ETF - Reconstitution" target="_blank" rel="noopener">Moat Index</a></strong> and <a href="https://www.vaneck.com/us/en/investments/morningstar-smid-moat-etf-smot/smot-reconstitution.pdf" title="SMOT - VanEck Morningstar SMID Moat ETF - Reconstitution" target="_blank" rel="noopener"><strong>SMID Moat Index.</strong></a></p>
<p>Additionally, in our moat investing webinar, we provide more information on current positioning and recent performance, and members of Morningstar&rsquo;s equity research team share their perspectives on market trends and the companies they cover. View the webinar here: <strong><a href="https://www.vaneck.com/us/en/webinar-registration/?id=98477157250&amp;utm_source=vaneck&amp;utm_medium=calendar" title="Beyond Big Tech: A Fresh Look at Equity Exposure">Beyond Big Tech: A Fresh Look at Equity Exposure</a></strong>.</p>

<h2 id="moat-highlights" class="jump-link-nav anchored-block" data-jumplink-title="Moat Highlights">Moat Index December Highlights: Boeing Shares Liftoff</h2>
<p>Sector allocations within the Moat Index were the primary drivers of relative performance versus the S&amp;P 500 in December with an underweight in technology having a noted negative impact. Overweights in health care and industrials also detracted. However, strong stock selection within these areas helped offset the negative allocation effect.</p>
<p>One of those beneficial stock selections was well-known aerospace and defense giant Boeing Co. (BA), which was the top contributor to performance in December. Boeing has taken investors for a turbulent ride in recent years with groundings and safety concerns around their 737 MAX jets as well as issues with their Starliner capsule, which stranded two U.S. astronauts on the International Space Station earlier this year. However, Boeing was aided by good news in December with the reopening of the Chinese market to Boeing&rsquo;s airplanes, as well as the announcement of a significant 100 jet purchase order from Pegasus Airlines. While Boeing shares soared during the month, gaining more than 13%, on the positive news, they remain attractively priced relative to Morningstar&rsquo;s fair value estimate of $191 per share.</p>
<p>Also within the top contributors list for December are two Magnificent Seven names, Alphabet Inc. (GOOGL) and Amazon.com Inc. (AMZN), which saw share price gains of 12% and 5.5%, respectively, during the month. Despite the Moat Index&rsquo;s structural underweight to the mega-caps that dominate broad market strategies, most of the Mag Seven are wide-moat companies and are eligible for inclusion in the index if Morningstar views their relative valuations as attractive. GOOGL&rsquo;s increased weighting during the December review, as it traded modestly below its $220 fair value estimate, is a recent example. Other top contributors include semiconductor testing equipment manufacturer Teradyne (TER) and the global leader in premium beauty products, Estee Lauder (EL).</p>
<p>On the opposite end, companies detracting the most in December include electronic bond trading platform operator MarketAxess Holdings (MKTX), document and design software firm Adobe (ADBE), consumer health and personal products company Kenvue (KVUE), the regional banking branch U.S. Bank (USB), and consumer credit bureau TransUnion (TRU).</p>
<h2>Top Contributors and Detractors from Moat Index - December 2024</h2>
<h3>Leading Contributors</h3>
<div class="wrapped-div">
<table style="width: 100%;">
<tbody>
<tr class="tbl-data">
<td class="tbl-header last text-left">Company</td>
<td class="tbl-header last text-left">Ticker</td>
<td class="tbl-header last text-left">Sector</td>
<td class="tbl-header last text-right">Avg. Weight (%)</td>
<td class="tbl-header last text-right">Contribution (%)</td>
</tr>
<tr class="tbl-data">
<td class="data-td data last text-left">Boeing Co.</td>
<td class="data-td data last text-left">BA</td>
<td class="data-td data last text-left">Industrials</td>
<td class="data-td data last text-right">2.06</td>
<td class="data-td data last text-right">0.29</td>
</tr>
<tr class="tbl-data">
<td class="data-td data last text-left">Alphabet Inc.</td>
<td class="data-td data last text-left">GOOGL</td>
<td class="data-td data last text-left">Communication Services</td>
<td class="data-td data last text-right">1.31</td>
<td class="data-td data last text-right">0.16</td>
</tr>
<tr class="tbl-data">
<td class="data-td data last text-left">Teradyne Inc.</td>
<td class="data-td data last text-left">TER</td>
<td class="data-td data last text-left">Technology</td>
<td class="data-td data last text-right">0.98</td>
<td class="data-td data last text-right">0.14</td>
</tr>
<tr class="tbl-data">
<td class="data-td data last text-left">Amazon.com Inc.</td>
<td class="data-td data last text-left">AMZN</td>
<td class="data-td data last text-left">Consumer Discretionary</td>
<td class="data-td data last text-right">1.32</td>
<td class="data-td data last text-right">0.07</td>
</tr>
<tr class="tbl-data">
<td class="data-td data last text-left">The Estee Lauder Companies Inc.</td>
<td class="data-td data last text-left">EL</td>
<td class="data-td data last text-left">Consumer Staples</td>
<td class="data-td data last text-right">1.70</td>
<td class="data-td data last text-right">0.07</td>
</tr>
</tbody>
</table>
</div>
<h3>Leading Detractors</h3>
<div class="wrapped-div">
<table style="width: 100%;">
<tbody>
<tr class="tbl-data">
<td class="tbl-header last text-left">Company</td>
<td class="tbl-header last text-left">Ticker</td>
<td class="tbl-header last text-left">Sector</td>
<td class="tbl-header last text-right">Avg. Weight (%)</td>
<td class="tbl-header last text-right">Contribution (%)</td>
</tr>
<tr class="tbl-data">
<td class="data-td data last text-left">MarketAxess Holdings Inc.</td>
<td class="data-td data last text-left">MKTX</td>
<td class="data-td data last text-left">Financials</td>
<td class="data-td data last text-right">2.61</td>
<td class="data-td data last text-right">-0.33</td>
</tr>
<tr class="tbl-data">
<td class="data-td data last text-left">Adobe Inc.</td>
<td class="data-td data last text-left">ADBE</td>
<td class="data-td data last text-left">Technology</td>
<td class="data-td data last text-right">2.26</td>
<td class="data-td data last text-right">-0.31</td>
</tr>
<tr class="tbl-data">
<td class="data-td data last text-left">Kenvue Inc.</td>
<td class="data-td data last text-left">KVUE</td>
<td class="data-td data last text-left">Consumer Staples</td>
<td class="data-td data last text-right">2.69</td>
<td class="data-td data last text-right">-0.31</td>
</tr>
<tr class="tbl-data">
<td class="data-td data last text-left">U.S. Bancorp</td>
<td class="data-td data last text-left">USB</td>
<td class="data-td data last text-left">Financials</td>
<td class="data-td data last text-right">2.89</td>
<td class="data-td data last text-right">-0.27</td>
</tr>
<tr class="tbl-data">
<td class="data-td data last text-left">TransUnion</td>
<td class="data-td data last text-left">TRU</td>
<td class="data-td data last text-left">Industrials</td>
<td class="data-td data last text-right">2.70</td>
<td class="data-td data last text-right">-0.23</td>
</tr>
</tbody>
</table>
</div>
<p class="chart-disclosure"><strong>Source: Morningstar, December 2024</strong>. Past performance is no guarantee of future results. Index performance is not illustrative of fund performance. Not intended as a recommendation to buy or to sell any of the securities mentioned herein.</p>

<h2 id="smid-moat-highlights" class="jump-link-nav anchored-block" data-jumplink-title="SMID Moat Highlights">SMID Moat Index December Highlights: Cloudflare&rsquo;s Cyber Edge</h2>
<p>The SMID Moat Index&rsquo;s lead over small- and mid-cap broad benchmarks in December was driven by a combination of strong stock selection and favorable sector exposure with overweights in technology and communication services, as well as an underweight in industrials being the most additive allocations.</p>
<p>Topping the list of leading contributors in December was web security and performance software company Cloudflare Inc. (NET). Morningstar views Cloudflare as well-positioned to succeed in both cybersecurity and edge computing, leveraging its role as a leading content delivery network that handles over 10% of global internet traffic and supports more than a quarter of the world&rsquo;s websites. With growing demand for cybersecurity amid rising cyberattacks, Cloudflare is poised to capitalize on the trend, while also exploring edge computing as large enterprise companies look to manage their data-related workflows. Shares of NET ended December up nearly 8% over the last month and more than 30% over the last three months.</p>
<p>Other top contributors include online video game and multimedia platform operator Roblox (RBLX), luxury fashion and accessory brands parent company Tapestry (TPR), semiconductor testing equipment manufacturer Teradyne (TER), and hotel and resort operator Wyndham (WH). Names that detracted most from the SMID Moat Index performance during the month include ride-sharing service provider Lyft (LYFT), recreational marine vehicle manufacturer Brunswick Corp. (BC), advertising services&nbsp;firm Omnicron Group (OMC), industrial and electrical distributor WESCO International (WCC), and home lawn and gardening products company Scotts Miracle Gro (SMG).</p>
<h2>Top Contributors and Detractors from SMID Moat Index - December 2024</h2>
<h3>Leading Contributors</h3>
<div class="wrapped-div">
<table style="width: 100%;">
<tbody>
<tr class="tbl-data">
<td class="tbl-header last text-left">Company</td>
<td class="tbl-header last text-left">Ticker</td>
<td class="tbl-header last text-left">Sector</td>
<td class="tbl-header last text-right">Avg. Weight (%)</td>
<td class="tbl-header last text-right">Contribution (%)</td>
</tr>
<tr class="tbl-data">
<td class="data-td data last text-left">Cloudflare Inc.</td>
<td class="data-td data last text-left">NET</td>
<td class="data-td data last text-left">Technology</td>
<td class="data-td data last text-right">1.53</td>
<td class="data-td data last text-right">0.12</td>
</tr>
<tr class="tbl-data">
<td class="data-td data last text-left">Roblox Corp.</td>
<td class="data-td data last text-left">RBLX</td>
<td class="data-td data last text-left">Communication Services</td>
<td class="data-td data last text-right">0.66</td>
<td class="data-td data last text-right">0.10</td>
</tr>
<tr class="tbl-data">
<td class="data-td data last text-left">Tapestry Inc.</td>
<td class="data-td data last text-left">TPR</td>
<td class="data-td data last text-left">Consumer Discretionary</td>
<td class="data-td data last text-right">1.68</td>
<td class="data-td data last text-right">0.09</td>
</tr>
<tr class="tbl-data">
<td class="data-td data last text-left">Teradyne Inc.</td>
<td class="data-td data last text-left">TER</td>
<td class="data-td data last text-left">Technology</td>
<td class="data-td data last text-right">0.49</td>
<td class="data-td data last text-right">0.07</td>
</tr>
<tr class="tbl-data">
<td class="data-td data last text-left">Wyndham Hotels &amp; Resorts Inc.</td>
<td class="data-td data last text-left">WH</td>
<td class="data-td data last text-left">Consumer Discretionary</td>
<td class="data-td data last text-right">1.52</td>
<td class="data-td data last text-right">0.05</td>
</tr>
</tbody>
</table>
</div>
<h3>Leading Detractors</h3>
<div class="wrapped-div">
<table style="width: 100%;">
<tbody>
<tr class="tbl-data">
<td class="tbl-header last text-left">Company</td>
<td class="tbl-header last text-left">Ticker</td>
<td class="tbl-header last text-left">Sector</td>
<td class="tbl-header last text-right">Avg. Weight (%)</td>
<td class="tbl-header last text-right">Contribution (%)</td>
</tr>
<tr class="tbl-data">
<td class="data-td data last text-left">Lyft Inc Class A</td>
<td class="data-td data last text-left">LYFT</td>
<td class="data-td data last text-left">Industrials</td>
<td class="data-td data last text-right">1.47</td>
<td class="data-td data last text-right">-0.38</td>
</tr>
<tr class="tbl-data">
<td class="data-td data last text-left">Brunswick Corp.</td>
<td class="data-td data last text-left">BC</td>
<td class="data-td data last text-left">Consumer Discretionary</td>
<td class="data-td data last text-right">1.24</td>
<td class="data-td data last text-right">-0.24</td>
</tr>
<tr class="tbl-data">
<td class="data-td data last text-left">Omnicom Group Inc.</td>
<td class="data-td data last text-left">OMC</td>
<td class="data-td data last text-left">Communication Services</td>
<td class="data-td data last text-right">1.30</td>
<td class="data-td data last text-right">-0.22</td>
</tr>
<tr class="tbl-data">
<td class="data-td data last text-left">WESCO International Inc.</td>
<td class="data-td data last text-left">WCC</td>
<td class="data-td data last text-left">Industrials</td>
<td class="data-td data last text-right">1.52</td>
<td class="data-td data last text-right">-0.22</td>
</tr>
<tr class="tbl-data">
<td class="data-td data last text-left">The Scotts Miracle Gro Co.</td>
<td class="data-td data last text-left">SMG</td>
<td class="data-td data last text-left">Materials</td>
<td class="data-td data last text-right">1.37</td>
<td class="data-td data last text-right">-0.19</td>
</tr>
</tbody>
</table>
</div>
<p class="chart-disclosure"><strong>Source: Morningstar, December 2024</strong>. Past performance is no guarantee of future results. Index performance is not illustrative of fund performance. Not intended as a recommendation to buy or to sell any of the securities mentioned herein.</p>

<h2 id="moat-strategies" class="jump-link-nav anchored-block" data-jumplink-title="Moat Strategies">Choose Your Moat Strategy</h2>
<p>VanEck&rsquo;s suite of <strong><a href="https://www.vaneck.com/us/en/blogs/moat-investing/moat-investing-powered-by-morningstar/" title="Quality Companies at Attractive Prices">moat investing strategies</a></strong> is powered by Morningstar&rsquo;s equity research team, which seeks quality companies trading at attractive valuations. The below ETFs offer access to US moat companies:</p>
<p><strong><a href="/link/9e43dd198c5f4e419f13220685081895.aspx" title="MOAT - VanEck Morningstar Wide Moat ETF">VanEck Morningstar Wide ETF (MOAT)</a></strong>: companies with a wide moat rating, which means Morningstar believes the company is likely to sustain its competitive advantage for at least the next 20 years.</p>
<p><strong><a href="/link/166321dbcfec440590fb51cf0ad629aa.aspx" title="SMOT - VanEck Morningstar SMID Moat ETF">VanEck Morningstar SMID Moat ETF (SMOT)</a></strong>: small and mid-cap moat companies.</p>
<p>To receive more <a href="https://www.vaneck.com/us/en/insights/moat-investing" title="Moat Investing Insights"><strong>Moat Investing</strong></a> insights, <a href="https://www.vaneck.com/us/en/subscribe/" title="Subscription Center"><strong>sign up in our subscription center</strong></a>.</p>
]]></content:encoded>
</item><item rdf:about="https://www.vaneck.com/us/en/blogs/digital-assets/matthew-sigel-vaneck-crypto-monthly-recap-for-december-2024/">
  <title>VanEck Crypto Monthly Recap for December 2024></title>
  <link>https://www.vaneck.com/us/en/blogs/digital-assets/matthew-sigel-vaneck-crypto-monthly-recap-for-december-2024/</link>
  <description><![CDATA[In December, blockchain activity surged with record DEX volumes despite crypto price drops. We highlight Hyperliquid's rise and Ethereum's challenges in the data availability market.]]></description>
  <dc:creator>Matthew  Sigel</dc:creator>
  <dc:date>01/06/2025 06:30:00</dc:date>
<content:encoded><![CDATA[

<p><strong>Please note that VanEck may have a position(s) in the digital asset(s) described below.</strong></p>
<p>After a spectacular November, most Smart Contract Platforms (SCPs) experienced significant price corrections in December. The Market Vectors Smart Contract Leaders Index (MVSCLE) declined by <strong>12%,</strong> with ETH down <strong>10%</strong> and SOL plunging <strong>21%.</strong> Conversely, BTC demonstrated resilience, down only <strong>4%,</strong> thanks to consistent buying from MicroStrategy and the exchange-traded products (ETPs). Notable token gainers in December included MNT <strong>(+38%)</strong>, TRX <strong>(+23%)</strong>, and SUI <strong>(+20%).</strong> Despite altcoins&rsquo; underperformance in the month, daily transactions across all chains reached a record high of <strong>13.7M</strong>, surpassing November&rsquo;s <strong>13M.</strong></p>
<ul class="content-list">
<li class="mt-2"><strong><a href="#top-blockchain">Revenue Comparison</a></strong></li>
<li class="mt-2"><strong><a href="#notable-performers">Notable Performers</a></strong></li>
<li class="mt-2"><strong><a href="#notable-laggards">Notable Laggards</a></strong></li>
<li class="mt-2"><strong><a href="#data-availability">Data Availability Market</a></strong></li>
</ul>
<h3 id="top-blockchain" class="jump-link-nav anchored-block" data-jumplink-title="Revenue Comparison">Bitcoin (BTC) Outperformed Other Majors During December Pullback</h3>
<div class="flourish-embed flourish-chart" data-src="visualisation/21019161"><script src="https://public.flourish.studio/resources/embed.js"></script><noscript><img loading="lazy" src="https://public.flourish.studio/visualisation/21019161/thumbnail" width="100%" alt="Bitcoin (BTC) Outperformed Other Majors During December Pullback" /></noscript></div>
<p class="chart-disclosure">Source: Market Vectors, Artemis as of 12/26/2024. MarketVector Smart Contract Leaders Index (MVSCLE) is designed to track the performance of the largest and most liquid smart contract assets, and is an investable subset of MarketVector Smart Contract Index. <strong>Index performance is not representative of fund performance. It is not possible to invest directly in an index. Past performance is no guarantee of future results. Not intended as a recommendation to buy or sell any securities named herein. </strong></p>
<p>The average daily revenues for SCPs reached <strong>$17M</strong> in December 2024, the highest since April. Ethereum reclaimed its revenue leadership, generating <strong>$7M</strong> daily compared to Solana&rsquo;s <strong>$4M</strong>. Despite emerging competitors like Sui, Base, and Hyperliquid, the top-earning chains in 2024 were Ethereum, Solana, TRX, BTC, and BNB.</p>
<p>DEX trading volume reached an all-time high of <strong>$433B</strong> in December, exceeding November&rsquo;s <strong>$380B.</strong> However, the gains were unevenly distributed. <strong>18 </strong>of the <strong>32 </strong>tracked chains recorded volume increases, led by Tron <strong>(+178%)</strong> and BNB <strong>(+54%). </strong>Notably, Solana&rsquo;s DEX volume fell <strong>(-10%)</strong> while Ethereum&rsquo;s was up <strong>(+27%)</strong> on the month. Chains such as Ton <strong>(-32%),</strong> Gnosis <strong>(-31%),</strong> and Scroll <strong>(-29%)</strong> saw the largest declines.</p>
<h3>Monthly Decentralized Exchange (DEX) Volume &ndash; All Chains (In Billions)</h3>
<div class="flourish-embed flourish-chart" data-src="visualisation/21019217"><script src="https://public.flourish.studio/resources/embed.js"></script><noscript><img loading="lazy" src="https://public.flourish.studio/visualisation/21019217/thumbnail" width="100%" alt="Monthly Decentralized Exchange (DEX) Volume &ndash; All Chains (In Billions)" /></noscript></div>
<p class="chart-disclosure">Source: Defillama as of 12/31/2024. <strong>Past performance is no guarantee of future results.</strong></p>
<h3>Price Returns</h3>
<div class="wrapped-div">
<table style="width: 600px;">
<tbody>
<tr class="tbl-data">
<td class="tbl-header last text-center">&nbsp;</td>
<td class="tbl-header last text-right">December (%)</td>
<td class="tbl-header last text-right">YTD (%)</td>
</tr>
<tr class="tbl-data">
<td class="data-td last">MarketVector Decentralized Finance Leaders Index</td>
<td class="data-td data last text-right">+13</td>
<td class="data-td data last text-right">+35</td>
</tr>
<tr class="tbl-data">
<td class="data-td last">Nasdaq Index</td>
<td class="data-td data last text-right">+1</td>
<td class="data-td data last text-right">+29</td>
</tr>
<tr class="tbl-data">
<td class="data-td last">S&amp;P 500 Index</td>
<td class="data-td data last text-right">-2</td>
<td class="data-td data last text-right">+23</td>
</tr>
<tr class="tbl-data">
<td class="data-td last">Bitcoin</td>
<td class="data-td data last text-right">-4</td>
<td class="data-td data last text-right">+123</td>
</tr>
<tr class="tbl-data">
<td class="data-td last">Ethereum</td>
<td class="data-td data last text-right">-7</td>
<td class="data-td data last text-right">+45</td>
</tr>
<tr class="tbl-data">
<td class="data-td last">MarketVector Infrastructure Application Leaders Index</td>
<td class="data-td data last text-right">-9</td>
<td class="data-td data last text-right">+5</td>
</tr>
<tr class="tbl-data">
<td class="data-td last">MarketVector Smart Contract Leaders Index</td>
<td class="data-td data last text-right">-12</td>
<td class="data-td data last text-right">+46</td>
</tr>
<tr class="tbl-data">
<td class="data-td last">Coinbase</td>
<td class="data-td data last text-right">-16</td>
<td class="data-td data last text-right">+43</td>
</tr>
<tr class="tbl-data">
<td class="data-td last">MarketVector Meme Coin Index</td>
<td class="data-td data last text-right">-20</td>
<td class="data-td data last text-right">NA</td>
</tr>
<tr class="tbl-data">
<td class="data-td last">MV Global Digital Assets Equity Index</td>
<td class="data-td data last text-right">-23</td>
<td class="data-td data last text-right">+40</td>
</tr>
</tbody>
</table>
</div>
<br />
<p class="chart-disclosure">Source: Bloomberg as of 12/31/2024. <strong>Index performance is not representative of fund performance. It is not possible to invest directly in an index. Past performance is no guarantee of future results. Not intended as a recommendation to buy or sell any securities named herein.</strong></p>
<h2>Top Blockchain Revenue Comparison</h2>
<p>Ethereum once dominated revenue generation, averaging five times the revenue of its closest competitor in 2023. However, its strategy to scale through Layer-2 (L2) blockchains&mdash;transactions processed off Ethereum and settled back to it&mdash;has redistributed economic value while other chains have gained users.</p>
<p>Recall that Ethereum&rsquo;s March 2024 upgrade created "blob space," significantly reducing costs for L2s while boosting transaction capacity by <strong>~100x.</strong> This shift allowed Ethereum to process more transactions but reduced its direct revenue share. In January 2023, Ethereum controlled <strong>66%</strong> of SCP revenues; by December 2024, this had fallen to <strong>41%.</strong> Lower blockspace prices and competition from chains like Solana and emerging players such as Sui, Base, and Hyperliquid also contributed to this decline.</p>
<p>Despite these challenges, Ethereum remains a cornerstone of the blockchain ecosystem. It continues to adapt by addressing community concerns about its economic model and the risks posed by centralized L2 sequencers. These centralized systems capture <strong>70-90%</strong> of transaction fees and are susceptible to single points of failure.</p>
<h3>Top Revenue Generating Blockchains by Month</h3>
<p><img loading="lazy" class="img-responsive w-100" alt="Top Revenue Generating Blockchains by Month" src="https://www.vaneck.com/contentassets/57be06206fa94034b0ba01e28afb4771/5186_crypto-monthly-december_table-1_2025-01_v1.svg" /></p>
<p class="chart-disclosure">Source: VanEck Research, Artemis as of 12/26/2024. <strong>Past performance is no guarantee of future results. Not intended as a recommendation to buy or sell any securities named herein. </strong></p>
<h2>Addressing Execution Layer Concerns</h2>
<p>Ethereum&rsquo;s developers are actively exploring solutions to strengthen its execution layer and improve scalability. A key proposal is increasing the gas limit by <strong>20%,</strong> enabling Ethereum to process more transactions per block. Gas measures resource utilization: a transfer between accounts consumes minimal gas, while complex operations like DEX trades consume significantly more. Currently, Ethereum targets <strong>15M</strong> gas per block with a cap of <strong>30M.</strong> This allows for approximately <strong>59 </strong>simple transactions per second or <strong>7 </strong>Uniswap trades.</p>
<p>While increasing the gas limit could reduce fees by <strong>10-30%,</strong> researchers like Dankrad Feist advocate for a more ambitious doubling of the gas limit to <strong>60M</strong>. This would not match Solana&rsquo;s throughput but would demonstrate Ethereum&rsquo;s commitment to scaling its L1 capabilities to accommodate mass adoption of decentralized applications (dApps).</p>
<p>Ethereum&rsquo;s governance model plays a crucial role in implementing changes. Unlike token-holder voting, changes to Ethereum are enacted by validators updating their software. As of December 2024, over <strong>20%</strong> of validators signaled support for increasing the gas limit, and this proportion continues to grow. If more than <strong>50%</strong> of the users adopt the software update, the change will be implemented network-wide.</p>
<p>We think Ethereum&rsquo;s evolution underscores its ability to adapt to the demands of a growing blockchain ecosystem. By addressing scalability and centralization challenges while maintaining its role as the backbone of decentralized finance and applications, Ethereum aims to solidify its leadership in an increasingly competitive environment.</p>
<h3>The Percentage of Ethereum Validators Raising Gas Limit is Increasing</h3>
<div class="flourish-embed flourish-chart" data-src="visualisation/21019304"><script src="https://public.flourish.studio/resources/embed.js"></script><noscript><img loading="lazy" src="https://public.flourish.studio/visualisation/21019304/thumbnail" width="100%" alt="The Percentage of Ethereum Validators Raising Gas Limit is Increasing" /></noscript></div>
<p class="chart-disclosure">Source: Dune @erigon as of 12/27/2024.</p>
<h2 id="notable-performers" class="jump-link-nav anchored-block" data-jumplink-title="Performers">December&rsquo;s Notable Performer &ndash; Hyperliquid&rsquo;s (HYPE) +234%</h2>
<h3>Hyperliquid Surges from 10% Market Share to 70% in One Year</h3>
<div class="flourish-embed flourish-chart" data-src="visualisation/21020797"><script src="https://public.flourish.studio/resources/embed.js"></script><noscript><img loading="lazy" src="https://public.flourish.studio/visualisation/21020797/thumbnail" width="100%" alt="Hyperliquid Surges from 10% Market Share to 70% in One Year" /></noscript></div>
<p class="chart-disclosure">Source: Artemis as of 12/27/2024. <strong>Past performance is no guarantee of future results. Not intended as a recommendation to buy or sell any securities named herein.</strong></p>
<p>One of the themes of December was the radical success of the Hyperliquid project and its token, $HYPE, which returned <strong>(+234%)</strong> in December alone. On November 29, 2024, Hyperliquid launched its token and airdropped <strong>27.5%</strong> of its total supply of $HYPE token to <strong>94K </strong>users. Initially worth $1B, the value of this airdrop surged to <strong>$7.5B</strong> in value at the time of writing, making the $HYPE airdrop the largest in the history of crypto. In just one month of trading, Hyperliquid ranks as the 13th most valuable project in crypto at around <strong>$28B</strong> in fully diluted value.</p>
<h2>Hyperliquid Review</h2>
<p>Hyperliquid is a blockchain originally designed to optimize one application &ndash; a decentralized perpetual futures exchange (Perp DEX). It is technically a &ldquo;Hybrid Blockchain&rdquo; that should be considered in both the Layer-1 (L1) and Layer-3 (L3) categories. Hyperliquid operates in its own set of validators that form Proof of Authority (PoA) consensus, which technically makes it an L1. However, Hyperliquid also posts proof of its activity to create an Arbitrum native bridge (an L2). Since most of Hyperliquid&rsquo;s trading capital is USDC, it is dependent upon Arbitrum and Ethereum for its state. If Ethereum or Arbitrum were to rollback its state affecting USDC, all dependent transactions on Hyperliquid would have to rollback as well. As a result, this makes it also an L3. This dual framework was chosen because it allows Hyperliquid to optimize its blockchain to process many more TPS than other blockchains while also giving Ethereum users a safer, more responsive bridge. The L1 architecture gives Hyperliquid a scaling advantage of competitors while the L3 framework gives Hyperliquid access to Ethereum&rsquo;s massive base of users and assets.</p>
<p>Hyperliquid is successful because it created a better product, harnessed itself to a strong distribution mechanism, and cultivated a loyal community. In just under a year, Hyperliquid has not only attained status as the top Perpetual (Perp) Futures Decentralized Exchange (DEX) in crypto but also currently hosts<strong> 5x</strong> the trading volume of its nearest competitor. In December, Hyperliquid&rsquo;s exchange hosted <a href="https://stats.hyperliquid.xyz/" title="Hyperliquid Stats" target="_blank" rel="noopener"><strong>$160B</strong></a> in perpetual futures trading volume <a href="https://hypurrscan.io/stats" title="Hyperliquid Explorer" target="_blank" rel="noopener"><strong>and $47M in trading</strong></a> perpetual futures trading revenues. Hyperliquid also operates a DEX for native assets on Hyperliquid (no bridged assets) and this has earned <strong>~$1.7M</strong> in spot trading fees.</p>
<p>Hyperliquid&rsquo;s success story begins with its product. It offers a better trading experience than most other DEXes because it is hosted on a purpose-built blockchain and optimized for high throughput. Hyperliquid can process <strong>100K </strong>orders per second, whereas most competitors like GMX and Vertex can process several magnitudes less. Even dYdX, which has its own bespoke trading blockchain, can only process <strong>2K</strong> orders per second. Additionally, Hyperliquid offers a cheaper product with a lower fee structure than many of its rivals. For example, in December 2024, Hyperliquid charged an average of <strong>3 basis points (bps) </strong>per $ of trading volume vs. GMX, who charged <strong>7 bps</strong> per $. Hyperliquid also gives open trading rebates to anyone with enough liquidity on its platform. This open rebate system contrasts with most other perpetual futures exchanges, which only offer rebates through non-public side deals.</p>
<p>Hyperliquid combines a better product and cheaper pricing with its ability to quickly onboard high-value users due to its close proximity to Ethereum. As a result of its hybrid L3 architecture, it can offer Ethereum users a relatively safer bridge and thus access <strong>$75B</strong> in application tokens, <strong>$111B</strong> in stablecoins, and <strong>$400B</strong> in ETH, all housed on Ethereum. dYdX, who created its own chain in the Cosmos, is unable to offer a comparably safe and simple asset bridging experience. Since launching its own chain in Fall 2023, dYdX has not exceeded <strong>$600M</strong> in TVL in its 15-month history, whereas Hyperliquid currently holds <strong>$2.2B</strong> in TVL.</p>
<p>Despite these advantages, Hyperliquid is a DEX, and these types of businesses tend to lack long-term competitive moats. This is because most DEXes are based on open-source code and offer features that are easy to copy. Because of this dynamic, each DEX has to find a way to glue users to its trading ecosystem. The solution that many choose is to introduce a token that can be used for the &ldquo;governance&rdquo; of the DEX. This token is often airdropped to users of the DEX as a reward for their activity. Many assume these tokens will eventually earn revenue from DEX usage and thus grant holders a stream of dividend-like rewards. As such, the effect of these airdrops is to give DEX users ownership shares in the DEX&rsquo;s success.</p>
<h3>Decentralized Exchange (DEX) Airdrop Token Performance After Airdrop</h3>
<div class="flourish-embed flourish-chart" data-src="visualisation/21020838"><script src="https://public.flourish.studio/resources/embed.js"></script><noscript><img loading="lazy" src="https://public.flourish.studio/visualisation/21020838/thumbnail" width="100%" alt="Decentralized Exchange (DEX) Airdrop Token Performance After Airdrop" /></noscript></div>
<p class="chart-disclosure">Source: Artemis as of 12/27/2024. <strong>Past performance is no guarantee of future results. Not intended as a recommendation to buy or sell any securities named herein.</strong></p>
<p>The airdrop &ldquo;games&rdquo; for DEXes arguably kicked off in mid-September 2020, with Sushiswap launching its SUSHI tokens in an attempt to steal Uniswap&rsquo;s user base. Within five days of SUSHI&rsquo;s airdrop, Uniswap created the UNI token and handed it out to its own users. The value of this UNI airdrop was <strong>$350M</strong> in 2020, and these same tokens are now worth around <strong>$1.4B</strong>. Thereafter, DEXes have competed for users by giving them valuable tokens. dYdX also launched a very successful airdrop in September 2021 when it gave its userbase <strong>75M</strong> token worth <strong>$1B</strong>. We consider Uniswap&rsquo;s and dYdX&rsquo;s airdrops successful because they catalyzed long-term business dominance in a sector of crypto without much competitive edge. Uniswap was the top DEX by volume every single month between July 2020 and October 2024, while dYdX held a similar crown amongst Perp DEXes between February 2021 and May 2024.</p>
<p>While many other DEXes have launched airdrops, very few have been able to translate their token airdrops into success for their platforms&rsquo; businesses. These failures partly reflect the difficulty of building a community of DEX users because most traders are &ldquo;mercenaries&rdquo; who lack loyalty to an application. Often, traders who expect an airdrop will inflate their activity to satisfy the airdrop&rsquo;s criteria; typically, tokens are allocated pro-rata based on trading volume to receive the highest number of tokens. This creates a feedback loop for many airdrop recipients creating fake activity, making a DEX appear more successful than reality, selling their tokens, and moving on to a fresh airdrop campaign. Thereafter, DEXes see volumes dry up, and their token prices decline as the inorganic activity that drove false usership statistics leaves. DEXes such as Gains, GMX, Vertex, RabbitX, and many others once commanded significant market shares of DEX Perp trading volumes, but each has declined into obscurity.</p>
<h3>Hyperliquid&rsquo;s Market Cap Exceeds All Peer Market Caps Combined</h3>
<div class="flourish-embed flourish-chart" data-src="visualisation/21021768"><script src="https://public.flourish.studio/resources/embed.js"></script><noscript><img loading="lazy" src="https://public.flourish.studio/visualisation/21021768/thumbnail" width="100%" alt="Hyperliquid&rsquo;s Market Cap Exceeds All Peer Market Caps Combined" /></noscript></div>
<p class="chart-disclosure">Source: Artemis as of 12/27/2024. <strong>Past performance is no guarantee of future results. Not intended as a recommendation to buy or sell any securities named herein.</strong></p>
<p>Though it is early, Hyperliquid has avoided the fate of most crypto DEXes and has reached valuations not seen by previous DEX projects. This is because Hyperliquid has built a growth story founded upon becoming a general-purpose blockchain that will accommodate other applications besides its &ldquo;hyper&rdquo; successful Perp DEX. This is interesting because it bucks the trend of most other blockchains that start from the beginning as general-purpose blockchains that hope to land a &ldquo;killer application.&rdquo; Hyperliquid&rsquo;s spot asset DEX already processed enough trading volume, <strong>$260M</strong> per day, to rank 8th among all DEXes. Because Hyperliquid is based upon EVM, it can attract developers from Ethereum who are seeking a chain that can better accommodate their applications&rsquo; use cases. Hyperliquid&rsquo;s valuation, which stands around <strong>$28B</strong>, is more valuable than most blockchains and has yet to attract much of a developer community. If Hyperliquid is unable to meet the growth expectations of its community, the prisoner&rsquo;s dilemma facing many newly rich $HYPE holders may quickly unravel. Once again, we can see another Icarian tale about crypto hubris.</p>
<h2>December&rsquo;s Notable Performer &ndash; Mantle (MNT) +35%</h2>
<h3>Total Value Locked Among Top Alt-DA Ethereum L2s</h3>
<div class="flourish-embed flourish-chart" data-src="visualisation/21021566"><script src="https://public.flourish.studio/resources/embed.js"></script><noscript><img loading="lazy" src="https://public.flourish.studio/visualisation/21021566/thumbnail" width="100%" alt="Total Value Locked Among Top Alt-DA Ethereum L2s" /></noscript></div>
<p class="chart-disclosure">Source: L2Beat as of 12/28/2024. <strong>Past performance is no guarantee of future results. Not intended as a recommendation to buy or sell any securities named herein.</strong></p>
<h2>Introduction to Mantle</h2>
<p>Mantle had a standout performance in December as it reached a series of technical milestones that further solidified its position as a leading &lsquo;Alt-DA&rsquo; Ethereum L2. The market has responded enthusiastically as Mantle&rsquo;s TVL surpassed <strong>$2B,</strong> and MNT&rsquo;s price approached its all-time high set in April 2024. Mantle&rsquo;s decentralized exchange (DEX) volumes indicated sustained user activity, measuring <strong>$1.4B</strong> in December after reaching back-to-back all-time highs of <strong>$1.6B</strong> and <strong>$2.3B</strong> in October and November. Total transactions increased to <strong>12.1M</strong> in December, up from <strong>9.9M</strong> and <strong>10.0M</strong> in October and November, respectively.</p>
<p>Mantle is an Ethereum L2 that hosts transactions on its own blockchain, posts proofs of that activity on Ethereum, and the full breadth of the data for that activity on a separate special-purpose network called &lsquo;Mantle DA&rsquo; for data availability. This procedure contrasts with most Ethereum &ldquo;roll-ups&rdquo; like Arbitrum and Optimism, which post both the data and settlements on Ethereum. Technically, this classifies Mantle as a &ldquo;validium&rdquo; rather than a true L2 roll-up.</p>
<p>As an 'Alt-DA' L2, Mantle DA uses a custom version of EigenLayer&rsquo;s EigenDA technology to ensure the raw transaction data needed to verify commitments remains publicly accessible. Instead of posting transaction data directly to Ethereum blobs, Mantle posts only state commitments&mdash;referred to as 'settlements'&mdash;to Ethereum for validation. These settlements are cryptographic proofs summarizing the current L2 state, such as account balances.</p>
<p>Mantle&rsquo;s modular design enhances scalability and cost efficiency compared to rollups but introduces additional risk by relying on a system external to Ethereum. Thus far, these systems have been less popular than roll-ups because they have not assembled active ecosystems. By total value locked (TVL), Mantle leads alt-DAs at <strong>$2.08B</strong> in TVL but lags rollups Arbitrum One <strong>($18.7B</strong>), Base <strong>($14.0B),</strong> and OP Mainnet <strong>($7.40B).</strong> Mantle&rsquo;s <strong>$1.6B</strong> of DEX volumes rank similarly, lagging Arbitrum&rsquo;s <strong>($33.7B),</strong> Base&rsquo;s <strong>($52.2B),</strong> and OP Mainnet&rsquo;s <strong>($5.3B</strong>). However, Mantle claims <strong>90%</strong> reduced costs compared to traditional Ethereum L2 rollups. If alt-DA L2s can securely sustain these cost savings, they may eventually surpass rollups in TVL.</p>
<h2>Mantle&rsquo;s Key Developments</h2>
<p>Mantle achieved several significant milestones in December, reinforcing its position as a leading Alt-DA Ethereum Layer 2.</p>
<p>First, Mantle announced a key partnership with Chainlink, adopting Chainlink&rsquo;s Cross-Chain Interoperability Protocol (CCIP). CCIP enables developers to create applications that seamlessly transfer tokens and communicate across multiple blockchains, making Mantle more attractive to projects requiring cross-chain functionality. Leveraging Chainlink&rsquo;s reputation for secure, battle-tested code, this partnership highlights Mantle&rsquo;s strategic focus on building brand network effects, onboarding liquidity, and attracting developers to its ecosystem.</p>
<p>Mantle also announced integration with Succinct&rsquo;s &lsquo;SP1&rsquo; zero-knowledge virtual machine (zkVM), marking a critical step in the L2&rsquo;s roadmap transitioning from an optimistic to a zero-knowledge (ZK) validity rollup. This is important because it reduces Mantle&rsquo;s transaction finality times from seven days to one hour. Finality is important because it lets traders know that their trades are settled so they can redeploy capital elsewhere. This boosts capital efficiency by enabling tighter trading spreads, lower borrowing rates in DeFi markets, and improved access to assets for traders and lenders. Further, by aligning with Ethereum&rsquo;s interoperability standards, this upgrade helps Mantle benefit from the growth of Ethereum&rsquo;s broader L2 ecosystem. This can be considered devices adopting the USB standard; it allows Mantle to seamlessly &ldquo;plug in&rdquo; to a network of compatible blockchains, including rollups like Arbitrum and Optimism.</p>
<p>Mantle&rsquo;s interoperability advancements culminated in December with the integration of Compound III, a significant milestone highlighting the network&rsquo;s growing liquidity and cross-chain capabilities. This upgrade introduced Ethena&rsquo;s USDe stablecoin, Ignition&rsquo;s wrapped Bitcoin FBTC, Mantle&rsquo;s liquid staking token mETH, and wETH as new collateral options, further boosting Mantle&rsquo;s DeFi ecosystem and network effects. To incentivize adoption, Mantle committed <strong>$10M</strong> in supply-side treasury liquidity on USDe markets and <strong>$1M</strong> in MNT rewards to incentivize users to interact with the protocol. However, at the time of writing, Mantle&rsquo;s USDe market activity is relatively modest, with a <strong>21%</strong> utilization rate, possibly reflecting cautious early adoption or a lack of immediate demand for borrowing.</p>
<h2 id="notable-laggards" class="jump-link-nav anchored-block" data-jumplink-title="Laggards">December&rsquo;s Notable Laggard &ndash; Celestia (TIA) -41%</h2>
<h3>Eclipse Accounted for ~95% of Celestia Blob Data in Late December</h3>
<div class="flourish-embed flourish-chart" data-src="visualisation/21021462"><script src="https://public.flourish.studio/resources/embed.js"></script><noscript><img loading="lazy" src="https://public.flourish.studio/visualisation/21021462/thumbnail" width="100%" alt="Eclipse Accounted for ~95% of Celestia Blob Data in Late December" /></noscript></div>
<p class="chart-disclosure">Source: Artemis as of 12/29/2024. <strong>Past performance is no guarantee of future results. Not intended as a recommendation to buy or sell any securities named herein.</strong></p>
<h2>Celestia&rsquo;s Key Developments</h2>
<p>Down <strong>(-41%)</strong>, Celestia was one of December&rsquo;s worst performers, despite recent traction in its core service: providing data availability services to other blockchains.</p>
<h2 id="data-availability" class="jump-link-nav anchored-block" data-jumplink-title="Data Availability">The Data Availability Market</h2>
<p>As a modular data availability (DA) blockchain, Celestia focuses on securing transaction data while leaving execution to other layers. Data availability ensures that transaction data remains accessible for public validation without requiring all participants to store it entirely, a critical component for scaling high-throughput applications like gaming, logistics tracking, and real-time financial settlements. This approach to data availability can be thought of like a library where everyone can access the same book without needing to store their own copy, ensuring efficient access without overwhelming storage resources. Through these efficiency gains, DA layers like Celestia aim to enable the mass adoption of modular blockchain architectures, gaining traction through Ethereum&rsquo;s scaling roadmap.</p>
<p>So far, Celestia&rsquo;s primary competitor in the data availability (DA) market has been Ethereum, though new entrants like EigenLayer DA, Avail, NEAR, and Sui are adding to the competition. Since the start of Q3, Ethereum has consistently received twice as much average weekly blob data as Celestia&mdash;that is, until the week of December 23rd. That week, Eclipse, a modular Ethereum L2 launched in early December using Celestia for data availability, saw a <strong>4,300%</strong> surge in transactions, causing Celestia to process <strong>~3.4x</strong> more blob data than Ethereum. This spike in demand was driven by Eclipse&rsquo;s blockchain design, which generates significant data volume as part of its high-throughput operations. By year&rsquo;s end, Eclipse accounted for <strong>~95%</strong> of Celestia&rsquo;s total blobs. Despite this influx, Eclipse remains a nascent ecosystem, with only <strong>~$36M</strong> in bridge deposits and most of its transactions being unrelated to user activity. While this demonstrates Celestia&rsquo;s ability to handle substantial data loads, its blob fees remain far lower than Ethereum&rsquo;s, earning just <strong>~$6K</strong> per week compared to Ethereum&rsquo;s <strong>$921K</strong>. Year-to-date, Celestia has generated <strong>~$72K</strong> in blob fees versus Ethereum&rsquo;s <strong>~$8.4M</strong>, highlighting Ethereum&rsquo;s dominance in the data availability (DA) market.</p>
<h2>TIA, ETH, and the Data Availability Market</h2>
<h3>Celestia&rsquo;s Blob Fees Stagnated as Ethereum&rsquo;s Grew Steadily in Q4</h3>
<div class="flourish-embed flourish-chart" data-src="visualisation/21021271"><script src="https://public.flourish.studio/resources/embed.js"></script><noscript><img loading="lazy" src="https://public.flourish.studio/visualisation/21021271/thumbnail" width="100%" alt="Celestia&rsquo;s Blob Fees Stagnated as Ethereum&rsquo;s Grew Steadily in Q4" /></noscript></div>
<p class="chart-disclosure">Source: Artemis as of 12/29/2024. <strong>Past performance is no guarantee of future results. Not intended as a recommendation to buy or sell any securities named herein.</strong></p>
<h2>Celestia vs. Ethereum as Data Availability (DA) Products</h2>
<p>Celestia&rsquo;s potential advantage as a data availability (DA) layer lies in its lower costs and innovative data availability sampling (DAS) architecture, which enables scalable and cost-efficient solutions for high-throughput applications. Referring back to our library analogy, data availability sampling is like each member of the library having a random assortment of pages of all the library&rsquo;s books; this prevents each member from having to store each of the library&rsquo;s books but ensures that each book can be reassembled if called upon. In the second half of 2024, Celestia&rsquo;s blobs earned <strong>$50.9K</strong> in fees at an average cost of <strong>$0.19 per MB</strong>, <strong>~1/60th</strong> the average cost of Ethereum&rsquo;s blobs, which earned <strong>$4.90M</strong> at an average cost of <strong>$11.14 per MB</strong>. This affordability positions Celestia as a compelling option for lower-stakes applications, such as gaming or supply chain solutions.</p>
<p>Despite Celestia&rsquo;s affordability and efficiency, many projects continue to prioritize Ethereum&rsquo;s blobspace due to its superior decentralization, security, and reliability. Combined with its robust Layer 2 ecosystem, Ethereum remains the preferred choice for mission-critical applications. Ethereum&rsquo;s network effects are further amplified by ongoing innovation among its L2s, which are actively reducing the number of blobs they consume. If Ethereum successfully scales its blobspace through DAS or other methods while maintaining its superior security, it may limit opportunities for low-cost upstarts like Celestia to gain significant market share.</p>
<h2>TIA vs. ETH as Data Availability (DA) Investments</h2>
<p>As investments, the differing value accrual mechanisms of Celestia&rsquo;s TIA and Ethereum&rsquo;s ETH are also important factors to consider. In Ethereum&rsquo;s DA model, blob fees are paid in ETH and burned, creating a deflationary effect on ETH&rsquo;s supply. Ethereum&rsquo;s recent blob fee growth may, therefore, be contributing to a potential bottom in the ETH/BTC ratio, which has been forming since mid-November. This deflationary mechanism, combined with ETH&rsquo;s extensive adoption across on-chain markets, games, and Layer 2 blockchains, strengthens its position as &ldquo;internet money.&rdquo;</p>
<p>In contrast, TIA&rsquo;s DA service fees, which are paid in TIA, are distributed to validators as staking rewards. This model creates sell pressure on TIA markets, as validators must sell earned tokens to realize rewards, whereas Ethereum&rsquo;s success as a DA layer creates a deflationary effect that benefits all ETH holders. Further, demand for TIA depends on Celestia&rsquo;s ability to attract rollups and modular blockchains as customers. While this effectively positions TIA as an investment tied to Celestia&rsquo;s adoption, its use cases are narrower compared to ETH, which benefits from broader retail money-like adoption and deflationary dynamics. As the DA market becomes increasingly commodified by other new entrants, TIA will need to establish a technical moat to lock in DA fees or develop its own value-accruing narrative like ETH&rsquo;s money utility to remain competitive.</p>
<h2>The Broader Data Availability (DA) Market</h2>
<h3>Ethereum&rsquo;s Economic Security Provides a Moat Attracting Total Value Secured (TVS)</h3>
<div class="flourish-embed flourish-chart" data-src="visualisation/21020753"><script src="https://public.flourish.studio/resources/embed.js"></script><noscript><img loading="lazy" src="https://public.flourish.studio/visualisation/21020753/thumbnail" width="100%" alt="Ethereum&rsquo;s Economic Security Provides a Moat Attracting Total Value Secured (TVS)" /></noscript></div>
<p class="chart-disclosure">Source: L2Beat as of 12/31/2024.</p>
<p>The public DA layer market has grown increasingly competitive as other players like Avail, EigenDA, NEAR DA, and others continue to push for new partnerships and announcements. However, the real, sustainable differentiation these services offer remains to be proven.</p>
<p>EigenDA, which launched in April 2024, leverages Ethereum&rsquo;s validator set to provide a decentralized data availability solution. By reusing Ethereum&rsquo;s security via &ldquo;restaking,&rdquo; EigenLayer positions itself as a cost-efficient alternative for rollups seeking reliable DA services without building separate consensus mechanisms. EigenDA has secured significant partnerships including Mantle and Celo. However, Mantle uses a custom (non-public) DA layer forked from EigenDA with significant modifications, most notably the removal of slashing conditions, and Celo&rsquo;s transition from an L1 to an Ethereum L2 is in testnet, so its TVL is not yet reflected in EigenDA&rsquo;s public DA layer&rsquo;s total value secured (TVS). Avail, which went live in July 2024, similarly offers modular DA capabilities optimized for zero-knowledge rollups, targeting high-throughput applications like entertainment and social networks, illustrated by its partnerships with Lens and Sophon. NEAR DA has partnered with RSS3, a decentralized network that supports open AI and the Open Web, affording it the second-highest TVS despite earning de minimis fees relative to Ethereum and Celestia. Mysten Labs, the developers behind Sui, is the latest to join the trend, announcing the whitepaper for a decentralized storage and DA protocol called Walrus in September.</p>
<p>Despite this diversity, many DA solutions offer comparable performance and cost structures, limiting their ability to stand out. Thus, Ethereum continues to dominate the DA market due to its superior network effects. User adoption and trust remain key strengths, with Ethereum&rsquo;s blobspace benefiting from the security and decentralization of its mature validator set. Ethereum&rsquo;s dominant developer ecosystem also reinforces its position with extensive tooling, SDKs, and compatibility with zk-rollups and optimistic rollups, locking in projects to its infrastructure. Additionally, Ethereum promotes interoperability and composability. A widely adopted DA layer promotes interoperability across various blockchains and rollups, fostering a broader ecosystem of composable applications. Ethereum&rsquo;s DA solutions are also associated with economies of scale, as a larger user base can distribute costs (e.g., for storage or validation) and theoretically coordinate governance more effectively, reducing fees and improving technical upgrades for everyone.</p>
<h2>Understanding Slashable Stake and Total Value Secured (TVS)</h2>
<p>Lastly, it is important to understand the role of &lsquo;economic security&rsquo; as it pertains to the data availability market, as it is this feature of Ethereum that arguably creates its biggest moat.</p>
<p>In the data availability market, &lsquo;economic security,&rsquo; quantified by &lsquo;slashable stake,&rsquo; is the total value of staked assets at risk of being slashed (penalized) if validators act maliciously. This ensures validators are incentivized to maintain honest behavior, as they have significant financial stakes in the network&rsquo;s security. Malicious behaviors include withholding critical data required for rollups or modular blockchains to verify their state, proposing blocks with incomplete or corrupted data, or colluding with other validators to make data unavailable. These actions could undermine the security and functionality of the network, disrupting applications and potentially leading to financial losses for users.</p>
<p>While Total Value Locked (TVL) measures the value of assets directly held within a single blockchain or Layer 2, Total Value Secured (TVS) represents the cumulative value of all blockchains that rely on a DA layer for security and scalability. For example, Ethereum&rsquo;s <strong>$46.9B</strong> in TVS reflects the value of its extensive and high-value rollup ecosystem, significantly higher than other public DA layers such as NEAR DA&rsquo;s <strong>$1.87B</strong> and Celestia&rsquo;s <strong>$0.95B</strong> in TVS.</p>
<p><strong>Links to third party websites are provided as a convenience and the inclusion of such links does not imply any endorsement, approval, investigation, verification or monitoring by us of any content or information contained within or accessible from the linked sites. By clicking on the link to a non-VanEck webpage, you acknowledge that you are entering a third-party website subject to its own terms and conditions. VanEck disclaims responsibility for content, legality of access or suitability of the third-party websites.</strong></p>
<style>
    .data-td.data {
        padding-right: 5px !important;
    }
    
    .wrapped-div {
        max-width: 100%;
    }
    
    @media (max-width: 1240px) {
        .wrapped-div {
            overflow-x: scroll;
        }
    }
    
    .wrapped-div-sector {
        max-width: 100%;
        overflow-x: scroll;
    }
    .flourish-credit {
        display: none !important;
    }
</style>
<p>To receive more <strong><a href="https://www.vaneck.com/us/en/insights/digital-assets/" title="Digital Assets Insights">Digital Assets</a></strong> insights, <strong><a href="https://www.vaneck.com/us/en/subscribe/" title="Subscription Center">sign up in our subscription center</a></strong>.</p>
]]></content:encoded>
</item><item rdf:about="https://www.vaneck.com/us/en/blogs/moat-investing/keepin-it-contrarian-moat-index-adds-health-care-reduces-tech/">
  <title>Keepin’ it Contrarian: Moat Index Adds Health Care, Reduces Tech></title>
  <link>https://www.vaneck.com/us/en/blogs/moat-investing/keepin-it-contrarian-moat-index-adds-health-care-reduces-tech/</link>
  <description><![CDATA[Thirteen companies rotated in and out of the Moat Index during its December quarterly rebalance.]]></description>
  <dc:creator>Brandon Rakszawski</dc:creator>
  <dc:date>12/24/2024 14:16:32</dc:date>
<content:encoded><![CDATA[

<p>The Morningstar<sup>&reg;</sup>&nbsp;Wide Moat Focus Index<sup>SM</sup>&nbsp;(the &ldquo;Moat Index&rdquo; or &ldquo;Index&rdquo;) underwent its quarterly review on December 20, 2024. The Index&rsquo;s review process systematically targets attractively priced, high quality U.S. companies, as identified by Morningstar&rsquo;s equity research analysts. Below are a few key takeaways from the December review and how the Moat Index is positioned following a U.S. presidential election and shifting market sentiment. The full review results are available here:</p>

<h2>Moat Index Review Takeaways:</h2>
<ul class="content-list">
<li class="mt-2"><strong>Health Care Top Overweight, Tech Even Larger Underweight</strong>
<p>The Moat Index pared back some of its industrials exposure as a result of less attractive company valuations and increased its health care exposure by dialing up the weight of one existing constituent and adding four new health care companies to the Index. Health care is currently one of the most undervalued sectors in the U.S. equity market, according to Morningstar&rsquo;s analysis. The Moat Index&rsquo;s underweight to the tech sector became more pronounced. Strong performance from several software companies allowed the Moat Index to systematically lock in gains and remove or scale down these companies&rsquo; positions.</p>
</li>
</ul>
<ul>
<li class="mt-2"><strong>Style Trends: Blend is Top Exposure, Value Increased and is Largest Overweight, Growth Decreased</strong>
<p>The S&amp;P 500 Index continued to reach all-time highs throughout the fourth quarter gaining significant momentum following the U.S. presidential election. As mega caps continue to dominate its makeup and its returns, the S&amp;P 500&rsquo;s growth style dominance remains on full display. Most importantly, the largest mega cap companies are becoming an <a href="/us/en/blogs/moat-investing/market-leadership-is-narrow-your-portfolio-shouldnt-be/" title="Market Leadership Is Narrow. Your Portfolio Shouldn&rsquo;t Be"><strong>increasingly larger part of investor portfolios</strong></a>. The Moat Index&rsquo;s contrarian nature has led its exposure toward attractively priced companies which has resulted in a value bias relative to the headline large cap index and allows investors to meaningfully participate in the U.S. equity market with the added benefit of portfolio diversification. To illustrate the point, as of December 20<sup>th</sup>, the &ldquo;Magnificent 7&rdquo; accounted for over one third of the S&amp;P 500&rsquo;s weight while they only represented about 5.5% among three companies.</p>
</li>
</ul>
<ul>
<li class="mt-2"><strong>U.S. Equity Exposure Without the Lofty Valuations</strong>
<p>Further to the diversification point above, the price/fair value ratio of the S&amp;P 500 Index currently sits at 1.07. This implies that the companies in the S&amp;P 500 are, overall, trading at approximately a 7% premium to fair value, according to Morningstar. This presents a challenge for investors grappling with these lofty valuations and portfolio concentration. The Moat Index represents high quality companies currently mispriced by the market, in Morningstar&rsquo;s view. It allows investors to consider a mix of well-positioned companies with upside potential that differ substantially from existing core portfolio positions. Currently, the Morningstar price/fair value ratio of the Moat Index is 0.83, implying a 17% discount to fair value.</p>
</li>
</ul>
<ul>
<li class="mt-2"><strong>New Names</strong>
<p>There were two companies that were added to the Moat Index for the first time in its over 17-year history:</p>
<p><strong>West Pharmaceutical Services (WST)</strong>: West Pharmaceutical has long traded at a premium to its fair value estimate and just recently became attractively priced enough to warrant inclusion in the Moat Index. West is a major player in the injectable pharmaceutical packaging market. West Pharmaceutical is required to coordinate closely with and develop trust from pharmaceutical customers to ensure stability, purity, and sterility of drugs to meet regulatory standards. West has a large market share in elastomer components for injectable drugs and benefits from the high switching cost associate with its customers disrupting their existing supply chain.</p>
<p><strong>Danaher Corporation (DHR)</strong>: Danaher is a unique Moat Index entrant in that it was just upgraded from a narrow moat rating to wide moat rating in November 2024. Its upgrade reflects the long durability of its customer switching costs, according to Morningstar, in addition to their strong intangible assets. This upgrade to its moat rating also boosted the length of time Morningstar expects Danaher to remain profitable, ultimately pushing their fair value estimate higher. This illustrates Morningstar&rsquo;s integrated research process by which moat ratings influence valuations. Danaher manufactures scientific instruments and consumables in the biotech, life sciences, and diagnostics industries.</p>
</li>
</ul>
<h3>4Q 2024 Moat Index Review Results</h3>
<p><strong>Moat Index Sector Shifts Following 4Q 2024 Review</strong></p>
<div class="flourish-embed flourish-chart" data-src="visualisation/20922027"><script src="https://public.flourish.studio/resources/embed.js"></script><noscript><img loading="lazy" src="https://public.flourish.studio/visualisation/20922027/thumbnail" width="100%" alt="Moat Index Sector Shifts Following 4Q 2024 Review" /></noscript></div>
<p><strong>Moat Index Sector Exposure Relative to S&amp;P 500 Index</strong></p>
<div class="flourish-embed flourish-chart" data-src="visualisation/20922229"><script src="https://public.flourish.studio/resources/embed.js"></script><noscript><img loading="lazy" src="https://public.flourish.studio/visualisation/20922229/thumbnail" width="100%" alt="Moat Index Sector Exposure Relative to S&amp;P 500 Index" /></noscript></div>
<p><strong>Moat Index Style Exposure Relative to S&amp;P 500 Index: Value Bias Persists</strong></p>
<div class="flourish-embed flourish-chart" data-src="visualisation/20922478"><script src="https://public.flourish.studio/resources/embed.js"></script><noscript><img loading="lazy" src="https://public.flourish.studio/visualisation/20922478/thumbnail" width="100%" alt="Moat Index Style Exposure Relative to S&amp;P 500 Index: Value Bias Persists" /></noscript></div>
<p class="chart-disclosure">Source: Morningstar. As of 12/20/2024 unless otherwise noted.</p>

<h2>Access Quality Companies and Attractive Valuations</h2>
<p><a href="/link/9e43dd198c5f4e419f13220685081895.aspx" title="MOAT - VanEck Morningstar Wide Moat ETF - Overview"><strong>VanEck Morningstar Wide Moat ETF (MOAT)</strong></a> and <a href="/link/ca0b4e316f1c4e1985e2d0b7d293f0e4.aspx" title="MWMZX - VanEck Morningstar Wide Moat Fund - Class Z"><strong>VanEck Morningstar Wide Moat Fund</strong></a> seek to replicate as closely as possible, before fees and expenses the price and yield performance of the Morningstar Wide Moat Focus Index.</p>

<p>To receive more <a href="https://www.vaneck.com/us/en/insights/moat-investing" title="Moat Investing Insights"><strong>Moat Investing</strong></a> insights, <a href="https://www.vaneck.com/us/en/subscribe/" title="Subscription Center"><strong>sign up in our subscription center</strong></a>.</p>
]]></content:encoded>
</item><item rdf:about="https://www.vaneck.com/us/en/blogs/thematic-investing/2025-tech-investing-predictions/">
  <title>Tech Investing in 2025: Emerging Trends and Market Opportunities></title>
  <link>https://www.vaneck.com/us/en/blogs/thematic-investing/2025-tech-investing-predictions/</link>
  <description><![CDATA[Gain insights into 2025&rsquo;s top tech trends and market opportunities. Learn what experienced investors should consider for smart tech investments.]]></description>
  <dc:creator>Nick Frasse</dc:creator>
  <dc:date>12/24/2024 06:30:00</dc:date>
<content:encoded><![CDATA[

<p>As we enter 2025, technology continues to drive innovation and economic growth, shaping the future of industries and markets. Advancements in artificial intelligence (AI), semiconductors, cloud computing, cybersecurity, and renewable technologies offer exciting opportunities for investors. However, predicting the ultimate winners in such a dynamic environment is challenging, making a diversified investment strategy critical.</p>
<h2>Economic and Technological Trends Driving Tech Investments</h2>
<p>The global economy is expected to provide strong tailwinds for the tech sector in 2025. Supportive policies and increased government spending are incentivizing innovation across a wide range of industries, including AI, semiconductors, cloud computing, and renewable energy. Advances in real-time AI processing are expanding applications from autonomous vehicles to healthcare solutions. Cloud computing continues to underpin digital transformation, offering scalable solutions to businesses worldwide, while cybersecurity remains essential as digital threats evolve.</p>
<h3>Edge Computing Market Value Worldwide</h3>
<p><strong>2019-2027 (In Billions)</strong></p>
<div class="flourish-embed flourish-chart" data-src="visualisation/20893866"><script src="https://public.flourish.studio/resources/embed.js"></script><noscript><img loading="lazy" src="https://public.flourish.studio/visualisation/20893866/thumbnail" width="100%" alt="Edge Computing Market Value Worldwide" /></noscript></div>
<p class="chart-disclosure"><strong>Statista July 2024</strong>: For illustrative purposes only. Past performance is no guarantee of future results. Not intended as a forecast or prediction of future results.</p>
<h2>Technology Behind the AI Boom</h2>
<p>Semiconductors are increasingly critical to these technologies, driving demand for advanced chip designs to support edge devices and AI inference. At the same time, renewable technologies are being adopted at scale, reflecting a growing global commitment to sustainable energy.</p>
<p>Nuclear energy is emerging as a key player in the clean energy transition, with <strong><a href="/link/5afc6af24fa14a2f81bdaeae023ebf0e.aspx" title="Investment Opportunities in SMRs: The Future of Nuclear Power">small modular reactors (SMRs)</a></strong> offering scalable and flexible power solutions. These developments align with the energy needs of AI and data centers, where consistent and reliable power is essential. <strong><a href="https://www.vaneck.com/us/en/investments/uranium-nuclear-energy-etf-nlr/overview/" title="NLR - VanEck Uranium and Nuclear ETF - Holdings and Performance">The VanEck Uranium+Nuclear Energy ETF (NLR)</a></strong> provides exposure to this revitalized industry, positioning investors to benefit from its growth.</p>

<h2>Market Opportunities in Technology for 2025</h2>
<p>The semiconductor industry remains a focal point, driven by the surging demand for AI applications and edge computing. Companies specializing in advanced chip designs are well-positioned for growth. <strong><a href="/link/9b8fb1812bc74764bf11fc85767838f9.aspx" title="SMHX - VanEck Fabless Semiconductor ETF - Holdings and Performance">The VanEck Fabless Semiconductor ETF (SMHX)</a></strong> offers targeted exposure to these innovators, capturing opportunities beyond traditional industry leaders.</p>
<p>Cloud computing and cybersecurity are foundational to the digital economy, enabling innovation while ensuring resilience against digital threats. These sectors, alongside AI and nuclear energy, are bolstered by global investment and policy support. The advent of SMRs (Small Modular Reactors), for instance, addresses energy needs for AI-driven industries, offering a sustainable solution to power-intensive technologies.</p>
<p>Globally, markets in Asia and North America are emerging as innovation hubs, spurred by private and public investment. Legislative efforts, such as the CHIPS Act in the U.S., exemplify how policy can reshape industries, drive competitive advantages, and strengthen supply chains.</p>
<h3>Technology Revenue Worldwide by Segment</h3>
<p><strong>2018-2028 (In Billions)</strong></p>
<div class="flourish-embed flourish-chart" data-src="visualisation/20894070"><script src="https://public.flourish.studio/resources/embed.js"></script><noscript><img loading="lazy" src="https://public.flourish.studio/visualisation/20894070/thumbnail" width="100%" alt="Technology Revenue Worldwide by Segment" /></noscript></div>
<p class="chart-disclosure"><strong>Segment 2024</strong>: For illustrative purposes only. Past performance is no guarantee of future results. Not intended as a forecast or prediction of future results.</p>
<h2>Diversifying Technology Investments: A Critical Strategy</h2>
<p>While individual sectors like semiconductors, nuclear energy, and cloud computing offer significant promise, predicting the precise winners remains challenging. This is where thematic ETFs provide practical solutions. Funds like <a href="/link/39c8d235748b4c26a5930c31d3ac0160.aspx" title="SMH - VanEck Semiconductor ETF - Holdings and Performance"><strong>SMH</strong></a>, <a href="/link/9b8fb1812bc74764bf11fc85767838f9.aspx" title="SMHX - VanEck Fabless Semiconductor ETF - Holdings and Performance"><strong>SMHX</strong></a>, and <a href="/link/49acb0d4174146e9a0269c9cb81c02bb.aspx" title="NLR - VanEck Uranium and Nuclear ETF - Holdings and Performance"><strong>NLR</strong></a> allow investors to capture broad trends while minimizing risks associated with betting on specific companies. These ETFs deliver diversified exposure to the sectors driving the next wave of technological and industrial growth.</p>
<p>2025 is set to be a defining year for technology investing. The convergence of AI, semiconductors, cloud computing, and renewable technologies highlights the importance of a diversified strategy. By leveraging VanEck&rsquo;s ETF offerings, investors can position their portfolios to benefit from the transformative potential of tech in the year ahead.</p>
<p><strong><a href="/link/51a8e065c6c4461c9cff5f40e29d7e79.aspx" title="Access Trends Through Thematic ETFs">Learn more about VanEck&rsquo;s suite of thematic ETFs.</a></strong></p>
<p>To receive more <a href="https://www.vaneck.com/us/en/insights/thematic-investing/" title="Thematic Investing Insights"><strong>Thematic Investing</strong></a> insights, <a href="https://www.vaneck.com/us/en/subscribe/" title="Subscription Center"><strong>sign up in our subscription center</strong></a>.</p>
]]></content:encoded>
</item><item rdf:about="https://www.vaneck.com/us/en/blogs/investment-outlook/plan-for-2025-predictions-from-our-portfolio-managers/">
  <title>Plan for 2025: Predictions from Our Portfolio Managers></title>
  <link>https://www.vaneck.com/us/en/blogs/investment-outlook/plan-for-2025-predictions-from-our-portfolio-managers/</link>
  <description><![CDATA[Get your portfolio ready with detailed insights from VanEck&rsquo;s investment team about the factors driving risk and returns in their respective asset classes.]]></description>
  <dc:creator> </dc:creator>
  <dc:date>12/24/2024 06:30:00</dc:date>
<content:encoded><![CDATA[

<p>CEO Jan van Eck <strong><a href="/us/en/blogs/investment-outlook/jan-van-eck-2025-outlook-at-the-doorstep-of-the-reckoning/" title="2025 Outlook: At the Doorstep of the Reckoning">recently outlined four pivotal macroeconomic trends</a></strong> shaping the investment landscape heading into 2025:</p>
<ol class="content-list">
<li class="mt-2">The U.S. faces a fiscal reckoning, with potential government spending cuts and persistent inflation risks underscoring the importance of diversified equity portfolios and robust inflation hedges.</li>
<li class="mt-2">Bull markets in gold and bitcoin may gain momentum, driven by inflationary pressures, fiscal uncertainty, and de-dollarization trends, making these assets essential for inflation protection.</li>
<li class="mt-2">Advancements in artificial intelligence (AI) are expected to drive significant growth beyond the tech sector, increasing electricity demand and creating investment opportunities in energy&mdash;particularly nuclear and natural gas&mdash;infrastructure, and utilities.</li>
<li class="mt-2">International equities present compelling opportunities, with India leading the way through rapid economic expansion and attractive valuations, while selective investments in China and other markets also warrant consideration.</li>
</ol>
<p>To complement these macro-level insights, we asked our portfolio managers to share their outlooks for their respective asset classes and highlight the most significant investment opportunities. Their insights below provide a view across various asset classes, offering guidance to empower your investment decisions for the year ahead.</p>
<ul class="content-list">
<li class="mt-2"><a href="#gold" title="Gold: Outlook Remains Bright for 2025"><strong>Gold: Outlook Remains Bright for 2025</strong></a></li>
<li class="mt-2"><a href="#natural-resources" title="Natural Resources: Poised for Growth with Economic Recovery and Lower Rates"><strong>Natural Resources: Poised for Growth with Economic Recovery and Lower Rates </strong></a></li>
<li class="mt-2"><a href="#emb" title="Emerging Markets Bond: Well-Positioned Amid Global Stimulus and High Yields"><strong>Emerging Markets Bond: Well-Positioned Amid Global Stimulus and High Yields</strong></a></li>
<li class="mt-2"><a href="#eme" title="Emerging Markets Equity: Focus on Fundamentals Amid Broader Uncertainty"><strong>Emerging Markets Equity: Focus on Fundamentals Amid Broader Uncertainty</strong></a></li>
<li class="mt-2"><a href="#fixed-income" title="Fixed Income: Up in Quality, Down in Duration, Ready for Opportunities"><strong>Fixed Income: Up in Quality, Down in Duration, Ready for Opportunities</strong></a></li>
<li class="mt-2"><a href="#muni" title="Municipal Bonds: Resilient, Robust, and Ready for 2025"><strong>Municipal Bonds: Resilient, Robust, and Ready for 2025</strong></a></li>
<li class="mt-2"><a href="#digital-assets" title="Digital Assets: New Highs, Expanding Use Cases and Growing Adoption"><strong>Digital Assets: New Highs, Expanding Use Cases and Growing Adoption</strong></a></li>
</ul>
<h2 id="gold" class="jump-link-nav anchored-block" data-jumplink-title="Gold">Gold: Outlook Remains Bright for 2025</h2>
<div class="d-flex justify-content-between align-items-center row my-3">
<div class="col-md-12">
<div class="row align-items-center">
<div class="col-md-12">
<div class="byline__author">
<div class="porthole porthole--lg byline__author-image no-print mr-3" style="background-image: url('https://www.vaneck.com/globalassets/home/corp/our-firm/investment-professionals/imaru-casanova.jpg');"><img loading="lazy" alt="Imaru Casanova Portfolio Manager, Gold and Precious Metals" class="porthole__image" src="https://www.vaneck.com/globalassets/home/corp/our-firm/investment-professionals/imaru-casanova.jpg" /></div>
<div style="position: relative;" class="byline__author-content"><a data-ve-gtm="blog-author" class="byline__author-name-link" href="/us/en/news-and-insights/thought-leaders/imaru-casanova/">
<h3 class="byline__author-name mt-0">Imaru&nbsp;Casanova</h3>
</a>
<div class="byline__author-title">Portfolio Manager, Gold and Precious Metals</div>
</div>
</div>
</div>
</div>
</div>
</div>
<!-- -->
<p><strong>Outlook</strong></p>
<p>We maintain a positive outlook for gold as we head into 2025, supported by strong fundamentals. Many of the catalysts that drove gold to record highs in 2024 remain in place:</p>
<ul class="content-list">
<li class="mt-2"><strong>Elevated Central Bank Buying:</strong> Although central bank purchases in 2024 may not match the record levels seen in 2022 and 2023 (the highest in over 50 years), we are on track for the 15th consecutive year of net purchases. Several central banks have announced plans to increase gold holdings (e.g., Poland is aiming for gold to be 20% of its total reserves).</li>
<li class="mt-2"><strong>Improving ETF Investment Demand:</strong> ETF demand for gold bottomed out in April 2024, marking 11 months of outflows and hitting its lowest level (in ounces) since January 2020&mdash;despite gold delivering an impressive 9.25% annualized return during the same period. Since May, ETF holdings have gradually increased, signaling renewed investor confidence and growing exposure to gold.</li>
<li class="mt-2"><strong>Geopolitical Uncertainty:</strong> Geopolitical risks continue to rise, with ongoing conflicts (e.g., Russia-Ukraine), heightened tensions in the Middle East, political instability in countries like France and South Korea, and emerging trade disputes among the U.S., China, Mexico, and Canada. These uncertainties add volatility to the markets, driving investors toward safe-haven assets like gold.</li>
</ul>
<p><strong>Investment Opportunities</strong></p>
<p>Gold miners represent the most compelling opportunity in the gold sector. Despite higher production costs, gold miners are generating significant free cash flow, with implied margins exceeding $1,000 per ounce of production.</p>
<p>Companies with strong business models, high-quality assets, and proven execution capabilities are not receiving due recognition in the form of higher market multiples. This disconnect presents a notable opportunity, which we expect will correct over time.</p>
<p>The primary challenge lies in shifting investor attention away from high-profile sectors like AI, cryptocurrency, and the "Magnificent Seven" stocks. A market correction or a pause in these sectors could prompt investors to explore alternative opportunities&mdash;and gold miners are well-positioned to capture this interest.</p>
<p><strong><a href="https://www.vaneck.com/us/en/insights/gold-investing/?p=1" title="Gold Investing">Explore more Gold Insights.</a></strong></p>
<h2 id="natural-resources" class="jump-link-nav anchored-block" data-jumplink-title="Natural Resources">Natural Resources: Poised for Growth with Economic Recovery and Lower Rates</h2>
<!-- <p><a href="/EPiServer/CMS/Content/en/us/insights/thought-leaders/shawn-reynolds,,209225/?epieditmode=false" title="Shawn Reynolds - Portfolio Manager, Global Resources"><strong>Shawn Reynolds, Portfolio Manager, Global Resources</strong></a></p> -->
<div class="d-flex justify-content-between align-items-center row my-3">
<div class="col-md-12">
<div class="row align-items-center">
<div class="col-md-6">
<div class="byline__author">
<div class="porthole porthole--lg byline__author-image no-print mr-3" style="background-image: url('https://www.vaneck.com/globalassets/home/corp/our-firm/investment-professionals/shawn-reynolds.jpg');"><img loading="lazy" alt="Shawn Reynolds Portfolio Manager, Global Resources" class="porthole__image" src="https://www.vaneck.com/globalassets/home/corp/our-firm/investment-professionals/shawn-reynolds.jpg" /></div>
<div style="position: relative;" class="byline__author-content"><a data-ve-gtm="blog-author" class="byline__author-name-link" href="/us/en/news-and-insights/thought-leaders/shawn-reynolds/">
<h3 class="byline__author-name mt-0">Shawn&nbsp;Reynolds</h3>
</a>
<div>
<div class="byline__author-title">Portfolio Manager, Global Resources</div>
</div>
</div>
</div>
</div>
</div>
</div>
</div>
<!-- -->
<p><strong>Outlook</strong></p>
<p>The natural resource sector demonstrated remarkable resilience in 2024, despite challenges from high interest rates, sticky inflation, and subdued demand from China, the world's largest commodity consumer. Prices for many commodities held steady or reached all-time highs, even amidst supply overhangs from OPEC+ and new production sources. As we move into 2025, the outlook is optimistic, supported by the anticipation of lower interest rates, China&rsquo;s economic recovery, and persistent geopolitical risks balancing oversupply concerns. These factors suggest a more favorable supply-demand dynamic for most commodities in 2025, creating a healthier market environment.</p>
<p>Natural resource companies have also evolved, emphasizing prudence and disciplined capital allocation over unchecked growth. This operational shift has brought stability to the sector and positioned it for stronger performance. Lower interest rates, substantial stimulus in China, and ongoing geopolitical risks may further enhance equity valuations. Historical trends support natural resource equities&rsquo; ability to outperform during periods of economic growth and inflation, aligning with their potential for long-term portfolio diversification and returns.</p>
<p><strong>Investment Opportunities</strong></p>
<p>Investment opportunities vary across sub-sectors. Metals and mining may see consolidation-driven growth as new mine development wanes, while demand benefits from global electrification and economic recovery in China. Traditional energy, particularly natural gas, stands to gain from structural demand shifts driven by AI and electrification trends. Agriculture may reflect moderating grain prices but face high prices for select soft commodities, and transitional resources will continue their steady growth, bolstered by sustained incentives under refined U.S. policies like the Inflation Reduction Act. Together, these dynamics suggest a broad array of opportunities across natural resources in 2025.</p>
<p><strong><a href="https://www.vaneck.com/us/en/insights/natural-resources/" title="Natural Resources">Explore more Natural Resources Insights.</a></strong></p>
<h2 id="emb" class="jump-link-nav anchored-block" data-jumplink-title="Emerging Markets">Emerging Markets Bond: Well-Positioned Amid Global Stimulus and High Yields</h2>
<!-- <p><a href="/EPiServer/CMS/Content/en/us/insights/thought-leaders/eric-fine,,222996/?epieditmode=false" title="Eric Fine - Portfolio Manager, Head of Active Emerging Markets Debt"><strong>Eric Fine, Portfolio Manager, Emerging Markets Bond</strong></a></p> -->
<div class="d-flex justify-content-between align-items-center row my-3">
<div class="col-md-12">
<div class="byline__author">
<div class="porthole porthole--lg byline__author-image no-print mr-3" style="background-image: url('https://www.vaneck.com/globalassets/home/corp/our-firm/investment-professionals/eric-fine.jpg');"><img loading="lazy" alt="Eric Fine Portfolio Manager, Head of Active Emerging Markets Debt" class="porthole__image" src="https://www.vaneck.com/globalassets/home/corp/our-firm/investment-professionals/eric-fine.jpg" /></div>
<div style="position: relative;" class="byline__author-content"><a data-ve-gtm="blog-author" class="byline__author-name-link" href="/us/en/news-and-insights/thought-leaders/eric-fine">
<h3 class="byline__author-name mt-0">Eric&nbsp;Fine</h3>
</a>
<div class="byline__author-title">Portfolio Manager, Head of Active Emerging Markets Debt</div>
</div>
</div>
</div>
</div>
<!-- -->
<p><strong>Outlook</strong></p>
<p>Our outlook for emerging market bonds is constructive. In particular, global and idiosyncratic fundamentals will be supportive of EM, and EM credit spreads and real yields are too high relative to these fundamentals. To our eye, key growth-positive global macroeconomic drivers will be U.S. stimulus (e.g., tax cuts, along with structural measures such as deregulation), combined with also-still-evolving Chinese stimulus. Such demand would have positive implications, of course, for commodities prices and for emerging market commodity exporters in particular. On U.S. stimulus, one could say it is impossible to predict given the incoming Trump administration&rsquo;s lack of policy specifics, particularly the relative role of tariffs. However, our general expectation is that guardrails are already in place, in the form of markets with a market-sensitive attitude in the U.S. government. In other words, the new administration does <strong><em>not</em></strong> want to do anything that blows up stock markets.</p>
<p>Now, tariffs are an obvious challenge for China, but we&rsquo;ve already been conditioned by President-elect Trump&rsquo;s initial indication (some might say negotiation tactic) of 10% additional tariffs (and 25% on Mexico and Canada). But even here, our general expectation is that the actual negotiations will be between two countries whose markets (and whose respective government&rsquo;s domestic political objectives of growth), will lead to something better than expected. What is &ldquo;expected&rdquo; is arguably hard to assess, because the Chinese exchange rate is managed. But what&rsquo;s remarkable about 2024 is how stable the Chinese currency has been, and this is the only serious transmission mechanism to EM. It&rsquo;s why EM Asian bonds have been particularly stable in 2024, for example. Finally, these dual stimuli look likely to be coming when the Fed continues to cut policy rates in 2025. A growthy-world plus Fed rate cuts is a formula for good performance in EM bonds, particularly those on the riskier end of the spectrum.</p>
<p><strong>Investment Opportunities</strong></p>
<p>The biggest opportunities are in high yield (HY) sovereign bonds in USD, and in selected high-yielding local-currency bonds. Many HY sovereigns benefit from commodities demand, especially many in sub-Saharan Africa, a region that is replacing Russia as a major commodities-supplier to Europe, for example. Yields in USD can range from 8-10% there. There are also many local currency markets that have high interest rates relative to inflation. South Africa pays 11% yields in local currency, despite inflation around 3% and being a big beneficiary of the stimulus we mention above. Mexico pays 10.5% yields, with inflation around 4.5%, and a currency that has already arguably priced/discounted tariff risks coming from the incoming U.S. administration.</p>
<p><strong><a href="https://www.vaneck.com/us/en/insights/emerging-markets-bonds/" title="Emerging Markets Bonds">Explore more Emerging Markets Bonds Insights.</a></strong></p>
<h2 id="eme" class="anchored-block">Emerging Markets Equity: Focus on Fundamentals Amid Broader Uncertainty</h2>
<!-- <p><a href="/EPiServer/CMS/Content/en/us/insights/thought-leaders/ola-el-shawarby,,210821/?epieditmode=false" title="Ola El-Shawarby - Portfolio Manager, Emerging Markets Equity"><strong>Ola El-Shawarby, Portfolio Manager, Emerging Markets Equity</strong></a></p> -->
<div class="d-flex justify-content-between align-items-center row my-3">
<div class="col-md-12">
<div class="row align-items-center">
<div class="col-md-6">
<div class="byline__author">
<div class="porthole porthole--lg byline__author-image no-print mr-3" style="background-image: url('https://www.vaneck.com/globalassets/home/corp/our-firm/investment-professionals/ola-el-shawarby_2022.06_v1.jpg');"><img loading="lazy" alt="Ola  El-Shawarby, CFA Portfolio Manager, Emerging Markets Equity" class="porthole__image" src="https://www.vaneck.com/globalassets/home/corp/our-firm/investment-professionals/ola-el-shawarby_2022.06_v1.jpg" /></div>
<div style="position: relative;" class="byline__author-content"><a data-ve-gtm="blog-author" class="byline__author-name-link" href="/link/f98f0ec11c0043b3803f14238bacfd2d.aspx">
<h3 class="byline__author-name mt-0">Ola El-Shawarby,&nbsp;CFA</h3>
</a>
<div class="byline__author-title">Portfolio Manager, Emerging Markets Equity</div>
</div>
</div>
</div>
</div>
</div>
</div>
<!-- -->
<p><strong>Outlook</strong></p>
<p>Emerging markets equities are entering 2025 with a dynamic mix of opportunities and challenges, underscoring the importance of a selective, high-conviction approach. While certain risks remain, the potential for strong returns is clear for investors focused on quality and long-term growth drivers, particularly considering attractive valuations and investors&rsquo; under-allocation to the EM equity space.</p>
<p>The risk of increased tariffs is currently a key consideration, with potential U.S./China trade restrictions and uncertainty around U.S./Mexico relations under the Trump administration creating some near-term volatility. Additionally, if inflationary pressures from U.S. policies result in a delay in the anticipated rate-cutting cycle or cause a stronger U.S. dollar, emerging markets could face headwinds. However, these scenarios also highlight the value of focusing on markets and sectors that are less exposed to such pressures.</p>
<p>On the positive side, China&rsquo;s pro-growth stimulus measures are providing critical support to its domestic economy, helping to stabilize broader emerging market sentiment. India remains a standout, with its robust structural growth story driven by domestic consumption, ongoing reforms, and expanding opportunities in manufacturing and technology. Across the board, sectors like digital transformation, financial inclusion, formalization of consumption, and renewable energy offer exciting, long-term growth potential.</p>
<p><strong>Investment Opportunities</strong></p>
<p>In this environment, the focus on high-quality companies with durable earnings and strong fundamentals is more important than ever. Active stock selection, grounded in deep research and disciplined risk management, allows investors to navigate global uncertainties while capturing the significant upside potential in emerging markets. With the right strategy, 2025 presents a promising landscape for thoughtful investors ready to take advantage of the opportunities ahead.</p>
<p><strong><a href="https://www.vaneck.com/us/en/insights/emerging-markets-equity/" title="Emerging Markets Equity">Explore more Emerging Markets Equity Insights.</a></strong></p>

<h2 id="fixed-income" class="jump-link-nav anchored-block" data-jumplink-title="Income">Fixed Income: Up in Quality, Down in Duration, Ready for Opportunities</h2>
<!-- <p><a href="/EPiServer/CMS/Content/en/us/insights/thought-leaders/fran-rodilosso,,72910/?epieditmode=false" title="Fran Rodilosso - Head of Fixed Income ETF Portfolio Management"><strong>Fran Rodilosso, Head of Fixed Income ETF Portfolio Management</strong></a></p> -->
<div class="d-flex justify-content-between align-items-center row my-3">
<div class="col-md-12">
<div class="byline__author">
<div class="porthole porthole--lg byline__author-image no-print mr-3" style="background-image: url('https://www.vaneck.com/globalassets/home/corp/our-firm/investment-professionals/fran-rodilosso.jpg');"><img loading="lazy" alt="Fran Rodilosso Head of Fixed Income ETF Portfolio Management" class="porthole__image" src="https://www.vaneck.com/globalassets/home/corp/our-firm/investment-professionals/fran-rodilosso.jpg" /></div>
<div style="position: relative;" class="byline__author-content"><a data-ve-gtm="blog-author" class="byline__author-name-link" href="/us/en/news-and-insights/thought-leaders/fran-rodilosso/" title="Fran Rodilosso - Head of Fixed Income ETF Portfolio Management">
<h3 class="byline__author-name mt-0">Fran Rodilosso</h3>
</a>
<div>
<div class="byline__author-title">Head of Fixed Income ETF Portfolio Management</div>
</div>
</div>
</div>
</div>
</div>
<!-- -->
<p><strong>Outlook</strong></p>
<p>Credit investors love to worry. Our team has spent a great deal of time looking for the canary in the coal mine within the credit space. Yet over the past two years, credit markets have withstood bouts of extreme rate volatility, a slow-moving train wreck in certain pockets of the commercial real estate sector, a mini crisis in the regional banking sector, quantitative tightening and so on. As 2024 ends, investment grade credit spreads are at all-time lows and high yield spreads are within striking distance. We contend that underlying fundamentals for the U.S. private sector, backward looking as they might be, can justify current levels. Lower default rates and high upgrade/downgrade ratios reflect the positive credit environment. Certainly, technicals have played a role as well, with excess cash chasing yields down the credit and liquidity spectra. We have consistently held the view throughout 2024 that absolute yields across corporate credit, emerging markets, and structured credit offer meaningful protection through current income, helping to cushion price losses from moderate spread widening, and are therefore likely to continue attracting investor capital. Thinking from a portfolio allocation and relative value perspective, we also believe that equity valuations, which at current levels should lead to lower expectations for future returns on equities, argue for making a robust and diversified allocation to fixed income.</p>
<p><strong>Investment Opportunities</strong></p>
<p>Looking at 2025, our favored positioning is the following:</p>
<ul class="content-list">
<li class="mt-2">Overweight shorter duration in dollar based fixed income to take advantage of higher yields and higher correlation to the direction of Fed target rates.</li>
<li class="mt-2">Up in quality within corporate and structured credit as the risk/reward for extending credit risk has been diminished.</li>
<li class="mt-2">Opportunistic addition of emerging markets exposure, where in many cases sovereign debt fundamentals are lot more friendly than those of developed countries, including the U.S.</li>
</ul>
<p>The basis for our duration call is not the number of cuts we believe the Fed will deliver next year (at least three is probably still in the cards), but rather on a combination of sustained U.S. growth and potential for renewed inflationary pressures (tariffs and immigration policy heighten this concern) on top of an increasingly worrying fiscal reality for the U.S. that renders long-term Treasuries less attractive. Our preferred credit positioning reflects, as we allude to above, valuations rather than fundamentals. We believe that an up-in-quality approach to credit will afford investors greater flexibility to pivot and add risk if and when a credit event occurs in 2025 and/or when the technical strength in the market reverses.</p>
<p>We believe an allocation to <strong><a href="/us/en/investments/clo-etf-cloi/overview/" title="CLOI - VanEck CLO ETF">CLOs, particularly within the investment grade tranches</a></strong>, remains an effective way to earn comparatively high yields while managing down both duration and credit risk exposure. <strong><a href="/us/en/investments/ig-floating-rate-etf-fltr/overview/" title="FLTR - VanEck IG Floating Rate ETF">Investment grade floating rate notes</a></strong> accomplish a similar goal, while <strong><a href="/link/edc87d2b16cf4498a2884c1752ac9fe0.aspx" title="MIG - VanEck Moody&rsquo;s Analytics IG Corporate Bond ETF">fixed rate investment grade corporate bonds</a></strong> are our preferred means of adding some duration and/or high-quality credit exposure to portfolios. Among other fixed income asset classes, we would maintain existing allocations to high yield and emerging markets debt&mdash;the additional yield and diversification benefits are present in both&mdash;and would look for opportunities to add risk when rate volatility or a market event drives spreads higher.</p>
<p><strong><a href="https://www.vaneck.com/us/en/insights/income-investing/" title="Income Investing">Explore more Income Investing Insights. </a></strong></p>
<h2 id="muni" class="anchored-block">Municipal Bonds: Resilient, Robust, and Ready for 2025</h2>
<!-- <p><a href="/EPiServer/CMS/Content/en/us/insights/thought-leaders/tamara-lowin,,247359/?epieditmode=false" title="Tamara Lowin - Senior Credit Analyst, Municipal Bonds"><strong>Tamara Lowin, Senior Credit Analyst, Municipal Bonds</strong></a></p> -->
<div class="d-flex justify-content-between align-items-center row my-3">
<div class="col-md-12">
<div class="row align-items-center">
<div class="col-md-6">
<div class="byline__author">
<div class="porthole porthole--lg byline__author-image no-print mr-3" style="background-image: url('https://www.vaneck.com/globalassets/home/us/insights/thought-leaders/tamara-lowin_2022.06_v1.jpg');"><img loading="lazy" alt="Tamara  Lowin Senior Municipal Credit Analyst" class="porthole__image" src="https://www.vaneck.com/globalassets/home/us/insights/thought-leaders/tamara-lowin_2022.06_v1.jpg" /></div>
<div style="position: relative;" class="byline__author-content"><a data-ve-gtm="blog-author" class="byline__author-name-link" href="/link/9217c92d0f9a407e8b869d637f8a9cce.aspx">
<h3 class="byline__author-name mt-0">Tamara&nbsp;Lowin</h3>
</a>
<div>
<div class="byline__author-title">Senior Municipal Credit Analyst</div>
</div>
</div>
</div>
</div>
</div>
</div>
</div>
<!-- -->
<p><strong>Outlook</strong></p>
<p>We expect strong performance from municipal bonds in 2025 due to record new issuance and sustained demand. Lower interest rates are bringing borrowers back to the market and we anticipate capital improvement and infrastructure projects to lead the way. Combined with strong demand across the credit curve, we envision opportunities to strategically rebalance portfolios. Investors will have the opportunity to be more selective, driving performance particularly in high yield.</p>
<p>Tax policy uncertainty is unlikely to resolve in the first year of the new presidential administration and municipal bonds will continue to provide stable and liquid investment grade opportunities for concerned investors &ndash; even with rumors of tax exemption changes on future municipal bonds. We do not expect a wholesale loss of the tax exemption in 2025, but those concerned with future access to tax-exempt municipal bond income will drive up demand further (read more here: <strong><a href="/us/en/blogs/municipal-bonds/what-trumps-presidency-means-for-municipal-bonds/" title="What Trump&rsquo;s Presidency Means for Municipal Bonds">What Trump&rsquo;s Presidency Means for Municipal Bonds</a></strong>).</p>
<p><strong>Investment Opportunities</strong></p>
<p>Municipals will offer strong and diverse opportunities for tax-conscious investors in 2025. New issuance will be robust across states and in most sectors, particularly focused on larger infrastructure projects. We expect increased new issuance from existing borrowers to enrich the market and liquidity, as they borrow for re-fundings and new projects in both the investment grade and high yield space.</p>
<p><strong><a href="/us/en/insights/municipal-bonds/" title="Municipal Bonds">Explore more Municipal Bonds Insights.</a></strong></p>
<h2 id="digital-assets" class="jump-link-nav anchored-block" data-jumplink-title="Digital Assets">Digital Assets: New Highs, Expanding Use Cases and Growing Adoption</h2>
<!--<p><a href="/EPiServer/CMS/Content/en/us/insights/thought-leaders/matthew-sigel,,128171/?epieditmode=false" title="Matthew Sigel - Head of Digital Assets Research"><strong>Matthew Sigel, Head of Digital Assets Research</strong></a></p>-->
<div class="d-flex justify-content-between align-items-center row my-3">
<div class="col-md-12">
<div class="byline__author">
<div class="porthole porthole--lg byline__author-image no-print mr-3" style="background-image: url('https://www.vaneck.com/globalassets/home/us/insights/thought-leaders/img-tl-matthew-sigel-645px.jpg');"><img loading="lazy" alt="David Schassler Head of Multi-Asset Solutions" class="porthole__image" src="https://www.vaneck.com/globalassets/home/us/insights/thought-leaders/img-tl-matthew-sigel-645px.jpg" /></div>
<div style="position: relative;" class="byline__author-content"><a data-ve-gtm="blog-author" class="byline__author-name-link" href="/link/b2b937a9c48a476890a9e6e7ad308413.aspx" title="Matthew Sigel &mdash; Head of Digital Assets Research">
<h3 class="byline__author-name mt-0">Matthew Sigel</h3>
</a>
<div class="byline__author-title">Head of Digital Assets Research</div>
</div>
</div>
</div>
</div>
<!-- -->
<p>In 2025, we anticipate new all-time highs for Bitcoin and Ethereum, as well as accelerating U.S. adoption of Bitcoin. Tokenized securities may also experience explosive growth, while stablecoin settlements may reach $300 billion in daily volumes, reflecting increased trust and utility in the digital asset ecosystem.</p>
<p>For a more in-depth look at these and predictions relating to decentralized finance, Layer-2 solutions for Bitcoin, AI-driven on-chain activity and NFTs, read: <a href="/us/en/blogs/digital-assets/matthew-sigel-vanecks-10-crypto-predictions-for-2025/" title="VanEck&rsquo;s 10 Crypto Predictions for 2025"><strong>VanEck&rsquo;s 10 Crypto Predictions for 2025</strong></a>.</p>
<p><strong><a href="/us/en/insights/digital-assets/" title="Digital Assets">Explore more Digital Assets Insights.</a></strong></p>
<p>To receive more <a href="https://www.vaneck.com/us/en/insights/investment-outlook/" title="Investment Outlook Insights"><strong>Investment Outlook</strong></a> insights, <a href="/link/5f45412c2143400497908cea2897f7d3.aspx" title=" Subscription Center"><strong>sign up in our subscription center</strong></a>.</p>
]]></content:encoded>
</item><item rdf:about="https://www.vaneck.com/us/en/blogs/income-investing/lender-on-lender-violence-should-clo-investors-be-concerned/">
  <title>Lender-on-Lender Violence: Should CLO Investors be Concerned?></title>
  <link>https://www.vaneck.com/us/en/blogs/income-investing/lender-on-lender-violence-should-clo-investors-be-concerned/</link>
  <description><![CDATA[The increasing use of liability management exercises (LMEs) is getting more attention, but their impact on CLOs is expected to be muted.]]></description>
  <dc:creator> </dc:creator>
  <dc:date>12/24/2024 06:30:00</dc:date>
<content:encoded><![CDATA[

<p>Distressed borrowers have increasingly pursued transactions in which lenders can improve their standing at the expense of others which would have been treated equally in more a traditional default or restructuring. As a result, LME activity, sometimes referred to as &ldquo;lender on lender violence,&rdquo; has received increased attention among CLO investors. This is what you need to know:</p>
<ul class="content-list">
<li class="mt-2"><strong>Why some investors are concerned about increasing LME activity</strong>: Overleveraged lower-rated issuers are increasingly turning to LMEs to manage near-term debt maturities, and the use of these tactics has resulted in more uncertainty for their lenders.</li>
<li class="mt-2"><strong>Why we expect the overall impact of increasing LME activity to be muted</strong>: LMEs often replace what would otherwise have been a more typical default outcome, and therefore we do not expect LME&rsquo;s to push up loan default rates overall relative to historical levels.</li>
<li class="mt-2"><strong>Selectivity in this environment is key:</strong> With rising LME activity, tranche investors must be selective and identify CLO managers who are nimble and can proactively manage portfolio risks.</li>
</ul>
<p>For a detailed overview of LMEs and their impact on the CLO market from PineBridge Investments, the subadvisor for the VanEck CLO ETF (CLOI) and VanEck AA-BB CLO ETF (CLOB).</p>
<p>To receive more <a href="/us/en/blogs/income-investing/" title="Income Investing Insights"><strong>Income Investing</strong></a> insights, <a href="/link/5f45412c2143400497908cea2897f7d3.aspx" title=" Subscription Center"><strong>sign up in our subscription center</strong></a>.</p>
]]></content:encoded>
</item><item rdf:about="https://www.vaneck.com/us/en/blogs/digital-assets/matthew-sigel-vaneck-mid-december-bitcoin-chaincheck/">
  <title>VanEck Mid-December Bitcoin ChainCheck></title>
  <link>https://www.vaneck.com/us/en/blogs/digital-assets/matthew-sigel-vaneck-mid-december-bitcoin-chaincheck/</link>
  <description><![CDATA[Bitcoin&rsquo;s historic rally, accelerating corporate and state adoption, and the onset of altcoin season signal a broader crypto bull market with BTC potentially reaching $180k by 2025.]]></description>
  <dc:creator>Nathan  Frankovitz</dc:creator>
  <dc:date>12/20/2024 06:30:00</dc:date>
<content:encoded><![CDATA[

<p><strong><u>Please note that VanEck has exposure to bitcoin.</u></strong></p>
<p><strong><u>Three key takeaways for mid-November &ndash; mid-December:</u></strong></p>
<ol class="content-list">
<li class="mt-2"><strong>Bitcoin&rsquo;s Rally Continues</strong>: BTC hit $108k in December, and despite expected volatility, indicators point to our base case price target of <strong>$180k</strong> by 2025.</li>
<li class="mt-2"><strong>Adoption Accelerates</strong>: Corporations, U.S. governments, and BRICS nations are potentially racing to adopt Bitcoin as a reserve asset.</li>
<li class="mt-2"><strong>Altcoin Season Ignites</strong>: Falling Bitcoin dominance&mdash;down <strong>6%</strong> MoM, the sharpest drop since 2022&mdash;signals a broader crypto rally underway.</li>
</ol>
<ul class="content-list">
<li class="mt-2"><a href="#price-action"><strong>Bitcoin&rsquo;s Price Action</strong></a></li>
<li class="mt-2"><a href="#treasury-adoption"><strong>Bitcoin Treasury Adoption</strong></a></li>
<li class="mt-2"><a href="#btc-act-models"><strong>Modeling BITCOIN Act Scenarios</strong></a></li>
<li class="mt-2"><a href="#altcoin"><strong>Altcoin Season Indicator</strong></a></li>
<li class="mt-2"><a href="#miners"><strong>Bitcoin Miners</strong></a></li>
<li class="mt-2"><a href="#monthly-dashboard"><strong>Bitcoin ChainCheck Monthly Dashboard</strong></a></li>
<li class="mt-2"><a href="#btc-network-activity"><strong>Bitcoin&rsquo;s Network Activity, Adoption, and Fees</strong></a></li>
</ul>
<h2 id="price-action" class="jump-link-nav anchored-block" data-jumplink-title="Price Action">Bitcoin&rsquo;s Price Action</h2>
<p><strong>Market sentiment: </strong>Bitcoin made history this month, breaking above <strong>$100k</strong> on December 5th and reaching a peak of <strong>$108k </strong>by December 17th. As we anticipated in <a href="https://www.vaneck.com/us/en/blogs/digital-assets/matthew-sigel-vaneck-mid-november-bitcoin-chaincheck/" title="VanEck Mid-November Bitcoin ChainCheck"><strong>last month&rsquo;s ChainCheck</strong></a>, indicators like perp funding rates and relative unrealized profits continue to signal that we have entered the stage of the cycle with the greatest one- to six-month upside potential.</p>
<p>This month, the rally&rsquo;s momentum is underpinned by three unprecedented forces: Bitcoin&rsquo;s growing adoption as an institutional reserve asset, rising altcoin speculation, and powerful synergies between crypto and AI. While we expect multiple <strong>20%</strong> retracements and possibly a <strong>40%</strong> drawdown on the path to our <a href="https://www.vaneck.com/us/en/blogs/digital-assets/matthew-sigel-vanecks-10-crypto-predictions-for-2025/#prediction-1" title="BTC Perps Funding &gt; 10% For Months Would be Bearish"><strong>$180k price target</strong></a>, these drivers suggest an acceleration of Bitcoin&rsquo;s upward trajectory into 2025.</p>
<h2 id="treasury-adoption" class="anchored-block">Bitcoin Treasury Adoption</h2>
<p>Institutional corporate and sovereign treasuries made unprecedented moves to adopt Bitcoin this month. Among corporates, a major milestone came as the Nasdaq-100 added MicroStrategy, the world&rsquo;s largest corporate holder of Bitcoin. As a result, funds and ETFs tracking the Nasdaq-100 will now have exposure to MSTR&rsquo;s <strong>~439k</strong> Bitcoin, marking a milestone in Bitcoin&rsquo;s adoption in traditional financial markets and paving the way for potential S&amp;P 500 inclusion. Sovereign nations are following closely, with President-elect Donald Trump emphasizing the U.S.&rsquo;s plan to compete with BRICS nations in energy, AI, and crypto dominance through deregulation and a national strategic Bitcoin reserve.</p>
<p>However, like corporates and retail investors, even individual U.S. states are beginning to effectively front-run national treasuries in their race to adopt Bitcoin.</p>
<h2>State-Level Bitcoin Competition in the U.S.</h2>
<ul class="content-list">
<li class="mt-2"><strong>November 19th</strong>: Pennsylvania Representative Mike Cabell introduced legislation to form the Pennsylvania Bitcoin Strategic Reserve, proposing allocating up to 10% of the state&rsquo;s <strong>$7 billion</strong> reserve to Bitcoin.</li>
<li class="mt-2"><strong>December 3rd:</strong> The Florida Blockchain Business Association (FBBA) stated that there is a &ldquo;very good chance&rdquo; of establishing a state strategic Bitcoin reserve in 2025, highlighted by pro-Bitcoin leadership in the state legislature and existing pension fund investments in crypto-related assets. This follows Florida&rsquo;s CFO Jimmy Patronis&rsquo; recommendation for the state to direct a portion of its retirement system into crypto. Similarly, Wisconsin and Michigan pension funds have already begun diversifying into Bitcoin.</li>
<li class="mt-2"><strong>December 9th:</strong> In Alabama, State Auditor Andrew Sorrell stated, <i>&ldquo;The debate over whether crypto will succeed has ended. Now, the fight for which states will benefit from it has begun.&rdquo;</i></li>
<li class="mt-2"><strong>December 12th:</strong> In Texas, State Representative Giovanni Capriglione, Chair of the Texas Pensions, Investments, and Financial Services Committee, officially filed for a <i>Texas Strategic Bitcoin Reserve</i> bill.</li>
<li class="mt-2"><strong>December 17th: </strong>Ohio state representative Derek Merrin filed the Ohio Bitcoin Reserve Act to hold Bitcoin within the state treasury.</li>
</ul>
<p>These state-level developments demonstrate the economic game theory driving Bitcoin adoption, setting the stage for broader national and international competition.</p>
<h3>National Bitcoin Policy: The BITCOIN Act and FASB&rsquo;s Impact</h3>
<p><strong>Betting Markets Gain Confidence in U.S. Strategic Bitcoin Reserve </strong></p>
<div class="flourish-embed flourish-chart" data-src="visualisation/20860548"><script src="https://public.flourish.studio/resources/embed.js"></script><noscript><img loading="lazy" src="https://public.flourish.studio/visualisation/20860548/thumbnail" width="100%" alt="Betting Markets Gain Confidence in U.S. Strategic Bitcoin Reserve" /></noscript></div>
<p class="chart-disclosure">Sources: Kalshi, Polymarket as of 12/17/2024.</p>
<p>At the national level, Bitcoin adoption is accelerating with significant policy and regulatory developments:</p>
<ul class="content-list">
<li class="mt-2"><strong>December 12th: </strong>After ringing the opening bell at the NYSE, President-elect Donald Trump reaffirmed support for the BITCOIN Act and confirmed his intent to establish a U.S. Strategic Bitcoin Reserve. When asked about creating a Bitcoin reserve similar to the nation&rsquo;s oil reserve, Trump responded, <i>&ldquo;Yeah, I think so. We&rsquo;re going to do something great with crypto because we don&rsquo;t want China or anybody else&mdash;not just China&mdash;but others are embracing it, and we want to be the head.&rdquo;</i> This builds on Trump&rsquo;s campaign promise at the <i>Bitcoin 2024 Conference</i> in July, where he pledged to create a <i>&ldquo;strategic national Bitcoin reserve&rdquo;</i> and predicted Bitcoin could surpass gold&rsquo;s <strong>$16 trillion</strong> market cap.<br /><br />To illustrate the potential impact of this legislation, see our section below, &lsquo;<a href="#btc-act-models" title="Modeling BITCOIN Act Scenarios"><strong>Modeling BITCOIN Act Scenarios.</strong></a>&rsquo;<br /><br /></li>
<li class="mt-2"><strong>December 16th</strong>: The U.S. Financial Accounting Standards Board (FASB) adopted new rules allowing companies to value Bitcoin at current market prices, fully effective in 2025. Previously, companies could only report Bitcoin at its purchase price, recording impairments but ignoring gains. This distorted financial statements and discouraged adoption. New rules ensure companies can report gains and losses based on market prices, improving transparency and simplifying Bitcoin&rsquo;s adoption as a corporate reserve asset.</li>
</ul>
<h2>BRICS Nations Take a Head Start</h2>
<p>While U.S. initiatives gain momentum, BRICS (<strong>Brazil, Russia, India, China, and South Africa</strong>) nations are already advancing their efforts to integrate Bitcoin to circumvent U.S. sanctions and reduce reliance on the U.S. dollar.</p>
<ul class="content-list">
<li class="mt-2"><strong>Russia: </strong>Since the BRICS Business Forum in mid-October, Russia has prioritized Bitcoin adoption. The country has partnered with BRICS allies to construct Bitcoin mining and AI facilities. In November, President Vladimir Putin proposed a <i>BRICS investment platform</i> using digital assets and later signed a law recognizing digital currencies as <i>property</i> for foreign trade settlements under an experimental legal regime (ELR).</li>
<li class="mt-2"><strong>Brazil: </strong>In late November, Brazilian Congressman Eros Biondini introduced legislation for the country to acquire Bitcoin until it comprises <strong>5%</strong> of Brazil&rsquo;s international reserves. This move signals Brazil&rsquo;s strategic intent to diversify its reserves and align with Bitcoin&rsquo;s rising global prominence.</li>
<li class="mt-2"><strong>China: </strong>Predictions at the <i>Bitcoin MENA 2024 Conference</i> by Anthony Scaramucci and Changpeng Zhao suggest that China may soon reintegrate Bitcoin mining operations and reserves. If realized, this would mark a significant shift in China&rsquo;s stance, further solidifying Bitcoin&rsquo;s role in global economic systems.</li>
</ul>
<p>Clearly, BRICS nations are positioning Bitcoin as a key tool in their strategy to de-dollarize and bolster economic resilience. Their coordinated efforts demonstrate an effort to challenge Western economic dominance.</p>
<h2>Emerging Global Players and Cities</h2>
<p>Beyond the BRICS nations, other countries and cities are accelerating Bitcoin adoption, highlighting its growing relevance as a reserve asset and financial innovation tool.</p>
<ul class="content-list">
<li class="mt-2"><strong>Suriname:</strong> In late October, Suriname&rsquo;s presidential candidate, Maya Prabhoe, outlined plans to replace the Suriname dollar with Bitcoin as the national currency and issue Bitcoin bonds.</li>
<li class="mt-2"><strong>United Kingdom: </strong>In early November, British pension specialist Cartwright guided the country&rsquo;s first pension fund to allocate 3% of its total assets into Bitcoin.</li>
<li class="mt-2"><strong>Poland: </strong>On November 17th, Presidential candidate Slawomir Mentzen proposed a national Bitcoin reserve and pledged to make Poland &ldquo;a cryptocurrency haven&rdquo; if elected in 2025.</li>
<li class="mt-2"><strong>Japan: </strong>On December 11th, Japanese lawmaker Satoshi Yamada submitted a letter to the country&rsquo;s House of Councillors, noting <i>&ldquo;the trend of establishing Bitcoin reserves in the United States and other countries&rdquo;</i> and asking, <i>&ldquo;Should Japan also introduce a system to convert part of its foreign exchange reserves into crypto assets such as Bitcoin?&rdquo;</i></li>
<li class="mt-2"><strong>Vancouver, Canada: </strong>Also on December 11th, Vancouver councilors passed a motion forwarded by Mayor Ken Sim titled &ldquo;Becoming a Bitcoin-Friendly City. " The motion advocates using Bitcoin as a reserve asset and accepting it for tax payments and fees.</li>
<li class="mt-2"><strong>Australia: </strong>Revealed in a December 12th report, Australia&rsquo;s AMP became the first major superannuation (retirement) fund to buy Bitcoin, having acquired <strong>$27M</strong> of Bitcoin in May 2024.</li>
<li class="mt-2"><strong>France: </strong>Speaking in Brussels on Monday, December 16th, French Legislator and European Parliament member Sarah Knafo declared her support for a strategic national Bitcoin reserve while denouncing the digital euro, a proposed central bank digital currency (CBDC) proposed by the European Central Bank.</li>
</ul>
<h3>Accelerating Institutional Bitcoin Adoption</h3>
<p><strong>Corporates, Governments, and Funds are Buying Retail&rsquo;s Bitcoin (BTC)</strong></p>
<div class="flourish-embed flourish-chart" data-src="visualisation/20861102"><script src="https://public.flourish.studio/resources/embed.js"></script><noscript><img loading="lazy" src="https://public.flourish.studio/visualisation/20861102/thumbnail" width="100%" alt="Corporates, Governments, and Funds are Buying Retail's Bitcoin (BTC)" /></noscript></div>
<p class="chart-disclosure">Source: bitcointreasuries.net as of 12/17/2024, <strong>Past performance is no guarantee of future results.</strong></p>
<p>These fundamental shifts in Bitcoin&rsquo;s market structure promise to accelerate the years-long trend of corporations and governments accumulating Bitcoin from retail holders. Between Q4 2022 and Q4 2024, corporates added <strong>~162k</strong> BTC, governments <strong>~377k</strong> BTC, and ETFs/investment funds <strong>~329k</strong> BTC to their reserves. It is important to note that governments&rsquo; BTC holdings largely stem from criminal seizures, primarily in the U.S., China, and Germany&mdash;though we expect this to shift towards deliberate open-market purchases like El Salvador&rsquo;s in the coming years.</p>
<p>As of December 17th, <strong>69 </strong>public companies hold Bitcoin on their balance sheets, a number we <a href="https://www.vaneck.com/us/en/blogs/digital-assets/matthew-sigel-vanecks-10-crypto-predictions-for-2025/#prediction-2" title="VanEck's 10 Crypto Predictions for 2025"><strong>expect to surpass 100 in 2025</strong></a>. On December 9th, Jetking Infotrain became India&rsquo;s first publicly traded company to add Bitcoin to its balance sheet. MicroStrategy, Marathon, and Riot continued their industry-leading accumulation of Bitcoin, adding <strong>~128.8k BTC</strong>, <strong>~6,500 BTC</strong>, and <strong>~5,800 BTC,</strong> respectively, since mid-November. Of course, many major decision-makers remain unconvinced. On December 10th, Microsoft shareholders nearly unanimously rejected a proposal to put Bitcoin on its balance sheet at a weighting of <strong>1%</strong> of its total assets. Regardless, the total Bitcoin held by private and public entities now stands at <strong>~985k </strong>BTC, on track to surpass Satoshi Nakamoto&rsquo;s estimated holdings of <strong>1.1 million BTC</strong> by 2025. Such rapid accumulation demonstrates a growing belief in Bitcoin&rsquo;s credibility as an institutional reserve asset.</p>
<p>Governments&rsquo; aggregate decrease in BTC holdings from Q3 2024 to today can be primarily attributed to Germany&rsquo;s selling of all <strong>~50,000 BTC</strong> it had seized. At an average sales price of <strong>$57.6k</strong>, Germany&rsquo;s BTC sale has reached a <strong>~$2.5 billion</strong> opportunity cost when measured against December 17th&rsquo;s price of <strong>~108k per BTC</strong>.</p>
<p>We believe the U.S. should avoid repeating Germany&rsquo;s mistake. While critics like Peter Schiff have urged President Biden to sell the U.S.&rsquo;s Bitcoin before Trump&rsquo;s inauguration, a well-managed reserve could provide significant long-term value. The analysis below illustrates this potential.</p>
<h2 id="btc-act-models" class="anchored-block">Modeling BITCOIN Act Scenarios</h2>
<p>We modeled outcomes based on the BITCOIN Act of 2024, introduced by Senator Cynthia Lummis. The Act proposes that the U.S. Treasury acquire <strong>1 million</strong> BTC over five years to counter rising inflation and global de-dollarization risks.</p>
<p>However, even without legislation, there are several steps Trump could take via executive action to initiate such a reserve:</p>
<ol class="content-list">
<li class="mt-2">Halt the sale of Bitcoin from the U.S. asset forfeiture reserve <strong>(~198k BTC).</strong></li>
<li class="mt-2">Revalue gold certificates&mdash;currently priced at 1970s levels&mdash;to today&rsquo;s value, unlocking <strong>~$693 billion</strong> in unrealized capital.</li>
<li class="mt-2">Leverage the $<strong>49.7 billion</strong> Exchange Stabilization Fund (ESF) under the authority of the Treasury Secretary.</li>
</ol>
<p>While the U.S. awaits a broader legislative framework for holding Bitcoin as a national reserve, the BITCOIN Act&rsquo;s proposed <strong>200,000 BTC</strong> first-year acquisition could be covered by repurposing seized Bitcoin. The remaining <strong>800,000 BTC</strong> could be financed through the ESF and/or diversification away from the Treasury&rsquo;s gold reserves&mdash;all without requiring money printing or taxpayer funds.</p>
<h3>Estimated U.S. Debt vs. Bitcoin (BTC) Reserve Growth (assuming 25% BTC CAGR)</h3>
<p><img loading="lazy" class="img-responsive w-100" src="https://www.vaneck.com/contentassets/fdf10b7363a14b5594b5081cc86206fe/5158_bitcoin-chaincheck-for-december_chart-3_v1.svg" title="Estimated U.S. Debt vs. Bitcoin (BTC) Reserve Growth (assuming 25% BTC CAGR)" /></p>
<p class="chart-disclosure">For illustration only.</p>
<img loading="lazy" class="img-responsive w-100" alt="Est. Bitcoin Reserve Value/ National Debt Value In 2049" src="https://www.vaneck.com/contentassets/fdf10b7363a14b5594b5081cc86206fe/5158_bitcoin-chaincheck-for-december_table-1_2024-12_v3_blog.svg" />
<h3>Assumptions</h3>
<div class="wrapped-div">
<table style="width: 500px;">
<tbody>
<tr class="tbl-data">
<td class="tbl-header last text-left" colspan="2">U.S. Debt Value</td>
</tr>
<tr class="tbl-data">
<td class="data-td last font-weight-normal text-left">Starting Debt (2025)</td>
<td class="data-td data last text-right">$ 37,000,000,000,000</td>
</tr>
<tr class="tbl-data">
<td class="data-td last font-weight-normal text-left">Debt CAGR</td>
<td class="data-td data last text-right">5.0%</td>
</tr>
<tr class="tbl-data">
<td class="data-td last font-weight-normal text-left">Final U.S. Debt Value (2049) (USD Trillions)</td>
<td class="data-td data last text-right">$ 119.3</td>
</tr>
<tr>
<td colspan="2">&nbsp;</td>
</tr>
<tr class="tbl-data">
<td class="tbl-header last text-left" colspan="2">Bitcoin Treasury Value</td>
</tr>
<tr class="tbl-data">
<td class="data-td last font-weight-normal text-left">BTC Price In 2025</td>
<td class="data-td data last text-right">$ 200,000</td>
</tr>
<tr class="tbl-data">
<td class="data-td last font-weight-normal text-left">BTC CAGR</td>
<td class="data-td data last text-right">25.0%</td>
</tr>
<tr class="tbl-data">
<td class="data-td last font-weight-normal text-left">Total BTC Purchased by 2029</td>
<td class="data-td data last text-right">1,000,000</td>
</tr>
<tr class="tbl-data">
<td class="data-td last font-weight-normal text-left">Final Bitcoin Treasury Value (2049) (USD Trillions)</td>
<td class="data-td data last text-right">$ 42.4</td>
</tr>
<tr>
<td colspan="2">&nbsp;</td>
</tr>
<tr class="tbl-data">
<td class="tbl-header last text-left" colspan="2">Bitcoin Adoption</td>
</tr>
<tr class="tbl-data">
<td class="data-td last font-weight-normal text-left">Implied BTC Price</td>
<td class="data-td data last text-right">$ 42,351,647</td>
</tr>
<tr class="tbl-data">
<td class="data-td last font-weight-normal text-left">Est. Bitcoin Reserve as % of National Debt:</td>
<td class="data-td data last text-right">35%</td>
</tr>
<tr class="tbl-data">
<td class="data-td last font-weight-normal text-left">BTC Market Cap as % of Global Financial Assets</td>
<td class="data-td data last text-right">18%</td>
</tr>
<tr>
<td colspan="2">&nbsp;</td>
</tr>
<tr class="tbl-data">
<td class="tbl-header last text-left" colspan="2">Global Financial Assets Value</td>
</tr>
<tr class="tbl-data">
<td class="data-td last font-weight-normal text-left">Global Financial Assets Value (2024)</td>
<td class="data-td data last text-right">$ 900,000,000,000,000</td>
</tr>
<tr class="tbl-data">
<td class="data-td last font-weight-normal text-left">Global Financial Assets CAGR</td>
<td class="data-td data last text-right">7.0%</td>
</tr>
<tr class="tbl-data">
<td class="data-td last font-weight-normal text-left">Global Financial Assets Value (2049)</td>
<td class="data-td data last text-right">$ 4,884,689,376,110,600</td>
</tr>
</tbody>
</table>
</div>
<br />
<p class="chart-disclosure">Source: VanEck Research as of 12/16/2024. <strong>Past performance is no guarantee of future results.</strong></p>
<p>Our analysis suggests that if the U.S. government follows the BITCOIN Act&rsquo;s proposed trajectory&mdash;acquiring <strong>1 million BTC</strong> by 2029&mdash;the reserve could represent an estimated <strong>35%</strong> of the national debt by 2049, offsetting <strong>~$42 trillion</strong> of liabilities. This optimistic scenario assumes that U.S. debt compounds at <strong>5.0%</strong> from a base of <strong>$37 trillion</strong> from 2025 &ndash; 2049, while Bitcoin compounds at <strong>25% </strong>annually over the same period from a starting value of <strong>$200,000,</strong> implying a value of <strong>~$42.3 million</strong> per Bitcoin in 2049. Assuming today&rsquo;s <strong>~$900 trillion</strong> of total global financial assets compound at <strong>7.0%</strong> from 2025 &ndash; 2049, Bitcoin would represent <strong>18%</strong> of global financial assets in this scenario.</p>
<h3>Altcoin Season has Started</h3>
<p><strong>Altcoin Season Indicator: Began on November 27<sup>th</sup></strong></p>
<div class="flourish-embed flourish-chart" data-src="visualisation/20862118"><script src="https://public.flourish.studio/resources/embed.js"></script><noscript><img loading="lazy" src="https://public.flourish.studio/visualisation/20862118/thumbnail" width="100%" alt="Altcoin Season Indicator: Began on November 27th" /></noscript></div>
<p class="chart-disclosure">Source: Artemis as of 12/16/2024.<strong> Past performance is no guarantee of future results.</strong></p>
<p>Because Bitcoin dominates crypto markets in terms of market cap, liquidity, and volume, its sustained performance often creates the conditions for so-called <i>&lsquo;altcoins&rsquo;</i>&mdash;any cryptocurrency other than Bitcoin&mdash;to perform. As new capital flows into the crypto markets, risk-on sentiment and wealth effects give rise to more nascent crypto applications like those involved with decentralized finance, gaming, and NFTs. The chart shows how many of the top 50 altcoins (by market cap) outperform Bitcoin over a 90-day period. If more than 60% of these altcoins outperform Bitcoin, it signals 'alt season,' when leading altcoins dominate performance.</p>
<h3>BTC Price Returns After Altcoin Season Indicator &gt;= 0.60 Begins (Jan 2017 - Present)</h3>
<div class="wrapped-div">
<table style="width: 100%;">
<tbody>
<tr class="tbl-data">
<td class="tbl-header last text-left">Duration of Indicator (Days)</td>
<td class="tbl-header last text-right">n =</td>
<td class="tbl-header last text-right">Average 1m Return (%)</td>
<td class="tbl-header last text-right">Average 3m Return (%)</td>
<td class="tbl-header last text-right">Average 6m Return (%)</td>
</tr>
<tr class="tbl-data">
<td class="data-td last font-weight-normal text-left">All</td>
<td class="data-td data last text-right">61</td>
<td class="data-td data last text-right">10</td>
<td class="data-td data last text-right">30</td>
<td class="data-td data last text-right">73</td>
</tr>
<tr class="tbl-data">
<td class="data-td last font-weight-normal text-left">&lt;7</td>
<td class="data-td data last text-right">41</td>
<td class="data-td data last text-right">11</td>
<td class="data-td data last text-right">25</td>
<td class="data-td data last text-right">71</td>
</tr>
<tr class="tbl-data">
<td class="data-td last font-weight-normal text-left">7-30</td>
<td class="data-td data last text-right">15</td>
<td class="data-td data last text-right">9</td>
<td class="data-td data last text-right">50</td>
<td class="data-td data last text-right">76</td>
</tr>
<tr class="tbl-data">
<td class="data-td last font-weight-normal text-left">&gt;30</td>
<td class="data-td data last text-right">5</td>
<td class="data-td data last text-right">0</td>
<td class="data-td data last text-right">12</td>
<td class="data-td data last text-right">81</td>
</tr>
</tbody>
</table>
</div>
<h3>% of Time BTC Returns are Positive 'X' Months After Indicator &gt;= 0.60 Begins (Jan 2017 - Present)</h3>
<div class="wrapped-div">
<table style="width: 100%;">
<tbody>
<tr class="tbl-data">
<td class="tbl-header last text-left">Duration of Indicator (Days)</td>
<td class="tbl-header last text-right">n =</td>
<td class="tbl-header last text-right">Average 1m Return (%)</td>
<td class="tbl-header last text-right">Average 3m Return (%)</td>
<td class="tbl-header last text-right">Average 6m Return (%)</td>
</tr>
<tr class="tbl-data">
<td class="data-td last font-weight-normal text-left">All</td>
<td class="data-td data last text-right">61</td>
<td class="data-td data last text-right">59</td>
<td class="data-td data last text-right">62</td>
<td class="data-td data last text-right">66</td>
</tr>
<tr class="tbl-data">
<td class="data-td last font-weight-normal text-left">&lt;7</td>
<td class="data-td data last text-right">41</td>
<td class="data-td data last text-right">59</td>
<td class="data-td data last text-right">61</td>
<td class="data-td data last text-right">63</td>
</tr>
<tr class="tbl-data">
<td class="data-td last font-weight-normal text-left">7-30</td>
<td class="data-td data last text-right">15</td>
<td class="data-td data last text-right">60</td>
<td class="data-td data last text-right">73</td>
</tr>
<tr class="tbl-data">
<td class="data-td last font-weight-normal text-left">&gt;30</td>
<td class="data-td data last text-right">5</td>
<td class="data-td data last text-right">60</td>
</tr>
</tbody>
</table>
</div>
<br />
<p class="chart-disclosure">Source: VanEck Research as of 12/16/2024. <strong>Past performance is no guarantee of future results.</strong></p>
<p>In this exercise, we analyzed the average 1, 3, and 6-month returns for BTC after the Altcoin Season Index crossed the <strong>60%</strong> threshold. We found that, on average, Bitcoin returns <strong>+10%, +30%,</strong> and <strong>+73%</strong> during the proceeding 1, 3, and 6 months after altcoin season begins, respectively. Notably, these returns increase as the duration of the altcoin season indicator increases. As of December 17th, this alt season indicator has been flashing for the past 20 days, suggesting that Bitcoin will perform even more strongly in the 3- to 6-month time horizons following November 27th than it would if the indicator had flashed for less than 7 days. Taking Bitcoin&rsquo;s opening price of <strong>~$92k</strong> on November 27th, the average 6-month returns of <strong>76%</strong> and <strong>81%</strong> following medium- to long-term Altcoin Season indicators would imply May 27th, 2025, Bitcoin prices of <strong>$161,920</strong> to <strong>$166,520</strong>, respectively. This tracks closely with our Bitcoin price target of <strong>$180,000 </strong>for this cycle.</p>
<p>We also measured the historical &lsquo;hit rate&rsquo; of Bitcoin&rsquo;s price, making positive returns in the 1, 3, and 6-months following the onset of altcoin season indicators. Curiously, with a nearly <strong>75%</strong> hit rate, indicators lasting between 7-30 days stand out from those less than a week or more than a month in duration. We believe this is explained by short-lived indicators being triggered more sporadically throughout market cycles, making them less predictive of sustained Bitcoin upside. Keeping in mind their considerably smaller sample size, we believe altcoin season indicators exceeding 30 days could be more reflective of peak market conditions. In contrast, indicators lasting only 7-30 days suggest more room for upside in the following three to six months. Whether the current altcoin season indicator lasts 30+ days or not, these results reinforce our confidence in a diversified crypto rally heading into 2025.</p>
<h2 id="miners" class="jump-link-nav anchored-block" data-jumplink-title="Miners">Bitcoin Miners</h2>
<p>This month, we updated our outlook on Bitcoin miners as the investing public and politicians become more aware of the intersections between crypto, AI, and energy.</p>
<h3>Synergies Between Crypto, AI, and Energy</h3>
<p><strong>Bitcoin Mining Stocks (12.12.2024)</strong></p>
<div class="wrapped-div">
<table style="width: 100%;">
<tbody>
<tr class="tbl-data">
<td class="tbl-header last text-left">Ticker</td>
<td class="tbl-header last text-center">BTC Pure Play?</td>
<td class="tbl-header last text-center">AI/HPC Pivot?</td>
<td class="tbl-header last text-center">BTC HOLDer?</td>
<td class="tbl-header last text-center">Vertically Integrated?</td>
<td class="tbl-header last text-right">Est. Qty. BTC HELD</td>
<td class="tbl-header last text-right">BTC HELD Value (millions)</td>
<td class="tbl-header last text-right">Enterprise Value ($m)</td>
<td class="tbl-header last text-right">BTC HELD % of EV</td>
</tr>
<tr class="tbl-data">
<td class="data-td data last text-left">BTDR</td>
<td class="data-td data last text-center">&nbsp;</td>
<td class="data-td data last text-center">X</td>
<td class="data-td data last text-center">&nbsp;</td>
<td class="data-td data last text-center">X</td>
<td class="data-td data last text-right">-</td>
<td class="data-td data last text-right">$0</td>
<td class="data-td data last text-right">$2,920</td>
<td class="data-td data last text-right">0%</td>
</tr>
<tr class="tbl-data">
<td class="data-td data last text-left">BTBT</td>
<td class="data-td data last text-center">&nbsp;</td>
<td class="data-td data last text-center">X</td>
<td class="data-td data last text-center">&nbsp;</td>
<td class="data-td data last text-right">813</td>
<td class="data-td data last text-right">$81</td>
<td class="data-td data last text-right">$566</td>
<td class="data-td data last text-right">14%</td>
</tr>
<tr class="tbl-data">
<td class="data-td data last text-left">BITF</td>
<td class="data-td data last text-center">&nbsp;</td>
<td class="data-td data last text-center">X</td>
<td class="data-td data last text-center">&nbsp;</td>
<td class="data-td data last text-right">1,221</td>
<td class="data-td data last text-right">$122</td>
<td class="data-td data last text-right">$929</td>
<td class="data-td data last text-right">13%</td>
</tr>
<tr class="tbl-data">
<td class="data-td data last text-left">CIFR</td>
<td class="data-td data last text-center">&nbsp;</td>
<td class="data-td data last text-center">X</td>
<td class="data-td data last text-center">&nbsp;</td>
<td class="data-td data last text-right">1,383</td>
<td class="data-td data last text-right">$138</td>
<td class="data-td data last text-right">$2,240</td>
<td class="data-td data last text-right">6%</td>
</tr>
<tr class="tbl-data">
<td class="data-td data last text-left">CLSK</td>
<td class="data-td data last text-center">X</td>
<td class="data-td data last text-center">&nbsp;</td>
<td class="data-td data last text-center">X</td>
<td class="data-td data last text-center">&nbsp;</td>
<td class="data-td data last text-right">9,297</td>
<td class="data-td data last text-right">$930</td>
<td class="data-td data last text-right">$3,700</td>
<td class="data-td data last text-right">25%</td>
</tr>
<tr class="tbl-data">
<td class="data-td data last text-left">CORZ</td>
<td class="data-td data last text-center">&nbsp;</td>
<td class="data-td data last text-center">X</td>
<td class="data-td data last text-center">&nbsp;</td>
<td class="data-td data last text-right">90</td>
<td class="data-td data last text-right">$9</td>
<td class="data-td data last text-right">$4,740</td>
<td class="data-td data last text-right">0%</td>
</tr>
<tr class="tbl-data">
<td class="data-td data last text-left">GLXY</td>
<td class="data-td data last text-center" colspan="4">&nbsp;</td>
<td class="data-td data last text-right">3,150</td>
<td class="data-td data last text-right">$315</td>
<td class="data-td data last text-right">$3,450</td>
<td class="data-td data last text-right">9%</td>
</tr>
<tr class="tbl-data">
<td class="data-td data last text-left">HIVE</td>
<td class="data-td data last text-center">&nbsp;</td>
<td class="data-td data last text-center">X</td>
<td class="data-td data last text-center">&nbsp;</td>
<td class="data-td data last text-right">2,713</td>
<td class="data-td data last text-right">$271</td>
<td class="data-td data last text-right">$520</td>
<td class="data-td data last text-right">52%</td>
</tr>
<tr class="tbl-data">
<td class="data-td data last text-left">HUT</td>
<td class="data-td data last text-center">&nbsp;</td>
<td class="data-td data last text-center">X</td>
<td class="data-td data last text-center">&nbsp;</td>
<td class="data-td data last text-right">&nbsp;9,122</td>
<td class="data-td data last text-right">$912</td>
<td class="data-td data last text-right">$3,050</td>
<td class="data-td data last text-right">30%</td>
</tr>
<tr class="tbl-data">
<td class="data-td data last text-left">IREN</td>
<td class="data-td data last text-center">&nbsp;</td>
<td class="data-td data last text-center">X</td>
<td class="data-td data last text-center">&nbsp;</td>
<td class="data-td data last text-right">-</td>
<td class="data-td data last text-right">$0</td>
<td class="data-td data last text-right">$2,820</td>
<td class="data-td data last text-right">0%</td>
</tr>
<tr class="tbl-data">
<td class="data-td data last text-left">MARA</td>
<td class="data-td data last text-center">X</td>
<td class="data-td data last text-center">&nbsp;</td>
<td class="data-td data last text-center">X</td>
<td class="data-td data last text-center">&nbsp;</td>
<td class="data-td data last text-right">34,959</td>
<td class="data-td data last text-right">$3,496</td>
<td class="data-td data last text-right">$8,080</td>
<td class="data-td data last text-right">43%</td>
</tr>
<tr class="tbl-data">
<td class="data-td data last text-left">RIOT</td>
<td class="data-td data last text-center">X</td>
<td class="data-td data last text-center">&nbsp;</td>
<td class="data-td data last text-center">X</td>
<td class="data-td data last text-center">&nbsp;</td>
<td class="data-td data last text-right">11,425</td>
<td class="data-td data last text-right">$1,143</td>
<td class="data-td data last text-right">$3,400</td>
<td class="data-td data last text-right">34%</td>
</tr>
<tr class="tbl-data">
<td class="data-td data last text-left">WULF</td>
<td class="data-td data last text-center">&nbsp;</td>
<td class="data-td data last text-center">X</td>
<td class="data-td data last text-center">&nbsp;</td>
<td class="data-td data last text-right">-</td>
<td class="data-td data last text-right">$0</td>
<td class="data-td data last text-right">$2,760</td>
<td class="data-td data last text-right">0%</td>
</tr>
</tbody>
</table>
</div>
<h3>Bitcoin Mining Stock Performance Averages by Category</h3>
<div class="wrapped-div">
<table style="width: 100%;">
<tbody>
<tr class="tbl-data">
<td class="tbl-header last text-left">Time Horizon</td>
<td class="tbl-header last text-right">BTC Pure Plays (%)</td>
<td class="tbl-header last text-right">Pivotooors (%)</td>
<td class="tbl-header last text-right">HOLDers (%)</td>
</tr>
<tr class="tbl-data">
<td class="data-td data last text-left">1M</td>
<td class="data-td data last text-right">-0.1</td>
<td class="data-td data last text-right">16.9</td>
<td class="data-td data last text-right">2.3</td>
</tr>
<tr class="tbl-data">
<td class="data-td data last text-left">3M</td>
<td class="data-td data last text-right">59.1</td>
<td class="data-td data last text-right">98.3</td>
<td class="data-td data last text-right">82.0</td>
</tr>
<tr class="tbl-data">
<td class="data-td data last text-left">6M</td>
<td class="data-td data last text-right">5.2</td>
<td class="data-td data last text-right">75.7</td>
<td class="data-td data last text-right">48.8</td>
</tr>
<tr class="tbl-data">
<td class="data-td data last text-left">1Y</td>
<td class="data-td data last text-right">27.2</td>
<td class="data-td data last text-right">157.9</td>
<td class="data-td data last text-right">65.3</td>
</tr>
</tbody>
</table>
</div>
<br />
<p class="chart-disclosure">Sources: FactSet, VanEck Research as of 12/12/2024.</p>
<p>To begin, we categorized Bitcoin mining companies into three major categories. BTC pure plays are Bitcoin miners who remain committed to maximizing their Bitcoin mining productivity. Opposite of BTC pure plays are so-called &ldquo;Pivotooors,&rdquo; colloquially referring to miners who have pivoted some amount of their existing Bitcoin mining capacity towards AI/HPC workloads. The third category, &ldquo;HOLDers,&rdquo; are Bitcoin miners whose Bitcoin holdings comprise <strong>20%</strong> or more of the company&rsquo;s enterprise value&mdash;an increasingly popular strategy in light of MicroStrategy&rsquo;s emergence as a household name for &ldquo;HOLDing&rdquo; Bitcoin like nobody else.</p>
<p>After categorizing these miners, we retrospectively analyzed each category&rsquo;s average returns over the last one, three, six, and twelve months. Across all time horizons, AI/HPC Pivotooors performed best, HOLDers performed second best, and BTC pure plays performed worst.</p>
<p>Given the revenue stability and capital efficiency of AI/HPC workloads, these results make sense. Core Scientific&rsquo;s partnership with cloud-computing hyperscaler CoreWeave highlights this trend: by repurposing <strong>700 MW</strong> of its <strong>1200 MW</strong> of contracted power, Core Scientific expects to earn <strong>~$1.04M</strong> per MW annually, delivering predictable, long-term cash flows. By comparison, based on its November production report, we estimate that Core Scientific earned an annualized <strong>~$0.64M</strong> per each of its <strong>500 MW</strong> dedicated to Bitcoin mining, even at elevated Bitcoin sales prices averaging <strong>~$85k</strong>.</p>
<p>In contrast, traditional Bitcoin mining faces high capital costs due to constant hardware upgrades, compounded by limited access to cheap credit. This often forces miners to dilute shares to finance operations. By pivoting to AI/HPC infrastructure, miners can achieve more sustainable margins and position themselves for data center REIT-like valuations. Currently, they are trading at <strong>~20&ndash;25x</strong> EV/EBITDA, significantly above the multiples of Bitcoin mining alone. As miners diversify into stable, high-margin services, this revaluation potential presents a compelling opportunity for investors.</p>
<p>As Bitcoin is up <strong>~153%</strong> YTD, it makes sense that HOLDers&mdash;essentially leveraged long BTC&mdash;have outperformed pure-play miners. However, because this strategy remains undiversified from Bitcoin&rsquo;s performance, we do not think it is as viable of a long-term strategy as pivoting into AI/HPC.</p>
<p>Lastly, we note that Bitdeer (BTDR), up <strong>108%</strong> MoM, is in a category of its own as the only vertically integrated Bitcoin miner in our list. BTDR&rsquo;s large and globally diversified power portfolio, ongoing Tier 3 AI/HPC data center pivot, and R&amp;D focus on its Bitcoin mining SEAL chips give the company significant strategic optionality. We believe the future of Bitcoin mining will shift away from standalone facilities, with a growing share of global hashrate coming from operations that utilize excess capacity from anchor tenants like AI/HPC data centers, industrial energy grids, and remote energy production. In such a landscape, the optionality of owning energy, AI/HPC infrastructure, and proprietary chip technology will likely prove more resilient than Bitcoin mining alone.</p>
<h3>Implied Enterprise Value per Watt</h3>
<p><strong>Bitcoin Miners - Estimated Current &amp; Target Power Capacities</strong></p>
<div class="wrapped-div">
<table style="width: 100%;">
<tbody>
<tr class="tbl-data">
<td class="tbl-header last text-center" rowspan="2">Publicly Traded<br />Bitcoin Miner</td>
<td class="tbl-header last text-center" colspan="3">Est. Power Capacity (MW)</td>
<td class="tbl-header last text-center" colspan="2">Primary Geographic Location(s)</td>
</tr>
<tr class="tbl-data">
<td class="tbl-header last text-right">Operating</td>
<td class="tbl-header last text-right">Near-Term Construction</td>
<td class="tbl-header last text-right">Total</td>
<td class="tbl-header last text-left">Operating</td>
<td class="tbl-header last text-left">Near-Term Construction</td>
</tr>
<tr class="tbl-data">
<td class="data-td data last text-left">Bitdeer (BTDR)</td>
<td class="data-td data last text-right">896</td>
<td class="data-td data last text-right">1,162</td>
<td class="data-td data last text-right">2,058</td>
<td class="data-td data last text-left">TX, TN, WA, Norway, Bhutant</td>
<td class="data-td data last text-left">OH, Norway, Bhutan</td>
</tr>
<tr class="tbl-data">
<td class="data-td data last text-left">Bit Digital (BTBT)</td>
<td class="data-td data last text-right">19</td>
<td class="data-td data last text-right">33</td>
<td class="data-td data last text-right">52</td>
<td class="data-td data last text-left">NY, TX, KY, Canada, Iceland</td>
<td class="data-td data last text-left">Canada</td>
</tr>
<tr class="tbl-data">
<td class="data-td data last text-left">Bitfarms (BITF)</td>
<td class="data-td data last text-right">324</td>
<td class="data-td data last text-right">631</td>
<td class="data-td data last text-right">955</td>
<td class="data-td data last text-left">WA, Canada, Paraguay, Argentina</td>
<td class="data-td data last text-left">PA, Paraguay</td>
</tr>
<tr class="tbl-data">
<td class="data-td data last text-left">Cipher Mining (CIFR)</td>
<td class="data-td data last text-right">327</td>
<td class="data-td data last text-right">770</td>
<td class="data-td data last text-right">1,097</td>
<td class="data-td data last text-left">TX</td>
</tr>
<tr class="tbl-data">
<td class="data-td data last text-left">Cleanspark (CLSK)</td>
<td class="data-td data last text-right">726</td>
<td class="data-td data last text-right">475</td>
<td class="data-td data last text-right">1,201</td>
<td class="data-td data last text-left">NY, TN, GA, MS</td>
<td class="data-td data last text-left">TN, WY</td>
</tr>
<tr class="tbl-data">
<td class="data-td data last text-left">Core Scientific (CORZ)</td>
<td class="data-td data last text-right">1,131</td>
<td class="data-td data last text-right">194</td>
<td class="data-td data last text-right">1,325</td>
<td class="data-td data last text-left">TX, ND, KY, NC, GA, AL</td>
<td class="data-td data last text-left">OK, TX, AL</td>
</tr>
<tr class="tbl-data">
<td class="data-td data last text-left">Galaxy Digital Mining (GLXY)</td>
<td class="data-td data last text-right">200</td>
<td class="data-td data last text-right">600</td>
<td class="data-td data last text-right">800</td>
<td class="data-td data last text-left">TX</td>
</tr>
<tr class="tbl-data">
<td class="data-td data last text-left">Hive Digital (HIVE)</td>
<td class="data-td data last text-right">140</td>
<td class="data-td data last text-right">100</td>
<td class="data-td data last text-right">240</td>
<td class="data-td data last text-left">Canada, Sweden, Iceland</td>
<td class="data-td data last text-left">Paraguay</td>
</tr>
<tr class="tbl-data">
<td class="data-td data last text-left">Hut 8 (HUT)</td>
<td class="data-td data last text-right">464</td>
<td class="data-td data last text-right">205</td>
<td class="data-td data last text-right">669</td>
<td class="data-td data last text-left">TX, NY, Canada</td>
<td class="data-td data last text-left">TX</td>
</tr>
<tr class="tbl-data">
<td class="data-td data last text-left">Iris Energy (IREN)</td>
<td class="data-td data last text-right">360</td>
<td class="data-td data last text-right">1,900</td>
<td class="data-td data last text-right">2,260</td>
<td class="data-td data last text-left">TX, Canada</td>
<td class="data-td data last text-left">TX</td>
</tr>
<tr class="tbl-data">
<td class="data-td data last text-left">Marathon Digital (MARA)</td>
<td class="data-td data last text-right">1,100</td>
<td class="data-td data last text-right">612</td>
<td class="data-td data last text-right">1,712</td>
<td class="data-td data last text-left">TX, ND, NE</td>
<td class="data-td data last text-left">TX</td>
</tr>
<tr class="tbl-data">
<td class="data-td data last text-left">Riot Platforms (RIOT)</td>
<td class="data-td data last text-right">1,200</td>
<td class="data-td data last text-right">800</td>
<td class="data-td data last text-right">2,000</td>
<td class="data-td data last text-left">TX, KY</td>
</tr>
<tr class="tbl-data">
<td class="data-td data last text-left">TeraWulf (WULF)</td>
<td class="data-td data last text-right">195</td>
<td class="data-td data last text-right">305</td>
<td class="data-td data last text-right">500</td>
<td class="data-td data last text-left">NY</td>
</tr>
<tr class="tbl-data">
<td class="data-td data last text-left">Total</td>
<td class="data-td data last text-right">7,082</td>
<td class="data-td data last text-right">7,787</td>
<td class="data-td data last text-right">14,869</td>
<td class="data-td data last text-left">&nbsp;</td>
</tr>
</tbody>
</table>
</div>
<br />
<p class="chart-disclosure">Sources: Company Notes, VanEck Research as of 12/13/2024.</p>
<h3>Bitcoin Miners&rsquo; Implied Enterprise Value/Watt</h3>
<div class="flourish-embed flourish-chart" data-src="visualisation/20862314"><script src="https://public.flourish.studio/resources/embed.js"></script><noscript><img loading="lazy" src="https://public.flourish.studio/visualisation/20862314/thumbnail" width="100%" alt="Bitcoin Miners' Implied Enterprise Value/Watt" /></noscript></div>
<p class="chart-disclosure">Sources: FactSet, VanEck Research as of 12/13/2024.</p>
<p>We examined the enterprise value of Bitcoin miners relative to their current and near-term target energy capacities. Despite its recent gains, we note that RIOT, IREN, BITF, and BTDR appear cheap by this measure.</p>
<p>While Bit Digital (BTBT) looks expensive, this can be explained by the recent termination of its <strong>36 MW</strong> in colocation mining services from Coinmint. Further, because it is not currently under construction, most of BTBT&rsquo;s <strong>288 MW</strong> expansion pipeline is not reflected in this table and chart. Additionally, the company&rsquo;s significant investments in Ethereum staking and AI/HPC infrastructure differentiate it, making this metric less straightforward for assessment.</p>
<h2 id="monthly-dashboard" class="anchored-block">Bitcoin ChainCheck Monthly Dashboard</h2>
<div class="wrapped-div">
<table style="width: 100%;">
<tbody>
<tr class="tbl-data"></tr>
<tr class="tbl-data">
<td class="tbl-header last text-left">As of December 17th, 2024</td>
<td class="tbl-header last text-right">7-day avg</td>
<td class="tbl-header last text-right">30 day change<sup>&sup1;</sup>&nbsp;(%)</td>
<td class="tbl-header last text-right">365 day change (%)</td>
<td class="tbl-header last text-right">Last 7 days Percentile<br />vs all-time history (%)</td>
</tr>
<tr class="tbl-data">
<td class="data-td last font-weight-normal text-left">Bitcoin Price</td>
<td class="data-td data last text-right">$ 101,606</td>
<td class="data-td data last text-right">15</td>
<td class="data-td data last text-right">142</td>
<td class="data-td data last text-right">100</td>
</tr>
<tr class="tbl-data">
<td class="data-td last font-weight-normal text-left">Daily Active Addresses</td>
<td class="data-td data last text-right">882,450</td>
<td class="data-td data last text-right">1</td>
<td class="data-td data last text-right">7</td>
<td class="data-td data last text-right">78</td>
</tr>
<tr class="tbl-data">
<td class="data-td last font-weight-normal text-left">Daily New Addresses</td>
<td class="data-td data last text-right">359,090</td>
<td class="data-td data last text-right">-3</td>
<td class="data-td data last text-right">-15</td>
<td class="data-td data last text-right">67</td>
</tr>
<tr class="tbl-data">
<td class="data-td last font-weight-normal text-left">Daily Transactions</td>
<td class="data-td data last text-right">461,339</td>
<td class="data-td data last text-right">-14</td>
<td class="data-td data last text-right">-22</td>
<td class="data-td data last text-right">93</td>
</tr>
<tr class="tbl-data">
<td class="data-td last font-weight-normal text-left">Daily Inscriptions</td>
<td class="data-td data last text-right">116,432</td>
<td class="data-td data last text-right">134</td>
<td class="data-td data last text-right">-52</td>
<td class="data-td data last text-right">60</td>
</tr>
<tr class="tbl-data">
<td class="data-td last font-weight-normal text-left">Total Transfer Volume (USD)</td>
<td class="data-td data last text-right">$ 71,770,207,988</td>
<td class="data-td data last text-right">-19</td>
<td class="data-td data last text-right">123</td>
<td class="data-td data last text-right">90</td>
</tr>
<tr class="tbl-data">
<td class="data-td last font-weight-normal text-left">% Supply Active, last 180 days</td>
<td class="data-td data last text-right">21</td>
<td class="data-td data last text-right">18</td>
<td class="data-td data last text-right">29</td>
<td class="data-td data last text-right">19</td>
</tr>
<tr class="tbl-data">
<td class="data-td last font-weight-normal text-left">% Supply Dormant for 3+ Years</td>
<td class="data-td data last text-right">46</td>
<td class="data-td data last text-right">-1</td>
<td class="data-td data last text-right">10</td>
<td class="data-td data last text-right">96</td>
</tr>
<tr class="tbl-data">
<td class="data-td last font-weight-normal text-left">Avg Fees (USD)</td>
<td class="data-td data last text-right">$ 3.20</td>
<td class="data-td data last text-right">-11</td>
<td class="data-td data last text-right">-86</td>
<td class="data-td data last text-right">84</td>
</tr>
<tr class="tbl-data">
<td class="data-td last font-weight-normal text-left">Avg Fees (BTC)</td>
<td class="data-td data last text-right">0.00003</td>
<td class="data-td data last text-right">-22</td>
<td class="data-td data last text-right">-94</td>
<td class="data-td data last text-right">10</td>
</tr>
<tr class="tbl-data">
<td class="data-td last font-weight-normal text-left">Percent of BTC Addresses in profit</td>
<td class="data-td data last text-right">99</td>
<td class="data-td data last text-right">0</td>
<td class="data-td data last text-right">15</td>
<td class="data-td data last text-right">98</td>
</tr>
<tr class="tbl-data">
<td class="data-td last font-weight-normal text-left">Unrealized profit/loss ratio</td>
<td class="data-td data last text-right">0.62</td>
<td class="data-td data last text-right">1</td>
<td class="data-td data last text-right">24</td>
<td class="data-td data last text-right">85</td>
</tr>
<tr class="tbl-data">
<td class="data-td last font-weight-normal text-left">Global Power Consumption (TWh)</td>
<td class="data-td data last text-right">151</td>
<td class="data-td data last text-right">8</td>
<td class="data-td data last text-right">63</td>
<td class="data-td data last text-right">100</td>
</tr>
<tr class="tbl-data">
<td class="data-td last font-weight-normal text-left">Total Daily BTC Miner Revenues (USD)</td>
<td class="data-td data last text-right">$ 49,136,272</td>
<td class="data-td data last text-right">20</td>
<td class="data-td data last text-right">-9</td>
<td class="data-td data last text-right">96</td>
</tr>
<tr class="tbl-data">
<td class="data-td last font-weight-normal text-left">Total Crypto Equities Market Cap<sup>*</sup>&nbsp;(USD) (MM)</td>
<td class="data-td data last text-right">$ 244,695</td>
<td class="data-td data last text-right">14</td>
<td class="data-td data last text-right">63</td>
<td class="data-td data last text-right">99</td>
</tr>
<tr class="tbl-data">
<td class="data-td last font-weight-normal text-left">Transfer volume from Miners to Exchanges (USD)</td>
<td class="data-td data last text-right">$ 5,222,700</td>
<td class="data-td data last text-right">-82</td>
<td class="data-td data last text-right">-33</td>
<td class="data-td data last text-right">88</td>
</tr>
<tr class="tbl-data">
<td class="data-td last font-weight-normal text-left">Bitcoin Dominance</td>
<td class="data-td data last text-right">55</td>
<td class="data-td data last text-right">-6</td>
<td class="data-td data last text-right">7</td>
<td class="data-td data last text-right">76</td>
</tr>
<tr class="tbl-data">
<td class="data-td last font-weight-normal text-left">Bitcoin Futures Annualized Basis</td>
<td class="data-td data last text-right">15</td>
<td class="data-td data last text-right">13</td>
<td class="data-td data last text-right">38</td>
<td class="data-td data last text-right">85</td>
</tr>
<tr class="tbl-data">
<td class="data-td last font-weight-normal text-left">Mining Difficulty (TH/s)</td>
<td class="data-td data last text-right">105</td>
<td class="data-td data last text-right">3</td>
<td class="data-td data last text-right">55</td>
<td class="data-td data last text-right">100</td>
</tr>
</tbody>
</table>
</div>
<br />
<p class="chart-disclosure"><sup>*</sup>&nbsp;DAPP market cap as a proxy, as of Nov 17th, 2024<br /><sup>1</sup>&nbsp;30 day change &amp; 365 day change are relative to the 7-day avg, not absolute</p>
<div class="wrapped-div">
<table style="width: 500px;">
<tbody>
<tr class="tbl-data"></tr>
<tr class="tbl-data">
<td class="tbl-header last text-left">Regional Trading</td>
<td class="tbl-header last text-right">MoM Change (%)</td>
<td class="tbl-header last text-right">YoY Change (%)</td>
</tr>
<tr class="tbl-data">
<td class="data-td last font-weight-normal text-left">Asia Hours Price Change MoM ($)</td>
<td class="data-td data last text-right">19</td>
<td class="data-td data last text-right">2</td>
</tr>
<tr class="tbl-data">
<td class="data-td last font-weight-normal text-left">US hours Price Change MoM ($)</td>
<td class="data-td data last text-right">8</td>
<td class="data-td data last text-right">3</td>
</tr>
<tr class="tbl-data">
<td class="data-td last font-weight-normal text-left">EU hours Price Change MoM ($)</td>
<td class="data-td data last text-right">9</td>
<td class="data-td data last text-right">4</td>
</tr>
</tbody>
</table>
</div>
<br />
<p class="chart-disclosure">Source: Glassnode, VanEck research as of 12/17/24. <strong>Past performance is no guarantee of future results.</strong></p>
<h2 id="btc-network-activity" class="jump-link-nav anchored-block" data-jumplink-title="Bitcoin's Network">Bitcoin&rsquo;s Network Activity, Adoption, and Fees</h2>
<p><strong>Daily Inscriptions: </strong>Inscriptions transactions surged <strong>134%</strong> month-over-month but remain down <strong>52%</strong> year-over-year (YoY), suggesting signs of life in speculative onchain activity on Bitcoin. This aligns with broader NFT market enthusiasm, as evidenced by Pudgy Penguins NFTs surpassing <strong>$100k</strong> this month.</p>
<p><strong>Active Supply: </strong>The percent of Bitcoin&rsquo;s supply active in the past 180 days is up <strong>18%</strong> month-over- month<strong> </strong>(MoM) and <strong>29%</strong> YoY, suggesting that elevated prices are waking up dormant wallets. However, supply dormant for 3+ years fell <strong>1%</strong> MoM and is only up <strong>10%</strong> YoY, suggesting most activity is concentrated among younger wallets.</p>
<p><strong>Average Fees: </strong>Average fees decreased modestly month-over-month, <strong>11%</strong> in USD terms. While they appear to be down significantly YoY, this is due to last December&rsquo;s network congestion caused by Bitcoin ordinals and BRC-20s spiking in popularity ahead of bullish ETF sentiment.</p>
<p><strong>Global Power Consumption &amp; Mining Difficulty: </strong>Global power consumption reached <strong>151 TWh</strong>, and mining difficulty rose <strong>8%</strong> Month over Month, both hitting all-time highs. This reflects a robust and growing network as miners scale operations to meet rising Bitcoin demand.</p>
<p><strong>Total Crypto Equities Market Cap: </strong>The total market cap for crypto equities rose <strong>14%</strong> MoM to a new all-time high, driven by strong BTC miner revenues, which remain near record levels. Daily BTC miner revenues increased 20% MoM, benefiting from elevated Bitcoin prices.</p>
<p><strong>Transfer Volume from Miners to Exchanges:</strong> Transfer volume from miners to exchanges fell 82% MoM, but last month&rsquo;s spike distorts this figure. Overall, miner selling appears to have stabilized at modestly higher levels than in previous months, indicating increased but not yet worrisome miner profit-taking.</p>
<p><strong>Bitcoin Dominance: </strong>Bitcoin dominance fell <strong>6%</strong> MoM, the sharpest one-month decline since 2022. This aligns with our analysis indicating the onset of <i>Altcoin Season</i>.</p>
<p><strong>Futures Sentiment: </strong>Annualized Bitcoin futures basis rose <strong>13%</strong> MoM, reflecting growing bullish sentiment. At the 85th percentile of historical levels, funding remains elevated but not extreme.</p>
<h3>Chart of the Month: Bitcoin is Leaving Exchanges at an Unprecedented Rate</h3>
<div class="flourish-embed flourish-chart" data-src="visualisation/20862506"><script src="https://public.flourish.studio/resources/embed.js"></script><noscript><img loading="lazy" src="https://public.flourish.studio/visualisation/20862506/thumbnail" width="100%" alt="Chart of the Month: Bitcoin is Leaving Exchanges at an Unprecedented Rate" /></noscript></div>
<p class="chart-disclosure">Source: Glassnode as of 12/18/2024. : <strong>Past performance is no guarantee of future results.</strong></p>
<p><strong>Links to third party websites are provided as a convenience and the inclusion of such links does not imply any endorsement, approval, investigation, verification or monitoring by us of any content or information contained within or accessible from the linked sites. By clicking on the link to a non-VanEck webpage, you acknowledge that you are entering a third-party website subject to its own terms and conditions. VanEck disclaims responsibility for content, legality of access or suitability of the third-party websites.</strong></p>
<style>
   .data-td.data {
   		padding-left: 5px !important;
        padding-right: 5px !important;
    }

    .data-head {
   		padding-left: 5px !important;
        padding-right: 5px !important;
    }

    .wrapped-div {
        max-width: 100%;
    }

    @media (max-width: 1240px) {
        .wrapped-div {
            overflow-x: scroll;
        }
    }

    
    .wrapped-div-sector {
        max-width: 100%;
        overflow-x: scroll;
    }
    .flourish-credit{
display: none !important;
}


</style>
<p>To receive more <strong><a href="https://www.vaneck.com/us/en/insights/digital-assets/" title="Digital Assets Insights">Digital Assets</a></strong> insights, <strong><a href="https://www.vaneck.com/us/en/subscribe/" title="Subscription Center">sign up in our subscription center</a></strong>.</p>
]]></content:encoded>
</item><item rdf:about="https://www.vaneck.com/us/en/blogs/thematic-investing/buzz-investing-optimism-fuels-continued-rally/">
  <title>BUZZ Investing: Optimism Fuels Continued Rally></title>
  <link>https://www.vaneck.com/us/en/blogs/thematic-investing/buzz-investing-optimism-fuels-continued-rally/</link>
  <description><![CDATA[Strong labor market data, persistent inflation, and investor optimism boosted markets, with Super Micro Computer leading gains amid restored confidence.]]></description>
  <dc:creator> </dc:creator>
  <dc:date>12/19/2024 06:30:00</dc:date>
<content:encoded><![CDATA[

<p>A series of economic and market developments shaped market activity during the recent period between index selection dates (November 14, 2024 &ndash; December 12, 2024, the &ldquo;Period&rdquo;). The U.S. Labor Department reported a robust addition of 227,000 jobs in November, above expectations, signaling continued strength in the labor market. However, a slight uptick in the unemployment rate to 4.2% reflected an expanding labor force. Inflation indicators showed persistent pressures, with the Consumer Price Index (CPI) rising 0.3% in November for an annual increase of 2.7% and the Producer Price Index (PPI) climbing 0.4% month-over-month, reaching 3.0% year-over-year. Despite this combination of strong labor market data and inflationary pressures, investors anticipated the 25-basis-point rate cut, reflecting confidence in the central bank&rsquo;s commitment to sustaining growth amid evolving economic conditions.</p>
<p>The BUZZ NextGen AI US Sentiment Leaders Index ("BUZZ Index") performed well during the Period, rising 11% and achieving a new all-time high on December 6. Broader market sentiment was bolstered by strong corporate earnings and optimism in growth sectors, with the Nasdaq Composite surpassing the 20,000 mark for the first time, driven by gains in major technology stocks such as Alphabet and Tesla. This confluence of robust economic indicators, earnings momentum, and monetary policy expectations contributed to a complex yet resilient market environment during the Period.</p>
<p>The BUZZ Index returned 16.70% during the month of November compared to a return of 5.87% for the S&amp;P 500 Index during the same period. Year-to-date, the BUZZ Index leads the S&amp;P 500 with returns of 36.00% and 28.07%, respectively, as of the end of November.</p>
<h2>Shares of Super Micro Computer, Inc. pace BUZZ Index Gains</h2>
<p>Super Micro Computer (NASDAQ: SMCI) stock price soared over 110% during the recent Period, driven by a series of positive developments that have eased investor concerns and restored confidence in the company. Following a tumultuous period marked by the resignation of its auditor, Ernst &amp; Young, and the threat of delisting, the company announced on December 2 that Nasdaq would allow it to retain its listing while reviewing its compliance plan. This news, coupled with the appointment of BDO USA as its new auditor, has reassured markets. Additionally, an independent special committee concluded its investigation into governance issues raised by Ernst &amp; Young, finding no evidence of fraud or misconduct. The company has adopted the committee&rsquo;s recommendations, including plans to appoint a new CFO and strengthen compliance oversight, further signaling a commitment to resolving governance concerns. With its core business in AI-driven servers remaining strong, investor sentiment has shifted significantly.</p>

<h3>Top BUZZ Index Contributors: November 14, 2024 &ndash; December 12, 2024</h3>
<div class="wrapped-div">
<table style="width: 100%;">
<tbody>
<tr class="tbl-data">
<td class="tbl-header last text-left">Company</td>
<td class="tbl-header last text-left">Ticker</td>
<td class="tbl-header last text-right">Average Weight (%)</td>
<td class="tbl-header last text-right">Return Contribution (%)</td>
</tr>
<tr class="tbl-data">
<td class="data-td last font-weight-normal text-left">Super Micro Computer Inc</td>
<td class="data-td data last text-left">SMCI</td>
<td class="data-td data last text-right">4.69</td>
<td class="data-td data last text-right">2.08</td>
</tr>
<tr class="tbl-data">
<td class="data-td last font-weight-normal text-left">MicroStrategy Inc</td>
<td class="data-td data last text-left">MSTR</td>
<td class="data-td data last text-right">1.44</td>
<td class="data-td data last text-right">1.09</td>
</tr>
<tr class="tbl-data">
<td class="data-td last font-weight-normal text-left">Tesla Inc</td>
<td class="data-td data last text-left">TSLA</td>
<td class="data-td data last text-right">3.34</td>
<td class="data-td data last text-right">1.07</td>
</tr>
<tr class="tbl-data">
<td class="data-td last font-weight-normal text-left">Palantir Technologies Inc</td>
<td class="data-td data last text-left">PLTR</td>
<td class="data-td data last text-right">3.36</td>
<td class="data-td data last text-right">0.74</td>
</tr>
<tr class="tbl-data">
<td class="data-td last font-weight-normal text-left">SoFi Technologies Inc</td>
<td class="data-td data last text-left">SOFI</td>
<td class="data-td data last text-right">3.53</td>
<td class="data-td data last text-right">0.73</td>
</tr>
<tr class="tbl-data">
<td class="data-td last font-weight-normal text-left">Unity Software Inc</td>
<td class="data-td data last text-left">U</td>
<td class="data-td data last text-right">2.44</td>
<td class="data-td data last text-right">0.65</td>
</tr>
<tr class="tbl-data">
<td class="data-td last font-weight-normal text-left">Robinhood Markets Inc</td>
<td class="data-td data last text-left">HOOD</td>
<td class="data-td data last text-right">3.11</td>
<td class="data-td data last text-right">0.63</td>
</tr>
<tr class="tbl-data">
<td class="data-td last font-weight-normal text-left">Boeing Co/The</td>
<td class="data-td data last text-left">BA</td>
<td class="data-td data last text-right">2.87</td>
<td class="data-td data last text-right">0.60</td>
</tr>
<tr class="tbl-data">
<td class="data-td last font-weight-normal text-left">Rivian Automotive Inc</td>
<td class="data-td data last text-left">RIVN</td>
<td class="data-td data last text-right">1.63</td>
<td class="data-td data last text-right">0.54</td>
</tr>
<tr class="tbl-data">
<td class="data-td last font-weight-normal text-left">Lucid Group Inc</td>
<td class="data-td data last text-left">LCID</td>
<td class="data-td data last text-right">1.95</td>
<td class="data-td data last text-right">0.51</td>
</tr>
</tbody>
</table>
</div>
<p class="chart-disclosure">Source: BUZZ Holdings ULC, Bloomberg. Past performance is no guarantee of future results. Index performance is not illustrative of fund performance. Not intended as a recommendation to buy or to sell any of the securities mentioned herein.</p>

<h2>Shares of Semiconductor companies among declining stocks in the BUZZ Index</h2>
<p>Intel Corporation (NASDAQ: INTC) has faced a nearly 20% decline in its stock price during the recent Period, driven by a series of developments that have shaken investor confidence. On December 2, CEO Pat Gelsinger unexpectedly retired, leaving uncertainty about the company&rsquo;s strategic direction amid mounting competition in the semiconductor industry. This leadership transition was compounded by an S&amp;P Global Ratings downgrade of Intel&rsquo;s credit rating from 'BBB+' to 'BBB,' citing slower-than-expected recovery efforts and uncertainties stemming from the management change. Additionally, Intel announced plans to restructure its manufacturing division into a standalone subsidiary, with interim co-CEOs indicating that a full spinoff is under consideration. While intended to streamline operations, this move has added to market apprehension about Intel&rsquo;s future.</p>
<p>NVIDIA Corp (NASDAQ: NVDA) and Advanced Micro Devices Inc (NASDAQ: AMD) fell approximately 6% during the Period. While Intel&rsquo;s issues were company-specific, the declines in NVDA and AMD may have reflected broader market concerns over slowing chip demand in certain segments and profit-taking after a strong rally in AI and semiconductor stocks earlier in the year. These pressures suggest investors may be more cautious toward the sector, even as long-term growth opportunities in AI and advanced computing remain intact.</p>
<h3>Bottom BUZZ Index Contributors: November 14, 2024 &ndash; December 12, 2024</h3>
<div class="wrapped-div">
<table style="width: 100%;">
<tbody>
<tr class="tbl-data">
<td class="tbl-header last text-left">Company</td>
<td class="tbl-header last text-left">Ticker</td>
<td class="tbl-header last text-right">Average Weight (%)</td>
<td class="tbl-header last text-right">Return Contribution (%)</td>
</tr>
<tr class="tbl-data">
<td class="data-td last font-weight-normal text-left">AST SpaceMobile Inc</td>
<td class="data-td data last text-left">ASTS</td>
<td class="data-td data last text-right">2.58</td>
<td class="data-td data last text-right">-0.42</td>
</tr>
<tr class="tbl-data">
<td class="data-td last font-weight-normal text-left">Intel Corp</td>
<td class="data-td data last text-left">INTC</td>
<td class="data-td data last text-right">2.25</td>
<td class="data-td data last text-right">-0.42</td>
</tr>
<tr class="tbl-data">
<td class="data-td last font-weight-normal text-left">NVIDIA Corp</td>
<td class="data-td data last text-left">NVDA</td>
<td class="data-td data last text-right">2.69</td>
<td class="data-td data last text-right">-0.19</td>
</tr>
<tr class="tbl-data">
<td class="data-td last font-weight-normal text-left">Viking Therapeutics Inc</td>
<td class="data-td data last text-left">VKTX</td>
<td class="data-td data last text-right">1.75</td>
<td class="data-td data last text-right">-0.19</td>
</tr>
<tr class="tbl-data">
<td class="data-td last font-weight-normal text-left">Advanced Micro Devices Inc</td>
<td class="data-td data last text-left">AMD</td>
<td class="data-td data last text-right">2.59</td>
<td class="data-td data last text-right">-0.16</td>
</tr>
<tr class="tbl-data">
<td class="data-td last font-weight-normal text-left">Lumen Technologies Inc</td>
<td class="data-td data last text-left">LUMN</td>
<td class="data-td data last text-right">0.40</td>
<td class="data-td data last text-right">-0.13</td>
</tr>
<tr class="tbl-data">
<td class="data-td last font-weight-normal text-left">Uber Technologies Inc</td>
<td class="data-td data last text-left">UBER</td>
<td class="data-td data last text-right">0.66</td>
<td class="data-td data last text-right">-0.10</td>
</tr>
<tr class="tbl-data">
<td class="data-td last font-weight-normal text-left">NU Holdings Ltd/Cayman Islands</td>
<td class="data-td data last text-left">NU</td>
<td class="data-td data last text-right">0.32</td>
<td class="data-td data last text-right">-0.08</td>
</tr>
<tr class="tbl-data">
<td class="data-td last font-weight-normal text-left">Cava Group Inc</td>
<td class="data-td data last text-left">CAVA</td>
<td class="data-td data last text-right">0.51</td>
<td class="data-td data last text-right">-0.06</td>
</tr>
<tr class="tbl-data">
<td class="data-td last font-weight-normal text-left">Sirius XM Holdings Inc</td>
<td class="data-td data last text-left">SIRI</td>
<td class="data-td data last text-right">0.47</td>
<td class="data-td data last text-right">-0.04</td>
</tr>
</tbody>
</table>
</div>
<p class="chart-disclosure">Source: BUZZ Holdings ULC, Bloomberg. Past performance is no guarantee of future results. Index performance is not illustrative of fund performance. Not intended as a recommendation to buy or to sell any of the securities mentioned herein.</p>
<h2>BUZZ Index December 2024 Rebalance Highlights</h2>
<p><strong>Zeta Global Holdings Corp.</strong><br />This month, the BUZZ Index adds Zeta Global Holdings Corp. (NYSE: ZETA) as a first-time entrant. The company provides multi-channel marketing tools and software, leveraging data analytics, machine learning, and AI to help businesses better understand online trends. Over the past decade, Zeta has expanded its capabilities through strategic cloud computing and predictive analytics acquisitions. After going public in June 2021 with a $1.7 billion valuation, Zeta's stock gained significant attention in 2024, climbing over 400% year-to-date by November amid growing interest in AI-driven solutions. However, on November 13, short-seller Culper Research published a report alleging financial irregularities, causing the stock to decline sharply by 50%. Zeta refuted the claims, and while its stock remains volatile, sentiment has recovered, suggesting continued investor confidence. Zeta Global debuts in the BUZZ Index this month with the maximum 3% weight.</p>
<p><strong>UnitedHealth Group Inc</strong><br />The killing of Brian Thompson, CEO of UnitedHealth Group (NYSE: UNH), on December 4th has drawn significant attention to the company and the broader U.S. private insurance industry. Thompson was fatally shot outside the hotel hosting UNH's investor day, an event that unexpectedly brought public scrutiny to the company's business practices rather than focusing condemnation on the crime itself. Social media platforms were flooded with criticism of UNH, with many users expressing frustration over its high claim denial rates and raising questions about longstanding issues within the private insurance sector. The incident has weighed on UNH's stock, which has fallen over 15% since the shooting, as the company faces intensified public and regulatory scrutiny. Despite the controversy, sentiment toward the stock has begun to recover, as investors may view the event as unlikely to materially impact the company's operational fundamentals. UnitedHealth Group joins the BUZZ Index this month as a new entrant with a 1.61% weight.</p>
<p>To receive more <a href="https://www.vaneck.com/us/en/insights/thematic-investing/" title="Thematic Investing Insights"><strong>Thematic Investing</strong></a> insights, <a href="https://www.vaneck.com/us/en/subscribe/" title="Subscription Center"><strong>sign up in our subscription center</strong></a>.</p>
]]></content:encoded>
</item><item rdf:about="https://www.vaneck.com/us/en/blogs/emerging-markets-bonds/em-debt-resilient-despite-perceived-risks-from-us-protectionism/">
  <title>EM Debt Resilient Despite Perceived Risks from US Protectionism></title>
  <link>https://www.vaneck.com/us/en/blogs/emerging-markets-bonds/em-debt-resilient-despite-perceived-risks-from-us-protectionism/</link>
  <description><![CDATA[Emerging markets continue to chug along, despite risks emanating for US Election.]]></description>
  <dc:creator>Eric Fine</dc:creator>
  <dc:date>12/17/2024 06:30:00</dc:date>
<content:encoded><![CDATA[

<p id="overview" class="jump-link-nav anchored-block" data-jumplink-title="Performance Overview">The <strong> <a href="/link/cae21763b8c742f0952c4e4e3234dab9.aspx" title="EMBUX - Emerging Markets Bond Fund - Class I - Overview">VanEck Emerging Markets Fund</a></strong> was down 0.73% in November, compared to 0.31% for its benchmark. Year-to-date, the fund gained 4.79%, compared to 3.74% for its benchmark, the 50% J.P. Morgan Government Bond Index-Emerging Markets Global Diversified (GBI-EM) and 50% J.P. Morgan Emerging Markets Bond Index (EMBI), and compared to 0.37% and 0.97% for the Global Agg and 10-Year US Treasuries, respectively. For the trailing 5-year period, the fund&rsquo;s cumulative return is 20.1%, compared to 0.5% for its benchmark (and down -8.7% and down -8.2% for the Global Agg and Treasuries, respectively). The decades-old story of emerging market (EM) bonds outperforming developed markets (DM) continues. During November, the fund&rsquo;s overweight in Brazil local currency caused underperformance. The fund reverted to neutral (in early December) as the situation plays out. The fund continues to like South Africa and Mexico (following its US and Mexican elections-related sell-offs). We continue to like curated local-currency, especially higher-beta, but have covered our underweight in duration. In USD, IG seems a pure US-rates trade (with some high-quality exceptions in the Gulf), while HY sovereigns remain our hunting ground. Carry is 8.0%, YTW is 9.9%, duration is 5.8 and local makes up around 57.2% of exposure.</p>

<h3>Average Annual Total Returns<sup>*</sup>&nbsp;(%) (In USD)</h3>
<div class="wrapped-div">
<table style="width: 100%;">
<tbody>
<tr class="tbl-data">
<td class="tbl-header last" colspan="10">As of November 30, 2024</td>
</tr>
<tr class="tbl-data">
<td class="data-head last text-right">&nbsp;</td>
<td class="data-head last text-right">1 Mth</td>
<td class="data-head last text-right">3 Mth</td>
<td class="data-head last text-right">YTD</td>
<td class="data-head last text-right">1 Yr</td>
<td class="data-head last text-right">3 Yrs</td>
<td class="data-head last text-right">5 Yrs</td>
<td class="data-head last text-right">10 Yrs</td>
</tr>
<tr class="tbl-data">
<td class="data-td last text-left">Class A: NAV (Inception 07/09/12)</td>
<td class="data-td data last text-right">-0.70</td>
<td class="data-td data last text-right">-0.19</td>
<td class="data-td data last text-right">4.43</td>
<td class="data-td data last text-right">8.49</td>
<td class="data-td data last text-right">2.28</td>
<td class="data-td data last text-right">3.42</td>
<td class="data-td data last text-right">1.58</td>
</tr>
<tr class="tbl-data">
<td class="data-td last text-left">Class A: Maximum 5.75% load</td>
<td class="data-td data last text-right">-6.41</td>
<td class="data-td data last text-right">-5.93</td>
<td class="data-td data last text-right">-1.57</td>
<td class="data-td data last text-right">2.25</td>
<td class="data-td data last text-right">0.28</td>
<td class="data-td data last text-right">2.20</td>
<td class="data-td data last text-right">0.98</td>
</tr>
<tr class="tbl-data">
<td class="data-td last text-left">Class I: NAV (Inception 07/09/12)</td>
<td class="data-td data last text-right">-0.73</td>
<td class="data-td data last text-right">-0.22</td>
<td class="data-td data last text-right">4.79</td>
<td class="data-td data last text-right">8.78</td>
<td class="data-td data last text-right">2.57</td>
<td class="data-td data last text-right">3.74</td>
<td class="data-td data last text-right">1.88</td>
</tr>
<tr class="tbl-data">
<td class="data-td last text-left">Class Y: NAV (Inception 07/09/12)</td>
<td class="data-td data last text-right">-0.66</td>
<td class="data-td data last text-right">-0.16</td>
<td class="data-td data last text-right">4.73</td>
<td class="data-td data last text-right">8.71</td>
<td class="data-td data last text-right">2.47</td>
<td class="data-td data last text-right">3.65</td>
<td class="data-td data last text-right">1.82</td>
</tr>
<tr class="tbl-data">
<td class="data-td last text-left">50% GBI-EM/50% EMBI</td>
<td class="data-td data last text-right">0.31</td>
<td class="data-td data last text-right">-0.33</td>
<td class="data-td data last text-right">3.73</td>
<td class="data-td data last text-right">7.85</td>
<td class="data-td data last text-right">0.16</td>
<td class="data-td data last text-right">0.11</td>
<td class="data-td data last text-right">1.58</td>
</tr>
</tbody>
</table>
</div>
<br />
<div class="wrapped-div">
<table style="width: 100%;">
<tbody>
<tr class="tbl-data">
<td class="tbl-header last" colspan="10">As of September 30, 2024</td>
</tr>
<tr class="tbl-data">
<td class="data-head last text-right">&nbsp;</td>
<td class="data-head last text-right">1 Mth</td>
<td class="data-head last text-right">3 Mth</td>
<td class="data-head last text-right">YTD</td>
<td class="data-head last text-right">1 Yr</td>
<td class="data-head last text-right">3 Yrs</td>
<td class="data-head last text-right">5 Yrs</td>
<td class="data-head last text-right">10 Yrs</td>
</tr>
<tr class="tbl-data">
<td class="data-td last text-left">Class A: NAV (Inception 07/09/12)</td>
<td class="data-td data last text-right">3.19</td>
<td class="data-td data last text-right">7.73</td>
<td class="data-td data last text-right">7.97</td>
<td class="data-td data last text-right">17.00</td>
<td class="data-td data last text-right">2.71</td>
<td class="data-td data last text-right">4.17</td>
<td class="data-td data last text-right">1.88</td>
</tr>
<tr class="tbl-data">
<td class="data-td last text-left">Class A: Maximum 5.75% load</td>
<td class="data-td data last text-right">-2.74</td>
<td class="data-td data last text-right">1.54</td>
<td class="data-td data last text-right">1.77</td>
<td class="data-td data last text-right">10.27</td>
<td class="data-td data last text-right">0.70</td>
<td class="data-td data last text-right">2.94</td>
<td class="data-td data last text-right">1.28</td>
</tr>
<tr class="tbl-data">
<td class="data-td last text-left">Class I: NAV (Inception 07/09/12)</td>
<td class="data-td data last text-right">3.26</td>
<td class="data-td data last text-right">7.84</td>
<td class="data-td data last text-right">8.44</td>
<td class="data-td data last text-right">17.58</td>
<td class="data-td data last text-right">3.07</td>
<td class="data-td data last text-right">4.52</td>
<td class="data-td data last text-right">2.20</td>
</tr>
<tr class="tbl-data">
<td class="data-td last text-left">Class Y: NAV (Inception 07/09/12)</td>
<td class="data-td data last text-right">3.35</td>
<td class="data-td data last text-right">7.98</td>
<td class="data-td data last text-right">8.41</td>
<td class="data-td data last text-right">17.52</td>
<td class="data-td data last text-right">2.96</td>
<td class="data-td data last text-right">4.46</td>
<td class="data-td data last text-right">2.14</td>
</tr>
<tr class="tbl-data">
<td class="data-td last text-left">50% GBI-EM/50% EMBI</td>
<td class="data-td data last text-right">2.62</td>
<td class="data-td data last text-right">7.57</td>
<td class="data-td data last text-right">6.80</td>
<td class="data-td data last text-right">16.02</td>
<td class="data-td data last text-right">0.15</td>
<td class="data-td data last text-right">0.78</td>
<td class="data-td data last text-right">1.98</td>
</tr>
</tbody>
</table>
</div>
<p class="chart-disclosure"><sup>*</sup>&nbsp;Returns less than one year are not annualized.</p>
<p class="chart-disclosure"><strong>Expenses: Class A: Gross 2.08%, Net 1.21%; Class I: Gross 1.34%, Net 0.86%; Class Y: Gross 1.35%, Net 0.96%.</strong> Expenses are capped contractually until 05/01/25 at 1.20% for Class A, 0.85% for Class I, 0.95% for Class Y. Caps excluding acquired fund fees and expenses, interest, trading, dividends, and interest payments of securities sold short, taxes, and extraordinary expenses.</p>
<p class="chart-disclosure"><strong>The performance data quoted represents past performance. Past performance is not a guarantee of future results. Investment return and principal value of an investment will fluctuate so that an investor&rsquo;s shares, when redeemed, may be worth more or less than their original cost. Performance may be lower or higher than performance data quoted. Please call 800.826.2333 or visit vaneck.com for performance current to the most recent month ended.</strong></p>
<p class="chart-disclosure">The &ldquo;Net Asset Value&rdquo; (NAV) of a Fund is determined at the close of each business day, and represents the dollar value of one share of the fund; it is calculated by taking the total assets of the fund, subtracting total liabilities, and dividing by the total number of shares outstanding. The NAV is not necessarily the same as the ETF&rsquo;s intraday trading value. Investors should not expect to buy or sell shares at NAV.</p>
<p id="em-debt-after-us-elections" class="jump-link-nav anchored-block" data-jumplink-title="EM Debt After US Elections"><strong>EM continues to chug along despite risks, real or imagined, emanating from US elections. </strong>The chart below shows EM bonds (local, USD sovereign, USD corporate) performing fairly well following the election, and especially relative to their performance in the 2016 election (which is also in the graph). We note this because EM bonds have been outperforming DM bonds (Treasuries and the Agg) on absolute and volatility-adjusted terms for the past couple decades. The story of EM bond outperformance continues even now. Those who follow us know that we expect local-currency bonds to be the next real winner, and the past 5 years have seen the best of EM (EM Asia) rally to see their yields equal to those of DMs. And this was in a period of great uncertainty in DM bond markets (UK Gilt crisis, US technical default and downgrade, Japan&rsquo;s exit from Yield Curve Contral).</p>
<h3>Exhibit 1 &ndash; EM Doing Fine After US Elections and Compared to 2016</h3>
<p><strong>EM Debt - Post-Election Reaction to Trump 1.0 and Trump 2.0</strong></p>
<p><img loading="lazy" class="img-responsive w-100" alt="Exhibit 1 &ndash; EM Doing Fine After US Elections and Compared to 2016" src="https://www.vaneck.com/contentassets/dc2d4a6b19924778b5a6ee62c712d5f9/5149_emb_chart-1_2024-12_blog.svg" /></p>
<p class="chart-disclosure">Source: VanEck Research, Bloomberg LP. Data as of December 2024.</p>
<p><strong>Is bullish data already priced by rates?</strong> Rates sold off sharply after mid-September, moving from 3.60% to 4.40%, before settling at the current 4.20%. We wrote last month that &ldquo;every economic data point released since the Fed&rsquo;s 50 basis point (bps) policy rate cut on September 18 has been stronger than expected&rdquo;, so this makes sense but may now be priced. Currently, inflation looks set to generate few concerns over coming months, so a December 18 rate cut is still in the cards (after being briefly priced out). If we follow the data, this should be bullish for EM currencies (EMFX) as well as rates. In fact, the only obvious headwind to our view is that US 2-year rates versus rest-of-world remain very high, as per the chart below. This could obviously support the US dollar. In fact, it was our most-commonly-cited risk to our bullish stance on Asian local currency bonds in recent years &ndash; that the US interest rate differential with China (or EM Asia, fill in the blank). And, low-and-behold CNY remained incredibly stable even during the JPY carry-trade unwind of the summer (see recent monthlies for those charts). As we noted in our monthlies, this anchored EMFX against this classic and legitimate challenge of low relative interest rates.</p>
<h3>Exhibit 2 &ndash; US 2-Year Rates High Verus ROW, EM Still Humming</h3>
<p><strong>2y US - 2y Rest Of The World<sup>*</sup>, bps</strong></p>
<div class="flourish-embed flourish-chart" data-src="visualisation/20809056"><script src="https://public.flourish.studio/resources/embed.js"></script><noscript><img loading="lazy" src="https://public.flourish.studio/visualisation/20809056/thumbnail" width="100%" alt="chart visualization" /></noscript></div>
<p class="chart-disclosure"><sup>*</sup>&nbsp;- ROTW are the U.S. main trade partners weighted by their respective trade shares.</p>
<p class="chart-disclosure">Source: VanEck Research, Bloomberg LP. Data as of December 2024.</p>

<p><strong>President-elect Trump&rsquo;s policy rhetoric is provocative, but also theatrical, contradictory, and lacking specifics. Could the big supposed &ldquo;challenges&rdquo; from the new administration end up being &ldquo;straw dogs&rdquo;?</strong> The optimistic angles from Trump&rsquo;s own framing of the issues are that Mexico and China should find it easy to clamp down on the fentanyl trade ( is that really a trade-off, is there a pro-fentanyl lobby?), that US labor markets won&rsquo;t suffer inflationary pressure if tighter immigration policy simply means deporting criminal migrants ( is that really a trade-off, or a release-valve?), and that tariffs on a BRICs currency which doesn&rsquo;t even exist is pure theatrics ( that&rsquo;s literally not a trade-off as BRICS do not have a currency). Our view is that so far there is high ratio of noise to signal, and that in the absence of actual policies, which aren&rsquo;t likely until January or later, data and facts will dominate. If a December rate cut in the US becomes a fact, this should boost EMFX in a market worried about and pricing a lot of tariff noise already. <strong>We&rsquo;ll worry about tariffs when we see the whites of their eyes.</strong></p>
<p><strong>It&rsquo;s all about the details in EM &ndash; Mexico good, Brazil bad, for example. </strong>Mexico suffered most from US elections but has since stabilized. Whereas Brazil has suffered the most, and from its own hands, and is not stabilizing. In addition, South Africa has been stable and carrying, due to its own hard policy work. Developments such as these will drive performance in EM, in our view, not top-down macro considerations. Our best performer this year has been not owning Mexico Mbonos, a big benchmark weight that suffered most from its own and US elections. We happen to see value there now at these cheaper levels, and would note that Mexican President Sheinbaum&rsquo;s first meeting with President-elect Trump went far better than his meeting with Canadian Prime Minister Trudeau (a DM), and Mexico seems very well-prepared. Brazil&rsquo;s President Lula, on the other hand, looks to be courting a fiscal crisis. We had given Brazil the benefit of the doubt given its cheapness, very independent and hawkish central bank, and strong external accounts. But Lula keeps under-performing on fiscal proposals and seems to be ignoring the market reaction. As a result, we intend to reduce our overweight and wait for greater policy clarity from the government.</p>

<h2 id="exposure-types-and-significant-changes" class="jump-link-nav anchored-block" data-jumplink-title="Exposure Types and Significant Changes">Exposure Types and Significant Changes</h2>
<p>The changes to our top positions are summarized below. Our largest positions in November were Mexico, South Africa, Brazil, Indonesia, and Turkey:</p>
<ul class="content-list">
<li class="mt-2">We increased our local currency exposure in Mexico and Colombia. Mexico&rsquo;s proposed 2025 fiscal consolidation is not ideal, but the government does target a smaller budget deficit with adjustment driven mostly by spending cuts, which improved the policy test score for the country. Colombia&rsquo;s Ministry of Finance announced deeper spending cuts, reducing the underlying fiscal risks for 2025 and improving the country&rsquo;s policy test score.</li>
<li class="mt-2">We also increased our local currency exposure in the Czech Republic and hard currency sovereign exposure in Ghana. With the debt restructuring completed, Ghana started trading its new external bonds, which look attractive relative to sovereign fundamentals. As regards the outcome of the December presidential elections, both candidates expressed commitment to fiscal consolidation, strengthening the policy test score for the country. In the Czech Republic, the central bank is getting closer to a policy pause, while the economy stands to benefit from China stimulus (via Germany), which should improve the technical test score.</li>
<li class="mt-2">Finally, we increased our hard currency sovereign exposure in Israel and Bahrain. The geopolitical backdrop for Israel improved a lot after the U.S. presidential elections, giving a nice boost to the country&rsquo;s policy test score. The move in Bahrain reflects our view that the U.S. duration sold off too much in the run up to the presidential elections and it can benefit from a more positive newsflow on the U.S. fiscal outlook as President-elect Trump&rsquo;s budget stance is getting more defined. In terms of our investment process, this improved the technical test score for the country.</li>
<li class="mt-2">We reduced our local currency exposure in Malaysia and Thailand, and hard currency corporate exposure in India. Our primary concern in India was a risk of contagion from corruption charges against Adani, and its potential implications for the banking sector and political stability. All these factors worsened the technical test score for the country. Low-yielders Thailand and Malaysia are also high-beta to China and its &ldquo;drip-drip&rdquo; policy stimulus, which worsened the technical test score for both countries.</li>
<li class="mt-2">We also reduced our local currency exposure in Peru, Brazil, and Chile, and hard currency sovereign exposure in Argentina. We decided to take profits in Argentina after a big rally on the back of the IMF expectations. In Brazil, the government&rsquo;s spending cuts plans lacked details and was further diluted by a promise of tax relief, worsening the policy test score for the country. Peru&rsquo;s policy rate differential with the U.S. is getting very narrow, and we see residual risks from additional pension withdrawals, which worsen the policy test score for the country. Regarding Chile, China's "drip-drip" bazooka might take longer to produce the actual growth results, and this worsens the technical test score for major commodity exporters like Chile.</li>
<li class="mt-2">Finally, we reduced our local currency exposure in Poland and Romania, and hard currency sovereign exposure in Paraguay. Poland&rsquo;s assets might get affected by another spike in geopolitical tensions after Ukraine initiated strikes on Russia with U.S.-made missiles. In terms of our investment process, this worsened Poland&rsquo;s policy and technical test scores. The political &ndash; and policy - risks in Romania are higher after the surprisingly strong performance of far-right candidates in the 1st round of the presidential elections and in the parliamentary elections, which worsened the policy test score for the country.</li>
</ul>
<p>To receive more <a href="https://www.vaneck.com/us/en/insights/emerging-markets-bonds/" title="Emerging Markets Bonds Insights"><strong>Emerging Markets Bonds</strong></a> insights, <a href="/link/5f45412c2143400497908cea2897f7d3.aspx" title=" Subscription Center"><strong>sign up in our subscription center</strong></a>.</p>
]]></content:encoded>
</item><item rdf:about="https://www.vaneck.com/us/en/blogs/investment-outlook/jan-van-eck-2025-outlook-at-the-doorstep-of-the-reckoning/">
  <title>2025 Outlook: At the Doorstep of the Reckoning></title>
  <link>https://www.vaneck.com/us/en/blogs/investment-outlook/jan-van-eck-2025-outlook-at-the-doorstep-of-the-reckoning/</link>
  <description><![CDATA[What can investors expect in 2025? Jan van Eck dives into inflation risks, the U.S. deficit, the next phase of AI and opportunities in international equities that investors won&rsquo;t want to miss.]]></description>
  <dc:creator>Jan van Eck</dc:creator>
  <dc:date>12/16/2024 05:00:00</dc:date>
<content:encoded><![CDATA[

<a href="/us/en/blogs/investment-outlook/jan-van-eck-q2-2026-outlook-the-reset-is-your-entry-point/" title="Jan van Eck's Latest Outlook"><strong>Looking for the latest outlook? Read the Q2 2026 Outlook.</strong></a>
<h2>Watch Video: Thoughtful Money with Jan van Eck</h2>
<p>Jan returns to Thougtful Money with Adam Taggart to discuss his 2025 outlook.&nbsp; Over the course of nearly 90 minutes, they cover current trends and the biggest investment opportunities ahead.</p>
<p>The investment landscape for 2025 is shaped by four key macroeconomic trends that call for prudence and strategic positioning:</p>
<ol class="content-list">
<li class="mt-2"><strong>The U.S. faces a fiscal reckoning as government spending cuts and inflation risks dominate the outlook.&nbsp;</strong>Investors should diversify equity portfolios and hedge against inflation risks.</li>
<li class="mt-2"><strong>Bull markets in gold and bitcoin are supported by inflationary pressures, fiscal uncertainty and de-dollarization trends.</strong> Investors should maintain positions in these assets as core inflation hedges.</li>
<li class="mt-2"><strong>The next phase of AI is driving broader market benefits, while soaring electricity demand underscores the importance of nuclear and natural gas.</strong> Investors should look beyond tech to energy, infrastructure and utilities.</li>
<li class="mt-2"><strong>India&rsquo;s rapid growth and relative value present compelling opportunities.</strong> Investors should increase exposure to India and consider selective exposure to China and other global equities.</li>
</ol>

<h2>The Challenge of Fed Loosening in a Persistent Inflation Environment</h2>
<p>The U.S. economy is at a critical juncture as fiscal policy takes center stage. Fiscal spending is unsustainable, and these problems are often addressed in the year after a Presidential election. My base case is that the incoming administration will be able to cut $500 billion in spending. While this signals an attempt to address fiscal imbalances, the cuts are unlikely to eliminate the deficit entirely. In simple terms, we will be going from two feet on the gas pedal to one foot on the gas. However, failure to follow through would exacerbate inflation risks, leading to higher long-term interest rates and potential market volatility. While the U.S. stock market has many things going for it&mdash;profit growth, a strong economy, low unemployment&mdash;high valuations and inflation risks caution against an overweight position.</p>
<h3>Services Inflation Still High</h3>
<div class="flourish-embed flourish-chart" data-src="visualisation/20817141"><script src="https://public.flourish.studio/resources/embed.js"></script><noscript><img loading="lazy" src="https://public.flourish.studio/visualisation/20817141/thumbnail" width="100%" alt="Services Inflation Still High" /></noscript></div>
<p class="chart-disclosure"><strong>Source: Bureau of Labor Statistics. Data as of October 2024.</strong> The "Consumer Price Index for All Urban Consumers: All Items Less Food &amp; Energy" is an aggregate of prices paid by urban consumers for a typical basket of goods, excluding food and energy. This measurement, known as "Core CPI," is widely used by economists because food and energy have very volatile prices. Past performance is no guarantee of future results.</p>
<p>Inflation remains persistent, especially in services and wages, defying expectations of rapid moderation. The Federal Reserve&rsquo;s approach of &ldquo;higher for longer&rdquo; interest rates reflects the huge fiscal stimulus, and while short-term rate cuts may occur, any sharp easing is unlikely barring a severe economic contraction.</p>
<p>Higher tariffs can also be inflationary, although only in a minor way. It should be noted that when analysts cite the 1930 Smoot-Hawley Tariff Act&rsquo;s so-called bad effect on global trade, this is usually overstated.</p>
<p><a><strong>How to Invest</strong>:</a></p>
<ul class="content-list">
<li class="mt-2">Avoid overconcentration in U.S. large-cap equities, which remain richly valued.</li>
<li class="mt-2">Alternatives include cash, short-duration fixed income, and international equities.</li>
</ul>
<h2>Gold and Bitcoin: Inflation Hedges in Focus</h2>
<p>Gold and bitcoin continue to stand out as robust hedges against inflation and fiscal uncertainty. Gold&rsquo;s bull market is underpinned by foreign central bank purchases and a global trend toward de-dollarization. Bitcoin, which recently surpassed $100,000, continues the bull cycle following its Q2 &ldquo;halvening,&rdquo; with potential to reach $150,000&ndash;$170,000 in this cycle.</p>
<h3>Bitcoin and Gold Have Led in 2024</h3>
<div class="flourish-embed flourish-chart" data-src="visualisation/20818495"><script src="https://public.flourish.studio/resources/embed.js"></script><noscript><img loading="lazy" src="https://public.flourish.studio/visualisation/20818495/thumbnail" width="100%" alt="Bitcoin and Gold Have Led in 2024" /></noscript></div>
<p class="chart-disclosure"><strong>Source: FactSet. Data as of November 30, 2024</strong>. &ldquo;U.S. Stocks&rdquo; represented by the S&amp;P 500 Index. &ldquo;REITs&rdquo; represented by FTSE NAREIT All REITs Index. &ldquo;EM Stocks&rdquo; represented by MSCI Emerging Markets Index. &ldquo;International Stocks&rdquo; represented by MSCI AC World ex USA Index. &ldquo;U.S. TIPS&rdquo; represented by Bloomberg U.S. TIPS (1-3 Year) Index. &ldquo;U.S. Bonds&rdquo; represented by Bloomberg U.S. Aggregate Bond Index. &ldquo;International Bonds&rdquo; represented by Bloomberg Global Aggregate ex US Index. &ldquo;Commodities&rdquo; represented by Bloomberg Commodity Index. Past performance is not indicative of future results. Index performance is not indicative of product performance. It is not possible to invest directly in an index.</p>
<p>Both assets have proven resilient in inflationary periods and align with the long-term shifts in investor sentiment toward alternative currencies and decentralized assets.</p>
<p><strong>How to Invest</strong>:</p>
<ul class="content-list">
<li class="mt-2">Global demand is supporting the momentum for gold, but be prepared for corrections.</li>
<li class="mt-2">Bitcoin can also act as a &ldquo;store of value&rdquo; holding, continuing in a three-year bull market as has followed prior &ldquo;halvenings.&rdquo;</li>
</ul>
<h2>AI Phase 2: From Tech Dominance to Broader Market Benefits</h2>
<p>While semiconductor stocks drove the initial wave of the AI trade, we believe that financial markets will reflect the fact that many businesses are realizing the productivity gains from AI. Companies are increasingly deploying AI to enhance operational efficiency, creating opportunities in sectors beyond tech. This phase is also fueling unprecedented demand for electricity, underscoring the strategic importance of reliable energy sources.</p>
<p>Nuclear energy is emerging as a critical player, with sudden bipartisan support and growing investments from hyperscale tech companies. The timeline for new nuclear facilities spans years, creating interim opportunities in natural gas and grid infrastructure as bridging solutions.</p>
<p><strong>How to Invest</strong>:</p>
<ul class="content-list">
<li class="mt-2">Diversify into sectors benefiting from the AI-driven energy demand, including natural gas, utilities, and infrastructure.</li>
<li class="mt-2">Reassess mega-cap tech exposure as valuations peak and growth shifts to other areas of the market.</li>
</ul>
<h2>Find Growth Beyond U.S. Borders: India and International Opportunities</h2>
<p>International markets, particularly India, offer compelling opportunities in 2025. India is poised to become as economically significant as continental Europe within the next decade, supported by robust consumer growth. While valuations are high, India&rsquo;s price/earnings-to-growth ratio is actually more attractive than the U.S., offering better value for future earnings.</p>
<p>The recent pullback in Indian markets presents a timely opportunity to enter or increase exposure. These dips allow investors to participate in one of the most compelling macro growth stories without overpaying at stretched valuations.</p>
<h3>Recent India Correction a Buying Opportunity</h3>
<div class="flourish-embed flourish-chart" data-src="visualisation/20819638"><script src="https://public.flourish.studio/resources/embed.js"></script><noscript><img loading="lazy" src="https://public.flourish.studio/visualisation/20819638/thumbnail" width="100%" alt="Recent India Correction a Buying Opportunity" /></noscript></div>
<p class="chart-disclosure"><strong>Source: Bloomberg. Data as of November 30, 2024</strong>. Past performance is no guarantee of future results.</p>
<p>China also presents a mixed opportunity. Despite challenges in its property market, low valuations and technological advancements in key industries provide selective investment potential.</p>
<p><strong>How to Invest</strong>:</p>
<ul class="content-list">
<li class="mt-2">Take advantage of dips in Indian markets for strategic entry points into this long-term growth story.</li>
<li class="mt-2">Consider China selectively, targeting technology leaders while avoiding sectors vulnerable to geopolitical tensions.</li>
</ul>
<h2>Key Takeaways for 2025</h2>
<ul class="content-list">
<li class="mt-2"><strong>Fiscal Reckoning and Inflation Risks</strong>: Reduce overexposure to U.S. stocks, and rebalance toward inflation-hedging strategies and global opportunities.</li>
<li class="mt-2"><strong>Gold and Bitcoin</strong>: Maintain or increase exposure to gold and bitcoin, assets for hedging inflation and fiscal uncertainty that are supported by long-term trends.</li>
<li class="mt-2"><strong>AI Phase 2</strong>: Look beyond tech to energy and infrastructure plays, including nuclear, natural gas and utilities.</li>
<li class="mt-2"><strong>India and International Opportunities</strong>: Expand allocations to India and global equities, taking advantage of dips for strategic entry points.</li>
</ul>
<p>To receive more <a href="https://www.vaneck.com/us/en/insights/investment-outlook/" title="Investment Outlook Insights"><strong>Investment Outlook</strong></a> insights, <a href="/link/5f45412c2143400497908cea2897f7d3.aspx" title=" Subscription Center"><strong>sign up in our subscription center</strong></a>.</p>
]]></content:encoded>
</item><item rdf:about="https://www.vaneck.com/us/en/blogs/digital-assets/matthew-sigel-vanecks-10-crypto-predictions-for-2025/">
  <title>VanEck’s 10 Crypto Predictions for 2025></title>
  <link>https://www.vaneck.com/us/en/blogs/digital-assets/matthew-sigel-vanecks-10-crypto-predictions-for-2025/</link>
  <description><![CDATA[We outline our top 10 Crypto Predictions for 2025.]]></description>
  <dc:creator>Matthew  Sigel</dc:creator>
  <dc:date>12/13/2024 06:30:00</dc:date>
<content:encoded><![CDATA[

<p><strong>Please note that VanEck may have a position(s) in the digital asset(s) described below.</strong></p>
<p>Before we get into our 2025 predictions, let&rsquo;s take a moment to review how our 2024 calls stacked up. <strong><a href="/us/en/blogs/digital-assets/matthew-sigel-vanecks-15-crypto-predictions-for-2024/" title="VanEck&rsquo;s 10 Crypto Predictions for 2025">Out of 15 predictions</a></strong> made back in December 2023, we score ourselves 8.5/15. A 0.566 batting average might not be perfect, but it&rsquo;s enough to keep us in the game. With Bitcoin (BTC) smashing $100k and Ethereum (ETH) breaking $4k, even some of our misses were part of a year to remember.</p>
<h2 id="crypto-review-2024" class="anchored-block">Crypto Predictions Review for 2024</h2>
<ol class="content-list">
<li class="mt-2">Debut of spot BTC ETP s &ndash; (1 point)</li>
<li class="mt-2">Bitcoin halving proceeds smoothly - (1 point)</li>
<li class="mt-2">Bitcoin reaches all-time high in 4Q2024 - (1 point)</li>
<li class="mt-2">Ethereum remains #2 to bitcoin - (1 point)</li>
<li class="mt-2">L2s dominate Ethereum activity (but L2 TVL still below Ethereum&rsquo;s) &ndash; (0.5 points)</li>
<li class="mt-2">Stablecoin market cap hits record high - (1 point)</li>
<li class="mt-2">Decentralized exchanges attain record share of spot volumes - (1 point)</li>
<li class="mt-2">SOL outperforms ETH - (1 point)</li>
<li class="mt-2">DePIN network adoption grows - (1 point)</li>
</ol>
<p>Now, let&rsquo;s get into the main event: our crypto predictions for 2025.</p>
<h2 id="top-10-predictions" class="anchored-block">Top 10 Crypto Predictions for 2025</h2>
<ol class="content-list">
<li class="mt-2" style="font-weight: bold;"><strong><a href="#prediction-1" title="Prediction #1"> Crypto bull market hits a medium-term peak in Q1, sets new highs in Q4 </a></strong></li>
<li class="mt-2" style="font-weight: bold;"><strong><a href="#prediction-2" title="Prediction #2"> U.S. embraces bitcoin with strategic reserve(s) and increased crypto adoption </a></strong></li>
<li class="mt-2" style="font-weight: bold;"><strong><a href="#prediction-3" title="Prediction #3"> Value of tokenized securities exceeds $50 billion </a></strong></li>
<li class="mt-2" style="font-weight: bold;"><strong><a href="#prediction-4" title="Prediction #4"> Stablecoins daily settlement volumes reach $300 billion </a></strong></li>
<li class="mt-2" style="font-weight: bold;"><strong><a href="#prediction-5" title="Prediction #5"> AI agents&rsquo; onchain activity surpasses 1 million agents </a></strong></li>
<li class="mt-2" style="font-weight: bold;"><strong><a href="#prediction-6" title="Prediction #6"> Bitcoin layer-2s reach 100,000 BTC in total value locked (TVL) </a></strong></li>
<li class="mt-2" style="font-weight: bold;"><strong><a href="#prediction-7" title="Prediction #7"> Ethereum blob space generates $1 billion in fees </a></strong></li>
<li class="mt-2" style="font-weight: bold;"><strong><a href="#prediction-8" title="Prediction #8"> DeFi hits all-time highs with $4 trillion DEX volumes and $200B TVL </a></strong></li>
<li class="mt-2" style="font-weight: bold;"><strong><a href="#prediction-9" title="Prediction #9"> NFT market recovery with trading volumes reaching $30 billion </a></strong></li>
<li class="mt-2" style="font-weight: bold;"><strong><a href="#prediction-10" title="Prediction #10"> DApp tokens narrow the performance gap with L1 tokens </a></strong></li>
</ol>
<h2 id="prediction-1" class="anchored-block">1. Crypto bull market hits a medium-term peak in Q1, sets new highs in Q4</h2>
<p>We believe the crypto bull market will persist through 2025, reaching its first peak in the first quarter. At the cycle&rsquo;s apex, we project Bitcoin (BTC) to be valued at around <strong>$180,000</strong>, with Ethereum (ETH) trading above <strong>$6,000</strong>. Other prominent projects, such as Solana (SOL) and Sui (SUI), could exceed <strong>$500</strong> and <strong>$10,</strong> respectively.</p>
<p>Following this first peak, we anticipate a <strong>30%</strong> retracement in BTC, with altcoins facing sharper declines of up to <strong>60%</strong> as the market consolidates during the summer. However, a recovery is likely in the fall, with major tokens regaining momentum and reclaiming previous all-time highs by the end of the year. To gauge when the market is nearing its top, we are monitoring <em>these key signals</em>:</p>
<ul class="content-list">
<li class="mt-2"><strong>Sustained High Funding Rates:</strong> When traders borrow to bet on BTC price increases, they are willing to pay funding rates exceeding <strong>10%</strong> for three months or more, which indicates speculative excess.</li>
</ul>
<h3>BTC Perps Funding &gt; 10% For Months Would be Bearish</h3>
<div class="flourish-embed flourish-chart" data-src="visualisation/20719289"><script src="https://public.flourish.studio/resources/embed.js"></script><noscript><img loading="lazy" src="https://public.flourish.studio/visualisation/20719289/thumbnail" width="100%" alt="BTC Perps Funding &gt; 10% For Months Would be Bearish" /></noscript></div>
<p class="chart-disclosure"><strong>Sources</strong>: Glass Node as of 12/8/2024. <strong>Past performance is no guarantee of future results. Not intended as a recommendation to buy or sell any securities named herein.</strong></p>
<ul class="content-list">
<li class="mt-2"><strong>Excessive Unrealized Profits:</strong> If the proportion of BTC holders sitting on significant paper gains (a profit-to-cost ratio of <strong>70%</strong> or higher) stabilizes, it suggests market euphoria.</li>
<li class="mt-2"><strong>Overvalued Market Cap Relative to Realized Value:</strong> When MVRV (market value to realized value) scores exceed <strong>5</strong>, it shows BTC prices are far above average purchase prices, often signaling overheated conditions.</li>
<li class="mt-2"><strong>Declining Bitcoin Dominance:</strong> If Bitcoin&rsquo;s share of the total crypto market drops below <strong>40%</strong>, it implies a speculative shift into riskier altcoins, a classic late-cycle behavior.</li>
<li class="mt-2"><strong>Mainstream Speculation:</strong> A flood of texts from non-crypto-savvy friends asking about questionable projects is a reliable signal of speculative mania near the top.</li>
</ul>
<p>These indicators have historically been reliable signals of market exuberance and will guide our outlook as we navigate 2025&rsquo;s anticipated market cycles.</p>
<p><img loading="lazy" class="img-responsive w-100" alt="Top Signal&rsquo; text message from an acquaintance from 5 years ago" src="https://www.vaneck.com/contentassets/c7c8335c59c34db9963a8b86aa5b034d/5127_crypto-predictions_infographic-01_2024-12_v1_blog.jpg" /></p>
<p class="chart-disclosure"><strong>Example</strong>: &lsquo;Top Signal&rsquo; text message from an acquaintance from 5 years ago.</p>
<h2 id="prediction-2" class="anchored-block">2. U.S. embraces bitcoin with strategic reserve(s) and increased crypto adoption</h2>
<p>The election of Donald Trump has already injected significant momentum into the crypto market, driven by his administration's appointments of crypto-friendly leaders to pivotal positions, including VP JD Vance, National Security Advisor Michael Waltz, Commerce Secretary Howard Lutnick, Treasury Secretary Scott Bessent, Securities and Exchange Commission (SEC) Chair Paul Atkins, Federal Deposit Insurance Corporation (FDIC) Chair Jelena McWilliams, and HHS Secretary RFK Jr, and more. These appointments signal not just the end of anti-crypto policies, such as the systematic de-banking of crypto companies and their founders, but also the start of a policy framework that positions Bitcoin as a strategic asset.</p>
<p><strong>Crypto ETPs: in-kind creations, staking, and new spot approvals </strong></p>
<p>New SEC leadership, or possibly the CFTC, will approve multiple new spot crypto exchange-traded products (ETPs) in the U.S., including the VanEck Solana offering. Ethereum ETP functionality expands to include staking, further enhancing its utility for holders, while both Ethereum and Bitcoin ETPs support in-kind creations/redemptions. The repeal of SEC Rule SAB 121, either by the SEC or Congress, will pave the way for banks and brokers to custody spot crypto, further integrating digital assets into traditional financial infrastructure.</p>
<p><strong>Sovereign bitcoin adoption: federal, state, and mining expansion</strong></p>
<p>We predict that by 2025, either the federal government or at least one U.S. state&mdash;likely Pennsylvania, Florida, or Texas&mdash;will establish a Bitcoin reserve. Federally, this is more likely to occur through an executive order utilizing the Treasury&rsquo;s Exchange Stabilization Fund (ESF), though bipartisan legislation remains a wildcard. Simultaneously, state governments may act independently, viewing Bitcoin as a hedge against fiscal uncertainty or a tool to attract crypto investment and innovation.</p>
<p>On the Bitcoin mining side, the number of countries mining Bitcoin with government resources is expected to reach <strong>double digits (currently at seven)</strong> as BRICS adoption grows. This trend is fueled by Russia&rsquo;s stated intent to settle international trade in crypto, highlighting Bitcoin's increasing importance in global economic strategies.</p>
<h3>Number of Countries Mining Bitcoin with Government Resources</h3>
<div class="flourish-embed flourish-chart" data-src="visualisation/20735145"><script src="https://public.flourish.studio/resources/embed.js"></script><noscript><img loading="lazy" src="https://public.flourish.studio/visualisation/20735145/thumbnail" width="100%" alt="Number of Countries Mining Bitcoin with Government Resources" /></noscript></div>
<p class="chart-disclosure"><strong>Source:</strong> VanEck Research as of 12/2024.</p>
<p>We expect this pro-Bitcoin stance to ripple across the broader U.S. crypto ecosystem. The share of global crypto developers based in the U.S. will rise from <strong>19% to 25%</strong> as regulatory clarity and incentives draw talent and companies back. Meanwhile, U.S.-based Bitcoin mining will flourish, with the U.S. share of global mining hash rate increasing from <strong>28% in 2024 to 35%</strong> by the end of 2025, driven by cheap energy and potentially favorable tax policies. Together, these trends will solidify America&rsquo;s leadership in the global Bitcoin economy.</p>
<h3>U.S.-Listed Company&rsquo;s Share of Bitcoin Hash Rate to Reach 35%</h3>
<div class="flourish-embed flourish-chart" data-src="visualisation/20716123"><script src="https://public.flourish.studio/resources/embed.js"></script><noscript><img loading="lazy" src="https://public.flourish.studio/visualisation/20716123/thumbnail" width="100%" alt="U.S.-Listed Company&rsquo;s Share of Bitcoin Hash Rate to Reach 35%" /></noscript></div>
<p class="chart-disclosure"><strong>Source:</strong> JP Morgan, VanEck Research s of 12/6/2024. <strong>Past performance is no guarantee of future results. </strong></p>
<p><strong>Corporate bitcoin holdings: poised to surge 43%</strong></p>
<p>In terms of corporate adoption, we expect companies to continue accumulating Bitcoin from retail holders. Currently, <strong>68 </strong>public companies hold Bitcoin on their balance sheets, a number we project to reach <strong>100 by 2025</strong>. Notably, we boldly predict that the total Bitcoin held by private and public companies&mdash;currently <strong>765,000 BTC</strong>&mdash;will surpass Satoshi Nakamoto's holdings of <strong>1.1 million BTC</strong> by next year. This implies a remarkable growth rate of <strong>43%</strong> in corporate Bitcoin holdings over the coming year.</p>
<h3>Gold vs. Bitcoin Ownership: Room for Corporates and Governments to Grow</h3>
<div class="flourish-embed flourish-chart" data-src="visualisation/20734900"><script src="https://public.flourish.studio/resources/embed.js"></script><noscript><img loading="lazy" src="https://public.flourish.studio/visualisation/20734900/thumbnail" width="100%" alt="Gold vs. Bitcoin Ownership: Room for Corporates and Governments to Grow" /></noscript></div>
<p class="chart-disclosure"><strong>Source:</strong> VanEck Research as of 12/2024.</p>
<h2 id="prediction-3" class="anchored-block">3. The value of tokenized securities exceeds $50 billion</h2>
<h3>Onchain Securities Grew 61% in 2024</h3>
<div class="flourish-embed flourish-chart" data-src="visualisation/20716352"><script src="https://public.flourish.studio/resources/embed.js"></script><noscript><img loading="lazy" src="https://public.flourish.studio/visualisation/20716352/thumbnail" width="100%" alt="Onchain Securities Grew 61% in 2024" /></noscript></div>
<p class="chart-disclosure"><strong>Sources:</strong> RWA.xyz, Defillama as of 12/6/2024. <strong>Past performance is no guarantee of future results. </strong></p>
<p>Crypto rails promise a better financial system through improved efficiency, decentralization, and greater transparency. We believe that 2025 will be the year that tokenized securities take off. Already, there is <strong>~$12B</strong> worth of tokenized securities on blockchains, with the majority <strong>($9.5B)</strong> being tokenized private credit securities listed on the Figure&rsquo;s semi-permissioned blockchain called Provenance.</p>
<p>In the future, we see enormous potential for tokenized securities to launch on public chains. We theorize that there are many incentives for investors to push for tokenized equity or debt securities launched exclusively onchain. In the next year, we project that entities like the DTCC will enable tokenized assets that seamlessly transition between public blockchains and private, closed infrastructure. This dynamic will result in standards for performing AML/KYC for on-chain investors. As a wildcard bet, we forecast that Coinbase will take the unprecedented step of tokenizing COIN stock and deploying it to its BASE blockchain.</p>
<h2 id="prediction-4" class="anchored-block">4. Stablecoins daily settlement volumes reach $300 billion</h2>
<h3>Monthly Stablecoin Transfers (USD) Were Up 180% YoY in 2024</h3>
<div class="flourish-embed flourish-chart" data-src="visualisation/20716746"><script src="https://public.flourish.studio/resources/embed.js"></script><noscript><img loading="lazy" src="https://public.flourish.studio/visualisation/20716746/thumbnail" width="100%" alt="Monthly Stablecoin Transfers (USD) Were Up 180% YoY in 2024" /></noscript></div>
<p class="chart-disclosure"><strong>Source:</strong> Artemis XYZ as of 12/6/2024. <strong>Past performance is no guarantee of future results. </strong></p>
<p>Stablecoins will leapfrog their niche role in crypto trading to become a core part of global commerce. By the end of 2025, we project stablecoins will settle <strong>$300B</strong> daily transfers&mdash;equivalent to <strong>5%</strong> of DTCC&rsquo;s current volumes, up from <strong>~$100B </strong>daily in November 2024. Their adoption by major tech companies (think Apple and Google) and payment networks (Visa, Mastercard) will redefine the economics of payments.</p>
<p>Beyond trading, the remittance market will explode. U.S.-Mexico stablecoin transfers, for instance, could grow <strong>5x, </strong>from<strong> $80M to $400M</strong> monthly. Why? Speed, cost savings, and the growing trust of millions who see stablecoins not as experiments but as practical tools. For all the talk of blockchain adoption, <em>stablecoins are its Trojan Horse</em>.</p>
<h2 id="prediction-5" class="anchored-block">5. AI agents&rsquo; onchain activity surpasses 1 million agents</h2>
<h3>Total Revenue for AI Agents is $8.7M in 5 Weeks</h3>
<div class="flourish-embed flourish-chart" data-src="visualisation/20717080"><script src="https://public.flourish.studio/resources/embed.js"></script><noscript><img loading="lazy" src="https://public.flourish.studio/visualisation/20717080/thumbnail" width="100%" alt="Total Revenue for AI Agents is $8.7M in 5 Weeks" /></noscript></div>
<p class="chart-disclosure"><strong>Sources</strong>: Dune @jdhpyer as of 12/6/2024. <strong>Past performance is no guarantee of future results</strong></p>
<p>One of the most compelling narratives we believe will translate into massive traction in 2025 is AI Agents. AI agents are specialized AI bots that direct users to achieve outcomes such as &ldquo;maximizing yield&rdquo; or &ldquo;spurring X/Twitter engagement.&rdquo; The agents optimize these outcomes by utilizing their abilities to change their strategies autonomously. AI agents are often fed data and trained to specialize in one domain. Currently, protocols like Virtuals give anyone the tools to create an AI agent to perform on-chain tasks. Virtuals allow non-experts to access decentralized AI agent contributors such as fine-tuners, dataset providers, and model developers so that non-technical people can create their own AI agents. The result will be the enormous proliferation of agents their creators can lease out to generate income.</p>
<p>The current focus of agent building has been DeFi, but we believe that AI agents will transcend financial activities. Agents can be employed to act as social media influencers, computer players in gaming, and interactive companions/helpers in consumer applications. Agents have already become important X/Twitter influencers, such as <strong><a href="https://x.com/aixbt_agent" title="Bixby" target="_blank" rel="noopener">Bixby</a></strong> and <a href="https://x.com/truth_terminal" title="Terminal of Truths" target="_blank" rel="noopener"><strong>Terminal of Truths</strong>,</a> who reached 92k and 197k followers, respectively. As such, we believe the enormous potential for agents will result in the birth of <strong>over 1 million new agents</strong> in 2025.</p>
<h2 id="prediction-6" class="anchored-block">6. Bitcoin layer-2s reach 100,000 BTC in total value locked (TVL)</h2>
<h3>Bitcoin L2s TVLs Reach 30k BTC, 600% Increase YTD 2024</h3>
<div class="flourish-embed flourish-chart" data-src="visualisation/20717239"><script src="https://public.flourish.studio/resources/embed.js"></script><noscript><img loading="lazy" src="https://public.flourish.studio/visualisation/20717239/thumbnail" width="100%" alt="Bitcoin L2s TVLs Reach 30k BTC, 600% Increase YTD 2024" /></noscript></div>
<p class="chart-disclosure"><strong>Sources:</strong> Defillama as of 12/6/2024. <strong>Past performance is no guarantee of future results. Not intended as a recommendation to buy or sell any securities named herein.</strong></p>
<p>We are closely monitoring the emergence of Bitcoin layer-2 (L2) blockchains, which hold immense potential for transforming Bitcoin's ecosystem. Scaling Bitcoin enables these L2 solutions to enable lower latency and higher transaction throughput, addressing the limitations of the base layer. Moreover, Bitcoin L2s enhance Bitcoin&rsquo;s capabilities by introducing smart contract functionality, which can power a robust decentralized finance (DeFi) ecosystem built around Bitcoin.</p>
<p>Currently, Bitcoin can be moved off the Bitcoin blockchain to smart contract platforms through bridged or wrapped BTC, which rely on third-party systems prone to hacks and security vulnerabilities. Bitcoin L2 solutions aim to address these risks by offering frameworks that integrate directly with Bitcoin's base layer, minimizing reliance on centralized intermediaries. While liquidity constraints and adoption hurdles remain, Bitcoin L2s promise to enhance security and decentralization, giving BTC holders greater confidence to use their Bitcoin in decentralized ecosystems actively.</p>
<p>As shown in the chart, Bitcoin L2 solutions have experienced explosive growth in 2024, with total value locked (TVL) surpassing <strong>30,000</strong> BTC&mdash;a <strong>600%</strong> increase year-to-date, amounting to approximately <strong>$3 billion</strong>. Currently, over <strong>75</strong> Bitcoin L2 projects are in development, though only a select few are likely to achieve significant adoption over the long term.</p>
<p>This rapid growth reflects strong demand from BTC holders seeking yield generation and broader utility for their assets. Bitcoin will also become an integral part of DeFi as chain abstraction technology and Bitcoin L2s mature into usable products for end users. For instance, platforms like Ika on Sui or Near&rsquo;s chain abstraction used by Infinex highlight how innovative multi-chain solutions will enhance Bitcoin&rsquo;s interoperability with other ecosystems.</p>
<p>By enabling secure and efficient on-chain borrowing, lending, and other permissionless DeFi solutions, Bitcoin L2s and abstraction technology will transform Bitcoin from a passive store of value into an active participant in decentralized ecosystems. As adoption scales, these technologies unlock substantial opportunities for on-chain liquidity, cross-chain innovation, and a more integrated financial future.</p>
<h2 id="prediction-7" class="anchored-block">7. Ethereum blob space generates $1 billion in fees</h2>
<h3>Ethereum Blobs Posted Per Day</h3>
<div class="flourish-embed flourish-chart" data-src="visualisation/20718689"><script src="https://public.flourish.studio/resources/embed.js"></script><noscript><img loading="lazy" src="https://public.flourish.studio/visualisation/20718689/thumbnail" width="100%" alt="Ethereum Blobs Posted Per Day" /></noscript></div>
<p class="chart-disclosure"><strong>Sources:</strong> Dune @hildobby as of 12/6/2024. <strong>Past performance is no guarantee of future results. </strong></p>
<p>The Ethereum community is actively debating whether Ethereum accrues sufficient value from its Layer-2 (L2) networks through Blob Space, a critical component of its scaling roadmap. Blob Space serves as a specialized data layer where L2s submit a compressed history of their transactions to Ethereum, paying fees in ETH on a per-blob basis. While this architecture underpins Ethereum&rsquo;s scalability, L2s currently remit minimal value to the Mainnet, achieving gross margins of approximately <strong>90%</strong>. This has sparked concerns that Ethereum&rsquo;s economic value could shift too heavily toward L2s, leaving the base layer underutilized.</p>
<p>Despite a recent slowdown in Blob Space growth, we project a sharp expansion in its usage by 2025, driven by three key factors:</p>
<ol class="content-list">
<li class="mt-2"><strong>Explosive L2 Adoption:</strong> Transaction volumes on Ethereum L2s are growing at an annualized rate exceeding <strong>300%</strong> as users migrate to lower-cost, high-throughput environments for DeFi, gaming, and social applications. The proliferation of consumer-facing dApps on L2s will significantly increase the demand for Blob Space as more transactions flow back to Ethereum for final settlement.</li>
<li class="mt-2"><strong>Rollup Optimizations:</strong> Advances in rollup technology, such as improved data compression and reduced costs for posting data to Blob Space, will encourage L2s to store more transaction data on Ethereum, unlocking higher throughput without sacrificing decentralization.</li>
<li class="mt-2"><strong>Introduction of High-Fee Use Cases:</strong> The rise of enterprise-grade applications, zk-rollup-powered financial solutions, and tokenized real-world assets will drive high-value transactions, prioritizing security and immutability, increasing willingness to pay Blob Space fees.</li>
</ol>
<p>By the end of 2025, we project that Blob Space fees will exceed <strong>$1 billion</strong>, up from negligible levels today. This growth will cement Ethereum&rsquo;s role as the ultimate settlement layer for decentralized applications while reinforcing its ability to capture value from its rapidly expanding L2 ecosystem. Ethereum&rsquo;s Blob Space will scale the network and serve as a key revenue stream, balancing the economic relationship between Mainnet and L2s.</p>
<h2 id="prediction-8" class="anchored-block">8. DeFi hits all-time highs with $4 trillion DEX volumes and $200B TVL</h2>
<h3>Total DeFi (Decentralized Finance) Total Value Locked (TVL)</h3>
<div class="flourish-embed flourish-chart" data-src="visualisation/20718785"><script src="https://public.flourish.studio/resources/embed.js"></script><noscript><img loading="lazy" src="https://public.flourish.studio/visualisation/20718785/thumbnail" width="100%" alt="Total DeFi (Decentralized Finance) Total Value Locked (TVL)" /></noscript></div>
<p class="chart-disclosure"><strong>Source:</strong> Defillama as of 12/6/2024. <strong>Past performance is no guarantee of future results. </strong></p>
<p>Despite record-high decentralized exchange (DEX) trading volumes, both in absolute terms and relative to centralized exchanges (CEXs), decentralized finance (DeFi) total value locked (TVL) remains <strong>24%</strong> below its peak. We anticipate that DEX trading volumes will surpass <strong>$4 trillion</strong> in 2025, capturing&nbsp;<strong>20%</strong> of CEX spot trading volumes, driven by the proliferation of AI-related tokens and new consumer-facing dApps.</p>
<p>Additionally, the influx of tokenized securities and high-value assets will catalyze DeFi growth, providing fresh liquidity and broader utility. As a result, we project DeFi TVL to rebound to over <strong>$200 billion</strong> by year-end, reflecting the rising demand for decentralized financial infrastructure in an evolving digital economy.</p>
<h2 id="prediction-9" class="anchored-block">9. NFT market recovery with trading volumes reaching $30 billion</h2>
<h3>NFT Volumes Fell in 2024; We Expect a Rebound in 2025</h3>
<div class="flourish-embed flourish-chart" data-src="visualisation/20718943"><script src="https://public.flourish.studio/resources/embed.js"></script><noscript><img loading="lazy" src="https://public.flourish.studio/visualisation/20718943/thumbnail" width="100%" alt="NFT Volumes Fell in 2024; We Expect a Rebound in 2025" /></noscript></div>
<p class="chart-disclosure"><strong>Source:</strong> as of: 12/6/2024. <strong>Past performance is no guarantee of future results. Not intended as a recommendation to buy or sell any securities named herein.</strong></p>
<p>The 2022&ndash;2023 bear market dealt a severe blow to the NFT sector, with trading volumes plummeting <strong>39%</strong> since 2023 and a staggering <strong>84%</strong> since 2022. While fungible token prices began to recover in 2024, most NFTs lagged behind, marked by weak prices and low activity until a turning point in November. Despite these challenges, a few standout projects have defied the downward trend by leveraging strong community bonds to transcend speculative value.</p>
<p>For instance, Pudgy Penguins have successfully transitioned into a consumer brand through collectible toys, while Miladys have gained cultural prominence within the realm of sardonic internet culture. Similarly, the Bored Ape Yacht Club (BAYC) has continued to evolve as a dominant cultural force, attracting widespread attention from brands, celebrities, and mainstream media.</p>
<p>As crypto wealth rebounds, we expect newly affluent users to diversify into NFTs, not merely as speculative investments but as assets with enduring cultural and historical significance. Established collections such as CryptoPunks and Bored Ape Yacht Club (BAYC) are well-positioned to benefit from this shift, given their strong cultural cachet and relevance. While BAYC and CryptoPunks remain significantly below their all-time trading peaks, down approximately <strong>90%</strong> and <strong>66%</strong> in ETH terms, respectively, other projects like Pudgy Penguins and Miladys have already exceeded their previous price highs.</p>
<p>Ethereum continues to dominate the NFT space, hosting the majority of significant collections. In 2024, it accounts for <strong>71%</strong> of NFT trading, a figure we project to rise to <strong>85%</strong> by 2025. This dominance is reflected in market capitalization rankings, where Ethereum-based NFTs occupy the entire <strong>top 10</strong> and <strong>16 of the top 20</strong> positions, underscoring the blockchain's central role in the NFT ecosystem.</p>
<p>Although NFT trading volumes may not revisit the euphoric highs of previous cycles, we think a <strong>$30</strong> billion annual turnover is doable, approximately <strong>55%</strong> of the 2021 peak, as the market shifts toward sustainability and cultural relevance over speculative hype.</p>
<h2 id="prediction-10" class="anchored-block">10. DApp tokens narrow the performance gap with L1 tokens</h2>
<h3>In 2024, Layer 1 Tokens Outperformed Leading dApps by 2x</h3>
<div class="flourish-embed flourish-chart" data-src="visualisation/20719101"><script src="https://public.flourish.studio/resources/embed.js"></script><noscript><img loading="lazy" src="https://public.flourish.studio/visualisation/20719101/thumbnail" width="100%" alt="In 2024, Layer 1 Tokens Outperformed Leading dApps by 2x" /></noscript></div>
<p class="chart-disclosure"><strong>Source:</strong> Market Vectors as of 12/8/2024. <strong>Past performance is no guarantee of future results. </strong>The <strong><a href="https://www.marketvector.com/indexes/digital-assets/marketvector-smart-contract-leaders" title="MarketVector&trade; Smart Contract Leaders Index" target="_blank" rel="noopener">MVSCLE</a></strong> index tracks Smart Contract Platforms. The <strong><a href="https://www.marketvector.com/indexes/digital-assets/marketvector-infrastructure-application-leaders" title="MarketVector&trade; Infrastructure Application Leaders Index" target="_blank" rel="noopener">MVIALE</a></strong> index tracks Infrastructure Application tokens.</p>
<p>A consistent theme of the 2024 bull market has been the significant outperformance of Layer-1 (L1) blockchain tokens compared to decentralized application (dApp) tokens. For instance, the <strong><a href="https://www.marketvector.com/indexes/digital-assets/marketvector-smart-contract-leaders" title="MarketVector&trade; Smart Contract Leaders Index" target="_blank" rel="noopener">MVSCLE</a></strong> index, which tracks Smart Contract Platforms, has gained <strong>80%</strong> year-to-date, while the <strong><a href="https://www.marketvector.com/indexes/digital-assets/marketvector-infrastructure-application-leaders" title="MarketVector&trade; Infrastructure Application Leaders Index" target="_blank" rel="noopener">MVIALE</a> </strong>index of application tokens has lagged with a <strong>35%</strong> return over the same period.</p>
<p>However, we anticipate this dynamic will shift later in 2024 as a wave of new dApps launches, delivering innovative and useful products that drive value to their respective tokens. Among the key thematic trends, we see artificial intelligence (AI) as a standout category for dApp innovation. Additionally, Decentralized Physical Infrastructure Networks (DePIN) projects offer immense potential to capture investor and user interest, contributing to a broader performance rebalancing between L1 tokens and dApp tokens.</p>
<p>This pivot underscores the growing importance of utility and product-market fit in determining the success of application tokens in the evolving crypto landscape.</p>
<p>To receive more <strong><a href="https://www.vaneck.com/us/en/insights/digital-assets/" title="Digital Assets Insights">Digital Assets</a></strong> insights, <strong><a href="https://www.vaneck.com/us/en/subscribe/" title="Subscription Center">sign up in our subscription center</a></strong>.</p>
]]></content:encoded>
</item><item rdf:about="https://www.vaneck.com/us/en/blogs/gold-investing/ima-casanova-gold-vs-gold-equities-post-election-pressures/">
  <title>Gold vs. Gold Equities: The Disconnect Won’t Last></title>
  <link>https://www.vaneck.com/us/en/blogs/gold-investing/ima-casanova-gold-vs-gold-equities-post-election-pressures/</link>
  <description><![CDATA[The gold sector faces post-election weakness, widening the gap between gold and gold equities. However, we believe macroeconomic factors support gold and the disconnect won&rsquo;t last forever.]]></description>
  <dc:creator>Imaru Casanova</dc:creator>
  <dc:date>12/13/2024 06:30:00</dc:date>
<content:encoded><![CDATA[

<p>Monthly gold market and economic insights from Imaru Casanova, Portfolio Manager, featuring her unique views on mining and gold&rsquo;s portfolio benefits.</p>

<h2>Gold and Gold Equities: Post-Election Insights and Investment Opportunities</h2>
<p>Following the U.S. presidential election on November 5, 2024, which resulted in Donald Trump's victory, gold prices declined. The so-called &ldquo;Trump Trade&rdquo; drove the U.S. Dollar and U.S. Treasury yields higher, while the S&amp;P<sup>1</sup>, Dow Jones<sup>2</sup>, and the Nasdaq<sup>3</sup>&nbsp;reached record highs throughout the month.</p>
<p>Gold faced significant pressure, closing as low as $2,563.25 on November 15. However, it demonstrated resilience, briefly closing above $2,700 for one trading session later in the month. Despite this recovery, November marked its worst monthly performance in over a year. The metal closed on November 29 at $2,643.15, reflecting a $100.83 drop per ounce or 3.67% decline for the month.</p>
<p>Looking ahead, we believe gold remains supported by both the U.S. and global macroeconomic factors. Expectations of inflationary policies under the new U.S. administration, heightened global geopolitical risks, strong central bank net buying, and anticipated rate cuts by the Federal Reserve suggest potential upward momentum for gold in the longer term.</p>
<h2>Gold Equities Under Pressure: Sentiment, Leverage, and Market Dislocations</h2>
<p>A weaker gold price led to gold equities underperforming the metal in November. The NYSE Arca Gold Miners Index (GDMNTR)<sup>4</sup>&nbsp;was down 7.09%, and the Small-/Mid-Cap Index, the MVIS Global Juniors Gold Miners Index (MVGDXJTR)<sup>5</sup>, was down 7.79% during the month. Gold equities are now lagging gold this year, which is surprising. We believe this is the compounding result of market dislocations in valuing the gold equities over the past several years.</p>
<p>We expect periods of rising gold prices to correspond with outperformance in gold stocks. However, while gold spot prices have risen 28% year to date, gold stocks (GDMNTR) were up only 21%. This disparity highlights poor sentiment toward the gold mining sector and the lack of investor interest.</p>
<p>The trading patterns of gold stocks during periods of rising versus declining gold prices further underscore this sentiment. Leverage works both ways, and we consistently emphasize this when discussing the benefits of investing in gold stocks. A movement in the gold price typically results in a significantly more meaningful move on miners&rsquo; cash margins, resulting in operating leverage to gold prices.</p>
<p>However, in recent years, the market&rsquo;s implied leverage of gold stocks to rising gold prices appears to be significantly lower than during periods of declining gold prices. We have been anecdotally making this observation, frustrated by the overly punitive impact this continues to have on the already oversold gold shares.</p>
<h2>Understanding the Market Shifts of Gold Stocks vs. Gold Prices</h2>
<p>Consider this year as an example: From the end of 2023 to the end of February, gold declined by 0.9%, while gold stocks were down 15.3%&mdash;a 17x multiple of gold&rsquo;s move. In contrast, between the end of February and October 22, gold gained 34.5%, while gold stocks rose 67.7%, representing a much smaller 1.96x to the metal&rsquo;s gains. Then, from October 22 to the end of November, gold fell by 3.9%, and gold miners as a group decreased by 14.8%&mdash;a 3.8x multiple of gold&rsquo;s decline.</p>
<p>These time periods correspond with the highs and lows of the GDMNTR this year. Furthering our analysis, we reviewed the quarterly ratios of GDMNTR moves relative to changes in the gold price over the past few years. The results confirmed our observations: on average, gold&rsquo;s upward trading was not nearly as beneficial to gold stocks, and decline in the metal&rsquo;s price disproportionally punished the sector.</p>
<p>Observe the comparisons of gold stocks versus gold in both &ldquo;up&rdquo; and &ldquo;down&rdquo; markets:</p>
<h3>On average, gold&rsquo;s upward trading was not nearly as beneficial to gold stocks.</h3>
<p><strong>Gold Stocks vs. Gold - Gold "Up" Markets</strong></p>
<p><img loading="lazy" class="img-responsive w-100" alt="Gold Stocks vs. Gold - Gold &quot;Up&quot; Markets" src="https://www.vaneck.com/contentassets/0a8e3f260009446e94e6c888ae840352/5133_nov-gold-commentary_chart-1_2024-12_v1_blog.svg" /></p>
<p class="chart-disclosure">Source: Bloomberg. Data as of September 2024. Past performance is no guarantee of future results.</p>
<h3>A decline in gold&rsquo;s price disproportionally punished gold stocks.</h3>
<p><strong>Gold Stocks vs. Gold - Gold "Down" Markets</strong></p>
<p><img loading="lazy" class="img-responsive w-100" alt="Gold Stocks vs. Gold - Gold &quot;Down&quot; Markets" src="https://www.vaneck.com/contentassets/b5ba812695a441db93f37854360c93de/5133_nov-gold-commentary_chart-2_2024-12_v1_blog.svg" /></p>
<p class="chart-disclosure">Source: Bloomberg. Data as of September 2024. Past performance is no guarantee of future results.</p>
<p>Since 2020, positive quarterly moves in the gold price have, on average, translated to outperformance by gold equities with a 1.96x multiple. We excluded the first and last quarters of 2020 from this calculation, as gold prices rose during those periods while gold stocks traded lower. Meanwhile, negative quarterly moves in the gold price led to underperformance of the gold equities by an average factor of 5.04x. We conducted the same analysis on a monthly basis and observed similar results.</p>
<h2>Gold Equities as a Compelling Opportunity Amidst Post-Election Weakness</h2>
<p>Over the past year, the significant gap between gold and gold equities had been narrowing. However, the post-election weakness in the gold sector has widened it again. With gold producers enjoying record margins and generating substantial free cash flow, we believe this disconnect won&rsquo;t last forever. Currently, the GDMNTR is trading approximately 35% below its September 2011 highs, despite the gold price being higher by 41% since that time.</p>
<p>For investors looking to hedge broader market risks through gold exposure, allocating to the gold mining sector alongside gold bullion presents a compelling opportunity.</p>
<p>To receive more <strong><a href="https://www.vaneck.com/us/en/insights/gold-investing/" title="Gold Investing Insights">Gold Investing</a></strong> insights, <strong><a href="https://www.vaneck.com/us/en/subscribe/" title="Subscription Center">sign up in our subscription center</a></strong>.</p>
]]></content:encoded>
</item><item rdf:about="https://www.vaneck.com/us/en/blogs/income-investing/fallen-angels-bond-downgrades-ahead/">
  <title>Fallen Angels: Bond Downgrades Ahead?></title>
  <link>https://www.vaneck.com/us/en/blogs/income-investing/fallen-angels-bond-downgrades-ahead/</link>
  <description><![CDATA[We expect an uptick in fallen angel activity in 2025, mainly due to idiosyncratic factors rather than systematic weakness.]]></description>
  <dc:creator>Nicolas  Fonseca, CFA</dc:creator>
  <dc:date>12/12/2024 06:30:00</dc:date>
<content:encoded><![CDATA[

<p id="november-updates" class="jump-link-nav anchored-block" data-jumplink-title="November Update">Fallen angels outperformed the broad high yield market by 0.17% (1.31% vs. 1.15%), benefiting from a longer duration, and narrowing year-to-date underperformance to 1.98%. The 10-year US Treasury yield ended the month at 4.18%, a 0.10% decline during the month.</p>
<p>The Fed cut rates by another 0.25% earlier in the month, bringing the range to 4.50-4.75%, and with increased clarity following the U.S. elections, has set the stage for a potential follow-up 0.25% cut in December. Lower-rated credits (CCC &amp; below) have outperformed higher-rated peers for five consecutive months, delivering an approximate 18% return year to date, with spreads trading in the low 700s (as measured in basis points). While this has driven underperformance for higher quality high yield such as fallen angels, it has also increased the downside risk of owning lower rated bonds as spreads hover near their tightest levels since the Global Financial Crisis.</p>
<p>We continue to monitor new fallen angel activity. Large potential fallen angels Boeing and Paramount continue to be multiple rating actions away from any potential downgrade to high yield, with the former on negative watch by two agencies and the latter with a negative outlook. However, we do expect an increase in fallen angel activity next year, driven largely by idiosyncratic factors, rather than a more systemic wave of downgrades. A major event or recession would change that outlook, but that is not our base case. Sell-side research has begun to provide their 2025 outlooks, which are all very similar in regards to credit migrations, stating that next year the expectation is more balanced backdropped with forecasts from $25-40bn both fallen angels while the rising stars range is $20-40bn. Looked at another way based solely on the number rating actions needed to become a fallen angel, the amount of BBB- debt at risk of downgrade to high yield has increased over the last few quarters to the highest its been since 2Q21, as detailed by J.P. Morgan (Exhibit 1).</p>
<h3>Exhibit 1: BBB- Debt At Risk of Downgrade Has Risen</h3>
<p><img loading="lazy" class="img-responsive w-100" alt="BBB- Debt At Risk of Downgrade Has Risen" src="https://www.vaneck.com/contentassets/274e606632814c6cbb1b3658f384a49c/5137_angl-december_chart-1_2024-12_v1_blog.svg" /></p>
<p class="chart-disclosure">Source: J.P. Morgan, Dealogic. Past performance is not indicative of future results.</p>
<p>Another factor contributing to potential downgrades is the anticipated pickup in mergers and acquisitions (M&amp;A) under a more favorable U.S. regulatory environment and lower interest rates. These transactions, often financed through debt, may increase leverage and weaken credit metrics that rating agencies evaluate. Fitch notes that M&amp;A credit implications are mixed, but more often than not lead to a median one-notch downgrade. An increase in leverage does not guarantee downgrades, but could lead to credit deterioration, especially if they signal aggressive financial policies.</p>
<p id="overall-statistics"><strong>Fallen Angels Overall Statistics:</strong> Broad high yield spreads continue to trade near their tightest levels since the Global Financial Crisis as they reached 260bps in the middle of the month, and ended November at 274 bps which is just 33 bps off their all-time low (since December 2003). Fallen angel spreads also tightened to 234, 34 bps off the all-time lows that occurred in October 2021. Both fallen angels and broad high yield saw price increases.</p>
<div class="wrapped-div">
<table style="width: 100%;">
<tbody>
<tr class="tbl-data">
<td class="tbl-header last text-center">&nbsp;</td>
<td class="tbl-header last text-center" style="border-right: outset;" colspan="6">Fallen Angels</td>
<td class="tbl-header last text-center" colspan="6">Broad HY</td>
</tr>
<tr class="tbl-data">
<td class="data-td last">&nbsp;</td>
<td class="data-head last text-right">12/31/2023</td>
<td class="data-head last text-right">3/31/2024</td>
<td class="data-head last text-right">6/30/2024</td>
<td class="data-head last text-right">9/30/2024</td>
<td class="data-head last text-right">10/31/2024</td>
<td class="data-head last text-right" style="border-right: outset;">11/30/2024</td>
<td class="data-head last text-right">12/31/2023</td>
<td class="data-head last text-right">3/31/2024</td>
<td class="data-head last text-right">6/30/2024</td>
<td class="data-head last text-right">9/30/2024</td>
<td class="data-head last text-right">10/31/2024</td>
<td class="data-head last text-right">11/30/2024</td>
</tr>
<tr class="tbl-data">
<td class="data-td last">Yield to Worst</td>
<td class="data-td data last text-right">6.99</td>
<td class="data-td data last text-right">6.92</td>
<td class="data-td data last text-right">7.10</td>
<td class="data-td data last text-right">6.43</td>
<td class="data-td data last text-right">6.77</td>
<td class="data-td data last text-right" style="border-right: outset;">6.62</td>
<td class="data-td data last text-right">7.69</td>
<td class="data-td data last text-right">7.75</td>
<td class="data-td data last text-right">7.94</td>
<td class="data-td data last text-right">6.98</td>
<td class="data-td data last text-right">7.33</td>
<td class="data-td data last text-right">7.16</td>
</tr>
<tr class="tbl-data">
<td class="data-td last">Par Weighted Price</td>
<td class="data-td data last text-right">91.20</td>
<td class="data-td data last text-right">91.22</td>
<td class="data-td data last text-right">90.32</td>
<td class="data-td data last text-right">93.69</td>
<td class="data-td data last text-right">92.31</td>
<td class="data-td data last text-right" style="border-right: outset;">92.99</td>
<td class="data-td data last text-right">91.86</td>
<td class="data-td data last text-right">93.18</td>
<td class="data-td data last text-right">92.98</td>
<td class="data-td data last text-right">96.72</td>
<td class="data-td data last text-right">95.72</td>
<td class="data-td data last text-right">96.40</td>
</tr>
<tr class="tbl-data">
<td class="data-td last">Effective Duration</td>
<td class="data-td data last text-right">5.41</td>
<td class="data-td data last text-right">5.32</td>
<td class="data-td data last text-right">5.08</td>
<td class="data-td data last text-right">5.04</td>
<td class="data-td data last text-right" style="border-right: outset;">5.01</td>
<td class="data-td data last text-right">3.31</td>
<td class="data-td data last text-right">3.28</td>
<td class="data-td data last text-right">3.26</td>
<td class="data-td data last text-right">3.04</td>
<td class="data-td data last text-right">3.19</td>
<td class="data-td data last text-right">3.09</td>
</tr>
<tr class="tbl-data">
<td class="data-td last">Full Market Value ($mn)</td>
<td class="data-td data last text-right">67,821</td>
<td class="data-td data last text-right">64,657</td>
<td class="data-td data last text-right">55,371</td>
<td class="data-td data last text-right">57,236</td>
<td class="data-td data last text-right">55,362</td>
<td class="data-td data last text-right" style="border-right: outset;">55,083</td>
<td class="data-td data last text-right">1,237,721</td>
<td class="data-td data last text-right">1,260,542</td>
<td class="data-td data last text-right">1,266,993</td>
<td class="data-td data last text-right">1,336,160</td>
<td class="data-td data last text-right">1,328,101</td>
<td class="data-td data last text-right">1,345,007</td>
</tr>
<tr class="tbl-data">
<td class="data-td last">OAS</td>
<td class="data-td data last text-right">285</td>
<td class="data-td data last text-right">247</td>
<td class="data-td data last text-right">252</td>
<td class="data-td data last text-right">261</td>
<td class="data-td data last text-right">245</td>
<td class="data-td data last text-right" style="border-right: outset;">234</td>
<td class="data-td data last text-right">339</td>
<td class="data-td data last text-right">315</td>
<td class="data-td data last text-right">321</td>
<td class="data-td data last text-right">303</td>
<td class="data-td data last text-right">288</td>
<td class="data-td data last text-right">274</td>
</tr>
<tr class="tbl-data">
<td class="data-td last">No. of Issues</td>
<td class="data-td data last text-right">143</td>
<td class="data-td data last text-right">138</td>
<td class="data-td data last text-right">126</td>
<td class="data-td data last text-right">124</td>
<td class="data-td data last text-right">122</td>
<td class="data-td data last text-right" style="border-right: outset;">122</td>
<td class="data-td data last text-right">1,837</td>
<td class="data-td data last text-right">1,864</td>
<td class="data-td data last text-right">1,863</td>
<td class="data-td data last text-right">1,873</td>
<td class="data-td data last text-right">1,875</td>
<td class="data-td data last text-right">1,878</td>
</tr>
</tbody>
</table>
</div>
<p class="chart-disclosure">Source: ICE Data Services, VanEck. Fallen Angels: ICE US Fallen Angel High Yield 10% Constrained Index. Broad HY: ICE BofA US High Yield Index. OAS refers to &ldquo;option-adjusted spread.&rdquo; Please see definition for this and other terms referenced herein in the disclosures and definitions portion of this blog. Past performance is no guarantee of future results. Index performance is not representative of strategy performance. It is not possible to invest in an index.</p>
<p id="fallen-angels" class="jump-link-nav anchored-block" data-jumplink-title="Fallen Angels"><strong>Fallen Angels:</strong> There were no new fallen angels in November.</p>
<div class="wrapped-div">
<table style="width: 100%;">
<tbody>
<tr class="tbl-data">
<td class="tbl-header last">Month-end Addition</td>
<td class="tbl-header last text-left">Name</td>
<td class="tbl-header last text-left">Rating</td>
<td class="tbl-header last text-left">Sector</td>
<td class="tbl-header last text-left">Industry</td>
<td class="tbl-header last text-right">% Mkt Value</td>
<td class="tbl-header last text-right">Price</td>
</tr>
<tr class="tbl-data">
<td class="data-td last font-weight-normal">January</td>
<td class="data-td data last text-left">Hudson Pacific Properties LP</td>
<td class="data-td data last text-left">BB1</td>
<td class="data-td data last text-left">Real Estate</td>
<td class="data-td data last text-left">REITs</td>
<td class="data-td data last text-right">2.18</td>
<td class="data-td data last text-right">88.05</td>
</tr>
<tr class="tbl-data">
<td class="data-td last font-weight-normal">February</td>
<td class="data-td data last text-left">Advance Auto Parts Inc.</td>
<td class="data-td data last text-left">BB1</td>
<td class="data-td data last text-left">Retail</td>
<td class="data-td data last text-left">Specialty Retail</td>
<td class="data-td data last text-right">2.52</td>
<td class="data-td data last text-right">91.20</td>
</tr>
<tr class="tbl-data">
<td class="data-td last font-weight-normal">September</td>
<td class="data-td data last text-left">OCI NV</td>
<td class="data-td data last text-left">BB1</td>
<td class="data-td data last text-left">Basic Industry</td>
<td class="data-td data last text-left">Chemicals</td>
<td class="data-td data last text-right">1.10</td>
<td class="data-td data last text-right">104.79</td>
</tr>
<tr class="tbl-data">
<td class="data-td last font-weight-normal">September</td>
<td class="data-td data last text-left">V.F. Corp</td>
<td class="data-td data last text-left">BB1</td>
<td class="data-td data last text-left">Retail</td>
<td class="data-td data last text-left">Specialty Retail</td>
<td class="data-td data last text-right">3.04</td>
<td class="data-td data last text-right">94.08</td>
</tr>
</tbody>
</table>
</div>

<p id="rising-stars" class="jump-link-nav anchored-block" data-jumplink-title="Rising Stars"><strong>Rising Stars:</strong> Marks and Spencer was upgraded to Baa3 from Ba1 by Moody&rsquo;s, based on the company&rsquo;s improved financial performance and strategic initiatives. Marks and Spencer was downgraded back in April 2020, entering the index at $91.57, providing a ~17% price return during almost 4.5 years. During the 12 months before the upgrade, Marks and Spencer price returned ~11% vs ~6% of the broad high yield market.</p>
<div class="wrapped-div">
<table style="width: 100%;">
<tbody>
<tr class="tbl-data">
<td class="tbl-header last">Month-end Exit</td>
<td class="tbl-header last text-left">Name</td>
<td class="tbl-header last text-left">Rating</td>
<td class="tbl-header last text-left">Sector</td>
<td class="tbl-header last text-left">Industry</td>
<td class="tbl-header last text-right">% Mkt Value</td>
<td class="tbl-header last text-right">Price</td>
</tr>
<tr class="tbl-data">
<td class="data-td last font-weight-normal">February</td>
<td class="data-td data last text-left">Las Vegas Sands Corp</td>
<td class="data-td data last text-left">BB1</td>
<td class="data-td data last text-left">Leisure</td>
<td class="data-td data last text-left">Gaming</td>
<td class="data-td data last text-right">3.12</td>
<td class="data-td data last text-right">93.19</td>
</tr>
<tr class="tbl-data">
<td class="data-td last font-weight-normal">March</td>
<td class="data-td data last text-left">Enlink Midstream Partners LP</td>
<td class="data-td data last text-left">BB1</td>
<td class="data-td data last text-left">Energy</td>
<td class="data-td data last text-left">Gas Distribution</td>
<td class="data-td data last text-right">2.30</td>
<td class="data-td data last text-right">88.92</td>
</tr>
<tr class="tbl-data">
<td class="data-td last font-weight-normal">April</td>
<td class="data-td data last text-left">FirstEnergy Corp.</td>
<td class="data-td data last text-left">BB1</td>
<td class="data-td data last text-left">Utility</td>
<td class="data-td data last text-left">Electric-Integrated</td>
<td class="data-td data last text-right">6.62</td>
<td class="data-td data last text-right">87.10</td>
</tr>
<tr class="tbl-data">
<td class="data-td last font-weight-normal">April</td>
<td class="data-td data last text-left">Rolls-Royce PLC</td>
<td class="data-td data last text-left">BB1</td>
<td class="data-td data last text-left">Capital Goods</td>
<td class="data-td data last text-left">Aerospace/Defense</td>
<td class="data-td data last text-right">1.51</td>
<td class="data-td data last text-right">96.00</td>
</tr>
<tr class="tbl-data">
<td class="data-td last font-weight-normal">July</td>
<td class="data-td data last text-left">Delta Air Lines Inc.</td>
<td class="data-td data last text-left">BB1</td>
<td class="data-td data last text-left">Transportation</td>
<td class="data-td data last text-left">Air Transportation</td>
<td class="data-td data last text-right">1.50</td>
<td class="data-td data last text-right">94.59</td>
</tr>
<tr class="tbl-data">
<td class="data-td last font-weight-normal">September</td>
<td class="data-td data last text-left">Port of Newcastle Investments Financing Pty Limited</td>
<td class="data-td data last text-left">BB1</td>
<td class="data-td data last text-left">Transportation</td>
<td class="data-td data last text-left">Transport Infrastructure/Services</td>
<td class="data-td data last text-right">0.52</td>
<td class="data-td data last text-right">95.59</td>
</tr>
<tr class="tbl-data">
<td class="data-td last font-weight-normal">November</td>
<td class="data-td data last text-left">Marks and Spencer PLC</td>
<td class="data-td data last text-left">BB1</td>
<td class="data-td data last text-left">Retail</td>
<td class="data-td data last text-left">Food &amp; Drug Retailers</td>
<td class="data-td data last text-right">0.57</td>
<td class="data-td data last text-right">107.07</td>
</tr>
</tbody>
</table>
</div>
<p class="chart-disclosure">Source: ICE Data Services, VanEck. Fallen Angels: ICE US Fallen Angel High Yield 10% Constrained Index. Past performance is no guarantee of future results. Not a recommendation to buy or sell any of the names/securities mentioned herein. Index performance is not representative of strategy performance. It is not possible to invest in an index.</p>
<p id="performance-by-sector" class="jump-link-nav anchored-block" data-jumplink-title="Performance by Sector"><strong>Fallen Angels Performance by Sector:</strong> All sectors within the fallen angel index posted positive returns for the month, with Financial Services posting the highest while Banking was the lowest. In terms of sector attribution versus a broad high yield, Telecom was the main contributor to outperformance, as Embarq Corporation, a main detractor in the first half of this year, has recovered following an upgrade in September despite still trading at distressed levels. Energy, Real Estate and Retail followed Telecom and were positive contributors to outperformance while the lack of Media exposure was the main detractor in November.</p>
<div class="wrapped-div-full">
<table style="width: 100%;">
<tbody>
<tr class="tbl-data">
<td class="tbl-header last text-center">&nbsp;</td>
<td class="tbl-header last text-center" style="border-right: outset;" colspan="6">Wgt (%)</td>
<td class="tbl-header last text-center" style="border-right: outset;" colspan="6">OAS</td>
<td class="tbl-header last text-center" style="border-right: outset;" colspan="6">Price</td>
<td class="tbl-header last text-right" colspan="2">Total Return</td>
</tr>
<tr class="tbl-data">
<td class="data-head last text-right">&nbsp;</td>
<td class="data-head last text-right">12/31/23</td>
<td class="data-head last text-right">3/31/24</td>
<td class="data-head last text-right">6/30/24</td>
<td class="data-head last text-right">9/30/24</td>
<td class="data-head last text-right">10/31/24</td>
<td class="data-head last text-right" style="border-right: outset;">11/30/24</td>
<td class="data-head last text-right">MTD</td>
</tr>
<tr class="tbl-data">
<td class="data-td last">Banking</td>
<td class="data-td data last text-right">4.79</td>
<td class="data-td data last text-right">4.62</td>
<td class="data-td data last text-right">5.38</td>
<td class="data-td data last text-right">5.45</td>
<td class="data-td data last text-right">5.64</td>
<td class="data-td data last text-right" style="border-right: outset;">5.69</td>
<td class="data-td data last text-right">231</td>
<td class="data-td data last text-right">235</td>
<td class="data-td data last text-right">220</td>
<td class="data-td data last text-right">210</td>
<td class="data-td data last text-right">181</td>
<td class="data-td data last text-right" style="border-right: outset;">181</td>
<td class="data-td data last text-right">97.91</td>
<td class="data-td data last text-right">97.11</td>
<td class="data-td data last text-right">97.36</td>
<td class="data-td data last text-right">101.29</td>
<td class="data-td data last text-right">101.12</td>
<td class="data-td data last text-right" style="border-right: outset;">101.08</td>
<td class="data-td data last text-right">0.41</td>
</tr>
<tr class="tbl-data">
<td class="data-td last">Basic Industry</td>
<td class="data-td data last text-right">1.70</td>
<td class="data-td data last text-right">3.20</td>
<td class="data-td data last text-right">3.73</td>
<td class="data-td data last text-right">4.78</td>
<td class="data-td data last text-right">4.85</td>
<td class="data-td data last text-right" style="border-right: outset;">4.89</td>
<td class="data-td data last text-right">171</td>
<td class="data-td data last text-right">186</td>
<td class="data-td data last text-right">156</td>
<td class="data-td data last text-right">190</td>
<td class="data-td data last text-right">184</td>
<td class="data-td data last text-right" style="border-right: outset;">174</td>
<td class="data-td data last text-right">97.24</td>
<td class="data-td data last text-right">94.37</td>
<td class="data-td data last text-right">95.03</td>
<td class="data-td data last text-right">99.25</td>
<td class="data-td data last text-right">96.84</td>
<td class="data-td data last text-right" style="border-right: outset;">97.65</td>
<td class="data-td data last text-right">1.28</td>
</tr>
<tr class="tbl-data">
<td class="data-td last">Capital Goods</td>
<td class="data-td data last text-right">5.85</td>
<td class="data-td data last text-right">6.17</td>
<td class="data-td data last text-right">5.41</td>
<td class="data-td data last text-right">5.31</td>
<td class="data-td data last text-right">5.43</td>
<td class="data-td data last text-right" style="border-right: outset;">5.49</td>
<td class="data-td data last text-right">200</td>
<td class="data-td data last text-right">153</td>
<td class="data-td data last text-right">161</td>
<td class="data-td data last text-right">198</td>
<td class="data-td data last text-right">172</td>
<td class="data-td data last text-right" style="border-right: outset;">167</td>
<td class="data-td data last text-right">97.34</td>
<td class="data-td data last text-right">97.38</td>
<td class="data-td data last text-right">97.51</td>
<td class="data-td data last text-right">98.72</td>
<td class="data-td data last text-right">97.75</td>
<td class="data-td data last text-right" style="border-right: outset;">97.81</td>
<td class="data-td data last text-right">0.53</td>
</tr>
<tr class="tbl-data">
<td class="data-td last">Consumer Goods</td>
<td class="data-td data last text-right">4.33</td>
<td class="data-td data last text-right">4.42</td>
<td class="data-td data last text-right">5.28</td>
<td class="data-td data last text-right">5.22</td>
<td class="data-td data last text-right">5.49</td>
<td class="data-td data last text-right" style="border-right: outset;">4.23</td>
<td class="data-td data last text-right">230</td>
<td class="data-td data last text-right">223</td>
<td class="data-td data last text-right">240</td>
<td class="data-td data last text-right">231</td>
<td class="data-td data last text-right">174</td>
<td class="data-td data last text-right" style="border-right: outset;">167</td>
<td class="data-td data last text-right">94.29</td>
<td class="data-td data last text-right">93.07</td>
<td class="data-td data last text-right">93.64</td>
<td class="data-td data last text-right">97.25</td>
<td class="data-td data last text-right">98.52</td>
<td class="data-td data last text-right" style="border-right: outset;">99.33</td>
<td class="data-td data last text-right">1.64</td>
</tr>
<tr class="tbl-data">
<td class="data-td last">Energy</td>
<td class="data-td data last text-right">14.75</td>
<td class="data-td data last text-right">11.17</td>
<td class="data-td data last text-right">12.27</td>
<td class="data-td data last text-right">12.13</td>
<td class="data-td data last text-right">12.35</td>
<td class="data-td data last text-right" style="border-right: outset;">12.57</td>
<td class="data-td data last text-right">259</td>
<td class="data-td data last text-right">235</td>
<td class="data-td data last text-right">239</td>
<td class="data-td data last text-right">267</td>
<td class="data-td data last text-right">249</td>
<td class="data-td data last text-right" style="border-right: outset;">212</td>
<td class="data-td data last text-right">92.49</td>
<td class="data-td data last text-right">93.95</td>
<td class="data-td data last text-right">93.44</td>
<td class="data-td data last text-right">95.40</td>
<td class="data-td data last text-right">94.02</td>
<td class="data-td data last text-right" style="border-right: outset;">95.68</td>
<td class="data-td data last text-right">2.23</td>
</tr>
<tr class="tbl-data">
<td class="data-td last">Financial Services</td>
<td class="data-td data last text-right">1.14</td>
<td class="data-td data last text-right">1.18</td>
<td class="data-td data last text-right">1.37</td>
<td class="data-td data last text-right">1.40</td>
<td class="data-td data last text-right">1.43</td>
<td class="data-td data last text-right" style="border-right: outset;">1.48</td>
<td class="data-td data last text-right">378</td>
<td class="data-td data last text-right">336</td>
<td class="data-td data last text-right">376</td>
<td class="data-td data last text-right">324</td>
<td class="data-td data last text-right">301</td>
<td class="data-td data last text-right" style="border-right: outset;">268</td>
<td class="data-td data last text-right">86.41</td>
<td class="data-td data last text-right">87.09</td>
<td class="data-td data last text-right">84.87</td>
<td class="data-td data last text-right">91.57</td>
<td class="data-td data last text-right">89.95</td>
<td class="data-td data last text-right" style="border-right: outset;">92.13</td>
<td class="data-td data last text-right">2.87</td>
</tr>
<tr class="tbl-data">
<td class="data-td last">Healthcare</td>
<td class="data-td data last text-right">4.10</td>
<td class="data-td data last text-right">4.44</td>
<td class="data-td data last text-right">5.15</td>
<td class="data-td data last text-right">5.29</td>
<td class="data-td data last text-right">4.10</td>
<td class="data-td data last text-right" style="border-right: outset;">4.11</td>
<td class="data-td data last text-right">270</td>
<td class="data-td data last text-right">210</td>
<td class="data-td data last text-right">207</td>
<td class="data-td data last text-right">157</td>
<td class="data-td data last text-right">198</td>
<td class="data-td data last text-right" style="border-right: outset;">192</td>
<td class="data-td data last text-right">88.73</td>
<td class="data-td data last text-right">90.80</td>
<td class="data-td data last text-right">91.12</td>
<td class="data-td data last text-right">95.88</td>
<td class="data-td data last text-right">91.85</td>
<td class="data-td data last text-right" style="border-right: outset;">92.83</td>
<td class="data-td data last text-right">1.52</td>
</tr>
<tr class="tbl-data">
<td class="data-td last">Insurance</td>
<td class="data-td data last text-right">1.32</td>
<td class="data-td data last text-right">1.43</td>
<td class="data-td data last text-right">1.65</td>
<td class="data-td data last text-right">1.67</td>
<td class="data-td data last text-right">1.68</td>
<td class="data-td data last text-right" style="border-right: outset;">2.45</td>
<td class="data-td data last text-right">323</td>
<td class="data-td data last text-right">244</td>
<td class="data-td data last text-right">238</td>
<td class="data-td data last text-right">237</td>
<td class="data-td data last text-right">218</td>
<td class="data-td data last text-right" style="border-right: outset;">199</td>
<td class="data-td data last text-right">94.10</td>
<td class="data-td data last text-right">96.82</td>
<td class="data-td data last text-right">96.11</td>
<td class="data-td data last text-right">100.34</td>
<td class="data-td data last text-right">98.44</td>
<td class="data-td data last text-right" style="border-right: outset;">99.64</td>
<td class="data-td data last text-right">1.44</td>
</tr>
<tr class="tbl-data">
<td class="data-td last">Leisure</td>
<td class="data-td data last text-right">7.90</td>
<td class="data-td data last text-right">5.10</td>
<td class="data-td data last text-right">5.92</td>
<td class="data-td data last text-right">4.90</td>
<td class="data-td data last text-right">4.31</td>
<td class="data-td data last text-right" style="border-right: outset;">4.38</td>
<td class="data-td data last text-right">228</td>
<td class="data-td data last text-right">170</td>
<td class="data-td data last text-right">180</td>
<td class="data-td data last text-right">234</td>
<td class="data-td data last text-right">238</td>
<td class="data-td data last text-right" style="border-right: outset;">223</td>
<td class="data-td data last text-right">93.21</td>
<td class="data-td data last text-right">95.08</td>
<td class="data-td data last text-right">94.48</td>
<td class="data-td data last text-right">95.41</td>
<td class="data-td data last text-right">93.18</td>
<td class="data-td data last text-right" style="border-right: outset;">93.97</td>
<td class="data-td data last text-right">1.29</td>
</tr>
<tr class="tbl-data">
<td class="data-td last">Real Estate</td>
<td class="data-td data last text-right">9.07</td>
<td class="data-td data last text-right">9.60</td>
<td class="data-td data last text-right">10.07</td>
<td class="data-td data last text-right">10.23</td>
<td class="data-td data last text-right">10.42</td>
<td class="data-td data last text-right" style="border-right: outset;">10.57</td>
<td class="data-td data last text-right">675</td>
<td class="data-td data last text-right">527</td>
<td class="data-td data last text-right">450</td>
<td class="data-td data last text-right">389</td>
<td class="data-td data last text-right">404</td>
<td class="data-td data last text-right" style="border-right: outset;">385</td>
<td class="data-td data last text-right">82.72</td>
<td class="data-td data last text-right">81.84</td>
<td class="data-td data last text-right">84.76</td>
<td class="data-td data last text-right">89.79</td>
<td class="data-td data last text-right">88.24</td>
<td class="data-td data last text-right" style="border-right: outset;">88.97</td>
<td class="data-td data last text-right">1.23</td>
</tr>
<tr class="tbl-data">
<td class="data-td last">Retail</td>
<td class="data-td data last text-right">14.38</td>
<td class="data-td data last text-right">18.02</td>
<td class="data-td data last text-right">20.45</td>
<td class="data-td data last text-right">21.67</td>
<td class="data-td data last text-right">22.13</td>
<td class="data-td data last text-right" style="border-right: outset;">21.67</td>
<td class="data-td data last text-right">242</td>
<td class="data-td data last text-right">179</td>
<td class="data-td data last text-right">196</td>
<td class="data-td data last text-right">252</td>
<td class="data-td data last text-right">222</td>
<td class="data-td data last text-right" style="border-right: outset;">221</td>
<td class="data-td data last text-right">86.39</td>
<td class="data-td data last text-right">89.54</td>
<td class="data-td data last text-right">88.19</td>
<td class="data-td data last text-right">88.38</td>
<td class="data-td data last text-right">87.51</td>
<td class="data-td data last text-right" style="border-right: outset;">87.30</td>
<td class="data-td data last text-right">0.67</td>
</tr>
<tr class="tbl-data">
<td class="data-td last">Services</td>
<td class="data-td data last text-right">0.64</td>
<td class="data-td data last text-right">0.66</td>
<td class="data-td data last text-right">0.79</td>
<td class="data-td data last text-right">0.78</td>
<td class="data-td data last text-right">0.80</td>
<td class="data-td data last text-right" style="border-right: outset;">0.81</td>
<td class="data-td data last text-right">243</td>
<td class="data-td data last text-right">217</td>
<td class="data-td data last text-right">206</td>
<td class="data-td data last text-right">202</td>
<td class="data-td data last text-right">193</td>
<td class="data-td data last text-right" style="border-right: outset;">174</td>
<td class="data-td data last text-right">94.78</td>
<td class="data-td data last text-right">94.51</td>
<td class="data-td data last text-right">94.67</td>
<td class="data-td data last text-right">98.11</td>
<td class="data-td data last text-right">96.36</td>
<td class="data-td data last text-right" style="border-right: outset;">97.23</td>
<td class="data-td data last text-right">1.32</td>
</tr>
<tr class="tbl-data">
<td class="data-td last">Technology &amp; Electronics</td>
<td class="data-td data last text-right">6.22</td>
<td class="data-td data last text-right">5.81</td>
<td class="data-td data last text-right">6.67</td>
<td class="data-td data last text-right">6.66</td>
<td class="data-td data last text-right">6.64</td>
<td class="data-td data last text-right" style="border-right: outset;">6.66</td>
<td class="data-td data last text-right">194</td>
<td class="data-td data last text-right">188</td>
<td class="data-td data last text-right">184</td>
<td class="data-td data last text-right">206</td>
<td class="data-td data last text-right">203</td>
<td class="data-td data last text-right" style="border-right: outset;">204</td>
<td class="data-td data last text-right">94.14</td>
<td class="data-td data last text-right">92.99</td>
<td class="data-td data last text-right">92.27</td>
<td class="data-td data last text-right">94.38</td>
<td class="data-td data last text-right">91.54</td>
<td class="data-td data last text-right" style="border-right: outset;">91.78</td>
<td class="data-td data last text-right">0.70</td>
</tr>
<tr class="tbl-data">
<td class="data-td last">Telecommunications</td>
<td class="data-td data last text-right">13.00</td>
<td class="data-td data last text-right">13.39</td>
<td class="data-td data last text-right">11.10</td>
<td class="data-td data last text-right">11.82</td>
<td class="data-td data last text-right">12.01</td>
<td class="data-td data last text-right" style="border-right: outset;">12.25</td>
<td class="data-td data last text-right">366</td>
<td class="data-td data last text-right">368</td>
<td class="data-td data last text-right">413</td>
<td class="data-td data last text-right">351</td>
<td class="data-td data last text-right">324</td>
<td class="data-td data last text-right" style="border-right: outset;">308</td>
<td class="data-td data last text-right">92.22</td>
<td class="data-td data last text-right">90.01</td>
<td class="data-td data last text-right">81.48</td>
<td class="data-td data last text-right">92.33</td>
<td class="data-td data last text-right">91.12</td>
<td class="data-td data last text-right" style="border-right: outset;">92.85</td>
<td class="data-td data last text-right">2.48</td>
</tr>
<tr class="tbl-data">
<td class="data-td last">Transportation</td>
<td class="data-td data last text-right">2.09</td>
<td class="data-td data last text-right">2.23</td>
<td class="data-td data last text-right">2.60</td>
<td class="data-td data last text-right">0.57</td>
<td class="data-td data last text-right" style="border-right: outset;">0.58</td>
<td class="data-td data last text-right">209</td>
<td class="data-td data last text-right">170</td>
<td class="data-td data last text-right">150</td>
<td class="data-td data last text-right">210</td>
<td class="data-td data last text-right">178</td>
<td class="data-td data last text-right" style="border-right: outset;">170</td>
<td class="data-td data last text-right">94.92</td>
<td class="data-td data last text-right">95.37</td>
<td class="data-td data last text-right">96.07</td>
<td class="data-td data last text-right">106.22</td>
<td class="data-td data last text-right">104.75</td>
<td class="data-td data last text-right" style="border-right: outset;">106.04</td>
<td class="data-td data last text-right">1.76</td>
</tr>
<tr class="tbl-data">
<td class="data-td last">Utility</td>
<td class="data-td data last text-right">8.71</td>
<td class="data-td data last text-right">8.54</td>
<td class="data-td data last text-right">2.17</td>
<td class="data-td data last text-right">2.11</td>
<td class="data-td data last text-right">2.16</td>
<td class="data-td data last text-right" style="border-right: outset;">2.18</td>
<td class="data-td data last text-right">139</td>
<td class="data-td data last text-right">122</td>
<td class="data-td data last text-right">185</td>
<td class="data-td data last text-right">203</td>
<td class="data-td data last text-right">166</td>
<td class="data-td data last text-right" style="border-right: outset;">173</td>
<td class="data-td data last text-right">92.18</td>
<td class="data-td data last text-right">91.13</td>
<td class="data-td data last text-right">96.23</td>
<td class="data-td data last text-right">99.44</td>
<td class="data-td data last text-right">98.53</td>
<td class="data-td data last text-right" style="border-right: outset;">98.54</td>
<td class="data-td data last text-right">0.46</td>
</tr>
<tr class="tbl-data">
<td class="data-td last">Total</td>
<td class="data-td data last text-right">100</td>
<td class="data-td data last text-right" style="border-right: outset;">100</td>
<td class="data-td data last text-right">285</td>
<td class="data-td data last text-right">247</td>
<td class="data-td data last text-right">252</td>
<td class="data-td data last text-right">261</td>
<td class="data-td data last text-right">245</td>
<td class="data-td data last text-right" style="border-right: outset;">234</td>
<td class="data-td data last text-right">91.20</td>
<td class="data-td data last text-right">91.22</td>
<td class="data-td data last text-right">90.32</td>
<td class="data-td data last text-right">93.69</td>
<td class="data-td data last text-right">92.31</td>
<td class="data-td data last text-right" style="border-right: outset;">92.99</td>
<td class="data-td data last text-right">1.31</td>
</tr>
</tbody>
</table>
</div>
<p class="chart-disclosure">Source: ICE Data Services, VanEck. Returns are based on partial period data. Fallen Angels: ICE US Fallen Angel High Yield 10% Constrained Index. Not intended as a recommendation to invest or divest in any of the sectors mentioned herein. Index performance is not representative of strategy performance. It is not possible to invest in an index.</p>
<p id="performance-by-rating" class="jump-link-nav anchored-block" data-jumplink-title="Performance by Rating"><strong>Fallen Angels Performance by Rating: </strong> No significant changes in the fallen angels rating allocation for November. The CC rated fallen angel, Embarq Corporation, outperformed higher and lower rated peers as it spread tightened significantly. Relative to the broad high yield market, fallen angel outperformance was primarily from the BB-rated issuers like Equitrans Midstream Corp and Rockies Express from the Energy Sector and Newell Brands from the Consumer Goods sector.</p>
<div class="wrapped-div-full">
<table style="width: 100%;">
<tbody>
<tr class="tbl-data">
<td class="tbl-header last text-center">&nbsp;</td>
<td class="tbl-header last text-center" style="border-right: outset;" colspan="6">Wgt (%)</td>
<td class="tbl-header last text-center" style="border-right: outset;" colspan="6">OAS</td>
<td class="tbl-header last text-center" style="border-right: outset;" colspan="6">Price</td>
<td class="tbl-header last text-right" colspan="4">Total Return</td>
</tr>
<tr class="tbl-data">
<td class="data-td last">&nbsp;</td>
<td class="data-td data last text-right">12/31/23</td>
<td class="data-td data last text-right">3/31/24</td>
<td class="data-td data last text-right">6/30/24</td>
<td class="data-td data last text-right">9/30/24</td>
<td class="data-td data last text-right">10/31/24</td>
<td class="data-td data last text-right" style="border-right: outset;">11/30/24</td>
<td class="data-td data last text-right">MTD</td>
</tr>
<tr class="tbl-data">
<td class="data-td last">BB</td>
<td class="data-td data last text-right">80.55</td>
<td class="data-td data last text-right">81.63</td>
<td class="data-td data last text-right">87.62</td>
<td class="data-td data last text-right">87.30</td>
<td class="data-td data last text-right">87.03</td>
<td class="data-td data last text-right" style="border-right: outset;">84.24</td>
<td class="data-td data last text-right">219</td>
<td class="data-td data last text-right">190</td>
<td class="data-td data last text-right">210</td>
<td class="data-td data last text-right">223</td>
<td class="data-td data last text-right">207</td>
<td class="data-td data last text-right" style="border-right: outset;">187</td>
<td class="data-td data last text-right">92.44</td>
<td class="data-td data last text-right">92.85</td>
<td class="data-td data last text-right">92.62</td>
<td class="data-td data last text-right">95.29</td>
<td class="data-td data last text-right">93.91</td>
<td class="data-td data last text-right" style="border-right: outset;">94.82</td>
<td class="data-td data last text-right">1.13</td>
</tr>
<tr class="tbl-data">
<td class="data-td last">B</td>
<td class="data-td data last text-right">13.43</td>
<td class="data-td data last text-right">12.87</td>
<td class="data-td data last text-right">7.89</td>
<td class="data-td data last text-right">7.32</td>
<td class="data-td data last text-right">7.39</td>
<td class="data-td data last text-right" style="border-right: outset;">10.03</td>
<td class="data-td data last text-right">317</td>
<td class="data-td data last text-right">330</td>
<td class="data-td data last text-right">371</td>
<td class="data-td data last text-right">382</td>
<td class="data-td data last text-right">385</td>
<td class="data-td data last text-right" style="border-right: outset;">406</td>
<td class="data-td data last text-right">96.46</td>
<td class="data-td data last text-right">93.99</td>
<td class="data-td data last text-right">90.73</td>
<td class="data-td data last text-right">92.36</td>
<td class="data-td data last text-right">90.22</td>
<td class="data-td data last text-right" style="border-right: outset;">88.84</td>
<td class="data-td data last text-right">1.31</td>
</tr>
<tr class="tbl-data">
<td class="data-td last">CCC</td>
<td class="data-td data last text-right">5.44</td>
<td class="data-td data last text-right">5.51</td>
<td class="data-td data last text-right">4.19</td>
<td class="data-td data last text-right">4.38</td>
<td class="data-td data last text-right">4.56</td>
<td class="data-td data last text-right" style="border-right: outset;">4.64</td>
<td class="data-td data last text-right">1,130</td>
<td class="data-td data last text-right">893</td>
<td class="data-td data last text-right">505</td>
<td class="data-td data last text-right">468</td>
<td class="data-td data last text-right">417</td>
<td class="data-td data last text-right" style="border-right: outset;">421</td>
<td class="data-td data last text-right">69.40</td>
<td class="data-td data last text-right">68.48</td>
<td class="data-td data last text-right">80.90</td>
<td class="data-td data last text-right">87.61</td>
<td class="data-td data last text-right">88.32</td>
<td class="data-td data last text-right" style="border-right: outset;">89.24</td>
<td class="data-td data last text-right">1.59</td>
</tr>
<tr class="tbl-data">
<td class="data-td last">CC*</td>
<td class="data-td data last text-right">&nbsp;</td>
<td class="data-td data last text-right">0.30</td>
<td class="data-td data last text-right">1.00</td>
<td class="data-td data last text-right">1.01</td>
<td class="data-td data last text-right" style="border-right: outset;">1.09</td>
<td class="data-td data last text-right">&nbsp;</td>
<td class="data-td data last text-right">5,719</td>
<td class="data-td data last text-right">1,703</td>
<td class="data-td data last text-right">1,734</td>
<td class="data-td data last text-right" style="border-right: outset;">1,476</td>
<td class="data-td data last text-right">&nbsp;</td>
<td class="data-td data last text-right">13.00</td>
<td class="data-td data last text-right">44.51</td>
<td class="data-td data last text-right">42.82</td>
<td class="data-td data last text-right" style="border-right: outset;">49.40</td>
<td class="data-td data last text-right">15.68</td>
</tr>
<tr class="tbl-data">
<td class="data-td last">Total</td>
<td class="data-td data last text-right">100</td>
<td class="data-td data last text-right" style="border-right: outset;">100.00</td>
<td class="data-td data last text-right">285</td>
<td class="data-td data last text-right">247</td>
<td class="data-td data last text-right">252</td>
<td class="data-td data last text-right">261</td>
<td class="data-td data last text-right">245</td>
<td class="data-td data last text-right" style="border-right: outset;">234</td>
<td class="data-td data last text-right">91.20</td>
<td class="data-td data last text-right">91.22</td>
<td class="data-td data last text-right">90.32</td>
<td class="data-td data last text-right">93.69</td>
<td class="data-td data last text-right">92.31</td>
<td class="data-td data last text-right" style="border-right: outset;">92.99</td>
<td class="data-td data last text-right">1.31</td>
</tr>
</tbody>
</table>
</div>
<p class="chart-disclosure">Source: ICE Data Services, VanEck. Fallen Angels: ICE US Fallen Angel High Yield 10% Constrained Index. Not intended as a recommendation to invest or divest in any of the sectors mentioned herein. Index performance is not representative of strategy performance. It is not possible to invest in an index. BB index: ICE BofA BB US High Yield Index; Single-B index: ICE BofA Single-B US High Yield Index; CCC &amp; Lower rated index ICE BofA CCC &amp; Lower US High Yield Index. *Doesn&rsquo;t have securities for all months of selective periods. Returns are based on partial period data.</p>

<p>To receive more <a href="/us/en/blogs/income-investing/" title="Income Investing Insights"><strong>Income Investing</strong></a> insights, <a href="/link/5f45412c2143400497908cea2897f7d3.aspx" title=" Subscription Center"><strong>sign up in our subscription center</strong></a>.</p>
]]></content:encoded>
</item><item rdf:about="https://www.vaneck.com/us/en/blogs/moat-investing/broad-market-gains-shape-moat-strategies-for-2025/">
  <title>Broad Market Gains Shape Moat Strategies for 2025></title>
  <link>https://www.vaneck.com/us/en/blogs/moat-investing/broad-market-gains-shape-moat-strategies-for-2025/</link>
  <description><![CDATA[U.S. equities soared in November, with small caps leading the rally. Moat strategies benefitted from strong earnings, but faced headwinds from sector allocations.]]></description>
  <dc:creator>Coulter Regal, CFA</dc:creator>
  <dc:date>12/10/2024 06:30:00</dc:date>
<content:encoded><![CDATA[

<p>In November, U.S. equity markets surged to new record highs, marking one of the best monthly performances of the year. The conclusion of the U.S. presidential election brought a wave of optimism to the market, as investors responded positively to the prospective changes in policy directions. This led to broad market gains, with small caps outperforming large caps, suggesting a broadening of the rally. The market was further buoyed by strong consumer spending data and Fed commentary noting confidence in easing inflationary pressures and labor market strength, which together painted a picture of sustained economic growth. Despite the generally bullish sentiment, there was some volatility as investors adjusted their portfolios in anticipation of the new administration's policies.</p>
<p>The <a href="https://www.vaneck.com/us/en/investments/morningstar-wide-moat-etf-moat/overview/" title="MOAT - VanEck Morningstar Wide Moat ETF - Overview"><strong>Morningstar Wide Moat Focus Index</strong></a> (the &ldquo;Moat Index&rdquo;) also had a strong showing in November, rising 4.46% during the month, but trailing the broader S&amp;P 500, which gained 5.87%. An overweight allocation to the health care sector, which was largely flat during the month, and the exclusion of a few soaring technology names, namely Tesla, were primary factors in the lagging performance. With just a few weeks of performance left in 2024, the Moat Index, and most other market segments, are unlikely to overtake the top-heavy S&amp;P 500 on the year, but may be well-positioned heading into the new year as investors lock in 2024 gains and adjust their portfolios for potential broader market participation in 2025.</p>
<p>For the first time since July, smaller-cap stocks outperformed their large-cap peers and did so by a notable margin. The broad small-cap benchmark gained 11% and the mid-cap benchmark about 9%, both posting their best monthly performances of the year. The <a href="https://www.vaneck.com/us/en/investments/morningstar-smid-moat-etf-smot/overview/" title="SMOT - VanEck Morningstar SMID Moat ETF - Overview"><strong>Morningstar US Small-Mid Cap Moat Focus Index</strong></a> (the &ldquo;SMID Moat Index&rdquo;) also participated in the small-cap rally, gaining nearly 7%, but trailed the benchmarks in part due to some earnings-related volatility. The rally in small-caps this month marks a notable change in risk appetite, and given that <a href="https://www.vaneck.com/us/en/blogs/moat-investing/three-reasons-to-consider-smid-caps-during-a-declining-rate-environment/" title="Three Reasons to Consider SMID-Caps During a Declining Rate Environment"><strong>valuations remain at decade lows relative to large-caps</strong></a>, this could be viewed as the beginning of a potentially longer trend.</p>
<h3>Small-cap Stocks Lead in November Surge</h3>
<div class="flourish-embed flourish-chart" data-src="visualisation/20715681"><script src="https://public.flourish.studio/resources/embed.js"></script><noscript><img loading="lazy" src="https://public.flourish.studio/visualisation/20715681/thumbnail" width="100%" alt="Small-cap Stocks Lead in November Surge" /></noscript></div>
<p class="chart-disclosure"><strong>Source: Morningstar. Data as of 11/30/2024.</strong> Large Caps represented by the S&amp;P 500 Index; Mid Caps represented by the S&amp;P MidCap 400 Index; Small Caps represented by the S&amp;P SmallCap 600 Index. Past performance is no guarantee of future results. Index performance is not representative of fund performance. It is not possible to invest directly in an index. Fund performance current to the most recent month end is available by visiting vaneck.com or by calling 800.826.2333.</p>

<h2 id="moat-index" class="jump-link-nav anchored-block" data-jumplink-title="Moat Highlights">Moat Index Highlights: Factory Floors to Fantasy Lands</h2>
<p>Carrying over from last month, earnings-related volatility continued to be a notable driver of performance as markets adjusted to the latest quarterly updates. Strong performance within the industrial and technology sectors also stands out with several names from these segments landing in the top contributors table for the month.</p>
<p>Topping the list for contributors this month is the wide moat industrial automation company, Emerson Electric (EMR). With roots dating back to the late 1800s, Emerson has become a leading specialty industrial machinery company that sells a wide range of software and hardware aimed at helping customers automate their manufacturing processes to increase both productivity and safety. Emerson announced strong Q4 earnings results that sent the shares of the company soaring more than 20% during the month. Morningstar raised its fair value estimate for EMR and continues to view its industrial automation business favorably. owever, with shares now trading at a premium to even the increased fair value estimate, EMR may be a candidate to rotate out of the index during the upcoming reconstitution.</p>
<p>Another top performer within the Moat Index was the iconic media and entertainment company, Walt Disney Co. (DIS). Like Emerson Electric, Disney also benefited from a strong earnings release that moved share prices up about 22% during the month. Morningstar senior equity analyst, Matthew Dolgin, raised his fair value estimate for Disney and commented the below in his analyst note.</p>
<p><i>Disney reported an excellent end to fiscal 2024, with very encouraging results and commentary surrounding the streaming and experiences businesses, both of which are critical to a healthy future. The strong performance of sports content allowed the legacy television business to hold up better than we expected in 2024, and the impact of legacy television in Disney&rsquo;s overall results is becoming less critical. We have growing confidence that Disney, with the help of a wide moat, has successfully evolved for the modern era, and we are raising our fair value estimate to $125 from $115.</i></p>

<p>October&rsquo;s top contributor, electronic trading platform leader MarketAxess (MKTX), found itself among the top detractors in the Moat Index as it gave back some gains following earnings that fell short of expectations. Other top detractors for November include specialty ingredients producer International Flavors &amp; Fragrances (IFF), medical diagnostics product developer Bio-Rad (BIO), drug manufacturer Pfizer (PFE) and independent military shipbuilder Brown-Foreman (BF.B).</p>
<h2>Top Contributors and Detractors from Moat Index - November 2024</h2>
<h3>Leading Contributors</h3>
<div class="wrapped-div">
<table style="width: 100%;">
<tbody>
<tr class="tbl-data">
<td class="tbl-header last text-left">Company</td>
<td class="tbl-header last text-left">Ticker</td>
<td class="tbl-header last text-left">Sector</td>
<td class="tbl-header last text-right">Avg. Weight (%)</td>
<td class="tbl-header last text-right">Contribution (%)</td>
</tr>
<tr class="tbl-data">
<td class="data-td data last text-left">Emerson Electric Co.</td>
<td class="data-td data last text-left">EMR</td>
<td class="data-td data last text-left">Industrials</td>
<td class="data-td data last text-right">2.46</td>
<td class="data-td data last text-right">0.57</td>
</tr>
<tr class="tbl-data">
<td class="data-td data last text-left">The Walt Disney Co.</td>
<td class="data-td data last text-left">DIS</td>
<td class="data-td data last text-left">Communication Services</td>
<td class="data-td data last text-right">2.43</td>
<td class="data-td data last text-right">0.54</td>
</tr>
<tr class="tbl-data">
<td class="data-td data last text-left">Salesforce Inc.</td>
<td class="data-td data last text-left">CRM</td>
<td class="data-td data last text-left">Technology</td>
<td class="data-td data last text-right">2.82</td>
<td class="data-td data last text-right">0.37</td>
</tr>
<tr class="tbl-data">
<td class="data-td data last text-left">Fortinet Inc.</td>
<td class="data-td data last text-left">FTNT</td>
<td class="data-td data last text-left">Technology</td>
<td class="data-td data last text-right">1.47</td>
<td class="data-td data last text-right">0.31</td>
</tr>
<tr class="tbl-data">
<td class="data-td data last text-left">U.S. Bancorp</td>
<td class="data-td data last text-left">USB</td>
<td class="data-td data last text-left">Financials</td>
<td class="data-td data last text-right">2.74</td>
<td class="data-td data last text-right">0.28</td>
</tr>
</tbody>
</table>
</div>
<h3>Leading Detractors</h3>
<div class="wrapped-div">
<table style="width: 100%;">
<tbody>
<tr class="tbl-data">
<td class="tbl-header last text-left">Company</td>
<td class="tbl-header last text-left">Ticker</td>
<td class="tbl-header last text-left">Sector</td>
<td class="tbl-header last text-right">Avg. Weight (%)</td>
<td class="tbl-header last text-right">Contribution (%)</td>
</tr>
<tr class="tbl-data">
<td class="data-td data last text-left">MarketAxess Holdings Inc.</td>
<td class="data-td data last text-left">MKTX</td>
<td class="data-td data last text-left">Financials</td>
<td class="data-td data last text-right">3.05</td>
<td class="data-td data last text-right">-0.32</td>
</tr>
<tr class="tbl-data">
<td class="data-td data last text-left">Intl. Flavors &amp; Fragrances Inc.</td>
<td class="data-td data last text-left">IFF</td>
<td class="data-td data last text-left">Materials</td>
<td class="data-td data last text-right">2.35</td>
<td class="data-td data last text-right">-0.19</td>
</tr>
<tr class="tbl-data">
<td class="data-td data last text-left">Bio-Rad Laboratories Inc.</td>
<td class="data-td data last text-left">BIO</td>
<td class="data-td data last text-left">Health Care</td>
<td class="data-td data last text-right">2.84</td>
<td class="data-td data last text-right">-0.14</td>
</tr>
<tr class="tbl-data">
<td class="data-td data last text-left">Pfizer Inc.</td>
<td class="data-td data last text-left">PFE</td>
<td class="data-td data last text-left">Health Care</td>
<td class="data-td data last text-right">2.34</td>
<td class="data-td data last text-right">-0.14</td>
</tr>
<tr class="tbl-data">
<td class="data-td data last text-left">Brown-Forman Corp.</td>
<td class="data-td data last text-left">BF.B</td>
<td class="data-td data last text-left">Consumer Staples</td>
<td class="data-td data last text-right">2.36</td>
<td class="data-td data last text-right">-0.10</td>
</tr>
</tbody>
</table>
</div>
<p class="chart-disclosure"><strong>Source: Morningstar, November 2024</strong>. Past performance is no guarantee of future results. Index performance is not illustrative of fund performance. Not intended as a recommendation to buy or to sell any of the securities mentioned herein.</p>

<h2 id="smid-moat-index" class="jump-link-nav anchored-block" data-jumplink-title="SMID Moat Highlights">SMID Moat Index Highlights:<strong> Purses and Passengers</strong></h2>
<p>Like its larger-cap sister index, earnings releases also played a key role in determining the top performance contributors and detractors of the smaller-cap SMID Moat Index in November. From a sector perspective, strong performance within financials and technology stood out, while materials was a notable laggard with the four largest detractors all belonging to this sector.</p>
<p>The luxury fashion and accessory brands parent, Tapestry Inc. (TPR), topped the list of leading contributors after the company delivered revenue and earnings that exceeded expectations as well as raising their full-year outlook. Shares of Tapestry soared more than 30% during the month on the news and now trade more in line with Morningstar&rsquo;s $59 estimate of fair value. Another name helping drive performance this month, also off the back of a positive earnings release that sent shares up 33%, was the ride-sharing service provider, Lyft (LYFT). Morningstar raised its fair value estimate from $15 to $20 and believes Lyft is well on its way to becoming a one-stop shop for on-demand transportation, citing its expansion into bike- and scooter-sharing markets and its pursuit of autonomous vehicles transportation.</p>
<p>Names that detracted most from SMID Moat Index performance during the month largely fell in the materials sector, including Celanese (CE) which is one of the world's largest producers of acetic acid directives and specialty polymers used in industrial and medical applications, home lawn and gardening products company Scotts Miracle Gro (SMG), the diversified global chemicals producer Dow Inc. (DOW), specialty ingredients producer International Flavors &amp; Fragrances (IFF), and electronic trading platform leader MarketAxess (MKTX).</p>
<h2>Top Contributors and Detractors from SMID Moat Index - November 2024</h2>
<h3>Leading Contributors</h3>
<div class="wrapped-div">
<table style="width: 100%;">
<tbody>
<tr class="tbl-data">
<td class="tbl-header last text-left">Company</td>
<td class="tbl-header last text-left">Ticker</td>
<td class="tbl-header last text-left">Sector</td>
<td class="tbl-header last text-right">Avg. Weight (%)</td>
<td class="tbl-header last text-right">Contribution (%)</td>
</tr>
<tr class="tbl-data">
<td class="data-td data last text-left">Tapestry Inc.</td>
<td class="data-td data last text-left">TPR</td>
<td class="data-td data last text-left">Consumer Discretionary</td>
<td class="data-td data last text-right">1.36</td>
<td class="data-td data last text-right">0.43</td>
</tr>
<tr class="tbl-data">
<td class="data-td data last text-left">Lyft Inc.</td>
<td class="data-td data last text-left">LYFT</td>
<td class="data-td data last text-left">Technology</td>
<td class="data-td data last text-right">1.17</td>
<td class="data-td data last text-right">0.39</td>
</tr>
<tr class="tbl-data">
<td class="data-td data last text-left">Discover Financial Services</td>
<td class="data-td data last text-left">DFS</td>
<td class="data-td data last text-left">Financials</td>
<td class="data-td data last text-right">1.49</td>
<td class="data-td data last text-right">0.35</td>
</tr>
<tr class="tbl-data">
<td class="data-td data last text-left">Chart Industries Inc.</td>
<td class="data-td data last text-left">GTLS</td>
<td class="data-td data last text-left">Industrials</td>
<td class="data-td data last text-right">0.55</td>
<td class="data-td data last text-right">0.33</td>
</tr>
<tr class="tbl-data">
<td class="data-td data last text-left">Block Inc.</td>
<td class="data-td data last text-left">SQ</td>
<td class="data-td data last text-left">Financials</td>
<td class="data-td data last text-right">1.41</td>
<td class="data-td data last text-right">0.32</td>
</tr>
</tbody>
</table>
</div>
<h3>Leading Detractors</h3>
<div class="wrapped-div">
<table style="width: 100%;">
<tbody>
<tr class="tbl-data">
<td class="tbl-header last text-left">Company</td>
<td class="tbl-header last text-left">Ticker</td>
<td class="tbl-header last text-left">Sector</td>
<td class="tbl-header last text-right">Avg. Weight (%)</td>
<td class="tbl-header last text-right">Contribution (%)</td>
</tr>
<tr class="tbl-data">
<td class="data-td data last text-left">Celanese Corp.</td>
<td class="data-td data last text-left">CE</td>
<td class="data-td data last text-left">Materials</td>
<td class="data-td data last text-right">0.65</td>
<td class="data-td data last text-right">-0.27</td>
</tr>
<tr class="tbl-data">
<td class="data-td data last text-left">The Scotts Miracle Gro Co.</td>
<td class="data-td data last text-left">SMG</td>
<td class="data-td data last text-left">Materials</td>
<td class="data-td data last text-right">1.64</td>
<td class="data-td data last text-right">-0.17</td>
</tr>
<tr class="tbl-data">
<td class="data-td data last text-left">Dow Inc.</td>
<td class="data-td data last text-left">DOW</td>
<td class="data-td data last text-left">Materials</td>
<td class="data-td data last text-right">1.16</td>
<td class="data-td data last text-right">-0.11</td>
</tr>
<tr class="tbl-data">
<td class="data-td data last text-left">Intl. Flavors &amp; Fragrances Inc.</td>
<td class="data-td data last text-left">IFF</td>
<td class="data-td data last text-left">Materials</td>
<td class="data-td data last text-right">1.22</td>
<td class="data-td data last text-right">-0.10</td>
</tr>
<tr class="tbl-data">
<td class="data-td data last text-left">MarketAxess Holdings Inc.</td>
<td class="data-td data last text-left">MKTX</td>
<td class="data-td data last text-left">Financials</td>
<td class="data-td data last text-right">0.71</td>
<td class="data-td data last text-right">-0.07</td>
</tr>
</tbody>
</table>
</div>
<p class="chart-disclosure"><strong>Source: Morningstar, November 2024</strong>. Past performance is no guarantee of future results. Index performance is not illustrative of fund performance. Not intended as a recommendation to buy or to sell any of the securities mentioned herein.</p>
<h2 id="moat-strategies" class="jump-link-nav anchored-block" data-jumplink-title="Moat Strategies">Choose Your Moat Strategy</h2>
<p>VanEck&rsquo;s suite of <strong><a title="Quality Companies at Attractive Prices" href="https://www.vaneck.com/us/en/blogs/moat-investing/moat-investing-powered-by-morningstar/">moat investing strategies</a></strong> is powered by Morningstar&rsquo;s equity research team, which seeks quality companies trading at attractive valuations. The below ETFs offer access to US moat companies:</p>
<p><strong><a title="MOAT - VanEck Morningstar Wide Moat ETF" href="/link/9e43dd198c5f4e419f13220685081895.aspx">VanEck Morningstar Wide ETF (MOAT)</a></strong>: companies with a wide moat rating, which means Morningstar believes the company is likely to sustain its competitive advantage for at least the next 20 years.</p>
<p><strong><a title="SMOT - VanEck Morningstar SMID Moat ETF" href="/link/166321dbcfec440590fb51cf0ad629aa.aspx">VanEck Morningstar SMID Moat ETF (SMOT)</a></strong>: small and mid-cap moat companies.</p>
<p>To receive more <a href="https://www.vaneck.com/us/en/insights/moat-investing" title="Moat Investing Insights"><strong>Moat Investing</strong></a> insights, <a href="https://www.vaneck.com/us/en/subscribe/" title="Subscription Center"><strong>sign up in our subscription center</strong></a>.</p>
]]></content:encoded>
</item><item rdf:about="https://www.vaneck.com/us/en/blogs/moat-investing/market-leadership-is-narrow-your-portfolio-shouldnt-be/">
  <title>Market Leadership Is Narrow. Your Portfolio Shouldn’t Be></title>
  <link>https://www.vaneck.com/us/en/blogs/moat-investing/market-leadership-is-narrow-your-portfolio-shouldnt-be/</link>
  <description><![CDATA[A select few mega cap companies drove the S&amp;P 500 Index to a banner year in 2024&mdash;but they&rsquo;ve also highlighted the need for diversification in a core equity portfolio.]]></description>
  <dc:creator>Brandon Rakszawski</dc:creator>
  <dc:date>12/09/2024 06:30:00</dc:date>
<content:encoded><![CDATA[

<h2>Key Takeaways:</h2>
<ul class="content-list">
<li class="mt-2"><strong>Exceptional performance</strong>: 2024 S&amp;P 500 Index performance has been among some of the strongest in history, adding to similarly strong performance in recent years. Can it continue?</li>
<li class="mt-2"><strong>Extreme concentration</strong>: Near-term success has been driven, in large part, by a select few mega cap companies. This has driven market concentration to levels we have not seen since the 1970s.</li>
<li class="mt-2"><strong>Broad ownership/overlap</strong>: Most investors likely have significant exposure to these leading mega cap stocks&mdash;not only from core index funds but also from many investments that bill themselves as smart or differentiated.</li>
<li class="mt-2"><strong>Stretched valuations</strong>: Rightly or wrongly, market valuations are stretched. Historically, similar valuation levels have been followed by long-term periods of muted or negative returns from the S&amp;P 500.</li>
</ul>
<p>2024 has been the year of the S&amp;P 500 Index&mdash;thanks to a select few mega cap companies. This well-documented lack of market breadth and narrow market leadership among mega cap tech companies have propelled the headline index to what is panning out to be its second straight year of greater than 25% gains &ndash; it was up 28.07% through November &ndash; something that has only occurred three times since 1930.</p>
<p>Many index-based alternatives to the &ldquo;beta&rdquo; offered by S&amp;P 500 Index investments have also thrived this year from exposure to the same leading companies. These alternatives range from factor investments to dividend strategies to the tech-heavy Nasdaq 100.</p>
<p>The performance leadership of these mega caps has increased concentration across the market, driving their portfolio exposure higher and stretching valuations. While these dynamics have challenged differentiated and valuation-focused strategies like that of the <a href="https://www.vaneck.com/us/en/investments/morningstar-wide-moat-etf-moat/overview/" title="MOAT - VanEck Morningstar Wide Moat ETF"><strong>VanEck Morningstar Wide Moat ETF (MOAT)</strong></a>, they highlight the need for diversification in core equity allocations. Heading into 2025, investors may benefit from reassessing their equity portfolio diversification.</p>
<h2 id="equity-performance" class="jump-link-nav anchored-block" data-jumplink-title="Equity Performance">Equity Market Performance in Perspective</h2>
<p>The S&amp;P 500&rsquo;s torrid pace in 2024 almost certainly won&rsquo;t reach all-time high calendar year levels, but on a historical basis, its return has been among its best in nearly 100 years.</p>
<h3>2024 S&amp;P 500 Index Performance Among Strongest Since 1928</h3>
<p><strong>Calendarized Performance Since 1928</strong></p>
<p><img loading="lazy" class="img-responsive w-100" alt="2024 S&amp;P 500 Index Performance Among Strongest Since 1928" src="https://www.vaneck.com/contentassets/37b523f9f1674bf7855ed772da88b1e1/5123_moat-performance-diversification_chart-1_2024-12_v1_blog.svg" /></p>
<p class="chart-disclosure">Source: Bloomberg, Datastream, Goldman Sachs Global Investment Research. Past performance is not a guarantee of future results. Index performance is not illustrative of fund performance. It is not possible to invest in an index.</p>
<p>Recent history has been particularly eye catching. Many of the S&amp;P 500&rsquo;s strongest years have occurred in the last five years. Since 1930, the S&amp;P 500 has posted a calendar year return of greater than 25% twenty-five times, three of those occurring in 2019, 2021 and 2023. The list also includes 1995, 1997 and 1998, preceding the dot-com bubble.</p>
<h2 id="market-concentration" class="jump-link-nav anchored-block" data-jumplink-title="Market Concentration">Market Concentration at Decades High</h2>
<p>The drivers of impressive 2024 index returns have been concentrated in a select few companies and have made some of the world&rsquo;s largest companies even larger. Most investors may not appreciate that these companies have grown to account for an increasing portion of headline market indexes, and in turn their own investment portfolio. For example, the largest U.S. companies haven&rsquo;t represented this much of the MSCI All Country World Index since the 1970s.</p>
<h3>Largest US Companies Dominating Global Index</h3>
<p><strong>Weight of Largest US Companies in MSCI ACWI (1973 &ndash; 2024)</strong></p>
<p><img loading="lazy" class="img-responsive w-100" alt="Largest US Companies Dominating Global Index" src="https://www.vaneck.com/contentassets/cc4eef31aa77427e800eb144edc8806f/5123_moat-performance-diversification_chart-2_2024-12_v1_blog.svg" /></p>
<p class="chart-disclosure">Source: Datastream, Goldman Sachs Global Investment Research. Past performance is not a guarantee of future results. Index performance is not illustrative of fund performance. It is not possible to invest in an index.</p>

<h2 id="holdings-overlap" class="jump-link-nav anchored-block" data-jumplink-title="Holdings Overlap">Extreme Overlap Across Portfolios</h2>
<p>As these mega-cap companies grow bigger, their corresponding exposure increases in S&amp;P 500 Index funds, as well as many other U.S. equity funds that provide similar exposures. This means that these companies will also naturally represent a more significant portion of investor portfolios.</p>
<p>Look no further than the top 10 holdings of many widely popular indexes that underly mutual funds and ETFs. Below is a small sample of popular indexes&mdash;ranging from factor indexes to dividend indexes&mdash;linked to funds with hundreds of billions in assets under management.</p>
<p>For ease of reading, we have indicated in bold blue text below the holdings that are unique among the top 10 for each index. Outside of the Morningstar Wide Moat Focus Index, which underlies our <strong><a title="MOAT - VanEck Morningstar Wide Moat ETF" href="https://www.vaneck.com/us/en/investments/morningstar-wide-moat-etf-moat/overview/">VanEck Morningstar Wide Moat ETF (MOAT)</a></strong>, almost all of the top 10 holdings of these popular indexes significantly overlap with the others.</p>
<h3>More of the Same - Top 10 Holdings of Popular U.S. Large Cap Indexes</h3>
<p><strong>Shading Represents Unique Holdings Among the Group&rsquo;s Top Ten (as of 9/30/2024)</strong></p>
<div class="row">
<div class="col-sm-12 col-md-6 col-lg-6 mb-4">
<div class="wrapped-div">
<table style="width: 100%;">
<tbody>
<tr class="tbl-data">
<td class="tbl-header last" colspan="3">S&amp;P 500 Index</td>
</tr>
<tr class="tbl-data">
<td class="data-td last">Name</td>
<td class="data-head last text-left">Ticker</td>
<td class="data-head last text-right">Weight</td>
</tr>
<tr class="tbl-data">
<td class="data-td last font-weight-normal">Apple</td>
<td class="data-td data last text-left">AAPL</td>
<td class="data-td data last text-right">7.3</td>
</tr>
<tr class="tbl-data">
<td class="data-td last font-weight-normal">Microsoft</td>
<td class="data-td data last text-left">MSFT</td>
<td class="data-td data last text-right">6.6</td>
</tr>
<tr class="tbl-data">
<td class="data-td last font-weight-normal">NVIDIA</td>
<td class="data-td data last text-left">NVDA</td>
<td class="data-td data last text-right">6.1</td>
</tr>
<tr class="tbl-data">
<td class="data-td last font-weight-normal">Amazon</td>
<td class="data-td data last text-left">AMZN</td>
<td class="data-td data last text-right">3.6</td>
</tr>
<tr class="tbl-data">
<td class="data-td last font-weight-normal">Meta</td>
<td class="data-td data last text-left">META</td>
<td class="data-td data last text-right">2.6</td>
</tr>
<tr class="tbl-data">
<td class="data-td last font-weight-normal">Alphabet A</td>
<td class="data-td data last text-left">GOOGL</td>
<td class="data-td data last text-right">2.0</td>
</tr>
<tr class="tbl-data">
<td class="data-td last font-weight-normal">Berkshire Hathaway</td>
<td class="data-td data last text-left">BRK.B</td>
<td class="data-td data last text-right">1.7</td>
</tr>
<tr class="tbl-data">
<td class="data-td last font-weight-normal">Alphabet C</td>
<td class="data-td data last text-left">GOOG</td>
<td class="data-td data last text-right">1.6</td>
</tr>
<tr class="tbl-data">
<td class="data-td last font-weight-normal">Broadcom</td>
<td class="data-td data last text-left">AVGO</td>
<td class="data-td data last text-right">1.6</td>
</tr>
<tr class="tbl-data">
<td class="data-td last font-weight-normal">Tesla</td>
<td class="data-td data last text-left">TSLA</td>
<td class="data-td data last text-right">1.5</td>
</tr>
</tbody>
</table>
</div>
</div>
<div class="col-sm-12 col-md-6 col-lg-6 mb-4">
<div class="wrapped-div">
<table style="width: 100%;">
<tbody>
<tr class="tbl-data">
<td class="tbl-header last" colspan="3">Morningstar Wide Moat Focus Index</td>
</tr>
<tr class="tbl-data">
<td class="data-td last">Name</td>
<td class="data-head last text-left">Ticker</td>
<td class="data-head last text-right">Weight</td>
</tr>
<tr class="tbl-data">
<td class="data-td last font-weight-normal"><span style="color: rgb(23, 70, 143);"><strong>TransUnion</strong></span></td>
<td class="data-td data last text-left"><span style="color: rgb(23, 70, 143);"><strong>TRU</strong></span></td>
<td class="data-td data last text-right"><span style="color: rgb(23, 70, 143);"><strong>2.8</strong></span></td>
</tr>
<tr class="tbl-data">
<td class="data-td last font-weight-normal"><span style="color: rgb(23, 70, 143);"><strong>Gilead Sciences</strong></span></td>
<td class="data-td data last text-left"><span style="color: rgb(23, 70, 143);"><strong>GILD</strong></span></td>
<td class="data-td data last text-right"><span style="color: rgb(23, 70, 143);"><strong>2.7</strong></span></td>
</tr>
<tr class="tbl-data">
<td class="data-td last font-weight-normal"><span style="color: rgb(23, 70, 143);"><strong>Kenvue</strong></span></td>
<td class="data-td data last text-left"><span style="color: rgb(23, 70, 143);"><strong>KVUE</strong></span></td>
<td class="data-td data last text-right"><span style="color: rgb(23, 70, 143);"><strong>2.6</strong></span></td>
</tr>
<tr class="tbl-data">
<td class="data-td last font-weight-normal"><span style="color: rgb(23, 70, 143);"><strong>MarketAxess</strong></span></td>
<td class="data-td data last text-left"><span style="color: rgb(23, 70, 143);"><strong>MKTX</strong></span></td>
<td class="data-td data last text-right"><span style="color: rgb(23, 70, 143);"><strong>2.6</strong></span></td>
</tr>
<tr class="tbl-data">
<td class="data-td last font-weight-normal"><span style="color: rgb(23, 70, 143);"><strong>Salesforce</strong></span></td>
<td class="data-td data last text-left"><span style="color: rgb(23, 70, 143);"><strong>CRM</strong></span></td>
<td class="data-td data last text-right"><span style="color: rgb(23, 70, 143);"><strong>2.6</strong></span></td>
</tr>
<tr class="tbl-data">
<td class="data-td last font-weight-normal"><span style="color: rgb(23, 70, 143);"><strong>Bristol-Myers Squibb</strong></span></td>
<td class="data-td data last text-left"><span style="color: rgb(23, 70, 143);"><strong>BMY</strong></span></td>
<td class="data-td data last text-right"><span style="color: rgb(23, 70, 143);"><strong>2.6</strong></span></td>
</tr>
<tr class="tbl-data">
<td class="data-td last font-weight-normal"><span style="color: rgb(23, 70, 143);"><strong>Autodesk</strong></span></td>
<td class="data-td data last text-left"><span style="color: rgb(23, 70, 143);"><strong>ADSK</strong></span></td>
<td class="data-td data last text-right"><span style="color: rgb(23, 70, 143);"><strong>2.6</strong></span></td>
</tr>
<tr class="tbl-data">
<td class="data-td last font-weight-normal"><span style="color: rgb(23, 70, 143);"><strong>Allegion</strong></span></td>
<td class="data-td data last text-left"><span style="color: rgb(23, 70, 143);"><strong>ALLE</strong></span></td>
<td class="data-td data last text-right"><span style="color: rgb(23, 70, 143);"><strong>2.6</strong></span></td>
</tr>
<tr class="tbl-data">
<td class="data-td last font-weight-normal"><span style="color: rgb(23, 70, 143);"><strong>Bio-Rad Labs</strong></span></td>
<td class="data-td data last text-left"><span style="color: rgb(23, 70, 143);"><strong>BIO</strong></span></td>
<td class="data-td data last text-right"><span style="color: rgb(23, 70, 143);"><strong>2.6</strong></span></td>
</tr>
<tr class="tbl-data">
<td class="data-td last font-weight-normal"><span style="color: rgb(23, 70, 143);"><strong>The Campbell's Co</strong></span></td>
<td class="data-td data last text-left"><span style="color: rgb(23, 70, 143);"><strong>CPB</strong></span></td>
<td class="data-td data last text-right"><span style="color: rgb(23, 70, 143);"><strong>2.53</strong></span></td>
</tr>
</tbody>
</table>
</div>
</div>
</div>
<div class="row">
<div class="col-sm-12 col-md-6 col-lg-6 mb-4">
<div class="wrapped-div">
<table style="width: 100%;">
<tbody>
<tr class="tbl-data">
<td class="tbl-header last" colspan="3">Russell 1000 Growth Index</td>
</tr>
<tr class="tbl-data">
<td class="data-td last">Name</td>
<td class="data-head last text-left">Ticker</td>
<td class="data-head last text-right">Weight</td>
</tr>
<tr class="tbl-data">
<td class="data-td last font-weight-normal">Apple</td>
<td class="data-td data last text-left">AAPL</td>
<td class="data-td data last text-right">12.3</td>
</tr>
<tr class="tbl-data">
<td class="data-td last font-weight-normal">Microsoft</td>
<td class="data-td data last text-left">MSFT</td>
<td class="data-td data last text-right">11.6</td>
</tr>
<tr class="tbl-data">
<td class="data-td last font-weight-normal">NVIDIA</td>
<td class="data-td data last text-left">NVDA</td>
<td class="data-td data last text-right">10.3</td>
</tr>
<tr class="tbl-data">
<td class="data-td last font-weight-normal">Amazon</td>
<td class="data-td data last text-left">AMZN</td>
<td class="data-td data last text-right">6.3</td>
</tr>
<tr class="tbl-data">
<td class="data-td last font-weight-normal">Meta</td>
<td class="data-td data last text-left">META</td>
<td class="data-td data last text-right">4.5</td>
</tr>
<tr class="tbl-data">
<td class="data-td last font-weight-normal">Alphabet A</td>
<td class="data-td data last text-left">GOOGL</td>
<td class="data-td data last text-right">3.5</td>
</tr>
<tr class="tbl-data">
<td class="data-td last font-weight-normal">Alphabet C</td>
<td class="data-td data last text-left">GOOG</td>
<td class="data-td data last text-right">3.0</td>
</tr>
<tr class="tbl-data">
<td class="data-td last font-weight-normal">Broadcom</td>
<td class="data-td data last text-left">AVGO</td>
<td class="data-td data last text-right">2.8</td>
</tr>
<tr class="tbl-data">
<td class="data-td last font-weight-normal">Tesla</td>
<td class="data-td data last text-left">TSLA</td>
<td class="data-td data last text-right">2.6</td>
</tr>
<tr class="tbl-data">
<td class="data-td last font-weight-normal">Eli Lilly</td>
<td class="data-td data last text-left">LLY</td>
<td class="data-td data last text-right">2.6</td>
</tr>
</tbody>
</table>
</div>
</div>
<div class="col-sm-12 col-md-6 col-lg-6 mb-4">
<div class="wrapped-div">
<table style="width: 100%;">
<tbody>
<tr class="tbl-data">
<td class="tbl-header last" colspan="3">Nasdaq 100 Index</td>
</tr>
<tr class="tbl-data">
<td class="data-td last">Name</td>
<td class="data-head last text-left">Ticker</td>
<td class="data-head last text-right">Weight</td>
</tr>
<tr class="tbl-data">
<td class="data-td last font-weight-normal">Apple</td>
<td class="data-td data last text-left">AAPL</td>
<td class="data-td data last text-right">9.0</td>
</tr>
<tr class="tbl-data">
<td class="data-td last font-weight-normal">Microsoft</td>
<td class="data-td data last text-left">MSFT</td>
<td class="data-td data last text-right">8.1</td>
</tr>
<tr class="tbl-data">
<td class="data-td last font-weight-normal">NVIDIA</td>
<td class="data-td data last text-left">NVDA</td>
<td class="data-td data last text-right">7.6</td>
</tr>
<tr class="tbl-data">
<td class="data-td last font-weight-normal">Broadcom</td>
<td class="data-td data last text-left">AVGO</td>
<td class="data-td data last text-right">5.3</td>
</tr>
<tr class="tbl-data">
<td class="data-td last font-weight-normal">Meta</td>
<td class="data-td data last text-left">META</td>
<td class="data-td data last text-right">5.1</td>
</tr>
<tr class="tbl-data">
<td class="data-td last font-weight-normal">Amazon</td>
<td class="data-td data last text-left">AMZN</td>
<td class="data-td data last text-right">5.0</td>
</tr>
<tr class="tbl-data">
<td class="data-td last font-weight-normal">Tesla</td>
<td class="data-td data last text-left">TSLA</td>
<td class="data-td data last text-right">3.2</td>
</tr>
<tr class="tbl-data">
<td class="data-td last font-weight-normal">Costco</td>
<td class="data-td data last text-left">COST</td>
<td class="data-td data last text-right">2.6</td>
</tr>
<tr class="tbl-data">
<td class="data-td last font-weight-normal">Alphabet A</td>
<td class="data-td data last text-left">GOOGL</td>
<td class="data-td data last text-right">2.5</td>
</tr>
<tr class="tbl-data">
<td class="data-td last font-weight-normal">Alphabet C</td>
<td class="data-td data last text-left">GOOG</td>
<td class="data-td data last text-right">2.4</td>
</tr>
</tbody>
</table>
</div>
</div>
</div>
<div class="row">
<div class="col-sm-12 col-md-6 col-lg-6 mb-4">
<div class="wrapped-div">
<table style="width: 100%; height: 268.594px;">
<tbody>
<tr class="tbl-data" style="height: 22.3828px;">
<td class="tbl-header last" style="height: 22.3828px;" colspan="3">MSCI USA Sector Neutral Quality Index</td>
</tr>
<tr class="tbl-data" style="height: 22.3828px;">
<td class="data-td last" style="height: 22.3828px;">Name</td>
<td class="data-head last text-left" style="height: 22.3828px;">Ticker</td>
<td class="data-head last text-right" style="height: 22.3828px;">Weight</td>
</tr>
<tr class="tbl-data" style="height: 22.3828px;">
<td class="data-td last font-weight-normal" style="height: 22.3828px;">NVIDIA</td>
<td class="data-td data last text-left" style="height: 22.3828px;">NVDA</td>
<td class="data-td data last text-right" style="height: 22.3828px;">5.9</td>
</tr>
<tr class="tbl-data" style="height: 22.3828px;">
<td class="data-td last font-weight-normal" style="height: 22.3828px;">Apple</td>
<td class="data-td data last text-left" style="height: 22.3828px;">AAPL</td>
<td class="data-td data last text-right" style="height: 22.3828px;">5.6</td>
</tr>
<tr class="tbl-data" style="height: 22.3828px;">
<td class="data-td last font-weight-normal" style="height: 22.3828px;">Microsoft</td>
<td class="data-td data last text-left" style="height: 22.3828px;">MSFT</td>
<td class="data-td data last text-right" style="height: 22.3828px;">4.7</td>
</tr>
<tr class="tbl-data" style="height: 22.3828px;">
<td class="data-td last font-weight-normal" style="height: 22.3828px;">Meta</td>
<td class="data-td data last text-left" style="height: 22.3828px;">META</td>
<td class="data-td data last text-right" style="height: 22.3828px;">4.2</td>
</tr>
<tr class="tbl-data" style="height: 22.3828px;">
<td class="data-td last font-weight-normal" style="height: 22.3828px;">Eli Lilly</td>
<td class="data-td data last text-left" style="height: 22.3828px;">LLY</td>
<td class="data-td data last text-right" style="height: 22.3828px;">4.1</td>
</tr>
<tr class="tbl-data" style="height: 22.3828px;">
<td class="data-td last font-weight-normal" style="height: 22.3828px;">Visa</td>
<td class="data-td data last text-left" style="height: 22.3828px;">V</td>
<td class="data-td data last text-right" style="height: 22.3828px;">4.0</td>
</tr>
<tr class="tbl-data" style="height: 22.3828px;">
<td class="data-td last font-weight-normal" style="height: 22.3828px;">Mastercard</td>
<td class="data-td data last text-left" style="height: 22.3828px;">MA</td>
<td class="data-td data last text-right" style="height: 22.3828px;">4.0</td>
</tr>
<tr class="tbl-data" style="height: 22.3828px;">
<td class="data-td last font-weight-normal" style="height: 22.3828px;">UnitedHealth</td>
<td class="data-td data last text-left" style="height: 22.3828px;">UNH</td>
<td class="data-td data last text-right" style="height: 22.3828px;">2.8</td>
</tr>
<tr class="tbl-data" style="height: 22.3828px;">
<td class="data-td last font-weight-normal" style="height: 22.3828px;">Costco</td>
<td class="data-td data last text-left" style="height: 22.3828px;">COST</td>
<td class="data-td data last text-right" style="height: 22.3828px;">2.5</td>
</tr>
<tr class="tbl-data" style="height: 22.3828px;">
<td class="data-td last font-weight-normal" style="height: 22.3828px;"><strong><span style="color: rgb(23, 70, 143);">Johnson &amp; Johnson</span></strong></td>
<td class="data-td data last text-left" style="height: 22.3828px;"><strong><span style="color: rgb(23, 70, 143);">JNJ</span></strong></td>
<td class="data-td data last text-right" style="height: 22.3828px;"><strong><span style="color: rgb(23, 70, 143);">2.3</span></strong></td>
</tr>
</tbody>
</table>
</div>
</div>
<div class="col-sm-12 col-md-6 col-lg-6 mb-4">
<div class="wrapped-div">
<table style="width: 100%; height: 268.594px;">
<tbody>
<tr class="tbl-data" style="height: 22.3828px;">
<td class="tbl-header last" style="height: 22.3828px;" colspan="3">S&amp;P U.S. Dividend Growers Index</td>
</tr>
<tr class="tbl-data" style="height: 22.3828px;">
<td class="data-td last" style="height: 22.3828px;">Name</td>
<td class="data-head last text-left" style="height: 22.3828px;">Ticker</td>
<td class="data-head last text-right" style="height: 22.3828px;">Weight</td>
</tr>
<tr class="tbl-data" style="height: 22.3828px;">
<td class="data-td last font-weight-normal" style="height: 22.3828px;">Apple</td>
<td class="data-td data last text-left" style="height: 22.3828px;">AAPL</td>
<td class="data-td data last text-right" style="height: 22.3828px;">4.8</td>
</tr>
<tr class="tbl-data" style="height: 22.3828px;">
<td class="data-td last font-weight-normal" style="height: 22.3828px;">Broadcom</td>
<td class="data-td data last text-left" style="height: 22.3828px;">AVGO</td>
<td class="data-td data last text-right" style="height: 22.3828px;">4.2</td>
</tr>
<tr class="tbl-data" style="height: 22.3828px;">
<td class="data-td last font-weight-normal" style="height: 22.3828px;">Microsoft</td>
<td class="data-td data last text-left" style="height: 22.3828px;">MSFT</td>
<td class="data-td data last text-right" style="height: 22.3828px;">3.8</td>
</tr>
<tr class="tbl-data" style="height: 22.3828px;">
<td class="data-td last font-weight-normal" style="height: 22.3828px;"><strong><span style="color: rgb(23, 70, 143);">JPMorgan Chase</span></strong></td>
<td class="data-td data last text-left" style="height: 22.3828px;"><strong><span style="color: rgb(23, 70, 143);">JPM</span></strong></td>
<td class="data-td data last text-right" style="height: 22.3828px;"><strong><span style="color: rgb(23, 70, 143);">3.2</span></strong></td>
</tr>
<tr class="tbl-data" style="height: 22.3828px;">
<td class="data-td last font-weight-normal" style="height: 22.3828px;">UnitedHealth</td>
<td class="data-td data last text-left" style="height: 22.3828px;">UNH</td>
<td class="data-td data last text-right" style="height: 22.3828px;">2.8</td>
</tr>
<tr class="tbl-data" style="height: 22.3828px;">
<td class="data-td last font-weight-normal" style="height: 22.3828px;">Exxon Mobil</td>
<td class="data-td data last text-left" style="height: 22.3828px;">XOM</td>
<td class="data-td data last text-right" style="height: 22.3828px;">2.8</td>
</tr>
<tr class="tbl-data" style="height: 22.3828px;">
<td class="data-td last font-weight-normal" style="height: 22.3828px;">Visa</td>
<td class="data-td data last text-left" style="height: 22.3828px;">V</td>
<td class="data-td data last text-right" style="height: 22.3828px;">2.3</td>
</tr>
<tr class="tbl-data" style="height: 22.3828px;">
<td class="data-td last font-weight-normal" style="height: 22.3828px;">Mastercard</td>
<td class="data-td data last text-left" style="height: 22.3828px;">MA</td>
<td class="data-td data last text-right" style="height: 22.3828px;">2.2</td>
</tr>
<tr class="tbl-data" style="height: 22.3828px;">
<td class="data-td last font-weight-normal" style="height: 22.3828px;"><strong><span style="color: rgb(23, 70, 143);">Procter &amp; Gamble</span></strong></td>
<td class="data-td data last text-left" style="height: 22.3828px;"><strong><span style="color: rgb(23, 70, 143);">PG</span></strong></td>
<td class="data-td data last text-right" style="height: 22.3828px;"><strong><span style="color: rgb(23, 70, 143);">2.1</span></strong></td>
</tr>
<tr class="tbl-data" style="height: 22.3828px;">
<td class="data-td last font-weight-normal" style="height: 22.3828px;"><strong><span style="color: rgb(23, 70, 143);">Home Depot</span></strong></td>
<td class="data-td data last text-left" style="height: 22.3828px;"><strong><span style="color: rgb(23, 70, 143);">HD</span></strong></td>
<td class="data-td data last text-right" style="height: 22.3828px;"><strong><span style="color: rgb(23, 70, 143);">2.1</span></strong></td>
</tr>
</tbody>
</table>
</div>
</div>
</div>
<p class="chart-disclosure">Source: Morningstar. Past performance is not a guarantee of future results. Index performance is not illustrative of fund performance. It is not possible to invest in an index. Not intended as a recommendation to buy or to sell any of the securities mentioned herein.</p>
<p>This eye-opening overlap is an important factor driving returns in many of these indexes in recent periods and suggests investors should be vigilant and aware of potential concentration across portfolios. This is particularly timely in light of the U.S. equity market regularly reaching all-time highs and with valuations at stretched levels.</p>
<h2 id="stretched-valuations" class="jump-link-nav anchored-block" data-jumplink-title="Stretched Valuations">Stretched Valuations Have Led to Muted Returns</h2>
<p>The forward P/E ratio of the S&amp;P 500 Index sat at approximately 24.6 at the end of November. This implies that the index is trading at more than 24x forward earnings estimates. Largely, investors have been happy to pay that multiple as many companies, particularly the Magnificent 7, have managed to notably expand profits in recent periods.</p>
<p>However, there are some forces at play that may cause concern at these multiples. First is the impact that generative AI has had on many of the largest tech companies in the market. Some believe the AI benefit afforded to the largest companies may have played out and expect these benefits to trickle through the market to other industries like software. Second, many attractive investment opportunities of late are in the midst of changing realities, such as the tech sector&rsquo;s shifting from capital-light to a more capital-intensive segment that is in need of data center infrastructure and is more susceptible to energy price fluctuations.</p>
<p>Stretched valuations and changing market dynamics are not necessarily reasons to shift a portfolio or underweight any given sector. In fact, many believe there is plenty of room to run from here. But they are certainly a good reason to consider diversification. Since 1991, high forward P/E ratios have preceded long-term S&amp;P 500 performance that was underwhelming at best, and in negative territory at worst.</p>
<h3>S&amp;P 500 Returns Have Been Underwhelming at Current Valuations</h3>
<p><strong>Forward P/E Ratios Relative to Future Annualized Return (8/1991 &ndash; 11/2014)</strong></p>
<p><img loading="lazy" class="img-responsive w-100" alt="S&amp;P 500 Returns Have Been Underwhelming at Current Valuations" src="https://www.vaneck.com/contentassets/abc33b44a9094ee0a131a9acf99f4f7f/5123_moat-performance-diversification_chart-3_2024-12_v1_blog.svg" /></p>
<p class="chart-disclosure">Source: FactSet; Morningstar. Past performance is not a guarantee of future results. Index performance is not illustrative of fund performance. It is not possible to invest in an index.</p>

<h2>Odds Have Been Against Off Benchmark Bets</h2>
<p>This combination of narrow market leadership, high market concentrations and significant investment overlap has put many differentiated investment strategies that diverge from broad-based indexes on unstable ground. Deviating from &ldquo;market weight&rdquo; can clearly put a &ldquo;stock picker&rdquo; at risk of underperformance, and most of these strategies &ndash; think active management, smart beta and fundamental analysis &ndash; have struggled at some point in this cycle.</p>
<p>Looking at the average returns of active vs. passive strategies within Morningstar&rsquo;s mutual fund and ETF dataset, you can see that active management has struggled this year. The average active fund has underperformed passive peers across U.S. large cap categories with the very minor exception of large cap growth funds.</p>
<p>What&rsquo;s telling is that even the average return of &ldquo;passive&rdquo; funds in the Morningstar US Fund Large Blend category, of which S&amp;P 500 Index funds are members, couldn&rsquo;t even keep pace with&hellip; the S&amp;P 500. Active managers have fared even worse.</p>
<h3>2024 Active Management Struggles</h3>
<p><strong>YTD Category Average Returns as of November 2024</strong></p>
<div class="flourish-embed flourish-chart" data-src="visualisation/20658439"><script src="https://public.flourish.studio/resources/embed.js"></script><noscript><img loading="lazy" src="https://public.flourish.studio/visualisation/20658439/thumbnail" width="100%" alt="YTD Category Average Returns as of November 2024" /></noscript></div>
<p class="chart-disclosure">Source: Morningstar. Past performance is not a guarantee of future results. Index performance is not illustrative of fund performance. It is not possible to invest in an index. Active and passive category figures represent average returns for mutual funds and ETFs deemed by Morningstar to be actively managed or index-based funds within their broad US Fund category groups.</p>
<p>So-called &ldquo;smart money&rdquo; is not faring much better. Hedge funds, as represented by the Credit Suisse Hedge Fund Index, have lagged the S&amp;P 500 Index notably. Through October, they posted a return of 8.01% vs. the S&amp;P 500&rsquo;s 20.97%.</p>
<h2>Diversify Your Portfolio with Quality Companies at Attractive Valuations</h2>
<p><a title="MOAT - VanEck Morningstar Wide Moat ETF" href="https://www.vaneck.com/us/en/investments/morningstar-wide-moat-etf-moat/overview/"><strong>VanEck Morningstar Wide Moat ETF (MOAT)</strong></a> seeks to replicate as closely as possible, before fees and expenses the price and yield performance of the Morningstar Wide Moat Focus Index. Its strategy targets high quality companies with durable competitive advantages that are also trading at attractive valuations.</p>
<p>Its focus on attractive valuations is what can give this systematic strategy its contrarian bias by leading it to out-of-favor stocks trading well below their intrinsic value. The strategy has long offered diversification benefits while historically providing a compelling risk/reward profile, in spite of its lack of exposure to mega cap tech and other leading exposures in the S&amp;P 500 Index.</p>
<p>To receive more <a href="/link/467c3d3c4f7d4e4683c5f375a6f1ce99.aspx" title="Moat Investing"><strong>Moat Investing</strong></a> insights, <a href="/link/ae79bb3728364f7995a3d4c4c27fff9a.aspx" title="ETF Newsletter"><strong>sign up to our newsletter</strong></a>.</p>
]]></content:encoded>
</item><item rdf:about="https://www.vaneck.com/us/en/blogs/model-portfolios/monthly-market-recap-trumpmania-2-0/">
  <title>November Market Recap: Trumpmania 2.0></title>
  <link>https://www.vaneck.com/us/en/blogs/model-portfolios/monthly-market-recap-trumpmania-2-0/</link>
  <description><![CDATA["Trump Trade 2.0" fueled U.S. equity and digital asset rallies, while real assets faltered under a strong dollar, with global markets reacting unevenly to pro-growth policies.]]></description>
  <dc:creator>David Schassler</dc:creator>
  <dc:date>12/05/2024 06:30:00</dc:date>
<content:encoded><![CDATA[

<h2>Overview</h2>
<p>November marked a transformative moment for U.S. markets as Donald Trump returned to the White House, igniting what many are calling 'Trump Trade 2.0.' His approach is characterized by an aggressive dismantling of entrenched systems, effectively taking a flamethrower to the establishment. The appointments of high-profile disruptors, such as Elon Musk and Vivek Ramaswamy, signal his intent to upend traditional governance and foster innovation.</p>
<ul class="content-list">
<li><a href="#stocks"><strong>Stocks</strong></a></li>
<li><a href="#bonds"><strong>Bonds</strong></a></li>
<li><a href="#real-assets"><strong>Real Assets</strong></a></li>
<li><a href="#digital-assets"><strong>Digital Assets</strong></a></li>
</ul>
<p>Markets responded swiftly, with U.S. equities surging amid optimism about pro-growth policies. Not all investments reacted favorably as real assets like gold and commodities struggled under a strong dollar, weaker demand expectations and diminishing uncertainty. Global equities and bonds saw more muted or mixed performance as the world adjusted to expectations of change under the new administration.</p>
<p>Digital assets rallied based on Donald Trump&rsquo;s pro-Bitcoin stance. Lyn Alden, one of my favorite investment strategists, posted this picture on X recently:</p>
<p><img loading="lazy" class="img-responsive w-100" alt="Bitcoin All-Time-High Narratives" src="https://www.vaneck.com/contentassets/a6ab8ea994ea41908ceaa931e81a7963/5118_model-portfolios-commentary_chart-1_2024-12_v1_commentary.svg" /></p>
<p class="chart-disclosure">Source: <a href="http://tradingeconomics.com/" title="Trading Economics" target="_blank" rel="noopener"><strong>tradingeconomics.com</strong></a> as of 12/4/2024. Past performance is not indicative of future results.</p>

<p>Bitcoin was doubted at $1, mocked at $100, dismissed at $1k, declared dead at $10k, and pronounced &lsquo;too late&rsquo; at $30k. Here we are now above $100k and the haters are still gonna hate.</p>
<p>Not to be outdone by Lyn Alden, John Ferrick, one of my favorite VanEck salespeople, uses this picture as his digital background for Zoom calls:</p>
<h3>Bitcoin Has Been the Best Performing Asset Class in 8 Out of the Past 11 Years</h3>
<p><img loading="lazy" class="img-responsive w-100" alt="Bitcoin Has Been the Best Performing Asset Class in 8 Out of the Past 11 Years" src="https://www.vaneck.com/contentassets/8a1f6ee0602741a3b92aaf37ccc60dc2/3999_3-reasons_table_2024-01_v1.svg" /></p>
<p class="chart-disclosure">Source: Morningstar, as of 9/30/2024. Bitcoin is represented by MarketVector Bitcoin PR USD; US Equities are represented by the S&amp;P 500 TR USD; Gold is represented by the S&amp;P GSCI Gold Spot; Emerging Markets is represented by Fidelity Emerging Markets TR; Real Estate is represented by the NASDAQ Global Real Estate TR USD; US Bonds are represented by Bloomberg US Aggregate Bond USD; Treasuries are represented by the Bloomberg Aggregate Bond Treasury TR USD; Commodities are represented by the Bloomberg Commodity TR USD.</p>
<p>The simplicity of this chart demonstrates a wildly powerful point: <strong>Bitcoin is consistently the top-performing asset, and we believe it needs to be owned.</strong></p>
<h2 id="stocks" class="anchored-block">Stocks</h2>
<p>U.S. equities rallied in November, driven by expectations of tax cuts, deregulation, and fiscal stimulus. The S&amp;P 500 Index gained 5.87%, with small-cap growth stocks, as measured by the Russell 2000 Growth Index, surging 12.26%. Small cap leadership reflects optimism around domestic-focused policies.</p>
<p>The S&amp;P 500 Index is now trading at a price-to-earnings ratio of over 27. That is significantly above the long-term (30-year) average of 19.7. Over the past 30 years, valuations have only been this high 7.4% percent of the time. The S&amp;P 500 Index is now up nearly 30% year-to-date and 57% over the past two-years. The acceleration of the stock market rally into already stretched valuations leaves it vulnerable to a near-term correction.</p>
<p>Elon Musk&rsquo;s appointment to co-lead the newly formed Department of Government Efficiency (DOGE) amplified investor sentiment. Tesla, emblematic of Musk&rsquo;s disruptive vision, surged 38% during the month, underscoring the renewed investor confidence in sectors tied to innovation and infrastructure. Musk&rsquo;s leadership, paired with biotech entrepreneur Vivek Ramaswamy, highlights the administration&rsquo;s focus on fostering efficiency and forward-thinking industries.</p>
<p>Global equities, however, faced challenges. The MSCI EAFE Index, representing developed international markets, declined 0.55%, while the MSCI Emerging Markets Index fell 3.58%. These declines were driven by a strengthening dollar, trade uncertainty, and slower growth expectations outside the U.S.</p>
<h2 id="bonds" class="anchored-block">Bonds</h2>
<p>Fixed income markets posted modest gains as investors adjusted to the shifting economic outlook. The Bloomberg U.S. Aggregate Bond Index rose 1.09%, benefiting from stable Federal Reserve expectations despite concerns about fiscal stimulus driving inflation. High-yield and corporate bonds outperformed government debt, reflecting increased risk appetite as markets anticipated pro-business policies under the Trump administration.</p>
<h2 id="real-assets" class="anchored-block">Real Assets</h2>
<p>Real assets struggled in November, with gold and commodities facing headwinds. Gold declined 3.67%, pressured by a strong dollar and broad reduction in uncertainty, which diminished its appeal as a hedge.</p>
<p>Commodities were mixed. WTI Crude oil edged down 1.82%, reflecting subdued expectations for global demand despite and increased probability of a cease fire in the Middle East. Copper, often viewed as an economic bellwether, fell sharply by 5.98%, signaling concerns about slowing international growth and potential trade disruptions tied to protectionist U.S. policies.</p>
<h2 id="digital-assets" class="anchored-block">Digital Assets</h2>
<p>Digital assets were among the strongest performers in November, with Bitcoin soaring 39%. This surge reflects growing optimism that the Trump administration will adopt a more favorable stance toward cryptocurrencies. President-elect Trump has signaled plans to remove the crypto-critical SEC Chair Gary Gensler and replace him with a leader more supportive of innovation in digital finance.</p>
<p>The market is also anticipating regulatory easing for cryptocurrency listings, exchanges, and mining operations, which could create a more hospitable environment for the sector. Speculation about a potential national Bitcoin reserve further underscores the administration&rsquo;s openness to integrating digital assets into its financial strategy. These developments have bolstered Bitcoin&rsquo;s role as both a hedge against inflation and a strategic asset.</p>
<h2>Final Thought</h2>
<p>November&rsquo;s market activity reflected the dramatic shift in political and economic expectations tied to Trump&rsquo;s return to power. His governance style&mdash;marked by bold appointments like Musk and Ramaswamy and a commitment to dismantling entrenched systems&mdash;has reshaped market dynamics.</p>
<p>With U.S.-centric assets and digital innovation poised to benefit, investors must remain vigilant in navigating a complex global landscape. As markets recalibrate to 'Trump Trade 2.0,' the focus will be on the administration&rsquo;s ability to deliver on its promises and sustain momentum in an evolving economic environment. Balancing optimism with caution will be key as this new chapter unfolds.</p>
<p>To receive more <strong><a href="https://www.vaneck.com/us/en/insights/guided-allocation/" title="Model Portfolio Insights">Model Portfolio</a></strong> insights, <strong><a href="https://www.vaneck.com/us/en/subscribe/" title="Subscription Center">sign up in our subscription center</a></strong>.</p>
]]></content:encoded>
</item><item rdf:about="https://www.vaneck.com/us/en/blogs/digital-assets/matthew-sigel-vaneck-crypto-monthly-recap-for-november-2024/">
  <title>VanEck Crypto Monthly Recap for November 2024></title>
  <link>https://www.vaneck.com/us/en/blogs/digital-assets/matthew-sigel-vaneck-crypto-monthly-recap-for-november-2024/</link>
  <description><![CDATA[November sparked a crypto revival with Trump&rsquo;s pro-crypto cabinet picks. Ethereum revealed faster block times and quantum-resistant upgrades, while Solana set revenue records amid memecoin mania.]]></description>
  <dc:creator>Matthew  Sigel</dc:creator>
  <dc:date>12/03/2024 08:30:00</dc:date>
<content:encoded><![CDATA[

<p><strong>Please note that VanEck may have a position(s) in the digital asset(s) described below.</strong></p>
<p>November 2024 will be remembered as a pivotal month in digital asset history after the re-election of Donald Trump and his proposed appointment of a half dozen pro-crypto cabinet members. Memecoins led the rally, surging +95% in November, while the MV Equal Weighted 100 Index (+71%) saw rare outperformance. Previous cycle favorites such as Cardano (+201%), Ripple (+225%), Polkadot (+121%), and Stellar (+477%) posted extraordinary gains as retail investors returned to their Coinbase accounts. Ethereum (+43%) and Bitcoin (+37%) continued to climb on the back of increased on-chain activity and evolving technical roadmaps.</p>
<ul class="content-list">
<li class="mt-2"><strong><a href="#eth-update">Ethereum Update and New Roadmap</a></strong></li>
<li class="mt-2"><strong><a href="#solana-update">Solana Update</a></strong></li>
<li class="mt-2"><strong><a href="#notable-performers">Notable Performers &ndash; Cardano, Polkadot</a></strong></li>
</ul>
<p>The favorable post-election regulatory environment in the U.S. has sparked several notable pivots: Binance revealed plans for a high-yield stablecoin, while Consensys, a major Ethereum contributor, announced a token launch for its L2 blockchain in Q2 2025. Ethena announced it will implement a fee switch to provide its ENA token holders with direct distributions of revenues from its application. This move has prompted speculation that other DeFI protocols will follow Ethena&rsquo;s lead, given the improved regulatory environment. For example, L2 projects such as Arbitrum and Starknet proposed enabling native token staking to reward holders.</p>
<p>After years of regulatory uncertainty discouraging value-accrual mechanisms, many projects clearly feel emboldened by the U.S. government&rsquo;s expectations of reduced enforcement actions.</p>
<h3>Price Returns</h3>
<div class="wrapped-div">
<table style="width: 600px;">
<tbody>
<tr class="tbl-data">
<td class="tbl-header last text-center">&nbsp;</td>
<td class="tbl-header last text-right">November (%)</td>
<td class="tbl-header last text-right">YTD (%)</td>
</tr>
<tr class="tbl-data">
<td class="data-td last">MarketVector Meme Coin Index</td>
<td class="data-td data last text-right">+95</td>
<td class="data-td data last text-right">NA</td>
</tr>
<tr class="tbl-data">
<td class="data-td last">MarketVector Digital Asset Broad 100 Equal Weight Index</td>
<td class="data-td data last text-right">+71</td>
<td class="data-td data last text-right">+43</td>
</tr>
<tr class="tbl-data">
<td class="data-td last">Coinbase</td>
<td class="data-td data last text-right">+65</td>
<td class="data-td data last text-right">+70</td>
</tr>
<tr class="tbl-data">
<td class="data-td last">MarketVector Decentralized Finance Leaders Index</td>
<td class="data-td data last text-right">+60</td>
<td class="data-td data last text-right">+20</td>
</tr>
<tr class="tbl-data">
<td class="data-td last">MarketVector Smart Contract Leaders Index</td>
<td class="data-td data last text-right">+59</td>
<td class="data-td data last text-right">+66</td>
</tr>
<tr class="tbl-data">
<td class="data-td last">MarketVector Infrastructure Application Leaders Index</td>
<td class="data-td data last text-right">+55</td>
<td class="data-td data last text-right">+15</td>
</tr>
<tr class="tbl-data">
<td class="data-td last">MV Global Digital Assets Equity Index</td>
<td class="data-td data last text-right">+42</td>
<td class="data-td data last text-right">+83</td>
</tr>
<tr class="tbl-data">
<td class="data-td last">Ethereum</td>
<td class="data-td data last text-right">+42</td>
<td class="data-td data last text-right">+56</td>
</tr>
<tr class="tbl-data">
<td class="data-td last">Bitcoin</td>
<td class="data-td data last text-right">+38</td>
<td class="data-td data last text-right">+129</td>
</tr>
<tr class="tbl-data">
<td class="data-td last">S&amp;P 500 Index</td>
<td class="data-td data last text-right">+6</td>
<td class="data-td data last text-right">+26</td>
</tr>
<tr class="tbl-data">
<td class="data-td last">Nasdaq Index</td>
<td class="data-td data last text-right">+6</td>
<td class="data-td data last text-right">+28</td>
</tr>
</tbody>
</table>
</div>
<br />
<p class="chart-disclosure"><strong>Source:</strong> Bloomberg as of 11/29/2024. <strong>Past performance is no guarantee of future results. Not intended as a recommendation to buy or sell any securities named herein.</strong></p>
<h2 id="eth-update" class="jump-link-nav anchored-block" data-jumplink-title="Ethereum Update">Ethereum Update and New Roadmap</h2>
<h3>Ethereum Blob Space Shows Life</h3>
<div class="flourish-embed flourish-chart" data-src="visualisation/20592966"><script src="https://public.flourish.studio/resources/embed.js"></script><noscript><img loading="lazy" src="https://public.flourish.studio/visualisation/20592966/thumbnail" width="100%" alt="Ethereum Blob Space Shows Life" /></noscript></div>
<p class="chart-disclosure"><strong>Source</strong>: Dune @Hilldobby as of 11/26/2024. <strong>Past performance is no guarantee of future results. Not intended as a recommendation to buy or sell any securities named herein.</strong></p>
<p>ETH (+43%) had a solid month of performance and retraced some of its relative underperformance against BTC (+38%). This performance was catalyzed by a pick-up in on-chain activity and the release of a refined technical roadmap. While Ethereum&rsquo;s revenues from its execution layer were up (+43%) month to month, reaching $6.4M per day, usage of Ethereum&rsquo;s &ldquo;Blobspace&rdquo; showed even more dramatic progress.</p>
<p>Blobspace, Ethereum&rsquo;s data availability layer, is finally receiving the consistent demand necessary to make it a viable &ldquo;business&rdquo; for Ethereum. In November, Ethereum recorded the highest Blobspace monthly fees at around $2.7M. While the number is miniscule next to Ethereum&rsquo;s execution layer revenue, which was $170M, we think the growth is encouraging.</p>
<p>As a reminder, Ethereum created a special &ldquo;layer&rdquo; on its blockchain, allowing Ethereum L2 blockchains to post proofs of each chain&rsquo;s activity. This is necessary because Ethereum L2s are run on a &ldquo;sequencer&rdquo; that does not have many of the safety properties of Ethereum. Because L2s do not have a series of validators checking to make sure each is being honest, but instead a sole sequencer, they need to post proofs of transactions to Ethereum. To encourage scaling, Ethereum decided to make a separate layer that allows L2s to post data to prove honest activity on each L2 cheaply. While this decision scales Ethereum by allowing for cheaper L2 transactions, it has been controversial with some investors because it lowers the demand for ETH to utilize Ethereum.</p>
<p>Ethereum prices Blobspace similarly to how it prices Blockspace, with the cost of using Ethereum related to &ldquo;target&rdquo; demand. Just like Blockspace, if utilization of Ethereum&rsquo;s Blobspace exceeds the target, the cost to L2s goes up exponentially, with each block increasing by 12.5% per consecutive period of usage exceeding the target. In that sense, the costs to L2s to use Blobspace can increase very quickly.</p>
<h3>Blobs Posted Have Increased the Limit of 3 Per Block</h3>
<div class="flourish-embed flourish-chart" data-src="visualisation/20593073"><script src="https://public.flourish.studio/resources/embed.js"></script><noscript><img loading="lazy" src="https://public.flourish.studio/visualisation/20593073/thumbnail" width="100%" alt="Blobs Posted Have Increased the Limit of 3 Per Block" /></noscript></div>
<p class="chart-disclosure"><strong>Source</strong>: Dune @Hilldobby as of 11/27/2024.</p>
<p>However, L2s have been utilizing mechanisms to increase their Blobspace efficiency. L2s now use the entirety of each blob&rsquo;s data before posting, which decreases the total number of blobs they must post. L2s are also working on methods to further compress their transactions' size, in bytes. For example, the &ldquo;optimistic&rdquo; L2s Arbitrum, Base, and Optimism have reduced the data they post per transaction by (-5%), (-37%), and (-67%), respectively, since June 2024. In November, Starknet announced its compression techniques could reduce the amount of data posted by 5x. These choices will result in lower fees paid to Ethereum (revenue from the standpoint of Ethereum and fees from the standpoint of L2s). One class of L2s, called &ldquo;optimistic&rdquo; roll-ups, could further increase data-saving by becoming &ldquo;zero-knowledge&rdquo; roll-ups.</p>
<p>Because L2s are constantly reducing the data they post to Ethereum to counteract the increase in L2 activity, Ethereum Blobspace usage is hovering right around its target. However, with more than 58 L2 roll-ups posting data to Ethereum and that number growing, any meaningful increase in activity may cause Blobspace demand to surpass the target usage. Already, the number of transactions created by major Ethereum L2s has grown (+263%) over the past year alone. If this trend continues, we could see even data posting pressures that will offset L2 countermeasures and lead to much higher prices for Ethereum Blobspace.</p>
<h3>Daily ETH and Major L2s Transactions Reach New Highs</h3>
<div class="flourish-embed flourish-chart" data-src="visualisation/20593115"><script src="https://public.flourish.studio/resources/embed.js"></script><noscript><img loading="lazy" src="https://public.flourish.studio/visualisation/20593115/thumbnail" width="100%" alt="Daily ETH and Major L2s Transactions Reach New Highs" /></noscript></div>
<p class="chart-disclosure"><strong>Source:</strong> Dune @Hilldobby as of 11/27/2024. <strong>Past performance is no guarantee of future results. Not intended as a recommendation to buy or sell any securities named herein.</strong></p>
<h2>Justin Drake Releases New Ethereum Roadmap</h2>
<p>Though it took some time, the Ethereum community finally prodded the &ldquo;devs to do something&rdquo; to spur more positive sentiment for ETH. As previously noted, ETH&rsquo;s price has underperformed in both absolute and relative terms year to date. In November, one of the most important figures in Ethereum, Justin Drake, asserted a concrete vision for Ethereum that includes specific dates for development releases. Called &ldquo;Beam Chain,&rdquo; Drake&rsquo;s vision is a substantial overhaul for Ethereum. Some of the most important features are:</p>
<ol class="content-list">
<li class="mt-2">4-Second Block Production and 12-Second Finality</li>
<li class="mt-2">An Ethereum zk Virtual Machine</li>
<li class="mt-2">Lowered Staking Requirements</li>
<li class="mt-2">Quantum-Computing Resistant Cryptography</li>
<li class="mt-2">Reduce Centralization Factors</li>
</ol>
<p>Speeding up block time and finality is important because it enables a quicker feedback loop for Ethereum users. Justin Drake&rsquo;s new vision is a massive improvement for Ethereum, which currently has block times of 12 seconds and finality of 13 minutes. One of the biggest drawbacks of Ethereum compared to newer blockchains is that performing on-chain activity takes much more time. Ethereum&rsquo;s new speed will also enable new types of applications and quicker interactions between its L2s and the network.</p>
<p>The second point is perhaps the most ambitious and potentially impactful of Drake&rsquo;s Beam Chain vision. Installing a zk Ethereum Virtual Machine (EVM) could increase Ethereum&rsquo;s throughput by 1000x or more. This is possible because an Ethereum zk Virtual Machine would create very large blocks (one block with many transactions). In a zk EVM environment, validators could build very large blocks and only send a fraction of the block&rsquo;s data for other validators to confirm. This should also lead to even faster block times while enabling validators to differentiate based on their ability to process large blocks.</p>
<h3>ETH/BTC Ratio Holds 0.3x</h3>
<div class="flourish-embed flourish-chart" data-src="visualisation/20593542"><script src="https://public.flourish.studio/resources/embed.js"></script><noscript><img loading="lazy" src="https://public.flourish.studio/visualisation/20593542/thumbnail" width="100%" alt="ETH/BTC Ratio Holds 0.3x" /></noscript></div>
<p class="chart-disclosure"><strong>Source:</strong> Artemis XYZ as of 11/26/2024. <strong>Past performance is no guarantee of future results. Not intended as a recommendation to buy or sell any securities named herein.</strong></p>
<p>Lowered staking requirements are fascinating because they enable decentralization while creating the potential for larger validators to process many more transactions. This would lead to different tiers of validators, with lower-tier ones simply verifying the authenticity of blocks.</p>
<p>Meanwhile, Drake&rsquo;s focus on quantum computer-resistant cryptography and centralization reduction will help make Ethereum viable in the long term. Quantum computers promise to break Ethereum&rsquo;s cryptography, which protects its entire blockchain, and Drake&rsquo;s plan will navigate this challenge by implementing new protections. On the second point, Drake intends to create a set of incentives and rules to make the Ethereum block-building ecosystem less concentrated in a few powerful entities. At the time of writing, around 88% of all blocks are built on Ethereum by two entities. Over the long run, these producers can be persuaded by legal or financial incentives to censor transactions. So, it is in Ethereum&rsquo;s best interest to expand its set of blockbuilders.</p>
<p>Perhaps the most important takeaway for ETH investors is that the Ethereum Foundation, Ethereum's research and implementation backbone, is now focused on scaling Ethereum&rsquo;s execution environment. Previously, Ethereum was more focused on scaling its system through L2s. As we previously mentioned, the flaw with that design is that it siphons blockchain activity away from Ethereum&rsquo;s Mainnet. Activity on L2 reduces the demand for Ethereum users to consume ETH, and part of ETH&rsquo;s economics (token go up) is driven by these users.</p>
<h3>Mainnet Fees in ETH (100-Day Moving Average)</h3>
<div class="flourish-embed flourish-chart" data-src="visualisation/20593142"><script src="https://public.flourish.studio/resources/embed.js"></script><noscript><img loading="lazy" src="https://public.flourish.studio/visualisation/20593142/thumbnail" width="100%" alt="Mainnet Fees in ETH (100-Day Moving Average)" /></noscript></div>
<p class="chart-disclosure"><strong>Source:</strong> Artemis XYZ as of 11/26/2024. <strong>Past performance is no guarantee of future results. Not intended as a recommendation to buy or sell any securities named herein.</strong></p>
<p>Besides reducing demand for ETH, activity on L2s remits transaction fees to L2 sequencers. These sequencers are run by L2 teams who must return capital to investors and drive value to their own tokens. Therefore, they are more likely to sell the collected ETH than ETH validators. Most importantly, however, L2 base fees are not burned on L2s as they are on Ethereum. Thus, substantial amounts of value accrual to ETH are lost because there is less buying pressure, more selling pressure, and less burn of ETH supply.</p>
<p>While Ethereum&rsquo;s focus on bringing more activity to its mainnet is promising, the slow rollout of updates in Justin Drake&rsquo;s roadmap raises some concerns. Upgrading a $400B blockchain understandably takes time, but a quicker pace is crucial to maintain competitiveness. With the proposed changes spanning until 2029, Ethereum risks losing ground to emerging blockchains with superior technology. Moreover, many planned updates rely on existing technologies, making their delayed implementation particularly frustrating for some in the community. Ethereum&rsquo;s ultimate goal, or "North Star," is to rival Bitcoin as the world&rsquo;s most important digital asset. Achieving this requires "ossification"&mdash;a finalized state with immutable economics. The sooner Ethereum reaches this state, the better positioned it will be to outcompete BTC (if that is the goal).</p>
<h2 id="solana-update" class="jump-link-nav anchored-block" data-jumplink-title="Solana Update">Solana Update</h2>
<h3>Solana Memecoin Mania Continues</h3>
<div class="flourish-embed flourish-chart" data-src="visualisation/20593566"><script src="https://public.flourish.studio/resources/embed.js"></script><noscript><img loading="lazy" src="https://public.flourish.studio/visualisation/20593566/thumbnail" width="100%" alt="Solana Memecoin Mania Continues" /></noscript></div>
<p class="chart-disclosure"><strong>Source:</strong> Artemis XYZ as of 11/27/2024. <strong>Past performance is no guarantee of future results. Not intended as a recommendation to buy or sell any securities named herein.</strong></p>
<p>In November, Solana produced another stellar month with returns of (+42%), with the SOL token reaching an all-time high of $262. The positive price action was partly driven by the exceptional on-chain trading activity of memecoins. Thus, Solana's revenues and DEX volumes hit monthly all-time highs in November. In fact, Solana&rsquo;s $177M in revenues generated in November is double the previous high recorded in October 2024 of $74M. The flurry of on-chain activity also translated into record revenue levels for the important Solana MEV project Jito and memecoin application Pump.fun. In November, Jito made $185M in revenues while Pump.fun earned over $92M in revenues. While Pump.fun takes revenue directly from memecoin trading on its application, Jito earns fees when MEV occurs on validators who run Jito&rsquo;s software.</p>
<p>As a reminder, MEV, or &ldquo;maximal extracted value,&rdquo; is the total value generated by arbitrage opportunities resulting from on-chain DEX trading. MEV is similar to high-frequency trading profits as both profits from speculators giving up the &ldquo;edge&rdquo; to make trades. Because crypto trading is more inefficient than trading in traditional finance, MEV can take significant shares of a transaction&rsquo;s value. In many cases, MEV can be 0.1% of a trade&rsquo;s value and as high as 10%, depending upon the volatility of the asset traded. Jito is an on-chain application that creates a market for entities to bid on MEV rights and remits 95% of market revenues to validators (and their stakers) who run Jito&rsquo;s software.</p>
<p>Due to Solana activity, popular Solana crypto wallet Phantom claimed the #1 spot in the Apple app store category for &ldquo;free utility apps.&rdquo; The positive news accelerated for Solana with Robinhood reinstating trading of SOL on Robinhood&rsquo;s popular trading application. Adding a catalyst for future on-chain trading activity, the popular NFT project Magic Eden announced that its token would be airdropped in December 2024. Meanwhile, many investors are anticipating the official announcement of a U.S. spot ETP for SOL including VanEck who has sponsored an ETP filing.</p>
<h2 id="notable-performers" class="jump-link-nav anchored-block" data-jumplink-title="Notable Performers">Notable Performers &ndash; Cardano&rsquo;s ADA (+201%), Polkadot&rsquo;s DOT (+121%)</h2>
<h3>Cardano Policy and Governance Spark a Major Rally</h3>
<div class="flourish-embed flourish-chart" data-src="visualisation/20593627"><script src="https://public.flourish.studio/resources/embed.js"></script><noscript><img loading="lazy" src="https://public.flourish.studio/visualisation/20593627/thumbnail" width="100%" alt="Cardano Policy and Governance Spark a Major Rally" /></noscript></div>
<p class="chart-disclosure"><strong>Source</strong>: Artemis XYZ as of 11/29/2024. <strong>Past performance is no guarantee of future results. Not intended as a recommendation to buy or sell any securities named herein.</strong></p>
<p>Cardano&rsquo;s ADA was one of the month's biggest winners (+201%). We attribute Cardano&rsquo;s rally to off-chain developments and speculation on Cardano&rsquo;s founder&rsquo;s role in determining future crypto policy. Initially, ADA&rsquo;s rally in the wake of Trump&rsquo;s presidential victory was relatively tepid as it moved (+8%) from November 5th to November 6th. However, Cardano&rsquo;s ADA took off with gusto following Cardano founder Charles Hoskinson&rsquo;s announcement on November 9 that he would be working with the US government to formulate crypto policy. As part of his initiative to drive engagement, Charles Hoskinson announced he will open a crypto policy office in Washington, DC. The result was a (+40%) rally on the news in a day. The momentum, led by retail traders, continued when Robinhood decided to relist ADA on November 13. Finally, on November 21, Cardano released an update to its constitution that addressed lingering issues in the community. Some key takeaways include:</p>
<ol class="content-list">
<li class="mt-2">Cardano&rsquo;s governance will be conducted on-chain by ADA holders who can propose and vote on governance actions.</li>
<li class="mt-2">Cardano&rsquo;s treasury will have a spending limit to ensure its long-term sustainability.</li>
<li class="mt-2">Cardano will continue important upgrades like post-quantum computing security while remaining decentralized.</li>
</ol>
<p>From the standpoint of on-chain usage statistics, Cardano&rsquo;s price seems to have been the catalyst of on-chain activity rather than the reverse. Cardano&rsquo;s TVL surged (+180%) in November as many Cardano project tokens rallied, which fed back to Cardano&rsquo;s DeFI TVL. The amount of stablecoins hosted on Cardano and daily average DEX volumes also increased significantly in November (+28%) and (+300%) respectively. However, the absolute amount of stablecoins and daily DEX volumes on Cardano remain small, with only $23M and $12.5M, respectively. These figures compare to Ethereum&rsquo;s, which averages around $100B in stablecoins and $3B in daily DEX turnover. Curiously, despite Cardano&rsquo;s long tenue, live since 2017, it does not host major stablecoins like Tether&rsquo;s USDT and Circle&rsquo;s USDC on its chain. In fact, each of Cardano&rsquo;s stablecoins are projects that only deploy to Cardano. While this presents a current pain point for Cardano users, it also represents a catalyst engine for future Cardano growth.</p>
<h3>Polkadot Announces JAM, DOT (+121%) in November</h3>
<div class="flourish-embed flourish-chart" data-src="visualisation/20593672"><script src="https://public.flourish.studio/resources/embed.js"></script><noscript><img loading="lazy" src="https://public.flourish.studio/visualisation/20593672/thumbnail" width="100%" alt="Polkadot Announces JAM, DOT (+121%) in November" /></noscript></div>
<p class="chart-disclosure"><strong>Source</strong>: Artemis XYZ as of 11/29/2024. <strong>Past performance is no guarantee of future results. Not intended as a recommendation to buy or sell any securities named herein.</strong></p>
<p>Polkadot has been one of the most frustrating ecosystems in crypto over the past 5 years. Polkadot was launched, with much acclaim, in 2020 and promised to be a technological leap over other smart contract platforms. This is because its sharded design would scale through &ldquo;para-blockchains,&rdquo; similar to the concept of Ethereum L2s. One advantage of Polkadot&rsquo;s system was that these connecting blockchains would be interoperable through Polkadot&rsquo;s &ldquo;Relay Chain.&rdquo; However, technical hick-ups and a snail-like onboarding pace for parachains caused Polkadot&rsquo;s ecosystem to implode. As Polkadot could not seize many users during the bull market of 2020-2021, projects deployed to Polkadot withered into irrelevance. While &ldquo;alt-chain&rdquo; Ethereum competitors such as Avalanche and Solana reached 90K and 600k daily active addresses by November 2021, Polkadot averaged 9k daily active addresses in that same month. Polkadot&rsquo;s lethargic go-to-market strategy persisted through the bear markets of 2022 and 2023. At the time of writing, Polkadot averaged only 8k daily active addresses in the month of November 2024.</p>
<p>Against this unencouraging backdrop, Polkadot&rsquo;s rally in November surprised many market participants. However, Polkadot and projects on its chain have progressed towards a more vibrant ecosystem. Currently, one of the most popular chains hosted on Polkadot is the Mythos Chain, a gaming and entertainment blockchain. Mythos hosts the popular game NFL Rivals, a trading card game similar to NFL Fantasy Football. In mid-November, Mythos announced that it would be launching a similar game in partnership with FIFA.</p>
<p>One of Polkadot's most interesting developments came from the recent Sub0 conference, where Gavin Wood gave an update to his vision for Polkadot&rsquo;s blockchain. Called JAM, Wood intends for a more agile Polkadot architecture that allows off-chain applications and blockchains to utilize Polkadot. Essentially, this will allow Polkadot to offer cloud-like services for projects that want to use permissionless blockchains for data security, resiliency, and decentralization. From investors' standpoint, this will allow Polkadot to compete with projects like Ethereum, Celestia, and other modular stack projects for applications. With JAM, a crypto project can offload its transaction to Polkadot&rsquo;s execution and data storage layers. So, for example, an application that utilizes another Chain&rsquo;s infrastructure could off-board components of its processing to Polkadot for cheaper pricing. Polkadot intends to launch this feature, called CoreVM, in 1Q2025.</p>
<h3>DeFi Blue-Chips Keep Pace: <strong>Aave (+42%), Uniswap (+64%), and MakerDAO (+42%)</strong></h3>
<p><img loading="lazy" class="img-responsive w-100" alt="DeFi Blue-Chips Keep Pace: Aave (+42%), Uniswap (+64%), and MakerDAO (+42%)" src="https://www.vaneck.com/contentassets/28caeed34b2a4b2583fbc6fed58841a1/5110_crypto-monthly_chart-9_2024-12_v1_blog.svg" /></p>
<p class="chart-disclosure"><strong>Source:</strong> Token Terminal as of 12/02/2024. <strong>Past performance is no guarantee of future results. Not intended as a recommendation to buy or sell any securities named herein.</strong></p>
<p>Large-cap DeFi protocols showed strength in November, as Aave, Uniswap, and Sky (formerly MakerDAO) delivered significant price gains through fundamental activity and broader market catalysts. Compared to average monthly fees from Q1 2023, Uniswap&rsquo;s, Aave&rsquo;s, and Sky&rsquo;s (formerly MakerDAO) November fees are up 120%, 544%, and 736%, respectively.</p>
<p>Increases in these protocols&rsquo; fees signal healthy growth in DeFi activity. Lending and borrowing activity on Aave surged amid heightened market volatility. Aave&rsquo;s fees are primarily driven by interest paid by borrowers, a portion of which is collected as protocol revenue (the Reserve Factor). Higher market activity and leverage demand translate directly into increased fee generation for the protocol. Uniswap, on the other hand, generates fees from trading activity on its decentralized exchange, where liquidity providers collect a small percentage of each trade. As Uniswap remains the dominant decentralized exchange in the Ethereum ecosystem, its fee growth reflects a resurgence in Ethereum-based trading volumes. Meanwhile, Sky primarily derives its fees from interest charged on its overcollateralized DAI stablecoin loans, as well as liquidation penalties during periods of market volatility.</p>
<p>In other fundamental developments, Aave crossed $30 billion in deposits in November&mdash;an achievement noted by Bitwise CEO Hunter Horsley, would rank it as the 64th largest U.S. bank by deposits if it were a traditional institution. Aave governance also proposed a partnership with Bitcoin-based Spiderchain this month, setting the stage to tap into Bitcoin liquidity through its nascent L2 ecosystem. Sentiment for DeFi more broadly was buoyed by positive market reactions to Trump&rsquo;s presidential election win, which is perceived as favorable for crypto-friendly policy. On November 6<sup>th</sup>, the day after Trump&rsquo;s election, AAVE and UNI gained 28% and 29%, respectively.</p>
<p>Uniswap&rsquo;s November performance was further bolstered by a landmark U.S. Fifth Circuit Appeals Court decision. The ruling, which declared immutable smart contracts like Tornado Cash&rsquo;s to be beyond the scope of traditional sanctions, overturned OFAC&rsquo;s sanctions. Arguably, this strengthens Uniswap&rsquo;s market position by setting a promising precedent on the legality of autonomous DeFi protocols. The market responded favorably, with Uniswap gaining 25% in market capitalization ($2.68 billion) the day after the announcement. For context, TORN, the native token of Tornado Cash, rose 1000% that day, from a $19M market cap to $187M. The Fifth Circuit&rsquo;s ruling underscores the importance of credibly immutable infrastructure, vindicating good-faith DeFi builders systematically intimidated for years through regulation by enforcement and debanking.</p>
<p><strong>Links to third party websites are provided as a convenience and the inclusion of such links does not imply any endorsement, approval, investigation, verification or monitoring by us of any content or information contained within or accessible from the linked sites. By clicking on the link to a non-VanEck webpage, you acknowledge that you are entering a third-party website subject to its own terms and conditions. VanEck disclaims responsibility for content, legality of access or suitability of the third-party websites.</strong></p>
<style>
    .data-td.data {
        padding-right: 5px !important;
    }
    
    .wrapped-div {
        max-width: 100%;
    }
    
    @media (max-width: 1240px) {
        .wrapped-div {
            overflow-x: scroll;
        }
    }
    
    .wrapped-div-sector {
        max-width: 100%;
        overflow-x: scroll;
    }
    .flourish-credit {
        display: none !important;
    }
</style>
<p>To receive more <strong><a href="https://www.vaneck.com/us/en/insights/digital-assets/" title="Digital Assets Insights">Digital Assets</a></strong> insights, <strong><a href="https://www.vaneck.com/us/en/subscribe/" title="Subscription Center">sign up in our subscription center</a></strong>.</p>
]]></content:encoded>
</item><item rdf:about="https://www.vaneck.com/us/en/blogs/digital-assets/matthew-sigel-how-el-salvador-became-latin-americas-comeback-story/">
  <title>How El Salvador Became Latin America’s Comeback Story></title>
  <link>https://www.vaneck.com/us/en/blogs/digital-assets/matthew-sigel-how-el-salvador-became-latin-americas-comeback-story/</link>
  <description><![CDATA[El Salvador&rsquo;s bold Bitcoin bet and sweeping reforms are turning it into Latin America&rsquo;s ultimate comeback story.]]></description>
  <dc:creator>Matthew  Sigel</dc:creator>
  <dc:date>11/25/2024 06:30:00</dc:date>
<content:encoded><![CDATA[

<p><strong>Please note that VanEck has exposure to bitcoin and Salvadoran sovereign debt.</strong></p>
<p><em>Special thanks to our EM Bond team for their perspective and contributions to this article. </em></p>
<h2>Introduction</h2>
<p>El Salvador has undergone a remarkable transformation under President Nayib Bukele, emerging as a beacon of innovation and resilience in Latin America. From adopting Bitcoin as legal tender to enacting sweeping fiscal and social reforms, the nation has defied global skepticism. VanEck recognized this potential <strong><a href="/link/7dca9d41e9e94a3b9875b48b58197366.aspx" title="Dispatch from El Salvador&rsquo;s Bitcoin Beach: The ESG View">early</a></strong> and made investments in Salvadoran sovereign debt. Despite the fierce rally in these assets, we estimate the nation&rsquo;s just-issued 30-year bond is still priced 200 basis points cheap compared to its fair value, with projected returns exceeding 33% over the next year should spreads narrow to our target.</p>
<p>During our visit to San Salvador last week to meet President Bukele and speak at the &ldquo;Adopting Bitcoin&rdquo; conference, we re-explored the ambitious vision driving El Salvador's future as the <i>"Singapore of Latin America."</i></p>
<ul class="content-list">
<li class="mt2"><a href="#el-salvador-challenges"><strong>El Salvador&rsquo;s Challenges</strong></a></li>
<li class="mt2"><a href="#bukele-turning-point"><strong>Bukele&rsquo;s Turning Point</strong></a></li>
<li class="mt2"><a href="#bitcoin-bold-role"><strong>Bitcoin&rsquo;s Bold Role</strong></a></li>
<li class="mt2"><a href="#el-salvador-vision"><strong>El Salvador&rsquo;s Vision</strong></a></li>
<li class="mt2"><a href="#energy-as-growth-fuel"><strong>Energy as Growth Fuel</strong></a></li>
<li class="mt2"><a href="#imf-and-us-relations"><strong>IMF and U.S. Relations</strong></a></li>
<li class="mt2"><a href="#contrarian-ppportunity"><strong>A Contrarian Opportunity</strong></a></li>
<li class="mt2"><a href="#closing-thoughts"><strong>Closing Thoughts</strong></a></li>
</ul>
<h2 id="el-salvador-challenges" class="anchored-block">El Salvador&rsquo;s Past: Challenges and Stagnation</h2>
<p>For decades after its 1979-1992 civil war, El Salvador faced crippling challenges:</p>
<p>Economic Struggles: National debt grew from 37.8% of GDP in 2001 to 95% by 2020, while economic growth averaged just 2%&mdash;the second-lowest in Central America.</p>
<p>High Crime Rates: Persistent violence and gang activity made El Salvador one of the most dangerous countries in the world, stifling investment and social cohesion.</p>
<p>Brain Drain and External Migration: Decades of instability prompted the migration of over 1.6 million Salvadorans abroad, primarily to the United States. This external migration hollowed out the local labor force and left the newly dollarized economy heavily reliant on remittances for hard currency, which at the peak accounted for 25% of GDP&mdash;approximately $8 billion annually.</p>
<h2 id="bukele-turning-point" class="jump-link-nav anchored-block" data-jumplink-title="Bukele&rsquo;s Turning Point">Bukele&rsquo;s Reforms: A Turning Point</h2>
<p>Since his election in 2019, President Bukele has reshaped El Salvador with sweeping reforms, and the economy has seen significant gains.</p>
<p>Crime Reduction: Homicide rates plummeted from 51 per 100,000 in 2018 to just 2.4 in 2023, transforming El Salvador into the safest country in Central and South America.</p>
<p>During VanEck&rsquo;s due diligence process, conversations with local taxi drivers revealed how Bukele&rsquo;s crackdown on gangs has profoundly improved daily life for ordinary Salvadorans. Many drivers emphasized that they no longer must pay &ldquo;protection money&rdquo; to criminal groups, a burden previously consuming a significant portion of their income. More than one driver shared that his children can now play soccer outside in the evenings without fear&mdash;something unimaginable just a few years ago. These stories strengthened our conviction by highlighting how reduced crime is not just a statistic but a tangible, transformative GDP multiplier for families and communities across the country.</p>
<p>Fiscal Discipline: Debt-to-GDP dropped to 59% in 2024, its lowest since 2008, thanks to $2.3 billion in sovereign bond refinancing and prudent budgetary measures.</p>
<p>GDP Growth: Between 2021 and 2023, GDP grew 19%, a significant acceleration compared to pre-2019 averages.</p>
<p>Tourism: The sector&rsquo;s GDP share rose from 11.7% in 2019 to 12.3% in 2023. From January to July 2024, inbound visitors surged 22% year over year, creating 36,000 new jobs and reducing unemployment to 2.76%.</p>
<p>Labor Force Participation: Participation reached 64.4%, the highest in El Salvador&rsquo;s history.</p>
<p>This set of catalysts has prompted Moody&rsquo;s to upgrade El Salvador&rsquo;s sovereign debt from Caa3 in May 2022 to Caa1 in May 2024 and S&amp;P to raise its rating from CCC+ in June 2022 to B- in November 2023. S&amp;P reaffirmed its B- rating with a "stable" outlook in April 2024. While these ratings are still considered &ldquo;Junk,&rdquo; their positive direction affirms El Salvador&rsquo;s strategy for financial renewal. We expect the ratings agencies to follow bond prices higher and upgrade ES debt further soon.</p>
<h3>Cumulative GDP Growth in Select Latin American Countries 2021 - 2023</h3>
<div class="flourish-embed flourish-chart" data-src="visualisation/20420802"><script src="https://public.flourish.studio/resources/embed.js"></script><noscript><img loading="lazy" src="https://public.flourish.studio/visualisation/20420802/thumbnail" width="100%" alt="Cumulative GDP Growth in Select Latin American Countries 2021 - 2023" /></noscript></div>
<p class="chart-disclosure">Source: World Bank as of 11/7/2024.</p>
<h2 id="bitcoin-bold-role" class="jump-link-nav anchored-block" data-jumplink-title="Bitcoin&rsquo;s Bold Role">Bitcoin: A Bold Experiment</h2>
<p>In June 2021, a supermajority of the Salvadoran Congress passed legislation making Bitcoin legal tender alongside the U.S. dollar. The government envisioned Bitcoin as a tool to encourage foreign investment, expand financial inclusion for the unbanked, and provide the nation with an uncorrelated reserve asset. The government offered $30 in Bitcoin to citizens who downloaded the Chivo Wallet to promote adoption. Research by Yale in February 2022 revealed that 68% of households were aware of the Chivo Wallet, and 78% of those had downloaded it.</p>
<p>By 2024, 8% of Salvadorans have used Bitcoin to make payments. While some international observers initially viewed this as a modest figure, we believe it represents a meaningful step forward for a country with historically low rates of electronic payment adoption. The integration of Bitcoin into daily life is creating a foundation for broader acceptance and innovation in financial technology.</p>
<p>El Salvador has also embraced Bitcoin as a reserve asset, holding 6,150 BTC, currently valued at ~$600 million with $150 million in unrealized gains. This sum currently represents 1.6% of the nation&rsquo;s GDP of $36 billion, underscoring the government&rsquo;s commitment to Bitcoin as a reserve asset. For comparison&rsquo;s sake, if the U.S. were to authorize a Bitcoin reserve of 1 million BTC at an average price of $150,000, under legislation that Wyoming Senator Cynthia Lummis has introduced, the reserve would be worth $150 billion, representing only 0.57% of the U.S.&rsquo;s GDP of $26.3 trillion.</p>
<h3>El Salvador's Bitcoin Worth &gt;$600M</h3>
<div class="flourish-embed flourish-chart" data-src="visualisation/20421556"><script src="https://public.flourish.studio/resources/embed.js"></script><noscript><img loading="lazy" src="https://public.flourish.studio/visualisation/20421556/thumbnail" width="100%" alt="El Salvador's Bitcoin Worth &gt;$600M" /></noscript></div>
<p class="chart-disclosure">Source: El Salvador Wallet Tracker, Artemis XYZ as of 11/21/24.</p>
<p>El Salvador&rsquo;s Bitcoin strategy extends beyond reserves. There are plans for $1 billion &ldquo;Volcano Bonds&rdquo;, half of whose proceeds would buy Bitcoin, aim to fund the development of Bitcoin City, a futuristic economic zone powered entirely by geothermal energy. This city is designed to attract international investment and innovation with zero taxes on income, property, or capital gains. Additionally, the government offers a &ldquo;Freedom Visa&rdquo; program, which grants citizenship to individuals who donate $1 million to the nation&rsquo;s development efforts.</p>
<p>While the Volcano Bonds have yet to be issued, the delay reflects a combination of strategic prudence&mdash;avoiding additional debt issuance in a high-interest rate environment&mdash;and geopolitical considerations as the government navigates sensitive negotiations with the IMF. By demonstrating fiscal restraint and prioritizing debt reduction, El Salvador strengthens its negotiating position while maintaining the option to issue the bonds under more favorable conditions in the future.</p>
<h2 id="el-salvador-vision" class="anchored-block">The Vision for El Salvador</h2>
<p>During our meeting with President Bukele, he outlined bold but achievable goals to position El Salvador as a hub for nearshoring U.S. export capacity. Pro-growth policies, including economic "free zones," aim to attract multinationals in auto parts and tech manufacturing sectors by offering tax-free value-added operations. These initiatives are already luring investment, supported by a deregulated energy market and infrastructure improvements.</p>
<p>Bukele also highlighted El Salvador&rsquo;s substantial untapped gold reserves, which he described as the largest per capita and per square mile in the world. These deposits represent an enormous economic opportunity, but the previous leftist government banned mining activities in 2017. Bukele expressed his intent to reverse this law, citing the potential to extract the metal responsibly while adhering to modern environmental and sustainability standards.</p>
<p>The president extended an invitation to VanEck&rsquo;s gold geologists to research the deposits, signaling his administration&rsquo;s willingness to collaborate with global experts to unlock this resource. If successful, gold mining could contribute to El Salvador&rsquo;s economic transformation, adding another layer to the country&rsquo;s diversification efforts.</p>
<p><img loading="lazy" class="img-responsive w-100" alt="Matthew Sigel and El Salvador's President Bukele" src="https://www.vaneck.com/contentassets/a97704121778404bae009c88b4a46fc7/5081_el-salvador-bitcoin-blog_image-1_2024-11_v2.jpg" /></p>
<p class="chart-disclosure">The author and President Bukele, as of 11/15/2024.</p>
<h2 id="energy-as-growth-fuel" class="anchored-block">Energy as a Catalyst for Growth</h2>
<p>Expanding energy capacity is central to El Salvador&rsquo;s economic strategy. During our meeting with a senior government official in the president&rsquo;s office tasked with coordinating between the state electricity company and private enterprises, key insights were shared about the nation&rsquo;s energy landscape and its potential to attract high-tech industries:</p>
<p>Current Energy Landscape:</p>
<p>Peak baseload demand: 1.2 GW; installed capacity: 2.5 GW.</p>
<p>Renewable energy (700 MW) includes geothermal, hydro, and one wind plant.</p>
<p>Base power is primarily hydro and geothermal, with bunker and natural gas providing 380 MW.</p>
<p>Planned Developments:</p>
<p>By 2035, El Salvador aims to expand geothermal energy capacity with six or seven new 50 MW plants.</p>
<p>A $1 billion government investment will fund energy projects over five years, with 15% of new generation reserved for government use.</p>
<p>While $0.16/kWh for industrial power isn&rsquo;t cheap, the senior official noted that this price is manageable for high-margin data center customers. This is particularly true given El Salvador&rsquo;s unique direct undersea cable access with 30-millisecond latency hops to Miami. According to the official we met, this connectivity, combined with the government&rsquo;s tax incentives, positions El Salvador as a competitive destination for data centers and AI-focused operations.</p>
<p>El Salvador&rsquo;s diversified energy strategy contrasts with neighboring Costa Rica, which faced energy shortages in 2023 due to its over-reliance on renewable energy sources like hydropower. Costa Rica's inability to meet demand during a dry season highlighted the risks of disconnecting fossil fuel-powered electricity generation &ndash; which they did for &ldquo;green&rdquo; purposes - without ensuring sufficient backup generation. In contrast, we think El Salvador&rsquo;s mix of geothermal, hydro, and natural gas may provide a more resilient energy portfolio capable of supporting industrial and technological growth.</p>
<p>Although no El Salvador data center customers had been announced at the time of publication, we heard confidence that agreements would be finalized soon, with companies drawn to the country's infrastructure, reliability, and policy advantages. Initiatives like the private Volcano Energy (23% owned by the El Salvador Government), which drives geothermal energy expansion for Bitcoin mining, further enhance El Salvador&rsquo;s potential crossover appeal for Bitcoin miners and other industries with long-term needs for sustainable and secure power.</p>
<h2 id="imf-and-us-relations" class="anchored-block">Relations with the IMF and the U.S.</h2>
<p>El Salvador&rsquo;s bold Bitcoin policy and fiscal reforms have complicated its relationships with international stakeholders, particularly the IMF and the U.S. During the Biden administration, diplomatic relations were strained. Sanctions were imposed on key Salvadoran officials, and human rights groups pressured the U.S. to take a tougher stance on the nation&rsquo;s aggressive anti-crime policies. As El Salvador remains heavily reliant on remittances&mdash;$8 billion annually, or 24% of GDP&mdash;primarily from the U.S., maintaining a strong bilateral relationship is critical.</p>
<p>The Biden administration&rsquo;s approach has created significant headwinds, but a Trump presidency offers the potential for a reset. With Trump&rsquo;s well-documented support for Bitcoin and focus on reshoring and &ldquo;friend-shoring&rdquo; supply chains, El Salvador could emerge as a strategic partner in U.S. efforts to build regional alliances. Trump advisors&rsquo; recent visit to El Salvador in June 2024, warmly received by the Bukele administration, has fueled speculation of closer cooperation in areas such as manufacturing, energy, migration, and Bitcoin mining.</p>
<p>The IMF&rsquo;s role remains central to El Salvador&rsquo;s financial trajectory. Many believe the IMF is keen to secure a deal before the Trump administration takes office, fearing that a shift in U.S. policy could alter the negotiation dynamics. The release of El Salvador&rsquo;s 2025 budget&mdash;a more austere spending plan designed to address the IMF&rsquo;s preconditions&mdash;has been seen as a move to improve the likelihood of aid. However, Bukele&rsquo;s subsequent major bond amortization isn&rsquo;t due until 2027, which gives him considerable room to negotiate without immediate pressure. Why hurry to negotiate when the IMF&rsquo;s position may change upon Trump&rsquo;s inauguration?</p>
<h2 id="contrarian-ppportunity" class="jump-link-nav anchored-block" data-jumplink-title="A Contrarian Opportunity">Investment Opportunity: A Contrarian Call</h2>
<p>VanEck&rsquo;s early recognition of El Salvador&rsquo;s potential has been validated with many of the bonds more than doubling from their 2022 lows.</p>
<p>Bond Valuation: We still estimate El Salvador&rsquo;s 30-year sovereign bond is priced 200 basis points cheap to fair value.</p>
<p>Projected Returns: If reforms continue as expected and spreads narrow to our fair value target, we anticipate a total return exceeding 33% in the next year.</p>
<h3>Since BTC Purchase, Salvadoran Debt (+18%)</h3>
<div class="flourish-embed flourish-chart" data-src="visualisation/20426311"><script src="https://public.flourish.studio/resources/embed.js"></script><noscript><img loading="lazy" src="https://public.flourish.studio/visualisation/20426311/thumbnail" width="100%" alt="Since BTC Purchase, Salvadoran Debt (+18%)" /></noscript></div>
<p class="chart-disclosure">Source: Bloomberg as of 11/8/2024.</p>
<h2 id="closing-thoughts" class="anchored-block">Conclusion</h2>
<p>El Salvador&rsquo;s transformation is a testament to bold policymaking and resilience. From fiscal reforms to Bitcoin adoption and energy innovation, the nation has defied global skepticism and achieved measurable success&mdash;whether through USD bond performance, GDP growth, or Bitcoin valuation, boosting its reserves. To date, these achievements have resulted from El Salvador&rsquo;s independent and often solitary efforts, pursued in the face of opposition from major international stakeholders, including the IMF and its largest shareholder, the U.S.</p>
<p>Now, however, the landscape may be shifting. As the potential for closer cooperation with the U.S. grows and IMF engagement becomes more likely, El Salvador is poised to move from a solitary pursuit of its goals to a collaborative one. This emerging tailwind of international support could remove one of the country&rsquo;s final hurdles, enabling it to achieve even greater economic integration and stability. For investors, this makes El Salvador&rsquo;s sovereign debt a compelling opportunity. We believe Bukele&rsquo;s Bitcoin gambit can serve as a model of innovation, determination, and independence for the emerging world.</p>
<p>To receive more <strong><a href="https://www.vaneck.com/us/en/insights/digital-assets/" title="Digital Assets Insights">Digital Assets</a></strong> and <a href="https://www.vaneck.com/us/en/insights/emerging-markets-bonds/" title="Emerging Markets Bonds Insights"><strong>Emerging Markets Bonds</strong></a> insights, <strong><a href="https://www.vaneck.com/us/en/subscribe/" title="Subscription Center">sign up in our subscription center</a></strong>.</p>
<style>
    .flourish-credit {
        display: none !important;
    }
</style>
]]></content:encoded>
</item><item rdf:about="https://www.vaneck.com/us/en/blogs/thematic-investing/buzz-investing-election-sparks-trump-trade-rally/">
  <title>BUZZ Investing: Election Sparks &#39;Trump Trade&#39; Rally></title>
  <link>https://www.vaneck.com/us/en/blogs/thematic-investing/buzz-investing-election-sparks-trump-trade-rally/</link>
  <description><![CDATA[Trump's election win spurred market optimism, driving rallies in equities, crypto, and cyclical sector.]]></description>
  <dc:creator> </dc:creator>
  <dc:date>11/25/2024 06:30:00</dc:date>
<content:encoded><![CDATA[

<p>The U.S. presidential election on November 5, 2024, proved to be a pivotal event for financial markets during the recent period between index selection dates (October 10, 2024 &ndash; November 21, 2024, the &ldquo;Period&rdquo;). Donald Trump secured victory, winning all key swing states and consolidating a strong mandate. This decisive outcome alleviated much of the political uncertainty that had weighed on investors. The so-called &lsquo;Trump trade&rsquo; ignited a rally in specific sectors like financials, energy, and industrials, which were perceived as primary beneficiaries of pro-business policies and deregulation. Bank stocks climbed sharply on the expectation of a lighter regulatory burden, while small-cap stocks gained momentum as investors anticipated tax reforms and investment-friendly policies. These sector-specific moves reflected targeted enthusiasm for the administration&rsquo;s policy outlook and its perceived alignment with corporate growth objectives.</p>
<p>More broadly, the election results fostered a wave of market optimism, contributing to a significant rally across major indices. Investors interpreted the mandate as a signal for increased fiscal stimulus and robust economic growth, lifting cyclical sectors and reinforcing a risk-on sentiment. Cryptocurrencies also experienced extraordinary gains, with Bitcoin surging 48% during the Period. This rally was driven by hedging against inflation concerns and renewed confidence in potential regulatory clarity for digital assets under the incoming administration. Adding to the market&rsquo;s momentum, the Federal Reserve cut interest rates by 25 basis points on November 7, reinforcing an accommodative monetary stance. This combination of reduced uncertainty, policy optimism, and supportive monetary conditions led to a sharp decline in expected forward market volatility, with the VIX index dropping over 30% to fall below 15. The BUZZ NextGen AI US Sentiment Leaders Index (the &ldquo;BUZZ Index&rdquo;) performed well in this environment, gaining nearly 9% during the Period.</p>
<p>The BUZZ Index returned 1.32% during the month of October compared to a return of -0.91% for the S&amp;P 500 Index during the same period. Year-to-date, the BUZZ Index lags the S&amp;P 500 with returns of 16.63% and 20.97%, respectively, as of the end of October.</p>
<h2>Shares of tech and crypto stocks lead gains in the BUZZ Index</h2>
<p>During the recent Period, MicroStrategy Inc (NASDAQ: MSTR) emerged as the largest contributor to BUZZ Index returns, with its share price surging 78.7%. The company&rsquo;s performance was closely tied to Bitcoin&rsquo;s 48% rally, as investor enthusiasm for cryptocurrencies bolstered MicroStrategy, the largest corporate holder of Bitcoin. SoFi Technologies Inc (NASDAQ: SOFI) also contributed significantly, with its stock climbing 55.3%, reflecting positive sentiment around its growing financial services platform and the broader market&rsquo;s appetite for innovation-driven companies.</p>
<p>Tesla Inc (NASDAQ: TSLA), another major contributor, rose 30.3% during the Period, benefiting not only from its strong market position but also from its perceived alignment with the incoming Trump administration. CEO Elon Musk&rsquo;s public support for Donald Trump during the campaign and Tesla&rsquo;s potential to gain from pro-business policies, including regulatory rollbacks and infrastructure investments, drove investor optimism. Other top contributors included Coinbase Global Inc (NASDAQ: COIN) (+69.7%) and Palantir Technologies Inc (NYSE: PLTR) (+36.0%), underscoring the strength of technology and cryptocurrency-linked sectors during a period of heightened market enthusiasm.</p>

<h3>Top BUZZ Index Contributors: October 10, 2024 &ndash; November 21, 2024</h3>
<div class="wrapped-div">
<table style="width: 100%;">
<tbody>
<tr class="tbl-data">
<td class="tbl-header last text-left">Company</td>
<td class="tbl-header last text-left">Ticker</td>
<td class="tbl-header last text-right">Average Weight (%)</td>
<td class="tbl-header last text-right">Return Contribution (%)</td>
</tr>
<tr class="tbl-data">
<td class="data-td last font-weight-normal text-left">MicroStrategy Inc</td>
<td class="data-td data last text-left">MSTR</td>
<td class="data-td data last text-right">3.98</td>
<td class="data-td data last text-right">2.37</td>
</tr>
<tr class="tbl-data">
<td class="data-td last font-weight-normal text-left">SoFi Technologies Inc</td>
<td class="data-td data last text-left">SOFI</td>
<td class="data-td data last text-right">3.75</td>
<td class="data-td data last text-right">1.70</td>
</tr>
<tr class="tbl-data">
<td class="data-td last font-weight-normal text-left">Coinbase Global Inc</td>
<td class="data-td data last text-left">COIN</td>
<td class="data-td data last text-right">2.15</td>
<td class="data-td data last text-right">1.19</td>
</tr>
<tr class="tbl-data">
<td class="data-td last font-weight-normal text-left">Palantir Technologies Inc</td>
<td class="data-td data last text-left">PLTR</td>
<td class="data-td data last text-right">3.21</td>
<td class="data-td data last text-right">1.07</td>
</tr>
<tr class="tbl-data">
<td class="data-td last font-weight-normal text-left">Tesla Inc</td>
<td class="data-td data last text-left">TSLA</td>
<td class="data-td data last text-right">3.08</td>
<td class="data-td data last text-right">0.91</td>
</tr>
<tr class="tbl-data">
<td class="data-td last font-weight-normal text-left">GameStop Corp</td>
<td class="data-td data last text-left">GME</td>
<td class="data-td data last text-right">3.08</td>
<td class="data-td data last text-right">0.90</td>
</tr>
<tr class="tbl-data">
<td class="data-td last font-weight-normal text-left">ROBLOX Corp</td>
<td class="data-td data last text-left">RBLX</td>
<td class="data-td data last text-right">1.90</td>
<td class="data-td data last text-right">0.65</td>
</tr>
<tr class="tbl-data">
<td class="data-td last font-weight-normal text-left">Robinhood Markets Inc</td>
<td class="data-td data last text-left">HOOD</td>
<td class="data-td data last text-right">2.28</td>
<td class="data-td data last text-right">0.57</td>
</tr>
<tr class="tbl-data">
<td class="data-td last font-weight-normal text-left">AppLovin Corp</td>
<td class="data-td data last text-left">APP</td>
<td class="data-td data last text-right">0.51</td>
<td class="data-td data last text-right">0.49</td>
</tr>
<tr class="tbl-data">
<td class="data-td last font-weight-normal text-left">Amazon.com Inc</td>
<td class="data-td data last text-left">AMZN</td>
<td class="data-td data last text-right">2.97</td>
<td class="data-td data last text-right">0.40</td>
</tr>
</tbody>
</table>
</div>
<p class="chart-disclosure">Source: BUZZ Holdings ULC, Bloomberg. Past performance is no guarantee of future results. Index performance is not illustrative of fund performance. Not intended as a recommendation to buy or to sell any of the securities mentioned herein.</p>

<h2>Super Micro Computer leads declining stocks in the BUZZ Index</h2>
<p>During the recent Period, Super Micro Computer Inc (NASDAQ: SMCI) was the largest detractor from BUZZ Index performance, with its stock declining 61.2%. The drop followed the resignation of Ernst &amp; Young as its auditor, citing concerns over transparency, internal controls, and governance practices. This development, combined with lingering scrutiny from a recent short-seller report alleging accounting irregularities, may have undermined investor confidence and prompted a significant sell-off.</p>
<p>Lucid Group Inc. (NASDAQ: LCID) also weighed on the index, with its shares declining 37.5%. This could potentially reflect persistent challenges in the electric vehicle sector, including rising competition and demand uncertainties. Advanced Micro Devices Inc. (NASDAQ: AMD) and Micron Technology Inc. (NASDAQ: MU) further detracted from performance as the semiconductor sector faced headwinds that may have included inventory overhangs and softening demand in certain markets.</p>
<h3>Bottom BUZZ Index Contributors: October 10, 2024 &ndash; November 21, 2024</h3>
<div class="wrapped-div">
<table style="width: 100%;">
<tbody>
<tr class="tbl-data">
<td class="tbl-header last text-left">Company</td>
<td class="tbl-header last text-left">Ticker</td>
<td class="tbl-header last text-right">Average Weight (%)</td>
<td class="tbl-header last text-right">Return Contribution (%)</td>
</tr>
<tr class="tbl-data">
<td class="data-td last font-weight-normal text-left">Super Micro Computer Inc</td>
<td class="data-td data last text-left">SMCI</td>
<td class="data-td data last text-right">2.35</td>
<td class="data-td data last text-right">-1.83</td>
</tr>
<tr class="tbl-data">
<td class="data-td last font-weight-normal text-left">Lucid Group Inc</td>
<td class="data-td data last text-left">LCID</td>
<td class="data-td data last text-right">1.21</td>
<td class="data-td data last text-right">-0.62</td>
</tr>
<tr class="tbl-data">
<td class="data-td last font-weight-normal text-left">Advanced Micro Devices Inc</td>
<td class="data-td data last text-left">AMD</td>
<td class="data-td data last text-right">2.60</td>
<td class="data-td data last text-right">-0.45</td>
</tr>
<tr class="tbl-data">
<td class="data-td last font-weight-normal text-left">Celsius Holdings Inc</td>
<td class="data-td data last text-left">CELH</td>
<td class="data-td data last text-right">1.53</td>
<td class="data-td data last text-right">-0.39</td>
</tr>
<tr class="tbl-data">
<td class="data-td last font-weight-normal text-left">AST SpaceMobile Inc</td>
<td class="data-td data last text-left">ASTS</td>
<td class="data-td data last text-right">2.53</td>
<td class="data-td data last text-right">-0.27</td>
</tr>
<tr class="tbl-data">
<td class="data-td last font-weight-normal text-left">Micron Technology Inc</td>
<td class="data-td data last text-left">MU</td>
<td class="data-td data last text-right">2.59</td>
<td class="data-td data last text-right">-0.26</td>
</tr>
<tr class="tbl-data">
<td class="data-td last font-weight-normal text-left">Boeing Co/The</td>
<td class="data-td data last text-left">BA</td>
<td class="data-td data last text-right">2.32</td>
<td class="data-td data last text-right">-0.19</td>
</tr>
<tr class="tbl-data">
<td class="data-td last font-weight-normal text-left">NIKE Inc</td>
<td class="data-td data last text-left">NKE</td>
<td class="data-td data last text-right">1.47</td>
<td class="data-td data last text-right">-0.15</td>
</tr>
<tr class="tbl-data">
<td class="data-td last font-weight-normal text-left">Moderna Inc</td>
<td class="data-td data last text-left">MRNA</td>
<td class="data-td data last text-right">0.38</td>
<td class="data-td data last text-right">-0.13</td>
</tr>
<tr class="tbl-data">
<td class="data-td last font-weight-normal text-left">Viking Therapeutics Inc</td>
<td class="data-td data last text-left">VKTX</td>
<td class="data-td data last text-right">1.16</td>
<td class="data-td data last text-right">-0.12</td>
</tr>
</tbody>
</table>
</div>
<p class="chart-disclosure">Source: BUZZ Holdings ULC, Bloomberg. Past performance is no guarantee of future results. Index performance is not illustrative of fund performance. Not intended as a recommendation to buy or to sell any of the securities mentioned herein.</p>
<h2><strong>BUZZ Index November 2024 Rebalance Highlights</strong></h2>
<p><strong>Reddit, Inc.</strong><br />Reddit (NYSE: RDDT) has firmly established itself as one of the world&rsquo;s most popular social media platforms, known for fostering long-form discussions and high levels of user engagement. Unlike platforms dominated by short-form or video content, Reddit distinguishes itself through in-depth exchanges of ideas and media, offering a unique and immersive user experience. Its cultural and financial influence was amplified during the 2021 &lsquo;meme stock&rsquo; frenzy, where it played a pivotal role in mobilizing retail investor interest. The company&rsquo;s highly anticipated March 2024 IPO, the second largest of the year, underscored its growing popularity and cultural significance. Since going public, RDDT shares have nearly tripled, including a more than 50% surge since late October, driven by a robust Q3 report that surpassed revenue expectations, highlighted strong user growth, and marked the company&rsquo;s first profitable quarter. These results bolstered investor confidence in its business model and may have supported the surge in positive investor sentiment. RDDT debuts in the BUZZ Index this month with a 1.1% weight.</p>
<p><strong>Crypto Sector.</strong><br />The U.S. presidential election on November 5 brought resolution to one of the most turbulent political cycles in recent memory. While polls showed a razor-thin race between Harris and Trump, betting markets had placed Trump&rsquo;s chances of victory at around 65%. His decisive win, though unexpected by some, provided financial markets with much-needed clarity and stability. One of the clearest beneficiaries of the election outcome was the cryptocurrency sector, buoyed by expectations of a pro-crypto stance from the incoming administration and newly elected congressional leaders. Bitcoin rallied nearly 47% during the Period, driven by optimism over regulatory support and increased adoption potential. The surge extended to crypto equities, with Coinbase (NASDAQ: COIN) leading the pack. Shares of the U.S.&rsquo;s most prominent crypto exchange soared almost 70% during the Period, fueled by rising sentiment tied to favorable policy expectations and the broader market&rsquo;s enthusiasm for digital assets. Positive investor sentiment on COIN rose sharply, making it one of the largest sentiment gainers this month and moving it to a maximum weight position in the BUZZ Index.</p>
<p>To receive more <a href="https://www.vaneck.com/us/en/insights/thematic-investing/" title="Thematic Investing Insights"><strong>Thematic Investing</strong></a> insights, <a href="https://www.vaneck.com/us/en/subscribe/" title="Subscription Center"><strong>sign up in our subscription center</strong></a>.</p>
]]></content:encoded>
</item><item rdf:about="https://www.vaneck.com/us/en/blogs/income-investing/mig-and-mbbb-etfs-question-answer/">
  <title>MIG and MBBB ETFs: Question &amp; Answer></title>
  <link>https://www.vaneck.com/us/en/blogs/income-investing/mig-and-mbbb-etfs-question-answer/</link>
  <description><![CDATA[This Q&amp;A answers key questions about MIG and MBBB ETFs and explains how investment-grade corporate bonds offer higher yields than U.S. Treasuries with limited credit risk, making them a strong core choice.]]></description>
  <dc:creator> </dc:creator>
  <dc:date>11/21/2024 06:30:00</dc:date>
<content:encoded><![CDATA[

<ul class="content-list">
<li><strong><a class="mt-2" href="#point-one">What are attractively valued bonds?</a></strong></li>
<li><strong><a class="mt-2" href="#point-two">What is the fair value of a corporate bond? </a></strong></li>
<li><strong><a class="mt-2" href="#point-three">What are the benefits of owning attractively valued bonds?</a></strong></li>
<li><strong><a class="mt-2" href="#point-four">Why use the Moody&rsquo;s Analytics credit risk model? </a></strong></li>
<li><strong><a class="mt-2" href="#point-five">What is the methodology of the indices?</a></strong></li>
<li><strong><a class="mt-2" href="#point-six">Can you provide some examples of the types of bonds that are selected?</a></strong></li>
<li><strong><a class="mt-2" href="#point-seven">What drives the outperformance of attractively valued bonds?</a></strong></li>
<li><strong><a class="mt-2" href="#point-eleven">How much outperformance is driven by duration?</a></strong></li>
<li><strong><a class="mt-2" href="#point-twelve">Does the outperformance from owning attractively valued bonds come from taking more risk?</a></strong></li>
<li><strong><a class="mt-2" href="#point-eight">Risk/Reward (Nov 2020 &ndash; Oct 2024)</a></strong></li>
<li><strong><a class="mt-2" href="#point-nine">Where can I find more information on the methodology and how attractively valued bonds performed historically? </a></strong></li>
<li><strong><a class="mt-2" href="#point-ten">How can investors buy VanEck's MIG and MBBB ETFs?</a></strong></li>
</ul>
<p>Investment grade corporate bonds provide a yield pickup over risk-free U.S. Treasuries with limited credit risk. They are an attractive core fixed income allocation for many investors because of their relative safety, yield enhancement and diversification potential.</p>
<p>The <a href="https://www.vaneck.com/us/en/investments/moodys-analytics-ig-corporate-bond-etf-mig/overview/" title="MIG - VanEck Moody's Analytics IG Corporate Bond ETF - Overview"><strong>VanEck Moody&rsquo;s Analytics IG Corporate Bond ETF (MIG)</strong></a> seeks to track, as closely as possible, before fees and expenses, the price and yield performance of the MVIS<sup>&reg;</sup>&nbsp;Moody&rsquo;s Analytics<sup>&reg;</sup>&nbsp;US Investment Grade Corporate Bond Index while the <a href="https://www.vaneck.com/us/en/investments/moodys-analytics-bbb-corporate-bond-etf-mbbb/overview/" title="MBBB - VanEck Moody's Analytics BBB Corporate Bond ETF - Overview"><strong>VanEck Moody&rsquo;s Analytics BBB Corporate Bond ETF (MBBB)</strong></a> seeks to track, as closely as possible, before fees and expenses, the price and yield performance of the MVIS<sup>&reg;</sup>&nbsp;Moody&rsquo;s Analytics<sup>&reg;</sup>&nbsp;US BBB Corporate Bond Index.</p>
<p>These indices identify the most attractively valued bonds based on their market spread relative to their fair value, a metric calculated by Moody&rsquo;s Analytics.</p>
<h2 id="point-one" class="anchored-block">What are attractively valued bonds?</h2>
<p>We define attractively valued bonds as those offering higher compensation relative to their estimated risk and is measured by comparing their credit spread based on the market price of the bond versus fair value. Bonds with significant excess spread above fair value overcompensate investors relative to actual estimated credit&nbsp;risk.</p>
<h2 id="point-two" class="anchored-block">What is the fair value of a corporate bond?</h2>
<p>Fair value estimates the compensation investors should demand for the risk they are taking by holding a bond and is expressed as the &ldquo;fair value spread.&rdquo;</p>
<p>Moody&rsquo;s Analytics calculates the fair value spread based on its expected probability of default, estimated recovery rate, maturity, issue size and other risk factors. It incorporates numerous data points, including a firm&rsquo;s balance sheet and its equity price to calculate the forward-looking probability of default.</p>
<h2 id="point-three" class="anchored-block">What are the benefits of owning attractively valued bonds?</h2>
<p>Attractively valued bonds represent both attractive income potential as well as upside price potential as market spreads converge to fair value. A bond with a positive excess spread versus its fair value spread represents a value opportunity. Similarly, avoiding bonds that exhibit unattractive levels of excess spread provides the potential to outperform the broad market. Holding bonds with low or negative excess spread means that investors are not being adequately rewarded, and these bonds pose downside risk if spread widens as the market begins to price-in higher levels of risk.</p>
<p><img loading="lazy" class="img-responsive w-100" alt="Benefits of owning attractively valued bonds" src="https://www.vaneck.com/contentassets/9289fff432524b29886b98c4876a4586/5063_migmbbb-faq_infographic-1_2024-11_v2_blog.svg" /></p>
<p class="chart-disclosure">Nazaren and Dwyer, Credit Risk Modeling of Public FIlms: EDF9, Moody's Analytics, June 2015.</p>
<h2 id="point-four" class="anchored-block">Why use the Moody&rsquo;s Analytics credit risk model?</h2>
<p>There is significant dispersion of credit risk pricing within the corporate bond market which offers the ability to build diversified portfolios with alpha potential and Moody&rsquo;s Analytics is the industry leader in credit risk modelling. Their models have won numerous industry awards, and over 1,000 of the world&rsquo;s largest institutional investors (including banks, insurance companies, government institutions and asset managers) use their models to power credit risk and portfolio management decision making.</p>
<p>A model is only as good as its inputs and the assumptions that underlie it, and we believe that the quality and coverage of Moody&rsquo;s Analytics data and the extensive research capabilities and resources dedicated to supporting the model have contributed to Moody&rsquo;s Analytics industry-leading role.</p>
<h2 id="point-five" class="anchored-block">What is the methodology of the indices?</h2>
<ol class="content-list">
<li class="mt-2">The index provider buckets the starting universe of corporate bonds into financials and non-financials, and then by duration.</li>
<li class="mt-2">It then screens for the liquid and priceable opportunity set of bonds.</li>
<li class="mt-2">Each bond&rsquo;s fair value spread is compared to the market spread to determine the most attractively valued bonds.</li>
<li class="mt-2">The index maintains exposure to the top 40% most attractively valued bonds and removes bonds that exhibit an excessively high probability of being downgraded to high yield.</li>
</ol>
<p><img loading="lazy" class="img-responsive w-100" alt="The methodology of the indices" src="https://www.vaneck.com/contentassets/9289fff432524b29886b98c4876a4586/5063_migmbbb-faq_infographic-2_2024-11_v1_blog.svg" /></p>
<h2 id="point-six" class="anchored-block">Can you provide some examples of the types of bonds that are selected?</h2>
<p><strong>Case study #1: Weyerhaeuser Company</strong><br />Weyerhaeuser&rsquo;s 4.0% 04/15/2030 bond entered the index in October 2022, as it exhibited an attractive excess spread in relation to all other bonds at that time. Its market spread gradually tightened towards fair value through April 2024, at which point it left the index. Although the bond still exhibited positive excess spread, the index focuses on bonds with the highest excess spread in the broad U.S. investment grade corporate market, and more attractive opportunities emerged.</p>
<p><img loading="lazy" class="img-responsive w-100" alt="Case study #1: Weyerhaeuser Company&lt;" src="https://www.vaneck.com/contentassets/9289fff432524b29886b98c4876a4586/5063_migmbbb-faq_chart-1_2024-11_v1_blog.svg" /></p>
<p class="chart-disclosure">Source: ICE Data Indices, Moody&rsquo;s Analytics, VanEck as of 10/31/2024. &nbsp;Index performance is not illustrative of fund performance. It is not possible to invest directly in an index. Please see index definitions included in disclosures below.</p>
<p><strong>Case study #2: Kraft Heinz Foods Company</strong><br />Kraft&rsquo;s 6.875% 01/26/2039 bond entered the index in March 2023, after being upgraded from high yield to investment grade, as it exhibited higher excess spread relative to its universe.</p>
<p><img loading="lazy" class="img-responsive w-100" alt="Case study #2: Kraft Heinz Foods Company" src="https://www.vaneck.com/contentassets/9289fff432524b29886b98c4876a4586/5063_migmbbb-faq_chart-2_2024-11_v1_blog.svg" /></p>
<p class="chart-disclosure">Source: ICE Data Indices, Moody&rsquo;s Analytics, VanEck as of 10/31/2024. &nbsp;Index performance is not illustrative of fund performance. It is not possible to invest directly in an index. Please see index definitions included in disclosures below.</p>
<h2 id="point-seven" class="anchored-block">What drives the outperformance of attractively valued bonds?</h2>
<p>Key factors that have driven outperformance relative to the broader corporate bond market:</p>
<ol class="content-list">
<li class="mt-2"><strong>Price Gains</strong> - as bond spreads compress, prices tend to rise.</li>
<li class="mt-2"><strong>Risk Management</strong> - avoids bonds that don&rsquo;t offer enough compensation for the risks involved.</li>
</ol>
<p>Attractively valued bonds have also provided yields that are in line, or higher than, the broad market.</p>
<p>As a result, this approach has delivered stronger total returns compared to standard benchmarks.</p>
<div class="wrapped-div">
<table style="width: 100%;">
<tbody>
<tr class="tbl-data">
<td class="tbl-header last text-left">&nbsp;</td>
<td class="tbl-header last text-left">Indices</td>
<td class="tbl-header last text-right">Price Return (%)</td>
<td class="tbl-header last text-right">Income Return (%)</td>
<td class="tbl-header last text-right">Total Return (%)</td>
<td class="tbl-header last text-right">Out/Underperformance (%)</td>
</tr>
<tr class="tbl-data">
<td class="data-td data last text-left" rowspan="4">1Y</td>
<td class="data-td data last text-left">Attractively Valued IG Corporates</td>
<td class="data-td data last text-right">9.50</td>
<td class="data-td data last text-right">4.92</td>
<td class="data-td data last text-right">14.42</td>
<td class="data-td data last text-right" rowspan="2">0.79</td>
</tr>
<tr class="tbl-data">
<td class="data-td data last text-left">Broad IG Benchmark</td>
<td class="data-td data last text-right">8.71</td>
<td class="data-td data last text-right">4.93</td>
<td class="data-td data last text-right">13.63</td>
</tr>
<tr class="tbl-data">
<td class="data-td data last text-left">Attractively Valued BBB Corporates</td>
<td class="data-td data last text-right">10.09</td>
<td class="data-td data last text-right">5.24</td>
<td class="data-td data last text-right">15.32</td>
<td class="data-td data last text-right" rowspan="2">0.69</td>
</tr>
<tr class="tbl-data">
<td class="data-td data last text-left">Broad BBB Benchmark</td>
<td class="data-td data last text-right">9.36</td>
<td class="data-td data last text-right">5.27</td>
<td class="data-td data last text-right">14.63</td>
</tr>
<tr class="tbl-data">
<td class="data-td data last text-left" rowspan="4">3Y</td>
<td class="data-td data last text-left">Attractively Valued IG Corporates</td>
<td class="data-td data last text-right">-5.19</td>
<td class="data-td data last text-right">4.08</td>
<td class="data-td data last text-right">-1.11</td>
<td class="data-td data last text-right" rowspan="2">0.70</td>
</tr>
<tr class="tbl-data">
<td class="data-td data last text-left">Broad IG Benchmark</td>
<td class="data-td data last text-right">-5.76</td>
<td class="data-td data last text-right">3.95</td>
<td class="data-td data last text-right">-1.81</td>
</tr>
<tr class="tbl-data">
<td class="data-td data last text-left">Attractively Valued BBB Corporates</td>
<td class="data-td data last text-right">-5.30</td>
<td class="data-td data last text-right">4.33</td>
<td class="data-td data last text-right">-0.97</td>
<td class="data-td data last text-right" rowspan="2">0.49</td>
</tr>
<tr class="tbl-data">
<td class="data-td data last text-left">Broad BBB Benchmark</td>
<td class="data-td data last text-right">-5.74</td>
<td class="data-td data last text-right">4.28</td>
<td class="data-td data last text-right">-1.46</td>
</tr>
</tbody>
</table>
</div>
<p class="chart-disclosure">Source: ICE Data Indices as of 10/31/2024. Index performance is not illustrative of fund performance. It is not possible to invest directly in an index. Please see index definitions included in disclosures below.</p>
<h2 id="point-eleven" class="anchored-block">How much outperformance is driven by duration?</h2>
<p>Valuations within the corporate bond universe are best compared against bonds with similar durations and in similar sectors. The indices compare and select bonds within the same sector (financials and non-financials) and within the same duration range to avoid unintended biases (e.g., an overweight to low duration bonds).</p>
<h2 id="point-twelve" class="anchored-block">Does the outperformance from owning attractively valued bonds come from taking more risk?</h2>
<p>No. Looking at the&nbsp; one-year expected default frequency, a metric estimating the likelihood of the company defaulting over the following 12 months, both indices display lower levels of default risk. Although the risk of default in investment grade bonds is generally very low, even these small differences are reflected in credit spreads and total returns.</p>
<div class="flourish-embed flourish-chart" data-src="visualisation/20387940"><script src="https://public.flourish.studio/resources/embed.js"></script><noscript><img loading="lazy" src="https://public.flourish.studio/visualisation/20387940/thumbnail" width="100%" alt="chart visualization" /></noscript></div>
<p class="chart-disclosure">Source: VanEck, Moody&rsquo;s Analytics as of 10/31/2024. Index performance is not illustrative of fund performance. It is not possible to invest directly in an index. Please see index definitions included in disclosures below.</p>
<p>Overall, analyzing bonds through the lens of fair value allows investors to buy undervalued bonds and avoid overpriced bonds, which have demonstrated a better risk/reward profile than the broad markets.&nbsp;</p>
<h2 id="point-eight" class="anchored-block">Risk/Reward (Nov 2020 &ndash; Oct 2024)</h2>
<p><img loading="lazy" class="img-responsive w-100" alt="Risk/Reward" src="https://www.vaneck.com/contentassets/9289fff432524b29886b98c4876a4586/5063_migmbbb-faq_chart-4_2024-11_v1_blog.svg" /></p>
<p class="chart-disclosure">Source: Morningstar. Index performance is not illustrative of fund performance. It is not possible to invest directly in an index. Please see index definitions included in disclosures below.</p>
<h2 id="point-nine" class="anchored-block">Where can I find more information on the methodology and how attractively valued bonds performed historically?</h2>
<p>More detailed information on the methodology can be found <a href="https://www.vaneck.com/us/en/blogs/income-investing/uncover-hidden-value-in-corporate-bonds/" title="Smarter Approaches to Corporate Credit"><strong>here</strong></a>, and <a href="https://www.vaneck.com/us/en/blogs/income-investing/find-your-investment-grade-edge-with-undervalued-bonds/" title="Find Your Investment Grade Edge with Undervalued Bonds"><strong>this blog</strong></a> describes how attractively valued bonds have performed historically.</p>
<h2 id="point-ten" class="anchored-block">How can investors buy VanEck's MIG and MBBB ETFs?</h2>
<p>Learn more here: <strong><a href="/link/edc87d2b16cf4498a2884c1752ac9fe0.aspx#how-to-buy-etf&amp;utm=MIG-Blog" title="How to buy VanEck ETFs?">VanEck Moody&rsquo;s Analytics IG Corporate Bond ETF</a></strong> and <strong><a href="/link/7990b344b89a462396880c6d210ada6c.aspx#how-to-buy-etf&amp;utm=MBBB-Blog" title="How to buy VanEck ETFs?">VanEck Moody&rsquo;s Analytics BBB Corporate Bond ETF</a></strong>.</p>
<p class="d-none d-lg-block"><a href="mailto:askvaneck@vaneck.com" title="Have More Questions? - Ask VanEck" rel="noopener"><img loading="lazy" class="img-responsive" src="https://www.vaneck.com/globalassets/home/us/insights/blogs/bm-blog-images/cta-faq_desktop-02.svg" alt="Have More Questions? - Ask VanEck" /></a></p>
<p class="d-lg-none"><a href="mailto:askvaneck@vaneck.com" title="Have More Questions? - Ask VanEck" rel="noopener"><img loading="lazy" class="img-responsive" src="https://www.vaneck.com/globalassets/home/us/insights/blogs/bm-blog-images/cta-faq_mobile-01.svg" alt="Have More Questions? - Ask VanEck" /></a></p>
<p>To receive more <a href="/us/en/blogs/income-investing/" title="Income Investing Insights"><strong>Income Investing</strong></a> insights, <a href="/link/5f45412c2143400497908cea2897f7d3.aspx" title=" Subscription Center"><strong>sign up in our subscription center</strong></a>.</p>
]]></content:encoded>
</item><item rdf:about="https://www.vaneck.com/us/en/blogs/digital-assets/matthew-sigel-vaneck-mid-november-bitcoin-chaincheck/">
  <title>VanEck Mid-November Bitcoin ChainCheck></title>
  <link>https://www.vaneck.com/us/en/blogs/digital-assets/matthew-sigel-vaneck-mid-november-bitcoin-chaincheck/</link>
  <description><![CDATA[Bitcoin surged past all-time highs, buoyed by regulatory tailwinds from Trump's election. With growing interest, indicators suggest a bullish rally could continue.]]></description>
  <dc:creator>Nathan  Frankovitz</dc:creator>
  <dc:date>11/21/2024 06:30:00</dc:date>
<content:encoded><![CDATA[

<p>As we anticipated in our <a href="https://www.vaneck.com/us/en/blogs/digital-assets/matthew-sigel-vaneck-mid-september-2024-bitcoin-chaincheck-1-year-review-edition/" title="VanEck Mid-September 2024 Bitcoin ChainCheck: 1-Year Review Edition"><strong>September Bitcoin ChainCheck</strong></a>, Bitcoin (BTC) price has surged upward in a high-volatility, post-election rally. Now in uncharted territory with no technical price resistance, we believe the next phase of the bull market is just beginning. This pattern mirrors what happened four years ago, when Bitcoin&rsquo;s price doubled between the 2020 election and year-end, followed by an additional ~137% gain in 2021. With a transformative shift in government support for Bitcoin underway, investor interest is rising rapidly; we are receiving inbound calls at an accelerating pace as many investors find themselves under-allocated to the asset class. While we remain vigilant for signs of overheating, we reiterate our cycle price target of $180k / BTC as a number of key indicators we track continue to signal green for this rally.</p>
<p>We also hosted an X (formerly Twitter) Spaces conversation with Senator Cynthia Lummis and Michael Saylor, exploring the timing and prospects for a U.S. Bitcoin Strategic Reserve and how more corporations are exploring adding Bitcoin to their corporate treasuries. <a href="https://x.com/i/spaces/1dRKZdbkWmvJB" title="₿itcoin as a National and Corporate Asset w/ Senator Lummis &amp; Saylor" target="_blank" rel="noopener"><strong>Listen here</strong></a>.</p>
<ul class="content-list">
<li class="mt2"><a href="#bitcoins-price-action"><strong>Bitcoin&rsquo;s Price Action</strong></a></li>
<li class="mt2"><a href="#key-indicators"><strong>Key Indicators</strong></a></li>
<li class="mt2"><a href="#bitcoins-network-activity"><strong>Bitcoin&rsquo;s Network Activity, Adoption, and Fees</strong></a></li>
<li class="mt2"><a href="#bitcoin-monthly-dashboard"><strong>Bitcoin ChainCheck Monthly Dashboard</strong></a></li>
<li class="mt2"><a href="#bitcoin-miners"><strong>Bitcoin Miners</strong></a></li>
</ul>
<h2 id="bitcoins-price-action" class="jump-link-nav anchored-block" data-jumplink-title="Price Action">Bitcoin&rsquo;s Price Action</h2>
<p><strong>Market sentiment: </strong>At $89,444, Bitcoin&rsquo;s 7-day moving average (7 DMA) is at an all-time high. On election night, Tuesday, Nov 5th, Bitcoin surged ~9% to new all-time highs of ~$75k as Polymarket&rsquo;s odds indicated Trump was winning the race, effectively front-running traditional news outlets&rsquo; election calls. This aligns with our previous observations of Bitcoin&rsquo;s price surging when Trump&rsquo;s odds improved on Polymarket, such as after his assassination attempt. Trump made Bitcoin and crypto central to his campaign, promising to end the SEC&rsquo;s regulation-by-enforcement approach and to &ldquo;make America the world capital for crypto and Bitcoin.&rdquo;</p>
<p>With Trump as the president-elect, regulatory headwinds are turning into tailwinds for the first time. Trump has already started appointing pro-crypto figures across the executive branch, while the Republican party now holds a unified government, increasing the likelihood of supportive legislation. Such legislation includes proposals like creating a national Bitcoin reserve&mdash;the odds of which are trading at 34% on Polymarket as of November 19th&mdash;and rewriting crypto market structure and stablecoin draft legislation. Under new leadership, we expect FIT21 will be rewritten in market- and privacy-friendly terms, while new stablecoin drafts will allow state-chartered banks to issue stablecoins without Fed approval.</p>
<p>At a time when nations like BRICS are exploring alternatives like Bitcoin to bypass USD sanctions and currency manipulation, stablecoins offer a strategic opportunity to export the U.S. dollar globally. By removing regulatory hurdles and enabling state-chartered banks to issue stablecoins, the U.S. can defend the dollar&rsquo;s global influence and capitalize on crypto&rsquo;s faster adoption in emerging markets, where financial services, hedges against local currency inflation, and DeFi are in high demand.</p>
<p>We expect SAB to be repealed within Trump&rsquo;s first quarter, if not by the SEC, then by Congress, spurring banks to announce crypto custody solutions. If Gary Gensler hasn&rsquo;t already resigned, we anticipate Trump will follow through on his promise to replace the SEC chairman, favoring more crypto-friendly candidates and ending the agency&rsquo;s notorious &ldquo;regulation by enforcement&rdquo; era. Additionally, we expect that in 2025, U.S. ETH ETFs will be amended to support staking, the SEC will accept the SOL ETF 19b-4, and in-kind creation and redemption will make these ETFs more tax-efficient and liquid. As Trump has previously acknowledged the shared energy-intensive nature of Bitcoin mining and AI, we anticipate energy deregulation&mdash;leading to cheaper, more abundant baseload power (e.g., nuclear)&mdash;will drive global leadership in energy, AI, and Bitcoin.</p>
<p>In our view, this election marks a bullish turning point, reversing years of offshoring jobs and capital caused by previous hawkish leadership. By fostering entrepreneurial dynamism, the U.S. is poised to become a global leader in crypto innovation and employment, transforming crypto into a critical industry for domestic growth and a key export to emerging markets.</p>
<p><strong>Bitcoin dominance: </strong>The 7-day moving average of Bitcoin dominance, a measure of Bitcoin&rsquo;s market cap relative to all crypto&rsquo;s aggregate market cap, rose 2 points to 59% this month, reaching levels not seen since March 2021. While the uptrend from 40% in November 2022 may persist in the near term, we expect it to peak soon. In September, we noted that a Harris victory might favor Bitcoin dominance due to Bitcoin&rsquo;s clearer regulatory status as a commodity. In contrast, Trump&rsquo;s pro-crypto stance and growing cabinet will likely spur investment more broadly across the crypto space. With Bitcoin reaching new highs under a pro-innovation regulatory backdrop, wealth effects and regulatory de-risking are poised to attract both crypto-native capital and new institutional investment into DeFi, boosting returns in the long tail of the asset class.</p>
<p><strong>Regional trading: </strong>At first glance, traders during Asian market hours appeared to significantly increase their Bitcoin holdings this month, defying a years-long trend of being net sellers to European and US traders. However, Bitcoin&rsquo;s price surge on election night occurred during Asian trading hours, likely driven by an unusually high proportion of US-based investors trading around the election. This exceptional event complicates attributing such price movements solely to regional dynamics. Consistent with historical behavior, traders during US and European hours continued accumulating BTC, sustaining the price performance trends observed in October.</p>
<div class="wrapped-div">
<table style="width: 500px;">
<tbody>
<tr class="tbl-data">
<td class="tbl-header last">Regional Trading</td>
<td class="tbl-header last text-right">MoM Change (%)</td>
<td class="tbl-header last text-right">YoY Change (%)</td>
</tr>
<tr class="tbl-data">
<td class="data-td last">Asia Hours Price Change MoM ($)</td>
<td class="data-td data last text-right">7</td>
<td class="data-td data last text-right">0</td>
</tr>
<tr class="tbl-data">
<td class="data-td last">U.S. Hours Price Change MoM ($)</td>
<td class="data-td data last text-right">4</td>
</tr>
<tr class="tbl-data">
<td class="data-td last">EU Hours Price Change MoM ($)</td>
<td class="data-td data last text-right">5</td>
<td class="data-td data last text-right">4</td>
</tr>
</tbody>
</table>
</div>
<br />
<p class="chart-disclosure">Source: Glassnodeas of 11/18/24. <strong>Past performance is no guarantee of future results.</strong></p>
<h2 id="key-indicators" class="jump-link-nav anchored-block" data-jumplink-title="Key Indicators">Key Indicators</h2>
<p>To evaluate this bull market's potential upside and remaining duration, we examined key indicators that assess risk levels and potential peaks. This month, we begin our analysis with perpetual futures, or "perps," where funding rates offer insight into market sentiment and help gauge the likelihood of an overheated market.</p>
<h3>Sustained High Perp Funding Rates (10%+) Can Signal Overheated Bitcoin Markets</h3>
<p><img loading="lazy" class="img-responsive w-100" alt="Sustained High Perp Funding Rates (10%+) Can Signal Overheated Bitcoin Markets" src="https://www.vaneck.com/contentassets/163fef20feb8427e9f50e904f30cd9d1/5069_bitcoin-chaincheck-nov_chart-1_2024-11_v1_blog.svg" /></p>
<h3>Average BTC Returns Versus Perp Funding Rates (04.01.20 - 11.11.24)</h3>
<p><img loading="lazy" class="img-responsive w-100" alt="Average BTC Returns Versus Perp Funding Rates (04.01.20 - 11.11.24)" src="https://www.vaneck.com/contentassets/163fef20feb8427e9f50e904f30cd9d1/5069_bitcoin-chaincheck-nov_table-1_2024-11_v1_blog.svg" /></p>
<h3>BTC Price Performance When 30 DMA Annualized Perps Fees Exceed 10%</h3>
<div class="wrapped-div">
<table style="width: 100%;">
<tbody>
<tr class="tbl-data">
<td class="tbl-header last text-center" colspan="3">Date Ranges</td>
<td class="tbl-header last text-center" colspan="4">Prices</td>
<td class="tbl-header last text-center" colspan="2">Returns</td>
</tr>
<tr class="tbl-data">
<td class="data-head data last text-left">Open</td>
<td class="data-head data last text-left">Close</td>
<td class="data-head data last text-right">Duration (Days)</td>
<td class="data-head data last text-right">Open ($)</td>
<td class="data-head data last text-right">Close ($)</td>
<td class="data-head data last text-right">Peak ($)</td>
<td class="data-head data last text-right">Low ($)</td>
<td class="data-head data last text-right">Open to Peak (%)</td>
<td class="data-head data last text-right">Open to Close (%)</td>
</tr>
<tr class="tbl-data">
<td class="data-td data last text-left">7/27/2020</td>
<td class="data-td data last text-left">9/15/2020</td>
<td class="data-td data last text-right">51</td>
<td class="data-td data last text-right">11,023</td>
<td class="data-td data last text-right">10,797</td>
<td class="data-td data last text-right">12,250</td>
<td class="data-td data last text-right">10,132</td>
<td class="data-td data last text-right">11</td>
<td class="data-td data last text-right">-2</td>
</tr>
<tr class="tbl-data">
<td class="data-td data last text-left">11/11/2020</td>
<td class="data-td data last text-left">5/21/2021</td>
<td class="data-td data last text-right">186</td>
<td class="data-td data last text-right">17,667</td>
<td class="data-td data last text-right">37,273</td>
<td class="data-td data last text-right">63,604</td>
<td class="data-td data last text-right">17,097</td>
<td class="data-td data last text-right">260</td>
<td class="data-td data last text-right">111</td>
</tr>
<tr class="tbl-data">
<td class="data-td data last text-left">8/31/2021</td>
<td class="data-td data last text-left">9/22/2021</td>
<td class="data-td data last text-right">23</td>
<td class="data-td data last text-right">47,238</td>
<td class="data-td data last text-right">43,569</td>
<td class="data-td data last text-right">52,611</td>
<td class="data-td data last text-right">40,634</td>
<td class="data-td data last text-right">11</td>
<td class="data-td data last text-right">-8</td>
</tr>
<tr class="tbl-data">
<td class="data-td data last text-left">10/19/2021</td>
<td class="data-td data last text-left">12/8/2021</td>
<td class="data-td data last text-right">51</td>
<td class="data-td data last text-right">64,238</td>
<td class="data-td data last text-right">50,521</td>
<td class="data-td data last text-right">67,589</td>
<td class="data-td data last text-right">48,963</td>
<td class="data-td data last text-right">5</td>
<td class="data-td data last text-right">-21</td>
</tr>
<tr class="tbl-data">
<td class="data-td data last text-left">11/12/2023</td>
<td class="data-td data last text-left">1/30/2024</td>
<td class="data-td data last text-right">80</td>
<td class="data-td data last text-right">37,058</td>
<td class="data-td data last text-right">42,912</td>
<td class="data-td data last text-right">46,944</td>
<td class="data-td data last text-right">35,534</td>
<td class="data-td data last text-right">27</td>
<td class="data-td data last text-right">16</td>
</tr>
<tr class="tbl-data">
<td class="data-td data last text-left">2/18/2024</td>
<td class="data-td data last text-left">4/26/2024</td>
<td class="data-td data last text-right">69</td>
<td class="data-td data last text-right">52,123</td>
<td class="data-td data last text-right">63,787</td>
<td class="data-td data last text-right">73,105</td>
<td class="data-td data last text-right">50,724</td>
<td class="data-td data last text-right">40</td>
<td class="data-td data last text-right">22</td>
</tr>
<tr class="tbl-data">
<td class="data-td data last text-left">6/18/2024</td>
<td class="data-td data last text-right">1</td>
<td class="data-td data last text-right">65,160</td>
<td class="data-td data last text-right">0</td>
</tr>
<tr class="tbl-data">
<td class="data-td data last text-left">11/10/2024</td>
<td class="data-td data last text-left">TBD</td>
<td class="data-td data last text-right">n/a</td>
<td class="data-td data last text-right">80,425</td>
<td class="data-td data last text-right">n/a</td>
</tr>
</tbody>
</table>
</div>
<br />
<p class="chart-disclosure">Source: Glassnode as of 11/12/2024. <strong>Past performance is no guarantee of future results.</strong></p>
<p>This month, we start by examining perpetual futures, or 'perps'&mdash;futures contracts where traders on the more popular side of the market pay a 'funding rate' to those on the opposite side. As markets skew, funding rates automatically rise to incentivize balance and compensate traders for directional risk. Thus, sustained high funding rates may be used to indicate an overheated market.</p>
<p>Starting from April 2020, we analyzed periods when the 30-day moving average perpetual funding rate exceeded 10%. These periods averaged ~66 days with 17% returns from open to close, though individual durations varied significantly. Only one period&mdash;the single-day spike on June 18th, 2024&mdash;was tactical, reflecting a short-term reaction. All other instances lasted several weeks, highlighting structural bullish sentiment that often drives significant short- to medium-term gains.For example, the high funding rate period starting August 31st, 2021, lasted 23 days, followed by a 28-day cooling-off period before re-igniting for another 51 days on October 19th. Counting this brief gap, the combined duration of elevated funding rates in 2021 totaled 99 days. Similarly, the current high funding rate period, which began on November 12th, 2024, lasted 80 days before a 19-day pause, resuming for another 69 days. Combined, this period spans 168 days, comparable to the 186 days observed from November 11th, 2020, to May 21st, 2021. Notably, Bitcoin purchases made on days when funding rates exceeded 10% yielded higher average returns over 30-day, 60-day, and 90-day time frames compared to purchases on days with lower funding rates.</p>
<p>However, the data also highlights a pattern of underperformance on longer time horizons. On average, purchases made on days when funding rates were above 10% began underperforming at the 180-day mark, with this trend becoming even more pronounced over 1-year and 2-year periods. As market cycles typically span about four years, this pattern suggests that sustained high funding rates often correspond with cycle tops and may serve as early indicators of an overheated market vulnerable to longer-term downside.</p>
<h3>Bitcoin Cycle Analysis</h3>
<div class="wrapped-div">
<table style="width: 100%;">
<tbody>
<tr class="tbl-data">
<td class="data-td data last text-right">&nbsp;</td>
<td class="tbl-header last text-center" colspan="3">Date Ranges</td>
<td class="tbl-header last text-center" colspan="3">Prices</td>
<td class="tbl-header last text-center" colspan="3">Durations (Days)</td>
<td class="tbl-header last text-center" colspan="3">Returns</td>
</tr>
<tr class="tbl-data">
<td class="data-head data last text-left">Cycle</td>
<td class="data-head data last text-left">Open</td>
<td class="data-head data last text-left">Peak</td>
<td class="data-head data last text-left">Close</td>
<td class="data-head data last text-right">Open ($)</td>
<td class="data-head data last text-right">Peak ($)</td>
<td class="data-head data last text-right">Close ($)</td>
<td class="data-head data last text-right">Open<br />to Peak</td>
<td class="data-head data last text-right">Peak<br />to Close</td>
<td class="data-head data last text-right">Total</td>
<td class="data-head data last text-right">Open<br />to Peak (%)</td>
<td class="data-head data last text-right">Peak<br />to Close (%)</td>
<td class="data-head data last text-right">Open<br />to Close (%)</td>
</tr>
<tr class="tbl-data">
<td class="data-td data last text-left">1</td>
<td class="data-td data last text-left">18-Nov-11</td>
<td class="data-td data last text-left">29-Nov-13</td>
<td class="data-td data last text-left">14-Jan-15</td>
<td class="data-td data last text-right">2</td>
<td class="data-td data last text-right">1,134</td>
<td class="data-td data last text-right">172</td>
<td class="data-td data last text-right">742</td>
<td class="data-td data last text-right">411</td>
<td class="data-td data last text-right">1153</td>
<td class="data-td data last text-right">55308</td>
<td class="data-td data last text-right">-85</td>
<td class="data-td data last text-right">8396</td>
</tr>
<tr class="tbl-data">
<td class="data-td data last text-left">2</td>
<td class="data-td data last text-left">14-Jan-15</td>
<td class="data-td data last text-left">16-Dec-17</td>
<td class="data-td data last text-left">15-Dec-18</td>
<td class="data-td data last text-right">172</td>
<td class="data-td data last text-right">19,588</td>
<td class="data-td data last text-right">3,237</td>
<td class="data-td data last text-right">1067</td>
<td class="data-td data last text-right">364</td>
<td class="data-td data last text-right">1431</td>
<td class="data-td data last text-right">11374</td>
<td class="data-td data last text-right">-83</td>
<td class="data-td data last text-right">1880</td>
</tr>
<tr class="tbl-data">
<td class="data-td data last text-left">3</td>
<td class="data-td data last text-left">15-Dec-18</td>
<td class="data-td data last text-left">10-Nov-21</td>
<td class="data-td data last text-left">21-Nov-22</td>
<td class="data-td data last text-right">3,237</td>
<td class="data-td data last text-right">67,589</td>
<td class="data-td data last text-right">15,798</td>
<td class="data-td data last text-right">1061</td>
<td class="data-td data last text-right">376</td>
<td class="data-td data last text-right">1437</td>
<td class="data-td data last text-right">2088</td>
<td class="data-td data last text-right">-77</td>
<td class="data-td data last text-right">488</td>
</tr>
<tr class="tbl-data">
<td class="data-td data last text-left">4</td>
<td class="data-td data last text-left">21-Nov-22</td>
<td class="data-td data last text-left">13-Nov-24</td>
<td class="data-td data last text-left">TBD</td>
<td class="data-td data last text-right">15,798</td>
<td class="data-td data last text-right">89,829</td>
<td class="data-td data last text-right">TBD</td>
<td class="data-td data last text-right">723</td>
<td class="data-td data last text-right">TBD</td>
<td class="data-td data last text-right">723</td>
<td class="data-td data last text-right">569</td>
<td class="data-td data last text-right">TBD</td>
</tr>
</tbody>
</table>
</div>
<br />
<p class="chart-disclosure">Cycle open is defined by the bear market low</p>
<p class="chart-disclosure">Cycle close is defined as the next low</p>
<p class="chart-disclosure">Source: Glassnode as of 11/13/2024. <strong>Past performance is no guarantee of future results.</strong></p>
<p>As of November 11th, Bitcoin has entered a new phase where funding rates again exceed 10%. This shift points toward stronger short- to medium-term momentum, as historically, elevated funding rates have been linked to higher 30-, 60-, and 90-day returns, reflecting heightened bullish sentiment and demand. However, as funding rates remain elevated, we may move out of the phase where longer-term (1-2 year) returns are as favorable. Given the current pro-Bitcoin regulatory environment, we anticipate another period of high performance, reminiscent of the post-2020 election phase when sustained 10%+ funding rates drove a 260% gain over 186 days. With Bitcoin currently trading near $90k, our $180k price target remains plausible, reflecting a potential cycle return of ~1,000% from the cycle&rsquo;s trough to peak.</p>
<h3>High Levels of Unrealized Profits Can Signal Peak Prices</h3>
<p><img loading="lazy" class="img-responsive w-100" alt="High Levels of Unrealized Profits Can Signal Peak Prices" src="https://www.vaneck.com/contentassets/163fef20feb8427e9f50e904f30cd9d1/5069_bitcoin-chaincheck-nov_chart-2_2024-11_v1_blog.svg" /></p>
<h3>Average BTC Returns Versus 30d Moving Average Relative Unrealized Profits (RUP) (11.13.16 - 11.13.24)</h3>
<p><img loading="lazy" class="img-responsive w-100" alt="Average BTC Returns Versus 30d Moving Average Relative Unrealized Profits (RUP) (11.13.16 - 11.13.24)" src="https://www.vaneck.com/contentassets/163fef20feb8427e9f50e904f30cd9d1/5069_bitcoin-chaincheck-nov_table-2_2024-11_v1_blog.svg" /></p>
<p class="chart-disclosure">Source: Glassnode as of 11/13/2024. <strong>Past performance is no guarantee of future results.</strong></p>
<h3>Average BTC Returns Versus 30d Moving Average Relative Unrealized Profits (RUP) (11.13.16 - 11.13.24)</h3>
<p><img loading="lazy" class="img-responsive w-100" alt="Average BTC Returns Versus 30d Moving Average Relative Unrealized Profits (RUP) (11.13.16 - 11.13.24)" src="https://www.vaneck.com/contentassets/163fef20feb8427e9f50e904f30cd9d1/5069_bitcoin-chaincheck-nov_table-3_2024-11_v1_blog.svg" /></p>
<p class="chart-disclosure">Source: Glassnode as of 11/13/2024. <strong>Past performance is no guarantee of future results.</strong></p>
<p>Next, we look towards Relative Unrealized Profit (RUP), another metric useful for highlighting overheated Bitcoin markets. Relative Unrealized Profit (RUP) measures the proportion of Bitcoin&rsquo;s market cap represented by unrealized gains&mdash;profits that exist on paper but have not yet been realized through selling. This metric rises when Bitcoin&rsquo;s price exceeds the last acquisition price for most holders, reflecting optimism as a larger proportion of the market moves into profit.</p>
<p>Historically, elevated 30-day moving average (DMA) RUP levels&mdash;especially above 0.60 and 0.70&mdash;signal strong market sentiment and potential overheating. As illustrated by the red bands in the chart, RUP 30 DMAs above 0.70 often align with market tops, as the high proportion of unrealized profits triggers profit-taking. Conversely, RUP levels below 0.60 indicate more favorable conditions for long-term buying, with historical data showing higher 1- and 2-year returns for purchases below this threshold.</p>
<p>Our analysis of the past two market cycles suggests that 30 DMA RUP levels between 0.60 and 0.70 tend to deliver the highest short- to medium-term returns (7-day to 180-day). This range ordinarily reflects the middle stages of a bull market, where optimism is rising but not yet excessive. In contrast, RUP &gt;0.70 in aggregate consistently correlates with negative returns across all time frames, reinforcing it as a strong sell signal.</p>
<p>As of November 13th, Bitcoin&rsquo;s 30 DMA RUP is ~0.54, with daily values exceeding 0.60 since November 11th. According to our detailed table, risks progressively increase as RUP approaches 0.70, emphasizing the urgency of acting within the 0.60&ndash;0.70 range for short-term trades. However, if RUP&rsquo;s 30 DMA rises closer to 0.70, it could signal an overheated market, advising caution for long-term positioning.</p>
<h3>Google Search Term Popularity for Crypto in the U.S.</h3>
<p><img loading="lazy" class="img-responsive w-100" alt="Average BTC Returns Versus 30d Moving Average Relative Unrealized Profits (RUP) (11.13.16 - 11.13.24)" src="https://www.vaneck.com/contentassets/163fef20feb8427e9f50e904f30cd9d1/5069_bitcoin-chaincheck-nov_chart-3_2024-11_v1_blog.svg" /></p>
<p class="chart-disclosure">Source: Google Trends as of 11/18/2024.<strong> Past performance is no guarantee of future results.</strong></p>
<p>The popularity of "crypto" as a Google search term serves as a strong gauge of retail investor interest and market momentum. Historically, peaks in search interest have closely aligned with crypto market cap peaks. For example, all-time highs in search interest in May and November 2021 preceded significant market drawdowns: a two-month ~55% correction after the May peak and a ~12-month, ~75% bear market following the November peak.</p>
<p>Currently, search term popularity sits at just 34% of its May 2021 peak and slightly below the 37% local peak observed in March 2024, when Bitcoin reached its highest price of this cycle. This relatively low level of search interest suggests that Bitcoin and the broader crypto markets have not yet entered speculative mania, leaving room for further growth before reaching the levels of mainstream attention typically associated with market tops.</p>
<h3>Coinbase App Store Rankings</h3>
<p><img loading="lazy" class="img-responsive w-100" alt="Average BTC Returns Versus 30d Moving Average Relative Unrealized Profits (RUP) (11.13.16 - 11.13.24)" src="https://www.vaneck.com/contentassets/163fef20feb8427e9f50e904f30cd9d1/5069_bitcoin-chaincheck-nov_chart-4_2024-11_v1_blog.svg" /></p>
<p class="chart-disclosure">Source: openbb.co as of 11/15/2024. <strong>Past performance is no guarantee of future results.</strong></p>
<p>Like Google searches for &ldquo;crypto,&rdquo; Coinbase&rsquo;s App Store ranking is a strong indicator of retail interest in the space. After a lengthy bear market, Coinbase re-entered the top 50 apps on March 5th of this year, following a ~34% surge in Bitcoin price over nine days as Bitcoin retested its 2021 all-time high of ~$69k. Despite Bitcoin reaching new highs of ~$74k later that month, retail interest waned as price volatility declined into the summer doldrums and attention shifted to the presidential race. However, Bitcoin&rsquo;s election-night breakout reignited retail interest, with Coinbase&rsquo;s App Store rank jumping from #412 to #9 between November 5th and 14th. This surge in engagement helped drive prices higher, alongside record Bitcoin ETF inflows (see Chart of The Month).</p>
<h2 id="bitcoins-network-activity" class="jump-link-nav anchored-block" data-jumplink-title="Network">Bitcoin&rsquo;s Network Activity, Adoption, and Fees</h2>
<p><strong>Daily transactions: </strong>The 7-day moving average of daily transactions is ~543k, a -15% month-over-month decline. Despite the decline, activity remains strong at the 96th percentile of Bitcoin&rsquo;s all-time history. Fewer transactions are being offset by larger payloads, as evidenced by rising transfer volumes.</p>
<p><strong>Ordinals inscriptions: </strong>Daily inscriptions (NFTs and meme coins on the Bitcoin blockchain) transactions increased 404% month-over-month, reflecting revitalized speculative enthusiasm likely stemming from price increases and regulatory tailwinds.</p>
<p><strong>Total transfer volume: </strong>Bitcoin transfer volume increased 118% month-over-month to a 7-day moving average of ~$85 billion.</p>
<p><strong>Average transaction fees: </strong>Bitcoin transaction fees fell 5% month-over-month to an average cost of $3.58, representing an average transaction fee of 0.0023% compared to the average transaction payload of ~$157k.</p>
<h2>Bitcoin Market Health and Profitability</h2>
<p><strong>Percent of addresses in profit: </strong>With Bitcoin price trading at all-time highs, ~99% of all Bitcoin addresses are currently profitable.</p>
<p><strong>Net unrealized profit/loss: </strong>This ratio increased 21% percent to 0.61 over the past month, indicating a significant increase in the ratio between Relative Unrealized Profit and Relative Unrealized Loss. As an indicator of market sentiment, this ratio sits in the &ldquo;Belief &ndash; Denial&rdquo; range, corresponding to market cycle phases of accelerated expansion and contraction between cycle peaks and troughs.</p>
<h3 id="bitcoin-monthly-dashboard" class="jump-link-nav anchored-block" data-jumplink-title="ChainCheck">Bitcoin ChainCheck Monthly Dashboad</h3>
<div class="wrapped-div">
<table style="width: 100%;">
<tbody>
<tr class="tbl-data">
<td class="tbl-header last">As of November 18th, 2024</td>
<td class="tbl-header last text-right">7-day avg</td>
<td class="tbl-header last text-right">30 day change<sup>1</sup>(%)</td>
<td class="tbl-header last text-right">365 day change (%)</td>
<td class="tbl-header last text-right">Last 7 days Percentile<br />vs all-time history (%)</td>
</tr>
<tr class="tbl-data">
<td class="data-td last">Bitcoin Price</td>
<td class="data-td data last text-right">$89,444</td>
<td class="data-td data last text-right">35</td>
<td class="data-td data last text-right">144</td>
<td class="data-td data last text-right">100</td>
</tr>
<tr class="tbl-data">
<td class="data-td last">Daily Active Addresses</td>
<td class="data-td data last text-right">865,648</td>
<td class="data-td data last text-right">25</td>
<td class="data-td data last text-right">-10</td>
<td class="data-td data last text-right">76</td>
</tr>
<tr class="tbl-data">
<td class="data-td last">Daily New Addresses</td>
<td class="data-td data last text-right">366,521</td>
<td class="data-td data last text-right">33</td>
<td class="data-td data last text-right">-31</td>
<td class="data-td data last text-right">69</td>
</tr>
<tr class="tbl-data">
<td class="data-td last">Daily Transactions</td>
<td class="data-td data last text-right">543,293</td>
<td class="data-td data last text-right">-15</td>
<td class="data-td data last text-right">-5</td>
<td class="data-td data last text-right">96</td>
</tr>
<tr class="tbl-data">
<td class="data-td last">Daily Inscriptions</td>
<td class="data-td data last text-right">51,883</td>
<td class="data-td data last text-right">-404</td>
<td class="data-td data last text-right">-83</td>
<td class="data-td data last text-right">47</td>
</tr>
<tr class="tbl-data">
<td class="data-td last">Total Transfer Volume (USD)</td>
<td class="data-td data last text-right">$ 85,273,299,135</td>
<td class="data-td data last text-right">118</td>
<td class="data-td data last text-right">209</td>
<td class="data-td data last text-right">92</td>
</tr>
<tr class="tbl-data">
<td class="data-td last">% Supply Active, last 180 days</td>
<td class="data-td data last text-right">18%</td>
<td class="data-td data last text-right">7</td>
<td class="data-td data last text-right">9</td>
<td class="data-td data last text-right">5</td>
</tr>
<tr class="tbl-data">
<td class="data-td last">% Supply Dormant for 3+ Years</td>
<td class="data-td data last text-right">46 %</td>
<td class="data-td data last text-right">1</td>
<td class="data-td data last text-right">13</td>
<td class="data-td data last text-right">100</td>
</tr>
<tr class="tbl-data">
<td class="data-td last">Avg Fees (USD)</td>
<td class="data-td data last text-right">$3.58</td>
<td class="data-td data last text-right">-5</td>
<td class="data-td data last text-right">-70</td>
<td class="data-td data last text-right">85</td>
</tr>
<tr class="tbl-data">
<td class="data-td last">Avg Fees (BTC)</td>
<td class="data-td data last text-right">0.00004</td>
<td class="data-td data last text-right">-30</td>
<td class="data-td data last text-right">-88</td>
<td class="data-td data last text-right">13</td>
</tr>
<tr class="tbl-data">
<td class="data-td last">Percent of BTC Addresses in profit</td>
<td class="data-td data last text-right">99%</td>
<td class="data-td data last text-right">6</td>
<td class="data-td data last text-right">21</td>
<td class="data-td data last text-right">99</td>
</tr>
<tr class="tbl-data">
<td class="data-td last">Unrealized profit/loss ratio</td>
<td class="data-td data last text-right">0.61</td>
<td class="data-td data last text-right">21</td>
<td class="data-td data last text-right">39</td>
<td class="data-td data last text-right">85</td>
</tr>
<tr class="tbl-data">
<td class="data-td last">Global Power Consumption (TWh)</td>
<td class="data-td data last text-right">140</td>
<td class="data-td data last text-right">10</td>
<td class="data-td data last text-right">58</td>
<td class="data-td data last text-right">100</td>
</tr>
<tr class="tbl-data">
<td class="data-td last">Total Daily BTC Miner Revenues (USD)</td>
<td class="data-td data last text-right">$41,737,495</td>
<td class="data-td data last text-right">30</td>
<td class="data-td data last text-right">4</td>
<td class="data-td data last text-right">92</td>
</tr>
<tr class="tbl-data">
<td class="data-td last">Total Crypto Equities' Market Cap<sup>*</sup>&nbsp;(USD) (MM)</td>
<td class="data-td data last text-right">$208,001</td>
<td class="data-td data last text-right">47</td>
<td class="data-td data last text-right">102</td>
<td class="data-td data last text-right">100</td>
</tr>
<tr class="tbl-data">
<td class="data-td last">Transfer volume from Miners to Exchanges (USD)</td>
<td class="data-td data last text-right">$29,052,882</td>
<td class="data-td data last text-right">803</td>
<td class="data-td data last text-right">-31</td>
<td class="data-td data last text-right">100</td>
</tr>
<tr class="tbl-data">
<td class="data-td last">Bitcoin Dominance</td>
<td class="data-td data last text-right">59%</td>
<td class="data-td data last text-right">4</td>
<td class="data-td data last text-right">16</td>
<td class="data-td data last text-right">88</td>
</tr>
<tr class="tbl-data">
<td class="data-td last">Bitcoin Futures Annualized Basis</td>
<td class="data-td data last text-right">13%</td>
<td class="data-td data last text-right">54</td>
<td class="data-td data last text-right">35</td>
<td class="data-td data last text-right">82</td>
</tr>
<tr class="tbl-data">
<td class="data-td last">Mining Difficulty (T)</td>
<td class="data-td data last text-right">102</td>
<td class="data-td data last text-right">10</td>
<td class="data-td data last text-right">57</td>
<td class="data-td data last text-right">100</td>
</tr>
</tbody>
</table>
</div>
<br />
<p class="chart-disclosure"><sup>*</sup>&nbsp;DAPP market cap as a proxy, as of Oct 18th, 2024</p>
<p class="chart-disclosure"><sup>1</sup>&nbsp;30 day change &amp; 365 day change are relative to the 7-day avg, not absolute</p>
<p class="chart-disclosure"><strong>Source</strong>: Glassnode, VanEck research as of 10/15/24. <strong>Past performance is no guarantee of future results.</strong></p>
<h2 id="bitcoin-miners" class="jump-link-nav anchored-block" data-jumplink-title="Miner Behavior">Bitcoin Miners &amp; Total Crypto Equities&rsquo; Market Cap</h2>
<p><strong>Mining Difficulty (T): </strong>Bitcoin's block difficulty rose from 92 terahashes (T) to 102 T, reflecting miners expanding and upgrading their fleets. The Bitcoin network automatically adjusts difficulty every 2,016 blocks (~two weeks) to ensure blocks are mined approximately every 10 minutes, increasing or decreasing the computational power needed to solve a block. Rising difficulty signals growing competition among miners and a robust, secure network.</p>
<p><strong>Total Daily BTC Miner Revenues:</strong> Increased 30% month-over-month, benefiting from Bitcoin&rsquo;s rally but suffering from a 30% decline in BTC-denominated transaction fees.</p>
<p><strong>Transfer Volume from Miners to Exchanges: </strong>On Friday, November 18th, miners transferred ~$181 million in BTC to exchanges&mdash;50x the preceding 30 days&rsquo; average&mdash;driving the 7-day moving average up 803% month-over-month. This extreme move reflects the highest level since March, prior to Bitcoin&rsquo;s latest halving. While persistently high levels of miner transfers to exchanges can signal an overheated market, this spike follows a summer of relatively low miner selling, suggesting profit-taking for operations and growth rather than a market peak.</p>
<p><strong>Total Crypto Equities&rsquo; Market Cap: </strong>The 30-day moving average of the MarketVector Digital Asset Equity Index (MVDAPP) rose 47% month-over-month, outperforming Bitcoin. Leading index components such as MicroStrategy and Bitcoin miners directly benefit from Bitcoin&rsquo;s price appreciation through their holdings or mining operations. Meanwhile, companies like Coinbase capitalize on broader crypto market gains as rising prices drive expectations of increased trading fees and other revenue streams.</p>
<h3>Chart of the Month</h3>
<p><img loading="lazy" class="img-responsive w-100" alt="Chart of the Month" src="https://www.vaneck.com/contentassets/163fef20feb8427e9f50e904f30cd9d1/5069_bitcoin-chaincheck-nov_chart-5_2024-11_v1_blog.svg" width="1044" /></p>
<p class="chart-disclosure"><strong>Source:</strong> farside.co.uk as of 11/18/2024. <strong>Past performance is no guarantee of future results.</strong></p>
<p><strong>Links to third party websites are provided as a convenience and the inclusion of such links does not imply any endorsement, approval, investigation, verification or monitoring by us of any content or information contained within or accessible from the linked sites. By clicking on the link to a non-VanEck webpage, you acknowledge that you are entering a third-party website subject to its own terms and conditions. VanEck disclaims responsibility for content, legality of access or suitability of the third-party websites.</strong></p>
<style>
   .data-td.data {
        padding-right: 5px !important;
    }

    .data-head {
        padding-right: 5px !important;
    }

    .wrapped-div {
        max-width: 100%;
    }

    @media (max-width: 1240px) {
        .wrapped-div {
            overflow-x: scroll;
        }
    }

    
    .wrapped-div-sector {
        max-width: 100%;
        overflow-x: scroll;
    }
    .flourish-credit{
display: none !important;
}


</style>
<p>To receive more <strong><a href="https://www.vaneck.com/us/en/insights/digital-assets/" title="Digital Assets Insights">Digital Assets</a></strong> insights, <strong><a href="https://www.vaneck.com/us/en/subscribe/" title="Subscription Center">sign up in our subscription center</a></strong>.</p>
]]></content:encoded>
</item><item rdf:about="https://www.vaneck.com/us/en/blogs/municipal-bonds/what-trumps-presidency-means-for-municipal-bonds/">
  <title>What Trump’s Presidency Means for Municipal Bonds></title>
  <link>https://www.vaneck.com/us/en/blogs/municipal-bonds/what-trumps-presidency-means-for-municipal-bonds/</link>
  <description><![CDATA[Trump&rsquo;s presidency could influence munis through potential changes in tax policies, adjustments to SALT deductions, tariffs, and Social Security income taxation.]]></description>
  <dc:creator>Tamara  Lowin</dc:creator>
  <dc:date>11/20/2024 06:30:00</dc:date>
<content:encoded><![CDATA[

<p>President-Elect Trump announced a broad and ambitious agenda during his campaign. While campaign promises don&rsquo;t always translate into policy, we assess below how some of his proposals might impact the municipal market. Regardless of whether these impacts are positive or negative, it&rsquo;s important to note that federal policy changes affect all sectors of the municipal market&mdash;a testament to its inherent strengths. Even as federal priorities shift every four to eight years, municipal bonds have consistently offered stable and reliable investment opportunities.</p>
<h2>Federal Tax Policy</h2>
<p>The Municipal Bond Tax Exemption: This tax exemption, like many others, appears more vulnerable to us in the face of federal budget challenges and we recommend caution on taking the tax exemption for granted. The Tax Cuts and Jobs Act (TCJA) halted the issuance of tax-exempt pre-refunding bonds, and additional legislation could likewise cause another sub-set of municipal debt to become taxable. We do not expect any changes to impact existing debt in the event of any changes. As uncertainty increases on this subject, we could see an increase in issuance before an anticipated loss of the product.</p>
<p>SALT deduction: Another hit from the TCJA is that this law caps state and local tax deductions at $10,000. The President-Elect commented in NY this fall that he would &ldquo;get SALT back.&rdquo; When state and local governments evaluate taxing capacity, the SALT deduction is part of the calculation. From a municipal credit perspective, the return of the deduction is positive: residents are paying lower taxes. They can spend more on the economy, and if necessary, there is capacity for tax increases if necessary.</p>
<p>Tariffs: The &ldquo;If&rsquo;s&rdquo; and &ldquo;How&rsquo;s&rdquo; abound on the Tariffs topic. With so little understood on the potential implementation, we do not want to dive deep into the multiple scenarios, but offer these thoughts:</p>
<ul class="content-list">
<li class="mt-2">Tariffs are regressive &ndash; akin to a consumption tax. If used to replace a progressive income tax, we should expect an increased need for social support programs paid for by our governments.</li>
<li class="mt-2">In 2022, the total import Value for Goods was $3.35 trillion. Under existing laws, $112 billion of Duty, Taxes, and Fees were collected &ndash; primarily due to tariffs imposed by Trump in his first term.<sup>1</sup></li>
<li class="mt-2">In 2022, the federal government collected $2.8 trillion in personal income taxes.<sup>2</sup></li>
</ul>
<p>If there are no more personal income taxes, there are no more federal taxes from which municipal bonds will be exempt. However, the numbers above show how difficult it would be to remove the federal income tax completely. If federal income tax rates fall, the tax exemption that municipal bonds provide is lower but still offers a value that would retain investor demand.</p>
<p>Social Security Income is no longer subject to federal income taxes: 60% of people who receive Social Security do not currently pay federal income taxes on their benefits. Depending on total income, up to 85% of social security revenues can be subject to federal income taxes.<sup>3</sup>&nbsp;The federal government's income from Social Security appears fairly low from a federal budget perspective. From state and local budget perspectives, exempted this income from federal income tax is a positive, particularly for states with a large retiree population where individuals will have more income to spend in the local economy.</p>
<h2>State Priorities</h2>
<p>Voters also opined on state and local ballot questions, putting new laws, taxes, and regulations in place. Below, we highlight some of the measures that will impact the municipal market in the near future.</p>
<h2>Education</h2>
<p>School choice measures failed in Colorado and Kentucky, keeping state dollars in the public domain. Traditional public school and charter school funding will not change.</p>
<p>Utah overwhelmingly approved a constitutional amendment increasing annual distributions from the State School Fund from 4% to 5%. The additional funding will benefit public education.</p>

<h2>Taxes</h2>
<p>Illinois posed an &ldquo;Advisory Question&rdquo; to take the temperature on residents&rsquo; opinion on creating a second tax bracket taxing personal income over $1 million an additional 3%. While the state's feedback supported the new tax bracket, any tax changes are not automatic. Recall that Illinois municipal bonds are not tax-exempt for state residents.</p>
<p>Voters in Washington State decided to continue applying the state's two-year-old capital gains excise tax, which has collected $1.2 billion so far.</p>
<p>(This is not a ballot vote, but while we are here, Louisiana&rsquo;s House Ways and Means Committee passed a bill that would change the state&rsquo;s graduated personal income tax rates to one 3% flat tax. It passed a second bill to eliminate the state&rsquo;s corporate franchise tax. The bills must pass through additional votes before the taxing methodology changes in the state.)</p>
<h2>Climate</h2>
<p>A Washington State ballot measure to repeal the state&rsquo;s Climate Commitment Act, which uses a &ldquo;cap and invest&rdquo; program to reduce greenhouse gas emissions, was rejected. The act will remain in place.</p>
<p>California voters approved a $10 billion bond measure to boost climate resilience. Funds are expected to support safe drinking water, wildfire prevention, drought preparedness, and clean air preservation. The market currently welcomes California&rsquo;s new issuance.</p>
<p>Honolulu, Hawaii, Louisiana, and South Dakota voted on measures that emphasized a need for environmental resiliency and the use of renewable energy sources.</p>
<h2>Healthcare</h2>
<p>California voters approved directing revenues from an existing tax on managed care health insurance plans to fund Medi-Cal (California&rsquo;s Medicaid program). The tax is expected to generate $35 billion over the next four years. This might not change how funds are currently budgeted, but as a rule, we aren&rsquo;t fans of laws that restrict budget independence. California has a history of passing well-meaning laws that stymie the state in budget crunches.</p>
<p>California voters also overwhelmingly approved Proposition 36, &ldquo;Increase Sentences for Drug and Theft Crimes.&rdquo; This measure reverses the 2014 Proposition 47, which reduced prison overcrowding. Proposition 36 also created &ldquo;treatment-mandated felonies&rdquo;: if charges are not contested, a drug treatment program can be provided instead of jail time. This removes a vital revenue stream used for mental health and addiction programs in the state, some of which have municipal debt outstanding.</p>
<h2>New Supply</h2>
<p>Voters nationwide approved referendums for over $50 billion of new debt issuance to support infrastructure and construction. Expensive plans to improve infrastructure were first put on hold when COVID-uncertainty broke down supply chains. Inflation then rendered project and borrowing costs unaffordable. In 2024, a falling rate environment unleashed a wave of new issuance, and we expect this to continue at a strong pace into 2025.</p>
<h2 id="takeaways" class="anchored-block">Takeaways</h2>
<p>The potential for evolving policies under a Trump presidency could bring significant shifts to the municipal bond market, from tax adjustments to social program funding changes. However, while federal policies and economic measures play a role, the priorities seen in recent local elections reveal the unique resilience of the municipal market. Voters have spoken on issues ranging from education and healthcare to environmental protection, shaping how local governments allocate resources and raise funds through debt issuance. These ballot decisions underscore that, even amid national uncertainty, local governance remains a powerful and stabilizing force, helping municipal bonds maintain their status as a stable investment option. Investors should stay informed and watch for legislative developments, but the market&rsquo;s long-term strength and adaptability to shifting policies provide a measure of confidence for the future.</p>
<p>Considering the likelihood of evolving federal policies and a set of diverse state-level initiatives, investing in municipal bonds remains a prudent strategy for those seeking tax-exempt income and portfolio stability. Navigating the complexities of individual municipal bonds&mdash;such as assessing credit quality, managing interest rate risk, and ensuring adequate diversification&mdash;can be challenging. <a href="http://vaneck.com/us/en/blogs/municipal-bonds/municipal-bond-etfs-expect-more-from-your-munis/" title="Municipal Bond ETFs &ndash; Expect More from Your Munis"><strong>VanEck's municipal bond ETFs</strong></a> offer a streamlined solution to these challenges.</p>
<p><a href="http://vaneck.com/us/en/blogs/municipal-bonds/municipal-bond-etfs-expect-more-from-your-munis/" title="Municipal Bond ETFs &ndash; Expect More from Your Munis"><strong>VanEck's municipal bond ETFs</strong></a> provide a comprehensive, efficient, and flexible approach to municipal bond investing. They are a compelling alternative to purchasing individual bonds, especially in a dynamic policy environment.</p>
<p>To receive more <a href="https://www.vaneck.com/us/en/insights/municipal-bonds/" title="Municipal Bonds Insights"><strong>Municipal Bonds</strong></a> insights, <a href="/link/5f45412c2143400497908cea2897f7d3.aspx" title=" Subscription Center"><strong>sign up in our subscription center</strong></a>.</p>
]]></content:encoded>
</item><item rdf:about="https://www.vaneck.com/us/en/blogs/emerging-markets-bonds/imf-fall-takeaways-emerging-markets-in-the-shadow-of-the-us-election/">
  <title>IMF Fall Takeaways: Emerging Markets in the Shadow of the US Election></title>
  <link>https://www.vaneck.com/us/en/blogs/emerging-markets-bonds/imf-fall-takeaways-emerging-markets-in-the-shadow-of-the-us-election/</link>
  <description><![CDATA[At the Fall IMF meeting, most investors were preoccupied with the looming outcome of the US Presidential election. Price action and investor sentiment indicate the &ldquo;Trump trade&rdquo; of long US dollar and short US Treasuries is largely hedged in emerging market risk assets.]]></description>
  <dc:creator>David Austerweil</dc:creator>
  <dc:date>11/20/2024 06:30:00</dc:date>
<content:encoded><![CDATA[

<h2 id="key-takeaways" class="jump-link-nav anchored-block" data-jumplink-title="Key Takeaways">Key Takeaways</h2>
<ul class="content-list">
<li class="mt-2">Investors were preoccupied with the pending outcome of the US Presidential election during IMF sessions with the majority correctly expecting a Trump win, but not GOP control of congress. Price action and investor sentiment indicate the &ldquo;Trump trade&rdquo; of long US dollar and short US Treasuries is largely hedged in emerging market risk assets.</li>
<li class="mt-2">President-elect Trump&rsquo;s stated policy on restricting immigration to the US, reducing the immigrant labor force, placing large tariffs on important trading partners and cutting taxes are all inflationary and risk rising R* in the US along with long term inflation expectations and rates.</li>
<li class="mt-2">There was a consensus that tariff policy would not be as damaging as feared with Trump using the threat of large tariffs including against China as a negotiating tool to quickly reach trade positive agreements for the US. Asia based investors stated a preference for this electoral outcome.</li>
<li class="mt-2">Oil prices were expected to decline on large increases in non-OPEC+ production in 2025 and the Trump administrations focus on increasing US production. EM oil importers such as Turkey, CEE, South Africa and Asia stand to benefit.</li>
<li class="mt-2">Investors continue to downplay the impact of the Chinese stimulus measures being unveiled by Beijing. Many emerging markets economies are set to benefit substantially from increased Chinese growth prospects and a stable Chinese property market.</li>
<li class="mt-2">Assuming Trump&rsquo;s most extreme policy proposals do not get enacted, emerging market currencies should benefit from a global growth environment where the world&rsquo;s two largest economies are stimulating and emerging market governments already know how to do business with the incoming Trump administration. Stability in CNY is a necessary condition for continued EM FX strength.</li>
</ul>

<h2 id="investor-sentiment" class="jump-link-nav anchored-block" data-jumplink-title="Investor Sentiment">Investors were anxiously waiting for an outcome</h2>
<p><strong>There was a noticeable lack of conviction among EM investors at the fall meetings. The US election was seen as binary and as leading EM assets on two opposing paths.</strong> Policy makers often wanted to hear our views on the US election (as if we had some uniquely helpful insight as Americans!). For their part, policy makers could only respond that they would work with whichever party wins and centered discussion on their own economies. Still, the US election used up most of the oxygen in the room and stifled conversations on global macro.</p>
<p>Given the IMF forecasts show barely any change from April, not much was lost. There was a lot of complacency in the consensus views. Only 2% of investors expected global growth to accelerate with almost 80% expecting a continuation of the current moderate growth path. Similarly, the majority expected US core PCE to end next year below 2.5% and just 5% expected it to be above 3%. Regarding US fiscal policy, just 6% of investors expected a reduction in the US deficit over the next 12 months. When asked about the path of the US dollar under a Trump win, just 23% of investors expected a weaker US dollar. And perhaps most importantly, only 25% of investors were planning to increase investments in Chinese assets with 39% still viewing China as not investable. While this is a huge improvement from the just 4% of investors looking to increase investments in China a year ago, there is still a substantial reallocation towards China to come if China follows through with its policy stimulus. In the face of continuous negative sentiment, Chinese assets can climb a wall of worry as economic data improves and policy support continues to increase incrementally over time.</p>
<p><strong>There was also a stated preference from Asian investors for a Trump presidency because they felt Asian governments, including China, could strike a deal with his administration quickly and get back to doing business whereas Harris&rsquo; anti-China stance was viewed as ideological and so it would be near-impossible to improve the business relationship with the US under her administration.</strong> The conventional wisdom was that President Trump would start with a low tariff rate such as 10% on Chinese goods and increase the rate on a preset schedule in order to pressure China toward reaching a favorable deal. China in return would like to increase foreign investment in its economy.</p>
<h2 id="monetary-and-fiscal-policy-risks" class="jump-link-nav anchored-block" data-jumplink-title="Monetary and Fiscal Policy Risks">Risks to US monetary policy from services inflation, tariffs, and immigration</h2>
<p>The IMF has been warning about sticky core services inflation globally leading to more persistent core inflation. In most advanced and developing economies, while core goods inflation is at or even below target, core services inflation remains 50% above pre-pandemic levels. The continued strength of the US economy along with a healthy labor market and continued pent up demand for services is keeping services inflation high. Additional tax cuts from the Trump administration would only add to that pressure. In contrast, goods inflation has declined to zero thanks to the easing of pandemic related trade bottlenecks and cheap Chinese exports.</p>
<h3>Inflation is Sticky &ndash; Driven by Services</h3>
<p><strong>(Percent, three month over three month, annualized)</strong></p>
<p><img loading="lazy" class="img-responsive w-100" alt="Inflation is Sticky &ndash; Driven by Services" src="https://www.vaneck.com/contentassets/cf32af66f9bb4827bf0836eee6af02d7/5064_imf-fall-meeting-emb-2024-11_chart-1_blog_v1.svg" /></p>
<p class="chart-disclosure">Source: International Monetary Fund, as of October 2024.</p>
<p><strong>There are two potential shocks that may arise from the incoming Trump administration&rsquo;s policy in January 2025: (1) tariffs, particularly very high tariffs on Chinese goods, and (2) restrictions on immigration to the US and a reduction of the US immigrant labor force.</strong> Both shocks could have large impacts on core inflation with tariffs at least temporarily derailing benign core goods inflation.</p>
<p>Under a tariff scenario where Trump implemented his most extreme tariff proposals of an across the board 10% tariff (Mexico and Canada would be exempt under USMCA) and a 60% tariff on China, it would add at least 0.8% to 2025 inflation and 0.6% to 2026 inflation with the impact felt as early as 2Q25. The real impact could be much higher with estimates of up to a 2.5% increase in CPI. There is hope that Trump will start with a more modest tariff rate and use the threat of much higher tariffs to reach a beneficial agreement with trading partners, most importantly China, but the risk is real and material including that no agreement is easily reached, and retaliatory measures are taken.</p>
<p>The second shock coming from restricting immigration to the US and potentially reducing the country&rsquo;s immigrant labor force would have a longer lasting impact, the damage from which would be much harder to recover. The increase in the US labor force coming from the surge in net immigration during 2022 and 2023 of an average 3 million per year (vs. an overage of 1mm in earlier years), may have reduced inflation by up to 0.5%. Undoing just this recent positive benefit risks raising 2025 inflation by another 0.5%. However, unlike tariffs, a permanent reduction in the labor force and a significantly reduced rate of new immigrant labor could raise R* substantially by permanently increasing inflation expectations, reducing potential growth and driving both wages and the unemployment rate higher.</p>
<p><strong>The combined shock of higher tariffs and reduced immigration could raise US inflation by at least 1.3% in 2025 which would not only stop the Fed from cutting interest rates but could significantly increase pressure on them to hike.</strong> As the market prices in Fed hikes at the same time tax cuts are considered by Congress, the US interest rate curve could bear steepen which would be very damaging for risk assets especially emerging markets. Immigrant labor has been the primary driver of US population growth over the past decade making it one of the primary drivers of GDP growth.</p>
<h2>Failure to rebuild fiscal buffers and the same old concerns on the US debt trajectory</h2>
<p>The IMF would like governments to use the current post-COVID period to rebuild fiscal buffers. However, developed markets have instead overpromised and underdelivered. In fact, outside the Euro area, developed markets promised to save and instead actually ended up spending more! In contrast, emerging markets implemented meaningful fiscal adjustments. Often the fiscal adjustment was because the EM economy was constrained by an IMF program or an inability to borrow more, but regardless of the reason the fiscal deficit was reduced.</p>
<h3>Fiscal Policy Stance</h3>
<p><strong>(Percentage Points: 2024 minus 2022 primary balance)</strong></p>
<p><img loading="lazy" class="img-responsive w-100" alt="Fiscal Policy Stanc" src="https://www.vaneck.com/contentassets/e8d50add35be484b9b51c16df7150013/5064_imf-fall-meeting-emb-2024-11_chart-2_blog_v1.svg" /></p>
<p class="chart-disclosure">Source: International Monetary Fund; as of October 2024.</p>
<p>During the fall IMF meetings, concern over the sustainability of US fiscal policy and the trajectory of US debt was less pronounced than in recent meetings probably because over the past year the feared risks to markets from profligate US spending had failed to materialize. In other words, while it would be unsustainable to run the current level of US fiscal deficits indefinitely, it is not today&rsquo;s problem and there is still (plenty of) time for the US to correct course.</p>
<p>In the US, interest expense will soon make up half of the entire fiscal deficit. Because of this, the incoming Trump government may at some point decide that interest rates are too high and that the Federal Reserve should play a role in easing the burden on government. If at this moment the fiscal deficit were not significantly reduced (an outcome no one expects), this would be the moment when fiscal dominance would directly impact the market with the US dollar declining materially in value and long-term interest rates rising even as short-term interest rates declined. Without some form of yield curve control, the US government would need to shorten even further the average duration of its borrowing to benefit from the low short term funding costs. <strong>The first warning sign to watch out for will be an inability of US treasury to fund itself with additional long-term debt without causing a meaningful, negative impact on pricing. </strong></p>
<h2>Europe is still everybody&rsquo;s favorite weak link</h2>
<p>Europe remained everybody&rsquo;s favorite weak link for the second year in a row. The region was a major beneficiary of the U.S.-created order and rules, but these are increasingly challenged by BRICS and the U.S. itself (especially under the Trump 2.0 presidency). As a result, Europe&rsquo;s growth model of reliance on cheap Russian energy, rising exports to China, relatively low military spending, and low interest rates might no longer be viable. At least three of these factors are no longer there, and at the same time the populist sentiment is staging a comeback across the region, driven by economic and energy uncertainty and insecurity, as well as immigration policies.</p>
<p>Over-regulation is another major issue, hitting Europe&rsquo;s industrial core &ndash; Germany &ndash; particularly hard. The direction of Europe&rsquo;s industrial policy is another major concern. According to a recent report from the IMF, industrial policy is driven mostly by climate mitigation, supply chain resilience, and security rather than competitiveness &ndash; the latter was the objective for only one-third of all industrial policy measures last year. Against this backdrop, structural reforms aiming to restore Europe&rsquo;s competitiveness is an afterthought at best &ndash; perhaps with the exception of the former &ldquo;periphery&rdquo; (Greece, Portugal, Spain), which had an epiphany after its debt crisis a decade ago. It should not come as a surprise that the Eurozone&rsquo;s real GDP growth is expected to stay close to 1% in real terms both in 2024 and next year. Downside growth risks in Europe will multiply if President Trump imposes a high uniform tariff on China, and this outcome will also be inflationary, posing additional policy challenges for the ECB.</p>
<h2>No love for China despite the recent market rally</h2>
<p>Investors remained unconvinced about China&rsquo;s economic and market prospects, despite a string of policy announcements that encompass all key areas (monetary, fiscal, market, and regulations) aimed at boosting growth and revitalizing the economy. Investors&rsquo; skepticism reflects, first and foremost, the fact that the recent previous attempts by China to reflate its economy lacked follow through with policy makers hitting the break soon after stepping on the gas. Investors second source of concern are the high odds of a tariff escalation under President Trump&rsquo;s administration, which might also incentivize further strategic decoupling between the two countries that could ultimately lead to China being &ldquo;uninvestable&rdquo;. The key barometer to watch for how increased US-China tension over tariffs translates into EM assets will be how China decides to manage CNY deprecation. If it allows CNY to depreciate materially to absorb the loss of competitiveness from large US tariffs, it will lead to a material adjustment higher in the US dollar. However, if China decides it wants to prioritize stability in CNY in the face of tariffs in order to deter domestic capital flight and project maturity and strength to the world, EM assets will react positively.</p>
<p>Another major issue is that China&rsquo;s stimulus so far has focused on reducing risks to local government balance sheets (it is not even large enough to resolve them) and not on stimulating domestic demand or reflating the property market. Policy makers are not implementing a shift away from China&rsquo;s focus on industrial policy and instead are providing just enough support to achieve the government&rsquo;s 5% growth target. By cutting tail risks in local government debt, including the reduction of &ldquo;hidden&rdquo; debt, it can free resources to boost consumption, social services, and investments in other projects at the local government level. In order to restore confidence in a sustainable way, however, the government may need to implement the measures it has so far avoided, including the development of the social safety net and taking measures to boost consumption in order rebalance the Chinese economy. It makes a lot of sense for China hold onto these additional measures as dry powder to use after President-elect Trump&rsquo;s inauguration. A more bullish, market-oriented plan might only emerge in Q1-25 (at the earliest).</p>
<p>For now, China is rebalancing from real estate into new industries, and quite successfully, often producing better products at lower prices. This means, however, that China is likely to remain a major deflationary force in the world, whereas countries that put up protectionist barriers will end up with higher inflation pressures. This scenario bodes well for many EMs, those which embrace Chinese goods, and it will make their bond markets more attractive.</p>
<h2 id="em-fundamentals-vs-global-pulls" class="jump-link-nav anchored-block" data-jumplink-title="EM Fundamentals vs. Global Pull">EM fundamentals vs. Global &ldquo;pull&rdquo; &ndash; Which one will prevail?</h2>
<p><strong>The rising influence of global factors in EM price movements is approaching a 15-year high in EM local debt and this makes US and Chinese policy uniquely influential at this moment.</strong> The benign interpretation of this fact is that with the U.S. election uncertainty now over and global investors over hedged with respect to adverse policy stemming from the US focus can return to China policy stimulus and domestic economy fundamentals leading to positive price action. The recent wave of EM sovereign rating upgrades, which account for a big portion of this year&rsquo;s rating actions, signal that EMs are entering this phase in better fundamental shape. However, lower income nations have been hit by a double whammy of social pressures associated with economic transformation and severe climate events, often without sufficient fiscal space to respond with corrective policy measures. It is reassuring that the percentage of economies experiencing social unrest is mostly lower than a few years ago, but the IMF programs in several low-income countries had to be adjusted to accommodate these risks.</p>
<h3>EM Sovereign Ratings Have Improved Over the Past 2 Years</h3>
<p><strong>Sovereign Rating Upgrades/Downgrades (Moody's, Fitch, S&amp;P)</strong></p>
<p><img loading="lazy" class="img-responsive w-100" alt="EM Sovereign Ratings Have Improved Over the Past 2 Years" src="https://www.vaneck.com/contentassets/e4a66846baaa40f69104e839a045a3f6/5064_imf-fall-meeting-emb-2024-11_chart-3_blog_v1.svg" /></p>
<p class="chart-disclosure">Source: VanEck Research: Bloomberg LP.</p>

<p>Many EMs are now facing a new domestic challenge of the fiscal policy trilemma. The IMF defines it as a combination of: (1) pressures to spend more on defense, climate, competitiveness, education, and health; (2) political resistance to taxation; and (3) the need to maintain public debt sustainability, and monetary and financial sustainability. The scope of the problem in major EMs and EM &ldquo;Graduates&rdquo; might be smaller than in the U.S., which now finds itself in the same group as lower-income countries as regards the share of interest payments in general governments revenue. Emerging markets have significantly lower debt/GDP ratio and generally smaller fiscal deficits than DM. However, there is no such thing in EM as fiscal &ldquo;immunity&rdquo;, especially in financial markets. Central Europe is facing a prospect of permanently higher defense spending. Asian EMs should tweak their growth models to accommodate structural shifts in China and commodity markets without jeopardizing their hard-won macroeconomic and institutional credibility. And LATAM&rsquo;s geopolitical advantages, &ldquo;relative peace&rdquo;, can no longer obscure concerns about fiscal consolidation.</p>
<h3>General Government Interest Payments</h3>
<p><strong>(Percent of general government revenues)</strong></p>
<p><img loading="lazy" class="img-responsive w-100" alt="General Government Interest Payments" src="https://www.vaneck.com/contentassets/0648550c414b414f97ab61d65130a83f/5064_imf-fall-meeting-emb-2024-11_chart-4__blog_v1.svg" /></p>
<p class="chart-disclosure">Source: IMF staff calculations.</p>
<p>EM&rsquo;s attitude towards the fiscal trilemma will separate winners form losers in the coming years. However, EM fundamental and institutional evolution will not be completely independent from the post-election policy trajectory in the U.S., China&rsquo;s attempts to re-boot its economy, geopolitical shifts, and the reshaping of the international trade system.</p>
<h2 id="em-winners-and-losers-under-trump" class="jump-link-nav anchored-block" data-jumplink-title="EM Winners and Losers Under Trump">The winners and losers under a Trump administration and major Chinese stimulus measures</h2>
<p><strong>EM winners: Argentina, Ecuador, El Salvador, Turkey, Israel, Saudi Arabia, Hungary, Zambia</strong></p>
<p>Argentina<strong>, </strong>Ecuador and El Salvador were the clearest winners from a new Trump presidency due to easier access to additional IMF funding (as the IMF&rsquo;s largest shareholder the US has an important say in lending decisions.)</p>
<p><strong>Argentina</strong> needs to negotiate a new IMF program and desperately wants to get new money added to its already record size loan. Up until now, the IMF has been unwilling to increase the size of the loan to Argentina, especially given the unsustainability of the current exchange rate regime and concerns that the new money could be wasted defending the exchange rate just like under the Macri administration.</p>
<p><strong>Ecuador</strong> is in compliance with its IMF program, runs a fiscal surplus and has rebuilt reserves. However, the country has faced electricity blackouts that last for up to 8 hours a day and there are concerns that this has damaged Noboa&rsquo;s popularity and his chance at re-election next year. Additional support from the IMF and the US in terms of new lending to plug Ecuador&rsquo;s financing gap in 2025 and help with additional generation capacity would go a long way to improving domestic sentiment and market confidence.</p>
<p><strong>El Salvador</strong> is at an impasse with the IMF due to the nation&rsquo;s bitcoin law and the IMF has indicated that it would not proceed with a lending program unless the legislation gets watered down. Trump is a fan of bitcoin and could help convince the IMF to accept the current state of affairs with regards to bitcoin in El Salvador.</p>
<p><strong>Turkey</strong> will benefit from an improved political relationship with the United States as well as potentially lower oil import prices due to increased US production and maybe less scrutiny of Russian oil imports. Erdogan remains committed to Mehmet Simsek&rsquo;s economic program that has been removing the relative price distortions in the economy including removing subsidies and hiking interest rates as well as implementing a fiscal adjustment. While the disinflation had been slower than hoped for to date, the approach is the correct one and so long as the Erdogan remains committed, inflation should return to target.</p>
<p><strong>Israel</strong> will likely be able to count greater support from of the US government under a Trump administration, strengthening its position in the Middle East, and a subsequent refocus on the Abraham Accords.</p>
<p><strong>Saudi Arabia</strong> considers President Trump a top international ally, and the country would be a key beneficiary of easing regional tensions through trade channels, financial linkages, and FDIs in strategic sectors. Still, a prospect of wider budget deficits, smaller current account surpluses (or even deficits), and issuance concerns are clouding the sentiment. Investors might be willing to overlook these issues if geopolitical risks subside, but the deteriorating fiscal (and arguably external) metrics might not be fully reflected in valuations.</p>
<p><strong>Hungary&rsquo;s</strong> Prime Minister Orban established a strong rapport with President Trump during his first term in office, and there is no reason why this relationship will not continue in the next 4 years - especially as the two leaders seem to share views on the resolution of the Ukrainian conflict and Hungary&rsquo;s role in it. It remains to be seen though whether this will speed up the disbursement of the EU funds. Geopolitical tailwinds aside, Hungary&rsquo;s fiscal consolidation progress got a nod of approval during the IMF meetings, which is a boon against the backdrop of ample domestic liquidity.</p>
<p><strong>Zambia</strong> should benefit from improved copper production and investment next year as well potentially higher copper prices if the demand outlook improves due to China&rsquo;s stimulus. It has started to rain again and if this continues it can help improve the outlook for power generation and prospects for a recovery in the harvest. Additionally, with the recent success of their sovereign bond restructuring, the yields on Zambia&rsquo;s local bonds have fallen rapidly and the government can benefit from lower funding costs.</p>
<p><strong>EM losers: Mexico, Poland, Romania, Colombia</strong></p>
<p><strong>Mexico</strong> will need to endure a similar negotiation process as under Trump&rsquo;s first administration where it will need to promise to limit migration across the shared US-Mexico border in exchange for avoiding new tariffs from the US. While it should be an easy agreement to reach as there is a precedent and process already, it will be the first geopolitical test for the new Sheinbaum administration.</p>
<p><strong>Poland</strong> would likely need to divert more resources to military spending should the Trump administration decide to reduce US involvement in NATO adding additional spending onto already high fiscal deficits.</p>
<p><strong>In Romania</strong>, one difficult-to-weight and difficult-to-time risk in Romania involves neighboring Moldova. Moldova has a pro-European government that was just re-elected. However, concerns about Russia&rsquo;s influence and how to resolve ethnic tensions could come to the fore, depending on the trajectory of both the Ukraine conflict, but also depending on the regional and global power calculations following any &ldquo;end&rdquo;.</p>
<p><strong>Colombia&rsquo;s </strong>President Petro continues to push the boundaries of the country&rsquo;s institutional frameworks with the proposal to increase distributions to regional governments threatening to veer the government debt stock towards unsustainability. Fortunately, Petro has been largely unsuccessful to date, proving the strength of Colombia&rsquo;s institutions. In a positive twist, Petro recently announced larger than expected budget cuts into year end to ensure the government&rsquo;s compliance with this year&rsquo;s fiscal rule.</p>
<p><strong>EM FX with a high Beta to CNY</strong> will be a loser in a scenario where aggressive US tariffs on Chinese goods leads to a large, one-off devaluation of CNY against the USD. CLP, THB, MYR, KRW and ZAR would be the most impacted. The table below is a useful guide to judge the relative sensitivity of global FX to a CNY devaluation.</p>
<h3>11/12/2024 - EMFX Beta to CNY (based on % weekly change)</h3>
<div class="flourish-embed flourish-table" data-src="visualisation/20369513"><script src="https://public.flourish.studio/resources/embed.js"></script><noscript><img loading="lazy" src="https://public.flourish.studio/visualisation/20369513/thumbnail" width="100%" alt="11/12/2024 - EMFX Beta to CNY (based on % weekly change)" /></noscript></div>
<h3>11/8/2024 - DMFX Majors Beta to CNY (based on weekly % change)</h3>
<div class="flourish-embed flourish-table" data-src="visualisation/20370466"><script src="https://public.flourish.studio/resources/embed.js"></script><noscript><img loading="lazy" src="https://public.flourish.studio/visualisation/20370466/thumbnail" width="100%" alt="11/12/2024 - EMFX Beta to CNY (based on % weekly change)" /></noscript></div>
<style>
.flourish-credit{
display: none !important;
}
</style>
<p class="chart-disclosure">Source: VanEck Research.</p>
<p>To receive more <a href="https://www.vaneck.com/us/en/insights/emerging-markets-bonds/" title="Emerging Markets Bonds Insights"><strong>Emerging Markets Bonds</strong></a> insights, <a href="/link/5f45412c2143400497908cea2897f7d3.aspx" title=" Subscription Center"><strong>sign up in our subscription center</strong></a>.</p>
]]></content:encoded>
</item><item rdf:about="https://www.vaneck.com/us/en/blogs/thematic-investing/fabless-semiconductor-companies-the-brains-behind-edge-computing/">
  <title>Fabless Semiconductor Companies: The Brains Behind Edge Computing></title>
  <link>https://www.vaneck.com/us/en/blogs/thematic-investing/fabless-semiconductor-companies-the-brains-behind-edge-computing/</link>
  <description><![CDATA[Fabless chip designers enable smart devices to think and act independently through edge computing, providing faster, more secure data processing for a variety of applications.]]></description>
  <dc:creator>Nick Frasse</dc:creator>
  <dc:date>11/15/2024 06:30:00</dc:date>
<content:encoded><![CDATA[

<h2>Setting the Stage: Billions of Devices, Billions of Data Points</h2>
<p>Every day, more devices&mdash;from home appliances and cars to industrial machinery&mdash;are connected to the internet. Known as the Internet of Things (IoT), this vast network of connected devices is projected to reach over 29 billion by 2030. Each device generates a constant stream of data, which, if managed correctly, can greatly enhance the functionality and efficiency of these devices.</p>
<h3>The Vast Network of Connected Devices is Projected to Reach Over 29 Billion by 2030</h3>
<p><img alt="The Vast Network of Connected Devices is Projected to Reach Over 29 Billion by 2030" src="https://www.vaneck.com/contentassets/78e1d2b5a7e54a0686e6a6ac58d16275/5040_smhx-blog_chart-1_2024-11_v1_blog.svg" class="chart-disclosure w-100" /></p>
<p class="chart-disclosure">Source: Statista, as of June 2024.&nbsp;<sup>*</sup>Projected numbers.</p>
<p>Imagine a smart refrigerator: This isn&rsquo;t just a cooler for your groceries; it&rsquo;s a connected device that monitors the freshness of your food, tracks expiration dates, and even suggests recipes based on available ingredients. To function effectively, the fridge needs to process data quickly, like recognizing when food is added or removed, analyzing if something is about to spoil, and alerting you.</p>
<p>Without edge computing, which stores data close to the device, the smart fridge would rely entirely on the cloud for this data processing. This means every time you add a new item, that data would need to travel to a distant server, be analyzed, and then return with the updated information. Not only could this introduce frustrating delays, like when you&rsquo;re rushing to prepare a meal&mdash;but it also can slow down functionality and strain network resources because the fridge has to send and receive constant data.</p>
<p>With edge computing, however, the fridge can process data locally and on-site. It can recognize items, track expiration dates, and send notifications in real time. This local processing power allows the fridge to operate with true &ldquo;smart&rdquo; capabilities, rather than relying on a distant cloud server, which could slow down responsiveness. In this way, edge computing enables the fridge to deliver instant results and real-time alerts, overcoming the potential lags or bandwidth issues that a cloud-only approach could cause.</p>
<h3>The Number of IoT-Connected Devices is Growing Rapidly</h3>
<p><strong>Number of IoT-Connected Devices Worldwide (2019 to 2033) by Vertical (in Millions)</strong></p>
<div class="wrapped-div">
<table style="width: 100%;">
<tbody>
<tr class="tbl-data" style="line-height: 1.25;">
<td class="tbl-header last text-right">&nbsp;</td>
<td class="tbl-header last text-right">Agriculture, Forestry &amp; Fishing</td>
<td class="tbl-header last text-right">Mining &amp; Quarrying</td>
<td class="tbl-header last text-right">Manufacturing</td>
<td class="tbl-header last text-right">Electricity, Gas, Steam &amp; A/C</td>
<td class="tbl-header last text-right">Water Supply &amp; Waste Management</td>
<td class="tbl-header last text-right">Construction</td>
<td class="tbl-header last text-right">Retail &amp; Wholesale</td>
<td class="tbl-header last text-right">Transportation &amp; Storage</td>
<td class="tbl-header last text-right">Accommodation &amp; Food Service</td>
<td class="tbl-header last text-right">Information &amp; Communication</td>
<td class="tbl-header last text-right">Finance &amp; Insurance</td>
<td class="tbl-header last text-right">Professional, Scientific &amp; Technical</td>
<td class="tbl-header last text-right">Administrative</td>
<td class="tbl-header last text-right">Government</td>
<td class="tbl-header last text-right">Health &amp; Social Care</td>
<td class="tbl-header last text-right">Arts &amp; Entertainment</td>
<td class="tbl-header last text-right">Other Services</td>
<td class="tbl-header last text-right">Consumer</td>
<td class="tbl-header last text-right">Cross-vertical</td>
<td class="tbl-header last text-right">Education</td>
</tr>
<tr class="tbl-data">
<td class="data-td data last text-left">2019</td>
<td class="data-td data last text-right">14.30</td>
<td class="data-td data last text-right">13.90</td>
<td class="data-td data last text-right">97.70</td>
<td class="data-td data last text-right">893.20</td>
<td class="data-td data last text-right">154.30</td>
<td class="data-td data last text-right">8.60</td>
<td class="data-td data last text-right">136.30</td>
<td class="data-td data last text-right">183.20</td>
<td class="data-td data last text-right">51.90</td>
<td class="data-td data last text-right">1.50</td>
<td class="data-td data last text-right">41</td>
<td class="data-td data last text-right">1</td>
<td class="data-td data last text-right">77.40</td>
<td class="data-td data last text-right">366.40</td>
<td class="data-td data last text-right">28.50</td>
<td class="data-td data last text-right">1.30</td>
<td class="data-td data last text-right">0</td>
<td class="data-td data last text-right">4,758.60</td>
<td class="data-td data last text-right">911.90</td>
<td class="data-td data last text-right">-</td>
</tr>
<tr class="tbl-data">
<td class="data-td data last text-left">2020</td>
<td class="data-td data last text-right">18.30</td>
<td class="data-td data last text-right">14.10</td>
<td class="data-td data last text-right">81.70</td>
<td class="data-td data last text-right">1,003.20</td>
<td class="data-td data last text-right">164.50</td>
<td class="data-td data last text-right">8.30</td>
<td class="data-td data last text-right">639.80</td>
<td class="data-td data last text-right">220.80</td>
<td class="data-td data last text-right">48.10</td>
<td class="data-td data last text-right">1.50</td>
<td class="data-td data last text-right">47.60</td>
<td class="data-td data last text-right">1.20</td>
<td class="data-td data last text-right">83.90</td>
<td class="data-td data last text-right">497</td>
<td class="data-td data last text-right">32.90</td>
<td class="data-td data last text-right">1.50</td>
<td class="data-td data last text-right">0</td>
<td class="data-td data last text-right">5,856.60</td>
<td class="data-td data last text-right">1,035</td>
<td class="data-td data last text-right">0.40</td>
</tr>
<tr class="tbl-data">
<td class="data-td data last text-left">2021</td>
<td class="data-td data last text-right">22.70</td>
<td class="data-td data last text-right">14.40</td>
<td class="data-td data last text-right">90.80</td>
<td class="data-td data last text-right">1,182.90</td>
<td class="data-td data last text-right">200.90</td>
<td class="data-td data last text-right">10.20</td>
<td class="data-td data last text-right">720.30</td>
<td class="data-td data last text-right">247.60</td>
<td class="data-td data last text-right">54.90</td>
<td class="data-td data last text-right">1.60</td>
<td class="data-td data last text-right">61.80</td>
<td class="data-td data last text-right">1.40</td>
<td class="data-td data last text-right">94.80</td>
<td class="data-td data last text-right">559.40</td>
<td class="data-td data last text-right">39.20</td>
<td class="data-td data last text-right">1.80</td>
<td class="data-td data last text-right">0.10</td>
<td class="data-td data last text-right">6,708.70</td>
<td class="data-td data last text-right">1,267.30</td>
<td class="data-td data last text-right">0.50</td>
</tr>
<tr class="tbl-data">
<td class="data-td data last text-left">2022</td>
<td class="data-td data last text-right">28.60</td>
<td class="data-td data last text-right">15.60</td>
<td class="data-td data last text-right">103</td>
<td class="data-td data last text-right">1,395.80</td>
<td class="data-td data last text-right">257.20</td>
<td class="data-td data last text-right">12.70</td>
<td class="data-td data last text-right">906.40</td>
<td class="data-td data last text-right">281.30</td>
<td class="data-td data last text-right">64.30</td>
<td class="data-td data last text-right">1.80</td>
<td class="data-td data last text-right">82.70</td>
<td class="data-td data last text-right">1.60</td>
<td class="data-td data last text-right">107.50</td>
<td class="data-td data last text-right">603.20</td>
<td class="data-td data last text-right">46.10</td>
<td class="data-td data last text-right">2.30</td>
<td class="data-td data last text-right">0.10</td>
<td class="data-td data last text-right">7,703.40</td>
<td class="data-td data last text-right">1,528.80</td>
<td class="data-td data last text-right">0.60</td>
</tr>
<tr class="tbl-data">
<td class="data-td data last text-left">2023*</td>
<td class="data-td data last text-right">38.20</td>
<td class="data-td data last text-right">17</td>
<td class="data-td data last text-right">113</td>
<td class="data-td data last text-right">1,459.80</td>
<td class="data-td data last text-right">308.80</td>
<td class="data-td data last text-right">14.30</td>
<td class="data-td data last text-right">1,120.60</td>
<td class="data-td data last text-right">326.20</td>
<td class="data-td data last text-right">71.20</td>
<td class="data-td data last text-right">4.40</td>
<td class="data-td data last text-right">72.50</td>
<td class="data-td data last text-right">2.20</td>
<td class="data-td data last text-right">83.60</td>
<td class="data-td data last text-right">682</td>
<td class="data-td data last text-right">56</td>
<td class="data-td data last text-right">3.70</td>
<td class="data-td data last text-right">0.10</td>
<td class="data-td data last text-right">9,612.90</td>
<td class="data-td data last text-right">2,057.70</td>
<td class="data-td data last text-right">14.80</td>
</tr>
<tr class="tbl-data">
<td class="data-td data last text-left">2024*</td>
<td class="data-td data last text-right">49.80</td>
<td class="data-td data last text-right">18</td>
<td class="data-td data last text-right">122.80</td>
<td class="data-td data last text-right">1,589.90</td>
<td class="data-td data last text-right">372.30</td>
<td class="data-td data last text-right">16.60</td>
<td class="data-td data last text-right">1,283.10</td>
<td class="data-td data last text-right">361.60</td>
<td class="data-td data last text-right">79.20</td>
<td class="data-td data last text-right">5</td>
<td class="data-td data last text-right">87.10</td>
<td class="data-td data last text-right">2.50</td>
<td class="data-td data last text-right">93.80</td>
<td class="data-td data last text-right">727.70</td>
<td class="data-td data last text-right">65.70</td>
<td class="data-td data last text-right">4.70</td>
<td class="data-td data last text-right">0.20</td>
<td class="data-td data last text-right">10,907.90</td>
<td class="data-td data last text-right">2,373.20</td>
<td class="data-td data last text-right">15.80</td>
</tr>
<tr class="tbl-data">
<td class="data-td data last text-left">2025*</td>
<td class="data-td data last text-right">65.20</td>
<td class="data-td data last text-right">19</td>
<td class="data-td data last text-right">133.80</td>
<td class="data-td data last text-right">1,725.50</td>
<td class="data-td data last text-right">438.50</td>
<td class="data-td data last text-right">19.10</td>
<td class="data-td data last text-right">1,459</td>
<td class="data-td data last text-right">402.40</td>
<td class="data-td data last text-right">86.40</td>
<td class="data-td data last text-right">5.60</td>
<td class="data-td data last text-right">103.20</td>
<td class="data-td data last text-right">2.80</td>
<td class="data-td data last text-right">105</td>
<td class="data-td data last text-right">771.20</td>
<td class="data-td data last text-right">76.60</td>
<td class="data-td data last text-right">5.90</td>
<td class="data-td data last text-right">0.40</td>
<td class="data-td data last text-right">12,264.50</td>
<td class="data-td data last text-right">2,664.30</td>
<td class="data-td data last text-right">16.80</td>
</tr>
<tr class="tbl-data">
<td class="data-td data last text-left">2026*</td>
<td class="data-td data last text-right">85.30</td>
<td class="data-td data last text-right">20.20</td>
<td class="data-td data last text-right">146</td>
<td class="data-td data last text-right">1,867.10</td>
<td class="data-td data last text-right">500.60</td>
<td class="data-td data last text-right">22</td>
<td class="data-td data last text-right">1,649</td>
<td class="data-td data last text-right">449.70</td>
<td class="data-td data last text-right">93.50</td>
<td class="data-td data last text-right">6</td>
<td class="data-td data last text-right">120.70</td>
<td class="data-td data last text-right">3.20</td>
<td class="data-td data last text-right">117.10</td>
<td class="data-td data last text-right">811</td>
<td class="data-td data last text-right">88.50</td>
<td class="data-td data last text-right">7.40</td>
<td class="data-td data last text-right">0.50</td>
<td class="data-td data last text-right">13,680.80</td>
<td class="data-td data last text-right">2,965.50</td>
<td class="data-td data last text-right">17.60</td>
</tr>
<tr class="tbl-data">
<td class="data-td data last text-left">2027*</td>
<td class="data-td data last text-right">110.80</td>
<td class="data-td data last text-right">21.30</td>
<td class="data-td data last text-right">158.90</td>
<td class="data-td data last text-right">2,016.60</td>
<td class="data-td data last text-right">556.80</td>
<td class="data-td data last text-right">25</td>
<td class="data-td data last text-right">1,852.20</td>
<td class="data-td data last text-right">488.20</td>
<td class="data-td data last text-right">100.90</td>
<td class="data-td data last text-right">6.40</td>
<td class="data-td data last text-right">139.60</td>
<td class="data-td data last text-right">3.60</td>
<td class="data-td data last text-right">129.40</td>
<td class="data-td data last text-right">849.30</td>
<td class="data-td data last text-right">101.40</td>
<td class="data-td data last text-right">9.10</td>
<td class="data-td data last text-right">0.80</td>
<td class="data-td data last text-right">15,155.50</td>
<td class="data-td data last text-right">3,279.30</td>
<td class="data-td data last text-right">18.50</td>
</tr>
<tr class="tbl-data">
<td class="data-td data last text-left">2028*</td>
<td class="data-td data last text-right">142.50</td>
<td class="data-td data last text-right">22.40</td>
<td class="data-td data last text-right">172.10</td>
<td class="data-td data last text-right">2,172.60</td>
<td class="data-td data last text-right">608.80</td>
<td class="data-td data last text-right">28.10</td>
<td class="data-td data last text-right">2,067</td>
<td class="data-td data last text-right">519.70</td>
<td class="data-td data last text-right">108.50</td>
<td class="data-td data last text-right">6.80</td>
<td class="data-td data last text-right">159.50</td>
<td class="data-td data last text-right">4</td>
<td class="data-td data last text-right">141.20</td>
<td class="data-td data last text-right">888.20</td>
<td class="data-td data last text-right">115.10</td>
<td class="data-td data last text-right">11</td>
<td class="data-td data last text-right">1.10</td>
<td class="data-td data last text-right">16,683</td>
<td class="data-td data last text-right">3,606.80</td>
<td class="data-td data last text-right">19.20</td>
</tr>
<tr class="tbl-data">
<td class="data-td data last text-left">2029*</td>
<td class="data-td data last text-right">181.10</td>
<td class="data-td data last text-right">23.50</td>
<td class="data-td data last text-right">185.40</td>
<td class="data-td data last text-right">2,321.70</td>
<td class="data-td data last text-right">656.50</td>
<td class="data-td data last text-right">31</td>
<td class="data-td data last text-right">2,291.90</td>
<td class="data-td data last text-right">549.60</td>
<td class="data-td data last text-right">116.50</td>
<td class="data-td data last text-right">7.30</td>
<td class="data-td data last text-right">180</td>
<td class="data-td data last text-right">4.40</td>
<td class="data-td data last text-right">152</td>
<td class="data-td data last text-right">928.60</td>
<td class="data-td data last text-right">129.70</td>
<td class="data-td data last text-right">13.10</td>
<td class="data-td data last text-right">1.50</td>
<td class="data-td data last text-right">18,235.20</td>
<td class="data-td data last text-right">3,948.10</td>
<td class="data-td data last text-right">20</td>
</tr>
<tr class="tbl-data">
<td class="data-td data last text-left">2030*</td>
<td class="data-td data last text-right">227.50</td>
<td class="data-td data last text-right">24.60</td>
<td class="data-td data last text-right">198.70</td>
<td class="data-td data last text-right">2,454.70</td>
<td class="data-td data last text-right">700.40</td>
<td class="data-td data last text-right">33.90</td>
<td class="data-td data last text-right">2,524.20</td>
<td class="data-td data last text-right">579.70</td>
<td class="data-td data last text-right">125</td>
<td class="data-td data last text-right">7.90</td>
<td class="data-td data last text-right">200.20</td>
<td class="data-td data last text-right">4.90</td>
<td class="data-td data last text-right">161.30</td>
<td class="data-td data last text-right">970.60</td>
<td class="data-td data last text-right">144.90</td>
<td class="data-td data last text-right">15.30</td>
<td class="data-td data last text-right">1.90</td>
<td class="data-td data last text-right">19,798.50</td>
<td class="data-td data last text-right">4,290.50</td>
<td class="data-td data last text-right">20.60</td>
</tr>
<tr class="tbl-data">
<td class="data-td data last text-left">2031*</td>
<td class="data-td data last text-right">282.40</td>
<td class="data-td data last text-right">25.60</td>
<td class="data-td data last text-right">211.70</td>
<td class="data-td data last text-right">2,568.50</td>
<td class="data-td data last text-right">740.60</td>
<td class="data-td data last text-right">36.80</td>
<td class="data-td data last text-right">2,761.60</td>
<td class="data-td data last text-right">610.30</td>
<td class="data-td data last text-right">133.90</td>
<td class="data-td data last text-right">8.70</td>
<td class="data-td data last text-right">219.60</td>
<td class="data-td data last text-right">5.30</td>
<td class="data-td data last text-right">168.90</td>
<td class="data-td data last text-right">1,013.50</td>
<td class="data-td data last text-right">160.80</td>
<td class="data-td data last text-right">17.50</td>
<td class="data-td data last text-right">2.50</td>
<td class="data-td data last text-right">21,367.50</td>
<td class="data-td data last text-right">4,630</td>
<td class="data-td data last text-right">21.30</td>
</tr>
<tr class="tbl-data">
<td class="data-td data last text-left">2032*</td>
<td class="data-td data last text-right">346.80</td>
<td class="data-td data last text-right">26.70</td>
<td class="data-td data last text-right">224.70</td>
<td class="data-td data last text-right">2,667</td>
<td class="data-td data last text-right">778.30</td>
<td class="data-td data last text-right">39.60</td>
<td class="data-td data last text-right">3,002.10</td>
<td class="data-td data last text-right">641.60</td>
<td class="data-td data last text-right">143.20</td>
<td class="data-td data last text-right">9.50</td>
<td class="data-td data last text-right">237.70</td>
<td class="data-td data last text-right">5.80</td>
<td class="data-td data last text-right">175</td>
<td class="data-td data last text-right">1,057.80</td>
<td class="data-td data last text-right">177.10</td>
<td class="data-td data last text-right">19.60</td>
<td class="data-td data last text-right">3.10</td>
<td class="data-td data last text-right">22,935.20</td>
<td class="data-td data last text-right">4,964.50</td>
<td class="data-td data last text-right">21.80</td>
</tr>
<tr class="tbl-data">
<td class="data-td data last text-left">2033*</td>
<td class="data-td data last text-right">421.70</td>
<td class="data-td data last text-right">27.70</td>
<td class="data-td data last text-right">237.70</td>
<td class="data-td data last text-right">2,753</td>
<td class="data-td data last text-right">813.90</td>
<td class="data-td data last text-right">42.50</td>
<td class="data-td data last text-right">3,244.60</td>
<td class="data-td data last text-right">673.70</td>
<td class="data-td data last text-right">152.90</td>
<td class="data-td data last text-right">10.50</td>
<td class="data-td data last text-right">254.30</td>
<td class="data-td data last text-right">6.20</td>
<td class="data-td data last text-right">179.80</td>
<td class="data-td data last text-right">1,103.50</td>
<td class="data-td data last text-right">193.70</td>
<td class="data-td data last text-right">21.70</td>
<td class="data-td data last text-right">3.70</td>
<td class="data-td data last text-right">24,493.70</td>
<td class="data-td data last text-right">5,291.80</td>
<td class="data-td data last text-right">22.30</td>
</tr>
</tbody>
</table>
</div>
<p class="chart-disclosure">Source: Statista, as of May 2024.&nbsp;<sup>*</sup>Projected numbers.</p>

<h2>Why Cloud Alone Isn&rsquo;t Enough</h2>
<p>While cloud computing is invaluable for storing and analyzing massive data sets, it can introduce challenges when it comes to real-time decision-making:</p>
<ol class="content-list">
<li class="mt-2">Latency: Cloud processing can be too slow for applications that need split-second responses. A smart fridge that relies solely on the cloud might take too long to respond to an action&mdash;like adding something to a shopping list&mdash;if there&rsquo;s network congestion or a distant server response delay.</li>
<li class="mt-2">Bandwidth Constraints: Constantly sending data to the cloud for analysis puts pressure on network bandwidth. For a house full of smart devices, this can mean slower performance as devices compete for bandwidth, especially during peak times.</li>
<li class="mt-2">Privacy Concerns: Edge computing allows sensitive information (like your grocery preferences) to be analyzed right on the device, reducing the need to send it to the cloud and minimizing data exposure.</li>
</ol>
<p>In essence, while the cloud is critical for overarching data storage and big-picture analysis, edge computing is essential for real-time, on-device functionality. This combination allows IoT devices to reach their full potential, delivering faster, more reliable performance that enhances user experience and preserves network efficiency.</p>
<h3>Edge Computing: From the Data Center to Your Device</h3>
<p><img src="https://www.vaneck.com/contentassets/c156afcd13b940e188c66c38d1a0f221/5040_smhx-infographic_2024-11_v1_blog.svg" class="img-responsive w-100" alt="Edge Computing: From the Data Center to Your Device" /></p>
<p class="chart-disclosure">Source: VanEck.</p>
<h2>Fabless Chip Designers Are Powering Edge Computing</h2>
<p>The companies building the brains for these edge computing devices are fabless semiconductor firms. Unlike traditional semiconductor companies, fabless firms focus exclusively on designing the advanced chips needed for edge computing and IoT. By outsourcing production to specialized manufacturers, they can stay agile and focus entirely on creating cutting-edge technology.</p>
<p>Here are examples of companies that are positioned to thrive as edge computing grows:</p>
<ul class="content-list">
<li class="mt-2">ARM Holdings<sup>1</sup>: A major player in mobile and IoT device chips, ARM designs energy-efficient processors that are ideal for low-power, high-performance devices at the edge, from refrigerators and smart home devices to industrial sensors.</li>
<li class="mt-2">Ambarella<sup>2</sup>: Known for its work in AI and computer vision, Ambarella develops chips that allow devices like security cameras and autonomous vehicles to &ldquo;see&rdquo; and interpret their surroundings in real time without needing to connect to the cloud.</li>
<li class="mt-2">Synaptics<sup>3</sup>: Focused on IoT and edge computing, Synaptics designs chips for smart devices, wearables, and other IoT applications. Their processors power everything from voice recognition in smart speakers to touch sensors in connected devices.</li>
</ul>
<p>These companies don&rsquo;t just make chips&mdash;they create the specialized &ldquo;brains&rdquo; that enable edge devices to think and act independently, providing faster, more secure data processing.</p>
<h2>How to Access Fabless Companies As They Lead the Edge Revolution</h2>
<p>With the world moving toward more connected, data-driven devices, fabless semiconductor companies are uniquely positioned to meet this demand. Their design-focused model allows them to create advanced chips for a variety of edge applications, from consumer electronics to industrial automation.</p>

<p>As IoT and AI continue to grow, edge computing will play an essential role in powering the connected world of the future. For investors looking to capture this trend, the <strong><a href="/link/9b8fb1812bc74764bf11fc85767838f9.aspx" title="SMHX - VanEck Fabless Semiconductor ETF - Holdings and Performance">VanEck Fabless Semiconductor ETF (SMHX)</a></strong> holds leading fabless semiconductor companies that are well-positioned to benefit from this shift. SMHX provides a targeted way to invest in the future of edge computing by focusing on fabless chip designers&mdash;companies that are truly powering the next generation of technology.</p>
<p>To receive more <a href="https://www.vaneck.com/us/en/insights/thematic-investing/" title="Thematic Investing Insights"><strong>Thematic Investing</strong></a> insights, <a href="https://www.vaneck.com/us/en/subscribe/" title="Subscription Center"><strong>sign up in our subscription center</strong></a>.</p>
]]></content:encoded>
</item><item rdf:about="https://www.vaneck.com/us/en/blogs/emerging-markets-bonds/rate-rally-reinforces-the-case-for-em-bonds/">
  <title>Rate Sell Off Reinforces the Case for EM Bonds></title>
  <link>https://www.vaneck.com/us/en/blogs/emerging-markets-bonds/rate-rally-reinforces-the-case-for-em-bonds/</link>
  <description><![CDATA[During the month US rates sold off, which we believe only reinforces the case for EM bonds.]]></description>
  <dc:creator>Eric Fine</dc:creator>
  <dc:date>11/14/2024 06:30:00</dc:date>
<content:encoded><![CDATA[


<p id="performance-overview" class="jump-link-nav anchored-block" data-jumplink-title="Performance Overview">The VanEck Emerging Markets Bond Fund was down 2.66% in October, compared to -3.17% for its benchmark. Year to date, the fund is up 5.55%, compared to up 3.41%, for its benchmark, the 50% J.P. Morgan Government Bond Index-Emerging Markets Global Diversified (GBI-EM) and 50% J.P. Morgan Emerging Markets Bond Index (EMBI), and compared to down -0.13%, -0.04% for the Global Agg and 10-year Treasuries, respectively. For the trailing 5-year period, the fund&rsquo;s cumulative return is 21.0%, compared to -1.0% for its benchmark (and-9.9% and -9.8% for the Global Agg and 10-year Treasuries, respectively). The decades-old story of emerging market bonds (EM) outperforming developed markets (DM) continues. During October, the fund ended its brief flirtation with Mexican local-currency government bonds and Colombian local-currency bonds. We allocated risk to Brazil and Chile local currency bonds, among others. We continue to like curated local currency, especially higher-beta, and have maintained our low duration into the September-October rates selloff. In USD, IG seems a pure US-rates trade (so we are averse), while HY sovereigns remain our hunting ground. Carry is 8.3%, YTW is 9.6%, duration is 5.5 and local makes up around 60% of exposure.</p>
<h3>Average Annual Total Returns<sup>*</sup>&nbsp;(%) (In USD)</h3>
<div class="wrapped-div">
<table style="width: 100%;">
<tbody>
<tr class="tbl-data">
<td class="tbl-header last" colspan="10">As of October 31, 2024</td>
</tr>
<tr class="tbl-data">
<td class="data-head last text-right">&nbsp;</td>
<td class="data-head last text-right">1 Mth</td>
<td class="data-head last text-right">3 Mth</td>
<td class="data-head last text-right">YTD</td>
<td class="data-head last text-right">1 Yr</td>
<td class="data-head last text-right">3 Yrs</td>
<td class="data-head last text-right">5 Yrs</td>
<td class="data-head last text-right">10 Yrs</td>
</tr>
<tr class="tbl-data">
<td class="data-td last text-left">Class A: NAV (Inception 07/09/12)</td>
<td class="data-td data last text-right">-2.60</td>
<td class="data-td data last text-right">3.02</td>
<td class="data-td data last text-right">5.17</td>
<td class="data-td data last text-right">15.62</td>
<td class="data-td data last text-right">1.83</td>
<td class="data-td data last text-right">3.56</td>
<td class="data-td data last text-right">1.66</td>
</tr>
<tr class="tbl-data">
<td class="data-td last text-left">Class A: Maximum 5.75% load</td>
<td class="data-td data last text-right">-8.20</td>
<td class="data-td data last text-right">-2.90</td>
<td class="data-td data last text-right">-0.88</td>
<td class="data-td data last text-right">8.97</td>
<td class="data-td data last text-right">-0.16</td>
<td class="data-td data last text-right">2.34</td>
<td class="data-td data last text-right">1.06</td>
</tr>
<tr class="tbl-data">
<td class="data-td last text-left">Class I: NAV (Inception 07/09/12)</td>
<td class="data-td data last text-right">-2.66</td>
<td class="data-td data last text-right">3.06</td>
<td class="data-td data last text-right">5.55</td>
<td class="data-td data last text-right">15.90</td>
<td class="data-td data last text-right">2.16</td>
<td class="data-td data last text-right">3.89</td>
<td class="data-td data last text-right">1.97</td>
</tr>
<tr class="tbl-data">
<td class="data-td last text-left">Class Y: NAV (Inception 07/09/12)</td>
<td class="data-td data last text-right">-2.75</td>
<td class="data-td data last text-right">2.97</td>
<td class="data-td data last text-right">5.43</td>
<td class="data-td data last text-right">15.73</td>
<td class="data-td data last text-right">2.07</td>
<td class="data-td data last text-right">3.82</td>
<td class="data-td data last text-right">1.89</td>
</tr>
<tr class="tbl-data">
<td class="data-td last text-left">50% GBI-EM/50% EMBI</td>
<td class="data-td data last text-right">-3.17</td>
<td class="data-td data last text-right">2.04</td>
<td class="data-td data last text-right">3.41</td>
<td class="data-td data last text-right">13.40</td>
<td class="data-td data last text-right">-0.71</td>
<td class="data-td data last text-right">-0.18</td>
<td class="data-td data last text-right">1.49</td>
</tr>
</tbody>
</table>
</div>
<br />
<div class="wrapped-div">
<table style="width: 100%;">
<tbody>
<tr class="tbl-data">
<td class="tbl-header last" colspan="10">As of September 30, 2024</td>
</tr>
<tr class="tbl-data">
<td class="data-head last text-right">&nbsp;</td>
<td class="data-head last text-right">1 Mth</td>
<td class="data-head last text-right">3 Mth</td>
<td class="data-head last text-right">YTD</td>
<td class="data-head last text-right">1 Yr</td>
<td class="data-head last text-right">3 Yrs</td>
<td class="data-head last text-right">5 Yrs</td>
<td class="data-head last text-right">10 Yrs</td>
</tr>
<tr class="tbl-data">
<td class="data-td last text-left">Class A: NAV (Inception 07/09/12)</td>
<td class="data-td data last text-right">3.19</td>
<td class="data-td data last text-right">7.73</td>
<td class="data-td data last text-right">7.97</td>
<td class="data-td data last text-right">17.00</td>
<td class="data-td data last text-right">2.71</td>
<td class="data-td data last text-right">4.17</td>
<td class="data-td data last text-right">1.88</td>
</tr>
<tr class="tbl-data">
<td class="data-td last text-left">Class A: Maximum 5.75% load</td>
<td class="data-td data last text-right">-2.74</td>
<td class="data-td data last text-right">1.54</td>
<td class="data-td data last text-right">1.77</td>
<td class="data-td data last text-right">10.27</td>
<td class="data-td data last text-right">0.70</td>
<td class="data-td data last text-right">2.94</td>
<td class="data-td data last text-right">1.28</td>
</tr>
<tr class="tbl-data">
<td class="data-td last text-left">Class I: NAV (Inception 07/09/12)</td>
<td class="data-td data last text-right">3.26</td>
<td class="data-td data last text-right">7.84</td>
<td class="data-td data last text-right">8.44</td>
<td class="data-td data last text-right">17.58</td>
<td class="data-td data last text-right">3.07</td>
<td class="data-td data last text-right">4.52</td>
<td class="data-td data last text-right">2.20</td>
</tr>
<tr class="tbl-data">
<td class="data-td last text-left">Class Y: NAV (Inception 07/09/12)</td>
<td class="data-td data last text-right">3.35</td>
<td class="data-td data last text-right">7.98</td>
<td class="data-td data last text-right">8.41</td>
<td class="data-td data last text-right">17.52</td>
<td class="data-td data last text-right">2.96</td>
<td class="data-td data last text-right">4.46</td>
<td class="data-td data last text-right">2.14</td>
</tr>
<tr class="tbl-data">
<td class="data-td last text-left">50% GBI-EM/50% EMBI</td>
<td class="data-td data last text-right">2.62</td>
<td class="data-td data last text-right">7.57</td>
<td class="data-td data last text-right">6.80</td>
<td class="data-td data last text-right">16.02</td>
<td class="data-td data last text-right">0.15</td>
<td class="data-td data last text-right">0.78</td>
<td class="data-td data last text-right">1.98</td>
</tr>
</tbody>
</table>
</div>
<style>
    .data-td.data {
        padding-right: 2px !important;
    }
    
    .wrapped-div {
        max-width: 100%;
    }
    
    @media (max-width: 768px) {
        .wrapped-div {
            overflow-x: scroll;
        }
    }
    
    .wrapped-div-sector {
        max-width: 100%;
        overflow-x: scroll;
    }
</style>
<p class="chart-disclosure"><sup>*</sup>&nbsp;Returns less than one year are not annualized.</p>
<p class="chart-disclosure"><strong>Expenses: Class A: Gross 2.08%, Net 1.21%; Class I: Gross 1.34%, Net 0.86%; Class Y: Gross 1.35%, Net 0.96%.</strong> Expenses are capped contractually until 05/01/25 at 1.20% for Class A, 0.85% for Class I, 0.95% for Class Y. Caps excluding acquired fund fees and expenses, interest, trading, dividends, and interest payments of securities sold short, taxes, and extraordinary expenses.</p>
<p class="chart-disclosure"><strong>The performance data quoted represents past performance. Past performance is not a guarantee of future results. Investment return and principal value of an investment will fluctuate so that an investor&rsquo;s shares, when redeemed, may be worth more or less than their original cost. Performance may be lower or higher than performance data quoted. Please call 800.826.2333 or visit vaneck.com for performance current to the most recent month ended.</strong></p>
<p class="chart-disclosure">The &ldquo;Net Asset Value&rdquo; (NAV) of a Fund is determined at the close of each business day, and represents the dollar value of one share of the fund; it is calculated by taking the total assets of the fund, subtracting total liabilities, and dividing by the total number of shares outstanding. The NAV is not necessarily the same as the ETF&rsquo;s intraday trading value. Investors should not expect to buy or sell shares at NAV.</p>

<p id="macro-analysis" class="jump-link-nav anchored-block" data-jumplink-title="Macro Analysis"><strong>Data &gt; US politics, for rates. </strong>Every economic data point released since the Fed&rsquo;s 50 basis points (bps) policy rate cut on September 18 has been stronger than expected, so bearish for rates. Perhaps the only &ldquo;bullish&rdquo; development for rates was a mini-&ldquo;peace dividend&rdquo; in the form of supposedly contained/managed conflict between Israel and Iran, that saw a big drop in oil prices in October. And that seems priced and possibly premature, as such a &ldquo;pause&rdquo; seems dictated by the US election, which once over is no longer a constraint, logically. Keep in mind other actors such as Yemen&rsquo;s Houthis, which survived Operation Prosperity Garden (as the Eisenhower carrier group had to exit the theater), none of which is affected by the &ldquo;ceasefire&rdquo; story. Also, Russia increasingly has &ldquo;maximalist&rdquo; objectives given its strong on-the-ground position and its sense that negotiation is pointless, so expecting peace simply due to a new US Executive seems overly hopeful. The world&rsquo;s wars are all expanding and appear built-in to the next few years&rsquo; (not months&rsquo;) future, while headlines of imminent ceasefires continue to get taken seriously. War is inflationary. And war busts through fiscal restraints, too (for those expecting a fiscal re-do under a Republican sweep scenario). That&rsquo;s all old news. But as we&rsquo;ve also learned, war (in its broader definition to include economic warfare) can undermine demand for some assets (US Treasuries) and boost demand for their opposites like bonds issued by EM governments with sustainable fiscal policy, independent central banks and no sanctions risk (and of course, gold).</p>
<h3>Exhibit 1 &ndash; US Economy Surprises To Upside After Fed 50 bp Cut</h3>
<p><img class="img-responsive w-100" alt="Exhibit 1 - US Economy Surprises To Upside After Fed 50 bp Cut" src="https://www.vaneck.com/contentassets/6b3f96c468194b158f29ac09558ec5a2/5047_emb-november_chart-1_2024-11_v1_blog.svg" /></p>
<p class="chart-disclosure">Source: Bloomberg, LP. Data as of November 2024.</p>
<p><strong>The rally in gold as rates began their October selloff is arguably the most important message of the last few months, auguring poorly for DM and the US dollar, but the market doesn&rsquo;t yet look at it that way.</strong> Gold is seen as unusual and isn&rsquo;t yet linked to central banks&rsquo; search for a wider range of safe assets including EM bonds; if anything, gold is connected to fiscal concerns (our &ldquo;fiscal dominance&rdquo; thesis). The IMF is somewhat alone (along with us) in thinking that this &ndash; central bank purchases of EM bonds &ndash; is important and has cited Singapore and Korea as early examples of EM bonds gaining reserve-status. But, to too many market professionals, this idea is either too complicated, too far off, or too uncertain. And it&rsquo;s all packaged as if we&rsquo;re supposed to expect a &ldquo;headline&rdquo; on &ldquo;BRICS&rdquo; and a perfect new currency. As we&rsquo;ve been arguing, there will be no headlines on EM bonds&rsquo; slow graduation to reserve status, it will be a long-term process. Fair enough so far, especially given all the attention on BRICs in the west lately. But our point is that these are <em>upside</em> risks to EM bonds with <em>already</em>-high real and/or nominal carry, so what&rsquo;s the issue? Seems to us the issue is one of courage and knowledge, as usual. We experience this in meetings. Which is fine, because markets have a solution for that, often involving chasing something at the wrong near-term moment. Sigh. For the past 5 years, the fund&rsquo;s cumulative return is +21.0%, compared to -1.0% for its EM benchmark (and down -9.9% and down -9.8% for the Agg and Treasuries, respectively). Steady headlines like those are more likely than headlines of &ldquo;EM local currency bonds dominate all DM bonds today&rdquo;. We updated the exhibit below &ndash; gold reserves/M0 for some big central banks, and the message is clear &ndash; EMs have a lot of gold relative to M0, DMs have very little gold relative to M0. Look at Japan and the UK on this chart if you think this doesn&rsquo;t matter. If you&rsquo;d like the chart explained in more detail (we think it is so profoundly simple it might be hard to understand), give us a call!</p>
<h3>Exhibit 2 &ndash; EMs (dark blue) Have High Gold Relative to M0, DMs (light blue) Have Low Gold Relative to M0</h3>
<p><img class="img-responsive w-100" alt="Exhibit 2 &ndash; EMs (dark blue) Have High Gold Relative to M0, DMs (light blue) Have Low Gold Relative to M0" src="https://www.vaneck.com/contentassets/f9a681e78101462da80e056c739528d6/5047_emb-november_chart-2_2024-9_v1_blog.svg" /></p>
<p class="chart-disclosure">Source: VanEck Research; Bloomberg, LP. Data as of October 2024.</p>

<p><strong>China &gt; US politics, for EM local currency.</strong> We haven&rsquo;t written much on US politics in this monthly and we aren&rsquo;t going to. First, we had an election game plan, which were our rate (and Mexico) views expressed in the fund (and in writing) this year; those were largely (though unintentionally) contrarian, perhaps interestingly, perhaps not. The most useless thing in the world at this late stage could be an election investing plan, in our view&hellip;way too over-determined, but we&rsquo;re just editorializing. Second, our election game plan was 90% a studious <em>avoidance</em> of drawing confident lines from politics to EM asset prices. Our primary framework was a) follow the data (as we do again, above) and b) downplay the table-pounding confidence that &ldquo;candidate X means &lsquo;this&rsquo; for global asset prices&rdquo;. (Mexico is an exception, more on that below.) China is a positive example for EM resilience, though, and a meaningful one. We wrote in previous pieces about the incredible stability of CNY, especially in the face of financial ripples from Japan&rsquo;s (to remind, a highly indebted DM which experimented with money policy) currency wobbles. Currencies are the primary transmission mechanism for economies, and the one from China was stable. So monetary policy is stabilizing, and such despite the extremely low interest-rate differential with the US (which worried us enough to graph it as a risk to our views in previous quarterlies).</p>
<h3>Exhibit 3 &ndash; CNY Insulated EM From DM Japan&rsquo;s Volatility</h3>
<p><img class="img-responsive w-100" alt="Exhibit 3 &ndash; CNY Insulated EM From DM Japan&rsquo;s Volatility" src="https://www.vaneck.com/contentassets/45e329748cb9466ab6848ded2b49e786/5047_emb-november_chart-3_2024-11_v1_blog.svg" /></p>
<p class="chart-disclosure">Source: VanEck Research; Bloomberg, LP. Data as of September 2024.</p>
<p><strong>What about Chinese fiscal policy?</strong> The key event for China, in our opinion, is that we are now in the fiscal realm! We think the story of the fiscal realm will follow the story of the two prior realms we&rsquo;ve already been through &ndash; the structural and the monetary realms. In both cases, there was never a &ldquo;bazooka&rdquo; moment. There was &ldquo;reflexivity&rdquo; in the form of greater policy support as market reactions and economic outcomes warranted &ndash; policies kept getting activated until they pointed to a need for policy support in the final realm, the fiscal. Anyway, our point is that if the structural and monetary realms are activated, entering the realm of fiscal policy means real final demand injected into an economy that has already prepared the ground. Just don&rsquo;t wait for a &ldquo;headline&rdquo; telling you so (or sell when you see it). One important basic note. The reason we are excited about Chinese bonds in the portfolio is precisely because China did <em>not</em> guarantee its property sector (and thus prevent the bonds from collapsing), and did <em>not</em> transfer risk to the government and ultimately undermine China. China allowed their bonds to collapse, making credit quality post-restructuring a completely different game, as well. This is good policy. During the global financial crisis and Eurozone crisis, DMs used policy to <em>support</em> asset prices and therefore injected greater moral hazard into policy.</p>
<p>By the way, there&rsquo;s a bit of a debate on China&rsquo;s debt levels, with the IMF including some debt as &ldquo;central government&rdquo;, but with prominent folks such as Michael Pettis and Brad Stetser arguing that much of it is mis-classified and is therefore much lower. The latter viewpoint is closer to our own. We only note this for <em>your</em> navigation purposes, we won&rsquo;t dissect that issue now. Anyway, China&rsquo;s new borrowing/spending plans are gel-ing and the currency and rates are <em>stable</em>, which is powerful evidence. In fact, now might be a good moment to mention that our base-case expectation is that China slowly becomes the center of international finance over the next decade. Just some context, as &ldquo;money demand&rdquo; is one of the least-understood economic phenomena of its importance. (Note: &ldquo;China&rdquo; itself was the fund&rsquo;s 2nd-best outperformer YTD, despite an underweight allocation, but that is direct Chinese exposure to a small selection of curated distressed property and other bonds, which is great but not the more general &ldquo;China&rdquo; we mean in this overall discussion.)</p>
<p><strong>US politics &gt; Mexico; Brazil &gt; US politics.</strong> Mexico is one of the fund&rsquo;s top performers versus its benchmark this month and year, as the fund had no or low exposure to its local-currency bonds (Mbonos), which are this year&rsquo;s market dog. After the country&rsquo;s presidential elections, a very long market puked, centering concerns on direct election of judges. Our process shows Mexico to be cheap on Step 1 (real rates versus fundamentals), but was rejected in Step 2 of the process (where we test bonds for non-systematic risks). In fact, we briefly changed our judgement on Step 2, thinking the market was oversold, but alas we stopped ourselves out, quickly and thankfully. We are still avoiding Mexico&rsquo;s local market. Migration battles with the US could dominate headlines. Limits on immigration are a bigger threat to inflation in the US than are tariffs, to our eye. And, Mexico&rsquo;s status as a &ldquo;near-shoring&rdquo; candidate is challenged by changes to its judiciary. This will take time, in our view. Finally, Mbono rates are highly correlated with US rates, and you know our views there. This is much less so for other EMs. Brazil is, like Mexico, very cheap on Step 1 of our investment process, with market rates around 13%, a policy rate of 10.75%, and inflation around 4.5%.&nbsp; But Brazil is more China-facing and swings to its own tune. That tune is of an economy that is basically strong on every front (especially external accounts), but has high debt that is always just on the verge of either being addressed or of blowing up. Our jaundiced eyes (30 years of covering Brazil) have even given us a simple rule of buying when fiscal concerns are peaking. Simple, but it often works. This rule gets reinforced by a strong independent monetary authority that just reversed course and hiked interest rates! You don&rsquo;t get a stronger messenger or friend than a country&rsquo;s own central bank. If it wasn&rsquo;t obvious, this juxtaposition of US-linked Mexico and EM-linked Brazil is another example of a globe characterized by an unstable DM combined with a strong China and EM, and we want exposure to the good story.</p>
<h2 id="exposure-types-and-significant-changes" class="jump-link-nav anchored-block" data-jumplink-title="Exposure Types and Significant Changes">Exposure Types and Significant Changes</h2>
<p>The changes to our top positions are summarized below. Our largest positions in October were Brazil, China, South Africa, Indonesia, and Poland:</p>
<ul class="content-list">
<li class="mt-2">We increased our local currency exposure in Poland, Turkey, Hungary, and Indonesia, and our hard currency corporate exposure in Turkey. The Polish central bank remains hawkish and investor positioning relatively light. The country should also be expected to benefit from a potential post-election ceasefire in Ukraine. Turkey&rsquo;s policy U-turn is progressing well, earning it another sovereign rating upgrade (from S&amp;P). Hungary shows signs of fiscal stabilization, while the central bank had paused its easing cycle. Indonesia&rsquo;s new cabinet lineup sent an orthodox policy signal to the market and the central bank prudently left the policy rate on hold before the U.S. presidential elections. In terms of our investment process, this improved the policy test score for these countries.</li>
<li class="mt-2">We also increased our local currency exposure in Brazil, Chile, and Uruguay. Brazil&rsquo;s central bank is tightening its policy stance to address sticky inflation expectations and uncertainty about spending cuts in 2025 and beyond. The failure of the social security referendum in Uruguay removed significant fiscal risks. These developments improved the policy test score in both countries. Chile is expected to benefit from China&rsquo;s policy stimulus and growth rebound, which should be copper-positive. In terms of our investment process, this improves the technical test score for the country.</li>
<li class="mt-2">Finally, we increased our hard currency sovereign exposure in Sri Lanka and Kazakhstan, and hard currency corporate exposure in China and Hong Kong. China stepped up comprehensive policy efforts to prop up the economy, and especially consumption and real estate, improving the policy test score for the country. Kazakhstan&rsquo;s assets should benefit from the nuclear revival, which strengthen the economic and technical test scores for the country. Sri Lanka&rsquo;s new president sent better policy signals after his election, defying gloomy expectations, and the new government had endorsed the debt restructuring deal, complying with the IMF targets.</li>
<li class="mt-2">We reduced our local currency exposure in Mexico, and Colombia. Mexico&rsquo;s domestic developments and policy signals are completely overshadowed by the U.S. presidential elections, worsening the technical test score for the country. Colombia was hit by another wave of negative fiscal headlines associated with the constitutional reform bill to increase regional budget transfers. This weakened the policy test score for the country.</li>
<li class="mt-2">We also reduced our hard currency sovereign exposure in Qatar and Bolivia, and local currency exposure in Malaysia and Thailand. We took profits in Malaysia and Thailand after the respective currencies&rsquo; mega-rally and with rising concerns that stronger growth in the U.S. can boost the U.S. Dollar, while local rates can get hit by duration concerns, which worsened the technical test score for both countries. Duration risks were behind our decision to reduce exposure in Qatar, whereas Bolivia might suffer from a lack of strong positive catalysts after the recent rally.</li>
<li class="mt-2">Finally, we reduced our hard currency corporate exposure in Israel and hard currency sovereign exposure in Suriname. Israel is uniquely exposed to geopolitical risks, which are expected to stay elevated in the run up to the U.S. presidential elections, worsening the policy test score for the country. Surinam&rsquo;s political noise will get louder and fiscal risks higher as the country gets closer to the elections. And it remains to be seen whether fiscal discipline can be maintained after the elections. These developments worsened the policy test score for the country.</li>
</ul>
<p>To receive more <a href="https://www.vaneck.com/us/en/insights/emerging-markets-bonds/" title="Emerging Markets Bonds Insights"><strong>Emerging Markets Bonds</strong></a> insights, <a href="/link/5f45412c2143400497908cea2897f7d3.aspx" title=" Subscription Center"><strong>sign up in our subscription center</strong></a>.</p>
]]></content:encoded>
</item><item rdf:about="https://www.vaneck.com/us/en/blogs/income-investing/fallen-angels-rates-rise-spreads-tighten/">
  <title>Fallen Angels: Rates Rise, Spreads Tighten></title>
  <link>https://www.vaneck.com/us/en/blogs/income-investing/fallen-angels-rates-rise-spreads-tighten/</link>
  <description><![CDATA[Fallen angels lagged behind broad high yield in October, primarily due to rising rates. Spreads tightened notably, with high-yield spreads dropping below 300bps for the first time since the GFC.]]></description>
  <dc:creator>Nicolas  Fonseca, CFA</dc:creator>
  <dc:date>11/14/2024 06:30:00</dc:date>
<content:encoded><![CDATA[

<p>Fallen angels (as represented by the ICE US Fallen Angel High Yield 10% Constrained Index, &ldquo;H0CF&rdquo;) underperformed the broad high yield market (as represented by the ICE BofA US High Yield Index, &ldquo;H0A0&rdquo;) in October by 0.29% (-0.84% vs -0.55%), driven mostly by the rise in rates throughout the month, increasing the YTD underperformance to 2.14% (5.30% vs 7.44%). The 10Y Treasury yield jumped 47bps to 4.28%, a level not seen since July, as the market continued to recalibrate its expectations on the direction of interest rates. The wait for new fallen angels continues as Boeing raised equity and was able to end its labor strike, potentially providing some breathing room for the company. Moody&rsquo;s confirmed Paramount&rsquo;s Baa3 rating with a negative outlook, and.&nbsp; S&amp;P Ratings has set its focus for new fallen angels on the commercial real estate sector, despite new back to office mandates and the U.S. Federal Reserve (Fed) easing cycle.</p>
<h2 id="rates-dominated-as-spreads-tightened" class="jump-link-nav anchored-block" data-jumplink-title="Rates Dominated as Spreads Tightened">Rates Dominated as Spreads Tightened</h2>
<p>In October, fallen angel and broad high-yield spreads tightened significantly, with high-yield spreads falling below 300 basis points for the first time since the global financial crisis (GFC). This tightening reflects strong economic fundamentals, robust credit conditions, ample liquidity and strong demand from yield-focused investors. Since October month-end, the higher rate/tighter spread trend accelerated following the U.S. election, likely reflecting adjusted forecasts for both growth and inflation.</p>
<p>Historically, fallen angel spreads have played a key role in overall yields, especially when rates were low following the GFC. However, post-COVID rate hikes aimed at controlling inflation brought rates back as a primary driver of returns, reducing the relative contribution of spreads. Generally speaking, spread makes up a smaller portion of yields when the rates are higher as seen on the below chart. With the Fed expected to continue to cut rates through 2025 in response to a stabilizing labor market, spreads may take the driver seat again. As spreads become more influential, especially if rates decline in a spread-widening environment, we anticipate higher quality bonds to outperform lower quality ones.</p>
<h3><strong>Rates Make Up Greater Portion of Yields</strong></h3>
<!-- <p><img class="img-responsive w-100" alt="Rates Make Up Greater Portion of Yields" src="https://www.vaneck.com/EPiServer/CMS/Content/contentassets/en/3615adf8d2214554b5143f6c7ff1e495/5048_angl-nov_chart-1_2024-11_v1.svg,,299113?epieditmode=false"></p> -->
<div class="flourish-embed flourish-chart" data-src="visualisation/20272239"><script src="https://public.flourish.studio/resources/embed.js"></script><noscript><img src="https://public.flourish.studio/visualisation/20272239/thumbnail" width="100%" alt="chart visualization" /></noscript></div>
<style>
.flourish-credit {
display:none;
}
</style>
<p class="chart-disclosure">Source: ICE Data Services, VanEck. Past performance is not indicative of future results.</p>
<p id="overall-statistics" class="jump-link-nav anchored-block" data-jumplink-title="Overall Statistics"><strong>Fallen Angels Overall Statistics:</strong> Fallen angel spreads tightened to 245bps, 14bps above their YTD low, however, broad high yield reached their tightest level since the post-financial crisis era (ending the month at 288bps) as yields rose due to a stronger economy and the possibility that the Fed may take a more gradual approach to rate cuts. Fallen angels and broad high yield average yields increased by 34 and 35bps, respectively, while the 10Y surged by 47bps to 4.28%, a level not seen since July as the market continues to recalibrate its expectations on growth and inflation. With rates rising, bond prices retreated in October, with fallen angels seeing a larger decline due to its longer maturity.</p>
<div class="wrapped-div">
<table style="width: 100%;">
<tbody>
<tr class="tbl-data">
<td class="tbl-header last text-center">&nbsp;</td>
<td class="tbl-header last text-center" style="border-right: outset;" colspan="5">Fallen Angels</td>
<td class="tbl-header last text-center" colspan="5">Broad HY</td>
</tr>
<tr class="tbl-data">
<td class="data-td last">&nbsp;</td>
<td class="data-head last text-right">12/31/2023</td>
<td class="data-head last text-right">3/31/2024</td>
<td class="data-head last text-right">6/30/2024</td>
<td class="data-head last text-right">9/30/2024</td>
<td class="data-head last text-right" style="border-right: outset;">10/31/2024</td>
<td class="data-head last text-right">12/31/2023</td>
<td class="data-head last text-right">3/31/2024</td>
<td class="data-head last text-right">6/30/2024</td>
<td class="data-head last text-right">9/30/2024</td>
<td class="data-head last text-right">10/31/2024</td>
</tr>
<tr class="tbl-data">
<td class="data-td last">Yield to Worst</td>
<td class="data-td data last text-right">6.99</td>
<td class="data-td data last text-right">6.92</td>
<td class="data-td data last text-right">7.10</td>
<td class="data-td data last text-right">6.43</td>
<td class="data-td data last text-right" style="border-right: outset;">6.77</td>
<td class="data-td data last text-right">7.69</td>
<td class="data-td data last text-right">7.75</td>
<td class="data-td data last text-right">7.94</td>
<td class="data-td data last text-right">6.98</td>
<td class="data-td data last text-right">7.33</td>
</tr>
<tr class="tbl-data">
<td class="data-td last">Par Weighted Price</td>
<td class="data-td data last text-right">91.20</td>
<td class="data-td data last text-right">91.22</td>
<td class="data-td data last text-right">90.32</td>
<td class="data-td data last text-right">93.69</td>
<td class="data-td data last text-right" style="border-right: outset;">92.31</td>
<td class="data-td data last text-right">91.86</td>
<td class="data-td data last text-right">93.18</td>
<td class="data-td data last text-right">92.98</td>
<td class="data-td data last text-right">96.72</td>
<td class="data-td data last text-right">95.72</td>
</tr>
<tr class="tbl-data">
<td class="data-td last">Effective Duration</td>
<td class="data-td data last text-right">5.41</td>
<td class="data-td data last text-right">5.32</td>
<td class="data-td data last text-right">5.08</td>
<td class="data-td data last text-right">5.04</td>
<td class="data-td data last text-right" style="border-right: outset;">5.04</td>
<td class="data-td data last text-right">3.31</td>
<td class="data-td data last text-right">3.28</td>
<td class="data-td data last text-right">3.26</td>
<td class="data-td data last text-right">3.04</td>
<td class="data-td data last text-right">3.19</td>
</tr>
<tr class="tbl-data">
<td class="data-td last">Full Market Value ($mn)</td>
<td class="data-td data last text-right">67,821</td>
<td class="data-td data last text-right">64,657</td>
<td class="data-td data last text-right">55,371</td>
<td class="data-td data last text-right">57,236</td>
<td class="data-td data last text-right" style="border-right: outset;">55,362</td>
<td class="data-td data last text-right">1,237,721</td>
<td class="data-td data last text-right">1,260,542</td>
<td class="data-td data last text-right">1,266,993</td>
<td class="data-td data last text-right">1,336,160</td>
<td class="data-td data last text-right">1,328,101</td>
</tr>
<tr class="tbl-data">
<td class="data-td last">OAS</td>
<td class="data-td data last text-right">285</td>
<td class="data-td data last text-right">247</td>
<td class="data-td data last text-right">252</td>
<td class="data-td data last text-right">261</td>
<td class="data-td data last text-right" style="border-right: outset;">245</td>
<td class="data-td data last text-right">339</td>
<td class="data-td data last text-right">315</td>
<td class="data-td data last text-right">321</td>
<td class="data-td data last text-right">303</td>
<td class="data-td data last text-right">288</td>
</tr>
<tr class="tbl-data">
<td class="data-td last">No. of Issues</td>
<td class="data-td data last text-right">143</td>
<td class="data-td data last text-right">138</td>
<td class="data-td data last text-right">126</td>
<td class="data-td data last text-right">124</td>
<td class="data-td data last text-right" style="border-right: outset;">122</td>
<td class="data-td data last text-right">1,837</td>
<td class="data-td data last text-right">1,864</td>
<td class="data-td data last text-right">1,863</td>
<td class="data-td data last text-right">1,873</td>
<td class="data-td data last text-right">1,875</td>
</tr>
</tbody>
</table>
</div>
<p class="chart-disclosure">Source: ICE Data Services, VanEck. Fallen Angels: ICE US Fallen Angel High Yield 10% Constrained Index. Broad HY: ICE BofA US High Yield Index. OAS refers to &ldquo;option-adjusted spread.&rdquo; Please see definition for this and other terms referenced herein in the disclosures and definitions portion of this blog. Past performance is no guarantee of future results. Index performance is not representative of strategy performance. It is not possible to invest in an index.</p>
<p><strong>Fallen Angels:</strong> There were no new fallen angels in October. Boeing, a potential fallen angel, had the largest stock sale by a U.S. company as it tried to repair its balance sheet to avoid a downgrade to high yield. Overall, the credit rating agencies were supportive of the equity raise and the end of its labor strike, alleviating some of the downgrade risk, although Boeing is still not completely out of the woods just yet. More broadly, Barclays estimates between $40bn to $60bn of new fallen angels in 2025 as interest rates remain high with big names such as Paramount, Warner Bros and Charter Communications at elevated risk of becoming fallen angels.</p>
<div class="wrapped-div">
<table style="width: 100%;">
<tbody>
<tr class="tbl-data">
<td class="tbl-header last">Month-end Addition</td>
<td class="tbl-header last text-left">Name</td>
<td class="tbl-header last text-left">Rating</td>
<td class="tbl-header last text-left">Sector</td>
<td class="tbl-header last text-left">Industry</td>
<td class="tbl-header last text-right">% Mkt Value</td>
<td class="tbl-header last text-right">Price</td>
</tr>
<tr class="tbl-data">
<td class="data-td last font-weight-normal">January</td>
<td class="data-td data last text-left">Hudson Pacific Properties LP</td>
<td class="data-td data last text-left">BB1</td>
<td class="data-td data last text-left">Real Estate</td>
<td class="data-td data last text-left">REITs</td>
<td class="data-td data last text-right">2.18</td>
<td class="data-td data last text-right">88.05</td>
</tr>
<tr class="tbl-data">
<td class="data-td last font-weight-normal">February</td>
<td class="data-td data last text-left">Advance Auto Parts Inc.</td>
<td class="data-td data last text-left">BB1</td>
<td class="data-td data last text-left">Retail</td>
<td class="data-td data last text-left">Specialty Retail</td>
<td class="data-td data last text-right">2.52</td>
<td class="data-td data last text-right">91.20</td>
</tr>
<tr class="tbl-data">
<td class="data-td last font-weight-normal">September</td>
<td class="data-td data last text-left">OCI NV</td>
<td class="data-td data last text-left">BB1</td>
<td class="data-td data last text-left">Basic Industry</td>
<td class="data-td data last text-left">Chemicals</td>
<td class="data-td data last text-right">1.10</td>
<td class="data-td data last text-right">104.79</td>
</tr>
<tr class="tbl-data">
<td class="data-td last font-weight-normal">September</td>
<td class="data-td data last text-left">V.F. Corp</td>
<td class="data-td data last text-left">BB1</td>
<td class="data-td data last text-left">Retail</td>
<td class="data-td data last text-left">Specialty Retail</td>
<td class="data-td data last text-right">3.04</td>
<td class="data-td data last text-right">94.08</td>
</tr>
</tbody>
</table>
</div>
<p class="chart-disclosure">Source: ICE Data Services, VanEck. Fallen Angels: ICE US Fallen Angel High Yield 10% Constrained Index. Past performance is no guarantee of future results. Not a recommendation to buy or sell any of the names/securities mentioned herein. Index performance is not representative of strategy performance. It is not possible to invest in an index.</p>

<p><strong>Rising Stars:</strong> No risings stars in October.</p>
<div class="wrapped-div">
<table style="width: 100%;">
<tbody>
<tr class="tbl-data">
<td class="tbl-header last">Month-end Exit</td>
<td class="tbl-header last text-left">Name</td>
<td class="tbl-header last text-left">Rating</td>
<td class="tbl-header last text-left">Sector</td>
<td class="tbl-header last text-left">Industry</td>
<td class="tbl-header last text-right">% Mkt Value</td>
<td class="tbl-header last text-right">Price</td>
</tr>
<tr class="tbl-data">
<td class="data-td last font-weight-normal">February</td>
<td class="data-td data last text-left">Las Vegas Sands Corp</td>
<td class="data-td data last text-left">BB1</td>
<td class="data-td data last text-left">Leisure</td>
<td class="data-td data last text-left">Gaming</td>
<td class="data-td data last text-right">3.12</td>
<td class="data-td data last text-right">93.19</td>
</tr>
<tr class="tbl-data">
<td class="data-td last font-weight-normal">March</td>
<td class="data-td data last text-left">Enlink Midstream Partners LP</td>
<td class="data-td data last text-left">BB1</td>
<td class="data-td data last text-left">Energy</td>
<td class="data-td data last text-left">Gas Distribution</td>
<td class="data-td data last text-right">2.30</td>
<td class="data-td data last text-right">88.92</td>
</tr>
<tr class="tbl-data">
<td class="data-td last font-weight-normal">April</td>
<td class="data-td data last text-left">FirstEnergy Corp.</td>
<td class="data-td data last text-left">BB1</td>
<td class="data-td data last text-left">Utility</td>
<td class="data-td data last text-left">Electric-Integrated</td>
<td class="data-td data last text-right">6.62</td>
<td class="data-td data last text-right">87.10</td>
</tr>
<tr class="tbl-data">
<td class="data-td last font-weight-normal">April</td>
<td class="data-td data last text-left">Rolls-Royce PLC</td>
<td class="data-td data last text-left">BB1</td>
<td class="data-td data last text-left">Capital Goods</td>
<td class="data-td data last text-left">Aerospace/Defense</td>
<td class="data-td data last text-right">1.51</td>
<td class="data-td data last text-right">96.00</td>
</tr>
<tr class="tbl-data">
<td class="data-td last font-weight-normal">July</td>
<td class="data-td data last text-left">Delta Air Lines Inc.</td>
<td class="data-td data last text-left">BB1</td>
<td class="data-td data last text-left">Transportation</td>
<td class="data-td data last text-left">Air Transportation</td>
<td class="data-td data last text-right">1.50</td>
<td class="data-td data last text-right">94.59</td>
</tr>
<tr class="tbl-data">
<td class="data-td last font-weight-normal">September</td>
<td class="data-td data last text-left">Port of Newcastle Investments Financing Pty Limited</td>
<td class="data-td data last text-left">BB1</td>
<td class="data-td data last text-left">Transportation</td>
<td class="data-td data last text-left">Transport Infrastructure/Services</td>
<td class="data-td data last text-right">0.52</td>
<td class="data-td data last text-right">95.59</td>
</tr>
</tbody>
</table>
</div>
<p class="chart-disclosure">Source: ICE Data Services, VanEck. Fallen Angels: ICE US Fallen Angel High Yield 10% Constrained Index. Past performance is no guarantee of future results. Not a recommendation to buy or sell any of the names/securities mentioned herein. Index performance is not representative of strategy performance. It is not possible to invest in an index.</p>
<p><strong>Fallen Angels Performance by Sector: </strong>The Healthcare and Leisure sectors decreased their exposure in the Index as one issuer was removed from each sector (an issuer didn&rsquo;t meet the index requirements; the other&rsquo;s bond was redeemed). Only Banking and Consumer Goods posted positive returns in October, driven by spread tightening in the Banking sector and spread tightening and price appreciating in the Consumer Goods sector. Regarding sector attribution vs a broad high yield, Consumer Goods was the main contributor while Tech was the main detractor. Within Consumer Goods, the fallen angel index only holds Newell Brands bonds which outperformed the +40 issuers in the broad high yield market. In Tech, Xerox was the main culprit.&nbsp;</p>
<div class="wrapped-div-full">
<table style="width: 100%;">
<tbody>
<tr class="tbl-data">
<td class="tbl-header last text-center">&nbsp;</td>
<td class="tbl-header last text-center" style="border-right: outset;" colspan="4">Wgt (%)</td>
<td class="tbl-header last text-center" style="border-right: outset;" colspan="4">OAS</td>
<td class="tbl-header last text-center" style="border-right: outset;" colspan="4">Price</td>
<td class="tbl-header last text-right">Total Return</td>
</tr>
<tr class="tbl-data">
<td class="data-head last">&nbsp;</td>
<td class="data-head data last text-right">12/31/23</td>
<td class="data-head data last text-right">6/30/24</td>
<td class="data-head data last text-right">9/30/24</td>
<td class="data-head data last text-right" style="border-right: outset;">10/31/24</td>
<td class="data-head data last text-right">12/31/23</td>
<td class="data-head data last text-right">6/30/24</td>
<td class="data-head data last text-right">9/30/24</td>
<td class="data-head data last text-right" style="border-right: outset;">10/31/24</td>
<td class="data-head data last text-right">12/31/23</td>
<td class="data-head data last text-right">6/30/24</td>
<td class="data-head data last text-right">9/30/24</td>
<td class="data-head data last text-right" style="border-right: outset;">10/31/24</td>
<td class="data-head data last text-right">MTD</td>
</tr>
<tr class="tbl-data">
<td class="data-td last">Banking</td>
<td class="data-td data last text-right">4.79</td>
<td class="data-td data last text-right">5.38</td>
<td class="data-td data last text-right">5.45</td>
<td class="data-td data last text-right" style="border-right: outset;">5.64</td>
<td class="data-td data last text-right">231</td>
<td class="data-td data last text-right">220</td>
<td class="data-td data last text-right">210</td>
<td class="data-td data last text-right" style="border-right: outset;">181</td>
<td class="data-td data last text-right">97.91</td>
<td class="data-td data last text-right">97.36</td>
<td class="data-td data last text-right">101.29</td>
<td class="data-td data last text-right" style="border-right: outset;">101.12</td>
<td class="data-td data last text-right">0.30</td>
</tr>
<tr class="tbl-data">
<td class="data-td last">Basic Industry</td>
<td class="data-td data last text-right">1.70</td>
<td class="data-td data last text-right">3.73</td>
<td class="data-td data last text-right">4.78</td>
<td class="data-td data last text-right" style="border-right: outset;">4.85</td>
<td class="data-td data last text-right">171</td>
<td class="data-td data last text-right">156</td>
<td class="data-td data last text-right">190</td>
<td class="data-td data last text-right" style="border-right: outset;">184</td>
<td class="data-td data last text-right">97.24</td>
<td class="data-td data last text-right">95.03</td>
<td class="data-td data last text-right">99.25</td>
<td class="data-td data last text-right" style="border-right: outset;">96.84</td>
<td class="data-td data last text-right">-1.99</td>
</tr>
<tr class="tbl-data">
<td class="data-td last">Capital Goods</td>
<td class="data-td data last text-right">5.85</td>
<td class="data-td data last text-right">5.41</td>
<td class="data-td data last text-right">5.31</td>
<td class="data-td data last text-right" style="border-right: outset;">5.43</td>
<td class="data-td data last text-right">200</td>
<td class="data-td data last text-right">161</td>
<td class="data-td data last text-right">198</td>
<td class="data-td data last text-right" style="border-right: outset;">172</td>
<td class="data-td data last text-right">97.34</td>
<td class="data-td data last text-right">97.51</td>
<td class="data-td data last text-right">98.72</td>
<td class="data-td data last text-right" style="border-right: outset;">97.75</td>
<td class="data-td data last text-right">-0.50</td>
</tr>
<tr class="tbl-data">
<td class="data-td last">Consumer Goods</td>
<td class="data-td data last text-right">4.33</td>
<td class="data-td data last text-right">5.28</td>
<td class="data-td data last text-right">5.22</td>
<td class="data-td data last text-right" style="border-right: outset;">5.49</td>
<td class="data-td data last text-right">230</td>
<td class="data-td data last text-right">240</td>
<td class="data-td data last text-right">231</td>
<td class="data-td data last text-right" style="border-right: outset;">174</td>
<td class="data-td data last text-right">94.29</td>
<td class="data-td data last text-right">93.64</td>
<td class="data-td data last text-right">97.25</td>
<td class="data-td data last text-right" style="border-right: outset;">98.52</td>
<td class="data-td data last text-right">1.83</td>
</tr>
<tr class="tbl-data">
<td class="data-td last">Energy</td>
<td class="data-td data last text-right">14.75</td>
<td class="data-td data last text-right">12.27</td>
<td class="data-td data last text-right">12.13</td>
<td class="data-td data last text-right" style="border-right: outset;">12.35</td>
<td class="data-td data last text-right">259</td>
<td class="data-td data last text-right">239</td>
<td class="data-td data last text-right">267</td>
<td class="data-td data last text-right" style="border-right: outset;">249</td>
<td class="data-td data last text-right">92.49</td>
<td class="data-td data last text-right">93.44</td>
<td class="data-td data last text-right">95.40</td>
<td class="data-td data last text-right" style="border-right: outset;">94.02</td>
<td class="data-td data last text-right">-0.93</td>
</tr>
<tr class="tbl-data">
<td class="data-td last">Financial Services</td>
<td class="data-td data last text-right">1.14</td>
<td class="data-td data last text-right">1.37</td>
<td class="data-td data last text-right">1.40</td>
<td class="data-td data last text-right" style="border-right: outset;">1.43</td>
<td class="data-td data last text-right">378</td>
<td class="data-td data last text-right">376</td>
<td class="data-td data last text-right">324</td>
<td class="data-td data last text-right" style="border-right: outset;">301</td>
<td class="data-td data last text-right">86.41</td>
<td class="data-td data last text-right">84.87</td>
<td class="data-td data last text-right">91.57</td>
<td class="data-td data last text-right" style="border-right: outset;">89.95</td>
<td class="data-td data last text-right">-1.27</td>
</tr>
<tr class="tbl-data">
<td class="data-td last">Healthcare</td>
<td class="data-td data last text-right">4.10</td>
<td class="data-td data last text-right">5.15</td>
<td class="data-td data last text-right">5.29</td>
<td class="data-td data last text-right" style="border-right: outset;">4.10</td>
<td class="data-td data last text-right">270</td>
<td class="data-td data last text-right">207</td>
<td class="data-td data last text-right">157</td>
<td class="data-td data last text-right" style="border-right: outset;">198</td>
<td class="data-td data last text-right">88.73</td>
<td class="data-td data last text-right">91.12</td>
<td class="data-td data last text-right">95.88</td>
<td class="data-td data last text-right" style="border-right: outset;">91.85</td>
<td class="data-td data last text-right">-1.88</td>
</tr>
<tr class="tbl-data">
<td class="data-td last">Insurance</td>
<td class="data-td data last text-right">1.32</td>
<td class="data-td data last text-right">1.65</td>
<td class="data-td data last text-right">1.67</td>
<td class="data-td data last text-right" style="border-right: outset;">1.68</td>
<td class="data-td data last text-right">323</td>
<td class="data-td data last text-right">238</td>
<td class="data-td data last text-right">237</td>
<td class="data-td data last text-right" style="border-right: outset;">218</td>
<td class="data-td data last text-right">94.10</td>
<td class="data-td data last text-right">96.11</td>
<td class="data-td data last text-right">100.34</td>
<td class="data-td data last text-right" style="border-right: outset;">98.44</td>
<td class="data-td data last text-right">-1.31</td>
</tr>
<tr class="tbl-data">
<td class="data-td last">Leisure</td>
<td class="data-td data last text-right">7.90</td>
<td class="data-td data last text-right">5.92</td>
<td class="data-td data last text-right">4.90</td>
<td class="data-td data last text-right" style="border-right: outset;">4.31</td>
<td class="data-td data last text-right">228</td>
<td class="data-td data last text-right">180</td>
<td class="data-td data last text-right">234</td>
<td class="data-td data last text-right" style="border-right: outset;">238</td>
<td class="data-td data last text-right">93.21</td>
<td class="data-td data last text-right">94.48</td>
<td class="data-td data last text-right">95.41</td>
<td class="data-td data last text-right" style="border-right: outset;">93.18</td>
<td class="data-td data last text-right">-0.91</td>
</tr>
<tr class="tbl-data">
<td class="data-td last">Real Estate</td>
<td class="data-td data last text-right">9.07</td>
<td class="data-td data last text-right">10.07</td>
<td class="data-td data last text-right">10.23</td>
<td class="data-td data last text-right" style="border-right: outset;">10.42</td>
<td class="data-td data last text-right">675</td>
<td class="data-td data last text-right">450</td>
<td class="data-td data last text-right">389</td>
<td class="data-td data last text-right" style="border-right: outset;">404</td>
<td class="data-td data last text-right">82.72</td>
<td class="data-td data last text-right">84.76</td>
<td class="data-td data last text-right">89.79</td>
<td class="data-td data last text-right" style="border-right: outset;">88.24</td>
<td class="data-td data last text-right">-1.30</td>
</tr>
<tr class="tbl-data">
<td class="data-td last">Retail</td>
<td class="data-td data last text-right">14.38</td>
<td class="data-td data last text-right">20.45</td>
<td class="data-td data last text-right">21.67</td>
<td class="data-td data last text-right" style="border-right: outset;">22.13</td>
<td class="data-td data last text-right">242</td>
<td class="data-td data last text-right">196</td>
<td class="data-td data last text-right">252</td>
<td class="data-td data last text-right" style="border-right: outset;">222</td>
<td class="data-td data last text-right">86.39</td>
<td class="data-td data last text-right">88.19</td>
<td class="data-td data last text-right">88.38</td>
<td class="data-td data last text-right" style="border-right: outset;">87.51</td>
<td class="data-td data last text-right">-0.58</td>
</tr>
<tr class="tbl-data">
<td class="data-td last">Services</td>
<td class="data-td data last text-right">0.64</td>
<td class="data-td data last text-right">0.79</td>
<td class="data-td data last text-right">0.78</td>
<td class="data-td data last text-right" style="border-right: outset;">0.80</td>
<td class="data-td data last text-right">243</td>
<td class="data-td data last text-right">206</td>
<td class="data-td data last text-right">202</td>
<td class="data-td data last text-right" style="border-right: outset;">193</td>
<td class="data-td data last text-right">94.78</td>
<td class="data-td data last text-right">94.67</td>
<td class="data-td data last text-right">98.11</td>
<td class="data-td data last text-right" style="border-right: outset;">96.36</td>
<td class="data-td data last text-right">-1.34</td>
</tr>
<tr class="tbl-data">
<td class="data-td last">Technology &amp; Electronics</td>
<td class="data-td data last text-right">6.22</td>
<td class="data-td data last text-right">6.67</td>
<td class="data-td data last text-right">6.66</td>
<td class="data-td data last text-right" style="border-right: outset;">6.64</td>
<td class="data-td data last text-right">194</td>
<td class="data-td data last text-right">184</td>
<td class="data-td data last text-right">206</td>
<td class="data-td data last text-right" style="border-right: outset;">203</td>
<td class="data-td data last text-right">94.14</td>
<td class="data-td data last text-right">92.27</td>
<td class="data-td data last text-right">94.38</td>
<td class="data-td data last text-right" style="border-right: outset;">91.54</td>
<td class="data-td data last text-right">-2.53</td>
</tr>
<tr class="tbl-data">
<td class="data-td last">Telecommunications</td>
<td class="data-td data last text-right">13.00</td>
<td class="data-td data last text-right">11.10</td>
<td class="data-td data last text-right">11.82</td>
<td class="data-td data last text-right" style="border-right: outset;">12.01</td>
<td class="data-td data last text-right">366</td>
<td class="data-td data last text-right">413</td>
<td class="data-td data last text-right">351</td>
<td class="data-td data last text-right" style="border-right: outset;">324</td>
<td class="data-td data last text-right">92.22</td>
<td class="data-td data last text-right">81.48</td>
<td class="data-td data last text-right">92.33</td>
<td class="data-td data last text-right" style="border-right: outset;">91.12</td>
<td class="data-td data last text-right">-0.68</td>
</tr>
<tr class="tbl-data">
<td class="data-td last">Transportation</td>
<td class="data-td data last text-right">2.09</td>
<td class="data-td data last text-right">2.60</td>
<td class="data-td data last text-right">0.57</td>
<td class="data-td data last text-right" style="border-right: outset;">0.57</td>
<td class="data-td data last text-right">209</td>
<td class="data-td data last text-right">150</td>
<td class="data-td data last text-right">210</td>
<td class="data-td data last text-right" style="border-right: outset;">178</td>
<td class="data-td data last text-right">94.92</td>
<td class="data-td data last text-right">96.07</td>
<td class="data-td data last text-right">106.22</td>
<td class="data-td data last text-right" style="border-right: outset;">104.75</td>
<td class="data-td data last text-right">-0.83</td>
</tr>
<tr class="tbl-data">
<td class="data-td last">Utility</td>
<td class="data-td data last text-right">8.71</td>
<td class="data-td data last text-right">2.17</td>
<td class="data-td data last text-right">2.11</td>
<td class="data-td data last text-right" style="border-right: outset;">2.16</td>
<td class="data-td data last text-right">139</td>
<td class="data-td data last text-right">185</td>
<td class="data-td data last text-right">203</td>
<td class="data-td data last text-right" style="border-right: outset;">166</td>
<td class="data-td data last text-right">92.18</td>
<td class="data-td data last text-right">96.23</td>
<td class="data-td data last text-right">99.44</td>
<td class="data-td data last text-right" style="border-right: outset;">98.53</td>
<td class="data-td data last text-right">-0.46</td>
</tr>
<tr class="tbl-data">
<td class="data-td last">Total</td>
<td class="data-td data last text-right">100</td>
<td class="data-td data last text-right" style="border-right: outset;">100</td>
<td class="data-td data last text-right">285</td>
<td class="data-td data last text-right">252</td>
<td class="data-td data last text-right">261</td>
<td class="data-td data last text-right" style="border-right: outset;">245</td>
<td class="data-td data last text-right">91.20</td>
<td class="data-td data last text-right">90.32</td>
<td class="data-td data last text-right">93.69</td>
<td class="data-td data last text-right" style="border-right: outset;">92.31</td>
<td class="data-td data last text-right">-0.84</td>
</tr>
</tbody>
</table>
</div>
<p class="chart-disclosure">Source: ICE Data Services, VanEck. Returns are based on partial period data. Fallen Angels: ICE US Fallen Angel High Yield 10% Constrained Index. Not intended as a recommendation to invest or divest in any of the sectors mentioned herein. Index performance is not representative of strategy performance. It is not possible to invest in an index.</p>

<p><strong>Fallen Angels Performance by Rating</strong>: There were no changes in the fallen angels rating allocation for October, with BB-rated fallen angels still dominating the Index. CCC rated fallen angels outperformed higher- and lower-rated peers as their spreads tightened by more than 10% to 417bps, reaching their post GFC low in October, and seeing their price increase as yields were relatively unchanged. Relative to the broad high yield market, the fallen angel underperformance was primarily from the spread effects of the BB-rated issuers.</p>
<div class="wrapped-div-full">
<table style="width: 100%;">
<tbody>
<tr class="tbl-data">
<td class="tbl-header last text-center">&nbsp;</td>
<td class="tbl-header last text-center" style="border-right: outset;" colspan="4">Wgt (%)</td>
<td class="tbl-header last text-center" style="border-right: outset;" colspan="4">OAS</td>
<td class="tbl-header last text-center" style="border-right: outset;" colspan="4">Price</td>
<td class="tbl-header last text-center">Total Return</td>
</tr>
<tr class="tbl-data">
<td class="data-td last">&nbsp;</td>
<td class="data-head last text-right">12/31/23</td>
<td class="data-head last text-right">6/30/24</td>
<td class="data-head last text-right">9/30/24</td>
<td class="data-head last text-right" style="border-right: outset;">10/31/24</td>
<td class="data-head last text-right">12/31/23</td>
<td class="data-head last text-right">6/30/24</td>
<td class="data-head last text-right">9/30/24</td>
<td class="data-head last text-right" style="border-right: outset;">10/31/24</td>
<td class="data-head last text-right">12/31/23</td>
<td class="data-head last text-right">6/30/24</td>
<td class="data-head last text-right">9/30/24</td>
<td class="data-head last text-right" style="border-right: outset;">10/31/24</td>
<td class="data-head last text-right">MTD</td>
</tr>
<tr class="tbl-data">
<td class="data-td last">BB</td>
<td class="data-td data last text-right">80.55</td>
<td class="data-td data last text-right">87.62</td>
<td class="data-td data last text-right">87.30</td>
<td class="data-td data last text-right" style="border-right: outset;">87.03</td>
<td class="data-td data last text-right">219</td>
<td class="data-td data last text-right">210</td>
<td class="data-td data last text-right">223</td>
<td class="data-td data last text-right" style="border-right: outset;">207</td>
<td class="data-td data last text-right">92.44</td>
<td class="data-td data last text-right">92.62</td>
<td class="data-td data last text-right">95.29</td>
<td class="data-td data last text-right" style="border-right: outset;">93.91</td>
<td class="data-td data last text-right">-0.85</td>
</tr>
<tr class="tbl-data">
<td class="data-td last">B</td>
<td class="data-td data last text-right">13.43</td>
<td class="data-td data last text-right">7.89</td>
<td class="data-td data last text-right">7.32</td>
<td class="data-td data last text-right" style="border-right: outset;">7.39</td>
<td class="data-td data last text-right">317</td>
<td class="data-td data last text-right">371</td>
<td class="data-td data last text-right">382</td>
<td class="data-td data last text-right" style="border-right: outset;">385</td>
<td class="data-td data last text-right">96.46</td>
<td class="data-td data last text-right">90.73</td>
<td class="data-td data last text-right">92.36</td>
<td class="data-td data last text-right" style="border-right: outset;">90.22</td>
<td class="data-td data last text-right">-1.79</td>
</tr>
<tr class="tbl-data">
<td class="data-td last">CCC</td>
<td class="data-td data last text-right">5.44</td>
<td class="data-td data last text-right">4.19</td>
<td class="data-td data last text-right">4.38</td>
<td class="data-td data last text-right" style="border-right: outset;">4.56</td>
<td class="data-td data last text-right">1,130</td>
<td class="data-td data last text-right">505</td>
<td class="data-td data last text-right">468</td>
<td class="data-td data last text-right" style="border-right: outset;">417</td>
<td class="data-td data last text-right">69.40</td>
<td class="data-td data last text-right">80.90</td>
<td class="data-td data last text-right">87.61</td>
<td class="data-td data last text-right" style="border-right: outset;">88.32</td>
<td class="data-td data last text-right">1.37</td>
</tr>
<tr class="tbl-data">
<td class="data-td last">CC*</td>
<td class="data-td data last text-right">&nbsp;</td>
<td class="data-td data last text-right">0.30</td>
<td class="data-td data last text-right">1.00</td>
<td class="data-td data last text-right" style="border-right: outset;">1.01</td>
<td class="data-td data last text-right">&nbsp;</td>
<td class="data-td data last text-right">5,719</td>
<td class="data-td data last text-right">1,703</td>
<td class="data-td data last text-right" style="border-right: outset;">1,734</td>
<td class="data-td data last text-right">&nbsp;</td>
<td class="data-td data last text-right">13.00</td>
<td class="data-td data last text-right">44.51</td>
<td class="data-td data last text-right" style="border-right: outset;">42.82</td>
<td class="data-td data last text-right">-2.17</td>
</tr>
<tr class="tbl-data">
<td class="data-td last">Total</td>
<td class="data-td data last text-right">100</td>
<td class="data-td data last text-right" style="border-right: outset;">100.00</td>
<td class="data-td data last text-right">285</td>
<td class="data-td data last text-right">252</td>
<td class="data-td data last text-right">261</td>
<td class="data-td data last text-right" style="border-right: outset;">245</td>
<td class="data-td data last text-right">91.20</td>
<td class="data-td data last text-right">90.32</td>
<td class="data-td data last text-right">93.69</td>
<td class="data-td data last text-right" style="border-right: outset;">92.31</td>
<td class="data-td data last text-right">-0.84</td>
</tr>
</tbody>
</table>
</div>
<p class="chart-disclosure">Source: ICE Data Services, VanEck. Fallen Angels: ICE US Fallen Angel High Yield 10% Constrained Index. Not intended as a recommendation to invest or divest in any of the sectors mentioned herein. Index performance is not representative of strategy performance. It is not possible to invest in an index. BB index: ICE BofA BB US High Yield Index; Single-B index: ICE BofA Single-B US High Yield Index; CCC &amp; Lower rated index ICE BofA CCC &amp; Lower US High Yield Index. *Doesn&rsquo;t have securities for all months of selective periods. Returns are based on partial period data.</p>
<p>To receive more <a href="/us/en/blogs/income-investing/" title="Income Investing Insights"><strong>Income Investing</strong></a> insights, <a href="/link/5f45412c2143400497908cea2897f7d3.aspx" title=" Subscription Center"><strong>sign up in our subscription center</strong></a>.</p>
]]></content:encoded>
</item><item rdf:about="https://www.vaneck.com/us/en/blogs/moat-investing/moat-stocks-review-navigating-bonds-beauty-and-battleships/">
  <title>Moat Stocks Review: Navigating Bonds, Beauty and Battleships></title>
  <link>https://www.vaneck.com/us/en/blogs/moat-investing/moat-stocks-review-navigating-bonds-beauty-and-battleships/</link>
  <description><![CDATA[October saw mixed performance across U.S. equities. Sector allocations created headwinds for the Moat Index, while strong stock selection bolstered the SMID Moat Index.]]></description>
  <dc:creator>Coulter Regal, CFA</dc:creator>
  <dc:date>11/12/2024 06:30:00</dc:date>
<content:encoded><![CDATA[

<p>U.S. equity markets exhibited mixed performance in October. Major indices briefly reached new all-time highs, before pulling back due in part to anticipation around the closely contested U.S. presidential election. The market movements were influenced by a mix of corporate earnings, economic data, and the potential policy implications of the election outcome. Despite some volatility towards the month's end, investor sentiment remained cautiously optimistic. The prospect of policy adjustments from the incoming administration added to the market's dynamics, though it was clear that traditional economic fundamentals like employment figures and inflation rates continued to play significant roles in investor decision-making.</p>
<p>After a strong third quarter, where the <strong><a href="https://www.vaneck.com/us/en/investments/morningstar-wide-moat-etf-moat/overview/" title="MOAT - VanEck Morningstar Wide Moat ETF - Overview">Morningstar Wide Moat Focus Index</a></strong> (the &ldquo;Moat Index&rdquo;) gained 12.1% compared to the S&amp;P 500&rsquo;s 5.8%, the Moat Index took a breather in October as it trailed the broader market. Sector allocation was the primary driver of underperformance during the month, as overweights in health care, industrials and consumer defensives detracted the most from performance. Quarterly earnings-related volatility in a few wide moat names also detracted. Year-to-date, the Moat Index, as well as most other segments of the equity market, remain laggards to an S&amp;P 500 that has been dragged up by the dominance of mega-cap technology.</p>
<p>Down market-cap, smaller companies also fell in October with the small- and mid-cap benchmarks down 2.6% and 0.7% during the month, respectively. The <strong><a title="SMOT - VanEck Morningstar SMID Moat ETF - Overview" href="https://www.vaneck.com/us/en/investments/morningstar-smid-moat-etf-smot/overview/">Morningstar US Small-Mid Cap Moat Focus Index</a></strong> (the &ldquo;SMID Moat Index&rdquo;) fared slightly better, falling only about half a percentage point. The SMID Moat Index&rsquo;s October outperformance was predominantly the result of strong stock selection by the strategy. Despite their relative underperformance the last few years, <strong><a title="Three Reasons to Consider SMID-Caps During a Declining Rate Environment" href="https://www.vaneck.com/us/en/blogs/moat-investing/three-reasons-to-consider-smid-caps-during-a-declining-rate-environment/">future prospects for SMID-caps appear to be improving.</a></strong></p>
<h3>Equities Choppy Leading into U.S. Elections</h3>
<div class="flourish-embed flourish-chart" data-src="visualisation/20235046"><script src="https://public.flourish.studio/resources/embed.js"></script><noscript><img src="https://public.flourish.studio/visualisation/20235046/thumbnail" width="100%" alt="Equities Choppy Leading into U.S. Elections" /></noscript></div>
<style>
.flourish-credit{
display: none !important;
}
</style>
<p class="chart-disclosure"><strong>Source: Morningstar. Data as of 10/31/2024.</strong> Past performance is no guarantee of future results. Index performance is not representative of fund performance. It is not possible to invest directly in an index. Fund performance current to the most recent month end is available by visiting vaneck.com or by calling 800.826.2333.</p>

<h2 id="moat-highlights" class="jump-link-nav anchored-block" data-jumplink-title="Moat Highlights">Moat Index Highlights: Bonds, Beauty and Battleships</h2>
<p>Sector allocations were the primary driver of performance in October, with overweights in health care, industrials, and consumer defensive sectors having the greatest negative impact. Volatility in quarterly earnings among some wide moat companies also detracted during the month. However, bright spots within the Moat Index remained and helped to offset this.</p>
<p>In the top slot of the contributors table this month is the wide moat MarketAxess (MKTX). MarketAxess is a leading electronic trading platform that connects broker-dealers and institutional investors. The company is primarily focused on credit based fixed income securities, with its main trading products being U.S. investment-grade and high-yield bonds as well as emerging market corporate debt. Morningstar believes that MarketAxess is well-positioned to benefit from the transition away from voice-negotiated trading toward electronic platforms, creating strong tailwinds for continued revenue growth. MKTX saw its share price rise nearly 13% in October to end the month around $290 per share, which still falls below Morningstar&rsquo;s $305 estimate of fair value.</p>
<p>The two largest detractors during the month were both related to volatility surrounding earnings as Estee Lauder (EL) and Huntington Ingalls (HII) both saw notable declines in the final days of the month following their quarterly releases. The global personal care and beauty product company Estee Lauder posted decent results with a beat on earnings per share, but signaled some uncertainty in forward guidance around sales growth in China. Morningstar adjusted their estimate of fair value down to $162 from $176 following the update, but still views shares as deeply undervalued at a 50% discount and continues to see a path to growth over the medium term as the macro backdrop brightens.</p>
<p>Huntington Ingalls (HII), a wide moat independent military shipbuilder responsible for supplying the U.S. Navy with destroyers and nuclear submarines, also saw near-term earnings-related volatility following prolonged contract negotiations with the Navy. However, Morningstar remains optimistic about Huntington Ingalls given its 40% discount to their fair value estimate and that Huntington is one of only two major shipbuilders for the U.S. Navy, which has a vested interest in maintaining the financial viability of the company.</p>
<h2>Top Contributors and Detractors from Moat Index - October 2024</h2>
<h3>Leading Contributors</h3>
<div class="wrapped-div">
<table style="width: 100%;">
<tbody>
<tr class="tbl-data">
<td class="tbl-header last text-left">Company</td>
<td class="tbl-header last text-left">Ticker</td>
<td class="tbl-header last text-left">Sector</td>
<td class="tbl-header last text-right">Avg. Weight (%)</td>
<td class="tbl-header last text-right">Contribution (%)</td>
</tr>
<tr class="tbl-data">
<td class="data-td data last text-left">MarketAxess Inc</td>
<td class="data-td data last text-left">MKTX</td>
<td class="data-td data last text-left">Financials</td>
<td class="data-td data last text-right">2.62</td>
<td class="data-td data last text-right">0.34</td>
</tr>
<tr class="tbl-data">
<td class="data-td data last text-left">Bristol-Myers Squibb Co</td>
<td class="data-td data last text-left">BMY</td>
<td class="data-td data last text-left">Health Care</td>
<td class="data-td data last text-right">2.64</td>
<td class="data-td data last text-right">0.24</td>
</tr>
<tr class="tbl-data">
<td class="data-td data last text-left">Bio-Rad Laboratories Inc</td>
<td class="data-td data last text-left">BIO</td>
<td class="data-td data last text-left">Health Care</td>
<td class="data-td data last text-right">2.58</td>
<td class="data-td data last text-right">0.18</td>
</tr>
<tr class="tbl-data">
<td class="data-td data last text-left">Salesforce Inc</td>
<td class="data-td data last text-left">CRM</td>
<td class="data-td data last text-left">Technology</td>
<td class="data-td data last text-right">2.58</td>
<td class="data-td data last text-right">0.17</td>
</tr>
<tr class="tbl-data">
<td class="data-td data last text-left">Altria Group Inc</td>
<td class="data-td data last text-left">MO</td>
<td class="data-td data last text-left">Consumer Staples</td>
<td class="data-td data last text-right">2.40</td>
<td class="data-td data last text-right">0.16</td>
</tr>
</tbody>
</table>
</div>
<h3>Leading Detractors</h3>
<div class="wrapped-div">
<table style="width: 100%;">
<tbody>
<tr class="tbl-data">
<td class="tbl-header last text-left">Company</td>
<td class="tbl-header last text-left">Ticker</td>
<td class="tbl-header last text-left">Sector</td>
<td class="tbl-header last text-right">Avg. Weight (%)</td>
<td class="tbl-header last text-right">Contribution (%)</td>
</tr>
<tr class="tbl-data">
<td class="data-td data last text-left">Estee Lauder</td>
<td class="data-td data last text-left">EL</td>
<td class="data-td data last text-left">Consumer Staples</td>
<td class="data-td data last text-right">2.38</td>
<td class="data-td data last text-right">-0.73</td>
</tr>
<tr class="tbl-data">
<td class="data-td data last text-left">Huntington Ingalls</td>
<td class="data-td data last text-left">HII</td>
<td class="data-td data last text-left">Industrials</td>
<td class="data-td data last text-right">2.44</td>
<td class="data-td data last text-right">-0.73</td>
</tr>
<tr class="tbl-data">
<td class="data-td data last text-left">Nike Inc</td>
<td class="data-td data last text-left">NKE</td>
<td class="data-td data last text-left">Consumer Discretionary</td>
<td class="data-td data last text-right">2.39</td>
<td class="data-td data last text-right">-0.30</td>
</tr>
<tr class="tbl-data">
<td class="data-td data last text-left">Agilent Technologies Inc</td>
<td class="data-td data last text-left">A</td>
<td class="data-td data last text-left">Health Care</td>
<td class="data-td data last text-right">2.51</td>
<td class="data-td data last text-right">-0.30</td>
</tr>
<tr class="tbl-data">
<td class="data-td data last text-left">Brown-Forman Corp</td>
<td class="data-td data last text-left">BF.B</td>
<td class="data-td data last text-left">Consumer Staples</td>
<td class="data-td data last text-right">2.56</td>
<td class="data-td data last text-right">-0.27</td>
</tr>
</tbody>
</table>
</div>
<style>
    .data-td.data {
        padding-right: 2px !important;
    }
    
    .wrapped-div {
        max-width: 100%;
    }
    
    @media (max-width: 768px) {
        .wrapped-div {
            overflow-x: scroll;
        }
    }
    
    .wrapped-div-sector {
        max-width: 100%;
        overflow-x: scroll;
    }
</style>
<p class="chart-disclosure"><strong>Source: Morningstar, October 2024</strong>. Past performance is no guarantee of future results. Index performance is not illustrative of fund performance. Not intended as a recommendation to buy or to sell any of the securities mentioned herein.</p>

<h2 id="smid-moat-highlights" class="jump-link-nav anchored-block" data-jumplink-title="SMID Moat Highlights">SMID Moat Index Highlights: Cruise Liners Chart Success</h2>
<p>The SMID Moat Index&rsquo;s lead over small- and mid-cap broad benchmarks in October was driven by favorable stock selection rather than sector over or underweights. Sailing ahead of the pack this month were two cruise line operators, Norwegian Cruise Line (NCLH) and Carnival (CCL) as both names gained around 20% in October. With pandemic-related changes in consumer behavior around travel well behind, Morningstar views these cruise liners as on a path to generate excess economic rents going forward. This optimism is reflected in Morningstar&rsquo;s fair value estimates for NCLH and CCL, $31.50 and $28.00, respectively, which indicate room for further advancement in share price for both.</p>
<p>Also positively contributing to the SMID Moat Index&rsquo;s performance in October was the mid-cap financial services and investment advisory firm LPL Financial (LPLA). Following a strong earnings release that saw the recruitment of new assets and ongoing retention and monetization of existing assets, shares of LPLA soared to end the month up 20%. Morningstar noted that they don't anticipate making a significant change to their $314 per share fair value estimate following the update, and that they assess shares as being fairly valued to modestly undervalued.</p>
<p>Names that detracted most from SMID Moat Index performance during the month include the aforementioned shipbuilder Huntington Ingalls, the government-sponsored healthcare plan focused managed care organization Centene (CNC), health diagnostics and research company IQVIA Holdings (IQV), semiconductor equipment and materials company Teradyne (TER), and toy and game company Hasbro (HAS).</p>
<h2>Top Contributors and Detractors from SMID Moat Index - October 2024</h2>
<h3>Leading Contributors</h3>
<div class="wrapped-div">
<table style="width: 100%;">
<tbody>
<tr class="tbl-data">
<td class="tbl-header last text-left">Company</td>
<td class="tbl-header last text-left">Ticker</td>
<td class="tbl-header last text-left">Sector</td>
<td class="tbl-header last text-right">Avg. Weight (%)</td>
<td class="tbl-header last text-right">Contribution (%)</td>
</tr>
<tr class="tbl-data">
<td class="data-td data last text-left">Norwegian Cruise Line</td>
<td class="data-td data last text-left">NCLH</td>
<td class="data-td data last text-left">Consumer Discretionary</td>
<td class="data-td data last text-right">1.33</td>
<td class="data-td data last text-right">0.31</td>
</tr>
<tr class="tbl-data">
<td class="data-td data last text-left">LPL Financial Holdings</td>
<td class="data-td data last text-left">LPLA</td>
<td class="data-td data last text-left">Financials</td>
<td class="data-td data last text-right">1.22</td>
<td class="data-td data last text-right">0.26</td>
</tr>
<tr class="tbl-data">
<td class="data-td data last text-left">Carnival Corp</td>
<td class="data-td data last text-left">CCL</td>
<td class="data-td data last text-left">Consumer Discretionary</td>
<td class="data-td data last text-right">1.35</td>
<td class="data-td data last text-right">0.26</td>
</tr>
<tr class="tbl-data">
<td class="data-td data last text-left">The Carlyle Group Inc</td>
<td class="data-td data last text-left">CG</td>
<td class="data-td data last text-left">Financials</td>
<td class="data-td data last text-right">1.38</td>
<td class="data-td data last text-right">0.22</td>
</tr>
<tr class="tbl-data">
<td class="data-td data last text-left">WESCO International Inc</td>
<td class="data-td data last text-left">WCC</td>
<td class="data-td data last text-left">Industrials</td>
<td class="data-td data last text-right">1.27</td>
<td class="data-td data last text-right">0.18</td>
</tr>
</tbody>
</table>
</div>
<h3>Leading Detractors</h3>
<div class="wrapped-div">
<table style="width: 100%;">
<tbody>
<tr class="tbl-data">
<td class="tbl-header last text-left">Company</td>
<td class="tbl-header last text-left">Ticker</td>
<td class="tbl-header last text-left">Sector</td>
<td class="tbl-header last text-right">Avg. Weight (%)</td>
<td class="tbl-header last text-right">Contribution (%)</td>
</tr>
<tr class="tbl-data">
<td class="data-td data last text-left">Huntington Ingalls</td>
<td class="data-td data last text-left">HII</td>
<td class="data-td data last text-left">Industrials</td>
<td class="data-td data last text-right">1.35</td>
<td class="data-td data last text-right">-0.40</td>
</tr>
<tr class="tbl-data">
<td class="data-td data last text-left">Centene Corp</td>
<td class="data-td data last text-left">CNC</td>
<td class="data-td data last text-left">Health Care</td>
<td class="data-td data last text-right">1.35</td>
<td class="data-td data last text-right">-0.23</td>
</tr>
<tr class="tbl-data">
<td class="data-td data last text-left">IQVIA Holdings Inc</td>
<td class="data-td data last text-left">IQV</td>
<td class="data-td data last text-left">Health Care</td>
<td class="data-td data last text-right">1.31</td>
<td class="data-td data last text-right">-0.17</td>
</tr>
<tr class="tbl-data">
<td class="data-td data last text-left">Teradyne Inc</td>
<td class="data-td data last text-left">TER</td>
<td class="data-td data last text-left">Technology</td>
<td class="data-td data last text-right">0.63</td>
<td class="data-td data last text-right">-0.13</td>
</tr>
<tr class="tbl-data">
<td class="data-td data last text-left">Hasbro Inc</td>
<td class="data-td data last text-left">HAS</td>
<td class="data-td data last text-left">Consumer Discretionary</td>
<td class="data-td data last text-right">1.41</td>
<td class="data-td data last text-right">-0.13</td>
</tr>
</tbody>
</table>
</div>
<p class="chart-disclosure"><strong>Source: Morningstar, October 2024</strong>. Past performance is no guarantee of future results. Index performance is not illustrative of fund performance. Not intended as a recommendation to buy or to sell any of the securities mentioned herein.</p>
<h2 id="moat-strategies" class="jump-link-nav anchored-block" data-jumplink-title="Moat Strategies">Choose Your Moat Strategy</h2>
<p>VanEck&rsquo;s suite of <strong><a title="Quality Companies at Attractive Prices" href="https://www.vaneck.com/us/en/blogs/moat-investing/moat-investing-powered-by-morningstar/">moat investing strategies</a></strong> is powered by Morningstar&rsquo;s equity research team, which seeks quality companies trading at attractive valuations. The below ETFs offer access to US moat companies:</p>
<p><strong><a title="MOAT - VanEck Morningstar Wide Moat ETF" href="/link/9e43dd198c5f4e419f13220685081895.aspx">VanEck Morningstar Wide ETF (MOAT)</a></strong>: companies with a wide moat rating, which means Morningstar believes the company is likely to sustain its competitive advantage for at least the next 20 years.</p>
<p><strong><a title="SMOT - VanEck Morningstar SMID Moat ETF" href="/link/166321dbcfec440590fb51cf0ad629aa.aspx">VanEck Morningstar SMID Moat ETF (SMOT)</a></strong>: small and mid-cap moat companies.</p>
<p>To receive more <a href="https://www.vaneck.com/us/en/insights/moat-investing" title="Moat Investing Insights"><strong>Moat Investing</strong></a> insights, <a href="https://www.vaneck.com/us/en/subscribe/" title="Subscription Center"><strong>sign up in our subscription center</strong></a>.</p>
]]></content:encoded>
</item><item rdf:about="https://www.vaneck.com/us/en/blogs/model-portfolios/monthly-market-recap-post-election-positioning/">
  <title>October Market Recap: Post-Election Positioning></title>
  <link>https://www.vaneck.com/us/en/blogs/model-portfolios/monthly-market-recap-post-election-positioning/</link>
  <description><![CDATA[The U.S. election has spurred market optimism. Financial excess remains the focus, favoring assets like gold, Bitcoin, and real estate.]]></description>
  <dc:creator>David Schassler</dc:creator>
  <dc:date>11/11/2024 06:30:00</dc:date>
<content:encoded><![CDATA[

<h2>Market Overview: A Tale of Change and Continuity</h2>
<p>The American people have spoken, and the result is in: President-elect Donald Trump and Vice President-elect J.D. Vance are set to lead the country. The markets cheered the Republican win, buoyed by hopes for tax cuts and deregulation. Tariffs might not thrill everyone, but this outcome lifted the fog of uncertainty. Now, we&rsquo;re watching to see if this new leadership can bridge a divided nation. Let&rsquo;s keep sight of the bigger picture. Our main investment theme&mdash;<i>financial excess</i>&mdash;is intact. When financial conditions are loose, assets with scarce value, like gold, bitcoin, and real estate, tend to outperform. This dynamic remains at the core of our strategy.</p>

<h2>Fiscal Policy: A Fork in the Road</h2>
<p>Modern American history is hallmarked by overspending, and the outcome of this election is unlikely to change that trajectory. Overspending is not specific to any political party. History shows both parties have a penchant for spending:</p>
<h3>U.S. Total Public Debt Across Presidential Terms over the Last 20 Years</h3>
<p><img class="img-responsive w-100" src="https://www.vaneck.com/contentassets/de2b8013dc9e4930b3dbd31180a8aa0a/5033_daves-monthly-commentary_chart-1_2024-11_v3_blog.svg" title="U.S. Total Public Debt Across Presidential Terms over the Last 20 Years" /></p>
<p class="chart-disclosure"><strong>Source</strong>: Bloomberg as of 2024.</p>
<p>The critical debate now concerns fiscal policy. Option one is austerity, which involves trimming debt and banking on economic growth fueled by innovations like AI. This is a hopeful scenario, but it may take longer to unfold. Option two? Fiscal dominance, where the government&rsquo;s debt demands push the central bank to prioritize keeping rates low, regardless of inflation risks. The likely near-term scenario is &ldquo;business as usual&rdquo;: over-borrow to overspend, just with red-leaning policies. The prudent move? Hope for growth but prepare for fiscal dominance&mdash;diversify with gold, bitcoin, and other real assets.</p>
<h2>Equities: A Challenging Month</h2>
<p>Stocks took a hit in October, facing rising geopolitical tensions, election jitters, and strong economic growth data. We seem to be in an awkward economic paradox where good news is bad and bad news is good because of the implications for future rate policies.</p>
<p>The month favored large-cap over small-cap, growth over value, and U.S. over international equities:</p>
<div class="wrapped-div">
<table style="width: 600px;">
<tbody>
<tr class="tbl-data">
<td class="tbl-header last text-left">Index</td>
<td class="tbl-header last text-right">October Return (%)</td>
</tr>
<tr class="tbl-data">
<td class="data-td last">S&amp;P 500</td>
<td class="data-td data last text-right">-0.91</td>
</tr>
<tr class="tbl-data">
<td class="data-td last">Russell 3000 Value</td>
<td class="data-td data last text-right">-1.20</td>
</tr>
<tr class="tbl-data">
<td class="data-td last">Russell 3000 Growth</td>
<td class="data-td data last text-right">-0.73</td>
</tr>
<tr class="tbl-data">
<td class="data-td last">Russell 2000</td>
<td class="data-td data last text-right">-1.44</td>
</tr>
<tr class="tbl-data">
<td class="data-td last">MSCI EAFE</td>
<td class="data-td data last text-right">-5.44</td>
</tr>
<tr class="tbl-data">
<td class="data-td last">MSCI Emerging Markets</td>
<td class="data-td data last text-right">-4.45</td>
</tr>
</tbody>
</table>
</div>
</div>
<br />
<style>
    .data-td.data {
        padding-right: 5px !important;
    }
    
    .wrapped-div {
        max-width: 100%;
    }
    
    @media (max-width: 1240px) {
        .wrapped-div {
            overflow-x: scroll;
        }
    }
    
    .wrapped-div-sector {
        max-width: 100%;
        overflow-x: scroll;
    }
</style>

<h2>Fixed Income: A Strong Job Market, Rising Rates</h2>
<p>Strong employment and consumer spending cast doubt on Fed rate cuts, sending bond prices down during the period. As demand for these bonds waned, yields climbed, pushing up borrowing costs across the board. A robust labor market turned expectations of rate cuts into a reality of rising interest costs.</p>
<h2>Real Assets: Gold Gains, Oil Lags</h2>
<p>Gold glistened in October, driven higher by the same factors that drove equities lower. Classic investor behavior is to buy top-performing assets. Gold is now that asset, and flows into gold ETFs are rising. Global physically backed gold ETFs have been experiencing inflows for the past six months and raised $4.3 billion in October. In our view, this trend is just beginning and will push gold prices significantly higher over the medium term.</p>
<p>Meanwhile, oil couldn&rsquo;t catch a break. At the same time, Middle East tensions briefly boosted prices, weak demand from China, and ample supply kept WTI below $70 per barrel&mdash;a classic case of the 'safe-haven' effect favoring gold. In contrast, oil struggled due to economic forces.</p>
<h2>Digital Assets: Bitcoin&rsquo;s Moonshot</h2>
<p>Bitcoin hit a historic high, soaring above $76,000 after the election results were announced. Trump&rsquo;s pro-crypto stance is fueling optimism, which could attract more institutional players and enhance bitcoin&rsquo;s appeal as a hedge against inflation. Trump&rsquo;s tax-cutting agenda only fuels Bitcoin&rsquo;s rise as a digital store of value.</p>
<h2>Bottom Line</h2>
<p>Our advice: balance hope and preparation. The landscape may change, but the need for diversification doesn&rsquo;t. In a world of fiscal excess and political shifts, gold, bitcoin, and other real assets remain smart hedges in a volatile landscape.</p>
<p>To receive more <strong><a href="https://www.vaneck.com/us/en/insights/guided-allocation/" title="Model Portfolio Insights">Model Portfolio</a></strong> insights, <strong><a href="https://www.vaneck.com/us/en/subscribe/" title="Subscription Center">sign up in our subscription center</a></strong>.</p>
]]></content:encoded>
</item><item rdf:about="https://www.vaneck.com/us/en/blogs/gold-investing/ima-casanova-october-gold-rally-and-key-earnings-insights/">
  <title>October Gold Rally and Key Earnings Insights></title>
  <link>https://www.vaneck.com/us/en/blogs/gold-investing/ima-casanova-october-gold-rally-and-key-earnings-insights/</link>
  <description><![CDATA[Gold continued to rally in October, closing at a record price on October 30. Performance of gold equities was mixed in October, in part due to a sharp sell-off of Newmont in late-October.]]></description>
  <dc:creator>Imaru Casanova</dc:creator>
  <dc:date>11/11/2024 06:30:00</dc:date>
<content:encoded><![CDATA[

<p>Monthly gold market and economic insights from Imaru Casanova, Portfolio Manager, featuring her unique views on mining and gold&rsquo;s portfolio benefits.</p>

<h2>Gold Hits Record Highs in October Amid Economic Shifts</h2>
<p>Gold prices continued to rally in October, reaching new highs throughout the month and closing at a record $2,787.61 per ounce on October 30. Key U.S. economic indicators&mdash;including the jobs report, CPI<sup>1</sup>, retail sales, PMIs<sup>2</sup>, consumer sentiment, Q3 GDP, and PCE<sup>3</sup>&mdash;signaled ongoing economic progress.</p>
<p>Gold equities had a mixed performance. The NYSE Arca Gold Miners Index (GDMNTR)<sup>4</sup>&nbsp;rose by only 1.42%, while the MVIS Global Juniors Gold Miners Index (MVGDXJTR)<sup>5</sup>&nbsp;outperformed gold, gaining 5.62% over the month.</p>
<p>By the end of October, markets anticipated a slower pace of the U.S. Federal Reserve (Fed) rate cuts compared to September&rsquo;s outlook. Gold showed strong resilience, reaching record highs despite a stronger dollar (up 3.17%) and rising Treasury yields (with the 10-year yield up by 50 basis points). Gold likely benefited from weakness in U.S. equities, as the NASDAQ<sup>6</sup>&nbsp;and S&amp;P 500<sup>7</sup>&nbsp;declined by 0.49% and 0.92%, respectively.</p>
<p>On October 31, the UK&rsquo;s Autumn Budget 2024 was released, impacting both UK and global markets amid concerns that the budget could spur inflation and prompt the Bank of England to delay rate cuts. In response, gold dropped over $40 per ounce, ending the month at $2,743.97, an increase of $109.39 per ounce or 4.15% overall for October.</p>
<h2>Newmont&rsquo;s Earnings Miss and Revised 2025 Guidance Impact Gold Sector</h2>
<p>A key factor influencing the sector&rsquo;s performance in October was the sharp sell-off of Newmont&rsquo;s (4.02% of Strategy net assets) shares on October 24. The previous day, Newmont reported Q3 2024 adjusted EPS<sup>8</sup>&nbsp;of $0.81, missing the consensus estimate of $0.86. While this slight earnings miss was largely due to higher costs, it was somewhat offset by positive news of strong share repurchases, debt reduction and a quarterly dividend of $0.25 per share.</p>
<p>Newmont expanded its share buyback program to $3 billion (up from $1 billion), with $750 million repurchased so far this year. Additionally, the company reduced its net debt by $483 million year-to-date, targeting a reduction to $5 billion by year-end, down from $6 billion. As of Q3, Newmont's balance sheet remained robust, with $3 billion in consolidated cash, approximately $7.1 billion in total liquidity and a net debt-to-adjusted EBITDA<sup>9</sup>&nbsp;ratio of 0.9x. The company also made progress on non-core asset sales, achieving $1.475 billion in sales year-to-date, putting it on track to surpass its $2 billion target.</p>
<p>During the October 24 conference call, Newmont issued preliminary 2025 guidance that fell short of expectations. The company projected 2025 production at around 5.6 million ounces, down from the previously anticipated 6.0 million ounces. It also indicated that costs would remain steady with 2024 levels, contrary to market expectations for year-over-year reductions. These revisions, along with weaker Q3 results and a higher cost outlook for 2024, drove Newmont&rsquo;s shares down nearly 15% that day. As a sector leader, Newmont&rsquo;s performance influenced the broader market, with most gold mining equities declining on October 24, despite a 0.76% increase in gold. The GDMNTR ended the day down 2.8%.</p>
<h2>Investor Concerns in Gold Mining Revealed by Newmont&rsquo;s Sell-Off</h2>
<p>Newmont&rsquo;s recent sell-off highlighted the key risks that concern investors in gold mining equities, explaining the market&rsquo;s intense, perhaps exaggerated, reaction:</p>
<ol class="content-list">
<li class="mt-2"><strong>Meeting Expectations</strong> &ndash; Consistently meeting targets is critical for the sector. While projecting production, operating and capital costs is complex, it&rsquo;s essential for companies to deliver as promised to build investor confidence. Underperformance or frequent revisions may not always impact the value of long-lived assets like gold mines, but markets closely track each company&rsquo;s ability to execute on their plans as an indicator of effective risk management. Companies that adopt cautious, precise guidance are more likely to meet or exceed expectations and may benefit from higher valuations as a result.</li>
<li class="mt-2"><strong>Margin Expansion and Free Cash Flow Generation</strong> &ndash; Following recent inflation-driven cost increases, investors are focused on the industry&rsquo;s cost management. A main concern raised by Newmont&rsquo;s report is whether its higher cost outlook signals a broader trend for the sector. With inflationary pressures easing and companies working to control costs, industry costs are expected to stabilize, and margins should expand as gold prices rise. Investors seek assurance that companies are achieving record margins and free cash flow amid record gold prices.</li>
<li class="mt-2"><strong>Delivering on Growth Strategies</strong> &ndash; Investors are carefully watching companies&rsquo; approaches to growth, from mine expansions and new projects to acquisitions. While sector consolidation, such as Newmont&rsquo;s acquisition of Newcrest, can deliver long-term benefits, integration also brings risks and complexities. Effective capital allocation and solid execution on growth initiatives are key to maintaining investor confidence, though acquisitions may temporarily pressure stock performance.</li>
</ol>
<h2>Agnico Eagle&rsquo;s Strong Q3 Results Boost Sector Confidence</h2>
<p>Newmont kicked off the earnings season, followed by another industry leader, Agnico Eagle (5.07% of Strategy net assets), on October 31 (with results released after market close on October 30 and a conference call on October 31). Agnico&rsquo;s strong Q3 2024 results provided exactly the boost the sector needed, delivering solid financial and operational performance, reaffirming yearly guidance, and presenting a positive outlook on costs, inflation, and project progress across all key areas.</p>
<ol class="content-list">
<li class="mt-2"><strong>Meeting Expectations</strong> &ndash; Agnico Eagle exceeded earnings expectations with an adjusted EPS of $1.14, above the consensus estimate of $1.01. Both production and costs for the quarter met projections, and the company maintained its 2024 guidance, aiming for 3.35 million ounces of production and all-in sustaining costs of $1,225 per ounce at the midpoint.</li>
<li class="mt-2"><strong>Margin Expansion and Free Cash Flow Generation</strong> &ndash; Agnico Eagle reported record operating cash flow and free cash flow for the quarter. The company reduced net debt by $375 million, bringing the year-to-date total to $1 billion, and improved its net debt-to-EBITDA ratio from 0.29x to 0.15x. Agnico declared a quarterly dividend of $0.40 per share and repurchased $30 million in shares, emphasizing its commitment to returning capital to shareholders, with $700 million returned year-to-date. On cost and inflation, Agnico noted that productivity improvements are stabilizing costs across its mines. Labor, which accounts for 45% of its cost structure, is projected to have a 3% inflation rate in 2025, down from 4.5% in 2023. Overall costs are expected to increase by about 5% year-over-year, supported by falling diesel and power costs and stable contract renewals. The company also reported no significant inflation in capital costs.</li>
<li class="mt-2"><strong>Delivering on Growth Strategies</strong> &ndash; Agnico reported steady progress on its Detour Complex, Odyssey and San Nicolas projects, with key infrastructure developments and ongoing permitting activities. Positive exploration results were released for Detour Underground, Hope Bay and East Gouldie. Agnico continues its strategy of small equity investments in geologically favorable, politically stable regions, including its recent investment in ATEX Resources (Chile), viewing it as a disciplined, early-stage approach to establish a strategic presence in a promising copper mining area.</li>
</ol>
<h2>Agnico Eagle&rsquo;s Strong Results Overshadowed by Market Drop</h2>
<p>Unfortunately for Agnico Eagle, its stellar report coincided with Halloween and a spooky day for gold, which traded down more than $40 per ounce, so Agnico shares didn&rsquo;t gain on the day. Perhaps the market has come to expect Agnico to consistently meet or beat expectations as it has done historically, earning a premium valuation in the sector.&nbsp; One thing is clear, delivering against plans, realizing margin expansion as the gold price increases, and executing on a disciplined and sustainable growth strategy are the key ingredients for outperformance in the gold mining sector.</p>
<p>To receive more <strong><a href="https://www.vaneck.com/us/en/insights/gold-investing/" title="Gold Investing Insights">Gold Investing</a></strong> insights, <strong><a href="https://www.vaneck.com/us/en/subscribe/" title="Subscription Center">sign up in our subscription center</a></strong>.</p>
]]></content:encoded>
</item><item rdf:about="https://www.vaneck.com/us/en/blogs/income-investing/why-clos-still-make-sense-when-the-fed-cuts-rates/">
  <title>Why CLOs Still Make Sense When the Fed Cuts Rates></title>
  <link>https://www.vaneck.com/us/en/blogs/income-investing/why-clos-still-make-sense-when-the-fed-cuts-rates/</link>
  <description><![CDATA[Since the Fed cut rates, CLOs have outperformed IG bonds, HY bonds, and the aggregate US market.]]></description>
  <dc:creator>William Sokol</dc:creator>
  <dc:date>11/07/2024 06:30:00</dc:date>
<content:encoded><![CDATA[

<p>One of the most common questions we receive from investors is: Why would we invest in collateralized loan obligations (CLOs), which pay floating rate coupons, if the Federal Reserve is cutting interest rates?</p>
<p>Our answer is simple: diversification, protection against volatility, higher credit spreads, and lower risk support the case for a strategic allocation to CLOs through market cycles.&nbsp;In addition, changing market environments can provide compelling opportunities for actively managed CLO strategies that can take advantage of higher yields.</p>
<p>Fundamentally, building a diversified portfolio that does not take outsized duration or credit bets can help to achieve better outcomes through market cycles, and we believe including credit-sensitive floating rate instruments like CLOs should be part of that. CLOs have outperformed Treasuries, investment grade corporates, and the broad U.S. aggregate market over the past decade, and outperformed high yield corporates and leveraged loans on a risk-adjusted basis. Their higher yield and low default risk, as well as floating rate nature, have driven this performance through varying market environments.</p>
<p>Since the current rate cutting cycle began in September, long term yields have <u>increased</u> and CLOs have outperformed investment grade bonds, high yield bonds and the aggregate U.S. market (which have experienced negative returns), as of . This is just another example of the benefits of diversification and insulating a portfolio against market volatility.</p>
<h3 id="clo-performance-since-first-cut" class="jump-link-nav anchored-block" data-jumplink-title="CLO Performance Since First Cut">CLOs Have Outperformed Since First Rate Cut (9/18/2024 &ndash; 10/31/2024)</h3>
<p><img class="img-responsive w-100" src="https://www.vaneck.com/contentassets/838b67d054cc457487a66e864ac020cb/5024_clos-falling-rate_chart-1_2024-11_v1_blog.svg" alt="CLOs Have Outperformed Since First Rate Cut" /></p>
<p class="chart-disclosure">Source: J.P. Morgan and ICE Data Indices as of 10/31/2024. CLOs represented by J.P. Morgan CLO Index; HY Corporates represented by ICE BofA US High Yield Index; IG Corporates represented by ICE BofA US Corporate Index; US Broad IG Market represented by ICE BofA US Broad Market Index. Past performance is no guarantee of future results. Index performance is not representative of fund performance. It is not possible to invest directly in an index.</p>
<p>When evaluating CLOs in a rate cutting environment, it&rsquo;s important to note that because coupons adjust with prevailing short-term rates, CLO prices are not materially impacted by rate declines. Another key point: because CLOs are securitized pools of leveraged loans, returns are largely driven by credit exposure, and that provides unique opportunities when market conditions change &ndash; for example when the economy enters a new rate cycle. The spreads achievable on CLOs, particularly within mezzanine tranches, is indicative of this significant credit element. For example, in the case of BB CLOs, the coupon spread above the 3-month Secured Overnight Funding Rate (&ldquo;SOFR&rdquo;) is greater than SOFR itself.</p>
<h3>CLO Coupons Well Above SOFR</h3>
<p><img class="img-responsive w-100" alt="CLO Coupons Well Above SOFR" src="https://www.vaneck.com/contentassets/12f4fd7284e74f7f84367ba04704ab3d/5024_clos-falling-rate_chart-2_2024-11_v1_blog.svg" /></p>
<p class="chart-disclosure">Source: J.P. Morgan and Bloomberg, as of 10/31/2024.</p>

<p>Historically, credit spreads tend to be negatively correlated with the direction of interest rates. For example, high yield bond spreads and 3-monthT-bill returns have exhibited a correlation of -12% since 12/31/2003, and the relationship is -38% compared to the 10-year U.S. Treasury bond.<sup>1</sup>&nbsp;When rates are declining, this means investors can capture higher spreads, particularly in lower rated tranches, allowing for the potential to both participate in upside price recovery and capture high absolute yields. To benefit from this dynamic, however, the ability to dynamically allocate to higher or lower quality tranches is necessary.</p>
<p>For example, during the last rate cutting cycle that began July 2019, which was driven by slowing economic growth, spreads widened. Through the third rate cut in that rate cutting cycle (in October), CLOs generally underperformed duration sensitive credit sectors, as longer-term yields declined modestly. However, by the end of January 2020, after three rate cuts, different CLO tranches exhibited very different performance, as shown below.</p>
<h3 id="clo-performance-during-last-rate-cut-regime" class="jump-link-nav anchored-block" data-jumplink-title="CLO Performance During Last Rate Cut Regime">BBB and BB CLOs Outperformed U.S. High Yield Bonds and Leveraged Loans as the Fed Cut Rates</h3>
<p><img class="img-responsive w-100" alt="BBB and BB CLOs Outperformed U.S. High Yield Bonds and Leveraged Loans as the Fed Cut Rates" src="https://www.vaneck.com/contentassets/f34691ea8a98467f8dd1cb900e25c5fe/5024_clos-falling-rate_chart-3_2024-11_v1_blog.svg" /></p>
<p class="chart-disclosure">Returns shown are cumulative over the indicated date ranges. Source:. VanEck, Morningstar and JP Morgan 8/31/2024: Morningstar. Broad CLOs represented by J.P. Morgan CLO Index, AAA Rated CLOs represented by J.P. Morgan CLO AAA Index, AA Rated CLOs represented by J.P. Morgan CLO AA Index, A Rated CLOs represented by J.P. Morgan CLO A Index, BBB Rated CLOs represented by J.P. Morgan CLO BBB Index, BB Rated CLOs represented by J.P. Morgan CLO BB Index, US IG represented by ICE BofA US Corporate Index, US HY represented by ICE BofA US High Yield Index, Leveraged Loans represented by Morningstar LSTA US Leveraged Loan 100 Index, ST Corp IG represented by ICE BofA 1-5 Year US Corporate Index and ST HY represented by ICE BofA 0-5 Year US High Yield Constrained Index. Past performance is no guarantee of future results. Index performance is not representative of fund performance. It is not possible to invest directly in an index.</p>
<p>U.S. investment grade corporates, with the longest duration among these asset classes, performed the best, driven by the decline in longer term bond yields. However, BBB and BB CLOs outperformed U.S. high yield bonds (both the broad market and 0-5 year high yield bonds) and leveraged loans. AAA rated tranches, the least credit and rate sensitive segments represented, underperformed while AA and A rated CLOs performed approximately in line with leveraged loans and short-term U.S. investment grade corporate bonds. We note that the Fed cut rates further in February 2020, which was due to the onset of COVID, so less relevant for this analysis.</p>
<p>While looking at a discrete time period can be helpful, we believe from a strategic portfolio perspective, looking at longer-term performance through a rate cycle is more relevant. Through this lens, the potential benefits of CLOs through different market environments is evident. All CLO rating categories, including AAAs, strongly outperformed investment grade bonds, with mezzanine tranches (AA-BB) performing best.</p>
<h3>All CLO Rating Categories Outperformed Through the Rate Cycle</h3>
<p><img class="img-responsive w-100" alt="All CLO Rating Categories Outperformed Through the Rate Cycle" src="https://www.vaneck.com/contentassets/eabf4b3cb86b45ee91031b30eadf2043/5024_clos-falling-rate_table-1_2024-11_v1_blog.svg" /></p>
<p class="chart-disclosure">Returns shown are cumulative over the indicated date ranges. Source:. VanEck, Morningstar and JP Morgan 10/31/2024: Morningstar. Broad CLOs represented by J.P. Morgan CLO Index, AAA Rated CLOs represented by J.P. Morgan CLO AAA Index, AA Rated CLOs represented by J.P. Morgan CLO AA Index, A Rated CLOs represented by J.P. Morgan CLO A Index, BBB Rated CLOs represented by J.P. Morgan CLO BBB Index, BB Rated CLOs represented by J.P. Morgan CLO BB Index, US IG represented by ICE BofA US Corporate Index, US HY represented by ICE BofA US High Yield Index, Leveraged Loans represented by Morningstar LSTA US Leveraged Loan 100 Index, ST Corp IG represented by ICE BofA 1-5 Year US Corporate Index and ST HY represented by ICE BofA 0-5 Year US High Yield Constrained Index. Past performance is no guarantee of future results. Index performance is not representative of fund performance. It is not possible to invest directly in an index.</p>
<p>Every situation is different, and the reason for rate declines will ultimately drive the opportunity. The current rate cutting cycle, for instance, has so far been characterized by continued economic growth and strong corporate fundamentals, and accordingly, tight credit spreads. Rich valuations may favor a cautious approach in this environment rather than full &ldquo;risk-on&rdquo; positioning. Within loans, however, pricing dispersion reflects more challenged fundamentals among certain issuers and sectors. If this becomes a broader trend, spread widening will provide more attractive opportunities than what exists currently. In a more dramatic scenario, such as a &ldquo;hard landing,&rdquo; we would expect more dramatic Fed rate cuts and significant widening throughout the capital stack but most acutely in BBB and below. This is when the most attractive opportunities may arise further down in the capital structure, and investors may benefit from both price appreciation and a high level of carry &ndash; despite low base rates. This last occurred in 2020 with the onset of COVID, when the Fed cut the policy rate to nearly 0%.</p>
<p>However, one does not need to wait for extreme environments such as 2020 to benefit from the higher spreads that CLOs can provide.&nbsp;CLOs have consistently provided significantly greater spreads versus bonds and loans of the same rating in all rate environments. In other words, CLO investors can earn more while not necessarily taking on additional credit risk.</p>
<h3>CLO Investors Can Earn More Without Taking On Additional Credit Risk</h3>
<p><img class="img-responsive w-100" alt="CLO Investors Can Earn More Without Taking On Additional Credit Risk" src="https://www.vaneck.com/contentassets/3a5a7724469943c08493946e360b2444/5024_clos-falling-rate_chart-4_2024-11_v1_blog.svg" /></p>
<p class="chart-disclosure">Source: JP Morgan and ICE Data Services as of 10/31/2024. Using OAS for corporate bonds and discount margins for CLOs. AAA Rated CLOs represented by J.P. Morgan CLO AAA Index, AA Rated CLOs represented by J.P. Morgan CLO AA Index, A Rated CLOs represented by J.P. Morgan CLO A Index, BBB Rated CLOs represented by J.P. Morgan CLO BBB Index, BB Rated CLOs represented by J.P. Morgan CLO BB Index, B Rated CLOs represented by J.P. Morgan CLO B Index AAA Rated Corps represented by the ICE BofA AAA US Corporate Index, AA Rated Corps represented by the ICE BofA AA US Corporate Index, A Rated Corps represented by the ICE BofA A US Corporate Index, BBB Rated Corps represented by the ICE BofA BBB US Corporate Index, BB Rated Corps represented by the ICE BofA BB US High Yield Index and B Rated Corps represented by the ICE BofA Single-B US High Yield Index. Index descriptions at the end of this presentation. Past performance is not indicative of future results. Index performance is not representative of fund performance. It is not possible to invest directly in an index. This is not an offer to buy or sell, or recommendation to buy or sell any of the securities mentioned herein.</p>
<p>In addition, CLOs provide a spread pickup over broad short-term corporate bonds with higher overall credit quality (CLOs are over 60% AAA in aggregate, with approximately 11% in BBB and below; short-term investment grade corporates are over 40% BBB rated).</p>
<p>One reason CLOs in aggregate can perform well in differing rate environments is that they have a full capital structure, from AAA to BB, and different tranches can behave differently because of their different exposures to the underlying loan portfolio. Opportunities may arise in one part of the capital structure and become relatively attractive versus other parts. The key is to invest in a strategy that can take advantage of these opportunities within the capital structure. An experienced manager can assess relative value and add or de-risk at the right time, while also adding value through rigorous bottom-up analysis of every unique CLO.</p>


<p id="clo-etfs" class="jump-link-nav anchored-block" data-jumplink-title="VanEck&rsquo;s CLO ETFs">The <a href="/link/e090deaddc774ac699a04b959d9254c6.aspx" title="CLOI - VanEck CLO ETF - Overview"><strong>VanEck CLO ETF (CLOI)</strong></a>, launched in June 2022, focuses on investment grade CLOs and offers investors a compelling way to add CLO exposure to their core bond portfolio. For investors seeking greater yield potential and who are able to tolerate additional volatility, the <a href="/link/d2f16468a9f14c1e807f6bb7fb597a3e.aspx" title="CLOB - VanEck AA-BB CLO ETF - Overview"><strong>VanEck AA-BB CLO ETF (CLOB)</strong></a> provides a way to access lower rated, or &ldquo;mezzanine,&rdquo; tranches between the AAA and equity tranches. Both ETFs are actively managed by PineBridge Investments, which has decades of experience in the CLO market.</p>
<p>To receive more <a href="/us/en/blogs/income-investing/" title="Income Investing Insights"><strong>Income Investing</strong></a> insights, <a href="/link/5f45412c2143400497908cea2897f7d3.aspx" title=" Subscription Center"><strong>sign up in our subscription center</strong></a>.</p>
]]></content:encoded>
</item><item rdf:about="https://www.vaneck.com/us/en/blogs/gold-investing/gold-outlook-visual-analysis-of-price-and-market-trends/">
  <title>Gold Outlook: Visual Analysis of Price and Market Trends></title>
  <link>https://www.vaneck.com/us/en/blogs/gold-investing/gold-outlook-visual-analysis-of-price-and-market-trends/</link>
  <description><![CDATA[In this chart book, we explore the trends driving gold&rsquo;s 2024 outperformance and explain why the asset class is well-positioned to continue its strong run.]]></description>
  <dc:creator>Andrew Musgraves</dc:creator>
  <dc:date>11/06/2024 06:30:00</dc:date>
<content:encoded><![CDATA[

<p>Gold and gold stocks have been among the strongest performing asset classes thus far this year, even outperforming US stocks. Gold stands well-positioned to continue its upward trajectory, with appeal for investors seeking both a safe haven and potential growth. A range of macroeconomic factors have aligned to set the stage for continued gold strength:</p>
<ul class="content-list">
<li class="mt-3"><strong>Geopolitical tensions</strong>: Rising global conflicts have heightened market risks, driving investors toward safe-haven assets like gold.</li>
<li class="mt-3"><strong>Expected rate cuts</strong>: Anticipated interest rate cuts in 2024 and 2025 could weaken the dollar, bolstering demand for gold.</li>
<li class="mt-3"><strong>Persistent inflation</strong>: Sticky inflation and concerns over a potential &ldquo;second wave&rdquo; sustain the value of gold as a hedge.</li>
<li class="mt-3"><strong>Strong central bank demand</strong>: Central banks, especially in emerging markets, continue to build gold reserves.</li>
<li class="mt-3"><strong>Robust physical demand from Asia</strong>: Demand for physical gold (including bars, coins and jewelry) in Asia contributes to price stability.</li>
<li class="mt-3"><strong>Resurgent Western investment</strong>: Renewed interest from Western investors could be a catalyst for gold&rsquo;s near-term growth.</li>
</ul>
<h2 id="point-thirteen" class="anchored-block">Gold Outlook: Visual Analysis of Price and Market Trends</h2>
<p>Explore our gold chart book, examining the trends driving gold&rsquo;s 2024 performance and the macro tailwinds aligning for gold to continue its run.</p>
<p>In our gold chart book, we explore the impact these factors have had on gold and gold stocks, as well as how they shape our outlook for this asset class.</p>
<h2>Key Takeaways:</h2>
<ol class="content-list">
<li class="mt-3">Gold and gold stocks are on pace to be among the top-performing assets in 2024.</li>
<li class="mt-3">Gold&rsquo;s price momentum, trading at higher ranges, fuels speculation about its potential to reach $3,000 per ounce.</li>
<li class="mt-3">Historically, gold has gained following Fed rate cuts, with cumulative returns averaging 25% over 500 trading days in the last three rate-cut cycles.</li>
<li class="mt-3">Though China&rsquo;s central bank purchases have recently slowed, China has been instrumental in driving recent price increases, and its actions remain a significant factor.</li>
<li class="mt-3">Major emerging markets, including Russia, India and China, continue to bolster gold reserves, reflecting a possible shift away from reliance on the U.S. dollar.</li>
<li class="mt-3">Central bank gold purchases in 2022 and 2023 have reached levels unseen since 1963, underscoring gold&rsquo;s role in national reserves.</li>
<li class="mt-3">Investment demand is showing signs of revival as ETF inflows track higher, a trend that could support continued price strength.</li>
</ol>
<p>Explore our full chart book on gold here: <strong><a href="https://www.vaneck.com/us/en/gold-investing/gold-outlook-market-trends-october-2024.pdf" title="Gold Outlook: Visual Analysis of Price and Market Trends" target="_blank" rel="noopener">Gold Outlook: Visual Analysis of Price and Market Trends</a></strong>.</p>
<p>To receive more <strong><a href="https://www.vaneck.com/us/en/insights/gold-investing/" title="Gold Investing Insights">Gold Investing</a></strong> insights, <strong><a href="https://www.vaneck.com/us/en/subscribe/" title="Subscription Center">sign up in our subscription center</a></strong>.</p>
]]></content:encoded>
</item><item rdf:about="https://www.vaneck.com/us/en/blogs/natural-resources/smr-investing/">
  <title>Investment Opportunities in SMRs: The Future of Nuclear Power></title>
  <link>https://www.vaneck.com/us/en/blogs/natural-resources/smr-investing/</link>
  <description><![CDATA[As global demand for electricity continues to grow, nuclear power has risen as a key solution. Small modular reactors (SMRs) allow for more scalable and flexible installation of nuclear power that would allow for wider adoption.]]></description>
  <dc:creator>Brandon Rakszawski</dc:creator>
  <dc:date>11/06/2024 06:30:00</dc:date>
<content:encoded><![CDATA[

<p>Nuclear is a major component of the energy mix needed to satisfy <a href="https://www.vaneck.com/us/en/blogs/natural-resources/three-forces-powering-the-nuclear-energy-surge/" title="Three Forces Powering the Nuclear Energy Surge"><strong>growing electricity demand while the world transitions to cleaner energy sources</strong></a>. To see this trend play out in real time, look no further than the various announcements in recent months by tech companies to secure nuclear power sources. Nuclear offers a long list of beneficial characteristics: its emissions levels are some of the lowest among energy sources, it is very efficient and can produce consistent power throughout the day, and its land-use footprint is small compared to other energy sources.</p>
<p>Historically, one hurdle for broader nuclear power adoption has been the slow development pace. The infrastructure required to build a large-scale nuclear reactor can be significant, and the regulatory approval process can often move at a snail&rsquo;s pace. For this reason, industry, customers, and public officials have turned their attention to small modular reactors (SMRs). SMRs are expected to allow for more scalable and flexible installation of nuclear power that, once further developed, may reduce the time to market significantly, with many other potential benefits.</p>
<h2 id="what-are-smrs" class="jump-link-nav anchored-block" data-jumplink-title="What are SMRs">What Are Small Modular Reactors?</h2>
<p>As their name implies, SMRs are small and modular. They are much smaller than large-scale traditional nuclear reactor facilities, in some cases as small as 1/10th the size of traditional nuclear reactors. Being modular allows them to be manufactured offsite and assembled on-site.</p>
<p>These features are important for several reasons. Their small scale may allow SMRs to be used in locations that could not otherwise support a large reactor. Also, SMRs can add additional capacity at existing nuclear power sites. The modular design allows reactors to be manufactured at scale and assembled on-site. This can significantly reduce the up-front capital costs associated with large reactor sites and significantly reduce construction times.</p>
<p>Safety is another attractive feature of SMR innovation. Traditional nuclear reactors rely on physical barriers between the radioactive reactor core and the environment, along with extensive protocols to monitor the reactor&rsquo;s safety and serve as backup to address human and computer errors. Many SMRs are designed with passive, self-cooling features that don&rsquo;t rely on operator intervention or computer action.</p>
<p>The elephant in the room when discussing SMRs is that they have long been in the design and innovation phase but have yet to be deployed in a meaningful way. The primary hurdle has been the cost associated with being first. Many plans have been canceled or reassessed as inflation and rising interest rates drove financing costs higher over the last several years. However, that is expected to change in short order as nuclear has been more widely recognized as an important &ldquo;green&rdquo; or &ldquo;sustainable&rdquo; power source, and significant amounts of financing have been made available to this space in recent years. Several projects are targeting completion by 2029, but the early 2030s may be a more reasonable timeline.</p>
<h2 id="tech-announcements" class="jump-link-nav anchored-block" data-jumplink-title="Tech Announcements">Recent Big Tech Announcements</h2>
<p>Many recent nuclear-related announcements by large tech firms such as Amazon have involved SMRs as an important component of their targeted nuclear power mix. As computing power related to <strong><a href="https://www.vaneck.com/us/en/blogs/natural-resources/ai-and-nuclear-power" title="AI's Impact on the Surge of Nuclear Investments: Everything You Need to Know">generative AI</a></strong> and other technologies increases, the need for expanding data centers is driving the expected demand for electricity higher. Nuclear, with its efficiency and clean footprint fits the bill as other power sources such as coal are dwindling and other renewable energy sources face adoption hurdles.</p>
<ul class="content-list">
<li class="mt-2"><strong>Microsoft: </strong>While Microsoft made headlines in September 2024 by announcing an agreement with Constellation Energy to revive the Three Mile Island nuclear power plant, it has also been researching SMRs behind the scenes. In October 2023, the firm posted a job description for a nuclear technology expert who will be asked to &ldquo;ensure technical feasibility and optimal integration of SMR and microreactor systems.&rdquo;</li>
<li class="mt-2"><strong>Alphabet </strong>(the parent company of Google): Announced on October 14, 2024, that it had agreed to purchase nuclear energy from SMRs being developed by Kairos Power and expects them to be up and running by 2030.</li>
<li class="mt-2"><strong>Amazon</strong>: on October 16, 2024, Amazon announced an agreement with Energy Northwest, a consortium of Washington state public utilities, to enable the development of SMRs in Washington and is targeting the early 2030s.</li>
<li class="mt-2"><strong>Amazon</strong>: On the same day, Amazon also announced a $500 million investment in X-energy, a leading developer of next-generation SMRs and fuel technology.</li>
<li class="mt-2"><strong>Amazon</strong>: In addition to the aforementioned announcements, Amazon also disclosed an agreement with Dominion Energy to explore an SMR project near Dominion&rsquo;s existing North Anna nuclear power plant, a major data center hub in Virgina.</li>
</ul>
<p>Many of the innovative companies in the SMR space remain private. Early-stage and venture capital investment is often a leading indicator of investment opportunities, and major investors such as Bill Gates, Sam Altman, Peter Thiel, and Ken Griffin have backed various start-ups developing next-generation technologies in this space.</p>

<h2>How to Invest in SMRs</h2>
<p>While many names catching headlines such as TerraPower, X-energy, and Kairos Power are private companies, several high-profile companies have gone public in recent years offering pure-play exposure to SMRs.</p>
<p>Investors can also look for more diversified companies participating in the SMR space. Several defense and engineering companies are heavily investing in SMR technologies and the advanced fuel required to power these SMRs while also participating in other areas of the nuclear ecosystem, such as the construction and maintenance of existing early-generation power plants. Public utilities are also investing in this space as they look to scale up capacity at existing facilities.</p>
<p>Exchange-traded funds or ETFs are also a great way to access this investment opportunity while diversifying exposure among SMR participants. Some funds offer broad-based exposure to the entire nuclear ecosystem while also including meaningful exposure to this more nascent segment of the market.</p>
<h2 id="smr-risks" class="jump-link-nav anchored-block" data-jumplink-title="SMR Risks">Risk to Consider When Investing in SMRs</h2>
<p>This area of the market is still in the early stages and there are somewhat limited options to invest in publicly. Of those pure-play SMR companies in the market, they are all susceptible to different commercial and regulatory paths to market, meaning that first mover advantage may reward the winner(s) of the race to build at scale.</p>
<p>Another risk to consider is the close association of SMRs with the artificial intelligence investment boom. While this association has fueled notable growth in the space, it certainly leaves SMR investments susceptible to market corrections and re-ratings as investors digest each company&rsquo;s path forward and the segment&rsquo;s position as a whole.</p>
<p>Diversification may be a prudent approach to mitigate the risk associated with single company exposure. The potential opportunity is robust, but a diversified, risk-aware approach may allow for a better risk-adjusted return experience over the long term.</p>
<h2 id="smr-companies" class="jump-link-nav anchored-block" data-jumplink-title="SMR Companies">SMR Companies to Watch</h2>
<p>Several public companies that are relatively new to the market are making great progress toward making SMRs a reality:</p>
<ul class="content-list">
<li class="mt-2"><strong>NuScale (SMR) </strong>(3.82% of NLR assets<sup>*</sup>): NuScale&rsquo;s path to public listing was via the SPAC merger process in May 2022. It has projects in Ohio, Pennsylvania, Quebec, Asia, and Europe, with notable attention paid to its efforts in Romania.</li>
<li class="mt-2"><strong>Oklo (OKLO) </strong>(3.98% of NLR assets<sup>*</sup>): Oklo also used the SPAC process to go public in May 2024. It is developing small scale SMRs that can utilize recycled uranium. It is targeting 2026 to break ground at their first site in Idaho and is aggressively hoping to have the reactor up and running by 2027, pending regulatory hurdles.</li>
</ul>
<p>Other long-standing public companies are heavily involved in the SMR ecosystem:</p>
<ul class="content-list">
<li class="mt-2"><strong>BWX Technologies (BWXT) </strong>(6.13% of NLR assets<sup>*</sup>): BWX traces its history to the 1800s and was involved in the Manhattan Project of the 1940s, among many other notable associations and accomplishments. It is involved in a range of nuclear and defense-related areas and has been heavily involved in commercial SMR design since 2009. It is also at the forefront of nuclear fuel innovation.</li>
<li class="mt-2"><strong>Kepco Engineering and Construction Company </strong>(2.11% of NLR assets<sup>*</sup>): A Korean company, Kepco is a diversified business that focuses on nuclear, thermal, and other clean power sources. It has been developing an offshore small modular reactor for years with the hopes of deploying as early as 2031.</li>
</ul>
<p>Within the private markets, several companies (among many others) are making significant progress and doing very exciting things in the SMR space and are worth watching in the event they eventually decide to tap the public markets:</p>
<ul class="content-list">
<li class="mt-2"><strong>TerraPower</strong>: Backed by Bill Gates, TerraPower is currently developing its first advanced reactor in Wyoming near the site of a retiring coal plant. It hopes the Wyoming proof of concept will be scaled broadly in the future.</li>
<li class="mt-2"><strong>X-energy</strong>: After announcing a plan to go public in 2022, the firm reversed course scrapping its SPAC merger arrangement in light of market conditions in late 2023. X-energy designs SMRs and manufactures a proprietary version of TRISO advanced fuel.</li>
<li class="mt-2"><strong>Kairos Power: </strong>Kairos caught headlines from its Google announcement in October 2024 and is currently working toward SMR development in Tennessee.</li>
</ul>
<h2 id="invest-in-smrs" class="jump-link-nav anchored-block" data-jumplink-title="Invest in SMRs">Invest in SMR Technology and the Entire Nuclear Ecosystem</h2>

<p>The <strong><a href="https://www.vaneck.com/us/en/investments/uranium-nuclear-energy-etf-nlr/overview/" title="NLR - VanEck Uranium and Nuclear ETF - Overview">VanEck Uranium and Nuclear ETF</a></strong> offers investors comprehensive exposure to the nuclear energy ecosystem. In addition to uranium miners, the strategy targets nuclear energy producers, companies involved in the construction, engineering, and maintenance of nuclear projects, and companies providing equipment, technology, and/or services to the nuclear power industry, with notable exposure to innovative SMR companies.</p>
<p>To receive more <a href="/us/en/insights/natural-resources/" title="Natural Resources Insights"><strong>Natural Resources</strong></a> insights, <a href="https://www.vaneck.com/us/en/subscribe/" title="Subscription Center"><strong>sign up in our subscription center</strong></a>.</p>
]]></content:encoded>
</item><item rdf:about="https://www.vaneck.com/us/en/blogs/thematic-investing/casino-real-estate-and-online-betting-the-two-new-high-rollers-in-gaming/">
  <title>Casino Real Estate and Online Betting: The Two New High-Rollers in Gaming></title>
  <link>https://www.vaneck.com/us/en/blogs/thematic-investing/casino-real-estate-and-online-betting-the-two-new-high-rollers-in-gaming/</link>
  <description><![CDATA[The gaming industry is being transformed by REITs like VICI Properties and Gaming and Leisure Properties, Inc., redefining how the world engages with casino properties and gaming.]]></description>
  <dc:creator>Drew  Anderson</dc:creator>
  <dc:date>11/05/2024 06:30:00</dc:date>
<content:encoded><![CDATA[

<p>The gaming industry - once defined by the glitter of casino floors and the whirl of slot machines - has morphed into something far more intricate and multi-dimensional. The days when gambling was limited to Las Vegas, Atlantic City and a few resort destinations are long gone. Today, the industry is undergoing a transformation driven by the rise of real estate investment trusts (REITs) like VICI Properties (VICI) and Gaming and Leisure Properties, Inc. (GLPI) and the explosive growth of online gaming and sports betting. These dual forces are reshaping how the world approaches gaming, creating a new financial and technological frontier that caters to physical and digital audiences.</p>
<p>We used to think of gambling as a simple transaction&mdash;people walk into a casino, drop their money, and hope for fortune&rsquo;s favor. But now, the industry is far more complex, and understanding it requires a look beyond the operators managing the games. Today, we must also consider the landlords who own the casinos and the new wave of companies turning every smartphone into a virtual betting terminal.</p>
<h2>It&rsquo;s Not About Getting Lucky</h2>
<p>Let's be clear&mdash;gaming&rsquo;s future isn't just about who runs the roulette tables or poker tournaments. It's also about who owns the land those tables sit on. Real estate, once a secondary concern for casino operators, has become a powerhouse business in its own right. Enter VICI Properties and Gaming and Leisure Properties, Inc., two behemoths once spinoffs that have turned the ownership of casino properties into a cash-generating juggernaut.</p>
<p>VICI Properties spun off from Caesars Entertainment (CZR), is now one of the largest real estate holders in the gaming world. We're not talking about a few Vegas hotels; we're talking about a portfolio that spans coast to coast, with assets ranging from Caesars Palace to the MGM Grand. In 2023 alone, <a href="https://investors.viciproperties.com/news/news-details/2024/VICI-Properties-Inc.-Announces-Fourth-Quarter-and-Full-Year-2023-Results/default.aspx" title="VICI Properties Inc. Announces Fourth Quarter and Full Year 2023 Results" target="_blank" rel="noopener"><strong>VICI's revenue surged by 35.8%,</strong></a> largely thanks to its aggressive acquisition strategy. They&rsquo;re not just snapping up casinos either - VICI has diversified its revenue streams beyond traditional gaming activities, scooping up assets like Bowlero bowling centers and the Chelsea Piers complex in New York. This strategic move into broader leisure properties helps attract a broader demographic of consumers while also providing insulation from future dips in its main casino business.</p>
<p>And then there&rsquo;s Gaming and Leisure Properties, Inc., the quieter but no less significant counterpart. Formed as a spin-off from Penn National Gaming (PENN), GLPI owns properties across the country, leasing them to some of the biggest casino operators. These long-term leases ensure that the tenants (the casino operators) are responsible for virtually all expenses, from taxes to maintenance. Rent escalation clauses are also baked into lease agreements, which means GLPI and VICI sit back and collect steady rent checks, giving them a predictable revenue stream that&rsquo;s less volatile than the ups and downs of daily gaming activity.</p>
<h3>Casino REITs Outperform Parent Company (Post Spin-Off)</h3>
<p><img alt="Casino REITs Outperform Parent Company (Post Spin-Off)" class="img-responsive w-100" src="https://www.vaneck.com/contentassets/56f25a6689944b7d9b4ca403cfca11d6/4992_bjk-gaming-blog_chart-1_2024-10_v1_blog.svg" /></p>
<br />
<p><img alt="Casino REITs Outperform Parent Company (Post Spin-Off)" class="img-responsive w-100" src="https://www.vaneck.com/contentassets/56f25a6689944b7d9b4ca403cfca11d6/4992_bjk-gaming-blog_chart-2_2024-10_v1_blog.svg" /></p>
<p class="chart-disclosure"><strong>Source: </strong>Morningstar. As of 9/30/24. Past performance is no guarantee of future results.</p>
<h2 id="all-in-from-anywhere" class="jump-link-nav anchored-block" data-jumplink-title="All-In from Everywhere">Able to Go All-In from Almost Anywhere</h2>
<p>But real estate isn&rsquo;t the only thing that&rsquo;s changed. The internet has fundamentally reshaped gambling, and the old stereotype of gamblers traveling to casinos is becoming increasingly outdated. Sports media outlets cover the betting odds of every event. With the rapid expansion of online gaming and sports betting, the action has moved from the neon-lit Strip to the palm of your hand.</p>
<p>Companies like DraftKings (DKNG) and FanDuel (FLUT) have exploded in popularity, capitalizing on loosening regulations around sports betting in the United States. Now, you don&rsquo;t need to travel to a brick-and-mortar casino to place a losing bet on the New York Jets. You can do it from your couch, car, or while waiting in line at the grocery store. This seamless integration of technology and gambling is no longer the future - it&rsquo;s the present.</p>
<h3 id="online-gambling-market" class="jump-link-nav anchored-block" data-jumplink-title="Online Gambling Market">Global Online Gambling Market Size (2017-2029)</h3>
<p><img alt="Global Online Gambling Market Size (2017-2029)" class="img-responsive w-100" src="https://www.vaneck.com/contentassets/772ab7f4d5c04d1692af46c98abb31a2/4992_bjk-gaming-blog_chart-3_2024-10_v1_blog.svg" /></p>
<p class="chart-disclosure"><strong>Source: </strong>Statista. As of 8/26/2024. Past performance is no guarantee of future results. Estimates are for illustrative purposes only and are not intended as predictions or projections of future results.</p>

<p>These companies&rsquo; success speaks volumes about the gaming industry's future: a mix of fast, mobile, and constant engagement. The global online gaming market is expected to hit <strong><a title="Market size of the online gambling industry worldwide from 2017 to 2023, with a forecast until 2029" href="https://www.statista.com/forecasts/270728/market-volume-of-online-gaming-worldwide" target="_blank" rel="noopener">$134 billion by 2029</a></strong>, and the convenience of betting on mobile devices is a huge factor behind this surge.</p>
<h2>Physical Meets Digital</h2>
<p>The symbiotic relationship between real estate and online gaming makes this transformation even more intriguing. Casino operators are increasingly partnering with online platforms to offer both physical and digital experiences. For example, a person might visit a casino owned by VICI Properties, play a few rounds at the blackjack table, and later that night, log into DraftKings to place a bet on a hockey game. Likewise, gaming incentive programs have also moved towards digitizing their strategy. In the traditional casino, high rollers and hot hands would often be rewarded with free cocktails, complimentary credits, or even residency at the resort if they flaunt their deep pockets. These positive feedback loops have re-emerged in digital sportsbooks through profit boosts, bonus payouts, and even tickets to major events!</p>
<p>These partnerships allow casinos to remain relevant in an increasingly digital world. By offering both in-person and online options, they capture a wider demographic of gamers, from high rollers who enjoy the atmosphere of a casino floor to the younger, tech-savvy crowd who prefer the convenience of an app.</p>
<h2>Building The Stack</h2>
<p>The most attractive aspect of this new gaming paradigm is the stability it offers to investors. Casino REITs, like VICI and GLPI, benefit from steady income through long-term leases, providing high dividend yields. REITs are a unique fund structure &ndash; to qualify, a company must have most assets invested in real estate, with at least 90% of its income being paid out to shareholders as dividends. Unlike traditional casino operators, who face daily fluctuations in gaming revenue, these REITs operate under a relatively low-risk business model. Even during economic downturns, tenants are contractually obligated to pay rent, ensuring a consistent revenue stream. This stability is reflected in performance, with REITs outperforming casino operators by 40% over the last three years.</p>
<p>On the other hand, online gaming companies offer more growth potential. With sports betting legalized in 38 states and counting, platforms like DraftKings are poised for massive expansion. For investors looking for a balance of stability and growth, the combination of casino real estate and online gaming is hard to beat.</p>
<h2>Gaming&rsquo;s Future is Here, and It&rsquo;s Diversified</h2>
<p>A singular model no longer defines the gaming industry. It&rsquo;s a multi-faceted ecosystem that now includes the physical world of casino real estate and the digital realm of online gaming. Whether you&rsquo;re an investor looking for reliable income through REITs like VICI and GLPI or seeking high-growth opportunities in online platforms like DraftKings, the gaming industry offers something for everyone.</p>

<p>For investors seeking exposure to the evolving gaming industry, <a href="https://www.vaneck.com/us/en/investments/gaming-etf-bjk/overview/" title="BJK - VanEck Gaming ETF - Performance and Holdings"><strong>BJK</strong></a> presents a compelling opportunity. This ETF provides access to both the stability of casino real estate through REITs and the dynamic growth of the online gaming market. By investing in <a href="https://www.vaneck.com/us/en/investments/gaming-etf-bjk/overview/" title="BJK - VanEck Gaming ETF - Performance and Holdings"><strong>BJK</strong></a>, you can tap into the expansion of both sectors, making it an attractive option for those looking to participate in the future of gaming.</p>
<p>To receive more <a href="https://www.vaneck.com/us/en/insights/thematic-investing/" title="Thematic Investing Insights"><strong>Thematic Investing</strong></a> insights, <a href="https://www.vaneck.com/us/en/subscribe/" title="Subscription Center"><strong>sign up in our subscription center</strong></a>.</p>
]]></content:encoded>
</item><item rdf:about="https://www.vaneck.com/us/en/blogs/digital-assets/matthew-sigel-vaneck-crypto-monthly-recap-for-october-2024/">
  <title>VanEck Crypto Monthly Recap for October 2024></title>
  <link>https://www.vaneck.com/us/en/blogs/digital-assets/matthew-sigel-vaneck-crypto-monthly-recap-for-october-2024/</link>
  <description><![CDATA[Bitcoin dominance climbs as ETH/BTC hits new lows. We analyze Solana vs. Ethereum on memecoin, NFT, and wash trading revenues.]]></description>
  <dc:creator>Matthew  Sigel</dc:creator>
  <dc:date>11/05/2024 06:30:00</dc:date>
<content:encoded><![CDATA[

<p><strong>Please note that VanEck may have a position(s) in the digital asset(s) described below.</strong></p>
<p>Bitcoin outperformed all major crypto tokens and asset classes again in October, +11% vs. the S&amp;P 500 and Nasdaq, both -1%, MSCI All Country World Index (ACWI), -2 %, and the Bloomberg Global Bond Aggregate -3.4% which was its worst month in more than 2 years. Investors flooded into Bitcoin ETPs (+$3.3B), sending Bitcoin&rsquo;s dominance to new highs for the cycle above 60%. Market breadth was poor, as more than 60% of our watch list fell in October, and small caps continued to underperform, down 9%.</p>
<ul class="content-list">
<li class="mt-2"><strong><a href="#eth-debate">Ethereum Stakeholders Debate Its Future</a></strong></li>
<li class="mt-2"><strong><a href="#eth-l2s">Ethereum L2s&rsquo; Decentralization Efforts</a></strong></li>
<li class="mt-2"><strong><a href="#eth-turnaround">How Ethereum Can Restore Confidence </a></strong></li>
<li class="mt-2"><strong><a href="#sol-usage">Solana Sees Dramatic Increase in Usage</a></strong></li>
<li class="mt-2"><strong><a href="#sol-vs-eth">Solana vs. Ethereum: Analyzing Memecoin, NFT, and Wash Trading Revenues</a></strong></li>
</ul>
<p>Among the winners, high-throughput Layer 1 smart contract platforms outperformed sharply, with APT (+18%), SOL (+10%), and SUI (+15%). Laggards for the month included Near (-23%), Polygon (-19%), and TON (-15%).</p>
<p>Some may be surprised to see BTC and ETH volatility fall in October (-11%) and (-4.5%) heading into the election to levels not seen since mid-summer. However, this is directly parallel to the 2020 action. As we have detailed in recent notes, we expect volatility to rise on election night.</p>
<h3>Price Returns</h3>
<div class="wrapped-div">
<table style="width: 600px;">
<tbody>
<tr class="tbl-data">
<td class="tbl-header last text-center">&nbsp;</td>
<td class="tbl-header last text-right">October (%)</td>
<td class="tbl-header last text-right">YTD (%)</td>
</tr>
<tr class="tbl-data">
<td class="data-td last">MV Global Digital Assets Equity Index</td>
<td class="data-td data last text-right">13</td>
<td class="data-td data last text-right">29</td>
</tr>
<tr class="tbl-data">
<td class="data-td last">Bitcoin</td>
<td class="data-td data last text-right">11</td>
<td class="data-td data last text-right">65</td>
</tr>
<tr class="tbl-data">
<td class="data-td last">Coinbase</td>
<td class="data-td data last text-right">2</td>
<td class="data-td data last text-right">4</td>
</tr>
<tr class="tbl-data">
<td class="data-td last">MarketVector Meme Coin Index</td>
<td class="data-td data last text-right">2</td>
<td class="data-td data last text-right">NA</td>
</tr>
<tr class="tbl-data">
<td class="data-td last">MarketVector Smart Contract Leaders Index</td>
<td class="data-td data last text-right">-1</td>
<td class="data-td data last text-right">3</td>
</tr>
<tr class="tbl-data">
<td class="data-td last">S&amp;P 500 Index</td>
<td class="data-td data last text-right">-1</td>
<td class="data-td data last text-right">20</td>
</tr>
<tr class="tbl-data">
<td class="data-td last">Nasdaq Index</td>
<td class="data-td data last text-right">-1</td>
<td class="data-td data last text-right">21</td>
</tr>
<tr class="tbl-data">
<td class="data-td last">Ethereum</td>
<td class="data-td data last text-right">-3</td>
<td class="data-td data last text-right">9</td>
</tr>
<tr class="tbl-data">
<td class="data-td last">MarketVector Decentralized Finance Leaders Index</td>
<td class="data-td data last text-right">-9</td>
<td class="data-td data last text-right">-18</td>
</tr>
<tr class="tbl-data">
<td class="data-td last">MarketVector Infrastructure Application Leaders Index</td>
<td class="data-td data last text-right">-15</td>
<td class="data-td data last text-right">-28</td>
</tr>
</tbody>
</table>
</div>
<br />
<p class="chart-disclosure"><strong>Source:</strong> Bloomberg as of 10/31/2024. <strong>Past performance is no guarantee of future results. Not intended as a recommendation to buy or sell any securities named herein.</strong></p>
<h3 id="eth-debate" class="jump-link-nav anchored-block" data-jumplink-title="ETH Debate">Ethereum Stakeholders Debate Its Future</h3>
<p><strong>ETH/BTC Made New Lows in October</strong></p>
<p><img class="img-responsive w-100" alt="Ethereum Stakeholders Debate Its Future" src="https://www.vaneck.com/contentassets/a1c8ed23840544798a660981b3337fe5/5010_crypto_chart-1_2024-10_v1_blog.svg" /></p>
<p class="chart-disclosure"><strong>Source:</strong> Artemis XYZ as of 10/30/2024. <strong>Past performance is no guarantee of future results. Not intended as a recommendation to buy or sell any securities named herein.</strong></p>
<p>While Ethereum&rsquo;s ETH (+3%) performed well this month relative to most Layer 1s, it continues to fall against Bitcoin, with ETH/BTC down (-9.5%) in October to new cycle lows. Amid the sour price action, some members of the Ethereum community, such as Doug Colkitt and Max Resnick, are pushing for a new direction. Principally, they believe Ethereum should focus on bringing more transactions to its L1 to accrue more value. On the flip side, Ethereum&rsquo;s core development team believes ETH&rsquo;s long-term value accrual comes from ETH being considered money. This group believes Ethereum&rsquo;s scaling through L2s will bring in 100s of millions of users who will need ETH to use the chains. Vitalik Buterin, the unofficial leader of Ethereum&rsquo;s development and strategy, reasserted his roadmap for Ethereum to become a neutral network that can service the world&rsquo;s financial needs. The waypoints towards his &ldquo;north star&rdquo; include:</p>
<ul class="content-list">
<li class="mt-2">Scale Ethereum transaction throughput through trust-minimized L2 blockchains</li>
<li class="mt-2">Maximize interoperability between L2 blockchains</li>
<li class="mt-2">Create cheap, abundant blockspace for L2s to settle to Ethereum</li>
<li class="mt-2">Maintain an extensive network of globally distributed, credibility-neutral validators</li>
<li class="mt-2">Minimize extractive activities like MEV</li>
<li class="mt-2">Build an economic system that prevents the centralization of Ethereum infrastructure.</li>
</ul>
<h3>ETH Decentralized Exchange (DEX) Volume Share Hits All-Time Low</h3>
<p><img class="img-responsive w-100" alt="ETH Decentralized Exchange (DEX) Volume Share Hits All-Time Low" src="https://www.vaneck.com/contentassets/a1c8ed23840544798a660981b3337fe5/5010_crypto_chart-2_2024-10_v1_blog.svg" /></p>
<p class="chart-disclosure"><strong>Source:</strong> Artemis XYZ as of 10/30/2024. <strong>Past performance is no guarantee of future results. Not intended as a recommendation to buy or sell any securities named herein.</strong></p>
<p>In the near term, Ethereum&rsquo;s roadmap has driven much of its financial activity to lower-cost L2s. Though these L2s charge ETH for transactions, Ethereum&rsquo;s drive to lower fees for these L2s has reduced Ethereum&rsquo;s overall revenues. This dynamic is reflexive as it causes less demand by users of Ethereum and its L2s to buy ETH. Because ETH is a commodity, its value is derived explicitly from the demand to use it. The above dynamic, along with anemic ETH ETP inflows, have led to ETH&rsquo;s relative price malaise in 2024.</p>
<p>ETH&rsquo;s long-term success hinges on attracting substantial L2 activity to use Ethereum&rsquo;s &ldquo;blob space&rdquo; to accelerate demand growth for ETH. The current amount of L2 activity is around 300 transactions per second (TPS), which has proven inadequate for preventing a shift in the economic take rate between ETH and its L2s. This challenge could persist until an Ethereum L2 goes truly viral. A pivot point might occur when Ethereum TPS grows high enough to increase ETH burn (from fees) enough to offset ETH issuance through inflation. Using the well-crafted <a href="https://ethereum-blob-simulator.netlify.app/" target="_blank" title="Ethereum Blob Simulator" rel="noopener"><strong>Ethereum Scenario Analysis</strong></a> page, we find this point to be a sustained TPS of around 600. This assumes blob space of 3/6 - target/max, and transaction size remains around 112.5 bytes.</p>
<p>However, over the next year, Ethereum will likely increase blob space to 4/8 - target/max. At the same time, L2s will add new compression technology to reduce the blob space they use on Ethereum. In fact, on 10/29/2024, Starkware demonstrated a transaction size of just 16 bytes by posting ~176MB for 11M transactions. If we assume that all chains can achieve this feat, combined with the 33% increase in blob space, the target for offsetting ETH issuance through L2s activity will balloon to <i>3,300</i> TPS, around 11 times what it is today.</p>
<h3>Simulation Results of ETH Burn from L2s</h3>
<p><img class="img-responsive w-100" alt="Simulation Results of ETH Burn from L2s" src="https://www.vaneck.com/contentassets/a1c8ed23840544798a660981b3337fe5/5010_crypto_infographic_2024-10_v1_blog.png" /></p>
<p class="chart-disclosure">Simulation Inputs: 150 roll-ups, 22 TPS, 4/8 blob, ETH price $3k, transaction (Tx) size 16. <strong>Source:</strong> Ethereum Blob Simulator as of 10/31/2024.</p>
<p>If we assume Ethereum&rsquo;s recent TPS growth rate of 250% is sustained, the point where L2s&rsquo;s blob-driven ETH burn offsets issuance might not be reached until mid-2026. In the meantime, Ethereum is facing strong competition from high throughput blockchains like Solana, Sui, Aptos, and others, which will compete for the users that drive these transactions. All the while, Ethereum&rsquo;s L2s are looking to push token value accrual for their own tokens (like OP, ARB, and ZK). The bearish argument for ETH would be that the growth rate for users is challenged, Ethereum&rsquo;s customers are trying to remit less value to Ethereum, and Ethereum is reducing pricing for its blockspace.</p>
<p>There are still many reasons to be bullish about ETH in a longer time frame. Ethereum and the EVM (Ethereum Virtual Machine) ecosystem still command a plurality of developer talent and a strong host of L2s, more than 110, seeking to attract new users and fresh developer talent. Ethereum has by far the most institutional adoption, with mainstream financial institutions such as VanEck and Blackrock building tokenized funds and apps. Ethereum is taking more shots on goal due to the vast number of teams trying to build/attract the killer app. Lastly, for all the talk about L2s, they currently pay less than 1% of total ETH gas fees. Any pickup in ETH Mainnet activity would drive fee generation, burn (ETH buyback), and reflexivity to the asset.</p>
<h2 id="eth-turnaround" class="jump-link-nav anchored-block" data-jumplink-title="ETH Turnaround">How Ethereum Can Restore Confidence</h2>
<p>What are some catalysts that may change the current consensus negativity around ETH? Here are some ideas being floated:</p>
<ul class="content-list">
<li class="mt-2">Forcing roll-ups to hold ETH to access blob space</li>
<li class="mt-2">Strongly encouraging L2s to back their sequencers with ETH instead of the L2 tokens</li>
<li class="mt-2">Making Ethereum&rsquo;s execution layer scale to fit more transactions</li>
</ul>
<h3 id="eth-l2s" class="jump-link-nav anchored-block" data-jumplink-title="ETH L2s">Ethereum L2s&rsquo; Decentralization Efforts</h3>
<p><strong>Stage 1 Rollups Now Dominate L2 Total Value Locked (VL) as Base Introduces Fraud Proofs</strong></p>
<p><img class="img-responsive w-100" alt="Ethereum L2s Decentralization Efforts" src="https://www.vaneck.com/contentassets/a1c8ed23840544798a660981b3337fe5/5010_crypto_chart-3_2024-10_v1_blog.svg" /></p>
<p class="chart-disclosure"><strong>Source:</strong> Artemis as of 10/29/2024.</p>
<p>While Ethereum continued to debate its future, its L2s had some major announcements. World Coin launched its widely anticipated Mainnet using Optimism&rsquo;s OP stack, which will connect seamlessly to OP Chains. In another win for Optimism&rsquo;s tech, US-based crypto exchange Kraken announced plans to create its Ethereum layer-2 blockchain called Ink. Adding to positive news for Optimism&rsquo;s tech, Ethereum&rsquo;s largest DEX, Uniswap, announced the creation of its own OP stack chain. Uniswap trading comprises ~70% of Ethereum&rsquo;s DEX volumes, and if significant portions of that volume moved to Uniswap&rsquo;s chain, it would be negative for Ethereum. Despite the good news for Optimism&rsquo;s superchain, the collection of blockchains using the OP stack, OP token waffled in October (-0.5%). This is partly due to questions about the OP token&rsquo;s value accrual from the superchain. Another Ethereum L2, Scroll, finally released its much-anticipated SCR token by dropping 7% of supply to its users, but its token&rsquo;s price has sunk (-34%) since its launch on 10/22/2024.</p>
<p>The burgeoning ecosystem of Ethereum L2s also made noteworthy strides toward decentralization in October. While L2 solutions have rapidly gained adoption over the past year due to their ability to provide fast and cost-effective on-chain transactions, they have faced increasing criticism for centralization risks&mdash;particularly regarding sequencers and operator control. In September, Ethereum founder Vitalik remarked that starting in 2025, he will only publicly mention L2s that have achieved &ldquo;Stage 1+&rdquo; decentralization; that is, L2 rollups governed by smart contracts instead of its operators. <a href="https://x.com/ayyyeandy/status/1850403584716017915" target="_blank" title="Andy on X" rel="noopener"><strong>According</strong></a> to Kaito AI, as of October 27th, Vitalik holds the #1 spot on CT (&ldquo;crypto Twitter&rdquo;) KOL (&ldquo;key opinion leader&rdquo;) mindshare for the previous 7 days and 30 days.</p>
<p>According to L2Beat, a research hub dedicated to tracking Ethereum layer 2 technologies, only four rollups have reached Stage 1 decentralization: Arbitrum One, OP Mainnet, dYdX v3, and Zksync Lite. However, dYdX v3 and ZkSync Lite are effectively deprecated, as dYdX has shifted to its Layer 1 on Cosmos (dYdX v4), and zkSync Lite has been largely superseded by zkSync Era, which supports smart contracts and more advanced use cases&mdash;but remains a Stage 0 rollup. Unlike Stage 0 rollups, Stage 1 rollups have implemented smart contract governance, fraud-proof systems, and provision for user exits without operator coordination, meaning that users are no longer fully dependent on centralized operators and can remove their funds from the L2 to Ethereum L1 independently. Essentially, Stage 1 rollups reduce the risk of theft, censorship, and other single points of failure, particularly for non-native assets (assets that have been bridged to the rollup). No L2 has yet reached Stage 2, which indicates the full elimination of centralized control by decentralizing the rollup&rsquo;s sequencers (agents responsible for ordering and bundling L2 transactions before submitting them to the L1) and making its fraud-proof systems (processes defending against malicious transactions) permissionless.</p>
<p>Just in time to heed Vitalik&rsquo;s urgent call for L2 decentralization, Coinbase&rsquo;s L2 blockchain Base introduced fault proofs on October 30th, marking a significant step toward Stage 1 decentralization. As Arbitrum, Base, and OP Mainnet lead Ethereum L2s by Total Value Locked (TVL), Base&rsquo;s fault proofs mean that Stage 1 networks could soon secure the majority of L2 TVL if Base implements its final criterion: a security council. According to Base&rsquo;s October 30th announcement, the security council&mdash;a set of approvers responsible for signing off on Base&rsquo;s smart contract upgrades&mdash;will decentralize beyond the Base and Optimism core teams in the coming months.</p>
<p>As noted above, the ETH L2 Scroll conducted its native SCR token&rsquo;s first airdrop to decentralize its protocol&rsquo;s governance. As of October 30th, SCR is trading at a $749 million fully diluted valuation. While still a Stage 0 rollup, Scroll stands out for its plans to decentralize its sequencers and prover infrastructure, similar to Arbitrum&rsquo;s planned BoLD (&ldquo;Bounded Liquidity Delay&rdquo;) upgrade. The BoLD upgrade is a key part of Arbitrum&rsquo;s Stage 2 rollup roadmap, aiming to unlock permissionless validation and decentralize its sequencers. Permissionless validation enables anyone&mdash;not just a centralized entity&mdash;to verify transactions, while sequencer decentralization reduces risks stemming from single-party control over transaction ordering, such as MEV (&ldquo;Maximal Extractable Value&rdquo;).</p>
<p>Finally, Linea shared its decentralization roadmap this month, outlining plans to introduce on-chain auctions for block proposers and transition to a proof-of-stake model for block validation, allowing any node to participate by staking tokens. By requiring nodes to bid for the right to propose blocks, on-chain block proposer auctions add economic incentives for honest participation, reducing the risks of transaction censorship and MEV. This shift marks Linea&rsquo;s transition from a centralized protocol to a permissionless system, where proof-of-stake validators participate in a QBFT consensus algorithm to confirm transactions. While these steps advance Linea's decentralization efforts, it remains a Stage 0 rollup due to its continued reliance on centralized sequencers and provers, which must be decentralized to achieve Stage 1.</p>
<h2 id="sol-usage" class="jump-link-nav anchored-block" data-jumplink-title="SOL Usage">Solana Sees Dramatic Increase in Usage</h2>
<p>In Solana land, SOL&rsquo;s (+10%) strong performance can be traced to a sizable uptick in chain usage. On Solana, DEX trading in October was up 132% compared to September&rsquo;s total. Due to this activity, Solana&rsquo;s blockchain earned its highest monthly revenues from transactions and MEV, which was $150.5M. Part of the run-up in Solana DEX trading stems was spawned by an AI Twitter account promoting a memecoin based on an internet meme from the mid-2000s. This AI account also controls a wallet funded by a donation from the famed Silicon Valley investor Marc Andreessen of the venture capital firm a16z. This AI agent accumulated the memecoin before relentlessly posting about it on X (formerly Twitter). At the time of writing, this &ldquo;AI Agent&rdquo; was the first to become a millionaire due to its token holdings in the memecoin. Meanwhile, the AI-promoted memecoin has now peaked at $800M in value.</p>
<h3 id="sol-vs-eth" class="jump-link-nav anchored-block" data-jumplink-title="SOL vs. ETH">Solana vs. Ethereum: Analyzing Memecoin, NFT, and Wash Trading Revenues</h3>
<p><strong>Solana vs. Ethereum: Share Revenue from Memecoins and NFTs</strong></p>
<p><img class="img-responsive w-100" alt="Solana vs. Ethereum: Analyzing Memecoin, NFT, and Wash Trading Revenues" src="https://www.vaneck.com/contentassets/a1c8ed23840544798a660981b3337fe5/5010_crypto_chart-4_2024-10_v1_blog.svg" /></p>
<p class="chart-disclosure"><strong>Source:</strong> Artemis, Dune, Flashbots, Jito, VanEck Research as of 10/30/2024.</p>
<p>The continued success of Solana attracting usership and financial activity has rankled some in the crypto community. On the first count, some contend that most of Solana&rsquo;s documented 111M monthly active wallets, compared to Ethereum&rsquo;s 5.4M, are mostly Sybil (fake) users. On the second view, detractors of Solana&rsquo;s success claim that Solana&rsquo;s on-chain revenue is driven by memecoin trading. It is further supposed that Solana&rsquo;s memecoin activity mainly comprises wash trading rather than organic volume. The naysayers of Solana extrapolate these assumptions to infer that the token performance of SOL is due to revenues derived from suspicious trading.</p>
<p>Concerning wallets, it is very difficult to untangle activity stemming from one user controlling many wallets versus more organic activity derived from one user controlling one wallet. We do agree that a very large portion of these wallets are not organic. To assess the &ldquo;FUD&rdquo; on memecoins, we analyzed recent memecoin activity on Solana and compared it to Ethereum&rsquo;s activity over the same period. Additionally, we compared current Solana and Ethereum activity to peak memecoin activity on Ethereum in the fall of 2021. To contextualize things further, we added NFT trading to the mix, which many crypto detractors formerly cited as an inorganic driver of blockchain fees.</p>
<p>We find that memecoin activity on Solana is significant, as around 34.3% of Solana&rsquo;s revenues derive from memecoin and NFT activity. This compares to around 6.6% of Ethereum revenues today and 20.3% of Ethereum Revenues between July and October 2021. We estimate that the <i>wash trading shar</i>e of memecoin and NFT volume is 41.4% on Solana, compared to 28.9% and 44.4%, respectively, for Ethereum in 2024 and 2021. <i>Wash trading</i> is the practice of buying and selling the same asset to create false market activity, inflating trade volumes without real risk or profit. Putting it together, we assess that <i>14.2%</i> of Solana revenues come directly from wash trading compared to 2% for Ethereum in 2024 and 9% in mid-2021. One important caveat to this analysis is that it assumes that Solana memecoin wash trading generates MEV in line with normal trading. Without MEV on these trades, our estimates would fall by 50%.</p>
<h3>Solana vs. Ethereum: Revenue Share from Wash Trading Estimates</h3>
<div class="wrapped-div">
<table style="width: 99.9867%;">
<tbody>
<tr class="tbl-data">
<td class="tbl-header last">&nbsp;</td>
<td class="tbl-header last text-right">Share of Revenues due to Memecoins + NFTs (%)</td>
<td class="tbl-header last text-right">Memecoin Washing Trading Estimate (%)</td>
<td class="tbl-header last text-right">NFT Washing Trading Estimate (%)</td>
<td class="tbl-header last text-right">Wash Trading Share of Memecoin + NFT Volume (%)</td>
<td class="tbl-header last text-right">Total Share of Revenues due to Wash Trading (%)</td>
</tr>
<tr class="tbl-data">
<td class="data-td data last text-left">Solana (last 90 Days)</td>
<td class="data-td data last text-right">34.31</td>
<td class="data-td data last text-right">41.56</td>
<td class="data-td data last text-right">9.50</td>
<td class="data-td data last text-right">41.39</td>
<td class="data-td data last text-right">14.20</td>
</tr>
<tr class="tbl-data">
<td class="data-td data last text-left">Ethereum (last 90 Days)</td>
<td class="data-td data last text-right">6.61</td>
<td class="data-td data last text-right">28.95</td>
<td class="data-td data last text-right">22.30</td>
<td class="data-td data last text-right">28.92</td>
<td class="data-td data last text-right">1.91</td>
</tr>
<tr class="tbl-data">
<td class="data-td data last text-left">Ethereum (July - Oct 2021)</td>
<td class="data-td data last text-right">20.32</td>
<td class="data-td data last text-right">56.27</td>
<td class="data-td data last text-right">44.44</td>
<td class="data-td data last text-right">9.03</td>
</tr>
</tbody>
</table>
</div>
<strong><strong><br /></strong></strong>
<p class="chart-disclosure"><strong>Source:</strong> Artemis, Dune, Flashbots, Jito, VanEck Research as of 10/30/2024.</p>
<p>We employed Dune queries of Solana and Ethereum&rsquo;s blockchain to accumulate memecoin and NFT activity over the specified time ranges to accomplish this analysis and. We then used MEV and transaction fee data from Artemis, Jito, and Flashbots to assess each chain's gas fee revenue and MEV. We triangulated these figures to estimate the portion of total blockchain revenues (fees + MEV) sourced from memecoin and NFT activity. For memecoins, we then pulled the total DEX trading activity for Solana and Ethereum. We filtered that activity for wash trading using a threshold value for the ratio of daily trading volume to a coin&rsquo;s market capitalization for a day&rsquo;s trading. If trading volume exceeds that threshold, it is considered to wash trading. We chose 0.05 as the threshold by calculating SOL&rsquo;s average V/MC over the last three months, ~0.0125, and multiplying it by 4, which is our estimation of memecoin volatility relative to that of SOL&rsquo;s. See the table below for sensitivity analysis on memecoin trading labeling.</p>
<p>To gauge NFT wash trading on Solana, we used Dune Analyst @tianjinfan&rsquo;s <strong><a href="https://dune.com/tianjinfan/solana-nft-wash-trading" title="Solana NFT Wash Trading" target="_blank" rel="noopener">methodology</a></strong>. For wash trading of NFTs on Ethereum, we used the mighty @hildobby&rsquo;s <strong><a href="https://community.dune.com/blog/nft-wash-trading-on-ethereum" target="_blank" title="NFT Wash Trading on Ethereum" rel="noopener">methodology</a></strong>.</p>
<h3>Solana vs. Ethereum: % of Memecoin Trades from Wash Trading</h3>
<p><strong>Memecoin Trading Wash Trading Activity As a Percentage of Memecion Trading </strong></p>
<div class="wrapped-div">
<table style="width: 100%;">
<tbody>
<tr class="tbl-data">
<td class="tbl-header last text-center" colspan="11">ETH</td>
</tr>
<tr class="tbl-data">
<td class="data-td data last text-left">Theshold V/MC</td>
<td class="data-td data last text-right">0.01</td>
<td class="data-td data last text-right">0.02</td>
<td class="data-td data last text-right">0.03</td>
<td class="data-td data last text-right">0.04</td>
<td class="data-td data last text-right">0.05</td>
<td class="data-td data last text-right">0.06</td>
<td class="data-td data last text-right">0.07</td>
<td class="data-td data last text-right">0.08</td>
<td class="data-td data last text-right">0.09</td>
<td class="data-td data last text-right">0.1</td>
</tr>
<tr class="tbl-data">
<td class="data-td data last text-left">% Trading Wash</td>
<td class="data-td data last text-right">72.85</td>
<td class="data-td data last text-right">48.69</td>
<td class="data-td data last text-right">37.79</td>
<td class="data-td data last text-right">32.72</td>
<td class="data-td data last text-right">28.95</td>
<td class="data-td data last text-right">24.47</td>
<td class="data-td data last text-right">21.26</td>
<td class="data-td data last text-right">17.59</td>
<td class="data-td data last text-right">16.35</td>
<td class="data-td data last text-right">15.24</td>
</tr>
</tbody>
</table>
</div>
<br />
<div class="wrapped-div">
<table style="width: 100%;">
<tbody>
<tr class="tbl-data">
<td class="tbl-header last text-center" colspan="11">SOL</td>
</tr>
<tr class="tbl-data">
<td class="data-td data last text-left">Theshold V/MC</td>
<td class="data-td data last text-right">0.01</td>
<td class="data-td data last text-right">0.02</td>
<td class="data-td data last text-right">0.03</td>
<td class="data-td data last text-right">0.04</td>
<td class="data-td data last text-right">0.05</td>
<td class="data-td data last text-right">0.06</td>
<td class="data-td data last text-right">0.07</td>
<td class="data-td data last text-right">0.08</td>
<td class="data-td data last text-right">0.09</td>
<td class="data-td data last text-right">0.1</td>
</tr>
<tr class="tbl-data">
<td class="data-td data last text-left">% Trading Wash</td>
<td class="data-td data last text-right">94.08</td>
<td class="data-td data last text-right">77.34</td>
<td class="data-td data last text-right">61.52</td>
<td class="data-td data last text-right">50.63</td>
<td class="data-td data last text-right">41.56</td>
<td class="data-td data last text-right">33.28</td>
<td class="data-td data last text-right">26.69</td>
<td class="data-td data last text-right">22.77</td>
<td class="data-td data last text-right">15.32</td>
<td class="data-td data last text-right">12.96</td>
</tr>
</tbody>
</table>
</div>
<br />
<p class="chart-disclosure"><strong>Source:</strong> Dune, VanEck Research as of 10/31/2024.</p>
<p>We believe Solana&rsquo;s greater amount of memecoin trading and wash trading is due to several factors. Solana is a high throughput chain that prices transactions 1/10,000<sup>th</sup>that of Ethereum&rsquo;s transactions. The opportunity cost of wash trading is much cheaper on Solana than on Ethereum. Next, memecoin activity on Solana is more active due to Solana&rsquo;s vibrant ecosystem of applications like pump.fun that simplify memecoin trading. Furthermore, due to Solana&rsquo;s low latency architecture, memecoin trading is a better user experience on Solana than on Ethereum. Finally, we assert that Solana&rsquo;s MEV architecture may drive higher token volumes. This is because Solana&rsquo;s MEV trading is driven by statistics-driven assessments of landing a transaction through submitting many orders for the same trade. Some of these likely land without capturing MEV, and this may juice trading figures higher than on Ethereum, where block building is done through discrete bidding rather than sending a high volume of orders.</p>
<p>If one contextualizes a potential SOL ETP among comparable investments, looking at companies like Alibaba, DraftKings, and the CME might be instructive. In Alibaba&rsquo;s case, there was initial skepticism about package volume that may have included &lsquo;empty packages&rsquo; to boost metrics, an issue that underwriter research addressed before BABA&rsquo;s 2014 NYSE IPO. Similarly, DraftKings and the CME derive much of their revenue from speculative trading, with both platforms providing incentives, like reduced fees or rebates, to encourage activity. By contrast, while Solana&rsquo;s transaction volumes include some wash trading and speculative activity, it doesn&rsquo;t incentivize users similarly, as its high activity levels are driven by the blockchain&rsquo;s low-cost, high-throughput design. Solana&rsquo;s on-chain activity is concentrated mainly in memecoins, making it a hub for speculative assets in the crypto world. However, unlike DraftKings, whose business is limited to gambling, Solana has the potential to expand beyond speculation into impactful use cases such as decentralized physical infrastructure networks (DePIN) and social media applications. While memecoins contribute significantly to Solana&rsquo;s current revenue, its high valuation&mdash;approximately 250x forward revenue&mdash;reflects investor expectations for future growth in non-speculative applications.</p>
<p>The analysis of Solana&rsquo;s revenue sources is important because it brings to light concerns about our proposed SOL ETP. Since there is reason to believe a significant portion of SOL&rsquo;s revenues are derived from suspicious trading, our ETP prospectus includes significant risk disclosures. That said, we believe this high amount of activity derives from Solana&rsquo;s high-quality user experience and will become a less important part of Solana&rsquo;s revenue base as new activity comes to Solana. Ethereum&rsquo;s transformation should be a guiding light for how Solana&rsquo;s DEX volumes can mature over time to trading fewer meme-related assets.</p>
<p>Lastly, to the anonymous Twitter account that keeps clogging our bosses&rsquo; inboxes and X mentions with complaints and threats on this topic, we would remind him or her that the United States operates under a disclosure-based regulatory regime. The issues above have been addressed throughout the risk factors in our current SOL ETP prospectus. VanEck is indeed taking on issuer liability by proposing to offer the Fund. VanEck and its Legal Department devote significant time and expense to ensure that all material risks are identified in an offering document and no material facts are omitted. Here is the relevant section:</p>
<h2>SOL Trading Platforms May Be Exposed to Fraud And Manipulation</h2>
<p>&ldquo;The SEC has identified possible sources of fraud and manipulation in the SOL market generally, including, among others (1) "wash trading"; (2) persons with a dominant position in SOL manipulating SOL pricing; (3) hacking of the SOL network and trading platforms; (4) malicious control of the Solana network; (5) trading based on material, non-public information (for example, plans of market participants to significantly increase or decrease their holdings in SOL, new sources of demand for SOL) or based on the dissemination of false and misleading information; (6) manipulative activity involving purported "stablecoins," including Tether (for more information, see "Risk Factors&mdash;Risk Factors Related to Digital Assets&mdash;Prices of SOL may be affected due to stablecoins (including Tether and US Dollar Coin ("USDC")), the activities of stablecoin issuers and their regulatory treatment"); and (7) fraud and manipulation at SOL trading platforms. Potential market manipulation, front-running, wash-trading, and other fraudulent or manipulative trading practices may inflate the volumes in the crypto market and/or cause distortions in price, which could adversely affect the Trust or cause losses to Shareholders.</p>
<h3>October&rsquo;s Notable Performer - ApeCoin (+40.1%)</h3>
<p><strong>ApeChain Reaches #4 in NFT Trading Volume ~1 Week After Launch</strong></p>
<p><img class="img-responsive w-100" alt="October&rsquo;s Notable Performer - ApeCoin (+40.1%)" src="https://www.vaneck.com/contentassets/a1c8ed23840544798a660981b3337fe5/5010_crypto_chart-5_2024-10_v1_blog.svg" /></p>
<p class="chart-disclosure"><strong>Source:</strong> Magiceden.us as of 10.29.2024. <strong>Past performance is no guarantee of future results. Not intended as a recommendation to buy or sell any securities named herein.</strong></p>
<p>ApeCoin (APE) experienced a dramatic rise in October, surging over 130% from its lows after Yuga Labs announced the launch of ApeChain&rsquo;s mainnet during ApeFest in Lisbon. Despite a subsequent 40% retracement, APE weekly trading volume jumped by over 1,100%, marking a significant increase in market activity. This heightened volatility and engagement reflect optimism and speculative activity surrounding the new chain's potential.</p>
<p>Launched initially as a governance token in March 2022, ApeCoin was designed to decentralize the Bored Ape Yacht Club (BAYC) community's involvement in digital art, gaming, and entertainment. During the 2021-2022 NFT boom, BAYC collections became highly valuable cultural assets, reaching six- and seven-figure price points and gaining celebrity endorsements and brand partnerships. However, as the NFT market waned, APE prices fell sharply alongside the BAYC collection&rsquo;s value, with both APE and BAYC experiencing drawdowns of over 95%. Despite this decline, ApeCoin DAO maintained its commitment to long-term incentives, distributing millions of APE tokens for staking rewards. As a result, APE&rsquo;s circulating supply surged from ~292 million to ~753 million tokens, increasing market supply and reducing scarcity. With only ~25% of coins still to be issued, vs. comps averaging 46%, this past context of price depreciation and token oversupply may have the stage for fresh interest spurred by the launch of ApeChain.</p>
<h3>~84% of APE&rsquo;s Unvested Supply Goes Towards the DAO, AIP Carve-Outs, and Founding Teams</h3>
<p><img class="img-responsive w-100" alt="84% of APEs Unvested Supply Goes Towards the DAO, AIP Carve-Outs, and Founding Teams" src="https://www.vaneck.com/contentassets/a1c8ed23840544798a660981b3337fe5/5010_crypto_chart-6_2024-10_v1_blog.svg" /></p>
<p class="chart-disclosure"><strong>Source:</strong> Apecoin.com as of 10/29/2024.</p>
<p>ApeChain is built as an Ethereum Layer 3 solution, utilizing Arbitrum&rsquo;s Orbit technology to create a scalable, high-throughput environment tailored to the BAYC community&rsquo;s creative and commercial activities. Unlike other Layer 2 networks that rely on Ethereum (ETH) for gas fees, ApeChain requires APE to power its transactions. This design decision directly increases demand for ApeCoin within the ecosystem, creating a value loop that could sustain token interest if ApeChain gains adoption.</p>
<p>With the Banana Bill (AIP-424), ApeCoin DAO has now allocated 100 million APE to commercial agreements and user incentives aimed at over 60 launch partners across gaming, IP, finance, and infrastructure sectors. These incentives are designed to facilitate value-accretive revenue-sharing agreements between the DAO and its commercial partners and to fund dApp user rewards. To enhance user engagement further, ApeChain offers native yield opportunities for APE, ETH, and stablecoins. These yields are funded through the Staking Pool Allocation, Lido&rsquo;s ETH 2.0 staking, and MakerDAO&rsquo;s sDAI, creating a &lsquo;sticky&rsquo; experience that encourages retention.</p>
<p>In its first week, ApeChain's top five NFT collections on Magic Eden outperformed other Layer 2 platforms like Polygon, Base, and Arbitrum in trading volume, indicating strong early interest. Sustained success will depend on the long-term effectiveness of these partnerships and user incentives.</p>
<p>One of ApeChain&rsquo;s unique features is its ecosystem-driven approach, particularly through its "Made by Apes" (MBA) program. MBA brings together over 400 brands that leverage BAYC intellectual property in various industries, from restaurants to music, apparel, and beyond. This extensive community involvement is a testament to the strength of BAYC&rsquo;s brand and network effects. However, the broader crypto market has grown wary of terms like "community" due to overuse during the NFT bubble, meaning ApeCoin DAO will need concrete metrics and examples to validate MBA&rsquo;s impact on ApeChain's growth.</p>
<p>Looking forward, the success of ApeChain and ApeCoin will hinge on Yuga Labs&rsquo; ability to scale the ecosystem and execute its roadmap, including the anticipated launch of the Otherside metaverse. While Otherside has not announced a full platform release date, the game is accessible through a monthly series of events called &ldquo;Project Dragon,&rdquo; where select NFT holders can test gameplay being developed by the Otherside Development Kit (&ldquo;ODK&rdquo;). The ODK is a suite of creation tools accessible to players who own Otherdeed NFTs (Otherside&rsquo;s virtual land titles). The ODK enables players to build customized, interoperable user-generated content (&ldquo;UGC&rdquo;), making much of the world&rsquo;s gameplay genuinely player-built and self-sustaining. This design strategy echoes UGC-rich social gaming platforms like Roblox and Fortnite but is distinguished by supporting crypto assets. However, like any UGC platform, its success will require sustained developer and player interest, particularly from outside the existing crypto community.</p>
<p>ApeChain&rsquo;s unique Layer 3 structure and strategic partnerships may give it a differentiated position within the NFT and social web3 landscape. Nonetheless, risks remain: token inflation could still challenge price stability, and competition from other decentralized networks may limit ApeChain&rsquo;s growth if its key features fail to resonate with users.</p>
<h3>APE Comp Table</h3>
<div class="wrapped-div">
<table style="width: 100%;">
<tbody>
<tr class="tbl-data">
<td class="tbl-header last text-left">Token</td>
<td class="tbl-header last text-right">24h Active Addresses (thousands)</td>
<td class="tbl-header last text-right">Market Cap<br />(USD millions)</td>
<td class="tbl-header last text-right">Circulating Supply<br />(%)</td>
<td class="tbl-header last text-right">Fully Diluted Market Cap<br />(USD millions)</td>
<td class="tbl-header last text-right">24h Trading Volume<br />(7DMA) (USD millions)</td>
<td class="tbl-header last text-right">Liquidity Ratio</td>
</tr>
<tr class="tbl-data">
<td class="data-td data last text-left">Flow (FLOW)<br />(%)</td>
<td class="data-td data last text-right">5.0</td>
<td class="data-td data last text-right">828</td>
<td class="data-td data last text-right">100</td>
<td class="data-td data last text-right">828</td>
<td class="data-td data last text-right">44</td>
<td class="data-td data last text-right">5</td>
</tr>
<tr class="tbl-data">
<td class="data-td data last text-left">Immutable (IMX)</td>
<td class="data-td data last text-right">111.0</td>
<td class="data-td data last text-right">2,290</td>
<td class="data-td data last text-right">82</td>
<td class="data-td data last text-right">2,810</td>
<td class="data-td data last text-right">61</td>
<td class="data-td data last text-right">3</td>
</tr>
<tr class="tbl-data">
<td class="data-td data last text-left">ApeChain (APE)</td>
<td class="data-td data last text-right">50.1</td>
<td class="data-td data last text-right">801</td>
<td class="data-td data last text-right">75</td>
<td class="data-td data last text-right">1,060</td>
<td class="data-td data last text-right">448</td>
<td class="data-td data last text-right">56</td>
</tr>
<tr class="tbl-data">
<td class="data-td data last text-left">Uniswap (UNI)</td>
<td class="data-td data last text-right">899.4</td>
<td class="data-td data last text-right">4,750</td>
<td class="data-td data last text-right">60</td>
<td class="data-td data last text-right">7,890</td>
<td class="data-td data last text-right">269</td>
<td class="data-td data last text-right">6</td>
</tr>
<tr class="tbl-data">
<td class="data-td data last text-left">Avalanche (AVAX)</td>
<td class="data-td data last text-right">34.5</td>
<td class="data-td data last text-right">10,840</td>
<td class="data-td data last text-right">57</td>
<td class="data-td data last text-right">19,060</td>
<td class="data-td data last text-right">300</td>
<td class="data-td data last text-right">3</td>
</tr>
<tr class="tbl-data">
<td class="data-td data last text-left">Mantle (MNT)</td>
<td class="data-td data last text-right">42.4</td>
<td class="data-td data last text-right">2,030</td>
<td class="data-td data last text-right">54</td>
<td class="data-td data last text-right">3,740</td>
<td class="data-td data last text-right">73</td>
<td class="data-td data last text-right">4</td>
</tr>
<tr class="tbl-data">
<td class="data-td data last text-left">Arbitrum (ARB)</td>
<td class="data-td data last text-right">701.2</td>
<td class="data-td data last text-right">2,150</td>
<td class="data-td data last text-right">40</td>
<td class="data-td data last text-right">5,420</td>
<td class="data-td data last text-right">320</td>
<td class="data-td data last text-right">15</td>
</tr>
<tr class="tbl-data">
<td class="data-td data last text-left">Ronin (RON)</td>
<td class="data-td data last text-right">907.4</td>
<td class="data-td data last text-right">549</td>
<td class="data-td data last text-right">35</td>
<td class="data-td data last text-right">1,550</td>
<td class="data-td data last text-right">16</td>
<td class="data-td data last text-right">3</td>
</tr>
<tr class="tbl-data">
<td class="data-td data last text-left">Optimism (OP)</td>
<td class="data-td data last text-right">74.4</td>
<td class="data-td data last text-right">2,130</td>
<td class="data-td data last text-right">29</td>
<td class="data-td data last text-right">7,300</td>
<td class="data-td data last text-right">324</td>
<td class="data-td data last text-right">15</td>
</tr>
<tr class="tbl-data">
<td class="data-td data last text-left">Xai (XAI)</td>
<td class="data-td data last text-right">73.3</td>
<td class="data-td data last text-right">140</td>
<td class="data-td data last text-right">27</td>
<td class="data-td data last text-right">520</td>
<td class="data-td data last text-right">33</td>
<td class="data-td data last text-right">24</td>
</tr>
<tr class="tbl-data">
<td class="data-td data last text-left">Polygon (POL)</td>
<td class="data-td data last text-right">485.6</td>
<td class="data-td data last text-right">869</td>
<td class="data-td data last text-right">26</td>
<td class="data-td data last text-right">3,330</td>
<td class="data-td data last text-right">95</td>
<td class="data-td data last text-right">11</td>
</tr>
<tr class="tbl-data">
<td class="data-td data last text-left">Blast (BLAST)</td>
<td class="data-td data last text-right">21.0</td>
<td class="data-td data last text-right">177</td>
<td class="data-td data last text-right">22</td>
<td class="data-td data last text-right">820</td>
<td class="data-td data last text-right">12</td>
<td class="data-td data last text-right">7</td>
</tr>
<tr class="tbl-data">
<td class="data-td data last text-left">Zksync Era (ZK)</td>
<td class="data-td data last text-right">76.3</td>
<td class="data-td data last text-right">497</td>
<td class="data-td data last text-right">17</td>
<td class="data-td data last text-right">2,840</td>
<td class="data-td data last text-right">103</td>
<td class="data-td data last text-right">21</td>
</tr>
</tbody>
</table>
</div>
<strong><strong><br /></strong></strong>
<p class="chart-disclosure"><strong>Source:</strong> OKX, Artemis, CoinMarketCap, DappRadar as of 10/29/2024.</p>
<p><strong>Links to third party websites are provided as a convenience and the inclusion of such links does not imply any endorsement, approval, investigation, verification or monitoring by us of any content or information contained within or accessible from the linked sites. By clicking on the link to a non-VanEck webpage, you acknowledge that you are entering a third-party website subject to its own terms and conditions. VanEck disclaims responsibility for content, legality of access or suitability of the third-party websites.</strong></p>
<p>To receive more <strong><a href="https://www.vaneck.com/us/en/insights/digital-assets/" title="Digital Assets Insights">Digital Assets</a></strong> insights, <strong><a href="https://www.vaneck.com/us/en/subscribe/" title="Subscription Center">sign up in our subscription center</a></strong>.</p>
<style>
    .data-td.data {
        padding-right: 5px !important;
    }
    
    .wrapped-div {
        max-width: 100%;
    }
    
    @media (max-width: 1240px) {
        .wrapped-div {
            overflow-x: scroll;
        }
    }
    
    .wrapped-div-sector {
        max-width: 100%;
        overflow-x: scroll;
    }
</style>
]]></content:encoded>
</item><item rdf:about="https://www.vaneck.com/us/en/blogs/digital-assets/matthew-sigel-optimal-crypto-allocation-for-portfolios/">
  <title>Optimal Crypto Allocation for Portfolios></title>
  <link>https://www.vaneck.com/us/en/blogs/digital-assets/matthew-sigel-optimal-crypto-allocation-for-portfolios/</link>
  <description><![CDATA[We explore the optimal bitcoin and ether allocations in traditional 60/40 and crypto-only portfolios.]]></description>
  <dc:creator>Matthew  Sigel</dc:creator>
  <dc:date>11/04/2024 06:30:00</dc:date>
<content:encoded><![CDATA[

<p><strong>Please note that VanEck has positions in ether and bitcoin.</strong></p>
<p><strong><em>The information, valuation scenarios and price targets presented on any digital assets in this blog are not intended as financial advice, a recommendation to buy or sell these digital assets, or any call to action. There may be risks or other factors not accounted for in these scenarios that may impede the performance these digital assets; their actual future performance is unknown, and may differ significantly from any valuation scenarios or projections/forecasts herein. Any projections, forecasts or forward-looking statements included herein are the results of a simulation based on our research, are valid as of the date of this communication and subject to change without notice, and are for illustrative purposes only. Please conduct your own research and draw your own conclusions.</em></strong></p>
<p>In recent years, interest in cryptocurrencies has shifted from being predominantly retail-focused to becoming a significant consideration for financial advisors and institutional investors. While retail investors may have accounted for as much as 80% of exchange-traded-products (ETPs) purchasers, some forward-thinking investment advisors and pension funds have begun to accumulate positions following extensive due diligence. A significant narrative driving this growth is the unlocking of access to ETPs at more broker platforms, which we expect to accelerate in the second half of 2024, and into next year.</p>

<p>One of the key pitches for bitcoin (BTC) is its role as a monetary asset and a hedge against chaos and inflation, often referred to as "digital gold." Bitcoin offers a non-correlated, provably scarce asset to diversify portfolios. On the other hand, ether (ETH) is more of a pure technology investment, allowing exposure to the growth of tokenization, NFTs, and DeFi (decentralized finance). For investors wanting to capitalize on tokenization, investing in ETH may be the best approach.</p>
<p>This comprehensive study evaluates the impact of incorporating bitcoin and ether into traditional investment portfolios, highlighting the potential benefits and risks associated with their inclusion. The analysis underscores how a strategic allocation to cryptocurrencies can enhance portfolio performance, marking a significant evolution in asset allocation strategies.</p>
<h2>Analysis Overview</h2>
<p>We conducted a comprehensive study to evaluate the impact of incorporating bitcoin (BTC) and ether (ETH) into a traditional 60% equity/40% bond investment portfolio, covering the period from September 1, 2015, to April 30, 2024. The analysis comprised five main components:</p>
<ol class="content-list">
<li class="mt-2">
<p><strong>Optimal Constrained Allocation in a Traditional 60/40 Portfolio:</strong> We assessed the ideal allocation of bitcoin and ether in a portfolio consisting of 60% equities and 40% bonds, with a maximum combined cryptocurrency allocation of 6%. This analysis utilized 169 sample portfolios with incremental additions of crypto exposure.</p>
<p><strong>Indexes Used</strong>:</p>
<ul class="content-list">
<li class="mt-2"><strong>S&amp;P 500 Index</strong>: Representing 60% of the equity portion. The S&amp;P 500 is a market-capitalization-weighted index of 500 leading publicly traded companies in the U.S.</li>
<li class="mt-2"><strong>Bloomberg Barclays US Aggregate Bond Index</strong>: Representing 40% of the bond portion. The Bloomberg US Aggregate Bond Index is a broad-based benchmark that measures the investment grade, US dollar-denominated, fixed-rate taxable bond market. The index includes Treasuries, government-related and corporate securities, fixed-rate agency MBS, ABS and CMBS (agency and non-agency).</li>
<li class="mt-2"><strong>MarketVector Bitcoin Index: </strong>Measures the performance of a digital assets portfolio that invests in bitcoin.</li>
<li class="mt-2"><strong>MarketVector Ethereum Index: </strong>Measures the performance of a digital assets portfolio that invests in ether.</li>
</ul>
<p><strong>These indexes are used as benchmarks to represent broader market performance. Direct allocation to bitcoin and Ethereum may result in different outcomes due to factors such as transaction costs, liquidity and market volatility. To maintain the desired allocation proportions, all portfolios were rebalanced on a monthly basis. This rebalancing helps keep the portfolio aligned with the strategic allocation targets.</strong></p>
</li>
<li class="mt-2"><strong>Drawdown and Sharpe Ratio Analysis:</strong> We examined the drawdown and Sharpe ratios of a subset of 16 representative portfolios to understand the risk-return tradeoffs. Our findings indicate that adding a modest allocation of cryptocurrencies (up to 6%) to a traditional 60/40 portfolio can substantially enhance the portfolio&rsquo;s Sharpe ratio with a relatively minor impact on drawdown. Monthly rebalancing was used to manage the allocation proportions and mitigate the effects of price volatility, helping the portfolio maintain its risk and return characteristics over time. For investors with a high-risk tolerance (up to ~20% annualized volatility), an allocation of up to 20% continues to improve the risk/reward profile of the overall portfolio. The optimal bitcoin and ether weights were approximately 70/30, providing the best risk-adjusted returns.</li>
<li class="mt-2"><strong>Optimal Bitcoin and Ether Allocation in a Crypto-Only Portfolio:</strong> We analyzed various permutations of bitcoin and ether weights in a portfolio composed solely of these two cryptocurrencies, aiming to maximize the Sharpe ratio and determine the ideal BTC/ETH allocation.</li>
<li class="mt-2"><strong>Efficient Frontier Using the Optimal Crypto Portfolio:</strong> We investigated the optimal weighting of the ideal BTC/ETH portfolio to maximize returns at various levels of volatility. This analysis illustrated a segment (with reasonable volatility levels) of the efficient frontier when integrating cryptocurrencies into the traditional 60/40 portfolio. The inclusion of a monthly rebalancing mechanism allowed the portfolios to adapt to market changes while keeping the strategic allocation intact.</li>
<li class="mt-2"><strong>Time Dependence of Efficient Frontier Results:</strong> We considered the impact of different starting points on the results from component 4. The analysis demonstrated that a larger crypto allocation consistently enhanced portfolio risk-adjusted returns across all available time periods.</li>
</ol>
<h2 id="optimal-allocation" class="jump-link-nav anchored-block" data-jumplink-title="Optimal Allocation">1. Optimal Allocation in a Traditional 60/40 Portfolio</h2>
<p>The primary objective was to determine the optimal allocation of bitcoin (BTC) and ether (ETH) within a traditional 60/40 portfolio, with a constraint limiting the combined weight of cryptocurrencies to a maximum of 6%. The analysis involved constructing 169 model portfolios with incremental crypto exposure, up to 3% each for BTC and ETH.</p>
<p>The results demonstrated that a portfolio comprising 3% BTC and 3% ETH, in conjunction with 57% S&amp;P 500 and 37% U.S. Bonds, yielded the highest return per unit of risk (standard deviation). In essence, maintaining a conservative overall allocation of 6% in cryptocurrencies, the maximum allowable allocation achieved the highest risk-adjusted returns. Monthly rebalancing was applied to maintain these allocations, helping to manage the volatility and ensure the portfolio stayed aligned with its strategic targets.</p>
<h3>Optimal BTC/ETH Allocation in a Traditional 60/40 Portfolio (9/1/2015 &ndash; 4/30/2024)</h3>
<p><img class="img-responsive w-100" alt="Optimal BTC/ETH Allocation in a Traditional 60/40 Portfolio (9/1/2015 &ndash; 4/30/2024)" src="https://www.vaneck.com/contentassets/89ff6eb9fa664c5d967caedc2270bcf9/4522_slc-may_chart-4_2024-6_v1_blog.svg" /></p>
<p class="chart-disclosure"><strong>Source:</strong> VanEck Research as of 5/28/2024. <strong>Past performance is no guarantee of future results. The information, valuation scenarios, and price targets in this blog are not intended as financial advice or any call to action, a recommendation to buy or sell, or as a projection of how ETH and BTC will perform in the future. Actual future performance of ETH and BTC is unknown, and may differ significantly from the hypothetical results depicted here. There may be risks or other factors not accounted for in the scenarios presented that may impede the performance. These are solely the results of a simulation based on our research, and are for illustrative purposes only. Please conduct your own research and draw your own conclusions.</strong></p>
<p>The findings indicate that a strategic inclusion of bitcoin and ether within a traditional portfolio framework can significantly enhance risk-adjusted returns, even with a conservative allocation.</p>
<h2 id="sharpe-ratio" class="jump-link-nav anchored-block" data-jumplink-title="Sharpe Ratio">2. Drawdown and Sharpe Ratio Analysis</h2>
<p>To evaluate the risk-return tradeoffs, we analyzed 16 representative 60/40 portfolios with incremental increases in cryptocurrency allocation up to the maximum limit of 6%. The key findings were:</p>
<ul class="content-list">
<li class="mt-2"><strong>Sharpe Ratio Improvement:</strong> The portfolio Sharpe ratio improved significantly as the cryptocurrency allocation increased.</li>
<li class="mt-2"><strong>Minimal Impact on Drawdown:</strong> The maximum drawdown increased only marginally, making the higher cryptocurrency allocation an attractive tradeoff for many investors.</li>
</ul>
<p>The data on maximum drawdown and Sharpe ratio demonstrated that a 6% cryptocurrency allocation resulted in a Sharpe ratio nearly double that of the traditional 60/40 portfolio while only modestly increasing drawdown. This highlights the favorable risk-return tradeoff when incorporating BTC and ETH into a traditional portfolio.</p>
<div class="wrapped-div">
<table style="width: 100%;">
<tbody>
<tr class="tbl-data">
<td class="tbl-header last">&nbsp;</td>
<td class="tbl-header last text-right">Max Drawdown</td>
<td class="tbl-header last text-right">Sharpe Ratio</td>
</tr>
<tr class="tbl-data">
<td class="data-td last">60% 40% Portfolio</td>
<td class="data-td data last text-right">-21.54</td>
<td class="data-td data last text-right">0.78</td>
</tr>
<tr class="tbl-data">
<td class="data-td last">59% 39% Portfolio, 1% Bitcoin and 1% Ethereum</td>
<td class="data-td data last text-right">-22.18</td>
<td class="data-td data last text-right">1.04</td>
</tr>
<tr class="tbl-data">
<td class="data-td last">58.5% 38.5% Portfolio, 3% Bitcoin</td>
<td class="data-td data last text-right">-22.21</td>
<td class="data-td data last text-right">1.04</td>
</tr>
<tr class="tbl-data">
<td class="data-td last">58.5% 38.5% Portfolio, 3% Ethereum</td>
<td class="data-td data last text-right">-22.85</td>
<td class="data-td data last text-right">1.24</td>
</tr>
<tr class="tbl-data">
<td class="data-td last">57% 37% Portfolio, 3% Bitcoin and 3% Ethereum</td>
<td class="data-td data last text-right">-23.60</td>
<td class="data-td data last text-right">1.44</td>
</tr>
</tbody>
</table>
</div>
<br />
<p class="chart-disclosure"><strong>Source:</strong> VanEck Research as of 5/28/2024. <strong>Past performance is no guarantee of future results. Sharpe ratio</strong> is a measure used in finance to evaluate the performance of an investment compared to a risk-free asset, after adjusting for its risk. It is calculated by subtracting the risk-free rate of return (such as the return on U.S. Treasury Bonds) from the rate of return for a portfolio and then dividing the result by the standard deviation of the portfolio returns. This ratio helps investors understand how much excess return they are receiving for the extra volatility that they endure for holding a riskier asset. A higher Sharpe ratio indicates a more attractive risk-adjusted return.<strong> The information, valuation scenarios, and price targets in this blog are not intended as financial advice or any call to action, a recommendation to buy or sell, or as a projection of how ETH and BTC will perform in the future. Actual future performance of ETH and BTC is unknown, and may differ significantly from the hypothetical results depicted here. There may be risks or other factors not accounted for in the scenarios presented that may impede the performance. These are solely the results of a simulation based on our research, and are for illustrative purposes only. Please conduct your own research and draw your own conclusions.</strong></p>
<p>These findings show the potential benefits of integrating cryptocurrencies into traditional investment portfolios, providing improved risk-adjusted returns with minimal increase in risk.</p>
<h2>3. Optimal Bitcoin and Ether Allocation in a Crypto-Only Portfolio</h2>
<p>Focusing exclusively on a portfolio comprising bitcoin and ether we tested various weighting combinations to determine the optimal mix for maximizing the Sharpe ratio. <strong>The analysis revealed that the ideal allocation was 71.4% bitcoin and 28.6% ether.</strong> This configuration yielded the highest Sharpe ratio, indicating the best risk-adjusted return for a crypto-only portfolio. The findings emphasize the importance for investors to hold both cryptocurrencies to maximize benefits. Additionally, the na&iuml;ve allocation of 50% BTC and 50% ETH also demonstrated substantial advantages, reinforcing the value of diversification within the crypto asset class.</p>
<h3>Comparative Metrics of Various Bitcoin-Ether Portfolio Allocations (9/1/2015 &ndash; 4/30/2024)</h3>
<p><img class="img-responsive w-100" alt="Comparative Metrics of Various Bitcoin-Ether Portfolio Allocations (9/1/2015 &ndash; 4/30/2024)" src="https://www.vaneck.com/contentassets/89ff6eb9fa664c5d967caedc2270bcf9/4522_slc-may_chart-5_2024-6_v2_blog.svg" /></p>
<div class="wrapped-div">
<table style="width: 100%;">
<tbody>
<tr class="tbl-data">
<td class="tbl-header last">&nbsp;</td>
<td class="tbl-header last text-right">Volatility</td>
<td class="tbl-header last text-right">CAGR</td>
<td class="tbl-header last text-right">Sharpe Ratio</td>
</tr>
<tr class="tbl-data">
<td class="data-td last">Ideal Portfolio (71.4% BTC - 28.6% ETH)</td>
<td class="data-td data last text-right">0.89</td>
<td class="data-td data last text-right">1.32</td>
<td class="data-td data last text-right">1.43</td>
</tr>
<tr class="tbl-data">
<td class="data-td last">100% Bitcoin</td>
<td class="data-td data last text-right">0.81</td>
<td class="data-td data last text-right">0.98</td>
<td class="data-td data last text-right">1.16</td>
</tr>
<tr class="tbl-data">
<td class="data-td last">100% Ether</td>
<td class="data-td data last text-right">1.58</td>
<td class="data-td data last text-right">1.35</td>
<td class="data-td data last text-right">0.83</td>
</tr>
<tr class="tbl-data">
<td class="data-td last">50% Bitcoin 50% Ether</td>
<td class="data-td data last text-right">1.04</td>
<td class="data-td data last text-right">1.44</td>
<td class="data-td data last text-right">1.33</td>
</tr>
<tr class="tbl-data">
<td class="data-td last">60% S&amp;P, 40% Bonds</td>
<td class="data-td data last text-right">0.10</td>
<td class="data-td data last text-right">0.09</td>
<td class="data-td data last text-right">0.37</td>
</tr>
</tbody>
</table>
</div>
<br />
<p class="chart-disclosure"><strong>Source:</strong> VanEck Research as of 5/28/2024. <strong>Past performance is no guarantee of future results. Volatility</strong> refers to the fluctuation in the returns of an asset or portfolio as measured by the standard deviation of returns. Higher volatility indicates greater risk and potentially higher returns, affecting the risk-adjusted returns measured by the Sharpe Ratio. <strong>Compound Annual Growth Rate (CAGR) </strong>represents the rate at which the value of ether (ETH) has grown annually over a specified time period. This metric is used to provide a smoothed annual growth rate, eliminating fluctuations and giving a clearer picture of long-term investment performance.<strong> Sharpe ratio</strong> is a measure used in finance to evaluate the performance of an investment compared to a risk-free asset after adjusting for its risk. It is calculated by subtracting the risk-free rate of return (such as the return on U.S. Treasury Bonds) from the rate of return for a portfolio and then dividing the result by the standard deviation of the portfolio returns. This ratio helps investors understand how much excess return they are receiving for the extra volatility that they endure for holding a riskier asset. A higher Sharpe ratio indicates a more attractive risk-adjusted return. <strong>The information, valuation scenarios, and price targets in this blog are not intended as financial advice or any call to action, a recommendation to buy or sell, or as a projection of how ETH and BTC will perform in the future. Actual future performance of ETH and BTC is unknown, and may differ significantly from the hypothetical results depicted here. There may be risks or other factors not accounted for in the scenarios presented that may impede the performance. These are solely the results of a simulation based on our research, and are for illustrative purposes only. Please conduct your own research and draw your own conclusions.</strong></p>
<p>These findings underscore the significant advantages of diversifying within the crypto asset class to achieve optimal risk-adjusted returns.</p>
<h2 id="efficient-Frontier" class="jump-link-nav anchored-block" data-jumplink-title="Efficient Frontier">4. The Efficient Frontier When Including Cryptocurrencies</h2>
<p>To determine the optimal allocation to cryptocurrencies within a traditional 60/40 portfolio while maintaining acceptable volatility levels, we analyzed the optimal weighting of an ideal cryptocurrency portfolio composed of 71.4% bitcoin and 28.6% ether. The objective was to maximize returns while maintaining specified volatility ranges (13%-25%), thus constructing an efficient frontier portfolio using these assets. These volatility levels are typically associated with broad investor portfolios. The resulting scatterplot indicated that integrating the optimal cryptocurrency portfolio into a traditional 60/40 portfolio can substantially enhance returns with varying degrees of risk.</p>
<h3>Additional Volatility from Cryptocurrencies Help Overall Returns (9/1/2015 &ndash; 4/30/2024)</h3>
<p><img class="img-responsive w-100" alt="Additional Volatility from Cryptocurrencies Help Overall Returns (9/1/2015 &ndash; 4/30/2024)" src="https://www.vaneck.com/contentassets/89ff6eb9fa664c5d967caedc2270bcf9/4522_slc-may_chart-6_2024-6_v3_blog.svg" /></p>
<p class="chart-disclosure"><strong>Source:</strong> VanEck Research as of 5/28/2024. <strong>Past performance is no guarantee of future results. Volatility refers</strong> to the fluctuation in the returns of an asset or portfolio as measured by the standard deviation of returns. Higher volatility indicates greater risk and potentially higher returns, affecting the risk-adjusted returns measured by the Sharpe Ratio. <strong>Compound Annual Growth Rate (CAGR) </strong>represents the rate at which the value of ether (ETH) has grown annually over a specified time period. This metric is used to provide a smoothed annual growth rate, eliminating fluctuations and giving a clearer picture of long-term investment performance. <strong>The information, valuation scenarios, and price targets in this blog are not intended as financial advice or any call to action, a recommendation to buy or sell, or as a projection of how ETH and BTC will perform in the future. Actual future performance of ETH and BTC is unknown, and may differ significantly from the hypothetical results depicted here. There may be risks or other factors not accounted for in the scenarios presented that may impede the performance. These are solely the results of a simulation based on our research, and are for illustrative purposes only. Please conduct your own research and draw your own conclusions.</strong></p>
<p>This analysis revealed a nearly linear relationship&mdash;a rarity when examining efficient frontiers&mdash;between risk and return as volatility increased. The conclusion drawn is that increased exposure to cryptocurrencies led to highly attractive risk/return tradeoffs.</p>
<h3>Sharpe Ratio for Blended Portfolio Levels Off at 22% Volatility (9/1/2015 &ndash; 4/30/2024)</h3>
<p><img class="img-responsive w-100" alt="Sharpe Ratio for Blended Portfolio Levels Off at 22% Volatility (9/1/2015 &ndash; 4/30/2024)" src="https://www.vaneck.com/contentassets/89ff6eb9fa664c5d967caedc2270bcf9/4522_slc-may_chart-7_2024-6_v2_blog.svg" /></p>
<p class="chart-disclosure"><strong>Source:</strong> VanEck Research as of 5/28/2024. <strong>Past performance is no guarantee of future results. The information, valuation scenarios, and price targets in this blog are not intended as financial advice or any call to action, a recommendation to buy or sell, or as a projection of how ETH and BTC will perform in the future. Actual future performance of ETH and BTC is unknown, and may differ significantly from the hypothetical results depicted here. There may be risks or other factors not accounted for in the scenarios presented that may impede the performance. These are solely the results of a simulation based on our research, and are for illustrative purposes only. Please conduct your own research and draw your own conclusions.</strong></p>
<p>The chart illustrates that the Sharpe ratio for the blended portfolio increases with volatility, reaching a plateau of around 22% volatility.</p>
<h2>5. Time Dependence of Efficient Frontier Results</h2>
<p>To determine whether different starting points have an impact on the risk/reward profile of the combined ideal crypto and 60/40 portfolios, we repeated the analysis in component 4, while repeatedly moving the starting point one quarter forward. Our only constraint was to include at least three years of returns. As such, we produced 23 sets of results and removed time dependence as a variable from the analysis.</p>
<p><strong>Our findings were: </strong></p>
<ul class="content-list">
<li class="mt-2">The analysis consistently indicated that, across all evaluated time periods, the optimal allocation to the ideal cryptocurrency portfolio increased proportionally with the level of risk assumed.</li>
</ul>
<h3>Optimal Weights Across Volatility for Time-Independent Portfolios</h3>
<p><img class="img-responsive w-100" alt="Optimal Weights Across Volatility for Time-Independent Portfolios" src="https://www.vaneck.com/contentassets/89ff6eb9fa664c5d967caedc2270bcf9/4522_slc-may_chart-8_2024-6_v2_blog.svg" /></p>
<p class="chart-disclosure"><strong>Source:</strong> VanEck Research as of 5/28/2024. <strong>Past performance is no guarantee of future results. The information, valuation scenarios, and price targets in this blog are not intended as financial advice or any call to action, a recommendation to buy or sell, or as a projection of how ETH and BTC will perform in the future. Actual future performance of ETH and BTC is unknown, and may differ significantly from the hypothetical results depicted here. There may be risks or other factors not accounted for in the scenarios presented that may impede the performance. These are solely the results of a simulation based on our research, and are for illustrative purposes only. Please conduct your own research and draw your own conclusions.</strong></p>
<p>The chart illustrates that increased allocations to cryptocurrencies consistently corresponded with higher optimal weights as volatility increased across all evaluated time periods.</p>
<h3>CAGR Across Volatility for Time-Independent Portfolios</h3>
<p><img class="img-responsive w-100" src="https://www.vaneck.com/contentassets/89ff6eb9fa664c5d967caedc2270bcf9/4522_slc-may_chart-9_2024-6_v2_blog.svg" alt="CAGR Across Volatility for Time-Independent Portfolios" /></p>
<p class="chart-disclosure"><strong>Source:</strong> VanEck Research as of 5/28/2024. <strong>Past performance is no guarantee of future results. The information, valuation scenarios, and price targets in this blog are not intended as financial advice or any call to action, a recommendation to buy or sell, or as a projection of how ETH and BTC will perform in the future. Actual future performance of ETH and BTC is unknown, and may differ significantly from the hypothetical results depicted here. There may be risks or other factors not accounted for in the scenarios presented that may impede the performance. These are solely the results of a simulation based on our research, and are for illustrative purposes only. Please conduct your own research and draw your own conclusions.</strong></p>
<p>Across all evaluated time periods, increased allocations to cryptocurrencies consistently corresponded with higher CAGRs.</p>
<h3>Sharpe Across Volatility for Time-Independent Portfolios</h3>
<p><img class="img-responsive w-100" src="https://www.vaneck.com/contentassets/89ff6eb9fa664c5d967caedc2270bcf9/4522_slc-may_chart-10_2024-6_v2_blog.svg" alt="Sharpe Across Volatility for Time-Independent Portfolios" /></p>
<p class="chart-disclosure"><strong>Source:</strong> VanEck Research as of 5/28/2024. <strong>Past performance is no guarantee of future results. The information, valuation scenarios, and price targets in this blog are not intended as financial advice or any call to action, a recommendation to buy or sell, or as a projection of how ETH and BTC will perform in the future. Actual future performance of ETH and BTC is unknown, and may differ significantly from the hypothetical results depicted here. There may be risks or other factors not accounted for in the scenarios presented that may impede the performance. These are solely the results of a simulation based on our research, and are for illustrative purposes only. Please conduct your own research and draw your own conclusions.</strong></p>
<p>The study's findings indicate that Sharpe ratios generally exhibited an upward trend with increasing volatility and higher allocations to cryptocurrencies.</p>
<h2 id="conclusion" class="jump-link-nav anchored-block" data-jumplink-title="Conclusion">Conclusion</h2>
<p><strong>The analysis provides robust evidence that incorporating a modest allocation of cryptocurrencies (up to 6%) into a traditional 60% equity/40% bond portfolio can significantly enhance the portfolio&rsquo;s Sharpe ratio while maintaining a relatively minor impact on drawdown. The optimal risk-adjusted returns for a crypto-only portfolio were achieved with an allocation approximately split 70/30 between bitcoin and ether.</strong></p>
<p><strong>While individual risk tolerance should guide investment decisions, the data indicates that a balanced inclusion of bitcoin and ether can offer substantial benefits in terms of return enhancement relative to the incremental risk introduced. These findings underscore the potential of cryptocurrencies to enhance portfolio performance in a controlled and quantifiable manner.</strong></p>
<style>
	.data-td.data {
			padding-right: 5px !important;
	}

	.wrapped-div {
			max-width: 100%;
	}

	@media (max-width: 1240px) {
			.wrapped-div {
					overflow-x: scroll;
			}
	}

	.wrapped-div-sector {
			max-width: 100%;
			overflow-x: scroll;
	}
</style>
<p>To receive more <strong><a href="https://www.vaneck.com/us/en/insights/digital-assets/" title="Digital Assets Insights">Digital Assets</a></strong> insights, <strong><a href="https://www.vaneck.com/us/en/subscribe/" title="Subscription Center">sign up in our subscription center</a></strong>.</p>
]]></content:encoded>
</item><item rdf:about="https://www.vaneck.com/us/en/blogs/moat-investing/a-better-way-to-equal-weight/">
  <title>A Better Way to Equal Weight></title>
  <link>https://www.vaneck.com/us/en/blogs/moat-investing/a-better-way-to-equal-weight/</link>
  <description><![CDATA[With market leadership concentrated in a few mega-cap stocks, an equal-weight strategy that invests through a Moat lens can help investors reduce concentration risk.]]></description>
  <dc:creator>Brandon Rakszawski</dc:creator>
  <dc:date>10/30/2024 06:30:00</dc:date>
<content:encoded><![CDATA[

<h2>Equal Weight is the Remedy for the Market&rsquo;s Current Concentration Risk</h2>
<p>The S&amp;P 500 has reached all-time highs multiple times this year, but much of the broad market's returns have been driven by a select few companies, often referred to as the "Magnificent 7," which are primarily mega-cap technology companies. These mega-cap tech stocks have dominated performance, leaving many investors over-reliant on a small group of companies.</p>
<p>While this concentration has worked in the short term, it exposes market-cap-weighted indexes (like the S&amp;P 500) to increased risk if those large companies start to underperform. For example, if there's a tech hiccup like a slowdown in demand, shrinking margins, or supply chain issues (particularly related to Taiwan), these stocks could become vulnerable, affecting returns significantly. To put this concentration risk in context, the top 10 stocks in the S&amp;P 500 currently account for 30%-35% of the total index.</p>
<p>The narrow market leadership has been particularly evident in the recent underperformance of equal-weighted strategies compared to their market-cap-weighted counterparts (see chart below). However, history suggests that market breadth can widen rapidly following such extremes. Currently, market breadth has hovered at lows not seen since COVID (2020) and the Dot-com boom (1999/2000).</p>
<h3>Narrow Leadership: S&amp;P 500 Equal Weighted Index Rolling 1 Year Excess Returns vs. S&amp;P 500 Index / 1/1990 - 9/2024</h3>
<p><img class="img-responsive w-100" alt="Narrow Leadership: S&amp;P 500 Equal Weighted Index Rolling 1 Year Excess Returns vs. S&amp;P 500 Index / 1/1990 - 8/2024" src="https://www.vaneck.com/contentassets/c6610d68b4134c369003ebc0c38cdf0e/4979_moat_chart-1_2024-10_v1_blog.svg" /></p>
<p class="chart-disclosure">Source: Morningstar. Data as of September 30, 2024. Past performance is not a guarantee of future results. Index performance is not illustrative of strategy performance. It is not possible to invest in an index. The S&amp;P 500 Index consists of 500 widely held large cap United States common stocks covering a variety of sectors. The S&amp;P 500 Equal Weighted Index is an equally weighted version of the market-cap weighted S&amp;P 500 Index. Any projections shown are for illustrative purposes only and are not intended as predictions of future results or events.</p>
<p>Contrary to a market-cap index, an equal-weighted strategy assigns the same percentage to each stock in a portfolio, regardless of the company's size, giving smaller companies the same influence as larger ones. This approach spreads risk evenly across all holdings and provides greater exposure to a more diversified basket of stocks.</p>
<h2>Not All Equal Weight Strategies are Created Equal</h2>
<p>The <a href="/link/9e43dd198c5f4e419f13220685081895.aspx" title="MOAT - VanEck Morningstar Wide Moat ETF - Overview"><strong>VanEck Morningstar Wide Moat ETF (MOAT)</strong></a> applies an equal-weight approach that has historically delivered several key benefits:</p>
<ul class="content-list">
<li><strong>Historical Outperformance</strong>: Since its inception in 2007, the Moat Index's equal-weighted strategy has delivered higher returns in 11 out of 18 years compared to the market-cap-weighted S&amp;P 500 Index. This suggests that equal weighting can offer stronger long-term growth potential.</li>
<li><strong>Improved Risk-Adjusted Returns</strong>: Equal weighting often leads to a higher Sharpe ratio, a key measure of risk-adjusted performance, when compared to market-cap-weighted indexes. This means investors can potentially earn higher returns without taking on additional risk.</li>
<li><strong>Diversification Potential</strong>: By reducing reliance on any single stock, equal-weighted strategies offer significant diversification benefits. This can protect portfolios from the volatility associated with mega-cap stocks and help spread risk more evenly across a broader set of companies.</li>
</ul>
<p>While other equal-weight strategies can deliver similar advantages, it&rsquo;s important for investors to realize that not all equal-weighted strategies perform the same. For example, MOAT takes an equal-weighted approach, but with a focus on companies that have sustainable competitive advantages or "economic moats." This approach, combined with an emphasis on attractive valuations, gives the MOAT ETF a slight value bias and has steered it away from mega-cap companies.</p>
<p>Although this positioning has been a headwind in 2024 due to the dominance of the "Magnificent 7," it could prove beneficial as market dynamics shift. Over the past decade<strong>, MOAT has outperformed the S&amp;P 500 Equal Weight Index by an impressive 80+ percentage points when it comes to cumulative returns</strong>, highlighting the potential of equal-weighted strategies that focus on high-quality companies with sustainable competitive advantages that are trading at attractive valuations</p>
<h3>MOAT Has Dominated The S&amp;P 500 Equal Weight Index Over the Past Decade</h3>
<p><img class="img-responsive w-100" alt="MOAT Has Dominated The S&amp;P 500 Equal Weight Index Over the Past Decade" src="https://www.vaneck.com/contentassets/545b35e18bd64553b2775b94de55f7be/4979_moat_chart-2_2024-10_v1_blog.svg" /></p>
<p class="chart-disclosure">Source: Morningstar. Data as of September 30, 2024. Past performance is not a guarantee of future results. Index performance is not illustrative of strategy performance. It is not possible to invest in an index.</p>
<h2>Explore VanEck&rsquo;s Moat Funds</h2>

<p>VanEck is proud to be a pioneer in the moat investment space, with a track record dating back to 2012 for our core strategy, the VanEck Morningstar Wide Moat ETF. All VanEck&rsquo;s moat strategies are powered by Morningstar&rsquo;s powerful research lens across different investment styles, market capitalizations and geographical regions to provide investors with a wide array of solutions to meet different investment objectives.</p>
<h3>Average Annual Total Returns<sup>*</sup>&nbsp;(%)</h3>
<div class="wrapped-div">
<table style="width: 100%;">
<tbody>
<tr class="tbl-data">
<td class="tbl-header last" colspan="10">As of September 30, 2024</td>
</tr>
<tr class="tbl-data">
<td class="data-head last text-right">&nbsp;</td>
<td class="data-head last text-right">1 MO</td>
<td class="data-head last text-right">3 MO</td>
<td class="data-head last text-right">YTD</td>
<td class="data-head last text-right">1 YR</td>
<td class="data-head last text-right">3 YR</td>
<td class="data-head last text-right">5 YR</td>
<td class="data-head last text-right">10 YR</td>
<td class="data-head last text-right">LIFE <br />04/24/12</td>
</tr>
<tr class="tbl-data">
<td class="data-td last text-left">MOAT (NAV)</td>
<td class="data-td data last text-right">1.74</td>
<td class="data-td data last text-right">11.93</td>
<td class="data-td data last text-right">14.31</td>
<td class="data-td data last text-right">29.02</td>
<td class="data-td data last text-right">10.96</td>
<td class="data-td data last text-right">15.47</td>
<td class="data-td data last text-right">13.49</td>
<td class="data-td data last text-right">14.82</td>
</tr>
<tr class="tbl-data">
<td class="data-td last text-left">MOAT (Share Price)</td>
<td class="data-td data last text-right">1.71</td>
<td class="data-td data last text-right">11.94</td>
<td class="data-td data last text-right">14.23</td>
<td class="data-td data last text-right">28.94</td>
<td class="data-td data last text-right">10.96</td>
<td class="data-td data last text-right">15.45</td>
<td class="data-td data last text-right">13.47</td>
<td class="data-td data last text-right">14.82</td>
</tr>
<tr class="tbl-data">
<td class="data-td last text-left">MWMFTR (Index)</td>
<td class="data-td data last text-right">1.79</td>
<td class="data-td data last text-right">12.08</td>
<td class="data-td data last text-right">14.75</td>
<td class="data-td data last text-right">29.68</td>
<td class="data-td data last text-right">11.55</td>
<td class="data-td data last text-right">16.04</td>
<td class="data-td data last text-right">14.08</td>
<td class="data-td data last text-right">15.40</td>
</tr>
<tr class="tbl-data">
<td class="data-td last text-left">Performance Differential (NAV - Index)</td>
<td class="data-td data last text-right">-0.05</td>
<td class="data-td data last text-right">-0.15</td>
<td class="data-td data last text-right">-0.44</td>
<td class="data-td data last text-right">-0.66</td>
<td class="data-td data last text-right">-0.59</td>
<td class="data-td data last text-right">-0.57</td>
<td class="data-td data last text-right">-0.59</td>
<td class="data-td data last text-right">-0.58</td>
</tr>
<tr class="tbl-data">
<td class="data-td last text-left">S&amp;P 500 Index</td>
<td class="data-td data last text-right">2.14</td>
<td class="data-td data last text-right">5.89</td>
<td class="data-td data last text-right">22.08</td>
<td class="data-td data last text-right">36.35</td>
<td class="data-td data last text-right">11.91</td>
<td class="data-td data last text-right">15.98</td>
<td class="data-td data last text-right">13.38</td>
<td class="data-td data last text-right">14.39</td>
</tr>
</tbody>
</table>
</div>
<p class="chart-disclosure">*Returns less than one year are not annualized.</p>
<p class="chart-disclosure">Effective June 20, 2016, Morningstar implemented several changes to the Morningstar Wide Moat Focus Index construction rules. Among other changes, the index increased its constituent count from 20 stocks to at least 40 stocks and modified its rebalance and reconstitution methodology. These changes may result in more diversified exposure, lower turnover, and longer holding periods for index constituents than under the rules in effect prior to this date. Past performance is no guarantee of future results.</p>
<p class="chart-disclosure">The gross expense ratio for MOAT is 0.47%.</p>
<p class="chart-disclosure"><strong>The performance data quoted represents past performance. Past performance is not a guarantee of future results. Investment return and principal value of an investment will fluctuate so that an investor's shares, when redeemed, may be worth more or less than their original cost. Performance may be lower or higher than performance data quoted. Please call 800.826.2333 or visit <a href="https://vaneck.com/" title="ETF &amp; Mutual Fund Manager">vaneck.com</a> for performance current to the most recent month ended.</strong></p>

<p>To receive more <a href="https://www.vaneck.com/us/en/insights/moat-investing" title="Moat Investing Insights"><strong>Moat Investing</strong></a> insights, <a href="https://www.vaneck.com/us/en/subscribe/" title="Subscription Center"><strong>sign up in our subscription center</strong></a>.</p>
]]></content:encoded>
</item><item rdf:about="https://www.vaneck.com/us/en/blogs/digital-assets/vanecks-journey-with-bitcoin/">
  <title>VanEck&#39;s Journey with Crypto></title>
  <link>https://www.vaneck.com/us/en/blogs/digital-assets/vanecks-journey-with-bitcoin/</link>
  <description><![CDATA[Explore major milestones for cryptocurrencies and VanEck&rsquo;s door-opening efforts to integrate them into mainstream investing.]]></description>
  <dc:creator> </dc:creator>
  <dc:date>10/24/2024 06:30:00</dc:date>
<content:encoded><![CDATA[

<p><i><strong>An investment in the VanEck Bitcoin ETF (&ldquo;HODL") or the VanEck Ethereum ETF ("ETHV") (collectively, the "Trusts") is subject to significant risk and may not be suitable for all investors. The Trusts are not investment companies registered under the Investment Company Act of 1940 (the &ldquo;1940 Act&rdquo;) and therefore are not subject to the same protections as mutual funds or ETFs registered under the 1940 Act. </strong></i></p>
<p><i><strong>The VanEck Ventures Fund I, L.P. (the &ldquo;Fund&rdquo;) is available to Qualified Purchasers Only. Please carefully read the Private Placement Memorandum (&ldquo;PPM&rdquo;) before investing (you can request it by emailing us at <a href="mailto:investorrelations@vaneck.com" title="Request Now">investorrelations@vaneck.com</a>). The Fund&rsquo;s investment program is speculative and entails substantial risks. The Fund is not an investment company registered under the 1940 Act, and therefore is not subject to the same regulatory requirements as mutual funds or ETFs registered under the Investment Company Act of 1940. The Fund is not suitable for all investors.</strong></i></p>
<p>From its early days as a fringe concept, Bitcoin has grown to become <strong><a href="https://www.vaneck.com/us/en/blogs/digital-assets/the-investment-case-for-bitcoin/" title="The Investment Case for Bitcoin">a formidable asset</a></strong>, capturing the attention of investors worldwide. Today, even more digital assets are on investors' radars due to a rise in tokenization and companies committed to their development.</p>
<p>Just as VanEck has been at the <strong><a href="https://www.vaneck.com/us/en/blogs/gold-investing/raising-the-bar-on-gold-investing/" title="VanEck Gold Investments - Gold ETFs, Funds and Trusts">forefront of gold investing</a></strong> since the firm&rsquo;s inception, VanEck has played a pivotal role in shaping the <strong><a href="/link/343cf2f03fec405589c8319433a957f6.aspx" title="Investing in Bitcoin and Digital Assets ">broader adoption of digital assets</a></strong> as a strategic allocation in an investment portfolio.</p>

<h2>A Timeline of VanEck&rsquo;s Journey with Crypto</h2>
<p><strong>2009: Bitcoin is born</strong></p>
<ul class="content-list">
<li>Bitcoin was introduced to the world by an anonymous entity, Satoshi Nakamoto. Bitcoin was designed to be a decentralized digital currency, free from governmental oversight.</li>
</ul>
<p><strong>2010: Bitcoin&rsquo;s first commercial transaction</strong></p>
<ul class="content-list">
<li>The first known commercial transaction using Bitcoin was the infamous purchase of two pizzas for 10,000 BTC. At that time, Bitcoin was worth only fractions of a penny.</li>
</ul>
<p><strong>2013: Bitcoin hits $1,000</strong></p>
<ul class="content-list">
<li>Bitcoin's price soared to $1,000, marking a significant milestone and garnering attention from mainstream investors.</li>
</ul>
<p><strong>2017: VanEck enters the crypto conversation</strong></p>
<ul class="content-list">
<li>VanEck recognizes that digital assets could provide both an alternative to existing currencies and gold, and technology to lower costs in the payments and financial industries. The firm starts to provide educational resources to help investors better understand Bitcoin, cryptocurrencies and other digital assets, and the role they play within a portfolio.</li>
</ul>
<p><strong>2017: Bitcoin&rsquo;s meteoric rise and futures trading</strong></p>
<ul class="content-list">
<li>Bitcoin&rsquo;s price skyrocketed to nearly $20,000, drawing parallels to gold&rsquo;s bull market in the 1970s. Additionally, the introduction of Bitcoin futures trading opened the doors for institutional investors, reminiscent of when gold futures were first introduced, providing legitimacy and stability to the market.</li>
</ul>
<p><strong>2017: VanEck becomes first ETF issuer to file for futures-based Bitcoin ETF</strong></p>
<ul class="content-list">
<li>On August 11, 2017, VanEck filed an S-1 for a Bitcoin futures ETF, becoming the first ETF issuer to file for an ETF that would invest in Bitcoin futures.</li>
</ul>
<p><strong>2017: VanEck subsidiary MarketVector Indexes unveils digital assets benchmark indexes</strong></p>
<ul class="content-list">
<li>On October 23, 2017, MarketVector launched a series of digital assets indexes designed to track the performance of the otherwise fragmented global digital assets markets, and became the first regulated index provider to meet investment industry benchmarking standards for digital assets indexes.</li>
</ul>
<p><strong>2018: VanEck files for spot Bitcoin ETP</strong></p>
<ul class="content-list">
<li>On June 6, 2018, VanEck filed for a spot Bitcoin exchange-listed product (in partnership with SolidX). We believe this structure gives investors a more efficient vehicle in which to gain direct Bitcoin exposure via a traditional broker, without paying roll costs associated with futures. The SEC subsequently rejected all spot BTC ETP applications due to concerns of &ldquo;market manipulation&rdquo;.</li>
</ul>
<p><strong>2020: Bitcoin halving event occurs</strong></p>
<ul class="content-list">
<li>The Bitcoin network experiences a halving event (which occurs approximately every four years), and the incentives for mining new blocks are reduced by half. This incident brings increased attention to Bitcoin&rsquo;s finite supply.</li>
</ul>
<p><strong>2020: VanEck launches spot Bitcoin ETN in Europe</strong></p>
<ul class="content-list">
<li>The firm&rsquo;s European arm launched a Bitcoin ETN on November 19, 2020, providing Europeans exchange-traded access to spot Bitcoin exposure without the hassle of self-custody.</li>
</ul>
<p><strong>2021: VanEck builds its digital assets team</strong></p>
<ul class="content-list">
<li>In 2021, VanEck began committing more resources to building out its <strong><a href="/link/8a941682150144598010e2784c931836.aspx#digital-assets" title="Digital Assets - Investment Professionals">digital assets research and investment team</a></strong>, bringing on board more crypto natives with knowledge of and passion for the digital assets space.</li>
</ul>
<p><strong>2021: VanEck becomes first ETF issuer to file for spot ether ETP</strong></p>
<ul class="content-list">
<li>On May 7, 2021, VanEck filed a S-1 for an ether ETP.</li>
</ul>
<p><strong>2021: El Salvador adopts Bitcoin as legal tender </strong></p>
<ul class="content-list">
<li><a href="/link/7dca9d41e9e94a3b9875b48b58197366.aspx" title="Dispatch from El Salvador's Bitcoin Beach: The ESG View"><strong>El Salvador</strong></a> became the first country to allow Bitcoin to be used in any transactions. Bitcoin joins the US dollar, which the country had adopted in 2021, as legal tender, and as part of the initiative, the Salvadoran government launched a digital wallet to promote the use of Bitcoin.</li>
</ul>
<p><strong>2021: MarketVector establishes sector classification system for digital assets</strong></p>
<ul class="content-list">
<li>MarketVector created the <strong><a href="/link/49e24e6451e74a7390e31ac831f4e929.aspx" title="Sorting Out the Crypto World">MarketVector Digital Asset Classification System</a></strong> in order to provide an efficient investment tool for capturing the breadth, depth, and progress of crypto sectors.</li>
</ul>
<p><strong>2021: VanEck leads $50M raise for Cadenza Ventures Crypto Fund</strong></p>
<ul class="content-list">
<li>Cadenza will use the funds to invest in crypto platforms and blockchain technologies internationally.</li>
</ul>
<p><strong>2021: VanEck launches Bitcoin Strategy ETF*</strong></p>
<ul class="content-list">
<li>VanEck introduced the VanEck Bitcoin Strategy ETF (XBTF), offering investors exposure to Bitcoin futures through a regulated and familiar structure.</li>
</ul>
<p><strong>2022: VanEck introduces the first NFT to be launched by an asset manager </strong></p>
<ul class="content-list">
<li>On 5/2/2022, VanEck launched and distributed the VanEck Community NFT. This initiative was the first of its kind among asset managers. It offers exclusive access to an inclusive community that is both free and provides real-world utility.</li>
</ul>
<p><strong>2023: VanEck launches Ethereum Strategy ETF*</strong></p>
<ul class="content-list">
<li>VanEck launched the Ethereum Strategy ETF (EFUT), offering investors exposure to Ether futures through a regulated and familiar structure.</li>
</ul>
<p><strong>2024: VanEck Bitcoin ETF (HODL) launches</strong></p>
<ul class="content-list">
<li>SEC approves spot bitcoin ETP applications for the first time. VanEck launched the <strong><a href="/link/c754aca617ab4535a8e611ded6d5b13c.aspx" title="HODL - VanEck Bitcoin ETF - Overview">VanEck Bitcoin ETF (HODL)</a></strong> and pledges 5% of profits to support Bitcoin core developers.</li>
</ul>
<p><strong>2024: VanEck becomes first ETF issuer to file for spot Solana ETP</strong></p>
<ul class="content-list">
<li>On June 27, 2024, VanEck filed an S-1 for a Solana ETP, becoming the first ETF issuer to file for an ETP that would invest in spot Solana.</li>
</ul>
<p><strong>2024: VanEck Ethereum ETF (ETHV) launches</strong></p>
<ul class="content-list">
<li>SEC approves spot ether ETP applications for the first time. VanEck launches the <strong><a href="/link/33e737a635434a35b8527d4846c72c50.aspx" title="ETHV - VanEck Ethereum ETF - Overview">VanEck Ethereum ETF (ETHV)</a></strong>.</li>
</ul>
<p><strong>2024: Venture Capital Fund launched</strong></p>
<ul class="content-list">
<li>VanEck announces the launch of VanEck Ventures, a $30 million early-stage fund to support innovation in fintech, digital assets and AI.</li>
</ul>
<p><strong>2025: VanEck launches Onchain Economy ETF (NODE)</strong></p>
<ul class="content-list">
<li>VanEck launched the <a href="/link/54b98110e4034531bd63d27f035b8bd9.aspx" title="NODE - VanEck Onchain Economy ETF - Overview"><strong>VanEck Onchain Economy ETF (NODE)</strong></a>, an actively managed ETF that provides access to the leading public companies and investment vehicles shaping the digital asset economy.</li>
</ul>
<h2>VanEck&rsquo;s Long-Term Commitment to Bitcoin</h2>
<p>Just as VanEck was a pioneer in gold investing, the firm has taken significant strides in bringing Bitcoin and Ethereum to a broader investor audience. By providing educational content, advocating for regulation, and introducing innovative investment vehicles, VanEck continues to play a pivotal role in the integration of digital assets into traditional investment portfolios. VanEck remains committed to empowering investors with the knowledge and tools needed to navigate this exciting and dynamic asset class.</p>
<p>To receive more <strong><a href="https://www.vaneck.com/us/en/insights/digital-assets/" title="Digital Assets Insights">Digital Assets</a></strong> insights, <strong><a href="https://www.vaneck.com/us/en/subscribe/" title="Subscription Center">sign up in our subscription center</a></strong>.</p>
<p><i><sup>*</sup>&nbsp;Please note that the VanEck Bitcoin Strategy ETF (XBTF) and the VanEck Ethereum Strategy ETF (EFUT) have been liquidated and are no longer available for investment. </i></p>
]]></content:encoded>
</item><item rdf:about="https://www.vaneck.com/us/en/blogs/municipal-bonds/take-a-closer-look-at-intermediate-munis-as-rates-remain-volatile/">
  <title>Take a Closer Look at Intermediate Munis as Rates Remain Volatile></title>
  <link>https://www.vaneck.com/us/en/blogs/municipal-bonds/take-a-closer-look-at-intermediate-munis-as-rates-remain-volatile/</link>
  <description><![CDATA[At the pace with which the Fed continues to cut rates, intermediate muni bonds offer a tax-efficient, diversified way for investors to capture income and potential price gains with balanced risk.]]></description>
  <dc:creator>Michael Cohick</dc:creator>
  <dc:date>10/23/2024 06:30:00</dc:date>
<content:encoded><![CDATA[

<p>Municipal bonds have long been a staple in the fixed-income portfolios of investors looking for tax-efficient income, particularly those in higher tax brackets. While traditionally seen as a conservative, income-generating tool, recent shifts in the Federal Reserve's stance on interest rates have created renewed interest in the potential benefits of municipal bond allocations.</p>
<p>As the Fed pivots and continues to loosen monetary policy, intermediate-duration municipal bonds offer a balanced path for investors looking to navigate interest rate shifts with a tax-efficient, diversified fixed-income option. Below, we explore how the current investment backdrop affects municipal bonds and why intermediate-duration bonds may provide an optimal mix of stability, income potential and tax efficiency for high-income investors.</p>
<h2>The Role of Municipal Bond ETFs in a Portfolio</h2>
<p><a href="https://www.vaneck.com/us/en/blogs/municipal-bonds/municipal-bond-etfs-expect-more-from-your-munis/" title="Municipal Bond ETFs &ndash; Expect More from Your Munis"><strong>Municipal bond ETFs</strong></a> allow investors to gain exposure to a diversified portfolio of municipal bonds, providing a way to capture both tax-exempt income and potential price appreciation. For those familiar with individual muni bonds, ETFs offer a simplified, liquid, and lower-cost alternative to holding a laddered portfolio of individual issues. Investors benefit from built-in diversification across municipalities and states, reducing exposure to the credit risk of any single issuer.</p>
<p>The tax-exempt nature of muni bonds, particularly when combined with the diversification offered by ETFs, makes them an attractive tool for high-income investors. Given the tax advantages, the yield from municipal bond ETFs often exceeds comparable taxable bonds when adjusted for taxes, making them a core holding for investors seeking predictable income with minimized tax drag.</p>
<h2>The Fed&rsquo;s Gradual Shift Toward Lower Rates</h2>
<p>The Federal Reserve&rsquo;s rate-setting actions are among the most critical drivers of bond prices. Although we&rsquo;re not yet in a low-rate environment, the Fed has signaled a slow move toward easing interest rates in response to inflation dynamics and broader economic trends. This gradual approach is intended to mitigate volatility, but it also presents opportunities for bond investors.</p>
<p>For example, bond prices tend to rise when rates fall, as newer, lower-yielding bonds make existing higher-yielding bonds more attractive. As rates gradually decline, intermediate-duration municipal bonds may experience upward price improvement. Intermediate-duration bonds are particularly suited to benefit from this shift, as their duration is long enough to capture some price gains from rate declines.</p>
<h3>Example: 5% Coupon Bond at Par: Price Change for a Given Fall in Rates</h3>
<div class="wrapped-div">
<table class="col-12 col-md-8">
<tbody>
<tr class="tbl-data">
<td class="tbl-header last text-right">If Rates Move Down %</td>
<td class="tbl-header last text-right">2-Year Bond %</td>
<td class="tbl-header last text-right">10-Year Bond %</td>
<td class="tbl-header last text-right">30-Year Bond %</td>
</tr>
<tr class="tbl-data">
<td class="data-td data last text-right">1.00</td>
<td class="data-td data last text-right">6.90</td>
<td class="data-td data last text-right">13.70</td>
</tr>
<tr class="tbl-data">
<td class="data-td data last text-right">2.00</td>
<td class="data-td data last text-right">1.90</td>
<td class="data-td data last text-right">13.20</td>
<td class="data-td data last text-right">24.70</td>
</tr>
<tr class="tbl-data">
<td class="data-td data last text-right">3.00</td>
<td class="data-td data last text-right">2.80</td>
<td class="data-td data last text-right">19.00</td>
<td class="data-td data last text-right">33.60</td>
</tr>
</tbody>
</table>
</div>
<style>
    .data-td.data {
        padding-right: 2px !important;
    }
    
    .wrapped-div {
        max-width: 100%;
    }
    
    @media (max-width: 768px) {
        .wrapped-div {
            overflow-x: scroll;
        }
    }
    
    .wrapped-div-sector {
        max-width: 100%;
        overflow-x: scroll;
    }
</style>
<p class="chart-disclosure">Solely for illustrative purposes to demonstrate the likely effect of interest rate decreases on bond prices. This illustration does not pertain to an investment or strategy.</p>
<h2>Benefits of Intermediate Duration Amid Move to Lower Rates</h2>
<p>For investors with an eye on interest rate movements, duration is a key consideration. Longer-duration bonds are more sensitive to rate changes, while shorter duration bonds tend to be more stable but offer lower yields. Intermediate-duration bonds offer a compromise, with moderate sensitivity to interest rate movements and reasonable income generation.</p>
<p>Intermediate muni bonds typically have durations between five and ten years, allowing the asset class to potentially capture price gains if rates fall further. However, although the Fed&rsquo;s rate moves are expected to be gradual, their intermediate duration helps mitigate the volatility that would come with a sharp, unexpected rate shift. While not immune to interest rate risk, intermediate bonds offer more stability compared to their long-duration counterparts, while still providing meaningful yield in the current environment.</p>

<h2>Three Reasons to Consider Intermediate Muni Bond ETFs</h2>
<p><strong>1. Well Positioned for a Gradual Rate Reduction</strong></p>
<p>In the context of slowly shifting interest rates, intermediate-duration bond ETFs are positioned to benefit from a decline in yields. Investors looking to optimize their exposure to fixed-income assets without excessive duration risk may find the balance of intermediate muni bonds appealing. In addition, intermediate duration means the asset class could capture price appreciation as rates move lower over time (though this is not guaranteed and depends on future Fed actions and broader market dynamics).</p>
<h3>AAA Municipal Yield Curve</h3>
<p><img class="img-responsive w-100" alt="AAA Municipal Yield Curve" src="https://www.vaneck.com/contentassets/4b8ee8647e054218bb1b1c9ee2cb835f/4957_muni-itm-blog_chart-1_2024-10_v1_blog.svg" /></p>
<p class="chart-disclosure">Source: ICE Data Services.</p>
<p>Additionally, intermediate-term bonds often provide better liquidity and more predictable cash flows than long-term bonds, which can be important for managing interest rate volatility. For investors unsure of how quickly or slowly the Fed will proceed with rate cuts, an allocation to intermediate-duration bonds may serve as a prudent middle ground. The reliability of an upward sloping yield curve for intermediate bonds means a solution like the <a href="https://www.vaneck.com/us/en/investments/intermediate-muni-etf-itm/overview/" title="ITM - VanEck Intermediate Muni ETF - Holdings and Performance"><strong>VanEck Intermediate Muni ETF (ITM)</strong></a> can generate attractive total returns over time.</p>
<p><strong>2. Tax-Exempt Income and Potential Yield Advantage</strong></p>
<p>The tax-exempt income generated by municipal bonds is one of the most compelling reasons to invest in the space. For investors in higher tax brackets, the effective tax-equivalent yield can significantly exceed that of comparable taxable bonds, especially in the context of shifting interest rates. While nominal yields on muni bonds might be lower than those of corporate or Treasury bonds, the after-tax yield is often more favorable when adjusted for the investor&rsquo;s marginal tax rate.</p>
<p>In an environment where yields across the fixed-income landscape are expected to compress gradually, tax-exempt income from muni bonds becomes increasingly valuable. For high-net-worth investors, intermediate muni bonds offer a way to generate income while reducing overall tax liabilities, thus improving portfolio efficiency.</p>
<p><strong>3. Gain Access to a High-Quality, Diversified Portfolio</strong></p>
<p>Many intermediate-duration municipal bond ETFs focus on investment-grade bonds, providing exposure to high-quality issuers while diversifying across states and municipalities. This geographic and credit diversification can add a layer of security, potentially helping to cushion portfolios from localized economic challenges.</p>
<p>Given the higher likelihood of economic uncertainty over the coming years, this diversification can provide some insulation from localized fiscal challenges. That said, no investment is without risk, and credit risk&mdash;while mitigated&mdash;remains a factor for even investment-grade municipal bonds.</p>

<h2>Invest in Intermediate Muni Bonds with VanEck</h2>
<p>For investors seeking a combination of tax-exempt income, moderate interest rate risk, and broad diversification, the <a href="https://www.vaneck.com/us/en/investments/intermediate-muni-etf-itm/overview/" title="ITM - VanEck Intermediate Muni ETF - Holdings and Performance"><strong>VanEck Intermediate Muni ETF (ITM)</strong></a> may be a compelling solution. Its intermediate duration offers a balanced exposure to interest rate changes, while its focus on high-quality municipal bonds and relatively low expense ratio make it an attractive option in a rate environment that is expected to shift gradually.</p>
<p>ITM's portfolio focuses on investment-grade municipal bonds, with more than 80% of its holdings rated A or higher. This concentration on high-quality issuers adds a layer of security, as investment-grade munis are less likely to default compared to lower-rated issues.</p>
<p>With an expense ratio of 0.24%, ITM is a cost-effective option compared to many actively managed municipal bond funds. In a world where bond yields are expected to remain low, minimizing fees is critical for preserving net returns. By keeping costs low, ITM allows investors to retain more of the yield, which is especially important as fixed-income returns may face pressure in a gradually declining rate environment.</p>
<p>However, it&rsquo;s crucial to recognize that ITM is not without risk, and future performance will depend on the path of interest rates, credit conditions, and broader economic factors. While ITM offers numerous benefits, investors should remain mindful of these potential risks:</p>
<ul class="content-list">
<li class="mt-2">Interest Rate Risk: Though the Fed&rsquo;s gradual approach suggests a manageable interest rate environment in the near term, unexpected increases in rates could negatively impact bond prices. Intermediate bonds like those in ITM may experience price declines if rates rise unexpectedly, although they would typically fare better than longer-duration bonds.</li>
<li class="mt-2">Credit Risk: Despite its focus on investment-grade issuers, ITM is not immune to credit risk. Municipalities can face fiscal pressure, and while defaults are rare for investment-grade muni bonds, they can occur.</li>
<li class="mt-2">Liquidity Risk: Municipal bonds, in general, tend to be less liquid than other fixed-income securities like Treasuries. Although ITM&rsquo;s ETF structure provides daily liquidity, severe market conditions could impact liquidity, particularly during times of distress.</li>
</ul>
<p>As always, investors should assess their own financial goals, risk tolerance, and tax situation before making any investment decisions.</p>
<p>To receive more <a href="https://www.vaneck.com/us/en/insights/municipal-bonds/" title="Municipal Bonds Insights"><strong>Municipal Bonds</strong></a> insights, <a href="/link/5f45412c2143400497908cea2897f7d3.aspx" title=" Subscription Center"><strong>sign up in our subscription center</strong></a>.</p>
]]></content:encoded>
</item><item rdf:about="https://www.vaneck.com/us/en/blogs/thematic-investing/buzz-investing-feds-50-bps-rate-cut-market-rally/">
  <title>BUZZ Investing: Fed’s 50 bps Rate Cut Market Rally></title>
  <link>https://www.vaneck.com/us/en/blogs/thematic-investing/buzz-investing-feds-50-bps-rate-cut-market-rally/</link>
  <description><![CDATA[The Federal Reserve&rsquo;s 50 bps interest rate cut, its first since March 2022, spurred positive market reactions, pushing indices to new highs amid inflation easing and expectations for further cuts.]]></description>
  <dc:creator> </dc:creator>
  <dc:date>10/22/2024 06:30:00</dc:date>
<content:encoded><![CDATA[

<p>A pivotal event during the recent period between index selection dates (September 12, 2024 &ndash; October 10, 2024, the &ldquo;Period&rdquo;) was the Federal Reserve&rsquo;s decision to implement a 50 bps interest rate cut, marking the first reduction since the current tightening cycle began in March 2022. Leading up to the Fed's September 18 meeting, investor expectations were highly divided. Following the Fed&rsquo;s July 31 policy meeting, the probability of a 50 bps cut hovered around 40%, with consensus reaching just over 60% the day before the decision. Concerns over a slowing economy, persistent inflationary pressures, and a weaker-than-expected jobs report contributed to the Fed's decision, signaling a potential shift toward more accommodative monetary policy in the coming months.</p>
<p>Despite recessionary fears that mirrored those from earlier in August, markets this time reacted more positively, with major indices reaching new all-time highs following the announcement. Investors seemed encouraged by softer inflation data and the prospect of further rate cuts, which buoyed sentiment across various sectors. The BUZZ NextGen AI US Sentiment Leaders Index (the &ldquo;BUZZ Index&rdquo;) performed well in this environment, gaining 6.4% during the Period.</p>
<h3>Fed Funds Rate - Probability of a 50 bps Cut in September</h3>
<p><img src="https://www.vaneck.com/contentassets/db1d46a5d81e4034af306f80c4f4846a/4949_buzz-blog-oct-2024_chart-1_2024-10_v1.svg" class="img-responsive w-100" alt="Fed Funds Rate - Probability of a 50 bps Cut in September" /></p>
<p class="chart-disclosure">Source: CME Group as of September 18, 2024.</p>

<p>The BUZZ Index returned 2.87% during the month of September compared to a return of 2.14% for the S&amp;P 500 Index during the same period. Year-to-date, the BUZZ Index lags the S&amp;P 500 with returns of 15.10% and 22.08%, respectively, as of the end of September.</p>
<h2>Shares of Microstrategy and Semiconductors Lead Gains in the BUZZ Index</h2>
<p>During the recent Period, MicroStrategy led gains in the BUZZ Index, rallying 40.2% and reaching an all-time high. This performance significantly outpaced bitcoin&rsquo;s 2.6% gain, as bitcoin exhibited volatility, surging 13% before retracing. As the largest corporate holder of bitcoin, MicroStrategy benefited from investor sentiment tied to bitcoin&rsquo;s movements, with its net asset value premium soaring to 2.5 times its bitcoin holdings&mdash;the highest since early 2021&mdash;further driving its stock's impressive performance. Semiconductor stocks were also key contributors to BUZZ Index gains during the Period, fueled by strong earnings from major players like AMD, Nvidia, and Intel, which reported growth in AI-driven data-center businesses. Easing concerns over U.S. export restrictions on chips to China further supported market sentiment. During the Period, notable gains were seen in Intel (+19.9%), Nvidia (+13.2%), AMD (+8.9%), and Micron (+21.2%).</p>
<h3>Top BUZZ Index Contributors: September 12, 2024 &ndash; October 10, 2024</h3>
<div class="wrapped-div">
<table style="width: 100%;">
<tbody>
<tr class="tbl-data">
<td class="tbl-header last">Company</td>
<td class="tbl-header last text-left">Ticker</td>
<td class="tbl-header last text-right">Average Weight (%)</td>
<td class="tbl-header last text-right">Return Contribution (%)</td>
</tr>
<tr class="tbl-data">
<td class="data-td last font-weight-normal">MicroStrategy Inc</td>
<td class="data-td data last text-left">MSTR</td>
<td class="data-td data last text-right">3.44</td>
<td class="data-td data last text-right">1.18</td>
</tr>
<tr class="tbl-data">
<td class="data-td last font-weight-normal">Intel Corp</td>
<td class="data-td data last text-left">INTC</td>
<td class="data-td data last text-right">3.25</td>
<td class="data-td data last text-right">0.57</td>
</tr>
<tr class="tbl-data">
<td class="data-td last font-weight-normal">Palantir Technologies Inc</td>
<td class="data-td data last text-left">PLTR</td>
<td class="data-td data last text-right">2.36</td>
<td class="data-td data last text-right">0.57</td>
</tr>
<tr class="tbl-data">
<td class="data-td last font-weight-normal">SoFi Technologies Inc</td>
<td class="data-td data last text-left">SOFI</td>
<td class="data-td data last text-right">3.17</td>
<td class="data-td data last text-right">0.50</td>
</tr>
<tr class="tbl-data">
<td class="data-td last font-weight-normal">NVIDIA Corp</td>
<td class="data-td data last text-left">NVDA</td>
<td class="data-td data last text-right">3.01</td>
<td class="data-td data last text-right">0.39</td>
</tr>
<tr class="tbl-data">
<td class="data-td last font-weight-normal">Meta Platforms Inc</td>
<td class="data-td data last text-left">META</td>
<td class="data-td data last text-right">3.10</td>
<td class="data-td data last text-right">0.34</td>
</tr>
<tr class="tbl-data">
<td class="data-td last font-weight-normal">PayPal Holdings Inc</td>
<td class="data-td data last text-left">PYPL</td>
<td class="data-td data last text-right">2.02</td>
<td class="data-td data last text-right">0.30</td>
</tr>
<tr class="tbl-data">
<td class="data-td last font-weight-normal">Advanced Micro Devices Inc</td>
<td class="data-td data last text-left">AMD</td>
<td class="data-td data last text-right">3.13</td>
<td class="data-td data last text-right">0.28</td>
</tr>
<tr class="tbl-data">
<td class="data-td last font-weight-normal">Micron Technology Inc</td>
<td class="data-td data last text-left">MU</td>
<td class="data-td data last text-right">1.35</td>
<td class="data-td data last text-right">0.26</td>
</tr>
<tr class="tbl-data">
<td class="data-td last font-weight-normal">Crowdstrike Holdings Inc</td>
<td class="data-td data last text-left">CRWD</td>
<td class="data-td data last text-right">1.43</td>
<td class="data-td data last text-right">0.26</td>
</tr>
</tbody>
</table>
</div>
<p class="chart-disclosure">Source: BUZZ Holdings ULC, Bloomberg. Past performance is no guarantee of future results. Index performance is not illustrative of fund performance. Not intended as a recommendation to buy or to sell any of the securities mentioned herein.</p>

<h2>Shares of EV Manufacturers Lead Declining Stocks in the BUZZ Index</h2>
<p>Shares of EV manufacturers, particularly Lucid and Rivian, have led to declines in the BUZZ Index during the recent period. Lucid fell 14.8%, marking a reversal after being a top contributor to BUZZ returns in the prior period, as production challenges and weaker delivery numbers weighed on investor sentiment. Rivian saw an even steeper decline of 25.2%, driven by rising costs and difficulties scaling production efficiently. Both companies faced increased pressure in a competitive market, with Lucid's high pricing strategy and Rivian's margin struggles contributing to their sharp losses.</p>
<h3>Bottom BUZZ Index Contributors: September 12, 2024 &ndash; October 10, 2024</h3>
<div class="wrapped-div">
<table style="width: 100%;">
<tbody>
<tr class="tbl-data">
<td class="tbl-header last">Company</td>
<td class="tbl-header last text-left">Ticker</td>
<td class="tbl-header last text-right">Average Weight (%)</td>
<td class="tbl-header last text-right">Return Contribution (%)</td>
</tr>
<tr class="tbl-data">
<td class="data-td last font-weight-normal">Lucid Group Inc</td>
<td class="data-td data last text-left">LCID</td>
<td class="data-td data last text-right">2.11</td>
<td class="data-td data last text-right">-0.40</td>
</tr>
<tr class="tbl-data">
<td class="data-td last font-weight-normal">Rivian Automotive Inc</td>
<td class="data-td data last text-left">RIVN</td>
<td class="data-td data last text-right">1.24</td>
<td class="data-td data last text-right">-0.34</td>
</tr>
<tr class="tbl-data">
<td class="data-td last font-weight-normal">Boeing Co/The</td>
<td class="data-td data last text-left">BA</td>
<td class="data-td data last text-right">1.54</td>
<td class="data-td data last text-right">-0.15</td>
</tr>
<tr class="tbl-data">
<td class="data-td last font-weight-normal">Trump Media &amp; Technology Group</td>
<td class="data-td data last text-left">DJT</td>
<td class="data-td data last text-right">0.45</td>
<td class="data-td data last text-right">-0.15</td>
</tr>
<tr class="tbl-data">
<td class="data-td last font-weight-normal">Viking Therapeutics Inc</td>
<td class="data-td data last text-left">VKTX</td>
<td class="data-td data last text-right">1.07</td>
<td class="data-td data last text-right">-0.13</td>
</tr>
<tr class="tbl-data">
<td class="data-td last font-weight-normal">Starbucks Corp</td>
<td class="data-td data last text-left">SBUX</td>
<td class="data-td data last text-right">2.25</td>
<td class="data-td data last text-right">-0.12</td>
</tr>
<tr class="tbl-data">
<td class="data-td last font-weight-normal">United States Steel Corp</td>
<td class="data-td data last text-left">X</td>
<td class="data-td data last text-right">1.05</td>
<td class="data-td data last text-right">-0.11</td>
</tr>
<tr class="tbl-data">
<td class="data-td last font-weight-normal">Ulta Beauty Inc</td>
<td class="data-td data last text-left">ULTA</td>
<td class="data-td data last text-right">0.61</td>
<td class="data-td data last text-right">-0.10</td>
</tr>
<tr class="tbl-data">
<td class="data-td last font-weight-normal">Summit Therapeutics Inc</td>
<td class="data-td data last text-left">SMMT</td>
<td class="data-td data last text-right">0.30</td>
<td class="data-td data last text-right">-0.09</td>
</tr>
<tr class="tbl-data">
<td class="data-td last font-weight-normal">Moderna Inc</td>
<td class="data-td data last text-left">MRNA</td>
<td class="data-td data last text-right">0.40</td>
<td class="data-td data last text-right">-0.09</td>
</tr>
</tbody>
</table>
</div>
<p class="chart-disclosure">Source: BUZZ Holdings ULC, Bloomberg. Past performance is no guarantee of future results. Index performance is not illustrative of fund performance. Not intended as a recommendation to buy or to sell any of the securities mentioned herein.</p>
<h2>BUZZ Index October 2024 Rebalance Highlights</h2>
<p><strong>AST SpaceMobile, Inc.</strong></p>
<p>This month, the BUZZ Index added AST SpaceMobile (NASDAQ: ASTS) as a first-time entrant. Founded in 2017, ASTS aims to be the first company to build a global cellular network based in space. The company's technology deploys satellites, known as BlueBirds, which act like cell towers, connecting directly to smartphones without the need for additional hardware&mdash;setting it apart from services like SpaceX&rsquo;s Starlink. If successful, this space-based approach could dramatically expand global connectivity, providing broadband access to areas beyond the reach of traditional ground networks. After going public in 2021 through a SPAC merger with New Providence Acquisition Corp, ASTS has made substantial progress this year, including testing its BlueBirds system, securing regulatory approvals, and partnering with telecom providers. Its stock surged from nearly $2 in April to over $38 by August, driven by rising investor interest following these milestones. A surge in positive investor sentiment followed, pushing ASTS into the BUZZ Index this month with a maximum of 3% weighting.</p>
<p><strong>Micron Technology, Inc.</strong></p>
<p>While Nvidia (NASDAQ: NVDA) continues to lead the AI GPU market, optimism surrounding the AI boom has extended to other chipmakers. Micron Technology (NASDAQ: MU), a key player in memory chips, recently capitalized on this trend, surprising the market on September 25th with stronger-than-expected revenue guidance for the upcoming year, driven by rising demand for its AI-related products. The next day, Micron&rsquo;s shares surged 20%, marking one of its largest single-day increases since 2011. Investor sentiment, already improving ahead of earnings, surged after the announcement, driving Micron's weight in the BUZZ Index to the maximum 3% for the month, underscoring renewed confidence in the stock's potential.</p>
<p>To receive more <a href="https://www.vaneck.com/us/en/insights/thematic-investing/" title="Thematic Investing Insights"><strong>Thematic Investing</strong></a> insights, <a href="https://www.vaneck.com/us/en/subscribe/" title="Subscription Center"><strong>sign up in our subscription center</strong></a>.</p>
]]></content:encoded>
</item><item rdf:about="https://www.vaneck.com/us/en/blogs/emerging-markets-bonds/tide-shifting-to-support-em-local-currency-bonds/">
  <title>Tide Shifting to Support EM Local Currency Bonds></title>
  <link>https://www.vaneck.com/us/en/blogs/emerging-markets-bonds/tide-shifting-to-support-em-local-currency-bonds/</link>
  <description><![CDATA[Despite recent headwinds from a strong U.S. dollar, EM local currency bonds present a compelling investment opportunity due to favorable fundamentals, easing U.S. monetary policy, and new Chinese stimulus measures.]]></description>
  <dc:creator>Fran Rodilosso</dc:creator>
  <dc:date>10/22/2024 06:30:00</dc:date>
<content:encoded><![CDATA[

<p>For much of the past four years, including most of this year, the strength of the U.S. dollar has been a headwind for emerging markets (EM) assets, including local currency sovereign bonds. Although the asset class has outperformed broad U.S. and global investment grade bonds, investor sentiment has been weak based on investment flows. This is despite very favorable fundamentals relative to developed markets. With favorable growth and fiscal trends, controlled inflation and high levels of real interest rates, all on top of a significantly lower gross debt-to-GDP ratio, the case for EM local currency bonds has been strong, in our opinion. The change in the rate cycle in the U.S. and the magnitude of new Chinese stimulus measures further strengthen the case, and we believe it&rsquo;s time for investors to consider an allocation to EM local currency bonds within their global bond portfolio.</p>
<p>Easing monetary policy in the U.S. removes a headwind that has been in place since the Fed began hiking aggressively in 2022. A soft landing in the U.S., which remains a likely scenario over the next six to twelve months, provides a &ldquo;goldilocks&rdquo; scenario of lower rates and support for economic growth. In China, new fiscal and monetary stimulus along with new measures to stimulate the domestic property market were announced. The dynamics taking place in the world&rsquo;s two largest economies are positive for global growth, and many of those benefits will accrue to emerging markets. For example, commodity sensitive currencies will likely benefit from higher growth. In that category, Latin American currencies have been the worst performers in the J.P. Morgan GBI-EM Global Core Index this year, providing upside potential in our opinion, particularly given that the new measures in China took the market by surprise. Latin America accounts for more than 25% of the index.</p>
<h3>EMFX Year-to-date Performance (as of 9/30/2024)</h3>
<p><img class="img-responsive w-100" alt="EMFX Year-to-date Performance (as of 9/30/2024)" src="https://www.vaneck.com/contentassets/cacea6b8f765498e80179f70e8d05eef/4951_emlc_chart-1_2024-10_v2_blog.svg" /></p>
<p class="chart-disclosure">Source: J.P. Morgan as of 9/30/2024. Index performance is not representative of strategy performance. It is not possible to invest directly in an index. Past performance is no guarantee of future results.</p>

<p>Longer term, we expect emerging markets to continue to compare favorably overall to the U.S. and other developed markets from a fundamental perspective. U.S. government spending and borrowing trends are highly unfavorable for the U.S. dollar, in our opinion, and there is little reason to expect any changes in the current trajectory. The continued monetary and fiscal stimulus also suggests that there could be higher inflation than we had seen the decade prior to the Covid-driven shock, and that may benefit commodity producers.</p>
<p>EM local currency sovereign bonds are generally considered a &ldquo;risk-on&rdquo; asset class, despite these favorable fundamentals, which exposes the asset class to certain technical risks in the near term. Geopolitical instability, the upcoming U.S. elections and a harder landing in the U.S. than currently anticipated are the most obvious risks. However, we believe the long-term fundamentals make the asset class attractive, particularly as we move into a period of Fed easing, stimulus measures being implemented globally and a weaker or stabilized U.S. dollar.</p>
<p>To receive more <a href="https://www.vaneck.com/us/en/insights/emerging-markets-bonds/" title="Emerging Markets Bonds Insights"><strong>Emerging Markets Bonds</strong></a> insights, <a href="/link/5f45412c2143400497908cea2897f7d3.aspx" title=" Subscription Center"><strong>sign up in our subscription center</strong></a>.</p>
]]></content:encoded>
</item><item rdf:about="https://www.vaneck.com/us/en/blogs/emerging-markets-equity/emerging-markets-ride-strengthening-tailwinds/">
  <title>Emerging Markets Ride Strengthening Tailwinds></title>
  <link>https://www.vaneck.com/us/en/blogs/emerging-markets-equity/emerging-markets-ride-strengthening-tailwinds/</link>
  <description><![CDATA[Fed easing and stronger China stimulus measures boost emerging markets equities returns in Q3 2024.]]></description>
  <dc:creator>Ola  El-Shawarby, CFA</dc:creator>
  <dc:date>10/21/2024 06:30:00</dc:date>
<content:encoded><![CDATA[

<p>Quarterly insights from Emerging Markets Portfolio Manager Ola El-Shawarby, featuring her unique views on emerging markets.</p>
<p>In the third quarter of 2024, emerging markets equities outperformed their developed and U.S. counterparts. Two highly anticipated developments - the start of the U.S. Federal Reserve (Fed) easing cycle and stronger stimulus measures out of China - were both announced during the quarter, which helped boost emerging markets equities returns.</p>
<p>Emerging markets equities have historically, on average, benefitted when the Fed begins cutting interest rates. Since 1988, emerging markets equities have outperformed developed markets in the 24 months after the last rate hike by an average of 17%.<sup>1</sup></p>
<p>China's recently announced strong economic stimulus has sparked a significant rally in its equity markets, particularly in Hong Kong, where shares surged dramatically. While the long-term impact of China's measures is uncertain, the immediate boost and strong signaling toward a pivot in policy direction provides additional support for global markets, providing a more positive momentum for Chinese and emerging markets equities, particularly given the light positioning in the asset class.</p>
<h2 id="market-review" class="jump-link-nav anchored-block" data-jumplink-title="Market Review">Market Review</h2>
<p>The overarching theme across markets is one of adapting to shifting macroeconomic environments and geopolitical pressures while maintaining a balance between growth opportunities and risk management. A coordinated approach to stimulus and fiscal policies is crucial for recovery, and there is growing focus on addressing inflationary pressures and market dynamics linked to global demand shifts, particularly in technology and artificial intelligence (AI). Our strategy emphasizes a proactive response to local dynamics while positioning our portfolio around resilient sectors with structural growth opportunities in an uncertain global landscape.</p>
<p><strong>Here is a brief overview of some of the largest emerging markets countries and how we view them:</strong></p>
<p><strong>China: </strong>Recent government policy and stimulus measures announced near the end of the quarter marked a directional and more decisive shift in tone towards more coordinated and targeted economic support that exceeded market expectations. While monetary easing has been implemented, specifics of fiscal stimulus are still awaited. Noteworthy signals that suggest a turning point in policy direction include equity market support, direct consumption stimulus for &ldquo;vulnerable populations,&rdquo; trade-in programs for consumer goods like home appliances and autos and a commitment to halting the decline in the property market as highlighted by statements from a recent Politburo meeting chaired by top Chinese leadership. Given the limited efficacy of prior measures on the ground, some investors remain skeptical and a lot depends on the implementation on the ground so we continue to watch developments there very closely.</p>
<p><strong>India: </strong>India's macroeconomic resilience remains a positive story, but elevated valuations make selectivity important. Investors may use India as a funding source for reallocations to China if conviction in a more sustainable turnaround and recovery in China continues to rise. This could create opportunities to buy high-quality structural growth Indian stocks at better valuations.</p>
<p><strong>Brazil: </strong>Early-year expectations of a continued declining interest rate trajectory have shifted on the back of higher concerns around fiscal spending and stronger-than-expected domestic consumption, leading ultimately to a more hawkish central bank. The combination of stronger-than-expected consumption driving upward revisions to Brazil&rsquo;s GDP growth and a weaker BRL meant that inflation became stickier than originally expected. That, coinciding with a leadership transition at the Central Bank of Brazil with an incoming Governor who is seeking to establish credibility with the market, triggered a dramatic shift in interest rates direction from a rate-cutting cycle that began in September of last year to a rate hiking cycle starting with 25 bps in September of this year and another 25bps in October.</p>
<p>The team visited Brazil this month to assess the implications of the new environment and spent some time on the ground meeting with company management across different sectors and different stakeholders. We came back with a more constructive view on the bottom-up story for most companies, particularly in light of very strong domestic consumption growth and that fears among local investors related to fiscal deterioration risks seem to be exaggerated. We note that as the external environment turns more favorable for Brazil and its currency with easing rates globally and improving outlooks on global growth and commodity prices potentially supported by China&rsquo;s stimulus, the rate hiking cycle may be short-lived. With stock valuations generally at attractive levels in Brazil, we saw an opportunity to upgrade our stock selection in this environment, shifting our focus from some of the more interest rate-sensitive industrial names towards more resilient beneficiaries of the stronger domestic demand growth in healthcare and consumption.</p>
<p><strong>Taiwan: </strong>TSMC (6.7% of Fund net assets<sup>*</sup>), the fund&rsquo;s largest position and a key player in Taiwan's market, is central to the AI-driven structural growth story and remains highly sensitive to global AI valuation trends. While we continue to believe in the uniqueness of TSMC&rsquo;s positioning in its sector globally and the strong fundamentals of the business, we will continue to rebalance our exposure as a function of shifting growth pace expectations and valuations.</p>
<p><strong>South Korea: </strong>Korea's market is largely driven by global AI and memory cycle expectations, rather than domestic consumption. Reduced demand from China earlier in the year and higher inventory levels have pressured traditional memory prices, partially affecting expectations for companies like Samsung. We had taken a more constructive view of Samsung and its ability to improve its HBM3 product development to achieve better alignment with the likes of Nvidia. The slower pace of HBM3 development and the weaker-than-expected operating margins in Q3 have been a disappointment and we continue to watch developments closely. However, despite downward revisions in Samsung&rsquo;s numbers, we believe current valuations offer a positive risk/reward outlook. In addition, Samsung is in the process of restructuring its entire semiconductor group under new leadership appointed in 2Q. There should be additional operational and profitability enhancements visible in the next quarter or two.</p>
<p><strong>Philippines: </strong>Our largest position in the Philippines, ICTSI (3.6% of Fund net assets<sup>*</sup>), with port assets across emerging markets, has been an outperformer on the back of solid execution, prompting some profit-taking. As we became more constructive on domestic demand in the Philippines due to a more pro-business leadership and found valuations to be very reasonable, we took the opportunity to add Ayala Land (Ayala) to the portfolio. Ayala is a high-quality name in the real estate sector with a solid execution track record and a strong growth pipeline in residential developments catering. We are optimistic about the structural demand growth for residential properties in the Philippines and expect affordability to improve going forward, with declining interest rates in the country.</p>
<p><strong>Mexico: </strong>Nearshoring remains a strong structural growth story, but recent political volatility has caused market fluctuations. A judicial reform pushed by the outgoing president in September has raised concerns about judicial independence in the country and whether this may have potential implications for the United States-Mexico-Canada Agreement (USMCA) down the line. We are inclined to believe that these concerns are likely to subside over time if the new President, Claudia Sheinbaum, takes a more moderate approach to implementing judicial reform and focuses on addressing key structural needs in Mexico, e.g., energy and security. In the meantime, our strategy has shifted towards a relatively more defensive positioning in Mexico and will continue to seek opportunities to acquire high-quality bottom-up names amidst the likely market volatility in the near term with the upcoming U.S. elections.</p>
<p><strong>Other markets: </strong>With prior success in finding quality compounders in some of the smaller markets, such as Georgia and Kazakhstan, that have been meaningful contributors to performance over time, we continue to look for quality names with idiosyncratic characteristics in different geographies with solid structural growth drivers. By way of example, we have recently added <strong>Credicorp (0.4% of Fund net assets<sup>*</sup>)</strong>, the leading bank in Peru, following a research trip to the country earlier this year, which led to a more constructive view on the country&rsquo;s political and macroeconomic environment. The bank is over-delivering on growth, digitization and asset quality expectations, offering a strong shareholder value compounder with favorable valuations, and diversifying the portfolio away from broader geopolitical risks.</p>

<h2 id="fund-performance" class="jump-link-nav anchored-block" data-jumplink-title="Fund Performance">Fund Performance</h2>
<p>The VanEck Emerging Markets Fund (the &ldquo;Fund&rdquo;) underperformed the MSCI EM IMI on the quarter-to-date basis ending September 30, 2024 (+2.77% for the Fund; +8.24% for the Index). Negative relative performance for the quarter was driven by stock selection in India, as well as allocation (weighting) and stock selection in Turkey.</p>
<p>China and Brazil were the Fund&rsquo;s top contributors for the quarter.</p>
<h3>Average Annual Total Returns (%) as of September 30, 2024</h3>
<div class="wrapped-div">
<table style="width: 100%;">
<tbody>
<tr class="tbl-data">
<td class="tbl-header last">&nbsp;</td>
<td class="tbl-header last text-center">3Q24<sup>&dagger;</sup></td>
<td class="tbl-header last text-center">YTD</td>
<td class="tbl-header last text-center">1YR</td>
<td class="tbl-header last text-center">3YR</td>
<td class="tbl-header last text-center">5YR</td>
<td class="tbl-header last text-center">10YR</td>
</tr>
<tr class="tbl-data">
<td class="data-td last text-left">Class A: NAV (Inception 12/20/93)</td>
<td class="data-td data last text-center">2.77</td>
<td class="data-td data last text-center">10.90</td>
<td class="data-td data last text-center">20.04</td>
<td class="data-td data last text-center">-5.52</td>
<td class="data-td data last text-center">0.47</td>
<td class="data-td data last text-center">1.64</td>
</tr>
<tr class="tbl-data">
<td class="data-td last text-left">Class A: Maximum 5.75% Load</td>
<td class="data-td data last text-center">-3.14</td>
<td class="data-td data last text-center">4.53</td>
<td class="data-td data last text-center">13.14</td>
<td class="data-td data last text-center">-7.37</td>
<td class="data-td data last text-center">-0.72</td>
<td class="data-td data last text-center">1.04</td>
</tr>
<tr class="tbl-data">
<td class="data-td last text-left">Class I: NAV (Inception 12/31/07)</td>
<td class="data-td data last text-center">2.97</td>
<td class="data-td data last text-center">11.39</td>
<td class="data-td data last text-center">20.70</td>
<td class="data-td data last text-center">-5.00</td>
<td class="data-td data last text-center">1.00</td>
<td class="data-td data last text-center">2.15</td>
</tr>
<tr class="tbl-data">
<td class="data-td last text-left">MSCI Emerging Markets Investable Markets Index (IMI)</td>
<td class="data-td data last text-center">8.24</td>
<td class="data-td data last text-center">16.26</td>
<td class="data-td data last text-center">25.59</td>
<td class="data-td data last text-center">1.01</td>
<td class="data-td data last text-center">6.52</td>
<td class="data-td data last text-center">4.25</td>
</tr>
<tr class="tbl-data">
<td class="data-td last text-left">MSCI Emerging Markets Index</td>
<td class="data-td data last text-center">8.72</td>
<td class="data-td data last text-center">16.86</td>
<td class="data-td data last text-center">26.05</td>
<td class="data-td data last text-center">0.40</td>
<td class="data-td data last text-center">5.75</td>
<td class="data-td data last text-center">4.02</td>
</tr>
</tbody>
</table>
</div>
<p class="chart-disclosure">The table presents past performance which is no guarantee of future results and which may be lower or higher than current performance. Returns reflect applicable fee waivers and/or expense reimbursements. Had the Fund incurred all expenses and fees, investment returns would have been reduced. Investment returns and Fund shares values will fluctuate so that investor's shares, when redeemed, may be worth more or less than their original cost. Fund returns assume that dividends and capital gains distributions have been reinvested in the Fund at net asset value (NAV). Index returns assume that dividends of the Index constituents in the Index have been reinvested. Performance information current to the most recent month end is available by calling 800.826.2333 or by visiting vaneck.com.</p>
<p class="chart-disclosure">Expenses: Class A: Gross 1.54%; Net 1.54%; Class I: Gross 1.19%; Net 1.01%. Expenses are capped contractually until 5/1/25 at 1.60% for Class A and 1.00% for Class I. Caps exclude acquired fund fees and expenses, interest, trading, dividends, interest payments of securities sold short, taxes and extraordinary expenses.</p>

<h2 id="fund-review" class="jump-link-nav anchored-block" data-jumplink-title="Fund Review">Fund Review</h2>
<p>On a sector level, Industrials, Materials and Utilities contributed to relative performance, while Financials, Health Care and Consumer Discretionary detracted. On a country level, Taiwan, Germany<sup>2</sup>and Brazil contributed to relative performance, while India, Turkey and China detracted.</p>
<h2>Top Contributors</h2>
<p>Top contributors to return on an absolute basis during the quarter:</p>
<ul class="content-list">
<li class="mt-2"><strong>MercadoLibre (&ldquo;MELI&rdquo;) (5.3% of Fund net assets</strong><sup><strong>*</strong></sup><strong>):</strong> MELI continues to report strong performance, with Gross Merchandise Value (GMV) growth accelerating to 36% in Brazil during Q2. Its GMV has consistently outpaced competitors, gaining market share each month. The company is also benefiting from the broader shift from offline to online shopping. Additionally, MELI is investing in expanding and improving its logistics network to stay ahead of both local retailers and international e-commerce platforms. The company's outlook remains highly promising, as e-commerce in Latin America is still underpenetrated. Advertising growth has the potential to improve margins, and there is a significant opportunity in Mercado Pago, a payment platform with one of the largest user bases in Latin America, where MELI enjoys a major advantage in customer acquisition costs due to its extensive database of client information. Overall, the future continues to look very positive for the company.</li>
<li class="mt-2"><strong>Prosus N.V. (4.5% of Fund net assets</strong><sup><strong>*</strong></sup><strong>): </strong>Prosus N.V. controls a diverse portfolio of leading internet assets across Asia, emerging Europe, MENA, and Latin America, including substantial stakes in Tencent Holdings (25%) and Delivery Hero (21%). The company is strategically positioned in key e-commerce sectors poised for growth, including online food delivery, online classifieds and fintech. Recent improvements in Tencent's profitability and improved sentiment toward the Chinese economy, fueled by stronger-than-expected stimulus announcements, have positively impacted Tencent&rsquo;s share price and enhanced the outlook for Prosus' stake. Efforts to reduce the discount to net asset value (NAV) through structural simplification are also encouraging. Additionally, the appointment of a new CEO, with a strong operational background in food delivery and complementary skills to the Group President &amp; CIO, signals a renewed focus on profitability, value maximization, and disciplined capital allocation. With a robust cash position, Prosus is well-positioned to act as a consolidator in its sectors, potentially seizing global opportunities.</li>
<li class="mt-2"><strong>International Container Terminal Services (&ldquo;ICTSI&rdquo;) (3.6% of Fund net assets</strong><sup><strong>*</strong></sup><strong>):</strong> ICTSI serves as a key indicator of emerging markets growth, leveraging its significant pricing power to achieve high operating leverage and the strongest margins among its peers. Continuous earnings per share (EPS) upgrades by analysts have kept ICTSI's valuations attractive, even after its notable outperformance. The company's 2025 estimated price&ndash;earnings ratio (PER) of 18x and earnings before interest, taxes, depreciation and amortization (EBITDA) multiple of 9.80x, while higher than Philippines Stock Exchange PSEi Index (PCOMP) averages, remain appealing, especially given its industry-leading return on equity (ROE). Key drivers of future growth include: (i) volume increases from recent expansions in Australia and Mexico, (ii) higher tariff rates at two major port operations&mdash;the Manila International Container Terminal and the Victoria International Container Terminal in Australia, and (iii) further global expansion through mergers and acquisitions. ICTSI is also well-positioned to benefit from macroeconomic trends like the U.S.-China decoupling and the global energy transition.</li>
</ul>
<h2><strong>Top Detractors</strong></h2>
<p>Top detractors to return on an absolute basis during the quarter:</p>
<ul class="content-list">
<li class="mt-2"><strong>Samsung Electronics (4.8% of Fund net assets</strong><sup><strong>*</strong></sup><strong>):</strong> It has been a challenging quarter for the semiconductor sector, and Samsung has particularly felt the impact. The company faced delays in rolling out its commercial-scale HBM3 memory, which is critical for AI and machine learning applications. This setback left Samsung vulnerable to the weak demand in China. All eyes are now on their third-quarter earnings report, expected at the end of October, to assess any progress in this crucial area. At present, Samsung's valuation appears to be under pressure, reflecting the uncertainty around its ability to catch up in this key segment.</li>
<li class="mt-2"><strong>SK hynix (2.5% of Fund net assets</strong><sup><strong>*</strong></sup><strong>):</strong> Like Samsung, SK hynix experienced significant profit-taking as the market anticipates third-quarter results. This was partly driven by setbacks at Nvidia, which impacted the entire sector globally. Additionally, analyst reports have raised concerns that memory demand for AI GPUs may fall short of expectations for the third and fourth quarters of 2024. While SK hynix has yet to report its third-quarter earnings, Micron, a close competitor, has already done so. Given the similarities between Micron and SK hynix, there's optimism that SK hynix&rsquo;s results will reach the higher end of expectations, which could positively influence its stock price.</li>
<li class="mt-2"><strong>Kaspi.kz (2.6% of Fund net assets</strong><sup><strong>*</strong></sup><strong>):</strong> Kaspi.kz JSC is Kazakhstan's leading payments, marketplace and fintech platform, engaging with over 90% of the country's adult population on a monthly basis. Kaspi's business model is highly profitable, driven by a well-integrated ecosystem that fuels growth across its three core segments. Since going public, first in London and more recently in the U.S., Kaspi has consistently exceeded market expectations, demonstrating its ability to leverage scale and its ecosystem to explore new opportunities, such as online grocery and travel services. Although the company's share price faced some pressure during the quarter following a short-seller report that raised governance concerns, a thorough analysis of these claims, combined with a formal statement of confidence from Kazakhstan's regulator regarding Kaspi&rsquo;s governance and risk management protocols, provided reassurance. Kaspi's response to the allegations further supports the view that there is insufficient evidence to validate the concerns. We remain confident in Kaspi&rsquo;s strong growth and earnings potential.</li>
</ul>
<style>
    .data-td.data {
        padding-right: 5px !important;
    }

    .wrapped-div {
        max-width: 100%;
    }

    @media (max-width: 1240px) {
        .wrapped-div {
            overflow-x: scroll;
        }
    }

    .wrapped-div-sector {
        max-width: 100%;
        overflow-x: scroll;
    }
</style>
<h2><strong>Top Buys &amp; Sells</strong></h2>
<p>During the period, we established new positions in the following:</p>
<ul class="content-list">
<li class="mt-2"><strong>Smartfit Escola de Ginastica (&ldquo;Smartfit&rdquo;) (0.5% of Fund net assets</strong><sup><strong>*</strong></sup><strong>):</strong> Smartfit, the largest fitness company in Latin America, offers a strong investment case due to its dominant market position and growth potential in an underpenetrated, fragmented market. Its affordable $20/month membership and resilient business model, with low churn, position it well for continued expansion. Mature gyms achieve 50% EBITDA margins and a 28% return on invested capital (ROIC), and with ongoing new gym openings, the company&rsquo;s growth is supported by both new locations and operating leverage. While there is a risk of stock overhang due to potential share sales by major shareholders, this could also improve liquidity.</li>
<li class="mt-2"><strong>Ayala Land Inc (0.5% of Fund net assets</strong><sup><strong>*</strong></sup><strong>):</strong> Ayala Land, the largest property developer in the Philippines, is well-positioned to benefit from the country's property market recovery following years of stagnation due to COVID. While investors are concerned about high, unsold inventory and the sustainability of growth in the high-end segment, these fears seem overdone, as reflected in the company&rsquo;s strong quarterly earnings. Ayala Land stands to gain significantly from the upcoming rate cut cycle due to its high residential exposure and stock performance, which has averaged a 60% gain during the last three easing cycles. Over the next three years, Ayala Land's revenue is expected to grow at a low double-digit rate, driven by the real estate market recovery, strong sales in the premium segment and increased mall revenue post-renovations. With slight margin expansion, EPS growth is projected at a 20-25% compound annual growth rate (CAGR).</li>
<li class="mt-2"><strong>Credicorp Ltd (0.4% of Fund net assets</strong><sup><strong>*</strong></sup><strong>):</strong> Credicorp offers a strong investment opportunity despite political instability and macroeconomic challenges in Peru. The company has consistently delivered positive results, supported by Peru&rsquo;s low banking penetration, high market concentration and favorable regulation. With improved macro conditions, Credicorp is poised for growth, including 3-5% loan growth in 2024 and 6-8% in 2025. The company is expected to achieve an ROE of 17-18% by 2025, with improving asset quality and business sentiment.</li>
</ul>
<p>During the period, we exited the following positions:</p>
<ul class="content-list">
<li class="mt-2"><strong>Qualitas Controladora SAB:</strong> The company delivered strong performance in 1H24, with volumes up 30% and a healthy combined ratio. However, a slowdown in volumes to more normalized levels of 20% is expected going forward. Despite the positive outlook, the company and the sector are facing concerns regarding tax litigation. The Mexican IRS is challenging the deduction of tax credits in the computation of the 16% VAT, a case now at the judicial level. The company has made no provisions for this issue and expects resolution in the next 6-12 months. Given the potential for a significant impact on profitability, the sector may experience volatility until the litigation is resolved.</li>
<li class="mt-2"><strong>Georgia Capital PLC:</strong> During the quarter, we exited our position in Georgia Capital and chose to consolidate our exposure in Georgia by focusing on Bank of Georgia. The bank continues to compound earnings and shareholder value, remaining the largest contributor to Georgia Capital&rsquo;s net asset value, while also offering greater liquidity as a stock.</li>
<li class="mt-2"><strong>MediaTek Inc: </strong>We exited our position in MediaTek this quarter, having gradually reduced it throughout the year. We believe there are more promising opportunities for capital allocation within the semiconductor sector, especially considering the unpredictable smartphone demand that MediaTek continues to face.</li>
</ul>
<h2 id="fund-positioning" class="jump-link-nav anchored-block" data-jumplink-title="Fund Positioning and Outlook">Fund Positioning and Outlook</h2>
<p>We remain grounded by our investment process and our positioning reflects our convictions from a bottom-up basis. Our process has created some positioning differentials versus the benchmark. Brazil remains overweight to start the quarter (11.3% Strategy weight versus 4.5% Index weight), as does the Philippines (5.5% versus 0.6% Index weight).</p>
<p>Taiwan and India remain underweight versus the benchmark.</p>
<p>The Strategy&rsquo;s objective is to find long-term structural growth companies at fair prices (S-GARP). Investments are chosen based on individual company analysis, focusing on quality, governance, innovative business models and low disruption risk, with active management and detailed research guiding our selection process.</p>

<p>To receive more <a href="/us/en/insights/emerging-markets-equity/" title="Emerging Markets Equity Insights"><strong>Emerging Markets Equity</strong></a> insights, <a href="/us/en/subscribe/" title="Subscription Center"><strong>sign up in our subscription center</strong></a>.</p>
]]></content:encoded>
</item><item rdf:about="https://www.vaneck.com/us/en/blogs/income-investing/clos-prove-resilient-as-rate-cuts-begin/">
  <title>CLOs Prove Resilient As Rate Cuts Begin></title>
  <link>https://www.vaneck.com/us/en/blogs/income-investing/clos-prove-resilient-as-rate-cuts-begin/</link>
  <description><![CDATA[The final weeks of September underscored the benefits of floating rate exposure, as CLOs delivered positive returns despite the start of the current rate-cutting cycle, fueled by high base rates and strong technicals.]]></description>
  <dc:creator> </dc:creator>
  <dc:date>10/21/2024 06:30:00</dc:date>
<content:encoded><![CDATA[

<p>The <strong><a href="/link/e090deaddc774ac699a04b959d9254c6.aspx" title="CLOI - VanEck CLO ETF - Overview">VanEck CLO ETF (CLOI)</a></strong> maintained its conservative positioning amid rich valuations and a tightening basis between higher and lower rated tranches. Duration trades paid off in the quarter, however, the final weeks of September illustrated the benefit of having a floating rate exposure given the highly uncertain path of rates going forward. CLOs continued to provide positive total returns despite the commencement of the current rate cutting cycle due to the still high base rates and very strong technicals. However, with expensive valuations and a bifurcated fundamental picture going forward, robust bottom-up security selection will be central to uncovering the best opportunities until any bouts of market weakness favor a shift lower in the capital stack. CLOI performed in line with its benchmark over the quarter.</p>
<h2 id="market-update" class="jump-link-nav anchored-block" data-jumplink-title="Market Update">Market Update</h2>
<p>CLOs generated positive total returns across the capital stack in September, the 18th consecutive month of positive returns at the overall index level and the 11th consecutive month of positive returns for all ratings tiers. Carry continues to drive returns given high base rates. The US labor market continued to moderate during the month, with the August payroll report coming up short of forecasts as nonfarm payrolls increased by 142k compared to the median forecast of 165k and bringing the three-month average to the lowest level since mid-2020. Meanwhile, US inflation continued to move closer to target, with the August CPI coming in at 2.5%. The weakening labor market alongside moderating inflation opened the door for the Fed to deliver an outsized 50 basis point (bps) rate cut with a shift in focus to maintaining &lsquo;maximum employment&rsquo;. The larger-than-expected cut highlights the FOMC&rsquo;s confidence that inflation will return to target given some of the labor market weakness.</p>
<p>Treasury rates were volatile during September, but decreased overall during the quarter.</p>
<p>Accordingly, floating rate CLOs and bank loans generated positive total returns but underperformed more duration-sensitive investment grade credit and high yield bonds.</p>
<div class="wrapped-div">
<table style="width: 100%;">
<tbody>
<tr class="tbl-data">
<td class="tbl-header last">Asset class</td>
<td class="tbl-header last text-right">Q3 2024 Return (%)</td>
<td class="tbl-header last text-right">Yield to Worst (%)</td>
<td class="tbl-header last text-right">Spreads (BPS)</td>
</tr>
<tr class="tbl-data">
<td class="data-td last font-weight-normal">CLOs</td>
<td class="data-td data last text-right">1.84</td>
<td class="data-td data last text-right">5.94</td>
<td class="data-td data last text-right">153</td>
</tr>
<tr class="tbl-data">
<td class="data-td last font-weight-normal">CLOs IG</td>
<td class="data-td data last text-right">1.79</td>
<td class="data-td data last text-right">5.65</td>
<td class="data-td data last text-right">123</td>
</tr>
<tr class="tbl-data">
<td class="data-td last font-weight-normal pl-4">AAA</td>
<td class="data-td data last text-right">1.68</td>
<td class="data-td data last text-right">5.42</td>
<td class="data-td data last text-right">101</td>
</tr>
<tr class="tbl-data">
<td class="data-td last font-weight-normal pl-4">AA</td>
<td class="data-td data last text-right">1.89</td>
<td class="data-td data last text-right">5.79</td>
<td class="data-td data last text-right">133</td>
</tr>
<tr class="tbl-data">
<td class="data-td last font-weight-normal pl-4">A</td>
<td class="data-td data last text-right">2.11</td>
<td class="data-td data last text-right">6.12</td>
<td class="data-td data last text-right">165</td>
</tr>
<tr class="tbl-data">
<td class="data-td last font-weight-normal pl-4">BBB</td>
<td class="data-td data last text-right">2.34</td>
<td class="data-td data last text-right">7.06</td>
<td class="data-td data last text-right">275</td>
</tr>
<tr class="tbl-data">
<td class="data-td last font-weight-normal pl-4">BB</td>
<td class="data-td data last text-right">2.69</td>
<td class="data-td data last text-right">11.09</td>
<td class="data-td data last text-right">686</td>
</tr>
<tr class="tbl-data">
<td class="data-td last font-weight-normal">Investment Grade Corporates</td>
<td class="data-td data last text-right">5.72</td>
<td class="data-td data last text-right">4.75</td>
<td class="data-td data last text-right">92</td>
</tr>
<tr class="tbl-data">
<td class="data-td last font-weight-normal">U.S. Agg</td>
<td class="data-td data last text-right">5.16</td>
<td class="data-td data last text-right">4.26</td>
<td class="data-td data last text-right">38</td>
</tr>
<tr class="tbl-data">
<td class="data-td last font-weight-normal">Leveraged Loans</td>
<td class="data-td data last text-right">2.04</td>
<td class="data-td data last text-right">7.95</td>
<td class="data-td data last text-right">331</td>
</tr>
<tr class="tbl-data">
<td class="data-td last font-weight-normal">High Yield Bonds</td>
<td class="data-td data last text-right">5.28</td>
<td class="data-td data last text-right">6.98</td>
<td class="data-td data last text-right">303</td>
</tr>
</tbody>
</table>
</div>
<p class="chart-disclosure">Source: JP Morgan and ICE Data Indices as of 9/30/2024. CLOs represented by J.P. Morgan Collateralized Loan Obligation Index, AAA Rated CLOs represented by J.P. Morgan CLO AAA Index, AA Rated CLOs represented by J.P. Morgan CLO AA Index, A Rated CLOs represented by J.P. Morgan CLO A Index, BBB Rated CLOs represented by J.P. Morgan CLO BBB Index, BB Rated CLOs represented by J.P. Morgan CLO BB Index, Investment Grade Corporates represented by ICE BofA US Corporate Index, US Agg is represented by the ICE BofA US Broad Market, Leveraged Loans represented by JP Morgan Leveraged Loan Index and High Yield Bonds represented by ICE BofA US High Yield Index.</p>

<p>CLO new issue supply decreased month-over-month following a busier than typical August, with $12.6bn pricing during the month, compared to $14.6bn in August. New issuance volume is now 69% higher than year-to-date 2023. CLO issuance has become more attractive as the arbitrage improved with lower liability costs, leading to the second fastest pace of BSL CLO primary issuance to start a year on record.</p>
<p>Refinancing and reset activity for the year is now $204.8bn compared to just $9.9bn year-to-date 2023. Year-to-date total issuance of $345.7bn is now 270% higher than the same period last year.</p>
<p>In the secondary market, TRACE supply increased month-over-month to $14.6bn from $14.1bn. Investment grade volumes decreased to $9.8bn from $10.8bn, while below investment grade volumes increased to $4.8bn from $3.3bn the prior month. Meanwhile total BWIC volume increased to $5.3bn and was the highest monthly volume since January.</p>
<p>Gross institutional loan issuance accelerated after the dearth of issuance in August, with $69.4bn pricing, after just $7.3bn priced in August. While opportunistic transactions including refinancings accounted for the lion&rsquo;s share of issuance again this month, there was a notable increase in dividend recapitalizations as well as a rise in M&amp;A and LBO activity. Opportunistic issuance rebounded from the August lows but remained below the average volume set in the first half of the year due in part to the smaller pool of loans trading above par. However, both repricing and refinancing volumes remain at a record pace year-to-date.</p>
<p>The trailing twelve-month default rate within the Morningstar US Leveraged Loan Index was roughly unchanged month-over-month at 0.80%. In contrast, as measured by JP Morgan, the default rate including distressed exchanges is 3.70%. Activity has been elevated as borrowers with unsustainable capital structures endeavored to manage their liabilities and avoid the bankruptcy process through liability management exercises, keeping the &ldquo;official&rdquo; default rate lower than otherwise. We anticipate the default rate to remain below historical averages in the near term for the leveraged loan market as a result. None-the-less, our expectations are that defaults, including distressed exchanges, will remain in the 3-4% range, above the long-term historical average of ~3%.</p>
<p>CLO fundamentals were mixed month-over-month, although with a more positive bias overall. US CLO spreads were tighter across most of the capital stack.</p>
<h3>Average Annual Total Returns<sup>*</sup>&nbsp;(%) Quarter End as of 09/30/24</h3>
<div class="wrapped-div">
<table style="width: 100%;">
<tbody>
<tr class="tbl-data">
<td class="tbl-header last">&nbsp;</td>
<td class="tbl-header last text-right">1 Month</td>
<td class="tbl-header last text-right">3 Month</td>
<td class="tbl-header last text-right">YTD</td>
<td class="tbl-header last text-right">1 Year</td>
<td class="tbl-header last text-right">LIFE 6/21/2022</td>
</tr>
<tr class="tbl-data">
<td class="data-td last">CLOI (NAV)</td>
<td class="data-td data last text-right">0.60</td>
<td class="data-td data last text-right">1.82</td>
<td class="data-td data last text-right">6.27</td>
<td class="data-td data last text-right">8.45</td>
<td class="data-td data last text-right">8.34</td>
</tr>
<tr class="tbl-data">
<td class="data-td last">CLOI (Share Price)</td>
<td class="data-td data last text-right">0.66</td>
<td class="data-td data last text-right">1.92</td>
<td class="data-td data last text-right">6.42</td>
<td class="data-td data last text-right">8.35</td>
</tr>
<tr class="tbl-data">
<td class="data-td last">J.P. Morgan Collateralized Loan Obligation Index</td>
<td class="data-td data last text-right">0.68</td>
<td class="data-td data last text-right">1.84</td>
<td class="data-td data last text-right">6.36</td>
<td class="data-td data last text-right">9.22</td>
<td class="data-td data last text-right">8.63</td>
</tr>
</tbody>
</table>
</div>
<p class="chart-disclosure"><sup>*</sup>&nbsp;Returns less than one year are not annualized.</p>
<p class="chart-disclosure"><strong>The performance data quoted represents past performance. Past performance is not a guarantee of future results. Investment return and principal value of an investment will fluctuate so that an investor's shares, when redeemed, may be worth more or less than their original cost. Performance may be lower or higher than performance data quoted. Please call 800.826.2333 or visit vaneck.com for performance current to the most recent month ended.</strong></p>
<p class="chart-disclosure">CLOI&rsquo;s gross expense ratio is 0.40% and the total expense ratio is 0.40%. Van Eck Associates Corporation (the &ldquo;Adviser&rdquo;) will pay all expenses of the Fund, except for the fee payment under the investment management agreement, acquired fund fees and expenses, interest expense, offering costs, trading expenses, taxes and extraordinary expenses. Notwithstanding the foregoing, the Adviser has agreed to pay the offering costs until at least May 1, 2025. &ldquo;Other Expenses&rdquo; have been restated to reflect current fees.</p>
<p class="chart-disclosure">Source: <strong>FactSet, J.P. Morgan, VanEck</strong>, as of June 30, 2024. Index performance is not representative of Fund performance. It is not possible to invest directly in an index.</p>
<h2 id="portfolio-strategy" class="jump-link-nav anchored-block" data-jumplink-title="Portfolio Strategy">Portfolio Strategy</h2>
<p>The borrowing rate for leveraged loan borrowers remains high following rate increases from central banks over the last two years. While there have been signs of softening and concerns over a weakening labor market, higher interest rates have yet to drive a material deterioration in credit metrics within the loan market, except for the weakest borrowers. Increased coupon payments for borrowers means that interest coverage ratios will continue to decline as the lagged effect of rate increases takes hold. Ultimately, the result will be higher leverage and even lower interest coverage ratios, leading to the risk of downgrade if companies are unable to refinance outstanding debt as maturities come due or grow revenues from a more robust economic environment. However, following more recent economic reports showing a softening labor market and moderating inflation, the Fed initiated the next rate-cutting cycle with a 50 bps cut in September. Market expectations with respect to Fed easing have moved lower than the most optimistic case in late September, but two more rate cuts are still priced in for 2024. Cuts will provide relief for more stressed borrowers.</p>
<p>CLO prices remain elevated following the significant rally this year with the average AAA-BBB price ending September above par and the basis between higher and lower rated tranches also tight. Against this backdrop, we have paused any broad risk on shifts lower in the capital stack. Were spreads to widen, we maintain the ability to shift further into lower rated tranches. With the majority of CLO paper trading above par, we continue to realize gains in securities that are trading above par in favor of credits which offer more positive price convexity and/or spread in the primary market.</p>
<p>Primary and secondary spreads tightened to start the year, with secondary AAA-A spreads ending September at or near the tightest levels since 1Q 2022. However, buying in the primary market continues to allow for wider spreads on a relative basis, even when taking spread duration into account.</p>
<h3>CLOI Total Return and Credit Allocation</h3>
<p><img class="img-responsive w-100" src="https://www.vaneck.com/contentassets/9485f642513848c0a41c99a21de9f375/4944_clo-quarterly_chart-1_2024-10_v1_blog.svg" alt="CLOI Total Return and Credit Allocation" /></p>
<p class="chart-disclosure">Source: <strong>FactSet, J.P. Morgan, VanEck</strong>, as of September 30, 2024. Index performance is not representative of Fund performance. It is not possible to invest directly in an index.</p>
<h2 id="outlook" class="jump-link-nav anchored-block" data-jumplink-title="Outlook">Outlook</h2>
<p>We&rsquo;re likely transitioning from a period of high growth to either a soft landing or a typical recession. From a top-down perspective, we see moderating inflation trending toward a soft landing and, alongside a softening labor market, is allowing central banks space to normalize policy. With the commencement of the Fed&rsquo;s easing cycle with an outsized 50bps cut, any economic deceleration should be cushioned by monetary policy becoming less restrictive in the year ahead. However, the pace of monetary policy changes remains highly uncertain following a blowout nonfarm payrolls report for September, which showed an increase of 254k compared to the median forecast of 150k. In addition, while there is significant uncertainty from the upcoming US elections, the expectations for on-going fiscal spending irrespective of the outcome should provide economic stimulus. There are likely to be certain industries and geographic regional impacts rather than broader recession concerns. Furthermore, geo-political risks appear to be elevated with the conflict in the Middle East escalating. From a fundamental credit profile perspective, the outlook is favorable despite a weakening trend with many metrics starting from high levels. We see no reason to change our default outlook, which calls for a modest increase but not a spike in default activity.</p>
<p>Despite limited net loan issuance, CLO new issuance has continued at a near record pace as managers take advantage of tighter liability spreads. We expect this will continue in the near term given current AAA spreads remain near the tights since early 2022, but this pace may be unsustainable unless M&amp;A and LBO activity picks up. Despite the higher-than-expected supply, CLOs continue to see strong demand given high all-in yields, which we expect to remain the case through year-end, despite the commencement of the Fed&rsquo;s rate cutting cycle. In addition to the traditional investor base of insurers, banks, and money managers (among others) &ndash; which have been a consistent source of demand given CLOs&rsquo; strong performance since the Covid period &ndash; the CLO market has also benefited from the growing presence of CLO exchange-traded funds. Japanese banks, traditionally big buyers of AAA rated paper, are also expected to make additional allocations to CLOs which could serve as a tailwind for further spread compression and ultimately additional CLO creation over the back half of the year and into early 2025. We have also seen a material increase in refinancing and reset activity in recent months as portfolios constructed with purchases in the secondary market take advantage of higher loan prices and tighter CLO spreads. This has also bolstered demand for new paper and led to tighter spreads as investors put proceeds back to work. Should the loan and CLO markets continue to rally, we would expect to see more portfolios benefit from the significant redemption optionality in CLOs.</p>
<p>Amid the supportive technical environment, we anticipate CLO spreads to trade in a range for the next 3-6 months and see spreads and yields attractive under most market scenarios over the next twelve months. Notwithstanding the shorter-term technical tailwinds, we believe expensive valuations and a fundamental picture bifurcated between vintages and, relatedly, between deals in and out of their reinvestment periods, calls for a robust bottom-up approach to security selection for long-term investors. Given the dispersion seen in the loan market, certain CLO portfolios holding weaker credits may eventually experience impairments to the lowest rated debt tranches, although some of the weakest borrowers may start to see some relief given rate cuts from the Fed. As a result, vintage, portfolio, and manager selection remains key. In addition, with tight valuations and risks tilted to the downside, we remain positioned higher in the capital stack overall, maintaining the ability to quickly shift lower in the capital stack should the market experience any bouts of weakness.</p>

<p>To receive more <a href="/us/en/blogs/income-investing/" title="Income Investing Insights"><strong>Income Investing</strong></a> insights, <a href="/link/5f45412c2143400497908cea2897f7d3.aspx" title=" Subscription Center"><strong>sign up in our subscription center</strong></a>.</p>
]]></content:encoded>
</item><item rdf:about="https://www.vaneck.com/us/en/blogs/natural-resources/geopolitics-take-center-stage-in-resources/">
  <title>Geopolitics Take Center Stage in Resources></title>
  <link>https://www.vaneck.com/us/en/blogs/natural-resources/geopolitics-take-center-stage-in-resources/</link>
  <description><![CDATA[Key drivers of commodity prices in Q3 included a slowing global growth outlook, China's historic stimulus, U.S. interest rate cuts and rising geopolitical tensions.]]></description>
  <dc:creator>Shawn Reynolds</dc:creator>
  <dc:date>10/21/2024 06:30:00</dc:date>
<content:encoded><![CDATA[

<p>Quarterly insights from Global Resources Portfolio Manager Shawn Reynolds, featuring his unique views on natural resources and commodities.</p>
<h2>Volatility Reigns</h2>
<p>Commodity prices were volatile during the quarter. Bloomberg Commodity Index<sup>1</sup>&nbsp;dropped -7.6% from end-June to early September before eventually rallying back to end the quarter down only -0.64%. From a macro perspective, the biggest drivers of commodity prices included a moderating global growth outlook, China&rsquo;s historic stimulus measures, interest rate cuts in the U.S. as well as escalating geopolitical tensions.</p>
<p>Most notable of these factors was China&rsquo;s announced stimulus measures. All told, the measures are expected to free up some 1 trillion yuan in capital, reduce interest expenses for homebuyers by approximately 150 billion yuan annually, encourage further borrowing and boost overall market liquidity.</p>
<p>As the largest consumer of raw materials globally, China&rsquo;s comments impacted commodity prices almost immediately. In the days following the announcement, metals such as iron ore, zinc, aluminum and copper were up approximately 12%, 7%, 6% and 5.5%, respectively. The boost was also felt by the producers themselves, with many of the largest miners up double digits over the same period.</p>
<p>On the flip side, oil prices continued to ease as the outlook for growth slowed more broadly and supply remained relatively robust. The majority of oil and gas producers &ndash; including both integrateds and independent producers &ndash; experienced modest losses on the quarter.</p>

<h2>Eyes on the Middle East</h2>
<p>There are multiple factors impacting the outlook for commodities and resource equities for the remainder of the year. First and foremost is China and how global markets continue to respond to the country&rsquo;s announced stimulus measures. Secondly is geopolitics &ndash; including the ongoing escalation of tensions in the Middle East and the outcome of U.S. elections in November. Finally, are lower interest rates in the U.S. and how that environment may benefit the renewables space.</p>
<p>We continue to keep a close eye on the Middle East just given the potential for all-out war in such an oil-rich region. While it is estimated that +OPEC has upwards of 6 million barrels per day of spare productive capacity available to come to market on short notice, much of that supply would still likely need to come through the region&rsquo;s Strait of Hormuz &ndash; a passage already fraught with risk.</p>
<p>To address the heightened geopolitical risk in the Middle East, it's useful to compare the situation to the natural gas and commodity price spikes experienced in Europe after Russia&rsquo;s invasion of Ukraine. However, the potential disruption in the Middle East could be significantly larger, given oil's critical role in the global economy. A major conflict in this region could exacerbate already volatile energy markets, impacting supply chains far beyond just oil-producing countries, and further magnifying the global implications for commodities and resource equities. The sheer scale of oil&rsquo;s influence makes any disruption potentially far more destabilizing globally.</p>
<p>Renewables, which have been negatively impacted by higher borrowing costs for the last several years, look to be one of the prime beneficiaries of a pivot to lower rates. Share prices of companies within the space have been rallying since expectations of interest rate cuts in the U.S. and that momentum may carry with further easing measures.</p>
<p>To receive more <a href="/us/en/insights/natural-resources/" title="Natural Resources Insights"><strong>Natural Resources</strong></a> insights, <a href="https://www.vaneck.com/us/en/subscribe/" title="Subscription Center"><strong>sign up in our subscription center</strong></a>.</p>
]]></content:encoded>
</item><item rdf:about="https://www.vaneck.com/us/en/blogs/income-investing/fallen-angels-new-downgrades-end-seven-month-drought/">
  <title>Fallen Angels: New Downgrades End Seven Month Drought></title>
  <link>https://www.vaneck.com/us/en/blogs/income-investing/fallen-angels-new-downgrades-end-seven-month-drought/</link>
  <description><![CDATA[The seven-month drought of fallen angels ended in September with two downgrades to high yield, while possible downgrades of Boeing and Paramount have the potential to have a significant impact.]]></description>
  <dc:creator>Nicolas  Fonseca, CFA</dc:creator>
  <dc:date>10/16/2024 06:30:00</dc:date>
<content:encoded><![CDATA[

<p>Fallen angels (as represented by the ICE US Fallen Angel High Yield 10% Constrained Index, &ldquo;H0CF&rdquo;) underperformed the broad high yield market (as represented by the ICE BofA US High Yield Index, &ldquo;H0A0&rdquo;) in September by 0.35% (1.28% vs. 1.63%), as lower quality bonds continued to outperform. This extended fallen angels&rsquo; Q3 underperformance to 0.23% (5.05% vs. 5.28%) and widened the YTD performance gap to 1.84% (6.18% vs. 8.03%). One of the key trends supporting high yield performance has been the outperformance of lower-rated bonds. The CCC &amp; Lower-rated index has returned an impressive 15.35% YTD, compared to 7.19% for Single-B and 6.82% for BB-rated bonds. The higher quality exposure that is characteristic of fallen angels (87% BB vs 54% in the broad high yield market) has been a headwind in terms of relative performance. In September, the fallen angel index had two new entrants: OCI NV and VF Corp, which were downgraded to high yield, adding approximately $2.4bn in face value to the Index, while in early October, S&amp;P placed Boeing on negative watch as approximately 33,000 workers remain on strike.</p>
<p>In mid-September, the U.S. Federal Reserve (Fed) cut interest rates by 0.50%, bringing them to a range of 4.75%&ndash;5.00%. This marked the first rate cut in four years, reflecting progress toward the Fed&rsquo;s 2% inflation target and indicating signs of softening in the labor market. While credit conditions have remained robust overall, the upcoming November elections and ongoing geopolitical risks in the Middle East could lead to heightened volatility in the coming months.</p>
<h2 id="positioning-for-q4" class="jump-link-nav anchored-block" data-jumplink-title="Fallen Angel Positioning for Q4 2024">Fallen Angel Positioning for Q4 2024</h2>
<p>Fallen angels offer a distinct value proposition within the high yield market. Since the pandemic, they have maintained higher quality, with over 80% of fallen angels rated BB, compared to approximately 50% for the broader high yield market. However, sector exposures have shifted significantly. Earlier this year, we highlighted Real Estate and Banking as key sectors to watch due to their overweight positions in fallen angels, offering attractive spreads and higher yields. These sectors have delivered positive performance, behind only Telecom, which was the highest contributor in both Q3 2024 and YTD.</p>
<p>Looking ahead to Q4, we continue to see Banking and Real Estate as sectors of interest, with overweights of 4.65% and 5.99%, while offering wider spreads (7bps and 110bps) and higher yields (48bps and 90bps), respectively. We are keeping a close eye on Capital Goods and Media, as downgrades of large issuers Boeing and Paramount have the potential to alter sector dynamics. Lastly, Retail and Telecom are significantly overweight in the fallen angel index by 15.53% and 6.24%, respectively.</p>
<h3>Sector Allocations: Fallen Angel US High Yield vs. Broad US High Yield (As of 9/30/2024)</h3>
<p><img class="img-responsive w-100" alt="Fallen Angel US High Yield vs. Broad US High Yield (as of 9/30/2024)" src="https://www.vaneck.com/contentassets/7e738b6fb219461391b4749a3f41610b/4927_angl-oct_chart-1_2024.10_v1_blog.svg" /></p>
<p class="chart-disclosure">Source: ICE Data services and VanEck.</p>
<p id="overall-statistics" class="jump-link-nav anchored-block" data-jumplink-title="Fallen Angels Overall Statistics"><strong>Fallen Angels Overall Statistics:</strong> Fallen angel yields continued their downward trend, ending the month at 6.43%. This marked the first time since the summer of 2022 that yields finished below 6.50%. The average price of fallen angels rose to $93.69, narrowing the gap relative to the long-term average, although remaining about $1.50 below that level. This reflected the broader trend in the high yield market, where average yield declined by 36bps to 6.98% and the average price increased to $96.72. We also note the shrinking yield differential between fallen angels and the broad high yield market. As of the end of September, the spread had narrowed to just 0.55%, its lowest level since the summer of 2021. This narrowing gap has occurred despite the stability of the overall credit quality of both markets, with the main driver being the compression of CCC and below spreads. The fallen angel index saw its largest market value increase in recent months, boosted by the addition of two fallen angels.</p>
<div class="wrapped-div">
<table style="width: 100%;">
<tbody>
<tr class="tbl-data">
<td class="tbl-header last text-center">&nbsp;</td>
<td class="tbl-header last text-center" style="border-right: outset;" colspan="4">Fallen Angels</td>
<td class="tbl-header last text-center" colspan="4">Broad HY</td>
</tr>
<tr class="tbl-data">
<td class="data-td last">&nbsp;</td>
<td class="data-head last text-right">12/31/23</td>
<td class="data-head last text-right">3/31/24</td>
<td class="data-head last text-right">6/30/24</td>
<td class="data-head last text-right" style="border-right: outset;">9/30/24</td>
<td class="data-head last text-right">12/31/23</td>
<td class="data-head last text-right">3/31/24</td>
<td class="data-head last text-right">6/30/24</td>
<td class="data-head last text-right">9/30/24</td>
</tr>
<tr class="tbl-data">
<td class="data-td last">Yield to Worst</td>
<td class="data-td data last text-right">6.99</td>
<td class="data-td data last text-right">6.92</td>
<td class="data-td data last text-right">7.10</td>
<td class="data-td data last text-right" style="border-right: outset;">6.43</td>
<td class="data-td data last text-right">7.69</td>
<td class="data-td data last text-right">7.75</td>
<td class="data-td data last text-right">7.94</td>
<td class="data-td data last text-right">6.98</td>
</tr>
<tr class="tbl-data">
<td class="data-td last">Par Weighted Price</td>
<td class="data-td data last text-right">91.20</td>
<td class="data-td data last text-right">91.22</td>
<td class="data-td data last text-right">90.32</td>
<td class="data-td data last text-right" style="border-right: outset;">93.69</td>
<td class="data-td data last text-right">91.86</td>
<td class="data-td data last text-right">93.18</td>
<td class="data-td data last text-right">92.98</td>
<td class="data-td data last text-right">96.72</td>
</tr>
<tr class="tbl-data">
<td class="data-td last">Effective Duration</td>
<td class="data-td data last text-right">5.41</td>
<td class="data-td data last text-right">5.32</td>
<td class="data-td data last text-right">5.08</td>
<td class="data-td data last text-right" style="border-right: outset;">5.04</td>
<td class="data-td data last text-right">3.31</td>
<td class="data-td data last text-right">3.28</td>
<td class="data-td data last text-right">3.26</td>
<td class="data-td data last text-right">3.04</td>
</tr>
<tr class="tbl-data">
<td class="data-td last">Full Market Value ($mn)</td>
<td class="data-td data last text-right">67,821</td>
<td class="data-td data last text-right">64,657</td>
<td class="data-td data last text-right">55,371</td>
<td class="data-td data last text-right" style="border-right: outset;">57,236</td>
<td class="data-td data last text-right">1,237,721</td>
<td class="data-td data last text-right">1,260,542</td>
<td class="data-td data last text-right">1,266,993</td>
<td class="data-td data last text-right">1,336,160</td>
</tr>
<tr class="tbl-data">
<td class="data-td last">OAS</td>
<td class="data-td data last text-right">285</td>
<td class="data-td data last text-right">247</td>
<td class="data-td data last text-right">252</td>
<td class="data-td data last text-right" style="border-right: outset;">261</td>
<td class="data-td data last text-right">339</td>
<td class="data-td data last text-right">315</td>
<td class="data-td data last text-right">321</td>
<td class="data-td data last text-right">330</td>
</tr>
<tr class="tbl-data">
<td class="data-td last">No. of Issues</td>
<td class="data-td data last text-right">143</td>
<td class="data-td data last text-right">138</td>
<td class="data-td data last text-right">126</td>
<td class="data-td data last text-right" style="border-right: outset;">124</td>
<td class="data-td data last text-right">1,837</td>
<td class="data-td data last text-right">1,864</td>
<td class="data-td data last text-right">1,863</td>
<td class="data-td data last text-right">1,873</td>
</tr>
</tbody>
</table>
</div>
<p class="chart-disclosure">Source: ICE Data Services, VanEck. Fallen Angels: ICE US Fallen Angel High Yield 10% Constrained Index. Broad HY: ICE BofA US High Yield Index. OAS refers to &ldquo;option-adjusted spread.&rdquo; Please see definition for this and other terms referenced herein in the disclosures and definitions portion of this blog. Past performance is no guarantee of future results. Index performance is not representative of strategy performance. It is not possible to invest in an index.</p>
<p><strong>Fallen Angels:</strong> The seven month drought of fallen angles ended in September as OCI NV and VF Corporation were downgraded to high yield, adding approximately $2.4bn in face value to the index. OCI NV senior unsecured notes were downgraded to Ba1 from Baa3 by Moody&rsquo;s as a result of multiple divestiture announcements by the company, which Moody&rsquo;s believes will greatly diminish its scale and business profile. VF Corporation was also downgraded to Ba1 from Baa3 by Moody&rsquo;s, reflecting a weaker credit profile as it transforms its business with various initiatives. We continue to watch for any action by Moody&rsquo;s on Paramount following its current review, as well as any additional rating actions on Boeing following S&amp;P placing it on negative watch. S&amp;P stated that their action reflects the possibility of a downgrade if the strike continues towards the end of the year, as Boeing will likely incur a cash outflow of $10bn and require additional funding. Two downgrades are needed for Boeing to become a fallen angel eligible for index inclusion.</p>
<div class="wrapped-div">
<table style="width: 100%;">
<tbody>
<tr class="tbl-data">
<td class="tbl-header last">Month-end Addition</td>
<td class="tbl-header last text-left">Name</td>
<td class="tbl-header last text-left">Rating</td>
<td class="tbl-header last text-left">Sector</td>
<td class="tbl-header last text-left">Industry</td>
<td class="tbl-header last text-right">% Mkt Value</td>
<td class="tbl-header last text-right">Price</td>
</tr>
<tr class="tbl-data">
<td class="data-td last font-weight-normal">January</td>
<td class="data-td data last text-left">Hudson Pacific Properties LP</td>
<td class="data-td data last text-left">BB1</td>
<td class="data-td data last text-left">Real Estate</td>
<td class="data-td data last text-left">REITs</td>
<td class="data-td data last text-right">2.18</td>
<td class="data-td data last text-right">88.05</td>
</tr>
<tr class="tbl-data">
<td class="data-td last font-weight-normal">February</td>
<td class="data-td data last text-left">Advance Auto Parts Inc.</td>
<td class="data-td data last text-left">BB1</td>
<td class="data-td data last text-left">Retail</td>
<td class="data-td data last text-left">Specialty Retail</td>
<td class="data-td data last text-right">2.52</td>
<td class="data-td data last text-right">91.20</td>
</tr>
<tr class="tbl-data">
<td class="data-td last font-weight-normal">September</td>
<td class="data-td data last text-left">OCI NV</td>
<td class="data-td data last text-left">BB1</td>
<td class="data-td data last text-left">Basic Industry</td>
<td class="data-td data last text-left">Chemicals</td>
<td class="data-td data last text-right">1.10</td>
<td class="data-td data last text-right">104.79</td>
</tr>
<tr class="tbl-data">
<td class="data-td last font-weight-normal">September</td>
<td class="data-td data last text-left">V.F. Corp</td>
<td class="data-td data last text-left">BB1</td>
<td class="data-td data last text-left">Retail</td>
<td class="data-td data last text-left">Specialty Retail</td>
<td class="data-td data last text-right">3.04</td>
<td class="data-td data last text-right">94.08</td>
</tr>
</tbody>
</table>
</div>
<p class="chart-disclosure">Source: ICE Data Services, VanEck. Fallen Angels: ICE US Fallen Angel High Yield 10% Constrained Index. Past performance is no guarantee of future results. Not a recommendation to buy or sell any of the names/securities mentioned herein. Index performance is not representative of strategy performance. It is not possible to invest in an index.</p>

<p><strong>Rising Stars:</strong> Port of Newcastle Investments Financing was upgraded by S&amp;P to BBB- from BB+&nbsp;on stronger financials, joining Delta Air Lines as the only rising stars in Q3. It was downgraded to high yield exactly one year ago, September 2023, entering the fallen angel index at $82.79 and exiting at $95.59, providing a 15% price return.</p>
<div class="wrapped-div">
<table style="width: 100%;">
<tbody>
<tr class="tbl-data">
<td class="tbl-header last">Month-end Exit</td>
<td class="tbl-header last text-left">Name</td>
<td class="tbl-header last text-left">Rating</td>
<td class="tbl-header last text-left">Sector</td>
<td class="tbl-header last text-left">Industry</td>
<td class="tbl-header last text-right">% Mkt Value</td>
<td class="tbl-header last text-right">Price</td>
</tr>
<tr class="tbl-data">
<td class="data-td last font-weight-normal">February</td>
<td class="data-td data last text-left">Las Vegas Sands Corp</td>
<td class="data-td data last text-left">BB1</td>
<td class="data-td data last text-left">Leisure</td>
<td class="data-td data last text-left">Gaming</td>
<td class="data-td data last text-right">3.12</td>
<td class="data-td data last text-right">93.19</td>
</tr>
<tr class="tbl-data">
<td class="data-td last font-weight-normal">March</td>
<td class="data-td data last text-left">Enlink Midstream Partners LP</td>
<td class="data-td data last text-left">BB1</td>
<td class="data-td data last text-left">Energy</td>
<td class="data-td data last text-left">Gas Distribution</td>
<td class="data-td data last text-right">2.30</td>
<td class="data-td data last text-right">88.92</td>
</tr>
<tr class="tbl-data">
<td class="data-td last font-weight-normal">April</td>
<td class="data-td data last text-left">FirstEnergy Corp.</td>
<td class="data-td data last text-left">BB1</td>
<td class="data-td data last text-left">Utility</td>
<td class="data-td data last text-left">Electric-Integrated</td>
<td class="data-td data last text-right">6.62</td>
<td class="data-td data last text-right">87.10</td>
</tr>
<tr class="tbl-data">
<td class="data-td last font-weight-normal">April</td>
<td class="data-td data last text-left">Rolls-Royce PLC</td>
<td class="data-td data last text-left">BB1</td>
<td class="data-td data last text-left">Capital Goods</td>
<td class="data-td data last text-left">Aerospace/Defense</td>
<td class="data-td data last text-right">1.51</td>
<td class="data-td data last text-right">96.00</td>
</tr>
<tr class="tbl-data">
<td class="data-td last font-weight-normal">July</td>
<td class="data-td data last text-left">Delta Air Lines Inc.</td>
<td class="data-td data last text-left">BB1</td>
<td class="data-td data last text-left">Transportation</td>
<td class="data-td data last text-left">Air Transportation</td>
<td class="data-td data last text-right">1.50</td>
<td class="data-td data last text-right">94.59</td>
</tr>
<tr class="tbl-data">
<td class="data-td last font-weight-normal">September</td>
<td class="data-td data last text-left">Port of Newcastle Investments Financing Pty Limited</td>
<td class="data-td data last text-left">BB1</td>
<td class="data-td data last text-left">Transportation</td>
<td class="data-td data last text-left">Transport Infrastructure/Services</td>
<td class="data-td data last text-right">0.52</td>
<td class="data-td data last text-right">95.59</td>
</tr>
</tbody>
</table>
</div>
<p class="chart-disclosure">Source: ICE Data Services, VanEck. Fallen Angels: ICE US Fallen Angel High Yield 10% Constrained Index. Past performance is no guarantee of future results. Not a recommendation to buy or sell any of the names/securities mentioned herein. Index performance is not representative of strategy performance. It is not possible to invest in an index.</p>
<p><strong>Fallen Angels Performance by Sector</strong>: Basic Industry and Retail saw their exposure increase with the addition of OCI NV and VF Corporation. Basic Industry is now just shy of a 5% exposure while Retail jumped to close to 22% and continues to be the top sector exposure within fallen angels. Aside from these two sectors, there were no major shifts for Q3. In terms of spread, the Transportation sector saw 71bps of tightening, the largest of all sectors, while its price jumped by over 8%. Fallen angel spreads saw some volatility in Q3, as they reached 310bps in early August, but overall have been trending down so far this year. Real Estate spreads remain volatile and display the highest spreads of all sectors. September is the first month since February 2023, when the Banking sector was slightly above par (right before the mini-crisis) where various sectors have seen their price above par, but unfortunately this was not enough to outperform broad high yield. Regarding sector attribution vs broad high yield for Q3 and YTD, the lack of Media exposure, alongside limited exposure to Services and Basic Industry, have been detractors to performance while Telcom, Banking and Real Estate continue to be contributors.</p>
<div class="wrapped-div">
<table style="width: 100%;">
<tbody>
<tr class="tbl-data">
<td class="tbl-header last text-center">&nbsp;</td>
<td class="tbl-header last text-center" style="border-right: outset;" colspan="4">Wgt (%)</td>
<td class="tbl-header last text-center" style="border-right: outset;" colspan="4">OAS</td>
<td class="tbl-header last text-center" style="border-right: outset;" colspan="4">Price</td>
<td class="tbl-header last text-right" colspan="2">Total Return</td>
</tr>
<tr class="tbl-data">
<td class="data-td last">&nbsp;</td>
<td class="data-head last text-right">12/31/23</td>
<td class="data-head last text-right">3/31/24</td>
<td class="data-head last text-right">6/30/24</td>
<td class="data-head last text-right" style="border-right: outset;">9/30/24</td>
<td class="data-head last text-right">12/31/23</td>
<td class="data-head last text-right">3/31/24</td>
<td class="data-head last text-right">6/30/24</td>
<td class="data-head last text-right" style="border-right: outset;">9/30/24</td>
<td class="data-head last text-right">12/31/23</td>
<td class="data-head last text-right">3/31/24</td>
<td class="data-head last text-right">6/30/24</td>
<td class="data-head last text-right" style="border-right: outset;">9/30/24</td>
<td class="data-head last text-right">MTD</td>
<td class="data-head last text-right">YTD</td>
</tr>
<tr class="tbl-data">
<td class="data-td last">Banking</td>
<td class="data-td data last text-right">4.79</td>
<td class="data-td data last text-right">4.62</td>
<td class="data-td data last text-right">5.38</td>
<td class="data-td data last text-right" style="border-right: outset;">5.45</td>
<td class="data-td data last text-right">231</td>
<td class="data-td data last text-right">235</td>
<td class="data-td data last text-right">220</td>
<td class="data-td data last text-right" style="border-right: outset;">210</td>
<td class="data-td data last text-right">97.91</td>
<td class="data-td data last text-right">97.11</td>
<td class="data-td data last text-right">97.36</td>
<td class="data-td data last text-right" style="border-right: outset;">101.29</td>
<td class="data-td data last text-right">2.18</td>
<td class="data-td data last text-right">7.70</td>
</tr>
<tr class="tbl-data">
<td class="data-td last">Basic Industry</td>
<td class="data-td data last text-right">1.70</td>
<td class="data-td data last text-right">3.20</td>
<td class="data-td data last text-right">3.73</td>
<td class="data-td data last text-right" style="border-right: outset;">4.78</td>
<td class="data-td data last text-right">171</td>
<td class="data-td data last text-right">186</td>
<td class="data-td data last text-right">156</td>
<td class="data-td data last text-right" style="border-right: outset;">190</td>
<td class="data-td data last text-right">97.24</td>
<td class="data-td data last text-right">94.37</td>
<td class="data-td data last text-right">95.03</td>
<td class="data-td data last text-right" style="border-right: outset;">99.25</td>
<td class="data-td data last text-right">0.89</td>
<td class="data-td data last text-right">6.71</td>
</tr>
<tr class="tbl-data">
<td class="data-td last">Capital Goods</td>
<td class="data-td data last text-right">5.85</td>
<td class="data-td data last text-right">6.17</td>
<td class="data-td data last text-right">5.41</td>
<td class="data-td data last text-right" style="border-right: outset;">5.31</td>
<td class="data-td data last text-right">200</td>
<td class="data-td data last text-right">153</td>
<td class="data-td data last text-right">161</td>
<td class="data-td data last text-right" style="border-right: outset;">198</td>
<td class="data-td data last text-right">97.34</td>
<td class="data-td data last text-right">97.38</td>
<td class="data-td data last text-right">97.51</td>
<td class="data-td data last text-right" style="border-right: outset;">98.72</td>
<td class="data-td data last text-right">0.74</td>
<td class="data-td data last text-right">5.60</td>
</tr>
<tr class="tbl-data">
<td class="data-td last">Consumer Goods</td>
<td class="data-td data last text-right">4.33</td>
<td class="data-td data last text-right">4.42</td>
<td class="data-td data last text-right">5.28</td>
<td class="data-td data last text-right" style="border-right: outset;">5.22</td>
<td class="data-td data last text-right">230</td>
<td class="data-td data last text-right">223</td>
<td class="data-td data last text-right">240</td>
<td class="data-td data last text-right" style="border-right: outset;">231</td>
<td class="data-td data last text-right">94.29</td>
<td class="data-td data last text-right">93.07</td>
<td class="data-td data last text-right">93.64</td>
<td class="data-td data last text-right" style="border-right: outset;">97.25</td>
<td class="data-td data last text-right">1.56</td>
<td class="data-td data last text-right">7.95</td>
</tr>
<tr class="tbl-data">
<td class="data-td last">Energy</td>
<td class="data-td data last text-right">14.75</td>
<td class="data-td data last text-right">11.17</td>
<td class="data-td data last text-right">12.27</td>
<td class="data-td data last text-right" style="border-right: outset;">12.13</td>
<td class="data-td data last text-right">259</td>
<td class="data-td data last text-right">235</td>
<td class="data-td data last text-right">239</td>
<td class="data-td data last text-right" style="border-right: outset;">267</td>
<td class="data-td data last text-right">92.49</td>
<td class="data-td data last text-right">93.95</td>
<td class="data-td data last text-right">93.44</td>
<td class="data-td data last text-right" style="border-right: outset;">95.40</td>
<td class="data-td data last text-right">0.20</td>
<td class="data-td data last text-right">7.19</td>
</tr>
<tr class="tbl-data">
<td class="data-td last">Financial Services</td>
<td class="data-td data last text-right">1.14</td>
<td class="data-td data last text-right">1.18</td>
<td class="data-td data last text-right">1.37</td>
<td class="data-td data last text-right" style="border-right: outset;">1.40</td>
<td class="data-td data last text-right">378</td>
<td class="data-td data last text-right">336</td>
<td class="data-td data last text-right">376</td>
<td class="data-td data last text-right" style="border-right: outset;">324</td>
<td class="data-td data last text-right">86.41</td>
<td class="data-td data last text-right">87.09</td>
<td class="data-td data last text-right">84.87</td>
<td class="data-td data last text-right" style="border-right: outset;">91.57</td>
<td class="data-td data last text-right">2.45</td>
<td class="data-td data last text-right">10.84</td>
</tr>
<tr class="tbl-data">
<td class="data-td last">Healthcare</td>
<td class="data-td data last text-right">4.10</td>
<td class="data-td data last text-right">4.44</td>
<td class="data-td data last text-right">5.15</td>
<td class="data-td data last text-right" style="border-right: outset;">5.29</td>
<td class="data-td data last text-right">270</td>
<td class="data-td data last text-right">210</td>
<td class="data-td data last text-right">207</td>
<td class="data-td data last text-right" style="border-right: outset;">157</td>
<td class="data-td data last text-right">88.73</td>
<td class="data-td data last text-right">90.80</td>
<td class="data-td data last text-right">91.12</td>
<td class="data-td data last text-right" style="border-right: outset;">95.88</td>
<td class="data-td data last text-right">1.45</td>
<td class="data-td data last text-right">12.45</td>
</tr>
<tr class="tbl-data">
<td class="data-td last">Insurance</td>
<td class="data-td data last text-right">1.32</td>
<td class="data-td data last text-right">1.43</td>
<td class="data-td data last text-right">1.65</td>
<td class="data-td data last text-right" style="border-right: outset;">1.67</td>
<td class="data-td data last text-right">323</td>
<td class="data-td data last text-right">244</td>
<td class="data-td data last text-right">238</td>
<td class="data-td data last text-right" style="border-right: outset;">237</td>
<td class="data-td data last text-right">94.10</td>
<td class="data-td data last text-right">96.82</td>
<td class="data-td data last text-right">96.11</td>
<td class="data-td data last text-right" style="border-right: outset;">100.34</td>
<td class="data-td data last text-right">1.46</td>
<td class="data-td data last text-right">11.67</td>
</tr>
<tr class="tbl-data">
<td class="data-td last">Leisure</td>
<td class="data-td data last text-right">7.90</td>
<td class="data-td data last text-right">5.10</td>
<td class="data-td data last text-right">5.92</td>
<td class="data-td data last text-right" style="border-right: outset;">4.90</td>
<td class="data-td data last text-right">228</td>
<td class="data-td data last text-right">170</td>
<td class="data-td data last text-right">180</td>
<td class="data-td data last text-right" style="border-right: outset;">234</td>
<td class="data-td data last text-right">93.21</td>
<td class="data-td data last text-right">95.08</td>
<td class="data-td data last text-right">94.48</td>
<td class="data-td data last text-right" style="border-right: outset;">95.41</td>
<td class="data-td data last text-right">0.93</td>
<td class="data-td data last text-right">6.23</td>
</tr>
<tr class="tbl-data">
<td class="data-td last">Real Estate</td>
<td class="data-td data last text-right">9.07</td>
<td class="data-td data last text-right">9.60</td>
<td class="data-td data last text-right">10.07</td>
<td class="data-td data last text-right" style="border-right: outset;">10.23</td>
<td class="data-td data last text-right">675</td>
<td class="data-td data last text-right">527</td>
<td class="data-td data last text-right">450</td>
<td class="data-td data last text-right" style="border-right: outset;">389</td>
<td class="data-td data last text-right">82.72</td>
<td class="data-td data last text-right">81.84</td>
<td class="data-td data last text-right">84.76</td>
<td class="data-td data last text-right" style="border-right: outset;">89.79</td>
<td class="data-td data last text-right">2.17</td>
<td class="data-td data last text-right">5.72</td>
</tr>
<tr class="tbl-data">
<td class="data-td last">Retail</td>
<td class="data-td data last text-right">14.38</td>
<td class="data-td data last text-right">18.02</td>
<td class="data-td data last text-right">20.45</td>
<td class="data-td data last text-right" style="border-right: outset;">21.67</td>
<td class="data-td data last text-right">242</td>
<td class="data-td data last text-right">179</td>
<td class="data-td data last text-right">196</td>
<td class="data-td data last text-right" style="border-right: outset;">252</td>
<td class="data-td data last text-right">86.39</td>
<td class="data-td data last text-right">89.54</td>
<td class="data-td data last text-right">88.19</td>
<td class="data-td data last text-right" style="border-right: outset;">88.38</td>
<td class="data-td data last text-right">0.73</td>
<td class="data-td data last text-right">3.94</td>
</tr>
<tr class="tbl-data">
<td class="data-td last">Services</td>
<td class="data-td data last text-right">0.64</td>
<td class="data-td data last text-right">0.66</td>
<td class="data-td data last text-right">0.79</td>
<td class="data-td data last text-right" style="border-right: outset;">0.78</td>
<td class="data-td data last text-right">243</td>
<td class="data-td data last text-right">217</td>
<td class="data-td data last text-right">206</td>
<td class="data-td data last text-right" style="border-right: outset;">202</td>
<td class="data-td data last text-right">94.78</td>
<td class="data-td data last text-right">94.51</td>
<td class="data-td data last text-right">94.67</td>
<td class="data-td data last text-right" style="border-right: outset;">98.11</td>
<td class="data-td data last text-right">0.64</td>
<td class="data-td data last text-right">7.55</td>
</tr>
<tr class="tbl-data">
<td class="data-td last">Technology &amp; Electronics</td>
<td class="data-td data last text-right">6.22</td>
<td class="data-td data last text-right">5.81</td>
<td class="data-td data last text-right">6.67</td>
<td class="data-td data last text-right" style="border-right: outset;">6.66</td>
<td class="data-td data last text-right">194</td>
<td class="data-td data last text-right">188</td>
<td class="data-td data last text-right">184</td>
<td class="data-td data last text-right" style="border-right: outset;">206</td>
<td class="data-td data last text-right">94.14</td>
<td class="data-td data last text-right">92.99</td>
<td class="data-td data last text-right">92.27</td>
<td class="data-td data last text-right" style="border-right: outset;">94.38</td>
<td class="data-td data last text-right">0.58</td>
<td class="data-td data last text-right">4.94</td>
</tr>
<tr class="tbl-data">
<td class="data-td last">Telecommunications</td>
<td class="data-td data last text-right">13.00</td>
<td class="data-td data last text-right">13.39</td>
<td class="data-td data last text-right">11.10</td>
<td class="data-td data last text-right" style="border-right: outset;">11.82</td>
<td class="data-td data last text-right">366</td>
<td class="data-td data last text-right">368</td>
<td class="data-td data last text-right">413</td>
<td class="data-td data last text-right" style="border-right: outset;">351</td>
<td class="data-td data last text-right">92.22</td>
<td class="data-td data last text-right">90.01</td>
<td class="data-td data last text-right">81.48</td>
<td class="data-td data last text-right" style="border-right: outset;">92.33</td>
<td class="data-td data last text-right">2.46</td>
<td class="data-td data last text-right">7.78</td>
</tr>
<tr class="tbl-data">
<td class="data-td last">Transportation</td>
<td class="data-td data last text-right">2.09</td>
<td class="data-td data last text-right">2.23</td>
<td class="data-td data last text-right">2.60</td>
<td class="data-td data last text-right" style="border-right: outset;">0.57</td>
<td class="data-td data last text-right">209</td>
<td class="data-td data last text-right">170</td>
<td class="data-td data last text-right">150</td>
<td class="data-td data last text-right" style="border-right: outset;">210</td>
<td class="data-td data last text-right">94.92</td>
<td class="data-td data last text-right">95.37</td>
<td class="data-td data last text-right">96.07</td>
<td class="data-td data last text-right" style="border-right: outset;">106.22</td>
<td class="data-td data last text-right">3.14</td>
<td class="data-td data last text-right">7.43</td>
</tr>
<tr class="tbl-data">
<td class="data-td last">Utility</td>
<td class="data-td data last text-right">8.71</td>
<td class="data-td data last text-right">8.54</td>
<td class="data-td data last text-right">2.17</td>
<td class="data-td data last text-right" style="border-right: outset;">2.11</td>
<td class="data-td data last text-right">139</td>
<td class="data-td data last text-right">122</td>
<td class="data-td data last text-right">185</td>
<td class="data-td data last text-right" style="border-right: outset;">203</td>
<td class="data-td data last text-right">92.18</td>
<td class="data-td data last text-right">91.13</td>
<td class="data-td data last text-right">96.23</td>
<td class="data-td data last text-right" style="border-right: outset;">99.44</td>
<td class="data-td data last text-right">1.64</td>
<td class="data-td data last text-right">4.26</td>
</tr>
<tr class="tbl-data">
<td class="data-td last">Total</td>
<td class="data-td data last text-right">100</td>
<td class="data-td data last text-right" style="border-right: outset;">100</td>
<td class="data-td data last text-right">285</td>
<td class="data-td data last text-right">247</td>
<td class="data-td data last text-right">252</td>
<td class="data-td data last text-right" style="border-right: outset;">261</td>
<td class="data-td data last text-right">91.20</td>
<td class="data-td data last text-right">91.22</td>
<td class="data-td data last text-right">90.32</td>
<td class="data-td data last text-right" style="border-right: outset;">93.69</td>
<td class="data-td data last text-right">1.28</td>
<td class="data-td data last text-right">6.19</td>
</tr>
</tbody>
</table>
</div>
<p class="chart-disclosure">Source: ICE Data Services, VanEck. Returns are based on partial period data. Fallen Angels: ICE US Fallen Angel High Yield 10% Constrained Index. Not intended as a recommendation to invest or divest in any of the sectors mentioned herein. Index performance is not representative of strategy performance. It is not possible to invest in an index.</p>

<p><strong>Fallen Angels Performance by Rating:</strong> No significant changes in the fallen angels rating allocation for September, however, the Real Estate sector had two one-notch downgrades: Hudson Pacific Properties to BB3 from BB2 and Service Properties Trust to B3 from B2. In terms of performance vs broad high yield for September, Q3 and YTD, higher quality (BB) has positively contributed to performance but lower quality (Single-B and CCC &amp; Below) have significantly detracted. The CCC &amp; Below index is up 15.35% so far this year, with most of the performance coming in Q3.</p>
<div class="wrapped-div">
<table style="width: 100%;">
<tbody>
<tr class="tbl-data">
<td class="tbl-header last text-center">&nbsp;</td>
<td class="tbl-header last text-center" style="border-right: outset;" colspan="4">Wgt (%)</td>
<td class="tbl-header last text-center" style="border-right: outset;" colspan="4">OAS</td>
<td class="tbl-header last text-center" style="border-right: outset;" colspan="4">Price</td>
<td class="tbl-header last text-right" colspan="4">Total Return</td>
</tr>
<tr class="tbl-data">
<td class="data-td last">&nbsp;</td>
<td class="data-head last text-right">12/31/23</td>
<td class="data-head last text-right">3/31/24</td>
<td class="data-head last text-right">6/30/24</td>
<td class="data-head last text-right" style="border-right: outset;">9/30/24</td>
<td class="data-head last text-right">12/31/23</td>
<td class="data-head last text-right">3/31/24</td>
<td class="data-head last text-right">6/30/24</td>
<td class="data-head last text-right" style="border-right: outset;">9/30/24</td>
<td class="data-head last text-right">12/31/23</td>
<td class="data-head last text-right">3/31/24</td>
<td class="data-head last text-right">6/30/24</td>
<td class="data-head last text-right" style="border-right: outset;">9/30/24</td>
<td class="data-head last text-right">MTD</td>
<td class="data-head last text-right">YTD</td>
</tr>
<tr class="tbl-data">
<td class="data-td last">BB</td>
<td class="data-td data last text-right">80.55</td>
<td class="data-td data last text-right">81.63</td>
<td class="data-td data last text-right">87.62</td>
<td class="data-td data last text-right" style="border-right: outset;">87.30</td>
<td class="data-td data last text-right">219</td>
<td class="data-td data last text-right">190</td>
<td class="data-td data last text-right">210</td>
<td class="data-td data last text-right" style="border-right: outset;">223</td>
<td class="data-td data last text-right">92.44</td>
<td class="data-td data last text-right">92.85</td>
<td class="data-td data last text-right">92.62</td>
<td class="data-td data last text-right" style="border-right: outset;">95.29</td>
<td class="data-td data last text-right">6.62</td>
<td class="data-td data last text-right">5.11</td>
</tr>
<tr class="tbl-data">
<td class="data-td last">B</td>
<td class="data-td data last text-right">13.43</td>
<td class="data-td data last text-right">12.87</td>
<td class="data-td data last text-right">7.89</td>
<td class="data-td data last text-right" style="border-right: outset;">7.32</td>
<td class="data-td data last text-right">317</td>
<td class="data-td data last text-right">330</td>
<td class="data-td data last text-right">371</td>
<td class="data-td data last text-right" style="border-right: outset;">382</td>
<td class="data-td data last text-right">96.46</td>
<td class="data-td data last text-right">93.99</td>
<td class="data-td data last text-right">90.73</td>
<td class="data-td data last text-right" style="border-right: outset;">92.36</td>
<td class="data-td data last text-right">2.92</td>
<td class="data-td data last text-right">4.38</td>
</tr>
<tr class="tbl-data">
<td class="data-td last">CCC</td>
<td class="data-td data last text-right">5.44</td>
<td class="data-td data last text-right">5.51</td>
<td class="data-td data last text-right">4.19</td>
<td class="data-td data last text-right" style="border-right: outset;">4.38</td>
<td class="data-td data last text-right">1,130</td>
<td class="data-td data last text-right">893</td>
<td class="data-td data last text-right">505</td>
<td class="data-td data last text-right" style="border-right: outset;">468</td>
<td class="data-td data last text-right">69.40</td>
<td class="data-td data last text-right">68.48</td>
<td class="data-td data last text-right">80.90</td>
<td class="data-td data last text-right" style="border-right: outset;">87.61</td>
<td class="data-td data last text-right">4.16</td>
<td class="data-td data last text-right">4.80</td>
</tr>
<tr class="tbl-data">
<td class="data-td last">CC<sup>*</sup></td>
<td class="data-td data last text-right">&nbsp;</td>
<td class="data-td data last text-right">0.30</td>
<td class="data-td data last text-right" style="border-right: outset;">1.00</td>
<td class="data-td data last text-right">&nbsp;</td>
<td class="data-td data last text-right">5,719</td>
<td class="data-td data last text-right" style="border-right: outset;">1,703</td>
<td class="data-td data last text-right">&nbsp;</td>
<td class="data-td data last text-right">13.00</td>
<td class="data-td data last text-right" style="border-right: outset;">44.51</td>
<td class="data-td data last text-right">253.61</td>
<td class="data-td data last text-right">4.91</td>
</tr>
<tr class="tbl-data">
<td class="data-td last">Total</td>
<td class="data-td data last text-right">100</td>
<td class="data-td data last text-right" style="border-right: outset;">100.00</td>
<td class="data-td data last text-right">285</td>
<td class="data-td data last text-right">247</td>
<td class="data-td data last text-right">252</td>
<td class="data-td data last text-right" style="border-right: outset;">261</td>
<td class="data-td data last text-right">91.20</td>
<td class="data-td data last text-right">91.22</td>
<td class="data-td data last text-right">90.32</td>
<td class="data-td data last text-right" style="border-right: outset;">93.69</td>
<td class="data-td data last text-right">6.19</td>
<td class="data-td data last text-right">5.04</td>
</tr>
</tbody>
</table>
</div>
<p class="chart-disclosure">Source: ICE Data Services, VanEck. allen Angels: ICE US Fallen Angel High Yield 10% Constrained Index. Not intended as a recommendation to invest or divest in any of the sectors mentioned herein. Index performance is not representative of strategy performance. It is not possible to invest in an index. BB index: ICE BofA BB US High Yield Index; Single-B index: ICE BofA Single-B US High Yield Index; CCC &amp; Lower rated index ICE BofA CCC &amp; Lower US High Yield Index.&nbsp;<sup>*</sup>Doesn&rsquo;t have securities for all months of selective periods. Returns are based on partial period data.&nbsp;</p>
<p>To receive more <a href="/us/en/blogs/income-investing/" title="Income Investing Insights"><strong>Income Investing</strong></a> insights, <a href="/link/5f45412c2143400497908cea2897f7d3.aspx" title=" Subscription Center"><strong>sign up in our subscription center</strong></a>.</p>
]]></content:encoded>
</item><item rdf:about="https://www.vaneck.com/us/en/blogs/digital-assets/matthew-sigel-vaneck-mid-october-bitcoin-chaincheck/">
  <title>VanEck Mid-October Bitcoin ChainCheck></title>
  <link>https://www.vaneck.com/us/en/blogs/digital-assets/matthew-sigel-vaneck-mid-october-bitcoin-chaincheck/</link>
  <description><![CDATA[We believe bitcoin is set for a breakout due to increased BTC holdings by miners, rising corporate treasury investments, and higher Bitcoin ETP flows.]]></description>
  <dc:creator>Matthew  Sigel</dc:creator>
  <dc:date>10/16/2024 06:30:00</dc:date>
<content:encoded><![CDATA[

<p><strong>Please note that VanEck has exposure to bitcoin.&nbsp;</strong></p>
<h2>Some Takeaways for Mid-September &ndash; Mid-October:</h2>
<ul class="content-list">
<li class="mt-2">Our recent check of Bitcoin&rsquo;s technicals and fundamentals has strengthened our conviction that bitcoin is poised for a high-volatility catch-up rally. Despite its <a href="https://www.vaneck.com/us/en/blogs/digital-assets/matthew-sigel-vaneck-mid-september-2024-bitcoin-chaincheck-1-year-review-edition/" title="VanEck Mid-September 2024 Bitcoin ChainCheck: 1-Year Review Edition"><strong>recently</strong></a> subdued volatility compared to other asset classes, mounting signs&mdash;including political momentum, increasing institutional adoption, and bullish on-chain and market data&mdash;indicate the likelihood of an impending breakout.</li>
<li class="mt-2">We noticed this month that publicly traded bitcoin miners, who now control a record ~30% of the global hashrate, have significantly increased their bitcoin (BTC) holdings. The U.S.-listed miners in our coverage added 2% to their BTC treasuries MoM in September, continuing their 11% MoM holding/buying spree from August despite increased prices. These additions coincide with an increasing number of BTC that has been untouched for 6+ months (currently in the 95% percentile vs. all-time history).</li>
<li class="mt-2">A growing list of public companies around the world are duplicating the corporate treasury strategy pioneered by MicroStrategy (+194% YTD). Corporate holdings of BTC rose 8% last month, led by MicroStrategy and German and Japanese firms.</li>
<li class="mt-2">We did some quantitative analysis on the predictive power between ETP flows and bitcoin price. Our findings support the conclusion that institutional flows are leading price, not following it.</li>
</ul>
<ul class="content-list">
<li class="mt2"><a href="#bitcoins-price-action"><strong>Bitcoin&rsquo;s Price Action</strong></a></li>
<li class="mt2"><a href="#bitcoin-etps-and-price-correlation"><strong>Bitcoin ETPs and Price Correlation</strong></a></li>
<li class="mt2"><a href="#bitcoin-monthly-dashboard"><strong>Bitcoin ChainCheck Monthly Dashboard</strong></a></li>
<li class="mt2"><a href="#bitcoins-network-activity"><strong>Bitcoin&rsquo;s Network Activity, Adoption, and Fees</strong></a></li>
<li class="mt2"><a href="#bitcoin-miners"><strong>Bitcoin Miners</strong></a></li>
</ul>
<h2 id="bitcoins-price-action" class="jump-link-nav anchored-block" data-jumplink-title="Price Action">Bitcoin&rsquo;s Price Action</h2>
<p>Bitcoin&rsquo;s price rose by 11% month-over-month (MoM), continuing to form higher highs and higher lows since the market bottomed in August. Still, volatility remains subdued relative to other FX pairs and investable asset classes. Recent positive poll numbers for Trump appear to be leading Bitcoin&rsquo;s latest rally, the impact of which can be seen in a decline in the % of coins that have moved in the last 6 months: now just 17%, in the third percentile of activity. We believe this &ldquo;buy and hold&rdquo; activity highlights BTC&rsquo;s growing appeal as a macro-hedge, particularly among institutional investors. Indeed, BitcoinTreasuries.net <a href="https://bitcointreasuries.net/" title="Bitcoin Treasuries" target="_blank" rel="noopener"><strong>data</strong></a> shows that public companies have increased their bitcoin holdings by ~8% since September 11th. Notable examples include Samara Asset Group&rsquo;s (SRAG GY) recently <a href="https://www.samara-ag.com/market-insights/samara-asset-group-to-issue-up-to-eu30-million-in-a-nordic-bond-to-acquire-lp-stakes-in-funds-and-grow-its-bitcoin-treasury" title="Samara Asset Group to Issue up to &euro;30 Million in a Nordic Bond to Acquire LP Stakes in Funds and Grow its Bitcoin Treasury" target="_blank" rel="noopener"><strong>announced</strong></a> plans to offer up to &euro;30m in senior bonds to purchase bitcoin. Japanese real estate manager Metaplanet, Inc. rallied over 15% on October 15th after the firm <a href="https://metaplanet.jp/wp-content/uploads/2024/10/Notice-of-Additional-Purchase-of-Bitcoin_October-15-2024.pdf" title="Notice of Additional Purchase of Bitcoin" target="_blank" rel="noopener"><strong>announced</strong></a> adding another 1 billion yen worth of bitcoin, bringing their total BTC treasury to ~855 BTC (~$56 million .D). Metaplanet shares are up 675% in the last 12 months.</p>
<p>Moreover, exchange-traded products (ETPs) and other funds hit a record-high aggregate ownership at nearly 1.1 million bitcoins in late September, approaching the same ownership level as Satoshi Nakamoto. Lastly, in a sign the U.S .market may be opening up to banks, BNY, the largest custodian bank in the world, received an SAB 121 <a href="https://unchainedcrypto.com/bny-clears-path-with-sec-to-custody-bitcoin-and-ether-for-exchange-traded-products/" title="BNY Clears Path With SEC to Custody Bitcoin and Ether for Exchange-Traded Products" target="_blank" rel="noopener"><strong>exemption</strong></a> from the SEC to custody crypto assets for digital asset ETPs, sidestepping the onerous requirement to list crypto as balance sheet liabilities. While the exception is limited, it potentially paves the way for the future of bank-custodied digital assets, pending discussions of &ldquo;additional use cases&rdquo; with the SEC.</p>
<ul class="content-list">
<li class="mt-2"><strong>Market Sentiment: </strong>The percentage of Bitcoin addresses in profit grew by 6% over the past 30 days, with nearly nine out of ten addresses sitting on gains today. The unrealized profit/loss ratio also improved by 6%, signaling a more positive outlook compared to the summer months, despite currently sitting at a neutral 0.48 on the 7-day average. Both metrics, at the 71st and 67th percentiles of their all-time history, suggest significant room for upside potential as the next leg of the bull market develops after eight months of choppy price action.</li>
<li class="mt-2"><strong>Bitcoin dominance: </strong>Bitcoin's dominance ticked up one point to 57%, maintaining highs not seen since April 2021 and further solidifying its status as the primary store of value within the crypto market. As detailed in last month&rsquo;s<a href="https://www.vaneck.com/us/en/blogs/digital-assets/matthew-sigel-vaneck-mid-september-2024-bitcoin-chaincheck-1-year-review-edition/" title="VanEck Mid-September 2024 Bitcoin ChainCheck: 1-Year Review Edition"><strong>report</strong></a>, we think Bitcoin is uniquely positioned among crypto assets to thrive in either a pro-crypto or crypto-hostile administration. We believe ongoing hostility from U.S. regulators like Gary Gensler toward non-Bitcoin digital assets could disrupt the usual pattern of Bitcoin dominance peaking around election time. While sectors like DeFi, L1s, L2s, and GameFi have seen short-term outperformance, Bitcoin has maintained its gains more consistently, as shown in this month&rsquo;s Chart of the Month. A more crypto-friendly Trump administration could potentially reverse this trend by introducing clearer regulations and de-risking investments in the more participatory proof-of-stake crypto assets.</li>
<li class="mt-2"><strong>Regional trading: </strong>The long-term geographical trend of Asia selling bitcoin to the U.S. and Europe remains intact, with traders during U.S. and EU hours driving the strongest price performance, +2% and +4%, respectively, in the last month.</li>
</ul>
<div class="wrapped-div">
<table style="width: 100%;">
<tbody>
<tr class="tbl-data">
<td class="tbl-header last">Regional Trading</td>
<td class="tbl-header last text-right">MoM Change (%)</td>
<td class="tbl-header last text-right">YoY Change (%)</td>
</tr>
<tr class="tbl-data">
<td class="data-td last">Asia Hours Price Change MoM ($)</td>
<td class="data-td data last text-right">0</td>
<td class="data-td data last text-right">1</td>
</tr>
<tr class="tbl-data">
<td class="data-td last">U.S. Hours Price Change MoM ($)</td>
<td class="data-td data last text-right">2</td>
<td class="data-td data last text-right">5</td>
</tr>
<tr class="tbl-data">
<td class="data-td last">EU Hours Price Change MoM ($)</td>
<td class="data-td data last text-right">4</td>
</tr>
</tbody>
</table>
</div>
<br />
<p class="chart-disclosure"><strong>Source</strong>: Glassnode, as of 10/14/24. <strong>Past performance is no guarantee of future results.</strong></p>
<ul class="content-list">
<li class="mt-2"><strong>Funding Rates: </strong>Over the past month, the 7-day moving average of annualized bitcoin futures funding rates rose by 8%, reflecting increased risk appetite as prices recovered. At the 49th percentile of its historical range, this indicates relatively neutral sentiment&mdash;especially given bitcoin&rsquo;s historically bullish market bias&mdash;suggesting room for increased leverage among aggressive traders.</li>
</ul>
<h2 id="bitcoin-etps-and-price-correlation" class="jump-link-nav anchored-block" data-jumplink-title="Bitcoin ETPs">Bitcoin ETPs and Price Correlation</h2>
<p>One of the standout findings this month is the growing influence of bitcoin ETPs on the market, marking a pivotal shift in bitcoin&rsquo;s market structure. U.S. bitcoin ETP net inflows totaled $19.4 billion through October 14th. The correlation between weekly ETP inflows and bitcoin's returns has shown a strong positive relationship, with an R&sup2; value of 0.3422. This trend became even stronger when analyzing weeks from July 1st &ndash; September 22nd, which yielded an R&sup2; value of 0.5791. Interestingly, we also found that daily ETP flows also showed some modest predictive power for BTC price changes in the following after-hours trading period (R&sup2; = .0527), demonstrating a spillover of US &ldquo;TradFi&rdquo; market momentum into the 24/7/365 crypto markets.</p>
<h3>U.S. Bitcoin ETP Inflows Help Drive Price Discovery</h3>
<p><img class="img-responsive w-100" alt="U.S. Bitcoin ETP Inflows Help Drive Price Discovery" src="https://www.vaneck.com/contentassets/1a7952ae9eab4e338d123267595e872d/4940_bitcoin-chaincheck-october_chart-1_2024-10_v2_blog.svg" /></p>
<p class="chart-disclosure"><strong>Source</strong>: Farside, Glassnode, YTD through September 30th.</p>
<p>These findings suggest that institutional participation via ETPs is playing an increasingly important role in bitcoin's price discovery process. When examining the reverse relationship, we found a less statistically significant impact. Bitcoin&rsquo;s after-hours returns (price movements overnight, on weekends, and on holidays) showed some predictive power for U.S. bitcoin ETP inflows on the following trading day (R&sup2; = 0.1261), suggestive of institutional momentum-chasing. We found this relationship strengthened on a weekly basis, with one week&rsquo;s bitcoin returns explaining the variance of the following week&rsquo;s U.S. bitcoin ETP inflows with an R&sup2; value of 0.3422. However, when filtering for July 1st&ndash; September 22nd, we found that there was no statistically significant relationship between bitcoin&rsquo;s returns in each given week and U.S. bitcoin ETP flows in the following week. These findings underscore the idea that institutional flows are leading price, not following it.</p>
<div class="wrapped-div">
<table style="width: 100%;">
<tbody>
<tr class="tbl-data">
<td class="tbl-header last">Directionality of Prediction</td>
<td class="tbl-header last text-right">R<sup>2</sup></td>
<td class="tbl-header last text-right">Slope</td>
<td class="tbl-header last text-right">Statistically Significant?<br />(&alpha; = 0.05)</td>
</tr>
<tr class="tbl-data">
<td class="data-td data last text-left">U.S. Bitcoin ETP Daily Net Flows (BTC) 🡒<br />After-Hours BTC Return (%)</td>
<td class="data-td data last text-right">0.0527</td>
<td class="data-td data last text-right">y = 3E-05x &ndash; 0.0004</td>
<td class="data-td data last text-right">Yes</td>
</tr>
<tr class="tbl-data">
<td class="data-td data last text-left">After-Hours BTC Return (%) 🡒<br />U.S. Bitcoin ETP Daily Net Flows (BTC)</td>
<td class="data-td data last text-right">0.1261</td>
<td class="data-td data last text-right">y = 2989.3x + 94.964</td>
<td class="data-td data last text-right">Yes</td>
</tr>
<tr class="tbl-data">
<td class="data-td data last text-left">U.S. Bitcoin ETP Weekly Net Flows ($bn) 🡒<br />Next Week&rsquo;s BTC Return (%)</td>
<td class="data-td data last text-right">0.00002</td>
<td class="data-td data last text-right">y = -0.0004x + 0.0151</td>
<td class="data-td data last text-right">No</td>
</tr>
<tr class="tbl-data">
<td class="data-td data last text-left">This Week&rsquo;s BTC Return (%) 🡒<br />Next Week&rsquo;s U.S. Bitcoin ETP Net Flows ($bn)</td>
<td class="data-td data last text-right">0.2974</td>
<td class="data-td data last text-right">Y= 6.9016x + 0.3998</td>
<td class="data-td data last text-right">Yes</td>
</tr>
<tr class="tbl-data">
<td class="data-td data last text-left">U.S. Bitcoin ETP Weekly Net Flows ($bn) 🡒<br />Same Week&rsquo;s BTC Return (%)</td>
<td class="data-td data last text-right">0.3422</td>
<td class="data-td data last text-right">y = 0.0465x &ndash; 0.0087</td>
<td class="data-td data last text-right">Yes</td>
</tr>
<tr class="tbl-data">
<td class="data-td data last text-left">U.S. Bitcoin ETP Weekly Net Flows ($bn) 🡒<br />Next Week&rsquo;s BTC Return (%)<br />(July 1st &ndash; September 22nd only)</td>
<td class="data-td data last text-right">0.0858</td>
<td class="data-td data last text-right">y = 2.3691x + 0.3213</td>
<td class="data-td data last text-right">No</td>
</tr>
<tr class="tbl-data">
<td class="data-td data last text-left">U.S. Bitcoin ETP Weekly Net Flows ($bn) 🡒<br />Same Week&rsquo;s BTC Return (%)<br />(July 1st &ndash; September 22nd only)</td>
<td class="data-td data last text-right">0.5791</td>
<td class="data-td data last text-right">y = 0.1028x &ndash; 0.0207</td>
<td class="data-td data last text-right">Yes</td>
</tr>
</tbody>
</table>
</div>
<br />
<p class="chart-disclosure"><strong>Source</strong>: Farside, Glassnode, YTD through September 30th. <strong>R-squared</strong>, the coefficient of determination, is a statistical measure that indicates the proportion of the variation in a dependent variable that is explained by the independent variable(s) in a regression model.</p>
<h2 id="bitcoin-monthly-dashboard" class="anchored-block">Bitcoin ChainCheck Monthly Dashboard</h2>
<div class="wrapped-div">
<table style="width: 100%;">
<tbody>
<tr class="tbl-data">
<td class="tbl-header last">As of October 15th, 2024</td>
<td class="tbl-header last text-right">7-day avg</td>
<td class="tbl-header last text-right">30 day change<sup>1</sup>(%)</td>
<td class="tbl-header last text-right">365 day change (%)</td>
<td class="tbl-header last text-right">Last 30 days Percentile<br />vs all-time history (%)</td>
</tr>
<tr class="tbl-data">
<td class="data-td last">Bitcoin Price</td>
<td class="data-td data last text-right">$ 62,493</td>
<td class="data-td data last text-right">8</td>
<td class="data-td data last text-right">131</td>
<td class="data-td data last text-right">97</td>
</tr>
<tr class="tbl-data">
<td class="data-td last">Daily Active Addresses</td>
<td class="data-td data last text-right">690,451</td>
<td class="data-td data last text-right">-3</td>
<td class="data-td data last text-right">-21</td>
<td class="data-td data last text-right">66</td>
</tr>
<tr class="tbl-data">
<td class="data-td last">Daily New Addresses</td>
<td class="data-td data last text-right">276,290</td>
<td class="data-td data last text-right">-8</td>
<td class="data-td data last text-right">-29</td>
<td class="data-td data last text-right">56</td>
</tr>
<tr class="tbl-data">
<td class="data-td last">Daily Transactions</td>
<td class="data-td data last text-right">661,649</td>
<td class="data-td data last text-right">13</td>
<td class="data-td data last text-right">144</td>
<td class="data-td data last text-right">97</td>
</tr>
<tr class="tbl-data">
<td class="data-td last">Daily Inscriptions</td>
<td class="data-td data last text-right">9,055</td>
<td class="data-td data last text-right">-63</td>
<td class="data-td data last text-right">-45</td>
<td class="data-td data last text-right">30</td>
</tr>
<tr class="tbl-data">
<td class="data-td last">Total Transfer Volume (USD)</td>
<td class="data-td data last text-right">$ 40,178,512,677</td>
<td class="data-td data last text-right">-30</td>
<td class="data-td data last text-right">103</td>
<td class="data-td data last text-right">85</td>
</tr>
<tr class="tbl-data">
<td class="data-td last">% Supply Active, last 180 days</td>
<td class="data-td data last text-right">17%</td>
<td class="data-td data last text-right">-14</td>
<td class="data-td data last text-right">1</td>
<td class="data-td data last text-right">3</td>
</tr>
<tr class="tbl-data">
<td class="data-td last">% Supply Dormant for 3+ Years</td>
<td class="data-td data last text-right">46 (%)</td>
<td class="data-td data last text-right">0</td>
<td class="data-td data last text-right">13</td>
<td class="data-td data last text-right">98</td>
</tr>
<tr class="tbl-data">
<td class="data-td last">Avg Fees (USD)</td>
<td class="data-td data last text-right">$ 2.66</td>
<td class="data-td data last text-right">257</td>
<td class="data-td data last text-right">43</td>
<td class="data-td data last text-right">57</td>
</tr>
<tr class="tbl-data">
<td class="data-td last">Avg Fees (BTC)</td>
<td class="data-td data last text-right">0.00004</td>
<td class="data-td data last text-right">228</td>
<td class="data-td data last text-right">-38</td>
<td class="data-td data last text-right">9</td>
</tr>
<tr class="tbl-data">
<td class="data-td last">Percent of BTC Addresses in profit</td>
<td class="data-td data last text-right">88</td>
<td class="data-td data last text-right">6</td>
<td class="data-td data last text-right">34</td>
<td class="data-td data last text-right">71</td>
</tr>
<tr class="tbl-data">
<td class="data-td last">Unrealized profit/loss ratio</td>
<td class="data-td data last text-right">0.48</td>
<td class="data-td data last text-right">6</td>
<td class="data-td data last text-right">81</td>
<td class="data-td data last text-right">67</td>
</tr>
<tr class="tbl-data">
<td class="data-td last">Global Power Consumption (TWh)</td>
<td class="data-td data last text-right">130</td>
<td class="data-td data last text-right">2</td>
<td class="data-td data last text-right">51</td>
<td class="data-td data last text-right">99</td>
</tr>
<tr class="tbl-data">
<td class="data-td last">Total Daily BTC Miner Revenues (USD)</td>
<td class="data-td data last text-right">$29,868,367</td>
<td class="data-td data last text-right">19</td>
<td class="data-td data last text-right">11</td>
<td class="data-td data last text-right">84</td>
</tr>
<tr class="tbl-data">
<td class="data-td last">Total Crypto Equities' Market Cap<sup>*</sup>&nbsp;(USD) (MM)</td>
<td class="data-td data last text-right">$134,115</td>
<td class="data-td data last text-right">20</td>
<td class="data-td data last text-right">159</td>
<td class="data-td data last text-right">73</td>
</tr>
<tr class="tbl-data">
<td class="data-td last">Transfer volume from Miners to Exchanges (USD)</td>
<td class="data-td data last text-right">$3,056,250</td>
<td class="data-td data last text-right">50</td>
<td class="data-td data last text-right">-59</td>
<td class="data-td data last text-right">72</td>
</tr>
<tr class="tbl-data">
<td class="data-td last">Bitcoin Dominance</td>
<td class="data-td data last text-right">57%</td>
<td class="data-td data last text-right">1</td>
<td class="data-td data last text-right">13</td>
<td class="data-td data last text-right">82</td>
</tr>
<tr class="tbl-data">
<td class="data-td last">Bitcoin Futures Annualized Basis</td>
<td class="data-td data last text-right">8%</td>
<td class="data-td data last text-right">11</td>
<td class="data-td data last text-right">86</td>
<td class="data-td data last text-right">49</td>
</tr>
<tr class="tbl-data">
<td class="data-td last">Mining Difficulty (T)</td>
<td class="data-td data last text-right">92</td>
<td class="data-td data last text-right">0</td>
<td class="data-td data last text-right">59</td>
<td class="data-td data last text-right">100</td>
</tr>
</tbody>
</table>
</div>
<br />
<p class="chart-disclosure"><sup>*</sup>&nbsp;DAPP market cap as a proxy, as of Oct 14th, 2024 <br /><sup>1</sup>&nbsp;30 day change &amp; 365 day change are relative to the 7-day avg, not absolute</p>
<p class="chart-disclosure"><strong>Source</strong>: Glassnode, VanEck research as of 10/15/24. <strong>Past performance is no guarantee of future results.</strong></p>
<h2 id="bitcoins-network-activity" class="anchored-block">Bitcoin&rsquo;s Network Activity, Adoption, and Fees</h2>
<p>On-chain metrics for Bitcoin have shown mixed results over the past month:</p>
<ul class="content-list">
<li class="mt-2"><strong>Daily transactions: </strong>Daily transactions grew 13% MoM. Transaction activity is historically high at the 97th percentile.</li>
<li class="mt-2"><strong>Ordinals inscriptions: </strong>Daily inscriptions (e.g. Bitcoin NFTs) transactions fell 63% MoM, a significant pullback from the Ordinal ecosystem&rsquo;s surge in activity in early September.</li>
<li class="mt-2"><strong>Total transfer volume: </strong>Total transfer volume declined by 30% MoM. However, this metric is somewhat overstated, as last month&rsquo;s transfer volumes peaked at highs not seen since April. Transfer volumes remain up 103% YoY and sit at their historical 85th percentile.</li>
<li class="mt-2"><strong>Average transaction fees: </strong>USD-denominated transaction fees increased by 257% to an average of $2.26 MoM, driven recently by increased Runes <a href="https://x.com/intotheblock/status/1846100358344413207" title="IntoTheBlock in X" target="_blank" rel="noopener"><strong>transactions</strong></a>. Runes are a type of fungible token standard on Bitcoin, primarily used for meme trading. While up 43% YoY in USD terms, fees are down 38% YoY in bitcoin (BTC) terms, pointing to the necessity of bitcoin&rsquo;s continued price appreciation for healthy miner economics. Bitcoin&rsquo;s so-called security budget, comprised of Bitcoin&rsquo;s (deflating) mining rewards and network transaction fees, remains a topic of concern for the network&rsquo;s long-term health. However, having weathered the four-year halving cycle reset this April, it is a relatively distant concern.</li>
</ul>
<h3>September Bitcoin Mined, Bought, and Sold by Pure-Play Miners</h3>
<p><img class="img-responsive w-100" alt="September Bitcoin Mined, Bought, and Sold by Pure-Play Miners" src="https://www.vaneck.com/contentassets/1a7952ae9eab4e338d123267595e872d/4940_bitcoin-chaincheck-october_chart-2_2024-10_v1_blog.svg" /></p>
<p class="chart-disclosure"><strong>Source</strong>: Company Filings, VanEck Research as of 10/14/2024.</p>
<h2 id="bitcoin-miners" class="jump-link-nav anchored-block" data-jumplink-title="Miner Behaviour">Bitcoin Miners</h2>
<ul>
<li class="mt-2"><strong>Total daily BTC miner revenues: </strong>Driven by higher prices and increased transaction fees from network activity, miner revenues reached ~$29.9 million, a 19% MoM increase.</li>
<li class="mt-2"><strong>Transfer volume from miners to exchanges (USD): </strong>After reaching YTD lows in early September, Bitcoin transfers from miners to exchanges increased by 50% MoM. Curiously, however, the U.S.-listed miners that we cover appeared to increase their holdings. This parallels the trend of European and American traders accumulating Bitcoin from Asian sellers. Among the 12 U.S.-listed miners in our coverage, the 9 maintaining Bitcoin treasuries have continued to increase their aggregate BTC holdings, driven primarily by the pure-play miners we noted in our AI/HPC <a title="Bitcoin Miners' AI Arbitrage Play to Boost Revenue" href="https://www.vaneck.com/us/en/blogs/digital-assets/matthew-sigel-bitcoin-miners-ai-arbitrage-play-to-boost-revenue/?ite=24965&amp;ito=1548&amp;itq=9d01c6a4-04ed-4f53-882c-81ced6f9c35b&amp;itx%5Bidio%5D=202056"><strong>research</strong></a>: MARA, RIOT, and CLSK. While other miners like CORZ and CIFR have divested from their BTC treasuries to fund AI/HPC buildouts, these pure-play miners are emulating MicroStrategy&rsquo;s leveraged Bitcoin approach by increasing their BTC positions. MARA particularly stood out for continuing its months-long Bitcoin buying spree, financed by ~$244 million in convertible note proceeds <a href="https://ir.mara.com/investors/news-events/press-releases/detail/1367/marathon-digital-holdings-inc-announces-pricing-of-oversubscribed-offering-of-convertible-senior-notes" title="Marathon Digital Holdings, Inc. Announces Pricing of Oversubscribed Offering of Convertible Senior Notes" target="_blank" rel="noopener"><strong>announced</strong></a> in August.</li>
<li class="mt-2"><strong>Publicly traded miners&rsquo; hashrate dominance: </strong>Publicly traded Bitcoin miners now control a record ~30% of the global hashrate. This concentration means that any further pivots by these listed miners toward AI/HPC could have significant implications for global hashrate and difficulty. Divesting from mining reduces the global hash rate and mining difficulty, making the sector more profitable for remaining players, all else being equal.</li>
<li class="mt-2"><strong>Rise of the pivotoors: </strong>As of October 14th, CORZ (+278%) leads our covered Bitcoin miners YTD. In fact, only miners that have announced AI/HPC pivots are positive on the year: CORZ, WULF (+97%), IREN (+26%), and CIFR (+5%). As referenced above, in late September, CIFR <a href="https://investors.ciphermining.com/news-releases/news-release-details/cipher-mining-announces-closing-its-acquisition-barber-lake-300" title="Cipher Mining Announces the Closing of its Acquisition of Barber Lake 300 MW Data Center Site" target="_blank" rel="noopener"><strong>announced</strong></a> selling over one-third of its bitcoin treasury to finance the acquisition of its new West Texas Barber Lake site. Similarly, in early October, WULF <a href="https://investors.terawulf.com/news-events/press-releases/detail/86/terawulf-monetizes-equity-interests-in-nautilus-joint" title="TeraWulf Monetizes Equity Interests in Nautilus Joint Venture to Fuel Expansion of HPC/AI and Bitcoin Mining at Flagship Lake Mariner Facility" target="_blank" rel="noopener"><strong>sold</strong></a> its 25% equity interest in the Nautilus Cryptomine joint venture to fuel further the expansion of its AI/HPC and self-mining efforts at its Lake Mariner facility.</li>
<li class="mt-2"><strong>Better late than never: </strong>In a fireside chat with Bernstein on October 3rd, RIOT&rsquo;s CEO Jason Les discussed the potential suitability of its Rockdale and Corsicana sites for AI/HPC. Relative to its peers, RIOT has been late in joining the AI/HPC discussion. Justifiably, Mr. Les explained that Riot does not want to create unnecessary hype nor invest in AI/HPC infrastructure without a customer. With MARA <a href="https://ir.mara.com/investors/news-events/press-releases/detail/1349/marathon-digital-holdings-unveils-two-phase-immersion-cooling-system-to-optimize-data-center-operations" title="Marathon Digital Holdings Unveils Two-Phase Immersion Cooling System To Optimize Data Center Operations" target="_blank" rel="noopener"><strong>indicating</strong></a> in March its strategic initiative to diversify its operations with its MARA 2PIC700 immersion cooling system, CLSK remains perhaps the only U.S.-listed miner in our coverage unequivocally committed to remaining a &ldquo;pure-play&rdquo; bitcoin miner&mdash;at least for now. Echoing RIOT&rsquo;s reluctance to create undue hype, CLSK&rsquo;s CEO Zach Bradford expressed skepticism about bitcoin miners&rsquo; ability to compete for high-quality revenues, stating that despite CLSK owning two buildings that could meet AI/HPC data center criteria, they are choosing to remain focused on efficient bitcoin mining. As of October 14th, RIOT is the best-performing mining stock over the last month, +25%.</li>
</ul>
<h3>Chart of the Month: Bitcoin&rsquo;s 2-Year Performance vs. Other Crypto Asset Categories</h3>
<p><img class="img-responsive w-100" alt="Bitcoin&rsquo;s 2-Year Performance vs. Other Crypto Asset Categories" src="https://www.vaneck.com/contentassets/1a7952ae9eab4e338d123267595e872d/4940_bitcoin-chaincheck-october_chart-3_2024-10_v1_blog.svg" /></p>
<p class="chart-disclosure"><strong>Source</strong>: TheTie as of 10/11/2024. <strong>Past performance is no guarantee of future results.</strong></p>
<p><strong>Notes:</strong></p>
<p>Net unrealized profit/loss ratio (NUPL) can be calculated by subtracting the realized market cap from the market cap and dividing the result by the market cap. When a high percentage of Bitcoin&rsquo;s market cap consists of unrealized profits, it can be interpreted that investors are greedy. Background reading <strong><a href="https://medium.com/@adamant_capital/a-primer-on-bitcoin-investor-sentiment-and-changes-in-saving-behavior-a5fb70109d32" title="A Primer on Bitcoin Investor Sentiment and Changes in Saving Behavior" target="_blank" rel="noopener">here</a></strong>.</p>
<p><strong>Links to third party websites are provided as a convenience and the inclusion of such links does not imply any endorsement, approval, investigation, verification or monitoring by us of any content or information contained within or accessible from the linked sites. By clicking on the link to a non-VanEck webpage, you acknowledge that you are entering a third-party website subject to its own terms and conditions. VanEck disclaims responsibility for content, legality of access or suitability of the third-party websites.</strong></p>
<style>
    .data-td.data {
        padding-right: 5px !important;
    }

    .wrapped-div {
        max-width: 100%;
    }

    @media (max-width: 1240px) {
        .wrapped-div {
            overflow-x: scroll;
        }
    }

    .wrapped-div-sector {
        max-width: 100%;
        overflow-x: scroll;
    }
</style>
<p>To receive more <strong><a href="https://www.vaneck.com/us/en/insights/digital-assets/" title="Digital Assets Insights">Digital Assets</a></strong> insights, <strong><a href="https://www.vaneck.com/us/en/subscribe/" title="Subscription Center">sign up in our subscription center</a></strong>.</p>
]]></content:encoded>
</item><item rdf:about="https://www.vaneck.com/us/en/blogs/emerging-markets-bonds/fed-cuts-plus-china-stimulus-solidify-em-bond-momentum/">
  <title>Fed Cuts Plus China Stimulus Solidify EM Bond Momentum></title>
  <link>https://www.vaneck.com/us/en/blogs/emerging-markets-bonds/fed-cuts-plus-china-stimulus-solidify-em-bond-momentum/</link>
  <description><![CDATA[China stimulus and the start to the Fed&rsquo;s cutting only adds to emerging market bonds strong momentum heading into the end of 2024.]]></description>
  <dc:creator>Eric Fine</dc:creator>
  <dc:date>10/14/2024 06:30:00</dc:date>
<content:encoded><![CDATA[

<p id="performance-overview" class="jump-link-nav anchored-block" data-jumplink-title="Performance Overview">The <strong><a href="/link/dbb866e8704049c784a0bdf9299143ea.aspx" title="EMBAX - Emerging Markets Bond Fund - Class A - Overview">VanEck Emerging Markets Bond Fund</a></strong> was up 3.26% in September, compared to up 2.62% for its benchmark. Year to date the fund is up 8.44%, compared to up 6.80% for its benchmark, the 50% J.P. Morgan Government Bond Index-Emerging Markets Global Diversified (GBI-EM) and 50% J.P. Morgan Emerging Markets Bond Index (EMBI), and compared to up 3.43% and 3.65% for the ICE BofA Broad Market Index (Global Agg) and 10-year Treasuries, respectively. For the trailing 5-year period, the fund&rsquo;s cumulative return is 24.7%, compared to 3.9% for its benchmark (and -6.1%, -6.5% for the Global Agg and 10-year Treasuries, respectively).</p>
<p>The decades-old story of emerging market (EM) bonds outperforming developed market (DM) continues. During September, the fund did very little in the way of portfolio adjustments, other than the last few implementations of our reduction in long-duration dollar-denominated investment grade, in favor of higher-beta EM local-currency. We also increased exposure to China property (before China&rsquo;s stimulus announcements). The reduction in duration is mostly to fund EM local exposure, and only somewhat a concern on the direction of US rates. We continue to like local-currency, especially higher-beta, and have reduced our duration into the rally in US rates. Brazil, Chile, Colombia, and Mexico now complement our previous Asian stalwarts (Thailand, Malaysia, Indonesia, Korea) and South Africa in local currency. In USD, investment grade seems a pure US-rates trade (so we are averse), while high yield sovereigns remain our hunting ground. Carry is 7.6%, yield to worst is 9.0%, duration is 6.5 and local makes up around 60.9% of exposure.</p>

<h3>Average Annual Total Returns<sup>*</sup>&nbsp;(%) (In USD)</h3>
<div class="wrapped-div">
<table style="width: 100%;">
<tbody>
<tr class="tbl-data">
<td class="tbl-header last" colspan="10">As of September 30, 2024</td>
</tr>
<tr class="tbl-data">
<td class="data-head last text-right">&nbsp;</td>
<td class="data-head last text-right">1 Mth</td>
<td class="data-head last text-right">3 Mth</td>
<td class="data-head last text-right">YTD</td>
<td class="data-head last text-right">1 Yr</td>
<td class="data-head last text-right">3 Yrs</td>
<td class="data-head last text-right">5 Yrs</td>
<td class="data-head last text-right">10 Yrs</td>
</tr>
<tr class="tbl-data">
<td class="data-td last text-left">Class A: NAV (Inception 07/09/12)</td>
<td class="data-td data last text-right">3.19</td>
<td class="data-td data last text-right">7.73</td>
<td class="data-td data last text-right">7.97</td>
<td class="data-td data last text-right">17.00</td>
<td class="data-td data last text-right">2.71</td>
<td class="data-td data last text-right">4.17</td>
<td class="data-td data last text-right">1.88</td>
</tr>
<tr class="tbl-data">
<td class="data-td last text-left">Class A: Maximum 5.75% load</td>
<td class="data-td data last text-right">-2.74</td>
<td class="data-td data last text-right">1.54</td>
<td class="data-td data last text-right">1.77</td>
<td class="data-td data last text-right">10.27</td>
<td class="data-td data last text-right">0.70</td>
<td class="data-td data last text-right">2.94</td>
<td class="data-td data last text-right">1.28</td>
</tr>
<tr class="tbl-data">
<td class="data-td last text-left">Class I: NAV (Inception 07/09/12)</td>
<td class="data-td data last text-right">3.26</td>
<td class="data-td data last text-right">7.84</td>
<td class="data-td data last text-right">8.44</td>
<td class="data-td data last text-right">17.58</td>
<td class="data-td data last text-right">3.07</td>
<td class="data-td data last text-right">4.52</td>
<td class="data-td data last text-right">2.20</td>
</tr>
<tr class="tbl-data">
<td class="data-td last text-left">Class Y: NAV (Inception 07/09/12)</td>
<td class="data-td data last text-right">3.35</td>
<td class="data-td data last text-right">7.98</td>
<td class="data-td data last text-right">8.41</td>
<td class="data-td data last text-right">17.52</td>
<td class="data-td data last text-right">2.96</td>
<td class="data-td data last text-right">4.46</td>
<td class="data-td data last text-right">2.14</td>
</tr>
<tr class="tbl-data">
<td class="data-td last text-left">50% GBI-EM/50% EMBI</td>
<td class="data-td data last text-right">2.62</td>
<td class="data-td data last text-right">7.57</td>
<td class="data-td data last text-right">6.80</td>
<td class="data-td data last text-right">16.02</td>
<td class="data-td data last text-right">0.15</td>
<td class="data-td data last text-right">0.78</td>
<td class="data-td data last text-right">1.98</td>
</tr>
</tbody>
</table>
</div>
<style>
    .data-td.data {
        padding-right: 2px !important;
    }
    
    .wrapped-div {
        max-width: 100%;
    }
    
    @media (max-width: 768px) {
        .wrapped-div {
            overflow-x: scroll;
        }
    }
    
    .wrapped-div-sector {
        max-width: 100%;
        overflow-x: scroll;
    }
</style>
<p class="chart-disclosure"><sup>*</sup>&nbsp;Returns less than one year are not annualized.</p>
<p class="chart-disclosure"><strong>Expenses: Class A: Gross 2.08%, Net 1.21%; Class I: Gross 1.34%, Net 0.86%; Class Y: Gross 1.35%, Net 0.96%.</strong> Expenses are capped contractually until 05/01/25 at 1.20% for Class A, 0.85% for Class I, 0.95% for Class Y. Caps excluding acquired fund fees and expenses, interest, trading, dividends, and interest payments of securities sold short, taxes, and extraordinary expenses.</p>
<p class="chart-disclosure"><strong>The performance data quoted represents past performance. Past performance is not a guarantee of future results. Investment return and principal value of an investment will fluctuate so that an investor&rsquo;s shares, when redeemed, may be worth more or less than their original cost. Performance may be lower or higher than performance data quoted. Please call 800.826.2333 or visit vaneck.com for performance current to the most recent month ended.</strong></p>
<p class="chart-disclosure">The &ldquo;Net Asset Value&rdquo; (NAV) of a Fund is determined at the close of each business day, and represents the dollar value of one share of the fund; it is calculated by taking the total assets of the fund, subtracting total liabilities, and dividing by the total number of shares outstanding. The NAV is not necessarily the same as the ETF&rsquo;s intraday trading value. Investors should not expect to buy or sell shares at NAV.</p>
<p id="china-stimulus-in-focus" class="jump-link-nav anchored-block" data-jumplink-title="China Stimulus In Focus"><strong>China&rsquo;s monetary, structural, and fiscal stimulus are supportive of commodities and rest-of-world (ROW) growth. A Fed cutting, combined with these new growth upside risks is a great setup for an EM that wins economically from these developments and whose starting point is even higher interest rates than DM. A key concern of ours, given our positioning, had been ROW growth, which is now less of a risk.</strong> We won&rsquo;t repeat the litany of monetary (policy rate cuts), structural (relaxations on property purchases), and now fiscal (actual spending/demand) policies Chinese authorities are fleshing out and implementing. Suffice it to say that the line into actual demand-creating policy has been crossed with the invocation of fiscal policy. Gone are the days when we could respond to policy initiatives by simply asking &ldquo;well, will these facilities be demanded?&rdquo; And, given the surprise this still seems to be to the market, being underweight the potential implications could be impractical.</p>
<p><strong>Very few expected or were positioned for this development, which means that the second-guessing isn&rsquo;t relevant for now. In particular, the main questions surrounding China stimulus -- &ldquo;US politics&rdquo;, &ldquo;geopolitics&rdquo;, &ldquo;China policy has no traction yet&rdquo;, or &ldquo;China is uninvestable&rdquo; -- are way too big. Don&rsquo;t get in your own way, it can be &ldquo;good&rdquo; even while you keep a close eye on it.</strong> Let&rsquo;s tackle some of these issues. Basically, one skeptical reaction to China is either a combination of &ldquo;US politics&rdquo; or &ldquo;geopolitics&rdquo; making China &ldquo;uninvestable&rdquo;. That may be true, given the unpredictability of tariffs and sanctions under a Republican-sweep scenario (remembering also that China can sanction the West, having a larger net international investment position). That&rsquo;s a real risk and a reasonable conclusion. But so what does this mean, practically? US elections first need to happen, and then we need to see zero-modulation or climb-down by a newly elected President Trump, or posit that none of these risks are already priced. That seems like too many assumptions, compared to the fact of Fed rate cuts, ongoing Chinese currency stability/strength, and policies that can anyway take years to work out. The other skeptical reaction to China is that economic support facilities only work when they are demanded and that there was no &ldquo;forced&rdquo; demand. To that, our point is twofold. First, the fiscal line of forced demand has been crossed and it&rsquo;s very rare to back down from these. Second, waiting for clear evidence of this demand doesn&rsquo;t seem to fit the job description of prediction, not observation.</p>
<p><strong>Speaking of &ldquo;geopolitics&rdquo;, recent actual (not speculative questions like those above) escalation between Israel/Iran has a straightforward implication that is positive for EM &ndash; higher commodity prices.</strong> As we&rsquo;ve argued before, the world is not de-globalizing, the West is de-globalizing and ROW are accelerating globalization. The biggest un-remarked fact in markets remains, to our eye, the massive positive terms-of-trade shock for EM, particularly Asia. It is buying oil at lower prices than we see on our screens, among all the other structural developments such as increased use of each other&rsquo;s currencies in trade and as reserve assets. These themes were developed in our &ldquo;Fiscal Dominance&rdquo; research pieces --- which reminds you that the problems with the West are more profound and fixed (high debt, for example) than whatever headlines happen to reveal them.</p>
<p><strong>CNY stability continues to anchor Asian EM as a safe-haven during rough times (e.g., the recent JPY carry trade unwind) and supportive during growth-positive times such as may be being inaugurated now. LATAM has lagged this strength and looks attractive, and more -- the market got beaten up being trapped in big overweights in Mexico and Brazil positions that were simply too heavy, but not bad. We were very underweight Mexico and Brazil, but switched to overweight in recent months. Fed rate cuts and China stimulus are a great setup for EM bonds, and investor non-participation only strengthens the case.</strong> Does it get any better than this? EM bonds have been ignored for a decade, because they have the word &ldquo;bonds&rdquo; in them and are vaguely considered risky. As we&rsquo;ve noted in our publications, EM bonds have outperformed DM bonds over multiple time periods in absolute and risk-adjusted terms. The weak headline performance of &ldquo;bonds&rdquo; tainted an EM bond world that outperformed in a &ldquo;bad bond&rdquo; world, and looks set to outperform in a &ldquo;good bond&rdquo; world. For the trailing 5 years into 9/30/24, our benchmark cumulative return was up around 4% while the Agg and treasuries were down around 6% (and our fund was up almost 25%). Please reach out to us if you want this sliced into different time periods or sub-classes, we&rsquo;ve done it all.</p>
<h3>Exhibit 1 &ndash; CNY Insulated EM From DM Japan&rsquo;s Volatility</h3>
<p><strong>Exchange Rate Trends: CNY vs. JPY</strong></p>
<p><img class="img-responsive w-100" alt="Exhibit 1 &ndash; CNY Insulated EM From DM Japan&rsquo;s Volatility" src="https://www.vaneck.com/contentassets/37c5239755614c828ba1db5675cd9251/4915_emb-october_chart-1_2024.10_v2_blog.svg" /></p>
<p class="chart-disclosure">Source: VanEck Research; Bloomberg LP; Data as of September 30, 2024</p>
<p><strong>We have no new charts in this monthly because they are by now exhausted &ndash; EM has low debt, pays you more, has outperformed DM over multiple time periods, was constrained by a Fed delaying cuts and growth concerns, which are now arguably addressed. Some recycled charts occur below.</strong></p>
<h3>Exhibit 2 &ndash; Asia EM Rallied During Risky Past 4 years</h3>
<p><strong>EM Regions - GBI-EM/5Y UST Yield Differentials, bps</strong></p>
<p><img class="img-responsive w-100" alt="Exhibit 2 &ndash; Asia EM Rallied During Risky Past 4 years" src="https://www.vaneck.com/contentassets/2702ddada3294d1ab34db3c01dbf6686/4915_emb-october_chart-2_2024.10_v1_blog.svg" /></p>
<p class="chart-disclosure">Source: VanEck Research, Bloomberg LP. Data as of September 2024.</p>
<h3>Exhibit 3 &ndash; LATAM and EMEA Still Have High Real Rates</h3>
<p><strong>Real Policy Rates in EM and DM (%)</strong></p>
<p><img class="img-responsive w-100" alt="Exhibit 3 &ndash; Latam and EMEA Still Have High Real Rates " src="https://www.vaneck.com/contentassets/79f0f369076e4345854f134a2b86fea3/4915_emb-october_chart-3_2024.10_v2_blog.svg" /></p>
<p class="chart-disclosure">Source: VanEck Research, Bloomberg LP. Data as of September 2024.</p>

<h2 id="exposure-types-and-changes" class="jump-link-nav anchored-block" data-jumplink-title="Exposure Types and Changes">Exposure Types and Significant Changes</h2>
<p>The changes to our top positions are summarized below. Our largest positions in September were Mexico, South Africa, Thailand, Indonesia, and Malaysia:</p>
<ul class="content-list">
<li class="mt-2">We increased our hard currency corporate exposure in China and Israel, and hard currency sovereign exposure in Argentina and El Salvador. The initial move in China took place on the back of easing property regulations in major cities, and we added more exposure as China unveiled its ambitious support package in late September. Our decisions in Argentina and El Salvador were also motivated by better policies &ndash; specifically by more orthodox 2025 fiscal targets. In terms of our investment process, this improved the policy test scores in all three countries. Israeli assets sold off a lot on the back of geopolitical turbulence, and some corporate valuations now look very attractive, improving the technical test score.</li>
<li class="mt-2">We also increased our local currency exposure in South Africa and Mexico. In Mexico, the market focused too much on judicial reform, while completely ignoring President Sheinbaum&rsquo;s positive signals on the fiscal front, as well as her shrewd cabinet appointments, both of which improved the policy test score for the country. South Africa&rsquo;s fiscal success is only now started to be noticed and acknowledged by the market, while the central bank had finally been able to start cutting interest rates following successful disinflation. In terms of our investment process, this improves the policy test score for the country.</li>
<li class="mt-2">Finally, we increased our hard currency sovereign exposure in Nigeria, Tunisia, and Sri Lanka. Nigeria is benefitting from the stabilizing oil prices and the resulting savings on fuel subsidies. These factors improve Nigeria&rsquo;s technical and economic test scores. Tunisia&rsquo;s international reserves look adequate, whereas a small current account deficit lowers external risks. Both factors improve the economic test score for the country. In Sri Lanka, the initial concerns about the presidential election results eased as President-elect sounded more conciliatory and less radical in his initial policy statements, giving a boost to the country&rsquo;s policy test score.</li>
<li class="mt-2">We reduced our hard currency sovereign exposure in Saudi Arabia, the United Arab Emirates, and Qatar, as well as hard currency quasi-sovereign exposure in Qatar. Our move reflected the fact that long duration positions are getting crowded, and the Fed&rsquo;s aggressive rate cuts might result in stronger growth and higher inflation pressures down the road. In terms of our investment process, this worsened the technical test score for all three countries.</li>
<li class="mt-2">We also reduced our hard currency sovereign exposure in the Dominican Republic and Poland. We used the Dominican Republic proceeds as funders for more interesting and attractively valued opportunities. In Poland, we were concerned about less attractive valuations and the impact of severe floods on the economy, which worsened the economic test score for the country.</li>
<li class="mt-2">Finally, we reduced our local currency exposure in Uruguay and Peru. Political and policy noise associated with the Uruguayan elections and the plebiscite worsened the policy test score for the country. In Peru, we freed space for other assets, following the timely and relatively cheap resolution of the national oil company&rsquo;s crisis. The resolution was hailed by two rating agencies which raised Peru's outlook from negative to stable.</li>
</ul>
<p>To receive more <a href="https://www.vaneck.com/us/en/insights/emerging-markets-bonds/" title="Emerging Markets Bonds Insights"><strong>Emerging Markets Bonds</strong></a> insights, <a href="/link/5f45412c2143400497908cea2897f7d3.aspx" title=" Subscription Center"><strong>sign up in our subscription center</strong></a>.</p>
]]></content:encoded>
</item><item rdf:about="https://www.vaneck.com/us/en/blogs/gold-investing/golden-rule-gold-belongs-in-every-investors-portfolio/">
  <title>Golden Rule: Gold Belongs in Every Investor’s Portfolio></title>
  <link>https://www.vaneck.com/us/en/blogs/gold-investing/golden-rule-gold-belongs-in-every-investors-portfolio/</link>
  <description><![CDATA[Traditional investment strategies often overlook gold, a proven asset that excels in uncertain times; even a small allocation can offer vital protection and enhance your portfolio amid inflation.]]></description>
  <dc:creator>David Schassler</dc:creator>
  <dc:date>10/14/2024 06:30:00</dc:date>
<content:encoded><![CDATA[

<p>For decades, the traditional investment strategy has centered on a blend of stocks and bonds. While stocks drive growth and bonds provide stability, this conventional mix can overlook a powerful asset that has proven its worth time and again: gold.</p>
<p>In today's world of rising uncertainties&mdash;marked by inflation, geopolitical tensions and soaring government debt&mdash;relying solely on traditional asset classes might not be sufficient to manage risk effectively. Gold offers a compelling alternative, delivering performance, protection and diversification when investors need it most.</p>
<h2>The Case for Gold</h2>
<p>Gold has consistently outperformed many other assets during times of economic stress. Its unique properties make it a haven during inflationary periods and a reliable store of value over the long term. As we navigate through an increasingly unpredictable financial landscape, the need for a safe-haven asset like gold has never been clearer.</p>
<p>Allocating even a small portion of your portfolio&mdash;whether it&rsquo;s 5%, 10%, or 20%&mdash;to gold can serve as a crucial hedge against market volatility. This independent asset is not just a safeguard; it also enhances your overall investment strategy, allowing you to capture potential upside without the correlation that often exists between stocks and bonds.</p>

<h2>A Timely Opportunity</h2>
<p>The recent outperformance of gold highlights its significance in current market conditions. With economic uncertainties looming, now is an opportune time to consider incorporating gold into your portfolio.</p>
<p>In a world that often feels chaotic, gold remains a steadfast option for protecting and growing your wealth. Don't overlook this golden opportunity&mdash;make sure your portfolio reflects the strength and stability that gold can provide. After all, when it comes to safeguarding your investments, there's no better time to shine than now!</p>

<p>To receive more <strong><a href="https://www.vaneck.com/us/en/insights/gold-investing/" title="Gold Investing Insights">Gold Investing</a></strong> insights, <strong><a href="https://www.vaneck.com/us/en/subscribe/" title="Subscription Center">sign up in our subscription center</a></strong>.</p>
]]></content:encoded>
</item><item rdf:about="https://www.vaneck.com/us/en/blogs/natural-resources/gold-drives-commodities-amid-energy-challenges/">
  <title>Gold Drives Commodities Amid Energy Challenges></title>
  <link>https://www.vaneck.com/us/en/blogs/natural-resources/gold-drives-commodities-amid-energy-challenges/</link>
  <description><![CDATA[This past quarter, the energy sector faced challenges from global economic conditions and potential oversupply, while the precious metals sector, notably gold, was the top performer.]]></description>
  <dc:creator>Roland Morris</dc:creator>
  <dc:date>10/14/2024 06:30:00</dc:date>
<content:encoded><![CDATA[

<h2>Mixed Performance in Q3: Precious Metals Shine While Energy Declines</h2>
<p>Commodity index returns were mixed in the third quarter. The energy sector declined sharply due to concerns over slowing global growth and potential oversupply from OPEC&rsquo;s (Organization of the Petroleum Exporting Countries) spare capacity. The precious metals sector, led by gold, was the strongest performer during the quarter. The UBS Constant Maturity Commodity Index (CMCITR) underperformed the Bloomberg Commodity Index (BCOM), which has a significantly larger exposure to gold and silver.</p>
<p>In the third quarter, CMCITR&rsquo;s performance declined by approximately 0.86%, while BCOM rose by 0.68%. Despite this CMCITR still outperformed BCOM year-to-date by about 0.39% (6.25% versus 5.86%).</p>

<h2>Sector Review: Gold&rsquo;s Gain Spearheaded Positive Returns</h2>
<p>The energy sector overall declined by 10%, with both WTI Crude Oil and Brent Crude Oil also falling by about 10%. The gains seen in the energy sector during the first half of the year were essentially reversed in the third quarter due to slowed economic growth in China and the European Union (EU). WTI Crude Oil traded in a range from $65 to $80, ending the quarter near the year's lows. OPEC is expected to modestly increase output in December. The ongoing war in the Middle East should continue to support prices, keeping crude within a trading range.</p>
<p>The precious metals sector was the top performer this past quarter, climbing approximately 12%. Gold spearheaded the gains with a 13% rise, while silver increased by 6%. Year-to-date, gold has surged 30%, outpacing all other commodity sectors. This surge is driven by investor demand for gold as a safe-haven asset amidst two wars (Middle East and Russia-Ukraine) and the U.S. election. BCOM has a 20% allocation to the precious metals sector, compared to CMCI's almost 7% allocation.</p>
<p>The agriculture sector gained about 3%. Additionally, coffee, cocoa and sugar led the sector higher and have been the strongest agricultural commodities all year. CMCITR has exposure to cocoa, whereas and BCOM does not. This difference in exposure has given CMCITR an advantage over BCOM.</p>
<p>The industrial metals sector rose approximately 2.5% in the quarter, with zinc and copper increasing by 5% and 3%, respectively. The outlook for copper improved early in the fourth quarter after China announced aggressive economic stimulus policies. CMCITR has a 25% exposure to the sector, compared to BCOM's 16% exposure. This could benefit CMCITR over BCOM in the fourth quarter.</p>
<p>The livestock sector rose approximately 3.5% in the quarter, with both cattle and hogs experiencing modest rallies.</p>
<h3>Comparative Index Sector Weights</h3>
<p><strong>CMCITR&rsquo;s higher weighting to Industrial Metals and Agriculture sectors helped offset negative performance in Q3 2024.</strong></p>
<p><img class="img-responsive w-100" alt="CMCITR&rsquo;s higher weighting to Industrial Metals and Agriculture sectors helped offset negative performance in Q3 2024." src="https://www.vaneck.com/contentassets/a5e709dc73c0464ab1c0f29f25bb8bc0/4918_cmci-oct_chart-1_2024.10_v1_blog.svg" /></p>
<p class="chart-disclosure"><strong>Source:</strong> VanEck, Bloomberg. Data as of September 2024.</p>
<h2>Outlook: Opportunities in Metals and Agriculture</h2>
<p>While the energy sector faces challenges from global economic conditions and potential oversupply, precious metals and industrial metals offer avenues for growth backed by geopolitical and economic developments. The agriculture sector is expected to remain robust, while the livestock sector is likely to see stable growth. Overall, we expect commodities to continue to perform positively during the fourth quarter.</p>

<p>To receive more <a href="/us/en/insights/natural-resources/" title="Natural Resources Insights"><strong>Natural Resources</strong></a> insights, <a href="https://www.vaneck.com/us/en/subscribe/" title="Subscription Center"><strong>sign up in our subscription center</strong></a>.</p>
]]></content:encoded>
</item><item rdf:about="https://www.vaneck.com/us/en/blogs/investment-outlook/jan-van-eck-market-outlook-better-than-the-headlines-suggest/">
  <title>Market Outlook Better Than the Headlines Suggest></title>
  <link>https://www.vaneck.com/us/en/blogs/investment-outlook/jan-van-eck-market-outlook-better-than-the-headlines-suggest/</link>
  <description><![CDATA[Amid the noise around political and economic uncertainty, several key factors point to a more promising investment landscape than the headlines suggest.]]></description>
  <dc:creator>Jan van Eck</dc:creator>
  <dc:date>10/14/2024 06:30:00</dc:date>
<content:encoded><![CDATA[

<a href="/us/en/blogs/investment-outlook/jan-van-eck-q2-2026-outlook-the-reset-is-your-entry-point/" title="Jan van Eck's Latest Outlook"><strong>Looking for the latest outlook? Read the Q2 2026 Outlook.</strong></a>
<p>With political and economic uncertainty, investors might feel tempted to scale back on risk. However, when you look beyond the headlines, the reality is that the investment landscape is more favorable than it seems.</p>
<p><strong><a href="https://www.vaneck.com/us/en/offsite-disclaimer/?id=294802&amp;button=no&amp;url=https://www.youtube.com/watch?v=RbuyWVN1x-Y" target="_blank" rel="noopener">In my Q4 outlook video</a></strong>, I highlighted the key drivers that are shaping markets. The main points I discussed are:</p>
<ol class="content-list">
<li>Monetary stimulus in the U.S. and China are a moderate support to financial markets.</li>
<li>U.S. equity valuations began normalizing in Q3 with the <strong><a href="/us/en/blogs/moat-investing/moat-stocks-gain-as-mega-caps-falter/" title="Moat Stocks Gain as Mega-Caps Falter">underperformance of tech</a></strong>.</li>
<li>Limited shifts in fiscal policy are to be expected in 2025.</li>
<li>Gold remains a top performer in 2024, driven by falling interest rates, geopolitical risks, and central bank buying, and the <strong><a href="/us/en/blogs/gold-investing/ready-set-gold-bull-run-may-have-just-begun/" title="Ready, Set, Gold! Bull Run May Have Just Begun">macroeconomic backdrop suggests further upside potential</a></strong>.</li>
</ol>
<p>The slides I reviewed can be found <a href="/link/9b4af3d8f62e4ece992aead9b43189ce.aspx" title="VanEck Q4 Investment Outlook: Better Than the Headlines" target="_blank" rel="noopener"><strong>here</strong></a>.</p>

<p>To receive more <a href="https://www.vaneck.com/us/en/insights/investment-outlook/" title="Investment Outlook Insights"><strong>Investment Outlook</strong></a> insights, <a href="/link/5f45412c2143400497908cea2897f7d3.aspx" title=" Subscription Center"><strong>sign up in our subscription center</strong></a>.</p>
]]></content:encoded>
</item><item rdf:about="https://www.vaneck.com/us/en/blogs/moat-investing/three-reasons-to-consider-smid-caps-during-a-declining-rate-environment/">
  <title>Three Reasons to Consider SMID-Caps During a Declining Rate Environment></title>
  <link>https://www.vaneck.com/us/en/blogs/moat-investing/three-reasons-to-consider-smid-caps-during-a-declining-rate-environment/</link>
  <description><![CDATA[Historically, as long as the economy remains stable (and out of a recession), rate cuts tend to support smaller- and mid-cap stocks more so than their larger cap peers.]]></description>
  <dc:creator>Brandon Rakszawski</dc:creator>
  <dc:date>10/11/2024 11:00:00</dc:date>
<content:encoded><![CDATA[

<p>The Fed finally began easing monetary policy, announcing a 50-basis point cut during its September meeting. While the magnitude of the first cut has been a source of debate (50 bps vs 25 bps), the main topic on the minds of advisors is how to adjust strategic asset allocations in a broader environment of declining interest rates.</p>
<p>Looking at previous periods of monetary easing, rate cuts have had a positive impact on small and mid-cap companies. These smaller firms typically carry more debt than larger corporations, making them more sensitive to rising interest rates. As long as the economy remains stable and avoids a recession, historical trends show that rate cuts generally provide stronger support for smaller-cap stocks compared to their large-cap counterparts.</p>
<p>Below we discuss three reasons why advisors should consider small- and mid- cap stocks now.</p>
<h2>Valuations Create an Attractive Entry Point</h2>
<ul class="content-list">
<li class="mt-2">Small and mid-cap stocks are trading at a significant discount compared to their large-cap counterparts, presenting an attractive entry point for investors.</li>
<li class="mt-2">Historically, valuation gaps between large and smaller companies tend to close over time, potentially paving the way for outsized gains as the market corrects this disparity and valuations revert to the mean.</li>
</ul>
<h3>SMID Cap Valuations Are At 20 Year Lows Relative To Large Caps</h3>
<p><img class="img-responsive w-100" alt="SMID Cap Valuations Are At 20 Year Lows Relative To Large Caps" src="https://www.vaneck.com/contentassets/4df76df4f2f84d6bb8b8a563c7b6443d/4923_smot-3-reasons-why_chart-1_2024.10_v1_blog.svg" /></p>
<p class="chart-disclosure">Source: VanEck, Morningstar. Data as of 9/30/24. SMID cap and large cap stocks are represented by the Russell 2500 Index and S&amp;P 500 Index, respectively.</p>
<h2>Strong Historical Relative Performance during Past Rate Cut Periods</h2>
<ul class="content-list">
<li class="mt-2">Smaller companies historically benefit more during rate-cut cycles, as cheaper borrowing costs fuel growth and expansion, often leading to stronger earnings growth.</li>
<li class="mt-2">As monetary policy loosens, investors typically rotate from safe, large-cap investments to higher-growth opportunities such as small-cap stocks.</li>
<li class="mt-2">Data from the five previous rate-cut periods since 1995 shows that small and mid-cap stocks have consistently outperformed large-cap stocks, especially over a longer time horizon following the first rate cut.</li>
</ul>
<h3>Average Performance during Previous 5 Rate Cuts (since 1995)</h3>
<p><img class="img-responsive w-100" alt="Average Performance during Previous 5 Rate Cuts (since 1995)" src="https://www.vaneck.com/contentassets/6681f856138b4d4e926dfe6d91dd3859/4923_smot-3-reasons-why_chart-2_2024.10_v1_blog.svg" /></p>
<p class="chart-disclosure">Source: VanEck, Morningstar. Small caps, mid caps and large caps are represented by the S&amp;P Small Cap 600 Index, S&amp;P Mid Cap 400 Index, and S&amp;P 500 Index, respectively. Periods of rate cuts start in 1995 and cover the following 5 periods: 7/6/1995, 9/29/1998, 1/3/2001, 9/18/2007, and 8/1/2019.</p>

<h2>Winning during Election Years (and Beyond)</h2>
<ul class="content-list">
<li class="mt-2">Changes in government policy and fiscal initiatives can often favor smaller businesses, with many mid- and small-cap companies positioned to benefit from proposed regulatory shifts and / or infrastructure spending.</li>
<li class="mt-2">Data from previous election years shows that small and mid-cap stocks have consistently outperformed large-cap stocks.</li>
</ul>
<h3>Average Performance during Previous Election Years (since 1996)</h3>
<p><img class="img-responsive w-100" alt="Average Performance during Previous Election Years (since 1996)" src="https://www.vaneck.com/contentassets/a8f5928331ed4f8481bede5a5f8aa1a7/4923_smot-3-reasons-why_chart-3_2024.10_v1_blog.svg" /></p>
<p class="chart-disclosure">Source: VanEck, Morningstar. Small caps, mid caps and large caps are represented by the S&amp;P Small Cap 600 Index, S&amp;P Mid Cap 400 Index, and S&amp;P 500 Index, respectively. Time period of analysis starts in 1996 and includes the month of November in the after-election returns.</p>
<h2>Tap into the Power of Moat Investing</h2>
<p>While the broader backdrop is favorable for the SMID-cap asset class, it&rsquo;s important to remember that small and mid-cap stocks have a wide range when it comes to quality. In fact, 41% of small cap companies and 17.5% of mid cap companies are unprofitable<sup>1</sup>. In addition, the lack of analyst coverage and research for small- and mid-cap stocks can lead to greater dispersion between a SMID-cap company&rsquo;s stock price and fair value.</p>
<p>The <a href="/link/166321dbcfec440590fb51cf0ad629aa.aspx?utm_source=pr&amp;utm_medium=pressrelease" title="SMOT - VanEck Morningstar SMID Moat ETF - Overview"><strong>VanEck Morningstar SMID Moat ETF (SMOT)</strong></a> can help investors gain exposure to the attractive tailwinds behind the SMID asset class and avoid the lower-quality unprofitable companies. Leveraging Morningstar&rsquo;s equity research team, SMOT provides focused exposure to SMID-cap stocks, targeting companies with long-term competitive advantages and attractive valuations.</p>
<p>SMOT seeks to track the <a href="/link/166321dbcfec440590fb51cf0ad629aa.aspx?utm_source=pr&amp;utm_medium=pressrelease" title="SMOT - VanEck Morningstar SMID Moat ETF - Overview"><strong>Morningstar<sup>&reg;</sup>&nbsp;US Small-Mid Cap Moat Focus Index<sup>SM</sup></strong></a>, which leverages Morningstar&rsquo;s forward-looking, rigorous research process, driven by over 100 analysts globally. The Index applies much of the same core index methodology principles as Morningstar&rsquo;s flagship <a href="/link/9e43dd198c5f4e419f13220685081895.aspx" title="MOAT - VanEck Morningstar Wide Moat ETF - Overview"><strong>Wide Moat Focus Index</strong></a>, but to a universe of small- and mid-cap companies. The Index targets SMID-cap companies with <a href="https://www.vaneck.com/us/en/blogs/moat-investing/how-a-moat-stock-gets-its-economic-moat/" title="How a Moat Stock Gets Its Economic Moat"><strong>long-term competitive advantages, known as moats</strong></a>, and attractive valuations.</p>
<p>We believe now is a opportune time to consider SMOT because historically, the ETF has held a larger weighting to mid-cap companies versus small-caps, which could bode well in the current environment as mid-caps tend to perform better than both small and large caps following rate cuts and presidential elections.</p>

<p>To receive more <a href="https://www.vaneck.com/us/en/insights/moat-investing" title="Moat Investing Insights"><strong>Moat Investing</strong></a> insights, <a href="https://www.vaneck.com/us/en/subscribe/" title="Subscription Center"><strong>sign up in our subscription center</strong></a>.</p>
]]></content:encoded>
</item><item rdf:about="https://www.vaneck.com/us/en/blogs/model-portfolios/monthly-market-recap-septembers-surprise-surge/">
  <title>September Market Recap: September’s Surprise Surge></title>
  <link>https://www.vaneck.com/us/en/blogs/model-portfolios/monthly-market-recap-septembers-surprise-surge/</link>
  <description><![CDATA[September brought bold market moves on both the domestic and international fronts. Stocks surged, especially Chinese equities, while bonds and gold benefited from falling interest rates.]]></description>
  <dc:creator>David Schassler</dc:creator>
  <dc:date>10/09/2024 09:30:00</dc:date>
<content:encoded><![CDATA[

<h2>Overview</h2>
<p>September was packed with economic shifts. Both the U.S. and China made bold moves to keep their economies buzzing. The U.S. Federal Reserve gave the economy a push with a 0.50% interest rate cut, while China rolled out a massive stimulus package. This included slashing bank reserve requirements, lowering mortgage rates, and pumping liquidity directly into their stock market. Talk about a double punch!</p>
<p>Meanwhile, artificial intelligence (AI) remained the talk of the town. With promises of game-changing innovations, the excitement is real, though the timeline is still a bit fuzzy. One thing is certain: this tech boom will require a lot more energy. And guess what? Nuclear power is standing tall as the front-runner. China is already leading the charge with over 20 nuclear reactors under construction, targeting a capacity of 25 gigawatts. Even Bill Gates is on board&mdash;Microsoft struck a groundbreaking deal with Constellation Energy to revive the Three Mile Island nuclear facility, planning to secure all its energy output by 2028. But it&rsquo;s not all sunshine. Tensions in the Middle East are heating up, pushing oil prices higher and rattling global markets. And as if things weren&rsquo;t tricky enough, a massive U.S. dockworker strike, which has since been suspended until January, hit 36 major ports on October 1.&nbsp; <br /><br />Let&rsquo;s dig into the specifics.</p>

<h2>Stocks: A Bright Spot</h2>
<p>September was a great month for stocks, especially in China. Large-cap Chinese stocks listed in the U.S. soared over 20%, thanks to China&rsquo;s bold central bank actions. With Chinese stocks trading at a price-to-earnings (P/E) ratio of 10 (compared to 26 for the S&amp;P 500), we believe there&rsquo;s still room to grow. The last two decades have shown us that betting against committed central banks is often a losing game.</p>
<p>Closer to home, U.S. large-cap growth stocks jumped nearly 3%, driven by lower interest rates that made growth companies more attractive.</p>

<h2>Bonds: Strong Performance, Especially Abroad</h2>
<p>In the bond market, lower interest rates boosted the value of bonds, with the Bloomberg Barclays U.S. Aggregate Bond Index returning nearly 3%. However, the real excitement was in foreign-denominated debt. Emerging market bonds priced in local currencies rose over 8%, benefiting from a weaker U.S. dollar as interest rates fell.</p>
<h2>Real Assets: Gold Shines Bright</h2>
<p>Gold had a golden month, thanks to falling real interest rates. The U.S. finds itself in a "debt trap," where the federal debt is so massive that typical economic growth can't sustain it. We believe the only way out of this trap is through low or negative real interest rates, where inflation outpaces interest rates, allowing the government to repay debt with devalued dollars. Historically, this has created a bullish environment for gold, and this year has been no exception. That said, don&rsquo;t be shocked if we see a short-term pullback in gold prices&mdash;they&rsquo;ve been on a tear.</p>
<h2>Digital Assets: A Crypto Climb</h2>
<p>Bitcoin surged over 8%, and Ethereum followed with a nearly 4% gain. What powered this rise? A combination of the U.S. and China easing monetary policies, stronger-than-expected U.S. economic data, and increased institutional involvement. Traditional banks are now offering custody services for Bitcoin and Ethereum, boosting confidence in the digital asset space.</p>
<p>To receive more <strong><a href="https://www.vaneck.com/us/en/insights/guided-allocation/" title="Model Portfolio Insights">Model Portfolio</a></strong> insights, <strong><a href="https://www.vaneck.com/us/en/subscribe/" title="Subscription Center">sign up in our subscription center</a></strong>.</p>
]]></content:encoded>
</item><item rdf:about="https://www.vaneck.com/us/en/blogs/thematic-investing/diversified-exposure-to-the-weight-loss-drug-market/">
  <title>Diversified Exposure to the Weight Loss Drug Market></title>
  <link>https://www.vaneck.com/us/en/blogs/thematic-investing/diversified-exposure-to-the-weight-loss-drug-market/</link>
  <description><![CDATA[Ozempic and Wegovy, along with other GLP-1 receptor agonists, are transforming obesity treatment, and the companies behind these drugs are experiencing unprecedented growth.]]></description>
  <dc:creator>Michael Cohick</dc:creator>
  <dc:date>10/09/2024 08:30:00</dc:date>
<content:encoded><![CDATA[

<h2>Capitalizing on the Success of GLP-1 Weight Loss Drugs</h2>
<p>In recent years, the pharmaceutical industry has seen a tremendous surge in the development of weight loss drugs, particularly GLP-1 receptor agonists such as Ozempic and Wegovy. These drugs have revolutionized the treatment of obesity, not only improving the quality of life for millions of people but also driving significant financial growth for the companies that produce them. As a result, pharmaceutical companies like Novo Nordisk and Eli Lilly, both involved in the production and distribution of these revolutionary drugs, have become increasingly attractive to investors. One investment vehicle that offers exposure to this lucrative sector is the <a href="/link/08c7d3f4029b4e1a85ec8795516a6f02.aspx" title="PPH - VanEck Pharmaceutical ETF - Overview"><strong>VanEck Pharmaceutical ETF (PPH)</strong></a>.</p>
<h2 id="about-glp1-drugs" class="jump-link-nav anchored-block" data-jumplink-title="About GLP-1 Drugs">Understanding the Popularity of GLP-1 Weight Loss Drugs</h2>
<p><strong>What are GLP-1 Receptor Agonists?</strong></p>
<p>GLP-1 (Glucagon-Like Peptide-1) receptor agonists, such as semaglutide (marketed under the brand names Ozempic and Wegovy), have emerged as highly effective treatments for managing Type 2 diabetes and obesity. These drugs work by mimicking the actions of the GLP-1 hormone, which helps regulate blood sugar and reduce appetite, leading to weight loss. Their effectiveness, ease of use (injection-based treatments), and strong clinical data have made them the gold standard for obesity treatment.</p>
<p><strong>Ozempic and Wegovy: Market Leaders</strong></p>
<p>Novo Nordisk&rsquo;s Ozempic and Wegovy have dominated the market, particularly in the fight against obesity. With obesity rates soaring globally, these drugs offer a solution to a growing public health crisis. Ozempic was initially approved for treating Type 2 diabetes, but it quickly gained off-label popularity for weight loss due to its side effect of substantial weight reduction. Wegovy, also produced by Novo Nordisk, specifically targets weight loss and was approved by the FDA for this purpose.</p>
<p>As public awareness of these drugs continues to grow, the demand is expected to rise sharply. Many experts predict that GLP-1 drugs could eventually become blockbuster products with multi-billion-dollar sales potential.</p>
<h2>The Market Opportunity for GLP-1 Drugs</h2>
<p><strong>Growing Global Obesity Epidemic</strong></p>
<p>Obesity is a significant global health issue, affecting over 650 million adults worldwide.<sup>1</sup>&nbsp;In the U.S. alone, obesity rates have tripled since 1975.<sup>2</sup>&nbsp;As obesity increases, so do related chronic conditions such as diabetes, heart disease, and hypertension, creating a massive market for treatments like GLP-1 drugs. Public health initiatives, coupled with greater awareness of the risks associated with obesity, are also driving more patients to seek medical treatment for weight loss.</p>
<h3>The Overweight Population Continues to Rise Worldwide</h3>
<p><img class="img-responsive w-100" src="https://www.vaneck.com/contentassets/297cc9c4bb144fd79dba285f3110eab6/4900_pph_chart-1_2024-10_v1_blog.svg" alt="The Overweight Population Continues to Rise Worldwide" /></p>
<p class="chart-disclosure">Source: Statista as of 1/30/2024.</p>
<p id="strong-demand" class="jump-link-nav anchored-block" data-jumplink-title="Strong Demand"><strong>Strong Demand and Market Forecasts</strong></p>
<p>GLP-1 receptor agonists like Ozempic, Wegovy, and potentially Tirzepatide are forecasted to see exponential growth in sales over the next decade. Novo Nordisk, for example, reported substantial growth in the sales of Ozempic and Wegovy, and the global market for anti-obesity drugs is expected to reach $50 billion by 2030.<sup>3</sup>&nbsp;This potential makes pharmaceutical companies developing these treatments extremely attractive for investors.</p>
<h3>GLP-1 Sales Are Predicted to More Than Double By 2029</h3>
<p><img class="img-responsive w-100" src="https://www.vaneck.com/contentassets/07260a6f78b14f4fa6adab3f27af2a1c/4900_pph_chart-2_2024-10_v1_blog.svg" alt="GLP-1 Sales Are Predicted to More Than Double By 2029" /></p>
<p class="chart-disclosure">Source: GlobalData, Drugs Database as of 3/6/2024.</p>
<p><strong>Government Support and Public Health Initiatives</strong></p>
<p>Governments across the world are beginning to recognize obesity as a chronic disease that requires medical treatment, further boosting the market for weight loss drugs. In the U.S., for example, the Biden administration has discussed expanding Medicare coverage to include anti-obesity medications, which would significantly increase the number of eligible patients and drive further demand for GLP-1 drugs.</p>

<h2 id="gain_exposure" class="jump-link-nav anchored-block" data-jumplink-title="Gain Exposure"><strong>PPH: A Diversified Way to Gain Exposure</strong></h2>
<p>The <a href="/link/08c7d3f4029b4e1a85ec8795516a6f02.aspx" title="PPH - VanEck Pharmaceutical ETF - Holdings and Performance"><strong>VanEck Pharmaceutical ETF (PPH)</strong></a> is designed to track the performance of the MVIS US Listed Pharmaceutical 25 Index, providing investors with exposure to the largest and most established pharmaceutical companies in the world. Investing in PPH offers diversified exposure to major pharmaceutical companies that are leaders in drug development and commercialization, including companies that produce GLP-1 receptor agonists.</p>
<p><strong>Key Holdings: Exposure to GLP-1 Leaders</strong></p>
<p>One main reason PPH is attractive in the context of the GLP-1 trend is its exposure to the two major pharmaceutical companies driving the weight loss revolution: Novo Nordisk and Eli Lilly.</p>
<ul class="content-list">
<li class="mt-2"><strong>Novo Nordisk</strong>: As the manufacturer of both Ozempic and Wegovy, Novo Nordisk has emerged as a major player in the obesity drug market. With strong sales growth from these products, Novo Nordisk has posted impressive revenue gains, and it remains well-positioned to continue benefiting from the increasing demand for GLP-1 drugs.</li>
<li class="mt-2"><strong>Eli Lilly</strong>: Another key player in the GLP-1 space, Eli Lilly has developed Tirzepatide (marketed as Mounjaro), which is currently being used for Type 2 diabetes but shows great promise as a future weight-loss drug. The company is undergoing clinical trials for weight loss applications, and if approved, it could rival Novo Nordisk&rsquo;s products and open another substantial revenue stream.</li>
</ul>
<h3>Strong Historical Performance</h3>
<p><img class="img-responsive w-100" src="https://www.vaneck.com/contentassets/eda4b91e3c2c44a78096210ea742a9d3/4900_pph_chart-3_2024-10_v1_blog.svg" alt="Strong Historical Performance" /></p>
<p class="chart-disclosure">Source: Morningstar. Past performance is no guarantee of future results.</p>
<div class="wrapped-div">
<table style="width: 100%;">
<tbody>
<tr class="tbl-data">
<td class="tbl-header last" colspan="9">Average Annual Total Returns<sup>*</sup>&nbsp;(%) as of 09/30/2024</td>
</tr>
<tr class="tbl-data">
<td class="data-head last">&nbsp;</td>
<td class="data-head last">1 MO</td>
<td class="data-head last">3 MO</td>
<td class="data-head last">YTD</td>
<td class="data-head last">1 YR</td>
<td class="data-head last">3 YR</td>
<td class="data-head last">5 YR</td>
<td class="data-head last">10 YR</td>
<td class="data-head last">LIFE<br />12/20/11</td>
</tr>
<tr class="tbl-data">
<td class="data-td last">PPH (NAV)</td>
<td class="data-td data last">-4.32</td>
<td class="data-td data last">4.37</td>
<td class="data-td data last">18.08</td>
<td class="data-td data last">21.33</td>
<td class="data-td data last">11.41</td>
<td class="data-td data last">12.83</td>
<td class="data-td data last">6.09</td>
<td class="data-td data last">10.07</td>
</tr>
<tr class="tbl-data">
<td class="data-td last">PPH (Share Price)</td>
<td class="data-td data last">-4.43</td>
<td class="data-td data last">4.28</td>
<td class="data-td data last">17.95</td>
<td class="data-td data last">21.15</td>
<td class="data-td data last">11.31</td>
<td class="data-td data last">12.79</td>
<td class="data-td data last">6.07</td>
<td class="data-td data last">10.15</td>
</tr>
<tr class="tbl-data">
<td class="data-td last">MVPPHTR (Index)</td>
<td class="data-td data last">-4.34</td>
<td class="data-td data last">4.31</td>
<td class="data-td data last">17.84</td>
<td class="data-td data last">20.94</td>
<td class="data-td data last">11.03</td>
<td class="data-td data last">12.46</td>
<td class="data-td data last">5.91</td>
<td class="data-td data last">9.90</td>
</tr>
<tr class="tbl-data">
<td class="data-td last">Performance Differential (NAV - Index)</td>
<td class="data-td data last">0.02</td>
<td class="data-td data last">0.06</td>
<td class="data-td data last">0.24</td>
<td class="data-td data last">0.39</td>
<td class="data-td data last">0.38</td>
<td class="data-td data last">0.37</td>
<td class="data-td data last">0.18</td>
<td class="data-td data last">0.17</td>
</tr>
</tbody>
</table>
</div>
<br />
<p class="chart-disclosure">*Returns less than one year are not annualized.</p>
<p class="chart-disclosure"><strong><i>The performance data quoted represents past performance. Past performance is not a guarantee of future results. Investment return and principal value of an investment will fluctuate so that an investor's shares, when redeemed, may be worth more or less than their original cost. Performance may be lower or higher than performance data quoted. Please call 800.826.2333 or visit vaneck.com for performance current to the most recent month ended.</i></strong></p>
<p class="chart-disclosure">PPH Total Expense Ratio: 0.36%</p>
<style>
    .wrapped-div {
        max-width: 100%;
    }

    @media (max-width: 768px) {
        .wrapped-div {
            overflow-x: scroll;
        }
    }

    .wrapped-div-sector {
        max-width: 100%;
        overflow-x: scroll;
    }
</style>
<div>
<div>
<p>PPH has historically performed well, thanks to its focus on stable, profitable pharmaceutical companies. The pharmaceutical industry, in general, is known for its resilience, as demand for medications tends to be steady even during economic downturns. This defensive quality makes PPH an appealing option for investors looking for long-term growth with relatively low volatility.</p>
<p><strong>Other Growth Drivers Beyond GLP-1 Drugs</strong></p>
<p>One of the key benefits of investing in PPH is the diversification it offers. While individual stocks can be volatile, especially in the pharmaceutical sector, PPH reduces risk by providing exposure to a broad basket of pharmaceutical companies. This allows investors to gain exposure to GLP-1 drug producers while mitigating the risks associated with holding single stocks.</p>
<p>Additionally, while GLP-1 drugs are a key growth driver, PPH&rsquo;s holdings are diversified across a wide range of pharmaceutical companies involved in different therapeutic areas, including oncology, cardiovascular diseases, and immunology. This diversified exposure helps ensure that even if one drug class faces challenges, the ETF&rsquo;s overall performance remains unimpacted.</p>
<h2 id="outlook" class="jump-link-nav anchored-block" data-jumplink-title="Outlook">Outlook: Why Now is a Good Time to Invest in PPH</h2>
<p><strong>Increasing Sales and Pipeline Expansions</strong></p>
<p>The success of Ozempic, Wegovy, and other GLP-1 drugs is just the beginning. Both Novo Nordisk and Eli Lilly are investing heavily in expanding their pipelines, with new formulations, indications, and next-generation drugs in development. As these products come to market, they will further boost the growth prospects of the companies held within PPH.</p>
<p><strong>Positive Investor Sentiment</strong></p>
<p>Investor interest in the pharmaceutical sector has increased in recent years, especially as new blockbuster drugs are brought to market. With obesity treatments like GLP-1 drugs at the forefront of innovation, companies like Novo Nordisk and Eli Lilly are viewed as strong long-term growth opportunities. This positive sentiment is reflected in the stock prices of these companies, which have surged as sales of their weight loss drugs have taken off.</p>
<p><strong>Hedge Against Economic Uncertainty</strong></p>
<p>In an uncertain economic environment, pharmaceutical companies tend to be resilient due to the inelastic demand for medications. With inflation concerns and market volatility, PPH offers a defensive play, providing stability and growth in an industry that historically performs well during economic downturns.</p>
<p>The rise of GLP-1 receptor agonists like Ozempic and Wegovy has reshaped the obesity treatment landscape, and the companies behind these drugs are experiencing unprecedented growth. As obesity rates continue to climb and more patients seek medical solutions for weight loss, the demand for these drugs will only increase. Novo Nordisk and Eli Lilly, both key players in this space, stand to benefit immensely.</p>
<p>PPH offers a diversified, lower-risk way to invest in the pharmaceutical sector, particularly in companies that are leading the charge in weight loss drug innovation. With the potential for continued strong sales, new product developments, and the increasing global focus on obesity treatment, PPH is well-positioned to deliver solid returns for long-term investors.</p>
</div>
</div>

<p>To receive more <a href="https://www.vaneck.com/us/en/insights/thematic-investing/" title="Thematic Investing Insights"><strong>Thematic Investing</strong></a> insights, <a href="https://www.vaneck.com/us/en/subscribe/" title="Subscription Center"><strong>sign up in our subscription center</strong></a>.</p>
]]></content:encoded>
</item><item rdf:about="https://www.vaneck.com/us/en/blogs/gold-investing/ima-casanova-fed-rate-cut-sparks-record-gold-price-amid-global-uncertainty/">
  <title>Fed Rate Cut Sparks Record Gold Price Amid Global Uncertainty></title>
  <link>https://www.vaneck.com/us/en/blogs/gold-investing/ima-casanova-fed-rate-cut-sparks-record-gold-price-amid-global-uncertainty/</link>
  <description><![CDATA[Geopolitical unrest and a surprise 50 bps rate cut from the Fed propelled the gold sector in September.]]></description>
  <dc:creator>Imaru Casanova</dc:creator>
  <dc:date>10/09/2024 06:30:00</dc:date>
<content:encoded><![CDATA[

<p>Monthly gold market and economic insights from Imaru Casanova, Portfolio Manager, featuring her unique views on mining and gold&rsquo;s portfolio benefits.</p>

<p>The long awaited first interest rate cut by the U.S. Federal Reserve (the &ldquo;Fed&rdquo;) was no doubt the focus of market participants during September. The Fed initiated its easing cycle with a larger-than-expected 50 basis point rate cut. Gold responded as expected, with the spot price jumping to a new all-time high of $2,685 per ounce (intraday) and $2,672 (at-the-close) on September 26. Gold&rsquo;s upward trajectory continues to be supported by significant conflict escalation in the Middle East. In addition, the rather unexpected and substantial monetary and fiscal stimulus measures announced by China, boosted the broader metals and mining sector. Gold recorded a 5.24% ($169 per ounce) gain during the month, closing at $2,634.58 on September 30.</p>
<h2>Positive Sentiments in the Gold Sector</h2>
<p>With gold reaching fresh highs almost every month so far this year, it is not surprising that the mood at the well-attended Gold Forum Americas and Precious Metals Summit, both hosted each September in Colorado, was positive and upbeat.</p>
<p>There are reasons for gold mining companies and gold equity investors to be excited:</p>
<ul class="content-list">
<li class="mt-3">Record gold prices are translating to record margins and free-cash-flow generation for gold producers</li>
<li class="mt-3">Supporting continuing debt reductions</li>
<li class="mt-3">Increasing dividends and share buybacks</li>
<li class="mt-3">Increasing exploration activities</li>
<li class="mt-3">Improved ability to fund growth projects</li>
</ul>
<h2>Strong Financial Performance</h2>
<p>The sector has been in solid footing for several years. The most recent inflationary cost pressures had a negative impact, primarily due to companies not anticipating it. This caused them to miss their cost targets and disappoint markets, as was mostly evident in 2022. However, the sector remained focused on internal cost reduction and optimization initiatives to help offset the external cost increases. Subsequently, as inflationary pressures subsided, operating costs appeared to be under control.</p>
<p>As the gold price rises, so do margins. Gold averaged a new record quarterly price in Q3 2024 of $2,474 per ounce. This compares with a Q3 2023 average of $1,927 per ounce and represents approximately a 100% margin expansion relative to Q3 2023. It is certainly reason for gold equity market participants to be enthusiastic.</p>

<h2>Strategic Focus and Confidence</h2>
<p>We met and attended presentations with over 50 companies at the Gold Forum Americas, and another 35 companies at the Precious Metals Summit. The message from the producers has not changed much over the last couple of years:</p>
<ul class="content-list">
<li class="mt-3">Focus on value creation through cost control</li>
<li class="mt-3">Operational efficiencies</li>
<li class="mt-3">Disciplined deployment of growth capital</li>
<li class="mt-3">Commitment to shareholder returns</li>
</ul>
<p>The key distinction this time around was that the management teams appeared more confident in their abilities to carry out their strategies and more comfortable discussing growth plans. All of this was afforded by the benefits of a much higher gold price. Companies continue to emphasize their focus on quality over quantity and on value over volumes, which to us is a very positive signal.</p>
<h2>Sector M&amp;A Likely as Juniors Seek Consolidation</h2>
<p>The junior companies (developers and emerging producers) were busy meeting with other companies at the conferences, which could lead to an increase in sector M&amp;A. This is good news, as we believe the gold sector is very much in need of consolidation. At these gold prices, more projects are viable, leading to potential expansion of the junior investment universe. However, permitting timelines have not improved, and this has significantly impacted the single asset, smaller companies, in development stage. Projects simply take longer to build, while the market is unwilling to wait. With gold at all-time highs, the focus is on cash flow generation in the short and medium term. The companies with long timelines to production have generally underperformed.</p>
<h2>Response Lacking Despite Strong Performance</h2>
<p>The number one question at these conferences seemed to be: &ldquo;Why haven&rsquo;t we seen a stronger response from gold stocks this year?&rdquo; For example, in September, gold was up over 5%, while the NYSE Arca Gold Miners Index (GDMNTR) was up only 3.07% during the month. The MVIS Global Juniors Gold Miners Index (MVGDXJTR) was up 6.62%, which outperformed gold, but not as much as expected. Gold and gold stocks are among the best performing assets in 2024. Gold stocks are up 28% year to date, which is in line with the metal, but below our expectations, given their strong leverage to the gold price.</p>
<h2>Investor Concerns: Is There Still Room For Gains In Gold Equities?</h2>
<p>With most investors still on the gold market sidelines, the number one question they are currently asking after such strong performance this year: &ldquo;Is there still room for more gains for the gold equities from here? Did we miss it?&rdquo; Gold equities as a group (GDMNTR) are trading at the same level as they were in 2020. Back then the gold price was $600 lower, and well below the historical highs reached in 2011. We reiterate our view that as market demand for gold assets increases, driven by the need to diversify and protect portfolios, the gold equities will offer the safety of gold with the potential for higher returns relative to the metal. This is based not only on their gold price leverage and our outlook for higher gold prices in the medium and longer term, but also on the companies&rsquo; strong fundamentals and the expectation of a market rerating that reflects the sector&rsquo;s improved health, profitability and sustainability.</p>
<p>To receive more <strong><a href="https://www.vaneck.com/us/en/insights/gold-investing/" title="Gold Investing Insights">Gold Investing</a></strong> insights, <strong><a href="https://www.vaneck.com/us/en/subscribe/" title="Subscription Center">sign up in our subscription center</a></strong>.</p>
]]></content:encoded>
</item><item rdf:about="https://www.vaneck.com/us/en/blogs/moat-investing/market-rotation-propels-moat-stocks/">
  <title>Market Rotation Propels Moat Stocks></title>
  <link>https://www.vaneck.com/us/en/blogs/moat-investing/market-rotation-propels-moat-stocks/</link>
  <description><![CDATA[Moat stocks surged 12% in Q3 as investors rotated away from the Mag 7 and toward more value-oriented areas of the market.]]></description>
  <dc:creator>Brandon Rakszawski</dc:creator>
  <dc:date>10/08/2024 06:30:00</dc:date>
<content:encoded><![CDATA[

<p>In September, U.S. equity markets extended their gains, with the S&amp;P 500 reaching new heights, buoyed by Federal Reserve Chair Jerome Powell&rsquo;s signal of a more dovish stance on monetary policy. Powell's commitment to sustaining economic health through the start of rate adjustments fueled optimism, overshadowing geopolitical concerns. This environment saw a significant rotation into value stocks, particularly in undervalued sectors, as investors sought balance amid a backdrop of easing monetary policy and a resilient, yet cooling, labor market. September's performance capped a strong quarter, setting a positive tone for market expectations into year-end.</p>
<p>The <strong><a href="/link/9e43dd198c5f4e419f13220685081895.aspx" title="MOAT - VanEck Morningstar Wide Moat ETF - Overview">Morningstar Wide Moat Focus Index </a></strong>(the &ldquo;Moat Index&rdquo;) finished up 1.8% in September, capping off what was a notably strong third quarter where the Index gained 12.1% compared to the S&amp;P 500&rsquo;s return of 5.8%. The broadening out of the market, away from the Magnificent 7 and toward more value-oriented areas, provided a strong tailwind during the quarter. Year-to-date, the Moat Index still has some ground to make versus the S&amp;P 500, but falling interest rates and the potential continued rotation away from mega-caps may prove supportive in the final months of the year.</p>
<p>Companies on the smaller end of the market cap spectrum also gained in September, but to a lesser extent. The small- and mid-cap benchmarks were up 0.9% and 1.2% during the month, respectively. The <strong><a href="/link/166321dbcfec440590fb51cf0ad629aa.aspx" title="SMOT - VanEck Morningstar SMID Moat ETF - Overview">Morningstar U.S. Small-Mid Cap Moat Focus Index</a></strong> (the &ldquo;SMID Moat Index&rdquo;) fared better however, benefiting from strong stock selection leading to a 2.3% gain in September. During the quarter, small- and mid-caps bounced with market participants keying in on attractive valuations relative to large-caps and economic conditions that remain stable as we head into the start of a rate cutting cycle.</p>
<h3>Moat Stocks Surged in Third Quarter | As of 9/30/2024</h3>
<p><img class="img-responsive w-100" alt="Moat Stocks Surged in Third Quarter" src="https://www.vaneck.com/contentassets/9fa6e7c7279749deb75ce25d76e6429d/4904_moat_chart-1_2024-10_v1_blog.svg" /></p>
<p class="chart-disclosure"><strong>Source: Morningstar. As of 9/30/2024.</strong> Past performance is no guarantee of future results. Index performance is not representative of fund performance. It is not possible to invest directly in an index. Fund performance current to the most recent month end is available by visiting vaneck.com or by calling 800.826.2333.</p>

<h2 id="moat-highlights" class="jump-link-nav anchored-block" data-jumplink-title="Moat Highlights">Moat Index Quarterly Review Highlights: Core Shift and Fresh Faces</h2>
<p>Both the Moat and SMID Moat Indexes underwent quarterly reviews on September 20, 2024. Each quarter they systematically target the most attractively priced, high quality U.S. companies within their respective universes. Below are a few takeaways from the reviews and how the indexes are now positioned. Full results of the most recent quarterly reviews are available here: <strong><a href="https://www.vaneck.com/us/en/investments/morningstar-wide-moat-etf-moat/moat-reconstitution.pdf" title="MOAT - VanEck Morningstar Wide Moat ETF" target="_blank" rel="noopener">Moat Index</a></strong> and <strong><a href="https://www.vaneck.com/us/en/investments/morningstar-smid-moat-etf-smot/smot-reconstitution.pdf" title="SMOT - VanEck Morningstar SMID Moat ETF" target="_blank" rel="noopener">SMID Moat Index</a></strong>.</p>
<p>Additionally, in our moat investing webinar, we provide more information on current positioning and recent performance, and members of Morningstar&rsquo;s equity research team shared their perspectives on market trends and the companies they cover.</p>
<p>During the September review, the Moat Index saw 14 stock positions change within the portfolio. This reshuffling resulted in a slight shift towards core/blend stocks. Despite the shift toward blend, the Moat Index&rsquo;s value posture remains in effect as its contrarian nature has led its exposure toward attractively priced companies in more value-oriented areas relative to the S&amp;P 500 Index. Sector wise, the index's composition remained largely stable with industrials, health care, and consumer staples being overweight, while technology remained the most significant underweight.</p>
<p>Although the overweight to value stocks reduced slightly this quarter, several first-time index constituents were added at this quarter&rsquo;s review reaffirming this value posture. The first timers added this quarter include industrial gas supplier Air Products and Chemicals (ADP), medical imaging leader GE HealthCare Technologies (GEHC), and industrial fluidics systems manufacturer&nbsp;Idex Corporation (IEX), among others, each bringing unique competitive advantages that have recently earned them 'wide moat' status from Morningstar. More information on these new entrants, and others, can be found in our <a href="/us/en/blogs/moat-investing/moat-index-3q-reconstitution-us-equity-exposure-without-the-lofty-valuations/" title="Moat Index 3Q Reconstitution: US Equity Exposure Without the Lofty Valuations"><strong>recent blog covering the reconstitution</strong></a> in more detail.</p>
<h3>Moat Index Sector Shifts Following 3Q 2024 Review | As of 9/20/2024</h3>
<img class="img-responsive w-100" alt="Moat Index Sector Shifts Following 3Q 2024 Review" src="https://www.vaneck.com/contentassets/f494c7c9b4484903a17ecbe458f6dc76/4904_moat_chart-2_2024-10_v1_blog.svg" />

<p class="chart-disclosure"><strong>Source: Morningstar. As of 9/20/2024</strong>. Index performance is not representative of fund performance. It is not possible to invest directly in an index.</p>
<h2>U.S. Equity Exposure Without the Lofty Valuations</h2>
<p>The price/fair value ratio of the S&amp;P 500 Index currently sits at 1.05. This implies that the companies in the S&amp;P 500 are, overall, trading at approximately a 5% premium, according to Morningstar. This presents a challenge for investors looking to deploy cash into U.S. markets that are, again, reaching all-time highs. The Moat Index represents high quality companies currently mispriced by the market, in Morningstar&rsquo;s view. It allows investors to consider a mix of well-positioned companies with upside potential. Currently, the Morningstar price/fair value ratio of the Moat Index is 0.86, implying a 14% discount to fair value.</p>
<h2 id="smot-highlights" class="jump-link-nav anchored-block" data-jumplink-title="SMID Moat Highlights">SMID Moat Index Highlights: Electrifying Surge in Utilities</h2>
<p>The latest quarterly reconstitution of the Morningstar US Small-Mid Cap Moat Focus Index (SMID Moat Index) showcased notable shifts, emphasizing adjustments in sector and size exposure based on evolving market valuations and opportunities. A prominent change was the exit of four electric utilities companies from the index, prompted by a roughly 20% surge in their stock values during the quarter. This rotation out of utilities, which had become the largest industry overweight following the prior June Index review, made room for increased allocations in financials, materials, and health care sectors, all of which saw an uptick this quarter.</p>
<p>Additionally, the reconstitution highlighted a continued trend towards increasing small-cap exposure, which rose by 2.4% this quarter, bringing it to about 34%, a notable increase from the 23% small-cap exposure at the start of the year. This shift signifies a tactical move towards valuation opportunities that are present in the small-cap segment of the market. In terms of style exposure, there was minimal shift; the index continues to maintain an underweight stance on growth stocks, preferring tilts towards value and core stocks.</p>
<h3>SMID Moat Index Sector Shifts Following 3Q 2024 Review | As of 9/20/2024</h3>
<img class="img-responsive w-100" alt="SMID Moat Index Sector Shifts Following 3Q 2024 Review" src="https://www.vaneck.com/contentassets/f6bbd92e22354755bbfaf3d67d16e5a9/4904_moat_chart-3_2024-10_v1_blog.svg" />

<p class="chart-disclosure"><strong>Source: Morningstar. As of 9/20/2024</strong>. Index performance is not representative of fund performance. It is not possible to invest directly in an index.</p>
<h2>Valuation Opportunity within SMID Moats</h2>
<p>The weighted average price-to-fair value of the SMID Moat Index fell from 0.88 to 0.83 following the September review, signaling a 17% discount to Morningstar&rsquo;s fair value estimate. The broad-based Russell 2500 Index featured fairly priced valuations with a weighted average price-to-fair value ratio of slightly over 1.00, as of the same date.</p>
<h2 id="overview" class="jump-link-nav anchored-block" data-jumplink-title="Moat Strategies">Choose Your Moat Strategy</h2>
<p>VanEck&rsquo;s suite of <strong><a href="/us/en/blogs/moat-investing/moat-investing-powered-by-morningstar/" title="Quality Companies at Attractive Prices">moat investing strategies</a></strong> is powered by Morningstar&rsquo;s equity research team, which seeks quality companies trading at attractive valuations. The below ETFs offer access to U.S. moat companies:</p>
<p><strong><a href="/link/9e43dd198c5f4e419f13220685081895.aspx" title="MOAT - VanEck Morningstar Wide Moat ETF - Overview">VanEck Morningstar Wide ETF (MOAT)</a>:</strong> companies with a wide moat rating, which means Morningstar believes the company is likely to sustain its competitive advantage for at least the next 20 years.</p>
<p><strong><a href="/link/166321dbcfec440590fb51cf0ad629aa.aspx" title="SMOT - VanEck Morningstar SMID Moat ETF - Overview">VanEck Morningstar SMID Moat ETF (SMOT)</a></strong>: small and mid-cap moat companies.</p>
<p>To receive more <a href="https://www.vaneck.com/us/en/insights/moat-investing" title="Moat Investing Insights"><strong>Moat Investing</strong></a> insights, <a href="https://www.vaneck.com/us/en/subscribe/" title="Subscription Center"><strong>sign up in our subscription center</strong></a>.</p>
]]></content:encoded>
</item><item rdf:about="https://www.vaneck.com/us/en/blogs/digital-assets/matthew-sigel-vaneck-crypto-monthly-recap-for-september-2024/">
  <title>VanEck Crypto Monthly Recap for September 2024></title>
  <link>https://www.vaneck.com/us/en/blogs/digital-assets/matthew-sigel-vaneck-crypto-monthly-recap-for-september-2024/</link>
  <description><![CDATA[In September, Bitcoin rose 7.7% in response to the Fed lowering rates and China&rsquo;s stimulus, while Ethereum lagged (+3.2%) as it continues to face market share loss and much lower fee generation.]]></description>
  <dc:creator>Matthew  Sigel</dc:creator>
  <dc:date>10/04/2024 06:30:00</dc:date>
<content:encoded><![CDATA[

<p><strong>Please note that VanEck may have a position(s) in the digital asset(s) described below.</strong></p>
<p>Bitcoin reacted strongly to the Fed&rsquo;s rate cut and China&rsquo;s stimulus, rallying 7.7% and beating Gold (+5%), Ethereum (+3.2%), MSCI ACWI (+2.3%) and the S&amp;P (+1.7%). Bitcoin ETP buyers returned with US versions attracting $1.2B in net inflows, a substantial rebound from August&rsquo;s negative number and not far from the monthly average of $2B. Cumulatively, the US ETFs have bought more Bitcoin than has been mined since their launch, which makes them very important to price formation. We will have more on this topic in an upcoming <strong><a href="https://www.vaneck.com/us/en/blogs/digital-assets/matthew-sigel-vaneck-mid-september-2024-bitcoin-chaincheck-1-year-review-edition/" title="VanEck Mid-September 2024 Bitcoin ChainCheck: 1-Year Review Edition">ChainCheck</a></strong>. Notably, Bitcoin&rsquo;s daily correlation with the Nasdaq is back to late 2023 levels, above 0.62 on a 30-day average. Allocators may want to see this fall before getting more aggressive.</p>
<ul class="content-list">
<li class="mt-2"><strong><a href="#notable-performer">Notable Performers - Sui, Solana and Aptos</a></strong></li>
<li class="mt-2"><strong><a href="#ethereums-gambit-and-l1-token-value">Ethereum&rsquo;s Gambit and L1 Token Value</a></strong></li>
<li class="mt-2"><strong><a href="#notable-laggard">Notable Laggard - Polygon</a></strong></li>
</ul>
<p>Memecoins paced gains +31%, while DeFi +19%, Layer 1s +11%, and crypto equities +11%. ETH continued to lag +3%, reflecting market share loss and much lower fee generation. However, ETH&rsquo;s market share appears to have bottomed mid-month at 5-year lows. Concurrently, Bitcoin Dominance rose to a 4-year high of 59% before slipping slightly. We remind readers that Bitcoin dominance peaked last cycle right after the election, at 70%, before falling back to 62% by the end of 2020. We think a Kamala Harris victory could produce a different outcome, challenging the pattern seen in the last cycle.</p>
<h3>Price Returns</h3>
<div class="wrapped-div">
<table style="width: 600px;">
<tbody>
<tr class="tbl-data">
<td class="tbl-header last text-center">&nbsp;</td>
<td class="tbl-header last text-right">September (%)</td>
<td class="tbl-header last text-right">YTD (%)</td>
</tr>
<tr class="tbl-data">
<td class="data-td last">MarketVector Meme Coin Index</td>
<td class="data-td data last text-right">31%</td>
<td class="data-td data last text-right">NA</td>
</tr>
<tr class="tbl-data">
<td class="data-td last">MarketVector Infrastructure Application Leaders Index</td>
<td class="data-td data last text-right">23%</td>
<td class="data-td data last text-right">-14%</td>
</tr>
<tr class="tbl-data">
<td class="data-td last">MarketVector Decentralized Finance Leaders Index</td>
<td class="data-td data last text-right">19%</td>
<td class="data-td data last text-right">-18%</td>
</tr>
<tr class="tbl-data">
<td class="data-td last">MarketVector Smart Contract Leaders Index</td>
<td class="data-td data last text-right">11%</td>
<td class="data-td data last text-right">4%</td>
</tr>
<tr class="tbl-data">
<td class="data-td last">MV Global Digital Assets Equity Index</td>
<td class="data-td data last text-right">10%</td>
<td class="data-td data last text-right">14%</td>
</tr>
<tr class="tbl-data">
<td class="data-td last">Bitcoin</td>
<td class="data-td data last text-right">8%</td>
<td class="data-td data last text-right">49%</td>
</tr>
<tr class="tbl-data">
<td class="data-td last">Nasdaq Index</td>
<td class="data-td data last text-right">3%</td>
<td class="data-td data last text-right">21%</td>
</tr>
<tr class="tbl-data">
<td class="data-td last">Ethereum</td>
<td class="data-td data last text-right">3%</td>
<td class="data-td data last text-right">14%</td>
</tr>
<tr class="tbl-data">
<td class="data-td last">S&amp;P 500 Index</td>
<td class="data-td data last text-right">2%</td>
<td class="data-td data last text-right">20%</td>
</tr>
<tr class="tbl-data">
<td class="data-td last">Coinbase</td>
<td class="data-td data last text-right">-2%</td>
<td class="data-td data last text-right">3%</td>
</tr>
</tbody>
</table>
</div>
<br />
<p class="chart-disclosure"><strong>Source:</strong> Bloomberg as of 9/30/2024. <strong>Past performance is no guarantee of future results. Not intended as a recommendation to buy or sell any securities named herein.</strong></p>
<p>Up-tober arrived early this year on the back of positive macro developments and an increase in on-chain activity. Across L1s, transaction activity increased (+3.5%) with Ethereum recapturing significant market share, from (31%) of total SCP fee revenues in August to (45%) in September. This came at the same time as Solana&rsquo;s revenues collapsed, spurred by a collapse (-75%) in memecoin activity, from (24%) of all SCP revenues in July to (10%) in September. While DEX volumes for all SCPs were down slightly month on month (-1.5%), the count of Daily Active Addresses (DAAs) was up (+28%) from August&rsquo;s average. Daily Active Addresses also reached a new all-time high of around 18.1M on September 12, 2024. Though DAAs is an imperfect proxy for usership due to the ability of people to control many wallets, monitoring DAAs still is valuable when it is triangulated with other metrics.</p>
<h3>Fee Market Share: ETH, TRX, BTC, SOL, BNB</h3>
<p><img class="img-responsive w-100" alt="Fee Market Share: ETH, TRX, BTC, SOL, BNB" src="https://www.vaneck.com/contentassets/1d51b7dd5d27499caf0cac55c5cdbf2d/4884_crypto-monthly-sep_chart-1_2024.10_v1_blog.svg" /></p>
<p class="chart-disclosure"><strong>Source:</strong> TokenTerminal as of 9/27/24. <strong>Past performance is no guarantee of future results. Not intended as a recommendation to buy or sell any securities named herein.</strong></p>
<p>On-chain liquidity, as measured by the market capitalization of stablecoins for cryptocurrencies, has reached $172.5B which is $3B more than at the start of September and $32.5B more than at the beginning of 2024. However, most likely tied to the decline in DEX volumes and CEX Volumes (-20%), average daily stablecoin transfer volumes dropped from $58B per day in August to $50B per day in September.</p>
<h2>Stablecoins on the Rise</h2>
<p>Interest in stablecoins continued to grow in September as <strong><a href="https://www.ledgerinsights.com/sony-bank-triasl-stablecoins-on-polygon-blockchain/" title="Sony Bank trials stablecoins on Polygon blockchain" target="_blank" rel="noopener">Sony Bank</a></strong> and <strong><a href="https://fortune.com/2024/09/26/fintech-robinhood-revolut-stablecoins/" title="Fintech giants Robinhood and Revolut eye stablecoins" target="_blank" rel="noopener">Revolut</a></strong> announced they will launch stablecoins. Meanwhile, Blackrock partnered with stablecoin issuer Ethena to create a new stablecoin, called <strong><a href="https://cryptobriefing.com/ethena-labs-ustb-stablecoin/" title="Ethena debuts UStb stablecoin backed by BlackRock to complement USDe">UStB</a></strong> backed by Blackrock&rsquo;s onchain BUIDL treasury fund. Following Ethena&rsquo;s earlier launch of a stablecoin backed by derivative positions on ETH, the large crypto market maker DWF will <strong><a href="https://cryptobriefing.com/synthetic-stablecoin-launch-details/" title="DWF Labs to debut its synthetic stablecoin as early as Q4 this year" target="_blank" rel="noopener">debut</a></strong> its own synthetic stablecoin as early as 4Q2024. Circle <strong><a href="https://www.circle.com/blog/usdc-now-available-in-brazil-and-mexico-through-national-payment-systems-with-local-currency" title="USDC now available in Brazil and Mexico through national payment systems, with local currency" target="_blank" rel="noopener">announced</a></strong> that its stablecoin USDC is now available for usage in Brazil and Mexico. Ripple <strong><a href="https://www.fxstreet.com/cryptocurrencies/news/xrp-could-rally-as-grayscale-xrp-trust-nav-jumps-to-1149-likely-catalyst-for-ripple-202409191507" title="XRP eyes gains as Ripple gears up for stablecoin launch, Grayscale XRP Trust notes rising NAV" target="_blank" rel="noopener">claims</a></strong> that its own stablecoin will first appear over the coming weeks. Meanwhile VanEck-backed Agora Finance,<sup>1</sup>&nbsp;with its AUSD offering, continued strong growth with $60M in AUM and onchain trading volumes exceeding $500M since launch.</p>
<p>The rush to create new stablecoins backed by fiat assets and short-term debt has been gaining momentum as more financial institutions recognize their potential. Stablecoins began in earnest with the introduction of Tether in 2014 and initially found usage quickly routing liquidity between crypto exchanges to rectify interexchange pricing disparities. The market capitalization of stablecoins has grown roughly 39x since 2020 which compares to 8x for that of BTC. The vast majority of stablecoins, more than (99%) by supply, are pegged to the US dollar. Additionally, (~93%), are backed by fiat assets like cash deposits, repurchase agreements and short-term US treasury debt. Stablecoins are now the base pair for most of cryptocurrency trading on both centralized (CEXes) and decentralized exchanges (DEXes). For example, (87%) of Binance&rsquo;s trading volumes are based in either FDUSD, USDT, or USDC.</p>
<p>The business model of the stablecoin issuer is to partner with entities that can attract usage demand such as crypto exchanges, blockchains, and dApps. These partnerships involve the sharing of revenues that stablecoins generate on the assets backing their assets with the partners that bring new holders. For example, Coinbase, which is a distribution partner of Circle&rsquo;s USDC, receives roughly (50%) of Circle&rsquo;s revenues. Due to the sizable revenue opportunities and disputes over value add, stablecoins firms and their partners often have a tenuous relationship. Recently, Binance again reassessed its partnership with Tether&rsquo;s USDT and instead chose to back FDUSD on Binance&rsquo;s exchange. To direct trading to FDUSD, Binance offered free trading on BTC, ETH and Binance&rsquo;s four other highest volume spot tokens if traders employed FDUSD. The result was that trading in Binance&rsquo;s flagship product, BTC, went from being based in USDT in 99% of trades in the month prior to FDUSD&rsquo;s debut in September 2023, to roughly 40% afterwards.</p>
<h3>FDUSD Now Accounts for 60% of BTC Volumes in 2024</h3>
<p><img class="img-responsive w-100" alt="FDUSD Now Accounts for 60% of BTC Volumes in 2024" src="https://www.vaneck.com/contentassets/1d51b7dd5d27499caf0cac55c5cdbf2d/4884_crypto-monthly-sep_chart-3_2024.10_v2_blog.svg" /></p>
<p class="chart-disclosure"><strong>Source:</strong> Binance as of 9/13/2024. <strong>Past performance is no guarantee of future results. Not intended as a recommendation to buy or sell any securities named herein.</strong></p>
<h2 id="notable-performer" class="jump-link-nav anchored-block" data-jumplink-title="Notable Performers - Sui, Solana and Aptos">Notable Performers - Sui, Solana and Aptos</h2>
<h3>Sui, Aptos and Solana DAAs Are Up 984% Since Jan 2024</h3>
<p><img class="img-responsive w-100" alt="Sui, Aptos and Solana DAAs Are Up 984% Since Jan 2024" src="https://www.vaneck.com/contentassets/1d51b7dd5d27499caf0cac55c5cdbf2d/4884_crypto-monthly-sep_chart-2_2024.10_v2_blog.svg" /></p>
<p class="chart-disclosure"><strong>Source:</strong> Artemis XYZ as of 9/26/2024. <strong>Past performance is no guarantee of future results. Not intended as a recommendation to buy or sell any securities named herein.</strong></p>
<p>So-called &ldquo;monolithic&rdquo; blockchains, which bundle consensus, execution, and data availability layers into a single protocol stack, outperformed in September, especially Sui whose SUI token was up (+118%) to reach $5B market cap. Sui also saw strength in active addresses (+140%) and revenues (+48%) compared to August. The biggest driver of activity on Sui has been memecoin speculation and the introduction of native stablecoins like AUSD and USDC. Sui is a project we closely watch due to its unique object-based architecture that supports higher throughput of transactions and lower latency than competitors like Solana and Ethereum. If we are to segment our investment theses on Layer-1 blockchains, we put Sui in the camp with Solana and Aptos as chains that are leveraging their high-performance characteristics to appeal to Web2 developers. Solana (+14%) and Aptos (+23%) also outperformed in September.</p>
<p>In late September, Solana supporters gathered for Solana&rsquo;s annual conference in Singapore. Among the most impactful announcements was the release of the much anticipated &ldquo;Frankendancer&rdquo; on Solana Mainnet and stand-up of &ldquo;Firedancer&rdquo; on Solana testnet. Both of the &ldquo;Dancers&rdquo; are new upgrades to Solana&rsquo;s core software which will enable Solana to process more transactions. The Dancers are a series of progressive implementations with Frankendancer launched first to incorporate some of Firedancer&rsquo;s early features. Firedancer claims to be able to scale Solana transactions throughput by a factor of 20x while also making the blockchain, known for days of downtime a few years back, more reliable. Thus far, it has been able to achieve 89k TPS on testnet. The leader of Solana, Anatoly Yakovenko, is so confident in Firedancer&rsquo;s breakthrough capabilities that he has announced he will <strong><a href="https://blockworks.co/news/lightspeed-newsletter-solana-firedancer-testnet" title="Solana Firedancer client now live on testnet" target="_blank" rel="noopener">remove</a></strong> Solana&rsquo;s &ldquo;Beta&rdquo; tag once Firedancer is implemented.</p>
<p>Aptos had a strong September despite a ~11M ($90.2M) token unlock, an (-8%) decline in fee revenue, and a (-2%) drop in DEX volumes. The main price catalyst for Aptos was the upgrade to Aptos&rsquo;s core software called Raptr that helped attract a (+30%) MtM increase in DAAs. Expected to <strong><a href="https://www.coinspeaker.com/aptos-raptr-bft-consensus-protocol/" title="Aptos Launches Raptr, New BFT Consensus Protocol" target="_blank" rel="noopener">launch</a></strong> in &ldquo;the near future,&rdquo; Aptos claims its end-to-end finality could be as low as 800ms while <strong><a href="https://x.com/SashaSpiegelman/status/1831577706091196685?ref_src=twsrc%5Etfw%7Ctwcamp%5Etweetembed%7Ctwterm%5E1831577706091196685%7Ctwgr%5Ef6f3170aaf3b3b48d0a172d21388560adf21f4e7%7Ctwcon%5Es1_&amp;ref_url=https%3A%2F%2Fwww.coinspeaker.com%2Faptos-raptr-bft-consensus-protocol%2F" title="Alexander Spiegelman on X" target="_blank" rel="noopener">supporting</a></strong> &ldquo;much higher throughput.&rdquo; This compares to current Solana finality of ~2-3s while putting it on par with Sui&rsquo;s which is currently around 800ms. We are excited to see more specific details of the upgrade in an upcoming whitepaper release. While the improvements in Aptos&rsquo;s technology is laudable, for Aptos&rsquo;s APT token to work, it will need to marry its advanced capabilities with compelling, novel use cases that summon new users to its blockchain. As this has not occurred yet; Aptos&rsquo;s share of Sui/Solana/Aptos&rsquo;s userbase has fallen from (12%) at the start of 2024, to (5%) today.</p>
<h2 id="ethereums-gambit-and-l1-token-value" class="jump-link-nav anchored-block" data-jumplink-title="Ethereum&rsquo;s Gambit and L1 Token Value">Ethereum&rsquo;s Gambit and L1 Token Value</h2>
<h3>ETH's (+14%) Return is ~1/3rd that of BTC's (+44%) in 2024</h3>
<p><img class="img-responsive w-100" alt="ETH's (+14%) Return is ~1/3rd that of BTC's (+44%) in 2024" src="https://www.vaneck.com/contentassets/1d51b7dd5d27499caf0cac55c5cdbf2d/4884_crypto-monthly-sep_chart-4_2024.10_v1_blog.svg" /></p>
<p class="chart-disclosure"><strong>Source:</strong> Artemis XYZ as of 9/27/2024. <strong>Past performance is no guarantee of future results. Not intended as a recommendation to buy or sell any securities named herein.</strong></p>
<p>ETH is up (+14%) YTD, but it&rsquo;s trailing behind BTC (+49%) and SOL (+52%). The catalyst? EIP-4844, implemented on March 13, 2024, which shifted Ethereum's economic model. EIP-4844 created a separate transaction layer for Layer-2 (L2) blockchains to post data cheaply, drastically reducing their demand for Ethereum&rsquo;s blockspace. Previously, L2s accounted for 20% of Ethereum&rsquo;s blockspace usage&mdash;now, that demand has evaporated.</p>
<p>The result? A collapse in Ethereum&rsquo;s transaction prices. Annual revenues plummeted from $7.2B in March to just $1.2B in September. Net ETH emissions flipped from deflationary (-1.15%) to inflationary (+0.34%)&mdash;more supply, less demand. This shift is directly tied to ETH&rsquo;s underperformance.</p>
<p>Ethereum made this move to expand its blockspace capacity for mass adoption, following a strategy similar to Solana&rsquo;s low-cost blockspace model. But for short-term investors, reducing Ethereum&rsquo;s &ldquo;take rate&rdquo; killed the narrative of ETH as a deflationary, dividend-like asset.</p>
<p>EIP-4844 isn&rsquo;t just a tactical shift; it fundamentally alters Ethereum&rsquo;s business model. Before, ETH generated revenue by monetizing transaction activity (base fees, priority fees, MEV fees). It charged users to access blockspace and positioned transactions within each block. Now, Ethereum aims to become a settlement and data availability layer for its L2s.</p>
<p>Ethereum&rsquo;s long-term vision assumes that L2s will scale to millions of users, paying ETH for settlement. This creates a system where L2s charge their customers in ETH, fueling the asset&rsquo;s value. Ethereum&rsquo;s core believers argue that this makes ETH &ldquo;money.&rdquo; While ETH can be money within Ethereum&rsquo;s ecosystem, it only holds value if L2s remain &ldquo;Ethereum aligned.&rdquo; So far, Ethereum hasn&rsquo;t enforced any real alignment, making this framework feel more like a loose confederacy.</p>
<p>The pact between Ethereum and its L2s could break if the economics shift. L2s are closer to end users, and historically, the closer you are to the user, the more valuable the business. If L2 ecosystems gain enough momentum and applications, they might leave Ethereum altogether to capture the monetary premium for themselves.</p>
<p>This leads to a critical question: what drives the value of a blockchain like Ethereum or Solana? Blockchains compete on three fronts:</p>
<ol>
<li class="mt-2">Economic value of blockspace</li>
<li class="mt-2">Liveness (the guarantee to transact)</li>
<li class="mt-2">Safety (the security of balances)</li>
</ol>
<p>Ethereum&rsquo;s strategy is to dominate on liveness and safety, leaving economic value to L2s. With $90B in locked value and 1M validators, Ethereum positions itself as the champion of &ldquo;immutable property rights,&rdquo; guaranteeing that users&rsquo; assets remain secure and usable.</p>
<p>Meanwhile, Solana and other monolithic chains are laser-focused on maximizing their Layer-1 (L1) economic value. These competitors have dedicated business development teams onboarding new projects, prioritizing users and applications. As Solana&rsquo;s economic value grows, security and liveness tend to follow, attracting more validators to the network.</p>
<p>Solana is also scaling usability&mdash;offering 1,000x more transaction throughput than Ethereum&rsquo;s L1 with lower latency. This allows Solana to serve a larger user base directly with better app interoperability, where SOL remains the only form of money. So, Solana binds users directly, while ETH relies on intermediaries (L2s) for value accrual.</p>
<p>Despite its current struggles, Ethereum&rsquo;s long-term vision still holds potential. Ethereum&rsquo;s robust censorship resistance (liveness) and security provide stronger property rights than Solana, making it a more permissionless and secure platform. Ethereum can still outcompete Web2 platforms that take massive fees (30%+).</p>
<p>Most importantly, Ethereum can still control its own destiny. Developers could force L2s to implement &ldquo;based sequencers,&rdquo; requiring validators to hold ETH for transaction sequencing. Ethereum could offer stronger guarantees like faster finality for L2s that remit more value to the main chain or even require L2s to collateralize ETH to use Ethereum&rsquo;s blob transaction layer. There is talk of implementing ETH&rsquo;s next fork in a way that minimizes excess supply.</p>
<p>If Ethereum makes these moves, it could regain lost economic value and stave off competition from its L2s or even Solana. Like with corporations and their stock price, an underperforming token can often trigger a pivot. Ethereum might be nearing that inflection point.</p>
<h3>L2 Margins for Optimism Are Up Nearly 4x to 99% Since Jan 2024</h3>
<p><img class="img-responsive w-100" alt="L2 Margins for Optimism Are Up Nearly 4x to 99% Since Jan 2024" src="https://www.vaneck.com/contentassets/1d51b7dd5d27499caf0cac55c5cdbf2d/4884_crypto-monthly-sep_chart-5_2024.10_v2_blog.svg" /></p>
<p class="chart-disclosure"><strong>Source:</strong> Dune <strong>@<a href="https://dune.com/queries/2914457/6846120" title="Rollup Profits" target="_blank" rel="noopener">sealaunch</a></strong> as of 9/30/2024; <br />We define L2 margins as the profits of L2 transactions/revenues of transactions. Profits are the transaction fee revenues on L2s less the costs associated with posting data to Ethereum (call data + blob fees) and verification of proofs (Zk L2s). <strong>Past performance is no guarantee of future results. Not intended as a recommendation to buy or sell any securities named herein.</strong></p>
<h2>NEAR (+30.9%)</h2>
<p>NEAR Protocol (NEAR) is up (+30.9%) over the last 30 days, rebounding after underperforming in August. Year-to-date, NEAR has delivered mid-range returns compared to other top Layer-1 protocols, exhibiting deeper drawdowns during the summer doldrums but more volatile upside in September&rsquo;s market resurgence. A $100 investment in NEAR on January 1st would now be worth $143.83, compared to $251.17 for TON, $208.73 for SUI, $189.01 for BNB, and $113.04 for Ethereum.</p>
<h3>NEAR Fees Are Up 94%, DAAs Are Up 200% Since Jan 2024</h3>
<p><img class="img-responsive w-100" alt="NEAR Fees Are Up 94%, DAAs Are Up 200% Since Jan 2024" src="https://www.vaneck.com/contentassets/1d51b7dd5d27499caf0cac55c5cdbf2d/4884_crypto-monthly-sep_chart-6_2024.10_v1_blog.svg" /></p>
<p class="chart-disclosure"><strong>Source:</strong> Artemis.xyz as of 9/30/2024. <strong>Past performance is no guarantee of future results. Not intended as a recommendation to buy or sell any securities named herein.</strong></p>
<p>NEAR&rsquo;s outperformance appears to be driven by both technical improvements and strategic user growth initiatives. In late August, NEAR <strong><a href="https://pages.near.org/blog/nightshade-2-launches-on-near-mainnet-introducing-stateless-validation/" title="Nightshade 2.0 Launches on NEAR Mainnet, Introducing Stateless Validation and Greater Scalability" target="_blank" rel="noopener">implemented</a></strong> Nightshade 2.0, a key milestone in its scalability roadmap. Nightshade&rsquo;s sharding architecture splits the blockchain into multiple &ldquo;shards&rdquo;. Each shard processes transactions in parallel, boosting throughput and efficiency. Additionally, stateless validation was introduced, meaning that validators no longer need to store the whole blockchain&rsquo;s state locally. Instead, validators need only retrieve the necessary parts (the &ldquo;state witnesses&rdquo;), which increases decentralization by lowering validator operating costs. Looking ahead, Nightshade 2.0 sets the stage for "dynamic re-sharding," a key upgrade planned for early 2025 that will allow the network to automatically adjust its shard count based on demand.</p>
<p>NEAR&rsquo;s September efforts also extended into chain abstraction, which is the process of eliminating the technical burdens of transacting across different blockchains. Top NEAR ecosystem applications like Sweatcoin (a fitness rewards app <strong><a href="https://sweateconomy.com/" title="SweatEconomy" target="_blank" rel="noopener">claiming</a></strong> 150 million total users) prefer chain abstraction to attract wider audiences, <strong><a href="https://x.com/NEARProtocol/status/1837114680558358706" title="NEAR Protocol on X" target="_blank" rel="noopener">according</a></strong> to NEAR cofounder Illia Polosukhin. NEAR Protocol&rsquo;s <strong><a href="https://dappradar.com/rankings/protocol/near?sort=uawCount&amp;order=desc" title="Top NEAR Dapps" target="_blank" rel="noopener">most popular</a></strong> app, &lsquo;HOT&rsquo; Wallet, <strong><a href="https://dappradar.com/dapp/hot-game?range-ha=all" title="Hot Game - DappRadar" target="_blank" rel="noopener">reached</a></strong> all-time highs of 2M unique active wallets in September, suggesting increased network adoption. Underscoring the strategic importance of NEAR&rsquo;s technical features, HOT Wallet&rsquo;s <strong><a href="https://hotdao.ai/" title="Hot Protocol" target="_blank" rel="noopener">ecosystem</a></strong> focuses on quality-of-life chain abstraction features such as gas-free swaps, cross-chain applications, and bridges.</p>
<p>NEAR&rsquo;s <strong><a href="https://x.com/NEARProtocol/status/1836752346593849376" title="NEAR Protocol on X" target="_blank" rel="noopener">AI-centric</a></strong> partnership strategy is also likely contributing to its strong September price performance. Hyperbolic, an AI &amp; GPU cloud resources project which raised a $7M <strong><a href="https://www.hyperbolic.xyz/blog/hyperbolic-secures-7-million-seed-funding-round" title="Hyperbolic Secures $7M Seed Round Led By Polychain Capital and Lightspeed Faction" target="_blank" rel="noopener">seed</a></strong> round in July, <strong><a href="https://x.com/hyperbolic_labs/status/1835490481020527085" title="Hyperbolic on X" target="_blank" rel="noopener">announced</a></strong> a partnership with NEAR this month. <strong><a href="https://near.ai/" title="NEARLY YOU" target="_blank" rel="noopener">NEAR.AI</a></strong> will use Hyperbolic&rsquo;s global network to process AI inference workloads from ChatGPT-like apps. Like other DePIN (&ldquo;Decentralized Physical Infrastructure&rdquo;) projects, this strategy aims at crowdsourcing resources to compete for business currently dominated by large, centralized players (in this case, data centers). Similarly, Ringfence.ai <strong><a href="https://x.com/NEARProtocol/status/1834264489715200187" title="NEAR Protocol on X" target="_blank" rel="noopener">partnered</a></strong> with NEAR to use the blockchain as part of its personal data storage &amp; monetization <strong><a href="https://ringfence.ai/how-it-works" title="Ringfence: How Does it Work?" target="_blank" rel="noopener">architecture</a></strong>. Arguably, this corroborates NEAR&rsquo;s <strong><a href="https://near.org/blog/user-owned-ai-is-near" title="User-Owned AI is NEAR" target="_blank" rel="noopener">thesis</a></strong> on &ldquo;user-owned AI&rdquo;.</p>
<h2>IMX (+24%)</h2>
<h3>Gaming-Oriented Blockchain Market Cap Dominance</h3>
<p><img class="img-responsive w-100" alt="Gaming-Oriented Blockchain Market Cap Dominance" src="https://www.vaneck.com/contentassets/1d51b7dd5d27499caf0cac55c5cdbf2d/4884_crypto-monthly-sep_chart-7_2024.10_v1_blog.svg" /></p>
<p class="chart-disclosure"><strong>Source:</strong> CoinMarketCap as of 9/30/2024. <strong>Past performance is no guarantee of future results. Not intended as a recommendation to buy or sell any securities named herein.</strong></p>
<p>One of the oldest gaming-focused crypto projects, Immutable (IMX), is a standout on our watchlist this month. In September, IMX gained a (+36%) market share against a few other gaming blockchain tokens like APE, BEAM, FLOW, RON, WAXP, and XAI.</p>
<p>Immutable was founded in 2018 after its creators' NFT trading card game, Gods Unchained, congested Ethereum, driving up transaction fees and delays. To address these issues, Immutable launched its own Ethereum L2 blockchains&mdash;Immutable X and Immutable zkEVM&mdash;and evolved into a full gaming platform.</p>
<p>In its September update, Immutable highlighted that its zkEVM blockchain, launched in Q1, reached 3 million monthly active users, a milestone that took other Layer 2 solutions 1 to 4 years to achieve. This growth comes from just 5-10% of its games. With a range of 400+ titles, Immutable takes more "shots on goal" than competitors. Its user-friendly Passport wallet, designed to overcome gamers' resistance to crypto, exceeded 2.2 million signups in September, boosted by one-click social logins with double the completion rate of traditional wallets.</p>
<p>Immutable&rsquo;s publicity has also been notable. At Gamescom, the world&rsquo;s largest gaming event in August, 7 of the top 10 games showcased were built on Immutable. In September, the company joined MARBLEX at Korea Blockchain Week to highlight their partnership, which brings Netmarble's high-performing titles (~$80M USD in 2024 revenue, 1M+ MAUs) into Immutable&rsquo;s ecosystem. The Asian market's higher crypto adoption and gaming asset spending per capita offer a promising pipeline.</p>
<p>The success of Immutable's titles reflects this momentum. Guild of Guardians surpassed 1 million downloads, and RavenQuest saw ~62k unique players within 9 days of early access. Immortal Rising 2, launched on Immutable&rsquo;s zkEVM on September 12th, became the #1 free game on Vietnam&rsquo;s iOS AppStore. Gamers can earn Gem tokens by completing quests across Immutable games and boost earnings by holding IMX tokens, potentially creating a flywheel for token demand.</p>
<h3>Gaming-Oriented Blockchain Comp Table</h3>
<p><img class="img-responsive w-100" alt="Gaming-Oriented Blockchain Comp Table" src="https://www.vaneck.com/contentassets/1d51b7dd5d27499caf0cac55c5cdbf2d/4884_crypto-monthly-sep_table-1_2024-10_v1_blog.svg" /></p>
<p class="chart-disclosure"><strong>Sources:</strong> DeFiLlama, DappRadar, CryptoSlam as of 9/30/2024. <strong>Past performance is no guarantee of future results. Not intended as a recommendation to buy or sell any securities named herein.</strong></p>
<p>IMX's year-to-date price has been middle-of-the-pack among its peers. FLOW (-35.2%) lags, with NBA Top Shot failing to replicate its 2021 volumes. Ronin (-0.5%) is more focused on its own IP, adding 13 titles to Axie Infinity. Beam (+11.1%) recently migrated to its own Avalanche subnet. WAX, though technically up (+1,097%) from its $0.02 January opening, is down (-60%) from its peak and struggles with a high fully diluted value and low circulating supply. ApeCoin (-50.6%) has been diluted since launch, with its dedicated ApeChain still pending.</p>
<p>Comparing chains is challenging due to obfuscated metrics and bots, but some general observations can still be made. IMX has a high valuation relative to its monthly unique active wallets (UAWs) and NFT buyers, suggesting a more dedicated user base. BEAM and XAI show high valuations relative to their low TVL, indicating speculative interest typical of newer ecosystems. WAX consistently lags, likely due to limited traction and bot activity. FLOW&rsquo;s fewer monthly NFT buyers spend significantly more than Ronin&rsquo;s, indicating either fewer bots or a more motivated collector base. Despite its weak gaming focus, FLOW&rsquo;s valuation per UAW is a standout in this cohort.</p>
<h2>Gaming-Oriented Tokens (+20%)</h2>
<h3>Year-to-Date Market Cap Growth: Gaming Tokens (Aggregate) vs. Bitcoin</h3>
<p><img class="img-responsive w-100" alt="Year-to-Date Market Cap Growth: Gaming Tokens (Aggregate) vs. Bitcoin" src="https://www.vaneck.com/contentassets/1d51b7dd5d27499caf0cac55c5cdbf2d/4884_crypto-monthly-sep_chart-8_2024.10_v1_blog.svg" /></p>
<p class="chart-disclosure"><strong>Source:</strong> The Tie as of 9/29/2024. <strong>Past performance is no guarantee of future results. Not intended as a recommendation to buy or sell any securities named herein.</strong></p>
<h3>Gaming-Oriented Token Comp Table (Plus Bitcoin)</h3>
<p><img class="img-responsive w-100" alt="Gaming-Oriented Token Comp Table" src="https://www.vaneck.com/contentassets/1d51b7dd5d27499caf0cac55c5cdbf2d/4884_crypto-monthly-sep_table-2_2024-10_v1_blog.svg" /></p>
<p class="chart-disclosure"><strong>Source:</strong> The Tie as of 9/30/2024. <strong>Past performance is no guarantee of future results. Not intended as a recommendation to buy or sell any securities named herein.</strong></p>
<p>Zooming out, we compared the aggregate valuations of 30 select gaming tokens&mdash;not just gaming blockchain tokens&mdash;against Bitcoin. Gaming tokens have shown much higher volatility than Bitcoin year-to-date. While they delivered double Bitcoin&rsquo;s returns in February, nearly all those gains were wiped out by July. As of September 29th, gaming tokens are up (+20%) YTD, supported by the broader bullish trend in September&rsquo;s crypto market.</p>
<p>As we noted in our mid-September <strong><a href="https://www.vaneck.com/us/en/blogs/digital-assets/matthew-sigel-vaneck-mid-september-2024-bitcoin-chaincheck-1-year-review-edition/" title="VanEck Mid-September 2024 Bitcoin ChainCheck: 1-Year Review Edition">ChainCheck</a></strong>, we expect Bitcoin to perform strongly in Q4. Gaming tokens could again outperform Bitcoin during a price surge, but interpreting that outperformance requires nuance. The gaming token category is driven by nascent distribution channels, evolving audiences, and speculative technologies. Prices reflect more speculation than organic demand, which may take years to materialize. Additionally, gaming tokens often suffer from low liquidity and high FDV (fully diluted valuation), meaning much of the value exists only on paper, with little realized by secondary market participants.</p>
<p>Thus, while gaming tokens may 'work' for VCs and token issuers, secondary market participants should exercise caution. Following the Pareto principle, we believe the long-term value in gaming will be concentrated among a few key players. In the longer run, we expect the broader gaming token category to underperform Bitcoin.</p>
<h2 id="notable-laggard" class="jump-link-nav anchored-block" data-jumplink-title="Notable Laggard - Polygon">September&rsquo;s Notable Laggard - POL (-4%)</h2>
<h3>1Y Returns of $100 Invested in Top Ethereum L2 Tokens</h3>
<p><img class="img-responsive w-100" alt="1Y Returns of $100 Invested in Top Ethereum L2 Tokens" src="https://www.vaneck.com/contentassets/1d51b7dd5d27499caf0cac55c5cdbf2d/4884_crypto-monthly-sep_chart-9_2024.10_v2_blog.svg" /></p>
<p class="chart-disclosure"><strong>Source:</strong> Artemis.xyz . <strong>Past performance is no guarantee of future results. Not intended as a recommendation to buy or sell any securities named herein.</strong></p>
<p>Polygon has been a notable laggard in September, trailing other Ethereum L2 tokens. Over the past 30 days, its token declined by (-3.96%), continuing a pattern of underperformance that&rsquo;s persisted since Q1. Daily active users (DAUs) have dropped by 2/3 since July, and fees have fallen by 50%. A $100 investment in Polygon on September 30th, 2023, would be worth $79.26 a year later, while similar investments in competitors like Immutable X ($305.56) and Mantle ($160.91) have fared much better.</p>
<p>Polymarket, a prediction marketplace hosted on Polygon, is booming. Polymarket&rsquo;s election betting volumes surged from ~$6.6M in December to over $500M in September. However, political bets comprise as much as 90% of weekly wagers. And only USDC deposits and withdrawals create onchain transactions.</p>
<p>Amid this disappointing price action, Polygon achieved a significant milestone in September with the MATIC token migrating to POL as part of the Polygon 2.0 roadmap. The POL token&rsquo;s design provides more interoperable utility to connect the various blockchains building on top of Polygon&rsquo;s &ldquo;Agglayer.&rdquo; Initially, POL serves as the gas and staking token of the Polygon PoS blockchain, similar to MATIC. However, in subsequent phases of Polygon 2.0&rsquo;s rollout, community votes will integrate POL&rsquo;s new technical capabilities into additional Polygon-connected blockchains. While activity on the decentralized &ldquo;AggLayer&rdquo; protocol has disappointed somewhat, with daily active addresses and transactions close to 52-week lows, Polygon Labs invested $5M in custom-built zero-knowledge VPU (&ldquo;verifiable processing units&rdquo;) chips for ZK proof generation to kickstart more growth.</p>
<p>Separately in the POL ecosystem, we are watching IoTeX, a decentralized physical infrastructure (DePIN) network that announced plans to integrate with Polygon&rsquo;s AggLayer as part of its IoTeX 2.0 upgrade. Multiple Polygon-based DePIN projects, including Geodnet and Dimo, already rely on IoTeX infrastructure, suggesting potential growth opportunities for DePIN use cases on the Polygon network.</p>
<p>We also noticed that INX, a regulated hub for cryptocurrency and security token trading built on the Poylgon PoS Chain, added four new tokenized equities: Gamestop, Microsoft, Google, and Tesla. Although INX conducted the first-ever SEC approved token IPO, raising $125M, the INX token is down 95% from its all-time highs. Let&rsquo;s see if former Grayscale CEO Michael Sonnenshein, who recently joined the board, can turn things around.</p>
<p><strong>Links to third party websites are provided as a convenience and the inclusion of such links does not imply any endorsement, approval, investigation, verification or monitoring by us of any content or information contained within or accessible from the linked sites. By clicking on the link to a non-VanEck webpage, you acknowledge that you are entering a third-party website subject to its own terms and conditions. VanEck disclaims responsibility for content, legality of access or suitability of the third-party websites.</strong></p>
<p>To receive more <strong><a href="https://www.vaneck.com/us/en/insights/digital-assets/" title="Digital Assets Insights">Digital Assets</a></strong> insights, <strong><a href="https://www.vaneck.com/us/en/subscribe/" title="Subscription Center">sign up in our subscription center</a></strong>.</p>
<style>
    .data-td.data {
        padding-right: 5px !important;
    }
    
    .wrapped-div {
        max-width: 100%;
    }
    
    @media (max-width: 1240px) {
        .wrapped-div {
            overflow-x: scroll;
        }
    }
    
    .wrapped-div-sector {
        max-width: 100%;
        overflow-x: scroll;
    }
</style>
]]></content:encoded>
</item><item rdf:about="https://www.vaneck.com/us/en/blogs/municipal-bonds/demographics-and-municipal-bonds-part-2-higher-education/">
  <title>Demographics and Municipal Bonds Part 2: Higher Education></title>
  <link>https://www.vaneck.com/us/en/blogs/municipal-bonds/demographics-and-municipal-bonds-part-2-higher-education/</link>
  <description><![CDATA[U.S. population growth and a stagnant under-18 cohort have reshaped enrollment in higher education. Four-year schools held steady, but community colleges declined, affecting smaller schools and the muni market.]]></description>
  <dc:creator>Tamara  Lowin</dc:creator>
  <dc:date>10/02/2024 06:30:00</dc:date>
<content:encoded><![CDATA[

<p>Between 2008 and 2022, the U.S. population grew by 10%, an increase of 30 million people. Digging into the data during this 15-year period reveals remarkable underlying changes in U.S. demographics, which impacted both the economy and the municipal bond market. Understanding these demographic trends explains what we currently see and prepares us for future impacts.</p>
<p>In our <a href="https://www.vaneck.com/us/en/blogs/municipal-bonds/a-15-year-analysis-demographics-and-municipal-bonds/" title="A 15-Year Analysis: Demographics and Municipal Bonds"><strong>last piece</strong></a>, we focused on the 55+ cohorts&mdash;the only ones to increase meaningfully over the period. Here, we explore the impact of the stagnant under-18-year-old cohort on higher education and what we should expect over the next couple of decades.</p>

<h2>Part 2: Demographics and Higher Education</h2>
<p>A deeper look into higher education enrollment data tells a story contrary to media headlines. While overall enrollment<sup>1</sup>&nbsp;decreased by 18% since its 2011 peak of 15.8 million students, four-year schools that we most associate with post-secondary education hold their own. The 3 million seat decline is mainly from two-year public schools like community colleges and for-profit institutions, which saw enrollment drop by two million and one million seats since 2011.</p>
<h3>Some Higher Ed Institutions See Enrollment Holding Steady</h3>
<img class="img-responsive w-100" alt="Some Higher Ed Institutions See Enrollment Holding Steady" src="https://www.vaneck.com/contentassets/3eef87af2f6f4ec99983aa103e96a033/4881_muni_chart-1_2024-9_v1_blog.svg" />
<p class="chart-disclosure">Source: U.S. Department of Education, National Center for Education Statistics, Integrated Postsecondary Education Data System (IPEDS). As of fall 2022.</p>
<h2>Lining up historical enrollment with population demographics</h2>
<p>While this demographic series looks at 2008 to the present, evaluating higher education attendance trends during that period requires going back to 1990, the birth year for students graduating high school in 2008. As it turns out, from 1990 to 2008, the U.S. population under 18 years old increased by 10 million, and the annual high school graduating class increased by 30% to 3,100. But post-secondary enrollment didn&rsquo;t keep up with the growth. Instead, we saw:</p>
<ul>
<li class="mt-3">Four-year state school enrollment increased by 9%, or 500,000 seats;</li>
<li class="mt-3">Four-year non-profit school enrollment increased by 1% or 25,000 seats, and</li>
<li class="mt-3">Two-year public community college enrollment declined by 41%, a loss of two million seats.<sup>2</sup></li>
</ul>
<h3>Population Under 18 Years Old Increased 15% Between 1990-2008</h3>
<img class="img-responsive w-100" alt="Population Under 18 Years Old Increased 15% Between 1990-2008" src="https://www.vaneck.com/contentassets/3eef87af2f6f4ec99983aa103e96a033/4881_muni_chart-2_2024-9_v1_blog.svg" />
<p class="chart-disclosure">Source: American College Testing Program, unpublished tabulations, derived from statistics collected by the Census Bureau, 1960 through 1969. U.S. Department of Commerce, Census Bureau, Current Population Survey (CPS), October 1970 through 2022.</p>
<p>Several factors have influenced college attendance over the past 15 years, but contrary to public opinion, the population doesn&rsquo;t appear to be a direct influence. Two likely contributors are the value proposition due to rising tuition costs and a growing economy with a strong job market. We expect the COVID-19 pandemic impact to be temporary as we already see improvement in 2023 figures. We will come back to these later.</p>
<p>The four-year institutions issue municipal debt, often secured predominately by tuition revenues. While the overall higher education trend isn&rsquo;t as straightforward as the media presents, there is no denying the struggles concentrated in small private nonprofit regional schools. The statistics indicate that high school graduates are more attracted to larger schools and public universities (called &ldquo;state schools&rdquo; due to large state subsidies that reduce tuition). Often, when faced with declining enrollment, schools first explore strategies that decrease profitability in a bid to draw more students. Conventional attempts include increasing scholarships, building new dorms or other facilities, and hiring more faculty to increase degree and major opportunities. If unsuccessful, these strategies weaken the school's profitability and concurrently decrease the endowment as funds are used for these higher expenses at an unsustainable pace.</p>
<p><strong>FTE</strong>: Full-time equivalent: a calculation showing how many students would be attending if all were enrolled full-time; for example, two part-time students could equal 1 FTE.</p>
<p><strong>Characteristics used to differentiate between institutions:</strong></p>
<p>Public vs Private<br />2-year vs. 4-year<br />Undergraduate vs Graduate<br />For-profit vs Non-profit<br />Grants degrees vs. Doesn&rsquo;t</p>
<p><strong>Our methodology</strong>: When possible, we used FTE based on Fall enrollment figures</p>
<h2>Does the future get brighter for small colleges?</h2>
<p>Pressure on higher education enrollment will increase over the next decade. Without dramatic changes in higher education opportunities, we expect more struggles, closures, and mergers. Here&rsquo;s why:</p>
<p>Compared to 1990-2008, which saw the number of graduating high school students increase 30% to 3,100, in 2022, just under 3,000 students graduated from high school. If the past 15 years saw a slight increase in four-year college attendance despite meaningful growth in the eligible applicant pool, the next 15 years, when there is no growth in this cohort, does not bode well for college attendance. Overall, small liberal arts colleges are not a dying breed, but we expect that decreasing enrollment will shrink the universe of smaller schools. Schools with a smaller geographic draw, weaker reputations, and limited offerings have less flexibility to adapt.</p>
<h3>The Under 18-Years-Old Population 2008-2023 Isn&rsquo;t Growing</h3>
<img class="img-responsive w-100" alt="The Under 18-Years-Old Population 2008-2023 Isn't Growing" src="https://www.vaneck.com/contentassets/3eef87af2f6f4ec99983aa103e96a033/4881_muni_chart-3_2024-9_v1_blog.svg" />
<p class="chart-disclosure">Source: American College Testing Program, unpublished tabulations, derived from statistics collected by the Census Bureau, 1960 through 1969. U.S. Department of Commerce, Census Bureau, Current Population Survey (CPS), October 1970 through 2022.</p>
<p>A potential positive for higher education enrollment is a cooling labor market. The value of an advanced degree rises when competition for jobs increases. School attendance is also a popular place to &ldquo;wait out&rdquo; a slowing economy. International student enrollment is also expected to rise, potentially above historic rates pre-COVID. That group hovers around 10% of enrollment and most often pays full tuition, a rarity for students with U.S. citizenship.</p>

<h2>The bigger demographic picture</h2>
<p>The staggering decline in two-year community college attendance has had a significant impact on our economy. With two million fewer annual graduates today than 15 years ago, this appears to be directly linked to the shortage of nursing and health science professions such as physician assistants, technicians, and radiologists&mdash;some of the most popular degrees obtained from community colleges.</p>
<p>In our last piece, we discussed the additional strain on hospitals and other healthcare facilities as the U.S. population ages. Over the past two years, we have seen hospital and nursing home beds reduced due to an insufficient supply of professionals to support them. Indeed, nurses are currently flown in from other countries to fulfill some of the demands.</p>
<p>A combination of a larger healthcare workforce and improved pay is required for the growing need for these positions. A softening job market could make these professions more attractive.</p>
<h2>Investment Implications</h2>
<p>As the population continues to age and the younger cohort shows little growth, stakeholders must navigate challenges within the municipal bond market with strategic foresight. While we expect the broad higher education sector to continue to face headwinds, we believe opportunities still exist within the market.</p>
<p>Regarding the management of <a href="https://www.vaneck.com/us/en/blogs/municipal-bonds/municipal-bond-etfs-expect-more-from-your-munis/" title="Municipal Bond ETFs &ndash; Expect More from Your Munis"><strong>VanEck&rsquo;s suite of municipal bond ETFs</strong></a>, we take a bifurcated approach. When evaluating investment grade bonds, we are more comfortable owning a broad array of higher education bonds from 4-year universities that we expect will continue to provide students with a robust value proposition. Within the high-yield funds, we remain selective and continue to judiciously seek opportunities within 4-year, small, rural colleges that attract a regional student body.</p>
<p>As we continue to analyze how these demographic shifts play out, one thing is certain: all sectors in the municipal bond market will feel the impact. We will continue to examine how demographic shifts affect states, cities, and other sectors in future editions of our series.</p>
<p>To receive more <a href="https://www.vaneck.com/us/en/insights/municipal-bonds/" title="Municipal Bonds Insights"><strong>Municipal Bonds</strong></a> insights, <a href="/link/5f45412c2143400497908cea2897f7d3.aspx" title=" Subscription Center"><strong>sign up in our subscription center</strong></a>.</p>
]]></content:encoded>
</item><item rdf:about="https://www.vaneck.com/us/en/blogs/municipal-bonds/municipal-bond-etfs-expect-more-from-your-munis/">
  <title>Municipal Bond ETFs – Expect More from Your Munis></title>
  <link>https://www.vaneck.com/us/en/blogs/municipal-bonds/municipal-bond-etfs-expect-more-from-your-munis/</link>
  <description><![CDATA[VanEck&rsquo;s municipal income ETFs offer investors the ability to exercise control over their portfolio yield, duration, and credit exposure at different points in the interest rate cycle.]]></description>
  <dc:creator> </dc:creator>
  <dc:date>09/30/2024 06:30:00</dc:date>
<content:encoded><![CDATA[

<script type="text/javascript" src="/static/js/jquery/jquery-3.3.1.min.js"></script> <script src="https://code.highcharts.com/highcharts.js"></script> <script src="//code.highcharts.com/modules/exporting.js" type="text/javascript"></script> <script src="/link/ddc32419d7244b299021e86650d30afd.aspx?cs=cdkwb" type="text/javascript"></script>
<p>ETFs and mutual funds have become an increasingly popular means of gaining exposure to municipal bonds. These funds offer investors convenient, diversified access to broad and targeted municipal markets. VanEck's municipal income ETFs offer investors the ability to exercise control over their portfolio yield, duration, and credit exposure at different points in the interest rate cycle.</p>
<h2>Target Exposures, Tax-Exempt Income and Low Cost Muni ETFs</h2>
<p>The indices underlying each ETF target specific maturity ranges or credit exposures, resulting in distinct performance yield and duration characteristics.</p>
<h2>Yield Curve Positioning - <a href="https://www.vaneck.com/us/en/investments/short-muni-etf-smb/overview/" title="SMB - VanEck Short Muni ETF - Overview">Short Muni ETF (SMB)</a>, <a href="https://www.vaneck.com/us/en/investments/intermediate-muni-etf-itm/overview/" title="ITM - VanEck Intermediate Muni ETF - Overview">Intermediate Muni ETF (ITM)</a>, <a href="https://www.vaneck.com/us/en/investments/long-muni-etf-mln/overview/" title="MLN - VanEck Long Muni ETF - Overview">Long Muni ETF (MLN)</a></h2>
<p>Our investment grade municipal ETF product offerings seek to track indices that reflect a unique segmentation of the investment grade municipal yield curve.</p>
<h2>Credit Quality Focused - <a href="https://www.vaneck.com/us/en/investments/high-yield-muni-etf-hyd/overview/" title="HYD - VanEck High Yield Muni ETF - Overview">High Yield Muni ETF (HYD)</a>, <a href="https://www.vaneck.com/us/en/investments/short-high-yield-muni-etf-shyd/overview/" title="SHYD - VanEck Short High Yield Muni ETF - Overview">Short High Yield Muni ETF (SHYD)</a></h2>
<p>Our credit-focused municipal ETF product offerings seek to track indices that include both the highest yielding and the highest credit quality available.</p>
<h2>Smart Beta - <a href="https://www.vaneck.com/us/en/investments/cef-municipal-income-etf-xmpt/overview/" title="XMPT - VanEck CEF Muni Income ETF - Overview">CEF Municipal Income ETF (XMPT)</a></h2>
<p>Intelligent index weighting rules that underweight CEFs trading at higher premiums and overweight those trading at wider discounts.</p>
<h2>Customized Municipal Exposures</h2>
<p>Based on their own views on credit and interest rates, investors may find a customized fit for their portfolio.</p>
<div class="wrapped-div">
<div class="row">
<div id="scatter" class="dynamic-chart" data-ve-gtm="interact-chart">&nbsp;</div>
</div>
</div>
<p class="chart-disclosure">Source: VanEck. As of 12/31/25. Past performance is no guarantee of future results. Modified Duration measures a bond&rsquo;s sensitivity to interest rate changes that reflects the change in a bond&rsquo;s price given a change in yield.<strong> 30-Day SEC Yield</strong> is a standard calculation developed by the Securities and Exchange Commission that allows for fairer comparisons among bond funds. It is based on the most recent 30-day period. This yield figure reflects the interest earned during the period after deducting a Fund&rsquo;s expenses for the period.<strong> Effective Duration</strong> measures a bond&rsquo;s sensitivity to interest rate changes that reflects the change in a bond&rsquo;s price given a change in yield. This duration measure is appropriate for bonds with embedded options. <strong><a href="https://www.vaneck.com/us/en/education/investment-ideas/income-ideas/#ETF-Performance" title="Explore Our ETFs and Mutual Funds">See standardized performance</a></strong>.</p>
<h2>ETFs Provide Low Cost Access to Municipal Bonds</h2>
<p>The fees of an investment vehicle are important; they affect an investor's ultimate return. As of December 31, 2025 the average net expense ratio of municipal bond ETFs was <strong> 47 </strong>bps lower as compared to municipal bond mutual funds, and was <strong>102 </strong>bps lower as compared to municipal bond closed-end funds. Many investors may prefer municipal bond ETFs for this reason.</p>
<h3>Morningstar Municipal Bond U.S. Category Group Average Net Expense</h3>
<br />
<div class="wrapped-div">
<div class="row">
<div id="column" class="dynamic-chart wrapped-div" data-ve-gtm="interact-chart">&nbsp;</div>
</div>
</div>
<p class="chart-disclosure">Source: Morningstar. As of 12/31/25. Fees for municipal bond ETFs compared against the average net expense ratio of mutual funds and closed-end funds in the Morningstar Municipal Bond U.S. Category Group. There were <strong>157 </strong>funds in the Muni ETF Category, <strong>367 </strong>funds in the Muni Mutual Fund Category, <strong>94 </strong>funds in the Muni Closed-End Fund Category.</p>
<p>To receive more <a href="https://www.vaneck.com/us/en/insights/municipal-bonds/" title="Municipal Bonds Insights"><strong>Municipal Bonds</strong></a> insights<strong>, </strong><a href="https://www.vaneck.com/us/en/subscribe/" title="Subscription Center
"><strong>sign up in our subscription center</strong></a><strong>.</strong></p>
<style type="text/css">
    .dynamic-chart {
        width: 100% !important;
    }

    .wrapped-div ,
    .wrapped-div-sector {
        max-width: 100%;
        overflow-x: hidden !important;
    }
</style>
]]></content:encoded>
</item><item rdf:about="https://www.vaneck.com/us/en/blogs/thematic-investing/buzz-investing-fed-signals-labor-focus-and-yield-curve-normalizes/">
  <title>BUZZ Investing: Fed Signals Labor Focus and Yield Curve Normalizes></title>
  <link>https://www.vaneck.com/us/en/blogs/thematic-investing/buzz-investing-fed-signals-labor-focus-and-yield-curve-normalizes/</link>
  <description><![CDATA[The market saw a brief sell-off in early August but swiftly recovered due to positive investor sentiment fueled by weaker economic data, expectations of Fed monetary easing.]]></description>
  <dc:creator> </dc:creator>
  <dc:date>09/26/2024 06:30:00</dc:date>
<content:encoded><![CDATA[

<p>The market turmoil that triggered a sharp sell-off and a spike in global equity volatility in early August proved temporary. Global markets began a swift recovery from the sell-off coinciding with the start of the recent period between index selection dates (August 8, 2024 - September 11, 2024, the &ldquo;Period&rdquo;). Investor sentiment turned positive as expectations grew for more aggressive monetary easing from the Federal Reserve, following weaker economic data and cooling inflation. The solid second-quarter earnings season, which showed no immediate signs of a broader economic slowdown, they have further supported this recovery. Fed Chair Jerome Powell&rsquo;s remarks at the Jackson Hole Symposium in late August reinforced the Fed's commitment to supporting the labor market, reducing concerns about further aggressive inflation control measures and boosting market sentiment.</p>
<p>One of the most significant developments during the Period was the normalization of the U.S. Treasury yield curve, which had been inverted for 783 consecutive days&mdash;an unprecedented duration. An inverted yield curve, where short-term interest rates exceed long-term rates, has historically been a reliable predictor of recessions, leading to heightened anxiety among investors anticipating a similar outcome. However, despite this prolonged inversion, the feared recession did not materialize, with the curve&rsquo;s return to positive territory alleviating some of the market concerns. This, combined with expectations of lower interest rates, helped drive the steady recovery in equity markets.</p>
<p>The BUZZ NextGen AI US Sentiment Leaders Index (the &ldquo;BUZZ Index&rdquo;) returned -1.88% during the month of August compared to a return of 2.43% for the S&amp;P 500 Index during the same period. Year-to-date, the BUZZ Index lags the S&amp;P 500 with returns of 11.88% and 19.53%, respectively, as of the end of August.</p>
<h2>Shares of EV manufacturers lead gains in the BUZZ Index</h2>
<p>The broader electric vehicle (EV) segment observed gains during the recent Period, fueled by increasing investor optimism around advancements in EV technology, infrastructure, and partnerships. As part of this trend, Lucid Group (NYSE: LCID) shares stood out, advancing 24.1%. The company made headlines with the upcoming production of its &lsquo;Gravity&rsquo; SUV and a strategic partnership to integrate Tesla's NACS charging connector, giving Lucid vehicles access to Tesla&rsquo;s extensive Supercharger network. Additionally, favorable analyst reports, several of which upgraded the stock, likely further contributed to Lucid&rsquo;s positive stock performance during the Period.</p>

<h3>Top BUZZ Index Contributors: August 8, 2024 &ndash; September 11, 2024</h3>
<div class="wrapped-div">
<table style="width: 100%;">
<tbody>
<tr class="tbl-data">
<td class="tbl-header last">Company</td>
<td class="tbl-header last text-left">Ticker</td>
<td class="tbl-header last text-right">Average Weight (%)</td>
<td class="tbl-header last text-right">Return Contribution (%)</td>
</tr>
<tr class="tbl-data">
<td class="data-td last font-weight-normal">Lucid Group Inc</td>
<td class="data-td data last text-left">LCID</td>
<td class="data-td data last text-right">2.88</td>
<td class="data-td data last text-right">0.63</td>
</tr>
<tr class="tbl-data">
<td class="data-td last font-weight-normal">Unity Software Inc</td>
<td class="data-td data last text-left">U</td>
<td class="data-td data last text-right">1.54</td>
<td class="data-td data last text-right">0.46</td>
</tr>
<tr class="tbl-data">
<td class="data-td last font-weight-normal">Tesla Inc</td>
<td class="data-td data last text-left">TSLA</td>
<td class="data-td data last text-right">3.07</td>
<td class="data-td data last text-right">0.45</td>
</tr>
<tr class="tbl-data">
<td class="data-td last font-weight-normal">Broadcom Inc</td>
<td class="data-td data last text-left">AVGO</td>
<td class="data-td data last text-right">1.76</td>
<td class="data-td data last text-right">0.39</td>
</tr>
<tr class="tbl-data">
<td class="data-td last font-weight-normal">Amazon.com Inc</td>
<td class="data-td data last text-left">AMZN</td>
<td class="data-td data last text-right">3.03</td>
<td class="data-td data last text-right">0.38</td>
</tr>
<tr class="tbl-data">
<td class="data-td last font-weight-normal">NVIDIA Corp</td>
<td class="data-td data last text-left">NVDA</td>
<td class="data-td data last text-right">3.19</td>
<td class="data-td data last text-right">0.38</td>
</tr>
<tr class="tbl-data">
<td class="data-td last font-weight-normal">DraftKings Inc</td>
<td class="data-td data last text-left">DKNG</td>
<td class="data-td data last text-right">1.62</td>
<td class="data-td data last text-right">0.37</td>
</tr>
<tr class="tbl-data">
<td class="data-td last font-weight-normal">SoFi Technologies Inc</td>
<td class="data-td data last text-left">SOFI</td>
<td class="data-td data last text-right">3.22</td>
<td class="data-td data last text-right">0.37</td>
</tr>
<tr class="tbl-data">
<td class="data-td last font-weight-normal">Advanced Micro Devices Inc</td>
<td class="data-td data last text-left">AMD</td>
<td class="data-td data last text-right">2.99</td>
<td class="data-td data last text-right">0.29</td>
</tr>
<tr class="tbl-data">
<td class="data-td last font-weight-normal">NIKE Inc</td>
<td class="data-td data last text-left">NKE</td>
<td class="data-td data last text-right">2.33</td>
<td class="data-td data last text-right">0.29</td>
</tr>
</tbody>
</table>
</div>
<p class="chart-disclosure">Source: BUZZ Holdings ULC, Bloomberg. Past performance is no guarantee of future results. Index performance is not illustrative of fund performance. Not intended as a recommendation to buy or to sell any of the securities mentioned herein.</p>
<h2>Shares of Trump Media &amp; Technology Group lead declining stocks in the BUZZ Index</h2>
<p>Shares of Trump Media &amp; Technology Group (NASDAQ: DJT) fell 39% during the recent Period, pacing all declining stocks in the BUZZ Index. A combination of factors may have contributed to the decline, including concerns over recent political developments including President Trump's poor performance in the latest Republican debate. Many investors associate DJT stock with Trump's political standing, and his diminished showing in polls following the debate has led to increased uncertainty about his Presidential aspirations and the company's prospects. Additionally, upcoming events like the expiration of a lock-up provision, which will allow insiders to sell their shares, have further contributed to the decline by raising fears of insider sell-offs. While revenue concerns remain, these political and market dynamics appear to have played a larger role in the recent drop in DJT's stock price.</p>
<h3>Bottom BUZZ Index Contributors: August 8, 2024 &ndash; September 11, 2024</h3>
<div class="wrapped-div">
<table style="width: 100%;">
<tbody>
<tr class="tbl-data">
<td class="tbl-header last">Company</td>
<td class="tbl-header last text-left">Ticker</td>
<td class="tbl-header last text-right">Average Weight (%)</td>
<td class="tbl-header last text-right">Return Contribution (%)</td>
</tr>
<tr class="tbl-data">
<td class="data-td last font-weight-normal">Trump Media &amp; Technology Group</td>
<td class="data-td data last text-left">DJT</td>
<td class="data-td data last text-right">1.86</td>
<td class="data-td data last text-right">-0.89</td>
</tr>
<tr class="tbl-data">
<td class="data-td last font-weight-normal">Coinbase Global Inc</td>
<td class="data-td data last text-left">COIN</td>
<td class="data-td data last text-right">2.76</td>
<td class="data-td data last text-right">-0.45</td>
</tr>
<tr class="tbl-data">
<td class="data-td last font-weight-normal">MARA Holdings Inc</td>
<td class="data-td data last text-left">MARA</td>
<td class="data-td data last text-right">2.71</td>
<td class="data-td data last text-right">-0.29</td>
</tr>
<tr class="tbl-data">
<td class="data-td last font-weight-normal">Rivian Automotive Inc</td>
<td class="data-td data last text-left">RIVN</td>
<td class="data-td data last text-right">2.36</td>
<td class="data-td data last text-right">-0.21</td>
</tr>
<tr class="tbl-data">
<td class="data-td last font-weight-normal">Intel Corp</td>
<td class="data-td data last text-left">INTC</td>
<td class="data-td data last text-right">2.50</td>
<td class="data-td data last text-right">-0.18</td>
</tr>
<tr class="tbl-data">
<td class="data-td last font-weight-normal">Alphabet Inc</td>
<td class="data-td data last text-left">GOOGL</td>
<td class="data-td data last text-right">2.66</td>
<td class="data-td data last text-right">-0.13</td>
</tr>
<tr class="tbl-data">
<td class="data-td last font-weight-normal">MicroStrategy Inc</td>
<td class="data-td data last text-left">MSTR</td>
<td class="data-td data last text-right">2.89</td>
<td class="data-td data last text-right">-0.12</td>
</tr>
<tr class="tbl-data">
<td class="data-td last font-weight-normal">Moderna Inc</td>
<td class="data-td data last text-left">MRNA</td>
<td class="data-td data last text-right">0.37</td>
<td class="data-td data last text-right">-0.08</td>
</tr>
<tr class="tbl-data">
<td class="data-td last font-weight-normal">Occidental Petroleum Corp</td>
<td class="data-td data last text-left">OXY</td>
<td class="data-td data last text-right">0.65</td>
<td class="data-td data last text-right">-0.07</td>
</tr>
<tr class="tbl-data">
<td class="data-td last font-weight-normal">Walgreens Boots Alliance Inc</td>
<td class="data-td data last text-left">WBA</td>
<td class="data-td data last text-right">0.53</td>
<td class="data-td data last text-right">-0.06</td>
</tr>
</tbody>
</table>
</div>
<p class="chart-disclosure">Source: BUZZ Holdings ULC, Bloomberg. Past performance is no guarantee of future results. Index performance is not illustrative of fund performance. Not intended as a recommendation to buy or to sell any of the securities mentioned herein.</p>
<h2>BUZZ Index September 2024 Rebalance Highlights</h2>
<p><strong>Chewy, Inc.</strong></p>
<p>Keith Gill, better known as Roaring Kitty, continues to grab the market's attention with his cryptic social media activity. Gill, who played a central role in the 2021 GameStop (GME) frenzy, returned in May to renew his support for GME through a series of mysterious posts on X (formerly Twitter). His backing of the stock is largely tied to his confidence in Ryan Cohen, GME's CEO. In late June, Gill hinted at a long position in Chewy (CHWY), the pet retailer Cohen founded, which sparked a 35% surge in the stock before it quickly pulled back. In a surprising twist, after a September 6th post that was interpreted as him exiting the stock, CHWY shares rose another 25%. Despite the uncertainty around whether Gill is buying or selling, the meme-driven nature of these trades suggests that volatility may continue. Investor sentiment toward CHWY has been rising, and the stock enters the BUZZ Index this month with a 1.38% weight.</p>
<p><strong>CAVA Group, Inc.</strong></p>
<p>Cava Group (NYSE: CAVA) has rapidly emerged as a major player in the fast-casual dining space, establishing itself as the largest Mediterranean restaurant chain in the U.S. over the past five years. Starting as a small chain in Maryland, the company capitalized on the rising demand for quick, healthy food options. A pivotal moment came in November 2018 when Cava acquired Zoes Kitchen for $300 million and transformed its 250 locations into Cava-branded restaurants. Similar to Chipotle Mexican Grill (NYSE: CMG), Cava has found success by offering customizable, health-focused meals at affordable prices, especially appealing to younger consumers. Since its IPO in June 2023, shares have skyrocketed by 200%, as investors are betting on strong future growth. Sentiment on the stock has been consistently positive and this month CAVA joins the BUZZ Index this month with a 1.1% weight.</p>
<style>
    .data-td.data {
        padding-right: 2px !important;
    }
    
    .wrapped-div {
        max-width: 100%;
    }
    
    @media (max-width: 768px) {
        .wrapped-div {
            overflow-x: scroll;
        }
    }
    
    .wrapped-div-sector {
        max-width: 100%;
        overflow-x: scroll;
    }
</style>
<p>To receive more <a href="https://www.vaneck.com/us/en/insights/thematic-investing/" title="Thematic Investing Insights"><strong>Thematic Investing</strong></a> insights, <a href="https://www.vaneck.com/us/en/subscribe/" title="Subscription Center"><strong>sign up in our subscription center</strong></a>.</p>
]]></content:encoded>
</item><item rdf:about="https://www.vaneck.com/us/en/blogs/gold-investing/ready-set-gold-bull-run-may-have-just-begun/">
  <title>Ready, Set, Gold! Bull Run May Have Just Begun></title>
  <link>https://www.vaneck.com/us/en/blogs/gold-investing/ready-set-gold-bull-run-may-have-just-begun/</link>
  <description><![CDATA[Gold&rsquo;s rally is starting to heat up. With more rate cuts on the horizon and signs of Western investors returning, we see gold prices potentially reaching even higher in the near term.]]></description>
  <dc:creator>Andrew Musgraves</dc:creator>
  <dc:date>09/26/2024 06:30:00</dc:date>
<content:encoded><![CDATA[

<p>Gold is one of the best performing asset classes year-to-date, outperforming U.S. and international equities and bonds, commodities and other real assets (broadly speaking). Continued global central bank buying and heightened geopolitical tensions were among the key drivers of gold&rsquo;s strong returns earlier in the year. More recently, the U.S. Federal Reserve&rsquo;s (Fed&rsquo;s) pivot on interest rates and nascent signs of returning investment demand have been more prevalent drivers and could, in our view, lead to even higher prices in the near-term.</p>
<h3>Gold Has Delivered Impressive Year-to-Date Performance</h3>
<img class="img-responsive w-100" alt="Gold Has Delivered Impressive Year-to-Date Performance" src="https://www.vaneck.com/contentassets/3ae3b0fe0b844a36aadcd4f8c7cff7e0/4866_gold-commentary_chart-1_2024.9_v1_blog.svg" />
<p class="chart-disclosure">Source: FactSet. Data as of September 23, 2024. &ldquo;U.S. Stocks&rdquo; represented by the S&amp;P 500 Index. &ldquo;REITs&rdquo; represented by FTSE NAREIT All REITs Index. &ldquo;EM Stocks&rdquo; represented by MSCI Emerging Markets Index. &ldquo;International Stocks&rdquo; represented by MSCI AC World ex USA Index. &ldquo;U.S. TIPS&rdquo; represented by Bloomberg U.S. TIPS (1-3 Year) Index. &ldquo;U.S. Bonds&rdquo; represented by Bloomberg U.S. Aggregate Bond Index. &ldquo;International Bonds&rdquo; represented by Bloomberg Global Aggregate ex US Index. &ldquo;Commodities&rdquo; represented by Bloomberg Commodity Index. Past performance is not indicative of future results.</p>
<p>Purchases from global central banks, particularly those in China and other emerging markets, has been a developing trend since the Global Financial Crisis (GFC). For the last several years, including the first half of 2024, this has contributed to strong gold demand. This trend, in our view, may suggest a broader desire by these countries to "de-dollarize," or reduce their dependence on the U.S. dollar. Not only have global central banks increased their gold reserves, many have communicated that they plan to continue purchasing more gold in the future.</p>
<h3>Gold Reserves of China and Other Emerging Markets Are Growing</h3>
<img class="img-responsive w-100" alt="Gold Reserves of China and Other Emerging Markets Are Growing" src="https://www.vaneck.com/contentassets/3ae3b0fe0b844a36aadcd4f8c7cff7e0/4866_gold-commentary_chart-2_2024.9_v1_blog.svg" />
<p class="chart-disclosure">Source: Goldman Sachs, World Gold Council, VanEck. Data as of June 2024.</p>
<p>More recently, the primary catalyst for higher gold prices has been the Fed&rsquo;s interest rate policy. The U.S. has focused on addressing high-interest rates in an attempt to achieve a "soft landing" for the economy following a period of record-high inflation. The Fed's recent 50 basis point reduction in its key interest rate was generally welcomed by gold markets. Historically, gold has performed well during such rate-cutting cycles, with an average cumulative return of around 25% over 500 trading days following the Fed's first cut. Rate cuts tend to weaken the U.S. dollar, further boosting gold&rsquo;s appeal to global investors, and as uncertainty about the broader economy grows, gold benefits from its status as a safe-haven asset.</p>
<h3>Gold Historically Performs Well Following First Fed Rate Cuts</h3>
<img class="img-responsive w-100" alt="Gold Historically Performs Well Following First Fed Rate Cuts" src="https://www.vaneck.com/contentassets/3ae3b0fe0b844a36aadcd4f8c7cff7e0/4866_gold-commentary_chart-3_2024.9_v1_blog.svg" />
<p class="chart-disclosure">Source: JPMorgan, VanEck. Data as of June 2024. Past performance is not indicative of future results.</p>
<p>Absent from gold&rsquo;s recent rally has been Western investment demand, tracked via gold-backed exchange-traded funds (ETFs), but flows into gold-backed ETFs have started to pick up. Historically, gold ETF flows have been a catalyst for higher gold prices. The question remains whether the disconnect between flows and prices will close and, if so, what implications it will have for an even higher gold price.</p>
<h3>Until Recently, Gold Prices and ETF Gold Holdings Were Closely Connected</h3>
<img class="img-responsive w-100" alt="Until Recently, Gold Prices and ETF Gold Holdings Were Closely Connected" src="https://www.vaneck.com/contentassets/3ae3b0fe0b844a36aadcd4f8c7cff7e0/4866_gold-commentary_chart-4_2024.9_v1_blog.svg" />
<p class="chart-disclosure">Source: World Gold Council. Data as of September 20, 2024. Past performance is not indicative of future results.</p>
<p>Looking forward, we believe gold is well positioned to continue its rally, especially if Western investors return to the market. The anticipation of further rate cuts by the Fed, along with continued inflationary pressures and geopolitical risks, are likely to further bolster gold's appeal as an attractive alternative to a weaker dollar and a hedge against market volatility. <a href="https://www.vaneck.com/us/en/blogs/gold-investing/ima-casanova-sticky-inflation-boosts-gold" title="Sticky Inflation Boosts Gold"><strong>With this backdrop, we believe that gold prices could reach their inflation-adjusted highs of $2,800 per ounce in the near term</strong></a>.</p>
<p>To receive more <strong><a href="https://www.vaneck.com/us/en/insights/gold-investing/" title="Gold Investing Insights">Gold Investing</a></strong> insights, <strong><a href="https://www.vaneck.com/us/en/subscribe/" title="Subscription Center">sign up in our subscription center</a></strong>.</p>
]]></content:encoded>
</item><item rdf:about="https://www.vaneck.com/us/en/blogs/income-investing/pursue-higher-yield-potential-with-clos/">
  <title>Pursue Higher Yield Potential with CLOs></title>
  <link>https://www.vaneck.com/us/en/blogs/income-investing/pursue-higher-yield-potential-with-clos/</link>
  <description><![CDATA[Mezzanine CLOs may offer a compelling opportunity for investors seeking higher yields and may be an attractive complement to high yield bonds and leveraged loans.]]></description>
  <dc:creator>William Sokol</dc:creator>
  <dc:date>09/25/2024 09:30:00</dc:date>
<content:encoded><![CDATA[

<p>The benefits of investing in collateralized loan obligations (CLOs) have become increasingly clear to investors over the past several years. At each rating category, CLOs provide a higher yield than similarly rated bonds and loans. Even a few rate cuts will likely not diminish this advantage, particularly as one moves down the ratings spectrum, and historically the spreads offered on CLOs have been consistently and significantly higher. In addition to their higher yields and spreads, the way CLOs are structured has resulted in significantly lower default rates versus bonds and loans. We believe this combination of yield potential and higher quality makes CLOs attractive in a fixed income portfolio, along with the diversification benefits they provide.</p>
<h3>CLOs Offer Higher Yield Than Similarly Rated Bonds and Loans</h3>
<p><strong>(as of 8/31/2024)</strong></p>
<p><img class="img-responsive w-100" alt="CLOs Offer Higher Yield Than Similarly Rated Bonds and Loans" src="https://www.vaneck.com/contentassets/8812ed46ddcb496090e1d0d6e9c504e2/4835_clob_chart-1_2024-9_v1_blog.svg" /></p>
<p class="chart-disclosure">Source: JP Morgan and ICE Data Services as of 8/31/2024. US CLO is based on the JP Morgan CLO Index, Corp/HY is based on ICE BofA US Corporate Index and ICE BofA US High Yield Index, and Leveraged Loans refers to J.P. Morgan Leveraged Loan Index. Leveraged Loan yield represents yield modelled to a 3-year maturity. US CLO Yield to Worst represents yield to call for premium priced securities or to maturity when priced at a discount to par based on forward reference rates. See index descriptions at the end of this blog. Past performance is not indicative of future results. This is not an offer to buy or sell, or recommendation to buy or sell any of the securities mentioned herein. Index performance is not illustrative of fund performance. It is not possible to invest directly in an index.</p>
<p>The <a href="/link/e090deaddc774ac699a04b959d9254c6.aspx" title="CLOI - VanEck CLO ETF - Overview"><strong>VanEck CLO ETF (CLOI)</strong></a>, launched in June 2022, focuses on investment grade CLOs and offers investors a compelling way to add CLO exposure to their core bond portfolio. For investors seeking greater yield potential and who are able to tolerate additional volatility, the <a href="/link/d2f16468a9f14c1e807f6bb7fb597a3e.aspx" title="CLOB - VanEck AA-BB CLO ETF - Overview"><strong>VanEck AA-BB CLO ETF (CLOB)</strong></a> provides a way to access lower rated, or &ldquo;mezzanine,&rdquo; tranches between the AAA and equity tranches. This part of the CLO capital structure offers significantly higher spreads, driving greater yield and total return potential. The increase in yield is particularly acute moving from A to BBB rated CLOs. For example, as shown in the chart below, BBB and BB rated CLOs have returned 5.9% and 9.3%, respectively, annually over the past decade. This compares to 3.5% for broad investment grade CLOs and 4.2% for U.S. high yield corporate bonds. However, this significantly greater return potential comes with heightened volatility, and other parts of the mezzanine universe, particularly AA and A rated CLOs, can provide a cushion against this volatility as well as greater liquidity. CLOB invests in the best opportunities within mezzanine CLOs, aiming to provide significantly greater return potential versus an AAA or investment grade strategy, with a strong focus on managing downside risk.</p>
<h3>CLOs&rsquo; Risk-Adjusted Returns Attractive Relative to Other Asset Classes</h3>
<p><strong>(10 Years as of 8/31/2024)</strong></p>
<p><img class="img-responsive w-100" alt="CLOs&rsquo; Risk-Adjusted Returns Attractive Relative to Other Asset Classes" src="https://www.vaneck.com/contentassets/fddb9a2aea3a4baa9e29d96072d6189b/4835_clob_chart-2_2024-9_v1_blog.svg" /></p>
<p class="chart-disclosure">Source: Morningstar. Broad CLOs represented by J.P. Morgan CLO Index, IG CLOs represented by J.P Morgan CLO IG Index, AA-BB CLOs represented by the J.P. Morgan CLOIE Balanced Mezzanine Index, AAA Rated CLOs represented by J.P. Morgan CLO AAA Index, AA Rated CLOs represented by J.P. Morgan CLO AA Index, A Rated CLOs represented by J.P. Morgan CLO A Index, BBB Rated CLOs represented by J.P. Morgan CLO BBB Index, BB Rated CLOs represented by J.P. Morgan CLO BB Index, US IG represented by ICE BofA US Corporate Index, US HY represented by ICE BofA US High Yield Index, Agg is represented by the ICE BofA US Broad Market, US IG FRNs represented by MVIS US Investment Grade Floating Rate Note Index, Leveraged Loans represented by Morningstar LSTA US Leveraged Loan 100 Index. See index descriptions at the end of this blog. Past performance is not indicative of future results. This is not an offer to buy or sell, or recommendation to buy or sell any of the securities mentioned herein. Index performance is not illustrative of fund performance. It is not possible to invest directly in an index.</p>

<p>With attractive yields and <a href="/link/1f27c091bcb74c0f8e851fd2b7ddf5a9.aspx?latest=true%2F#point-three" title="CLOI ETF: Question and Answer"><strong>built-in risk protections</strong></a>, mezzanine CLOs may be an attractive complement to a high yield bond portfolio. In addition, CLOB can provide diversification potential because of the floating rate nature of CLOs and the differences in underlying exposures. CLOs are backed by leveraged loans, which have different issuer and sector representation versus the high yield market. Alternatively, leveraged loan investors may find CLOB to be an attractive replacement for direct loan investments due to the structural protections that CLOs provide, without a significant impact on yield. On average, PineBridge Investments estimates<sup>1</sup>&nbsp;that even in a stressed market environment, it would take an annual default rate of nearly 10% within underlying loan portfolios to experience a default in BBB CLOs. That is more than three times higher than the historical average default rate of leverage loans. BB CLOs, on average, could incur a 6% annual default rate in the underlying loan portfolios, or about twice the historical average. CLOB also provides an efficient way to add tactical exposure to lower rated credit after significant market moves, allowing investors to capture a potential recovery in prices.</p>
<p>Similar to CLOI, CLOB is sub-advised by PineBridge Investments, bringing decades of CLO market expertise to investors through an ETF. PineBridge manages $2.5 billion in CLO tranche investments for institutional investors (as of 6/30/2024), and has been a CLO issuer since the 1990s. In addition to extensive due diligence on CLO managers, PineBridge looks through CLO portfolios to analyze each individual loan and make buy and sell decisions based on their fundamental views of the portfolio. They can then determine which tranche of a CLO provides the most attractive value. Combined with a top-down approach based on macro views, we believe this active approach can provide the best opportunities in CLO investing.</p>
<p>Downgrade risk increases as one moves further down the CLO capital stack and must be monitored closely. Within mezzanine CLOs in particular, PineBridge&rsquo;s ability to perform loan-level analysis will be increasingly important given the <a href="/us/en/blogs/income-investing/shifting-fundamentals-call-for-clo-selectivity/" title="Shifting Fundamentals Call for CLO Selectivity"><strong>growing dispersion beginning to appear in the credit market</strong></a>. In addition, following the first rate cuts by the Federal Reserve since 2020, a turn in U.S. monetary policy may generate added volatility in credit markets. With valuations currently very tight, unexpected events can drive sharp drawdowns and also provide opportunities.</p>
<p>CLOB&rsquo;s active approach adapts to this changing environment and allows investors to capture opportunities when they arise. For example, an allocation to AA and A rated CLOs can provide a cushion against volatility as well as dry powder to take advantage of market selloffs and shift into lower rated tranches when value appears. In contrast, a strategy focused only on CLOs rated BBB and below may experience very steep drawdowns and will not be able to raise liquidity without realizing significant losses. We believe that a broader investment focus that can de-risk in periods of stress and opportunistically invest where there is the greatest value is the most prudent way for investors to approach mezzanine CLO investing.</p>
<p>The <a href="/link/d2f16468a9f14c1e807f6bb7fb597a3e.aspx" title="CLOB VanEck AA-BB CLO ETF"><strong>VanEck AA-BB CLO ETF (CLOB)</strong></a> is an actively managed ETF, sub-advised by PineBridge Investments, and invests primarily in mezzanine tranches of CLOs.</p>

<p>To receive more <a href="/us/en/blogs/income-investing/" title="Income Investing Insights"><strong>Income Investing</strong></a> insights, <a href="/link/5f45412c2143400497908cea2897f7d3.aspx" title=" Subscription Center"><strong>sign up in our subscription center</strong></a>.</p>
]]></content:encoded>
</item><item rdf:about="https://www.vaneck.com/us/en/blogs/income-investing/clos-too-good-to-be-true/">
  <title>CLOs: Too Good to Be True?></title>
  <link>https://www.vaneck.com/us/en/blogs/income-investing/clos-too-good-to-be-true/</link>
  <description><![CDATA[We discuss three reasons why CLOs have had the most attractive risk-adjusted returns in fixed income over the past decade and look at why active management is essential in mitigating risks.]]></description>
  <dc:creator>William Sokol</dc:creator>
  <dc:date>09/25/2024 06:30:00</dc:date>
<content:encoded><![CDATA[

<p>One of the most frequently asked questions we receive from investors new to collateralized loan obligations (CLOs) is whether their higher yield and spread profile with near-zero default risk is &ldquo;too good to be true.&rdquo; How is this risk/return profile, which has driven the most attractive risk-adjusted returns in fixed income over the past decade, possible? There are several factors that help explain this:</p>
<ol class="content-list">
<li><strong>High yielding collateral</strong>: CLOs are backed by a pool of leveraged loans, which are non-investment grade and produce high levels of income that gets distributed to CLO tranche investors. As of February 29, 2024, leveraged loans yielded 9.2% versus 5.5% on investment grade (IG) corporate bonds.</li>
<li><strong>Structural protections</strong>: Each tranche of a CLO has varying degrees of subordination, which insulates investors from default losses. Active management, collateral requirements, and overcollateralization provide additional protection. Combined with the lower loss rates on senior secured loans relative to high yield bonds, the risk of default in investment grade CLO tranches is negligible. The average CLO portfolio would need to experience default rates several multiples of the historical average, typically for several consecutive years, for the first dollar of loss even in BBB and BB rated tranches. There has never been a default in AAA rated CLOs.</li>
</ol>
<h3>Extreme Levels of Defaults Would Be Needed to Impair A CLO Tranche</h3>
<p><img class="img-responsive w-100" src="https://www.vaneck.com/contentassets/f2a61014fd3d4fa08f57c89c0cc88df3/4841_clo_chart-5_2024-9_v1_blog.svg" alt="Extreme Levels of Defaults Would Be Needed to Impair A CLO Tranche" /></p>
<p class="chart-disclosure">Source: PineBridge Investments analysis as of 2/28/2024 and J.P. Morgan for Leveraged Loan Annual Default Rate (2001-2023). Any views represent the opinion of the investment manager, are valid as of the date indicated and are subject to change. Past performance is not indicative of future results. This is not an offer to buy or sell, or recommendation to buy or sell any of the securities mentioned herein.</p>
<ol class="content-list" start="3">
<li><strong>CLO market structure</strong>: CLOs are not homogenous (even those with the same rating are not one in the same) and require extensive due diligence before investing, introducing a risk premium. Every portfolio is different in terms of underlying issuers, sectors and vintages. Deal documentation can vary, as well as CLO manager style. These differences highlight the need for active management by an experienced CLO tranche portfolio management team. Further, each tranche has a unique investor base with different return targets, which can drive yields higher. For example, banks are the biggest investors in AAA CLOs, and a CLO cannot be issued without placing the AAA tranche. Accordingly, changes to bank capital requirements can have an outsized impact on AAA CLO spread levels. Lastly, non-institutional investors have not had access to the asset class until recently with the advent of CLO ETFs.</li>
</ol>
<p>After walking through these points, the follow-up question is often &ldquo;if that&rsquo;s true, what can go wrong?&rdquo; Although default risk is not the primary risk of CLO tranche investing, CLO tranche investing is not risk-free. In particular, spread and downgrade risk need to be carefully monitored. Deterioration in the underlying loan market can result in downgrades of CLO tranches, which can drive prices lower. And like any credit investment, wider spreads will impact market values. March 2020 provides a recent example of how CLOs perform versus other corporate asset classes in a tail-risk scenario (see exhibit).</p>

<h3>CLOs Fared Much Better than High Yield and Leveraged Loans During the Covid-Fueled Sell-Off in March 2020</h3>
<p><img loading="lazy" class="img-responsive w-100" src="https://www.vaneck.com/contentassets/6cc47997148a4f4eb18c7b8b36da349e/4227_cloi_chart-2_2024.03_blog.svg" alt="CLOs Fared Much Better than High Yield and Leveraged Loans During the Covid-Fueled Sell-Off in March 2020" /></p>
<p class="chart-disclosure">Source: ICE Data Indices, Morningstar. Drawdown is the largest drop from a peak to a bottom from March 1, 2020 to March 30, 2020. CLOs represented by J.P. Morgan CLO Index; HY Corporates represented by ICE BofA High Yield Index; US Treasuries represented by ICE BofA US Treasury Index; IG Corporates represented by ICE BofA US Corporate Bond Index; Leveraged Loans represented by Morningstar LSTA US Leveraged Loan 100 Index. Index performance is not representative of Fund performance. It is not possible to invest directly in an index.</p>
<p>CLOs, in aggregate (i.e. from AAA to BB rated tranches) experienced a drawdown similar to investment grade corporate bonds during the COVID selloff. High yield bonds and leveraged loans fared much worse. In addition, CLOs fully recovered by August 2020 and did not experience a spike in defaults. So, CLOs are clearly not free from market risk, but an allocation did not add more downside risk versus other credit sectors in this extreme volatility, even with exposure to CLOs rated below AAA.</p>

<h2>Conclusion</h2>
<p>CLOs have had a compelling run over the past decade, especially when compared to their fixed income peers. Like all investments &ndash; CLOs are not risk free, and tail risks, like the March 2020 Covid sell-off, do occur. But, even in that scenario, CLOs performed in line with investment grade corporate bonds, and better than high yield bonds and leveraged loans. We believe this resilience illustrates that, rather than being &ldquo;too good to be true,&rdquo; the structural features of CLOs and the CLO market explain why this asset class has been able to perform so well.</p>
<p>The <a href="/link/e090deaddc774ac699a04b959d9254c6.aspx" title="CLOI - VanEck CLO ETF - Overview"><strong>VanEck CLO ETF (CLOI)</strong></a> and <a href="/link/d2f16468a9f14c1e807f6bb7fb597a3e.aspx" title="CLOB - VanEck AA-BB CLO ETF - Overview"><strong>VanEck AA-BB CLO ETF (CLOB)</strong></a> are actively managed ETFs, sub-advised by PineBridge Investments. CLOI provides access to investment grade CLOs, and CLOB invests primarily in mezzanine tranches of CLOs. Both ETFs benefit from PineBridge&rsquo;s decades of CLO market experience, both as a CLO manager and CLO tranche investor, and deep leveraged finance expertise.</p>
<p>To receive more <strong><a href="https://www.vaneck.com/us/en/insights/income-investing/" title="Income Investing Insights">Income Investing</a></strong> insights, <strong><a href="https://www.vaneck.com/us/en/subscribe/" title="Subscription Center">sign up in our subscription center</a></strong>.</p>
]]></content:encoded>
</item><item rdf:about="https://www.vaneck.com/us/en/blogs/income-investing/clo-cheat-sheet-how-to-answer-questions-about-clos/">
  <title>CLO Cheat Sheet: How To Answer Questions About CLOs></title>
  <link>https://www.vaneck.com/us/en/blogs/income-investing/clo-cheat-sheet-how-to-answer-questions-about-clos/</link>
  <description><![CDATA[CLOs have delivered the most attractive risk-adjusted returns in fixed income over the past decade, but they are often deemed &ldquo;too complex&rdquo;. This guide helps you address your clients&rsquo; questions.]]></description>
  <dc:creator> </dc:creator>
  <dc:date>09/25/2024 06:30:00</dc:date>
<content:encoded><![CDATA[

<p>Collateralized Loan Obligations (CLOs) have delivered the most attractive risk-adjusted returns in fixed income over the past decade. However, understanding their key components&mdash;such as credit quality, high yield, duration, and simplified access through ETFs&mdash;can be challenging. This piece aims to provide a straightforward explanation of CLOs, highlighting their benefits to investment portfolios, and includes links to resources for deeper exploration of specific topics.</p>
<h2>What is a CLO?</h2>
<ul class="content-list">
<li class="mt-2">
<p>CLOs are securitized, actively managed and diversified portfolios of corporate bank loans.</p>
</li>
<li class="mt-2">
<p>CLOs typically hold anywhere from 200-300 loans from corporate issuers spread across various sectors and industries.</p>
</li>
<li class="mt-2">
<p>The underlying collateral (the leveraged loans) of CLOs are senior and secured, meaning they have the senior-most claim on all the issuer&rsquo;s assets in the event of bankruptcy.</p>
</li>
</ul>
<p><strong>Dive Deeper</strong><br /><a href="https://www.vaneck.com/us/en/blogs/income-investing/a-guide-to-collateralized-loan-obligations-clos/" title="A Guide to Collateralized Loan Obligations (CLOs)"><strong>A Guide to Collateralized Loan Obligations (CLOs)</strong></a><br /><a href="https://www.vaneck.com/us/en/blogs/income-investing/the-power-of-clos-higher-yields-and-built-in-risk-protection/" title="The Power of CLOs: Higher Yields and Built-In Risk Protection"><strong>The Power of CLOs: Higher Yields and Built-In Risk Protection</strong></a></p>
<br />
<h2>Are CLOs a new investment vehicle? And how big is the CLO market?</h2>
<ul class="content-list">
<li class="mt-2">
<p>No, institutional investors have had access to CLOs for about three decades. However, most financial advisors and individual investors only recently gained access to the asset class with the advent of CLO ETFs.</p>
</li>
<li class="mt-2">
<p>The global CLO market reached the $1T benchmark size in 2021 and is now approximately equal in size to the U.S. high yield bond market.</p>
</li>
<li class="mt-2">
<p>While banks and insurance companies are the primary institutional owners of CLOs historically, retail investors have continued to gain a presence in the CLO market, with over $10B in CLO AUM across ETFs.</p>
</li>
</ul>
<h2>How are CLOs structured?</h2>
<ul class="content-list">
<li class="mt-2">
<p>Each CLO issues a series of floating rate bonds, along with a first-loss equity tranche. The tranches differ in terms of subordination and priority&mdash;and, thus, rank lowest to highest in order of riskiness (and return).</p>
</li>
<li class="mt-2">
<p>The cash flows generated from the underlying portfolio of loans is used to pay interest sequentially to CLO debt holders, starting with the most senior AAA tranche.</p>
</li>
<li class="mt-2">
<p>Remaining cash flows are then paid to the AA, A, BBB, and BB tranches.</p>
</li>
<li class="mt-2">
<p>The equity tranche receives the residual cash flows once all of the senior and mezzanine tranches have been paid in order.</p>
</li>
<li class="mt-2">
<p>Losses are absorbed first by the equity tranche, and to the extent that losses exceed the value of the CLO equity, by the debt tranches starting with the most junior tranche first.</p>
</li>
<li class="mt-2">
<p>Due to credit enhancements, priority of cash flows, diversification, active management and other risk protections, most tranches earn investment grade ratings despite the underlying leveraged loans themselves having below investment grade ratings.</p>
</li>
</ul>

<h2>Are CLOs the same thing as CDOs?</h2>
<ul class="content-list">
<li class="mt-2">CDOs, or collateralized debt obligations (CDOs) are a vehicle that hold a variety of debt instruments including bonds or mortgages (including subprime mortgages).</li>
<li class="mt-2">CDOs are not the same thing as CLOs. CDOs were at the forefront the GFC (not CLOs!).</li>
</ul>
<p><strong>Dive Deeper</strong><br /><a href="https://www.vaneck.com/us/en/blogs/income-investing/clos-vs-cdos-understanding-the-difference/" title="CLOs vs. CDOs: Understanding the Difference"><strong>CLOs vs. CDOs: Understanding the Difference</strong></a></p>
<br />
<h2>How did CLOs perform during the last two market crises?</h2>
<ul class="content-list">
<li class="mt-2">CLOs experienced fewer defaults than corporate bonds of the same rating during and in the years following the global financial crisis (and also during the COVID-19 drawdown). No AAA or AA rated CLO has ever defaulted, and default rates even at the BBB level are extremely rare historically.</li>
<li class="mt-2">In the most recent COVID-19 drawdown, CLOs experienced a lower return drawdown than leveraged loans and high yield bonds, and a similar drawdown to investment grade corporate bonds.</li>
</ul>
<h3>CLOs are More Resilient to Defaults</h3>
<p><strong>Annual global defaults rates<sup>1</sup>: CLO vs Corporates (2001 &ndash; 2022)</strong></p>
<p><img class="img-responsive w-100" src="https://www.vaneck.com/contentassets/44123faa27084c4cb74cd16bd9dde900/4560_clo-cheat-sheet_chart-1_2024.6_v1_blog.svg" alt="CLOs are More Resilient to Defaults" /></p>
<p class="chart-disclosure">Source:<sup>1</sup>S&amp;P Global: Default, Transition, and Recovery: 2022 Annual Global Leveraged Loan CLO Default And Rating Transition Study. 2CLO Spotlight: Thirty Years Strong: U.S. CLO Tranche Defaults From 1994 Through First-Quarter 2024. Past performance is not indicative of future results. This is not an offer to buy or sell, or recommendation to buy or sell any of the securities mentioned herein. Default rate for CLOS and Corporate includes all rated entities. Corporate (Sec-grade) includes only companies rated BB+ and below.</p>
<h2>How do changing interest rates impact CLOs?</h2>
<ul class="content-list">
<li class="mt-2">
<p>CLOs are floating-rate instruments with quarterly resets, similar to bank loans giving them an average duration of approximately 0.25 years. Because the coupon resets with prevailing short-term rates, investors earn higher income if rates are elevated or increasing, while coupons will decrease if short-term rates decline.</p>
</li>
<li class="mt-2">
<p>With nearly zero interest rate duration, CLOs can be thought of as a pure credit instrument and an excellent complement with a negative correlation to a fixed coupon asset such as intermediate and long term US Treasuries.</p>
</li>
</ul>
<p><strong>Dive Deeper</strong><br /><a href="https://www.vaneck.com/us/en/blogs/income-investing/clos-not-just-for-rising-rates/" title="CLOs: Not Just For Rising Rates"><strong>CLOs: Not Just for Rising Rates</strong></a></p>
<br />
<h2>What are the main benefits of investing in CLOs?</h2>
<ul class="content-list">
<li class="mt-2"><strong>Attractive yields</strong></li>
<li class="mt-2"><strong>Attractive Carry</strong></li>
<li class="mt-2"><strong>Near Zero Duration</strong></li>
<li class="mt-2"><strong>Low Volatility</strong></li>
<li class="mt-2"><strong>Low Default Rates</strong></li>
<li class="mt-2"><strong>Low Correlation to Traditional Fixed Income</strong></li>
</ul>
<h2>Adding CLOs Provided Better Outcomes and Yields</h2>
<h3>Investment Grade CLOs</h3>
<p><img class="img-responsive w-100" src="https://www.vaneck.com/contentassets/c9809d5a29a944ee9d975626d95b415d/4841_clo_chart-1_2024-9_v1_blog.svg" alt="Adding CLOs Provided Better Outcomes (as of 8/31/2024)" /></p>
<h3>&hellip;And Better Yields</h3>
<p><img class="img-responsive w-100" src="https://www.vaneck.com/contentassets/c9809d5a29a944ee9d975626d95b415d/4841_clo_chart-2_2024-9_v1_blog.svg" alt="And Better Yields (as of 8/31/2024)" /></p>
<p class="chart-disclosure">As of August 31, 2024. Source: JP Morgan and ICE Data Services. CLOs refers to the J.P. Morgan Collateralized Loan Obligation Index (CLOIE) and Agg refers to the ICE BofA US Broad Market Index. CLO Yield to Worst represents yield to call for premium priced securities or to maturity when priced at a discount to par based on forward reference rates. See index descriptions at the end of this blog. Past performance is not indicative of future results. This is not an offer to buy or sell, or recommendation to buy or sell any of the securities mentioned herein. For illustrative purposes only. Please see important disclosures regarding hypothetical performance at the end of this blog.</p>
<h3>Mezzanine CLOs</h3>
<p><img class="img-responsive w-100" src="https://www.vaneck.com/contentassets/6a9e15d58829446d9ade2917c56c2729/4841_clo_chart-3_2024-9_v1_blog.svg" alt="Adding CLOs Provided Better Outcomes (as of 8/31/2024)" /></p>
<p><img class="img-responsive w-100" src="https://www.vaneck.com/contentassets/6a9e15d58829446d9ade2917c56c2729/4841_clo_chart-4_2024-9_v1_blog.svg" alt="And Better Yields (as of 8/31/2024)" width="1044" height="540" /></p>
<p class="chart-disclosure">As of August 31, 2024. Source: JP Morgan and ICE Data Services. AA-BB CLOs represented by the J.P. Morgan CLOIE Balanced Mezzanine Index and HY refers to the ICE BofA US High Yield Index. CLO Yield to Worst represents yield to call for premium priced securities or to maturity when priced at a discount to par based on forward reference rates. See index descriptions at the end of this blog. Past performance is not indicative of future results. This is not an offer to buy or sell, or recommendation to buy or sell any of the securities mentioned herein. For illustrative purposes only. Please see important disclosures regarding hypothetical performance at the end of this blog.</p>
<p><strong>Dive Deeper</strong><br /><a href="https://www.vaneck.com/us/en/blogs/income-investing/get-to-know-clos-with-william-sokol/" title="Get to Know CLOs with William Sokol"><strong>Get to Know CLOs with William Sokol</strong></a><br /><a href="https://www.vaneck.com/us/en/blogs/income-investing/clos-too-good-to-be-true/" title="CLOs: Too Good to Be True?"><strong>CLOs: Too Good to Be True?</strong></a><br /><a href="https://www.vaneck.com/us/en/blogs/income-investing/why-invest-in-clos/" title="Why Invest in CLOs?"><strong>Why Invest in CLOs?</strong></a></p>
<br />
<h2>Is CLO investing better suited for active management?</h2>
<ul class="content-list">
<li class="mt-2">
<p>Replicating an index of CLOs is extremely difficult or essentially impossible, and significant opportunity to add value through active management exists due to the unique characteristics of the CLO market.</p>
</li>
<li class="mt-2">
<p>The CLO asset class is not homogenous and there are significant opportunities to add value through security selection and top-down positioning. But you need specialized knowledge and experience to identify these opportunities.</p>
</li>
<li class="mt-2">
<p>Just one CLO can have over 300 underlying loans and have unique structural features. You need a manager who can drill down and analyze the portfolio at the individual loan-level, in addition to analyzing the CLO manager and understanding and stress-testing the structure itself.</p>
</li>
</ul>
<p><strong>Dive Deeper</strong><br /><a href="https://www.vaneck.com/us/en/blogs/income-investing/looking-beyond-aaa-rated-clos-pays-off/" title="Looking Beyond AAA Rated CLOs Pays Off"><strong>Looking Beyond AAA Rated CLOs Pays Off</strong></a> <br /><a href="https://www.vaneck.com/us/en/blogs/income-investing/shifting-fundamentals-call-for-clo-selectivity/" title="Shifting Fundamentals Call for CLO Selectivity"><strong>Shifting Fundamentals Call for CLO Selectivity</strong></a></p>

<h2>Where do CLOs fit in my portfolio?</h2>
<ul class="content-list">
<li class="mt-2">
<p>Investment grade CLOs can be used in a portfolio in a variety of ways as both a complement to the core, an income producing alternative asset, or as a component to a high quality short duration cash+ bucket.</p>
</li>
<li class="mt-2">
<p>Investment grade CLOs are not in the Bloomberg Aggregate Bond Index (the Agg) and have a near zero correlation to the Agg, therefore they offer Agg-benchmarked investors a strong portfolio diversifier and yield enhancer within their core bond portfolio.</p>
</li>
<li class="mt-2">
<p>Similarly, mezzanine CLOs can enhance a high yield allocation by increasing yield and providing rate and credit diversification. Overlap with high yield portfolios may also be relatively low, as a growing universe of issuers access funding only through the loan market and there are significant sector exposure differences between the high yield and loan markets.</p>
</li>
<li class="mt-2">
<p>Mezzanine CLOs accessed through the ETF wrapper also provide an efficient way to add tactical exposure to lower rated credit after significant market moves, allowing investors to capture a potential recovery in prices.</p>
</li>
<li class="mt-2">
<p>CLOs can also be used to adjust the overall duration of a core bond portfolio without a meaningful change to the overall credit profile.</p>
</li>
<li class="mt-2">
<p>CLOs are not considered a core fixed income asset and therefore can be used as an income producing alternative asset.</p>
</li>
<li class="mt-2">
<p>Mezzanine CLOs may be an attractive way for senior loan investors concerned about deteriorating fundamentals to decrease risk without significantly sacrificing yield, as CLO investors benefit from built-in risk protections while maintaining exposure to the loan market, including the floating rate exposure.</p>
</li>
<li class="mt-2">
<p>For investors utilizing short duration high quality cash enhancement vehicles that seek to out yield treasuries with a high margin of safety, investment grade CLOs can be an excellent component.</p>
</li>
</ul>
<p><strong>Dive Deeper</strong><br /><a href="https://www.vaneck.com/us/en/blogs/income-investing/clos-now-a-core-necessity/" title="CLOs Now a Core Necessity"><strong>CLOs Now a Core Necessity</strong></a> <br /><a href="/link/2848ef40fa19486aa8789d07389b920f.aspx" title="Pursue Higher Yield Potential with CLOs"><strong>Pursue Higher Yield Potential with CLOs</strong></a></p>
<br />
<p>To receive more <a href="/us/en/blogs/income-investing/" title="Income Investing Insights"><strong>Income Investing</strong></a> insights, <a href="/us/en/subscribe" title=" Subscription Center"><strong>sign up in our subscription center</strong></a>.</p>
]]></content:encoded>
</item><item rdf:about="https://www.vaneck.com/us/en/blogs/income-investing/find-your-investment-grade-edge-with-undervalued-bonds/">
  <title>Find Your Investment Grade Edge with Undervalued Bonds></title>
  <link>https://www.vaneck.com/us/en/blogs/income-investing/find-your-investment-grade-edge-with-undervalued-bonds/</link>
  <description><![CDATA[A recent report from Moody&rsquo;s Analytics explores how portfolios built around the most attractively valued bonds have significantly outperformed the broad market historically.]]></description>
  <dc:creator> </dc:creator>
  <dc:date>09/25/2024 06:30:00</dc:date>
<content:encoded><![CDATA[

<p>Investment grade corporate bonds provide a yield pickup over risk-free U.S. Treasuries with limited credit risk. They are an attractive core fixed income allocation for many investors because of their relative safety, yield enhancement and diversification potential. In a large, core asset class such as this, is significant outperformance possible?</p>
<p>According to Moody&rsquo;s Analytics, the answer may be &ldquo;yes.&rdquo; As shown below, the most attractively valued bonds within this $4.1 trillion asset class have significantly outperformed the broad market historically. In contrast, the most overvalued bonds have significantly underperformed the market. Value is measured by comparing the market pricing of a bond to its fair value, as calculated by Moody&rsquo;s Analytics based on the bond&rsquo;s forward-looking probability of default. Bonds that have a high market spread relative to fair value overcompensate investors relative to the risk they are taking. The outperformance from focusing on attractively valued bonds can come from bond prices adjusting upwards towards fair value as well as the ability to capture higher yields relative to the risk taken. In addition, outperformance can also come from avoiding overvalued bonds where market prices adjust downwards towards fair value.</p>
<h3>Attractively Valued Bonds Historically Outperform the Broad Market</h3>
<img class="img-responsive w-100" alt="Attractively Valued Bonds Historically Outperform the Broad Market" src="https://www.vaneck.com/contentassets/6a7531d2acfe443394f4bb614eb458a4/4852_moodys-research-blog_chart-1_2024-9_v1_blog.svg" />
<p class="chart-disclosure">Source: Moody&rsquo;s Analytics and ICE Data Indices. US Corporate Bonds: ICE BofA US Corporate Index (C0A0) tracks the performance of US dollar denominated investment grade corporate debt publicly issued and settled in the US domestic market. Undervalued Bonds: Top 20% of C0A0 ranked by the ratio of a bond&rsquo;s option-adjusted spread to Moody&rsquo;s Analytics&rsquo; fair value spread. Overvalued Bonds: Bottom 20% of C0A0 ranked by the ratio of a bond&rsquo;s option-adjusted spread to Moody&rsquo;s Analytics fair value spread.</p>

<p>To receive more <a href="/us/en/blogs/income-investing/" title="Income Investing Insights"><strong>Income Investing</strong></a> insights, <a href="/link/5f45412c2143400497908cea2897f7d3.aspx" title=" Subscription Center"><strong>sign up in our subscription center</strong></a>.</p>
]]></content:encoded>
</item><item rdf:about="https://www.vaneck.com/us/en/blogs/income-investing/clos-question-and-answer/">
  <title>CLOI ETF and CLOB ETF: Question and Answer></title>
  <link>https://www.vaneck.com/us/en/blogs/income-investing/clos-question-and-answer/</link>
  <description><![CDATA[We explore how CLOs are structured&mdash;including their &ldquo;built-in&rdquo; risk protection and how they compare to other fixed income instruments.]]></description>
  <dc:creator>William Sokol</dc:creator>
  <dc:date>09/24/2024 06:30:00</dc:date>
<content:encoded><![CDATA[

<p>Collateralized loan obligations (CLOs) have been gaining wider prominence in recent years. CLOs have historically offered a compelling combination of attractive yield relative to similarly rated bonds and loans, strong risk protection, and floating rate coupons that limit their price sensitivity to interest rate volatility. In this Q&amp;A, we answer frequently asked questions about CLOs&mdash;including their structure and how they compare to other fixed income options&mdash;and specifically about the&nbsp;<strong><a href="/link/593077b21448427e9fc687481484e097.aspx" title="CLOI - VanEck CLO ETF - Overview">VanEck CLO ETF (CLOI)</a></strong> and <a href="/link/d2f16468a9f14c1e807f6bb7fb597a3e.aspx" title="CLOB - VanEck AA-BB CLO ETF - Overview"><strong>VanEck AA-BB CLO ETF (CLOB)</strong></a>.</p>
<ul class="content-list">
<li class="mt-2"><strong><a href="#point-one">What is a CLO?</a></strong></li>
<li class="mt-2"><strong><a href="#point-two">What are the benefits of CLOs?</a></strong></li>
<li class="mt-2"><strong><a href="#point-three">What do you mean by &ldquo;built-in risk protection&rdquo;?</a></strong></li>
<li class="mt-2"><strong><a href="#point-four">Didn't CLOs play a role in the Global Financial Crisis?</a></strong></li>
<li class="mt-2"><strong><a href="#point-five">How do CLOs compare to other fixed income options like bonds or loans?</a></strong></li>
<li class="mt-2"><strong><a href="#point-six">How big is the CLO market? Who are the main participants?</a></strong></li>
<li class="mt-2"><strong><a href="#point-seven">Is there liquidity in the CLO market?</a></strong></li>
<li class="mt-2"><strong><a href="#point-eight">Are there benefits to active management in CLOs?</a></strong></li>
<li class="mt-2"><strong><a href="#point-nine">How do CLOs fit into my fixed income portfolio?</a></strong></li>
<li class="mt-2"><strong><a href="#point-ten">How can I access CLOs?</a></strong></li>
<li class="mt-2"><strong><a href="#point-elevan">What is the investment strategy of CLOI and CLOB and how are they managed?</a></strong></li>
<li class="mt-2"><strong><a href="#point-twelve">What is the process used to select securities and construct the portfolio?</a></strong></li>
<li class="mt-2"><strong><a href="#point-thirteen">How can investors buy VanEck ETFs?</a></strong></li>
</ul>
<h2 id="point-one" class="anchored-block">What is a CLO?</h2>
<p>A CLO is a portfolio of predominantly senior secured bank loans that is securitized and actively managed. Each CLO issues a series of floating rate bonds, along with a first-loss equity tranche. The tranches differ in terms of subordination and priority&ndash;and, thus, lowest to highest in order of riskiness.</p>
<h3>Subordination and Priority of CLO Tranches</h3>
<p><img loading="lazy" class="img-responsive w-100" src="https://www.vaneck.com/contentassets/8c0f06ced22542c38bc9f238bd98c42c/cloi_chart-02_2022.06_v1_blog.svg" alt="Subordination and Priority of CLO Tranches" /></p>
<p class="chart-disclosure">Source: PineBridge Investments. This is not an offer to buy or sell, or recommendation to buy or sell any of the securities mentioned herein.</p>
<p>CLOs are actively managed vehicles&mdash;i.e., they have a reinvestment period during which the manager can buy and sell loans within the portfolio and reinvest within the parameters set forth by the governing documents. Managers can add value by reinvesting and positioning portfolios to increase returns in benign economic environments and protect against downside risk during weaker economic times.</p>
<p>Each CLO has a defined lifecycle in which collateral is purchased, managed, redeemed, and returned to investors. The standard lifecycle includes five stages:</p>
<ol class="content-list">
<li class="mt-2"><strong>Warehousing (3-6 months)</strong>: The manager purchases the initial collateral before the closing date.</li>
<li class="mt-2"><strong>Ramp-up (1-6 months):</strong> Following the closing date, the manager purchases the remaining collateral to complete the original portfolio. After the ramp-up is complete, the manager also performs monthly tests to ensure the portfolio&rsquo;s ability to cover its interest and principal payments.</li>
<li class="mt-2"><strong>Reinvestment (1-5 years):</strong> Following the ramp-up period, the manager can reinvest all loan proceeds, either purchasing or selling bank loans to improve the portfolio&rsquo;s credit quality.</li>
<li class="mt-2"><strong>Non-call (first 0.5 to 2 years of reinvestment):</strong> Loan-tranche holders earn a per-tranche yield spread specified at closing, after which the majority equity-tranche holder can call or refinance the loan tranches.</li>
<li class="mt-2"><strong>Repayment and deleveraging (1-4 years):</strong> As underlying loans are paid off, the manager pays down the loan tranches in order of seniority and distributes the remaining proceeds to the equity-tranche holders.</li>
</ol>
<h3>CLO Lifecycle</h3>
<p><img loading="lazy" class="img-responsive w-100" src="https://www.vaneck.com/contentassets/8c0f06ced22542c38bc9f238bd98c42c/cloi_chart-01_2022.06_v1_blog.svg" alt="CLO Lifecycle" /></p>
<p class="chart-disclosure">Source: VanEck. This is not an offer to buy or sell, or recommendation to buy or sell any of the securities mentioned herein.</p>
<h2 id="point-two" class="anchored-block">What are the benefits of CLOs?</h2>
<p>Historically, CLOs have offered attractive yields relative to other corporate debt categories, including bank loans, high yield bonds, and investment grade bonds within the same rating category. CLOs are also floating-rate instruments, meaning they have low sensitivity to changes in interest rates. As interest rates rise or fall, CLO yields will move accordingly, and their prices have historically moved less than those of fixed-rate instruments. These characteristics can be advantageous to investors in diversified fixed income portfolios.</p>
<p>In addition, CLOs have built-in risk protection, which has historically helped them experience lower levels of principal loss when compared with corporate debt and other securitized products.</p>
<h2 id="point-three" class="anchored-block">What do you mean by &ldquo;built-in risk protection&rdquo;?</h2>
<p>Cash flows are the lifeblood of a CLO. They determine the distribution of income and principal, which determines the return on investment. Cash flow distributions are paid sequentially starting with the senior-most tranche until each loan tranche has been paid its full distribution, a process commonly referred to as a &ldquo;waterfall.&rdquo; Equity-tranche holders receive the residual distributions.</p>
<p>Accordingly, the &ldquo;built-in risk protection&rdquo; of a CLO starts with the strength of its underlying collateral, i.e. the likelihood the collateral pool will continue to generate sufficient cash flow over the life of a CLO. Leveraged loans (the underlying collateral of CLOs) are senior and secured, meaning they have the senior-most claim on all the issuer&rsquo;s assets in the event of a bankruptcy. Historically, leveraged loans&rsquo; senior secured status has consistently led to lower default rates and higher recoveries compared to unsecured high-yield bonds. CLOs further reduce risk by creating diverse portfolios of leveraged loans&mdash;typically 150&ndash;250 borrowers&mdash;and actively managing that portfolio.</p>
<p>In addition to the attractive risk profile and active management of its underlying collateral, the structure of CLOs helps mitigate risk. For example, coverage tests are a vital mechanism to detect and correct collateral deterioration, which directly affects the allocation of cash flows. All CLOs have covenants that require the manager to test the portfolio&rsquo;s ability to cover its interest and principal payments monthly. Among the many such tests, the most common are the interest coverage and overcollateralization tests. Interest coverage dictates that the income generated by the underlying pool of loans must be greater than the interest due on the outstanding debt in the CLO, while overcollateralization requires the principal amount of the underlying pool of loans to be greater than the principal amount of outstanding CLO tranches. If the tests come up short, cash flows are diverted from equity-tranche holders and more junior debt and diverted them to retire the loan tranches in order of seniority until the breaches are cured by the manager.</p>
<div class="epi-contentfragment">how-to-invest-insights-cloi</div>
<br />
<h2 id="point-four" class="anchored-block">Didn't CLOs play a role in the Global Financial Crisis?</h2>
<p>CLOs are a type of structured credit, an asset class that includes subprime mortgage-backed securities and collateralized debt obligations, two market segments at the epicenter of the 2008 Global Financial Crisis. As a result, the perception exists among some investors and media professionals that all structured credit is inherently riskier than more traditional fixed income. Historical evidence, however, tells a much different story, especially for CLOs. For example, of the approximately $500B of U.S. CLOs issued from 1994-2009 and rated by S&amp;P, only 0.88% experienced defaults. Among CLOs issued since the Global Financial Crisis, no investment grade tranche has ever defaulted.</p>
<p>This strong historical performance is a testament to the built-in risk protections of CLOs, many of which have only gotten stronger with age. In 2010, the second vintage of CLOs began (referred to as &ldquo;CLO 2.0&rdquo;). CLOs in the 2.0 vintage changed in response to the financial crisis by strengthening credit support and shortening the period in which loan interest and proceeds could be reinvested into additional loans.</p>
<p>The current vintage (&ldquo;CLO 3.0&rdquo;) began in 2014 and aimed to further reduce risk by eliminating high yield bonds and adhering to the Volcker Rule and other new regulations. In 2020, the Volcker Rule was further amended, and high yield bonds are now allowed back into CLOs. Currently, few CLOs allow for investments into high yield bonds, and those that do generally limit the exposure to 5%-10%. To compensate for the exposure to high yield, these CLOs have increased levels of subordination aimed to better protect debt tranches.</p>
<h2 id="point-five" class="anchored-block">How do CLOs compare to other fixed income options like bonds or loans?</h2>
<p>CLOs have been tested through two major market crises. Through both the Global Financial Crisis and COVID-19 drawdown, the asset class ultimately experienced fewer defaults than corporate bonds of the same rating. We believe this resilience combined with the potential for upside returns makes the asset class compelling for long-term investors.</p>
<p>CLOs have low sensitivity to changes in interest rates due to their floating rate coupons, a characteristic that is similar to leveraged loans but with additional risk protections due to the CLO structure. Further, CLOs trade similarly to bonds and are generally not subject to the extended settlement times associated with loan settlement. These characteristics can be advantageous to investors in diversified fixed income portfolios.</p>
<h2 id="point-six" class="anchored-block">How big is the CLO market? Who are the main participants?</h2>
<p>The global CLO market is approximately $1.2 trillion in size. CLOs play a very important role in global financing markets and account for more than 60% of the leveraged loan market, a dynamic that leads to robust annual issuance.</p>
<p>CLOs are issued and managed by asset managers. Ownership of CLOs varies by tranche. The least risky, senior-most tranches are mainly owned by insurance companies (which favor income-producing investments) as well as banks (which need high-quality capital to meet regulatory requirements). The equity tranche is the riskiest and offers potential upside and a degree of control.</p>
<div class="epi-contentfragment">how-to-invest-insights-clob</div>
<br />
<h2 id="point-seven" class="anchored-block">Is there liquidity in the CLO market?</h2>
<p>Primary market issuance of CLOs hit a record level in 2021 and was running at a record annual pace through August 2024. In addition, there is a robust secondary market for CLOs, where trading volume has grown and shown resilience through volatile periods (e.g., the COVID-19 market drawdown). This is particularly true among investment grade tranches, where the secondary trading market has grown to $13B per month on average over the last two years.</p>
<h2 id="point-eight" class="anchored-block">Are there benefits to active management in CLOs?</h2>
<p>Replicating the main CLO benchmark is impossible due to the composition of the CLO market and the way CLOs trade. Further, given the tremendous diversity of CLO managers, vintages, underlying exposures and deal terms, there is significant opportunity for an experienced CLO tranche investor to add value.</p>
<p>Capturing opportunities in the CLO market requires an active approach and the expertise to perform bottom-up research on the individual bank loans in the underlying collateral pool. Some CLOs can have more than 200 issuers in their collateral pool. Accordingly, investment managers must have significant research capabilities to fully evaluate the underlying credit risk in each CLO. In addition, managers need relationships with primary and secondary market desks to appropriately trade and source opportunities.</p>
<p>At the same time, the importance of understanding a CLO&rsquo;s structural characteristics cannot be underestimated. Two CLOs with the same exact collateral assets may produce varied performance due to different structural nuances. Additionally, the legal documentation that governs a typical CLO can be in excess of 300 pages. Extensive due diligence is needed on CLO managers to understand their style and process, and to determine whether they are more &ldquo;debt friendly&rdquo; or &ldquo;equity friendly.&rdquo;</p>
<h2 id="point-nine" class="anchored-block">How do CLOs fit into my fixed income portfolio?</h2>
<p>The enhanced yields and credit spreads provided by CLOs may help to maintain an attractive overall yield for an income focused portfolio. Although CLOs can introduce volatility if credit spreads widen, their historical default loss rate is extremely low, both on an absolute basis and relative to similarly rated bonds and loans.<sup>1</sup>&nbsp;Thus, investors have been able to earn a higher level of income with significantly lower default risk.</p>
<p>The floating rate nature of CLOs means there is very little sensitivity to interest rates. Investors looking to shorten their overall duration might consider an allocation to CLOs from their investment grade or high yield fixed coupon investments. In addition, each CLO typically contains at least 150-250 unique issuer exposures. As high yield borrowers, these issuers won&rsquo;t overlap with investment grade exposures, providing additional issuer diversification. Furthermore, overlap with high yield portfolios may also be relatively low, as a growing universe of issuers access funding only through the loan market and significant sector exposure differences between the high yield and loan markets.</p>
<h2 id="point-ten" class="anchored-block">How can I access CLOs?</h2>
<p>Until recently, it has been difficult for investors to add exposure to CLOs. The market is largely institutional, and investors such as banks, insurance companies and hedge funds often purchase CLOs directly or invest through institutional separate accounts, which often carry minimums of $50M to $100M. Actively managed multi-sector or core bond funds may include an allocation to CLOs, but investors cannot control the level of exposure and it may vary significantly over time.</p>
<p>The <strong><a href="/link/593077b21448427e9fc687481484e097.aspx" title="CLOI - VanEck CLO ETF - Overview">VanEck CLO ETF (CLOI)</a></strong>, launched in June 2022, provides access to investment grade CLOs, and may be an attractive way to efficiently access this market with the liquidity, transparency and low cost features of an ETF. <a href="/link/e090deaddc774ac699a04b959d9254c6.aspx" title="CLOI - VanEck CLO ETF - Overview"><strong>CLOI</strong></a>&rsquo;s investment grade focus may make it an attractive component within a core bond portfolio, providing attractive yield with low credit risk, as well as the diversification potential provided by CLOs.</p>
<p>For investors who are searching for a higher yield and can tolerate potentially higher volatility, the <a href="/link/d2f16468a9f14c1e807f6bb7fb597a3e.aspx" title="CLOB - VanEck AA-BB CLO ETF - Overview"><strong>VanEck AA-BB CLO ETF (CLOB)</strong></a> focuses on CLO debt between the highest rated AAA tranche and the equity tranche, known as &ldquo;mezzanine&rdquo; tranches. <a href="/link/d2f16468a9f14c1e807f6bb7fb597a3e.aspx" title="CLOB - VanEck AA-BB CLO ETF - Overview"><strong>CLOB</strong></a> can complement a high yield bond allocation through higher rated exposure, or be an attractive replacement for direct leverage loan exposure due to the structural risk protection of CLOs with competitive yield levels.</p>
<h2 id="point-elevan" class="anchored-block">What is the investment strategy of CLOI and CLOB and how are they managed?</h2>
<p><a href="/link/e090deaddc774ac699a04b959d9254c6.aspx" title="CLOI - VanEck CLO ETF - Overview"><strong>CLOI</strong></a> invests primarily in investment grade tranches of CLOs. The fund may invest up to 20% in BB rated CLOs, but will not invest in CLOs rated below BB-/Ba3 or equity tranches of CLOs. <a href="/link/d2f16468a9f14c1e807f6bb7fb597a3e.aspx" title="CLOB - VanEck AA-BB CLO ETF - Overview"><strong>CLOB</strong></a> invests primarily in mezzanine tranches, focusing on AA to BB rated CLOs. The Fund will not invest in equity tranches.</p>
<p>Both ETFs are actively managed by PineBridge Investments, the funds&rsquo; sub-adviser, and are managed to provide an enhanced return by identifying the most attractive segments of the CLO market, while avoiding downgrades and default losses. PineBridge can move throughout the CLO capital structure to potentially add alpha, adding risk when there are opportunities and de-risking in periods of market volatility. For example, a &ldquo;risk-on&rdquo; position may be reflected in a significant BBB exposure in <a href="/link/e090deaddc774ac699a04b959d9254c6.aspx" title="CLOI - VanEck CLO ETF - Overview"><strong>CLOI</strong></a>, and a portfolio tilted to BB in <a href="/link/d2f16468a9f14c1e807f6bb7fb597a3e.aspx" title="CLOB - VanEck AA-BB CLO ETF - Overview"><strong>CLOB</strong></a>. In periods of volatility or when valuations in lower rated tranches are not attractive, portfolios will be focused on more senior tranches&mdash;for example AAAs in <a href="/link/e090deaddc774ac699a04b959d9254c6.aspx" title="CLOI - VanEck CLO ETF - Overview"><strong>CLOI</strong></a> and AA and A rated tranches in <a href="/link/d2f16468a9f14c1e807f6bb7fb597a3e.aspx" title="CLOB - VanEck AA-BB CLO ETF - Overview"><strong>CLOB</strong></a>. Liquidity is also a primary consideration for both ETFs, and the portfolios are managed to provide adequate liquidity even in periods of market volatility.</p>
<h2 id="point-twelve" class="anchored-block">What is the process used to select securities and construct the portfolio?</h2>
<p>PineBridge draws on its decades of CLO market experience and the credit expertise of its leveraged finance team to identify credit and CLO manager risk within a CLO. The process is summarized below:</p>
<ol class="content-list">
<li class="mt-2"><strong>CLO Manager Due Diligence: </strong>Based on a systematic due diligence process, PineBridge classifies CLO managers, and focuses investments on those with an established process and team.</li>
<li class="mt-2"><strong>Re-Underwrite CLO</strong>: PineBridge collects and analyzes fundamental loan-level data using its proprietary credit platform, which drives portfolio credit analysis, risk measurement and optimization. The team reviews each CLO&rsquo;s structure and documentation, which&mdash;combined with the collateral analysis and stress-test analysis&mdash;is the basis of the investment analysis.</li>
<li class="mt-2"><strong>Construct Portfolio</strong>: Portfolios are constructed by PineBridge using both bottom-up deal selection from the re-underwriting process and a top-down overlay that incorporates the group&rsquo;s credit views.</li>
<li class="mt-2"><strong>Risk Monitoring</strong>: There is ongoing compliance and risk monitoring, as well as regular reviews of the portfolio and CLO-specific metrics that can result in rebalancing. Various portfolio and performance metrics act as &ldquo;credit review triggers&rdquo; and form the basis of the sell discipline.</li>
</ol>
<p><a href="/link/e090deaddc774ac699a04b959d9254c6.aspx" title="CLOI - VanEck CLO ETF - Overview"><strong>CLOI</strong></a> and <a href="/link/d2f16468a9f14c1e807f6bb7fb597a3e.aspx" title="CLOB - VanEck AA-BB CLO ETF - Overview"><strong>CLOB</strong></a> are managed to avoid downgrade and default risk, which is done by stressing CLO tranche cashflows through loan-by-loan and portfolio level changes in default rates, recovery rates and interest rates, among other factors. The portfolio is monitored for early warnings that might signal a change in fundamentals.</p>
<h2 id="point-thirteen" class="anchored-block">How to buy CLOI?</h2>
<p>VanEck ETFs can be purchased the same way you would buy a stock, through a broker or with your advisor.</p>
<script>
    //Temporary script
    $(function () {
        $(".popup-youtube, .popup-vimeo, .popup-gmaps").on("click", function (e) {
            e.preventDefault();
            var width = $(window).width();
            if (width > 768) {
                openSimpleIframeModalDialog($(this).attr('href'), "video-modal");
            } else if ($(this).is('.popup-youtube')) {
                var target = $(this).attr('data-video');
                self.location = target;
            }
        });
    });
</script>
<style>
    .modal.fade.video-modal div.modal-dialog {
        margin: 7% auto !important;
    }

    .modal-simple-iframe .close span {
        font-size: 35px;
        line-height: 1;
    }
</style>
<p class="d-none d-lg-block"><a href="mailto:askvaneck@vaneck.com" title="Have More Questions? - Ask VanEck" rel="noopener"><img class="img-responsive" src="https://www.vaneck.com/globalassets/home/us/insights/blogs/bm-blog-images/cta-faq_desktop-02.svg" alt="Have More Questions? - Ask VanEck" /></a></p>
<p class="d-lg-none"><a href="mailto:askvaneck@vaneck.com" title="Have More Questions? - Ask VanEck" rel="noopener"><img class="img-responsive" src="https://www.vaneck.com/globalassets/home/us/insights/blogs/bm-blog-images/cta-faq_mobile-01.svg" alt="Have More Questions? - Ask VanEck" /></a></p>
<p>To receive more <a href="/us/en/blogs/income-investing/" title="Income Investing Insights"><strong>Income Investing</strong></a> insights, <a href="/link/5f45412c2143400497908cea2897f7d3.aspx" title=" Subscription Center"><strong>sign up in our subscription center</strong></a>.</p>
]]></content:encoded>
</item><item rdf:about="https://www.vaneck.com/us/en/blogs/moat-investing/moat-index-3q-reconstitution-us-equity-exposure-without-the-lofty-valuations/">
  <title>Moat Index 3Q Reconstitution: US Equity Exposure Without the Lofty Valuations></title>
  <link>https://www.vaneck.com/us/en/blogs/moat-investing/moat-index-3q-reconstitution-us-equity-exposure-without-the-lofty-valuations/</link>
  <description><![CDATA[Fourteen companies rotated in and out of the Moat Index during its quarterly rebalance, but exposures remain cut from the same cloth: similar sector biases, a value bias, and the same relentless focus on attractive valuations.]]></description>
  <dc:creator>Brandon Rakszawski</dc:creator>
  <dc:date>09/23/2024 08:30:00</dc:date>
<content:encoded><![CDATA[

<p>The Morningstar<sup>&reg;</sup>&nbsp;Wide Moat Focus Index<sup>SM</sup>&nbsp;(the &ldquo;Moat Index&rdquo; or &ldquo;Index&rdquo;) underwent its quarterly review on September 20, 2024. The Index&rsquo;s review process systematically targets attractively priced, high quality U.S. companies, as identified by Morningstar&rsquo;s equity research analysts. Below are a few key takeaways from the September review and how the Moat Index is positioned amid the major shifts in economic policy. The full review results are available here:</p>

<h2>Takeaways: Sector Biases, Value Posture Remains but Shrinks, Avoid Pricey Mega Caps</h2>
<ul class="content-list">
<li class="mt-2"><strong>More of The Same: Industrials Remain Top Overweight, Tech Top Underweight</strong>
<p>Despite seeing 14 stock positions change during the September review, the Moat Index maintained notably similar sector positioning relative to the S&amp;P 500 with an overweight to industrial stocks filling in for the sizable underweight to the tech sector. Within tech, exposure comes primarily in the form of software companies and pockets of opportunities in the semiconductor segment.</p>
</li>
<li class="mt-2"><strong>Value Posture in Effect as Growth-Dominated Market Continues its Climb</strong>
<p>The S&amp;P 500 Index, widely owned by investors of all types by way of index funds, has reached new all-time highs in September 2024 following the Fed&rsquo;s first rate cut of the cycle. As mega caps continue to dominate its makeup and its returns, the S&amp;P 500&rsquo;s growth dominance remains on full display. The Moat Index&rsquo;s contrarian nature has led its exposure toward attractively priced companies which has resulted in a value bias relative to the headline large cap index. Though this overweight to value stocks has reduced slightly this quarter, several first time index constituents were added at this quarter&rsquo;s review reaffirming this value posture:</p>
<p><strong>Air Products and Chemicals (APD):</strong> Long-time supplier of industrial gases that benefits from switching costs as customers are often willing to pay a premium for commodities products in order to lock in long-term contracts with reputable suppliers to ensure no interruption in service. APD was upgraded to a wide moat rating in April 2024 making it eligible for the Moat Index.</p>
<p><strong>GE HealthCare Technologies (GEHC):</strong> A leader in medical imaging led by their intangible assets, GEHC was spun out from General Electric in January 2023 allowing the firm to operate independently and streamline its focus on core competencies. Morningstar began covering GEHC in July 2024 with an initial wide moat rating.</p>
<p><strong>Idex Corporation (IEX):</strong> Another example of a long-standing industrial company recently upgraded to wide moat, IEX provides a wide array of equipment that is often mission-critical for its customers. This leaves no room for sustained product failures and affords the firm a notable switching costs source of moat.</p>
<p><strong>NXP Semiconductor (NXPI): </strong>NXP is one of the largest suppliers of semiconductors to the automotive market and its wide moat stems from intangible assets around proprietary analog and mixed signal chip design and manufacturing expertise. From a segment of a sector largely trading at premiums to fair value, NXPI offers a compelling valuation story as it has traded around a 25% discount to Morningstar&rsquo;s fair value estimate in recent weeks.</p>
<p><strong>Otis Worldwide (OTIS):</strong> The leading global elevator and escalator original equipment manufacturer is entering the index for the first time since earning a wide moat rating from Morningstar in 2020. While it doesn&rsquo;t trade at the steep discount of some other Moat Index companies, Morningstar projects robust earnings growth in the coming decade despite macro headwinds making this wide moat company an attractive addition.</p>
<p><strong>United Parcel Service (UPS):</strong> UPS has earned Morningstar&rsquo;s exclusive wide moat rating for more than twenty years but has yet to be included in the Moat Index, until now.</p>
</li>
<li class="mt-2"><strong>U.S. Equity Exposure Without the Lofty Valuations</strong>
<p>The price/fair value ratio of the S&amp;P 500 Index currently sits at 1.05. This implies that the companies in the S&amp;P 500 are, overall, trading at approximately a 5% premium, according to Morningstar. This presents a challenge for investors looking to deploy cash into U.S. markets that are, again, reaching all-time highs. The Moat Index represents high quality companies currently mispriced by the market, in Morningstar&rsquo;s view. It allows investors to consider a mix of well-positioned companies with upside potential. Currently, the Morningstar price/fair value ratio of the Moat Index is 0.86, implying a 14% discount to fair value.</p>
</li>
</ul>
<h2>3Q 2024 Moat Index Review Results</h2>
<h3>Sector Shifts Following 3Q 2024 Review</h3>
<p><img class="img-responsive w-100" alt="Moat Index Sector Shifts Following 2Q 2024 Review" src="https://www.vaneck.com/contentassets/0ea7cb0fc96342c39ff57691065d077f/4855_moat-index-recon-update-q324_chart-1_v1.svg" /></p>
<h3>Sector Exposure Relative to S&amp;P 500 Index</h3>
<p><img class="img-responsive w-100" alt="Moat Index Sector Exposure Relative to S&amp;P 500 Index" src="https://www.vaneck.com/contentassets/0ea7cb0fc96342c39ff57691065d077f/4855_moat-index-recon-update-q324_chart-2_v1.svg" /></p>
<h3>Style Exposure Relative to S&amp;P 500 Index: Value Bias Persists</h3>
<p><img class="img-responsive w-100" alt="Moat Index Style Exposure Relative to S&amp;P 500 Index: Value Bias Persists" src="https://www.vaneck.com/contentassets/0ea7cb0fc96342c39ff57691065d077f/4855_moat-index-recon-update-q324_chart-3_v1.svg" /></p>
<p class="chart-disclosure">Source: Morningstar. As of 9/20/2024 unless otherwise noted.</p>
<h2>Access Quality Companies and Attractive Valuations</h2>
<p><a href="/link/9e43dd198c5f4e419f13220685081895.aspx" title="MOAT - VanEck Morningstar Wide Moat ETF - Overview"><strong>VanEck Morningstar Wide Moat ETF (MOAT)</strong></a> and <a href="/link/ca0b4e316f1c4e1985e2d0b7d293f0e4.aspx" title="MWMZX - VanEck Morningstar Wide Moat Fund - Class Z"><strong>VanEck Morningstar Wide Moat Fund</strong></a> seek to replicate as closely as possible, before fees and expenses the price and yield performance of the Morningstar Wide Moat Focus&nbsp;Index.</p>

<p>To receive more <a href="https://www.vaneck.com/us/en/insights/moat-investing" title="Moat Investing Insights"><strong>Moat Investing</strong></a> insights, <a href="https://www.vaneck.com/us/en/subscribe/" title="Subscription Center"><strong>sign up in our subscription center</strong></a>.</p>
]]></content:encoded>
</item><item rdf:about="https://www.vaneck.com/us/en/blogs/moat-investing/moat-index-how-equal-weighting-boosts-excess-returns/">
  <title>Moat Index: How Equal Weighting Boosts Excess Returns></title>
  <link>https://www.vaneck.com/us/en/blogs/moat-investing/moat-index-how-equal-weighting-boosts-excess-returns/</link>
  <description><![CDATA[The Morningstar<sup>&reg;</sup>&nbsp;Wide Moat Focus Index's equal-weighting strategy has contributed to strong risk-adjusted returns since its inception in 2007. Explore further in Morningstar&rsquo;s report.]]></description>
  <dc:creator> </dc:creator>
  <dc:date>09/23/2024 06:30:00</dc:date>
<content:encoded><![CDATA[

<p>Powered by Morningstar&rsquo;s forward-looking equity research, the Morningstar<sup>&reg;</sup>&nbsp;Wide Moat Focus Index (&ldquo;Moat Index&rdquo;) comprises quality companies with sustainable competitive advantages that are trading at attractive valuations. The competitive advantages of these companies form moats that are expected to help companies fend off competition and maintain profitability into the future.</p>
<p>Morningstar has identified <a href="/us/en/blogs/moat-investing/moat-investing-powered-by-morningstar/" title="Quality Companies at Attractive Prices"><strong>five sources of moat</strong></a>, including switching costs, intangible assets, network effect, cost advantage, and efficient scale. Its equity research team conducts a moat and valuation screen to determine the index constituents, and then an equal-weighting scheme is applied. This Morningstar report focuses on the equal weighting approach and explores how it has contributed to the Moat Index&rsquo;s long-term risk-adjusted returns.</p>
<p><strong>Key Takeaways: </strong></p>
<ul class="content-list">
<li><strong>Historical Outperformance: </strong>Since inception in 2007, the Moat Index&rsquo;s equal weighting strategy has delivered higher returns in 11 of 18 years compared to its market cap-weighted counterpart.</li>
<li><strong>Improved Risk-Adjusted Returns</strong>: The equal-weighted strategy has contributed to a stronger risk-adjusted performance over time, achieving a higher Sharpe ratio than market cap-weighted indexes.</li>
<li><strong>Diversification Potential</strong>: Equal weighting reduces reliance on any single large-cap stock, providing significant diversification benefits in a broader strategic asset allocation.</li>
<li><strong>Short-Term Challenges:</strong> The recent dominance of mega-cap stocks like the Magnificent 7, particularly in 2023-2024, has posed challenges for the equal-weighted strategy, as being underweight these stocks lead to underperformance compared to market cap-weighted benchmarks.</li>
<li><strong>Long-Term Strength:</strong> The equal weighting approach enables each holding to significantly impact index returns, avoiding dependence on a few heavily weighted stocks, a dynamic that has helped drive excess returns historically.</li>
</ul>

<h2>Explore VanEck&rsquo;s Moat Investing Funds</h2>
<p>VanEck has a track record dating back to 2012 for our core strategy, the <a href="/link/9e43dd198c5f4e419f13220685081895.aspx" title="MOAT - VanEck Morningstar Wide Moat ETF - Holdings and Performance"><strong>VanEck Morningstar Wide Moat ETF (MOAT)</strong></a>. VanEck&rsquo;s moat strategies are all powered by Morningstar&rsquo;s powerful research lens across different investment styles, market capitalizations and geographical regions to provide investors with a wide array of solutions to meet different investment objectives.</p>
<div class="wrapped-div">
<table style="width: 100%;">
<tbody>
<tr class="tbl-data">
<td class="data-td last" style="text-align: left;" rowspan="4">US Moats</td>
<td class="data-td data last" style="text-align: left;"><a href="/link/166321dbcfec440590fb51cf0ad629aa.aspx" title="SMOT - VanEck Morningstar SMID Moat ETF - Holdings and Performance"><strong>SMOT - VanEck Morningstar SMID Moat ETF</strong></a></td>
</tr>
<tr class="tbl-data">
<td class="data-td data last" style="text-align: left;"><a href="/link/9e43dd198c5f4e419f13220685081895.aspx" title="MOAT - VanEck Morningstar Wide Moat ETF - Holdings and Performance"><strong>MOAT - VanEck Morningstar Wide Moat ETF</strong></a></td>
</tr>
<tr class="tbl-data">
<td class="data-td data last" style="text-align: left;"><a href="/link/fd582da052ba46c79bfc112c078a6256.aspx" title="MVAL - VanEck Morningstar Wide Moat Value ETF - Holdings and Performance"><strong>MVAL - VanEck Morningstar Wide Moat Value ETF</strong></a></td>
</tr>
<tr class="tbl-data">
<td class="data-td data last" style="text-align: left;"><a href="/link/ca0b4e316f1c4e1985e2d0b7d293f0e4.aspx" title="MWMZX - VanEck Morningstar Wide Moat Fund - Class Z - Holdings and Performance"><strong>MWMZX - VanEck Morningstar Wide Moat Fund &ndash; Class Z</strong></a></td>
</tr>
<tr class="tbl-data">
<td class="data-td last" style="text-align: left;">International Moats</td>
<td class="data-td data last" style="text-align: left;"><a href="/link/f178b77e7fb54bb88cd5377ffe6bcd94.aspx" title="MOTI - VanEck Morningstar International Moat ETF - Holdings and Performance"><strong>MOTI - VanEck Morningstar International Moat ETF</strong></a></td>
</tr>
<tr class="tbl-data">
<td class="data-td last" style="text-align: left;">Global Moats</td>
<td class="data-td data last" style="text-align: left;"><a href="/link/bb4d770567584bce80c2b19628f010a1.aspx" title="MOTG - VanEck Morningstar Global Wide Moat ETF - Holdings and Performance"><strong>MOTG - VanEck Morningstar Global Wide Moat ETF</strong></a></td>
</tr>
</tbody>
</table>
</div>

<p>To receive more <a href="https://www.vaneck.com/us/en/insights/moat-investing" title="Moat Investing Insights"><strong>Moat Investing</strong></a> insights, <a href="https://www.vaneck.com/us/en/subscribe/" title="Subscription Center"><strong>sign up in our subscription center</strong></a>.</p>
]]></content:encoded>
</item><item rdf:about="https://www.vaneck.com/us/en/blogs/digital-assets/matthew-sigel-vaneck-mid-september-2024-bitcoin-chaincheck-1-year-review-edition/">
  <title>VanEck Mid-September 2024 Bitcoin ChainCheck: 1-Year Review Edition></title>
  <link>https://www.vaneck.com/us/en/blogs/digital-assets/matthew-sigel-vaneck-mid-september-2024-bitcoin-chaincheck-1-year-review-edition/</link>
  <description><![CDATA[We review Bitcoin&rsquo;s fundamentals, adoption, correlations, and volatility while exploring the potential impact of Fed rate cuts and the U.S. elections.]]></description>
  <dc:creator>Matthew  Sigel</dc:creator>
  <dc:date>09/19/2024 06:30:00</dc:date>
<content:encoded><![CDATA[

<p><strong>Please note that VanEck has exposure to bitcoin.</strong></p>
<p>Bitcoin's (BTC) YTD (+36% as of 9/16) performance surpasses nearly every other major asset class (again),<sup>1</sup>&nbsp;but some investors have been spooked by the recent drawdown, a ~21% correction from the March peak. In this note, we examine the current state of the Bitcoin blockchain, including its recent fundamentals, correlation with other assets, volatility, ETP traction, our take on the likely impact of the U.S. election, and express our more global view on the role of decentralized networks in increasingly censored digital landscapes.</p>
<ul class="content-list">
<li><a href="#bitcoin-fundamentals"><strong>Bitcoin Fundamentals</strong></a></li>
<li><a href="#bitcoin-miner"><strong>Bitcoin Miner Behavior</strong></a></li>
<li><a href="#rising-institutional"><strong>Rising Institutional &amp; Sovereign Adoption</strong></a></li>
<li><a href="#asset-correlations"><strong>Asset Correlations &amp; Volatility</strong></a></li>
<li><a href="#impact-of-election"><strong>Impact of the Fed &amp; U.S. Elections</strong></a></li>
<li><a href="#decentralization"><strong>Decentralization: A Global Need</strong></a></li>
<li><a href="#conclusion"><strong>Conclusion</strong></a></li>
</ul>
<p><img class="img-responsive w-100" alt="Bitcoin YoY Fundamentals" src="https://www.vaneck.com/contentassets/b35d2db2f869418ca374ec136cb389b5/4839_bitcoin-chaincheck_table-1_2024-9_v1_blog.svg" /></p>
<h3 id="bitcoin-fundamentals" class="anchored-block">Bitcoin Fundamentals</h3>
<div class="wrapped-div">
<table style="width: 100%;">
<tbody>
<tr class="tbl-data">
<td class="tbl-header last">As of September 16th, 2024</td>
<td class="tbl-header last text-right">7-day Average</td>
<td class="tbl-header last text-right">365 day change (%)</td>
<td class="tbl-header last text-right">Last 30 days Percentile<br />vs all-time history (%)</td>
</tr>
<tr class="tbl-data">
<td class="data-td last">Bitcoin Price</td>
<td class="data-td data last text-right">$58,584</td>
<td class="data-td data last text-right">124</td>
<td class="data-td data last text-right">96</td>
</tr>
<tr class="tbl-data">
<td class="data-td last">Bitcoin Dominance</td>
<td class="data-td data last text-right">56%</td>
<td class="data-td data last text-right">15</td>
<td class="data-td data last text-right">81</td>
</tr>
<tr class="tbl-data">
<td class="data-td last">Unrealized profit/loss ration</td>
<td class="data-td data last text-right">0.46</td>
<td class="data-td data last text-right">106</td>
<td class="data-td data last text-right">67</td>
</tr>
<tr class="tbl-data">
<td class="data-td last">Bitcoin Daily Trading Volumes (USD)</td>
<td class="data-td data last text-right">$28,897,783,504</td>
<td class="data-td data last text-right">173</td>
<td class="data-td data last text-right">n/a</td>
</tr>
<tr class="tbl-data">
<td class="data-td last">Daily Inscriptions</td>
<td class="data-td data last text-right">23,170</td>
<td class="data-td data last text-right">-93</td>
<td class="data-td data last text-right">41</td>
</tr>
<tr class="tbl-data">
<td class="data-td last">Daily Active Addresses</td>
<td class="data-td data last text-right">725,109</td>
<td class="data-td data last text-right">-34</td>
<td class="data-td data last text-right">96</td>
</tr>
<tr class="tbl-data">
<td class="data-td last">Avg Fees (USD)</td>
<td class="data-td data last text-right">$0.77</td>
<td class="data-td data last text-right">-52</td>
<td class="data-td data last text-right">55</td>
</tr>
<tr class="tbl-data">
<td class="data-td last">Total Transfer Volume (USD)</td>
<td class="data-td data last text-right">57,892,857,781</td>
<td class="data-td data last text-right">202</td>
<td class="data-td data last text-right">84</td>
</tr>
<tr class="tbl-data">
<td class="data-td last">Total Crypto Equities' Market Cap<sup>*</sup>&nbsp;(USD) (MM)</td>
<td class="data-td data last text-right">$112,040</td>
<td class="data-td data last text-right">87</td>
<td class="data-td data last text-right">67</td>
</tr>
<tr class="tbl-data">
<td class="data-td last">Transfer Volume from Miners to Exchanges (USD)</td>
<td class="data-td data last text-right">$1,802,327</td>
<td class="data-td data last text-right">-60</td>
<td class="data-td data last text-right">68</td>
</tr>
</tbody>
</table>
</div>
<br />
<p class="chart-disclosure"><strong>Sources:</strong> Glassnode, Artemis.xyzs of 9/16/2024. <strong>Past performance is no guarantee of future results.</strong></p>
<div class="wrapped-div">
<table style="width: 100%;">
<tbody>
<tr class="tbl-data">
<td class="tbl-header last">Regional Trading</td>
<td class="tbl-header last text-right">YTD Average ($)</td>
<td class="tbl-header last text-right">2023 Average ($)</td>
<td class="tbl-header last text-right">2022 Average ($)</td>
<td class="tbl-header last text-right">2020 - 2021 Average $)</td>
</tr>
<tr class="tbl-data">
<td class="data-td last">Asia Hours Price Change MoM ($)</td>
<td class="data-td data last text-right">-192</td>
<td class="data-td data last text-right">494</td>
<td class="data-td data last text-right">-988</td>
<td class="data-td data last text-right">-418</td>
</tr>
<tr class="tbl-data">
<td class="data-td last">US hours Price Change MoM ($)</td>
<td class="data-td data last text-right">1,080</td>
<td class="data-td data last text-right">1,158</td>
<td class="data-td data last text-right">-930</td>
<td class="data-td data last text-right">1,299</td>
</tr>
<tr class="tbl-data">
<td class="data-td last">EU hours Price Change MoM ($)</td>
<td class="data-td data last text-right">1,005</td>
<td class="data-td data last text-right">462</td>
<td class="data-td data last text-right">-721</td>
<td class="data-td data last text-right">-834</td>
</tr>
</tbody>
</table>
</div>
<br />
<p class="chart-disclosure"><strong>Sources:</strong> Glassnode, Artemis.xyzs of 9/16/2024. <strong>Past performance is no guarantee of future results.</strong></p>
<p>We begin our analysis with the tables above, which reveal how Bitcoin&rsquo;s key fundamentals have changed over the past year. Twelve months to date, bitcoin&rsquo;s price is up 124%, outperforming nearly every major asset class. Even within crypto, BTC has outperformed. Bitcoin dominance, a measure of Bitcoin&rsquo;s market cap versus crypto&rsquo;s total market cap, is up 15% YoY to 56%.</p>
<p>There is clearly much more interest in Bitcoin and digital assets today than one year ago. Bitcoin trading volumes have grown 173% YoY, significantly outpacing equity trading volumes, up ~18% YoY. Although price returns for equities have been great, capital formation has been dismal. Capital raised from global equity IPOs is on a $68B pace for 2024, a 31% decline vs. 2023. The number of IPOs is on pace to fall by 42%. (For context, $748B was raised in 4,000 IPOs in the debt-fueled 2021 bonanza). Among private transactions, U.S. Venture Capital invested is up 9% y/y, while Crypto VC flows are up 87% over the same period.</p>
<p>Bitcoin&rsquo;s adoption as an investment vehicle isn&rsquo;t driven by the same forces today as in 2023 when it rose 155%. Then, Bitcoin inscriptions were a viral innovation enabling users to store media files directly on the Bitcoin blockchain. Inscriptions ushered in a viral new wave of blockchain-based art, notably bringing retail liquidity and trading fees to the Bitcoin blockchain, which was previously left out of the NFT craze of the last market cycle. Like previous NFTs, however, the trend ended in a crash, reflected by the 93% YoY drawdown in daily inscriptions transactions. The decline in inscriptions undoubtedly explains the 34% and 52% YoY declines in daily active addresses and transaction fees, respectively. With Bitcoin&rsquo;s on-chain activity diminished, bitcoin&rsquo;s price appreciation this year is better explained by growing adoption as money: a vehicle for storing and transferring value.</p>
<p>Despite fewer on-chain retail transactions, USD-denominated on-chain Bitcoin transfer volumes are up 202% YoY, implying larger overall ticket sizes. In parallel, despite lower fees, Bitcoin-related equities are capturing value by facilitating the growth of its monetary network&rsquo;s adoption, with their collective market cap up 87% YoY.</p>
<p>Based on month-over-month (MoM) price changes by region, the long-term trend of Asia selling BTC to North America continued in 2024, with investors enjoying outsized benefits during US trading hours.</p>
<h2 id="bitcoin-miner" class="jump-link-nav anchored-block" data-jumplink-title="Miner Behavior">Bitcoin Miner Behavior</h2>
<p>2024 has been a terrible year for Bitcoin Miner fundamentals. The Bitcoin Hashprice, a unit of profitability in the industry that measures the revenue earned for each one trillion cryptographic hash calculations per second, is down 97% y/y, far exceeding its 10-year CAGR of 69%, otherwise known as Bitcoin Miners&rsquo; &ldquo;melting ice cube.&rdquo; However, publicly traded miners entered the year reasonably well-capitalized, and with their low power costs and benefits of scale, now control 27% of the Bitcoin hash rate (a measure of total compute power securing the network), compared to 15% back in 24% a year ago and 15% in 2022. Now, with the halving well behind us, USD-denominated transfer volumes from miners to exchanges (a proxy for selling pressure) are down 60% YoY, indicating that miners have weathered the halving event and are now in financial solid positions&mdash;especially when considering the recent emergence of AI growth strategies.</p>
<p>Let&rsquo;s dig deeper into the hash rate and the post-halving action. Following the halving on April 19th, the 7-day moving average of Bitcoin&rsquo;s hash fell ~15% from its all-time high of 650 EH/s to 552 EH/s by June 28th, in line with what we predicted before the event. This period corresponds to miners continuing to sell BTC, presumably indicating the forced exit of weaker, less efficient players. By July 26th, however, the network <a href="https://studio.glassnode.com/metrics?a=BTC&amp;ema=0&amp;m=mining.HashRateMean&amp;mAvg=7&amp;mMedian=0&amp;s=1704085200&amp;u=1726508548&amp;zoom=ytd" title="BTC: Mean Hash Rate (7d Moving Average)" target="_blank" rel="noopener"><strong>hash rate</strong></a> had rebounded to reach a new all-time high of ~670 EH/s, indicating that these more well-capitalized miners filled the void by increasing capacity. With today&rsquo;s mining <a href="https://www.coinwarz.com/mining/bitcoin/difficulty-chart" title="Bitcoin Difficulty Chart" target="_blank" rel="noopener"><strong>difficulty</strong></a> at all-time highs, miners compete harder than ever for their share of the network&rsquo;s block rewards. However, the most recent data show that miners have begun accumulating bitcoin holdings for the first time since the halving.</p>
<h3>Aggregate BTC Supply Held by Miners Increased for the First Time since the Halving</h3>
<p><img class="img-responsive w-100" alt="Aggregate BTC Supply Held by Miners Increased for the First Time since the Halving" src="https://www.vaneck.com/contentassets/b35d2db2f869418ca374ec136cb389b5/4839_bitcoin-chaincheck_chart-1_2024-9_v1_blog.svg" /></p>
<p class="chart-disclosure"><strong>Source:</strong> Glassnode as of 9/13/2024.</p>
<p>Observing the divergence in miner behavior has been fascinating and relevant to share performance. Some miners like Cleanspark (CLSK), Cipher Mining (CIFR), and Marathon Digital (MARA) are leveraging their strength by aggressively increasing their BTC positions. Generally, those are underperforming. A handful of others, notably Core Scientific (CORZ), Bit Digital (BTBT), and Hut8 (HUT), have reduced their holdings to pay off debts, upgrade their fleets, and pursue new business opportunities.</p>
<h3>Some Publicly Traded Miners Adjust BTC Holding Strategies, Anticipating BTC Price Action &amp; New Business Opportunities</h3>
<p><img class="img-responsive w-100" alt="Some Publicly Traded Miners Adjust BTC Holding Strategies, Anticipating BTC Price Action &amp; New Business Opportunities" src="https://www.vaneck.com/contentassets/b35d2db2f869418ca374ec136cb389b5/4839_bitcoin-chaincheck_chart-2_2024-9_v1_blog.svg" /></p>
<p class="chart-disclosure"><strong>Source:</strong> Company Filings, Monthly Production Reports as of 9/10/2024.<strong> Past performance is no guarantee of future results.</strong></p>
<p>Some bitcoin miners are increasingly capitalizing on a new revenue opportunity by entering the AI and high-performance computing (HPC) markets. AI &ldquo;hyperscalers&rdquo; are placing a premium on access to near-term power due to bottlenecks in grid expansions, cloud computing&rsquo;s strong pricing power, and the resulting power capacity arms race. CORZ, for example, has secured multiple contracts with AI hyperscaler CoreWeave, which is projected to generate over $4.7 billion in revenue by providing 382 MW of infrastructure over the next 12 years. This compares to the company&rsquo;s last 12 months&rsquo; revenues of $574M. While miners&rsquo; pivot to AI is a time arbitrage opportunity in the near term, it may also prove to be a long-term strategic advantage by dampening revenue volatility and lowering the cost of capital for miners. Our <a href="https://www.vaneck.com/us/en/blogs/digital-assets/matthew-sigel-bitcoin-miners-ai-arbitrage-play-to-boost-revenue/" title="Bitcoin Miners' AI Arbitrage Play to Boost Revenue"><strong>previous research</strong></a> estimates that if 20% of miners&rsquo; energy capacity is allocated to AI/HPC, the total additional yearly profits could exceed $13.9 billion for a cohort of companies who collectively lost $350M net over the last 12 months. We see substantial value in this strategy.</p>
<h2>Historical Context of The Halving</h2>
<p>143 days post-halving, bitcoin is overdue by historical standards to reach and sustain prices above its price at halving. Below, we explain why we think a catch-up rally is the most likely outcome. The TLDR is that bitcoin&rsquo;s price lags behind previous cycles due to a mix of election anxiety and specific sales by entities unlikely to repeat. Meanwhile, the most important adoption from our perspective, that of nation-states, is accelerating. We will explain this in detail below.</p>
<h3>History Suggests Logarithmic BTC Price Growth Post-Halving</h3>
<p><img class="img-responsive w-100" alt="History Suggests Logarithmic BTC Price Growth Post-Halving" src="https://www.vaneck.com/contentassets/b35d2db2f869418ca374ec136cb389b5/4839_bitcoin-chaincheck_chart-3_2024-9_v1_blog.svg" /></p>
<p class="chart-disclosure"><strong>Source:</strong> Glassnode as of 9/12/2024. <strong>Past performance is no guarantee of future results.</strong></p>
<h2 id="rising-institutional" class="jump-link-nav anchored-block" data-jumplink-title="Institutional Adoption">Rising Institutional &amp; Sovereign Adoption</h2>
<p><strong>Growth Drivers</strong></p>
<p>The diverging trends between Bitcoin&rsquo;s on-chain activity and its growth as an investment vehicle can be attributed to two main forces: institutional adoption and the increasing involvement of sovereign nations in mining and cross-border trade. First, driven by technical abstractions and regulatory improvements (e.g., custody solutions, ETPs), individuals and corporations increasingly gain exposure to Bitcoin without touching the blockchain themselves. Second, there is a growing trend of countries adopting Bitcoin for monetary and trade purposes. Combined, these trends are shifting the dynamics of both Bitcoin&rsquo;s on-chain fundamentals and off-chain markets.</p>
<p>Clearly, institutional adoption has increased. Since launching in January of this year, bitcoin ETPs gained over $19 billion in new inflows from hedge funds, RIAs, insurance companies, and pension funds through August. <a>However, while hedge fund holdings of bitcoin ETPs grew 38% in Q2, RIA bitcoin ETP holdings only grew 4%.<sup>2</sup>&nbsp;Full-service, national brokerage (so-called &lsquo;Wirehouse&rsquo;) adoption of bitcoin ETPs has clearly been slower than some hoped. We attribute this to a lack of updated &ldquo;60/40&rdquo; macro model portfolios that include bitcoin. While we believe this &ldquo;sell-side&rdquo; research will eventually materialize, some managers are increasingly marketing and distributing &ldquo;all in one&rdquo; or model portfolios incorporating bitcoin. While we wait for potentially more aggressive allocations from brokers like Morgan Stanley and UBS, it is possible that their hesitancy may accelerate market share losses to independent advisors and vertically integrated models. We will closely watch institutional inflows or outflows into crypto as these can serve as leading indicators of broader market sentiment.</a></p>
<a> </a>
<p><a>Shifting focus from institutional to sovereign adoption, seven nations are now mining bitcoin with direct support from the national government, with three new entrants this year (Ethiopia, Kenya, and Argentina). We believe this trend is a key indicator of the global shift towards de-dollarization. For example, Russia's pilot of cross-border trade denominated in crypto raises questions about which nations might follow suit, especially when the war inevitably ends. The implications for Bitcoin are significant, as government-level mining and cross-border crypto transactions could bolster Bitcoin&rsquo;s role as a global reserve asset, as we wrote about in </a><a href="https://www.vaneck.com/us/en/blogs/digital-assets/matthew-sigel-bitcoin-2050-valuation-scenarios-global-medium-of-exchange-and-reserve-asset/" title="Bitcoin 2050 Valuation Scenarios: Global Medium of Exchange and Reserve Asset"><strong>recent research</strong></a>. As de-dollarization gains momentum, we anticipate more countries and increased governmental involvement in digital assets, especially Bitcoin.</p>
<h2 id="asset-correlations" class="jump-link-nav anchored-block" data-jumplink-title="Asset Correlations &amp; Volatility">Asset Correlations &amp; Volatility</h2>
<h3>Do Sharp Deviations in BTC and NASDAQ&rsquo;s Correlation Predict a Shift in BTC&rsquo;s Price?</h3>
<p><img class="img-responsive w-100" alt="Do Sharp Deviations in BTC and NASDAQ&rsquo;s Correlation Predict a Shift in BTC&rsquo;s Price?" src="https://www.vaneck.com/contentassets/b35d2db2f869418ca374ec136cb389b5/4839_bitcoin-chaincheck_chart-4_2024-9_v1_blog.svg" /></p>
<p class="chart-disclosure"><strong>Source:</strong> Bloomberg as of 9/11/2024. <strong>Past performance is no guarantee of future results.</strong></p>
<p>Digging into broader market correlation and volatility data, we observe signals that suggest a potential breakout, marking the end of the summer doldrums that have defined Bitcoin&rsquo;s post-halving price action. After a sharp decline, BTC&rsquo;s correlation with the NASDAQ printed a local bottom on March 13th&mdash;the day of Bitcoin&rsquo;s all-time high. Six months later, the correlation between these assets peaked on September 6th. This peak coincides with bitcoin miners&rsquo; slowdown in coin selling and a 3+ year high in long-term holders adding to their BTC positions. We think this might indicate a possible shift in market structure.</p>
<h3>Long-Term BTC Holders Ended the Summer by Buying BTC at Record 3Y Rates</h3>
<p><img class="img-responsive w-100" alt="Long-Term BTC Holders Ended the Summer by Buying BTC at Record 3Y Rates" src="https://www.vaneck.com/contentassets/b35d2db2f869418ca374ec136cb389b5/4839_bitcoin-chaincheck_chart-5_2024-9_v1_blog.svg" /></p>
<p class="chart-disclosure"><strong>Source:</strong> Glassnode as of 9/11/2024.<strong> Past performance is no guarantee of future results.</strong></p>
<p>On the topic of correlation, such a focus among clients, we want to highlight that despite the rising daily correlation in recent months, our analysis revealed a weak <em>Pearson </em>correlation of -0.056 between bitcoin&rsquo;s daily price changes and its 90-day correlation with the NASDAQ over the 365 days leading to September 10th, 2024. Why is the Pearson Correlation important? To explain this, imagine two runners (bitcoin and the NASDAQ) running side by side. Regular correlation shows that they generally move in the same direction&mdash;speeding up or slowing down together over time. However, Pearson correlation looks at the details, such as how closely their individual strides match each other. Even if they&rsquo;re running in the same general direction, their steps might not align. One runner could have uneven, unpredictable steps while the other moves more consistently. In this case, bitcoin&rsquo;s daily price changes are like those uneven steps, which don&rsquo;t strongly influence how closely it tracks the NASDAQ in the long term. We believe these headline correlations exaggerate the real connection between bitcoin and NASDAQ, especially when focusing on short-term fluctuations.</p>
<p>As we look ahead, volatility remains a key factor in determining bitcoin&rsquo;s near-term price action. By comparing the annualized volatility of bitcoin and other major assets, we can gain insight into how Bitcoin&rsquo;s current stability fits into broader market trends. For example, while BTC and ETH are trading close to their 1Y average volatility, traditional assets like the S&amp;P 500, NASDAQ, and JPY are experiencing higher-than-usual vol. This divergence suggests to us that Bitcoin may be poised for a breakout from its current pattern.</p>
<h3>The S&amp;P 500, NASDAQ&rsquo;s, and JPY&rsquo;s Current Volatilities are at Relative 1Y Highs Compared to BTC&rsquo;s, ETH&rsquo;s, and Gold&rsquo;s</h3>
<p><img class="img-responsive w-100" alt="The S&amp;P 500, NASDAQ&rsquo;s, and JPY&rsquo;s Current Volatilities are at Relative 1Y Highs Compared to BTC&rsquo;s, ETH&rsquo;s, and Gold&rsquo;s" src="https://www.vaneck.com/contentassets/b35d2db2f869418ca374ec136cb389b5/4839_bitcoin-chaincheck_chart-6_2024-9_v1_blog.svg" /></p>
<p class="chart-disclosure"><strong>Source:</strong> Bloomberg as of 9/11/2024. <strong>Past performance is no guarantee of future results. Volatility refers to the fluctuation in the returns of an asset or portfolio as measured by the standard deviation of returns.</strong></p>
<p>The question, of course, is whether bitcoin&rsquo;s next volatile move will be to the upside or downside. We note that a combination of entity-specific selling and political uncertainties have kept most of the risk-on capital that typically flows to bitcoin sidelined. In July and August, the German &amp; U.S. governments transferred 62k bitcoin to exchanges, presumably for sale, while Mt. Gox and Gemini bankruptcy distributions totaled another 124k bitcoin. That&rsquo;s $11B in non-repeatable sales, roughly equivalent to the net inflows to bitcoin ETPs in the first two months of trading. The market&rsquo;s cautious risk appetite has instead favored tech companies like NVIDIA, which has driven outsized returns for the NASDAQ. However, we believe that much of the fear surrounding carry trade unwinds and election outcomes are largely priced in. Thus, we anticipate the bitcoin breakout will be bullish with the upcoming debt ceiling deadline on September 30th and the approaching U.S. Presidential Election the most obvious catalysts for upside volatility.</p>
<p>Furthermore, while BTC&rsquo;s correlation with the NASDAQ fluctuates, its more consistent inverse correlation with the USD offers a more logical and persistent explanation for its outsized performance. As illustrated in the chart below, the low interest rates, quantitative easing, and money printing of 2020 only intensified this process. More simply, in the parlance of that era, &ldquo;money printer go brrr.&rdquo;</p>
<h2 id="impact-of-election" class="jump-link-nav anchored-block" data-jumplink-title="Fed &amp; U.S. Elections">Impact of the Fed &amp; U.S. Elections</h2>
<h3>Intensified by 2020&rsquo;s &lsquo;Money Printing&rsquo;, BTC is Persistently Negatively Correlated with USD</h3>
<p><img class="img-responsive w-100" alt="Intensified by 2020&rsquo;s &lsquo;Money Printing&rsquo;, BTC is Persistently Negatively Correlated with USD" src="https://www.vaneck.com/contentassets/b35d2db2f869418ca374ec136cb389b5/4839_bitcoin-chaincheck_chart-7_2024-9_v1_blog.svg" /></p>
<p class="chart-disclosure"><strong>Source:</strong> Bloomberg as of 9/11/2024. <strong>Past performance is no guarantee of future results.</strong></p>
<p><strong>Fed Rate Cuts</strong></p>
<p>Both the Fed&rsquo;s upcoming rate decisions and the U.S. presidential election present significant potential impacts on the digital assets space. Suppose the Fed continues cutting rates in response to slowing economic growth. In that case, it may be bullish for risk-on assets like bitcoin, which may once again benefit as investors seek high-return alternatives to low-yield bonds. As we have illustrated, digital assets have shown a strong correlation to a weak dollar and money supply growth (global liquidity), making them particularly sensitive to shifts in monetary policy. Investors should also closely monitor the actions of other central banks, as the Bank of Japan&rsquo;s recent mere 0.25% interest rate hike caused cascading liquidations due to over-levered carry trades unwinding around the globe. While such events clearly threaten the near-term risk appetite for Bitcoin and other digital assets, we think they reveal the weakness underlying today&rsquo;s fiat currencies and thus underscore the rising popularity of decentralized monetary assets like bitcoin and gold.</p>
<p><strong>U.S. General Election </strong></p>
<p>On the political front, we think that while Kamala Harris and Donald Trump are bullish for Bitcoin, each presents more nuanced implications for the broader digital asset markets. Both administrations will likely maintain fiscal spending if not further accelerate, which could lead to further quantitative easing&mdash;especially if exacerbated by anti-business policies. Suppose Kamala Harris were to retain Gary Gensler as SEC Chair or align closely with the Elizabeth Warren wing of the Democratic Party when it comes to finance policy, which looks increasingly likely. In that case, the digital assets industry generally is expected to confront a tightening regulatory environment that would dampen institutional adoption of digital assets in the U.S., further restricting domestic entrepreneurial activity. On Bitcoin alone, however, we would argue that a Kamala Harris presidency might be even better for Bitcoin than a second term for Trump because it would, in our view, accelerate many of the structural issues that drive Bitcoin adoption in the first place. You can find our explanation of those issues in <a href="https://www.vaneck.com/us/en/blogs/digital-assets/matthew-sigel-bitcoin-2050-valuation-scenarios-global-medium-of-exchange-and-reserve-asset" title="Bitcoin 2050 Valuation Scenarios: Global Medium of Exchange and Reserve Asset"><strong>this research</strong></a>. Should that happen, Bitcoin&rsquo;s unique regulatory clarity will likely make it even more competitive than other digital assets.</p>
<p>Conversely, we believe a Trump presidency is generally bullish for the entire crypto ecosystem, as it would likely produce more deregulation and business-friendly policies&mdash;perhaps particularly so for crypto entrepreneurs, who regulators have increasingly scrutinized in the past four years. Regardless of the election outcome, the trend of growing fiscal deficits and rising national debt will likely continue. This suggests a weakening of the U.S. dollar, a macroeconomic environment in which Bitcoin has historically thrived.</p>
<p id="decentralization" class="anchored-block"><strong>Decentralization: A Global Need</strong></p>
<p>Through a broader political lens, 2024 has seen escalating global efforts to police online speech, with growing implications for financial freedom. Australia's just-<a href="https://minister.infrastructure.gov.au/rowland/media-release/government-introduce-legislation-combat-seriously-harmful-misinformation-and-disinformation#:~:text=The%20Communications%20Legislation%20Amendment%20(Combatting,protections%20for%20freedom%20of%20speech." title="Government to introduce legislation to combat seriously harmful misinformation and disinformation" target="_blank" rel="noopener"><strong>proposed</strong></a> Misinformation Bill is a prime example of how spreading information that undermines public confidence in the banking system could become illegal. Given that Australian banks have increasingly frozen customer accounts in recent years, this law raises the chilling possibility that if your bank freezes your account, discussing it could make you a criminal. This highlights how far-reaching and ambiguous such attempts to police misinformation can be.</p>
<p>Similar laws have been passed in other countries, such as Brazil&rsquo;s Fake News Bill, which led to the ban of X (formerly Twitter) in September 2024 due to the platform&rsquo;s failure to meet transparency requirements. In Canada, platforms like Meta have already blocked access to news in response to legislation. Privacy-focused platforms like Telegram are under scrutiny. After Telegram&rsquo;s founder Pavel Durov was arrested in France, the platform updated its FAQ to reflect more aggressive content moderation policies and a potential new law enforcement reporting system.</p>
<div class="wrapped-div">
<table style="width: 100%;">
<tbody>
<tr class="tbl-data">
<td class="tbl-header last">Country</td>
<td class="tbl-header last">Bill Name</td>
<td class="tbl-header last">Status</td>
<td class="tbl-header last">Language That Policies Free Speech</td>
<td class="tbl-header last">Practical Impact</td>
<td class="tbl-header last">Date Passed</td>
</tr>
<tr class="tbl-data">
<td class="data-td last font-weight-normal">Australia</td>
<td class="data-td data last text-left">Misinformation Bill</td>
<td class="data-td data last text-left">Proposed</td>
<td class="data-td data last text-left">Speech causing "harm to public confidence in the banking system" is targeted.</td>
<td class="data-td data last text-left">Fines up to 5% of global revenue. Potential to stifle legitimate debate.</td>
<td class="data-td data last text-left">TBD</td>
</tr>
<tr class="tbl-data">
<td class="data-td last font-weight-normal">Brazil</td>
<td class="data-td data last text-left">PL 2630/2020 (Fake News Bill)</td>
<td class="data-td data last text-left">Passed</td>
<td class="data-td data last text-left">Platforms must remove "harmful content", especially around elections and public health.</td>
<td class="data-td data last text-left">X was banned in Brazil in September 2024 for non-compliance with transparency and legal requirements.</td>
<td class="data-td data last text-left">Jul-20</td>
</tr>
<tr class="tbl-data">
<td class="data-td last font-weight-normal">Canada</td>
<td class="data-td data last text-left">Bill C-1B (Online News Act)</td>
<td class="data-td data last text-left">Passed</td>
<td class="data-td data last text-left">Platforms must compensate Canadian publishers for sharing news content.</td>
<td class="data-td data last text-left">Meta blocked all news access in Canada; Google threatened to do the same.</td>
<td class="data-td data last text-left">Jun-23</td>
</tr>
<tr class="tbl-data">
<td class="data-td last font-weight-normal">UK</td>
<td class="data-td data last text-left">Online Safety act</td>
<td class="data-td data last text-left">Passed</td>
<td class="data-td data last text-left">Platforms must remove "harmful content" and ensure age-appropriate experiences for children.</td>
<td class="data-td data last text-left">Fines up to &pound;18 million or 10% of global revenue. TikTok faced scrutiny over child safety.</td>
<td class="data-td data last text-left">Jan-24</td>
</tr>
<tr class="tbl-data">
<td class="data-td last font-weight-normal">EU</td>
<td class="data-td data last text-left">Digital Services Act (DSA)</td>
<td class="data-td data last text-left">Passed</td>
<td class="data-td data last text-left">Requires platforms to remove illegal content, including hate speech and "disinformation".</td>
<td class="data-td data last text-left">Expanded in 2023 to cover Big Tech platforms (45M+ users), imposing fines of up to 6% of global revenue.</td>
<td class="data-td data last text-left">Nov-22</td>
</tr>
<tr class="tbl-data">
<td class="data-td last font-weight-normal">Hong Kong</td>
<td class="data-td data last text-left">Name Pending - Financial Services and Treasury Bureau AI Guidelines</td>
<td class="data-td data last text-left">Framework In Preparation</td>
<td class="data-td data last text-left">No specific language yet. However, Western AI models are reportedly unavailable. We think this is likely due to fears of uncensored (e.g., pro-democracy) LLM content emerging.</td>
<td class="data-td data last text-left">Restricts access to unfettered information for those in HK, threatening competitiveness. Per a Bloomberg News report, most companies did not respond to queries on the topic, and only Google confirmed Gemini AI is unavailable.</td>
<td class="data-td data last text-left">TBD</td>
</tr>
</tbody>
</table>
</div>
<br />
<p class="chart-disclosure"><strong>Source:</strong> VanEck research as of 9/17/24.</p>
<p>As Big Tech withdraws from key markets to avoid liability, the fragmentation of information and rising criticisms about &ldquo;fake news&rdquo; appear to be an inevitable result. Indeed, we argue that the ideological and political capture of centralized internet behemoths like Google threatens individuals&rsquo; access to credible and independent information. Earlier this year, when asked to generate historically accurate depictions of 18th-century British royalty, Google&rsquo;s newly released AI produced images of Asian and Black kings. When asked to create an image of "crypto programmers being bros in a sparse office," it refused, stating that the request furthered &ldquo;harmful stereotypes&rdquo; about "brogrammers.&rdquo; These walled garden AI offerings are not credible, and we believe there is considerable white space for open-source competitors to gain share, many of whom use crypto tokens to bootstrap their networks.</p>
<h2 id="conclusion" class="anchored-block">Conclusion</h2>
<p>We believe Bitcoin's long-term growth is driven by powerful, enduring mega-themes: the rising need for decentralized, censorship-resistant networks, growing institutional adoption through ETPs and model portfolios, and increasing sovereign involvement in mining and cross-border trade. As inflation and currency devaluation continue challenging fiat monetary systems, bitcoin can serve as a vital hedge. Demographically, Bitcoin enjoys strong support from younger generations, positioning it to potentially benefit as Boomer wealth turns over. As these structural forces deepen, bitcoin&rsquo;s role as a global reserve asset continues to strengthen, reinforcing our conviction that the long-term Bull Market is intact.</p>
<p><strong>Notes:</strong></p>
<p>Net unrealized profit/loss ratio (NUPL) can be calculated by subtracting the realized market cap from the market cap and dividing the result by the market cap. When a high percentage of Bitcoin&rsquo;s market cap consists of unrealized profits, it can be interpreted that investors are greedy. Background reading <strong><a href="https://medium.com/@adamant_capital/a-primer-on-bitcoin-investor-sentiment-and-changes-in-saving-behavior-a5fb70109d32" title="A Primer on Bitcoin Investor Sentiment and Changes in Saving Behavior" target="_blank" rel="noopener">here</a></strong>.</p>
<p><strong>Links to third party websites are provided as a convenience and the inclusion of such links does not imply any endorsement, approval, investigation, verification or monitoring by us of any content or information contained within or accessible from the linked sites. By clicking on the link to a non-VanEck webpage, you acknowledge that you are entering a third-party website subject to its own terms and conditions. VanEck disclaims responsibility for content, legality of access or suitability of the third-party websites.</strong></p>
<p>To receive more <strong><a href="https://www.vaneck.com/us/en/insights/digital-assets/" title="Digital Assets Insights">Digital Assets</a></strong> insights, <strong><a href="https://www.vaneck.com/us/en/subscribe/" title="Subscription Center">sign up in our subscription center</a></strong>.</p>
<style>
    .data-td.data {
        padding-right: 5px !important;
    }

    .wrapped-div {
        max-width: 100%;
    }

    @media (max-width: 1240px) {
        .wrapped-div {
            overflow-x: scroll;
        }
    }

    .wrapped-div-sector {
        max-width: 100%;
        overflow-x: scroll;
    }
</style>
]]></content:encoded>
</item><item rdf:about="https://www.vaneck.com/us/en/blogs/emerging-markets-bonds/fed-cuts-are-positive-for-em-local-bonds/">
  <title>Fed Cuts Are Positive For EM Local Bonds></title>
  <link>https://www.vaneck.com/us/en/blogs/emerging-markets-bonds/fed-cuts-are-positive-for-em-local-bonds/</link>
  <description><![CDATA[Emerging markets have held real rates high for too long. Will the Fed&rsquo;s rate cutting regime signal a change?]]></description>
  <dc:creator>Eric Fine</dc:creator>
  <dc:date>09/18/2024 06:30:00</dc:date>
<content:encoded><![CDATA[

<p id="performance-review" class="jump-link-nav anchored-block" data-jumplink-title="Performance Review">The <strong><a href="/link/dbb866e8704049c784a0bdf9299143ea.aspx" title="EMBAX - Emerging Markets Bond Fund - Class A - Overview">VanEck Emerging Markets Bond Fund</a></strong> was up 2.50% in August, compared to 2.70% for its benchmark, the 50% J.P. Morgan Government Bond Index-Emerging Markets Global Diversified (GBI-EM) and 50% J.P. Morgan Emerging Markets Bond Index (EMBI). Year to date, the fund is up 4.63%, compared to up 4.06% for its benchmark, and compared to the ICE BofA Broad Market Index (Global Agg), which was up 1.74%. The decades-old story of emerging markets (EM) bonds outperforming developed markets (DM) continues. During August, the fund continued increasing local currency exposure in Mexico, covering a big underweight in Mexico local that existed most of this year. We are also considering rotating into Brazil, Chile, and Poland local currency, using our Asian local exposure as a funder due to its incredible outperformance. We continue to like duration, and we have our maximum allocation allowed to local currency, now including the high betas following their weakness (Mexico, Chile), while maintaining our overweight in South Africa local. South Africa was one of our only high-beta local exposures throughout this year, and performance and fundamentals cooperated, so no change there. We held underweights in Brazil and Mexico, though, and only initiated these positions after their weak performance (some of which continued in August). Carry is 7.5%, yield to worst is 8.6%, duration is 7.2 and local makes up around 58.1% of exposure.</p>

<h3>Average Annual Total Returns<sup>*</sup>&nbsp;(%) (In USD)</h3>
<div class="wrapped-div">
<table style="width: 100%;">
<tbody>
<tr class="tbl-data">
<td class="tbl-header last" colspan="10">As of August 31, 2024</td>
</tr>
<tr class="tbl-data">
<td class="data-head last text-right">&nbsp;</td>
<td class="data-head last text-right">1 MO</td>
<td class="data-head last text-right">3 MO</td>
<td class="data-head last text-right">YTD</td>
<td class="data-head last text-right">1 YR</td>
<td class="data-head last text-right">3 YR</td>
<td class="data-head last text-right">5 YR</td>
<td class="data-head last text-right">10 YR</td>
</tr>
<tr class="tbl-data">
<td class="data-td last text-left">Class A: NAV (Inception 07/09/12)</td>
<td class="data-td data last text-right">2.50</td>
<td class="data-td data last text-right">4.67</td>
<td class="data-td data last text-right">4.63</td>
<td class="data-td data last text-right">10.79</td>
<td class="data-td data last text-right">0.71</td>
<td class="data-td data last text-right">3.98</td>
<td class="data-td data last text-right">1.30</td>
</tr>
<tr class="tbl-data">
<td class="data-td last text-left">Class A: Maximum 5.75% load</td>
<td class="data-td data last text-right">-3.39</td>
<td class="data-td data last text-right">-1.35</td>
<td class="data-td data last text-right">-1.38</td>
<td class="data-td data last text-right">4.42</td>
<td class="data-td data last text-right">-1.26</td>
<td class="data-td data last text-right">2.76</td>
<td class="data-td data last text-right">0.70</td>
</tr>
<tr class="tbl-data">
<td class="data-td last text-left">Class I: NAV (Inception 07/09/12)</td>
<td class="data-td data last text-right">2.53</td>
<td class="data-td data last text-right">4.89</td>
<td class="data-td data last text-right">5.02</td>
<td class="data-td data last text-right">11.10</td>
<td class="data-td data last text-right">1.06</td>
<td class="data-td data last text-right">4.31</td>
<td class="data-td data last text-right">1.62</td>
</tr>
<tr class="tbl-data">
<td class="data-td last text-left">Class Y: NAV (Inception 07/09/12)</td>
<td class="data-td data last text-right">2.45</td>
<td class="data-td data last text-right">4.69</td>
<td class="data-td data last text-right">4.90</td>
<td class="data-td data last text-right">10.94</td>
<td class="data-td data last text-right">0.97</td>
<td class="data-td data last text-right">4.24</td>
<td class="data-td data last text-right">1.54</td>
</tr>
<tr class="tbl-data">
<td class="data-td last text-left">50% GBI-EM/50% EMBI</td>
<td class="data-td data last text-right">2.70</td>
<td class="data-td data last text-right">4.58</td>
<td class="data-td data last text-right">4.08</td>
<td class="data-td data last text-right">9.69</td>
<td class="data-td data last text-right">-1.63</td>
<td class="data-td data last text-right">0.31</td>
<td class="data-td data last text-right">1.36</td>
</tr>
</tbody>
</table>
</div>
<br />
<div class="wrapped-div">
<table style="width: 100%;">
<tbody>
<tr class="tbl-data">
<td class="tbl-header last" colspan="8">As of June 30, 2024</td>
</tr>
<tr class="tbl-data">
<td class="data-head last text-right">&nbsp;</td>
<td class="data-head last text-right">1 MO</td>
<td class="data-head last text-right">3 MO</td>
<td class="data-head last text-right">YTD</td>
<td class="data-head last text-right">1 YR</td>
<td class="data-head last text-right">3 YR</td>
<td class="data-head last text-right">5 YR</td>
<td class="data-head last text-right">10 YR</td>
</tr>
<tr class="tbl-data">
<td class="data-td last text-left">Class A: NAV (Inception 07/09/12)</td>
<td class="data-td data last text-right">0.26</td>
<td class="data-td data last text-right">0.52</td>
<td class="data-td data last text-right">0.22</td>
<td class="data-td data last text-right">4.94</td>
<td class="data-td data last text-right">-0.76</td>
<td class="data-td data last text-right">2.28</td>
<td class="data-td data last text-right">0.88</td>
</tr>
<tr class="tbl-data">
<td class="data-td last text-left">Class A: Maximum 5.75% load</td>
<td class="data-td data last text-right">-5.51</td>
<td class="data-td data last text-right">-5.26</td>
<td class="data-td data last text-right">-5.54</td>
<td class="data-td data last text-right">-1.10</td>
<td class="data-td data last text-right">-2.70</td>
<td class="data-td data last text-right">1.08</td>
<td class="data-td data last text-right">0.29</td>
</tr>
<tr class="tbl-data">
<td class="data-td last text-left">Class I: NAV (Inception 07/09/12)</td>
<td class="data-td data last text-right">0.43</td>
<td class="data-td data last text-right">0.58</td>
<td class="data-td data last text-right">0.55</td>
<td class="data-td data last text-right">5.26</td>
<td class="data-td data last text-right">-0.40</td>
<td class="data-td data last text-right">2.60</td>
<td class="data-td data last text-right">1.21</td>
</tr>
<tr class="tbl-data">
<td class="data-td last text-left">Class Y: NAV (Inception 07/09/12)</td>
<td class="data-td data last text-right">0.19</td>
<td class="data-td data last text-right">0.45</td>
<td class="data-td data last text-right">0.40</td>
<td class="data-td data last text-right">5.03</td>
<td class="data-td data last text-right">-0.51</td>
<td class="data-td data last text-right">2.51</td>
<td class="data-td data last text-right">1.12</td>
</tr>
<tr class="tbl-data">
<td class="data-td last text-left">50% GBI-EM/50% EMBI</td>
<td class="data-td data last text-right">-0.23</td>
<td class="data-td data last text-right">-0.66</td>
<td class="data-td data last text-right">-0.72</td>
<td class="data-td data last text-right">4.91</td>
<td class="data-td data last text-right">-2.88</td>
<td class="data-td data last text-right">-0.61</td>
<td class="data-td data last text-right">0.91</td>
</tr>
</tbody>
</table>
</div>
<style>
    .data-td.data {
        padding-right: 2px !important;
    }
    
    .wrapped-div {
        max-width: 100%;
    }
    
    @media (max-width: 768px) {
        .wrapped-div {
            overflow-x: scroll;
        }
    }
    
    .wrapped-div-sector {
        max-width: 100%;
        overflow-x: scroll;
    }
</style>
<p class="chart-disclosure"><sup>*</sup>&nbsp;Returns less than one year are not annualized.</p>
<p class="chart-disclosure"><strong>Expenses: Class A: Gross 2.55%, Net 1.22%; Class I: Gross 2.51%, Net 0.87%; Class Y: Gross 2.91%, Net 0.97%.</strong> Expenses are capped contractually until 05/01/24 at 1.25% for Class A, 0.95% for Class I, 1.00% for Class Y. Caps excluding acquired fund fees and expenses, interest, trading, dividends, and interest payments of securities sold short, taxes, and extraordinary expenses.</p>
<p class="chart-disclosure"><strong>The performance data quoted represents past performance. Past performance is not a guarantee of future results. Investment return and principal value of an investment will fluctuate so that an investor&rsquo;s shares, when redeemed, may be worth more or less than their original cost. Performance may be lower or higher than performance data quoted. Please call 800.826.2333 or visit vaneck.com for performance current to the most recent month ended.</strong></p>
<p class="chart-disclosure">The &ldquo;Net Asset Value&rdquo; (NAV) of a Fund is determined at the close of each business day, and represents the dollar value of one share of the fund; it is calculated by taking the total assets of the fund, subtracting total liabilities, and dividing by the total number of shares outstanding. The NAV is not necessarily the same as the ETF&rsquo;s intraday trading value. Investors should not expect to buy or sell shares at NAV.</p>
<p id="cuts-in-focus" class="jump-link-nav anchored-block" data-jumplink-title="US Rate Cuts In Focus"><strong>US rate cuts are in focus. This is the moment &ndash; EMs have been maintaining high real rates arguably for too long, and are simply waiting for the cue from the Fed. </strong>The key is, of course, whether rate cuts are inaugurating a soft or hard landing. A hard landing would be adverse for credit spreads and emerging markets currencies (EMFX), arguably. We don't know whether the landing will be hard or soft. But, we think there's no evidence yet of a hard landing, so we are sticking with the data-focused view we've maintained this year. We also note that 2s/5s became less inverted, the nominal steepness of which would be the next element of the bullish rolldown thesis we've discussed in other monthlies. 2s/10s are close to steep, 5s/10s steepness, in our opinion, would "lock-in" the rolldown argument for duration (namely that in forecasting returns, the roll down the curve generates great confidence). One last point: rate cuts could flip the stock/bond correlation, boosting demand for bonds and bond duration. Low inflation and inflation volatility point to a change in the classic stock/bond correlation that is behind the 60/40 "rule". If bonds now go up when stocks go down, that must generate greater interest in bonds but particularly bond duration. UBS calculates that when inflation is at 2.6%, the stock/bond correlation flips. Anyway, the setup remains that EMs have maintained high real rates for too long, arguably, and Fed cuts open the door to rate and FX rallies in EM. Note also that Chinese private and government-related ownership of US dollars (USD) is significant (some estimate$1tn), and therefore the idea that lower rates in the US could see them sell USD and move onshore to China is real. Exhibits 1 and 2 below quantifies the bigger picture. Basically, EM Asia has been so orthodox for so long that its borrowing rates are the same as that of the United States. This was the famous flight-to-quality to Asia we've been harping on about for the past few years. That seems established to us. But, look at Latin America (LATAM) and EMEA which still have big real yield premia over DM. The Asia rally confirms the thesis, and LATAM and EMEA now have more relative value as a result (later we note that we have taken profit on some Asia exposure and are moving into higher-beta LATAM and EMEA).</p>
<h3>Exhibit 1 - Asia EM Rallied During Risky Last 4 Years</h3>
<p><strong>EM Regions - GBI-EM/5Y UST Yield Differentials, bps</strong></p>
<img class="img-responsive w-100" alt="EM Regions - GBI-EM/5Y UST Yield Differentials, bps" src="https://www.vaneck.com/contentassets/3e7991e7d28240b688601c8870aecde3/4836_emb_chart-1_2024-9_v1_blog.svg" />
<p class="chart-disclosure">Source: VanEck Research, Bloomberg LP. Data as of August 2024.</p>
<!-- b3-->
<h3>Exhibit 2 &ndash; LATAM and EMEA Still Have High Real Rates</h3>
<p><strong>Real Policy Rates in EM and DM (%)</strong></p>
<img class="img-responsive w-100" alt="Real Policy Rates in EM and DM (%)" src="https://www.vaneck.com/contentassets/3e7991e7d28240b688601c8870aecde3/4836_emb_chart-2_2024-9_v1_blog.svg" />
<!-- disc-->
<p class="chart-disclosure">Source: VanEck Research, Bloomberg LP. Data as of August 2024.</p>
<p><strong>Another month, another DM crisis brewing? </strong>Mario Draghi (remember him?) called for the issuance of common bonds by the European Union (EU) and threw some big numbers (800 bn EUR) at the amount of financing required to get Europe growing again. The German Finance Minister took three hours to respond with a "nein". It's a bad setup. And adding to the contradictions, Draghi lamented the absence of tech innovation... and the next day EU Commissioner Vestager announces record fines on Apple and Google. As everyone hopefully knows, there remain profound contradictions in the EU and Euro Zone's (EZ) policy framework that are unresolved. The EZ has one money (EUR), but many fiscal policies and many financial systems. The fiscal inconsistency was supposed to be checked by the Maastricht criteria, which were basically thrown out of the window the moment any important (e.g., France) country gets into trouble. Financial systems are heterogeneous, so they are obviously leveraging the monetary system in inconsistent ways as well. Normally, these basic issues are sorted before a currency zone is set up. In Europe, crisis seems to be the only catalyst for reform.</p>
<p><strong>Unfortunately, a key looming risk is direct NATO-Russia war. </strong>We think market participants are reluctant to think about this scenario, as many consider it is impossible to trade, which could be true. In any case, it appears to us that long-range attacks into Russian territory by Ukraine have been given a "green light". It also appears to us that there is great risk in this development, and we think that further escalation will see Russian counter attacks outside of Ukraine. We say this just to acknowledge it. The clearest implication, though, is lower US rates and an even-more cooperative Fed. Spreads could widen and there could be a knee-jerk USD rally. Look what happened when another DM, Japan, was rocking the world this summer. China's renminbi (CNY) was rock solid, insulating Asian EM as well as all EMFX to a big extent. Also consider what would happen to commodity prices in this environment, keeping in mind that LATAM are largely commodity exporters. We wanted to flush some of these things out before anything happens, so our clients have an outline of our thinking and reaction function.</p>
<p><strong>Speaking of the significant political and policy risks in DM, US elections are coming into focus. </strong>Our simple scenarios are that a Republican sweep is likely a challenge for EM due to the risk of a USD rally as tariffs and unfettered fiscal policy get priced. If the Democrats control either the House (the Senate seems out of reach) or the White House, then we see a more unequivocally positive environment - fiscal will be fettered and policies behind a potential USD rally (such as tariffs) get watered or negotiated down. Our main view is that it is still too early, given not just election uncertainty (including post-election), but the risk surrounding the reality of policy changes, or that positions become negotiations. Tariffs are already somewhat old news, too. One thing we suspect is that a Trump Administration 2.0 would not simply be a repeat of Trump 1.0 in which Mexico was the new and clear target. China is more in the crosshairs here, of course, but can handle it. Government debt is low. Reserves are high. Inflation is very low compared to the US, meaning CNY continues to cheapen in real terms. Offshore "Chinese" USD may amount to $1tn, which could move onshore as US rates decline. Remember <a href="https://www.vaneck.com/us/en/blogs/emerging-markets-bonds/another-dm-crisis-with-em-the-safe-haven/#exhibit-3" title="Another DM Crisis, With EM The Safe Haven?"><strong>our chart from our last monthly</strong></a> in which we showed how a rock-solid CNY insulated Asian and other EMFX from DM Japan's instability during the summer.</p>
<h3>Exhibit 3 - CNY Insulated EM From DM Japan's Volatility</h3>
<p><strong>Exchange Rate Trends: CNY vs. JPY</strong></p>
<img class="img-responsive w-100" alt="Exchange Rate Trends: CNY vs. JPY" src="https://www.vaneck.com/contentassets/3e7991e7d28240b688601c8870aecde3/4836_emb_chart-3_2024-9_v2_blog.svg" />
<!-- disc-->
<p class="chart-disclosure">Source: VanEck Research, Bloomberg LP. Data as of August 2024.</p>

<h2 id="exposure-types" class="jump-link-nav anchored-block" data-jumplink-title="Exposure Types and Changes">Exposure Types and Significant Changes</h2>
<p>The changes to our top positions are summarized below. Our largest positions in August were Mexico, Thailand, South Africa, Indonesia, and Brazil:</p>
<ul class="content-list">
<li class="mt-2">We increased our local currency and hard currency sovereign exposure in Peru. Peru's inflation backdrop and outlook are extremely benign, and this leaves room for additional rate cuts without an "oversized" negative impact on the currency. In terms of our investment process, this improves the economic text score for the country.</li>
<li class="mt-2">We also increased our hard currency sovereign exposure in Romania. We focused on the longer segment of the curve, which should benefit from lower global interest rates with policy easing already underway in the Eurozone and about to start in the U.S. We are mindful of the forthcoming parliamentary and presidential elections in Romania (both of which can temporarily increase headline noise), and the resulting high financing needs, but the country continues to benefit from sizable inflows of the EU funds, which help to alleviate some of these pressures. In terms of our investment process, this translates into the improved technical test score for the country.</li>
<li class="mt-2">Finally, we increased our local currency exposure in Mexico. Mexico's local valuations improved a lot after the recent selloff which was caused by the market's "sudden" realization that the outgoing president's judicial reform is likely to be approved in September (even though this was clear for a few months now). The market's very large net long exposure in Mexico did not help either. We realize that the market volatility might remain high until the presidential elections in the U.S. However, the sentiment is likely to improve when President-elect Sheinbaum is inaugurated in early October, and the approval of the 2025 budget in mid-November can provide an additional powerful catalyst, because it should show significant post-election fiscal adjustment.</li>
<li class="mt-2">We reduced our local currency exposure in South Africa. We think that the market continues to underestimate many aspects of South Africa's story - including fiscal improvements, solid external accounts, and the government of national unity's ability to implement reforms. However, local bonds rallied a lot after the elections, and we thought it would be prudent to take some profits to fund other interesting opportunities in EM.</li>
<li class="mt-2">We also reduced our hard currency corporate exposure in China and Hong Kong. China's activity indicators continue to disappoint, but authorities are sticking to their "drip/targeted" stimulus approach. Further, there is still no progress in terms of resolving real estate issues - despite some encouraging noise regarding buying unfinished houses and converting them to rental units. These developments worsened the policy test score for China and Hong Kong.</li>
<li class="mt-2">Finally, we reduced our hard currency corporate exposure in Brazil and Nigeria. We see no additional positive policy catalysts in Nigeria right now, which worsens the country' policy test score. Many Brazilian corporates are high beta to global recession concerns, which weakens their technical test score.</li>
</ul>
<p>To receive more <a href="https://www.vaneck.com/us/en/insights/emerging-markets-bonds/" title="Emerging Markets Bonds Insights"><strong>Emerging Markets Bonds</strong></a> insights, <a href="/link/5f45412c2143400497908cea2897f7d3.aspx" title=" Subscription Center"><strong>sign up in our subscription center</strong></a>.</p>
]]></content:encoded>
</item><item rdf:about="https://www.vaneck.com/us/en/blogs/income-investing/surge-in-fallen-angels-expected-amid-economic-uncertainty/">
  <title>Surge in Fallen Angels Expected Amid Economic Uncertainty></title>
  <link>https://www.vaneck.com/us/en/blogs/income-investing/surge-in-fallen-angels-expected-amid-economic-uncertainty/</link>
  <description><![CDATA[With higher rates pressuring balance sheets and economic uncertainty ahead, U.S. companies at risk of downgrade have risen to $93B from $19B in January, while the risk of rising stars remains relatively low. &nbsp;]]></description>
  <dc:creator>Nicolas  Fonseca, CFA</dc:creator>
  <dc:date>09/13/2024 06:30:00</dc:date>
<content:encoded><![CDATA[

<p>Fallen angels (as represented by the ICE US Fallen Angel High Yield 10% Constrained Index, &ldquo;H0CF&rdquo;) and broad high yield (as represented by the ICE BofA US High Yield Index, &ldquo;H0A0&rdquo;) performed relatively in line in August, 1.53% vs 1.59%, with fallen angels trailing the broad market by 1.45% YTD (4.84% vs 6.29%). The CCC &amp; Lower rated index continues to outperform Single-B and BB rated bonds (9.65%, 5.94% and 5.67% respectively). This lower quality outperformance has been supported by resilient U.S. growth data and the Consumer Price Index (CPI) reporting below 3% for the first time in three years, strengthening the case for a potential rate cut in September. Weaker employment figures have also lent support for a rate cut, although the implications on lower rated credit are likely less positive.</p>
<h2>Are Fallen Angels Coming?</h2>
<p>August was the seventh consecutive month with no downgrade activity, with Advance Auto Parts the most recent fallen angel in February. However, Bloomberg recently predicted that the high yield market may experience an increase in fallen angels due to increasing economic uncertainty and negative outlooks for specific sectors. With elevated interest rates pressuring balance sheets, Bloomberg estimates that U.S. companies at risk of downgrades has risen to US$93 billion, up from US$19 billion in January, while rising star risk is relatively low, as seen on the chart below. The last time the amount of fallen angels was this high, according to Bloomberg, was in 2020, which turned out to be the calendar year with the largest amount of debt downgraded.</p>
<p>Rating agencies appear to be recognizing signs of credit deterioration among higher-rated issuers. Recent actions, such as Intel's downgrade to BBB+ and CVS&rsquo;s negative outlook, which places it on the verge of a BBB- rating, suggest growing concern. We are closely monitoring Boeing (Capital Goods sector), Centene (Healthcare) and Paramount (Media), as these issuers also face a higher likelihood of downgrades to high yield. If downgraded, they could significantly impact the fallen angel index, potentially hitting the 10% issuer weight cap.</p>
<h3>Rising-Star, Fallen-Angel Candidates</h3>
<p><img alt="Rising-Star, Fallen-Angel Candidates" src="https://www.vaneck.com/contentassets/10da8c9ffc8946309a91b4d8110403b3/4819_angl_chart-1_2024-9_blog.svg" class="img-responsive w-100" /></p>
<p class="chart-disclosure">Source: Bloomberg Intelligence, August 20, 2024.</p>
<p><strong>Fallen Angels Overall Statistics:</strong> Fallen angel yields decreased in August by 16bps to 6.65%, just 4bps above their 12-month low, while the average price increased to $92.88, a level not seen since August 2022. Broad high yield saw similar changes, with yields decreasing 27bps and the average price increasing to $95.47. The move down in yields/jump in prices continues to reflect the 10-year U.S. Treasury rallying since April, when it reached 4.70% and ended August at 3.91%, while spreads have generally stayed range-bound.</p>
<div class="wrapped-div">
<table style="width: 100%;">
<tbody>
<tr class="tbl-data">
<td class="tbl-header last text-center">&nbsp;</td>
<td class="tbl-header last text-center" style="border-right: outset;" colspan="4">Fallen Angels</td>
<td class="tbl-header last text-center" colspan="4">Broad HY</td>
</tr>
<tr class="tbl-data">
<td class="data-td last">&nbsp;</td>
<td class="data-head last text-right">12/31/23</td>
<td class="data-head last text-right">6/30/24</td>
<td class="data-head last text-right">7/31/24</td>
<td class="data-head last text-right" style="border-right: outset;">8/31/24</td>
<td class="data-head last text-right">12/31/23</td>
<td class="data-head last text-right">6/30/24</td>
<td class="data-head last text-right">7/31/24</td>
<td class="data-head last text-right">8/31/24</td>
</tr>
<tr class="tbl-data">
<td class="data-td last">Yield to Worst</td>
<td class="data-td data last text-right">6.99</td>
<td class="data-td data last text-right">7.10</td>
<td class="data-td data last text-right">6.81</td>
<td class="data-td data last text-right" style="border-right: outset;">6.65</td>
<td class="data-td data last text-right">7.69</td>
<td class="data-td data last text-right">7.94</td>
<td class="data-td data last text-right">7.61</td>
<td class="data-td data last text-right">7.34</td>
</tr>
<tr class="tbl-data">
<td class="data-td last">Par Weighted Price</td>
<td class="data-td data last text-right">91.20</td>
<td class="data-td data last text-right">90.32</td>
<td class="data-td data last text-right">91.90</td>
<td class="data-td data last text-right" style="border-right: outset;">92.88</td>
<td class="data-td data last text-right">91.86</td>
<td class="data-td data last text-right">92.98</td>
<td class="data-td data last text-right">94.37</td>
<td class="data-td data last text-right">95.47</td>
</tr>
<tr class="tbl-data">
<td class="data-td last">Effective Duration</td>
<td class="data-td data last text-right">5.41</td>
<td class="data-td data last text-right">5.08</td>
<td class="data-td data last text-right">5.06</td>
<td class="data-td data last text-right" style="border-right: outset;">5.01</td>
<td class="data-td data last text-right">3.31</td>
<td class="data-td data last text-right">3.26</td>
<td class="data-td data last text-right">3.17</td>
<td class="data-td data last text-right">3.07</td>
</tr>
<tr class="tbl-data">
<td class="data-td last">Full Market Value ($mn)</td>
<td class="data-td data last text-right">67,821</td>
<td class="data-td data last text-right">55,371</td>
<td class="data-td data last text-right">54,885</td>
<td class="data-td data last text-right" style="border-right: outset;">55,634</td>
<td class="data-td data last text-right">1,237,721</td>
<td class="data-td data last text-right">1,266,993</td>
<td class="data-td data last text-right">1,282,279</td>
<td class="data-td data last text-right">1,307,475</td>
</tr>
<tr class="tbl-data">
<td class="data-td last">OAS</td>
<td class="data-td data last text-right">285</td>
<td class="data-td data last text-right">252</td>
<td class="data-td data last text-right">259</td>
<td class="data-td data last text-right" style="border-right: outset;">263</td>
<td class="data-td data last text-right">339</td>
<td class="data-td data last text-right">321</td>
<td class="data-td data last text-right">325</td>
<td class="data-td data last text-right">317</td>
</tr>
<tr class="tbl-data">
<td class="data-td last">No. of Issues</td>
<td class="data-td data last text-right">143</td>
<td class="data-td data last text-right">126</td>
<td class="data-td data last text-right">122</td>
<td class="data-td data last text-right" style="border-right: outset;">122</td>
<td class="data-td data last text-right">1,837</td>
<td class="data-td data last text-right">1,863</td>
<td class="data-td data last text-right">1,858</td>
<td class="data-td data last text-right">1,863</td>
</tr>
</tbody>
</table>
</div>
<p class="chart-disclosure">Source: ICE Data Services, VanEck. Fallen Angels: ICE US Fallen Angel High Yield 10% Constrained Index. Broad HY: ICE BofA US High Yield Index. OAS refers to &ldquo;option-adjusted spread.&rdquo; Please see definition for this and other terms referenced herein in the disclosures and definitions portion of this blog. Past performance is no guarantee of future results. Index performance is not representative of strategy performance. It is not possible to invest in an index.</p>
<p><strong>Fallen Angels:</strong> No fallen angels in August.</p>
<div class="wrapped-div">
<table style="width: 100%;">
<tbody>
<tr class="tbl-data">
<td class="tbl-header last">Month-end Addition</td>
<td class="tbl-header last text-left">Name</td>
<td class="tbl-header last text-left">Rating</td>
<td class="tbl-header last text-left">Sector</td>
<td class="tbl-header last text-left">Industry</td>
<td class="tbl-header last text-right">% Mkt Value</td>
<td class="tbl-header last text-right">Price</td>
</tr>
<tr class="tbl-data">
<td class="data-td last font-weight-normal">January</td>
<td class="data-td data last text-left">Hudson Pacific Properties LP</td>
<td class="data-td data last text-left">BB1</td>
<td class="data-td data last text-left">Real Estate</td>
<td class="data-td data last text-left">REITs</td>
<td class="data-td data last text-right">2.18</td>
<td class="data-td data last text-right">88.05</td>
</tr>
<tr class="tbl-data">
<td class="data-td last font-weight-normal">February</td>
<td class="data-td data last text-left">Advance Auto Parts Inc.</td>
<td class="data-td data last text-left">BB1</td>
<td class="data-td data last text-left">Retail</td>
<td class="data-td data last text-left">Specialty Retail</td>
<td class="data-td data last text-right">2.52</td>
<td class="data-td data last text-right">91.20</td>
</tr>
</tbody>
</table>
</div>
<p class="chart-disclosure">Source: ICE Data Services, VanEck. Fallen Angels: ICE US Fallen Angel High Yield 10% Constrained Index. Past performance is no guarantee of future results. Not a recommendation to buy or sell any of the names/securities mentioned herein. Index performance is not representative of strategy performance. It is not possible to invest in an index.</p>

<p><strong>Rising Stars:</strong> No rising stars in August.</p>
<div class="wrapped-div">
<table style="width: 100%;">
<tbody>
<tr class="tbl-data">
<td class="tbl-header last">Month-end Exit</td>
<td class="tbl-header last text-left">Name</td>
<td class="tbl-header last text-left">Rating</td>
<td class="tbl-header last text-left">Sector</td>
<td class="tbl-header last text-left">Industry</td>
<td class="tbl-header last text-right">% Mkt Value</td>
<td class="tbl-header last text-right">Price</td>
</tr>
<tr class="tbl-data">
<td class="data-td last font-weight-normal">February</td>
<td class="data-td data last text-left">Las Vegas Sands Corp</td>
<td class="data-td data last text-left">BB1</td>
<td class="data-td data last text-left">Leisure</td>
<td class="data-td data last text-left">Gaming</td>
<td class="data-td data last text-right">3.12</td>
<td class="data-td data last text-right">93.19</td>
</tr>
<tr class="tbl-data">
<td class="data-td last font-weight-normal">March</td>
<td class="data-td data last text-left">Enlink Midstream Partners LP</td>
<td class="data-td data last text-left">BB1</td>
<td class="data-td data last text-left">Energy</td>
<td class="data-td data last text-left">Gas Distribution</td>
<td class="data-td data last text-right">2.30</td>
<td class="data-td data last text-right">88.92</td>
</tr>
<tr class="tbl-data">
<td class="data-td last font-weight-normal">April</td>
<td class="data-td data last text-left">FirstEnergy Corp.</td>
<td class="data-td data last text-left">BB1</td>
<td class="data-td data last text-left">Utility</td>
<td class="data-td data last text-left">Electric-Integrated</td>
<td class="data-td data last text-right">6.62</td>
<td class="data-td data last text-right">87.10</td>
</tr>
<tr class="tbl-data">
<td class="data-td last font-weight-normal">April</td>
<td class="data-td data last text-left">Rolls-Royce PLC</td>
<td class="data-td data last text-left">BB1</td>
<td class="data-td data last text-left">Capital Goods</td>
<td class="data-td data last text-left">Aerospace/Defense</td>
<td class="data-td data last text-right">1.51</td>
<td class="data-td data last text-right">96.00</td>
</tr>
<tr class="tbl-data">
<td class="data-td last font-weight-normal">July</td>
<td class="data-td data last text-left">Delta Air Lines Inc.</td>
<td class="data-td data last text-left">BB1</td>
<td class="data-td data last text-left">Transportation</td>
<td class="data-td data last text-left">Air Transportation</td>
<td class="data-td data last text-right">1.50</td>
<td class="data-td data last text-right">94.59</td>
</tr>
</tbody>
</table>
</div>
<p class="chart-disclosure">Source: ICE Data Services, VanEck. Fallen Angels: ICE US Fallen Angel High Yield 10% Constrained Index. Past performance is no guarantee of future results. Not a recommendation to buy or sell any of the names/securities mentioned herein. Index performance is not representative of strategy performance. It is not possible to invest in an index.</p>

<p><strong>Fallen Angels Performance by Sector:</strong> There were no major sector allocation shifts within fallen angels but when compared to broad high yield, fallen angels are heavily overweight Banking, Retail, Real Estate and Telecom while underweight Services, Autos and Media. In August, fallen angels saw general price improvements across most sectors with Telecom, Financial Services and Healthcare performing particularly well in terms of price recovery. In terms of total return, all sectors except for Transportation posted positive returns in August with Telecom, Financial Services and Healthcare having the highest total returns, mostly driven by price appreciation and spread tightening.</p>
<div class="wrapped-div">
<table style="width: 100%;">
<tbody>
<tr class="tbl-data">
<td class="tbl-header last text-center">&nbsp;</td>
<td class="tbl-header last text-center" style="border-right: outset;" colspan="4">Wgt (%)</td>
<td class="tbl-header last text-center" style="border-right: outset;" colspan="4">OAS</td>
<td class="tbl-header last text-center" style="border-right: outset;" colspan="4">Price</td>
<td class="tbl-header last text-right">Total Return</td>
</tr>
<tr class="tbl-data">
<td class="data-td last">&nbsp;</td>
<td class="data-head last text-right">12/31/23</td>
<td class="data-head last text-right">6/30/24</td>
<td class="data-head last text-right">7/31/24</td>
<td class="data-head last text-right" style="border-right: outset;">8/31/24</td>
<td class="data-head last text-right">12/31/23</td>
<td class="data-head last text-right">6/30/24</td>
<td class="data-head last text-right">7/31/24</td>
<td class="data-head last text-right" style="border-right: outset;">8/31/24</td>
<td class="data-head last text-right">12/31/23</td>
<td class="data-head last text-right">6/30/24</td>
<td class="data-head last text-right">7/31/24</td>
<td class="data-head last text-right" style="border-right: outset;">8/31/24</td>
<td class="data-head last text-right">MTD</td>
</tr>
<tr class="tbl-data">
<td class="data-td last">Banking</td>
<td class="data-td data last text-right">4.79</td>
<td class="data-td data last text-right">5.38</td>
<td class="data-td data last text-right">5.47</td>
<td class="data-td data last text-right" style="border-right: outset;">5.48</td>
<td class="data-td data last text-right">231</td>
<td class="data-td data last text-right">220</td>
<td class="data-td data last text-right">229</td>
<td class="data-td data last text-right" style="border-right: outset;">229</td>
<td class="data-td data last text-right">97.91</td>
<td class="data-td data last text-right">97.36</td>
<td class="data-td data last text-right">98.48</td>
<td class="data-td data last text-right" style="border-right: outset;">99.58</td>
<td class="data-td data last text-right">1.58</td>
</tr>
<tr class="tbl-data">
<td class="data-td last">Basic Industry</td>
<td class="data-td data last text-right">1.70</td>
<td class="data-td data last text-right">3.73</td>
<td class="data-td data last text-right">3.81</td>
<td class="data-td data last text-right" style="border-right: outset;">3.79</td>
<td class="data-td data last text-right">171</td>
<td class="data-td data last text-right">156</td>
<td class="data-td data last text-right">174</td>
<td class="data-td data last text-right" style="border-right: outset;">173</td>
<td class="data-td data last text-right">97.24</td>
<td class="data-td data last text-right">95.03</td>
<td class="data-td data last text-right">96.14</td>
<td class="data-td data last text-right" style="border-right: outset;">97.24</td>
<td class="data-td data last text-right">1.55</td>
</tr>
<tr class="tbl-data">
<td class="data-td last">Capital Goods</td>
<td class="data-td data last text-right">5.85</td>
<td class="data-td data last text-right">5.41</td>
<td class="data-td data last text-right">5.44</td>
<td class="data-td data last text-right" style="border-right: outset;">5.46</td>
<td class="data-td data last text-right">200</td>
<td class="data-td data last text-right">161</td>
<td class="data-td data last text-right">195</td>
<td class="data-td data last text-right" style="border-right: outset;">188</td>
<td class="data-td data last text-right">97.34</td>
<td class="data-td data last text-right">97.51</td>
<td class="data-td data last text-right">97.31</td>
<td class="data-td data last text-right" style="border-right: outset;">98.46</td>
<td class="data-td data last text-right">1.64</td>
</tr>
<tr class="tbl-data">
<td class="data-td last">Consumer Goods</td>
<td class="data-td data last text-right">4.33</td>
<td class="data-td data last text-right">5.28</td>
<td class="data-td data last text-right">5.52</td>
<td class="data-td data last text-right" style="border-right: outset;">5.45</td>
<td class="data-td data last text-right">230</td>
<td class="data-td data last text-right">240</td>
<td class="data-td data last text-right">208</td>
<td class="data-td data last text-right" style="border-right: outset;">242</td>
<td class="data-td data last text-right">94.29</td>
<td class="data-td data last text-right">93.64</td>
<td class="data-td data last text-right">96.63</td>
<td class="data-td data last text-right" style="border-right: outset;">96.22</td>
<td class="data-td data last text-right">0.10</td>
</tr>
<tr class="tbl-data">
<td class="data-td last">Energy</td>
<td class="data-td data last text-right">14.75</td>
<td class="data-td data last text-right">12.27</td>
<td class="data-td data last text-right">12.55</td>
<td class="data-td data last text-right" style="border-right: outset;">12.49</td>
<td class="data-td data last text-right">259</td>
<td class="data-td data last text-right">239</td>
<td class="data-td data last text-right">242</td>
<td class="data-td data last text-right" style="border-right: outset;">247</td>
<td class="data-td data last text-right">92.49</td>
<td class="data-td data last text-right">93.44</td>
<td class="data-td data last text-right">95.25</td>
<td class="data-td data last text-right" style="border-right: outset;">95.68</td>
<td class="data-td data last text-right">0.93</td>
</tr>
<tr class="tbl-data">
<td class="data-td last">Financial Services</td>
<td class="data-td data last text-right">1.14</td>
<td class="data-td data last text-right">1.37</td>
<td class="data-td data last text-right">1.39</td>
<td class="data-td data last text-right" style="border-right: outset;">1.41</td>
<td class="data-td data last text-right">378</td>
<td class="data-td data last text-right">376</td>
<td class="data-td data last text-right">355</td>
<td class="data-td data last text-right" style="border-right: outset;">334</td>
<td class="data-td data last text-right">86.41</td>
<td class="data-td data last text-right">84.87</td>
<td class="data-td data last text-right">87.60</td>
<td class="data-td data last text-right" style="border-right: outset;">89.81</td>
<td class="data-td data last text-right">3.03</td>
</tr>
<tr class="tbl-data">
<td class="data-td last">Healthcare</td>
<td class="data-td data last text-right">4.10</td>
<td class="data-td data last text-right">5.15</td>
<td class="data-td data last text-right">5.34</td>
<td class="data-td data last text-right" style="border-right: outset;">5.39</td>
<td class="data-td data last text-right">270</td>
<td class="data-td data last text-right">207</td>
<td class="data-td data last text-right">202</td>
<td class="data-td data last text-right" style="border-right: outset;">184</td>
<td class="data-td data last text-right">88.73</td>
<td class="data-td data last text-right">91.12</td>
<td class="data-td data last text-right">93.11</td>
<td class="data-td data last text-right" style="border-right: outset;">94.91</td>
<td class="data-td data last text-right">2.35</td>
</tr>
<tr class="tbl-data">
<td class="data-td last">Insurance</td>
<td class="data-td data last text-right">1.32</td>
<td class="data-td data last text-right">1.65</td>
<td class="data-td data last text-right">1.69</td>
<td class="data-td data last text-right" style="border-right: outset;">1.70</td>
<td class="data-td data last text-right">323</td>
<td class="data-td data last text-right">238</td>
<td class="data-td data last text-right">244</td>
<td class="data-td data last text-right" style="border-right: outset;">239</td>
<td class="data-td data last text-right">94.10</td>
<td class="data-td data last text-right">96.11</td>
<td class="data-td data last text-right">98.02</td>
<td class="data-td data last text-right" style="border-right: outset;">99.42</td>
<td class="data-td data last text-right">1.97</td>
</tr>
<tr class="tbl-data">
<td class="data-td last">Leisure</td>
<td class="data-td data last text-right">7.90</td>
<td class="data-td data last text-right">5.92</td>
<td class="data-td data last text-right">6.05</td>
<td class="data-td data last text-right" style="border-right: outset;">5.98</td>
<td class="data-td data last text-right">228</td>
<td class="data-td data last text-right">180</td>
<td class="data-td data last text-right">196</td>
<td class="data-td data last text-right" style="border-right: outset;">210</td>
<td class="data-td data last text-right">93.21</td>
<td class="data-td data last text-right">94.48</td>
<td class="data-td data last text-right">95.26</td>
<td class="data-td data last text-right" style="border-right: outset;">95.41</td>
<td class="data-td data last text-right">0.57</td>
</tr>
<tr class="tbl-data">
<td class="data-td last">Real Estate</td>
<td class="data-td data last text-right">9.07</td>
<td class="data-td data last text-right">10.07</td>
<td class="data-td data last text-right">10.58</td>
<td class="data-td data last text-right" style="border-right: outset;">10.40</td>
<td class="data-td data last text-right">675</td>
<td class="data-td data last text-right">450</td>
<td class="data-td data last text-right">385</td>
<td class="data-td data last text-right" style="border-right: outset;">415</td>
<td class="data-td data last text-right">82.72</td>
<td class="data-td data last text-right">84.76</td>
<td class="data-td data last text-right">88.18</td>
<td class="data-td data last text-right" style="border-right: outset;">88.24</td>
<td class="data-td data last text-right">0.47</td>
</tr>
<tr class="tbl-data">
<td class="data-td last">Retail</td>
<td class="data-td data last text-right">14.38</td>
<td class="data-td data last text-right">20.45</td>
<td class="data-td data last text-right">19.39</td>
<td class="data-td data last text-right" style="border-right: outset;">19.13</td>
<td class="data-td data last text-right">242</td>
<td class="data-td data last text-right">196</td>
<td class="data-td data last text-right">232</td>
<td class="data-td data last text-right" style="border-right: outset;">251</td>
<td class="data-td data last text-right">86.39</td>
<td class="data-td data last text-right">88.19</td>
<td class="data-td data last text-right">87.49</td>
<td class="data-td data last text-right" style="border-right: outset;">87.26</td>
<td class="data-td data last text-right">0.16</td>
</tr>
<tr class="tbl-data">
<td class="data-td last">Services</td>
<td class="data-td data last text-right">0.64</td>
<td class="data-td data last text-right">0.79</td>
<td class="data-td data last text-right" style="border-right: outset;">0.80</td>
<td class="data-td data last text-right">243</td>
<td class="data-td data last text-right">206</td>
<td class="data-td data last text-right">204</td>
<td class="data-td data last text-right" style="border-right: outset;">188</td>
<td class="data-td data last text-right">94.78</td>
<td class="data-td data last text-right">94.67</td>
<td class="data-td data last text-right">96.48</td>
<td class="data-td data last text-right" style="border-right: outset;">97.91</td>
<td class="data-td data last text-right">1.92</td>
</tr>
<tr class="tbl-data">
<td class="data-td last">Technology &amp; Electronics</td>
<td class="data-td data last text-right">6.22</td>
<td class="data-td data last text-right">6.67</td>
<td class="data-td data last text-right">6.79</td>
<td class="data-td data last text-right" style="border-right: outset;">6.81</td>
<td class="data-td data last text-right">194</td>
<td class="data-td data last text-right">184</td>
<td class="data-td data last text-right">207</td>
<td class="data-td data last text-right" style="border-right: outset;">195</td>
<td class="data-td data last text-right">94.14</td>
<td class="data-td data last text-right">92.27</td>
<td class="data-td data last text-right">92.85</td>
<td class="data-td data last text-right" style="border-right: outset;">94.23</td>
<td class="data-td data last text-right">1.90</td>
</tr>
<tr class="tbl-data">
<td class="data-td last">Telecommunications</td>
<td class="data-td data last text-right">13.00</td>
<td class="data-td data last text-right">11.10</td>
<td class="data-td data last text-right">11.88</td>
<td class="data-td data last text-right" style="border-right: outset;">12.40</td>
<td class="data-td data last text-right">366</td>
<td class="data-td data last text-right">413</td>
<td class="data-td data last text-right">396</td>
<td class="data-td data last text-right" style="border-right: outset;">362</td>
<td class="data-td data last text-right">92.22</td>
<td class="data-td data last text-right">81.48</td>
<td class="data-td data last text-right">86.34</td>
<td class="data-td data last text-right" style="border-right: outset;">90.86</td>
<td class="data-td data last text-right">5.79</td>
</tr>
<tr class="tbl-data">
<td class="data-td last">Transportation</td>
<td class="data-td data last text-right">2.09</td>
<td class="data-td data last text-right">2.60</td>
<td class="data-td data last text-right">1.10</td>
<td class="data-td data last text-right" style="border-right: outset;">1.08</td>
<td class="data-td data last text-right">209</td>
<td class="data-td data last text-right">150</td>
<td class="data-td data last text-right">249</td>
<td class="data-td data last text-right" style="border-right: outset;">281</td>
<td class="data-td data last text-right">94.92</td>
<td class="data-td data last text-right">96.07</td>
<td class="data-td data last text-right">99.28</td>
<td class="data-td data last text-right" style="border-right: outset;">98.27</td>
<td class="data-td data last text-right">-0.49</td>
</tr>
<tr class="tbl-data">
<td class="data-td last">Utility</td>
<td class="data-td data last text-right">8.71</td>
<td class="data-td data last text-right">2.17</td>
<td class="data-td data last text-right">2.22</td>
<td class="data-td data last text-right" style="border-right: outset;">2.22</td>
<td class="data-td data last text-right">139</td>
<td class="data-td data last text-right">185</td>
<td class="data-td data last text-right">206</td>
<td class="data-td data last text-right" style="border-right: outset;">210</td>
<td class="data-td data last text-right">92.18</td>
<td class="data-td data last text-right">96.23</td>
<td class="data-td data last text-right">97.19</td>
<td class="data-td data last text-right" style="border-right: outset;">98.24</td>
<td class="data-td data last text-right">1.50</td>
</tr>
<tr class="tbl-data">
<td class="data-td last">Total</td>
<td class="data-td data last text-right">100</td>
<td class="data-td data last text-right" style="border-right: outset;">100</td>
<td class="data-td data last text-right">285</td>
<td class="data-td data last text-right">252</td>
<td class="data-td data last text-right">259</td>
<td class="data-td data last text-right" style="border-right: outset;">263</td>
<td class="data-td data last text-right">91.20</td>
<td class="data-td data last text-right">90.32</td>
<td class="data-td data last text-right">91.90</td>
<td class="data-td data last text-right" style="border-right: outset;">92.88</td>
<td class="data-td data last text-right">1.53</td>
</tr>
</tbody>
</table>
</div>
<p class="chart-disclosure">Source: ICE Data Services, VanEck. Returns are based on partial period data. Fallen Angels: ICE US Fallen Angel High Yield 10% Constrained Index. Not intended as a recommendation to invest or divest in any of the sectors mentioned herein. Index performance is not representative of strategy performance. It is not possible to invest in an index.</p>
<p><strong>Fallen Angels Performance by Rating:</strong> No significant changes in the fallen angels rating allocation in August, as there were no new fallen angels or rising stars, however, within the fallen angel index, Dresdner Funding Trust I, EQM and Telecom Italia were upgraded by one notch within the BB rated bucket to BB1, BB1 and BB2 respectively. BB1 now represents approximately 33% of the fallen angel index, three times more than what it is in the broad high yield index, offering a compelling case for investors who still think of a hard landing in the coming months. In terms of performance, lower quality issuers outperformed in August as they saw their spreads tightened while BB and single-B rated issuer spreads widened during the month.</p>
<div class="wrapped-div">
<table style="width: 100%;">
<tbody>
<tr class="tbl-data">
<td class="tbl-header last text-center">&nbsp;</td>
<td class="tbl-header last text-center" style="border-right: outset;" colspan="4">Wgt (%)</td>
<td class="tbl-header last text-center" style="border-right: outset;" colspan="4">OAS</td>
<td class="tbl-header last text-center" style="border-right: outset;" colspan="4">Price</td>
<td class="tbl-header last text-right">Total Return</td>
</tr>
<tr class="tbl-data">
<td class="data-td last">&nbsp;</td>
<td class="data-head last text-right">12/31/23</td>
<td class="data-head last text-right">6/30/24</td>
<td class="data-head last text-right">7/31/24</td>
<td class="data-head last text-right" style="border-right: outset;">8/31/24</td>
<td class="data-head last text-right">12/31/23</td>
<td class="data-head last text-right">6/30/24</td>
<td class="data-head last text-right">7/31/24</td>
<td class="data-head last text-right" style="border-right: outset;">8/31/24</td>
<td class="data-head last text-right">12/31/23</td>
<td class="data-head last text-right">6/30/24</td>
<td class="data-head last text-right">7/31/24</td>
<td class="data-head last text-right" style="border-right: outset;">8/31/24</td>
<td class="data-head last text-right">MTD</td>
</tr>
<tr class="tbl-data">
<td class="data-td last">BB</td>
<td class="data-td data last text-right">80.55</td>
<td class="data-td data last text-right">87.62</td>
<td class="data-td data last text-right">86.83</td>
<td class="data-td data last text-right" style="border-right: outset;">86.60</td>
<td class="data-td data last text-right">219</td>
<td class="data-td data last text-right">210</td>
<td class="data-td data last text-right">220</td>
<td class="data-td data last text-right" style="border-right: outset;">224</td>
<td class="data-td data last text-right">92.44</td>
<td class="data-td data last text-right">92.62</td>
<td class="data-td data last text-right">93.84</td>
<td class="data-td data last text-right" style="border-right: outset;">94.52</td>
<td class="data-td data last text-right">1.17</td>
</tr>
<tr class="tbl-data">
<td class="data-td last">B</td>
<td class="data-td data last text-right">13.43</td>
<td class="data-td data last text-right">7.89</td>
<td class="data-td data last text-right">8.05</td>
<td class="data-td data last text-right" style="border-right: outset;">7.92</td>
<td class="data-td data last text-right">317</td>
<td class="data-td data last text-right">371</td>
<td class="data-td data last text-right">358</td>
<td class="data-td data last text-right" style="border-right: outset;">392</td>
<td class="data-td data last text-right">96.46</td>
<td class="data-td data last text-right">90.73</td>
<td class="data-td data last text-right">91.76</td>
<td class="data-td data last text-right" style="border-right: outset;">91.88</td>
<td class="data-td data last text-right">0.62</td>
</tr>
<tr class="tbl-data">
<td class="data-td last">CCC</td>
<td class="data-td data last text-right">5.44</td>
<td class="data-td data last text-right">4.19</td>
<td class="data-td data last text-right">4.45</td>
<td class="data-td data last text-right" style="border-right: outset;">4.50</td>
<td class="data-td data last text-right">1,130</td>
<td class="data-td data last text-right">505</td>
<td class="data-td data last text-right">481</td>
<td class="data-td data last text-right" style="border-right: outset;">465</td>
<td class="data-td data last text-right">69.40</td>
<td class="data-td data last text-right">80.90</td>
<td class="data-td data last text-right">84.64</td>
<td class="data-td data last text-right" style="border-right: outset;">86.70</td>
<td class="data-td data last text-right">2.97</td>
</tr>
<tr class="tbl-data">
<td class="data-td last">CC</td>
<td class="data-td data last text-right">&nbsp;</td>
<td class="data-td data last text-right">0.30</td>
<td class="data-td data last text-right">0.67</td>
<td class="data-td data last text-right" style="border-right: outset;">0.99</td>
<td class="data-td data last text-right">&nbsp;</td>
<td class="data-td data last text-right">5,719</td>
<td class="data-td data last text-right">2,603</td>
<td class="data-td data last text-right" style="border-right: outset;">1,729</td>
<td class="data-td data last text-right">&nbsp;</td>
<td class="data-td data last text-right">13.00</td>
<td class="data-td data last text-right">29.14</td>
<td class="data-td data last text-right" style="border-right: outset;">43.48</td>
<td class="data-td data last text-right">49.22</td>
</tr>
<tr class="tbl-data">
<td class="data-td last">Total</td>
<td class="data-td data last text-right">100</td>
<td class="data-td data last text-right" style="border-right: outset;">100.00</td>
<td class="data-td data last text-right">285</td>
<td class="data-td data last text-right">252</td>
<td class="data-td data last text-right">259</td>
<td class="data-td data last text-right" style="border-right: outset;">263</td>
<td class="data-td data last text-right">91.20</td>
<td class="data-td data last text-right">90.32</td>
<td class="data-td data last text-right">91.90</td>
<td class="data-td data last text-right" style="border-right: outset;">92.88</td>
<td class="data-td data last text-right">1.53</td>
</tr>
</tbody>
</table>
</div>
<p class="chart-disclosure">Source: ICE Data Services, VanEck. Fallen Angels: ICE US Fallen Angel High Yield 10% Constrained Index. Not intended as a recommendation to invest or divest in any of the sectors mentioned herein. Index performance is not representative of strategy performance. It is not possible to invest in an index. BB index: ICE BofA BB US High Yield Index; Single-B index: ICE BofA Single-B US High Yield Index; CCC &amp; Lower rated index ICE BofA CCC &amp; Lower US High Yield Index.</p>
<p>To receive more <a href="/us/en/blogs/income-investing/" title="Income Investing Insights"><strong>Income Investing</strong></a> insights, <a href="/link/5f45412c2143400497908cea2897f7d3.aspx" title=" Subscription Center"><strong>sign up in our subscription center</strong></a>.</p>
]]></content:encoded>
</item><item rdf:about="https://www.vaneck.com/us/en/blogs/municipal-bonds/the-case-for-long-term-munis-positioning-for-rate-cuts/">
  <title>The Case for Long-Term Munis: Positioning for Rate Cuts></title>
  <link>https://www.vaneck.com/us/en/blogs/municipal-bonds/the-case-for-long-term-munis-positioning-for-rate-cuts/</link>
  <description><![CDATA[With potential rate cuts on the horizon, long-term municipal bonds are emerging as an attractive option due to their higher yields, tax benefits, and potential for price appreciation.]]></description>
  <dc:creator>Drew  Anderson</dc:creator>
  <dc:date>09/13/2024 06:30:00</dc:date>
<content:encoded><![CDATA[

<h2>The Case for Long-Term Munis: Positioning for Rate Cuts</h2>
<p>The Federal Funds rate has held steady at 5.33% for over a year, but the Federal Reserve (Fed) is now signaling that this period may be coming to an end. With potential rate cuts on the horizon in September, long-term municipal bonds are becoming more attractive. This blog will explore why now could be the ideal time to consider reallocating into long-term munis.</p>
<ul class="content-list">
<li class="mt-2"><a href="#fed-rate-cycles"><strong>Fed Rate Cycles and Long-Term Munis</strong></a></li>
<li class="mt-2"><a href="#case-for-longterm-munis"><strong>The Case for Long-Term Munis</strong></a></li>
<li class="mt-2"><a href="#credit-quality"><strong>Superior Credit Quality</strong></a></li>
<li class="mt-2"><a href="#historical-performance"><strong>Strong Historical Performance</strong></a></li>
<li class="mt-2"><a href="#yields-tax-benifits"><strong>Competitive Yields and Tax Benefits</strong></a></li>
<li class="mt-2"><a href="#municipal-bond-issuance"><strong>Strong Municipal Bond Issuance</strong></a></li>
</ul>
<h2 id="fed-rate-cycles" class="anchored-block">Understanding the Fed Rate Cycles and Long-Term Munis</h2>
<p>Historically, long-term bonds, including munis, tend to benefit when the Fed shifts from hawkish to dovish, and historical data shows strong returns after these shifts. This potential makes long-term munis attractive as these longer bonds offer higher income and potential total returns.</p>
<h2 id="case-for-longterm-munis" class="anchored-block">The Case for Long-Term Munis</h2>
<p>Long-term municipal bonds are emerging as a strong alternative to Treasuries. Municipal bonds are exempt from federal taxes and, in some cases, exempt from state and local taxes. They typically offer solid credit quality and can provide a higher tax-equivalent yield compared to taxable bonds. The longer the duration, the larger the potential for price appreciation during periods of interest rate cuts. For example, the ICE Long AMT-Free Broad National Municipal Index (MBNL), which tracks 'long munis,' has a modified duration to worst of 13 years. This means that if interest rates dropped by 1%, the index&rsquo;s price could potentially rise by approximately 13%. The current modified duration to worst of long munis is still near the longest it&rsquo;s been in the last ten years, meaning these bonds are more sensitive to interest rate changes than usual.</p>
<h3>Current Era of Duration is the Longest in a Decade</h3>
<p><img class="img-responsive w-100" alt="Current Era of Duration is the Longest in a Decade" src="https://www.vaneck.com/contentassets/90901891e2f44870b450d24d2113c30e/4822_long-munis-rate-cuts_chart-1_2024-9_v1_blog.svg" /></p>
<p class="chart-disclosure">Source: ICE. As of 8/31/2024. Past performance is no guarantee of future results. Modified Duration measures a bond&rsquo;s sensitivity to interest rate changes that reflect the change in a bond&rsquo;s price given a change in yield. Please see index definitions disclosures at the bottom of the page. Index performance is not illustrative of fund performance. It is not possible to invest directly in an index.</p>

<h2 id="credit-quality" class="anchored-block">Superior Credit Quality</h2>
<p>Long-term munis credit quality is better compared to a decade ago. Improved credit rating processes and the enhanced financial health of issuers have led to lower default rates for municipal bonds relative to corporate bonds. Ratings illustrate this strength in quality. According to ICE, the average credit rating for municipal bonds has steadily improved over the past decade, rising from 760 to 780. Meanwhile, the average credit rating for U.S. Treasuries dropped from 864 to 816 after Fitch downgraded them to AA+. Muni credit ratings have become a comparable alternative to those of U.S. Treasuries.</p>
<h3>Munis and Treasuries Have Similar Credit Quality</h3>
<p><img class="img-responsive w-100" alt="Munis and Treasuries Have Similar Credit Quality" src="https://www.vaneck.com/contentassets/90901891e2f44870b450d24d2113c30e/4822_long-munis-rate-cuts_chart-2_2024-9_v1_blog.svg" /></p>
<p class="chart-disclosure">Source: ICE. As of 8/31/2024. Past performance is no guarantee of future results. The ICE Average Credit Rating is a composite rating calculating using simple averages of ratings from Moody&rsquo;s, S&amp;P and Fitch. The composite rating is calculated by assigning a numeric equivalent to the ratings in each agency&rsquo;s scale. See index definitions and disclosures at the bottom of the page. Index performance is not illustrative of fund performance. It is not possible to invest directly in an index.</p>
<h2 id="historical-performance" class="anchored-block">Strong Historical Performance</h2>
<p>Long-term munis have demonstrated resilience during market transitions and are well-positioned to bounce back as rate cuts potentially begin. Their market position is expected to strengthen further.</p>
<h3>Long-Term Munis Outperformance During Rate Cuts</h3>
<p><img class="img-responsive w-100" alt="Long-Term Munis Outperformance During Rate Cuts" src="https://www.vaneck.com/contentassets/90901891e2f44870b450d24d2113c30e/4822_long-munis-rate-cuts_chart-3_2024-9_v1_blog.svg" /></p>
<p class="chart-disclosure">Source: ICE. As of 8/31/2024. Past performance is no guarantee of future results. See index definitions disclosures at the bottom of the page. Index performance is not illustrative of fund performance. It is not possible to invest directly in an index.</p>

<h2 id="yields-tax-benifits" class="anchored-block">Competitive Yields and Tax Advantages</h2>
<p>Long-term munis offer competitive yields when compared to other fixed-income assets. Proposed changes in top marginal tax rates could increase demand for tax-exempt munis, especially with the potential sunsetting of the Tax Cuts and Jobs Act (TCJA) in 2025. This would bring back a top marginal rate of 39.6%. The election could have a significant impact on munis, depending on how the future administration handles the top marginal tax rate. Former President Trump has previously suggested extending the TCJA, while Vice President Harris will likely let the TJCA expire.</p>
<h3>Long-Term Munis Top Other Bond Categories in Yield to Worst</h3>
<p><img class="img-responsive w-100" alt="Long-Term Munis Top Other Bond Categories in Yield to Worst" src="https://www.vaneck.com/contentassets/90901891e2f44870b450d24d2113c30e/4822_long-munis-rate-cuts_chart-4_2024-9_v1_blog.svg" /></p>
<p class="chart-disclosure">Source: ICE. As of 8/26/2024. Yield to Worst (YTW) is a measure of the lowest possible yield that can be received on a bond that fully operates within the terms of its contract without defaulting. See index definitions disclosures at the bottom of the page. Index performance is not illustrative of fund performance. It is not possible to invest directly in an index.</p>
<h2 id="municipal-bond-issuance" class="anchored-block">Strong Municipal Bond Issuance</h2>
<p>Lastly, the supply of municipal bonds has gotten off to a big start this year. Even with the possibility of lower rates in the future, issuers have issued more new debt than ever in the last decade. Issuers may be getting ahead of the U.S. election. The increased issuance earlier this year presents a unique buying opportunity due to the higher supply, often leading to better prices for investors.</p>
<h3>Muni Issuance this Year (Through July) is the Highest in a Decade</h3>
<p><img class="img-responsive w-100" alt="Muni Issuance this Year (Through January) is the Highest in a Decade" src="https://www.vaneck.com/contentassets/90901891e2f44870b450d24d2113c30e/4822_long-munis-rate-cuts_chart-5_2024-9_v1_blog.svg" /></p>
<p class="chart-disclosure">Source: Bloomberg . As of July 31, 2024.</p>
<p>To receive more <a href="https://www.vaneck.com/us/en/insights/municipal-bonds/" title="Municipal Bonds Insights"><strong>Municipal Bonds</strong></a> insights, <a href="/link/5f45412c2143400497908cea2897f7d3.aspx" title=" Subscription Center"><strong>sign up in our subscription center</strong></a>.</p>
]]></content:encoded>
</item><item rdf:about="https://www.vaneck.com/us/en/blogs/emerging-markets-equity/india-is-the-most-promising-emerging-market/">
  <title>India Is the Most Promising Emerging Market></title>
  <link>https://www.vaneck.com/us/en/blogs/emerging-markets-equity/india-is-the-most-promising-emerging-market/</link>
  <description><![CDATA[VanEck&rsquo;s Angus Shillington joined the Forward Guidance podcast to discuss the bright prospects for India and address common misperceptions about the related investment opportunity.]]></description>
  <dc:creator>Angus Shillington</dc:creator>
  <dc:date>09/12/2024 06:30:00</dc:date>
<content:encoded><![CDATA[

<p>India&rsquo;s transformational reforms, digitization and favorable demographics are propelling the country&rsquo;s growth, and its equity market is one of the highest performing markets of the past decade. According to the International Monetary Fund (IMF), India is on track to become the third-largest country by GDP within the next five years. Such significant economic growth is not just a reflection of the country&rsquo;s vast population but is indicative of its robust economic activities, rising consumer base, and the entrepreneurial spirit that thrives within its borders.</p>

<p>However, India&rsquo;s growth story comes with nuances. Its equity market is often perceived as expensive compared to other emerging markets like China, but this valuation reflects strong economic reforms, a vibrant digital economy and lower risk profile. For investors, the key lies in understanding these dynamics and strategically navigating India's diverse investment landscape to capitalize on its long-term growth potential. In a recent Forward Guidance podcast, Angus Shillington explores this opportunity in detail and addresses common misconceptions about India.</p>
<p>Key takeaways from the podcast include:</p>
<ul class="content-list">
<li class="mt-2"><strong>Economic transformation:</strong> Robust reforms, rapid digitization and heavy infrastructure investment are driving increased productivity, reduced costs and greater efficiency, boosting its appeal to investors.</li>
<li class="mt-2"><strong>Sector opportunities in India:</strong> Growth in sectors like digital infrastructure, consumer finance, logistics, and industrials is driven by companies leveraging digital platforms and an expanding middle class.</li>
<li class="mt-2"><strong>Challenges and market perception:</strong> Although Indian equities are seen as expensive relative to other emerging markets, valuations need to be viewed in the context of their growth prospects, quality and lower risk profile.</li>
</ul>

<p>To receive more <a href="/us/en/insights/emerging-markets-equity/" title="Emerging Markets Equity Insights"><strong>Emerging Markets Equity</strong></a> insights, <a href="/us/en/subscribe/" title="Subscription Center"><strong>sign up in our subscription center</strong></a>.</p>
]]></content:encoded>
</item><item rdf:about="https://www.vaneck.com/us/en/blogs/investment-outlook/prepare-for-election-outcomes-views-from-our-portfolio-managers/">
  <title>Prepare for Election Outcomes: Views from Our Portfolio Managers></title>
  <link>https://www.vaneck.com/us/en/blogs/investment-outlook/prepare-for-election-outcomes-views-from-our-portfolio-managers/</link>
  <description><![CDATA[From broad macro perspectives to outlooks for specific asset classes, here are insights from our portfolio managers to get your portfolio ready for the upcoming election.]]></description>
  <dc:creator> </dc:creator>
  <dc:date>09/11/2024 06:30:00</dc:date>
<content:encoded><![CDATA[

<p>With the election just around the corner, investors are preparing for the potential ripple effects across the economy and capital markets. At a high level, <a href="https://www.vaneck.com/us/en/news-and-insights/thought-leaders/jan-van-eck/" title="Jan van Eck &mdash; Chief Executive Officer"><strong>CEO Jan van Eck</strong></a> has discussed <a href="https://www.vaneck.com/us/en/blogs/investment-outlook/jan-van-eck-global-growth-returns-and-the-2025-fiscal-reckoning/" title="Global Growth Returns and the 2025 Fiscal Reckoning"><strong>how large fiscal deficits continue to be</strong></a>, thanks to the boom in government spending. This has contributed to <strong><a href="https://www.vaneck.com/us/en/blogs/investment-outlook/jan-van-eck-adapt-your-portfolio-for-market-distortions-and-fiscal-risks/" title="Adapt Your Portfolio for Market Distortions and Fiscal Risks">higher for longer inflation and helps explain why the Fed hasn&rsquo;t been easing</a></strong>.</p>
<p>The Trump and Biden administrations have been large spenders, creating a budget deficit of 7% despite being in an economic boom with low unemployment. Medicare and Social Security deficits are looming, which sets 2025 up to be a critical year for fiscal policy.</p>
<p>To provide investors further guidance on how to manage their portfolios through the remainder of the year, we asked a group of our experienced investment professionals these three questions:</p>
<ol class="content-list">
<li class="mt-2">How do issues around the election impact your outlook for your asset class?</li>
<li class="mt-2">Are there particular indicators investors should be watching closely?</li>
<li class="mt-2">What do you view as the biggest risks and opportunities in your space through the end of 2024?</li>
</ol>
<p>Find below their insights on what to look out for in their respective asset classes.</p>
<ul class="content-list">
<li class="mt-2"><a href="#digital-assets"><strong>Digital Assets: Regulation and De-Dollarization</strong></a></li>
<li class="mt-2"><a href="#emerging-markets-bond"><strong>Emerging Markets Bond: Fiscal Dominance Subdues DM, Benefits EM</strong></a></li>
<li class="mt-2"><a href="#emerging-markets-equity"><strong>Emerging Markets Equity: Keep an Eye on Trade Intensity</strong></a></li>
<li class="mt-2"><a href="#gold"><strong>Gold: Will Demand from Western Investors Return?</strong></a></li>
<li class="mt-2"><a href="#global-resources"><strong>Global Resources: All Eyes on Global Growth</strong></a></li>
<li class="mt-2"><a href="#fixed-income"><strong>Fixed Income: Stay on the Short-End of Fixed Income</strong></a></li>
<li class="mt-2"><a href="#municipal-bonds"><strong>Municipal Bonds: Lower Rates Should Help Municipal Borrowers</strong></a></li>
</ul>
<h2 id="digital-assets" class="jump-link-nav anchored-block" data-jumplink-title="Digital Assets">Digital Assets: Regulation and De-Dollarization</h2>
<!--<p><a href="https://www.vaneck.com/us/en/news-and-insights/thought-leaders/matthew-sigel/" title="Matthew Sigel &mdash; Head of Digital Assets Research"><strong>Matthew Sigel, Head of Digital Assets Research</strong></a></p>--> <!------>
<div class="d-flex justify-content-between align-items-center row my-3">
<div class="col-md-12">
<div class="byline__author">
<div class="porthole porthole--lg byline__author-image no-print mr-3" style="background-image: url('https://www.vaneck.com/globalassets/home/us/insights/thought-leaders/img-tl-matthew-sigel-645px.jpg');"><img alt="David Schassler Head of Multi-Asset Solutions" class="porthole__image" src="https://www.vaneck.com/globalassets/home/us/insights/thought-leaders/img-tl-matthew-sigel-645px.jpg" /></div>
<div style="position: relative;" class="byline__author-content"><a data-ve-gtm="blog-author" class="byline__author-name-link" href="/link/b2b937a9c48a476890a9e6e7ad308413.aspx?latest=true" title="Matthew Sigel &mdash; Head of Digital Assets Research">
<h3 class="byline__author-name mt-0">Matthew Sigel</h3>
</a>
<div class="byline__author-title">Head of Digital Assets Research</div>
</div>
</div>
</div>
</div>
<!------>
<p><strong>Outlook</strong></p>
<p>The upcoming election will be a pivotal moment for the digital assets space, as fiscal and monetary policies could diverge significantly depending on the administration in power. Digital assets have shown a strong correlation to a weak dollar and money supply growth, making them particularly sensitive to shifts in these areas. Additionally, if Kamala Harris were to retain Gary Gensler as SEC Chair or align closely with the Elizabeth Warren wing of the Democratic Party when it comes to finance policy, we could see a tightening regulatory environment that would likely dampen institutional adoption of digital assets. Conversely, a Trump presidency is generally bullish for the ecosystem, including Bitcoin, Ethereum, and even less mature projects, as it may lead to a more lenient regulatory framework. While Bitcoin and Ethereum, whose regulatory status is clearer, might still thrive under Harris, the broader crypto market would likely face more headwinds.</p>
<p><strong>Indicators to Watch</strong></p>
<p>Investors should closely monitor the actions of central banks, particularly around interest rates and money supply, as these are critical to the liquidity that drives digital asset markets. Additionally, there is a growing trend of countries mining Bitcoin at the government level&mdash;seven nations now, with three new entrants this year. This trend is a key indicator of the global shift towards de-dollarization. Russia's pilot of cross-border trade denominated in crypto, for example, raises questions about which nations might follow suit. The implications for Bitcoin are significant, as government-level mining and cross-border crypto transactions could bolster Bitcoin&rsquo;s role as a global reserve asset, as we wrote about in <a href="https://www.vaneck.com/us/en/blogs/digital-assets/matthew-sigel-bitcoin-2050-valuation-scenarios-global-medium-of-exchange-and-reserve-asset" title="Bitcoin 2050 Valuation Scenarios: Global Medium of Exchange and Reserve Asset"><strong>recent research</strong></a>. As de-dollarization gains momentum, we anticipate more countries and increased governmental involvement in digital assets, especially Bitcoin. Of course, we will also be closely watching institutional inflows or outflows into crypto ETFs, as these can serve as leading indicators of broader market sentiment.</p>
<p><strong>Risks and Opportunities</strong></p>
<p>The biggest risk and opportunity in the digital asset space through the end of the year hinges on the U.S. election, which will set the tone for regulation and institutional adoption for the next four years. Historically, markets tend to be jittery during the uncertainty phase of an election cycle but often rally once the winner is confirmed. We believe the upside is larger for digital assets under a Trump presidency, which might foster a more favorable regulatory environment. Conversely, a Harris victory could present challenges, particularly for projects beyond Bitcoin and Ethereum. However, unless the election outcome is heavily disputed, Bitcoin should benefit as the reality of four more years of potentially reckless fiscal policy solidifies.</p>
<p><a href="https://www.vaneck.com/us/en/insights/digital-assets/" title="Digital Assets Insights"><strong>Explore more Digital Assets Insights.</strong></a></p>
<h2 id="emerging-markets-bond" class="jump-link-nav anchored-block" data-jumplink-title="Emerging Markets">Emerging Markets Bond: Fiscal Dominance Subdues DM, Benefits EM</h2>
<!--p><a href="https://www.vaneck.com/us/en/news-and-insights/thought-leaders/eric-fine/" title="Eric Fine &mdash; Portfolio Manager, Head of Active Emerging Markets Debt"><strong>Eric Fine, Portfolio Manager, Head of Active Emerging Markets Debt</strong></a></p-->
<div class="d-flex justify-content-between align-items-center row my-3">
<div class="col-md-12">
<div class="byline__author">
<div class="porthole porthole--lg byline__author-image no-print mr-3" style="background-image: url('https://www.vaneck.com/globalassets/home/corp/our-firm/investment-professionals/eric-fine.jpg');"><img alt="Eric Fine Portfolio Manager, Head of Active Emerging Markets Debt" class="porthole__image" src="https://www.vaneck.com/globalassets/home/corp/our-firm/investment-professionals/eric-fine.jpg" /></div>
<div style="position: relative;" class="byline__author-content"><a data-ve-gtm="blog-author" class="byline__author-name-link" href="/us/en/news-and-insights/thought-leaders/eric-fine">
<h3 class="byline__author-name mt-0">Eric&nbsp;Fine</h3>
</a>
<div class="byline__author-title">Portfolio Manager, Head of Active Emerging Markets Debt</div>
</div>
</div>
</div>
</div>
<p><strong>Outlook</strong></p>
<p>U.S. political developments confirm our longstanding &ldquo;fiscal dominance&rdquo; theme that the risks to markets are in developed markets (DM), not emerging markets (EM). In particular, the entire U.S. election process, almost regardless of outcome, will confirm EM political and policy stability relative to DM.</p>
<p>We&rsquo;ve already seen heightened U.S. political risk in a last-minute change in the Democratic Party&rsquo;s presidential candidate and an assassination attempt on the Republican candidate. It is not clear that the U.S. election itself will be the end of these risks. These political trends are exhibiting themselves in Europe (UK riots, French and German elections) and Japan, which is also challenged by high debt and a central bank whose independence is being questioned. Juxtapose this against Indonesian, Indian, Mexican, and South African elections this year, which were largely uncontentious and most importantly all saw continuity. Indonesia and Mexico actually saw stronger incumbent parties, with India and South Africa seeing challenges to the incumbent party that still translated into great (arguably greater) economic policy continuity. All these countries adhere to fiscal rules and are backed by largely independent central banks, which were not even part of the political and policy discussion. They had elections, and voters agreed on the things bond markets care about. Not sure that can be said in many DMs.</p>
<p>What this means is more of the same. In our opinion, EM bonds will continue to outperform DM bonds. DMs like the U.S. will face greater fiscal and monetary challenges, EMs less so. Is there really any outcome other than fiscal stimulus and an asset-price focused central bank into an economic downturn following the U.S. elections, regardless of who wins the presidential election? EM central banks, on the other hand, have kept much higher real rates for longer, compared to the U.S., so the inauguration of a Fed cutting cycle should benefit EMs (especially in local currency). Also, part of our &ldquo;fiscal dominance&rdquo; theme notes that EMs are important creditors/lenders to DM. When these central banks determine what bonds they want as assets, they have always required high real rates and good fiscal policy. We are not seeing this in DMs like the U.S., though, these central banks are increasingly using EM bonds as assets and decreasingly using DM bonds as assets. A Fed rate-cutting cycle at this stage will only diminish the attractiveness of DM bonds relative to EM.</p>
<p><strong>Indicators to Watch</strong></p>
<p>Stability in the Chinese yuan (CNY) has shielded many EMs, particularly in Asia. During the August yen carry-trade unwind, JPY and many G-10 currencies were very volatile. But not CNY, due to Chinese policy that we believe is sustainable. This allowed many EM currencies to rally during this supposed period of instability, with the Malaysian ringgit, for example, up 5% during the episode.</p>
<p><strong>Risks and Opportunities</strong></p>
<p>The biggest risks in emerging markets bonds come from DM. A sharp economic downturn in the U.S. would likely result in higher long-end interest rates, which could reprice interest rates globally. However, there are significant opportunities in EM bonds. In local-currency and hard-currency bonds, risk premia (real rates in local currency and spreads in hard currency) are high, so a rate-cutting cycle could clearly underpin EMs&mdash;particularly EM local currency markets, where EM central banks have been keeping rates arguably too high for too long waiting for the Fed. In hard currency, the spread is really in the HY sovereign space, with a number of countries winning from geopolitics (for example, replacing Russia as a commodities supplier to Europe).</p>
<p><a href="https://www.vaneck.com/us/en/insights/emerging-markets-bonds/" title="Emerging Markets Bonds Insights"><strong>Explore more Emerging Markets Bonds Insights.</strong></a></p>
<h2 id="emerging-markets-equity" class="anchored-block">Emerging Markets Equity: Keep an Eye on Trade Intensity</h2>
<!--p><a href="/EPiServer/CMS/Content/en/us/insights/thought-leaders/ola-el-shawarby,,210821/?epieditmode=false" title="Ola El-Shawarby &mdash; Portfolio Manager, Emerging Markets Equity"><strong>Ola El-Shawarby, Portfolio Manager, Emerging Markets Equity</strong></a></p-->
<div class="d-flex justify-content-between align-items-center row my-3">
<div class="col-md-12">
<div class="row align-items-center">
<div class="col-md-6">
<div class="byline__author">
<div class="porthole porthole--lg byline__author-image no-print mr-3" style="background-image: url('https://www.vaneck.com/globalassets/home/corp/our-firm/investment-professionals/ola-el-shawarby_2022.06_v1.jpg');"><img alt="Ola  El-Shawarby, CFA Portfolio Manager, Emerging Markets Equity" class="porthole__image" src="https://www.vaneck.com/globalassets/home/corp/our-firm/investment-professionals/ola-el-shawarby_2022.06_v1.jpg" /></div>
<div style="position: relative;" class="byline__author-content"><a data-ve-gtm="blog-author" class="byline__author-name-link" href="/link/f98f0ec11c0043b3803f14238bacfd2d.aspx#ola-el-shawarby,-cfa">
<h3 class="byline__author-name mt-0">Ola El-Shawarby,&nbsp;CFA</h3>
</a>
<div class="byline__author-title">Portfolio Manager, Emerging Markets Equity</div>
</div>
</div>
</div>
</div>
</div>
</div>
<p><strong>Outlook</strong></p>
<p>As the U.S. elections approach, emerging markets face potential impacts from shifts in U.S. trade policies, interest rates and geopolitical stances. Specific issues vary by country but U.S.-China trade relations and technology-related policies, Mexico&rsquo;s trade agreements and Russia&rsquo;s geopolitical tensions are all critical factors. Since many of the current trade barriers put in place against China have been orchestrated by the prior Trump administration (with no meaningful improvement during the Biden era), we do not expect a very significant change in U.S.-China relations post elections, despite likely market volatility in the near term. Similarly, since U.S.-Mexico trade agreements have already been revised during the previous Trump era and the Mexico nearshoring story remains structural and strategic for the U.S., we expect stabilization after the current election noise. That said, we are keeping an eye on the ongoing less favorable judicial reform process in Mexico, which may come under criticism by the incoming U.S. administration and potentially impact U.S.-Mexican relations, particularly in the case of a Harris presidency.</p>
<p>Overall, we note a persistent drift towards lower trade intensity compared with economic growth. In part, this is driven by enhanced political appetite for home-biased industrial policies and higher tariffs. We don&rsquo;t see this changing after the November election; however, we think that the Democratic ticket may produce a more nuanced approach to China in particular. We also note that a more accommodating Fed policy leading to lower U.S. rates and potentially a weaker U.S. dollar bodes well for emerging markets overall.</p>
<p><strong>Indicators to Watch</strong></p>
<p>Investors should closely monitor campaign platforms, Federal Reserve statements, economic data releases, and changes in trade policies for early indications of policy shifts. Key indicators include currency and commodity price movements, particularly the U.S. dollar, investment flows, and market sentiment, alongside legislative and regulatory developments in the U.S. and EM countries.</p>
<p>The pace of the decline in short-end rates in the U.S. will matter for the ability of many EM central banks to cut rates.</p>
<p><strong>Risks and Opportunities</strong></p>
<p>In emerging markets equities, a key risk is a potential delay or reversal in the expected rate easing cycle within the U.S. and emerging markets, which could disrupt market stability. An uptick in the strength of the U.S. dollar is another risk factor that could negatively affect emerging market equities. Political risks are also a concern, with less favorable outcomes in upcoming elections and continued geopolitical tensions potentially creating an uncertain investment climate. Additionally, an escalation in the economic conflict between the U.S. and China could further strain international relations and market sentiment. On the opportunity side, emerging markets could benefit from lower-than-anticipated inflation in the U.S., which might lead to more aggressive interest rate cuts and a subsequent weakening of the dollar, making emerging market equities more attractive. A more decisive policy approach by the Chinese government to address the property issue and stimulate the Chinese domestic market would be a positive indicator, offering a potential boost to global market confidence. Lastly, a calming of geopolitical tensions and favorable outcomes in key upcoming elections could provide a conducive environment for market growth.</p>
<p><a href="https://www.vaneck.com/us/en/insights/emerging-markets-equity/" title="Emerging Markets Equity Insights"><strong>Explore more Emerging Markets Equity Insights.</strong></a></p>
<h2 id="gold" class="jump-link-nav anchored-block" data-jumplink-title="Natural Resources">Gold: Will Demand from Western Investors Return?</h2>
<!--p><a href="https://www.vaneck.com/us/en/news-and-insights/thought-leaders/imaru-casanova/" title="Imaru Casanova &mdash; Portfolio Manager, Gold and Precious Metals"><strong>Ima Casanova, Portfolio Manager, Gold and Precious Metals</strong></a></p-->
<div class="d-flex justify-content-between align-items-center row my-3">
<div class="col-md-12">
<div class="row align-items-center">
<div class="col-md-12">
<div class="byline__author">
<div class="porthole porthole--lg byline__author-image no-print mr-3" style="background-image: url('https://www.vaneck.com/globalassets/home/corp/our-firm/investment-professionals/imaru-casanova.jpg');"><img alt="Imaru Casanova Portfolio Manager, Gold and Precious Metals" class="porthole__image" src="https://www.vaneck.com/globalassets/home/corp/our-firm/investment-professionals/imaru-casanova.jpg" /></div>
<div style="position: relative;" class="byline__author-content"><a data-ve-gtm="blog-author" class="byline__author-name-link" href="/us/en/news-and-insights/thought-leaders/imaru-casanova/">
<h3 class="byline__author-name mt-0">Imaru&nbsp;Casanova</h3>
</a>
<div class="byline__author-title">Portfolio Manager, Gold and Precious Metals</div>
</div>
</div>
</div>
</div>
</div>
</div>
<p><strong>Outlook</strong></p>
<p>The path of U.S. monetary policy should continue to have a meaningful impact on gold prices over the near term. Specifically, we believe that the Fed&rsquo;s plans to reduce interest rates, in reaction to cooling inflation and relatively stable unemployment, signal a stronger outlook for gold. Historically, this has often proven to be the case.</p>
<h3>Gold Historically Performs Well Following First Fed Rate Cuts</h3>
<p><img class="img-responsive w-100" alt="Gold Historically Performs Well Following First Fed Rate Cuts" src="https://www.vaneck.com/contentassets/a8e6d8e537dc4d42ba0ca773325719c8/4812_election-outlook_chart-1_2024-9_v1_blog.svg" /></p>
<p class="chart-disclosure">Source: JPMorgan, VanEck. Data as of July 31, 2024. Past performance is not indicative of future results.</p>
<p>The next U.S. administration&rsquo;s plans for stimulus measures, foreign policy and environmental regulation are also worth monitoring, as these factors can have significant implications for both the price of gold and the broader mining industry. For now, substantial stimulus measures or an escalation of geopolitical tensions, irrespective of the governing party, are viewed as &ldquo;gold-positive&rdquo; factors.</p>
<p><strong>Indicators to Watch</strong></p>
<p>Beyond the factors mentioned above, investors should continue to monitor U.S. inflation trends and leading indicators of recession. A resurgence of inflation or early signs of a recession could unsettle U.S. markets, potentially triggering a shift from equities to safe-haven assets like gold.</p>
<p>For gold miners, we believe it is crucial to track both the price of gold as well as All-In Sustaining Costs (AISC). These two metrics&mdash;gold price and AISC&mdash;are key determinants of miners' profit margins and serve as a good barometer of their financial health. Currently, with costs remaining relatively contained and gold prices at all-time highs, we see the potential for significant free cash flow generation among miners.</p>
<h3>Margins for Miners Healthy Despite Higher Costs</h3>
<div class="wrapped-div">
<table style="width: 100%;">
<tbody>
<tr class="tbl-data">
<td class="tbl-header last">Company</td>
<td class="tbl-header last text-right">AISC ($)</td>
<td class="tbl-header last text-right">Gold Price (Avg., $/oz)</td>
<td class="tbl-header last text-right">Implied Margin ($)</td>
</tr>
<tr class="tbl-data">
<td class="data-td last">10-Year Average (thru Q4 2023)</td>
<td class="data-td data last text-right">1,053</td>
<td class="data-td data last text-right">1,497</td>
<td class="data-td data last text-right">444</td>
</tr>
<tr class="tbl-data">
<td class="data-td last">5-Year Average (thru Q4 2023)</td>
<td class="data-td data last text-right">1,156</td>
<td class="data-td data last text-right">1,747</td>
<td class="data-td data last text-right">591</td>
</tr>
<tr class="tbl-data">
<td class="data-td last">Q1 2024</td>
<td class="data-td data last text-right">1,429</td>
<td class="data-td data last text-right">2,072</td>
<td class="data-td data last text-right">643</td>
</tr>
<tr class="tbl-data">
<td class="data-td last"><strong>Q2 2024</strong></td>
<td class="data-td data last text-right"><strong>1,428</strong></td>
<td class="data-td data last text-right"><strong>2,338</strong></td>
<td class="data-td data last text-right"><strong>910</strong></td>
</tr>
</tbody>
</table>
</div>
<p class="chart-disclosure">The all-in sustaining cost (AISC) is a metric used by gold mining companies to calculate the cost of their mining operations.</p>
<p class="chart-disclosure">Source: Scotiabank, VanEck. Data as of June 30, 2024.</p>
<p><strong>Risks and Opportunities</strong></p>
<p>The biggest opportunities for gold, in our view, are: 1) the potential return of Western investors to gold, and 2) continued strong purchasing by central banks. Investment demand, traditionally the main driver of gold prices, has been relatively weak during the latest gold rally. We believe that renewed interest from Western investors, driven by heightened risks to the U.S. economy, could propel gold prices to $2,700 to $2,800 per ounce.</p>
<p>Additionally, despite robust purchases of gold in recent years, central banks in emerging markets remain underexposed to gold relative to their total reserves, with indications of further increases. If both investor and central bank demand for gold and gold equities continues to improve, this additional demand could significantly boost gold prices and the valuations of gold stocks.</p>
<p>The biggest risk to gold prices remains the possibility of a &ldquo;soft landing&rdquo; for the U.S. economy, where sustained positive growth is achieved alongside consistently lower inflation. In such a scenario, investors may favor &ldquo;growthier&rdquo; assets like technology stocks over gold.</p>
<p><a href="https://www.vaneck.com/us/en/insights/gold-investing/" title="Gold Insights"><strong>Explore more Gold Insights.</strong></a></p>
<h2 id="global-resources" class="anchored-block">Natural Resources: All Eyes on Global Growth</h2>
<div class="d-flex justify-content-between align-items-center row my-3">
<div class="col-md-12">
<div class="row align-items-center">
<div class="col-md-6">
<div class="byline__author">
<div class="porthole porthole--lg byline__author-image no-print mr-3" style="background-image: url('https://www.vaneck.com/globalassets/home/corp/our-firm/investment-professionals/shawn-reynolds.jpg');"><img alt="Shawn Reynolds Portfolio Manager, Global Resources" class="porthole__image" src="https://www.vaneck.com/globalassets/home/corp/our-firm/investment-professionals/shawn-reynolds.jpg" /></div>
<div style="position: relative;" class="byline__author-content"><a data-ve-gtm="blog-author" class="byline__author-name-link" href="/us/en/news-and-insights/thought-leaders/shawn-reynolds/#shawn-reynolds">
<h3 class="byline__author-name mt-0">Shawn&nbsp;Reynolds</h3>
</a>
<div>
<div class="byline__author-title">Portfolio Manager, Global Resources</div>
</div>
</div>
</div>
</div>
</div>
</div>
</div>
<!--p><a href="https://www.vaneck.com/us/en/news-and-insights/thought-leaders/shawn-reynolds/" title="Shawn Reynolds &mdash; Portfolio Manager, Global Resources"><strong>Shawn Reynolds, Portfolio Manager, Global Resources</strong></a></p-->
<p><strong>Outlook</strong></p>
<p>We continue to believe there is a compelling rationale to invest in global resources to protect against event risks. Geopolitics currently remains the most pressing issue from a macroeconomic perspective. The ongoing war between Russia and Ukraine, mounting tensions in the Middle East, and planned tariffs on Chinese imports into the U.S. and Europe are just a few of the adjacent factors having a meaningful impact on commodity prices today. Global elections&mdash;and speculation about how incoming administrations will engage on these issues&mdash;appear to be intensifying matters.</p>
<p><strong>Indicators to Watch</strong></p>
<p>At the macro level, aside from the issues noted above, we continue to keep a close eye on U.S. inflation and global growth. Historically, inflation has had a way of persisting and resource equities have always exhibited some form of leverage to global growth.</p>
<p>At the industry level, we continue to monitor capital allocation decisions &ndash; capital expenditures, dividends, share repurchases and inorganic growth as well as overall balance sheet health. Moderated levels of spending on new resource growth continue to have long-term, structural supply implications while investors&rsquo; demands for free cash flow generation and return of capital remain a priority.</p>
<p><strong>Risks and Opportunities</strong></p>
<p>The biggest risk to commodities and resource equities is a muted global growth outlook and/or full-on economic recession. Such an environment could put commodity prices at risk and create considerable operating headwinds for associated producers.</p>
<p>Lower rates have the potential to stimulate economic growth, which is generally price-positive for commodities. In our view, interest rate cuts also present meaningful opportunity for renewable resource companies, which generally tend to benefit by way of more favorable financing terms.</p>
<p><a href="https://www.vaneck.com/us/en/insights/natural-resources/" title="Natural Resources Insights"><strong>Explore more Natural Resources Insights.</strong></a></p>
<h2 id="fixed-income" class="jump-link-nav anchored-block" data-jumplink-title="Income">Fixed Income: Stay on the Short-End of Fixed Income</h2>
<div class="d-flex justify-content-between align-items-center row my-3">
<div class="col-md-12">
<div class="row align-items-center">
<div class="col-md-6">
<div class="byline__author">
<div class="porthole porthole--lg byline__author-image no-print mr-3" style="background-image: url('https://www.vaneck.com/globalassets/home/corp/our-firm/investment-professionals/fran-rodilosso.jpg');"><img alt="Fran Rodilosso Head of Fixed Income ETF Portfolio Management" class="porthole__image" src="https://www.vaneck.com/globalassets/home/corp/our-firm/investment-professionals/fran-rodilosso.jpg" /></div>
<div style="position: relative;" class="byline__author-content"><a data-ve-gtm="blog-author" class="byline__author-name-link" href="/us/en/news-and-insights/thought-leaders/fran-rodilosso/">
<h3 class="byline__author-name mt-0">Fran&nbsp;Rodilosso</h3>
</a>
<div>
<div class="byline__author-title">Head of Fixed Income ETF Portfolio Management</div>
</div>
</div>
</div>
</div>
</div>
</div>
</div>
<!--p><a href="https://www.vaneck.com/us/en/news-and-insights/thought-leaders/fran-rodilosso/" title="Fran Rodilosso &mdash; Head of Fixed Income ETF Portfolio Management"><strong>Fran Rodilosso, Head of Fixed Income ETF Portfolio Management</strong></a></p-->
<p><strong>Outlook</strong></p>
<p>The election season is overlapping with a turn in U.S. monetary policy, with the first rate cut of the cycle looming some 15 months after the last hike. In many ways the market has priced in both events&mdash;the nuance being that elections have little to do with changes in the business cycle and both major parties will be reluctant to completely remove stimulus that the other has instituted (even in the case of a Republican sweep).</p>
<p>This election&rsquo;s impact is likely to be much more significant in terms of regulatory conditions and the strength of institutions that will impact the U.S. economy over the course of time than it will be on measurable economic conditions for the ensuing 12-24 months. There are of course a few &ldquo;soundbite&rdquo; policy initiatives that could also have a more immediate impact on the market, including the threat of removing Fed independence, major changes in capital gains treatment and blanket tariffs. If and to what degree these soundbites turn into viable policy initiatives will be a 2025 question.</p>
<p>Therefore, we see the election results as having limited immediate impact on rates, domestic credit, or emerging markets credit. Unfortunately, some of the longer-term dynamics in place&mdash;a federal deficit that will exceed 7% of GDP for years to come, resource scarcity especially around energy transition, and global conflicts&mdash;eventually will catch up with markets. The deficit issue itself will keep us cautious on Treasuries and duration for the foreseeable future.</p>
<p><strong>Indicators to Watch</strong></p>
<p>During the mini growth panic this past summer, credit markets displayed much lower volatility than one would have expected given the moves in equities. With the yield curve inverted and credit spreads tight for most of the last two years, credit has continued to flow freely via the public bond and private credit markets. The stress that has defined the commercial real estate sector has not spilled over to other areas of the capital markets. These indicators (among others) signal that financial conditions have remained somewhat easy despite the more than 500 bps of rate hikes. We believe the first real signs of durable market stress and a potential recession will show through in the debt markets. We will remain on the lookout for liquidity events, downgrade trends and increased dispersion in credit market pricing, all of which would also show up in wider spreads.</p>
<p><strong>Risks and Opportunities</strong></p>
<p>A rate shock would be the event that catches most of the market off balance at this point. We have seen shifts in investor positioning in anticipation of lower rates across the curve, and some of the calm in credit markets is certainly ascribable to the expectation of reasonable refinancing rates for borrowers. Any dollar strength that would accompany unexpectedly higher rates would likely hit EMs hard as well. The most likely causes of a rate shock would be unexpectedly high growth and/or an inflation spike, but mounting debt or Fed independence issues could shake market confidence at some point as well. We believe that maintaining front-end exposure (where yields remain higher) and a quality bias within credit will continue to earn attractive carry and protect against both a rate shock/spread widening event and a growth-led credit scare. Extending duration via a barbell approach is one way to maintain a healthy amount of front-end exposure, and we like the use of <a href="https://www.vaneck.com/us/en/blogs/income-investing/clos-now-a-core-necessity/" title="CLOs Now a Core Necessity"><strong>investment grade CLOs</strong></a> for this purpose.</p>
<p>As we remain on the lookout for a turn in the credit markets, we believe that <a href="https://www.vaneck.com/us/en/blogs/income-investing/fallen-angel-bonds-higher-quality-high-yield/" title="Fallen Angel Bonds: Higher Quality High Yield"><strong>fallen angel high yield bonds</strong></a> could emerge as one of the more exciting opportunities, and within high yield allocations, their high BB exposure should provide some downside protection into such a turn. On balance, we see emerging markets debt as one of the few bastions of value and a defense against the rising debt/deficit situation in the U.S., as well as the possible political disruption that could follow election day. Further fiscal stimulus in the U.S. will benefit EM assets as well.</p>
<p><a href="https://www.vaneck.com/us/en/insights/income-investing/" title="Income Investing Insights"><strong>Explore more Income Investing Insights.</strong></a></p>
<h2 id="municipal-bonds" class="anchored-block">Municipal Bonds: Lower Rates Should Help Municipal Borrowers</h2>
<!--p><a href="/EPiServer/CMS/Content/en/us/insights/thought-leaders/tamara-lowin,,247359/?epieditmode=false" title="Tamara Lowin &mdash; Senior Credit Analyst"><strong>Tamara Lowin, Senior Credit Analyst, Municipal Bonds</strong></a></p-->
<div class="d-flex justify-content-between align-items-center row my-3">
<div class="col-md-12">
<div class="row align-items-center">
<div class="col-md-6">
<div class="byline__author">
<div class="porthole porthole--lg byline__author-image no-print mr-3" style="background-image: url('https://www.vaneck.com/globalassets/home/us/insights/thought-leaders/tamara-lowin_2022.06_v1.jpg');"><img alt="Tamara  Lowin Senior Municipal Credit Analyst" class="porthole__image" src="https://www.vaneck.com/globalassets/home/us/insights/thought-leaders/tamara-lowin_2022.06_v1.jpg" /></div>
<div style="position: relative;" class="byline__author-content"><a data-ve-gtm="blog-author" class="byline__author-name-link" href="/link/9217c92d0f9a407e8b869d637f8a9cce.aspx">
<h3 class="byline__author-name mt-0">Tamara&nbsp;Lowin</h3>
</a>
<div>
<div class="byline__author-title">Senior Municipal Credit Analyst</div>
</div>
</div>
</div>
</div>
</div>
</div>
</div>
<p><strong>Outlook</strong></p>
<p>On a federal level, investors are most focused on the municipal tax exemption. While the ultimate objective of the tax exemption is to reduce borrowing costs for municipal borrowers, it is often viewed as a tax shelter for the wealthy who, with the highest tax bracket, have the most to gain in tax-exempt income. The constant re-education of staffers and representatives on the Hill is always required, but the current budget challenges and an additional $4 billion expense, if the Tax Cuts and Jobs Act of 2017 is extended, argue for some form of municipal tax exemption remaining in the conversation. Relatedly, changes in federal income tax rates and the AMT exemption are high on our watch list.</p>
<p>We are also watching regulations, elections, constitutional amendments and tax resolutions on state ballots this fall. Utah&rsquo;s proposed constitutional amendment would likely result in lower school funding, for example. Several states want to reduce property tax burdens, and Washington State is looking to repeal its capital gains tax. All of these could impact the credit strength of municipal bonds. Past funding and regulation have significantly impacted the quality and accessibility of healthcare across states (and thus the healthcare providers). We are looking at ballot initiatives and races that could impact future funding, nursing home bed count, and any regulations like professional to patient requirements.</p>
<p><strong>Indicators to Watch</strong></p>
<p>The mass exodus of local government employees, teachers and healthcare professionals from the workforce remains a significant financial stress on the education and healthcare sectors, as salary and wage expenses increase significantly and are unlikely to decline as long as temporary employees are required. Employment and wage-related trends on both federal and state levels will indicate if and where the pressure will be relieved. Home sales and mortgage applications will likewise indicate consumer confidence and state migration trends.</p>
<p><strong>Risks and Opportunities</strong></p>
<p>Declining interest rates mean municipal borrowers can more easily access the market. Projects that were shelved due to higher borrowing rates are becoming more affordable as interest rates decline. Strained borrowers will once more have the opportunity to refinance existing debt to reduce the pressure of their annual debt payments&mdash;a long tradition in the municipal market that has not been available over the past few years. In high yield sectors seeing an increase in stressed borrowers, the reemergence of refinancing means struggling municipal borrowers have a mattress at the bottom of the cliff. As a result, we expect to see an increase in debt issuance in the fourth quarter.</p>
<p><a href="https://www.vaneck.com/us/en/insights/municipal-bonds/" title="Municipal Bonds Insights"><strong>Explore more Municipal Bonds Insights.</strong></a></p>
<p>To receive more <a href="/us/en/insights/investment-outlook" title="Investment Outlook Insights"><strong>Investment Outlook</strong></a> insights, <a href="https://www.vaneck.com/us/en/subscribe/" title="Subscription Center"><strong>sign up in our subscription center</strong></a>.</p>
<style>
    .data-td.data {
        padding-right: 5px !important;
    }

    .wrapped-div {
        max-width: 100%;
    }

    @media (max-width: 1240px) {
        .wrapped-div {
            overflow-x: scroll;
        }
    }

    .wrapped-div-sector {
        max-width: 100%;
        overflow-x: scroll;
    }
</style>
]]></content:encoded>
</item><item rdf:about="https://www.vaneck.com/us/en/blogs/gold-investing/ima-casanova-as-gold-hits-high-miners-remain-an-opportunity/">
  <title>As Gold Hits High, Miners Remain an Opportunity></title>
  <link>https://www.vaneck.com/us/en/blogs/gold-investing/ima-casanova-as-gold-hits-high-miners-remain-an-opportunity/</link>
  <description><![CDATA[Spot Gold Hits Record Highs in August, but Gold Stocks Lag&mdash;Are Equities Ready for a Turnaround?]]></description>
  <dc:creator>Imaru Casanova</dc:creator>
  <dc:date>09/11/2024 06:30:00</dc:date>
<content:encoded><![CDATA[

<p>Monthly gold market and economic insights from Imaru Casanova, Portfolio Manager, featuring her unique views on mining and gold&rsquo;s portfolio benefits.</p>

<h2>Here comes the volatility</h2>
<p>August 2024 was a month of significant volatility in global financial markets. On August 5, a sharp sell-off in equities spread across the globe. The primary trigger appears to have been a surprise rate hike from Japan's central bank after decades of near-zero rates, which led to a sudden unwinding of carry trades and a dramatic sell-off in global equities. TOPIX (Tokyo Stock Price Index)<sup>1</sup>&nbsp;saw its largest one-day drop since 1987, falling by 12%. In the United States, the S&amp;P 500<sup>2</sup>&nbsp;and Nasdaq Composite<sup>3</sup>&nbsp;indices also experienced significant declines. The turbulence was exacerbated by fears that the U.S. economic expansion may be coming to an end (following a weaker than expected July jobs report), while the rest of the world&rsquo;s economies are struggling.</p>
<h2>Not immune, but resilient&hellip;</h2>
<p>Gold and gold equities were not immune to the turmoil, but like the rest of the markets, managed to bounce back after the panic subsided. Supported by expectations of lower interest rates, financial markets stabilized towards month end. During his Jackson Hole speech<sup>*</sup>, U.S. Federal Reserve Chairman Jerome Powell said, &ldquo;the time has come for policy to adjust&rdquo;, reaffirming expectations for a rate cut in September. Gold set new records once again in August, trading above the $2,500 per ounce level by mid-month, and reaching an all-time high of $2,524.64 at the close on August 27. Gold was up $55.79 (2.28%) during the month of August, closing at $2,503.39 per ounce on August 30.</p>
<p>Gold stocks also bounced back after the early August &ldquo;everything&rdquo; sell-off, although the larger caps fared much better than the smaller companies. NYSE Arca Gold Miners Index (GDMNTR)<sup>4</sup>&nbsp;was up 2.44% during the month, while the MVIS Global Juniors Gold Miners Index (MVGDXJTR)<sup>5</sup>&nbsp;was up only 0.42%.</p>
<h2>Where&rsquo;s the leverage?</h2>
<p>Gold stocks didn&rsquo;t outperform gold bullion in August. This is surprising considering that gold reached new highs, and that the cash flow generation and the valuations of these companies have most certainly improved. We estimate that, on average for the sector, margins expanded by about 8% in August compared to July. This is based on average all-in sustaining costs for the sector of around $1,400 per ounce and average gold spot prices for July and August of $2,392 and $2,470, respectively. Similarly, for those companies not yet in production (smaller caps), the value of their estimated gold in the ground has increased with the higher spot price, yet their valuations were practically unchanged during the month.</p>
<p>This suggests that the market is not yet valuing in these record gold prices. In their most recent Gold Monthly Statistics, Scotiabank estimates that the gold price reflected in the gold mining equities is on average about a 23% discount to current spot gold price. Scotiabank&rsquo;s report also contains historical data for a variety of valuation metrics for the sector which show that current valuations are at historical lows. Today, the adjusted market capitalization of Scotiabank&rsquo;s universe per ounce of reserves in the ground is at the lowest multiple to the gold price as it has ever been.</p>
<h2>Replacing gold reserves is getting harder</h2>
<p>Yet, replacing these reserves is harder today than it has ever been before, which, in theory, should render each ounce more valuable. BofA Global Research (via S&amp;P Global Market Intelligence data), estimates a sharp decline in the number of new gold discoveries, from an average of about 18 discoveries annually from 1990-1999, to 12 annual discoveries in the 2000s, to just 4 in the 2010s.<sup>&dagger;</sup>&nbsp;They estimate there have been only 5 major gold discoveries from 2020 to 2023. Finding large, economic gold deposits is becoming increasingly harder.</p>
<h3>Global Gold Discoveries &amp; Exploration Budgets</h3>
<p><img class="img-responsive w-100" alt="Global Gold Discoveries &amp; Exploration Budgets" src="https://www.vaneck.com/contentassets/69111d3b33c54b4987f6217082fd134e/4809_gold_chart-1_2024-9_v1_blog.svg" /></p>
<p class="chart-disclosure">Source: BofA Global Research (via S&amp;P Global Market Intelligence). Data as of August 2024.</p>

<p>We expect the gold price to remain supported around current levels with potential to go even higher when western investors decide it is time to search for the benefits gold has historically offered. This should eventually lead to more appetite for gold stocks and a re-rating of the sector to reflect valuation multiples more in-line with those observed in previous gold bull markets.</p>
<h3>Adjusted Market Cap per Ounce of Reserve (Divided by Gold Price)</h3>
<p><img class="img-responsive w-100" alt="Adjusted Market Cap per Ounce of Reserve (Divided by Gold Price)" src="https://www.vaneck.com/contentassets/b469a301c67f40d1b4e3d1f5a83427f2/4809_gold_chart-2_2024-9_v1_blog.svg" /></p>
<p class="chart-disclosure">Source: Scotiabank. Data as of August 2024. Figures represent the average of Scotiabank&rsquo;s North American coverage.</p>
<h2>Will we see a rebound in Western investment demand?</h2>
<p>Western investors have not yet jumped into the gold markets in full force. However, over the last couple of months, the World Gold Council reported estimated positive fund flows into the North American gold bullion ETF products during July and August and into the European products since May.<sup>&Dagger;</sup>&nbsp;This is an important reversal in the persistent trend of outflows global gold bullion ETFs have experienced since mid-2022. Is this the initial stages of returning investment demand?</p>
<p>The early August (and early September) equity markets&rsquo; weakness is signaling increasing concern about the health of the U.S. economy and the risk of a recession. Investors looking for more defensive, recession proof opportunities or simply a place to hide during periods of heightened uncertainty and volatility, may finally turn to the gold sector. The historically cheap, financially strong gold mining equities should stand out as an attractive play to gain gold exposure.</p>
<h3>Gold ETF Flows by Region (Tonnes)</h3>
<p><img class="img-responsive w-100" alt="Gold ETF Flows by Region (Tonnes)" src="https://www.vaneck.com/contentassets/5094f175c8014430a6b5898b5f84e3fc/4809_gold_chart-3_2024-9_v1_blog.svg" /></p>
<p class="chart-disclosure">Source: World Gold Council. Data as of August 2024.</p>
<p>To receive more <strong><a href="https://www.vaneck.com/us/en/insights/gold-investing/" title="Gold Investing Insights">Gold Investing</a></strong> insights, <strong><a href="https://www.vaneck.com/us/en/subscribe/" title="Subscription Center">sign up in our subscription center</a></strong>.</p>
]]></content:encoded>
</item><item rdf:about="https://www.vaneck.com/us/en/blogs/moat-investing/moat-strategies-gain-on-strong-stock-selection/">
  <title>Moat Strategies Gain on Strong Stock Selection></title>
  <link>https://www.vaneck.com/us/en/blogs/moat-investing/moat-strategies-gain-on-strong-stock-selection/</link>
  <description><![CDATA[Morningstar&rsquo;s Moat Index and SMID Moat Index both beat their respective benchmarks in August. Savvy stock selection was a key difference maker for both strategies.]]></description>
  <dc:creator>Coulter Regal, CFA</dc:creator>
  <dc:date>09/10/2024 06:30:00</dc:date>
<content:encoded><![CDATA[

<p>In August, U.S. equity markets moved higher with the S&amp;P 500 gaining approximately 2.4%, driven by expectations of Federal Reserve rate cuts following Chairman Jerome Powell's comments at Jackson Hole. Powell's indication of policy adjustment, hinting at a shift from combating inflation to supporting economic growth, spurred a continuation of the market rotation <a href="https://www.vaneck.com/us/en/blogs/moat-investing/moat-stocks-gain-as-mega-caps-falter/" title="Moat Stocks Gain as Mega-Caps Falter"><strong>from tech giants towards value stocks</strong></a>. This shift was underpinned by a cooling job market and controlled inflation, setting the stage for potential rate cuts, potentially as soon as the Fed&rsquo;s September meeting. The market's reaction showcased a broadening of gains, reflecting optimism in policy easing and continued economic resilience, despite geopolitical tensions.</p>
<p>The <a href="https://www.vaneck.com/us/en/investments/morningstar-wide-moat-etf-moat/overview/" title="MOAT - VanEck Morningstar Wide Moat ETF - Overview"><strong>Morningstar Wide Moat Focus Index&rsquo;s</strong></a> (the &ldquo;Moat Index&rdquo;) strong July carried over into August with the Moat Index gaining 4.43% and outperforming the S&amp;P 500 Index by 200 basis points during the month. Driving this outperformance was strong stock selection and supportive sector allocations with overweights in the consumer defensive and healthcare segments. Year-to-date, the Moat Index trails the S&amp;P 500, given its value bias and structural underweight to mega-caps. However, the performance gap has narrowed considerably in the last two months, as market dynamics shift away from big tech and toward more value-oriented areas.</p>
<p>Smaller U.S. companies took a breather in August following their remarkable rally in July that saw small- and mid-cap indexes rise as much as 10%. The <a href="https://www.vaneck.com/us/en/investments/morningstar-smid-moat-etf-smot/overview/" title="SMOT - VanEck Morningstar SMID Moat ETF - Overview"><strong>Morningstar US Small-Mid Cap Moat Focus Index</strong></a> (the &ldquo;SMID Moat Index&rdquo;) still found pockets of growth within the cohort as the Index gained about 1% during the month, while the broader benchmark indexes were down slightly. The SMID Moat Index&rsquo;s August outperformance was predominantly the result of favorable stock selection rather than sector over or underweights.</p>
<h3>Moat Stock Outperformance Continued in August</h3>
<p><img class="img-responsive w-100" alt="Moat Stock Outperformance Continued in August" src="https://www.vaneck.com/contentassets/acb22cce403d4580be1f02e89e7572d9/4810_moat_chart-1_2024-9_v1_blog.svg" /></p>
<p class="chart-disclosure"><strong>Source: Morningstar. Data as of 8/31/2024.</strong> Past performance is no guarantee of future results. Index performance is not representative of fund performance. It is not possible to invest directly in an index. Fund performance current to the most recent month end is available by visiting vaneck.com or by calling 800.826.2333.</p>

<h2 id="moat-highlights" class="jump-link-nav anchored-block" data-jumplink-title="Moat Highlights">Moat Index Highlights: Cybersecurity and Coffee Boost Moat Index</h2>
<p>Strong stock selection within the Moat Index was the primary driver of relative performance versus the S&amp;P 500 in August with cybersecurity and coffee providing a boost. Favorable sector allocation was also additive during the month with overweights in consumer defensive and healthcare contributing as well as an underweight to technology.</p>
<p>In the top slot of the contributors table this month is wide moat company Fortinet (FTNT). Fortinet is a leader in the security space with solutions ranging from network security firewalls to security operations. Morningstar believes that Fortinet&rsquo;s platform approach to cybersecurity, which combines key aspects of a business&rsquo; security needs under one umbrella, has enabled the firm to grow its wallet share among existing clients while adding new ones. This approach led to a strong second quarter earnings release that saw revenue and profitability surpass expectations, sending Fortinet shares up over 30% during the month.</p>
<p>Also landing in the top contributors table this month is one of the world&rsquo;s most widely recognized restaurant brands, Starbucks (SBUX). Shares of Starbucks exploded higher on news that the specialty coffee chain had lured Brian Niccol to head the company as its new CEO. Niccol comes with a sterling restaurant industry track record from his time as CEO at the wide moat burrito chain Chipotle and the Mexican-inspired fast-food chain Taco Bell. Investors sent a strong message that leadership matters as shares of Starbucks finished up over 20% in August.</p>
<p>Names detracting from the Moat Index this month include the e-commerce marketplace operator Etsy (ETSY), global beauty products seller Estee Lauder (EL), drug manufacturer Pfizer (PFE), aerospace and defense company Boeing (BA), and industrial equipment and software business Emerson Electric (EMR).</p>
<h2>Top Contributors and Detractors from Moat Index - August 2024</h2>
<h3>Leading Contributors</h3>
<div class="wrapped-div">
<table style="width: 100%;">
<tbody>
<tr class="tbl-data">
<td class="tbl-header last">Company</td>
<td class="tbl-header last text-left">Ticker</td>
<td class="tbl-header last text-left">Sector</td>
<td class="tbl-header last text-right">Avg. Weight (%)</td>
<td class="tbl-header last text-right">Contribution (%)</td>
</tr>
<tr class="tbl-data">
<td class="data-td last font-weight-normal">Fortinet Inc</td>
<td class="data-td data last text-left">FTNT</td>
<td class="data-td data last text-left">Technology</td>
<td class="data-td data last text-right">2.08</td>
<td class="data-td data last text-right">0.67</td>
</tr>
<tr class="tbl-data">
<td class="data-td last font-weight-normal">Starbucks Corp</td>
<td class="data-td data last text-left">SBUX</td>
<td class="data-td data last text-left">Consumer Cyclical</td>
<td class="data-td data last text-right">2.18</td>
<td class="data-td data last text-right">0.48</td>
</tr>
<tr class="tbl-data">
<td class="data-td last font-weight-normal">Kenvue Inc</td>
<td class="data-td data last text-left">KVUE</td>
<td class="data-td data last text-left">Consumer Defensive</td>
<td class="data-td data last text-right">2.37</td>
<td class="data-td data last text-right">0.47</td>
</tr>
<tr class="tbl-data">
<td class="data-td last font-weight-normal">Veeva Systems Inc</td>
<td class="data-td data last text-left">VEEV</td>
<td class="data-td data last text-left">Healthcare</td>
<td class="data-td data last text-right">2.21</td>
<td class="data-td data last text-right">0.28</td>
</tr>
<tr class="tbl-data">
<td class="data-td last font-weight-normal">Altria Group Inc</td>
<td class="data-td data last text-left">MO</td>
<td class="data-td data last text-left">Consumer Defensive</td>
<td class="data-td data last text-right">2.68</td>
<td class="data-td data last text-right">0.26</td>
</tr>
</tbody>
</table>
</div>
<h3>Leading Detractors</h3>
<div class="wrapped-div">
<table style="width: 100%;">
<tbody>
<tr class="tbl-data">
<td class="tbl-header last">Company</td>
<td class="tbl-header last text-left">Ticker</td>
<td class="tbl-header last text-left">Sector</td>
<td class="tbl-header last text-right">Avg. Weight (%)</td>
<td class="tbl-header last text-right">Contribution (%)</td>
</tr>
<tr class="tbl-data">
<td class="data-td last font-weight-normal">Etsy Inc</td>
<td class="data-td data last text-left">ETSY</td>
<td class="data-td data last text-left">Consumer Cyclical</td>
<td class="data-td data last text-right">2.38</td>
<td class="data-td data last text-right">-0.35</td>
</tr>
<tr class="tbl-data">
<td class="data-td last font-weight-normal">Estee Lauder</td>
<td class="data-td data last text-left">EL</td>
<td class="data-td data last text-left">Consumer Defensive</td>
<td class="data-td data last text-right">1.87</td>
<td class="data-td data last text-right">-0.23</td>
</tr>
<tr class="tbl-data">
<td class="data-td last font-weight-normal">Pfizer Inc</td>
<td class="data-td data last text-left">PFE</td>
<td class="data-td data last text-left">Healthcare</td>
<td class="data-td data last text-right">2.65</td>
<td class="data-td data last text-right">-0.20</td>
</tr>
<tr class="tbl-data">
<td class="data-td last font-weight-normal">Emerson Electric Co</td>
<td class="data-td data last text-left">EMR</td>
<td class="data-td data last text-left">Industrials</td>
<td class="data-td data last text-right">1.28</td>
<td class="data-td data last text-right">-0.11</td>
</tr>
<tr class="tbl-data">
<td class="data-td last font-weight-normal">Boeing Co</td>
<td class="data-td data last text-left">BA</td>
<td class="data-td data last text-left">Industrials</td>
<td class="data-td data last text-right">1.23</td>
<td class="data-td data last text-right">-0.07</td>
</tr>
</tbody>
</table>
</div>
<p class="chart-disclosure"><strong>Source: Morningstar, August 2024</strong>. Past performance is no guarantee of future results. Index performance is not illustrative of fund performance. Not intended as a recommendation to buy or to sell any of the securities mentioned herein.</p>

<h2 id="smid-moat-highlights" class="jump-link-nav anchored-block" data-jumplink-title="SMID Moat Highlights">SMID Moat Index Highlights: Dashing Ahead on Stock Selection</h2>
<p>The SMID Moat Index&rsquo;s lead over small- and mid-cap broad benchmarks in August was driven by favorable stock selection rather than sector over or underweights. Leading the pack of SMID moat companies in August was the mid-cap food order aggregator and delivery company DoorDash (DASH). DoorDash released strong earnings at the beginning of the month, boasting quarterly records for key metrics like total orders and gross order value. Shares of DASH finished up over 16% during the month. Longer term, Morningstar expects international opportunities, increased penetration in new verticals such as grocery, and an uptick in advertising sales to support top-line growth for DASH.</p>
<p>Also contributing to the SMID Moat Index&rsquo;s performance in August was the wide moat healthcare information services company Veeva Systems (VEEV). Veeva is the leading provider of cloud-based software solutions tailored to the life sciences industry. It provides an ecosystem of products to address the operating challenges and regulatory requirements that companies in the space face. Veeva reported solid second-quarter results that came in above expectations with the firm demonstrating strong performance throughout the customer size spectrum with wins from both large pharmas and small biotech, sending shares up 12% during the month. Despite this rise, Morningstar&rsquo;s estimate of fair value for VEEV is $273 per share, indicating upside potential remains.</p>
<p>Names that detracted most from SMID Moat Index performance during the month include the specialty industrial machinery company Chart Industries (GTLS), home fragrance and body care retailer Bath &amp; Body Works (BBWI), alternative asset manager The Carlyle Group (CG), drug discovery and development services company Charles River Laboratories (CRL), and regional automobile dealership Asbury Automotive Group (ABG).</p>
<h2>Top Contributors and Detractors from SMID Moat Index - August 2024</h2>
<h3>Leading Contributors</h3>
<div class="wrapped-div">
<table style="width: 100%;">
<tbody>
<tr class="tbl-data">
<td class="tbl-header last">Company</td>
<td class="tbl-header last text-left">Ticker</td>
<td class="tbl-header last text-left">Sector</td>
<td class="tbl-header last text-right">Avg. Weight (%)</td>
<td class="tbl-header last text-right">Contribution (%)</td>
</tr>
<tr class="tbl-data">
<td class="data-td last font-weight-normal">DoorDash Inc</td>
<td class="data-td data last text-left">DASH</td>
<td class="data-td data last text-left">Communication Services</td>
<td class="data-td data last text-right">1.13</td>
<td class="data-td data last text-right">0.18</td>
</tr>
<tr class="tbl-data">
<td class="data-td last font-weight-normal">Veeva Systems Inc</td>
<td class="data-td data last text-left">VEEV</td>
<td class="data-td data last text-left">Healthcare</td>
<td class="data-td data last text-right">1.16</td>
<td class="data-td data last text-right">0.15</td>
</tr>
<tr class="tbl-data">
<td class="data-td last font-weight-normal">WEC Energy Group</td>
<td class="data-td data last text-left">WEC</td>
<td class="data-td data last text-left">Utilities</td>
<td class="data-td data last text-right">1.39</td>
<td class="data-td data last text-right">0.13</td>
</tr>
<tr class="tbl-data">
<td class="data-td last font-weight-normal">Lithia Motors Inc</td>
<td class="data-td data last text-left">LAD</td>
<td class="data-td data last text-left">Consumer Cyclical</td>
<td class="data-td data last text-right">1.25</td>
<td class="data-td data last text-right">0.11</td>
</tr>
<tr class="tbl-data">
<td class="data-td last font-weight-normal">Global Payments Inc</td>
<td class="data-td data last text-left">GPN</td>
<td class="data-td data last text-left">Industrials</td>
<td class="data-td data last text-right">1.23</td>
<td class="data-td data last text-right">0.11</td>
</tr>
</tbody>
</table>
</div>
<h3>Leading Detractors</h3>
<div class="wrapped-div">
<table style="width: 100%;">
<tbody>
<tr class="tbl-data">
<td class="tbl-header last">Company</td>
<td class="tbl-header last text-left">Ticker</td>
<td class="tbl-header last text-left">Sector</td>
<td class="tbl-header last text-right">Avg. Weight (%)</td>
<td class="tbl-header last text-right">Contribution (%)</td>
</tr>
<tr class="tbl-data">
<td class="data-td last font-weight-normal">Chart Industries Inc</td>
<td class="data-td data last text-left">GTLS</td>
<td class="data-td data last text-left">Industrials</td>
<td class="data-td data last text-right">1.49</td>
<td class="data-td data last text-right">-0.36</td>
</tr>
<tr class="tbl-data">
<td class="data-td last font-weight-normal">Bath &amp; Body Works Inc</td>
<td class="data-td data last text-left">BBWI</td>
<td class="data-td data last text-left">Consumer Cyclical</td>
<td class="data-td data last text-right">1.17</td>
<td class="data-td data last text-right">-0.18</td>
</tr>
<tr class="tbl-data">
<td class="data-td last font-weight-normal">The Carlyle Group Inc</td>
<td class="data-td data last text-left">CG</td>
<td class="data-td data last text-left">Financial Services</td>
<td class="data-td data last text-right">0.79</td>
<td class="data-td data last text-right">-0.15</td>
</tr>
<tr class="tbl-data">
<td class="data-td last font-weight-normal">Charles River Laboratories Int.</td>
<td class="data-td data last text-left">CRL</td>
<td class="data-td data last text-left">Healthcare</td>
<td class="data-td data last text-right">0.73</td>
<td class="data-td data last text-right">-0.14</td>
</tr>
<tr class="tbl-data">
<td class="data-td last font-weight-normal">Asbury Automotive Group</td>
<td class="data-td data last text-left">ABG</td>
<td class="data-td data last text-left">Consumer Cyclical</td>
<td class="data-td data last text-right">1.58</td>
<td class="data-td data last text-right">-0.14</td>
</tr>
</tbody>
</table>
</div>
<p class="chart-disclosure"><strong>Source: Morningstar, August 2024</strong>. Past performance is no guarantee of future results. Index performance is not illustrative of fund performance. Not intended as a recommendation to buy or to sell any of the securities mentioned herein.</p>
<h2 id="moat-strategies" class="jump-link-nav anchored-block" data-jumplink-title="Moat Strategies">Choose Your Moat Strategy</h2>
<p>VanEck&rsquo;s suite of <strong><a href="https://www.vaneck.com/us/en/blogs/moat-investing/moat-investing-powered-by-morningstar/" title="Quality Companies at Attractive Prices">moat investing strategies</a></strong> is powered by Morningstar&rsquo;s equity research team, which seeks quality companies trading at attractive valuations. The below ETFs offer access to U.S. moat companies:</p>
<p><strong><a href="/link/9e43dd198c5f4e419f13220685081895.aspx" title="MOAT - VanEck Morningstar Wide Moat ETF - Overview">VanEck Morningstar Wide ETF (MOAT)</a>:</strong> companies with a wide moat rating, which means Morningstar believes the company is likely to sustain its competitive advantage for at least the next 20 years.</p>
<p><strong><a href="/link/166321dbcfec440590fb51cf0ad629aa.aspx" title="SMOT - VanEck Morningstar SMID Moat ETF - Overview">VanEck Morningstar SMID Moat ETF (SMOT)</a></strong>: small and mid-cap moat companies.</p>
<p>To receive more <strong><a href="https://www.vaneck.com/us/en/insights/moat-investing/" title="Moat Investing Insights">Moat Investing</a></strong> insights, <strong><a href="https://www.vaneck.com/us/en/subscribe/" title="Preference Center">sign up in our subscription center</a></strong>.</p>
<style>
    .data-td.data {
        padding-right: 5px !important;
    }

    .wrapped-div {
        max-width: 100%;
    }

    @media (max-width: 1240px) {
        .wrapped-div {
            overflow-x: scroll;
        }
    }

    .wrapped-div-sector {
        max-width: 100%;
        overflow-x: scroll;
    }
</style>
]]></content:encoded>
</item><item rdf:about="https://www.vaneck.com/us/en/blogs/model-portfolios/monthly-market-recap-fed-soothes-with-future-rate-cuts/">
  <title>August Market Recap: Fed Soothes with Future Rate Cuts></title>
  <link>https://www.vaneck.com/us/en/blogs/model-portfolios/monthly-market-recap-fed-soothes-with-future-rate-cuts/</link>
  <description><![CDATA[In August, high interest rates caused market volatility, prompting the Fed to signal future rate cuts.]]></description>
  <dc:creator>David Schassler</dc:creator>
  <dc:date>09/06/2024 06:30:00</dc:date>
<content:encoded><![CDATA[

<h2>Overview</h2>
<p>Well, so much for a sleepy summer. High interest rates are hitting the U.S. economy, and the market is screaming. The Federal Reserve (Fed) heard the cries and reacted in typical &ldquo;Fed fashion&rdquo; by comforting the ailing markets with the soothing sounds of future rate cuts.</p>
<ul class="content-list">
<li><a href="#stocks"><strong>Stocks</strong></a></li>
<li><a href="#bonds"><strong>Bonds</strong></a></li>
<li><a href="#real-assets"><strong>Real Assets</strong></a></li>
<li><a href="#digital-assets"><strong>Digital Assets</strong></a></li>
</ul>
<p>The month started with a weak U.S. jobs report and news that Japan increased its interest rates to 0.25% from 0%. This sent the CBOE Volatility Index (&ldquo;the Fear Index&rdquo;) soaring from 16 to 38, and crowd favorites, such as the yen carry trade and the most important stock in the world, Nvidia, were down double digits.</p>
<p>During his Jackson Hole speech in late August, Fed Chair Jerome Powell signaled future rate cuts. He said: &ldquo;The time has come for policy to adjust. The direction of travel is clear, and the timing and pace of rate cuts will depend on incoming data, the evolving outlook, and the balance of risks.&rdquo; So, there you have it, folks. Rates are going lower, and the incoming data has been weak. The latest U.S. employment reports show that fewer people are hired, new job openings are sparse, and layoffs are becoming more frequent. &nbsp;</p>
<p>A material downward shift in interest rates may fan the inflationary flames. Assuming that inflation is licked because it has trended downward recently with economic growth defies what history has taught us about the stubbornness of past inflationary cycles.</p>
<p>Stay diversified and consider stocks, bonds, real assets, and digital assets for your portfolio.</p>
<h2 id="stocks" class="jump-link-nav anchored-block" data-jumplink-title="Stocks">Stocks</h2>
<p>Somehow, we have entered an alternative universe. In this universe, what never worked finally did, and what always worked finally didn&rsquo;t. Starting in mid-July, value stocks outperformed growth stocks, small-cap outperformed large-cap, and international stocks outperformed U.S. stocks.</p>
<p>You didn&rsquo;t need a crystal ball to know that Nvidia would correct. Nvidia&rsquo;s move over the past year was too big and fast, and its impact on the overall market was astonishing. However, AI and the current importance of Nvidia are not simply hype stories like those in the &ldquo;dash to trash&rdquo; liquidity avalanche of 2020. AI is a wildly innovative and disruptive technology, and Nvidia, as a key component of that technology, is a $3+ trillion company growing earnings at a rate of over 130%. A continued slowdown in economic activity will undeniably lead to belt-tightening in corporate America. Investing in future growth through AI will likely slow as tough choices need to be made. However, if the AI thesis is right, and we believe that it is, then investors should eventually buy-the-dip &ldquo;B-DIP&rdquo; and not run for the hills.</p>
<p>Nvidia reported an impressive $32.5 billion in revenues, above the average forecast of $31.9 billion, but warned of manufacturing challenges with its new Blackwell processor. That was enough to pump the brakes on the Nvidia rally while other growth stocks continued their path higher. Falling interest rates are expected to support high-growth stocks. Lower interest rates benefit growth stocks because, in a lower interest rate environment, two birds in the bush may be worth more than one in the hand.</p>
<h2 id="bonds" class="jump-link-nav anchored-block" data-jumplink-title="Bonds">Bonds</h2>
<p>Lately, it&rsquo;s been a great time to be a long-term Treasury bond. Since June 30, long-term Treasuries are up over 7%, while the yields on those bonds have fallen from 4.73% to 4.17%. Increased concerns about future economic growth and decreased concerns about inflation push interest rates down at the long end of the curve.</p>
<p>The Fed controls the short end of the curve and, as we have noted, has communicated its intent to lower interest rates. Investors are advised to proceed with caution regarding credit risk going forward. Economic growth is slowing. Now is <em>not</em> the time to lend money to borrowers with questionable means to repay it.</p>
<h2 id="real-assets" class="jump-link-nav anchored-block" data-jumplink-title="Real Assets">Real Assets</h2>
<p>Always remember the golden rule: He who has the gold makes the rules. Central banks are massive holders of gold reserves, have increased their gold reserves, and have communicated that they plan on purchasing more gold in the future. This is happening as the government attacks your savings through excessive spending, borrowing, and money printing. Fight back to protect your purchasing power. If you haven&rsquo;t already, consider diversifying into gold.</p>
<p>Gold reached an all-time high of $2,500<sup>1</sup>&nbsp;in August, and we think it will go much higher in the years to come. There is a strong relationship between the price of gold and the money supply, with the supply of U.S. dollars rising and the supply of gold remaining relatively constant. The simple solution is to buy gold. The near-term catalysts for buying gold are falling interest rates, which makes gold relatively more attractive because it does not offer a yield and as protection against a looming recession and geopolitical risks. The medium- to long-term catalysts are currency debasement, financial instability, and inflation.</p>

<h2 id="digital-assets" class="jump-link-nav anchored-block" data-jumplink-title="Digital Assets">Digital Assets</h2>
<p>There was considerable downside pressure on bitcoin and other digital assets during the month, driven by a significant upswing in broad market volatility. Bitcoin was down 11% in August. Yet, bitcoin maintained strong support above $50,000 during the month, supported by strong demand and reduced selling pressure from miners. Ethereum did not fare as well. It was down over 20% during the month.</p>
<p>To receive more <strong><a href="https://www.vaneck.com/us/en/insights/guided-allocation/" title="Model Portfolio Insights">Model Portfolio</a></strong> insights, <strong><a href="https://www.vaneck.com/us/en/subscribe/" title="Subscription Center">sign up in our subscription center</a></strong>.</p>
]]></content:encoded>
</item><item rdf:about="https://www.vaneck.com/us/en/blogs/thematic-investing/espo-etf-question-and-answer/">
  <title>ESPO ETF: Question &amp; Answer></title>
  <link>https://www.vaneck.com/us/en/blogs/thematic-investing/espo-etf-question-and-answer/</link>
  <description><![CDATA[The Q&amp;A blog outlines the criteria for ESPO ETF inclusion, the growth outlook for the video game and eSports sector, potential challenges, projected market expansion, and key trends.]]></description>
  <dc:creator>A. J. Talukdar</dc:creator>
  <dc:date>09/05/2024 06:30:00</dc:date>
<content:encoded><![CDATA[

<ul class="content-list">
<li><a href="#point-one"><strong>How do you define Video Games and eSports Companies?</strong></a></li>
<li><a href="#point-two"><strong>What companies are eligible for inclusion in the ESPO ETF?</strong></a></li>
<li><a href="#point-three"><strong>What is the long-term outlook for the Video Game and eSports sector?</strong></a></li>
<li><a href="#point-four"><strong>What are the threats to the industry?</strong></a></li>
<li><a href="#point-five"><strong>What is the projected growth of the industry?</strong></a></li>
<li><a href="#point-six"><strong>What are the major trends in the industry?</strong></a></li>
<li><a href="#point-seven"><strong>Who are the industry leaders?</strong></a></li>
<li><a href="#point-eight"><strong>What is the global vs. regional market exposure of ESPO?</strong></a></li>
<li><a href="#point-nine"><strong>How to buy ESPO?</strong></a></li>
</ul>
<h2 id="point-one" class="anchored-block">How do you define Video Games and eSports Companies?</h2>
<p>Video game and eSports companies are defined as companies which generate at least 50% of their revenues from:</p>
<ul class="content-list">
<li class="mt-2">Video game development</li>
<li class="mt-2">Gaming software or hardware (processors, graphics cards, controllers, headsets, consoles)</li>
<li class="mt-2">Offering streaming services</li>
<li class="mt-2">Developing games or hardware used in eSports events</li>
<li class="mt-2">Being directly involved in eSports events as league operators, teams, distributors, or platforms</li>
</ul>
<h2 id="point-two" class="jump-link-nav anchored-block" data-jumplink-title="Company Inclusion">What companies are eligible for inclusion in the ESPO ETF?</h2>
<p>The <strong><a href="/link/d41cc1b7916f46e5bb3ee751f311c4f2.aspx" title="ESPO - VanEck Video Gaming and eSports ETF - Overview">ESPO</a></strong> ETF&rsquo;s objective is to track the performance of its underlying index, the <a href="https://www.marketvector.com/indexes/sector/mvis-global-video-gaming-esports" title="MVIS Global Video Gaming &amp; eSports Index" target="_blank" rel="noopener"><strong>MVIS Global Video Gaming and eSports Index (MVESPOTR)</strong></a>. This global index tracks the performance of the largest and most liquid companies in the video gaming and eSports industry, ranking them by free-float market cap. Companies such as Nintendo, Capcom, and Electronic Arts rank amongst the fund&rsquo;s top 10 holdings &ndash; and diversification is built in with an 8% max weight to any given company in the fund portfolio.</p>
<h2 id="point-three" class="jump-link-nav anchored-block" data-jumplink-title="Long-term Outlook">What is the long-term outlook for the Video Game and eSports sector?</h2>
<p>Global macro conditions are ideal for synergistic growth within the gaming/eSports industry; long-term sentiment is positive and attracts attention. Emerging markets continue producing an organic growth rate of new players joining PC and consoles. eSports are also gaining global momentum, debuting as a medal event at the 2023 Asian Games last fall<sup>1</sup>&nbsp;and set for the first eSports Olympics in 2025. Younger generations raised online remain engaged as they age with strong user retention. Annual developments in tech, like Apple&rsquo;s new Vision Pro headset, directly impact the gaming industry, allowing innovations in user experience and immersion. Developers are already implementing the exponential advancements in AI capabilities to make games more hyper-realistic.</p>

<h2 id="point-four" class="anchored-block">What are the threats to the industry?</h2>
The industry&rsquo;s path to future growth might be riddled with short-term volatility. Layoffs have persisted well past 2021; Tech was not the only sector prone to over-hiring through the pandemic, and lagging effects are expected to continue into 2025. Artificial Intelligence proves to be a double-edged sword; while being able to maximize productivity for developers, live actors and game performers have now become obsolete with GenAI&rsquo;s capabilities to capture real emotion and lifelike detail in characters.
<p>Gaming is also attracting significant interest from major players like the Mag7. Microsoft acquired Blizzard Studios for a landmark $68 billion in 2022, and Netflix is currently beta-testing its new cloud gaming service with a new gaming boss hired from Epic Studios. Even Disney&rsquo;s Bob Igor expressed his interest in a piece of the pie, announcing their $1.5B investment into Epic Games this February. Saudi Arabia&rsquo;s Public Investment Fund is also pushing into the industry, with its subsidiary Savvy Games Group operating as an esports platform and acquirer, already amassing $37.9B AUM since inception.</p>
<h2 id="point-five" class="anchored-block">What is the projected growth of the industry?</h2>
<p>The global video games market is projected to grow from $187B in 2024 to $213B by 2027<sup>2</sup>. To put this into perspective, in 2022, the gaming industry raked in an estimated $184B, far surpassing music ($26.4B) and movie ($26.2B) industry revenues <i>combined.</i> Some key factors include:</p>
<p>The number of gamers worldwide is expected to reach 3.32 billion, with Asia reaching 1.48 billion and Europe following with 715 million. Emerging economies are an important factor in the future growth of the gaming industry. As these regions experience increased internet penetration and higher smartphone adoption rates, a brand new audience is gaining access to gaming. This expansion is further supported by the rollout of affordable 5G networks, which enhance connectivity and allow for high-quality gaming experiences without the need for expensive hardware.</p>
<p>Growth is shifting from West to East following younger demographics. Niko Partners' 2023 study tracked the growth of the Asia and MENA (Egypt, Saudi Arabia, UAE) regions in the gaming market: By 2028, these hotspots are expected to host nearly 2 billion gamers, up from 1.6 billion last year. About 50% of the internet population in Saudi Arabia are already regular gamers. As part of its Vision 2030 plan, the country aims to establish 250 gaming firms and produce over 30 top 300 titles by 2031. The International Olympic Committee (IOC) has also partnered with Saudi Arabia to host the Olympic Esports Games for the next 12 years<sup>3</sup>.</p>
<h2 id="point-six" class="jump-link-nav anchored-block" data-jumplink-title="Major Trends">What are the major trends in the industry?</h2>
<p>The future of the video gaming and eSports industry is shaped by several key trends, with mobile gaming leading the charge. Mobile gaming is poised to contribute nearly half of the global gaming revenue, driven by the expanding mobile app ecosystems and the impact of global antitrust legislation like the EU&rsquo;s Digital Markets Act. This shift encourages companies like Epic Games and Microsoft to expand into mobile platforms while consumer brands and IPs leverage mobile gaming through strategic partnerships and in-game experiences. Emerging markets in the Asia-Pacific region, particularly China, India, and Indonesia, are set to dominate the global gaming landscape, with significant growth expected in both mobile gaming and eSports, supported by improved internet infrastructure and the popularity of free-to-play models.</p>
<p>Additionally, advancements in AI and VR are set to revolutionize the gaming experience, enabling more efficient game development and enhanced player immersion. AI tools are streamlining the development process, from automating bug fixes to enabling more dynamic in-game interactions. VR is evolving with innovative hardware like the Virtuix Omni treadmill and Apple&rsquo;s Vision Pro. These technologies are enhancing the gameplay experience and expanding the capabilities of game developers and hardware manufacturers. As these trends converge, the gaming and eSports industry is poised for significant growth and innovation in the coming years.</p>
<h2 id="point-seven" class="anchored-block">Who are the industry leaders?</h2>
<p>The gaming industry is dominated by well-known global conglomerates such as Sony, Microsoft, Nintendo, Tencent, and Electronic Arts, all of which maintain steady product launches and planned releases through 2026. In the console gaming market, Sony's PlayStation, Microsoft's Xbox, and Nintendo's Switch are the top contenders, with Sony's PS5 leading in sales at 39.9 million units as of September 2023. Nintendo is set to launch a new Switch model in 2025, while improved versions of the PS5 and Xbox are anticipated in late 2024, highlighting the ongoing competition and innovation in the console segment.</p>
<h3>Console Sales (2022-Present)</h3>
<p><img class="img-responsive w-100" alt="Console Sales (2022-Present)" src="https://www.vaneck.com/contentassets/4e802a76e47249c68b68eba32dd9601b/4798_espo_chart-1_2024-8_blog.svg" /></p>
<p class="chart-disclosure"><strong>Source: </strong>vgchartz.com as of 2024.</p>
<p>Financially, Tencent leads the industry with $7.4 billion in revenue, followed by Apple and Sony, generating $3.6 billion and $3.4 billion, respectively. Other top earners include Microsoft, NetEase, and Google, all ranking highly on Newzoo&rsquo;s 2023 global games report. Despite their high revenue rankings, companies like Apple, Microsoft, and Google derive most of their earnings from non-gaming segments, underscoring the dominance of dedicated gaming companies like Sony and Tencent in the industry. This financial landscape highlights these companies' global influence and their significant role in shaping gaming's future.</p>
<p class="d-none d-lg-block"><img class="img-responsive" src="https://www.vaneck.com/contentassets/be6d02bbb3914f6b8f71791195538af3/option-1-1044x800.svg" alt="Video Games and eSports Companies Revenues" /></p>
<p class="d-lg-none"><img class="img-responsive" alt="Video Games and eSports Companies Revenues" src="https://www.vaneck.com/contentassets/be6d02bbb3914f6b8f71791195538af3/option-2-615x800.svg" /></p>
<p class="chart-disclosure"><strong>Source: </strong>Newzoo as of May 2024</p>

<h2 id="point-eight" class="jump-link-nav anchored-block" data-jumplink-title="Country Exposure">What is the global vs. regional market exposure of ESPO?</h2>
<p>ESPO&rsquo;s portfolio exposure is 36.78% US and 63.22% global as of July 31st, 2024.</p>
<h3>Country Exposure % of the VanEck Video Gaming and eSports ETF</h3>
<p><img class="img-responsive w-100" alt="Country Exposure % of the VanEck Video Gaming and eSports ETF" src="https://www.vaneck.com/contentassets/d6e46f5f80394ca8809327a7d6045f8b/4798_espo_chart-2_2024-8_blog.svg" /></p>
<p class="chart-disclosure"><strong>Source: </strong>Vaneck, Morningstar as of 7/31/2024.</p>
<h2 id="point-nine" class="anchored-block">How to buy ESPO?</h2>
<p><a href="https://www.vaneck.com/us/en/investments/video-gaming-esports-etf-espo/overview/#how-to-buy-etf&amp;utm=ESPO-Blog" title="How to buy VanEck ETFs?"><strong>Learn more here.</strong></a></p>
<p class="d-none d-lg-block"><a href="mailto:askvaneck@vaneck.com" title="Have More Questions? - Ask VanEck" rel="noopener"><img loading="lazy" class="img-responsive" src="https://www.vaneck.com/globalassets/home/us/insights/blogs/bm-blog-images/cta-faq_desktop-02.svg" alt="Have More Questions? - Ask VanEck" /></a></p>
<p class="d-lg-none"><a href="mailto:askvaneck@vaneck.com" title="Have More Questions? - Ask VanEck" rel="noopener"><img loading="lazy" class="img-responsive" src="https://www.vaneck.com/globalassets/home/us/insights/blogs/bm-blog-images/cta-faq_mobile-01.svg" alt="Have More Questions? - Ask VanEck" /></a></p>
<p>To receive more <a href="https://www.vaneck.com/us/en/insights/thematic-investing/" title="Thematic Investing Insights"><strong>Thematic Investing</strong></a> insights, <a href="https://www.vaneck.com/us/en/subscribe/" title="Subscription Center"><strong>sign up in our subscription center</strong></a>.</p>
]]></content:encoded>
</item><item rdf:about="https://www.vaneck.com/us/en/blogs/digital-assets/matthew-sigel-vaneck-crypto-monthly-recap-for-august-2024/">
  <title>VanEck Crypto Monthly Recap for August 2024></title>
  <link>https://www.vaneck.com/us/en/blogs/digital-assets/matthew-sigel-vaneck-crypto-monthly-recap-for-august-2024/</link>
  <description><![CDATA[In August, most crypto assets saw significant declines amid rising market volatility and a risk-off environment driven by macroeconomic factors such as the yen carry trade implosion.]]></description>
  <dc:creator>Matthew  Sigel</dc:creator>
  <dc:date>09/05/2024 06:30:00</dc:date>
<content:encoded><![CDATA[

<p><strong>Please note that VanEck may have a position(s) in the digital asset(s) described below.</strong></p>
<p>Most crypto assets fell sharply in August as fundamental usage and financial statistics slipped against the broader market backdrop of rising volatility. For the month of August, Bitcoin (BTC) fell 11%, Ethereum (ETH) -24%, and Solana (SOL) -21%, vs. the S&amp;P +2% and the Nasdaq +1%. The market capitalization of all Smart Contract Platforms (SCP) ended August (-12%) lower than it closed in July.</p>
<ul class="content-list">
<li><strong><a href="#breaking-down-ethereums-struggles">Breaking Down Ethereum&rsquo;s Struggles</a></strong></li>
<li><strong><a href="#notable-performer">Notable Performer - Tron</a></strong></li>
<li><strong><a href="#notable-Laggards">Notable Laggard - zkSync</a></strong></li>
</ul>
<p>Though the precipitating event for the dismal price performance was a risk-off typhoon spawned by the yen carry trade, general sentiment for crypto remained poor even after the event. The apex of the pandemonium was August 5, when BTC wicked as low as $49k while ETH crashed to $2.1k after opening the month at around $64.6k and $3.2k respectively. Though Bitcoin has regained some of its value since the &ldquo;flash crash,&rdquo; sitting around $ 58k at the time of writing, ETH is still wallowing around $2.5k. The impact of the yen carry trade implosion translated into BTC and ETH&rsquo;s August 30-day volatility climbing (+48%) and (+52%) higher than the previous month, as well as Bitcoin&rsquo;s 90-day correlation with the Nasdaq rising to an 18-month high of 38%.</p>
<p>Besides macro factors driving prices lower, blockchain usage deteriorated in August. For example, daily active usership was down (-10%) in August, fees generated fell (-12%), and DEX volumes sagged (-4%) compared to July. The German &amp; US Governments also transferred 62k Bitcoin to exchanges, presumably for sale, while Mt. Gox and Gemini bankruptcy distributions totaled another 124k Bitcoin. That&rsquo;s $11B in non-repeatable sales, roughly equivalent to the net inflows to Bitcoin ETPs in the first two months of trading. Lastly, driving weak price action at month-end, the SEC sent a Wells Notice to OpenSea, one of the largest NFT exchanges, claiming that the company is an unregistered broker. The action is another sign that regulation by enforcement may continue in the US unless Donald Trump wins the election.</p>
<h3>Price Returns</h3>
<div class="wrapped-div">
<table style="width: 600px;">
<tbody>
<tr class="tbl-data">
<td class="tbl-header last text-center">&nbsp;</td>
<td class="tbl-header last text-right">August (%)</td>
<td class="tbl-header last text-right">YTD (%)</td>
</tr>
<tr class="tbl-data">
<td class="data-td last">Bitcoin</td>
<td class="data-td data last text-right">-11</td>
<td class="data-td data last text-right">38</td>
</tr>
<tr class="tbl-data">
<td class="data-td last">MarketVector Smart Contract Leaders Index</td>
<td class="data-td data last text-right">-12</td>
<td class="data-td data last text-right">-6</td>
</tr>
<tr class="tbl-data">
<td class="data-td last">MV Global Digital Assets Equity Index</td>
<td class="data-td data last text-right">-14</td>
<td class="data-td data last text-right">3</td>
</tr>
<tr class="tbl-data">
<td class="data-td last">Coinbase</td>
<td class="data-td data last text-right">-19</td>
<td class="data-td data last text-right">5</td>
</tr>
<tr class="tbl-data">
<td class="data-td last">S&amp;P 500 Index</td>
<td class="data-td data last text-right">2</td>
<td class="data-td data last text-right">18</td>
</tr>
<tr class="tbl-data">
<td class="data-td last">Nasdaq Index</td>
<td class="data-td data last text-right">1</td>
<td class="data-td data last text-right">18</td>
</tr>
<tr class="tbl-data">
<td class="data-td last">Ethereum</td>
<td class="data-td data last text-right">-24</td>
<td class="data-td data last text-right">9</td>
</tr>
<tr class="tbl-data">
<td class="data-td last">MarketVector Meme Coin Index</td>
<td class="data-td data last text-right">-24</td>
<td class="data-td data last text-right">NA</td>
</tr>
<tr class="tbl-data">
<td class="data-td last">MarketVector Decentralized Finance Leaders Index</td>
<td class="data-td data last text-right">-28</td>
<td class="data-td data last text-right">-31</td>
</tr>
<tr class="tbl-data">
<td class="data-td last">MarketVector Infrastructure Application Leaders Index</td>
<td class="data-td data last text-right">-14</td>
<td class="data-td data last text-right">-28</td>
</tr>
</tbody>
</table>
</div>
<br />
<p class="chart-disclosure"><strong>Source:</strong> Bloomberg as of 8/31/2024. <strong>Past performance is no guarantee of future results. Not intended as a recommendation to buy or sell any securities named herein.</strong></p>
<h3>Market Cap of Smart Contract Platforms (SCPs) Fell 12% in August</h3>
<p><img class="w-100 img-responsive" alt="Market Cap of Smart Contract Platforms (SCPs) Fell 11% in August " src="https://www.vaneck.com/contentassets/4f849f079ebe4e5ebb205d633317db86/4800_crypto-monthly_chart-1_2024-9_v1_blog.svg" /></p>
<p class="chart-disclosure"><strong>Source:</strong> Artemis XYZ as of 8/27/2024. <strong>Past performance is no guarantee of future results. Not intended as a recommendation to buy or sell any securities named herein.</strong></p>
<p>One of the most controversial issues in the month of August was the partnership between Bitgo, the custodian of WBTC, and Justin Sun. A very important DeFi &ldquo;primitive,&rdquo; WBTC, or &ldquo;Wrapped Bitcoin,&rdquo; is a token on Ethereum that is backed by Bitcoin custodied at the crypto exchange Bitgo. Someone who wishes to use mint WBTC can send their Bitcoin to Bitgo, which then issues the WBTC on Ethereum. WBTC is backed 1:1 by Bitcoin, held by Bitgo, which provides <a href="https://wbtc.network/dashboard/audit" title="WBTC, Bitgo, Wrapped Bitcoin, ERC20 token, Bitgo, Cryptocurrency, Cryptocurrency exchange, Tokenization" target="_blank" rel="noopener"><strong>attestations</strong></a> of holdings.</p>
<p>At the time of writing, more than 153k BTC worth $9.2B have been &ldquo;wrapped&rdquo; into WBTC for use in Ethereum&rsquo;s DeFi. As part of the new partnership agreement, Bitgo will move custody of WBTC outside of the United States to three different Asian countries. The crypto community reacted negatively to these developments due to the negative perception of Justin Sun and past issues with other projects brought under his aegis, like <a href="https://www.dlnews.com/articles/defi/justin-sun-responds-after-usdd-stablecoin-removes-bitcoin/" title="Justin Sun responds after USDD stablecoin silently removes $732m of Bitcoin collateral" target="_blank" rel="noopener"><strong>USDD</strong></a> and <a href="https://blocktribune.com/archblock-sues-tron-founder-justin-sun-over-shady-trueusd-acquisition/" title="Archblock sues Tron Founder Justin Sun over shady TrueUSD acquisition" target="_blank" rel="noopener"><strong>TrueUSD</strong></a>. MakerDAO, the entity that runs the permissionless crypto-backed stablecoin DAI, passed a governance proposal banning wBTC as used for collateral to create DAI. To seize the initiative, Coinbase <a href="https://crypto.news/coinbase-teases-new-wrapped-bitcoin-product-amid-ongoing-wbtc-controversy/" title="Coinbase teases new wrapped Bitcoin product amid ongoing WBTC controversy" target="_blank" rel="noopener"><strong>announced</strong></a> its own wrapped version of BTC called wbBTC. At the same time, Bitcoin L2 Babylon unexpectedly <a href="https://www.coindesk.com/tech/2024/08/19/bitcoin-staking-platform-babylon-to-start-phased-mainnet-launch-this-week/" title="Bitcoin Staking Platform Babylon to Start Phased Mainnet Launch This Week" target="_blank" rel="noopener"><strong>declared</strong></a> the launch of their mainnet the week after Bitgo&rsquo;s new custody announcement. Meanwhile, existing competitors such as tBTC and BTC.b saw modest inflows of 250 BTC and 50 BTC.</p>
<h3>Daily Memecoin Volumes on Solana Fall Back to 2023 Levels</h3>
<p><img class="w-100 img-responsive" alt="Daily Memecoin Volumes on Solana Fall Back to 2023 Levels" src="https://www.vaneck.com/contentassets/4f849f079ebe4e5ebb205d633317db86/4800_crypto-monthly_chart-2_2024-9_v1_blog.svg" /></p>
<p class="chart-disclosure"><strong>Source:</strong> Dune @ally as of 8/28/2024. <strong>Past performance is no guarantee of future results. Not intended as a recommendation to buy or sell any securities named herein.</strong></p>
<p>Solana (-21%) has had a mixed month as several underlying issues surfaced to generate a minor FUD (fear, uncertainty, doubt) cycle. Speculation is the lifeblood of crypto, and no more is this a reality than on Solana, which accounts for ~22% of all DEX trading, of which 47% has been memecoin trading since June 1, 2024. It is apparent to many in the crypto community that Solana memecoin trading is rife with fraudulent activity. A coin supposedly associated with Donald Trump was &ldquo;rugged&rdquo; for <a href="https://decrypt.co/243414/trump-meme-coin-djt-falls-nearly-zero-rugs" title="Trump Meme Coin DJT Falls to Nearly Zero as Dev-Linked Wallet 'Rugs'" target="_blank" rel="noopener"><strong>$2M</strong></a>, someone hacked McDonald&rsquo;s Instagram account to announce a memecoin that eventually scammed buyers out of <a href="https://cryptopotato.com/mcdonalds-instagram-hacked-to-promote-solana-based-scam-meme-coin-grimace/" title="McDonald&rsquo;s Instagram Hacked to Promote Solana-Based Scam Meme Coin &lsquo;Grimace&rsquo;" target="_blank" rel="noopener"><strong>$700k</strong></a>, while other tokens with liquidities of &lt;$100k are seeing daily trading volumes &gt;$10M. The result has been that many traders on Solana have lost money due to memecoins. It is estimated that only 0.76% of <a href="https://crypto.news/only-0-76-of-pump-fun-wallets-made-1000-or-more-cn-research/" title="Only 0.76% of pump.fun wallets made $1,000 or more: CN research" target="_blank" rel="noopener"><strong>wallets</strong></a> on Solana&rsquo;s top memecoin platform, pump.fun, are profitable.</p>
<p>Many small traders are catching on to the fact that memecoin trading is usually a zero-sum game. This change in sentiment has driven memecoin trading down (-43%) month-to-month while total DEX volume on Solana is down (-48%). As a result, Solana's monthly fees have declined (35%). On the positive front for Solana, the first (and second) spot SOL ETF <a href="https://cointelegraph.com/news/brazil-first-spot-solana-etf-launch" title="Brazil poised to launch world&rsquo;s first spot Solana ETF ahead of global markets" target="_blank" rel="noopener"><strong>debuted</strong></a> in Brazil, while the interesting DePIN project Grass announced its token airdrop, and the perpetual futures platform Drift launched a prediction market. The stablecoin of PayPal, PYUSD, reached $664M in supply on Solana, nearly double the $345M of PYUSD on Ethereum. In August, the total supply of all stablecoins on Solana reached $3.9B, 160% greater than a year earlier.</p>
<p>A budding challenge for the widespread adoption of Solana is its blockchain's massive size in computer storage space. Solana is designed to process tens of thousands of transactions per second and has consistently demonstrated this capability. Blockchain transactions are essentially &ldquo;writes&rdquo; to each blockchain&rsquo;s database of information. The more transactions, the more &ldquo;writes&rdquo; occur, and this causes more data to be stored on a blockchain. While Bitcoin&rsquo;s blocks are around 1.6MB in size and occur every 10 minutes, Solana blocks can be as large as 128MB, and these blocks occur around every half second. The result is that the Bitcoin blockchain is around 550 GB in size for 15 years of history, while Solana&rsquo;s chain is around 150TB (272x bigger) for roughly 4.5 years of history.</p>
<p>This is an issue because it makes it very difficult and expensive for people to store its history and query its contents. Looking at past events or simple things like an account&rsquo;s historical balances is cost-prohibitive. Solana expects private entities to spin up to provide services for those wishing to comb Solana&rsquo;s history. <a href="https://www.alliumdata.com/" title="Allium Data" target="_blank" rel="noopener"><strong>Allium</strong></a>, an S-tier data services provider, is one of the few entities that can effectively assess Solana&rsquo;s history. This presents a challenge to anyone who wants to create assets on Solana.</p>
<p>If an audit is to occur or an issue crops up, someone has to spend large sums of money to untangle Solana&rsquo;s historical archive. The instability of Solana&rsquo;s consensus mechanism and its history of outages add to the challenges posed by Solana&rsquo;s substantial history. Because of these two issues, it is nearly impossible to prove that Solana&rsquo;s chain has operated without any faults (double spending of currency) and without sifting through the entire chain. Though this is a challenge with any blockchain, Solana&rsquo;s massive data output creates novel difficulties that are not posed by lower throughput chains. It must also be noted that while history is challenging to verify by new nodes, real-time verification of chain functionality can be verified by anyone with a full node. Newer high-throughput blockchains, such as Aptos and Sui, have different design philosophies that seek to address these challenges. But realistically, Solana&rsquo;s big data limitations will likely plague other high-capacity blockchains.</p>
<p>Hosted on the Polygon blockchain, Polymarket has crept into the news cycle during the US presidential election season as an exciting use case of crypto technology. Polymarket is a permissionless prediction market that allows users to create betting markets and speculate on the outcome of off-chain events in politics, sports, finance, and popular culture. The smart contracts that power Polymarket are hosted on the Polygon blockchain. These smart contracts receive, interpret, and execute better payoffs using data brought on the chain by the crypto &ldquo;oracle&rdquo; Uma. The pseudo-anonymous nature of Polymarket combined with its limitless, global accessibility allows it to incorporate valuable information more efficiently and dynamically than is possible outside of crypto. Because people can create any market with any type of outcome without a central party to prevent the flow of information by limiting markets or betting, Polymarket is arguably a more accurate prediction engine than any web2 betting platform. While web2 companies can be pressured to censor or alter markets, Polymarket&rsquo;s decentralized system prevents outside parties from stopping the incentivized transfer of knowledge that prediction markets enable.</p>
<p>The recent attention on Polymarket has focused on its political prediction markets, such as the winner of the US presidential election or the winners of key US congressional races. Polymarket is generating enormous controversy with detractors contending that public opinion can be swayed by large-pocketed investors who manipulate prediction markets. Regardless, Polymarket usage has surged, with over $440M in wagers placed by over 60k monthly active traders in August. Recently, its data feeds have been integrated into Bloomberg terminals worldwide. Despite its popularity, Polymarket has only generated $17.9k in fees for the Polygon blockchain where it is hosted.</p>
<h3>Polymarket&rsquo;s Monthly Active Users Up 3600% since EoY 2024</h3>
<p><img class="img-responsive w-100" alt="Polymarket&rsquo;s Monthly Active Users Up 3600% since EoY 2024" src="https://www.vaneck.com/contentassets/4f849f079ebe4e5ebb205d633317db86/4800_crypto-monthly_chart-3_2024-9_v1_blog.svg" /></p>
<p class="chart-disclosure"><strong>Source:</strong> Dune @rchen8 as of 8/29/2024. <strong>Past performance is no guarantee of future results. Not intended as a recommendation to buy or sell any securities named herein.</strong></p>
<p>In stablecoin news, Tether, the company behind the largest stablecoin USDT, has <a href="https://www.unlock-bc.com/127679/tether-abandons-plans-for-own-blockchain-amid-market-saturation/" title="Tether Abandons Plans for Own Blockchain Launch Amid Market Saturation" target="_blank" rel="noopener"><strong>shelved</strong></a> plans to launch its blockchain, citing market saturation. Another interesting development is that Maker, the entity behind the collateral-backed stablecoin DAI, has decided to rebrand to SKY. As part of its move, Maker will upgrade its DAI token to USDS and change its governance token, MAKER, to SKY. Users can choose to upgrade their existing DAI or MAKER tokens to receive token rewards and the Sky Savings Rate, which will only be available in certain jurisdictions. As part of the sweeping changes Maker calls its &ldquo;Endgame,&rdquo; Maker will allow independent entities called Stars to launch innovative stablecoins. Meanwhile, Circle, the creator of USDC, has launched the Euro-backed stablecoin EURC on Base.</p>
<p>Meanwhile, <a>the VanEck-backed Agora stablecoin<sup>1</sup>&nbsp;has proven to be one of the fastest-growing stablecoins in crypto. Since its launch on August 19, it has grown to $57.5M on Avalanche and Ethereum. Agora intends to grow rapidly by expanding its presence to other chains such as Sui. This would make Agora the first fiat-backed stablecoin on Sui. Agora&rsquo;s strategy is to grow through revenue-sharing agreements and distribution partnerships. Some target partnerships include protocols, on-chain applications, centralized exchanges, and other important entities in crypto. Nick Van Eck, founder of Agora, believes that stablecoins will become a $10T asset class expanding to enterprises issuing their own stablecoins. For more on stablecoins, please look out for our upcoming research piece on the topic.</a></p>
<a>
<h2 id="breaking-down-ethereums-struggles" class="jump-link-nav anchored-block" data-jumplink-title="Ethereum&rsquo;s Struggles">Breaking Down Ethereum&rsquo;s Struggles</h2>
<p>One of the most confounding topics has been the consistent underperformance of ETH since the beginning of the bull market in crypto assets in November 2023. Of the 22 major L1 projects that we track, Ethereum ranks 13th with a yearly return of 62%. While this absolute return is spectacular, this is less than &frac12; of BTC&rsquo;s 138% return, and far below Solana&rsquo;s astounding 624% return over the same period of time. During periods of crypto price pullbacks, Ethereum has also underperformed. For example, over the past 90 days, ETH (-30%) ranks 12th place among the group of 22 and has been outshined by competitors such as BNB (-5%), Tron&rsquo;s TRX (+37%) and TON (-3%). More recently, over the past 30 days, ETH has been an abysmal (-23%), which ranks it 19th among the 22 layer 1 blockchains we track.</p>
<h2>ETH is the 18th Worst Performing Asset Over the Last 30 Days</h2>
<p><img class="w-100 img-responsive" alt="ETH is the 18th Worst Performing Asset Over the Last 30 Days" src="https://www.vaneck.com/contentassets/4f849f079ebe4e5ebb205d633317db86/4800_crypto-monthly_chart-4_2024-9_v1_blog.svg" /></p>
<p class="chart-disclosure"><strong>Source:</strong> Artemis XYZ as of 8/29/2024. <strong>Past performance is no guarantee of future results. Not intended as a recommendation to buy or sell any securities named herein.</strong></p>
<h2>We attribute ETH&rsquo;s dismal performance to the following factors:</h2>
<ol class="content-list">
<li>Decline in revenues
<ol class="content-list" style="list-style-type: lower-alpha;">
<li>Speculation moving to high throughput blockchains</li>
<li>L2 blockchains cannibalize Ethereum&rsquo;s revenue items like transaction fees and MEV</li>
</ol>
</li>
<li>Deliberate policy choices
<ol class="content-list" style="list-style-type: lower-alpha;">
<li>Ethereum has reduced fees for its L2 customers</li>
<li>Ethereum relies upon L2s</li>
</ol>
</li>
<li>Value Extraction by Service Entities
<ol class="content-list" style="list-style-type: lower-alpha;">
<li>L2s, data availability blockchains, staking, and re-staking take away Ethereum&rsquo;s value</li>
</ol>
</li>
</ol>
<p>Without question, the best use case for public blockchains at this early stage is speculation. The current monetization of SCPs relies on people moving assets or trading them on-chain. This generates revenue for blockchains through transaction fees and maximal extractable value (MEV), ultimately bringing value to tokenholders. Without speculation driving on-chain revenues, a blockchain must bank its worth on uncertain long-term potential.</p>
<h2>Ethereum's Decline in the Face of Faster Competitors</h2>
<p>Ethereum was once the epicenter of crypto speculation because it was the first smart contract platform to attract novel projects and allow users to speculate upon their tokens. However, the competitive landscape has changed, with more capable blockchains eating into Ethereum&rsquo;s once-dominant position.</p>
<p>These chains apply advancements in distributed systems technology to handle more transaction throughput and faster transaction processing. While Ethereum can process ~15 TPS per second with transaction confirmation times measured in minutes, chains like Solana, Sui, and Aptos can process thousands per second with confirmation latency measured in seconds. Simultaneously, the new crop of blockchains has figured out how to parallelize transactions that can be processed alongside each other. This allows transactions unrelated to congested areas on the blockchain to execute their logic unencumbered. Ethereum only allows transactions to process sequentially, and if one part of Ethereum is bombarded with demand, transactions on other parts are held in queue. As a result, the user experience for Ethereum&rsquo;s traders is clunky, and the number of individuals who can utilize Ethereum is limited.</p>
<p>Because of Ethereum&rsquo;s bottlenecks, developers building novel applications are increasingly deploying their projects to chains that can accommodate a better user experience and more users. These projects are also deploying their tokens to these new chains. Many innovative, non-financial crypto projects, like Helium and Hivemapper, reside on more advanced blockchains. Slowly, Ethereum is not only losing its dominance as a place to speculate, but it is also losing the tokens that appeal to speculators.</p>
<h2>Ethereum&rsquo;s Diminishing Fee Revenues</h2>
<p>Quantifying Ethereum&rsquo;s loss of its pole position among blockchains, since 2022, the share of all blockchain fees received by Ethereum has fallen from 86% to 33%, while its share of DEX volume has declined from 42% to 29%.</p>
<h3>ETH Share of Fees Has Fallen Sharply; Decentralized Exchange (DEX) Volume Share is More Stable</h3>
<p><img class="img-responsive w-100" alt="ETH Share of Fees Has Fallen Sharply; Decentralized Exchange (DEX) Volume Share is More Stable" src="https://www.vaneck.com/contentassets/4f849f079ebe4e5ebb205d633317db86/4800_crypto-monthly_chart-5_2024-9_v1_blog.svg" /></p>
<p class="chart-disclosure"><strong>Source:</strong> Artemis XYZ as of 8/27/2024. <strong>Past performance is no guarantee of future results. Not intended as a recommendation to buy or sell any securities named herein.</strong></p>
<h2>Ethereum's Shift to Layer-2: A Double-Edged Sword?</h2>
<p>Ethereum&rsquo;s solution to improve its scalability, pushing transactions to L2 blockchains, has thus far failed to drive value to ETH. Not only do the L2 blockchains increasingly cut into Ethereum economics through multiple pathways, but they also offer a suboptimal user experience while still offering far less transaction throughput than Ethereum competitors.</p>
<p>On the first dimension, value accrual to ETH, pushing transactions to its orbiting blockchains, also moves revenue-generating components like MEV and transaction fees to those L2 chains. Though L2s remit value to Ethereum by posting proofs and batches of transactions, Ethereum&rsquo;s share of transaction fees in its ecosystem (Ethereum + L2s) alone has dropped from 98% to 89% since 2022. MEV is difficult to calculate but can be approximated as a portion of DEX volumes. At the start of 2023, Ethereum commanded 90% of DEX volumes in its ecosystem, whereas today, that share is around 52%. The MEV that is generated by these DEX volumes accrues to the L2s instead of Ethereum.</p>
<p>The shift to L2s has also expanded the amount of available Ethereum blockspace, which has lowered the price of transactions. To make transactions even less costly, Ethereum passed EIP-4844, which created a new data processing lane for batches of L2 transactions. This has reduced revenues for both Ethereum and its L2s. At the start of 2024, Ethereum collected ~$6M; in August, that figure was $1.2M. The pie has shrunk at the behest of Ethereum, lowering its blockspace pricing, and because of Layer-2s. Ethereum&rsquo;s share of that pie has also diminished. Compared to 180 days ago, the 7 Day Moving Average of Ethereum&rsquo;s fees is down (-89%)! By comparison, Bitcoin&rsquo;s fees have sagged (-13%) while Tron&rsquo;s and Solana&rsquo;s are up (+125%) and (+114%). This lack of fee generation has bled into Ethereum becoming an inflationary economic system, with inflation now sitting at 0.74% and 944K of yearly issuance worth $2.45B in new supply.</p>
<h2>New Tokens and Competitors: Ethereum's Growing Challenges</h2>
<p>At the same time, many tokens have been launched that currently, or in the future, cleave value from Ethereum&rsquo;s ecosystem. These include L2, Data availability, re-staking, and staking tokens. Each of these product groups offers a competing service to Ethereum. Influential investors holding billions of dollars worth of tokens will demand that these projects cut into Ethereum&rsquo;s core businesses. Many of these projects have yet to launch a token, but we can estimate the value they have subtracted from Ethereum by looking at the collective FDV of their tokens. The twelve who have launched or have pre-markets for their tokens&rsquo; values have captured roughly 11% of Ethereum&rsquo;s ecosystem value. As more projects launch tokens, there will be further competition in Ethereum&rsquo;s service set, driving the price of Ethereum&rsquo;s core services lower while offering competing investment opportunities. This pricing pressure may shrink the economic pie available to ETH holders while increasing competition for investor interest.</p>
<h3>ETH&rsquo;s Share of Ethereum Ecosystem Services Token Value Has Decreased from 97% to 89% since Jan 2023</h3>
<p><img class="img-responsive w-100" alt="ETH&rsquo;s Share of Ethereum Ecosystem Services Token Value Has Decreased from 97% to 89% since Jan 2023 " src="https://www.vaneck.com/contentassets/4f849f079ebe4e5ebb205d633317db86/4800_crypto-monthly_chart-6_2024-9_v1_blog.svg" /></p>
<p class="chart-disclosure"><strong>Source:</strong> Artemis XYZ as of 8/27/2024. <strong>Past performance is no guarantee of future results. Not intended as a recommendation to buy or sell any securities named herein.</strong></p>
</a>
<p><a>Among Ethereum L2s, Polygon and Optimism stood out this month for significant increases in developer activity, with their contracts per deployer 30-day moving averages up ~7.9x and ~4.8x, respectively. However, MATIC &amp; OP tokens performed in the middle of the pack, down (-15%) and (-14 %), respectively. Polygon PoS developers are likely busy deploying contracts in preparation for the PIP-19 component of the broader </a><a href="https://polygon.technology/blog/polygon-2-0-implementation-officially-begins-the-first-set-of-pips-polygon-improvement-proposals-released" title="Polygon 2.0 Implementation Officially Begins, The First Set of PIPs (Polygon Improvement Proposals) Released" target="_blank" rel="noopener"><strong>Polygon 2.0</strong></a> rollout, scheduled for September 4th. This <a href="https://polygon.technology/blog/save-the-date-matic-pol-migration-coming-september-4th-everything-you-need-to-know#:~:text=POL%20upgrade%3A%20MATIC%20tokens%20held,POL%20on%20September%204%2C%202024." title="MATIC Held in Smart Contracts on Polygon PoS" target="_blank" rel="noopener"><strong>upgrade</strong></a> will transition Polygon&rsquo;s native MATIC token to the ecosystem&rsquo;s next-generation POL token, which is designed to accommodate an array of ZK-based L2 chains with community staking and governance. POL is optimized for the development of the aggregated Polygon network (&ldquo;<a href="https://polygon.technology/blog/the-beginners-guide-to-aggregated-blockchains" title="The Beginner&rsquo;s Guide to Aggregated Blockchains" target="_blank" rel="noopener"><strong>AggLayer</strong></a>&rdquo;). This network aims to be a unique scaling solution, moving beyond the current binary competition between modular and monolithic blockchain thesis dominated by Ethereum and Solana.</p>
<h3>Polygon &amp; Optimism Dev Outputs Surge Ahead of Upgrades</h3>
<p><img class="img-responsive w-100" alt="Polygon &amp; Optimism Dev Outputs Surge Ahead of Upgrades " src="https://www.vaneck.com/contentassets/4f849f079ebe4e5ebb205d633317db86/4800_crypto-monthly_chart-7_2024-9_v1_blog.svg" /></p>
<p class="chart-disclosure"><strong>Source</strong>: Artemis XYZ as of 8/28/2024. <strong>Past performance is no guarantee of future results. Not intended as a recommendation to buy or sell any securities named herein.</strong></p>
<p>Optimism developers increased their output this month due to two main catalysts: addressing recently discovered fraud proof <a href="https://gov.optimism.io/t/upgrade-proposal-10-granite-network-upgrade/8733" title="Upgrade Proposal #10: Granite Network Upgrade" target="_blank" rel="noopener"><strong>vulnerabilities</strong></a> and preparing for interoperability upgrades ahead of OP Labs' Superchain upgrade in early 2025. The Granite Network Upgrade <a href="https://vote.optimism.io/proposals/46514799174839131952937755475635933411907395382311347042580299316635260952272" title="Upgrade Proposal #10: Granite Network Upgrade" target="_blank" rel="noopener"><strong>proposal</strong></a>, made in response to third-party audits identifying security issues in Optimism&rsquo;s fault proof, includes both security and performance enhancements. The proposal passed on August 28th and is scheduled for execution on September 10th.</p>
<p>More proactively, Optimism <a href="https://blog.oplabs.co/solving-interoperability-for-the-superchain-and-beyond/" title="Solving Interoperability for the Superchain and beyond" target="_blank" rel="noopener"><strong>announced</strong></a> its &lsquo;Superchain&rsquo; roadmap this month, a three-milestone plan to bring interoperability to the OP Stack. According to <a href="https://l2beat.com/scaling/summary" title="Value Locked" target="_blank" rel="noopener"><strong>L2Beat</strong></a>, nine of the top 20 Ethereum L2s are built using Optimism&rsquo;s OP Stack codebase. If successful, this roadmap could significantly reduce the liquidity and user fragmentation currently affecting the Ethereum L2 ecosystem. Bringing interoperability to the OP Stack could elevate its user experience to be comparable with high-performance L1s like Solana while retaining the security, applications, and user base of the Ethereum ecosystem. Adding to the Superchain&rsquo;s gravity, Sony Group <a href="https://soneium.org/en/blog/introducing-soneium-by-sony-block-solutions-labs-for-the-future-of-web3/" title="Introducing Soneium by Sony Block Solutions Labs for the Future of Web3" target="_blank" rel="noopener"><strong>announced</strong></a> the development of its own Ethereum L2, &lsquo;Soneium&rsquo; that will be built using the OP Stack for both general Sony Group ecosystem applications. Additionally, Soneium will allow the exploration of new purposes, including &ldquo;&hellip;the protection of rights to creativity created by creators, new mechanisms for returning profits to support creators and fans, and opportunities for creators to be active across the digital and real worlds.&rdquo; Notably, the Japanese Prime Minister will speak at a Web3 Event in Tokyo later this year.</p>
<p>Arbitrum&rsquo;s native ARB token underperformed this month, down (-23%), with the L2 blockchain showing no meaningful increase in average developer output or total developer count. Earlier in the month, Arbitrum&rsquo;s DAO proposed and <a href="https://snapshot.org/#/arbitrumfoundation.eth/proposal/0xb581f3aed701ae889c1d79406acdf3d653e6eb4323cb5e46635f729e6313da4d" title="ARB Staking: Unlock ARB Utility and Align Governance" target="_blank" rel="noopener"><strong>approved</strong></a> the development of an ARB staking mechanism, which plans to stream DAO-generated rewards from the L2&rsquo;s sequencer along with MEV, validator fees, token inflation, and treasury diversification rewards to eligible token holders who are delegated to active governance participants.</p>
<p>Alongside Uniswap&rsquo;s UNI token, ARB was also <a href="https://www.businesswire.com/news/home/20240821785704/en/Prometheum-Capital-Adds-Two-New-Digital-Asset-Securities-to-Custodial-Platform" title="Prometheum Capital Adds Two New Digital Asset Securities to Custodial Platform" target="_blank" rel="noopener"><strong>added</strong></a> to the custodial business of the controversial Special Purpose Broker-Dealer, Prometheus Capital. Contrary to more nuanced takes from many crypto industry participants, Prometheum is aligned with the SEC&rsquo;s stance that traditional securities laws provide clear guidance on digital assets transactions. Given Uniswap&rsquo;s embattlement with the SEC, one could view ARB&rsquo;s addition to Prometheum as a bullish catalyst in terms of institutional distribution and liquidity or as a bearish catalyst in terms of exposure to the SEC. In either case, ARB appeared to lag other L2s in organic growth this month.</p>
<h3>Base Has ~10x More Contract Deployers Than Other Top L2s</h3>
<p><img class="img-responsive w-100" alt="Base Has ~10x More Contract Deployers Than Other Top L2s" src="https://www.vaneck.com/contentassets/4f849f079ebe4e5ebb205d633317db86/4800_crypto-monthly_chart-8_2024-9_v1_blog.svg" /></p>
<p class="chart-disclosure"><strong>Source</strong>: Artemis XYZ as of 8/28/2024. <strong>Past performance is no guarantee of future results. Not intended as a recommendation to buy or sell any securities named herein.</strong></p>
<p>Coinbase&rsquo;s Base blockchain is the largest Ethereum L2 by daily active addresses. Base also boasts a substantial number of smart contract deployers. Data from Artemis.xyz shows that Base has nearly an order of magnitude more addresses deploying smart contracts on its L2 than Arbitrum, Blast, OP Mainnet, or Polygon PoS combined. Like other entrepreneurs, crypto developers must strategically anticipate where their customers will be. We think developers they are increasingly choosing to build on Coinbase&rsquo;s Base because it enjoys a key competitive moat: a direct-to-consumer onramp from its dominant centralized exchange.</p>
<p>In an increasingly fragmented L2 landscape, Coinbase&rsquo;s unique nexus of onchain and offchain users, developers, and liquidity offers compelling virtual real estate for building a crypto business. As Base is also part of the OP Stack, it <a href="https://optimism.mirror.xyz/ciJzgxmb_fJU8wgiqrEXG_XYnAkuBrdG1biVk0BseiU" title="How (and why) the Superchain drives fees to the Optimism Collective" target="_blank" rel="noopener"><strong>participates</strong></a> in the Superchain&rsquo;s revenue sharing model. According to the &lsquo;Superchain Health Dashboard&rsquo;, Base contributed an estimated 142.45 ETH (~$367k) month-to-date to the Superchain Collective as of August 29th, second only to OP Mainnet itself. Base and Optimism thus present an interesting synergy, with Optimism potentially playing the long-term role of a relatively decentralized modular scaling solution counterpart to Coinbase&rsquo;s more centralized, retail-centric strategy.</p>
<h2 id="notable-performer" class="jump-link-nav anchored-block" data-jumplink-title="Notable Performers">August&rsquo;s Notable Performer - Tron (+20%)</h2>
<h3>Tron&rsquo;s Stablecoin Market Cap Outpaces Other Leading L1s</h3>
<p><img class="img-responsive w-100" alt="Tron&rsquo;s Stablecoin Market Cap Outpaces Other Leading L1s" src="https://www.vaneck.com/contentassets/4f849f079ebe4e5ebb205d633317db86/4800_crypto-monthly_chart-9_2024-9_v1_blog.svg" /></p>
<p class="chart-disclosure"><strong>Source:</strong> Artemis.xyz as of 08/28/24. <strong>Past performance is no guarantee of future results. Not intended as a recommendation to buy or sell any securities named herein.</strong></p>
<p>Up (+20%), Tron&rsquo;s native TRX token stood out once again this month, reaching levels not seen since April 2021. The blockchain&rsquo;s significant performance may largely be attributed to the mid-August <a href="https://cointelegraph.com/press-releases/sunpump-beta-launches-on-tron-driving-innovation-in-meme-coin-development" title="SunPump Beta launches on TRON, driving innovation in meme coin development" target="_blank" rel="noopener"><strong>launch</strong></a> of the Sun Pump platform Beta&mdash;a platform modeled after Solana&rsquo;s infamous pump.fun and named after Tron&rsquo;s founder Justin Sun. Sun Pump is a streamlined tool to launch meme coins in seconds. As of August 28<sup>th</sup>, Sun Pump has <a href="https://dune.com/hashed_official/sunpumpmeme" title="SunPump: Tron Memecoin Launchpad" target="_blank" rel="noopener"><strong>already</strong></a> launched over 56,000 meme coins on Tron, generating over 23 million TRX in revenue for an estimated $3.64 million USD. Effective August 25th, Tron <a href="https://x.com/justinsuntron/status/1827763144426750262" title="H.E. Justin Sun - Twitter" target="_blank" rel="noopener"><strong>executed</strong></a> Proposal #92 to increase the blockchain&rsquo;s energy cap, lowering gas fees and increasing transaction throughput in response to the increased user activity.</p>
<p>Sun Pump&rsquo;s initial success marks a significant diversification in Tron&rsquo;s adoption drivers, which historically have been centered around stablecoin investments and transfers in the APAC region and emerging economies. Data from Artemis, visualized in the chart above, illustrates the disproportionate amount of stablecoin value issued to the Tron blockchain relative to other leading smart contract blockchains. Indeed, while other blockchains experienced sizable drawdowns in stablecoin market caps during the bear market, Tron&rsquo;s blockchain demonstrated more sustained USD stablecoin retention and growth, even <a href="https://tether.to/en/transparency/?tab=usdt" title="Transparency" target="_blank" rel="noopener"><strong>surpassing</strong></a> Ethereum as the blockchain with the most circulating Tether (USDT), the world&rsquo;s largest stablecoin by market cap.</p>
<p>However, Tron was not without headwinds or controversy this month. After the Tron DAO Reserve <a href="https://www.dlnews.com/articles/defi/justin-sun-responds-after-usdd-stablecoin-removes-bitcoin/" title="Justin Sun responds after USDD stablecoin silently removes $732m of Bitcoin collateral" target="_blank" rel="noopener"><strong>removed</strong></a> ~$732 million of Bitcoin backing the USDD stablecoin (<a href="https://cointelegraph.com/news/justin-sun-says-removing-12k-bitcoin-usdd-defi-101" title="Justin Sun says removing 12K Bitcoin from USDD is just &lsquo;DeFi 101&rsquo;" target="_blank" rel="noopener"><strong>purportedly</strong></a> without community vote), Justin Sun <a href="https://x.com/justinsuntron/status/1826537914173718893" title="H.E. Justin Sun - twitter" target="_blank" rel="noopener"><strong>tweeted</strong></a> to assuage concerns, stating, &ldquo;The TRON DAO Reserve plans to spend time upgrading USDD in the future to make it a more competitive decentralized stablecoin in the market&rdquo;, after lamenting that &ldquo;&hellip;the capital utilization  is not very efficient.&rdquo;</p>
<p>We maintain a positive view of Tron&rsquo;s retail market penetration as a stablecoin-centric network. However, we hold a highly cautious view of the ecosystem&rsquo;s exposure to Justin Sun&rsquo;s control, given his questionable past actions with USDD and other projects. Bluechip, a third-party stablecoin ratings agency, <a href="https://bluechip.org/coins/usdd" title="USDD" target="_blank" rel="noopener"><strong>estimated</strong></a> that USDD&rsquo;s 53% collateralization was comprised of 69% TRX, 29% BTC, and 2% TUSD&mdash;<i>before</i> the latest BTC withdrawal. USDD was initially inspired to compete with the now-collapsed UST stablecoin involved in Terra/LUNA, and we fear it risks suffering a similar fate due to its reliance on TRX for collateral. We are also concerned about the general challenges facing USDT holders who want to off-ramp their tokens to fiat. USDT can be redeemed for dollars by only a few entities, and many holders are supposed have to swap for USDC to offramp their USDT. Additionally, moving USDT from Tron to Ethereum is nearly impossible, adding to our concern of collusion between Sun and Tether to block exits for Tron&rsquo;s USDT holders.</p>
<h2 id="notable-Laggards" class="jump-link-nav anchored-block" data-jumplink-title="Notable Laggards">August&rsquo;s Notable Laggard - zkSync (-24.05%)</h2>
<h3>zkSync User Growth Lags Base, Arbitrum, and Others as Ethereum L2 Ecosystem Activity Bounces</h3>
<p><img class="img-responsive w-100" alt="zkSync User Growth Lags Base, Arbitrum, and Others as Ethereum L2 Ecosystem Activity Bounces" src="https://www.vaneck.com/contentassets/4f849f079ebe4e5ebb205d633317db86/4800_crypto-monthly_chart-10_2024-9_v1_blog.svg" /></p>
<p class="chart-disclosure"><strong>Source:</strong> Artemis.xyz, as of 08/28/24. <strong>Past performance is no guarantee of future results. Not intended as a recommendation to buy or sell any securities named herein.</strong></p>
<p>zkSync&rsquo;s native ZK token experienced a significant decline of (-24%) this month, driven partly by its underperforming user growth compared to other Ethereum Layer 2 solutions. As the chart above illustrates, the growth of zkSync&rsquo;s daily active addresses&mdash;a proxy for users&mdash;lags that of Base, Arbitrum, and other leading L2s, even as overall activity in the Ethereum L2 ecosystem rebounds. Absent a clear negative catalyst. However, zkSync&rsquo;s stagnation can primarily be attributed to the vacuum left by the absence of its previous driver: airdrop farming.</p>
<p>Previously, zkSync fueled speculation about a potential airdrop, prompting users to interact with its network to increase their potential eligibility. For instance, a September 2023 zkSync blog post <a href="https://zksync.mirror.xyz/TKWRSWULp-UNmx4I8A1bp81vQgWXZlQzUCelO8kQpS4" title="Transitioning zkSync's Ecosystem Management to DappRadar: Another Step Toward Decentralization" target="_blank" rel="noopener"><strong>mentioned</strong></a> plans to &ldquo;fully decentralize the protocol&rsquo;s technology, community governance&hellip;,&rdquo; and emphasized &ldquo;empowering the community with ownership.&rdquo; On June 11th, zkSync finally revealed details about the airdrop of its native ZK token. However, the distribution was criticized for lacking sybil resistance, a vulnerability in which a single entity can use multiple accounts to gain disproportionate amounts of airdropped tokens. After ZK token claims began the following week, one user <a href="https://x.com/k1z4_/status/1804498112154620370" title="k1z4 - Twitter" target="_blank" rel="noopener"><strong>claimed</strong></a> to have received over 6.6 million tokens across 350 Sybil wallets, valued at nearly $1.2 million. Simultaneously, many good-faith users found themselves <a href="https://cryptobriefing.com/zksync-airdrop-controversy-exposed/" title="zkSync airdrop under fire for Sybil attacks and ineligibility cases" target="_blank" rel="noopener"><strong>ineligible</strong></a> for the airdrop, rubbing salt in the wounds of loyal community members and highlighting the inefficacy of zkSync&rsquo;s approach to &ldquo;fair&rdquo; ZK token distributions.</p>
<p>The combined effects of the resulting negative sentiment, lack of ongoing user incentives, and 83% <a href="https://coinmarketcap.com/currencies/zksync/" title="zkSync price today, ZK to USD live price, marketcap and chart" target="_blank" rel="noopener"><strong>overhanging</strong></a> ZK supply contribute to selling pressure. Moreover, the Ethereum L2 competitive landscape remains fierce, with L2s like Base gaining traction with the development of features like on-chain verification-enabled <a href="https://www.coinbase.com/onchain-verify" title="Verify your wallet to unlock onchain experiences" target="_blank" rel="noopener"><strong>applications</strong></a>. It is logical that growth driven by organic demand for on-chain applications and more direct-to-consumer distribution such as Coinbase&rsquo;s is more sustainable than the airdrop hype that may have driven much of zkSync&rsquo;s initial growth.</p>
<p><strong>Links to third party websites are provided as a convenience and the inclusion of such links does not imply any endorsement, approval, investigation, verification or monitoring by us of any content or information contained within or accessible from the linked sites. By clicking on the link to a non-VanEck webpage, you acknowledge that you are entering a third-party website subject to its own terms and conditions. VanEck disclaims responsibility for content, legality of access or suitability of the third-party websites.</strong></p>
<p>To receive more <strong><a href="https://www.vaneck.com/us/en/insights/digital-assets/" title="Digital Assets Insights">Digital Assets</a></strong> insights, <strong><a href="https://www.vaneck.com/us/en/subscribe/" title="Subscription Center">sign up in our subscription center</a></strong>.</p>
<style>
    .data-td.data {
        padding-right: 5px !important;
    }

    .wrapped-div {
        max-width: 100%;
    }

    @media (max-width: 1240px) {
        .wrapped-div {
            overflow-x: scroll;
        }
    }

    .wrapped-div-sector {
        max-width: 100%;
        overflow-x: scroll;
    }
</style>
]]></content:encoded>
</item><item rdf:about="https://www.vaneck.com/us/en/blogs/natural-resources/understanding-the-components-of-commodity-futures-returns/">
  <title>Understanding the Components of Commodity Futures Returns></title>
  <link>https://www.vaneck.com/us/en/blogs/natural-resources/understanding-the-components-of-commodity-futures-returns/</link>
  <description><![CDATA[Returns from commodity futures are influenced by more than just the price of the underlying commodity; spot price, roll yield, and collateral return are also key elements.]]></description>
  <dc:creator> </dc:creator>
  <dc:date>09/03/2024 06:30:00</dc:date>
<content:encoded><![CDATA[

<p>Investing in commodity futures offers a unique way to diversify portfolios and capitalize on price movements in resources such as oil, metals or agricultural products. However, the returns from commodity futures are influenced by more than just the price of the underlying commodity. There are three key components to consider: spot price, roll yield and collateral return. Understanding these elements is crucial for investors seeking to optimize their strategies in the commodities market.</p>
<h2>Spot Price: The Foundation of Futures Returns</h2>
<p>The spot price is the current market price at which a particular commodity can be bought or sold for immediate delivery. In the context of commodity futures, the spot price plays a central role as it represents the actual market value of the underlying asset at a given time.</p>
<p>Changes in the spot price directly impact the value of a futures contract. For example, if you hold a futures contract for oil and the spot price of oil rises, the value of your contract typically increases as well, assuming other factors remain constant. Thus, the spot price is the most straightforward component of commodity futures returns&mdash;when the spot price rises, so do the returns on the futures contract.</p>

<h2>Roll Yield: The Impact of Contango and Backwardation</h2>
<p>Roll yield is a more complex but crucial concept for understanding the total return from a futures investment. Roll yield arises from the practice of "rolling" futures contracts&mdash;replacing an expiring contract with a new one to maintain exposure to the commodity.</p>
<p>Futures contracts have expiration dates, and as they approach expiry, investors often sell their positions in the expiring contract and purchase new contracts further out on the curve. The difference in price between the expiring contract and the new one determines the roll yield.</p>
<ul class="content-list">
<li class="mt-2"><strong>Contango:</strong> When the futures curve is in contango, the prices of longer-dated futures contracts are higher than those of near-term contracts. In this situation, rolling into a new contract usually results in a negative roll yield, as investors must pay more to purchase the new contract than they receive from selling the expiring one.</li>
<li class="mt-2"><strong>Backwardation:</strong> Conversely, when the futures curve is in backwardation, longer-dated contracts are cheaper than near-term ones. This scenario typically results in a positive roll yield, as investors can sell the expiring contract at a higher price and buy the new one at a lower price.</li>
</ul>
<p>The state of the futures curve&mdash;whether in contango or backwardation&mdash;can significantly influence the overall returns of a commodity futures investment. In markets that are consistently in backwardation, the positive roll yield can enhance returns, while in markets in contango, the negative roll yield can erode potential profits.</p>
<h2>Collateral Return: The Interest on Cash Reserves</h2>
<p>Collateral return, or collateral yield, is the third component of futures returns. It refers to the interest earned on the cash or cash-equivalent assets held to collateralize a futures position. Since futures contracts typically require only a portion of the contract value to be posted as margin, the remaining funds can be invested in short-term, risk-free instruments, such as Treasury bills.</p>
<p>The return from these investments, known as collateral return, may not be as significant as the spot price or roll yield, but it still contributes to the overall return on a futures investment. For institutional investors managing large portfolios, even small differences in collateral returns can add up over time, making this a non-negligible factor in futures investing.</p>

<h2>Why These Components Matter</h2>
<p>Understanding these three components&mdash;spot price, roll yield, and collateral return&mdash;is essential for anyone investing in commodity futures. Together, they determine the total return on a futures investment, and each plays a unique role. Consider 2022...</p>
<p>2022 was marked by disruptions in global energy supply and a dramatic rise in global interest rates&mdash;both of which significantly impacted commodity futures returns. Russia&rsquo;s invasion of Ukraine in late February and the U.S. Federal Reserve&rsquo;s aggressive stance to combat rising inflation in the U.S. led to significant gains in both the price of energy-related commodities and yields on U.S. Treasuries. While the prices of many energy commodities eventually fell from their early-to-mid-year peaks, the futures curves of nearly all energy commodities remained in extreme backwardation for the remainder of 2022. Consequently, roll yields&mdash;as well as the nearly 4.75% yield earned on most short-term U.S. Treasuries by year-end&mdash;were significant contributors to commodity returns beyond just spot price movements.</p>
<p>For both individual and institutional investors, understanding these components allows for more informed decision-making and better risk management. By carefully analyzing the interplay between spot prices, roll yield and collateral returns, investors can craft strategies that align with their risk tolerance and investment objectives, ultimately optimizing their outcomes in the commodities market.</p>
<h2>Why Consider the &ldquo;Constant Maturity&rdquo; Approach?</h2>
<p><a href="https://www.vaneck.com/us/en/investments/cm-commodity-index-fund-cmcax/overview/" title="CMCAX - CM Commodity Index Fund - Class A - Overview"><strong>VanEck CM Commodity Index Fund</strong></a> and <strong><a href="https://www.vaneck.com/us/en/investments/cmci-commodity-strategy-etf-cmci/overview/" title="CMCI - VanEck CMCI Commodity Strategy ETF - Overview">VanEck CMCI Commodity Strategy ETF</a></strong> &ndash; VanEck&rsquo;s passively managed strategies that track the UBS Constant Maturity Commodity Index (CMCITR) &ndash; offer truly diversified commodity exposure&mdash;including exposure across each of the major commodities sectors (energy, agriculture, industrial metals, precious metals and livestock), as well across maturities for each individual commodity (ranging from one month to three years, effectively spreading exposure to each commodity component along the futures curve).</p>
<p>With CMCITR, the maturity of each commodity component remains fixed at a predefined time interval from the current date. The &ldquo;constant maturity&rdquo; concept is achieved by a continuous rolling process, where a weighted percentage of contracts are swapped for longer-dated contracts daily. This procedure produces a more continuous form of &ldquo;pure&rdquo; commodity exposure and provides a better balance of forward price behavior than traditional commodity indices. Additionally, this feature of CMCITR can minimize exposure to the negative effects of roll yield, making the index more representative of the underlying market price movements.</p>
<p>To understand more about how this approach works, check out <strong><a href="https://www.vaneck.com/us/en/blogs/natural-resources/investing-in-commodities-intelligently-question-and-answer/" title="Investing in Commodities Intelligently: Question and Answer">Investing in Commodities Intelligently: Question and Answer</a></strong>.</p>

<p>To receive more <a href="/us/en/insights/natural-resources/" title="Natural Resources Insights"><strong>Natural Resources</strong></a> insights, <a href="https://www.vaneck.com/us/en/subscribe/" title="Subscription Center"><strong>sign up in our subscription center</strong></a>.</p>
]]></content:encoded>
</item><item rdf:about="https://www.vaneck.com/us/en/blogs/thematic-investing/access-trends-through-thematic-etfs/">
  <title>Access Trends Through Thematic ETFs></title>
  <link>https://www.vaneck.com/us/en/blogs/thematic-investing/access-trends-through-thematic-etfs/</link>
  <description><![CDATA[Exchanged-Traded Funds can be useful tools for investors seeking to participate in specific and targeted economic opportunities, often referred to as &ldquo;themes&rdquo;.]]></description>
  <dc:creator>John Patrick Lee, CFA</dc:creator>
  <dc:date>08/30/2024 06:30:00</dc:date>
<content:encoded><![CDATA[

<p>Exchange-Traded Funds can be useful tools for investors seeking to participate in specific and, targeted economic opportunities. Often, these are referred to as &ldquo;themes&rdquo;, which may be based in advancements such as technology or they can be solution driven&mdash;solutions investors seek to combat particular market conditions, like inflation. While ETFs that target themes generally tend to be concentrated portfolios, their addition to a portfolio is intended to add value not only from a return perspective, but to also aid with diversification and overall risk.</p>
<p>Investors who are considering using ETFs within their portfolios to target particular themes should first do their due diligence. It is important to understand the key attributes of the strategy you&rsquo;re considering; like index rules or the investment methodology, purity of exposure to a theme and also the potential longevity of a theme.</p>
<p>VanEck has purpose-built a variety of ETFs for accessing timely and relevant trends shaping the modern investment landscape. See the table illustrated in the below.</p>
<div class="wrapped-div">
<table class="w-100" style="width: 91.2548%; height: 544.765px;">
<tbody>
<tr class="tbl-data" style="height: 22.3906px;">
<td class="tbl-header last text-center" style="width: 100%; height: 22.3906px;" colspan="11">VanEck ETFs That Provide Thematic Accessibility</td>
</tr>
<tr class="tbl-data" style="height: 44.7812px;">
<td class="data-td last" style="width: 5.00417%; height: 44.7812px;">Ticker</td>
<td class="data-td last" style="width: 22.6856%; height: 44.7812px;">Fund</td>
<td class="data-td last text-center" style="width: 9.84153%; height: 44.7812px;">Demographics</td>
<td class="data-td last text-center" style="width: 8.25688%; height: 44.7812px;">Automation</td>
<td class="data-td last text-center" style="width: 6.92244%; height: 44.7812px;">Energy<br />Transition</td>
<td class="data-td last text-center" style="width: 7.92327%; height: 44.7812px;">Disruptive<br />Technology</td>
<td class="data-td last text-center" style="width: 7.58966%; height: 44.7812px;">Healthcare<br />Innovation</td>
<td class="data-td last text-center" style="width: 9.17431%; height: 44.7812px;">Infrastructure</td>
<td class="data-td last text-center" style="width: 7.08924%; height: 44.7812px;">Reshoring</td>
<td class="data-td last text-center" style="width: 6.58882%; height: 44.7812px;">Resource<br />Scarcity</td>
<td class="data-td last text-center" style="width: 8.9241%; height: 44.7812px;">Sustainability</td>
</tr>
<tr class="tbl-data" style="height: 22.3906px;">
<td class="data-td last" style="width: 5.00417%; height: 22.3906px;"><a href="/link/018811e6db344b7691fd273a97737194.aspx" title="Vaneck Alternative Asset Manager ETF - GPZ">GPZ</a></td>
<td class="data-td last" style="width: 22.6856%; height: 22.3906px;"><a href="/link/018811e6db344b7691fd273a97737194.aspx" title="Vaneck Alternative Asset Manager ETF - GPZ">Alternative Asset Manager ETF</a></td>
<td class="data-td data last text-center" style="width: 9.84153%; height: 22.3906px;">&nbsp;</td>
<td class="data-td data last text-center" style="width: 8.25688%; height: 22.3906px;">&nbsp;</td>
<td class="data-td data last text-center" style="width: 6.92244%; height: 22.3906px;">&nbsp;</td>
<td class="data-td data last text-center" style="width: 7.92327%; height: 22.3906px;">■</td>
<td class="data-td data last text-center" style="width: 7.58966%; height: 22.3906px;">&nbsp;</td>
<td class="data-td data last text-center" style="width: 9.17431%; height: 22.3906px;">■</td>
<td class="data-td data last text-center" style="width: 7.08924%; height: 22.3906px;">&nbsp;</td>
<td class="data-td data last text-center" style="width: 6.58882%; height: 22.3906px;">■</td>
<td class="data-td data last text-center" style="width: 8.9241%; height: 22.3906px;">&nbsp;</td>
</tr>
<tr class="tbl-data" style="height: 22.3906px;">
<td class="data-td last" style="width: 5.00417%; height: 22.3906px;"><a href="/link/9986c21ffd02450e946827f799653749.aspx" title="VAVX - Avalanche ETF">VAVX</a></td>
<td class="data-td last" style="width: 22.6856%; height: 22.3906px;"><a href="/link/9986c21ffd02450e946827f799653749.aspx" title="VAVX - Avalanche ETF">Avalanche ETF</a></td>
<td style="width: 9.84153%; height: 22.3906px;">■</td>
<td style="width: 8.25688%; height: 22.3906px;">&nbsp;</td>
<td style="width: 6.92244%; height: 22.3906px;">&nbsp;</td>
<td style="width: 7.92327%; height: 22.3906px;">■</td>
<td style="width: 7.58966%; height: 22.3906px;">&nbsp;</td>
<td style="width: 9.17431%; height: 22.3906px;">&nbsp;</td>
<td style="width: 7.08924%; height: 22.3906px;">&nbsp;</td>
<td style="width: 6.58882%; height: 22.3906px;">■</td>
<td style="width: 8.9241%; height: 22.3906px;">&nbsp;</td>
</tr>
<tr class="tbl-data" style="height: 22.3906px;">
<td class="data-td last" style="width: 5.00417%; height: 22.3906px;"><a href="https://www.vaneck.com/us/en/investments/biotech-etf-bbh/overview/" title="Vaneck Biotech ETF - BBH">BBH</a></td>
<td class="data-td last" style="width: 22.6856%; height: 22.3906px;"><a href="https://www.vaneck.com/us/en/investments/biotech-etf-bbh/overview/" title="Vaneck Biotech ETF - BBH">Biotech ETF</a></td>
<td class="data-td data last text-center" style="width: 9.84153%; height: 22.3906px;">■</td>
<td class="data-td data last text-center" style="width: 8.25688%; height: 22.3906px;">&nbsp;</td>
<td class="data-td data last text-center" style="width: 6.92244%; height: 22.3906px;">&nbsp;</td>
<td class="data-td data last text-center" style="width: 7.92327%; height: 22.3906px;">■</td>
<td class="data-td data last text-center" style="width: 7.58966%; height: 22.3906px;">■</td>
<td class="data-td data last text-center" style="width: 9.17431%; height: 22.3906px;">&nbsp;</td>
<td class="data-td data last text-center" style="width: 7.08924%; height: 22.3906px;">&nbsp;</td>
<td class="data-td data last text-center" style="width: 6.58882%; height: 22.3906px;">&nbsp;</td>
<td class="data-td data last text-center" style="width: 8.9241%; height: 22.3906px;">&nbsp;</td>
</tr>
<tr class="tbl-data" style="height: 22.3906px;">
<td class="data-td last" style="width: 5.00417%; height: 22.3906px;"><a href="https://www.vaneck.com/us/en/investments/bitcoin-trust-hodl/overview/" title="Vaneck Bitcoin ETF - HODL">HODL</a></td>
<td class="data-td last" style="width: 22.6856%; height: 22.3906px;"><a href="https://www.vaneck.com/us/en/investments/bitcoin-trust-hodl/overview/" title="Vaneck Bitcoin ETF - HODL">Bitcoin ETF</a></td>
<td class="data-td data last text-center" style="width: 9.84153%; height: 22.3906px;">■</td>
<td class="data-td data last text-center" style="width: 8.25688%; height: 22.3906px;">&nbsp;</td>
<td class="data-td data last text-center" style="width: 6.92244%; height: 22.3906px;">&nbsp;</td>
<td class="data-td data last text-center" style="width: 7.92327%; height: 22.3906px;">■</td>
<td class="data-td data last text-center" style="width: 7.58966%; height: 22.3906px;">&nbsp;</td>
<td class="data-td data last text-center" style="width: 9.17431%; height: 22.3906px;">&nbsp;</td>
<td class="data-td data last text-center" style="width: 7.08924%; height: 22.3906px;">&nbsp;</td>
<td class="data-td data last text-center" style="width: 6.58882%; height: 22.3906px;">■</td>
<td class="data-td data last text-center" style="width: 8.9241%; height: 22.3906px;">&nbsp;</td>
</tr>
<tr class="tbl-data" style="height: 44.7812px;">
<td class="data-td last" style="width: 5.00417%; height: 22.3906px;"><a href="/link/bc13e94806954f2da2fab526cace351b.aspx" title="Vaneck Digital Native Economy ETF - GENZ">GENZ</a></td>
<td class="data-td last" style="width: 22.6856%; height: 22.3906px;"><a href="/link/bc13e94806954f2da2fab526cace351b.aspx" title="Vaneck Digital Native Economy ETF - GENZ">Digital Native Economy ETF</a></td>
<td class="data-td data last text-center" style="width: 9.84153%; height: 22.3906px;">■</td>
<td class="data-td data last text-center" style="width: 8.25688%; height: 22.3906px;">&nbsp;</td>
<td class="data-td data last text-center" style="width: 6.92244%; height: 22.3906px;">&nbsp;</td>
<td class="data-td data last text-center" style="width: 7.92327%; height: 22.3906px;">&nbsp;■</td>
<td class="data-td data last text-center" style="width: 7.58966%; height: 22.3906px;">&nbsp;</td>
<td class="data-td data last text-center" style="width: 9.17431%; height: 22.3906px;">&nbsp;</td>
<td class="data-td data last text-center" style="width: 7.08924%; height: 22.3906px;">&nbsp;</td>
<td class="data-td data last text-center" style="width: 6.58882%; height: 22.3906px;">&nbsp;</td>
<td class="data-td data last text-center" style="width: 8.9241%; height: 22.3906px;">&nbsp;</td>
</tr>
<tr class="tbl-data" style="height: 44.7812px;">
<td class="data-td last" style="width: 5.00417%; height: 44.7812px;"><a href="https://www.vaneck.com/us/en/investments/digital-transformation-etf-dapp/overview/" title="Vaneck Digital Transformation ETF - DAPP">DAPP</a></td>
<td class="data-td last" style="width: 22.6856%; height: 44.7812px;"><a href="https://www.vaneck.com/us/en/investments/digital-transformation-etf-dapp/overview/" title="Vaneck Digital Transformation ETF - DAPP">Digital Transformation<br />ETF</a></td>
<td class="data-td data last text-center" style="width: 9.84153%; height: 44.7812px;">■</td>
<td class="data-td data last text-center" style="width: 8.25688%; height: 44.7812px;">&nbsp;</td>
<td class="data-td data last text-center" style="width: 6.92244%; height: 44.7812px;">&nbsp;</td>
<td class="data-td data last text-center" style="width: 7.92327%; height: 44.7812px;">■</td>
<td class="data-td data last text-center" style="width: 7.58966%; height: 44.7812px;">&nbsp;</td>
<td class="data-td data last text-center" style="width: 9.17431%; height: 44.7812px;">&nbsp;</td>
<td class="data-td data last text-center" style="width: 7.08924%; height: 44.7812px;">&nbsp;</td>
<td class="data-td data last text-center" style="width: 6.58882%; height: 44.7812px;">&nbsp;</td>
<td class="data-td data last text-center" style="width: 8.9241%; height: 44.7812px;">&nbsp;</td>
</tr>
<tr class="tbl-data" style="height: 44.7812px;">
<td class="data-td last" style="width: 5.00417%; height: 44.7812px;"><a href="https://www.vaneck.com/us/en/investments/enviromental-services-etf-evx/overview/" title="Vaneck Environmental Services ETF - EVX">EVX</a></td>
<td class="data-td last" style="width: 22.6856%; height: 44.7812px;"><a href="https://www.vaneck.com/us/en/investments/enviromental-services-etf-evx/overview/" title="Vaneck Environmental Services ETF - EVX">Environmental<br />Services ETF</a></td>
<td class="data-td data last text-center" style="width: 9.84153%; height: 44.7812px;">&nbsp;</td>
<td class="data-td data last text-center" style="width: 8.25688%; height: 44.7812px;">&nbsp;</td>
<td class="data-td data last text-center" style="width: 6.92244%; height: 44.7812px;">■</td>
<td class="data-td data last text-center" style="width: 7.92327%; height: 44.7812px;">&nbsp;</td>
<td class="data-td data last text-center" style="width: 7.58966%; height: 44.7812px;">&nbsp;</td>
<td class="data-td data last text-center" style="width: 9.17431%; height: 44.7812px;">■</td>
<td class="data-td data last text-center" style="width: 7.08924%; height: 44.7812px;">&nbsp;</td>
<td class="data-td data last text-center" style="width: 6.58882%; height: 44.7812px;">&nbsp;</td>
<td class="data-td data last text-center" style="width: 8.9241%; height: 44.7812px;">&nbsp;</td>
</tr>
<tr class="tbl-data" style="height: 22.3906px;">
<td class="data-td last" style="width: 5.00417%; height: 22.3906px;"><a href="https://www.vaneck.com/us/en/investments/ethereum-etf-ethv/overview/" title="Vaneck Ethereum ETF - ETHV">ETHV</a></td>
<td class="data-td last" style="width: 22.6856%; height: 22.3906px;"><a href="https://www.vaneck.com/us/en/investments/ethereum-etf-ethv/overview/" title="Vaneck Ethereum ETF - ETHV">Ethereum ETF</a></td>
<td class="data-td data last text-center" style="width: 9.84153%; height: 22.3906px;">■</td>
<td class="data-td data last text-center" style="width: 8.25688%; height: 22.3906px;">&nbsp;</td>
<td class="data-td data last text-center" style="width: 6.92244%; height: 22.3906px;">&nbsp;</td>
<td class="data-td data last text-center" style="width: 7.92327%; height: 22.3906px;">■</td>
<td class="data-td data last text-center" style="width: 7.58966%; height: 22.3906px;">&nbsp;</td>
<td class="data-td data last text-center" style="width: 9.17431%; height: 22.3906px;">&nbsp;</td>
<td class="data-td data last text-center" style="width: 7.08924%; height: 22.3906px;">&nbsp;</td>
<td class="data-td data last text-center" style="width: 6.58882%; height: 22.3906px;">■</td>
<td class="data-td data last text-center" style="width: 8.9241%; height: 22.3906px;">&nbsp;</td>
</tr>
<tr class="tbl-data" style="height: 44.7812px;">
<td class="data-td last" style="width: 5.00417%; height: 44.7812px;"><a href="https://www.vaneck.com/us/en/investments/fabless-semiconductor-etf-smhx/overview/" title="Vaneck Fabless Semiconductor ETF - SMHX">SMHX</a></td>
<td class="data-td last" style="width: 22.6856%; height: 44.7812px;"><a href="https://www.vaneck.com/us/en/investments/fabless-semiconductor-etf-smhx/overview/" title="Vaneck Fabless Semiconductor ETF - SMHX">Fabless Semiconductor<br />ETF</a></td>
<td class="data-td data last text-center" style="width: 9.84153%; height: 44.7812px;">&nbsp;</td>
<td class="data-td data last text-center" style="width: 8.25688%; height: 44.7812px;">&nbsp;</td>
<td class="data-td data last text-center" style="width: 6.92244%; height: 44.7812px;">■</td>
<td class="data-td data last text-center" style="width: 7.92327%; height: 44.7812px;">■</td>
<td class="data-td data last text-center" style="width: 7.58966%; height: 44.7812px;">&nbsp;</td>
<td class="data-td data last text-center" style="width: 9.17431%; height: 44.7812px;">&nbsp;</td>
<td class="data-td data last text-center" style="width: 7.08924%; height: 44.7812px;">■</td>
<td class="data-td data last text-center" style="width: 6.58882%; height: 44.7812px;">&nbsp;</td>
<td class="data-td data last text-center" style="width: 8.9241%; height: 44.7812px;">&nbsp;</td>
</tr>
<tr class="tbl-data" style="height: 44.7812px;">
<td class="data-td last" style="width: 5.00417%; height: 29.7812px;"><a href="https://www.vaneck.com/us/en/investments/office-and-commercial-reit-desk/overview/" title="Vaneck Office and Commercial REIT ETF - DESK">DESK</a></td>
<td class="data-td last" style="width: 22.6856%; height: 29.7812px;"><a href="https://www.vaneck.com/us/en/investments/office-and-commercial-reit-desk/overview/" title="Vaneck Office and Commercial REIT ETF - DESK">Office and Commercial<br />REIT ETF</a></td>
<td class="data-td data last text-center" style="width: 9.84153%; height: 29.7812px;">■</td>
<td class="data-td data last text-center" style="width: 8.25688%; height: 29.7812px;">&nbsp;</td>
<td class="data-td data last text-center" style="width: 6.92244%; height: 29.7812px;">&nbsp;</td>
<td class="data-td data last text-center" style="width: 7.92327%; height: 29.7812px;">&nbsp;</td>
<td class="data-td data last text-center" style="width: 7.58966%; height: 29.7812px;">&nbsp;</td>
<td class="data-td data last text-center" style="width: 9.17431%; height: 29.7812px;">■</td>
<td class="data-td data last text-center" style="width: 7.08924%; height: 29.7812px;">&nbsp;</td>
<td class="data-td data last text-center" style="width: 6.58882%; height: 29.7812px;">&nbsp;</td>
<td class="data-td data last text-center" style="width: 8.9241%; height: 29.7812px;">&nbsp;</td>
</tr>
<tr class="tbl-data" style="height: 44.7812px;">
<td class="data-td last" style="width: 5.00417%; height: 22.3906px;"><a href="https://www.vaneck.com/us/en/investments/onchain-economy-etf-node/overview/" title="VanEck Onchain Economy ETF - NODE">NODE</a></td>
<td class="data-td last" style="width: 22.6856%; height: 22.3906px;"><a href="https://www.vaneck.com/us/en/investments/onchain-economy-etf-node/overview/" title="VanEck Onchain Economy ETF - NODE">Onchain Economy ETF</a></td>
<td class="data-td data last text-center" style="width: 9.84153%; height: 22.3906px;">■</td>
<td class="data-td data last text-center" style="width: 8.25688%; height: 22.3906px;">&nbsp;</td>
<td class="data-td data last text-center" style="width: 6.92244%; height: 22.3906px;">■</td>
<td class="data-td data last text-center" style="width: 7.92327%; height: 22.3906px;">■</td>
<td class="data-td data last text-center" style="width: 7.58966%; height: 22.3906px;">&nbsp;</td>
<td class="data-td data last text-center" style="width: 9.17431%; height: 22.3906px;">■</td>
<td class="data-td data last text-center" style="width: 7.08924%; height: 22.3906px;">&nbsp;</td>
<td class="data-td data last text-center" style="width: 6.58882%; height: 22.3906px;">&nbsp;</td>
<td class="data-td data last text-center" style="width: 8.9241%; height: 22.3906px;">&nbsp;</td>
</tr>
<tr class="tbl-data" style="height: 44.7812px;">
<td class="data-td last" style="width: 5.00417%; height: 22.3906px;"><a href="https://www.vaneck.com/us/en/investments/pharmaceutical-etf-pph/overview/" title="Vaneck Pharmaceutical ETF - PPH">PPH</a></td>
<td class="data-td last" style="width: 22.6856%; height: 22.3906px;"><a href="https://www.vaneck.com/us/en/investments/pharmaceutical-etf-pph/overview/" title="Vaneck Pharmaceutical ETF - PPH">Pharmaceutical ETF</a></td>
<td class="data-td data last text-center" style="width: 9.84153%; height: 22.3906px;">■</td>
<td class="data-td data last text-center" style="width: 8.25688%; height: 22.3906px;">&nbsp;</td>
<td class="data-td data last text-center" style="width: 6.92244%; height: 22.3906px;">&nbsp;</td>
<td class="data-td data last text-center" style="width: 7.92327%; height: 22.3906px;">■</td>
<td class="data-td data last text-center" style="width: 7.58966%; height: 22.3906px;">■</td>
<td class="data-td data last text-center" style="width: 9.17431%; height: 22.3906px;">&nbsp;</td>
<td class="data-td data last text-center" style="width: 7.08924%; height: 22.3906px;">&nbsp;</td>
<td class="data-td data last text-center" style="width: 6.58882%; height: 22.3906px;">&nbsp;</td>
<td class="data-td data last text-center" style="width: 8.9241%; height: 22.3906px;">&nbsp;</td>
</tr>
<tr class="tbl-data" style="height: 44.7812px;">
<td class="data-td last" style="width: 5.00417%; height: 22.3906px;"><a href="https://www.vaneck.com/us/en/investments/retail-etf-rth/overview/" title="Vaneck Retail ETF - RTH">RTH</a></td>
<td class="data-td last" style="width: 22.6856%; height: 22.3906px;"><a href="https://www.vaneck.com/us/en/investments/retail-etf-rth/overview/" title="Vaneck Retail ETF - RTH">Retail ETF</a></td>
<td class="data-td data last text-center" style="width: 9.84153%; height: 22.3906px;">■</td>
<td class="data-td data last text-center" style="width: 8.25688%; height: 22.3906px;">■</td>
<td class="data-td data last text-center" style="width: 6.92244%; height: 22.3906px;">&nbsp;</td>
<td class="data-td data last text-center" style="width: 7.92327%; height: 22.3906px;">■</td>
<td class="data-td data last text-center" style="width: 7.58966%; height: 22.3906px;">&nbsp;</td>
<td class="data-td data last text-center" style="width: 9.17431%; height: 22.3906px;">&nbsp;</td>
<td class="data-td data last text-center" style="width: 7.08924%; height: 22.3906px;">&nbsp;</td>
<td class="data-td data last text-center" style="width: 6.58882%; height: 22.3906px;">&nbsp;</td>
<td class="data-td data last text-center" style="width: 8.9241%; height: 22.3906px;">&nbsp;</td>
</tr>
<tr class="tbl-data" style="height: 44.7812px;">
<td class="data-td last" style="width: 5.00417%; height: 22.3906px;"><a href="https://www.vaneck.com/us/en/investments/robotics-etf-ibot/overview/" title="Vaneck Robotics ETF - IBOT">IBOT</a></td>
<td class="data-td last" style="width: 22.6856%; height: 22.3906px;"><a href="https://www.vaneck.com/us/en/investments/robotics-etf-ibot/overview/" title="Vaneck Robotics ETF - IBOT">Robotics ETF</a></td>
<td class="data-td data last text-center" style="width: 9.84153%; height: 22.3906px;">■</td>
<td class="data-td data last text-center" style="width: 8.25688%; height: 22.3906px;">■</td>
<td class="data-td data last text-center" style="width: 6.92244%; height: 22.3906px;">&nbsp;</td>
<td class="data-td data last text-center" style="width: 7.92327%; height: 22.3906px;">■</td>
<td class="data-td data last text-center" style="width: 7.58966%; height: 22.3906px;">■</td>
<td class="data-td data last text-center" style="width: 9.17431%; height: 22.3906px;">■</td>
<td class="data-td data last text-center" style="width: 7.08924%; height: 22.3906px;">■</td>
<td class="data-td data last text-center" style="width: 6.58882%; height: 22.3906px;">&nbsp;</td>
<td class="data-td data last text-center" style="width: 8.9241%; height: 22.3906px;">&nbsp;</td>
</tr>
<tr class="tbl-data" style="height: 44.7812px;">
<td class="data-td last" style="width: 5.00417%; height: 22.3906px;"><a href="https://www.vaneck.com/us/en/investments/semiconductor-etf-smh/overview/" title="Vaneck Semiconductor ETF - SMH">SMH</a></td>
<td class="data-td last" style="width: 22.6856%; height: 22.3906px;"><a href="https://www.vaneck.com/us/en/investments/semiconductor-etf-smh/overview/" title="Vaneck Semiconductor ETF - SMH">Semiconductor ETF</a></td>
<td class="data-td data last text-center" style="width: 9.84153%; height: 22.3906px;">&nbsp;</td>
<td class="data-td data last text-center" style="width: 8.25688%; height: 22.3906px;">&nbsp;</td>
<td class="data-td data last text-center" style="width: 6.92244%; height: 22.3906px;">■</td>
<td class="data-td data last text-center" style="width: 7.92327%; height: 22.3906px;">■</td>
<td class="data-td data last text-center" style="width: 7.58966%; height: 22.3906px;">&nbsp;</td>
<td class="data-td data last text-center" style="width: 9.17431%; height: 22.3906px;">&nbsp;</td>
<td class="data-td data last text-center" style="width: 7.08924%; height: 22.3906px;">■</td>
<td class="data-td data last text-center" style="width: 6.58882%; height: 22.3906px;">&nbsp;</td>
<td class="data-td data last text-center" style="width: 8.9241%; height: 22.3906px;">&nbsp;</td>
</tr>
<tr class="tbl-data" style="height: 44.7812px;">
<td class="data-td last" style="width: 5.00417%; height: 22.3906px;"><a href="/link/21dc1afa747e4e8bb27a50c2c0e8b03b.aspx" title="VSOL - Solana ETF">VSOL</a></td>
<td class="data-td last" style="width: 22.6856%; height: 22.3906px;"><a href="/link/21dc1afa747e4e8bb27a50c2c0e8b03b.aspx" title="VSOL - Solana ETF">Solana ETF</a></td>
<td style="width: 9.84153%; height: 22.3906px;">■</td>
<td style="width: 8.25688%; height: 22.3906px;">&nbsp;</td>
<td style="width: 6.92244%; height: 22.3906px;">&nbsp;</td>
<td style="width: 7.92327%; height: 22.3906px;">■</td>
<td style="width: 7.58966%; height: 22.3906px;">&nbsp;</td>
<td style="width: 9.17431%; height: 22.3906px;">&nbsp;</td>
<td style="width: 7.08924%; height: 22.3906px;">&nbsp;</td>
<td style="width: 6.58882%; height: 22.3906px;">&nbsp;</td>
<td style="width: 8.9241%; height: 22.3906px;">■</td>
</tr>
<tr class="tbl-data" style="height: 44.7812px;">
<td class="data-td last" style="width: 5.00417%; height: 44.7812px;"><a href="https://www.vaneck.com/us/en/investments/video-gaming-esports-etf-espo/overview/" title="Vaneck Video Gaming and eSports ETF - ESPO">ESPO</a></td>
<td class="data-td last" style="width: 22.6856%; height: 44.7812px;"><a href="https://www.vaneck.com/us/en/investments/video-gaming-esports-etf-espo/overview/" title="Vaneck Video Gaming and eSports ETF - ESPO">Video Gaming and<br />eSports ETF</a></td>
<td class="data-td data last text-center" style="width: 9.84153%; height: 44.7812px;">■</td>
<td class="data-td data last text-center" style="width: 8.25688%; height: 44.7812px;">&nbsp;</td>
<td class="data-td data last text-center" style="width: 6.92244%; height: 44.7812px;">&nbsp;</td>
<td class="data-td data last text-center" style="width: 7.92327%; height: 44.7812px;">■</td>
<td class="data-td data last text-center" style="width: 7.58966%; height: 44.7812px;">&nbsp;</td>
<td class="data-td data last text-center" style="width: 9.17431%; height: 44.7812px;">&nbsp;</td>
<td class="data-td data last text-center" style="width: 7.08924%; height: 44.7812px;">&nbsp;</td>
<td class="data-td data last text-center" style="width: 6.58882%; height: 44.7812px;">&nbsp;</td>
<td class="data-td data last text-center" style="width: 8.9241%; height: 44.7812px;">&nbsp;</td>
</tr>
</tbody>
</table>
</div>
<br />
<p>To receive more <strong><a href="https://www.vaneck.com/us/en/insights/thematic-investing/" title="Thematic Investing Insights">Thematic Investing</a></strong> insights, <strong><a href="https://www.vaneck.com/us/en/subscribe/" title="Subscription Center">sign up in our subscription center</a></strong>.</p>
<style type="text/css">
    .wrapped-div {
        max-width: 100%;
    }

    @media (max-width: 1240px) {
        .wrapped-div {
            overflow-x: scroll;
        }
    }

    .wrapped-div-sector {
        max-width: 100%;
        overflow-x: scroll;
    }
</style>
]]></content:encoded>
</item><item rdf:about="https://www.vaneck.com/us/en/blogs/income-investing/grnb-etf-question-and-answer/">
  <title>GRNB ETF: Question &amp; Answer></title>
  <link>https://www.vaneck.com/us/en/blogs/income-investing/grnb-etf-question-and-answer/</link>
  <description><![CDATA[This blog is intended to answer frequently asked questions about green bonds and more specifically, the VanEck Green Bond ETF (GRNB).]]></description>
  <dc:creator>Sunny  Bokhari</dc:creator>
  <dc:date>08/29/2024 06:30:00</dc:date>
<content:encoded><![CDATA[

<ul class="content-list">
<li><a href="#point-one"><strong>What are green bonds?</strong></a></li>
<li><a href="#point-two"><strong>What are the bonds in the VanEck Green Bond ETF (GRNB) used for?</strong></a></li>
<li><a href="#point-three"><strong>How are green bonds different from conventional bonds?</strong></a></li>
<li><a href="#point-four"><strong>Who can issue green bonds?</strong></a></li>
<li><a href="#point-five"><strong>What is the size of the green bond market?</strong></a></li>
<li><a href="#point-six"><strong>What are the benefits of investing in green bonds?</strong></a></li>
<li><a href="#point-seven"><strong>How are green bonds evaluated?</strong></a></li>
<li><a href="#point-eight"><strong>Are green bonds regulated?</strong></a></li>
<li><a href="#point-nine"><strong>How do green bonds compare to other labeled bonds like sustainable bonds, social bonds, sustainability-linked bonds, and transition bonds?</strong></a></li>
<li><a href="#point-ten"><strong>How are bonds in VanEck Green Bond ETF (GRNB) assessed for inclusion?</strong></a></li>
<li><a href="#point-eleven"><strong>What is the criteria for bonds to be designated as &ldquo;green&rdquo; by Climate Bonds Initiative (CBI)?</strong></a></li>
<li><a href="#point-twelve"><strong>How to buy VanEck ETFs?</strong></a></li>
</ul>
<h2 id="point-one" class="jump-link-nav anchored-block" data-jumplink-title="About Green Bonds">What are green bonds?</h2>
<p>Green bonds are financial instruments earmarked to fund projects that have positive environmental or climate-related impacts. These projects could include renewable energy initiatives, energy efficiency improvements, sustainable land use projects, clean transportation, and more. Green bonds are issued by governments, supra-nationals, municipalities, corporations, and financial institutions.</p>
<h2 id="point-two" class="anchored-block">What are the bonds in the VanEck Green Bond ETF (GRNB) used for?</h2>
<p>The majority of the projects financed by bonds in <strong><a href="https://www.vaneck.com/us/en/investments/green-bond-etf-grnb/overview/" title="GRNB - VanEck Green Bond ETF - Overview">GRNB&rsquo;s</a></strong> portfolio fall into three broad categories: Renewable Energy (35%), Green Buildings (24%) and Clean Transportation (20%).</p>
<h3>GRNB funds projects including renewable energy and green buildings.</h3>
<p><img loading="lazy" class="img-responsive w-100" src="https://www.vaneck.com/contentassets/2ee345f075ab46638dbde0948c7b0bce/4770_grnb_qa_chart-1_2024-8_v1_blog.svg" alt="GRNB funds projects including renewable energy and green buildings." /></p>
<style>
    .data-td.data {
        padding-right: 5px !important;
    }
    
    .data-head { 
    padding-right: 5px !important;
    }

    .wrapped-div {
        max-width: 100%;
    }

    @media (max-width: 1240px) {
        .wrapped-div {
            overflow-x: scroll;
        }
    }

    .wrapped-div-sector {
        max-width: 100%;
        overflow-x: scroll;
    }
</style>
<p class="chart-disclosure">Source: VanEck and Issuer reported data as of 9/30/2023.</p>

<p>Unsurprisingly, renewable energy has remained a primary recipient of capital over the past few years. Given the investment needs within the energy sector alone to transition to a net zero economy, this is unlikely to slow down in the foreseeable future. Several U.S. utilities, including MidAmerican Energy, Duke Energy and Xcel Energy, have issued green bonds to finance solar and wind projects across the country. In addition, transmission and distribution infrastructure, smart electric meters and <strong><a href="https://www.vaneck.com/us/en/blogs/sustainable-investing/fast-changing-innovation-the-battery-race-powers-forward/" title="Fast-Changing Innovation: The Battery Race Powers Forward">battery storage technology</a></strong> have also been financed by bonds in <a href="/link/0f22371fe87042dd880bda58e6a65b73.aspx" title="GRNB - VanEck Green Bond ETF - Overview"><strong>GRNB</strong></a>.</p>
<p>Green building development and retrofits are also a crucial piece of achieving global climate goals, considering that 42% of annual global CO<sub>2</sub> emissions are generated by buildings.<sup>1</sup>&nbsp;Several U.S. REITs including Alexandria Real Estate Equities, SL Green Realty, Boston Properties, and Vornado have all issued green bonds financing certified green commercial, retail and residential properties, including the iconic One Vanderbilt Building in midtown Manhattan.</p>
<p>Similarly, transport will continue to be an area of focus in the fight against climate change, as it currently accounts for approximately 25% of global emissions and is growing at a rate that is faster than any other sector.<sup>2</sup>&nbsp;With automobiles as the largest contributor to emissions within the transport category, green bonds such as those issued by Toyota Auto Receivables, Kia Motors and Hyundai Capital Services to finance purchases of <strong><a href="https://www.vaneck.com/us/en/blogs/sustainable-investing/the-electric-vehicle-revolution-charges-ahead/" title="The Electric Vehicle Revolution Charges Ahead">electric vehicles</a></strong> may become increasingly common in the industry. Mass transport projects including those constructed and operated by the Metropolitan Transit Authority in New York City and the MTR in Hong Kong, both of which issued green bonds held by <a href="/link/0f22371fe87042dd880bda58e6a65b73.aspx" title="GRNB - VanEck Green Bond ETF - Overview"><strong>GRNB</strong></a>, will continue to play a major role in reducing emissions in urban areas, contributing to more livable and sustainable cities globally.</p>
<p>Other project categories remain a much smaller recipient of green investment, but we believe these may see greater investment in coming years. Although most focus and investment tend to go to projects that may stop or slow global warming, adapting to the existing impacts of climate change also requires significant investment. An increasing focus on the catastrophic impact of the loss of biodiversity may also lead to greater investment in land and aquatic conservation efforts, which will require funding. Climate change adaptation and terrestrial/aquatic biodiversity conservation efforts both received less than 1% of green bond proceeds among bonds in <strong><a href="/link/0f22371fe87042dd880bda58e6a65b73.aspx" title="GRNB - VanEck Green Bond ETF - Overview">GRNB&rsquo;s</a></strong> portfolio.</p>
<h2 id="point-three" class="anchored-block">How are green bonds different from conventional bonds?</h2>
<p>Green bonds are no different than other bonds except that the funds raised are exclusively allocated to environmentally friendly projects. All else equal, a green bond has the same risk and return drivers as a conventional bond from the same issuer. As a result, investors should expect similar yields and returns. However, unlike conventional bonds, green bond proceeds are allocated only to projects or activities with positive environmental benefits and provide investors with transparency around how proceeds are used, and in most cases, the environmental impact those projects or activities have. This allows investors to have confidence that their investment is funding projects or activities with a positive impact.</p>
<p>The process of issuing green bonds is like that of conventional bonds. The main benefit to issuers is diversification of their investor base. Due to generally strong demand for green bonds, an efficient issuance process is typically oversubscribed. In some instances, the supply and demand imbalance has been reported to drive lower funding costs for issuers. However, in general, yield differences are small, and overall, there does not appear to be any significant structural difference in yields between green bonds and conventional bonds. We believe this reflects the fact that green bonds and conventional bonds have the same risk and return drivers, all else equal.</p>
<h2 id="point-four" class="anchored-block">Who can issue green bonds?</h2>
<p>Any entity that wants to finance environmentally sustainable projects can issue a green bond. The global green bond market includes sovereigns, supra-nationals, government agencies, local governments, and corporate and asset-backed issuers. The composition of the market resembles broad multi-sector bond benchmarks. Issuers must clearly disclose the bond&rsquo;s use of proceeds, and in some cases, satisfy any requirements by regulatory bodies or third parties.</p>
<h3>Non-financial and financial corporate entities have the highest green bond issuance globally.</h3>
<h3>Cumulative Total Global Green Bond Issuance By Entity</h3>
<p><img loading="lazy" class="img-responsive w-100" src="https://www.vaneck.com/contentassets/06e1cea4729b4a7c95b00b1d633b0bcb/4770_grnb_qa_chart-2_2024-8_v1_blog.svg" alt="Non-financial and financial corporate entities have the highest green bond issuance globally." /></p>
<p class="chart-disclosure">Source: Climate Bonds Initiative. Data as of 7/29/2024.</p>
<h2 id="point-five" class="jump-link-nav anchored-block" data-jumplink-title="Green Bond Market">What is the size of the green bond market?</h2>
<p>The global issuance of green bonds has been steadily increasing with cumulative global green bond issuance now exceeding about $3.0 trillion.<sup>3</sup>&nbsp;Approximately $557 billion of labeled green bonds were issued in 2023 and $428 billion has been issued year to date.<sup>3</sup></p>
<h3>The green bond market has experienced significant growth in recent years.</h3>
<h3>Green Bond Issuance (2009 &ndash; 2023)</h3>
<p><img class="img-responsive w-100" src="https://www.vaneck.com/contentassets/35868f8b77d84ba5b2e59b1a8bb8c386/4770_grnb_qa_chart-3_2024-8_v1_blog.svg" alt="Green Bond Issuance (2009 to 2023)" /></p>
<h2 id="point-six" class="jump-link-nav anchored-block" data-jumplink-title="Benefits">What are the benefits of investing in green bonds?</h2>
<p>Investing in green bonds may offer several benefits within a portfolio. Because green bonds are like conventional bonds, they allow investors to incorporate sustainability into their fixed income portfolios without having any significant impact on risk and return. Similar to the broad U.S. bond market, the USD-denominated green bond market is multi-sector, primarily investment grade and similar from a yield and duration standpoint and does not carry foreign currency risk.</p>
<p>Although similar in terms of risk and return, the green bond market is more tilted towards corporates and has a lower weighting to government securities. For example, the U.S. broad market had a 49% weight to U.S. Treasuries as of 6/30/2024, however, the U.S. Treasury has not yet issued a green bond. Accordingly, an allocation to USD-denominated green bonds within a core bond portfolio provides additional diversification. Within corporates, investors may benefit from a higher tilt towards issuers proactively addressing and managing climate risks in their overall business.</p>
<p>Finally, green bonds allow investors to align their investments with their values and sustainability goals by supporting environmentally beneficial projects. Because green bonds are tied to the projects they finance, they also provide transparency into the projects&rsquo; environmental impacts.</p>
<h2 id="point-seven" class="anchored-block">How are green bonds evaluated?</h2>
<p>Green bond issuers often use third-party organizations to evaluate green bond issuance. These organizations assess whether the issuer&rsquo;s framework aligns with market best practices, proceeds are allocated to eligible green projects and pre/post disclosures are properly reported. This helps to increase transparency and alleviate investor concerns about greenwashing. In some cases, the projects financed by green bonds will also be assessed against certain environmental impact performance standards. Outside of these independent evaluations initiated by the issuer, organizations including the Climate Bonds Initiative independently evaluate green bond issues against certain criteria to determine whether the bond is truly &ldquo;green.&rdquo; See <a>below</a> for more details.</p>
<h2 id="point-eight" class="anchored-block">Are green bonds regulated?</h2>
<p>While there is no global regulatory framework for green bonds, various market-accepted guidelines and standards have been developed to promote transparency, integrity, and credibility in the market. Examples include the Green Bond Principles, which provide guidelines for issuers and investors, and the Climate Bonds Standard, which sets criteria for certifying green bonds.</p>
<p>Regulators in key regions have introduced guidelines and incentives to encourage market standards and growth in the green bond and sustainable finance markets. The European Union has adopted the EU Green Bond Standard and Taxonomy Regulation, the most ambitious regulatory framework of its kind. In the absence of a formal regulatory framework adopted by the U.S. or a formal global market standard, differences are likely to exist in green bond regulations by region. In the U.S., state and local entities can offer tax-exempt municipal green bonds to finance projects with environmental benefits. In China, The People's Bank of China and the China Securities Regulatory Commission have established guidelines for green bond issuance. Japan's Ministry of the Environment and India&rsquo;s SEBI have issued their own guidelines. The UK supports green bonds through its Green Finance Strategy. These measures promote sustainable projects and the transition to a greener economy.</p>
<p>In addition, the <strong><a href="https://www.vaneck.com/us/en/blogs/income-investing/how-green-bonds-overcome-esg-data-challenge/" title="How Green Bonds Overcome ESG Data Challenge">green bond taxonomy</a></strong> developed by the Climate Bonds Initiative (CBI) has provided a valuable tool for international investors to assess green bonds, in the absence of a global standard. The CBI is a non-governmental organization focused on mobilizing the global fixed income markets for climate solutions. One of the ways they promote market growth is by creating standards to give investors and issuers the confidence needed to build a large, liquid and mainstream green bond market. The CBI taxonomy is the backbone of various labeling and certification schemes and provides a guide to climate aligned assets and projects. The CBI taxonomy is grounded in the latest climate science and guided by the overall objective of achieving a drastic and rapid reduction of greenhouse gas emissions to limit global warming to below 2 degrees Celsius. The taxonomy provides investors and other market participants confidence that their green bond investment is aligned with the climate objectives of the Paris Agreement.</p>
<h3 id="point-nine" class="anchored-block">How do green bonds compare to other labeled bonds like sustainable bonds, social bonds, sustainability-linked bonds, and transition bonds?</h3>
<div class="wrapped-div">
<table style="width: 100%;">
<tbody>
<tr class="tbl-data">
<td class="tbl-header last">Bond Type</td>
<td class="tbl-header last">Purpose</td>
<td class="tbl-header last">Use of Proceeds</td>
</tr>
<tr class="tbl-data">
<td class="data-td last">Green bonds</td>
<td class="data-td data last text-left">Finance environmentally friendly projects</td>
<td class="data-td data last text-left">Exclusively for green projects (e.g., renewable energy, clean transportation)</td>
</tr>
<tr class="tbl-data">
<td class="data-td last">Sustainable bonds</td>
<td class="data-td data last text-left">Fund projects with both environmental and social benefits</td>
<td class="data-td data last text-left">Combination of green and social projects</td>
</tr>
<tr class="tbl-data">
<td class="data-td last">Social bonds</td>
<td class="data-td data last text-left">Fund projects with positive social outcomes</td>
<td class="data-td data last text-left">Exclusively for social projects (e.g., affordable housing, healthcare)</td>
</tr>
<tr class="tbl-data">
<td class="data-td last">Sustainability-linked bonds (SLBs)</td>
<td class="data-td data last text-left">Incentivize issuers to achieve sustainability performance targets</td>
<td class="data-td data last text-left">Can be used for general purposes</td>
</tr>
<tr class="tbl-data">
<td class="data-td last">Transition bonds</td>
<td class="data-td data last text-left">Support companies transitioning from high carbon to lower carbon operations</td>
<td class="data-td data last text-left">Fund activities that enable a sustainable transition</td>
</tr>
</tbody>
</table>
</div>
<p class="chart-disclosure">Source: VanEck Research.</p>

<p>Green bonds are solely used for environmental projects, while sustainable, social and other bonds include broader scopes. Sustainability-linked bonds (SLBs) are similar to regular bonds but include incentives for issuers to meet sustainability targets, with penalties like interest rate increases for non-compliance. Transition bonds focus on helping carbon-intensive sectors transition to greener practices. SLBs focus on performance verification.</p>
<p>Some issuers prefer SLBs because the funds can be used for general purposes, unlike green bonds, which are earmarked for specific projects. This flexibility makes SLBs attractive to high-emission industries like cement and steel, which may struggle to find eligible green projects. However, a recent study by the CBI found that more than 80% of 768 sustainability-linked bonds (SLBs) issued from 2018 through November of last year are not aligned with global climate goals. Issuance of SLBs spiked in 2021 post-Covid but has dropped since due to heightened concerns around the credibility of the SLB market.<sup>4</sup></p>
<h3 id="point-ten" class="anchored-block">How are bonds in VanEck Green Bond ETF (GRNB) assessed for inclusion?</h3>
<p><a href="/link/0f22371fe87042dd880bda58e6a65b73.aspx" title="GRNB - VanEck Green Bond ETF - Overview"><strong>GRNB</strong></a> seeks to track the S&amp;P Green Bond U.S. Dollar Select Index. To be eligible for inclusion in the index the bonds should adhere to the following criteria:</p>
<div class="wrapped-div">
<table style="width: 100%;">
<tbody>
<tr class="tbl-data"></tr>
<tr class="tbl-data">
<td class="tbl-header last">Criteria</td>
<td class="tbl-header last">Details</td>
</tr>
<tr class="tbl-data">
<td class="data-td last">Security selection</td>
<td class="data-td data last text-left">- Bond proceeds must finance environmentally friendly. projects, with public disclosure of issuance rationale.<br />- Bonds must be designated as &ldquo;green&rdquo; by the Climate Bonds Initiative.<br />- Tax-exempt municipal bonds are excluded.</td>
</tr>
<tr class="tbl-data">
<td class="data-td last">Currency</td>
<td class="data-td data last text-left">Bonds must be denominated in U.S. dollars.</td>
<td style="height: 21px;" height="21">&nbsp;</td>
</tr>
<tr class="tbl-data">
<td class="data-td last">Liquidity</td>
<td class="data-td data last text-left">Bonds must have at least $200 million of par amount outstanding.</td>
<td style="height: 39px;" height="39">&nbsp;</td>
</tr>
<tr class="tbl-data">
<td class="data-td last">Credit rating</td>
<td class="data-td data last text-left">- Bonds must be rated by at least one rating agency for inclusion unless issued by a government-sponsored enterprise (up to 10%).<br />- Maximum weight of 20% of bonds rated below BBB.</td>
</tr>
<tr class="tbl-data">
<td class="data-td last">Issuer cap</td>
<td class="data-td data last text-left">No single issuer can represent more than 10% of the Index.</td>
</tr>
<tr class="tbl-data">
<td class="data-td last">Weighting</td>
<td class="data-td data last text-left">Constituents are weighted by market value, subject to limits on credit quality and issuer concentration.</td>
<td style="height: 39px;" height="39">&nbsp;</td>
</tr>
</tbody>
</table>
</div>
<br />
<h2 id="point-eleven" class="anchored-block">What is the criteria for bonds to be designated as &ldquo;green&rdquo; by Climate Bonds Initiative (CBI)?</h2>
<p>CBI requires detailed reporting on the use of proceeds and only designates bonds to be &ldquo;green&rdquo; if 100% of net proceeds fund environmental projects that align with the CBI taxonomy. It excludes sustainability-linked bonds due to lack of transparency on the use of proceeds data and excludes sustainability bonds that fund significant allocations to social-related investments such as schools or hospitals. If there is insufficient data to determine whether the proceeds are aligned with the taxonomy, the bond is not designated as green. Further, the CBI may revise a bond&rsquo;s status if new information is released post-issuance that would change a prior designation.</p>
<h2 id="point-twelve" class="anchored-block">How to Invest?</h2>
<p><a href="https://www.vaneck.com/us/en/investments/green-bond-etf-grnb/overview/" title="GRNB - VanEck Green Bond ETF - Overview"><strong>VanEck Green Bond ETF (GRNB)</strong></a> provides exposure to bonds that fund projects and activities that positively impact the environment. It includes only U.S. dollar-denominated bonds designated as &ldquo;green&rdquo; by the Climate Bonds Initiative.</p>
<p><a href="https://www.vaneck.com/us/en/investments/ethereum-etf-ethv/overview/#how-to-buy-etf&amp;utm=ETHV-Blog" title="How to buy VanEck ETFs?"><strong>Learn more here.</strong></a></p>
<p class="d-none d-lg-block"><a href="mailto:askvaneck@vaneck.com" title="Have More Questions? - Ask VanEck" rel="noopener"><img loading="lazy" class="img-responsive" src="https://www.vaneck.com/globalassets/home/us/insights/blogs/bm-blog-images/cta-faq_desktop-02.svg" alt="Have More Questions? - Ask VanEck" /></a></p>
<p class="d-lg-none"><a href="mailto:askvaneck@vaneck.com" title="Have More Questions? - Ask VanEck" rel="noopener"><img loading="lazy" class="img-responsive" src="https://www.vaneck.com/globalassets/home/us/insights/blogs/bm-blog-images/cta-faq_mobile-01.svg" alt="Have More Questions? - Ask VanEck" /></a></p>
<p>To receive more <a href="https://www.vaneck.com/us/en/insights/income-investing/" title="Income Investing Insights"><strong>Income Investing</strong></a> insights, <a href="https://www.vaneck.com/us/en/subscribe/" title="Subscription Center"><strong>sign up in our subscription center</strong></a>.</p>
]]></content:encoded>
</item><item rdf:about="https://www.vaneck.com/us/en/blogs/thematic-investing/fabless-chip-designers-shaping-the-future-of-semiconductors/">
  <title>Fabless Chip Designers: Shaping the Future of Semiconductors></title>
  <link>https://www.vaneck.com/us/en/blogs/thematic-investing/fabless-chip-designers-shaping-the-future-of-semiconductors/</link>
  <description><![CDATA[Fabless semiconductor companies&rsquo; focus on design and innovation allows them to maintain a competitive edge in a market characterized by rapid technological advancements and intense competition.]]></description>
  <dc:creator> </dc:creator>
  <dc:date>08/28/2024 18:15:00</dc:date>
<content:encoded><![CDATA[

<h2 id="Fabless-Basics" class="jump-link-nav anchored-block" data-jumplink-title="Fabless Basics">What is the Fabless Semiconductor Model?</h2>
<p>The term "fabless" in the semiconductor industry refers to companies that design and sell semiconductor chips but do not own the manufacturing facilities, known as fabs, where these chips are produced. Instead, fabless companies partner with specialized foundries&mdash;like Taiwan Semiconductor Manufacturing Company (TSMC)&mdash;that handle the complex and capital-intensive process of chip fabrication. This model allows fabless firms to concentrate their resources on innovation, design, and marketing, while leveraging the advanced manufacturing capabilities of their foundry partners.</p>
<h2>Advantages of the Fabless Model</h2>
<p>The fabless model has emerged as a dominant force in the semiconductor industry, offering several advantages over traditional integrated device manufacturers (IDMs) that handle both design and manufacturing in-house. One of the key advantages is cost efficiency. Building and maintaining state-of-the-art fabs requires significant capital investment, often running into billions of dollars. Fabless companies avoid these costs, allowing them to operate with a lighter capital structure. This financial flexibility enables them to allocate more resources to research and development (R&amp;D), driving innovation and staying ahead of technological trends.</p>
<h3>Fabless Firms Spend Less on Manufacturing, Driving Higher Free Cash Flow</h3>
<p><strong>CAPEX to Operating Cash Flow</strong></p>
<p><img class="img-responsive w-100" alt="CAPEX to Operating Cash Flow" src="https://www.vaneck.com/contentassets/b6addbdc17d54dc1b6271d132439020b/4765_smhx-launch_chart-1_2024-8_v1_blog.svg" /></p>
<h3>Fabless Companies Invest More in R&amp;D Relative to Sales</h3>
<p><strong>Research &amp; Development Expense to Sales</strong></p>
<p><img class="img-responsive w-100" alt="Research &amp; Development Expense to Sales" src="https://www.vaneck.com/contentassets/b6addbdc17d54dc1b6271d132439020b/4765_smhx-launch_chart-4_2024-8_v1_blog.svg" /></p>
<p class="chart-disclosure">Source: MarketVector as of 2023. Past Performance is no guarantee of future results. Data listed does not represent the funds underlying indices. This is not an offer to buy or sell, or recommendation to buy or sell any of the securities mentioned herein. <strong>Index performance is not illustrative of fund performance. It is not possible to invest directly in an index. The performance data quoted represents past performance. Past performance is not a guarantee of future results. Investment return and principal value of an investment will fluctuate so that an investor's shares, when redeemed, may be worth more or less than their original cost. Performance may be lower or higher than performance data quoted. </strong>See important disclosures and index descriptions at end.</p>

<p>Additionally, the fabless model provides greater agility and scalability. Fabless companies can quickly adapt to market changes by adjusting production levels through their foundry partners without the constraints of managing large manufacturing operations. This flexibility not only enhances their ability to meet fluctuating demand but also reduces the risks associated with holding large inventories during market downturns.</p>
<h2 id="Business-Dynamics" class="jump-link-nav anchored-block" data-jumplink-title="Business Dynamics">The Business Dynamics of Fabless Companies</h2>
<p><strong>Capital Structure and Margins</strong></p>
<p>Fabless semiconductor companies benefit from a capital-light structure, which translates into higher gross margins compared to their IDM counterparts. By outsourcing manufacturing, these companies avoid the substantial costs associated with running fabs, including equipment upgrades and maintenance. This allows fabless firms to maintain leaner operations, contributing to healthier profit margins and more predictable cash flows.</p>
<p><strong>Intangibles: R&amp;D and Collaboration</strong></p>
<p>The success of fabless companies is heavily reliant on continuous innovation, driven by robust R&amp;D efforts and a culture of fostering creativity and collaboration. Since fabless companies are not burdened with the operational challenges of manufacturing, they can focus intensively on developing cutting-edge chip designs that meet the evolving needs of their customers. A strong emphasis on R&amp;D also enables these companies to differentiate themselves in a highly competitive market, ensuring they remain at the forefront of technological advancements.</p>
<p><strong>Agility and Scalability</strong></p>
<p>One of the standout features of the fabless model is its inherent agility. Fabless companies can quickly scale production up or down based on market demand, a flexibility that is crucial in the fast-paced tech industry. This ability to respond rapidly to changing market conditions not only improves their competitive positioning but also reduces the financial risks associated with fluctuating demand. As a result, fabless companies can capitalize on emerging trends and opportunities more effectively than IDMs.</p>
<p><strong>Business Risk and Cyclicality</strong></p>
<p>While the semiconductor industry is known for its cyclical nature, fabless companies are somewhat insulated from the full impact of these cycles. By focusing on design and innovation rather than the capital-intensive manufacturing process, fabless companies can better manage the volatility associated with semiconductor demand. Their focus on R&amp;D-driven growth helps to smooth out the peaks and troughs of industry cycles, providing a more stable business environment.</p>
<h2>The Origin Story of Fabless Companies</h2>
<p>The semiconductor industry has evolved significantly over the years. Notably, the fabless model has become increasingly prevalent as manufacturing chips in-house has become economically and strategically challenging. The high cost of building and maintaining fabs, combined with the rapid pace of technological advancement, has made it difficult for companies to compete if they also manage manufacturing.</p>
<p><strong>TSMC as the Leading Foundry:</strong></p>
<p>The shift towards the fabless model was greatly influenced by the founding of Taiwan Semiconductor Manufacturing Company (TSMC) in 1987 by Morris Chang. TSMC pioneered the concept of a dedicated foundry, offering manufacturing services to companies that focused solely on chip design. TSMC&rsquo;s success demonstrated that separating design from manufacturing could lead to more efficient, higher-quality production. This model quickly became the preferred approach for many semiconductor companies, with TSMC emerging as the go-to partner for fabless firms worldwide.</p>
<p><strong>AMD&rsquo;s Strategic Move to Spin Off Manufacturing:</strong></p>
<p>In 2009, Advanced Micro Devices (AMD) strategically decided to spin off its manufacturing operations, creating GlobalFoundries. This move underscored the growing recognition that managing both design and manufacturing was no longer a sustainable or competitive business model, particularly as the complexity and cost of chip fabrication continued to rise. By focusing on design, AMD was able to streamline its operations and concentrate on developing high-performance processors, which have since become a significant growth driver for the company.</p>
<h2 id="Key-Companies" class="jump-link-nav anchored-block" data-jumplink-title="Key Companies">Emergence of New Competitors in the Fabless Ecosystem</h2>
<p>The fabless model opened the door for a new wave of semiconductor companies to enter the market, focusing on innovation in chip design rather than the capital-intensive manufacturing process. Key companies that emerged during this period include:</p>
<ul class="content-list">
<li class="mt-2">Altera (1983): Specialized in programmable logic devices and was eventually acquired by Intel, further highlighting the industry's shift towards the fabless model.</li>
<li class="mt-2">Qualcomm (1985): Became a leader in wireless telecommunications products and services, particularly mobile chipsets, capitalizing on the fabless approach to rapidly innovate in the fast-growing mobile market.</li>
<li class="mt-2">Broadcom (1991): Known for its innovations in networking and broadband communications, Broadcom rapidly grew into a major player by leveraging the fabless model to focus on advanced chip design.</li>
<li class="mt-2">Nvidia (1993): Initially focused on graphics processing units (GPUs), Nvidia has become a dominant force in AI, gaming, and data centers by continuously innovating its chip designs without the burden of managing fabrication plants.</li>
</ul>
<p><strong>Example: Apple as a Fabless Designer</strong></p>
<p>Although Apple does not fit the traditional fabless model, its approach to chip design aligns with the core principles of the fabless industry. Apple&rsquo;s move into chip design, epitomized by its M1 and M2 series processors, highlights the strategic benefits of focusing on design while outsourcing manufacturing to partners like TSMC. This strategy has allowed Apple to create highly integrated and optimized processors that are tailored to its ecosystem of products, driving significant performance and efficiency gains.</p>
<p>Collectively, the fabless semiconductor model has proven to be a highly successful approach in the rapidly evolving semiconductor industry. By focusing on design and innovation while leveraging specialized foundries for manufacturing, fabless companies have been able to maintain a competitive edge in a market characterized by rapid technological advancements and intense competition.</p>
<h3>Cumulative Performance of Fabless Names Outpaces the Category and Broad Markets</h3>
<p><img class="img-responsive w-100" alt="Cumulative Performance of Fabless Names Outpaces the Category and Broad Markets" src="https://www.vaneck.com/contentassets/85f1d0a6070e44ea927f1cfd3c0be85d/4765_smhx-launch_chart-2_2024-8_v1_blog.svg" /></p>
<p class="chart-disclosure">Source: Morningstar, Data as of 07/31/2024. The BlueStar Top 10 U.S. Listed Fabless Semis does not represent the funds underlying indices. <strong>The performance data quoted represents past performance. Past performance is not a guarantee of future results. Investment return and principal value of an investment will fluctuate so that an investor's shares, when redeemed, may be worth more or less than their original cost. Performance may be lower or higher than performance data quoted.</strong> See important disclosures and index descriptions at end. This is not an offer to buy or sell, or recommendation to buy or sell any of the securities mentioned herein. Futures carry additional risks and are not suitable for all investors.</p>

<p>As the demand for advanced semiconductors continues to grow, driven by trends such as AI, 5G, and IoT, and supported by government initiatives like the <strong><a href="https://www.vaneck.com/us/en/blogs/thematic-investing/fabless-semiconductor-companies-winners-in-the-chips-act-era/" title="Fabless Semiconductor Companies: Winners in the CHIPS Act Era">CHIPS Act</a></strong> in the United States, fabless companies are well-positioned to lead the industry forward. For investors, this presents a compelling opportunity to gain exposure to a dynamic and potentially high-growth segment of the technology sector, especially through targeted investment vehicles like the first-of-its-kind <a href="https://www.vaneck.com/us/en/investments/fabless-semiconductor-etf-smhx/overview/" title="SMHX - VanEck Fabless Semiconductor ETF - Holdings and Performance"><strong>VanEck US Listed Fabless Semiconductor ETF (SMHX)</strong></a>. SMHX offers unique access to the leading companies driving innovation in the semiconductor space, making it an attractive option for those looking to capitalize on the future of technology.</p>
<p>To receive more <a href="https://www.vaneck.com/us/en/insights/thematic-investing/" title="Thematic Investing Insights"><strong>Thematic Investing</strong></a> insights, <a href="https://www.vaneck.com/us/en/subscribe/" title="Subscription Center"><strong>sign up in our subscription center</strong></a>.</p>
]]></content:encoded>
</item><item rdf:about="https://www.vaneck.com/us/en/blogs/thematic-investing/the-case-for-fabless-semiconductor-diversification-opportunities-beyond-nvidia/">
  <title>The Case for Fabless Semiconductor Diversification: Opportunities Beyond Nvidia></title>
  <link>https://www.vaneck.com/us/en/blogs/thematic-investing/the-case-for-fabless-semiconductor-diversification-opportunities-beyond-nvidia/</link>
  <description><![CDATA[Investors should consider diversifying into the broader fabless semiconductor market to balance risk and capture opportunities beyond Nvidia as competition in the industry intensifies.]]></description>
  <dc:creator>Nick Frasse</dc:creator>
  <dc:date>08/28/2024 18:10:00</dc:date>
<content:encoded><![CDATA[

<p>Nvidia has become a cornerstone in the semiconductor industry, especially for investors who have enjoyed its remarkable growth and exceptional margins. However, there is increasing speculation that these margins could eventually be pressured as competition intensifies. As this potential scenario becomes more apparent, investors should consider diversifying their exposure to the broader fabless semiconductor market. This strategy could offer a balanced approach, allowing investors to benefit from the growth of other fabless companies that might challenge Nvidia&rsquo;s market position.</p>
<h2 id="Case-for-Diversification" class="jump-link-nav anchored-block" data-jumplink-title="Case for Diversification">A Growing Case for Diversification</h2>
<p>Nvidia&rsquo;s AI and graphics processing success has been extraordinary, yet the semiconductor landscape is rapidly evolving. Competitors such as AMD, Qualcomm, and other emerging players are continually innovating and could potentially gain market share at Nvidia&rsquo;s expense. Given the uncertainties surrounding Nvidia&rsquo;s future dominance, diversifying exposure within the fabless semiconductor space could help manage risks while capturing potential opportunities across the sector.</p>
<p>Investing in a Fabless Semiconductor ETF provides a way to gain exposure to a wide range of companies operating under the fabless model. This approach could allow investors to participate in the broader industry trends that have driven Nvidia&rsquo;s success while spreading risk across multiple companies that are well-positioned to benefit from ongoing innovations in the semiconductor industry.</p>
<h3>Fabless Chip Designer Revenue Globally 2017-2023 (By Quarter)</h3>
<p><img class="img-responsive w-100" alt="Fabless Chip Designer Revenue Globally 2017-2023 (By Quarter)" src="https://www.vaneck.com/contentassets/584fe0d6af784cf0a26d5ed6486294f0/4771_smhx-diversification-blog_chart-1_2024-8_v1_blog.svg" /></p>
<p class="chart-disclosure"><strong>Source:</strong> Statistica as of December 2023. <strong>Past performance is no guarantee of future results. Index performance is not illustrative of fund performance. Not intended as a recommendation to buy or to sell any of the securities mentioned herein.</strong></p>
<h2 id="AMD-Acquires-ZT" class="jump-link-nav anchored-block" data-jumplink-title="AMD Acquires ZT">AMD&rsquo;s Acquisition of ZT Systems: Reinforcing the Fabless Trend</h2>
<p>AMD&rsquo;s recent $4.9 billion acquisition of ZT Systems marks a strategic expansion into the data center market, particularly in server and cloud solutions. A critical aspect of this acquisition is AMD&rsquo;s intention to spin off ZT Systems' manufacturing operations, aligning with the fabless model that AMD has championed. This move allows AMD to maintain its focus on chip design and innovation while outsourcing the capital-intensive and complex manufacturing process.</p>
<p>This approach is not new for AMD. Over a decade ago, AMD spun off its manufacturing operations, leading to the creation of GlobalFoundries. By transitioning to a fabless model, AMD could streamline its operations, reduce costs, and concentrate on what it does best&mdash;developing high-performance semiconductors. The ZT Systems acquisition, paired with the planned manufacturing spin-off, reflects AMD's continued commitment to the fabless strategy, which has proven successful.</p>
<p>This strategic focus on design and innovation, while leveraging specialized foundries for production, positions AMD to better compete with Nvidia and other industry giants. It also underscores the broader industry trend toward the fabless model, where companies can achieve greater agility and efficiency by outsourcing production to dedicated foundries like TSMC.</p>
<h2 id="Apples-Fabless-Role" class="jump-link-nav anchored-block" data-jumplink-title="Apple&rsquo;s Fabless Role">Apple&rsquo;s Role in the Fabless Movement</h2>
<p>Apple&rsquo;s evolution into a key player in the semiconductor space underscores the appeal of the fabless model. Apple has effectively embraced a fabless strategy by designing its own chips, such as the M1 and A-series processors, and outsourcing their manufacturing to TSMC. This approach has enabled Apple to produce highly efficient, performance-optimized chips tailored to its devices without the burden of owning and operating semiconductor fabrication plants.</p>
<p>Apple&rsquo;s success with this model suggests that other technology companies might explore similar strategies, further validating the fabless approach. The ability to innovate and control chip design while leveraging the expertise of specialized foundries for production is becoming an increasingly attractive business model in the tech industry.</p>
<h2 id="The-Fabless-Future" class="jump-link-nav anchored-block" data-jumplink-title="The Fabless Future">Considering the Fabless Future</h2>
<p>The semiconductor industry is in a state of flux, with the fabless model gaining traction as a preferred strategy for many leading companies. As Nvidia&rsquo;s margins face potential pressures from growing competition, diversifying investments within the fabless sector could offer a way to navigate these uncertainties. By spreading exposure across a range of fabless companies, investors might be better positioned to benefit from industry growth while managing the risks associated with any single company's future performance.</p>

<p><a href="https://www.vaneck.com/us/en/investments/fabless-semiconductor-etf-smhx/overview/" title="SMHX - VanEck Fabless Semiconductor ETF - Holdings and Performance"><strong>VanEck Fabless Semiconductor ETF (SMHX)</strong></a> aims to provide a diversified portfolio that captures this dynamic industry's broad spectrum of opportunities. While Nvidia remains a dominant player, SMHX offers exposure to other fabless companies that could challenge Nvidia&rsquo;s market share and thrive in the evolving semiconductor landscape.</p>
<p>As the industry continues to shift toward the fabless model, investors may want to consider broadening their semiconductor exposure. By doing so, they could potentially benefit from the ongoing innovations and competitive dynamics shaping the future of the semiconductor market while also managing the uncertainties inherent in this rapidly changing industry.</p>
<h3>Cumulative Performance of Fabless Names Outpaces the Category and Broad Markets</h3>
<p><img class="img-responsive w-100" alt="Cumulative Performance of Fabless Names Outpaces the Category and Broad Markets" src="https://www.vaneck.com/contentassets/23cc96ffa3e84f7dae8e05e9d8066455/4765_smhx-launch_chart-2_2024-8_v1_blog.svg" /></p>
<p class="chart-disclosure">Source: Morningstar, Data as of 07/31/2024. The BlueStar Top 10 U.S. Listed Fabless Semis does not represent the funds underlying indices. <strong>The performance data quoted represents past performance. Past performance is not a guarantee of future results. Investment return and principal value of an investment will fluctuate so that an investor's shares, when redeemed, may be worth more or less than their original cost. Performance may be lower or higher than performance data quoted.</strong> See important disclosures and index descriptions at end. This is not an offer to buy or sell, or recommendation to buy or sell any of the securities mentioned herein. Futures carry additional risks and are not suitable for all investors.</p>

<p>To receive more <a href="https://www.vaneck.com/us/en/insights/thematic-investing/" title="Thematic Investing Insights"><strong>Thematic Investing</strong></a> insights, <a href="https://www.vaneck.com/us/en/subscribe/" title="Subscription Center"><strong>sign up in our subscription center</strong></a>.</p>
]]></content:encoded>
</item><item rdf:about="https://www.vaneck.com/us/en/blogs/thematic-investing/smhx-etf-question-and-answer/">
  <title>SMHX ETF: Question &amp; Answer></title>
  <link>https://www.vaneck.com/us/en/blogs/thematic-investing/smhx-etf-question-and-answer/</link>
  <description><![CDATA[Fabless semiconductor companies focus on design and outsource manufacturing, allowing them to innovate rapidly and scale efficiently without the costs of owning fabrication plants.]]></description>
  <dc:creator> </dc:creator>
  <dc:date>08/28/2024 18:05:00</dc:date>
<content:encoded><![CDATA[

<p>The demand for semiconductors is escalating across various industries, driven by advancements in technologies such as AI, 5G, IoT, and electric vehicles. Fabless companies, with their cost-efficient and flexible business model, are well-positioned to meet this growing demand. Investing in fabless semiconductor companies through the <strong><a href="https://www.vaneck.com/us/en/investments/fabless-semiconductor-etf-smhx/overview/" title="SMHX - VanEck Fabless Semiconductor ETF | Overview ">VanEck Fabless Semiconductor ETF (SMHX)</a></strong>, the first of its kind in the industry, offers a strategic opportunity to capitalize on the sector's growth and innovation.</p>
<ul class="content-list">
<li><a href="#point-one"><strong>What is a Fabless Semiconductor Company?</strong></a></li>
<li><a href="#point-two"><strong>How Does the Fabless Semiconductor Business Model Work?</strong></a></li>
<li><a href="#point-three"><strong>What are the Key Advantages of Fabless Semiconductor Companies Over Integrated Semiconductor Companies?</strong></a></li>
<li><a href="#point-four"><strong>What is the Macro Outlook for Fabless Semiconductors?</strong></a></li>
<li><a href="#point-five"><strong>How Are Fabless Semiconductor Companies Driving Innovation in AI?</strong></a></li>
<li><a href="#point-six"><strong>How Do Government Policies Impact the Fabless Semiconductor Industry?</strong></a></li>
<li><a href="#point-seven"><strong>Why Choose SMHX? </strong></a></li>
<li><a href="#point-eight"><strong>How to buy SMHX? </strong></a></li>
</ul>
<h2 id="point-one" class="anchored-block">What is a Fabless Semiconductor Company?</h2>
<p>A fabless semiconductor company is a firm that specializes in designing and selling semiconductor chips but outsources the manufacturing process to specialized foundries, which have the expertise and infrastructure to produce the chips. Unlike integrated device manufacturers (IDMs), which handle both design and production in-house, fabless companies focus solely on the innovation and development of semiconductor designs. This model allows them to concentrate on cutting-edge design without the significant capital expenditure associated with building and maintaining fabrication facilities. By partnering with foundries, fabless companies can leverage advanced manufacturing technologies without being constrained by the costs and logistics of in-house production.</p>
<h2 id="point-two" class="anchored-block">How Does the Fabless Semiconductor Business Model Work?</h2>
<p>The fabless semiconductor business model revolves around several key processes. Initially, the company focuses on research, development, and the intricate design of semiconductor chips. Once the designs are finalized, the actual manufacturing is outsourced to specialized foundries, such as TSMC or GlobalFoundries. Post-fabrication, the chips undergo rigorous testing for quality and performance, often by third-party testing companies, and are subsequently packaged for sale. This model allows fabless companies to innovate rapidly and scale efficiently without the substantial investment and operational complexities associated with owning and operating fabrication plants.</p>
<h2 id="point-three" class="anchored-block">What are the Key Advantages of Fabless Semiconductor Companies Over Integrated Semiconductor Companies?</h2>
<p>Fabless semiconductor companies offer several key advantages over integrated semiconductor companies that manage both design and manufacturing in-house. Firstly, fabless companies benefit from cost efficiency as they avoid the substantial capital investment and ongoing expenses related to building and maintaining fabrication facilities. This enables them to allocate more resources towards research and development, fostering greater innovation. Secondly, the fabless model provides flexibility, allowing these companies to quickly adapt to technological advancements and market changes without being tied to specific manufacturing processes. Additionally, by partnering with various foundries, fabless companies gain access to the latest manufacturing technologies, enhancing their ability to produce cutting-edge products. This partnership also leads to increased manufacturing capabilities, which can result in more competitive pricing for their chips. Finally, this model allows for better scalability, enabling companies to adjust production levels in response to market demand without the constraints of fixed manufacturing capacities.</p>
<h2 id="point-four" class="anchored-block">What is the Macro Outlook for Fabless Semiconductors?</h2>
<p>The long-term outlook for fabless semiconductors is highly promising due to several driving factors. The continuous expansion of digital technologies globally ensures sustained demand for advanced semiconductor chips. As industries such as consumer electronics, automotive, telecommunications, and healthcare increasingly rely on sophisticated semiconductor components, the need for innovative chip designs will continue to grow. The rise of transformative technologies like artificial intelligence, 5G, the Internet of Things (IoT), and autonomous vehicles is expected to further propel the demand for specialized semiconductor solutions. These technologies require high-performance and energy-efficient chips, positioning fabless companies at the forefront of technological advancements.</p>
<p>Moreover, the shift towards a digital and interconnected world underscores the critical role of semiconductors in enabling future innovations. Governments and private sectors worldwide are investing heavily in semiconductor research and development, ensuring the continuous evolution and competitiveness of fabless companies. Despite potential challenges, such as supply chain disruptions and geopolitical tensions, the fabless semiconductor industry's agility and focus on innovation make it well-positioned for long-term growth and success.</p>
<h2 id="point-five" class="anchored-block">How Are Fabless Semiconductor Companies Driving Innovation in AI?</h2>
<p>Fabless semiconductor companies play a crucial role in advancing artificial intelligence (AI) technologies. They design specialized chips, such as GPUs and AI accelerators, that are optimized for the complex computations required by AI applications. These chips provide the necessary processing power for tasks such as training machine learning models and running inference algorithms in real-time. Furthermore, AI is increasingly being utilized in the semiconductor design process itself, where machine learning algorithms help optimize chip performance and efficiency. This integration of AI in both the development and utilization of semiconductors creates a cycle of innovation that continually pushes the boundaries of what these technologies can achieve. As AI applications expand into new areas such as autonomous driving, smart cities, and advanced robotics, the demand for high-performance semiconductors from fabless companies is set to grow significantly.</p>
<h2 id="point-six" class="anchored-block">How Do Government Policies Impact the Fabless Semiconductor Industry?</h2>
<p>Government policies and initiatives have a profound impact on the fabless semiconductor industry. Legislative measures, such as the U.S. CHIPS Act and the European Chips Act, aim to boost domestic semiconductor production and reduce reliance on foreign suppliers. These policies provide substantial funding for research, development, and manufacturing, fostering innovation and enhancing supply chain security. By supporting local semiconductor industries, governments aim to create a more resilient and competitive sector. These initiatives also focus on workforce development, ensuring that there is a skilled talent pool to drive future advancements. Additionally, the increased manufacturing capabilities resulting from these policies can shift the supply-demand dynamic in favor of designers, creating a more competitive pricing environment. As more foundries become available and manufacturing capacity grows, fabless companies can benefit from reduced production costs and increased negotiating power. As countries recognize the strategic importance of semiconductors in the global economy, continued governmental support is likely to play a key role in the growth and stability of the fabless semiconductor industry.</p>
<h2 id="point-seven" class="anchored-block">Why Choose SMHX?</h2>
<p>The <strong><a href="https://www.vaneck.com/us/en/investments/fabless-semiconductor-etf-smhx/overview/" title="SMHX - VanEck Fabless Semiconductor ETF | Overview ">VanEck Fabless Semiconductor ETF (SMHX)</a></strong> is the only ETF to offer targeted exposure to fabless semiconductor companies, making it a unique investment opportunity to access the sector's growth and innovation. By choosing <a href="/link/9b8fb1812bc74764bf11fc85767838f9.aspx" title="SMHX - VanEck Fabless Semiconductor ETF - Overview"><strong>SMHX</strong></a>, investors gain diversified exposure to leading fabless semiconductor companies, mitigating individual stock risk while capturing the sector's growth potential. This ETF provides a balanced investment in a dynamic and essential industry, poised for continued expansion and technological breakthroughs.</p>
<h3>Cumulative Performance of Fabless Names Outpaces the Category and Broad Markets</h3>
<p><img loading="lazy" class="img-responsive w-100" alt="Cumulative Performance of Fabless Names Outpaces the Category and Broad Markets" src="https://www.vaneck.com/contentassets/fc30b3ffbd0e43608d8af5cf0ac013e2/4765_smhx-launch_chart-2_2024-8_v1_blog.svg" /></p>
<p class="chart-disclosure">Source: Morningstar, Data as of 07/31/2024. The BlueStar Top 10 U.S. Listed Fabless Semis does not represent the funds underlying indices. <strong>The performance data quoted represents past performance. Past performance is not a guarantee of future results. Investment return and principal value of an investment will fluctuate so that an investor's shares, when redeemed, may be worth more or less than their original cost. Performance may be lower or higher than performance data quoted.</strong> See important disclosures and index descriptions at end. This is not an offer to buy or sell, or recommendation to buy or sell any of the securities mentioned herein. Futures carry additional risks and are not suitable for all investors.</p>
<h2 id="point-eight" class="anchored-block">How to buy SMHX?</h2>
<p>VanEck ETFs can be purchased the same way you would buy a stock, through a broker or with your advisor.</p>
<p class="d-none d-lg-block"><a href="mailto:askvaneck@vaneck.com" title="Have More Questions? - Ask VanEck" rel="noopener"><img class="img-responsive" src="https://www.vaneck.com/globalassets/home/us/insights/blogs/bm-blog-images/cta-faq_desktop-02.svg" alt="Have More Questions? - Ask VanEck" /></a></p>
<p class="d-lg-none"><a href="mailto:askvaneck@vaneck.com" title="Have More Questions? - Ask VanEck" rel="noopener"><img class="img-responsive" src="https://www.vaneck.com/globalassets/home/us/insights/blogs/bm-blog-images/cta-faq_mobile-01.svg" alt="Have More Questions? - Ask VanEck" /></a></p>
<p>To receive more <a href="https://www.vaneck.com/us/en/insights/thematic-investing/" title="Thematic Investing Insights"><strong>Thematic Investing</strong></a> insights, <a href="https://www.vaneck.com/us/en/subscribe/" title="Subscription Center"><strong>sign up in our subscription center</strong></a>.</p>
]]></content:encoded>
</item><item rdf:about="https://www.vaneck.com/us/en/blogs/thematic-investing/fabless-semiconductor-companies-winners-in-the-chips-act-era/">
  <title>Fabless Semiconductor Companies: Winners in the CHIPS Act Era></title>
  <link>https://www.vaneck.com/us/en/blogs/thematic-investing/fabless-semiconductor-companies-winners-in-the-chips-act-era/</link>
  <description><![CDATA[The CHIPS Act is revolutionizing the semiconductor industry, giving fabless chip designers lower production costs, improved technology access, and greater flexibility, driving innovation and competitiveness. &nbsp;]]></description>
  <dc:creator>Nick Frasse</dc:creator>
  <dc:date>08/28/2024 06:30:00</dc:date>
<content:encoded><![CDATA[

<p>The global semiconductor industry is experiencing a transformation driven by government initiatives like the CHIPS Act in the United States. These efforts aim to boost semiconductor production, but the ripple effects extend far beyond the factories. One significant beneficiary of this surge in manufacturing capacity is the chip design sector. By outsourcing their production, chip designers stand to gain from the increased competitiveness and efficiency of semiconductor manufacturing.</p>
<h2>CHIPS Act from Ten Thousand Feet</h2>
<p>The CHIPS Act, officially known as the CHIPS and Science Act, is a substantial government initiative aimed at revitalizing the semiconductor industry in the United States. With over $52 billion allocated for manufacturing and research, this act seeks to reduce dependency on foreign manufacturing, create jobs, and secure the supply chain. While these goals are ambitious, the broader impact on the semiconductor ecosystem is equally important.</p>
<h3>Current Funding Totals by Company</h3>
<div class="wrapped-div">
<table style="width: 600px;">
<tbody>
<tr class="tbl-data">
<td class="tbl-header last">Company</td>
<td class="tbl-header last text-left">Amount</td>
<td class="tbl-header last text-left">Factory Locations</td>
</tr>
<tr class="tbl-data">
<td class="data-td last font-weight-normal">Intel</td>
<td class="data-td data last text-left">$8.5 billion</td>
<td class="data-td data last text-left">Arizona, New Mexico, Oregon, Ohio</td>
</tr>
<tr class="tbl-data">
<td class="data-td last font-weight-normal">TSMC</td>
<td class="data-td data last text-left">$6.6 billion</td>
<td class="data-td data last text-left">Arizona</td>
</tr>
<tr class="tbl-data">
<td class="data-td last font-weight-normal">Samsung</td>
<td class="data-td data last text-left">$6.4 billion</td>
<td class="data-td data last text-left">Texas</td>
</tr>
<tr class="tbl-data">
<td class="data-td last font-weight-normal">Micron</td>
<td class="data-td data last text-left">$6.14 billion</td>
<td class="data-td data last text-left">New York</td>
</tr>
<tr class="tbl-data">
<td class="data-td last font-weight-normal">Global Foundries</td>
<td class="data-td data last text-left">$1.5 billion</td>
<td class="data-td data last text-left">New York, Vermont</td>
</tr>
<tr class="tbl-data">
<td class="data-td last font-weight-normal">Microchip Technology</td>
<td class="data-td data last text-left">$162 million</td>
<td class="data-td data last text-left">Colorado, Oregon</td>
</tr>
<tr class="tbl-data">
<td class="data-td last font-weight-normal">Polar Semiconductor</td>
<td class="data-td data last text-left">$120 million</td>
<td class="data-td data last text-left">Minnesota</td>
</tr>
<tr class="tbl-data">
<td class="data-td last font-weight-normal">BAE Systems</td>
<td class="data-td data last text-left">$35 million</td>
<td class="data-td data last text-left">New Hampshire</td>
</tr>
<tr class="tbl-data">
<td class="data-td last font-weight-normal"><strong>Total</strong></td>
<td class="data-td data last text-left"><strong>$17.1 billion</strong></td>
<td class="data-td data last text-left">&nbsp;</td>
</tr>
</tbody>
</table>
</div>
<style>
    .wrapped-div {
        max-width: 100%;
    }

    @media (max-width: 1240px) {
        .wrapped-div {
            overflow-x: scroll;
        }
    }

    .wrapped-div-sector {
        max-width: 100%;
        overflow-x: scroll;
    }
</style>

<h2>Increased Manufacturing Capacity</h2>
<p>The increase in manufacturing capacity is substantial. So far, Intel has received $8.5 billion from the Act for its semiconductor projects, including new factories in Ohio, Arizona, New Mexico, and Oregon. Similarly, TSMC and Samsung have received significant funding to expand their U.S. operations. The Semiconductor Industry Association estimates that the CHIPS Act has already garnered over $450 billion in private investments, further boosting global manufacturing capacity.</p>
<p>This legislative funding and similar global initiatives are set to reshape the semiconductor industry. While the primary goal is to secure supply chains and reduce dependency on foreign manufacturing, the benefits for chip designers are clear. Increased manufacturing capacity, driven by substantial investments, could create a more competitive environment, lowering production costs and improving access to advanced technologies. Fabless, aka Chip design companies, can leverage these advantages and focus on innovation and development, ultimately benefiting from global semiconductor production's increased flexibility and scalability.</p>
<h2>Fundamental Benefit for Fabless Semiconductor Companies</h2>
<p>Chip design companies typically do not own manufacturing facilities and rely on third-party manufacturers to produce their designs. This model, the fabless model, allows these businesses to focus on innovation and development without the heavy capital investment required for building and maintaining fabs. As global manufacturing capacity increases, several benefits emerge for chip designers:</p>
<ul class="content-list">
<li class="mt-2"><strong>Lower Production Costs:</strong> With more fabs competing for business, production costs will likely decrease. This competition among manufacturers can lead to lower prices for chip production, benefiting designers who can negotiate better deals.</li>
<li class="mt-2"><strong>Improved Access to Advanced Technology:</strong> Increased investments in manufacturing also mean more advanced technology will be available. Fabs will upgrade their processes to attract business, providing chip designers access to state-of-the-art manufacturing techniques that can improve the performance and efficiency of their designs.</li>
<li class="mt-2"><strong>Greater Flexibility and Scalability:</strong> As more fabs come online, chip designers will have greater flexibility in choosing manufacturing partners. This flexibility allows them to scale production quickly in response to market demands, reducing the risk of supply chain disruptions.</li>
<li class="mt-2"><strong>Focus on Core Competencies:</strong> By outsourcing production, chip designers can concentrate on their core competencies&mdash;innovative design and development. This focus can lead to more cutting-edge products and a stronger competitive position in the market.</li>
</ul>
<h2>Potential Supply-Demand Dynamic Shift</h2>
<p>With substantial investments flowing into the construction and expansion of fabrication plants (fabs), the global production of semiconductors is set to rise. This increase in manufacturing capacity could create a supply-demand imbalance that benefits the chip designers.</p>
<p>Historically, the semiconductor industry has seen periods of boom and bust. During times of high demand, manufacturing capacity often struggles to keep up, leading to shortages and higher prices. Conversely, when supply exceeds demand, prices fall, and manufacturing becomes more competitive. The current wave of investments aims to build a more resilient and flexible supply chain, but it also means that more fabs will be capable of producing a higher volume of chips.</p>
<p><img class="img-responsive w-100" src="https://www.vaneck.com/contentassets/5adc85607117418580960e222596f6c6/4594_smh-fabless_chart-1_2024-06_v1_blog.svg" alt="SMH Index Holdings" /></p>
<p class="chart-disclosure">Source: VanEck as of 6/21/2024.</p>

<h2>How to Invest In Semiconductor Companies</h2>
<p>Funds like <strong><a href="https://www.vaneck.com/us/en/investments/semiconductor-etf-smh/overview/" title="SMH - VanEck Semiconductor ETF - Overview">VanEck Semiconductor ETF (SMH)</a></strong> benefit from the CHIPS Act in two ways: investing in foundries that should see higher revenue from new manufacturing plants and allocating to fabless chip designers who benefit from more competitive pricing due to increased manufacturing. Investors can also access targeted exposure to fabless chip designers with the <a href="/link/9b8fb1812bc74764bf11fc85767838f9.aspx" title="SMHX - VanEck Fabless Semiconductor ETF - Overview"><strong>VanEck Fabless Semiconductor ETF (SMHX)</strong></a>.</p>
<h3>Cumulative Performance of Fabless Names Outpaces the Category and Broad Markets</h3>
<p><img class="img-responsive w-100" alt="Cumulative Performance of Fabless Names Outpaces the Category and Broad Markets" src="https://www.vaneck.com/contentassets/352dd17461154594bb2de2e79c911f3b/4765_smhx-launch_chart-2_2024-8_v1_blog.svg" /></p>
<p class="chart-disclosure">Source: Morningstar, Data as of 07/31/2024. The BlueStar Top 10 U.S. Listed Fabless Semis does not represent the funds underlying indices. <strong>The performance data quoted represents past performance. Past performance is not a guarantee of future results. Investment return and principal value of an investment will fluctuate so that an investor's shares, when redeemed, may be worth more or less than their original cost. Performance may be lower or higher than performance data quoted.</strong> See important disclosures and index descriptions at end. This is not an offer to buy or sell, or recommendation to buy or sell any of the securities mentioned herein. Futures carry additional risks and are not suitable for all investors.</p>
<p>To receive more <a href="https://www.vaneck.com/us/en/insights/thematic-investing/" title="Thematic Investing Insights"><strong>Thematic Investing</strong></a> insights, <a href="https://www.vaneck.com/us/en/subscribe/" title="Subscription Center"><strong>sign up in our subscription center</strong></a>.</p>
]]></content:encoded>
</item><item rdf:about="https://www.vaneck.com/us/en/blogs/digital-assets/matthew-sigel-vaneck-mid-august-2024-bitcoin-chaincheck/">
  <title>VanEck Mid-August 2024 Bitcoin ChainCheck></title>
  <link>https://www.vaneck.com/us/en/blogs/digital-assets/matthew-sigel-vaneck-mid-august-2024-bitcoin-chaincheck/</link>
  <description><![CDATA[Bitcoin network activity stayed robust with an 83% surge in Ordinals inscriptions, while funding costs for Bitcoin futures dropped, reflecting a risk appetite seen in earlier market recoveries.]]></description>
  <dc:creator>Matthew  Sigel</dc:creator>
  <dc:date>08/23/2024 06:30:00</dc:date>
<content:encoded><![CDATA[

<p><strong>Please note that VanEck has exposure to bitcoin.</strong></p>
<p>Our mid-August 2024 ChainCheck provides insight into Bitcoin's mixed on-chain signals and highlights notable off-chain developments. Over the past 30 days, we have observed Bitcoin's market resilience amid U.S. election season volatility and innovative shifts in the mining industry.</p>
<p>Some takeaways for Mid-July &ndash; Mid-August:</p>
<ul class="content-list">
<li><a href="#price-action"><strong>Bitcoin&rsquo;s Price Action</strong></a></li>
<li><a href="#chaincheck-monthly-dashboard"><strong>Bitcoin ChainCheck Monthly Dashboard</strong></a></li>
<li><a href="#network-activity"><strong>Bitcoin&rsquo;s Network Activity, Adoption, and Fees</strong></a></li>
<li><a href="#market-health"><strong>Bitcoin Market Health and Profitability</strong></a></li>
<li><a href="#miners"><strong>Bitcoin Miners</strong></a></li>
</ul>
<h2 id="price-action" class="jump-link-nav anchored-block" data-jumplink-title="Price Action">Bitcoin&rsquo;s Price Action</h2>
<ul class="content-list">
<li class="mt-2"><strong>Market sentiment:</strong> At $59,052, bitcoin&rsquo;s 7-day moving average (7 DMA) is down 9% over the past 30 days. Bitcoin surged in late July, outperforming the SPX and NDX, fueled by Donald Trump's rising poll numbers after the assassination attempt and optimism over the RNC's 2024 platform&mdash;the first U.S. party platform to endorse crypto with explicit, positive policies. However, this enthusiasm ended abruptly in early August, which saw bitcoin prices briefly dipping into the upper $ 40,000s amid one of the worst stock market selloffs since the COVID pandemic. Importantly, the selloff was not catalyzed by the crypto markets but by the unwinding of the Japanese Yen carry trade, which saw hundreds of millions of dollars of loan liquidations caused by a meager 0.25% interest rate hike from the Bank of Japan&mdash;if anything, highlighting the frailty of global financial markets and underscoring the case for hard money assets and commodities like bitcoin and gold. On balance, investor sentiment appears neutral to us.</li>
<li class="mt-2"><strong>Bitcoin dominance: </strong>Interestingly, as illustrated by rising Bitcoin dominance (+4% MoM), Bitcoin benefits from optimism around electing a pro-crypto administration as a hedge against it. In the past 30 days, bitcoin dominance made multi-year highs not seen since April 2021. While the entire digital assets ecosystem would benefit from more crypto-friendly regulators, Bitcoin is uniquely positioned to outperform the rest of the crypto market if a more crypto-hostile administration is elected, thanks to regulatory clarity around its status as a commodity.</li>
<li class="mt-2"><strong>Regional trading:</strong></li>
<ul style="list-style-type: circle;">
<li class="mt-2"><strong>Asia hours: </strong>BTC&rsquo;s 7 DMA price fell 4% this month during Asian trading hours.</li>
<li class="mt-2"><strong>U.S. hours:</strong> 7 DMA prices fell 6% this month as Trump odds fell.</li>
<li class="mt-2"><strong>EU hours: </strong>The MoM change in BTC&rsquo;s 7 DMA price increased 1% among European traders this month, possibly due to them adding during selloffs in the larger Asian and American markets.</li>
</ul>
</ul>
<div class="wrapped-div">
<table style="width: 500px;">
<tbody>
<tr class="tbl-data">
<td class="tbl-header last">Regional Trading</td>
<td class="tbl-header last text-right">MoM Change (%)</td>
<td class="tbl-header last text-right">YoY Change (%)</td>
</tr>
<tr class="tbl-data">
<td class="data-td last">Asia Hours Price Change MoM ($)</td>
<td class="data-td data last text-right">-4</td>
<td class="data-td data last text-right">-9</td>
</tr>
<tr class="tbl-data">
<td class="data-td last">US hours Price Change MoM ($)</td>
<td class="data-td data last text-right">-6</td>
<td class="data-td data last text-right">-14</td>
</tr>
<tr class="tbl-data">
<td class="data-td last">EU hours Price Change MoM ($)</td>
<td class="data-td data last text-right">1</td>
<td class="data-td data last text-right">2</td>
</tr>
</tbody>
</table>
</div>
<br />
<p class="chart-disclosure">Source: Glassnode, as of 8/19/24. <strong>Past performance is no guarantee of future results.</strong></p>
<ul class="content-list">
<li class="mt-2"><strong>Funding rates:</strong></li>
<ul style="list-style-type: circle;">
<li class="mt-2">Over the past 30 days, the 7 DMA annualized cost of funding Bitcoin futures has dropped from ~11.6% to ~8.8% for a relative decline of ~24%. These levels indicate a risk appetite similar to those seen during market recoveries following 20%+ BTC price drops in early May and July of this year.</li>
</ul>
</ul>
<h3 id="chaincheck-monthly-dashboard" class="anchored-block">Bitcoin ChainCheck Monthly Dashboard</h3>
<div class="wrapped-div">
<table style="width: 100%;">
<tbody>
<tr class="tbl-data">
<td class="tbl-header last">As of August 19th, 2024</td>
<td class="tbl-header last text-right">7-day avg</td>
<td class="tbl-header last text-right">30 day change (%)</td>
<td class="tbl-header last text-right">365 day change (%)</td>
<td class="tbl-header last text-right">Last 30 days Percentile vs<br />all-time history (%)</td>
</tr>
<tr class="tbl-data">
<td class="data-td last">Bitcoin Price</td>
<td class="data-td data last text-right">$59,052</td>
<td class="data-td data last text-right">-9</td>
<td class="data-td data last text-right">115</td>
<td class="data-td data last text-right">97</td>
</tr>
<tr class="tbl-data">
<td class="data-td last">Daily Active Addresses</td>
<td class="data-td data last text-right">682,650</td>
<td class="data-td data last text-right">-9</td>
<td class="data-td data last text-right">-31</td>
<td class="data-td data last text-right">64</td>
</tr>
<tr class="tbl-data">
<td class="data-td last">Daily New Addresses</td>
<td class="data-td data last text-right">307,935</td>
<td class="data-td data last text-right">10</td>
<td class="data-td data last text-right">-38</td>
<td class="data-td data last text-right">55</td>
</tr>
<tr class="tbl-data">
<td class="data-td last">Daily Transactions</td>
<td class="data-td data last text-right">620,810</td>
<td class="data-td data last text-right">11</td>
<td class="data-td data last text-right">15</td>
<td class="data-td data last text-right">99</td>
</tr>
<tr class="tbl-data">
<td class="data-td last">Daily Inscriptions</td>
<td class="data-td data last text-right">58,268</td>
<td class="data-td data last text-right">83</td>
<td class="data-td data last text-right">-80</td>
<td class="data-td data last text-right">44</td>
</tr>
<tr class="tbl-data">
<td class="data-td last">Total Transfer Volume (USD)</td>
<td class="data-td data last text-right">$41,790,828,073</td>
<td class="data-td data last text-right">-14</td>
<td class="data-td data last text-right">73</td>
<td class="data-td data last text-right">85</td>
</tr>
<tr class="tbl-data">
<td class="data-td last">% Supply Active, last 180 days</td>
<td class="data-td data last text-right">23</td>
<td class="data-td data last text-right">0</td>
<td class="data-td data last text-right">18</td>
<td class="data-td data last text-right">24</td>
</tr>
<tr class="tbl-data">
<td class="data-td last">% Supply Active, last 3+ years</td>
<td class="data-td data last text-right">46</td>
<td class="data-td data last text-right">0</td>
<td class="data-td data last text-right">14</td>
<td class="data-td data last text-right">99</td>
</tr>
<tr class="tbl-data">
<td class="data-td last">Avg Fees (USD)</td>
<td class="data-td data last text-right">$0.79</td>
<td class="data-td data last text-right">-44</td>
<td class="data-td data last text-right">-17</td>
<td class="data-td data last text-right">61</td>
</tr>
<tr class="tbl-data">
<td class="data-td last">Avg Fees (BTC)</td>
<td class="data-td data last text-right">0.00001</td>
<td class="data-td data last text-right">-39</td>
<td class="data-td data last text-right">-61</td>
<td class="data-td data last text-right">9</td>
</tr>
<tr class="tbl-data">
<td class="data-td last">Percent of BTC Addresses in profit</td>
<td class="data-td data last text-right">84</td>
<td class="data-td data last text-right">-9</td>
<td class="data-td data last text-right">29</td>
<td class="data-td data last text-right">72</td>
</tr>
<tr class="tbl-data">
<td class="data-td last">Unrealized profit/loss ratio</td>
<td class="data-td data last text-right">0.47</td>
<td class="data-td data last text-right">-10</td>
<td class="data-td data last text-right">73</td>
<td class="data-td data last text-right">69</td>
</tr>
<tr class="tbl-data">
<td class="data-td last">Global Power Consumption (TWh)</td>
<td class="data-td data last text-right">123</td>
<td class="data-td data last text-right">6</td>
<td class="data-td data last text-right">57</td>
<td class="data-td data last text-right">99</td>
</tr>
<tr class="tbl-data">
<td class="data-td last">Total Daily BTC Miner Revenues (USD)</td>
<td class="data-td data last text-right">$27,383,215</td>
<td class="data-td data last text-right">-12</td>
<td class="data-td data last text-right">-2</td>
<td class="data-td data last text-right">84</td>
</tr>
<tr class="tbl-data">
<td class="data-td last">Transfer volume from Miners to Exchanges (USD)</td>
<td class="data-td data last text-right">$2,118,744</td>
<td class="data-td data last text-right">-21</td>
<td class="data-td data last text-right">-59</td>
<td class="data-td data last text-right">67</td>
</tr>
<tr class="tbl-data">
<td class="data-td last">Bitcoin Dominance</td>
<td class="data-td data last text-right">56</td>
<td class="data-td data last text-right">4</td>
<td class="data-td data last text-right">15</td>
<td class="data-td data last text-right">81</td>
</tr>
<tr class="tbl-data">
<td class="data-td last">Bitcoin Futures Annualized Basis</td>
<td class="data-td data last text-right">9</td>
<td class="data-td data last text-right">-24</td>
<td class="data-td data last text-right">37</td>
<td class="data-td data last text-right">62</td>
</tr>
</tbody>
</table>
</div>
<br />
<p class="chart-disclosure">Source: Glassnode, VanEck research as of 8/19/24. <strong>Past performance is no guarantee of future results.</strong></p>
<h2 id="network-activity" class="jump-link-nav anchored-block" data-jumplink-title="Network Activity">Bitcoin&rsquo;s Network Activity, Adoption, and Fees</h2>
<ul class="content-list">
<li class="mt-2"><strong>Daily transactions:</strong> Average daily transactions on the Bitcoin blockchain dropped 11% from their all-time highs set last month. However, this figure still rests at the 99<sup>th</sup>percentile of all-time history, indicating sustained network adoption.</li>
<li class="mt-2"><strong>Ordinals inscriptions:</strong> Curiously, Ordinals inscription transactions increased 83% after months of decline. While the metric is still down 80% YoY, this month&rsquo;s surge in activity is a welcome change for Ordinals ecosystem artists, developers, and users. We believe activity may be picking up amid cautious optimism particular to Bitcoin ecosystem dominance.</li>
<li class="mt-2"><strong>Total transfer volume:</strong> Transfer volumes were down 14% for the month. After adjusting for 9% price declines, this number was essentially flat in the 85<sup>th</sup>percentile.</li>
<li class="mt-2"><strong>Average transaction fees:</strong> Average transaction fees dropped 44% to $0.79 this month, down 17% year-over-year, despite increased daily transactions. This decline is driven by Bitcoin's hash rate reaching new highs in 2024 and reduced network congestion. Fees have been decreasing since their June spike, where they peaked at ~$50 per transaction due to a surge in unconfirmed transactions, <strong><a href="https://cointelegraph.com/news/bitcoin-network-transaction-fees-temporarily-soar-to-nearly-52" title="Bitcoin Network Transaction Fees Temporarily Soar To Nearly $52" target="_blank" rel="noopener">reportedly</a></strong> linked to OKX's wallet sorting. Concurrently, Bitcoin's difficulty adjusted to a record high level at the start of August, with further increases <strong><a href="https://www.coinwarz.com/mining/bitcoin/difficulty-chart" title="Bitcoin Difficulty Chart" target="_blank" rel="noopener">expected</a></strong> in the next adjustment anticipated on August 28th.</li>
</ul>
<h2 id="market-health" class="jump-link-nav anchored-block" data-jumplink-title="Market Health">Bitcoin Market Health and Profitability</h2>
<ul class="content-list">
<li class="mt-2"><strong>Percent of addresses in profit:</strong> The weekly average of Bitcoin addresses in profit declined 9% over the past 30 days, reducing the total to 84% and representing the 72nd percentile of the metric&rsquo;s all-time history. Despite the pain for short-term investors, we remind newcomers to the asset class that this drawdown is well within the bounds of a typical bull market retracement.</li>
<li class="mt-2"><strong>Net unrealized profit/loss:</strong> This ratio dropped 1% to an average of 0.47 this month, hovering just below the 'Optimism &mdash; Anxiety' and 'Belief &mdash; Denial' sentiment line drawn at 0.50. This week's reading reinforces the neutral sentiment noted earlier, as this metric has remained close to this line since late June.</li>
</ul>
<h2 id="miners" class="jump-link-nav anchored-block" data-jumplink-title="Miners">Bitcoin Miners</h2>
<ul class="content-list">
<li class="mt-2"><strong>Total daily BTC miner revenues: </strong>Daily mining revenue averages dropped 12% to approximately $27.4 million this month, a metric we advise caution in over-indexing. While bitcoin mining revenues have faced challenges due to post-halving block reward reductions and low network fees, many publicly traded bitcoin miners in the <strong><a href="https://www.marketvector.com/indexes/sector/mvis-global-digital-assets-equity" title="MVIS&reg; Global Digital Assets Equity Index" target="_blank" rel="noopener">MarketVector Digital Asset Equity Index (MVDAPP)</a></strong> are outperforming this year by capitalizing on opportunities in AI and high-performance cloud computing. For instance, miners like Core Scientific (CORZ) and Hut 8 (HUT) are reallocating power capacity to meet the growing demand for AI/HPC infrastructure. Early indications suggest that AI/HPC could deliver significantly higher margins per megawatt than traditional bitcoin mining, offering a compelling avenue for miners to diversify their revenue streams. We are closely monitoring this trend and have published in-depth research on our updated thesis for bitcoin miners, which can be accessed here: <strong><a href="https://www.vaneck.com/us/en/blogs/digital-assets/matthew-sigel-bitcoin-miners-ai-arbitrage-play-to-boost-revenue/" title="Bitcoin Miners' AI Arbitrage Play to Boost Revenue" rel="noopener">Bitcoin Miners' AI Arbitrage Play to Boost Revenue</a>.</strong></li>
<li class="mt-2"><strong>Transfer volume from miners to exchanges (USD): </strong>Transfer volumes from miners to exchanges fell 21% over the past 30 days, suggesting stabilization from miners after their post-halving selling increased significantly in June and July. We believe some miners&rsquo; strong equities performance on the back of their emerging AI/HPC story may contribute to this month&rsquo;s increased &lsquo;HODL&rsquo; strategy, in which bitcoin miners keep their bitcoin in anticipation of monetizing it at higher future values.</li>
</ul>
<h3>Chart of the Month: Bitcoin Miner Selloffs Hit New Lows as Halving Pressure Eases</h3>
<p><img class="img-responsive w-100" src="https://www.vaneck.com/contentassets/714d250a8f414492b4f08147f99e8f3e/4760_bitcoin-monthly-aug_chart-1_2024-8_v1_blog.svg" alt="Bitcoin Miner Selloffs Hit New Lows as Halving Pressure Eases" /></p>
<p class="chart-disclosure">Source: Glassnode, VanEck research as of 8/19/24. <strong>Past performance is no guarantee of future results.</strong></p>
<p><strong>Notes:</strong></p>
<p>Net unrealized profit/loss ratio (NUPL) can be calculated by subtracting the realized market cap from the market cap and dividing the result by the market cap. When a high percentage of Bitcoin&rsquo;s market cap consists of unrealized profits, it can be interpreted that investors are greedy. Background reading <strong><a href="https://medium.com/@adamant_capital/a-primer-on-bitcoin-investor-sentiment-and-changes-in-saving-behavior-a5fb70109d32" title="A Primer on Bitcoin Investor Sentiment and Changes in Saving Behavior" target="_blank" rel="noopener">here</a></strong>.</p>
<p><strong>Links to third party websites are provided as a convenience and the inclusion of such links does not imply any endorsement, approval, investigation, verification or monitoring by us of any content or information contained within or accessible from the linked sites. By clicking on the link to a non-VanEck webpage, you acknowledge that you are entering a third-party website subject to its own terms and conditions. VanEck disclaims responsibility for content, legality of access or suitability of the third-party websites.</strong></p>
<p>To receive more <strong><a href="https://www.vaneck.com/us/en/insights/digital-assets/" title="Digital Assets Insights">Digital Assets</a></strong> insights, <strong><a href="https://www.vaneck.com/us/en/subscribe/" title="Subscription Center">sign up in our subscription center</a></strong>.</p>
<style>
    .data-td.data {
        padding-right: 5px !important;
    }

    .wrapped-div {
        max-width: 100%;
    }

    @media (max-width: 1240px) {
        .wrapped-div {
            overflow-x: scroll;
        }
    }

    .wrapped-div-sector {
        max-width: 100%;
        overflow-x: scroll;
    }
</style>
]]></content:encoded>
</item><item rdf:about="https://www.vaneck.com/us/en/blogs/income-investing/investing-in-mortgage-reits/">
  <title>Investing in Mortgage REITs></title>
  <link>https://www.vaneck.com/us/en/blogs/income-investing/investing-in-mortgage-reits/</link>
  <description><![CDATA[Understand the risks, benefits, and strategies for investing in Mortgage REITs.]]></description>
  <dc:creator> </dc:creator>
  <dc:date>08/20/2024 06:30:00</dc:date>
<content:encoded><![CDATA[

<p><strong>Key Takeaways:</strong></p>
<ul class="content-list">
<li class="mt-2">Mortgage REITs invest in real estate debt, targeting high dividends from interest and capital gains.</li>
<li class="mt-2">They offer liquid, income-focused real estate exposure but are sensitive to rates, credit, and prepayments.</li>
<li class="mt-2">Investors can access mREITs directly or via ETFs like MORT for diversified, actively managed exposure.</li>
</ul>
<p>Mortgage Real Estate Investment Trusts (mREITs) are a vital component of the investment landscape, providing investors with an opportunity to participate in the real estate sector without directly owning properties. This article offers a comprehensive guide to understanding and investing in Mortgage REITs, covering their structure, methods of income generation, benefits, risks, and the latest market trends.</p>
<h2 id="intro" class="jump-link-nav anchored-block" data-jumplink-title="Intro to Mortgage REITs">What is a Mortgage REIT?</h2>
<p>Mortgage Real Estate Investment Trusts are specialized financial vehicles that provide funding for real estate through the purchase of mortgages and mortgage-backed securities. Unlike Equity REITs, which directly own and manage physical real estate assets, Mortgage REITs invest in the debt associated with real estate properties. Here's a simplified explanation of how they operate and their key characteristics:</p>
<p><strong>Basic Concept of Mortgage REITs</strong></p>
<p>Mortgage REITs serve as intermediaries between capital markets and real estate markets by raising capital from investors to purchase existing mortgages or mortgage-backed securities. They do not buy the properties themselves but rather the debt secured by these properties. This allows them to generate income primarily from the interest received from these debt instruments.</p>
<p><strong>Key Characteristics and Features</strong></p>
<ul class="content-list">
<li><strong>Interest Income:</strong> The core business model of a Mortgage REIT revolves around interest income. They earn this income on the difference between the interest rates they charge on mortgage loans and the interest rates they pay on their own borrowings. This spread is a critical component of their profitability.</li>
<li class="mt-2"><strong>Use of Leverage:</strong> To amplify their earnings, Mortgage REITs often employ leverage, meaning they borrow capital at lower short-term interest rates to invest in long-term mortgage assets that pay higher rates. This leverage can significantly increase their returns but also amplifies risks, especially when interest rates rise unexpectedly.</li>
<li class="mt-2"><strong>Risk Management:</strong> Effective risk management is crucial for Mortgage REITs due to their exposure to interest rate fluctuations, credit risks, and prepayment risks. They must carefully assess the creditworthiness of borrowers and the potential for changes in interest rates which could affect their profit margins.</li>
<li class="mt-2"><strong>Diversification:</strong> Many Mortgage REITs diversify their investments across different types of mortgage assets and geographic regions to mitigate risks. This diversification can include a mix of residential and commercial mortgages and a variety of loan types.</li>
<li class="mt-2"><strong>Tax Considerations:</strong> Like all REITs, Mortgage REITs must distribute at least 90% of their taxable income to shareholders as dividends. This requirement makes them attractive to investors seeking regular income distributions.</li>
<li class="mt-2"><strong>Market Sensitivity:</strong> The performance of Mortgage REITs is closely linked to the real estate market and broader economic conditions. They are particularly sensitive to changes in interest rates and the overall health of the economy.</li>
</ul>
<p>Mortgage REITs offer a unique approach to investing in real estate, providing exposure to real estate markets without requiring direct investment in physical properties. Their ability to generate income through interest, coupled with strategic management of their loan portfolios, makes them an intriguing option for investors looking to diversify their investments beyond traditional equity and bonds.</p>
<h2>How do Mortgage REITs Make Money?</h2>
<p>Mortgage REITs primarily generate revenue through two key financial strategies: interest income from mortgage loans and mortgage-backed securities, and capital gains from the sale of these assets. Here's a more detailed look at each revenue stream:</p>
<p><strong>Interest Income</strong></p>
<p>The predominant source of income for Mortgage REITs is the interest they earn on the mortgage loans and mortgage-backed securities they hold in their portfolios. These securities are typically loans backed by real property where the mREITs act as lenders. The interest income is derived from the difference, or spread, between the interest rates charged on these mortgage loans and the interest rates mREITs pay on their own debt. This spread is crucial because it represents the profit margin for the REIT:</p>
<ul class="content-list">
<li><strong>Asset Selection:</strong> MREITs carefully select and manage their portfolio of mortgages and related securities to maximize interest income. This involves choosing loans with favorable interest rates and terms.</li>
<li class="mt-2"><strong>Risk and Return:</strong> Higher interest rates on loans can lead to higher income but also bring increased risk, including potential defaults by borrowers. Effective risk management is essential to maintain a healthy spread and protect the principal.</li>
</ul>
<p><strong>Capital Gains</strong></p>
<p>In addition to interest income, Mortgage REITs can also make money through capital gains. These gains are realized when mREITs sell mortgage assets that have increased in value due to changes in the market or improvements in the credit profiles of the underlying loans. Capital gains are not as regular as interest income but can significantly boost a REIT's earnings:</p>
<ul class="content-list">
<li><strong>Market Movements:</strong> Changes in the real estate market or the broader economic environment can affect the value of mortgage assets. For instance, if property values increase or interest rates drop, the value of pre-existing higher-interest loans may rise.</li>
<li class="mt-2"><strong>Strategic Sales:</strong> MREITs may decide to sell certain assets at a profit based on their market timing strategies or shifts in their investment focus. Such sales require strategic foresight and market acumen to maximize returns.</li>
</ul>
<p><strong>Balancing Income and Risk</strong></p>
<p>Mortgage REITs must balance the pursuit of high-interest income and potential capital gains with the management of associated risks. This balance is key to sustaining profitability, especially in fluctuating economic conditions. Strategies include diversification of the mortgage portfolio, careful credit analysis, and hedging against interest rate changes.</p>
<p>By leveraging these methods, Mortgage REITs provide investors with potentially attractive returns linked to real estate finance, all while offering a distinct approach compared to direct property investments. This blend of interest income and capital gains, coupled with strategic asset management, defines the core of how Mortgage REITs operate and thrive financially.</p>
<h2 id="benefits" class="jump-link-nav anchored-block" data-jumplink-title="Benefits">Benefits of Investing in Mortgage REITs</h2>
<p>Investing in Mortgage REITs offers a variety of advantages not only to investors but also to homeowners, businesses, and the broader financial markets. Here's an expanded look at the benefits these entities provide:</p>
<p><strong>For Investors</strong></p>
<ul class="content-list">
<li><strong>High Income Potential:</strong> Mortgage REITs typically offer higher dividend yields compared to many other types of equities. This is due to the requirement that REITs must distribute at least 90% of their taxable income to shareholders in the form of dividends. Investors looking for steady income streams may find mREITs particularly attractive.</li>
<li class="mt-2"><strong>Exposure to Real Estate Market Dynamics:</strong> Investors gain exposure to the real estate market without the need to directly purchase or manage properties. This can be especially beneficial during periods of strong housing market performance, where mREITs can capitalize on higher interest incomes from their mortgage holdings.</li>
</ul>
<p><strong>For Homeowners</strong></p>
<ul class="content-list">
<li><strong>Increased Financing Opportunities:</strong> By providing funding for mortgages, mREITs increase the availability of mortgage credit for potential homeowners. This can be particularly important in under-served markets or during times when traditional bank lending is tight, helping more people achieve homeownership.</li>
<li class="mt-2"><strong>Potential for Better Loan Terms:</strong> The competition among mortgage providers, including mREITs, can lead to more favorable loan terms, including lower interest rates for homeowners. This can make housing more affordable and accessible.</li>
</ul>
<p><strong>For Businesses</strong></p>
<ul class="content-list">
<li><strong>Access to Commercial Real Estate Financing:</strong> MREITs also invest in commercial mortgages, which provides businesses with essential access to capital for purchasing, developing, or refurbishing commercial properties. This can be crucial for business expansion and economic growth.</li>
<li class="mt-2"><strong>Flexible Financing:</strong> For businesses that may not meet the stringent lending criteria of traditional banks, mREITs offer an alternative source of capital with potentially more flexible terms.</li>
</ul>
<p><strong>For Financial Markets</strong></p>
<ul class="content-list">
<li><strong>Enhancing Market Liquidity:</strong> MREITs contribute significantly to the liquidity of the real estate and credit markets by purchasing and selling mortgage-backed securities. This liquidity is crucial for the overall health of the financial markets, allowing for smoother transactions and more stable prices.</li>
<li class="mt-2"><strong>Risk Distribution:</strong> By converting loans into tradable securities, mREITs help distribute and mitigate risk across a wider range of investors. This risk distribution is vital for the stability of the financial system, particularly during periods of economic uncertainty.</li>
</ul>
<p>Overall, the benefits of investing in Mortgage REITs extend far beyond simple financial returns. They play a critical role in facilitating access to real estate capital, enhancing liquidity in financial markets, and providing investment opportunities that are tied to real estate market conditions but without the associated management burdens. This makes mREITs an integral part of the financial landscape, offering unique advantages to a wide array of stakeholders.</p>
<h2>Risk Considerations</h2>
<p>Investing in Mortgage REITs involves several risks that potential investors must carefully consider:</p>
<p><strong>Interest Rate Risk</strong></p>
<p>Mortgage REITs are particularly sensitive to changes in interest rates. As rates rise, the cost of borrowing can increase for these trusts, potentially reducing the income spread between their mortgage assets and their liabilities. This can lead to diminished earnings and lower dividend payouts.</p>
<p><strong>Credit Risk</strong></p>
<p>The quality of the mortgage assets that Mortgage REITs invest in can vary, leading to credit risk. If borrowers default on their loans, it directly impacts the income generated by the REIT. Economic downturns or poor asset selection can exacerbate this risk, affecting the overall performance of the REIT.</p>
<p><strong>Prepayment Risk</strong></p>
<p>Prepayment risk occurs when mortgage holders repay their loans earlier than expected, often due to falling interest rates allowing them to refinance at lower rates. This can result in Mortgage REITs having to reinvest the returned capital at lower, less profitable rates, thus reducing their income potential.</p>
<p><strong>Rollover Risk</strong></p>
<p>Rollover risk pertains to the need to refinance or roll over debt used to fund the mortgage assets. When the terms of the debt expire, Mortgage REITs must secure new financing, which can be particularly problematic if the credit conditions have tightened or interest rates have increased. This risk can affect the stability and predictability of returns.</p>
<p>Understanding and managing these risks is crucial for investors considering Mortgage REITs as part of their investment portfolios. Effective risk management strategies can mitigate these concerns and enhance the stability of returns from Mortgage REIT investments.</p>

<h2 id="different-types" class="jump-link-nav anchored-block" data-jumplink-title="Different Types">Types of Mortgage REITs</h2>
<p>Mortgage REITs (mREITs) come in various forms, each targeting specific sectors of the real estate market and employing distinct strategies to manage and mitigate risks. Understanding the differences between these types can help investors choose the right mREIT for their investment portfolio. Below, we explore the three primary types of Mortgage REITs: Residential, Commercial, and Hybrid, and compare them with Equity REITs to highlight their unique investment approaches and risk profiles.</p>
<h3>Residential Mortgage REITs</h3>
<p>Residential Mortgage REITs invest primarily in residential real estate mortgages. This type focuses on properties where individuals and families reside, such as single-family homes and apartment buildings. These REITs generate income from the interest paid on these residential loans. The performance of residential mREITs is closely tied to the health of the housing market; they tend to provide stable returns when residential markets are strong and interest rates are stable. However, they can be vulnerable to downturns in the housing market or increases in default rates among homeowners.</p>
<h3>Commercial Mortgage REITs</h3>
<p>Commercial Mortgage REITs focus on lending for commercial properties, such as office buildings, retail spaces, and industrial complexes. The returns on these investments can be higher due to potentially higher interest rates charged on commercial loans compared to residential loans. However, these REITs also carry higher risks since commercial property markets can be more volatile and sensitive to economic changes than residential markets. The success of commercial mREITs often depends on the ability to manage non-payment risks and the general health of the business sector.</p>
<h3>Hybrid Mortgage REITs</h3>
<p>Hybrid Mortgage REITs diversify their portfolios by investing in both residential and commercial mortgages. This mixed approach helps balance the risks and returns since the performance of one sector can offset the downturns in another. Hybrids are designed to provide investors with more stable earnings across different market conditions, reducing the impact of sector-specific economic shifts.</p>
<h2>Mortgage REITs vs Equity REITs</h2>
<p>Mortgage REITs primarily earn income from interest margins on the loans they provide, which is influenced by interest rate fluctuations and the credit quality of their loans. In contrast, Equity REITs invest directly in real estate properties and earn income through rent and property appreciation. This fundamental difference leads to distinct risk profiles and investment strategies. Equity REITs are generally less sensitive to interest rate changes but more dependent on property values and rental market conditions, making them more suitable for investors seeking growth through property appreciation and rent increases.</p>
<p>Each type of Mortgage REIT offers unique opportunities and risks, and the choice between them and how they compare to Equity REITs depends largely on an investor&rsquo;s risk tolerance, investment horizon, and objectives.</p>

<h2 id="how-to-invest" class="jump-link-nav anchored-block" data-jumplink-title="How to Invest">How to Invest in Mortgage REITs</h2>
<p>Investing in Mortgage REITs offers a unique approach to gaining exposure to the real estate sector with a focus on income generation through interest earnings. Whether you're a seasoned investor or new to real estate investments, following these steps can help you begin your journey with Mortgage REITs:</p>
<ul class="content-list">
<li><strong>Educate Yourself About MREITs:</strong> Before investing, understand what Mortgage REITs are and how they differ from other types of REITs and investment vehicles. Knowledge about their revenue generation through interest on mortgages and the risks associated with interest rates and real estate market fluctuations is crucial.</li>
<li class="mt-2"><strong>Assess Your Investment Goals and Risk Tolerance:</strong> Determine if mREITs align with your overall investment strategy. Consider if you are seeking high income through dividends, how much market volatility you can handle, and your long-term investment goals.</li>
</ul>
<p><strong>Choosing the Right Mortgage REITs for Your Portfolio</strong></p>
<ul class="content-list">
<li><strong>Diversification:</strong> Look for mREITs that have a diversified portfolio in terms of geography and type of real estate, as this can help manage risk.</li>
<li class="mt-2"><strong>Management Track Record:</strong> Evaluate the track record of the management team. Strong leadership that has navigated through various market conditions can be a good sign of a robust mREIT.</li>
<li class="mt-2"><strong>Financial Health:</strong> Analyze key financial indicators such as dividend yield, return on equity, and debt-to-equity ratio. A healthy mREIT typically has a sustainable payout ratio and prudent debt management.</li>
<li class="mt-2"><strong>Market Trends and Economic Indicators</strong>: Consider how current economic conditions, such as interest rates and real estate market trends, might impact the performance of mREITs. For instance, rising interest rates might negatively affect mREITs, while a booming real estate market could provide positive tailwinds.</li>
<li class="mt-2"><strong>Regulatory Landscape:</strong> Be aware of any regulatory changes that could affect the mortgage and real estate sectors. Changes in regulations can impact the profitability and operational capabilities of mREITs.</li>
</ul>
<p>By following these steps and criteria, you can make more informed decisions about including Mortgage REITs in your investment portfolio, aligning your choices with your financial goals and risk tolerance.</p>
<h3>Direct Investments vs ETFs</h3>
<p>Investors can either directly purchase shares of Mortgage REITs or invest via ETFs that hold portfolios of mREIT stocks, offering diversification and potentially reduced risk.</p>
<p>Direct investments allow investors to choose specific mREITs, which can provide higher returns if well chosen. ETFs, however, offer the advantage of instant diversification and may be suitable for investors seeking exposure to the space but who may not be able to conduct credit research on each individual mREIT.</p>
<h2>Current Trends and Outlook for Mortgage REITs</h2>
<p>Several prevailing trends and economic indicators are shaping the landscape for Mortgage REITs. Investors considering mREITs need to be aware of these dynamics to make informed decisions about their portfolios. Here&rsquo;s an analysis of the current trends and what they suggest about the outlook for mREITs:</p>
<p>1. Interest Rate Environment</p>
<p>The interest rate environment remains a critical factor for mREITs. As of late, the trend has been towards rising rates, a response to inflationary pressures and economic recovery efforts. If the Federal Reserve continues to increase rates to manage inflation, mREITs could face challenges due to increased borrowing costs and potential declines in asset values. However, well-managed mREITs with effective hedging strategies may navigate these challenges more smoothly than others.</p>
<p>2. Economic Recovery and Housing Market Strength</p>
<p>The ongoing economic recovery from the global disruptions of recent years continues to impact the real estate sector significantly. A robust economic recovery could bolster the housing market, benefiting residential mREITs through increased demand for housing and potentially higher mortgage rates. Conversely, if economic recovery falters, it could dampen this outlook.</p>
<p>3. Technological Advancements and Innovation</p>
<p>Technological advancements are increasingly influencing the real estate sector. Innovations in how mortgages are processed, serviced, and managed could lead to efficiencies and cost savings for mREITs. Furthermore, the adoption of fintech in mortgage lending could expand the opportunities for mREITs to invest in new types of mortgage products and services.</p>
<p>4. Market Volatility and Risk Management</p>
<p>Market volatility, partly driven by global economic uncertainties and geopolitical tensions, is likely to persist. mREITs will need to maintain robust risk management frameworks to handle potential market fluctuations effectively. This includes managing credit risk, interest rate risk, and funding risks in a volatile environment.</p>
<p>5. Shifts in Consumer Behavior</p>
<p>Changes in consumer behavior, including trends towards remote work and migration away from urban centers, could reshape demand patterns in the housing market. mREITs focusing on residential properties might need to adjust their investment strategies to align with these shifts, potentially focusing more on suburban and rural mortgages.</p>
<h3>Impact of Interest Rates</h3>
<p>Interest rates play a crucial role in determining the profitability and viability of Mortgage REITs. Rising interest rates can have a significant impact on these entities in several ways:</p>
<ul class="content-list">
<li><strong>Increased Borrowing Costs:</strong> mREITs often rely on short-term borrowing to finance long-term mortgage loans. As interest rates rise, the cost of borrowing increases, which can compress the interest rate spread that mREITs earn on their investments. This reduction in spread can directly affect their profitability and, by extension, their ability to pay dividends.</li>
<li class="mt-2"><strong>Asset Value Decline:</strong> The value of the fixed-rate mortgage securities that mREITs hold tends to decrease as interest rates rise. This is because the newer issues in the market may offer higher yields, making the older, lower-yielding securities less attractive. A drop in asset values can impact the balance sheet strength of mREITs.</li>
<li class="mt-2"><strong>Refinancing Risk:</strong> Higher interest rates reduce the likelihood of homeowners refinancing their mortgages, which can lead to a longer-than-expected duration of the mortgage assets held by mREITs. This can be a risk if the rates continue to rise and the mREITs need to adjust their asset strategies.</li>
<li class="mt-2"><strong>Effective Rate Management Strategies:</strong> To mitigate these risks, successful mREITs employ various rate management strategies such as using interest rate swaps and other derivatives to hedge against rising rates. Selecting mREITs that demonstrate strong and effective interest rate management can be crucial for investors.</li>
</ul>
<h3>Regulatory Changes</h3>
<p>Regulatory changes can also have profound effects on the operations and success of mREITs. Potential regulatory impacts include:</p>
<ul class="content-list">
<li><strong>Capital Requirements:</strong> Changes in regulatory standards regarding capital reserves for mREITs can affect how much capital these entities need to hold against their investments. Increased capital requirements could reduce the leverage mREITs can employ, potentially lowering their income generation capacity.</li>
<li class="mt-2"><strong>Mortgage Lending Practices:</strong> Regulations that alter the qualifications required for mortgage lending or the characteristics of mortgage products can influence the types of loans available for mREITs to invest in. Stricter lending standards could reduce the pool of available mortgages, affecting mREITs' growth opportunities.</li>
<li class="mt-2"><strong>Taxation Changes:</strong> Amendments in tax laws regarding REITs&rsquo; operations or their distribution requirements can impact the profitability and operational strategies of mREITs. For instance, changes in the treatment of dividends could affect investor sentiment and capital inflows.</li>
<li class="mt-2"><strong>Housing Finance Reform:</strong> Any reform in housing finance at the federal level, such as changes to entities like Fannie Mae and Freddie Mac, can influence the mortgage markets significantly. Reforms might alter the risk profile of mortgage-backed securities or change the competitive landscape for mREITs.</li>
<li class="mt-2"><strong>Compliance Costs:</strong> New regulations may increase compliance costs for mREITs, affecting their net income. Higher compliance costs could necessitate operational changes to maintain profitability.</li>
</ul>
<h2>Conclusion</h2>
<p>Mortgage REITs offer a unique blend of high dividend potential and exposure to real estate markets, suited for diverse investment portfolios. With a thoughtful approach and consideration of current trends, Mortgage REITs can be a valuable addition to an investor's strategic asset allocation.</p>
<p>To learn more about mortgage REITs, explore the <a href="https://www.vaneck.com/us/en/investments/mortgage-reit-income-mort/overview/" title="MORT - VanEck Mortgage REIT Income ETF - Holdings and Performance" target="_blank" rel="noopener"><strong>VanEck Mortgage REIT Income ETF (MORT).</strong></a></p>
<p>To receive more <a href="/us/en/blogs/income-investing/" title="Income Investing Insights"><strong>Income Investing</strong></a> insights, <a href="https://www.vaneck.com/us/en/preference-center/" title=" Subscription Center"><strong>sign up in our subscription center</strong></a>.</p>
]]></content:encoded>
</item><item rdf:about="https://www.vaneck.com/us/en/blogs/thematic-investing/buzz-investing-us-stocks-tanks-on-japan-rate-hike-and-economic-woes/">
  <title>BUZZ Investing: US Stocks Tank on Japan Rate Hike and Economic Woes></title>
  <link>https://www.vaneck.com/us/en/blogs/thematic-investing/buzz-investing-us-stocks-tanks-on-japan-rate-hike-and-economic-woes/</link>
  <description><![CDATA[US stocks experienced a sharp downturn, driven by disappointing economic data, heightened volatility, and shifts in central bank policies, reversing earlier market gains fueled by AI optimism and strong earnings.]]></description>
  <dc:creator> </dc:creator>
  <dc:date>08/20/2024 06:30:00</dc:date>
<content:encoded><![CDATA[

<p>During the recent period between index selection dates (July 11, 2024 &ndash; August 8, 2024, the &ldquo;Period&rdquo;), US stocks witnessed a downturn, likely influenced by a mix of economic indicators, central bank actions, and shifting investor sentiment. The Cboe Volatility Index (VIX), known as Wall Street&rsquo;s fear gauge, spiked dramatically, soaring from levels in the mid-teens to an intraday peak of over 65 on August 5th. This surge in volatility followed the release of disappointing U.S. economic data, including a contraction in the Institute for Supply Management's manufacturing index and a weaker-than-expected July jobs report. These developments rekindled fears of a looming recession. They led to speculation that the Federal Reserve might have missed an opportunity to cut interest rates, causing market participants to anticipate more aggressive rate cuts in the near future.</p>
<p>The situation was further complicated by a rate hike from the Bank of Japan, which strengthened the yen and triggered the unwinding of the yen carry trade. In this strategy, investors borrow in yen to invest in higher-yielding assets like U.S. tech stocks. This may have intensified the selling pressure on these stocks, contributing to the broader market decline. The sell-off marked a sharp reversal from the market's recent highs, fueled by optimism around artificial intelligence and strong corporate earnings. Despite hitting a record high just a month earlier, the market's sudden shift highlighted the dangers of an overvalued and overly concentrated market, especially as investors rotated away from mega-cap growth stocks amid growing economic uncertainties.</p>
<p>The BUZZ NextGen AI US Sentiment Leaders Index (the &ldquo;BUZZ Index&rdquo;) returned 0.51% during the month of July compared to a return of 1.22% for the S&amp;P 500 Index during the same period. Year-to-date, the BUZZ Index slightly lags the S&amp;P 500 with returns of 14.03% and 16.70%, respectively, as of the end of July.</p>
<h2>Gains in the BUZZ Index were driven by a limited number of stocks</h2>
<p>Amidst the broad selloff in equities during the recent Period, the BUZZ Index observed few contributions to positive returns, with just 17% of the Index&rsquo;s holdings contributing positively to performance during the recent Period. Amongst those, shares of PayPal Holdings Inc (NASDAQ: PYPL) and shares of Palantir Technologies Inc (NYSE: PLTR) were notable. Both companies saw their stocks rise following the release of their second-quarter earnings reports. PayPal reported better-than-expected second-quarter revenue and earnings and upgraded its full-year earnings outlook, anticipating stronger growth ahead. Palantir's stock surged after the company raised its annual outlook, driven by strong demand for AI software and its military business success.</p>

<h3>Top BUZZ Index Contributors: July 11, 2024 &ndash; August 8, 2024</h3>
<div class="wrapped-div">
<table style="width: 100%;">
<tbody>
<tr class="tbl-data">
<td class="tbl-header last">Company</td>
<td class="tbl-header last text-left">Ticker</td>
<td class="tbl-header last text-right">Average Weight (%)</td>
<td class="tbl-header last text-right">Return Contribution (%)</td>
</tr>
<tr class="tbl-data">
<td class="data-td last font-weight-normal">Trump Media &amp; Technology Group</td>
<td class="data-td data last text-left">DJT</td>
<td class="data-td data last text-right">1.04</td>
<td class="data-td data last text-right">0.31</td>
</tr>
<tr class="tbl-data">
<td class="data-td last font-weight-normal">PayPal Holdings Inc</td>
<td class="data-td data last text-left">PYPL</td>
<td class="data-td data last text-right">2.51</td>
<td class="data-td data last text-right">0.18</td>
</tr>
<tr class="tbl-data">
<td class="data-td last font-weight-normal">Palantir Technologies Inc</td>
<td class="data-td data last text-left">PLTR</td>
<td class="data-td data last text-right">1.27</td>
<td class="data-td data last text-right">0.14</td>
</tr>
<tr class="tbl-data">
<td class="data-td last font-weight-normal">Robinhood Markets Inc</td>
<td class="data-td data last text-left">HOOD</td>
<td class="data-td data last text-right">0.71</td>
<td class="data-td data last text-right">0.09</td>
</tr>
<tr class="tbl-data">
<td class="data-td last font-weight-normal">NIKE Inc</td>
<td class="data-td data last text-left">NKE</td>
<td class="data-td data last text-right">2.37</td>
<td class="data-td data last text-right">0.08</td>
</tr>
<tr class="tbl-data">
<td class="data-td last font-weight-normal">Meta Platforms Inc</td>
<td class="data-td data last text-left">META</td>
<td class="data-td data last text-right">2.69</td>
<td class="data-td data last text-right">0.07</td>
</tr>
<tr class="tbl-data">
<td class="data-td last font-weight-normal">McDonald's Corp</td>
<td class="data-td data last text-left">MCD</td>
<td class="data-td data last text-right">0.96</td>
<td class="data-td data last text-right">0.05</td>
</tr>
<tr class="tbl-data">
<td class="data-td last font-weight-normal">Altria Group Inc</td>
<td class="data-td data last text-left">MO</td>
<td class="data-td data last text-right">0.27</td>
<td class="data-td data last text-right">0.05</td>
</tr>
<tr class="tbl-data">
<td class="data-td last font-weight-normal">Shopify Inc</td>
<td class="data-td data last text-left">SHOP</td>
<td class="data-td data last text-right">0.99</td>
<td class="data-td data last text-right">0.04</td>
</tr>
<tr class="tbl-data">
<td class="data-td last font-weight-normal">Philip Morris International Inc</td>
<td class="data-td data last text-left">PM</td>
<td class="data-td data last text-right">0.41</td>
<td class="data-td data last text-right">0.04</td>
</tr>
</tbody>
</table>
</div>
<p class="chart-disclosure">Source: BUZZ Holdings ULC, Bloomberg. Past performance is no guarantee of future results. Index performance is not illustrative of fund performance. Not intended as a recommendation to buy or to sell any of the securities mentioned herein.</p>
<h2>Semiconductor stocks lead declining stocks in the BUZZ Index</h2>
<p>Semiconductor stocks led declines in the BUZZ Index during the recent Period, with major players like Advanced Micro Devices Inc (NASDAQ: AMD), Intel Corp (NASDAQ: INTC), Micron Technology Inc (NASDAQ: MU), and NVIDIA Corp (NASDAQ: NVDA) experiencing significant drops, averaging nearly 28%. The sector's downturn was exacerbated by former President Donald Trump's remarks suggesting Taiwan should fund its own defense against China, a critical hub for the global chip industry. Additionally, reports of the Biden administration considering stricter controls on chip exports to China further weighed on the market. While investors had previously flocked to semiconductor stocks due to optimism around AI, the current pullback, driven by geopolitical tensions and valuation concerns, may suggest a period of reassessment and caution in the sector.</p>
<h3>Bottom BUZZ Index Contributors: July 11, 2024 &ndash; August 8, 2024</h3>
<div class="wrapped-div">
<table style="width: 100%;">
<tbody>
<tr class="tbl-data">
<td class="tbl-header last">Company</td>
<td class="tbl-header last text-left">Ticker</td>
<td class="tbl-header last text-right">Average Weight (%)</td>
<td class="tbl-header last text-right">Return Contribution (%)</td>
</tr>
<tr class="tbl-data">
<td class="data-td last font-weight-normal">Snap Inc</td>
<td class="data-td data last text-left">SNAP</td>
<td class="data-td data last text-right">1.97</td>
<td class="data-td data last text-right">-1.13</td>
</tr>
<tr class="tbl-data">
<td class="data-td last font-weight-normal">Advanced Micro Devices Inc</td>
<td class="data-td data last text-left">AMD</td>
<td class="data-td data last text-right">2.63</td>
<td class="data-td data last text-right">-0.75</td>
</tr>
<tr class="tbl-data">
<td class="data-td last font-weight-normal">Intel Corp</td>
<td class="data-td data last text-left">INTC</td>
<td class="data-td data last text-right">1.43</td>
<td class="data-td data last text-right">-0.67</td>
</tr>
<tr class="tbl-data">
<td class="data-td last font-weight-normal">Micron Technology Inc</td>
<td class="data-td data last text-left">MU</td>
<td class="data-td data last text-right">2.05</td>
<td class="data-td data last text-right">-0.64</td>
</tr>
<tr class="tbl-data">
<td class="data-td last font-weight-normal">NVIDIA Corp</td>
<td class="data-td data last text-left">NVDA</td>
<td class="data-td data last text-right">2.80</td>
<td class="data-td data last text-right">-0.51</td>
</tr>
<tr class="tbl-data">
<td class="data-td last font-weight-normal">Tesla Inc</td>
<td class="data-td data last text-left">TSLA</td>
<td class="data-td data last text-right">3.20</td>
<td class="data-td data last text-right">-0.50</td>
</tr>
<tr class="tbl-data">
<td class="data-td last font-weight-normal">Super Micro Computer Inc</td>
<td class="data-td data last text-left">SMCI</td>
<td class="data-td data last text-right">1.09</td>
<td class="data-td data last text-right">-0.49</td>
</tr>
<tr class="tbl-data">
<td class="data-td last font-weight-normal">Amazon.com Inc</td>
<td class="data-td data last text-left">AMZN</td>
<td class="data-td data last text-right">2.90</td>
<td class="data-td data last text-right">-0.45</td>
</tr>
<tr class="tbl-data">
<td class="data-td last font-weight-normal">Lululemon Athletica Inc</td>
<td class="data-td data last text-left">LULU</td>
<td class="data-td data last text-right">2.34</td>
<td class="data-td data last text-right">-0.44</td>
</tr>
<tr class="tbl-data">
<td class="data-td last font-weight-normal">Rivian Automotive Inc</td>
<td class="data-td data last text-left">RIVN</td>
<td class="data-td data last text-right">2.79</td>
<td class="data-td data last text-right">-0.37</td>
</tr>
</tbody>
</table>
</div>
<p class="chart-disclosure">Source: BUZZ Holdings ULC, Bloomberg. Past performance is no guarantee of future results. Index performance is not illustrative of fund performance. Not intended as a recommendation to buy or to sell any of the securities mentioned herein.</p>

<h2>BUZZ Index August 2024 Rebalance Highlights</h2>
<p><strong>Intel Corporation</strong></p>
<p>Artificial intelligence has been the dominant theme driving the semiconductor sector to new heights in 2024, with Nvidia Corp (NASDAQ: NVDA) emerging as the clear industry leader. In contrast, Intel Corporation (NASDAQ: INTC) has largely missed out on the rally. Before its disastrous August 1st earnings report, which revealed lower margins, declining sales, layoffs of 15,000 employees, and a dividend suspension, Intel's stock was already down 33% year-to-date. The report triggered a 26% one-day drop&mdash;the worst since 2000. Despite its recent struggles, Intel remains a key player in the CPU market, where it still holds the largest market share. Investor sentiment towards Intel has begun to improve, reflecting hope in the company&rsquo;s potential to rebound as the AI era continues to unfold. In August, Intel's stock reached a maximum 3% weight in the Index.</p>
<p><strong>Trump Media &amp; Technology Group Corp.</strong></p>
<p>On July 13th, 2024, a dramatic assassination attempt on Donald Trump during a rally in Pennsylvania sent shockwaves across the nation, marking the first such political attack in the U.S. since 1981. Although the initial shock had little immediate effect on the stock market when it opened on Monday, the incident quickly began to shift the financial landscape. As Trump's election odds surged in betting markets, sectors tied to the "Trump trade" &mdash; including energy, firearms, and cryptocurrency &mdash; experienced a boost. The most notable beneficiary was Trump Media &amp; Technology Group (NASDAQ: DJT), the company behind the Truth Social platform, which saw its shares soar by over 30% in the wake of the attempt. Despite those gains being short-lived, investor confidence in Trump has remained resilient, reflected in DJT's weight in the BUZZ Index rising to a maximum of 3% this month.</p>
<p>To receive more <a href="https://www.vaneck.com/us/en/insights/thematic-investing/" title="Thematic Investing Insights"><strong>Thematic Investing</strong></a> insights, <a href="https://www.vaneck.com/us/en/subscribe/" title="Subscription Center"><strong>sign up in our subscription center</strong></a>.</p>
<style>
    .wrapped-div {
        max-width: 100%;
    }

    @media (max-width: 1240px) {
        .wrapped-div {
            overflow-x: scroll;
        }
    }

    .wrapped-div-sector {
        max-width: 100%;
        overflow-x: scroll;
    }
</style>
]]></content:encoded>
</item><item rdf:about="https://www.vaneck.com/us/en/blogs/emerging-markets-bonds/another-dm-crisis-with-em-the-safe-haven/">
  <title>Another DM Crisis, With EM The Safe Haven?></title>
  <link>https://www.vaneck.com/us/en/blogs/emerging-markets-bonds/another-dm-crisis-with-em-the-safe-haven/</link>
  <description><![CDATA[Another developed market, Japan, has spurred global market jitters, reinforcing our mantra that DM is the new EM.]]></description>
  <dc:creator>Eric Fine</dc:creator>
  <dc:date>08/16/2024 06:30:00</dc:date>
<content:encoded><![CDATA[

<p id="performance-review" class="jump-link-nav anchored-block" data-jumplink-title="Performance Review">The <a href="https://www.vaneck.com/us/en/investments/emerging-markets-bond-fund-embax/overview/" title="EMBAX - Emerging Markets Bond Fund - Class A - Overview"><strong>VanEck Emerging Markets Bond Fund</strong></a> was up 1.98% in July, compared to up 2.07% for its benchmark, the 50% J.P. Morgan Government Bond Index-Emerging Markets (GBI-EM) Global Diversified and 50% J.P. Morgan Emerging Markets Bond Index (EMBI). Year to date, the fund is up 2.39%, outperforming its benchmark, which is up 1.34%, the ICE BofA Global Broad Market Index, which was down 0.51% and the FTSE 10-year Treasury benchmark, which was up 0.84%. The decades-old story of emerging market (EM) bonds outperforming developed markets (DM) continues. During July, the fund increased local currency exposure in Mexico, covering a big underweight in Mexico local after it sold off. The fund was also underweight Brazil local, which also got sold off in July, and the fund is looking to establish a tactical long position there as well, likely during August. We continue to like duration as well as selected EMFX, now including the high beta currencies following their weakness (Mexico, Brazil). Carry is 7.5%, yield to worst (YTW) is 8.8%, duration is 7.0, and local makes up around 55% of exposure.</p>

<h3>Average Annual Total Returns<sup>*</sup>&nbsp;(%) (In USD)</h3>
<div class="wrapped-div">
<table style="width: 100%;">
<tbody>
<tr class="tbl-data">
<td class="tbl-header last" colspan="10">As of July 31, 2024</td>
</tr>
<tr class="tbl-data">
<td class="data-head last text-right">&nbsp;</td>
<td class="data-head last text-right">1 MO</td>
<td class="data-head last text-right">3 MO</td>
<td class="data-head last text-right">YTD</td>
<td class="data-head last text-right">1 YR</td>
<td class="data-head last text-right">3 YR</td>
<td class="data-head last text-right">5 YR</td>
<td class="data-head last text-right">10 YR</td>
</tr>
<tr class="tbl-data">
<td class="data-td last text-left">Class A: NAV (Inception 07/09/12)</td>
<td class="data-td data last text-right">1.85</td>
<td class="data-td data last text-right">3.86</td>
<td class="data-td data last text-right">2.08</td>
<td class="data-td data last text-right">5.17</td>
<td class="data-td data last text-right">0.19</td>
<td class="data-td data last text-right">2.23</td>
<td class="data-td data last text-right">1.06</td>
</tr>
<tr class="tbl-data">
<td class="data-td last text-left">Class A: Maximum 5.75% load</td>
<td class="data-td data last text-right">-4.00</td>
<td class="data-td data last text-right">-2.11</td>
<td class="data-td data last text-right">-3.79</td>
<td class="data-td data last text-right">-0.88</td>
<td class="data-td data last text-right">-1.77</td>
<td class="data-td data last text-right">1.03</td>
<td class="data-td data last text-right">0.47</td>
</tr>
<tr class="tbl-data">
<td class="data-td last text-left">Class I: NAV (Inception 07/09/12)</td>
<td class="data-td data last text-right">1.86</td>
<td class="data-td data last text-right">3.99</td>
<td class="data-td data last text-right">2.42</td>
<td class="data-td data last text-right">5.49</td>
<td class="data-td data last text-right">0.54</td>
<td class="data-td data last text-right">2.58</td>
<td class="data-td data last text-right">1.39</td>
</tr>
<tr class="tbl-data">
<td class="data-td last text-left">Class Y: NAV (Inception 07/09/12)</td>
<td class="data-td data last text-right">1.98</td>
<td class="data-td data last text-right">4.01</td>
<td class="data-td data last text-right">2.39</td>
<td class="data-td data last text-right">5.41</td>
<td class="data-td data last text-right">0.42</td>
<td class="data-td data last text-right">2.52</td>
<td class="data-td data last text-right">1.32</td>
</tr>
<tr class="tbl-data">
<td class="data-td last text-left">50% GBI-EM/50% EMBI</td>
<td class="data-td data last text-right">2.07</td>
<td class="data-td data last text-right">3.58</td>
<td class="data-td data last text-right">1.34</td>
<td class="data-td data last text-right">4.58</td>
<td class="data-td data last text-right">-2.22</td>
<td class="data-td data last text-right">-0.41</td>
<td class="data-td data last text-right">1.15</td>
</tr>
</tbody>
</table>
</div>
<br />
<div class="wrapped-div">
<table style="width: 100%;">
<tbody>
<tr class="tbl-data">
<td class="tbl-header last" colspan="8">As of June 30, 2024</td>
</tr>
<tr class="tbl-data">
<td class="data-head last text-right">&nbsp;</td>
<td class="data-head last text-right">1 MO</td>
<td class="data-head last text-right">3 MO</td>
<td class="data-head last text-right">YTD</td>
<td class="data-head last text-right">1 YR</td>
<td class="data-head last text-right">3 YR</td>
<td class="data-head last text-right">5 YR</td>
<td class="data-head last text-right">10 YR</td>
</tr>
<tr class="tbl-data">
<td class="data-td last text-left">Class A: NAV (Inception 07/09/12)</td>
<td class="data-td data last text-right">0.26</td>
<td class="data-td data last text-right">0.52</td>
<td class="data-td data last text-right">0.22</td>
<td class="data-td data last text-right">4.94</td>
<td class="data-td data last text-right">-0.76</td>
<td class="data-td data last text-right">2.28</td>
<td class="data-td data last text-right">0.88</td>
</tr>
<tr class="tbl-data">
<td class="data-td last text-left">Class A: Maximum 5.75% load</td>
<td class="data-td data last text-right">-5.51</td>
<td class="data-td data last text-right">-5.26</td>
<td class="data-td data last text-right">-5.54</td>
<td class="data-td data last text-right">-1.10</td>
<td class="data-td data last text-right">-2.70</td>
<td class="data-td data last text-right">1.08</td>
<td class="data-td data last text-right">0.29</td>
</tr>
<tr class="tbl-data">
<td class="data-td last text-left">Class I: NAV (Inception 07/09/12)</td>
<td class="data-td data last text-right">0.43</td>
<td class="data-td data last text-right">0.58</td>
<td class="data-td data last text-right">0.55</td>
<td class="data-td data last text-right">5.26</td>
<td class="data-td data last text-right">-0.40</td>
<td class="data-td data last text-right">2.60</td>
<td class="data-td data last text-right">1.21</td>
</tr>
<tr class="tbl-data">
<td class="data-td last text-left">Class Y: NAV (Inception 07/09/12)</td>
<td class="data-td data last text-right">0.19</td>
<td class="data-td data last text-right">0.45</td>
<td class="data-td data last text-right">0.40</td>
<td class="data-td data last text-right">5.03</td>
<td class="data-td data last text-right">-0.51</td>
<td class="data-td data last text-right">2.51</td>
<td class="data-td data last text-right">1.12</td>
</tr>
<tr class="tbl-data">
<td class="data-td last text-left">50% GBI-EM/50% EMBI</td>
<td class="data-td data last text-right">-0.23</td>
<td class="data-td data last text-right">-0.66</td>
<td class="data-td data last text-right">-0.72</td>
<td class="data-td data last text-right">4.91</td>
<td class="data-td data last text-right">-2.88</td>
<td class="data-td data last text-right">-0.61</td>
<td class="data-td data last text-right">0.91</td>
</tr>
</tbody>
</table>
</div>
<style>
.data-td.data {
        padding-right: 2px !important;
    }
    .wrapped-div {
        max-width: 100%;
    }

    @media (max-width: 768px) {
        .wrapped-div {
            overflow-x: scroll;
        }
    }

    .wrapped-div-sector {
        max-width: 100%;
        overflow-x: scroll;
    }
</style>
<br />
<p class="chart-disclosure"><sup>*</sup>&nbsp;Returns less than one year are not annualized.</p>
<p class="chart-disclosure"><strong>Expenses: Class A: Gross 2.55%, Net 1.22%; Class I: Gross 2.51%, Net 0.87%; Class Y: Gross 2.91%, Net 0.97%.</strong> Expenses are capped contractually until 05/01/24 at 1.25% for Class A, 0.95% for Class I, 1.00% for Class Y. Caps excluding acquired fund fees and expenses, interest, trading, dividends, and interest payments of securities sold short, taxes, and extraordinary expenses.</p>
<p class="chart-disclosure"><strong>The performance data quoted represents past performance. Past performance is not a guarantee of future results. Investment return and principal value of an investment will fluctuate so that an investor&rsquo;s shares, when redeemed, may be worth more or less than their original cost. Performance may be lower or higher than performance data quoted. Please call 800.826.2333 or visit vaneck.com for performance current to the most recent month ended.</strong></p>
<p class="chart-disclosure">The &ldquo;Net Asset Value&rdquo; (NAV) of a Fund is determined at the close of each business day, and represents the dollar value of one share of the fund; it is calculated by taking the total assets of the fund, subtracting total liabilities, and dividing by the total number of shares outstanding. The NAV is not necessarily the same as the ETF&rsquo;s intraday trading value. Investors should not expect to buy or sell shares at NAV.</p>
<p id="market-review" class="jump-link-nav anchored-block" data-jumplink-title="Market Review"><strong>Yet again, a DM (this time, Japan) is blowing up global markets</strong>. An over-indebted DM that led the world in money experimentation ended up with&hellip;hiking rates into an economic downturn! This follows market-unsettling elections in France, riots in the UK under a new PM, and extreme political uncertainty in the US. And of course, geopolitics. Our mantra remains that DM is the new EM. More on Japan below. We update our stylized &ldquo;history of the world&rdquo; chart below. What is noteworthy is the number of accumulating DM crises, consistent with our longstanding &ldquo;fiscal dominance&rdquo; thesis for some DMs.</p>
<h3>Exhibit 1 &ndash; Dissaving DM Vulnerable to Crises, High-Saving EM Not Vulnerable</h3>
<p><img class="img-responsive w-100" src="https://www.vaneck.com/contentassets/b92e51b25d8a4c228247f1b23c9ea59b/4738_emb-august-2024_chart-1_2024-8_v1_blog.svg" alt="Dissaving DM Vulnerable to Crises, High-Saving EM Not Vulnerable" /></p>
<p class="chart-disclosure">Source: Bloomberg, LP as of December 2023</p>

<p><strong>This uncertain environment is a recipe for an ongoing US rates rally.</strong> As we&rsquo;ve been noting, the US&rsquo; surprising demand strength up until now has been supported by asset prices, which are now faltering. We can&rsquo;t see how consumption and investment decisions by individuals and corporations won&rsquo;t be dampened profoundly, due to the uncertainties we note above. Oh, and remember how the market just positioned as if US politics were supposed to get US rates higher? We remain attracted to duration as we highlighted in our last several monthly commentaries. Initially, the argument was that the market had dramatically reduced its implied cuts from 6 to 2, and we thought that was a &ldquo;clearing&rdquo; moment, plus some other reasons. What about now? We have a pretty simple view. First, the clearest implication of the Japanese yen (JPY) kerfuffle is that pressure on the Fed to cut has increased (more on this argument when we discuss Japan later). Second, the 5-year yield is now below the 10-year&rsquo;s yield! Rolldown could become a big theme next year, as longer-dated bonds get anchored by this fact, maybe eventually anchored by 2s, who knows. It&rsquo;s a more serious version, institutional version of the &ldquo;those T-bill rates won&rsquo;t exist to get you through the next few years&rdquo; argument. Third, we think the market is digesting &ldquo;Trump trades&rdquo; too fully, with a unanimous assumption of higher long-term rates and detailed, confident analyses of uncertain election outcomes and vague policy prescriptions. Maybe, but maybe it&rsquo;s way too early and policy way too uncertain as well as contradictory to be betting on politics right now. We continue to choose to focus on the data and markets&rsquo; reactions to the July 12 US CPI report re-affirms this focus, we think. That report opened the door to the subsequent rally in duration and even the now-famous &ldquo;rotation&rdquo; into small caps! Our view is that that theme of data-driven support for stable or lower rates is intact until we see or that it isn&rsquo;t or gets priced. Also remember that the surprising attenuation of demand in the US appears to have been driven by the portfolio balance channel (the so-called &ldquo;wealth effect&rdquo;), injecting a potentially self-reinforcing dynamic to selloffs in stocks. Our only new concern is that the above could be written, and thus our view liking duration might not be as unusual as it was last quarter. However, we think the &ldquo;Trump trade&rdquo; distractions interrupted a still-ongoing data-driven process, basically.</p>
<p><strong>Before we move away from rates, we should highlight a key question surrounding declining rates &ndash; will they be driven by a soft landing or something harder?</strong> We don&rsquo;t know. We do have a strong view that the profound political and geopolitical uncertainty confronting many developed markets has to have an adverse impact on individual and corporate consumption and investment behavior. It simply must. There is no way that the German Finance Ministry is adjusting its budget to new political rallies (cutting defense allocations to Ukraine by half) and the global auto industry is absorbing the impact of possible changes to the green agenda on EV plans, and that&rsquo;s all there will be. After decades in EM observing the implications of collapsed trust in institutions as well as political uncertainty, we feel strongly that this is &ldquo;a thing&rdquo;, as the kids say, and it&rsquo;s DM&rsquo;s turn. Acknowledging it is not celebrating it, by the way. We say that because we also observe an unnerving projection of politics onto asset-price predictions.</p>
<p><strong>EM real rates are very high, going into a US rate-cutting cycle.</strong> We won&rsquo;t elaborate on this because it&rsquo;s been the theme of so many of our pieces. But it remains glaring, and virtually every EM central bank in the world is awaiting the starting gun from the Fed (as are investors). So instead, we&rsquo;ll focus on our worries here. Other than obvious US growth metrics (to show whether rates are going down, but growth is or isn&rsquo;t suffering along the way), we are sensitive to ROW growth given that we are an emerging markets fund &ndash; EM growth out- or under-performance will be a key determinant of asset prices, especially in local currency. Anyway, our point is that that is the more formal way in which we&rsquo;ll look at risks to &ldquo;growth&rdquo;, but US data will obviously be viewed as an underlying driver. (The key counter to all of this self-doubt and worry about relative growth rates and our risk positions is China, in particular its cheap and strong currency which is the primary transmission mechanism between China and the EMs, which we discuss later.) These are worries over our core view that too many EMs have maintained real rates that are too high, for too long, and that the Fed cutting opens the doors to rallies in EM local currency bond markets.</p>
<h3>Exhibit 2 &ndash; EM Real Rates Were Kept Too High, Now the Fed is Opening Door to Cuts</h3>
<p><img class="img-responsive w-100" src="https://www.vaneck.com/contentassets/b92e51b25d8a4c228247f1b23c9ea59b/4738_emb-august-2024_chart-2_2024-8_v1_blog.svg" alt="EM Real Rates Were Kept Too High, Now the Fed is Opening Door to Cuts" /></p>
<p class="chart-disclosure">Source: As of August 2024, VanEck Research, Bloomberg LP</p>
<p><strong>Does Japan have a plan, other than kicking the can? Yes &ndash; hike interest rates into a declining economy and ever-more-indebted government!</strong> Japan mattered this quarter. And not just because it remains a shining model for the bad state of over-indebted DM governments that co-opted their central banks, which are now paying the price. The one thing that always struck us about Japanese central bankers is that despite all the money experimentation, they do remember the textbooks and seem (or claim) to worry about &ldquo;trust in bank notes&rdquo; (a quote from one of my meetings years ago). So, they are hiking rates to compensate for the feared nominal interest-rate differential with the US. Too bad about the declining economy and over-indebted government! This is not sustainable and should be noted as other DMs will face the same eventual hard trade-offs (with the US by far the least-dirty shirt of the DM bunch, despite its dirtying efforts with the extremely stimulative fiscal policy during low unemployment, underlining the risks of dollar rallies to which we are alert). For what it&rsquo;s worth, risks right this moment still seem to be to the downside in USD/JPY, the points above are to paint a picture of the basic context which is not good.</p>
<p><strong>Here's the deal &ndash; get real.</strong> Our view is that the nominal rate-differential is too narrow a lens, and that the fiscal and central bank balance sheet adjustments are the bigger driver, long term. After all, if you want to find an unattractive interest-rate differential with the US which did not result in currency and bond weakness, just look at China! So, what&rsquo;s our bottom line on this? Japan remains a good example of what&rsquo;s coming for many DMs. But, the concrete impact on EMs was largely temporary &ndash; JPY weakness encouraged carry trades in EMs, which get and got wash-outs when JPY rallies. The end. The bigger story of a challenged Japan hasn&rsquo;t gone away &ndash; did we tell you they&rsquo;re hiking into economic weakness and a heavily-indebted government? It really says it all. But the short-term hit to carry trades has likely disappeared for now. And China has been the key to insulating EMs, which we discuss next. We can pan Japan&rsquo;s plan, as it&rsquo;s in a jam, but try as we might, there&rsquo;s no impact from it&rsquo;s plight. For now. Even Korea (whose export mix overlaps with Japan&rsquo;s) has performed strongly, in no small part to&hellip;China.</p>
<p><strong>China and CNY matter more than Japan and JPY, and thank goodness because CNY was a flight-to-safety currency during the yen carry trade wash-out.</strong> CNY stability anchors all Asian EMFX (witness the Malaysian ringgit&rsquo;s 5% rally during the JPY kerfuffle), if not more. But, China isn&rsquo;t rescuing global demand as it did following previous DM crises such as the global financial crisis (GFC) and the Covid lockdowns; like most EMs, ginning up markets or even GDP isn&rsquo;t the first reaction function that it often appears to be in DMs. CNY and Chinese government bonds (CGBs) were remarkably strong throughout all the risk events this year, despite an incredibly tight rate differential with the US. We have to emphasize a key observation &ndash; a simple nominal rate comparison isn&rsquo;t that useful! The real rate differential with the US looks a lot different, in China&rsquo;s favor. Our point is so simple and so unstated, we&rsquo;ll state it &ndash; persistently low inflation in China relative to its trading partners has meant that its real effective exchange rate has cheapened incredibly. We show the REER calculation using manufacturing inflation below. CNY is stable as well as cheap (so, literally, &ldquo;risk/return&rdquo;), in a sea of turmoil including &ldquo;neighboring&rdquo; Japan. This has insulated especially Asian local markets dramatically, a phenomenon we&rsquo;ve now observed with you for over three years. A major portion of the EM debt market (EM Asia) continues to be a flight-to-safety &ldquo;graduate&rdquo;. That&rsquo;s our story until there&rsquo;s evidence it&rsquo;s changing.</p>
<h3 id="exhibit-3" class="anchored-block">Exhibit 3 &ndash; China&rsquo;s Low Inflation Has Led to Cheaper Real Effective Exchange Rates (REER) vs. USD</h3>
<p><img class="img-responsive w-100" src="https://www.vaneck.com/contentassets/b92e51b25d8a4c228247f1b23c9ea59b/4738_emb-august-2024_chart-3_2024-8_v1_blog.svg" alt="China&rsquo;s Low Inflation Has Led to Cheaper Real Effective Exchange Rates (REER) vs. USD" /></p>
<p class="chart-disclosure">Source: BofA Global Research, Bloomberg, Japan Research Institute</p>
<h2 id="portfolio-positioning" class="jump-link-nav anchored-block" data-jumplink-title="Portfolio Positioning">Exposure Types and Significant Changes</h2>
<p>The changes to our top positions are summarized below. Our largest positions in July were South Africa, Brazil, Thailand, Indonesia, and Mexico:</p>
<ul class="content-list">
<li class="mt-2">We increased our local currency exposure in Brazil. Brazilian bonds sold off a lot after a series of unorthodox comments by President Lula about the fiscal policy stance and the central bank's independence, but there are signs that the central bank&rsquo;s new governor will be a credible official rather than a political appointee. The market might also be pricing in too many rate hikes in Brazil despite a fairly benign inflation outlook. In terms of our investment process, this improved the policy and technical test scores for the country.</li>
<li class="mt-2">We also increased our hard currency sovereign exposure in Chile. The country should be expected to benefit from the additional stimulus signals in China after the 3rd Plenum and July&rsquo;s Politburo meeting, which hinted at using &ldquo;new policy instruments&rdquo; to prop up growth &ndash; in addition to the recent changes in the monetary policy framework (using the 7-day reverse repo rate as the key policy rate) and surprising rate cuts. In terms of our investment process, this translates into the improved technical test score.</li>
<li class="mt-2">Finally, we increased our local currency exposure in Colombia, where bonds got sold off on the back of another fiscal scare (and some unfortunate headlines by President Petro). However, there was no negative follow-through, and the 2025 budget still aims to respect the fiscal rule, which improved the policy test score for the country. We are mindful of risks though, including a lack of details about deficit financing, which might keep the market&rsquo;s attention firmly on the spending side.</li>
<li class="mt-2">We reduced our local currency exposure in Poland and Hungary. Geopolitical risks in the region can increase in the run up to the presidential elections in the US, as the market might price in alternative scenarios regarding President Trump 2.0 and the situation in Ukraine. In Hungary, there are additional complications associated with the country&rsquo;s EU presidency. These factors worsened the policy test scores for both countries.</li>
<li class="mt-2">We also reduced our hard currency sovereign exposure in the United Arab Emirates and Kuwait. These were lower-yielding funders for other opportunities. In addition, growth concerns in China and the U.S. might weigh on commodity prices, including oil, worsening technical test scores for both countries.</li>
<li class="mt-2">Finally, we reduced our local currency exposure in Taiwan, hard currency sovereign exposure in El Salvador, and hard currency corporate and quasi-sovereign exposure in China. In China, authorities are aware of growth problems but sticking to the &ldquo;drip&rdquo; stimulus for now. There are indicators that the central government might allow using its balance sheet to address real estate turmoil, but until that happens, China&rsquo;s policy test score will not be improving. The Taiwanese dollar is highly correlated with the Chinese renminbi, which might be affected by growth and geopolitical concerns. As regards El Salvador, we chose to take profits on our position, seeing limited upside.</li>
</ul>
<p>To receive more <strong><a href="https://www.vaneck.com/us/en/insights/emerging-markets-bonds/" title="Emerging Markets Bonds Insights">Emerging Markets Bonds</a></strong> insights, <strong><a href="https://www.vaneck.com/us/en/subscribe/" title="Subscription Center">sign up in our subscription center</a></strong>.</p>
]]></content:encoded>
</item><item rdf:about="https://www.vaneck.com/us/en/blogs/digital-assets/matthew-sigel-bitcoin-miners-ai-arbitrage-play-to-boost-revenue/">
  <title>Bitcoin Miners&#39; AI Arbitrage Play to Boost Revenue></title>
  <link>https://www.vaneck.com/us/en/blogs/digital-assets/matthew-sigel-bitcoin-miners-ai-arbitrage-play-to-boost-revenue/</link>
  <description><![CDATA[Bitcoin miners are shifting to AI and HPC, unlocking new revenue through strategic arbitrage, with an estimated $37.6 billion net present value by converting 20% of their capacity by 2027.]]></description>
  <dc:creator>Matthew  Sigel</dc:creator>
  <dc:date>08/16/2024 06:30:00</dc:date>
<content:encoded><![CDATA[

<p>This month, we update the fundamental thesis for publicly traded bitcoin miners, highlighting their increasingly important roles in AI/HPC (high-performance computing) and energy markets. Publicly traded miners now control a record percentage of Bitcoin's global hash rate, and their collective market cap reached an all-time high in July. The <a href="https://www.marketvector.com/indexes/sector/mvis-global-digital-assets-equity" target="_blank" title="MVIS Global Digital Assets Equity Index" rel="noopener"><strong>MarketVector Digital Asset Equity Index</strong></a>, tracking these stocks, has risen 2.8% as of August 12th, underperforming the bitcoin price by 3,000 bps. At these levels, we believe investors are missing a major arbitrage between bitcoin miners and AI/HPC data centers.</p>
<ul class="content-list">
<li><a href="#bitcoin-miners-ai-arbitrage"><strong>Arbitrage Between Miners and AI Data Centers</strong></a></li>
<li><a href="#bitcoin-miners-revenue-potential"><strong>Bitcoin Miners Revenue Potential of AI/HPC</strong></a></li>
<li><a href="#bitcoin-miners-value-boost-at-current-valuations"><strong>Bitcoin Miners Value Boost at Current Valuations</strong></a></li>
</ul>
<h2 id="bitcoin-miners-ai-arbitrage" class="jump-link-nav anchored-block" data-jumplink-title="Bitcoin Miners AI Arbitrage">Arbitrage Between Miners and AI Data Centers</h2>
<p>We speak to many investors who are still unaware that bitcoin miners now have significant exposure to AI. The synergy is simple: AI companies need energy, and bitcoin miners have it. As the market values the growing AI/HPC data center market, access to power&mdash;especially in the near term&mdash;is commanding a premium. Due to heightened energy demands from bitcoin miners and data centers, North American grid interconnection queues now exceed four years. However, by drawing large loads and collaborating with power grids by participating in grid balancing programs, existing bitcoin miners are uniquely equipped to support AI/HPC immediately. Suitable bitcoin mining sites can energize GPUs for AI in less than a year, compared to the 4+ years required for greenfield AI data center developments to go online. Highlighting the potential value of this time arbitrage, we found that bitcoin miners trade at an average of ~$4.5M per megawatt (MW) of installed capacity, compared to above $30M / MW for some data center stocks. If properly equipped with power, bandwidth, and cooling systems, bitcoin mining sites are ideal for capturing this value for AI/HPC cloud services.</p>
<p>Early adopters like Core Scientific (CORZ) are reaping the rewards. On June 3rd, CORZ, the 4th largest bitcoin miner by hash rate, <a href="https://investors.corescientific.com/news-events/press-releases/detail/74/core-scientific-to-provide-approximately-200-mw-of-infrastructure-to-host-coreweaves-high-performance-computing-services-capturing-significant-ai-compute-opportunity" title="Core Scientific to Provide Approximately 200 MW of Infrastructure to Host CoreWeave's High-Performance Computing Services, Capturing Significant AI Compute Opportunity" target="_blank" rel="noopener"><strong>secured</strong></a> a 12-year contract with AI hyperscaler CoreWeave, projected to generate over $3.5 billion in revenue for providing 200 MW of infrastructure. CoreWeave <a href="https://investors.corescientific.com/news-events/press-releases/detail/78/core-scientific-announces-new-contract-with-coreweave-for-delivery-of-approximately-70-mw-of-additional-infrastructure-to-host-high-performance-computing-operations" title="Core Scientific Announces New Contract with CoreWeave for Delivery of Approximately 70 MW of Additional Infrastructure to Host High-Performance Computing Operations" target="_blank" rel="noopener"><strong>exercised</strong></a> its first option for additional capacity three weeks later, adding $1.225 billion for an extra 70 MW over 12 years. Then, in early August, CoreWeave exercised yet <a href="https://investors.corescientific.com/news-events/press-releases/detail/84/core-scientific-announces-exercise-of-additional-contract-option-by-coreweave-for-delivery-of-approximately-112-mw-of-additional-infrastructure-to-host-high-performance-computing-operations?utm_campaign=Twitter+Press+Release&amp;utm_source=twitter&amp;utm_medium=social&amp;utm_content=1722946256" title="Core Scientific Announces Exercise of Additional Contract Option by CoreWeave for Delivery of Approximately 112 MW of Additional Infrastructure to Host High-Performance Computing Operations" target="_blank" rel="noopener"><strong>another</strong></a> option for Core Scientific to deliver 112 more MW of HPC to host NVIDIA GPUs. Core Scientific could soon become one of the U.S.&rsquo;s largest data center operators if CoreWeave exercises up to 118 MW of further expansions. Following the first announcement, CORZ has added $1.6B to its market cap, with the shares +99% vs. the MarketVector Digital Asset Equity Index (+0.29%), which is by far the best-performing constituent.</p>
<h2 id="bitcoin-miners-revenue-potential" class="jump-link-nav anchored-block" data-jumplink-title="Bitcoin Miners Revenue Potential">Bitcoin Miners Revenue Potential of AI/HPC</h2>
<p>Accordingly, we believe investors should understand the potential size of the AI/HPC opportunity for bitcoin miners. This analysis examined the capital requirements and potential revenue if publicly traded bitcoin miners pivoted varying percentages of their energy capacity to serve AI &amp; HPC customers. Based on an interview with Hut 8&rsquo;s CEO at Bitcoin Nashville and third-party estimates, we assume revenues of $1.30 per kWh. By multiplying the $1.30 per kWh rate by 1,000 (to convert to MWh), then by 24 hours a day, and 365 days a year, we calculate the annual revenue per MW. After applying an 80% utilization rate&mdash;a rate that Hive Digital <a href="https://hivedigitaltechnologies.com/news/hive-digital-provides-update-on-gpu-infrastructure-for-ai-and-hpc/" title="HIVE Digital Provides Update on GPU Infrastructure for AI and HPC" target="_blank" rel="noopener"><strong>surpassed</strong></a> as demand for its AI/HPC servers grew in 2023&mdash;we project an annualized revenue of approximately $9.11 million per MW. The capital required to outfit these AI-oriented data centers is enormous. Borrowing from Core Scientific&rsquo;s capital expense <a href="https://d1io3yog0oux5.cloudfront.net/_29f165f721db5a30e45231d90d8afb78/corescientific/files/pages/corescientific/db/949/content/Core_Scientific_Investor_Day_Presentation_2024.06.12_%281%29.pdf" title="Investor and Analyst Day" target="_blank" rel="noopener"><strong>estimates</strong></a> of $5 million to $8 million per MW for converting Bitcoin mining infrastructure to AI/HPC, we conservatively apply a $7.5 million per MW cost of conversion in our model, arriving at a total of ~$23.1 billion for the infrastructure alone. We also assumed that the collective pivot would require 1,681,600 Nvidia H100 GPUs, each costing $32,500 or a total of ~$54.7 billion&mdash;for the first generation alone! As we further assumed that GPUs would need to be sold and replaced after four years, with depreciation derived by <a href="https://epochai.org/blog/trends-in-machine-learning-hardware" title="Trends in Machine Learning Hardware" target="_blank" rel="noopener"><strong>assuming</strong></a> GPU performance (FLOP/s) doubling every 2.30 years, our model includes two additional sets of replacement GPUs over the 13-year project.</p>
<p>Bitcoin miners generally have bad balance sheets, either because of too much debt, too much share issuance, <a href="https://www.vaneck.com/us/en/blogs/digital-assets/matthew-sigel-bitcoin-miners-excessive-comp-prompts-shareholder-concern/" title="Bitcoin Miners' Excessive Comp Prompts Shareholder Concern"><strong>too much executive compensation</strong></a>, or some combination of all three. This cycle is somewhat better, as many miners restructured during the bear market. What&rsquo;s great about AI/HPC is that the customers are willing to fund the capex, potentially providing a lower cost of capital for the bitcoin miners to strike their next energy deal. For example, per the terms of CORZ&rsquo;s first agreement with CoreWeave, CoreWeave will provide ~80% of the capex to retrofit Core Scientific&rsquo;s existing infrastructure for AI/HPC and additionally pre-finance Core Scientific&rsquo;s ~20% share of the capex through deferred hosting payment revenue.</p>
<h2>Revenue Impact of Bitcoin Miners Shifting Capacity to AI</h2>
<h3>Estimated Current &amp; Target Power Capacities of MVDAPP Index Bitcoin Miner Constituents</h3>
<div class="wrapped-div">
<table style="width: 100%; height: 335.937px;">
<tbody>
<tr class="tbl-data">
<td class="tbl-header last text-left">Publicly Traded Bitcoin Miner</td>
<td class="tbl-header last text-center" style="border-right: outset;" colspan="3">Est. Power Capacity (MW)</td>
<td class="tbl-header last text-center" colspan="2">Primary Geographic Location(s)</td>
</tr>
<tr class="tbl-data">
<td class="data-head last text-right">&nbsp;</td>
<td class="data-head last text-right">Current</td>
<td class="data-head last text-right">Target Additional</td>
<td class="data-head last text-right" style="border-right: outset;">Target Total</td>
<td class="data-head last text-left">Current Capacity</td>
<td class="data-head last text-left">Target Capacity</td>
</tr>
<tr class="tbl-data">
<td class="data-td last">Bitdeer (BTDR)</td>
<td class="data-td data last text-right">895</td>
<td class="data-td data last text-right">1,645</td>
<td class="data-td text-right data last" style="border-right: outset;">2,540</td>
<td class="data-td data last text-left">TX, Norway, Bhutan</td>
<td class="data-td text-left data last">TX, OH, Norway, Bhutan</td>
</tr>
<tr class="tbl-data">
<td class="data-td last">Bit Digital (BTBT)</td>
<td class="data-td data last text-right">85</td>
<td class="data-td data last text-right">40</td>
<td class="data-td text-right data last" style="border-right: outset;">125</td>
<td class="data-td data last text-left">NY, TX, KY, Canada, Iceland</td>
<td class="data-td text-left data last">TBD</td>
</tr>
<tr class="tbl-data">
<td class="data-td last">Bitfarms (BITF)</td>
<td class="data-td data last text-right">310</td>
<td class="data-td data last text-right">338</td>
<td class="data-td text-right data last" style="border-right: outset;">648</td>
<td class="data-td data last text-left">WA, Canada, Paraguay, Argentina</td>
<td class="data-td text-left data last">PA, Paraguay</td>
</tr>
<tr class="tbl-data">
<td class="data-td last">Cipher Mining (CIFR)</td>
<td class="data-td data last text-right">237</td>
<td class="data-td data last text-right">360</td>
<td class="data-td text-right data last" style="border-right: outset;">597</td>
<td class="data-td data last text-left">TX</td>
<td class="data-td text-left data last">TX</td>
</tr>
<tr class="tbl-data">
<td class="data-td last">Cleanspark (CLSK)</td>
<td class="data-td data last text-right">400</td>
<td class="data-td data last text-right">580</td>
<td class="data-td text-right data last" style="border-right: outset;">980</td>
<td class="data-td data last text-left">GA, MS, WY, NY, TN</td>
<td class="data-td text-left data last">TN, WY</td>
</tr>
<tr class="tbl-data">
<td class="data-td last">Core Scientific (CORZ)</td>
<td class="data-td data last text-right">832</td>
<td class="data-td data last text-right">285</td>
<td class="data-td text-right data last" style="border-right: outset;">1,117</td>
<td class="data-td data last text-left">TX, NC, GA, KY,ND</td>
<td class="data-td text-left data last">TX</td>
</tr>
<tr class="tbl-data">
<td class="data-td last">Hive Digital (HIVE)</td>
<td class="data-td data last text-right">140</td>
<td class="data-td data last text-right">100</td>
<td class="data-td text-right data last" style="border-right: outset;">240</td>
<td class="data-td data last text-left">Canada, Sweden, Iceland</td>
<td class="data-td text-left data last">Paraguay</td>
</tr>
<tr class="tbl-data">
<td class="data-td last">Hut 8 (HUT)</td>
<td class="data-td data last text-right">1,162</td>
<td class="data-td data last text-right">1,100</td>
<td class="data-td text-right data last" style="border-right: outset;">2,262</td>
<td class="data-td data last text-left">TX,NB, NY, Canada</td>
<td class="data-td text-left data last">TX</td>
</tr>
<tr class="tbl-data">
<td class="data-td last">Iris Energy (IREN)</td>
<td class="data-td data last text-right">260</td>
<td class="data-td data last text-right">2,310</td>
<td class="data-td text-right data last" style="border-right: outset;">2,570</td>
<td class="data-td data last text-left">TX, Canada</td>
<td class="data-td text-left data last">TX, Canada</td>
</tr>
<tr class="tbl-data">
<td class="data-td last">Marathon Digital (MARA)</td>
<td class="data-td data last text-right">1,000</td>
<td class="data-td data last text-right">200</td>
<td class="data-td text-right data last" style="border-right: outset;">1,200</td>
<td class="data-td data last text-left">TX, ND, NE</td>
<td class="data-td text-left data last">TX</td>
</tr>
<tr class="tbl-data">
<td class="data-td last">Riot Platforms (RIOT)</td>
<td class="data-td data last text-right">1,160</td>
<td class="data-td data last text-right">730</td>
<td class="data-td text-right data last" style="border-right: outset;">1,890</td>
<td class="data-td data last text-left">TX, KY</td>
<td class="data-td text-left data last">TX, KY</td>
</tr>
<tr class="tbl-data">
<td class="data-td last">TeraWulf (WULF)</td>
<td class="data-td data last text-right">245</td>
<td class="data-td data last text-right">300</td>
<td class="data-td text-right data last" style="border-right: outset;">545</td>
<td class="data-td data last text-left">NY, PA</td>
<td class="data-td text-left data last">NY, PA</td>
</tr>
<tr class="tbl-data">
<td class="data-td last">Total</td>
<td class="data-td data last text-right"><strong>6,726</strong></td>
<td class="data-td data last text-right"><strong>7,988</strong></td>
<td class="data-td text-right data last" style="border-right: outset;"><strong>14,714</strong></td>
<td class="data-td data last text-left">&nbsp;</td>
<td class="data-td text-left data last">&nbsp;</td>
</tr>
</tbody>
</table>
</div>
<br />
<p class="chart-disclosure">Source: Company filings, Bloomberg, VanEck Research of 8/12/2024. <strong>Past performance is no guarantee of future results. Not intended as a recommendation to buy or sell any securities named herein. The information and valuation scenarios in this blog are not intended as financial advice or any call to action, a recommendation to buy or sell, or as a projection of how bitcoin will perform in the future. Actual future performance of bitcoin is unknown, and may differ significantly from the hypothetical results depicted here. There may be risks or other factors not accounted for in the scenarios presented that may impede the performance. These are solely the results of a simulation based on our research, and are for illustrative purposes only. Please conduct your own research and draw your own conclusions.</strong></p>
<p>Our discounted cash flow (DCF) model applies a <strong>17% discount rate </strong>over a <strong>13-year </strong>project duration to evaluate the profit potential for miners if they convert energy currently dedicated to bitcoin mining to AI/HPC. We estimated each miner's current and target power capacity based on publicly available investor documentation. Then, we determined the present value of each miner&rsquo;s opportunity to allocate<strong> 20%</strong> of their current and target power capacity to AI/HPC. While still illustrative, please note that each of these estimates may exceed or fall short of each miner&rsquo;s actual power capacity expansion, depending on what they have publicly disclosed as of our research and how they execute in the years ahead. We also assume no changes in miners&rsquo; power contracts with grid operators, typically lasting only a few years, so that miners can adapt to dynamic energy markets. While large-scale industrial customers like bitcoin miners generally have strong bargaining power to achieve stable or even reduced energy costs over time, it is important to acknowledge the risk that this cost variable could increase over our model&rsquo;s lengthy 13-year duration&mdash;mainly if anti-growth regulations, such as net zero policies, are implemented. In terms of buildout, we assumed a 50% per year project completion rate, meaning that the megawatts allocated to AI/HPC revenues in our projection increase linearly from 0% to 50% at the start of year 2 and plateau at 100% at the beginning of year three. While some locations, such as in Core Scientific's first CoreWeave announcement, can achieve operational status in one year or less, we estimated two years to account for additional work required at mining sites that are less suitable or still under construction. We assumed a power usage effectiveness (PUE) ratio of 1.4, meaning that due to cooling, ventilation, and other overhead infrastructure, 1.4 MW of power would need to be drawn for each 1.0 MW of active AI/HPC.</p>
<h2 id="bitcoin-miners-value-boost-at-current-valuations" class="jump-link-nav anchored-block" data-jumplink-title="Bitcoin Miners Value Boost at Current Valuations">Bitcoin Miners Potential Value Boost from AI Conversion at Current Valuations</h2>
<h3>Financial Overview, AI/HPC Strategies, &amp; Estimated Upside Potential Among MVDAPP Index Publicly Traded Bitcoin Miners (2024)</h3>
<p><img class="img-responsive w-100" alt="Financial Overview, AI/HPC Strategies, &amp; Estimated Upside Potential Among MVDAPP Index Publicly Traded Bitcoin Miners (2024)" src="https://www.vaneck.com/contentassets/e3214ebe89154b8e8b5caba6fa2db092/4740_bitcoin-miners--ai-blog_table-1_2024-8_v1_blog.svg" /></p>
<p class="chart-disclosure">Source: Company filings, Bloomberg, VanEck Research of 8/12/2024. <strong>Past performance is no guarantee of future results. Not intended as a recommendation to buy or sell any securities named herein. The information and valuation scenarios in this blog are not intended as financial advice or any call to action, a recommendation to buy or sell, or as a projection of how bitcoin will perform in the future. Actual future performance of bitcoin is unknown, and may differ significantly from the hypothetical results depicted here. There may be risks or other factors not accounted for in the scenarios presented that may impede the performance. These are solely the results of a simulation based on our research, and are for illustrative purposes only. Please conduct your own research and draw your own conclusions.</strong></p>
<p>If AI/HPC comprises <strong>20% </strong>of these miners&rsquo; energy capacity by 2027, and assuming they could fund the investment, we think the publicly traded bitcoin miners&rsquo; total additional yearly profits could exceed an average of <strong>$13.9 billion per year over 13 years</strong>, compared to the trailing 12 months net income for the group at <strong>-$335 million</strong>. After factoring in the 17% discount rate, in the aggregate, we estimate the net present value of this opportunity to be <strong>~$37.6 billion</strong>, compared to the current total market cap of the 12 companies under consideration, which sits at <strong>~$19.7 billion</strong> as of August 12th, 2024. Please note that this exercise assumes miners buy the GPUs themselves when most would likely pursue a hosting model like Core Scientific. While the hosting model will lower the margin potential, it will also slash the required investment. Either way, we think that for many miners, the NPV of converting 20% of MW capacity can easily double the value of the stock. Preliminary findings suggest that miners already exploring or working with HPC, such as CORZ and WULF, are year-to-date outperforming those with no AI/HPC plans such as MARA and RIOT. In fact, likely driven by their ambitions in constructing AI/HPC revenue streams, CORZ and WULF are the only miners who have outperformed bitcoin YTD.</p>
<p>One major obstacle is that only a small percentage of existing bitcoin mining centers have the necessary proximity to major cities, bandwidth, redundancies, and other critical infrastructure needed for AI/HPC conversion. In contrast, established hyperscalers like Equinix already benefit from specialized infrastructure, economies of scale, and the resultant network effects from years of operation and customer success. Bitcoin miners entering the AI/HPC market will likely face lower margins as they work to develop similar operational expertise, recognition, and trust. Additionally, while crypto's regulatory and security demands might partially translate to AI/HPC, working in both industries introduces further challenges. Still, given the lower cost of capital from potential customers such as hyperscalers and the relatively small amount of aggregate power we assume will be converted (20% of planned capacity, or 3GW, compared to Jefferies estimates that 6GW of electricity is required to power NVIDIA GPUs already ordered for 2025), we believe these AI pivots will not cause over-supply and can be highly accretive for miners at current valuations. Moreover, if bitcoin miners can meet Tier 3 and 4 data center standards (achieving 99.982%+ uptime with multiple fault-proof redundancies) while continuing to leverage their expertise in energy grids and digital asset monetization, they could become uniquely attractive long-term investments, bridging two of this century's fastest-growing industries.</p>
<p>Many miners are leaning toward the complementary strategies presented by Bitcoin &amp; AI/HPC. In its May 2024 update, Iris Energy noted that cloud services help optimize capital costs and diversify revenue streams, smoothing returns through Bitcoin&rsquo;s cycle. In the same month, Terawulf (WULF) outlined models for cloud services, customer colocations, and built-to-suit data centers to optimize land, power, and capital for long-term value creation. Further underscoring the opportunity, in June, the early-stage technology private equity firm Coatue <a href="https://hut8.com/2024/06/24/hut-8-announces-150-million-strategic-investment-from-coatue-to-partner-in-building-next-generation-ai-infrastructure-platform/" title="Hut 8 Announces $150 Million Strategic Investment from Coatue to Partner in Building Next Generation AI Infrastructure Platform" target="_blank" rel="noopener"><strong>invested</strong></a> $150M through a convertible note into Hut 8 to build next-generation AI infrastructure. As of August 12th, WULF (+58%) and CORZ (+176%) are the two best-performing bitcoin miners YTD, while IREN (+5%) has also outperformed despite a recent power-trading loss, vs. the MarketVector Digital Asset Equity Index +2.8%.</p>
<p>We hope investors don&rsquo;t overlook another stakeholder taking part in bitcoin miners&rsquo; growth trend: electric grid operators. Bitcoin miners are attractive to grids like The Electric Reliability Council of Texas (ERCOT) because they have scalable, high-quality energy. Unlike other large power buyers, bitcoin miners can curtail consumption during peak demand, smoothing and lowering electrical costs across the grid. Exemplifying this practice, Riot (RIOT) <a href="https://www.riotplatforms.com/riot-platforms-reports-full-year-2023-financial-results-current-operational-and-financial-highlights/" title="Riot Platforms Reports Full Year 2023 Financial Results, Current Operational and Financial Highlights" target="_blank" rel="noopener"><strong>earned</strong></a> $71.2M in power credits from ERCOT in 2023, generating over 25% of its revenue. While Bitcoin&rsquo;s unique role as such a dispatchable energy resource or &ldquo;economic battery&rdquo; has been recognized as a driver of &ldquo;green&rdquo; energy investment for some time, we believe that miners&rsquo; more recent integration of AI/HPC further accentuates this dynamic, adding a new layer of versatility and value.</p>
<p>While the miner AI/HPC trend is nascent, it represents a significant merger of two high-growth tech sectors, creating a fascinating game theory dynamic. As some miners go offline to run GPUs, Bitcoin&rsquo;s difficulty algorithm will automatically adjust, allowing the remaining miners to gain a slightly larger market share. Consequently, unless the US aggressively builds more electricity-generating capacity, it may lose its share in not one but <i>multiple</i> new digital industries. As the synergies between bitcoin mining, AI/HPC, and electrical grids continue maturing&mdash;ideally in an energy-abundant, technologically progressive regulatory environment&mdash;we believe the miners in the MarketVector Digital Asset Equity Index, collectively, should be able to easily double their market capitalization by 2028, even assuming no growth in bitcoin profits.</p>
<p><strong>Links to third party websites are provided as a convenience and the inclusion of such links does not imply any endorsement, approval, investigation, verification or monitoring by us of any content or information contained within or accessible from the linked sites. By clicking on the link to a non-VanEck webpage, you acknowledge that you are entering a third-party website subject to its own terms and conditions. VanEck disclaims responsibility for content, legality of access or suitability of the third-party websites.</strong></p>
<p>To receive more <strong><a href="https://www.vaneck.com/us/en/insights/digital-assets/" title="Digital Assets Insights">Digital Assets</a></strong> insights, <strong><a href="https://www.vaneck.com/us/en/subscribe/" title="Subscription Center">sign up in our subscription center</a></strong>.</p>
]]></content:encoded>
</item><item rdf:about="https://www.vaneck.com/us/en/blogs/economic-trends/implementing-vanecks-macro-views-in-your-portfolio/">
  <title>Implementing VanEck’s Macro Views in Your Portfolio></title>
  <link>https://www.vaneck.com/us/en/blogs/economic-trends/implementing-vanecks-macro-views-in-your-portfolio/</link>
  <description><![CDATA[Diversify beyond U.S. mega-caps, stay short on fixed income while selectively adding duration, and seize global growth opportunities with our targeted strategies to navigate today&rsquo;s market challenges.]]></description>
  <dc:creator>Patrick Schramm</dc:creator>
  <dc:date>08/16/2024 06:30:00</dc:date>
<content:encoded><![CDATA[

<p>CEO Jan van Eck recently shared <strong><a href="https://www.vaneck.com/us/en/blogs/investment-outlook/jan-van-eck-adapt-your-portfolio-for-market-distortions-and-fiscal-risks/" title="Adapt Your Portfolio for Market Distortions and Fiscal Risks">his outlook on the markets from a macro perspective</a></strong>. Jan&rsquo;s outlook pieces are always nuanced and timely, and in my conversations with clients, I know that many advisors appreciate his insights. That said, a response I often encounter when I share Jan&rsquo;s outlook is: <i>this is really interesting, but how do I implement these views in my portfolio?</i></p>
<p><strong>Here&rsquo;s the punchline for today&rsquo;s markets:</strong> We believe advisors should diversify due to U.S. equity market distortions, stay short on fixed income while selectively adding duration for a barbell approach, and look to commodities and select emerging markets as global growth picks up.</p>
<p>Below we explore these three points in more detail and share how advisors can make these allocations using VanEck&rsquo;s product suite.</p>
<h2 id="diversify-equities" class="jump-link-nav anchored-block" data-jumplink-title="Diversify Equities">Takeaway 1: U.S. equity market remains highly distorted. Avoid over-exposure to mega-caps.</h2>
<p>Although the S&amp;P 500 Index had an impressive 15.5% rally through the first half of 2024, this rise was notably distorted. When we compare the performance of large-cap growth vs. value stocks, we see that growth outperformance mirrors the levels seen during the so-called internet bubble of 1999. Following the 1999 peak in growth stocks, the Nasdaq 100 Index fell in the 2000-2007 period. The tech boom leading up to 2000 shows performance patterns remarkably similar to current market trends.</p>
<h3>Growth/Value Distortion Reaches Internet Bubble Levels</h3>
<p><img class="img-responsive w-100" alt="Growth/Value Distortion Reaches Internet Bubble Levels" src="https://www.vaneck.com/contentassets/a78e2156eb4442af966d80620cba498f/4690_jve-investment-outlook_chart-1_2024-7_v1_blog.svg" /></p>
<p class="chart-disclosure">Source: Morningstar. Data as of July 17, 2024. Past performance is not a guarantee of future results. Index performance is not illustrative of fund performance. It is not possible to invest in an index. Value represented by Russell 1000 Value Index. Growth represented by Russell 1000 Growth Index.</p>

<p>Today&rsquo;s tech giants are exhibiting more solid sales growth and profitability than during the 1999 internet bubble, and their high earnings helped drive up their valuations. However, we note that there is a difference between high growth companies and high ROIC (return on invested capital)<sup>1</sup>&nbsp;companies. High absolute growth levels tend to mean revert over time. In periods where above-average growth is concentrated in a small handful of companies, capital tends to be over-allocated to chase high growth, which is based on short-term momentum and often unsustainable. Meanwhile, high ROIC companies are focused on sustainable growth and thoughtful allocation of capital aimed at protecting and growing market share over time.</p>
<p>We saw the risk of over-exposure to mega-caps play out in July&rsquo;s tech sell-off, which may indicate the start of a <strong><a href="https://www.vaneck.com/us/en/blogs/moat-investing/moat-stocks-gain-as-mega-caps-falter/" title="Moat Stocks Gain as Mega-Caps Falter">market rotation into more value-oriented stocks</a></strong>.</p>
<p><strong>How to invest:</strong> We suggest advisors ensure that their equity portfolio is diversified and not overly concentrated in the S&amp;P 500 market cap index. Consider including mid caps, small caps, and international stocks to spread risk and capture broader market opportunities. Rather than short-term growth prospects, we favor high ROIC companies that accrue value more consistently over time. This environment is also a good reminder for advisors to make sure they are actively rebalancing their equity portfolios to avoid overexposure to overvalued growth stocks.</p>
<h2>Related VanEck strategies:</h2>
<ul class="content-list">
<li class="mt-2"><strong><a href="https://www.vaneck.com/us/en/investments/morningstar-wide-moat-etf-moat/overview/" title="MOAT - VanEck Morningstar Wide Moat ETF - Overview">VanEck Morningstar Wide Moat ETF (MOAT)</a>:</strong> Focuses on quality companies with sustainable competitive advantages that are also trading at attractive prices relative to Morningstar&rsquo;s fair value estimate. This approach results in a slight value bias that may give MOAT a <a href="https://www.vaneck.com/us/en/blogs/moat-investing/moat-index-holds-contrarian-edge-in-todays-market/?id=94135128471&amp;utm_source=vaneck&amp;utm_medium=calendar" title="Moat Index Holds Contrarian Edge in Today's Market"><strong>contrarian edge</strong></a> considering current market dynamics. Morningstar research analysts, in the process of identifying wide moat companies, tend to focus on high ROIC companies that prioritize long-term growth.</li>
<li class="mt-2"><strong><a href="https://www.vaneck.com/us/en/investments/morningstar-smid-moat-etf-smot/overview/" title="SMOT - VanEck Morningstar SMID Moat ETF - Overview">VanEck Morningstar SMID Moat ETF (SMOT)</a>:</strong> Offers diversification from large-caps by investing in small- and mid-cap companies, using the same moat investing strategy of targeting companies with strong economic moats and attractive valuations. Assuming growth doesn&rsquo;t slow meaningfully, we believe small and mid caps may benefit from the lower rates and improved earnings momentum. SMOT can help mitigate exposure to companies with negative earnings and weak fundamentals.</li>
</ul>
<h2 id="fixed-income-barbell" class="jump-link-nav anchored-block" data-jumplink-title="Fixed Income Barbell">Takeaway 2: Fiscal and monetary environment calls for barbell approach to fixed income</h2>
<p>While the presidential election is still several months away, I get no shortage of questions from advisors about our views on geopolitical risk and how the outcome of the election is likely to impact markets. Advisors likely face these same questions from their clients.</p>
<p>Regardless of who wins, government spending levels are currently very high, and addressing this issue will likely become a priority after the presidential election. The Trump and Biden administrations have been large spenders, creating a budget deficit of 7% despite being in an economic boom with low unemployment. Looming Medicare and Social Security deficits make 2025 a critical year for fiscal policy.</p>
<p>This may contribute to the Fed&rsquo;s hesitation to cut interest rates in the aftermath of pandemic-related spending and monetary policies. A significant drop in interest rates is unlikely unless a severe economic contraction occurs. Our view is that the government will need to employ a combination of tax increases and spending cuts to manage the debt, while the Fed may opt to cut rates to stimulate that. Though not necessarily negative for stocks and bonds, there is a risk of 10-year interest rates spiking if these fiscal challenges are not adequately addressed.</p>
<p><strong>How to invest:</strong> Given the high interest rates on short-term fixed income, we are encouraging advisors to adopt a barbell approach to fixed income. With 4-6 interest rate cuts priced into the market in the next year, capturing yield through collateralized loan obligations (CLOs) and floating rate notes may make sense over nominal treasuries, but selectively adding some duration also makes sense in the near-medium term. As high yield spreads widen, bank loan investors may want to consider a rotation into longer duration high yield corporate bonds, particularly higher quality ones. This barbell strategy balances the benefits of short-term yield with potential opportunities in longer-term investments.</p>
<h2>Related VanEck strategies:</h2>
<ul class="content-list">
<li class="mt-2"><strong><a href="https://www.vaneck.com/us/en/investments/clo-etf-cloi/overview/" title="CLOI - VanEck CLO ETF - Overview">VanEck CLO ETF (CLOI)</a>: </strong>Actively managed by PineBridge Investments and dynamically allocates to investment grade collateralized loan obligations (CLOs), offering exposure to floating-rate assets and investments with built-in risk protection. We believe CLOs have a place in investors&rsquo; <strong><a href="https://www.vaneck.com/us/en/blogs/income-investing/clos-now-a-core-necessity/" title="CLOs Now a Core Necessity">core bond portfolios</a></strong>.</li>
<li class="mt-2"><strong><a href="https://www.vaneck.com/us/en/investments/ig-floating-rate-etf-fltr/overview/" title="FLTR - VanEck IG Floating Rate ETF - Overview">VanEck IG Floating Rate ETF (FLTR)</a>:</strong> Provides access to investment-grade floating rate notes, helping to mitigate interest rate risk while maintaining yield potential.</li>
<li><strong><a href="https://www.vaneck.com/us/en/investments/angel-high-yield-bond-etf-angl/overview/" title="ANGL - VanEck Fallen Angel High Yield Bond ETF - Overview">VanEck Fallen Angel High Yield Bond (ANGL)</a>:</strong> Offers exposure to high yield bonds originally issued as investment grade corporate bonds. Fallen angel bonds have historically had a higher average credit quality than the broad high yield universe.<sup>2</sup></li>
</ul>
<h2 id="global-growth" class="jump-link-nav anchored-block" data-jumplink-title="Global Growth">Takeaway 3: Capitalize on global growth with commodities and select emerging markets.</h2>
<p>There has been a noticeable uptick in global growth, which has positive implications for various sectors, including commodities. The U.S. is growing at a slower pace, but growth engines like India have been growing rapidly.</p>
<p><strong>How to invest:</strong> With global growth picking up, commodities are likely to benefit, making them a viable addition to a diversified investment strategy. Our discussions with clients have been focusing on the longer term structural forces that are coming together. These include low capital expenditures and investments in new discoveries as well as a trend towards onshoring and nearshoring, which is influenced by structural demand for clean energy, grid and infrastructure upgrades, and new sources such as crypto mining and AI demand. In addition, we have written extensively on the <a href="https://www.vaneck.com/us/en/blogs/emerging-markets-equity/indias-economic-rise-demands-investor-attention/" title="India's Economic Rise Demands Investor Attention"><strong>strong growth prospects of India</strong></a>, as the country&rsquo;s rapid digitization, thriving equity market and demographic trends are creating compelling investment opportunities that we believe investors should be exploring.</p>
<h2>Related VanEck strategies:</h2>
<ul class="content-list">
<li class="mt-2"><strong><a href="https://www.vaneck.com/us/en/investments/india-growth-leaders-etf-glin/overview/" title="GLIN - VanEck India Growth Leaders ETF - Overview">VanEck India Growth Leaders ETF (GLIN)</a>:</strong> Focuses on fundamentally sound Indian companies that exhibit attractive growth potential at a reasonable price.</li>
<li class="mt-2"><strong><a href="https://www.vaneck.com/us/en/investments/digital-india-etf-dgin/overview/" title="DGIN - VanEck Digital India ETF - Overview">VanEck Digital India ETF (DGIN)</a>:</strong> Provides access to companies involved in supporting the digitization of the Indian economy.</li>
<li class="mt-2"><strong><a href="https://www.vaneck.com/us/en/investments/natural-resources-etf-hap/overview/" title="HAP - VanEck Natural Resources ETF - Overview">VanEck Natural Resources ETF (HAP)</a>:</strong> Offers exposure to global natural resources companies involved in activities related to a broad spectrum of raw materials and commodities, including metals, energy sources, and agricultural products.</li>
<li><a href="https://www.vaneck.com/us/en/investments/cmci-commodity-strategy-etf-cmci/overview/" title="CMCI - VanEck CMCI Commodity Strategy ETF - Overview"><strong>VanEck CMCI Commodity Strategy ETF (CMCI)</strong></a> and <strong><a href="https://www.vaneck.com/us/en/investments/cm-commodity-index-fund-cmcax/overview/" title="CMCAX - CM Commodity Index Fund - Class A - Overview">VanEck CM Commodity Index Fund</a>:</strong> Passively managed strategies tracking the UBS Constant Maturity Commodity Index and investing in commodity-linked derivative instruments and more conservative fixed income securities, such as short-term U.S. treasuries.</li>
</ul>
<p>To receive more <strong><a href="https://www.vaneck.com/us/en/insights/economic-trends/" title="Economic Trends Insights">Economic Trends</a></strong> insights, <strong><a href="https://www.vaneck.com/us/en/subscribe/" title="Subscription Center">sign up in our subscription center</a></strong>.</p>
]]></content:encoded>
</item><item rdf:about="https://www.vaneck.com/us/en/blogs/model-portfolios/multi-asset-solutions-macro-july-2024-update/">
  <title>Multi-Asset Solutions: Macro July 2024 Update></title>
  <link>https://www.vaneck.com/us/en/blogs/model-portfolios/multi-asset-solutions-macro-july-2024-update/</link>
  <description><![CDATA[The S&amp;P 500 had a strong first half, but rising financial instability and conflicting government and monetary policies may lead to stagnation, high inflation, and an uneven economic impact.]]></description>
  <dc:creator>David Schassler</dc:creator>
  <dc:date>08/15/2024 06:30:00</dc:date>
<content:encoded><![CDATA[

<h2>Swing At the Fat Pitches: Heightened Volatility Creates Bargains</h2>
<p><strong>Overview</strong></p>
<p>The first half of the year has been nothing short of spectacular for the S&amp;P 500 Index. However, financial conditions are changing due to concerns over slowing global growth, inflation, huge deficits, and geopolitical tensions. The offsetting forces of extreme government deficit spending and tight monetary policy are creating a peculiar economic regime that is contributing to a debt spiral and financial instability, likely leading to stagnating growth and elevated inflation. Bifurcations are being made between the beneficiaries of fiscal excess and the casualties of monetary tightening, allowing the economy to sputter without falling into a recession.</p>
<ul class="content-list">
<li class="mt-2"><a href="#stocks"><strong>Stocks</strong></a></li>
<li class="mt-2"><a href="#bonds"><strong>Bonds</strong></a></li>
<li class="mt-2"><a href="#commodities"><strong>Commodities</strong></a></li>
<li class="mt-2"><a href="#digital-assets"><strong>Digital Assets</strong></a></li>
</ul>
<p>Over the medium to long term, innovation through artificial intelligence (&ldquo;AI&rdquo;) is creating a mega catalyst. We believe that AI will be at least as disruptive as the internet was in the 1990s. And, like AI right now, there was incredible enthusiasm around the internet. In the end, the internet over-delivered expectations and drastically changed the world. We believe that AI will eventually do the same.</p>
<p>Massive innovation changes society; not every company involved will survive or thrive. The internet broke down borders, increased competition, and improved the quality of life for billions of people worldwide. Companies that failed to innovate are no longer with us. Netflix replaced Blockbuster, and Amazon replaced Sears. There are countless other examples. Expect the same to happen once again.</p>
<p>However, over the near term, corporations are spending billions of dollars on AI, and slowing earnings growth is forcing tough questions on how and when there will be a return on this investment. During tough times, valuations and spending become a focus point, and that is what is happening now.</p>
<p>Stay diversified, stay invested, and swing at the fat pitches because periods of heightened volatility create bargains for the astute investor.</p>
<h2 id="stocks" class="jump-link-nav anchored-block" data-jumplink-title="Stocks">Stocks</h2>
<p>Slowing growth is forcing a re-think on companies with questionable valuations (Magnificent 7) and those that haven&rsquo;t participated in this great bull run (small-cap and value-oriented equities). This led to a rotation where small-cap value stocks (Russell 2000 Value Index) outperformed the Mag 7 stocks by 13% in July.</p>
<p>Nvidia was breaking the laws of financial gravity and is finally showing weakness. Nvidia is now down over 20% from its all-time high in mid-July. However, context is always key. Nvidia is still up well over 100% year-to-date and boasts a market capitalization of $2.7 trillion. If Nvidia&rsquo;s market cap continues to expand at its rate this year, it will be larger than the market cap of the entire S&amp;P 500 Index in less than three years. Do we think that will happen? Absolutely not. It is way too early to crown any winners. The success of Nvidia and others will attract competition. That competition will create future rounds of winners and losers. Yahoo once had a market cap greater than Apple, Google, or Amazon!</p>
<h2 id="bonds" class="jump-link-nav anchored-block" data-jumplink-title="Bonds">Bonds</h2>
<p>We&rsquo;re in the midst of an epic battle between monetary and fiscal policies. Monetary policy is fighting inflation, primarily through higher interest rates, which force the economy to deleverage. Simultaneously, deficit spending during an economic expansion is adding fuel to the economy.</p>
<p>The market expects the Fed to begin cutting interest rates at its September meeting and reduce them by 0.75% in total by 2024.</p>
<p>Interest rates across the treasury curve fell while credit spreads, or the premium paid to assume default risk, widened modestly in July as investors favored the safety of U.S. government debt due to increased economic uncertainty.</p>
<p>Investors in fixed income are advised to proceed with caution. Now is not the time to make big credit or duration bets. The timing of the next recession, the future path of inflation, and many other economic and political risks that may impact both interest rates and credit spreads create a murky path forward, at best.</p>
<h2 id="commodities" class="jump-link-nav anchored-block" data-jumplink-title="Commodities">Commodities</h2>
<p>July was not a good month for most commodities as prices fell based on concerns about global demand. Central to global growth concerns is China, which is the largest importer of crude oil and many other commodities. Beijing recently supported its economy through interest rate cuts. Energy, industrial metals, and agricultural commodities were down 8%, 7%, and 5%, respectively.</p>
<p>Alternatively, gold prices advanced 4% during the month as the same bearish factors that created headwinds for other assets caused tailwinds for gold. In our view, gold is the ultimate store-of-value asset and an essential component of any diversified asset allocation.</p>

<h2 id="digital-assets" class="jump-link-nav anchored-block" data-jumplink-title="Digital Assets">Digital Assets</h2>
<p>The big news in digital assets during the month was the launch of the physically backed ether ETPs. These ETPs raised $800 million in the first two days of trading, following the launch of the spot bitcoin ETPs in January.</p>
<p>Bitcoin is now around 15 years old and, like any teenager, is fighting for its place in the world. Bitcoin and other digital assets are maturing, and investors are noticing. The launch of physically backed digital asset ETPs further institutionalizes these assets and dramatically increases the ease of ownership for investors.</p>
<p>New asset classes are not created frequently. If you are still staying on the sidelines, stop. Failure to allocate to bitcoin has only harmed your performance. Every investor should consider allocating 1-3% of their portfolio to bitcoin.</p>
<p>To receive more <strong><a href="https://www.vaneck.com/us/en/insights/guided-allocation/" title="Model Portfolio Insights">Model Portfolio</a></strong> insights, <strong><a href="https://www.vaneck.com/us/en/subscribe/" title="Subscription Center">sign up in our subscription center</a></strong>.</p>
]]></content:encoded>
</item><item rdf:about="https://www.vaneck.com/us/en/blogs/income-investing/shifting-fundamentals-call-for-clo-selectivity/">
  <title>Shifting Fundamentals Call for CLO Selectivity></title>
  <link>https://www.vaneck.com/us/en/blogs/income-investing/shifting-fundamentals-call-for-clo-selectivity/</link>
  <description><![CDATA[Although CLOs have rallied and demand remains strong, early signs of weaker fundamentals highlight the need for a more selective, bottom-up approach to CLO investing.]]></description>
  <dc:creator> </dc:creator>
  <dc:date>08/15/2024 06:30:00</dc:date>
<content:encoded><![CDATA[

<p>The collateralized loan obligation (CLO) market has experienced a significant rally since late 2022, with prices soaring and spreads tightening to levels not seen since early 2022. The increasing demand for CLO paper, fueled by the expansion of CLO ETFs and strategic reallocations by major investors like Japan's Norinchukin Bank, has driven spreads tighter, particularly at the AAA level. This has also led to elevated valuations, with most CLO tranches trading above fair value. As a result, the spread basis between ratings and manager tiers has compressed, making it more difficult for investors to achieve alpha. Despite these challenges, the demand for CLOs is expected to remain strong, supported by both traditional investors and the burgeoning CLO ETF market.</p>
<p>However, the market is starting to exhibit signs of weaker fundamentals, with a noticeable increase in deals exposed to lower-rated Caa/CCC holdings. This trend underscores the importance of a bottom-up approach, which involves a detailed analysis of the underlying CLO portfolios to mitigate risks associated with the rising CCC exposure. A robust selection process can help identify opportunities and generate superior investment outcomes, especially in a market where technical tailwinds may persist in the short term but where fundamental risks are becoming more pronounced.</p>
<p>In the article, <a href="https://www.vaneck.com/us/en/offsite-disclaimer/?id=290182&amp;button=no&amp;url=https://www.pinebridge.com/en-us/institution/insights/after-the-clo-rally-selectivity-will-be-key-as-fundamentals-shift/" title="PineBridge Investments - After the CLO Rally, Selectivity Will Be Key as Fundamentals Shift" target="_blank" rel="noopener"><strong>After the CLO Rally, Selectivity Will Be Key as Fundamentals Shift</strong></a>, PineBridge Investments explores in-depth the uptick in market activity and the importance of a more selective, bottom-up approach in navigating the risks and opportunities in CLOs.</p>

<h2>Key Takeaways</h2>
<ul class="content-list">
<li class="mt-2"><strong>Strong Demand for CLOs:</strong> Demand for collateralized loan obligations (CLOs) has been robust, driven by the growth of CLO ETFs, reallocations by large investors, and sustained interest from traditional CLO investors.</li>
<li class="mt-2"><strong>Rising Prices and Tightening Spreads:</strong> The average price of AAA to BBB-rated CLOs is now above par, approaching five-year highs, with a decline in the spread basis between rating tiers, making it more challenging to generate alpha.</li>
<li class="mt-2"><strong>Emerging Weaker Fundamentals:</strong> Signs of weaker fundamentals are emerging, with increasing Caa/CCC exposure, necessitating a bottom-up approach for better investment outcomes.</li>
<li class="mt-2"><strong>Selectivity is Crucial:</strong> Given the current market dynamics, a selective approach focusing on the underlying CLO portfolio holdings is essential to navigate risks and enhance potential returns.</li>
</ul>
<p>Ultimately, we believe a more selective, bottom-up approach will result in stronger risk-adjusted returns and outperformance potential over the broader market and peers in the long run.</p>
<h2>Investing in CLOs with VanEck</h2>
<p>The <strong><a href="https://www.vaneck.com/us/en/investments/clo-etf-cloi/overview/" title="CLOI - VanEck CLO ETF - Holdings and Performance">VanEck CLO ETF (CLOI)</a></strong>, subadvised by PineBridge, may offer an attractive way for investors to efficiently access the CLO market with the liquidity, transparency and low cost features of an ETF. CLOI invests primarily in investment grade CLO tranches and may invest up to 20% in BB-rated CLOs (but will not invest in CLOs rated below BB-/Ba3 or equity tranches of CLOs). Drawing on decades of CLO experience, through PineBridge&rsquo;s active management, CLOI can move throughout the CLO capital structure to potentially add alpha, adding risk when there are opportunities and de-risking in periods of market volatility.</p>

<p>To receive more <a href="/us/en/blogs/income-investing/" title="Income Investing Insights"><strong>Income Investing</strong></a> insights, <a href="/link/5f45412c2143400497908cea2897f7d3.aspx" title=" Subscription Center"><strong>sign up in our subscription center</strong></a>.</p>
]]></content:encoded>
</item><item rdf:about="https://www.vaneck.com/us/en/blogs/income-investing/fallen-angels-outperformance-after-fed-cuts/">
  <title>Fallen Angels: Outperformance After Fed Cuts></title>
  <link>https://www.vaneck.com/us/en/blogs/income-investing/fallen-angels-outperformance-after-fed-cuts/</link>
  <description><![CDATA[Given high volatility, elevated valuations and economic growth concerns, we believe the case for higher quality exposure is particularly strong for high yield investors.]]></description>
  <dc:creator>Nicolas  Fonseca, CFA</dc:creator>
  <dc:date>08/14/2024 07:30:00</dc:date>
<content:encoded><![CDATA[

<p id="overview" class="jump-link-nav anchored-block" data-jumplink-title="Overview">Fallen angels (as represented by the ICE US Fallen Angel High Yield 10% Constrained Index, &ldquo;H0CF&rdquo;) outperformed broad high yield (as represented by the ICE BofA US High Yield Index, &ldquo;H0A0&rdquo;) by 19bps in July (2.15% vs 1.96%), reducing the YTD underperformance to 1.37% (3.26% vs 4.63%). Both strategies performed similarly until the last day of the month when fallen angels posted a gain of 0.48% vs 0.23% for high yield. This difference occurred as the U.S Federal Reserve (Fed) left rates unchanged but indicated confidence in disinflationary trends, which was interpreted by the market as dovish and resulted in an increase in the implied probability of a September rate cut. Long term Treasury yields declined gradually through the month, resulting in longer duration assets outperforming as shown in the chart below. But the decline began to accelerate in the last week &ndash; particularly on the day of the Fed meeting &ndash; perhaps reflecting concerns that the Fed may have kept the policy rate too restrictive for too long. In addition, after hitting their tightest level since December 2021 on July 23, high yield bond spreads began widening through the last week of the month. This view of a potential &ldquo;hard landing&rdquo; found further support at the end of the week with weak economic data, particularly related to employment, resulting in a sharp decline in bond yields, but also a significant widening in credit spreads. Whether this is indicative of a recession and the start of a more significant widening cycle in credit remains to be seen, but it&rsquo;s worth noting that despite a sharp increase in spreads through August 5, high yield bond spreads remain below their 10-year average. With higher volatility, valuations that remain historically high and increasing concerns about economic growth, we believe the case for higher quality exposure is particularly strong right now for high yield investors.</p>
<h2 id="rate-cut-in-sight" class="jump-link-nav anchored-block" data-jumplink-title="Rate Cut in Sight?">Rate Cut in Sight?</h2>
<p>As mentioned above, the probability of a September rate cut has significantly increased over the past few days. With that in mind, we examined the performance of fallen angels and broad high yield bonds during the last two periods when the Fed lowered rates&mdash;September 2007 and August 2019&mdash;to understand how fallen angels have historically behaved in rate-cutting cycles. Fallen angels outperformed broad high yield over various time periods following the first rate reduction (see chart below), with spreads widening over the following months after the first cut as the economy experienced a slowdown/recession. Note that those cuts occurred under varying economic and market conditions, but we believe that the in current cycle, the higher quality and differentiated sector exposure may be drivers of outperformance going forward, as they have in the past.</p>
<h3>Historically, Fallen Angels Have Outperformed Broad HY After Fed Rate Cuts</h3>
<p><img class="img-responsive w-100" src="https://www.vaneck.com/contentassets/d6273f3ac5604d7db6adc39ea3bf165f/4732_angl_chart-2_2024-8_blog.svg" alt="Historically, Fallen Angels Have Outperformed Broad HY After Fed Rate Cuts" /></p>
<p class="chart-disclosure">Source: ICE Data Services, VanEck. Past performance is no guarantee of future results.</p>

<p>We also analyzed performance from the last hike to the first cut and from the last hike to the last cut. In both cases, fallen angels outperformed by an average of 0.80%. From the last hike to the first cut (June 2006 to September 2007 and December 2018 to August 2019), both strategies posted double-digit returns, with fallen angels leading by 0.71% on average. In contrast, from the last hike to the last cut (June 2006 to December 2008 and December 2018 to March 2020), broad high yield posted negative returns in both periods, while fallen angels achieved positive returns in the latter period.</p>
<p id="performance-review" class="jump-link-nav anchored-block" data-jumplink-title="Performance Review"><strong>Fallen Angels Overall Statistics:</strong> Fallen angels yields decreased by 29bps to 6.81% in July, the lowest this year, while the fallen angels price jumped to $91.90, the highest it has been since February 2023 when it reached $92.06. Broad high yield saw similar changes, with yields decreasing 33bps and its price increasing to $94.37, which is just $2.28 below its average since December 2003. The move down in yields/jump in prices reflected the 10-year U.S. treasury rallying 27bps in July and finishing at 4.09%.</p>
<div class="wrapped-div">
<table style="width: 100%;">
<tbody>
<tr class="tbl-data">
<td class="tbl-header last text-center">&nbsp;</td>
<td class="tbl-header last text-center" style="border-right: outset;" colspan="4">Fallen Angels</td>
<td class="tbl-header last text-center" colspan="4">Broad HY</td>
</tr>
<tr class="tbl-data">
<td class="data-head last text-right">&nbsp;</td>
<td class="data-head last text-right">12/31/23</td>
<td class="data-head last text-right">3/31/24</td>
<td class="data-head last text-right">6/30/24</td>
<td class="data-head last text-right" style="border-right: outset;">7/31/24</td>
<td class="data-head last text-right">12/31/23</td>
<td class="data-head last text-right">3/31/24</td>
<td class="data-head last text-right">6/30/24</td>
<td class="data-head last text-right">7/31/24</td>
</tr>
<tr class="tbl-data">
<td class="data-td last">Yield to Worst</td>
<td class="data-td data last text-right">6.99</td>
<td class="data-td data last text-right">6.92</td>
<td class="data-td data last text-right">7.10</td>
<td class="data-td text-right data last" style="border-right: outset;">6.81</td>
<td class="data-td data last text-right">7.69</td>
<td class="data-td data last text-right">7.75</td>
<td class="data-td data last text-right">7.94</td>
<td class="data-td data last text-right">7.61</td>
</tr>
<tr class="tbl-data">
<td class="data-td last">Par Weighted Price</td>
<td class="data-td data last text-right">91.20</td>
<td class="data-td data last text-right">91.22</td>
<td class="data-td data last text-right">90.32</td>
<td class="data-td text-right data last" style="border-right: outset;">91.90</td>
<td class="data-td data last text-right">91.86</td>
<td class="data-td data last text-right">93.18</td>
<td class="data-td data last text-right">92.98</td>
<td class="data-td data last text-right">94.37</td>
</tr>
<tr class="tbl-data">
<td class="data-td last">Effective Duration</td>
<td class="data-td data last text-right">5.41</td>
<td class="data-td data last text-right">5.32</td>
<td class="data-td data last text-right">5.08</td>
<td class="data-td text-right data last" style="border-right: outset;">5.06</td>
<td class="data-td data last text-right">3.31</td>
<td class="data-td data last text-right">3.28</td>
<td class="data-td data last text-right">3.26</td>
<td class="data-td data last text-right">3.17</td>
</tr>
<tr class="tbl-data">
<td class="data-td last">Full Market Value ($mn)</td>
<td class="data-td data last text-right">67,821</td>
<td class="data-td data last text-right">64,657</td>
<td class="data-td data last text-right">55,371</td>
<td class="data-td text-right data last" style="border-right: outset;">54,885</td>
<td class="data-td data last text-right">1,237,721</td>
<td class="data-td data last text-right">1,260,542</td>
<td class="data-td data last text-right">1,266,993</td>
<td class="data-td data last text-right">1,282,279</td>
</tr>
<tr class="tbl-data">
<td class="data-td last">OAS</td>
<td class="data-td data last text-right">285</td>
<td class="data-td data last text-right">247</td>
<td class="data-td data last text-right">252</td>
<td class="data-td text-right data last" style="border-right: outset;">259</td>
<td class="data-td data last text-right">339</td>
<td class="data-td data last text-right">315</td>
<td class="data-td data last text-right">321</td>
<td class="data-td data last text-right">325</td>
</tr>
<tr class="tbl-data">
<td class="data-td last">No. of Issues</td>
<td class="data-td data last text-right">143</td>
<td class="data-td data last text-right">138</td>
<td class="data-td data last text-right">126</td>
<td class="data-td text-right data last" style="border-right: outset;">122</td>
<td class="data-td data last text-right">1,837</td>
<td class="data-td data last text-right">1,864</td>
<td class="data-td data last text-right">1,863</td>
<td class="data-td data last text-right">1,858</td>
</tr>
</tbody>
</table>
</div>
<p class="chart-disclosure">Source: ICE Data Services, VanEck. Fallen Angels: ICE US Fallen Angel High Yield 10% Constrained Index. Broad HY: ICE BofA US High Yield Index. OAS refers to &ldquo;option-adjusted spread.&rdquo; Please see definition for this and other terms referenced herein in the disclosures and definitions portion of this blog. Past performance is no guarantee of future results. Index performance is not representative of strategy performance. It is not possible to invest in an index.</p>
<p><strong>Fallen Angels:</strong> No fallen angels in July.</p>
<div class="wrapped-div">
<table style="width: 100%;">
<tbody>
<tr class="tbl-data">
<td class="tbl-header last">Month-end Addition</td>
<td class="tbl-header last">Name</td>
<td class="tbl-header last">Rating</td>
<td class="tbl-header last">Sector</td>
<td class="tbl-header last">Industry</td>
<td class="tbl-header last text-right">% Mkt Value</td>
<td class="tbl-header last text-right">Price</td>
</tr>
<tr class="tbl-data">
<td class="data-td last font-weight-normal">January</td>
<td class="data-td data last text-left">Hudson Pacific Properties LP</td>
<td class="data-td data last text-left">BB1</td>
<td class="data-td data last text-left">Real Estate</td>
<td class="data-td data last text-left">REITs</td>
<td class="data-td data last text-right">2.18</td>
<td class="data-td data last text-right">88.05</td>
</tr>
<tr class="tbl-data">
<td class="data-td last font-weight-normal">February</td>
<td class="data-td data last text-left">Advance Auto Parts Inc.</td>
<td class="data-td data last text-left">BB1</td>
<td class="data-td data last text-left">Retail</td>
<td class="data-td data last text-left">Specialty Retail</td>
<td class="data-td data last text-right">2.52</td>
<td class="data-td data last text-right">91.20</td>
</tr>
</tbody>
</table>
</div>
<p class="chart-disclosure">Source: ICE Data Services, VanEck. Fallen Angels: ICE US Fallen Angel High Yield 10% Constrained Index. Past performance is no guarantee of future results. Not a recommendation to buy or sell any of the names/securities mentioned herein. Index performance is not representative of strategy performance. It is not possible to invest in an index.</p>
<p><strong>Rising Stars:</strong> Delta Air Lines was removed from the index in July (1.5% exposure), as it was upgraded by Fitch to BBB- from BB+, reflecting improved credit metrics post-COVID-19 pandemic. Fitch joins Moody&rsquo;s as the two agencies rating Delta as investment grade, while S&amp;P still rates it as high yield. Delta entered the fallen angel index in April 2020, at the peak of the pandemic, with a par weighted price of $80.59 and exits at $94.59, while broad high yield saw it prices change to $94.37 from $89.09. Rising stars have accounted for 15% of the index market value so far this year.</p>
<div class="wrapped-div">
<table style="width: 100%;">
<tbody>
<tr class="tbl-data">
<td class="tbl-header last">Month-end Exit</td>
<td class="tbl-header last">Name</td>
<td class="tbl-header last">Rating</td>
<td class="tbl-header last">Sector</td>
<td class="tbl-header last">Industry</td>
<td class="tbl-header last text-right">% Mkt Value</td>
<td class="tbl-header last text-right">Price</td>
</tr>
<tr class="tbl-data">
<td class="data-td last font-weight-normal">February</td>
<td class="data-td data last text-left">Las Vegas Sands Corp</td>
<td class="data-td data last text-left">BB1</td>
<td class="data-td data last text-left">Leisure</td>
<td class="data-td data last text-left">Gaming</td>
<td class="data-td data last text-right">3.12</td>
<td class="data-td data last text-right">93.19</td>
</tr>
<tr class="tbl-data">
<td class="data-td last font-weight-normal">March</td>
<td class="data-td data last text-left">Enlink Midstream Partners LP</td>
<td class="data-td data last text-left">BB1</td>
<td class="data-td data last text-left">Energy</td>
<td class="data-td data last text-left">Gas Distribution</td>
<td class="data-td data last text-right">2.30</td>
<td class="data-td data last text-right">88.92</td>
</tr>
<tr class="tbl-data">
<td class="data-td last font-weight-normal">April</td>
<td class="data-td data last text-left">FirstEnergy Corp.</td>
<td class="data-td data last text-left">BB1</td>
<td class="data-td data last text-left">Utility</td>
<td class="data-td data last text-left">Electric-Integrated</td>
<td class="data-td data last text-right">6.62</td>
<td class="data-td data last text-right">87.10</td>
</tr>
<tr class="tbl-data">
<td class="data-td last font-weight-normal">April</td>
<td class="data-td data last text-left">Rolls-Royce PLC</td>
<td class="data-td data last text-left">BB1</td>
<td class="data-td data last text-left">Capital Goods</td>
<td class="data-td data last text-left">Aerospace/Defense</td>
<td class="data-td data last text-right">1.51</td>
<td class="data-td data last text-right">96.00</td>
</tr>
<tr class="tbl-data">
<td class="data-td last font-weight-normal">July</td>
<td class="data-td data last text-left">Delta Air Lines Inc.</td>
<td class="data-td data last text-left">BB1</td>
<td class="data-td data last text-left">Transportation</td>
<td class="data-td data last text-left">Air Transportation</td>
<td class="data-td data last text-right">1.50</td>
<td class="data-td data last text-right">94.59</td>
</tr>
</tbody>
</table>
</div>
<p class="chart-disclosure">Source: ICE Data Services, VanEck. Fallen Angels: ICE US Fallen Angel High Yield 10% Constrained Index. Past performance is no guarantee of future results. Not a recommendation to buy or sell any of the names/securities mentioned herein. Index performance is not representative of strategy performance. It is not possible to invest in an index.</p>

<p><strong>Fallen Angels Performance by Sector:</strong> The exit of Delta Air Lines reduced the index&rsquo;s exposure to the Transportation sector to 1.10%. Energy, Retail and Telecom sector weights increased slightly. In terms of performance, all sectors except for Retail, the largest exposure at 19.39%, posted positive returns in July with Telecom and Real Estate having the highest returns. Prices, in general, increased as yields decreased throughout the month. Comparing fallen angel vs broad high yield performance, Telecom and Real Estate were also the top contributors to outperformance with both fallen angel sectors being overweight 2.2x and 2.4x, respectively, while still posting higher returns. Retail and Media (no exposure) were the top two detractors, with Walgreens being the main culprit in Retail as fallen angels were significantly overweight (spreads widened by 39bps in July).</p>
<div class="wrapped-div">
<table style="width: 100%;">
<tbody>
<tr class="tbl-data">
<td class="tbl-header last text-right">&nbsp;</td>
<td class="tbl-header last text-center" style="border-right: outset;" colspan="4">Wgt (%)</td>
<td class="tbl-header last text-center" style="border-right: outset;" colspan="4">OAS</td>
<td class="tbl-header last text-center" style="border-right: outset;" colspan="4">Price</td>
<td class="tbl-header last text-right">Total Return</td>
</tr>
<tr class="tbl-data">
<td class="data-head last text-right">&nbsp;</td>
<td class="data-head last text-right">12/31/23</td>
<td class="data-head last text-right">3/31/24</td>
<td class="data-head last text-right">6/30/24</td>
<td class="data-head last text-right" style="border-right: outset;">7/31/24</td>
<td class="data-head last text-right">12/31/23</td>
<td class="data-head last text-right">3/31/24</td>
<td class="data-head last text-right">6/30/24</td>
<td class="data-head last text-right" style="border-right: outset;">7/31/24</td>
<td class="data-head last text-right">12/31/23</td>
<td class="data-head last text-right">3/31/24</td>
<td class="data-head last text-right">6/30/24</td>
<td class="data-head last text-right" style="border-right: outset;">7/31/24</td>
<td class="data-head last text-right">MTD</td>
</tr>
<tr class="tbl-data">
<td class="data-td last">Banking</td>
<td class="data-td data last text-right">4.79</td>
<td class="data-td data last text-right">4.62</td>
<td class="data-td data last text-right">5.38</td>
<td class="data-td text-right data last" style="border-right: outset;">5.47</td>
<td class="data-td data last text-right">231</td>
<td class="data-td data last text-right">235</td>
<td class="data-td data last text-right">220</td>
<td class="data-td text-right data last" style="border-right: outset;">229</td>
<td class="data-td data last text-right">97.91</td>
<td class="data-td data last text-right">97.11</td>
<td class="data-td data last text-right">97.36</td>
<td class="data-td text-right data last" style="border-right: outset;">98.48</td>
<td class="data-td data last text-right">1.62</td>
</tr>
<tr class="tbl-data">
<td class="data-td last">Basic Industry</td>
<td class="data-td data last text-right">1.70</td>
<td class="data-td data last text-right">3.20</td>
<td class="data-td data last text-right">3.73</td>
<td class="data-td text-right data last" style="border-right: outset;">3.81</td>
<td class="data-td data last text-right">171</td>
<td class="data-td data last text-right">186</td>
<td class="data-td data last text-right">156</td>
<td class="data-td text-right data last" style="border-right: outset;">174</td>
<td class="data-td data last text-right">97.24</td>
<td class="data-td data last text-right">94.37</td>
<td class="data-td data last text-right">95.03</td>
<td class="data-td text-right data last" style="border-right: outset;">96.14</td>
<td class="data-td data last text-right">1.60</td>
</tr>
<tr class="tbl-data">
<td class="data-td last">Capital Goods</td>
<td class="data-td data last text-right">5.85</td>
<td class="data-td data last text-right">6.17</td>
<td class="data-td data last text-right">5.41</td>
<td class="data-td text-right data last" style="border-right: outset;">5.44</td>
<td class="data-td data last text-right">200</td>
<td class="data-td data last text-right">153</td>
<td class="data-td data last text-right">161</td>
<td class="data-td text-right data last" style="border-right: outset;">195</td>
<td class="data-td data last text-right">97.34</td>
<td class="data-td data last text-right">97.38</td>
<td class="data-td data last text-right">97.51</td>
<td class="data-td text-right data last" style="border-right: outset;">97.31</td>
<td class="data-td data last text-right">0.27</td>
</tr>
<tr class="tbl-data">
<td class="data-td last">Consumer Goods</td>
<td class="data-td data last text-right">4.33</td>
<td class="data-td data last text-right">4.42</td>
<td class="data-td data last text-right">5.28</td>
<td class="data-td text-right data last" style="border-right: outset;">5.52</td>
<td class="data-td data last text-right">230</td>
<td class="data-td data last text-right">223</td>
<td class="data-td data last text-right">240</td>
<td class="data-td text-right data last" style="border-right: outset;">208</td>
<td class="data-td data last text-right">94.29</td>
<td class="data-td data last text-right">93.07</td>
<td class="data-td data last text-right">93.64</td>
<td class="data-td text-right data last" style="border-right: outset;">96.63</td>
<td class="data-td data last text-right">3.68</td>
</tr>
<tr class="tbl-data">
<td class="data-td last">Energy</td>
<td class="data-td data last text-right">14.75</td>
<td class="data-td data last text-right">11.17</td>
<td class="data-td data last text-right">12.27</td>
<td class="data-td text-right data last" style="border-right: outset;">12.55</td>
<td class="data-td data last text-right">259</td>
<td class="data-td data last text-right">235</td>
<td class="data-td data last text-right">239</td>
<td class="data-td text-right data last" style="border-right: outset;">242</td>
<td class="data-td data last text-right">92.49</td>
<td class="data-td data last text-right">93.95</td>
<td class="data-td data last text-right">93.44</td>
<td class="data-td text-right data last" style="border-right: outset;">95.25</td>
<td class="data-td data last text-right">2.41</td>
</tr>
<tr class="tbl-data">
<td class="data-td last">Financial Services</td>
<td class="data-td data last text-right">1.14</td>
<td class="data-td data last text-right">1.18</td>
<td class="data-td data last text-right">1.37</td>
<td class="data-td text-right data last" style="border-right: outset;">1.39</td>
<td class="data-td data last text-right">378</td>
<td class="data-td data last text-right">336</td>
<td class="data-td data last text-right">376</td>
<td class="data-td text-right data last" style="border-right: outset;">355</td>
<td class="data-td data last text-right">86.41</td>
<td class="data-td data last text-right">87.09</td>
<td class="data-td data last text-right">84.87</td>
<td class="data-td text-right data last" style="border-right: outset;">87.60</td>
<td class="data-td data last text-right">3.64</td>
</tr>
<tr class="tbl-data">
<td class="data-td last">Healthcare</td>
<td class="data-td data last text-right">4.10</td>
<td class="data-td data last text-right">4.44</td>
<td class="data-td data last text-right">5.15</td>
<td class="data-td text-right data last" style="border-right: outset;">5.34</td>
<td class="data-td data last text-right">270</td>
<td class="data-td data last text-right">210</td>
<td class="data-td data last text-right">207</td>
<td class="data-td text-right data last" style="border-right: outset;">202</td>
<td class="data-td data last text-right">88.73</td>
<td class="data-td data last text-right">90.80</td>
<td class="data-td data last text-right">91.12</td>
<td class="data-td text-right data last" style="border-right: outset;">93.11</td>
<td class="data-td data last text-right">2.64</td>
</tr>
<tr class="tbl-data">
<td class="data-td last">Insurance</td>
<td class="data-td data last text-right">1.32</td>
<td class="data-td data last text-right">1.43</td>
<td class="data-td data last text-right">1.65</td>
<td class="data-td text-right data last" style="border-right: outset;">1.69</td>
<td class="data-td data last text-right">323</td>
<td class="data-td data last text-right">244</td>
<td class="data-td data last text-right">238</td>
<td class="data-td text-right data last" style="border-right: outset;">244</td>
<td class="data-td data last text-right">94.10</td>
<td class="data-td data last text-right">96.82</td>
<td class="data-td data last text-right">96.11</td>
<td class="data-td text-right data last" style="border-right: outset;">98.02</td>
<td class="data-td data last text-right">2.49</td>
</tr>
<tr class="tbl-data">
<td class="data-td last">Leisure</td>
<td class="data-td data last text-right">7.90</td>
<td class="data-td data last text-right">5.10</td>
<td class="data-td data last text-right">5.92</td>
<td class="data-td text-right data last" style="border-right: outset;">6.05</td>
<td class="data-td data last text-right">228</td>
<td class="data-td data last text-right">170</td>
<td class="data-td data last text-right">180</td>
<td class="data-td text-right data last" style="border-right: outset;">196</td>
<td class="data-td data last text-right">93.21</td>
<td class="data-td data last text-right">95.08</td>
<td class="data-td data last text-right">94.48</td>
<td class="data-td text-right data last" style="border-right: outset;">95.26</td>
<td class="data-td data last text-right">1.24</td>
</tr>
<tr class="tbl-data">
<td class="data-td last">Real Estate</td>
<td class="data-td data last text-right">9.07</td>
<td class="data-td data last text-right">9.60</td>
<td class="data-td data last text-right">10.07</td>
<td class="data-td text-right data last" style="border-right: outset;">10.58</td>
<td class="data-td data last text-right">675</td>
<td class="data-td data last text-right">527</td>
<td class="data-td data last text-right">450</td>
<td class="data-td text-right data last" style="border-right: outset;">385</td>
<td class="data-td data last text-right">82.72</td>
<td class="data-td data last text-right">81.84</td>
<td class="data-td data last text-right">84.76</td>
<td class="data-td text-right data last" style="border-right: outset;">88.18</td>
<td class="data-td data last text-right">4.41</td>
</tr>
<tr class="tbl-data">
<td class="data-td last">Retail</td>
<td class="data-td data last text-right">14.38</td>
<td class="data-td data last text-right">18.02</td>
<td class="data-td data last text-right">20.45</td>
<td class="data-td text-right data last" style="border-right: outset;">19.39</td>
<td class="data-td data last text-right">242</td>
<td class="data-td data last text-right">179</td>
<td class="data-td data last text-right">196</td>
<td class="data-td text-right data last" style="border-right: outset;">232</td>
<td class="data-td data last text-right">86.39</td>
<td class="data-td data last text-right">89.54</td>
<td class="data-td data last text-right">88.19</td>
<td class="data-td text-right data last" style="border-right: outset;">87.49</td>
<td class="data-td data last text-right">-0.55</td>
</tr>
<tr class="tbl-data">
<td class="data-td last">Services</td>
<td class="data-td data last text-right">0.64</td>
<td class="data-td data last text-right">0.66</td>
<td class="data-td data last text-right">0.79</td>
<td class="data-td text-right data last" style="border-right: outset;">0.79</td>
<td class="data-td data last text-right">243</td>
<td class="data-td data last text-right">217</td>
<td class="data-td data last text-right">206</td>
<td class="data-td text-right data last" style="border-right: outset;">204</td>
<td class="data-td data last text-right">94.78</td>
<td class="data-td data last text-right">94.51</td>
<td class="data-td data last text-right">94.67</td>
<td class="data-td text-right data last" style="border-right: outset;">96.48</td>
<td class="data-td data last text-right">2.30</td>
</tr>
<tr class="tbl-data">
<td class="data-td last">Technology &amp; Electronics</td>
<td class="data-td data last text-right">6.22</td>
<td class="data-td data last text-right">5.81</td>
<td class="data-td data last text-right">6.67</td>
<td class="data-td text-right data last" style="border-right: outset;">6.79</td>
<td class="data-td data last text-right">194</td>
<td class="data-td data last text-right">188</td>
<td class="data-td data last text-right">184</td>
<td class="data-td text-right data last" style="border-right: outset;">207</td>
<td class="data-td data last text-right">94.14</td>
<td class="data-td data last text-right">92.99</td>
<td class="data-td data last text-right">92.27</td>
<td class="data-td text-right data last" style="border-right: outset;">92.85</td>
<td class="data-td data last text-right">1.07</td>
</tr>
<tr class="tbl-data">
<td class="data-td last">Telecommunications</td>
<td class="data-td data last text-right">13.00</td>
<td class="data-td data last text-right">13.39</td>
<td class="data-td data last text-right">11.10</td>
<td class="data-td text-right data last" style="border-right: outset;">11.88</td>
<td class="data-td data last text-right">366</td>
<td class="data-td data last text-right">368</td>
<td class="data-td data last text-right">413</td>
<td class="data-td text-right data last" style="border-right: outset;">396</td>
<td class="data-td data last text-right">92.22</td>
<td class="data-td data last text-right">90.01</td>
<td class="data-td data last text-right">81.48</td>
<td class="data-td text-right data last" style="border-right: outset;">86.34</td>
<td class="data-td data last text-right">6.55</td>
</tr>
<tr class="tbl-data">
<td class="data-td last">Transportation</td>
<td class="data-td data last text-right">2.09</td>
<td class="data-td data last text-right">2.23</td>
<td class="data-td data last text-right">2.60</td>
<td class="data-td text-right data last" style="border-right: outset;">1.10</td>
<td class="data-td data last text-right">209</td>
<td class="data-td data last text-right">170</td>
<td class="data-td data last text-right">150</td>
<td class="data-td text-right data last" style="border-right: outset;">249</td>
<td class="data-td data last text-right">94.92</td>
<td class="data-td data last text-right">95.37</td>
<td class="data-td data last text-right">96.07</td>
<td class="data-td text-right data last" style="border-right: outset;">99.28</td>
<td class="data-td data last text-right">0.85</td>
</tr>
<tr class="tbl-data">
<td class="data-td last">Utility</td>
<td class="data-td data last text-right">8.71</td>
<td class="data-td data last text-right">8.54</td>
<td class="data-td data last text-right">2.17</td>
<td class="data-td text-right data last" style="border-right: outset;">2.22</td>
<td class="data-td data last text-right">139</td>
<td class="data-td data last text-right">122</td>
<td class="data-td data last text-right">185</td>
<td class="data-td text-right data last" style="border-right: outset;">206</td>
<td class="data-td data last text-right">92.18</td>
<td class="data-td data last text-right">91.13</td>
<td class="data-td data last text-right">96.23</td>
<td class="data-td text-right data last" style="border-right: outset;">97.19</td>
<td class="data-td data last text-right">1.45</td>
</tr>
<tr class="tbl-data">
<td class="data-td last">Total</td>
<td class="data-td data last text-right">100</td>
<td class="data-td text-right data last" style="border-right: outset;">100</td>
<td class="data-td data last text-right">285</td>
<td class="data-td data last text-right">247</td>
<td class="data-td data last text-right">252</td>
<td class="data-td text-right data last" style="border-right: outset;">259</td>
<td class="data-td data last text-right">91.20</td>
<td class="data-td data last text-right">91.22</td>
<td class="data-td data last text-right">90.32</td>
<td class="data-td text-right data last" style="border-right: outset;">91.90</td>
<td class="data-td data last text-right">2.15</td>
</tr>
</tbody>
</table>
</div>
<p class="chart-disclosure">Source: ICE Data Services, VanEck. Returns are based on partial period data. Fallen Angels: ICE US Fallen Angel High Yield 10% Constrained Index. Not intended as a recommendation to invest or divest in any of the sectors mentioned herein. Index performance is not representative of strategy performance. It is not possible to invest in an index.</p>
<p><strong>Fallen Angels Performance by Rating:</strong> The rating exposure remained stable with BB-rated bonds still dominating fallen angels at approximately 87% exposure. The higher quality of fallen angels continues to offer a compelling case for those investors looking for higher yields and lower volatility, as broad high yield exposure to BB-rated bonds is just 53%. The six issuers that represent the CCC and CC rated buckets in fallen angels outperformed their higher rated peers, but when compared to the broad high yield, the BB-rated bonds were the top contributors to July&rsquo;s outperformance. The +120% return in Embarq Corporation (the only issuer rated CC) also contributed, but to a lesser degree due to its small exposure.</p>
<div class="wrapped-div">
<table style="width: 100%;">
<tbody>
<tr class="tbl-data">
<td class="tbl-header last text-center">&nbsp;</td>
<td class="tbl-header last text-center" style="border-right: outset;" colspan="4">Wgt (%)</td>
<td class="tbl-header last text-center" style="border-right: outset;" colspan="4">OAS</td>
<td class="tbl-header last text-center" style="border-right: outset;" colspan="4">Price</td>
<td class="tbl-header last text-right">Total Return</td>
</tr>
<tr class="tbl-data">
<td class="data-head last text-right">&nbsp;</td>
<td class="data-head last text-right">12/31/23</td>
<td class="data-head last text-right">3/31/24</td>
<td class="data-head last text-right">6/30/24</td>
<td class="data-head last text-right" style="border-right: outset;">7/31/24</td>
<td class="data-head last text-right">12/31/23</td>
<td class="data-head last text-right">3/31/24</td>
<td class="data-head last text-right">6/30/24</td>
<td class="data-head last text-right" style="border-right: outset;">7/31/24</td>
<td class="data-head last text-right">12/31/23</td>
<td class="data-head last text-right">3/31/24</td>
<td class="data-head last text-right">6/30/24</td>
<td class="data-head last text-right" style="border-right: outset;">7/31/24</td>
<td class="data-head last text-right">MTD</td>
</tr>
<tr class="tbl-data">
<td class="data-td last">BB</td>
<td class="data-td data last text-right">80.55</td>
<td class="data-td data last text-right">81.63</td>
<td class="data-td data last text-right">87.62</td>
<td class="data-td text-right data last" style="border-right: outset;">86.83</td>
<td class="data-td data last text-right">219</td>
<td class="data-td data last text-right">190</td>
<td class="data-td data last text-right">210</td>
<td class="data-td text-right data last" style="border-right: outset;">220</td>
<td class="data-td data last text-right">92.44</td>
<td class="data-td data last text-right">92.85</td>
<td class="data-td data last text-right">92.62</td>
<td class="data-td text-right data last" style="border-right: outset;">93.84</td>
<td class="data-td data last text-right">1.64</td>
</tr>
<tr class="tbl-data">
<td class="data-td last">B</td>
<td class="data-td data last text-right">13.43</td>
<td class="data-td data last text-right">12.87</td>
<td class="data-td data last text-right">7.89</td>
<td class="data-td text-right data last" style="border-right: outset;">8.05</td>
<td class="data-td data last text-right">317</td>
<td class="data-td data last text-right">330</td>
<td class="data-td data last text-right">371</td>
<td class="data-td text-right data last" style="border-right: outset;">358</td>
<td class="data-td data last text-right">96.46</td>
<td class="data-td data last text-right">93.99</td>
<td class="data-td data last text-right">90.73</td>
<td class="data-td text-right data last" style="border-right: outset;">91.76</td>
<td class="data-td data last text-right">1.63</td>
</tr>
<tr class="tbl-data">
<td class="data-td last">CCC</td>
<td class="data-td data last text-right">5.44</td>
<td class="data-td data last text-right">5.51</td>
<td class="data-td data last text-right">4.19</td>
<td class="data-td text-right data last" style="border-right: outset;">4.45</td>
<td class="data-td data last text-right">1,130</td>
<td class="data-td data last text-right">893</td>
<td class="data-td data last text-right">505</td>
<td class="data-td text-right data last" style="border-right: outset;">481</td>
<td class="data-td data last text-right">69.40</td>
<td class="data-td data last text-right">68.48</td>
<td class="data-td data last text-right">80.90</td>
<td class="data-td text-right data last" style="border-right: outset;">84.64</td>
<td class="data-td data last text-right">5.16</td>
</tr>
<tr class="tbl-data">
<td class="data-td last">CC</td>
<td class="data-td data last text-right">&nbsp;</td>
<td class="data-td data last text-right">0.30</td>
<td class="data-td text-right data last" style="border-right: outset;">0.67</td>
<td class="data-td data last text-right">&nbsp;</td>
<td class="data-td data last text-right">5,719</td>
<td class="data-td text-right data last" style="border-right: outset;">2,603</td>
<td class="data-td data last text-right">&nbsp;</td>
<td class="data-td data last text-right">13.00</td>
<td class="data-td text-right data last" style="border-right: outset;">29.14</td>
<td class="data-td data last text-right">122.95</td>
</tr>
<tr class="tbl-data">
<td class="data-td last">Total</td>
<td class="data-td data last text-right">100</td>
<td class="data-td text-right data last" style="border-right: outset;">100.00</td>
<td class="data-td data last text-right">285</td>
<td class="data-td data last text-right">247</td>
<td class="data-td data last text-right">252</td>
<td class="data-td text-right data last" style="border-right: outset;">259</td>
<td class="data-td data last text-right">91.20</td>
<td class="data-td data last text-right">91.22</td>
<td class="data-td data last text-right">90.32</td>
<td class="data-td text-right data last" style="border-right: outset;">91.90</td>
<td class="data-td data last text-right">2.15</td>
</tr>
</tbody>
</table>
</div>
<p class="chart-disclosure">Source: ICE Data Services, VanEck. Fallen Angels: ICE US Fallen Angel High Yield 10% Constrained Index. Not intended as a recommendation to invest or divest in any of the sectors mentioned herein. Index performance is not representative of strategy performance. It is not possible to invest in an index. BB index: ICE BofA BB US High Yield Index; Single-B index: ICE BofA Single-B US High Yield Index; CCC &amp; Lower rated index ICE BofA CCC &amp; Lower US High Yield Index.</p>
<p>To receive more <a href="/us/en/blogs/income-investing/" title="Income Investing Insights"><strong>Income Investing</strong></a> insights, <a href="/link/5f45412c2143400497908cea2897f7d3.aspx" title=" Subscription Center"><strong>sign up in our subscription center</strong></a>.</p>
]]></content:encoded>
</item><item rdf:about="https://www.vaneck.com/us/en/blogs/income-investing/preferreds-look-attractive-but-mind-the-financials/">
  <title>Preferred Securities Look Attractive, but Mind the Financials></title>
  <link>https://www.vaneck.com/us/en/blogs/income-investing/preferreds-look-attractive-but-mind-the-financials/</link>
  <description><![CDATA[Preferred securities are trading at attractive discounts, however, just as many are looking to manage their Mag 7 exposure, we believe the same risk management applies to preferreds as well.]]></description>
  <dc:creator>Coulter Regal, CFA</dc:creator>
  <dc:date>08/14/2024 06:30:00</dc:date>
<content:encoded><![CDATA[

<p>Preferred securities prices were hit hard during the rate hiking cycle, leading to valuations not seen since the Global Financial Crisis and creating an attractive entry point for income-oriented investors. Some caution is warranted, however, as turmoil in financials and banks, industries which dominate preferred issuance, continues to linger.</p>
<h2>Attractive Valuation and Yield Offer Entry to Preferred Securities</h2>
<p>Given their long-dated maturities, and even perpetual nature, preferreds are highly sensitive to changing interest rates and bond yields. With the historic pace of the rate hiking cycle between 2022 and 2023, preferred prices plunged as the Federal Funds Rate rose from near zero to over five percent. Today, preferreds are trading at discounts to par value not seen since the Global Financial Crisis, representing attractive total return opportunities.</p>
<h3>Historical Price to Par of The Preferreds Market | Jan. 2000 &ndash; July 2024</h3>
<p><img class="img-responsive w-100" src="https://www.vaneck.com/contentassets/f32876ca57484fb282fbf35d1b6f6796/4225_pfxf_chart-1_2023.03_blog.svg" alt="Historical Price to Par of the Preferreds Market" /></p>
<p class="chart-disclosure">Source: ICE Data Indices. Preferreds Market represented by the ICE BofA Fixed Rate Preferred Securities Index (P0P1). As of 7/31/2024.</p>
<p>The average price of the ICE BofA Fixed Rate Preferred Securities Index is now trading at a price-to-par ratio of roughly 0.92, indicating an 8% discount to par and an even greater discount to the 1.07 ratio seen in July 2021, just prior to the start of the rate hiking cycle. Outside of the 2008-2009 financial crisis and very briefly during the 2020 COVID crash, preferreds have rarely traded at the discount level seen today, creating a potential capital appreciation opportunity for investors.</p>
<p>Low prices have created an attractive opportunity from a yield perspective as well. Since yield moves inversely to price, the decline in prices has sent yields on preferreds soaring. The average yield-to-worst of the ICE BofA Fixed Rate Preferred Securities Index is now at about 6%. This is up sharply compared to the 3% average yield-to-worst seen at the beginning of 2022, giving investors the chance to lock in high yields on top of the capital appreciation opportunity.</p>
<h2>Preferred Securities Have Historically Been Strong Performers Following Rate Hikes</h2>
<p>Valuation and yield are one part of the story, but how can investors expect preferreds to perform given our position in current the rate cycle? Looking back at the performance of preferreds during the last four rate hiking cycles, after interest rates peak, returns in the preferreds market have been strong for the next two years. On average preferreds have returned over 15% in the two years following the final rate hike of the cycle. This average return increases to over 20% if you exclude the 2005-2008 rate cycle which was impacted by the Global Financial Crisis. While past performance is not a predictor of future outcomes, this data provides a favorable historical foundation.</p>
<p>Looking at the current cycle, this trend of strong performance following the final rate hike appears to be playing out similar to past cycles. Since the last rate increase, in July 2023, the preferreds market is up a little more than 10%. While it is still early, this recent performance could be a sign of more positive returns in the months ahead, particularly if rate cuts do begin this year and the U.S. economy remains resilient.</p>

<h3>Preferreds Performance During Interest Rate Cycles | As of July 2024</h3>
<p><img class="img-responsive w-100" src="https://www.vaneck.com/contentassets/173333cf54724c99a60d5e303ef630d8/d75f3336-dcee-4933-87b7-a9fb3e159072.svg" alt="Performance of Preferreds During Interest Rate Cycles" /></p>
<p class="chart-disclosure">Source: ICE Data Indices. Preferreds Market represented by the ICE BofA Fixed Rate Preferred Securities Index (P0P1). As of 7/31/2024.</p>
<h2>The Concentration Risk That Few Are Talking About</h2>
<p>Concerns are abundant around the concentration risk of the meg-cap &ldquo;Magnificent 7,&rdquo;&nbsp; which command nearly 30% of the S&amp;P 500 and significantly influence the U.S. equity market. This concern is well-founded, but there exists another, and arguably more severe, concentration risk that has flown under the radar: the high financials and bank exposure within the preferred securities market.</p>
<p>Following the financial crisis in 2008, banks and other financial institutions began issuing a significant amount of preferred securities to meet the higher capital levels required by regulators. This proliferation of preferreds issuance by financial companies resulted in the sector's concentration, which now makes up over 80% of the U.S. preferreds market. Drilling down even further, the banking industry is specifically responsible for about half of this financial concentration, with the remainder being financial services and insurance companies<sup>1</sup>.</p>
<p>This issue, though not receiving the same level of attention as the Mag 7, poses a risk that demands scrutiny, particularly as the turmoil of New York Community Bank (NYCM) seen just earlier this year reminds us that many banks are still navigating a challenging environment with high interest rates and impacted commercial real estate loan portfolios that could take years to playout. With banks making up roughly 40% of the preferreds market, any loss of confidence in the sector could severely impact the portfolios of investors. Just like many are looking to manage their Mag 7 equity exposure, I would argue that the same risk management is warranted in the preferreds market as well.</p>
<h2>Access to Preferred Securities Without the Financials</h2>
<p>Those looking to take advantage of the valuation and yield opportunities present in the preferreds market while also avoiding bank exposure should consider the <a href="https://www.vaneck.com/us/en/investments/preferred-securities-ex-financials-etf-pfxf/overview/" title="PFXF - VanEck Preferred Securities ex Financials ETF - Holdings and Performance"><strong>VanEck Preferred Securities ex Financials ETF (PFXF)</strong></a>. PFXF offers investors access to the U.S.-listed preferred securities market that excludes securities issued by financials, which many might find particularly attractive given the current banking concerns.</p>
<p>Beyond the obvious benefits of excluding financials in the current market, ex-financial preferreds generally also offer a number of other benefits over the broad preferreds market that investors might find attractive. Historically higher yield, greater sector diversification and strong relative performance compared to broad preferreds universe.</p>
<p>The <a href="https://www.vaneck.com/us/en/investments/preferred-securities-ex-financials-etf-pfxf/overview/" title="PFXF - VanEck Preferred Securities ex Financials ETF - Holdings and Performance"><strong>VanEck Preferred Securities ex Financials ETF (PFXF)</strong></a> seeks to replicate as closely as possible, before fees and expenses, the price and yield performance of the ICE Exchange-Listed Fixed &amp; Adjustable Rate Non-Financial Preferred Securities Index (PFAN), which is intended to track the overall performance of U.S. exchange-listed hybrid debt, preferred stock and convertible preferred stock issued by non-financial corporations.</p>
<p>To receive more <a href="https://www.vaneck.com/us/en/insights/income-investing/" title="Income Investing insights"><strong>Income Investing</strong></a> insights, <a href="/link/5f45412c2143400497908cea2897f7d3.aspx" title=" Subscription Center"><strong>sign up in our subscription center</strong></a>.</p>
]]></content:encoded>
</item><item rdf:about="https://www.vaneck.com/us/en/blogs/income-investing/understanding-cbis-green-bond-dataset-methodology/">
  <title>How Are Green Bonds Evaluated?></title>
  <link>https://www.vaneck.com/us/en/blogs/income-investing/understanding-cbis-green-bond-dataset-methodology/</link>
  <description><![CDATA[Learn how green bonds are evaluated and classified by the Climate Bond Initiative&rsquo;s methodology, which adheres to foundational principles and employs a thorough and transparent screening process.]]></description>
  <dc:creator>Sunny  Bokhari</dc:creator>
  <dc:date>08/13/2024 06:30:00</dc:date>
<content:encoded><![CDATA[

<p>As the global community intensifies its work to combat climate change, the need to finance these efforts has become increasingly evident. Green bonds, which fund projects with environmental benefits, are at the forefront of this movement. The Climate Bonds Initiative (CBI), an international not-for-profit organization, has established standards to independently evaluate green bonds and identify assets or projects consistent with a 2-degree global warming target set by the COP 21 Paris Agreement. Grounded in climate science and developed through a multi-stakeholder approach, CBI&rsquo;s taxonomy aims to standardize criteria for green investments and support market growth by reducing greenwashing risk. The CBI has developed a robust methodology to screen and classify green bonds, and the <strong><a href="https://www.vaneck.com/us/en/investments/green-bond-etf-grnb/overview/" title="GRNB - VanEck Green Bond ETF - Overview">VanEck Green Bond ETF (GRNB)</a></strong> tracks an index that only includes green bonds aligned with the CBI taxonomy.</p>
<h2>Foundational Principles</h2>
<p>The CBI's Green Bond Dataset Methodology is built on four foundational principles designed to protect the environmental integrity of the bonds:</p>
<p><img class="img-responsive w-100" alt="Foundational Principles" src="https://www.vaneck.com/contentassets/3e037ff109614f49aca44ceb82694d8f/4725_grnb-blog-and-email_infographic_2024-8_v1_option-1.svg" /></p>
<ol class="content-list">
<li class="mt-2"><strong>Green Credentials and Environmental Impact:</strong> Mandates that projects funded by green bonds result in significant emissions reductions or other positive environmental impacts. This ensures that the financial support is directed towards genuinely green initiatives.</li>
<li class="mt-2"><strong>Science-Based Verification:</strong> Based on scientific research and data-driven insights to substantiate and verify the environmental benefits of funded projects.</li>
<li class="mt-2"><strong>Flexibility and Practicality:</strong> Designed to be both scientifically rigorous and practically usable to accommodate evolving technologies and shifting environmental priorities.</li>
<li class="mt-2"><strong>Minimum Safeguards:</strong> Includes safeguards that screen out activities potentially harmful to the environment to prevent negative environmental impacts.</li>
</ol>
<h2>Key Considerations in the Screening Process</h2>
<p>The screening process of the Green Bond Dataset Methodology involves multiple steps to ensure that only bonds with strong green credentials are included and integrates critical considerations for robustness and flexibility:</p>
<h3>Climate Bonds Initiative Green Bonds Assessment Process</h3>
<p class="d-none d-lg-block"><img class="img-responsive" alt="Key Considerations in the Screening Process" src="https://www.vaneck.com/contentassets/3e037ff109614f49aca44ceb82694d8f/4725_grnb-blog-and-email_infographic-2_2024-8_v1_dekstop.svg" /></p>
<p class="d-lg-none"><img class="img-responsive" alt="Key Considerations in the Screening Process" src="https://www.vaneck.com/contentassets/3e037ff109614f49aca44ceb82694d8f/4725_grnb-blog-and-email_infographic-2_2024-8_v1_mobile.svg" /></p>
<p class="chart-disclosure">Source: Climate Bonds Initiative.</p>
<ul class="content-list">
<li class="mt-2"><strong>Comprehensive Search:</strong> The methodology involves a wide-ranging search across financial platforms, focusing on self-labeled green bonds and considering other relevant labels such as &ldquo;blue&rdquo; and &ldquo;climate action&rdquo; bonds.</li>
<li class="mt-2"><strong>Sector-Specific Definitions:</strong> Bonds are evaluated based on their alignment with sector-specific definitions and eligibility conditions, so that the financed projects deliver significant environmental benefits.</li>
<li class="mt-2"><strong>Flexible Approaches:</strong> A margin of flexibility allows for up to 10% of deal size to be allocated where there is uncertainty about alignment, accommodating sectors where metrics may not be readily available.</li>
<li class="mt-2"><strong>Lookback Period:</strong> A two-year lookback period is employed for complex assessments to analyze the issuer&rsquo;s expenditures and evaluate alignment with eligibility criteria.</li>
<li class="mt-2"><strong>Exclusions and Additional Considerations:</strong> Bonds with more than 10% of total proceeds allocated to non-green activities are excluded. Sectors such as fossil fuel power, inefficient building standards, and non-aligned expenses are not considered, so that only genuinely green projects are funded.</li>
</ul>

<h2>Ongoing Review and Reclassification</h2>
<p>The Climate Bonds Initiative (CBI) uses a variety of sources to analyze a bond&rsquo;s use of proceeds and to conduct ongoing reviews of the bonds in the Green Bonds Dataset. CBI considers information provided by issuers as well as external assessments by third parties. The CBI also reviews post-issuance green bond reporting, including environmental impact reports, to assess compliance.</p>
<p>If an issuer is unable to meet green bond methodology criteria based on information collected, the bond will be removed from the Green Bond Dataset. Similarly, a bond can be retroactively added to the Green Bond Dataset if an issuer discloses satisfactory information on use-of-proceeds data and associated impact.</p>
<p>The Climate Bonds Initiative's Green Bond Dataset Methodology provides a robust framework for evaluating and classifying green bonds. By adhering to foundational principles and employing a thorough screening process ensuring transparency, the methodology supports the growth of a credible and reliable green bond market. As the world continues its transition towards a low-carbon and climate-resilient future, such methodologies are crucial in helping investors direct capital towards projects that genuinely benefit the environment.</p>

<h2>How to Invest in Green Bonds?</h2>
<p><a href="https://www.vaneck.com/us/en/investments/green-bond-etf-grnb/overview/" title="GRNB - VanEck Green Bond ETF - Overview"><strong>VanEck Green Bond ETF (GRNB<sup>&reg;</sup>)</strong></a> seeks to replicate, as closely as possible, before fees and expenses, the price and yield performance of the S&amp;P Green Bond U.S. Dollar Select Index (SPGRUSST). The index is comprised of U.S. dollar-denominated bonds issued to finance environmentally friendly projects. To be eligible the issuer must clearly indicate the intended use of proceeds, and the bond must be designated as &ldquo;green&rdquo; by the Climate Bonds Initiative.</p>
<p>To receive more <a href="https://www.vaneck.com/us/en/insights/income-investing/" title="Income Investing Insights"><strong>Income Investing</strong></a> insights, <a href="https://www.vaneck.com/us/en/subscribe/" title="Subscription Center"><strong>sign up in our subscription center</strong></a>.</p>
]]></content:encoded>
</item><item rdf:about="https://www.vaneck.com/us/en/blogs/thematic-investing/ai-across-industries/">
  <title>AI in Unexpected Places: Transforming Healthcare, Gaming, Retail, and Beyond></title>
  <link>https://www.vaneck.com/us/en/blogs/thematic-investing/ai-across-industries/</link>
  <description><![CDATA[Explore the transformative impact of artificial intelligence as it forges new paths across a range of unexpected industries, revolutionizing healthcare, gaming, and retail.]]></description>
  <dc:creator>Drew  Anderson</dc:creator>
  <dc:date>08/12/2024 06:30:00</dc:date>
<content:encoded><![CDATA[

<h1>Unexpected Industries Using AI: Healthcare, Gaming, &amp; More</h1>
<p>Artificial intelligence (AI) has made its mark in many unexpected places, creating innovative solutions and transforming industries in ways that were once thought impossible. From healthcare to gaming and retail, AI is driving efficiencies, enhancing user experiences, and creating new opportunities for growth. In this blog, we will explore AI&rsquo;s transformative power in three unexpected industries:</p>
<ul class="content-list">
<li class="mt-2"><strong><a href="#AI-in-Healthcare">AI in Healthcare: Revolutionizing patient care and drug development.</a></strong></li>
<li class="mt-2"><strong><a href="#AI-in-Gaming">AI in Gaming: Enhancing player experience and game development.</a></strong></li>
<li class="mt-2"><strong><a href="#AI-in-Retail">AI in Retail: Improving customer experience and operational efficiencies.</a></strong></li>
</ul>
<h2 id="AI-in-Healthcare" class="jump-link-nav anchored-block" data-jumplink-title="AI in Healthcare">Generative AI in Healthcare</h2>
<p>The integration of Generative AI in healthcare represents a significant leap forward in streamlining operations, reducing costs, and enhancing patient care. This advanced application of AI is transforming how healthcare professionals approach their daily tasks and interact with patients.</p>
<p><strong>Automating Routine Tasks</strong></p>
<p>Generative AI is adept at automating routine administrative and clinical tasks, which typically consume a substantial amount of healthcare professionals' time. By handling these tasks, AI allows healthcare staff to dedicate more time to direct patient care. For instance, AI systems can automatically update patient records, schedule appointments, and manage billing, which reduces administrative burdens and minimizes the risk of human error.</p>
<p><strong>Creating Personalized Treatment Plans</strong></p>
<p>One of the most impactful applications of Generative AI is in the development of personalized treatment plans. By analyzing vast amounts of data from electronic health records (EHRs), genetic information, and ongoing research, AI can identify the most effective treatment options tailored to individual patient needs. This approach is particularly beneficial in complex cases such as cancer or chronic diseases, where treatment customization can significantly improve outcomes.</p>
<p><strong>Predicting Patient Outcomes</strong></p>
<p>Generative AI also plays a crucial role in predicting patient outcomes. It can process and analyze historical health data and current clinical inputs to forecast the progression of a disease or the likely response to a specific treatment. This capability is invaluable for proactive management of conditions, enabling interventions that are timely and more likely to succeed, thereby enhancing the quality of care and patient satisfaction.</p>
<p><strong>Assisting with Diagnosis</strong></p>
<p>AI's ability to assist with diagnosis is another area where it provides substantial benefits. Generative AI models are trained on vast datasets and can recognize patterns that may be subtle or complex for human eyes. For instance, AI-driven diagnostic tools can analyze imaging scans to detect abnormalities, such as tumors in their early stages, with high accuracy. This aids in early diagnosis, which is often critical for successful treatment outcomes.</p>
<p><strong>Cost Reduction</strong></p>
<p>By automating routine tasks, personalizing treatment plans, and improving diagnostic accuracy, Generative AI significantly cuts healthcare costs. It reduces the need for repetitive tests, unnecessary procedures, and helps in allocating resources more effectively. Hospitals and healthcare systems that adopt these AI technologies can expect not only improved patient care but also enhanced operational efficiencies, leading to substantial cost savings.</p>
<p>Generative AI is revolutionizing the healthcare industry by providing tools that improve efficiency, reduce costs, and enhance the quality of patient care. As this technology continues to evolve and integrate deeper into various healthcare processes, its potential to transform the landscape of healthcare is immense. By embracing Generative AI, healthcare providers can ensure better health outcomes, optimized operations, and a more sustainable healthcare system.</p>
<h3>AI in Pharmaceuticals</h3>
<p><strong><a href="https://www.vaneck.com/us/en/blogs/thematic-investing/how-the-pharmaceutical-industry-is-using-ai/" title="How the Pharmaceutical Industry is Using AI">Pharmaceutical firms are incorporating AI in their operations</a></strong> to drive better patient outcomes, analyze data, and streamline drug development processes. AI is currently being implemented within the industry to reduce human error, streamline processes and analyze data to develop new pharmaceuticals. As a result, AI has the potential to improve patient outcomes, lower costs for industry participants, and revolutionize the pharmaceutical industry.</p>
<p>Industry-leading pharmaceutical firms are adopting artificial intelligence to drive value for the future of their enterprise. For example, companies like Eli Lilly<sup>*</sup>&nbsp;are leveraging AI to innovate and reduce the costs associated with drug development. Technological advancements in AI are crucial for advancing drug development and enhancing patient care, enabling faster and more accurate discovery of new therapies.</p>
<h3>AI in Biotech</h3>
<p>AI is revolutionizing biotech research and development by providing powerful tools for data analysis and generating valuable insights. Here&rsquo;s a closer look at how specific companies are leveraging AI in this sector:</p>
<p><strong>Amgen<sup>*</sup></strong></p>
<p>Amgen is at the forefront of utilizing AI to accelerate drug discovery and development. By employing AI algorithms, Amgen can analyze vast datasets of genetic information, patient records, and biological data to identify potential drug targets more quickly and accurately. AI helps streamline the process of identifying compounds that have the highest likelihood of success, significantly reducing the time and cost associated with traditional drug discovery methods. Moreover, AI-driven predictive modeling allows Amgen to simulate the effects of drugs on biological systems, enabling the design of more effective and targeted therapies.</p>
<p><strong>AI's Broader Impact on Biotech</strong></p>
<p>Beyond individual companies, AI is transforming the biotech landscape by enabling the development of personalized medicine and precision therapies. AI algorithms analyze patient-specific data to tailor treatments that match the genetic and biological profiles of individuals, leading to more effective and targeted interventions. This personalized approach is particularly valuable in treating complex diseases such as cancer, where AI can identify the most promising treatment options based on a patient&rsquo;s unique characteristics.</p>
<p>Additionally, AI is facilitating the integration of multi-omics data (such as genomics, proteomics, and metabolomics) to provide a holistic understanding of biological processes. This comprehensive analysis helps researchers uncover new biomarkers, understand disease mechanisms, and develop novel therapeutic strategies. AI&rsquo;s ability to synthesize and interpret vast amounts of biological data is driving innovation in biotech research and paving the way for groundbreaking discoveries.</p>
<h2 id="AI-in-Gaming" class="jump-link-nav anchored-block" data-jumplink-title="AI in Gaming">AI in Gaming</h2>
<p>The gaming industry has long been a testing ground for AI technologies, with AI enhancing both game development and player experience. AI is used to create more realistic and dynamic game environments, adapt game difficulty levels, and personalize gaming experiences based on player behavior. Advanced Micro Devices (AMD)<sup>*</sup>&nbsp;is a key player in developing AI-powered semiconductors that improve graphics and performance in gaming consoles. Electronic Arts (EA)<sup>*</sup>&nbsp;uses AI to transform real-life football players into lifelike video game characters, offering players an immersive experience. AI's growing influence on game development is shaping industry trends and pushing the boundaries of what's possible in gaming.</p>
<p><strong>Enhancing Game Development</strong></p>
<p>AI plays a crucial role in modern game development, providing developers with tools that create more realistic and dynamic environments. These tools can generate complex game landscapes and realistic non-player character (NPC) behaviors, reducing the workload on human developers and allowing for more creative freedom in game design. AI algorithms can automate the creation of detailed textures and intricate environments, which traditionally would take countless man-hours to craft manually.</p>
<p><strong>Adapting Game Difficulty Levels</strong></p>
<p>AI enhances player engagement by dynamically adjusting game difficulty. By analyzing player performance and behavior, AI can modify game challenges in real-time, providing a tailored experience that keeps the game accessible and challenging for players of all skill levels. This adaptive difficulty helps maintain a consistent level of challenge, improving player satisfaction and retention.</p>
<p><strong>Personalizing Player Experience</strong></p>
<p>AI-driven systems are used to personalize the gaming experience, making it more engaging for each player. By observing a player&rsquo;s choices and behaviors, AI can alter game narratives and interactions to fit individual preferences. This customization extends to recommending game content that aligns with the player's interests, further enhancing their engagement with the game.</p>
<p><strong>Electronic Arts (EA)</strong></p>
<p>Electronic Arts utilizes AI to bring a high level of realism and interactivity to its games. A notable application is in sports games like FIFA, where EA uses AI to transform real-life football players into detailed, lifelike video game characters. This is achieved through sophisticated motion capture technologies combined with AI algorithms that analyze and replicate player movements, facial expressions, and even playing styles. By incorporating these realistic simulations, EA provides gamers with an immersive experience that closely mirrors actual sporting events.</p>
<p>EA also leverages AI in enhancing gameplay mechanics and interactivity. For instance, AI is used to improve NPC intelligence, making them react more realistically to player actions and decisions within the game. This leads to more believable and responsive game worlds where each player&rsquo;s actions have a profound impact on the game environment and narrative.</p>
<p><strong>Shaping Industry Trends</strong></p>
<p>The influence of AI is also evident in the broader gaming industry trends. Developers are increasingly adopting AI to push the boundaries of what games can offer, from deeply immersive virtual realities to complex, evolving storylines that adapt to player decisions. AI is also instrumental in the development of augmented reality (AR) and virtual reality (VR), where it helps to create more immersive and interactive experiences.</p>
<h2 id="AI-in-Retail" class="jump-link-nav anchored-block" data-jumplink-title="AI in Retail">AI in Retail</h2>
<p>AI is transforming the retail industry by offering solutions that enhance customer experience, optimize inventory management, and streamline supply chain operations. Here&rsquo;s a detailed look at how AI is driving these changes and the impact on major players like Amazon<sup>*</sup>&nbsp;and JD.com<sup>*</sup>:</p>
<p><strong>Enhancing Customer Experience</strong></p>
<p>AI technologies are central to creating personalized and engaging shopping experiences for customers. By analyzing vast amounts of customer data, AI can identify patterns and preferences, enabling retailers to tailor marketing efforts to individual shoppers. This personalization is evident in targeted advertisements, customized email campaigns, and product recommendations that align with a customer's past behavior and interests.</p>
<p>AI-powered chatbots and virtual assistants are also improving customer service by providing instant support and answers to queries, enhancing the overall shopping experience. These AI-driven tools can handle a wide range of customer interactions, from answering frequently asked questions to assisting with product selection and purchase decisions.</p>
<p><strong>Optimizing Inventory Management</strong></p>
<p>Effective inventory management is crucial for retailers to meet customer demands without overstocking. AI plays a significant role in predicting demand trends by analyzing historical sales data, market conditions, and external factors such as seasonality and promotions. These insights allow retailers to make informed decisions about stock levels, minimizing excess inventory and reducing holding costs.</p>
<p>AI systems also enable real-time inventory tracking, ensuring that stock levels are accurately monitored across various locations. This capability helps retailers quickly identify and address discrepancies, leading to more efficient inventory management and reduced waste.</p>
<p><strong>Streamlining Supply Chain Operations</strong></p>
<p>AI is revolutionizing supply chain management by automating and optimizing various processes, resulting in faster and more efficient operations. Machine learning algorithms analyze data from multiple sources to identify bottlenecks, optimize delivery routes, and predict potential disruptions. This proactive approach allows retailers to mitigate risks and maintain smooth operations.</p>
<p>AI-driven robotics and automation systems are increasingly used in warehouses to improve picking, packing, and sorting processes. These technologies increase efficiency and accuracy while reducing labor costs and the likelihood of human error.</p>
<p><strong>Amazon: Leading the Way in AI Integration</strong></p>
<p>Amazon is a pioneer in using AI to transform its retail operations. The company employs AI to manage its vast inventory and automate its supply chain, ensuring products are delivered to customers quickly and efficiently. Amazon&rsquo;s AI systems analyze customer purchasing patterns and trends to optimize inventory placement, reducing delivery times and costs.</p>
<p>The company&rsquo;s AI-driven recommendation engine is a prime example of how AI enhances customer experience. By analyzing customer behavior, the recommendation engine suggests products that are most likely to interest individual shoppers, driving sales and customer satisfaction.</p>
<h2>How Semiconductors are Fueling the AI Industry</h2>
<p>The development of advanced semiconductors is crucial to the growth of artificial intelligence, as they provide the necessary processing power to run complex AI algorithms efficiently. Semiconductors, particularly those designed for AI applications, enable the rapid processing of vast amounts of data, making them indispensable in powering AI technologies across various industries.</p>

<p>Key Roles of Semiconductors in AI</p>
<ol class="content-list">
<li class="mt-2"><strong>Processing Power:</strong> Semiconductors are the backbone of AI computing, providing the raw processing power required to handle intensive computations. This is particularly important for AI tasks such as machine learning and deep learning, which involve large-scale data processing and complex mathematical operations.</li>
<li class="mt-2"><strong>Energy Efficiency:</strong> Advanced semiconductors are designed to deliver high performance while minimizing energy consumption. This efficiency is vital for AI applications that require constant processing, such as real-time data analysis and autonomous systems, where energy constraints can be a significant concern.</li>
<li class="mt-2"><strong>Scalability:</strong> Semiconductor technology enables the scaling of AI systems to accommodate growing data volumes and increasing computational demands. With advancements in semiconductor design, such as smaller transistor sizes and innovative architectures, AI systems can be scaled to meet the needs of diverse applications, from cloud computing to edge devices.</li>
<li class="mt-2"><strong>Specialized AI Chips:</strong> The development of specialized AI chips, such as Graphics Processing Units (GPUs), Tensor Processing Units (TPUs), and Application-Specific Integrated Circuits (ASICs), has been instrumental in accelerating AI performance. These chips are optimized for parallel processing and efficient execution of AI algorithms, offering significant advantages over traditional Central Processing Units (CPUs).</li>
</ol>
<p><strong>Impact on AI-Driven Industries</strong></p>
<p>The continued development of advanced semiconductors is vital to the progress of AI, providing the foundation for innovations that drive the industry forward. As semiconductor technologies evolve, they will unlock new possibilities for AI applications across diverse sectors, enhancing capabilities and expanding the reach of AI solutions. For a comprehensive analysis of how semiconductors are shaping the AI landscape, you can explore <strong><a href="https://www.vaneck.com/us/en/blogs/thematic-investing/silicon-alchemists-and-ai-2023-semiconductors-outlook/" title="Silicon Alchemists &amp; AI: 2023 Semiconductors Outlook">VanEck's 2023 Semiconductor Outlook</a></strong>.</p>
<h2>Conclusion</h2>
<p>AI is reshaping industries across the board, from healthcare and pharmaceuticals to gaming and retail. As AI continues to evolve, its applications will expand, driving innovation and efficiency in even more unexpected areas.</p>
<p>To learn more about ways to invest in AI and related sectors, please explore the VanEck strategies below:</p>
<div class="wrapped-div">
<table style="width: 450px;">
<tbody>
<tr class="tbl-data">
<td class="tbl-header last">Ticker</td>
<td class="tbl-header last text-left">Name</td>
</tr>
<tr class="tbl-data">
<td class="data-td last font-weight-normal"><strong><a href="https://www.vaneck.com/us/en/investments/biotech-etf-bbh/overview/" title="BBH - VanEck Biotech ETF - Holdings and Performance">BBH</a></strong></td>
<td class="data-td data last text-left"><strong><a href="https://www.vaneck.com/us/en/investments/biotech-etf-bbh/overview/" title="BBH - VanEck Biotech ETF - Holdings and Performance">Biotech ETF</a></strong></td>
</tr>
<tr class="tbl-data">
<td class="data-td last font-weight-normal"><strong><a href="https://www.vaneck.com/us/en/investments/gaming-etf-bjk/overview/" title="BJK - VanEck Gaming ETF - Holdings and Performance">BJK</a></strong></td>
<td class="data-td data last text-left"><a href="https://www.vaneck.com/us/en/investments/gaming-etf-bjk/overview/" title="BJK - VanEck Gaming ETF - Holdings and Performance"><strong>Gaming ETF</strong></a></td>
</tr>
<tr class="tbl-data">
<td class="data-td last font-weight-normal"><strong><a href="https://www.vaneck.com/us/en/investments/pharmaceutical-etf-pph/overview/" title="PPH - VanEck Pharmaceutical ETF - Holdings and Performance">PPH</a></strong></td>
<td class="data-td data last text-left"><strong><a href="https://www.vaneck.com/us/en/investments/pharmaceutical-etf-pph/overview/" title="PPH - VanEck Pharmaceutical ETF - Holdings and Performance">Pharmaceutical ETF</a></strong></td>
</tr>
<tr class="tbl-data">
<td class="data-td last font-weight-normal"><strong><a href="https://www.vaneck.com/us/en/investments/retail-etf-rth/overview/" title="RTH - VanEck Retail ETF - Holdings and Performance">RTH</a></strong></td>
<td class="data-td data last text-left"><strong><a href="https://www.vaneck.com/us/en/investments/retail-etf-rth/overview/" title="RTH - VanEck Retail ETF - Holdings and Performance">Retail ETF</a></strong></td>
</tr>
<tr class="tbl-data">
<td class="data-td last font-weight-normal"><strong><a href="https://www.vaneck.com/us/en/investments/robotics-etf-ibot/overview/" title="IBOT - VanEck Robotics ETF - Holdings and Performance">IBOT</a></strong></td>
<td class="data-td data last text-left"><strong><a href="https://www.vaneck.com/us/en/investments/robotics-etf-ibot/overview/" title="IBOT - VanEck Robotics ETF - Holdings and Performance">Robotics ETF</a></strong></td>
</tr>
<tr class="tbl-data">
<td class="data-td last font-weight-normal"><strong><a href="https://www.vaneck.com/us/en/investments/semiconductor-etf-smh/overview/" title="SMH - VanEck Semiconductor ETF - Holdings and Performance ">SMH</a></strong></td>
<td class="data-td data last text-left"><strong><a href="https://www.vaneck.com/us/en/investments/semiconductor-etf-smh/overview/" title="SMH - VanEck Semiconductor ETF - Holdings and Performance">Semiconductor ETF</a></strong></td>
</tr>
<tr class="tbl-data">
<td class="data-td last font-weight-normal"><a href="https://www.vaneck.com/us/en/investments/video-gaming-esports-etf-espo/overview/" title="ESPO - VanEck Video Gaming and eSports ETF - Holdings and Performance "><strong>ESPO</strong></a></td>
<td class="data-td data last text-left"><a href="https://www.vaneck.com/us/en/investments/video-gaming-esports-etf-espo/overview/" title="ESPO - VanEck Video Gaming and eSports ETF - Holdings and Performance"><strong>Video Gaming and eSports ETF</strong></a></td>
</tr>
</tbody>
</table>
</div>
<br />
<p>To receive more <a href="https://www.vaneck.com/us/en/insights/thematic-investing/" title="Thematic Investing Insights"><strong>Thematic Investing</strong></a> insights, <a href="https://www.vaneck.com/us/en/subscribe/" title="Subscription Center"><strong>sign up in our subscription center</strong></a>.</p>
<style>
    .wrapped-div {
        max-width: 100%;
    }

    @media (max-width: 1240px) {
        .wrapped-div {
            overflow-x: scroll;
        }
    }

    .wrapped-div-sector {
        max-width: 100%;
        overflow-x: scroll;
    }
</style>
]]></content:encoded>
</item><item rdf:about="https://www.vaneck.com/us/en/blogs/gold-investing/ima-casanova-miners-margins-grow-as-gold-soars-to-fresh-highs/">
  <title>Miners’ Margins Grow as Gold Soars to Fresh Highs></title>
  <link>https://www.vaneck.com/us/en/blogs/gold-investing/ima-casanova-miners-margins-grow-as-gold-soars-to-fresh-highs/</link>
  <description><![CDATA[Gold reached new highs in July due to concerns over escalating global geopolitical risks, a shift towards safer and more defensive assets and speculation about an imminent Fed rate cut.]]></description>
  <dc:creator>Imaru Casanova</dc:creator>
  <dc:date>08/09/2024 06:30:00</dc:date>
<content:encoded><![CDATA[

<p>Monthly gold market and economic insights from Imaru Casanova, Portfolio Manager, featuring her unique views on mining and gold&rsquo;s portfolio benefits.</p>

<h2>Another month, another high!</h2>
<p>Gold reached intra-day highs of $2,431 in April; $2,450 in May; and $2,483 per ounce in July. Gold&rsquo;s rally this year has been impressive. The sideways price action that we were expecting, following such a strong start to the year, has occurred at a much higher level than we would have predicted.</p>
<h3>Gold has averaged around $2,358 per ounce since its April peak</h3>
<p><img class="img-responsive w-100" alt="Gold has averaged around $2,358 per ounce since its April peak" src="https://www.vaneck.com/contentassets/b2f621aa52cf4e16bd0cd2b48d323433/4720_gold_chart-1_2024-8_blog.svg" /></p>
<p class="chart-disclosure">Source: Bloomberg. Data as of July 31, 2024.</p>

<h2>Key drivers: heightened geopolitical risk and market rotation</h2>
<p>In July, gold continued to be supported by heightened global geopolitical risk as the U.S. elections took an unexpected turn, and tensions worsened in the Middle East. Gold's strength in July coincided with a 1.60% decline in the Nasdaq 100 Index<sup>1</sup>, reflecting a broader pullback in equity markets driven by powerful technology stocks. &ldquo;Rotation&rdquo; was a hot word in financial markets in July &ndash; it is fair to assume that gold would benefit from such a rotation into safer, cheaper, or more defensive assets. Investment demand, as gauged by the holdings of gold bullion backed ETFs, picked up in July, with net inflows resulting in a 1.8% increase in holdings during the month.</p>
<h2>Also&hellip;rate cuts</h2>
<p>Last, but not least, lower-than-expected June U.S. Consumer Price Index<sup>2</sup>&nbsp;readings seem to have convinced markets that the U.S. Federal Reserve (Fed) will soon cut rates, supporting gold. At the end of July, three 25 basis point cuts were priced in for 2024, compared to two cuts priced in at the end of June. Lower real interest rates have historically been positive for gold. The performance of gold in the year or so following the start of the last three rate cutting cycles supports this view (chart below). Gold closed on July 31 at $2,447.60 per ounce, up $120.85 or 5.19% during the month.</p>
<h3>Historically, gold has performed well following the Fed&rsquo;s first rate cuts</h3>
<p><img class="img-responsive w-100" alt="Historically, gold has performed well following the Fed&rsquo;s first rate cuts" src="https://www.vaneck.com/contentassets/52d24fcaedbf439ea2e98f41de83854f/4720_gold_chart-2_2024-8_blog.svg" /></p>
<p class="chart-disclosure">Source: JPMorgan, VanEck. Data as of July 31, 2024.</p>
<h2>Miners are starting to shine</h2>
<p>Gold stocks showed their gold price leverage in July. The NYSE Arca Gold Miners Index (GDMNTR)<sup>3</sup>&nbsp;and the MVIS Global Juniors Gold Miners Index (MVGDXJTR)<sup>4</sup>&nbsp;were up 10.91% and 8.38%, respectively, amply outperforming bullion. For the gold miners, these record gold prices mean record margins. With costs contained, their free cash flow generation expanded significantly in Q2 (see table below).</p>
<h3>Healthy margins for miners these days&mdash;despite higher costs</h3>
<div class="wrapped-div">
<table style="width: 100%;">
<tbody>
<tr class="tbl-data">
<td class="tbl-header last">&nbsp;</td>
<td class="tbl-header last text-right">AISC ($)</td>
<td class="tbl-header last text-right">Gold Price (Avg., $/oz)</td>
<td class="tbl-header last text-right">Implied Margin ($)</td>
</tr>
<tr class="tbl-data">
<td class="data-td last">10-Year Average (thru Q4 2023)</td>
<td class="data-td data last text-right">1,053</td>
<td class="data-td data last text-right">1,497</td>
<td class="data-td data last text-right">444</td>
</tr>
<tr class="tbl-data">
<td class="data-td last">5-Year Average (thru Q4 2023)</td>
<td class="data-td data last text-right">1,156</td>
<td class="data-td data last text-right">1,747</td>
<td class="data-td data last text-right">591</td>
</tr>
<tr class="tbl-data">
<td class="data-td last">Q1 2024</td>
<td class="data-td data last text-right">1,429</td>
<td class="data-td data last text-right">2,072</td>
<td class="data-td data last text-right">643</td>
</tr>
<tr class="tbl-data">
<td class="data-td last">Q2 2024</td>
<td class="data-td data last text-right">1,428</td>
<td class="data-td data last text-right">2,338</td>
<td class="data-td data last text-right">910</td>
</tr>
</tbody>
</table>
</div>
<p class="chart-disclosure">The all-in sustaining cost (AISC) is a metric used by gold mining companies to calculate the cost of their mining operations. The World Gold Council first introduced the metric in 2013.</p>
<p class="chart-disclosure">Source: Scotiabank, VanEck. Data as of June 30, 2024.</p>
<p>Gold companies have been reporting their financial and operating results for Q2 2024. We track a universe of companies during the earnings season to assess how they deliver against expectations, and thus far, the updates appear to be a net positive for the sector with about 80% of results beating or meeting consensus estimates. This is encouraging, and we continue to stress how critical it is that these companies consistently meet their targets. Achieving this should lead to higher valuations that are supported not only by high free cash flow yields during periods of record gold prices, but also by the markets&rsquo; conviction that these companies are solid, sustainable and profitable businesses, able to offer positive returns throughout the commodity cycles.</p>
<h2>Demand could still be a major catalyst</h2>
<p>As of end-July, gold and gold stocks were among the top performing assets so far this year. While gold has reached new highs, gold stocks remain well below their historic peaks. Even a slight increase in global capital allocations to gold and gold mining stocks could have a material impact on the price of gold and gold equities, given that the sector represents a very small percentage (approximately 1%<sup>*</sup>) of global financial assets. Similarly, despite very robust purchasing of gold in recent years, as a group, central banks of emerging economies remain relatively underinvested in gold, with indications that they are looking to increase their percentage of total reserves held in gold. If both investors and central banks&rsquo; sentiment towards gold and gold equities continues to improve from here, the additional demand could have a significant positive impact on the gold price and the valuations of gold stocks.</p>
<h3>China/EM central banks have been big buyers&hellip;but could be bigger&hellip;</h3>
<p><img class="img-responsive w-100" alt="China/EM central banks have been big buyers...but could be bigger..." src="https://www.vaneck.com/contentassets/a9f6164b0eec4de58414ca85ad045598/4720_gold_chart-3_2024-8_blog.svg" /></p>
<p class="chart-disclosure">Source: Goldman Sachs, World Gold Council. Data as of June 30, 2024.</p>
<p>To receive more <strong><a href="https://www.vaneck.com/us/en/insights/gold-investing/" title="Gold Investing Insights">Gold Investing</a></strong> insights, <strong><a href="https://www.vaneck.com/us/en/subscribe/" title="Subscription Center">sign up in our subscription center</a></strong>.</p>
<style>
    .data-td.data {
        padding-right: 5px !important;
    }
    
    .data-head { 
    padding-right: 5px !important;
    }

    .wrapped-div {
        max-width: 100%;
    }

    @media (max-width: 1240px) {
        .wrapped-div {
            overflow-x: scroll;
        }
    }

    .wrapped-div-sector {
        max-width: 100%;
        overflow-x: scroll;
    }
</style>
]]></content:encoded>
</item><item rdf:about="https://www.vaneck.com/us/en/blogs/moat-investing/moat-stocks-gain-as-mega-caps-falter/">
  <title>Moat Stocks Gain as Mega-Caps Falter></title>
  <link>https://www.vaneck.com/us/en/blogs/moat-investing/moat-stocks-gain-as-mega-caps-falter/</link>
  <description><![CDATA[As mega-cap tech stocks stumbled, July may mark the onset of a market rotation into more value-oriented investments. This may prove favorable for Morningstar&rsquo;s Moat Index.]]></description>
  <dc:creator>Coulter Regal, CFA</dc:creator>
  <dc:date>08/08/2024 06:30:00</dc:date>
<content:encoded><![CDATA[

<p>July saw a notable shift in U.S. equities. The Magnificent 7 tech sell-off drove a divergence between mega-cap growth stocks and the more value-oriented and smaller large-cap segment of the market. Nvidia and the rest of the Mag 7 have led the market for much of the year, and their sharp declines in July pulled down the broader market indexes. Meanwhile, small-caps and value-oriented areas of the market saw significant gains during the same period. While this rotation out of the mega-caps has only recently emerged, this trend may just have legs as many investors now appear to be looking for ways to reduce their exposure to the <strong><a href="https://www.vaneck.com/us/en/blogs/investment-outlook/jan-van-eck-adapt-your-portfolio-for-market-distortions-and-fiscal-risks/#market-distortion" title="Adapt Your Portfolio for Market Distortions and Fiscal Risks">historic levels of concentration in equity markets</a></strong> today.</p>
<p>The <a href="https://www.vaneck.com/us/en/investments/morningstar-wide-moat-etf-moat/overview/" title="MOAT - VanEck Morningstar Wide Moat ETF - Overview"><strong>Morningstar Wide Moat Focus Index</strong></a> (the &ldquo;Moat Index&rdquo;) significantly outperformed in July, gaining 5.44% versus the 1.22% return for the S&amp;P 500 Index. Driving this outperformance was an underweight to mega-cap tech, as well as strong stock selection, particularly within the industrials sector. More on drivers of performance are below. Year-to-date, the Moat Index remains a laggard to S&amp;P 500, given its value bias and structural underweight to mega-caps, but this <a href="https://www.vaneck.com/us/en/blogs/moat-investing/moat-index-holds-contrarian-edge-in-todays-market/" title="Moat Index Holds Contrarian Edge in Today&rsquo;s Market"><strong>contrarian positioning</strong></a> may prove favorable going forward as market dynamics shift.</p>
<p>After months of struggle, U.S. smaller cap stocks staged a remarkable turnaround in July, with the pure small-cap benchmark rising over 10% and the mid-cap benchmark up nearly 6%. A strong consumer price index (CPI) release on July 11 was a primary catalyst for this rally in smaller names. The CPI report showed further easing in inflation, increasing the market-implied odds of a September rate cut by the U.S. Federal Reserve. The <a href="https://www.vaneck.com/us/en/investments/morningstar-smid-moat-etf-smot/index/" title="SMOT - VanEck Morningstar SMID Moat ETF - Overview"><strong>Morningstar US Small-Mid Cap Moat Focus Index</strong></a> (the &ldquo;SMID Moat Index&rdquo;) trailed pure small-caps, but slightly outpaced mid-caps in July.</p>
<h3>Moat Stocks Rebound in July</h3>
<p><img class="img-responsive w-100" src="https://www.vaneck.com/contentassets/7647bf784b5849e1af43f46f823397ea/4719_moat-smot-monthly_chart-1_2024-8_v1_blog.svg" alt="Moat Stocks Rebound in July" /></p>
<p class="chart-disclosure"><strong>Source: Morningstar. Data as of 7/31/2024.</strong> Past performance is no guarantee of future results. Index performance is not representative of fund performance. It is not possible to invest directly in an index. Fund performance current to the most recent month end is available by visiting vaneck.com or by calling 800.826.2333.</p>
<h2 id="magnificent-rotation" class="jump-link-nav anchored-block" data-jumplink-title="Magnificent Rotation">The Beginning of a Magnificent Rotation?</h2>
<p>Much of this year has been characterized by extreme levels of concentration within the U.S. equity market, driven by the Magnificent 7 and the mania around AI. Over the last few weeks, Nvidia and mega-cap tech have stumbled in what could be characterized as the start of a &ldquo;Magnificent Rotation.&rdquo; Stretched valuations and questions around when the massive capital expenditures in AI will begin to deliver a return have led investors to take some chips off the table and rotate into more value-oriented areas of the market.</p>
<p>Since Nvidia&rsquo;s mid-June all-time high, it has fallen roughly 20% through the beginning of August, dragging down the broader market, while the Moat Index gained over 5% during the same period. The Moat Index benefited from its focus on high quality companies with attractive valuations, which has guided it toward a slight value bias and pushed it away from mega-cap tech. The Moat Index&rsquo;s positioning has been a headwind for much of 2024, but may now prove beneficial considering current market dynamics. Further illustrating the rotation away from the Mag 7, the equal weighted variant of the S&amp;P 500 index was also up during the period; however, its low-conviction methodology that indiscriminately allocates equally to all 500 constituents lagged the Moat Index.</p>
<h3>Moat Index Rebounds on Rotation Away from Mega-Caps</h3>
<p><img class="img-responsive w-100" src="https://www.vaneck.com/contentassets/6db3969ed3b44ac2aa69e1afa3462a82/4719_moat-smot-monthly_chart-2_2024-8_v1_blog.svg" alt="Moat Index Rebounds on Rotation Away from Mega-Caps" /></p>
<p class="chart-disclosure"><strong>Source: Morningstar. As of 8/1/2024</strong>. Past performance is no guarantee of future results. Index performance is not representative of fund performance. It is not possible to invest directly in an index. Fund performance current to the most recent month end is available by visiting vaneck.com or by calling 800.826.2333.</p>

<h2 id="moat-highlights" class="jump-link-nav anchored-block" data-jumplink-title="Moat Highlights">Moat Index Highlights: Notable Stock Selection</h2>
<p>Beyond the underweight to mega-cap tech, strong stock selection within the strategy was also a notable driver of relative performance in July. Selection effect during the month accounted for over 300 basis points of outperformance versus the S&amp;P 500. The majority of that is attributable to Industrial names, which are heavily featured in the top contributors table this month.</p>
<p>Consumer credit bureaus TransUnion (TRU) and Equifax (EFX) were both top contributors to performance during the month off the back of strong second quarter earnings results that sent shares of TRU and EFX up 21% and 15%, respectively. On TransUnion, Morningstar equity analyst Rajiv Bhatia maintained his $100 fair value estimate, noting that he continues to view the risk/reward profile on TRU shares as attractive. Other top contributors within Industrials include aerospace and defense manufacturer RTX as well as residential and commercial security products company Allegion (ALLE), which were each up over 15% in July.</p>
<p>Names detracting from the Moat Index this month were largely within the Technology sector, with the semiconductor industrial automation equipment provider Teradyne Inc. (TER) and the well-known mega-cap tech conglomerate Alphabet (GOOGL) both as top detractors. Other detractors include Charles Schwab (SCHW), global beauty products seller Estee Lauder (EL) and drug manufacturer Biogen (BIIB).</p>
<h2>Top Contributors and Detractors from Moat Index - July 2024</h2>
<h3>Leading Contributors</h3>
<div class="wrapped-div">
<table style="width: 100%;">
<tbody>
<tr class="tbl-data">
<td class="tbl-header last">Company</td>
<td class="tbl-header last text-left">Ticker</td>
<td class="tbl-header last text-left">Sector</td>
<td class="tbl-header last text-right">Avg. Weight (%)</td>
<td class="tbl-header last text-right">Contribution (%)</td>
</tr>
<tr class="tbl-data">
<td class="data-td last font-weight-normal">TransUnion</td>
<td class="data-td data last text-left">TRU</td>
<td class="data-td data last text-left">Industrials</td>
<td class="data-td data last text-right">2.33</td>
<td class="data-td data last text-right">0.51</td>
</tr>
<tr class="tbl-data">
<td class="data-td last font-weight-normal">RTX Corp.</td>
<td class="data-td data last text-left">RTX</td>
<td class="data-td data last text-left">Industrials</td>
<td class="data-td data last text-right">2.56</td>
<td class="data-td data last text-right">0.44</td>
</tr>
<tr class="tbl-data">
<td class="data-td last font-weight-normal">Allegion</td>
<td class="data-td data last text-left">ALLE</td>
<td class="data-td data last text-left">Industrials</td>
<td class="data-td data last text-right">2.35</td>
<td class="data-td data last text-right">0.37</td>
</tr>
<tr class="tbl-data">
<td class="data-td last font-weight-normal">Bristol-Myers Squibb Co.</td>
<td class="data-td data last text-left">BMY</td>
<td class="data-td data last text-left">Healthcare</td>
<td class="data-td data last text-right">2.20</td>
<td class="data-td data last text-right">0.36</td>
</tr>
<tr class="tbl-data">
<td class="data-td last font-weight-normal">Equifax Inc.</td>
<td class="data-td data last text-left">EFX</td>
<td class="data-td data last text-left">Industrials</td>
<td class="data-td data last text-right">2.32</td>
<td class="data-td data last text-right">0.35</td>
</tr>
</tbody>
</table>
</div>
<h3>Leading Detractors</h3>
<div class="wrapped-div">
<table style="width: 100%;">
<tbody>
<tr class="tbl-data">
<td class="tbl-header last">Company</td>
<td class="tbl-header last text-left">Ticker</td>
<td class="tbl-header last text-left">Sector</td>
<td class="tbl-header last text-right">Avg. Weight (%)</td>
<td class="tbl-header last text-right">Contribution (%)</td>
</tr>
<tr class="tbl-data">
<td class="data-td last font-weight-normal">Teradyne Inc.</td>
<td class="data-td data last text-left">TER</td>
<td class="data-td data last text-left">Technology</td>
<td class="data-td data last text-right">1.68</td>
<td class="data-td data last text-right">-0.19</td>
</tr>
<tr class="tbl-data">
<td class="data-td last font-weight-normal">Charles Schwab Corp.</td>
<td class="data-td data last text-left">SCHW</td>
<td class="data-td data last text-left">Financial Services</td>
<td class="data-td data last text-right">1.35</td>
<td class="data-td data last text-right">-0.16</td>
</tr>
<tr class="tbl-data">
<td class="data-td last font-weight-normal">The Estee Lauder Companies Inc.</td>
<td class="data-td data last text-left">EL</td>
<td class="data-td data last text-left">Consumer Defensive</td>
<td class="data-td data last text-right">2.10</td>
<td class="data-td data last text-right">-0.13</td>
</tr>
<tr class="tbl-data">
<td class="data-td last font-weight-normal">Biogen Inc.</td>
<td class="data-td data last text-left">BIIB</td>
<td class="data-td data last text-left">Healthcare</td>
<td class="data-td data last text-right">1.30</td>
<td class="data-td data last text-right">-0.10</td>
</tr>
<tr class="tbl-data">
<td class="data-td last font-weight-normal">Alphabet Inc.</td>
<td class="data-td data last text-left">GOOGL</td>
<td class="data-td data last text-left">Technology</td>
<td class="data-td data last text-right">1.72</td>
<td class="data-td data last text-right">-0.10</td>
</tr>
</tbody>
</table>
</div>
<br />
<p class="chart-disclosure"><strong>Source: Morningstar, July 2024</strong>. Past performance is no guarantee of future results. Index performance is not illustrative of fund performance. Not intended as a recommendation to buy or to sell any of the securities mentioned herein.</p>

<h2 id="smid-moat-highlights" class="jump-link-nav anchored-block" data-jumplink-title="SMID Moat Highlights">SMID Moat Index Highlights: Morningstar Raises Allegion Fair Value Estimate</h2>
<p>The smaller cap SMID Moat Index also benefited from the above-mentioned TransUnion (TRU) as the mid-cap stock&rsquo;s July performance led the pack of SMID moat companies as well. Regional automobile dealership Asbury Automotive Group (ABG) was also a top contributor as shares rose over 18% in anticipation of its early August quarter earnings report. Another top contributor was Allegion (ALLE), a global leader in security products and solutions, which saw its share price spike following a strong earnings report. Morningstar&rsquo;s Brian Bernard noted that wide-moat Allegion&rsquo;s second quarter financial performance came in ahead of expectations with increased forward guidance as well. Brain raised his fair value estimate to $151 per share due to a more optimistic near-term revenue growth profit margin outlook.</p>
<p>Names that most negatively contributed to the SMID Moat Index performance during the month include internet content and e-commerce platform Pinterest (PINS), North America&rsquo;s second-largest ride-sharing service provider Lyft (LYFT), packed food company Lamb Weston (LW), the largest global cruise company Carnival (CCL), and independent broker/dealer LPL Financial (LPLA), which all declined by double digits in July.</p>
<h2>Top Contributors and Detractors from SMID Moat Index - July 2024</h2>
<h3>Leading Contributors</h3>
<div class="wrapped-div">
<table style="width: 100%;">
<tbody>
<tr class="tbl-data">
<td class="tbl-header last">Company</td>
<td class="tbl-header last text-left">Ticker</td>
<td class="tbl-header last text-left">Sector</td>
<td class="tbl-header last text-right">Avg. Weight (%)</td>
<td class="tbl-header last text-right">Contribution (%)</td>
</tr>
<tr class="tbl-data">
<td class="data-td last font-weight-normal">TransUnion</td>
<td class="data-td data last text-left">TRU</td>
<td class="data-td data last text-left">Industrials</td>
<td class="data-td data last text-right">1.26</td>
<td class="data-td data last text-right">0.28</td>
</tr>
<tr class="tbl-data">
<td class="data-td last font-weight-normal">Asbury Automotive Group</td>
<td class="data-td data last text-left">ABG</td>
<td class="data-td data last text-left">Consumer Cyclical</td>
<td class="data-td data last text-right">1.40</td>
<td class="data-td data last text-right">0.26</td>
</tr>
<tr class="tbl-data">
<td class="data-td last font-weight-normal">Mattel Inc.</td>
<td class="data-td data last text-left">MAT</td>
<td class="data-td data last text-left">Consumer Cyclical</td>
<td class="data-td data last text-right">1.21</td>
<td class="data-td data last text-right">0.23</td>
</tr>
<tr class="tbl-data">
<td class="data-td last font-weight-normal">SS&amp;C Technologies</td>
<td class="data-td data last text-left">SSNC</td>
<td class="data-td data last text-left">Technology</td>
<td class="data-td data last text-right">1.37</td>
<td class="data-td data last text-right">0.23</td>
</tr>
<tr class="tbl-data">
<td class="data-td last font-weight-normal">Allegion</td>
<td class="data-td data last text-left">ALLE</td>
<td class="data-td data last text-left">Industrials</td>
<td class="data-td data last text-right">1.29</td>
<td class="data-td data last text-right">0.21</td>
</tr>
</tbody>
</table>
</div>
<h3>Leading Detractors</h3>
<div class="wrapped-div">
<table style="width: 100%;">
<tbody>
<tr class="tbl-data">
<td class="tbl-header last">Company</td>
<td class="tbl-header last text-left">Ticker</td>
<td class="tbl-header last text-left">Sector</td>
<td class="tbl-header last text-right">Avg. Weight (%)</td>
<td class="tbl-header last text-right">Contribution (%)</td>
</tr>
<tr class="tbl-data">
<td class="data-td last font-weight-normal">Pinterest Inc.</td>
<td class="data-td data last text-left">PINS</td>
<td class="data-td data last text-left">Communication Services</td>
<td class="data-td data last text-right">0.82</td>
<td class="data-td data last text-right">-0.23</td>
</tr>
<tr class="tbl-data">
<td class="data-td last font-weight-normal">Lyft Inc.</td>
<td class="data-td data last text-left">LYFT</td>
<td class="data-td data last text-left">Technology</td>
<td class="data-td data last text-right">1.13</td>
<td class="data-td data last text-right">-0.17</td>
</tr>
<tr class="tbl-data">
<td class="data-td last font-weight-normal">Lamb Weston Inc.</td>
<td class="data-td data last text-left">LW</td>
<td class="data-td data last text-left">Consumer Defensive</td>
<td class="data-td data last text-right">0.57</td>
<td class="data-td data last text-right">-0.16</td>
</tr>
<tr class="tbl-data">
<td class="data-td last font-weight-normal">Carnival Corp.</td>
<td class="data-td data last text-left">CCL</td>
<td class="data-td data last text-left">Consumer Cyclical</td>
<td class="data-td data last text-right">1.47</td>
<td class="data-td data last text-right">-0.16</td>
</tr>
<tr class="tbl-data">
<td class="data-td last font-weight-normal">LPL Financial Inc.</td>
<td class="data-td data last text-left">LPLA</td>
<td class="data-td data last text-left">Financial Services</td>
<td class="data-td data last text-right">0.67</td>
<td class="data-td data last text-right">-0.14</td>
</tr>
</tbody>
</table>
</div>
<br />
<p class="chart-disclosure"><strong>Source: Morningstar, July 2024</strong>. Past performance is no guarantee of future results. Index performance is not illustrative of fund performance. Not intended as a recommendation to buy or to sell any of the securities mentioned herein.</p>
<h2>Choose Your Moat Strategy</h2>
<p>VanEck&rsquo;s suite of <strong><a href="https://www.vaneck.com/us/en/blogs/moat-investing/moat-investing-powered-by-morningstar/" title="Quality Companies at Attractive Prices">moat investing strategies</a></strong> is powered by Morningstar&rsquo;s equity research team, which seeks quality companies trading at attractive valuations. The below ETFs offer access to US moat companies:</p>
<p><strong><a href="/link/9e43dd198c5f4e419f13220685081895.aspx" title="MOAT - VanEck Morningstar Wide Moat ETF - Overview">VanEck Morningstar Wide Moat ETF (MOAT)</a>:</strong> companies with a wide moat rating, which means Morningstar believes the company is likely to sustain its competitive advantage for at least the next 20 years.</p>
<p><strong><a href="/link/166321dbcfec440590fb51cf0ad629aa.aspx" title="SMOT - VanEck Morningstar SMID Moat ETF - Overview">VanEck Morningstar SMID Moat ETF (SMOT)</a></strong>: small and mid-cap moat companies.</p>
<p>To receive more&nbsp;<strong><a href="https://www.vaneck.com/us/en/insights/moat-investing/" title="Moat Investing Insights">Moat Investing</a></strong> insights, <strong><a href="https://www.vaneck.com/us/en/subscribe/" title="Preference Center">sign up in our subscription center</a></strong>.</p>
<style>
    .data-td.data {
        padding-right: 5px !important;
    }

    .wrapped-div {
        max-width: 100%;
    }

    @media (max-width: 1240px) {
        .wrapped-div {
            overflow-x: scroll;
        }
    }

    .wrapped-div-sector {
        max-width: 100%;
        overflow-x: scroll;
    }
</style>
]]></content:encoded>
</item><item rdf:about="https://www.vaneck.com/us/en/blogs/digital-assets/matthew-sigel-vaneck-crypto-monthly-recap-for-july-2024/">
  <title>VanEck Crypto Monthly Recap for July 2024></title>
  <link>https://www.vaneck.com/us/en/blogs/digital-assets/matthew-sigel-vaneck-crypto-monthly-recap-for-july-2024/</link>
  <description><![CDATA[Before August&rsquo;s bloodbath, Bitcoin rose 6% in July, while Ethereum lagged, facing ETH ETP outflows and fee revenue issues due to EIP-4844.]]></description>
  <dc:creator>Matthew  Sigel</dc:creator>
  <dc:date>08/07/2024 06:30:00</dc:date>
<content:encoded><![CDATA[

<p><strong>Please note that VanEck may have a position(s) in the digital asset(s) described below.</strong></p>
<p>Bitcoin rose (+6%) in July vs. ETH (-4%), while the Nasdaq and S&amp;P 500 were (-1%) and (+1%), respectively. Bitcoin Magazine held its annual conference in Nashville, which VanEck attended, along with two of the three Presidential candidates (Trump and RFK Jr.), both of whom announced plans to establish US strategic reserves of BTC. We&rsquo;ve been writing about this possibility for years and released a <strong><a href="https://www.vaneck.com/us/en/blogs/digital-assets/matthew-sigel-bitcoin-2050-valuation-scenarios-global-medium-of-exchange-and-reserve-asset" title="Bitcoin 2050 Valuation Scenarios: Global Medium of Exchange and Reserve Asset">new model</a></strong> detailing some of our assumptions in July.</p>
<ul class="content-list">
<li><strong><a href="#Notable-Performers">Notable Performers: Helium (HLT) and Hivemapper (HONEY)</a></strong></li>
<li><strong><a href="#Notable-Laggards">Notable Laggards: Uniswap (UNI) and Lido (LDO)</a></strong></li>
</ul>
<p>Versus&rsquo; bitcoin&rsquo;s (+6%) gain, the market capitalization of layer 1 smart contract platform (SCP) tokens rose (+4%). Among SCPs, the clear winner of the month was Solana&rsquo;s SOL token, which recorded a gain of (+20%). Though it was not the worst-performing token of the month, Ethereum&rsquo;s ETH (-2%) lagged other majors as the ETH ETPs saw outflows of -$750M over the first 5 trading days.</p>
<p>Some of the largest catalysts for the month included the ether ETP launches, the German State of Saxony selling large tranches of BTC ($3B), and the return of BTC to Mt Gox claimants. Since July 5, Mt Gox has remitted $7B of its total $9B to estate account holders. Additionally, the US Congress failed to override the veto of the SAB 121 bill, as expected, while Circle obtained approval to issue USDC and EURC under Europe&rsquo;s MiCA regulatory framework.</p>
<h3>Price Returns</h3>
<div class="wrapped-div">
<table style="width: 600px;">
<tbody>
<tr class="tbl-data">
<td class="tbl-header last text-center">&nbsp;</td>
<td class="tbl-header last text-right">July (%)</td>
<td class="tbl-header last text-right">YTD (%)</td>
</tr>
<tr class="tbl-data">
<td class="data-td last">Bitcoin</td>
<td class="data-td data last text-right">6</td>
<td class="data-td data last text-right">54</td>
</tr>
<tr class="tbl-data">
<td class="data-td last">MarketVector Smart Contract Leaders Index</td>
<td class="data-td data last text-right">4</td>
<td class="data-td data last text-right">13</td>
</tr>
<tr class="tbl-data">
<td class="data-td last">MV Global Digital Assets Equity Index</td>
<td class="data-td data last text-right">4</td>
<td class="data-td data last text-right">42</td>
</tr>
<tr class="tbl-data">
<td class="data-td last">Coinbase</td>
<td class="data-td data last text-right">1</td>
<td class="data-td data last text-right">29</td>
</tr>
<tr class="tbl-data">
<td class="data-td last">S&amp;P 500 Index</td>
<td class="data-td data last text-right">1</td>
<td class="data-td data last text-right">16</td>
</tr>
<tr class="tbl-data">
<td class="data-td last">Nasdaq Index</td>
<td class="data-td data last text-right">-1</td>
<td class="data-td data last text-right">17</td>
</tr>
<tr class="tbl-data">
<td class="data-td last">Ethereum</td>
<td class="data-td data last text-right">-4</td>
<td class="data-td data last text-right">45</td>
</tr>
<tr class="tbl-data">
<td class="data-td last">MarketVector Meme Coin Index</td>
<td class="data-td data last text-right">-4</td>
<td class="data-td data last text-right">NA</td>
</tr>
<tr class="tbl-data">
<td class="data-td last">MarketVector Decentralized Finance Leaders Index</td>
<td class="data-td data last text-right">-10</td>
<td class="data-td data last text-right">-6</td>
</tr>
<tr class="tbl-data">
<td class="data-td last">MarketVector Infrastructure Application Leaders Index</td>
<td class="data-td data last text-right">-12</td>
<td class="data-td data last text-right">-17</td>
</tr>
</tbody>
</table>
</div>
<br />
<p class="chart-disclosure"><strong>Source:</strong> Bloomberg, as of 7/31/2024. <strong>Past performance is no guarantee of future results. Not intended as a recommendation to buy or sell any securities named herein.</strong></p>
<p>ETH ETPs finally launched on July 23. Net selling of the high-priced ETHE offering totaled -$1.7b or (-20%) of starting AUM compared to GBTC selling of -$2.1B (-8% of AUM) over the first 5 days of trading. In total, ETH ETPs saw outflows of -$750M vs bitcoin ETPs gaining +$846M of inflows. Though we partly attribute ETH&rsquo;s weakness to the outflows from the ETP launch, ETH also stumbled in July due to more pressing issues around its economics.</p>
<p>The financial effects of Ethereum&rsquo;s decision to implement EIP-4844 are still dragging on the price of ETH. This is because Ethereum fee revenue from user transactions continues to disappoint as the result of the changes enabled by EIP-4844. At the time of writing, ETH&rsquo;s average daily fee revenue was only $3M, the lowest since October 2023. This revenue drop occurs because EIP-4844 Ethereum created a new layer for Layer-2 data that reduced demand for transaction blockspace. The new layer, called &ldquo;Blob Space,&rdquo; is specifically designed to offer cheaper prices to Ethereum&rsquo;s L2 roll-ups who post their data to Ethereum. Blob Space also has its own pricing mechanism that adjusts pricing according to blockchain usage. However, since the demand for Blob Space is below targeted capacity, Blob Space prices have remained minuscule, averaging between $25k-$50k per day. Due to EIP-4844 lowering L2 prices, it is speculated that Ethereum L2s users have saved over $680M since EIP-4844 was instantiated on March 13, 2024.</p>
<h3>July Daily Blob Space Fees (USD) are the 2nd Lowest Recorded</h3>
<p><img class="w-100 img-responsive" src="https://www.vaneck.com/contentassets/59665648c2a145f386df939f61a4a9bb/4706_crypto-monthly-july-2024_chart-2_2024-8_v1_blog.svg" alt="July Daily Blob Space Fees (USD) are the 2nd Lowest Recorded." /></p>
<p class="chart-disclosure"><strong>Source:</strong> Dune @Hildobby as of 07/29/24. <strong>Past performance is no guarantee of future results. Not intended as a recommendation to buy or sell any securities named herein.</strong></p>
<p>Outside of the ETPs and government selling, the crypto news cycle spun out relatively few noteworthy items as we have reached the seasonal bear market for hard work (summer). Bitcoin fees declined an epic (-75%) in July compared to June. Curiously, the transaction count for Bitcoin was up (+7%) month to month, but the fee revenue for Runes, Inscriptions, and Regular transactions was down (-76%), (-59%), and (-79%), respectively. These declines in activity occurred because we did not see wild swings in transaction fees due to demand surges to trade Bitcoin&rsquo;s NFTs (Runes and Inscriptions).</p>
<p>Solana, whose SOL token had a banner month surging (+20%), also flipped Ethereum in average daily DEX volume for the first time in smart contract blockchain history. However, there is some dispute about the data due to the prevalence of wash trading on Solana versus Ethereum. Solana also recently announced an upgrade to compress the size of its blockchain history through zero-knowledge proof data compression. The upgrade enables Solana to retain and potentially improve its decentralized over the long-term (+10 years). Due to Solana&rsquo;s high throughput of transactions, Solana&rsquo;s blockchain requires massive amounts of data storage. Without effective data compression, Solana&rsquo;s blockchain growth would increasingly demand higher network bandwidth and more expensive servers to run nodes, resulting in more centralization. Hamilton Lane also made a big announcement to allow investors access to a private credit fund called SCOPE on Solana.</p>
<p>Polygon (-8%), a middle of the pack performer on the month who is pushing a new &ldquo;chain of chains&rdquo; architecture called the &ldquo;agg layer&rdquo; at the same time they are introducing a token upgrade and migration, will have its new token begin replacing on Sept 4, 2024. The new token, POL, will be swappable 1:1 for the old token, MATIC. Another interesting trend that continued in July was the ascension of the NEAR (+2%) blockchain from a usership standpoint. NEAR remains the second most used blockchain, by daily active users, at 1.95M, just below TRON at 2.1M. Just over 1 year ago NEAR had only 67k daily active users. Most of NEAR&rsquo;s usership is billed to be user-generated rather than bot-created, as NEAR&rsquo;s activity relates to a discount shopping application called Kai Kai, which is based in Taiwan.</p>
<h2 id="Notable-Performers" class="jump-link-nav anchored-block" data-jumplink-title="Notable Performers">July&rsquo;s Notable Performers - HNT (+39%)</h2>
<h3>Helium (HNT) &ndash; 1Y Market Cap (Circulating)</h3>
<p><img class="w-100 img-responsive" src="https://www.vaneck.com/contentassets/59665648c2a145f386df939f61a4a9bb/4706_crypto-monthly-july-2024_chart-3_2024-8_v1_blog.svg" alt="Helium (HNT) - 1Y Market Cap (Circulating)" /></p>
<p class="chart-disclosure"><strong>Source:</strong> Artemis XYZ as of 07/24/24. <strong>Past performance is no guarantee of future results. Not intended as a recommendation to buy or sell any securities named herein.</strong></p>
<p>Helium Network&rsquo;s native Helium Network Token (&ldquo;HNT&rdquo;) outperformed in July, driven by a variety of fundamental developments. Originally developed solely as an Internet of Things (IoT) network on its blockchain, Helium migrated to Solana in April 2023 before launching its consumer mobile service, Helium Mobile, in December. On July 15th, Helium Mobile <strong><a href="https://dune.com/queries/2859736/4782690" target="_blank" rel="noopener" title="Total Helium Mobile Subscriber NFTs">crossed </a></strong>100,000 subscribers, demonstrating noteworthy adoption for a crypto-based consumer application.</p>
<p>Helium Mobile combines legacy cellular networks with its own decentralized network of hotspots, offering subscribers 5G &lsquo;hybrid coverage&rsquo; for $20 per month. As a decentralized network, it is operated by individuals who run wireless hotspots from common places such as cafes, shops, or their homes. These operators earn MOBILE tokens as they provide coverage to nearby subscribers. In late June, Helium <strong><a href="https://blog.hellohelium.com/helium-mobile-expands-coverage-in-new-york-with-boosted-locations/" target="_blank" rel="noopener" title="Helium Mobile Expands Coverage in New York with Boosted Locations">announced </a></strong>boosted hotspot rewards for New York&rsquo;s most highly trafficked areas, indicating a strategy focused on delivering service to dense population centers.</p>
<p>Additionally, the network progressed on several other <strong><a href="https://blog.hellohelium.com/helium-mobile-network-roadmap-progress-july/" target="_blank" rel="noopener" title="Helium Mobile: Progress Toward Building the Future of Mobile Networks">initiatives </a></strong>to accelerate service scaling. The newly launched Helium Mobile Licensing Program will enable third-party device manufacturers to build hardware such as RAKwireless&rsquo;s mobile hotspot. The network is also becoming OpenRoaming-compatible. This allows cellular users of other networks to connect to Helium hotspots when they are out of range of their home networks. This enhances service and lowers mobile traffic costs for partnered cellular providers. We believe these developments suggest Helium&rsquo;s ability to ideate and deploy new scaling incentives, signaling the potential for continued innovation and growth.</p>
<p>One key catalyst for HNT's outperformance in July was the re-calibration of investor expectations for Helium, driven by its potential to become a hub for thousands of DePIN projects. Previously, Helium was seen as a network with limited growth and upside potential due to its focus on WiFi, Mobile, and IoT services. However, the introduction of Helium Improvement Proposal (HIP) 128, which adds an &ldquo;Energy Network&rdquo; rewarding solar power and battery resources, has changed this perception.</p>
<p>The real value of Helium may lie not in its current businesses but in its potential to coordinate many new DePIN projects. Helium's network of operators, incentivized by HNT, will likely support and bootstrap new networks, just as they did with Helium IoT.</p>
<p>This new dynamic positions Helium as a launchpad for DePIN projects, offering a geographically distributed and committed network of operators. While the total addressable market and growth potential for HNT have increased, the likelihood of capturing a significant portion remains low. Nevertheless, this shift in expectations helped drive HNT to a strong +39% performance in July.</p>
<h2>HONEY (+57%)</h2>
<h3>Weekly Mappers Earning HONEY Rewards</h3>
<p><img class="w-100 img-responsive" src="https://www.vaneck.com/contentassets/59665648c2a145f386df939f61a4a9bb/4706_crypto-monthly-july-2024_chart-4_2024-8_v1_blog.svg" alt="Weekly Mappers Earning HONEY Rewards" /></p>
<p class="chart-disclosure"><strong>Source:</strong> Dune Analytics - @insights4vc as of 07/27/24. <strong>Past performance is no guarantee of future results. Not intended as a recommendation to buy or sell any securities named herein.</strong></p>
<p>Hivemapper (HONEY) echoed Helium&rsquo;s success as the second biggest mover this month, further suggesting market enthusiasm around maturing DePIN projects. Launched on Solana in November 2022, Hivemapper&rsquo;s network aims to capture a living map of the globe through a decentralized fleet of drivers. Hivemapper&rsquo;s 5,600+ weekly mapping contributors <strong><a href="https://hivemapper.com/network/coverage?center=42.657214%2C-79.339862%2C2.510035105070945" title="Hivemapper - Build a Decentralized Global Map" target="_blank" rel="noopener">added </a></strong>~0.88M unique kilometers in the past 30 days to its total unique coverage of 14.60M km, representing 24% of global coverage. In late June, Hivemapper <strong><a href="https://x.com/Hivemapper/status/1806013817501241406?ref_src=twsrc%5Etfw%7Ctwcamp%5Etweetembed%7Ctwterm%5E1806013817501241406%7Ctwgr%5E6594c1085a2b7947d95bf49d97ed418e542575ce%7Ctwcon%5Es1_&amp;ref_url=https%3A%2F%2Fbeincrypto.com%2Fdepin-startup-maps-5x-faster-google%2F" title="Scaling our map at 4-5X the speed of Google." target="_blank" rel="noopener">reported </a></strong>that its map's growth rate is 4-5 times faster than Google's. This rapid growth is driven by investors who have equipped Uber, Lyft, Amazon, and commercial truck fleets with Hivemapper devices.</p>
<p>The basic idea involves users attaching specialized cameras to their cars, automatically sending images to the Hivemapper network to create highly up-to-date 3D maps. In return for supplying image data, drivers earn HONEY tokens. These images are used to update and expand a global map that Hivemapper utilizes in two main ways: to enhance its navigation app, aimed at competing with Google and Apple Maps, and to create a valuable data set available for enterprises &amp; fleet managers to purchase exclusively with HONEY tokens. In theory, this enables users who contribute data to the network to share in the economics of reducing costs and improving resiliency in the otherwise highly monopolized market of mapping networks. According to Hivemapper&rsquo;s Q2 2024 <strong><a href="https://assets.ctfassets.net/n5g2b08mtiib/4xixOOzKZHy76XHg2CjuQN/08c2791432d635fd32f9dc386e956244/Hivemapper_QuarterlyReport_Q2_Compressed.pdf" title="Hivemapper Q2 Quarterly Report" target="_blank" rel="noopener">report </a></strong>published July 25th, the project added a Fortune 50 company, municipalities, property management companies, and two of the top 10 global online map providers to its customer base.</p>
<p>Hivemapper also started the month with a new exchange <strong><a href="https://blog.kraken.com/product/trading-for-mnt-kuji-and-honey-starts-july-2" title="Trading for MNT, KUJI and HONEY starts July 3 - Kraken Blog" target="_blank" rel="noopener">listing </a></strong>on Kraken, likely increasing the token&rsquo;s liquidity and distribution. We believe that these factors&mdash;in addition to growing awareness of the DePIN sector more broadly&mdash;likely contributed to HONEY&rsquo;s standout month.</p>
<h2 id="Notable-Laggards" class="jump-link-nav anchored-block" data-jumplink-title="Notable Laggards">July&rsquo;s Notable Laggards - UNI (-21%)</h2>
<h3>Decentralized Exchange (DEX) Volume Market Share</h3>
<p><img class="w-100 img-responsive" src="https://www.vaneck.com/contentassets/59665648c2a145f386df939f61a4a9bb/4706_crypto-monthly-july-2024_chart-5_2024-8_v1_blog.svg" alt="Decentralized Exchange (DEX) Volume Market Share" /></p>
<p class="chart-disclosure"><strong>Source: <a href="https://www.theblock.co/data/decentralized-finance/dex-non-custodial/dex-volume-monthly" title="DEX Volume" target="_blank" rel="noopener">The Block</a></strong> as of 07/26/2024. <strong>Past performance is no guarantee of future results. Not intended as a recommendation to buy or sell any securities named herein.</strong></p>
<p>Despite an overall surge in crypto markets, Uniswap&rsquo;s native UNI token experienced a significant drawdown this month. As the largest decentralized exchange (DEX) by volume, Uniswap has been a DeFi mainstay ever since UNI reached $1B+ valuations shortly after its September 2020 airdrop. However, Uniswap faces several coinciding challenges that may drive poor market performance.</p>
<p>In February of this year, Uniswap&rsquo;s governance <strong><a href="https://gov.uniswap.org/t/temperature-check-activate-uniswap-protocol-governance/22936" title="Activate Uniswap Protocol Governance " target="_blank" rel="noopener">proposed </a></strong>activating the protocol&rsquo;s fee mechanism, which would distribute a percentage of the DEX&rsquo;s trading fees pro rata to UNI token holders. UNI surged over 100% in the following weeks, adding approximately $4.5B to its market cap. However, the DAO rejected the proposal in March, and UNI&rsquo;s price suffered shortly after.</p>
<p>In April, Uniswap Labs, the SoHo-based core development team, announced receiving a Wells notice from the U.S. Securities and Exchange Commission, notifying them of a planned enforcement action for violating securities laws. The matter remains pending, which the market may interpret as a significant ongoing regulatory risk.</p>
<p>Furthermore, Solana has taken over 300% of relative market capitalization from Ethereum over the past year, eroding Uniswap&rsquo;s competitive advantage when compared to other major DEXs outside of Ethereum&rsquo;s ecosystem. The bar chart above displays the relative share of volumes between six leading DEXs, illustrating how top Solana-based DEXs Raydium and Orca have steadily increased Solana&rsquo;s share of DEX volumes to reach new <strong><a href="https://x.com/matthew_sigel/status/1815369101813952952" title="Matthew Sigel, recovering CFA on X" target="_blank" rel="noopener">highs </a></strong>in July.</p>
<p>Even within the Ethereum ecosystem, Uniswap is facing new competitive pressures. Ironically, Aerodrome Finance took a dominant share of DEX volumes on Coinbase&rsquo;s Base network this month, while Aerodrome distributed trading fees to its token holders. As regulation, competition, and Ethereum-centric exposure are likely priced into UNI&rsquo;s market, we are monitoring for shifts in these factors as potential bullish catalysts.</p>
<h2>LDO (-15%)</h2>
<h3>Lido Market Share of Ethereum Staking Shrinking 18bps in July</h3>
<p><img class="w-100 img-responsive" src="https://www.vaneck.com/contentassets/59665648c2a145f386df939f61a4a9bb/4706_crypto-monthly-july-2024_chart-6_2024-8_v1_blog.svg" alt="Lido Market Share of Ethereum Staking Shrinking 18bps in July" /></p>
<p class="chart-disclosure"><strong>Source:</strong> Artemis XYZ as of 07/29/2024. <strong>Past performance is no guarantee of future results. Not intended as a recommendation to buy or sell any securities named herein.</strong></p>
<p>LDO, the most valuable liquid staking token, Ethereum, was down (-15%) on the month amid potential legal issues, Ethereum revenue challenges, and broader ETH underperformance. Lido also lost market share of Ethereum staking in July, decreasing (-18bps) from 29.15% to 28.97%, despite positive net flows into Lido&rsquo;s staking contract. Though Lido&rsquo;s growth in ETH TVL is encouraging, its loss of market share amid a substantial unlock (780k ETH) from Pendle Finance&rsquo;s Ethereum re-staking application has disappointed many investors. However, Lido's performance was above average compared to peer token categories, Ethereum liquid staking governance tokens (median -23%) and liquid re-staking governance tokens (median -31%).</p>
<p>The biggest challenge facing Lido and other liquid staking tokens is the reduction in the yield earned by Ethereum stakers. The average yield accrued to ETH stakers is (-28%) lower YoY, moving from 4.1% per annum to 2.9%. Since liquid staking projects earn a take rate on ETH stakers who opt into liquid staking pools, declining yield means decreased revenues. This yield is derived from two sources: inflationary yield from Ethereum monetary policy and fee revenue captured by Ethereum. Most of the yield decline stems from the drop in Ethereum revenues. The current decrease in Ethereum revenues is the direct consequence of EIP-4844 which reduced prices for Ethereum Layer-2s to post data to Ethereum. In July, Ethereum revenues were (-36%) lower month-to-month while Lido&rsquo;s were off (-15%) in dollar terms and down (-8%) in ETH terms.</p>
<p>Lido not only grappled with sagging revenue in July, but it also struggled with ongoing legal issues. As a consequence of an SEC lawsuit against the important Ethereum infrastructure company called Consensys, Lido was cited as an unlicensed dealer of securities. The liquid token that Lido grants users who stake their ETH with Lido&rsquo;s validator network, stETH, is being deemed a security by the SEC. In their brief, the SEC argues that Lido&rsquo;s stETH reward structure, ownership details, and marketing materials are strong evidence that stETH is a security. In response, Lido intends to combat the allegations by accelerating the decentralization of its network while enabling permissionless entry by new validators.</p>
<h3>LDO Market Cap Has Been Declining Relative to Ethereum in 2024</h3>
<p><img class="w-100 img-responsive" src="https://www.vaneck.com/contentassets/59665648c2a145f386df939f61a4a9bb/4706_crypto-monthly-july-2024_chart-7_2024-8_v1_blog.svg" alt="LDO Market Cap Has Been Declining Relative to Ethereum in 2024" /></p>
<p class="chart-disclosure"><strong>Source:</strong> Artemis XYZ as of 07/29/2024. <strong>Past performance is no guarantee of future results. Not intended as a recommendation to buy or sell any securities named herein.</strong></p>
<p><strong>Links to third party websites are provided as a convenience and the inclusion of such links does not imply any endorsement, approval, investigation, verification or monitoring by us of any content or information contained within or accessible from the linked sites. By clicking on the link to a non-VanEck webpage, you acknowledge that you are entering a third-party website subject to its own terms and conditions. VanEck disclaims responsibility for content, legality of access or suitability of the third-party websites.</strong></p>
<p>To receive more <strong><a href="https://www.vaneck.com/us/en/insights/digital-assets/" title="Digital Assets Insights">Digital Assets</a></strong> insights, <strong><a href="https://www.vaneck.com/us/en/subscribe/" title="Subscription Center">sign up in our subscription center</a></strong>.</p>
<style>
    .data-td.data {
        padding-right: 5px !important;
    }

    .wrapped-div {
        max-width: 100%;
    }

    @media (max-width: 1240px) {
        .wrapped-div {
            overflow-x: scroll;
        }
    }

    .wrapped-div-sector {
        max-width: 100%;
        overflow-x: scroll;
    }
</style>
]]></content:encoded>
</item><item rdf:about="https://www.vaneck.com/us/en/blogs/digital-assets/ethv-etf-question-and-answer/">
  <title>ETHV ETF: Question &amp; Answer></title>
  <link>https://www.vaneck.com/us/en/blogs/digital-assets/ethv-etf-question-and-answer/</link>
  <description><![CDATA[The VanEck Ethereum ETF delivers convenient exposure to Ethereum&mdash;in this blog you&rsquo;ll find answers to the most frequently asked questions about ETHV.]]></description>
  <dc:creator> </dc:creator>
  <dc:date>08/02/2024 06:30:00</dc:date>
<content:encoded><![CDATA[

<p><strong>Investing in the VanEck Ethereum ETF involves significant risk and may not be suitable for all investors. We use the generic term &ldquo;ETF&rdquo; to refer to exchange-traded investment vehicles, including those that are required to register under the Investment Company Act of 1940, as amended (the &ldquo;40 Act&rdquo;), as well as other exchange-traded products which are not subject to the registration of the &lsquo;40 Act. The Trust is not an investment company registered under the Investment Company Act of 1940 or a commodity pool for the purposes of the Commodity Exchange Act, and thus offers investors fewer protections.</strong></p>
<ul class="content-list">
<li><a href="#point-one"><strong>Why should investors consider ETHV?</strong></a></li>
<li><a href="#point-two"><strong>Why should investors consider investing in ether now?</strong></a></li>
<li><a href="#point-three"><strong>What is the investment strategy for ETHV?</strong></a></li>
<li><a href="#point-four"><strong>How does the VanEck Ethereum ETF track the price of ether?</strong></a></li>
<li><a href="#point-five"><strong>How do Ethereum ETPs compare to direct ether ownership?</strong></a></li>
<li><a href="#point-six"><strong>What are the differences between ETHV and other ether investment options?</strong></a></li>
<li><a href="#point-seven"><strong>How do Ethereum ETPs work?</strong></a></li>
<li><a href="#point-nine"><strong>What are the tax implications compared to direct ether investment?</strong></a></li>
<li><a href="#point-ten"><strong>What kind of fees does ETHV have?</strong></a></li>
<li><a href="#point-eleven"><strong>How is the ether in ETHV custodied?</strong></a></li>
<li><a href="#point-twelve"><strong>Who is Gemini?</strong></a></li>
<li><a href="#point-thirteen"><strong>Who is Coinbase?</strong></a></li>
<li><a href="#point-fourteen"><strong>What are the risks of buying an Ethereum ETP?</strong></a></li>
<li><a href="#point-fifteen"><strong>How does the Trust audit its ether?</strong></a></li>
<li><a href="#point-sixteen"><strong>How can investors buy ETHV?</strong></a></li>
</ul>
<h2 id="point-one" class="jump-link-nav anchored-block" data-jumplink-title="Why ETHV?">Why should investors consider ETHV?</h2>
<p><strong><a href="https://www.vaneck.com/us/en/investments/ethereum-etf-ethv/overview/" title="ETHV - VanEck Ethereum ETF - Overview">ETHV </a></strong>offers a convenient way to <strong><a href="https://www.vaneck.com/us/en/blogs/digital-assets/ethereum-101-a-beginners-guide/" title="Ethereum 101: A Beginner&rsquo;s Guide">gain exposure to ether (ETH)</a></strong> without the complexities of direct ownership. It&rsquo;s a cost-efficient method to obtain ether exposure, managed by VanEck, a well-established ETF issuer <strong><a href="https://www.vaneck.com/us/en/blogs/digital-assets/vanecks-journey-with-bitcoin/" title="VanEck's Journey with Crypto">with extensive experience in crypto-related products</a></strong>. <a href="/link/33e737a635434a35b8527d4846c72c50.aspx" title="ETHV - VanEck Ethereum ETF - Overview"><strong>ETHV</strong></a> also benefits from expert management and qualified custody of ether. The combination of these factors enables <a href="/link/33e737a635434a35b8527d4846c72c50.aspx" title="ETHV - VanEck Ethereum ETF - Overview"><strong>ETHV</strong></a> to make it easier and potentially more secure for investors to add ether to their portfolios.</p>
<h2 id="point-two" class="anchored-block">Why should investors consider investing in ether now?</h2>
<p><a href="https://www.vaneck.com/us/en/blogs/digital-assets/ethereum-101-a-beginners-guide/" title="Ethereum 101: A Beginner&rsquo;s Guide"><strong>Ethereum </strong></a>is an open-source &ldquo;App Store&rdquo; that runs software and allows for transfer of value. Ether is the native <strong><a href="/link/343cf2f03fec405589c8319433a957f6.aspx" title="Investing in Crypto">cryptocurrency </a></strong>of the <strong><a href="https://www.vaneck.com/us/en/blogs/digital-assets/smart-contract-and-ethereum-explained-faq/" title="Smart Contract and Ethereum Explained: FAQ">Ethereum network</a></strong>, and powers the use of <strong><a href="https://www.vaneck.com/us/en/blogs/digital-assets/what-are-smart-contracts/" title="What are Smart Contracts?">smart contracts </a></strong>and decentralized applications (dApps). This makes ether integral to the functioning and growth of the Ethereum ecosystem. As a digital asset, ether offers several key benefits:</p>
<ul class="content-list">
<li><strong>Utility and Demand</strong>: Ether is used to pay for transaction fees and computational services on the Ethereum network, driving continuous demand.</li>
<li><strong>Smart Contract Platform</strong>: Ethereum's capability to facilitate smart contracts and dApps makes Ether a crucial part of many innovative <strong><a href="https://www.vaneck.com/us/en/blogs/digital-assets/blockchain-basics/" title="What is Blockchain Technology? ">blockchain solutions</a></strong>.</li>
<li><strong>Portfolio Diversification</strong>: Investing in ether can provide potential portfolio diversification benefits, as it operates differently from traditional financial assets.</li>
<li><strong>Adoption and Growth</strong>: With a robust development community and growing mainstream acceptance, ether's role in the digital economy is expanding rapidly.</li>
</ul>
<h2 id="point-three" class="anchored-block">What is the investment strategy for ETHV?</h2>
<p>The Trust&rsquo;s investment objective is to reflect the performance of the price of ether less the expenses of the Trust&rsquo;s operations. The Trust is a passive investment vehicle that does not seek to pursue any investment strategy beyond tracking the price of ETH.</p>
<h2 id="point-four" class="anchored-block">How does the VanEck Ethereum ETF track the price of ether?</h2>
<p>The product aims to closely track the spot price of the <a href="https://www.marketvector.com/indexes/digital-assets/marketvector-ethereum-benchmark-rate#:~:text=The%20MarketVector%E2%84%A2%20Ethereum%20Benchmark,million%20in%20assets%20under%20management." title="EBR MarketVector&trade; Ethereum Benchmark Rate" target="_blank" rel="noopener"><strong>MarketVector Ethereum Benchmark Rate (EBR)</strong>.</a> Its NAV (Net Asset Value) is calculated based on the current market value of the ether it holds, less any applicable fees and expenses.&nbsp;</p>
<h2 id="point-five" class="anchored-block">How do Ethereum ETPs compare to direct ether ownership?</h2>
<p>Direct ether ownership requires interacting with a crypto exchange, managing storage, and ensuring security, all of which can be complex.&nbsp;<strong><a href="https://www.vaneck.com/us/en/investments/ethereum-etf-ethv/overview/" title="ETHV - VanEck Ethereum ETF - Overview">ETHV </a></strong>can be bought and sold on traditional stock exchanges, making it accessible through brokerage accounts, simplifying the process for investors.</p>
<h2 id="point-six" class="anchored-block">What are the differences between ETHV and other ether investment options?</h2>
<p>The differences between <strong><a href="/link/33e737a635434a35b8527d4846c72c50.aspx" title="ETHV - VanEck Ethereum ETF - Overview">ETHV</a></strong> and other investment options are outlined in the table below:</p>
<div class="wrapped-div">
<table style="width: 100%;">
<tbody>
<tr class="tbl-data">
<td class="tbl-header last">Investment Option</td>
<td class="tbl-header last text-left">Pros</td>
<td class="tbl-header last text-left">Cons</td>
</tr>
<tr class="tbl-data">
<td class="data-td last">Direct Ether Investing</td>
<td class="data-td data last text-left">Full ownership, high control</td>
<td class="data-td data last text-left">Requires significant knowledge, complex storage, and security management</td>
</tr>
<tr class="tbl-data">
<td class="data-td last">Ether ETNs/ETPs (e.g., ETHV)</td>
<td class="data-td data last text-left">Easy trading, managed by experienced issuers</td>
<td class="data-td data last text-left">Management fees, dependent on ETP structure performance</td>
</tr>
<tr class="tbl-data">
<td class="data-td last">Crypto Hedge Funds</td>
<td class="data-td data last text-left">Professional management, potential for higher returns</td>
<td class="data-td data last text-left">High initial investment, lock-up periods, complex fee structures</td>
</tr>
</tbody>
</table>
</div>
<br />
<h2 id="point-seven" class="jump-link-nav anchored-block" data-jumplink-title="How do Ethereum ETPs work?">How do Ethereum ETPs work?</h2>
<p><strong>How does the fund's creation/redemption process work?</strong></p>
<p>The Fund has an all-cash creation and redemption process. For creations, the Sponsor receives cash from the Authorized Participant (AP) in exchange for shares of the Fund. For redemptions, the Sponsor receives shares of the Fund from the AP in exchange for cash. Following a creation or redemption order, the Trust utilizes liquidity providers and Gemini Clearing to execute and settle the underlying ether. All trading costs (as pertaining to the underlying ether transactions) for each primary market order will be passed back to the Authorized Participant(s) placing the creation/redemption order(s). The Fund does not offer in-kind creations or redemptions.</p>
<p><strong>How does the fund buy and sell ether?</strong></p>
<p>For creations, the Sponsor uses cash delivered by APs to purchase ether from third-party liquidity providers. Once the purchase is made, the ether is delivered to the Trust&rsquo;s custodian, Gemini Trust Company, LLC, ensuring secure storage. To satisfy redemptions, the Sponsor sells ether to a third-party liquidity provider in exchange for cash.</p>
<h2 id="point-nine" class="anchored-block">What are the tax implications compared to direct ether investment?</h2>
<p>The VanEck Ethereum ETF is a grantor trust for U.S. federal income tax purposes. As a result, the Trust itself is not subject to U.S. federal income tax. Instead, the Trust&rsquo;s income and expenses &ldquo;flow through&rdquo; to the Shareholders. Shareholders generally will be treated, for U.S. federal income tax purposes, as if they directly owned a pro rata share of the underlying assets held in the Trust. Shareholders also will be treated as if they directly received their respective pro rata shares of the Trust&rsquo;s income and proceeds, and directly incurred their pro rata share of the Trust&rsquo;s expenses. Most state and local tax authorities follow U.S. Income tax rules in this regard. However, Shareholders should contact their own tax advisors as to the tax consequences of ownership of <a href="/link/33e737a635434a35b8527d4846c72c50.aspx" title="ETHV - VanEck Ethereum ETF - Overview"><strong>ETHV</strong></a> shares.</p>
<h2 id="point-ten" class="anchored-block">What kind of fees does ETHV have?</h2>
<p><a href="/link/33e737a635434a35b8527d4846c72c50.aspx" title="ETHV - VanEck Ethereum ETF - Overview"><strong>ETHV</strong></a> has an Expense Ratio of 0.20%, which means you pay 20 cents per year for every 100 dollars you invest.</p>
<h2 id="point-eleven" class="anchored-block">How is the ether in ETHV custodied?</h2>
<p>The Trust&rsquo;s ether is held by its crypto custodians (currently, Gemini Trust Company, LLC and Coinbase Custody Trust, LLC), which act as the ether Custodian, responsible for securely storing all the Trust&rsquo;s ether related to its ether Account and Clearing Account.</p>

<h2 id="point-twelve" class="anchored-block">Who is Gemini?</h2>
<p>Gemini is a leading cryptocurrency exchange and custodian known for its robust security measures and regulatory compliance. It is a full-reserve exchange and custodian, regulated by NYDFS, licensed in all 50 US states, and holds multiple licenses globally. In addition, Gemini includes multi-signature technology, role-based governance protocols, physical security, multiple layers of biometric access controls, and $100M in digital asset insurance coverage. It has also completed SOC 1 Type II and SOC 2 Type II audits, and is ISO 27001 certified. The company&rsquo;s strong operational standards means all customer funds are held 1:1 and are available for withdrawal.</p>
<p>Below are comprehensive details about Gemini and how the company safeguards customer assets through its adherence to strict compliance and operational protocols:</p>
<ul class="content-list">
<li><strong>Storage Solutions:</strong>
<ul class="content-list">
<li>Cold Storage: Gemini is required to hold the Trust&rsquo;s ether in cold storage, which involves storing private keys completely offline to protect against unauthorized access and cyber threats. Cold storage is used for long-term security.</li>
<li>Hot Storage: Ether that needs to be accessible temporarily for operations, such as creations, redemptions, or to pay the Sponsor Fee and extraordinary expenses, is held in hot wallets. These wallets are connected to the internet but are used only for short periods.</li>
</ul>
</li>
</ul>
<ul class="content-list">
<li><strong>Custody Structure and Security:</strong>
<ul class="content-list">
<li>Gemini employs hardware security modules (HSMs) to generate, store, and manage private keys for both cold and hot storage.</li>
<li>Multi-signature technology and geographically diverse storage locations across the United States are used to enhance security and reduce risks.</li>
<li>All private keys are stored in air-gapped environments with multiple levels of physical security and monitoring controls.</li>
</ul>
</li>
</ul>
<ul class="content-list">
<li><strong>Regulatory Compliance:</strong>
<ul class="content-list">
<li>As a fiduciary under Section 100 of the New York Banking Law, Gemini is held to stringent capital reserve requirements and banking compliance standards.</li>
<li>Gemini is subject to various U.S. federal and state laws, including anti-money laundering regulations, the Bank Secrecy Act, and the USA PATRIOT Act.</li>
</ul>
</li>
</ul>
<ul class="content-list">
<li><strong>Insurance Coverage:</strong>
<ul class="content-list">
<li>Gemini maintains a $100 million specie policy covering fraud, theft, and cyber-security breaches, and a $25 million crime policy. This insurance applies to all digital assets held by Gemini, including those of the Trust.</li>
<li>Although the Trust is not a named beneficiary, the insurance covers customer losses, including those suffered by the Trust, from specified events such as fraud and theft.</li>
</ul>
</li>
</ul>
<h2 id="point-thirteen" class="anchored-block">Who is Coinbase?</h2>
<p>Coinbase is a prominent cryptocurrency exchange and custodian acclaimed for its extensive security protocols and regulatory adherence. The company operates as a licensed and regulated entity in the U.S. and various jurisdictions worldwide. Coinbase also engages in regular SOC 1 and SOC 2 Type II audits and employs comprehensive security features. These include cold storage for the majority of assets, multi-signature technology, encrypted private keys stored within high-security environments, and $320M in digital asset insurance coverage. Ensures that customer assets are held in segregated or omnibus accounts with strict adherence to accounting controls. The company&rsquo;s strong operational standards ensure the protection and integrity of customer assets.</p>
<p>Below are comprehensive details about Coinbase and how the company safeguards customer assets through its adherence to strict compliance and operational protocols:</p>
<ul class="content-list">
<li><strong>Information Security Management Program:</strong>
<ul class="content-list">
<li>Led by the Chief Security Officer with independent SOC 1 and SOC 2 Type II attestations.</li>
<li>Includes policies, procedures, and standards to manage information security risks</li>
<li>Detailed Physical Security program with access control processes, emergency procedures, CCTV, and security systems governed by a board-approved policy.</li>
</ul>
</li>
</ul>
<ul class="content-list">
<li><strong>Custody and Security of Assets:</strong>
<ul class="content-list">
<li>Vault wallet: Assets are secured within a cold storage environment with segregated wallets. Extensive key management technology, operations, and personnel ensure security.</li>
<li>Trading balance: majority of assets kept in cold storage with some in hot wallets.</li>
</ul>
</li>
</ul>
<ul class="content-list">
<li><strong>Secure Storage of Client Keys/Assets</strong>
<ul class="content-list">
<li>Vault wallet: secure key generation, dual encrypted private key material, and geographically redundant storage. Transactions require cryptographic consensus across multiple operators.</li>
<li>Trading wallet: private keys are stored within high security online environments, encrypted at rest, and transactions are signed in protected environments.</li>
</ul>
</li>
</ul>
<ul class="content-list">
<li><strong>Insurance Coverage</strong>
<ul class="content-list">
<li>Commercial Crime insurance policy covering loss of client assets with coverage for employee collusion, theft, security breaches, and fraudulent transfers. This insurance has been renewed annually since 2013, providing broad and deep coverage.</li>
</ul>
</li>
</ul>
<h2 id="point-fourteen" class="anchored-block">What are the risks of buying an Ethereum ETP?</h2>
<ul class="content-list">
<li><strong>Ether Market Risks:</strong> The value of ether can be extremely volatile and unpredictable.</li>
<li><strong>Regulatory Risks:</strong> Changes in laws or regulations affecting ether may impact the value of the Trust's holdings.</li>
<li><strong>Operational Risks:</strong> There are risks related to the custody and security of the Trust's ether holdings.</li>
<li><strong>Market Trading Risks:</strong> There may be a lack of liquidity in the shares, affecting their market price.</li>
</ul>
<h2 id="point-fifteen" class="anchored-block">How does the Trust audit its ether?</h2>
<p>On a daily basis, the Sponsor and the accounting agent reconcile the ether position at Gemini and Coinbase. As part of the Trust's annual audit, auditors confirm the existence of ether positions. Gemini and Coinbase have a SOC 1 Report produced by an independent auditor outlining controls around the safekeeping of assets.</p>

<h2 id="point-sixteen" class="jump-link-nav anchored-block" data-jumplink-title="How to buy?">How can investors buy ETHV?</h2>
<p>Investors can buy <a href="/link/33e737a635434a35b8527d4846c72c50.aspx" title="ETHV - VanEck Ethereum ETF - Overview"><strong>ETHV</strong></a> shares through their existing brokerage accounts, such as Charles Schwab and Robinhood, by searching for the ticker symbol "<a href="/link/33e737a635434a35b8527d4846c72c50.aspx" title="ETHV - VanEck Ethereum ETF - Overview"><strong>ETHV</strong></a>", making it a convenient addition to any investment portfolio.</p>
<p><a href="https://www.vaneck.com/us/en/investments/ethereum-etf-ethv/overview/#how-to-buy-etf&amp;utm=ETHV-Blog" title="How to buy VanEck ETFs?"><strong>Learn more here.</strong></a></p>
<p class="d-none d-lg-block"><a href="mailto:askvaneck@vaneck.com" title="Have More Questions? - Ask VanEck" rel="noopener"><img loading="lazy" class="img-responsive" src="https://www.vaneck.com/globalassets/home/us/insights/blogs/bm-blog-images/cta-faq_desktop-02.svg" alt="Have More Questions? - Ask VanEck" /></a></p>
<p class="d-lg-none"><a href="mailto:askvaneck@vaneck.com" title="Have More Questions? - Ask VanEck" rel="noopener"><img loading="lazy" class="img-responsive" src="https://www.vaneck.com/globalassets/home/us/insights/blogs/bm-blog-images/cta-faq_mobile-01.svg" alt="Have More Questions? - Ask VanEck" /></a></p>
<p>To receive more <strong><a href="https://www.vaneck.com/us/en/insights/digital-assets/" title="Digital Assets Insights">Digital Assets</a></strong> insights, <strong><a href="https://www.vaneck.com/us/en/subscribe/" title="Subscription Center">sign up in our subscription center</a></strong>.</p>
]]></content:encoded>
</item><item rdf:about="https://www.vaneck.com/us/en/blogs/moat-investing/explore-the-strongholds-moat-index-holdings-overview/">
  <title>Explore the Strongholds: Moat Index Holdings Overview></title>
  <link>https://www.vaneck.com/us/en/blogs/moat-investing/explore-the-strongholds-moat-index-holdings-overview/</link>
  <description><![CDATA[Get Morningstar&rsquo;s moat analysis and business outlooks for all 55 companies in the Morningstar<sup>&reg;</sup>&nbsp;Wide Moat Focus Index.]]></description>
  <dc:creator> </dc:creator>
  <dc:date>07/31/2024 06:30:00</dc:date>
<content:encoded><![CDATA[

<p>Powered by Morningstar&rsquo;s forward-looking equity research, the Morningstar<sup>&reg;</sup>&nbsp;Wide Moat Focus Index comprises quality companies with sustainable competitive advantages that are trading at attractive valuations. The competitive advantages of these companies form moats that are expected to help companies fend off competition and maintain profitability into the future. Morningstar has identified <strong><a href="https://www.vaneck.com/us/en/blogs/moat-investing/moat-investing-powered-by-morningstar/" title="Quality Companies at Attractive Prices">five sources of moat</a></strong>, including switching costs, intangible assets, network effect, cost advantage, and efficient scale.</p>
<p>In this detailed report, Morningstar&rsquo;s global analyst team provides their moat analysis for each of the 55 holdings currently in the Morningstar<sup>&reg;</sup>&nbsp;Wide Moat Focus Index. Learn how each company is positioned in the current market environment and the factors contributing to their moat.</p>

<h2>Explore VanEck&rsquo;s Moat Funds</h2>
<p>VanEck is proud to be a pioneer in the moat investment space, with a track record dating back to 2012 for our core strategy, <strong><a href="https://www.vaneck.com/us/en/investments/morningstar-wide-moat-etf-moat/overview/" title="MOAT - VanEck Morningstar Wide Moat ETF - Overview">the VanEck Morningstar Wide Moat ETF</a></strong>. All of VanEck&rsquo;s moat strategies are powered by Morningstar&rsquo;s powerful research lens across different investment styles, market capitalizations and geographical regions to provide investors with a wide array of solutions to meet different investment objectives.</p>
<div class="wrapped-div">
<table style="width: 100%;">
<tbody>
<tr class="tbl-data">
<td class="data-td last" style="text-align: left;" rowspan="3">US Moats</td>
<td class="data-td data last" style="text-align: left;"><a href="https://www.vaneck.com/us/en/investments/morningstar-smid-moat-etf-smot/overview/" title="SMOT - VanEck Morningstar SMID Moat ETF - Overview"><strong>SMOT - VanEck Morningstar SMID Moat ETF</strong></a></td>
</tr>
<tr class="tbl-data">
<td class="data-td data last" style="text-align: left;"><a href="https://www.vaneck.com/us/en/investments/morningstar-wide-moat-etf-moat/overview/" title="MOAT - VanEck Morningstar Wide Moat ETF - Overview"><strong>MOAT - VanEck Morningstar Wide Moat ETF</strong></a></td>
</tr>
<tr class="tbl-data">
<td class="data-td data last" style="text-align: left;"><a href="https://www.vaneck.com/us/en/investments/morningstar-wide-moat-fund-mwmzx/overview/" title="MWMZX - VanEck Morningstar Wide Moat Fund - Class Z - Overview"><strong>MWMZX - VanEck Morningstar Wide Moat Fund &ndash; Class Z</strong></a></td>
</tr>
<tr class="tbl-data">
<td class="data-td last" style="text-align: left;">International Moats</td>
<td class="data-td data last" style="text-align: left;"><a href="https://www.vaneck.com/us/en/investments/morningstar-international-moat-etf-moti/overview/" title="MOTI - VanEck Morningstar International Moat ETF - Overview"><strong>MOTI - VanEck Morningstar International Moat ETF</strong></a></td>
</tr>
<tr class="tbl-data">
<td class="data-td last" style="text-align: left;">Global Moats</td>
<td class="data-td data last" style="text-align: left;"><a href="https://www.vaneck.com/us/en/investments/morningstar-global-wide-moat-etf-motg/overview/" title="MOTG - VanEck Morningstar Global Wide Moat ETF - Overview"><strong>MOTG - VanEck Morningstar Global Wide Moat ETF</strong></a></td>
</tr>
</tbody>
</table>
</div>

<p>To receive more <strong><a href="https://www.vaneck.com/us/en/insights/moat-investing/" title="Moat Investing Insights">Moat Investing</a></strong> insights, <strong><a href="https://www.vaneck.com/us/en/subscribe/" title="Preference Center">sign up in our subscription center</a></strong>.</p>
<style type="text/css">
.wrapped-div {
    max-width: 100%;
}
@media (max-width: 768px) {
    .wrapped-div {
        overflow-x: scroll;
    }
}
.wrapped-div-sector {
    max-width: 100%;
    overflow-x: scroll;
}
</style>
]]></content:encoded>
</item><item rdf:about="https://www.vaneck.com/us/en/blogs/moat-investing/moat-index-holds-contrarian-edge-in-todays-market/">
  <title>Moat Index Holds Contrarian Edge in Today’s Market></title>
  <link>https://www.vaneck.com/us/en/blogs/moat-investing/moat-index-holds-contrarian-edge-in-todays-market/</link>
  <description><![CDATA[Amid the recent mega cap tech sell-off, which helps underscore the distortion in the US equity market, the Morningstar Moat Index&rsquo;s contrarian position may give it a strategic edge.]]></description>
  <dc:creator>Brandon Rakszawski</dc:creator>
  <dc:date>07/31/2024 06:30:00</dc:date>
<content:encoded><![CDATA[

<ul class="content-list">
<li class="mt-2">The Morningstar Wide Moat Focus Index&rsquo;s contrarian positioning (slight value bias and smaller large caps) may set it up well, considering market dynamics.</li>
<li class="mt-2">Growth stocks relative to value stocks are at levels not seen since March of 2000 and the internet bubble.</li>
<li class="mt-2">Market breadth in 2024 has been lower than we have seen since the late 1990s.</li>
</ul>
<p><strong><a href="https://www.vaneck.com/us/en/investments/morningstar-wide-moat-etf-moat/overview/" title="MOAT - VanEck Morningstar Wide Moat ETF - Holdings and Performance">VanEck Morningstar Wide Moat ETF (MOAT)</a></strong> and its underlying index, the Morningstar Wide Moat Focus Index, have established a contrarian US equity posture, thanks to Morningstar&rsquo;s equity research methodology. The Index&rsquo;s focus on attractive valuations has guided it toward a slight value bias and its equal-weight methodology has pushed it away from mega cap companies. This has been a headwind due to the narrow mega cap growth leadership in 2024, but may prove beneficial considering current market dynamics.</p>
<h3>Shift Away from Mega Cap Growth as S&amp;P 500 Index Doubles Down (12/2022 &ndash; 6/2024)</h3>
<p><img class="img-responsive w-100" alt="Shift Away from Mega Cap Growth as S and P 500 Index Doubles Down" src="https://www.vaneck.com/contentassets/581c952de91e422892510cd6dfed6ade/4699_moat-contrarian-positioning_chart-1_2024-7_v1_blog.svg" /></p>
<p class="chart-disclosure">Source: Morningstar. Past performance is not a guarantee of future results. Index performance is not illustrative of fund performance. It is not possible to invest in an index.</p>

<p>The relationship between large cap growth and value stocks has stretched to levels last seen in March of 2000, the height of the dot-com bubble.</p>
<h3>Growth-to-Value Ratio Reaches Dot-Com Bubble Levels (1/1990 &ndash; 7/2024)</h3>
<p><img class="img-responsive w-100" alt="Growth-to-Value Ratio Reaches Dot-Com Bubble Levels" src="https://www.vaneck.com/contentassets/51d99f2f80fa439ea79ca9977a6da779/4699_moat-contrarian-positioning_chart-2_2024-7_v1_blog.svg" /></p>
<p class="chart-disclosure">Source: Morningstar. Past performance is not a guarantee of future results. Index performance is not illustrative of fund performance. It is not possible to invest in an index. Chart represents the ratio of the Russell 1000 Growth Index vs. Russell 1000 Value Index.</p>
<p>Market breadth is also at extremely low levels, meaning that there is very narrow leadership in recent periods. This is evidenced by the rolling one-year excess returns of the equal-weighted version of the S&amp;P 500 Index relative to the market capitalization-weighted headline benchmark. Market breadth, as measured by this relative performance, has historically widened out rapidly following these extreme levels, which may suggest a good set up for the equal-weighted Moat Index.</p>
<h3>Market Breadth at Low Levels (1/1990 &ndash; 6/2024)</h3>
<p><img class="img-responsive w-100" alt="Market Breadth at Low Levels" src="https://www.vaneck.com/contentassets/1e3cd380445143319607f1be6f33fae7/4699_moat-contrarian-positioning_chart-3_2024-7_v1_blog.svg" /></p>
<p class="chart-disclosure">Source: Morningstar. Past performance is not a guarantee of future results. Index performance is not illustrative of fund performance. It is not possible to invest in an index.</p>

<h2>Access Quality Companies at Attractive Valuations</h2>
<p><strong><a href="https://www.vaneck.com/us/en/investments/morningstar-wide-moat-etf-moat/overview/" title="MOAT - VanEck Morningstar Wide Moat ETF - Holdings and Performance">VanEck Morningstar Wide Moat ETF (MOAT)</a></strong> seeks to replicate as closely as possible, before fees and expenses the price and yield performance of the Morningstar Wide Moat Focus Index.</p>
<p>To receive more <strong><a href="https://www.vaneck.com/us/en/insights/moat-investing/" title="Moat Investing Insights">Moat Investing</a></strong> insights, <strong><a href="https://www.vaneck.com/us/en/subscribe/" title="Preference Center">sign up in our subscription center</a></strong>.</p>
]]></content:encoded>
</item><item rdf:about="https://www.vaneck.com/us/en/blogs/municipal-bonds/2024-mid-year-update-are-municipal-bonds-on-the-road-to-recovery/">
  <title>2024 Mid-Year Update: Are Municipal Bonds on the Road to Recovery?></title>
  <link>https://www.vaneck.com/us/en/blogs/municipal-bonds/2024-mid-year-update-are-municipal-bonds-on-the-road-to-recovery/</link>
  <description><![CDATA[Muni bonds underperformed in the first half of 2024 due to robust economic conditions and increased supply, but strong credit fundamentals and potential rate cuts could improve performance later.]]></description>
  <dc:creator>James Colby</dc:creator>
  <dc:date>07/31/2024 06:30:00</dc:date>
<content:encoded><![CDATA[

<p>Through the first half of this year, municipal bonds fell short of projected performance expectations. The essential elements of a reliable source of income due to strong credit quality and benefits of interest income exempt from taxes remain foundational. Yet, the anticipated strong performance of the asset class so far has not materialized. So, we ask if our outlook has changed for the remainder of the year to provide some context for our outlook for the second half of 2024.</p>
<h2>Expectations for the Second Half of 2024</h2>
<p>The risks we discussed in our <a href="https://www.vaneck.com/us/en/blogs/municipal-bonds/muni-trends-to-watch-in-2024/" title="Muni Trends to Watch in 2024"><strong>Muni Trends to Watch in 2024</strong></a> focused on the U.S. economic environment, individual state laws and the municipal sector's challenges. Appropriately, we felt that our domestic economy would fairly quickly feel the bite of higher rates and efforts of the Federal Reserve (&ldquo;Fed&rdquo;) to tighten monetary policy to temper inflation. History tells us not to ignore the risks of recession. The market&rsquo;s consensus in the direction of Fed rate cuts in early 2024 would have put municipals on a path to strong positive performance results because muni rates would have dropped. As we now see, that call was premature. Robust economic performance and lingering inflation have pushed out the likelihood of rate cuts to the third or fourth quarters as is the timing for better muni market performance.</p>
<p>Supply of new-issue bonds is the other primary area of change. The increase in newly issued bonds originates from a significant increase in the re-financing of older, outstanding debt.<sup>*</sup>&nbsp;Since this component is now expected to add $30-50 billion to year-end totals, the immediate effect has been to keep rates high and within zones of comparative attractiveness. It would not be surprising to see additional supply later this year, primarily in re-financing, should the Fed cut rates and spur a potential muni rally. Increased supply would provide a greater variety of available bonds in the market and a moderate move to lower rates&mdash;a classic example of cause and effect.</p>
<h2>YTD statistics:</h2>
<ul class="content-list">
<li class="mt-2">Issuance (as of June) $241.5 billion, +31.9% Y/Y</li>
<li class="mt-2">Trading (as of June) $13.0 billion ADV, +2.9% Y/Y</li>
<li class="mt-2">Outstanding (as of 1Q24) $4.1 trillion, +1.0% Y/Y</li>
</ul>
<p><img class="img-responsive w-100" src="https://www.vaneck.com/contentassets/dfbeb0f4dfba4e76ad9b0c78a6d13667/4695_muni-july_chart-1_2024-7_v1_blog.svg" alt="Municipal Bond Issuance" /></p>
<p class="chart-disclosure">Source: SIFMA Research.</p>

<p>The fundamentals of municipal credit remain strong, backed by robust employment numbers and wage stability. Although some of the traditional measures of spreads between credit quality do not stand out as compelling, the taxable equivalent yields do argue for allocation to this asset class. Municipal high yield has offered such an outcome year-to-date. And if rate cuts materialize, coupled with a return to a normalized yield curve, compelling returns may be the expected result for investment grade in the coming months.</p>
<p>To navigate this environment, we offer a variety of <a href="https://www.vaneck.com/us/en/blogs/municipal-bonds/municipal-bond-etfs-expect-more-from-your-munis/" title="Municipal Bond ETFs &ndash; Expect More from Your Munis"><strong>municipal bond ETFs</strong></a>, including high yield and investment grade options, designed to help investors capitalize on these trends while benefiting from tax-exempt income.</p>
<p>To receive more <strong><a href="https://www.vaneck.com/us/en/insights/municipal-bonds/" title="Municipal Bonds Insights">Municipal Bonds</a></strong> insights, <strong><a href="https://www.vaneck.com/us/en/subscribe/" title="Subscription Center">sign up in our subscription center</a></strong>.</p>
]]></content:encoded>
</item><item rdf:about="https://www.vaneck.com/us/en/blogs/investment-outlook/jan-van-eck-adapt-your-portfolio-for-market-distortions-and-fiscal-risks/">
  <title>Adapt Your Portfolio for Market Distortions and Fiscal Risks></title>
  <link>https://www.vaneck.com/us/en/blogs/investment-outlook/jan-van-eck-adapt-your-portfolio-for-market-distortions-and-fiscal-risks/</link>
  <description><![CDATA[Investors should diversify due to U.S. equity market distortions, stay short on fixed income, and look to commodities as global growth picks up.]]></description>
  <dc:creator>Jan van Eck</dc:creator>
  <dc:date>07/30/2024 06:30:00</dc:date>
<content:encoded><![CDATA[

<a href="/us/en/blogs/investment-outlook/jan-van-eck-q2-2026-outlook-the-reset-is-your-entry-point/" title="Jan van Eck's Latest Outlook"><strong>Looking for the latest outlook? Read the Q2 2026 Outlook.</strong></a>
<div class="row">
<div class="col-md-4 col-xs-12"><a href="https://www.youtube.com/embed/jFlGlao6Hgo" data-video="https://youtu.be/jFlGlao6Hgo" class="popup-youtube" title="Watch Video"><img class="img-responsive" style="margin-right: 15px; margin-top: 0px;" src="https://www.vaneck.com/EPiServer/CMS/Content/contentassets/en/0e210d6a51e04e2dbec0ca05d3ccd4cb/4676_jve-q3-outlook_2024-7_thumbnail_v1.jpg,,289355/Download?epieditmode=False" alt="Watch Video" align="left" /></a></div>
<div class="col-md-8 col-xs-12"><br /><strong><a href="https://www.youtube.com/embed/jFlGlao6Hgo" data-video=" https://youtu.be/jFlGlao6Hgo" class="popup-youtube" title="Watch Video">Watch Video</a><br /></strong><a href="https://www.youtube.com/embed/jFlGlao6Hgo" data-video="https://youtu.be/jFlGlao6Hgo" class="popup-youtube" title="Watch Video" style="font-size: 16px; font-weight: bold; padding: 10px 0px 0px; margin-right: 20px; width: 202px;">Stay Diversified and Stay Short</a></div>
</div>
<br />
<p>As we zoom out and examine the financial markets from a macro perspective, we highlight here three key factors investors should be paying attention to and our takeaways from these observations:</p>
<ol class="content-list">
<li class="mt-2"><strong>The U.S. equity market remains highly distorted.</strong> Investors should diversify their equity portfolios to avoid over-exposure to megacaps in the S&amp;P 500.</li>
<li class="mt-2"><strong>As fiscal spending surges and a reckoning looms, we expect gradual easing by the Federal Reserve, with a small risk of a rate spike.</strong> Investors should stay on the short-end of fixed income.</li>
<li class="mt-2"><strong>Global growth is picking up.</strong> Investors should look to commodities for global growth exposure.</li>
</ol>

<h2 id="market-distortion" class="jump-link-nav anchored-block" data-jumplink-title="Market Distortion">U.S. Equity Market Distortion: Growth Dramatically Outperforms Value</h2>
<p>The S&amp;P 500 may have rallied 15.5% through the first half of 2024, but this rise was notably distorted. Comparing the performance of large-cap growth and value stocks over the past few decades, we see that growth outperformance matches the so-called internet bubble of 1999.</p>
<h3>Growth/Value Distortion Reaches Internet Bubble Levels</h3>
<p><img class="img-responsive w-100" alt="Growth/Value Distortion Reaches Internet Bubble Levels" src="https://www.vaneck.com/contentassets/ae003ac522384a238e48b966dcc3b523/4690_jve-investment-outlook_chart-1_2024-7_v1_blog.svg" /></p>
<p class="chart-disclosure">Source: Morningstar. Data as of July 17, 2024. Past performance is not a guarantee of future results. Index performance is not illustrative of fund performance. It is not possible to invest in an index. Value represented by Russell 1000 Value Index. Growth represented by Russell 1000 Growth Index.</p>

<p>This is not new. The S&amp;P 500 market cap index has been buoyed by the strong performance of mega-cap tech companies, including leading chip manufacturer Nvidia, given their large weighting within the index. Comparing different segments of the equity market in different eras, we see that the Nasdaq 100 Index has led the market since 2014, followed by the S&amp;P market cap index. The equal-weight S&amp;P index has lagged, indicating that the average large-cap stock's performance has been considerably lower. Small caps, international stocks and emerging markets stocks have also underperformed.</p>
<h3>Market Cap Weighted S&amp;P 500 Index Doesn&rsquo;t Always Rule</h3>
<p><strong>Price Performance in Different Regimes</strong></p>
<div class="wrapped-div">
<table style="width: 100%;">
<tbody>
<tr class="tbl-data">
<td class="tbl-header last">&nbsp;</td>
<td class="tbl-header last text-right">2014 - Current (%)</td>
<td class="tbl-header last text-right">2000 - 2007 (%)</td>
<td class="tbl-header last text-right">1996 - 2000 (%)</td>
</tr>
<tr class="tbl-data">
<td class="data-td last">S&amp;P 500 Index</td>
<td class="data-td data last text-right">177</td>
<td class="data-td data last text-right">1</td>
<td class="data-td data last text-right">148</td>
</tr>
<tr class="tbl-data">
<td class="data-td last">S&amp;P 500 Equal Weight Index</td>
<td class="data-td data last text-right">117</td>
<td class="data-td data last text-right">78</td>
<td class="data-td data last text-right">77</td>
</tr>
<tr class="tbl-data">
<td class="data-td last">Nasdaq 100 Index</td>
<td class="data-td data last text-right">406</td>
<td class="data-td data last text-right">-52</td>
<td class="data-td data last text-right">714</td>
</tr>
<tr class="tbl-data">
<td class="data-td last">Russell 2000 Index</td>
<td class="data-td data last text-right">74</td>
<td class="data-td data last text-right">44</td>
<td class="data-td data last text-right">81</td>
</tr>
<tr class="tbl-data">
<td class="data-td last">MSCI International Developed Index</td>
<td class="data-td data last text-right">19</td>
<td class="data-td data last text-right">36</td>
<td class="data-td data last text-right">55</td>
</tr>
<tr class="tbl-data">
<td class="data-td last">MSCI Emerging Markets Index</td>
<td class="data-td data last text-right">1</td>
<td class="data-td data last text-right">160</td>
<td class="data-td data last text-right">12</td>
</tr>
</tbody>
</table>
</div>
<p class="chart-disclosure">Source: New Edge, Cameron Dawson. RIA. Newedgewealth.com dated June 14, 2024.</p>
<p>After the 1999 peak in growth stocks, the Nasdaq actually fell in the next period, 2000-2007. The prior trend was almost entirely reversed. Emerging markets and international equities significantly outperformed, with equal-weight indices showing dramatic outperformance. The tech run-up leading up to 2000 presents performance figures that are strikingly similar to the current market trends, underscoring the cyclical nature of stock performance across different eras. This historical context illustrates that periods starting with overvalued growth stocks can lead to vastly different market returns, despite the tech companies' growth.</p>
<p>Nvidia&rsquo;s forward price-to-earnings ratio is at about 33 times earnings, and this high valuation reflects expectations of growth. Although Nvidia and other tech giants like Apple and Google are exhibiting more solid sales growth and profitability than during the 1999 internet bubble, these are rich valuations that come with risks. If there's a tech hiccup like a slowdown in demand, shrinking margins, or supply chain issues, particularly related to Taiwan, these stocks could become vulnerable, affecting returns significantly.</p>
<h3>Nvidia Valuations Are High But Mixed in Historical Context</h3>
<p><img class="img-responsive w-100" alt="Nvidia Valuations Are High But Mixed in Historical Context" src="https://www.vaneck.com/contentassets/548b7ec04b2e48fcb5663bcdd1480066/4690_jve-investment-outlook_chart-2_2024-7_v1_blog.svg" /></p>
<p class="chart-disclosure">Source: Bloomberg. Data as of July 22, 2024. Forward P/E on 12-month basis (next 4 quarters), this is lower than 2024 calendar year.</p>
<h2 id="fiscal-focus" class="jump-link-nav anchored-block" data-jumplink-title="Fiscal Focus">U.S. Budget Deficit Nears All-Time Highs</h2>
<p>I highlighted last quarter <strong><a href="https://www.vaneck.com/us/en/blogs/investment-outlook/jan-van-eck-global-growth-returns-and-the-2025-fiscal-reckoning/" title="Global Growth Returns and the 2025 Fiscal Reckoning">how large fiscal deficits continue to be</a></strong>, thanks to the boom in government spending. This has contributed to higher for longer inflation and helps explain why the Fed hasn&rsquo;t been easing.</p>
<p>The Trump and Biden administrations have been large spenders, creating a budget deficit of 7% despite being in an economic boom with low unemployment. Medicare and Social Security deficits are looming and sets 2025 up to be a critical year for fiscal policy.</p>
<h3>High Budget Deficit Despite Economic Boom and Low Unemployment</h3>
<p><img class="img-responsive w-100" alt="High Budget Deficit Despite Economic Boom and Low Unemployment" src="https://www.vaneck.com/contentassets/7971c997a23d46f38a87f4daa5156cd4/4690_jve-investment-outlook_chart-3_2024-7_v1_blog.svg" /></p>
<p class="chart-disclosure">Source: MacroPolicy Perspectives/OMB, BLS/Haver. Any projections shown are for illustrative purposes only and are not intended as predictions of future results or events.</p>
<p>This helps explain, in part, the Fed&rsquo;s hesitation to cut interest rates as it navigates the aftermath of pandemic-related spending and monetary policies. Even if the Fed cuts interest rates, a significant drop is unlikely unless there's a severe economic contraction. My view is that the government will need to employ some combination of tax increases and spending cuts to manage the debt, while the Fed may cut rates to stimulate that. While this scenario isn't disastrous for the stock and bond markets, there remains a risk of 10-year interest rates spiking if these fiscal challenges are not adequately addressed.</p>
<h2 id="global-growth" class="jump-link-nav anchored-block" data-jumplink-title="Global Growth">Global Growth Picks Up</h2>
<p>The <strong><a href="https://www.vaneck.com/us/en/blogs/investment-outlook/jan-van-eck-global-growth-returns-and-the-2025-fiscal-reckoning/" title="Global Growth Returns and the 2025 Fiscal Reckoning">global economy moved into expansion mode</a></strong> at the start of the year, as measured by global PMI. The U.S. is growing at a slower pace, but growth engines like India have been growing rapidly. China&rsquo;s growth statistics have been relatively weak, though I think they are making progress towards resolving their property issues. I think the rest of Asia has been key in carrying global growth. This is supportive of commodities demand, and we saw in Q2 the start of a commodity prices rally.</p>
<h3>Global Growth Back to Expansion</h3>
<p><img class="img-responsive w-100" alt="Global Growth Back to Expansion" src="https://www.vaneck.com/contentassets/8230ff10205c4369b578c1c801da1d12/4690_jve-investment-outlook_chart-4_2024-7_v1_blog.svg?m=20240730" width="1044" height="540" /></p>
<p class="chart-disclosure">Source: Bloomberg. Data as of July 2024. Purchasing Managers&rsquo; Index: economic indicators derived from monthly surveys of private sector companies. A reading above 50 indicates expansion, and a reading below 50 indicates contraction.</p>
<h2 id="investment-implications" class="jump-link-nav anchored-block" data-jumplink-title="Investment Implications">Key Takeaways and Investment Implications</h2>
<ol class="content-list">
<li class="mt-2"><strong>Market distortion:</strong> At the end of the second quarter, the stock market was significantly distorted, with growth stocks dramatically outperforming value stocks. Stocks like Nvidia, while not excessively overvalued, still show significant distortion when viewed over a multi-year period.
<p><strong>How to invest:</strong> Ensure that your equity portfolio is diversified and not overly concentrated in the S&amp;P 500 market cap index. Consider including equal weight large caps, mid caps, small caps, and international stocks to spread risk and capture broader market opportunities. It's important to rebalance your equity portfolios to avoid overexposure to overvalued growth stocks.</p>
</li>
<li class="mt-2"><strong>Fiscal spending:</strong> Government spending levels are currently very high, and addressing this issue will likely become a priority after the presidential election.
<p><strong>How to invest:</strong> Given the high interest rates on short-term fixed income, I suggest staying on the short end to mitigate the risk of a potential spike in long-term interest rates. This approach offers a safer return profile in the current fiscal environment.</p>
</li>
<li class="mt-2"><strong>Global growth:</strong> There has been a noticeable uptick in global growth, which has positive implications for various sectors, including commodities.
<p><strong>How to invest: </strong>With global growth picking up, commodities are likely to benefit, making them a viable addition to a diversified investment strategy.</p>
</li>
</ol>
<p>To receive more <a href="/us/en/insights/investment-outlook" title="Investment Outlook Insights"><strong>Investment Outlook</strong></a> insights, <a href="https://www.vaneck.com/us/en/subscribe/" title="Subscription Center"><strong>sign up in our subscription center</strong></a>.</p>
<style>
    .data-td.data {
        padding-right: 5px !important;
    }
    
    .data-head { 
    padding-right: 5px !important;
    }

    .wrapped-div {
        max-width: 100%;
    }

    @media (max-width: 1240px) {
        .wrapped-div {
            overflow-x: scroll;
        }
    }

    .wrapped-div-sector {
        max-width: 100%;
        overflow-x: scroll;
    }
</style>
]]></content:encoded>
</item><item rdf:about="https://www.vaneck.com/us/en/blogs/income-investing/clo-returns-driven-by-carry-and-price-gains/">
  <title>CLO Returns Driven by Carry and Price Gains></title>
  <link>https://www.vaneck.com/us/en/blogs/income-investing/clo-returns-driven-by-carry-and-price-gains/</link>
  <description><![CDATA[CLOs generated positive total returns in Q2. Due to tight valuations, we are positioned higher in the capital stack overall with the ability to shift lower should the market experience weakness.]]></description>
  <dc:creator> </dc:creator>
  <dc:date>07/26/2024 06:30:00</dc:date>
<content:encoded><![CDATA[

<hr />
<p>The <strong><a href="https://www.vaneck.com/us/en/investments/clo-etf-cloi/overview/" title="CLOI - VanEck CLO ETF - Holdings and Performance">VanEck CLO ETF</a></strong> (the &ldquo;Fund&rdquo;) returned 2.05% in the second quarter of 2024, approximately in line with its benchmark (please see below for standardized performance<sup>1</sup>). We have paused further rotation lower in the capital stack as we believe the relative value opportunities have begun to shift, as CLO prices have rallied significantly this year. Tight valuations and dispersion in the loan market argue for a bottom-up approach to identify opportunities to take advantage of currently elevated yields while avoiding CLOs with weaker credits. Vintage, portfolio and manager selection remain key. We maintain the ability to shift further into lower-rated tranches when the risk/reward profile becomes more favorable.</p>
<ul class="content-list">
<li><strong><a href="#point-one">Market Update</a></strong></li>
<li><strong><a href="#point-two">Portfolio Strategy</a></strong></li>
<li><strong><a href="#point-three">Outlook</a></strong></li>
</ul>
<h2 id="point-one" class="jump-link-nav anchored-block" data-jumplink-title="Market Update">Market Update: Strong CLO Total Returns</h2>
<p>CLOs generated positive total returns in June, the 15th consecutive month of positive returns at the overall index level. CLO returns were positive across the capital stack for the eighth month in a row. Carry continues to drive strong returns given high base rates, while price returns were negative. The macroeconomic environment was supportive during the month with the market pricing for somewhere between Goldilocks conditions and a mild economic slowdown. Treasuries rallied on the back of a very favorable US CPI report, weaker economic data, political unrest in France, and Fed projections suggesting a delayed but not necessarily less substantial easing cycle. Treasury rates rallied in June, with 5- and 10-year Treasury rates trading 13 bps and 10 bps lower, respectively.</p>
<p>CLOs generated strong total returns across the capital stack in Q2, driven primarily by carry, outperforming investment grade corporates, fixed rate high yield bonds and leveraged loans.</p>
<div class="wrapped-div">
<table style="width: 100%;">
<tbody>
<tr class="tbl-data">
<td class="tbl-header last">Asset class</td>
<td class="tbl-header last text-right">Q2 2024 Return (%)</td>
<td class="tbl-header last text-right">H1 2024 Return (%)</td>
<td class="tbl-header last text-right">Yield to Worst (%)</td>
<td class="tbl-header last text-right">Spreads (BPS)</td>
</tr>
<tr class="tbl-data">
<td class="data-td last font-weight-normal">CLOs</td>
<td class="data-td data last text-right">2.07</td>
<td class="data-td data last text-right">4.43</td>
<td class="data-td data last text-right">6.66</td>
<td class="data-td data last text-right">152</td>
</tr>
<tr class="tbl-data">
<td class="data-td last font-weight-normal">CLOs IG</td>
<td class="data-td data last text-right">1.93</td>
<td class="data-td data last text-right">4.06</td>
<td class="data-td data last text-right">6.38</td>
<td class="data-td data last text-right">124</td>
</tr>
<tr class="tbl-data">
<td class="data-td last font-weight-normal pl-4">AAA</td>
<td class="data-td data last text-right">1.77</td>
<td class="data-td data last text-right">3.64</td>
<td class="data-td data last text-right">6.16</td>
<td class="data-td data last text-right">99</td>
</tr>
<tr class="tbl-data">
<td class="data-td last font-weight-normal pl-4">AA</td>
<td class="data-td data last text-right">2.03</td>
<td class="data-td data last text-right">4.40</td>
<td class="data-td data last text-right">6.51</td>
<td class="data-td data last text-right">139</td>
</tr>
<tr class="tbl-data">
<td class="data-td last font-weight-normal pl-4">A</td>
<td class="data-td data last text-right">2.32</td>
<td class="data-td data last text-right">5.06</td>
<td class="data-td data last text-right">6.91</td>
<td class="data-td data last text-right">185</td>
</tr>
<tr class="tbl-data">
<td class="data-td last font-weight-normal pl-4">BBB</td>
<td class="data-td data last text-right">2.94</td>
<td class="data-td data last text-right">6.54</td>
<td class="data-td data last text-right">7.78</td>
<td class="data-td data last text-right">279</td>
</tr>
<tr class="tbl-data">
<td class="data-td last font-weight-normal pl-4">BB</td>
<td class="data-td data last text-right">4.52</td>
<td class="data-td data last text-right">11.24</td>
<td class="data-td data last text-right">11.41</td>
<td class="data-td data last text-right">649</td>
</tr>
<tr class="tbl-data">
<td class="data-td last font-weight-normal">Investment Grade Corporates</td>
<td class="data-td data last text-right">0.12</td>
<td class="data-td data last text-right">0.04</td>
<td class="data-td data last text-right">5.52</td>
<td class="data-td data last text-right">96</td>
</tr>
<tr class="tbl-data">
<td class="data-td last font-weight-normal">U.S. Agg</td>
<td class="data-td data last text-right">0.19</td>
<td class="data-td data last text-right">-0.47</td>
<td class="data-td data last text-right">5.04</td>
<td class="data-td data last text-right">42</td>
</tr>
<tr class="tbl-data">
<td class="data-td last font-weight-normal">Leveraged Loans</td>
<td class="data-td data last text-right">1.92</td>
<td class="data-td data last text-right">4.62</td>
<td class="data-td data last text-right">9.09</td>
<td class="data-td data last text-right">373</td>
</tr>
<tr class="tbl-data">
<td class="data-td last font-weight-normal">High Yield Bonds</td>
<td class="data-td data last text-right">1.09</td>
<td class="data-td data last text-right">2.62</td>
<td class="data-td data last text-right">7.94</td>
<td class="data-td data last text-right">321</td>
</tr>
</tbody>
</table>
</div>
<p class="chart-disclosure">Source: JP Morgan and ICE Data Indices as of 6/30/2024. CLOs represented by J.P. Morgan Collateralized Loan Obligation Index CLOs IG represented by J.P. Morgan Collateralized Loan Obligation IG Index, AAA Rated CLOs represented by J.P. Morgan CLO AAA Index, AA Rated CLOs represented by J.P. Morgan CLO AA Index, A Rated CLOs represented by J.P. Morgan CLO A Index, BBB Rated CLOs represented by J.P. Morgan CLO BBB Index, BB Rated CLOs represented by J.P. Morgan CLO BB Index, Investment Grade Corporates represented by ICE BofA US Corporate Index, US Agg is represented by the ICE BofA US Broad Market, Leveraged Loans represented by JP Morgan Leveraged Loan Index and High Yield Bonds represented by ICE BofA US High Yield Index.</p>
<p>CLO new issue supply slowed month-over-month, with $11.2bn pricing during the month, the lowest monthly volume of the year, following $24.0bn in May, which was the highest monthly volume since November 2021. New issuance volume is now 80% higher than year-to-date 2023 and is the fastest pace on record. Meanwhile, refinancing and reset activity continued at a torrid pace in June, with $29.3bn pricing, after $23.5bn and $20.3bn in May and April, respectively. Year-to-date total issuance of $212.3bn is now 276% higher than the same period last year.</p>
<p>Gross institutional loan issuance continued at a brisk pace in June, with $53.9bn pricing, after $51.0bn priced in May. Issuance was still driven by repricing and refinancing transactions. Issuers remained focused on reducing borrowing costs and pushing out maturity walls. The technical supply-demand shortage persisted for another month despite a decline in net demand. Net inflows for retail loan funds declined to $804 million, down from $3.0bn last month.</p>
<p>The trailing twelve-month default rate within the Morningstar US Leveraged Loan Index decreased to 0.92% in June from 1.08% in May. In contrast, as measured by JP Morgan, the default rate including distressed exchanges is 3.10%. This shows that activity has been elevated as borrowers with unsustainable capital structures endeavored to manage their liabilities and avoid the bankruptcy process. We anticipate the default rate to remain below historical averages in the near term for the leveraged loan market. However, we expect that defaults, including distressed exchanges, will remain in the 3-4% range, above the long-term historical average of ~3%. CLO fundamentals were mixed month-over-month.</p>
<h3>Average Annual Total Returns* (%) Quarter End as of 06/30/24</h3>
<div class="wrapped-div">
<table style="width: 100%;">
<tbody>
<tr class="tbl-data">
<td class="tbl-header last">&nbsp;</td>
<td class="tbl-header last text-right">1 Month</td>
<td class="tbl-header last text-right">3 Month</td>
<td class="tbl-header last text-right">YTD</td>
<td class="tbl-header last text-right">1 Year</td>
<td class="tbl-header last text-right">LIFE 6/21/2022</td>
</tr>
<tr class="tbl-data">
<td class="data-td last">CLOI (NAV)</td>
<td class="data-td data last text-right">0.50</td>
<td class="data-td data last text-right">2.05</td>
<td class="data-td data last text-right">4.37</td>
<td class="data-td data last text-right">9.15</td>
<td class="data-td data last text-right">8.46</td>
</tr>
<tr class="tbl-data">
<td class="data-td last">CLOI (Share Price)</td>
<td class="data-td data last text-right">0.52</td>
<td class="data-td data last text-right">1.88</td>
<td class="data-td data last text-right">4.42</td>
<td class="data-td data last text-right">8.88</td>
<td class="data-td data last text-right">8.42</td>
</tr>
<tr class="tbl-data">
<td class="data-td last">J.P. Morgan Collateralized Loan Obligation Index</td>
<td class="data-td data last text-right">0.49</td>
<td class="data-td data last text-right">2.07</td>
<td class="data-td data last text-right">4.44</td>
<td class="data-td data last text-right">10.52</td>
<td class="data-td data last text-right">8.77</td>
</tr>
</tbody>
</table>
</div>
<p class="chart-disclosure"><sup>*</sup>&nbsp;Returns less than one year are not annualized.</p>
<p class="chart-disclosure"><sup>1</sup>&nbsp;CLOI Performance as of 6/30/2024.</p>
<p class="chart-disclosure"><strong>The performance data quoted represents past performance. Past performance is not a guarantee of future results. Investment return and principal value of an investment will fluctuate so that an investor's shares, when redeemed, may be worth more or less than their original cost. Performance may be lower or higher than performance data quoted. Please call 800.826.2333 or visit vaneck.com for performance current to the most recent month ended.</strong></p>
<p class="chart-disclosure">CLOI&rsquo;s total expense ratio 0.40%. Van Eck Associates Corporation (the &ldquo;Adviser&rdquo;) will pay all expenses of the Fund, except for the fee payment under the investment management agreement, acquired fund fees and expenses, interest expense, offering costs, trading expenses, taxes and extraordinary expenses. Notwithstanding the foregoing, the Adviser has agreed to pay the offering costs until at least May 1, 2025. &ldquo;Other Expenses&rdquo; have been restated to reflect current fees.</p>

<p class="chart-disclosure">Source: <strong>FactSet, J.P. Morgan, VanEck</strong>, as of June 30, 2024. Index performance is not representative of Fund performance. It is not possible to invest directly in an index.</p>
<h2 id="point-two" class="jump-link-nav anchored-block" data-jumplink-title="Portfolio Strategy">Portfolio Strategy</h2>
<p>The borrowing rate for leveraged loan borrowers remains high following rate increases from central banks over the last two years. While there have been signs of softening, higher interest rates have yet to drive a material deterioration in credit metrics within the loan market or undercut economic growth. However, with expectations for rates to remain higher for longer, increased coupon payments for borrowers mean that interest coverage ratios will continue to decline as the lagged effect of rate increases takes hold. Ultimately, the result will be higher leverage and even lower interest coverage ratios, leading to the risk of downgrade if companies are unable to refinance outstanding debt as maturities come due or grow revenues from a more robust economic environment. Market expectations with respect to Fed easing for the year have been reset, with two rate cuts now priced in for 2024, starting in September. Cuts will provide relief for more stressed borrowers.</p>
<p>CLO prices have rallied significantly this year with the average AAA-BBB price ending June above par, with the basis between higher and lower-rated tranches tightening through the 5-year median. As a result, we have paused any further rotations lower in the capital stack as the relative value opportunities have begun to shift. Were spreads to widen, we maintain the ability to shift further into lower rated tranches. With the majority of CLO paper trading above par, we continue to realize gains in securities that are trading above par in favor of credits, which offer more positive price convexity and/or spread in the primary market.</p>
<p>Primary and secondary spreads tightened to start the year. However, buying in the primary market continues to allow for wider spreads on a relative basis, even when taking spread duration into account.</p>
<h3>Overall Defensive While Selectively Adding Risk</h3>
<p><img class="img-responsive w-100" src="https://www.vaneck.com/contentassets/2167b1fc01e54b799bfeb58184a42523/4678_cloi-july_chart-1_2024-7_v1_blog.svg" alt="CLOI Total Return and Credit Allocation" /></p>
<p class="chart-disclosure">Source: <strong>FactSet, J.P. Morgan, VanEck</strong>, as of June 30, 2024. Index performance is not representative of Fund performance. It is not possible to invest directly in an index.</p>
<h2 id="point-three" class="jump-link-nav anchored-block" data-jumplink-title="Outlook">Outlook Ahead: CLO New Issuance Expected to Continue</h2>
<p>Looking toward the second half, we believe that at the index level, most fixed income risk asset classes are trading through fair value to varying degrees &ndash; a critical investment challenge that argues for a bottom-up approach that considers specific subsegments of individual issuers&rsquo; attractions or risks. With limited opportunities for spread compression and price appreciation, targeting assets that are poised to return currently elevated yield income, such as CLOs, should produce an attractive outcome. Loan fundamentals have remained stable amid limited leverage-accretive LBO and M&amp;A activity due to prohibitive financing costs. Companies have instead been prioritizing liability management, including extending near-term debt maturities and reducing nominal spreads. Modest, but still positive corporate revenue and earnings growth will buttress fundamentals while stressed credits continue to be impaired by idiosyncratic factors.</p>
<p>Despite limited net loan issuance, CLO new issuance has continued at a record pace as managers take advantage of tighter liability spreads. We expect this will continue in the near term given current AAA spreads are at the tightest levels since early 2022, but this pace may be unsustainable unless M&amp;A and LBO activity picks up. Despite the higher-than-expected supply, CLOs continue to see strong demand given high all-in yields, which we expect to remain the case through year-end. In addition to the traditional investor base which has been a consistent source of demand, the CLO market has benefitted from the growing presence of CLO ETFs. Japanese banks, traditionally big buyers of AAA-rated paper, are also expected to make additional allocations to CLOs which could serve as a tailwind for further spread compression and ultimately additional CLO creation over the back half of the year and into early 2025. We have also seen a material increase in refinancing and reset activity in recent months as portfolios constructed with purchases in the secondary market take advantage of higher loan prices and tighter CLO spreads. This has also bolstered demand for new paper and led to tighter spreads as investors put proceeds back to work. Should the loan and CLO markets continue to rally, we would expect to see more portfolios benefit from the significant redemption optionality in CLOs, although that potential universe has shrunk materially given the level of activity already this year.</p>
<p>Amid the supportive technical environment, we anticipate CLO spreads to trade in a range for the next 3-6 months and we see spreads and yields as attractive under most market scenarios over the next twelve months. However, given the dispersion seen in the loan market, certain CLO portfolios holding weaker credits may eventually experience impairments to the lowest-rated debt tranches. As a result, vintage, portfolio, and manager selection remain key. In addition, with tight valuations and risks tilted to the downside, we remain positioned higher in the capital stack overall, maintaining the ability to quickly shift lower in the capital stack should the market experience any bouts of weakness.</p>

<h2>Investing in CLOs with VanEck</h2>
<p>The <a href="https://www.vaneck.com/us/en/investments/clo-etf-cloi/overview/" title="CLOI - VanEck CLO ETF - Holdings and Performance"><strong>VanEck CLO ETF (CLOI)</strong></a>, subadvised by PineBridge, may offer an attractive way for investors to efficiently access this market with the liquidity, transparency and low cost features of an ETF. CLOI invests primarily in investment grade CLO tranches and may invest up to 20% in BB-rated CLOs (but will not invest in CLOs rated below BB-/Ba3 or equity tranches of CLOs).</p>
<p>CLOI aims to provide an enhanced yield by identifying the most attractive segments of the CLO market, while avoiding downgrades and default losses. Through our active management, we can move throughout the CLO capital structure to potentially add alpha, adding risk when there are opportunities and de-risking in periods of market volatility.</p>
<p>To receive more <a href="/us/en/blogs/income-investing/" title="Income Investing Insights"><strong>Income Investing</strong></a> insights, <a href="/us/en/subscribe" title=" Subscription Center"><strong>sign up in our subscription center</strong></a>.</p>
]]></content:encoded>
</item><item rdf:about="https://www.vaneck.com/us/en/blogs/natural-resources/global-growth-gains-spur-resources-in-q2/">
  <title>Global Growth Gains Spur Resources in Q2></title>
  <link>https://www.vaneck.com/us/en/blogs/natural-resources/global-growth-gains-spur-resources-in-q2/</link>
  <description><![CDATA[Commodities, led by metals and energy, rose during the quarter amid a constructive environment fueled by signs of global growth and tight market conditions based on supply and demand fundamentals.]]></description>
  <dc:creator>Shawn Reynolds</dc:creator>
  <dc:date>07/26/2024 06:30:00</dc:date>
<content:encoded><![CDATA[

<p>Quarterly insights from Global Resources Portfolio Manager Shawn Reynolds, featuring his unique views on natural resources and commodities.</p>

<p>Broadly speaking, commodities trended higher on the quarter, with gains led by metals and energy. The environment for commodities was constructive, highlighted by modest, though encouraging, signs of global growth and perceived market tightness based on underlying supply and demand fundamentals. Apart from sectors mentioned above, resource equities mostly underperformed relative to their commodity counterparts.</p>
<h2>Metals Headline Commodity Price Gains</h2>
<ul class="content-list">
<li class="mt-2"><strong>Gold &amp; Precious Metals &ndash;</strong> Gold reached new all-time highs of $2,450/oz (intraday) in May. Continued central bank buying and strong physical demand buoyed prices. Meanwhile, gold miners&rsquo; shares were supported by higher prices and confirmation of controlled cost inflation.</li>
<li class="mt-2"><strong>Base &amp; Industrial Metals &ndash;</strong> Supply concerns, spurred speculative buying of copper in the first and second quarters of 2024. By late-May, copper reached all-time highs of $11,104/mt (intraday). Headlines of a potential deal between two large producers also attracted further attention to the copper space.</li>
<li class="mt-2"><strong>Oil &amp; Gas &ndash;</strong> Oil prices eased as concerns over a broader, regional escalation of war in the Middle East subsided. Weaker-than-anticipated gasoline and diesel demand, paired with higher reported inventory levels, also dragged. Meanwhile, natural gas prices rallied on increased energy demands (for cooling) in Asia and ongoing Russian supply threats. U.S. Exploration and Production (E&amp;P) and oilfield service markets also continued to experience consolidation.</li>
<li class="mt-2"><strong>Renewables &amp; Alternatives &ndash;</strong> The sell-off in renewables slowed in the second quarter, amid prospects of a potential start to a rate cutting cycle in late-2024. Near-record installations of U.S. solar capacity during the first quarter (mostly utility-scale builds) also pointed to signs of strength. However, challenges remain for the industry, based on a lack of available labor, interconnection delays and trade uncertainty. The announced bankruptcy of a major customer for a solar inverter manufacturer and its subsequent issuance of a large convertible senior note also raised alarms around the current financial health of major players in the industry.</li>
<li class="mt-2"><strong>Agriculture &ndash;</strong> Wheat prices surged through May on reported unfavorable crop conditions in the Black Sea region. Tight cattle supply and a rotation into poultry aided higher chicken prices during the quarter. Despite higher natural gas prices, fertilizer supply remained ample with Northern seasonal demand abating. Threat of oversupplied fertilizer markets persist with the potential for China to restart phosphate exports.</li>
</ul>

<h2>Constructive Outlook Remains in Place</h2>
<p>We remain constructive on the outlook for commodities and resource equities heading into the second half of 2024. For now, inflation remains relatively persistent, and the likelihood of lower rates would be a net positive for commodities and emerging markets. Likewise, geopolitical risks seem likely to remain elevated just given the contentious, polarized nature of elections, globally, and a seemingly-narrow pathway for speedy resolution of military conflicts in Ukraine and the Middle East.</p>
<p>Fundamentally, we are seeing added support from evolving secular demand and supply dynamics. This includes structural demand support from de-globalization themes (such as re- or on-shoring or trade protectionism), increased power generation (due to the advent of artificial intelligence, data centers and additional grid buildout) and the on-going resources transition.</p>
<p>There are also several restraints on the supply side. Most notably, these include weak investment (due to reduced capital expenditures, sector-wide), increased resource expropriation, and supply chain disruptions.</p>

<p>To receive more&nbsp;<a href="/us/en/insights/natural-resources/" title="Natural Resources Insights"><strong>Natural Resources</strong></a> insights, <a href="https://www.vaneck.com/us/en/subscribe/" title="Subscription Center"><strong>sign up in our subscription center</strong></a>.</p>
]]></content:encoded>
</item><item rdf:about="https://www.vaneck.com/us/en/blogs/digital-assets/matthew-sigel-bitcoin-2050-valuation-scenarios-global-medium-of-exchange-and-reserve-asset/">
  <title>Bitcoin 2050 Valuation Scenarios: Global Medium of Exchange and Reserve Asset></title>
  <link>https://www.vaneck.com/us/en/blogs/digital-assets/matthew-sigel-bitcoin-2050-valuation-scenarios-global-medium-of-exchange-and-reserve-asset/</link>
  <description><![CDATA[Our digital assets research team outlines their assumptions for a scenario in which bitcoin could reach $2.9 million per coin by 2050, driven by its adoption as a global medium of exchange and a reserve asset.]]></description>
  <dc:creator>Matthew  Sigel</dc:creator>
  <dc:date>07/24/2024 06:30:00</dc:date>
<content:encoded><![CDATA[

<p><strong>Please note that VanEck has positions in bitcoin.</strong></p>
<p><strong><i>The information, valuation scenarios and price targets presented on any digital assets in this blog are not intended as financial advice, a recommendation to buy or sell these digital assets, or any call to action. There may be risks or other factors not accounted for in these scenarios that may impede the performance these digital assets; their actual future performance is unknown, and may differ significantly from any valuation scenarios or projections/forecasts herein. Any projections, forecasts or forward-looking statements included herein are the results of a simulation based on our research, are valid as of the date of this communication and subject to change without notice, and are for illustrative purposes only. Please conduct your own research and draw your own conclusions.</i></strong></p>
<h2>Introduction</h2>
<p>By 2050, we see bitcoin (BTC) solidifying its position as a key international medium of exchange, ultimately becoming one of the world&rsquo;s reserve currencies. This projection is rooted in the anticipated erosion of trust in current reserve assets. Crucially, we believe that Bitcoin&rsquo;s scalability issues which have been the primary barrier to its widespread adoption, will be resolved by emerging Bitcoin Layer-2 (L2) solutions. The combination of Bitcoin&rsquo;s immutable property rights and sound money principles with the enhanced functionality provided by L2 solutions could enable the creation of a global financial system capable of better meeting the developing world's needs.</p>

<h2>Executive Summary: Bitcoin Price of $2.9M by 2050</h2>
<p>It is conceivable that by 2050 Bitcoin could be used to settle 10% of the globe&rsquo;s international trade and 5% of the world&rsquo;s domestic trade. This scenario would result in central banks holding 2.5% of their assets in BTC. Using assumptions about global growth, investor BTC demand, and Bitcoin&rsquo;s turnover, we apply a velocity of money equation to suggest a <strong>potential price of $2.9M per Bitcoin,</strong> translating to a total market cap of $61 trillion. Applying our existing framework for valuing Ethereum L2s, we estimate that Bitcoin L2s could collectively be worth $7.6T, approximately 12% of BTC&rsquo;s total value.</p>
<h2>Shifting Trends in the International Monetary System</h2>
<p>To understand Bitcoin's potential role in the future financial landscape, it is crucial to examine the current and shifting trends in the International Monetary System (IMS). Persistent trends in the IMS favor the ascension of Bitcoin as the world&rsquo;s economies turn away from current reserve currencies. We theorize that the chief driver of this shift will be declines in the relative global GDP of current economic leaders such as the U.S., the EU, the UK, and Japan. The changes will be further catalyzed by diminishing confidence in current reserve currencies as long-term stores of value due to unrestrained deficit spending and the short-sighted geopolitical decisions by the issuing nations. Notably, concerns about the property rights guaranteed by Western monetary and financial systems, particularly in the United States, are growing.</p>
<p>Driven by the deteriorating franchise of current reserve currencies, many businesses and consumers worldwide may recognize the endemic shortcomings of alternative fiat currencies. In this environment of uncertainty, businesses and consumers worldwide are likely to recognize the endemic flaws of alternative fiat currencies, thereby generating demand for a <i>neutral medium of exchange with immutable property rights and predictable monetary policy. <strong>This is where Bitcoin comes in.</strong></i></p>
<p>This piece will outline:</p>
<ol class="content-list">
<li><a href="#monetary-system-trends"><strong>Transformation of the International Monetary System</strong></a></li>
<li><a href="#future-monetary-system-trends"><strong>Future Monetary System Trends</strong></a></li>
<li><a href="#ims-issues"><strong>IMS Issues and Bitcoin Solutions</strong></a></li>
<li><a href="#bitcoin-scaling-and-l2s"><strong>Bitcoin Scaling with Layer-2 Solutions</strong></a></li>
<li><a href="#bitcoin-2050-price-scenarios"><strong>Bitcoin 2050 Price Predictions with Layer-2s</strong></a></li>
</ol>
<h2 id="monetary-system-trends" class="jump-link-nav anchored-block" data-jumplink-title="Monetary System Trends">Trust Anchors the International Monetary System</h2>
<p>A currency&rsquo;s importance in the International Monetary System is best indicated by its share of cross-border payments and central bank reserves. The current system is dominated by a handful of currencies, including the U.S. Dollar, Euro, GBP, and Yen. A currency&rsquo;s usage hinges on its utility, perceived value stability, and trust in the fiscal discipline of its issuer. The more significant a country's share of global GDP, the more its currency is used in international trade, creating a feedback loop that reinforces its dominance. Historically, changes to the IMS occur slowly, but we are now witnessing a pivotal transformation.</p>
<p>Using a currency for international trade also provides an impetus for a banking system to develop around a currency to provide the financial oil to lubricate its usage. Changes to the system occur but over relatively glacial periods of time. The 20th century began with a gold standard dominated by the British Pound Sterling that gradually moved by the 1970s to one backed by a fiat U.S. dollar.
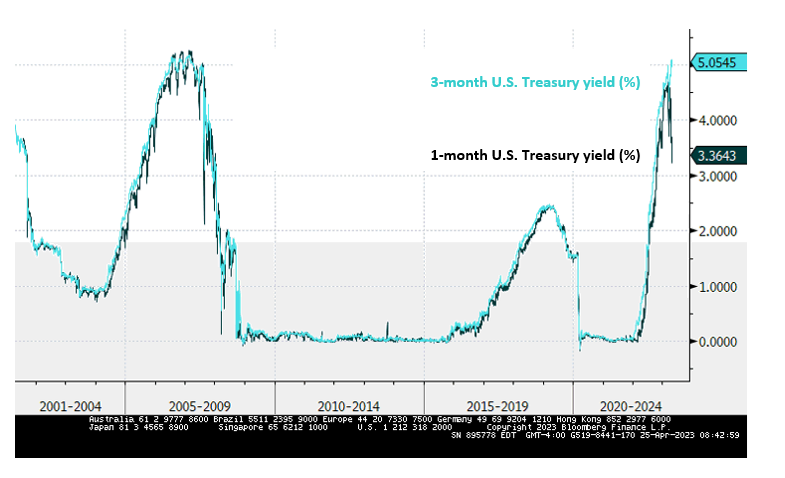
</p>
<p>For the last 45 years, the dollar&rsquo;s share of foreign currency cross-border payments (CBP) has been remarkably stable. Besides a momentary spike in dollar usage during the dollar rally of the early 1980s, the dollar&rsquo;s share of foreign currency cross-border payments has been stable at around 61%. We attribute this dollar-centric system to credible fiscal policy, consistently strong global GDP share (25%), a dominant share of the world&rsquo;s <a href="https://milex.sipri.org/sipri" title="SIPRI Military Expenditure Database" target="_blank" rel="noopener"><strong>defense spending</strong></a> (48%), and a robust domestic rule of law. The cumulative effects of these deliberate policies have provided U.S. dollar holders comfort in the USD as a store of value globally accepted for goods and services. Dollars can be used to purchase high-quality capital/consumer goods, invest in the world&rsquo;s premier companies, and even earn risk-free interest by lending to the government of the United States. Most importantly, U.S. dollar holders believed that the rule of law safeguarded their currency positions and could be litigated in an impartial U.S. court system. But this system is beginning to change.</p>
<h2>The Decline of the Euro and Yen in Global Trade</h2>
<h3>Trade Settled in USD is Stable While EUR and JPY is Falling</h3>
<p><img loading="lazy" class="img-responsive w-100" alt="Trade Settled in USD is Stable While EUR and JPY is Falling" src="https://www.vaneck.com/contentassets/c6ff48fc86554e698ed50369e84aee2c/4648_bitcoin-valuation_chart-1_2024-7_v1_blog.svg" /></p>
<p class="chart-disclosure"><strong>Source:</strong> BIS as of: 6/17/2024.</p>
<p>Though the dollar&rsquo;s status in international usage is relatively stable for the time being, currencies such as the euro (as well as its predecessors) and the yen have seen their share of <a href="https://www.bis.org/cpmi/cross_border/publications.htm" title="BIS/CPMI publications" target="_blank" rel="noopener"><strong>global trade settlement</strong></a> fall significantly. From its peak usage in the mid-2000s when it satisfied ~22% of the world&rsquo;s foreign cross-border payments, the euro has since declined, as of 4Q2023, to only 14.5%. Regarding its share of the Central Bank, FX reserves moved from 25.3% in the late 2000s to around 19.75% in 2023. The yen has experienced a similar decline in usage from its peak in the mid-1990s, from 12% to just under 5% in 4Q2024. Similarly, JPY's central bank reserves have dropped from 6.2% in the mid-2000s to around 5.4% today. This reduction in cross-border currency settlement and reserves has occurred in tandem with the EU and Japan's decline in relative GDP, defense spending, and debt to GDP.</p>
<h2>Relationship Between GDP Share and Currency Usage</h2>
<p>Between 1980 and 2023, the EU&rsquo;s share of global defense spending declined (-45%) as it shifted from 25% of the world&rsquo;s expenditures to 14% in 2023. The EU&rsquo;s share of global GDP fell (-43%) from 29% to 16% over that same period. Simultaneously, the EU&rsquo;s <a href="https://www.imf.org/external/datamapper/GGXWDG_NGDP@WEO/OEMDC/ADVEC/WEOWORLD" title="General government gross debt" target="_blank" rel="noopener"><strong>sovereign debt to GDP</strong></a> has increased ~34% from <a href="https://www.imf.org/external/datamapper/GGXWDG_NGDP@WEO/OEMDC/ADVEC/WEOWORLD" title="General government gross debt" target="_blank" rel="noopener"><strong>66% </strong></a>in 1995 to <a href="https://data.ecb.europa.eu/data/datasets/MPD?dataset%5B0%5D=Macroeconomic%20Projection%20Database%20%28MPD%29&amp;filterSequence=dataset&amp;advFilterDataset%5B0%5D=Macroeconomic%20Projection%20Database%20%28MPD%29&amp;resetAllFilters=true&amp;sort=t_ecb_last_update" title="Macroeconomic Projection Database - MPD" target="_blank" rel="noopener"><strong>89%</strong></a> in 2023. While Japan&rsquo;s share of the globe&rsquo;s military expenditures has remained consistently minuscule due to its U.S. security pact, at around 2-3%, its share of global GDP has fallen. At the same time, its government debt to GDP has increased. Between 1995 and 2023, Japan&rsquo;s share of global GDP dropped from around 17% to just over 4% - a capitulation of (-77%). Of course, between 1980 and 2023, Japan&rsquo;s government debt to GDP exploded 426%, changing from 47.8% to 251.8%. These occurrences have happened in tandem with the drop in yen and euro usage in global trade.</p>
<p>Among the major reserve currencies, we performed regression analysis to assess the relationship between changes in a nation&rsquo;s share of GDP and changes in its share of cross-border payments (CBP). <strong>CBP</strong> refers to international transactions involving the transfer of funds across national borders. Each of these tests produced t-values greater than 4 with R2 values ranging between .3 and .5, implying a significant relationship between GDP and CBP with a high degree of correlation. This finding informs our expectations of the currencies that will dominate the international monetary system in the future. Our model forecasts that Japan, Great Britain, and the EU will decline as a portion of the world&rsquo;s productivity, collectively falling from 27% of global GDP in 2020 to less than 15% by 2050. We believe this will also lead to declining usage of their currencies, as the Principal Four currencies are bound to declining demographics.</p>
<h3>GDP Decline Correlates with Cross-Border Payments (CBP): Japan, Great Britain, and the EU to Lose FX Share</h3>
<p><img loading="lazy" class="img-responsive w-100" alt="GDP Decline Correlates with Cross-Border Payments (CBP): Japan, Great Britain, and the EU to Lose FX Share" src="https://www.vaneck.com/contentassets/c6ff48fc86554e698ed50369e84aee2c/4648_bitcoin-valuation_chart-2_2024-7_v1_blog.svg" /></p>
<p class="chart-disclosure"><strong>Source:</strong> VanEck Research, <a href="https://www.imf.org/external/datamapper/NGDPDPC@WEO/OEMDC/ADVEC/WEOWORLD" title="GDP per capita, current prices" target="_blank" rel="noopener"><strong>IMF</strong></a>, BIS as of 6/21/2024. Any projections shown are for illustrative purposes only, are valid as of the posting date of this content, and are subject to change without notice.</p>
<h2 id="future-monetary-system-trends">Future Trends for the &ldquo;Principal Four&rdquo; Currencies</h2>
<p>Our data analysis strongly suggests that current reserve currencies have declined in importance as their issuing nations have become less economically relevant and more fiscally irresponsible. We believe this trend will persist and accelerate in the future. Specifically, we find a substantial reason to believe that the share of cross-border payments conducted in the dollar, the yen, the euro, and the pound (&ldquo;The Principal Four&rdquo;) will continue to fall. Based upon our projections of their GDP share, we estimate that cross-border payments conducted in these four currencies will decline to 64% in 2050 from 2023&rsquo;s share of 86%. In the vacuum left by these currencies&rsquo; decline, there is ample opportunity for Bitcoin to gain adoption as an important alternative to settle international trade.</p>
<p>Our analysis begins with the well-known fact that developed economies&rsquo; populations are aging. Within the Principal Four nations, the share of the elderly population will increase between 20-40% by 2050. In Japan, the share of citizenry above 65 years old will reach <a href="https://www.nippon.com/en/features/h00011/" title="Global Japan: 2050 Simulations and Strategies" target="_blank" rel="noopener"><strong>39%,</strong></a> while <i>25% of all Japanese will be older than 75 years old.</i> These demographic trends will force the productivity of each of these nations to sag over time. Additionally, compared to developing economies, where relatively simple investments can improve economic growth rates in infrastructure, education, and technology, advanced economies cannot dramatically improve productivity with low-hanging, high-return improvements. The consequence of this demographic and economic reality is that the IMF <a href="https://www.imf.org/en/Publications/WEO/Issues/2023/10/10/world-economic-outlook-october-2023" title="World Economic Outlook" target="_blank" rel="noopener"><strong>projects</strong></a> much slower economic growth rates for developed countries than for developing ones. As the graph above indicates, we project that the share of GDP of the Principal Four&rsquo;s economies will decline to only 36% of global GDP in 2050 from 71% in 1984.</p>
<p>While the share of the global GDP of the Principal Four shrinks, the fiscal picture of each of these nations will also grow dim. The compound effects of demographic decline combined with low economic growth rates mean that the Debt to GDP of these nations will explode. To estimate the fiscal situation of the Principal Four in 2050, we employed IMF estimates of GDP growth and demographic projections of each of the underlying four entities. After that, we applied expectations for average debt maturity, inflation, deficit spending, and GDP growth. Our long-run forecasts are informed by each governing body&rsquo;s long-term debt projections and adjusted based on demographic trends.</p>
<h3>2050 Debt and Interest Rate Scenario Analysis</h3>
<div class="wrapped-div">
<table style="width: 100%;">
<tbody>
<tr class="tbl-data">
<td class="tbl-header last">Debt-to-GDP Ratio</td>
<td class="tbl-header last text-right">Current Situation (%)</td>
<td class="tbl-header last text-right">2050 - Base Case (%)</td>
<td class="tbl-header last text-right">2050 - Crises Persist Every 10 Years (%)</td>
<td class="tbl-header last text-left">Interest Payment in GDP</td>
<td class="tbl-header last text-right">Current Situation (%)</td>
<td class="tbl-header last text-right">2050 - Base Case (%)</td>
<td class="tbl-header last text-right">2050 - Crises Persist Every 10 Years (%)</td>
</tr>
<tr class="tbl-data">
<td class="data-td last">EU</td>
<td class="data-td data last text-right">89</td>
<td class="data-td data last text-right">127</td>
<td class="data-td data last text-right">181</td>
<td class="data-td data last text-left"><strong>EU</strong></td>
<td class="data-td data last text-right">4</td>
<td class="data-td data last text-right">5</td>
<td class="data-td data last text-right">7</td>
</tr>
<tr class="tbl-data">
<td class="data-td last">Japan</td>
<td class="data-td data last text-right">252</td>
<td class="data-td data last text-right">340</td>
<td class="data-td data last text-right">441</td>
<td class="data-td data last text-left"><strong>Japan</strong></td>
<td class="data-td data last text-right">8</td>
<td class="data-td data last text-right">10</td>
<td class="data-td data last text-right">13</td>
</tr>
<tr class="tbl-data">
<td class="data-td last">U.S.</td>
<td class="data-td data last text-right">99</td>
<td class="data-td data last text-right">191</td>
<td class="data-td data last text-right">259</td>
<td class="data-td data last text-left"><strong>U.S.</strong></td>
<td class="data-td data last text-right">4</td>
<td class="data-td data last text-right">8</td>
<td class="data-td data last text-right">10</td>
</tr>
<tr class="tbl-data">
<td class="data-td last">Great Britain</td>
<td class="data-td data last text-right">98</td>
<td class="data-td data last text-right">153</td>
<td class="data-td data last text-right">213</td>
<td class="data-td data last text-left"><strong>Great Britain</strong></td>
<td class="data-td data last text-right">4</td>
<td class="data-td data last text-right">6</td>
<td class="data-td data last text-right">9</td>
</tr>
</tbody>
</table>
</div>
<strong><strong><strong><strong><br /></strong></strong></strong></strong>
<p class="chart-disclosure"><strong>Source:</strong> VanEck Research, <a href="https://www.imf.org/external/datamapper/NGDP_RPCH@WEO/OEMDC/ADVEC/WEOWORLD" title="Real GDP growth" target="_blank" rel="noopener"><strong>IMF</strong></a> as of 6/12/2024. Any projections shown are those of VanEck and based on the firm&rsquo;s own research, are for illustrative purposes only, are valid as of the posting date of this content and are subject to change without notice.</p>
<h2>Base Scenario Debt Projections</h2>
<p>In our &ldquo;Base&rdquo; scenario, we project that federal government debt payments as a percentage of GDP for the four major reserve currency nations will be north of 5% per year. In the case of Japan and the U.S., this may be as high as 10% and 8%, respectively. These forecasts do not consider major crises like the 2001 Terrorist attacks, the Financial Crisis 2008, or the Pandemic of 2020, where deficit spending by reserve currency nations exploded. In the past 25 years, the United States has endured these major catastrophes that added debt outlays worth 19%, 40%, and 26% of GDP,&nbsp;<a href="https://www.macrotrends.net/global-metrics/countries/USA/united-states/debt-to-gdp-ratio#:~:text=U.S.%20debt%20to%20gdp%20ratio%20for%202022%20was%20115.70%25%2C%20a,a%201.74%25%20increase%20from%202018." title="U.S. Debt to GDP Ratio 1960-2024" target="_blank" rel="noopener"><strong>respectively</strong></a>. Given the past frequency of these cataclysmic events in the past, we assert that it is almost certain they will continue in the future. The consequence of this crisis cycle persistence would be to raise our projections for Debt to GDP and interest rate expense. Adding three deficit spending shock scenarios over the next 26 years increases interest rate expense as a portion of GDP by ~25%.</p>
<p>There are more reasons our &ldquo;Base&rdquo; projections may paint a debt picture too rosy. The burgeoning structural factors in developed nations, particularly the U.S., portend increasing fiscal recklessness. This is because we do not add to our analysis the terminal consequences of the&nbsp;<a href="https://www.brookings.edu/wp-content/uploads/2019/08/WP54_Brooks-Liscow_updated.pdf" title="Infrastructure Costs" target="_blank" rel="noopener"><strong>cost disease</strong></a> and <a href="https://www.nytimes.com/2021/11/28/us/infrastructure-megaprojects.html" title="Years of Delays, Billions in Overruns: The Dismal History of Big Infrastructure - The New York Times" target="_blank" rel="noopener"><strong>ineptitude</strong></a> in U.S. institutions that have produced such failures as billion-dollar EV charging stations, 4-billion-dollar-per-mile subway lines, 36-billion-dollar-per-mile high-speed tracks, and billion-dollar littoral combat ships cannot <a href="https://nationalinterest.org/blog/buzz/us-navy-wont-send-littoral-combat-ships-red-sea-208874#:~:text=Part%20of%20the%20issue%20is,the%20Houthi%20positions%20within%20Yemen." title="The U.S. Navy Won't Send Littoral Combat Ships to the Red Sea" target="_blank" rel="noopener"><strong>fight in the littorals</strong></a>. As a result, we have substantial reason to believe that government debt as a portion of GDP will increase beyond our projections. Most curiously, we have seen Principal Four government <a href="https://www.gao.gov/products/gao-24-106987#:~:text=Despite%20strong%20economic%20growth%2C%20the,trillion%20in%20fiscal%20year%202023." title="Debt Levels Driven by Increasingly Large Annual Deficits" target="_blank" rel="noopener"><strong>deficits persist</strong></a> even during strong periods of &ldquo;robust&rdquo; economic <a href="https://www.washingtonpost.com/business/2023/09/03/us-debt-deficit-rises-interest-rate/" title="U.S. debt is growing as possible government shutdown looms - The Washington Post" target="_blank" rel="noopener"><strong>growth</strong></a>. As such, it is pretty clear that the governments of advanced economies have realized that reducing spending is political suicide. By this logic, outsized deficits persist until a dramatic reckoning forces change. Our projections should be considered low-end because we also assume a sanguine interest rate environment with rates averaging 3-4%. There is a good chance that the globe&rsquo;s bond investors will demand much higher interest rates as debt servicing costs explode.</p>
<p>It is also important to remember that the United States and its Western allies have shifted increasingly towards the expensive bureaucratic management of issues rather than cost-effective solutions. Increasingly, layers of management and bureaucracy interject themselves to bloat the costs of all manner of social, government, and even private sector entities, which massively escalate the costs of solutions. In <a href="https://revcycleintelligence.com/news/healthcare-administrative-spending-increased-by-50#:~:text=January%2031%2C%202024%20%2D%20Administrative%20costs,healthcare%20administrative%20spending%20in%202022." title="Healthcare Administrative Spending Increased by 50%" target="_blank" rel="noopener"><strong>Healthcare</strong></a>, <a href="https://www.usnews.com/education/articles/one-culprit-in-rising-college-costs" title="One Culprit in Rising College Costs: Administrative Expenses" target="_blank" rel="noopener"><strong>Higher Education</strong></a>, and <a href="https://www.nationaldefensemagazine.org/articles/2021/10/19/pentagon-personnel-costs-at-historic-high" title="Pentagon Personnel Costs at Historic High" target="_blank" rel="noopener"><strong>Defense</strong></a>, such administration costs will endure because powerful interests benefit from expansion.</p>
<p>While politicians can reward their favorite constituencies with sinecures, employees within these systems see hiring additional staff as the path to increased pay and promotions. This creates an incentivized structure for vested parties, who <a href="https://www.opensecrets.org/industries" title="Interest Groups" target="_blank" rel="noopener"><strong>spend enormous</strong></a> amounts of money, to enlarge the bureaucratic blobs rather than streamline them. The result is that problems are not solved; they are managed. The wars on <a href="https://www.nbcnews.com/meet-the-press/data-download/costs-war-drugs-continue-soar-rcna92032" title="Costs in the war on drugs continue to soar" target="_blank" rel="noopener"><strong>drugs</strong></a>, homelessness, and terror have spawned multi-billion dollar industries that rely upon the growth and long-term management of these problems rather than the cost-effective shrinking and resolution of these challenges. This is a fiscal cancer without an antidote that will continue to eat into the long-term productivity and fiscal soundness of the Principal Four. There are many organized beneficiaries of administrative largesse, and no effective political constituencies can counter them.</p>
<h3>Interest Expenses of the Four Major Governments Will Surge</h3>
<p><img loading="lazy" class="img-responsive w-100" alt="Interest Expense of the Principal Four Will Surge" src="https://www.vaneck.com/contentassets/c6ff48fc86554e698ed50369e84aee2c/4648_bitcoin-valuation_chart-3_2024-7_v1_blog.svg" /></p>
<p class="chart-disclosure"><strong>Source:</strong> VanEck Research, <a href="https://www.imf.org/external/datamapper/NGDP_RPCH@WEO/OEMDC/ADVEC/WEOWORLD" title="Real GDP growth" target="_blank" rel="noopener"><strong>IMF</strong></a> as of 6/27/2024. Any projections shown are those of VanEck and based on the firm&rsquo;s own research, are for illustrative purposes only, are valid as of the posting date of this content and are subject to change without notice.</p>
<p>The direct consequence is that the reserve currencies of today, such as the USD, GBP, EURO, and JPY, will see their usefulness as a store of value and a medium of exchange erode. The fiscal and economic issues likely facing the Principal Four portend a gradual reduction in their currencies used as reserve assets and in international trade. However, we believe that the most powerful argument for seeing a shift away from the current international monetary system is the deterioration in <i>property rights</i> afforded to nations and businesses who transact and hold Dollars, Euro, Yen and Sterling.</p>
<h2>Deterioration of Property Rights</h2>
<p>The most important reason why central banks or businesses hold a currency as a reserve asset is the belief that the currency will retain usefulness and value over time. This relates not only to the money&rsquo;s ability to buy a consistent basket of goods and services over time but also to the free ability to engage in legally permitted trade with that money. Nations and their businesses need to have assurance that not only can they access their funds (and the global financial system supporting them) but also be able to use those funds as they see fit. With respect to the currencies of the Principal Four, many nations would contend that the property rights of holding Principal Four assets are deteriorating over time.</p>
<h2>Increasing Use of Sanctions</h2>
<p>One surest way to deprive people or entities of their assets in the International Monetary System (IMS) is to place them on the U.S.&rsquo;s <a href="https://sanctionssearch.ofac.treas.gov/" title="Sanctions List Search" target="_blank" rel="noopener"><strong>OFAC sanctions list</strong></a>. Sanctioning entities is a policy tool that can be employed only when critical national security interests of the United States are threatened. This tool is enforced at the point of payment and settlement systems, such as the banking federations that run SWIFT (International), CHIPs (USA), TARGET2 (EU), CHAPs (UK), and FXYCS (Japan). While those systems are controlled by many banks outside the United States direct regulatory control, the threat of secondary sanctions pressures all banks to agree to enact U.S. policy. When the U.S. announces sanctions, the other Principal Currencies also follow.</p>
<h3>U.S. Sanctioned Entities Increased 529% Since 2009</h3>
<p><img loading="lazy" class="img-responsive w-100" alt="US Sanctioned Entities Increased 529% Since 2009" src="https://www.vaneck.com/contentassets/c6ff48fc86554e698ed50369e84aee2c/4648_bitcoin-valuation_chart-4_2024-7_v1_blog.svg" /></p>
<p class="chart-disclosure"><strong>Source:</strong> <a href="https://www.cnas.org/publications/reports/sanctions-by-the-numbers" title="Sanctions by the Numbers: U.S. Sanctions Designations and Delistings, 2009&ndash;2019" target="_blank" rel="noopener"><strong>CNAS</strong></a> as of 6/21/2024.</p>
<p>Over the past 25 years, the U.S. has increasingly used the power of sanctions to advance its geopolitical interests. More explicitly, in 2022, the U.S. sanctioned 2,796 entities, a 529% increase from 2009. Though the increase in 2022 was related to Russia&rsquo;s invasion of Ukraine, the trend of increasing the use of sanctions indicates a clear policy choice since at least 2001 following the attacks of September 11th. In the entire year of 2002, following the September 11th attacks, the official U.S. Sanctions report was 17 <a href="https://www.treasury.gov/ofac/downloads/sdnew02.pdf" title="Office of Foreign Assets Control" target="_blank" rel="noopener"><strong>pages</strong></a> long. In 2021, 2022, and 2023, that same OFAC list had ballooned to <a href="https://www.treasury.gov/ofac/downloads/sdnnew21.pdf" title="Office of Foreign Assets Control" target="_blank" rel="noopener"><strong>247</strong></a>, <a href="https://www.treasury.gov/ofac/downloads/sdnnew22.pdf" title="Office of Foreign Assets Control" target="_blank" rel="noopener"><strong>825</strong></a>, and <a href="https://www.treasury.gov/ofac/downloads/sdnnew23.pdf" title="Office of Foreign Assets Control" target="_blank" rel="noopener"><strong>479</strong></a> pages respectively. Even before the Russian invasion, the U.S. had increasingly used sanctions as a foreign policy tool.</p>
<p>Beyond the five nations comprehensively sanctioned by the U.S.&rsquo;s <a href="https://orpa.princeton.edu/export-controls/sanctioned-countries" title="OFAC Sanctioned Countries" target="_blank" rel="noopener"><strong>OFAC</strong></a>, 17 other nations have various levels of sanctions imposed upon them. Likewise, another 13 countries are banned from using their U.S. Dollars to buy military equipment. Collectively, these 35 nations hold 31.6% of the world&rsquo;s population and 22% of the globe&rsquo;s GDP. This dynamic is exacerbated by the U.S. and Europe&rsquo;s recent actions to sanction and even <a href="https://apnews.com/article/russia-ukraine-treasury-sanctions-assets-congress-0a3bc97a2d6d77ce3650c767db6ea7ed" title="The US is now allowed to seize Russian state assets. How would that work?" target="_blank" rel="noopener"><strong>seize</strong></a> the $300B in foreign exchange reserves and other offshore assets of the Russian Federation. As a result, many nations of the world are justly <a href="https://www.ft.com/content/0d77f54b-af74-4186-9cae-237528ad7d69" title="The clash over whether to commandeer Russia&rsquo;s frozen assets" target="_blank" rel="noopener"><strong>worried</strong></a> about the state of their assets in the current IMS. But the actions to undermine faith in reserve currencies are not just happening on the international scene; examining the erosion of property rights in the United States, we argue that the reputation of the U.S. Dollar as an instrument with inviolable property rights is also being damaged.</p>
<p>Inside the United States, actions by all three branches of the U.S. government are causing many outsiders to question the rule of law and property rights. Recently, United States Justices have arbitrarily canceled contractual obligations tied to corporate performance targets because the rewards are regarded as <strong><a href="https://www.aljazeera.com/news/2024/2/1/why-did-a-court-cancel-elon-musks-tesla-salary-package" title="Why has a court blocked Elon Musk&rsquo;s $56bn Tesla pay?" target="_blank" rel="noopener">excessive</a></strong>. In another high-profile case, substantial penalties have been exacted as the result of business fraud <a href="https://www.nytimes.com/2024/02/16/nyregion/trump-civil-fraud-trial-ruling.html" title="Trump Fraud Trial Penalty Will Exceed $450 Million" target="_blank" rel="noopener"><strong>charges</strong></a> without an affected party in that fraud. Recently, ownership rights have been denied to property holders due to <a href="https://www.asiafinancial.com/us-orders-chinese-crypto-firm-to-sell-land-near-us-missile-base" title="US Orders Chinese Crypto Firm to Sell Land Near Missile Base" target="_blank" rel="noopener"><strong>national security</strong></a>, <a href="https://www.oyez.org/cases/2004/04-108" title="Kelo v. New London" target="_blank" rel="noopener"><strong>eminent domain</strong></a>, and <a href="https://www.supremecourt.gov/opinions/23pdf/22-585_k5fm.pdf" title="22-585 Culley v. Marshall (05/09/2024)" target="_blank" rel="noopener"><strong>civil asset forfeiture</strong></a>. Remembering the New Deal Era property rights violations, including the seizure of private gold holdings and the technical default on the Fourth Liberty Loan, is important. Logically, the same precedents used to seize gold could also be used to take other assets to fill the breach of fiscal insolvency. Looking forward, we see the rise in populism pushing new curbs on property rights in the U.S. by <a href="https://www.blankrome.com/publications/how-recent-laws-affect-foreign-purchase-us-real-estate" title="How Recent Laws Affect Foreign Purchase of U.S. Real Estate" target="_blank" rel="noopener"><strong>restricting</strong></a> investment opportunities or <a href="https://www.brookings.edu/articles/why-we-need-reparations-for-black-americans/" title="Why we need reparations for Black Americans" target="_blank" rel="noopener"><strong>seizing assets</strong></a> for past injustices.</p>
<p>In summary, institutional momentum within the United States to abrogate property rights is increasing. At the same time, fiscal reasons for seizing property are materializing. How will U.S. dollar (and proxy currencies) holders respond to a climate of arbitrary seizure supported by legal precedence? Increasingly, nations have stopped only making loud noises about injustices, real and potential; they have begun to walk away from the current stalwarts of the International Monetary System.</p>
<h2 id="ims-issues" class="jump-link-nav anchored-block" data-jumplink-title="IMS Issues">A New International Monetary System is Emerging</h2>
<h3>Chinese Yuan (RMB) Usage Has Doubled Over the Past Year</h3>
<p><img loading="lazy" class="img-responsive w-100" alt="RMB Usage Has Doubled Over the Past Year" src="https://www.vaneck.com/contentassets/c6ff48fc86554e698ed50369e84aee2c/4648_bitcoin-valuation_chart-5_2024-7_v1_blog.svg" /></p>
<p class="chart-disclosure"><strong>Source:</strong> <a href="https://www.swift.com/our-solutions/compliance-and-shared-services/business-intelligence/renminbi/rmb-tracker/rmb-tracker-document-centre" title="RMB Tracker document centre" target="_blank" rel="noopener"><strong>SWIFT</strong></a> as of 6/18/2024.</p>
<p>One of the beneficiaries of the shifting global monetary dynamics has been the Chinese Yuan (RMB) currency. Recently, China has made agreements to settle bilateral trade in RMB with, among many other nations, <a href="https://english.news.cn/20231005/d65510543e3f4d98b705058274ca82a8/c.html#:~:text=RIO%20DE%20JANEIRO%2C%20Oct.,Bank%20of%20China%20Brazil%20SA." title="China, Brazil trade in local currencies for first time" target="_blank" rel="noopener"><strong>Saudi Arabia</strong></a>, the <a href="https://eastasiaforum.org/2024/01/17/chinese-yuan-gains-currency-in-the-gulf-states/" title="Chinese yuan gains currency in the Gulf states" target="_blank" rel="noopener"><strong>Gulf States</strong></a>, <a href="https://www.as-coa.org/articles/explainer-chinas-free-trade-agreements-latin-america" title="Explainer: China's Free-Trade Agreements in Latin America" target="_blank" rel="noopener"><strong>Bolivia</strong></a>, <a href="https://www.as-coa.org/articles/explainer-chinas-free-trade-agreements-latin-america" title="Explainer: China's Free-Trade Agreements in Latin America" target="_blank" rel="noopener"><strong>Ecuador</strong></a>, and <a href="https://english.news.cn/20231005/d65510543e3f4d98b705058274ca82a8/c.html#:~:text=RIO%20DE%20JANEIRO%2C%20Oct.,Bank%20of%20China%20Brazil%20SA." title="China, Brazil trade in local currencies for first time" target="_blank" rel="noopener"><strong>Brazil</strong></a>. The RMB is now used <a href="https://asia.nikkei.com/Business/Markets/Currencies/Yuan-exceeds-dollar-in-China-s-bilateral-trade-for-first-time" title="Yuan exceeds dollar in China's bilateral trade for first time" target="_blank" rel="noopener"><strong>more</strong></a> than the USD to settle China&rsquo;s international trade. Russia, the international monetary pariah, has recently <a href="https://www.cnbc.com/2024/06/12/moscow-exchange-halts-dollar-and-euro-trade-after-us-sanctions.html" title="Dollar and euro trade halted on Russia's biggest exchange due to new U.S. sanctions" target="_blank" rel="noopener"><strong>halted trading</strong></a> of Dollars and Euros on its Moscow Stock Exchange. At the same time, its major commodities producer, Rosneft, has issued two RMB-denominated bonds of <a href="https://www.rosneft.com/press/releases/item/212071/" title="Rosneft Successfully Completed Yuan Bond Placement" target="_blank" rel="noopener"><strong>&yen;10B</strong></a> and <a href="https://www.rosneft.com/press/releases/item/214091/" title="Rosneft makes its second RMB bond placement" target="_blank" rel="noopener"><strong>&yen;15B</strong></a> each. Some Indian oil refiners have begun to <a href="https://www.offshore-technology.com/news/indian-refiners-pay-in-yuan-for-russian-oil-import/" title="Indian refiners pay in yuan for Russian oil imports" target="_blank" rel="noopener"><strong>pay for oil</strong></a> in RMB. The result is that Chinese RMB made up 4.52% of all transactions in April 2024 using the SWIFT system, almost <a href="https://www.swift.com/our-solutions/compliance-and-shared-services/business-intelligence/renminbi/rmb-tracker/rmb-tracker-document-centre" title="RMB Tracker document centre" target="_blank" rel="noopener"><strong>double</strong></a> what it was in April 2023.</p>
<p>Outside of the RMB, countries increasingly utilize local currencies over those of the Principal Four. For example, India has created agreements to <a href="https://www.reuters.com/world/india-ties-up-with-uae-settle-trade-rupees-2023-07-15/" title="India ties up with UAE to settle trade in rupees" target="_blank" rel="noopener"><strong>buy oil</strong></a> in Rupees (INR), settle <a href="https://www.mea.gov.in/press-releases.htm?dtl/36446/Settlement_of_IndiaMalaysia_Trade_in_Indian_Rupee_INR#:~:text=Trade%20between%20India%20and%20Malaysia,in%20Indian%20Rupee%20(INR)." title="Settlement of India-Malaysia Trade in Indian Rupee (INR)" target="_blank" rel="noopener"><strong>trade</strong></a> with Malaysia using INR, and even create a local currency settlement system with nine other central banks. Most alarmingly, in 2023, Saudi Arabia, which openly declared it is open to pricing oil in currencies other than the U.S. dollar, has recently joined a China-led <a href="https://www.reuters.com/technology/saudi-arabia-joins-bis-led-central-bank-digital-currency-trial-2024-06-05/" title="Saudi Arabia joins BIS- and China-led central bank digital currency project" target="_blank" rel="noopener"><strong>central bank digital currency project</strong></a>.</p>
<p>But what does this emerging system look like, and <i>why will this benefit Bitcoin?</i></p>
<h2>A Multi-Polar Currency System</h2>
<h3>2050 Projections: BTC, RMB, and Other Currencies Share Rise from 4.77% to 23%</h3>
<p><img loading="lazy" class="img-responsive w-100" alt="2050 Projections: BTC, RMB, and Other Currencies Share Rise from 4.77% to 23%" src="https://www.vaneck.com/contentassets/c6ff48fc86554e698ed50369e84aee2c/4648_bitcoin-valuation_chart-6_2024-7_v1_blog.svg" /></p>
<h3>Changes to the Composition of International Currency Reserves (incl. Gold and BTC)</h3>
<div class="wrapped-div">
<table style="width: 100%;">
<tbody>
<tr class="tbl-data">
<td class="tbl-header last">&nbsp;</td>
<td class="tbl-header last text-right">USD (%)</td>
<td class="tbl-header last text-right">EURO (%)</td>
<td class="tbl-header last text-right">YEN (%)</td>
<td class="tbl-header last text-right">GBP (%)</td>
<td class="tbl-header last text-right">RMB (%)</td>
<td class="tbl-header last text-right">AUD (%)</td>
<td class="tbl-header last text-right">CAD (%)</td>
<td class="tbl-header last text-right">CHF (%)</td>
<td class="tbl-header last text-right">Other (%)</td>
<td class="tbl-header last text-right">Gold (%)</td>
<td class="tbl-header last text-right">BTC (%)</td>
</tr>
<tr class="tbl-data">
<td class="data-td last">2023 Share</td>
<td class="data-td data last text-right">45.3</td>
<td class="data-td data last text-right">15.5</td>
<td class="data-td data last text-right">4.4</td>
<td class="data-td data last text-right">3.8</td>
<td class="data-td data last text-right">1.8</td>
<td class="data-td data last text-right">1.6</td>
<td class="data-td data last text-right">2.0</td>
<td class="data-td data last text-right">0.2</td>
<td class="data-td data last text-right">3.0</td>
<td class="data-td data last text-right">22.4</td>
<td class="data-td data last text-right">0.0</td>
</tr>
<tr class="tbl-data">
<td class="data-td last">2050 Share</td>
<td class="data-td data last text-right">38.4</td>
<td class="data-td data last text-right">8.0</td>
<td class="data-td data last text-right">1.0</td>
<td class="data-td data last text-right">2.0</td>
<td class="data-td data last text-right">12.5</td>
<td class="data-td data last text-right">1.5</td>
<td class="data-td data last text-right">1.8</td>
<td class="data-td data last text-right">0.2</td>
<td class="data-td data last text-right">7.2</td>
<td class="data-td data last text-right">24.9</td>
<td class="data-td data last text-right">2.5</td>
</tr>
</tbody>
</table>
</div>
<strong><strong><strong><strong><strong><strong><br /></strong></strong></strong></strong></strong></strong>
<p class="chart-disclosure"><strong>Source:</strong> VanEck Research, <a href="https://data.imf.org/?sk=E6A5F467-C14B-4AA8-9F6D-5A09EC4E62A4" title="Currency Composition of Official Foreign Exchange Reserve - IMF Data" target="_blank" rel="noopener"><strong>IMF</strong></a> as of 6/18/2024. Any projections shown are those of VanEck and based on the firm&rsquo;s own research, are for illustrative purposes only, are valid as of the posting date of this content and are subject to change without notice.</p>
<h2>Changes to the Composition of International Currency Reserves</h2>
<p>We anticipate that many countries exploring alternatives to the current International Monetary System will encounter limited appealing options. By 2050, we foresee an increase in bilateral trade agreements and a rise in the use of China&rsquo;s RMB. Consequently, we project that trading using emerging market currencies could drive the "Other" category from 3% to 7.5% of central bank reserves. Similarly, we see China&rsquo;s RMB potentially approaching 12.5% of global reserves. These shifts are likely to come at the expense of the Principal Four currencies, with smaller market share losses observed among developed commodity producers like Canada and Australia. Notably, we envision a scenario where global reserves of Bitcoin increase to 2.5%, with its share of domestic and international trade potentially rising to 5% and 10%, respectively.</p>
<p>This dynamic might unfold due to the challenges posed by other arrangements that could replace the current Principal Four currency system. While bilateral trading agreements and the rise of emerging market economies could boost the adoption of emerging market currencies, trust issues are likely to inhibit their widespread acceptance. Historical instances, such as the Latin American Debt Crisis of the 1980s and the Asian Currency Crisis of the 1990s, highlight the risks and incentives for developing countries to default on international obligations or engage in money printing.</p>
<p>While China&rsquo;s RMB might gain value alongside the country's relative GDP growth, general skepticism towards China and reluctance to embrace it as a reserve currency nation could limit RMB usage from reaching levels comparable to the U.S. dollar. Additionally, using more local currencies in international trade assumes a perfect alignment of economic interests between nations. However, many developing nations primarily export low-value goods like commodities, which do not match the high-value finished goods of advanced economies. This disparity in trade value will likely compel debtor nations to undermine their financial obligations through monetary expansion.</p>
<h2>Bitcoin as a Reserve Currency</h2>
<p>In short, the most challenging issues of adopting a new currency regime revolve around the trust and issuance policy of potential replacement currencies. Quite frankly, there are not many emerging markets countries that can inspire enough confidence in their financial outlook to justify enshrining them into reserve status. Some countries may turn to China and other developing economies to hold reserve balances. However, many who are dissatisfied with the menu of bad reserve options may increasingly turn to Bitcoin because it solves many pain points that are afflicting current reserve currency users.</p>
<h2>Bitcoin&rsquo;s properties make it a useful reserve currency</h2>
<p>Bitcoin offers its holders:</p>
<ol class="content-list">
<li>Trustlessness</li>
<li>Neutrality</li>
<li>Immutable monetary policy</li>
<li>Perfect property rights</li>
</ol>
<p>Designed to replace fiat money, Bitcoin is a massive improvement over current monetary systems because its system replaces corruptible human authorities with immutable logic. Bitcoin holders do not have to be concerned about an entity diluting BTC&rsquo;s value, employing Bitcoin to advance political goals or Bitcoin abusing its users. Bitcoin&rsquo;s important innovation is removing the affliction of biased government actors that can prevent the property rights of BTC holders. Bitcoin is a politically and economically agnostic system that swaps out biased actors for straightforward software algorithms.</p>
<p>Bitcoin&rsquo;s framework enables anyone, from national governments to local citizens, to hold and transact BTC without an intermediary to block their usage. This system contrasts with current systems that rely upon various middlemen and trusted entities, like banks and payment providers, to facilitate transactions. From a national sovereignty standpoint, this is immensely important as it empowers nations to retain greater control over their foreign policies. Considering costs, Bitcoin&rsquo;s design also removes numerous parties who take financial tolls on transactions routed through the current international monetary system.</p>
<p>As opposed to fiat currencies, which have an average lifespan of 35 years and often succumb to monetary inflation, Bitcoin has a fixed monetary policy that focuses on maintaining BTC&rsquo;s value. Bitcoin&rsquo;s monetary policy is decided by users who rigidly enforce a pre-determined inflationary strategy that culminates once a total supply of 21 million BTC is reached. Holders of BTC take comfort in knowing that Bitcoin&rsquo;s value cannot be capriciously diluted by a central bank with conflicting interests. Bitcoin&rsquo;s immutable, hard-money design is reinforced by a dedicated base of users and core contributors committed to its economic principles. This dedication has resulted in multiple forks that have siphoned off those who attempted to alter Bitcoin&rsquo;s core properties. Thus, Bitcoin can be aptly described as the "religion of sound money."</p>
<p>Bitcoin offers central banks, investors, and international trade participants a value proposition not currently offered by any fiat currency. <i>No fiat currency can offer these properties as each will always be subject to the whims of a political class terminally incentivized to print money.</i> The purpose of a constitution is to delineate a government's power limits, checking the arbitrary abuses of power common throughout history. Bitcoin applies constitutional constraints to money, representing a system created by the people, for the people.</p>
<p>Bitcoin is also unique among the dominant monies of the international monetary system because it offers its holders infinite property rights. As the issuer of BTC is the Bitcoin software itself, and its protocol does not allow for the seizure of BTC, only those with access to an account&rsquo;s private keys can access its Bitcoin. There is no way to freeze someone&rsquo;s Bitcoin or prevent them from sending BTC to anyone else. Barring hacks and thefts, Bitcoin holders do not need to worry about the arbitrary seizure of their assets because they <a href="https://www.forbes.com/sites/instituteforjustice/2021/10/25/new-proof-that-police-use-civil-forfeiture-to-take-from-those-who-cant-fight-back/" title="New Proof That Police Use Civil Forfeiture To Take From Those Who Can&rsquo;t Fight Back" target="_blank" rel="noopener"><strong>talked to the wrong person</strong></a> or <a href="https://www.cnn.com/2022/02/20/americas/canada-trucker-protest-covid-sunday/index.html" title="Canadian authorities freeze financial assets for those involved in ongoing protests in Ottawa" target="_blank" rel="noopener"><strong>participated in a protest</strong></a>. Given the concerns about asset confiscation by the U.S. or other Principal Four nations, we see the inviolable system of property rights offered by Bitcoin as extremely valuable.</p>
<h3>International Payments Systems</h3>
<div class="wrapped-div">
<table style="width: 100%;">
<tbody>
<tr class="tbl-data">
<td class="tbl-header last">System &amp; Type</td>
<td class="tbl-header last text-left">Operator</td>
<td class="tbl-header last text-left">Participants</td>
<td class="tbl-header last text-left">Volume</td>
</tr>
<tr class="tbl-data">
<td class="data-td last">Fedwire (Large-value, Wholesale)</td>
<td class="data-td data last text-left">Federal Reserve</td>
<td class="data-td data last text-left">Banks and other Federal Reserve account holders</td>
<td class="data-td data last text-left">In 2021: Transactions: 204.5M Total value: $991.8T</td>
</tr>
<tr class="tbl-data">
<td class="data-td last">CHIPS (Large-value, Wholesale)</td>
<td class="data-td data last text-left">The Clearing House</td>
<td class="data-td data last text-left">Large banks (43 total)</td>
<td class="data-td data last text-left">In 2021: Transactions: 127.9B Total value: $448.7T</td>
</tr>
<tr class="tbl-data">
<td class="data-td last">FedACH</td>
<td class="data-td data last text-left">Federal Reserve</td>
<td class="data-td data last text-left">Banks, Treasury, government agencies</td>
<td class="data-td data last text-left">In 2021: Commercial ACH Transactions: 17.9B Total value: $37.0T Government ACH Transactions: 2.0B Total value: $8.1T</td>
</tr>
<tr class="tbl-data">
<td class="data-td last">Electronic Payments Network (ACH)</td>
<td class="data-td data last text-left">The Clearing House</td>
<td class="data-td data last text-left">Banks (approximately 300)</td>
<td class="data-td data last text-left">In 2021: Transactions: 29.1B Total value: $72.6T</td>
</tr>
<tr class="tbl-data">
<td class="data-td last">SWIFT</td>
<td class="data-td data last text-left">SWIFT (Society for Worldwide Interbank Financial Telecommunication)</td>
<td class="data-td data last text-left">Over 11,000 financial institutions in more than 200 countries</td>
<td class="data-td data last text-left">In 2021: 16.45B million messages Total Value: ~$650T+</td>
</tr>
<tr class="tbl-data">
<td class="data-td last">SEPA (Single Euro Payments Area)</td>
<td class="data-td data last text-left">European Payments Council</td>
<td class="data-td data last text-left">Banks and payment service providers in the EU and EEA</td>
<td class="data-td data last text-left">In 2022: 8 billion transactions, valued at &euro;5.5 trillion</td>
</tr>
<tr class="tbl-data">
<td class="data-td last">TARGET2</td>
<td class="data-td data last text-left">European Central Bank</td>
<td class="data-td data last text-left">Central banks and commercial banks in the Eurozone</td>
<td class="data-td data last text-left">In 2023: &euro;2.2 trillion per day on average</td>
</tr>
<tr class="tbl-data">
<td class="data-td last">CHAPS (Clearing House Automated Payment System)</td>
<td class="data-td data last text-left">Bank of England</td>
<td class="data-td data last text-left">UK banks and financial institutions</td>
<td class="data-td data last text-left">In 2021: Transactions: 49 million Total value: &pound;84.7 trillion</td>
</tr>
<tr class="tbl-data">
<td class="data-td last">FXYCS (Foreign Exchange Yen Clearing System)</td>
<td class="data-td data last text-left">Bank of Japan</td>
<td class="data-td data last text-left">Japanese banks and financial institutions</td>
<td class="data-td data last text-left">In 2021: Transactions: 29 million Total value: &yen;9 quadrillion</td>
</tr>
<tr class="tbl-data">
<td class="data-td last">CIPS (Cross-Border Interbank Payment System)</td>
<td class="data-td data last text-left">People's Bank of China</td>
<td class="data-td data last text-left">Financial institutions in over 100 countries</td>
<td class="data-td data last text-left">In 2023: Transactions: 6.61 million Total value: &yen;123.06 trillion ($17.09 trillion)</td>
</tr>
</tbody>
</table>
</div>
<br />
<p class="chart-disclosure"><strong>Source:</strong> VanEck Research,<strong> </strong><a href="https://home.treasury.gov/system/files/136/Future-of-Money-and-Payments.pdf" title="The Future of Money and Payments" target="_blank" rel="noopener"><strong>U.S. Treasury</strong></a> as of 6/18/2024.</p>
<h2>Challenges for Bitcoin as a Medium of International Trade</h2>
<p>For Bitcoin to become an effective medium of international trade, significant evolution is necessary. Bitcoin can potentially bring substantial value to users of the International Monetary System (IMS) by addressing many issues inherent in the current paradigm. However, as it stands, Bitcoin is incapable of serving as a major cross-border payment currency. This limitation is due to Bitcoin&rsquo;s inability to process enough transactions to meet the demands of the global financial system.</p>
<p>Currently, Bitcoin can handle approximately 7-15 transactions per second, depending on metadata. Each Bitcoin block is processed every 10 minutes, with transaction finalization typically requiring 5-6 blocks. Consequently, Bitcoin can manage only about 576,000 daily transactions, processed in 10-minute increments of roughly 4,000 transactions each. By contrast, the SWIFT system handles <a href="https://www.swift.com/about-us/discover-swift/fin-traffic-figures" title="Swift FIN Traffic &amp; Figures" target="_blank" rel="noopener"><strong>45 million</strong></a> messages daily, while CHIPs processes around 350 million daily transactions.</p>
<p>In addition, the Bitcoin software governing the network does not support complex smart contract languages. This means that within the Bitcoin system, users cannot create sophisticated financial applications, such as those possible on more advanced blockchains like Ethereum or Solana. As a result, for functions like banking, trading, and complex escrow, Bitcoin users would need to route their transactions through centralized entities. While this approach could scale Bitcoin, it would diminish many of Bitcoin&rsquo;s critical properties for international trade.</p>
<p>The limited functionality of Bitcoin is a deliberate design choice. The core developers of Bitcoin believe that adding more functions would introduce new attack vectors, increase centralization, and dilute Bitcoin&rsquo;s core purpose. Historically, those who favored a more complex, higher-throughput Bitcoin with smart contracts branched off to create different crypto projects.</p>
<p>But these dynamics are rapidly changing in today&rsquo;s Bitcoin community, as new solutions are being adopted that may satisfy both the hard money zealots and those who want a more capable Bitcoin. These solutions are coming about because many are thinking about the long-term useability of Bitcoin.</p>
<h2>Why Countries Don't Transact in Gold</h2>
<p>Understanding the challenges Bitcoin faces as a medium of international trade can be informed by examining why countries don't currently transact in gold. Historically, gold was used as a reserve currency and medium of international trade. However, several significant issues led to its decline in this role.</p>
<p><strong>1. Physical inconvenience and logistics</strong></p>
<p>While it is theoretically possible to transact in gold by moving bars from one room of a storage facility to another, this method is impractical on a large scale. The physical nature of gold makes it cumbersome and expensive to transport and store securely. Despite the use of electronic systems to record gold transactions, the underlying need for physical movement of gold remains a logistical challenge, especially for large volumes.</p>
<p><strong>2. Lack of flexibility</strong></p>
<p>Gold does not offer the flexibility required for modern financial systems. It cannot be easily divided into smaller units for everyday transactions, nor is it commonly used to support complex financial instruments due to the physical limitations above. While digital representations of gold exist, they still fundamentally rely on the physical asset, which limits their practicality in a fast-paced global economy.</p>
<p><strong>3. Security risks</strong></p>
<p>Holding and transporting gold involves significant security risks, including theft and loss. The need for extensive security measures adds to the cost and complexity of using gold as a medium of exchange. These risks are exacerbated in international transactions involving multiple parties and jurisdictions.</p>
<p><strong>4. Technological and financial integration</strong></p>
<p>Modern economies are highly integrated with advanced financial systems that require rapid, secure, and flexible transactions. Gold, even when digitized, does not integrate seamlessly with these systems. The speed and efficiency of electronic fiat transactions far surpass what is achievable with gold, making fiat currencies more suitable for contemporary financial infrastructure.</p>
<p>Bitcoin shares some of gold's hurdles, such as the potential for security risks. However, Bitcoin overcomes many of gold's limitations. Unlike gold, Bitcoin is inherently digital, making it easier to transfer and divide. It also offers greater flexibility through its programmability, which, despite current limitations, holds potential for future enhancements. Moreover, Bitcoin transactions can be secured cryptographically, reducing some security risks associated with physical gold. While using a neutral FX like Bitcoin (or Gold) for trade payments seems unlikely in today&rsquo;s world, it&rsquo;s conceivable that such a significant shift could occur in the future, driven by the need for a stable, secure, and flexible medium of exchange amid shifting geopolitics.</p>
<h3>The Velocity of Bitcoin in 2024 is 25% of its 2018 Figure</h3>
<p><img loading="lazy" class="img-responsive w-100" alt="The Velocity of Bitcoin in 2024 is 25% of its 2018 Figure" src="https://www.vaneck.com/contentassets/c6ff48fc86554e698ed50369e84aee2c/4648_bitcoin-valuation_chart-7_2024-7_v1_blog.svg" /></p>
<p class="chart-disclosure"><strong>Source: <a href="https://studio.glassnode.com/metrics?a=BTC&amp;m=indicators.Velocity&amp;s=1514273709&amp;u=1719705600&amp;zoom=" title="BTC: Velocity" target="_blank" rel="noopener">Glassnode</a></strong> as of 6/30/2024.</p>
<h2 id="bitcoin-scaling-and-l2s" class="jump-link-nav anchored-block" data-jumplink-title="Bitcoin Scaling and L2s">Scaling Bitcoin with Layer-2 Solutions</h2>
<p>Since many recognize that Bitcoin&rsquo;s limited transaction throughput results from the non-negotiable economic principles of its community, they have sought to scale Bitcoin through different techniques. It has become a consensus that Bitcoin must scale in order for it to thrive or possibly even survive. This is because miners who have high fixed and variable costs secure Bitcoin's network. Since its inception, 94% of all revenues earned by miners in BTC have been in the form of inflationary block rewards. As Bitcoin&rsquo;s inflation is limited, for miners to cover their expenses, transactions on Bitcoin must eventually become the overwhelming majority of fees paid to miners to counter reduced inflation. In the year before the halving of BTC inflation on 4/19/2024, BTC miners received nearly $13B worth of revenues from inflation versus $1.1B in revenue from transactions. To allow miners to earn enough revenue to engage in their operations over the long run, the price of BTC must go up enough to offset the decline in inflation, or transactions must increase to make up the bulk of fees.</p>
<p>Thus, the Bitcoin community is trying to scale BTC in a way that provides essential revenue to miners by encouraging more transactions on Bitcoin. Part of this shift will also create minor but crucial changes to Bitcoin&rsquo;s core software. Curiously, this necessity for transactions somewhat counters Bitcoin&rsquo;s product market fit as a store of value asset &ndash; people should not sell stores of value. This has manifested itself in BTC&rsquo;s velocity of money as it has fallen from 0.042 in 2018 to 0.014 in 2024. Regardless, the need to scale Bitcoin has resulted in the creation of many solutions that move Bitcoin&rsquo;s value without using its chain. These are generally referred to as <strong>&ldquo;Layer-2 Solutions.&rdquo;</strong> The segment of off-chain Bitcoin scaling consists of two major subcomponents &ndash; those that use centralized players to create BTC-backed crypto tokens on other blockchains and those that use decentralized systems to do the same.</p>
<h2>
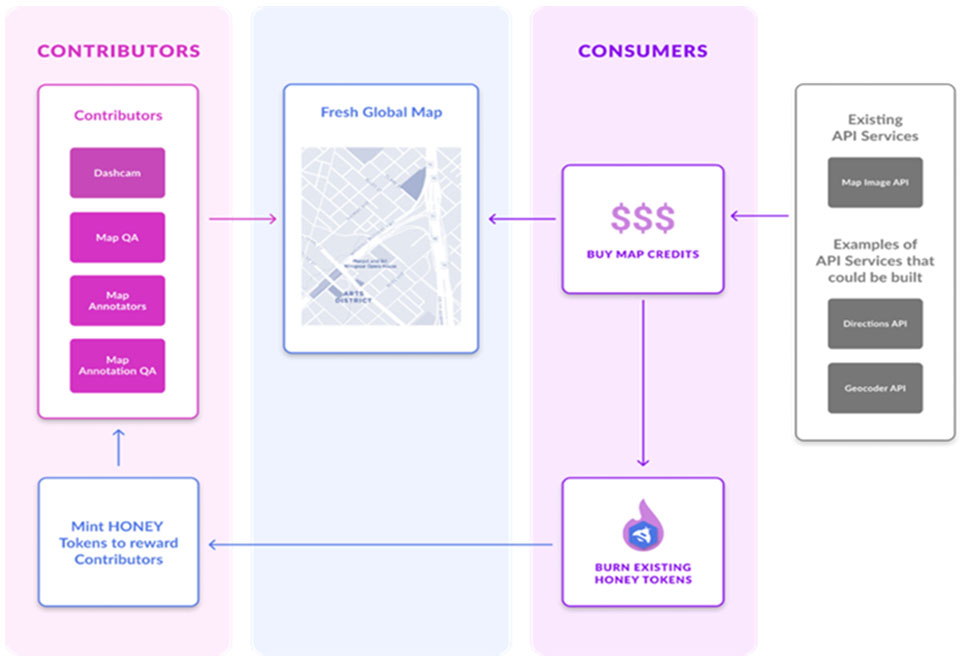
Centralized BTC-Backed Tokens</h2>
<p>In the centralized setup, entities like crypto exchanges, trading firms, or miners custody BTC and provide BTC depositors with certificates representing ownership of that BTC. These certificates, redeemable for Bitcoin, are created by &ldquo;minting&rdquo; crypto tokens on various blockchains and exchanges. The most well-known of these is <strong>wBTC,</strong> called <strong>&ldquo;wrapped Bitcoin.&rdquo;</strong> In this paradigm, a centralized exchange called BitGo custodies and locks BTC to issue a crypto asset called wBTC to whoever provided the BTC. This is called <strong>&ldquo;wrapping,&rdquo;</strong> and the wBTC is then issued to ecosystems like Ethereum, where its value closely follows the price of BTC. wBTC is used widely in DeFi on Ethereum and Tron, with ~$10B worth of BTC wrapped into wBTC.</p>
<p>The keystone of these wrapped BTC products is that one must trust the issuing entity not to engage in fraud or re-hypothecate the BTC that backs the minted BTC representations. The challenge of this system is the counterparty risks involved with whoever custodies and wraps the BTC. Another drawback of centralized solutions like wBTC is that they do not garner additional revenues for the Bitcoin network. Because the BTC is locked on Bitcoin and never moved, it does not generate the transaction revenues that will become the lifeblood of Bitcoin.</p>
<h3>BTC Total Value Locked (TVL) is Dominated by wBTC with Others Emerging</h3>
<p><img loading="lazy" class="img-responsive w-100" alt="BTC TVL is Dominated by wBTC with Others Emerging" src="https://www.vaneck.com/contentassets/c6ff48fc86554e698ed50369e84aee2c/4648_bitcoin-valuation_chart-8_2024-7_v1_blog.svg" /></p>
<p class="chart-disclosure"><strong>Source: <a href="https://defillama.com/chains/Bitcoin%20Sidechains" title="Total Value Locked All Chains" target="_blank" rel="noopener">Defillama</a></strong> as of 6/24/2024.</p>
<h2>Decentralized BTC-Backed Tokens</h2>
<p>The other subgroup of &ldquo;off-chain&rdquo; scaling for Bitcoin is considered &ldquo;trustless&rdquo; because they do not involve centralized parties but instead rely upon decentralized solutions. This group consists of various types of software that employ protocols to combine components of Bitcoin&rsquo;s software alongside off-chain networks like blockchains or similar trustless networks. The core of these solutions are Bitcoin multi-signature schemes that lock BTC in an account on BTC while minting a representation of Bitcoin on another blockchain. This series of off-chain scaling solutions allows users to transmit representations, essentially ownership certificates, corresponding to locked BTC on Bitcoin. Generally, this is referred to as <strong>&ldquo;bridging,&rdquo;</strong> and the group of off-chain solutions that &ldquo;bridge&rdquo; Bitcoin are referred to as Bitcoin Layer-2s (L2). However, the concept of a Bitcoin L2 encompasses a wide range of different solutions compared to more concrete definitions of <a href="https://www.vaneck.com/us/en/blogs/digital-assets/matthew-sigel-vanecks-ethereum-layer-2s-valuation-prediction-by-2030/" title="VanEck&rsquo;s Ethereum Layer-2s Valuation Prediction by 2030"><strong>Ethereum L2s</strong></a> (see our piece on Ethereum L2s). First, Bitcoin L2s are not all blockchains like most Ethereum L2s. Second, Ethereum L2s rely upon Ethereum to securely run their blockchains. While some Bitcoin L2s intend to use Bitcoin for security in the future, many are their blockchains that simply bridge BTC to their chains to allow it to be transacted. Most importantly, only some Bitcoin L2s intend to add value to the network by creating value for miners.</p>
<h2>Lightning Network and &ldquo;State Channels&rdquo;</h2>
<p>One popular but extremely limited Bitcoin Layer-2 is called the Lightning Network, which allows off-chain Bitcoin certificates to be created and sent through a user-created network called a <strong>&ldquo;Payment Channel.&rdquo;</strong> In this setup, users can transact as much as they like off-chain, and when they want to settle their transactions, they can close this Payment Channel. When this is done, the resulting changes in BTC balances between the different parties are finalized as a single transaction on Bitcoin. Payment channels are a subset of a broader group of scaling solutions called <strong>&ldquo;State Channels,&rdquo;</strong> which allow for off-chain representations of BTC to interact with dApps off-chain and have the result of the transactions settled at sporadic or pre-determined time intervals.</p>
<p>The term "State" in state channels refers to the current status of all participants' balances and other relevant variables in a series of transactions. The main feature of state channels is that most transaction data is kept off-chain, meaning transactions are conducted privately between parties and not immediately recorded on the blockchain. Only the final state, or the result of multiple off-chain transactions, is submitted to the blockchain. This approach allows faster transactions and reduced fees since only the final settlement is recorded on-chain. When participants wish to withdraw their balances, the final state of the off-chain data is reconciled and broadcast to the Bitcoin blockchain. Because Lightning Network has many drawbacks and potential security vulnerabilities, its usage has been minimal ($323M in TVL ~0.026% of BTC supply).</p>
<h2>Sidechains and Merged Mining</h2>
<p>Another widely used form of Bitcoin L2s is <strong>&ldquo;Sidechains.&rdquo;</strong> These apply the concept of state channels for scaling Bitcoin by minting representations of BTC off-chain but accomplish the off-chain transactions of BTC on a separate blockchain from Bitcoin. Sidechains have consensus mechanisms that may, but do not always, rely upon Bitcoin&rsquo;s consensus. They can be considered mini-economic zones tethered to Bitcoin by bridges. These bridges are the protocols that employ various combinations of complex math, software, and economics to lock BTC on Bitcoin&rsquo;s blockchain to allow the creation of a token on the sidechain that represents that locked BTC. When users transact the &ldquo;bridged&rdquo; representations of BTC on sidechains, they can redeem BTC on Bitcoin by &ldquo;settling&rdquo; the result of their transactions to receive the transacted BTC.</p>
<p>These sidechains allow for the trading of BTC off of Bitcoin, enabling greater transaction throughput (in BTC) than the Bitcoin blockchain allows. This is because many transactions can occur off chain with the bridged Bitcoin and then be settled, when necessary, back on Bitcoin in large batches across many accounts. This is similar to the <a href="https://www.gatecity.bank/education/help/business/ach-origination/what-is-an-ach-batch/#:~:text=An%20automated%20clearing%20house%20(ACH)%20batch%20is%20a%20group%20of,to%20send%20the%20ACH%20transactions." title="What is an ACH batch?" target="_blank" rel="noopener"><strong>ACH batching system</strong></a> in the United States, where banks can record a database of interbank transfers and settle them at the end of the day. One important distinction among sidechains is whether or not BTC is the &ldquo;native currency&rdquo; of the blockchain. If BTC is the principal currency, all transactions must be paid for with BTC fees; if not, other currencies are accepted to pay transaction fees. Circling back to the value added to Bitcoin&rsquo;s network, most sidechains do not add value to Bitcoin&rsquo;s network because nearly all transactions of BTC&rsquo;s value occur off chain. However, mainly where BTC is the native currency of sidechains, they add value to Bitcoin by creating more demand for BTC.</p>
<p>The sidechain &ldquo;L2s&rdquo; of Bitcoin vary greatly in how they operate. Some may be a Proof-of-Stake network like Ethereum, where there are validators who run the chain and are staked by various cryptocurrencies. Others, like Stacks, utilize locked BTC on Bitcoin to back validators that run and safeguard the chain. Another interesting consensus mechanism is called &ldquo;Merged Mining.&rdquo; Merged mining, used by Bitcoin L2s Rootstock and BOB, is when Bitcoin miners embed block hashes (compressed data) from the &ldquo;merged mined&rdquo; chains somewhere within the Bitcoin block. At almost no additional cost, any Bitcoin miner that opts into merge mining another blockchain is adding checkpoints of the happenings on that blockchain on Bitcoin. In return, miners are paid for this service in those chains' transaction fees (in BTC).</p>
<h3>Bitcoin Layer-2 Rollups Advantages</h3>
<p class="d-none d-lg-block"><img loading="lazy" class="img-responsive w-100" alt="Bitcoin Layer-2 Rollups Advantages" src="https://www.vaneck.com/contentassets/c6ff48fc86554e698ed50369e84aee2c/4648_bitcoin-valuation_infographic-1_2024-7_v1_blog.svg" /></p>
<p class="d-lg-none"><img loading="lazy" class="img-responsive w-100" alt="Bitcoin Layer-2 Rollups Advantages" src="https://www.vaneck.com/contentassets/c6ff48fc86554e698ed50369e84aee2c/4648_bitcoin-valuation_infographic-1_2024-7_mobile_v1.svg" /></p>
<p class="chart-disclosure"><strong>Source:</strong> VanEck Research as of 6/25/2024.</p>
<p>The next generation of Bitcoin Layer-2 blockchains are called &ldquo;<strong>Rollups,&rdquo;</strong> they intend to scale Bitcoin while transporting the security properties of the Bitcoin blockchain to other blockchains. A<strong> rollup</strong> works by posting transaction data or proofs to a parent blockchain such as Bitcoin or Ethereum. Because the parent blockchain hosts the data that allows anyone the ability to prove the validity of a rollup, the rollup relies upon the parent blockchain&rsquo;s security. A <strong>"sovereign rollup"</strong> posts data that allows others to prove transaction authenticity, whereas a <strong>"validity rollup"</strong> involves sending and executing proofs of a Bitcoin L2 rollup&rsquo;s transactions on Bitcoin.</p>
<p>The main difference between these two types of rollups lies in data posting and software requirements. Sovereign rollups post significantly more data to Bitcoin&rsquo;s limited capacity and do not require changes to Bitcoin&rsquo;s core software. In contrast, validity rollups post less data but require a Bitcoin software update called a &ldquo;soft fork.&rdquo; Rollups are heralded as the holy grail of Bitcoin scaling because they enhance off-chain scaling without compromising Bitcoin&rsquo;s core principles of trustlessness and decentralization. They also increase transaction revenue for Bitcoin miners, as settling proofs and posting data involve multiple transactions. Despite their promise, implementing rollups on Bitcoin poses significant challenges, potentially necessitating changes to Bitcoin&rsquo;s core software.</p>
<h2>Challenges with Rollups and Software Changes</h2>
<p>The first branch of scaling improvements resulting from changes to Bitcoin&rsquo;s software has occurred in notable but limited ways. One upgrade is called <strong>Segregated Witness (SegWit),</strong> and the other is called <strong>Taproot. SegWit</strong> makes transactions on Bitcoin more efficient by separating transaction signatures from transaction data, which permits up to <a href="https://learnmeabitcoin.com/beginners/guide/segwit/" title="SegWit" target="_blank" rel="noopener"><strong>4x more transactions</strong></a> to fit in each of Bitcoin&rsquo;s 1MB blocks. <strong>Taproot,</strong> another soft fork upgrade of Bitcoin, changed Bitcoin&rsquo;s underlying cryptography scheme to be more efficient. This improvement allows transactions to become more compact and faster. Together, these two changes have enabled the Bitcoin core software to store transactions and any kind of data, as evidenced by the surge of NFTs and memecoins on the Bitcoin network.</p>
<p>However, Bitcoin software does not necessarily need to be changed to accommodate sovereign rollups. The significant volume of data these rollups would post, even if compressed, limits Bitcoin&rsquo;s scaling potential. Even with compression levels akin to Ethereum rollups like Base and Arbitrum, Bitcoin's transaction throughput would be around 55 TPS with completely full blocks. Massively increasing compression or creating multiple rollups posting together would be necessary for substantial scaling.</p>
<p>Validity rollups, which address Bitcoin's limited data components, require changes to Bitcoin&rsquo;s core software to execute proofs. Some developers are creating an upgrade called <strong>BitVM </strong>to enable validity rollups on Bitcoin. BitVM introduces rules for verifying fraud and validity proofs through challenges and responses sent via Bitcoin transactions. This not only scales Bitcoin but also enables trustless bridges, replacing centrally wrapped BTC representations like wBTC. BitVM is under development, expected to be production-ready in about 18 months, and its implementation would require a Bitcoin community soft fork.</p>
<h2>Future Prospects: OP_CAT and Covenants</h2>
<p>Another promising software update that may allow Bitcoin to scale to meet the needs of the world&rsquo;s financial system is called <strong>OP_CAT.</strong> A change in Bitcoin&rsquo;s software, <strong>OP_CAT,</strong> enables programming complexity on Bitcoin, allowing for primitive smart contracts called covenants on Bitcoin. Using covenants, software engineers can also create the logic on Bitcoin necessary to support both sovereign rollups and validity rollups. <a href="https://starkware.co/scaling-bitcoin-for-mass-use/" title="Scaling Bitcoin for mass use: A realistic vision" target="_blank" rel="noopener"><strong>Starknet</strong></a>, a Layer-2 blockchain on Ethereum, has committed $1M to core developers researching OP_CAT. Starknet has also announced they intend to employ OP_CAT to settle <a href="https://starkware.co/scaling-bitcoin-for-mass-use/" title="Scaling Bitcoin for mass use: A realistic vision" target="_blank" rel="noopener"><strong>Starknet&rsquo;s</strong></a> validity proofs on Bitcoin.</p>
<h2>Bitcoin L2s Today</h2>
<h3>Bitcoin Layer-2s Are Dominated by Rollups and Sidechains</h3>
<p><img loading="lazy" class="img-responsive w-100" alt="Bitcoin Layer-2s Are Dominated by Rollups and Sidechains" src="https://www.vaneck.com/contentassets/c6ff48fc86554e698ed50369e84aee2c/4648_bitcoin-valuation_chart-10_2024-7_v1_blog.svg" /></p>
<p class="chart-disclosure"><strong>Source: <a href="https://btcl2.info/ANVM" title="BTC L2" target="_blank" rel="noopener">BTCL2.INFO</a></strong> as of 6/24/2024</p>
<p>More than 73 active projects are currently creating Bitcoin L2s with more than <a href="https://cointelegraph.com/magazine/bitcoin-layer2-sidechains-not-really-bitcoin-l2s/" title="&lsquo;Bitcoin layer 2s&rsquo; aren&rsquo;t really L2s at all: Here&rsquo;s why that matters" target="_blank" rel="noopener"><strong>$3.61B</strong></a> in total value locked. However, the space is nascent as only 26 of these L2s currently have live mainnets. Because it is so early, most of them have little traction. One of the early leaders is Merlin Chain. Despite being the largest Bitcoin L2 by TVL (BTC bridged to the chain), with <a href="https://btcl2.info/Merlin%20Chain" title="Merlin Chain" target="_blank" rel="noopener"><strong>$1.33B</strong></a>, it only averages between 50-80K daily transactions. This puts it in the same camp, by activity, as Cosmos Hub, Cardano, and Gnosis Chain. Indicative of the early lack of interest in Merlin Chain is that its most popular application by transaction count, MerlinSwap, retains only <a href="https://merlinswap.org/farm/dynamic" title="MerlinSwap" target="_blank" rel="noopener"><strong>~$2.85M</strong></a> in TVL.</p>
<p>The current competitive dynamic of Bitcoin L2s focuses on attracting TVL and developers. TVL primarily comes from large holders such as independent whales, miners, and investment funds. Private investment rounds offer discounts to investors who bring BTC to L2s. Business development operations target large BTC and other crypto holders to secure TVL commitments. Attracting developers is another strategic goal, with approximately 40 projects supporting EVM and aiming to recruit Ethereum developers. Currently, about 312 developers are working on BTC L2s, compared to 960 on Ethereum L2s and 966 on Ethereum.</p>
<p>At this stage, we do not see any clearly emerging winners in the Bitcoin L2 space, as many have not launched or conducted official marketing campaigns. As the space is so early, we focus on 16 projects we believe have high potential for scaling Bitcoin. We base this list upon the reputation of the builders of these chains, the project backers, and committed TVL (if available).</p>
<h3>High Potential Bitcoin Layer -2s</h3>
<div class="wrapped-div">
<table style="width: 100%;">
<tbody>
<tr class="tbl-data">
<td class="tbl-header last">Company</td>
<td class="tbl-header last text-left">Type</td>
<td class="tbl-header last text-left">EVM Compatible</td>
<td class="tbl-header last text-left">Stage</td>
<td class="tbl-header last text-right">TVL ($)</td>
</tr>
<tr class="tbl-data">
<td class="data-td last">Alpen</td>
<td class="data-td data last text-left">Validity Rollup</td>
<td class="data-td data last text-left">Yes</td>
<td class="data-td data last text-left">Testnet to be launch</td>
<td class="data-td data last text-right">0</td>
</tr>
<tr class="tbl-data">
<td class="data-td last">Babylon</td>
<td class="data-td data last text-left">Side Chain</td>
<td class="data-td data last text-left">No</td>
<td class="data-td data last text-left">Testnet launched</td>
<td class="data-td data last text-right">0</td>
</tr>
<tr class="tbl-data">
<td class="data-td last">BEVM</td>
<td class="data-td data last text-left">Side Chain</td>
<td class="data-td data last text-left">Yes</td>
<td class="data-td data last text-left">Mainnet launched</td>
<td class="data-td data last text-right">900,490</td>
</tr>
<tr class="tbl-data">
<td class="data-td last">Bitlayer</td>
<td class="data-td data last text-left">Other</td>
<td class="data-td data last text-left">Yes</td>
<td class="data-td data last text-left">Testnet to be launch</td>
<td class="data-td data last text-right">0</td>
</tr>
<tr class="tbl-data">
<td class="data-td last">Bison Network</td>
<td class="data-td data last text-left">Validity Rollup</td>
<td class="data-td data last text-left">No</td>
<td class="data-td data last text-left">Testnet launched</td>
<td class="data-td data last text-right">0</td>
</tr>
<tr class="tbl-data">
<td class="data-td last">BOB</td>
<td class="data-td data last text-left">Validity Rollup</td>
<td class="data-td data last text-left">Yes</td>
<td class="data-td data last text-left">Mainnet launched</td>
<td class="data-td data last text-right">39,370,000</td>
</tr>
<tr class="tbl-data">
<td class="data-td last">Botanix</td>
<td class="data-td data last text-left">Side Chain</td>
<td class="data-td data last text-left">Yes</td>
<td class="data-td data last text-left">Testnet launched</td>
<td class="data-td data last text-right">0</td>
</tr>
<tr class="tbl-data">
<td class="data-td last">BSquared Network</td>
<td class="data-td data last text-left">Validity Rollup</td>
<td class="data-td data last text-left">Yes</td>
<td class="data-td data last text-left">Testnet launched</td>
<td class="data-td data last text-right">135,250,000</td>
</tr>
<tr class="tbl-data">
<td class="data-td last">Citrea</td>
<td class="data-td data last text-left">Validity Rollup</td>
<td class="data-td data last text-left">Yes</td>
<td class="data-td data last text-left">Testnet to be launch</td>
<td class="data-td data last text-right">0</td>
</tr>
<tr class="tbl-data">
<td class="data-td last">DOVI</td>
<td class="data-td data last text-left">Side Chain</td>
<td class="data-td data last text-left">No</td>
<td class="data-td data last text-left">Testnet to be launch</td>
<td class="data-td data last text-left">0</td>
</tr>
<tr class="tbl-data">
<td class="data-td last">Lightning Network</td>
<td class="data-td data last text-left">State Channel</td>
<td class="data-td data last text-left">No</td>
<td class="data-td data last text-left">Mainnet launched</td>
<td class="data-td data last text-right">320,760,000</td>
</tr>
<tr class="tbl-data">
<td class="data-td last">MAP Protocol</td>
<td class="data-td data last text-left">Side Chain</td>
<td class="data-td data last text-left">Yes</td>
<td class="data-td data last text-left">Mainnet launched</td>
<td class="data-td data last text-right">110,290,000</td>
</tr>
<tr class="tbl-data">
<td class="data-td last">Mezo</td>
<td class="data-td data last text-left">Side Chain</td>
<td class="data-td data last text-left">Yes</td>
<td class="data-td data last text-left">Testnet to be launch</td>
<td class="data-td data last text-right">110,230,000</td>
</tr>
<tr class="tbl-data">
<td class="data-td last">Rootstock</td>
<td class="data-td data last text-left">Side Chain</td>
<td class="data-td data last text-left">Yes</td>
<td class="data-td data last text-left">Testnet to be launch</td>
<td class="data-td data last text-right">192,690,000</td>
</tr>
<tr class="tbl-data">
<td class="data-td last">SatoshiVM</td>
<td class="data-td data last text-left">Validity Rollup</td>
<td class="data-td data last text-left">Yes</td>
<td class="data-td data last text-left">Mainnet launched</td>
<td class="data-td data last text-right">1,100,000</td>
</tr>
<tr class="tbl-data">
<td class="data-td last">Stacks</td>
<td class="data-td data last text-left">Side Chain</td>
<td class="data-td data last text-left">No</td>
<td class="data-td data last text-left">Mainnet launched</td>
<td class="data-td data last text-right">116,760,000</td>
</tr>
</tbody>
</table>
</div>
<strong><strong><strong><strong><strong><strong><br /></strong></strong></strong></strong></strong></strong>
<p class="chart-disclosure"><strong>Source: <a href="https://btcl2.info/ANVM" title="Explore BTC L2 Projects" target="_blank" rel="noopener">BTCL2.INFO</a></strong> as of 6/26/2024.</p>
<h2 id="bitcoin-2050-price-scenarios" class="jump-link-nav anchored-block" data-jumplink-title="Bitcoin 2050 Price Scenarios">Bitcoin Valuation by 2050</h2>
<p>To value Bitcoin in 2050, we use a straightforward velocity of money equation incorporating three key components:</p>
<ol class="content-list">
<li>GDP of local and international trade settled on Bitcoin</li>
<li>Supply of actively circulating BTC</li>
<li>Velocity of BTC</li>
</ol>
<h2>Valuation Premise</h2>
<p>Our key assumption for 2050 is that Bitcoin will become an essential part of the International Monetary System, gaining market share from the Principal Four currencies. We expect BTC to be widely used in international trade, becoming a significant medium of exchange and a valuable store of wealth. This leads to a Gresham&rsquo;s Law-like feedback loop: as BTC becomes more useful and valuable, central banks and long-term investors will want to hold more BTC, reducing the amount available in the floating supply.</p>
<p>We begin by estimating global trade and the world&rsquo;s GDP based on 2023 baseline GDP figures and growth projections. We assume that populist movements and the desire for re-shoring result in trade growing slower than average global GDP growth &ndash; 2% vs 3%. We then assume Bitcoin&rsquo;s share of cross-border payments relative to our outlook of other currencies used in international trade. We suppose that the Principal Four&rsquo;s share of international trade declines due to deteriorating economic and fiscal fundamentals and eroding property rights. The Principal Four&rsquo;s share of reserve assets also declines due to international trade flow declines. We imagine a market share decline of 20% with the RMB, BTC, emerging market currencies, and gold claiming market share. From a medium-of-exchange standpoint, we see BTC taking 10% of cross-border payments and 5% of domestic trade as possible.</p>
<p>We anticipate that 2.5% of central bank assets will be held in BTC in this base case. Because of its importance as a store of value, we also foresee 85% of BTC effectively removed from circulating supply due to investors seeking its store-of-value properties. Assuming a velocity of BTC of around 1.5, the average of U.S. <a href="https://fred.stlouisfed.org/series/M2SL" title="M2 (M2SL)" target="_blank" rel="noopener"><strong>monetary velocity</strong></a> since the GFC, we arrive at a value per Bitcoin of $2.9M. Considering the world&rsquo;s entire base of assets, this would be 1.66% of all financial assets compared to our estimate of today&rsquo;s share of 0.1%.</p>
<h3>Bitcoin Price Scenario by 2050: Base, Bear, Bull Scenarios</h3>
<div class="wrapped-div">
<table style="width: 100%;">
<tbody>
<tr class="tbl-data">
<td class="tbl-header last">&nbsp;</td>
<td class="tbl-header last text-right">Base</td>
<td class="tbl-header last text-right">Bear</td>
<td class="tbl-header last text-right">Bull</td>
</tr>
<tr class="tbl-data">
<td class="data-td last">International Trade Growth Rate (%)</td>
<td class="data-td data last text-right">2.00</td>
</tr>
<tr class="tbl-data">
<td class="data-td last">Global GDP Growth Rate (%)</td>
<td class="data-td data last text-right">3.00</td>
</tr>
<tr class="tbl-data">
<td class="data-td data last text-left">&nbsp;</td>
<td class="data-td data last text-right">&nbsp;</td>
</tr>
<tr class="tbl-data">
<td class="data-td last">Total Global International Trade ($M)</td>
<td class="data-td data last text-right">44,223,730</td>
</tr>
<tr class="tbl-data">
<td class="data-td last">Global Domestic GDP ($M)</td>
<td class="data-td data last text-right">186,580,126</td>
</tr>
<tr class="tbl-data">
<td class="data-td last">Bitcoin Settlement TAM ($M)</td>
<td class="data-td data last text-right">230,803,856</td>
</tr>
<tr class="tbl-data">
<td class="data-td data last text-left">&nbsp;</td>
<td class="data-td data last text-right">&nbsp;</td>
</tr>
<tr class="tbl-data">
<td class="data-td last">Bitcoin Share of International Trade (%)</td>
<td class="data-td data last text-right">10.00</td>
<td class="data-td data last text-right">2.00</td>
<td class="data-td data last text-right">20.00</td>
</tr>
<tr class="tbl-data">
<td class="data-td last">Bitcoin Share of Domestic GDP (%)</td>
<td class="data-td data last text-right">5.00</td>
<td class="data-td data last text-right">1.00</td>
<td class="data-td data last text-right">10.00</td>
</tr>
<tr class="tbl-data">
<td class="data-td data last text-left">&nbsp;</td>
<td class="data-td data last text-right">&nbsp;</td>
</tr>
<tr class="tbl-data">
<td class="data-td last">Total Trade in BTC ($)</td>
<td class="data-td data last text-right">13,751,379</td>
<td class="data-td data last text-right">2,750,276</td>
<td class="data-td data last text-right">27,502,759</td>
</tr>
<tr class="tbl-data">
<td class="data-td last">Velocity Adjustment</td>
<td class="data-td data last text-right">1.50</td>
<td class="data-td data last text-right">2.50</td>
</tr>
<tr class="tbl-data">
<td class="data-td last">Total Bitcoin Vel Adjust Trade ($)</td>
<td class="data-td data last text-right">9,167,586</td>
<td class="data-td data last text-right">1,833,517.24</td>
<td class="data-td data last text-right">11,001,103.43</td>
</tr>
<tr class="tbl-data">
<td class="data-td data last text-left">&nbsp;</td>
<td class="data-td data last text-right">&nbsp;</td>
</tr>
<tr class="tbl-data">
<td class="data-td last">% of Bitcoin out of Circulation (%)</td>
<td class="data-td data last text-right">85.00</td>
<td class="data-td data last text-right">33.00</td>
<td class="data-td data last text-right">99.00</td>
</tr>
<tr class="tbl-data">
<td class="data-td data last text-left">&nbsp;</td>
<td class="data-td data last text-right">&nbsp;</td>
</tr>
<tr class="tbl-data">
<td class="data-td last">Bitcoin Circulating Supply</td>
<td class="data-td data last text-right">3,150,000</td>
<td class="data-td data last text-right">14,070,000</td>
<td class="data-td data last text-right">210,000</td>
</tr>
<tr class="tbl-data">
<td class="data-td data last text-left">&nbsp;</td>
<td class="data-td data last text-right">&nbsp;</td>
</tr>
<tr class="tbl-data">
<td class="data-td last">Price Per Bitcoin ($)</td>
<td class="data-td data last text-right"><strong>2,910,345</strong></td>
<td class="data-td data last text-right"><strong>130,314</strong></td>
<td class="data-td data last text-right"><strong>52,386,207</strong></td>
</tr>
<tr class="tbl-data">
<td class="data-td data last text-left">&nbsp;</td>
<td class="data-td data last text-right">&nbsp;</td>
</tr>
<tr class="tbl-data">
<td class="data-td last">Bitcoin Price Today ($k)</td>
<td class="data-td data last text-right">60</td>
</tr>
<tr class="tbl-data">
<td class="data-td last">CAGR through 2050 (%)</td>
<td class="data-td data last text-right">16</td>
<td class="data-td data last text-right">3</td>
<td class="data-td data last text-right">50</td>
</tr>
<tr class="tbl-data">
<td class="data-td last">Total BTC Market Cap ($)</td>
<td class="data-td data last text-right">61,117,241,276,969</td>
<td class="data-td data last text-right">2,736,592,892,999</td>
<td class="data-td data last text-right">1,100,110,342,985,440</td>
</tr>
<tr class="tbl-data">
<td class="data-td last">Percent of World Financial Assets (%)</td>
<td class="data-td data last text-right">1.66</td>
<td class="data-td data last text-right">0.07</td>
<td class="data-td data last text-right">29.79</td>
</tr>
</tbody>
</table>
</div>
<strong><strong><strong><strong><strong><strong><br /></strong></strong></strong></strong></strong></strong>
<p class="chart-disclosure"><strong>Source:</strong> VanEck Research as of 6/26/2024. <strong>Past performance is no guarantee of future results. The information, valuation scenarios, and price targets in this blog are not intended as financial advice or any call to action, a recommendation to buy or sell, or as a projection of how bitcoin will perform in the future. Actual future performance of bitcoin is unknown, and may differ significantly from the hypothetical results depicted here. There may be risks or other factors not accounted for in the scenarios presented that may impede the performance. These are solely the results of a simulation based on our research, and are for illustrative purposes only. Please conduct your own research and draw your own conclusions.</strong></p>
<h2>Valuation of Bitcoin L2s</h2>
<p>We apply our 2050 valuation framework for smart contract platforms (SCPs) to the Bitcoin Layer-2 space as a whole, based on end market capture. This valuation technique mirrors our approach to Solana, Ethereum, and Ethereum Layer-2 blockchains. Our approach projects the TAM revenues of businesses that will eventually utilize public SCPs like Ethereum and Bitcoin L2s. From there, we establish a take rate on activity that SCPs will charge businesses that deploy on SCPs. This can be thought of as a platform fee similar to Apple&rsquo;s App Store or Amazon&rsquo;s online marketplace.</p>
<p>Bitcoin is the chief mover and most important blockchain that has found a strong product-market fit as a store of value assets. Now, important members of its community are intent on enabling Bitcoin to become a settlement system for connected smart contract platforms. This approach mirrors that of Ethereum. Because Bitcoin has immense name-brand recognition and is a more successful asset than Ethereum, we envision a scenario where Bitcoin L2s take 50% of our market for smart contract platforms.</p>
<p>If Bitcoin is to become a reserve asset, we anticipate that Bitcoin L2&rsquo;s market share of the smart contract platform market will be around 50%. We suppose that the Bitcoin L2 space will consist of tens of thousands of L2s that will be state channels, rollups, and future types of technology that are yet to be conceived. Suppose BTC becomes a staple of the International Monetary System. In that case, financial entities across the world will compete to build their L2s to house each&rsquo;s BTC activities, including trading, exchange, and lending. Some of these solutions will be centralized solutions that rely upon trust. Still, we believe the value proposition of Bitcoin is diluted unless Bitcoin L2s, even those owned by financial institutions, have decentralization properties.</p>
<p>We could even foresee the emergence of fractional reserve systems that echo early banking before the world transitioned to fiat currencies. In this environment, it is even possible that most blockchains that exist today may become Bitcoin L2s to tap into the value of BTC&rsquo;s strong asset properties. Regardless, we believe there is now strong reason to believe that BTC has become one of the world&rsquo;s most important assets, and Bitcoin L2s take on immense value by increasing the utility of Bitcoin. This would give the entire suite of L2s a valuation of $7.6T, which would be around 12.5% of the value of BTC itself.</p>
<h2>Bitcoin L2s Valuation Scenario:</h2>
<div class="wrapped-div">
<table style="width: 450px;">
<tbody>
<tr class="tbl-data">
<td class="tbl-header last" colspan="2">Bitcoin L2 Scenario Analysis</td>
</tr>
<tr class="tbl-data">
<td class="data-td last font-weight-normal">Bitcoin Ecosystem Smart Contract Market Share</td>
<td class="data-td data last text-right">50.00%</td>
</tr>
<tr class="tbl-data">
<td class="data-td last">Bitcoin L2 Economics</td>
<td class="data-td data last text-right">&nbsp;</td>
</tr>
<tr class="tbl-data">
<td class="data-td last font-weight-normal">Estimated Revenue 2050</td>
<td class="data-td data last text-right">$182,194.88</td>
</tr>
<tr class="tbl-data">
<td class="data-td last font-weight-normal">Global Tax Rate on Crypto</td>
<td class="data-td data last text-right">15%</td>
</tr>
<tr class="tbl-data">
<td class="data-td last font-weight-normal">Sequencer Cut</td>
<td class="data-td data last text-right">1.00%</td>
</tr>
<tr class="tbl-data">
<td class="data-td last font-weight-normal">Value to Tokenholders in 2030</td>
<td class="data-td data last text-right">$153,316.99</td>
</tr>
<tr class="tbl-data">
<td class="data-td last font-weight-normal">FCF Terminal Multiple</td>
<td class="data-td data last text-right">50.00</td>
</tr>
<tr class="tbl-data">
<td class="data-td last">L2 FDV 2030</td>
<td class="data-td data last text-right"><strong>$7,665,849.70</strong></td>
</tr>
<tr class="tbl-data">
<td class="data-td last font-weight-normal">&nbsp;</td>
<td class="data-td data last text-right">&nbsp;</td>
</tr>
<tr class="tbl-data">
<td class="data-td last">Crypto Terminal Market Share</td>
<td class="data-td data last text-right"><strong>Base (%)</strong></td>
</tr>
<tr class="tbl-data">
<td class="data-td last font-weight-normal">Finance, Banking, Payments</td>
<td class="data-td data last text-right">10.00</td>
</tr>
<tr class="tbl-data">
<td class="data-td last font-weight-normal">Metaverse, Social and Gaming</td>
<td class="data-td data last text-right">5.00</td>
</tr>
<tr class="tbl-data">
<td class="data-td last font-weight-normal">Infrastructure</td>
<td class="data-td data last text-right">7.50</td>
</tr>
<tr class="tbl-data">
<td class="data-td last font-weight-normal">&nbsp;</td>
<td class="data-td data last text-right">&nbsp;</td>
</tr>
<tr class="tbl-data">
<td class="data-td last">Bitcoin L2 Value Capture of End Market Revenue</td>
<td class="data-td data last text-right">&nbsp;</td>
</tr>
<tr class="tbl-data">
<td class="data-td last font-weight-normal">Finance, Banking, Payments</td>
<td class="data-td data last text-right">10.00</td>
</tr>
<tr class="tbl-data">
<td class="data-td last font-weight-normal">Metaverse, Social and Gaming</td>
<td class="data-td data last text-right">10.00</td>
</tr>
<tr class="tbl-data">
<td class="data-td last font-weight-normal">Infrastructure</td>
<td class="data-td data last text-right">5.00</td>
</tr>
</tbody>
</table>
</div>
<strong><strong><strong><strong><strong><strong><br /></strong></strong></strong></strong></strong></strong>
<p class="chart-disclosure"><strong>Source:</strong> VanEck Research as of 6/26/2024. <strong>Past performance is no guarantee of future results. The information, valuation scenarios, and price targets in this blog are not intended as financial advice or any call to action, a recommendation to buy or sell, or as a projection of how bitcoin will perform in the future. Actual future performance of bitcoin is unknown, and may differ significantly from the hypothetical results depicted here. There may be risks or other factors not accounted for in the scenarios presented that may impede the performance. These are solely the results of a simulation based on our research, and are for illustrative purposes only. Please conduct your own research and draw your own conclusions.</strong></p>
<h2>Bitcoin Investment Risks</h2>
<p>Bitcoin is over 15 years old today and has demonstrated remarkable resilience through multiple economic cycles. Though it has established itself as an important store of value assets, our projection of its price more than 25 years into the future is predicated on the assumption that increasing numbers of people around the globe use Bitcoin as a medium of exchange. In fact, Bitcoin&rsquo;s future value derives from the widespread belief it is the ideal currency that has the potential to succeed in fewer forms of money. Great volumes of ink have been spilled agonizing over the flimsiness of Bitcoin&rsquo;s value deriving from nothing other than perception. However, we believe the memetic value of BTC as sound money is the firmest foundation upon which Bitcoin rests.</p>
<p>Our chief risks to our Bitcoin thesis include:</p>
<p><strong>1. Sustainability of Bitcoin mining</strong></p>
<p>While we reject most premises and conclusions of &ldquo;ESG,&rdquo; it is important to recognize the implied power demands that future Bitcoin mining will require. This is particularly concerning from the standpoint of the anticipated miner costs of securing the network. Since 2018, the Bitcoin network&rsquo;s hash rate has grown 71.7% CAGR compared to price increases of 24% CAGR. Extrapolating this linearly to our $2.9M BTC scenario implies a hash rate growth of 48% CAGR, suggesting a hash rate growing from 600M TH/s to 13.1B TH/s. If we assume miner efficiency continues to decrease power consumption per TH/s at 12% per year, the total power consumption of the Bitcoin network would be 9.181M GW/h, which is around 2.16 times the 2022 capacity of the <a href="https://www.eia.gov/energyexplained/electricity/electricity-in-the-us-generation-capacity-and-sales.php" title="Electricity generation, capacity, and sales in the United States" target="_blank" rel="noopener"><strong>U.S. Grid</strong></a> (4.24M GW/h) and corresponds to 15% of the world&rsquo;s projected power production in 2050. We expect our Bitcoin thesis will not materialize without new innovations in chip design and further breakthroughs in the cost of energy production.</p>
<h3>Projected BTC Consumption of World&rsquo;s Power Supply Reaches 15% in 2050</h3>
<p><img loading="lazy" class="img-responsive w-100" alt="Projected BTC Consumption of World&rsquo;s Power Supply Reaches 15% in 2050" src="https://www.vaneck.com/contentassets/c6ff48fc86554e698ed50369e84aee2c/4648_bitcoin-valuation_chart-11_2024-7_v1_blog.svg" /></p>
<p class="chart-disclosure"><strong>Source:</strong> VanEck Research, <a href="https://www.eia.gov/totalenergy/data/browser/" title="TOTAL ENERGY" target="_blank" rel="noopener"><strong>EIA</strong></a> as of 7/3/2024. Any projections shown are those of VanEck and based on the firm&rsquo;s own research, are for illustrative purposes only, are valid as of the posting date of this content and are subject to change without notice.</p>
<p><strong>2. Failed economics of miners</strong></p>
<p>Bitcoin can be described as a financial shark that needs a consistent influx of BTC buying to offset the selling by miners who must cover their fixed and variable costs. As Bitcoin inflation dwindles, transactions on chain must drive demand for BTC as well as pay for miner expenditures.</p>
<p><strong>3. Failure to scale</strong></p>
<p>If Bitcoin cannot become an important medium of exchange because adequate scaling is not completed, our core thesis for its meteoric rise will be broken.</p>
<p><strong>4. Competition from other cryptocurrencies</strong></p>
<p>We are in the early laps of the race to create more perfect, permissionless money. While BTC has found a &gt;$1T market capitalization off of belief in its potential, there is no shortage of ecosystems attempting to take Bitcoin&rsquo;s market share. Most importantly, these competing blockchains boast higher capabilities to onboard more users into systems whose functionality approaches that of the current financial system. While many of these blockchains are not pushing their native currencies as money and could potentially act as facilitating mechanisms of BTC, there is a high chance that many may try to make their tokens perfect money. Specifically, Ethereum has enshrined ETH as the money of its ecosystem and is, whether acknowledged or not, competing with Bitcoin.</p>
<p><strong>5. Community schism</strong></p>
<p>We have discussed the challenges facing BTC and its long-term need to pay miners for the costs of mining BTC. The BTC community is an exceptional group of individuals who believe in BTC&rsquo;s long-term potential. However, they are highly divided regarding creating a sustainable environment for Bitcoin. This debate could lead to another schism in the community that results in one or several Bitcoin hard forks with BTC&rsquo;s value split across the new networks.</p>
<p><strong>6. Disastrous changes to Bitcoin&rsquo;s monetary policy</strong></p>
<p>To sustain BTC over the long run, it may be necessary to impose a tax on BTC holders. This is because the current velocity of BTC, being miniscule at about 1/30th that of the U.S. Dollar, does not support the economics of Bitcoin miners. The result may be implementing different ways to &ldquo;tax&rdquo; stationary BTC. By itself, one move to sustain BTC through a new &ldquo;taxation&rdquo; like inflation would not destroy BTC. However, this would shatter the perception that BTC&rsquo;s monetary policy is permanent. Bitcoin changing policy is akin to Caesar&rsquo;s Rubicon fording endeavor (arguably, Marius/Sulla and earlier tyrants already &ldquo;Crossed the Rubicon&rdquo;). Many BTC holders would suspect that continued deviations from sound money policies would be likely.</p>
<p><strong>7. Government bans and attacks</strong></p>
<p>One of the enduring beliefs of governments worldwide is that the monetary system should remain under federal control. There is a great potential that if BTC becomes wildly successful, countries worldwide will coordinate to have it banned. Because Bitcoin&rsquo;s ledger is public and many wallets can be traced to IP addresses (most wallet providers almost certainly keep IP addresses), banning Bitcoin would not be challenging. Given the authority of the United States to control its money is <a href="https://www.presidency.ucsb.edu/documents/executive-order-6102-forbidding-the-hoarding-gold-coin-gold-bullion-and-gold-certificates" title="Executive Order 6102&mdash;Forbidding the Hoarding of Gold Coin, Gold Bullion and Gold Certificates" target="_blank" rel="noopener"><strong>unchallenged</strong></a>, they could easily justify the seizure of mining operations within the U.S.&rsquo;s jurisdiction. A coordinated attack, even if it is just announced and not executed, could seriously disrupt Bitcoin due to the reliance of Bitcoin miners on high prices. Though Bitcoin could survive, organized government action would reduce its long-term potential.</p>
<p><strong>8. Capture by oligarchical financial entities</strong></p>
<p>In January 2024, many in the crypto and Bitcoin communities celebrated the approval of Bitcoin spot ETFs with ardent zest. At the time of writing, BTC spot ETFs held more than <a href="https://studio.glassnode.com/metrics?a=BTC&amp;m=institutions.BtcUsSpotEtfBalancesAll" title="BTC: US Bitcoin Spot ETF Balances " target="_blank" rel="noopener"><strong>865k</strong></a> BTC, which amounts to around 4.1% of the total BTC supply. Over time, we believe that the holdings of BTC by &ldquo;big finance&rdquo; will dramatically increase. Many negative scenarios could emerge if BTC holdings of big finance increase to the majority of supply. One of these could be that BTC becomes increasingly controlled by both large financial institutions and governments. One more far-fetched scenario could involve the government seizing BTC from these centralized entities and market dumping the BTC to destroy the economic system of Bitcoin. Another potential possibility is a financial crisis catalyzed by BTC's re-hypothecation through some lending network where margin calls in BTC find everyone is &ldquo;swimming naked.&rdquo; At the same time, it could come to pass that the financial control of BTC by large investment firms would change the culture of BTC and lead to new policies that benefit large holders at the expense of smaller ones.</p>
<p><strong>9. Theft and hacking</strong></p>
<p>A major issue with permissionless bearer assets like BTC is that they belong to anyone who controls the private keys to move them. The hacks of Bitcoin have been <a href="https://www.coinbureau.com/analysis/biggest-bitcoin-hacks/" title="The Coin Bureau" target="_blank" rel="noopener"><strong>prolific</strong></a> and mostly involve cracking centralized institutions that hold large amounts of BTC. In the future, software upgrades to Bitcoin and the emergence of Layer-2 solutions mean that the surface area of hacking attacks has grown massively. If thefts by sanctioned state actors persist, it could lend governments of the world more ammunition to ban Bitcoin.</p>
<p><strong>10. Financial attack</strong></p>
<p>Hyper-financialization has led to outsized compensation for financial employees who can break poorly designed economic systems. Most famously, this dynamic spawned financial attacks on the <strong><a href="https://theeconreview.com/2018/10/16/how-soros-broke-the-british-pound/" title="How Soros Broke the British Pound" target="_blank" rel="noopener">currency systems</a></strong> of advanced G7 nations. The profits from breaching Bitcoin&rsquo;s economic system could be more than 2 orders higher than those from breaking the Bank of England. The economic security of Bitcoin relates to the amount that is spent to &ldquo;secure&rdquo; its network. The sum of Bitcoin&rsquo;s economic security is $14.1B, which is the total that miners receive from transaction fees and inflation. With miner equities hovering around 1.2 EV/S, this implies that enterprise values to miners are around $21B (being generous with 1.5x EV/S). At the same time, BTC&rsquo;s market capitalization is $1.2T. One straightforward financial attack (BTC holders hate this simple trick!) would be to buy all the BTC miners, short hundreds of billions of dollars worth of BTC, and shut down the miners. The resulting chaos would likely pay off well above the cost of the purchase of the miners. Today, neither the liquidity nor the secure counterparties exit to pull off the trade, but this may change.</p>
<p><strong>11. Core software failure</strong></p>
<p>Bitcoin&rsquo;s software simplicity is enforced because it makes Bitcoin more resistant to hacks. The less complex a code system is the less potential for bugs and exploits that could destroy Bitcoin. Bitcoin likely needs to perform at least two substantial upgrades to its software to survive. As mentioned previously, Bitcoin must alter its economic system to be sustainable for miners in the long term. Second, Bitcoin must upgrade its cryptography scheme to counter the rise of quantum computing. Though breakthroughs for widespread quantum computing may be years away, Bitcoin will eventually have to change substantial components of its system by introducing quantum cryptography. This is because quantum computing will render Bitcoin&rsquo;s current cryptography unsafe and easily crackable. Regardless of how these major upgrades occur, when Bitcoin core software is upgraded, it can introduce novel vulnerabilities that threaten the long-term success of Bitcoin.</p>
<p><strong>Links to third party websites are provided as a convenience and the inclusion of such links does not imply any endorsement, approval, investigation, verification or monitoring by us of any content or information contained within or accessible from the linked sites. By clicking on the link to a non-VanEck webpage, you acknowledge that you are entering a third-party website subject to its own terms and conditions. VanEck disclaims responsibility for content, legality of access or suitability of the third-party websites.</strong></p>
<p>To receive more <strong><a href="https://www.vaneck.com/us/en/insights/digital-assets/" title="Digital Assets Insights">Digital Assets</a></strong> insights, <strong><a href="https://www.vaneck.com/us/en/subscribe/" title="Subscription Center">sign up in our subscription center</a></strong>.</p>
<style>
    .data-td.data {
        padding-right: 5px !important;
    }
    
    .data-head { 
    padding-right: 5px !important;
    }

    .wrapped-div {
        max-width: 100%;
    }

    @media (max-width: 1240px) {
        .wrapped-div {
            overflow-x: scroll;
        }
    }

    .wrapped-div-sector {
        max-width: 100%;
        overflow-x: scroll;
    }
</style>
]]></content:encoded>
</item><item rdf:about="https://www.vaneck.com/us/en/blogs/income-investing/fallen-angels-index-shift-looms-as-potential-entrants-emerge/">
  <title>Fallen Angels Index Shift Looms as Potential Entrants Emerge></title>
  <link>https://www.vaneck.com/us/en/blogs/income-investing/fallen-angels-index-shift-looms-as-potential-entrants-emerge/</link>
  <description><![CDATA[Potential fallen angels in H2 2024 may reshape Index; wider spreads in Telecom and Real Estate sectors dampened Index performance in June.]]></description>
  <dc:creator>Nicolas  Fonseca, CFA</dc:creator>
  <dc:date>07/24/2024 06:30:00</dc:date>
<content:encoded><![CDATA[

<p>After outperforming in Q1 by 0.10%, fallen angels (as represented by the ICE US Fallen Angel High Yield 10% Constrained Index, &ldquo;H0CF&rdquo;) underperformed broad high yield (as represented by the ICE BofA US High Yield Index, &ldquo;H0A0&rdquo;) by 1.60% in Q2 and now lag by 1.53% YTD. Most Q2 underperformance can be attributed to credit deterioration in weaker credits within the Telecom and Real Estate sectors. Within Telecom, Embarq had been trading at distressed levels all year but deteriorated further in June following a downgrade. In addition, Lumen Technologies spreads widened significantly through the quarter. Within Real Estate, Office Properties Income Trust, a REIT focused on office properties, conducted a distressed exchange, reflecting ongoing concerns in that sector. Fallen angels continue to be overweight the Real Estate sector by approximately 2.5x versus the broad high yield market. Rates have also taken a toll on fallen angels this year, as intermediate and long maturity US Treasury yields have increased approximately 0.50%, most of which occurred in Q1.</p>
<h2 id="deep-dive-on-retail" class="jump-link-nav anchored-block" data-jumplink-title="Latter Half of 2024 Expectations">What Lies Ahead for the Remainder of the Year?</h2>
<p>J.P. Morgan is expecting fallen angels to outpace rising stars for the remainder of the year, with approximately $30bn downgrades expected and only $5bn in rising stars. The downgrades are expected to occur within Media, Basic Industry, Retail, among others, and are mostly idiosyncratic in nature. One of the issuers, Paramount, is already rated high yield by S&amp;P (BB+), while Fitch has it on negative watch (BBB-) and Moody&rsquo;s put its Baa3 on review for downgrade after it agreed to sell itself to SkyDance due to ongoing pressures that will continue to impact the businesses. Below we analyze how Paramount would impact the fallen angel index, if it were to be downgraded to high yield:</p>
<ul class="content-list">
<li class="mt-2">The fallen angel index hasn&rsquo;t had exposure to the Media sector since the middle of 2019, and Paramount would be the only issuer in the sector.</li>
<li class="mt-2">With approximately $13bn in debt, Paramount would likely reach the index&rsquo;s 10% issuer cap, making it the largest exposure in the index. The largest exposure now belongs to Walgreens with just over 6% weight in the Retail sector.</li>
<li class="mt-2">Paramount&rsquo;s duration is slightly longer than 7 years, which would increase the fallen angel index duration.</li>
<li class="mt-2">Over the last 6 months, the average price return of Paramount bonds in the broad investment grade index was -8.25%.</li>
</ul>
<h3>Paramount Par Weighted Price (last 6 months)</h3>
<p><img class="img-responsive w-100" src="https://www.vaneck.com/contentassets/2a95388796b54013b22d7bae6b02a766/4674_angl-july_chart-1_2024-7_v1_blog.svg" alt="Paramount Par Weighted Price (last 6 months)" /></p>
<p class="chart-disclosure">Source: ICE Data Services, VanEck. Past performance is no guarantee of future results.</p>

<p id="fallen-angel-statistics" class="jump-link-nav anchored-block" data-jumplink-title="Fallen Angel Statistics"><strong>Fallen Angels Overall Statistics:</strong> Fallen angel yields decreased by 20bps in June to 7.10% but remain elevated vs Q1 and the end of last year, while spreads continue to trade rangebound in the mid-200s. Broad high yield saw similar changes, with yields decreasing 10bps but still above the end of Q1 and spreads experiencing minimal changes. After hitting 4.70% in May, the 10-year U.S. treasury yield ended June at 4.28% amid a benign CPI/PCE reports, unemployment ticking up slightly above 4% and the median Fed calling for a 0.25% cut by the end of this year. Minor changes in the fallen angel index have brought duration slightly down while the broad yield duration has been muted. Regarding defaults, the broad high yield market saw Petrofac default in June ($600 million par outstanding), adding to 5 issuers that defaulted in Q1 for a total of $4,144m vs $0 for fallen angels.</p>
<div class="wrapped-div">
<table style="width: 100%;">
<tbody>
<tr class="tbl-data">
<td class="tbl-header last text-center">&nbsp;</td>
<td class="tbl-header last text-center" style="border-right: outset;" colspan="3">Fallen Angels</td>
<td class="tbl-header last text-center" colspan="3">Broad HY</td>
</tr>
<tr class="tbl-data">
<td class="data-head last text-right">&nbsp;</td>
<td class="data-head last text-right">12/31/23</td>
<td class="data-head last text-right">3/31/24</td>
<td class="data-head last text-right" style="border-right: outset;">6/30/24</td>
<td class="data-head last text-right">12/31/23</td>
<td class="data-head last text-right">3/31/24</td>
<td class="data-head last text-right">6/30/24</td>
</tr>
<tr class="tbl-data">
<td class="data-td last">Yield to Worst</td>
<td class="data-td data last text-right">6.99</td>
<td class="data-td data last text-right">6.92</td>
<td class="data-td text-right data last" style="border-right: outset;">7.10</td>
<td class="data-td data last text-right">7.69</td>
<td class="data-td data last text-right">7.75</td>
<td class="data-td data last text-right">7.94</td>
</tr>
<tr class="tbl-data">
<td class="data-td last">Par Weighted Price</td>
<td class="data-td data last text-right">91.20</td>
<td class="data-td data last text-right">91.22</td>
<td class="data-td text-right data last" style="border-right: outset;">90.32</td>
<td class="data-td data last text-right">91.86</td>
<td class="data-td data last text-right">93.18</td>
<td class="data-td data last text-right">92.98</td>
</tr>
<tr class="tbl-data">
<td class="data-td last">Effective Duration</td>
<td class="data-td data last text-right">5.41</td>
<td class="data-td data last text-right">5.32</td>
<td class="data-td text-right data last" style="border-right: outset;">5.08</td>
<td class="data-td data last text-right">3.31</td>
<td class="data-td data last text-right">3.28</td>
<td class="data-td data last text-right">3.26</td>
</tr>
<tr class="tbl-data">
<td class="data-td last">Full Market Value ($mn)</td>
<td class="data-td data last text-right">67,821</td>
<td class="data-td data last text-right">64,657</td>
<td class="data-td text-right data last" style="border-right: outset;">55,371</td>
<td class="data-td data last text-right">1,237,721</td>
<td class="data-td data last text-right">1,260,542</td>
<td class="data-td data last text-right">1,266,993</td>
</tr>
<tr class="tbl-data">
<td class="data-td last">OAS</td>
<td class="data-td data last text-right">285</td>
<td class="data-td data last text-right">247</td>
<td class="data-td text-right data last" style="border-right: outset;">252</td>
<td class="data-td data last text-right">339</td>
<td class="data-td data last text-right">315</td>
<td class="data-td data last text-right">321</td>
</tr>
<tr class="tbl-data">
<td class="data-td last">No. of Issues</td>
<td class="data-td data last text-right">143</td>
<td class="data-td data last text-right">138</td>
<td class="data-td text-right data last" style="border-right: outset;">126</td>
<td class="data-td data last text-right">1,837</td>
<td class="data-td data last text-right">1,864</td>
<td class="data-td data last text-right">1,863</td>
</tr>
</tbody>
</table>
</div>
<p class="chart-disclosure">Source: ICE Data Services, VanEck. Fallen Angels: ICE US Fallen Angel High Yield 10% Constrained Index. Broad HY: ICE BofA US High Yield Index. OAS refers to &ldquo;option-adjusted spread.&rdquo; Please see definition for this and other terms referenced herein in the disclosures and definitions portion of this blog. Past performance is no guarantee of future results. Index performance is not representative of strategy performance. It is not possible to invest in an index.</p>
<p><strong>Fallen Angels:</strong> The fallen angel index had no new entrants in Q2, but we continue to believe there is potential for idiosyncratic downgrades in coming months with Boeing and Paramount being the largest.</p>
<div class="wrapped-div">
<table style="width: 100%;">
<tbody>
<tr class="tbl-data">
<td class="tbl-header last">Month-end Addition</td>
<td class="tbl-header last">Name</td>
<td class="tbl-header last">Rating</td>
<td class="tbl-header last">Sector</td>
<td class="tbl-header last">Industry</td>
<td class="tbl-header last text-right">% Mkt Value</td>
<td class="tbl-header last text-right">Price</td>
</tr>
<tr class="tbl-data">
<td class="data-td last font-weight-normal">January</td>
<td class="data-td data last text-left">Hudson Pacific Properties LP</td>
<td class="data-td data last text-left">BB1</td>
<td class="data-td data last text-left">Real Estate</td>
<td class="data-td data last text-left">REITs</td>
<td class="data-td data last text-right">2.18</td>
<td class="data-td data last text-right">88.05</td>
</tr>
<tr class="tbl-data">
<td class="data-td last font-weight-normal">February</td>
<td class="data-td data last text-left">Advance Auto Parts Inc.</td>
<td class="data-td data last text-left">BB1</td>
<td class="data-td data last text-left">Retail</td>
<td class="data-td data last text-left">Specialty Retail</td>
<td class="data-td data last text-right">2.52</td>
<td class="data-td data last text-right">91.20</td>
</tr>
</tbody>
</table>
</div>
<p class="chart-disclosure">Source: ICE Data Services, VanEck. Fallen Angels: ICE US Fallen Angel High Yield 10% Constrained Index. Past performance is no guarantee of future results. Not a recommendation to buy or sell any of the names/securities mentioned herein. Index performance is not representative of strategy performance. It is not possible to invest in an index.</p>
<p><strong>Rising Stars:</strong> There were no rising stars in May or June, but FirstEnergy and Rolls-Royce were upgraded to investment grade during the quarter in April. It appears the momentum for rising stars has continued to weaken, relative to the last few years.</p>
<div class="wrapped-div">
<table style="width: 100%;">
<tbody>
<tr class="tbl-data">
<td class="tbl-header last">Month-end Exit</td>
<td class="tbl-header last">Name</td>
<td class="tbl-header last">Rating</td>
<td class="tbl-header last">Sector</td>
<td class="tbl-header last">Industry</td>
<td class="tbl-header last text-right">% Mkt Value</td>
<td class="tbl-header last text-right">Price</td>
</tr>
<tr class="tbl-data">
<td class="data-td last font-weight-normal">February</td>
<td class="data-td data last text-left">Las Vegas Sands Corp</td>
<td class="data-td data last text-left">BB1</td>
<td class="data-td data last text-left">Leisure</td>
<td class="data-td data last text-left">Gaming</td>
<td class="data-td data last text-right">3.12</td>
<td class="data-td data last text-right">93.19</td>
</tr>
<tr class="tbl-data">
<td class="data-td last font-weight-normal">March</td>
<td class="data-td data last text-left">Enlink Midstream Partners LP</td>
<td class="data-td data last text-left">BB1</td>
<td class="data-td data last text-left">Energy</td>
<td class="data-td data last text-left">Gas Distribution</td>
<td class="data-td data last text-right">2.30</td>
<td class="data-td data last text-right">88.92</td>
</tr>
<tr class="tbl-data">
<td class="data-td last font-weight-normal">April</td>
<td class="data-td data last text-left">FirstEnergy Corp.</td>
<td class="data-td data last text-left">BB1</td>
<td class="data-td data last text-left">Utility</td>
<td class="data-td data last text-left">Electric-Integrated</td>
<td class="data-td data last text-right">6.62</td>
<td class="data-td data last text-right">87.10</td>
</tr>
<tr class="tbl-data">
<td class="data-td last font-weight-normal">April</td>
<td class="data-td data last text-left">Rolls-Royce PLC</td>
<td class="data-td data last text-left">BB1</td>
<td class="data-td data last text-left">Capital Goods</td>
<td class="data-td data last text-left">Aerospace/Defense</td>
<td class="data-td data last text-right">1.51</td>
<td class="data-td data last text-right">96.00</td>
</tr>
</tbody>
</table>
</div>
<p class="chart-disclosure">Source: ICE Data Services, VanEck. Fallen Angels: ICE US Fallen Angel High Yield 10% Constrained Index. Past performance is no guarantee of future results. Not a recommendation to buy or sell any of the names/securities mentioned herein. Index performance is not representative of strategy performance. It is not possible to invest in an index.</p>

<p><strong>Fallen Angels Performance by Sector:</strong> No major change in the sector allocation over the past few months due to the lack of fallen angels and rising stars. In terms of performance, all sectors except for Financial Services, RE, Retail and Telecom (approximately 43% exposure) posted positive returns in June, with Healthcare and Tech being the top performers, although their contribution to return was limited due to their relatively low exposure (approximately 12%). In terms of attribution vs broad high yield in June, the impact of wider spreads was the main culprit of the underperformance by fallen angels especially within Telecom, with two issuers (Embarq and Lumen Technologies) seeing their spreads widened to +5000bps and +2000bps respectively. Within Real Estate, Office Properties Income Trust (OPI, 0.83% exposure) conducted a distressed exchange and was removed from the index due to not meeting index minimum face amount outstanding requirements. Within Retail, Walgreens (6.29% exposure) spreads widened by close to 80bps. The idiosyncratic nature of these events has affected their price, especially in Real Estate and Telecom, but with the exit of OPI and the now low weightings of Embarq and Lumen Tech (0.49%), further downside in these names is limited.</p>
<div class="wrapped-div">
<table style="width: 100%;">
<tbody>
<tr class="tbl-data">
<td class="tbl-header last text-right">&nbsp;</td>
<td class="tbl-header last text-center" style="border-right: outset;" colspan="3">Wgt (%)</td>
<td class="tbl-header last text-center" style="border-right: outset;" colspan="3">OAS</td>
<td class="tbl-header last text-center" style="border-right: outset;" colspan="3">Price</td>
<td class="tbl-header last text-center" style="border-right: outset;" colspan="1">Total Return</td>
<td class="tbl-header last text-right">Total Return</td>
</tr>
<tr class="tbl-data">
<td class="data-head last text-right">&nbsp;</td>
<td class="data-head last text-right">12/31/23</td>
<td class="data-head last text-right">3/31/24</td>
<td class="data-head last text-right" style="border-right: outset;">6/30/24</td>
<td class="data-head last text-right">12/31/23</td>
<td class="data-head last text-right">3/31/24</td>
<td class="data-head last text-right" style="border-right: outset;">6/30/24</td>
<td class="data-head last text-right">12/31/23</td>
<td class="data-head last text-right">3/31/24</td>
<td class="data-head last text-right" style="border-right: outset;">6/30/24</td>
<td class="data-head last text-right" style="border-right: outset;">MTD</td>
<td class="data-head last text-right">YTD</td>
</tr>
<tr class="tbl-data">
<td class="data-td last">Banking</td>
<td class="data-td data last text-right">4.79</td>
<td class="data-td data last text-right">4.62</td>
<td class="data-td text-right data last" style="border-right: outset;">5.38</td>
<td class="data-td data last text-right">231</td>
<td class="data-td data last text-right">235</td>
<td class="data-td text-right data last" style="border-right: outset;">220</td>
<td class="data-td data last text-right">97.91</td>
<td class="data-td data last text-right">97.11</td>
<td class="data-td text-right data last" style="border-right: outset;">97.36</td>
<td class="data-td text-right data last" style="border-right: outset;">0.45</td>
<td class="data-td data last text-right">2.11</td>
</tr>
<tr class="tbl-data">
<td class="data-td last">Basic Industry</td>
<td class="data-td data last text-right">1.70</td>
<td class="data-td data last text-right">3.20</td>
<td class="data-td text-right data last" style="border-right: outset;">3.73</td>
<td class="data-td data last text-right">171</td>
<td class="data-td data last text-right">186</td>
<td class="data-td text-right data last" style="border-right: outset;">156</td>
<td class="data-td data last text-right">97.24</td>
<td class="data-td data last text-right">94.37</td>
<td class="data-td text-right data last" style="border-right: outset;">95.03</td>
<td class="data-td text-right data last" style="border-right: outset;">0.80</td>
<td class="data-td data last text-right">2.51</td>
</tr>
<tr class="tbl-data">
<td class="data-td last">Capital Goods</td>
<td class="data-td data last text-right">5.85</td>
<td class="data-td data last text-right">6.17</td>
<td class="data-td text-right data last" style="border-right: outset;">5.41</td>
<td class="data-td data last text-right">200</td>
<td class="data-td data last text-right">153</td>
<td class="data-td text-right data last" style="border-right: outset;">161</td>
<td class="data-td data last text-right">97.34</td>
<td class="data-td data last text-right">97.38</td>
<td class="data-td text-right data last" style="border-right: outset;">97.51</td>
<td class="data-td text-right data last" style="border-right: outset;">1.02</td>
<td class="data-td data last text-right">2.85</td>
</tr>
<tr class="tbl-data">
<td class="data-td last">Consumer Goods</td>
<td class="data-td data last text-right">4.33</td>
<td class="data-td data last text-right">4.42</td>
<td class="data-td text-right data last" style="border-right: outset;">5.28</td>
<td class="data-td data last text-right">230</td>
<td class="data-td data last text-right">223</td>
<td class="data-td text-right data last" style="border-right: outset;">240</td>
<td class="data-td data last text-right">94.29</td>
<td class="data-td data last text-right">93.07</td>
<td class="data-td text-right data last" style="border-right: outset;">93.64</td>
<td class="data-td text-right data last" style="border-right: outset;">0.36</td>
<td class="data-td data last text-right">2.43</td>
</tr>
<tr class="tbl-data">
<td class="data-td last">Energy</td>
<td class="data-td data last text-right">14.75</td>
<td class="data-td data last text-right">11.17</td>
<td class="data-td text-right data last" style="border-right: outset;">12.27</td>
<td class="data-td data last text-right">259</td>
<td class="data-td data last text-right">235</td>
<td class="data-td text-right data last" style="border-right: outset;">239</td>
<td class="data-td data last text-right">92.49</td>
<td class="data-td data last text-right">93.95</td>
<td class="data-td text-right data last" style="border-right: outset;">93.44</td>
<td class="data-td text-right data last" style="border-right: outset;">1.00</td>
<td class="data-td data last text-right">3.49</td>
</tr>
<tr class="tbl-data">
<td class="data-td last">Financial Services</td>
<td class="data-td data last text-right">1.14</td>
<td class="data-td data last text-right">1.18</td>
<td class="data-td text-right data last" style="border-right: outset;">1.37</td>
<td class="data-td data last text-right">378</td>
<td class="data-td data last text-right">336</td>
<td class="data-td text-right data last" style="border-right: outset;">376</td>
<td class="data-td data last text-right">86.41</td>
<td class="data-td data last text-right">87.09</td>
<td class="data-td text-right data last" style="border-right: outset;">84.87</td>
<td class="data-td text-right data last" style="border-right: outset;">-0.63</td>
<td class="data-td data last text-right">1.32</td>
</tr>
<tr class="tbl-data">
<td class="data-td last">Healthcare</td>
<td class="data-td data last text-right">4.10</td>
<td class="data-td data last text-right">4.44</td>
<td class="data-td text-right data last" style="border-right: outset;">5.15</td>
<td class="data-td data last text-right">270</td>
<td class="data-td data last text-right">210</td>
<td class="data-td text-right data last" style="border-right: outset;">207</td>
<td class="data-td data last text-right">88.73</td>
<td class="data-td data last text-right">90.80</td>
<td class="data-td text-right data last" style="border-right: outset;">91.12</td>
<td class="data-td text-right data last" style="border-right: outset;">1.29</td>
<td class="data-td data last text-right">5.51</td>
</tr>
<tr class="tbl-data">
<td class="data-td last">Insurance</td>
<td class="data-td data last text-right">1.32</td>
<td class="data-td data last text-right">1.43</td>
<td class="data-td text-right data last" style="border-right: outset;">1.65</td>
<td class="data-td data last text-right">323</td>
<td class="data-td data last text-right">244</td>
<td class="data-td text-right data last" style="border-right: outset;">238</td>
<td class="data-td data last text-right">94.10</td>
<td class="data-td data last text-right">96.82</td>
<td class="data-td text-right data last" style="border-right: outset;">96.11</td>
<td class="data-td text-right data last" style="border-right: outset;">0.55</td>
<td class="data-td data last text-right">5.31</td>
</tr>
<tr class="tbl-data">
<td class="data-td last">Leisure</td>
<td class="data-td data last text-right">7.90</td>
<td class="data-td data last text-right">5.10</td>
<td class="data-td text-right data last" style="border-right: outset;">5.92</td>
<td class="data-td data last text-right">228</td>
<td class="data-td data last text-right">170</td>
<td class="data-td text-right data last" style="border-right: outset;">180</td>
<td class="data-td data last text-right">93.21</td>
<td class="data-td data last text-right">95.08</td>
<td class="data-td text-right data last" style="border-right: outset;">94.48</td>
<td class="data-td text-right data last" style="border-right: outset;">0.57</td>
<td class="data-td data last text-right">3.38</td>
</tr>
<tr class="tbl-data">
<td class="data-td last">Real Estate</td>
<td class="data-td data last text-right">9.07</td>
<td class="data-td data last text-right">9.60</td>
<td class="data-td text-right data last" style="border-right: outset;">10.07</td>
<td class="data-td data last text-right">675</td>
<td class="data-td data last text-right">527</td>
<td class="data-td text-right data last" style="border-right: outset;">450</td>
<td class="data-td data last text-right">82.72</td>
<td class="data-td data last text-right">81.84</td>
<td class="data-td text-right data last" style="border-right: outset;">84.76</td>
<td class="data-td text-right data last" style="border-right: outset;">-0.37</td>
<td class="data-td data last text-right">-1.36</td>
</tr>
<tr class="tbl-data">
<td class="data-td last">Retail</td>
<td class="data-td data last text-right">14.38</td>
<td class="data-td data last text-right">18.02</td>
<td class="data-td text-right data last" style="border-right: outset;">20.45</td>
<td class="data-td data last text-right">242</td>
<td class="data-td data last text-right">179</td>
<td class="data-td text-right data last" style="border-right: outset;">196</td>
<td class="data-td data last text-right">86.39</td>
<td class="data-td data last text-right">89.54</td>
<td class="data-td text-right data last" style="border-right: outset;">88.19</td>
<td class="data-td text-right data last" style="border-right: outset;">-0.08</td>
<td class="data-td data last text-right">3.59</td>
</tr>
<tr class="tbl-data">
<td class="data-td last">Services</td>
<td class="data-td data last text-right">0.64</td>
<td class="data-td data last text-right">0.66</td>
<td class="data-td text-right data last" style="border-right: outset;">0.79</td>
<td class="data-td data last text-right">243</td>
<td class="data-td data last text-right">217</td>
<td class="data-td text-right data last" style="border-right: outset;">206</td>
<td class="data-td data last text-right">94.78</td>
<td class="data-td data last text-right">94.51</td>
<td class="data-td text-right data last" style="border-right: outset;">94.67</td>
<td class="data-td text-right data last" style="border-right: outset;">0.64</td>
<td class="data-td data last text-right">2.51</td>
</tr>
<tr class="tbl-data">
<td class="data-td last">Technology &amp; Electronics</td>
<td class="data-td data last text-right">6.22</td>
<td class="data-td data last text-right">5.81</td>
<td class="data-td text-right data last" style="border-right: outset;">6.67</td>
<td class="data-td data last text-right">194</td>
<td class="data-td data last text-right">188</td>
<td class="data-td text-right data last" style="border-right: outset;">184</td>
<td class="data-td data last text-right">94.14</td>
<td class="data-td data last text-right">92.99</td>
<td class="data-td text-right data last" style="border-right: outset;">92.27</td>
<td class="data-td text-right data last" style="border-right: outset;">1.26</td>
<td class="data-td data last text-right">1.30</td>
</tr>
<tr class="tbl-data">
<td class="data-td last">Telecommunications</td>
<td class="data-td data last text-right">13.00</td>
<td class="data-td data last text-right">13.39</td>
<td class="data-td text-right data last" style="border-right: outset;">11.10</td>
<td class="data-td data last text-right">366</td>
<td class="data-td data last text-right">368</td>
<td class="data-td text-right data last" style="border-right: outset;">413</td>
<td class="data-td data last text-right">92.22</td>
<td class="data-td data last text-right">90.01</td>
<td class="data-td text-right data last" style="border-right: outset;">81.48</td>
<td class="data-td text-right data last" style="border-right: outset;">-1.49</td>
<td class="data-td data last text-right">-6.68</td>
</tr>
<tr class="tbl-data">
<td class="data-td last">Transportation</td>
<td class="data-td data last text-right">2.09</td>
<td class="data-td data last text-right">2.23</td>
<td class="data-td text-right data last" style="border-right: outset;">2.60</td>
<td class="data-td data last text-right">209</td>
<td class="data-td data last text-right">170</td>
<td class="data-td text-right data last" style="border-right: outset;">150</td>
<td class="data-td data last text-right">94.92</td>
<td class="data-td data last text-right">95.37</td>
<td class="data-td text-right data last" style="border-right: outset;">96.07</td>
<td class="data-td text-right data last" style="border-right: outset;">0.85</td>
<td class="data-td data last text-right">3.79</td>
</tr>
<tr class="tbl-data">
<td class="data-td last">Utility</td>
<td class="data-td data last text-right">8.71</td>
<td class="data-td data last text-right">8.54</td>
<td class="data-td text-right data last" style="border-right: outset;">2.17</td>
<td class="data-td data last text-right">139</td>
<td class="data-td data last text-right">122</td>
<td class="data-td text-right data last" style="border-right: outset;">185</td>
<td class="data-td data last text-right">92.18</td>
<td class="data-td data last text-right">91.13</td>
<td class="data-td text-right data last" style="border-right: outset;">96.23</td>
<td class="data-td text-right data last" style="border-right: outset;">0.35</td>
<td class="data-td data last text-right">-0.38</td>
</tr>
<tr class="tbl-data">
<td class="data-td last">Total</td>
<td class="data-td data last text-right">100</td>
<td class="data-td text-right data last" style="border-right: outset;">100.00</td>
<td class="data-td data last text-right">285</td>
<td class="data-td data last text-right">247</td>
<td class="data-td text-right data last" style="border-right: outset;">252</td>
<td class="data-td data last text-right">91.20</td>
<td class="data-td data last text-right">91.22</td>
<td class="data-td text-right data last" style="border-right: outset;">90.32</td>
<td class="data-td text-right data last" style="border-right: outset;">0.24</td>
<td class="data-td data last text-right">1.09</td>
</tr>
</tbody>
</table>
</div>
<p class="chart-disclosure">Source: ICE Data Services, VanEck. Returns are based on partial period data. Fallen Angels: ICE US Fallen Angel High Yield 10% Constrained Index. Not intended as a recommendation to invest or divest in any of the sectors mentioned herein. Index performance is not representative of strategy performance. It is not possible to invest in an index.</p>
<p><strong>Fallen Angels Performance by Rating:</strong> The total weight of BB rated bonds increased to 87.62% from 81.63% at the end of Q1, as Telecom Italia Capital was upgraded to Ba3 from B1 by Moody&rsquo;s due to improvement of the company&rsquo;s financial profile as the European Commission approved Telecom&rsquo;s Italia sale of its fixed line business to KKR. The BB rated bucket had not seen this high exposure of BB rated bonds since the end of 2022, when it fell below 90%. Another Telecom issuer, Embarq Corp was downgraded to CC from CCC following a downgrade by Fitch to CCC- from B after a significant decline in liquidity and expectations that the company may need to restructure its debt. Year to date, BB rated fallen angel bonds have performed in line with the broad BBs. However, single-B and CCC &amp; lower rated fallen angels have significantly underperformed due to both lower carry and wider spreads in those ratings categories relative to the broad market.</p>
<div class="wrapped-div">
<table style="width: 100%;">
<tbody>
<tr class="tbl-data">
<td class="tbl-header last text-center">&nbsp;</td>
<td class="tbl-header last text-center" style="border-right: outset;" colspan="3">Wgt (%)</td>
<td class="tbl-header last text-center" style="border-right: outset;" colspan="3">OAS</td>
<td class="tbl-header last text-center" style="border-right: outset;" colspan="3">Price</td>
<td class="tbl-header last text-center" style="border-right: outset;" colspan="1">Total Return</td>
<td class="tbl-header last text-right">Total Return</td>
</tr>
<tr class="tbl-data">
<td class="data-head last text-right">&nbsp;</td>
<td class="data-head last text-right">12/31/23</td>
<td class="data-head last text-right">3/31/24</td>
<td class="data-head last text-right" style="border-right: outset;">6/30/24</td>
<td class="data-head last text-right">12/31/23</td>
<td class="data-head last text-right">3/31/24</td>
<td class="data-head last text-right" style="border-right: outset;">6/30/24</td>
<td class="data-head last text-right">12/31/23</td>
<td class="data-head last text-right">3/31/24</td>
<td class="data-head last text-right" style="border-right: outset;">6/30/24</td>
<td class="data-head last text-right" style="border-right: outset;">MTD</td>
<td class="data-head last text-right">YTD</td>
</tr>
<tr class="tbl-data">
<td class="data-td last">BB</td>
<td class="data-td data last text-right">80.55</td>
<td class="data-td data last text-right">81.63</td>
<td class="data-td text-right data last" style="border-right: outset;">87.62</td>
<td class="data-td data last text-right">219</td>
<td class="data-td data last text-right">190</td>
<td class="data-td text-right data last" style="border-right: outset;">210</td>
<td class="data-td data last text-right">92.44</td>
<td class="data-td data last text-right">92.85</td>
<td class="data-td text-right data last" style="border-right: outset;">92.62</td>
<td class="data-td text-right data last" style="border-right: outset;">0.50</td>
<td class="data-td data last text-right">2.43</td>
</tr>
<tr class="tbl-data">
<td class="data-td last">B</td>
<td class="data-td data last text-right">13.43</td>
<td class="data-td data last text-right">12.87</td>
<td class="data-td text-right data last" style="border-right: outset;">7.89</td>
<td class="data-td data last text-right">317</td>
<td class="data-td data last text-right">330</td>
<td class="data-td text-right data last" style="border-right: outset;">371</td>
<td class="data-td data last text-right">96.46</td>
<td class="data-td data last text-right">93.99</td>
<td class="data-td text-right data last" style="border-right: outset;">90.73</td>
<td class="data-td text-right data last" style="border-right: outset;">2.12</td>
<td class="data-td data last text-right">-0.79</td>
</tr>
<tr class="tbl-data">
<td class="data-td last">CCC</td>
<td class="data-td data last text-right">5.44</td>
<td class="data-td data last text-right">5.51</td>
<td class="data-td text-right data last" style="border-right: outset;">4.19</td>
<td class="data-td data last text-right">1,130</td>
<td class="data-td data last text-right">893</td>
<td class="data-td text-right data last" style="border-right: outset;">505</td>
<td class="data-td data last text-right">69.40</td>
<td class="data-td data last text-right">68.48</td>
<td class="data-td text-right data last" style="border-right: outset;">80.90</td>
<td class="data-td text-right data last" style="border-right: outset;">-7.19</td>
<td class="data-td data last text-right">-12.88</td>
</tr>
<tr class="tbl-data">
<td class="data-td last">CC</td>
<td class="data-td data last text-right">&nbsp;</td>
<td class="data-td text-right data last" style="border-right: outset;">0.30</td>
<td class="data-td data last text-right">&nbsp;</td>
<td class="data-td text-right data last" style="border-right: outset;">5719</td>
<td class="data-td data last text-right">&nbsp;</td>
<td class="data-td text-right data last" style="border-right: outset;">13.00</td>
<td class="data-td text-right data last" style="border-right: outset;">&nbsp;</td>
<td class="data-td data last text-right">2.47</td>
</tr>
<tr class="tbl-data">
<td class="data-td last">Total</td>
<td class="data-td data last text-right">100</td>
<td class="data-td text-right data last" style="border-right: outset;">100.00</td>
<td class="data-td data last text-right">285</td>
<td class="data-td data last text-right">247</td>
<td class="data-td text-right data last" style="border-right: outset;">252</td>
<td class="data-td data last text-right">91.20</td>
<td class="data-td data last text-right">91.22</td>
<td class="data-td text-right data last" style="border-right: outset;">90.32</td>
<td class="data-td text-right data last" style="border-right: outset;">0.24</td>
<td class="data-td data last text-right">1.09</td>
</tr>
</tbody>
</table>
</div>
<p class="chart-disclosure">Source: ICE Data Services, VanEck. Fallen Angels: ICE US Fallen Angel High Yield 10% Constrained Index. Not intended as a recommendation to invest or divest in any of the sectors mentioned herein. Index performance is not representative of strategy performance. It is not possible to invest in an index. BB index: ICE BofA BB US High Yield Index; Single-B index: ICE BofA Single-B US High Yield Index; CCC &amp; Lower rated index ICE BofA CCC &amp; Lower US High Yield Index.</p>
<p>To receive more <a href="/us/en/blogs/income-investing/" title="Income Investing Insights"><strong>Income Investing</strong></a> insights, <a href="/link/5f45412c2143400497908cea2897f7d3.aspx" title=" Subscription Center"><strong>sign up in our subscription center</strong></a>.</p>
]]></content:encoded>
</item><item rdf:about="https://www.vaneck.com/us/en/blogs/thematic-investing/buzz-investing-fed-signals-potential-rate-cuts-amid-cooling-inflation/">
  <title>BUZZ Investing: Fed Signals Potential Rate Cuts Amid Cooling Inflation></title>
  <link>https://www.vaneck.com/us/en/blogs/thematic-investing/buzz-investing-fed-signals-potential-rate-cuts-amid-cooling-inflation/</link>
  <description><![CDATA[U.S. markets experienced significant gains driven by the AI sector, with NVIDIA reaching a $3 trillion market cap, amidst investor hopes for potential Fed interest rate cuts.]]></description>
  <dc:creator> </dc:creator>
  <dc:date>07/23/2024 06:30:00</dc:date>
<content:encoded><![CDATA[

<p>During the recent period between index selection dates (June 12, 2024 &ndash; July 11, 2024, the &ldquo;Period&rdquo;), U.S. domestic markets saw meaningful gains, particularly within the artificial intelligence sector. NVIDIA (NASDAQ: NVDA) achieved a notable milestone, reaching a $3 trillion market capitalization and temporarily surpassing Microsoft (NASDAQ: MSFT) as the world's most valuable company on June 18th. However, these gains have raised concerns among some investors about the concentration of growth in mega-cap stocks. They argue that this focus has masked broader market weaknesses and resulted in the narrowest market breadth in over two decades.</p>
<p>Federal Reserve Chair Jerome Powell's testimony to Congress hinted at potential interest rate cuts, contributing to market optimism. Powell noted signs of a cooling labor market and suggested that further economic softening might be unwelcome. Positive inflation data further fueled speculation, with the May Consumer Price Index (CPI) showing lower-than-expected inflation rates, reinforcing hopes for earlier-than-expected rate cuts. These developments led to further gains in equity markets and a decrease in Treasury yields, reflecting increased investor confidence in potential monetary easing by the Fed.</p>
<p>The BUZZ NextGen AI US Sentiment Leaders Index (the &ldquo;BUZZ Index&rdquo;) returned 2.15% during the month of June compared to a return of 3.59% for the S&amp;P 500 Index during the same period. Year-to-date, the BUZZ Index slightly lags the S&amp;P 500 with returns of 13.45% and 15.29%, respectively, as of the end of June.</p>
<p>For more on rebalancing results and a full breakdown of index constituents added and removed for the month, view the BUZZ Index reconstitution report.</p>

<h3>Top BUZZ Index Contributors: June 12, 2024 &ndash; July 11, 2024</h3>
<div class="wrapped-div">
<table style="width: 100%;">
<tbody>
<tr class="tbl-data">
<td class="tbl-header last">Company</td>
<td class="tbl-header last text-left">Ticker</td>
<td class="tbl-header last text-right">Average Weight (%)</td>
<td class="tbl-header last text-right">Return Contribution (%)</td>
</tr>
<tr class="tbl-data">
<td class="data-td last font-weight-normal">Tesla Inc</td>
<td class="data-td data last text-left">TSLA</td>
<td class="data-td data last text-right">3.54</td>
<td class="data-td data last text-right">1.10</td>
</tr>
<tr class="tbl-data">
<td class="data-td last font-weight-normal">Palantir Technologies Inc</td>
<td class="data-td data last text-left">PLTR</td>
<td class="data-td data last text-right">3.30</td>
<td class="data-td data last text-right">0.51</td>
</tr>
<tr class="tbl-data">
<td class="data-td last font-weight-normal">Rivian Automotive Inc</td>
<td class="data-td data last text-left">RIVN</td>
<td class="data-td data last text-right">2.00</td>
<td class="data-td data last text-right">0.49</td>
</tr>
<tr class="tbl-data">
<td class="data-td last font-weight-normal">Super Micro Computer Inc</td>
<td class="data-td data last text-left">SMCI</td>
<td class="data-td data last text-right">2.67</td>
<td class="data-td data last text-right">0.43</td>
</tr>
<tr class="tbl-data">
<td class="data-td last font-weight-normal">Lucid Group Inc</td>
<td class="data-td data last text-left">LCID</td>
<td class="data-td data last text-right">1.60</td>
<td class="data-td data last text-right">0.43</td>
</tr>
<tr class="tbl-data">
<td class="data-td last font-weight-normal">Advanced Micro Devices Inc</td>
<td class="data-td data last text-left">AMD</td>
<td class="data-td data last text-right">3.08</td>
<td class="data-td data last text-right">0.41</td>
</tr>
<tr class="tbl-data">
<td class="data-td last font-weight-normal">Apple Inc</td>
<td class="data-td data last text-left">AAPL</td>
<td class="data-td data last text-right">3.16</td>
<td class="data-td data last text-right">0.20</td>
</tr>
<tr class="tbl-data">
<td class="data-td last font-weight-normal">Viking Therapeutics Inc</td>
<td class="data-td data last text-left">VKTX</td>
<td class="data-td data last text-right">1.19</td>
<td class="data-td data last text-right">0.20</td>
</tr>
<tr class="tbl-data">
<td class="data-td last font-weight-normal">Unity Software Inc</td>
<td class="data-td data last text-left">U</td>
<td class="data-td data last text-right">1.92</td>
<td class="data-td data last text-right">0.17</td>
</tr>
<tr class="tbl-data">
<td class="data-td last font-weight-normal">Carvana Co</td>
<td class="data-td data last text-left">CVNA</td>
<td class="data-td data last text-right">1.18</td>
<td class="data-td data last text-right">0.15</td>
</tr>
</tbody>
</table>
</div>
<p class="chart-disclosure">Source: BUZZ Holdings ULC, Bloomberg. Past performance is no guarantee of future results. Index performance is not illustrative of fund performance. Not intended as a recommendation to buy or to sell any of the securities mentioned herein.</p>

<p>Shares of Coinbase Global Inc. (NASDAQ: COIN) and MicroStrategy Inc. (NASDAQ: MSTR) both fell approximately 15% during the Period, in tandem with a 15% drop in bitcoin's price. Several factors may have contributed to this decline. Media reports indicated that the failed cryptocurrency exchange Mt. Gox might begin returning bitcoin to creditors, who are viewed as likely to sell since the token's value was only in the hundreds of dollars when the exchange collapsed a decade ago. Additionally, speculators faced challenges such as waning demand for U.S. bitcoin exchange-traded products, signs that governments are offloading seized tokens, and political uncertainty in the U.S. A report that German authorities are preparing to sell 50,000 seized bitcoins, further fueled a bearish outlook for the cryptocurrency market. Moreover, beleaguered bitcoin miners are under pressure to sell their holdings to maintain profitability, further exacerbating the decline in bitcoin and related stocks.</p>
<h3>Bottom BUZZ Index Contributors: June 12, 2024 &ndash; July 11, 2024</h3>
<div class="wrapped-div">
<table style="width: 100%;">
<tbody>
<tr class="tbl-data">
<td class="tbl-header last">Company</td>
<td class="tbl-header last text-left">Ticker</td>
<td class="tbl-header last text-right">Average Weight (%)</td>
<td class="tbl-header last text-right">Return Contribution (%)</td>
</tr>
<tr class="tbl-data">
<td class="data-td last font-weight-normal">Coinbase Global Inc</td>
<td class="data-td data last text-left">COIN</td>
<td class="data-td data last text-right">2.85</td>
<td class="data-td data last text-right">-0.52</td>
</tr>
<tr class="tbl-data">
<td class="data-td last font-weight-normal">MicroStrategy Inc</td>
<td class="data-td data last text-left">MSTR</td>
<td class="data-td data last text-right">2.80</td>
<td class="data-td data last text-right">-0.52</td>
</tr>
<tr class="tbl-data">
<td class="data-td last font-weight-normal">Trump Media &amp; TechGroup</td>
<td class="data-td data last text-left">DJT</td>
<td class="data-td data last text-right">2.22</td>
<td class="data-td data last text-right">-0.52</td>
</tr>
<tr class="tbl-data">
<td class="data-td last font-weight-normal">Robinhood Markets Inc</td>
<td class="data-td data last text-left">HOOD</td>
<td class="data-td data last text-right">3.03</td>
<td class="data-td data last text-right">-0.27</td>
</tr>
<tr class="tbl-data">
<td class="data-td last font-weight-normal">Marathon Digital Holdings Inc</td>
<td class="data-td data last text-left">MARA</td>
<td class="data-td data last text-right">2.97</td>
<td class="data-td data last text-right">-0.19</td>
</tr>
<tr class="tbl-data">
<td class="data-td last font-weight-normal">SoFi Technologies Inc</td>
<td class="data-td data last text-left">SOFI</td>
<td class="data-td data last text-right">2.74</td>
<td class="data-td data last text-right">-0.12</td>
</tr>
<tr class="tbl-data">
<td class="data-td last font-weight-normal">Enphase Energy Inc</td>
<td class="data-td data last text-left">ENPH</td>
<td class="data-td data last text-right">0.49</td>
<td class="data-td data last text-right">-0.12</td>
</tr>
<tr class="tbl-data">
<td class="data-td last font-weight-normal">Dell Technologies Incc</td>
<td class="data-td data last text-left">DELL</td>
<td class="data-td data last text-right">1.46</td>
<td class="data-td data last text-right">-0.12</td>
</tr>
<tr class="tbl-data">
<td class="data-td last font-weight-normal">PayPal Holdings Inc</td>
<td class="data-td data last text-left">PYPL</td>
<td class="data-td data last text-right">1.94</td>
<td class="data-td data last text-right">-0.11</td>
</tr>
<tr class="tbl-data">
<td class="data-td last font-weight-normal">Lululemon Athletica Inc</td>
<td class="data-td data last text-left">LULU</td>
<td class="data-td data last text-right">1.16</td>
<td class="data-td data last text-right">-0.10</td>
</tr>
</tbody>
</table>
</div>
<p class="chart-disclosure">Source: BUZZ Holdings ULC, Bloomberg. Past performance is no guarantee of future results. Index performance is not illustrative of fund performance. Not intended as a recommendation to buy or to sell any of the securities mentioned herein.</p>
<h2>BUZZ Index July 2024 Rebalance Highlights</h2>
<strong><u>Rivian Automotive Inc</u></strong>
<p>Although the EV sector has faced waning investor enthusiasm in recent years, rising positive sentiment suggests a potential comeback for these stocks. The BUZZ Index has shown a steady increase in the weightings of EV stocks throughout 2024, reflecting renewed investor confidence. This shift was recently underscored by impressive Q2 results, with total EV sales in the US rising by approximately 20% quarter-over-quarter. Traditional automakers are reporting record-high sales for their EV lineups, while pure-EV companies like Tesla (NASDAQ: TSLA) and Lucid (NASDAQ: LCID) are surpassing delivery expectations. Notably, Rivian (NASDAQ: RIVN) has created a major stir by partnering with Volkswagen in a $5 billion joint venture. Shares of RIVN gapped higher following the announcement and are now up approximately 50% since the deal was announced. Positive investor sentiment also jumped on the news, propelling RIVN to a maximum 3% weight this month within the BUZZ Index.</p>
<strong><u>Nike Inc</u></strong>
<p>On June 28th, Nike announced its earnings and reported an unexpected decline in sales for the latest quarter. The market was taken aback, particularly since many other apparel retailers had posted strong results. As a result, Nike's shares plummeted nearly 20% the next day, marking the worst single day decline in the company's history. Analyzing the situation revealed several missteps, including poor marketing execution and the strategic shift of inventory and traffic from third-party retailers to its own website&mdash;a move that made sense during the pandemic but backfired as consumers returned to physical stores. This shift enabled rapidly expanding athletic apparel brands like On to gain access to previously unavailable shelf space. Despite the disappointing earnings, investor sentiment turned positive. Value investors may see the nearly 60% drop from Nike's all-time highs as a buying opportunity, especially with the Summer Olympics on the horizon. Consequently, Nike (NYSE: NKE) has re-entered the Index this month with a maximum 3% weight.</p>
<p>To receive more <a href="https://www.vaneck.com/us/en/insights/thematic-investing/" title="Thematic Investing Insights"><strong>Thematic Investing</strong></a> insights, <a href="https://www.vaneck.com/us/en/subscribe/" title="Subscription Center"><strong>sign up in our subscription center</strong></a>.</p>
<style>
    .wrapped-div {
        max-width: 100%;
    }

    @media (max-width: 1240px) {
        .wrapped-div {
            overflow-x: scroll;
        }
    }

    .wrapped-div-sector {
        max-width: 100%;
        overflow-x: scroll;
    }
</style>
]]></content:encoded>
</item><item rdf:about="https://www.vaneck.com/us/en/blogs/digital-assets/ethereum-investment-case/">
  <title>The Investment Case for Ethereum in 2024></title>
  <link>https://www.vaneck.com/us/en/blogs/digital-assets/ethereum-investment-case/</link>
  <description><![CDATA[<p>Dive into our expert analysis of Ethereum as an investment, covering its market dynamics, technological strengths, and long-term potential.<strong> </strong></p>]]></description>
  <dc:creator>Denis   Zinoviev</dc:creator>
  <dc:date>07/22/2024 06:30:00</dc:date>
<content:encoded><![CDATA[

<p><strong>Please note that VanEck has exposure to Ethereum.</strong></p>
<p>Since its release in 2015, <a href="https://www.vaneck.com/us/en/blogs/digital-assets/ethereum-101-a-beginners-guide/" title="Ethereum 101 a beginners guide"><strong>Ethereum</strong></a> adoption has grown exponentially, attracting hundreds of millions of users, and gaining the attention of mainstream investment firms and payment applications. As a decentralized platform enabling smart contracts and distributed applications (dApps) to be built and run without any downtime, fraud, control, or interference from a third party, Ethereum stands out in the cryptocurrency world. This article evaluates Ethereum&rsquo;s potential as an investment, considering its unique position and future prospects in the evolving financial landscape.</p>
<ul class="content-list">
<li><a href="#price-influences"><strong>Price Influences: Market Sentiment and Global Trends</strong></a></li>
<li><a href="#historical-price-analysis"><strong>Historical Price Analysis: From Launch to 2024</strong></a></li>
<li><a href="#should-you buy-ethereum"><strong>Ethereum's Investment Appeal: Should You Buy Ethereum?</strong></a></li>
<li><a href="#ethereum-vs-other-investment-options"><strong>Ethereum vs Other Investment Options: A Comparative Analysis</strong></a></li>
<li><a href="#price-forecasting"><strong>Ethereum Price Forecasting</strong></a></li>
</ul>
<h2>Understanding Ethereum: More Than Just a Cryptocurrency</h2>
<p>Ethereum leverages blockchain technology but extends beyond being just a cryptocurrency. The Ethereum Virtual Machine (EVM) is central to its operations, differentiating it from other digital currencies. The EVM, a sandboxed virtual stack embedded within each Ethereum node, executed bytecode and smart contracts &ndash; self-executing contracts with terms directly written into code, operating without downtime, censorship, or fraud. This innovation shifts the paradigm from traditional contracts requiring intermediaries to automated, trustless transactions.</p>
<h2>Market Dynamics: Assessing Ethereum's Investment Viability</h2>
<h3 id="price-influences" class="jump-link-nav anchored-block" data-jumplink-title="Price Influences">Price Influences: Market Sentiment and Global Trends</h3>
<p>The price of Ethereum is influenced by market sentiment, driven by news, social media, and overall attitude towards the crypto market, which significantly&nbsp;impacts Ethereum&rsquo;s price. Positive news about institutional adoption can lead to price surges, while negative sentiment, such as fears of regulatory crackdowns, can cause price drops.</p>
<p><strong>Market Sentiment</strong>: Investor sentiment plays a crucial role in the cryptocurrency market, often driven by news, social media, and overall investor attitude towards the crypto space. For example, positive news about institutional adoption of Ethereum can lead to price surges, as seen when large financial institutions announce their support for Ethereum or when there's a growing interest in decentralized finance platforms built on Ethereum. Conversely, negative sentiment, such as the spreading of unfounded rumors or fears of a regulatory crackdown, can lead to significant price drops.</p>
<p><strong>Global Economic Trends</strong>: Macroeconomic factors such as inflation rates, interest rates, and economic policies in major economies can significantly impact Ethereum's price. For instance, during times of high inflation, some investors may turn to cryptocurrencies like Ethereum as a hedge against their local currency's devaluation. Similarly, changes in monetary policy, such as the Federal Reserve's interest rate decisions, can influence investor appetite for riskier assets like Ethereum.</p>
<p><strong>Regulatory Changes</strong>: The regulatory environment surrounding cryptocurrencies is continually evolving and can have immediate impacts on their prices. Positive regulatory news, such as a country legalizing cryptocurrencies or clarifying tax guidance, can lead to price increases. Conversely, negative regulatory actions, such as bans or restrictive regulations in significant markets like the US, China, or South Korea, can lead to sharp declines in price. For example, China's crackdown on cryptocurrency mining and trading in 2021 led to a significant drop in the price of Ethereum and other cryptocurrencies.</p>
<p><strong>Technological Developments</strong>: Advances in Ethereum&rsquo;s technology or its ecosystem can also influence its price. The transition from Ethereum 1.0 to Ethereum 2.0, with its shift to proof-of-stake (PoS), aimed to reduce transaction fees and increase transaction speed and energy efficiency. Such upgrades can lead to positive price movements as they address scalability and cost issues. However, delays or problems in these technological upgrades can lead to negative market reactions.<strong> </strong></p>
<h3 id="historical-price-analysis" class="jump-link-nav anchored-block" data-jumplink-title="Historical Price Analysis">Historical Price Analysis: From Launch to 2024</h3>
<p>Ethereum has experienced significant volatility since its launch, reflecting market dynamics, technological milestones, and investor sentiment.</p>
<p><strong>2017 Boom: </strong>Ethereum&rsquo;s first major price increase occurred in 2017, peaking at around $1,400 in early 2018, alongside a broader cryptocurrency market boom.</p>
<p><strong>2020-2021 Growth: </strong>Significant growth in 2020 and 2021 saw Ethereum reaching new highs above $4,000, driven by its growing adoption and the booming DeFi sector.</p>
<p><strong>Crypto ETFs: </strong>The adoption of Exchange-Traded Funds (ETFs) has further boosted Ethereum&rsquo;s price. ETFs provide a regulated way to gain exposure to cryptocurrencies, attracting both individual and institutional investors and increasing demand for Ethereum.</p>

<h2 id="should-you buy-ethereum" class="jump-link-nav anchored-block" data-jumplink-title="Should You Buy Ethereum?">Ethereum's Investment Appeal: Should You Buy Ethereum?</h2>
<p>Investing in Ethereum is about more than just buying a cryptocurrency; it's about investing in a platform with wide-ranging applications, from DeFi to tokenization and beyond. In our view, the investment case for Ethereum is strong and diverse:</p>
<p><strong>Technological Edge</strong>: Ethereum's platform allows for creating smart contracts, programs that automatically execute when certain conditions are met. This feature has huge potential in reshaping industries, from finance to art.</p>
<p><strong>Market Share</strong>: Ethereum's platform supports numerous other cryptocurrencies. Its influence is clear when you consider that, as of September 2023, 10 of the top 20 cryptocurrencies are based on or linked to Ethereum.</p>
<p><strong>Applications</strong>: Ethereum&rsquo;s versatility extends beyond cryptocurrencies to DeFi, games, and major organizations integrating blockchain technology.</p>
<h2 id="ethereum-vs-other-investment-options" class="jump-link-nav anchored-block" data-jumplink-title="Ethereum vs Other Investment Options">Ethereum vs Other Investment Options: A Comparative Analysis</h2>
<p>Comparing Ethereum with traditional investment options such as stocks, bonds, or even other cryptocurrencies is crucial for understanding its unique risk and reward profile. While Ethereum offers high growth potential, it also comes with higher volatility and risks, particularly regulatory and technological challenges.</p>
<p><strong>Bitcoin: </strong>Often viewed as a store of value or digital gold, bitcoin appeals to investors seeking a hedge against economic instability.</p>
<p><strong>Ethereum: </strong>With its broad utility and foundational role in DeFi and NFT spaces, Ethereum presents a different investment proposition focused on decentralized technology&rsquo;s potential.</p>
<p>Learn more in <a href="https://www.vaneck.com/us/en/blogs/digital-assets/bitcoin-vs-ethereum/" title="Bitcoin vs ethereum"><strong>Bitcoin vs. Ethereum in 2024: Comparison &amp; Outlook</strong></a></p>
<h2>Ethereum&rsquo;s Long-Term Investment Potential</h2>
<p>Expert predictions for Ethereum are generally optimistic, though they acknowledge the potential for volatility driven by regulatory changes, technological advancements, and market adoption. Ethereum is undergoing a significant transition to Ethereum 2.0, which promises to bring scalability, security, and sustainability improvements through the shift to Proof of Stake and the introduction of sharding.</p>
<p>These developments could significantly impact their performance, adoption, and investor interest, presenting both challenges and opportunities for the future.</p>
<h2 id="price-forecasting" class="jump-link-nav anchored-block" data-jumplink-title="Price Forecasting">Ethereum Price Forecasting</h2>
<p>Thanks to improving functionality, lower take-rates, and an ethos of inclusivity, we are bullish on decentralized software protocols as an alternative to existing intermediaries. Among the contenders to capture a majority of economic value&mdash;as is common in digital platforms&mdash;Ethereum stands out to us as one of the most probable long-term disruptors. <a href="https://www.vaneck.com/us/en/blogs/digital-assets/matthew-sigel-ethereum-to-redefine-finance-on-the-way-to-118k/" title="Ethereum to redefine finance"><strong>According to our recent analysis</strong></a>, we believe Ethereum may emerge as a powerhouse among digital assets, with a predicted token price of $11.8k by 2030. Ethereum's unique approach combines a globally distributed infrastructure, smart contract capabilities, and a digital commerce model that enables trustless transactions.</p>
<h2>Conclusion</h2>
<p>Ethereum&rsquo;s unique combination of technological innovation, market influence, and application versatility sets it apart from other cryptocurrencies and traditional investment options alike.</p>
<p>Ethereum's foundational technology, the Ethereum Virtual Machine, and its pioneering smart contract functionality, represent a seismic shift in how we conceive of and execute contractual agreements and transactions. By eliminating intermediaries and enabling decentralized applications, Ethereum has laid the groundwork for a future where decentralized finance and other blockchain-based solutions can flourish.</p>
<p>The price of Ethereum, subject to the ebb and flow of market sentiment, global economic trends, regulatory landscapes, and technological advancements, underscores the volatile yet potentially rewarding nature of investing in digital assets. Noteworthy is Ethereum's adaptability and resilience in the face of these challenges, highlighted by its ongoing transition to Ethereum 2.0. This upgrade promises to address some of the most significant concerns surrounding scalability and sustainability, further solidifying Ethereum's position in the market.</p>
<p>Looking ahead, the long-term investment potential of Ethereum seems optimistic, driven by its technological advancements, growing adoption, and the broadening scope of its applications. However, as with any investment, potential investors should approach with caution, recognizing the inherent volatility and risks associated with the cryptocurrency market.</p>
<p>To receive more <strong><a href="https://www.vaneck.com/us/en/insights/digital-assets/" title="Digital Assets Insights">Digital Assets</a></strong> insights, <strong><a href="https://www.vaneck.com/us/en/subscribe/" title="Subscription Center">sign up in our subscription center</a></strong>.</p>
]]></content:encoded>
</item><item rdf:about="https://www.vaneck.com/us/en/blogs/emerging-markets-bonds/india-joins-local-em-debt-indices/">
  <title>India Joins Local EM Debt Indices></title>
  <link>https://www.vaneck.com/us/en/blogs/emerging-markets-bonds/india-joins-local-em-debt-indices/</link>
  <description><![CDATA[India&rsquo;s inclusion in the J.P. Morgan&rsquo;s GBI-EM suite of local currency indices could potentially open the door to more foreign investment and support for the country&rsquo;s economic progress.]]></description>
  <dc:creator>Fran Rodilosso</dc:creator>
  <dc:date>07/19/2024 06:30:00</dc:date>
<content:encoded><![CDATA[

<p>At the end of June, Indian government bonds joined J.P. Morgan&rsquo;s GBI-EM suite of local currency indices in the most significant reconstitution since China&rsquo;s inclusion in 2020. After several years of discussions with regulators and the index provider, and the foreign investor community to address operational issues, approximately $400 billion worth of bonds were included with a 1% weight, which is expected to increase by 1% per month until reaching a maximum of 10%. The bonds entering the index are issued by the Reserve Bank of India (RBI) under the Fully Accessible Route (FAR) for non-resident investors, which do not have investment restrictions. Inclusion may attract a broader base of investors by bringing more attention to the country&rsquo;s local debt market, and it is estimated to drive approximately $30 billion worth of passive inflows. This is in addition to about $11 billion worth of inflows that occurred prior to index inclusion since the announcement last October. We believe that increased participation of foreign investors may provide additional support to the country&rsquo;s economic progress.</p>
<h2>High Growth, but High Debt</h2>
<p>India&rsquo;s strong GDP growth has made it a standout in the global economy. At the same time, however, the country has run elevated fiscal deficits and accumulated significant debt. Government spending on subsidies, social welfare programs, infrastructure projects, and interest payments on previous borrowing have led to a persistently high deficit. This worsened after the COVID-19 pandemic, driving the deficit to its historical peak. As the pandemic&rsquo;s impact lessened, economic activity resumed, businesses reopened, and consumer spending increased, the latter of which became a major catalyst for higher Goods and Services Tax (&ldquo;GST&rdquo;) collections (more on this later).</p>
<p>Persistent fiscal deficits has led to significant debt issuance. At 82.5% of GDP, India has one of the highest public debt levels among emerging markets. But, one can argue that India&rsquo;s strong economic growth can support its fiscal spending and high debt levels. Nonetheless, debt investors should continue to monitor the country&rsquo;s fiscal policies, particularly following President Modi&rsquo;s narrower-than-expected victory which may impact the potential for reform. Indian bond yields increased by the highest amount in eight months following the election outcome. However, this was short-lived, and S&amp;P Global Ratings raised its rating outlook for India to &ldquo;positive&rdquo; from &ldquo;stable&rdquo; in May saying they expect growth momentum and fiscal stability to continue regardless of the election outcome, supporting the agency&rsquo;s constructive outlook on India&rsquo;s credit profile. The increased foreign capital into domestic debt markets may also provide additional flexibility to finance the government&rsquo;s ongoing fiscal priorities.</p>
<h2>A Rising Digital Power</h2>
<p>India&rsquo;s advancements in digital technology have driven impressive levels of financial inclusion (approximately 90% of residents over 18 have accounts with financial institutions vs. 20% a decade ago).<sup>1</sup>&nbsp;Increased financial inclusion can have a positive impact on the country&rsquo;s economic profile by bringing more activity into the formal economy. <strong><a href="https://www.vaneck.com/us/en/blogs/emerging-markets-equity/enabling-indias-digital-disruption/" title="Enabling India's Digital Disruption">The Unified Payments Platform (UPI)</a></strong> has been one of the most crucial pillars of India&rsquo;s digital payments growth, as it has allowed for efficient electronic payments, even for those without a debt or credit card. Amid the COVID-19 pandemic and aided by the Indian government&rsquo;s push for cashless transactions, UPI transactions surged significantly, boosting economic activity within the country. Importantly, this has also driven a significant improvement in tax compliance and transparency. It is now easier for the authorities to track and collect taxes since the digital transactions in the system provide a clear economic activity record. As these digital payments increasingly become a part of people&rsquo;s lives, the process of economic formalization continues to benefit from better transparency and a broader tax base. India&rsquo;s GST collections are currently expected to grow at more than 7% monthly over the current fiscal year, which provides new revenue sources for continued investment in infrastructure and other projects, as well as support to the country&rsquo;s credit profile.</p>
<h3>India&rsquo;s Goods and Services Tax Collections Are Surging</h3>
<p><img class="img-responsive w-100" src="https://www.vaneck.com/contentassets/6c97ba417525417caff2e5768f2bfac4/4666_india-joins-local-em_chart-1_2024-7_v1_blog.svg" alt="India's Goods and Services Tax Collections Are Surging" /></p>
<p class="chart-disclosure">Source: India Ministry of Finance, National Payments Corporation of India (NPCI).</p>

<h2>Looking Ahead</h2>
<p>India&rsquo;s inclusion into J.P. Morgan&rsquo;s GBI-EM suite marks an important milestone in its financial history by increasing foreign investor participation in the country&rsquo;s domestic bond market, albeit in a limited way. The country&rsquo;s advancements in digitalization have proven effective in increasing financial inclusiveness efforts and tax revenues. Along with impressive economic growth this has provided support to the country&rsquo;s ability to maintain its spending and debt levels. However foreign bond investors and rating agencies will continue to monitor for signs of progress in achieving the government&rsquo;s stated goals to narrow its fiscal deficit in coming years.</p>
<p>To receive more <strong><a href="https://www.vaneck.com/us/en/insights/emerging-markets-bonds/" title="Emerging Markets Bonds Insights">Emerging Markets Bonds</a></strong> insights, <strong><a href="https://www.vaneck.com/us/en/subscribe/" title="Subscription Center">sign up in our subscription center</a></strong>.</p>
]]></content:encoded>
</item><item rdf:about="https://www.vaneck.com/us/en/blogs/emerging-markets-bonds/developed-markets-face-greater-political-risks-than-emerging-markets/">
  <title>Developed Markets Face Greater Political Risks Than Emerging Markets></title>
  <link>https://www.vaneck.com/us/en/blogs/emerging-markets-bonds/developed-markets-face-greater-political-risks-than-emerging-markets/</link>
  <description><![CDATA[Political and geopolitical risks are escalating, challenging developed markets and creating potential opportunities for emerging markets debt investors.]]></description>
  <dc:creator>Eric Fine</dc:creator>
  <dc:date>07/17/2024 06:30:00</dc:date>
<content:encoded><![CDATA[

<p id="summary" class="jump-link-nav anchored-block" data-jumplink-title="Summary">The <strong><a href="https://www.vaneck.com/us/en/investments/emerging-markets-bond-fund-embax/overview/" title="EMBAX - Emerging Markets Bond Fund - Class A - Overview">VanEck Emerging Markets Bond Fund</a></strong> gained 0.15% in June, compared to a 1.11% loss for its benchmark, the 50% J.P. Morgan Government Bond Index-Emerging Markets (GBI-EM) Global Diversified and 50% J.P. Morgan Emerging Markets Bond Index (EMBI). Year to date, the Fund is up 0.55%, compared to -0.72% for its benchmark (and compared to global developed market (DM) bonds, as measured by the Bloomberg Global Aggregate Index which was down 3.3% and U.S. 10-year Treasuries which fell by 2.0%). The decades-old story of emerging markets (EM) bonds outperforming DM continued in the first half of the year.<strong> </strong>During June, the Fund increased local currency exposure in Mexico. Initially, the Fund had a significant underweight in Mexico local currency, but established a long position after the market was crushed by the country&rsquo;s June election outcome. The Fund was also significantly underweight Brazil local, which also fell sharply in June. We are currently exploring a potential tactical long position in Brazil local currency debt. We continue to favor duration as well as selected emerging markets currencies (EMFX), now including many of the high-betas (South Africa, Colombia, Hungary, Chile) following their weakness (Mexico, Brazil). Carry is 7.4%, yield to worst is 8.9%, duration is 6.8 and local makes up around 53% of exposure.</p>

<p>Exhibit 1 shows EM bonds continued outperformance of DM bonds in 2024 as well as over the past 7 years (in earlier pieces we take these tables back decades and get the same result, and we&rsquo;ve done volatility-adjusted research pieces, too, of course). The exhibit also highlights that an active approach like ours can boost returns over that of the EM benchmark (which has consistently beaten DM bonds).</p>
<h3>Exhibit 1 &ndash; EM Continues to Outshine DM Bonds</h3>
<div class="wrapped-div">
<table style="width: 100%;">
<tbody>
<tr class="tbl-data">
<td class="tbl-header last" colspan="10">As of June 30, 2024</td>
</tr>
<tr class="tbl-data">
<td class="data-head last text-right">&nbsp;</td>
<td class="data-head last text-right">1H'24</td>
<td class="data-head last text-right">2023</td>
<td class="data-head last text-right">2022</td>
<td class="data-head last text-right">2021</td>
<td class="data-head last text-right">2020</td>
<td class="data-head last text-right">2019</td>
<td class="data-head last text-right">2018</td>
<td class="data-head last text-right">2017</td>
<td class="data-head last text-right">7 Years</td>
</tr>
<tr class="tbl-data">
<td class="data-td last text-left">VanEck Emerging Markets Bond Fund I</td>
<td class="data-td data last text-right">0.55</td>
<td class="data-td data last text-right">10.97</td>
<td class="data-td data last text-right">-7.22</td>
<td class="data-td data last text-right">-4.30</td>
<td class="data-td data last text-right">11.60</td>
<td class="data-td data last text-right">13.10</td>
<td class="data-td data last text-right">-6.21</td>
<td class="data-td data last text-right">11.96</td>
<td class="data-td data last text-right">2.92</td>
</tr>
<tr class="tbl-data">
<td class="data-td last text-left">50%JPM GBI-EM GD and 50%JPM EMBI GD</td>
<td class="data-td data last text-right">-0.72</td>
<td class="data-td data last text-right">11.92</td>
<td class="data-td data last text-right">-14.75</td>
<td class="data-td data last text-right">-5.32</td>
<td class="data-td data last text-right">4.02</td>
<td class="data-td data last text-right">14.31</td>
<td class="data-td data last text-right">-5.15</td>
<td class="data-td data last text-right">12.74</td>
<td class="data-td data last text-right">0.75</td>
</tr>
<tr class="tbl-data">
<td class="data-td last text-left">Bloomberg Global Aggregate TR USD</td>
<td class="data-td data last text-right">-3.16</td>
<td class="data-td data last text-right">5.72</td>
<td class="data-td data last text-right">-16.25</td>
<td class="data-td data last text-right">-4.71</td>
<td class="data-td data last text-right">9.20</td>
<td class="data-td data last text-right">6.84</td>
<td class="data-td data last text-right">-1.20</td>
<td class="data-td data last text-right">7.39</td>
<td class="data-td data last text-right">-0.45</td>
</tr>
<tr class="tbl-data">
<td class="data-td last text-left">ICE BofA Gbl Brd Mkt TR USD</td>
<td class="data-td data last text-right">-3.32</td>
<td class="data-td data last text-right">5.56</td>
<td class="data-td data last text-right">-16.87</td>
<td class="data-td data last text-right">-5.24</td>
<td class="data-td data last text-right">8.94</td>
<td class="data-td data last text-right">6.85</td>
<td class="data-td data last text-right">-1.09</td>
<td class="data-td data last text-right">6.95</td>
<td class="data-td data last text-right">-0.72</td>
</tr>
<tr class="tbl-data">
<td class="data-td last text-left">FTSE Treasury Benchmark 10 Yr USD</td>
<td class="data-td data last text-right">-1.99</td>
<td class="data-td data last text-right">3.54</td>
<td class="data-td data last text-right">-16.65</td>
<td class="data-td data last text-right">-3.51</td>
<td class="data-td data last text-right">10.37</td>
<td class="data-td data last text-right">8.85</td>
<td class="data-td data last text-right">-0.02</td>
<td class="data-td data last text-right">2.13</td>
<td class="data-td data last text-right">-0.28</td>
</tr>
</tbody>
</table>
</div>
<h3>Average Annual Total Returns<sup>*</sup>&nbsp;(%) (In USD)</h3>
<div class="wrapped-div">
<table style="width: 100%;">
<tbody>
<tr class="tbl-data">
<td class="tbl-header last" colspan="8">Month End as of June 30, 2024</td>
</tr>
<tr class="tbl-data">
<td class="data-head last text-right">&nbsp;</td>
<td class="data-head last text-right">1 MO</td>
<td class="data-head last text-right">3 MO</td>
<td class="data-head last text-right">YTD</td>
<td class="data-head last text-right">1 YR</td>
<td class="data-head last text-right">3 YR</td>
<td class="data-head last text-right">5 YR</td>
<td class="data-head last text-right">10 YR</td>
</tr>
<tr class="tbl-data">
<td class="data-td last text-left">Class A: NAV (Inception 07/09/12)</td>
<td class="data-td data last text-right">0.26</td>
<td class="data-td data last text-right">0.52</td>
<td class="data-td data last text-right">0.22</td>
<td class="data-td data last text-right">4.94</td>
<td class="data-td data last text-right">-0.76</td>
<td class="data-td data last text-right">2.28</td>
<td class="data-td data last text-right">0.88</td>
</tr>
<tr class="tbl-data">
<td class="data-td last text-left">Class A: Maximum 5.75% load</td>
<td class="data-td data last text-right">-5.51</td>
<td class="data-td data last text-right">-5.26</td>
<td class="data-td data last text-right">-5.54</td>
<td class="data-td data last text-right">-1.10</td>
<td class="data-td data last text-right">-2.70</td>
<td class="data-td data last text-right">1.08</td>
<td class="data-td data last text-right">0.29</td>
</tr>
<tr class="tbl-data">
<td class="data-td last text-left">Class I: NAV (Inception 07/09/12)</td>
<td class="data-td data last text-right">0.43</td>
<td class="data-td data last text-right">0.58</td>
<td class="data-td data last text-right">0.55</td>
<td class="data-td data last text-right">5.26</td>
<td class="data-td data last text-right">-0.40</td>
<td class="data-td data last text-right">2.60</td>
<td class="data-td data last text-right">1.21</td>
</tr>
<tr class="tbl-data">
<td class="data-td last text-left">Class Y: NAV (Inception 07/09/12)</td>
<td class="data-td data last text-right">0.19</td>
<td class="data-td data last text-right">0.45</td>
<td class="data-td data last text-right">0.40</td>
<td class="data-td data last text-right">5.03</td>
<td class="data-td data last text-right">-0.51</td>
<td class="data-td data last text-right">2.51</td>
<td class="data-td data last text-right">1.12</td>
</tr>
<tr class="tbl-data">
<td class="data-td last text-left">50% GBI-EM/50% EMBI</td>
<td class="data-td data last text-right">-0.23</td>
<td class="data-td data last text-right">-0.66</td>
<td class="data-td data last text-right">-0.72</td>
<td class="data-td data last text-right">4.91</td>
<td class="data-td data last text-right">-2.88</td>
<td class="data-td data last text-right">-0.61</td>
<td class="data-td data last text-right">0.91</td>
</tr>
</tbody>
</table>
</div>
<style>
.data-td.data {
        padding-right: 2px !important;
    }
    .wrapped-div {
        max-width: 100%;
    }

    @media (max-width: 768px) {
        .wrapped-div {
            overflow-x: scroll;
        }
    }

    .wrapped-div-sector {
        max-width: 100%;
        overflow-x: scroll;
    }
</style>
<p class="chart-disclosure"><sup>*</sup>&nbsp;Returns less than one year are not annualized.</p>
<p class="chart-disclosure"><strong>Expenses: Class A: Gross 2.55%, Net 1.22%; Class I: Gross 2.51%, Net 0.87%; Class Y: Gross 2.91%, Net 0.97%.</strong> Expenses are capped contractually until 05/01/24 at 1.25% for Class A, 0.95% for Class I, 1.00% for Class Y. Caps excluding acquired fund fees and expenses, interest, trading, dividends, and interest payments of securities sold short, taxes, and extraordinary expenses.</p>
<p class="chart-disclosure"><strong>The performance data quoted represents past performance. Past performance is not a guarantee of future results. Investment return and principal value of an investment will fluctuate so that an investor&rsquo;s shares, when redeemed, may be worth more or less than their original cost. Performance may be lower or higher than performance data quoted. Please call 800.826.2333 or visit vaneck.com for performance current to the most recent month ended.</strong></p>
<p class="chart-disclosure">The &ldquo;Net Asset Value&rdquo; (NAV) of a Fund is determined at the close of each business day, and represents the dollar value of one share of the fund; it is calculated by taking the total assets of the fund, subtracting total liabilities, and dividing by the total number of shares outstanding. The NAV is not necessarily the same as the ETF&rsquo;s intraday trading value. Investors should not expect to buy or sell shares at NAV.</p>
<p id="domestic-and-geopolitical-risks" class="jump-link-nav anchored-block" data-jumplink-title="Domestic and Geopolitical Risks"><strong>U.S. political risk is beginning to drive U.S. rates</strong>, whereas EM always pays a risk premium for perceived political risk. The U.S. yield curve steepened after a recent boost to former President Trump&rsquo;s re-election prospects. The important observation is that political and policy risks are continuing to drive asset prices in the developed markets, to now include the U.S. Also, we believe this recent <i>bear</i> steepening reaction is not correct. This bear steepening reaction to former President Trump&rsquo;s improved election prospects is supposed to be due to likely fiscal stimulus or heightened concern. We worry that too much of market participants&rsquo; reactions are not focused purely on policy. Let&rsquo;s look only at economic policy, positing trade, fiscal, monetary, and structural policy as the key elements. We &ldquo;table&rdquo; it out below, as we remain stunned by how unwilling many market participants are to engage with political facts, whether welcomed or not. Our conclusion is that on trade, fiscal, and monetary policy, both Trump and President Biden are equally &ldquo;market friendly&rdquo; (or unfriendly), with Trump maybe having an edge, (but we rate the difference &lsquo;Meh&rsquo;). Structural policy (i.e., taxation and regulation) is where the key differences are, with a Trump de-regulation effort obviously holding the prospect of boosting productivity and growth. And, supply-side economic thinking would also note that higher growth is the easier answer to any fiscal issues, maybe upgrading Trump&rsquo;s grade. <i>The big problem is &ndash; so what if this is true?</i> We won&rsquo;t list the ongoing risks as we head to U.S. elections in November, but we think the market needs to <i>actually get through</i> all of these before it looks dispassionately at policy&hellip;and we agree, it&rsquo;s too early to look through the election itself.</p>
<p>So, if the politics are still up in the air and too far away, what does that leave us with? It leaves us with data-dependency. And the data are clearly weakening, as Fed Chair Powell noted during his Sintra comments in early July. So, we&rsquo;ll continue to defer to the data, which we think will have the Fed cutting in September or November. But we&rsquo;ll be respectful of price action, as there are clearly binary views on politics at least, if not on policy. What happens after that (likely recession fears and fiscal fears as a result), is still too early for the market to discount, in our view. One step at a time, but we are not covering our eyes.</p>
<h3>Exhibit 2 &ndash; Economic Policy Over Politics: Trump or Biden &ldquo;Market Friendly&rdquo;?</h3>
<div class="wrapped-div">
<table style="width: 100%;">
<tbody>
<tr class="tbl-data">
<td class="tbl-header last">&nbsp;</td>
<td class="tbl-header last">Biden or Trump the &ldquo;Market Friendly&rdquo; Winner?</td>
<td class="tbl-header last">Comment/Implication</td>
</tr>
<tr class="tbl-data">
<td class="data-td last">Trade Policy</td>
<td class="data-td data last text-left">Meh</td>
<td class="data-td data last text-left">Who can be more anti-China is the new political game</td>
</tr>
<tr class="tbl-data">
<td class="data-td last">Fiscal Policy</td>
<td class="data-td data last text-left">Meh/Trump</td>
<td class="data-td data last text-left">Trump&rsquo;s fiscal boost was during Covid, Biden&rsquo;s during post-Covid expansion, arguably making Trump better on Fiscal</td>
</tr>
<tr class="tbl-data">
<td class="data-td last">Monetary Policy</td>
<td class="data-td data last text-left">Meh/Trump</td>
<td class="data-td data last text-left">Biden&rsquo;s Fed appointments have not been inflation hawks</td>
</tr>
<tr class="tbl-data">
<td class="data-td last">Structural Policy</td>
<td class="data-td data last text-left">Trump</td>
<td class="data-td data last text-left">De-regulation and tax cuts boost productivity/growth and encourage capital inflows&hellip;but this is after an uncertain election and quarters away</td>
</tr>
</tbody>
</table>
</div>
<br />
<p><strong>Political risks in DM are bigger than those in EM.</strong> French snap elections raise the prospect of a divided government that will likely resurrect fiscal concerns to a highly indebted sovereign in a euro zone currency union that escaped its crises about a decade ago without fixing its core deficiencies. Comments from Germany&rsquo;s finance minister questioning potential ECB support for the French bond market underscore the risks in France. For what it&rsquo;s worth, your author is French-born and has worked as a security-cleared U.S. official in Paris, during the country&rsquo;s last <i>cohabitation</i> government (the only claim is of comfort and experience, not certitude). That DM situation is more fraught than hyped political risk in Mexico and South Africa, in our view. Probably self-evidently. Just to get one basic economic fact out of the way &ndash; Mexico and South Africa have floating exchange rates with independent central banks, and most of their debt is in their own currency. That can&rsquo;t be said of France is basic, so please don&rsquo;t forget it. (And don&rsquo;t forget that the currency union is still not backed by a fiscal or financial union.) A floating exchange-rate absorbs these problems, and recently looks like it did so in Mexico (where we owned none, but bought after the natural and healthy financial market reaction). This is not an existential moment for Mexico, where the incoming government has already committed to orthodox fiscal targets and appointed an excellent finance minister. Mexico was just crowded and mispriced, but it&rsquo;s not on the edge of an abyss. In South Africa the story is easier. Financial news made the initial headline the ANC&rsquo;s loss of its 50% majority, when in reality market professionals were only debating a range of 39%-41%. Anyway, the reality was always going to be a coalition government and the market got its dream outcome of an ANC alliance (through a Government of National Unity) with the very market-friendly DA. This is simply a good outcome (whatever the country&rsquo;s longer-term prospects). The story is easier because the South African rand is actually up against the US Dollar year to date.</p>
<style>
.data-td.data {
        padding-right: 2px !important;
    }
    .wrapped-div {
        max-width: 100%;
    }

    @media (max-width: 768px) {
        .wrapped-div {
            overflow-x: scroll;
        }
    }

    .wrapped-div-sector {
        max-width: 100%;
        overflow-x: scroll;
    }
</style>

<h3>Exhibit 3 &ndash; France: Another DM to Worry About That Isn&rsquo;t Japan or U.S.</h3>
<p><img class="img-responsive w-100" alt="France: Another DM to Worry About That Isn't Japan or US" src="https://www.vaneck.com/contentassets/ecd594cf816e4856801e941af985be8f/4650_emb_chart-1_2024-7_v1_blog.svg" /></p>
<style>
.data-td.data {
        padding-right: 2px !important;
    }
    .wrapped-div {
        max-width: 100%;
    }

    @media (max-width: 768px) {
        .wrapped-div {
            overflow-x: scroll;
        }
    }

    .wrapped-div-sector {
        max-width: 100%;
        overflow-x: scroll;
    }
</style>
<p class="chart-disclosure">Source: Bloomberg. As of July 3, 2024.</p>
<p><strong>Geopolitical risks continue, challenging DM but creating opportunities for EM.</strong> Ongoing supply risks support commodity prices. And central banks continue to diversify their reserve assets to include safe EMs with high real rates, sustainable fiscal, and no sanctions risk (central banks aren&rsquo;t only replacing U.S. treasuries with gold). None of this is new. We will repeat two things. First, the correct lens for the two hot geopolitical conflicts in Europe is NATO vs. Russia (not Ukraine vs. Russia) and Israel vs. Iran vs. Turkey (not Israel vs. Hamas or Hezbollah); you have to look at the right &ldquo;thing&rdquo;, and these &ldquo;things&rdquo; are escalating. Second, an &ldquo;obvious to us&rdquo; scenario that seems to get no attention is that in the NATO vs. Russia conflict, Odessa is now likely &ldquo;in play&rdquo;. Given the absence of any peaceful solutions (the Swiss peace conference and following G7 meeting were about broadening sanctions against those with links to Russia), Russia is likely to table its latest offer of freezing the current conflict and resume its grind westward. This will likely remind markets of geopolitical risks, particularly given the importance of Odessa to grain exports (Odessa is Ukraine&rsquo;s main port along with Mykolaiv. Just look at Odessa on the map below. We think an Odessa that escapes the conflict is likely faded.</p>
<h3>Exhibit 4 &ndash; Odessa</h3>
<p><img alt="Odessa" src="https://www.vaneck.com/contentassets/0c901d4945d24a3396beeb1e58028325/4650_emb_inforgraphic-1_2024-7_v1_blog.png" /></p>
<h2 id="exposure-types-and-significant-changes" class="jump-link-nav anchored-block" data-jumplink-title="Exposure Types and Significant Changes">Exposure Types and Significant Changes</h2>
<p>The changes to our top positions are summarized below. Our largest positions in June were South Africa, Thailand, China, Indonesia, and Poland:</p>
<ul class="content-list">
<li class="mt-2">We increased our local currency exposure in Poland and Hungary. Poland remains the cleanest disinflation and policy story in Central Europe with potential growth upside. These factors improved the policy and economic test scores for the country. Hungary&rsquo;s central bank is slowing the pace of rate cuts, while Europe&rsquo;s growth outlook is improving relative to the U.S. In terms of our investment process, this strengthened Hungary&rsquo;s policy and technical test scores.</li>
<li class="mt-2">We also increased our local currency exposure in Mexico and South Africa, and hard currency sovereign exposure in South Africa. The market&rsquo;s initial interpretation of the election results was extremely negative. This view was challenged by the subsequent moves of President-elect Sheinbaum, including the new cabinet&rsquo;s technocratic lineup and Sheinbaum's commitment to sharp fiscal consolidation. Further, given that the pre-election positioning was predominantly long, Mexico&rsquo;s local rates and the currency sold off a lot after the elections significantly improving valuations. In terms of our investment process, this improved the policy and technical test scores for the country. South Africa&rsquo;s post-election journey was somewhat similar, with the market taking some time to warm up to the idea of the government of national unity (and the continuation of reforms and fiscal discipline). Once this happened, local rates and the currency staged a rally, explaining a big part of the increase in our exposure. These developments improved South Africa&rsquo;s policy test scores.</li>
<li class="mt-2">Finally, we increased our hard currency sovereign exposure in Qatar, the United Arab Emirates, and Saudi Arabia. The key argument here is that longer duration should do better with the softening U.S. growth outlook. In terms of our investment process, this improved the technical test score for these countries.</li>
<li class="mt-2">We reduced our local currency exposure in Brazil and Chile, and hard currency sovereign exposure in Argentina. The key concern in Brazil is growing uncertainty about the pace of fiscal consolidation and the new governor of the central bank, who might be more inclined to follow President Lula&rsquo;s pro-growth policy &ldquo;suggestions&rdquo;. This resulted in the worsening policy test score for the country. Chile might be affected by China's slow recovery progress and limited policy follow-through after big initial statements, which poses risks to copper prices. Further, the narrowing policy differential with the U.S. if the central bank continues to cut rates can put more pressure on the currency. In terms of our investment process, this worsened the policy and technical test scores for the country. We took profits in Argentina as the policy momentum is stalling &ndash; especially the approval of the watered-down omnibus bill and the central bank&rsquo;s failure to capitalize on good harvest and boost international reserves. These factors worsened the policy test score for Argentina.</li>
<li class="mt-2">We also reduced our hard currency sovereign exposure in Nigeria, Suriname, and Ghana. We took profits in Nigeria, as the government is figuring out how to proceed with policy adjustment and reforms. The key concern in Suriname is domestic politics, which might get noisy in the runup to the presidential elections. We also see limited upside in Ghana in the run-up to the elections. In terms of our investment process, this worsened the policy test scores for these countries.</li>
<li class="mt-2">Finally, we reduced our local currency exposure in Peru and hard currency quasi-sovereign exposure in Singapore. We used these positions as funders for other more interesting opportunities. Peru might be affected by a slow pace of China&rsquo;s recovery (which might weight on copper prices), and the narrowing policy rate differential with the U.S. In addition, there is a risk of contagion from the &ldquo;bad LATAM&rdquo; regional story. These factors worsened the technical test score for the country.</li>
</ul>
<p>To receive more <strong><a href="https://www.vaneck.com/us/en/insights/emerging-markets-bonds/" title="Emerging Markets Bonds Insights">Emerging Markets Bonds</a></strong> insights, <strong><a href="https://www.vaneck.com/us/en/subscribe/" title="Subscription Center">sign up in our subscription center</a></strong>.</p>
<style>
.data-td.data {
        padding-right: 2px !important;
    }
    .wrapped-div {
        max-width: 100%;
    }

    @media (max-width: 768px) {
        .wrapped-div {
            overflow-x: scroll;
        }
    }

    .wrapped-div-sector {
        max-width: 100%;
        overflow-x: scroll;
    }
</style>
]]></content:encoded>
</item><item rdf:about="https://www.vaneck.com/us/en/blogs/emerging-markets-equity/taiwan-and-india-thrive-in-q2/">
  <title>Taiwan and India Thrive In Q2></title>
  <link>https://www.vaneck.com/us/en/blogs/emerging-markets-equity/taiwan-and-india-thrive-in-q2/</link>
  <description><![CDATA[At the end of Q2 2024, India and Taiwan remained at the forefront of returns, with global investors eyeing potential U.S. rate cuts and the resulting currency tailwinds from a weakened dollar.]]></description>
  <dc:creator>Ola  El-Shawarby, CFA</dc:creator>
  <dc:date>07/15/2024 06:30:00</dc:date>
<content:encoded><![CDATA[

<p>During the second quarter of 2024, emerging markets equities held steady, slightly surpassing U.S. equities and showing moderate outperformance compared to their counterparts in developed markets. Once again, many of the same trends that played out in the first quarter of the year extended into the second quarter.</p>
<p>India and Taiwan continued to lead returns for the MSCI EM IMI benchmark. India&rsquo;s positive macro dynamics generated positive, market-leading returns, while Taiwan&rsquo;s standout company, Taiwan Semiconductor Manufacturing Co., capitalized on A.I. tailwinds. China searched for footing and notched a positive quarter. Same as in Q1, Brazil fared poorly as investors grappled with political instability and fears of high government spending.</p>
<p>From a macro perspective, the same issues remain. Global investors remain under-invested in emerging markets equities as they wait for a green light to deploy new money. While many emerging markets countries have begun cutting rates, which is typically positive for equities, most investors are waiting for the U.S. to begin its own rate cutting so that the dollar weakens. An accommodative U.S. Federal Reserve (Fed) potentially bodes well for emerging markets equities, which would benefit from currency tailwinds on a weakened dollar.</p>
<ul class="content-list">
<li><strong><a href="#fund-performance">Fund Performance</a></strong></li>
<li><strong><a href="#fund-review">Fund Review</a></strong></li>
<li><strong><a href="#fund-positioning-outlook">Fund Positioning and Outlook</a></strong></li>
</ul>
<h2 id="fund-performance" class="jump-link-nav anchored-block" data-jumplink-title="Fund Performance">Fund Performance</h2>
<p>The VanEck Emerging Markets Fund (the &ldquo;Fund&rdquo;) underperformed the MSCI EM IMI on the quarter-to-date basis ending June 30, 2024 (+3.51% for the Fund; +5.13% for the Index). The Fund is slightly outperforming its benchmark year-to-date (+7.92% for the Fund; +7.41% for the Index). Negative relative performance for the quarter was driven by allocation (weighting) in Brazil, stock selection in China and allocation in Georgia. Turkey and South Korea contributed positively for the quarter through a mix of both allocation and stock selection.</p>
<p>India was the Fund&rsquo;s top absolute contributor for the quarter, followed by Taiwan and Turkey. Turkey&rsquo;s strong performance is notable, as it was principally driven by a single name (MLP Saglik Hizmetleri, 3.1% of Fund net assets<sup>*</sup>) in which the Fund holds a large overweight position compared to the benchmark.</p>
<p>For the second straight quarter, Brazil was a top detractor on both a relative and absolute basis. Nevertheless, we remain highly confident in the compelling investment prospects for our selected companies in Brazil, which will benefit from an eventual resumption of declining inflation and rates. Of note, while our sizeable holding in MercadoLibre is categorized as Brazil, it should really be regarded as a pan-Latin America company.</p>
<p>China contributed positively on an absolute basis, but negatively on a relative basis. We believe that economic growth is uneven, and in particular, domestic consumption is subdued, in part due to slow resolution of property market issues. However, large cap Chinese companies are demonstrating resilience in top-line growth, improvement in operating margins and an increased willingness to reward shareholders with dividends and share buybacks.</p>
<h3>Average Annual Total Returns (%) as of June 30, 2024</h3>
<div class="wrapped-div">
<table style="width: 100%;">
<tbody>
<tr class="tbl-data">
<td class="tbl-header last">&nbsp;</td>
<td class="tbl-header last text-right">2Q2024<sup>&dagger;</sup></td>
<td class="tbl-header last text-right">YTD</td>
<td class="tbl-header last text-right">1YR</td>
<td class="tbl-header last text-right">3YR</td>
<td class="tbl-header last text-right">5YR</td>
<td class="tbl-header last text-right">10YR</td>
</tr>
<tr class="tbl-data">
<td class="data-td last">Class A: NAV (Inception 12/20/93)</td>
<td class="data-td data last text-right">3.51</td>
<td class="data-td data last text-right">7.92</td>
<td class="data-td data last text-right">14.52</td>
<td class="data-td data last text-right">-9.05</td>
<td class="data-td data last text-right">-0.54</td>
<td class="data-td data last text-right">1.10</td>
</tr>
<tr class="tbl-data">
<td class="data-td last">Class A: Maximum 5.75% Load</td>
<td class="data-td data last text-right">-2.44</td>
<td class="data-td data last text-right">1.71</td>
<td class="data-td data last text-right">7.94</td>
<td class="data-td data last text-right">-10.83</td>
<td class="data-td data last text-right">-1.71</td>
<td class="data-td data last text-right">0.50</td>
</tr>
<tr class="tbl-data">
<td class="data-td last">Class I: NAV (Inception 12/31/07)</td>
<td class="data-td data last text-right">3.61</td>
<td class="data-td data last text-right">8.18</td>
<td class="data-td data last text-right">15.08</td>
<td class="data-td data last text-right">-8.56</td>
<td class="data-td data last text-right">-0.04</td>
<td class="data-td data last text-right">1.61</td>
</tr>
<tr class="tbl-data">
<td class="data-td last">MSCI Emerging Markets Investable Markets Index (IMI)</td>
<td class="data-td data last text-right">5.13</td>
<td class="data-td data last text-right">7.41</td>
<td class="data-td data last text-right">13.56</td>
<td class="data-td data last text-right">-4.11</td>
<td class="data-td data last text-right">3.93</td>
<td class="data-td data last text-right">3.09</td>
</tr>
<tr class="tbl-data">
<td class="data-td last">MSCI Emerging Markets Index</td>
<td class="data-td data last text-right">5.00</td>
<td class="data-td data last text-right">7.49</td>
<td class="data-td data last text-right">12.55</td>
<td class="data-td data last text-right">-5.07</td>
<td class="data-td data last text-right">3.10</td>
<td class="data-td data last text-right">2.79</td>
</tr>
</tbody>
</table>
</div>
<br />
<style>
    .data-td.data {
        padding-right: 5px !important;
    }
    
    .data-head { 
    padding-right: 5px !important;
    }

    .wrapped-div {
        max-width: 100%;
    }

    @media (max-width: 1240px) {
        .wrapped-div {
            overflow-x: scroll;
        }
    }

    .wrapped-div-sector {
        max-width: 100%;
        overflow-x: scroll;
    }
</style>
<p class="chart-disclosure"><strong>The table presents past performance which is no guarantee of future results and which may be lower or higher than current performance. Returns reflect applicable fee waivers and/or expense reimbursements. Had the Fund incurred all expenses and fees, investment returns would have been reduced. Investment returns and Fund shares values will fluctuate so that investor's shares, when redeemed, may be worth more or less than their original cost. Fund returns assume that dividends and capital gains distributions have been reinvested in the Fund at net asset value (NAV). Index returns assume that dividends of the Index constituents in the Index have been reinvested. Performance information current to the most recent month end is available by calling 800.826.2333 or by visiting vaneck.com.</strong></p>
<p class="chart-disclosure"><strong>Expenses: Class A: Gross 1.59%; Net 1.59%; Class I: Gross 1.23%; Net 1.01%. Expenses are capped contractually until 5/1/25 at 1.60% for Class A and 1.00% for Class I. Caps exclude acquired fund fees and expenses, interest, trading, dividends, interest payments of securities sold short, taxes and extraordinary expenses.</strong></p>

<h2 id="fund-review" class="jump-link-nav anchored-block" data-jumplink-title="Fund Review">Fund Review</h2>
<p>On a sector level, Health Care, Real Estate and Materials contributed to relative performance, while Industrials, Financials and Consumer Discretionary detracted. On a country level, Turkey, South Korea and Saudi Arabia contributed to relative performance, while Brazil, China and Georgia detracted.</p>
<h2>Top Contributors</h2>
<p>Top contributors to return on an absolute basis during the quarter:</p>
<ul class="content-list">
<li class="mt-2"><strong>MLP Saglik Hizmetleri (3.1% of Fund net assets<sup>*</sup>): </strong>MLP Saglik Hizmetleri is the largest private hospital operator in Turkey. The company has consistently achieved real sales growth, outperforming inflation over the last decade. The growing trend of holding private insurance in Turkey has significantly expanded the addressable market. Additionally, we believe that margins will improve as wage inflation decreases.</li>
<li class="mt-2"><strong>Taiwan Semiconductor Manufacturing Co. (&ldquo;TSMC&rdquo;) (7.8% of Fund net assets<sup>*</sup>): </strong>TSMC has experienced upward revisions to earnings forecasts throughout the first half of 2024. Expected one-year earnings per share (EPS) growth exceeds 20%. This growth, combined with broad sectoral interest in semiconductors, has contributed to a strong quarterly performance. We anticipate these trends will persist due to TSMC&rsquo;s market leadership and high barriers to entry. Additionally, TSMC's preliminary moves to increase capital expenditure (CAPEX) and expand its manufacturing base beyond Japan are noteworthy. These strategies aim to alleviate geopolitical tensions related to Taiwan and reduce our risk concerns related to the geographic concentration of manufacturing capacity.</li>
<li class="mt-2"><strong>Phoenix Mills Ltd (2.7% of Fund net assets<sup>*</sup>):&nbsp;</strong>Phoenix Mills Ltd is a diversified real estate developer and operator of large retail malls in India. It is known for being an exceptional allocator of capital and a disciplined investor. The strong performance of Phoenix Mills' shares this year can be attributed to growth in earnings from existing projects and increased expectations for earnings in retail, residential and office projects, both new and existing. Notably, the rapid development of urban light transport in Indian cities amplifies the attractiveness of Phoenix Mills&rsquo; prime locations and exceptional product quality.</li>
</ul>
<h2>Top Detractors</h2>
<p>Top detractors to return on an absolute basis during the quarter:</p>
<ul class="content-list">
<li class="mt-2"><strong>JSL SA (2.8% of Fund net assets<sup>*</sup>):&nbsp;</strong>JSL remains overlooked by investors despite its solid fundamentals. It is a growth company with clear competitive advantages, solid execution, a large addressable market, attractive ROIC levels and double-digit EPS growth (a 3-year CAGR of approximately 30%). The stock has declined this year despite a positive outlook, with no news or changes in earnings expectations, and in our view its valuation remains very attractive. JSL share performance challenges arise from limited liquidity, local investors shifting away from illiquid stocks, a strong focus on short-term gains and encountering redemption pressures. Additionally, the stock&rsquo;s outperformance in 2023 has impacted its performance this year for technical reasons rather than fundamentals.</li>
<li class="mt-2"><strong>Regional S.A.B. (1.2% of Fund net assets<sup>*</sup>):&nbsp;</strong>Regional&rsquo;s shares have been weak mostly due to political reasons, as momentum has shifted since the recent election with concerns about government intervention in the sector and higher taxes. Fundamentally, the story has not changed, but the shares could remain volatile given the political cycle in Mexico and the upcoming U.S. elections.</li>
<li class="mt-2"><strong>Bank of Georgia (2.3% of Fund net assets<sup>*</sup>):&nbsp;</strong>Bank of Georgia Group Plc stands as one of the two dominant forces in the Georgian banking sector, holding over 33% of the market share. Throughout the quarter, the bank had surpassed expectations, underpinned by robust earnings achieved in 2023, building upon an already strong performance in 2022, with its return on equity consistently exceeding 25%. Furthermore, Bank of Georgia recently disclosed the acquisition of a majority stake in Ameriabank, an Armenian bank. This strategic move is anticipated to be earnings accretive and introduces further growth prospects in a new market.</li>
</ul>
<h2>Top Buys &amp; Sells</h2>
<p>During the period, we established new positions in the following:</p>
<ul class="content-list">
<li class="mt-2"><strong>KEI Industries Ltd (&ldquo;KEI&rdquo;) (0.7% of Fund net assets<sup>*</sup>):&nbsp;</strong>KEI is a leading manufacturer and supplier of wires and cables, including high-voltage and specialty cables. Demand is accelerating in its home market of India, and the company targets optimized capital efficiency through a disciplined approach to capital allocation that has been successful and is expected to be repeatable in the coming years.</li>
<li class="mt-2"><strong>Al Rajhi Bank (0.6% of Fund net assets<sup>*</sup>):</strong> Al Rajhi, based in Saudi Arabia, is one of the largest banks in the region. Despite underperforming due to higher interest rates affecting its operations, we took the opportunity to initiate an investment in anticipation of brighter prospects ahead, aligning with Al Rajhi Bank&rsquo;s new three-year strategy.</li>
<li class="mt-2"><strong>PDD Holdings Inc (&ldquo;PDD&rdquo;) (0.6% of Fund net assets<sup>*</sup>):</strong> PDD is one of the leading global e-commerce operators, consistently gaining market share in China and achieving significant success with its Temu brand overseas. Although challenges due to tariff adjustments may impact the relative value proposition of its overseas business, we believe that the current valuation more than accounts for that threat.</li>
<li class="mt-2"><strong>Proya Cosmetics Co (0.5% of Fund net assets<sup>*</sup>):</strong> Proya is a cosmetics company in China benefiting from a persistent increase in preference for local brands over overseas brands in the industry. The company has executed well and is growing significantly faster than the industry.</li>
<li class="mt-2"><strong>H World Group Ltd (0.4% of Fund net assets<sup>*</sup>):</strong> H World owns, operates and franchises hotels in China. Domestic travel has increased substantially since COVID-19 restrictions were lifted, and we believe that H World is the highest quality way to capitalize on the domestic travel trend.</li>
</ul>
<p>During the period, we exited the following positions:</p>
<ul class="content-list">
<li class="mt-2"><strong>ReNew Energy Global (&ldquo;ReNew&rdquo;)(0.0% of Fund net assets<sup>*</sup>):&nbsp;</strong>ReNew is a developer of renewable energy projects in India. Its pipeline is strong, but execution has been slower than expected and leverage remains high. We swapped our holding in ReNew for KEI (see above).</li>
<li class="mt-2"><strong>JD.com (0.0% of Fund net assets<sup>*</sup>): </strong>JD is an e-commerce operator in China. We essentially swapped our investment in JD for PDD (see above) due to better prospects.</li>
<li class="mt-2"><strong>Fu Shou Yuan International (&ldquo;FSY&rdquo;) (0.0% of Fund net assets<sup>*</sup>):&nbsp;</strong>FSY is a funeral services and cemetery operator in China. While long-term growth for the company is solid, partly driven by mergers and acquisitions, current growth remains tepid. As a result, we felt there were better opportunities elsewhere.</li>
<li class="mt-2"><strong>Yum China Holdings (&ldquo;Yum&rdquo;)(0.0% of Fund net assets<sup>*</sup>):&nbsp;</strong>Yum operates fast food franchises in China, particularly KFC. Recent operating results have been disappointing, partly due to fierce competition in the market. The company had benefitted from a "foreign premium" for its offerings, but with subdued consumption in China, value for money has become more important, favoring its cheaper competitors.</li>
<li class="mt-2"><strong>SUPCON Technology Co (&ldquo;SUPCON&rdquo;)(0.0% of Fund net assets<sup>*</sup>):&nbsp;</strong>SUPCON manufactures and distributes industrial automation equipment in China and overseas. We exited our small remaining position due to a pessimistic outlook for one of its most important segments (chemical), weaker-than-anticipated margins and less robust cash flow projections.</li>
</ul>

<h2 id="fund-positioning-outlook" class="jump-link-nav anchored-block" data-jumplink-title="Fund Positioning and Outlook">Fund Positioning and Outlook</h2>
<p>We remain grounded by our investment process and our positioning reflects our convictions from a bottom-up basis. Our process has created some positioning differentials versus the benchmark, for example, Brazil remains overweight to start the quarter (11.1% Fund weight versus 4.1% Index weight) as does the Philippines (5.4% versus 0.5% Index weight). South Korea, Taiwan and China remain underweight versus the benchmark.</p>
<p>The Fund's objective is to find long-term structural growth companies at fair prices (S-GARP). Investments are chosen based on individual company analysis, focusing on quality, governance, innovative business models and low disruption risk, with active management and detailed research guiding our selection process.</p>
<p><a href="/us/en/blogs/emerging-markets-equity/taiwan-and-india-thrive-in-q2.pdf" rel="noopener" target="_blank" title="Taiwan and India Thrive In Q2"><strong>A PDF version of this commentary can be downloaded&nbsp;here.</strong></a></p>
<p>To receive more <a href="/us/en/insights/emerging-markets-equity/" title="Emerging Markets Equity Insights"><strong>Emerging Markets Equity</strong></a> insights, <a href="/us/en/subscribe/" title="Subscription Center"><strong>sign up in our subscription center</strong></a>.</p>
]]></content:encoded>
</item><item rdf:about="https://www.vaneck.com/us/en/blogs/gold-investing/ima-casanova-a-brief-pause-after-a-strong-gold-rally/">
  <title>A Brief Pause After a Strong Gold Rally?></title>
  <link>https://www.vaneck.com/us/en/blogs/gold-investing/ima-casanova-a-brief-pause-after-a-strong-gold-rally/</link>
  <description><![CDATA[Chinese central bank gold bullion purchases lagged in June, contributing to flat prices for the month. Agnico Eagle's Ontario, Canada mine may emerge as a promising prospect for the gold industry.]]></description>
  <dc:creator>Imaru Casanova</dc:creator>
  <dc:date>07/12/2024 06:30:00</dc:date>
<content:encoded><![CDATA[

<p>Monthly gold market and economic insights from Imaru Casanova, Portfolio Manager, featuring her unique views on mining and gold&rsquo;s portfolio benefits. <a href="https://www.vaneck.com/us/en/blogs/gold-investing/ima-casanova-a-brief-pause-after-a-strong-gold-rally.pdf" title="A Brief Pause After a Strong Gold Rally?" target="_blank" rel="noopener"><strong>An expanded PDF version of this commentary, including fund specific information can be downloaded here.</strong></a></p>
<h2>Mixed News Drives Flat Prices in May</h2>
<p>After reaching a new all-time high in May, offsetting forces kept gold unchanged during the month of June. Gold traded as high as $2,376 per ounce on June 6. On June 7, gold closed at its monthly low of $2,294 following news that the central bank of China did not buy any gold bullion in May. Global central bank gold buying has been one of the main drivers of this year&rsquo;s gold rally, with the Chinese central bank behind a large percentage of those purchases. The People&rsquo;s Bank of China has been reporting bullion purchases since November 2022, 18 consecutive months of buying. The pause in buying likely raised concern among gold market participants that this important driver of gold demand could weaken. In contrast, gold investment demand has been in decline since April 2022, but in June, global holdings of gold bullion backed exchange traded products finally registered inflows, albeit small, after 12 consecutive months of net outflows. Is western investment demand, the main driver of gold rallies historically, staging a comeback?</p>
<p>Gold also gathered some support from inflation readings (May CPI and PCE) that were interpreted by the market as increasing the likelihood of interest rate cuts by the U.S. Federal Reserve (Fed). At the end of June, the market was pricing in two 25 basis point cuts in 2024, compared to only one 25 basis point cut being priced in at the end of May. Lower real interest rates have historically been supportive of higher gold prices. Gold closed at $2,326.75 per ounce on June 28, essentially unchanged from its May 31 close of $2,327.33.</p>
<h2>Rally in Miners Stalls (Despite Positive Outlook)</h2>
<p>Gold stocks did not fare quite as well as the metal in June; NYSE Arca Gold Miners Index (GDMNTR)<sup>1</sup>&nbsp;and the MVIS Global Juniors Gold Miners Index (MVGDXJTR)<sup>2</sup>&nbsp;were down 3.71% and -6.33%, respectively. We are disappointed with this outcome. The lack of investor interest in gold as an asset class in recent years has frequently led to gold stocks underperforming the metal, not only in a declining gold price environment, which is justified, but also in periods of flat or sideways gold price action. There were no sector wide results, updates or any major events that could explain the generally widespread underperformance across the sector. Quite the opposite, in fact. Many companies provided project updates during the month of June that, in aggregate, we viewed as largely positive.</p>
<p>We took the time to catalogue the announcements, news and updates released by the companies in our gold mining universe during the month of June. We logged approximately 45 company releases including: drilling results; completion of debt and equity financing; completion of mergers and acquisitions; new economic studies, as well as maiden resource estimates, and permits and regulatory approvals for several projects; construction updates, including declaration of first gold pour, from several new mines approaching production; mine specific news and production guidance revisions; comprehensive reviews of companies and assets via investor days; and a new life of mine plan for one of the largest gold mines in the world.</p>
<p>Our original assessment, deeming the news flow broadly positive, was supported by our classification of each release as having the potential of being positive/neutral or negative to the outlook of the company. We classified over 40 of the updates as potentially positive/neutral and only 4 as potentially negative. For reference, the negative news included short term production guidance downgrades due to weather/geotechnical related disruptions; and a serious incident at a single asset, junior company (not held by the Strategy) that halted its operations. Fundamentally, in our opinion, any signs of trouble or weakness were significantly outweighed by signs of strength and health of the sector.</p>
<h2>A Closer Look at Agnico Eagle&rsquo;s Detour Lake</h2>
<p>We had the opportunity to visit Agnico Eagle&rsquo;s (5.01% of Strategy net assets) Detour Lake mine in Ontario. The mine and its potential can certainly be highlighted as a bright spot for the gold industry. We toured the open pit, the processing plant, the tailings dam, the site where the underground exploration ramp portal will be constructed, the maintenance shop and the training center (fleet operating simulator). Overall, our impressions were positive. The mine, the plant and the team showed well. The site visit followed the release of a new life of mine plan and underground project for the asset. The company also hosted a two-hour technical session to review the details of the new plan and project ahead of the site visit. The 2024 plan updates the existing open pit mine production profile and incorporates updated costing. The company has also completed a preliminary economic assessment for a proposed underground mining and mill throughput optimization project, demonstrating the potential to increase the Detour Lake mine's overall production to an average of approximately one million ounces of gold per year over a 14-year period, starting in 2030.</p>
<p><img class="img-responsive w-100" src="https://www.vaneck.com/contentassets/69e9aded16fa4d9fa681c8eb9fbb98b2/img-agnico-eagles-detour-lake-blog.jpg" title="Portfolio Manager Imaru Casanova  visiting Agnico Eagle's Detour Lake mine in Ontario" /></p>
<p class="chart-disclosure">Portfolio Manager Imaru Casanova visiting Agnico Eagle's Detour Lake mine in Ontario.</p>

<p>Annual production is expected to increase to approximately one million ounces per year from 2030 to 2043. This is an increase of approximately 43% or 300,000 ounces of gold annually, when compared to average annual production from 2024 to 2029. From 2044 until 2054, the mine is planned to process stockpile material, producing an average of about 300 thousand ounces of gold per year. Additional exploration has the potential to add ounces to the mine plan in future years and extend the life of the mine beyond 2054. With costs declining as production increases over the next twenty years, the cash flow generation of Detour Lake expands significantly (see chart below). With a pathway to one million ounces, Detour Lake has the potential to move from being one of the 10 largest gold mines in the world, to being one of the top 5 gold mines in the world, in one of the most attractive mining jurisdictions. There is a lot for Agnico Eagle investors to be excited about, providing a great opportunity for Agnico to demonstrate why they are the highest quality gold mining company in the world, and solidify the case behind its historical valuation premium relative to its peers.</p>
<h3>Agnico Eagle's "Pathway to One Million Ounce Producer"</h3>
<p><img class="img-responsive w-100" src="https://www.vaneck.com/contentassets/14055f333cbd4849acaa8fe2109d9470/4636_gold_chart-1_2024-7_v1_blog.svg" alt="Agnico Eagles Pathway to One Million Ounce Producer" /></p>
<p class="chart-disclosure"><sup>1</sup>&nbsp;Higher Cash Cost in stockpile reclaim period reflects drawdown of long-term low-grade stockpiles, lower head grade, and re-handling costs. Open Pit feed offset by Underground to Stockpile Reclaim period is 52Mt at 0.5g/t.</p>
<p class="chart-disclosure"><sup>2</sup>&nbsp;Free cash flow (FCF) represents the cash that a company generates after accounting for cash outflows to support operations and maintain its capital assets, and is non-GAAP measure.</p>
<p class="chart-disclosure">Source: Agnico Eagle. Data as of June 2024.</p>
<p class="chart-disclosure">Free cash flow (FCF) represents the cash that a company generates after accounting for cash outflows to support operations and maintain its capital assets.</p>
<p>To receive more <strong><a href="https://www.vaneck.com/us/en/insights/gold-investing/" title="Gold Investing Insights">Gold Investing</a></strong> insights, <strong><a href="https://www.vaneck.com/us/en/subscribe/" title="Subscription Center">sign up in our subscription center</a></strong>.</p>
]]></content:encoded>
</item><item rdf:about="https://www.vaneck.com/us/en/blogs/natural-resources/industrial-metals-sector-boosts-commodities/">
  <title>Industrial Metals Sector Boosts Commodities></title>
  <link>https://www.vaneck.com/us/en/blogs/natural-resources/industrial-metals-sector-boosts-commodities/</link>
  <description><![CDATA[This past quarter, industrial metals was the strongest sector. Looking ahead, we believe commodity prices could continue to rally due to a possible U.S. easing and rising geopolitical risks.]]></description>
  <dc:creator>Roland Morris</dc:creator>
  <dc:date>07/12/2024 06:30:00</dc:date>
<content:encoded><![CDATA[

<h2>Roll Yield Maintained Positive Performance</h2>
<p>The UBS Constant Maturity Commodity Index (CMCITR) was up 1.89% during the second quarter but underperformed the Bloomberg Commodity Index (BCOM), which was up 2.89%. However, year-to-date, CMCITR outperformed BCOM by more than 2% (7.17% versus 5.14%).</p>
<p>While BCOM&rsquo;s outperformance during the quarter was mostly attributed to a larger allocation in natural gas and precious metals commodities, CMCITR outperformed in roll yield. CMCITR&rsquo;s curve positioning and roll methodology continue to outperform BCOM in a relatively flat roll yield environment.</p>
<h3>CMCITR Outperformed in Q2 2024 Due to Roll Yield Contribution</h3>
<p><img class="img-responsive w-100" src="https://www.vaneck.com/contentassets/6d1c4b861ab845a49c860324fd0ef029/4639_cmci_chart-1_2024-7_v1_blog.svg" alt="CMCITR Outperformed in Q2 2024 Due to Roll Yield Contribution" /></p>
<p class="chart-disclosure"><strong>Source: Bloomberg.</strong> Data as of June 2024. Past performance is no guarantee of future results. Index performance is not illustrative of fund performance. It is not possible to invest in an index.</p>

<h2>Sector Lookback: Industrial Metals: Strongest Sector in Q2</h2>
<p>Natural gas, WTI crude oil and Brent crude oil led the energy sector in Q2. U.S. natural gas prices rose sharply primarily due to extremely warm weather in the U.S. and the continued war in Ukraine. WTI crude oil and Brent crude oil both rose about 2% in the quarter, however, products such as gasoil, heating oil, and unleaded gas, were slightly lower.</p>
<p>The agriculture sector declined in Q2, with only wheat and coffee being higher. Cocoa prices fell but were still up sharply for the year. BCOM&rsquo;s zero allocation to cocoa ensured no negative contribution to performance for the quarter; however, the index missed out on the year-to-date contribution when the commodity showed returns of 100%.</p>
<p>Corn was down 10% and soybeans were down around 5%, which had negative impacts on the agriculture sector during Q2.</p>
<p>The industrial metals sector was the strongest in Q2, with total returns of around 9%. Copper increased 10% and zinc 21%, both of which were the strongest performers. CMCITR&rsquo;s higher allocation to the sector helped relative performance versus BCOM but did not offset BCOM&rsquo;s outperformance in energy and precious metals.</p>
<p>The precious metals sector rose in Q2 by 7%. Silver led the sector, increasing about 18% in the quarter. BCOM has a higher allocation to precious metals than CMCITR. Although the precious metals sector holds the smallest weight in both indices, its overweight in BCOM (20%) added positive contribution to returns (+1.1%) over CMCITR (weight: 6.3%).</p>
<p>The livestock sector fell in Q2 due to a decline of 11% in lean hog prices, which offset a small gain in live cattle prices.</p>
<h3>Comparative Index Sector Weights</h3>
<p><strong>CMCITR&rsquo;s higher weighting to Industrial Metals helped relative performance in Q2 2024</strong></p>
<p><img class="img-responsive w-100" src="https://www.vaneck.com/contentassets/516e87cd3ec049dbbcc62dd1cbfb131d/4639_cmci_chart-2_2024-7_v1_blog.svg" alt="Comparative Index Sector Weights" /></p>
<p class="chart-disclosure"><strong>Source:</strong> VanEck, Bloomberg. Data as of June 2024.</p>

<h2>Outlook: Can Commodity Prices Continue to Rally?</h2>
<p>Commodity prices could continue to rally in the second half of the year. The U.S. economy started to slow down in Q2, raising the chances of the Federal Reserve (Fed) cutting interest rates in September 2024. If that happens, it is expected that the U.S. dollar will decline, thus helping to push commodity prices higher in the fall and winter. In addition to a possible U.S. easing, global geopolitical risks are rising. Concerns surrounding the candidates&rsquo; suitability for the U.S. presidential election later could also cause geopolitical risks to rise even further in the second half of 2024.</p>
<p>Learn more about the <strong><a href="https://www.vaneck.com/us/en/investments/cm-commodity-index-fund-cmcax/overview/" title="CMCAX - CM Commodity Index Fund - Class A - Overview">VanEck CM Commodity Index Fund</a></strong> and the <a href="https://www.vaneck.com/us/en/investments/cmci-commodity-strategy-etf-cmci/overview/" title="CMCI - VanEck CMCI Commodity Strategy ETF - Overview"><strong>VanEck CMCI Commodity Strategy ETF (CMCI)</strong></a>, which seek to track, before fees and expenses, the CMCITR.</p>
<p>To receive more <a href="/us/en/insights/natural-resources/" title="Natural Resources Insights"><strong>Natural Resources</strong></a> insights, <a href="https://www.vaneck.com/us/en/subscribe/" title="Subscription Center"><strong>sign up in our subscription center</strong></a>.</p>
]]></content:encoded>
</item><item rdf:about="https://www.vaneck.com/us/en/blogs/income-investing/higher-yield-and-diversification-with-floating-rate-opportunities/">
  <title>Higher Yield and Diversification with Floating Rate Opportunities></title>
  <link>https://www.vaneck.com/us/en/blogs/income-investing/higher-yield-and-diversification-with-floating-rate-opportunities/</link>
  <description><![CDATA[We answer your questions about the floating rate market and discuss unique income strategies to prepare you for what&rsquo;s ahead.]]></description>
  <dc:creator>Fran Rodilosso</dc:creator>
  <dc:date>07/11/2024 01:30:00</dc:date>
<content:encoded><![CDATA[

<p>With the Fed on hold and rates expected to remain higher for longer, floating rate instruments offer a way to generate higher yields while also providing diversification benefits within a core income portfolio. In our view, these are three compelling ways to gain exposure to floating rate instruments:</p>
<ol>
<li><a href="https://www.vaneck.com/us/en/investments/clo-etf-cloi/overview/" title="CLOI - VanEck CLO ETF - Holdings and Performance"><strong>Collateralized loan obligations (CLOs)</strong></a> can offer investors high yield potential with built-in risk protection</li>
<li>Corporate floating rate notes <a href="https://www.vaneck.com/us/en/investments/ig-floating-rate-etf-fltr/overview/" title="FLTR - VanEck IG Floating Rate ETF - Holdings and Performance"><strong>(FRNs)</strong></a> can be attractive as a high quality cash complement</li>
<li>Access the <a href="https://www.vaneck.com/us/en/investments/bdc-income-etf-bizd/overview/" title="BIZD - VanEck BDC Income ETF - Holdings and Performance"><strong> benefits of private credit through a liquid and diversified exposure</strong></a> such as business development companies (BDCs)</li>
</ol>
<p>In a <a href="https://www.vaneck.com/us/en/webinar-registration/?id=95082662336&amp;utm_source=vaneck&amp;utm_medium=calendar" title="Enhance Income Potential with Floating Rate Opportunities"><strong> recent webinar</strong></a>, VanEck&rsquo;s Bill Sokol and Coulter Regal discussed the outlook for these areas of the floating rate market with Fran Rodilosso, Portfolio Manager, Head of Fixed Income ETFs. See below for key highlights from the discussion.</p>
<h2>Current Environment and Outlook</h2>
<ul class="content-list">
<li class="mt-2"><strong>CLO spreads have rallied strongly, yields remain high</strong>. CLO spreads were above historical averages until recently. Overall yields remain significantly higher than historical averages, a reflection of the current environment of high short-term rates. (8:16)</li>
<li class="mt-2"><strong>Loan fundamentals remain strong</strong>. Leverage in the loan market is at four-year lows, and although average interest coverage has recently declined, it remains at very high levels relative to history. This fundamental backdrop suggests that issuing companies are in a position of relative strength. (10:51)</li>
<li class="mt-2"><strong>Defaults are increasing but remain subdued</strong>. In both the high yield bond and loan markets, there has not been a large increase in defaults&mdash;historically, defaults peak 1-2 years after the Fed stops hiking interest rates. (13:05)</li>
</ul>

<h2><strong>Collateralized Loan Obligations: Engineered for Income with Built-in Risk Protection (14:52)</strong></h2>
<ul class="content-list">
<li class="mt-2">A CLO is a portfolio of predominantly senior secured bank loans (aka leveraged loans) that is securitized and actively managed. CLOs are not just a hedge against rising rates. They also have historically provided higher levels of income for a lower level of risk &ndash; making a clear case for a strategic allocation.</li>
<li class="mt-2">CLOs are structured to help mitigate risk through the strength of their underlying collateral as well as built-in traits such as subordination, active management and the cashflow waterfall that is designed to ensure senior debt investors get paid first. This has historically helped them experience significantly lower default rates compared to corporate debt and other securitized products.</li>
<li class="mt-2">High yields and very low default rates have resulted in a track record of strong risk-adjusted returns versus other fixed income asset classes, particularly among investment grade rated CLO tranches.</li>
</ul>

<h2>Enhanced Yield Floating Rate Notes (FRNs) (41:27)</h2>
<ul class="content-list">
<li class="mt-2">FRNs have coupons that are based on a short-term base rate such as the Secured Overnight Funding Rate (SOFR), which reflects short-term funding costs, and an additional fixed spread that reflects the credit risk of the issuer.</li>
<li class="mt-2">In the current &ldquo;higher for longer&rdquo; environment, investment grade corporate floating rate notes may continue to offer an attractive combination of enhanced yields and safety. The floating rate nature of FRNs means they have low or negative correlation to rate-sensitive fixed income asset classes, such as Treasuries or fixed coupon investment grade bonds. This may allow FRNs to fulfill two primary roles that fixed income can have within a balanced portfolio: income and diversification.</li>
<li class="mt-2">Further, this is achieved without adding significant credit risk since the bonds carry investment grade ratings. This contrasts with leveraged loans, which provide higher yields but much higher credit risk.</li>
</ul>

<h2>Business Development Companies (BDCs): Access the Income Potential of Private Credit (45:43)</h2>
<ul class="content-list">
<li class="mt-2">BDCs are a compelling option for investors seeking exposure to the potential benefits of private credit without sacrificing the ability to access their capital when necessary.</li>
<li class="mt-2">BDCs generate income by lending to, and investing in, middle market companies in a variety of ways including equity, debt and hybrid financial instruments.</li>
<li class="mt-2">BDCs offer the same benefits as traditional private credit strategies &ndash; the potential for higher yields and diversification away from traditional stocks and bonds &ndash; but in a much more liquid form.</li>
</ul>

<p class="mt-2">Listen to a full replay of the discussion below.</p>

<p class="mt-2">To receive more <a href="/us/en/blogs/income-investing/" title="Income Investing Insights"><strong>Income Investing</strong></a> insights, <a href="/link/5f45412c2143400497908cea2897f7d3.aspx" title=" Subscription Center"><strong>sign up in our subscription center</strong></a>.</p>
]]></content:encoded>
</item><item rdf:about="https://www.vaneck.com/us/en/blogs/municipal-bonds/a-15-year-analysis-demographics-and-municipal-bonds/">
  <title>A 15-Year Analysis: Demographics and Municipal Bonds></title>
  <link>https://www.vaneck.com/us/en/blogs/municipal-bonds/a-15-year-analysis-demographics-and-municipal-bonds/</link>
  <description><![CDATA[Between 2008 and 2022, the U.S. population grew by 10%, with increases exclusively in the 55+ age brackets, raising the median age to 40 and impacting municipal bonds and the economy.]]></description>
  <dc:creator>Tamara  Lowin</dc:creator>
  <dc:date>07/10/2024 06:30:00</dc:date>
<content:encoded><![CDATA[

<p>Between 2008-2022, the U.S. population grew by 10%, an increase of 30 million people. Digging into the data during this 15-year period, the underlying changes in U.S. demographics are remarkable, impacting both the economy and municipal bond sectors. Understanding these demographic trends both explains what we currently see and prepares us for future impacts.</p>
<p>If you're still with us and haven&rsquo;t rushed off to the Census Bureau website to dive into the statistics (like us), stay tuned; we will publish a series of pieces that break down these demographic changes and the possible implications.</p>
<h2>Part 1: Median Age of the U.S. Population</h2>
<p>The population increase over the 15-year period occurred exclusively in the 55-and-older age brackets. Over this period, the U.S. median age increased by 2 years to 40 as those age brackets grew by 40%. &nbsp;We have already seen changes in demand due to an aging population, and the data suggests that the U.S. population will continue to age faster: the number of individuals 65+ doubled while the 55&ndash;65-year-old bracket increased by 25%. Both &ldquo;young states,&rdquo; like Utah, with a median age of 32, and &ldquo;old states,&rdquo; like Florida, with a median age of 43, saw their population of 55 and older residents increase by roughly 50% during this period.</p>
<h3>Recent Population Growth is Only Found in the 55+ Age Brackets</h3>
<p><img class="img-responsive w-100" src="https://www.vaneck.com/contentassets/cee6cdaeb22d43b3a63af82e7b6567bf/4627_muni_chart-1_2024-7_v1_blog.svg" alt="Recent Population Growth is Only Found in the 55+ Age Brackets" /></p>
<p class="chart-disclosure"><strong>Source</strong>: U.S. Census Bureau as of 2022.</p>

<p>While the aging population impacts the entire economy and municipal sectors, for this piece we focus on two:</p>
<p><strong>1. The Hospital Sector:</strong> The National Center for Health Statistics reports that 55&ndash;64-year-old individuals spend an average of 10 days per year in the hospital, while the 65+ cohort averages 17 days. Below 55-year-olds, the number of hospital days is dramatically lower.</p>
<p><strong>Our Analysis: </strong>Demand for hospital beds and healthcare professionals will continue to rise, straining hospital budgets further. Depending on the metropolitan service area, we expect an increase in healthcare mergers to improve financial efficiencies and combat growing demand.&nbsp; We expect a shift in demand for specializations that older adults rely upon the most like cancer and cardiology.&nbsp; Hospitals that receive significant revenues from Medicare and Medicaid will require more public funding to remain solvent.</p>
<p><strong>Investment Implications: </strong>Attracting medical professionals and accessing technology will help hospitals stand out as investment opportunities.&nbsp; We anticipate hospitals located in larger metropolitan areas being more successful in courting employees, rural hospitals will be at a disadvantage.&nbsp; We also expect teaching hospitals like Baylor Scott &amp; White and Geisinger Health System, to have an edge as the vanguards for new procedures that shorten hospital stays or eliminate bed demand altogether.&nbsp; Hospitals that provide a wide range of services, both inpatient and outpatient/clinic, will have increased flexibility and diverse revenue streams to stabilize overall performance.&nbsp; Finally, we favor states like Massachusetts and Washington that offer stronger support to their healthcare infrastructure, as we anticipate that their hospitals will fare better.</p>
<p><strong>2. Federal and Local Taxes:</strong> The Medicare and Social Security burden continues its unsustainable growth, while the U.S. Bureau of Labor Statistics reports that the number of employed persons increased by just 12%.&nbsp; Extrapolating from Census data we see that the ratio of individuals of employment age (25-64) to retirees (65+) changed from just above 4:1 to 3:1 over the past 15 years.</p>
<p><strong>Our Analysis: </strong>The aging population necessitates increased government support. The most likely source is the personal income tax rates, but changes in the tax treatment of other categories like capital gains, medical insurance premiums, mortgage interest (again), and potentially municipal bonds are among those that could be considered. &nbsp;Any increases in federal taxes reduce state and local governments&rsquo; headroom to raise taxes of their own.&nbsp; With the worker-to-retiree ratio already strained, states will need to figure out how to raise revenues without driving out their high earners and wealthy residents. Increased income tax rates would increase municipal bond demand, further driving performance.</p>
<p><strong>Investment Implications: </strong>&nbsp;State and local governments with a history of balanced budgets and healthy reserves are in a stronger position. Those that have done a better job of living within their means, like the State of Maryland or the City of Winston-Salem for example, now have increased flexibility and fewer hurdles to raise taxes and borrow debt. Per-person budget spending, as well as governments&rsquo; willingness and ability to make smart decisions, will be crucial. In addition, the security structure of these bonds must be carefully evaluated: ones that are lenient in the issuance of additional debt hold more risk as their revenue pool could become diluted.</p>
<p>All sectors will continue to feel the impact of the older median age as this trend continues. We will keep looking for credits that possess the flexibility to adjust to the changing needs of their population. We will continue to examine how demographic shifts are impacting states and cities, as well as other sectors, in future editions of our series.</p>
<p>By taking a diversified approach to the market, including through our wide range of <a href="https://www.vaneck.com/us/en/blogs/municipal-bonds/municipal-bond-etfs-expect-more-from-your-munis/" title="Municipal Bond ETFs &ndash; Expect More from Your Munis"><strong>municipal bond ETFs</strong></a>, investors can navigate these changing demographics and seize potential emerging opportunities.</p>
<p>To receive more <strong><a href="https://www.vaneck.com/us/en/insights/municipal-bonds/" title="Municipal Bonds Insights">Municipal Bonds</a></strong> insights, <strong><a href="https://www.vaneck.com/us/en/subscribe/" title="Subscription Center">sign up in our subscription center</a></strong>.</p>
]]></content:encoded>
</item><item rdf:about="https://www.vaneck.com/us/en/blogs/moat-investing/moat-stocks-steady-amid-techs-market-surge/">
  <title>Moat Stocks Steady Amid Tech’s Market Surge></title>
  <link>https://www.vaneck.com/us/en/blogs/moat-investing/moat-stocks-steady-amid-techs-market-surge/</link>
  <description><![CDATA[As U.S. equities climbed, Morningstar&rsquo;s Moat Index kept its value bias, offering a diversifier from concentration risk and the SMID Moat Index shifted from tech to materials and utilities as it seeks valuation opportunities.]]></description>
  <dc:creator>Coulter Regal, CFA</dc:creator>
  <dc:date>07/09/2024 06:30:00</dc:date>
<content:encoded><![CDATA[

<p>U.S. equities climbed higher in June as the S&amp;P 500 posted its seventh positive month out of the last eight. The broad market index rose more than 3% during the month to cap off what has been a strong first half of 2024. Notably though, and characteristic of what we have seen all year, June&rsquo;s gains were once again top-heavy, with just a handful of mega-cap tech names driving the majority of market performance. The Magnificent 7 (NVIDIA, Microsoft, Apple, Google, Tesla, Meta and Amazon) make up about 30% of the S&amp;P 500 and have accounted for 60% of the index&rsquo;s performance so far this year. Further illustrating this lopsided market is the equal-weighted S&amp;P 500, which was down half a percent in June and is trailing the market cap-weighted variant by 10 percentage points year to date.</p>
<p>The <strong><a href="/link/9e43dd198c5f4e419f13220685081895.aspx" title="MOAT - VanEck Morningstar Wide Moat ETF - Overview">Morningstar Wide Moat Focus Index</a></strong> (the &ldquo;Moat Index&rdquo;) finished flat during June, trailing the broader market but finishing ahead of the equal-weight S&amp;P 500 Index. Driving underperformance was the Moat Index&rsquo;s current value bias and structural underweight to the Magnificent 7, which comprises only 4.5% of the Moat Index by way of Alphabet, Amazon and Microsoft. The Index&rsquo;s differentiated exposure, while susceptible to periods of underperformance at times, has historically provided impressive long-term performance and can serve as a useful diversifier away from the concentration risk present in today&rsquo;s market.</p>
<p>Companies on the smaller end of the market cap spectrum were notable laggards in June, with small- and mid-cap benchmarks down 2.38% and 1.58% during the month, respectively. The <strong><a href="/link/166321dbcfec440590fb51cf0ad629aa.aspx" title="SMOT - VanEck Morningstar SMID Moat ETF - Overview">Morningstar U.S. Small-Mid Cap Moat Focus Index</a></strong> (the &ldquo;SMID Moat Index&rdquo;) fared slightly better, down only 98 basis points during the month. The higher for longer interest rate regime has weighed on small-cap performance so far this year, but the expected commencement of easier monetary policy in the second half of the year may put some wind at the back of this cohort.</p>
<h3>Mega-cap Tech Dominated Indexes Lead at the Half | As of 6/30/2024</h3>
<p><img class="img-responsive w-100" src="https://www.vaneck.com/contentassets/7311fb2c76da456b8a8295d4d1fa51d0/4626_moat-smot_chart-1_2024-7_v1_blog.svg" alt="Mega-cap Tech Dominated Indexes Lead at the Half | As of 6/30/2024" /></p>
<p class="chart-disclosure"><strong>Source: Morningstar. As of 6/30/2024</strong>. Past performance is no guarantee of future results. Index performance is not representative of fund performance. It is not possible to invest directly in an index. Fund performance current to the most recent month end is available by visiting vaneck.com or by calling 800.826.2333.</p>
<h2 id="moat-index-review" class="jump-link-nav anchored-block" data-jumplink-title="Moat Index Review">Moat Index Quarterly Review Highlights: Staying the Course as Valuations Lead the Way</h2>
<p>Both the Moat and SMID Moat Indexes underwent quarterly reviews on June 21, 2024. Each quarter they systematically target the most attractively priced, high quality U.S. companies within their respective universes. Below are a few takeaways from the reviews and how the indexes are now positioned. Full results of the most recent quarterly reviews are available here: <strong>Moat Index</strong> and <strong>SMID Moat Index</strong>.</p>
<p>Additionally, in our recent moat investing webinar, we provided more information on current positioning and recent performance, and members of Morningstar&rsquo;s equity research team shared their perspectives on market trends and the companies they cover. View the webinar replay here: <strong>Are Semiconductor Moats Worth the Price?</strong></p>
<p>The Moat Index entered 2024 with a contrarian bias toward large cap stocks (as opposed to the mega caps that dominate the S&amp;P 500 Index) and a very slight value posture. That bias has remained through the first two quarterly reviews of the year. The Moat Index remains notably underweight growth stocks relative to the S&amp;P 500, with core stocks that exhibit characteristics of both growth and value making up much of the difference. The recent exposure has reflected the valuation opportunities in the U.S. market among high quality, wide moat companies as the Index&rsquo;s systematic, rules-based process avoids the tendency to follow the crowd.</p>
<p>From a sector perspective, Financials exposure was reduced on the heels of a strong quarter (or strong several quarters in some cases) from banks. Allocations to Bank of America, Bank of New York Mellon, Charles Schwab and Wells Fargo were all removed or reduced. Offsetting the reduced Financials exposure were increases to areas like Consumer Staples, Industrials and Technology. Despite the increase in technology names, which came by way of software companies like Adobe, Autodesk and Fortinet, the sector still sits at a notable 14% underweight relative to the S&amp;P 500.</p>
<h3>Moat Index Sector Shifts Following 2Q 2024 Review</h3>
<p><img class="img-responsive w-100" src="https://www.vaneck.com/contentassets/740a2fad6cd54d908aae4d427654d787/4626_moat-smot_chart-2_2024-7_v1_blog.svg" alt="Moat Index Sector Shifts Following 2Q 2024 Review" /></p>
<p class="chart-disclosure"><strong>Source: Morningstar. As of 6/21/2024</strong>. Index performance is not representative of fund performance. It is not possible to invest directly in an index.</p>
<h2>U.S. Equity Exposure Without the Lofty Valuations</h2>
<p>The price/fair value ratio of the S&amp;P 500 Index currently sits at 1.05. This implies that the companies in the S&amp;P 500 are, overall, trading at approximately a 5% premium, according to Morningstar. This presents a challenge for investors looking to deploy cash into U.S. markets that have already appreciated by more than 15% this year. The Moat Index represents high quality companies currently mispriced by the market, in Morningstar&rsquo;s view. It allows investors to consider a mix of well-positioned companies with upside potential. Currently, the Morningstar price/fair value ratio of the Moat Index is 0.81, implying a 19% discount to fair value.</p>
<h2 id="smid-moat-index-review" class="jump-link-nav anchored-block" data-jumplink-title="SMID Moat Index Review">SMID Moat Index Highlights: Materials and Utilities Replace Expensive Tech</h2>
<p>In the latest quarterly update, the shift in the SMID Moat Index saw a notable reallocation from expensive technology stocks to more traditional sectors like Materials and Utilities. Technology stocks experienced the most substantial sector change, decreasing by 3.9%, with nine companies, of which five were semiconductor companies, exiting the index. As a result, technology's representation in the index has reduced to 12%, which is slightly below the sector's weight in the Russell 2500 index.</p>
<p>Conversely, the Materials and Utilities sectors witnessed increases, rising by 2.2% and 1.5% respectively. New additions to the index include prominent companies like Scots Miracle-Gro, Corteva, WEC Energy, and Portland General Electric, among others. Following these additions, Materials and Utilities now represent 9% and 7% of the index, positioning them as overweights when compared to their presence in the Russell 2500. At the industry level, Electric Utilities have emerged as the largest overweight, contrasting with Regional Banks and Biotech, which are now the most significant underweights.</p>
<h3>SMID Moat Index Sector Shifts Following 2Q 2024 Review</h3>
<p><img class="img-responsive w-100" src="https://www.vaneck.com/contentassets/5bb86974f1854de69689ef378707bc49/4626_moat-smot_chart-3_2024-7_v1_blog.svg" alt="SMID Moat Index Sector Shifts Following 2Q 2024 Review" /></p>
<p class="chart-disclosure"><strong>Source: Morningstar. As of 6/21/2024</strong>. Index performance is not representative of fund performance. It is not possible to invest directly in an index.</p>
<h2>Valuation Opportunity within SMID Moats</h2>
<p>The weighted average price-to-fair value of the SMID Moat Index fell from 0.83 to 0.80 following the June review, signaling a 20% discount to Morningstar&rsquo;s fair value estimate. The broad-based Russell 2500 Index featured fairly priced valuations with a weighted average price-to-fair value ratio of slightly over 1.00, as of the same date.</p>

<h2 id="moat-index-top-contributors-and-detractors" class="jump-link-nav anchored-block" data-jumplink-title="Choose Your Moat">Choose Your Moat Strategy</h2>
<p>VanEck&rsquo;s suite of <strong><a href="https://www.vaneck.com/us/en/blogs/moat-investing/moat-investing-powered-by-morningstar/" title="Quality Companies at Attractive Prices">moat investing strategies</a></strong> is powered by Morningstar&rsquo;s equity research team, which seeks quality companies trading at attractive valuations. The below ETFs offer access to U.S. moat companies:</p>
<p><strong><a href="/link/9e43dd198c5f4e419f13220685081895.aspx" title="MOAT - VanEck Morningstar Wide Moat ETF - Overview">VanEck Morningstar Wide ETF (MOAT)</a>:</strong> companies with a wide moat rating, which means Morningstar believes the company is likely to sustain its competitive advantage for at least the next 20 years.</p>
<p><strong><a href="/link/166321dbcfec440590fb51cf0ad629aa.aspx" title="SMOT - VanEck Morningstar SMID Moat ETF - Overview">VanEck Morningstar SMID Moat ETF (SMOT)</a></strong>: small and mid-cap moat companies.<a href="https://www.vaneck.com/us/en/investments/morningstar-wide-moat-growth-etf-mgro/overview/" title="MGRO - VanEck Morningstar Wide Moat Growth ETF - Overview"></a></p>
<p>To receive more <strong><a href="https://www.vaneck.com/us/en/insights/moat-investing/" title="Moat Investing Insights">Moat Investing</a></strong> insights, <strong><a href="https://www.vaneck.com/us/en/subscribe/" title="Preference Center">sign up in our subscription center</a></strong>.</p>
]]></content:encoded>
</item><item rdf:about="https://www.vaneck.com/us/en/blogs/emerging-markets-bonds/hyem-etf-question-and-answer/">
  <title>HYEM ETF: Question and Answer></title>
  <link>https://www.vaneck.com/us/en/blogs/emerging-markets-bonds/hyem-etf-question-and-answer/</link>
  <description><![CDATA[High yield emerging markets corporate bonds can help investors generate higher yields without taking on additional credit risk compared to a more U.S. focused high yield allocation.]]></description>
  <dc:creator> </dc:creator>
  <dc:date>07/08/2024 06:30:00</dc:date>
<content:encoded><![CDATA[

<p>High yield (HY) emerging markets (EM) corporate bonds are a compelling investment opportunity that is often overlooked in a broader strategic asset allocation. In this Q&amp;A, we explore the size, composition and advantages of the EM high yield corporate bond market. We also provide insights into the risk profile of the asset class, performance drivers, and accessing exposure with the <strong><a href="https://www.vaneck.com/us/en/investments/emerging-markets-high-yield-bond-etf-hyem/overview/" title="HYEM - Emerging Markets High Yield Bond ETF - Holdings and Performance">VanEck Emerging Markets High Yield Bond ETF (HYEM)</a></strong>.</p>
<ul class="content-list">
<li><a href="#point-one"><strong>What is the size and composition of the high yield EM corporate bond market?</strong></a></li>
<li><a href="#point-two"><strong>Why invest in high yield EM corporates?</strong></a></li>
<li><a href="#point-three"><strong>What is the credit quality profile of EM high yield corporates?</strong></a></li>
<li><a href="#point-four"><strong>What are the major risk/performance drivers of high yield EM corporate bonds?</strong></a></li>
<li><a href="#point-five"><strong>How do high yield EM corporates fit within a portfolio?</strong></a></li>
<li><a href="#point-six"><strong>How can investors access high yield emerging markets corporate bonds?</strong></a></li>
<li><a href="#point-seven"><strong>How can investors buy VanEck ETFs?</strong></a></li>
</ul>
<h2 id="point-one" class="anchored-block">What is the size and composition of the high yield EM corporate bond market?</h2>
<p>The global high yield space has a market value of approximately $1.4 trillion, of which emerging markets issuers make up about 17%. The ICE BofA Diversified High Yield US Emerging Markets Corporate Plus Index tracks EM HY corporate bonds issued by companies across 48 countries and 20 sectors. Sector exposures within the EM HY corporate bond universe are shown below.</p>
<h3>High Yield EM Breakdown by Sector</h3>
<div class="wrapped-div">
<table style="width: 500px;">
<tbody>
<tr class="tbl-data">
<td class="tbl-header last">Sector</td>
<td class="tbl-header last text-right">Weight (%)</td>
</tr>
<tr class="tbl-data">
<td class="data-td data last text-left">Energy</td>
<td class="data-td data last text-right">19.9</td>
</tr>
<tr class="tbl-data">
<td class="data-td data last text-left">Banking</td>
<td class="data-td data last text-right">14.1</td>
</tr>
<tr class="tbl-data">
<td class="data-td data last text-left">Basic Industry</td>
<td class="data-td data last text-right">13.0</td>
</tr>
<tr class="tbl-data">
<td class="data-td data last text-left">Utility</td>
<td class="data-td data last text-right">8.3</td>
</tr>
<tr class="tbl-data">
<td class="data-td data last text-left">Transportation</td>
<td class="data-td data last text-right">5.7</td>
</tr>
<tr class="tbl-data">
<td class="data-td data last text-left">Real Estate</td>
<td class="data-td data last text-right">5.2</td>
</tr>
<tr class="tbl-data">
<td class="data-td data last text-left">Leisure</td>
<td class="data-td data last text-right">5.1</td>
</tr>
<tr class="tbl-data">
<td class="data-td data last text-left">Local-Authority</td>
<td class="data-td data last text-right">4.6</td>
</tr>
<tr class="tbl-data">
<td class="data-td data last text-left">Telecommunications</td>
<td class="data-td data last text-right">4.0</td>
</tr>
<tr class="tbl-data">
<td class="data-td data last text-left">Financial Services</td>
<td class="data-td data last text-right">3.6</td>
</tr>
</tbody>
</table>
</div>
<br />
<style>
.data-td.data {
        padding-right: 2px !important;
    }
    .wrapped-div {
        max-width: 100%;
    }

    @media (max-width: 768px) {
        .wrapped-div {
            overflow-x: scroll;
        }
    }

    .wrapped-div-sector {
        max-width: 100%;
        overflow-x: scroll;
    }
</style>
<p class="chart-disclosure">Source: ICE Data Indices as of 5/31/2024.</p>
<h2 id="point-two" class="anchored-block">Why invest in high yield EM corporates?</h2>
<p>Investing in high yield EM corporates can provide several benefits within a broader high yield portfolio, including yield pickup, higher quality and diversification benefits. A yield comparison versus other fixed income asset classes is shown below.</p>
<h3>Higher Yields Than US, Global and Other EM Fixed Income</h3>
<p><img class="img-responsive w-100" src="https://www.vaneck.com/contentassets/705e9aa0e0474561905fa7bc0f589b2a/4610_hyem-faq-june_chart-01_2024-7_v1_blog.svg" alt="Higher Yields Than US, Global and Other EM Fixed Income" /></p>
<p class="chart-disclosure">Source: ICE Data Indices, LLC and J.P. Morgan as of 3/31/2024. EM High Yield Corp: ICE BofA Diversified High Yield US Emerging Markets Corporate Plus Index; Local Currency EM Sovereign: J.P. Morgan GBI-EM Global Diversified; USD EM Sovereign: J.P. Morgan EMBI Global Diversified; U.S. High Yield Corp: ICE BofA U.S. High Yield Index; US IG Corp: ICE BofA Corporate Bonds Index; US Agg: ICE BofA US Broad Market Index; Global Agg: ICE BofA Global Broad Market Index. Yield to Worst measures the lowest of either yield.</p>
<p>Emerging markets companies generally must pay higher yields compared to developed markets corporates to compensate investors for the risks associated with investing in emerging markets. However, some of this perceived risk is related to a &ldquo;stigma&rdquo; that EM issuers must overcome, rather than a riskier credit profile. For example, even at the same rating level, EM issuers generally pay a premium. Further, compared to U.S. HY bond issuers, EM HY corporate bonds have a higher tilt to BB rated bonds and conversely, a lower exposure to single B and CCC issuers. In addition, high yield EM issuers have historically exhibited lower levels of leverage (given their higher spreads), which translates to a higher spread per unit of leverage. In other words, high yield EM corporate bond investors are being paid <em>more</em> to take <em>less</em> risk compared to U.S. high yield bond investors.</p>
<h3>High Yield EM Bonds Offer Attractive Compensation for Risk</h3>
<p><img class="img-responsive w-100" src="https://www.vaneck.com/contentassets/2e68d36473ef4644bf18cd8aa3e61efe/4610_hyem-faq-june_chart-02_2024-7_v1_blog.svg" alt="High Yield EM Bonds Offer Attractive Compensation for Risk" /></p>
<p class="chart-disclosure">Source: BofA Research, as of 12/31/2023. EM HY is represented by ICE BofA High Yield US Emerging Markets Liquid Corporate Plus Index; US HY is represented by ICE BofA US High Yield Index.</p>
<p>Adding EM high yield corporate bond exposure can therefore allow investors to generate higher yields without taking on additional credit risk compared to a more U.S. focused high yield allocation.</p>
<h2 id="point-three" class="anchored-block">What is the credit quality profile of EM high yield corporates?</h2>
<p>The overall credit quality of the bonds held in the HY EM corporate bond index is higher than that of U.S. HY bonds (as represented by the ICE BofA U.S. High Yield Index), with a higher weighting to BB rated bonds and a lower weighting to single B and below rated bonds. EM high yield corporate bonds have historically exhibited a similar annual average default rate versus U.S. HY corporate bonds (note: the relatively high default rate in 2022 was primarily due to Russian issuers and companies in the Chinese property sector).</p>
<h3>Emerging Markets HY Bonds Tilt to Higher Quality</h3>
<p><img class="img-responsive w-100" src="https://www.vaneck.com/contentassets/f945caa1a97f42e89487335b5d680862/4610_hyem-faq-june_chart-03_2024-7_v1_blog.svg" alt="Emerging Markets HY Bonds Tilt to Higher Quality" /></p>
<p class="chart-disclosure">Source: FactSet and ICE Data Indices, LLC as of 5/31/2024. EM High Yield Corp Bonds: ICE BofA Diversified High Yield US Emerging Markets Corporate Plus Index; U.S. High Yield Corporate Bonds: ICE BofA U.S. High Yield Index. Yield to Worst measures the lowest of either yield</p>

<h2 id="point-four" class="anchored-block">What are the major risk/performance drivers of high yield EM corporate bonds?</h2>
<p>High yields (due to significant credit spreads, i.e., the differential between HY EM bonds and risk-free benchmarks such as U.S. treasuries) are the primary return contributor for HY EM corporate bonds. Investors benefit from the high level of interest that can be earned by holding these bonds. However, movements in spreads can introduce price volatility. Although investors benefit from a decline in credit spreads, which may reflect lower perceived risk implied by market pricing, bond prices will decline if spreads widen. In periods of stress, high yield credit spreads can widen significantly.</p>
<p>In addition to credit spreads, the direction of U.S. interest rates will also impact returns because the bonds are denominated in U.S. dollars. A decline in interest rates results in higher bond prices, increasing total returns, while an increase in U.S. interest rates will detract from total return. Investing in EM corporates also involves unique risk drivers, such as political instability in emerging markets, which can lead to changes in economic policies and regulatory environments that impact corporate profits. HY EM corporate issuers may also have currency risk, as fluctuations in their local currency against the U.S. dollar can affect their ability to repay debt. Additionally, EM corporates often operate in less mature and less transparent markets, which can increase both credit and liquidity risks.</p>
<h2 id="point-five" class="anchored-block">How do high yield EM corporates fit within a portfolio?</h2>
<p>An allocation to high yield EM corporates can allow investors to build a higher-yielding, more complete global high yield portfolio that provides exposure to emerging markets growth opportunities. High yield emerging markets corporate bonds are not represented in U.S. high yield bond benchmarks, which creates significant diversification potential. Second, HY EM corporates allow investors to capitalize on the growth potential within EM, as many of these countries have shown higher growth rates than developed markets. EM corporates that derive most of their revenue in these higher growth countries may potentially benefit from higher corporate earnings and improved fundamentals. Moreover, HY EM corporates can serve as a complement to EM equities, offering potentially lower volatility and a different risk-return profile. Alongside an EM equity allocation, EM corporate bond exposure can allow investors to capture EM growth opportunities, while generating attractive income and lowering the volatility of an overall EM allocation.</p>
<div class="wrapped-div">
<table style="width: 90%;">
<tbody>
<tr class="tbl-data">
<td class="tbl-header last" style="width: 100%;" colspan="5">10Y Risk/Return Characteristics</td>
</tr>
<tr class="tbl-data">
<td class="data-head last">&nbsp;</td>
<td class="data-head last text-right">Return (%)</td>
<td class="data-head last text-right">St Dev</td>
<td class="data-head last text-right">Max Drawdown</td>
<td class="data-head last text-right">Sharpe Ratio</td>
</tr>
<tr class="tbl-data">
<td class="data-td last">ICE Div HY EM Corp +</td>
<td class="data-td data last text-right">3.3</td>
<td class="data-td data last text-right">9.5</td>
<td class="data-td data last text-right">-26.3</td>
<td class="data-td data last text-right">0.23</td>
</tr>
<tr class="tbl-data">
<td class="data-td last">MSCI EM</td>
<td class="data-td data last text-right">2.7</td>
<td class="data-td data last text-right">17.2</td>
<td class="data-td data last text-right">-36.0</td>
<td class="data-td data last text-right">0.15</td>
</tr>
</tbody>
</table>
</div>
<br />
<p class="chart-disclosure">Source: Morningstar as of 5/31/2024. EM HY Corp is represented by ICE BofA Diversified High Yield US Emerging Markets Corporate Plus Index; EM Equities is represented by MSCI Emerging Markets Index.</p>

<br />
<h2 id="point-six" class="anchored-block">How can investors access high yield emerging markets corporate bonds?</h2>
<p>The <strong><a href="https://www.vaneck.com/us/en/investments/emerging-markets-high-yield-bond-etf-hyem/overview/" title="HYEM - VanEck Emerging Markets High Yield Bond ETF - Holdings and Performance">VanEck Emerging Markets High Yield Bond ETF (HYEM<sup>&reg;</sup>)</a></strong> seeks to replicate the price and yield performance of the ICE BofA Diversified High Yield US Emerging Markets Corporate Plus Index (EMLH), which consists of U.S. dollar-denominated bonds issued by non-sovereign emerging markets issuers that are rated below investment grade and that are issued in the major domestic and Eurobond markets.</p>
<h2 id="point-seven" class="anchored-block">How can investors buy VanEck ETFs?</h2>
<p><strong><a href="https://www.vaneck.com/us/en/investments/emerging-markets-high-yield-bond-etf-hyem/overview/#how-to-buy-etf&amp;utm=HYEM-Blog" title="How to buy VanEck ETFs?"> Learn more here.</a></strong></p>
<p class="d-none d-lg-block"><a href="mailto:askvaneck@vaneck.com" title="Have More Questions? - Ask VanEck" rel="noopener"><img class="img-responsive" src="https://www.vaneck.com/globalassets/home/us/insights/blogs/bm-blog-images/cta-faq_desktop-02.svg" alt="Have More Questions? - Ask VanEck" /></a></p>
<p>To receive more&nbsp;<strong><a href="https://www.vaneck.com/us/en/insights/emerging-markets-bonds/" title="Emerging Markets Bonds Insights">Emerging Markets Bonds</a></strong>&nbsp;insights,&nbsp;<strong><a href="https://www.vaneck.com/us/en/subscribe/" title="Subscription Center">sign up in our subscription&nbsp;center</a></strong>.</p>
<style>
.data-td.data {
        padding-right: 2px !important;
    }
    .wrapped-div {
        max-width: 100%;
    }

    @media (max-width: 768px) {
        .wrapped-div {
            overflow-x: scroll;
        }
    }

    .wrapped-div-sector {
        max-width: 100%;
        overflow-x: scroll;
    }
</style>
]]></content:encoded>
</item><item rdf:about="https://www.vaneck.com/us/en/blogs/emerging-markets-equity/how-indias-digital-economy-compares-to-china/">
  <title>How India’s Digital Economy Compares to China></title>
  <link>https://www.vaneck.com/us/en/blogs/emerging-markets-equity/how-indias-digital-economy-compares-to-china/</link>
  <description><![CDATA[The compelling investment opportunity in India's consumer internet sector is driven by a combination of supportive infrastructure, favorable regulatory conditions, and a burgeoning startup ecosystem.]]></description>
  <dc:creator>Angus Shillington</dc:creator>
  <dc:date>07/05/2024 06:30:00</dc:date>
<content:encoded><![CDATA[

<p>In the consumer internet sector, major markets such as the U.S., Europe, China, and India have each followed broadly similar development patterns, focusing on payments, e-commerce, gaming, search, and social media. However, distinct regulatory and competitive dynamics in these regions have created unique investment landscapes. While the industry's major players have become well-established in China, India's consumer internet sector remains nascent, offering varied investment prospects compared to its more mature counterpart in China.</p>
<h2>Market Dynamics and Competitive Landscapes</h2>
<p>In China, major platforms like Alibaba, Tencent, and Baidu offer extensive service ecosystems and dominate the market. However, these companies face heightened regulatory intervention, intense competition and slowing consumption growth, which impacts their long-term growth and investment appeal, in our view. Chinese tech companies are now trying to improve investor sentiment through cost-cutting and stock repurchases in the face of fundamental growth challenges.<sup>1</sup></p>
<p>India's tech landscape presents a stark contrast, with a fragmented market structure that encourages competition and boasts numerous innovative startups. India's digital economy is defined by its favorable demographics, impactful policy decisions, a large informal economy, and deep inefficiencies, along with distinct regulatory frameworks. These factors suggest a future market structure and investment landscape markedly different from China's. The chart below shows how a thriving ecosystem has already emerged, contrasting China's tech landscape which is now characterized by a small number of platform companies.</p>
<h3>India&rsquo;s Robust Tech Landscape Spans Multiple Sub-Industries</h3>
<p><img class="img-responsive w-100" src="https://www.vaneck.com/contentassets/3eda24e720d04f73ba973bd590b95a68/4604_dgin-india-blog-june_infographic-1_2024-06_v1_blog.svg" alt="India's Robust Tech Landscape" /></p>
<p class="chart-disclosure">Source: Antler as of March 2023.</p>
<h2>Performance Analysis: India Tech is Outperforming China</h2>
<p>Since 2022, Indian tech companies have notably outperformed their Chinese counterparts. This outperformance is likely due to the different stages of market maturity: India remains in a mass adoption phase with extensive digital growth potential, while China&rsquo;s mature market is contending with sometimes unpredictable regulatory measures and slowing consumption growth.</p>
<h3>Returns Since 2022</h3>
<div class="wrapped-div">
<table style="width: 100%;">
<tbody>
<tr class="tbl-data">
<td class="tbl-header last">&nbsp;</td>
<td class="tbl-header last text-right">YTD</td>
<td class="tbl-header last text-right">1 Year</td>
<td class="tbl-header last text-right">Since Common Inception <strong>*</strong> &nbsp;</td>
</tr>
<tr class="tbl-data">
<td class="data-td last">MVIS Digital India NR USD</td>
<td class="data-td data last text-right">4.12</td>
<td class="data-td data last text-right">30.25</td>
<td class="data-td data last text-right">-0.63</td>
</tr>
<tr class="tbl-data">
<td class="data-td last">CSI Overseas China Internet PR USD</td>
<td class="data-td data last text-right">7.01</td>
<td class="data-td data last text-right">16.94</td>
<td class="data-td data last text-right">-7.98</td>
</tr>
</tbody>
</table>
</div>
<style type="text/css">
    .wrapped-div {
        max-width: 100%;
    }

    @media (max-width: 1240px) {
        .wrapped-div {
            overflow-x: scroll;
        }


    }
</style>
<p class="chart-disclosure"><sup>*</sup>&nbsp;Reflects annualized returns since 12/28/2021. Data as of May 31, 2024.</p>
<p>India's differentiated growth outlook is driven by its free-market structure and <strong><a href="https://www.vaneck.com/us/en/blogs/emerging-markets-equity/enabling-indias-digital-disruption/" title="Enabling India's Digital Disruption">Digital Stack</a></strong>, which ensures essential services like payments and KYC are free and universally accessible. This has so far prevented monopolistic moats around these functions that are prevalent in other markets. India&rsquo;s ubiquitous United Payments Interface (UPI) is a prime example of the success of the Digital Stack.</p>
<h3>Foundations of India Stack</h3>
<p><img class="img-responsive w-100" src="https://www.vaneck.com/contentassets/3eda24e720d04f73ba973bd590b95a68/4604_dgin-india-blog-june_infographic-2_2024-06_v1_blog.svg" alt="Foundations of indias stack" /></p>
<p class="chart-disclosure">Source: VanEck.</p>
<h2>Key Infrastructure and Startup Ecosystem Comparisons</h2>
<p>In China, early tech giants captured critical infrastructural niches, creating substantial barriers to entry. This had the ultimate effect of concentrating revenues and growth potential within a few key players (Tencent, Alibaba, Meituan, etc). In contrast, India's Digital Stack supports an environment where success hinges on competitive product offerings rather than control over platform-centric advantages and enables a level playing field. The presence of major e-commerce players like Meesho, Flipkart, and Amazon in India illustrates a competitive market not dominated by a single entity. In the chart below, note that Others represent nearly 20% of the universe.</p>
<h3>Competitive Platform Landscape with Many Players</h3>
<p><img class="img-responsive w-100" src="https://www.vaneck.com/contentassets/3eda24e720d04f73ba973bd590b95a68/4604_dgin-india-blog-june_chart-1_2024-06_v1_blog.svg" alt="Competitive Platform Landscape with Many Players" /></p>
<p class="chart-disclosure">Source: VanEck as of June 2024.</p>
<p>The comparative analysis of market concentration is highlighted by the weights of the top five holdings in the CSI Overseas China Internet Index versus the MVIS&reg; Digital India Index within their respective MSCI benchmark indexes. The data shows a significant increase in concentration in Chinese tech firms starting in 2020, in contrast to a more consistent diversification in India over time. Currently, the top five holdings of the CSI Overseas China Internet Index represent 33% of the MSCI China Index, while the top five holdings of the MVIS Digital India Index represent only 19% of the MSCI India Index. This concentration difference underscores the different market structures of the China and India digital ecosystems, with China being much more concentrated by a smaller number of large firms.</p>
<h3>India&rsquo;s Tech Market is Less Concentrated Compared to China</h3>
<p><img src="https://www.vaneck.com/contentassets/79cf11c1cf5448d79cc33e8723fb03de/4604_dgin-india-blog-june_chart-2_2024-06_v1_blog.svg" alt="India's Tech Market" /></p>
<p class="chart-disclosure">Source: VanEck, Factset as of June 2024.</p>

<h2>India&rsquo;s Hands-Off Regulatory Environment</h2>
<p>Within the consumer internet and tech sector, India&rsquo;s market- and demand-driven economy contrasts China&rsquo;s, which many investors view as being more centrally controlled and prone to unforeseen regulation. Indian regulators have adopted a more hands-off approach, relying more on competitive market forces to determine industry winners and losers. The current Indian administration has preemptively reduced the need for disruptive interventions, fostering a healthier investment climate, largely credited to India&rsquo;s Digital Stack.</p>
<p>On the other hand, Chinese regulators are seen as being unpredictable, especially towards the tech sector, and vacillating between too much regulation and not enough. Starting in 2020, the Chinese government implemented a regulatory crackdown that spanned antitrust, data, and labor regulations, in addition to imposing massive fines on tech giants for anti-competitive business practices. The unprecedented new regulations and enforcement led to a steep selloff in Chinese tech and somewhat negative sentiment for Chinese tech stocks since the regulations were announced.</p>
<p>Going forward, India&rsquo;s market structure and differing regulatory philosophy are likely to support a more vibrant and diverse digital enterprise landscape in India, regulated more by market forces and competition rather than heavy-handed government control.</p>
<h2>Accessing India&rsquo;s Tech Growth</h2>
<p>The compelling investment opportunity in India&rsquo;s consumer internet sector is driven by a combination of supportive infrastructure, favorable regulatory conditions, and a burgeoning startup ecosystem. We believe this positions India as a more attractive investment destination compared to China for the digital opportunity set, offering substantial growth and innovation potential in the coming years.</p>
<p>For investors looking to capitalize on the dynamic growth potential of India's tech sector, the <strong><a href="https://www.vaneck.com/us/en/investments/digital-india-etf-dgin/overview/" title="DGIN - VanEck Digital India ETF - Overview">VanEck Digital India ETF (DGIN)</a></strong> offers a strategic entry point. This ETF provides exposure to a diverse array of companies thriving within India&rsquo;s supportive digital infrastructure and regulatory environment.</p>
<p>To receive more <a href="/us/en/insights/emerging-markets-equity/" title="Emerging Markets Equity Insights"><strong>Emerging Markets Equity</strong></a> insights, <a href="/us/en/subscribe/" title="Subscription Center"><strong>sign up in our subscription center</strong></a>.</p>
]]></content:encoded>
</item><item rdf:about="https://www.vaneck.com/us/en/blogs/digital-assets/matthew-sigel-vaneck-crypto-monthly-recap-for-june-2024/">
  <title>VanEck Crypto Monthly Recap for June 2024></title>
  <link>https://www.vaneck.com/us/en/blogs/digital-assets/matthew-sigel-vaneck-crypto-monthly-recap-for-june-2024/</link>
  <description><![CDATA[Digital assets dropped as trading volumes and volatility hit yearly lows. Despite weak prices, daily active addresses on Layer 1 blockchains hit a new high, and regulatory rulings favored Binance and potential ether ETPs.]]></description>
  <dc:creator>Matthew  Sigel</dc:creator>
  <dc:date>07/05/2024 06:30:00</dc:date>
<content:encoded><![CDATA[

<p><strong>Please note that VanEck may have a position(s) in the digital asset(s) described below.</strong></p>
<p>Digital assets slumped in June as trading volumes and volatility followed seasonal patterns and fell to year-to-date lows. The German and U.S. governments moved long-dormant bitcoin (about $500M) onto crypto exchanges, presumably for sale, ahead of a likely distribution of Mt. Gox bankruptcy claims to creditors as large as 142,000 bitcoin, worth about $9B at current prices. We also noticed a substantial pickup (+45% m/m) in Bitcoin miners&rsquo; transfers to crypto exchanges, adding to the spot selling pressure, as U.S.-based miners accelerated their transition to AI and high-performance compute (HPC) with core mining economics suffering in the wake of the Bitcoin halving. Meanwhile, Ethereum&rsquo;s new pricing model is causing additional ETH inflation, which is a worrying change in the market structure.</p>
<p>Bitcoin and Ethereum slumped 10% for the month vs. the S&amp;P 500 and Nasdaq Composite, up 4% and 6%, respectively. Bitcoin miners were the big winners in June (+15%), while small-caps (-25%), infrastructure leaders (-25%) and DeFi (-18%) lagged.</p>
<ul class="content-list">
<li><strong><a href="#upcoming-token-unlocks">Upcoming Token Unlocks</a></strong></li>
<li><strong><a href="#ethereum-and-ethereum-L2s-update">Ethereum and Ethereum L2s Update</a></strong></li>
<li><strong><a href="#solana-and-bitcoin-L2s-update">Solana and Bitcoin L2s Update</a></strong></li>
<li><strong><a href="#notable-performers-ton-and-tron">Notable Performers: TON and TRON</a></strong></li>
<li><strong><a href="#notable-laggard-near">Notable Laggard: NEAR</a></strong></li>
</ul>
<p>Despite the weak price action, total daily active addresses of Layer 1 blockchains made a new all-time high in June at 11.7 million, bitcoin funding rates rebounded to 5%, and we observe a significant $10B in short liquidations possible should Bitcoin regain $74k. Also, at month-end, DC federal judge Amy Jackson dismissed charges against Binance for the secondary sales of unregistered securities. This ruling cited Judge Analisa Torres&rsquo; 2023 ruling in the SEC&rsquo;s case against Ripple Labs. Coupled with the likely listing of spot ether ETPs (exchange-traded products), the SEC&rsquo;s initial hostility to proof-of-stake coins is being whittled away by the courts.</p>
<h3>Price Returns</h3>
<div class="wrapped-div">
<table style="width: 100%;">
<tbody>
<tr class="tbl-data">
<td class="tbl-header last text-center">&nbsp;</td>
<td class="tbl-header last text-right">June</td>
<td class="tbl-header last text-right">YTD</td>
</tr>
<tr class="tbl-data">
<td class="data-td last">Coinbase</td>
<td class="data-td data last text-right">-2%</td>
<td class="data-td data last text-right">+213%</td>
</tr>
<tr class="tbl-data">
<td class="data-td last">Bitcoin</td>
<td class="data-td data last text-right">-10%</td>
<td class="data-td data last text-right">+44%</td>
</tr>
<tr class="tbl-data">
<td class="data-td last">MarketVector Smart Contract Leaders Index</td>
<td class="data-td data last text-right">-14%</td>
<td class="data-td data last text-right">+8%</td>
</tr>
<tr class="tbl-data">
<td class="data-td last">MarketVector Infrastructure Application Leaders Index</td>
<td class="data-td data last text-right">-24%</td>
<td class="data-td data last text-right">-7%</td>
</tr>
<tr class="tbl-data">
<td class="data-td last">MV Global Digital Assets Equity Index</td>
<td class="data-td data last text-right">+18%</td>
<td class="data-td data last text-right">+15%</td>
</tr>
<tr class="tbl-data">
<td class="data-td last">MarketVector Decentralized Finance Leaders Index</td>
<td class="data-td data last text-right">-18%</td>
<td class="data-td data last text-right">+3%</td>
</tr>
<tr class="tbl-data">
<td class="data-td last">Ethereum</td>
<td class="data-td data last text-right">-11%</td>
<td class="data-td data last text-right">+46%</td>
</tr>
<tr class="tbl-data">
<td class="data-td last">Nasdaq Index</td>
<td class="data-td data last text-right">+6%</td>
<td class="data-td data last text-right">+18%</td>
</tr>
<tr class="tbl-data">
<td class="data-td last">S&amp;P 500 Index</td>
<td class="data-td data last text-right">+3%</td>
<td class="data-td data last text-right">+15%</td>
</tr>
<tr class="tbl-data">
<td class="data-td last">MarketVector Meme Coin Index</td>
<td class="data-td data last text-right">-30%</td>
<td class="data-td data last text-right">-NA</td>
</tr>
</tbody>
</table>
</div>
<br />
<h3>Layer 1 Blockchain Daily Active Addresses Hit New Highs</h3>
<p><img class="w-100 img-responsive" alt="Layer 1 Blockchain Daily Active Addresses Hit New Highs" src="https://www.vaneck.com/contentassets/5d552f3e83644c85aca80f68054581f1/4614_scl-june_chart-1_2024-7_v1_blog.svg" /></p>
<p class="chart-disclosure"><strong>Source:</strong> Artemis XYZ as of 6/27/2024. <strong>Past performance is no guarantee of future results. Not intended as a recommendation to buy or sell any securities named herein.</strong></p>
<p>In June, the Layer 1 blockchain we track collectively lost 11% of its market cap or around $237B in total value. Despite the price reaction, some fundamentals were surprisingly robust. On-chain average Daily Active Addresses (DAA) reached a new high at 11.7M, surpassing the previous high of 10.9M in May 2024. Layer 1 revenues rose (+20%) month-to-month. And though DEX volumes fell (-7.1%), stablecoins on-chain increased (+1.5%). TVL fell (-9.2%) but by less than the DeFi tokens themselves, which underperformed and, as a category, fell 18% (the majority of TVL in DeFi is ETH &amp; more volatile crypto tokens).</p>
<h2 id="upcoming-token-unlocks" class="jump-link-nav anchored-block" data-jumplink-title="Token Unlocks">Upcoming Token Unlocks</h2>
<p>The current chief focus on the crypto &ldquo;navel-gazoooor&rdquo; is the large amount of upcoming token unlocks. This is a symptom of the greater phenomenon of crypto projects initially releasing a small part of their total supply of tokens. The typical justification, with a strong rationale for helping a project succeed, is that many projects hold tokens in reserve to incentivize community behavior far into the future. This strategy results in only limited amounts of tokens being released to the community during the initial phases of a project&rsquo;s launch. Additionally, projects stagger the release of tokens to both community members and investors because they want to decrease the selling pressure on price from those unlocked tokens being sold. As crypto market pricing is hardly efficient yet, the mechanical activity of selling large volumes of unlocked tokens into a market depresses prices with higher volatility, a vicious combination for any manager. The result is that projects often engage in tactics to ensure that tokens are not market-sold by participants. Most of the methods that projects employ to prevent selling revolve around promising incentives for &ldquo;locking&rdquo; tokens over long periods of time. These periods are sometimes four years long; the longer the lock, the greater the reward. This is believed to be justified because reducing sellable supply will allow price support to build while the project&rsquo;s revenues and credibility solidify over time.</p>
<p>This practice, though common, is highly controversial. Many projects like Ethereum released most of their supply relatively quickly. Some market observers contend that the token supply games are simply a cynical ploy by crypto companies to build massive valuations driven by manipulative trading practices. These critics claim that the more unsavory projects partner with shady market makers to &ldquo;paint&rdquo; prices higher and that doing this is much easier if there is very little floating token supply to sell. The game, the critics claim, anchors crypto traders to artificially high prices that persist as team and investor tokens unlock, allowing the teams and investors to sell at higher prices than if token prices started low. Ammunition to these critics is ample as some crypto projects have seemingly engaged in this activity while allowing their team members and certain investors to have earlier unlocks than others. Additionally, all but the most sophisticated crypto investors cannot track these token unlocks, and often, the unlocks are not guaranteed by smart contracts but are guarded only by the honesty of individuals.</p>
<p>Although a troubling practice, thankfully, such behavior is not super common. But there is enough of it to justify the compulsion of projects to detail their unlock schedules more accurately, how those schedules are enforced, and where token balances that will unlock sit (so they can be tracked). It would be even more helpful if investor balances were publicly flagged so that anyone could track their wallets to ensure the locked token holders keep their word. Additionally, everyone in crypto should understand the benefits those locked tokens receive during the locking period, such as voting power and even token inflation. In TradFi, such transparency is often enforced by a self-regulatory organization (SRO) at the behest of a regulator.</p>
<p>Recently, the crypto markets have been sagging in part due to these token unlocks. Some participants have been zeroing in on the relatively dramatic number of tokens coming to market over the coming year. For example, in the period between June 17 and July 17, 2024, more than $740M in tokens will be unlocked. Many of these projects unlocking tokens do not have a substantial floating supply, and this deluge of tokens will depress prices. Some example projects unlocking include Aptos and Arbitrum, each of which will have around $85M and $80M in sell pressure stemming from these unlocks in the coming 30 days. Aptos, whose current token supply is 356M worth $2.5B, will increase its floating supply to 682M tokens by January 1, 2025. Current prices imply $2.3B of token supply that will materialize over the next 5 months. While most investors in a strong project like Aptos may not sell recklessly, the potential for that unlocked supply to be sold worries many and causes underperformance.</p>
<h3>Aptos Floating Supply More Than Doubles in 2024</h3>
<p><img class="w-100 img-responsive" alt="Aptos Floating Supply More Than Doubles in 2024" src="https://www.vaneck.com/contentassets/5d552f3e83644c85aca80f68054581f1/4614_scl-june_chart-2_2024-7_v1_blog.svg" /></p>
<p class="chart-disclosure"><strong>Source: <a href="https://aptosfoundation.org/currents/aptos-tokenomics-overview" title="Aptos Tokenomics Overview" target="_blank" rel="noopener">Aptos Foundation</a></strong> as of 6/27/2024. <strong>Past performance is no guarantee of future results. Not intended as a recommendation to buy or sell any securities named herein.</strong></p>
<h2 id="ethereum-and-ethereum-L2s-update" class="jump-link-nav anchored-block" data-jumplink-title="Ethereum L2s">Ethereum and Ethereum L2s Update</h2>
<p>Ethereum fell 11% in June, modestly outperforming most Layer 1 tokens. We have seen increasing amounts of activity migrate to Ethereum&rsquo;s Layer-2 blockchains (L2s). This is evidenced by Ethereum&rsquo;s declining share of DEX Volumes relative to its L2 blockchains. Though Ethereum&rsquo;s blockchain still holds most of DEX activity, Ethereum&rsquo;s scaling design intends to push more of its activity out to the peripheral Layer-2 blockchains. Ethereum&rsquo;s role in the future is to be a trusted layer where these L2 blockchains settle their transactions and thus gain from Ethereum&rsquo;s security. One component of this design is to accept data from the Layer-2 blockchains. Ethereum is engineered to host L2 data in a special layer called &ldquo;blob space.&rdquo; Blob space was created due to an Ethereum software upgrade called EIP 4844 that enabled these batching transactions and priced blob space usage much cheaper than non-blob space transactions.</p>
<p>As blob space fees are intended to become the majority of Ethereum&rsquo;s revenues, blob space has become an important tracking metric. This shift of activity off of Ethereum, alongside the creation of blob space, has decreased the fees that Ethereum generates. Blob space can be thought of as the compression of thousands of transactions into one &ndash; the posting of the blob to Ethereum. The result is that Ethereum revenues have declined (-69%) in the 75 days since the creation of blob space through EIP 4844, compared to the 75 days before. This has led to a dramatic 90% or more decrease in transaction fees across Ethereum and its L2s.</p>
<p>The decline in fees has triggered renewed inflation in Ethereum&rsquo;s monetary system. Currently, around (+0.62%) is added to the supply of ETH each year due to network inflation. Prior to EIP 4844, ETH supply was declining around (-0.37%) annually due to the transaction burn (80% of fees) offsetting supply inflation. However, this renewed inflationary dynamic could be temporary, as Ethereum blob space activity began to surge at the end of June.</p>
<p>Block space pricing has the same dynamic as Ethereum&rsquo;s regular transaction pricing. Ethereum targets 50% usage of its blockchain, with fees rising exponentially if usage exceeds this target. Similarly, Ethereum aims for 3 blobs per block. If more blobs are submitted, posting costs can increase rapidly by 12.5% per block, where the number of blobs consecutively exceeds the target level of 3 blobs.</p>
<p>L2s can do many things to decrease the number of blobs they post, similar to how a company can manage its profit margins. However, as more L2s materialize and/or more activity happens on L2s, blob space pricing should still go up. Ethereum is just about creating the number of blocks needed to push pricing up exponentially.</p>
<h3>The Number of Blobs is Rising, but it Must Exceed 3 for &ldquo;Pricing Power&rdquo;</h3>
<p><img class="w-100 img-responsive" alt="The Number of Blobs is Rising, but it Must Exceed 3 for &ldquo;Pricing Power&rdquo;" src="https://www.vaneck.com/contentassets/5d552f3e83644c85aca80f68054581f1/4614_scl-june_chart-3_2024-7_v1_blog.svg" /></p>
<p class="chart-disclosure"><strong>Source: Dune @hildobby</strong> as of 6/27/2024.</p>
<p>In June, the Ethereum community solidified plans for its next major upgrade, 'Pectra.' Key changes include enabling account abstraction and increasing the maximum staking per validator from 32 ETH to 2048 ETH. Account abstraction will significantly improve user experience by allowing developers to create more intuitive environments. This includes web-based wallets and applications that pay gas fees for users, simplifying many pain points for new blockchain users.</p>
<p>The validator balance increase is more significant than many suppose and may even help the Ethereum scale. While Ethereum aims to be decentralized, the current network of more than 1M validators causes issues. It takes a long time for all these validators to see and respond to network changes like state updates (account balances and software changes). The upgrade to increase the staking limit per validator aims to consolidate multiple validators into one. This could result in a smaller network with 100-200k validators rather than 1m. Reducing the validator count may also pave the way for increasing Ethereum&rsquo;s transaction throughput by increasing block size or decreasing block time. This is because a smaller network, by validator count, should be able to process data more efficiently.</p>
<h3>Layer-2 Blockchains Have Grown Usership Massively</h3>
<p><img class="w-100 img-responsive" alt="Layer-2 Blockchains Have Grown Usership Massively" src="https://www.vaneck.com/contentassets/5d552f3e83644c85aca80f68054581f1/4614_scl-june_chart-4_2024-7_v1_blog.svg" /></p>
<p class="chart-disclosure"><strong>Source:</strong> Artemis XYZ as of 6/28/2024. <strong>Past performance is no guarantee of future results. Not intended as a recommendation to buy or sell any securities named herein.</strong></p>
<p>In Ethereum Layer-2 Blockchain news, the trend of activity migrating to Ethereum continues. However, this has yet to translate into momentum for the token prices of Ethereum Layer-2 Blockchains due to inflation. For example, usership on Arbitrum, Optimism, and Mantle have been up 358%, 73%, and 260%, respectively, since the beginning of the year. While ETH price is up (+46%) YTD, the Layer-2 token prices of MNT, ARB, and OP have returned (+24%), (-53%), and (-55%) in that order. We attribute this dynamic to a few different factors. First, ETH has had ETP-related demand. However, if we track returns before the ETP announcement on May 20, ARB and OP still lagged ETH prince increases at (-44%) and (-39%) respectively versus ETH at (+31%). Though Mantle&rsquo;s MNT token outperformed ETH before the ETP announcement (+46%), Starkware&rsquo;s STRK token was also down relative to ETH with a YTD (incepted on Feb 20) of (-46%). Before the ETH ETP, many assumed that Layer-2 blockchain tokens would act as higher beta price bets on ETH would outperform ETH after an ETP announcement.</p>
<h3>Every L2&rsquo;s Fees Has Declined More than Ethereum&rsquo;s YTD</h3>
<p><img class="w-100 img-responsive" alt="Every L2&rsquo;s Fees Has Declined More than Ethereum&rsquo;s YTD" src="https://www.vaneck.com/contentassets/5d552f3e83644c85aca80f68054581f1/4614_scl-june_chart-5_2024-7_v1_blog.svg" /></p>
<p class="chart-disclosure"><strong>Source: Artemis XYZ</strong> as of 6/28/2024. <strong>Past performance is no guarantee of future results. Not intended as a recommendation to buy or sell any securities named herein.</strong></p>
<p>We theorize that the status of L2 blockchains&rsquo; tokens, as well as L2s&rsquo; higher degree of revenue decline than Ethereum, have caused a significant amount of the price deterioration. On the first point, it&rsquo;s important to remember that Layer-2 tokens are hard-to-value governance tokens. Nearly all L2 tokens have no economic role in the financial systems of L2 blockchains. Though this dynamic may change in the future, the result is that the economic value of most L2 tokens remains uncertain for now. More clarity on the financial implications of L2 tokens would catalyze outsized responses to those token prices, and we will be closely observing the progress.</p>
<p>Regarding on-chain revenues, L2 revenues have fallen substantially more than Ethereum&rsquo;s revenues due to EIP 4844. This revenue underperformance has transpired despite more significant activity on L2s compared to Ethereum. With the exception of Base, which has no token (other than the COIN stock), every single L2 blockchain has lost revenue generation at a greater scale than Ethereum has since the beginning of the year and post-EIP 4844.</p>
<p>Why has this occurred? It&rsquo;s because of the aforementioned EIP 4844, which lowered fees on Ethereum. Initially, many hypothesized that EIP 4844 would reduce prices so dramatically on L2s that lots of users and their money would relocate to Ethereum&rsquo;s L2s. The result would be that the increased activity, alongside reduced costs of posting data to Ethereum (through data blobs), would enable L2s to increase profit margins. Though some supposed that L2s would see decreased topline revenues because of lowered prices to users, they would become more profitable because they could increase their margins. The follow-through would cause the outsized performance of L2 tokens.</p>
<p>What actually happened was that L2s, in price competition, reduced both their pricing and their margins on activity. At the same time, Ethereum saw renewed activity that helped its revenue generation decline less than the L2s. That renewed activity manifested as a result of cheaper fees on Ethereum spurred by EIP 4844. From a fundamental standpoint, we can attribute the price performance of ETH relative to its L2s not only to outside catalysts like the ETP but also to the decline in relative activity of the L2s. Finally, we also want to mention that L2 tokens suffer from the same previously mentioned issue with dilutionary supply coming to market. Arbitrum and Optimism have only unlocked 30% and 26% of the total supply. As many investors still holding those tokens may want to realize their gains, increases in floating tokens will likely translate into more significant selling pressure.</p>
<h2 id="solana-and-bitcoin-L2s-update" class="jump-link-nav anchored-block" data-jumplink-title="BTC and SOL L2s">Solana and Bitcoin L2s Update</h2>
<p>Outside of Ethereum, other Layer-2 narratives have been emerging. The Solana L2 Sonic, focused on gaming, recently announced a $12M raise. Meanwhile, the Bitcoin L2 narrative is beginning to solidify as Starkware announced $1M in prize money to teams that enable zero-knowledge proofs to be settled on Bitcoin. At the time of writing, more than 100 projects claimed to build Bitcoin Layer-2 solutions. For more details on how Bitcoin L2s work, please watch for our upcoming Bitcoin Price Target blog.</p>
<h3>Bitcoin TVL is Dominated by wBTC and Others Emerging</h3>
<p><img class="w-100 img-responsive" alt="Bitcoin TVL is Dominated by wBTC and Others Emerging" src="https://www.vaneck.com/contentassets/5d552f3e83644c85aca80f68054581f1/4614_scl-june_chart-6_2024-7_v1_blog.svg" /></p>
<p class="chart-disclosure"><strong>Source: <a href="https://defillama.com/chains/Bitcoin%20Sidechains" title="Bitcoin Sidechains TVL - DefiLlama" target="_blank" rel="noopener">Defillama</a></strong> as of 6/24/2024. <strong>Past performance is no guarantee of future results. Not intended as a recommendation to buy or sell any securities named herein.</strong></p>
<p>Another exciting development in June is Arweave&rsquo;s continued pivot to decentralized AI. Due to the launch of an AI coin called AO on Arweave, Arweave&rsquo;s TVL ($260) now exceeds that of NEAR ($213M) and Cardano ($241M). This activity stems from people bridging to utilize Arweave&rsquo;s AI protocol AO, which provides compute for AI projects like LLMs to run their logic on chain, within smart contracts. Another blockchain applying its blockchain to new use cases is NEAR, whose endeavor into Data Availability (DA) has led to the spinout of an internal project called Nuffle, which intends to provide the infrastructure for crypto projects to use NEAR as a DA layer. Nuffle was able to attract $13M in funding.</p>
<p>In the Solana ecosystem, following the launch of Tiplink, a lightweight wallet and payment solution, Solana Labs announced &ldquo;Blinks,&rdquo; which are web links that allow anyone, even those without a crypto wallet, to send, receive and perform other actions on the Solana blockchain. For example, users create a wallet by clicking on a link, making trades, or sending coins. This promises to onboard more users to Solana because it insulates them from having to do complicated blockchain activities like connecting wallets or managing private keys. Users of Blinks click on a link and manage their crypto through the link.</p>
<p>Solana also solved one of its key issues by releasing zk compression technology to compress its massive history. Measuring over 200TB, the Solana blockchain has become a massive, decentralized database that is too big for many of its nodes to handle. As Solana&rsquo;s high throughput ensures the future generation of more data, many observers feared Solana&rsquo;s blockchain data size would grow too cumbersome to manage. Solana&rsquo;s zk compression uses zero-knowledge technology to shrink the storage required for Solana&rsquo;s data.</p>
<h2 id="notable-performers-ton-and-tron" class="anchored-block">June&rsquo;s Notable Winner - TRX (+11%)</h2>
<h3>Tron Fees Show Uptrend Over the Last 3 Years</h3>
<p><img class="w-100 img-responsive" alt="Tron Fees Show Uptrend Over the Last 3 Years" src="https://www.vaneck.com/contentassets/5d552f3e83644c85aca80f68054581f1/4614_scl-june_chart-7_2024-7_v1_blog.svg" /></p>
<p class="chart-disclosure"><strong>Source:<a href="https://defillama.com/chains/Bitcoin%20Sidechains" title="Bitcoin Sidechains TVL - DefiLlama" target="_blank" rel="noopener"> Artemis</a></strong> XYZ as of 6/24/2024. <strong>Past performance is no guarantee of future results. Not intended as a recommendation to buy or sell any securities named herein.</strong></p>
<p>This month&rsquo;s price performance of TRX highlighted Tron&rsquo;s ability to attract and retain global users, especially in the APAC region. $USDT markets hit 24-hour trading volumes of $53B, surpassing Visa&rsquo;s Q1 average. P2P transfer volumes are climbing near record highs above $13B / day. Leading all blockchains in both metrics, Tron reached 2.1M DAUs and $59.25B USDT <strong><a href="https://tether.to/en/transparency/?tab=usdt" title="Transparency" target="_blank" rel="noopener">circulating</a></strong> on-chain. Only Ethereum comes close at $50.47B, followed third by Solana at $773M. This user activity has driven Tron to <strong><a href="https://x.com/tokenterminal/status/1802454038602260600/photo/1" title="Token Terminal on X" target="_blank" rel="noopener">record</a></strong> monthly fees annualized at over $1.65B, passing 4-5% APY yields to stakers delegating TRX to Super Representatives (&ldquo;SRs&rdquo;).</p>
<h3>TON Price and Daily Active Addresses Show Significant YTD Increases - TON (+16%)</h3>
<p><img class="w-100 img-responsive" alt="TON Price and Daily Active Addresses Show Significant YTD Increases" src="https://www.vaneck.com/contentassets/5d552f3e83644c85aca80f68054581f1/4614_scl-june_chart-8_2024-7_v1_blog.svg" /></p>
<p class="chart-disclosure"><strong>Source: <a href="https://defillama.com/chains/Bitcoin%20Sidechains" title="Bitcoin Sidechains TVL - DefiLlama" target="_blank" rel="noopener">Artemis</a></strong> XYZ as of 6/24/2024. <strong>Past performance is no guarantee of future results. Not intended as a recommendation to buy or sell any securities named herein.</strong></p>
<p>TON coin stood out as one of this cycle&rsquo;s top performers this month, driven by success converting Telegram&rsquo;s user base of 930M into on-chain actors. This surge in activity coincides with high investor interest, as highlighted by Telegram founder Pavel Durov&rsquo;s hint of a potential IPO in a recent Financial Times interview, where he claimed a valuation of $30B+ for the platform. Additionally, Pantera Capital&rsquo;s strong endorsement in their May Letter titled &ldquo;TON, Our Largest Investment Ever&rdquo; invited potential investors to subscribe to a private round.</p>
<p>The primary narrative driving activity on TON has been incentivized airdrops facilitated through &ldquo;clicker&rdquo; apps that encourage users to click buttons to increase their airdrop allocation. One example is NOTCOIN, whose spring airdrop maintains a ~$1.65B valuation. A newer entrant, Hamster Kombat, <strong><a href="https://x.com/hamster_kombat/status/1805337674045342059" title="x.com" target="_blank" rel="noopener">claims</a></strong> to have reached 200M players (~20%+ of Telegram users) as of June 24. However, this claim is not easily reconciled with daily active addresses.</p>
<p>As of June 26, the network surpassed $500M in USDT supply just two months after rolling out support for Tether. TON DEX trading volumes hovered near all-time highs this month (see chart in NEAR report below), driven by heightened daily active addresses. As for the fundamental case for Telegram, the platform claims its generous 50:50 ad-revenue share for channels with 1000+ subscribers will drive user growth in key regions, including Asia, Latin America, and the Middle East.</p>
<h2 id="notable-laggard-near" class="anchored-block">June&rsquo;s Notable Laggard - NEAR (-33%)</h2>
<h3>TON&rsquo;s DEX Trading Volumes Surpass NEAR Protocol&rsquo;s</h3>
<p><img class="w-100 img-responsive" alt="TON&rsquo;s DEX Trading Volumes Surpass NEAR Protocol&rsquo;s" src="https://www.vaneck.com/contentassets/5d552f3e83644c85aca80f68054581f1/4614_scl-june_chart-9_2024-7_v1_blog.svg" /></p>
<p class="chart-disclosure"><strong>Source: <a href="https://defillama.com/chains/Bitcoin%20Sidechains" title="Bitcoin Sidechains TVL - DefiLlama" target="_blank" rel="noopener">Artemis</a></strong> XYZ as of 6/24/2024. <strong>Past performance is no guarantee of future results. Not intended as a recommendation to buy or sell any securities named herein.</strong></p>
<p>NEAR Protocol&rsquo;s token investors suffered large losses this month, erasing much of the coin&rsquo;s YTD outperformance. While daily active addresses and daily transactions remain near all-time highs, both upward trends appear to be plateauing. Further, the blockchain&rsquo;s daily fees saw a downward inflection beginning in early June, with 7 DMA fees down to $36k on Thursday from a peak of $46k on June 3rd (-21%). Though NEAR&rsquo;s Telegram wallet app <a href="https://dev.near.org/nearcatalog.near/widget/Index?id=hot-near-wallet-telegram" title="NEAR Catalog by nearcatalog.near on BOS" target="_blank" rel="noopener"><strong>&lsquo;HOT-Near&rsquo;</strong></a> possesses more users than all of TON, TON has ~7x more DEX transaction volumes than NEAR. Additionally, Telegram&rsquo;s native Wallet Bot recently released new features, including USDT integration and Wallet Earn&rsquo;s. This may give TON&rsquo;s Telegram wallet an advantage over the HOT-Near Wallet. Such improvements roughly coincided with viral TON narratives like Notcoin&rsquo;s <a href="https://beincrypto.com/notcoin-not-airdrop-claim-is-over/" title="What's Next for Notcoin (NOT) After Airdrop Claim Ends" target="_blank" rel="noopener"><strong>airdrop</strong></a> and other clicker games like &lsquo;Hamster Kombat,&rsquo; ostensibly <a href="https://cointelegraph.com/news/hamster-kombat-guinness-world-record-200m-users" title="Hamster Kombat destined for Guinness World Record?" target="_blank" rel="noopener"><strong>reaching</strong></a> hundreds of millions of users in weeks.</p>
<p>It appears likely that Telegram&rsquo;s bullish news and the TON ecosystem&rsquo;s recent virality are siphoning user activity and capital from NEAR through superior distribution. Further, NEAR Protocol&rsquo;s thesis is primarily driven by the potential for AI &amp; blockchain interplay, which has particularly suffered from recent bearishness. Other leading AI and AI-adjacent tokens, such as Bittensor (-34%), Render (-24%), and The Graph (-31%), also significantly underperformed this month as the AI narrative shifted to <strong><a href="https://www.vaneck.com/us/en/blogs/digital-assets/matthew-sigel-vaneck-june-2024-bitcoin-chaincheck/" title="VanEck June 2024 Bitcoin ChainCheck">Bitcoin Miners (see our ChainCheck here)</a></strong>. NEAR&rsquo;s performance could bounce back if the blockchain improves in distributing itself to organic users and sees improvements in its exposure to AI developments.</p>
<p><strong>Links to third party websites are provided as a convenience and the inclusion of such links does not imply any endorsement, approval, investigation, verification or monitoring by us of any content or information contained within or accessible from the linked sites. By clicking on the link to a non-VanEck webpage, you acknowledge that you are entering a third-party website subject to its own terms and conditions. VanEck disclaims responsibility for content, legality of access or suitability of the third-party websites.</strong></p>
<p>To receive more <strong><a href="https://www.vaneck.com/us/en/insights/digital-assets/" title="Digital Assets Insights">Digital Assets</a></strong> insights, <strong><a href="https://www.vaneck.com/us/en/subscribe/" title="Subscription Center">sign up in our subscription center</a></strong>.</p>
<style>
    .data-td.data {
        padding-right: 5px !important;
    }

    .wrapped-div {
        max-width: 100%;
    }

    @media (max-width: 1240px) {
        .wrapped-div {
            overflow-x: scroll;
        }
    }

    .wrapped-div-sector {
        max-width: 100%;
        overflow-x: scroll;
    }
</style>
]]></content:encoded>
</item><item rdf:about="https://www.vaneck.com/us/en/blogs/digital-assets/matthew-sigel-vaneck-june-2024-bitcoin-chaincheck/">
  <title>VanEck June 2024 Bitcoin ChainCheck></title>
  <link>https://www.vaneck.com/us/en/blogs/digital-assets/matthew-sigel-vaneck-june-2024-bitcoin-chaincheck/</link>
  <description><![CDATA[The latest analysis of the Bitcoin ecosystem reveals Bitcoin miners increasing coin sales and shifting power to AI amid low profitability and market doldrums.]]></description>
  <dc:creator>Matthew  Sigel</dc:creator>
  <dc:date>07/01/2024 06:30:00</dc:date>
<content:encoded><![CDATA[

<p><strong>Please note that VanEck has exposure to bitcoin.</strong></p>
<p>Our June 2024 ChainCheck goes deeper into the dynamics within the Bitcoin ecosystem during this market&rsquo;s summer doldrums. Amid Bitcoin's low volatility and broader crypto market pullbacks, this month&rsquo;s data highlights a pickup in Bitcoin miners&rsquo; coin sales due to low profitability, with many miners pivoting some of their power capacity to AI. As the market has re-considered the value of those power contracts, Bitcoin miners&rsquo; total market cap reached an all-time high in June.</p>
<ul class="content-list">
<li><a href="#price-action"><strong>Bitcoin&rsquo;s Price Action</strong></a></li>
<li><a href="#network-activity"><strong>Bitcoin&rsquo;s Network Activity, Adoption, and Fees</strong></a></li>
<li><a href="#market-health"><strong>Bitcoin Market Health and Profitability</strong></a></li>
<li><a href="#miners"><strong>Bitcoin Miners</strong></a></li>
<li><a href="#chaincheck-monthly-dashboard"><strong>Bitcoin ChainCheck Monthly Dashboard</strong></a></li>
</ul>
<p>Some takeaways for June 2024:</p>
<h2 id="price-action" class="jump-link-nav anchored-block" data-jumplink-title="Price Action">Bitcoin&rsquo;s Price Action</h2>
<ul class="content-list">
<li class="mt-2"><strong>Market sentiment:</strong> Bitcoin&rsquo;s 30-day moving average (30 DMA) price gained 4% over the last 30 days (May 26th - June 24th), currently standing at $67,288. This represents the 99th percentile of all-time 30 DMA price history. Bitcoin&rsquo;s 30 DMA YoY performance climbed to 146% after prices continued consolidating under all-time highs, conserving most of the market&rsquo;s Q1&rsquo;24 gains. An average of 94% of Bitcoin addresses were in profit this month, up 2% MoM.</li>
<li class="mt-2"><strong>Regional trading:</strong> Post-halving adjustments have brought distinct changes in regional market behaviors:</li>
<ul style="list-style-type: circle;">
<li class="mt-2"><strong>Asia hours:</strong> BTC&rsquo;s 30 DMA price increased by 1% this month, contrasting with last month&rsquo;s (-4%) decrease, suggesting new optimism among traders in the region.</li>
<li class="mt-2"><strong>U.S. hours:</strong> Price averages increased by 2% this month, sustaining this market&rsquo;s bullishness after last month&rsquo;s 4% growth, but at a slowed pace in the face of altcoin market headwinds.</li>
<li class="mt-2"><strong>EU hours:</strong> Price averages increased by 2% this month, up from a (-2%) decrease last month, cautiously mirroring Asia&rsquo;s increased optimism.</li>
</ul>
</ul>
<div class="wrapped-div">
<table style="width: 500px;">
<tbody>
<tr class="tbl-data">
<td class="tbl-header last">&nbsp;</td>
<td class="tbl-header last text-right">MoM Change (%)</td>
<td class="tbl-header last text-right">YoY Change (%)</td>
</tr>
<tr class="tbl-data">
<td class="data-td last">Asia Hours Price Change MoM ($)</td>
<td class="data-td data last text-right">1</td>
</tr>
<tr class="tbl-data">
<td class="data-td last">US hours Price Change</td>
<td class="data-td data last text-right">2</td>
<td class="data-td data last text-right">53</td>
</tr>
<tr class="tbl-data">
<td class="data-td last">EU hours Price Change</td>
<td class="data-td data last text-right">2</td>
<td class="data-td data last text-right">29</td>
</tr>
</tbody>
</table>
</div>
<br />
<p class="chart-disclosure">Source: Glassnode, as of 6/24/24. <strong>Past performance is no guarantee of future results.</strong></p>
<ul class="content-list">
<li class="mt-2"><strong>Funding rates</strong>: The average annualized funding cost for bitcoin futures saw a 25% MoM increase to 12%, bouncing back from May&rsquo;s capitulation. We think many hedge funds are playing this cash-and-carry (long spot, short futures) trade. We read the elevated funding rates as positive for risk appetite in the space and indicative of similar dollar funding shortages as plagued last cycle.</li>
</ul>
<h2 id="network-activity" class="jump-link-nav anchored-block" data-jumplink-title="Network Activity">Bitcoin&rsquo;s Network Activity, Adoption, and Fees</h2>
<ul class="content-list">
<li class="mt-2"><strong>Daily transactions:</strong> Last month&rsquo;s significant 20% increase in 30 DMA transaction counts continued at 7% MoM growth this month, breaking into the 99th percentile of historical activity with ~603k daily transactions.</li>
<li class="mt-2"><strong>Ordinal inscriptions:</strong> Daily inscriptions have shrunk (-51%) MoM to an average of 4,525/day, compounding the abrupt (-79%) market shift away from Ordinals observed in May. Average daily inscriptions are down (-97%) YoY, starkly contrasting last year&rsquo;s frenzied experimentation with the new Bitcoin tech. Importantly, however, the market capitalizations of leading Ordinals collections have not experienced declines quite as dramatically. We read this significant retraction in Ordinals ecosystem activity as an important process for the market to process excess noise.</li>
<li class="mt-2"><strong>Total transfer volume:</strong> Total transfer volumes&rsquo; 30 DMA increased by 5% MoM to $45.29 billion, maintaining the network&rsquo;s high-value transfer activity despite low price volatility. Yet these numbers are still dwarfed by the last cycle&rsquo;s highs, wherein the metric sustained twelve-figure levels from Q3&rsquo;21 &ndash; Q2&rsquo;22. With this month&rsquo;s print representing only the 86th percentile in all-time history, Bitcoin&rsquo;s current transfer volumes suggest the market has room to run.</li>
<li class="mt-2"><strong>Average transaction fees:</strong> The $7.62 30 DMA transaction fee represented 88% growth in dollar terms MoM, rebounding from last month&rsquo;s (-78%) decline despite persistent blockspace decongestion from lowered Ordinals activity. The healthy rebound in fees was disproportionately driven by pronounced activity on June 7th and 8th during Bitcoin&rsquo;s most recent local top. As Bitcoin&rsquo;s security budget comprises transaction fees and inflation (which recently <strong><a href="https://www.vaneck.com/us/en/blogs/digital-assets/matthew-sigel-bitcoin-halving-explained-history-impact-and-2024-predictions/" title="Bitcoin Halving Explained: History, Impact, and 2024 Predictions" rel="noopener">halved in April</a></strong>), the recent lack of sticky fee revenue from Ordinals underscores the importance of continued development in the inscription and Bitcoin Layer-2 spaces.</li>
</ul>
<h2 id="market-health" class="jump-link-nav anchored-block" data-jumplink-title="Market Health">Bitcoin Market Health and Profitability</h2>
<ul class="content-list">
<li class="mt-2"><strong>Percent of addresses in profit</strong>: A modest 1% uptick to a 30 DMA of 94% addresses in profit reflected prices stabilizing under March&rsquo;s new all-time highs. Notably, this appears to be the longest period that Bitcoin&rsquo;s price has traded below the multi-year all-time high after initially breaking through it. However, this summer&rsquo;s lull may be partially explained as this market cycle &ldquo;cooling off&rdquo; after making new all-time highs before the halving, unlike the 2013-2017 &amp; 2017-2021 cycles. Such behavior could reflect traders&rsquo; expectations for this cycle to repeat the four-year cadence suggested by previous cycles. If the current cycle&rsquo;s durability adheres to previous trends, this could indicate a potential market top between Q2-Q4 2025.</li>
<li class="mt-2"><strong>Net unrealized profit/loss:</strong> This ratio&rsquo;s 30 DMA remained unchanged at 0.55, suggesting a cautious but not pessimistic sentiment.</li>
</ul>
<h2 id="miners" class="jump-link-nav anchored-block" data-jumplink-title="Miners">Bitcoin Miners</h2>
<ul class="content-list">
<li class="mt-2"><strong>Total daily BTC miner revenues</strong>: Daily mining revenue averaged $33.30 million last month, representing a 7% MoM gain, offering a slight reprieve after last month&rsquo;s (-49%) MoM decline. Bitcoin mining economics dictate thinner margins post-halving, as the cost of mining each Bitcoin effectively doubles overnight. Without a rebound in Ordinals activity to subsidize fees or more significant BTC price appreciation, more miners may soon be forced offline. That said, Bitcoin Miners equities&rsquo; outperformed in May as several explored re-allocating existing power to AI use-cases. The total Bitcoin miner market cap reached an all-time high in June.</li>
<li class="mt-2"><strong>Transfer volume from Miners to Exchanges (USD)</strong>: Miners sent an average of $3.29M in BTC per day to exchanges over the last month, up 45% MoM, indicating the setting of a potential bottom in this metric. Such a post-halving miner capitulation is a typical post-halving phenomenon and is associated with downward price pressure. Notably, however, as the market adjusts to the reduced supply of new BTC, such phases are usually followed by periods of recovery and significant price appreciation, with surviving miners benefiting from price increases. We view miners&rsquo; recent transfers to exchanges as being analogous to their Q3&rsquo;20 flows, while today&rsquo;s prices remain relatively &ldquo;ahead of schedule,&rdquo; hovering at previous all-time highs more similarly to Q4&rsquo;20. Accordingly, we interpret increased exchange flows as a bullish indicator.</li>
</ul>
<h2>Chart of the Month:</h2>
<h3>Bitcoin Transfer Volume from Miners to Exchanges vs. Bitcoin Price</h3>
<p><img class="img-responsive w-100" src="https://www.vaneck.com/contentassets/a05f764bf81a4f3a9e59c62c505bf41c/4605_bitcoin_chart-1_2024-06_v2_blog.svg" alt="Bitcoin Transfer Volume from Miners to Exchanges vs. Bitcoin Price" /></p>
<p class="chart-disclosure">Source: Glassnode, VanEck research as of 6/24/24. <strong>Past performance is no guarantee of future results.</strong></p>
<div id="chaincheck-monthly-dashboard" class="anchored-block">
<div class="wrapped-div">
<table style="width: 100%;">
<tbody>
<tr class="tbl-data">
<td class="tbl-header last" style="width: 100%;" colspan="5">Bitcoin ChainCheck Monthly Dashboard as of June 24th, 2024</td>
</tr>
<tr class="tbl-data">
<td class="data-head last">&nbsp;</td>
<td class="data-head last text-right">30-day avg (%)</td>
<td class="data-head last text-right">30 day change (%)</td>
<td class="data-head last text-right">365 day change (%)</td>
<td class="data-head last text-right">Last 30 days Percentile vs<br />all-time history (%)</td>
</tr>
<tr class="tbl-data">
<td class="data-td last">Bitcoin Price</td>
<td class="data-td data last text-right">$67,288</td>
<td class="data-td data last text-right">4</td>
<td class="data-td data last text-right">146</td>
<td class="data-td data last text-right">99</td>
</tr>
<tr class="tbl-data">
<td class="data-td last">Daily Active Addresses</td>
<td class="data-td data last text-right">648,750</td>
<td class="data-td data last text-right">-7</td>
<td class="data-td data last text-right">-31</td>
<td class="data-td data last text-right">59</td>
</tr>
<tr class="tbl-data">
<td class="data-td last">Daily New Addresses</td>
<td class="data-td data last text-right">256,658</td>
<td class="data-td data last text-right">-11</td>
<td class="data-td data last text-right">-42</td>
<td class="data-td data last text-right">50</td>
</tr>
<tr class="tbl-data">
<td class="data-td last">Daily Transactions</td>
<td class="data-td data last text-right">603,374</td>
<td class="data-td data last text-right">7</td>
<td class="data-td data last text-right">45</td>
<td class="data-td data last text-right">99</td>
</tr>
<tr class="tbl-data">
<td class="data-td last">Daily Inscriptions</td>
<td class="data-td data last text-right">4,525</td>
<td class="data-td data last text-right">-51</td>
<td class="data-td data last text-right">-97</td>
<td class="data-td data last text-right">14</td>
</tr>
<tr class="tbl-data">
<td class="data-td last">Total Transfer Volume (USD)</td>
<td class="data-td data last text-right">45,278,475,150</td>
<td class="data-td data last text-right">5</td>
<td class="data-td data last text-right">62</td>
<td class="data-td data last text-right">86</td>
</tr>
<tr class="tbl-data">
<td class="data-td last">% Supply Active, last 180 days</td>
<td class="data-td data last text-right">24</td>
<td class="data-td data last text-right">1</td>
<td class="data-td data last text-right">29</td>
<td class="data-td data last text-right">31</td>
</tr>
<tr class="tbl-data">
<td class="data-td last">% Supply Active, last 3+ years</td>
<td class="data-td data last text-right">46</td>
<td class="data-td data last text-right">0</td>
<td class="data-td data last text-right">15</td>
<td class="data-td data last text-right">99</td>
</tr>
<tr class="tbl-data">
<td class="data-td last">Avg Fees (USD)</td>
<td class="data-td data last text-right">7.62</td>
<td class="data-td data last text-right">88</td>
<td class="data-td data last text-right">126</td>
<td class="data-td data last text-right">87</td>
</tr>
<tr class="tbl-data">
<td class="data-td last">Avg Fees (BTC)</td>
<td class="data-td data last text-right">0.00011</td>
<td class="data-td data last text-right">74</td>
<td class="data-td data last text-right">-11</td>
<td class="data-td data last text-right">22</td>
</tr>
<tr class="tbl-data">
<td class="data-td last">Percent of BTC Addresses in profit</td>
<td class="data-td data last text-right">94</td>
<td class="data-td data last text-right">2</td>
<td class="data-td data last text-right">38</td>
<td class="data-td data last text-right">84</td>
</tr>
<tr class="tbl-data">
<td class="data-td last">Unrealized profit/loss ratio</td>
<td class="data-td data last text-right">0.55</td>
<td class="data-td data last text-right">0</td>
<td class="data-td data last text-right">99</td>
<td class="data-td data last text-right">78</td>
</tr>
<tr class="tbl-data">
<td class="data-td last">Global Power Consumption (TWh)</td>
<td class="data-td data last text-right">115</td>
<td class="data-td data last text-right">-1</td>
<td class="data-td data last text-right">60</td>
<td class="data-td data last text-right">99</td>
</tr>
<tr class="tbl-data">
<td class="data-td last">Total Daily BTC Miner Revenues (USD)</td>
<td class="data-td data last text-right">33,299,939</td>
<td class="data-td data last text-right">7</td>
<td class="data-td data last text-right">27</td>
<td class="data-td data last text-right">86</td>
</tr>
<tr class="tbl-data">
<td class="data-td last">Total Crypto Equities' Market Cap<strong>*</strong> (USD) (MM)</td>
<td class="data-td data last text-right">148,067</td>
<td class="data-td data last text-right">5</td>
<td class="data-td data last text-right">153</td>
<td class="data-td data last text-right">93</td>
</tr>
<tr class="tbl-data">
<td class="data-td last">Transfer volume from Miners to Exchanges (USD)</td>
<td class="data-td data last text-right">3,291,688</td>
<td class="data-td data last text-right">45</td>
<td class="data-td data last text-right">-44</td>
<td class="data-td data last text-right">71</td>
</tr>
<tr class="tbl-data">
<td class="data-td last">Bitcoin Dominance</td>
<td class="data-td data last text-right">54</td>
<td class="data-td data last text-right">0.23</td>
<td class="data-td data last text-right">13</td>
<td class="data-td data last text-right">79</td>
</tr>
<tr class="tbl-data">
<td class="data-td last">Bitcoin Futures Annualized Basis</td>
<td class="data-td data last text-right">12</td>
<td class="data-td data last text-right">25</td>
<td class="data-td data last text-right">237</td>
<td class="data-td data last text-right">80</td>
</tr>
</tbody>
</table>
</div>
</div>
<br />
<p class="chart-disclosure">Source: Glassnode, VanEck research as of 6/24/24. <strong>Past performance is no guarantee of future results.</strong></p>
<p><strong>Notes:</strong></p>
<p>Net unrealized profit/loss ratio (NUPL) can be calculated by subtracting the realized market cap from the market cap and dividing the result by the market cap. When a high percentage of Bitcoin&rsquo;s market cap consists of unrealized profits, it can be interpreted that investors are greedy. Background reading <strong><a href="https://medium.com/@adamant_capital/a-primer-on-bitcoin-investor-sentiment-and-changes-in-saving-behavior-a5fb70109d32" title="A Primer on Bitcoin Investor Sentiment and Changes in Saving Behavior" target="_blank" rel="noopener">here</a></strong>.</p>
<p><strong>Links to third party websites are provided as a convenience and the inclusion of such links does not imply any endorsement, approval, investigation, verification or monitoring by us of any content or information contained within or accessible from the linked sites. By clicking on the link to a non-VanEck webpage, you acknowledge that you are entering a third-party website subject to its own terms and conditions. VanEck disclaims responsibility for content, legality of access or suitability of the third-party websites.</strong></p>
<p>To receive more <strong><a href="https://www.vaneck.com/us/en/insights/digital-assets/" title="Digital Assets Insights">Digital Assets</a></strong> insights, <strong><a href="https://www.vaneck.com/us/en/subscribe/" title="Subscription Center">sign up in our subscription center</a></strong>.</p>
<style>
    .data-td.data {
        padding-right: 5px !important;
    }

    .wrapped-div {
        max-width: 100%;
    }

    @media (max-width: 1240px) {
        .wrapped-div {
            overflow-x: scroll;
        }
    }

    .wrapped-div-sector {
        max-width: 100%;
        overflow-x: scroll;
    }
</style>
]]></content:encoded>
</item><item rdf:about="https://www.vaneck.com/us/en/blogs/moat-investing/moat-investing-powered-by-morningstar/">
  <title>Quality Companies at Attractive Prices></title>
  <link>https://www.vaneck.com/us/en/blogs/moat-investing/moat-investing-powered-by-morningstar/</link>
  <description><![CDATA[Moat investing represents a simple concept: Invest in companies with sustainable competitive advantages trading at attractive valuations. Access Morningstar&rsquo;s philosophy with <a href="/link/166321dbcfec440590fb51cf0ad629aa.aspx" title="SMOT - VanEck Morningstar SMID Moat ETF - Overview"><strong>SMOT</strong></a>, <a href="/link/9e43dd198c5f4e419f13220685081895.aspx" title="MOAT - VanEck Morningstar Wide Moat ETF - Overview"><strong>MOAT</strong></a>, and <a href="/link/f178b77e7fb54bb88cd5377ffe6bcd94.aspx" title="MOTI - VanEck Morningstar International Moat ETF - Overview"><strong>MOTI</strong></a>.]]></description>
  <dc:creator> </dc:creator>
  <dc:date>06/30/2024 06:30:00</dc:date>
<content:encoded><![CDATA[

<p><a href="/link/9dc0306f791f4f9e845d21f065c50da0.aspx?epsremainingpath=/moat-investing-powered-by-morningstar-2" title="Moat Investing, Powered by Morningstar"><strong>Moat investing</strong></a> represents a simple concept: Invest in companies with sustainable competitive advantages trading at attractive valuations. Morningstar&rsquo;s forward-looking equity research turns this philosophy into an actionable investment strategy by combining its Economic Moat Rating and its forward-looking Fair Value Estimate.</p>
<h2>Finding Economic Moats</h2>
<p>Economic moats are sustainable competitive advantages that are expected to allow companies to fend off competition and sustain profitability into the future. Morningstar has identified five sources of economic moats.</p>
<h2>The Five Sources of Economic Moats</h2>
<div class="row pt-3 pb-3 align-items-center">
<div class="col-md-3 col-xs-12 col-lg-2"><img class="img-responsive w-100 center-image" src="https://www.vaneck.com/contentassets/43aa0a7a225f43a2be4f48ed12b1b927/switching-costs.svg" alt="Switching Costs" /></div>
<div class="col-md-9 col-xs-12 col-lg-10">
<p><strong>Switching Costs</strong></p>
<p>Switching costs give a company pricing power by locking customers into its unique ecosystem. Beyond the expense of moving, they can also be measured by the effort, time, and psychological toll of switching to a competitor.</p>
</div>
</div>
<hr style="border: 1px solid #E6E7E8;" />
<div class="row pt-3 pb-3 align-items-center">
<div class="col-md-3 col-xs-12 col-lg-2"><img class="img-responsive w-100 center-image" src="https://www.vaneck.com/contentassets/43aa0a7a225f43a2be4f48ed12b1b927/intangible-assets.svg" alt="Intangible Assets" /></div>
<div class="col-md-9 col-xs-12 col-lg-10">
<p><strong>Intangible Assets</strong></p>
<p>Though not always easy to quantify, intangible assets may include brand recognition, patents, and regulatory licenses. They may prevent competitors from duplicating products or allow a company to charge premium pricing.</p>
</div>
</div>
<hr style="border: 1px solid #E6E7E8;" />
<div class="row pt-3 pb-3 align-items-center">
<div class="col-md-3 col-xs-12 col-lg-2"><img class="img-responsive w-100 center-image" src="https://www.vaneck.com/contentassets/43aa0a7a225f43a2be4f48ed12b1b927/network-effect.svg" alt="Network Effect" /></div>
<div class="col-md-9 col-xs-12 col-lg-10">
<p><strong>Network Effect</strong></p>
<p>A network effect is present when the value of a product or service grows as its user base expands. Each additional customer increases the product&rsquo;s or service&rsquo;s value exponentially.</p>
</div>
</div>
<hr style="border: 1px solid #E6E7E8;" />
<div class="row pt-3 pb-3 align-items-center">
<div class="col-md-3 col-xs-12 col-lg-2"><img class="img-responsive w-100 center-image" src="https://www.vaneck.com/contentassets/43aa0a7a225f43a2be4f48ed12b1b927/cost-advantage.svg" alt="Cost Advantage" /></div>
<div class="col-md-9 col-xs-12 col-lg-10">
<p><strong>Cost Advantage</strong></p>
<p>Companies that are able to produce products or services at lower costs than competitors are often able to sell at the same price as competition and gather excess profit, or have the option to undercut competition.</p>
</div>
</div>
<hr style="border: 1px solid #E6E7E8;" />
<div class="row pt-3 pb-3 align-items-center">
<div class="col-md-3 col-xs-12 col-lg-2"><img class="img-responsive w-100 center-image" src="https://www.vaneck.com/contentassets/43aa0a7a225f43a2be4f48ed12b1b927/efficient-scale.svg" alt="Efficient Scale" /></div>
<div class="col-md-9 col-xs-12 col-lg-10">
<p><strong>Efficient Scale</strong></p>
<p>In a market limited in size, potential new competitors have little incentive to enter because doing so would lower the industry&rsquo;s returns below the cost of capital.</p>
</div>
</div>
<p>Learn more about what makes a moat in our <a href="/us/en/investments/morningstar-wide-moat-etf-moat/what-makes-a-moat-white-paper.pdf/" title="What Makes a Moat? Morningstar&rsquo;s Five Sources of Moat" target="_blank" rel="noopener"><strong>whitepaper</strong></a>.</p>
<h2>Assessing Valuations</h2>
<p>Equally important to identifying companies with sustainable competitive advantages is ensuring you do not overpay for them. Morningstar&rsquo;s forward-looking valuation research determines how much a company is worth today based on tomorrow&rsquo;s expected cash flow. Each company covered by Morningstar receives this Fair Value Estimate.</p>
<h2>Morningstar Equity Research</h2>
<p>Morningstar&rsquo;s equity research team of more than 100 analysts covers over 1,500 companies globally. More than 200 asset managers and 75,000 financial advisors rely on Morningstar&rsquo;s research. All of Morningstar&rsquo;s equity analysts follow a single, consistent research methodology.</p>
<h2>Morningstar Repeatable Research Process</h2>
<div class="row pt-3 pb-3 align-items-center">
<div class="col-md-3 col-xs-12 col-lg-2"><img class="img-responsive w-100 center-image" src="https://www.vaneck.com/contentassets/43aa0a7a225f43a2be4f48ed12b1b927/fundamental-analysis.svg" alt="Fundamental Analysis" /></div>
<div class="col-md-9 col-xs-12 col-lg-10">
<p><strong>Fundamental Analysis</strong></p>
<p>Analyst conducts company and industry research, which may include financial statement analysis, trade show visits, industry reports, site visits and conference calls.</p>
</div>
</div>
<hr style="border: 1px solid #E6E7E8;" />
<div class="row pt-3 pb-3 align-items-center">
<div class="col-md-3 col-xs-12 col-lg-2"><img class="img-responsive w-100 center-image" src="https://www.vaneck.com/contentassets/43aa0a7a225f43a2be4f48ed12b1b927/economic-moat-rating.svg" alt="Economic Moat Rating" /></div>
<div class="col-md-9 col-xs-12 col-lg-10">
<p><strong>Economic Moat Rating</strong></p>
<p>Analyst assesses the strength of the company&rsquo;s competitive advantage, or moat, assigning a rating of None, Narrow, or Wide.</p>
</div>
</div>
<hr style="border: 1px solid #E6E7E8;" />
<div class="row pt-3 pb-3 align-items-center">
<div class="col-md-3 col-xs-12 col-lg-2"><img class="img-responsive w-100 center-image" src="https://www.vaneck.com/contentassets/43aa0a7a225f43a2be4f48ed12b1b927/company-valuation.svg" alt="Company Valuation" /></div>
<div class="col-md-9 col-xs-12 col-lg-10">
<p><strong>Company Valuation</strong></p>
<p>Analyst considers past financial results, competitive position, and future prospects to forecast the company&rsquo;s cash flows. Assumptions are entered into proprietary discounted cash flow model.</p>
</div>
</div>
<hr style="border: 1px solid #E6E7E8;" />
<div class="row pt-3 pb-3 align-items-center">
<div class="col-md-3 col-xs-12 col-lg-2"><img class="img-responsive w-100 center-image" src="https://www.vaneck.com/contentassets/43aa0a7a225f43a2be4f48ed12b1b927/fair-value-estimate.svg" alt="Fair Value Estimate" /></div>
<div class="col-md-9 col-xs-12 col-lg-10">
<p><strong>Fair Value Estimate</strong></p>
<p>Using Morningstar&rsquo;s proprietary discounted cash flow model, the analyst develops a Fair Value Estimate, which represents the intrinsic value of that company.</p>
</div>
</div>
<hr style="border: 1px solid #E6E7E8;" />
<div class="row pt-3 pb-3 align-items-center">
<div class="col-md-3 col-xs-12 col-lg-2"><img class="img-responsive w-100 center-image" src="https://www.vaneck.com/contentassets/43aa0a7a225f43a2be4f48ed12b1b927/moat-investing.svg" alt="Moat Investing" /></div>
<div class="col-md-9 col-xs-12 col-lg-10">
<p><strong>Moat Investing</strong></p>
<p>Identify companies with sustainable competitive advantages and attractive valuations.</p>
</div>
</div>
<h2>Proven Long-Term U.S. Strategy</h2>
<p>Applying Morningstar&rsquo;s moat investing philosophy to U.S. companies has historically generated excess returns relative to the broad U.S. equity markets. This investment approach, represented by the Morningstar Wide Moat Focus Index, offers a systematic approach to targeting attractively priced wide moat companies each quarter. This forward-looking philosophy has resulted in excess returns since 2007 for this long-term, core investment strategy.</p>
<style type="text/css">
    .wrapped-div {
        max-width: 100%;
    }

    @media (max-width: 768px) {
        .wrapped-div {
            overflow-x: scroll;
        }
    }

    .wrapped-div-sector {
        max-width: 100%;
        overflow-x: scroll;
    }
</style>
<style type="text/css">
    @media (max-width: 767px) {
        .center-image {
            display: block;
            margin-left: auto;
            margin-right: auto;
            width: 125px !important;
            padding-bottom: 15px;
        }
    }

   @media (min-width: 768px) {
        .custom-padding {
            display: block;
            margin-left: 25px;
            padding-left: 25px;
        }
    }

    @media (min-width: 992px) {
        .custom-padding {
            display: block;
            margin-left: 45px;
            padding-left: 45px;
        }
    }
</style>

<!--h3>Cumulative Morningstar Wide Moat Focus Index Return</h3>
<p><strong>2/14/07 - 12/31/21</strong></p>
<div id="cumulative-chart-container" class="center" data-ve-gtm="interact-chart">&nbsp;</div>
<img class="chart-img img-responsive" style="display: none;" src="https://www.vaneck.com/uploadedImages/special/moti/moat-cumulative-index-returns.jpg" alt="Cumulative Morningstar Wide Moat Focus Index Return" />
<script>
window.addEventListener("load", function(){
setTimeout(function(){
		highchartsList.series.forEach(function(ser){
    const totalPoints = ser.points.length
    lastPoint = ser.points;
    const value = Number(lastPoint.y).toFixed(0)
    lastPoint.update({
            dataLabels: {
                enabled: true,
                color: '#000',
                style: {
                    fontFamily: "Open Sans, Arial",
                    color: "#666666",
                    fontSize: "14px",
                    fontWeight: "bold",
                    fontStyle: "normal"
                },
                y: -18,
                x: 0,
                format: value + "%"
            }
        });
});
}, 1200)
})
</script-->
<p class="chart-disclosure">Source: Morningstar. Past performance is no guarantee of future results. Index performance is not representative of fund performance. For fund performance current to the most recent month-end, visit vaneck.com. Investors cannot invest directly in the Index.</p>
<p class="chart-disclosure">Effective June 20, 2016, Morningstar implemented several changes to the Morningstar Wide Moat Focus Index construction rules. Among other changes, the index increased its constituent count from 20 stocks to at least 40 stocks and modified its rebalance and reconstitution methodology. These changes may result in more diversified exposure, lower turnover, and longer holding periods for index constituents than under the rules in effect prior to this date. Past performance is no guarantee of future results.</p>
<h2>Explore VanEck&rsquo;s Moat Funds</h2>
<p>Leverage Morningstar&rsquo;s forward-looking moat investment philosophy across global equity markets.</p>
<div class="wrapped-div">
<table style="width: 600px; height: 310.01px;">
<tbody>
<tr class="tbl-data" style="height: 65.5521px;">
<td class="data-td data last align-middle" style="text-align: left; height: 198.031px; width: 155.198px;" rowspan="3"><strong>US Moats</strong></td>
<td class="data-td data last" style="text-align: left; height: 65.5521px; width: 417.219px;"><a href="/link/166321dbcfec440590fb51cf0ad629aa.aspx" title="SMOT - VanEck Morningstar SMID Moat ETF - Overview"><strong>SMOT - VanEck Morningstar SMID Moat ETF</strong></a></td>
</tr>
<tr class="tbl-data" style="height: 65.5521px;">
<td class="data-td data last" style="text-align: left; height: 65.5521px; width: 417.219px;"><a href="/link/9e43dd198c5f4e419f13220685081895.aspx" title="MOAT - VanEck Morningstar Wide Moat ETF - Overview"><strong>MOAT - VanEck Morningstar Wide Moat ETF</strong></a></td>
</tr>
<tr class="tbl-data" style="height: 66.9271px;">
<td class="data-td data last" style="text-align: left; height: 66.9271px; width: 417.219px;"><a href="/link/ca0b4e316f1c4e1985e2d0b7d293f0e4.aspx" title="MWMZX - VanEck Morningstar Wide Moat Fund - Class Z - Overview"><strong>MWMZX - VanEck Morningstar Wide Moat Fund &ndash; Class Z</strong></a></td>
</tr>
<tr style="height: 22.3958px;">
<td style="text-align: left; color: rgb(50, 50, 50); width: 155.198px; height: 22.3958px;"><strong>International Moats</strong></td>
<td style="text-align: left; width: 417.219px; height: 22.3958px;"><strong><a href="/link/f178b77e7fb54bb88cd5377ffe6bcd94.aspx" title="MOTI - VanEck Morningstar International Moat ETF - Overview">MOTI - VanEck Morningstar International Moat ETF</a></strong></td>
</tr>
<tr class="tbl-data" style="height: 44.7917px;">
<td class="data-td last" style="text-align: left; color: rgb(50, 50, 50); height: 44.7917px; width: 155.198px;"><strong>Global Moats</strong></td>
<td class="data-td data last" style="text-align: left; height: 44.7917px; width: 417.219px;"><a href="/link/bb4d770567584bce80c2b19628f010a1.aspx" title="MOTG - VanEck Morningstar Global Wide Moat ETF - Overview"><strong>MOTG - VanEck Morningstar Global Wide Moat ETF</strong></a></td>
</tr>
</tbody>
</table>
</div>
<br />
<p>To receive more <strong><a href="/us/en/insights/moat-investing" title="Moat Investing Insights">Moat Investing</a></strong> insights, <strong><a href="https://www.vaneck.com/us/en/subscribe/" title="Subscription Center">sign up in our subscription center</a></strong>.</p>
<style type="text/css">
.wrapped-div {
    max-width: 100%;
}
@media (max-width: 768px) {
    .wrapped-div {
        overflow-x: scroll;
    }
}
.wrapped-div-sector {
    max-width: 100%;
    overflow-x: scroll;
}
</style>
]]></content:encoded>
</item><item rdf:about="https://www.vaneck.com/us/en/blogs/digital-assets/matthew-sigel-mid-year-review-vanecks-15-crypto-predictions-for-2024/">
  <title>Mid-Year Review: VanEck’s 15 Crypto Predictions for 2024></title>
  <link>https://www.vaneck.com/us/en/blogs/digital-assets/matthew-sigel-mid-year-review-vanecks-15-crypto-predictions-for-2024/</link>
  <description><![CDATA[We review and score our top 15 Crypto Predictions for 2024 that we outlined last year.]]></description>
  <dc:creator>Denis   Zinoviev</dc:creator>
  <dc:date>06/28/2024 06:30:00</dc:date>
<content:encoded><![CDATA[

<p><strong>Please note that VanEck may have a position(s) in the digital asset(s) described below.</strong></p>
<p>Scoreboard check! We've hit the mid-year mark of 2024, and it's time to tally up our top <a href="https://www.vaneck.com/us/en/blogs/digital-assets/matthew-sigel-vanecks-15-crypto-predictions-for-2024/" title="VanEck's 15 Crypto Predictions for 2024"><strong>15 Crypto Predictions for 2024</strong></a> that we outlined at the end of last year. <i>Spoiler alert:</i> our home-field referee awarded us 95 out of 150 possible points.</p>
<p>From bitcoin&rsquo;s price hitting all-time highs to Solana&rsquo;s continued rise, our predictions have been put to the test. Let&rsquo;s break down the play-by-play of where we nailed it and where we missed the mark. Join us as we review the key developments and trends shaping the crypto market this year so far.</p>
<p><a href="#first-bitcoin"><strong>1. U.S. Recession and First Bitcoin ETPs</strong></a><br /><a href="#bitcoin-halving"><strong>2. A Smooth Bitcoin Halving</strong></a><br /><a href="#bitcoins-all-time-high"><strong>3. Bitcoin&rsquo;s All-Time High in Q4</strong></a><br /><a href="#ethereum-won"><strong>4. Ethereum Won&rsquo;t Flip Bitcoin in 2024</strong></a><br /><a href="#ethereum-l2-dominance"><strong>5. Ethereum Layer 2 (L2) Dominance</strong></a><br /><a href="#nft-activity"><strong>6. NFT Activity Rebounds</strong></a><br /><a href="#binance-loses"><strong>7. Binance Loses Top Spot</strong></a><br /><a href="#stablecoin-growth"><strong>8. Stablecoin Market Cap Growth</strong></a><br /><a href="#dex-market"><strong>9. DEX Market Share Increase</strong></a><br /><a href="#bitcoin-yield"><strong>10. Bitcoin Yield Opportunities</strong></a><br /><a href="#blockchain-game"><strong>11. Breakout Blockchain Game</strong></a><br /><a href="#solanas-rise"><strong>12. Solana&rsquo;s Continued Rise</strong></a><br /><a href="#depin-networks"><strong>13. Adoption of DePin Networks</strong></a><br /><a href="#corporate-crypto"><strong>14. New Corporate Crypto Accounting</strong></a><br /><a href="#reconciliation"><strong>15. KYC and DeFi Reconciliation</strong></a></p>
<h2 id="first-bitcoin" class="anchored-block">1. The U.S. Recession and the First Spot Bitcoin ETPs</h2>
<p><strong>Prediction</strong>: The U.S. would enter a recession in the first half of 2024, and the first spot bitcoin ETPs would launch with significant inflows, keeping Bitcoin above $30k.</p>
<p><strong>Review:</strong> Although there are clear signs of economic slowing, with GDP slowing to a 1.3% annualized growth rate, the U.S. has not officially entered a recession. Key indicators like consumer spending and corporate earnings have shown resilience, mitigating the impacts of inflation and supply chain issues. However, the U.S. yield curve has been inverted for more than 700 days, the longest such streak in bond market history, often a precursor to recession. Jobless claims and corporate bankruptcy filings have also risen.</p>
<p>As for the spot bitcoin ETPs, the approval and launch of the first spot bitcoin ETPs on January 11, 2024, was a significant milestone. The ETPs saw overwhelming demand, with inflows surpassing $2 billion in the first month alone. This influx of investment played a crucial role in driving bitcoin to an all-time high of $73,000 in March and maintaining its price above $30k throughout the year. The success of these ETPs has provided a new, regulated avenue for investors to gain exposure to Bitcoin, significantly boosting its market appeal and stability.</p>
<p><strong>Rating: </strong>7/10</p>
<h3>U.S. Yield Curve Now Inverted for Record Length</h3>
<p><img class="img-responsive w-100" src="https://www.vaneck.com/contentassets/9e096396d21d4ccba7c772d0cb7f9472/4595_midyear-2024-crypto_chart-1_2024-06_v1_blog.svg" alt="A graph showing a graph of a stock market" /></p>
<p class="chart-disclosure">Source: Bloomberg as of 6/24/2024. <strong>Past performance is not indicative of future results. Not intended as a recommendation to buy or sell any of the names mentioned herein.</strong></p>
<h3>Bitcoin Price 2010 &ndash; Present</h3>
<p><img class="img-responsive w-100" src="https://www.vaneck.com/contentassets/3500a5235f5647dbba04a24606c59fb7/4595_midyear-2024-crypto_chart-2_2024-06_v1_blog.svg" alt="BTC Price Chart" /></p>
<p class="chart-disclosure">Source: Glassnode as of 6/23/2024. <strong>Past performance is not indicative of future results. Not intended as a recommendation to buy or sell any of the names mentioned herein.</strong></p>
<h2 id="bitcoin-halving" class="anchored-block">2. Bitcoin Halving</h2>
<p><strong>Prediction</strong>: The Bitcoin halving in April 2024 would proceed without major issues, and post-halving, bitcoin would rise above $48k.</p>
<p><strong>Review:</strong> The Bitcoin halving event in April 2024 occurred without any significant disruptions, demonstrating the network&rsquo;s stability and robustness. This halving reduced the block reward from 6.25 BTC to 3.125 BTC, effectively decreasing the rate at which new Bitcoin is introduced into circulation. Contrary to expectations of a brief consolidation period post-halving, bitcoin surged to a new all-time high of $73,000 in March, well ahead of the halving. This early rally was likely fueled by the anticipation of the halving and the massive inflows from newly launched bitcoin ETPs. Bitcoin&rsquo;s price remains strong at $67,500, far surpassing the $48k target we had set post-halving.</p>
<p><strong>Rating:</strong> 10/10</p>
<h3>Bitcoin Price Pre- and Post-Halving (April 2024 - June 2024)</h3>
<p><img class="img-responsive w-100" src="https://www.vaneck.com/contentassets/cfacd568c4404e83b5da56fd556ad1b5/4595_midyear-2024-crypto_chart-3_2024-06_v1_blog.svg" alt="Bitcoin Price Pre- and Post-Halving" /></p>
<p class="chart-disclosure">Source: Glassnode as of 6/23/2024. <strong>Past performance is not indicative of future results. Not intended as a recommendation to buy or sell any of the names mentioned herein.</strong></p>
<h3>Bitcoin Hashrate 2009 &ndash; Present</h3>
<p><img class="img-responsive w-100" src="https://www.vaneck.com/contentassets/cf2197005d074686ae2a43d57bb9f5eb/4595_midyear-2024-crypto_chart-4_2024-06_v1_blog.svg" alt="Bitcoin Hashrate 2009 - Present" /></p>
<p class="chart-disclosure">Source: Glassnode as of 6/23/2024. <strong>Past performance is not indicative of future results. Not intended as a recommendation to buy or sell any of the names mentioned herein.</strong></p>
<h2 id="bitcoins-all-time-high" class="jump-link-nav anchored-block" data-jumplink-title="Bitcoin&rsquo;s All-Time High">3. Bitcoin&rsquo;s All-Time High in Q4</h2>
<p><strong>Prediction</strong>: Bitcoin will reach an all-time high in Q4 2024, driven by political changes and regulatory optimism.</p>
<p><strong>Review:</strong> Bitcoin&rsquo;s price soared to a new all-time high of $73,000 in March 2024, much earlier than our Q4 prediction. This surge was driven by the approval and subsequent success of the spot bitcoin ETPs in January, which attracted significant investment and heightened market confidence. The early achievement of this milestone was facilitated by positive regulatory developments and growing institutional interest. Although this prediction came to fruition ahead of schedule, the factors we predicted to drive the new high&mdash;regulatory progress and market optimism&mdash;were spot-on. The current price of $67,500 reflects the sustained interest and confidence in Bitcoin as a leading digital asset.</p>
<p><strong>Rating:</strong> 9/10</p>
<h3>Historical Bitcoin Price Movements Around Major Regulatory Changes</h3>
<p><img class="img-responsive w-100" src="https://www.vaneck.com/contentassets/e984b65b52344496832c6b4b96380be7/4595_midyear-2024-crypto_chart-5_2024-06_v1_blog.svg" alt="Bitcoin Price Movements Around Major Regulatory Changes" /></p>
<p class="chart-disclosure">Source: Glassnode as of 6/23/2024. <strong>Past performance is not indicative of future results. Not intended as a recommendation to buy or sell any of the names mentioned herein.</strong></p>
<h2 id="ethereum-won" class="anchored-block">4. Ethereum Won&rsquo;t Flip Bitcoin in 2024</h2>
<p><strong>Prediction</strong>: Ethereum would not surpass Bitcoin in market cap but outperform mega-cap tech stocks.</p>
<p><strong>Review:</strong> Ethereum remains well behind Bitcoin in market capitalization, particularly in light of Bitcoin&rsquo;s record-breaking performance this year. Despite this, Ethereum has had a strong year, outpacing many of the largest tech stocks in terms of growth and market performance. Its ecosystem continues to expand, driven by advancements like the EIP-4844 upgrade and the growing adoption of Layer 2 solutions. Despite not surpassing Bitcoin, Ethereum&rsquo;s resilience and robust growth align well with our prediction of its strong market performance relative to major tech stocks.</p>
<p><strong>Rating:</strong> 10/10</p>
<h3>Ether Returns vs. Major Tech Stocks</h3>
<p><img class="img-responsive w-100" src="https://www.vaneck.com/contentassets/3c32ce95691e45e7bfb3e1cb66fd732d/4595_midyear-2024-crypto_chart-6_2024-06_v1_blog.svg" alt="Ether Returns vs. Major Tech Stocks" /></p>
<p class="chart-disclosure">Source: Morningstar as of 6/21/2024. <strong>Past performance is not indicative of future results. Not intended as a recommendation to buy or sell any of the names mentioned herein.</strong></p>
<h3>Price Ratio Comparison - Bitcoin vs. Ether</h3>
<p><img class="img-responsive w-100" src="https://www.vaneck.com/contentassets/fb4368e21c9e4e65ba7bfe07e0e8d788/4595_midyear-2024-crypto_chart-7_2024-06_v1_blog.svg" alt="Price Ratio Comparison - Bitcoin vs. Ether" /></p>
<p class="chart-disclosure">Source: Glassnode as of 6/23/2024. <strong>Past performance is not indicative of future results. Not intended as a recommendation to buy or sell any of the names mentioned herein.</strong></p>
<h2 id="ethereum-l2-dominance" class="jump-link-nav anchored-block" data-jumplink-title="Ethereum L2 Dominance">5. Ethereum Layer 2 (L2) Dominance</h2>
<p><strong>Prediction</strong>: Post EIP-4844, Ethereum Layer 2 solutions would capture the majority of EVM-compatible TVL and volume.</p>
<p><strong>Review:</strong> While the rollout of EIP-4844 has significantly boosted the adoption of Ethereum Layer 2 solutions, we are still waiting to see L2s attract more TVL or DEX activity than Ethereum. However, while Ethereum TVL share vs. L2s is roughly where it was at the beginning of 2024, DEX Volumes are slowly transitioning to L2s. This is mainly because Ethereum has made a dedicated data layer for L2s to post data. This moved activity from Ethereum&rsquo;s transaction layer, freeing up block space and making transactions on Ethereum less expensive. While L2s cost substantially less than Ethereum to use, often 100x cheaper, many participants still choose to pay higher Ethereum fees. This may be due to the stickiness of Ethereum TVL, the broader range of trading venues, and the large supply of tradeable assets.</p>
<p>Within L2s, the consolidation of market share among the leading solutions is evident, with Base and Arbitrum seizing the majority (~80) of DEX Volume and TVL (&gt;50%). The consolidation amongst L2s demonstrates the power of composability and network effect.</p>
<p><strong>Rating:</strong> 3/10</p>
<h3>Total Value Locked (TVL) In DeFi on Ethereum</h3>
<p><img class="img-responsive w-100" src="https://www.vaneck.com/contentassets/edf2265e92a34ffc9bfbe33f17397637/4595_midyear-2024-crypto_chart-8_2024-06_v1_blog.svg" alt="Total Value Locked (TVL) In DeFi on Ethereum" /></p>
<p class="chart-disclosure">Source: Glassnode as of 6/23/2024. <strong>Past performance is not indicative of future results. Not intended as a recommendation to buy or sell any of the names mentioned herein.</strong></p>
<h3>DEX Volumes are Moving to Base and Arbitrum</h3>
<p><img class="img-responsive w-100" src="https://www.vaneck.com/contentassets/b870375fbc7644c4bcfa6f3b1439ed4c/4595_midyear-2024-crypto_chart-9_2024-06_v1_blog.svg" alt="DEX Volumes are Moving to Base and Arbitrum" /></p>
<p class="chart-disclosure">Source: Artemis.xyz as of 6/23/2024. <strong>Past performance is not indicative of future results. Not intended as a recommendation to buy or sell any of the names mentioned herein.</strong></p>
<h3>Ethereum DEX Volumes Still Exceeds L2 DEX Volumes</h3>
<p><img class="img-responsive w-100" src="https://www.vaneck.com/contentassets/896334e876a14328a6050b3acc15e02c/4595_midyear-2024-crypto_chart-10_2024-06_v1_blog.svg" alt="Ethereum DEX Volumes Still Exceeds L2 DEX Volume" /></p>
<p class="chart-disclosure">Source: Artemis.xyz as of 6/23/2024. <strong>Past performance is not indicative of future results. Not intended as a recommendation to buy or sell any of the names mentioned herein.</strong></p>
<h3>Ethereum Share of TVL is Roughly Where it Began in 2024</h3>
<p><img class="img-responsive w-100" src="https://www.vaneck.com/contentassets/f9a335be5fca4f569559972effd7aaf5/4595_midyear-2024-crypto_chart-11_2024-06_v1_blog.svg" alt="Ethereum Share of TVL is Roughly Where it Began in 2024" /></p>
<p class="chart-disclosure">Source: Artemis.xyz as of 6/23/2024. <strong>Past performance is not indicative of future results. Not intended as a recommendation to buy or sell any of the names mentioned herein.</strong></p>
<h2 id="nft-activity" class=" anchored-block">6. NFT Activity Rebounds</h2>
<p><strong>Prediction:</strong> The NFT market experienced a resurgence in the first half of 2024 compared to the latter half of 2023, predominantly on Ethereum, which remains the leader in NFT activity. New high-profile collections and ongoing interest have driven trading volumes upward, although these volumes are still far from the all-time highs seen in 2021. An exciting development has been the introduction of NFTs on the Bitcoin network through the Ordinals protocol, adding a new dimension to the market and attracting a fresh wave of investors and collectors. Despite this positive trend, the overall NFT volume far from its previous peaks. Instead, some of the speculative trading volume has shifted towards meme coins, which have supplanted NFTs in attracting speculative investors</p>
<p><strong>Rating:</strong> 3/10</p>
<h3>Monthly NFT Trading Volumes (Ethereum vs. Bitcoin)</h3>
<p><img class="img-responsive w-100" src="https://www.vaneck.com/contentassets/a6b4a5f090ca4acd83093624d5a22090/4595_midyear-2024-crypto_chart-12_2024-06_v1_blog.svg" alt="Monthly NFT Trading Volumes (Ethereum vs. Bitcoin)" /></p>
<p class="chart-disclosure">Source: Artemis.xyz and cryptoslam! as of 6/24/2024. <strong>Past performance is not indicative of future results. Not intended as a recommendation to buy or sell any of the names mentioned herein.</strong></p>
<h2 id="binance-loses" class=" anchored-block">7. Binance Loses Top Spot</h2>
<p><strong>Prediction</strong>: Binance would lose its position as the top spot trading exchange.</p>
<p><strong>Review:</strong> Despite regulatory scrutiny and increasing competition, Binance has retained its position as the leading centralized exchange by trading volume in 2024. However, its dominance is being challenged by competitors like OKX, Bybit, and Coinbase, which have gained market share. Binance's deep liquidity and extensive user base support its leadership, but the narrowing gap with its rivals suggests a more competitive landscape. Although Binance has yet to lose its top spot and still holds over half of all spot volumes, the intensifying competition highlights the changing dynamics in the centralized exchange market.</p>
<p><strong>Rating:</strong> 6/10</p>
<h3>Binance Share of Spot Volume is Down Slightly</h3>
<p><img class="img-responsive w-100" src="https://www.vaneck.com/contentassets/deee35de66ff42c2b8109ce010f01ab0/4595_midyear-2024-crypto_chart-13_2024-06_v1_blog.svg" alt="Binance Share of Spot Volume is Down Slightly" /></p>
<p class="chart-disclosure">Source: Artemis.xyz as of 6/15/2024. <strong>Past performance is not indicative of future results. Not intended as a recommendation to buy or sell any of the names mentioned herein.</strong></p>
<p><img class="img-responsive w-100" src="https://www.vaneck.com/contentassets/deee35de66ff42c2b8109ce010f01ab0/4595_midyear-2024-crypto_infographic-1_2024-06_v2_blog.png" alt="Binance vs. Competitors Trading Volume" /></p>
<p class="chart-disclosure">Source: Coinmarketcap as of 6/15/2024. <strong>Past performance is not indicative of future results. Not intended as a recommendation to buy or sell any of the names mentioned herein.</strong></p>
<h2 id="stablecoin-growth" class="jump-link-nav anchored-block" data-jumplink-title="Stablecoin Growth">8. Stablecoin Market Cap Growth</h2>
<p><strong>Prediction</strong>: The stablecoin market cap would reach a new all-time high, with USDC surpassing USDT in market share.</p>
<p><strong>Review:</strong> The stablecoin market has continued to grow in 2024, but it has yet to achieve the $200 billion milestone. USDC has been gaining ground, particularly among institutional users, due to its reputation for regulatory compliance. However, USDT remains the dominant stablecoin, primarily because of its entrenched position on Tron, which accounts for ~50% of USDT supply and widespread usage in trading. The dynamics between USDC and USDT show a trend toward increasing competition, with USDC closing the gap but not yet overtaking USDT. The stablecoin market&rsquo;s growth and evolving competitive landscape reflects our prediction, though the shift in dominance is still developing.</p>
<p><strong>Rating:</strong> 6/10</p>
<h3>USDT, USDC, and Total Stablecoin Market Cap</h3>
<p><img class="img-responsive w-100" src="https://www.vaneck.com/contentassets/32b0939dd3c641ccad467e8e36ffe9d3/4595_midyear-2024-crypto_chart-14_2024-06_v1_blog.svg" alt="DEX Volumes are Moving to Base and Arbitrum" /></p>
<p class="chart-disclosure">Source: Glassnode as of 6/23/2024. <strong>Past performance is not indicative of future results. Not intended as a recommendation to buy or sell any of the names mentioned herein.</strong></p>
<h2 id="dex-market" class="anchored-block">9. DEX Market Share Increase</h2>
<p><strong>Prediction</strong>: Decentralized exchanges (DEXes) would capture a larger share of the spot trading market.</p>
<p><strong>Review:</strong> Decentralized exchanges have continued to grow in market share throughout 2024. The improved user interfaces, lower fees, and enhanced liquidity offered by DEXes have attracted more traders. High-throughput blockchains and Layer 2 solutions have further facilitated this growth by providing faster and cheaper transactions. The ongoing trend towards self-custody and decentralized finance (DeFi) supports this shift, with DEXes capturing an increasingly significant portion of the spot trading market. This aligns well with our prediction and underscores the evolving preference for decentralized trading platforms.</p>
<p><strong>Rating:</strong> 7/10</p>
<h3>DEXes Are Taking Market Share From CEXes</h3>
<p><img class="img-responsive w-100" src="https://www.vaneck.com/contentassets/5a239db462504115979d833c1890ed83/4595_midyear-2024-crypto_chart-15_2024-06_v1_blog.svg" alt="DEXes Are Taking Market Share From CEXes" /></p>
<p class="chart-disclosure">Source: Artemis.xyz as of 6/15/2024. <strong>Past performance is not indicative of future results. Not intended as a recommendation to buy or sell any of the names mentioned herein.</strong></p>
<h2 id="blockchain-game" class="anchored-block">10. Bitcoin Yield Opportunities</h2>
<p><strong>Prediction</strong>: Remittances and smart contract platforms would create new yield opportunities for Bitcoin.</p>
<p><strong>Review:</strong> Bitcoin&rsquo;s role in remittances has expanded in 2024, particularly in regions with high remittance flows and limited access to traditional financial services. Platforms leveraging Bitcoin and Layer 2 solutions like the Lightning Network have made transactions faster and cheaper. Additionally, yield opportunities for Bitcoin holders have emerged through staking and lending protocols that offer returns on bitcoin assets. These developments align well with our prediction, as they enhance Bitcoin&rsquo;s utility beyond mere transactions and provide new ways for holders to earn yields. However, the full potential of these opportunities is still unfolding, with ongoing adoption and innovation.</p>
<p><strong>Rating:</strong> 4/10</p>
<h2 id="blockchain-game" class="anchored-block">11. Breakout Blockchain Game</h2>
<p><strong>Prediction</strong>: A blockchain game would surpass 1 million daily active users.</p>
<p><strong>Review: </strong>While several blockchain games have seen significant user engagement in 2024, none have consistently reached the 1 million daily active users milestone. High-quality titles like Illuvium and Guild of Guardians have attracted large communities but are still building their user bases. The integration of blockchain technology in gaming continues to evolve, with improvements in-game mechanics and user experience driving growth. Despite not hitting the 1 million user mark, these developments suggest a strong foundation for future success in the blockchain gaming sector. The potential for a breakout hit remains promising as the market matures.</p>
<p><strong>Rating:</strong> 5/10</p>
<h2 id="solanas-rise" class="jump-link-nav anchored-block" data-jumplink-title="Solana&rsquo;s Rise">12. Solana&rsquo;s Continued Rise</h2>
<p><strong>Prediction</strong>: Solana would become a top 3 blockchain by market cap, TVL, and active users and join the ETPs wars.</p>
<p><strong>Review:</strong> Solana will continue to grow and strengthen its position in the blockchain ecosystem in 2024. It ranks highly in market capitalization, total value locked (TVL), and active users, though it has not yet cracked the top 3 in all these categories. Solana&rsquo;s ecosystem has attracted a wide range of projects and users, contributing to its strong market presence. However, solana-based ETPs have not yet emerged, contrary to our expectations. Despite this, Solana&rsquo;s ongoing growth and innovation highlight its significant impact and potential in blockchain.</p>
<p><strong>Rating:</strong> 7/10</p>
<h3>Solana&rsquo;s Fees Have Increased 56x Over the Last Year</h3>
<p><img class="img-responsive w-100" src="https://www.vaneck.com/contentassets/ac4fd48a0a4c409cb15c48536144fbaa/4595_midyear-2024-crypto_chart-16_2024-06_v1_blog.svg" alt="Solana's Fees Have Increased 56x Over the Last Year" /></p>
<p class="chart-disclosure">Source: Coinmarketcap as of 6/15/2024. <strong>Past performance is not indicative of future results. Not intended as a recommendation to buy or sell any of the names mentioned herein.</strong></p>
<h2 id="depin-networks" class="anchored-block">13. Adoption of DePin Networks</h2>
<p><strong>Prediction</strong>: Decentralized physical infrastructure networks like Hivemapper and Helium would see significant adoption.</p>
<p><strong>Review:</strong> Decentralized physical infrastructure (DePin) networks such as Hivemapper and Helium have made notable progress in 2024. Hivemapper has expanded its mapping capabilities, and Helium has increased its subscriber base for its decentralized wireless network. These networks use blockchain technology to create community-driven services, offering an alternative to traditional centralized systems. While adoption has grown, these platforms are still in the early stages of capturing significant market share from established giants like Google and traditional telecom providers. The potential for disruptive growth remains, but widespread adoption is yet to be fully realized.</p>
<p><strong>Rating:</strong> 7/10</p>
<h3>Growth Metrics of Hivemapper and Helium Networks</h3>
<p><img class="img-responsive w-100" src="https://www.vaneck.com/contentassets/ccd3a8b4552340d5856cf9ccb69b70fc/4595_midyear-2024-crypto_chart-17_2024-06_v1_blog.svg" alt="Growth Metrics of Hivemapper and Helium Networks" /></p>
<p class="chart-disclosure">Source: Artemis.xyz as of 6/13/2024. <strong>Past performance is not indicative of future results. Not intended as a recommendation to buy or sell any of the names mentioned herein.</strong></p>
<p><img class="img-responsive w-100" src="https://www.vaneck.com/contentassets/025ab122fc114df89d89b09a8e4cb7dd/4595_midyear-2024-crypto_chart-18_2024-06_v1_blog.svg" alt="Hivemapper Total Km Mapped" /></p>
<p class="chart-disclosure">Source: Hivemapper as of 6/15/2024. <strong>Past performance is not indicative of future results. Not intended as a recommendation to buy or sell any of the names mentioned herein.</strong></p>
<h2 id="corporate-crypto" class="anchored-block">14. New Corporate Crypto Accounting</h2>
<p><strong>Prediction</strong>: New FASB guidelines would rejuvenate corporate crypto holdings, and Coinbase would break out L2 revenues.</p>
<p><strong>Review:</strong> The Financial Accounting Standards Board (FASB) guidelines allowing corporates to report mark-to-market gains on crypto assets are set to take effect in 2025, with anticipation building throughout 2024. Some non-crypto companies have already added BTC to their treasuries, and these include US publicly traded health tech company Semler Scientific ($40M), wealth and payments business Mogo ($5M), Japanese hotel services company Metaplanet ($7.2M). But wide-scale adoption has yet to occur. Within crypto, Defi Technologies recently added $7.5M in BTC to its treasury. However, the adoption of BTC by a greater treasury has yet to materialize.</p>
<p>Coinbase, while advancing its Layer 2 (L2) solutions like Base Protocol, has not reported L2-specific revenues in its filings and instead tucks it under the broader category of &ldquo;Subscriptions and Services.&rdquo;. The corporate adoption of crypto assets is increasing, with more firms exploring blockchain applications and digital asset holdings. Our prediction points towards future developments that are still on the horizon, with current trends suggesting growing interest and preparation for these changes.</p>
<p><strong>Rating:</strong> 5/10</p>
<h3>Corporate Holdings of Crypto Assets</h3>
<p><img class="img-responsive w-100" src="https://www.vaneck.com/contentassets/3c65fd0b6f7948558e5489d765ee0052/4595_midyear-2024-crypto_infographic-2_2024-06_v2_blog.png" alt="Corporate Holdings of Crypto Assets" /></p>
<p class="chart-disclosure">Source: BitcoinTreasuries.net as of 6/15/2024. <strong>Past performance is not indicative of future results. Not intended as a recommendation to buy or sell any of the names mentioned herein.</strong></p>
<h2 id="reconciliation" class="anchored-block">15. KYC and DeFi Reconciliation</h2>
<p><strong>Prediction</strong>: KYC-enabled DeFi applications would gain significant traction.</p>
<p><strong>Review:</strong> The integration of Know Your Customer (KYC) features into decentralized finance (DeFi) platforms has begun to take shape in 2024. Leading protocols like Uniswap have started experimenting with KYC-enabled functionalities to attract institutional liquidity and comply with regulatory requirements. These developments are bridging the gap between traditional finance and DeFi, making it easier for institutions to engage in decentralized ecosystems. While adopting KYC features is still early, it has generated significant interest and could transform how DeFi operates. The traction gained so far supports our prediction, although widespread adoption is still forthcoming.</p>
<p><strong>Rating:</strong> 6/10</p>
<h2>Conclusion</h2>
<p>Our mid-year review shows that while some predictions have materialized as expected, others are still unfolding or have missed the mark. Bitcoin&rsquo;s unprecedented rally and the successful launch of spot bitcoin ETPs have been standout developments. We will continue to track these trends and incorporate the above data into future updates. Stay tuned!</p>
<p><strong>Links to third party websites are provided as a convenience and the inclusion of such links does not imply any endorsement, approval, investigation, verification or monitoring by us of any content or information contained within or accessible from the linked sites. By clicking on the link to a non-VanEck webpage, you acknowledge that you are entering a third-party website subject to its own terms and conditions. VanEck disclaims responsibility for content, legality of access or suitability of the third-party websites.</strong></p>
]]></content:encoded>
</item><item rdf:about="https://www.vaneck.com/us/en/blogs/income-investing/clos-belong-in-your-core-q-and-a-with-laila-kollmorgen/">
  <title>CLOs Belong in Your Core: Q&amp;A with Laila Kollmorgen></title>
  <link>https://www.vaneck.com/us/en/blogs/income-investing/clos-belong-in-your-core-q-and-a-with-laila-kollmorgen/</link>
  <description><![CDATA[CLOs have historically offered attractive yield premiums with robust risk profiles. It&rsquo;s time to include them in your core bond allocation.]]></description>
  <dc:creator> </dc:creator>
  <dc:date>06/27/2024 06:30:00</dc:date>
<content:encoded><![CDATA[

<p><strong><a href="https://vaneck.com/us/en/videos/meet-pinebridge-portfolio-manager-laila-kollmorgen/" title="Meet PineBridge Portfolio Manager Laila Kollmorgen">PineBridge Investments&rsquo; Laila Kollmorgen</a></strong> discusses the growing appeal of <a href="/link/e090deaddc774ac699a04b959d9254c6.aspx" title="CLOI - VanEck CLO ETF - Overview"><strong>CLO</strong></a>s and the importance of active management in this Q&amp;A. Pinebridge sub-advises the actively managed <a href="https://www.vaneck.com/us/en/investments/clo-etf-cloi/overview/" title="CLOI - VanEck CLO ETF - Holdings and Performance"><strong>VanEck CLO ETF (CLOI)</strong></a>.</p>
<ul class="content-list">
<li><strong><a href="#point-one">How does a CLO work?</a></strong></li>
<li><strong><a href="#point-two">How does the structure of a CLO help its risk profile?</a></strong></li>
<li><strong><a href="#point-three">How do CLOs compare to other income investments?</a></strong></li>
<li><strong><a href="#point-four">What are the benefits of active management in CLOs?</a></strong></li>
<li><strong><a href="#point-five">What is PineBridge&rsquo;s experience in the CLO space?</a></strong></li>
<li><strong><a href="#point-six">How should investors think about CLOs in their broader fixed income portfolio?</a></strong></li>
</ul>
<h2 id="point-one" class="jump-link-nav anchored-block" data-jumplink-title="Structure">How does a CLO work?</h2>
<p>For those who are not overly familiar with the asset class, the first thing investors need to understand about collateralized loan obligations (<a href="/link/e090deaddc774ac699a04b959d9254c6.aspx" title="CLOI - VanEck CLO ETF - Overview"><strong>CLO</strong></a>s) is the collateral: they are a securitized pool of senior secured loans, also known as leveraged loans. <a href="/link/e090deaddc774ac699a04b959d9254c6.aspx" title="CLOI - VanEck CLO ETF - Overview"><strong>CLO</strong></a>s hold floating-rate, secured loans, which have seniority over other claimants in the event of an insolvency. One of the key differences between a <a href="/link/e090deaddc774ac699a04b959d9254c6.aspx" title="CLOI - VanEck CLO ETF - Overview"><strong>CLO</strong></a> and other types of securitizations is that a <a href="/link/e090deaddc774ac699a04b959d9254c6.aspx" title="CLOI - VanEck CLO ETF - Overview"><strong>CLO</strong></a> is an actively managed vehicle, typically having a 5-year reinvestment period and 2-year non-call period during which the <a href="/link/e090deaddc774ac699a04b959d9254c6.aspx" title="CLOI - VanEck CLO ETF - Overview"><strong>CLO</strong></a> manager is not allowed to redeem or refinance the tranches of the <a href="/link/e090deaddc774ac699a04b959d9254c6.aspx" title="CLOI - VanEck CLO ETF - Overview"><strong>CLO</strong></a>. Given that the <a href="/link/e090deaddc774ac699a04b959d9254c6.aspx" title="CLOI - VanEck CLO ETF - Overview"><strong>CLO</strong></a> manager is responsible for portfolio construction, security selection and risk management, their role is key to how the <a href="/link/e090deaddc774ac699a04b959d9254c6.aspx" title="CLOI - VanEck CLO ETF - Overview"><strong>CLO</strong></a> performs over the lifetime of the deal.</p>
<p><a href="/link/e090deaddc774ac699a04b959d9254c6.aspx" title="CLOI - VanEck CLO ETF - Overview"><strong>CLO</strong></a>s are composed of multiple tranches of debt, each with different seniorities, and an equity tranche. The cash flows from the underlying loan portfolio are distributed sequentially, starting with the most senior tranche. This hierarchy provides protection to senior tranche investors, as losses are first absorbed by equity tranche holders.</p>
<h3>All About the Cash Flows: Understanding How a CLO Works</h3>
<p><img loading="lazy" class="img-responsive w-100" src="https://www.vaneck.com/contentassets/2e185784a6044c2e99f5fd5d9616f649/4591_cloi-qa_infographic-1_2024-6_v1_blog.svg" alt="All About the Cashflows: Understanding How a CLO Works" /></p>
<p class="chart-disclosure">Source: PineBridge Investments. This is not an offer to buy or sell, or recommendation to buy or sell any of the securities mentioned herein.</p>

<h2 id="point-two" class="jump-link-nav anchored-block" data-jumplink-title="Risk Profile">How does the structure of a CLO help its risk profile?</h2>
<p>One of the biggest misconceptions about <a href="/link/e090deaddc774ac699a04b959d9254c6.aspx" title="CLOI - VanEck CLO ETF - Overview"><strong>CLO</strong></a>s is that they are inherently risky. In fact, the opposite is true. <a href="/link/e090deaddc774ac699a04b959d9254c6.aspx" title="CLOI - VanEck CLO ETF - Overview"><strong>CLO</strong></a>s, structurally, have <a href="https://www.vaneck.com/us/en/blogs/income-investing/clos-question-and-answer/#point-three" title="CLOI ETF: Question and Answer"><strong>built-in risk protections</strong></a> that have historically helped them experience lower levels of principal loss when compared with corporate debt and other securitized products. This built-in risk protection comes in many forms, including active management, credit support, covenants and collateral requirements, and excess spread.</p>
<h3>CLOs Benefit from Multiple Structural Protections</h3>
<div class="wrapped-div">
<table style="width: 100%;">
<tbody>
<tr class="tbl-data">
<td class="data-td last">Active Management</td>
<td class="data-td data last text-left">CLO managers analyze issuers and apply sector expertise to construct portfolios. Fees are generally linked to performance.</td>
</tr>
<tr class="tbl-data">
<td class="data-td last">Credit Support</td>
<td class="data-td data last text-left">Subordinated tranches absorb losses first.</td>
</tr>
<tr class="tbl-data">
<td class="data-td last">Credit Support</td>
<td class="data-td data last text-left">Subordinated tranches absorb losses first.</td>
</tr>
<tr class="tbl-data">
<td class="data-td last">Covenants &amp; Collateral Requirements</td>
<td class="data-td data last text-left">CLOs have features that are protective of debt tranches:
<ul class="content-list mb-0">
<li>CLO portfolios are subject to quality and diversity tests that must be met</li>
<li>Interest cash flows are diverted to pay off senior tranches if tests such as interest coverage or overcollateralization are not met</li>
</ul>
</td>
</tr>
<tr class="tbl-data">
<td class="data-td last">Excess Spread</td>
<td class="data-td data last text-left">Excess income vs interest paid on debt tranches provides protection in case coverage tests are not met, which can be used to buy additional assets or pay down notes.</td>
</tr>
</tbody>
</table>
</div>
<br />
<p>These structural protections have been tested through two major market crises. Many investors are surprised to learn that through both the Global Financial Crisis and COVID-19 drawdown, the asset class ultimately experienced fewer defaults than corporate bonds of the same rating&mdash;this resilience combined with the potential for upside returns makes the asset class compelling for long-term minded investors.</p>
<h2 id="point-three" class="jump-link-nav anchored-block" data-jumplink-title="Income Comparison">How do CLOs compare to other income investments?</h2>
<p>Historically, <a href="/link/e090deaddc774ac699a04b959d9254c6.aspx" title="CLOI - VanEck CLO ETF - Overview"><strong>CLO</strong></a>s have offered a higher yield relative to other corporate debt categories, including bank loans, high yield bonds, and investment grade bonds. Once investors start to understand the attractive risk profile of <a href="/link/e090deaddc774ac699a04b959d9254c6.aspx" title="CLOI - VanEck CLO ETF - Overview"><strong>CLO</strong></a>s, I&rsquo;m often asked how this is possible. If it is less risky and has historically experienced fewer defaults, why does a <a href="/link/e090deaddc774ac699a04b959d9254c6.aspx" title="CLOI - VanEck CLO ETF - Overview"><strong>CLO</strong></a> tranche consistently have a higher spread compared to similarly rated corporate bonds?</p>
<p>The first thing I point out is that <a href="/link/e090deaddc774ac699a04b959d9254c6.aspx" title="CLOI - VanEck CLO ETF - Overview"><strong>CLO</strong></a>s are complex, which adds a premium. In addition, due to regulatory changes following the 2008 Global Financial Crisis, large, regulated investors like banks and insurance companies had the minimum risk based capital requirements raised for <a href="/link/e090deaddc774ac699a04b959d9254c6.aspx" title="CLOI - VanEck CLO ETF - Overview"><strong>CLO</strong></a>s, meaning that this investor base requires a higher spread to invest in the asset class. And this raises another common misconception about <a href="/link/e090deaddc774ac699a04b959d9254c6.aspx" title="CLOI - VanEck CLO ETF - Overview"><strong>CLO</strong></a>s&mdash;many investors think they are illiquid. We&rsquo;ve all read the articles about the illiquidity in the US Treasury and IG bond markets. However, the difference for <a href="/link/e090deaddc774ac699a04b959d9254c6.aspx" title="CLOI - VanEck CLO ETF - Overview"><strong>CLO</strong></a>s is that the asset class doesn&rsquo;t rely on 10 market makers to provide liquidity. <a href="/link/e090deaddc774ac699a04b959d9254c6.aspx" title="CLOI - VanEck CLO ETF - Overview"><strong>CLO</strong></a>s, like all securitizations, trade in an auction process. Lists are sent out typically for next day trading. This allows time for investors like us to analyze the deals and determine if we want to participate in the auction. Investment grade tranches typically get a significant number of bids, and even high yield down to single B tranches will typically get multiple bids. In times of market stress, fewer bids may be received (as would be anticipated in even Treasury and IG markets), but the difference is that in the <a href="/link/e090deaddc774ac699a04b959d9254c6.aspx" title="CLOI - VanEck CLO ETF - Overview"><strong>CLO</strong></a> market, many of the bids are coming from end accounts and not a dealer.</p>
<p>While <a href="/link/e090deaddc774ac699a04b959d9254c6.aspx" title="CLOI - VanEck CLO ETF - Overview"><strong>CLO</strong></a>s are floating rate instruments, meaning they have low sensitivity to changes in interest rates, prices do change as a result of spread duration. As interest rates rise or fall, <a href="/link/e090deaddc774ac699a04b959d9254c6.aspx" title="CLOI - VanEck CLO ETF - Overview"><strong>CLO</strong></a> yields and prices will move accordingly. However, because <a href="/link/e090deaddc774ac699a04b959d9254c6.aspx" title="CLOI - VanEck CLO ETF - Overview"><strong>CLO</strong></a> spread duration is lower than a typical IG, <a href="/link/e090deaddc774ac699a04b959d9254c6.aspx" title="CLOI - VanEck CLO ETF - Overview"><strong>CLO</strong></a> prices have historically moved less. These characteristics can be advantageous to investors in diversified fixed income portfolios.</p>
<h3>The Attractive Risk-Adjusted Returns of CLOs vs Other Asset Classes (10 Years as of 3/31/2024)</h3>
<p><img loading="lazy" class="img-responsive w-100" src="https://www.vaneck.com/contentassets/8de1fe9fe44344fb869a1d3e691202c5/4591_cloi-qa_chart-1_2024-6_v1_blog.svg" alt="The Attractive Risk-Adjusted Returns of CLOs vs Other Asset Classes (10 Years as of 3/31/2024)" /></p>
<div class="wrapped-div">
<table style="width: 100%;">
<tbody>
<tr class="tbl-data">
<td class="data-td last">Rating</td>
<td class="data-td last font-weight-normal">CLOs</td>
<td class="data-td last font-weight-normal">&gt;AAA Rated CLOs</td>
<td class="data-td last font-weight-normal">A Rated CLOs</td>
<td class="data-td last font-weight-normal">BBB Rated CLOs</td>
<td class="data-td last font-weight-normal">BB Rated CLOs</td>
<td class="data-td last font-weight-normal">US IG</td>
<td class="data-td last font-weight-normal">US HY</td>
<td class="data-td last font-weight-normal">Leveraged Loans</td>
<td class="data-td last font-weight-normal">US IG FRNs</td>
<td class="data-td last font-weight-normal">Agg</td>
</tr>
<tr class="tbl-data">
<td class="data-td last">Return</td>
<td class="data-td data last text-right">3.65</td>
<td class="data-td data last text-right">2.99</td>
<td class="data-td data last text-right">3.58</td>
<td class="data-td data last text-right">4.33</td>
<td class="data-td data last text-right">5.69</td>
<td class="data-td data last text-right">8.9</td>
<td class="data-td data last text-right">2.67</td>
<td class="data-td data last text-right">4.36</td>
<td class="data-td data last text-right">4.11</td>
<td class="data-td data last text-right">2.57</td>
<td class="data-td data last text-right">1.57</td>
</tr>
<tr class="tbl-data">
<td class="data-td last">Sharpe Ratio</td>
<td class="data-td data last text-right">0.6</td>
<td class="data-td data last text-right">0.7</td>
<td class="data-td data last text-right">0.53</td>
<td class="data-td data last text-right">0.52</td>
<td class="data-td data last text-right">0.49</td>
<td class="data-td data last text-right">0.53</td>
<td class="data-td data last text-right">0.21</td>
<td class="data-td data last text-right">0.41</td>
<td class="data-td data last text-right">0.55</td>
<td class="data-td data last text-right">0.45</td>
<td class="data-td data last text-right">0.04</td>
</tr>
</tbody>
</table>
</div>
<br />
<p class="chart-disclosure">Source: Morningstar. CLOs represented by J.P. Morgan CLO Index; AAA Rated CLOs represented by J.P. Morgan CLO AAA Index, AA Rated CLOs represented by J.P. Morgan CLO AA Index, A Rated CLOs represented by J.P. Morgan CLO A Index, BBB Rated CLOs represented by J.P. Morgan CLO BBB Index, BB Rated CLOs represented by J.P. Morgan CLO BB Index, US IG represented by ICE BofA US Corporate Index, US HY represented by ICE BofA US High Yield Index, Agg is represented by the ICE BofA US Broad Market, US IG FRNs represented by MVIS US Investment Grade Floating Rate Note Index, Leveraged Loans represented by Morningstar LSTA US Leveraged Loan 100 Index. See index descriptions at the end of this presentation. Past performance is not indicative of future results. This is not an offer to buy or sell, or recommendation to buy or sell any of the securities mentioned herein.</p>

<h2 id="point-four" class="jump-link-nav anchored-block" data-jumplink-title="Active Management">What are the benefits of active management in CLOs?</h2>
<p>As I said earlier, <a href="/link/e090deaddc774ac699a04b959d9254c6.aspx" title="CLOI - VanEck CLO ETF - Overview"><strong>CLO</strong></a>s are complex investments. Due to the significant diversity of <a href="/link/e090deaddc774ac699a04b959d9254c6.aspx" title="CLOI - VanEck CLO ETF - Overview"><strong>CLO</strong></a> managers, vintages, underlying exposures and deal documentation, replicating the main <a href="/link/e090deaddc774ac699a04b959d9254c6.aspx" title="CLOI - VanEck CLO ETF - Overview"><strong>CLO</strong></a> benchmark is impossible due to the idiosyncratic nature of <a href="/link/e090deaddc774ac699a04b959d9254c6.aspx" title="CLOI - VanEck CLO ETF - Overview"><strong>CLO</strong></a>s.</p>
<p>Capturing opportunities in the <a href="/link/e090deaddc774ac699a04b959d9254c6.aspx" title="CLOI - VanEck CLO ETF - Overview"><strong>CLO</strong></a> market requires an active approach and the expertise to perform bottoms-up research on the individual bank loans in the underlying collateral pool. Most <a href="/link/e090deaddc774ac699a04b959d9254c6.aspx" title="CLOI - VanEck CLO ETF - Overview"><strong>CLO</strong></a>s can have more than 200 issuers in their collateral pool. Accordingly, investment managers must have significant research capabilities to fully evaluate the underlying credit risk in each <a href="/link/e090deaddc774ac699a04b959d9254c6.aspx" title="CLOI - VanEck CLO ETF - Overview"><strong>CLO</strong></a>. In addition, managers need relationships with primary and secondary market desks to appropriately trade and source opportunities.</p>
<p>At the same time, the importance of understanding a <a href="/link/e090deaddc774ac699a04b959d9254c6.aspx" title="CLOI - VanEck CLO ETF - Overview"><strong>CLO</strong></a>&rsquo;s structural characteristics cannot be underestimated. Two <a href="/link/e090deaddc774ac699a04b959d9254c6.aspx" title="CLOI - VanEck CLO ETF - Overview"><strong>CLO</strong></a>s with the same exact collateral assets may produce varied performance due to different structural nuances. Additionally, the legal documentation that governs a typical <a href="/link/e090deaddc774ac699a04b959d9254c6.aspx" title="CLOI - VanEck CLO ETF - Overview"><strong>CLO</strong></a> can be in excess of 300 pages. There&rsquo;s no substitute for deep <a href="/link/e090deaddc774ac699a04b959d9254c6.aspx" title="CLOI - VanEck CLO ETF - Overview"><strong>CLO</strong></a> tranche management experience, which provides the combination of skills, practice, tactical and strategic savvy, adjustment-making, and chronological perspective needed in this complicated asset class.</p>
<h2 id="point-five" class="anchored-block">What is PineBridge&rsquo;s experience in the CLO space?</h2>
<p>PineBridge is the subadvisor of the <a href="https://www.vaneck.com/us/en/investments/clo-etf-cloi/overview/" title="CLOI - VanEck CLO ETF - Holdings and Performance"><strong>VanEck CLO ETF (CLOI)</strong></a>. For those not familiar with PineBridge, we are a private, global asset manager, managing approximately $168B in assets, with more than 700 employees globally (~230 of which are investment professionals) located in 24 office locations worldwide (as of 3/31/2024).</p>
<p>Having a global footprint, we develop our top-down views through monthly investment meetings discussing rates, FX, multi-asset, fixed income and leveraged finance. The majority of our assets are in fixed income and I sit within the leveraged finance group, where we manage approximately $28B in AUM (as of 3/31/2024), spread across high yield, leveraged loans, the <a href="/link/e090deaddc774ac699a04b959d9254c6.aspx" title="CLOI - VanEck CLO ETF - Overview"><strong>CLO</strong></a>s that we issue and manage ourselves and the business line that I run, <a href="/link/e090deaddc774ac699a04b959d9254c6.aspx" title="CLOI - VanEck CLO ETF - Overview"><strong>CLO</strong></a> tranche investing. I joined PineBridge nine years ago to start the business line as part of the firm&rsquo;s Leveraged Finance Group. I was already familiar with PineBridge&rsquo;s <a href="/link/e090deaddc774ac699a04b959d9254c6.aspx" title="CLOI - VanEck CLO ETF - Overview"><strong>CLO</strong></a> platform, having invested in both their US and European <a href="/link/e090deaddc774ac699a04b959d9254c6.aspx" title="CLOI - VanEck CLO ETF - Overview"><strong>CLO</strong></a>s.</p>
<p>It&rsquo;s important to understand why being part of the leveraged finance team is so important. Pinebridge has 15 credit analysts, focused on the high yield and leveraged loan markets in the US and Europe. It's this bottoms-up analysis that is behind the credit selection in our high yield, loan, and <a href="/link/e090deaddc774ac699a04b959d9254c6.aspx" title="CLOI - VanEck CLO ETF - Overview"><strong>CLO</strong></a> strategies, and, ultimately, behind each <a href="/link/e090deaddc774ac699a04b959d9254c6.aspx" title="CLOI - VanEck CLO ETF - Overview"><strong>CLO</strong></a> tranche investment made. PineBridge has been issuing <a href="/link/e090deaddc774ac699a04b959d9254c6.aspx" title="CLOI - VanEck CLO ETF - Overview"><strong>CLO</strong></a>s since 1999 and European <a href="/link/e090deaddc774ac699a04b959d9254c6.aspx" title="CLOI - VanEck CLO ETF - Overview"><strong>CLO</strong></a>s since 2006. It&rsquo;s imperative to understand the dynamics between the high yield, leveraged loan and <a href="/link/e090deaddc774ac699a04b959d9254c6.aspx" title="CLOI - VanEck CLO ETF - Overview"><strong>CLO</strong></a> markets to appreciate the technical and fundamental aspects of how these markets are linked.</p>
<p>When it comes to <a href="/link/e090deaddc774ac699a04b959d9254c6.aspx" title="CLOI - VanEck CLO ETF - Overview"><strong>CLO</strong></a>s, our main focus is on managing downgrade risk. We monitor <a href="/link/e090deaddc774ac699a04b959d9254c6.aspx" title="CLOI - VanEck CLO ETF - Overview"><strong>CLO</strong></a>-specific metrics to detect early signs of credit deterioration, allowing us to address potential downgrades proactively. Using the entire capital stack in a <a href="/link/e090deaddc774ac699a04b959d9254c6.aspx" title="CLOI - VanEck CLO ETF - Overview"><strong>CLO</strong></a>, we incorporate insights from our global team to build and position portfolios strategically. This approach helps us navigate market volatility.</p>
<h3>PineBridge CLO Tranche Investment Philosophy</h3>
<p><img loading="lazy" class="img-responsive w-100" src="https://www.vaneck.com/contentassets/f81b8cb54b504dfe9747c0e1dbade36b/4591_cloi-qa_infographic-2_2024-6_v2_blog.svg" alt="PineBridge CLO Tranche Investment Philosophy" /></p>
<p class="chart-disclosure">Source: PineBridge Investments. For illustrative purposes only. Any views represent the opinion of the investment manager and are subject to change. Risk process and frequency subject to change at the discretion of management as warranted by market volatility or other considerations. Past performance is not indicative of future results.</p>
<h2 id="point-six" class="jump-link-nav anchored-block" data-jumplink-title="CLOs in Your Core">How should investors think about CLOs in their broader fixed income portfolio?</h2>
<p>We believe <a href="/link/e090deaddc774ac699a04b959d9254c6.aspx" title="CLOI - VanEck CLO ETF - Overview"><strong>CLO</strong></a>s should be part of an investor&rsquo;s core bond portfolio. As the chart below shows, adding anywhere from a 10-30% <a href="/link/e090deaddc774ac699a04b959d9254c6.aspx" title="CLOI - VanEck CLO ETF - Overview"><strong>CLO</strong></a> allocation to a broad market allocation may increase the yield in a portfolio, increases the Sharpe ratio and decreases the potential max drawdown.</p>
<h3>Adding CLOs Provided Better Outcomes (as of 3/31/2024)</h3>
<p><img loading="lazy" class="img-responsive w-100" src="https://www.vaneck.com/contentassets/50e8a1cc32eb4199bbb64e50a4b1ad68/4591_cloi-qa_chart-2_2024-6_v1_blog.svg" alt="Adding CLOs Provided Better Outcomes (as of 3/31/2024)" /></p>
<div class="wrapped-div">
<table style="width: 100%;">
<tbody>
<tr class="tbl-data">
<td class="data-td last">10Y Stats</td>
<td class="data-td data last text-right">Agg</td>
<td class="data-td data last text-right">Agg+10% CLO</td>
<td class="data-td data last text-right">Agg+20% CLO</td>
<td class="data-td data last text-right">Agg+30% CLO</td>
<td class="data-td data last text-right">CLOs</td>
</tr>
<tr class="tbl-data">
<td class="data-td last">Sharpe Ratio</td>
<td class="data-td data last text-right">0.04</td>
<td class="data-td data last text-right">0.09</td>
<td class="data-td data last text-right">0.15</td>
<td class="data-td data last text-right">0.22</td>
<td class="data-td data last text-right">0.6</td>
</tr>
<tr class="tbl-data">
<td class="data-td last">Max Drawdown</td>
<td class="data-td data last text-right">-17.38</td>
<td class="data-td data last text-right">-15.58</td>
<td class="data-td data last text-right">-13.96</td>
<td class="data-td data last text-right">-12.42</td>
<td class="data-td data last text-right">-8.68</td>
</tr>
</tbody>
</table>
</div>
<h3>And Better Yields (as of 3/31/2024)</h3>
<p><img loading="lazy" class="img-responsive w-100" src="https://www.vaneck.com/contentassets/50e8a1cc32eb4199bbb64e50a4b1ad68/4591_cloi-qa_chart-3_2024-6_v1_blog.svg" alt="And Better Yields (as of 3/31/2024)" /></p>
<p class="chart-disclosure">Source: JP Morgan and ICE Data Services. CLOs refers to the J.P. Morgan Collateralized Loan Obligation Index (CLOIE) and Agg refers to the ICE BofA US Broad Market Index. CLO Yield to Worst represents yield to call for premium priced securities or to maturity when priced at a discount to par based on forward reference rates. See index descriptions at the end of this presentation. Past performance is not indicative of future results. This is not an offer to buy or sell, or recommendation to buy or sell any of the securities mentioned herein. For illustrative purposes only.</p>
<p>The <a href="/link/e090deaddc774ac699a04b959d9254c6.aspx" title="CLOI - VanEck CLO ETF - Overview"><strong>CLO</strong></a> market is largely institutional, with banks, insurance companies and hedge funds often purchasing <a href="/link/e090deaddc774ac699a04b959d9254c6.aspx" title="CLOI - VanEck CLO ETF - Overview"><strong>CLO</strong></a>s directly or through institutional separate accounts that may carry minimums of $50M or more. This may make access difficult for many investors.</p>
<div style="border: 1px solid black; padding: 15px;">
<h2>Investing in CLOs with VanEck</h2>
<p>The <a href="https://www.vaneck.com/us/en/investments/clo-etf-cloi/overview/" title="CLOI - VanEck CLO ETF - Holdings and Performance"><strong>VanEck CLO ETF (CLOI)</strong></a>, subadvised by PineBridge, may offer an attractive way for investors to efficiently access this market with the liquidity, transparency and low cost features of an ETF. <a href="/link/e090deaddc774ac699a04b959d9254c6.aspx" title="CLOI - VanEck CLO ETF - Overview"><strong>CLOI</strong></a> invests primarily in investment grade <a href="/link/e090deaddc774ac699a04b959d9254c6.aspx" title="CLOI - VanEck CLO ETF - Overview"><strong>CLO</strong></a> tranches and may invest up to 20% in BB-rated <a href="/link/e090deaddc774ac699a04b959d9254c6.aspx" title="CLOI - VanEck CLO ETF - Overview"><strong>CLO</strong></a>s (but will not invest in <a href="/link/e090deaddc774ac699a04b959d9254c6.aspx" title="CLOI - VanEck CLO ETF - Overview"><strong>CLO</strong></a>s rated below BB-/Ba3 or equity tranches of <a href="/link/e090deaddc774ac699a04b959d9254c6.aspx" title="CLOI - VanEck CLO ETF - Overview"><strong>CLO</strong></a>s).<br /><br /><a href="/link/e090deaddc774ac699a04b959d9254c6.aspx" title="CLOI - VanEck CLO ETF - Overview"><strong>CLOI</strong></a> aims to provide an enhanced yield by identifying the most attractive segments of the <a href="/link/e090deaddc774ac699a04b959d9254c6.aspx" title="CLOI - VanEck CLO ETF - Overview"><strong>CLO</strong></a> market, while avoiding downgrades and default losses. Through our active management, we can move throughout the <a href="/link/e090deaddc774ac699a04b959d9254c6.aspx" title="CLOI - VanEck CLO ETF - Overview"><strong>CLO</strong></a> capital structure to potentially add alpha, adding risk when there are opportunities and de-risking in periods of market volatility.</p>
</div>
<p class="mt-2">To receive more <a href="/us/en/blogs/income-investing/" title="Income Investing Insights"><strong>Income Investing</strong></a> insights, <a href="/link/5f45412c2143400497908cea2897f7d3.aspx" title=" Subscription Center"><strong>sign up in our subscription center</strong></a>.</p>
<style>
    .wrapped-div {
        max-width: 100%;
    }

    @media (max-width: 1240px) {
        .wrapped-div {
            overflow-x: scroll;
        }
    }

    .wrapped-div-sector {
        max-width: 100%;
        overflow-x: scroll;
    }
</style>
]]></content:encoded>
</item><item rdf:about="https://www.vaneck.com/us/en/blogs/moat-investing/valuations-steer-moat-indexs-contrarian-bias/">
  <title>Valuations Steer Moat Index’s Contrarian Bias></title>
  <link>https://www.vaneck.com/us/en/blogs/moat-investing/valuations-steer-moat-indexs-contrarian-bias/</link>
  <description><![CDATA[The Moat Index maintains its value bias and Mag 7 underweight following its latest quarterly rebalance.]]></description>
  <dc:creator>Brandon Rakszawski</dc:creator>
  <dc:date>06/26/2024 06:30:00</dc:date>
<content:encoded><![CDATA[

<p>The Morningstar<sup>&reg;</sup>&nbsp;Wide Moat Focus Index<sup>SM</sup>&nbsp;(the &ldquo;Moat Index&rdquo; or &ldquo;Index&rdquo;) underwent its quarterly review on June 21, 2024. The Index&rsquo;s review process systematically targets attractively priced, high quality U.S. companies. Below are some key takeaways from the June review and how the Moat Index is positioned entering the second half of 2024. The full review results are available here: <strong><a href="https://www.vaneck.com/us/en/investments/morningstar-wide-moat-etf-moat/moat-reconstitution.pdf" target="_blank" title="MOAT - VanEck Morningstar Wide Moat ETF" rel="noopener">2Q 2024 Index Reconstitution</a></strong>.</p>
<h2>Moat Index Review Takeaways: Value Bias, Mag 7 Underweight, Valuation Discount</h2>
<ul class="content-list">
<li class="mt-2"><strong>Staying the Course as Valuations Lead the Way</strong></li>
</ul>
<p style="margin-left: .5in;">The Moat Index entered 2024 with a contrarian bias toward large cap stocks (as opposed to the mega caps that dominate the S&amp;P 500 Index) and a very slight value posture. That bias has remained through the first two quarter reviews of the year. The Moat Index remains notably underweight growth stocks relative to the S&amp;P 500 with core stocks that exhibit characteristics of both growth and value making up much of the difference. The recent exposure has reflected the valuation opportunities in the U.S. market among high quality, wide moat companies as the Index&rsquo;s systematic, rules-based process avoids the tendency to follow the crowd.</p>
<ul class="content-list">
<li class="mt-2"><strong>The Magnificent 7 Continues its Climb</strong></li>
</ul>
<p style="margin-left: .5in;">The S&amp;P 500 Index, widely owned by investors of all types by way of index funds, has seen several of the Magnificent 7 companies battle it out for the title of largest market cap over the last several weeks. The result: more Magnificent 7 exposure in investors&rsquo; portfolios (<strong><a href="https://www.vaneck.com/us/en/blogs/moat-investing/moats-future-focus-beyond-ai-and-short-term-setbacks/" title="MOAT's Future Focus: Beyond AI and Short-Term Setbacks">and more influence on market returns</a></strong>). While Magnificent 7 exposure has increased from 28% of the S&amp;P 500 at the end 2023 to 32% at present, the Moat Index comprises only 4.4% by way of Alphabet, Amazon, and Microsoft. The Moat Index has been consistently underweight these seven companies, offering investors differentiated exposure to U.S. equities.</p>
<ul class="content-list">
<li class="mt-2"><strong>U.S. Equity Exposure Without the Lofty Valuations</strong></li>
</ul>
<p style="margin-left: .5in;">The price/fair value ratio of the S&amp;P 500 Index currently sits at 1.05. This implies that the companies in the S&amp;P 500 are, overall, trading at approximately a 5% premium, according to Morningstar. This presents a challenge for investors looking to deploy cash into U.S. markets that have already appreciated by more than 15% this year. The Moat Index represents high quality companies currently mispriced by the market, in Morningstar&rsquo;s view. It allows investors to consider a mix of well-positioned companies with upside potential. Currently, the Morningstar price/fair value ratio of the Moat Index is 0.81, implying a 19% discount to fair value.</p>

<h2>2Q 2024 Moat Index Review Results</h2>
<h3>Moat Index Sector Shifts Following 2Q 2024 Review</h3>
<p><img class="img-responsive w-100" src="https://www.vaneck.com/contentassets/c052487694154fa8a61a57e0e0ff4e84/4592_moat_chart-1_2024-06_v1_blog.svg" alt="Moat Index Sector Shifts Following 2Q 2024 Review" /></p>
<h3>Moat Index Sector Exposure Relative to S&amp;P 500 Index</h3>
<p><img class="img-responsive w-100" src="https://www.vaneck.com/contentassets/c052487694154fa8a61a57e0e0ff4e84/4592_moat_chart-2_2024-06_v1_blog.svg" alt="Moat Index Sector Exposure Relative to S and P 500 Index" /></p>
<h3>Moat Index Style Exposure Relative to S&amp;P 500 Index: Value Bias Persists</h3>
<p><img class="img-responsive w-100" src="https://www.vaneck.com/contentassets/c052487694154fa8a61a57e0e0ff4e84/4592_moat_chart-3_2024-06_v1_blog.svg" alt="Moat Index Style Exposure Relative to S and P 500 Index: Value Bias Persists" /></p>
<p class="chart-disclosure">Source: Morningstar. As of 6/21/2024 unless otherwise noted.</p>
<h2>Access Quality Companies and Attractive Valuations</h2>
<p><strong><a href="https://www.vaneck.com/us/en/investments/morningstar-wide-moat-etf-moat/index/" title="MOAT - VanEck Morningstar Wide Moat ETF - Holdings and Performance">VanEck Morningstar Wide Moat ETF (MOAT)</a></strong> and <strong><a href="https://www.vaneck.com/us/en/investments/morningstar-wide-moat-fund-mwmzx/overview/" title="MWMZX - VanEck Morningstar Wide Moat Fund - Class Z - Overview">VanEck Morningstar Wide Moat Fund</a></strong> seek to replicate as closely as possible, before fees and expenses the price and yield performance of the Morningstar Wide Moat Focus Index.</p>
<p>To receive more <strong><a href="https://www.vaneck.com/us/en/insights/moat-investing/" title="Moat Investing Insights">Moat Investing</a></strong> insights, <strong><a href="https://www.vaneck.com/us/en/subscribe/" title="Preference Center">sign up in our subscription center</a></strong>.</p>
]]></content:encoded>
</item><item rdf:about="https://www.vaneck.com/us/en/blogs/thematic-investing/buzz-investing-us-stocks-rally-as-nvidia-climbs-higher/">
  <title>BUZZ Investing: U.S. Stocks Rally as Nvidia Climbs Higher></title>
  <link>https://www.vaneck.com/us/en/blogs/thematic-investing/buzz-investing-us-stocks-rally-as-nvidia-climbs-higher/</link>
  <description><![CDATA[The stock market surged due to weaker-than-expected jobs and CPI reports, boosting investor confidence. Nvidia led the gains, soaring over 41% thanks to strong earnings and a stock split announcement.]]></description>
  <dc:creator> </dc:creator>
  <dc:date>06/25/2024 06:30:00</dc:date>
<content:encoded><![CDATA[

<p>U.S. domestic markets experienced significant gains during the recent period between Index selection dates (May 9, 2024 &ndash; June 12, 2024, the &ldquo;Period&rdquo;). Equity markets rallied following a weaker-than-expected jobs report and a softer CPI report. The April CPI report released on May 15th showed a year-over-year gain of 3.4%, lower than the previous month, reinforcing hopes that inflation was being effectively controlled. These factors combined created a bullish environment for stocks, as investors anticipated a more accommodative monetary policy. The bond market gained, highlighted by 2-year treasury note yields, which fell by 7 bps, closing the Period at a yield of 4.75%. The BUZZ NextGen AI US Sentiment Leaders Index (the &ldquo;BUZZ Index&rdquo;) gained 4.5% during the Period.</p>
<p>The BUZZ Index returned 5.37% during the month of May compared to a return of 4.96% for the S&amp;P 500 Index during the same period. Year-to-date, the BUZZ Index slightly lags the S&amp;P 500 with returns of 11.07% and 11.30%, respectively, as of the end of May.</p>
<h2>Shares of NVIDIA Pace Advancing Stocks within the BUZZ Index</h2>
<p>Shares of NVIDIA Corporation (NASD: NVDA) led advancers within the BUZZ Index, soaring over 41% during the recent Period and pushing its market capitalization past $3 trillion. This surge followed the company's May 22nd earnings report, which exceeded expectations. Nvidia posted a record Q1 2024 revenue of $26.0 billion, up 262% year-over-year and 18% from the previous quarter, driven by a 427% increase in its data center segment revenue to $22.6 billion due to strong demand for AI and high-performance computing solutions. Additionally, Nvidia's announcement of a 10-for-1 stock split, aimed to improve liquidity and make Nvidia's shares more affordable to retail investors, was well received as investors continued to cheer the company&rsquo;s strong market position and growth potential.</p>
<p>Shares of Robinhood Markets (HOOD) contributed to BUZZ Index gains, surging 37% during the Period as investor interest in meme stocks was reignited. This resurgence followed Keith Gill, also known as "Roaring Kitty," posting on X for the first time since the peak of the 2021 meme stock frenzy. His posts about GameStop (GME) sparked a dramatic rally in the stock and revived the perception that social media-driven retail trading might be making a comeback.</p>

<h3>Top BUZZ Index Contributors: May 9, 2024 &ndash; June 12, 2024</h3>
<div class="wrapped-div">
<table style="width: 100%;">
<tbody>
<tr class="tbl-data">
<td class="tbl-header last">Company</td>
<td class="tbl-header last text-left">Ticker</td>
<td class="tbl-header last text-right">Average Weight (%)</td>
<td class="tbl-header last text-right">Return Contribution (%)</td>
</tr>
<tr class="tbl-data">
<td class="data-td last font-weight-normal">NVIDIA Corp</td>
<td class="data-td data last text-left">NVDA</td>
<td class="data-td data last text-right">3.50</td>
<td class="data-td data last text-right">1.24</td>
</tr>
<tr class="tbl-data">
<td class="data-td last font-weight-normal">Robinhood Markets Inc</td>
<td class="data-td data last text-left">HOOD</td>
<td class="data-td data last text-right">3.17</td>
<td class="data-td data last text-right">1.02</td>
</tr>
<tr class="tbl-data">
<td class="data-td last font-weight-normal">MicroStrategy Inc</td>
<td class="data-td data last text-left">MSTR</td>
<td class="data-td data last text-right">3.50</td>
<td class="data-td data last text-right">0.74</td>
</tr>
<tr class="tbl-data">
<td class="data-td last font-weight-normal">Coinbase Global Inc</td>
<td class="data-td data last text-left">COIN</td>
<td class="data-td data last text-right">3.08</td>
<td class="data-td data last text-right">0.66</td>
</tr>
<tr class="tbl-data">
<td class="data-td last font-weight-normal">Apple Inc</td>
<td class="data-td data last text-left">AAPL</td>
<td class="data-td data last text-right">3.10</td>
<td class="data-td data last text-right">0.47</td>
</tr>
<tr class="tbl-data">
<td class="data-td last font-weight-normal">Rivian Automotive Inc</td>
<td class="data-td data last text-left">RIVN</td>
<td class="data-td data last text-right">2.45</td>
<td class="data-td data last text-right">0.39</td>
</tr>
<tr class="tbl-data">
<td class="data-td last font-weight-normal">Palantir Technologies Inc</td>
<td class="data-td data last text-left">PLTR</td>
<td class="data-td data last text-right">2.99</td>
<td class="data-td data last text-right">0.37</td>
</tr>
<tr class="tbl-data">
<td class="data-td last font-weight-normal">Micron Technology Inc</td>
<td class="data-td data last text-left">MU</td>
<td class="data-td data last text-right">1.25</td>
<td class="data-td data last text-right">0.32</td>
</tr>
<tr class="tbl-data">
<td class="data-td last font-weight-normal">Meta Platforms Inc</td>
<td class="data-td data last text-left">META</td>
<td class="data-td data last text-right">2.92</td>
<td class="data-td data last text-right">0.21</td>
</tr>
<tr class="tbl-data">
<td class="data-td last font-weight-normal">Microsoft Corp</td>
<td class="data-td data last text-left">MSFT</td>
<td class="data-td data last text-right">2.53</td>
<td class="data-td data last text-right">0.17</td>
</tr>
</tbody>
</table>
</div>
<p class="chart-disclosure">Source: BUZZ Holdings ULC, Bloomberg. Past performance is no guarantee of future results. Index performance is not illustrative of fund performance. Not intended as a recommendation to buy or to sell any of the securities mentioned herein.</p>
<p>Trump Media &amp; Technology Group Corp (NASD: DJT) was the top detractor to BUZZ Index performance during the Period. Several key factors may have contributed to its share price&rsquo;s recent decline, including recently revised financial statements which uncovered financial inconsistencies after a re-audit by a new firm. At the same time, the company reported significant net losses for 2023, exacerbating worries about its financial stability. Finally, the conviction of former President Donald Trump in a hush money trial may have further damaged investor confidence. Shares of Paramount Global (NASD: PARA) detracted from BUZZ Index performance after Shari Redstone's National Amusements ended talks with Skydance Media for a controlling stake due to failing to reach acceptable terms. This development is the latest in a prolonged saga for control of Paramount, known for its extensive portfolio of television networks, film studios, and streaming services.</p>
<h3>Bottom BUZZ Index Contributors: May 9, 2024 &ndash; June 12, 2024</h3>
<div class="wrapped-div">
<table style="width: 100%;">
<tbody>
<tr class="tbl-data">
<td class="tbl-header last">Company</td>
<td class="tbl-header last text-left">Ticker</td>
<td class="tbl-header last text-right">Average Weight (%)</td>
<td class="tbl-header last text-right">Return Contribution (%)</td>
</tr>
<tr class="tbl-data">
<td class="data-td last font-weight-normal">Trump Media Tech Group</td>
<td class="data-td data last text-left">DJT</td>
<td class="data-td data last text-right">2.00</td>
<td class="data-td data last text-right">-0.61</td>
</tr>
<tr class="tbl-data">
<td class="data-td last font-weight-normal">Paramount Global</td>
<td class="data-td data last text-left">PARA</td>
<td class="data-td data last text-right">2.86</td>
<td class="data-td data last text-right">-0.47</td>
</tr>
<tr class="tbl-data">
<td class="data-td last font-weight-normal">Viking Therapeutics Inc</td>
<td class="data-td data last text-left">VKTX</td>
<td class="data-td data last text-right">0.82</td>
<td class="data-td data last text-right">-0.38</td>
</tr>
<tr class="tbl-data">
<td class="data-td last font-weight-normal">Celsius Holdings Inc</td>
<td class="data-td data last text-left">CELH</td>
<td class="data-td data last text-right">0.93</td>
<td class="data-td data last text-right">-0.25</td>
</tr>
<tr class="tbl-data">
<td class="data-td last font-weight-normal">Snowflake Inc</td>
<td class="data-td data last text-left">SNOW</td>
<td class="data-td data last text-right">1.14</td>
<td class="data-td data last text-right">-0.16</td>
</tr>
<tr class="tbl-data">
<td class="data-td last font-weight-normal">Super Micro Computer Inc</td>
<td class="data-td data last text-left">SMCI</td>
<td class="data-td data last text-right">2.99</td>
<td class="data-td data last text-right">-0.14</td>
</tr>
<tr class="tbl-data">
<td class="data-td last font-weight-normal">Carvana Co</td>
<td class="data-td data last text-left">CVNA</td>
<td class="data-td data last text-right">1.61</td>
<td class="data-td data last text-right">-0.14</td>
</tr>
<tr class="tbl-data">
<td class="data-td last font-weight-normal">DraftKings Inc</td>
<td class="data-td data last text-left">DKNG</td>
<td class="data-td data last text-right">1.15</td>
<td class="data-td data last text-right">-0.14</td>
</tr>
<tr class="tbl-data">
<td class="data-td last font-weight-normal">Block Inc</td>
<td class="data-td data last text-left">SQ</td>
<td class="data-td data last text-right">0.98</td>
<td class="data-td data last text-right">-0.13</td>
</tr>
<tr class="tbl-data">
<td class="data-td last font-weight-normal">Lululemon Athletica Inc</td>
<td class="data-td data last text-left">LULU</td>
<td class="data-td data last text-right">0.68</td>
<td class="data-td data last text-right">-0.10</td>
</tr>
</tbody>
</table>
</div>
<p class="chart-disclosure">Source:BUZZ Holdings ULC, Bloomberg. Past performance is no guarantee of future results. Index performance is not illustrative of fund performance. Not intended as a recommendation to buy or to sell any of the securities mentioned herein.</p>
<h2>BUZZ Index June 2024 Rebalance Highlights</h2>
<strong><u>Unity Software Inc</u></strong>
<p>Unity Software Inc. (NYSE: U) is the creator of the Unity Engine, one of the most widely used design platforms in the game development industry. The Unity kit allows less-specialized developers to create complex content, ranging from mobile apps to full-scale 3D games. It was the emergence of the iPhone in 2007 that helped propel the company to dominance, as the ease with which apps could be created with Unity's engine was unparalleled. By 2012, it was estimated that half of mobile game developers were using Unity. Despite Unity's market dominance, the company has made repeated blunders since its IPO in 2020, culminating in its disastrous decision last year to charge developers based on the number of installations of their software. The backlash was severe and greatly damaged Unity's reputation, resulting in their former CEO stepping down and a round of layoffs. Last month, Unity announced a new permanent CEO and proposed "resetting&rdquo; the company in an attempt to rebuild. The stock, down 60% YTD, may be becoming increasingly attractive from a value perspective, while positive investor sentiment jumped following the company's management reshuffle. This month, U is the largest addition in the BUZZ Index, with a maximum 3% weight.</p>
<strong><u>On Holding AG</u></strong>
<p>This month the BUZZ Index features a first-time entrant, On Holding AG (NYSE: ONON), makers of the On-branded line of running shoes. Founded by competitive runner Olivier Bernhard in 2010, the Swiss brand quickly gained credibility, with its shoes being adopted by many of the country&rsquo;s top athletes. Within a decade, On captured almost half of Swiss running shoe market share. As word of the shoe&rsquo;s performance spread, the company expanded internationally, evolving into a lifestyle brand and collaborating with fashion designers. The onboarding of Roger Federer as a shareholder and face of the company in 2019 catapulted On&rsquo;s popularity, and the company eventually went public in 2021. Shares of ONON are up 50% so far this year as the brand continues to gain momentum in the US, and sentiment has also been on the rise. ONON joins the BUZZ Index this month with a 0.49% weight.</p>
<p>For more on rebalancing results and a full breakdown of index constituents added and removed for the month, view the <a href="/us/en/blogs/thematic-investing/buzz-investing-us-stocks-rally-as-nvidia-climbs-higher/buzz-reconstitution-june-2024.pdf" title="BUZZ VanEck Social Sentiment ETF" target="_blank" rel="noopener"><strong>BUZZ Index reconstitution</strong></a> report.</p>
<p>To receive more <a href="https://www.vaneck.com/us/en/insights/thematic-investing/" title="Thematic Investing Insights"><strong>Thematic Investing</strong></a> insights, <a href="https://www.vaneck.com/us/en/subscribe/" title="Subscription Center"><strong>sign up in our subscription center</strong></a>.</p>
<style>
    .wrapped-div {
        max-width: 100%;
    }

    @media (max-width: 1240px) {
        .wrapped-div {
            overflow-x: scroll;
        }
    }

    .wrapped-div-sector {
        max-width: 100%;
        overflow-x: scroll;
    }
</style>
]]></content:encoded>
</item><item rdf:about="https://www.vaneck.com/us/en/blogs/digital-assets/cheat-sheet-how-to-answer-questions-on-bitcoin/">
  <title>Cheat Sheet: How To Answer Questions On Bitcoin></title>
  <link>https://www.vaneck.com/us/en/blogs/digital-assets/cheat-sheet-how-to-answer-questions-on-bitcoin/</link>
  <description><![CDATA[Bitcoin has been around for more than a decade, but has been garnering a lot more attention lately. Use this cheat sheet to help you answer the most common questions.]]></description>
  <dc:creator> </dc:creator>
  <dc:date>06/21/2024 06:30:00</dc:date>
<content:encoded><![CDATA[


<h2>What is Bitcoin?</h2>
<ul class="content-list">
<li class="mt-2"><strong>Peer-to-peer network:</strong> Bitcoin is a peer-to-peer network that allows users to transfer value directly to each other without intermediaries, using open-source software.</li>
<li class="mt-2"><strong>Transparency:</strong> Transactions and addresses (akin to bank account) are publicly visible. Each transaction is recorded on a public ledger called the blockchain.</li>
<li class="mt-2"><strong>Limited supply:</strong> With a capped supply of 21 million coins, bitcoin has become a popular store of value and emerging medium of exchange.</li>
</ul>
<h2>How does Bitcoin work/operate?</h2>
<ul class="content-list">
<li class="mt-2"><strong>Open to all:</strong> Anyone can download bitcoin core software and run it on a personal computer.</li>
<li class="mt-2"><strong>Community-driven:</strong> Developers work on it voluntarily, for free, and the code is open for anyone to review and contribute.</li>
<li class="mt-2"><strong>Verification:</strong> New/pending transactions are added to the ledger by hardware (miners) using computational power to solve complex mathematical problems.</li>
<li class="mt-2"><strong>Consensus upgrades: </strong>Bitcoin upgrades are proposed and implemented through a voting process among the network participants.</li>
</ul>
<h2>How is Bitcoin valued?</h2>
<ul class="content-list">
<li class="mt-2"><strong>Digital gold: </strong>Bitcoin can be thought of like &ldquo;digital gold&rdquo;. Like gold, bitcoin offers investors a finite supply (there will only ever be 21 million bitcoins). This scarcity creates a store of value for investors.</li>
</ul>
<ul class="content-list">
<li class="mt-2"><strong>How big is Bitcoin?</strong>
<ul style="list-style-type: circle;">
<li class="mt-2">Bitcoin adoption and activity has grown tremendously.</li>
<li class="mt-2">19 million Bitcoin in circulation (again 21 million will ever be created).</li>
<li class="mt-2">As of April 2024, its market cap was around $1.2 trillion USD.</li>
<li class="mt-2">1B+ unique addresses, about 600-800K use the network to transfer value every day.</li>
</ul>
</li>
</ul>
<p>Overall, there&rsquo;s 2 trillion in wealth, the size of the ETF industry in 2014.</p>
<h2>Is Bitcoin safe? Can it be hacked?</h2>
<ul class="content-list">
<li class="mt-2"><strong>Decentralization:</strong> Bitcoin operates on a decentralized network spread across the globe, eliminating a central point of control that could be attacked.</li>
</ul>
<ul class="content-list">
<li class="mt-2"><strong>Blockchain Technology:</strong> Bitcoin transactions are recorded on a public ledger called the blockchain, with each block containing a cryptographic hash of the previous one, forming an immutable chain. Altering any transaction would mean changing all subsequent blocks, a task made computationally infeasible by the network's immense computing power.</li>
</ul>
<ul class="content-list">
<li class="mt-2"><strong>Cryptography:</strong> Bitcoin transactions are protected by cryptographic keys: a public key (wallet address) and a private key. Users sign transactions with their private key, which can be verified by others using the public key. Keeping the private key safe ensures bitcoins remain secure.</li>
</ul>

<h2>What is Bitcoin mining?</h2>
<ul class="content-list">
<li class="mt-2"><strong>Creation and verification:</strong> Bitcoin mining is the process by which new bitcoins are created and transactions are verified and added to the blockchain.</li>
<li class="mt-2"><strong>Mathematical puzzles:</strong> Miners use computers to solve complex mathematical puzzles that validate and secure transactions.</li>
<li class="mt-2"><strong>Network maintenance:</strong> Miners are essential in maintaining the Bitcoin network and are compensated with new Bitcoin and transaction fees.</li>
</ul>
<h2>What are the benefits of investing in Bitcoin?</h2>
<ul class="content-list">
<li class="mt-2"><strong>Potential inflation hedge: </strong>Bitcoin is not subject to the same inflationary pressures as traditional currencies, potentially making it a hedge against monetary stimulus and erosion of purchasing power.</li>
<li class="mt-2"><strong>Diversification benefits: </strong>Bitcoin historically has a low correlation to traditional asset classes, like stocks and bonds, offering potential diversification benefits.</li>
</ul>
<h2>What are Bitcoin&rsquo;s biggest risks?</h2>
<ul class="content-list">
<li class="mt-2"><strong>Volatility:</strong> Since Bitcoin is a relatively new asset, its price can be highly volatile over short periods.</li>
<li class="mt-2"><strong>Market Risk:</strong> Like gold, Bitcoin's value is influenced by supply and demand dynamics, investor sentiment, and macroeconomic factors.</li>
</ul>
<h2>How much should I allocate to Bitcoin?</h2>
<ul class="content-list">
<li class="mt-2"><strong>Individual goals:</strong> Every investor has unique and diverse goals. Your risk appetite and investment time horizon will determine where Bitcoin fits in your portfolio.</li>
</ul>
<ul class="content-list">
<li class="mt-2"><strong>Enhancing portfolios:</strong> Bitcoin can enhance risk-return profiles. <strong><a href="https://www.vaneck.com/us/en/blogs/digital-assets/the-investment-case-for-bitcoin/#small-bitcoin-exposure-enhances-results" title="The Investment Case for Bitcoin - Small Bitcoin Exposure Enhances Results
">As this chart shows</a></strong>, a small allocation to Bitcoin has significantly enhanced the cumulative return of a traditional 60% equity and 40% bond mix while only minimally impacting overall volatility.</li>
</ul>
<h2>What are the advantages of a Bitcoin exchange traded fund?</h2>
<ul class="content-list">
<li class="mt-2"><strong>Cost:</strong> Customers on exchanges pay around 2% for transactions. All costs by exchange traded funds are including in publicly available fees.</li>
<li class="mt-2"><strong>Custody:</strong> Bitcoin held on exchanges are not actually held by the individual so there&rsquo;s significant counterparty risk. Exchange traded funds use segregated qualified custody to alleviate this risk.</li>
<li class="mt-2"><strong>Portfolio Monitoring and Regulation:</strong> As adoption expands, Bitcoin exchange traded funds fit into traditional portfolio monitoring with trims/adds as part of total portfolio analysis and rebalancing. Plus, the exchange traded fund structure presents standard investment oversight from regulatory and financial parties.</li>
</ul>
<h2>Have Unanswered Questions? Ask Us!</h2>
<p>We hope this introduction provided you with a better understanding of Bitcoin. For those looking to integrate Bitcoin into their portfolios, please reach out to your VanEck representative. If you have more questions or need further insights, feel free to submit a question.</p>
<p class="d-none d-lg-block"><a href="mailto:askvaneck@vaneck.com" title="Have More Questions? - Ask VanEck" rel="noopener"> <img class="img-responsive" src="https://www.vaneck.com/globalassets/home/us/insights/blogs/bm-blog-images/cta-faq_desktop-02.svg" alt="Have More Questions? - Ask VanEck" /></a></p>
<p class="d-lg-none"><a href="mailto:askvaneck@vaneck.com" title="Have More Questions? - Ask VanEck" rel="noopener"> <img class="img-responsive" src="https://www.vaneck.com/globalassets/home/us/insights/blogs/bm-blog-images/cta-faq_mobile-01.svg" alt="Have More Questions? - Ask VanEck" /></a></p>
<p>Have more questions? Find answers by visiting our <strong><a href="/link/343cf2f03fec405589c8319433a957f6.aspx">Bitcoin and Digital Assets Education Center.</a></strong></p>
<p>To receive more <strong><a href="https://www.vaneck.com/us/en/insights/digital-assets/" title="Digital Assets Insights">Digital Assets</a></strong> insights, <strong><a href="https://www.vaneck.com/us/en/subscribe/" title="Subscription Center">sign up in our subscription center</a></strong>.</p>
<style type="text/css">
    .wrapped-div {
        max-width: 100%;
    }

    @media (max-width: 768px) {
        .wrapped-div {
            overflow-x: scroll;
        }
    }

    .wrapped-div-sector {
        max-width: 100%;
        overflow-x: scroll;
    }
</style>
]]></content:encoded>
</item><item rdf:about="https://www.vaneck.com/us/en/blogs/emerging-markets-bonds/em-debt-are-investors-looking-at-the-wrong-risks/">
  <title>EM Debt: Are Investors Looking at the Wrong Risks?></title>
  <link>https://www.vaneck.com/us/en/blogs/emerging-markets-bonds/em-debt-are-investors-looking-at-the-wrong-risks/</link>
  <description><![CDATA[Despite profound political risk in developed markets, market participants are still shouting that EM has all the political risk. They&rsquo;re wrong, here&rsquo;s why.]]></description>
  <dc:creator>Eric Fine</dc:creator>
  <dc:date>06/17/2024 06:30:00</dc:date>
<content:encoded><![CDATA[

<p id="summary" class="jump-link-nav anchored-block" data-jumplink-title="Summary">The <strong><a href="https://www.vaneck.com/us/en/investments/emerging-markets-bond-fund-embax/overview/" title="EMBAX - Emerging Markets Bond Fund - Class A">VanEck Emerging Markets Bond Fund</a></strong> was up 1.65% in May, compared to 1.71% for its benchmark, the 50% J.P. Morgan Government Bond Index-Emerging Markets (GBI-EM) Global Diversified and 50% J.P. Morgan Emerging Markets Bond Index (EMBI). Year to date, the fund has outperformed its benchmark by 60 basis points (bps) (the fund is up 0.12% compared to down 48 bps for the benchmark). During May, the fund increased local currency exposure in Asia (Thailand, Malaysia, Indonesia), and added some China corporate exposure due to China&rsquo;s economic and policy traction. We reduced local currency exposure in Brazil, which is a popular overweight, where the country is beginning an important debate on the role of the central bank. We&rsquo;ll sit that debate out as it is too profound and fraught, especially given bullish positioning. We also increased duration in the fund. We continue to think selected emerging markets currencies (EMFX) will outperform and are tilting toward longer duration as U.S. rate concerns appear over-ripe. Rate cuts will of course support EM local currency. But, we curate and had underweights in Mexico local and now Brazil local (where the market is very long), and are maintaining our overweight in South Africa (where the market is very underweight and developments seem positive). These country-specific stances will be determinant, &ldquo;EM local vs. hard&rdquo; will not. That&rsquo;s the way active EM bonds are supposed to be managed, not by providing benchmark exposure. We end May with a carry of 6.8%, yield to worst of 8.8%, duration of 6.1, and around 54.5% of the fund in local currency. Our biggest outright exposures are South Africa (local), Thailand (local), Indonesia (local), China (Hard), and Malaysia (local).</p>
<p><a href="/us/en/blogs/emerging-markets-bonds/em-debt-are-investors-looking-at-the-wrong-risks/em-debt-are-investors-looking-at-the-wrong-risks.pdf" rel="noopener" target="_blank" title="EM Debt: Are Investors Looking at the Wrong Risks?"><strong>View here for the PDF version of this blog.</strong></a></p>
<h3>Average Annual Total Returns<sup>*</sup>&nbsp;(%) (In USD)</h3>
<div class="wrapped-div">
<table style="width: 100%;">
<tbody>
<tr class="tbl-data">
<td class="tbl-header last" colspan="8">Month End as of May 31, 2024</td>
</tr>
<tr class="tbl-data">
<td class="data-head last text-right">&nbsp;</td>
<td class="data-head last text-right">1 MO</td>
<td class="data-head last text-right">3 MO</td>
<td class="data-head last text-right">YTD</td>
<td class="data-head last text-right">1 YR</td>
<td class="data-head last text-right">3 YR</td>
<td class="data-head last text-right">5 YR</td>
<td class="data-head last text-right">10 YR</td>
</tr>
<tr class="tbl-data">
<td class="data-td last">Class A: NAV (Inception 07/09/12)</td>
<td class="data-td data last text-right">1.71</td>
<td class="data-td data last text-right">0.94</td>
<td class="data-td data last text-right">-0.03</td>
<td class="data-td data last text-right">7.45</td>
<td class="data-td data last text-right">-1.08</td>
<td class="data-td data last text-right">3.05</td>
<td class="data-td data last text-right">0.92</td>
</tr>
<tr class="tbl-data">
<td class="data-td last">Class A: Maximum 5.75% load</td>
<td class="data-td data last text-right">-4.14</td>
<td class="data-td data last text-right">-4.87</td>
<td class="data-td data last text-right">-5.78</td>
<td class="data-td data last text-right">1.27</td>
<td class="data-td data last text-right">-3.02</td>
<td class="data-td data last text-right">1.83</td>
<td class="data-td data last text-right">0.32</td>
</tr>
<tr class="tbl-data">
<td class="data-td last">Class I: NAV (Inception 07/09/12)</td>
<td class="data-td data last text-right">1.65</td>
<td class="data-td data last text-right">0.91</td>
<td class="data-td data last text-right">0.12</td>
<td class="data-td data last text-right">7.80</td>
<td class="data-td data last text-right">-0.77</td>
<td class="data-td data last text-right">3.32</td>
<td class="data-td data last text-right">1.21</td>
</tr>
<tr class="tbl-data">
<td class="data-td last">Class Y: NAV (Inception 07/09/12)</td>
<td class="data-td data last text-right">1.79</td>
<td class="data-td data last text-right">0.99</td>
<td class="data-td data last text-right">0.20</td>
<td class="data-td data last text-right">7.80</td>
<td class="data-td data last text-right">-0.81</td>
<td class="data-td data last text-right">3.30</td>
<td class="data-td data last text-right">1.16</td>
</tr>
<tr class="tbl-data">
<td class="data-td last">50% GBI-EM/50% EMBI</td>
<td class="data-td data last text-right">1.71</td>
<td class="data-td data last text-right">0.59</td>
<td class="data-td data last text-right">-0.48</td>
<td class="data-td data last text-right">8.05</td>
<td class="data-td data last text-right">-2.89</td>
<td class="data-td data last text-right">0.31</td>
<td class="data-td data last text-right">1.01</td>
</tr>
</tbody>
</table>
</div>
<br />
<div class="wrapped-div">
<table style="width: 100%;">
<tbody>
<tr class="tbl-data">
<td class="tbl-header last" style="width: 100%;" colspan="8">Quarter End as of March 31, 2024</td>
</tr>
<tr class="tbl-data">
<td class="data-head last text-right">&nbsp;</td>
<td class="data-head last text-right">1 MO</td>
<td class="data-head last text-right">3 MO</td>
<td class="data-head last text-right">YTD</td>
<td class="data-head last text-right">1 YR</td>
<td class="data-head last text-right">3 YR</td>
<td class="data-head last text-right">5 YR</td>
<td class="data-head last text-right">10 YR</td>
</tr>
<tr class="tbl-data">
<td class="data-td last">Class A: NAV (Inception 07/09/12)</td>
<td class="data-td data last text-right">0.68</td>
<td class="data-td data last text-right">-0.29</td>
<td class="data-td data last text-right">6.76</td>
<td class="data-td data last text-right">0.35</td>
<td class="data-td data last text-right">2.90</td>
<td class="data-td data last text-right">1.39</td>
</tr>
<tr class="tbl-data">
<td class="data-td last">Class A: Maximum 5.75% load</td>
<td class="data-td data last text-right">-5.11</td>
<td class="data-td data last text-right">-6.02</td>
<td class="data-td data last text-right">0.62</td>
<td class="data-td data last text-right">-1.62</td>
<td class="data-td data last text-right">1.69</td>
<td class="data-td data last text-right">0.79</td>
</tr>
<tr class="tbl-data">
<td class="data-td last">Class I: NAV (Inception 07/09/12)</td>
<td class="data-td data last text-right">0.76</td>
<td class="data-td data last text-right">-0.03</td>
<td class="data-td data last text-right">7.28</td>
<td class="data-td data last text-right">0.69</td>
<td class="data-td data last text-right">3.26</td>
<td class="data-td data last text-right">1.71</td>
</tr>
<tr class="tbl-data">
<td class="data-td last">Class Y: NAV (Inception 07/09/12)</td>
<td class="data-td data last text-right">0.73</td>
<td class="data-td data last text-right">-0.05</td>
<td class="data-td data last text-right">7.14</td>
<td class="data-td data last text-right">0.57</td>
<td class="data-td data last text-right">3.19</td>
<td class="data-td data last text-right">1.64</td>
</tr>
<tr class="tbl-data">
<td class="data-td last">50% GBI-EM/50% EMBI</td>
<td class="data-td data last text-right">1.03</td>
<td class="data-td data last text-right">-0.05</td>
<td class="data-td data last text-right">8.10</td>
<td class="data-td data last text-right">-1.45</td>
<td class="data-td data last text-right">0.48</td>
<td class="data-td data last text-right">1.42</td>
</tr>
</tbody>
</table>
</div>
<br />
<p class="chart-disclosure"><sup>*</sup>&nbsp;Returns less than one year are not annualized.</p>
<p class="chart-disclosure"><strong>Expenses: Class A: Gross 2.55%, Net 1.22%; Class I: Gross 2.51%, Net 0.87%; Class Y: Gross 2.91%, Net 0.97%.</strong> Expenses are capped contractually until 05/01/24 at 1.25% for Class A, 0.95% for Class I, 1.00% for Class Y. Caps excluding acquired fund fees and expenses, interest, trading, dividends, and interest payments of securities sold short, taxes, and extraordinary expenses.</p>
<p class="chart-disclosure"><strong>The performance data quoted represents past performance. Past performance is not a guarantee of future results. Investment return and principal value of an investment will fluctuate so that an investor&rsquo;s shares, when redeemed, may be worth more or less than their original cost. Performance may be lower or higher than performance data quoted. Please call 800.826.2333 or visit vaneck.com for performance current to the most recent month ended.</strong></p>
<p class="chart-disclosure">The &ldquo;Net Asset Value&rdquo; (NAV) of a Fund is determined at the close of each business day, and represents the dollar value of one share of the fund; it is calculated by taking the total assets of the fund, subtracting total liabilities, and dividing by the total number of shares outstanding. The NAV is not necessarily the same as the ETF&rsquo;s intraday trading value. Investors should not expect to buy or sell shares at NAV.</p>
<p id="overlooked-risks" class="jump-link-nav anchored-block" data-jumplink-title="Overlooked Risks"><strong>U.S. rates: Get ready for growing recession talk and a rally in duration for which the market is completely unprepared.</strong> &ldquo;High for long&rdquo; is priced in, but economic weakness is not, so look for the market&rsquo;s latest narrative to implode&hellip;soon. Too much of U.S. consumption, and thus growth, has been attenuated by the &ldquo;wealth effect&rdquo;, making any recession self-reinforcing, to our eye. This topic has to be the most-chewed-upon morsel at the moment, so we&rsquo;re not sure what to say that might be additive or that we haven&rsquo;t said before. We&rsquo;ll just recap our argument. It&rsquo;s our judgment that the following are important drivers of lower policy and market rates for the coming months:</p>
<ol class="content-list">
<li class="mt-2">
<p>Low confidence due to unprecedented U.S. political and policy uncertainty is a significant challenge to economic actors&rsquo; propensities to consume, save, and invest.</p>
</li>
<li class="mt-2">
<p>Real incomes and wealth are challenged, especially at lower ends of economic wealth (in a political year).</p>
</li>
<li class="mt-2">
<p>Fed reaction functions see high oil prices (or tariffs, even) as reasons to <i>ease</i> policy rates (as the higher input costs strain consumers or producers).</p>
</li>
<li class="mt-2">
<p>The market is only publishing &ldquo;high for long&rdquo; articles at this point and bond positioning is very cautious on duration, despite roughly 4 cuts having already been priced out this year. &lsquo;Nuf said as they say.</p>
</li>
</ol>
<p><strong>Politics: Despite profound political risk in the U.S. and Europe, market participants keep shouting that EM has all the political risk worth focusing on. This is wrong.</strong> Mexican, South African, and Indian elections are accepted by all parties, and the near-term implications are mostly for <i>policy</i>, not <i>politics</i>. This is our day job and we happened to have had a big underweight in Mexico, due to <i>policy</i> risk, for example. In particular, our concern was that the Mexican central bank would have more dovish board members (among other risks), while positioning is all bullish. Given Moreno&rsquo;s &ldquo;super-majority&rdquo; emanating from the elections, this <i>policy</i> risk is now on steroids. But it&rsquo;s not <i>political</i> risk. In South Africa, professionals had been watching whether the ruling ANC would fall below 40% of the vote-take, but the initial headlines and focus were on the not-news fact of the ANC losing its 50% majority. That was never in question, the issue was always the ANC&rsquo;s coalition decisions after the election in which they&rsquo;d lose their majority, and right now a coalition with the market-friendly DA appears likeliest. This would be very positive policy news for South Africa for a market that is underweight, but it is not <i>political</i> risk per se. The U.S. and Europe face <i>both</i> political and policy risk (which we won&rsquo;t comment on, as popular media are filled with examples).</p>
<p><strong>Geopolitics: Risks are expanding and escalating, maintaining EM-supportive supply risk in commodities. </strong>The true conflicts in Europe and the Middle East (or West Asia) are now - NATO v. Russia in Europe and Israel v. Iran v. Turkey in the Middle East (not Ukraine v. Russia, and Israel v. Hamas). Popular media attention will turn to the risks of nuclear conflict, we&rsquo;d expect, supporting U.S. bond duration. NATO operation and use of longer-range missiles fired into Russia are an obvious risk, and the absence of any dialog between adversaries points to no resolution. Importantly and practically, this means that any &ldquo;ceasefire&rdquo; between Ukraine and Russia will be a pause in a bigger conflict. We say this because we could easily see some sort of &ldquo;ceasefire&rdquo; and recognition of the actual situation on the ground, (and Ukraine&rsquo;s Zelensky might need to be ousted by his compatriots to allow this to happen). But, this will be a pause in a broadened conflict, at best. Similarly in the Middle East (or West Asia), any pause in the Israel/Hamas conflict must be viewed in the context of the expanding Israel/Iran/Turkey conflict, so don&rsquo;t be lulled if those scenarios happen. Witness recent Israeli strikes on Iranian ally Syria. The theater has expanded, don&rsquo;t get overly excited by any pauses in the drama that just buy time.</p>
<style>
.data-td.data {
        padding-right: 2px !important;
    }
    .wrapped-div {
        max-width: 100%;
    }

    @media (max-width: 768px) {
        .wrapped-div {
            overflow-x: scroll;
        }
    }

    .wrapped-div-sector {
        max-width: 100%;
        overflow-x: scroll;
    }
</style>

<h3>RMB Use In Trade Transcends USD</h3>
<p><img class="img-responsive w-100" src="https://www.vaneck.com/contentassets/e4fe339be6134c68b7f3eb89ceffdf31/4563_emb_chart-1_2024-6_v1_blog.svg" alt="RMB Use In Trade Transcends USD" /></p>
<p class="chart-disclosure">Source: SAFE.<br />Notes: Includes receipts and payments between domestic non-banking sectors and non-residents through domestic banks, excluding receipts and payments in cash.</p>
<h2 id="exposure-types-and-significant-changes" class="jump-link-nav anchored-block" data-jumplink-title="Exposure Types and Significant Changes">Exposure Types and Significant Changes</h2>
<p>The changes to our top positions are summarized below. Our largest positions in May were South Africa, Thailand, Indonesia, China, and Malaysia:</p>
<ul class="content-list">
<li class="mt-2">We increased our local currency exposure in Thailand, Malaysia, and Indonesia. EM Asia&rsquo;s local duration looks more attractive now given the outlook for rate cuts in the U.S. (which has priced out roughly four cuts this year. In addition, Asian EMs can benefit from China's measures to support the housing sector and prop up growth. These factors improved the technical test score for all three countries. Further, Thailand&rsquo;s stronger than expected Q1 GDP growth can ease pressure on the central bank to cut rates, while Thailand&rsquo;s tourism is doing well (including tourists from China). This strengthened the economic and policy test scores for the country.</li>
<li class="mt-2">We also increased our hard currency corporate exposure in Qatar and the United Arab Emirates. We were motivated by recent geopolitical developments in which the friction has moved from within the region to between bigger players in the region (the battle is Israel v. Turkey v. Iran, with Israel v. Hamas largely contained so far), as well as China&rsquo;s authorities push to resolve the housing crisis and improve the growth outlook, which should support the outlook for commodity prices, including oil. Further, the gradually cooling U.S. economy points to further disinflation, leaving room for the Fed rate cuts and supporting duration. In terms of our investment process, this improved the technical test scores for both countries.</li>
<li class="mt-2">Finally, we increased our local currency and hard currency sovereign exposure in South Africa, and hard currency corporate exposures in China. China&rsquo;s increase was due to a larger and more targeted support for housing, including unfinished projects and unsold housing stock. This is a move in the right direction, and it improved the policy test score for the country. South Africa&rsquo;s pre-election polls pointed to a less extreme governing coalition, against the backdrop of better fiscal outcomes and an absence of the pre-election spending spree. The coalition talks are still on-going, but there is a good chance of having a market-friendly alliance between the ANC and the DA party. If this scenario materializes, it will improve the policy test score for the country.</li>
<li class="mt-2">We reduced our local currency exposure in Brazil. The central bank is poised to pause as inflation expectations continue to drift higher (including the expectations for 2026 lately). The pace of fiscal consolidation also looks less certain, while the appointment of the central bank&rsquo;s new governor might push towards more policy easing than necessary. In terms of our investment process, this weakened the economic and policy test scores for the country. The market is bullish, but likely unprepared for a long policy debate on the status of the central bank.</li>
<li class="mt-2">We also reduced our hard currency quasi-sovereign exposure in Mexico (Pemex), and local currency exposure in Singapore. We used Singapore&rsquo;s bond as a funder for other higher-yielding opportunities. Bonds issued by Mexico&rsquo;s state-owned petroleum company PEMEX staged a nice rally recently, due to continued government support for the oil producer; that support is significantly already priced and was the basic thesis for the investment, so we decided to take profits on this position. Pemex also has a layer of ESG risk that may not be priced into the bonds.</li>
<li class="mt-2">Finally, we reduced our hard currency sovereign exposure in Gabon and local currency exposure in Kenya. Our meeting with Gabon&rsquo;s country delegation raised several concerns, including the government&rsquo;s intention to issue more sovereign bonds despite a great deal of fiscal uncertainty and with no clear explanation regarding the use of proceeds. In Kenya, we are getting negative signals about the government&rsquo;s ability to boost revenue collection (as well as taxes on local financial instruments). These developments weakened the policy test scores for both countries, and we decided to take profits in Kenya as local bonds rallied a lot since we bought them.</li>
</ul>
<p>To receive more&nbsp;<strong><a href="https://www.vaneck.com/us/en/insights/emerging-markets-bonds/" title="Emerging Markets Bonds Insights">Emerging Markets Bonds</a></strong>&nbsp;insights,&nbsp;<strong><a href="https://www.vaneck.com/us/en/subscribe/" title="Subscription Center">sign up in our subscription&nbsp;center</a></strong>.</p>
]]></content:encoded>
</item><item rdf:about="https://www.vaneck.com/us/en/blogs/income-investing/watch-these-fallen-angel-sectors-real-estate-and-banking/">
  <title>Watch These Fallen Angel Sectors: Real Estate and Banking></title>
  <link>https://www.vaneck.com/us/en/blogs/income-investing/watch-these-fallen-angel-sectors-real-estate-and-banking/</link>
  <description><![CDATA[Real Estate and Banking continue to be the sectors to watch going forward. May 2024 ends with no new fallen angels or rising stars.]]></description>
  <dc:creator>Nicolas  Fonseca, CFA</dc:creator>
  <dc:date>06/17/2024 06:30:00</dc:date>
<content:encoded><![CDATA[

<p>In May, fallen angels (as represented by the ICE US Fallen Angel High Yield 10% Constrained Index, &ldquo;H0CF&rdquo;) underperformed the broad high yield market (as represented by the ICE BofA US High Yield Index, &ldquo;H0A0&rdquo;) by 0.13% (1.01% vs 1.14%). Fallen angels now lag by 0.79% YTD, with returns of 0.85% vs 1.64% for the broad high yield market. Within broad high yield, BB and CCC and below rated bonds posted the same return, 1.23%, while single B rated bonds underperformed by 0.27%, posting 0.96% in May. Lower quality high yield continues to be ahead so far this year due to much higher yields (average yields of 13.5%, to date), as well as a shorter duration, which translated into a -0.87% price return and 3.68% income return for the CCC and lower rated bonds. Fallen angel spreads are still tight, currently at 260bps, which is 2bps below the YTD average, 31bps below the 3Y average and 102bps below the 10Y average, but 60bps above the lowest all time spread, which occurred in October 2021, at 200bps.</p>
<p><img class="img-responsive w-100" src="https://www.vaneck.com/contentassets/dc4876432e6240cf94c6a913146cdd2c/4558_angl_chart-1_2024-6_v2.svg" alt="Fallen Angel Spreads Over Various Time Periods" /></p>
<p class="chart-disclosure">Source: ICE Data Services, VanEck. Past performance is no guarantee of future results.</p>

<h2>Where are Fallen Angels sectors relative to Broad HY now?</h2>
<p>Fallen angels deliver a distinct value proposition that sets them apart from the overall high yield market. Fallen angels generally have differentiated sector exposure, which has been one of the drivers of long-term outperformance as these issuers tend to have sector biases as a result of broad economic factors (for example, going overweight Autos in 2004/2005 and Energy in 2016, the COVID pandemic and what is now playing out in the Real Estate sector). Historically this has allowed investors to participate in an entire sector&rsquo;s recovery, as bonds may be oversold prior to downgrade and subsequently recover in price.</p>
<p>The table below details the current positioning of fallen angels vs broad high yield.</p>
<ul>
<li class="mt-2">Fallen angels have a more distinct sector exposure than broad high yield, which has helped drive prior differentiated returns. Banking and Real Estate are indicative, as fallen angels are overweight 6.7x and 3.3x, respectively, and both offer wider spreads (3bps and 249bps wider) and higher yields (33bps and 245bps). The lack of Auto and Media exposure in fallen angels differs from broad high yield, as the latter has approximately 11% combined exposure to both sectors.</li>
<li class="mt-2">All fallen angels sectors have a longer duration than high yield which investors can take advantage of when rate cuts occur to avoid or limit reinvestment risk while still maintaining caution on excessive duration risk.</li>
</ul>
<div class="wrapped-div">
<table style="width: 100%;">
<tbody>
<tr class="tbl-data">
<td class="tbl-header last">Sector</td>
<td class="tbl-header last text-left">Exposure</td>
<td class="tbl-header last text-left">Spreads</td>
<td class="tbl-header last text-left">Yield</td>
<td class="tbl-header last text-left">Duration</td>
</tr>
<tr class="tbl-data">
<td class="data-td last font-weight-normal">Automotive*</td>
<td class="data-td data last text-left">Underweight</td>
<td class="data-td data last text-left">&nbsp;</td>
</tr>
<tr class="tbl-data">
<td class="data-td last font-weight-normal">Banking</td>
<td class="data-td data last text-left">Overweight</td>
<td class="data-td data last text-left">Wider</td>
<td class="data-td data last text-left">Higher</td>
<td class="data-td data last text-left">Longer</td>
</tr>
<tr class="tbl-data">
<td class="data-td last font-weight-normal">Basic Industry</td>
<td class="data-td data last text-left">Underweight</td>
<td class="data-td data last text-left">Tighter</td>
<td class="data-td data last text-left">Lower</td>
<td class="data-td data last text-left">Longer</td>
</tr>
<tr class="tbl-data">
<td class="data-td last font-weight-normal">Capital Goods</td>
<td class="data-td data last text-left">Underweight</td>
<td class="data-td data last text-left">Tighter</td>
<td class="data-td data last text-left">Lower</td>
<td class="data-td data last text-left">Longer</td>
</tr>
<tr class="tbl-data">
<td class="data-td last font-weight-normal">Consumer Goods</td>
<td class="data-td data last text-left">Overweight</td>
<td class="data-td data last text-left">Tighter</td>
<td class="data-td data last text-left">Lower</td>
<td class="data-td data last text-left">Longer</td>
</tr>
<tr class="tbl-data">
<td class="data-td last font-weight-normal">Energy</td>
<td class="data-td data last text-left">Overweight</td>
<td class="data-td data last text-left">Wider</td>
<td class="data-td data last text-left">Lower</td>
<td class="data-td data last text-left">Longer</td>
</tr>
<tr class="tbl-data">
<td class="data-td last font-weight-normal">Financial Services</td>
<td class="data-td data last text-left">Underweight</td>
<td class="data-td data last text-left">Wider</td>
<td class="data-td data last text-left">Higher</td>
<td class="data-td data last text-left">Longer</td>
</tr>
<tr class="tbl-data">
<td class="data-td last font-weight-normal">Healthcare</td>
<td class="data-td data last text-left">Underweight</td>
<td class="data-td data last text-left">Tighter</td>
<td class="data-td data last text-left">Lower</td>
<td class="data-td data last text-left">Longer</td>
</tr>
<tr class="tbl-data">
<td class="data-td last font-weight-normal">Insurance</td>
<td class="data-td data last text-left">Underweight</td>
<td class="data-td data last text-left">Tighter</td>
<td class="data-td data last text-left">Lower</td>
<td class="data-td data last text-left">Longer</td>
</tr>
<tr class="tbl-data">
<td class="data-td last font-weight-normal">Leisure</td>
<td class="data-td data last text-left">Underweight</td>
<td class="data-td data last text-left">Tighter</td>
<td class="data-td data last text-left">Lower</td>
<td class="data-td data last text-left">Longer</td>
</tr>
<tr class="tbl-data">
<td class="data-td last font-weight-normal">Media*</td>
<td class="data-td data last text-left">Underweight</td>
<td class="data-td data last text-left">&nbsp;</td>
</tr>
<tr class="tbl-data">
<td class="data-td last font-weight-normal">Real Estate</td>
<td class="data-td data last text-left">Overweight</td>
<td class="data-td data last text-left">Wider</td>
<td class="data-td data last text-left">Higher</td>
<td class="data-td data last text-left">Longer</td>
</tr>
<tr class="tbl-data">
<td class="data-td last font-weight-normal">Retail</td>
<td class="data-td data last text-left">Overweight</td>
<td class="data-td data last text-left">Tighter</td>
<td class="data-td data last text-left">Lower</td>
<td class="data-td data last text-left">Longer</td>
</tr>
<tr class="tbl-data">
<td class="data-td last font-weight-normal">Services</td>
<td class="data-td data last text-left">Underweight</td>
<td class="data-td data last text-left">Tighter</td>
<td class="data-td data last text-left">Lower</td>
<td class="data-td data last text-left">Longer</td>
</tr>
<tr class="tbl-data">
<td class="data-td last font-weight-normal">Technology &amp; Electronics</td>
<td class="data-td data last text-left">Overweight</td>
<td class="data-td data last text-left">Tighter</td>
<td class="data-td data last text-left">Lower</td>
<td class="data-td data last text-left">Longer</td>
</tr>
<tr class="tbl-data">
<td class="data-td last font-weight-normal">Telecommunications</td>
<td class="data-td data last text-left">Overweight</td>
<td class="data-td data last text-left">Tighter</td>
<td class="data-td data last text-left">Lower</td>
<td class="data-td data last text-left">Longer</td>
</tr>
<tr class="tbl-data">
<td class="data-td last font-weight-normal">Transportation</td>
<td class="data-td data last text-left">Overweight</td>
<td class="data-td data last text-left">Tighter</td>
<td class="data-td data last text-left">Lower</td>
<td class="data-td data last text-left">Longer</td>
</tr>
<tr class="tbl-data">
<td class="data-td last font-weight-normal">Utility</td>
<td class="data-td data last text-left">Underweight</td>
<td class="data-td data last text-left">Tighter</td>
<td class="data-td data last text-left">Lower</td>
<td class="data-td data last text-left">Longer</td>
</tr>
</tbody>
</table>
</div>
<br />
<p class="chart-disclosure"><sup>*</sup>No fallen angel exposure. As of 5/31/24.</p>
<p class="chart-disclosure">Source: ICE Data Services, VanEck.</p>

<p><strong>Fallen Angels Overall Statistics:</strong> Fallen angel yields decreased by 13bps to 7.30% while spreads continue to trade rangebound in the mid-200s. Broad high yield saw similar changes, with yields decreasing 16bps but still above 8.00% and spreads experiencing minimal changes, as the 10Y rallied with yields falling approximately 20bps due to slightly better inflation data and strong earnings. With no fallen angel or rising star activity this past month, the change in duration was muted.</p>
<div class="wrapped-div">
<table style="width: 100%;">
<tbody>
<tr class="tbl-data">
<td class="tbl-header last text-center">&nbsp;</td>
<td class="tbl-header last text-center" style="border-right: outset;" colspan="4">Fallen Angels</td>
<td class="tbl-header last text-center" colspan="4">Broad HY</td>
</tr>
<tr class="tbl-data">
<td class="data-head last text-right">&nbsp;</td>
<td class="data-head last text-right">12/31/23</td>
<td class="data-head last text-right">3/31/24</td>
<td class="data-head last text-right">4/30/24</td>
<td class="data-head last text-right" style="border-right: outset;">5/31/24</td>
<td class="data-head last text-right">12/31/23</td>
<td class="data-head last text-right">3/31/24</td>
<td class="data-head last text-right">4/30/24</td>
<td class="data-head last text-right">5/31/24</td>
</tr>
<tr class="tbl-data">
<td class="data-td last">Yield to Worst</td>
<td class="data-td data last text-right">6.99</td>
<td class="data-td data last text-right">6.92</td>
<td class="data-td data last text-right">7.43</td>
<td class="data-td text-right data last" style="border-right: outset;">7.30</td>
<td class="data-td data last text-right">7.69</td>
<td class="data-td data last text-right">7.75</td>
<td class="data-td data last text-right">8.20</td>
<td class="data-td data last text-right">8.04</td>
</tr>
<tr class="tbl-data">
<td class="data-td last">Par Weighted Price</td>
<td class="data-td data last text-right">91.20</td>
<td class="data-td data last text-right">91.22</td>
<td class="data-td data last text-right">89.25</td>
<td class="data-td text-right data last" style="border-right: outset;">89.73</td>
<td class="data-td data last text-right">91.86</td>
<td class="data-td data last text-right">93.18</td>
<td class="data-td data last text-right">91.88</td>
<td class="data-td data last text-right">92.54</td>
</tr>
<tr class="tbl-data">
<td class="data-td last">Effective Duration</td>
<td class="data-td data last text-right">5.41</td>
<td class="data-td data last text-right">5.32</td>
<td class="data-td data last text-right">5.20</td>
<td class="data-td text-right data last" style="border-right: outset;">5.13</td>
<td class="data-td data last text-right">3.31</td>
<td class="data-td data last text-right">3.28</td>
<td class="data-td data last text-right">3.36</td>
<td class="data-td data last text-right">3.32</td>
</tr>
<tr class="tbl-data">
<td class="data-td last">Full Market Value ($mn)</td>
<td class="data-td data last text-right">67,821</td>
<td class="data-td data last text-right">64,657</td>
<td class="data-td data last text-right">57,955</td>
<td class="data-td text-right data last" style="border-right: outset;">55,954</td>
<td class="data-td data last text-right">1,237,721</td>
<td class="data-td data last text-right">1,260,542</td>
<td class="data-td data last text-right">1,245,972</td>
<td class="data-td data last text-right">1,266,219</td>
</tr>
<tr class="tbl-data">
<td class="data-td last">OAS</td>
<td class="data-td data last text-right">285</td>
<td class="data-td data last text-right">247</td>
<td class="data-td data last text-right">255</td>
<td class="data-td text-right data last" style="border-right: outset;">260</td>
<td class="data-td data last text-right">339</td>
<td class="data-td data last text-right">315</td>
<td class="data-td data last text-right">318</td>
<td class="data-td data last text-right">320</td>
</tr>
<tr class="tbl-data">
<td class="data-td last">No. of Issues</td>
<td class="data-td data last text-right">143</td>
<td class="data-td data last text-right">138</td>
<td class="data-td data last text-right">130</td>
<td class="data-td text-right data last" style="border-right: outset;">129</td>
<td class="data-td data last text-right">1,837</td>
<td class="data-td data last text-right">1,864</td>
<td class="data-td data last text-right">1,881</td>
</tr>
</tbody>
</table>
</div>
<br />
<p class="chart-disclosure">Source: ICE Data Services, VanEck. Fallen Angels: ICE US Fallen Angel High Yield 10% Constrained Index. Broad HY: ICE BofA US High Yield Index. OAS refers to &ldquo;option-adjusted spread.&rdquo; Please see definition for this and other terms referenced herein in the disclosures and definitions portion of this blog. Past performance is no guarantee of future results. Index performance is not representative of strategy performance. It is not possible to invest in an index.</p>
<p><strong>Fallen Angels:</strong> There were no fallen angels in May but we continue to keep an eye on real estate exposure, as early June saw Moody&rsquo;s put six regional banks on review for downgrades due to their substantial exposure to commercial real estate loans, particularly in office space. Boeing continues to be on our radar as all three rating agencies rated it BBB-/Baa3 with a negative watch/outlook.</p>
<div class="wrapped-div">
<table style="width: 100%;">
<tbody>
<tr class="tbl-data">
<td class="tbl-header last">Month-end Addition</td>
<td class="tbl-header last">Name</td>
<td class="tbl-header last">Rating</td>
<td class="tbl-header last">Sector</td>
<td class="tbl-header last">Industry</td>
<td class="tbl-header last text-right">% Mkt Value</td>
<td class="tbl-header last text-right">Price</td>
</tr>
<tr class="tbl-data">
<td class="data-td last font-weight-normal">January</td>
<td class="data-td data last text-left">Hudson Pacific Properties LP</td>
<td class="data-td data last text-left">BB1</td>
<td class="data-td data last text-left">Real Estate</td>
<td class="data-td data last text-left">REITs</td>
<td class="data-td data last text-right">2.18</td>
<td class="data-td data last text-right">88.05</td>
</tr>
<tr class="tbl-data">
<td class="data-td last font-weight-normal">February</td>
<td class="data-td data last text-left">Advance Auto Parts Inc.</td>
<td class="data-td data last text-left">BB1</td>
<td class="data-td data last text-left">Retail</td>
<td class="data-td data last text-left">Specialty Retail</td>
<td class="data-td data last text-right">2.52</td>
<td class="data-td data last text-right">91.20</td>
</tr>
</tbody>
</table>
</div>
<br />
<p class="chart-disclosure">Source: ICE Data Services, VanEck. Fallen Angels: ICE US Fallen Angel High Yield 10% Constrained Index. Past performance is no guarantee of future results. Not a recommendation to buy or sell any of the names/securities mentioned herein. Index performance is not representative of strategy performance. It is not possible to invest in an index.</p>
<p><strong>Rising Stars:</strong> None in May.</p>
<div class="wrapped-div">
<table style="width: 100%;">
<tbody>
<tr class="tbl-data">
<td class="tbl-header last">Month-end Exit</td>
<td class="tbl-header last">Name</td>
<td class="tbl-header last">Rating</td>
<td class="tbl-header last">Sector</td>
<td class="tbl-header last">Industry</td>
<td class="tbl-header last text-right">% Mkt Value</td>
<td class="tbl-header last text-right">Price</td>
</tr>
<tr class="tbl-data">
<td class="data-td last font-weight-normal">February</td>
<td class="data-td data last text-left">Las Vegas Sands Corp</td>
<td class="data-td data last text-left">BB1</td>
<td class="data-td data last text-left">Leisure</td>
<td class="data-td data last text-left">Gaming</td>
<td class="data-td data last text-right">3.12</td>
<td class="data-td data last text-right">93.19</td>
</tr>
<tr class="tbl-data">
<td class="data-td last font-weight-normal">March</td>
<td class="data-td data last text-left">Enlink Midstream Partners LP</td>
<td class="data-td data last text-left">BB1</td>
<td class="data-td data last text-left">Energy</td>
<td class="data-td data last text-left">Gas Distribution</td>
<td class="data-td data last text-right">2.30</td>
<td class="data-td data last text-right">88.92</td>
</tr>
<tr class="tbl-data">
<td class="data-td last font-weight-normal">April</td>
<td class="data-td data last text-left">FirstEnergy Corp.</td>
<td class="data-td data last text-left">BB1</td>
<td class="data-td data last text-left">Utility</td>
<td class="data-td data last text-left">Electric-Integrated</td>
<td class="data-td data last text-right">6.62</td>
<td class="data-td data last text-right">87.10</td>
</tr>
<tr class="tbl-data">
<td class="data-td last font-weight-normal">April</td>
<td class="data-td data last text-left">Rolls-Royce PLC</td>
<td class="data-td data last text-left">BB1</td>
<td class="data-td data last text-left">Capital Goods</td>
<td class="data-td data last text-left">Aerospace/Defense</td>
<td class="data-td data last text-right">1.51</td>
<td class="data-td data last text-right">96.00</td>
</tr>
</tbody>
</table>
</div>
<br />
<p class="chart-disclosure">Source: ICE Data Services, VanEck. Fallen Angels: ICE US Fallen Angel High Yield 10% Constrained Index. Past performance is no guarantee of future results. Not a recommendation to buy or sell any of the names/securities mentioned herein. Index performance is not representative of strategy performance. It is not possible to invest in an index.</p>
<p><strong>Fallen Angels Performance by Sector:</strong> All sectors, except for Real Estate, posted positive returns in May, with Transportation and Insurance being the top performers, although their contribution to return was limited due to their small exposures. Real Estate and Telecom were bottom performers, as both were the only sectors to see their price decline in May. These sectors have the lowest average price, highest spreads and among the highest weightings (approximately 22%) within fallen angels. Relative to broad high yield, fallen angels&rsquo; Retail and Banking sectors were top contributors to performance due to their overweights, while Real Estate was the main detractor to performance due to its high weighting and wider spreads, with most issuers in the index exposed to commercial real estate.</p>
<div class="wrapped-div">
<table style="width: 100%;">
<tbody>
<tr class="tbl-data">
<td class="tbl-header last text-right">&nbsp;</td>
<td class="tbl-header last text-center" style="border-right: outset;" colspan="4">Wgt (%)</td>
<td class="tbl-header last text-center" style="border-right: outset;" colspan="4">OAS</td>
<td class="tbl-header last text-center" style="border-right: outset;" colspan="4">Price</td>
<td class="tbl-header last text-right">Total Return</td>
</tr>
<tr class="tbl-data">
<td class="data-head last text-right">&nbsp;</td>
<td class="data-head last text-right">12/31/23</td>
<td class="data-head last text-right">3/31/24</td>
<td class="data-head last text-right">4/30/24</td>
<td class="data-head last text-right" style="border-right: outset;">5/31/24</td>
<td class="data-head last text-right">12/31/23</td>
<td class="data-head last text-right">3/31/24</td>
<td class="data-head last text-right">4/30/24</td>
<td class="data-head last text-right" style="border-right: outset;">5/31/24</td>
<td class="data-head last text-right">12/31/23</td>
<td class="data-head last text-right">3/31/24</td>
<td class="data-head last text-right">4/30/24</td>
<td class="data-head last text-right" style="border-right: outset;">5/31/24</td>
<td class="data-head last text-right">MTD</td>
</tr>
<tr class="tbl-data">
<td class="data-td last">Banking</td>
<td class="data-td data last text-right">4.79</td>
<td class="data-td data last text-right">4.62</td>
<td class="data-td data last text-right">5.13</td>
<td class="data-td text-right data last" style="border-right: outset;">5.40</td>
<td class="data-td data last text-right">231</td>
<td class="data-td data last text-right">235</td>
<td class="data-td data last text-right">219</td>
<td class="data-td text-right data last" style="border-right: outset;">208</td>
<td class="data-td data last text-right">97.91</td>
<td class="data-td data last text-right">97.11</td>
<td class="data-td data last text-right">96.29</td>
<td class="data-td text-right data last" style="border-right: outset;">97.37</td>
<td class="data-td data last text-right">1.54</td>
</tr>
<tr class="tbl-data">
<td class="data-td last">Basic Industry</td>
<td class="data-td data last text-right">1.70</td>
<td class="data-td data last text-right">3.20</td>
<td class="data-td data last text-right">3.55</td>
<td class="data-td text-right data last" style="border-right: outset;">3.71</td>
<td class="data-td data last text-right">171</td>
<td class="data-td data last text-right">186</td>
<td class="data-td data last text-right">155</td>
<td class="data-td text-right data last" style="border-right: outset;">150</td>
<td class="data-td data last text-right">97.24</td>
<td class="data-td data last text-right">94.37</td>
<td class="data-td data last text-right">93.46</td>
<td class="data-td text-right data last" style="border-right: outset;">94.67</td>
<td class="data-td data last text-right">1.69</td>
</tr>
<tr class="tbl-data">
<td class="data-td last">Capital Goods</td>
<td class="data-td data last text-right">5.85</td>
<td class="data-td data last text-right">6.17</td>
<td class="data-td data last text-right">5.10</td>
<td class="data-td text-right data last" style="border-right: outset;">5.36</td>
<td class="data-td data last text-right">200</td>
<td class="data-td data last text-right">153</td>
<td class="data-td data last text-right">158</td>
<td class="data-td text-right data last" style="border-right: outset;">171</td>
<td class="data-td data last text-right">97.34</td>
<td class="data-td data last text-right">97.38</td>
<td class="data-td data last text-right">96.00</td>
<td class="data-td text-right data last" style="border-right: outset;">96.96</td>
<td class="data-td data last text-right">1.45</td>
</tr>
<tr class="tbl-data">
<td class="data-td last">Consumer Goods</td>
<td class="data-td data last text-right">4.33</td>
<td class="data-td data last text-right">4.42</td>
<td class="data-td data last text-right">4.96</td>
<td class="data-td text-right data last" style="border-right: outset;">5.20</td>
<td class="data-td data last text-right">230</td>
<td class="data-td data last text-right">223</td>
<td class="data-td data last text-right">229</td>
<td class="data-td text-right data last" style="border-right: outset;">228</td>
<td class="data-td data last text-right">94.29</td>
<td class="data-td data last text-right">93.07</td>
<td class="data-td data last text-right">93.14</td>
<td class="data-td text-right data last" style="border-right: outset;">93.80</td>
<td class="data-td data last text-right">1.24</td>
</tr>
<tr class="tbl-data">
<td class="data-td last">Energy</td>
<td class="data-td data last text-right">14.75</td>
<td class="data-td data last text-right">11.17</td>
<td class="data-td data last text-right">12.25</td>
<td class="data-td text-right data last" style="border-right: outset;">12.02</td>
<td class="data-td data last text-right">259</td>
<td class="data-td data last text-right">235</td>
<td class="data-td data last text-right">225</td>
<td class="data-td text-right data last" style="border-right: outset;">234</td>
<td class="data-td data last text-right">92.49</td>
<td class="data-td data last text-right">93.95</td>
<td class="data-td data last text-right">92.37</td>
<td class="data-td text-right data last" style="border-right: outset;">92.96</td>
<td class="data-td data last text-right">1.34</td>
</tr>
<tr class="tbl-data">
<td class="data-td last">Financial Services</td>
<td class="data-td data last text-right">1.14</td>
<td class="data-td data last text-right">1.18</td>
<td class="data-td data last text-right">1.29</td>
<td class="data-td text-right data last" style="border-right: outset;">1.36</td>
<td class="data-td data last text-right">378</td>
<td class="data-td data last text-right">336</td>
<td class="data-td data last text-right">332</td>
<td class="data-td text-right data last" style="border-right: outset;">341</td>
<td class="data-td data last text-right">86.41</td>
<td class="data-td data last text-right">87.09</td>
<td class="data-td data last text-right">84.75</td>
<td class="data-td text-right data last" style="border-right: outset;">85.86</td>
<td class="data-td data last text-right">1.79</td>
</tr>
<tr class="tbl-data">
<td class="data-td last">Healthcare</td>
<td class="data-td data last text-right">4.10</td>
<td class="data-td data last text-right">4.44</td>
<td class="data-td data last text-right">4.90</td>
<td class="data-td text-right data last" style="border-right: outset;">5.08</td>
<td class="data-td data last text-right">270</td>
<td class="data-td data last text-right">210</td>
<td class="data-td data last text-right">189</td>
<td class="data-td text-right data last" style="border-right: outset;">200</td>
<td class="data-td data last text-right">88.73</td>
<td class="data-td data last text-right">90.80</td>
<td class="data-td data last text-right">89.50</td>
<td class="data-td text-right data last" style="border-right: outset;">90.36</td>
<td class="data-td data last text-right">1.37</td>
</tr>
<tr class="tbl-data">
<td class="data-td last">Insurance</td>
<td class="data-td data last text-right">1.32</td>
<td class="data-td data last text-right">1.43</td>
<td class="data-td data last text-right">1.55</td>
<td class="data-td text-right data last" style="border-right: outset;">1.64</td>
<td class="data-td data last text-right">323</td>
<td class="data-td data last text-right">244</td>
<td class="data-td data last text-right">233</td>
<td class="data-td text-right data last" style="border-right: outset;">227</td>
<td class="data-td data last text-right">94.10</td>
<td class="data-td data last text-right">96.82</td>
<td class="data-td data last text-right">94.75</td>
<td class="data-td text-right data last" style="border-right: outset;">96.07</td>
<td class="data-td data last text-right">1.89</td>
</tr>
<tr class="tbl-data">
<td class="data-td last">Leisure</td>
<td class="data-td data last text-right">7.90</td>
<td class="data-td data last text-right">5.10</td>
<td class="data-td data last text-right">5.56</td>
<td class="data-td text-right data last" style="border-right: outset;">5.82</td>
<td class="data-td data last text-right">228</td>
<td class="data-td data last text-right">170</td>
<td class="data-td data last text-right">168</td>
<td class="data-td text-right data last" style="border-right: outset;">169</td>
<td class="data-td data last text-right">93.21</td>
<td class="data-td data last text-right">95.08</td>
<td class="data-td data last text-right">93.59</td>
<td class="data-td text-right data last" style="border-right: outset;">94.34</td>
<td class="data-td data last text-right">1.22</td>
</tr>
<tr class="tbl-data">
<td class="data-td last">Real Estate</td>
<td class="data-td data last text-right">9.07</td>
<td class="data-td data last text-right">9.60</td>
<td class="data-td data last text-right">10.65</td>
<td class="data-td text-right data last" style="border-right: outset;">10.84</td>
<td class="data-td data last text-right">675</td>
<td class="data-td data last text-right">527</td>
<td class="data-td data last text-right">515</td>
<td class="data-td text-right data last" style="border-right: outset;">593</td>
<td class="data-td data last text-right">82.72</td>
<td class="data-td data last text-right">81.84</td>
<td class="data-td data last text-right">81.17</td>
<td class="data-td text-right data last" style="border-right: outset;">79.66</td>
<td class="data-td data last text-right">-1.43</td>
</tr>
<tr class="tbl-data">
<td class="data-td last">Retail</td>
<td class="data-td data last text-right">14.38</td>
<td class="data-td data last text-right">18.02</td>
<td class="data-td data last text-right">19.55</td>
<td class="data-td text-right data last" style="border-right: outset;">20.35</td>
<td class="data-td data last text-right">242</td>
<td class="data-td data last text-right">179</td>
<td class="data-td data last text-right">172</td>
<td class="data-td text-right data last" style="border-right: outset;">174</td>
<td class="data-td data last text-right">86.39</td>
<td class="data-td data last text-right">89.54</td>
<td class="data-td data last text-right">87.58</td>
<td class="data-td text-right data last" style="border-right: outset;">88.59</td>
<td class="data-td data last text-right">1.48</td>
</tr>
<tr class="tbl-data">
<td class="data-td last">Services</td>
<td class="data-td data last text-right">0.64</td>
<td class="data-td data last text-right">0.66</td>
<td class="data-td data last text-right">0.74</td>
<td class="data-td text-right data last" style="border-right: outset;">0.78</td>
<td class="data-td data last text-right">243</td>
<td class="data-td data last text-right">217</td>
<td class="data-td data last text-right">195</td>
<td class="data-td text-right data last" style="border-right: outset;">194</td>
<td class="data-td data last text-right">94.78</td>
<td class="data-td data last text-right">94.51</td>
<td class="data-td data last text-right">93.53</td>
<td class="data-td text-right data last" style="border-right: outset;">94.47</td>
<td class="data-td data last text-right">1.41</td>
</tr>
<tr class="tbl-data">
<td class="data-td last">Technology &amp; Electronics</td>
<td class="data-td data last text-right">6.22</td>
<td class="data-td data last text-right">5.81</td>
<td class="data-td data last text-right">6.27</td>
<td class="data-td text-right data last" style="border-right: outset;">6.53</td>
<td class="data-td data last text-right">194</td>
<td class="data-td data last text-right">188</td>
<td class="data-td data last text-right">185</td>
<td class="data-td text-right data last" style="border-right: outset;">190</td>
<td class="data-td data last text-right">94.14</td>
<td class="data-td data last text-right">92.99</td>
<td class="data-td data last text-right">90.44</td>
<td class="data-td text-right data last" style="border-right: outset;">91.51</td>
<td class="data-td data last text-right">1.60</td>
</tr>
<tr class="tbl-data">
<td class="data-td last">Telecommunications</td>
<td class="data-td data last text-right">13.00</td>
<td class="data-td data last text-right">13.39</td>
<td class="data-td data last text-right">14.04</td>
<td class="data-td text-right data last" style="border-right: outset;">11.22</td>
<td class="data-td data last text-right">366</td>
<td class="data-td data last text-right">368</td>
<td class="data-td data last text-right">401</td>
<td class="data-td text-right data last" style="border-right: outset;">397</td>
<td class="data-td data last text-right">92.22</td>
<td class="data-td data last text-right">90.01</td>
<td class="data-td data last text-right">84.66</td>
<td class="data-td text-right data last" style="border-right: outset;">83.32</td>
<td class="data-td data last text-right">0.46</td>
</tr>
<tr class="tbl-data">
<td class="data-td last">Transportation</td>
<td class="data-td data last text-right">2.09</td>
<td class="data-td data last text-right">2.23</td>
<td class="data-td data last text-right">2.43</td>
<td class="data-td text-right data last" style="border-right: outset;">2.55</td>
<td class="data-td data last text-right">209</td>
<td class="data-td data last text-right">170</td>
<td class="data-td data last text-right">151</td>
<td class="data-td text-right data last" style="border-right: outset;">143</td>
<td class="data-td data last text-right">94.92</td>
<td class="data-td data last text-right">95.37</td>
<td class="data-td data last text-right">94.20</td>
<td class="data-td text-right data last" style="border-right: outset;">95.65</td>
<td class="data-td data last text-right">1.95</td>
</tr>
<tr class="tbl-data">
<td class="data-td last">Utility</td>
<td class="data-td data last text-right">8.71</td>
<td class="data-td data last text-right">8.54</td>
<td class="data-td data last text-right">2.04</td>
<td class="data-td text-right data last" style="border-right: outset;">2.14</td>
<td class="data-td data last text-right">139</td>
<td class="data-td data last text-right">122</td>
<td class="data-td data last text-right">163</td>
<td class="data-td text-right data last" style="border-right: outset;">169</td>
<td class="data-td data last text-right">92.18</td>
<td class="data-td data last text-right">91.13</td>
<td class="data-td data last text-right">95.62</td>
<td class="data-td text-right data last" style="border-right: outset;">96.33</td>
<td class="data-td data last text-right">1.20</td>
</tr>
<tr class="tbl-data">
<td class="data-td last">Total</td>
<td class="data-td data last text-right">100</td>
<td class="data-td text-right data last" style="border-right: outset;">100</td>
<td class="data-td data last text-right">285</td>
<td class="data-td data last text-right">247</td>
<td class="data-td data last text-right">255</td>
<td class="data-td text-right data last" style="border-right: outset;">260</td>
<td class="data-td data last text-right">91.20</td>
<td class="data-td data last text-right">91.22</td>
<td class="data-td data last text-right">89.25</td>
<td class="data-td text-right data last" style="border-right: outset;">89.73</td>
<td class="data-td data last text-right">1.01</td>
</tr>
</tbody>
</table>
</div>
<br />
<p class="chart-disclosure">Source: ICE Data Services, VanEck. Returns are based on partial period data. Fallen Angels: ICE US Fallen Angel High Yield 10% Constrained Index. Not intended as a recommendation to invest or divest in any of the sectors mentioned herein. Index performance is not representative of strategy performance. It is not possible to invest in an index.</p>
<p><strong>Fallen Angels Performance by Rating:</strong> No major changes within the rating exposure for fallen angels this past month, with BBs still at an 80% exposure. Higher quality within fallen angels outperformed lower quality, as lower quality spreads widened and their prices declined.</p>
<div class="wrapped-div">
<table style="width: 100%;">
<tbody>
<tr class="tbl-data">
<td class="tbl-header last text-center">&nbsp;</td>
<td class="tbl-header last text-center" style="border-right: outset;" colspan="4">Wgt (%)</td>
<td class="tbl-header last text-center" style="border-right: outset;" colspan="4">OAS</td>
<td class="tbl-header last text-center" style="border-right: outset;" colspan="4">Price</td>
<td class="tbl-header last text-right">Total Return</td>
</tr>
<tr class="tbl-data">
<td class="data-head last text-right">&nbsp;</td>
<td class="data-head last text-right">12/31/23</td>
<td class="data-head last text-right">3/31/24</td>
<td class="data-head last text-right">4/30/24</td>
<td class="data-head last text-right" style="border-right: outset;">5/31/24</td>
<td class="data-head last text-right">12/31/23</td>
<td class="data-head last text-right">3/31/24</td>
<td class="data-head last text-right">4/30/24</td>
<td class="data-head last text-right" style="border-right: outset;">5/31/24</td>
<td class="data-head last text-right">12/31/23</td>
<td class="data-head last text-right">3/31/24</td>
<td class="data-head last text-right">4/30/24</td>
<td class="data-head last text-right" style="border-right: outset;">5/31/24</td>
<td class="data-head last text-right">MTD</td>
</tr>
<tr class="tbl-data">
<td class="data-td last">BB</td>
<td class="data-td data last text-right">80.55</td>
<td class="data-td data last text-right">81.63</td>
<td class="data-td data last text-right">80.48</td>
<td class="data-td text-right data last" style="border-right: outset;">83.23</td>
<td class="data-td data last text-right">219</td>
<td class="data-td data last text-right">190</td>
<td class="data-td data last text-right">188</td>
<td class="data-td text-right data last" style="border-right: outset;">193</td>
<td class="data-td data last text-right">92.44</td>
<td class="data-td data last text-right">92.85</td>
<td class="data-td data last text-right">91.72</td>
<td class="data-td text-right data last" style="border-right: outset;">92.49</td>
<td class="data-td data last text-right">1.29</td>
</tr>
<tr class="tbl-data">
<td class="data-td last">B</td>
<td class="data-td data last text-right">13.43</td>
<td class="data-td data last text-right">12.87</td>
<td class="data-td data last text-right">13.79</td>
<td class="data-td text-right data last" style="border-right: outset;">11.05</td>
<td class="data-td data last text-right">317</td>
<td class="data-td data last text-right">330</td>
<td class="data-td data last text-right">343</td>
<td class="data-td text-right data last" style="border-right: outset;">361</td>
<td class="data-td data last text-right">96.46</td>
<td class="data-td data last text-right">93.99</td>
<td class="data-td data last text-right">89.95</td>
<td class="data-td text-right data last" style="border-right: outset;">90.33</td>
<td class="data-td data last text-right">0.60</td>
</tr>
<tr class="tbl-data">
<td class="data-td last">CCC</td>
<td class="data-td data last text-right">5.44</td>
<td class="data-td data last text-right">5.51</td>
<td class="data-td data last text-right">5.73</td>
<td class="data-td text-right data last" style="border-right: outset;">5.72</td>
<td class="data-td data last text-right">1,130</td>
<td class="data-td data last text-right">893</td>
<td class="data-td data last text-right">982</td>
<td class="data-td text-right data last" style="border-right: outset;">1,034</td>
<td class="data-td data last text-right">69.40</td>
<td class="data-td data last text-right">68.48</td>
<td class="data-td data last text-right">63.68</td>
<td class="data-td text-right data last" style="border-right: outset;">61.98</td>
<td class="data-td data last text-right">-1.89</td>
</tr>
<tr class="tbl-data">
<td class="data-td last">Total</td>
<td class="data-td data last text-right">100</td>
<td class="data-td text-right data last" style="border-right: outset;">100</td>
<td class="data-td data last text-right">285</td>
<td class="data-td data last text-right">247</td>
<td class="data-td data last text-right">255</td>
<td class="data-td text-right data last" style="border-right: outset;">260</td>
<td class="data-td data last text-right">91.20</td>
<td class="data-td data last text-right">91.22</td>
<td class="data-td data last text-right">89.25</td>
<td class="data-td text-right data last" style="border-right: outset;">89.73</td>
<td class="data-td data last text-right">1.01</td>
</tr>
</tbody>
</table>
</div>
<br />
<p class="chart-disclosure">Source: ICE Data Services, VanEck. Fallen Angels: ICE US Fallen Angel High Yield 10% Constrained Index. Not intended as a recommendation to invest or divest in any of the sectors mentioned herein. Index performance is not representative of strategy performance. It is not possible to invest in an index. BB index: ICE BofA BB US High Yield Index; Single-B index: ICE BofA Single-B US High Yield Index; CCC &amp; Lower rated index ICE BofA CCC &amp; Lower US High Yield Index.</p>
<p>To receive more <a href="/us/en/blogs/income-investing/" title="Income Investing Insights"><strong>Income Investing</strong></a> insights, <a href="/link/5f45412c2143400497908cea2897f7d3.aspx" title=" Subscription Center"><strong>sign up in our subscription center</strong></a>.</p>
<style>
    .data-td.data {
        padding-right: 5px !important;
    }
    
    .data-head { 
    padding-right: 5px !important;
    }

    .wrapped-div {
        max-width: 100%;
    }

    @media (max-width: 1240px) {
        .wrapped-div {
            overflow-x: scroll;
        }
    }

    .wrapped-div-sector {
        max-width: 100%;
        overflow-x: scroll;
    }
</style>
]]></content:encoded>
</item><item rdf:about="https://www.vaneck.com/us/en/blogs/emerging-markets-equity/significant-strides-in-indias-infrastructure/">
  <title>Significant Strides in India’s Infrastructure></title>
  <link>https://www.vaneck.com/us/en/blogs/emerging-markets-equity/significant-strides-in-indias-infrastructure/</link>
  <description><![CDATA[Angus Shillington recently sat down with Barron's to discuss why infrastructure is key to Prime Minister Modi's ambitions to make India a global manufacturing center.]]></description>
  <dc:creator>Angus Shillington</dc:creator>
  <dc:date>06/12/2024 06:30:00</dc:date>
<content:encoded><![CDATA[

<p>India is making significant strides in expanding its infrastructure with a focus on building more roads and railroads. This ambitious push aims to enhance connectivity, boost economic growth, and improve the quality of life for its citizens.</p>
<p>While recent headlines have focused on market volatility stemming from election results that showed a stronger-than-expected opposition challenge to Prime Minister Modi, the longer-term investment landscape for India remains strong. We believe investors should view the results positively as they promise stability and the prospect of continued reforms at a moderated pace, ensuring continuity and reducing the likelihood of abrupt policy shifts.</p>

<p>Key highlights from the article include:</p>
<h2>National Highways Expansion</h2>
<ul class="content-list">
<li class="mt-2">The Indian government has undertaken extensive projects to expand the national highway network.</li>
<li class="mt-2">New highways and expressways are being constructed to reduce travel time and improve connectivity between major cities and economic hubs.</li>
</ul>
<h2>High-Speed Rail Projects and Dedicated Freight Corridors</h2>
<ul class="content-list">
<li class="mt-2">India is investing in high-speed rail projects, including the ambitious Mumbai-Ahmedabad High-Speed Rail Corridor, which will connect Mumbai (the financial hub of India) with Ahmedabad, the largest city in the state of Gujarat.</li>
<li class="mt-2">These projects are expected to revolutionize travel by significantly reducing travel time between major cities.</li>
<li class="mt-2">The development of dedicated freight corridors is also a primary focus to drive the efficiency of freight transportation.</li>
</ul>
<h2>Key Stocks to Watch</h2>
<p>Reliance Industries, ICICI Bank, and HDFC Bank are key players benefiting from the country's economic growth. Reliance Industries, a conglomerate focusing on telecommunications, retail and renewable energy industries, is well-positioned to capitalize on new opportunities arising from infrastructure expansion. HDFC Bank is a private sector bank in India that caters to a range of banking services covering commercial and investment banking as well as transaction or retail banking. In scale, it could be conceptualized as the &ldquo;J.P. Morgan Chase of India.&rdquo; Similarly, ICICI Bank, one of India's largest private sector banks, is positioned to benefit from increased lending and financial services demand, driven by the government's infrastructure projects, as the increased economic activity is likely to spur greater consumer spending and loan uptake from the burgeoning middle class.</p>
<p>To put all this in perspective, total infrastructure spending in India over the past five years has been roughly $800 billion. Relative to gross domestic product, that&rsquo;s the equivalent of the United States spending $6 trillion, or five times as much as the (already enormous) 2021 infrastructure bill.</p>
<p>As Angus says, &ldquo;You don&rsquo;t go back from this kind of momentum.&rdquo; Read the full article <strong><a href="https://www.vaneck.com/us/en/offsite-disclaimer/?id=282595&amp;button=no&amp;urlhttps://www.barrons.com/articles/india-is-building-more-roads-and-railroads-7-stocks-to-buy-050d6855" target="_blank" rel="noopener" title="India Is Building More Roads and Railroads. 7 Stocks to buy. - Barron's">here</a></strong>.</p>
<h2>How to Invest in India with VanEck</h2>
<p>The <a href="https://www.vaneck.com/us/en/investments/india-growth-leaders-etf-glin/overview/" title="GLIN - VanEck India Growth Leaders ETF - Holdings and Performance"><strong>VanEck India Growth Leaders ETF (GLIN)</strong></a> offers exposure to fundamentally sound Indian companies exhibiting attractive growth at a reasonable price across the broad Indian economy.</p>
<p>The <strong><a href="https://www.vaneck.com/us/en/investments/digital-india-etf-dgin/overview/" title="DGIN - VanEck Digital India ETF - Holdings and Performance">VanEck Digital India ETF (DGIN)</a></strong> offers access to the structural digital growth story of India and could be an appealing investment opportunity for investors looking to seek technology or growth exposure in emerging markets.</p>
<p><a href="https://www.vaneck.com/us/en/investments/emerging-markets-fund-gbfax/overview/" title="GBFAX - Emerging Markets Fund - Class A - Overview"><strong>VanEck Emerging Markets Fund </strong></a>offers access to the structural digital growth story of India for investors seeking technology or growth exposures in emerging markets.</p>
<p>To receive more <a href="/us/en/insights/emerging-markets-equity/" title="Emerging Markets Equity Insights"><strong>Emerging Markets Equity</strong></a> insights, <a href="/us/en/subscribe/" title="Subscription Center"><strong>sign up in our subscription center</strong></a>.</p>
]]></content:encoded>
</item><item rdf:about="https://www.vaneck.com/us/en/blogs/moat-investing/moats-future-focus-beyond-ai-and-short-term-setbacks/">
  <title>MOAT’s Future Focus: Beyond AI and Short-Term Setbacks></title>
  <link>https://www.vaneck.com/us/en/blogs/moat-investing/moats-future-focus-beyond-ai-and-short-term-setbacks/</link>
  <description><![CDATA[We examine the Moat Index&rsquo;s YTD performance, key headwinds&mdash;including AI momentum&mdash;and how its strongest relative performance has historically followed periods of notable underperformance.]]></description>
  <dc:creator>Brandon Rakszawski</dc:creator>
  <dc:date>06/11/2024 06:30:00</dc:date>
<content:encoded><![CDATA[

<p>The Morningstar Wide Moat Focus Index (&ldquo;Moat Index&rdquo;) ended May trailing the S&amp;P 500 Index by nearly 9% thus far in 2024. Several headwinds have influenced this short-term underperformance, not least of which was the momentum behind the generative AI trade. Here we will touch on these headwinds and put them into longer-term context.</p>
<h3>Year to Date Return | as of May 31, 2024</h3>
<div class="wrapped-div">
<table>
<tbody>
<tr class="tbl-data">
<td class="tbl-header last">&nbsp;</td>
<td class="tbl-header last text-right">YTD Return (%)</td>
</tr>
<tr class="tbl-data">
<td class="data-td last font-weight-normal">Moat Index</td>
<td class="data-td data last text-right">2.34</td>
</tr>
<tr class="tbl-data">
<td class="data-td last font-weight-normal">S&amp;P 500 Index</td>
<td class="data-td data last text-right">11.30</td>
</tr>
<tr class="tbl-data">
<td class="data-td last font-weight-normal">Morningstar US Market Index</td>
<td class="data-td data last text-right">10.48</td>
</tr>
</tbody>
</table>
</div>
<br />
<p class="chart-disclosure">Source: Morningstar. Past performance is no guarantee of future results. Index performance is not representative of fund performance. It is not possible to invest directly in an index. Fund performance current to the most recent month end is available by visiting vaneck.com or by calling 800.826.2333.</p>
<div class="row">
<div class="col-md-4 col-xs-12"><a href="https://www.youtube.com/embed/1pmXynKAhVE" data-video="https://youtu.be/1pmXynKAhVE " class="popup-youtube" title="Watch Video"><img class="img-responsive" style="margin-right: 15px; margin-top: 0px;" src="https://www.vaneck.com/contentassets/7c84be4288ba4f2a9964b8bd4ede015a/4541_moat-q2-update_brandon_thumbnail_2024-06_v2.jpg" alt="Watch Video" align="left" /></a></div>
<div class="col-md-8 col-xs-12"><br /><strong><a href="https://www.youtube.com/embed/1pmXynKAhVE" data-video=" https://youtu.be/1pmXynKAhVE " class="popup-youtube" title="Watch Video">Watch Video</a><br /></strong><a href="https://www.youtube.com/embed/1pmXynKAhVE" data-video="https://youtu.be/1pmXynKAhVE " class="popup-youtube" title="Watch Video" style="font-size: 16px; font-weight: bold; padding: 10px 0px 0px; margin-right: 20px; width: 202px;">Performance Drivers of the Moat Index</a></div>
</div>
<br />&gt; <br />
<h2>Key Moat Index Performance Drivers</h2>
<ol class="content-list">
<li class="mt-2"><strong>Nvidia &amp; Generative AI Hype</strong>: Through May, Nvidia has accounted for approximately one third of the S&amp;P 500 Index&rsquo;s return. That is worth repeating: one company out of 500 accounts for 33% of the S&amp;P 500&rsquo;s return. With <a href="https://www.vaneck.com/us/en/blogs/moat-investing/is-nvidias-wide-moat-worth-the-price/" title="Is Nvidia&rsquo;s Wide Moat Worth the Price?"><strong>no exposure to Nvidia</strong></a> in 2024&mdash;due to Morningstar&rsquo;s assessment that the stock has generally been priced at a premium to fair value&mdash;approximately 36% of the Moat Index&rsquo;s underperformance has come from its lack of Nvidia.</li>
<li class="mt-2">
<p><strong>Equal Weighting</strong>: The Moat Index&rsquo;s equal weighting methodology has proven a headwind relative to market cap weighted approaches because of very low market breadth (i.e., a small number of companies are accounting for much of the market&rsquo;s returns). While we&rsquo;ve seen brief periods in 2024 when market breadth has increased, by and large a select few companies have accounted for most of the market&rsquo;s returns. The Magnificent 7 stocks (Alphabet, Amazon, Apple, Meta, Microsoft, Nvidia, and Tesla) accounted for more than 50% of the S&amp;P 500 Index&rsquo;s YTD returns&mdash;and that includes disappointing starts to the year from Tesla and Apple. Excluding these two laggards, nearly 60% of the S&amp;P 500 YTD returns are explained by the remaining Magnificent 5 companies.</p>
<p>The S&amp;P 500 Equal Weighted Index is now trading at levels relative to the market cap-weighted S&amp;P 500 Index that haven&rsquo;t been seen since the Global Financial Crisis.</p>
</li>
</ol>
<h3>Lack of Breadth: S&amp;P 500 Equal Weighted Index Price vs. S&amp;P 500 Index Price | 20 Years as of 5/31/2024</h3>
<p><img class="img-responsive w-100" src="https://www.vaneck.com/contentassets/4ca4f45f04704527bbac30649d2dc2eb/4549_moat-june_chart-1_2024-6_v1_blog.svg" alt="Lack of Breadth: S&amp;P 500 Equal Weighted Index Price vs. S&amp;P 500 Index Price" /></p>
<p class="chart-disclosure">Source: BofA Global Investment Strategy; Morningstar; Represents share price of RSP vs. SPY.</p>
<ol class="content-list" start="3">
<li class="mt-2">
<p><strong>Stock Selections</strong>: several stocks in the Moat Index have posted disappointing returns in 2024 in the face of both idiosyncratic headwinds and macro-driven concerns. That is not to say that others have not performed well.</p>
</li>
</ol>
<style>
/* Default styles for mobile devices */
table {
    width: 100%;
}

/* Styles for desktop devices */
@media (min-width: 768px) {
    table {
        width: 50%;
    }
}
</style>
<h3>Bottom 5 Performing Moat Index Overweight Stock Picks vs. S&amp;P 500 Index</h3>
<div class="wrapped-div">
<table style="width: 100%; height: 156.69px;">
<tbody>
<tr class="tbl-data" style="height: 44.7685px;">
<td class="tbl-header last" style="height: 44.7685px;">Company</td>
<td class="tbl-header last" style="height: 44.7685px;">Ticker</td>
<td class="tbl-header last text-right" style="height: 44.7685px;">Moat Index Weight<br />Relative to S&amp;P 500 (%)</td>
<td class="tbl-header last text-right" style="height: 44.7685px;">Return in Moat Index (%)</td>
<td class="tbl-header last text-right" style="height: 44.7685px;">Contribution to YTD<br />Moat Index Return (%)</td>
</tr>
<tr class="tbl-data" style="height: 22.3843px;">
<td class="data-td last font-weight-normal" style="height: 22.3843px;">MarketAxess</td>
<td class="data-td data last text-left" style="height: 22.3843px;">MKTX</td>
<td class="data-td data last text-right" style="height: 22.3843px;">2.21</td>
<td class="data-td data last text-right" style="height: 22.3843px;">-31.61</td>
<td class="data-td data last text-right" style="height: 22.3843px;">-0.90</td>
</tr>
<tr class="tbl-data" style="height: 22.3843px;">
<td class="data-td last font-weight-normal" style="height: 22.3843px;">Etsy</td>
<td class="data-td data last text-left" style="height: 22.3843px;">ETSY</td>
<td class="data-td data last text-right" style="height: 22.3843px;">2.23</td>
<td class="data-td data last text-right" style="height: 22.3843px;">-21.69</td>
<td class="data-td data last text-right" style="height: 22.3843px;">-0.56</td>
</tr>
<tr class="tbl-data" style="height: 22.3843px;">
<td class="data-td last font-weight-normal" style="height: 22.3843px;">Gilead Sciences&nbsp; &nbsp; &nbsp; &nbsp; &nbsp; &nbsp; &nbsp; &nbsp; &nbsp; &nbsp; &nbsp; &nbsp; &nbsp; &nbsp; &nbsp; &nbsp; &nbsp;&nbsp;</td>
<td class="data-td data last text-left" style="height: 22.3843px;">GILD</td>
<td class="data-td data last text-right" style="height: 22.3843px;">2.02</td>
<td class="data-td data last text-right" style="height: 22.3843px;">-19.84</td>
<td class="data-td data last text-right" style="height: 22.3843px;">-0.50</td>
</tr>
<tr class="tbl-data" style="height: 22.3843px;">
<td class="data-td last font-weight-normal" style="height: 22.3843px;">Estee Lauder&nbsp;</td>
<td class="data-td data last text-left" style="height: 22.3843px;">EL</td>
<td class="data-td data last text-right" style="height: 22.3843px;">2.25</td>
<td class="data-td data last text-right" style="height: 22.3843px;">-14.84</td>
<td class="data-td data last text-right" style="height: 22.3843px;">-0.36</td>
</tr>
<tr class="tbl-data" style="height: 22.3843px;">
<td class="data-td last font-weight-normal" style="height: 22.3843px;">Biogen</td>
<td class="data-td data last text-left" style="height: 22.3843px;">BIIB</td>
<td class="data-td data last text-right" style="height: 22.3843px;">2.16</td>
<td class="data-td data last text-right" style="height: 22.3843px;">-13.07</td>
<td class="data-td data last text-right" style="height: 22.3843px;">-0.31</td>
</tr>
</tbody>
</table>
</div>
<br />
<h3>Top 5 Performing Moat Index Overweight Stock Picks vs. S&amp;P 500 Index</h3>
<div class="wrapped-div">
<table style="width: 100%;">
<tbody>
<tr class="tbl-data">
<td class="tbl-header last">Company</td>
<td class="tbl-header last">Ticker</td>
<td class="tbl-header last text-right">Moat Index Weight<br />Relative to S&amp;P 500 (%)</td>
<td class="tbl-header last text-right">Return in Moat Index (%)</td>
<td class="tbl-header last text-right">Contribution to YTD<br />Moat Index Return (%)</td>
</tr>
<tr class="tbl-data">
<td class="data-td last font-weight-normal">Teradyne</td>
<td class="data-td data last text-left">TER</td>
<td class="data-td data last text-right">2.63</td>
<td class="data-td data last text-right">30.14</td>
<td class="data-td data last text-right">0.78</td>
</tr>
<tr class="tbl-data">
<td class="data-td last font-weight-normal">RTX Corp</td>
<td class="data-td data last text-left">RTX</td>
<td class="data-td data last text-right">2.38</td>
<td class="data-td data last text-right">29.76</td>
<td class="data-td data last text-right">0.71</td>
</tr>
<tr class="tbl-data">
<td class="data-td last font-weight-normal">Walt Disney Co</td>
<td class="data-td data last text-left">DIS</td>
<td class="data-td data last text-right">1.60</td>
<td class="data-td data last text-right">15.08</td>
<td class="data-td data last text-right">0.50</td>
</tr>
<tr class="tbl-data">
<td class="data-td last font-weight-normal">International Flavors &amp; Fragrances</td>
<td class="data-td data last text-left">IFF</td>
<td class="data-td data last text-right">2.59</td>
<td class="data-td data last text-right">19.35</td>
<td class="data-td data last text-right">0.50</td>
</tr>
<tr class="tbl-data">
<td class="data-td last font-weight-normal">Wells Fargo</td>
<td class="data-td data last text-left">WFC</td>
<td class="data-td data last text-right">1.66</td>
<td class="data-td data last text-right">23.31</td>
<td class="data-td data last text-right">0.52</td>
</tr>
</tbody>
</table>
</div>
<br />
<p class="chart-disclosure">Source: Morningstar. YTD data as of 5/31/2024. Past performance is no guarantee of future results. Index performance is not representative of fund performance. It is not possible to invest directly in an index. Fund performance current to the most recent month end is available by visiting vaneck.com or by calling 800.826.2333.</p>
<ol class="content-list" start="4">
<li class="mt-2">
<p><strong>Momentum</strong>: the Moat Index allocates to those wide moat stocks with attractive valuations. Often, attractive valuations correspond with preceding price declines and, as such, the Moat Index tends to have a negative relationship to the momentum factor. This has been challenging in 2024 as momentum has been the top performing traditional factor this year.</p>
</li>
</ol>
<style>
    .data-td.data {
        padding-right: 5px !important;
    }

    .wrapped-div {
        max-width: 100%;
    }

    @media (max-width: 1240px) {
        .wrapped-div {
            overflow-x: scroll;
        }
    }

    .wrapped-div-sector {
        max-width: 100%;
        overflow-x: scroll;
    }
</style>

<h2>Performance in Context</h2>
<p>The Moat Index offers investors differentiated, core US equity exposure that has historically provided impressive long-term upside and downside characteristics. However, because it is differentiated, it can be susceptible to periods of underperformance.</p>
<p>While the discomfort of 2024 underperformance is palpable, this is not necessarily out of the ordinary. There have been several similar periods in recent history, all with notable outcomes.</p>
<h3>MOAT Index Performance Relative to the Morningstar US Market Index</h3>
<div class="wrapped-div">
<table style="width: 100%;">
<tbody>
<tr class="tbl-data">
<td class="tbl-header last">Time Period</td>
<td class="tbl-header last text-right">Relative<br />Performance (%)</td>
<td class="tbl-header last text-right">Length</td>
<td class="tbl-header last text-right">Date Range</td>
<td class="tbl-header last text-right">Subsequent 1 Yr<br />Excess Return (%)</td>
<td class="tbl-header last text-right">Subsequent 3 Yr<br />Excess Return (%)</td>
</tr>
<tr class="tbl-data">
<td class="data-td last font-weight-normal">YTD 2024</td>
<td class="data-td data last text-right">-8.14</td>
<td class="data-td data last text-right">5.0 Months</td>
<td class="data-td data last text-right">1/1/2024 &ndash; 5/31/2024</td>
<td class="data-td data last text-right">TBD</td>
</tr>
<tr class="tbl-data">
<td class="data-td last font-weight-normal">Late 2020</td>
<td class="data-td data last text-right">-10.46</td>
<td class="data-td data last text-right">5.0 Months</td>
<td class="data-td data last text-right">6/8/2020 &ndash; 11/6/2020</td>
<td class="data-td data last text-right">5.02</td>
<td class="data-td data last text-right">14.26</td>
</tr>
<tr class="tbl-data">
<td class="data-td last font-weight-normal">Late 2021</td>
<td class="data-td data last text-right">-8.81</td>
<td class="data-td data last text-right">5.8 Months</td>
<td class="data-td data last text-right">6/10/2021 &ndash; 11/29/2021</td>
<td class="data-td data last text-right">6.15</td>
<td class="data-td data last text-right">6.31</td>
</tr>
<tr class="tbl-data">
<td class="data-td last font-weight-normal">Late 2017</td>
<td class="data-td data last text-right">-5.31</td>
<td class="data-td data last text-right">4.2 Months</td>
<td class="data-td data last text-right">7/3/2017 &ndash; 11/6/2017</td>
<td class="data-td data last text-right">5.31</td>
<td class="data-td data last text-right">4.10</td>
</tr>
</tbody>
</table>
</div>
<br />
<p class="chart-disclosure">Source: Morningstar. As of 5/31/2024. Past performance is no guarantee of future results. Index performance is not representative of fund performance. It is not possible to invest directly in an index. Fund performance current to the most recent month end is available by visiting vaneck.com or by calling 800.826.2333.</p>
<p>Taking this concept one step further, the Moat Index has a long-term history of posting impressive relative returns following periods of underperformance. This is a testament to the long-term nature of the strategy and illustrates that it can take time for the market to realize the true value of undervalued stocks. In the example below, the Moat Index has posted impressive excess returns, on average, in the one and three-year periods following six month stretches of notable underperformance.</p>
<h3>MOAT&rsquo;s Index Has Outperformed, on Average, Following Periods of Underperformance</h3>
<p><img class="img-responsive w-100" src="https://www.vaneck.com/contentassets/4175051822014f0fb7d52a8568446d97/4549_moat-june_chart-2_2024-6_v1_blog.svg" alt="MOAT&rsquo;s Index Has Outperformed, on Average, Following Periods of Underperformance" /></p>
<p class="chart-disclosure">Source: Morningstar. 2/28/2007 &ndash; 3/31/2024. Past performance is no guarantee of future results. Index performance is not representative of fund performance. It is not possible to invest directly in an index. Fund performance current to the most recent month end is available by visiting vaneck.com or by calling 800.826.2333.</p>
<strong>Morningstar&rsquo;s Director of Equity Research, Index Strategies, Andrew Lane published a detailed analysis of year-to-date performance of the Morningstar Wide Moat Focus Index:</strong>
<style>
    .data-td.data {
        padding-right: 5px !important;
    }

    .wrapped-div {
        max-width: 100%;
    }

    @media (max-width: 1240px) {
        .wrapped-div {
            overflow-x: scroll;
        }
    }

    .wrapped-div-sector {
        max-width: 100%;
        overflow-x: scroll;
    }
</style>

<p>To receive more <strong><a href="https://www.vaneck.com/us/en/insights/moat-investing/" title="Moat Investing Insights">Moat Investing</a></strong> insights, <strong><a href="https://www.vaneck.com/us/en/subscribe/" title="Preference Center">sign up in our subscription center</a></strong>.</p>
]]></content:encoded>
</item><item rdf:about="https://www.vaneck.com/us/en/blogs/gold-investing/ima-casanova-gold-soars-to-fresh-highs-as-regional-risks-rise/">
  <title>Gold Soars to Fresh Highs as Regional Risks Rise></title>
  <link>https://www.vaneck.com/us/en/blogs/gold-investing/ima-casanova-gold-soars-to-fresh-highs-as-regional-risks-rise/</link>
  <description><![CDATA[Gold surged to a record $2,450 in May, driven by strong central bank buying and Asian demand. Miners outperformed, but gold eased by month's end due to a stronger dollar and higher bond yields.]]></description>
  <dc:creator>Imaru Casanova</dc:creator>
  <dc:date>06/11/2024 06:30:00</dc:date>
<content:encoded><![CDATA[

<p>Monthly gold market and economic insights from Imaru Casanova, Portfolio Manager, featuring her unique views on mining and gold&rsquo;s portfolio benefits. <a href="/us/en/blogs/gold-investing/ima-casanova-gold-soars-to-fresh-highs-as-regional-risks-rise/gold-monthly-commentary-may-2024.pdf" target="_blank" rel="noopener" title="Gold Soars to Fresh Highs as Regional Risks Rise"><strong>An expanded PDF version of this commentary, including fund specific information can be downloaded here.</strong></a></p>
<h2>Gold Continues to Reach New Highs</h2>
<p>Gold has been supported this year by strong central bank gold buying and robust demand from Asia, especially China. Rising geopolitical tensions in the Middle East have likely also contributed to gold&rsquo;s strength. In May, gold continued to reach new highs, trading at an intraday record price of $2,450 and closing at $2,425.31 per ounce on May 20. Gold eased during the remainder of the month, likely influenced by a stronger dollar and higher bond yields towards month-end. Gold closed at $2,327.33 per ounce on May 31, registering a 1.8% ($41.08) monthly gain.</p>
<h2>Miners Are Also Continuing To Outshine</h2>
<p>Gold equities continued to significantly outperform gold bullion in May. NYSE Arca Gold Miners Index (GDMNTR)<sup>1</sup>&nbsp;and the MVIS Global Juniors Gold Miners Index (MVGDXJTR)<sup>2</sup>&nbsp;were up 5.98% and 10.62%, respectively. We believe miners&rsquo; amplified leverage to the metal reflects both: 1) gold stocks playing catch up, coming from oversold levels relative to bullion; and 2) overall strong fundamentals for the sector as evidenced by Q1 2024 financial and operating results, where &ldquo;in lines&rdquo; and &ldquo;beats&rdquo; outnumbered &ldquo;misses&rdquo;.</p>
<p>We have repeatedly brought attention to the importance of companies meeting expectations with respect to their share price performance and May is a good example of that. All else being equal, a gold price forecast of $2,300 per ounce for Q2 2024 (in line with the average spot price so far for this quarter) should result in significantly higher earnings and cash flow generation for the industry in Q2 compared to Q1, when the spot gold price averaged about $2,070 per ounce. Another strong earnings season for the sector should support further increases in valuation multiples assigned to gold equities.</p>

<h2>In Focus: Regional And Country-Specific Risks</h2>
<p>We have also highlighted the impact of jurisdiction risk on companies&rsquo; valuations. Gold mining companies face many risks related to the regions where they operate. Markets have a hard time differentiating between broader jurisdictional risk and risks to mining operations, specifically. Companies operating in a country or region with heightened political instability, for example, will typically trade at a discount even if their businesses have been operating normally and are unaffected by unrest or risk of turmoil.</p>
<p>Managing country exposure within a portfolio of gold equities is a challenging task. With more than 50 elections taking place around the globe in 2024, this task comes into sharper focus. Elections bring with them political, social, and economic uncertainty; they can be politically destabilizing, lead to social upheaval, or significantly change (for better or worse) the growth outlook of a country or region and, therefore, its general investment appeal. The outcome of an election can trigger impactful responses in the financial markets, as investors attempt to assess the potential ramifications of a new government.</p>
<h2>Is Mexico Still In Its &ldquo;Prime&rdquo;?</h2>
<p>The mining sector was closely watching the outcome of Mexico&rsquo;s presidential election in early June. Mexico is the world&rsquo;s largest producer of silver (accounting for about 25% of global silver production in 2023) and among the top 10 global gold producers (about 4% of global gold production in 2023). It also produced about 3% and 5% of the world&rsquo;s copper and zinc, respectively in 2023.<sup>*</sup></p>
<p>Despite many challenges, it is fair to say that Mexico, for a long time, ranked among the world&rsquo;s most prime mining jurisdictions. However, this &ldquo;prime&rdquo; rating recently came into question when Andres Manuel Lopez Obrador (AMLO) was elected Mexico&rsquo;s president in 2018. The market&rsquo;s concerns were justified too. Under AMLO&rsquo;s administration, no new mining concessions have been granted and a proposal to reform the country&rsquo;s mining law was approved in 2023.</p>
<p>Some of the most significant changes in the new law (nicely summarized in a recent report by Scotiabank Global Equity Research) include:</p>
<ul class="content-list">
<li>A 30-year limit on mining concessions (compared to a 50-year limit under the old mining law)</li>
<li>Added grounds for cancelling current mining concessions as well as a more extensive list of requirements to maintain a valid mining concession</li>
<li>Creation of additional environmental concessions for mining use (no new concessions will be granted in regions without availability of water, in natural protected areas or if there is a risk to the general population)</li>
<li>Concession allowance on a per-mineral or per-substance basis (compared to previous mining concessions granted for the totality of the underlying resources)</li>
</ul>
<p>At the end of his six-year presidential term, AMLO has also proposed a significant number of changes (20) to Mexico&rsquo;s constitution, including two proposals that directly impact the mining industry. These include a proposal to no longer grant concessions for open-pit mines and to grant water concessions for domestic-use-only in regions with water scarcity.</p>
<p>Our discussions with the management of several mining companies with operations and/or projects in Mexico gave us reason to be cautiously optimistic, with most companies expecting that a new government (even if still a MORENA party government) would be a welcome change for the mining industry. President elect, Claudia Sheinbaum &ndash; a scientist, engineer and academic &ndash; was seen as a more pragmatic candidate and likely to have more moderate views compared to AMLO. However, a lot of the optimism also stems from the fact that approval of constitutional changes would require her party to have a super-majority in congress, and this was an outcome most market participants were not expecting. Her landslide victory came with the MORENA party achieving qualified majority in the lower chamber, and very close to also achieving super-majority in the senate. This took markets by surprise, with Mexican equities and the Mexican peso dropping to reflect a more negative outlook for the country.</p>
<p>As far as the mining industry is concerned, Sheinbaum has not specifically discussed her plans for the sector, but she has promised to continue to push forward AMLO&rsquo;s agenda. It is still too early to predict what her approach will be towards mining, but her party&rsquo;s position in congress gives her the power to make changes that could potentially adversely affect the industry. &ldquo;More of the same&rdquo; seems the most likely outcome for now, which is disappointing. Comments by the re-appointed Minister of Finance seem to have offered some reassurance to investors. The president elect&rsquo;s acceptance speech appears to have also included promises for an autonomous central bank, adherence to legality and a commitment to boost private investment (both national and foreign). So, perhaps not all hope is lost. We continue to look forward to being able to upgrade Mexico in our rankings, making it a prime destination for mining investment once again.</p>
<p>To receive more <strong><a href="https://www.vaneck.com/us/en/insights/gold-investing/" title="Gold Investing Insights">Gold Investing</a></strong> insights, <strong><a href="https://www.vaneck.com/us/en/subscribe/" title="Subscription Center">sign up in our subscription center</a></strong>.</p>
]]></content:encoded>
</item><item rdf:about="https://www.vaneck.com/us/en/blogs/moat-investing/moat-stocks-await-rebound-following-may-headwinds/">
  <title>Moat Stocks Await Rebound Following May Headwinds></title>
  <link>https://www.vaneck.com/us/en/blogs/moat-investing/moat-stocks-await-rebound-following-may-headwinds/</link>
  <description><![CDATA[The Morningstar Wide Moat Focus Index faced challenges in May due to its equal-weighting, value stock bias and lack of mega-cap tech exposure. History may provide context for what comes next.]]></description>
  <dc:creator>Coulter Regal, CFA</dc:creator>
  <dc:date>06/10/2024 06:30:00</dc:date>
<content:encoded><![CDATA[

<ul class="content-list">
<li><a href="#historical-track-record"><strong>History Suggests Better Days Ahead for Moat Stocks</strong></a></li>
<li><a href="#moat-index-top-contributors-and-detractors"><strong>Moat Index Top Contributors and Detractors</strong></a></li>
<li><a href="#smid-moat-index-holdings"><strong>SMID Moat Index Top Contributors and Detractors</strong></a></li>
</ul>
<p>US equities re-initiated their upward trend in May with markets ending the month higher, but not without some volatility. To start the month, the three major US stock indices rallied from prior month declines and not only fully recovered from April drawdowns but went on to set new all-time highs by mid-May. Helping move markets higher was positive inflation data and quarterly earnings results. However, ending the month was a divergence in performance between AI-tangential tech and nearly everything else. The Dow Jones Industrial Average slid over 4% from its new high water mark, giving up much of its gains to end the month up slightly, while the S&amp;P 500 and Nasdaq finished May up a noteworthy 5% and 7%, respectively. Once again it was the narrow leadership of mega-cap tech supporting the market with Nvidia, Apple, Alphabet, Microsoft and Meta accounting for 60% of the S&amp;P 500&rsquo;s return in May. Notably though, signs of doubt appeared in big tech on the final trading day of the month with the Nasdaq falling nearly 2% intraday before mounting a late day rally to close flat.</p>
<p>The <strong><a href="/link/9e43dd198c5f4e419f13220685081895.aspx" title="MOAT - VanEck Morningstar Wide Moat ETF - Overview">Morningstar Wide Moat Focus Index</a></strong> (the &ldquo;Moat Index&rdquo;) experienced a challenging performance in May, lagging the S&amp;P 500 by more than 300 basis points. This was largely due to its equal-weighting scheme, bias toward value stocks, and the simple absence of Nvidia and other mega-cap technology names among its holdings. These are the same headwinds that have challenged the Index for much of the year, leading to a frustrating 2024, so far, for moat investing patrons. However, with a track record spanning more than 15 years, the Moat Index has experienced similar periods before. More importantly, these difficult periods have historically been followed by periods with some of the strongest outperformance. More on this later.</p>
<p>Smaller US companies also rebounded in May, following steep April declines, with the small- and mid-cap broad benchmarks keeping pace with the S&amp;P 500 during the month. The rally moved small-caps back into positive territory for the year while mid-caps held their notable lead but still lagged large-caps. The <strong><a href="/link/166321dbcfec440590fb51cf0ad629aa.aspx" title="SMOT - VanEck Morningstar SMID Moat ETF - Overview">Morningstar US Small-Mid Cap Moat Focus Index</a></strong> (the &ldquo;SMID Moat Index&rdquo;) did not fully participate in the rally due to its stock selection, despite positive sector positioning.</p>

<h3>Moat Stocks Faced Strong Headwinds in May | As of 5/31/2024</h3>
<p><img loading="lazy" class="img-responsive w-100" src="https://www.vaneck.com/contentassets/db595d4a27534af6b68010470e231242/4548_moat_chart-1_2024.6_v1_blog.svg" alt="Moat Stocks Faced Strong Headwinds in May | As of 5/31/2024" /></p>
<p class="chart-disclosure"><strong>Source: Morningstar. As of 5/31/2024</strong>. Past performance is no guarantee of future results. Index performance is not representative of fund performance. It is not possible to invest directly in an index. Fund performance current to the most recent month end is available by visiting vaneck.com or by calling 800.826.2333.</p>
<h2 id="historical-track-record" class="jump-link-nav anchored-block" data-jumplink-title="Historical Track Record">History Suggests Better Days Ahead for Moat Stocks</h2>
<p>The Moat Index has faced challenging headwinds for much of this year given its equal-weighting approach amidst a market with narrow leadership and record levels of concentration. While it can be tough to weather periods of underperformance, subscribers of the moat investing philosophy have often been rewarded on the other side of the storm. Historically, the Moat Index has experienced its strongest relative performance following periods of notable underperformance.</p>
<p>During the more than 15 years of live history for the Moat Index, when it has underperformed the S&amp;P 500 by more than 2.5% in any six-month period, the Index has gone on to substantially outperform in the following 1- and 3-year periods. In fact, the Moat Index has outperformed the S&amp;P 500 by an average of 4.28% annually in the three years following six-month periods with greater than -5% relative performance. While history is no guarantee, it can still serve as a useful guide, and the historical context suggests potentially better days ahead for moat stocks.</p>
<h3>Outperformance Historically Followed Periods of Underperformance | 2/28/2007 &ndash; 5/31/2024</h3>
<p><img loading="lazy" class="img-responsive w-100" src="https://www.vaneck.com/contentassets/fbcc96c5b225439ebfbb9424025bfc60/4548_moat_chart-2_2024.6_v1_blog.svg" alt="Outperformance Historically Followed Periods of Underperformance | 2/28/2007 - 5/31/2024" /></p>
<p class="chart-disclosure"><strong>Source: Morningstar, May 2024.</strong> Past performance is no guarantee of future results. Index performance is not illustrative of fund performance. Effective 6/20/2016, Morningstar implemented several changes to the Morningstar Wide Moat Focus Index construction rules. Among other changes, the index increased its constituent count from 20 stocks to at least 40 stocks and modified its rebalance and reconstitution methodology. These changes may result in more diversified exposure, lower turnover and longer holding periods for index constituents than under the rules in effect prior to this date.</p>
<h2 id="moat-index-top-contributors-and-detractors" class="jump-link-nav anchored-block" data-jumplink-title="Moat Index Holdings">Moat Index Top Contributors and Detractors</h2>
<p>While Nvidia does not currently make the cut for the Moat Index, that doesn&rsquo;t mean the index has no exposure to the semiconductor market. The Moat Index instead includes the perhaps lesser-known semiconductor equipment and materials company Teradyne (TER), which gained over 20% in May, landing it at the top of the list in terms of contributors to performance during the month.</p>
<p>Teradyne is a heavyweight supplier of automated test equipment for semiconductors, boasting market-leading capabilities that run the gamut of chips. It is one of two companies worldwide that can produce testers for the most cutting-edge semiconductors, thanks to robust engineering talent across hardware and software and a structural lead in organic investment. The firm is a vital partner to chipmakers across the industry and has an impressively strong relationship with Apple and Taiwan Semiconductor. Teradyne&rsquo;s market leadership exhibits itself in industry-leading margins, strong returns on invested capital, and a top market share. Following its rise in May, the stock now trades just about on par with Morningstar&rsquo;s $135 estimate of fair value.</p>
<p>The largest detractor to performance within the Moat Index during the month was beauty products company Estee Lauder (EL). Estee Lauder fell more than 15% in May following mixed earnings results which showed beats on revenue and earnings per share, but soured investors with lower than expected guidance. Despite the negative reaction by the market, Morningstar was encouraged by Estee Lauder&rsquo;s inventory management, agility in product innovation and consumer-facing initiatives which combined to fuel top-line growth and drove gross margin expansion. Morningstar also sees EL as being poised to benefit from growth opportunities in global markets like Asia, India and Brazil as middle-market consumers upgrade from lower quality mass brands. EL currently trades at a 40% discount to Morningstar&rsquo;s $210 estimate of fair value.</p>
<h3>Top Contributors and Detractors from Moat Index - May 2024</h3>
<div class="wrapped-div">
<table style="width: 100%;">
<tbody>
<tr class="tbl-data">
<td class="tbl-header last" colspan="5">Leading Contributors</td>
</tr>
<tr class="tbl-data">
<td class="tbl-header last">Company</td>
<td class="tbl-header last text-left">Ticker</td>
<td class="tbl-header last text-left">Sector</td>
<td class="tbl-header last text-right">Avg. Weight (%)</td>
<td class="tbl-header last text-right">Contribution (%)</td>
</tr>
<tr class="tbl-data">
<td class="data-td last font-weight-normal">Teradyne Inc</td>
<td class="data-td data last text-left">TER</td>
<td class="data-td data last text-left">Technology</td>
<td class="data-td data last text-right">2.83</td>
<td class="data-td data last text-right">0.60</td>
</tr>
<tr class="tbl-data">
<td class="data-td last font-weight-normal">International Flavors &amp;<br />Fragrances Inc</td>
<td class="data-td data last text-left">IFF</td>
<td class="data-td data last text-left">Materials</td>
<td class="data-td data last text-right">2.69</td>
<td class="data-td data last text-right">0.37</td>
</tr>
<tr class="tbl-data">
<td class="data-td last font-weight-normal">Pfizer Inc.</td>
<td class="data-td data last text-left">PFE</td>
<td class="data-td data last text-left">Healthcare</td>
<td class="data-td data last text-right">2.19</td>
<td class="data-td data last text-right">0.30</td>
</tr>
<tr class="tbl-data">
<td class="data-td last font-weight-normal">C.H. Robinson Worldwide</td>
<td class="data-td data last text-left">CHRW</td>
<td class="data-td data last text-left">Industrials</td>
<td class="data-td data last text-right">1.25</td>
<td class="data-td data last text-right">0.27</td>
</tr>
<tr class="tbl-data">
<td class="data-td last font-weight-normal">RTX Corp.</td>
<td class="data-td data last text-left">RTX</td>
<td class="data-td data last text-left">Industrials</td>
<td class="data-td data last text-right">2.86</td>
<td class="data-td data last text-right">0.20</td>
</tr>
</tbody>
</table>
</div>
<br />
<div class="wrapped-div">
<table style="width: 100%;">
<tbody>
<tr class="tbl-data">
<td class="tbl-header last" colspan="5">Leading Detractors</td>
</tr>
<tr class="tbl-data">
<td class="tbl-header last">Company</td>
<td class="tbl-header last text-left">Ticker</td>
<td class="tbl-header last text-left">Sector</td>
<td class="tbl-header last text-right">Avg. Weight (%)</td>
<td class="tbl-header last text-right">Contribution (%)</td>
</tr>
<tr class="tbl-data">
<td class="data-td last font-weight-normal">The Estee Lauder<br />Companies Inc.</td>
<td class="data-td data last text-left">EL</td>
<td class="data-td data last text-left">Consumer Staples</td>
<td class="data-td data last text-right">2.58</td>
<td class="data-td data last text-right">-0.40</td>
</tr>
<tr class="tbl-data">
<td class="data-td last font-weight-normal">Veeva Systems Inc.</td>
<td class="data-td data last text-left">VEEV</td>
<td class="data-td data last text-left">Health Care</td>
<td class="data-td data last text-right">2.40</td>
<td class="data-td data last text-right">-0.29</td>
</tr>
<tr class="tbl-data">
<td class="data-td last font-weight-normal">Etsy Inc.</td>
<td class="data-td data last text-left">ETSY</td>
<td class="data-td data last text-left">Consumer Cyclical</td>
<td class="data-td data last text-right">2.27</td>
<td class="data-td data last text-right">-0.17</td>
</tr>
<tr class="tbl-data">
<td class="data-td last font-weight-normal">Salesforce Inc.</td>
<td class="data-td data last text-left">CRM</td>
<td class="data-td data last text-left">Technology</td>
<td class="data-td data last text-right">1.24</td>
<td class="data-td data last text-right">-0.16</td>
</tr>
<tr class="tbl-data">
<td class="data-td last font-weight-normal">Bristol-Myers Squibb Co.</td>
<td class="data-td data last text-left">BMY</td>
<td class="data-td data last text-left">Health Care</td>
<td class="data-td data last text-right">2.04</td>
<td class="data-td data last text-right">-0.13</td>
</tr>
</tbody>
</table>
</div>
<br />
<p class="chart-disclosure"><strong>Source: Morningstar, May 2024.</strong> Past performance is no guarantee of future results. Index performance is not illustrative of fund performance. Not intended as a recommendation to buy or to sell any of the securities mentioned herein.</p>
<h2 id="smid-moat-index-holdings" class="jump-link-nav anchored-block" data-jumplink-title="SMID Moat Index Holdings">SMID Moat Index Top Contributors and Detractors</h2>
<p>The smaller cap SMID Moat Index also benefited from the above-mentioned Teradyne (TER) as the mid-cap stock&rsquo;s May performance led the pack of SMID moat companies as well. Consumer electronics retailer Best Buy (BBY) was also a top contributor following better than expected earnings results late in the month, which sent the shares up nearly 20% in the final days of May. Morningstar noted Best Buy&rsquo;s revenue and earnings results were largely in line with their expectations and that the rapid repricing of the stock was likely reflecting the market&rsquo;s unnecessarily dim top-line expectations before the earnings release. Morningstar maintained their $90 estimate of fair value for Best Buy with shares of the company ending the month trading in the mid-$80 range.</p>
<p>Names that most negatively contributed to the SMID Moat Index performance during the month include payroll and human capital management software solutions company Dayforce (DAY), global payment processing and software solutions company Global Payments (GPN), online food order aggregator and deliverer DoorDash (DASH), and travel services agency Expedia (EXPE), which all declined by double digits in May.</p>
<h3>Top Contributors and Detractors from SMID Moat Index - May 2024</h3>
<div class="wrapped-div">
<table style="width: 100%;">
<tbody>
<tr class="tbl-data">
<td class="tbl-header last " colspan="5">Leading Contributors</td>
</tr>
<tr class="tbl-data">
<td class="tbl-header last">Company</td>
<td class="tbl-header last text-left">Ticker</td>
<td class="tbl-header last text-left">Sector</td>
<td class="tbl-header last text-right">Avg. Weight (%)</td>
<td class="tbl-header last text-right">Contribution (%)</td>
</tr>
<tr class="tbl-data">
<td class="data-td last font-weight-normal">Teradyne Inc.</td>
<td class="data-td data last text-left">TER</td>
<td class="data-td data last text-left">Technology</td>
<td class="data-td data last text-right">1.50</td>
<td class="data-td data last text-right">0.32</td>
</tr>
<tr class="tbl-data">
<td class="data-td last font-weight-normal">Best Buy Co Inc.</td>
<td class="data-td data last text-left">BBY</td>
<td class="data-td data last text-left">Consumer Cyclical</td>
<td class="data-td data last text-right">1.28</td>
<td class="data-td data last text-right">0.20</td>
</tr>
<tr class="tbl-data">
<td class="data-td last font-weight-normal">DuPont de Nemours Inc.</td>
<td class="data-td data last text-left">DD</td>
<td class="data-td data last text-left">Materials</td>
<td class="data-td data last text-right">1.32</td>
<td class="data-td data last text-right">0.18</td>
</tr>
<tr class="tbl-data">
<td class="data-td last font-weight-normal">Corning Inc.</td>
<td class="data-td data last text-left">GLW</td>
<td class="data-td data last text-left">Technology</td>
<td class="data-td data last text-right">1.38</td>
<td class="data-td data last text-right">0.17</td>
</tr>
<tr class="tbl-data">
<td class="data-td last font-weight-normal">Pinterest Inc.</td>
<td class="data-td data last text-left">PINS</td>
<td class="data-td data last text-left">Communication Services</td>
<td class="data-td data last text-right">0.67</td>
<td class="data-td data last text-right">0.16</td>
</tr>
</tbody>
</table>
</div>
<br />
<div class="wrapped-div">
<table style="width: 100%;">
<tbody>
<tr class="tbl-data">
<td class="tbl-header last " colspan="5">Leading Detractors</td>
</tr>
<tr class="tbl-data">
<td class="tbl-header  last">Company</td>
<td class="tbl-header last text-left">Ticker</td>
<td class="tbl-header last text-left">Sector</td>
<td class="tbl-header last text-right">Avg. Weight (%)</td>
<td class="tbl-header last text-right">Contribution (%)</td>
</tr>
<tr class="tbl-data">
<td class="data-td last font-weight-normal">Dayforce Inc.</td>
<td class="data-td data last text-left">DAY</td>
<td class="data-td data last text-left">Technology</td>
<td class="data-td data last text-right">1.29</td>
<td class="data-td data last text-right">-0.25</td>
</tr>
<tr class="tbl-data">
<td class="data-td last font-weight-normal">Global Payments Inc</td>
<td class="data-td data last text-left">GPN</td>
<td class="data-td data last text-left">Industrials</td>
<td class="data-td data last text-right">1.34</td>
<td class="data-td data last text-right">-0.23</td>
</tr>
<tr class="tbl-data">
<td class="data-td last font-weight-normal">DoorDash Inc</td>
<td class="data-td data last text-left">DASH</td>
<td class="data-td data last text-left">Communication Services</td>
<td class="data-td data last text-right">1.51</td>
<td class="data-td data last text-right">-0.22</td>
</tr>
<tr class="tbl-data">
<td class="data-td last font-weight-normal">Expedia Group Inc</td>
<td class="data-td data last text-left">EXPE</td>
<td class="data-td data last text-left">Consumer Cyclical</td>
<td class="data-td data last text-right">1.30</td>
<td class="data-td data last text-right">-0.21</td>
</tr>
<tr class="tbl-data">
<td class="data-td last font-weight-normal">Skyworks Solutions Inc.</td>
<td class="data-td data last text-left">SWKS</td>
<td class="data-td data last text-left">Technology</td>
<td class="data-td data last text-right">1.35</td>
<td class="data-td data last text-right">-0.17</td>
</tr>
</tbody>
</table>
</div>
<br />
<p class="chart-disclosure"><strong>Source: Morningstar, April 2024.</strong> Past performance is no guarantee of future results. Index performance is not illustrative of fund performance. Not intended as a recommendation to buy or to sell any of the securities mentioned herein.</p>
<h2>Choose Your Moat Strategy</h2>
<p>VanEck&rsquo;s suite of <strong><a href="https://www.vaneck.com/us/en/blogs/moat-investing/moat-investing-powered-by-morningstar/" title="Quality Companies at Attractive Prices">moat investing strategies</a></strong> is powered by Morningstar&rsquo;s equity research team, which seeks quality companies trading at attractive valuations. The below ETFs offer access to US moat companies:</p>
<p><strong><a href="/link/9e43dd198c5f4e419f13220685081895.aspx" title="MOAT - VanEck Morningstar Wide Moat ETF - Overview">VanEck Morningstar Wide Moat ETF (MOAT)</a>:</strong> companies with a wide moat rating, which means Morningstar believes the company is likely to sustain its competitive advantage for at least the next 20 years.</p>
<p><strong><a href="/link/166321dbcfec440590fb51cf0ad629aa.aspx" title="SMOT - VanEck Morningstar SMID Moat ETF - Overview">VanEck Morningstar SMID Moat ETF (SMOT)</a></strong>: small and mid-cap moat companies.</p>
<p>To receive more <strong><a href="https://www.vaneck.com/us/en/insights/moat-investing/" title="Moat Investing Insights">Moat Investing</a></strong> insights, <strong><a href="https://www.vaneck.com/us/en/subscribe/" title="Preference Center">sign up in our subscription center</a></strong>.</p>
<style>
    .data-td.data {
        padding-right: 5px !important;
    }

    .wrapped-div {
        max-width: 100%;
    }

    @media (max-width: 1240px) {
        .wrapped-div {
            overflow-x: scroll;
        }
    }

    .wrapped-div-sector {
        max-width: 100%;
        overflow-x: scroll;
    }
</style>
]]></content:encoded>
</item><item rdf:about="https://www.vaneck.com/us/en/blogs/thematic-investing/vaneck-semiconductor-etf-smh-2024-holdings-and-performance-recap/">
  <title>VanEck Semiconductor ETF (SMH) 2024 Holdings and Performance Recap></title>
  <link>https://www.vaneck.com/us/en/blogs/thematic-investing/vaneck-semiconductor-etf-smh-2024-holdings-and-performance-recap/</link>
  <description><![CDATA[The SMH ETF had stronger performance in Q1 - Review the top contributors and detractors and updated holdings data.]]></description>
  <dc:creator>Nick Frasse</dc:creator>
  <dc:date>06/06/2024 06:30:00</dc:date>
<content:encoded><![CDATA[

<h2>SMH Performance Overview for Q1 2024</h2>
<p><strong><a href="/link/39c8d235748b4c26a5930c31d3ac0160.aspx" title="SMH - VanEck Semiconductor ETF - Holdings and Performance">VanEck Semiconductor ETF</a></strong> has had a strong performance in Q1 of 2024 versus the prior quarter, up 28.9%. Performance was positive for most of the portfolio, with exposure to NVIDIA Corp. ($NVDA) being the largest positive contributor over the quarter. Semiconductors continue to be a primary driver of technological innovation globally, whether it's complex systems on a chip or basic memory and components; we believe the sector is a long-term trend that investors should consider.</p>
<h3>Daily holdings as of 3/29/24</h3>
<div class="wrapped-div">
<table style="width: 100%;">
<tbody>
<tr class="tbl-data">
<td class="data-td last">Name</td>
<td class="data-td last text-right">Ticker</td>
<td class="data-td last text-right">Portfolio Weighting %</td>
<td class="data-td last text-right">Position Market Value</td>
<td class="data-td last text-right">Shares</td>
</tr>
<tr class="tbl-data">
<td class="data-td last">NVIDIA Corp</td>
<td class="data-td data last text-right">NVDA</td>
<td class="data-td data last text-right">20.55</td>
<td class="data-td data last text-right">3,780,677,559</td>
<td class="data-td data last text-right">4,184,202</td>
</tr>
<tr class="tbl-data">
<td class="data-td last">Taiwan Semiconductor Manufacturing Co Ltd ADR</td>
<td class="data-td data last text-right">TSM</td>
<td class="data-td data last text-right">11.86</td>
<td class="data-td data last text-right">2,182,101,052</td>
<td class="data-td data last text-right">16,038,964</td>
</tr>
<tr class="tbl-data">
<td class="data-td last">Broadcom Inc</td>
<td class="data-td data last text-right">AVGO</td>
<td class="data-td data last text-right">7.69</td>
<td class="data-td data last text-right">1,414,490,806</td>
<td class="data-td data last text-right">1,067,210</td>
</tr>
<tr class="tbl-data">
<td class="data-td last">ASML Holding NV ADR</td>
<td class="data-td data last text-right">ASML</td>
<td class="data-td data last text-right">4.88</td>
<td class="data-td data last text-right">896,926,813</td>
<td class="data-td data last text-right">924,219</td>
</tr>
<tr class="tbl-data">
<td class="data-td last">Texas Instruments Inc</td>
<td class="data-td data last text-right">TXN</td>
<td class="data-td data last text-right">4.60</td>
<td class="data-td data last text-right">846,429,598</td>
<td class="data-td data last text-right">4,858,674</td>
</tr>
<tr class="tbl-data">
<td class="data-td last">Qualcomm Inc</td>
<td class="data-td data last text-right">QCOM</td>
<td class="data-td data last text-right">4.58</td>
<td class="data-td data last text-right">842,077,376</td>
<td class="data-td data last text-right">4,973,877</td>
</tr>
<tr class="tbl-data">
<td class="data-td last">Intel Corp</td>
<td class="data-td data last text-right">INTC</td>
<td class="data-td data last text-right">4.50</td>
<td class="data-td data last text-right">828,682,690</td>
<td class="data-td data last text-right">18,761,211</td>
</tr>
<tr class="tbl-data">
<td class="data-td last">Lam Research Corp</td>
<td class="data-td data last text-right">LRCX</td>
<td class="data-td data last text-right">4.49</td>
<td class="data-td data last text-right">826,317,370</td>
<td class="data-td data last text-right">850,497</td>
</tr>
<tr class="tbl-data">
<td class="data-td last">Micron Technology Inc</td>
<td class="data-td data last text-right">MU</td>
<td class="data-td data last text-right">4.41</td>
<td class="data-td data last text-right">811,880,019</td>
<td class="data-td data last text-right">6,886,759</td>
</tr>
<tr class="tbl-data">
<td class="data-td last">Applied Materials Inc</td>
<td class="data-td data last text-right">AMAT</td>
<td class="data-td data last text-right">4.41</td>
<td class="data-td data last text-right">811,682,715</td>
<td class="data-td data last text-right">3,935,813</td>
</tr>
<tr class="tbl-data">
<td class="data-td last">Advanced Micro Devices Inc</td>
<td class="data-td data last text-right">AMD</td>
<td class="data-td data last text-right">4.32</td>
<td class="data-td data last text-right">795,076,679</td>
<td class="data-td data last text-right">4,405,101</td>
</tr>
<tr class="tbl-data">
<td class="data-td last">Analog Devices Inc</td>
<td class="data-td data last text-right">ADI</td>
<td class="data-td data last text-right">3.59</td>
<td class="data-td data last text-right">659,592,465</td>
<td class="data-td data last text-right">3,334,812</td>
</tr>
<tr class="tbl-data">
<td class="data-td last">KLA Corp</td>
<td class="data-td data last text-right">KLAC</td>
<td class="data-td data last text-right">3.45</td>
<td class="data-td data last text-right">635,282,352</td>
<td class="data-td data last text-right">909,404</td>
</tr>
<tr class="tbl-data">
<td class="data-td last">Synopsys Inc</td>
<td class="data-td data last text-right">SNPS</td>
<td class="data-td data last text-right">3.22</td>
<td class="data-td data last text-right">593,309,012</td>
<td class="data-td data last text-right">1,038,161</td>
</tr>
<tr class="tbl-data">
<td class="data-td last">Cadence Design Systems Inc</td>
<td class="data-td data last text-right">CDNS</td>
<td class="data-td data last text-right">2.99</td>
<td class="data-td data last text-right">549,266,945</td>
<td class="data-td data last text-right">1,764,543</td>
</tr>
<tr class="tbl-data">
<td class="data-td last">NXP Semiconductors NV</td>
<td class="data-td data last text-right">NXPI</td>
<td class="data-td data last text-right">2.01</td>
<td class="data-td data last text-right">370,674,822</td>
<td class="data-td data last text-right">1,496,044</td>
</tr>
<tr class="tbl-data">
<td class="data-td last">Marvell Technology Inc</td>
<td class="data-td data last text-right">MRVL</td>
<td class="data-td data last text-right">1.75</td>
<td class="data-td data last text-right">322,695,022</td>
<td class="data-td data last text-right">4,552,695</td>
</tr>
<tr class="tbl-data">
<td class="data-td last">Microchip Technology Inc</td>
<td class="data-td data last text-right">MCHP</td>
<td class="data-td data last text-right">1.69</td>
<td class="data-td data last text-right">310,287,244</td>
<td class="data-td data last text-right">3,458,781</td>
</tr>
<tr class="tbl-data">
<td class="data-td last">STMicroelectronics NV ADR</td>
<td class="data-td data last text-right">STM</td>
<td class="data-td data last text-right">1.25</td>
<td class="data-td data last text-right">229,676,957</td>
<td class="data-td data last text-right">5,311,678</td>
</tr>
<tr class="tbl-data">
<td class="data-td last">Monolithic Power Systems Inc</td>
<td class="data-td data last text-right">MPWR</td>
<td class="data-td data last text-right">1.02</td>
<td class="data-td data last text-right">186,961,146</td>
<td class="data-td data last text-right">275,990</td>
</tr>
<tr class="tbl-data">
<td class="data-td last">ON Semiconductor Corp</td>
<td class="data-td data last text-right">ON</td>
<td class="data-td data last text-right">0.91</td>
<td class="data-td data last text-right">168,065,648</td>
<td class="data-td data last text-right">2,285,053</td>
</tr>
<tr class="tbl-data">
<td class="data-td last">Skyworks Solutions Inc</td>
<td class="data-td data last text-right">SWKS</td>
<td class="data-td data last text-right">0.61</td>
<td class="data-td data last text-right">112,493,028</td>
<td class="data-td data last text-right">1,038,525</td>
</tr>
<tr class="tbl-data">
<td class="data-td last">Teradyne Inc</td>
<td class="data-td data last text-right">TER</td>
<td class="data-td data last text-right">0.54</td>
<td class="data-td data last text-right">99,354,939</td>
<td class="data-td data last text-right">880,572</td>
</tr>
<tr class="tbl-data">
<td class="data-td last">Qorvo Inc</td>
<td class="data-td data last text-right">QRVO</td>
<td class="data-td data last text-right">0.39</td>
<td class="data-td data last text-right">70,962,184</td>
<td class="data-td data last text-right">617,976</td>
</tr>
<tr class="tbl-data">
<td class="data-td last">Universal Display Corp</td>
<td class="data-td data last text-right">OLED</td>
<td class="data-td data last text-right">0.29</td>
<td class="data-td data last text-right">53,005,825</td>
<td class="data-td data last text-right">314,668</td>
</tr>
</tbody>
</table>
</div>
<br />
<p class="chart-disclosure"><strong>Source: VanEck.</strong> SMH holdings as of 3/29/2024. Holdings may vary. Please visit <strong><a href="/link/39c8d235748b4c26a5930c31d3ac0160.aspx" title="SMH - VanEck Semiconductor ETF - Holdings and Performance">vaneck.com/SMH</a></strong> for most recent fund holdings.</p>
<style>
        .data-td.data {
                padding-right: 5px !important;
        }

        .wrapped-div {
                max-width: 100%;
        }

        @media (max-width: 1240px) {
                .wrapped-div {
                        overflow-x: scroll;
                }
        }

        .wrapped-div-sector {
                max-width: 100%;
                overflow-x: scroll;
        }
</style>

<h2>SMH Top Holdings</h2>
<h2>Top two contributors for SMH in Q1 2024</h2>
<p><strong>NVIDIA Corp. (NVDA) &ndash; 20.54% Weight | 16.35% Contribution to return</strong></p>
<p>In Q1 2024, NVIDIA reported earnings per share (EPS) of $5.98, a significant increase of 629% from the previous year. The company achieved a record total revenue of $26.0 billion, up 262% year-over-year and 18% from the previous quarter. This impressive growth was driven primarily by the Data Center sector, which posted a record revenue of $22.6 billion, a 427% increase from the previous year. The Gaming sector also contributed with revenue of $2.6 billion, marking an 18% increase year-over-year despite an 8% decline from the previous quarter.</p>
<p>Additionally, the Professional Visualization and Automotive sectors reported revenues of $427 million and $329 million, respectively, with the latter showing a notable year-over-year growth of 114%.</p>
<p>Looking ahead, NVIDIA projects revenues of around $11 billion for the next quarter, reflecting continued strong performance across its sectors. CEO Jensen Huang highlighted the company's focus on accelerated computing and generative AI as key drivers of future growth, aligning with current industry trends.</p>
<p><strong>Taiwan Semiconductor Manufacturing Co. (TSM) &ndash; 11.86% Weight | 2.92% Contribution to return</strong></p>
<p>In Q1 2024, Taiwan Semiconductor Manufacturing Company (TSMC) reported robust financial performance. The company achieved earnings per share (EPS) of $1.38, exceeding the analyst consensus estimate of $1.31. TSMC's revenue for the quarter was $18.87 billion, surpassing expectations of $18.41 billion. This represents a slight improvement over the previous year's revenue figures, showcasing steady growth despite challenging market conditions.</p>
<p>The strong performance was driven primarily by the advanced technology node production and the increasing demand for high-performance computing and automotive applications. TSMC's strategic investments in expanding its manufacturing capacity and technological advancements have positioned it well to capitalize on the growing demand for semiconductors globally.</p>
<p>TSMC has provided optimistic guidance for the upcoming quarters, anticipating continued growth across its various business segments. The company remains focused on expanding its technological leadership and addressing the diverse needs of its global customer base.</p>
<h2>Top two detractors for SMH in Q1 2024</h2>
<p><strong>Intel Corporation (INTC) &ndash; 4.50% Weight | -0.80% Contribution to return</strong></p>
<p>In Q1 2024, Intel reported earnings per share (EPS) of $0.18 on revenue of $12.7 billion, up 9% year-over-year. Despite this, Intel's performance was below expectations due to a combination of factors, including a gross margin of 45.1%, which was only slightly above guidance, and a significant loss per share on a GAAP basis of $0.09.</p>
<p>Intel's underperformance can be attributed to continuing struggles in its client computing and data center businesses, which faced intense competition and slower-than-expected recovery in demand. Additionally, high capital expenditures for ongoing technological advancements and strategic investments, such as the Intel Foundry initiative, have weighed heavily on profitability.</p>
<p>Looking ahead, Intel's guidance for Q2 2024 includes revenue projections between $12.5 billion and $13.5 billion, with a non-GAAP EPS estimate of $0.10, reflecting cautious optimism amidst challenging market conditions.</p>
<p><strong>STMicroelectronics &ndash; 1.25% Weight | -0.26% Contribution to return</strong></p>
<p>In Q1 2024, STMicroelectronics reported net revenues of $3.47 billion and a gross margin of 41.7%, both below expectations. Year-over-year, net revenues decreased by 18.4%, and net income dropped by 50.9% to $513 million. The decline was driven by weaker performance in the Automotive and Industrial sectors despite gains in Personal Electronics.</p>
<p>For Q2 2024, STMicroelectronics projects revenues of $3.2 billion, a 26% year-over-year decline. The full-year revenue outlook has been revised to $14-$15 billion due to challenging market conditions and prolonged inventory corrections in the Industrial sector. Despite these issues, the company maintains its $2.5 billion CapEx plan, focusing on strategic manufacturing initiatives.</p>
<h3>Standardized Performance</h3>
<div class="wrapped-div">
<table style="width: 100%;">
<tbody>
<tr class="tbl-data">
<td class="tbl-header last" colspan="10"><strong>Quarter End Returns as of 3/31/2024</strong></td>
</tr>
<tr class="tbl-data">
<td class="tbl-header last">&nbsp;</td>
<td class="tbl-header last text-right">&nbsp;</td>
<td class="tbl-header last text-right">1 Yr</td>
<td class="tbl-header last text-right">5 Yr</td>
<td class="tbl-header last text-right">10 Yr</td>
<td class="tbl-header last text-right">Since Inception</td>
<td class="tbl-header last text-right">Inception Date</td>
<td class="tbl-header last text-right" colspan="2">Expense Ratio (%)</td>
</tr>
<tr class="tbl-data">
<td class="data-td last font-weight-normal" rowspan="2">VanEck Semiconductor ETF</td>
<td class="data-td data last text-right" rowspan="2">SMH</td>
<td class="data-td data last text-right">NAV</td>
<td class="data-td data last text-right">71.94</td>
<td class="data-td data last text-right">34.64</td>
<td class="data-td data last text-right">27.21</td>
<td class="data-td data last text-right">26.27</td>
<td class="data-td data last text-right" rowspan="2">12/20/2011</td>
<td class="data-td data last text-right">Gross</td>
<td class="data-td data last text-right">0.35</td>
</tr>
<tr class="tbl-data">
<td class="data-td data last text-right">Mkt Price</td>
<td class="data-td data last text-right">72</td>
<td class="data-td data last text-right">34.64</td>
<td class="data-td data last text-right">27.21</td>
<td class="data-td data last text-right">26.24</td>
<td class="data-td data last text-right">Net</td>
<td class="data-td data last text-right">0.35</td>
</tr>
</tbody>
</table>
</div>
<br />
<p class="chart-disclosure"><strong>Source: VanEck.</strong> Van Eck Associates Corporation (the &ldquo;Adviser&rdquo;) will pay all expenses of the Fund, except for the fee payment under the investment management agreement, acquired fund fees and expenses, interest expense, offering costs, trading expenses, taxes and extraordinary expenses. Notwithstanding the foregoing, the Adviser has agreed to pay the offering costs until at least February 1, 2025. &ldquo;Other Expenses&rdquo; have been restated to reflect current fees.</p>
<p class="chart-disclosure">The performance data quoted represents past performance. Past performance is not a guarantee of future results. Investment return and principal value of an investment will fluctuate so that an investor's shares, when redeemed, may be worth more or less than their original cost. Performance may be lower or higher than performance data quoted. Please call 800.826.2333 or visit vaneck.com for performance current to the most recent month ended.</p>
<p class="chart-disclosure">The "Net Asset Value" (NAV) of a Fund is determined at the close of each business day, and represents the dollar value of one share of the fund; It is calculated by taking the total assets of the fund, subtracting total liabilities, and dividing by the total number of shares outstanding. The NAV is not necessarily the same as the ETF's intraday trading value. Investors should not expect to buy or sell shares at NAV.</p>
<p>To receive more <a href="https://www.vaneck.com/us/en/insights/thematic-investing/" title="Thematic Investing Insights"><strong>Thematic Investing</strong></a> insights, <a href="https://www.vaneck.com/us/en/subscribe/" title="Subscription Center"><strong>sign up in our subscription center</strong></a>.</p>
<style type="text/css">
    .wrapped-div {
        max-width: 100%;
    }

    @media (max-width: 1240px) {
        .wrapped-div {
            overflow-x: scroll;
        }
    }

    .wrapped-div-sector {
        max-width: 100%;
        overflow-x: scroll;
    }
</style>
]]></content:encoded>
</item><item rdf:about="https://www.vaneck.com/us/en/blogs/emerging-markets-equity/boots-on-the-ground-assessing-investment-opportunities-in-chile-and-argentina/">
  <title>Boots on the Ground: Assessing Investment Opportunities in Chile and Argentina></title>
  <link>https://www.vaneck.com/us/en/blogs/emerging-markets-equity/boots-on-the-ground-assessing-investment-opportunities-in-chile-and-argentina/</link>
  <description><![CDATA[VanEck Emerging Markets Equity Senior Analyst Patricia Gonzalez traveled to Chile and Argentina to meet with local companies and governing authorities and evaluate investment opportunities.]]></description>
  <dc:creator>Patricia Gonzalez</dc:creator>
  <dc:date>06/05/2024 06:30:00</dc:date>
<content:encoded><![CDATA[

<p>Ongoing economic reforms in Chile and Argentina could support structural growth and attractive investment opportunities in their consumer discretionary and financials sectors. Chile is experiencing an economic turnaround partly driven by strong demand for copper, its chief export. Attractive equity valuations and a recovering consumer and lending environment warrant a deeper understanding of the country&rsquo;s investment climate. Meanwhile, Argentina is undergoing transformative economic reforms aimed at reducing fiscal imbalances and controlling inflation. These structural changes could revive the country&rsquo;s economy.</p>
<h2 id="chile-growth-drivers" class="jump-link-nav anchored-block" data-jumplink-title="Chile: Growth Drivers">Chile: Growth Drivers Present a Bright Outlook</h2>
<p>Overall, we detected a renewed positive sentiment among local companies and government authorities on Chile&rsquo;s growth trajectory. Chile is experiencing a wave of optimism, driven by a constructive outlook from corporates and improved visibility following potential changes to its constitution. The country&rsquo;s new president envisions a stronger role of government in provision of social services and reduced income inequality in the country. One of his flagship policies is overhauling the current pension system by replacing pension fund managers with private investment managers and raising the minimum guaranteed pension provided by the state. He expects the changes to the constitution approved before the end of his term in office and is pushing for a fast-track vote on the pension reform<sup>1</sup>.</p>
<p>The Chilean economy has had a positive start in 2024, with higher-than-expected growth. The country&rsquo;s economic activity index was up 4.5% in February, its largest increase in 2 years,<sup>2</sup>&nbsp;on the back of strong mining and transportation sector performance. Chile&rsquo;s GDP is expected to reach 2.8%, which is a significant increase from 0.2% in 2023. The country&rsquo;s inflation is projected to trend down to 3% and subsequently, interest rates could come down to 4.5-5.0%. We believe this could help stimulate consumption in the economy and lift the economy via demand growth.</p>
<h2 id="copper-and-chiles-economy" class="jump-link-nav anchored-block" data-jumplink-title="Copper and Chile&rsquo;s Economy">Copper and Chile&rsquo;s Economy</h2>
<p>Chile is the world&rsquo;s largest copper producer and strong demand for the metal typically bodes well for the economy. On top of the current demand for copper as a key metal in energy transition industries, artificial intelligence (AI) demand has the potential to be another pillar to copper&rsquo;s long-term structural demand growth. AI, which feeds on power from increasingly large data centers that commonly use copper wiring, could propel copper prices higher.</p>

<h3>MSCI Chile vs. Copper Price</h3>
<p><img class="img-responsive w-100" src="https://www.vaneck.com/contentassets/a908f01c375a4491affb4e87c0889623/4523_eme_chile-argentina_chart-1_2024.6_v1_blog.svg" alt="MSCI Chile vs. Copper Price" /></p>
<p class="chart-disclosure">Source: Bloomberg Finance L.P., J.P. Morgan as of 12/31/2023.</p>
<p>Historically, Chilean equities and copper prices have shown a correlation of 85% in yearly returns in the last 20 years.<sup>3</sup>&nbsp;This trend showed a decoupling since October 2019 coinciding with the higher macropolitical uncertainty. We expect the correlation to increase again as political uncertainty subsides and believe a strong upside for copper could be a positive catalyst for Chilean equities.</p>
<h2 id="attractive-valuations" class="jump-link-nav anchored-block" data-jumplink-title="Attractive Valuations">Attractive Valuations</h2>
<p>Chile is currently trading at 7.2x forward P/E, below its 10-year average of 14.0x. Compared to other LATAM countries, we note it is the second most discounted market after Colombia. Given the strong macroeconomic tailwinds, we believe Chilean equities could offer an attractive entry point to investors considering exposure.</p>
<h3>Chile Forward P/E vs.10Y Average</h3>
<p><img class="img-responsive w-100" src="https://www.vaneck.com/contentassets/a908f01c375a4491affb4e87c0889623/4523_eme_chile-argentina_chart-2_2024.6_v1_blog.svg" alt="Chile Forward P/E vs. 10Y Average" /></p>
<p class="chart-disclosure">Source: Bloomberg Finance L.P., J.P. Morgan as of 12/31/2023.</p>
<h3>LatAm P/E Discount vs.10Y Average</h3>
<p><img class="img-responsive w-100" src="https://www.vaneck.com/contentassets/a908f01c375a4491affb4e87c0889623/4523_eme_chile-argentina_chart-3_2024.6_v1_blog.svg" alt="LatAm P/E Discount vs. 10Y Average" /></p>
<p class="chart-disclosure">Source: Bloomberg Finance L.P., J.P. Morgan as of 12/31/2023.</p>
<h2>Revival in Consumer Activity and Lending</h2>
<p>Chile is likely to undergo one of the strongest easing cycles in LATAM with an expected rate cut of 375bps by the end of the year. The country is witnessing a recovery in consumer activity that had declined after the end of pandemic-related stimulus and pension payments, with even challenging sectors like department stores showing signs of improvement. We believe the overall lending environment is improving and could boost consumer demand, especially in retail. From this perspective, we think Chilean shopping malls offer an interesting investment opportunity. A recovery in Chile&rsquo;s retail sales during 2024 could act as a tailwind for this industry and we believe this could be a good entry point for investors as the monetary easing cycle is still in its initial phase. We particularly like Parque Arauco, a real estate company which operates shopping malls. Parque Arauco is focused primarily on Peru and Colombia in the Andean region, a high-growth area when looking at the shopping malls segment in LATAM. It also has the cheapest valuation in the industry and could benefit from its new multifamily property portfolio.</p>
<h2 id="argentina-economic-reforms" class="jump-link-nav anchored-block" data-jumplink-title="Argentina: Economic Reforms">Argentina: Economic Reforms Show Promise</h2>
<p>Argentina is undergoing a transformative period under President Milei's administration. The government has acted swiftly to address deep-seated economic distortions by cutting federal aid, devaluing the peso, eliminating subsidies, and reducing fiscal and monetary imbalances.</p>
<p>The Argentine government is also pushing for comprehensive structural reforms in the labor, tax, and energy sectors. The approval of the Omnibus bill that includes clauses on privatization, investment incentives, delegation of powers, labor reform and tax changes could improve investor sentiment and help the country secure a new IMF development loan. Argentina&rsquo;s Lower House approved the bill at the end of April. The bill is now up for a vote in the Senate and a potential approval could lift Argentinian equities.</p>
<p>The government&rsquo;s policies have already started to yield results, with the fiscal deficit reduced to 0% and inflation dropping from above 20% per month to single digits in April 2024.</p>
<h3>Headline CPI</h3>
<p><img class="img-responsive w-100" src="https://www.vaneck.com/contentassets/a908f01c375a4491affb4e87c0889623/4523_eme_chile-argentina_chart-4_2024.6_v1_blog.svg" alt="Headline CPI" /></p>
<p class="chart-disclosure">Source: INDEC and J.P. Morgan as of 1/31/2024.</p>
<p>Controlling inflation remains the cornerstone of Argentina's economic revival. The goal is to bring inflation down to 4-5% per month by year-end. Achieving this target would be a significant milestone, instilling confidence among local and international investors and potentially leading to a multi-year period of capital inflows and expanded market activity.</p>
<h2 id="sector-opportunities" class="jump-link-nav anchored-block" data-jumplink-title="Sector Opportunities">Structural Reforms and Sector Opportunities</h2>
<p>We believe the banking sector could be an interesting investment opportunity. The sector's low levels of penetration and concentration present opportunities for consolidation and expansion. As inflation stabilizes, lower interest rates are expected to stimulate loan demand, starting with corporate lending and eventually extending to consumer and mortgage lending.</p>
<p>Most Argentineans are educated and almost 40% of the population is considered middle class. The money generated by the Argentineans has been consistently exported or hidden as dollars as a defensive measure to preserve value. The estimated savings held outside the banking system is above $200bn.<sup>4</sup>&nbsp;This amount is many times the size of local banks and placing at least some of that money back to work in Argentina could have a significant multiplier effect on credit.</p>
<p>With more than 70 banks in the market but only 10 managing 70% of the market, there is substantial room for growth and consolidation in the industry. We think banks like Grupo Galicia and Banco Macro are well-positioned to capitalize on these opportunities.</p>
<p>Historically, Argentinean banks have had a purely transactional role and have operated on a small scale. The banking sector could take off if the government succeeds in containing inflation. Argentinean corporates and consumers have low levels of debt leverage and there is room for credit growth. The banking sector could also benefit if the savings rate increases as real rates go up.</p>
<h2>Scouting Investment Opportunities</h2>
<p>Chile's growth momentum, driven by a strong commodity outlook, along with Argentina's bold economic reforms, may begin to offer compelling investment opportunities. While we do not have exposure to these markets yet, we believe there are pockets of structural growth opportunities in these two countries. Staying attuned to ongoing reforms and market developments will be key to successfully navigating these dynamic markets.</p>
<p>To receive more <a href="/us/en/insights/emerging-markets-equity/" title="Emerging Markets Equity Insights"><strong>Emerging Markets Equity</strong></a> insights, <a href="/us/en/subscribe/" title="Subscription Center"><strong>sign up in our subscription center</strong></a>.</p>
<style type="text/css">
    .wrapped-div {
        max-width: 100%;
    }

    @media (max-width: 1240px) {
        .wrapped-div {
            overflow-x: scroll;
        }


    }
</style>
]]></content:encoded>
</item><item rdf:about="https://www.vaneck.com/us/en/blogs/digital-assets/matthew-sigel-eth-2030-price-target/">
  <title>ETH 2030 Price Target and Optimal Portfolio Allocations></title>
  <link>https://www.vaneck.com/us/en/blogs/digital-assets/matthew-sigel-eth-2030-price-target/</link>
  <description><![CDATA[We estimate ETH's price to hit $22k by 2030 in our updated base case scenario and explore optimal BTC and ETH allocations in both traditional 60/40 and crypto-only portfolios.]]></description>
  <dc:creator>Matthew  Sigel</dc:creator>
  <dc:date>06/05/2024 06:30:00</dc:date>
<content:encoded><![CDATA[

<p><strong>Please note that VanEck has positions in ether and bitcoin.</strong></p>
<p><strong><i>The information, valuation scenarios and price targets presented on any digital assets in this blog are not intended as financial advice, a recommendation to buy or sell these digital assets, or any call to action. There may be risks or other factors not accounted for in these scenarios that may impede the performance these digital assets; their actual future performance is unknown, and may differ significantly from any valuation scenarios or projections/forecasts herein. Any projections, forecasts or forward-looking statements included herein are the results of a simulation based on our research, are valid as of the date of this communication and subject to change without notice, and are for illustrative purposes only. Please conduct your own research and draw your own conclusions.</i></strong></p>
<p>We anticipate that spot ether ETFs are nearing approval to trade on U.S. stock exchanges. This development would allow financial advisors and institutional investors to hold this unique asset with the security of qualified custodians, and benefit from the pricing and liquidity advantages characteristic of ETFs. In response, we've updated our financial model and reevaluated the fundamental investment case for ETH. We also performed a series of quantitative analyses on how ether (ETH) interacts with bitcoin (BTC) in a traditional 60/40 portfolio, focusing on the tradeoff between risk and return.</p>
<p><strong><a href="/us/en/blogs/digital-assets/matthew-sigel-eth-2030-price-target.pdf" target="_blank" title="ETH 2030 Price Target and Optimal Portfolio Allocations" rel="noopener">View here</a></strong> for a PDF version of this blog.</p>
<p>The key takeaways of this piece are:</p>
<ol class="content-list">
<li class="mt-2">Driven by a strong value proposition to entrepreneurs, the Ethereum network is likely to continue its rapid market share growth from traditional financial market participants and, increasingly, Big Tech. Should it do so while maintaining its dominant position among smart contract platforms, we see a credible path to $66B in free cash flow to token holders supporting a $2.2 trillion asset, or $22k per coin, by 2030.</li>
<li class="mt-2">Adding a modest allocation of cryptocurrencies (up to 6%) to a traditional 60/40 portfolio can substantially improve the portfolio&rsquo;s Sharpe ratio with a relatively minor impact on drawdown. <strong>An allocation close to 70/30 between bitcoin and ether</strong> for a crypto-only portfolio provided the best risk-adjusted returns.</li>
</ol>
<ul class="content-list">
<li><a href="#investment-case"><strong>Ether&rsquo;s Investment Case: An Evaluation</strong></a></li>
<li><a href="#price-target"><strong>Ether Price Target Update for 2030: Base, Bull, and Bear Case Scenarios</strong></a></li>
<li><a href="#optimal-allocations"><strong>Bitcoin and Ether: Optimal Portfolio Allocations</strong></a></li>
<li><a href="#investment-risks"><strong>Ether Investment Risks</strong></a></li>
</ul>
<h2 id="investment-case" class="jump-link-nav anchored-block" data-jumplink-title="Investment Case">The Investment Case for Ethereum: An Evaluation</h2>
<p><strong>Ether (ETH), the native token of Ethereum,</strong> is a novel asset that exposes investors to a high-growth, internet-native commercial system called Ethereum that threatens to disrupt existing financial businesses and Big Tech platforms like Google and Apple. Ethereum is a successful <i>digital economy</i> that attracts -<strong><a href="https://app.artemis.xyz/chains" target="_blank" title="Chain Compare - Artemis Terminal" rel="noopener">~20M</a></strong> monthly active users while settling <strong><a href="https://app.artemis.xyz/chains" target="_blank" title="Chain Compare - Artemis Terminal" rel="noopener">$4T</a></strong> in settlement value and facilitating <strong><a href="https://app.artemis.xyz/chains" target="_blank" title="Chain Compare - Artemis Terminal" rel="noopener">$5.5T</a></strong> in stablecoin transfers over the last twelve months. Ethereum secures over <strong><a href="https://app.artemis.xyz/stablecoins?stablecoinMetric=STABLECOIN_MC&amp;chain=arbitrum" target="_blank" title="Stablecoins - Artemis Terminal" rel="noopener">$91.2B</a></strong> in stablecoins, <strong><a href="https://app.rwa.xyz/treasuries" target="_blank" title="RWA.xyz - Treasuries" rel="noopener">$6.7B</a></strong> in tokenized off-chain assets, and <strong><a href="https://cryptoslate.com/blockchain/ethereum/" target="_blank" title="Ethereum Tokens - CryptoSlate" rel="noopener">$308B</a></strong> in digital assets. The centerpiece asset of this financial system is the ETH token, and in our updated base case, we believe it to be worth $22k by 2030, representing a total return of 487% from today&rsquo;s ETH price, a compound annual growth rate (CAGR) of 37.8%.</p>
<p>We project ETH&rsquo;s 2030 valuation based upon a forecast of $66B in free cashflows generated by Ethereum and accruing to the ETH token. We estimate 33x valuation multiple on those cashflows. As Ethereum is a platform for applications, we begin our valuation by estimating the market size of business sectors that blockchain applications will disrupt. We estimate the total addressable market (TAM) to be $15T based on annual revenues in these industry verticals:</p>
<ul class="content-list">
<li class="mt-2">Finance, Banking, and Payments (FBP) - $10.9T</li>
<li class="mt-2">Marketing, Advertising, Social and Gaming (MASG) - $1.1T</li>
<li class="mt-2">Infrastructure (I) - $1.8T</li>
<li class="mt-2">Artificial Intelligence (AI) - $1.4T</li>
</ul>
<p>From our TAM figures, we apply market capture estimates of these revenues utilizing blockchains such as Ethereum. These penetration rates are 7.5%, 20%, 10%, and 5% for FBP, MASG, I, and AI, respectively (Fig 6). After that, we predict the share of crypto applications built on Ethereum rather than other blockchains, and our base case is 70%. We then estimate the fees that Ethereum will charge app users, which is effectively a &ldquo;take rate&rdquo; on these applications&rsquo; revenues, and we calculate this will be 5-10%. We recently updated our<strong><a href="https://www.vaneck.com/us/en/blogs/digital-assets/matthew-sigel-ethereum-price-target-118k-by-2030/" title="How High Will Ethereum's Price Go?"> ETH model</a></strong> from Spring 2023 to add the AI end-market to reflect Ethereum&rsquo;s great potential in that sector. The other impactful adjustments to our previous model are increased burn of ETH supply, greater end market capture, and a higher take rate on underlying economic activity. We believe these changes are justified by fundamentals, recent innovations that make Ethereum more accessible, and changing politics in the U.S.</p>
<h3>Fig 1. ETH&rsquo;s Trailing Twelve-Months (TTM) Metrics</h3>
<div class="wrapped-div">
<table style="width: 100%;">
<tbody>
<tr class="tbl-data">
<td class="data-td last">Ethereum Smart Contract Market Share</td>
<td class="data-td data last text-right">58%</td>
</tr>
<tr class="tbl-data">
<td class="data-td last">Revenue (Millions)</td>
<td class="data-td data last text-right">$3,461</td>
</tr>
<tr class="tbl-data">
<td class="data-td last">Validator Cut</td>
<td class="data-td data last text-right">5.00%</td>
</tr>
<tr class="tbl-data">
<td class="data-td last">Value to Tokenholders (Millions)</td>
<td class="data-td data last text-right">$3,288</td>
</tr>
<tr class="tbl-data">
<td class="data-td last">Current FCF Multiple</td>
<td class="data-td data last text-right">137.84x</td>
</tr>
<tr class="tbl-data">
<td class="data-td last">ETH FDV (Millions)</td>
<td class="data-td data last text-right">$453,282</td>
</tr>
<tr class="tbl-data">
<td class="data-td last">ETH Supply (Millions)</td>
<td class="data-td data last text-right">120.13</td>
</tr>
<tr class="tbl-data">
<td class="data-td last">ETH Price</td>
<td class="data-td data last text-right">$3,773</td>
</tr>
</tbody>
</table>
</div>
<br />
<p class="chart-disclosure">Source: <strong><a href="https://app.artemis.xyz/chains" target="_blank" title="Chain Compare - Artemis Terminal" rel="noopener">Artemis XYZ</a></strong> as of 5/28/2024. Not a recommendation to buy or sell any of the names mentioned herein. <strong>Past performance is no guarantee of future results. Trailing Twelve-Months (TTM) </strong>refers to the past 12 consecutive months of data up to the current date, used for financial analysis to provide a recent historical perspective. <strong>Free Cash Flow (FCF)</strong> is the net amount of ether available from the network's operations after considering all network costs, like gas fees used for transactions and smart contracts. <strong>Fully Diluted Valuation (FDV),</strong> represents the total market value of all ether (ETH) tokens, based on the current price, if the entire projected supply were already in circulation. This includes both the existing supply and any future ether that will be minted.</p>
<h3 id="price-target" class="jump-link-nav anchored-block" data-jumplink-title="2030 Price Target">Fig 2. Ether Price Target for 2030: Base, Bull, and Bear Case Scenarios</h3>
<div class="wrapped-div">
<table style="width: 100%;">
<tbody>
<tr class="tbl-data">
<td class="tbl-header last">&nbsp;</td>
<td class="tbl-header last text-right">Base Case</td>
<td class="tbl-header last text-right">Bull Case</td>
<td class="tbl-header last text-right">Bear Case</td>
</tr>
<tr class="tbl-data">
<td class="data-td last">Ethereum Terminal Smart Contract Market Share</td>
<td class="data-td data last text-right">70.00%</td>
<td class="data-td data last text-right">90.00%</td>
<td class="data-td data last text-right">15.00%</td>
</tr>
<tr class="tbl-data">
<td class="data-td last">ETH Price Target</td>
<td class="data-td data last text-right">&nbsp;</td>
</tr>
<tr class="tbl-data">
<td class="data-td last">Estimated Revenue 2030 ($M)</td>
<td class="data-td data last text-right">$78,501</td>
<td class="data-td data last text-right">$361,641</td>
<td class="data-td data last text-right">$2,477</td>
</tr>
<tr class="tbl-data">
<td class="data-td last">Global Tax Rate on Crypto</td>
<td class="data-td data last text-right">15%</td>
</tr>
<tr class="tbl-data">
<td class="data-td last">Validator Cut</td>
<td class="data-td data last text-right">1.00%</td>
</tr>
<tr class="tbl-data">
<td class="data-td last">FCF to Tokenholders in 2030 ($M)</td>
<td class="data-td data last text-right">$66,058</td>
<td class="data-td data last text-right">$304,321</td>
<td class="data-td data last text-right">$2,084</td>
</tr>
<tr class="tbl-data">
<td class="data-td last">FCF Terminal Multiple</td>
<td class="data-td data last text-right">33.33</td>
<td class="data-td data last text-right">50</td>
<td class="data-td data last text-right">20</td>
</tr>
<tr class="tbl-data">
<td class="data-td last">ETH FDV ($M)</td>
<td class="data-td data last text-right">$2,201,945</td>
<td class="data-td data last text-right">$15,216,032</td>
<td class="data-td data last text-right">$41,681</td>
</tr>
<tr class="tbl-data">
<td class="data-td last">ETH Supply in 2030</td>
<td class="data-td data last text-right">100.07</td>
<td class="data-td data last text-right">98.85</td>
<td class="data-td data last text-right">115.73</td>
</tr>
<tr class="tbl-data">
<td class="data-td last">Token Price 2030 (USD)</td>
<td class="data-td data last text-right"><strong>$22,000</strong></td>
<td class="data-td data last text-right"><strong>$154,000</strong></td>
<td class="data-td data last text-right"><strong>$360</strong></td>
</tr>
</tbody>
</table>
</div>
<br />
<p class="chart-disclosure"><strong>Source: VanEck Research as of 5/28/2024. Past performance is no guarantee of future results. The information, valuation scenarios, and price targets in this blog are not intended as financial advice or any call to action, a recommendation to buy or sell, or as a projection of how ETH will perform in the future. Actual future performance of ETH is unknown, and may differ significantly from the hypothetical results depicted here. There may be risks or other factors not accounted for in the scenarios presented that may impede the performance. These are solely the results of a simulation based on our research, and are for illustrative purposes only. Please conduct your own research and draw your own conclusions.</strong></p>
<p>We believe ETH is a revolutionary asset with few parallels in the non-crypto financial world. ETH can be thought of as &ldquo;<i>Digital Oil</i>&rdquo; because it is consumed by engaging in activity on Ethereum. ETH can also be viewed as &ldquo;<i>Programmable Money</i>&rdquo; as the financialization of ETH and other Ethereum assets can occur automatically, without any intermediary or censorship, on the Ethereum blockchain. Furthermore, we consider ETH a &ldquo;<i>Yield Bearing Commodity</i>&rdquo; because it can earn yield in ETH by being pledged, non-custodially, to validators who govern the Ethereum network. Finally, we believe ETH can be deemed an &ldquo;<i>Internet Reserve Currency</i>&rdquo; as it is the base asset that prices all activity and most digital assets within the $1T+ Ethereum ecosystem and its 50+ connecting blockchains.</p>
<h3>Fig 3. Ethereum Ecosystem Daily Active Users Have Grown 71% CAGR</h3>
<p><img class="img-responsive w-100" src="https://www.vaneck.com/contentassets/7b4357803f974f8d8ae9c080999dc0a5/4522_slc-may_chart-1_2024-6_v1_blog.svg" alt="Ethereum Ecosystem Daily Active Users Have Grown 71% CAGR" /></p>
<p class="chart-disclosure"><strong>Source</strong>: <strong><a href="https://app.artemis.xyz/chains" target="_blank" title="Chain Compare - Artemis Terminal" rel="noopener">Artemis XYZ</a></strong>as of 5/28/2024. Not a recommendation to buy or sell any of the names mentioned herein. <strong>Past performance is no guarantee of future results. Compound Annual Growth Rate (CAGR)</strong> represents the rate at which the value of ether (ETH) has grown annually over a specified time period. This metric is used to provide a smoothed annual growth rate, eliminating fluctuations and giving a clearer picture of long-term investment performance.</p>
<p>Regardless of its classification, ETH benefits from the growing usage of the Ethereum blockchain. Ethereum is a vibrant economic platform that can be considered a &ldquo;Digital Mall&rdquo; whose usership has grown <strong><a href="https://app.artemis.xyz/chains" target="_blank" title="Chain Compare - Artemis Terminal" rel="noopener">~1500%</a></strong>, and revenue has surged at a <strong><a href="https://app.artemis.xyz/chains" target="_blank" title="Chain Compare - Artemis Terminal" rel="noopener">161% CAGR</a></strong> since 2019. Over the past year, Ethereum has generated <strong><a href="https://tokenterminal.com/terminal/projects/ethereum" target="_blank" title="Chain Compare - Artemis Terminal" rel="noopener">$3.4B</a></strong> in revenue, and this value accrues directly to ETH holders. Because ETH must be purchased to utilize Ethereum, all ETH holders benefit from the demand-driven currency inflows. Additionally, <strong><a href="https://etherscan.io/chart/dailyethburnt" target="_blank" title="Daily Ether Burnt Chart - Etherscan" rel="noopener">~80%</a></strong> of these revenues in ETH are used to buy back and &ldquo;burn&rdquo; circulating ETH to remove it from circulation permanently. This is analogous to irreversible stock buybacks.</p>
<p>Over the last six months, <strong><a href="https://dune.com/blockworks_research/eth" target="_blank" title="Ethereum Asset Profile" rel="noopener">541k</a></strong> of ETH worth $1.58B, 0.4% of all supply, has been removed. Thus, holders of ETH double benefit from Ethereum activity due to both usership-driven ETH purchases and the burning of supply. ETH users can also earn a yield on ETH, in ETH, which amounts to <strong><a href="https://www.stakingrewards.com/asset/ethereum-2-0" target="_blank" title="Ethereum (ETH) Staking Rewards Calculator - Earn 3.63% - Staking Rewards" rel="noopener">~3.5%</a></strong> per annum. This is done by <strong>&ldquo;staking&rdquo;</strong> ETH to Ethereum network entities called validators to provide them with the necessary collateral bond to run the Ethereum network.</p>
<h3>Fig 4. Ethereum Revenue Per User Exceeds Most Web2 Businesses</h3>
<p><img class="img-responsive w-100" src="https://www.vaneck.com/contentassets/7b4357803f974f8d8ae9c080999dc0a5/4522_slc-may_chart-2_2024-6_v1_blog.svg" alt="Ethereum Revenue per User Exceeds Most Web2 Businesses" /></p>
<p class="chart-disclosure"><strong>Source</strong>: <strong><a href="https://www.businessofapps.com/data/app-data" target="_blank" title="App Statistics - Business of Apps" rel="noopener">Business of Apps</a></strong>, <strong><a href="https://app.artemis.xyz/chains" target="_blank" title="Chain Compare - Artemis Terminal" rel="noopener"> Artemis XYZ</a></strong> as of 5/28/2024.</p>
<p>Compared to web2 applications, Ethereum (<strong><a href="https://www.businessofapps.com/data/app-data" title="App Statistics - Business of Apps" target="_blank" rel="noopener">$3.4B</a></strong>) generates more revenue than Etsy (<strong><a href="https://www.businessofapps.com/data/app-data" target="_blank" title="App Statistics - Business of Apps" rel="noopener">$2.7B</a></strong>), Twitch (<strong><a href="https://www.businessofapps.com/data/app-data" title="App Statistics - Business of Apps" target="_blank" rel="noopener">$2.6B</a></strong>) and Roblox <strong><a href="https://www.businessofapps.com/data/app-data" target="_blank" title="App Statistics - Business of Apps" rel="noopener">($2.7B</a></strong>). Ethereum (20M) boasts more monthly active users than Instacart (<strong><a href="https://www.businessofapps.com/data/app-data" target="_blank" title="App Statistics - Business of Apps" rel="noopener">14M</a></strong>), Robinhood (<strong><a href="https://www.businessofapps.com/data/app-data" target="_blank" title="App Statistics - Business of Apps" rel="noopener">10.6M</a></strong>), and Vrbo (<strong><a href="https://www.businessofapps.com/data/app-data" target="_blank" title="App Statistics - Business of Apps" rel="noopener">17.5M</a></strong>). Additionally, the average Ethereum monthly active user generates $172 in annual revenue, comparable to Apple Music, $100; Netflix, $142; and Instagram, <strong><a href="https://www.businessofapps.com/data/app-data" target="_blank" title="App Statistics - Business of Apps" rel="noopener">$25.</a></strong> We categorize Ethereum as a platform business similar to the Apple App Store or Google Play. However, Ethereum has a substantial edge over web2 platforms because it offers the Ethereum users and Ethereum app business owners unique value propositions not available outside of crypto.</p>
<p>The most appealing aspect of using Ethereum is its potential cost savings to businesses and users. Whereas Apple and Google take around <strong><a href="https://www.insightpartners.com/ideas/do-you-have-to-pay-the-apple-tax-its-complicated/#:~:text=What%20is%20the%20Apple%20Tax,subject%20to%20a%2030%25%20surcharge." target="_blank" title="Do you have to pay the Apple Tax? It's complicated. - Insight Partners" rel="noopener">30%</a></strong> of hosted application revenue, Ethereum currently extracts around <strong><a href="https://tokenterminal.com/terminal/projects/ethereum" target="_blank" title="Token Terminal - Fundamentals for crypto" rel="noopener">24%</a></strong> (14% for non-DeFI apps). Additionally, we believe that Ethereum&rsquo;s take rate will drop to 5-10% over the next 18 months as activity shifts to less-expensive Ethereum Layer-2 Blockchains (current take rates of 0.25%-3%). For more information on Ethereum Layer-2s, see <strong><a href="https://www.vaneck.com/us/en/blogs/digital-assets/matthew-sigel-vanecks-ethereum-layer-2s-valuation-prediction-by-2030/" title="VanEck's Ethereum Layer-2s Valuation Prediction by 2030">our April report</a></strong> on the topic. From the payments angle, credit card processors and other payment apps like PayPal syphon <strong><a href="https://www.businessofapps.com/data/paypal-statistics/" target="_blank" title="App Statistics - Business of Apps" rel="noopener">1.94%</a></strong> on all payments (<strong><a href="https://www.businessofapps.com/data/paypal-statistics/" target="_blank" title="App Statistics - Business of Apps" rel="noopener">2.9%</a></strong> on business transactions) while Visa charges <strong><a href="https://www.fool.com/the-ascent/research/average-credit-card-processing-fees-costs-america/" target="_blank" title="Average Credit Card Processing Fees and Costs in 2023 | The Motley Fool" rel="noopener">1.79-2.43%</a></strong> or more. By contrast, on Ethereum, users pay around <strong><a href="https://app.artemis.xyz/stablecoins?stablecoinMetric=STABLECOIN_MC&amp;chain=arbitrum" target="_blank" title="Stablecoins - Artemis Terminal" rel="noopener"><i>0.001%</i></a></strong> for a simple transfer, which is less than 1/1000th of the cost of current leading payment applications.</p>
<p>Compared to data-centric social networking platforms like Facebook, we believe Ethereum may enable more capable and lucrative applications for entrepreneurs. Ethereum allows applications to freely interconnect and innovate using a permissionless deployment environment and open-source data. Thus, anyone can create an application and tap into important data, including all user activity on a chain - which would be like Visa giving away customer payment data for free! For example, the social media app called Farcaster currently collects <strong><a href="https://dune.com/queries/3235416/5411632" target="_blank" title="Farcaster Revenue by Month" rel="noopener">$75.5</a></strong> per monthly active user, whereas Facebook makes around <strong><a href="https://www.businessofapps.com/data/app-data" target="_blank" title="App Statistics - Business of Apps" rel="noopener">$44</a></strong>. Even more compelling, the incentive structure of open-source has spawned a far more engaging application as the average daily time on the app for Facebook is <strong><a href="https://backlinko.com/facebook-users" target="_blank" title="Facebook User and Growth Statistics to Know in 2024" rel="noopener">31 minutes</a></strong> versus <strong><a href="https://dune.com/queries/3473026/5837091" target="_blank" title="Average Session Time per day (in minutes)" rel="noopener"><i>350 minutes</i></a></strong> for Farcaster.</p>
<p>The result of Ethereum&rsquo;s attributes is that some of the margins earned by Big Finance, Big Tech, and Big Data could be transferred to users in the form of consumer welfare. As more data is generated in public and more commerce is moved off expensive, closed financial rails, business moats will erode. The result will be potential business formation around the low-margin economics of open-source. Consumers and app builders will migrate to Ethereum because it is cheaper and provides more value than current stalwarts. We believe that, over the next 5-10 years, between 7% and 20% of Web2/Big Finance business topline, trillions of dollars, can be squeezed by systems like Ethereum and remitted mostly back to users and app builders. Furthermore, the unique ownership properties of Ethereum allow for a censorship-free digital existence on social media and gaming applications. These features will be increasingly valuable if government censorship of information continues to grow.</p>
<p>There is also strong reason to believe blockchains like Ethereum will become important back-end infrastructure for Artificial Intelligence applications. The proliferation of AI Agents and an AI Agent economy will demand unrestrained transfer of value, definitive proof of humanity, and clearly defined data/model provenance. These unique properties are available on blockchains, but evade existing tech infrastructure. We explored many of the implications of crypto and AI in our February 2024 <strong><a href="https://www.vaneck.com/us/en/blogs/digital-assets/matthew-sigel-vanecks-crypto-ai-revenue-predictions-by-2030/" title="VanEck's Crypto AI Revenue Predictions by 2030">piece</a></strong>. We estimate that the TAM for global AI productivity gains may be as high as $8.5T by 2030. Based upon assumptions of business adoption of 66%, AI software value capture of 25%, and a 72% non-hardware value capture, we see the TAM of potential revenues for crypto and AI to be $911B by 2030, with $45.5B in revenues for open-source AI applications and infrastructure, of which $1.2B in revenues may flow back to ETH holders directly.</p>
<p>Currently, the majority of activity on Ethereum is financial activity. Decentralized exchanges and banking protocols comprise 49% of Ethereum&rsquo;s revenues, while <strong><a href="https://app.artemis.xyz/home" target="_blank" title="Home - Artemis Terminal" rel="noopener">20%</a></strong> is accounted for by simple transfers of value. These revenues are bucketed under Finance, Banking, and Payments (FGP). Meanwhile, Infrastructure (I) takes up the next largest share, around 19%, which relates to decentralized businesses t, and creates software to service decentralized apps. Finally, we classify activity related to social media and NFTs within the Marketing, Advertising, Social Media, and Gaming (MASG) category. MASG contributed 11% of those revenues. Currently, AI plays a very minor role in generating revenue for Ethereum.</p>
<p>Ethereum revenues from the aforementioned end-market activities are Ethereum revenue items. These include Transaction Fees, Layer-2 Settlement, Blockspace Ordering (MEV), and Security as a Service. Transaction Fees are charges users (and, in the future, autonomous agents) pay to engage with applications or transfer value on Ethereum. Layer-2 Settlement is the revenue derived from Ethereum Layer-2s Blockchains paying Ethereum for the privilege of &ldquo;settling&rdquo; transactions. <strong>MEV</strong> is revenue generated by users paying for the right to order a block of transactions. Security as a Service is the usage of ETH as collateral to &ldquo;back&rdquo; permissionless applications that need this value to perform their business functions. Over the last year, ~72% of Ethereum revenues stemmed from transactions, MEV made up around 19%, L2 settlements were around 9%, while Security as a Service has not officially launched.</p>
<p>As we believe Ethereum&rsquo;s strongest value proposition is to finance, we project in 2030 that 71% of Ethereum&rsquo;s revenues will derive from financial businesses (FGP). Due to experimentation and the benefits of Ethereum&rsquo;s open-source financial and data system, we believe MASG will grow to 17%, which will slightly displace Infrastructure, which will provide 8% of revenues. On the balance, AI will account for 2% of Ethereum&rsquo;s revenues. However, we could see AI&rsquo;s topline contribution grow by magnitude or more if decentralized AI software demonstrates its immense potential.</p>
<p>From the standpoint of revenue items, we estimate that individual mainnet transactions will only make up 1.5% of revenues. Layer-2 Settlements, which bundle blobs of transactions on the mainnet, will dramatically increase to roughly 76% of revenues. This is because we anticipate that the majority of activity will occur on Ethereum Layer-2 blockchains but that most of the value from those transactions will accrue to Ethereum. Meanwhile, MEV maintains its importance at 18% of proceeds, while Security as a Service will become 4.5% of Ethereum&rsquo;s topline.</p>
<h3>Fig 5. Ethereum Revenues are Skewed Toward Financial Applications</h3>
<p><img class="img-responsive w-100" src="https://www.vaneck.com/contentassets/7b4357803f974f8d8ae9c080999dc0a5/4522_slc-may_chart-3_2024-6_v1_blog.svg" alt="Ethereum Revenues are Skewed Toward Financial Applications" /></p>
<div class="wrapped-div">
<table style="width: 100%;">
<tbody>
<tr class="tbl-data">
<td class="data-head last text-right">AI (%)</td>
<td class="data-head last text-right">Infrastructure (%)</td>
<td class="data-head last text-right">Finance (%)</td>
<td class="data-head last text-right">Gaming (%)</td>
<td class="data-head last text-right">Advertising &amp; Marketing (%)</td>
<td class="data-head last text-right">Payment s(%)</td>
<td class="data-head last text-right">Social Media (%)</td>
</tr>
<tr>
<td class="data-head last text-right">0.80</td>
<td class="data-head last text-right">18.81</td>
<td class="data-head last text-right">48.71</td>
<td class="data-head last text-right">1.78</td>
<td class="data-head last text-right">8.93</td>
<td class="data-head last text-right">20.36</td>
<td class="data-head last text-right">0.62</td>
</tr>
</tbody>
</table>
</div>
<br />
<p class="chart-disclosure">Source: <strong><a href="https://app.artemis.xyz/chains" target="_blank" title="Home - Artemis Terminal" rel="noopener">Artemis XYZ</a></strong>, VanEck Research as of 5/28/2024. Not a recommendation to buy or sell any of the names mentioned herein. <strong>Past performance is no guarantee of future results.</strong></p>
<h3>Fig 6. Detailed Ethereum Revenue Model for 2030</h3>
<div class="wrapped-div">
<table style="width: 100%;">
<tbody>
<tr class="tbl-data">
<td class="tbl-header last">End Market TAM ($M)</td>
<td class="tbl-header last text-right">&nbsp;</td>
<td class="tbl-header last text-right">&gt;&nbsp;</td>
<td class="tbl-header last text-right">&nbsp;</td>
</tr>
<tr class="tbl-data">
<td class="data-td data last text-left">Finance, Banking, Payments</td>
<td class="data-td data last text-right">10,930,973</td>
</tr>
<tr class="tbl-data">
<td class="data-td data last text-left">Marketing, Advertising, Social and Gaming</td>
<td class="data-td data last text-right">1,033,109</td>
</tr>
<tr class="tbl-data">
<td class="data-td data last text-left">Infrastructure</td>
<td class="data-td data last text-right">1,865,527</td>
</tr>
<tr class="tbl-data">
<td class="data-td data last text-left">Artificial Intelligence</td>
<td class="data-td data last text-right">911,022</td>
</tr>
<tr class="tbl-data">
<td class="data-head last">&nbsp;</td>
<td class="data-head last text-right">&nbsp;</td>
</tr>
<tr class="tbl-data">
<td class="data-td last">Crypto Terminal Market Share</td>
<td class="data-td last text-right">Base(%)</td>
<td class="data-td last text-right">Bull(%)</td>
<td class="data-td last text-right">Bear(%)</td>
</tr>
<tr class="tbl-data">
<td class="data-td data last text-left">Finance, Banking, Payments</td>
<td class="data-td data last text-right">7.50</td>
<td class="data-td data last text-right">15.00</td>
<td class="data-td data last text-right">1.00</td>
</tr>
<tr class="tbl-data">
<td class="data-td data last text-left">Marketing, Advertising, Social and Gaming</td>
<td class="data-td data last text-right">20.00</td>
<td class="data-td data last text-right">50.00</td>
<td class="data-td data last text-right">5.00</td>
</tr>
<tr class="tbl-data">
<td class="data-td data last text-left">Infrastructure</td>
<td class="data-td data last text-right">10.00</td>
<td class="data-td data last text-right">20.00</td>
<td class="data-td data last text-right">1.00</td>
</tr>
<tr class="tbl-data">
<td class="data-td data last text-left">Artificial Intelligence</td>
<td class="data-td data last text-right">5.00</td>
<td class="data-td data last text-right">25.00</td>
<td class="data-td data last text-right">2.00</td>
</tr>
<tr>
<td class="data-td data last text-right">&nbsp;</td>
</tr>
<tr class="tbl-data">
<td class="data-td last">Ethereum Ecosystem Value Capture</td>
<td class="data-td data last text-right">&nbsp;</td>
</tr>
<tr class="tbl-data">
<td class="data-td data last text-left">Finance, Banking, Payments</td>
<td class="data-td data last text-right">5.00</td>
<td class="data-td data last text-right">7.50</td>
<td class="data-td data last text-right">2.50</td>
</tr>
<tr class="tbl-data">
<td class="data-td data last text-left">Marketing, Advertising, Social and Gaming</td>
<td class="data-td data last text-right">10.00</td>
<td class="data-td data last text-right">15.00</td>
<td class="data-td data last text-right">5.00</td>
</tr>
<tr class="tbl-data">
<td class="data-td data last text-left">Artificial Intelligence</td>
<td class="data-td data last text-right">5.00</td>
<td class="data-td data last text-right">7.50</td>
<td class="data-td data last text-right">2.50</td>
</tr>
<tr class="tbl-data">
<td class="data-td data last text-left">Infrastructure</td>
<td class="data-td data last text-right">5.00</td>
<td class="data-td data last text-right">7.50</td>
<td class="data-td data last text-right">2.50</td>
</tr>
<tr>
<td class="data-td data last text-right">&nbsp;</td>
</tr>
<tr class="tbl-data">
<td class="data-td last">MEV Revenue</td>
<td class="data-td data last text-right">&nbsp;</td>
</tr>
<tr class="tbl-data">
<td class="data-td data last text-left">MEV LT Take Rate</td>
<td class="data-td data last text-right">0.10</td>
<td class="data-td data last text-right">0.15</td>
<td class="data-td data last text-right">0.05</td>
</tr>
<tr class="tbl-data">
<td class="data-td data last text-left">MEV Value Accrual to Token</td>
<td class="data-td data last text-right">90.00</td>
<td class="data-td data last text-right">95.00</td>
<td class="data-td data last text-right">80.00</td>
</tr>
<tr>
<td class="data-td data last text-right">&nbsp;</td>
</tr>
<tr class="tbl-data">
<td class="data-td last">Ethereum Security as a Service</td>
<td class="data-td data last text-right">&nbsp;</td>
</tr>
<tr class="tbl-data">
<td class="data-td data last text-left">Percent Supply of ETH</td>
<td class="data-td data last text-right">10</td>
<td class="data-td data last text-right">15</td>
<td class="data-td data last text-right">5</td>
</tr>
<tr class="tbl-data">
<td class="data-td data last text-left">ETH Opportunity Cost Multiple</td>
<td class="data-td data last text-right">250</td>
<td class="data-td data last text-right">500</td>
<td class="data-td data last text-right">150</td>
</tr>
<tr>
<td class="data-td data last text-right">&nbsp;</td>
</tr>
<tr class="tbl-data">
<td class="data-td last">Revenue Items ($)</td>
<td class="data-td data last text-right">&nbsp;</td>
</tr>
<tr class="tbl-data">
<td class="data-td data last text-left">Transactions</td>
<td class="data-td data last text-right">1,242</td>
<td class="data-td data last text-right">5,140</td>
<td class="data-td data last text-right">22</td>
</tr>
<tr class="tbl-data">
<td class="data-td data last text-left">Layer 2 Settlement</td>
<td class="data-td data last text-right">59,330</td>
<td class="data-td data last text-right">257,278</td>
<td class="data-td data last text-right">2,136</td>
</tr>
<tr class="tbl-data">
<td class="data-td data last text-left">MEV - Block Builder Revenue</td>
<td class="data-td data last text-right">14,265</td>
<td class="data-td data last text-right">56,108</td>
<td class="data-td data last text-right">261</td>
</tr>
<tr class="tbl-data">
<td class="data-td data last text-left">Ethereum Security as a Service</td>
<td class="data-td data last text-right">3,628</td>
<td class="data-td data last text-right">42,852</td>
<td class="data-td data last text-right">20</td>
</tr>
<tr class="tbl-data">
<td class="data-td last">Revenue Total</td>
<td class="data-td data last text-right">78,501</td>
<td class="data-td data last text-right">361,641</td>
<td class="data-td data last text-right">2,477</td>
</tr>
</tbody>
</table>
</div>
<br />
<p class="chart-disclosure"><strong>Source:</strong> VanEck Research as of 5/28/2024. <strong>Past performance is no guarantee of future results. The information, valuation scenarios, and price targets in this blog are not intended as financial advice or any call to action, a recommendation to buy or sell, or as a projection of how ETH will perform in the future. Actual future performance of ETH is unknown, and may differ significantly from the hypothetical results depicted here. There may be risks or other factors not accounted for in the scenarios presented that may impede the performance. These are solely the results of a simulation based on our research, and are for illustrative purposes only. Please conduct your own research and draw your own conclusions.</strong></p>
<h2 id="optimal-allocations" class="jump-link-nav anchored-block" data-jumplink-title="Optimal Allocations">Bitcoin and Ether: Optimal Portfolio Allocations</h2>
<h2>Analysis Overview</h2>
<p>We performed a study to evaluate the impact of including bitcoin (BTC) and ether (ETH) in a traditional 60/40 investment portfolio, covering the period from 9/1/15 to 4/30/24. The analysis was conducted through five main components:</p>
<ol class="content-list">
<li class="mt-2"><strong>Optimal constrained allocation in a traditional 60/40 portfolio</strong>: We assessed the ideal weight of BTC and ETH in a 60% equity and 40% bond portfolio, limiting the maximum combined allocation to 6%. This was done using 169 sample portfolios with incremental additions of crypto exposure.</li>
<li class="mt-2"><strong>Drawdown and Sharpe ratio analysis</strong>: We examined the drawdown and Sharpe ratios of a subset of 16 representative portfolios to understand the risk-return tradeoffs. Adding a modest allocation of cryptocurrencies <strong>(up to 6%)</strong> to a traditional 60/40 portfolio can substantially improve the portfolio&rsquo;s Sharpe ratio with a relatively minor impact on drawdown. For investors with high-risk tolerance (up to ~20% annualized volatility), an allocation of up to 20% continues to improve the risk/reward of the overall portfolio. Between BTC &amp; ETH, we see a roughly<strong> 70/30 </strong>weight as providing the best risk-adjusted returns.</li>
<li class="mt-2"><strong>Optimal BTC and ETH allocation in a crypto-only portfolio</strong>: We analyzed every permutation of BTC and ETH weights in a portfolio consisting only of these two cryptocurrencies, aiming to maximize the Sharpe ratio and arrive at an ideal BTC/ETH weight.</li>
<li class="mt-2"><strong>Efficient frontier using the optimal crypto portfolio</strong>: We investigated the optimal weighting of the ideal BTC/ETH portfolio to maximize return given various levels of volatility to illustrate a portion (with reasonable volatility levels) of the efficient frontier when adding crypto to the 60/40.</li>
<li class="mt-2"><strong>Time dependence of efficient frontier results</strong>: We considered the impact of various starting points on the results from study #4. By doing so, we show that a larger crypto allocation helped portfolio risk-adjusted returns across every available time period.</li>
</ol>
<h2>1. Optimal allocation in a traditional 60/40 portfolio</h2>
<p>The primary goal was to identify the optimal allocation of BTC and ETH within a traditional 60/40 portfolio, constrained to a maximum of<strong> 6% </strong>combined weight in cryptocurrencies. The analysis involved creating 169 model portfolios with incremental crypto exposure (up to 3% each for BTC and ETH).</p>
<p><strong>The results indicated that a portfolio with 3% bitcoin and 3% ether (alongside 57% S&amp;P 500 and 37% U.S. Bonds) provided the highest return per unit of risk (standard deviation).</strong> In other words, while maintaining a conservative overall allocation of 6%, the maximum allowable allocation to crypto achieved the highest risk-adjusted returns.</p>
<h3>Optimal BTC/ETH Allocation in a Traditional 60/40 Portfolio for Risk-Adjusted Returns (9/1/2015 &ndash; 4/30/2024)</h3>
<p><img class="img-responsive w-100" src="https://www.vaneck.com/contentassets/7b4357803f974f8d8ae9c080999dc0a5/4522_slc-may_chart-4_2024-6_v1_blog.svg" alt="Risk Return Profile 9/1/2015 &ndash; 4/30/2024 " /></p>
<p class="chart-disclosure"><strong>Source:</strong> VanEck Research as of 5/28/2024. <strong>Past performance is no guarantee of future results. The information, valuation scenarios, and price targets in this blog are not intended as financial advice or any call to action, a recommendation to buy or sell, or as a projection of how ETH and BTC will perform in the future. Actual future performance of ETH and BTC is unknown, and may differ significantly from the hypothetical results depicted here. There may be risks or other factors not accounted for in the scenarios presented that may impede the performance. These are solely the results of a simulation based on our research, and are for illustrative purposes only. Please conduct your own research and draw your own conclusions.</strong></p>
<h2>2. Drawdown and Sharpe ratio analysis</h2>
<p>To evaluate the risk-return tradeoffs, we analyzed 16 representative 60/40 portfolios with incremental increases in crypto allocation, up to the same 6% maximum. The key findings were:</p>
<ul class="content-list">
<li class="mt-2"><strong>Sharpe Ratio Improvement</strong>: Portfolio Sharpe ratio improves significantly as the crypto allocation increases.</li>
<li class="mt-2"><strong>Minimal Impact on Drawdown</strong>: Maximum drawdown only increased marginally, making the higher crypto allocation an attractive tradeoff for many investors.</li>
</ul>
<p>Data on max drawdown and Sharpe ratio showed that a 6% crypto allocation resulted in a Sharpe ratio nearly double that of the 60/40 portfolio, while only modestly increasing drawdown. This emphasizes the very favorable risk-return tradeoff when adding BTC and ETH to a traditional portfolio.</p>
<div class="wrapped-div">
<table style="width: 100%;">
<tbody>
<tr class="tbl-data">
<td class="tbl-header last">&nbsp;</td>
<td class="tbl-header last text-right">Max Drawdown</td>
<td class="tbl-header last text-right">Sharpe Ratio</td>
</tr>
<tr class="tbl-data">
<td class="data-td last">60% 40% Portfolio</td>
<td class="data-td data last text-right">-21.54</td>
<td class="data-td data last text-right">0.78</td>
</tr>
<tr class="tbl-data">
<td class="data-td last">59.5% 39.5% Portfolio, 1% Bitcoin</td>
<td class="data-td data last text-right">-21.74</td>
<td class="data-td data last text-right">0.87</td>
</tr>
<tr class="tbl-data">
<td class="data-td last">59% 39% Portfolio, 2% Bitcoin</td>
<td class="data-td data last text-right">-21.94</td>
<td class="data-td data last text-right">0.96</td>
</tr>
<tr class="tbl-data">
<td class="data-td last">59.5% 39.5% Portfolio, 1% Ethereum</td>
<td class="data-td data last text-right">-21.98</td>
<td class="data-td data last text-right">0.95</td>
</tr>
<tr class="tbl-data">
<td class="data-td last">59% 39% Portfolio, 1% Bitcoin and 1% Ethereum</td>
<td class="data-td data last text-right">-22.18</td>
<td class="data-td data last text-right">1.04</td>
</tr>
<tr class="tbl-data">
<td class="data-td last">58.5% 38.5% Portfolio, 3% Bitcoin</td>
<td class="data-td data last text-right">-22.21</td>
<td class="data-td data last text-right">1.04</td>
</tr>
<tr class="tbl-data">
<td class="data-td last">58.5% 38.5% Portfolio, 2% Bitcoin and 1% Ethereum</td>
<td class="data-td data last text-right">-22.38</td>
<td class="data-td data last text-right">1.12</td>
</tr>
<tr class="tbl-data">
<td class="data-td last">59% 39% Portfolio, 2% Ethereum</td>
<td class="data-td data last text-right">-22.42</td>
<td class="data-td data last text-right">1.10</td>
</tr>
<tr class="tbl-data">
<td class="data-td last">58.5% 38.5% Portfolio, 1% Bitcoin and 2% Ethereum</td>
<td class="data-td data last text-right">-22.62</td>
<td class="data-td data last text-right">1.19</td>
</tr>
<tr class="tbl-data">
<td class="data-td last">58% 38% Portfolio, 3% Bitcoin and 1% Ethereum</td>
<td class="data-td data last text-right">-22.64</td>
<td class="data-td data last text-right">1.20</td>
</tr>
<tr class="tbl-data">
<td class="data-td last">58% 38% Portfolio, 2% Bitcoin and 2% Ethereum</td>
<td class="data-td data last text-right">-22.82</td>
<td class="data-td data last text-right">1.26</td>
</tr>
<tr class="tbl-data">
<td class="data-td last">58.5% 38.5% Portfolio, 3% Ethereum</td>
<td class="data-td data last text-right">-22.85</td>
<td class="data-td data last text-right">1.24</td>
</tr>
<tr class="tbl-data">
<td class="data-td last">58% 38% Portfolio, 1% Bitcoin and 3% Ethereum</td>
<td class="data-td data last text-right">-23.05</td>
<td class="data-td data last text-right">1.31</td>
</tr>
<tr class="tbl-data">
<td class="data-td last">57.5% 37.5% Portfolio, 3% Bitcoin and 2% Ethereum</td>
<td class="data-td data last text-right">-23.08</td>
<td class="data-td data last text-right">1.33</td>
</tr>
<tr class="tbl-data">
<td class="data-td last">57.5% 37.5% Portfolio, 2% Bitcoin and 3% Ethereum</td>
<td class="data-td data last text-right">-23.25</td>
<td class="data-td data last text-right">1.38</td>
</tr>
<tr class="tbl-data">
<td class="data-td last">57% 37% Portfolio, 3% Bitcoin and 3% Ethereum</td>
<td class="data-td data last text-right">-23.60</td>
<td class="data-td data last text-right">1.44</td>
</tr>
</tbody>
</table>
</div>
<br />
<p class="chart-disclosure"><strong>Source:</strong> VanEck Research as of 5/28/2024. <strong>Past performance is no guarantee of future results. Sharpe ratio</strong> is a measure used in finance to evaluate the performance of an investment compared to a risk-free asset, after adjusting for its risk. It is calculated by subtracting the risk-free rate of return (such as the return on U.S. Treasury Bonds) from the rate of return for a portfolio and then dividing the result by the standard deviation of the portfolio returns. This ratio helps investors understand how much excess return they are receiving for the extra volatility that they endure for holding a riskier asset. A higher Sharpe ratio indicates a more attractive risk-adjusted return.<strong> The information, valuation scenarios, and price targets in this blog are not intended as financial advice or any call to action, a recommendation to buy or sell, or as a projection of how ETH and BTC will perform in the future. Actual future performance of ETH and BTC is unknown, and may differ significantly from the hypothetical results depicted here. There may be risks or other factors not accounted for in the scenarios presented that may impede the performance. These are solely the results of a simulation based on our research, and are for illustrative purposes only. Please conduct your own research and draw your own conclusions.</strong></p>
<h2>3. Optimal BTC and ETH allocation in a crypto-only portfolio</h2>
<p>Focusing solely on a BTC and ETH portfolio, we tested every possible weighting combination to determine the optimal mix for maximizing the Sharpe ratio. <strong>The analysis revealed that the ideal allocation was 71.4 % bitcoin and 28.6% ether.</strong> This configuration yielded the highest Sharpe ratio, indicating the best risk-adjusted return <strong>for a crypto-only portfolio. </strong>The findings underscored investors' need to hold both cryptocurrencies to maximize benefits. The na&iuml;ve allocation of 50% BTC and 50% ETH also demonstrated substantial advantages, reinforcing the value of diversification within the crypto asset class.</p>
<h3>Comparative Metrics of Various BTC-ETH Portfolio Allocations</h3>
<p><img class="img-responsive w-100" src="https://www.vaneck.com/contentassets/7b4357803f974f8d8ae9c080999dc0a5/4522_slc-may_chart-5_2024-6_v2_blog.svg" alt="Comparative Metrics of Various BTC-ETH Portfolio Allocations " /></p>
<div class="wrapped-div">
<table style="width: 100%;">
<tbody>
<tr class="tbl-data">
<td class="tbl-header last">&nbsp;</td>
<td class="tbl-header last text-right">Volatility</td>
<td class="tbl-header last text-right">CAGR</td>
<td class="tbl-header last text-right">Sharpe Ratio</td>
</tr>
<tr class="tbl-data">
<td class="data-td last">Ideal Portfolio (71.4% BTC - 28.6% ETH)</td>
<td class="data-td data last text-right">0.89</td>
<td class="data-td data last text-right">1.32</td>
<td class="data-td data last text-right">1.43</td>
</tr>
<tr class="tbl-data">
<td class="data-td last">100% Bitcoin</td>
<td class="data-td data last text-right">0.81</td>
<td class="data-td data last text-right">0.98</td>
<td class="data-td data last text-right">1.16</td>
</tr>
<tr class="tbl-data">
<td class="data-td last">100% Ether</td>
<td class="data-td data last text-right">1.58</td>
<td class="data-td data last text-right">1.35</td>
<td class="data-td data last text-right">0.83</td>
</tr>
<tr class="tbl-data">
<td class="data-td last">50% Bitcoin 50% Ether</td>
<td class="data-td data last text-right">1.04</td>
<td class="data-td data last text-right">1.44</td>
<td class="data-td data last text-right">1.33</td>
</tr>
<tr class="tbl-data">
<td class="data-td last">60% S&amp;P, 40% Bonds</td>
<td class="data-td data last text-right">0.10</td>
<td class="data-td data last text-right">0.09</td>
<td class="data-td data last text-right">0.37</td>
</tr>
</tbody>
</table>
</div>
<br />
<p class="chart-disclosure"><strong>Source:</strong> VanEck Research as of 5/28/2024. <strong>Past performance is no guarantee of future results. Volatility</strong> refers to the fluctuation in the returns of an asset or portfolio as measured by the standard deviation of returns. Higher volatility indicates greater risk and potentially higher returns, affecting the risk-adjusted returns measured by the Sharpe Ratio. <strong>Compound Annual Growth Rate (CAGR) </strong>represents the rate at which the value of ether (ETH) has grown annually over a specified time period. This metric is used to provide a smoothed annual growth rate, eliminating fluctuations and giving a clearer picture of long-term investment performance.<strong> Sharpe ratio</strong> is a measure used in finance to evaluate the performance of an investment compared to a risk-free asset after adjusting for its risk. It is calculated by subtracting the risk-free rate of return (such as the return on U.S. Treasury Bonds) from the rate of return for a portfolio and then dividing the result by the standard deviation of the portfolio returns. This ratio helps investors understand how much excess return they are receiving for the extra volatility that they endure for holding a riskier asset. A higher Sharpe ratio indicates a more attractive risk-adjusted return. <strong>The information, valuation scenarios, and price targets in this blog are not intended as financial advice or any call to action, a recommendation to buy or sell, or as a projection of how ETH and BTC will perform in the future. Actual future performance of ETH and BTC is unknown, and may differ significantly from the hypothetical results depicted here. There may be risks or other factors not accounted for in the scenarios presented that may impede the performance. These are solely the results of a simulation based on our research, and are for illustrative purposes only. Please conduct your own research and draw your own conclusions.</strong></p>
<h2>4. The efficient frontier when Including crypto</h2>
<p>To arrive at the optimal allocation to crypto without constraints while maintaining reasonable volatility, we looked at the optimal weighting of the ideal crypto portfolio (28.6% ETH and 71.4% BTC) to be added to the traditional 60/40 portfolio. The goal was to maximize returns while maintaining given levels of volatility (13%-25%) and hence produce a portfolio of the efficient frontier using those assets, with levels of volatility typically associated with broad investor portfolios. The resulting scatterplot demonstrated that incorporating the optimal crypto portfolio into a traditional 60/40 portfolio could significantly enhance returns with varying degrees of risk.</p>
<h3>Additional Volatility from Digital Assets Helps Overall Returns</h3>
<p><img class="img-responsive w-100" src="https://www.vaneck.com/contentassets/7b4357803f974f8d8ae9c080999dc0a5/4522_slc-may_chart-6_2024-6_v3_blog.svg" alt="Additional Volatility from Digital Assets Helps Overall Returns" /></p>
<p class="chart-disclosure"><strong>Source:</strong> VanEck Research as of 5/28/2024. <strong>Past performance is no guarantee of future results. Volatility</strong> refers to the fluctuation in the returns of an asset or portfolio as measured by the standard deviation of returns. Higher volatility indicates greater risk and potentially higher returns, affecting the risk-adjusted returns measured by the Sharpe Ratio. Compound Annual Growth Rate (CAGR) represents the rate at which the value of ether (ETH) has grown annually over a specified time period. This metric is used to provide a smoothed annual growth rate, eliminating fluctuations and giving a clearer picture of long-term investment performance. The information, valuation scenarios, and price targets in this blog are not intended as financial advice or any call to action, a recommendation to buy or sell, or as a projection of how ETH and BTC will perform in the future. Actual future performance of ETH and BTC is unknown, and may differ significantly from the hypothetical results depicted here. There may be risks or other factors not accounted for in the scenarios presented that may impede the performance. These are solely the results of a simulation based on our research, and are for illustrative purposes only. Please conduct your own research and draw your own conclusions.</p>
<p>This analysis revealed a nearly linear relationship, a rarity when looking at efficient frontiers, between risk and return as volatility rose. The conclusion is that increased crypto exposure led to very attractive risk/return tradeoffs.</p>
<h3>Sharpe Ratio for Blended Portfolio Levels off at 22% Vol</h3>
<p><img class="img-responsive w-100" src="https://www.vaneck.com/contentassets/7b4357803f974f8d8ae9c080999dc0a5/4522_slc-may_chart-7_2024-6_v2_blog.svg" alt="Sharpe Ratio for Blended Portfolio Levels off at 22% Vol" /></p>
<p class="chart-disclosure"><strong>Source:</strong> VanEck Research as of 5/28/2024. <strong>Past performance is no guarantee of future results. The information, valuation scenarios, and price targets in this blog are not intended as financial advice or any call to action, a recommendation to buy or sell, or as a projection of how ETH and BTC will perform in the future. Actual future performance of ETH and BTC is unknown, and may differ significantly from the hypothetical results depicted here. There may be risks or other factors not accounted for in the scenarios presented that may impede the performance. These are solely the results of a simulation based on our research, and are for illustrative purposes only. Please conduct your own research and draw your own conclusions.</strong></p>
<h2>5. Time dependence of efficient frontier results</h2>
<p>To determine whether different starting points have an impact on the risk/reward profile of the combined ideal crypto and 60/40 portfolios, we repeated the analysis in 4, while repeatedly moving the starting point 1 quarter forward. Our only constraint was to include at least 3 years of returns. As such, we were able to produce 23 sets of results, and remove time dependence as a variable from the analysis.</p>
<h2>Our findings were:</h2>
<ul class="content-list">
<li class="mt-2">The optimal weight of the ideal crypto portfolio increased as risk is added across all time periods.</li>
</ul>
<h3>Weights Across Volatility for Time Independent Portfolios</h3>
<p><img class="img-responsive w-100" src="https://www.vaneck.com/contentassets/7b4357803f974f8d8ae9c080999dc0a5/4522_slc-may_chart-8_2024-6_v2_blog.svg" alt="Weights Across Volatility for Time Independent Portfolios" /></p>
<p class="chart-disclosure"><strong>Source:</strong> VanEck Research as of 5/28/2024. <strong>Past performance is no guarantee of future results. The information, valuation scenarios, and price targets in this blog are not intended as financial advice or any call to action, a recommendation to buy or sell, or as a projection of how ETH and BTC will perform in the future. Actual future performance of ETH and BTC is unknown, and may differ significantly from the hypothetical results depicted here. There may be risks or other factors not accounted for in the scenarios presented that may impede the performance. These are solely the results of a simulation based on our research, and are for illustrative purposes only. Please conduct your own research and draw your own conclusions. </strong></p>
<ul class="content-list">
<li class="mt-2">Higher crypto allocations allowed for higher CAGRs across all time periods.</li>
</ul>
<h3>CAGR Across Volatility for Time Independent Portfolios</h3>
<p><img class="img-responsive w-100" src="https://www.vaneck.com/contentassets/7b4357803f974f8d8ae9c080999dc0a5/4522_slc-may_chart-9_2024-6_v2_blog.svg" alt="CAGR Across Volatility for Time Independent Portfolios" /></p>
<p class="chart-disclosure">Source: VanEck Research as of 5/28/2024. <strong>Past performance is no guarantee of future results. The information, valuation scenarios, and price targets in this blog are not intended as financial advice or any call to action, a recommendation to buy or sell, or as a projection of how ETH and BTC will perform in the future. Actual future performance of ETH and BTC is unknown, and may differ significantly from the hypothetical results depicted here. There may be risks or other factors not accounted for in the scenarios presented that may impede the performance. These are solely the results of a simulation based on our research, and are for illustrative purposes only. Please conduct your own research and draw your own conclusions.</strong></p>
<ul class="content-list">
<li class="mt-2">Sharpe Ratios generally increased with volatility and crypto allocations.</li>
</ul>
<h3>Sharpe Across Volatility for Time Independent Portfolios</h3>
<p><img class="img-responsive w-100" src="https://www.vaneck.com/contentassets/7b4357803f974f8d8ae9c080999dc0a5/4522_slc-may_chart-10_2024-6_v2_blog.svg" alt="Sharpe Across Volatility for Time Independent Portfolios" /></p>
<p class="chart-disclosure">Source: VanEck Research as of 5/28/2024. <strong>Past performance is no guarantee of future results. The information, valuation scenarios, and price targets in this blog are not intended as financial advice or any call to action, a recommendation to buy or sell, or as a projection of how ETH and BTC will perform in the future. Actual future performance of ETH and BTC is unknown, and may differ significantly from the hypothetical results depicted here. There may be risks or other factors not accounted for in the scenarios presented that may impede the performance. These are solely the results of a simulation based on our research, and are for illustrative purposes only. Please conduct your own research and draw your own conclusions.</strong></p>
<p><strong>In other words, the results from study #4 are independent of the starting point, and thus bolster the case for including a balanced mix of ETH &amp; BTC up to the 6% weight we studied.</strong></p>
<h2 id="investment-risks" class="jump-link-nav anchored-block" data-jumplink-title="Investment Risks">Ether Investment Risks</h2>
<p>While ETH boasts a market cap of over $400 billion and is considered a well-established smart contracts platform, it's important to note that investing in ETH comes with significant risks.</p>
<ol class="content-list">
<li class="mt-2">Dependence on speculation
<ol style="list-style-type: lower-alpha;">
<li class="mt-2">At this stage, Ethereum&rsquo;s ecosystem is heavily dependent upon speculation to generate revenues. If the overall appetite for risk declines, ETH may exhibit substantial downside beta to the SP500 or NASDAQ Composite.</li>
</ol>
</li>
<li class="mt-2">Regulatory risk
<ol style="list-style-type: lower-alpha;">
<li class="mt-2">Depending upon regulation. ETH or many of the assets within its ecosystem may be classified as securities. This could cause many Ethereum businesses to have to register with the SEC or face serious legal consequences.</li>
<li class="mt-2">The largest financial firms have substantial lobbyist presence as well as former employees appointed to the highest levels of most governments around the world. These former employees could create regulatory moats that disfavor disrupters like Ethereum.</li>
</ol>
</li>
<li class="mt-2">Interest rate risk
<ol style="list-style-type: lower-alpha;">
<li class="mt-2">As a high-risk asset, rate hikes or otherwise restrictive global liquidity could have an outsized impact on ETH&rsquo;s valuation compared to other asset classes.</li>
</ol>
</li>
<li class="mt-2">Competition
<ol style="list-style-type: lower-alpha;">
<li class="mt-2">The emerging smart contract platform space is incredibly competitive. Though Ethereum has a substantial lead, high performance blockchain such as Solana and Sui have some technical advantages and have focused on business development and user experience. This may allow them to challenge Ethereum&rsquo;s dominance over the long run.</li>
</ol>
</li>
<li class="mt-2">Financial firms evolve
<ol style="list-style-type: lower-alpha;">
<li class="mt-2">One of the biggest advantages of Ethereum is that it enables a cheaper financial system because it removes many high-cost aspects of the current financial system. If financial firms pivot to implement cost savings measures, they could retain user base.</li>
<li class="mt-2">Existing financial firms could also create rival blockchain smart contract platforms that cut into Ethereum&rsquo;s long-term potential.</li>
</ol>
</li>
<li class="mt-2">Geopolitical
<ol style="list-style-type: lower-alpha;">
<li class="mt-2">Money control is the most important domain of government power. Geopolitical events, such as major regional war or even elevated geopolitical tensions, could push the governments around the world to squash non-sovereign financial systems and forms of money.</li>
</ol>
</li>
</ol>
<h2>Conclusion</h2>
<p>The analysis clearly shows that adding a modest allocation of cryptocurrencies (up to 6%) to a traditional 60/40 portfolio can substantially improve the portfolio&rsquo;s Sharpe ratio with a relatively minor impact on drawdown. <strong>An allocation close to 70/30 between bitcoin and ether for a crypto-only portfolio provided the best risk-adjusted returns.</strong></p>
<p>Investors should consider their individual risk tolerance, but the data suggests that a balanced inclusion of BTC and ETH can offer outsized benefits in terms of return enhancement relative to the incremental risk introduced. The findings highlight the potential of cryptocurrencies to improve portfolio performance in a controlled and measurable way.</p>
<p><strong>Links to third party websites are provided as a convenience and the inclusion of such links does not imply any endorsement, approval, investigation, verification or monitoring by us of any content or information contained within or accessible from the linked sites. By clicking on the link to a non-VanEck webpage, you acknowledge that you are entering a third-party website subject to its own terms and conditions. VanEck disclaims responsibility for content, legality of access or suitability of the third-party websites.</strong></p>
<p>To receive more <strong><a href="https://www.vaneck.com/us/en/insights/digital-assets/" title="Digital Assets Insights">Digital Assets</a></strong>insights, <strong><a href="https://www.vaneck.com/us/en/subscribe/" title="Subscription Center">sign up in our subscription center</a>.</strong></p>
<style>
        .data-td.data {
                padding-right: 5px !important;
        }

        .wrapped-div {
                max-width: 100%;
        }

        @media (max-width: 1240px) {
                .wrapped-div {
                        overflow-x: scroll;
                }
        }

        .wrapped-div-sector {
                max-width: 100%;
                overflow-x: scroll;
        }
</style>
]]></content:encoded>
</item><item rdf:about="https://www.vaneck.com/us/en/blogs/digital-assets/matthew-sigel-vaneck-may-2024-bitcoin-chaincheck/">
  <title>VanEck May 2024 Bitcoin ChainCheck></title>
  <link>https://www.vaneck.com/us/en/blogs/digital-assets/matthew-sigel-vaneck-may-2024-bitcoin-chaincheck/</link>
  <description><![CDATA[The latest analysis of the Bitcoin ecosystem shows major shifts post-halving, with decreased inscriptions and revenues prompting miners to explore AI and M&amp;A for diversification.]]></description>
  <dc:creator>Matthew  Sigel</dc:creator>
  <dc:date>05/31/2024 06:30:00</dc:date>
<content:encoded><![CDATA[

<p><strong>Please note that VanEck has exposure to bitcoin.</strong></p>
<p>In our May 2024 Bitcoin ChainCheck, we dive deeper into the shifts within the Bitcoin ecosystem following the recent halving event. This month's analysis observes a major pullback in inscriptions (-79%) and Bitcoin mining revenues (-49%). In response to the tougher operating environment, the network&rsquo;s total hash rate fell 4% in the month, and Bitcoin mining equities fell 9%. Such challenges are leading many miners to either explore AI applications or M&amp;A to achieve diversification or more scale.</p>
<ul class="content-list">
<li><a href="#price-action"><strong>Bitcoin&rsquo;s Price Action</strong></a></li>
<li><a href="#network-activity"><strong>Bitcoin&rsquo;s Network Activity, Adoption, and Fees</strong></a></li>
<li><a href="#market-health"><strong>Bitcoin Market Health and Profitability</strong></a></li>
<li><a href="#miners"><strong>Bitcoin Miners</strong></a></li>
<li><a href="#chaincheck-monthly-dashboard"><strong>Bitcoin ChainCheck Monthly Dashboard</strong></a></li>
</ul>
<p>Some takeaways for May 2024:</p>
<h2 id="price-action" class="jump-link-nav anchored-block" data-jumplink-title="Price Action">Bitcoin&rsquo;s Price Action</h2>
<ul class="content-list">
<li><strong>Market sentiment:</strong> Bitcoin prices displayed a slight decline of 2% over the last 30 days, currently standing at $64,815. Despite this minor setback, BTC is still up 136% y/y.</li>
<li class="mt-2"><strong>Regional trading:</strong> Post-halving adjustments and ETF availability have brought distinct changes in regional market behaviors, with Bitcoin exhibiting clear relative strength during U.S. trading hours.</li>
</ul>
<div class="wrapped-div">
<table style="width: 100%;">
<tbody>
<tr class="tbl-data">
<td class="tbl-header last">&nbsp;</td>
<td class="tbl-header last text-right">MoM Change (%)</td>
<td class="tbl-header last text-right">YoY Change (%)</td>
</tr>
<tr class="tbl-data">
<td class="data-td last">Asia Hours Price Change MoM ($)</td>
<td class="data-td data last text-right">-4</td>
<td class="data-td data last text-right">8</td>
</tr>
<tr class="tbl-data">
<td class="data-td last">U.S. hours Price Change</td>
<td class="data-td data last text-right">4</td>
<td class="data-td data last text-right">82</td>
</tr>
<tr class="tbl-data">
<td class="data-td last">EU hours Price Change</td>
<td class="data-td data last text-right">-2</td>
<td class="data-td data last text-right">41</td>
</tr>
</tbody>
</table>
</div>
<br />
<p class="chart-disclosure">Source: Glassnode, as of 5/28/24. <strong>Past performance is no guarantee of future results.</strong></p>
<ul class="content-list">
<li><strong>Funding rates:</strong> The annualized cost on Bitcoin Futures saw a significant reduction to 10%, possibly indicating decreased speculation or lower bullish sentiment in the market.</li>
</ul>
<h2 id="network-activity" class="jump-link-nav anchored-block" data-jumplink-title="Network Activity">Bitcoin&rsquo;s Network Activity, Adoption, and Fees</h2>
<ul class="content-list">
<li><strong>Daily transactions:</strong> There has been a notable increase of 20% this month in transactions, likely due to ongoing re-adjustments post-halving. Such activity is in the 98th percentile of activity.</li>
<li class="mt-2"><strong>Ordinal inscriptions:</strong> A steep 79% reduction in daily inscriptions has occurred, suggesting a strong market shift away from these assets.</li>
<li class="mt-2"><strong>Total transfer volume:</strong> Total transfer value across the network decreased by 13% to $44.60 billion, albeit still maintaining robust activity metrics in the 85th percentile of all-time history.</li>
<li class="mt-2"><strong>Average transaction fees:</strong> Fees experienced a dramatic downturn of 78%, averaging $3.68, which points to decreased network congestion as inscriptions have dwindled.</li>
</ul>
<h2 id="market-health" class="jump-link-nav anchored-block" data-jumplink-title="Market Health">Bitcoin Market Health and Profitability</h2>
<ul class="content-list">
<li><strong>Percent of addresses in profit</strong>: A slight drop was noted, with 93% of addresses remaining in profit. As we have noted, when this number reaches 100% after a multi-year gap, as it did in January, Bitcoin tends to make repeated all-time highs in the subsequent year.</li>
<li class="mt-2"><strong>Net unrealized profit/loss:</strong> This ratio decreased to 0.56, interpreting a cautious yet not overly pessimistic sentiment.</li>
</ul>
<h2 id="miners" class="jump-link-nav anchored-block" data-jumplink-title="Miners">Bitcoin Miners</h2>
<ul class="content-list">
<li><strong>Total daily BTC miner revenues</strong>: Miners faced a sharp revenue drop of 49% to $30.83 million, reflecting the impacts of lower transaction fees and mining rewards post-halving.&nbsp;We have noticed some recent M&amp;A among Bitcoin miners, with U.S.-listed RIOT making a bid for Canadian Bitfarms (BITF) after accumulating a 10% stake in the open market, which follows the closing of Hut8 Mining&rsquo;s purchase of US Bitcoin late last year.</li>
</ul>
<h3>Chart of the Month: BTC 30-Day Average Fees (USD)</h3>
<p><img class="img-responsive w-100" src="https://www.vaneck.com/contentassets/d21d837c4fd747cb882c9f66f26bd1f4/4517_bitcoin-may_chart-1_2024-5_v1_blog.svg" alt="Chart of the Month: BTC 30-Day Average Fees (USD)" /></p>
<p class="chart-disclosure"><strong>Source:</strong> Glassnode, VanEck research as of 5/28/24. <strong>Past performance is no guarantee of future results.</strong></p>
<div id="chaincheck-monthly-dashboard" class="anchored-block">
<div class="wrapped-div">
<table style="width: 100%;">
<tbody>
<tr class="tbl-data">
<td class="tbl-header last" style="width: 100%;" colspan="5">Bitcoin ChainCheck Monthly Dashboard as of May 28th, 2024</td>
</tr>
<tr class="tbl-data">
<td class="data-head last">&nbsp;</td>
<td class="data-head last text-right">30-day avg</td>
<td class="data-head last text-right">30 day change (%)</td>
<td class="data-head last text-right">365 day change (%)</td>
<td class="data-head last text-right">Last 30 days Percentile vs<br />all-time history (%)</td>
</tr>
<tr class="tbl-data">
<td class="data-td last">Bitcoin Price</td>
<td class="data-td data last text-right">$64,815</td>
<td class="data-td data last text-right">-2</td>
<td class="data-td data last text-right">136</td>
<td class="data-td data last text-right">99</td>
</tr>
<tr class="tbl-data">
<td class="data-td last">Daily Active Addresses</td>
<td class="data-td data last text-right">687,147</td>
<td class="data-td data last text-right">-16</td>
<td class="data-td data last text-right">-18</td>
<td class="data-td data last text-right">62</td>
</tr>
<tr class="tbl-data">
<td class="data-td last">Daily New Addresses</td>
<td class="data-td data last text-right">282,394</td>
<td class="data-td data last text-right">-21</td>
<td class="data-td data last text-right">-30</td>
<td class="data-td data last text-right">54</td>
</tr>
<tr class="tbl-data">
<td class="data-td last">Daily Transactions</td>
<td class="data-td data last text-right">571,778</td>
<td class="data-td data last text-right">20</td>
<td class="data-td data last text-right">8</td>
<td class="data-td data last text-right">98</td>
</tr>
<tr class="tbl-data">
<td class="data-td last">Daily Inscriptions</td>
<td class="data-td data last text-right">8,359</td>
<td class="data-td data last text-right">-79</td>
<td class="data-td data last text-right">-97</td>
<td class="data-td data last text-right">16</td>
</tr>
<tr class="tbl-data">
<td class="data-td last">Total Transfer Volume (USD)</td>
<td class="data-td data last text-right">$44,602,891,094</td>
<td class="data-td data last text-right">-13</td>
<td class="data-td data last text-right">105</td>
<td class="data-td data last text-right">85</td>
</tr>
<tr class="tbl-data">
<td class="data-td last">% Supply Active, last 180 days</td>
<td class="data-td data last text-right">24%</td>
<td class="data-td data last text-right">3</td>
<td class="data-td data last text-right">21</td>
<td class="data-td data last text-right">29</td>
</tr>
<tr class="tbl-data">
<td class="data-td last">% Supply Active, last 3+ years</td>
<td class="data-td data last text-right">46%</td>
<td class="data-td data last text-right">2</td>
<td class="data-td data last text-right">16</td>
<td class="data-td data last text-right">100</td>
</tr>
<tr class="tbl-data">
<td class="data-td last">Avg Fees (USD)</td>
<td class="data-td data last text-right">$3.68</td>
<td class="data-td data last text-right">-78</td>
<td class="data-td data last text-right">-51</td>
<td class="data-td data last text-right">83</td>
</tr>
<tr class="tbl-data">
<td class="data-td last">Avg Fees (BTC)</td>
<td class="data-td data last text-right">0.00006</td>
<td class="data-td data last text-right">-78</td>
<td class="data-td data last text-right">-79</td>
<td class="data-td data last text-right">17</td>
</tr>
<tr class="tbl-data">
<td class="data-td last">Percent of BTC Addresses in profit</td>
<td class="data-td data last text-right">93%</td>
<td class="data-td data last text-right">-1</td>
<td class="data-td data last text-right">37</td>
<td class="data-td data last text-right">79</td>
</tr>
<tr class="tbl-data">
<td class="data-td last">Unrealized profit/loss ratio</td>
<td class="data-td data last text-right">0.56</td>
<td class="data-td data last text-right">-3</td>
<td class="data-td data last text-right">94</td>
<td class="data-td data last text-right">77</td>
</tr>
<tr class="tbl-data">
<td class="data-td last">Global Power Consumption (TWh)</td>
<td class="data-td data last text-right">117</td>
<td class="data-td data last text-right">-3</td>
<td class="data-td data last text-right">69</td>
<td class="data-td data last text-right">99</td>
</tr>
<tr class="tbl-data">
<td class="data-td last">Total Daily BTC Miner Revenues (USD)</td>
<td class="data-td data last text-right">$30,832,877</td>
<td class="data-td data last text-right">-49</td>
<td class="data-td data last text-right">4</td>
<td class="data-td data last text-right">85</td>
</tr>
<tr class="tbl-data">
<td class="data-td last">Total Crypto Equities' Market Cap (USD) (MM)</td>
<td class="data-td data last text-right">$141,047</td>
<td class="data-td data last text-right">-9</td>
<td class="data-td data last text-right">164</td>
<td class="data-td data last text-right">91</td>
</tr>
<tr class="tbl-data">
<td class="data-td last">Transfer volume from Miners to Exchanges (USD)</td>
<td class="data-td data last text-right">$2,289,134</td>
<td class="data-td data last text-right">-44</td>
<td class="data-td data last text-right">-42</td>
<td class="data-td data last text-right">67</td>
</tr>
<tr class="tbl-data">
<td class="data-td last">Bitcoin Dominance</td>
<td class="data-td data last text-right">53%</td>
<td class="data-td data last text-right">0.38</td>
<td class="data-td data last text-right">15</td>
<td class="data-td data last text-right">78</td>
</tr>
<tr class="tbl-data">
<td class="data-td last">Bitcoin Futures Annualized Basis</td>
<td class="data-td data last text-right">10%</td>
<td class="data-td data last text-right">-28</td>
<td class="data-td data last text-right">270</td>
<td class="data-td data last text-right">66</td>
</tr>
</tbody>
</table>
</div>
</div>
<br />
<p class="chart-disclosure">Source: Glassnode, VanEck research as of 5/28/24. <strong>Past performance is no guarantee of future results.</strong></p>
<p><strong>Notes:</strong></p>
<p>Net unrealized profit/loss ratio (NUPL) can be calculated by subtracting the realized market cap from the market cap and dividing the result by the market cap. When a high percentage of Bitcoin&rsquo;s market cap consists of unrealized profits, it can be interpreted that investors are greedy. Background reading <strong><a href="https://medium.com/@adamant_capital/a-primer-on-bitcoin-investor-sentiment-and-changes-in-saving-behavior-a5fb70109d32" title="A Primer on Bitcoin Investor Sentiment and Changes in Saving Behavior" target="_blank" rel="noopener">here</a></strong>.</p>
<p><strong>Links to third party websites are provided as a convenience and the inclusion of such links does not imply any endorsement, approval, investigation, verification or monitoring by us of any content or information contained within or accessible from the linked sites. By clicking on the link to a non-VanEck webpage, you acknowledge that you are entering a third-party website subject to its own terms and conditions. VanEck disclaims responsibility for content, legality of access or suitability of the third-party websites.</strong></p>
<p>To receive more <strong><a href="https://www.vaneck.com/us/en/insights/digital-assets/" title="Digital Assets Insights">Digital Assets</a></strong> insights, <strong><a href="https://www.vaneck.com/us/en/subscribe/" title="Subscription Center">sign up in our subscription center</a></strong>.</p>
<style>
    .data-td.data {
        padding-right: 5px !important;
    }

    .wrapped-div {
        max-width: 100%;
    }

    @media (max-width: 1240px) {
        .wrapped-div {
            overflow-x: scroll;
        }
    }

    .wrapped-div-sector {
        max-width: 100%;
        overflow-x: scroll;
    }
</style>
]]></content:encoded>
</item><item rdf:about="https://www.vaneck.com/us/en/blogs/emerging-markets-bonds/china-bonds-are-still-too-big-to-ignore/">
  <title>China Bonds Are Still Too Big To Ignore></title>
  <link>https://www.vaneck.com/us/en/blogs/emerging-markets-bonds/china-bonds-are-still-too-big-to-ignore/</link>
  <description><![CDATA[Despite recent headwinds, China&rsquo;s vast and diverse bond market is too big to exclude from long-term focused portfolios.]]></description>
  <dc:creator>Fran Rodilosso</dc:creator>
  <dc:date>05/28/2024 06:30:00</dc:date>
<content:encoded><![CDATA[

<p>As China navigates a bumpy economic recovery and investor sentiment appears to be near all-time lows, we wanted to revisit the investment case for continued exposure, specifically from a fixed income perspective. In short, despite current headwinds, we believe China is too big for global bond investors to ignore, and recent headwinds are an example of how its economy stands apart from the rest of the world. Further, the onshore market, which is the second largest globally, is extremely vast and diverse, allowing investors to selectively find exposure that may help strengthen an overall global bond portfolio in the long term.</p>
<p>From a yield perspective, the case for China bonds has undoubtedly become less compelling following a decline of about 100 basis points (bps) since their recent high in 2020. China&rsquo;s 10-year government bond yield recently hit its lowest level on record, approximately 2.2%. Further, and perhaps more importantly, the yield differential versus the U.S. hit its lowest level as well, with the 10-year bond yielding 2.4% less than its U.S. counterpart. Chinese bond yields are also well below emerging markets peers, which on average yield about 7%, based on the J.P. Morgan GBI-EM Global Diversified Index as of May 10, 2024. To be sure, China&rsquo;s size and single-A credit rating make a direct comparison challenging, and its global economic standing and resources make it hard to compare against similarly rated countries like Iceland and Israel, but the trend has been clear.</p>
<h3>China Bond Yields Have Hit a Bottom, while CNY Has Depreciated</h3>
<p><img class="img-responsive w-100" src="https://www.vaneck.com/contentassets/83c6c9fbbf8146c4a98ac5902470429b/4509_cbon_chart-1_2024-5_v1_blog.svg" alt="China Bond Yields Have Hit a Bottom, while CNY Has Depreciated" /></p>
<p class="chart-disclosure">Source: ICE Data Services and JP Morgan, as of 3/31/2024. Yield Pickup is represented by the difference between ICE BofA China Government Index yield and ICE BofA Developed Markets Sovereign Bond Index yield. <strong>Past performance is no guarantee of future results.</strong></p>
<p>For bond investors, the yield decline over the past few years has provided significant support to returns while most global markets counterparts have struggled. The FTSE Chinese Government Bond Index returned about 1.9% per year as of April 30, 2024 since Chinese bond yields peaked in November 2020, while G-7 government bonds returned -7.8% annually. These returns include an approximate 9% depreciation of the Chinese renminbi (CNY) versus the U.S. dollar over the period. Although the CNY depreciation is notable for an historically stable currency, the currency did outperform its broader emerging markets currencies in that period.</p>

<p>To be sure, performance in recent years reflects structural challenges in the domestic economy that must be addressed before foreign investors return with confidence. Data has been mixed. A recent upside surprise in manufacturing PMI was promising, albeit not overwhelmingly so, while other data such as credit aggregates continue to be sluggish. Optimism on the policy front, particularly to address real estate sector concerns, and potentially renewed stimulus measures have provided hope for a more sustainable economic growth trajectory going forward, which may help to stoke foreign investor interest once again. We also note that longer term, assuming prudent policies are pursued and stable, robust growth can continue (albeit at lower levels than what was seen in previous decades), bond yields at current levels may be a reflection of China&rsquo;s economic strength globally and need not rise substantially to justify a role in a diversified global bond portfolio.</p>
<p>Focusing on corporates, we believe there have been some positive trends. First, many troubled issuers (particularly in the real estate sector) have seen substantial declines in value or have defaulted, and therefore been removed from the index. This has resulted in a significantly lower exposure to China within the ICE Diversified High Yield US Emerging Markets Corporate Plus Index: approximately 2.2% as of May 10, 2024 versus nearly 8% four years ago. Credit spreads of onshore bonds have, in general, seen a modest decline over the past two years. With heightened caution by foreign investors following stress in corporate sectors such as real estate and certain financials, we believe reliance on global credit ratings may provide more confidence to invest in onshore corporates. The vast majority of the local corporate market relies on local ratings, which are not comparable to Western credit ratings and can cause confusion.</p>
<p>Although overshadowed by sluggish macroeconomic indicators, we believe the uncorrelated nature of the onshore market to the rest of the world is an important takeaway. It is worth remembering that Chinese bond yields increased following the onset of COVID-19 amid domestic economic resilience while U.S. bond yields plummeted. Over the past decade, the broad onshore Chinese bond market has exhibited a low correlation to the U.S. and global broad markets, as well as other core asset classes, and a lower correlation to these asset classes than the broad EM local currency sovereign bond market.</p>
<p>To receive more&nbsp;<strong><a href="https://www.vaneck.com/us/en/insights/emerging-markets-bonds/" title="Emerging Markets Bonds Insights">Emerging Markets Bonds</a></strong>&nbsp;insights,&nbsp;<strong><a href="https://www.vaneck.com/us/en/subscribe/" title="Subscription Center">sign up in our subscription&nbsp;center</a></strong>.</p>
]]></content:encoded>
</item><item rdf:about="https://www.vaneck.com/us/en/blogs/digital-assets/matthew-sigel-vaneck-statement-on-sec-approval-of-spot-ether-etf-filings/">
  <title>VanEck Statement on SEC Approval of Spot Ether ETF Filings></title>
  <link>https://www.vaneck.com/us/en/blogs/digital-assets/matthew-sigel-vaneck-statement-on-sec-approval-of-spot-ether-etf-filings/</link>
  <description><![CDATA[The SEC approved CBOE's proposal to list and trade our spot ether ETF. This milestone anticipates more legal victories and increased investments in Bitcoin, Ethereum, and other blockchains.]]></description>
  <dc:creator>Matthew  Sigel</dc:creator>
  <dc:date>05/23/2024 21:00:00</dc:date>
<content:encoded><![CDATA[

<p>We are so thrilled to report that the U.S. Securities and Exchange Commission (SEC) has approved, pursuant to Section 19(b) of the Securities Exchange Act of 1934, our exchange partner Chicago Board Options Exchange (CBOE)&rsquo;s proposed rule change to list and trade a spot ether ETF on the CBOE.</p>
<p>We expect this trend will pave the way for more victories via new laws and in the courts, helping to draw investment to Bitcoin, Ethereum, and other open-source blockchain software.</p>
<p>We applaud this decision, as we believe the evidence clearly shows that ETH is a decentralized commodity, not a security. ETH&rsquo;s status as a commodity has now been recognized in a variety of circumstances, including the Commodity Futures Trading Commission (CFTC)&rsquo;s regulation of ETH futures, public statements by Commission officials, rulings by federal courts, and now, hopefully, this ETF.</p>
<p>The high degree of correlation between ETH spot prices and Chicago Mercantile Exchange (CME) ethereum futures prices, similar to the correlation seen with bitcoin, proved that the spot ETH market is tightly linked to the regulated futures market. This tight linkage supports the listing of spot ETH ETFs, allowing for the market surveillance the SEC requires. Additionally, the presence of liquid, regulated ETH futures trading on the CME and the approval of ETFs tracking those futures demonstrated to all neutral observers that Ethereum meets the same criteria as Bitcoin for an ETF holding the spot asset. The SEC approved the listing of spot Bitcoin ETFs based on these exact criteria, and we have long believed that Ethereum warrants the same treatment.</p>
<p>Any claim that Ethereum's move to proof-of-stake has turned it into a security, or that staking itself is a securities transaction, is misguided and harmful to innovation. Proof-of-stake is simply an alternative consensus mechanism to proof-of-work mining&mdash;it does not fundamentally alter Ethereum's decentralized nature or transform ETH into a security issued by a central entity. In fact, Ethereum has become highly decentralized since the DAO hack in 2016, with no centralized issuer or promoter controlling a material supply or percentage of validators. The Ethereum Foundation's ETH holdings have steadily declined to just 0.30% of the circulating supply, and Vitalik Buterin holds around 0.23%. This widespread distribution of ETH contradicts the idea of it being a security issued by a common enterprise.</p>
<p>We have also heard arguments that Ethereum&rsquo;s <i>transition</i> to proof-of-stake (PoS) was a securities transaction. This misunderstands the decentralized nature of Ethereum&rsquo;s governance. Ethereum&rsquo;s transition to PoS was driven by social consensus, involving broad community discussions, transparent development processes, and voting mechanisms within a decentralized network. This contrasts sharply with traditional financial systems, where decisions are made by centralized entities or a small group of registered stakeholders. Changes in Ethereum are proposed through Ethereum Improvement Proposals (EIPs), debated publicly, and adopted only with widespread community support, ensuring no central authority controls the network. This decentralized, community-driven process highlights that Ethereum remains a decentralized commodity, not a security, as its evolution reflects the collective agreement of its diverse global participants. As the UK Prime Minister on this topic just recently said: &ldquo;We are pro-open source. Open-source drives innovation. It creates start-ups. It creates communities. There must be a very high bar for any restrictions on open source.&rdquo;</p>
<p>Many traditional finance market participants may not fully understand that ETH is not just a speculative asset but has extensive real-world utility underpinning a vibrant decentralized application ecosystem. Ethereum supports over 270 million unique user addresses and processes an average of 1.2 million transactions daily. On-chain value settlements exceeded $2.8T over the last year, compared to global remittances of $860B, PayPal volumes of $1.5T and Visa network volume of $15T.</p>
<p>Ethereum boasts a robust developer community, with more than 2,300 monthly active developers contributing to 113,000 distinct Githib repositories. Thanks to the network effects from this decentralized community, Ethereum has become the foundational layer for a vast ecosystem of over 3,000 applications, including financial services, games and collectibles. Its smart contract functionality enables automated lending/borrowing, decentralized exchanges, NFT marketplaces, play-to-earn games and tokenization of real-world assets. Major companies like Reddit, Ubisoft, Nike and Visa have launched Ethereum-based projects.</p>
<p>Regulating Ethereum NFTs differently from physical collectibles like baseball cards or Rolex watches is often absurd&mdash;both represent unique digital/physical scarcity and ownership. A Bored Ape Yacht Club NFT and a rare 1952 Topps Mickey Mantle rookie card can serve similar purposes as status symbols and stores of value. However, governance structures like those enabled by Ethereum underpin much of the innovation happening in open-source databases, including real-world asset tokenization. Stifling this utility through misguided regulation would hamper technological progress and drive those talented entrepreneurs overseas.</p>
<p>The inconsistent stances taken by different U.S. regulators have made the situation even more confusing. While the SEC has recently declined to clarify ETH&rsquo;s status, the CFTC has allowed Ether futures products to trade. The Chairman of the CFTC has stated repeatedly that ETH is a commodity. Even the SEC's own guidance has stated that a digital asset may transition away from being a security as it becomes sufficiently decentralized over time, though critical details are lacking. Adding to the contradictions, just last week, the U.S. Attorney's Office for the Southern District of New York unveiled an indictment that referred to Ethereum as a "decentralized" blockchain, seemingly at odds with the SEC's apparent security designation. Needless to say, this regulatory discord has fostered harmful uncertainty and, contrary to the SEC's mandate of capital formation, has inflicted a lot of pain in the market.</p>
<p>That&rsquo;s why it is so encouraging to observe the growing bipartisan support for digital assets in DC, reflecting widespread voter input, evidenced by the recent repeal of SAB 121, an accounting rule hostile to crypto enacted through unorthodox means. We expect this trend will lead to further victories via new laws and in the courts that draw investment to Bitcoin, Ethereum, and other open-source blockchain software.</p>
<p>To receive more <strong><a href="https://www.vaneck.com/us/en/insights/digital-assets/" title="Digital Assets Insights">Digital Assets</a></strong> insights, <strong><a href="https://www.vaneck.com/us/en/subscribe/" title="Subscription Center">sign up in our subscription center</a></strong>.</p>
<p>We look forward to further updates.</p>
]]></content:encoded>
</item><item rdf:about="https://www.vaneck.com/us/en/blogs/thematic-investing/buzz-investing-strong-earnings-boost-optimism/">
  <title>BUZZ Investing: Strong Earnings Boost Optimism></title>
  <link>https://www.vaneck.com/us/en/blogs/thematic-investing/buzz-investing-strong-earnings-boost-optimism/</link>
  <description><![CDATA[<p>U.S. markets swung due to economic shifts, with initial drops from inflation fears followed by recovery hopes of relaxed Fed policies. Despite setbacks like weak GDP and rising treasury yields, improved earnings and employment data drove optimism.</p>]]></description>
  <dc:creator> </dc:creator>
  <dc:date>05/20/2024 06:30:00</dc:date>
<content:encoded><![CDATA[

<p>U.S. markets exhibited increased volatility, yet closed little changed, during the recent period between Index selection dates (April 11, 2024 &ndash; May 9, 2024, the &ldquo;Period&rdquo;). Equities saw substantial declines during the first part of the Period, with the S&amp;P 500 and the tech-heavy Nasdaq Composite posting losses which nearly halved the year's earlier gains. The downturn was triggered by the April 10th release of March's Retail Sales report, which unexpectedly showed robust consumer spending, heightening inflation fears. This led to a spike in treasury yields, with both 2-year and 10-year Treasury yields rising to their highest levels since November 2023, prompting a sell-off in stocks, particularly growth-oriented equities that are typically sensitive to interest rates. Economic growth also underperformed expectations, with GDP increasing at only a 1.6% annualized rate in the first quarter, below the forecasted 2.4%.</p>
<p>In the second half of the Period, domestic equities experienced a revival as investor optimism grew, fueled by expectations that the Federal Reserve might lower interest rates. Weaker-than-expected U.S. employment data prompted this shift in sentiment for April and indications of slowing wage growth from government reports. Additionally, positive momentum was supported by solid earnings reports for the first quarter. With nearly 90% of S&amp;P 500 Index companies having reported for this earnings season, upbeat first-quarter results have pushed some Wall Street analysts to boost profit projections as quarterly earnings reports came in largely above expectations.</p>
<p>The BUZZ NextGen AI US Sentiment Leaders Index (the &ldquo;BUZZ Index&rdquo;) returned -8.25% during the month of April compared to a return of -4.08% for the S&amp;P 500 Index during the same period. Year-to-date, the BUZZ Index lags the S&amp;P 500 with returns of 5.40% and 6.04%, respectively, as of the end of April.</p>
<h2>Shares of Paramount Global Pace Advancing Stocks within the BUZZ Index</h2>
<p>Shares of Paramount Global (NASD: PARA) led advancers within the BUZZ NextGen AI US Sentiment Leaders Index (the &ldquo;BUZZ Index&rdquo;) during the recent Period. Paramount Global has recently garnered extensive media attention due to multiple parties' takeover interest. The contest features offers from David Ellison's Skydance Media, Apollo Global Management, and Sony Group Corp. Shari Redstone, Paramount's influential nonexecutive chairwoman and daughter of its founder, plays a key role in the ongoing boardroom drama. On April 29th, Bob Bakish resigned as President and CEO of Paramount, and the company established an office for the CEO to lead. The board is now considering a "go-shop" approach to explore additional offers. In a notable development, Warren Buffett announced at Berkshire Hathaway's annual meeting that he had sold all his shares in Paramount at a significant loss, adding another twist to the company's ongoing saga as the company's future remains uncertain amidst a high-stakes battle for control.</p>
<div class="wrapped-div">
<table style="width: 100%;">
<tbody>
<tr class="tbl-data">
<td class="tbl-header last " colspan="4">Top BUZZ Index Contributors: April 11, 2024 &ndash; May 9, 2024</td>
</tr>
<tr class="tbl-data">
<td class="data-td  last">Company</td>
<td class="data-head last">Ticker</td>
<td class="data-head last">Average Weight (%)</td>
<td class="data-head last">Return Contribution (%)</td>
</tr>
<tr class="tbl-data">
<td class="data-td last font-weight-normal">Paramount Global</td>
<td class="data-td data last">PARA</td>
<td class="data-td data last">3.14</td>
<td class="data-td data last">0.55</td>
</tr>
<tr class="tbl-data">
<td class="data-td last font-weight-normal">Carvana Co</td>
<td class="data-td data last">CVNA</td>
<td class="data-td data last">1.33</td>
<td class="data-td data last">0.54</td>
</tr>
<tr class="tbl-data">
<td class="data-td last font-weight-normal">Viking Therapeutics Inc</td>
<td class="data-td data last">VKTX</td>
<td class="data-td data last">0.87</td>
<td class="data-td data last">0.24</td>
</tr>
<tr class="tbl-data">
<td class="data-td last font-weight-normal">Alphabet Inc</td>
<td class="data-td data last">GOOGL</td>
<td class="data-td data last">3.26</td>
<td class="data-td data last">0.20</td>
</tr>
<tr class="tbl-data">
<td class="data-td last font-weight-normal">Lucid Group Inc</td>
<td class="data-td data last">LCID</td>
<td class="data-td data last">2.26</td>
<td class="data-td data last">0.18</td>
</tr>
<tr class="tbl-data">
<td class="data-td last font-weight-normal">Apple Inc</td>
<td class="data-td data last">AAPL</td>
<td class="data-td data last">3.10</td>
<td class="data-td data last">0.16</td>
</tr>
<tr class="tbl-data">
<td class="data-td last font-weight-normal">Boeing Co/The</td>
<td class="data-td data last">BA</td>
<td class="data-td data last">3.03</td>
<td class="data-td data last">0.15</td>
</tr>
<tr class="tbl-data">
<td class="data-td last font-weight-normal">JPMorgan Chase &amp; Co</td>
<td class="data-td data last">JPM</td>
<td class="data-td data last">0.86</td>
<td class="data-td data last">0.10</td>
</tr>
<tr class="tbl-data">
<td class="data-td last font-weight-normal">Pfizer Inc</td>
<td class="data-td data last">PFE</td>
<td class="data-td data last">1.11</td>
<td class="data-td data last">0.09</td>
</tr>
<tr class="tbl-data">
<td class="data-td last font-weight-normal">Rivian Automotive Inc</td>
<td class="data-td data last">RIVN</td>
<td class="data-td data last">2.11</td>
<td class="data-td data last">0.08</td>
</tr>
</tbody>
</table>
</div>
<br />
<p class="chart-disclosure">Source: BUZZ Holdings ULC, Bloomberg. Past performance is no guarantee of future results. Index performance is not illustrative of fund performance. Not intended as a recommendation to buy or to sell any of the securities mentioned herein.</p>
<p>Crypto-related stocks were featured among the top detractors to BUZZ Index performance. Cryptocurrency exchange platform Coinbase Global Inc (NASD: COIN) and Bitcoin-invested software company MicroStrategy Inc (NASD: MSTR) fell 20% and 18.6% respectively as the price of Bitcoin declined over 11% during the Period. Bitcoin's price decline may be due to a post-halving correction, a slowdown in ETF inflows, and broader economic conditions including stock market fluctuations and Federal Reserve policy expectations. Despite an initial surge post-halving, Bitcoin's extraordinary pre-halving bull run may have been a contributing factor to an expected market correction.</p>
<div class="wrapped-div">
<table style="width: 100%;">
<tbody>
<tr class="tbl-data">
<td class="tbl-header last " colspan="4">Bottom BUZZ Index Contributors: April 11, 2024 &ndash; May 9, 2024</td>
</tr>
<tr class="tbl-data">
<td class="data-td  last">Company</td>
<td class="data-head last">Ticker</td>
<td class="data-head last">Average Weight (%)</td>
<td class="data-head last">Return Contribution (%)</td>
</tr>
<tr class="tbl-data">
<td class="data-td last font-weight-normal">Coinbase Global Inc</td>
<td class="data-td data last">COIN</td>
<td class="data-td data last">2.75</td>
<td class="data-td data last">-0.66</td>
</tr>
<tr class="tbl-data">
<td class="data-td last font-weight-normal">MicroStrategy Inc</td>
<td class="data-td data last">MSTR</td>
<td class="data-td data last">2.49</td>
<td class="data-td data last">-0.52</td>
</tr>
<tr class="tbl-data">
<td class="data-td last font-weight-normal">Super Micro Computer Inc</td>
<td class="data-td data last">SMCI</td>
<td class="data-td data last">2.66</td>
<td class="data-td data last">-0.48</td>
</tr>
<tr class="tbl-data">
<td class="data-td last font-weight-normal">Intel Corp</td>
<td class="data-td data last">INTC</td>
<td class="data-td data last">1.67</td>
<td class="data-td data last">-0.35</td>
</tr>
<tr class="tbl-data">
<td class="data-td last font-weight-normal">Advanced Micro Devices Inc</td>
<td class="data-td data last">AMD</td>
<td class="data-td data last">2.78</td>
<td class="data-td data last">-0.31</td>
</tr>
<tr class="tbl-data">
<td class="data-td last font-weight-normal">Meta Platforms Inc</td>
<td class="data-td data last">META</td>
<td class="data-td data last">2.88</td>
<td class="data-td data last">-0.30</td>
</tr>
<tr class="tbl-data">
<td class="data-td last font-weight-normal">SoFi Technologies Inc</td>
<td class="data-td data last">SOFI</td>
<td class="data-td data last">3.03</td>
<td class="data-td data last">-0.24</td>
</tr>
<tr class="tbl-data">
<td class="data-td last font-weight-normal">Lyft Inc</td>
<td class="data-td data last">LYFT</td>
<td class="data-td data last">0.74</td>
<td class="data-td data last">-0.21</td>
</tr>
<tr class="tbl-data">
<td class="data-td last font-weight-normal">Palantir Technologies Inc</td>
<td class="data-td data last">PLTR</td>
<td class="data-td data last">2.98</td>
<td class="data-td data last">-0.21</td>
</tr>
<tr class="tbl-data">
<td class="data-td last font-weight-normal">Robinhood Markets Inc</td>
<td class="data-td data last">HOOD</td>
<td class="data-td data last">2.68</td>
<td class="data-td data last">-0.18</td>
</tr>
</tbody>
</table>
</div>
<br />
<p class="chart-disclosure">Source: BUZZ Holdings ULC, Bloomberg. Past performance is no guarantee of future results. Index performance is not illustrative of fund performance. Not intended as a recommendation to buy or to sell any of the securities mentioned herein.</p>
<h2>BUZZ Index May 2024 Rebalance Highlights</h2>
<p><strong><u>Trump Media &amp; Technology Group</u></strong></p>
<p>Trump Media &amp; Technology Group (NASD: DJT), one of the most controversial SPAC merger announcements, has been under intense scrutiny since its proposed combination with former SPAC Digital World Acquisition Corp (DWAC) was announced in October 2021. The merger aimed to launch Donald Trump's media company Truth Social, a social media platform akin to Twitter but centered on conservative values. The announcement initially catapulted DWAC's stock to $175, but the stock later plunged nearly 90% during the 2022-2023 bear market. Despite this volatility, the stock rebounded to above $50 per share in January when DWAC shareholders, and regulators, finally approved the merger. Post-closing, shares of DWAC now trade under the appropriately reimagined ticker symbol "DJT". As the 2024 Presidential elections approach, increased political rhetoric could once again place DJT in the spotlight. This month, DJT makes its debut in the BUZZ Index with a maximum 3% weight.</p>
<p><strong><u>SNAP Inc</u></strong></p>
<p>Snap (NASD: SNAP) surprised the market with its Q1 earnings report last month, showing substantial growth across various advertising revenue streams. While Snap still lags Meta Platforms Inc. (NASD: META) in user numbers, it has recently excelled in attracting and retaining advertisers. The company has been cutting costs, reducing its workforce by 10% in February, and has benefited from political developments like the proposed congressional bill to ban TikTok, potentially removing a major competitor. Following the earnings report, SNAP shares surged 50% in a week, signaling a potential uptrend after nearly a year of stagnation. This month, SNAP rejoined the BUZZ Index with a 1.57% weight, reflecting renewed positive investor sentiment towards the company's prospects.</p>
<p>For more on rebalancing results and a full breakdown of index constituents added and removed for the month, view the <a href="/us/en/blogs/thematic-investing/buzz-investing-strong-earnings-boost-optimism/buzz-reconstitution-may-2024.pdf" title="BUZZ VanEck Social Sentiment ETF" target="_blank" rel="noopener"><strong>BUZZ Index reconstitution</strong></a> report.</p>
<p>To receive more <a href="https://www.vaneck.com/us/en/insights/thematic-investing/" title="Thematic Investing Insights"><strong>Thematic Investing</strong></a> insights, <a href="https://www.vaneck.com/us/en/subscribe/" title="Subscription Center"><strong>sign up in our subscription center</strong></a>.</p>
<style>
    .wrapped-div {
        max-width: 100%;
    }

    @media (max-width: 1240px) {
        .wrapped-div {
            overflow-x: scroll;
        }
    }

    .wrapped-div-sector {
        max-width: 100%;
        overflow-x: scroll;
    }
</style>
]]></content:encoded>
</item><item rdf:about="https://www.vaneck.com/us/en/blogs/income-investing/the-evolution-of-retail-within-fallen-angels/">
  <title>The Evolution of Retail within Fallen Angels></title>
  <link>https://www.vaneck.com/us/en/blogs/income-investing/the-evolution-of-retail-within-fallen-angels/</link>
  <description><![CDATA[Retail, now the Index&rsquo;s largest exposure, has been the top contributor to performance over the past twelve months. FirstEnergy Corp. and Rolls-Royce exited the Index at the end of the month.]]></description>
  <dc:creator>Nicolas  Fonseca, CFA</dc:creator>
  <dc:date>05/17/2024 06:30:00</dc:date>
<content:encoded><![CDATA[

<p>In April, fallen angels (as represented by the ICE US Fallen Angel High Yield 10% Constrained Index, &ldquo;H0CF&rdquo;) underperformed the broad high yield market (as represented by the ICE BofA US High Yield Index, &ldquo;H0A0&rdquo;) by 0.74% (-1.74% vs -1.00%). Year to date, fallen angels are now lagging by 0.66%, with returns of -0.16% vs 0.50% for the broad high yield market as longer duration continues to impact fallen angels. Within broad high yield, single B rated bonds outperformed BB and CCC &amp; below rated bonds in April, while CCC &amp; below rated bonds continue to outperform higher quality YTD.</p>
<h2 id="deep-dive-on-retail" class="jump-link-nav anchored-block" data-jumplink-title="Deep Dive on Retail">Deep Dive on Retail</h2>
<p>Retail sector exposure within the fallen angel universe has increased to almost 20% from only about 6% in December 2022, due mainly to two large fallen angels and rising stars in other sectors. Retail is now the largest sector in the index. Below is a quick recap of what has brought us to this point:</p>
<p>In December 2022, Retail exposure in the Index was comprised of 10 issuers across 4 industries: Specialty Retail (approximately 0.9% weight), Department Stores (approximately 3.5%), Food &amp; Drug Retailers (approximately 0.5%) and Restaurants (approximately 0.9%), with Nordstrom being the largest issuer at 2.0% weight.&nbsp;&nbsp;</p>


<p>By November 2023, Retail sector exposure increased to just under 10%, as the index was experiencing multiple rising stars from other sectors. In December 2023, Walgreens entered the index with a 5% weight (approximately $4.4 billion par amount) following its downgrade by Moody&rsquo;s, reflecting its high financial leverage and losses in its U.S. healthcare segment, bringing the sector exposure to approximately 14% of the index.</p>
<p>In February 2024, Advance Auto Parts entered the index with a 2% weight (approximately $2 billion of par amount), following its downgrade by Moody&rsquo;s due to expected lower sales growth and higher expenses, bringing total Retail exposure to 17%.</p>
<p>Overall Retail exposure is currently comprised of 11 different issuers within four industries: Specialty Retail (approximately 4.3% weight), Department Stores (approximately 6.9%), Food &amp; Drug Retailers (approximately 7.3%) and Restaurants (approximately 1.1%). Retail has been the best performing sector over the past 12 months, with a 16.51% return, and the second highest performing sector over the past six months, behind Financial Services, as it posted 15.69% contributing positively to the fallen angel index performance. Most of the performance has come from approximately 300bps of spread tightening over the last 12 months.&nbsp;&nbsp;&nbsp;</p>
<p>Compared to other sectors, Retail has the longest duration (6.5), followed closely by Telecom, the second largest exposure. Retail has always been one of the sectors with a long duration due to the inclusion of YUM Brands (9.9), Macy&rsquo;s (9.8) and Marks &amp; Spencer (8.4). Walgreens added to the duration length, as it entered the index with an average duration of 7.8.</p>
<p id="fallen-angel-statistics" class="jump-link-nav anchored-block" data-jumplink-title="Fallen Angel Statistics"><strong>Fallen Angels Overall Statistics: </strong>Fallen angel yields increased by 51bps to 7.43% and spreads were relatively flat. Broad high yield saw similar changes, with yields increasing 45bps to 8.20% and spreads experiencing minimal changes. Yields jumped significantly as the 10Y increased by 49bps in April to 4.69%, a level not seen since October of last year, largely due to persistent inflationary pressures and the market&rsquo;s reassessment for the potential of multiple rate cuts this year. In early May, the U.S. Federal Reserve (&ldquo;Fed&rdquo;) confirmed its stance that the next policy move is unlikely to be a rate hike; however, it is prepared to maintain interest rates at current levels until significant improvements are observed in economic data. Given the current environment of higher yields and lower prices, it is expected that this may bolster total returns going forward, provide a cushion against potential volatility and support the continued technical tailwind of strong investor demand.</p>
<div class="wrapped-div">
<table style="width: 100%;">
<tbody>
<tr class="tbl-data">
<td class="tbl-header last text-center">&nbsp;</td>
<td class="tbl-header last text-center" style="border-right: outset;" colspan="3">Fallen Angels</td>
<td class="tbl-header last text-center" colspan="3">Broad HY</td>
</tr>
<tr class="tbl-data">
<td class="data-head last">&nbsp;</td>
<td class="data-head last">12/31/23</td>
<td class="data-head last">3/31/24</td>
<td class="data-head last" style="border-right: outset;">4/30/24</td>
<td class="data-head last">12/31/23</td>
<td class="data-head last">3/31/24</td>
<td class="data-head last">4/30/24</td>
</tr>
<tr class="tbl-data">
<td class="data-td last">Yield to Worst</td>
<td class="data-td data last">6.99</td>
<td class="data-td data last">6.92</td>
<td class="data-td data last" style="border-right: outset;">7.43</td>
<td class="data-td data last">7.69</td>
<td class="data-td data last">7.75</td>
<td class="data-td data last">8.20</td>
</tr>
<tr class="tbl-data">
<td class="data-td last">Price</td>
<td class="data-td data last">91.20</td>
<td class="data-td data last">91.22</td>
<td class="data-td data last" style="border-right: outset;">89.25</td>
<td class="data-td data last">91.86</td>
<td class="data-td data last">93.18</td>
<td class="data-td data last">91.88</td>
</tr>
<tr class="tbl-data">
<td class="data-td last">Effective Duration</td>
<td class="data-td data last">5.41</td>
<td class="data-td data last">5.32</td>
<td class="data-td data last" style="border-right: outset;">5.20</td>
<td class="data-td data last">3.31</td>
<td class="data-td data last">3.28</td>
<td class="data-td data last">3.36</td>
</tr>
<tr class="tbl-data">
<td class="data-td last">Full Market Value ($mn)</td>
<td class="data-td data last">67,821</td>
<td class="data-td data last">64,657</td>
<td class="data-td data last" style="border-right: outset;">57,955</td>
<td class="data-td data last">1,237,721</td>
<td class="data-td data last">1,260,542</td>
<td class="data-td data last">1,245,972</td>
</tr>
<tr class="tbl-data">
<td class="data-td last">OAS</td>
<td class="data-td data last">285</td>
<td class="data-td data last">247</td>
<td class="data-td data last" style="border-right: outset;">255</td>
<td class="data-td data last">339</td>
<td class="data-td data last">315</td>
<td class="data-td data last">318</td>
</tr>
<tr class="tbl-data">
<td class="data-td last">No. of Issues</td>
<td class="data-td data last">143</td>
<td class="data-td data last">138</td>
<td class="data-td data last" style="border-right: outset;">130</td>
<td class="data-td data last">1,837</td>
<td class="data-td data last">1,864</td>
</tr>
</tbody>
</table>
</div>
<br />
<p class="chart-disclosure">Source: ICE Data Services, VanEck. Fallen Angels: ICE US Fallen Angel High Yield 10% Constrained Index. Broad HY: ICE BofA US High Yield Index. OAS refers to &ldquo;option-adjusted spread.&rdquo; Please see definition for this and other terms referenced herein in the disclosures and definitions portion of this blog. Past performance is no guarantee of future results. Index performance is not representative of strategy performance. It is not possible to invest in an index.</p>

<p><strong>New Fallen Angels:</strong> None in April.</p>
<div class="wrapped-div">
<table style="width: 100%;">
<tbody>
<tr class="tbl-data">
<td class="tbl-header last">Month-end Addition</td>
<td class="tbl-header last text-center">Name</td>
<td class="tbl-header last text-center">Rating</td>
<td class="tbl-header last text-center">Sector</td>
<td class="tbl-header last text-center">Industry</td>
<td class="tbl-header last text-center">% Mkt Value</td>
<td class="tbl-header last text-center">Price</td>
</tr>
<tr class="tbl-data">
<td class="data-td last font-weight-normal">January</td>
<td class="data-td data last">Hudson Pacific Properties LP</td>
<td class="data-td data last">BB1</td>
<td class="data-td data last">Real Estate</td>
<td class="data-td data last">REITs</td>
<td class="data-td data last">2.18</td>
<td class="data-td data last">88.05</td>
</tr>
<tr class="tbl-data">
<td class="data-td last font-weight-normal">February</td>
<td class="data-td data last">Advance Auto Parts Inc.</td>
<td class="data-td data last">BB1</td>
<td class="data-td data last">Retail</td>
<td class="data-td data last">Specialty Retail</td>
<td class="data-td data last">2.52</td>
<td class="data-td data last">91.20</td>
</tr>
</tbody>
</table>
</div>
<br />
<p class="chart-disclosure">Source: ICE Data Services, VanEck. Fallen Angels: ICE US Fallen Angel High Yield 10% Constrained Index. Past performance is no guarantee of future results. Not a recommendation to buy or sell any of the names/securities mentioned herein. Index performance is not representative of strategy performance. It is not possible to invest in an index.</p>
<p><strong>Rising Stars:</strong> FirstEnergy Corp. and Rolls-Royce exited the index in April after being part of the 2020 wave of COVID-related downgrades. FirstEnergy Corp. entered the index in November 2020 at $111.88 (a much higher price than some if its peers, as the energy sector had recovered from its large drawdown of May 2020), while Rolls-Royce entered the index in June 2020 at $96.67; both posted negative prices returns during their time in the fallen angel index. FirstEnergy was upgraded by Moody&rsquo;s to Baa3 from Ba1, reflecting a much stronger financial profile due to actions take over the past few years. Rolls-Royce saw an upgrade from all three rating agencies in March. Moody&rsquo;s upgraded to Ba1 from Ba2 due to improvement in credit ratios well ahead of expectations, S&amp;P upgraded to BBB- from BB+ on a stronger than anticipated performance, which lead to meaningful deleveraging, and Fitch upgraded to BBB- from BB+, on confidence that Rolls-Royce will sustain solid financial metrics, which are already reflective of an investment-grade profile, supported by its strong business profile.</p>
<div class="wrapped-div">
<table style="width: 100%;">
<tbody>
<tr class="tbl-data">
<td class="tbl-header last">Month-end Exit</td>
<td class="tbl-header last text-center">Name</td>
<td class="tbl-header last text-center">Rating</td>
<td class="tbl-header last text-center">Sector</td>
<td class="tbl-header last text-center">Industry</td>
<td class="tbl-header last text-center">% Mkt Value</td>
<td class="tbl-header last text-center">Price</td>
</tr>
<tr class="tbl-data">
<td class="data-td last font-weight-normal">February</td>
<td class="data-td data last">Las Vegas Sands Corp</td>
<td class="data-td data last">BB1</td>
<td class="data-td data last">Leisure</td>
<td class="data-td data last">Gaming</td>
<td class="data-td data last">3.12</td>
<td class="data-td data last">93.19</td>
</tr>
<tr class="tbl-data">
<td class="data-td last font-weight-normal">March</td>
<td class="data-td data last">Enlink Midstream Partners LP</td>
<td class="data-td data last">BB1</td>
<td class="data-td data last">Energy</td>
<td class="data-td data last">Gas Distribution</td>
<td class="data-td data last">2.30</td>
<td class="data-td data last">88.92</td>
</tr>
<tr class="tbl-data">
<td class="data-td last font-weight-normal">April</td>
<td class="data-td data last">FirstEnergy Corp.</td>
<td class="data-td data last">BB1</td>
<td class="data-td data last">Utility</td>
<td class="data-td data last">Electric-Integrated</td>
<td class="data-td data last">6.62</td>
<td class="data-td data last">87.10</td>
</tr>
<tr class="tbl-data">
<td class="data-td last font-weight-normal">April</td>
<td class="data-td data last">Rolls-Royce PLC</td>
<td class="data-td data last">BB1</td>
<td class="data-td data last">Capital Goods</td>
<td class="data-td data last">Aerospace/Defense</td>
<td class="data-td data last">1.51</td>
<td class="data-td data last">96.00</td>
</tr>
</tbody>
</table>
</div>
<br />
<p class="chart-disclosure">Source: ICE Data Services, VanEck. Fallen Angels: ICE US Fallen Angel High Yield 10% Constrained Index. Past performance is no guarantee of future results. Not a recommendation to buy or sell any of the names/securities mentioned herein. Index performance is not representative of strategy performance. It is not possible to invest in an index.</p>
<p><strong>Fallen Angels Performance by Sector:</strong> Utility and Capital Goods exposures decreased with the two rising stars this past month. Utility exposure within fallen angels was significantly reduced in April with the exit of FirstEnergy (9% to approximately 2%), with the weight being redistributed among the other sectors. Retail, Energy and Real Estate gained more than 1% with Retail at an approximate 20% allocation, which is about 3.2x of the weight in the broad high yield market. Only four sectors saw spread widening, with Telecom being the major detractor. Relative to broad high yield, the top detractors from performance were Telecom and Retail, while the top contributors were the absence of Media and the selection effect within Consumer Goods sector, which was the only sector with a positive total return in the month (note that fallen angels only have one issuer, Newell Brands, within this sector while broad high yield has more than 40).</p>
<div class="wrapped-div">
<table style="width: 100%;">
<tbody>
<tr class="tbl-data">
<td class="tbl-header last text-center">&nbsp;</td>
<td class="tbl-header last text-center" style="border-right: outset;" colspan="3">Wgt (%)</td>
<td class="tbl-header last text-center" style="border-right: outset;" colspan="3">OAS</td>
<td class="tbl-header last text-center" style="border-right: outset;" colspan="3">Price</td>
<td class="tbl-header last text-center">Total Return</td>
</tr>
<tr class="tbl-data">
<td class="data-head last">&nbsp;</td>
<td class="data-head last">12/31/23</td>
<td class="data-head last">3/31/24</td>
<td class="data-head last" style="border-right: outset;">4/30/24</td>
<td class="data-head last">12/31/23</td>
<td class="data-head last">3/31/24</td>
<td class="data-head last" style="border-right: outset;">4/30/24</td>
<td class="data-head last">12/31/23</td>
<td class="data-head last">3/31/24</td>
<td class="data-head last" style="border-right: outset;">4/30/24</td>
<td class="data-head last">MTD</td>
</tr>
<tr class="tbl-data">
<td class="data-td last">Banking</td>
<td class="data-td data last">4.79</td>
<td class="data-td data last">4.62</td>
<td class="data-td data last" style="border-right: outset;">5.13</td>
<td class="data-td data last">231</td>
<td class="data-td data last">235</td>
<td class="data-td data last" style="border-right: outset;">219</td>
<td class="data-td data last">97.91</td>
<td class="data-td data last">97.11</td>
<td class="data-td data last" style="border-right: outset;">96.29</td>
<td class="data-td data last">-0.37</td>
</tr>
<tr class="tbl-data">
<td class="data-td last">Basic Industry</td>
<td class="data-td data last">1.70</td>
<td class="data-td data last">3.20</td>
<td class="data-td data last" style="border-right: outset;">3.55</td>
<td class="data-td data last">171</td>
<td class="data-td data last">186</td>
<td class="data-td data last" style="border-right: outset;">155</td>
<td class="data-td data last">97.24</td>
<td class="data-td data last">94.37</td>
<td class="data-td data last" style="border-right: outset;">93.46</td>
<td class="data-td data last">-0.52</td>
</tr>
<tr class="tbl-data">
<td class="data-td last">Capital Goods</td>
<td class="data-td data last">5.85</td>
<td class="data-td data last">6.17</td>
<td class="data-td data last" style="border-right: outset;">5.10</td>
<td class="data-td data last">200</td>
<td class="data-td data last">153</td>
<td class="data-td data last" style="border-right: outset;">158</td>
<td class="data-td data last">97.34</td>
<td class="data-td data last">97.38</td>
<td class="data-td data last" style="border-right: outset;">96.00</td>
<td class="data-td data last">-0.97</td>
</tr>
<tr class="tbl-data">
<td class="data-td last">Consumer Goods</td>
<td class="data-td data last">4.33</td>
<td class="data-td data last">4.42</td>
<td class="data-td data last" style="border-right: outset;">4.96</td>
<td class="data-td data last">230</td>
<td class="data-td data last">223</td>
<td class="data-td data last" style="border-right: outset;">229</td>
<td class="data-td data last">94.29</td>
<td class="data-td data last">93.07</td>
<td class="data-td data last" style="border-right: outset;">93.14</td>
<td class="data-td data last">0.62</td>
</tr>
<tr class="tbl-data">
<td class="data-td last">Energy</td>
<td class="data-td data last">14.75</td>
<td class="data-td data last">11.17</td>
<td class="data-td data last" style="border-right: outset;">12.25</td>
<td class="data-td data last">259</td>
<td class="data-td data last">235</td>
<td class="data-td data last" style="border-right: outset;">225</td>
<td class="data-td data last">92.49</td>
<td class="data-td data last">93.95</td>
<td class="data-td data last" style="border-right: outset;">92.37</td>
<td class="data-td data last">-1.17</td>
</tr>
<tr class="tbl-data">
<td class="data-td last">Financial Services</td>
<td class="data-td data last">1.14</td>
<td class="data-td data last">1.18</td>
<td class="data-td data last" style="border-right: outset;">1.29</td>
<td class="data-td data last">378</td>
<td class="data-td data last">336</td>
<td class="data-td data last" style="border-right: outset;">332</td>
<td class="data-td data last">86.41</td>
<td class="data-td data last">87.09</td>
<td class="data-td data last" style="border-right: outset;">84.75</td>
<td class="data-td data last">-2.17</td>
</tr>
<tr class="tbl-data">
<td class="data-td last">Healthcare</td>
<td class="data-td data last">4.10</td>
<td class="data-td data last">4.44</td>
<td class="data-td data last" style="border-right: outset;">4.90</td>
<td class="data-td data last">270</td>
<td class="data-td data last">210</td>
<td class="data-td data last" style="border-right: outset;">189</td>
<td class="data-td data last">88.73</td>
<td class="data-td data last">90.80</td>
<td class="data-td data last" style="border-right: outset;">89.50</td>
<td class="data-td data last">-0.96</td>
</tr>
<tr class="tbl-data">
<td class="data-td last">Insurance</td>
<td class="data-td data last">1.32</td>
<td class="data-td data last">1.43</td>
<td class="data-td data last" style="border-right: outset;">1.55</td>
<td class="data-td data last">323</td>
<td class="data-td data last">244</td>
<td class="data-td data last" style="border-right: outset;">233</td>
<td class="data-td data last">94.10</td>
<td class="data-td data last">96.82</td>
<td class="data-td data last" style="border-right: outset;">94.75</td>
<td class="data-td data last">-1.60</td>
</tr>
<tr class="tbl-data">
<td class="data-td last">Leisure</td>
<td class="data-td data last">7.90</td>
<td class="data-td data last">5.10</td>
<td class="data-td data last" style="border-right: outset;">5.56</td>
<td class="data-td data last">228</td>
<td class="data-td data last">170</td>
<td class="data-td data last" style="border-right: outset;">168</td>
<td class="data-td data last">93.21</td>
<td class="data-td data last">95.08</td>
<td class="data-td data last" style="border-right: outset;">93.59</td>
<td class="data-td data last">-1.13</td>
</tr>
<tr class="tbl-data">
<td class="data-td last">Real Estate</td>
<td class="data-td data last">9.07</td>
<td class="data-td data last">9.60</td>
<td class="data-td data last" style="border-right: outset;">10.65</td>
<td class="data-td data last">675</td>
<td class="data-td data last">527</td>
<td class="data-td data last" style="border-right: outset;">515</td>
<td class="data-td data last">82.72</td>
<td class="data-td data last">81.84</td>
<td class="data-td data last" style="border-right: outset;">81.17</td>
<td class="data-td data last">-0.38</td>
</tr>
<tr class="tbl-data">
<td class="data-td last">Retail</td>
<td class="data-td data last">14.38</td>
<td class="data-td data last">18.02</td>
<td class="data-td data last" style="border-right: outset;">19.55</td>
<td class="data-td data last">242</td>
<td class="data-td data last">179</td>
<td class="data-td data last" style="border-right: outset;">172</td>
<td class="data-td data last">86.39</td>
<td class="data-td data last">89.54</td>
<td class="data-td data last" style="border-right: outset;">87.58</td>
<td class="data-td data last">-1.82</td>
</tr>
<tr class="tbl-data">
<td class="data-td last">Services</td>
<td class="data-td data last">0.64</td>
<td class="data-td data last">0.66</td>
<td class="data-td data last" style="border-right: outset;">0.74</td>
<td class="data-td data last">243</td>
<td class="data-td data last">217</td>
<td class="data-td data last" style="border-right: outset;">195</td>
<td class="data-td data last">94.78</td>
<td class="data-td data last">94.51</td>
<td class="data-td data last" style="border-right: outset;">93.53</td>
<td class="data-td data last">-0.58</td>
</tr>
<tr class="tbl-data">
<td class="data-td last">Technology &amp; Electronics</td>
<td class="data-td data last">6.22</td>
<td class="data-td data last">5.81</td>
<td class="data-td data last" style="border-right: outset;">6.27</td>
<td class="data-td data last">194</td>
<td class="data-td data last">188</td>
<td class="data-td data last" style="border-right: outset;">185</td>
<td class="data-td data last">94.14</td>
<td class="data-td data last">92.99</td>
<td class="data-td data last" style="border-right: outset;">90.44</td>
<td class="data-td data last">-2.27</td>
</tr>
<tr class="tbl-data">
<td class="data-td last">Telecommunications</td>
<td class="data-td data last">13.00</td>
<td class="data-td data last">13.39</td>
<td class="data-td data last" style="border-right: outset;">14.04</td>
<td class="data-td data last">366</td>
<td class="data-td data last">368</td>
<td class="data-td data last" style="border-right: outset;">401</td>
<td class="data-td data last">92.22</td>
<td class="data-td data last">90.01</td>
<td class="data-td data last" style="border-right: outset;">84.66</td>
<td class="data-td data last">-5.20</td>
</tr>
<tr class="tbl-data">
<td class="data-td last">Transportation</td>
<td class="data-td data last">2.09</td>
<td class="data-td data last">2.23</td>
<td class="data-td data last" style="border-right: outset;">2.43</td>
<td class="data-td data last">209</td>
<td class="data-td data last">170</td>
<td class="data-td data last" style="border-right: outset;">151</td>
<td class="data-td data last">94.92</td>
<td class="data-td data last">95.37</td>
<td class="data-td data last" style="border-right: outset;">94.20</td>
<td class="data-td data last">-0.80</td>
</tr>
<tr class="tbl-data">
<td class="data-td last">Utility</td>
<td class="data-td data last">8.71</td>
<td class="data-td data last">8.54</td>
<td class="data-td data last" style="border-right: outset;">2.04</td>
<td class="data-td data last">139</td>
<td class="data-td data last">122</td>
<td class="data-td data last" style="border-right: outset;">163</td>
<td class="data-td data last">92.18</td>
<td class="data-td data last">91.13</td>
<td class="data-td data last" style="border-right: outset;">95.62</td>
<td class="data-td data last">-2.12</td>
</tr>
<tr class="tbl-data">
<td class="data-td last">Total</td>
<td class="data-td data last">100</td>
<td class="data-td data last" style="border-right: outset;">100</td>
<td class="data-td data last">285</td>
<td class="data-td data last">247</td>
<td class="data-td data last" style="border-right: outset;">255</td>
<td class="data-td data last">91.20</td>
<td class="data-td data last">91.22</td>
<td class="data-td data last" style="border-right: outset;">89.25</td>
<td class="data-td data last">-1.74</td>
</tr>
</tbody>
</table>
</div>
<br />
<p class="chart-disclosure">Source: ICE Data Services, VanEck. Returns are based on partial period data. Fallen Angels: ICE US Fallen Angel High Yield 10% Constrained Index. Not intended as a recommendation to invest or divest in any of the sectors mentioned herein. Index performance is not representative of strategy performance. It is not possible to invest in an index.</p>
<p><strong>Fallen Angels Performance by Rating:</strong> There were no major changes with the rating exposure for fallen angels during the month. Higher quality outperformed lower quality, as only BB-rated bonds saw their spreads tighten (almost unchanged) while lower quality widened, but all posted negative price returns.</p>
<div class="wrapped-div">
<table style="width: 100%;">
<tbody>
<tr class="tbl-data">
<td class="tbl-header last text-center">&nbsp;</td>
<td class="tbl-header last text-center" style="border-right: outset;" colspan="3">Wgt (%)</td>
<td class="tbl-header last text-center" style="border-right: outset;" colspan="3">OAS</td>
<td class="tbl-header last text-center" style="border-right: outset;" colspan="3">Price</td>
<td class="tbl-header last text-center">Total Return</td>
</tr>
<tr class="tbl-data">
<td class="data-head last">&nbsp;</td>
<td class="data-head last">12/31/23</td>
<td class="data-head last">3/31/24</td>
<td class="data-head last" style="border-right: outset;">4/30/24</td>
<td class="data-head last">12/31/23</td>
<td class="data-head last">3/31/24</td>
<td class="data-head last" style="border-right: outset;">4/30/24</td>
<td class="data-head last">12/31/23</td>
<td class="data-head last">3/31/24</td>
<td class="data-head last" style="border-right: outset;">4/30/24</td>
<td class="data-head last">MTD</td>
</tr>
<tr class="tbl-data">
<td class="data-td last">BB</td>
<td class="data-td data last">80.55</td>
<td class="data-td data last">81.63</td>
<td class="data-td data last" style="border-right: outset;">80.48</td>
<td class="data-td data last">219</td>
<td class="data-td data last">190</td>
<td class="data-td data last" style="border-right: outset;">188</td>
<td class="data-td data last">92.44</td>
<td class="data-td data last">92.85</td>
<td class="data-td data last" style="border-right: outset;">91.72</td>
<td class="data-td data last">-1.14</td>
</tr>
<tr class="tbl-data">
<td class="data-td last">B</td>
<td class="data-td data last">13.43</td>
<td class="data-td data last">12.87</td>
<td class="data-td data last" style="border-right: outset;">13.79</td>
<td class="data-td data last">317</td>
<td class="data-td data last">330</td>
<td class="data-td data last" style="border-right: outset;">343</td>
<td class="data-td data last">96.46</td>
<td class="data-td data last">93.99</td>
<td class="data-td data last" style="border-right: outset;">89.95</td>
<td class="data-td data last">-3.70</td>
</tr>
<tr class="tbl-data">
<td class="data-td last">CCC</td>
<td class="data-td data last">5.44</td>
<td class="data-td data last">5.51</td>
<td class="data-td data last" style="border-right: outset;">5.73</td>
<td class="data-td data last">1,130</td>
<td class="data-td data last">893</td>
<td class="data-td data last" style="border-right: outset;">982</td>
<td class="data-td data last">69.40</td>
<td class="data-td data last">68.48</td>
<td class="data-td data last" style="border-right: outset;">63.68</td>
<td class="data-td data last">-6.17</td>
</tr>
<tr class="tbl-data">
<td class="data-td last">Total</td>
<td class="data-td data last">100</td>
<td class="data-td data last" style="border-right: outset;">100</td>
<td class="data-td data last">285</td>
<td class="data-td data last">247</td>
<td class="data-td data last" style="border-right: outset;">255</td>
<td class="data-td data last">91.20</td>
<td class="data-td data last">91.22</td>
<td class="data-td data last" style="border-right: outset;">89.25</td>
<td class="data-td data last">-1.74</td>
</tr>
</tbody>
</table>
</div>
<br />
<p class="chart-disclosure">Source: ICE Data Services, VanEck. Fallen Angels: ICE US Fallen Angel High Yield 10% Constrained Index. Not intended as a recommendation to invest or divest in any of the sectors mentioned herein. Index performance is not representative of strategy performance. It is not possible to invest in an index. BB index: ICE BofA BB US High Yield Index; Single-B index: ICE BofA Single-B US High Yield Index; CCC &amp; Lower rated index ICE BofA CCC &amp; Lower US High Yield Index.</p>
<p>To receive more <a href="/us/en/blogs/income-investing/" title="Income Investing Insights"><strong>Income Investing</strong></a> insights, <a href="/us/en/subscribe" title=" Subscription Center"><strong>sign up in our subscription center</strong></a>.</p>
<style type="text/css">
    .wrapped-div {
        max-width: 100%;
    }

    @media (max-width: 768px) {
        .wrapped-div {
            overflow-x: scroll;
        }
    }

    .wrapped-div-sector {
        max-width: 100%;
        overflow-x: scroll;
    }
</style>
]]></content:encoded>
</item><item rdf:about="https://www.vaneck.com/us/en/blogs/municipal-bonds/see-a-fork-in-the-road/">
  <title>See a Fork in the Road?></title>
  <link>https://www.vaneck.com/us/en/blogs/municipal-bonds/see-a-fork-in-the-road/</link>
  <description><![CDATA[Barclays sees stable municipal yields due to supply, while BofA predicts lower rates from Quantitative Tapering and economic softening.]]></description>
  <dc:creator>James Colby</dc:creator>
  <dc:date>05/17/2024 06:30:00</dc:date>
<content:encoded><![CDATA[

<p>Yogi Berra said, &ldquo;pick it up&rdquo;. Common sense asks, &ldquo;Why is it there?&rdquo;. In this instance, the fork in the road represents a current dichotomy of opinion: how will our fixed-income markets, specifically the municipal market, perform this summer?</p>
<p>Research commentaries from Barclays and Bank America Merrill Lynch (&ldquo;BofA&rdquo;) effectively present their differing opinions on the direction the market will take over the next three months.</p>
<p>Barclays suggests that the burgeoning supply dynamics will continue throughout the summer, effectively capping the downward movement of yields in the muni space.<sup>1</sup>&nbsp;Although June and July are typically months where many bonds mature and coupon payments are made, evidence of uneven flows in previous weeks supports the notion that absent a reversal in guidance from the Federal Reserve (&ldquo;Fed&rdquo;) and a move to lower rates, a rally is unlikely.</p>
<p>BofA securities, however, build its outlook on technical observations which include<sup>2</sup>:</p>
<ul class="content-list">
<li>The announced start of Quantitative Tapering in June will reduce the monthly runoff of Treasuries holdings, leading to a bull steepening of the curve. Any move by Treasuries to lower yields will pull municipals along with it.</li>
<li>Perceived weakening implied in the economic data released in April, possibly pointing to a softening of the labor market, would underpin a Fed decision to consider moving rates lower &ndash; sooner.</li>
<li>Continued demand from seasonal reinvestment (maturities and coupon payments) and the normal improvement in the buy/sell ratios at quarter end will likely be supported by the continuing inflows seen, especially in the SMA platforms. Hence, a summer rally.</li>
</ul>

<p>These two views certainly have their merits. But still trying to understand the Fork? It would seem to us that capturing tax-exempt flow in an exchange-traded fund (&ldquo;ETF&rdquo;), such as the <a href="https://www.vaneck.com/us/en/investments/intermediate-muni-etf-itm/overview/" title="ITM - VanEck Intermediate Muni ETF - Overview"><strong>VanEck Intermediate Muni ETF (ITM)</strong></a>, might be a good parking spot until evidence points you in which direction to go.</p>
<p>To receive more <strong><a href="https://www.vaneck.com/us/en/insights/municipal-bonds/" title="Municipal Bonds Insights">Municipal Bonds</a></strong> insights, <strong><a href="https://www.vaneck.com/us/en/subscribe/" title="Subscription Center">sign up in our subscription center</a></strong>.</p>
]]></content:encoded>
</item><item rdf:about="https://www.vaneck.com/us/en/blogs/thematic-investing/fact-check-will-robots-replace-us/">
  <title>Fact-Check: Will Robots Replace Us?></title>
  <link>https://www.vaneck.com/us/en/blogs/thematic-investing/fact-check-will-robots-replace-us/</link>
  <description><![CDATA[The rise of AI and robotics prompts both optimism and worry about the future of work, as technologies displace some jobs but historically create new opportunities, boosting productivity and employment.]]></description>
  <dc:creator>Drew  Anderson</dc:creator>
  <dc:date>05/16/2024 06:30:00</dc:date>
<content:encoded><![CDATA[

<h2>Fact-Check: Will Robots Replace Us?</h2>
<p>The rise of artificial intelligence (AI), automation, and robotics has sparked both anticipation and apprehension regarding the future of work. With the explosion of technological advancements, the question "Will robots take my job?&rdquo; is valid. Within the next five years, one in 16 workers may need to change careers due to robotics and AI (<strong><a href="https://www.mckinsey.com/featured-insights/mckinsey-explainers/what-is-the-future-of-work" title="What is the future of work?" target="_blank" rel="noopener">McKinsey</a></strong>)<sup>1</sup>. Many of these are highly skilled workers.</p>
<p>As alarming as predictions like these are, it's crucial to note that robots will merely displace, not completely replace. Robots' complete takeover of jobs is unrealistic, and we can look to the past to see why that is.</p>
<h2 id="New Jobs Creation" class="jump-link-nav anchored-block" data-jumplink-title="New Jobs Creation">New Jobs Creation</h2>
<p>History demonstrates that technological advancements typically create more jobs than they eliminate. While robots and automation may displace specific roles, they also open avenues for the emergence of new occupations. Adapting to these changes and seizing the opportunities they present is critical.</p>
<p>The creation of new jobs often correlates with heightened productivity. Businesses adopting new technologies work more efficiently, increasing worker output. This productivity surge can drive company expansion, resulting in more job opportunities. Additionally, increased efficiency may lower prices, stimulating consumer spending and further job creation across various sectors.</p>
<p class="d-none d-lg-block"><img class="img-responsive w-100" src="https://www.vaneck.com/contentassets/3df36f4344b84502aada2acc2330e3f2/4452_da_infographic_blog_2024-5_v3.svg" alt="Robots Driving Higher Productivity and New Jobs" /></p>
<p class="d-lg-none"><img class="img-responsive w-100" src="https://www.vaneck.com/contentassets/3df36f4344b84502aada2acc2330e3f2/4452_da_infographic_2024-5_v3.png" alt="Robots Driving Higher Productivity and New Jobs" /></p>
<p>The integration of robotics in manufacturing has spawned roles in robotics manufacturing, software development, and system integration. Similarly, fields such as artificial intelligence, data science, and cybersecurity have experienced significant growth. However, this labor abundance contributes to another challenge humans will face soon.</p>
<h2 id="Labor Shortage" class="jump-link-nav anchored-block" data-jumplink-title="Labor Shortage">Global Labor Force Shortage</h2>
<p>The looming global labor force shortage must be discussed more, as declining birth rates and aging populations in countries like China, South Korea, and Japan exacerbate it. Even the United States is experiencing this as fertility rates dropped 3% this past year (<strong><a href="https://www.cdc.gov/nchs/pressroom/nchs_press_releases/2024/20240525.htm" title="U.S. Fertility Rate Drops to Another Historic Low" target="_blank" rel="noopener">CDC</a></strong>). The fertility rate has been well below replacement for decades. Amongst developed nations, the split between adults who are working age and those who are retired will be nearly 50/50. That is, too many people depend on the working class at our current levels of efficiency. With these demographic changes, innovative solutions are imperative to maintain economic productivity.</p>
<h3>Percentage of Working Age vs. Retirement Age</h3>
<p><img class="img-responsive w-100" src="https://www.vaneck.com/contentassets/3df36f4344b84502aada2acc2330e3f2/4478_ibot_chart-1_2024-5_v1_blog.svg" alt="Percentage of Working Age vs. Retirement Age" /></p>
<p class="chart-disclosure"><strong>Source:</strong> United Nations. As of July 2022. Annual old-age dep. ratio  (%). *Assuming constant fertility and mortality. They are not intended as a forecast or prediction of future results.</p>
<p>In this context, robots and automation technologies can be valuable allies rather than adversaries. By augmenting human labor with robotic assistance, industries can mitigate manpower shortages and enhance efficiency. For instance, in Japan, where the aging population poses a significant challenge, robots are deployed in healthcare settings to alleviate strain on the healthcare system.</p>
<h2>Complementary Nature of Humans and Robots</h2>
<p>With their capacity for tackling precise and repetitive tasks, robots still lean on human insight for activities that require flexibility, inventive thought, and nuanced decision-making. This mutual dependency bolsters the argument for collaboration, not competition, as we move towards the future of work.</p>
<p>Collaborating robots, or "cobots," are interweaving into this dynamic, revolutionizing the manufacturing landscape with safe, cost-efficient automation solutions. These innovative cobots operate in tandem with human workers, broadening the scope of automation through user-friendly interfaces that boost productivity and workplace safety.</p>
<p>This surge in automation sweeps away monotonous tasks from the human workload, granting workers the freedom to contribute higher cognitive skills that demand emotional intelligence, critical thinking, and interpersonal abilities traits genuinely human and beyond the reach of mechanical substitution.</p>
<h2 id="Investing in the Future" class="jump-link-nav anchored-block" data-jumplink-title="Investing in the Future">Investing in the Future</h2>
<p>The rise of robotics and automation presents not a harbinger of joblessness but an opportunity for economic sustainability. Far from rendering human labor obsolete, these technological advances ensure the continuation of work in the face of global labor shortages and the retirement of older generations. By pairing robotic efficiency with human creativity and problem-solving, we can forge a collaborative future that elevates productivity and fosters job creation in AI, data science, and robotics sectors.</p>
<p>Investors can participate in the growth of industries poised to shape the future of work through instruments like the <strong><a href="https://www.vaneck.com/us/en/investments/robotics-etf-ibot/overview/" title="IBOT - VanEck Robotics ETF -Overview">VanEck Robotics ETF</a></strong>, capturing the growth of forward-looking industries while remaining cognizant of the broader trends shaping our evolving economy. The future is not to be feared⁠&mdash;it is to be shaped with optimism, where humans utilize machines to progress toward a prosperous tomorrow.</p>
<p>To receive more <a href="https://www.vaneck.com/us/en/insights/thematic-investing/" title="Thematic Investing Insights"><strong>Thematic Investing</strong></a> insights, <a href="https://www.vaneck.com/us/en/subscribe/" title="Subscription Center"><strong>sign up in our subscription center</strong></a>.</p>
]]></content:encoded>
</item><item rdf:about="https://www.vaneck.com/us/en/blogs/emerging-markets-bonds/fed-waiting-game-an-em-debt-perspective/">
  <title>Fed Waiting Game: An EM Debt Perspective></title>
  <link>https://www.vaneck.com/us/en/blogs/emerging-markets-bonds/fed-waiting-game-an-em-debt-perspective/</link>
  <description><![CDATA[As we wait on the Fed and watch the US fiscal deficit rise, emerging markets are showing why they deserve a deeper look from investors.]]></description>
  <dc:creator>Eric Fine</dc:creator>
  <dc:date>05/15/2024 06:30:00</dc:date>
<content:encoded><![CDATA[

<p id="The VanEck Emerging Markets" class="jump-link-nav anchored-block" data-jumplink-title=" Performance Overview">The VanEck Emerging Markets Bond Fund was down 1.5%, compared to down 2.1% for its benchmark, the 50% J.P. Morgan Government Bond Index-Emerging Markets (GBI-EM) Global Diversified and 50% J.P. Morgan Emerging Markets Bond Index (EMBI) in April. Developed market (DM) government bonds (JP Morgan&rsquo;s GBI Global) were down 2.7%, totally consistent with our view that emerging market (EM) bonds should outperform DM bonds. During April, the Fund initiated or increased exposure to several big local currency markets, which had all sold off during the month including Mexico, Brazil, South Africa, and Turkey. We also added to Nigeria and China corporates in US dollar denominated debt. We continue to think EM local currency and low duration are good answers for the current environment. We end April with carry of 7.3%, yield to worst of 9.4%, duration of 5.0, and 46.3% of the fund in local currency. Our biggest exposures are Mexico (local and hard), Brazil (local and hard), Indonesia (local and hard), Chile (local), and South Africa (local and hard).</p>
<div class="wrapped-div">
<table style="width: 100%;">
<tbody>
<tr class="tbl-data">
<td class="tbl-header last" colspan="8">Average Annual Total Returns<sup>*</sup>&nbsp;(%) as of April 30, 2024</td>
</tr>
<tr class="tbl-data">
<td class="data-head last">&nbsp;</td>
<td class="data-head last">1 MO</td>
<td class="data-head last">3 MO</td>
<td class="data-head last">YTD</td>
<td class="data-head last">1 YR</td>
<td class="data-head last">3 YR</td>
<td class="data-head last">5 YR</td>
<td class="data-head last">10 YR</td>
</tr>
<tr class="tbl-data">
<td class="data-td last">Class A: NAV (Inception 07/09/12)</td>
<td class="data-td data last">-1.43</td>
<td class="data-td data last">-0.69</td>
<td class="data-td data last">-1.71</td>
<td class="data-td data last">4.64</td>
<td class="data-td data last">-1.15</td>
<td class="data-td data last">2.56</td>
<td class="data-td data last">0.99</td>
</tr>
<tr class="tbl-data">
<td class="data-td last">Class A: Maximum&nbsp;0.0575% load</td>
<td class="data-td data last">-7.09</td>
<td class="data-td data last">-6.40</td>
<td class="data-td data last">-7.37</td>
<td class="data-td data last">-1.37</td>
<td class="data-td data last">-3.09</td>
<td class="data-td data last">1.36</td>
<td class="data-td data last">0.39</td>
</tr>
<tr class="tbl-data">
<td class="data-td last">Class I: NAV (Inception 07/09/12)</td>
<td class="data-td data last">-1.48</td>
<td class="data-td data last">-0.67</td>
<td class="data-td data last">-1.51</td>
<td class="data-td data last">4.87</td>
<td class="data-td data last">-0.82</td>
<td class="data-td data last">2.88</td>
<td class="data-td data last">1.30</td>
</tr>
<tr class="tbl-data">
<td class="data-td last">Class Y: NAV (Inception 07/09/12)</td>
<td class="data-td data last">-1.51</td>
<td class="data-td data last">-0.54</td>
<td class="data-td data last">-1.56</td>
<td class="data-td data last">4.72</td>
<td class="data-td data last">-0.91</td>
<td class="data-td data last">2.81</td>
<td class="data-td data last">1.24</td>
</tr>
<tr class="tbl-data">
<td class="data-td last">50% GBI-EM/50% EMBI</td>
<td class="data-td data last">-2.10</td>
<td class="data-td data last">-0.90</td>
<td class="data-td data last">-2.16</td>
<td class="data-td data last">5.09</td>
<td class="data-td data last">-2.87</td>
<td class="data-td data last">0.04</td>
<td class="data-td data last">1.09</td>
</tr>
</tbody>
</table>
</div>
<br />
<div class="wrapped-div">
<table style="width: 100%;">
<tbody>
<tr class="tbl-data">
<td class="tbl-header last" style="width: 100%;" colspan="8">Average Annual Total Returns<sup>*</sup>&nbsp;(%) as of March 31, 2024</td>
</tr>
<tr class="tbl-data">
<td class="data-head last" style="width: 41.8717%;">&nbsp;</td>
<td class="data-head last" style="width: 8.82353%;">1 MO</td>
<td class="data-head last" style="width: 8.82353%;">3 MO</td>
<td class="data-head last" style="width: 8.23529%;">YTD</td>
<td class="data-head last" style="width: 7.54011%;">1 YR</td>
<td class="data-head last" style="width: 8.23529%;">3 YR</td>
<td class="data-head last" style="width: 7.54011%;">5 YR</td>
<td class="data-head last" style="width: 8.93048%;">10 YR</td>
</tr>
<tr class="tbl-data">
<td class="data-td last" style="width: 41.8717%;">Class A: NAV (Inception 07/09/12)</td>
<td class="data-td data last" style="width: 8.82353%;">0.68</td>
<td class="data-td data last" style="width: 8.82353%;">-0.29</td>
<td class="data-td data last" style="width: 8.23529%;">-0.29</td>
<td class="data-td data last" style="width: 7.54011%;">6.76</td>
<td class="data-td data last" style="width: 8.23529%;">0.35</td>
<td class="data-td data last" style="width: 7.54011%;">2.90</td>
<td class="data-td data last" style="width: 8.93048%;">1.39</td>
</tr>
<tr class="tbl-data">
<td class="data-td last" style="width: 41.8717%;">Class A: Maximum 5.75% load</td>
<td class="data-td data last" style="width: 8.82353%;">-5.11</td>
<td class="data-td data last" style="width: 8.82353%;">-6.02</td>
<td class="data-td data last" style="width: 8.23529%;">-6.02</td>
<td class="data-td data last" style="width: 7.54011%;">0.62</td>
<td class="data-td data last" style="width: 8.23529%;">-1.62</td>
<td class="data-td data last" style="width: 7.54011%;">1.69</td>
<td class="data-td data last" style="width: 8.93048%;">0.79</td>
</tr>
<tr class="tbl-data">
<td class="data-td last" style="width: 41.8717%;">Class I: NAV (Inception 07/09/12)</td>
<td class="data-td data last" style="width: 8.82353%;">0.76</td>
<td class="data-td data last" style="width: 8.82353%;">-0.03</td>
<td class="data-td data last" style="width: 8.23529%;">-0.03</td>
<td class="data-td data last" style="width: 7.54011%;">7.28</td>
<td class="data-td data last" style="width: 8.23529%;">0.69</td>
<td class="data-td data last" style="width: 7.54011%;">3.26</td>
<td class="data-td data last" style="width: 8.93048%;">1.71</td>
</tr>
<tr class="tbl-data">
<td class="data-td last" style="width: 41.8717%;">Class Y: NAV (Inception 07/09/12)</td>
<td class="data-td data last" style="width: 8.82353%;">0.73</td>
<td class="data-td data last" style="width: 8.82353%;">-0.05</td>
<td class="data-td data last" style="width: 8.23529%;">-0.05</td>
<td class="data-td data last" style="width: 7.54011%;">7.14</td>
<td class="data-td data last" style="width: 8.23529%;">0.57</td>
<td class="data-td data last" style="width: 7.54011%;">3.19</td>
<td class="data-td data last" style="width: 8.93048%;">1.64</td>
</tr>
<tr class="tbl-data">
<td class="data-td last" style="width: 41.8717%;">50% GBI-EM/50% EMBI</td>
<td class="data-td data last" style="width: 8.82353%;">1.03</td>
<td class="data-td data last" style="width: 8.82353%;">-0.05</td>
<td class="data-td data last" style="width: 8.23529%;">-0.05</td>
<td class="data-td data last" style="width: 7.54011%;">8.10</td>
<td class="data-td data last" style="width: 8.23529%;">-1.45</td>
<td class="data-td data last" style="width: 7.54011%;">0.48</td>
<td class="data-td data last" style="width: 8.93048%;">1.42</td>
</tr>
</tbody>
</table>
</div>
<br />
<p class="chart-disclosure"><sup>*</sup>&nbsp;Returns less than one year are not annualized.</p>
<p class="chart-disclosure"><strong>Expenses: Class A: Gross 2.55%, Net 1.22%; Class I: Gross 2.51%, Net 0.87%; Class Y: Gross 2.91%, Net 0.97%. </strong>Expenses are capped contractually until 05/01/24 at 1.25% for Class A, 0.95% for Class I, 1.00% for Class Y. Caps excluding acquired fund fees and expenses, interest, trading, dividends, and interest payments of securities sold short, taxes, and extraordinary expenses.</p>
<p class="chart-disclosure"><strong>The performance data quoted represents past performance. Past performance is not a guarantee of future results. Investment return and principal value of an investment will fluctuate so that an investor&rsquo;s shares, when redeemed, may be worth more or less than their original cost. Performance may be lower or higher than performance data quoted. Please call 800.826.2333 or visit vaneck.com for performance current to the most recent month ended.</strong></p>
<p class="chart-disclosure">The &ldquo;Net Asset Value&rdquo; (NAV) of a Fund is determined at the close of each business day, and represents the dollar value of one share of the fund; it is calculated by taking the total assets of the fund, subtracting total liabilities, and dividing by the total number of shares outstanding. The NAV is not necessarily the same as the ETF&rsquo;s intraday trading value. Investors should not expect to buy or sell shares at NAV.</p>
<style>
    .wrapped-div {
        max-width: 100%;
    }

    @media (max-width: 768px) {
        .wrapped-div {
            overflow-x: scroll;
        }
    }

    .wrapped-div-sector {
        max-width: 100%;
        overflow-x: scroll;
    }
</style>


<p><strong>Are we there yet? More specifically, now that everyone is bearish on Treasuries (and the Fed), is it time to be bullish? </strong></p>
<p>Since everyone is bearish now, let&rsquo;s start with the bullish side. On the bullish side for rates is the simple fact that four 25 bp rate cuts were priced out of 2024 during the quarter, and recession risks are arguably rising! If this is a pendulum (which it could be), it can swing back. Moreover, there are signs of internal economic weakness in the US, though those redound to forecasting (data such as car loan delinquencies, home affordability, etc.), rather than ex-post evidence. Our EM eyes would also tell us that pronounced political uncertainty always hurts growth, why would the US be any different? To strengthen the argument beyond rising recession risk, which is the main implication of the previous sentence, the Fed&rsquo;s reaction function doesn&rsquo;t present any obvious obstacles to allowing rate cut expectations to resume. Higher oil prices are a tax on the consumer to Fed thinking (and whether that is wrong or right, Fed policy is not viewed as being able to manage oil prices, other than in extremely destabilizing ways), so arguably pushes the Fed toward easing. The Fed has been claiming that even though its Financial Conditions Index (FCI) shows easing conditions, the Fed&rsquo;s messaging has emphasized the simple real rate (which is a dovish framing). Similarly, when I speak with my rates colleagues in the market, I almost get laughed at when I wonder &ldquo;why wouldn&rsquo;t a strong disinflationary stance help the political-economic dynamic?&rdquo; We ask the question because in most EM countries, harnessing a central bank to achieve economic outcomes beyond inflation is a non-starter for voters on the left (and on the right, obviously). Inflation kills the poor and can kill governments, so we would argue that this is a simple observation of global economic history. Anyway, we agree it&rsquo;s ludicrous to imagine a Fed hiking with open political support, but not ludicrous to say they <em>should</em> (which is what Larry Summers is saying, without our flourishes). And if they should but don&rsquo;t, well, here we are. There is not much more to say on this potential climax as our conclusion has always been the same &ndash; caution on duration. The fund is still strongly biased to be capped at neutral duration at most (though there are always some long-duration assets worth having at moments, which sometimes boils down to a diversification strategy &ndash; we can&rsquo;t be too certain of our view on limited duration, too).</p>
<p><strong>The verdict at IMF meetings, again - EM the winner, DM the problem, all due to &ldquo;fiscal dominance&rdquo;. </strong></p>
<p>We clearly won&rsquo;t let this topic go, and why should we? We discuss it in great detail in our <strong><a href="https://www.vaneck.com/us/en/blogs/emerging-markets-bonds/fiscal-dominance-the-clarifying-lens-for-em-and-dm-bonds/" title="Fiscal Dominance: The Clarifying Lens for EM (and DM) Bonds">white paper</a></strong>, and recently our teammates Dave Austerweil and Natalia Gurushina&rsquo;s wrote about it in a <a href="https://www.vaneck.com/us/en/blogs/emerging-markets-bonds/imf-2024-spring-meetings-takeaways-emerging-market-stars-shine-bright/" title="IMF 2024 Spring Meetings Takeaways: Emerging Market Stars Shine Bright"><strong>full piece on the IMF meetings</strong></a>. The IMF doubled down on the theme at recent meetings. At the annual meeting in October 2023, the IMF made it the focus of the meetings, and that continued at the April meeting! We are not alone; this is a major sleeper issue that too many just ignore. More specifically, there were a couple of interesting framings that emanated around recent IMF meetings. Exhibit 1 shows that the US primary fiscal deficit is extremely sensitive to inflation surprises, whereas EMs primary balances are insensitive to inflation surprises. This is obviously due to high US debt compared to low EM debt, so it epitomizes the fiscal or debt constraint. In other words, if you think US fiscal issues will get solved, you better also expect high inflation.</p>
<p>Exhibit 2 below shows that US inflation is among the countries with higher inflation globally, but it&rsquo;s recent rise is stark. This is completely consistent with R-star data we used in our &ldquo;fiscal dominance&rdquo; white paper, showing EMs&rsquo; R-star is declining, and DM&rsquo;s R-star is arguably rising. If so, that&rsquo;s deep, though slow. Only a crisis will change this, in our opinion. A final note:&nbsp; all this analysis essentially lays out tracks and barriers for the fund, we are not thinking about fiscal dominance every day and trading EM based on that view. We are using our EM-focused investment process to do its job, while making sure that the portfolio doesn&rsquo;t bump into any of the implications of these seemingly nebulous facts. Low duration, high spread, idiosyncrasy, benefiting from higher commodity prices, etc. It just happens that EMs have many winners and DMs have many losers, so we&rsquo;re in an attractive alpha territory in EM bonds.</p>
<h3>Exhibit 1 &ndash; US Primary Deficit Depends on Inflation, EM Primary Deficit Does Not</h3>
<p><img class="img-responsive w-100" src="https://www.vaneck.com/contentassets/52e6289862f64d47b7adbeea62bf84ae/4468_emb_chart-1_2024-5_v1_blog.svg" alt="Exhibit 1 - US Primary Deficit Depends on Inflation, EM Primary Deficit Does Not" /></p>
<p class="chart-disclosure">Source: International Monetary Fund, Data as of April 2024.</p>
<h3>Exhibit 2 &ndash; Inflation Is High and Moving Higher in the US, Not EM</h3>
<p><img class="img-responsive w-100" src="https://www.vaneck.com/contentassets/52e6289862f64d47b7adbeea62bf84ae/4468_emb_chart-2_2024-5_v1_blog.svg" alt="Exhibit 2 - Inflation Is High and Moving Higher in the US, Not EM" /></p>
<p class="chart-disclosure">Source: Deutsche Bank, Refinitiv, Haver Analytics.</p>
<h2 id="Is China a good story?-layer-2s-update" class="jump-link-nav anchored-block" data-jumplink-title="Is China a good story?">Is China a good story?</h2>
<p>It sure looks like a name with extreme bearish positioning combined with good fundamental news, and we all know what Paul Tudor Jones said when the technical and the fundamental line up. Policy is firming, with the government signaling that it will support project completions on swaths of ongoing building. And there&rsquo;s the Purchasing Managers Index (PMI) showing expansion. US officials essentially confirmed all of this by expressing concern of &ldquo;overcapacity&rdquo;, which to other eyes is simple productivity and competitive advantage. In fact, that&rsquo;s a teachable moment, as since at least 2008 the US and DM abandoned many orthodox playbooks because, well, it would be painful. Fair, but not an attractive investment context for the DM, as investors must pay for this political risk. Ultimately, China looks set to face higher US and European tariffs, and sanctions from the US are basically on long-term autopilot to &ldquo;more&rdquo;, so we remain nimble and cautious. But, for us in China, that continues to mean small, diversified exposures to beaten-up names. China has been a &ldquo;little engine that could&rdquo;, with small exposure doing a lot of work. But we can&rsquo;t marry the trade.</p>
<h2 id="Exposure Types and Significant Changes" class="jump-link-nav anchored-block" data-jumplink-title="Portfolio Positioning">Exposure Types and Significant Changes</h2>
<p>The changes to our top positions are summarized below. Our largest positions in April were Mexico, Brazil, Indonesia, Chile, and South Africa:</p>
<ul class="content-list">
<li class="mt-2">We increased our local currency exposure in Mexico, South Africa, Turkey, and Brazil. Mexico&rsquo;s central bank sounds very cautious on the pace of policy easing while domestic activity is firming. South Africa&rsquo;s growth gauges also look more encouraging, and the economy can further benefit from China&rsquo;s recovery. A lot of political risks are already priced in, and the latest polls point to a more manageable and less radical governing coalition. Brazil&rsquo;s valuations look attractive, and the currency was lagging the peers, affected in part by concerns about Petrobras dividends, which had subsequently been resolved. Finally, Turkey&rsquo;s policy U-turn is firmly in place after the local elections, the central bank remains hawkish and vigilant, and there are now good prospects for capital inflows and fewer reasons for capital flight.</li>
<li class="mt-2">We also increased our hard currency corporate exposure in China, Singapore, and Argentina, as well as hard currency sovereign exposure in Argentina. We are seeing more signs of economic adjustment in Argentina, including fiscal performance, the current account balance improvement, and higher international reserves. There are further attempts to keep the policy U-turn going, and the key reform bill is now in the parliament. China&rsquo;s economy continues to recover, and authorities signal more policy support with an emphasis on real estate, which can be a much-needed catalyst both for the sector and domestic consumption. Singapore&rsquo;s bond was a new and attractively priced issue.&nbsp;</li>
<li class="mt-2">Finally, we increased our hard currency sovereign exposure in Nigeria, El Salvador, Bolivia, and Bahamas. In Nigeria, we are seeing more positive signals on the policy front, especially the exchange rate unification and tight monetary stance. El Salvador issued a new bond which eased their payment schedule. The Bahamas government is deleveraging aggressively, and the IMF meetings suggest that there can be less deviation from the 2024 fiscal target. In Bolivia, the senate authorized USD325 million in external financing and a major sugar mill announced a sizable investment project to boost its ethanol capacity.</li>
<li class="mt-2">We reduced our local currency exposure in Poland, Colombia, and Malaysia. Poland&rsquo;s central bank and the government might be too busy playing political games, while inflation might accelerate a lot if price caps are removed. The country&rsquo;s valuations also do not look attractive. Colombia&rsquo;s fiscal concerns refuse to die down, and the Minister of Finance just added more fuel to the fire by saying that he wants to make the already stretched fiscal rule more &ldquo;flexible&rdquo;. A major disadvantage in Malaysia is that its low-carry currency is highly correlated with the Chinese renminbi.</li>
<li class="mt-2">We also reduced our hard currency sovereign exposure in Saudi Arabia, United Arab Emirates, and Qatar. Saudi Arabia might be moving from twin surpluses to twin deficits, and this is not reflected in valuations.&nbsp;A lack of a clear medium-term fiscal strategy also generates confusion against the backdrop of seemingly &ldquo;never-ending&rdquo; issuance as new debt is more expensive and the maturity profile gets heavier. Duration concerns were a major consideration in Qatar, especially if the U.S. Federal Reserve has less room to cut. The United Arab Emirates&rsquo; status as a proxy for global duration was the reason we decided to use the position as a funder for more interesting opportunities.</li>
<li class="mt-2">Finally, we reduced our hard currency sovereign exposure in Romania. Romania&rsquo;s pre-election fiscal spending and political noise create a worrisome backdrop, with additional concerns coming from a citizenship bill which might potentially require military intervention in neighboring Moldova if the Russia-Ukraine conflict escalates and spreads further.</li>
</ul>
<p>To receive more&nbsp;<strong><a href="https://www.vaneck.com/us/en/insights/emerging-markets-bonds/" title="Emerging Markets Bonds Insights">Emerging Markets Bonds</a></strong>&nbsp;insights,&nbsp;<strong><a href="https://www.vaneck.com/us/en/subscribe/" title="Subscription Center">sign up in our subscription&nbsp;center</a></strong>.</p>
<style>
    .wrapped-div {
        max-width: 100%;
    }

    @media (max-width: 768px) {
        .wrapped-div {
            overflow-x: scroll;
        }
    }

    .wrapped-div-sector {
        max-width: 100%;
        overflow-x: scroll;
    }
</style>
]]></content:encoded>
</item><item rdf:about="https://www.vaneck.com/us/en/blogs/gold-investing/ima-casanova-sticky-inflation-boosts-gold/">
  <title>Sticky Inflation Boosts Gold></title>
  <link>https://www.vaneck.com/us/en/blogs/gold-investing/ima-casanova-sticky-inflation-boosts-gold/</link>
  <description><![CDATA[Gold continued to rally in April, trading above $2,400 during the month. The convergence of diverse economic and geopolitical factors suggests the potential for gold to further bolster its gains.]]></description>
  <dc:creator>Imaru Casanova</dc:creator>
  <dc:date>05/13/2024 06:30:00</dc:date>
<content:encoded><![CDATA[

<p>Monthly gold market and economic insights from Imaru Casanova, Portfolio Manager, featuring her unique views on mining and gold&rsquo;s portfolio benefits. <a href="/us/en/blogs/gold-investing/ima-casanova-sticky-inflation-boosts-gold/gold-monthly-commentary-april-2024.pdf" target="_blank" rel="noopener" title="Sticky Inflation Boosts Gold"><strong>An expanded PDF version of this commentary, including fund specific information can be downloaded here.</strong></a></p>
<h2>Gold: reaching new all-time highs (again)</h2>
<p>Gold&rsquo;s strength continued in April, with the spot price of the metal repeatedly reaching new highs throughout the month. Gold traded at an intraday high of $2,431 per ounce on April 12, and closed as high as $2,392 on April 19, which coincided with the S&amp;P 500 Index<sup>1</sup>&nbsp;and the NASDAQ Composite Index<sup>2</sup>&nbsp;lows for the month. Gold pared back gains as the broader equity markets bounced back, but still managed to outperform, closing at $2,286.25 on April 30, up $56.38 per ounce or $2.53% during the period. This compares to monthly losses of more than 4% for the S&amp;P 500 and NASDAQ, and a gain of 1.60% for the U.S. dollar (DXY Index<sup>3</sup>).</p>

<h2>Inflation in the driver&rsquo;s seat for now?</h2>
<p>Changing expectations around the U.S. Federal Reserve&rsquo;s (Fed&rsquo;s) monetary policy path were a major driver of gold prices in 2023. Gold generally found support as the odds of Fed rate cuts increased and vice versa. This year, however, we are starting to see a decoupling between Fed path expectations and gold. The odds and number of cuts expected in 2024 have been reduced significantly in the first months of the year, yet gold keeps making fresh highs. We think this may be driven by renewed concerns around inflation.</p>
<p>In April, for example, an inline jobs report for March, combined with higher-than-expected CPI figures that showed an uptick in inflation in the U.S. (3.5% year-over-year in March vs. 3.2% in February), translated to U.S. consumer sentiment declining by more than forecast and inflation expectations increasing. The University of Michigan&rsquo;s preliminary April Consumer Sentiment Index<sup>4</sup>&nbsp;dropped to 77.9 from 79.4 in the previous month and compared to the median estimate by economists of 79. Consumers estimated prices will climb at an annual rate of 3.1% year on year, up from the 2.9% expected a month earlier and the highest so far this year. Later in the month, Q1 2024 preliminary annualized quarter-over-quarter GDP came in at 1.6%, well below expectations of 2.5%, while the Core Personal Consumption Expenditures Index<sup>5</sup>&nbsp;was up 2.8% year-over-year versus estimates of 2.7%. Anecdotally, the use of the word &ldquo;stagflation&rdquo; in the headlines of news articles and reports appears to have ticked up significantly during the month.</p>
<p>Expectations for slower economic growth and higher inflation are generally supportive of gold prices. A pullback of the broader equity markets, like we had in April, and rising global geopolitical tensions provide further support, as investors turn to gold as a safe-haven and portfolio hedge/diversifier.</p>
<h2>Western investment demand still absent</h2>
<p>Yet, western investors appear mostly absent in the gold markets today, with recent strength fueled by central banks, and demand out of Asia, primarily China. The World Gold council reported that global gold bullion backed ETFs lost 114 tons during Q1 2024, a 4% decline in total holdings.<sup>*</sup>&nbsp;Interestingly, while North America and Europe saw ETF outflows, Asian listed funds had inflows during the quarter, the fourth consecutive quarter of inflows.</p>
<h3>Gold ETF Flows and Assets</h3>
<p><img class="img-responsive w-100" src="https://www.vaneck.com/contentassets/c972c09cee254c72a83e842884fe4bb4/4459_gold_chart-1_2024-5_v1_blog.svg" alt="Gold ETF Flows and Assets" /></p>
<p class="chart-disclosure">Source: World Gold Council. Data as of March 31, 2024.</p>
<p>Investment demand, the main driver of gold prices historically, has been in decline during this last gold rally. We believe the return of Western investment demand supported by increased risks to the U.S. economy and a deeper correction of the equity markets, has the potential to drive gold prices even higher. How much higher? A simple calculation based on historical data can provide an estimate of future potential gains. The last time gold bullion backed ETF holdings were at around current levels was in late 2019. By late 2020, about a year later, these holdings had reached peak levels and the gold price had risen over $400 per ounce. Thus, If ETF holdings were to return to their historical peak (reached in 2020) and based on the same historical correlation between these holdings and the gold price during that period, it is not unreasonable to assume that gold could climb another $400 per ounce from present levels. That would take the gold price to approximately $2,700 per ounce, based on April&rsquo;s closing price, and to about $2,800 based on its most recent high. Coincidently, that would put gold right around the inflation adjusted price reached in January 1980, when gold traded at an intra-month high of $850 per ounce (equivalent to a CPI-adjusted $2,819 per ounce as of end of Q1 2024).</p>


<h3>Gold Price &ndash; Nominal vs. CPI-Adjusted</h3>
<p><img class="img-responsive w-100" src="https://www.vaneck.com/contentassets/58fe9f1b40ed47259819d5e51fc56ecd/4459_gold_chart-2_2024-5_v1_blog.svg" alt="Gold Price - Nominal vs. CPI-Adjusted" /></p>
<p class="chart-disclosure">Source: VanEck, Bloomberg. Data as of March 31, 2024. Note: January 1980&rsquo;s intra-month high of $815 (in nominal terms) would be equal to approximately $2,819 in today&rsquo;s (2024) dollars.</p>
<p>Of course, that would require the continued support of the current drivers of demand&mdash;particularly the official sector. Central banks have emerged as an important driver of gold prices over the last two years. They appear to be on a longer-term trend of gold buying. Central banks net purchases of gold in Q1 2024 (290 tonnes) represented the highest quarterly figure on record since 2000, and was 69% higher than the five-year quarterly average of 171 tonnes, demonstrating the banks&rsquo; accelerating appetite for gold despite the metal&rsquo;s strong rally during the period.<sup>&dagger;</sup>&nbsp;However, it&rsquo;s a little too early to assess how price sensitive these purchases may be and whether further gains in the gold price could dampen demand from this sector. Gold has had a very impressive rally so far this year. We wouldn&rsquo;t be surprised to see gold pulling back a bit and entering a period of consolidation at a lower level from present, though still well above $2,000, before embarking on the next leg of its rally.</p>
<h2>Miners gain back ground</h2>
<p>Talking about peaks&hellip;the gold miners have certainly covered some ground over the last couple of months, but they are still nowhere near their all-time highs. After a very strong March, the NYSE Arca Gold Miners Index (GDMNTR)<sup>6</sup>&nbsp;and the MVIS Global Juniors Gold Miners Index (MVGDXJTR)<sup>7</sup>&nbsp;continued to significantly outperform gold in the month of April, up 6.11% and 6.28%, respectively. GDMNTR closed at 1,164.30 on April 30, compared to its September 2011 high of 1971.01, when gold was trading at approximately $1,800 per ounce. This suggests there may still be plenty of runway for gold stocks as they reclaim their role as a leveraged play on the gold price. Our expectations of a sector re-rating are not only supported by continued strength in the gold price, but also anchored to generally solid company fundamentals. We are encouraged by financial and operating results reported by gold companies for Q1 2024, which seem to be mostly in-line with expectations for the group so far.</p>
<h3>Relative Price Ratio &ndash; Gold Miners vs. Gold (Sep-2011 and Aug-2020 to Apr-2024)</h3>
<p><img class="img-responsive w-100" src="https://www.vaneck.com/contentassets/58fe9f1b40ed47259819d5e51fc56ecd/4459_gold_chart-3_2024-5_v1_blog.svg" alt="Relative Price Ratio - Gold Miners vs. Gold (Sep-2011 and Aug-2020 to Apr-2024)" /></p>
<p class="chart-disclosure">Source: FactSet, Bloomberg, VanEck. Data as of April 2024.</p>
<p>To receive more <strong><a href="https://www.vaneck.com/us/en/insights/gold-investing/" title="Gold Investing Insights">Gold Investing</a></strong> insights, <strong><a href="https://www.vaneck.com/us/en/subscribe/" title="Subscription Center">sign up in our subscription center</a></strong>.</p>
]]></content:encoded>
</item><item rdf:about="https://www.vaneck.com/us/en/blogs/model-portfolios/as-inflation-holds-steady-golds-ready/">
  <title>As Inflation Holds Steady, Gold’s Ready></title>
  <link>https://www.vaneck.com/us/en/blogs/model-portfolios/as-inflation-holds-steady-golds-ready/</link>
  <description><![CDATA[<p>Inflation remains high, and the US economy is slowing. It&rsquo;s time for investors to allocate to real assets like commodities and gold.</p>]]></description>
  <dc:creator>David Schassler</dc:creator>
  <dc:date>05/09/2024 06:30:00</dc:date>
<content:encoded><![CDATA[

<p>Remember the argument that &ldquo;inflation is transitory&rdquo;? My best inflation protection over the past few years would have been to take one dollar from every inflation denier every time they argued that inflation won&rsquo;t happen, won&rsquo;t last or some permutation of both.</p>
<p>Our macro theme is stagflation. And from our perspective, the data is telling us that we&rsquo;re going to be correct. The U.S. economy is slowing (GDP is at 1.6%) and inflation is not (CPI is at 3.5%). Expect the market ride to get bumpier as investors adapt to the current environment. In reaction, Fed Chair Powell stated, &ldquo;Recent data has clearly not given us greater confidence that inflation is coming fully under control and instead indicates that it's likely to take longer than expected to achieve that confidence.&rdquo;</p>


<p>Investors have a terrible habit of overcomplicating simple problems, so let&rsquo;s start with a few basics:</p>
<ol class="content-list">
<li>Since February 2020, the supply of money has increased by over 40%, which helped spark inflation.<sup>1</sup></li>
<li>High inflation regimes have historically persisted a very long time.</li>
<li>High interest rates, coupled with an <strong><a href="https://www.vaneck.com/us/en/blogs/investment-outlook/jan-van-eck-global-growth-returns-and-the-2025-fiscal-reckoning/" title="Global Growth Returns and the 2025 Fiscal Reckoning">extreme public debt burden</a></strong> and insatiable government spending, will cause instability, more money creation, and will likely perpetuate inflation.</li>
</ol>
<p>We have been loudly warning about <strong><a href="https://www.vaneck.com/us/en/blogs/natural-resources/inflation-is-here-time-to-get-real-with-real-assets/" title="Inflation Is Here: Time to Get Real with Real Assets">persistently high inflation</a></strong> and the need for <strong><a href="https://www.vaneck.com/us/en/blogs/natural-resources/play-the-inflation-trade/" title="Play the Inflation Trade">inflation protection</a></strong> since 2021. Over the last few years, and as we expected, inflation has refused to dissipate, to the dismay of politicians, market experts and investors. Given the current economic, geopolitical and, perhaps most importantly, supply/demand dynamics of commodity markets, the message remains steadfast: Hoping and ignoring will not solve anything. Diversifying into real assets is the solution. Why?</p>
<p>High inflation, by definition, is a purchasing power problem. When fiat currencies experience excess supply, assets with scarcity increase in value. Some of the best examples of scarce assets are gold, commodities, natural resource equities, real estate, and infrastructure, which make up 100% of the <strong><a href="https://www.vaneck.com/us/en/investments/inflation-allocation-etf-raax/overview/" title="RAAX - VanEck Real Assets ETF - Overview">VanEck Real Assets ETF (RAAX)</a></strong> portfolio.</p>

<p><br />Our top pick for <strong><a href="https://vaneck.com/us/en/videos/get-used-to-higher-rates-and-inflation-focus-on-these-assets/" title="Get Used to Higher Rates and Inflation. Focus on These Assets">hedging inflation in today&rsquo;s environment</a></strong> are commodities&mdash;with a special emphasis on gold, historically the top performing asset as the economy approaches the late stages of the inflationary cycle. In the 1970s, like today, gold investors needed patience. During the first half of the inflation cycle of the 1970s, gold kept pace with commodities, as both outperformed stocks.</p>
<h3>Gold Keeps Pace Through First Half of the 1970s Inflation Regime</h3>
<p><img class="img-responsive w-100" src="https://www.vaneck.com/contentassets/5342f1833dba4dac8e494d56fbb33895/4454_aa_chart-1_2024-5_v1_blog.svg" alt="Gold Keeps Pace Through First Half of the 1970s Inflation Regime" /></p>
<p class="chart-disclosure">Source: Bloomberg.Past performance is no guarantee of future results. Index performance is not illustrative of fund performance. It is not possible to invest directly in an index.</p>
<p>Five years later, as investors realized and finally accepted that inflation was &ldquo;sticky&rdquo;ing around, they flocked to gold to protect their purchasing power, and sent it soaring.</p>
<h3>Gold Climbs Higher in Second Half of the 1970s Inflation Regime</h3>
<p><img class="img-responsive w-100" src="https://www.vaneck.com/contentassets/5342f1833dba4dac8e494d56fbb33895/4454_aa_chart-2_2024-5_v1_blog.svg" alt="Gold Climbs Higher in Second Half of the 1970s Inflation Regime" /></p>
<p class="chart-disclosure">Source: Bloomberg. Past performance is no guarantee of future results. Index performance is not illustrative of fund performance. It is not possible to invest directly in an index.</p>
<p>This rhymes with the current market dynamic. It is now three years since the Fed woke the sleeping inflation giant and key real assets are amongst the top performing assets.</p>
<div class="wrapped-div">
<table style="width: 500px;">
<tbody>
<tr class="tbl-data">
<td class="tbl-header last" colspan="2">Real Assets Among Performance Leaders: 4/30/2021 &ndash; 4/30/2024</td>
</tr>
<tr class="tbl-data">
<td class="data-head last">&nbsp;</td>
<td class="data-head last">Total Return</td>
</tr>
<tr class="tbl-data">
<td class="data-td last">Gold ($/ounce)</td>
<td class="data-td data last">29.23%</td>
</tr>
<tr class="tbl-data">
<td class="data-td last">S&amp;P 500 Index</td>
<td class="data-td data last">26.13%</td>
</tr>
<tr class="tbl-data">
<td class="data-td last">Bloomberg Commodity Index</td>
<td class="data-td data last">23.17%</td>
</tr>
<tr class="tbl-data">
<td class="data-td last">Bloomberg Barclays US Aggregate Bond Index</td>
<td class="data-td data last">-10.24%</td>
</tr>
</tbody>
</table>
</div>
<br />
<p class="chart-disclosure">Source: Bloomberg, as of 4/30/2024.</p>
<p>We expect the price of gold to climb much higher from here and surprise even those that are bullish on the shiny metal.</p>
<p>In conclusion, the late stage of the inflation cycle has arrived, which, historically, features additional (and longer than expected) upward pressure on prices, high interest rates, slowing economic activity, and attractive returns on assets with scarcity. As such, our allocations to commodities and gold are on the rise and so should yours.</p>
<style>
    .wrapped-div {
        max-width: 100%;
    }

    @media (max-width: 768px) {
        .wrapped-div {
            overflow-x: scroll;
        }
    }

    .wrapped-div-sector {
        max-width: 100%;
        overflow-x: scroll;
    }
</style>
<p>To receive more <strong><a href="https://www.vaneck.com/us/en/insights/guided-allocation/" title="Model Portfolio Insights">Model Portfolio</a></strong> insights, <strong><a href="https://www.vaneck.com/us/en/subscribe/" title="Subscription Center">sign up in our subscription center</a></strong>.</p>
]]></content:encoded>
</item><item rdf:about="https://www.vaneck.com/us/en/blogs/municipal-bonds/municipal-bond-etf-portfolio-manager-transition-plans-faq/">
  <title>Municipal Bond ETF Portfolio Manager Transition Plans FAQ></title>
  <link>https://www.vaneck.com/us/en/blogs/municipal-bonds/municipal-bond-etf-portfolio-manager-transition-plans-faq/</link>
  <description><![CDATA[VanEck has announced plans for a change in the portfolio management of its long-standing municipal bond Exchange Traded Funds (ETFs).]]></description>
  <dc:creator> </dc:creator>
  <dc:date>05/09/2024 06:30:00</dc:date>
<content:encoded><![CDATA[

<ul class="content-list">
<li><a href="#point-one"><strong>Is Municipal Bond Portfolio Manager Jim Colby retiring?</strong></a></li>
<li><a href="#point-two"><strong>Who will serve as the Funds&rsquo; new portfolio manager?</strong></a></li>
<li><a href="#point-three"><strong>Who is on the Investment Team and what are their roles before and after the transition?</strong></a></li>
<li><a href="#point-four"><strong>How does Ms. Wang&rsquo;s promotion to Portfolio Manager change her role or her responsibilities?</strong></a></li>
<li><a href="#point-five"><strong>How will elements of the Funds&rsquo; investment process differ with Ms. Wang as Portfolio Manager?</strong></a></li>
</ul>
<h2 id="point-one" class="anchored-block">Is Municipal Bond Portfolio Manager Jim Colby retiring?</h2>
<p>No, Jim is stepping down from his role as Portfolio Manager for the <a href="https://www.vaneck.com/us/en/investments/short-muni-etf-smb/overview/" title="SMB - VanEck Short Muni ETF - Overview"><strong>VanEck Short Muni ETF (SMB)</strong></a>, <a href="https://www.vaneck.com/us/en/investments/intermediate-muni-etf-itm/overview/" title="ITM - VanEck Intermediate Muni ETF - Overview"><strong>VanEck Intermediate Muni ETF (ITM)</strong></a>, <a href="https://www.vaneck.com/us/en/investments/long-muni-etf-mln/overview/" title="MLN - VanEck Long Muni ETF - Overview"><strong>VanEck Long Muni ETF (MLN)</strong></a>, <a href="https://www.vaneck.com/us/en/investments/short-high-yield-muni-etf-shyd/overview/" title="SHYD - VanEck Short High Yield Muni ETF - Overview"><strong>VanEck Short High Yield Muni ETF (SHYD)</strong></a>, and <a href="https://www.vaneck.com/us/en/investments/high-yield-muni-etf-hyd/overview/" title="HYD - VanEck High Yield Muni ETF - Overview"><strong>VanEck High Yield Muni ETF (HYD)</strong></a>, effective July 1, 2024. He will continue to be a key part of the team as Senior Municipal Strategist following the transition.</p>
<h2 id="point-two" class="anchored-block">Who will serve as the Funds&rsquo; new Portfolio Manager?</h2>
<p>Effective July 1, 2024, the Funds&rsquo; current Deputy Portfolio Manager, Stephanie Wang, CFA, will assume the role of Portfolio Manager.</p>
<p>Stephanie's transition to Portfolio Manager is a natural step forward in her career, reflecting her increasing involvement and expanding responsibilities in overseeing the management of the Funds. Her leadership is anticipated to further enhance the performance of the Funds, while remaining aligned with investor objectives.</p>
<p>Stephanie has played a vital role within the Municipal Fixed Income Investment Team since 2016, when she began her career at VanEck as a Quantitative Analyst specializing in both tax-exempt and taxable fixed income. With almost eight years of industry expertise, her portfolio management capabilities and insights are strengthened by her academic qualifications, including an MS and BBA from Baruch College.</p>
<h2 id="point-three" class="anchored-block">Who is on the Investment Team and what are their roles before and after the change?</h2>
<div class="wrapped-div">
<table style="width: 100%;">
<tbody>
<tr class="tbl-data">
<td class="tbl-header last">Team Member</td>
<td class="tbl-header last text-center">Role Prior to July 1, 2024</td>
<td class="tbl-header last text-center">Role as of July 1, 2024</td>
</tr>
<tr class="tbl-data">
<td class="data-td last font-weight-normal">Fran Rodilosso</td>
<td class="data-td data last">Head of Fixed Income ETF Portfolio Management</td>
</tr>
<tr class="tbl-data">
<td class="data-td last font-weight-normal">Jim Colby</td>
<td class="data-td data last">Portfolio Manager and Senior Municipal Strategist</td>
<td class="data-td data last">Senior Municipal Strategist</td>
</tr>
<tr class="tbl-data">
<td class="data-td last font-weight-normal">Stephanie Wang</td>
<td class="data-td data last">Deputy Portfolio Manager (tax-exempts)</td>
<td class="data-td data last">Portfolio Manager (tax-exempts)</td>
</tr>
<tr class="tbl-data">
<td class="data-td last font-weight-normal">Tamara Lowin</td>
<td class="data-td data last">Senior Credit Analyst (tax-exempts)</td>
</tr>
<tr class="tbl-data">
<td class="data-td last font-weight-normal">Daniel Cho</td>
<td class="data-td data last">Associate Portfolio Manager (taxables)</td>
</tr>
<tr class="tbl-data">
<td class="data-td last font-weight-normal">Jared Model</td>
<td class="data-td data last">Senior Trader</td>
</tr>
<tr class="tbl-data">
<td class="data-td last font-weight-normal">Tucker van Eck</td>
<td class="data-td data last">Portfolio Management Associate</td>
</tr>
</tbody>
</table>
</div>
<br />
<h2 id="point-four" class="anchored-block">How does Stephanie&rsquo;s promotion to Portfolio Manager change her role and responsibilities?</h2>
<p>Stephanie&rsquo;s promotion to Portfolio Manager significantly expands her responsibilities. Her role will shift from providing critical support to all aspects of the portfolio management process to leading the Funds&rsquo; strategic direction and investment decisions, aligning with each Fund&rsquo;s respective investment objective.</p>
<h2 id="point-five" class="anchored-block">How will elements of the Funds&rsquo; investment processes differ with Ms. Wang as Portfolio Manager?</h2>
<p><strong>There are no proposed changes to the Funds&rsquo; principal investment strategies.</strong></p>
<p>The Funds will continue to seek to replicate as closely as possible, before fees and expenses, the price and yield performance of their respective indices, each of which are intended to track the overall performance of various segments of the U.S. dollar denominated tax-exempt bond market.</p>
<style type="text/css">
    .wrapped-div {
    max-width: 100%;
    }
   
    @media (max-width: 1024px) {
    .wrapped-div {
    overflow-x: scroll;
    }
    }
   
    .wrapped-div-sector {
    max-width: 100%;
    overflow-x: scroll;
    }
   </style>
]]></content:encoded>
</item><item rdf:about="https://www.vaneck.com/us/en/blogs/moat-investing/moat-stocks-react-to-inflation-and-slowing-growth/">
  <title>Moat Stocks React to Inflation and Slowing Growth></title>
  <link>https://www.vaneck.com/us/en/blogs/moat-investing/moat-stocks-react-to-inflation-and-slowing-growth/</link>
  <description><![CDATA[Inflation and slowing growth reset US equities in April. We explore the impact on moat stocks, and how Morningstar's adjustments to fair values and moat ratings are shaping expectations.]]></description>
  <dc:creator>Brandon Rakszawski</dc:creator>
  <dc:date>05/08/2024 06:30:00</dc:date>
<content:encoded><![CDATA[


<p>April was a reset month for US equity markets, as investors digested persistent inflation data and declining GDP growth. It was the first negative month of the year, from a total return perspective, pausing what had been a consistent upward trajectory for US stocks to start the year. What did not change was the influence of a select few companies on returns. While Alphabet and Tesla were two of the few companies to contribute positively to S&amp;P 500 Index returns, several of the &ldquo;Magnificent 7&rdquo; stocks led the market lower. Microsoft, Meta, Nvidia, and Amazon were four of the top five negative contributors to S&amp;P 500 Index returns in April. This dynamic continues to make things difficult for differentiated, high active share strategies. This is especially true for those that aren&rsquo;t typically focused on pockets of the market that have squeaked out success this year, such as energy stocks and subsets of the utilities and materials sectors.</p>
<p>The <strong><a href="https://www.vaneck.com/us/en/investments/morningstar-wide-moat-etf-moat/overview/" title="MOAT - VanEck Morningstar Wide Moat ETF - Overview">Morningstar Wide Moat Focus Index</a></strong> (the &ldquo;Moat Index&rdquo;) modestly lagged the S&amp;P 500 Index in April, losing 4.96%. Driving this underperformance was stock selection, particularly from the health care and industrials sectors. For the year-to-date, it has been a story of stock selection across the board, both overweights and underweights. More on that below.</p>
<p>Down-market cap, smaller US companies suffered in April in the face of a higher-for-longer interest rate outlook. Higher rates mean potentially higher funding cost for smaller companies that may have less reliable cash flows than their larger peers. The <strong><a href="https://www.vaneck.com/us/en/investments/morningstar-smid-moat-etf-smot/overview/" title="SMOT - VanEck Morningstar SMID Moat ETF - Overview">Morningstar US Small-Mid Cap Moat Focus Index</a></strong> (the &ldquo;SMID Moat Index&rdquo;) performed mostly in line with the Russell 2500 Index, representing the SMID cap market as a whole.</p>

<style>
    .wrapped-div {
        max-width: 100%;
    }

    @media (max-width: 1240px) {
        .wrapped-div {
            overflow-x: scroll;
        }
    }

    .wrapped-div-sector {
        max-width: 100%;
        overflow-x: scroll;
    }
</style>

<h3>Smaller Caps Bear Brunt of Reset Month | As of 4/30/2024</h3>
<p><img loading="lazy" class="img-responsive w-100" src="https://www.vaneck.com/contentassets/e941dcd6c0934b348500838e62ab3ef0/4453_moat-smot_chart-1_2024-5_v1_blog.svg" alt="Smaller Caps Bear Brunt of Reset Month | As of 4/30/2024" /></p>
<p class="chart-disclosure"><strong>Source: Morningstar. As of 4/30/2024</strong>. Past performance is no guarantee of future results. Index performance is not representative of fund performance. It is not possible to invest directly in an index. Fund performance current to the most recent month end is available by visiting vaneck.com or by calling 800.826.2333.</p>
<h2>Moat Index Highlights</h2>
<p><strong>Selection Drives Performance, Again</strong></p>
<p>Stock selection has been the primary driver of relative performance since the Moat Index was launched in 2007. That continued in April and is the key driver of the short-term underperformance relative to the S&amp;P 500 Index in 2024. The elephant in the room in 2024 is Nvidia. The Moat Index has not held Nvidia, which has been a notable headwind considering Nvidia alone has accounted for nearly 40% of the S&amp;P 500 Index&rsquo;s 2024 return thus far.</p>
<p>Health care companies Bristol-Myers Squibb (BMY) and Veeva Systems (VEEV) were notable underperformers in April. BMY shares suffered following mixed earnings results that were released near the end of the month. Despite the negative market sentiment, Morningstar maintained its $63 per share fair value estimate and believes the market is underestimating the strength of the firm&rsquo;s next-generation drugs. Morningstar does acknowledge the magnitude of BMY&rsquo;s patent cliff over the next five years. However, Morningstar believes the firm has enough new products to mitigate pressures from generics and maintains its wide economic moat rating.</p>
<p>VEEV, while in the health care sector, is very much a technology-oriented company. It is the leading provider of cloud-based software solutions specific to the life sciences industry, according to Morningstar. An unexpected departure of the company&rsquo;s chief financial officer and principal financial officer was announced April 1, 2024, which drove market sentiment lower during the month. However, Morningstar believes the transition will not come with any significant operational disruptions and VEEV&rsquo;s notable <strong><a href="https://www.vaneck.com/us/en/blogs/moat-investing/investors-guide-to-switching-costs/" title="An Investor's Guide to Switching Costs">switching costs</a></strong> remain intact. VEEV shares currently trade at an approximately 25% discount to Morningstar&rsquo;s fair value estimate.</p>
<h2>Medtronic Downgrade</h2>
<p>In late March, Morningstar stripped medical device manufacturer Medtronic PLC (MDT) of its wide economic moat rating. Moat rating downgrades from wide are rare and in the case of MDT&rsquo;s, Morningstar&rsquo;s concern is risk of material value destruction as opposed to deteriorating moat sources. Many medical device companies augment their internally developed innovation through M&amp;A activities and MDT is no exception. However, their acquisition of Covidien has depressed returns on invested capital for a prolonged period, and Morningstar stands wary of additional value destruction risk through what is likely to be further industry consolidation. MDT is expected to work its way out of the Moat Index in the coming reviews.</p>
<h3>Top Contributors and Detractors from Moat Index - April 2024</h3>
<div class="wrapped-div">
<table style="width: 750px;">
<tbody>
<tr class="tbl-data">
<td class="tbl-header last " colspan="5">Leading Contributors</td>
</tr>
<tr class="tbl-data">
<td class="data-td  last">Company</td>
<td class="data-head last">Ticker</td>
<td class="data-head last">Sector</td>
<td class="data-head last">Avg. Weight (%)</td>
<td class="data-head last">Contribution (%)</td>
</tr>
<tr class="tbl-data">
<td class="data-td last font-weight-normal">Alphabet Inc</td>
<td class="data-td data last">GOOGL</td>
<td class="data-td data last">Communication Services</td>
<td class="data-td data last">2.68</td>
<td class="data-td data last">0.21</td>
</tr>
<tr class="tbl-data">
<td class="data-td last font-weight-normal">Tyler Technologies Inc</td>
<td class="data-td data last">TYL</td>
<td class="data-td data last">Information Technology</td>
<td class="data-td data last">2.38</td>
<td class="data-td data last">0.20</td>
</tr>
<tr class="tbl-data">
<td class="data-td last font-weight-normal">RTX Corp</td>
<td class="data-td data last">RTX</td>
<td class="data-td data last">Industrials</td>
<td class="data-td data last">2.61</td>
<td class="data-td data last">0.11</td>
</tr>
<tr class="tbl-data">
<td class="data-td last font-weight-normal">Campell Soup Co</td>
<td class="data-td data last">CPB</td>
<td class="data-td data last">Consumer Staples</td>
<td class="data-td data last">2.37</td>
<td class="data-td data last">0.09</td>
</tr>
<tr class="tbl-data">
<td class="data-td last font-weight-normal">Teradyne Inc</td>
<td class="data-td data last">TER</td>
<td class="data-td data last">Information Technology</td>
<td class="data-td data last">2.61</td>
<td class="data-td data last">0.08</td>
</tr>
</tbody>
</table>
</div>
<br />
<div class="wrapped-div">
<table style="width: 750px;">
<tbody>
<tr class="tbl-data">
<td class="tbl-header last " colspan="5">Leading Detractors</td>
</tr>
<tr class="tbl-data">
<td class="data-td  last">Company</td>
<td class="data-head last">Ticker</td>
<td class="data-head last">Sector</td>
<td class="data-head last">Avg. Weight (%)</td>
<td class="data-head last">Contribution (%)</td>
</tr>
<tr class="tbl-data">
<td class="data-td last font-weight-normal">Equifax Inc</td>
<td class="data-td data last">EFX</td>
<td class="data-td data last">Industrials</td>
<td class="data-td data last">2.52</td>
<td class="data-td data last">-0.45</td>
</tr>
<tr class="tbl-data">
<td class="data-td last font-weight-normal">Bristol-Myers Squibb Co</td>
<td class="data-td data last">BMY</td>
<td class="data-td data last">Health Care</td>
<td class="data-td data last">2.39</td>
<td class="data-td data last">-0.43</td>
</tr>
<tr class="tbl-data">
<td class="data-td last font-weight-normal">Veeva Systems Inc</td>
<td class="data-td data last">VEEV</td>
<td class="data-td data last">Health Care</td>
<td class="data-td data last">2.66</td>
<td class="data-td data last">-0.38</td>
</tr>
<tr class="tbl-data">
<td class="data-td last font-weight-normal">Comcast Corp</td>
<td class="data-td data last">CMCSA</td>
<td class="data-td data last">Communication Services</td>
<td class="data-td data last">2.39</td>
<td class="data-td data last">-0.27</td>
</tr>
<tr class="tbl-data">
<td class="data-td last font-weight-normal">Allegion PLC</td>
<td class="data-td data last">ALLE</td>
<td class="data-td data last">Industrials</td>
<td class="data-td data last">2.67</td>
<td class="data-td data last">-0.26</td>
</tr>
</tbody>
</table>
</div>
<br />
<p class="chart-disclosure"><strong>Source: Morningstar, April 2024.</strong> Past performance is no guarantee of future results. Index performance is not illustrative of fund performance. Not intended as a recommendation to buy or to sell any of the securities mentioned herein.</p>
<h2>SMID Moat Index Highlights</h2>
<p><strong>The Good and the Bad Through a Difficult Environment</strong></p>
<p>Following a strong performance month in March, SMID cap stocks finished well in negative territory in April, as the market digested inflation and growth data. Several stocks helped buoy returns for the SMID Moat Index during the period. Equitrans Midstream (ETRN) continued its strong performance following the announced acquisition by EQT in an all-stock transaction due to close in the fourth quarter of 2024. Morningstar sees the acquisition as a good deal for ETRN shareholders. Hasbro (HAS) also performed strongly in April after releasing impressive profitability figures toward the end of the month. The toy and game company completed its divestiture of eOne entertainment business, allowing profitability to swing significantly higher for the quarter. Morningstar maintained its $84 per share fair value estimate following the release and shares finished the month trading near a 25% discount according to Morningstar.</p>
<p>Trinet Group (TNET) was the leading detractor from SMID Moat Index returns in April. It provides outsourced payroll and human capital management services. Shares of TNET slid in late April after a challenging quarter in which higher insurance costs weighed on profitability. Despite the results, Morningstar maintained its $145 fair value estimate and narrow moat rating. CarMax (KMX) also negatively impacted SMID Moat Index returns as market sentiment soured after earnings were released in mid-April. Despite missing expectations for the quarter, Morningstar does not see CarMax as having a demand problem. Rather, it sees an issue of consumer affordability resulting from high interest rates on auto loans. Morningstar did reduce KMX&rsquo;s fair value estimate from $135 per share to $125, but the company still trades at nearly a 50% discount to fair value.</p>
<h3>Top Contributors and Detractors from SMID Moat Index - April 2024</h3>
<div class="wrapped-div">
<table style="width: 750px;">
<tbody>
<tr class="tbl-data">
<td class="tbl-header last " colspan="5">Leading Contributors</td>
</tr>
<tr class="tbl-data">
<td class="data-td  last">Company</td>
<td class="data-head last">Ticker</td>
<td class="data-head last">Sector</td>
<td class="data-head last">Avg. Weight (%)</td>
<td class="data-head last">Contribution (%)</td>
</tr>
<tr class="tbl-data">
<td class="data-td last font-weight-normal">Equitrans Midstream</td>
<td class="data-td data last">ETRN</td>
<td class="data-td data last">Energy</td>
<td class="data-td data last">1.41</td>
<td class="data-td data last">0.12</td>
</tr>
<tr class="tbl-data">
<td class="data-td last font-weight-normal">Hasbro Inc</td>
<td class="data-td data last">HAS</td>
<td class="data-td data last">Consumer Discretionary</td>
<td class="data-td data last">0.71</td>
<td class="data-td data last">0.07</td>
</tr>
<tr class="tbl-data">
<td class="data-td last font-weight-normal">Zebra Technologies Corp</td>
<td class="data-td data last">ZBRA</td>
<td class="data-td data last">Information Technology</td>
<td class="data-td data last">1.38</td>
<td class="data-td data last">0.06</td>
</tr>
<tr class="tbl-data">
<td class="data-td last font-weight-normal">Tyler Technologies</td>
<td class="data-td data last">TYL</td>
<td class="data-td data last">Information Technology</td>
<td class="data-td data last">0.65</td>
<td class="data-td data last">0.06</td>
</tr>
<tr class="tbl-data">
<td class="data-td last font-weight-normal">Interactive Brokers Group</td>
<td class="data-td data last">IBRK</td>
<td class="data-td data last">Financials</td>
<td class="data-td data last">1.43</td>
<td class="data-td data last">0.04</td>
</tr>
</tbody>
</table>
</div>
<br />
<div class="wrapped-div">
<table style="width: 750px;">
<tbody>
<tr class="tbl-data">
<td class="tbl-header last " colspan="5">Leading Detractors</td>
</tr>
<tr class="tbl-data">
<td class="data-td  last">Company</td>
<td class="data-head last">Ticker</td>
<td class="data-head last">Sector</td>
<td class="data-head last">Avg. Weight (%)</td>
<td class="data-head last">Contribution (%)</td>
</tr>
<tr class="tbl-data">
<td class="data-td last font-weight-normal">Trinet Group</td>
<td class="data-td data last">TNET</td>
<td class="data-td data last">Industrials</td>
<td class="data-td data last">1.34</td>
<td class="data-td data last">-0.32</td>
</tr>
<tr class="tbl-data">
<td class="data-td last font-weight-normal">CarMax Inc</td>
<td class="data-td data last">KMX</td>
<td class="data-td data last">Consumer Discretionary</td>
<td class="data-td data last">1.42</td>
<td class="data-td data last">-0.31</td>
</tr>
<tr class="tbl-data">
<td class="data-td last font-weight-normal">Lyft Inc</td>
<td class="data-td data last">LYFT</td>
<td class="data-td data last">Industrials</td>
<td class="data-td data last">1.47</td>
<td class="data-td data last">-0.28</td>
</tr>
<tr class="tbl-data">
<td class="data-td last font-weight-normal">Tapestry Inc</td>
<td class="data-td data last">TPR</td>
<td class="data-td data last">Consumer Discretionary</td>
<td class="data-td data last">1.48</td>
<td class="data-td data last">-0.24</td>
</tr>
<tr class="tbl-data">
<td class="data-td last font-weight-normal">Brunswick Corp</td>
<td class="data-td data last">BC</td>
<td class="data-td data last">Consumer Discretionary</td>
<td class="data-td data last">1.36</td>
<td class="data-td data last">-0.22</td>
</tr>
</tbody>
</table>
</div>
<br />
<p class="chart-disclosure"><strong>Source: Morningstar, April 2024.</strong> Past performance is no guarantee of future results. Index performance is not illustrative of fund performance. Not intended as a recommendation to buy or to sell any of the securities mentioned herein.</p>
<h2>Choose Your Moat Strategy</h2>
<p>VanEck&rsquo;s suite of <strong><a href="https://www.vaneck.com/us/en/blogs/moat-investing/moat-investing-powered-by-morningstar/" title="Quality Companies at Attractive Prices">moat investing strategies</a></strong> is powered by Morningstar&rsquo;s equity research team, which seeks quality companies trading at attractive valuations. The below ETFs offer access to US moat companies:</p>
<p><strong><a href="/link/9e43dd198c5f4e419f13220685081895.aspx" title="MOAT - VanEck Morningstar Wide Moat ETF - Overview">VanEck Morningstar Wide Moat ETF (MOAT)</a>:</strong> companies with a wide moat rating, which means Morningstar believes the company is likely to sustain its competitive advantage for at least the next 20 years.</p>
<p><strong><a href="/link/166321dbcfec440590fb51cf0ad629aa.aspx" title="SMOT - VanEck Morningstar SMID Moat ETF - Overview">VanEck Morningstar SMID Moat ETF (SMOT)</a></strong>: small and mid-cap moat companies.</p>
<style>
    .wrapped-div {
        max-width: 100%;
    }

    @media (max-width: 1240px) {
        .wrapped-div {
            overflow-x: scroll;
        }
    }

    .wrapped-div-sector {
        max-width: 100%;
        overflow-x: scroll;
    }
</style>
]]></content:encoded>
</item><item rdf:about="https://www.vaneck.com/us/en/blogs/emerging-markets-bonds/imf-2024-spring-meetings-takeaways-emerging-market-stars-shine-bright/">
  <title>IMF 2024 Spring Meetings Takeaways: Emerging Market Stars Shine Bright></title>
  <link>https://www.vaneck.com/us/en/blogs/emerging-markets-bonds/imf-2024-spring-meetings-takeaways-emerging-market-stars-shine-bright/</link>
  <description><![CDATA[<p>At the Spring IMF meetings, our EM Debt investment team noted improved investor sentiment since the Fall, with emerging markets now shining brightly on the global stage.</p>]]></description>
  <dc:creator>David Austerweil</dc:creator>
  <dc:date>05/03/2024 06:30:00</dc:date>
<content:encoded><![CDATA[

<h2 id="Overview" class="jump-link-nav anchored-block" data-jumplink-title="Overview">EM investors and policy makers are enjoying their moment</h2>
<p>At the 2024 IMF Spring meeting, most of the concerns over emerging markets (EM) from the Fall 2023 meeting &ndash; from global rates to specific problematic EMs &ndash; had been addressed. The mood at the IMF Spring meetings was notably upbeat, which was a refreshing change from the amount of concern expressed about US fiscal policy and global markets at the Fall meetings in Marrakech. Over those six months, US 10-year yields peaked at 4.99, declined to a low of 3.79 and sold back off to 4.63. It&rsquo;s been a wild ride, but emerging markets digested the volatility and higher rates remarkably well.</p>
<p>There are good reasons markets faired so well and sentiment improved. The market is still pricing in just under two interest rate cuts by the Federal Reserve this year and this pricing is still validated by the Fed&rsquo;s dot plot. The IMF upgraded US growth forecasts for 2024 by +0.6% of GDP and Chinese PMIs are back to expansion. Most importantly, there has been a very large loosening of financial conditions since the Fed pivot in December.</p>
<p>EM investors and policy makers have further reasons to celebrate. There aren&rsquo;t any bad EM stories right now, with almost all of the typical problem cases in EM making meaningful policy adjustments. While top line index performance is lackluster due to the sell-off in US Treasury yields, there have been exceptional returns for lower-rated sovereigns. Almost every one of those low rated credits is attempting a policy U-turn (or at least some reforms), and so it would be unfair to characterize these returns as a &ldquo;Dash for Trash&rdquo; even if it appears that way at first sight. Most investors were able to capture some of this alpha.</p>

<style>
    .wrapped-div {
        max-width: 100%;
    }

    @media (max-width: 768px) {
        .wrapped-div {
            overflow-x: scroll;
        }
    }

    .wrapped-div-sector {
        max-width: 100%;
        overflow-x: scroll;
    }
</style>


<h3>J.P. Morgan EMBI Global Diversified Index Total Returns</h3>
<div class="wrapped-div">
<table style="width: 100%;">
<tbody>
<tr class="tbl-data">
<td class="tbl-header last " colspan="3">EMBIGD Total Returns</td>
</tr>
<tr class="tbl-data">
<td class="data-td last">Rating</td>
<td class="data-head last">YTD</td>
<td class="data-head last">6M</td>
</tr>
<tr class="tbl-data">
<td class="data-td last font-weight-normal">AA</td>
<td class="data-td data last">-4.2%</td>
<td class="data-td data last">7.2%</td>
</tr>
<tr class="tbl-data">
<td class="data-td last font-weight-normal">A</td>
<td class="data-td data last">-3.1%</td>
<td class="data-td data last">6.2%</td>
</tr>
<tr class="tbl-data">
<td class="data-td last font-weight-normal">BBB</td>
<td class="data-td data last">-3.5%</td>
<td class="data-td data last">6.5%</td>
</tr>
<tr class="tbl-data">
<td class="data-td last font-weight-normal">BB</td>
<td class="data-td data last">-2.6%</td>
<td class="data-td data last">8.5%</td>
</tr>
<tr class="tbl-data">
<td class="data-td last font-weight-normal">B</td>
<td class="data-td data last">3.1%</td>
<td class="data-td data last">15.9%</td>
</tr>
<tr class="tbl-data">
<td class="data-td last font-weight-normal">C</td>
<td class="data-td data last">22.7%</td>
<td class="data-td data last">37.0%</td>
</tr>
<tr class="tbl-data">
<td class="data-td last font-weight-normal">NR</td>
<td class="data-td data last">-1.8%</td>
<td class="data-td data last">10.9%</td>
</tr>
</tbody>
</table>
</div>
<br />
<p class="chart-disclosure">Source: JP Morgan. Past performance is no guarantee of future results.</p>
<p>The index is an unmanaged, market-capitalization weighted, total-return index tracking the traded market for U.S.-dollar-denominated Brady bonds, Eurobonds, traded loans, and local market debt instruments issued by sovereign and quasi-sovereign entities.</p>
<p>Surveys show that investors expect goldilocks to continue through at least the end of the year. Recession is no longer the baseline scenario and core PCE is expected to remain below 3%. The Fed is expected to cut interest rates one or two times and long-term interest rates are expected to remain not too far from 4.5%.</p>
<p>However, there is reason to believe this complacent view may be a mistake. The December pivot by the Fed was the primary catalyst behind the magnitude of the market move. Given the strength of US employment and inflation data received since, the pivot is looking more and more like a policy mistake. The Fed would need to see more than a few months of benign inflation readings before it can cut rates and the timing of the first cut would be uncomfortably close to the US Presidential election. There is a reasonable chance that high for longer US rates could turn into higher for longer US rates and this could be too much for goldilocks to withstand.</p>
<h2 id="higher-for-longer-rates" class="jump-link-nav anchored-block" data-jumplink-title="Higher for Longer Rates">US interest rates will stay high for longer but nobody cares (for now)</h2>
<p>The outlook for US inflation is particularly troubling. The IMF narrative was that walking the &ldquo;last mile&rdquo; for inflation to converge to target could take even longer than expected. However, a large portion of last year&rsquo;s disinflation was due to non-core prices like food and energy. Those prices are no longer declining and have posted surprisingly strong gains to start the year. Demand in the US has remained strong as the labor market is still tight and growth keeps surprising to the upside. Uncertainty about both energy and goods supply has also increased due to risks from a widening Israel-Gaza conflict. Even more concerning is that core inflation appears to be increasing again and fiscal pressures might be to blame.</p>
<h3>Decomposition of inflation drivers.</h3>
<p><strong>(Percentage point deviation from December 2019; three-month average inflation, annualized)</strong></p>
<p><img src="https://www.vaneck.com/contentassets/a0a19c9689d445a1a9e3ef130d3cfdb6/4441_emb-imf_chart-1_2024-5_v1_blog.svg" alt="Decomposition of inflation drivers" /></p>
<p class="chart-disclosure">Source: International Monetary Fund. Data as of April 2024. Past performance is no guarantee of future results.</p>
<p>There was a level of acceptance during the meetings that US fiscal policy would remain expansionary for years to come but that it would not pose a major problem for the US or the rest of the world. IMF estimates, however, show a material contribution from fiscal shocks to core inflation in the US. As the Fed keeps rates high, the combination of deficits and high rates is also leading to an exploding contribution of interest expense to the deficit. The risk is that persistently loose fiscal policy eventually raises long-term inflation expectations. If the Fed needs to shift gears from high for longer to rate hikes, it will break the spell cast by the expectation of future rate cuts and easy financial conditions.</p>
<h3>Decomposition of changes in US core inflation</h3>
<p><strong>(Percentage points)</strong></p>
<p><img src="https://www.vaneck.com/contentassets/a0a19c9689d445a1a9e3ef130d3cfdb6/4441_emb-imf_chart-2_2024-5_v1_blog.svg" alt="Decomposition of changes in US Core inflation" /></p>
<p class="chart-disclosure">Source: International Monetary Fund. Data as of April 2024. Past performance is no guarantee of future results.</p>
<h3>Interest payments</h3>
<p><strong>(percent of revenues)</strong></p>
<p><img src="https://www.vaneck.com/contentassets/a0a19c9689d445a1a9e3ef130d3cfdb6/4441_emb-imf_chart-3_2024-5_v1_blog.svg" alt="Interest Payments" /></p>
<p class="chart-disclosure">Source: International Monetary Fund. Data as of April 2024. Not intended as a prediction of future results. For illustrative purposes only.</p>
<h2 id="china" class="jump-link-nav anchored-block" data-jumplink-title="China">China is doubling down on industrial policy but so is the rest of the world</h2>
<p>There were continuing concerns about China&rsquo;s unwillingness to rehabilitate its property sector and risks that China could experience deflation this year with 5% real GDP growth translating into only 4% nominal GDP growth. Deflation in China would be particularly worrying given the very high levels of total economy debt. But these fears most likely reflect peak pessimism in China where investors remain uniquely bearish. The Chinese economy appears to be bottoming with Chinese PMIs back in expansionary territory and new reports of a massive bailout effort to complete that backlog of unfinished homes that would be funded by PBOC QE! If policy makers follow through, it would likely mark the low in Chinese interest rates and result in a sharp change in sentiment towards China.</p>
<p>Chinese policy makers are already providing stimulus to China&rsquo;s old economic model of manufacturing including high tech manufacturing. Just as in the past, this is hugely beneficial to commodity markets and to many emerging markets. However, the rest of the world is becoming frustrated with the flood of cheap products hurting domestic profitability. It is only a matter of time before the US increases tariffs on Chinese products and this will happen under a Biden or Trump Presidency. There is clear bipartisan agreement that Chinese overcapacity is undercutting US producers and the only question to be resolved by the US election is the magnitude of the US response. Chinese export overcapacity was one of the few global disinflationary forces and tariff policy could reverse it.</p>
<p>It isn&rsquo;t just the US that wants to retaliate against China. Europe wants to put tariffs on Chinese electric vehicles. Chile and Brazil just put tariffs on Chinese steel. According to the IMF, there were 3,200 new restrictions on trade in 2022 and 3,000 new restrictions on trade in 2023, up significantly from 1,900 in 2019. Additionally, industrial policy is a global trend with the US subsidizing its own green energy investment as well as chip manufacturing. As global trade gets fragmented along geopolitical fault lines, the main one being the US or China, it is rational for countries to secure their own production and supply chains. The result leads to a reduction in global trade, especially between competing trade blocs.</p>
<h2 id="em-central-bank-policy" class="jump-link-nav anchored-block" data-jumplink-title="EM Central Bank Policy">Many EM central banks adjust policy to incorporate high for longer</h2>
<p>Emerging market central banks, who like the Fed still need to &ldquo;walk the last mile of disinflation&rdquo;, used the Spring meetings to communicate a tightening to their monetary policy stance. Brazil and Mexico were the most active each, with multiple central bankers meeting investors at multiple events.</p>
<p>Brazil changed its rate path guidance to be meeting dependent while communicating a shallower cutting cycle from the previous pace of 50 bps of cuts per meeting. Mexico communicated strongly that it had not just embarked on a cutting cycle and that it would remain on hold at the next policy meeting. In both Mexico and Brazil, inflation expectations remain too high above target for central bankers to consider additional cuts. Indonesia, where inflation is already within target, hiked interest rates to contain an exchange rate overshoot that could feed back to inflation expectations.</p>
<p>There were some central banks, most notably Chile, who did not see any impact from the Fed&rsquo;s policy stance on domestic inflation and communicated they would stay the course on rate cuts. The market, up until recently, has punished their exchange rates for it. As outlined in the Fall IMF notes, the currencies of countries with high real interest rates and hawkish policy stances should continue to perform well even if the Fed remains on hold for longer.</p>
<h3>Current easing cycle: changes in the market-implied trough (terminal) rates between 12/27/2023 and 4/22/2024 (bps)</h3>
<p><img src="https://www.vaneck.com/contentassets/a0a19c9689d445a1a9e3ef130d3cfdb6/4441_emb-imf_chart-4_2024-5_v1_blog.svg" alt="Current easing cycle" /></p>
<p class="chart-disclosure">Source: VanEck Research, Bloomberg. Data as of April 2024.</p>
<h2>Mission accomplished for the Common Framework and the Global Sovereign Debt Roundtable</h2>
<p>Zambia, who had the unfortunate luck of being the crash test dummy of the common framework, just recently reached an agreement with the majority of its bilateral and private creditors. The landmark agreement is the result of a multiyear process of Paris Club creditors achieving a mutual understanding with their Chinese creditor counterparts about what restructuring terms are acceptable to both groups. Now that the learning process is over, future restructurings for low income countries should proceed much faster and the shorter timeline for restructurings makes all defaulted sovereign debt have higher net present values (NPVs). There are a number of EM sovereign restructurings that are nearing completion, including Ghana, Sri Lanka, Ukraine and Ethiopia. Because of this progress, the Common Framework was no longer a major topic of discussion.</p>
<p>The last remaining obstacle is for governments to reach agreements with private creditors who continue to search for creative solutions to capture a little more value while remaining within the restructuring constraints provided by the IMF&rsquo;s debt sustainability analysis and comparability of treatment with official creditors. In Zambia, this took the form of a value recovery bond with triggers related to the IMF upgrading Zambia&rsquo;s debt carrying capacity or Zambia&rsquo;s exports and fiscal revenues exceeding IMF projections. Similar instruments are being discussed in Ghana and Sri Lanka where it appears agreements with private creditor groups are close. It will be interesting to see how much value these value recovery instruments hold over the long term as similar instruments from past restructurings have often not performed as well as expected.</p>
<p>Ukraine is the most interesting case of an expectations gap between what the official sector needs for a country&rsquo;s debt sustainability and what private creditors want. There is no longer discussion of Ukraine winning the war with Russia and a negotiated stalemate appears to be the best potential outcome near term. However, creditors are actively discussing with the government restructuring terms that would restart coupon payments to private creditors! It appears both unethical and strategically bizarre to pay anything to private creditors while Ukraine&rsquo;s sovereignty is at existential risk and it is struggling to buy ammunition and pay its military. At the same time, the IMF is pushing for a restructuring that incorporates the downside scenario from its debt sustainability analysis into restructuring valuations.</p>
<h2>There weren&rsquo;t any truly negative EM stories</h2>
<p>Argentina, Turkey, and Nigeria have exciting reform stories and meetings with policy makers were standing room only. Brazil, Mexico, Ecuador and Angola presented well while Colombia, Panama and Saudi Arabia were more complicated stories. However, there were not any emerging market countries that raised investor&rsquo;s alarm bells over an imminent crisis and this was a refreshing change from previous meetings.</p>
<p>In <strong>Argentina</strong>, investors are extremely constructive due to Milei&rsquo;s economic team already achieving a primary surplus in the first quarter of his new government. Hyperinflation is no longer a concern and the pace of disinflation is much faster than forecasters expected. The economy, however, is in a deep recession and the exchange rate policy remains unsustainable. Dismantling exchange rate controls and making the fiscal adjustment more sustainable will be the keys to Argentina&rsquo;s success over the medium term.</p>
<p>In <strong>Turkey</strong>, the central bank hiked the policy rate by 500 bps to 50% in March due to higher-than-expected inflation and too strong domestic demand. With President Erdogan&rsquo;s support, the economic team has unwound most of the unorthodox policy measures and the economy shows signs of rebalancing. The central bank has aggressive inflation targets of 36% by year end 2024 and 14% by year end 2025. While these targets are likely too optimistic, investors believe policy rates are high enough to more than offset potential Turkish lira devaluation.</p>
<p>In <strong>Nigeria</strong>, policy makers have taken bold steps to dismantle the exchange controls of the Buhari administration and to clear the sizable foreign-exchange backlog. After initially overshooting, the Naira has recovered value rapidly with many foreign investors participating. It was hard to miss the good feelings shared between investors and policy makers during Q&amp;A sessions. But there are still critical challenges ahead for Nigerian policymakers including tackling sizable fuel subsidies and creating a credible monetary policy framework with well-defined inflation targets and positive real interest rates.</p>
<p><strong>Ecuador</strong> did not hold many investors meetings due to being very close to reaching the just concluded 4 year $4bn EFF program with the IMF. Policy makers stressed their commitment to reaching an IMF agreement and to implementing a credible fiscal adjustment that would allow them to regain market access sometime in the not too distant future.</p>
<p><strong>Brazil</strong> continues to over-deliver on the growth and disinflation fronts, and its external position is comfortable. However, Brazil is yet to fully exorcise its fiscal demons. The new fiscal framework approved in 2023 guarantees that expenditure growth cannot outpace revenues, which is a good sign for primary balances and debt stabilization. But tax reform remains key for the medium-term fiscal outlook. Until there is more certainty on the fiscal side, the central bank might need to keep its real policy rate high for longer.</p>
<p><strong>Mexico&rsquo;s</strong> key storyline is monetary prudence against the backdrop of sticky inflation and election uncertainties both in Mexico and the U.S. Mexico&rsquo;s fiscal cycle is being frontloaded, negating the impact of high real interest rates on the economy (especially services). Near- and friend-shoring should be growth -positive, but they can also affect monetary policy going forward.</p>
<p><strong>Angola</strong> might finally get a much-needed positive catalyst in the form of stabilizing (or even improving) oil production as maintenance issues are now resolved, while a more flexible exchange rate leads external adjustment via imports&rsquo; decompression. Authorities continue to push forward reforms &ndash; including full commitment to fiscal targets - and growth returned to positive territory.</p>
<p><strong>Panama</strong> is on track to lose its investment grade status this year, and a lack of clear underlying strategy to improve fiscal outcomes is a key reason why. Another near-term problem is that local politicians seem to underestimate the potential fiscal impact of losing the arbitration process with First Quantum. The likely outcome is that Panama&rsquo;s rates will have to go up and its debt/GDP ratio will stop declining.</p>
<p><strong>Colombia</strong> plans to run a fiscal deficit this year that will be the same size as the deficit ceiling from the fiscal rule in order to maximize spending. The risk is that any slippage would lead to a breach of the fiscal rule and subsequent rating downgrades. The Ministry of Finance promises it will cut expenditures to investments if necessary to avoid this scenario which would further dampen already low growth. Additionally, inflation expectations are not as strongly anchored as in other countries, and the government's spending plans makes it even harder for the central bank to achieve its inflation target.<strong> </strong></p>
<p><strong>Saudi Arabia's</strong> story was disappointing. The country might be moving from twin surpluses to twin deficits, and this is not reflected in valuations. A lack of clear medium-term fiscal strategy also generates confusion against the backdrop of seemingly &ldquo;never-ending" issuance as new debt is more expensive and the maturity profile gets heavier. Authorities also started to realize that mega-projects might be more difficult to implement, weighing on plans to diversify the economy. Rising regional geopolitical tensions is another reason to remain cautious, despite high oil prices.</p>
<h2 id="looking-ahead" class="jump-link-nav anchored-block" data-jumplink-title="Looking Ahead">Looking Ahead</h2>
<p>The prevailing consensus among investors suggests that both US interest rates and the US deficit will persist at elevated levels for an extended period, While US exceptionalism can continue for years without causing any accidents, US inflation appears poised to rise in the coming months, potentially disrupting the narrative of a gradual convergence towards target levels. Such a development could destabilize the complacency fostered by accommodating financial conditions.</p>
<p>Emerging markets have been able to digest this new reality remarkably well. Formerly troubled nations like Turkey and Argentina are actively pursuing substantial reform initiatives, while Zambia's successful restructuring agreement with bondholders signals the potential for similar resolutions with other defaulted sovereigns. This period heralds a shining moment for emerging markets on the global stage.</p>
<p>To receive more <a href="https://www.vaneck.com/us/en/insights/emerging-markets-bonds/" title="Emerging Markets Bonds Insights"><strong>Emerging Markets Bonds</strong></a> insights, <a href="https://www.vaneck.com/us/en/subscribe/" title="Subscription Center"><strong>sign up in our subscription center</strong></a>.</p>
<style>
    .wrapped-div {
        max-width: 100%;
    }

    @media (max-width: 768px) {
        .wrapped-div {
            overflow-x: scroll;
        }
    }

    .wrapped-div-sector {
        max-width: 100%;
        overflow-x: scroll;
    }
</style>
]]></content:encoded>
</item><item rdf:about="https://www.vaneck.com/us/en/blogs/digital-assets/matthew-sigel-vaneck-crypto-monthly-recap-for-april-2024/">
  <title>VanEck Crypto Monthly Recap for April 2024></title>
  <link>https://www.vaneck.com/us/en/blogs/digital-assets/matthew-sigel-vaneck-crypto-monthly-recap-for-april-2024/</link>
  <description><![CDATA[Digital asset prices declined amid an oversupply of new alt-tokens, with Bitcoin posting its first negative return in eight months, and increased U.S. regulatory scrutiny on self-custody.]]></description>
  <dc:creator>Matthew  Sigel</dc:creator>
  <dc:date>05/03/2024 06:30:00</dc:date>
<content:encoded><![CDATA[

<p><strong>Please note that VanEck may have a position(s) in the digital asset(s) described below.</strong></p>
<p>In April, March&rsquo;s euphoria faded into a downward price grind for digital assets and produced Bitcoin&rsquo;s first negative return in eight months (-14%) amid an over-supply of new alt-token supply, falling on-chain activity and a regulatory assault on self-custody by U.S. authorities. Smart contract platforms, excluding Bitcoin, fell 28% on the month while trading volumes and on-chain revenues also declined sharply. Altcoins bore the brunt of the mushy price action as the average return outside of ETH/BTC was -37% on the month. Many names like Starknet and Aptos fell by almost 50%. The story of the month can best be described as the cooling of speculative froth amid more troubling macro signals, a stagnation of user activity, and a worsening of the regulatory environment in the U.S.</p>
<ul class="content-list">
<li><strong><a href="#smart-contract-platform-update">Smart Contract Platform Update</a></strong></li>
<li><strong><a href="#bitcoin-and-bitcoin-layer-2s-update">Bitcoin and Bitcoin Layer-2s Update</a></strong></li>
<li><strong><a href="#eigenlayer-deep-dive">Eigenlayer Deep Dive</a></strong></li>
<li><strong><a href="#altcoins-update">Altcoins Update</a></strong></li>
<li><strong><a href="#notable-performer-gnosis">Notable Performer: Gnosis</a></strong></li>
<li><strong><a href="#notable-laggard-apto">Notable Laggard: Aptos</a></strong></li>
</ul>
<p id="smart-contract-platform-update" class="jump-link-nav anchored-block" data-jumplink-title="SCPs Update">On the last point, note the following in April:</p>
<ul class="content-list">
<li>The U.S. Securities and Exchange Commission (SEC) issued a Wells Notice to the Uniswap foundation, signaling the agency&rsquo;s intent to bring a lawsuit against the DeFi giant, which Uniswap founder Hayden Adams promised to fight.</li>
<li>The IRS ignored all industry comments and released a draft crypto reporting form that included reporting requirements for un-hosted wallets, which is unfeasible in many circumstances.</li>
<li>The SEC amended its complaint against Justin Sun with arguments that he &ldquo;traveled extensively&rdquo; in the US between 2017 and 2019 while marketing and promoting certain tokens, signaling a possible escalation in agency efforts to hold him accountable.</li>
<li>Consensys flipped the script on the SEC, suing the regulator in the favorable 5th circuit instead of allowing the SEC to bring a lawsuit first. Similar to the Coinbase lawsuit, this suit features William Savitt from Wachtell as lead counsel and appears to be part of a larger play to create a potential circuit split if the rulings differ from the Coinbase case in S.D.N.Y. (2nd Cir.), Binance case in D.D.C. (Fed. Cir.), or Kraken case in N.D.Cal. (9th Cir.).</li>
<li>Media reports revealed that Gary Gensler now considers Ethereum a security despite calling the 2nd largest crypto asset a commodity while he taught at MIT and declining to answer direct questions from lawmakers on the issue.</li>
<li>Samourai Wallet and associated Bitcoin mixing protocol developers were arrested and charged with conspiracy to commit money laundering and conspiracy to operate an unlicensed money-transmitting business.</li>
<li>The FBI issued a warning that users should avoid self-custody wallets that do not collect KYC information as they are likely operating illegal money-transmitting services.</li>
<li>The DOJ updated its response in the Tornado Cash case, suggesting that even decentralized, non-custodial services need to implement KYC/AML and register with the Financial Crimes Enforcement Network (FinCEN). Again, this is not feasible for most open-source projects.</li>
</ul>
<p>All of the above suggests that the Biden administration is hurrying to make DeFi and self-custody functionally illegal in the United States before voters can express political intentions at the ballot box in November. We have already noticed a heightened correlation between bitcoin&rsquo;s price action and Trump&rsquo;s victory odds over the last 6 months. We think such a relationship may rise further over the next six months before the Supreme Court or legislators can definitively address these issues.</p>
<div class="wrapped-div">
<table style="width: 600px;">
<tbody>
<tr class="tbl-data">
<td class="tbl-header last text-center">&nbsp;</td>
<td class="tbl-header last text-center">April</td>
<td class="tbl-header last text-center">1 Year</td>
</tr>
<tr class="tbl-data">
<td class="data-td last">Nasdaq Index</td>
<td class="data-td data last">4%</td>
<td class="data-td data last">56%</td>
</tr>
<tr class="tbl-data">
<td class="data-td last">S&amp;P 500 Index</td>
<td class="data-td data last">-4%</td>
<td class="data-td data last">28%</td>
</tr>
<tr class="tbl-data">
<td class="data-td last">Bitcoin</td>
<td class="data-td data last">-14%</td>
<td class="data-td data last">104%</td>
</tr>
<tr class="tbl-data">
<td class="data-td last">Ethereum</td>
<td class="data-td data last">-16%</td>
<td class="data-td data last">56%</td>
</tr>
<tr class="tbl-data">
<td class="data-td last">Coinbase</td>
<td class="data-td data last">-23%</td>
<td class="data-td data last">280%</td>
</tr>
<tr class="tbl-data">
<td class="data-td last">MarketVector Smart Contract Leaders Index</td>
<td class="data-td data last">-28%</td>
<td class="data-td data last">72%</td>
</tr>
<tr class="tbl-data">
<td class="data-td last">MarketVector Infrastructure Application Leaders Index</td>
<td class="data-td data last">-38%</td>
<td class="data-td data last">47%</td>
</tr>
<tr class="tbl-data">
<td class="data-td last">MarketVector Decentralized Finance Leaders Index</td>
<td class="data-td data last">-39%</td>
<td class="data-td data last">34%</td>
</tr>
<tr class="tbl-data">
<td class="data-td last">MarketVector Media &amp; Entertainment Leaders Index</td>
<td class="data-td data last">-39%</td>
<td class="data-td data last">-14%</td>
</tr>
</tbody>
</table>
</div>
<br />
<p class="chart-disclosure">Source: Bloomberg as of 4/30/2024. <strong>Past performance is not indicative of future results. Not intended as a recommendation to buy or sell any of the names mentioned herein.</strong></p>
<h3>Smart Contract Platform Fully Diluted Valuation (FDV) Sags Alongside On-Chain Revenues, ex BTC</h3>
<p><img class="w-100 img-responsive" src="https://www.vaneck.com/contentassets/ff743ddddde44b19b7b7ab7a91966c4c/4439_scl-april-2024_chart-1_blog_2024-5_v1.svg" alt="Smart Contract Platform Fully Diluted Valuation (FDV) Sags Alongside On-Chain Revenues, ex BTC" /></p>
<p class="chart-disclosure">Source: Artemis XYZ as of 4/29/2024.&nbsp; <em><strong>Past performance is no guarantee of future results. Not intended as a recommendation to buy or sell any securities named herein.</strong></em></p>
<p>The crypto market buckled under the weight of April airdrops, with the majority of them quickly selling off post-launch. Notable airdrop duds include KMNO (-33%), REZ (-33%), W (-56%), PRCL (-33.4%), and SAGA (-54%). We count $9B of new circulating token supply and more than $70B to be unlocked/vested over the next 2-5 years, a considerable headwind to many token prices. Also, as we detail below, the granddaddy of all anticipated airdrops disappointed many stakeholders. That project is Eigenlayer, whose EIGEN token was finally announced, and though the token is still not tradeable, pre-launch markets point to an FDV of roughly $10B, which is as low as 1/3rd of what the most optimistic analysts were predicting. The most promising developing narrative is the Bitcoin Renaissance, but it is very early days here.</p>
<h2>The Bitcoin Renaissance and Runes</h2>
<p>Though BTC&rsquo;s performance was anemic (-14%), network usage reached new record highs as transactions and on-chain revenue hit all-time record highs of ~927k and $81.6M on April 20th, the day after the halving. This activity was spawned by the bitcoin halving, but its genesis can be traced to the creation of new speculative assets on Bitcoin using &ldquo;hacks&rdquo; of Bitcoin&rsquo;s core software. The latest iteration of these assets was Bitcoin Runes which is a standard for creating fungible tokens that is designed to succeed the BRC-20 standard. Runes are more efficient than BRC-20s because they employ a UTXO model that eliminates the Bitcoin network overhead inherent in BRC-20 tokens. Runes are called such because they are created and transferred using a Bitcoin software component in Bitcoin UTXOs called &ldquo;Runestones.&rdquo; Runestones allow tokens to be minted on Bitcoin with a name as well as other rules such as minting ability and total supply of tokens.</p>
<p>BRC-20s and Runes represent attempts by Bitcoin core developers to solve the long-term network security issues facing Bitcoin. The Bitcoin network has a &ldquo;security budget&rdquo; that is derived from the economic value miners receive for securing the network. This economic value that miners earn is the combination of network transaction fees as well as inflationary rewards minted for producing Bitcoin blocks. Unless the price of Bitcoin continues its parabolic trajectory, the security budget of miners will decrease alongside the BTC emissions. The path to stemming a declining security budget is to increase transaction revenues to the BTC network. Though some BTC maximalists believe BTC should only be used to store and transact BTC, there is a significant minority amongst the core developers who want to change Bitcoin to spur transaction growth. A shift in the Bitcoin community is occurring, and it's uncertain if we will see another return to the community feuds of the past.</p>
<h2 id="bitcoin-and-bitcoin-layer-2s-update" class="jump-link-nav anchored-block" data-jumplink-title="Bitcoin and L2 s Update">Bitcoin Layer-2 Blockchains</h2>
<p>Beyond trying to create a larger security budget through transaction revenue, the other core reason for BTC Layer-2 Blockchains (L2s) to exist is to give BTC holders the ability to use their stagnant BTC to earn yield. After the disastrous BTC lending market collapse and the billions in BTC lost in 2022, many entities with large amounts of BTC have been looking to utilize their idle capital. Though BTC <strong><a href="https://www.btceden.org/" title="BTC - Self Introduction" target="_blank" rel="noopener">Eden</a></strong> tracks only 18 projects, we track over 50+ projects. The definition of Bitcoin L2s is a bit more nuanced and flexible than L2s for Ethereum. While there is great nuance even for Ethereum L2s, they typically rely upon Ethereum for settling their state differences (the changes in everyone&rsquo;s token balances and smart contract additions/updates). Often Ethereum L2s also post the compressed transaction data to Ethereum to prove state differences.</p>
<p>Bitcoin L2s, however, typically begin with a bridge that connects each chain to Bitcoin. This bridge acts as a value transport layer that locks BTC and mints a representation of that BTC on the L2. Some projects are building their own bridges from scratch, while others are relying upon existing, proven bridges like tBTC and Interlay. There are many competing designs for Bitcoin L2s. In its current form, Bitcoin is designed as neither a settlement layer nor a data availability layer &ndash; both constructs are necessary for there to be a true L2 roll-up to Bitcoin. The result is a myriad of approaches, including &ldquo;merged mining,&rdquo; &ldquo;sidechains,&rdquo; the evolution towards a &ldquo;roll-up,&rdquo; and even more exotic approaches to security. In some cases, Bitcoin L2s adopt more than one of these approaches simultaneously in order to secure their blockchains.</p>
<p>Merged mining involves miner pools opting into &ldquo;mining&rdquo; a blockchain alongside Bitcoin. This typically involves submitting proof of work for two or more blockchains. A current example of this is <strong><a href="https://rootstock.io/" title="Build together on Bitcoin" target="_blank" rel="noopener">Rootstock</a></strong>. Another type of Bitcoin L2 is the &ldquo;side-chain,&rdquo; which is most often secured by a separate group of non-Bitcoin miners, a Proof of Stake validator set, or a federation of Bitcoin/native token holders. The ultimate Bitcoin L2, however, is one that is a roll-up. A roll-up is a blockchain that settles its state transitions and/or proofs of that transition to a host blockchain alongside the data to prove that the state transition is valid.</p>
<p>Additionally, the current crop of bridges relies upon trusting other parties through a multi-signature approach. This means that a group of people hold key shards that, when combined with some majority of signers, allow for the unlock of &ldquo;bridged&rdquo; BTC. Though it is early, most of the Bitcoin L2s have additional/flimsier trust assumptions than most Ethereum L2s.</p>
<p>However, this reality will change once the BitVM, an open-source Bitcoin virtual machine, is launched. Though it is roughly 12-18 months from becoming implemented on Bitcoin, BitVM promises to enable Turing-complete logic to allow for Bitcoin smart contracts. Though the smart contracts themselves would not be on Bitcoin but instead on other blockchains, BitVM will allow Bitcoin to act as a settlement and verification layer for Bitcoin roll-ups and trust-minimized bridging. The follow on to BitVM, BitVM v2, will allow for data to be stored on Bitcoin that will enable BTC L2s to become complete roll-ups.</p>
<p>Look for more color on BTC L2s in our upcoming deep dive on the BTC L2 landscape.</p>
<h2 id="eigenlayer-deep-dive" class="jump-link-nav anchored-block" data-jumplink-title="Eigenlayer">Ethereum Re-Staking Game and Eigenlayer</h2>
<h3>Eigenlayer TVL (USD) Continues to Levitate</h3>
<p><img class="w-100 img-responsive" src="https://www.vaneck.com/contentassets/ff743ddddde44b19b7b7ab7a91966c4c/4439_scl-april-2024_chart-2_blog_2024-5_v1.svg" alt="Eigenlayer TVL (USD) Continues to Levitate" /></p>
<p class="chart-disclosure">Source: Defillama as of 4/30/2024.<strong> Past performance is no guarantee of future results. Not intended as a recommendation to buy or sell any securities named herein.</strong></p>
<p>In our past monthly reviews, we discussed the re-staking game that was being created to facilitate Eigenlayer, which promised to be the next &ldquo;new thing&rdquo; for Ethereum. Eigenlayer was premised on the notion that lots of service businesses could exist off of the Ethereum blockchain and still rely upon the economic value of ETH to secure their services. Many people outside of crypto are somewhat baffled by the necessity to secure a business using ETH. This is because most off-chain businesses rely upon legal recourse to business agreement violations as well as reputational damage from poor business dealings.</p>
<p>In the permissionless blockchain world, it is very difficult to rely upon the rule of law or reputation because other parties are often anonymous or may reside in countries with flimsy legal systems. In blockchain, cryptography, and consensus, as well as computer code, act as guarantees to ensure businesses are transacted according to immutable rules. However, many businesses necessitate additional trust beyond what is available on Ethereum or rely upon processes that would be too expensive to conduct on the blockchain.</p>
<p>The result is that a number of interesting businesses that would be palatable to blockchain users do not exist. Eigenlayer was developed to allow ETH holders to lend out their ETH as economic bonds in exchange for yield, allowing these complex but useful businesses to gain users due to an economic bond. This economic bond would also act as a form of recompense if a business agreement was not executed properly.</p>
<p>Eigenlayer emerged as the darling of the Ethereum ecosystem because it promised not only a new way to gain yield on Ethereum, but also allow new businesses and services to exist for Ethereum users. Cynically, it also meant that investors would have new projects to invest in, dreams to sell, and tokens to dump. A large ecosystem cropped up around &ldquo;re-staking&rdquo; ETH, as a number of on-chain protocols, to give users tokens in exchange for enabling them to spin up Eigenlayer-centric businesses.</p>
<p>Since Eigenlayer is premised on allowing users to stake ETH to back businesses, it opened up its vaults as a marketing ploy to allow users to deposit funds before its functionality officially launched. To spur users to supply their ETH, they promised that users would earn points which would correspond to an allocation of $EIGEN tokens when Eigenlayer officially launches. Additionally, the &ldquo;re-staking&rdquo; businesses that would operate Eigenlayer validators to verify the transactions promised to give users each an allocation of their tokens as well. Thus, two tiers of entities cropped up that each promised value to Eigenlayer users. But the sum of that value to be given to users was never confirmed.</p>
<p>To great fanfare, users allocated over 5M ETH worth north of $15B into Eigenlayer, giving it the second highest TVL of any crypto application in just under 10 months. Many anticipated that the &ldquo;yield&rdquo; from &ldquo;farming&rdquo; Eigenlayer points as well as the re-staked tokens would result in astronomical yields&mdash;some estimating as high as 100%+ returns from simply locking up ETH.</p>
<p>However, cracks in this speculative furor appeared early as the liquid re-staking token for Renzo, ezETH, de-pegged from its approximate ETH value. ezETH, like other liquid staking tokens, should have a bedrock value that is close to ETH because its swappable for ETH once withdrawals are enabled. But, as holders of ezETH cannot withdraw ETH from Renzo&rsquo;s staking contract yet, ezETH&rsquo;s price is subject to the laws of supply and demand. More risk-tolerant users seemed to forget this reality and sought to leverage their ezETH points farming by borrowing heavily against their ezETH position on borrow/lend platforms. After Renzo protocol released the distribution schedule of their $REZ token, users were very disappointed, and they sold their ezETH for ETH. This resulted in the price dropping below the liquidation level and caused a cascade of liquidation that caused ezETH to drop in price from ~$3150 to as low as $~800.</p>
<p>Eigenlayer finally launched its token on April 29, and to many, it was a massive flop. Early users received 5% of total supply rather than the 10-20% many anticipated, and the tokens are unclaimable for an unspecified period of time. Eigenlayer also blocked anyone who resides in the US and many other countries from claiming their tokens. Though the token has not officially begun trading, early estimates project that the FDV of $EIGEN tokens will be around $10B which is much less than the $30B that many were anticipating. The ETH-BTC ratio made a three-year low on April 13th.</p>
<h2 id="altcoins-update" class="jump-link-nav anchored-block" data-jumplink-title="Altcoins Update">Altcoin News</h2>
<p>Solana, which has been plagued by unreliable transaction processing due to arbitrage bot spam activity, seems to be nearing a fix to solve the congestion issues. Anza, a Solana software-focused developer team, has deployed a testnet upgrade that will provide a stop-gap measure to the network issues until a more permanent solution is developed.</p>
<p>Cosmos, who has been very quiet over the past few months, announced a strong update to its business functionality called interchain security. In the latest iteration, Cosmos announced that it intends to move to partial set security which allows some validators to opt in to security provision. This is an improvement that allows validators to pick and choose which consumer chains they secure to avoid allocating resources to unsafe or low-profit chains.</p>
<p>Meanwhile, Avalanche demonstrated a successful test of its Hyper SDK, a software development kit that allows anyone to create blockchains. The test demonstrated a blazing-fast 100k TPS in a globally distributed node set up with 50 nodes. Avalanche also announced an integration with Stripe for Fiat-to-Crypto onboarding as well as an Amazon Ink partnership for deploying blockchains, called Subnets, on its network.</p>
<p>In the Ethereum L2 landscape, Arbitrum released the BOLD upgrade on its testnet, which allows anyone to submit fraud proofs to Ethereum for Arbitrum activity. This is a substantial upgrade and the first permissionless implementation of fraud proofs which helps decentralize Arbitrum. Scroll, an emerging zero-knowledge (zk) Ethereum L2 blockchain, joined the legion of projects offering points for desired user activity. In Scroll&rsquo;s case, it is offering points for users who deploy capital to Scroll&rsquo;s chain. Another interesting development is the announcement by Hashkey, a Hong Kong based financial services group, to create its own zk L2 blockchain.</p>
<p>Though price action was relatively dire, stablecoin data has proven a bit more encouraging. While stablecoin transfer volume continues to reach highs not seen since 2021, the 30-day moving average of daily active addresses reached its all-time high in April 2024 with 1.66M addresses.</p>
<h3>Stablecoin Daily Active Addresses Reach All-Time Highs</h3>
<p><img class="w-100 img-responsive" src="https://www.vaneck.com/contentassets/ff743ddddde44b19b7b7ab7a91966c4c/4439_scl-april-2024_chart-3_blog_2024-5_v1.svg" alt="Stablecoin Daily Active Addresses Reach All-Time Highs" /></p>
<p class="chart-disclosure">Source: Artemis XYZ as of 4/30/2024. <strong>Past performance is no guarantee of future results. Not intended as a recommendation to buy or sell any securities named herein.</strong></p>
<h2 id="notable-performer-gnosis" class="anchored-block">April&rsquo;s Notable Leader</h2>
<p><strong>GNO (-14%)</strong></p>
<h3>Gnosis Ranks Lowest in Daily Active Addresses Amongst Comparable Blockchains</h3>
<p><img class="w-100 img-responsive" src="https://www.vaneck.com/contentassets/ff743ddddde44b19b7b7ab7a91966c4c/4439_scl-april-2024_chart-4_blog_2024-5_v1.svg" alt="Gnosis Ranks Lowest in Daily Active Addresses Amongst Comparable Blockchains" /></p>
<p class="chart-disclosure">Source: Artemis XYZ as of 4/30/2024. <strong>Past performance is no guarantee of future results. Not intended as a recommendation to buy or sell any securities named herein.</strong></p>
<p>Gnosis is an Ethereum sidechain that calls itself a &ldquo;sister&rdquo; chain to Ethereum. As such, it is an Ethereum-compatible blockchain with its own validator set that implements much of the same software architecture of Ethereum. Gnosis acts as an Ethereum infrastructure layer as it creates popular products such as CoW Swap, Gnosis Safe, the Open Ethereum Client. Additionally, Gnosis has focused on some cutting-edge use cases in payments, called <strong><a href="https://www.vaneck.com/us/en/blogs/digital-assets/matthew-sigel-cracking-the-crypto-adoption-code/" title="Cracking the Crypto Adoption Code">Gnosis Pay</a></strong>, which created the first permissionless debit card that links directly to an on-chain wallet.</p>
<p>An interesting dynamic of the Gnosis chain is that gas for on-chain activities is paid for using xDAI, a stablecoin, while the GNO token is used for staking Gnosis&rsquo;s beacon chain and for governance of Gnosis chain as well as the Gnosis DAO&rsquo;s Treasury. Gnosis also runs a venture arm to incubate projects that will ultimately benefit the Gnosis chain. Most recently, Gnosis has spun out both CoW Swap (a DEX that is designed to save users gas on swaps) and Safe Protocol (a non-custodial treasury wallet used by many crypto projects that secures &gt;$100B in assets). In a March 2024 blog post, Gnosis announced that it intends to use the DAO treasury to fund and foster projects to drive value to tokenholders.</p>
<p>Gnosis&rsquo;s most audacious venture is Gnosis Wallet, which is assembling a full-state, mobile-first bank that integrates Gnosis Safe, Gnosis Pay, CoW Swap, and other applications native to the Gnosis chain. The main catalyst for Gnosis in April was the passage of GIP-98, which funds the investment of GnosisDAO into a project called HOPR to create a VPN service called GnosisVPN. News of the quorum being reached to pass GIP-98 catalyzed a ~20% increase in GNO price over the next few days.</p>
<p>The price exuberance in April is due not only to the potential of GnosisVPN, but also to future investments using DAO funds that mirror the success of CoW Swap ($220 FDV) and SAFE ($1.75B FDV).</p>
<h2 id="notable-laggard-apto" class="anchored-block">April&rsquo;s Notable Laggard</h2>
<p><strong>APT (-52%)</strong></p>
<h3>Aptos Generates 7.5% of the Revenue Per User of Sui</h3>
<p><img class="w-100 img-responsive" src="https://www.vaneck.com/contentassets/ff743ddddde44b19b7b7ab7a91966c4c/4439_scl-april-2024_chart-5_blog_2024-5_v1.svg" alt="Aptos Generates 7.5% of the Revenue Per User of Sui" /></p>
<p class="chart-disclosure">Source: Artemis XYZ as of 4/30/2024. <strong>Past performance is no guarantee of future results. Not intended as a recommendation to buy or sell any securities named herein.</strong></p>
<p>The price action of April was unkind to Aptos as its APT token lost (-52%) after a very auspicious March when it increased (+44%). On-chain activity reflected a plummeting lack of interest in Aptos as it lost the most on-chain revenue (-54%), month to month, of any chain outside of Ethereum. While Ethereum and its ecosystem of L2s have a logical reason for why revenues declined, the cost of blockspace decreased massively due to Blob Space, Aptos does not.</p>
<p>Aptos has a lot to offer from the standpoint of developer experience and blockchain technology. Aptos is a successor to the Facebook Diem project and its blockchain-optimized, rust-based, Move language. The move is billed as being substantially more developer-friendly than existing blockchain smart contract languages such as Move and Rust. In practice, developers claim that using Move has decreased development time by as much as 80%. The move is also claimed to be a safer language than other general-purpose blockchain languages. Aptos implements Move and utilizes a derivative of an optimistic transaction processing system called the AptosBFT that is claimed to reach 100k TPS. It also has a large war chest of funds as it has raised more than $350M to fund its development and its ecosystem.</p>
<p>Despite its high potential, Aptos has not been able to achieve meaningful adoption. Currently, Aptos is second to last in terms of fee revenue, averaging around $3.5K per day. For context, this places it behind the Cosmos Hub, which does not have any smart contract functionality and whose only source of fee revenues is users transacting between wallets or unstaking tokens. While Aptos has a respectable amount of daily active users, ~115K in April, it hosts a Lilliputian amount of DEX volumes. Aptos DEX volumes are the fourth worst among projects we track, ~ $16M per day in April, which ranks it in the same tier as Starknet, Near, Fantom, and Scroll.</p>
<p><strong>Links to third party websites are provided as a convenience and the inclusion of such links does not imply any endorsement, approval, investigation, verification or monitoring by us of any content or information contained within or accessible from the linked sites. By clicking on the link to a non-VanEck webpage, you acknowledge that you are entering a third-party website subject to its own terms and conditions. VanEck disclaims responsibility for content, legality of access or suitability of the third-party websites.</strong></p>
<p>To receive more <strong><a href="https://www.vaneck.com/us/en/insights/digital-assets/" title="Digital Assets Insights">Digital Assets</a></strong> insights, <strong><a href="https://www.vaneck.com/us/en/subscribe/" title="Subscription Center">sign up in our subscription center</a></strong>.</p>
<style>
	.data-td.data {
		padding-right: 5px !important;
	}

	.wrapped-div {
		max-width: 100%;
	}

	@media (max-width: 1240px) {
		.wrapped-div {
			overflow-x: scroll;
		}
	}

	.wrapped-div-sector {
		max-width: 100%;
		overflow-x: scroll;
	}
</style>
]]></content:encoded>
</item><item rdf:about="https://www.vaneck.com/us/en/blogs/moat-investing/the-moat-show-catch-the-latest-episodes/">
  <title>The Moat Show:  Catch the Latest Episodes></title>
  <link>https://www.vaneck.com/us/en/blogs/moat-investing/the-moat-show-catch-the-latest-episodes/</link>
  <description><![CDATA[<p>On The Moat Show, we uncover the companies with economic moats, one stock or sector at a time, by bringing on analysts from Morningstar to share their in-depth insights with you. Here&rsquo;s a rundown of our 4 most recent episodes.</p>]]></description>
  <dc:creator> </dc:creator>
  <dc:date>05/02/2024 06:30:00</dc:date>
<content:encoded><![CDATA[

<h2><a class="popup-youtube" data-video="https://youtu.be/Cvp-Q-03RUU" href="https://www.youtube.com/embed/Cvp-Q-03RUU" title="Watch Video">The Moat Show Ep. 7: Masco with Morningstar's Brian Bernard</a></h2>
<div class="row">
<div class="col-md-4 col-xs-12"><a class="popup-youtube" data-video="https://youtu.be/Cvp-Q-03RUU" href="https://www.youtube.com/embed/Cvp-Q-03RUU" title="Watch Video"><img class="img-responsive" style="margin-right: 15px; margin-top: 0px;" src="https://www.vaneck.com/EPiServer/CMS/Content/contentassets/en/0828c0ca4c334f68ae8d69cf8af074f6/4348_the-moat-show-brian-bernard-masco_thumbnail_2024-05.jpg,,279560/Download?epieditmode=False" alt="Watch Video" align="left" /></a></div>
<div class="col-md-8 col-xs-12"><br /><strong><a class="popup-youtube" data-video="https://youtu.be/Cvp-Q-03RUU" href="https://www.youtube.com/embed/Cvp-Q-03RUU" title="Watch Video">Watch Video</a></strong><br /><a class="popup-youtube" data-video="https://www.youtube.com/embed/Cvp-Q-03RUU" href="https://www.youtube.com/embed/Cvp-Q-03RUU" style="font-size: 16px; font-weight: bold; padding: 10px 0px 0px; margin-right: 20px; width: 202px;" title="Watch Video">The Moat Show Ep. 7: Masco with Morningstar's Brian Bernard</a></div>
</div>
<br />
<p>Learn about Masco's history, valuation, and competitive edge in the home improvement industry with insights from Morningstar&rsquo;s Brian Bernard.</p>
<br />
<h2><a a="" class="popup-youtube" data-video="https://bcove.video/3JxIZJX" href="https://bcove.video/3JxIZJX" title="Watch Video">The Moat Show Ep. 6: TransUnion with Morningstar's Rajiv Bhatia</a></h2>
<div class="row">
<div class="col-md-4 col-xs-12"><a class="popup-youtube" data-video="https://bcove.video/3JxIZJX" href="https://bcove.video/3JxIZJX" title="Watch Video"><img class="img-responsive" style="margin-right: 15px; margin-top: 0px;" src="https://www.vaneck.com/contentassets/9fa19dbfadb0441b9331a9cc3fdf3b59/3918_the-moat-show-rajivbhatia-transunion_thumbnail_2024-01.jpg/Download/" alt="Watch Video" align="left" /></a></div>
<div class="col-md-8 col-xs-12"><br /><strong><a class="popup-youtube" data-video=" https://bcove.video/3JxIZJX" href="https://bcove.video/3JxIZJX" title="Watch Video">Watch Video</a></strong><br /><a class="popup-youtube" data-video="https://bcove.video/3JxIZJX" href="https://bcove.video/3JxIZJX" style="font-size: 16px; font-weight: bold; padding: 10px 0px 0px; margin-right: 20px; width: 202px;" title="Watch Video">The Moat Show Ep. 6: TransUnion with Morningstar's Rajiv Bhatia</a></div>
</div>
<br />
<p>Dive into Transunion's competitive edge and the dynamics of the consumer credit reporting landscape with insights from Rajiv Bhatia, CFA, a seasoned Morningstar Equity Analyst.</p>

<h2><a a="" class="popup-youtube" data-video="https://bcove.video/4aymGzt" href="https://bcove.video/4aymGzt" title="Watch Video">The Moat Show Ep. 5: Campbell Soup Company with Morningstar's Erin Lash</a></h2>
<div class="row">
<div class="col-md-4 col-xs-12"><a class="popup-youtube" data-video="https://bcove.video/4aymGzt" href="https://bcove.video/4aymGzt" title="Watch Video"><img class="img-responsive" style="margin-right: 15px; margin-top: 0px;" src="https://www.vaneck.com/contentassets/05e0e3449542404b91ab0e86f08fbd9c/3761_the-moat-show-ep5_erin-lash_campbell_2023.11_v1.jpg/Download/" alt="Watch Video" align="left" /></a></div>
<div class="col-md-8 col-xs-12"><br /><strong><a class="popup-youtube" data-video=" https://bcove.video/4aymGzt" href="https://bcove.video/4aymGzt" title="Watch Video">Watch Video</a></strong><br /><a class="popup-youtube" data-video="https://bcove.video/4aymGzt" href="https://bcove.video/4aymGzt" style="font-size: 16px; font-weight: bold; padding: 10px 0px 0px; margin-right: 20px; width: 202px;" title="Watch Video">The Moat Show Ep. 5: Campbell Soup Company with Morningstar's Erin Lasha</a></div>
</div>
<br />
<p>Explore Campbell Soup Company&rsquo;s economic moat and the state of the consumer-packaged goods (CPG) industry with Erin Lash, Director, Consumer Equity Research at Morningstar.</p>
<br />
<h2><a a="" class="popup-youtube" data-video="https://bcove.video/4cTVkoY" href="https://bcove.video/4cTVkoY" title="Watch Video">The Moat Show Ep. 4: Domino&rsquo;s Pizza with Morningstar's Sean Dunlop</a></h2>
<div class="row">
<div class="col-md-4 col-xs-12"><a class="popup-youtube" data-video="https://bcove.video/4cTVkoY" href="https://bcove.video/4cTVkoY" title="Watch Video"><img class="img-responsive" style="margin-right: 15px; margin-top: 0px;" src="https://www.vaneck.com/contentassets/86cb8bd4d15d42379cadeb3798358038/3466_moat-show-ep-4_thumbnail_2023_08_v1.jpg/Download/" alt="Watch Video" align="left" /></a></div>
<div class="col-md-8 col-xs-12"><br /><strong><a class="popup-youtube" data-video=" https://bcove.video/4cTVkoY" href="https://bcove.video/4cTVkoY" title="Watch Video">Watch Video</a></strong><br /><a class="popup-youtube" data-video="https://bcove.video/4cTVkoY" href="https://bcove.video/4cTVkoY" style="font-size: 16px; font-weight: bold; padding: 10px 0px 0px; margin-right: 20px; width: 202px;" title="Watch Video">The Moat Show Ep. 4: Domino&rsquo;s Pizza with Morningstar's Sean Dunlop</a></div>
</div>
<br />
<p>Explore Domino&rsquo;s economic moat, its business strategies, and the state of its competitive positioning with Morningstar analyst Sean Dunlop on The Moat Show.</p>
<br />
<h2><a a="" class="popup-youtube" data-video="https://bcove.video/3U9czeL" href="https://bcove.video/3U9czeL" title="Watch Video">The Moat Show Ep. 3: Semiconductors with Morningstar's Brian Colello</a></h2>
<div class="row">
<div class="col-md-4 col-xs-12"><a class="popup-youtube" data-video="https://bcove.video/3U9czeL" href="https://bcove.video/3U9czeL" title="Watch Video"><img class="img-responsive" style="margin-right: 15px; margin-top: 0px;" src="https://www.vaneck.com/contentassets/aacd4289d776474f830fc1ffac6e5621/3313_the-moat-show-brian-colello-semiconductors_thumbnail_2023.07_v1.jpg" alt="Watch Video" align="left" /></a></div>
<div class="col-md-8 col-xs-12"><br /><strong><a class="popup-youtube" data-video=" https://bcove.video/3U9czeL" href="https://bcove.video/3U9czeL" title="Watch Video">Watch Video</a></strong><br /><a class="popup-youtube" data-video="https://bcove.video/3U9czeL" href="https://bcove.video/3U9czeL" style="font-size: 16px; font-weight: bold; padding: 10px 0px 0px; margin-right: 20px; width: 202px;" title="Watch Video">The Moat Show Ep. 3: Semiconductors with Morningstar's Brian Colello</a></div>
</div>
<br />
<p>Despite a booming 2023 for semiconductors, some AI-focused chip stocks might still be undervalued, says Brian Colello, Morningstar&rsquo;s Director of Technology Equity. He offers valuable insights into industry trends, valuations, risks, and economic moats.</p>
<br />
<h2><a class="popup-youtube" data-video="https://bcove.video/3TTWEQ5" href="https://bcove.video/3TTWEQ5" title="Watch Video">The Moat Show Ep. 2: Zimmer Biomet with Morningstar's Debbie Wang</a></h2>
<div class="row">
<div class="col-md-4 col-xs-12"><a class="popup-youtube" data-video="https://bcove.video/3TTWEQ5" href="https://bcove.video/3TTWEQ5" title="Watch Video"><img class="img-responsive" style="margin-right: 15px; margin-top: 0px;" src="https://www.vaneck.com/contentassets/4b4a5e8f759e4947b515b1448287d811/3223_the-moat-show-debbie-wang-zimmer-biomet_2023.06_thumbnail_v1.jpg" alt="Watch Video" align="left" /></a></div>
<div class="col-md-8 col-xs-12"><br /><strong><a class="popup-youtube" data-video=" https://bcove.video/3TTWEQ5" href="https://bcove.video/3TTWEQ5" title="Watch Video">Watch Video</a></strong><br /><a class="popup-youtube" data-video="https://bcove.video/3TTWEQ5" href="https://bcove.video/3TTWEQ5" style="font-size: 16px; font-weight: bold; padding: 10px 0px 0px; margin-right: 20px; width: 202px;" title="Watch Video">The Moat Show Ep. 2: Zimmer Biomet with Morningstar's Debbie Wang </a></div>
</div>
<br />
<p>Despite ongoing industry challenges and changes such as patient backlogs, hospital staffing shortages, and the rise of robotics, orthopedic implants company Zimmer Biomet may present untapped opportunities, according to Morningstar's Senior Analyst, Debbie Wang.</p>
<br />
<h2><a class="popup-youtube" data-video="https://bcove.video/3PUXkUd" href="https://bcove.video/3PUXkUd" title="Watch Video">The Moat Show Ep. 1: Meta Platforms with Morningstar&rsquo;s Ali Mogharabi</a></h2>
<div class="row">
<div class="col-md-4 col-xs-12"><a class="popup-youtube" data-video="https://bcove.video/3PUXkUd" href="https://bcove.video/3PUXkUd" title="Watch Video"><img class="img-responsive" style="margin-right: 15px; margin-top: 0px;" src="https://www.vaneck.com/contentassets/c9c2e45fdcd947398a9cf3949764dc51/3057_moat-educational-series---q2-videos_thumbnail_2023.04_v1.jpg" alt="Watch Video" align="left" /></a></div>
<div class="col-md-8 col-xs-12"><br /><strong><a class="popup-youtube" data-video=" https://bcove.video/3PUXkUd" href="https://bcove.video/3PUXkUd" title="Watch Video">Watch Video</a></strong><br /><a class="popup-youtube" data-video="https://bcove.video/3PUXkUd" href="https://bcove.video/3PUXkUd" style="font-size: 16px; font-weight: bold; padding: 10px 0px 0px; margin-right: 20px; width: 202px;" title="Watch Video">The Moat Show Ep. 1: Meta Platforms with Morningstar&rsquo;s Ali Mogharabi</a></div>
</div>
<br />
<p>In the face of a volatile social media landscape, Morningstar analyst Ali Mogharabi provides deep insights into Meta Platforms' wide economic moat, valuation, and cash flow models. Key discussion points also include an exploration of Meta Platforms' AI projects.</p>
<br />
<p>To receive more <a href="https://www.vaneck.com/us/en/insights/moat-investing/" title="Moat Investing Insights"><strong>Moat Investing</strong></a> insights, <a href="https://www.vaneck.com/us/en/subscribe/" title=" Subscription Center"><strong>sign up in our subscription center</strong></a>.</p>
]]></content:encoded>
</item><item rdf:about="https://www.vaneck.com/us/en/blogs/digital-assets/matthew-sigel-vaneck-april-2024-bitcoin-chaincheck/">
  <title>VanEck April 2024 Bitcoin ChainCheck></title>
  <link>https://www.vaneck.com/us/en/blogs/digital-assets/matthew-sigel-vaneck-april-2024-bitcoin-chaincheck/</link>
  <description><![CDATA[April's on-chain, post-halving Bitcoin snapshot: Minor revenue dip for miners, rising transaction fees, slight price decline with strong year-over-year growth.]]></description>
  <dc:creator>Matthew  Sigel</dc:creator>
  <dc:date>05/02/2024 06:30:00</dc:date>
<content:encoded><![CDATA[

<p><strong>Please note that VanEck has exposure to bitcoin.</strong></p>
<p>In our April 2024 Bitcoin ChainCheck, we analyze the shifts occurring after the April 19 halving. We're beginning to observe key metrics that highlight the resilience and evolving dynamics of the Bitcoin blockchain.</p>
<ul class="content-list">
<li><a href="#price-action"><strong>Bitcoin&rsquo;s Price Action</strong></a></li>
<li><a href="#network-activity"><strong>Bitcoin&rsquo;s Network Activity, Adoption, and Fees</strong></a></li>
<li><a href="#market-health"><strong>Bitcoin Market Health and Profitability</strong></a></li>
<li><a href="#miners"><strong>Bitcoin Miners</strong></a></li>
<li><a href="#chaincheck-monthly-dashboard"><strong>Bitcoin ChainCheck Monthly Dashboard</strong></a></li>
</ul>
<p>Some takeaways for April 2024:</p>
<h2 id="price-action" class="jump-link-nav anchored-block" data-jumplink-title="Price Action">Bitcoin&rsquo;s Price Action</h2>
<ul class="content-list">
<li><strong>Market sentiment:</strong> The immediate aftermath of the bitcoin halving has seen a slight dip in price by 2% over the last 30 days, settling at $66,472. Despite this short-term pullback, the year-over-year increase stands at an impressive 130%.</li>
<li><strong>Regional trading:</strong> Post-halving adjustments have brought distinct changes in regional market behaviors:</li>
<ul class="content-list">
<li>Asia hours: Prices dipped by 7% month-over-month, showing market caution in Asian trading sessions. Let&rsquo;s see if the new Hong Kong spot bitcoin and ethereum ETFs reverse this trend.</li>
<li>Unlike Asia, U.S. trading hours saw a 4% increase, indicating stronger confidence or possible accumulation phases during these hours.</li>
<li>EU hours: European trading showed modest growth with a 1% increase, reflecting steady but cautious participation.</li>
</ul>
</ul>
<div class="wrapped-div">
<table style="width: 500px;">
<tbody>
<tr class="tbl-data">
<td class="tbl-header last">&nbsp;</td>
<td class="tbl-header last text-center">MoM Change (%)</td>
<td class="tbl-header last text-center">YoY Change (%)</td>
</tr>
<tr class="tbl-data">
<td class="data-td last">Asia Hours Price Change MoM ($)</td>
<td class="data-td data last">-7%</td>
<td class="data-td data last">19%</td>
</tr>
<tr class="tbl-data">
<td class="data-td last">U.S. hours Price Change</td>
<td class="data-td data last">4%</td>
<td class="data-td data last">56%</td>
</tr>
<tr class="tbl-data">
<td class="data-td last">EU hours Price Change</td>
<td class="data-td data last">1%</td>
<td class="data-td data last">35%</td>
</tr>
</tbody>
</table>
</div>
<br />
<p class="chart-disclosure">Source: Glassnode, as of 4/28/24. <strong>Past performance is no guarantee of future results.</strong></p>
<ul class="content-list">
<li><strong>Funding rates</strong>: The annualized cost to roll Bitcoin Futures decreased 31% to 15%, indicating a significant reduction in market leverage and bullish sentiment post-halving.</li>
</ul>
<h2 id="network-activity" class="jump-link-nav anchored-block" data-jumplink-title="Network Activity">Bitcoin&rsquo;s Network Activity, Adoption, and Fees</h2>
<ul class="content-list">
<li class="mt-2"><strong>Daily transactions:</strong> Transaction count surged by 27% this month, a robust rebound that puts the heightened network usage post-halving in the 97th percentile of all-time activity.</li>
<li class="mt-2"><strong>Ordinal inscriptions:</strong> Post-halving adjustments saw a sharp 60% decrease in daily inscriptions, landing in the 30th percentile historically. This significant reduction may reflect a shift in priorities or valuation of Ordinals after the release of "Runes,&rdquo; a new fungible token protocol recently launched on the Bitcoin blockchain. Unlike Ordinals, which inscribe unique data onto individual Satoshis creating NFTs, Runes utilize the existing UTXO model to issue fungible tokens with minimal blockchain impact. This could explain why the drop in inscriptions hasn't captured any growth from Runes, as they fundamentally differ in their blockchain usage and purpose. Despite Runes&rsquo; minimal impact on data load, their transactions still accrue fees, contributing to the high transaction fees observed this month. Runes, focusing on fungibility, offer streamlined integration with Bitcoin's infrastructure, potentially setting a new direction for token usage on the network. However, it's important to note that despite the robust monthly averages for transaction fees, we observed a significant decline in these fees at the end of the month, indicating a possible easing of network congestion.</li>
<li class="mt-2"><strong>Total transfer volume:</strong> Despite a 26% month-over-month decrease, the $51.16 billion transferred across the Bitcoin network keeps it in the 87th percentile for historical activity. This indicates the enduring use of Bitcoin for value transfers amidst broader market adjustments.</li>
<li><strong>Average transaction fees:</strong> With the increase in network activity, average transaction fees in USD soared by 126%, reaching an average of $16.77. This uptick places the current fee structure in the 95th percentile historically, reflecting the higher cost of transacting on an increasingly busy network.</li>
</ul>
<h2 id="market-health" class="jump-link-nav anchored-block" data-jumplink-title="Market Health">Bitcoin Market Health and Profitability</h2>
<ul class="content-list">
<li class="mt-2"><strong>Percent of addresses in profit</strong>: 94% of Bitcoin addresses remain in profit despite a slight decline of 4% over the month. We have noted before that when this figure hits 100%, as it did in March, Bitcoin tends to make repeated all-time highs over the subsequent year, albeit with a frequent 20% corrections.</li>
<li class="mt-2"><strong>Net unrealized profit/loss:</strong> The unrealized profit/loss ratio is 0.58, indicating a healthy but not overly euphoric market sentiment.</li>
</ul>
<h2 id="miners" class="jump-link-nav anchored-block" data-jumplink-title="Miners">Bitcoin Miners</h2>
<ul class="content-list">
<li class="mt-2"><strong>Total daily BTC miner revenues</strong>: Miners' daily revenues slightly declined by 5% to $61.9 million but remain extraordinarily high historically in the 99th percentile, thanks to the elevated Bitcoin prices and transaction fees.</li>
</ul>
<h3>Chart of the Month: BTC 30-Day Average Fees (USD)</h3>
<p><img class="img-responsive w-100" src="https://www.vaneck.com/contentassets/0ccfd3422359423ebaa64210d73a56ea/4438_bitcoin-april-blog_chart-1_2024-5_v1_blog.svg" alt="BTC 30-Day Average Fees" /></p>
<p class="chart-disclosure">Source: Glassnode, VanEck research as of 4/28/24. <strong>Past performance is no guarantee of future results.</strong></p>
<div id="chaincheck-monthly-dashboard" class="anchored-block">
<div class="wrapped-div">
<table style="width: 100%;">
<tbody>
<tr class="tbl-data">
<td class="tbl-header last" style="width: 100%;" colspan="5">Bitcoin ChainCheck Monthly Dashboard as of April 28th, 2024</td>
</tr>
<tr class="tbl-data">
<td class="data-head last">&nbsp;</td>
<td class="data-head last text-center">30-day avg</td>
<td class="data-head last text-center">30 day change</td>
<td class="data-head last text-center">365 day change</td>
<td class="data-head last text-center">Last 30 days Percentile vs all-time history</td>
</tr>
<tr class="tbl-data">
<td class="data-td last font-weight-normal">Bitcoin Price</td>
<td class="data-td data last">$66,472</td>
<td class="data-td data last">-2%</td>
<td class="data-td data last">130%</td>
<td class="data-td data last">99%</td>
</tr>
<tr class="tbl-data">
<td class="data-td last font-weight-normal">Daily Active Addresses</td>
<td class="data-td data last">821,239</td>
<td class="data-td data last">-13%</td>
<td class="data-td data last">-16%</td>
<td class="data-td data last">75%</td>
</tr>
<tr class="tbl-data">
<td class="data-td last font-weight-normal">Daily New Addresses</td>
<td class="data-td data last">357,935</td>
<td class="data-td data last">-11%</td>
<td class="data-td data last">-21%</td>
<td class="data-td data last">70%</td>
</tr>
<tr class="tbl-data">
<td class="data-td last font-weight-normal">Daily Transactions</td>
<td class="data-td data last">479,308</td>
<td class="data-td data last">27%</td>
<td class="data-td data last">34%</td>
<td class="data-td data last">97%</td>
</tr>
<tr class="tbl-data">
<td class="data-td last font-weight-normal">Daily Inscriptions</td>
<td class="data-td data last">40,860</td>
<td class="data-td data last">-60%</td>
<td class="data-td data last">-40%</td>
<td class="data-td data last">30%</td>
</tr>
<tr class="tbl-data">
<td class="data-td last font-weight-normal">Total Transfer Volume (USD)</td>
<td class="data-td data last">$51,160,414,411</td>
<td class="data-td data last">-26%</td>
<td class="data-td data last">113%</td>
<td class="data-td data last">87%</td>
</tr>
<tr class="tbl-data">
<td class="data-td last font-weight-normal">% Supply Active, last 180 days</td>
<td class="data-td data last">23%</td>
<td class="data-td data last">20%</td>
<td class="data-td data last">7%</td>
<td class="data-td data last">27%</td>
</tr>
<tr class="tbl-data">
<td class="data-td last font-weight-normal">% Supply Active, last 3+ years</td>
<td class="data-td data last">45%</td>
<td class="data-td data last">0%</td>
<td class="data-td data last">14%</td>
<td class="data-td data last">100%</td>
</tr>
<tr class="tbl-data">
<td class="data-td last font-weight-normal">Avg Fees (USD)</td>
<td class="data-td data last">$16.77</td>
<td class="data-td data last">126%</td>
<td class="data-td data last">672%</td>
<td class="data-td data last">95%</td>
</tr>
<tr class="tbl-data">
<td class="data-td last font-weight-normal">Avg Fees (BTC)</td>
<td class="data-td data last">0.00026</td>
<td class="data-td data last">132%</td>
<td class="data-td data last">241%</td>
<td class="data-td data last">50%</td>
</tr>
<tr class="tbl-data">
<td class="data-td last font-weight-normal">Percent of BTC Addresses in profit</td>
<td class="data-td data last">94%</td>
<td class="data-td data last">-4%</td>
<td class="data-td data last">29%</td>
<td class="data-td data last">82%</td>
</tr>
<tr class="tbl-data">
<td class="data-td last font-weight-normal">Unrealized profit/loss ratio</td>
<td class="data-td data last">0.58</td>
<td class="data-td data last">-6%</td>
<td class="data-td data last">76%</td>
<td class="data-td data last">80%</td>
</tr>
<tr class="tbl-data">
<td class="data-td last font-weight-normal">Global Power Consumption (TWh)</td>
<td class="data-td data last">121</td>
<td class="data-td data last">5%</td>
<td class="data-td data last">82%</td>
<td class="data-td data last">100%</td>
</tr>
<tr class="tbl-data">
<td class="data-td last font-weight-normal">Total Daily BTC Miner Revenues (USD)</td>
<td class="data-td data last">$61,908,771</td>
<td class="data-td data last">-5%</td>
<td class="data-td data last">132%</td>
<td class="data-td data last">99%</td>
</tr>
<tr class="tbl-data">
<td class="data-td last font-weight-normal">Total Crypto Equities' Market Cap (USD) (MM)</td>
<td class="data-td data last">$150,739</td>
<td class="data-td data last">17%</td>
<td class="data-td data last">156%</td>
<td class="data-td data last">96%</td>
</tr>
<tr class="tbl-data">
<td class="data-td last font-weight-normal">Transfer volume from Miners to Exchanges (USD)</td>
<td class="data-td data last">$4,174,007</td>
<td class="data-td data last">-27%</td>
<td class="data-td data last">23%</td>
<td class="data-td data last">84%</td>
</tr>
<tr class="tbl-data">
<td class="data-td last font-weight-normal">Bitcoin Dominance</td>
<td class="data-td data last">53%</td>
<td class="data-td data last">2.15%</td>
<td class="data-td data last">15%</td>
<td class="data-td data last">78%</td>
</tr>
<tr class="tbl-data">
<td class="data-td last font-weight-normal">Bitcoin Futures Annualized Basis</td>
<td class="data-td data last">15%</td>
<td class="data-td data last">-31%</td>
<td class="data-td data last">310%</td>
<td class="data-td data last">77%</td>
</tr>
</tbody>
</table>
</div>
</div>
<br />
<p class="chart-disclosure">Source: Glassnode, VanEck research as of 4/28/24. <strong>Past performance is no guarantee of future results.</strong></p>
<p><strong>Notes:</strong></p>
<p>Net unrealized profit/loss ratio (NUPL) can be calculated by subtracting the realized market cap from the market cap and dividing the result by the market cap. When a high percentage of Bitcoin&rsquo;s market cap consists of unrealized profits, it can be interpreted that investors are greedy. Background reading <strong><a href="https://medium.com/@adamant_capital/a-primer-on-bitcoin-investor-sentiment-and-changes-in-saving-behavior-a5fb70109d32" title="A Primer on Bitcoin Investor Sentiment and Changes in Saving Behavior" target="_blank" rel="noopener">here</a></strong>.</p>
<p><strong>Links to third party websites are provided as a convenience and the inclusion of such links does not imply any endorsement, approval, investigation, verification or monitoring by us of any content or information contained within or accessible from the linked sites. By clicking on the link to a non-VanEck webpage, you acknowledge that you are entering a third-party website subject to its own terms and conditions. VanEck disclaims responsibility for content, legality of access or suitability of the third-party websites.</strong></p>
<p>To receive more <strong><a href="https://www.vaneck.com/us/en/insights/digital-assets/" title="Digital Assets Insights">Digital Assets</a></strong> insights, <strong><a href="https://www.vaneck.com/us/en/subscribe/" title="Subscription Center">sign up in our subscription center</a></strong>.</p>
<style>
	.data-td.data {
		padding-right: 5px !important;
	}

	.wrapped-div {
		max-width: 100%;
	}

	@media (max-width: 1240px) {
		.wrapped-div {
			overflow-x: scroll;
		}
	}

	.wrapped-div-sector {
		max-width: 100%;
		overflow-x: scroll;
	}
</style>
]]></content:encoded>
</item><item rdf:about="https://www.vaneck.com/us/en/blogs/income-investing/fallen-angel-bonds-higher-quality-high-yield/">
  <title>Fallen Angel Bonds: Higher Quality High Yield></title>
  <link>https://www.vaneck.com/us/en/blogs/income-investing/fallen-angel-bonds-higher-quality-high-yield/</link>
  <description><![CDATA[<span style="color: #000000; font-family: Verdana, Arial, Helvetica, sans-serif; font-size: 14px; background-color: #ffffff; float: none; display: inline;">Fallen angel high yield bonds provide a distinct value proposition that sets them apart from the broad high yield market.</span>]]></description>
  <dc:creator>William Sokol</dc:creator>
  <dc:date>04/30/2024 06:30:00</dc:date>
<content:encoded><![CDATA[

<script type="text/javascript" src="/static/js/jquery/jquery-3.3.1.min.js"></script>
<script src="https://code.highcharts.com/highcharts.js"></script>
<script src="//code.highcharts.com/modules/exporting.js" type="text/javascript"></script>
<script src="/EPiServer/CMS/Content/contentassets/en/e66b417c3bfd4c84b6f2db77a49de552/angl-chart.js,,281179/Download?epieditmode=False" type="text/javascript"></script>
<p>Fallen angel high yield bonds are part of the overall high yield universe but unique in that they were originally issued with investment grade ratings and later downgraded to non-investment grade, or high yield. Fallen angel bonds provide a distinct value proposition that sets them apart from the broad high yield market.<sup>1</sup>&nbsp;The distinction between the high yield bond market and the much larger investment grade market, with unique investor bases and issuers, creates a structural inefficiency when a bond crosses over from one category to the other. Historically, bonds have declined in price prior to being downgraded to high yield, and recovered following the downgrade. Systematically investing in these undervalued bonds has been a source of outperformance for fallen angel investors historically, while also resulting in unique sector exposures and higher overall credit quality<sup>2</sup>&nbsp;relative to the broad high yield market as measure by ICE BofA High Yield Index. Learn more about how the <strong><a href="/link/556544a031994c20a060fccda003c185.aspx" title="ANGL - VanEck Fallen Angel High Yield Bond ETF - Overview">VanEck Fallen Angel High Yield Bond ETF (ANGL<sup>&reg;</sup>)</a></strong> can offer investors an efficient way to access this unique segment.</p>
<h2>High Yield Bonds Through the Cycle</h2>
<p>The unique performance drivers of fallen angel bonds (systematically buying oversold bonds, differentiated sector exposure and higher credit quality) have driven outperformance versus the broad high yield in 14 out of the last 20 years.<sup>3</sup>&nbsp;This outperformance has occurred in different market environments, illustrating an attractive consistency of outperformance. Further, fallen angels have historically outperformed in environments with both rising and declining interest rates, and in widening and very tight spread environments. This all-weather outperformance is a result of the different role each performance driver can play in various stages of a market cycle.</p>
<h3>Fallen Angel High Yield Bond Batting Average Increases with Time (1/31/2004 &ndash; 4/30/2024)</h3>
<br />
<div class="epi-contentfragment">column-chart</div>
<br />
<div class="wrapped-div">
<table style="width: 100%;">
<tbody>
<tr class="tbl-data">
<td class="tbl-header last">&nbsp;</td>
<td class="tbl-header last" style="text-align: center;">1 Month<br />Rolling Periods</td>
<td class="tbl-header last" style="text-align: center;">6 Month<br />Rolling Periods</td>
<td class="tbl-header last" style="text-align: center;">1 Year<br />Rolling Periods</td>
<td class="tbl-header last" style="text-align: center;">3 Year<br />Rolling Periods</td>
<td class="tbl-header last" style="text-align: center;">5 Year<br />Rolling Periods</td>
<td class="tbl-header last" style="text-align: center;">7 Year<br />Rolling Periods</td>
<td class="tbl-header last" style="text-align: center;">10 Year<br />Rolling Periods</td>
</tr>
<tr class="tbl-data">
<td class="data-td last" style="text-align: left;">Total Periods</td>
<td class="data-td data last">244</td>
<td class="data-td data last">239</td>
<td class="data-td data last">233</td>
<td class="data-td data last">209</td>
<td class="data-td data last">185</td>
<td class="data-td data last">161</td>
<td class="data-td data last">125</td>
</tr>
<tr class="tbl-data">
<td class="data-td last" style="text-align: left;">Total Outperformed</td>
<td class="data-td data last">142</td>
<td class="data-td data last">165</td>
<td class="data-td data last">164</td>
<td class="data-td data last">188</td>
<td class="data-td data last">183</td>
<td class="data-td data last">161</td>
<td class="data-td data last">125</td>
</tr>
<tr class="tbl-data">
<td class="data-td last" style="text-align: left;">Batting Average (%)</td>
<td class="data-td data last">58</td>
<td class="data-td data last">69</td>
<td class="data-td data last">70</td>
<td class="data-td data last">90</td>
<td class="data-td data last">99</td>
<td class="data-td data last">100</td>
</tr>
</tbody>
</table>
</div>
<br />
<p class="chart-disclosure">Source: Morningstar. Past performance is not indicative of future results. See disclaimers and index descriptions at the end of this presentation. Fallen Angel U.S. High Yield by the ICE US Fallen Angel High Yield 10% Constrained Index (H0CF) and Broad U.S. High Yield by ICE BofA High Yield Index (H0A0). Fallen Angel U.S. High Yield index data on and prior to February 28, 2020 reflects that of the ICE BofA US Fallen Angel High Yield Index (H0FA). From February 28, 2020 forward, the Fallen Angel U.S. High Yield index data reflects that of the Fund's underlying index, the ICE US Fallen Angel High Yield 10% Constrained Index (H0CF). Fallen Angel U.S. High Yield index data history which includes periods prior to February 28, 2020 links H0FA and H0CF and is not intended for third party use.</p>
<p class="chart-disclosure">Batting Average is measured by dividing the number of periods a portfolio or investment strategy outperforms a benchmark by the total number of periods.</p>
<h2>Not All High Yield Bonds Are Created Equal</h2>
<p>Fallen angels stand apart from original-issue high yield bonds, offering a higher quality, high yield bond strategy that has historically outperformed the broad high yield bond market, including actively managed funds. Fallen angel high yield bonds, historically, tend to be issued by larger, more established companies, have a higher rate of upgrades to investment grade<sup>4</sup>&nbsp;and offer a contrarian approach to investing in bonds exposed to heavy selling.</p>
<h3>Fallen Angel Bonds vs. Broad High Yield Bonds Returns</h3>
<div class="highcharts" id="linechart">&nbsp;</div>
<p class="chart-disclosure">Source: ICE and Morningstar. Data as of 4/30/2024. This chart is for illustrative purposes only. Index performance is not illustrative of fund performance. Fund performance current to the most recent month end is available by visiting vaneck.com. Historical information is not indicative of future results; current data may differ from data quoted. Indexes are unmanaged and are not securities in which an investment can be made. Current data may differ from data quoted. Past performance is no guarantee of future results; VanEck Fallen Angel High Yield Bond ETF commenced on 4/10/2012. An investor cannot invest directly in an index. The results assume that no cash was added to or assets withdrawn from the Index. Index returns do not represent Fund returns. The Index does not charge management fees or brokerage expenses, nor does the Index lend securities, and no revenues from securities lending were added to the performance shown. Broad high yield bond market and active managers are represented by the ICE BofA US High Yield Index and Morningstar High-Yield Bond category average, respectively. See disclaimers and index descriptions at the end of this presentation.</p>
<p class="chart-disclosure">Fallen Angel U.S. High Yield is represented by the ICE US Fallen Angel High Yield 10% Constrained Index (H0CF) and the Broad U.S. High Yield by ICE BofA High Yield Index (H0A0). Fallen Angel U.S. High Yield index data on and prior to February 28, 2020 reflects that of the ICE BofA US Fallen Angel High Yield Index (H0FA). From February 28, 2020 forward, the Fallen Angel U.S. High Yield index data reflects that of the Fund's underlying index, the ICE US Fallen Angel High Yield 10% Constrained Index (H0CF). Fallen Angel U.S. High Yield index data history which includes periods prior to February 28, 2020 links H0FA and H0CF and is not intended for third party use.</p>
<p>To receive more <a href="/us/en/blogs/income-investing/" title="Income Investing Insights"><strong>Income Investing</strong></a> insights, <a href="/link/5f45412c2143400497908cea2897f7d3.aspx" title=" Subscription Center"><strong>sign up in our subscription center</strong></a>.</p>
<style type="text/css">
    .wrapped-div {
        max-width: 100%;
    }

    @media (max-width: 768px) {
        .wrapped-div {
            overflow-x: scroll;
        }
    }

    .wrapped-div-sector {
        max-width: 100%;
        overflow-x: scroll;
    }
</style>
]]></content:encoded>
</item><item rdf:about="https://www.vaneck.com/us/en/blogs/emerging-markets-equity/enabling-indias-digital-disruption/">
  <title>Enabling India’s Digital Disruption></title>
  <link>https://www.vaneck.com/us/en/blogs/emerging-markets-equity/enabling-indias-digital-disruption/</link>
  <description><![CDATA[<p>India Stack is empowering individuals, businesses, and entire communities to thrive in the digital age by leveraging mobile technology, 5G connectivity, and a robust digital infrastructure.</p>]]></description>
  <dc:creator>Sunny  Bokhari</dc:creator>
  <dc:date>04/30/2024 06:30:00</dc:date>
<content:encoded><![CDATA[

<p>India&rsquo;s soft infrastructure, commonly referred to as &ldquo;India Stack,&rdquo; is the cornerstone of India&rsquo;s digital transformation. India Stack's facilitation of banking services and digital payments has promoted digital disruption in traditional businesses. It has simplified KYC (Know Your Customer) processes for financial institutions and has made digital payments ubiquitous in India. By democratizing access to financial services and formal credit across income levels, the country has created a digital ecosystem powering its economy. The systems put in place by India Stack are serving as the foundation for digital disruption across multiple industries and creating attractive investment opportunities.</p>
<h2 id="understanding-india-stack" class="jump-link-nav anchored-block" data-jumplink-title="Understanding India Stack">Understanding India&rsquo;s Soft Infrastructure &ndash; &ldquo;India Stack&rdquo;</h2>
<p>At its core, India Stack consists of:</p>
<p><strong>Identity layer:</strong> India&rsquo;s social security number Aadhaar, a simple digital ID has (a) simplified KYC processes and lowered onboarding costs for financial institutions, (b) allowed direct benefit transfers from the government, and (c) enabled digital payment services to new bank account holders.</p>
<p><strong>Payments layer:</strong> Unified Payments Interface (UPI) is India&rsquo;s instant payment system that offers transaction-free seamless money transfers using the digital ID layer provided by Aadhaar.</p>
<p><strong>Data layer: </strong>A digital database called &ldquo;DigiLocker&rdquo; (online data repository of e-documents) stores important data from Aadhaar, driver licenses, health records, and more.</p>
<p>Together, these systems enable online, paperless, cashless, and privacy-respecting digital access to a variety of public and private services. These elements collectively form a robust foundation for various sectors to build innovative solutions.</p>
<h3>Foundations of India Stack</h3>
<p><img class="img-responsive w-100" src="https://www.vaneck.com/contentassets/90093de63648430593e63a358143440e/4394_india-blog-april_infographic-2_2024-4_v1_blog.svg" alt="Foundations of indias stack" /></p>
<p class="chart-disclosure">Source: VanEck.</p>

<h2 id="mobile-phone-access" class="jump-link-nav anchored-block" data-jumplink-title="Mobile Phone Access and 5G">Mobile Phone Access and 5G: Catalysts of Change</h2>
<p>Central to India Stack's success is the widespread access to mobile phones, particularly smartphones, and the ongoing deployment of 5G technology led by Reliance Industries Ltd.&rsquo;s Jio (7.9% of DGIN net assets)<sup>*</sup>&nbsp;and Bharti Airtel (6.7% of DGIN net assets)<sup>*</sup>. With over 158 million 5G smartphones in circulation and a projected 40% expansion by 2026<sup>1</sup>, India&rsquo;s mobile market is poised for exponential growth. This unprecedented connectivity is bridging the digital divide, introducing individuals to a world of digital applications and services. As smartphone penetration deepens, mobile-based solutions enabled by India Stack are becoming increasingly ubiquitous, driving financial inclusion and economic participation.</p>
<h2 id="enhancing-financial-inclusion" class="jump-link-nav anchored-block" data-jumplink-title="Enhancing Financial Inclusion">Enhancing Financial Inclusion</h2>
<p>India Stack has been instrumental in expanding financial inclusion by making banking services more accessible. The Aadhaar-based e-KYC process has streamlined account opening, eliminating the need for cumbersome paperwork and lowering e-KYC costs for financial institutions by almost 50%<sup>2</sup>. According to industry estimates, banks&rsquo; costs of onboarding customers in India decreased from $23 to $0.10 with the use of India Stack<sup>.2</sup>&nbsp;Reduced costs have made lower income clients more attractive to service and have brought millions of unbanked individuals into the formal financial system. This key initiative was led by the Indian government&rsquo;s Jan Dhan Yojana, a financial inclusion program aimed at providing universal banking access to all Indian citizens.</p>
<p>Banking access paired with UPI has revolutionized digital payments, making transactions quick, secure, and available to all, regardless of location or socioeconomic status. Some of the 3rd party digital payments apps benefitting from increased adoption of UPI include One Communications Ltd. (1.1% of DGIN net assets)<sup>*</sup>, Walmart&rsquo;s PhonePe and Google Pay. Seeking to capitalize on the UPI boom, Reliance Industries (7.9% of DGIN net assets)<sup>*</sup>&nbsp;recently introduced the Jio Pay app for merchants utilizing UPI and is selling them UPI Hub services, a centralized payment system offering small merchants the ability to accept payments and generate customer insights by collecting transaction data. Reliance also lets its cell phone customers pay using UPI via the MyJio app. Its JioBharat (inexpensive smartphone) also comes equipped to support UPI payments, creating a positive feedback loop between its e-commerce and business solutions offerings.</p>
<p><img class="img-responsive w-100" src="https://www.vaneck.com/contentassets/b5cf43b7e9da4722be5e37043a1d31d1/4394_create-india-blog-april-2024_image_v2.jpg" alt="Enhancing Financial Inclusion" /></p>
<p class="chart-disclosure">Source: Getty Images.</p>
<style>
    .wrapped-div {
        max-width: 100%;
    }

    @media (max-width: 768px) {
        .wrapped-div {
            overflow-x: scroll;
        }
    }

    .wrapped-div-sector {
        max-width: 100%;
        overflow-x: scroll;
    }
</style>


<h2>Driving Economic Growth through Credit Expansion</h2>
<p>As financial inclusion grows, so does the potential for economic empowerment. India Stack's support of banking services and digital payments has created more avenues for income generation, especially benefiting individuals who were previously excluded from the formal economy. Through formal financial services, individuals and businesses can now access credit more easily, fueling investment, entrepreneurship, and economic growth. This symbiotic relationship between income growth and credit expansion is driving a virtuous cycle of economic development across the nation.</p>
<p>Since the launch of India&rsquo;s financial inclusion program, 510 million new bank accounts have been<sup>3</sup>&nbsp;opened. Currently, these accounts carry an average balance of about $100, totaling about $50 billion in customer accounts across India.<sup>3</sup>&nbsp;The widespread adoption of digital payments and ease of onboarding customers via India Stack&rsquo;s e-KYC is revolutionizing India&rsquo;s fintech industry. Digital app facing non-banking financial corporations (NBFCs) are burgeoning in India, as more companies see the opportunity to extend credit to small/micro vendors and consumers. Reserve Bank of India approved at least 10 such NBFCs just over the last 3 months.<sup>4</sup>These companies offer digital payments, provide credit, and offer other financial services directly to app users. This trend is benefitting e-commerce players as well as consumer financial services companies in India, creating a strong growth trajectory for companies providing digital solutions to Indian consumers. Jio Financial Services (4.4% of DGIN net assets)<sup>*</sup>&nbsp;is at the forefront of digital finance in India. Some other new digital NBFCs disrupting older brick and mortar lenders include Lendingkart, Ugrocapital, Zip Loan, and LendenClub among others.</p>
<h3>India Stack&rsquo;s Network Effect: Scaling up Exponential Growth</h3>
<p><img class="img-responsive w-100" src="https://www.vaneck.com/contentassets/9ee7e6af8f8d46ff955352eec00b6be9/4394_india-blog-april_infographic-1_2024-4_v1_blog.svg" alt="India Stack&rsquo;s Network Effect" /></p>
<p class="chart-disclosure">Source: VanEck as of 3/31/2024.</p>
<h2 id="enhancing-digital-economy" class="jump-link-nav anchored-block" data-jumplink-title="Enabling the Digital Economy">Enabling E-commerce, Fintech, and the Digital Economy</h2>
<p>Companies across various industries are leveraging India Stack's digital infrastructure to innovate. The availability of digital payments through UPI has made it easier for individuals to shop online and for businesses to accept payments digitally.</p>
<p>India is home to about 60 million micro firms with less than 10 employees that contribute 30% to India&rsquo;s GDP.<sup>5</sup>&nbsp;These micro enterprises have historically lacked access to formal credit. FinTech apps are now able to leverage formalized data such as transaction value, e-bills, e-invoices etc. to underwrite loans to these micro vendors. As a result, India&rsquo;s small micro enterprises are expanding offerings and using digital means to reach consumers that can also afford more via expanded credit. This is creating a positive feedback loop to lift the country&rsquo;s economy.</p>
<p>With over 800 million users, India is the 2nd largest internet market in the world<sup>6</sup>&nbsp;and e-commerce is expected to grow at 19.6% CAGR by 2030.<sup>7</sup>Companies at the center of this digitization of marketplaces in India are benefitting. Zomato (6.2% of DGIN net assets)<sup>*</sup>, a food delivery app, has seen incredible growth in its monthly transacting customers and restaurant partners. The company is seeing more growth in its Hyperpure revenue segment, which focuses on local grocery deliveries from kiryana stores (India&rsquo;s bodegas) to end users. Similarly, Delhivery (1.7% of DGIN net assets)<sup>*</sup>, a leading logistics provider in India, is seeing tremendous growth from connecting the micro vendors to customers and also through B2B deliveries via their proprietary logistics model that allows for fast delivery at competitive prices. There are also other apps allowing more people to participate in the formal economy, for example, ones that let customers order home-cooked meals from stay-at-home moms.</p>
<div class="wrapped-div">
<table style="width: 100%;">
<tbody>
<tr class="tbl-data">
<td class="tbl-header last" style="width: 100%;" colspan="3"><a id="companies-benefitting" class="jump-link-nav anchored-block" data-jumplink-title="Companies Benefitting"></a>Companies Benefiting from India Stack</td>
</tr>
<tr class="tbl-data">
<td class="data-td last">Company</td>
<td class="data-head last">Portfolio Weight<sup>*</sup>(%)</td>
<td class="data-head last">Benefits</td>
</tr>
<tr class="tbl-data">
<td class="data-td last font-weight-normal">Reliance Industries Limited</td>
<td class="data-td data last">7.9</td>
<td class="data-td data last">Through its Jio Digital Services, Reliance Industries operates India&rsquo;s largest telecom company with over 400 million subscribers. Reliance Jio offers integrated digital solutions built around India Stack from 5G mobile data connectivity to payment services through Jio Pay utilizing UPI. Its JioBharat (inexpensive smartphones) also come equipped to support UPI payments, creating a positive feedback loop between its e-commerce and business solutions offerings.</td>
</tr>
<tr class="tbl-data">
<td class="data-td last font-weight-normal">Tata Consultancy Services<sup>**</sup></td>
<td class="data-td data last">6.7</td>
<td class="data-td data last">Tata Neu, developed by Tata Group, is India's first super user app that gives customers one app access to shop for anything from groceries and electronics to fashion and travel. The group recently entered the digital payments space by launching Tata Pay to integrate UPI into its e-commerce offerings via other mobile apps.</td>
</tr>
<tr class="tbl-data">
<td class="data-td last font-weight-normal">Zomato Limited</td>
<td class="data-td data last">6.2</td>
<td class="data-td data last">India&rsquo;s premier food delivery app in the country is now offering payment services, allowing merchants to accept payments in its app to increase app engagement through a seamless client experience. This gives it the ability to cross-sell business services to restaurant partners.</td>
</tr>
<tr class="tbl-data">
<td class="data-td last font-weight-normal text-nowrap">Jio Financial Services Limited</td>
<td class="data-td data last">4.4</td>
<td class="data-td data last">Jio Financial Services digitally delivers a range of financial products, such as instant loans, insurance plans, digital banking, and payments. It reaches individuals and small businesses often untapped in urban, semi-urban, and rural areas of India.</td>
</tr>
<tr class="tbl-data">
<td class="data-td last font-weight-normal">Delhivery Limited</td>
<td class="data-td data last">1.7</td>
<td class="data-td data last">India's leading logistics provider benefitting from the e-commerce boost.</td>
</tr>
<tr class="tbl-data">
<td class="data-td last font-weight-normal">One 97 Communications</td>
<td class="data-td data last">1.1</td>
<td class="data-td data last">3rd party digital payments app that uses the UPI system to offer small and micro merchants payment services.</td>
</tr>
<tr class="tbl-data">
<td class="data-td last font-weight-normal">IndiaMART InterMESH</td>
<td class="data-td data last">0.6</td>
<td class="data-td data last">One of the top B2B platforms in the country accepts payments through UPI, creating a seamless experience for users.</td>
</tr>
</tbody>
</table>
</div>
<br />
<p class="chart-disclosure"><sup>*</sup>&nbsp;Data as of 3/31/2024 Source: FactSet.</p>
<p class="chart-disclosure"><sup>**</sup>&nbsp;4.9% weight in VanEck India Growth Leaders ETF (GLIN) as of 3/31/2024</p>
<h2>Unlocking Value</h2>
<p>Bringing 1.4 billion people online into a digital economy is expected to unlock tremendous value. India Stack has emerged as a transformative force, driving financial inclusion, economic growth, and digital innovation in India. In the interim budget, India&rsquo;s Finance Minister called India Stack a factor of production in the 21 st century facilitating savings of 32.4 billion dollars for the government or 0.9% of GDP in 2023.<sup>8</sup>By leveraging mobile technology, 5G connectivity, and a robust digital infrastructure, India Stack is empowering individuals, businesses, and entire communities to thrive in the digital age. As India's digital economy continues to evolve, companies at the forefront of this transformation are poised for unprecedented growth. The interconnectivity of the networks created by digital integration of the economy could have knock-on effects lifting the broader Indian economy with it.</p>
<h2>How to Invest in India with VanEck</h2>
<p>The <strong><a href="https://www.vaneck.com/us/en/investments/digital-india-etf-dgin/overview/" title="DGIN - VanEck Digital India ETF - Overview">VanEck Digital India ETF (DGIN)</a></strong> offers access to the structural digital growth story of India and could be an appealing investment opportunity for investors looking to seek technology or growth exposure in emerging markets.</p>
<p>The <a href="https://www.vaneck.com/us/en/investments/india-growth-leaders-etf-glin/overview/" title="GLIN - VanEck India Growth Leaders ETF - Overview"><strong>VanEck India Growth Leaders ETF (GLIN)</strong></a> offers exposure to fundamentally sound Indian companies exhibiting attractive growth at a reasonable price across the broad Indian economy.</p>
<p>To receive more <a href="/us/en/insights/emerging-markets-equity/" title="Emerging Markets Equity Insights"><strong>Emerging Markets Equity</strong></a> insights, <a href="/us/en/subscribe/" title="Subscription Center"><strong>sign up in our subscription center</strong></a>.</p>
<style>
    .wrapped-div {
        max-width: 100%;
    }

    @media (max-width: 768px) {
        .wrapped-div {
            overflow-x: scroll;
        }
    }

    .wrapped-div-sector {
        max-width: 100%;
        overflow-x: scroll;
    }
</style>
]]></content:encoded>
</item><item rdf:about="https://www.vaneck.com/us/en/blogs/thematic-investing/diversifying-your-semiconductor-portfolio-beyond-nvidia/">
  <title>Diversifying Your Semiconductor Portfolio Beyond Nvidia></title>
  <link>https://www.vaneck.com/us/en/blogs/thematic-investing/diversifying-your-semiconductor-portfolio-beyond-nvidia/</link>
  <description><![CDATA[<p>Nvidia's AI chip dominance is under siege from AMD, Intel, startups, and tech giants, as new technologies emerge to disrupt the market and investor expectations.</p>]]></description>
  <dc:creator>Nick Frasse</dc:creator>
  <dc:date>04/30/2024 06:30:00</dc:date>
<content:encoded><![CDATA[

<p>Semiconductor chips are crucial in artificial intelligence (AI), fueling everything from vast data centers to small edge computing devices. Nvidia has established itself as the leader in this field, particularly with its innovative H100 and most recent launch, Blackwell B200 GPUs. These products have helped Nvidia secure a dominant position in the AI chip market. However, as with all technology, the landscape is inherently dynamic, and new competitors are emerging to challenge Nvidia's supremacy.</p>
<ul class="content-list">
<li><a href="#challengers-chip-at-nvidias-edge"><strong>Challengers Chip at Nvidia's Edge </strong></a></li>
<li><a href="#tech-giants-forge-own-chip-paths"><strong>Tech Giants Forge Own Chip Paths</strong></a></li>
<li><a href="#diversification-reigns-in-chip-race"><strong>Diversification Reigns in Chip Race</strong></a></li>
</ul>
<h2 id="challengers-chip-at-nvidias-edge" class="jump-link-nav anchored-block" data-jumplink-title="Challengers Chip at Nvidia's Edge">Challengers Chip at Nvidia's Edge: Rising Competitors</h2>
<p>A mix of established names and nimble startups challenges Nvidia's dominance in the semiconductor sector. Advanced Micro Devices (AMD), its closest competitor, is gaining ground with its MI300 GPUs, designed to compete directly with Nvidia&rsquo;s offerings. Intel, another heavyweight that has lagged in the last decade, is making significant strides with its Gaudi 3 chips, promising superior performance and energy efficiency compared to Nvidia&rsquo;s products.</p>
<p>Beyond these well-known players, many startups are also entering the fray. Companies like Cerebras Systems and Groq are introducing innovative technologies that promise to revolutionize AI chip performance and efficiency. Cerebras has developed the most significant commercial chip ever made, significantly accelerating large AI models' processing capabilities. Meanwhile, Groq focuses on delivering speedy processing times for AI tasks, claiming performance that surpasses Nvidia's latest products.</p>
<p>This innovation indicates a shift in the semiconductor industry, suggesting that Nvidia&rsquo;s position, while strong, may not be as unassailable as it once seemed. For investors, this growing competition implies potential disruption for Nvidia as market dynamics evolve.</p>
<h3>AI Data Server Revenue for Nvidia, Intel &amp; AMD (2021-2023)</h3>
<p><img class="img-responsive w-100" src="https://www.vaneck.com/contentassets/32afd485fea74d7a8edad8c6559455c3/4419_smh_chart-1_2024-4_v1_blog.svg" alt="AI Data Server Revenue for Nvidia, Intel and AMD" /></p>
<p class="chart-disclosure"><strong>Source:</strong> Nvidia, February 2024. Past performance is no guarantee of future results. Not intended as a recommendation to buy or to sell any of the securities mentioned herein.</p>
<h2 id="tech-giants-forge-own-chip-paths" class="jump-link-nav anchored-block" data-jumplink-title="Tech Giants Forge Own Chip Paths">Tech Giants Forge Own Chip Paths: Impacting the Semiconductor Industry</h2>
<p>One of the most significant factors influencing the semiconductor industry is the current imbalance between supply and demand. Nvidia has benefited from this scenario, selling its high-performance chips at a premium to enterprise clients desperate to meet the escalating demand for AI capabilities. However, this supply constraint is prompting major tech companies to develop semiconductor solutions.</p>
<p>For instance, tech giants like Amazon and Google are not only significant consumers of Nvidia chips. Still, they are also investing heavily in their chip development projects to reduce reliance on external suppliers like Nvidia. This move towards self-sufficiency could lead to a more balanced supply-demand equation in the semiconductor market. As more companies enter the chip manufacturing space, the increased supply could lead to more competitive pricing, potentially impacting Nvidia's profit margins.</p>
<p>Additionally, geopolitical and economic factors could be critical in shaping the semiconductor industry. Trade policies, international relations, and global economic conditions can all affect chip manufacturing and distribution, influencing prices and availability globally. These factors, combined with the technological shifts within the industry, suggest a future where Nvidia may face more competitive pressures, making a solid case for investor diversification.</p>

<h2 id="diversification-reigns-in-chip-race" class="jump-link-nav anchored-block" data-jumplink-title="Diversification Reigns in Chip Race">Diversification Reigns in Chip Race</h2>
<p><strong><a href="https://www.vaneck.com/us/en/investments/semiconductor-etf-smh/overview/" title="SMH - VanEck Semiconductor ETF - VanEck">The VanEck Semiconductor ETF (SMH)</a></strong> offers investors a strategic avenue to gain exposure to the broader semiconductor sector, including companies like AMD, Intel, and other players in the AI chip market. This diversified approach allows investors to capitalize on the sector's growth while aiming to mitigate the risks associated with the performance of any single name.</p>
<p><strong><a href="https://www.vaneck.com/us/en/investments/semiconductor-etf-smh/overview/" title="SMH - VanEck Semiconductor ETF - VanEck">SMH</a></strong> provides a diversified portfolio of established leaders and a range of other players in the semiconductor industry. As the market for AI chips grows and evolves, we believe <strong><a href="https://www.vaneck.com/us/en/blogs/thematic-investing/semiconductor-stronghold-competitive-advantages-create-collective-success/" title="SMH benefits from a team of winners">SMH benefits from a team of winners</a></strong>.</p>
<h3>Revenues in the Semiconductor Space are Broadly Diversified (2019-2023)</h3>
<p><img class="img-responsive w-100" src="https://www.vaneck.com/contentassets/e2de3bdab1bb434a91e1aeff2c211ba1/4419_smh_chart-2_2024-4_v2_blog.svg" alt="Revenues in the Semiconductor Space are Broadly Diversified" /></p>
<p class="chart-disclosure"><strong>Source:</strong> Gartner, January 2024. Past performance is no guarantee of future results. Not intended as a recommendation to buy or to sell any of the securities mentioned herein.</p>
<p>As we observe the continuing advancements and shifts in the semiconductor industry, no single company will likely dominate indefinitely. The AI chip market is set to become increasingly competitive, and investing broadly in the sector helps investors access the space. This approach ensures investors can invest in cutting-edge technology while maintaining a diversified stance in a traditionally volatile asset class.</p>
<p>To receive more <a href="https://www.vaneck.com/us/en/insights/thematic-investing/" title="Thematic Investing Insights"><strong>Thematic Investing</strong></a> insights, <a href="https://www.vaneck.com/us/en/subscribe/" title="Subscription Center"><strong>sign up in our subscription center</strong></a>.</p>
]]></content:encoded>
</item><item rdf:about="https://www.vaneck.com/us/en/blogs/municipal-bonds/municipal-bond-q1-2024-performance/">
  <title>Municipal Bond Q1 2024 Performance></title>
  <link>https://www.vaneck.com/us/en/blogs/municipal-bonds/municipal-bond-q1-2024-performance/</link>
  <description><![CDATA[Q1 2024 saw shifts in the municipal bond market, with rising yields and increased issuance presenting new investment opportunities despite broader economic volatility.]]></description>
  <dc:creator>Michael Cohick</dc:creator>
  <dc:date>04/29/2024 06:30:00</dc:date>
<content:encoded><![CDATA[

<p>The first quarter of 2024 brought some notable shifts in the municipal bond landscape, reflecting broader economic trends and market dynamics. Although interest rate fluctuations drove a slight decline broadly, investment-grade municipals held up better than most comparable quality taxable fixed income sectors, and high yield munis performed on par with high yield corporates. By the end of the quarter, we saw muni yields rising particularly in the short end of the curve, an increase in issuance and narrowing spreads, which may create buying opportunities for investors. The first quarter of 2024 brought some notable shifts in the municipal bond landscape, reflecting broader economic trends and market dynamics.</p>
<p>The ICE Broad Municipal Bond Index (MUNI) experienced a modest decline of -0.28% during this period, following a robust 5.99% return in 2023. This dip was primarily influenced by interest rate volatility, driven by stronger-than-expected economic data and inflation figures. Consequently, expectations for policy rate cuts in 2024 were pushed back, causing municipal yields to rise across the curve. Short-term yields saw a more pronounced increase compared to intermediate and long-term yields, resulting in a flatter municipal yield curve.</p>
<p>The changing outlook on policy rates also impacted the U.S. Treasury (UST) curve, albeit to a lesser extent. The term structure shift indicated a decreased risk premium for interest rates. Longer-dated bonds underperformed shorter-dated ones due to their higher interest rate sensitivity. However, A-rated and BBB-rated bonds outperformed among quality cohorts, as their higher yields helped offset the impact of rising rates.</p>
<h2>Tax-Exempt Munis Surpass Comparable Taxable Fixed Income</h2>
<p>In comparison to taxable fixed income indexes, investment grade munis outperformed the ICE U.S. Treasury Index and the ICE U.S. Aggregate Index. This outperformance was partly driven by differences in index level duration. Broad high yield municipals outperformed US high yield corporates in the first quarter. Investor demand for municipals improved, with municipal mutual fund net inflows of $10.4 billion compared to the previous quarter's outflow of $16.6 billion. On the supply side, lower interest rates led to a 24% increase in year-to-date municipal bond issuance compared to the same period in 2023, with a notable decrease in taxable issuance.</p>
<h3>Fixed Income Returns and Statistics</h3>
<div class="wrapped-div">
<table style="width: 100%;">
<tbody>
<tr class="tbl-data">
<td class="tbl-header last">Index</td>
<td class="tbl-header last text-center">Index Name</td>
<td class="tbl-header last text-center">Q1 24 Return</td>
<td class="tbl-header last text-center">2023 Return</td>
<td class="tbl-header last text-center">Yield to Worst</td>
<td class="tbl-header last text-center">Duration to Worst</td>
</tr>
<tr class="tbl-data">
<td class="data-td last" colspan="6">Tax Exempts</td>
</tr>
<tr class="tbl-data">
<td class="data-td last font-weight-normal">MUNI</td>
<td class="data-td data last">Broad Muni</td>
<td class="data-td data last">-0.28</td>
<td class="data-td data last">5.99</td>
<td class="data-td data last">3.31</td>
<td class="data-td data last">5.11</td>
</tr>
<tr class="tbl-data">
<td class="data-td last font-weight-normal">MBNS</td>
<td class="data-td data last">Short Muni</td>
<td class="data-td data last">-0.05</td>
<td class="data-td data last">3.56</td>
<td class="data-td data last">2.86</td>
<td class="data-td data last">2.21</td>
</tr>
<tr class="tbl-data">
<td class="data-td last font-weight-normal">MBNI</td>
<td class="data-td data last">Intermediate Muni</td>
<td class="data-td data last">-0.32</td>
<td class="data-td data last">6.03</td>
<td class="data-td data last">3.05</td>
<td class="data-td data last">5.10</td>
</tr>
<tr class="tbl-data">
<td class="data-td last font-weight-normal">MBNL</td>
<td class="data-td data last">Long Muni</td>
<td class="data-td data last">-0.58</td>
<td class="data-td data last">8.52</td>
<td class="data-td data last">3.91</td>
<td class="data-td data last">7.94</td>
</tr>
<tr class="tbl-data">
<td class="data-td last font-weight-normal">MIHX</td>
<td class="data-td data last">Short High Yield Muni</td>
<td class="data-td data last">1.53</td>
<td class="data-td data last">5.55</td>
<td class="data-td data last">4.77</td>
<td class="data-td data last">3.85</td>
</tr>
<tr class="tbl-data">
<td class="data-td last font-weight-normal">MHYX</td>
<td class="data-td data last">Broad High Yield Muni</td>
<td class="data-td data last">1.95</td>
<td class="data-td data last">7.91</td>
<td class="data-td data last">5.09</td>
<td class="data-td data last">7.44</td>
</tr>
<tr class="tbl-data">
<td class="data-td last font-weight-normal">&nbsp;</td>
<td class="data-td data last">&nbsp;</td>
</tr>
<tr class="tbl-data">
<td class="data-td last" colspan="6">Taxables</td>
</tr>
<tr class="tbl-data">
<td class="data-td last font-weight-normal">H0A0</td>
<td class="data-td data last">US High Yield Corporate</td>
<td class="data-td data last">1.51</td>
<td class="data-td data last">13.46</td>
<td class="data-td data last">7.69</td>
<td class="data-td data last">3.65</td>
</tr>
<tr class="tbl-data">
<td class="data-td last font-weight-normal">C0A0</td>
<td class="data-td data last">US Corporate</td>
<td class="data-td data last">-0.08</td>
<td class="data-td data last">8.40</td>
<td class="data-td data last">5.15</td>
<td class="data-td data last">6.82</td>
</tr>
<tr class="tbl-data">
<td class="data-td last font-weight-normal">DQTM</td>
<td class="data-td data last">Taxable Muni</td>
<td class="data-td data last">-0.38</td>
<td class="data-td data last">8.35</td>
<td class="data-td data last">4.99</td>
<td class="data-td data last">9.50</td>
</tr>
<tr class="tbl-data">
<td class="data-td last font-weight-normal">US00</td>
<td class="data-td data last">US Aggreate</td>
<td class="data-td data last">-0.66</td>
<td class="data-td data last">5.39</td>
<td class="data-td data last">4.60</td>
<td class="data-td data last">6.22</td>
</tr>
<tr class="tbl-data">
<td class="data-td last font-weight-normal">IDCOT310</td>
<td class="data-td data last">US Treasury 3-10 Year</td>
<td class="data-td data last">-0.77</td>
<td class="data-td data last">4.13</td>
<td class="data-td data last">3.91</td>
<td class="data-td data last">5.06</td>
</tr>
<tr class="tbl-data">
<td class="data-td last font-weight-normal">IDCOT7</td>
<td class="data-td data last">US Treasury 7-10 Year</td>
<td class="data-td data last">-1.34</td>
<td class="data-td data last">3.39</td>
<td class="data-td data last">3.89</td>
<td class="data-td data last">7.37</td>
</tr>
</tbody>
</table>
</div>
<br />
<p class="chart-disclosure">Source: ICE Data Services. As of 3/31/2024. MUNI: ICE US Broad Municipal Index, MBNS: ICE Short AMT-Free Broad National Municipal Index, MBNI: ICE Intermediate AMT-Free Broad National Municipal Index, MBNL: ICE Long AMT-Free Broad National Municipal Index, MIHX: ICE 1-12 Year Broad High Yield Crossover Municipal Index, MHYX: ICE Broad High Yield Crossover Municipal Index, H0A0: ICE BofA US High Yield Index, C0A0: ICE BofA US Corporate Index, DQTM: ICE BofA US Taxable Municipal Securities Index, US00: ICE BofA US Broad Market Index, IDCOT310: ICE U.S. Treasury 3-10 Year Bond Index, IDCOT7: ICE US Treasury 7-10 Year Bond Index. Index performance is not illustrative of fund performance. It is not possible to invest directly in an index.</p>
<p>Rising muni yields made tax-exempts more attractive for prospective investors. The shift in relative value was most noticeable in the front-end of the yield curve. Tax-equivalent yields became more favorable compared to taxable alternatives, particularly for investors in higher tax brackets.</p>
<h3>Municipal AAA &amp; US Treasury Yield Curves</h3>
<p><strong>3/31/2024</strong></p>
<p><img class="img-responsive w-100" src="https://www.vaneck.com/contentassets/0487f5eb01544b55949f17475bc1777b/4418_muni-q1_chart-1_2024-4_v1_blog.svg" alt="Municipal AAA and US Treasury Yield Curves" /></p>
<p class="chart-disclosure">Source: ICE Data. As of 3/31/2024. Past performance is not a guarantee of future results. Index performance is not illustrative of fund performance. It is not possible to invest directly in an index.</p>
<p>Credit spreads narrowed during the quarter, mirroring the broader asset rally at the end of 2023. This trend, especially among investment-grade categories, suggests room for marginal credit improvement. However, Moody's Investors Service's negative outlook for the U.S. credit rating remains unresolved, potentially impacting relative valuation measures and MT ratios.</p>
<h3>HY Muni vs. IG Muni Index Yield Spread</h3>
<p><strong>12/31/2010 - 3/31/2024</strong></p>
<p><img class="img-responsive w-100" src="https://www.vaneck.com/contentassets/0487f5eb01544b55949f17475bc1777b/4418_muni-q1_chart-2_2024-4_v1_blog.svg" alt="HY Muni vs. IG Muni Index Yield Spread" /></p>
<p class="chart-disclosure">Source: ICE Data. As of 3/31/2024. Yield spread is the difference between the yield to worst of the ICE Core High Yield &amp; Unrated Municipal Index and the yield to worst of ICE US Broad Municipal Index. See end for index descriptions. Yield to worst is generally defined as being the lowest yield that a buyer can expect to receive. Past performance is not a guarantee of future results. Index performance is not illustrative of fund performance. It is not possible to invest directly in an index.</p>
<p>Strong economic data and the fundamental strength of municipalities support current credit spread levels and may indicate further spread tightening. While tax season historically affects investor demand for municipal bonds in the short term, any resulting spread widening could present buying opportunities. Moreover, the resolution of government funding issues and a favorable outlook for tax-exempt municipals reinforce long-term prospects despite expensive valuations relative to taxable alternatives, and investors in the highest tax brackets can still find value in tax-equivalent municipal bond yields.</p>
<p><a href="https://www.vaneck.com/us/en/blogs/municipal-bonds/municipal-bond-etfs-expect-more-from-your-munis/" title="Municipal Bond ETFs &ndash; Expect More from Your Munis"><strong>Explore Municipal Bond Opportunities</strong></a></p>
<p>To receive more <strong><a href="https://www.vaneck.com/us/en/insights/municipal-bonds/" title="Municipal Bonds Insights">Municipal Bonds</a></strong> insights, <strong><a href="https://www.vaneck.com/us/en/subscribe/" title="Subscription Center">sign up in our subscription center</a></strong>.</p>
<style type="text/css">
 .wrapped-div {
 max-width: 100%;
 }

 @media (max-width: 1024px) {
 .wrapped-div {
 overflow-x: scroll;
 }
 }

 .wrapped-div-sector {
 max-width: 100%;
 overflow-x: scroll;
 }
</style>
]]></content:encoded>
</item><item rdf:about="https://www.vaneck.com/us/en/blogs/emerging-markets-bonds/advisors-may-want-to-increase-emerging-market-bond-allocations/">
  <title>Advisors May Want to Increase Emerging Market Bond Allocations></title>
  <link>https://www.vaneck.com/us/en/blogs/emerging-markets-bonds/advisors-may-want-to-increase-emerging-market-bond-allocations/</link>
  <description><![CDATA[In a recent Investment News article, Eric Fine explains why emerging market bond allocations have nowhere to go but up&mdash;and why he believes that&rsquo;s exactly where they should be headed.]]></description>
  <dc:creator>Eric Fine</dc:creator>
  <dc:date>04/23/2024 06:30:00</dc:date>
<content:encoded><![CDATA[

<p>Emerging market (EM) bonds represent one of the most compelling &ndash; and most misunderstood &ndash; opportunities for global investors. Despite strong underlying fundamentals and historical performance, EM bonds are frequently under-allocated as a fixed income asset.</p>
<p>Eric Fine recently sat down with Investment News to explain why advisors should take a closer look at this overlooked asset class:</p>
<ul class="content-list">
<li class="mt-2">While there is risk in EM bonds, there is not as much as many advisors and investors believe. This is especially true in the current global economic environment.</li>
<li class="mt-2">Emerging market fundamentals look compelling relative to developed markets across a range of metrics, including fiscal deficits and current account deficits.</li>
<li class="mt-2">EM bonds also boast higher yields that significantly outpace developed markets.</li>
<li class="mt-2">Despite these advantages, a very low percentage of advisors allocate assets to EM debt funds.</li>
</ul>
<div class="row mb-3">
<div class="col-md-4 col-xs-12"><a href="https://www.youtube.com/embed/CUJXGie58ug" data-video="https://youtu.be/CUJXGie58ug" class="popup-youtube" title="Watch Video" rel="noopener"><img class="img-responsive" style="margin-right: 15px; margin-top: 0px;" src="https://www.vaneck.com/contentassets/ab98fc7d84b4400abcd58d2a228b9fe2/4326_emb-q2-video-update_2024-04_thumbnail_v1.jpg" alt="Watch Video" align="left" /></a></div>
<div class="col-md-8 col-xs-12"><br /><strong><a href="https://www.youtube.com/embed/CUJXGie58ug" data-video=" https://youtu.be/CUJXGie58ug" class="popup-youtube" title="Watch Video" rel="noopener">Watch Video</a><br /></strong><a href="https://www.youtube.com/embed/CUJXGie58ug" data-video="https://youtu.be/CUJXGie58ug" class="popup-youtube" title="Watch Video" style="font-size: 16px; font-weight: bold; padding: 10px 0px 0px; margin-right: 20px; width: 202px;" rel="noopener">Top Developments in EM Bonds</a></div>
</div>

<p>To receive more <a href="https://www.vaneck.com/us/en/insights/emerging-markets-bonds/" title="Emerging Markets Bonds Insights"><strong>Emerging Markets Bonds</strong></a> insights, <a href="https://www.vaneck.com/us/en/subscribe/" title="Subscription Center"><strong>sign up in our subscription center</strong></a>.</p>
]]></content:encoded>
</item><item rdf:about="https://www.vaneck.com/us/en/blogs/income-investing/clo-strategy-selectively-adds-risk-amid-rally/">
  <title>CLO Strategy Selectively Adds Risk Amid Rally></title>
  <link>https://www.vaneck.com/us/en/blogs/income-investing/clo-strategy-selectively-adds-risk-amid-rally/</link>
  <description><![CDATA[CLOs started the year strong and new issuance is at record pace. Tighter AAA spreads and a stable economic outlook drove a modest shift in our CLO strategy into lower investment grade tranches, but selection is key.]]></description>
  <dc:creator> </dc:creator>
  <dc:date>04/23/2024 06:30:00</dc:date>
<content:encoded><![CDATA[

<p>The <strong><a href="https://www.vaneck.com/us/en/investments/clo-etf-cloi/overview/" title="CLOI - VanEck CLO ETF- Overview">VanEck CLO ETF (CLOI)</a></strong> shifted modestly into lower investment grade tranches over the quarter. This adjustment followed the tightening of the spread at the top of the capital stack since summer of 2023. The Fund reduced its AAA exposure to 37% and increased its allocation to AA, A and BBB rated CLOs to 38%, 9% and 17%, respectively. Higher conviction in a stable economic environment and strong technicals allow the Fund to benefit from higher spreads in lower rated tranches, while staying positioned overall at the top of the capital stack. Should more attractive entry points emerge lower in the investment grade portion of the capital stack within the next six months, as we currently anticipate, we would shift further down in the cap stack and look to add below investment grade rated classes. But given expectations for the pace of downgrades to pick up into the second half of 2024, we remain very selective when investing in mezzanine tranches. The Fund performed in line with its benchmark in Q1.</p>
<h2 id="market-update" class="jump-link-nav anchored-block" data-jumplink-title="Market Update">Market Update: CLO Rally Continues</h2>
<p>In March, CLOs rallied across the capital stack for the fifth consecutive month alongside better-than-feared earnings and continued strong demand as all-in yields remain high. In the US, inflation surprised higher for the second consecutive month in February. Expectations are for the path of inflation to continue its downward trajectory, though inflation has proven stickier than many had anticipated. While the Fed indicated they believe cuts will likely be appropriate at some point this year, sticky inflation alongside strong growth and a resilient consumer has resulted in a data dependent Federal Reserve that would indicate inflation is on a sustainable path towards their 2% target. Alongside hotter inflation, market expectations for rate cuts continue to be pushed back with only 2 rate cuts now priced in for 2024.</p>
<p>CLOs generated strong total returns across the capital stack in Q1, driven primarily by carry, outperforming investment grade corporates and fixed rate high yield bonds, while high rated CLOs underperformed leverages loans.</p>
<div class="wrapped-div">
<table style="width: 100%;">
<tbody>
<tr class="tbl-data">
<td class="tbl-header last">Asset class</td>
<td class="text-center tbl-header last">Q1 2024 Return (%)</td>
<td class="text-center tbl-header last">Yield to Worst (%)</td>
<td class="text-center tbl-header last">Spreads (bps)</td>
</tr>
<tr class="tbl-data">
<td class="data-td last font-weight-normal">CLOs</td>
<td class="data-td data last">2.31</td>
<td class="data-td data last">6.70</td>
<td class="data-td data last">177</td>
</tr>
<tr class="tbl-data">
<td class="data-td last font-weight-normal pl-3">AAA</td>
<td class="data-td data last">1.84</td>
<td class="data-td data last">6.13</td>
<td class="data-td data last">105</td>
</tr>
<tr class="tbl-data">
<td class="data-td last font-weight-normal pl-3">AA</td>
<td class="data-td data last">2.33</td>
<td class="data-td data last">6.54</td>
<td class="data-td data last">178</td>
</tr>
<tr class="tbl-data">
<td class="data-td last font-weight-normal pl-3">A</td>
<td class="data-td data last">2.68</td>
<td class="data-td data last">6.92</td>
<td class="data-td data last">240</td>
</tr>
<tr class="tbl-data">
<td class="data-td last font-weight-normal pl-3">BBB</td>
<td class="data-td data last">3.49</td>
<td class="data-td data last">8.22</td>
<td class="data-td data last">362</td>
</tr>
<tr class="tbl-data">
<td class="data-td last font-weight-normal pl-3">BB</td>
<td class="data-td data last">6.43</td>
<td class="data-td data last">12.07</td>
<td class="data-td data last">766</td>
</tr>
<tr class="tbl-data">
<td class="data-td last font-weight-normal">Investment Grade Corporates</td>
<td class="data-td data last">-0.08</td>
<td class="data-td data last">5.36</td>
<td class="data-td data last">94</td>
</tr>
<tr class="tbl-data">
<td class="data-td last font-weight-normal">U.S. Agg</td>
<td class="data-td data last">-0.66</td>
<td class="data-td data last">4.89</td>
<td class="data-td data last">42</td>
</tr>
<tr class="tbl-data">
<td class="data-td last font-weight-normal">Leveraged Loans</td>
<td class="data-td data last">2.65</td>
<td class="data-td data last">9.13</td>
<td class="data-td data last">378</td>
</tr>
<tr class="tbl-data">
<td class="data-td last font-weight-normal">High Yield Bonds</td>
<td class="data-td data last">1.51</td>
<td class="data-td data last">7.75</td>
<td class="data-td data last">315</td>
</tr>
</tbody>
</table>
</div>
<br />
<p class="chart-disclosure">Source: JP Morgan and ICE Data Indices as of 3/31/2024. CLOs represented by J.P. Morgan Collateralized Loan Obligation Index, AAA Rated CLOs represented by J.P. Morgan CLO AAA Index, AA Rated CLOs represented by J.P. Morgan CLO AA Index, A Rated CLOs represented by J.P. Morgan CLO A Index, BBB Rated CLOs represented by J.P. Morgan CLO BBB Index, BB Rated CLOs represented by J.P. Morgan CLO BB Index, Investment Grade Corporates represented by ICE BofA US Corporate Index, US Agg is represented by the ICE BofA US Broad Market, Leveraged Loans represented by JP Morgan Leveraged Loan Index and High Yield Bonds represented by ICE BofA US High Yield Index.</p>
<p>The supply of new CLOs decreased month-over-month, with $15.3B pricing during the month, following $19.8B in February. New issuance volume is now 42% higher than the first quarter of 2023. Meanwhile, refinancing and reset activity accelerated in March, with $19.5B pricing, after $15.2B in February. Year-to-date total issuance of $86.8B is now 156% higher than the same period last year.</p>
<p>In the secondary market, TRACE supply decreased month-over-month to $18.4B from $19.6B in February. Investment grade volumes decreased to $13.5B from $15.7B, while below investment grade volumes increased to $4.9B from $3.9B in February. Total BWIC volumes decreased slightly to $4.4B in March from $4.5B in February. Despite the decrease month-over-month, TRACE and BWIC volumes remained at healthy levels.</p>
<p>The trailing 12-month default rate within the Morningstar US Leveraged Loan Index decreased to 1.14% in March from 1.41% in February, with only one new default. In contrast, distressed exchange activity continued at a brisk pace, as borrowers with unsustainable capital structures endeavored to manage their liabilities and avoid the bankruptcy process. We anticipate the default rate to remain below historical averages in the near-term for the leveraged loan market. However, our expectations are that defaults, including distressed exchanges, will increase to 3-4% later in the year, above the long-term historical average of ~3%.</p>
<p>CLO fundamentals were mixed month-over-month. On the positive side, exposure to CCC/Caa rated credits decreased to 6.1%/4.5% from 6.2%/4.6% and the OC cushion increased 11bp to 393bp. Meanwhile, exposure to loans pricing below $80 increased 0.3% to 4.0%, and the weighted average spread decreased 1bp to 366bp.</p>

<h2 id="portfolio-strategy" class="jump-link-nav anchored-block" data-jumplink-title="Portfolio Strategy">Portfolio Strategy: Modest Shift to Lower Investment Grade Tranches</h2>
<p>The borrowing rate for leveraged loan borrowers has risen alongside rate increases from central banks over the last two years. Higher interest rates have yet to drive a material deterioration in credit metrics within the loan market or undercut economic growth. However, with expectations for rates to remain higher for longer, increased coupon payments for borrowers means that interest coverage ratios will continue to decline, as the lagged effect of rate increases takes hold. Ultimately, the result will be higher leverage and even lower interest coverage ratios. This may lead to the risk of downgrade, if companies are unable to refinance outstanding debt as maturities come due or grow revenues from a more robust economic environment. While another hot inflation report for March and more recent hawkish comments from the Fed have moved back the timeline for eventual rate cuts, the expectation remains that multiple rate cuts are likely to occur throughout the year. Were this to come to fruition, that could provide relief to more stressed loan borrowers.</p>
<p>Given spread tightening at the top of the capital stack since the middle of last year, we have been shifting portfolios into lower investment grade tranches. Given expectations for the pace of downgrades to pick up into the second half of 2024, we remain very selective when investing lower in mezzanine tranches. Were spreads to widen, we maintain the ability to shift further into lower rated tranches. Given the rise in CLO paper trading above par, we continue to realize gains for AAA rated securities that are trading above par in favor of AAs and selective A and BBB rated credits, which offer more positive price convexity and/or spread. Despite recent shifts, portfolios remain primarily positioned in the top part of the capital stack (AAA/AA/A), which buffers investors from lower tranche downgrades or losses at the equity tranche level.</p>
<p>Primary and secondary spreads tightened to start the year. However, buying in the primary market continues to allow for wider spreads on a relative basis, even when taking spread duration into account. CLO issuance has become more attractive as the arbitrage improved with lower liability costs, leading to the fastest pace of primary issuance to start a year on record. While our preference is currently for primary issuance, we continue to find opportunities in the secondary market, where purchases below par provide positive convexity, which may be attractive as interest rates fall.</p>
<h3>CLOI Total Return and Credit Allocation</h3>
<p><img class="img-responsive w-100" src="https://www.vaneck.com/contentassets/1b54d2d284b14ab8b689f6274c938054/4392_cloi-q1_chart-1_2024-4_v2_blog.svg" alt="CLOI Total Return and Credit Allocation" /></p>
<p class="chart-disclosure"><strong>Source: FactSet, JPMorgan, VanEck</strong>, as of March 31, 2024. Index performance is not representative of Fund performance. It is not possible to invest directly in an index.</p>
<h2 id="outlook" class="jump-link-nav anchored-block" data-jumplink-title="Outlook">Outlook Ahead: Base Case for Stability Ahead</h2>
<p>Despite the lack of change in tight valuations, we have greater conviction in the base case for a stable economic environment ahead. This is further underpinned by the Fed&rsquo;s affirmation of maintaining its rate cut outlook for 2024, despite a revision upward of inflation expectations and overall economic strength. Greater economic confidence is also resulting in a stronger technical backdrop, as investors continue to seek credit based on attractive overall yields rather than tight spreads. Therefore, despite rich spread valuations which would call for higher caution, there isn&rsquo;t a need to be uber-cautious as downside economic growth probabilities decline further.</p>
<p>Within the CLO market, new issuance has started the year at a record pace, as managers take advantage of tightening liability spreads. This may continue in the near term given current AAA spreads at the tightest levels since early 2022, but this pace may be unsustainable given the lack of net new loan issuance unless M&amp;A and LBO activity picks up. Despite the higher-than-expected supply, CLOs continue to see strong demand given high all-in yields, which we expect to remain at attractive levels given more muted rate cut expectations. We have also seen a material increase in refinancing and reset activity in recent months, as portfolios constructed with purchases in the secondary market take advantage of the rally in the loan market and tighter CLO spreads. Should the loan and CLO markets continue to rally, we would expect to see more portfolios benefit from the significant redemption optionality in CLOs, although that potential universe has shrunk materially given the level of activity already this year. However, given the dispersion seen in the loan market, certain CLO portfolios holding weaker credits may eventually experience impairments to the lowest rated debt tranches, even if the majority of the loan market continues to rally. As a result, vintage, portfolio and manager selection remains key.</p>
<p>We anticipate CLO spreads to trade in a range for the next 3-6 months and see spreads and yields attractive under most market scenarios over the next 12 months. We also expect the CLO market to continue to be supported by a strong technical backdrop. Notwithstanding the deluge of new issuance to start the year, we do not expect issuance to approach 2021 or 2022 levels, unless there is a material pickup in net new loan issuance. This should limit the potential for any extreme spread widening in the near term. Given tighter valuations and risks tilted to the downside, we remain positioned higher in the capital stack overall. However, we have taken advantage of selective attractive opportunities at the BBB level and continue to look for attractive entry points lower in the investment grade portion of the capital stack. Should the backdrop begin to improve within the next six months, as we currently anticipate, we would shift lower in the capital stack and look to add below investment grade rated classes to the portfolio.</p>
<div class="wrapped-div">
<table style="width: 100%;">
<tbody>
<tr class="tbl-data">
<td class="tbl-header last" style="width: 100%;" colspan="5">Average Annual Total Returns<sup>*</sup>&nbsp;(%) as of March 31, 2024</td>
</tr>
<tr class="tbl-data">
<td class="data-head last" style="width: 55.615%;">&nbsp;</td>
<td class="data-head last" style="width: 11.7112%;">1 MO</td>
<td class="data-head last" style="width: 11.7112%;">3 MO</td>
<td class="data-head last" style="width: 10.9626%;">YTD</td>
<td class="data-head last" style="width: 10%;">1 YR</td>
</tr>
<tr class="tbl-data">
<td class="data-td last" style="width: 55.615%;">CLOI(NAV))</td>
<td class="data-td data last" style="width: 11.7112%;">0.88</td>
<td class="data-td data last" style="width: 11.7112%;">2.27</td>
<td class="data-td data last" style="width: 10.9626%;">2.27</td>
<td class="data-td data last" style="width: 10%;">9.18</td>
</tr>
<tr class="tbl-data">
<td class="data-td last" style="width: 55.615%;">CLOI(Share Price)</td>
<td class="data-td data last" style="width: 11.7112%;">0.88</td>
<td class="data-td data last" style="width: 11.7112%;">2.49</td>
<td class="data-td data last" style="width: 10.9626%;">2.49</td>
<td class="data-td data last" style="width: 10%;">9.15</td>
</tr>
<tr class="tbl-data">
<td class="data-td last" style="width: 55.615%;">J.P. Morgan Collateralized Loan Obligation Index</td>
<td class="data-td data last" style="width: 11.7112%;">0.72</td>
<td class="data-td data last" style="width: 11.7112%;">2.31</td>
<td class="data-td data last" style="width: 10.9626%;">2.31</td>
<td class="data-td data last" style="width: 10%;">10.91</td>
</tr>
</tbody>
</table>
</div>
<br />
<p class="chart-disclosure"><sup>*</sup>&nbsp;Returns less than one year are not annualized.</p>
<p class="chart-disclosure"><strong>The performance data quoted represents past performance. Past performance is not a guarantee of future results. Investment return and principal value of an investment will fluctuate so that an investor's shares, when redeemed, may be worth more or less than their original cost. Performance may be lower or higher than performance data quoted. Please call 800.826.2333 or visit vaneck.com for performance current to the most recent month ended.</strong></p>
<p class="chart-disclosure"><strong>The gross expense ratio for CLOI is 0.4%. CLOI Fees &amp; Expenses: Van Eck Associates Corporation (the &ldquo;Adviser&rdquo;) will pay all expenses of the Fund, except for the fee payment under the investment management agreement, acquired fund fees and expenses, interest expense, offering costs, trading expenses, taxes and extraordinary expenses. Notwithstanding the foregoing, the Adviser has agreed to pay the offering costs until at least May 1, 2024.</strong></p>
<p class="chart-disclosure"><strong>The net expense ratio for CLOI is 0.4%.</strong></p>
<p class="chart-disclosure">The "Net Asset Value" (NAV) of a Fund is determined at the close of each business day, and represents the dollar value of one share of the fund; it is calculated by taking the total assets of the fund, subtracting total liabilities, and dividing by the total number of shares outstanding. The NAV is not necessarily the same as the ETF 's intraday trading value. Investors should not expect to buy or sell shares at NAV.</p>
<p>To receive more <a href="https://www.vaneck.com/us/en/insights/income-investing/" title="Income Investing insights"><strong>Income Investing</strong></a> insights, <a href="/link/5f45412c2143400497908cea2897f7d3.aspx" title=" Subscription Center"><strong>sign up in our subscription center</strong></a>.</p>
<style type="text/css">
    .wrapped-div {
        max-width: 100%;
    }

    @media (max-width: 1024px) {
        .wrapped-div {
            overflow-x: scroll;
        }
    }

    .wrapped-div-sector {
        max-width: 100%;
        overflow-x: scroll;
    }
</style>
]]></content:encoded>
</item><item rdf:about="https://www.vaneck.com/us/en/blogs/thematic-investing/buzz-investing-cpi-surge-spikes-bond-yields/">
  <title>BUZZ Investing: CPI Surge Spikes Bond Yields></title>
  <link>https://www.vaneck.com/us/en/blogs/thematic-investing/buzz-investing-cpi-surge-spikes-bond-yields/</link>
  <description><![CDATA[Interest rates rose after the March CPI report indicated unexpected inflation persistence, shaking financial markets and increasing two-year Treasury yields.]]></description>
  <dc:creator> </dc:creator>
  <dc:date>04/22/2024 06:30:00</dc:date>
<content:encoded><![CDATA[

<p>U.S. domestic markets extended their gains during the recent period between Index selection dates (March 14, 2024 &ndash; April 11, 2024, the &ldquo;Period&rdquo;). Equity markets were largely influenced by the Federal Reserve's decisions during its second Federal Open Market Committee (FOMC) meeting of the year. On March 20th, in an announcement broadly expected by investors, the Fed opted to maintain the upper bound of its target Federal Funds rate at 5.50%. The updated "dot plot" from the Fed suggested a median forecast of three rate reductions by the end of 2024, with further cuts anticipated in the following two years, aiming to achieve a long-term &ldquo;neutral rate&rdquo; &ndash; one which is neither stimulative nor restrictive toward economic growth &ndash; of 2.5%. This announcement was interpreted by investors as an affirmation of the Fed's recent dovish policy stance, emphasizing support for economic stability and growth rather than signaling any new shifts in monetary policy.</p>
<p>Interest rates held steady in the weeks following the March FOMC meeting before spiking higher following the release of the March 2024 Consumer Price Index (CPI) report on April 10th which showed a year-over-year increase of 3.5%, up from 3.2% in February, suggesting a stronger persistence of inflation. This unexpected uptick led to weakness across financial markets, particularly affecting the two-year Treasury bond yields, which rose 15 bps as investors adjusted their expectations for the timing of Federal Reserve interest rate cuts.</p>
<p>The BUZZ NextGen AI US Sentiment Leaders Index (the &ldquo;BUZZ Index&rdquo;) returned 5.39% during the month of March compared to a return of 3.22% for the S&amp;P 500 Index during the same period. Year-to-date, the BUZZ Index leads the S&amp;P 500 with returns of 14.88% and 10.56%, respectively, as of the end of March.</p>
<h2>Shares of Coinbase Global Pace Advancing Stocks within the BUZZ Index</h2>
<p>In the recent Period, shares of Coinbase Global Inc. (NASD: COIN) led gains within the BUZZ Index. COIN benefitted from continued gains in the price of bitcoin and other cryptocurrencies, which provided a supportive background to broader crypto market trends. Micron Technology (NASD: MU) stood out as its shares gained nearly 40% during the recent Period. The company released its second-quarter earnings on March 20th, which showcased a significant financial turnaround, including a substantial increase in revenue to $5.82 billion from $4.73 billion in the previous quarter and $3.69 billion year-over-year. Investors may increasingly be of the view that Micron is well-positioned for future growth, especially in sectors driven by advancements in artificial intelligence.</p>
<div class="wrapped-div">
<table style="width: 100%;">
<tbody>
<tr class="tbl-data">
<td class="tbl-header last " colspan="4">Top BUZZ Index Contributors: March 14, 2024 &ndash; April 11, 2024</td>
</tr>
<tr class="tbl-data">
<td class="data-td  last">Company</td>
<td class="data-head last">Ticker</td>
<td class="data-head last">Average Weight (%)</td>
<td class="data-head last">Return Contribution (%)</td>
</tr>
<tr class="tbl-data">
<td class="data-td last font-weight-normal">Coinbase Global Inc</td>
<td class="data-td data last">COIN</td>
<td class="data-td data last">3.68</td>
<td class="data-td data last">0.60</td>
</tr>
<tr class="tbl-data">
<td class="data-td last font-weight-normal">Alphabet Inc</td>
<td class="data-td data last">GOOGL</td>
<td class="data-td data last">3.05</td>
<td class="data-td data last">0.33</td>
</tr>
<tr class="tbl-data">
<td class="data-td last font-weight-normal">Micron Technology Inc</td>
<td class="data-td data last">MU</td>
<td class="data-td data last">0.88</td>
<td class="data-td data last">0.24</td>
</tr>
<tr class="tbl-data">
<td class="data-td last font-weight-normal">SoFi Technologies Inc</td>
<td class="data-td data last">SOFI</td>
<td class="data-td data last">2.94</td>
<td class="data-td data last">0.22</td>
</tr>
<tr class="tbl-data">
<td class="data-td last font-weight-normal">Meta Platforms Inc</td>
<td class="data-td data last">META</td>
<td class="data-td data last">3.00</td>
<td class="data-td data last">0.19</td>
</tr>
<tr class="tbl-data">
<td class="data-td last font-weight-normal">Tesla Inc</td>
<td class="data-td data last">TSLA</td>
<td class="data-td data last">2.97</td>
<td class="data-td data last">0.18</td>
</tr>
<tr class="tbl-data">
<td class="data-td last font-weight-normal">Amazon.com Inc</td>
<td class="data-td data last">AMZN</td>
<td class="data-td data last">2.96</td>
<td class="data-td data last">0.17</td>
</tr>
<tr class="tbl-data">
<td class="data-td last font-weight-normal">PayPal Holdings Inc</td>
<td class="data-td data last">PYPL</td>
<td class="data-td data last">2.86</td>
<td class="data-td data last">0.14</td>
</tr>
<tr class="tbl-data">
<td class="data-td last font-weight-normal">Walt Disney Co/The</td>
<td class="data-td data last">DIS</td>
<td class="data-td data last">1.88</td>
<td class="data-td data last">0.12</td>
</tr>
<tr class="tbl-data">
<td class="data-td last font-weight-normal">Robinhood Markets Inc</td>
<td class="data-td data last">HOOD</td>
<td class="data-td data last">2.20</td>
<td class="data-td data last">0.12</td>
</tr>
</tbody>
</table>
</div>
<br />
<p class="chart-disclosure">Source: BUZZ Holdings ULC, Bloomberg. Past performance is no guarantee of future results. Index performance is not illustrative of fund performance. Not intended as a recommendation to buy or to sell any of the securities mentioned herein.</p>
<p>Technology-related stocks were featured among the top detractors to BUZZ Index performance. Super Micro Computer Inc. (NASD: SMCI) was notable as its share declined more than 17% during the recent Period. The stock's downturn may be linked to a broader retreat in demand for technology companies and was likely exacerbated by an announcement of a proposed public offering of common stock, which can often lead to share price volatility due to concerns about share dilution and valuation impacts. The public offering involved the launch of 2,000,000 shares of common stock with the possibility of an additional 300,000 shares being offered through underwriters, subject to market conditions. Super Micro Computer Inc., known for its server and storage solutions, also made headlines for its new server family and expanded compute portfolio, suggesting a strategic push towards cutting-edge technologies like AI and edge computing. However, despite these growth initiatives, the company also faced legal scrutiny with investigations on behalf of investors, which may have negatively influenced investor sentiment during the Period.</p>
<div class="wrapped-div">
<table style="width: 100%;">
<tbody>
<tr class="tbl-data">
<td class="tbl-header last " colspan="4">Bottom BUZZ Index Contributors: March 14, 2024 &ndash; April 11, 2024</td>
</tr>
<tr class="tbl-data">
<td class="data-td  last">Company</td>
<td class="data-head last">Ticker</td>
<td class="data-head last">Average Weight (%)</td>
<td class="data-head last">Return Contribution (%)</td>
</tr>
<tr class="tbl-data">
<td class="data-td last font-weight-normal">Super Micro Computer Inc</td>
<td class="data-td data last">SMCI</td>
<td class="data-td data last">2.92</td>
<td class="data-td data last">-0.73</td>
</tr>
<tr class="tbl-data">
<td class="data-td last font-weight-normal">Rivian Automotive Inc</td>
<td class="data-td data last">RIVN</td>
<td class="data-td data last">2.53</td>
<td class="data-td data last">-0.39</td>
</tr>
<tr class="tbl-data">
<td class="data-td last font-weight-normal">MicroStrategy Inc</td>
<td class="data-td data last">MSTR</td>
<td class="data-td data last">3.51</td>
<td class="data-td data last">-0.36</td>
</tr>
<tr class="tbl-data">
<td class="data-td last font-weight-normal">Advanced Micro Devices Inc</td>
<td class="data-td data last">AMD</td>
<td class="data-td data last">2.84</td>
<td class="data-td data last">-0.27</td>
</tr>
<tr class="tbl-data">
<td class="data-td last font-weight-normal">Palantir Technologies Inc</td>
<td class="data-td data last">PLTR</td>
<td class="data-td data last">2.79</td>
<td class="data-td data last">-0.19</td>
</tr>
<tr class="tbl-data">
<td class="data-td last font-weight-normal">Intel Corp</td>
<td class="data-td data last">INTC</td>
<td class="data-td data last">1.44</td>
<td class="data-td data last">-0.17</td>
</tr>
<tr class="tbl-data">
<td class="data-td last font-weight-normal">Celsius Holdings Inc</td>
<td class="data-td data last">CELH</td>
<td class="data-td data last">1.04</td>
<td class="data-td data last">-0.14</td>
</tr>
<tr class="tbl-data">
<td class="data-td last font-weight-normal">Boeing Co/The</td>
<td class="data-td data last">BA</td>
<td class="data-td data last">2.74</td>
<td class="data-td data last">-0.14</td>
</tr>
<tr class="tbl-data">
<td class="data-td last font-weight-normal">Lucid Group Inc</td>
<td class="data-td data last">LCID</td>
<td class="data-td data last">2.21</td>
<td class="data-td data last">-0.12</td>
</tr>
<tr class="tbl-data">
<td class="data-td last font-weight-normal">Shopify Inc</td>
<td class="data-td data last">SHOP</td>
<td class="data-td data last">0.96</td>
<td class="data-td data last">-0.10</td>
</tr>
</tbody>
</table>
</div>
<br />
<p class="chart-disclosure">Source: BUZZ Holdings ULC, Bloomberg. Past performance is no guarantee of future results. Index performance is not illustrative of fund performance. Not intended as a recommendation to buy or to sell any of the securities mentioned herein.</p>
<h2>BUZZ Index April 2024 Rebalance Highlights</h2>
<p><strong><u>Viking Therapeutics, Inc.</u></strong></p>
<p>The biotech sector has been extremely active since the start of the year. While shares of the iShares Biotechnology ETF (NASD: IBB) have been flat for most of 2024, several individual biotech stocks have been extremely volatile. The sector has also been the most active in terms of capital markets activity, with over 50 secondary offerings and 7 IPOs year-to-date. Viking Therapeutics (VKTX) is the latest example of a stock that has been moving on company-specific news. On February 26th, the company reported that the latest trials on its weight-loss drug had far exceeded expectations and showed significant improvement over the leading existing obesity drugs from Eli Lilly (NYSE: LLY) and Novo Nordisk (NYSE: NVO). Shares of VKTX more than doubled the following day and have been range-bound since, while sentiment surged on the news and has been growing steadily. This month, VKTX entered the BUZZ Index for the first time with a 1.08% weight.</p>
<p><strong><u>Paramount Global</u></strong></p>
<p>Paramount Global (NASD: PARA) has been involved in several noteworthy events over the past few years. In March 2021, the company, then known as Viacom CBS, witnessed a surge in share price attributed to concentrated buying by Bill Hwang&rsquo;s Archegos Capital Management, which eventually held over half of the company's shares. This led to an unprecedented rally where the stock catapulted from $10 to $100 within a year. However, Archegos&rsquo; collapse triggered a drastic 50% plummet in PARA&rsquo;s share value. Several key developments have since occurred, including Berkshire acquiring a 15.4% stake in May 2022, a rebrand from the name Viacom CBS, and a potential merger with Warner Bros. Discovery in January of this year, which was subsequently called off just a month later. Earlier this month, Paramount announced it was in preliminary merger talks with Skydance Media. Sentiment on PARA, which had been steadily rising in recent months, jumped on the merger speculation, pushing the stock to a 3% maximum weight in the BUZZ Index.</p>
<p>For more on rebalancing results and a full breakdown of index constituents added and removed for the month, view the <a href="https://www.vaneck.com/us/en/blogs/thematic-investing/buzz-investing-cpi-surge-spikes-bond-yields/buzz-reconstitution-april-2024.pdf" title="BUZZ VanEck Social Sentiment ETF" target="_blank" rel="noopener"><strong>BUZZ Index reconstitution</strong></a> report.</p>
<p>To receive more <a href="https://www.vaneck.com/us/en/insights/thematic-investing/" title="Thematic Investing Insights"><strong>Thematic Investing</strong></a> insights, <a href="https://www.vaneck.com/us/en/subscribe/" title="Subscription Center"><strong>sign up in our subscription center</strong></a>.</p>
<style>
    .wrapped-div {
        max-width: 100%;
    }

    @media (max-width: 1240px) {
        .wrapped-div {
            overflow-x: scroll;
        }
    }

    .wrapped-div-sector {
        max-width: 100%;
        overflow-x: scroll;
    }
</style>
]]></content:encoded>
</item><item rdf:about="https://www.vaneck.com/us/en/blogs/emerging-markets-bonds/golden-age-for-em-bonds/">
  <title>Golden Age for EM Bonds></title>
  <link>https://www.vaneck.com/us/en/blogs/emerging-markets-bonds/golden-age-for-em-bonds/</link>
  <description><![CDATA[Sharply rising precious metals prices and strong fiscal and monetary stances in EM bonds may provide opportunities for emerging markets debt investors.]]></description>
  <dc:creator>Eric Fine</dc:creator>
  <dc:date>04/22/2024 06:30:00</dc:date>
<content:encoded><![CDATA[

<p id="fund-performance" class="jump-link-nav anchored-block" data-jumplink-title="Fund Performance">The <a href="https://www.vaneck.com/us/en/investments/emerging-markets-bond-fund-embax/overview/" title="EMBAX - Emerging Markets Bond Fund - Class A - Overview"><strong>VanEck Emerging Markets Bond Fund</strong></a> was up 0.73% in March, compared to +1.03% for its benchmark, the 50% J.P Morgan Government Bond Index- Emerging Markets (GBI-EM) Global Diversified and 50% J.P. Morgan Emerging Markets Bond Index (EMBI). Year-to-date, the fund is down -0.05%, in line with the benchmark. Developed markets (DM) government bonds (JP Morgan&rsquo;s GBI Global) were down -3.18% YTD, totally consistent with our view that emerging markets (EM) bonds should outperform DM bonds. Ecuador in USD (our overweight there) was the big winner in March, with Chile local (our overweight there) the loser. During March, the fund made several country-specific changes. We took profit on our remaining China USD exposure and on Nigeria in USD; we also reduced Mexico and Brazil in local currency. We increased exposure to Saudi, UAE, Qatar and Romania in USD with low duration; and we increased exposure to local Malaysia, Singapore and Taiwan Region after their selloffs. Duration ended the month lower. We end March with carry of 6.2%, YTW of 7.95%, duration of 6.4 and 46.7% of the fund in local currency. Our biggest exposures are Brazil (local and hard), Poland (local and hard), Colombia (local and hard), Mexico (hard) and Indonesia (local and hard). <a href="/us/en/blogs/emerging-markets-bonds/golden-age-for-em-bonds/golden-age-for-em-bonds.pdf" rel="noopener" target="_blank" title="Golden Age for EM Bonds"><strong>View here for a PDF version of this blog</strong></a>.</p>
<div class="wrapped-div">
<table style="width: 100%;">
<tbody>
<tr class="tbl-data">
<td class="tbl-header last" style="width: 100%;" colspan="8">Average Annual Total Returns<sup>*</sup>&nbsp;(%) as of March 31, 2024</td>
</tr>
<tr class="tbl-data">
<td class="data-head last" style="width: 41.8717%;">&nbsp;</td>
<td class="data-head last" style="width: 8.82353%;">1 MO</td>
<td class="data-head last" style="width: 8.82353%;">3 MO</td>
<td class="data-head last" style="width: 8.23529%;">YTD</td>
<td class="data-head last" style="width: 7.54011%;">1 YR</td>
<td class="data-head last" style="width: 8.23529%;">3 YR</td>
<td class="data-head last" style="width: 7.54011%;">5 YR</td>
<td class="data-head last" style="width: 8.93048%;">10 YR</td>
</tr>
<tr class="tbl-data">
<td class="data-td last" style="width: 41.8717%;">Class A: NAV (Inception 07/09/12)</td>
<td class="data-td data last" style="width: 8.82353%;">0.68</td>
<td class="data-td data last" style="width: 8.82353%;">-0.29</td>
<td class="data-td data last" style="width: 8.23529%;">-0.29</td>
<td class="data-td data last" style="width: 7.54011%;">6.76</td>
<td class="data-td data last" style="width: 8.23529%;">0.35</td>
<td class="data-td data last" style="width: 7.54011%;">2.90</td>
<td class="data-td data last" style="width: 8.93048%;">1.39</td>
</tr>
<tr class="tbl-data">
<td class="data-td last" style="width: 41.8717%;">Class A: Maximum 5.75% load</td>
<td class="data-td data last" style="width: 8.82353%;">-5.11</td>
<td class="data-td data last" style="width: 8.82353%;">-6.02</td>
<td class="data-td data last" style="width: 8.23529%;">-6.02</td>
<td class="data-td data last" style="width: 7.54011%;">0.62</td>
<td class="data-td data last" style="width: 8.23529%;">-1.62</td>
<td class="data-td data last" style="width: 7.54011%;">1.69</td>
<td class="data-td data last" style="width: 8.93048%;">0.79</td>
</tr>
<tr class="tbl-data">
<td class="data-td last" style="width: 41.8717%;">Class I: NAV (Inception 07/09/12)</td>
<td class="data-td data last" style="width: 8.82353%;">0.76</td>
<td class="data-td data last" style="width: 8.82353%;">-0.03</td>
<td class="data-td data last" style="width: 8.23529%;">-0.03</td>
<td class="data-td data last" style="width: 7.54011%;">7.28</td>
<td class="data-td data last" style="width: 8.23529%;">0.69</td>
<td class="data-td data last" style="width: 7.54011%;">3.26</td>
<td class="data-td data last" style="width: 8.93048%;">1.71</td>
</tr>
<tr class="tbl-data">
<td class="data-td last" style="width: 41.8717%;">Class Y: NAV (Inception 07/09/12)</td>
<td class="data-td data last" style="width: 8.82353%;">0.73</td>
<td class="data-td data last" style="width: 8.82353%;">-0.05</td>
<td class="data-td data last" style="width: 8.23529%;">-0.05</td>
<td class="data-td data last" style="width: 7.54011%;">7.14</td>
<td class="data-td data last" style="width: 8.23529%;">0.57</td>
<td class="data-td data last" style="width: 7.54011%;">3.19</td>
<td class="data-td data last" style="width: 8.93048%;">1.64</td>
</tr>
<tr class="tbl-data">
<td class="data-td last" style="width: 41.8717%;">50% GBI-EM/50% EMBI</td>
<td class="data-td data last" style="width: 8.82353%;">1.03</td>
<td class="data-td data last" style="width: 8.82353%;">-0.05</td>
<td class="data-td data last" style="width: 8.23529%;">-0.05</td>
<td class="data-td data last" style="width: 7.54011%;">8.10</td>
<td class="data-td data last" style="width: 8.23529%;">-1.45</td>
<td class="data-td data last" style="width: 7.54011%;">0.48</td>
<td class="data-td data last" style="width: 8.93048%;">1.42</td>
</tr>
</tbody>
</table>
</div>
<br />
<p class="chart-disclosure"><sup>*</sup>&nbsp;Returns less than one year are not annualized.</p>
<p class="chart-disclosure"><strong><em>Expenses: Class A: Gross 2.55%, Net 1.22%; Class I: Gross 2.51%, Net 0.87%; Class Y: Gross 2.91%, Net 0.97%. </em></strong><em>Expenses are capped contractually until 05/01/24 at 1.25% for Class A, 0.95% for Class I, 1.00% for Class Y. Caps excluding acquired fund fees and expenses, interest, trading, dividends, and interest payments of securities sold short, taxes, and extraordinary expenses.</em></p>
<p class="chart-disclosure"><strong><em>The performance data quoted represents past performance. Past performance is not a guarantee of future results. Investment return and principal value of an investment will fluctuate so that an investor&rsquo;s shares, when redeemed, may be worth more or less than their original cost. Performance may be lower or higher than performance data quoted. Please call 800.826.2333 or visit vaneck.com for performance current to the most recent month ended.</em></strong></p>
<p class="chart-disclosure"><em>The &ldquo;Net Asset Value&rdquo; (NAV) of a Fund is determined at the close of each business day, and represents the dollar value of one share of the fund; it is calculated by taking the total assets of the fund, subtracting total liabilities, and dividing by the total number of shares outstanding. The NAV is not necessarily the same as the ETF&rsquo;s intraday trading value. Investors should not expect to buy or sell shares at NAV.</em></p>
<p id="market-review" class="jump-link-nav anchored-block" data-jumplink-title="Market Review"><strong>Commodities up/bonds down, with precious metals sending the strongest signal within commodities &ndash; this is good for commodity prices but bad for yields, which means opportunities in EM bonds. </strong>Sharply rising precious metals prices are always the end result of debt debasement, though there are many frameworks that also link prices to inflation or non-fiscal metrics. Following the global financial crisis (GFC), we wrote a piece in which we divided global central bank money/liabilities by their gold reserves/assets (in order to measure strains on individual central banks and the global money system). The spirit of the question was &ldquo;<em>what would happen if the U.S. dollar loses its reserve status and is replaced by gold</em>?&rdquo; What we found was that many EM central banks have a high ratio of gold reserves to money liabilities, indicating that they were more resilient in a scenario in which the U.S. dollar&rsquo;s reserve status was declining.</p>
<p><strong>EM Bonds have strong fiscal and monetary stances compared to DM bonds. </strong>Central banks aren&rsquo;t just accumulating gold, they are buying EM local currency bonds (especially Asian bonds) as reserve assets, too. This is a slower process, but so was central bank gold accumulation until this year. Do you want to predict the day it gains traction, or get access to an asset class that has a buyer base with big balance sheets and a secular path? When Saudi receives Chinese renminbi (CNY) for oil, what do you think it will do with the CNY? (Answer: buy CNY bonds.) This point was central to our &ldquo;<a href="https://www.vaneck.com/us/en/blogs/emerging-markets-bonds/fiscal-dominance-the-clarifying-lens-for-em-and-dm-bonds/" title="Fiscal Dominance: The Clarifying Lens for EM (and DM) Bonds"><strong>fiscal dominance</strong></a>&rdquo; piece. And in that piece, we honed in on EM central bank gold holdings, which have been rising for over a decade. The DM central banks have only just begun to get in on the act, if at all. This, at least, means more careful consideration about whether you&rsquo;re getting paid enough premium to reward that risk in DM.</p>
<p><strong>Fed Funicular falters &ndash; will a stop at a higher terminal rate need to be built? </strong>We don&rsquo;t know. But, we can find bonds in EM that &ldquo;don&rsquo;t care&rdquo;. We&rsquo;ve used the funicular framing in previous pieces and find it helpful. If the Bayesian facts are that the next decision &ldquo;node&rdquo; occurs <em>when</em> the inflation/employment data <em>might be worse, </em>that&rsquo;s key, game-theoretically. If the right <em>date</em> for that node is July, where do you think the world will be then and do you have confidence in that view, what with wars, locusts and golems about? If you don&rsquo;t, EM bonds have many ways to insulate you from the range of scenarios, of saying &ldquo;these EM bonds do best across the scenarios&rdquo;. So, you get your carry and the price either goes up or down based on U.S. rates. What it shows is what it always shows &ndash; EM bonds do best across the rate scenarios. <strong>The carry in EM bonds is so high it allows you to not base your fixed income investing on your opinion on the U.S. Federal Reserve (Fed). Sounds good to us.</strong></p>
<style>
    .wrapped-div {
        max-width: 100%;
    }

    @media (max-width: 768px) {
        .wrapped-div {
            overflow-x: scroll;
        }
    }

    .wrapped-div-sector {
        max-width: 100%;
        overflow-x: scroll;
    }
</style>

<h2 id="exposure-types-and-significant-changes" class="jump-link-nav anchored-block" data-jumplink-title="Exposure Types and Significant Changes">EXPOSURE TYPES AND SIGNIFICANT CHANGES</h2>
<p>The changes to our top positions are summarized below. Our largest positions in March were Brazil, Poland, Colombia, Indonesia and Mexico:</p>
<ul class="content-list">
<li class="mt-2">We increased our hard currency sovereign exposure in Saudi Arabia, the United Arab Emirates, Qatar, Romania and Poland. Romania&rsquo;s political noise is set to increase in the run up to the elections, but at the same time a smart issuance policy and the EU funds&rsquo; inflows should continue to shelter sovereign bonds, improving the economic and policy test scores for the country. Poland&rsquo;s sovereign bonds might be less sensitive to political games around the central bank governor's removal. In terms of our investment process, this boosts the country&rsquo;s technical test score. As regards the remaining countries, a combination of attractive valuations and solid fundamentals is compelling, and there are also better technical factors as the rest of the region often lacks longer bonds.</li>
<li class="mt-2">We also increased our local currency exposure in Malaysia, Singapore and Taiwan Region. Malaysia is a fundamentally solid and less correlated to EM credit, which gave a boost to our duration exposure. In terms of our investment process, this reflected the improved technical test score. Singapore&rsquo;s music tourism appears to be a new growth driver, against the backdrop of lower than expected inflation and a very small fiscal deficit in 2024. All these factors improve the economic test score for the country. Taiwan Region&rsquo;s local exposure was a nice way to get FX yield pickup.</li>
<li class="mt-2">Finally, we increased our hard currency sovereign exposure in Benin, Paraguay, Barbados and Cameroon. All these sovereign bonds have attractive valuations (hence, the solid technical test scores). Benin and Cameroon also show the renewed reform momentum, which improved their respective policy test scores.</li>
<li class="mt-2">We reduced our local currency exposure in Mexico and Brazil. The Mexican peso&rsquo;s net long positioning is getting stretched, and there are legitimate concerns about pre-election spending and the central bank&rsquo;s initiating its cutting before the Fed&rsquo;s, which worsen the country&rsquo;s policy test score. Brazil&rsquo;s price action was affected by elevated positioning as well as some idiosyncratic risks, such as Petrobras&rsquo;s dividends story and the government&rsquo;s fiscal performance, which worsen the policy and technical test scores for the country.</li>
<li class="mt-2">We also reduced our hard currency corporate and quasi-sovereign exposure in China. The economy appears to be bottoming out, reducing incentives to increase policy support. We are also disappointed by a lack of clarity about the resolution of real estate developers&rsquo; debt, which is a major headwind to the sector and GDP growth in general, worsening the policy test score for the country.</li>
<li class="mt-2">Finally, we reduced our hard currency sovereign exposure in Mozambique, Mongolia and Nigeria. We took profits in Nigeria after sovereign bonds&rsquo; post-election rally. Sovereign valuations in Mongolia and Mozambique and getting stretched, worsening the technical test scores for both countries.</li>
</ul>
<p>To receive more <a href="https://www.vaneck.com/us/en/insights/emerging-markets-bonds/" title="Emerging Markets Bonds Insights"><strong>Emerging Markets Bonds</strong></a> insights, <a href="https://www.vaneck.com/us/en/subscribe/" title="Subscription Center"><strong>sign up in our subscription center</strong></a>.</p>
<style>
    .wrapped-div {
        max-width: 100%;
    }

    @media (max-width: 768px) {
        .wrapped-div {
            overflow-x: scroll;
        }
    }

    .wrapped-div-sector {
        max-width: 100%;
        overflow-x: scroll;
    }
</style>
]]></content:encoded>
</item><item rdf:about="https://www.vaneck.com/us/en/blogs/digital-assets/matthew-sigel-geodnet-why-were-bullish/">
  <title>GEODNET: Why We&#39;re Bullish></title>
  <link>https://www.vaneck.com/us/en/blogs/digital-assets/matthew-sigel-geodnet-why-were-bullish/</link>
  <description><![CDATA[VanEck's investment in GEODNET&rsquo;s GEOD token reflects our belief in its profitable approach in a fast-growing autonomous vehicle market.]]></description>
  <dc:creator>Patrick Bush</dc:creator>
  <dc:date>04/19/2024 06:30:00</dc:date>
<content:encoded><![CDATA[

<p><strong>Please note that VanEck may have a position(s) in the digital asset(s) described below.</strong></p>
<p>We are excited to announce that VanEck has made an investment in GEODNET&rsquo;s GEOD token. This investment was made directly with the GEODNET Foundation. Post purchase, VanEck owns less than 50bps of a fully diluted supply of GEOD tokens. We have chosen to allocate to GEOD tokens because GEODNET is a unique, revenue-generating business that sagely employs crypto-economics to provide a cheaper, superior service compared to incumbent businesses. Furthermore, GEODNET occupies a niche in a briskly growing market, with a 10.5% compound annual growth rate (CAGR) and substantial upside potential from autonomous vehicle technologies.</p>
<ul class="content-list">
<li><a href="#what-is-geodnet"><strong>What is GEODNET? </strong></a></li>
<li><a href="#precise-in-location-data"><strong>GEODNET: Precise in Location Data</strong></a></li>
<li><a href="#how-the-network-functions"><strong>GEODNET: How the Network Functions</strong></a></li>
<li><a href="#how-the-economics-work"><strong>GEODNET: How the Economics Work</strong></a></li>
<li><a href="#key-performance-indicators"><strong>GEODNET: Key Performance Indicators</strong></a></li>
<li><a href="#current-and-potential-use-cases"><strong>GEODNET: Current and Potential Use Cases </strong></a></li>
<li><a href="#comparison-to-non-crypto-businesses"><strong>GEODNET: Comparison to Non-Crypto Businesses</strong></a></li>
<li><a href="#valuation-framework"><strong>GEODNET: Valuation Framework</strong></a></li>
<li><a href="#key-risks"><strong>GEODNET: Key Risks</strong></a></li>
</ul>
<h2 id="what-is-geodnet" class="anchored-block">What is GEODNET?</h2>
<p>GEODNET is a project that utilizes cryptocurrency to bootstrap a network of GNSS, Global Navigation Satellite Systems like GPS, and correction services that substantially improve the accuracy of location data. Using token incentives, we believe GEODNET has done an exceptional job bootstrapping a network of <a href="https://console.geodnet.com/map" title="GEOD Network" target="_blank" rel="noopener"><strong>5,061</strong></a> nodes to provide real value to end users. Already, GEODNET is generating meaningful revenue from customers who are substituting GEODNET&rsquo;s data over more expensive alternatives. GEODNET has created products for users in agriculture, drones, construction, and IoT. As of March 2024, GEODNET boasts an annualized recurring revenue (ARR) of $630k. We forecast that GEODNET will increase its market share of the $3.4B GNSS correction market because GEODNET&rsquo;s service is substantially cheaper while offering higher location fidelity than many incumbents.</p>
<p><img class="img-responsive w-100" src="https://www.vaneck.com/contentassets/123b8cc5a83d4babb3f32e114d2919a9/4363_geodnet_image-1_2024-4_v1.png" alt="GEODNET footprint" /></p>
<p class="chart-disclosure"><strong>Source:</strong> GEODNET as of 4/4/2024.</p>
<h2 id="precise-in-location-data" class="anchored-block">GEODNET: Precise in Location Data</h2>
<p>Satellite-based location systems, such as GPS (USA), GLONASS (Russia), Galileo (Europe), and BeiDou (China), are premised on a constellation of satellites that transmit signals to allow people on the ground to infer location data. Due to atmospheric interference, space weather, and satellite time synchronization errors, those signals are degraded to only be accurate within 10-20 feet. While this is adequate for many applications, more is needed for many advanced use cases of location data. GEODNET provides location accuracy of around &frac12; inch with re-positioning updates every second. GEODNET matches or exceeds the capabilities of competitors and is done so at a fraction of competitor price points.</p>
<p>Some of these include precision farming, building advanced surveying and building construction, urban planning, mapping, and navigation. For example, John Deere&rsquo;s AutoTrac is an upgrade for existing tractors to allow the trackers to self-drive to reduce waste, improve yields, and increase energy efficiency. Products such as AutoTrac and other similar auto-steering and guidance kits can directly use real-time kinematics (RTK) data from networks like GEODNET to operate at high precision.</p>
<p><img class="img-responsive w-100" src="https://www.vaneck.com/contentassets/123b8cc5a83d4babb3f32e114d2919a9/4363_geodnet_image-2_2024-4_v1.jpg" alt="John Deere" /></p>
<p class="chart-disclosure"><strong>Source:</strong> John Deere as of 4/4/2024.</p>
<h2 id="how-the-network-functions" class="jump-link-nav anchored-block" data-jumplink-title="GEODNET: How it Works">GEODNET: How the Network Functions</h2>
<p>GEODNET is in the decentralized physical infrastructure networks, or DePIN, class of crypto projects that employs token incentives to create a network of physical infrastructure. Similar to DIMO, Hivemapper, and Helium, GEODNET distributes tokens to people who run hardware to create a network of &ldquo;miners&rdquo; that supplies useful services. In the case of GEODNET, the miners operate internet-connected devices that collect satellite positioning signals and make them more accurate. Users buy these devices using their own money, which is available from online retailers and install them according to <strong><a href="https://www.youtube.com/watch?v=3j5-HyDYbVI" title="GEODNET - Space Weather station Crypto Miner Unboxing" target="_blank" rel="noopener">instructions</a></strong> online. While users can purchase devices through GEODNET partners, GEODNET supports a variety of devices built by dozens of different manufacturers. As such, its network is not reliant upon one or even several suppliers.</p>
<p>Users must install devices with a clear view of the night sky to track incoming satellite signals. After a user installs the device, he must set up a wallet, and the user&rsquo;s location is auto affirmed with the GNSS receiver with a crypto chip built into it. The user maintains the device, which interprets incoming GNSS satellite signals and transmits the correction data to a centralized, off-chain repository. GEODNET miners each exist within a subdivision called a Hex. A Hex is a hexagonal area around the miner that is 20km from side to side. While many miners can exist within the same Hex, additional miners, after the first reliable miner, receive decreased rewards. Within each Hex, the miner can provide GPS correction data that provides &frac12; inch accuracy to any end users operating within that Hex.</p>
<h2 id="how-the-economics-work" class="anchored-block">GEODNET: How the Economics Work</h2>
<p>In exchange for remitting consistent correction data, miners receive GEOD tokens. Currently, miners receive, on average, 48 GEOD tokens per day in exchange for a triple-band (high fidelity) miner and 24 for a dual-band (lower quality). At present, this translates into $4,029.60 worth of tokens per year, meaning that a user&rsquo;s device costs ($700 to buy a device) are paid back in around two months. As such, GEODNET does not itself pay for its network&rsquo;s miners, and thus, it does not have to outlay tens of millions of dollars for devices, real estate, permits, and internet connectivity. Founder Mike Horton tried to bootstrap a network similar to GEODNET but ran into high capital costs, complex site acquisition and permitting processes, and other expensive obstacles. <em>In essence, miners outlay capital to create a network and are rewarded directly in an incentive, the token, that rises in value as the network becomes more valuable. </em></p>
<h3>Current System - CORS (Base Stations)</h3>
<p><img class="img-responsive w-100" src="https://www.vaneck.com/contentassets/123b8cc5a83d4babb3f32e114d2919a9/4363_geodnet_infographic-chart_2024-4_v1_blog.svg" alt="Current System - CORS (Base Stations)" /></p>
<p class="chart-disclosure"><strong>Source:</strong> GEODNET as of 4/4/2024.</p>
<p>End-users who want to receive correction data can either purchase the wholesale data directly from the GEODNET Foundation or they can purchase products and services that rely upon GEODNET data from 3rd parties. While some competitors price differentiate their offerings based upon latency and accuracy of the signal, GEODNET provides its highly accurate data of the same quality to all. Customers can buy GEODNET data directly from GEODNET or its partners and pay using traditional payment methods. They can also buy devices that utilize precise location data, like construction surveying equipment, from a third-party reseller who utilizes GEODNET data on the back end. One of the benefits of GEODNET&rsquo;s partnership model is that it allows different use cases to command different prices. This is possible because GEODNET has a 50/50 revenue share with third-party re-sellers.</p>
<p>Because GEODNET has removed many of the costs of running its GNSS enhancement network, it has a substantial pricing advantage over its competitors. For example:</p>
<div class="wrapped-div">
<table style="width: 100%;">
<tbody>
<tr class="tbl-data">
<td class="tbl-header last">Service</td>
<td class="tbl-header last text-center">Annual Price</td>
<td class="tbl-header last text-center">Accuracy</td>
<td class="tbl-header last text-center">Latency</td>
</tr>
<tr class="tbl-data">
<td class="data-td last font-weight-normal">Terrastar L</td>
<td class="data-td data last">$400</td>
<td class="data-td data last">15-20cm</td>
<td class="data-td data last">5 min</td>
</tr>
<tr class="tbl-data">
<td class="data-td last font-weight-normal">ublox</td>
<td class="data-td data last">$660</td>
<td class="data-td data last">3-6cm</td>
<td class="data-td data last">30s</td>
</tr>
<tr class="tbl-data">
<td class="data-td last font-weight-normal">Point One</td>
<td class="data-td data last">$600</td>
<td class="data-td data last">10cm</td>
<td class="data-td data last">5s</td>
</tr>
<tr class="tbl-data">
<td class="data-td last font-weight-normal">Omnistar</td>
<td class="data-td data last">$1,100</td>
<td class="data-td data last">10cm</td>
<td class="data-td data last">n/a</td>
</tr>
<tr class="tbl-data">
<td class="data-td last font-weight-normal">VRS Now</td>
<td class="data-td data last">$1,850</td>
<td class="data-td data last">2cm</td>
<td class="data-td data last">8s</td>
</tr>
<tr class="tbl-data">
<td class="data-td last font-weight-normal">Terrastar C</td>
<td class="data-td data last">$1,050</td>
<td class="data-td data last">2.5cm</td>
<td class="data-td data last">3 min</td>
</tr>
<tr class="tbl-data">
<td class="data-td last font-weight-normal">GEODNET</td>
<td class="data-td data last">$400</td>
<td class="data-td data last">1cm</td>
<td class="data-td data last">1s</td>
</tr>
</tbody>
</table>
</div>
<br />
<p class="chart-disclosure"><strong>Source:</strong> VanEck Research as of 4/4/2024. Not a recommendation to buy or sell any of the names mentioned herein<strong>. Past performance is no guarantee of future results.</strong></p>
<p>Since GEODNET is a non-profit organization chartered in Singapore, there is no equity component. The result is that GEODNET currently utilizes 80% of its revenues to buy GEOD tokens in the open market and GEODNET then burns those tokens. This is vastly superior to the share buyback model, as burned tokens can never again be re-issued. The buy/burns are done <strong><a href="https://polygonscan.com/token/0xac0f66379a6d7801d7726d5a943356a172549adb" title="Polygonscan - Geodnet Token (GEOD)" target="_blank" rel="noopener">transparently</a></strong> and this is the mechanism by which GEODNET translates its network&rsquo;s revenues into value for the token.</p>
<p><img class="img-responsive w-100" src="https://www.vaneck.com/contentassets/123b8cc5a83d4babb3f32e114d2919a9/4363_geodnet_image-3_2024-4_v1.jpg" alt="HYFIX Spatital Intelligence" /></p>
<p class="chart-disclosure"><strong>Source</strong>: HYFIX.AI as of 4/4/2024.</p>
<h2 id="key-performance-indicators" class="anchored-block">GEODNET: Key Performance Indicators</h2>
<p>GEODNET is a highly scalable two-sided network. The foundation of the network is the nodes that transmit the location data, the supply side, and the corresponding coverage area. At the time of writing, there were 5,061 nodes that provided significant coverage across 60 countries on all seven continents. On the flip side is the demand for the services. This is how much money customers are paying to utilize GEODNET&rsquo;s network. In March 2024, GEODNET earned $52K in revenue, which corresponds to an annual revenue rate of ~$630K. Because of the nature of GEODNET&rsquo;s business, this is recurring revenue.</p>
<h3>GEODNET Network Size and Annual Recurring Revenue (ARR) Growth &gt;2x in 1 Year</h3>
<p><img class="img-responsive w-100" src="https://www.vaneck.com/contentassets/123b8cc5a83d4babb3f32e114d2919a9/4363_geodnet_chart_2024-4_v1_blog.svg" alt="GEODNET Network Size and Annual Recurring Revenue" /></p>
<p class="chart-disclosure"><strong>Source:</strong> GEODNET as of 4/4/2024. Not a recommendation to buy or sell any of the names mentioned herein<strong>. Past performance is no guarantee of future results.</strong></p>
<h2 id="current-and-potential-use-cases" class="jump-link-nav anchored-block" data-jumplink-title="GEODNET: Use Cases">GEODNET: Current and Potential Use Cases</h2>
<p>The real-time kinematics (RTK) market is estimated to be a $3.4B market with diverse applications that range from construction to agriculture to automated driving. Adding more precise location data to many different businesses and services brings substantial value to end users through cost-savings and new product capabilities. One interesting product that has been greatly improved directly from GEODNET&rsquo;s services is robotic lawnmowers. Using high fidelity enables these devices to perform their functions faster and with less wasted energy.</p>
<p>Already, farmers can employ RTK technology to improve agronomy to enable smarter, more efficient application of pesticides, fertilizers and seeding due to improved mapping of soil sampling. RTK technology and the suite of opportunities it enables will help farmers save money while reducing the amount of pollution they emit. For construction businesses, GEODNET not only allows builders to understand precise map location, but also near-exact vertical location as well.</p>
<p>In the future, technologies such as Advanced Driver Assistance Systems and Lane-Level navigation will depend on hyper-precise positioning. Additionally, there is a long tail of AR/VR applications who can massively benefit from GEODNET&rsquo;s position accuracy.</p>
<h2 id="comparison-to-non-crypto-businesses" class="anchored-block">GEODNET: Comparison to Non-Crypto Businesses</h2>
<p>While small, private businesses operate regional networks to sell precision location data, the most reasonable publicly traded comparison to GEODNET is Trimble (TRMB). Though Trimble is a different enterprise than GEODNET in many respects, its principal component is the monetization of geospatial data. Additionally, both GEODNET and Trimble have similar-sized networks at ~5k nodes.</p>
<p>Trimble is a business that offers software, hardware, and services that rely upon or create geospatial data for a diverse array of end markets. Its customers include agriculture, construction, engineering, surveying, maritime industries, and more. Basically, Trimble touches any sector that must incorporate or produce geospatial information as a core part of its business. To bring value to its customers, Trimble offers a diverse suite of hardware products that also include software and services.</p>
<p>Trimble operates as a "solutions&rdquo; enterprise that begins with low-margin hardware but ultimately drives customers to high-margin ARR businesses like software and services. Trimble makes money not only by &ldquo;selling&rdquo; geospatial data but also by allowing its customers to generate that data, analyze it, and use that data to power Trimble-manufactured products/software. This business approach necessitates substantial investments in manufacturing, inventory, and a robust sales force.</p>
<p>As such, Trimble&rsquo;s GNSS correction services segment is embedded as a component of its broader approach. The consequence of Trimble&rsquo;s multifaceted arrangement is arguably a lower-margin business that compensates for reduced margins by focusing on customer lock-in. To wit, 53% of Trimble&rsquo;s revenue in 4Q2023 was recurring, while its free cash flow (FCF) margin was 14.6%. Because of these dynamics and due to Trimble&rsquo;s slow but steady growth, TRMB&rsquo;s equity has traded at an average of 28.75x its FCF since the beginning of 2022.</p>
<p>By contrast, GEODNET operates as a pure information business that provides useful data that is sold wholesale or re-marketed by other businesses as part of those businesses&rsquo; integrated product or service offerings. GEODNET&rsquo;s approach is special because it outsources data collection to service providers who are paid using GEOD tokens. At the same time, GEODNET uses partnerships to outsource sales of its data to service businesses and OEMs who incorporate GEODNET&rsquo;s precision data as part of their product or services.</p>
<p>As such, GEODNET is a business that does not own its network, manufacture products, or even maintain sales channels for products that utilize its data. GEODNET is a network whose value is the information it provides rather than the bevy of services stapled on top of it.</p>
<p>GEODNET is a pure network value.</p>
<p>We foresee a future where many companies like Trimble deprecate their existing corrections network in order to use GEODNET. Realistically, Trimble&rsquo;s existing GNSS correction network is a cost center that facilitates its core business services. We project that by replacing its network with GEODNET, Trimble can save $50M in annual personal protective equipment (PPE) expenses.</p>
<h2 id="valuation-framework" class="jump-link-nav anchored-block" data-jumplink-title="GEODNET: Valuation">GEODNET: Valuation Framework</h2>
<p>We arrive at the 2030 valuation of GEODNET based upon a 30x cash flow multiple. We select this conservative multiple as it corresponds to comparable companies like TRMB. The cashflows are then used to buy back tokens. We estimate the cashflows by projecting the market size for the GNSS correction market and then assume GEODNET is able to achieve a 5% market share. We believe that this is feasible and may even underestimate GEODNET&rsquo;s potential due to:</p>
<ol class="content-list">
<li>High network replication costs</li>
<li>Niche industry based upon relationships and asymmetric knowledge</li>
<li>Strong pipeline of customers and high leadership reputation in the industry</li>
<li>Long-term cost advantage</li>
<li>Well-seasoned team with past success building businesses</li>
</ol>
<p>The result is that we project a 2030 token price of <strong>$9.58 </strong>based upon an <strong>80%</strong> net margin that is applied to the buyback and burn of the token and a token supply of 640M.</p>
<p class="chart-disclosure"><strong>Past performance is no guarantee of future results. The information, valuation scenarios, and price targets in this blog are not intended as financial advice or any call to action, a recommendation to buy or sell, or as a projection of how GEODNET&rsquo;s GEOD token will perform in the future. Actual future performance of GEODNET&rsquo;s GEOD token is unknown and may differ significantly from the hypothetical results depicted here. There may be risks or other factors not accounted for in the scenarios presented that may impede the performance. These are solely the results of a simulation based on our research and are for illustrative purposes only. Please conduct your own research and draw your own conclusions.</strong></p>
<h2 id="key-risks" class="jump-link-nav anchored-block" data-jumplink-title="GEODNET: Key Risks">GEODNET: Key Risks</h2>
<p>The key risks of GEODNET stem from incumbents replicating its service or using existing competitive advantages to box out GEODNET. Similarly, there are risks to its crypto reward structure that is premised on its token continuing to have value. There are also technological threats posed by 6G cellular networks, WiFi location triangulation, and similar technologies to provide very inexpensive or free high-precision location data. See below for more color on the key risks to GEODNET.</p>
<ul class="content-list">
<li>Legal structure
<ul>
<li>The legal structure of the buyback and burn model may not have a solid legal foundation</li>
<li>Change in buyback structure to be below 80%</li>
</ul>
</li>
<li>Metastable System
<ul>
<li>Token incentives drop too rapidly due to yearly halvening to drive network growth
<ul>
<li>Drops to 0.56 per base station, per day, by 2030</li>
</ul>
</li>
<li>Price catalyzes a death spiral as the network declines due to the collapse of incentives</li>
</ul>
</li>
<li>Competitive response
<ul>
<li>Someone akin to American Tower sees value in this business and decides to replicate it using its network</li>
</ul>
</li>
<li>Competing technologies
<ul>
<li>For example, novel approaches like utilizing future Wi-Fi or 6<sup>th</sup>General Cellular signals might be enhanced to allow precise location data to be obtained cheaper or even for free</li>
</ul>
</li>
<li>Sales channels cannot interdict incumbents
<ul>
<li>Existing incumbents have location correction services integrated at the point of manufacture of devices and the creation of software</li>
</ul>
</li>
<li>Resale of data without a license
<ul>
<li>Hacking and remitting the data without a license may cannibalize revenues</li>
</ul>
</li>
</ul>
<p><strong>Links to third party websites are provided as a convenience and the inclusion of such links does not imply any endorsement, approval, investigation, verification or monitoring by us of any content or information contained within or accessible from the linked sites. By clicking on the link to a non-VanEck webpage, you acknowledge that you are entering a third-party website subject to its own terms and conditions. VanEck disclaims responsibility for content, legality of access or suitability of the third-party websites.</strong></p>
<p>To receive more <strong><a href="https://www.vaneck.com/us/en/insights/digital-assets/" title="Digital Assets Insights">Digital Assets</a></strong> insights, <strong><a href="https://www.vaneck.com/us/en/subscribe/" title="Subscription Center">sign up in our subscription center</a></strong>.</p>
]]></content:encoded>
</item><item rdf:about="https://www.vaneck.com/us/en/blogs/emerging-markets-equity/shareholder-notice-rsx-and-rsxj-liquidation/">
  <title>Shareholder Notice: RSX and RSXJ Liquidation></title>
  <link>https://www.vaneck.com/us/en/blogs/emerging-markets-equity/shareholder-notice-rsx-and-rsxj-liquidation/</link>
  <description><![CDATA[VanEck has commenced plans to liquidate the VanEck Russia ETF (RSX) and VanEck Russia Small-Cap ETF (RSXJ) as described below. The Funds will not engage in any investment activities except to wind up affairs.]]></description>
  <dc:creator> </dc:creator>
  <dc:date>04/19/2024 05:30:00</dc:date>
<content:encoded><![CDATA[

<p>This update is to inform you of important developments relating to the Funds.</p>
<p>VanEck Russia ETF (RSX) and VanEck Russia Small-Cap ETF (RSXJ) (together, the &ldquo;Funds&rdquo;) have suspended the right of redemption of fund shares pursuant to an exemptive order issued by the Securities and Exchange Commission on December 28, 2022, in order to permit the Funds to liquidate their portfolios. The Funds made an initial liquidating distribution to shareholders of a pro-rata share of current liquid assets, less a reserve to cover operating and liquidation expenses for an extended period. The initial distribution occurred on January 12, 2023. In addition, RSX made additional liquidating distributions on July 27, 2023, September 29, 2023, April 19, 2024, October 7, 2024 and December 24, 2024. In addition, RSXJ made an additional liquidating distribution on October 7, 2024. The Funds may make additional liquidating distributions, although additional distributions may not occur.</p>
<p>The effect of geopolitical affairs and sanctions imposed by the United States and other countries on transactions in Russian equities, and on related clearance and payment systems, have rendered a substantial number of the Funds&rsquo; positions illiquid, including many depositary receipts. The Funds&rsquo; inability to buy, sell, and take or make delivery of Russian securities has made it impossible to manage the Funds consistent with their investment objectives. The Funds will not engage in any business or investment activities except for the purposes of winding up their affairs. VanEck cautions investors that it is expected that the liquidation of the Funds will take an extended period of time, if circumstances involving Russian securities markets do not improve.</p>
<p>The plan of liquidation provides that the Funds will terminate (a) after payment of a final liquidating distribution and redemption of all shares outstanding, (b) after the Russian securities held by the Funds cease to represent valid interests in their issuers, or if earlier than (a) or (b) on a date after December 31, 2023 as determined by the Funds&rsquo; Board of Trustees upon recommendation of the Funds&rsquo; investment adviser. It is possible that the liquidation period could extend well beyond December 31, 2023. Due to the uncertainty involved, there can be no assurance that shareholders would receive any liquidating distribution relating to the Russian securities and depositary receipts after the initial distribution, described above. The distribution to shareholders of sale proceeds of Russian securities and depositary receipts, if any, will be reduced by expenses related to the sale and the distribution; other Fund operating and liquidation expenses will be paid out of the reserve.</p>
<p>Future updates regarding the status of the fund and its liquidation may be published on the Funds&rsquo; webpages: <strong><a href="/link/d3b992b357a54737b7361ef6c9560663.aspx" title="RSX - VanEck Russia ETF - Overview">VanEck Russia ETF (RSX)</a></strong> and <strong><a href="/link/187079475eb44aec8286b950a0c60279.aspx" title="RSXJ - VanEck Russia Small-Cap ETF - Overview">VanEck Russia Small-Cap ETF (RSXJ)</a></strong>. Should you have additional questions concerning this update or the liquidation process, please contact us at 1-800-826-2333.</p>

]]></content:encoded>
</item><item rdf:about="https://www.vaneck.com/us/en/blogs/emerging-markets-equity/emerging-markets-stock-selection-drives-q1-performance/">
  <title>Stock Selection Drives Q1 Performance></title>
  <link>https://www.vaneck.com/us/en/blogs/emerging-markets-equity/emerging-markets-stock-selection-drives-q1-performance/</link>
  <description><![CDATA[The Fund&rsquo;s outperformance versus its benchmark in Q1 2024 was due, in large part, to stock selection in the Philippines and weightings in Kazakhstan and Georgia.]]></description>
  <dc:creator>Ola  El-Shawarby, CFA</dc:creator>
  <dc:date>04/18/2024 06:30:00</dc:date>
<content:encoded><![CDATA[

<p>In the first quarter of 2024, emerging markets equities underperformed their developed markets counterparts. Overall, many of the trends and themes that played out during 2023 continued into the first quarter of 2024. The same countries that performed well last year (Taiwan Region &amp; India) kicked off the year with a strong start. Taiwan Region&rsquo;s strong performance was primarily due to its exposure to the A.I. mega-trend through its largest company, Taiwan Semiconductor Manufacturing Co. India continues to benefit from the macro tailwinds of a booming economy and impactful government policies. Brazil stands out in contrast as a large Q1 detractor following a strong 2023.</p>
<p>From a macro perspective, emerging markets investors remain laser-focused on the prospect of U.S. interest rate cuts this year. An accommodative Fed potentially bodes well for emerging markets equities, which would benefit from currency tailwinds if the dollar weakens. Unfortunately for EM investors, the dollar rallied for the majority of the first quarter as did long-term U.S. rates. Dollar strength undoubtedly contributed to emerging markets equity underperformance compared to their developed counterparts in Q1.</p>
<ul class="content-list">
<li><strong><a href="#fund-performance">Fund Performance</a></strong></li>
<li><strong><a href="#fund-review">Fund Review</a></strong></li>
<li><strong><a href="#fund-positioning-outlook">Fund Positioning and Outlook</a></strong></li>
</ul>
<h2 id="fund-performance" class="jump-link-nav anchored-block" data-jumplink-title="Fund Performance">Fund Performance</h2>
<p>The VanEck Emerging Markets Fund (the &ldquo;Fund&rdquo;) outperformed the MSCI EM IMI on the quarter-to-date basis ending March 31, 2024 (+4.3% for the Fund; +2.2% for the Index). Positive relative performance was principally driven by stock selection in the Philippines and allocation (weighting) in Kazakhstan and Georgia.</p>
<p>After a positive, though somewhat muted 2023, the Philippines started the year off on the right foot as the top country contributor in the first quarter of 2024. The Fund&rsquo;s Philippines&rsquo; stock selection effect boosted performance by 0.90%, with allocation also helping. The Philippines is the Fund&rsquo;s second-largest country overweight to end the quarter (5.9% Fund weight; 0.7% Benchmark weight).</p>
<p>Brazil remains our largest country overweight (13.1% Fund weight; 5.2% Benchmark weight). After a stellar 2023, Brazil&rsquo;s allocation effect was the single largest detractor to fund performance in Q1 2024; stock selection effect from Brazil was negligible. However, we continue to have high conviction in the solid investment case for Brazil going forward with further expected rate cuts, declining inflation, accelerating economic growth and attractive valuations.</p>
<p>Our exposure to China contributed negatively on an absolute basis for the quarter, but was slightly positive on a relative basis. We are encouraged by some recent data coming out of China pointing towards a stabilizing / improving economic environment including better than expected March 2024 Purchasing Managers' Index (PMI) numbers and stronger travel and consumption trends during recent Chinese holiday seasons. We continue to focus on optimizing our stock selection in the country.</p>
<style type="text/css">
    .wrapped-div {
        max-width: 100%;
    }

    @media (max-width: 768px) {
        .wrapped-div {
            overflow-x: scroll;
        }
    }

    .wrapped-div-sector {
        max-width: 100%;
        overflow-x: scroll;
    }
</style>

<h3>Average Annual Total Returns (%) as of March 31, 2024</h3>
<div class="wrapped-div">
<table style="width: 100%;">
<tbody>
<tr class="tbl-data">
<td class="tbl-header last">&nbsp;</td>
<td class="tbl-header last text-center">1Q24<sup>&dagger;</sup></td>
<td class="tbl-header last text-center">YTD</td>
<td class="tbl-header last text-center">1YR</td>
<td class="tbl-header last text-center">3YR</td>
<td class="tbl-header last text-center">5YR</td>
<td class="tbl-header last text-center">10YR</td>
</tr>
<tr class="tbl-data">
<td class="data-td last">Class A: NAV (Inception 12/20/93)</td>
<td class="data-td data last">4.26</td>
<td class="data-td data last">13.12</td>
<td class="data-td data last">-9.00</td>
<td class="data-td data last">-0.15</td>
<td class="data-td data last">1.24</td>
</tr>
<tr class="tbl-data">
<td class="data-td last">Class A: Maximum 5.75% Load</td>
<td class="data-td data last">-1.74</td>
<td class="data-td data last">6.61</td>
<td class="data-td data last">-10.78</td>
<td class="data-td data last">-1.33</td>
<td class="data-td data last">0.64</td>
</tr>
<tr class="tbl-data">
<td class="data-td last">Class I: NAV (Inception 12/31/07)</td>
<td class="data-td data last">4.40</td>
<td class="data-td data last">13.81</td>
<td class="data-td data last">-8.50</td>
<td class="data-td data last">0.36</td>
<td class="data-td data last">1.75</td>
</tr>
<tr class="tbl-data">
<td class="data-td last">MSCI Emerging Markets Investable Markets Index (IMI)</td>
<td class="data-td data last">2.17</td>
<td class="data-td data last">9.76</td>
<td class="data-td data last">-3.93</td>
<td class="data-td data last">2.98</td>
<td class="data-td data last">3.22</td>
</tr>
<tr class="tbl-data">
<td class="data-td last">MSCI Emerging Markets Index</td>
<td class="data-td data last">2.37</td>
<td class="data-td data last">8.15</td>
<td class="data-td data last">-5.05</td>
<td class="data-td data last">2.22</td>
<td class="data-td data last">2.95</td>
</tr>
</tbody>
</table>
</div>
<br />
<p class="chart-disclosure"><strong>The table presents past performance which is no guarantee of future results and which may be lower or higher than current performance. Returns reflect applicable fee waivers and/or expense reimbursements. Had the Fund incurred all expenses and fees, investment returns would have been reduced. Investment returns and Fund shares values will fluctuate so that investor's shares, when redeemed, may be worth more or less than their original cost. Fund returns assume that dividends and capital gains distributions have been reinvested in the Fund at net asset value (NAV). Index returns assume that dividends of the Index constituents in the Index have been reinvested. Performance information current to the most recent month end is available by calling 800.826.2333 or by visiting vaneck.com.</strong></p>
<p class="chart-disclosure"><strong>Expenses: Class A: Gross 1.54%; Net 1.54%; Class I: Gross 1.19%; Net 1.01%. Expenses are capped contractually until 5/1/24 at 1.60% for Class A and 1.00% for Class I. Caps exclude acquired fund fees and expenses, interest, trading, dividends, interest payments of securities sold short, taxes and extraordinary expenses.</strong></p>
<style type="text/css">
    .wrapped-div {
        max-width: 100%;
    }

    @media (max-width: 768px) {
        .wrapped-div {
            overflow-x: scroll;
        }
    }

    .wrapped-div-sector {
        max-width: 100%;
        overflow-x: scroll;
    }
</style>


<h2 id="fund-review" class="jump-link-nav anchored-block" data-jumplink-title="Fund Review">Fund Review</h2>
<p>On a sector level, Financials, Information Technology and Energy contributed to relative performance, while Consumer Discretionary, Utilities and Health Care detracted. On a country level, the Philippines, Kazakhstan and Georgia contributed to relative performance, while Brazil, Egypt and Uruguay detracted.</p>
<h2>Top Contributors</h2>
<p>Top contributors to return on an absolute basis during the quarter:</p>
<ul class="content-list">
<li><strong>Taiwan Semiconductor Manufacturing Co (&ldquo;TSMC&rdquo;) (7.2% of Fund net assets<sup>*</sup>):</strong> Buoyed by the tailwind from AI advancements, TSMC experienced upward revisions in earnings forecasts early in the first quarter of 2024, projecting an expected 1-year earnings per share (EPS) growth exceeding 20%. This uplift, coupled with broad sectoral interest in semiconductors, contributed to a strong quarterly performance. We anticipate these trends will persist in bolstering TSMC's share price over the course of this year. Additionally, TSMC's preliminary moves to escalate capital expenditure (CAPEX) and expand its manufacturing base beyond Japan are noteworthy. Such strategies aim to alleviate geopolitical tensions related to Taiwan Region.</li>
<li><strong>International Container Terminal Services, Inc. (&ldquo;ICTSI&rdquo;) (3.7% of Fund net assets<sup>*</sup>):</strong> ICTSI, the world's eighth-largest port operator by throughput, serves as a barometer for emerging markets growth, boasting significant pricing power that enables high operating leverage and an earnings before interest, taxes, depreciation and amortization (EBITDA) margin around 60%&mdash;the highest among its peers. Despite a challenging macro environment in 2023, ICTSI has shown remarkable resilience, growing volumes and yields, leading to upward revisions from analysts. The company trades above its 10-year historical average by one standard deviation, yet the outlook for 2024 and beyond remains positive. Expected drivers of future growth include volume increases from recent expansions in Australia and Mexico, yield improvements in Manila and further global expansion via mergers and acquisitions. ICTSI is also poised to benefit from major global trends such as the U.S.-China decoupling and the energy transition.</li>
<li><strong>Bank of Georgia (2.6% of Fund net assets<sup>*</sup>):</strong> Bank of Georgia Group Plc stands as one of the two dominant forces in the Georgian banking sector, holding over 33% of the market share. Throughout the quarter, the bank has surpassed expectations, underpinned by robust earnings achieved in 2023, which built upon an already strong performance in 2022, with its return on equity consistently exceeding 25%. Furthermore, Bank of Georgia recently disclosed the acquisition of a majority stake in Ameriabank, an Armenian bank. This strategic move is anticipated to be earnings accretive and introduces further growth prospects in a new market.</li>
</ul>
<h2>Top Detractors</h2>
<p>Top detractors to return on an absolute basis during the quarter:</p>
<ul class="content-list">
<li><strong>Commercial International Bank - EGPT (&ldquo;CIB&rdquo;) (1.5% of Fund net assets<sup>*</sup>):</strong> CIB's recent underperformance can primarily be attributed to currency devaluation. However, the bank maintains a strong position with a liquid balance sheet, and its net interest margins (NIMs) are poised to benefit from rising interest rates, which in turn, will bolster return on equity (ROE). Looking ahead, a more stable foreign exchange (FX) regime is anticipated, alongside a gradual normalization of macroeconomic trends, including inflation, interest rates, the cost of risk, and lending growth. Post-devaluation, stock liquidity has seen improvement, positioning CIB as a prominent and investable name within the market.</li>
<li><strong>Vamos Locacao de Caminhoes, Maquinas e Equipamentos SA (&ldquo;Vamos&rdquo;) (1.8% of Fund net assets<sup>*</sup>):</strong> Vamos, a leading rental provider of trucks, equipment and machinery in Brazil, reported earnings that slightly missed expectations in both revenue and EBITDA. The underperformance was attributed to a challenging macroeconomic environment, prompting the company to shift from accelerating fleet allocation to a more selective contract issuance, alongside challenges in its dealership operations. Although truck sales are showing signs of improvement, heavy machinery sales remain weak, reflecting a 50/50 split in their performance. The agricultural sector's weaker sentiment, driven by anticipated poor crop yields, is affecting farmers' capital spending. However, 2024 is expected to bring better prospects for the sector, buoyed by lower interest rates and pent-up demand for fleet renewal amid an expansion in planted areas. Vamos is at a pivotal moment, with recovery anticipated in 2024. The company is poised to continue consolidating its leadership in the relatively untapped truck rental market, leveraging its competitive advantages in truck purchasing and scale.</li>
<li><strong>HDFC Bank (&ldquo;HDFC&rdquo;) (2.1% of Fund net assets<sup>*</sup>):</strong> HDFC Bank reported disappointing earnings results in February, highlighting escalating competition and delays in integrating a significant acquisition made last year. The impact of these challenges is evident in the share price performance over the past quarter. However, early indications suggest strategic adjustments are underway that could steer profitability back to previous levels.</li>
</ul>
<h2>Top Buys &amp; Sells</h2>
<p>During the period, we established new positions in the following:</p>
<ul class="content-list">
<li><strong>SK Hynix Inc. (&ldquo;Hynix&rdquo;) (2.4% of Fund net assets<sup>*</sup>):</strong> Hynix has ascended to become the world's preeminent manufacturer of HBM3 (the latest generation of high bandwidth memory) processors, surpassing both Samsung and Micron. HBM3, a specialist computer memory essential for AI developments, operates in conjunction with graphic processing units (GPUs) to enhance memory capacity, speed and power efficiency. Our investment thesis centers on two key predictions: firstly, that HBM3 will embody a structural growth trend, and secondly, that Hynix has established a quasi-contractual relationship with Nvidia. This relationship positions Hynix to capitalize on Nvidia's growth trajectories and its commanding presence in the GPU market.</li>
<li><strong>Piraeus Financial Holdings SA (1.1% of Fund net assets<sup>*</sup>):</strong> Piraeus Bank stands among the top four banks in Greece, boasting a robust deposit franchise within the country. The management team has executed an impressive restructuring and turnaround of the bank's operations post Greek financial crisis. This includes cleansing its portfolio of non-performing exposures, enhancing operational efficiency and expanding fee-based income. We are confident that the bank is well-positioned to achieve growth that surpasses sector averages and to generate sustainable returns. Despite its promising outlook, Piraeus Bank continues to trade at an unjustifiably lower valuation compared to its peers. We capitalized on a liquidity event during the quarter, triggered by the government's reduction of its stake in Piraeus, to establish our position in the bank.</li>
<li><strong>Trip.com Group Ltd (&ldquo;TCOM&rdquo;) (0.4% of Fund net assets<sup>*</sup>):</strong> TCOM is a well-established online travel agency (OTA) that operates chiefly across four platforms: Ctrip and Qunar in China, alongside Skyscanner and Trip.com for international markets. We initiated a position in TCOM during the first quarter, buoyed by our optimistic outlook on the revival of both inbound/outbound and domestic travel within China, fueled by the nation's reopening and visa exemption policies. Our optimism is supported by ongoing positive indicators in travel expenditure. Furthermore, we anticipate TCOM to achieve strong margins, benefitting from the cost-structure optimization undertaken during the pandemic, and its business model's capacity to leverage operating efficiencies as travel demand rebounds.</li>
<li><strong>BBB Foods Inc. (0.3% of Fund net assets<sup>*</sup>):</strong> Tiendas BBB has emerged as Mexico's premier hard discounter. The company went public in the first quarter of 2023, at which point we initiated our investment. We are attracted to the company's business model, the proven success of its retail format, the relatively low market penetration in Mexico, and the substantial growth opportunities that lie ahead.</li>
</ul>
<p>During the period, we exited the following positions:</p>
<ul class="content-list">
<li><strong>Wuxi Biologics Inc (0.0% of Fund net assets<sup>*</sup>):</strong> Over the past decade, Wuxi Biologics experienced significant benefits from robust biotech funding and the trend toward outsourcing Contract Development and Manufacturing Organization (CDMO) services to Asia. Nevertheless, in light of increased geopolitical risks, particularly due to the U.S. Biosecure Act, and reduced visibility in earnings, we chose to divest our position. After our exit, Wuxi Biologics adjusted its 2024 guidance downwards, citing challenges in securing commercial projects amidst the evolving geopolitical landscape.</li>
<li><strong>LG Chem Ltd (0.0% of Fund net assets<sup>*</sup>):</strong> LG Chem was initially perceived as a strategic non-China investment to leverage the surging demand for EV batteries. However, we decided to exit our position upon recognizing a shift in the competitive landscape: LG Chem's customers were gradually becoming competitors as they started to integrate battery assembly into their operations. Concurrently, LG Chem's substantial capital expenditures in the U.S., heavily dependent on subsidies, presented an additional risk. These subsidies could potentially be revoked in the event of a sudden change in the U.S. administration. Given these developments, we assessed that the risks had escalated to a point where they no longer warranted the expected returns.</li>
<li><strong>Bank BTPN Syariah Tbk PT (0.0% of Fund net assets<sup>*</sup>):</strong> The performance of the Bank BTPN Syariah&rsquo;s business has declined in recent years. Previously, it boasted a 30% Return on Equity (ROE) with loan growth exceeding 15%. However, the business model now appears to be compromised, with loan growth nearly stagnant (compared to 10% for peers) and significant asset quality concerns, leading to an approximate 15% ROE. Given these challenges and our outlook that a turnaround is unlikely soon, we made the decision to exit our position.</li>
<li><strong>Zai Lab Ltd (0.0% of Fund net assets<sup>*</sup>):</strong> Zai Lab&rsquo;s business model was previously regarded as a potent strategy for establishing an "innovation moat" within China. However, significant shifts in the domestic reimbursement system over the last three years have led us to reassess the attractiveness of Zai Lab's business model. In the long term, we harbor reservations about Zai Lab's ability to effectively manage R&amp;D development and control marketing expenses. Consequently, we have decided to exit our position.</li>
<li><strong>Clear Sale SA (0.0% of Fund net assets<sup>*</sup>):</strong> Clear Sale is currently implementing changes aimed at enhancing its cash flow generation, a process that is complex and expected to unfold over time. Meanwhile, performance remains subdued, falling short of forecasts, with Brazil's e-commerce sector facing significant challenges due to a difficult macroeconomic environment. Consequently, we have opted to divest our stake to concentrate on investments that offer clearer visibility and stronger growth prospects.</li>
<li><strong>Raizen SA (0.0% of Fund net assets<sup>*</sup>):</strong> Raizen&rsquo;s performance fell short of expectations over the past year. While there are promising opportunities in second-generation Ethanol (E2G), these are viewed as long-term prospects. In the interim, significant volatility in results is anticipated, particularly in the Sugar &amp; Ethanol sectors. Consequently, we have chosen to divest from this position in favor of opportunities with clearer visibility of outcomes.</li>
</ul>
<h2 id="fund-positioning-outlook" class="jump-link-nav anchored-block" data-jumplink-title="Fund Positioning and Outlook">Fund Positioning and Outlook</h2>
<p>We remain grounded by our investment process and our positioning reflects our convictions from a bottom-up basis. Our process has created some positioning differentials versus the benchmark. Brazil remains overweight to start the quarter (13.1% Fund weight versus 5.2% Index weight), as does the Philippines (5.9% versus 0.7% Index weight).</p>
<p>South Korea, Taiwan Region and China remain underweight versus the benchmark.</p>
<p>The Fund&rsquo;s objective is to find long-term structural growth companies at fair prices (S-GARP). Investments are chosen based on individual company analysis, focusing on quality, governance, innovative business models and low disruption risk, with active management and detailed research guiding our selection process.</p>
<p><a href="/us/en/blogs/emerging-markets-equity/emerging-markets-stock-selection-drives-q1-performance/eme-quarterly-commentary-q1-2024.pdf" rel="noopener" target="_blank" title="Emerging Markets &ndash; Stock Selection Drives Q1 Performance"><strong>A PDF version of this commentary can be downloaded&nbsp;here.</strong></a></p>
<p>To receive more <a href="/us/en/insights/emerging-markets-equity/" title="Emerging Markets Equity Insights"><strong>Emerging Markets Equity</strong></a> insights, <a href="/us/en/subscribe/" title="Subscription Center"><strong>sign up in our subscription center</strong></a>.</p>
]]></content:encoded>
</item><item rdf:about="https://www.vaneck.com/us/en/blogs/natural-resources/signs-of-life-in-global-resources/">
  <title>Signs of Life in Global Resources></title>
  <link>https://www.vaneck.com/us/en/blogs/natural-resources/signs-of-life-in-global-resources/</link>
  <description><![CDATA[<p>Constrained supply conditions, disruptions in the supply chain and growing interest in the global energy transition global energy transition may result in a significant upturn for global resource equities.</p>]]></description>
  <dc:creator>Shawn Reynolds</dc:creator>
  <dc:date>04/18/2024 06:30:00</dc:date>
<content:encoded><![CDATA[

<p>Quarterly insights from Global Resources Portfolio Manager Shawn Reynolds, featuring his unique views on natural resources and commodities. <a href="/us/en/blogs/natural-resources/signs-of-life-in-global-resources/grf-quarterly-commentary-1q-2024.pdf" rel="noopener" target="_blank" title="GRF Quarterly Commentary -1Q 2024"><strong><em>An expanded PDF version of this commentary, including fund specific information can be downloaded here.</em></strong> </a></p>
<h2>Oil Strength and A Late-Quarter Rally Lift Resources</h2>
<p>Geopolitical conflict and the specter of ongoing weakness in the Chinese economy continued to have an outsized impact on commodity prices for most of the quarter. Persistent inflationary pressure and a lack of clarity of U.S. rate policy also swayed investor sentiment. With the exception of Oil &amp; Gas, many resource sectors actually struggled for the first two months of the year, before finally exhibiting some signs of life by mid-to-late March (most notably, copper).</p>
<h2>Oil &amp; Gas</h2>
<p>Oil demand is expected to reach an all-time record high in 2024. Demand growth still projects to be strong as well, reverting to pre-pandemic levels. Escalating Middle-East tensions, including Houthi attacks on Red Sea shipping, contributed to much of the market&rsquo;s supply concerns in the first quarter. Additionally, OPEC+&rsquo;s announcement of planned extensions to its production cuts has further aided prices.</p>
<h2>Renewables &amp; Alternatives</h2>
<p>High financing costs and struggles to prove commercial viability have weighed on renewables. More recently, oversupply risks are also starting to impact profitability and share prices. Industry-wide, deal volumes are down as revenue volatility and fluctuating electricity prices have deterred long-term arrangements. Despite marginally slowing growth rates, electric vehicle sales in the U.S. and rest of the world continue to climb. Nevertheless, returns from battery and component material producers remain lackluster.</p>
<h2>Base &amp; Industrial Metals</h2>
<p>Many miners were beneficiaries of iron ore&rsquo;s rally in the fourth quarter of 2023. While that rally appears to have stalled, tighter copper supply &ndash; primarily due to ongoing mine disruptions &ndash; has provided a much-needed boost<em>. </em>On the other hand, &ldquo;green&rdquo; metals prices continued their retreat on concerns of slowing demand growth and near-term oversupply, particularly in lithium.</p>
<h2>Gold &amp; Precious Metals</h2>
<p>Gold continues to rally to new all-time highs on geopolitical concerns and central bank purchases<em>. </em>After failing to match gold&rsquo;s first quarter moves to new highs, gold miners are now trading at a significant discount<em>. </em>Cost inflation appears relatively subdued, for now, which should allow for further margin expansion.</p>
<h2>Agriculture</h2>
<p>Chicken demand remains robust, supported by substitution from beef after low cattle herds drove prices substantially higher during the last several quarters. Pre-planting applications in the U.S. (due to warmer weather) have crimped fertilizer supply, adding to recent, mild price increases<em>. </em>An abundant South-American corn and soybean supply, meanwhile, are capping grains early in the year.</p>
<h2>Outlook: Synchronized Gains</h2>
<p>Performance across the resource equity space has been fairly unsynchronized since late-2021, when a strong run-up in commodity prices contributed to historically-strong inflation globally. However, as inflation levels off, there appears to be several signs we may be reaching another inflection point. At present, we are still seeing tighter-than-average supply conditions across a broad range of commodities&mdash;including, most notably, crude oil and copper, but also fertilizers and other manufacturing/production inputs.</p>
<p>&nbsp;Likewise, we are also seeing sentiment around global growth shifting from one of modest bearishness to modest bullishness with interest rate cuts looming on the horizon. All of this is coinciding with a number of reported supply chain disruptions that are being exaggerated by escalating geopolitical conflict. Further, we believe that the global energy transition &ndash; though relatively dormant, conversationally &ndash; has not died. If anything, in our view, it has been fervently expanding, as measured by record capital investment, capacity installations and electric vehicle sales within just the last year. Combined &ndash; and absent any type of systemic financial risks &ndash; resource equity markets appear primed for one of these synchronized bounces off of its lows.</p>
<p>To receive more&nbsp;<a href="/us/en/insights/natural-resources/" title="Natural Resources Insights"><strong>Natural Resources</strong></a> insights, <a href="https://www.vaneck.com/us/en/subscribe/" title="Subscription Center"><strong>sign up in our subscription center</strong></a>.</p>
]]></content:encoded>
</item><item rdf:about="https://www.vaneck.com/us/en/blogs/income-investing/spreads-in-control/">
  <title>Spreads in Control></title>
  <link>https://www.vaneck.com/us/en/blogs/income-investing/spreads-in-control/</link>
  <description><![CDATA[<p>Fallen angels outperformed broad high yield by 0.24% in March and 0.10% YTD, due in part, to tighter spreads. Q1 2024 saw two fallen angels and two rising stars.</p>
]]></description>
  <dc:creator>Nicolas  Fonseca, CFA</dc:creator>
  <dc:date>04/17/2024 06:30:00</dc:date>
<content:encoded><![CDATA[

<p>In March, fallen angels (as represented by the ICE US Fallen Angel High Yield 10% Constrained Index, &ldquo;H0CF&rdquo;) outperformed the broad high yield market (as represented by the ICE BofA US High Yield Index, &ldquo;H0A0&rdquo;) by 0.24% (1.43% vs to 1.19%), and year-to-date, they are leading by 0.10%, with returns of 1.61% vs 1.51% for the broad high yield market.The majority of this outperformance can be attributed to tighter credit spreads, as fallen angel spreads tightened by 38bps compared to 24bps for the broad high yield. The impact offset the rise in bond yields. Hotter than expected inflation and jobs numbers so far this year have driven a re-pricing of market expectations for rate cuts to better align with U.S. Federal Reserve (Fed) guidance and some are now wondering if there could be no rate cuts at all this year. Longer term bond yields have moved upwards and as a result, yields on fallen angels (currently approximately 7%) remain significantly higher than historical averages despite the tightening of spreads over the past six months.</p>
<h2>Spreads Drive Outperformance</h2>
<p>The price return of fallen angels has historically served as a significant distinguishing factor compared to the broad high yield market from a total return perspective. Bonds that experience downgrades to high yield often undergo a recovery in the subsequent months following the rating adjustments. Typically, a higher volume of downgrades correlates with higher returns, as evidenced during events like the COVID-19 pandemic or the oil crisis of 2016. However, over the past few years, the strong credit environment has led to a dearth of new fallen angels, and the higher duration of fallen angels has driven a lag in price returns versus the broad HY market over the 1-year and 3-year periods. This has been offset, to a degree, by positive price performance of a significant number of &ldquo;rising stars&rdquo; over the period. The higher quality of fallen angels has also been a return detractor relative to the broad market, given the strong risk-on environment we&rsquo;ve seen recently and the generally lower yields of the segment.</p>
<p>More recently, fallen angels have outperformed broad HY, following the pause of the Fed's hiking campaign in the summer of 2023 and the rise in bond yields over the past 3 years subsiding. Although bond yields remain elevated and we expect to continue to see bouts of rate volatility (similar to what we&rsquo;ve seen recently), we generally expect long term yields to be range bound over the next year or so. Rate cuts down the road provide the potential for a duration tailwind, although we are generally expecting yield curve normalization rather than a significant decline in long-term bond yields, at least based on the current macro environment.</p>
<p>As the Fed contemplates rate cuts sometime this year, high yield investors should not focus solely on every data point the Fed considers but rather acknowledge that rate cuts are likely coming, and what the impact on the asset class may be. Historically, once the Fed initiates its easing cycle, BB-rated bonds have demonstrated outperformance (as discussed in our <strong><a href="https://www.vaneck.com/us/en/blogs/income-investing/fallen-angels-watching-sectors-quality-and-carry-in-2024/" title="Fallen Angels: Watching Sectors, Quality and Carry in 2024" rel="noopener">2024 outlook</a></strong>) within high yield.</p>
<h3>Cumulative Price, Income and Total Return</h3>
<div class="wrapped-div">
<table style="width: 100%;">
<tbody>
<tr class="tbl-data">
<td class="tbl-header last text-center">&nbsp;</td>
<td class="tbl-header last text-center" style="border-right: outset;" colspan="3">Fallen Angel</td>
<td class="tbl-header last text-center" style="border-right: outset;" colspan="3">Broad HY</td>
<td class="tbl-header last text-center">Price Return</td>
</tr>
<tr class="tbl-data">
<td class="data-head last">&nbsp;</td>
<td class="data-head last">Price</td>
<td class="data-head last">Income</td>
<td class="data-head last" style="border-right: outset;">Total</td>
<td class="data-head last">Price</td>
<td class="data-head last">Income</td>
<td class="data-head last" style="border-right: outset;">Total</td>
<td class="data-head last">Difference</td>
</tr>
<tr class="tbl-data">
<td class="data-td last">3m</td>
<td class="data-td data last">0.20%</td>
<td class="data-td data last">1.41%</td>
<td class="data-td data last" style="border-right: outset;">1.61%</td>
<td class="data-td data last">-0.11%</td>
<td class="data-td data last">1.62%</td>
<td class="data-td data last" style="border-right: outset;">1.51%</td>
<td class="data-td data last">0.31%</td>
</tr>
<tr class="tbl-data">
<td class="data-td last">6m</td>
<td class="data-td data last">7.07%</td>
<td class="data-td data last">3.08%</td>
<td class="data-td data last" style="border-right: outset;">10.15%</td>
<td class="data-td data last">5.22%</td>
<td class="data-td data last">3.46%</td>
<td class="data-td data last" style="border-right: outset;">8.68%</td>
<td class="data-td data last">1.85%</td>
</tr>
<tr class="tbl-data">
<td class="data-td last">9m</td>
<td class="data-td data last">5.13%</td>
<td class="data-td data last">4.59%</td>
<td class="data-td data last" style="border-right: outset;">9.72%</td>
<td class="data-td data last">4.07%</td>
<td class="data-td data last">5.18%</td>
<td class="data-td data last" style="border-right: outset;">9.25%</td>
<td class="data-td data last">1.06%</td>
</tr>
<tr class="tbl-data">
<td class="data-td last">1Y</td>
<td class="data-td data last">4.82%</td>
<td class="data-td data last">6.12%</td>
<td class="data-td data last" style="border-right: outset;">10.95%</td>
<td class="data-td data last">4.08%</td>
<td class="data-td data last">6.96%</td>
<td class="data-td data last" style="border-right: outset;">11.04%</td>
<td class="data-td data last">0.75%</td>
</tr>
<tr class="tbl-data">
<td class="data-td last">3Y</td>
<td class="data-td data last">-9.56%</td>
<td class="data-td data last">15.96%</td>
<td class="data-td data last" style="border-right: outset;">6.39%</td>
<td class="data-td data last">-11.08%</td>
<td class="data-td data last">17.85%</td>
<td class="data-td data last" style="border-right: outset;">6.77%</td>
<td class="data-td data last">1.52%</td>
</tr>
<tr class="tbl-data">
<td class="data-td last">5Y</td>
<td class="data-td data last">0.90%</td>
<td class="data-td data last">31.30%</td>
<td class="data-td data last" style="border-right: outset;">32.20%</td>
<td class="data-td data last">-10.05%</td>
<td class="data-td data last">31.89%</td>
<td class="data-td data last" style="border-right: outset;">21.84%</td>
<td class="data-td data last">10.95%</td>
</tr>
<tr class="tbl-data">
<td class="data-td last">10Y</td>
<td class="data-td data last">6.23%</td>
<td class="data-td data last">82.52%</td>
<td class="data-td data last" style="border-right: outset;">88.75%</td>
<td class="data-td data last">-18.38%</td>
<td class="data-td data last">71.65%</td>
<td class="data-td data last" style="border-right: outset;">53.27%</td>
<td class="data-td data last">24.61%</td>
</tr>
</tbody>
</table>
</div>
<br />
<p class="chart-disclosure">Source: ICE Data Services, VanEck. Fallen Angels: ICE US Fallen Angel High Yield 10% Constrained Index. Broad HY: ICE BofA US High Yield Index. Index performance is not representative of fund performance. It is not possible to invest in an index. Past performance is no guarantee of future results.</p>
<style>
	.wrapped-div {
		max-width: 100%;
	}

	@media (max-width: 768px) {
		.wrapped-div {
			overflow-x: scroll;
		}
	}

	.wrapped-div-sector {
		max-width: 100%;
		overflow-x: scroll;
	}
</style>


<p><span style="text-decoration: underline;"><strong>Fallen Angels Overall Statistics:</strong></span> The yields on fallen angels dipped 17bps to 6.92% in March, but are overall flat so far this year while spreads keep trending downwards, finishing Q1 at 247bps. We haven&rsquo;t been at these levels since January 2022 when the average spread reached 204bps. Given that inflation and interest rates are likely to remain elevated for longer, with the 10Y rising to 4.20% from 3.88% at the end of last year, we believe investors may capitalize on the advantages of the relatively high yields and attractive credit fundaments within the higher quality segments in high yield. Regarding defaults, the broad high yield market witnessed two issuers default in March: Enviva and Curo Group ($1,750 million par outstanding), adding to Cano Health and Audacy Capital Corp for a total of $3,044m vs $0 for fallen angels.</p>
<div class="wrapped-div">
<table style="width: 100%;">
<tbody>
<tr class="tbl-data">
<td class="tbl-header last text-center">&nbsp;</td>
<td class="tbl-header last text-center" style="border-right: outset;" colspan="2">Fallen Angels</td>
<td class="tbl-header last text-center" colspan="2">Broad HY</td>
</tr>
<tr class="tbl-data">
<td class="data-head last">&nbsp;</td>
<td class="data-head last">12/31/2023</td>
<td class="data-head last" style="border-right: outset;">3/31/2024</td>
<td class="data-head last">12/31/2023</td>
<td class="data-head last">3/31/2024</td>
</tr>
<tr class="tbl-data">
<td class="data-td last">Yield to Worst</td>
<td class="data-td data last">6.99</td>
<td class="data-td data last" style="border-right: outset;">6.92</td>
<td class="data-td data last">7.69</td>
<td class="data-td data last">7.75</td>
</tr>
<tr class="tbl-data">
<td class="data-td last">Effective Duration</td>
<td class="data-td data last">5.41</td>
<td class="data-td data last" style="border-right: outset;">5.32</td>
<td class="data-td data last">3.31</td>
<td class="data-td data last">3.28</td>
</tr>
<tr class="tbl-data">
<td class="data-td last">Full Market Value ($mn)</td>
<td class="data-td data last">67,821</td>
<td class="data-td data last" style="border-right: outset;">64,657</td>
<td class="data-td data last">1,237,721</td>
<td class="data-td data last">1,260,542</td>
</tr>
<tr class="tbl-data">
<td class="data-td last">OAS</td>
<td class="data-td data last">285</td>
<td class="data-td data last" style="border-right: outset;">247</td>
<td class="data-td data last">339</td>
<td class="data-td data last">315</td>
</tr>
<tr class="tbl-data">
<td class="data-td last">No. of Issues</td>
<td class="data-td data last">143</td>
<td class="data-td data last" style="border-right: outset;">138</td>
<td class="data-td data last">1,837</td>
<td class="data-td data last">1,864</td>
</tr>
</tbody>
</table>
</div>
<br />
<p class="chart-disclosure">Source: ICE Data Services, VanEck. Fallen Angels: ICE US Fallen Angel High Yield 10% Constrained Index. Broad HY: ICE BofA US High Yield Index. OAS refers to &ldquo;option-adjusted spread.&rdquo; Please see definition for this and other terms referenced herein in the disclosures and definitions portion of this blog. Past performance is no guarantee of future results. Index performance is not representative of fund performance. It is not possible to invest in an index.</p>
<p><span style="text-decoration: underline;"><strong>New Fallen Angels:</strong></span> There were no new fallen angels in March, and a total of two in the first quarter of 2024. We continue to monitor issuers that may be impacted by commercial real estate exposure. S&amp;P downgraded five regional bank (First Commonwealth Financial, M&amp;T Bank, Synovus, Trustmark Corp and Valley National Bancorp) outlooks due to their real estate exposure and the continuing challenges within the space, especially in the office property market as office vacancy rates hit an all-time high of 19.6% at the end of 2023, according to Moody&rsquo;s Analytics. Outside of real estate, Moody&rsquo;s placed Boeing&rsquo;s Baa2 rating on review for downgrade as they believe Boeing will be unable to deliver enough planes to maintain free cash flow, but the company remains multiple notches away from high yield. Closer to fallen angel status is Paramount Global, as both S&amp;P and Fitch downgraded it (Fitch to BBB- from BBB;S&amp;P to BB+ from BBB-) citing continued cord cutting and elevated costs of building their streaming services.</p>
<div class="wrapped-div">
<table style="width: 100%;">
<tbody>
<tr class="tbl-data">
<td class="tbl-header last">Month-end Addition</td>
<td class="tbl-header last text-center">Name</td>
<td class="tbl-header last text-center">Rating</td>
<td class="tbl-header last text-center">Sector</td>
<td class="tbl-header last text-center">Industry</td>
<td class="tbl-header last text-center">% Mkt Value</td>
<td class="tbl-header last text-center">Price</td>
</tr>
<tr class="tbl-data">
<td class="data-td last font-weight-normal">January</td>
<td class="data-td data last">Hudson Pacific Properties LP</td>
<td class="data-td data last">BB1</td>
<td class="data-td data last">Real Estate</td>
<td class="data-td data last">REITs</td>
<td class="data-td data last">2.18</td>
<td class="data-td data last">88.05</td>
</tr>
<tr class="tbl-data">
<td class="data-td last font-weight-normal">February</td>
<td class="data-td data last">Advance Auto Parts Inc.</td>
<td class="data-td data last">BB1</td>
<td class="data-td data last">Retail</td>
<td class="data-td data last">Specialty Retail</td>
<td class="data-td data last">2.52</td>
<td class="data-td data last">91.20</td>
</tr>
</tbody>
</table>
</div>
<br />
<p class="chart-disclosure">Source: ICE Data Services, VanEck. Fallen Angels: ICE US Fallen Angel High Yield 10% Constrained Index. Past performance is no guarantee of future results. Not a recommendation to buy or sell any of the names/securities mentioned herein. Index performance is not representative of fund performance. It is not possible to invest in an index.</p>
<p><strong><span style="text-decoration: underline;">Rising Stars:</span></strong> Enlink Midstream exited the index in March, after joining in July 2018 at $90.71, as S&amp;P upgraded it to BBB+ from BB+ due to a significant reduction of its leverage over the past several years. During its time in the fallen angel index, Enlink provided a price return of -1.98% but a total return of approximately +45% vs the energy sector at approximately +11%.</p>
<div class="wrapped-div">
<table style="width: 100%;">
<tbody>
<tr class="tbl-data">
<td class="tbl-header last">Month-end Exit</td>
<td class="tbl-header last text-center">Name</td>
<td class="tbl-header last text-center">Rating</td>
<td class="tbl-header last text-center">Sector</td>
<td class="tbl-header last text-center">Industry</td>
<td class="tbl-header last text-center">% Mkt Value</td>
<td class="tbl-header last text-center">Price</td>
</tr>
<tr class="tbl-data">
<td class="data-td last font-weight-normal">February</td>
<td class="data-td data last">Las Vegas Sands Corp</td>
<td class="data-td data last">BB1</td>
<td class="data-td data last">Leisure</td>
<td class="data-td data last">Gaming</td>
<td class="data-td data last">3.12</td>
<td class="data-td data last">93.19</td>
</tr>
<tr class="tbl-data">
<td class="data-td last font-weight-normal">March</td>
<td class="data-td data last">Enlink Midstream Partners LP</td>
<td class="data-td data last">BB1</td>
<td class="data-td data last">Energy</td>
<td class="data-td data last">Gas Distribution</td>
<td class="data-td data last">2.30</td>
<td class="data-td data last">88.92</td>
</tr>
</tbody>
</table>
</div>
<br />
<p class="chart-disclosure">Source: ICE Data Services, VanEck. Fallen Angels: ICE US Fallen Angel High Yield 10% Constrained Index. Past performance is no guarantee of future results. Not a recommendation to buy or sell any of the names/securities mentioned herein. Index performance is not representative of fund performance. It is not possible to invest in an index.</p>
<p><span style="text-decoration: underline;"><strong>Fallen Angels Performance by Sector:</strong></span> Retail exposure within fallen angels is now 18% (an increase of more than 3% YTD) while Energy sector exposure is now close to 11% (a decrease of more than 3%), after Enlink exited the index. Leisure exposure was cut in half during the quarter after LVS exited in February. In terms of spreads, all sectors except Banking, Basic Industry and Telecom saw their spreads tighten YTD, with the Real Estate sector now 148bps tighter than at the beginning of the year but still above 500bps. In terms of attribution relative to broad high yield, the outperformance so far this year was notably influenced by fallen angels being overweight Retail (almost 3x) and the lack of Media exposure. Fallen angels underweight to Basic Industry and Services detracted the most during Q1.</p>
<div class="wrapped-div">
<table style="width: 100%;">
<tbody>
<tr class="tbl-data">
<td class="tbl-header last text-center" style="width: 22.8342%;">&nbsp;</td>
<td class="tbl-header last text-center" style="border-right: outset; width: 17.7005%;" colspan="2">Wgt (%)</td>
<td class="tbl-header last text-center" style="border-right: outset; width: 17.861%;" colspan="2">OAS</td>
<td class="tbl-header last text-center" style="border-right: outset; width: 17.861%;" colspan="2">Price</td>
<td class="tbl-header last text-center" style="width: 11.9251%;">Total Return</td>
<td class="tbl-header last text-center" style="width: 11.7647%;">Total Return</td>
</tr>
<tr class="tbl-data">
<td class="data-head last" style="width: 22.8342%;">&nbsp;</td>
<td class="data-head last" style="width: 9.30481%;">12/31/23</td>
<td class="data-head last" style="border-right: outset; width: 8.39572%;">3/31/24</td>
<td class="data-head last" style="width: 9.46524%;">12/31/23</td>
<td class="data-head last" style="border-right: outset; width: 8.39572%;">3/31/24</td>
<td class="data-head last" style="width: 9.46524%;">12/31/23</td>
<td class="data-head last" style="border-right: outset; width: 8.39572%;">3/31/24</td>
<td class="data-head last" style="width: 11.9251%;">MTD</td>
<td class="data-head last" style="width: 11.7647%;">YTD</td>
</tr>
<tr class="tbl-data">
<td class="data-td last" style="width: 22.8342%;">Banking</td>
<td class="data-td data last" style="width: 9.30481%;">4.79</td>
<td class="data-td data last" style="border-right: outset; width: 8.39572%;">4.62</td>
<td class="data-td data last" style="width: 9.46524%;">231</td>
<td class="data-td data last" style="border-right: outset; width: 8.39572%;">235</td>
<td class="data-td data last" style="width: 9.46524%;">97.91</td>
<td class="data-td data last" style="border-right: outset; width: 8.39572%;">97.11</td>
<td class="data-td data last" style="width: 11.9251%;">-0.24</td>
<td class="data-td data last" style="width: 11.7647%;">0.48</td>
</tr>
<tr class="tbl-data">
<td class="data-td last" style="width: 22.8342%;">Basic Industry</td>
<td class="data-td data last" style="width: 9.30481%;">1.70</td>
<td class="data-td data last" style="border-right: outset; width: 8.39572%;">3.20</td>
<td class="data-td data last" style="width: 9.46524%;">171</td>
<td class="data-td data last" style="border-right: outset; width: 8.39572%;">186</td>
<td class="data-td data last" style="width: 9.46524%;">97.24</td>
<td class="data-td data last" style="border-right: outset; width: 8.39572%;">94.37</td>
<td class="data-td data last" style="width: 11.9251%;">0.24</td>
<td class="data-td data last" style="width: 11.7647%;">0.53</td>
</tr>
<tr class="tbl-data">
<td class="data-td last" style="width: 22.8342%;">Capital Goods</td>
<td class="data-td data last" style="width: 9.30481%;">5.85</td>
<td class="data-td data last" style="border-right: outset; width: 8.39572%;">6.17</td>
<td class="data-td data last" style="width: 9.46524%;">200</td>
<td class="data-td data last" style="border-right: outset; width: 8.39572%;">153</td>
<td class="data-td data last" style="width: 9.46524%;">97.34</td>
<td class="data-td data last" style="border-right: outset; width: 8.39572%;">97.38</td>
<td class="data-td data last" style="width: 11.9251%;">1.66</td>
<td class="data-td data last" style="width: 11.7647%;">1.35</td>
</tr>
<tr class="tbl-data">
<td class="data-td last" style="width: 22.8342%;">Consumer Goods</td>
<td class="data-td data last" style="width: 9.30481%;">4.33</td>
<td class="data-td data last" style="border-right: outset; width: 8.39572%;">4.42</td>
<td class="data-td data last" style="width: 9.46524%;">230</td>
<td class="data-td data last" style="border-right: outset; width: 8.39572%;">223</td>
<td class="data-td data last" style="width: 9.46524%;">94.29</td>
<td class="data-td data last" style="border-right: outset; width: 8.39572%;">93.07</td>
<td class="data-td data last" style="width: 11.9251%;">1.54</td>
<td class="data-td data last" style="width: 11.7647%;">0.20</td>
</tr>
<tr class="tbl-data">
<td class="data-td last" style="width: 22.8342%;">Energy</td>
<td class="data-td data last" style="width: 9.30481%;">14.75</td>
<td class="data-td data last" style="border-right: outset; width: 8.39572%;">11.17</td>
<td class="data-td data last" style="width: 9.46524%;">259</td>
<td class="data-td data last" style="border-right: outset; width: 8.39572%;">235</td>
<td class="data-td data last" style="width: 9.46524%;">92.49</td>
<td class="data-td data last" style="border-right: outset; width: 8.39572%;">93.95</td>
<td class="data-td data last" style="width: 11.9251%;">1.58</td>
<td class="data-td data last" style="width: 11.7647%;">2.31</td>
</tr>
<tr class="tbl-data">
<td class="data-td last" style="width: 22.8342%;">Financial Services</td>
<td class="data-td data last" style="width: 9.30481%;">1.14</td>
<td class="data-td data last" style="border-right: outset; width: 8.39572%;">1.18</td>
<td class="data-td data last" style="width: 9.46524%;">378</td>
<td class="data-td data last" style="border-right: outset; width: 8.39572%;">336</td>
<td class="data-td data last" style="width: 9.46524%;">86.41</td>
<td class="data-td data last" style="border-right: outset; width: 8.39572%;">87.09</td>
<td class="data-td data last" style="width: 11.9251%;">2.01</td>
<td class="data-td data last" style="width: 11.7647%;">2.40</td>
</tr>
<tr class="tbl-data">
<td class="data-td last" style="width: 22.8342%;">Healthcare</td>
<td class="data-td data last" style="width: 9.30481%;">4.10</td>
<td class="data-td data last" style="border-right: outset; width: 8.39572%;">4.44</td>
<td class="data-td data last" style="width: 9.46524%;">270</td>
<td class="data-td data last" style="border-right: outset; width: 8.39572%;">210</td>
<td class="data-td data last" style="width: 9.46524%;">88.73</td>
<td class="data-td data last" style="border-right: outset; width: 8.39572%;">90.80</td>
<td class="data-td data last" style="width: 11.9251%;">2.55</td>
<td class="data-td data last" style="width: 11.7647%;">3.75</td>
</tr>
<tr class="tbl-data">
<td class="data-td last" style="width: 22.8342%;">Insurance</td>
<td class="data-td data last" style="width: 9.30481%;">1.32</td>
<td class="data-td data last" style="border-right: outset; width: 8.39572%;">1.43</td>
<td class="data-td data last" style="width: 9.46524%;">323</td>
<td class="data-td data last" style="border-right: outset; width: 8.39572%;">244</td>
<td class="data-td data last" style="width: 9.46524%;">94.10</td>
<td class="data-td data last" style="border-right: outset; width: 8.39572%;">96.82</td>
<td class="data-td data last" style="width: 11.9251%;">1.90</td>
<td class="data-td data last" style="width: 11.7647%;">4.46</td>
</tr>
<tr class="tbl-data">
<td class="data-td last" style="width: 22.8342%;">Leisure</td>
<td class="data-td data last" style="width: 9.30481%;">7.90</td>
<td class="data-td data last" style="border-right: outset; width: 8.39572%;">5.10</td>
<td class="data-td data last" style="width: 9.46524%;">228</td>
<td class="data-td data last" style="border-right: outset; width: 8.39572%;">170</td>
<td class="data-td data last" style="width: 9.46524%;">93.21</td>
<td class="data-td data last" style="border-right: outset; width: 8.39572%;">95.08</td>
<td class="data-td data last" style="width: 11.9251%;">1.25</td>
<td class="data-td data last" style="width: 11.7647%;">2.71</td>
</tr>
<tr class="tbl-data">
<td class="data-td last" style="width: 22.8342%;">Real Estate</td>
<td class="data-td data last" style="width: 9.30481%;">9.07</td>
<td class="data-td data last" style="border-right: outset; width: 8.39572%;">9.60</td>
<td class="data-td data last" style="width: 9.46524%;">675</td>
<td class="data-td data last" style="border-right: outset; width: 8.39572%;">527</td>
<td class="data-td data last" style="width: 9.46524%;">82.72</td>
<td class="data-td data last" style="border-right: outset; width: 8.39572%;">81.84</td>
<td class="data-td data last" style="width: 11.9251%;">1.44</td>
<td class="data-td data last" style="width: 11.7647%;">0.82</td>
</tr>
<tr class="tbl-data">
<td class="data-td last" style="width: 22.8342%;">Retail</td>
<td class="data-td data last" style="width: 9.30481%;">14.38</td>
<td class="data-td data last" style="border-right: outset; width: 8.39572%;">18.02</td>
<td class="data-td data last" style="width: 9.46524%;">242</td>
<td class="data-td data last" style="border-right: outset; width: 8.39572%;">179</td>
<td class="data-td data last" style="width: 9.46524%;">86.39</td>
<td class="data-td data last" style="border-right: outset; width: 8.39572%;">89.54</td>
<td class="data-td data last" style="width: 11.9251%;">2.77</td>
<td class="data-td data last" style="width: 11.7647%;">4.06</td>
</tr>
<tr class="tbl-data">
<td class="data-td last" style="width: 22.8342%;">Services</td>
<td class="data-td data last" style="width: 9.30481%;">0.64</td>
<td class="data-td data last" style="border-right: outset; width: 8.39572%;">0.66</td>
<td class="data-td data last" style="width: 9.46524%;">243</td>
<td class="data-td data last" style="border-right: outset; width: 8.39572%;">217</td>
<td class="data-td data last" style="width: 9.46524%;">94.78</td>
<td class="data-td data last" style="border-right: outset; width: 8.39572%;">94.51</td>
<td class="data-td data last" style="width: 11.9251%;">0.84</td>
<td class="data-td data last" style="width: 11.7647%;">1.02</td>
</tr>
<tr class="tbl-data">
<td class="data-td last" style="width: 22.8342%;">Technology &amp; Electronics</td>
<td class="data-td data last" style="width: 9.30481%;">6.22</td>
<td class="data-td data last" style="border-right: outset; width: 8.39572%;">5.81</td>
<td class="data-td data last" style="width: 9.46524%;">194</td>
<td class="data-td data last" style="border-right: outset; width: 8.39572%;">188</td>
<td class="data-td data last" style="width: 9.46524%;">94.14</td>
<td class="data-td data last" style="border-right: outset; width: 8.39572%;">92.99</td>
<td class="data-td data last" style="width: 11.9251%;">1.42</td>
<td class="data-td data last" style="width: 11.7647%;">0.76</td>
</tr>
<tr class="tbl-data">
<td class="data-td last" style="width: 22.8342%;">Telecommunications</td>
<td class="data-td data last" style="width: 9.30481%;">13.00</td>
<td class="data-td data last" style="border-right: outset; width: 8.39572%;">13.39</td>
<td class="data-td data last" style="width: 9.46524%;">366</td>
<td class="data-td data last" style="border-right: outset; width: 8.39572%;">368</td>
<td class="data-td data last" style="width: 9.46524%;">92.22</td>
<td class="data-td data last" style="border-right: outset; width: 8.39572%;">90.01</td>
<td class="data-td data last" style="width: 11.9251%;">-0.20</td>
<td class="data-td data last" style="width: 11.7647%;">-0.52</td>
</tr>
<tr class="tbl-data">
<td class="data-td last" style="width: 22.8342%;">Transportation</td>
<td class="data-td data last" style="width: 9.30481%;">2.09</td>
<td class="data-td data last" style="border-right: outset; width: 8.39572%;">2.23</td>
<td class="data-td data last" style="width: 9.46524%;">209</td>
<td class="data-td data last" style="border-right: outset; width: 8.39572%;">170</td>
<td class="data-td data last" style="width: 9.46524%;">94.92</td>
<td class="data-td data last" style="border-right: outset; width: 8.39572%;">95.37</td>
<td class="data-td data last" style="width: 11.9251%;">1.49</td>
<td class="data-td data last" style="width: 11.7647%;">1.76</td>
</tr>
<tr class="tbl-data">
<td class="data-td last" style="width: 22.8342%;">Utility</td>
<td class="data-td data last" style="width: 9.30481%;">8.71</td>
<td class="data-td data last" style="border-right: outset; width: 8.39572%;">8.54</td>
<td class="data-td data last" style="width: 9.46524%;">139</td>
<td class="data-td data last" style="border-right: outset; width: 8.39572%;">122</td>
<td class="data-td data last" style="width: 9.46524%;">92.18</td>
<td class="data-td data last" style="border-right: outset; width: 8.39572%;">91.13</td>
<td class="data-td data last" style="width: 11.9251%;">1.55</td>
<td class="data-td data last" style="width: 11.7647%;">0.23</td>
</tr>
<tr class="tbl-data">
<td class="data-td last" style="width: 22.8342%;">Total</td>
<td class="data-td data last" style="width: 9.30481%;">100</td>
<td class="data-td data last" style="border-right: outset; width: 8.39572%;">100</td>
<td class="data-td data last" style="width: 9.46524%;">285</td>
<td class="data-td data last" style="border-right: outset; width: 8.39572%;">247</td>
<td class="data-td data last" style="width: 9.46524%;">91.20</td>
<td class="data-td data last" style="border-right: outset; width: 8.39572%;">91.22</td>
<td class="data-td data last" style="width: 11.9251%;">1.43</td>
<td class="data-td data last" style="width: 11.7647%;">1.61</td>
</tr>
</tbody>
</table>
</div>
<br />
<p class="chart-disclosure">Source: ICE Data Services, VanEck. Returns are based on partial period data. Fallen Angels: ICE US Fallen Angel High Yield 10% Constrained Index. Not intended as a recommendation to invest or divest in any of the sectors mentioned herein. Index performance is not representative of fund performance. It is not possible to invest in an index.</p>
<p><span style="text-decoration: underline;"><strong>Fallen Angels Performance by Rating:</strong></span> Within the fallen angel index and in the general broad high yield market, CCC and lower rated issuers continue to outperform their higher rated peers as they&rsquo;ve had better than expected earnings. For context, CCC and lower rated bonds (as the ICE BofA CCC &amp; Lower US HY Index) have outperformed the broad HY market 12 times in the last 16 months and YTD, CCC and lower rated bonds are up 3.22% vs 1.51% for the broad market.</p>
<div class="wrapped-div">
<table style="width: 100%; height: 154.734px;">
<tbody>
<tr class="tbl-data" style="height: 20.3906px;">
<td class="tbl-header last text-center" style="width: 6.79144%; height: 20.3906px;">&nbsp;</td>
<td class="tbl-header last text-center" style="border-right: outset; width: 21.4439%; height: 20.3906px;" colspan="2">Wgt (%)</td>
<td class="tbl-header last text-center" style="border-right: outset; width: 21.5508%; height: 20.3906px;" colspan="2">OAS</td>
<td class="tbl-header last text-center" style="border-right: outset; width: 21.5508%; height: 20.3906px;" colspan="2">Price</td>
<td class="tbl-header last text-center" style="width: 14.385%; height: 20.3906px;">Total Return</td>
<td class="tbl-header last text-center" style="width: 14.2781%; height: 20.3906px;">Total Return</td>
</tr>
<tr class="tbl-data" style="height: 22.3906px;">
<td class="data-head last" style="width: 6.79144%; height: 22.3906px;">&nbsp;</td>
<td class="data-head last" style="width: 11.2299%; height: 22.3906px;">12/31/23</td>
<td class="data-head last" style="border-right: outset; width: 10.2139%; height: 22.3906px;">3/31/24</td>
<td class="data-head last" style="width: 11.3369%; height: 22.3906px;">12/31/23</td>
<td class="data-head last" style="border-right: outset; width: 10.2139%; height: 22.3906px;">3/31/24</td>
<td class="data-head last" style="width: 11.3369%; height: 22.3906px;">12/31/23</td>
<td class="data-head last" style="border-right: outset; width: 10.2139%; height: 22.3906px;">3/31/24</td>
<td class="data-head last" style="width: 14.385%; height: 22.3906px;">MTD</td>
<td class="data-head last" style="width: 14.2781%; height: 22.3906px;">YTD</td>
</tr>
<tr class="tbl-data" style="height: 22.3906px;">
<td class="data-td last" style="width: 6.79144%; height: 22.3906px;">BB</td>
<td class="data-td data last" style="width: 11.2299%; height: 22.3906px;">80.55</td>
<td class="data-td data last" style="border-right: outset; width: 10.2139%; height: 22.3906px;">81.63</td>
<td class="data-td data last" style="width: 11.3369%; height: 22.3906px;">219</td>
<td class="data-td data last" style="border-right: outset; width: 10.2139%; height: 22.3906px;">190</td>
<td class="data-td data last" style="width: 11.3369%; height: 22.3906px;">92.44</td>
<td class="data-td data last" style="border-right: outset; width: 10.2139%; height: 22.3906px;">92.85</td>
<td class="data-td data last" style="width: 14.385%; height: 22.3906px;">1.54</td>
<td class="data-td data last" style="width: 14.2781%; height: 22.3906px;">1.78</td>
</tr>
<tr class="tbl-data" style="height: 22.3906px;">
<td class="data-td last" style="width: 6.79144%; height: 22.3906px;">B</td>
<td class="data-td data last" style="width: 11.2299%; height: 22.3906px;">13.43</td>
<td class="data-td data last" style="border-right: outset; width: 10.2139%; height: 22.3906px;">12.87</td>
<td class="data-td data last" style="width: 11.3369%; height: 22.3906px;">317</td>
<td class="data-td data last" style="border-right: outset; width: 10.2139%; height: 22.3906px;">330</td>
<td class="data-td data last" style="width: 11.3369%; height: 22.3906px;">96.46</td>
<td class="data-td data last" style="border-right: outset; width: 10.2139%; height: 22.3906px;">93.99</td>
<td class="data-td data last" style="width: 14.385%; height: 22.3906px;">0.00</td>
<td class="data-td data last" style="width: 14.2781%; height: 22.3906px;">0.30</td>
</tr>
<tr class="tbl-data" style="height: 22.3906px;">
<td class="data-td last" style="width: 6.79144%; height: 22.3906px;">CCC</td>
<td class="data-td data last" style="width: 11.2299%; height: 22.3906px;">5.44</td>
<td class="data-td data last" style="border-right: outset; width: 10.2139%; height: 22.3906px;">5.51</td>
<td class="data-td data last" style="width: 11.3369%; height: 22.3906px;">1,130</td>
<td class="data-td data last" style="border-right: outset; width: 10.2139%; height: 22.3906px;">893</td>
<td class="data-td data last" style="width: 11.3369%; height: 22.3906px;">69.40</td>
<td class="data-td data last" style="border-right: outset; width: 10.2139%; height: 22.3906px;">68.48</td>
<td class="data-td data last" style="width: 14.385%; height: 22.3906px;">3.16</td>
<td class="data-td data last" style="width: 14.2781%; height: 22.3906px;">1.96</td>
</tr>
<tr class="tbl-data" style="height: 22.3906px;">
<td class="data-td last" style="width: 6.79144%; height: 22.3906px;">CC*</td>
<td class="data-td data last" style="width: 11.2299%; height: 22.3906px;">0.58</td>
<td class="data-td data last" style="border-right: outset; width: 10.2139%; height: 22.3906px;">&nbsp;</td>
<td class="data-td data last" style="width: 11.3369%; height: 22.3906px;">809</td>
<td class="data-td data last" style="border-right: outset; width: 10.2139%; height: 22.3906px;">&nbsp;</td>
<td class="data-td data last" style="width: 11.3369%; height: 22.3906px;">76.82</td>
<td class="data-td data last" style="border-right: outset; width: 10.2139%; height: 22.3906px;">&nbsp;</td>
<td class="data-td data last" style="width: 14.385%; height: 22.3906px;">&nbsp;</td>
<td class="data-td data last" style="width: 14.2781%; height: 22.3906px;">2.47</td>
</tr>
<tr class="tbl-data" style="height: 22.3906px;">
<td class="data-td last" style="width: 6.79144%; height: 22.3906px;">Total</td>
<td class="data-td data last" style="width: 11.2299%; height: 22.3906px;">100</td>
<td class="data-td data last" style="border-right: outset; width: 10.2139%; height: 22.3906px;">100</td>
<td class="data-td data last" style="width: 11.3369%; height: 22.3906px;">285</td>
<td class="data-td data last" style="border-right: outset; width: 10.2139%; height: 22.3906px;">247</td>
<td class="data-td data last" style="width: 11.3369%; height: 22.3906px;">91.20</td>
<td class="data-td data last" style="border-right: outset; width: 10.2139%; height: 22.3906px;">91.22</td>
<td class="data-td data last" style="width: 14.385%; height: 22.3906px;">1.43</td>
<td class="data-td data last" style="width: 14.2781%; height: 22.3906px;">1.61</td>
</tr>
</tbody>
</table>
</div>
<br />
<p class="chart-disclosure">Source: ICE Data Services, VanEck. Fallen Angels: ICE US Fallen Angel High Yield 10% Constrained Index. Not intended as a recommendation to invest or divest in any of the sectors mentioned herein. Index performance is not representative of fund performance. It is not possible to invest in an index. BB index: ICE BofA BB US High Yield Index; Single-B index: ICE BofA Single-B US High Yield Index; CCC &amp; Lower rated index ICE BofA CCC &amp; Lower US High Yield Index.</p>
<p>To receive more <strong><a href="https://www.vaneck.com/us/en/insights/income-investing/" title="Income Investing Insights">Income Investing</a></strong> insights, <strong><a href="https://www.vaneck.com/us/en/subscribe/" title="Subscription Center">sign up in our subscription center</a></strong>.</p>
<style>
	.wrapped-div {
		max-width: 100%;
	}

	@media (max-width: 768px) {
		.wrapped-div {
			overflow-x: scroll;
		}
	}

	.wrapped-div-sector {
		max-width: 100%;
		overflow-x: scroll;
	}
</style>
]]></content:encoded>
</item><item rdf:about="https://www.vaneck.com/us/en/blogs/investment-outlook/jan-van-eck-global-growth-returns-and-the-2025-fiscal-reckoning/">
  <title>Global Growth Returns and the 2025 Fiscal Reckoning></title>
  <link>https://www.vaneck.com/us/en/blogs/investment-outlook/jan-van-eck-global-growth-returns-and-the-2025-fiscal-reckoning/</link>
  <description><![CDATA[Amid all-time highs for gold and sticky inflation, we turn our eye to the concerning fiscal outlook for 2025. Investors should be prepared.]]></description>
  <dc:creator>Jan van Eck</dc:creator>
  <dc:date>04/17/2024 06:30:00</dc:date>
<content:encoded><![CDATA[

<a href="/us/en/blogs/investment-outlook/jan-van-eck-q2-2026-outlook-the-reset-is-your-entry-point/" title="Jan van Eck's Latest Outlook"><strong>Looking for the latest outlook? Read the Q2 2026 Outlook.</strong></a>
<p>They say that no one rings the bell at market tops and bottoms, but some important bells are ringing. Most importantly, <strong><a href="https://www.vaneck.com/us/en/blogs/gold-investing/ima-casanova-with-gold-at-new-highs-miners-consider-more-than-price/" title="With Gold at New Highs, Miners Consider More than Price">gold prices are hitting all-time highs</a></strong> despite <i>outflows</i> from U.S. gold bullion ETFs. Gold prices aren&rsquo;t just rallying in a small way. They are reaching, bitcoin-like, for the sky.</p>
<p>At the end of 2023, we suggested that the three major macro factors&mdash;monetary policy, government spending and global economic growth&mdash;would not change much in 2024 (see <strong><a href="https://www.vaneck.com/us/en/blogs/investment-outlook/jan-van-eck-2024-macro-predictions-sideways-2-0/" title="2024 Macro Predictions: Sideways 2.0">2024 Macro Predictions: Sideways 2.0</a></strong>).</p>
<div class="row">
<div class="col-md-4 col-xs-12"><a href="https://www.youtube.com/embed/JWIxI74majE" data-video="https://youtu.be/JWIxI74majE" class="popup-youtube" title="Watch Video"><img class="img-responsive" style="margin-right: 15px; margin-top: 0px;" src="https://www.vaneck.com/contentassets/45a8dc40672e4eb0b0003c8b53b37b49/4361_jve-q2-commentary-video_thumbnail_2024-4_v1.jpg" alt="Watch Video" align="left" /></a></div>
<div class="col-md-8 col-xs-12"><br /><strong><a href="https://www.youtube.com/embed/JWIxI74majE" data-video=" https://youtu.be/JWIxI74majE" class="popup-youtube" title="Watch Video">Watch Video</a><br /></strong><a href="https://www.youtube.com/embed/JWIxI74majE" data-video="https://youtu.be/JWIxI74majE" class="popup-youtube" title="Watch Video" style="font-size: 16px; font-weight: bold; padding: 10px 0px 0px; margin-right: 20px; width: 202px;">Global Growth Is Back as Fiscal Reckoning Looms in 2025</a></div>
</div>
<br />
<p>Now, gold is signaling that government spending policy could be wildly stimulative, and commodities are signaling that global growth may be picking up. While the &ldquo;wildly stimulative&rdquo; scenario&mdash;which I will define as big fiscal deficits in 2025 with a failure to address impending Social Security bankruptcy&mdash;may only rest at 10% probability, we repeat that investors should prepare for this with a gold/bitcoin/real assets allocation. These assets are in a bull market, which means that healthy corrections can be expected (20%?).</p>
<h2>Monetary Policy: Not Very Stimulative to Maybe Looser</h2>
<p>I feel like a broken record, but our favorite inflation measure is wage inflation, not food or gas prices. That is the kind of inflation which is endemic and hard to manage once it takes hold. And with wage inflation around 4.5%, not near the Fed&rsquo;s 2% target, we didn&rsquo;t expect a big Fed loosening coming into 2024. And that was correct&mdash;the Fed has not cut interest rates yet this year.</p>
<p>Yet, the two most important central banks in the world have softened their language. First, the U.S. Fed said that it would reduce its selling schedule of bonds in Chairman Jerome Powell&rsquo;s comments after the March meeting. And Powell said that the 2% inflation was always a &ldquo;long-term&rdquo; target, which suggests that the 2% target is less important in 2024. Therefore, the Fed might be looser&mdash;even though wage inflation continues. And while it&rsquo;s probably false, there have been rumors in China of central bank bond-buying, which they haven&rsquo;t done in over a decade and never under President Xi Jinping. So, maybe marginally looser monetary policy, but with high wage inflation, we still expect no major changes.</p>


<h2>Government Spending: Muted to Out of Control</h2>
<p>We entered 2024 expecting that Republicans, in control of the House of Representatives, would seek to slow government spending. While we probably didn&rsquo;t sufficiently appreciate the amount of some of the Biden Administration&rsquo;s spending, like with the environmental Inflation Reduction Act (IRA), we didn&rsquo;t expect any upside surprises in government spending in 2024. But by focusing on the change in spending, we probably underappreciated how large the fiscal deficits continue to be. These deficits are keeping the economy hot&mdash;at full employment&mdash;and also pressuring inflation higher.</p>
<p>Now let&rsquo;s look at 2025, which I think the markets are beginning to do. 2025 is a very important policy year for fiscal discipline. The reason is that Social Security will go bankrupt in 2033. If major fiscal problems are only addressed the year after a Presidential election, then it has to be address in 2025, because 2029 is WAY too late to fix any entitlement problem. But in Q1, we just learned that the major parties have nominated the two most profligate &ldquo;peacetime&rdquo; spenders in U.S. history.</p>
<p>We have 7% budget deficits in the middle of an economic boom! We may look back on this the same way we now look back at 1% interest rates on 10-year debt&mdash;an amazing situation that shouldn&rsquo;t be and can&rsquo;t last.</p>
<p>Now we see that the markets are looking at 2025 and worrying. Fiscal spending is not bad for financial markets, of course, until it translates into much higher interest rates.</p>
<p>Are there signals, besides gold, that the market is concerned about 2025? Are other bells ringing? Actually, yes. U.S. credit default swaps are at elevated levels after rising in 2023 during the budget standoff. And <strong><a href="https://www.vaneck.com/us/en/blogs/emerging-markets-bonds/fiscal-dominance-the-clarifying-lens-for-em-and-dm-bonds/" title="Fiscal Dominance: The Clarifying Lens for EM (and DM) Bonds">emerging market debt</a></strong> has actually been outperforming U.S. debt for the last three years.</p>
<p>My last piece of evidence for the &ldquo;out of control&rdquo; scenario is an article from alternative media site, the Free Press. In an article mainly on social commentary, we suddenly see this chart on government spending.</p>
<h3>Federal Government Current Expenditures: Interest Payments</h3>
<p><img class="img-responsive w-100" src="https://www.vaneck.com/contentassets/1b0ff0a0f49847219cc232d645e7f7be/4366_jve-investment-outlook-blog_chart-3_2024-4_v1.svg" alt="Federal Government Current Expenditures: Interest Payment" /></p>
<p class="chart-disclosure">Source: U.S. Bureau of Economic Analysis.</p>
<h2>Global Growth: From Low Levels to Expansion</h2>
<p>In the first quarter of 2024, the world economy moved into expansion mode, with good upwards momentum. As well, economic data from China in March was quite strong.</p>
<h3>Global Growth Picking Up</h3>
<p><img class="img-responsive w-100" src="https://www.vaneck.com/contentassets/1b0ff0a0f49847219cc232d645e7f7be/4366_jve-investment-outlook-blog_chart-1_2024-4_v1.svg" alt="Global Growth Picking Up" /></p>
<p class="chart-disclosure">Source: Bloomberg. Data as of April 2024. Purchasing Managers&rsquo; Index: economic indicators derived from monthly surveys of private sector companies. A reading above 50 indicates expansion, and a reading below 50 indicates contraction.</p>
<p>For growth, my favorite statistic is the PMI, partially because it shows a &ldquo;yes or no&rdquo; answer. If PMI is over 50, we are in expansion mode. And both global growth and China manufacturing moved into expansion mode in Q1. This is the reason commodity returns have been strong so far this year&mdash;and this data supports an allocation to commodities.</p>
<h3>China Back In Expansion Mode</h3>
<p><img class="img-responsive w-100" src="https://www.vaneck.com/contentassets/1b0ff0a0f49847219cc232d645e7f7be/4366_jve-investment-outlook-blog_chart-2_2024-4_v1.svg" alt="China Back In Expansion Mode" /></p>
<p class="chart-disclosure">Source: Bloomberg. Data as of April 2024.</p>
<p>You can look back at the ideas we had for 2024 here: <strong><a href="https://www.vaneck.com/us/en/blogs/investment-outlook/jan-van-eck-top-investment-picks-for-2024-india-and-bitcoin/" title="Top Investment Picks for 2024: India and Bitcoin">Top Investment Picks for 2024: India and Bitcoin</a></strong>.</p>
<p>To receive more <a href="/us/en/insights/investment-outlook" title="Investment Outlook Insights"><strong>Investment Outlook</strong></a> insights, <a href="https://www.vaneck.com/us/en/subscribe/" title="Subscription Center"><strong>sign up in our subscription center</strong></a>.</p>
]]></content:encoded>
</item><item rdf:about="https://www.vaneck.com/us/en/blogs/emerging-markets-equity/glin-etf-question-and-answer/">
  <title>GLIN ETF: Question &amp; Answer></title>
  <link>https://www.vaneck.com/us/en/blogs/emerging-markets-equity/glin-etf-question-and-answer/</link>
  <description><![CDATA[VanEck India Growth Leaders ETF (GLIN) seeks to replicate an all-cap index that selects fundamentally strong Indian firms with attractive growth potential at reasonable prices.]]></description>
  <dc:creator> </dc:creator>
  <dc:date>04/16/2024 06:30:00</dc:date>
<content:encoded><![CDATA[

<ul class="content-list">
<li><a href="#point-one"><strong>What is GLIN&rsquo;s investment strategy?</strong></a></li>
<li><a href="#point-two"><strong>What is GARP investing?</strong></a></li>
<li><a href="#point-three"><strong>How does GLIN&rsquo;s index identify attractive growth opportunities at a reasonable price?</strong></a></li>
<li><a href="#point-four"><strong>Why does GARP investing make sense in India?</strong></a></li>
<li><a href="#point-five"><strong>What are the characteristics of GLIN&rsquo;s index compared to benchmark indexes?</strong></a></li>
<li><a href="#point-six"><strong>How does GLIN fit within a client&rsquo;s overall portfolio?</strong></a></li>
<li><a href="#point-seven"><strong>How can investors buy VanEck ETFs?</strong></a></li>
</ul>
<h2 id="point-one" class="anchored-block">What is GLIN&rsquo;s investment strategy?</h2>
<p>VanEck India Growth Leaders ETF (<a href="/link/6eb23584c31940ce96a2427607da5914.aspx" title="GLIN - VanEck India Growth Leaders ETF - Overview"><strong>GLIN</strong></a>) seeks to replicate the MarketGrader India All-Cap Growth Leaders Index. The Index selects fundamentally sound India companies with attractive growth potential at a reasonable price. This is often referred to as growth at a reasonable price, or GARP, investing.</p>
<h2 id="point-two" class="anchored-block">What is GARP investing?</h2>
<p>GARP, or Growth at a Reasonable Price, is an investment strategy that combines aspects of both growth and value investing to approach stock selection. The GARP approach identifies companies with strong growth characteristics (or those exhibiting strong earnings and revenue growth) with prices that do not reflect excessive optimism, potentially offering a better risk/reward profile compared to focusing only on growth or value.</p>
<p>Essentially, GARP investing aims to avoid the extremes of investing solely for growth (which can lead to paying too much for a stock) or investing solely for value (which can lead to missing out on growth opportunities or investing in lower quality companies).</p>
<h2 id="point-three" class="anchored-block">How does GLIN&rsquo;s index identify attractive growth opportunities at a reasonable price?</h2>
<p>To start, the index provider (MarketGrader) gives each eligible Indian company a proprietary score based on fundamental inputs. A stock&rsquo;s score is based on publicly available data and is sourced across 24 different metrics, which measure Growth, Value, and Quality (cash flow and profitability). By weight, the order of importance in calculating the score is Growth, then Value, and then Quality. Stocks with high scores typically exhibit GARP characteristics, while stocks with low scores may have low growth, high valuations, or some combination of the two.</p>
<p><img loading="lazy" class="img-responsive w-100" src="https://www.vaneck.com/contentassets/1591eabcea30412a914e9dca84d98ae0/4336_glin-faq_infographic-1_2024-04_v2.svg" alt="Growth/Value/Quality Pyramid" /></p>
<p class="chart-disclosure">Source: VanEck, April 2024.</p>
<p>The index then selects the top 80 stocks by rank and weights them according to market cap, and rebalances semi-annually.</p>
<div class="epi-contentfragment">faq-banner-cta</div>
<h2 id="point-four" class="anchored-block">Why does GARP investing make sense in India?</h2>
<p>We believe that India presents a compelling investment opportunity for investors looking to participate in the emerging markets growth theme. However, India&rsquo;s valuations may give pause to some investors, as they currently remain elevated compared to a 20-year historical average.</p>
<h3>India&rsquo;s Valuation Is Near 20-Year Highs</h3>
<p><img loading="lazy" class="img-responsive w-100" src="https://www.vaneck.com/contentassets/1591eabcea30412a914e9dca84d98ae0/4336_glin-faq_chart-1_2024-04_v2.svg" alt="India's Valuation Is At 20-year Highs" /></p>
<p class="chart-disclosure">Source: Factset as of 3/31/24. Past performance is no guarantee of future results.</p>
<p>At the end of March, <a href="/link/6eb23584c31940ce96a2427607da5914.aspx" title="GLIN - VanEck India Growth Leaders ETF - Overview"><strong>GLIN</strong></a>&rsquo;s trailing 12-month P/E sat just under the long-term valuation average of the MSCI India Index. By investing in <a href="/link/6eb23584c31940ce96a2427607da5914.aspx" title="GLIN - VanEck India Growth Leaders ETF - Overview"><strong>GLIN</strong></a>, investors can potentially sidestep valuation concerns while still participating in a dynamic growth opportunity.</p>
<h2 id="point-five" class="anchored-block">What are the characteristics of GLIN&rsquo;s index compared to benchmark indexes?</h2>
<p>The rules-based index driven by fundamental input will include strong growth, good value and high quality names, and excludes weak growth, bad value, and low quality names.</p>
<p>The underlying GARP methodology, which drives the strategy, leads to portfolio characteristics that deviate from the MSCI India Index. <a href="/link/6eb23584c31940ce96a2427607da5914.aspx" title="GLIN - VanEck India Growth Leaders ETF - Overview"><strong>GLIN</strong></a>&rsquo;s index has higher sales and EPS growth, a lower P/E ratio, and a much smaller percentage of PEG. A popular way to measure GARP within a portfolio is to examine the PEG ratio. PEG ratio is a measure of valuation (P/E) divided by a growth metric. A PEG ratio under 1 typically indicates that a portfolio is providing relatively attractive value for a given unit of growth. Finally, a much smaller percentage of the portfolio has negative EPS growth.</p>
<div class="wrapped-div">
<table style="width: 100%;">
<tbody>
<tr class="tbl-data">
<td class="tbl-header last">Characteristic</td>
<td class="tbl-header last text-center">MarketGrader India All-Cap Growth Leaders Index</td>
<td class="tbl-header last text-center">MSCI India Index</td>
</tr>
<tr class="tbl-data">
<td class="data-td last">Sales Growth</td>
<td class="data-td data last">20.2%</td>
<td class="data-td data last">15.8%</td>
</tr>
<tr class="tbl-data">
<td class="data-td last">EPS Growth</td>
<td class="data-td data last">29.4%</td>
<td class="data-td data last">19.6%</td>
</tr>
<tr class="tbl-data">
<td class="data-td last">PEG</td>
<td class="data-td data last">0.8</td>
<td class="data-td data last">1.4</td>
</tr>
<tr class="tbl-data">
<td class="data-td last">Forward P/E</td>
<td class="data-td data last">18.0</td>
<td class="data-td data last">23.8</td>
</tr>
<tr class="tbl-data">
<td class="data-td last">P/B</td>
<td class="data-td data last">3.8</td>
<td class="data-td data last">4.4</td>
</tr>
<tr class="tbl-data">
<td class="data-td last">Negative Sales Growth (% of Index)</td>
<td class="data-td data last">2.5%</td>
<td class="data-td data last">5.1%</td>
</tr>
<tr class="tbl-data">
<td class="data-td last">Negative EPS Growth (% of Index)</td>
<td class="data-td data last">12.4%</td>
<td class="data-td data last">19.1%</td>
</tr>
</tbody>
</table>
</div>
<br />
<p class="chart-disclosure"><strong>Source: VanEck, Bloomberg as of 3/31/24.</strong></p>
<p class="chart-disclosure">Forward P/E represents the weighted harmonic mean of 12-month Forward Price to Earnings Ratio. P/B represents the weighted harmonic mean of the Price to Book. Sales Growth represents the weighted harmonic mean of sales growth over the previous 12 months. EPS Growth represents the weighted harmonic mean of EPS growth over the previous12months. PEG represents the weighted harmonic average of each constituent&rsquo;s Trailing 12 month Price to Earnings Ratio divided by its sales growth over previous 12 months. Negative Sales Growth and Negative EPS Growth represents the weighting of the portfolio consisting of stocks with negative sales and EPS growth.</p>
<p>Overall, we believe that a GARP approach is a suitable way to tackle investing in a market that may exhibit lofty valuations.</p>
<h2 id="point-six" class="anchored-block">How does GLIN fit within a client&rsquo;s overall portfolio?</h2>
<p>Depending on an individual client&rsquo;s risk profile, <a href="/link/6eb23584c31940ce96a2427607da5914.aspx" title="GLIN - VanEck India Growth Leaders ETF - Overview"><strong>GLIN</strong></a> can be used as a complement to a core emerging markets equity strategy to boost Indian equity exposure, while simultaneously side-stepping potentially excessive valuations. Clients may also consider using a core/satellite approach to investing in India by using <a href="/link/6eb23584c31940ce96a2427607da5914.aspx" title="GLIN - VanEck India Growth Leaders ETF - Overview"><strong>GLIN</strong></a> as the core portion and the VanEck Digital India ETF (DGIN) as the satellite. DGIN provides targeted exposure to the Indian digital economy and does not incorporate any GARP methodology. By using these two strategies together, clients can access the broad economic opportunity set within a valuation-sensitive framework, while also participating in a promising area of growth within the Indian economy.</p>
<div class="wrapped-div">
<table style="width: 100%;">
<tbody>
<tr class="tbl-data">
<td class="tbl-header last" colspan="8">Average Annual Total Returns<sup>*</sup>&nbsp;(%) as of March 31, 2024</td>
</tr>
<tr class="tbl-data">
<td class="data-td last">&nbsp;</td>
<td class="data-head last">1 Month</td>
<td class="data-head last">3 Month</td>
<td class="data-head last">YTD</td>
<td class="data-head last">1 Year</td>
<td class="data-head last">3 Year</td>
<td class="data-head last">5 Year</td>
<td class="data-head last">10 Year</td>
</tr>
<tr class="tbl-data">
<td class="data-td last">GLIN (NAV)</td>
<td class="data-td data last">-0.92</td>
<td class="data-td data last">7.27</td>
<td class="data-td data last">48.59</td>
<td class="data-td data last">12.19</td>
<td class="data-td data last">2.24</td>
<td class="data-td data last">3.81</td>
</tr>
<tr class="tbl-data">
<td class="data-td last">GLIN (Share Price)</td>
<td class="data-td data last">-0.84</td>
<td class="data-td data last">7.04</td>
<td class="data-td data last">49.64</td>
<td class="data-td data last">12.56</td>
<td class="data-td data last">2.31</td>
<td class="data-td data last">3.77</td>
</tr>
<tr class="tbl-data">
<td class="data-td last">MGINGRNR (Index)</td>
<td class="data-td data last">-1.86</td>
<td class="data-td data last">7.50</td>
<td class="data-td data last">52.71</td>
<td class="data-td data last">13.56</td>
<td class="data-td data last">4.14</td>
<td class="data-td data last">4.74</td>
</tr>
<tr class="tbl-data">
<td class="data-td last">Performance Differential (NAV - Index)</td>
<td class="data-td data last">0.94</td>
<td class="data-td data last">-0.23</td>
<td class="data-td data last">-4.12</td>
<td class="data-td data last">-1.37</td>
<td class="data-td data last">-1.90</td>
<td class="data-td data last">-0.93</td>
</tr>
</tbody>
</table>
</div>
<br />
<p class="chart-disclosure"><sup>*</sup>&nbsp;Returns less than one year are not annualized.</p>
<p class="chart-disclosure">Index data prior to May 1, 2020 reflects that of the MVIS India Small Cap Index (MVSCIFTR). From May 1, 2020 forward, the index data reflects that of the Fund's underlying index, the MarketGrader India All Cap Growth Leaders Index (MGINGRNR), and is not intended for third party use.</p>
<p class="chart-disclosure"><strong>The performance data quoted represents past performance. Past performance is not a guarantee of future results. Investment return and principal value of an investment will fluctuate so that an investor's shares, when redeemed, may be worth more or less than their original cost. Performance may be lower or higher than performance data quoted. Please call 800.826.2333 or visit vaneck.com for performance current to the most recent month ended.</strong></p>
<p class="chart-disclosure">The gross expense ratio of the fund is 0.80%. Van Eck Associates Corporation (the "Adviser") has agreed to waive fees and/or pay Fund expenses to the extent necessary to prevent the operating expenses of the Fund (excluding acquired fund fees and expenses, interest expense, trading expenses, taxes and extraordinary expenses) from exceeding 0.70% of the Fund's average daily net assets per year until at least May 1, 2025. During such time, the expense limitation is expected to continue until the Fund's Board of Trustees acts to discontinue all or a portion of such expense limitation.</p>
<h2 id="point-seven" class="anchored-block">How can investors buy VanEck ETFs?</h2>
<p><a href="https://www.vaneck.com/us/en/investments/india-growth-leaders-etf-glin/overview/#how-to-buy-etf&amp;utm=GLIN-Blog" title="How to buy VanEck ETFs?"><strong>Learn more here.</strong></a></p>
<p class="d-none d-lg-block"><a href="mailto:askvaneck@vaneck.com" title="Have More Questions? - Ask VanEck" rel="noopener"><img loading="lazy" class="img-responsive" src="https://www.vaneck.com/globalassets/home/us/insights/blogs/bm-blog-images/cta-faq_desktop-02.svg" alt="Have More Questions? - Ask VanEck" /></a></p>
<p class="d-lg-none"><a href="mailto:askvaneck@vaneck.com" title="Have More Questions? - Ask VanEck" rel="noopener"><img loading="lazy" class="img-responsive" src="https://www.vaneck.com/globalassets/home/us/insights/blogs/bm-blog-images/cta-faq_mobile-01.svg" alt="Have More Questions? - Ask VanEck" /></a></p>
<p>To receive more <a href="/us/en/insights/emerging-markets-equity/" title="Emerging Markets Equity Insights"><strong>Emerging Markets Equity</strong></a> insights, <a href="/us/en/subscribe/" title="Subscription Center"><strong>sign up in our subscription center</strong></a>.</p>
<style type="text/css">
    .wrapped-div {
        max-width: 100%;
    }

    @media (max-width: 768px) {
        .wrapped-div {
            overflow-x: scroll;
        }
    }

    .wrapped-div-sector {
        max-width: 100%;
        overflow-x: scroll;
    }
</style>
]]></content:encoded>
</item><item rdf:about="https://www.vaneck.com/us/en/blogs/digital-assets/matthew-sigel-bitcoin-halving-explained-history-impact-and-2024-predictions/">
  <title>Bitcoin Halving Explained: History, Impact, &amp; 2024 Predictions></title>
  <link>https://www.vaneck.com/us/en/blogs/digital-assets/matthew-sigel-bitcoin-halving-explained-history-impact-and-2024-predictions/</link>
  <description><![CDATA[This blog simplifies the Bitcoin halving, examines price trends before and after past cycles, and offers our prediction for the 2024 halving.]]></description>
  <dc:creator>Matthew  Sigel</dc:creator>
  <dc:date>04/16/2024 06:30:00</dc:date>
<content:encoded><![CDATA[

<p><strong>Please note that VanEck may have a position(s) in the digital asset(s) described below.</strong></p>
<p>The next Bitcoin halving is set for ~April 19, 2024, bringing opportunities and uncertainties for the Bitcoin community. This event, built into Bitcoin's foundational code, changes the rewards for miners and could significantly influence Bitcoin's value and role within the broader ecosystem.</p>
<ul class="content-list">
<li><strong><a href="#bitcoin-halving-cycle">The Bitcoin Halving Cycle Explained</a></strong></li>
<li><strong><a href="#bitcoin-halvings-history">A History of Bitcoin Halvings</a></strong></li>
<li><strong><a href="#bitcoin-halving-what-to-expect">The 2024 Bitcoin Halving: What to Expect</a></strong></li>
<li><strong><a href="#bitcoin-halving-miners-impact">Bitcoin Halving Impact on Miners &amp; Market</a></strong></li>
<li><strong><a href="#future-of-bitcoin">The Future of Bitcoin Post-Halving</a></strong></li>
</ul>
<h2 id="bitcoin-halving-cycle" class="anchored-block">The Bitcoin Halving Cycle Explained</h2>
<p>Bitcoin halving is a critical event in the world of Bitcoin that impacts investors and others involved with it. About every four years, the reward for mining new Bitcoin blocks is cut in half. This is done to control the supply of Bitcoin and make it more like scarce resources such as gold. The halving helps keep Bitcoin's value stable over time by reducing the rate at which new Bitcoins are created.</p>
<p>Bitcoin halving was introduced by its creator, Satoshi Nakamoto, to control inflation and ensure the digital currency remains a deflationary asset. Initially, miners received 50 bitcoins as a reward for processing transactions and supporting the blockchain network. After the first halving in 2012, this reward was cut to 25 bitcoins, and it has halved subsequently at regular intervals, with the reward decreasing further each time.</p>

<style>
	.data-td.data {
		padding-right: 5px !important;
	}

	.wrapped-div {
		max-width: 100%;
	}

	@media (max-width: 1240px) {
		.wrapped-div {
			overflow-x: scroll;
		}
	}

	.wrapped-div-sector {
		max-width: 100%;
		overflow-x: scroll;
	}
</style>

<h2 id="bitcoin-halvings-history" class="jump-link-nav anchored-block" data-jumplink-title="Bitcoin Halvings: History">A History of Bitcoin Halvings</h2>
<p>Bitcoin's halving history is interesting, showing its growth from its beginnings in 2009. Since then, Bitcoin has experienced several halving events, each one playing a big part in its development.</p>
<ol class="content-list">
<li><strong>The first halving (November 2012):</strong> The inaugural Bitcoin halving occurred when the network reached 210,000 blocks. The mining reward was reduced from 50 to 25 bitcoins per block. This event marked the first test of Satoshi&rsquo;s theory of controlled money supply and deflationary economics. Despite initial uncertainties, the Bitcoin network remained stable, and the aftermath saw the price of Bitcoin catapult from $10.59 to $126.24 within 180 days, reinforcing the viability of its underlying economic principles.</li>
<li><strong>The second halving (July 2016):</strong> With bitcoin firmly established in the public consciousness, the second halving reduced the block reward to 12.5 bitcoins. This period saw the rise of cryptocurrency as a legitimate investment class, with increasing participation from both retail and institutional investors. Following this halving, bitcoin experienced a significant rise, peaking at over $1002.92 and laying the groundwork for the bull run of 2017.</li>
<li><strong>The third halving (May 2020):</strong> The last halving reduced the reward to 6.25 bitcoins per block. Occurring amid global economic uncertainties due to the COVID-19 pandemic, this halving was watched closely by investors worldwide. It played a crucial role in bitcoin&rsquo;s remarkable performance through 2020 and into 2021, with the cryptocurrency reaching new all-time highs of $14,849.09 within 180 days and becoming a focal point of discussions around digital currencies&rsquo; role in the future of finance.</li>
</ol>
<div class="wrapped-div">
<table style="width: 100%;">
<tbody>
<tr class="tbl-data">
<td class="tbl-header last">2012</td>
<td class="tbl-header last text-center">30 days before</td>
<td class="tbl-header last text-center">Day after</td>
<td class="tbl-header last text-center">30 days after</td>
<td class="tbl-header last text-center">180 days after</td>
</tr>
<tr class="tbl-data">
<td class="data-td last">Bitcoin Price</td>
<td class="data-td data last">$10.59</td>
<td class="data-td data last">$12.45</td>
<td class="data-td data last">$13.42</td>
<td class="data-td data last">$126.25</td>
</tr>
<tr class="tbl-data">
<td class="data-td last">Hash Rate (Terahash)</td>
<td class="data-td data last">22.532T</td>
<td class="data-td data last">27.053T</td>
<td class="data-td data last">24.271T</td>
<td class="data-td data last">106.334T</td>
</tr>
<tr class="tbl-data">
<td class="data-td last">30 Day Volatility</td>
<td class="data-td data last">56.80</td>
<td class="data-td data last">34.85</td>
<td class="data-td data last">27.18</td>
<td class="data-td data last">132.9</td>
</tr>
<tr class="tbl-data">
<td class="data-td last">Miner outflows to Exchanges (seven day moving average) (BTC)</td>
<td class="data-td data last">63.39</td>
<td class="data-td data last">17.70</td>
<td class="data-td data last">5.40</td>
<td class="data-td data last">40.76</td>
</tr>
</tbody>
</table>
</div>
<br />
<div class="wrapped-div">
<table style="width: 100%;">
<tbody>
<tr class="tbl-data">
<td class="tbl-header last">2016</td>
<td class="tbl-header last text-center">30 days before</td>
<td class="tbl-header last text-center">Day after</td>
<td class="tbl-header last text-center">30 days after</td>
<td class="tbl-header last text-center">180 days after</td>
</tr>
<tr class="tbl-data">
<td class="data-td last">Bitcoin Price</td>
<td class="data-td data last">$577.07</td>
<td class="data-td data last">$651.30</td>
<td class="data-td data last">$591.59</td>
<td class="data-td data last">$1002.9</td>
</tr>
<tr class="tbl-data">
<td class="data-td last">Hash Rate (Exahash)</td>
<td class="data-td data last">1.560E</td>
<td class="data-td data last">1.658E</td>
<td class="data-td data last">1.478E</td>
<td class="data-td data last">2.199E</td>
</tr>
<tr class="tbl-data">
<td class="data-td last">30 Day Volatility</td>
<td class="data-td data last">40.08</td>
<td class="data-td data last">97.29</td>
<td class="data-td data last">48.23</td>
<td class="data-td data last">54.73</td>
</tr>
<tr class="tbl-data">
<td class="data-td last">Miner outflows to Exchanges (seven day moving average) (BTC)</td>
<td class="data-td data last">713.83</td>
<td class="data-td data last">227.02</td>
<td class="data-td data last">145.96</td>
<td class="data-td data last">240.78</td>
</tr>
</tbody>
</table>
</div>
<br />
<div class="wrapped-div">
<table style="width: 100%;">
<tbody>
<tr class="tbl-data">
<td class="tbl-header last">2020</td>
<td class="tbl-header last text-center">30 days before</td>
<td class="tbl-header last text-center">Day after</td>
<td class="tbl-header last text-center">30 days after</td>
<td class="tbl-header last text-center">180 days after</td>
</tr>
<tr class="tbl-data">
<td class="data-td last">Bitcoin Price</td>
<td class="data-td data last">$6852.50</td>
<td class="data-td data last">$8800.73</td>
<td class="data-td data last">$9870.79</td>
<td class="data-td data last">$14849</td>
</tr>
<tr class="tbl-data">
<td class="data-td last">Hash Rate (Exahash)</td>
<td class="data-td data last">116.498E</td>
<td class="data-td data last">116.840E</td>
<td class="data-td data last">111.554E</td>
<td class="data-td data last">122.967E</td>
</tr>
<tr class="tbl-data">
<td class="data-td last">30 Day Volatility</td>
<td class="data-td data last">157.59</td>
<td class="data-td data last">75.26</td>
<td class="data-td data last">48.77</td>
<td class="data-td data last">45.74</td>
</tr>
<tr class="tbl-data">
<td class="data-td last">Miner outflows to Exchanges (seven day moving average) (BTC)</td>
<td class="data-td data last">293.67</td>
<td class="data-td data last">484.54</td>
<td class="data-td data last">167.71</td>
<td class="data-td data last">219.84</td>
</tr>
</tbody>
</table>
</div>
<br />
<div class="wrapped-div">
<table style="width: 100%;">
<tbody>
<tr class="tbl-data">
<td class="tbl-header last">2024</td>
<td class="tbl-header last text-center">30 days before</td>
<td class="tbl-header last text-center">Day after</td>
<td class="tbl-header last text-center">30 days after</td>
<td class="tbl-header last text-center">180 days after</td>
</tr>
<tr class="tbl-data">
<td class="data-td last">Bitcoin Price</td>
<td class="data-td data last">$67880.97</td>
<td class="data-td data last">-</td>
</tr>
<tr class="tbl-data">
<td class="data-td last">Hash Rate (Exahash)</td>
<td class="data-td data last">617.620E</td>
<td class="data-td data last">-</td>
</tr>
<tr class="tbl-data">
<td class="data-td last">30 Day Volatility</td>
<td class="data-td data last">66.09</td>
<td class="data-td data last">-</td>
</tr>
<tr class="tbl-data">
<td class="data-td last">Miner outflows to Exchanges (seven day moving average) (BTC)</td>
<td class="data-td data last">86.26</td>
<td class="data-td data last">-</td>
</tr>
</tbody>
</table>
</div>
<br />
<p class="chart-disclosure"><strong>Source:</strong> Glassnode as of 4/10/2024. <strong>Past performance is not a guarantee of future results</strong>. Not intended as a recommendation to buy or to sell any of the securities mentioned herein. A Terahash represents 1 trillion hashes per second. A Exahash represents 1 quintillion hashes per second. Past performance is not a guarantee of future results.</p>
<h3>Bitcoin&rsquo;s most explosive gains are typically post-halving</h3>
<p><img class="img-responsive w-100" src="https://www.vaneck.com/contentassets/40c99b05e408497b93a54462c7cbee73/4351_bitcoin-halving-blog_chart-1_2024-04_blog.svg" alt="Bitcoin's most explosive gains are typically post-halving" /></p>
<p class="chart-disclosure"><strong>Source:</strong> Glassnode as of 4/10/2024. <strong>Past performance is not a guarantee of future results.</strong> Not intended as a recommendation to buy or to sell any of the securities mentioned herein. A Terahash represents 1 trillion hashes per second. A Exahash represents 1 quintillion hashes per second. Past performance is not a guarantee of future results.</p>
<h2 id="bitcoin-halving-what-to-expect" class="jump-link-nav anchored-block" data-jumplink-title="Bitcoin Halving: What to Expect">The 2024 Bitcoin Halving: What to Expect</h2>
<p>The forthcoming halving promises to be a watershed event, with the reward diminishing to 3.125 bitcoins per block. This moment is expected to profoundly impact the mining landscape, potentially reshaping profitability metrics and accelerating technological advancements in mining efficiency. Historical precedents suggest a period of adjustment as miners navigate the reduced incentives, with potential implications for the network&rsquo;s hash rate and overall security.</p>
<p>Historically, the hash rate (the total computational power dedicated to mining and processing transactions) dips after a halving as unprofitable miners disconnect, but it tends to recover within weeks. This is because the halving reinforces Bitcoin's scarcity, potentially driving up the price and increasing profits for those able to keep mining. If the price increase outpaces the reward reduction, as has been the case in the year after each prior halving, mining can remain profitable, even with fewer coins per block. This is because the survivors pick up the network's market share as others exit. Additionally, the halving incentivizes miners to invest in more efficient equipment to stay competitive. So, the hash rate tends to experience a temporary dip, followed by a rise in efficiency and overall hash rate in the long run.</p>
<p>That is why we suggested in our <strong><a href="https://www.vaneck.com/us/en/blogs/digital-assets/matthew-sigel-vanecks-15-crypto-predictions-for-2024/#uneventful-fourth-bitcoin-halving" title="VanEck's 15 Crypto Predictions for 2024">2024 predictions piece</a></strong> that investors underweight bitcoin miners in the six months prior to halving, as the market generally discounts the first-order effect of higher costs. Miners often issue lots of capital during this tricky period. Post-halving, some miners may be forced to shut down, leading to a potential short-term decrease in the network's hash rate &ndash; the combined computational power dedicated to mining.</p>
<h2 id="bitcoin-halving-miners-impact" class="jump-link-nav anchored-block" data-jumplink-title="Bitcoin Halving: Miners Impact">Bitcoin Halving Impact on the Miners and the Market</h2>
<p>That said, the impact on bitcoin miners will vary. Power costs associated with running energy-intensive mining equipment make up the largest expense for miners, typically accounting for 75-85% of a miner&rsquo;s total cash operating expenses. Current power costs for the listed universe average around $0.04/kWh. At this cost, we estimate the all-in cash costs of the top 10 listed miners will be about $45k/bitcoin post-halving. Larger miners with lower per-coin costs will see their margins shrink but likely remain profitable, especially if the price of bitcoin appreciates. We believe the halving will likely lead to consolidation within the mining industry, with smaller miners being squeezed out and larger players expanding their market share. However, this trend is already in place, as publicly traded miners now control a record % of the hash rate. Historically, bitcoin mining equities have recovered strongly post-halving and outperformed the spot price in halving years.</p>
<h2 id="future-of-bitcoin" class="anchored-block">The Future of Bitcoin Post-Halving</h2>
<p>As mining rewards decrease, transaction fees may become more important for miner profitability. The halving emphasizes Bitcoin's scarcity, attracting investment and speculation. It reaffirms Bitcoin's principles as a decentralized, limited, and secure asset, shaping its role in the evolving financial landscape.</p>
<p><strong>Links to third party websites are provided as a convenience and the inclusion of such links does not imply any endorsement, approval, investigation, verification or monitoring by us of any content or information contained within or accessible from the linked sites. By clicking on the link to a non-VanEck webpage, you acknowledge that you are entering a third-party website subject to its own terms and conditions. VanEck disclaims responsibility for content, legality of access or suitability of the third-party websites.</strong></p>
<p>To receive more <strong><a href="https://www.vaneck.com/us/en/insights/digital-assets/" title="Digital Assets Insights">Digital Assets</a></strong> insights, <strong><a href="https://www.vaneck.com/us/en/subscribe/" title="Subscription Center">sign up in our subscription center</a></strong>.</p>
<style>
	.data-td.data {
		padding-right: 5px !important;
	}

	.wrapped-div {
		max-width: 100%;
	}

	@media (max-width: 1240px) {
		.wrapped-div {
			overflow-x: scroll;
		}
	}

	.wrapped-div-sector {
		max-width: 100%;
		overflow-x: scroll;
	}
</style>
]]></content:encoded>
</item><item rdf:about="https://www.vaneck.com/us/en/blogs/natural-resources/increased-demand-fuels-commodities-rally/">
  <title>Increased Demand Fuels Commodities Rally></title>
  <link>https://www.vaneck.com/us/en/blogs/natural-resources/increased-demand-fuels-commodities-rally/</link>
  <description><![CDATA[This past quarter, gains in the energy sector offset losses from 2023. Looking ahead to the rest of the year, commodities are poised to benefit from Fed easing and continued political conflict.]]></description>
  <dc:creator>Roland Morris</dc:creator>
  <dc:date>04/15/2024 06:30:00</dc:date>
<content:encoded><![CDATA[

<h2>Energy Sector Fuels Commodities Rebound</h2>
<p>The energy sector led all sector gains in Q1 2024 by a wide margin and provided most of the gains for the UBS Constant Maturity Commodity Index (CMCITR), which was up 5.18%. CMCITR outperformed its primary competitor, the Bloomberg Commodity Index (BCOM), by almost 3%.</p>
<p>The continued geopolitical conflicts in Ukraine and the Middle East, along with existing OPEC production cuts, triggered strong energy sector gains. Global demand for oil was also stronger than expected, with the U.S. economy leading the charge. U.S. interest rates and the U.S. dollar rose during the quarter, which are normally a headwind for commodities. Commodities rallied despite the stronger dollar, supply concerns and stronger demand.</p>
<h2>Energy&rsquo;s Gains Reverted 2023&rsquo;s Losses; Natural Gas Still Struggled</h2>
<p>The energy sector gained 10% over the quarter. WTI Crude oil and Brent Crude oil were both up about 12%; gasoil up by 15%, heating oil up by 12%, and unleaded gasoline up by 18%. In March of this year, Ukraine began an attack on Russian energy infrastructure targets, concentrating on oil refineries. This led to global supply concerns for crude oil refined products, heating oil, gasoil or diesel and gasoline.</p>
<p>U.S. natural gas fell sharply in Q1 2024, declining by 14%. The Biden administration stopped approving new LNG export facilities, which has hurt the longer-term outlook for U.S. natural gas. As a result, those natural gas producers have started to cut back on production, which stabilized prices between $1.50 and $2. CMCITR, by design, has a smaller allocation to U.S. natural gas of 3.7% versus BCOM&rsquo;s 5.9% exposure. This difference was the largest reason for CMCITR&rsquo;s outperformance versus the benchmark BCOM in the energy sector.</p>
<p>The agriculture sector was up 2% in the quarter, largely driven by cocoa. London cocoa was up 139% and NY cocoa was up 126% by the end of the quarter. Weather problems led to very poor crops in West Africa, the world&rsquo;s largest producer of cocoa. CMCITR has exposure to both London cocoa and NY cocoa, while BCOM does not invest in cocoa. Sugar and cotton also had sizeable gains in the quarter. These gains offset losses in corn, soybeans, and wheat. CMCITR&rsquo;s investment in cocoa contributed to the outperformance versus BCOM in the sector.</p>
<p>The industrial metals sector was up about 1%. Copper led the sector gains, which offset losses in aluminum and zinc. Towards the end of Q1 2024, China&rsquo;s economic performance showed signs of improvement. Should this trend continue, it could potentially support the demand for industrial metals, as China is still the largest consumer of industrial metals.</p>
<p>The precious metals sector was up 7%, led by gold&rsquo;s 7.5% gain. Geopolitical tensions supported gold prices despite the higher U.S. interest rates and stronger dollar.</p>
<p>The livestock sector was up 10% due to a strong rally in hog prices, which were up 16.5% during the quarter.</p>
<h3>Estimated Roll Yield Contribution Q1 2024</h3>
<p><img class="img-responsive w-100" src="https://www.vaneck.com/contentassets/2776b02b1ca74b00b3ea8e03fc06272f/4327_cmci_chart-1_2024.4_blog.svg" alt="Estimated Roll Yield Contribution Q1 2024" /></p>
<p class="chart-disclosure"><strong>Source: Bloomberg. Data as of March 2024.</strong> Past performance is no guarantee of future results. Index performance is not illustrative of fund performance. It is not possible to invest in an index.</p>
<h2>Outlook: Political Conflicts are Still Creating Global Demand for Commodities</h2>
<p>Looking ahead to the rest of the year, commodities should benefit from the expected Federal Reserve (Fed) easing later this year. If the Fed begins the easing process, the U.S. dollar and interest rates should fall, triggering stronger global growth and demand for commodities. Additionally, the Russia-Ukraine war looks likely to drag on for a long time, and the Middle East war could expand into wider regional conflict.</p>
<h3>Q1 2024 Index Sector Weightings</h3>
<p><img class="img-responsive w-100" src="https://www.vaneck.com/contentassets/2776b02b1ca74b00b3ea8e03fc06272f/4327_cmic_chart-2_2024.4_blog.svg" alt="Q1 2024 Index Sector Weightings" /></p>
<p class="chart-disclosure"><strong>Source: VanEck, Bloomberg. Data as of March 2024.</strong></p>
<p>Learn more about the <strong><a href="https://www.vaneck.com/us/en/investments/cm-commodity-index-fund-cmcax/overview/" title="CMCAX - CM Commodity Index Fund - Class A - Overview">VanEck CM Commodity Index Fund</a></strong> and the <a href="https://www.vaneck.com/us/en/investments/cmci-commodity-strategy-etf-cmci/overview/" title="CMCI - VanEck CMCI Commodity Strategy ETF - Overview"><strong>VanEck CMCI Commodity Strategy ETF (CMCI)</strong></a>, which seek to track, before fees and expenses, the CMCITR.</p>
<p>To receive more <a href="/us/en/insights/natural-resources/" title="Natural Resources Insights"><strong>Natural Resources</strong></a> insights, <a href="https://www.vaneck.com/us/en/subscribe/" title="Subscription Center"><strong>sign up in our subscription center</strong></a>.</p>
]]></content:encoded>
</item><item rdf:about="https://www.vaneck.com/us/en/blogs/thematic-investing/buzz-investing-echoes-of-mission-accomplished-amid-inflation-battle/">
  <title>BUZZ Investing: Echoes of &#39;Mission Accomplished&#39; Amid Inflation Battle></title>
  <link>https://www.vaneck.com/us/en/blogs/thematic-investing/buzz-investing-echoes-of-mission-accomplished-amid-inflation-battle/</link>
  <description><![CDATA[U.S. stock markets ended the year strong after the Fed held interest rates steady, prompting revised expectations and signaling lower interest rates in 2024.]]></description>
  <dc:creator> </dc:creator>
  <dc:date>04/10/2024 06:30:00</dc:date>
<content:encoded><![CDATA[

<p>Domestic stock markets changed little during the recent period between Index selection dates (December 14, 2023 to January 10, 2024, the &ldquo;Period&rdquo;). U.S. domestic markets ended 2023 on a high note, as stocks rallied following the Federal Reserve's (Fed) decision during its December 13th Federal Open Market Committee (FOMC) meeting to maintain its target interest rate at 5.50%, marking the third consecutive meeting without a rate change. Fed Chair Jerome Powell, in his post-meeting remarks, cited the central bank&rsquo;s successful effort in controlling inflation, noting <i>"real progress in core inflation"</i> had been achieved following a period of aggressive rate hikes over the last 18 months.</p>
<p>Several market analysts drew parallels between the Federal Reserve's unforeseen dovish turn and President George W. Bush's famous <strong>"Mission Accomplished"</strong> declaration, noting the potential similarity in their premature sense of achievement. Powell's remarks caught the market off guard, leading to a swift shift in the prevailing 'higher for longer' interest rate outlook. This change in sentiment triggered a notable increase in prices and a corresponding decline in yields, particularly in the two-year and longer segments of the yield curve. Some market participants speculated that the Fed's actions might be politically influenced, aiming to avoid a recession ahead of the 2024 Presidential election.</p>
<p>The accompanying table presents the Federal Reserve's dot plot of projected midpoint levels for the Fed Funds Target Rate at the end of 2024, as outlined after the September 2023 and December 2023 meetings. The Fed dot plot depicts each Fed official&rsquo;s projection of the appropriate midpoint of the Fed Target Rate at the end of a calendar year. The table reveals a decrease in the median projected midpoint levels of the Fed Funds Target Rate for 2024, from 5.125% to 4.625%. This change suggests a consensus among most FOMC members aligning with Chairman Powell's perspective on future inflation. The latest dot plot reveals that the committee is now leaning towards more substantial rate reductions in 2024, a shift from their more conservative forecasts made in September 2023.</p>
<h3>FED DOT Plot &ndash; 2024 Year-End Projected Levels</h3>
<p><img class="img-responsive w-100" src="https://www.vaneck.com/contentassets/d574f4f2552b494fa21a7054fa78a2e8/4028_buzz_table_2024-1_v1_2024-01_v1.svg" alt="FED DOT Plot - 2024 Year-End Projected Levels" /></p>
<p>The BUZZ NextGen AI US Sentiment Leaders Index (the &ldquo;BUZZ Index&rdquo;) returned 11.75% during the month of December compared to a return of 4.54% for the S&amp;P 500 Index during the same period. The BUZZ Index finished ahead of the S&amp;P 500 on the year with returns of 54.95% and 26.29%, respectively, as of the end of December.</p>
<h2>&lsquo;Magnificent 7&rsquo; Stocks Pace Advancing Stocks within the BUZZ Index</h2>
<p>Five of seven 'Magnificent Seven' stocks were featured in the Top 10 contributors (NVIDIA, Meta, Alphabet, Microsoft, &amp; Amazon) to BUZZ Index performance during the recent Period, with shares of NVDA featured as the top contributor BUZZ Index returns. At the recent Consumer Electronics Show ("CES") trade show, NVDA introduced three cutting-edge desktop graphics chips that enhance AI capabilities on personal computers without relying on internet-based services. This strategic move pits Nvidia against competitors Intel and AMD, who have been advocating for AI PCs that promise enhanced security and responsiveness through on-device AI processing. In 2023, Nvidia's market cap surpassed $1 trillion, joining the ranks of tech giants like Apple, Microsoft, Amazon, and Alphabet. Continuing this upward trajectory, Nvidia's stock reached a new all-time high on January 8th, 2024, coinciding with their CES trade show announcement.</p>
<div class="wrapped-div">
<table style="width: 750px;">
<tbody>
<tr class="tbl-data">
<td class="tbl-header last " colspan="4">Top BUZZ Index Contributors: December 14, 2023 &ndash; January 10, 2024</td>
</tr>
<tr class="tbl-data">
<td class="data-td  last">Company</td>
<td class="data-head last">Ticker</td>
<td class="data-head last">Average Weight (%)</td>
<td class="data-head last">Return Contribution (%)</td>
</tr>
<tr class="tbl-data">
<td class="data-td last font-weight-normal">NVIDIA Corp</td>
<td class="data-td data last">NVDA</td>
<td class="data-td data last">2.94</td>
<td class="data-td data last">0.37</td>
</tr>
<tr class="tbl-data">
<td class="data-td last font-weight-normal">Meta Platforms Inc</td>
<td class="data-td data last">META</td>
<td class="data-td data last">2.83</td>
<td class="data-td data last">0.30</td>
</tr>
<tr class="tbl-data">
<td class="data-td last font-weight-normal">Moderna Inc</td>
<td class="data-td data last">MRNA</td>
<td class="data-td data last">1.23</td>
<td class="data-td data last">0.29</td>
</tr>
<tr class="tbl-data">
<td class="data-td last font-weight-normal">Advanced Micro Devices Inc</td>
<td class="data-td data last">AMD</td>
<td class="data-td data last">3.07</td>
<td class="data-td data last">0.23</td>
</tr>
<tr class="tbl-data">
<td class="data-td last font-weight-normal">Alphabet Inc</td>
<td class="data-td data last">GOOGL</td>
<td class="data-td data last">2.56</td>
<td class="data-td data last">0.20</td>
</tr>
<tr class="tbl-data">
<td class="data-td last font-weight-normal">Celsius Holdings Inc</td>
<td class="data-td data last">CELH</td>
<td class="data-td data last">0.95</td>
<td class="data-td data last">0.16</td>
</tr>
<tr class="tbl-data">
<td class="data-td last font-weight-normal">Enphase Energy Inc</td>
<td class="data-td data last">ENPH</td>
<td class="data-td data last">1.20</td>
<td class="data-td data last">0.16</td>
</tr>
<tr class="tbl-data">
<td class="data-td last font-weight-normal">Pfizer Inc</td>
<td class="data-td data last">PFE</td>
<td class="data-td data last">2.10</td>
<td class="data-td data last">0.15</td>
</tr>
<tr class="tbl-data">
<td class="data-td last font-weight-normal">Microsoft Corp</td>
<td class="data-td data last">MSFT</td>
<td class="data-td data last">2.92</td>
<td class="data-td data last">0.13</td>
</tr>
<tr class="tbl-data">
<td class="data-td last font-weight-normal">Amazon.com Inc</td>
<td class="data-td data last">AMZN</td>
<td class="data-td data last">2.96</td>
<td class="data-td data last">0.11</td>
</tr>
</tbody>
</table>
</div>
<br />
<p class="chart-disclosure">Source: BUZZ Holdings ULC, Bloomberg. Past performance is no guarantee of future results. Index performance is not illustrative of fund performance. Not intended as a recommendation to buy or to sell any of the securities mentioned herein.</p>
<p>Electric vehicle (&ldquo;EV&rdquo;) manufacturers Lucid Group Inc (NASD: LCID), Rivian Automotive Inc (NASD: RIVN), and Tesla Inc (NASD: TSLA) were all featured among the top detractors to performance during the recent Period with shares of the three widely followed EV manufacturers down 33.7%, 15.0%, and 6.8% respectively. The downturn in EV stock performance may be linked to a variety of reasons. A significant recent factor is Tesla's recall of approximately 1.6 million vehicles across its Models S, X, 3, and Y in China, addressing potential crash risks in their autonomous driving systems. Furthermore, Tesla has accelerated a series of price reductions to boost demand, a strategy that has prompted other EV manufacturers to follow suit. These ongoing price cuts began in 2023 and are a strategic response to the economic pressure exerted by rising interest rates, a challenge affecting the entire EV sector. Amidst these developments, investors are increasingly focusing on company margins and profitability, prioritizing these financial metrics over future growth projections.</p>
<div class="wrapped-div">
<table style="width: 750px;">
<tbody>
<tr class="tbl-data">
<td class="tbl-header last " colspan="4">Bottom BUZZ Index Contributors: December 14, 2023 &ndash; January 10, 2024</td>
</tr>
<tr class="tbl-data">
<td class="data-td  last">Company</td>
<td class="data-head last">Ticker</td>
<td class="data-head last">Average Weight (%)</td>
<td class="data-head last">Return Contribution (%)</td>
</tr>
<tr class="tbl-data">
<td class="data-td last font-weight-normal">Lucid Group Inc</td>
<td class="data-td data last">LCID</td>
<td class="data-td data last">2.41</td>
<td class="data-td data last">-1.02</td>
</tr>
<tr class="tbl-data">
<td class="data-td last font-weight-normal">SoFi Technologies Inc</td>
<td class="data-td data last">SOFI</td>
<td class="data-td data last">3.08</td>
<td class="data-td data last">-0.31</td>
</tr>
<tr class="tbl-data">
<td class="data-td last font-weight-normal">Rivian Automotive Inc</td>
<td class="data-td data last">RIVN</td>
<td class="data-td data last">2.36</td>
<td class="data-td data last">-0.30</td>
</tr>
<tr class="tbl-data">
<td class="data-td last font-weight-normal">GameStop Corp</td>
<td class="data-td data last">GME</td>
<td class="data-td data last">2.13</td>
<td class="data-td data last">-0.22</td>
</tr>
<tr class="tbl-data">
<td class="data-td last font-weight-normal">Palantir Technologies Inc</td>
<td class="data-td data last">PLTR</td>
<td class="data-td data last">2.69</td>
<td class="data-td data last">-0.21</td>
</tr>
<tr class="tbl-data">
<td class="data-td last font-weight-normal">Paramount Global</td>
<td class="data-td data last">PARA</td>
<td class="data-td data last">1.32</td>
<td class="data-td data last">-0.21</td>
</tr>
<tr class="tbl-data">
<td class="data-td last font-weight-normal">Tesla Inc</td>
<td class="data-td data last">TSLA</td>
<td class="data-td data last">2.96</td>
<td class="data-td data last">-0.20</td>
</tr>
<tr class="tbl-data">
<td class="data-td last font-weight-normal">Apple Inc</td>
<td class="data-td data last">AAPL</td>
<td class="data-td data last">2.81</td>
<td class="data-td data last">-0.17</td>
</tr>
<tr class="tbl-data">
<td class="data-td last font-weight-normal">Boeing Co/The</td>
<td class="data-td data last">BA</td>
<td class="data-td data last">1.34</td>
<td class="data-td data last">-0.17</td>
</tr>
<tr class="tbl-data">
<td class="data-td last font-weight-normal">Roku Inc</td>
<td class="data-td data last">ROKU</td>
<td class="data-td data last">0.89</td>
<td class="data-td data last">-0.17</td>
</tr>
</tbody>
</table>
</div>
<br />
<p class="chart-disclosure">Source: BUZZ Holdings ULC, Bloomberg. Past performance is no guarantee of future results. Index performance is not illustrative of fund performance. Not intended as a recommendation to buy or to sell any of the securities mentioned herein.</p>
<h2>Sentiment Stock Highlight &ndash; Rocket Companies Inc.</h2>
<p>Rocket Companies, Inc. (NYSE: RKT), the fintech mortgage company, has seen a surge in positive investor sentiment in recent weeks. The parent company of Rocket Mortgage, formerly known as Quicken Loans, RKT has established itself in recent years as one of the premier providers of mortgages and loans for retail clients. Its fully online approach to the mortgage process and its philosophy of &lsquo;digital convenience&rsquo; propelled the company's growth over the past decade and helped it become the largest provider of Federal Housing Administration (&ldquo;FHA&rdquo;) loans and residential mortgages in the US. Since going public in August 2020, shares of RKT have been under pressure amid the rising interest rate environment, declining 60% from its IPO price by mid-2022. However, the recent dovish pivot by the Federal Reserve, notably in its latest dot plot projections, has the markets expecting lower rates in 2024. RKT jumped 55% in December after the Fed's meeting. This month RKT is a notable re-entry into the BUZZ Index, achieving its highest weighting in over two years at 1.85%.</p>
<h3>Rocket Companies Stock Price | December 2021 &ndash; January 2024</h3>
<p><img class="img-responsive w-100" src="https://www.vaneck.com/contentassets/d574f4f2552b494fa21a7054fa78a2e8/4028_buzz_blog_chart_1_blog_2024-01_v1.svg" alt="Rocket Companies Stock Price | December 2021 - January 2024" /></p>
<p class="chart-disclosure">Source: BUZZ Holdings ULC, Bloomberg. Past performance is no guarantee of future results. Index performance is not illustrative of fund performance. Not intended as a recommendation to buy or to sell any of the securities mentioned herein.</p>
<h2>BUZZ Index January 2024 Rebalance Highlights</h2>
<p><strong>Crypto-Related Stocks</strong></p>
<p>Crypto-related stocks have surged in recent months, with MicroStrategy (NASDAQ: MSTR), Coinbase (NASDAQ: COIN), and Marathon Digital (NASDAQ: MARA) up 57%, 125%, and 165%, respectively, before pulling back to start this year. Current investor sentiment indicates the potential for a fresh wave of positive momentum within the industry. This optimism is reflected in both MARA and MSTR, which each climbed to a peak of 3% weighting in the BUZZ Index this month.</p>
<p>For more on rebalancing results and a full breakdown of index constituents added and removed for the month, view the <a href="https://www.vaneck.com/us/en/blogs/thematic-investing/buzz-investing-echoes-of-mission-accomplished-amid-inflation-battle/buzz-reconstitution-january-2024.pdf" title="BUZZ VanEck Social Sentiment ETF" target="_blank" rel="noopener"><strong>BUZZ Index reconstitution</strong></a> report.</p>
<p>To receive more <a href="https://www.vaneck.com/us/en/insights/thematic-investing/" title="Thematic Investing Insights"><strong>Thematic Investing</strong></a> insights, <a href="https://www.vaneck.com/us/en/subscribe/" title="Subscription Center"><strong>sign up in our subscription center</strong></a>.</p>
<style>
    .wrapped-div {
        max-width: 100%;
    }

    @media (max-width: 1240px) {
        .wrapped-div {
            overflow-x: scroll;
        }
    }

    .wrapped-div-sector {
        max-width: 100%;
        overflow-x: scroll;
    }
</style>
]]></content:encoded>
</item><item rdf:about="https://www.vaneck.com/us/en/blogs/gold-investing/ima-casanova-with-gold-at-new-highs-miners-consider-more-than-price/">
  <title>With Gold at New Highs, Miners Consider More than Price></title>
  <link>https://www.vaneck.com/us/en/blogs/gold-investing/ima-casanova-with-gold-at-new-highs-miners-consider-more-than-price/</link>
  <description><![CDATA[Gold closed at an all-time high in March; a disciplined, cautious and consistent approach to acquisitions may bode well for gold equities.]]></description>
  <dc:creator>Imaru Casanova</dc:creator>
  <dc:date>04/10/2024 06:30:00</dc:date>
<content:encoded><![CDATA[

<p>Monthly gold market and economic insights from Imaru Casanova, Portfolio Manager, featuring her unique views on mining and gold&rsquo;s portfolio benefits. <a href="/us/en/blogs/gold-investing/ima-casanova-with-gold-at-new-highs-miners-consider-more-than-price/gold-monthly-commentary-march-2024.pdf" target="_blank" rel="noopener" title="With Gold at New Highs, Miners Consider More than Price"><strong>An expanded PDF version of this commentary, including fund specific information can be downloaded here.</strong></a></p>
<h2>Gold Reaches New All-Time Highs</h2>
<p>After several failed attempts over the last three years, gold finally managed to break through its August 2020 high of $2,075 per ounce. This time, the breakout was decisive, with gold closing new all-times high every week in March. The strong rally took gold to a close of $2,229.87 per ounce on March 28, a whopping 9.08% ($185.56 per ounce) monthly gain. Gold continued to set fresh highs in the first few days of April. While COMEX gold open interest and net long positioning did increase in March, gold bullion exchange traded fund holdings continued to decline, after a few days of net inflows.</p>
<p>We have been highlighting the widening valuation gap between gold and gold equities. In March, gold equities finally displayed their leverage to the gold price. This may mark the beginning of a long-anticipated trend reversal for gold mining equities. After years of underperformance against the metal, the NYSE Arca Gold Miners Index (GDMNTR)<sup>1</sup>&nbsp;and the MVIS Global Juniors Gold Miners Index (MVGDXJTR)<sup>2</sup>&nbsp;significantly outperformed gold in the month of March, up 19.61% and 21.50%, respectively. Year to date, as of the end of March, gold is up 8.09%, and gold equities are finally posting a gain, with GDMNTR up 1.27% and MVGDXJTR up 1.14%.</p>
<h2>Where from Here?</h2>
<p>We believe gold has the potential to trade in a higher range &ndash; above the $2,000 per ounce level &ndash; in 2024. In recent years, strong rallies, such as the one gold has been enjoying this past month, have often been followed by periods of consolidation around an established, higher level with the metal trading in a sideways pattern until a new catalyst emerges driving prices even higher. The return of investment demand, as evidenced by inflows into global gold bullion ETFs, could be that catalyst, with a potential to drive gold above $2,500 per ounce, in our view.</p>

<h2>For Miners, It&rsquo;s About More Than Just the Gold Price&hellip;</h2>
<p>A rising gold price environment has historically been accompanied by strong performance by gold equities. The sector outperformers must also demonstrate that they are fundamentally positioned and have a sound strategy that will translate higher gold prices into improved cash flow and higher returns, which will deliver growth. Organic growth does not come easy in the gold sector. Finding new gold deposits, or defining/expanding existing ones, is a difficult, lengthy, and capital-intensive process. Most senior and mid-tier companies struggle to simply replace their annual production. To significantly expand their depleting reserve and resource base, companies generally must acquire other companies or assets. All things equal, the more advanced a project is, the higher its valuation and the faster the company can deliver growth.</p>
<p>But acquiring the right projects is not easy either. Companies must achieve an acceptable balance between the price paid and the level of risk associated with the project, and they must demonstrate to markets their ability to deliver attractive returns. There were many terrible acquisitions in the past gold bull market when companies were rushing to increase production&hellip;at any cost. Gold stocks were punished for it, companies learned and today the sector leaders are disciplined and cautious acquirers.</p>
<h2>Alamos + Argonaut: A Blueprint for Deal Making</h2>
<p>Last month, Alamos Gold (5.78% of Strategy net assets), one of the Strategy&rsquo;s top holdings, announced that it had entered into a definitive agreement to acquire all of the issued and outstanding shares of Argonaut Gold (not held by Strategy). There are several aspects of this transaction worth highlighting:</p>
<ul class="content-list">
<li class="mt-2">Alamos has a good acquisition track record. Today, the consensus net present value of its acquired asset base far exceeds its acquisition costs, demonstrating value creation. The market rewarded that successful execution history with the stock trading up 7% on the day the deal was announced (March 27), despite it being an all-share deal resulting in the issuance of shares representing about 5% of the company&rsquo;s market cap.</li>
<li class="mt-2">Alamos expects to realize immediate synergies from the use of shared infrastructure, which combined with operating, procurement and tax savings should lead to more than $515M in synergies.</li>
</ul>
<h3>Alamos: demonstrating sound value creation via thoughtful acquisition</h3>
<p><strong>Acquisition Savings &amp; Synergies</strong></p>
<p><img class="img-responsive w-100" src="https://www.vaneck.com/contentassets/f0f86d76b20449a5b1e0a7989d52beec/4320_gold_chart-1_2024-04_v2_blog.svg" alt="Alamos: Acquisition Savings and Synergies" /></p>
<p class="chart-disclosure"><sup>1</sup>&nbsp;Synergies pre-tax and undiscounted over life of mine; after-tax discounted value of synergies is $250m</p>
<p><strong>Estimated NPV and FCF by Project</strong></p>
<p><img class="img-responsive w-100" src="https://www.vaneck.com/contentassets/f0f86d76b20449a5b1e0a7989d52beec/4320_gold_chart-2_2024-04_v1_blog.svg" alt="Alamos: Estimated NPV and FCF by Project" /></p>
<p class="chart-disclosure">Source: Alamos Gold. Data as of March 2024.</p>
<p class="chart-disclosure"><sup>1</sup>&nbsp;Based on consensus analyst net present value (NPV) estimates</p>
<p class="chart-disclosure"><sup>2</sup>&nbsp;Cumulative free cash flow (FCF) generated since acquisition as of Q4 2023. Please refer to Cautionary Notes on non-GAAP Measures and Additional GAAP Measures</p>
<p class="chart-disclosure"><sup>3</sup>&nbsp;Acquisition cost based on the value of Richmont Mines on closing ($627 million), net of $58 million in cash on its balance sheet. Royalty &amp; NPI repurchases totaled $71 million</p>
<ul class="content-list">
<li class="mt-2">The proposed transaction includes the spin out of Argonaut&rsquo;s non-core assets to its existing shareholders as a newly created junior gold producer. Alamos existing shareholders don&rsquo;t have to worry about the integration of these assets into Alamo&rsquo;s portfolio.</li>
<li class="mt-2">Under the proposed transaction, Alamos will acquire Argonaut&rsquo;s Magino mine, which is located adjacent to its Island Gold mine in Ontario, Canada, making this combination very logical. The integration of these two operations is significantly de-risked as a result, and will create one of the largest and lowest cost gold mines in Canada.</li>
<li class="mt-2">With the addition of Magino, Alamos&rsquo; assets in Canada will represent more than 85% of the company&rsquo;s consensus net asset value, potentially leading to higher valuation multiples for the company to reflect an improved geopolitical risk profile.</li>
<li class="mt-2">The Magino mine reached commercial production in November 2023, so the acquired asset delivers immediate production (and cash flow) growth to Alamos, with an estimated mine life of 19 years and the potential for mine life extensions from a large mineral resource base.</li>
</ul>

<h2>Disciplined and Consistent Approach</h2>
<p>Alamos management carefully executed the process to achieve this growth. It has long been in a position to make acquisitions given its strong balance sheet and cash flow generation. However, it was patient, choosing instead to deploy capital to extend and expand its existing mines, until the right opportunity came about. This acquisition is a slam dunk. Plain and simple. It makes sense, as highlighted by the points above. Alamos needs to demonstrate to the markets once again that it can unlock the promised value from this combination. This disciplined and consistent approach has earned the company a premium valuation relative to its peers and should lead to continued outperformance.</p>
<p>To receive more <strong><a href="https://www.vaneck.com/us/en/insights/gold-investing/" title="Gold Investing Insights">Gold Investing</a></strong> insights, <strong><a href="https://www.vaneck.com/us/en/subscribe/" title="Subscription Center">sign up in our subscription center</a></strong>.</p>
]]></content:encoded>
</item><item rdf:about="https://www.vaneck.com/us/en/blogs/moat-investing/smid-cap-moat-companies-shine-in-march/">
  <title>SMID-Cap Moat Companies Shine in March></title>
  <link>https://www.vaneck.com/us/en/blogs/moat-investing/smid-cap-moat-companies-shine-in-march/</link>
  <description><![CDATA[Mid-caps posted stronger returns than large-caps in March. Meanwhile, a broadening market may present a supportive trend for the Morningstar Wide Moat Focus Index.]]></description>
  <dc:creator>Coulter Regal, CFA</dc:creator>
  <dc:date>04/10/2024 06:30:00</dc:date>
<content:encoded><![CDATA[

<p>The 2024 market rally continued in March with the S&amp;P 500 gaining over 3% during the month and finishing the quarter up over 10%. This marks the fifth positive month in a row for the S&amp;P 500 and its strongest first-quarter result since 2019. The market&rsquo;s move up was supported by strong economic data and confidence that rate cuts, despite a delay in timing and reduced magnitude, are still on the horizon. Divergence in the Magnificent 7 continued this month with only two, NVIDIA and Alphabet, of the seven names outperforming the market. In a positive sign for market breadth, it was previously less favored areas of the market like energy, materials, and utilities that led in March.</p>
<p>The <a href="https://www.vaneck.com/us/en/investments/morningstar-wide-moat-etf-moat/overview/" title="MOAT - VanEck Morningstar Wide Moat ETF - Overview"><strong>Morningstar Wide Moat Focus Index</strong></a> (the &ldquo;Moat Index&rdquo;) had a strong month, gaining 3.59%, and outperforming the S&amp;P 500. Driving this outperformance were overweight allocations to the materials and industrial sectors as well as positive stock selection during the month. For the full quarter, the Moat Index lagged the market due to its structural underweight to the Magnificent 7; however, continued broadening out of the market could prove to be tailwind for the Index going forward.</p>
<p>Companies on the smaller end of the market cap spectrum outperformed large-caps this month, with mid-caps outpacing the S&amp;P 500 by over 200 basis points. Small-caps performed more in line with the broad market and continue to be notable laggards versus both mid- and large-caps year to date. The <a href="https://www.vaneck.com/us/en/investments/morningstar-smid-moat-etf-smot/overview/" title="SMOT - VanEck Morningstar SMID Moat ETF - Overview"><strong>Morningstar US Small-Mid Cap Moat Focus Index</strong></a> (the &ldquo;SMID Moat Index&rdquo;) benefited from its mid-cap exposure, returning 4.75% during the month, outperforming both the large- and small-caps benchmarks, but lagging some versus pure mid-caps.</p>

<style type="text/css">
    .wrapped-div {
        max-width: 100%;
    }

    @media (max-width: 1240px) {
        .wrapped-div {
            overflow-x: scroll;
        }


    }
</style>

<h3>Moat Stocks Outperformed in March | As of 3/31/2024</h3>
<p><img loading="lazy" class="img-responsive w-100" src="https://www.vaneck.com/contentassets/2a253c5e7367430b9d87116fc251c2ea/4330_moat_chart-1_2024-04_v1_blog.svg" alt="Moat Stocks Outperformed in March" /></p>
<p class="chart-disclosure"><strong>Source: Morningstar. As of 3/31/2024</strong>. Past performance is no guarantee of future results. Index performance is not representative of fund performance. It is not possible to invest directly in an index. Fund performance current to the most recent month end is available by visiting vaneck.com or by calling 800.826.2333.</p>
<h2>Moat Value Now Available</h2>
<p>Last month I introduced the anticipated launch of&nbsp;the <a href="https://www.vaneck.com/us/en/investments/morningstar-wide-moat-value-etf-mval/overview/" title="MVAL - VanEck Morningstar Wide Moat Value ETF - Overview"><strong>VanEck Morningstar Wide Moat Value ETF (MVAL)</strong></a>, and this month I am excited to announce that MVAL is now officially trading and available to investors. As a reminder, this new strategy follows the same proven moat investing philosophy as our long tenured <a href="https://www.vaneck.com/us/en/investments/morningstar-wide-moat-etf-moat/overview/" title="MOAT - VanEck Morningstar Wide Moat ETF - Overview"><strong>VanEck Morningstar Wide ETF (MOAT)</strong></a>, but offer dedicated exposure to value.</p>
<p>MVAL allows investors to access Morningstar&rsquo;s forward-looking equity research that identifies quality companies trading at attractive valuations versus value in the US market. Be sure to read our&nbsp;<strong>Target Value with Morningstar&rsquo;s Moat Strategy&nbsp;</strong>and&nbsp;<a href="https://www.vaneck.com/us/en/blogs/moat-investing/mval-etf-and-mgro-etf-question-answer/">MVAL FAQ</a>&nbsp;blogs to learn more about this strategy and how it can complement your investment goals.</p>
<h2>Moat Index Quarterly Review Highlights</h2>
<p>Both the Moat and SMID Moat Indexes underwent quarterly reviews on March 15, 2024. Each quarter they systematically target the most attractively priced, high quality US companies within their respective universes. Below are a few takeaways from the reviews and how the indexes are now positioned. Full results of the most recent quarterly reviews are available here:&nbsp;<a href="https://www.vaneck.com/us/en/investments/morningstar-wide-moat-etf-moat/moat-reconstitution.pdf" title="MOAT - VanEck - Morningstar Wide Moat ETF" target="_blank" rel="noopener"><strong>Moat Index</strong></a> and <a href="https://www.vaneck.com/us/en/investments/morningstar-smid-moat-etf-smot/smot-reconstitution.pdf" title="SMOT - VanEck - Morningstar SMID Moat ETF" target="_blank" rel="noopener"><strong>SMID Moat Index</strong></a>.</p>
<p>Additionally, in our recent moat investing webinar, we provided more information on current positioning and recent performance, and members of Morningstar&rsquo;s equity research team shared their perspective on market trends and the companies they cover.&nbsp;<strong><a href="https://www.vaneck.com/us/en/webinar-registration/?id=96641143322&amp;utm_source=vaneck&amp;utm_medium=calendar" title="Strategizing Beyond the Mag 7 with Moat Stocks">View the webinar replay here</a></strong>.</p>
<p><strong>Value and Defensive Positioning Maintained</strong></p>
<p>At the March review, the Moat Index continued its move away from richly priced growth and technology names, and instead favoring more defensive and value-oriented sectors of the market. This is a trend we have seen play out gradually over the last few quarterly reviews since early 2023, when the Moat Index leaned into technology given their extreme declines in valuations from a down year in 2022. Exposure to consumer staples and health care increased this quarter, while technology now sits at a 15% underweight relative to the S&amp;P 500.</p>
<div class="wrapped-div">
<table style="width: 100%;">
<tbody>
<tr class="tbl-data">
<td class="tbl-header last text-left">Moat Index Style Exposure</td>
<td class="tbl-header last text-right">Current Exposure (%)</td>
<td class="tbl-header last text-right">Rebalance Change (%)</td>
<td class="tbl-header last text-right">Relative to S&amp;P 500 Index (%)</td>
</tr>
<tr class="tbl-data">
<td class="data-td last text-left">Value</td>
<td class="data-td data last text-right">34.5</td>
<td class="data-td data last text-right">+3.6</td>
<td class="data-td data last text-right">+12.1</td>
</tr>
<tr class="tbl-data">
<td class="data-td last text-left">Core</td>
<td class="data-td data last text-right">45.3</td>
<td class="data-td data last text-right">-2.3</td>
<td class="data-td data last text-right">+5.4</td>
</tr>
</tbody>
</table>
</div>
<br />
<p class="chart-disclosure"><strong>Source: Morningstar. As of 3/15/2024</strong>. Index performance is not representative of fund performance. It is not possible to invest directly in an index.</p>
<p><strong>Attractive Valuation in Moat Stocks</strong></p>
<p>The weighted average price-to-fair value of the Moat Index fell to 0.85 following the March review, signaling a 15% discount to Morningstar&rsquo;s fair value estimate. This is in contrast to the price/fair value ratio of the S&amp;P 500 Index, which sat at 1.03, as of the same date. This suggests that the companies in the S&amp;P 500 are, in aggregate, 3% overvalued according to Morningstar.</p>
<h2>SMID Moat Index Highlights</h2>
<p><strong>Utilities Favored, Not Regional Banks</strong></p>
<p>This quarter, the SMID Moat Index saw the addition of several electric companies, resulting in utilities seeing the largest increase in exposure from a sector perspective and moving from an underweight to a slight overweight relative to the Russell 2500 Index. Attractive valuations were the driving force of this move, with five electric companies added in total, including Entergy (ETR), FirstEnergy (FE) and Edison International (EIX), among others.</p>
<p>On the other end, financials and consumer discretionary were the sectors with the largest decreases in exposure this quarter. Within financials, it was regional banks accounting for the largest underweight from an industry perspective. Relative to the Russell 2500, the SMID Moat Index is underweight regional banks by nearly 5% following the March review. It&rsquo;s possible we see a reversal of this trend, as many of these banks are excluded due to negative momentum rather than pure valuation. As a reminder, the SMID Moat Index incorporates a momentum filter as a means to help mitigate risk by reducing exposure to &ldquo;falling knives&rdquo;, or stocks with low valuations but poor momentum, which may weigh on returns and add to near-term volatility.</p>
<p><strong>Valuation Opportunity within SMID Moats</strong></p>
<p>The weighted average price-to-fair value of the SMID Moat Index fell from 0.85 to 0.82 following the March review, signaling an 18% discount to Morningstar&rsquo;s fair value estimate. The broad-based Russell 2500 Index featured a weighted average price-to-fair value ratio of 1.06 as of the same date.</p>
<h2>Choose Your Moat Strategy</h2>
<p>VanEck&rsquo;s suite of moat investing strategies is powered by Morningstar&rsquo;s equity research team, which seeks <a href="https://www.vaneck.com/us/en/blogs/moat-investing/moat-investing-powered-by-morningstar/" title="Quality Companies at Attractive Prices"><strong>quality companies trading at attractive valuations</strong></a>. The below ETFs offer access to US moat companies:</p>
<p><a href="https://www.vaneck.com/us/en/investments/morningstar-wide-moat-etf-moat/overview/" title="MOAT - VanEck Morningstar Wide Moat ETF - Overview"><strong>VanEck Morningstar Wide ETF (MOAT)</strong></a>: companies with a wide moat rating, which means Morningstar believes the company is likely to sustain its competitive advantage for at least the next 20 years.</p>
<p><a href="https://www.vaneck.com/us/en/investments/morningstar-smid-moat-etf-smot/overview/" title="SMOT - VanEck Morningstar SMID Moat ETF - Overview"><strong>VanEck Morningstar SMID Moat ETF (SMOT)</strong></a>: small and mid-cap moat companies.</p>
<p><a href="https://www.vaneck.com/us/en/investments/morningstar-wide-moat-value-etf-mval/overview/" title="MVAL - VanEck Morningstar Wide Moat Value ETF - Overview"><strong>VanEck Morningstar Wide Moat Value ETF (MVAL)</strong></a>: wide moat companies within Morningstar&rsquo;s value style category.</p>
<p>To receive more <strong><a href="https://www.vaneck.com/us/en/insights/moat-investing/" title="Moat Investing Insights">Moat Investing</a></strong> insights, <strong><a href="https://www.vaneck.com/us/en/subscribe/" title="Preference Center">sign up in our subscription center</a></strong>.</p>
]]></content:encoded>
</item><item rdf:about="https://www.vaneck.com/us/en/blogs/digital-assets/matthew-sigel-vanecks-ethereum-layer-2s-valuation-prediction-by-2030/">
  <title>VanEck’s Ethereum Layer-2s Valuation Prediction by 2030></title>
  <link>https://www.vaneck.com/us/en/blogs/digital-assets/matthew-sigel-vanecks-ethereum-layer-2s-valuation-prediction-by-2030/</link>
  <description><![CDATA[We evaluate Ethereum Layer-2s across 5 key areas and detail our $1T base case valuation prediction for ETH L2s by 2030.]]></description>
  <dc:creator>Patrick Bush</dc:creator>
  <dc:date>04/03/2024 06:30:00</dc:date>
<content:encoded><![CDATA[

<p><strong>Please note that VanEck may have a position(s) in the digital asset(s) described below.</strong></p>
<p><strong>In this piece we:</strong></p>
<ul class="content-list">
<li>We conclude that Ethereum Layer- 2 landscape is crowded with few winner-take-all characteristics for now.</li>
<li>Evaluate Layer-2 blockchains through a lens of developer experience, user experience, &amp; technical capability.</li>
<li>Show assumptions behind our $1 trillion market cap base case valuation for Ethereum Layer-2s by 2030.</li>
</ul>
<ul class="content-list">
<li><strong><a href="#blockchains-overview">Layer-2 Blockchains Overview</a></strong></li>
<li><strong><a href="#role-in-scaling-ethereums-network">Layer-2s Role in Scaling Ethereum's Network</a></strong></li>
<li><strong><a href="#optimistic-roll-ups">Layer-2s Types: Optimistic Roll-Ups and Zero-Knowledge Roll-Ups</a></strong></li>
<li><strong><a href="#revenue-models">Layer-2s Revenue Models</a></strong></li>
<li><strong><a href="#on-chain-cost-structures">Layer-2s On-Chain Cost Structures</a></strong></li>
<li><strong><a href="#off-chain-cost-structures">Layer-2s Off-Chain Cost Structures</a></strong></li>
<li><strong><a href="#answer-to-l2-data-costs">EIP-4844&rsquo;s Answer to L2 Data Costs</a></strong></li>
<li><strong><a href="#across-5-key-areas">Evaluating Layer-2s Across 5 Key Areas</a></strong></li>
<li><strong><a href="#valuation-prediction-by-2030">Ethereum Layer-2s Valuation Prediction by 2030</a></strong></li>
</ul>
<h2 id="blockchains-overview" class="anchored-block">Layer-2 Blockchains Overview</h2>
<p>Ethereum's dominance in smart contracts faces a critical hurdle: scalability. While the network offers unparalleled security and decentralization, transaction fees and processing times soar when usage intensifies. To overcome this, Layer 2 solutions have emerged, and advancements like the recent fork EIP-4844 promise to unlock even greater scalability for these Ethereum offshoots. Here we analyze an array of Layer 2 solutions from the perspective of transaction pricing, developer experience, user experience, trust assumption, and ecosystem size.</p>
<p>Layer-2 (L2) blockchains are connected networks that operate on top of a primary blockchain, like Ethereum, to increase its capacity for processing transactions. By handling transactions off the main blockchain and then settling them back on it, L2 solutions help to scale the blockchain's capabilities without compromising its security or decentralization.</p>
<p>Ethereum&rsquo;s current capabilities are well-known to be inadequate for hosting all of the globe&rsquo;s financial transactions. To be more precise, the world&rsquo;s financial system will need to process more than Ethereum&rsquo;s long-term limit of around 19.2 USDC or 6.8 Uniswap trades per second. However, this is a limitation by design because Ethereum&rsquo;s stewards believe that censorship resistance is best achieved by making it inexpensive for anyone to run Ethereum nodes.</p>
<p>The result is that Ethereum limits its chain&rsquo;s capabilities to cut down on networking requirements, data storage needs, and computer hardware demands of its nodes. This practically limits how many bytes of data Ethereum can process over a given period of time. As transactions on a blockchain are nothing more than pieces of data that the blockchain agrees are correct, the capabilities of a blockchain can be measured simply by how much <i>useful data</i> it can handle.</p>
<p><img loading="lazy" class="img-responsive w-100" src="https://www.vaneck.com/contentassets/ad7543f7529d487f83c7313fd32a60ac/4275_digital-assets_graphic-1_2024-03.png" alt="Measuring a Blockchain" /></p>
<p class="chart-disclosure"><strong>Source:</strong> VanEck Research as of 3/15/2024.</p>
<p>To address these constraints, Ethereum's developers initially proposed a &ldquo;sharding&rdquo; solution, which involved splitting the blockchain into 64 smaller, interconnected sub-blockchains called &ldquo;shards.&rdquo; Each of these shards would process transactions within each&rsquo;s own containerized child blockchains and then submit proofs of the activity to be reconciled by Ethereum&rsquo;s parent blockchain. While this approach appeared promising, and some of its components debuted on Polkadot starting in 2020, Ethereum developers eventually discarded the sharding plan called Ethereum 2.0. This is because they believed it was technically infeasible and incapable of scaling to Ethereum&rsquo;s vision of becoming a blockchain for billions of users.</p>
<p>Instead, Ethereum's roadmap shifted towards leveraging Layer-2 (L2) blockchains. These L2 networks handle most transactions off the main Ethereum blockchain, only settling the highest-value transactions directly on it. This approach reduces the load on the main blockchain, allowing it to process more transactions efficiently. In this dynamic, Ethereum accrues value because the costs of these settlements must be paid in ETH; this strategy also reinforces the value of ETH as the true &ldquo;oil&rdquo; powering the entire ecosystem of connected chains.</p>
<p>At its core, Ethereum's primary challenge is its limited capacity to process, store, and compute data in the form of financial transactions. This bottleneck in data throughput is being addressed by offloading much of the data processing and computation to Layer-2 blockchains. As a result, Ethereum's development is now concentrated on enhancing its ability to integrate compressed transaction data from these L2 blockchains. But how exactly do these connected blockchains function, and what are their business models?</p>
<h3>Ethereum Ecosystem Transactions vs. Ethereum Mainnet Market Share</h3>
<p><img loading="lazy" class="img-responsive w-100" src="https://www.vaneck.com/contentassets/ad7543f7529d487f83c7313fd32a60ac/4275_digital-assets_chart-2_2024-03_blog.svg" alt="Ethereum Ecosystem Transactions vs. Ethereum Mainnet Market Share" /></p>
<p class="chart-disclosure">The Ethereum Ecosystem is growing while Ethereum&rsquo;s share is shrinking. <strong>Source:</strong> Artemis XYZ as of 3/22/2024. Not a recommendation to buy or sell any of the names mentioned herein.&nbsp;<strong>Past performance is no guarantee of future results.</strong></p>
<h2 id="role-in-scaling-ethereums-network" class="anchored-block">Layer-2s Role in Scaling Ethereum's Network</h2>
<p>Layer-2 (L2) blockchains enhance Ethereum's capabilities by aggregating multiple transactions into condensed bundles, known as "roll-ups.&rdquo; These &ldquo;bundles&rdquo; of transactions are posted by L2s to Ethereum at various intervals that are spaced apart to balance transaction demand, security, and cost. As such, Ethereum is becoming a <i>&ldquo;blockchain of blockchains.&rdquo;</i></p>
<p>Each L2 generally consists of its own series of smart contracts on Ethereum that keep track of L2 transaction history, facilitate data transfer between the L2 and Ethereum, run fault proof or zk verifier contract (more on this below), and function as an asset escrow between Ethereum and the L2. Very powerful computers called &ldquo;sequencers&rdquo; ingest and order all the transactions that occur on the L2 blockchains. This is more capable and cheaper than Ethereum because L2s run one very powerful server computer that simply intakes transactions and orders them. This dynamic allows L2s to process greater data throughput than Ethereum. By contrast, Ethereum transaction processing involves 100s of thousands of globally distributed validator nodes sending, interpreting, and agreeing upon transaction data. This takes a lot more time due to the Ethereum consensus process and involves duplicating the work of one computer on each of the 100s of thousands of Ethereum nodes. Logically, a single computer like a sequencer processing transaction is much cheaper and faster than a system of globally dispersed, less capable computers that need to collectively use gigabits of internet bandwidth to message and hundreds of thousands of CPUs to process blockchain transactions.</p>
<h2 id="optimistic-roll-ups" class="jump-link-nav anchored-block" data-jumplink-title="L2 Types">Types of Layer-2s: Optimistic Roll-Ups (ORUs) and Zero-Knowledge Roll-Ups (ZKUs)</h2>
<p>There are two main types of L2s connected to Ethereum: <strong>optimistic roll-ups (ORUs)</strong> and <strong>zero-knowledge roll-ups (ZKUs)</strong>. Both settle their ledger balances, or "state," on Ethereum by sending a compressed version called a <strong>"Merkle Root." </strong>ORUs also post a condensed batch of transaction data to allow for verification and traceability of ledger changes over time.</p>
<p>Settlement in Layer-2 blockchains (L2s) can be compared to updating a baseball game's scoreboard inning by inning, with the transaction data serving as the detailed play-by-play. For <strong>optimistic roll-ups (ORUs),</strong> they operate on the principle of optimism, meaning they are presumed to be accurate unless proven otherwise. If an entity, such as a high-frequency trading firm or a mathematically adept researcher, identifies an incorrect or faulty Merkle root, they can submit a fraud attestation, known as a fault-proof, to Ethereum. Entities monitoring ORUs for fraud have a seven-day window, referred to as a "challenge period," to detect any fraudulent activity following a state update. Once this period concludes, the transactions within the ORU are deemed final. If a fault-proof successfully demonstrates fraud, the smart contract overseeing the ORU's state will revert all transactions to the state before the fraud commenced. The challenge period extends for seven days, after which each batch of transactions is irrevocably finalized.</p>
<p>At the time of writing, of the forty-six L2s we track through <a target="_blank" href="https://l2beat.com/scaling/risk" title="l2beat - Risk Analysis" rel="noopener"><strong>l2beat</strong></a>, only four chains have fraud proofs live. Two of those four are under the umbrella of Arbitrum, which boasts the highest total value locked (TVL) of any L2 at $4.31B and only allows fraud proofs from a whitelisted group of entities.</p>
<p>The most popular ORUs are Arbitrum, Blast, Optimism, Manta, Metis, Mantle, and Base.</p>
<h3>Total Value Locked (TVL) vs. Annualized Revenues Optimistic Roll-Ups (ORUs)</h3>
<p><img loading="lazy" class="img-responsive w-100" src="https://www.vaneck.com/contentassets/ad7543f7529d487f83c7313fd32a60ac/4275_digital-assets_chart-3_2024-03_blog.svg" alt="Total Value Locked (TVL) vs. Annualized Revenues Optimistic Roll-Ups (ORUs)" /></p>
<p class="chart-disclosure"><strong>Source:</strong> Defillama, TokenTerminal as of 3/12/2024. Not a recommendation to buy or sell any of the names mentioned herein. <strong>Past performance is no guarantee of future results.</strong></p>
<p>A <strong>zero-knowledge roll-up (ZKU)</strong> operates similarly to an ORU, with one key difference. While ORUs submit both transaction data Merkle roots and state Merkle roots to Ethereum, ZKUs only send a zero-knowledge proof of the transaction data. This is because ZKUs do not operate under the assumption that the submitted state roots are correct. Instead, once the proof is submitted to Ethereum, a smart contract verifies the authenticity of the ZKU's transaction bundle.</p>
<p>As a result, ZKUs do not have fault proofs because proofs are generated with each state update. Unlike ORUs, ZKU transaction data is considered final once the proof is accepted on Ethereum, ensuring immediate finality and eliminating the need for a challenge period.</p>
<p>The most important ZKUs are currently Starkware, zkSync, zkScroll, Linea and *c zkEVM</p>
<p>The base economics of ZKUs and ORUs are very similar to those of L1 blockchains. Both types of roll-ups make money when users create activity on their chains and pay fees in ETH to Ethereum. Currently, all L2s price their transactions in ETH because that is the token needed to settle transaction data to Ethereum.</p>
<h2 id="revenue-models" class="jump-link-nav anchored-block" data-jumplink-title="L2 Revenue Models">Layer-2s Revenue Models</h2>
<p>Regardless of the process, it is <i>important to understand that transaction ordering has value and that blockchains can make money by selling the rights to transaction ordering. This diagram illustrates how three different transaction sequencing models can create different revenue streams.</i></p>
<p><img loading="lazy" class="img-responsive w-100" src="https://www.vaneck.com/contentassets/ad7543f7529d487f83c7313fd32a60ac/4291_ethereum-l2_graphic-1_2024-03_v2.svg" alt="Sequencing Revenue Models" /></p>
<p class="chart-disclosure"><strong>Source:</strong> VanEck Research as of 3/25/2024. Explanation: Assume that TX2 is a high value transaction, buying $1M of a token on an L2. In FIFO, everyone pays the sequencer the same amount. In Priority Ordering, TX2 pays the sequencer to be first. In Auctioning Specific Slots, TX3 and TX4 pay extra to be ahead of and behind TX2.</p>
<h2>Layer-2s Transaction Sequencing: Priority, FIFO, and Auctioning</h2>
<p>L2s charge users a fee for transaction inclusion in each block. This is composed of a base fee and a priority fee. Some L2s charge priority fees, like <strong><a target="_blank" href="https://docs.optimism.io/stack/transactions/fees" title="Transaction Fees on OP Mainnet" rel="noopener">Optimism</a></strong>. <strong>Priority fees</strong> give users the ability to be first in line at the top of the block of transactions. In the last 6 months, the top 10 L2s on Ethereum made $232M in revenues from user transactions alone. This ability to &ldquo;cut the line&rdquo; by paying priority fees benefits users engaging in time-sensitive activities, such as arbitrage trading.</p>
<p>Arbitrum adopts a <strong>first-in-first-out (FIFO) </strong>sequencing approach to transactions as they arrive. In certain cases, users may prefer their transactions to follow specific others on the block. A common strategy, known as <strong>"back-running,"</strong> involves positioning a transaction right after a significant trade to exploit price discrepancies across decentralized exchanges (DEXs) for arbitrage opportunities. More malicious transaction ordering techniques, such as "sandwich attacks," involve strategically placing buy orders immediately before a user's planned trade and sell orders immediately after. This manipulation drives up the price of the desired token just before the user's transaction executes, forcing them to purchase at a disadvantageous, inflated price.</p>
<p>On Ethereum, ordering is monetized by a software addition added to Ethereum&rsquo;s validator software. This software, called <strong>Flashbots,</strong> allows for validators to auction off the right to order transactions (and insert their own) to outside entities. This auction generates<strong> "maximal extractable value" (MEV),</strong> adding to the validators' and stakers' yields. While L2s have the potential to monetize MEV by auctioning off block ordering rights, no L2 has officially done so yet. However, trading firms may already be positioning their servers close to L2 servers, akin to practices in equity and commodities exchanges.</p>
<p>Looking forward, many L2s plan to decentralize their sequencer set, which may involve staking tokens &mdash; possibly ETH from an Eigenlayer DA or from each roll-up&rsquo;s native token. The sequencer decentralization could unlock new revenue streams from MEV. To contextualize, Ethereum's MEV take rate on DEX volume averages around 4 basis points (bps), while other blockchains like Polygon and Solana have rates of 0.4bps and 3.5bps, respectively. These rates likely understate the full scope of MEV due to the challenges in tracking and the incentives to conceal profits. By estimating MEV take rates against DEX volumes, if Arbitrum's MEV was captured at a rate of 3.0bps, it would amount to $58.9 million &mdash; a significant 57% of Arbitrum's fee-only revenue.</p>
<h3>Arbitrum Revenues with 3bps of MEV on DEX Volumes</h3>
<p><img loading="lazy" class="img-responsive w-100" src="https://www.vaneck.com/contentassets/ad7543f7529d487f83c7313fd32a60ac/4275_digital-assets_chart-13_2024-03_blog.svg" alt="Arbitrum Revenues with 3bps of MEV on DEX Volumes" /></p>
<p class="chart-disclosure"><strong>Source:</strong> Artemis XYZ as of 3/20/2024. Not a recommendation to buy or sell any of the names mentioned herein. <strong>Past performance is no guarantee of future results.</strong></p>
<h2 id="on-chain-cost-structures" class="jump-link-nav anchored-block" data-jumplink-title="L2 Cost Structures">Layer-2s On-Chain Cost Structures</h2>
<p>Layer-2s (L2) primarily incur costs through Ethereum gas fees as they regularly post transaction data, settlements, and proofs to Ethereum. But zero-knowledge roll-ups (ZKUs) and optimistic roll-ups (ORUs) differ in their cost structures. While both update their states on the L1, ORUs have to pay onerous on-chain data costs while ZKUs must expend money proof generations and verification. Regardless, the consequence of the dependence on Ethereum is that the L2s input cost is subject to the volatility of Ethereum blockspace. For the most part, this cost difference is passed on to the user. However, the margins that L2s earn are quite volatile as a result.</p>
<p>Prior to EIP-4844, L2s posted both settlement data and proofs to Ethereum as single transactions in the &ldquo;message field&rdquo; of each transaction structure called <strong>&ldquo;call data.&rdquo;</strong> This was a &ldquo;hack&rdquo; to utilize one component of Ethereum&rsquo;s standard transaction format for the purpose of holding compressed L2 data. Though this is novel, it is very expensive. For example, for the month of February, Optimism paid $5.7M, Arbitrum paid $7.2M, and Scroll paid $6.7M for posting call data to Ethereum.</p>
<p><img loading="lazy" class="img-responsive w-100" src="https://www.vaneck.com/contentassets/ad7543f7529d487f83c7313fd32a60ac/4275_digital-assets-graphic-5-2024-03_v1.svg" alt="Layer-2 Economics" /></p>
<p class="chart-disclosure"><strong>Source:</strong> VanEck Research, Celestia as of 3/14/2024.</p>
<p>The cost components for ZKUs are inherently higher compared to ORUs because ZKUs submit both zero-knowledge proofs and call data to Ethereum. While ORUs may also involve proof costs, these are generally outsourced to third parties who challenge the state if needed, and therefore they do not heavily influence ORUs' base costs. The verification of ZKUs&rsquo; zero-knowledge proofs on Ethereum can be extremely costly. Despite Ethereum's optimization efforts, such as native op codes to streamline zk-proof verification, the expenses remain significant&mdash;for example, Scroll's ZKU incurred $1.1 million in proofing fees in just the first 13 days of March.</p>
<p>As a result of these high proving costs, the average profit margin for ORUs over the last six months stands at 26.7%, contrasting with 21% for ZKUs. Logically, a roll-up could send more transactions in fewer batches to decrease variable batch posting expenses. Infrequent batch posting, however, could also come as a result of less transaction throughput happening on the L2s. Regardless, L2 batch post frequency to Ethereum is a profitability lever an L2 can pull, but one that comes at the expense of user experience. In practice, L2s decide batch posting as a calculus of how many transactions they can fit into a block, Ethereum L1 gas prices, and each L2 incoming flow of transactions.</p>
<h3>L2 Batches Per Day vs. Ethereum Settlement Costs</h3>
<p><img loading="lazy" class="img-responsive w-100" src="https://www.vaneck.com/contentassets/ad7543f7529d487f83c7313fd32a60ac/4275_digital-assets_chart-6_2024-03_blog.svg" alt="L2 Batches Per Day vs. Ethereum Settlement Costs" /></p>
<p class="chart-disclosure"><strong>Source:</strong> Dune @niftytable, Etherscan as of 3/14/2024. Not a recommendation to buy or sell any of the names mentioned herein. <strong>Past performance is no guarantee of future results.</strong></p>
<p>Technically, L2s can post more expansive understandings of what occurs on L2s besides the simple &ldquo;scoreboard&rdquo; settlements. Price competition amongst L2s to serve users the cheapest transactions cause L2s to often choose the most economical data to post. Often, this means just posting &ldquo;state differences&rdquo; for ZKUs, and for ORUs, it means posting highly compressed transaction data. Curiously, though ZKUs do not technically have to post full transaction data, some still do so. While Starknet and zkSync only post &ldquo;state differences,&rdquo; Linea, Polygon, and Scroll post full transaction data. This is done because it may be challenging for things like explorers and wallets to track blockchains without the transaction data. Another possibility is that posting full transaction data allows more transparency so that anyone can run a node to track a ZKU. ZKUs may also be open to opening up a prover to anyone in the future, and posting full transaction data to Ethereum allows ZKUs to &ldquo;decentralize&rdquo; their blockchains at the point of the &ldquo;provers.&rdquo;</p>
<p>A cost reduction that many L2s currently make is to improve the efficiency of their compression. For example, on February 13th, Linea deployed a new compression scheme that increased compression on the chain by a factor of 10x, moving from around 500 bytes per transaction to the mid-50s. Other L2s, both ORUs and ZKUs, had an average transaction size on Ethereum of 300 bytes for 2024. While compressing transactions may save on data costs to the L2, it reduces its potential due to the time it takes to compress transactions.</p>
<h3>L2 On Chain Margins by Month</h3>
<p><img loading="lazy" class="img-responsive w-100" src="https://www.vaneck.com/contentassets/ad7543f7529d487f83c7313fd32a60ac/4275_digital-assets-chart-7-2024-03_v1_blog.svg" alt="L2 On Chain Margins by Month" /></p>
<p class="chart-disclosure"><strong>Source:</strong> Dune @niftytable, Artemis XYZ as of 3/13/2024. Not a recommendation to buy or sell any of the names mentioned herein. <strong>Past performance is no guarantee of future results.</strong></p>
<h2 id="answer-to-l2-data-costs" class="anchored-block">EIP-4844&rsquo;s Answer to L2 Data Costs: Blob Space</h2>
<p>On March 13, 2024, Ethereum passed the Dencun upgrade, which had a handful of important changes, the most significant of which was the creation of what is called <strong>&ldquo;Blob Space.&rdquo;</strong> Prior to this upgrade, the main challenge for Layer-2s was the prohibitive cost associated with posting transaction data to Ethereum. Recognizing this, Ethereum&rsquo;s solution was the strategic creation of a specialized data layer, colloquially known as Blob Space, designed exclusively for L2 data postings.</p>
<p>This newly established layer offers a targeted transaction environment tailored to receiving data from L2 networks. Blob Space's innovative aspect is its transient data handling&mdash;data blobs posted here are retained for only four weeks before deletion, significantly reducing Ethereum's data overhead. Consequently, L2s have the option to bypass the main Ethereum layer and directly post to Blob Space.</p>
<p>The Blob Space layer of Ethereum has its own gas prices that abide by the same rule set as Ethereum&rsquo;s regular execution layer. The result is that transactions from L2s to publish data no longer have to compete with regular Ethereum transactions for blockspace. The dedicated transaction layer is also designed to price the cost of data much cheaper than posting to Ethereum as call data. At the time of writing, the Data Blobs have reduced gas usage charges to L2s by (-96%).</p>
<h3>L2 Data Publishing Costs to Ethereum (ETH)</h3>
<p><img loading="lazy" class="img-responsive w-100" src="https://www.vaneck.com/contentassets/ad7543f7529d487f83c7313fd32a60ac/4275_digital-assets-chart-8-2024-03_v1_blog.svg" alt="L2 Data Publishing Costs to Ethereum (ETH)" /></p>
<p class="chart-disclosure"><strong>Source:</strong> Dune @niftytable, Artemis XYZ as of 3/19/2024. Not a recommendation to buy or sell any of the names mentioned herein. <strong>Past performance is no guarantee of future results.</strong></p>
<h2 id="off-chain-cost-structures" class="anchored-block">Layer-2s Off-Chain Cost Structures</h2>
<p>The first part of the off-chain cost expense for Layer-2s (L2s) are the sequencers they use for ordering transactions. This is basically just a high-end server that sits in a data center. For most L2s, the foundation or business entity behind that L2 pays for the cost of the sequencer. In the grand scheme of things, the costs of running the sequencers themselves are minor at around $1000 to $2000 in equipment and perhaps another $3000 to 5000 in manpower per month. This cost is consistent for both Optimistic Roll-Ups (ORUs) and Zero-Knowledge Roll-Ups (ZKUs).</p>
<p>A lesser discussed but significant cost element for ZKUs involves the operation of provers. Unlike sequencers that produce the state root, the provers are responsible for creating the zk-proof that undergoes verification on the Ethereum network. This computational process usually takes place on cloud computing platforms like AWS.</p>
<p>According to the decentralized zk prover project <a target="_blank" href="https://gevulot.com/" title="Gevulot" rel="noopener"><strong>Gevulot</strong></a>, the costs of the proof will run between &ldquo;10-20% of the cost of verification on Ethereum.&rdquo; Additionally, these costs scale with the amount of transactions that are being generated by each L2s. ZKUs are faced with a balancing act between costs and user experience, with the option to reduce the frequency of proofs posted to Ethereum as a potential cost-saving measure. Through a process known as <strong>recursion,</strong> ZKU provers can consolidate several proofs into a single submission, which, while increasing off-chain computational demands, can optimize the economics by mitigating the costly proof verifications conducted on Ethereum.</p>
<p>At the time of writing, all ZKUs run their own provers and directly pay for the costs of proof generation. Over time, however, many intend to decentralize proof generation.</p>
<h2 id="across-5-key-areas" class="jump-link-nav anchored-block" data-jumplink-title="L2 Evaluation">Evaluating Layer-2s Across 5 Key Areas</h2>
<p>In our analysis of key Layer-2s, we use five principal variables to measure potential success or failure:</p>
<ol class="content-list">
<li>Transaction pricing &ndash; the cost to users of transacting</li>
<li>Developer experience &ndash; the ease of building products and applications</li>
<li>User experience &ndash; the simplicity of depositing, withdrawing, and transacting</li>
<li>Trust Assumptions - liveness and safety assumptions</li>
<li>Ecosystem size &ndash; how many interesting things there are to do</li>
</ol>
<h2>1. Layer-2s Transaction Pricing</h2>
<p>The root of transaction pricing differentiation comes from a combination of data compression, data posting efficiency, L2 scale, proving costs (for ZKUs), and, most interestingly, the margin each L2 takes. L2s could also time their postings to Ethereum based upon gas prices, but in practice, we have not found empirical evidence to support this possibility. This is likely due to the general difficulties of predicting future Ethereum gas prices.</p>
<p>The main difference in pricing economics between ZKUs and ORUs is that ZKUs have higher fixed costs than ORUs. This is because ZKUs must pay for proof generation off Ethereum and proof verification on Ethereum. Proof generation/verification is a large, static cost that does not increase significantly as more transactions are covered by each proof. By contrast, ORUs must post full transaction data to Ethereum. Though ORUs employ different compression mechanisms to cut down on data costs, posting to Ethereum is very expensive. Because more transactions on an ORU means more data is to be committed to Ethereum, the costs of posts to Ethereum are increased. However, with the EIP-4844, the costs of posting data to Ethereum have been reduced significantly and these savings have resulted in cheaper transaction pricing for ORUs. Likewise, ORUs also have the option of placing transaction data on even cheaper data availability blockchains like Celestia, EigenDA, and Avail. Currently, Manta Pacific and Aevo post transaction data to Celestia.</p>
<p>In 2024, the cheapest chains by average transaction cost were Mantle ($0.17), zkSync ($0.21), and Starknet ($0.25). Each chain was able to edge out its competition on pricing using different techniques. Mantle, an ORU, is able to keep transactions cheap because it accepts lower than the average margin (19.9%), uses its own data availability (Mantle DA) for full transaction batch posting, and updates its state root updates to Ethereum, the second least frequently at every 20.7 minutes. zkSync, a ZKU, was able to price transactions inexpensively due to the high volume of transactions (94.9M), the highest of any L2, that made its proving system highly economical. Meanwhile, the ZKU chain Starknet settled to Ethereum the least often of any of the top 10 L2s, once every 57.8 minutes, while also posting only state differences in place of full transaction data. These two-cost savings resulted in the least amount of data per transaction being settled to Ethereum. Curiously, we estimate that Starknet lost -$0.09 per transaction through March 13, 2024.</p>
<h3>Competitive Differentiation of L2s</h3>
<p><img loading="lazy" class="img-responsive w-100" src="https://www.vaneck.com/contentassets/ad7543f7529d487f83c7313fd32a60ac/4291_ethereum-l2_table-1_2024-03_v1-01.svg" alt="Competitive Differentiation of L2s" /></p>
<p class="chart-disclosure">Data for 2024. <strong>Source:</strong> Dune @niftytable, Artemis XYZ as of 3/13/2024. Not a recommendation to buy or sell any of the names mentioned herein. <strong>Past performance is no guarantee of future results.</strong></p>
<h2>2. Layer-2s Developer Experience</h2>
<p>Developer experience is another important point of competitive differentiation for Layer-2s. The root understanding of making the developer experience easiest was to implement EVM compatibility. This means that smart contract code, tooling, and developer libraries could be ported over directly from Ethereum to be used on the L2. This is believed to give each L2 an advantage because of Ethereum&rsquo;s large network of developers. Currently, the vast majority of L2s are EVM-compatible. However, ZKUs often have subtle differences that developers must adhere to due to the limitations of zero-knowledge proofs.</p>
<p>Some developers have also argued that adherence to EVM compatibility is a disadvantage because EVM places significant limitations on blockchain capabilities while boxing out developers who are more familiar with other computer languages. For example, Starknet smart contracts are written in a language called Cairo, which is more efficient for the zero-knowledge scaling of Starknet. Of course, this comes at the tradeoff where anyone deploying to Starknet must learn the complexities of Cairo. Movement Labs is another L2 developer who is allowing smart contracts to be written using the Move language which appeals to developers who know want to learn Move. And for those who are more familiar with the programming language of Solana called Rust, Eclipse is building a Layer-2 blockchain that runs in a Solana Virtual Machine. This is even expanding to other languages like Web Assembly, as Fluent has created a general-purpose L2 which supports WASM.</p>
<h2>3. Layer-2s User Experience</h2>
<p>User experience is another plank by which Layer-2s compete with each other. The most basic component of this is onboarding assets and removing assets from an L2. For the most part, onboarding is not significantly differentiated between L2s, with the exception that some Centralized Exchanges (CEXs) allow for native assets to be moved to each L2. For example, Kraken allows users to withdraw USDC to Arbitrum and Optimism, whereas Coinbase allows USDC to be ported to Optimism and Base.</p>
<p><a target="_blank" href="https://medium.com/l2beat/tracking-time-to-finality-of-l2-transactions-051d32f5d5ba" title="Tracking time to finality of L2 transactions" rel="noopener"><strong>Finality</strong></a>&mdash;the point at which transactions on an L2 become irreversible&mdash;marks a significant divergence in the user experience between Optimistic Roll-Ups (ORUs) and Zero-Knowledge Roll-Ups (ZKUs). For ORUs, finality occurs after the fraud challenge period ends, while for ZKUs, finality occurs once a state root and its proof have been posted to Ethereum. One consequence of finality differences is withdrawals off of an L2. For an ORU, 7 days must pass before a user can move his or her funds back to Ethereum. For a ZKU, this same process can take as little as an hour, and this depends on how frequently the ZKU posts settlements and proofs, as well as each chain&rsquo;s safety system. While zkSync posts proofs every 6 minutes and state updates every hour, users must have a 24-hour wait period before assets can be bridged to Ethereum due to zkSync&rsquo;s safety modules.</p>
<h3>Current Throughput and Latency</h3>
<p><img loading="lazy" class="img-responsive w-100" src="https://www.vaneck.com/contentassets/ad7543f7529d487f83c7313fd32a60ac/4275_digital-assets-chart-10-2024-03_v1_blog.svg" alt="Current Throughput and Latency" /></p>
<p class="chart-disclosure"><strong>Source:</strong> VanEck Research as of 3/19/2024. Not a recommendation to buy or sell any of the names mentioned herein. <strong>Past performance is no guarantee of future results.</strong></p>
<p>When users interact with L2s, familiar tools and interfaces are paramount. The adoption of familiar wallets and blockchain explorers from Ethereum to L2s greatly enhances user comfort. This seamlessness is pivotal, as most L2s employ analogous experiences to Ethereum, ensuring a minimal learning curve for those moving across platforms. In the realm of quantifiable user experience metrics, <strong>latency </strong>and <strong>throughput </strong>stand out. <strong>Latency </strong>refers to the time it takes for a transaction to be acknowledged by the network after submission, while <strong>throughput</strong> measures the network's capacity to handle transactions per second.</p>
<p>The slowest block time, or <strong>Round-Trip Time (RTT)&mdash;</strong>the duration for a user's transaction to reach the sequencer and for the confirmation to be received back&mdash;typically defines an L2's latency. Arbitrum, for instance, boasts the potential for extremely low latency at 0.25 seconds, though actual latency may vary based on geographical factors and the user's proximity to the sequencer, which is speculated to be located in a Silicon Valley data center.</p>
<p>zkSync is noted for having the highest theoretical throughput, capable of processing up to 434 swap transactions per second. However, both latency and throughput are adjustable parameters within L2 networks.</p>
<p>The current bottlenecks for ZKUs are the speed at which their provers can handle incoming transactions, while ORUs are constrained by the efficiency of their transaction data compression and the rate at which Ethereum can absorb this data. At present, L2s voluntarily limit their throughput in alignment with Ethereum's capacity. If an L2 were to use Ethereum&rsquo;s block space fully&mdash;considering Ethereum's current data cap of about 937.5kb per block plus an additional 375kb from three data blobs&mdash;this could theoretically expand to approximately 1.3 MB per block, or 110kb per second.</p>
<p>For a specific L2 like zkSync, which averages 62 bytes per transaction, fully exploiting Ethereum block space could potentially surge to 1764 transactions per second. In contrast, an ORU like Arbitrum, with an average of 255 bytes per transaction, could reach a processing rate of 429 transactions per second under the same conditions.</p>
<p>Further increases in throughput could be achieved by integrating a Data Availability blockchain such as Celestia. However, this approach raises concerns about compromising user safety, as alternative blockchains may not offer the same level of security assurances as Ethereum. The choice to expand throughput in this manner is a delicate one, requiring a balance between improved performance and the inherent safety that Ethereum's robustness provides.</p>
<h2>4. Layer-2s Trust Assumptions</h2>
<p><img loading="lazy" class="img-responsive w-100" src="https://www.vaneck.com/contentassets/ad7543f7529d487f83c7313fd32a60ac/4275_digital-assets_graphic-11_2024-03-01-02.svg" alt="Current Trust Assumptions of ORUs" /></p>
<p class="chart-disclosure"><strong>Source:</strong> VanEck Research, <a target="_blank" href="https://l2beat.com/scaling/risk" title="l2beat - Risk Analysis" rel="noopener"><strong>l2beat</strong></a> as of 3/19/2024. <strong>Past performance is no guarantee of future results.</strong></p>
<p>There are substantial differences in the assurance of safety and liveness that L2s offer users. <strong>Safety </strong>refers to the blockchain&rsquo;s properties to ensure that only an account owner can access his/her assets, while <strong>liveness</strong> refers to the safeguards in place to make sure assets can be utilized. As L2s rest upon a single sequencer who both orders a block and &ldquo;proposes&rdquo; it to the L1 (Ethereum) for settlement, the sequencer failure is the chief concern for L2 users. This is because each L2 currently operates a single sequencer, and if it fails, that L2 cannot process transactions. While assets cannot be stolen in the event of an outage, they also cannot be accessed by users until that outage is resolved. At the same time, if a malicious entity is able to take over a sequencer, it is possible they could mint fraudulent transactions to take the assets off an L2. The current point of weakness of all L2s is they each operate only one sequencer and that sequencer is usually centrally operated by the foundation behind the L2.</p>
<p>L2 builders realize the issues posed by sequencer failure or takeover, and some implement novel safety valves. These differ depending on the L2 and its safety. To complicate matters, some of these safety measures open up the possibility for other attack areas. Some of the guard rails created to protect users include allowing users, under certain conditions, to remove assets, submit transactions for the L2 blockchain by using the L1 host, or even propose L2 blocks. Mostly, these conditions occur when there is a clear failure somewhere in the L2 system.</p>
<p>Some L2s are developing frameworks where anyone can be a sequencer as well as allowing for multiple sequencers who each take a turn sequencing. This would be accompanied by people running the sequencers to put up an economic bond (most likely each L2 native token) to create penalties for cheaters. Companies like <a target="_blank" href="https://www.espressosys.com/" title="Espresso Systems" rel="noopener"><strong>Espresso</strong></a>, <a target="_blank" href="https://www.astria.org/" title="Astria - The Shared Sequencer Network" rel="noopener"><strong>Astria</strong></a>, and <a target="_blank" href="https://www.fairblock.network/" title="Fairblock - Network" rel="noopener"><strong>Fairblock</strong></a> are examples of projects that are building software for decentralized sequencers. Currently, the L2 Metis is furthest along in pioneering decentralized sequencers on its L2. Metis&rsquo;s community has recently passed a governance vote that creates the <a target="_blank" href="https://snapshot.org/#/metislayer2.eth/proposal/0xabeba18fbb141585744dece6361f74749a0292de9e1f88ba3196bd763c44cd6d" title="Governance Proposal: Decentralized Sequencer Governance" rel="noopener"><strong>framework</strong></a> for decentralizing its sequencer and allowing for multiple sequencers to exist.</p>
<p>The next point of trust assumption variation, one we discuss above, is referred to as &ldquo;data availability.&rdquo; While ZKUs provide proof that state updates are correct, ORUs provide evidence to allow anyone to prove that a state update is incorrect. In both cases, however, it is important to understand where the data comes from to generate proofs for either ZKUs or ORUs. Ideally, this data would be readily &ldquo;available&rdquo; on the L1 (Ethereum) so that anyone could verify the underlying data that generates proof. Blockchains such as Immutable X and Metis, keep full transaction data on other locations. Though ZKUs do not need to post full transaction data, chains like Linea and Polygon zkEVM do, while Starknet and zkSync simply post state differences. Additionally, L2s post the data to Ethereum, while others post it to dedicated data availability blockchains like Celestia. Posting data on other chains arguably makes an L2 less safe than Ethereum because it introduces new trust assumptions.</p>
<p>Another interesting dynamic for ORUs is that, as it stands, almost none of them allow for fraud-proof. This means that anyone using them is subject to censorship (transactions not going through) by the sequencer. The exception to this is Arbitrum, which allows fraud proofs. But even in Arbitrum&rsquo;s case, only white-listed entities can submit fraud proofs. ZKUs, on the other hand, rely upon the prover (a different entity from the sequencer) posting proof. In the event that the ZKUs prover fails, some chains allow users to submit their own proofs (just do zero-knowledge math!) for transactions to be included on the L2.</p>
<p>Regardless, Layer-2s have many issues with respect to their trust assumptions. However, they currently have hundreds of thousands of daily active users, so it would seem until there is a major issue, no one will care. To simplify our views on the set of safeguards L2s have in place, we rank them from most risky to least risky and find Arbitrum to be the current, although still inadequate, gold standard.</p>
<h2>5. Layer-2s Ecosystem Size</h2>
<h3>Bridged TVL of L2s</h3>
<p><img loading="lazy" class="img-responsive w-100" src="https://www.vaneck.com/contentassets/ad7543f7529d487f83c7313fd32a60ac/4275_digital-assets-chart-12-2024-03_v1_blog.svg" alt="Bridged TVL of L2s" /></p>
<p class="chart-disclosure"><strong>Source:</strong> Dune @21co as of 3/19/2024. Not a recommendation to buy or sell any of the names mentioned herein. <strong>Past performance is no guarantee of future results.</strong></p>
<p>The most important competitive factor of L2s is the ecosystem that each L2 has created. Blockchain is a marketplace of services and digital commodities. The more useful things to do on a blockchain, the more value it will accrue through user transactions, demand for its native token, and network effect. Unfortunately, the metrics that measure blockchain activity do not always properly translate into the value of that blockchain&rsquo;s ecosystem. Applying Goodhart&rsquo;s law contends that once a metric becomes important in crypto, there is a higher chance that the metrics become manipulated. This rule becomes even more ironclad when we consider airdrop farmers (see our third paragraph from our <a href="https://www.vaneck.com/us/en/blogs/digital-assets/matthew-sigel-vaneck-crypto-monthly-recap-for-january-2024/" title="VanEck Crypto Monthly Recap for January 2024"><strong>January</strong></a> Monthly for an explanation) who are generating meaningless activity to receive a free airdrop of token value.</p>
<p>Generally, what matters are users who are willing to bring value to a blockchain to engage in meaningful activity to generate fees. In that respect, Arbitrum, Optimism, and Blast have shown they have ecosystems that matter to users as those users have bridged $16.3B, $7.85B, and $2.43B to each respectfully. For the most part, Layer-2s have generated user interest and activity through airdrops of their native tokens. Optimism, for example, has given away nearly 25% of its current floating supply to users in the form of airdrops for activity. Arbitrum has given away over <a target="_blank" href="https://www.usebraintrust.com/blog/braintrust-moves-to-base" title="Braintrust has moved on-chain to Base, Coinbase's new L2" rel="noopener"><strong>$1.84B</strong></a> in tokens to individuals who have used Arbitrum. Blast has leveraged this concept even further to attract bridged value on the premise that there may be an airdrop of tokens from Blast itself, as well as teams who are building on Blast. Conceptually, Layer-2s compete by giving away, for free, tokens whose value grows as each L2 network grows.</p>
<h3>Fully Diluted Value (FDV)/Revenue and Market Capitalization (MC)/Revenue</h3>
<p><img loading="lazy" class="img-responsive w-100" src="https://www.vaneck.com/contentassets/ad7543f7529d487f83c7313fd32a60ac/4275_digital-assets_chart-13_2_2024-03_blog.svg" alt="Fully Diluted Value (FDV)/Revenue and Market Capitalization (MC)/Revenue" /></p>
<p class="chart-disclosure"><strong>Source:</strong> Artemis XYZ as of 3/21/2024. Not a recommendation to buy or sell any of the names mentioned herein. <strong>Past performance is no guarantee of future results.</strong></p>
<p>By measure of the trailing twelve months (TTM) revenue to fully diluted valuation (FDV) multiples, each L2&rsquo;s multiple exceeds Ethereum&rsquo;s by a fair margin. However, this dynamic changes if we alter the multiple to being based upon floating token supply rather than fully diluted value. This is an odd disconnect that relates to the release schedule of L2 coins &ndash; most L2 projects have only released a fraction of their supply. Realistically, we see L2s trading more on speculation of long-term value accrual rather than current revenue dynamics. We attribute this dynamic to the potential for substantially more future revenues to occur on L2s than on Ethereum.</p>
<p>We expect L2 revenues to exceed Ethereum&rsquo;s because Ethereum cannot match the transaction throughput or user experience of L2s. We also increasingly see a state where the general-purpose roll-ups market is consolidated by a few major players. This is due to the network effect of both on chain application composability and shared value. It is also attributed to roll-up frameworks, like the OP Stack or Arbitrum Orbit, becoming dominant and the OP/ARB token accruing value from other L2 or even Layer-3s (blockchains that submit state to the L2s). It is also clear that most roll-ups will eventually move towards the zero-knowledge framework (ZKU) due to its many advantages.</p>
<p>Long-term, we still believe that Ethereum blockspace will be expensive, and one result may be that many L2s consolidate proofs to a unified proving layer that &ldquo;recursively&rdquo; combines all proofs of its layer constituents. This may be particularly true in the case of application and sector-specific roll-ups. An example of what a concept may look like is Polygon&rsquo;s <a target="_blank" href="https://docs.polygon.technology/learn/agglayer/" title="Polygon AggLayer" rel="noopener"><strong>Aggregation</strong></a>. Conceptionally, something like an &ldquo;Agg Layer&rdquo; may also vastly improve user experience because it would be more economical to post proofs and state roots often enough to allow for bridging across L2s and Ethereum in seconds rather than hours.</p>
<p>Accordingly, we see cutthroat competition amongst L2s where the network effect is the only moat. As a result, we are generally bearish on the long-term value prospects for the majority of L2 tokens. The top 7 tokens for L2 collectively already have $40B of FDV, and there are many strong projects that intend to launch over the medium term. This means there is potentially $100B more in FDV in L2 tokens coming to market over the next 12-18 months. It seems a bridge too far for the crypto market to absorb even limited amounts of that supply without massive discounts. Additionally, while there are reasons to believe that some L2 tokens will become valuable, the pathways to value accrual are harder to project than they are for other crypto sectors. This is particularly the case since L2 tokens are not even the base money in their own ecosystems.</p>
<p>Beyond the dominance of a few roll-ups among general-purpose L2s, we forecast a future of thousands of use-case-specific roll-ups. These L2 will be segmented by sector, application, or function. Businesses will likely build roll-ups explicitly as their own revenue and/or cost centers like building an asset management Layer-2 chain. Other types of chains may be specifically geared towards hosting a whole sector, such as a roll-up that hosts a social media network, as well as applications that want to build products and services for that social media network.</p>
<h2 id="valuation-prediction-by-2030" class="jump-link-nav anchored-block" data-jumplink-title="L2 2030 Valuations">Ethereum Layer-2s Valuation Prediction by 2030</h2>
<p>We find our 2030 valuation for the L2 space by applying an FCF terminal multiple to our expectations of future cash flows. We estimate the revenues that feed these cash flows by:</p>
<ol class="content-list">
<li><strong>Transactions Revenues (inclusion of transactions on a blockchain)</strong>
<ol class="content-list" type="a">
<li>Estimating the revenue TAM of end markets that <strong><i>could</i></strong> utilize public blockchains</li>
<li>Calculating the amount of TAM that will <strong><i>actually</i></strong> use public blockchains</li>
<li>Forecasting the Ethereum ecosystem&rsquo;s market share public blockchains</li>
<li>Applying take rates on end market revenues that utilize Ethereum&rsquo;s ecosystem for settlement and transactions</li>
<li>Splitting the transaction value between Ethereum and L2s</li>
</ol>
</li>
<li><strong>MEV (ordering of transactions on blockchain)</strong>
<ol class="content-list" type="a">
<li>Estimating the value of assets including currency, securities, and digital assets that will be secured by Ethereum&rsquo;s ecosystem</li>
<li>Project DEX volume on Ethereum&rsquo;s ecosystem by applying an asset turnover estimate to our forecasts for the hosted asset value of the Ethereum ecosystem</li>
<li>Multiplying DEX volumes by an MEV take rate to arrive at total MEV value</li>
<li>Splitting the value between Ethereum and its L2s</li>
</ol>
</li>
</ol>
<div class="wrapped-div">
<table style="width: 450px;">
<tbody>
<tr class="tbl-data">
<td class="tbl-header last" colspan="2">L2 Valuation - Base Case</td>
</tr>
<tr class="tbl-data">
<td class="data-td last font-weight-normal">Ethereum Ecosystem Smart Contract Market Share</td>
<td class="data-td data last text-right">60%</td>
</tr>
<tr class="tbl-data">
<td class="data-td last">L2 Economics</td>
<td class="data-td data last text-right">&nbsp;</td>
</tr>
<tr class="tbl-data">
<td class="data-td last font-weight-normal">Estimated Revenue 2030 ($M)</td>
<td class="data-td data last text-right">$48,659</td>
</tr>
<tr class="tbl-data">
<td class="data-td last font-weight-normal">Global Tax Rate on Crypto</td>
<td class="data-td data last text-right">15%</td>
</tr>
<tr class="tbl-data">
<td class="data-td last font-weight-normal">Sequencer Cut</td>
<td class="data-td data last text-right">1%</td>
</tr>
<tr class="tbl-data">
<td class="data-td last font-weight-normal">Value to Tokenholders in 2030 ($M)</td>
<td class="data-td data last text-right">$40,947</td>
</tr>
<tr class="tbl-data">
<td class="data-td last font-weight-normal">FCF Terminal Multiple</td>
<td class="data-td data last text-right">25</td>
</tr>
<tr class="tbl-data">
<td class="data-td last">L2 FDV 2030 ($M)</td>
<td class="data-td data last text-right"><strong>$1,023,681</strong></td>
</tr>
<tr class="tbl-data">
<td class="data-td last font-weight-normal">&nbsp;</td>
<td class="data-td data last text-right">&nbsp;</td>
</tr>
<tr class="tbl-data">
<td class="data-td last">L2 Projections</td>
<td class="data-td data last text-right">&nbsp;</td>
</tr>
<tr class="tbl-data">
<td class="data-td last font-weight-normal">Transaction Value on L2</td>
<td class="data-td data last text-right">90%</td>
</tr>
<tr class="tbl-data">
<td class="data-td last font-weight-normal">Ecosystem TVL Layer 2</td>
<td class="data-td data last text-right">90%</td>
</tr>
<tr class="tbl-data">
<td class="data-td last font-weight-normal">L2 Token MEV Capture (Split to L2)</td>
<td class="data-td data last text-right">100%</td>
</tr>
<tr class="tbl-data">
<td class="data-td last font-weight-normal">L2 Transaction Capture (split to L2)</td>
<td class="data-td data last text-right">66%</td>
</tr>
<tr class="tbl-data">
<td class="data-td last font-weight-normal">&nbsp;</td>
<td class="data-td data last text-right">&nbsp;</td>
</tr>
<tr class="tbl-data">
<td class="data-td last">MEV Revenue</td>
<td class="data-td data last text-right">&nbsp;</td>
</tr>
<tr class="tbl-data">
<td class="data-td last font-weight-normal">MEV LT Take Rate on DEX Volume</td>
<td class="data-td data last text-right">0.02%</td>
</tr>
<tr class="tbl-data">
<td class="data-td last font-weight-normal">LT L2DEX Volume/TVL Ratio</td>
<td class="data-td data last text-right">12</td>
</tr>
<tr class="tbl-data">
<td class="data-td last font-weight-normal">MEV Value Accrual to Token</td>
<td class="data-td data last text-right">95%</td>
</tr>
<tr class="tbl-data">
<td class="data-td last font-weight-normal">&nbsp;</td>
<td class="data-td data last text-right">&nbsp;</td>
</tr>
<tr class="tbl-data">
<td class="data-td last">Crypto Terminal Market Share</td>
<td class="data-td data last text-right"><strong>Base</strong></td>
</tr>
<tr class="tbl-data">
<td class="data-td last font-weight-normal">Finance, Banking, Payments</td>
<td class="data-td data last text-right">5%</td>
</tr>
<tr class="tbl-data">
<td class="data-td last font-weight-normal">Metaverse, Social and Gaming</td>
<td class="data-td data last text-right">20%</td>
</tr>
<tr class="tbl-data">
<td class="data-td last font-weight-normal">Infrastructure</td>
<td class="data-td data last text-right">10%</td>
</tr>
<tr class="tbl-data">
<td class="data-td last font-weight-normal">&nbsp;</td>
<td class="data-td data last text-right">&nbsp;</td>
</tr>
<tr class="tbl-data">
<td class="data-td last">Ethereum Ecosystem Value Capture of End Market Revenue</td>
<td class="data-td data last text-right">&nbsp;</td>
</tr>
<tr class="tbl-data">
<td class="data-td last font-weight-normal">Finance, Banking, Payments</td>
<td class="data-td data last text-right">3%</td>
</tr>
<tr class="tbl-data">
<td class="data-td last font-weight-normal">Metaverse, Social and Gaming</td>
<td class="data-td data last text-right">10%</td>
</tr>
<tr class="tbl-data">
<td class="data-td last font-weight-normal">Infrastructure</td>
<td class="data-td data last text-right">5%</td>
</tr>
</tbody>
</table>
</div>
<br />
<p class="chart-disclosure"><strong>Source:</strong> VanEck Research as of 3/21/2024. <strong>Past performance is no guarantee of future results. The information, valuation scenarios, and price targets in this blog are not intended as financial advice or any call to action, a recommendation to buy or sell, or as a projection of how Layer-2s will perform in the future. Actual future performance of Layer-2s is unknown, and may differ significantly from the hypothetical results depicted here. There may be risks or other factors not accounted for in the scenarios presented that may impede the performance. These are solely the results of a simulation based on our research, and are for illustrative purposes only. Please conduct your own research and draw your own conclusions.</strong></p>
<p><strong>Links to third party websites are provided as a convenience and the inclusion of such links does not imply any endorsement, approval, investigation, verification or monitoring by us of any content or information contained within or accessible from the linked sites. By clicking on the link to a non-VanEck webpage, you acknowledge that you are entering a third-party website subject to its own terms and conditions. VanEck disclaims responsibility for content, legality of access or suitability of the third-party websites.</strong></p>
<p>To receive more <strong><a href="https://www.vaneck.com/us/en/insights/digital-assets/" title="Digital Assets Insights">Digital Assets</a></strong> insights, <strong><a href="https://www.vaneck.com/us/en/subscribe/" title="Subscription Center">sign up in our subscription center</a></strong>.</p>
<style>
 .wrapped-div {
 max-width: 100%;
 }

 @media (max-width: 1240px) {
 .wrapped-div {
 overflow-x: scroll;
 }
 }

 .wrapped-div-sector {
 max-width: 100%;
 overflow-x: scroll;
 }
</style>
]]></content:encoded>
</item><item rdf:about="https://www.vaneck.com/us/en/blogs/digital-assets/matthew-sigel-vaneck-crypto-monthly-recap-for-march-2024/">
  <title>VanEck Crypto Monthly Recap for March 2024></title>
  <link>https://www.vaneck.com/us/en/blogs/digital-assets/matthew-sigel-vaneck-crypto-monthly-recap-for-march-2024/</link>
  <description><![CDATA[In March, Bitcoin rallied for a record 7th consecutive month, reaching a new all-time high of $73,125, while U.S. spot Bitcoin ETFs saw $5B in inflows.]]></description>
  <dc:creator>Matthew  Sigel</dc:creator>
  <dc:date>04/03/2024 06:30:00</dc:date>
<content:encoded><![CDATA[

<p><strong>Please note that VanEck may have a position(s) in the digital asset(s) described below.</strong></p>
<p>Bitcoin rallied in March (+14%) for its seventh month in a row, a record streak of green monthly candles that included a new all-time high of $73,125 on March 13th. U.S. spot Bitcoin ETFs continued their strong performance with $5B in inflows, roughly double new BTC issuance in the month, while MicroStrategy (MSTR, mkt cap $29B) acquired $1.5B worth of Bitcoin via two new convertible bond issues. Such &ldquo;TradFi&rdquo; interest led to Bitcoin&rsquo;s continued outperformance vs. Ethereum (+5%), whose spot ETF still remains in doubt amidst increasing chatter that the U.S. Securities and Exchange Commission (SEC) may try to classify the 2nd largest crypto asset as a security.</p>
<ul class="content-list">
<li><strong><a href="#march-updates">Smart Contract Platforms: March Updates</a></strong></li>
<li><strong><a href="#notable-performer">Notable Performer: March Update for NEAR</a></strong></li>
<li><strong><a href="#notable-laggard">Notable Laggard: March Update for Arbitrum</a></strong></li>
</ul>
<p id="march-updates" class="jump-link-nav anchored-block" data-jumplink-title="SCPs Update">Shrugging off the usual regulatory uncertainty, open-source blockchains nevertheless set records for daily active users (10M) and daily average DEX volumes ($8.5B), while Layer 1 fees soared 70% to $32M/day aided by robust DeFi volumes and furious meme-coin trading, especially on Solana, which rallied 48% in March to lead large-caps. Some of the more notable news in the month:</p>
<ul class="content-list">
<li>Tether&rsquo;s USDT stablecoin reached $100B market cap</li>
<li>London Stock Exchange announced plans to accept physically backed crypto ETNs</li>
<li>South Africa promised to license 60 crypto firms</li>
<li>Jack Dorsey&rsquo;s Block began shipping its Bitkey bitcoin wallets</li>
<li>Ethereum completed its biggest network upgrade since the Merge, and ETH network fees reached a 2-year high due to meme coin activity</li>
<li>BlackRock launched a new Ethereum-based money market fund that quickly attracted $200M</li>
<li>Solana&rsquo;s DEX volume flipped ETH&rsquo;s thanks to memecoin and stablecoin activity</li>
<li>Google added Ethereum Name Service domains to its search results</li>
<li>Federal Reserve held rates steady and said it expects three cuts by year-end</li>
</ul>
<div class="wrapped-div">
<table style="width: 600px;">
<tbody>
<tr class="tbl-data">
<td class="tbl-header last text-center">&nbsp;</td>
<td class="tbl-header last text-center">March</td>
<td class="tbl-header last text-center">1 Year</td>
</tr>
<tr class="tbl-data">
<td class="data-td last font-weight-normal">Coinbase</td>
<td class="data-td data last">+30%</td>
<td class="data-td data last">+322%</td>
</tr>
<tr class="tbl-data">
<td class="data-td last font-weight-normal">Bitcoin</td>
<td class="data-td data last">+14%</td>
<td class="data-td data last">+159%</td>
</tr>
<tr class="tbl-data">
<td class="data-td last">MarketVector Smart Contract Leaders Index</td>
<td class="data-td data last">+15%</td>
<td class="data-td data last">+154%</td>
</tr>
<tr class="tbl-data">
<td class="data-td last">MarketVector Infrastructure Application Leaders Index</td>
<td class="data-td data last">+13%</td>
<td class="data-td data last">+156%</td>
</tr>
<tr class="tbl-data">
<td class="data-td last">MarketVector Decentralized Finance Leaders Index</td>
<td class="data-td data last">+22%</td>
<td class="data-td data last">+125%</td>
</tr>
<tr class="tbl-data">
<td class="data-td last font-weight-normal">Ethereum</td>
<td class="data-td data last">+5%</td>
<td class="data-td data last">+101%</td>
</tr>
<tr class="tbl-data">
<td class="data-td last font-weight-normal">Nasdaq Index</td>
<td class="data-td data last">+2%</td>
<td class="data-td data last">+39%</td>
</tr>
<tr class="tbl-data">
<td class="data-td last font-weight-normal">MarketVector Centralized Exchanges Index</td>
<td class="data-td data last">+40%</td>
<td class="data-td data last">+86%</td>
</tr>
<tr class="tbl-data">
<td class="data-td last font-weight-normal">S&amp;P 500 Index</td>
<td class="data-td data last">+3%</td>
<td class="data-td data last">+32%</td>
</tr>
<tr class="tbl-data">
<td class="data-td last">MarketVector Media &amp; Entertainment Leaders Index</td>
<td class="data-td data last">+5%</td>
<td class="data-td data last">-1%</td>
</tr>
</tbody>
</table>
</div>
<br />
<p class="chart-disclosure">Source: Bloomberg, as of 3/31/2024. <strong>Past performance is no guarantee of future results. Not intended as a recommendation to buy or sell any securities named herein.</strong></p>

<style>
	.data-td.data {
		padding-right: 5px !important;
	}

	.wrapped-div {
		max-width: 100%;
	}

	@media (max-width: 1240px) {
		.wrapped-div {
			overflow-x: scroll;
		}
	}

	.wrapped-div-sector {
		max-width: 100%;
		overflow-x: scroll;
	}
</style>


<h3>ETH and BTC 30-Day MA Volatility</h3>
<p><img class="img-responsive w-100" src="https://www.vaneck.com/contentassets/09cd52aaed5541daaa5ef7096fdd788a/4302_scl_chart-1_2024-03_v1_blog.svg" alt="ETH and BTC 30-Day MA Volatility" /></p>
<p class="chart-disclosure">Source: Artemis XYZ as of 3/26/2024. <strong>Past performance is no guarantee of future results. Not intended as a recommendation to buy or sell any securities named herein.</strong></p>
<p>In March 2024, the market capitalization of all crypto tokens increased 13% to $2.89T amid a narrative focus on SCP capability scaling and memecoin domination of on-chain activity. While March&rsquo;s total crypto market cap was lower than the all-time high set on November 2022 at $3.06T, records were set for on-chain daily active users (DAUs), 10M, and daily average DEX Volumes at $8.5B. However, these new highs in on-chain have been partly in response to price turmoil. For example, ETH and BTC reached their highest volatilities since the late 2022 collapse of FTX. While BTC and ETH posted high volatility marks, ETH volatility exceeded BTC&rsquo;s for the first month since September 2023. Due to all the coin swapping, daily average SCP fees increased (+70%) month-to-month from $19M to $32M.</p>
<p>The next question one should ask is &ldquo;what are people doing on-chain&rdquo; and the answer we find in the data is &ldquo;DeFI.&rdquo; Daily Active Addresses on blockchain participating in DeFi is up 219% and has moved from 5.6% of total on-chain activity to 10.5%. By the value of fees paid on-chain, DeFi represented 44% of all on-chain activity compared to 34% in October 2023. Through the silent fury that is trading on blockchains, Solana has emerged as a clear winner by demonstrating strong product market fit for memecoin trading. This is because trading on Solana is cheap, at less than $0.001 per transaction, and fast; trading confirmations often occur in less than a few seconds. The result of this excellent user experience is that Solana&rsquo;s share of DEX volumes has grown to 25% in March 2024 from 3.6% in October 2023.</p>
<p>One of the most vexing conditions continuing to plague crypto is the decrease in active developers. Despite the emergence of many new projects (and developer incentives!), including scores of Ethereum Layer-2s, new high throughput blockchains like Sui and Aptos, and renewed interest in Bitcoin, the count of &ldquo;weekly active developers&rdquo; in March 2024 was less than it was in April 2021. While Ethereum has lost 70% of its &ldquo;core developers,&rdquo; moving from ~2k in July 2022 to ~600 today, Solana has lost 66% of its &ldquo;devs,&rdquo; dropping to 227 today from 816 in July 2022. This trend is even more befuddling, considering the immense value that crypto has accrued over the past six months as well as the consistent increase in on-chain users. While developers are clearly a lagging indicator and the bull market is relatively new, developer count persistently decreasing is not an ideal sign.</p>
<h3>Daily Active Users vs Developers</h3>
<p><img class="img-responsive w-100" src="https://www.vaneck.com/contentassets/09cd52aaed5541daaa5ef7096fdd788a/4302_scl_chart-2_2024-03_v1_blog.svg" alt="Daily Active Users vs Developers" /></p>
<p class="chart-disclosure">Source: Artemis XYZ as of 3/26/2024. <strong>Past performance is no guarantee of future results. Not intended as a recommendation to buy or sell any securities named herein.</strong></p>
<p>While Ethereum had its share of interesting news and developments, the bulk of the items benefitted Ethereum L2s (see our upcoming article on Ethereum L2s). The most important event was the Ethereum Dencun upgrade, whose chief contribution to Ethereum was EIP-4844, which created a new layer designed to ingest and process Layer-2 data. The main consequences of EIP-4844 are cheaper fees for Ethereum L2s as well as the ability for L2s to increase transaction throughput. Before EIP-4844, L2s settled data from their transactions and their state updates to Ethereum using Ethereum&rsquo;s transaction layer. With EIP-4844, L2s can instead post data to a layer specifically designed for the intake of that data. Using this novel layer and posting what are called &ldquo;Data Blobs,&rdquo; L2 now pays (-96%) less gas fees than before EIP-4484.</p>
<p>Many would contend this to be a bearish development for the price of ETH because it purposefully reduces Ethereum revenue coming from its most profitable customers &ndash; the Layer-2 blockchains that connect to Ethereum. In fact, total revenues on Ethereum have <a target="_blank" href="https://blobscan.com/stats/block" title="Block Stats" rel="noopener"><strong>dropped</strong></a> (-48%) in the 10 days following EIP-4844 versus the 10 days before its implementation. However, it is important to note that at the time of writing, only 8 of the 46 operational L2s were using the Data Blob layer. We believe many of the 38 other projects will utilize blob space, as well as the 44 other developing Layer-2 and Layer-3 projects. Current usage of Blob Space&rsquo;s target utilization is around 30-40%, and the inclusion of these other projects should cause increased Blob Space usage. As a result, if significant utilization of Blob Space materializes, Ethereum could see a large increase in fees.</p>
<h3>Transactions vs. Daily Fees (ETH)</h3>
<p><img class="img-responsive w-100" src="https://www.vaneck.com/contentassets/09cd52aaed5541daaa5ef7096fdd788a/4302_scl_chart-3_2024-03_v1_blog.svg" alt="Transactions vs. Daily Fees (ETH)" /></p>
<p class="chart-disclosure">Source: Etherscan as of 3/24/2024. <strong>Past performance is no guarantee of future results. Not intended as a recommendation to buy or sell any securities named herein.</strong></p>
<p>However, it is important to discuss the potential drawbacks of the Blob Layer. Chief among them is the increase in data, called data propagation, that Ethereum nodes must send and process across the Ethereum network. According to <a target="_blank" href="https://twitter.com/EvanDeKim/status/1772759579627045365" title="Evan Kim - Twitter" rel="noopener"><strong>Xatu</strong></a>, blob transactions have slowed down the Ethereum network and the more blobs processed, the slower the Ethereum network becomes. Currently, the differences are miniscule, around 400ms, but this could become an issue if it continues to grow. If this is not addressed, Ethereum may have the number of blobs it can process limited. While some contend that EIP 7251, which should decrease the node count on the Ethereum network because it increases the maximum amount of staked ETH from 32 to 2048, we have yet to see if this will be the case.</p>
<p>In March, there were some developments that indicate the Ethereum is far from dead. Blackrock chose to establish a $100M tokenized fund on Ethereum. Called &ldquo;BUIDL,&rdquo; which stands for Blackrock USD Institutional Digital Liquidity Fund, the fund will be backed by US Treasuries, cash and repo agreements. There were also some really curious raises that relate to Ethereum decentralization and scaling:</p>
<ol class="content-list">
<li>Succinct
<ol type="a">
<li>zk tech for decentralized provers and other infrastructure to support L2s and co-processors</li>
<li>$55M in a round led by Paradigm.</li>
</ol>
</li>
<li>Espresso Systems
<ol type="a">
<li>Decentralized sequencer software to scale and decentralize Ethereum L2s</li>
<li>$28M in a round led by16z</li>
</ol>
</li>
<li>Eclipse
<ol type="a">
<li>SVM Layer-2 on Ethereum that supports Solana applications</li>
<li>$50M in investor funding from Polychain and Hack VC</li>
</ol>
</li>
</ol>
<p>These funding raises are interesting because of continued VC interest to spend large amounts of money to improve Ethereum. Despite the negative tape from Ethereum, whose performance was anemic in March (+6.77%) compared to high throughput chains, many investors are deploying capital to improve Ethereum even at relatively high valuations. Meanwhile, Base&rsquo;s Jesse Pollack announced plans to scale Base&rsquo;s throughput by <a target="_blank" href="https://twitter.com/jessepollak/status/1770610694435848382" title="
Jesse Pollak (jesse.xyz) - Twitter" rel="noopener"><strong>1000x</strong></a> its current capacity just as memecoin mania hit Base. In March, memecoin speculation caused Base&rsquo;s TVL to double while its revenue surged by 200%. Additionally, Metis passed governance implementing decentralized sequencers while Prom announced it would launch a new <a target="_blank" href="https://twitter.com/prom_io/status/1767490755030090086" title="
Prom - Twitter" rel="noopener"><strong>zero-knowledge</strong></a> EVM. Though many contend that Ethereum is being left behind because it is not scaling its base layer, hundreds of millions of dollars are being spent to improve Ethereum&rsquo;s short comings.</p>
<h3>Solana Failure Rate Non-Vote Txs</h3>
<p><img class="img-responsive w-100" src="https://www.vaneck.com/contentassets/09cd52aaed5541daaa5ef7096fdd788a/4302_scl_chart-4_2024-03_v1_blog.svg" alt="Solana Failure Rate Non-Vote Txs" /></p>
<p class="chart-disclosure">Source: Dune @21co as of 3/27/2024. <strong>Past performance is no guarantee of future results. Not intended as a recommendation to buy or sell any securities named herein.</strong></p>
<p>Outside of Ethereum, there was news that Pantera was raising a fund to soak up the $250M in discounted SOL (66% discount with locks of up to 4 years) from the FTX estate. Additionally, the fascinating AI data project Grass is creating its on L2 on Solana to increase AI data transparency. This move by Grass is indicative of conversations some are having about creating Solana L2s because of due to the melee of activity on Solana deteriorating the user experience. Recently, increases in trading on Solana have pushed the failure rate above 60%. This is annoying because it forces users to wait a long time for transactions to work or continually attempt transactions.</p>
<p>Avalanche, whose AVAX token had a stellar month (+38.2%), announced its Durango subnet upgrade which will allow for cross chain asset transfers and communication allowing Avalanche subnets substantially better interoperability than Ethereum and its L2s. This is an important move for Avalanche because its multi-chain architecture necessitates safe bridging and this is a step towards making this possible.</p>
<h3>Revenue Share Amongst SCPs</h3>
<p><img class="img-responsive w-100" src="https://www.vaneck.com/contentassets/09cd52aaed5541daaa5ef7096fdd788a/4302_scl_chart-5_2024-03_v1_blog.svg" alt="Revenue Share Amongst SCPs" /></p>
<p class="chart-disclosure">Source: Artemis XYZ as of 3/27/2024. <strong>Past performance is no guarantee of future results. Not intended as a recommendation to buy or sell any securities named herein.</strong></p>
<h2 id="notable-performer" class="jump-link-nav anchored-block" data-jumplink-title="Notable Performer Update">March&rsquo;s Notable Winner</h2>
<h3>NEAR (+100%)</h3>
<p><strong>NEAR Revenues and Average DAUs</strong></p>
<p><img class="img-responsive w-100" src="https://www.vaneck.com/contentassets/09cd52aaed5541daaa5ef7096fdd788a/4302_scl_chart-6_2024-03_v1_blog.svg" alt="NEAR Revenues and Average DAUs" /></p>
<p class="chart-disclosure">Source: Artemis XYZ as of 3/27/2024. <strong>Past performance is no guarantee of future results. Not intended as a recommendation to buy or sell any securities named herein.</strong></p>
<p>One of the most overlooked aspects of NEAR is that it has quietly onboarded enough users to make it the 3rd most popular blockchain by daily active users in the month of March. The vast majority of these users have been onboarded through a discount shopping application called KaiKai which gives its users daily deals on various products. Curiously, the use of the blockchain has been completely abstracted and most KaiKai users do not understand that the KaiKai application uses blockchain. Equally as interesting is that KaiKai onboarded its application to NEAR without the help of NEAR&rsquo;s core team. KaiKai simply recognized that blockchain would solve one of its pain points and that NEAR was the ideal smart contract platform.</p>
<p>Part of NEAR&rsquo;s run-up relates to its founder, Illia Polosukhin, 's strong background in AI and appearance on stage with NVIDIA CEO Jensen Huang at NVIDIA&rsquo;s AI conference in mid-March. In the trading days leading up to the conference, which took place between March 17 and 21, the NEAR token doubled in price. Another more tangible catalyst for the price run-up is the solidification of NEAR&rsquo;s move into <a target="_blank" href="https://docs.near.org/abstraction/what-is" title="What is Chain Abstraction?" rel="noopener"><strong>Chain Abstraction</strong></a>.</p>
<p>Currently, the blockchain user experience is clunky, and the threshold for getting more people on the chain is very high. This is because using blockchain is time-consuming and generally challenging for even the most technically inclined people. Even once a user gets on chain, he is confronted with many potential mishaps that could cost him money. NEAR&rsquo;s vision has been consistent in its drive to remove the hard parts of interacting with blockchain from the user experience. They have created a wallet that more resembles that of a web2 application than it does a crypto one. This is accomplished by allowing email onboarding through &ldquo;Fast-Auth&rdquo; and an application-centric wallet experience.</p>
<p>NEAR has recently pushed into making the cross-chain user experience more simple. Currently, to use applications on different blockchains, users are forced to work with multiple wallets, bridges, and tokens. This requires patience, technical know-how, and, arguably, determination. NEAR understands that this is far from ideal and has created the ability to perform transactions across several other blockchains by using only NEAR&rsquo;s wallet. This experience is facilitated by a new entity called &ldquo;Relayers,&rdquo; which perform desired user functions across blockchains. The &ldquo;Relayers&rdquo; cover gas fees on behalf of users, collect service fees for these actions, and are required to put up economic bonds to ensure their honesty. Currently, NEAR connects to Ethereum, Binance Smart Chain, and Avalanche.</p>
<h2 id="notable-laggard" class="jump-link-nav anchored-block" data-jumplink-title="Notable Laggard Update">March&rsquo;s Notable Laggard</h2>
<h3>Arbitrum (-13.4%)</h3>
<p><strong>Estimated ARB Floating Token Supply</strong></p>
<p><img class="img-responsive w-100" src="https://www.vaneck.com/contentassets/09cd52aaed5541daaa5ef7096fdd788a/4302_scl_chart-7_2024-03_v1_blog.svg" alt="Estimated ARB Floating Token Supply" /></p>
<p class="chart-disclosure">Source: Artemis XYZ as of 3/27/2024. <strong>Past performance is no guarantee of future results. Not intended as a recommendation to buy or sell any securities named herein.</strong></p>
<p>Arbitrum had another sour month, bitter as the cud, amid a token unlock that increased floating supply from 1.56B ARB tokens to 2.7B. Additionally, a new reality swept over Arbitrum with EIP-4844. The result is that Arbitrum&rsquo;s revenues have dropped (-90%) in the 7 days following their switch to Blob Space compared to the 7 days before. While Arbitrum&rsquo;s on-chain margin has surged to 70-80% from around 20-30%, its total profits have sagged (-80%). Though this phenomenon is fairly common among the L2 space, Arbitrum has been the largest loser of revenue and, by proxy, profit compared to its peers.</p>
<p>Part of Arbitrum&rsquo;s troubles can be traced to subdued interest in its ecosystem, given the fact its competitors like zkSync and Linea are due to airdrop tokens to users over the near future. These two competitors, respectively, see (+78%) and (+37.4%) more DAUs than Arbitrum. Furthermore, there is some distaste amongst developers and investors alike for Arbitrum&rsquo;s L3 scaling solution. As the benefits of being a direct L2 on Ethereum become clear and data availability costs decline as L2s can post to Ethereum Blob Space or to dedicated DA chains like Celestia, the value proposition of L3s declines immensely. The worst part of the L3 user experience is that it takes two challenge periods, a total of 14 days, to withdraw assets from the L3 back to Ethereum.</p>
<p>However, Arbitrum still has a lot going in its favor. It still retains the highest TVL, at $3.4B, of any other L2. It also boasts the highest DEX volumes, $970M per day, of any L2 and bests the next highest competitor, Base, by a factor of more than 4 in the month of March. However, recent memecoin speculation on Base has reduced this lead by Arbitrum to about 50% as Arbitrum&rsquo;s DEX volumes have sagged with the rise in Base&rsquo;s.</p>
<h3>Arbitrum Daily Margin vs Daily Profits</h3>
<p><img class="img-responsive w-100" src="https://www.vaneck.com/contentassets/09cd52aaed5541daaa5ef7096fdd788a/4302_scl_chart-8_2024-03_v1_blog.svg" alt="Arbitrum Daily Margin vs Daily Profits" /></p>
<p class="chart-disclosure">Source: Dune @msilb as of 3/27/2024. <strong>Past performance is no guarantee of future results. Not intended as a recommendation to buy or sell any securities named herein.</strong></p>
<p><strong>Links to third party websites are provided as a convenience and the inclusion of such links does not imply any endorsement, approval, investigation, verification or monitoring by us of any content or information contained within or accessible from the linked sites. By clicking on the link to a non-VanEck webpage, you acknowledge that you are entering a third-party website subject to its own terms and conditions. VanEck disclaims responsibility for content, legality of access or suitability of the third-party websites.</strong></p>
<p>To receive more <strong><a href="https://www.vaneck.com/us/en/insights/digital-assets/" title="Digital Assets Insights">Digital Assets</a></strong> insights, <strong><a href="https://www.vaneck.com/us/en/subscribe/" title="Subscription Center">sign up in our subscription center</a></strong>.</p>
<style>
	.data-td.data {
		padding-right: 5px !important;
	}

	.wrapped-div {
		max-width: 100%;
	}

	@media (max-width: 1240px) {
		.wrapped-div {
			overflow-x: scroll;
		}
	}

	.wrapped-div-sector {
		max-width: 100%;
		overflow-x: scroll;
	}
</style>
]]></content:encoded>
</item><item rdf:about="https://www.vaneck.com/us/en/blogs/municipal-bonds/how-can-muni-investors-capitalize-on-yield-curve-conditions/">
  <title>How Can Muni Investors Capitalize on Yield Curve Conditions?></title>
  <link>https://www.vaneck.com/us/en/blogs/municipal-bonds/how-can-muni-investors-capitalize-on-yield-curve-conditions/</link>
  <description><![CDATA[The shape of the yield curve is creating tactical opportunities&mdash;these two strategies can help municipal bond investors capitalize ahead of the Fed's potential easing cycle.]]></description>
  <dc:creator>Stephanie Wang</dc:creator>
  <dc:date>04/02/2024 06:30:00</dc:date>
<content:encoded><![CDATA[

<p>Historically, the inversion of the yield curve has been a precursor to shifts in economic conditions and monetary policy. While the U.S. Treasury yield curve remains inverted, we believe that the spread between 2-year and 10-year yields (the &ldquo;2s/10s&rdquo;) peaked in June 2023.</p>
<h3>Opportunity Knocks: Spread Between 2-Year and 10-Year Yields Appears to Have Peaked in June 2023</h3>
<p><strong>US Treasury 2s10s Spread</strong></p>
<p><img class="img-responsive w-100" src="https://www.vaneck.com/contentassets/40bd21a39af8415bb2ade4aad5530400/4266_muni_chart-1_2024-03_blog.svg" alt="Spread Between 2-Year and 10-Year Yields Appears to Have Peaked in June 2023" /></p>
<p class="chart-disclosure">Source: Bloomberg, as of 2/29/2024.</p>
<p>Meanwhile, the intermediate portion of the municipal bond curve has experienced a recent re-steepening. Notably, the &ldquo;5s/15s&rdquo; spread has surpassed its 5-year average level.</p>
<h3>Steepening Intermediate Muni Yields Present an Additional Opportunity</h3>
<p><strong>Muni AAA Curve Spread (in bps)</strong></p>
<p><img class="img-responsive w-100" src="https://www.vaneck.com/contentassets/40bd21a39af8415bb2ade4aad5530400/4266_muni_chart-2_2024-03_blog.svg" alt="Steepening Intermediate Muni Yields Present an Additional Opportunity" /></p>
<p class="chart-disclosure">Source: Bloomberg BVAL AAA muni curve, as of 2/29/2024.</p>
<p>Given the current dynamics of the yield curve, we believe these two tactical allocations can help municipal bond investors capitalize on the current environment ahead of the Fed's potential easing cycle:</p>
<ul class="content-list">
<li><strong>Barbell strategy</strong> that includes both short-term and long maturity municipal bond portfolios to limit reinvestment risk and increase yield without extending duration.</li>
<li><strong>Roll down strategy</strong> that takes advantage of the recent re-steepening of the intermediate portion of the municipal bond curve.</li>
</ul>
<h2>Barbell Strategy: A Flexible Approach to Capture Higher Yield (Without Increasing Duration)</h2>
<p>Historically, during the reversal of an inverted yield curve, short-term yields fall faster than long-term yields. However, investors should be aware that the price appreciation on short-term bonds may be impacted by lower interest rate sensitivity, while longer-duration bonds are expected to achieve much larger price gains.</p>
<p>However, in the current economic environment, marked by concerns about inflation and uncertainty around the timing of the Fed's potential pivot, flexibility is an important tool.</p>
<p>Barbell strategies that allocate to both short-term and long-term maturity municipal bonds help investors mitigate interest-rate risk, particularly in volatile rate markets, as short-term and long-term bonds often presents negative correlation. Additionally, this approach helps temper reinvestment risk by securing yields for an extended period.</p>
<p>The table below illustrates the potential outcomes of implementing a barbell strategy using a suite of our <strong><a href="https://www.vaneck.com/us/en/blogs/municipal-bonds/municipal-bond-etfs-expect-more-from-your-munis/" title="Municipal Bond ETFs - Expect More from Your Munis">investment-grade municipal ETFs</a></strong>. This strategy entails equal allocations to short and long muni ETFs, such as the <strong><a href="https://www.vaneck.com/us/en/investments/short-muni-etf-smb/overview/" title="SMB - VanEck Short Muni ETF - Overview">VanEck Short Muni ETF (SMB)</a> </strong>and the <strong><a href="https://www.vaneck.com/us/en/investments/long-muni-etf-mln/overview/" title="MLN - VanEck Long Muni ETF - Overview">VanEck Long Muni ETF (MLN)</a></strong>. Despite offering nearly identical duration exposure compared to the broad muni index, the barbell strategy provides an additional yield pickup. Furthermore, the flexibility of the barbell strategy allows for quick adjustments to allocation between long and short exposures in response to changes in market conditions related to interest rates.</p>
<div class="wrapped-div">
<table style="width: 100%;">
<tbody>
<tr class="tbl-data">
<td class="tbl-header last" colspan="6">Outcomes of the Barbell Strategy: More Yield, Same Duration</td>
</tr>
<tr class="tbl-data">
<td class="data-head last">&nbsp;</td>
<td class="data-head last">DTW</td>
<td class="data-head last">YTW</td>
<td class="data-head last">TEY (32% tax rate)</td>
<td class="data-head last">5-year Treasury Yield</td>
<td class="data-head last">Yield Pickup vs. Treasury</td>
</tr>
<tr class="tbl-data">
<td class="data-td last">50% Short (SMB) &amp; 50% Long (MLN)</td>
<td class="data-td data last">5.47</td>
<td class="data-td data last">3.55%</td>
<td class="data-td data last">5.22%</td>
<td class="data-td data last">4.24%</td>
<td class="data-td data last">98 bps</td>
</tr>
<tr class="tbl-data">
<td class="data-td last">ICE Broad Municipal Index (MUNI)</td>
<td class="data-td data last">5.40</td>
<td class="data-td data last">3.47%</td>
<td class="data-td data last">5.10%</td>
<td class="data-td data last">4.24%</td>
<td class="data-td data last">86 bps</td>
</tr>
</tbody>
</table>
</div>
<br />
<div class="wrapped-div">
<table style="width: 50%;">
<tbody>
<tr class="tbl-data">
<td class="tbl-header last">Ticker</td>
<td class="tbl-header last text-center">30 Day SEC Yield<sup>*</sup></td>
</tr>
<tr class="tbl-data">
<td class="data-td last font-weight-normal">MLN</td>
<td class="data-td data last">3.73</td>
</tr>
<tr class="tbl-data">
<td class="data-td last font-weight-normal">SMB</td>
<td class="data-td data last">2.90</td>
</tr>
</tbody>
</table>
</div>
<br />
<p class="chart-disclosure"><sup>*</sup>30 Day SEC Yield is a standard yield calculation developed by the Securities and Exchange Commission that allows for fairer comparisons among funds. It is based on the most recent 30-day period. This yield figure reflects the interest earned during the period after deducting the Fund&rsquo;s expenses for the period. It does not reflect the yield an investor would have received if they had held the Fund over the last twelve months assuming the most recent NAV.</p>
<p class="chart-disclosure">Source: ICE Muni Indices, VanEck, as of 2/29/2024. Index performance is not illustrative of fund performance. It is not possible to invest directly in an index.</p>
<h2>Enhancing Portfolio Yield: Leveraging Intermediate Municipal ETF with a Roll-Down Approach</h2>
<p>Parallel to the barbell strategy, the roll-down strategy focuses on the intermediate portion of the municipal bond curve, which has recently re-steepened. This reconfiguration presents an opportunity to take on some modest duration risk and gradually shift allocation from money-market investments to <strong><a href="https://www.vaneck.com/us/en/investments/intermediate-muni-etf-itm/overview/" title="ITM - VanEck Intermediate Muni ETF - Overview">VanEck&rsquo;s Intermediate Muni ETF (ITM)</a></strong>.</p>
<style type="text/css">
    .data-head {
        padding-right: 15px;
    }

    .wrapped-div {
        max-width: 100%;
    }

    @media (max-width: 1240px) {
        .wrapped-div {
            overflow-x: scroll;
        }
    }

    .wrapped-div-sector {
        max-width: 100%;
        overflow-x: scroll;
    }
</style>

<p>ITM specifically focuses on bonds with maturities ranging from 6 to 17 years (highlighted in the shaded region in the chart below). This strategy aims to enhance overall yield by capturing additional roll-down return from the steepest part of the curve, in addition to the current yield. As of the end of January 2024, close to 60% of ITM is allocated in the 10-15 year maturity range, which we consider to be the sweet spot on the curve, as the 10s/15s spread has widened the most compared to other parts of the curve.</p>
<h3>Going Where the Yield Is: ITM Focuses on the Belly of the Muni Curve</h3>
<p><strong>Muni AAA Yield Curve</strong></p>
<p><img class="img-responsive w-100" src="https://www.vaneck.com/contentassets/1b9251bef7ce441cbab4902ff4bdba62/4266_muni_chart-3_2024-03_blog.svg" alt="ITM Focuses on the Belly of the Muni Curve" /></p>
<p class="chart-disclosure">Source: Bloomberg BVAL AAA muni curve, as of 2/29/2024.</p>
<p>As investors navigate the uncertainties of the current economic and monetary policy environment, the strategic use of barbell and roll-down strategies in municipal bond portfolios offers a nuanced approach to maximizing potential yield advantages while managing the risks associated with interest rate volatility. These strategies provide a comprehensive framework for investors looking to optimize their portfolios in anticipation of the Federal Reserve's potential policy adjustments and the yield curve's eventual normalization.</p>
<p>To receive more <a href="https://www.vaneck.com/us/en/insights/municipal-bonds/" title="Municipal Bonds Insights"><strong>Municipal Bonds</strong></a> insights, <a href="https://www.vaneck.com/us/en/subscribe/" title="Subscription Center"><strong>sign up in our subscription center</strong></a>.</p>
]]></content:encoded>
</item><item rdf:about="https://www.vaneck.com/us/en/blogs/digital-assets/matthew-sigel-vaneck-march-2024-bitcoin-chaincheck/">
  <title>VanEck March 2024 Bitcoin ChainCheck></title>
  <link>https://www.vaneck.com/us/en/blogs/digital-assets/matthew-sigel-vaneck-march-2024-bitcoin-chaincheck/</link>
  <description><![CDATA[March's on-chain Bitcoin snapshot: Increased transfers, fewer transactions, record mining revenues despite Ordinals slowdown.]]></description>
  <dc:creator>Matthew  Sigel</dc:creator>
  <dc:date>04/01/2024 06:30:00</dc:date>
<content:encoded><![CDATA[

<p><strong>Please note that VanEck has exposure to bitcoin.</strong></p>
<p>Our on-chain snapshot for March 2024 reveals heightened transfer activity, fewer transactions, and record Bitcoin mining revenues even with a slowdown in Ordinals demand. At these levels, we still like Bitcoin miners for a catch-up trade.</p>
<ul class="content-list">
<li><a href="#price-action"><strong>Bitcoin&rsquo;s Price Action</strong></a></li>
<li><a href="#network-activity"><strong>Bitcoin&rsquo;s Network Activity, Adoption, and Fees</strong></a></li>
<li><a href="#market-health"><strong>Bitcoin Market Health and Profitability</strong></a></li>
<li><a href="#miners"><strong>Bitcoin Miners</strong></a></li>
<li><a href="#monthly-dashboard"><strong>Bitcoin ChainCheck Monthly Dashboard</strong></a></li>
</ul>
<p>Some takeaways for March 2024:</p>
<h2 id="price-action" class="jump-link-nav anchored-block" data-jumplink-title="Price Action">Bitcoin&rsquo;s Price Action</h2>
<ul class="content-list">
<li class="mt-2"><strong>Market sentiment:</strong> In March, Bitcoin's price surged to an average of $65,504, a 38% monthly increase, reflecting growing investor confidence as we approach the next halving event.</li>
<li class="mt-2"><strong>Regional trading:</strong> Trading volumes across the U.S., Asia, and Europe are becoming more balanced, with a 10% increase in price changes across these regions, potentially indicating a more globally unified investment interest in Bitcoin.</li>
</ul>
<p><img class="img-responsive w-100" src="https://www.vaneck.com/contentassets/81c650de6d5147bfbebc3cc258efd83c/4289_da_table-1_2024-03_v1.svg" alt="Regional Trading" /></p>
<p class="chart-disclosure">Source: Glassnode, as of 3/25/24. <strong>Past performance is no guarantee of future results.</strong></p>
<ul class="content-list">
<li class="mt-2"><strong>Funding rates:</strong> The annualized cost to roll Bitcoin futures contracts jumped sharply to 21%, indicating bullishness about Bitcoin price and a shortage of dollar funding across the space.</li>
</ul>


<h2 id="network-activity" class="jump-link-nav anchored-block" data-jumplink-title="Network Activity">Bitcoin&rsquo;s Network Activity, Adoption, and Fees</h2>
<ul class="content-list">
<li class="mt-2"><strong>Daily transactions:</strong> In contrast to the market's upward trajectory, Bitcoin's daily transactions declined by 4%.</li>
<li class="mt-2"><strong>Ordinal inscriptions:</strong> Daily inscriptions dropped by 27%, reflecting reduced activity in this specific area of the Bitcoin network.</li>
<li class="mt-2"><strong>Total transfer volume: </strong>$69.34 billion in value was transferred across the Bitcoin network daily, an explosive increase of 74%, elevating this activity into the 90th percentile of historical performance.</li>
<li class="mt-2"><strong>Average transaction fees:</strong> The average user paid $7.68 in fees to send a Bitcoin transaction in March, an increase of 25% of m/m, reflecting the growing cost of network participation amid surging demand, a fee level that ranks within the 93rd percentile historically.</li>
</ul>
<h2 id="market-health" class="jump-link-nav anchored-block" data-jumplink-title="Market Health">Bitcoin Market Health and Profitability</h2>
<ul class="content-list">
<li class="mt-2"><strong>Percent of addresses in profit</strong>: 98% of Bitcoin addresses are now in profit, suggesting nearly universal profitability for Bitcoin holders in the current market climate. Historically, once this number reaches 100%, the Bitcoin price tends to make repeated all-time highs.</li>
<li class="mt-2"><strong>Net unrealized profit/loss:</strong> This ratio climbed to 0.61, indicating a growing optimism within the market, but not yet at the &ldquo;euphoric&rdquo; levels above 0.75 that mark previous peaks.</li>
</ul>
<h2 id="miners" class="jump-link-nav anchored-block" data-jumplink-title="Miners ">Bitcoin Miners</h2>
<ul class="content-list">
<li class="mt-2"><strong>Total daily BTC miner revenues</strong>: Miners enjoyed a significant 35% boost in average daily revenues in March, reaching $62.84 million, a figure that places their earnings in the 99th percentile for historical miner revenue. We have been expecting Bitcoin miners to reverse their recent underperformance YTD, which is beginning to occur.</li>
</ul>
<h3>Chart of the Month: Bitcoin vs. Bitcoin Miners</h3>
<p><img class="img-responsive w-100" src="https://www.vaneck.com/contentassets/c808847ba9fa4256ba1e1db3d8a94f33/4289_da_chart_2024-03_v1_blog.svg" alt="Chart of the Month: Bitcoin vs. Bitcoin Miners" /></p>
<p class="chart-disclosure">Source: Bloomberg, as of 3/25/24. XBTUSD Curncy is the XBTFUSD Spot Exchange Rate. BTCMINER Index is a custom index. See definitions in disclosures. <strong>Past performance is no guarantee of future results.</strong></p>
<h3 id="monthly-dashboard" class="anchored-block">Bitcoin ChainCheck Monthly Dashboard</h3>
<p><img class="img-responsive w-100" src="https://www.vaneck.com/contentassets/c808847ba9fa4256ba1e1db3d8a94f33/4289_da_table-2_2024-03_v1.svg" alt="Bitcoin ChainCheck Monthly Dashboard" /></p>
<p class="chart-disclosure">Source: Glassnode, VanEck research as of 3/25/24. <strong>Past performance is no guarantee of future results.</strong></p>
<p><strong>Notes:</strong></p>
<p>Net unrealized profit/loss ratio (NUPL) can be calculated by subtracting the realized market cap from the market cap and dividing the result by the market cap. When a high percentage of Bitcoin&rsquo;s market cap consists of unrealized profits, it can be interpreted that investors are greedy. Background reading <a href="https://medium.com/@adamant_capital/a-primer-on-bitcoin-investor-sentiment-and-changes-in-saving-behavior-a5fb70109d32" title="A Primer on Bitcoin Investor Sentiment and Changes in Saving Behavior" target="_blank" rel="noopener"><strong>here</strong></a>.</p>
<p><strong>Links to third party websites are provided as a convenience and the inclusion of such links does not imply any endorsement, approval, investigation, verification or monitoring by us of any content or information contained within or accessible from the linked sites. By clicking on the link to a non-VanEck webpage, you acknowledge that you are entering a third-party website subject to its own terms and conditions. VanEck disclaims responsibility for content, legality of access or suitability of the third-party websites.</strong></p>
<p>To receive more <strong><a href="https://www.vaneck.com/us/en/insights/digital-assets/" title="Digital Assets Insights">Digital Assets</a></strong> insights, <strong><a href="https://www.vaneck.com/us/en/subscribe/" title="Subscription Center">sign up in our subscription center</a></strong>.</p>
]]></content:encoded>
</item><item rdf:about="https://www.vaneck.com/us/en/blogs/gold-investing/raising-the-bar-on-gold-investing/">
  <title>VanEck Gold Investments - Gold ETFs, Funds &amp; Trusts></title>
  <link>https://www.vaneck.com/us/en/blogs/gold-investing/raising-the-bar-on-gold-investing/</link>
  <description><![CDATA[VanEck has provided investors access to gold, one of the most vital metals in the world, for over 50 years with both actively and passively managed solutions.]]></description>
  <dc:creator> </dc:creator>
  <dc:date>03/31/2024 06:30:00</dc:date>
<content:encoded><![CDATA[

<p><strong>Key Takeaways</strong></p>
<ul class="content-list">
<li class="mt-2">Gold&rsquo;s unique characteristics&mdash;as a store of value, a hedge against systemic risk and a diversifier&mdash;remain relevant amid evolving market dynamics and shifting macro conditions.</li>
<li class="mt-2">VanEck&rsquo;s range of gold-related products, including physical-backed trusts, gold ETFs and gold mining equity funds, offers investors multiple exposures to the precious metal&rsquo;s performance and underlying drivers.</li>
<li class="mt-2">Over extended periods, gold has shown resilience versus traditional asset classes, reinforcing its role in diversified portfolios and the rationale for maintaining a strategic allocation.</li>
</ul>
<p>The over 50 year longevity of providing investors access to gold reflects the expertise and commitment that VanEck maintains to one of the most vital metals in the world, which continues today across both actively and passively managed solutions. VanEck has been at the forefront of gold investing since the firm&rsquo;s inception and launched the nation&rsquo;s first gold stock fund,&nbsp;<a href="/link/305237df17384439b28745fea31dded1.aspx" title="INIVX - International Investors Gold Fund - Class A - Overview"><strong>VanEck International Investors Gold Fund (INIVX)</strong></a>, in 1968, and also issued the first gold miners ETF, <strong><a href="/link/0ef4cceba0a44fbe8de2f60e7952a27d.aspx" title="GDX - VanEck Gold Miners ETF - Overview">VanEck Gold Miners ETF (GDX)</a></strong>, in 2006.</p>
<h2>A Look Into VanEck&rsquo;s Gold Investing Solutions</h2>
<p>Gold is one of the most vital metals in the world and a unique asset, with the ability to enhance portfolio diversification, act as store of value, and hedges against systemic risk. VanEck has long been considered a leader in gold-related investments and has been managing gold funds since 1968, including the nation&rsquo;s first open-ended gold equity mutual fund.</p>
<h3>Gold ETFs</h3>
<p>Gold ETFs are exchange-traded funds that invest in physical gold, gold futures, or stocks of gold mining companies. They offer a convenient way to gain exposure to the price movements of gold without the need to hold the physical metal, and they can be bought and sold like stocks through a brokerage account.</p>
<p><strong>GDX: VanEck Gold Miner&rsquo;s ETF</strong></p>
<p>The <strong><a href="/link/0ef4cceba0a44fbe8de2f60e7952a27d.aspx" title="GDX - VanEck Gold Miners ETF - Overview">VanEck</a></strong><sup><strong><a href="/link/0ef4cceba0a44fbe8de2f60e7952a27d.aspx" title="GDX - VanEck Gold Miners ETF - Overview">&reg;</a></strong></sup><a href="/link/0ef4cceba0a44fbe8de2f60e7952a27d.aspx" title="GDX - VanEck Gold Miners ETF - Overview"><strong>&nbsp;Gold Miners ETF (GDX)</strong></a>, launched in 2006, is the first gold miners ETF in the U.S. It seeks to replicate as closely as possible, before fees and expenses, the price and yield performance of the <a href="https://www.vaneck.com/us/en/investments/gold-miners-etf-gdx/overview/" title="GDX - VanEck Gold Miners ETF - Overview"><strong>MarketVector Global Gold Miners Index (MVGDXTR)</strong></a>, a pure-play, global index, tracking the performance of the largest publicly-traded companies in the gold mining industry.</p>
<p><strong>GDXJ: VanEck Junior Gold Miners ETF</strong></p>
<p>The <strong><a href="/link/a89bf56fe3cd4ec69342e1472f50889b.aspx" title="GDXJ - VanEck Junior Gold Miners ETF - Overview">VanEck Junior Gold Miners ETF (GDXJ)</a></strong> seeks to replicate as closely as possible, before fees and expenses, the price and yield performance of the <strong><a href="/link/a89bf56fe3cd4ec69342e1472f50889b.aspx" title="GDXJ - VanEck Junior Gold Miners ETF - Overview">MVIS</a></strong><sup><strong><a href="/link/a89bf56fe3cd4ec69342e1472f50889b.aspx" title="GDXJ - VanEck Junior Gold Miners ETF - Overview">&reg;</a></strong></sup><a href="/link/a89bf56fe3cd4ec69342e1472f50889b.aspx" title="GDXJ - VanEck Junior Gold Miners ETF - Overview"><strong>&nbsp;Global Junior Gold Miners Index (MVGDXJTR)</strong></a>, which is intended to track the overall performance of small-capitalization companies that are involved primarily in the mining for gold and/or silver.</p>
<h3>Gold Funds</h3>
<p>Gold funds are mutual funds or closed-end funds that invest in gold-related assets. These might include physical gold, gold futures, and stocks of companies involved in the gold industry, such as mining, refining, or production.</p>
<p><strong>VanEck International Investors Gold Fund</strong></p>
<p>The <strong><a href="/link/305237df17384439b28745fea31dded1.aspx" title="INIVX - International Investors Gold Fund - Class A - Overview">VanEck International Investors Gold Fund</a></strong> is an actively managed portfolio, with a nearly 60 year track record, that primarily invests in gold-mining&nbsp;equities. An investment in gold miners offers several benefits beyond that of other gold-related investments.</p>
<ul class="content-list">
<li>Leverage to gold prices &ndash; For most gold miners, profitability is measured by the average cost of production relative to the current price of gold. High or rising gold prices can thus magnify profits earned by gold miners, which often translates to higher share prices.</li>
<li>Yield opportunity &ndash; Investors are often being &ldquo;paid&rdquo; to own gold mining stocks, with many gold companies opting to return capital to shareholders in the form of dividends. On the other hand, investors in physical gold often have to pay for ownership (in the form of storage).</li>
<li>Idiosyncratic return drivers &ndash; Performance of gold miners is not wholly dependent on the price of gold. Over time, gold miners may exploit efficiency gains from new technologies, capitalize on exploration success or else become the target of a larger acquisition.</li>
</ul>
<p>All of these factors may influence their return prospects regardless of gold prices.</p>
<h3>Gold Trusts</h3>
<p>Gold trusts are investment vehicles that hold physical gold for investors. They offer a direct exposure to the price of gold and are traded on stock exchanges. Gold trusts are a popular choice for investors looking to add gold to their portfolios without the complexities of futures contracts or the security issues of storing physical gold.</p>
<p><strong>OUNZ: VanEck Merk Gold ETF</strong></p>
<p>The <strong><a href="/link/982ab5546e32473b85c7b266bc6b2be6.aspx" title="OUNZ - VanEck Merk Gold ETF - Overview">VanEck Merk Gold ETF (OUNZ)</a></strong> seeks to provide investors with a convenient and cost-efficient way to buy and hold gold through an exchange traded product with the option to take physical delivery of gold. For the purpose of facilitating delivery, Merk Investments LLC has developed a proprietary process for the conversion of London Bars into gold coins and bars in denominations investors may desire. Another benefit of this approach is that taking delivery of gold is not a taxable event as investors merely take possession of what they already own: the gold.</p>
<h2>Why Invest In Gold?</h2>
<p>For centuries, gold has served as a form of exchange, a safe haven investment (in times of financial market turmoil) as well as a hedge against severe inflation. As an investment, gold delivers the ability to enhance portfolio diversification, acts as store of value, and hedges against systemic risk. In addition, gold has outperformed traditional asset classes over the last 20 years.</p>
<h3>Gold Outperformance Since 2000</h3>

<p class="chart-disclosure">Source: FactSet, VanEck. Data as of June 30, 2025. U.S. Stocks represented by S&amp;P<sup>&reg;</sup>&nbsp;500 Index; U.S.Bonds represented by Bloomberg Barclays U.S. Aggregate Bond Index; Gold ($/oz) represented by LBMA PM Gold Price; U.S. Treasuries represented by the Bloomberg Barclays U.S. 1-3 Year Treasury Bond Index. Past performance is no guarantee of future results. Index performance is not illustrative of fund performance. It is not possible to invest directly in an index.</p>
<p>While these portfolio benefits have remained consistent, the rationale for including an allocation to gold and gold stocks today has gained significant relevance.</p>
<h2>Summary &amp; Conclusion</h2>
<p>As a truly unique asset, gold enhances portfolio diversification, acts as store of value, and hedges against systemic risk. In addition, gold has outperformed traditional asset classes over the last 20 years.</p>
<p>Read <strong><a href="https://www.vaneck.com/us/en/blogs/gold-investing/ima-casanova-gold-bull-market-endures-early-2026-volatility/gold-monthly-commentary-january-2026.pdf" title="Monthly Gold Commentary" target="_blank" rel="noopener">VanEck&rsquo;s Monthly Gold Commentary</a></strong> to learn more about the current gold market and how to position portfolios in today's environment.</p>
<!--h3>Gold Miner Valuations (Relative to S&amp;P 500)<sup>*</sup></h3>
<div id="highchart-yield">&nbsp;</div>
<p class="chart-disclosure">Source: FactSet, VanEck. Data as of September 2021. Values represent the constiuent average of the NYSE Arca Gold Miners Index.</p-->
<div class="wrapped-div">
<table style="width: 100%;">
<tbody>
<tr class="tbl-data">
<td class="tbl-header last">Actively Managed Gold Mining</td>
<td class="tbl-header last">Passively Managed Gold Mining</td>
<td class="tbl-header last">Physical Gold with Option for Delivery</td>
</tr>
<tr class="tbl-data">
<td class="data-td last"><strong><a href="/link/305237df17384439b28745fea31dded1.aspx" title="INIVX - International Investors Gold Fund - Class A - Overview">VanEck International Investors Gold Fund</a></strong></td>
<td class="data-td last"><strong><a href="/link/0ef4cceba0a44fbe8de2f60e7952a27d.aspx" title="GDX - VanEck Gold Miners ETF - Overview">GDX</a></strong><sup><strong><a href="/link/0ef4cceba0a44fbe8de2f60e7952a27d.aspx" title="GDX - VanEck Gold Miners ETF - Overview">&reg;</a></strong></sup><a href="/link/0ef4cceba0a44fbe8de2f60e7952a27d.aspx" title="GDX - VanEck Gold Miners ETF - Overview"><strong>&nbsp;VanEck Gold Miners ETF</strong></a></td>
<td class="data-td last"><strong><a href="/link/982ab5546e32473b85c7b266bc6b2be6.aspx" title="OUNZ - VanEck Merk Gold ETF - Overview">VanEck Merk</a></strong><sup><strong><a href="/link/982ab5546e32473b85c7b266bc6b2be6.aspx" title="OUNZ - VanEck Merk Gold ETF - Overview">&reg;</a></strong></sup><a href="/link/982ab5546e32473b85c7b266bc6b2be6.aspx" title="OUNZ - VanEck Merk Gold ETF - Overview"><strong>&nbsp;Gold ETF</strong></a></td>
</tr>
<tr class="tbl-data">
<td class="data-td last">&nbsp;</td>
<td class="data-td last"><strong><a href="/link/a89bf56fe3cd4ec69342e1472f50889b.aspx" title="GDXJ - VanEck Junior Gold Miners ETF - Overview">GDXJ</a></strong><sup><strong><a href="/link/a89bf56fe3cd4ec69342e1472f50889b.aspx" title="GDXJ - VanEck Junior Gold Miners ETF - Overview">&reg;</a></strong></sup><a href="/link/a89bf56fe3cd4ec69342e1472f50889b.aspx" title="GDXJ - VanEck Junior Gold Miners ETF - Overview"><strong>&nbsp;VanEck Junior Gold Miners ETF</strong></a></td>
<td class="data-td last">&nbsp;</td>
</tr>
</tbody>
</table>
</div>
<br />
<p>To receive more <a href="/us/en/blogs/gold-investing" title="Gold Investing Insights"><strong>Gold Investing</strong></a> insights, <a href="/link/5f45412c2143400497908cea2897f7d3.aspx" title=" Subscription Center"><strong>sign up in our subscription center</strong></a>.</p>
<style type="text/css">
    .wrapped-div {
        max-width: 100%;
    }

    @media (max-width: 768px) {
        .wrapped-div {
            overflow-x: scroll;
        }
    }

    .wrapped-div-sector {
        max-width: 100%;
        overflow-x: scroll;
    }
</style>
]]></content:encoded>
</item><item rdf:about="https://www.vaneck.com/us/en/blogs/emerging-markets-equity/emerging-markets-equity-question-and-answer/">
  <title>Our Approach to Emerging Markets Equity: Question &amp; Answer></title>
  <link>https://www.vaneck.com/us/en/blogs/emerging-markets-equity/emerging-markets-equity-question-and-answer/</link>
  <description><![CDATA[The growth, evolution and transformation of emerging markets (EM) may create long-term opportunities. We address questions about our approach to investing in EM equity in this Q&amp;A.]]></description>
  <dc:creator> </dc:creator>
  <dc:date>03/31/2024 06:30:00</dc:date>
<content:encoded><![CDATA[

<p>Demographics, technology and the rising middle class have transformed emerging markets (EM), where about 86% of the world&rsquo;s population lives.<sup>1</sup>&nbsp;Emerging and developing economies are estimated to account for approximately 61.46% of global GDP on a purchasing-power-parity (PPP)<sup>1</sup>&nbsp;basis, yet their equity markets remain underrepresented relative to their economic size: emerging markets still make up a small portion of global equity market capitalization, around ~10-13% of global indices.<sup>2</sup>&nbsp;This mismatch creates a once-in-a-lifetime, long-term opportunity for global investors - as emerging markets grow, evolve and transform, the size of their capital markets will become more prominent over time as well. This blog intends to answer frequently asked questions about investing in emerging markets equities, and more specifically, the <a href="/link/9693620792bb48508b2a7622224fd8bc.aspx" title="VanEck Emerging Markets Equity SMA"><strong>VanEck Emerging Markets Equity Strategy</strong></a>.</p>
<ul class="content-list">
<li><a href="#point-one"><strong>How does VanEck approach investing in emerging markets?</strong></a></li>
<li><a href="#point-two"><strong>What is structural growth at a reasonable price?</strong></a></li>
<li><a href="#point-three"><strong>What are the benefits of an all-cap approach?</strong></a></li>
<li><a href="#point-four"><strong>How does the strategy source and evaluate investment ideas?</strong></a></li>
<li><a href="#point-five"><strong>Why choose an active emerging markets approach?</strong></a></li>
<li><strong><a href="#point-six">How can investors buy VanEck Mutual Funds?</a></strong></li>
</ul>
<h2 id="point-one" class="anchored-block">How does VanEck approach investing in emerging markets?</h2>
<p>VanEck&rsquo;s Emerging Markets Equity Strategy is an active, bottom-up investment solution focused on identifying and investing in forward-looking, sustainable and structural growth at a reasonable price (&ldquo;S GARP&rdquo;) companies in emerging markets countries around the world. The portfolio is powered by our investment team&rsquo;s quest for innovation, disruption, sustainable business models and responsible management, with the flexibility to invest across market caps, sectors and countries in the EM space.</p>
<h2 id="point-two" class="anchored-block">What is structural growth at a reasonable price?</h2>
<p>Growth at a reasonable price, or GARP as it is more commonly known, is an investment approach that strikes a balance between strong earnings potential and attractive value. The VanEck Emerging Markets Equity Strategy takes the GARP investment approach one step further by targeting companies that are also well-positioned to benefit from the structural, long-term growth trends that are fundamentally transforming EM economies.</p>
<p>We believe that companies driven by domestic demand and local consumer trends represent the future of emerging markets and global economic growth. The VanEck Emerging Markets Equity Strategy allows investors access to these growth opportunities, which may not be captured in their existing portfolios as well as widely used market indices.</p>
<h2 id="point-three" class="anchored-block">What are the benefits of an all-cap approach?</h2>
<p>The MSCI Emerging Markets Index and the MSCI Emerging Markets Investment Market Index do not fully represent the universe of opportunity in emerging markets. As of today, the indices are dominated by mega-large and large-cap companies, including highly cyclical, state-owned enterprises in the energy and materials sectors, as well as low-growth companies in the utilities and telecommunications sectors. Instead of growing because of forward-looking, sustainable and structural growth themes, many of these mega-large and large-cap companies grew due to being systematically favored by their own governments through cheap capital, access to raw materials and preferential treatment.</p>
<p>Due to their methodology, the aforementioned indices do not fully capture structural growth companies that started small and grew larger through sustainable business models and responsible management. There is no shortage of such companies in emerging markets. In many cases, some of the carefully selected and properly researched small caps (i.e., companies with market capitalizations below $2B) may be the next generation&rsquo;s disruptive force on a global scale, often powered by new technologies.</p>
<p>The VanEck Emerging Markets Equity Strategy is truly an all-cap portfolio with no market capitalization bias, allowing access to entrepreneurial ownership in growing sectors within emerging markets countries. By investing across market capitalizations, the VanEck strategy delivers access to a richer set of opportunities across emerging markets.</p>
<div class="epi-contentfragment">faq-banner-cta</div>
<h2 id="point-four" class="anchored-block">How does the strategy source and evaluate investment ideas?</h2>
<p>VanEck has been investing internationally since opening its doors in 1955. Since its inception, our Emerging Markets Equity Strategy has been governed by its time-tested investment philosophy, process and stock selection approach.</p>
<p>VanEck&rsquo;s Emerging Markets Equity Strategy is led by <strong><a href="https://vaneck.com/us/en/videos/meet-ola-el-shawarby/" title="Meet Portfolio Manager Ola El-Shawarby">Ola El-Shawarby , Portfolio Manager,</a></strong> who has over 20 years of dedicated emerging markets investment experience. Ola is supported by a deeply experienced team of career emerging markets analysts, who are dedicated solely to this product and have significant experience living and working in emerging market countries.</p>
<p>Prior to conducting their bottom-up, fundamental research, the <strong><a href="/link/106898cae90542488044d09a3e8a0ff9.aspx" title="GBFAX - Emerging Markets Fund - Class A - Investment Team">Investment Team</a></strong> screens the EM universe to eliminate stocks with poor governance, unreasonable valuations, liquidity issues, and/or a lack of structural, persistent growth. Eliminating a significant portion of the EM universe allows the team to focus on a targeted subset of forward-looking, sustainable and structural growth stocks. Through many years of investment research, deep expertise and local knowledge of emerging markets around the world, the Investment Team is able to identify stocks of companies with sustainable business models and responsible management teams.</p>
<p>VanEck&rsquo;s Emerging Markets Equity Strategy also taps into the firm&rsquo;s broader resources. By leveraging the firm&rsquo;s broader investment resources, the Strategy can fully evaluate market and factor risks that may affect EM stocks.</p>
<h2 id="point-five" class="anchored-block">Why choose an active emerging markets approach?</h2>
<p>Because emerging markets are diverse and evolve at a much faster pace, passive vehicles may be at a structural disadvantage compared to active managers who have the flexibility to continuously evaluate and shift exposures to companies, sectors and countries with the optimal risk-adjusted growth potential in mind.</p>
<p>Sell discipline is a key component of our investment process and risk management, and the Investment Team constantly monitors portfolio holdings. When fundamentals deteriorate due to poor corporate execution, management change, corporate governance issues or industry concerns, the VanEck Emerging Markets Equity Strategy quickly pivots and exits positions.</p>
<p>In addition, market-cap weighted indices tracking emerging markets tend to be backward looking, influenced by the movement of companies that have succeeded in the past, without regard for future growth potential or risks. While this approach could work in mature and diverse economies with indices that tend to be more balanced and stable (i.e., the U.S. economy and the S&amp;P 500 Index), it may not be appropriate for emerging markets. Most widely used indices have sector and country exposures that poorly capture current EM trends, leading investors to potentially miss out on forward-looking, sustainable, structural growth opportunities as emerging markets continue to evolve. In our portfolio, country and sector exposures are a byproduct of our bottom-up stock selection process. Given our portfolio&rsquo;s focus on domestic demand, local consumer trends companies, our sector and country allocations are aligned with the future of emerging markets.</p>
<h2 id="point-six" class="anchored-block">How can investors buy VanEck Mutual Funds?</h2>
<p><strong><a href="/link/d3bbfae5899e4b0dbbb596fad4befa1a.aspx#how-to-buy-mutual-funds&amp;utm=EME-Blog" title="How to buy VanEck Mutual Funds?">Learn more here.</a></strong></p>
<p class="d-none d-lg-block"><a href="mailto:askvaneck@vaneck.com" title="Have More Questions? - Ask VanEck" rel="noopener"><img loading="lazy" class="img-responsive" src="https://www.vaneck.com/globalassets/home/us/insights/blogs/bm-blog-images/cta-faq_desktop-02.svg" alt="Have More Questions? - Ask VanEck" /></a></p>
<p class="d-lg-none"><a href="mailto:askvaneck@vaneck.com" title="Have More Questions? - Ask VanEck" rel="noopener"><img loading="lazy" class="img-responsive" src="https://www.vaneck.com/globalassets/home/us/insights/blogs/bm-blog-images/cta-faq_mobile-01.svg" alt="Have More Questions? - Ask VanEck" /></a></p>
<p>To receive more <a href="/us/en/insights/emerging-markets-equity/" title="Emerging Markets Equity Insights"><strong>Emerging Markets Equity</strong></a> insights, <a href="/link/5f45412c2143400497908cea2897f7d3.aspx" title=" Subscription Center"><strong>sign up in our subscription center</strong></a>.</p>
]]></content:encoded>
</item><item rdf:about="https://www.vaneck.com/us/en/blogs/emerging-markets-equity/indias-economic-rise-demands-investor-attention/">
  <title>India’s Economic Rise Demands Investor Attention></title>
  <link>https://www.vaneck.com/us/en/blogs/emerging-markets-equity/indias-economic-rise-demands-investor-attention/</link>
  <description><![CDATA[India's rapid digitization, thriving equity market and demographic trends are creating compelling investment opportunities that we believe investors should be exploring.]]></description>
  <dc:creator>Angus Shillington</dc:creator>
  <dc:date>03/31/2024 06:30:00</dc:date>
<content:encoded><![CDATA[

<p>India is carving out a unique niche in the global investment landscape and becoming a rising investment destination. Key drivers include:</p>
<ul class="content-list">
<li>High GDP growth supported by policy tailwinds.</li>
<li>Expanding digital sector fueled by increasing smartphone users.</li>
<li>Government-led initiatives promoting financial inclusion and fintech.</li>
<li>Young, English-proficient workforce.</li>
<li>Thriving equity market that has surpassed China&rsquo;s.</li>
</ul>
<p>In this blog, we delve into these dynamics, highlighting the emerging trends that make India an investment haven that demands attention.</p>
<h2>High GDP Growth Supported by Policy Tailwinds</h2>
<p>India is poised to be a financial powerhouse in the coming years, and current trends suggest a promising horizon for investors who are willing to dive into this rapidly expanding market. Here&rsquo;s why the Indian economy offers a strong growth proposition:</p>
<p><strong>A Roaring Economy</strong>: According to the International Monetary Fund (IMF), India is on track to become the third-largest country by GDP within the next five years. Such significant economic growth is not just a reflection of the country&rsquo;s vast population but is indicative of its robust economic activities, rising consumer base, and the entrepreneurial spirit that thrives within its borders.</p>
<p><strong>Policy Tailwinds in Place</strong>: Indian policymakers have laid the groundwork for a conducive business environment. These policy tailwinds, crafted with a forward-looking vision, are instrumental in ensuring that the country sustains prolonged periods of growth. Streamlined regulations, business-friendly reforms, and incentives for both domestic and foreign investors have positioned India as an attractive destination for capital.</p>
<p><strong>A Commitment to Reinvestment</strong>: India isn&rsquo;t just resting on its laurels. There's a noticeable push across various sectors of the economy to reinvest and rejuvenate. Whether it&rsquo;s the modernization of its age-old infrastructure, making strides in healthcare access, or addressing the housing needs of its vast population, there's a palpable momentum.</p>
<h2>India Fiscal Policy Priorities Create Positive Feedback Loop</h2>
<p>Tax revenues are growing much faster than GDP, and are being invested in areas that promote growth. Tax revenue growth rate is projected to double between 2021 and 2024. Policy spending decisions are highly targeted, leading to infrastructure upgrades, higher employment and higher consumption.</p>
<p>&ldquo;Transportation&rdquo; and &ldquo;Transfer to State&rdquo; spending is earmarked mostly for new road and rail infrastructure. &ldquo;Other&rdquo; category spending growth is declining, and includes inefficient areas like food subsidies, tax administration and other government expenses. We believe that the effects of these policy decisions will lead to an economic growth multiplier, which will be visible for many years to come.</p>
<p><img loading="lazy" class="img-responsive w-100" src="https://www.vaneck.com/contentassets/0275ad7b99ca4f9b8ac896085595b817/3768_update-india-macro-blog_table_2023.10_v1_blog.svg" alt="Table showing India&rsquo;s targeted fiscal spending priorities" /></p>
<p class="chart-disclosure"><sup>*</sup>&nbsp;Projected.</p>
<p class="chart-disclosure"><sup>**</sup>&nbsp;Reflects the average projected growth rate of other categories as of 2024.</p>
<p class="chart-disclosure"><strong>Source: </strong>VanEck, Bloomberg as of 9/30/2023. Past performance is no guarantee of future results. Not intended as a prediction of future results; projections shown for illustrative purposes only.</p>
<h2>India&rsquo;s Economy is Growing Too Fast to Ignore</h2>
<div class="row">
<div class="col-md-6 col-xs-12 mb-4">
<div class="wrapped-div">
<table style="width: 100%;">
<tbody>
<tr class="tbl-data">
<td class="tbl-header last" style="text-align: center;">Country</td>
<td class="tbl-header last" style="text-align: center;">2022 GDP (in Billion $)</td>
</tr>
<tr class="tbl-data">
<td class="data-td data last">United States</td>
<td class="data-td data last">25,464</td>
</tr>
<tr class="tbl-data">
<td class="data-td data last">China</td>
<td class="data-td data last">18,100</td>
</tr>
<tr class="tbl-data">
<td class="data-td data last">Japan</td>
<td class="data-td data last">4,233</td>
</tr>
<tr class="tbl-data">
<td class="data-td data last">Germany</td>
<td class="data-td data last">4,075</td>
</tr>
<tr class="tbl-data">
<td class="data-td data last"><strong>India</strong></td>
<td class="data-td data last"><strong>3,386</strong></td>
</tr>
</tbody>
</table>
</div>
</div>
<div class="col-md-6 col-xs-12 mb-4">
<div class="wrapped-div">
<table style="width: 100%;">
<tbody>
<tr class="tbl-data">
<td class="tbl-header last" style="text-align: center;">Country</td>
<td class="tbl-header last" style="text-align: center;">Projected 2028 GDP (in Billion $)</td>
</tr>
<tr class="tbl-data">
<td class="data-td data last">United States</td>
<td class="data-td data last">32,349</td>
</tr>
<tr class="tbl-data">
<td class="data-td data last">China, People's Republic of</td>
<td class="data-td data last">27,492</td>
</tr>
<tr class="tbl-data">
<td class="data-td data last"><strong>India</strong></td>
<td class="data-td data last"><strong>5,575</strong></td>
</tr>
<tr class="tbl-data">
<td class="data-td data last">Japan</td>
<td class="data-td data last">5,344</td>
</tr>
<tr class="tbl-data">
<td class="data-td data last">Germany</td>
<td class="data-td data last">5,044</td>
</tr>
</tbody>
</table>
</div>
</div>
</div>
<h3>India GDP Rebound has Exceeded Expectations Post-Covid</h3>
<p><img loading="lazy" class="img-responsive w-100" src="https://www.vaneck.com/contentassets/0275ad7b99ca4f9b8ac896085595b817/3629_dgin_chart-01_2022.09_blog.svg" alt="Line chart comparing GDP of major advanced economies, emerging and developed economies, China and India" /></p>
<p class="chart-disclosure"><strong>Source: </strong>IMF as of 12/31/2023. Not intended as a recommendation to buy or sell any securities mentioned herein. Past performance is no guarantee of future results.</p>
<h2>Investment Opportunities in India's Rising Digital Sector</h2>
<p>With over 800 million smartphone users and a rapidly expanding population, India presents a fertile ground for <strong><a href="https://www.vaneck.com/us/en/blogs/emerging-markets-equity/indias-digital-gold-rush-the-rise-of-digitization-and-e-commerce/" title="India's Digital Gold Rush: The Rise of Digitization and E-commerce">digital sector opportunities</a></strong>. This demographic trend is not confined to urban areas, but is also making significant inroads into rural regions, expanding the digital consumer base. The digital revolution in India, fueled by increasing smartphone penetration and internet access, drives growth across various sectors, including e-commerce, digital payments, and online entertainment.</p>
<h3>India&rsquo;s Digital Revolution Drives Growth in Mobile Usage</h3>
<p><img loading="lazy" class="img-responsive w-100" src="https://www.vaneck.com/contentassets/0275ad7b99ca4f9b8ac896085595b817/6045_india-evergreen-blog_chart-1_2025-8_blog.svg" alt="India's Digital Revolution Drives Growth in Mobile Usage" /></p>
<p class="chart-disclosure">Source: TRAI, CLSA, World Economic Forums &ldquo;Future of Consumption in Fast-Growth Consumer Markets: India&rdquo; as of 12/31/2024.</p>
<p>According to TRAI, India is projected to have over 800 million smartphone users by 2023. This digital transformation is creating a ripple effect across the economy, opening up new avenues for businesses and investors. For instance, the e-commerce market in India is expected to grow exponentially in the coming years. Similarly, the <a href="https://www.vaneck.com/us/en/blogs/emerging-markets-equity/from-cash-to-clicks-the-unstoppable-rise-of-digital-payments-in-india/" title="From Cash to Clicks: The Unstoppable Rise of Digital Payments in India"><strong>digital payments sector</strong></a> is projected to reach new heights, driven by growth in mobile payments. These trends underscore the vast potential of India&rsquo;s digital sector, offering a myriad of opportunities for investors. These opportunities encompass both the digital disruptors, in addition to the companies that are facilitating the disruptions (like traditional I.T. consultancy firms).</p>
<h2>India&rsquo;s Government Pushes for Financial Inclusion and Fintech</h2>
<p>The Indian government's initiatives are pivotal in promoting financial inclusion and boosting the fintech sector. The Pradhan Mantri Jan Dhan Yojana (PMJDY), a financial inclusion program, has led to the opening of over 400 million bank accounts as of 2021. Another significant initiative is the Unified Payments Interface (UPI), a real-time payment system that has revolutionized financial transactions in India.</p>
<h3>UPI: India&rsquo;s Public Venmo</h3>
<p><img loading="lazy" class="img-responsive w-100" src="https://www.vaneck.com/contentassets/0275ad7b99ca4f9b8ac896085595b817/6045_india-evergreen-blog_chart-2_2025-8_blog.svg" alt="UPI: India's Public Venmo" /></p>
<p class="chart-disclosure">Source: National Payments Corporation of India (NPCI) as of 7/31/2025.</p>
<p>The National Payments Corporation of India (NPCI) reports that UPI transactions crossed 2.3 billion in volume and INR 4.3 trillion in value in January 2021, indicating widespread adoption of digital financial services. These government-led initiatives promote financial inclusion and drive the growth of the fintech sector, creating a conducive environment for investment.</p>
<h2>Contextualizing the India Opportunity Set</h2>
<p>Here's a closer look at where India stands amid its emerging market peers.</p>
<p>India is currently the third-largest weighting in the MSCI Emerging Markets (EM) Index, trailing only behind China and Taiwan. This ranking underscores India&rsquo;s prominence and influence in the global emerging market landscape. India also has a smaller weighted average market cap, is lower yielding and has a 2x P/E.</p>
<p>Relative to the Index, India is overweight energy (primarily due to Reliance Industries), overweight financials, and overweight materials. India is underweight IT (primarily due to Asian companies such as TSMC and Samsung), underweight communication services, and underweight consumer discretionary.</p>
<h3>Sector Weight Comparison of MSCI India IMI Index vs MSCI EM IMI Index</h3>
<p><img loading="lazy" class="img-responsive w-100" src="https://www.vaneck.com/contentassets/0275ad7b99ca4f9b8ac896085595b817/6045_india-evergreen-blog_chart-4_2025-8_blog.svg" alt="Bar chart comparing sector weights" /></p>
<p class="chart-disclosure"><strong>Source:</strong> Factset as of 6/30/2025.</p>
<h2>Demographic Trends Deliver Competitive Edge to India</h2>
<p>India&rsquo;s demographics make the country well-positioned for unique expansion opportunities, especially compared to China. With a median age of 28 years, India has one of the youngest populations in the world. This young workforce is large and English-proficient, providing a competitive edge over other countries.</p>
<h3>India&rsquo;s Distinct Demographic Advantages vs. China</h3>
<p><img loading="lazy" class="img-responsive w-100" src="https://www.vaneck.com/contentassets/0275ad7b99ca4f9b8ac896085595b817/3475_chart-03_2023.08_blog.svg" alt="India's Distinct Demographic Advantages vs. China" /></p>
<p class="chart-disclosure">Source: worldometers.info, lingoda.com, higherlanguage.com as of June 2023.</p>
<p>According to a recent report, India is the second-largest English-speaking country globally, a significant advantage for businesses looking to expand in the region. In contrast, China's population is aging, with the median age expected to reach 48 years by 2050. This demographic comparison underscores the potential that India holds as an investment destination. Combining a young, English-proficient workforce and a rapidly growing consumer base makes India an attractive market for both businesses and investors.</p>
<h2>India&rsquo;s Thriving Equity Market Overtakes China&rsquo;s</h2>
<p>India's equity market has outperformed China's, and India&rsquo;s trend of higher earnings growth is expected to continue to outpace China significantly. We believe this long-term outperformance is driven by a combination of factors, including economic reforms, strong corporate earnings growth, and positive investor sentiment. However, a disappointing COVID-19 recovery in China on the back of strict lockdowns in addition to geopolitical tensions may be behind India's short-term outperformance.</p>
<h3>Indian Stocks Outperforming EM, U.S. and China Since 2001</h3>
<p><img loading="lazy" class="img-responsive w-100" src="https://www.vaneck.com/contentassets/0275ad7b99ca4f9b8ac896085595b817/6045_india-evergreen-blog_chart-7_2025-8_blog.svg" alt="Indian Stocks Outperforming EM, U.S. and China for 20 Years" /></p>
<p class="chart-disclosure"><strong>Source:</strong> Morningstar as of 7/31/2025. Past performance is no guarantee of future results. Index performance is not illustrative of fund performance. It is not possible to invest directly in an index.</p>
<p>Across multiple benchmark indexes, including both the MSCI India Index and the IISL Nifty 50 Index, India has delivered significant outperformance versus China benchmark indexes, including the CSI 300 and the MSCI China Index. We believe this robust performance of India's equity market reflects the country's strong economic fundamentals and investors' positive outlook toward India's economic prospects. The expected higher earnings growth further enhances the attractiveness of India's equity market, making it a compelling investment destination, in our view.</p>
<h3>India Earnings Outpacing China</h3>
<p><img loading="lazy" class="img-responsive w-100" src="https://www.vaneck.com/contentassets/0275ad7b99ca4f9b8ac896085595b817/3629_dgin_chart-06_2022.09_blog.svg" alt="Line chart comparing earnings in India vs. China" /></p>
<p class="chart-disclosure">Source: Bloomberg as of 6/30/23.</p>
<p>Furthermore, after soaring to extended levels during the COVID-19 pandemic, valuations are finally returning to a more normal range.</p>
<h3>Valuations in India within 20-years Historical Range</h3>
<p><img loading="lazy" class="img-responsive w-100" src="https://www.vaneck.com/contentassets/0275ad7b99ca4f9b8ac896085595b817/6045_india-evergreen-blog_chart-6_2025-8_blog.svg" alt="Valuations in India Back to Normal" /></p>
<p class="chart-disclosure">Source: Bloomberg as of 7/31/2025.</p>
<h2>Now Is the Time to Invest in India</h2>
<p>India is rapidly transforming into a <strong><a href="https://www.vaneck.com/us/en/blogs/emerging-markets-equity/indias-opportunities-impossible-to-ignore/" title="India's Opportunities: Impossible to Ignore">powerhouse investment hub</a></strong>. Its booming digital sector, combined with a strong equity market, is drawing global attention. Additionally, the government's committed push for financial inclusion and fintech innovation is further fueling this interest. When compared to China, India's demographic advantage amplifies its allure. Simply put, we believe India's strong economic foundations and massive market potential make it an irresistible destination for investments.</p>
<p>For further analysis, download the presentation: <a href="/link/ecce3be942b14f4681392be65589a789.aspx" target="_blank" title="Positioning India for the Next Ten Years" rel="noopener"><strong>Positioning India for the Next Ten Years</strong>.</a></p>
<h2>Investing in India with VanEck</h2>
<p><a href="https://www.vaneck.com/us/en/investments/digital-india-etf-dgin/overview/" title="DGIN - VanEck Digital India ETF - Overview"><strong>VanEck Digital India ETF (DGIN)</strong></a> offers exposure to companies involved in the digitization of the Indian economy.</p>
<p><a href="https://www.vaneck.com/us/en/investments/emerging-markets-fund-gbfax/overview/" title="GBFAX - Emerging Markets Fund - Class A - Overview"><strong>VanEck Emerging Markets Fund</strong></a> offers access to the structural digital growth story of India for investors seeking technology or growth exposures in emerging markets.</p>
<p><strong><a href="https://www.vaneck.com/us/en/investments/india-growth-leaders-etf-glin/overview/" title="GLIN - VanEck India Growth Leaders ETF - Overview">VanEck India Growth Leaders ETF (GLIN)</a></strong> offers exposure to fundamentally sound Indian companies exhibiting attractive growth at a reasonable price.</p>
<p>To receive more <a href="/us/en/insights/emerging-markets-equity/" title="Emerging Markets Equity Insights"><strong>Emerging Markets Equity</strong></a> and <a href="/us/en/insights/economic-trends/" title="Economic Trends Insights"><strong>Economic Trends</strong></a> insights, <a href="/us/en/subscribe/" title="Subscription Center"><strong>sign up in our subscription center</strong></a>.</p>
<style type="text/css">
    .wrapped-div {
        max-width: 100%;
    }

    @media (max-width: 1240px) {
        .wrapped-div {
            overflow-x: scroll;
        }


    }
</style>
]]></content:encoded>
</item><item rdf:about="https://www.vaneck.com/us/en/blogs/moat-investing/diversify-with-moat-stocks-amid-mag-7-divergence/">
  <title>Diversify with Moat Stocks Amid Mag 7 Divergence></title>
  <link>https://www.vaneck.com/us/en/blogs/moat-investing/diversify-with-moat-stocks-amid-mag-7-divergence/</link>
  <description><![CDATA[As U.S. equities surged in February, performance among the Magnificent 7 notably diverged. A potential sign of improving market breadth, this may create opportunities for overlooked moat stocks.]]></description>
  <dc:creator>Coulter Regal, CFA</dc:creator>
  <dc:date>03/28/2024 06:30:00</dc:date>
<content:encoded><![CDATA[

<p>U.S. equity markets pushed higher in February, as the S&amp;P 500 climbed more than 5% during the month to break 5,000 for the first time ever. This extends its positive streak to four months in a row. A strong fourth-quarter earnings season and continued momentum in AI-related stocks were drivers of this performance. Notable this month though, was some divergence in performance within the mega-cap Magnificent 7. NVIDIA, Meta and Amazon continued their dominance, while Apple, Tesla, Microsoft, and Alphabet lagged the market. Could this be a sign that market leadership is starting to broaden out? This may create opportunities in segments of the market that have been overlooked, like value-oriented stocks, as well as small- and mid-caps.</p>
<p>The <a href="https://www.vaneck.com/us/en/investments/morningstar-wide-moat-etf-moat/index/" title="MOAT - VanEck Morningstar Wide Moat ETF"><strong>Morningstar Wide Moat Focus Index</strong></a> (the &ldquo;Moat Index&rdquo;) also had a strong February, rising 4.26% during the month, but lagged the broader market by some. The Moat Index&rsquo;s equal weight methodology and focus on valuation leads to a general underweight in the mega-cap names that receive significant weight in the popular broad indexes. This underweight has been a headwind for the Index of late; however, despite this, the Moat Index still managed to outperform the S&amp;P 500 by over 600 basis points in 2023 and has also outperformed in longer trailing periods as well. We believe the moat strategy is a great way to diversify the extreme mega-cap exposure most investors have across their portfolio without sacrificing performance potential over the long-term.</p>

<style>
    .wrapped-div {
        max-width: 100%;
    }

    @media (max-width: 1240px) {
        .wrapped-div {
            overflow-x: scroll;
        }
    }

    .wrapped-div-sector {
        max-width: 100%;
        overflow-x: scroll;
    }
</style>
<p>Smaller-cap companies bounced back during the month after falling in January following the significant rally seen during the last couple months of 2023. Signs of life in this segment of the market may be an additional clue that market breadth is improving and the mega-caps will no longer have to shoulder all the weight. The <a href="/link/c0c4da50e177415b9f750d3c0eea4e0a.aspx" title="SMOT - VanEck Morningstar SMID Moat ETF"><strong>Morningstar US Small-Mid Cap Moat Focus Index</strong></a> (the &ldquo;SMID Moat Index&rdquo;) returned 6.57% during the month, outperforming S&amp;P 500 and both the pure small- and mid-cap benchmarks.</p>
<h3>U.S. Equities Rally in February | As of 2/29/2024</h3>
<p><img loading="lazy" class="img-responsive w-100" src="https://www.vaneck.com/contentassets/dcc3f6251b4040c6b4350fd7f6e721ea/4209_moat-chart1-2024-03_v1_blog.svg" alt="U.S. Equities Rally in February" /></p>
<p class="chart-disclosure"><strong>Source: Morningstar. As of 2/29/2024</strong>. Past performance is no guarantee of future results. Index performance is not representative of fund performance. It is not possible to invest directly in an index. Fund performance current to the most recent month end is available by visiting vaneck.com or by calling 800.826.2333.</p>
<h2>Introducing Value Style Moat Investing</h2>
<p>At VanEck, we strive to be a leader in forward-looking and intelligently designed investment solutions. We began offering investors access to Morningstar&rsquo;s moat investing philosophy in 2012, providing exposure to quality companies at attractive valuations through the <a href="https://www.vaneck.com/us/en/investments/morningstar-wide-moat-etf-moat/overview/" title="MOAT - VanEck Morningstar Wide Moat ETF"><strong>VanEck Morningstar Wide Moat ETF (MOAT)</strong></a>. Since then, our moat investing suite has grown to include funds that apply this same approach to <a href="https://www.vaneck.com/us/en/investments/morningstar-smid-moat-etf-smot/overview/" title="SMOT - VanEck Morningstar SMID Moat ETF"><strong>small- and mid-cap U.S. equities</strong></a>, <a href="https://www.vaneck.com/us/en/investments/morningstar-international-moat-etf-moti/overview/" title="MOTI VanEck Morningstar International Moat ETF"><strong>international non-U.S. equities</strong></a> and <a href="https://www.vaneck.com/us/en/investments/morningstar-global-wide-moat-etf-motg/overview/" title="MOTG VanEck Morningstar Global Wide Moat ETF"><strong>global equities</strong></a>.</p>
<style>
    .wrapped-div {
        max-width: 100%;
    }

    @media (max-width: 1240px) {
        .wrapped-div {
            overflow-x: scroll;
        }
    }

    .wrapped-div-sector {
        max-width: 100%;
        overflow-x: scroll;
    }
</style>
<p>Building on this success, we're excited to announce the launch of the <a href="/link/fd582da052ba46c79bfc112c078a6256.aspx" title="MVAL - VanEck Morningstar Wide Moat Value ETF - Holdings and Performance"><strong>VanEck Morningstar Wide Moat Value ETF (MVAL)</strong></a>.</p>
<p>These new strategies follow the same moat investing philosophy of targeting quality companies at attractive prices, but are tailored for investors looking to fine-tune their exposure through distinct style lenses. Unlike the blended style approach of our flagship MOAT ETF, which can naturally tilt towards growth or value based on market opportunities, this strategy offers dedicated exposure to value styles. This evolution represents our commitment to providing a more nuanced approach to moat investing, enabling our investors to align their portfolios more closely with their individual investment philosophies and market outlooks.</p>
<p>Subscribe to our&nbsp;<a href="https://www.vaneck.com/us/en/insights/moat-investing/" title="Moat Investing"><strong>Moat Investing Insights</strong></a> to stay updated on MVAL, as well key insights on our other moat investing strategies.</p>
<h3>Moat Value and Growth Historical Style Trail | Nov. 2022 &ndash; Feb. 2024</h3>
<p><img loading="lazy" class="img-responsive w-100" src="https://www.vaneck.com/contentassets/682d28e617df4edfac82618ba0e28abc/4209_moat-chart2-2024-03_v1_blog.svg" alt="Moat Value and Growth Historical Style Trail" /></p>
<p class="chart-disclosure"><strong>Source: Morningstar. As of 2/29/2024. </strong>Size of circles increase from start date to end date.&nbsp;Past performance is no guarantee of future results. Index performance is not representative of fund performance. It is not possible to invest directly in an index. Fund performance current to the most recent month end is available by visiting vaneck.com or by calling 800.826.2333.</p>
<h2>Materials and Industrials Lead the Moat Index in February</h2>
<p>This month there was clear sector representation within the leading drivers to February performance of the Moat Index. The materials sector, with Coreva (CTVA) and Ecolab (ECL), and the industrials sector, with Masco (MAS) and Equifax (EFX) accounted for four of the top five contributors in the Index. However, it was Walt Disney (DIS) that was the top contributor, up over 16%, with CEO Bob Iger reporting a strong start to the year and announcements of partnerships with Epic Games and Taylor Swift as well as a forthcoming sports streaming platform.</p>
<p>Detractors from performance this month also exhibited some sector concentration. Health care names Biogen (BIIB), Gilead Sciences (GILD) and Medtronic (MDT) all landed in the detractors list within the Moat Index. Drug manufacturer Biogen was the top February detractor after falling 12% following its earnings release. Despite this, Morningstar still maintained their $303 fair value estimate for Biogen and views the company as undervalued.</p>
<p style="margin-left: 20px;"><strong>Biogen Morningstar Analyst Comments | by Karen Anderson, CFA &ndash; February 13, 2024</strong><br /><i>We&rsquo;re maintaining our $303 fair value estimate for Biogen after the firm reported 2023 results that were in line with our expectations and earnings guidance for 2024 that was ahead of our prior forecast, as contract manufacturing declines are poised to improve gross margins more than we had anticipated, and as the firm&rsquo;s cost savings program develops further, allowing bottom-line growth in 2024. We think the market is likely disappointed by the slow launch of Alzheimer&rsquo;s drug Leqembi as well as Biogen and Eisai&rsquo;s decision to invest in a 30% U.S. Leqembi salesforce expansion. Biogen remains in transition as the firm&rsquo;s portfolio of multiple sclerosis drugs comes under pressure from generic and branded competition, and as newer drugs are just starting to launch, but we think top-line growth will return in 2025. Overall, we continue to see Biogen&rsquo;s newer products and innovative pipeline supporting a wide moat.</i></p>
<h3>Top Contributors and Detractors from Moat Index - February 2024</h3>
<div class="wrapped-div">
<table style="width: 100%;">
<tbody>
<tr class="tbl-data">
<td class="tbl-header last" colspan="5">Leading Contributors</td>
</tr>
<tr class="tbl-data">
<td class="data-td  last">Company</td>
<td class="data-head last">Ticker</td>
<td class="data-head last">Sector</td>
<td class="data-head last">Avg. Weight (%)</td>
<td class="data-head last">Contribution (%)</td>
</tr>
<tr class="tbl-data">
<td class="data-td last" style="font-weight: normal;">The Walt Disney Co</td>
<td class="data-td data last">DIS</td>
<td class="data-td data last">Communication Services</td>
<td class="data-td data last">2.55</td>
<td class="data-td data last">0.41</td>
</tr>
<tr class="tbl-data">
<td class="data-td last" style="font-weight: normal;">Corteva Inc</td>
<td class="data-td data last">CTVA</td>
<td class="data-td data last">Materials</td>
<td class="data-td data last">2.23</td>
<td class="data-td data last">0.40</td>
</tr>
<tr class="tbl-data">
<td class="data-td last" style="font-weight: normal;">Masco Corp</td>
<td class="data-td data last">MAS</td>
<td class="data-td data last">Industrials</td>
<td class="data-td data last">2.68</td>
<td class="data-td data last">0.39</td>
</tr>
<tr class="tbl-data">
<td class="data-td last" style="font-weight: normal;">Ecolab Inc</td>
<td class="data-td data last">ECL</td>
<td class="data-td data last">Materials</td>
<td class="data-td data last">2.54</td>
<td class="data-td data last">0.34</td>
</tr>
<tr class="tbl-data">
<td class="data-td last" style="font-weight: normal;">Equifax Inc</td>
<td class="data-td data last">EFX</td>
<td class="data-td data last">Industrials</td>
<td class="data-td data last">2.74</td>
<td class="data-td data last">0.33</td>
</tr>
</tbody>
</table>
</div>
<br />
<div class="wrapped-div">
<table style="width: 100%;">
<tbody>
<tr class="tbl-data">
<td class="tbl-header last" colspan="5">Leading Detractors</td>
</tr>
<tr class="tbl-data">
<td class="data-td  last">Company</td>
<td class="data-head last">Ticker</td>
<td class="data-head last">Sector</td>
<td class="data-head last">Avg. Weight (%)</td>
<td class="data-head last">Contribution (%)</td>
</tr>
<tr class="tbl-data">
<td class="data-td last" style="font-weight: normal;">Biogen Inc</td>
<td class="data-td data last">BIIB</td>
<td class="data-td data last">Health Care</td>
<td class="data-td data last">2.37</td>
<td class="data-td data last">-0.28</td>
</tr>
<tr class="tbl-data">
<td class="data-td last" style="font-weight: normal;">Comcast Corp</td>
<td class="data-td data last">CMCSA</td>
<td class="data-td data last">Communication Services</td>
<td class="data-td data last">2.53</td>
<td class="data-td data last">-0.20</td>
</tr>
<tr class="tbl-data">
<td class="data-td last" style="font-weight: normal;">Gilead Sciences Inc</td>
<td class="data-td data last">GILD</td>
<td class="data-td data last">Health Care</td>
<td class="data-td data last">2.38</td>
<td class="data-td data last">-0.19</td>
</tr>
<tr class="tbl-data">
<td class="data-td last" style="font-weight: normal;">International Flavors &amp; Fragrances Inc</td>
<td class="data-td data last">IFF</td>
<td class="data-td data last">Materials</td>
<td class="data-td data last">2.63</td>
<td class="data-td data last">-0.17</td>
</tr>
<tr class="tbl-data">
<td class="data-td last" style="font-weight: normal;">Medtronic</td>
<td class="data-td data last">MDT</td>
<td class="data-td data last">Health Care</td>
<td class="data-td data last">2.57</td>
<td class="data-td data last">-0.12</td>
</tr>
</tbody>
</table>
</div>
<br />
<p class="chart-disclosure"><strong>Source: Morningstar, February 2024</strong>. Past performance is no guarantee of future results. Index performance is not illustrative of fund performance. Not intended as a recommendation to buy or to sell any of the securities mentioned herein.</p>
<h2>SMID Moat Index Top Contributors and Detractors</h2>
<p>Small- and mid-cap stocks roared back this month and within the SMID Moat Index, it was consumer discretionary that lead the pack in terms of contributors. Tapestry Inc. (TPR), luxury goods company and owner of the Coach, Kate Spade, and Stuart Weitzman brands, among others, was the top contributor returning over 20% in February. Also representing consumer discretionary was fashion brand Ralph Lauren (RL) and online food order aggregator and delivery company DoorDash (DASH). Companies detracting from performance were from a variety of sectors, including industrial parts distributor WESCO International (WCC), pharmaceuticals company Ionis (IONS), and Boston Beer Co. (SAM).</p>
<h3>Top Contributors and Detractors from SMID Moat Index - February 2024</h3>
<div class="wrapped-div">
<table style="width: 100%;">
<tbody>
<tr class="tbl-data">
<td class="tbl-header last" colspan="5">Leading Contributors</td>
</tr>
<tr class="tbl-data">
<td class="data-td last">Company</td>
<td class="data-head last">Ticker</td>
<td class="data-head last">Sector</td>
<td class="data-head last">Avg. Weight (%)</td>
<td class="data-head last">Contribution (%)</td>
</tr>
<tr class="tbl-data">
<td class="data-td last" style="font-weight: normal;">Tapestry Inc</td>
<td class="data-td data last">TPR</td>
<td class="data-td data last">Consumer Discretionary</td>
<td class="data-td data last">1.54</td>
<td class="data-td data last">0.35</td>
</tr>
<tr class="tbl-data">
<td class="data-td last" style="font-weight: normal;">Interactive Brokers Group</td>
<td class="data-td data last">IBKR</td>
<td class="data-td data last">Financials</td>
<td class="data-td data last">1.30</td>
<td class="data-td data last">0.29</td>
</tr>
<tr class="tbl-data">
<td class="data-td last" style="font-weight: normal;">DoorDash Inc</td>
<td class="data-td data last">DASH</td>
<td class="data-td data last">Consumer Discretionary</td>
<td class="data-td data last">1.49</td>
<td class="data-td data last">0.29</td>
</tr>
<tr class="tbl-data">
<td class="data-td last" style="font-weight: normal;">Ralph Lauren Corp</td>
<td class="data-td data last">RL</td>
<td class="data-td data last">Consumer Discretionary</td>
<td class="data-td data last">0.79</td>
<td class="data-td data last">0.23</td>
</tr>
<tr class="tbl-data">
<td class="data-td last" style="font-weight: normal;">Charles River Laboratories International Inc</td>
<td class="data-td data last">CRL</td>
<td class="data-td data last">Health Care</td>
<td class="data-td data last">1.33</td>
<td class="data-td data last">0.23</td>
</tr>
</tbody>
</table>
</div>
<br />
<div class="wrapped-div">
<table style="width: 100%;">
<tbody>
<tr class="tbl-data">
<td class="tbl-header last" colspan="5">Leading Detractors</td>
</tr>
<tr class="tbl-data">
<td class="data-td last">Company</td>
<td class="data-head last">Ticker</td>
<td class="data-head last">Sector</td>
<td class="data-head last">Avg. Weight (%)</td>
<td class="data-head last">Contribution (%)</td>
</tr>
<tr class="tbl-data">
<td class="data-td last" style="font-weight: normal;">WESCO International Inc</td>
<td class="data-td data last">WCC</td>
<td class="data-td data last">Industrials</td>
<td class="data-td data last">1.42</td>
<td class="data-td data last">-0.20</td>
</tr>
<tr class="tbl-data">
<td class="data-td last" style="font-weight: normal;">Ionis Pharmaceuticals Inc</td>
<td class="data-td data last">IONS</td>
<td class="data-td data last">Health Care</td>
<td class="data-td data last">1.41</td>
<td class="data-td data last">-0.17</td>
</tr>
<tr class="tbl-data">
<td class="data-td last" style="font-weight: normal;">Boston Beer Co Inc</td>
<td class="data-td data last">SAM</td>
<td class="data-td data last">Consumer Staples</td>
<td class="data-td data last">1.22</td>
<td class="data-td data last">-0.14</td>
</tr>
<tr class="tbl-data">
<td class="data-td last" style="font-weight: normal;">Expedia Group Inc</td>
<td class="data-td data last">EXPE</td>
<td class="data-td data last">Consumer Discretionary</td>
<td class="data-td data last">1.55</td>
<td class="data-td data last">-0.12</td>
</tr>
<tr class="tbl-data">
<td class="data-td last" style="font-weight: normal;">Fox Corp</td>
<td class="data-td data last">FOXA</td>
<td class="data-td data last">Communication Services</td>
<td class="data-td data last">1.34</td>
<td class="data-td data last">-0.10</td>
</tr>
</tbody>
</table>
</div>
<br />
<p class="chart-disclosure"><strong>Source: Morningstar, February 2024</strong>. Past performance is no guarantee of future results. Index performance is not illustrative of fund performance. Not intended as a recommendation to buy or to sell any of the securities mentioned herein.</p>
<h2>Accessing Moat Stocks</h2>
<p><a href="/link/9e43dd198c5f4e419f13220685081895.aspx" title="MOAT - VanEck Morningstar Wide Moat ETF"><strong>VanEck Morningstar Wide ETF (MOAT)</strong></a> seeks to replicate as closely as possible, before fees and expenses the price and yield performance of the Morningstar Wide Moat Focus Index.</p>
<p><a href="/link/166321dbcfec440590fb51cf0ad629aa.aspx" title="SMOT - VanEck Morningstar SMID Moat ETF"><strong>VanEck Morningstar SMID Moat ETF (SMOT)</strong></a> seeks to track as closely as possible, before fees and expenses, the price and yield performance of the Morningstar US Small-Mid Cap Moat Focus Index.</p>
<p>To receive more <strong><a href="https://www.vaneck.com/us/en/insights/moat-investing/" title="Moat Investing Insights">Moat Investing</a></strong> insights, <strong><a href="https://www.vaneck.com/us/en/subscribe/" title="Preference Center">sign up in our subscription center</a></strong>.</p>
<style>
    .wrapped-div {
        max-width: 100%;
    }

    @media (max-width: 1240px) {
        .wrapped-div {
            overflow-x: scroll;
        }
    }

    .wrapped-div-sector {
        max-width: 100%;
        overflow-x: scroll;
    }
    .modal-backdrop.sticky-premium-form-backdrop {
    opacity: 1.8 !important;
    }
</style>
]]></content:encoded>
</item><item rdf:about="https://www.vaneck.com/us/en/blogs/moat-investing/choose-your-moat-style-growth-or-value/">
  <title>Target Value with Morningstar’s Moat Strategy></title>
  <link>https://www.vaneck.com/us/en/blogs/moat-investing/choose-your-moat-style-growth-or-value/</link>
  <description><![CDATA[Introducing MVAL ETF, allowing investors to apply the proven moat investment philosophy of the MOAT ETF to a strategy with a consistent style exposure.]]></description>
  <dc:creator>Brandon Rakszawski</dc:creator>
  <dc:date>03/28/2024 06:30:00</dc:date>
<content:encoded><![CDATA[

<p>Clients asked. We delivered. We are thrilled to now offer the <a href="/link/fd582da052ba46c79bfc112c078a6256.aspx" title="&gt;MVAL - VanEck Morningstar Wide Moat Value ETF - Holdings and Performance"><strong>VanEck Morningstar Wide Moat Value ETF (MVAL)</strong></a>.This new ETF is built on the foundation of our flagship&nbsp;<a href="/link/9e43dd198c5f4e419f13220685081895.aspx" title="MOAT - VanEck Morningstar Wide Moat ETF - Holdings and Performance"><strong>VanEck Morningstar Wide Moat ETF (MOAT)</strong></a>. Since MOAT&rsquo;s launch in 2012, much of its success and appeal has come from its focus on valuations when selecting among US wide moat companies each quarter. As a result, the MOAT portfolio is dynamic, allowing valuation opportunities to influence its ever-changing sector and style exposure. Based on the feedback we&rsquo;ve received from MOAT investors, we recognize there is a desire to apply this proven moat investment philosophy to strategies with a consistent style exposure.</p>
<p>MVAL allows investors to access Morningstar&rsquo;s forward-looking equity research that identifies quality companies trading at attractive valuations <i>and</i> express their views on growth versus value in the US market.</p>
<h2>Same Philosophy, New Style</h2>
<p>This new moat style strategy has the same DNA as our flagship MOAT ETF. It targets quality US companies that Morningstar analysts assign a wide economic moat rating and are also among the most attractively priced relative to their Morningstar fair value estimate.</p>
<p>The two key differences between the new strategy and MOAT come in the form of a consistent style exposure and a slightly more concentrated portfolio size, think 35-45 stocks for MVAL versus 45-55 stocks for MOAT.</p>
<p>MVAL seeks to track the Morningstar<sup>&reg;</sup>&nbsp;US Broad Value Wide Moat Focus Index<sup>SM</sup>, which leverages Morningstar&rsquo;s long-standing style methodology that fuels their well-recognized Style Box classification system. This index targets its style exposure by selecting companies from the targeted style category as well as blend stocks with value. The Index then tilts weightings to favor those stocks with the purest targeted style characteristics. The result is consistent style exposure.</p>

<h2>Differentiated Style Exposure</h2>
<p>Like MOAT, our new style moat ETF will offer investors differentiated exposure. We expect MVAL to hold unique companies and feature varying sector exposure relative to many common style indexes in the market as well as an actively managed strategy.</p>
<p>MVAL will allow investors to gain exposure to value stocks without adding to certain exposures that are likely already significant across their portfolios.</p>
<h2>No Overlap Among Top Value Index Holdings</h2>
<div class="row">
<div class="col-sm-12 col-md-6 col-lg-6 mb-4">
<div class="wrapped-div">
<table style="width: 100%;">
<tbody>
<tr class="tbl-data">
<td class="tbl-header last" colspan="2">MVAL&rsquo;s Index</td>
</tr>
<tr class="tbl-data">
<td class="data-td last">Name</td>
<td class="data-head last">Ticker</td>
</tr>
<tr class="tbl-data">
<td class="data-td last font-weight-normal">Masco Corporation</td>
<td class="data-td data last">MAS</td>
</tr>
<tr class="tbl-data">
<td class="data-td last font-weight-normal">Int&rsquo;l Flavors &amp; Fragrances</td>
<td class="data-td data last">IFF</td>
</tr>
<tr class="tbl-data">
<td class="data-td last font-weight-normal">RTX Corp</td>
<td class="data-td data last">RTX</td>
</tr>
<tr class="tbl-data">
<td class="data-td last font-weight-normal">Charles Schwab</td>
<td class="data-td data last">SCHW</td>
</tr>
<tr class="tbl-data">
<td class="data-td last font-weight-normal">Altria Group</td>
<td class="data-td data last">MO</td>
</tr>
<tr class="tbl-data">
<td class="data-td last font-weight-normal">U.S. Bancorp</td>
<td class="data-td data last">USB</td>
</tr>
<tr class="tbl-data">
<td class="data-td last font-weight-normal">Zimmer Biomet</td>
<td class="data-td data last">ZBH</td>
</tr>
<tr class="tbl-data">
<td class="data-td last font-weight-normal">Comcast Corp</td>
<td class="data-td data last">CMCSA</td>
</tr>
<tr class="tbl-data">
<td class="data-td last font-weight-normal">Medtronic</td>
<td class="data-td data last">MDT</td>
</tr>
</tbody>
</table>
</div>
</div>
<div class="col-sm-12 col-md-6 col-lg-6 mb-4">
<div class="wrapped-div">
<table style="width: 100%;">
<tbody>
<tr class="tbl-data">
<td class="tbl-header last" colspan="2">Russell 1000 Value Index</td>
</tr>
<tr class="tbl-data">
<td class="data-td last">Name</td>
<td class="data-head last">Ticker</td>
</tr>
<tr class="tbl-data">
<td class="data-td last font-weight-normal">Berkshire Hathaway</td>
<td class="data-td data last">BRK.B</td>
</tr>
<tr class="tbl-data">
<td class="data-td last font-weight-normal">JPMorgan Chase</td>
<td class="data-td data last">JPM</td>
</tr>
<tr class="tbl-data">
<td class="data-td last font-weight-normal">Exxon Mobil</td>
<td class="data-td data last">XOM</td>
</tr>
<tr class="tbl-data">
<td class="data-td last font-weight-normal">Johnson &amp; Johnson</td>
<td class="data-td data last">JNJ</td>
</tr>
<tr class="tbl-data">
<td class="data-td last font-weight-normal">Proctor &amp; Gamble</td>
<td class="data-td data last">PG</td>
</tr>
<tr class="tbl-data">
<td class="data-td last font-weight-normal">Merck &amp; Co</td>
<td class="data-td data last">MRK</td>
</tr>
<tr class="tbl-data">
<td class="data-td last font-weight-normal">Chevron Corp</td>
<td class="data-td data last">CVX</td>
</tr>
<tr class="tbl-data">
<td class="data-td last font-weight-normal">Bank of America</td>
<td class="data-td data last">BAC</td>
</tr>
<tr class="tbl-data">
<td class="data-td last font-weight-normal">The Walt Disney Co</td>
<td class="data-td data last">DIS</td>
</tr>
</tbody>
</table>
</div>
</div>
</div>
<p class="chart-disclosure">Source: Morningstar and FTSE Russell. MVAL&rsquo;s Index as of 3/20/2024. Russell 1000 Value Index as of 2/29/2024. Shaded cells represent common top holdings. Past performance is no guarantee of future results. Index performance is not representative of fund performance. It is not possible to invest directly in an index.</p>
<h2>Stay In the Loop</h2>
<p><a href="https://www.vaneck.com/us/en/subscribe/" title="Subscribe to VanEck Insights"></a>Subscribe to our <a href="https://www.vaneck.com/us/en/insights/moat-investing/" title="Moat Investing Insights"><strong>Moat Investing Insights</strong></a> to receive updates on MVAL and insights on our other moat investing strategies.</p>
<style type="text/css">
    .wrapped-div {
        max-width: 100%;
    }

    @media (max-width: 1240px) {
        .wrapped-div {
            overflow-x: scroll;
        }


    }
</style>
]]></content:encoded>
</item><item rdf:about="https://www.vaneck.com/us/en/blogs/moat-investing/mval-etf-and-mgro-etf-question-answer/">
  <title>MVAL ETF: Question &amp; Answer></title>
  <link>https://www.vaneck.com/us/en/blogs/moat-investing/mval-etf-and-mgro-etf-question-answer/</link>
  <description><![CDATA[Morningstar&rsquo;s proven strategy of identifying quality companies trading at attractive valuations is now available in a value style-oriented ETF.]]></description>
  <dc:creator> </dc:creator>
  <dc:date>03/27/2024 06:30:00</dc:date>
<content:encoded><![CDATA[


<ul class="content-list">
<li><strong><a href="#point-one">How does Morningstar identify moat companies?</a></strong></li>
<li><strong><a href="#point-two">How is the MVAL index constructed?</a></strong></li>
<li><strong><a href="#point-three">How does Morningstar determine its style score?</a></strong></li>
<li><strong><a href="#point-four">What is the overlap of MVAL with MOAT?</a></strong></li>
<li><strong><a href="#point-five">What is the relative sector exposures of MVAL?</a></strong></li>
<li><strong><a href="#point-six">How should investors use MVAL in relation to MOAT?</a></strong></li>
<li><strong><a href="#point-seven">How can investors buy VanEck&rsquo;s MVAL ETF?</a></strong></li>
</ul>
<p>Moat investing is based on a simple concept: invest in companies with sustainable competitive advantages. Morningstar builds on this philosophy by seeking out moat stocks trading at attractive valuations relative to their equity research team&rsquo;s forward-looking estimate of fair value. This approach has stood the test of time, with the live track record for the&nbsp;<a href="/link/9f629c73a31846bb9e480b95e2c7f330.aspx" title="MOAT - VanEck Morningstar Wide Moat ETF - Index"><strong>Morningstar<sup>&reg;</sup>&nbsp;Wide Moat Focus Index<sup>SM</sup></strong></a>&nbsp;exceeding 15 years.</p>
<p>With the launch of the <a href="/link/fd582da052ba46c79bfc112c078a6256.aspx" title="MVAL - VanEck Morningstar Wide Moat Value ETF - Holdings and Performance"><strong>VanEck Morningstar Wide Moat Value (MVAL)</strong></a> ETF, Morningstar&rsquo;s proven strategy of identifying quality companies trading at attractive valuations is now available for investors seeking targeted value exposure.</p>
<h2 id="point-one" class="anchored-block">How does Morningstar identify moat companies?</h2>
<p>Morningstar has identified five attributes that may contribute to a company&rsquo;s moat: <strong><a href="https://www.vaneck.com/us/en/blogs/moat-investing/switching-costs-build-moats-and-retain-customers2/" title="Switching Costs Build Moats and Retain Customers">switching costs</a>, <a href="https://www.vaneck.com/us/en/blogs/moat-investing/intangible-assets-the-leading-source-of-moats2/" title="Intangible Assets: The Leading Source of Moats">intangible assets</a>, <a href="https://www.vaneck.com/us/en/blogs/moat-investing/network-effect-a-proven-way-to-create-a-moat/" title="Network Effect: A Proven Way to Create a Moat">network effect</a>, <a href="https://www.vaneck.com/us/en/blogs/moat-investing/cost-leadership-creates-moats2/" title="Cost Leadership Provides Market Control">cost leadership</a></strong> and <strong><a href="https://www.vaneck.com/us/en/blogs/moat-investing/efficient-scale-moats-with-natural-monopoly/" title="Efficient Scale: Moats with Natural Monopoly">efficient scale</a></strong>. Companies may demonstrate one or a combination of these five sources of moat.</p>
<p>To determine the width of a company&rsquo;s moat, Morningstar analysts consider the nature of the company&rsquo;s competitive advantage and how effectively it will persist given the industry in which the company operates. Companies are assigned one of three economic moat ratings: none, narrow or wide. Having a wide moat means Morningstar believes the company can maintain its competitive advantage for at least the next 20 years, and a narrow moat means the company can do this for at least 10 years. A company with no moat either has a competitive advantage that is not sustainable or no advantage, according to Morningstar. (For more on how Morningstar analysts determine a company&rsquo;s moat rating, read <strong><a href="https://www.vaneck.com/us/en/blogs/moat-investing/moat-question-and-answer/#point-two" title="MOAT ETF: Question and Answer  - How does Morningstar identify moat companies?">MOAT ETF: Question &amp; Answer</a></strong>.)</p>
<h2 id="point-two" class="anchored-block">How is the MVAL index constructed?</h2>
<p>From a fundamental perspective, <a href="/link/fd582da052ba46c79bfc112c078a6256.aspx" title="MVAL - VanEck Morningstar Wide Moat Value ETF - Overview"><strong>MVAL</strong></a> uses the same rigorous screening process as the <strong><a href="https://www.vaneck.com/us/en/investments/morningstar-wide-moat-etf-moat/overview/" title="MOAT - VanEck Morningstar Wide Moat ETF - Holdings and Performance">VanEck Morningstar Wide Moat ETF (MOAT)</a></strong>. Morningstar&rsquo;s 100 equity analysts follow a <strong><a href="https://www.vaneck.com/us/en/blogs/moat-investing/moat-investing-powered-by-morningstar/" title="Quality Companies at Attractive Prices">consistent, forward-looking research methodology</a></strong> that includes its economic moat rating and fair value estimate based on Morningstar&rsquo;s proprietary discounted cash flow model. To be eligible for the index, companies must have a wide moat rating and an attractive price-to-fair-value ratio. For <a href="/link/fd582da052ba46c79bfc112c078a6256.aspx" title="MVAL - VanEck Morningstar Wide Moat Value ETF - Overview"><strong>MVAL</strong></a>, the strategy applies an additional screen to identify stocks with value characteristics.</p>
<p><img loading="lazy" class="img-responsive w-100" src="https://www.vaneck.com/contentassets/fa380ec8959b472c8190900417fbf3c6/4236_mval-mgr_image_2024-03_blog_v2.jpg" alt="Starting universe, eligibility criteria, and portfolio construction of Morningstar US Market Index." /></p>
<h2 id="point-three" class="anchored-block">How does Morningstar determine its style score?</h2>
<p>Morningstar&rsquo;s style score aligns with the Morningstar Style Box and informs the eligibility and weighting scheme of <a href="/link/fd582da052ba46c79bfc112c078a6256.aspx" title="MVAL - VanEck Morningstar Wide Moat Value ETF - Overview"><strong>MVAL</strong></a>.</p>
<p>In <a href="/link/fd582da052ba46c79bfc112c078a6256.aspx" title="MVAL - VanEck Morningstar Wide Moat Value ETF - Overview"><strong>MVAL</strong></a>, inputs into the style score include traditional value metrics such as a stock&rsquo;s historical price-to-book and price-to-sales ratios. <a href="/link/fd582da052ba46c79bfc112c078a6256.aspx" title="MVAL - VanEck Morningstar Wide Moat Value ETF - Overview"><strong>MVAL</strong></a> also includes a forward looking metric to determine the style score (price-to-projected earnings).</p>
<h2 id="point-four" class="anchored-block">What is the overlap of MVAL with MOAT?</h2>
<p>In general, investors should expect a high overlap between MOAT and <a href="/link/fd582da052ba46c79bfc112c078a6256.aspx" title="MVAL - VanEck Morningstar Wide Moat Value ETF - Overview"><strong>MVAL</strong></a>, which select from the same pool of 140 &ndash; 150 U.S. wide moat companies.</p>
<p>However, at any point in time, MOAT can have more overlap.</p>
<div class="epi-contentfragment">faq-banner-cta-mval</div>
<h2 id="point-five" class="anchored-block">What is the relative sector exposures of MVAL?</h2>
<p>Sector exposure will vary due to the active share associated with a concentrated portfolio as well as the impact of the moat and valuation screens. <a href="/link/fd582da052ba46c79bfc112c078a6256.aspx" title="MVAL - VanEck Morningstar Wide Moat Value ETF - Overview"><strong>MVAL</strong></a> has dynamic index sector exposure, as companies doing business in various segments of the market have become more or less attractively priced. Historically, <a href="/link/fd582da052ba46c79bfc112c078a6256.aspx" title="MVAL - VanEck Morningstar Wide Moat Value ETF - Overview"><strong>MVAL</strong></a> has had more healthcare and financial services exposure.</p>
<h2 id="point-six" class="anchored-block">How should investors use MVAL in relation to MOAT?</h2>
<p><a href="/link/fd582da052ba46c79bfc112c078a6256.aspx" title="MVAL - VanEck Morningstar Wide Moat Value ETF - Overview"><strong>MVAL</strong></a> is intended for investors who have a strategic view on value and want to gain targeted style exposure in their portfolios. Conversely, MOAT allows Morningstar valuation research to influence style exposures over time and should be thought of more as a core equity allocation.</p>
<p>Regardless of the specific reason, investors seeking to make an allocation to value companies should look for a strategy that does more than just provide broad-market exposure. We believe the focused approach of <a href="/link/fd582da052ba46c79bfc112c078a6256.aspx" title="MVAL - VanEck Morningstar Wide Moat Value ETF - Overview"><strong>MVAL</strong></a>, that selectively identifies companies by considering competition and competitive advantages as well as valuations, may be a better choice.</p>
<h2 id="point-seven" class="anchored-block">How can investors buy VanEck&rsquo;s MVAL ETF?</h2>
<p>Learn more here: <strong><a href="/link/fd582da052ba46c79bfc112c078a6256.aspx#how-to-buy-etf&amp;utm=MVAL-Blog" title="How to buy VanEck ETFs?">VanEck Morningstar Wide Moat Value ETF</a></strong>.</p>
<p class="d-none d-lg-block"><a href="mailto:askvaneck@vaneck.com" title="Have More Questions? - Ask VanEck" rel="noopener"><img loading="lazy" class="img-responsive" src="https://www.vaneck.com/globalassets/home/us/insights/blogs/bm-blog-images/cta-faq_desktop-02.svg" alt="Have More Questions? - Ask VanEck" /></a></p>
<p class="d-lg-none"><a href="mailto:askvaneck@vaneck.com" title="Have More Questions? - Ask VanEck" rel="noopener"><img loading="lazy" class="img-responsive" src="https://www.vaneck.com/globalassets/home/us/insights/blogs/bm-blog-images/cta-faq_mobile-01.svg" alt="Have More Questions? - Ask VanEck" /></a></p>
<p>To receive more <strong><a href="https://www.vaneck.com/us/en/insights/moat-investing/" title="Moat Investing Insights">Moat Investing</a></strong> insights, <strong><a href="https://www.vaneck.com/us/en/subscribe/" title="Preference Center">sign up in our subscription center</a></strong>.</p>
]]></content:encoded>
</item><item rdf:about="https://www.vaneck.com/us/en/blogs/thematic-investing/buzz-investing-us-markets-climb-amid-crypto-rally/">
  <title>BUZZ Investing: U.S. Markets Climb Amid Crypto Rally></title>
  <link>https://www.vaneck.com/us/en/blogs/thematic-investing/buzz-investing-us-markets-climb-amid-crypto-rally/</link>
  <description><![CDATA[U.S. domestic markets saw gains, driven by advancements in cryptocurrency-related stocks and shifting investor expectations regarding interest rate expectations.]]></description>
  <dc:creator> </dc:creator>
  <dc:date>03/25/2024 06:30:00</dc:date>
<content:encoded><![CDATA[

<p>U.S. domestic markets gained during the recent period between Index selection dates (February 8, 2024 &ndash; March 21, 2024, the &ldquo;Period&rdquo;). The S&amp;P 500 Index climbed by 3.3%, while the tech-heavy Nasdaq Composite Index increased by 2.3%. This marked the second consecutive Period the Nasdaq didn't outperform the S&amp;P 500, indicating a diversification of market gains beyond the dominant 'Magnificent Seven' mega-cap tech stocks that have previously led market rallies. The BUZZ NextGen AI US Sentiment Leaders Index (the &ldquo;BUZZ Index&rdquo;) notably outperformed with a 9.4% rise, primarily fueled by significant advancements in cryptocurrency-related stocks, in sync with Bitcoin's impressive 56% jump. This surge in Bitcoin's value followed the introduction of new U.S. spot bitcoin exchange-traded products, drawing substantial investments. NVIDIA Corp (NASD: NVDA) emerged as a focal point of the earnings season, its stock soaring over 28% during the month and eclipsing a $2 trillion valuation. This surge was fueled by the company's impressive revenue growth of 265%, significantly outpacing analyst expectations, largely due to its booming artificial intelligence business.</p>
<p>The release of the Federal Reserve's FOMC minutes on February 22nd further shaped market dynamics, revealing the Fed's cautious approach towards interest rate adjustments. Despite expectations for eventual rate cuts, the minutes clarified that such changes would not occur imminently, leading to a significant shift in investor expectations regarding the timing of these adjustments. According to the CME FedWatch Tool, the probability of the Fed maintaining current rates through the June meeting surged from under 4% to over 40% during the Period. Reflecting shifting interest rate expectations, 2-year bond yields rose by 24 bps during the Period. This recalibration of expectations regarding monetary policy underscored the nuanced relationship between central bank policy, economic data, and market movements, highlighting the delicate balance the Fed seeks to maintain amidst ongoing economic uncertainties.</p>
<h3>Target Rate Probabilities for June 2024 Fed Meeting</h3>
<p><img class="img-responsive w-100" src="https://www.vaneck.com/contentassets/ce32ce1fa2c34032b340437b8b557a67/4259_buzz-blog-2024-01_v1_blog.svg" alt="Target Rate Probabilities for June 2024 Fed Meeting" /></p>
<p class="chart-disclosure">Source: CME FedWatch Tool</p>
<p>The BUZZ Index returned 13.08% during the month of February compared to a return of 5.34% for the S&amp;P 500 Index during the same period. Year-to-date, the BUZZ Index leads the S&amp;P 500 with returns of 9.00% and 7.11%, respectively, as of the end of February.</p>
<h2>Shares of Cryptocurrency-related Stocks Pace Advancing Stocks Within the BUZZ Index</h2>
<p>In the recent Period, MicroStrategy Inc (NASD: MSTR), recognized for its substantial Bitcoin investments, saw its stock soar by 185.3%, nearly tripling in value, while Coinbase (NASD: COIN), a premier cryptocurrency exchange, experienced a 76.6% rise. These two companies accounted for almost two-thirds of the BUZZ Index's growth during this Period. Super Micro Computer Inc (NASD: SMCI), known for its high-performance server technology catering to data centers, cloud computing, and enterprise IT, also enjoyed significant growth with its shares increasing nearly 62%. This surge elevated the company's market capitalization beyond $50 billion, a milestone largely attributed to its robust financial performance and strategic positioning in the AI server domain, further enhanced by its strong partnership with Nvidia.</p>
<div class="wrapped-div">
<table style="width: 750px;">
<tbody>
<tr class="tbl-data">
<td class="tbl-header last " colspan="4">Top BUZZ Index Contributors: February 8, 2024 &ndash; March 21, 2024</td>
</tr>
<tr class="tbl-data">
<td class="data-td  last">Company</td>
<td class="data-head last">Ticker</td>
<td class="data-head last">Average Weight (%)</td>
<td class="data-head last">Return Contribution (%)</td>
</tr>
<tr class="tbl-data">
<td class="data-td last font-weight-normal">MicroStrategy Inc</td>
<td class="data-td data last">MSTR</td>
<td class="data-td data last">3.57</td>
<td class="data-td data last">4.13</td>
</tr>
<tr class="tbl-data">
<td class="data-td last font-weight-normal">Coinbase Global Inc</td>
<td class="data-td data last">COIN</td>
<td class="data-td data last">4.07</td>
<td class="data-td data last">2.18</td>
</tr>
<tr class="tbl-data">
<td class="data-td last font-weight-normal">Super Micro Computer Inc</td>
<td class="data-td data last">SMCI</td>
<td class="data-td data last">3.51</td>
<td class="data-td data last">1.29</td>
</tr>
<tr class="tbl-data">
<td class="data-td last font-weight-normal">Robinhood Markets Inc</td>
<td class="data-td data last">HOOD</td>
<td class="data-td data last">1.98</td>
<td class="data-td data last">0.98</td>
</tr>
<tr class="tbl-data">
<td class="data-td last font-weight-normal">NVIDIA Corp</td>
<td class="data-td data last">NVDA</td>
<td class="data-td data last">3.38</td>
<td class="data-td data last">0.83</td>
</tr>
<tr class="tbl-data">
<td class="data-td last font-weight-normal">Celsius Holdings Inc</td>
<td class="data-td data last">CELH</td>
<td class="data-td data last">1.34</td>
<td class="data-td data last">0.67</td>
</tr>
<tr class="tbl-data">
<td class="data-td last font-weight-normal">Marathon Digital Holdings Inc</td>
<td class="data-td data last">MARA</td>
<td class="data-td data last">0.57</td>
<td class="data-td data last">0.64</td>
</tr>
<tr class="tbl-data">
<td class="data-td last font-weight-normal">Carvana Co</td>
<td class="data-td data last">CVNA</td>
<td class="data-td data last">1.41</td>
<td class="data-td data last">0.57</td>
</tr>
<tr class="tbl-data">
<td class="data-td last font-weight-normal">Advanced Micro Devices Inc</td>
<td class="data-td data last">AMD</td>
<td class="data-td data last">3.18</td>
<td class="data-td data last">0.35</td>
</tr>
<tr class="tbl-data">
<td class="data-td last font-weight-normal">PayPal Holdings Inc</td>
<td class="data-td data last">PYPL</td>
<td class="data-td data last">2.94</td>
<td class="data-td data last">0.34</td>
</tr>
</tbody>
</table>
</div>
<br />
<p class="chart-disclosure">Source: BUZZ Holdings ULC, Bloomberg. Past performance is no guarantee of future results. Index performance is not illustrative of fund performance. Not intended as a recommendation to buy or to sell any of the securities mentioned herein.</p>
<p>During the recent Period, electric vehicle (EV) manufacturers Lucid Group Inc (NASD: LCID), Rivian Automotive Inc (NASD: RIVN), and Tesla Inc (NASD: TSLA) experienced notable declines in their stock performance. LCID's stock dropped by 25% as the company missed quarterly revenue targets and reported significant cash burn, further impacted by its production guidance falling short of expectations. RIVN's shares reached a new low after announcing underwhelming fourth-quarter results, including a 10% reduction in its salaried workforce, prompting sharp analyst downgrades. Meanwhile, Boeing (NYSE: BA) saw a 13.4% decrease in its stock value, largely attributed to persistent safety and quality concerns following new incidents involving its passenger jets, which have heightened scrutiny and affected the company's reputation.</p>
<div class="wrapped-div">
<table style="width: 750px;">
<tbody>
<tr class="tbl-data">
<td class="tbl-header last " colspan="4">Bottom BUZZ Index Contributors: February 8, 2024 &ndash; March 21, 2024</td>
</tr>
<tr class="tbl-data">
<td class="data-td  last">Company</td>
<td class="data-head last">Ticker</td>
<td class="data-head last">Average Weight (%)</td>
<td class="data-head last">Return Contribution (%)</td>
</tr>
<tr class="tbl-data">
<td class="data-td last font-weight-normal">Lucid Group Inc</td>
<td class="data-td data last">LCID</td>
<td class="data-td data last">2.56</td>
<td class="data-td data last">-0.76</td>
</tr>
<tr class="tbl-data">
<td class="data-td last font-weight-normal">Rivian Automotive Inc</td>
<td class="data-td data last">RIVN</td>
<td class="data-td data last">1.55</td>
<td class="data-td data last">-0.71</td>
</tr>
<tr class="tbl-data">
<td class="data-td last font-weight-normal">Affirm Holdings Inc</td>
<td class="data-td data last">AFRM</td>
<td class="data-td data last">1.03</td>
<td class="data-td data last">-0.51</td>
</tr>
<tr class="tbl-data">
<td class="data-td last font-weight-normal">Tesla Inc</td>
<td class="data-td data last">TSLA</td>
<td class="data-td data last">2.74</td>
<td class="data-td data last">-0.44</td>
</tr>
<tr class="tbl-data">
<td class="data-td last font-weight-normal">Boeing Co/The</td>
<td class="data-td data last">BA</td>
<td class="data-td data last">2.69</td>
<td class="data-td data last">-0.38</td>
</tr>
<tr class="tbl-data">
<td class="data-td last font-weight-normal">SoFi Technologies Inc</td>
<td class="data-td data last">SOFI</td>
<td class="data-td data last">2.85</td>
<td class="data-td data last">-0.37</td>
</tr>
<tr class="tbl-data">
<td class="data-td last font-weight-normal">Paramount Global</td>
<td class="data-td data last">PARA</td>
<td class="data-td data last">1.81</td>
<td class="data-td data last">-0.28</td>
</tr>
<tr class="tbl-data">
<td class="data-td last font-weight-normal">Apple Inc</td>
<td class="data-td data last">AAPL</td>
<td class="data-td data last">2.71</td>
<td class="data-td data last">-0.24</td>
</tr>
<tr class="tbl-data">
<td class="data-td last font-weight-normal">Roku Inc</td>
<td class="data-td data last">ROKU</td>
<td class="data-td data last">0.44</td>
<td class="data-td data last">-0.19</td>
</tr>
<tr class="tbl-data">
<td class="data-td last font-weight-normal">Unity Software Inc</td>
<td class="data-td data last">U</td>
<td class="data-td data last">0.56</td>
<td class="data-td data last">-0.13</td>
</tr>
</tbody>
</table>
</div>
<br />
<p class="chart-disclosure">Source: BUZZ Holdings ULC, Bloomberg. Past performance is no guarantee of future results. Index performance is not illustrative of fund performance. Not intended as a recommendation to buy or to sell any of the securities mentioned herein.</p>
<h2>BUZZ Index March 2024 Rebalance Highlights</h2>
<p><strong><u>Lyft, Inc.</u></strong></p>
<p>Lyft Inc's (NASD: LYFT) Q4 earnings report last month was highlighted by strong performance and optimistic guidance. Initially, Lyft&rsquo;s earnings were notable for a significant reporting mishap, where EBITDA margins were incorrectly stated as 5% rather than the accurate 0.5%, leading to a dramatic 70% spike in Lyft&rsquo;s shares during after-hours trading until the company issued a correction. Although this mistake led to a flurry of social media ridicule, focus quickly returned to Lyft's solid earnings. In a ride-sharing industry where profitability has been challenging, Lyft reported a 4% increase in revenue and significantly narrowed its losses from -$588 million in Q4 2022 to just -$26 million in the recent quarter. With margins expected to improve, Lyft is on track to be free cash flow positive this year. This turnaround in performance has notably boosted sentiment toward LYFT, culminating in its recent addition to the BUZZ Index with a 1.4% weight.</p>
<p><strong><u>Rivian Automotive, Inc.</u></strong></p>
<p>After years of hype and excitement in the electric vehicle industry led by the surge of Tesla (NASD: TSLA), the environment for EVs has soured over the past year. The major traditional automakers, who had rushed to electrify their existing lineups, were having trouble recouping costs amidst declining demand for their vehicles. Dedicated EV automakers, such as Lucid (NASDAQ: LCID) and Rivian (NASDAQ: RIVN), who had finally started to mass produce their cars, were dealing with production obstacles and difficulty bringing down prices. Nevertheless, online sentiment towards RIVN and LCID has remained high, evident in the rising weights of these stocks within the BUZZ Index, even as they lagged following their recent earnings. On March 7th, RIVN announced its new R2 model in a planned reveal event. In a complete surprise however, Rivian also announced a second new model, the R3, which is expected to cost as little as $35,000 USD. The stock jumped on the announcement, and sentiment surged. This month RIVN climbs to a maximum 3% weight in the BUZZ Index.</p>
<p>For more on rebalancing results and a full breakdown of index constituents added and removed for the month, view the <a href="https://www.vaneck.com/us/en/blogs/thematic-investing/buzz-investing-us-markets-climb-amid-crypto-rally/buzz-reconstitution-march-2024.pdf" title="BUZZ VanEck Social Sentiment ETF" target="_blank" rel="noopener"><strong>BUZZ Index reconstitution</strong></a> report.</p>
<p>To receive more <a href="https://www.vaneck.com/us/en/insights/thematic-investing/" title="Thematic Investing Insights"><strong>Thematic Investing</strong></a> insights, <a href="https://www.vaneck.com/us/en/subscribe/" title="Subscription Center"><strong>sign up in our subscription center</strong></a>.</p>
<style>
    .wrapped-div {
        max-width: 100%;
    }

    @media (max-width: 1240px) {
        .wrapped-div {
            overflow-x: scroll;
        }
    }

    .wrapped-div-sector {
        max-width: 100%;
        overflow-x: scroll;
    }
</style>
]]></content:encoded>
</item><item rdf:about="https://www.vaneck.com/us/en/blogs/natural-resources/natural-resources-for-today-and-tomorrow/">
  <title>Natural Resources for Today and Tomorrow></title>
  <link>https://www.vaneck.com/us/en/blogs/natural-resources/natural-resources-for-today-and-tomorrow/</link>
  <description><![CDATA[Several massive shifts are currently underway in commodity markets. We discuss how investors can benefit from the attractive features of natural resources investing without omitting these important changes occurring.]]></description>
  <dc:creator>Alicia  Barkley</dc:creator>
  <dc:date>03/21/2024 06:30:00</dc:date>
<content:encoded><![CDATA[

<p>Commodity investing can play several important roles in a portfolio. The asset class has provided a hedge against inflation, strong diversification characteristics, and participation in global growth trends.</p>
<p>In moderate inflationary periods (2%-6%), commodities outperformed U.S. stocks and U.S. bonds.</p>
<p><img class="img-responsive w-100" src="https://www.vaneck.com/contentassets/b0919abf29274eeb91caca54172c8171/4254_hap-march-chart-1-2024-03_v1_blog.svg" alt="Commodities Outperform US stocks and bonds in moderate periods of inflation" /></p>
<p class="chart-disclosure">Source: VanEck , FactSet , Bloomberg. Data as of February 2024. Past performance is no indication of future results.</p>
<p>But investing in commodities can be complex. Physical exposure to many energy products, metals, and agricultural goods is often not practical and investing in commodities derivatives such as futures contracts can be complicated and time-intensive to manage. Many investors look to resources companies to gain exposure to commodities with the benefit of liquidity and ease of access.</p>
<p>The challenge here is the depth of investment possibilities within the equity markets. Energy companies range from large integrated oil &amp; gas companies to exploratory drilling companies. Materials companies are no less differentiated from companies that produce industrial metals like copper to those locating and producing gold, silver, and/or platinum.</p>
<p>We believe a well-diversified strategy built to take advantage of today&rsquo;s ever-changing landscape can serve an investor well through market cycles.</p>
<h2>Global Natural Resources Exposure</h2>
<p><a href="https://www.vaneck.com/us/en/investments/natural-resources-etf-hap/overview/" title="HAP - VanEck Natural Resources ETF - Overview"><strong>VanEck Natural Resources ETF (HAP)</strong></a> offers a well-rounded, diversified, take on natural resources. It&rsquo;s global focus avoid concentration is North American companies and missed opportunities from the many leading companies outside of the region.</p>
<p>Additionally, many strategies focus on the old guard: energy, metals, and perhaps agriculture. HAP provides investors access to not only those traditional segments, but also areas of innovation within the asset class, such as renewable energy.</p>
<p>The following chart shows the sub-theme&rsquo;s exposure in the asset class:</p>
<h3>Sub Theme Weights</h3>
<p><img class="img-responsive w-100" src="https://www.vaneck.com/contentassets/b0919abf29274eeb91caca54172c8171/4254_hap-march-chart-2-2024-03_v1_blog.svg" alt="HAP's wide scope will allow it to participate in what we believe to be the early innings of major transformations" /></p>
<p class="chart-disclosure">Source: FactSet. Data as of 03/15/2024.</p>
<p>This broadened scope should allow HAP to participate in what we believe to be the early innings of major transformations such as the energy transition and the push to produce more with less from the agricultural industry.</p>
<h2>Current Trends and Future Positioning</h2>
<p>Several massive shifts are currently underway in commodity markets. HAP&rsquo;s scope allows investors to potentially benefit from the attractive features of natural resources investing without omitting these important changes occurring.</p>
<p><strong>Agricultural Innovation</strong></p>
<p>Opportunities abound in the agriculture sector as current trends including agri-drones, artificial intelligence and robotics, precision farming, and others, have paved the way to make it possible to feed the forecasted 10 billion people on the planet in a few years. Deere and Company (5.13% of net assets), Corteva Inc. (2.38% of net assets), Bayer AG (2.26% of net assets), and Nutrien Ltd., (2.19% of net assets) are some of the companies that have made significant technological improvements in the agri-business industry. Coupled with unstable geo-political conditions in parts of the world, this sector has its fair share of potential risks, but agriculture and food demand, in general, tend to be more resilient during the peaks and valleys of economic cycles.</p>
<p><strong>Energy Transition</strong></p>
<p>Renewable energy is clearly the long-term future as governments focus on reducing their reliance on fossil fuels and improving the environmental impact of energy production.</p>
<p>Renewable energy sources are expected to provide between 45% - 50% of global generation by 2030 and between 65% - 85% by 2050. Solar is estimated to be the largest contributor of renewable energy, followed by wind.<sup>1</sup></p>
<h3>Renewables dominate new generation, while clean firm and gas power generation increase across most scenarios</h3>
<p><img class="img-responsive w-100" src="https://www.vaneck.com/contentassets/b0919abf29274eeb91caca54172c8171/4254_hap-march-chart-3-2024-03_v1_blog.svg" alt="Renewables dominate new generation, while clean firm and gas power generation increase across most scenarios" /></p>
<p class="chart-disclosure"><sup>1</sup>&nbsp;Excludes generation from storage (pumped hydro, batteries, LDES (long-duration energy storage)).</p>
<p class="chart-disclosure"><sup>2</sup>&nbsp;Other includes bioenergy (with and without CCUS (carbon capture, utilizationn, and storage), geothermal, and oil.</p>
<p class="chart-disclosure"><sup>3</sup>&nbsp;Includes gas and coal plants with CCUS, nuclear, and hydrogen.</p>
<p class="chart-disclosure">Source: McKinsey Energy Solutions Global Energy Perspectiive 2023.</p>
<p>In addition to being the largest contributor of renewable energy, solar energy is forecasted to see about $2.8 trillion in global clean energy investments by 2030.</p>
<div class="wrapped-div">
<table style="width: 100%;">
<tbody>
<tr class="tbl-data">
<td class="tbl-header last text-left">Type</td>
<td class="tbl-header last text-center">Global Investment (2022-2030P)</td>
<td class="tbl-header last text-center">Share of Investment</td>
</tr>
<tr class="tbl-data">
<td class="data-td data last" style="text-align: left;">Distributed Solar</td>
<td class="data-td data last">$1.5T</td>
<td class="data-td data last">26%</td>
</tr>
<tr class="tbl-data">
<td class="data-td data last" style="text-align: left;">Utility Scale Solar</td>
<td class="data-td data last">$1.3T</td>
<td class="data-td data last">23%</td>
</tr>
<tr class="tbl-data">
<td class="data-td data last" style="text-align: left;">Onshore Wind</td>
<td class="data-td data last">$1.1T</td>
<td class="data-td data last">20%</td>
</tr>
<tr class="tbl-data">
<td class="data-td data last" style="text-align: left;">Offshore Wind</td>
<td class="data-td data last">$774.2B</td>
<td class="data-td data last">14%</td>
</tr>
<tr class="tbl-data">
<td class="data-td data last" style="text-align: left;">Energy Storage</td>
<td class="data-td data last">$373.6B</td>
<td class="data-td data last">7%</td>
</tr>
<tr class="tbl-data">
<td class="data-td data last" style="text-align: left;">Other Renewables</td>
<td class="data-td data last">$557.1B</td>
<td class="data-td data last">10%</td>
</tr>
</tbody>
</table>
</div>
<br />
<p class="chart-disclosure">Source: S&amp;P Global, <strong><a href="https://www.visualcapitalist.com/global-clean-energy-spending-forecasts/" title="Visualized: Global Clean Energy Spending Forecasts (2022-2030)" target="_blank" rel="noopener">https://www.visualcapitalist.com/global-clean-energy-spending-forecasts/</a></strong>.</p>
<p>S&amp;P Global notes that &ldquo;Investments in solar account for nearly half of the global total, with 26% going to smaller-scale &ldquo;distributed&rdquo; solar systems, such as rooftop solar panels across households, businesses, and other public institutions. Wind power is projected to attract the next largest slices of investments with more investments slated for onshore wind projects (20%), while offshore wind&mdash;which generates power on wind farms built across bodies of water&mdash;is set to receive $774.2 billion or 14% of estimated funds. Overall, current forecasts expect $700 billion per year of renewable energy investment through 2050. However, under a net-zero model, an annual figure of $1.4 trillion would be needed to reach zero emissions by 2050.&rdquo;<sup>2</sup></p>
<p>To achieve renewable energy, however, clean energy technologies are necessary to facilitate solar and wind. Copper, zinc, nickel, manganese, chromium, molybdenum, rare earths, silicon, and other metals are all sources of clean energy. Wind farms require copper for generators, wiring, tubing, cables, and transformers. Offshore wind turbines and solar panel fixtures need zinc to handle extreme environmental conditions. Climax Molybdenum Company, a subsidiary of Freeport-McMoran (1.84% of net assets), is one of the world&rsquo;s leading molybdenum producer and supplier. Its affiliation with Freeport-McMoran, one of the largest producers of copper and zinc, is instrumental in the development of options to obtain clean energy.</p>
<p>It's no secret that nuclear energy and uranium are in the spotlight recently. The uranium spot price shot up from $24.63 in January 2020, to $100.25 in January 2024. Nuclear&rsquo;s limelight is due in part to innovations. For more insights read <a href="https://www.vaneck.com/us/en/blogs/natural-resources/a-resurgence-of-nuclear-energy/" title="A Resurgence of Nuclear Energy?"><strong>A Resurgence of Nuclear Energy?</strong></a>.</p>
<p>With the energy transition well underway, we believe HAP allows investors to access all the desirable features commodity equities have offered historically while also directly participating in the innovations of tomorrow. Its exposure to renewable energy companies and miners producing the metals needed to power the energy transition are examples of just that.</p>
<p>To receive more <strong><a href="https://www.vaneck.com/us/en/insights/natural-resources/" title="Natural Resources Insights">Natural Resources</a> </strong>insights, <strong><a href="https://www.vaneck.com/us/en/subscribe/" title="Subscription Center">sign up in our subscription center</a>.</strong></p>
<style>
    .wrapped-div {
        max-width: 100%;
    }

    @media (max-width: 768px) {
        .wrapped-div {
            overflow-x: scroll;
        }
    }

    .wrapped-div-sector {
        max-width: 100%;
        overflow-x: scroll;
    }
</style>
]]></content:encoded>
</item><item rdf:about="https://www.vaneck.com/us/en/blogs/moat-investing/quality-stock-selection-with-a-contrarian-bias/">
  <title>Quality Stock Selection with a Contrarian Bias></title>
  <link>https://www.vaneck.com/us/en/blogs/moat-investing/quality-stock-selection-with-a-contrarian-bias/</link>
  <description><![CDATA[Discover how Morningstar's valuation focus for its moat investing approach helps identify contrarian opportunities among quality companies]]></description>
  <dc:creator> </dc:creator>
  <dc:date>03/20/2024 06:30:00</dc:date>
<content:encoded><![CDATA[

<p>A focus on valuations has played a major role in the <a href="https://www.vaneck.com/us/en/blogs/moat-investing/decade-of-dominance-the-etf-that-quietly-beats-the-s-and-p-500/" title="Decade of Dominance: The ETF that Quietly Beats the S&amp;P 500"><strong>historical success</strong></a> of the Morningstar<sup>&reg;</sup>&nbsp;Wide Moat Focus Index<sup>SM</sup>. The Index regularly targets <a href="https://www.vaneck.com/us/en/blogs/moat-investing/moat-investing-powered-by-morningstar/" title="Quality Companies at Attractive Prices"><strong>quality companies trading at attractive valuations</strong></a>. This often leads to confusion with value investing, but this strategy is more akin to contrarian investing. Whereas value investors look for stocks that meet certain traditional investment criteria, contrarians focus more on the market sentiment that may be driving an attractive valuation. However, many price declines are warranted and not representative of an attractive investment opportunity, so investors need to determine when the negative sentiment is justified and when it represents an opportunity.</p>
<p>Morningstar&rsquo;s moat investing philosophy leverages a team of more than <a href="https://www.vaneck.com/us/en/blogs/moat-investing/moat-question-and-answer/#point-one" title="MOAT ETF: Question &amp; Answer"><strong>100 equity analysts</strong></a> to identify attractively priced wide moat opportunities&mdash;in other words, those companies that have built competitive advantages that should allow them to recover from negative market sentiment. While not intentionally contrarian, the Index reflects a contrarian bias as a result of its screening and construction methodology, which includes a focus on valuations.</p>

<p>To receive more <strong><a href="https://www.vaneck.com/us/en/insights/moat-investing/" title="Moat Investing Insights">Moat Investing</a></strong> insights, <strong><a href="https://www.vaneck.com/us/en/subscribe/" title="Preference Center">sign up in our subscription center</a></strong>.</p>
]]></content:encoded>
</item><item rdf:about="https://www.vaneck.com/us/en/blogs/emerging-markets-bonds/cynical-bull-an-emerging-markets-debt-perspective/">
  <title>Cynical Bull – An Emerging Markets Debt Perspective></title>
  <link>https://www.vaneck.com/us/en/blogs/emerging-markets-bonds/cynical-bull-an-emerging-markets-debt-perspective/</link>
  <description><![CDATA[Fed rate cuts are coming, but moving too swiftly is a risk. We discuss the implications for emerging markets debt investors.]]></description>
  <dc:creator>Eric Fine</dc:creator>
  <dc:date>03/19/2024 06:30:00</dc:date>
<content:encoded><![CDATA[

<p>The <strong><a href="https://www.vaneck.com/us/en/investments/emerging-markets-bond-fund-embux/overview/" title="EMBUX - Emerging Markets Bond Fund - Class I - Overview">VanEck Emerging Markets Bond Fund (the Fund)</a></strong> was up 0.2% in February in line with its benchmark, the 50% J.P. Morgan Government Bond Index-Emerging Markets (GBI-EM) Global Diversified and 50% J.P. Morgan Emerging Markets Bond Index (EMBI). Year to date, the Fund is outperforming its benchmark by around 30 basis points (bps). From a country perspective, Zambia and Ecuador were winners, Egypt (not owning it) was a loser. We increased exposure to local currency (due to increases in Brazil and the Philippines) and increased duration (via hard-currency bonds), in line with the market now pricing out a lot of the Fed&rsquo;s cuts. We end February with carry of 7.1%, yield to worst of 8.6%, duration of 5.5, and 50% of the Fund in local currency. Our biggest exposures are Brazil (local), Mexico (local and hard), Indonesia (local), Colombia (local), and Poland (local). <a href="/us/en/blogs/emerging-markets-bonds/cynical-bull-an-emerging-markets-debt-perspective/cynical-bull-an-emerging-markets-debt-perspective.pdf" target="_blank" rel="noopener" title="Cynical Bull - An Emerging Markets Debt Perspective"><strong>View here for a PDF version of this blog.</strong></a></p>
<div class="wrapped-div">
<table style="width: 100%;">
<tbody>
<tr class="tbl-data">
<td class="tbl-header last" colspan="8">Average Annual Total Returns<sup>*</sup>&nbsp;(%) as of February 29, 2024</td>
</tr>
<tr class="tbl-data">
<td class="data-td last">&nbsp;</td>
<td class="data-head last">1 Month</td>
<td class="data-head last">3 Month</td>
<td class="data-head last">YTD</td>
<td class="data-head last">1 Year</td>
<td class="data-head last">3 Year</td>
<td class="data-head last">5 Year</td>
<td class="data-head last">10 Year</td>
</tr>
<tr class="tbl-data">
<td class="data-td last">Class A: NAV (Inception 07/09/12)</td>
<td class="data-td data last">0.07</td>
<td class="data-td data last">2.88</td>
<td class="data-td data last">-0.96</td>
<td class="data-td data last">7.63</td>
<td class="data-td data last">-0.60</td>
<td class="data-td data last">2.86</td>
<td class="data-td data last">1.57</td>
</tr>
<tr class="tbl-data">
<td class="data-td last">Class A: Maximum 5.75% load</td>
<td class="data-td data last">-5.69</td>
<td class="data-td data last">-3.03</td>
<td class="data-td data last">-6.66</td>
<td class="data-td data last">1.44</td>
<td class="data-td data last">-2.54</td>
<td class="data-td data last">1.65</td>
<td class="data-td data last">0.97</td>
</tr>
<tr class="tbl-data">
<td class="data-td last">Class I: NAV (Inception 07/09/12)</td>
<td class="data-td data last">0.06</td>
<td class="data-td data last">2.99</td>
<td class="data-td data last">-0.78</td>
<td class="data-td data last">8.09</td>
<td class="data-td data last">-0.26</td>
<td class="data-td data last">3.18</td>
<td class="data-td data last">1.88</td>
</tr>
<tr class="tbl-data">
<td class="data-td last">Class Y: NAV (Inception 07/09/12)</td>
<td class="data-td data last">0.25</td>
<td class="data-td data last">2.99</td>
<td class="data-td data last">-0.78</td>
<td class="data-td data last">7.95</td>
<td class="data-td data last">-0.33</td>
<td class="data-td data last">3.12</td>
<td class="data-td data last">1.81</td>
</tr>
<tr class="tbl-data">
<td class="data-td last">50% GBI-EM/50% EMBI</td>
<td class="data-td data last">0.20</td>
<td class="data-td data last">2.86</td>
<td class="data-td data last">-1.07</td>
<td class="data-td data last">9.72</td>
<td class="data-td data last">-2.45</td>
<td class="data-td data last">0.28</td>
<td class="data-td data last">1.52</td>
</tr>
</tbody>
</table>
</div>
<br />
<div class="wrapped-div">
<table style="width: 100%;">
<tbody>
<tr class="tbl-data">
<td class="tbl-header last" colspan="8">Average Annual Total Returns<sup>*</sup>&nbsp;(%) as of December 31, 2023</td>
</tr>
<tr class="tbl-data">
<td class="data-td last">&nbsp;</td>
<td class="data-head last">1 Month</td>
<td class="data-head last">3 Month</td>
<td class="data-head last">YTD</td>
<td class="data-head last">1 Year</td>
<td class="data-head last">3 Year</td>
<td class="data-head last">5 Year</td>
<td class="data-head last">10 Year</td>
</tr>
<tr class="tbl-data">
<td class="data-td last">Class A: NAV (Inception 07/09/12)</td>
<td class="data-td data last">3.88</td>
<td class="data-td data last">8.36</td>
<td class="data-td data last">10.91</td>
<td class="data-td data last">-0.79</td>
<td class="data-td data last">4.14</td>
<td class="data-td data last">1.80</td>
</tr>
<tr class="tbl-data">
<td class="data-td last">Class A: Maximum 5.75% load</td>
<td class="data-td data last">-2.09</td>
<td class="data-td data last">2.13</td>
<td class="data-td data last">4.53</td>
<td class="data-td data last">-2.73</td>
<td class="data-td data last">2.92</td>
<td class="data-td data last">1.20</td>
</tr>
<tr class="tbl-data">
<td class="data-td last">Class I: NAV (Inception 07/09/12)</td>
<td class="data-td data last">3.81</td>
<td class="data-td data last">8.43</td>
<td class="data-td data last">10.97</td>
<td class="data-td data last">-0.49</td>
<td class="data-td data last">4.46</td>
<td class="data-td data last">2.10</td>
</tr>
<tr class="tbl-data">
<td class="data-td last">Class Y: NAV (Inception 07/09/12)</td>
<td class="data-td data last">3.80</td>
<td class="data-td data last">8.40</td>
<td class="data-td data last">11.03</td>
<td class="data-td data last">-0.57</td>
<td class="data-td data last">4.39</td>
<td class="data-td data last">2.03</td>
</tr>
<tr class="tbl-data">
<td class="data-td last">50% GBI-EM/50% EMBI</td>
<td class="data-td data last">3.97</td>
<td class="data-td data last">8.63</td>
<td class="data-td data last">11.95</td>
<td class="data-td data last">-3.31</td>
<td class="data-td data last">1.46</td>
<td class="data-td data last">1.71</td>
</tr>
</tbody>
</table>
</div>
<br />
<p class="chart-disclosure"><sup>*</sup>&nbsp;Returns less than one year are not annualized.</p>
<p class="chart-disclosure"><strong>Expenses: Class A: Gross 2.55%, Net 1.22%; Class I: Gross 2.51%, Net 0.87%; Class Y: Gross 2.91%, Net 0.97%.</strong> Expenses are capped contractually until 05/01/24 at 1.25% for Class A, 0.95% for Class I, 1.00% for Class Y. Caps excluding acquired fund fees and expenses, interest, trading, dividends, and interest payments of securities sold short, taxes, and extraordinary expenses.</p>
<p class="chart-disclosure"><strong>The performance data quoted represents past performance. Past performance is not a guarantee of future results. Investment return and principal value of an investment will fluctuate so that an investor&rsquo;s shares, when redeemed, may be worth more or less than their original cost. Performance may be lower or higher than performance data quoted. Please call 800.826.2333 or visit vaneck.com for performance current to the most recent month ended.</strong></p>
<p class="chart-disclosure">The &ldquo;Net Asset Value&rdquo; (NAV) of a Fund is determined at the close of each business day, and represents the dollar value of one share of the fund; it is calculated by taking the total assets of the fund, subtracting total liabilities, and dividing by the total number of shares outstanding. The NAV is not necessarily the same as the ETF&rsquo;s intraday trading value. Investors should not expect to buy or sell shares at NAV.</p>
<p id="fund-performance" class="jump-link-nav anchored-block" data-jumplink-title="Fund Performance"><strong>Fun with the Fed Funicular.</strong> At the start of this year, the market priced in 6 Fed rate cuts in 2024, which has now reverted to back to the original consensus of 3 cuts. The market has been back and forth between 3 and 6 cuts, just like a funicular. One extremely simple implication for a funicular with only two stops is that, with the current station being 3 cuts, there&rsquo;s now room to go back to 6! A more interesting and complex implication, though, is that it takes time for this funicular to go back-and-forth, and while it is doing so, it increases the risk that inflation base-effects fade and nascent inflation and inflation expectations creep into Fed thinking (there are wars and tariffs about). The odds of a new stop on the funicular have logically risen. Moving forward, though, this also logically means that the odds of a mistaken rate cut (too early or too large) have risen. This is a bit cute and arguably time-inconsistent. Our only point is that while we see the upside risks to emerging markets (EM) currencies and EM bonds from the start of a Fed rate cutting cycle and are positioned appropriately, everyone else also sees it, so you have to be aware of each step on the path. Navigating the path is often the best one can do. Obviously, this all needs to fit into a formal process, but lucky us, Bayes exists for exactly these purposes. Rather than getting into Bayes, we&rsquo;ll say that we&rsquo;re worried about a contingent probability. Getting very specific, we think the implications are as follows:</p>
<ul class="content-list">
<li>The funicular should go back towards pricing 6 cuts if we assume nothing has changed (which is reasonable), we&rsquo;re just in a phase of pricing between 3 and 6 until the Fed actually starts cutting. Be patient.</li>
<li>As the funicular goes back and forth over time, we&rsquo;re getting more stagflationary data. If it continues, this means that when the Fed easing cycle begins (whenever that is), yield curves could bear steepen soon after.</li>
<li>This could be viewed as a rejection of Fed credibility, along with already record-high gold and bitcoin prices. That would represent a major new node/decision point for the year.</li>
<li>This is a contingent scenario to help us prepare for a likely cutting cycle, not (yet) central case, and we explicitly state that the setback (the moment in the bullet above) is likely <i>not</i> the next &ldquo;thing&rdquo;, or &ldquo;node&rdquo;, rate cuts still are. Thus the &ldquo;cynical bull&rdquo;.</li>
</ul>
<p><strong>Holy debt-debasement thesis-confirmation, Batman!</strong> We&rsquo;ve been pounding the table for many years now about how &ldquo;fiscal dominance&rdquo; is driving <i>everything</i> in markets. We even finally wrote a stand-alone <strong><a href="https://www.vaneck.com/us/en/blogs/emerging-markets-bonds/fiscal-dominance-the-clarifying-lens-for-em-and-dm-bonds/" title="Fiscal Dominance: The Clarifying Lens for EM (and DM) Bonds">white paper on it</a></strong>. The thesis was that the dollar was entering new territory, which created even greater alpha opportunities in EM bonds. I assume it is obvious to our readers that new record prices for gold and bitcoin smack of debt-debasement, too, also noted in the piece. It&rsquo;s on, and EM debt has winners in the form of government bonds with high real yields backed by strong fiscal policy. It&rsquo;s not just gold and bitcoin which are winners! Central banks are not just buying gold, they are buying EM local-currency government bonds (wouldn&rsquo;t you, especially if the alternative was lower-yielding Treasuries?). By the way, did you know that the CBO projects no recession for the next 10 years and assumes 10-year Treasuries will have lower yields than currently?</p>
<p><strong>Still not allowed to talk at cocktail parties.</strong> War and politics are important facts that markets try to ignore. This is wrong &ndash; these are analyzable events for which there may be appropriate portfolio responses. You need a central case, but you also need to do scenario analysis, whether you like the stories or not. War is inflationary, and US politics look likely to generate inflation risks. You may not get joy discussing these at a cocktail party, but markets don&rsquo;t ignore reality. The conclusions are often simple and easily optimized. It just takes courage, not brains. For example, such a concern as ours above translates into caution on duration, clearly, and ours is currently right on top of our benchmark&rsquo;s duration. In addition, Chinese corporate bonds are highly illiquid and thus subject to top-down geopolitical risk headlines&hellip;so we&rsquo;ve largely taken profit on these this past month. These are random examples, but the point is that rarely do major portfolio constraints arise from these scenarios, just challenges and opportunities. Anyway, our key point on geopolitics remains that is the developed market (DM) economies that are suffering from war, while many EMs are winners because of commodity exports, low debt, independent central banks that pay high real rates, and good economic structure. EM also doesn&rsquo;t sanction each other&rsquo;s savings, making their bonds that much safer. Other central banks noticed and are putting EM local currency bonds on their balance sheets (as with gold), as we noted in many of our previous commentaries. US politics are an even more sensitive topic at cocktail parties, but last I checked tariffs are an inflationary tax, and last I checked both parties were essentially out-doing each other on this front. The election is this year; there&rsquo;s no reason to be &ldquo;surprised&rdquo; when those telegraphed outcomes materialize.</p>
<h3 id="central-banks-fewer-treasuries" class="jump-link-nav anchored-block" data-jumplink-title="Central Banks Fewer Treasuries">Exhibit 1 &ndash; Central Banks Hold Fewer Treasuries</h3>
<p><strong>Foreign Exchange Holdings in U.S. Dollars, % of allocated reserves</strong></p>
<p><img class="img-responsive w-100" src="https://www.vaneck.com/contentassets/e0182081da7a49d4a9e5ebaabacd2b3b/4234_emb-monthly-mar-2024-03_v1_blog.svg" alt="Global Central Banks Hold Fewer Treasuries Today" /></p>
<p class="chart-disclosure">Source: Bloomberg LP; Data as of December 2023.</p>
<style>
    .wrapped-div {
        max-width: 100%;
    }

    @media (max-width: 768px) {
        .wrapped-div {
            overflow-x: scroll;
        }
    }

    .wrapped-div-sector {
        max-width: 100%;
        overflow-x: scroll;
    }
</style>

<h2 id="exposure-types-and-significant-changes" class="jump-link-nav anchored-block" data-jumplink-title="EXPOSURE TYPES AND SIGNIFICANT CHANGES">EXPOSURE TYPES AND SIGNIFICANT CHANGES</h2>
<p>The changes to our top positions are summarized below. Our largest positions in February were Brazil, Mexico, China, Indonesia, and Colombia:</p>
<ul class="content-list">
<li class="mt-2">We increased our local currency exposure in Brazil and the Philippines. In Brazil, we were attracted by very high real rates (=attractive valuations), which make the country much less dependent on the Fed&rsquo;s rate cycle, as well as by a steady (and moderate) pace of rate cuts against the backdrop of on-going disinflation. A key risk in Brazil is fiscal underperformance, but other factors improved the policy and technical test scores for the country. The Philippine bond that we added were attractively valued, while the central bank is doing a great job managing the currency&rsquo;s volatility and can potentially have room for rate cuts in H2.</li>
<li class="mt-2">We also increased our hard currency sovereign exposure in Kenya, Angola, and Gabon, and our local currency exposure in Kenya. Kenya&rsquo;s new bond addressed the forthcoming 2024 Eurobond maturity and was attractively priced. The central bank let the currency adjust in nominal terms, reducing pressure on international reserves, while hiking the policy rate. This improved the policy test score for the country. Gabon has just completed its Article IV talks with the IMF, which praised authorities&rsquo; initial efforts to reform the economy, despite numerous challenges. In terms of our investment process, this improved the policy test score for the country.</li>
<li class="mt-2">Finally, we increased our hard currency sovereign exposure in Ecuador and Qatar. There is a lot of optimism about Ecuador&rsquo;s reforms (including just approved tax reform and the VAT rate hike), which improve an IMF deal prospects and the policy text score for the country. Qatar continues to benefit from strong technical (such as a lack of longer-term issuance in the rest of the region), which supports the technical test score for the country.</li>
<li class="mt-2">We reduced our local currency exposure in Mexico and Malaysia. The latter&rsquo;s valuations look less attractive vs. other options, hence the worsening technical test score. Mexico&rsquo;s central bank might be pivoting to the dovish side prematurely against the backdrop of slower &ldquo;last mile&rdquo; disinflation and the pre-election spending, especially if the U.S. Federal Reserve stays on hold for longer.</li>
<li class="mt-2">We also reduced our hard currency corporate exposure in Turkey and China, as well as local exposure in Turkey. In Turkey, the decision to re-tap the corporate bond market within four months of the original issue sent a disappointing signal from the company&rsquo;s management. We also decided to take profits on the inflation-linked bond as the new governor might be even more hawkish than his predecessor, resulting in faster disinflation down the road. In terms of our investment process, this worsened the policy test score for that particular bond. China&rsquo;s lack of clarity regarding the resolution of real estate developers&rsquo; debt remains a major headwind &ndash; both for GDP growth in general and the housing sector specifically &ndash; undermining the policy and economic test scores for the country.</li>
<li class="mt-2">Finally, we reduced our local currency exposure in Uruguay, Sri Lanka, and South Korea. The common theme here is that local valuations no longer look particularly attractive, including Sri Lanka&rsquo;s short-end T-bills. In terms of our investment process, this worsened the technical test score for these countries.</li>
</ul>
<p>To receive more <a href="https://www.vaneck.com/us/en/insights/emerging-markets-bonds/" title="Emerging Markets Bonds Insights"><strong>Emerging Markets Bonds</strong></a> insights, <a href="https://www.vaneck.com/us/en/subscribe/" title="Subscription Center"><strong>sign up in our subscription center</strong></a>.</p>
<style>
    .wrapped-div {
        max-width: 100%;
    }

    @media (max-width: 768px) {
        .wrapped-div {
            overflow-x: scroll;
        }
    }

    .wrapped-div-sector {
        max-width: 100%;
        overflow-x: scroll;
    }
</style>
]]></content:encoded>
</item><item rdf:about="https://www.vaneck.com/us/en/blogs/income-investing/revisiting-performance-through-tight-spreads/">
  <title>Revisiting Performance Through Tight Spreads></title>
  <link>https://www.vaneck.com/us/en/blogs/income-investing/revisiting-performance-through-tight-spreads/</link>
  <description><![CDATA[Spreads remain tight, but fallen angels have historically outperformed in similar environments; sector exposures continue to evolve, following one new fallen angel and one rising star last month.]]></description>
  <dc:creator>Nicolas  Fonseca, CFA</dc:creator>
  <dc:date>03/14/2024 06:30:00</dc:date>
<content:encoded><![CDATA[

<p>In February, fallen angels (as represented by the ICE US Fallen Angel High Yield 10% Constrained Index, &ldquo;H0CF&rdquo;) underperformed the broad high yield market (as represented by the ICE BofA US High Yield Index, &ldquo;H0A0&rdquo;) by 0.70% (-0.40% vs 0.30%). Year-to-date, fallen angels are behind by 0.14%, posting returns of 0.17% versus 0.32% for the broad high yield market.</p>
<p>During the same period, lower-quality assets outperformed their higher-rated counterparts, and short-duration investments outpaced long-duration ones. This trend coincided with a 0.26% increase in the 10-year yield, reaching 4.25% by the end of February. The strong rally in risk-assets that began in the fourth quarter continued through February, which has resulted in tight spreads in all credit asset classes. High yield bond spreads are not far from their post-COVID spreads while high overall yields have continued to attract investors, despite these tight spread levels.</p>
<h2>Revisiting Performance Through Tight Spreads</h2>
<p>In our <strong><a href="https://www.vaneck.com/us/en/blogs/income-investing/fallen-angels-the-year-in-review/" title="Fallen Angels: The Year In Review">2021 outlook</a></strong> for fallen angels, we extensively covered their performance in tight spread environments, marked by a downtrend from the elevated levels observed in March 2020, when both fallen angels and broad high yield stood at around 1000bps, to the mid to low 300s. By October 2021, fallen angels spreads reached their all-time lows at 200bps, while broad high yield saw spreads hit 301 bps, approximately 60bps wider than their previous all-time lows in June 2007 at 241bps.</p>
<p>Currently, we find ourselves in a situation with similar spread levels, where fallen angels have spreads at 260bps and broad high yield stands at 329bps. It is noteworthy that this similarity in spread levels exists in vastly different economic environments. Historically, fallen angels have outperformed in periods of below average spread levels.</p>
<p>This has been driven by the fallen angel technical effect (price recovery or appreciation after bonds are downgraded to high yield), contrarian sector exposures and a higher average credit. These factors have collectively contributed to the resilience and potential for outperformance by fallen angels in periods where spreads remain below their long-term average for prolonged periods. With overweights to Retail and Real Estate sectors (which have increased, particularly exposure to commercial REITs) and an 82% allocation to BB rated bonds, compared to 50% for broad high yield, fallen angels may be positioned favorably.</p>
<h3>Fallen Angels Outperformance Over Tight Spread Periods</h3>
<p><img class="img-responsive w-100" src="https://www.vaneck.com/contentassets/4bac0e98046b4cd782daf47a6882752c/4220_angl_chart-1_2023.03_blog.svg" alt=" bar chart comparing Fallen Angels Outperformance Over Tight Spread Periods" /></p>
<div class="wrapped-div">
<table style="width: 100%;">
<tbody>
<tr class="tbl-data">
<td class="tbl-header last text-center">&nbsp;</td>
<td class="tbl-header last text-center" colspan="2">Cumulative Total Return</td>
<td class="tbl-header last text-center">&nbsp;</td>
</tr>
<tr class="tbl-data">
<td class="data-head last">Beg Date</td>
<td class="data-head last">End Date</td>
<td class="data-head last"># Years</td>
<td class="data-head last">Fallen Angel</td>
<td class="data-head last">Broad HY</td>
<td class="data-head last">Over/underperformance</td>
</tr>
<tr class="tbl-data">
<td class="data-td data last">12/31/2003</td>
<td class="data-td data last">11/14/2007</td>
<td class="data-td data last">3.87</td>
<td class="data-td data last">30.65</td>
<td class="data-td data last">30.55</td>
<td class="data-td data last">0.11</td>
</tr>
<tr class="tbl-data">
<td class="data-td data last">1/11/2011</td>
<td class="data-td data last">6/2/2011</td>
<td class="data-td data last">0.39</td>
<td class="data-td data last">6.86</td>
<td class="data-td data last">4.90</td>
<td class="data-td data last">1.96</td>
</tr>
<tr class="tbl-data">
<td class="data-td data last">1/2/2013</td>
<td class="data-td data last">12/9/2014</td>
<td class="data-td data last">1.93</td>
<td class="data-td data last">16.84</td>
<td class="data-td data last">9.24</td>
<td class="data-td data last">7.60</td>
</tr>
<tr class="tbl-data">
<td class="data-td data last">2/3/2015</td>
<td class="data-td data last">7/21/2015</td>
<td class="data-td data last">0.46</td>
<td class="data-td data last">1.25</td>
<td class="data-td data last">1.00</td>
<td class="data-td data last">0.25</td>
</tr>
<tr class="tbl-data">
<td class="data-td data last">9/29/2016</td>
<td class="data-td data last">3/5/2020</td>
<td class="data-td data last">3.43</td>
<td class="data-td data last">27.85</td>
<td class="data-td data last">21.92</td>
<td class="data-td data last">5.93</td>
</tr>
<tr class="tbl-data">
<td class="data-td data last">10/6/2016</td>
<td class="data-td data last">6/15/2022</td>
<td class="data-td data last">5.69</td>
<td class="data-td data last">-1.20</td>
<td class="data-td data last">-2.39</td>
<td class="data-td data last">1.20</td>
</tr>
<tr class="tbl-data">
<td class="data-td data last">7/19/2022</td>
<td class="data-td data last">2/29/2024</td>
<td class="data-td data last">1.62</td>
<td class="data-td data last">14.39</td>
<td class="data-td data last">14.36</td>
<td class="data-td data last">0.03</td>
</tr>
<tr class="tbl-data">
<td class="data-td data last">&nbsp;</td>
<td class="data-td data last"><strong>Average -&gt;</strong></td>
<td class="data-td data last"><strong>2.49</strong></td>
<td class="data-td data last">&nbsp;</td>
<td class="data-td data last"><strong>2.44</strong></td>
</tr>
</tbody>
</table>
</div>
<br />
<p class="chart-disclosure">Source: ICE Data Services, VanEck. Fallen Angels: ICE US Fallen Angel High Yield 10% Constrained Index. Broad HY: ICE BofA US High Yield Index. Index performance is not representative of fund performance. It is not possible to invest in an index. Past performance is no guarantee of future results.</p>
<p><strong><u>Fallen Angels Overall Statistics:</u> </strong>The yields on fallen angels recently surpassed 7%, while spreads experienced a tightening of 23bps over the past month, settling at 260bps. Although this level has not been observed since April 2022, it remains notably higher (60bps) than the lows recorded in October 2021 at 200bps. This trend persists due to ongoing resilient economic growth, better-than-expected earnings and elevated yields, with the 10-year yield rising to 4.25% from 3.99%. Given the sustained elevation in yields, we believe investors still have the opportunity to capitalize on higher yields, providing a potential cushion if spreads were to widen significantly. In terms of defaults, fallen angels have yet to experience any so far this year, in contrast to the broad high yield market, which saw another issuer, Cano Health (holding $300 million par outstanding), default. This brings the total defaults for the broader high-yield market to two for the year, thus far. The discrepancy in default rates emphasizes the relative resilience of fallen angels and higher quality amid the evolving economic landscape.</p>
<div class="wrapped-div">
<table style="width: 100%;">
<tbody>
<tr class="tbl-data">
<td class="tbl-header last text-center">&nbsp;</td>
<td class="tbl-header last text-center" style="border-right: outset;" colspan="3">Fallen Angels</td>
<td class="tbl-header last text-center" colspan="3">Broad HY</td>
</tr>
<tr class="tbl-data">
<td class="data-head last">&nbsp;</td>
<td class="data-head last">12/31/2023</td>
<td class="data-head last">1/31/2024</td>
<td class="data-head last" style="border-right: outset;">2/29/2024</td>
<td class="data-head last">12/31/2023</td>
<td class="data-head last">1/31/2024</td>
<td class="data-head last">2/29/2024</td>
</tr>
<tr class="tbl-data">
<td class="data-td last">Yield to Worst</td>
<td class="data-td data last">6.99</td>
<td class="data-td data last">6.96</td>
<td class="data-td data last" style="border-right: outset;">7.09</td>
<td class="data-td data last">7.69</td>
<td class="data-td data last">7.84</td>
<td class="data-td data last">7.90</td>
</tr>
<tr class="tbl-data">
<td class="data-td last">Effective Duration</td>
<td class="data-td data last">5.41</td>
<td class="data-td data last">5.43</td>
<td class="data-td data last" style="border-right: outset;">5.43</td>
<td class="data-td data last">3.31</td>
<td class="data-td data last">3.33</td>
<td class="data-td data last">3.34</td>
</tr>
<tr class="tbl-data">
<td class="data-td last">Full Market Value ($mn)</td>
<td class="data-td data last">67,821</td>
<td class="data-td data last">67,726</td>
<td class="data-td data last" style="border-right: outset;">66,327</td>
<td class="data-td data last">1,237,721</td>
<td class="data-td data last">1,245,514</td>
<td class="data-td data last">1,251,788</td>
</tr>
<tr class="tbl-data">
<td class="data-td last">OAS</td>
<td class="data-td data last">285</td>
<td class="data-td data last">283</td>
<td class="data-td data last" style="border-right: outset;">260</td>
<td class="data-td data last">339</td>
<td class="data-td data last">359</td>
<td class="data-td data last">329</td>
</tr>
<tr class="tbl-data">
<td class="data-td last">No. of Issues</td>
<td class="data-td data last">143</td>
<td class="data-td data last" style="border-right: outset;">144</td>
<td class="data-td data last">1,837</td>
<td class="data-td data last">1,847</td>
<td class="data-td data last">1,862</td>
</tr>
</tbody>
</table>
</div>
<br />
<p class="chart-disclosure">Source: ICE Data Services, VanEck. Fallen Angels: ICE US Fallen Angel High Yield 10% Constrained Index. Broad HY: ICE BofA US High Yield Index. OAS refers to &ldquo;option-adjusted spread.&rdquo; Please see definition for this and other terms referenced herein in the disclosures and definitions portion of this blog. Past performance is no guarantee of future results. Index performance is not representative of fund performance. It is not possible to invest in an index.</p>
<p><strong><u>New Fallen Angels:</u></strong> In February, Advance Auto Parts (AAP) entered the index and added 2.52% to the Retail sector which now represents the largest exposure of the fallen angel index at 17.20%. AAP was downgraded by Moody&rsquo;s to Baa3 from Baa2 as it expects AAP&rsquo;s EBITDA margins to remain below historical levels, reflecting lower sales growth and gross margins with much higher expenses. Moody&rsquo;s still rates the company as investment grade, but S&amp;P had downgraded it to BB+ from BBB- in September 2023 due to weak credit metrics, as its sales were relatively flat while its competitors grew. Following the Moody&rsquo;s downgrade, the average rating is high yield. The average price of AAP&rsquo;s bonds six months ago was $89.17, and it entered the index at an average price of $91.20.</p>
<div class="wrapped-div">
<table style="width: 100%;">
<tbody>
<tr class="tbl-data">
<td class="tbl-header last">Month-end Addition</td>
<td class="tbl-header last text-center">Name</td>
<td class="tbl-header last text-center">Rating</td>
<td class="tbl-header last text-center">Sector</td>
<td class="tbl-header last text-center">Industry</td>
<td class="tbl-header last text-center">% Mkt Value</td>
<td class="tbl-header last text-center">Price</td>
</tr>
<tr class="tbl-data">
<td class="data-td last font-weight-normal">January</td>
<td class="data-td data last">Hudson Pacific Properties LP</td>
<td class="data-td data last">BB1</td>
<td class="data-td data last">Real Estate</td>
<td class="data-td data last">REITs</td>
<td class="data-td data last">2.18</td>
<td class="data-td data last">88.05</td>
</tr>
<tr class="tbl-data">
<td class="data-td last font-weight-normal">February</td>
<td class="data-td data last">Advance Auto Parts Inc.</td>
<td class="data-td data last">BB1</td>
<td class="data-td data last">Retail</td>
<td class="data-td data last">Specialty Retail</td>
<td class="data-td data last">2.52</td>
<td class="data-td data last">91.20</td>
</tr>
</tbody>
</table>
</div>
<br />
<p class="chart-disclosure">Source: ICE Data Services, VanEck. Fallen Angels: ICE US Fallen Angel High Yield 10% Constrained Index. Past performance is no guarantee of future results. Not a recommendation to buy or sell any of the names/securities mentioned herein. Index performance is not representative of fund performance. It is not possible to invest in an index.</p>
<p><strong><u>Rising Stars:</u></strong> The first rising star of the year is Las Vegas Sands (LVS), exiting the index at $93.19 (weight 3.12%) while joining the index back in June 2022 at $89.72 (3.32%), providing a 3.87% price return over the 20 months in the index. During the same 20 months, the fallen angel index price return was 2.10%. On February 1, LVS was upgraded by Fitch to BBB- from BB+, reflecting the strong rebound in Macao and outperformance in Singapore. LVS highlighted the growth in Macao during most of 2023 as all COVID-19 measures were dropped in the region, allowing for gamblers to come and go as they pleased with no capacity limits in their casinos. S&amp;P was ahead of Fitch&rsquo;s upgrade, as it upgraded LVS to BBB- from BB+ in July 2022 for very similar reasons: accelerating recovery in Macao's cash flows.</p>
<div class="wrapped-div">
<table style="width: 100%;">
<tbody>
<tr class="tbl-data">
<td class="tbl-header last">Month-end Exit</td>
<td class="tbl-header last text-center">Name</td>
<td class="tbl-header last text-center">Rating</td>
<td class="tbl-header last text-center">Sector</td>
<td class="tbl-header last text-center">Industry</td>
<td class="tbl-header last text-center">% Mkt Value</td>
<td class="tbl-header last text-center">Price</td>
</tr>
<tr class="tbl-data">
<td class="data-td last font-weight-normal">February</td>
<td class="data-td data last">Las Vegas Sands Corp</td>
<td class="data-td data last">BB1</td>
<td class="data-td data last">Leisure</td>
<td class="data-td data last">Gaming</td>
<td class="data-td data last">3.12</td>
<td class="data-td data last">93.19</td>
</tr>
</tbody>
</table>
</div>
<br />
<p class="chart-disclosure">Source: ICE Data Services, VanEck. Fallen Angels: ICE US Fallen Angel High Yield 10% Constrained Index. Past performance is no guarantee of future results. Not a recommendation to buy or sell any of the names/securities mentioned herein. Index performance is not representative of fund performance. It is not possible to invest in an index.</p>
<p><strong><u>Fallen Angels Performance by Sector:</u></strong> Retail exposure jumped to 17% with the addition of AAP into the index, while the Leisure sector&rsquo;s exposure was cut almost in half after LVS&rsquo; exit. Spreads tightened during the month, except for Basic Industry and Services, which saw their spreads widen by 25bps and 3bps, respectively, while all but the Financial and Retail sectors saw their prices increase. In terms of attribution relative to broad high yield, the underperformance was notably influenced by two of the largest sectors, Real Estate and Telecom, while the lack of Media exposure in fallen angels was a contributor.</p>
<div class="wrapped-div">
<table style="width: 100%;">
<tbody>
<tr class="tbl-data">
<td class="tbl-header last text-center">&nbsp;</td>
<td class="tbl-header last text-center" style="border-right: outset;" colspan="3">Wgt (%)</td>
<td class="tbl-header last text-center" style="border-right: outset;" colspan="3">OAS</td>
<td class="tbl-header last text-center" style="border-right: outset;" colspan="3">Price</td>
<td class="tbl-header last">Total Return</td>
</tr>
<tr class="tbl-data">
<td class="data-head last">&nbsp;</td>
<td class="data-head last">12/31/2023</td>
<td class="data-head last">1/31/2024</td>
<td class="data-head last" style="border-right: outset;">2/29/2024</td>
<td class="data-head last">12/31/2023</td>
<td class="data-head last">1/31/2024</td>
<td class="data-head last" style="border-right: outset;">2/29/2024</td>
<td class="data-head last">12/31/2023</td>
<td class="data-head last">1/31/2024</td>
<td class="data-head last" style="border-right: outset;">2/29/2024</td>
<td class="data-head last">MTD</td>
</tr>
<tr class="tbl-data">
<td class="data-td last font-weight-normal">Banking</td>
<td class="data-td data last">4.79</td>
<td class="data-td data last">4.47</td>
<td class="data-td data last" style="border-right: outset;">4.52</td>
<td class="data-td data last">231</td>
<td class="data-td data last">217</td>
<td class="data-td data last" style="border-right: outset;">217</td>
<td class="data-td data last">97.91</td>
<td class="data-td data last">99.24</td>
<td class="data-td data last" style="border-right: outset;">97.81</td>
<td class="data-td data last">-0.96</td>
</tr>
<tr class="tbl-data">
<td class="data-td last font-weight-normal">Basic Industry</td>
<td class="data-td data last">1.70</td>
<td class="data-td data last">1.73</td>
<td class="data-td data last" style="border-right: outset;">3.14</td>
<td class="data-td data last">171</td>
<td class="data-td data last">151</td>
<td class="data-td data last" style="border-right: outset;">176</td>
<td class="data-td data last">97.24</td>
<td class="data-td data last">98.06</td>
<td class="data-td data last" style="border-right: outset;">94.55</td>
<td class="data-td data last">-0.93</td>
</tr>
<tr class="tbl-data">
<td class="data-td last font-weight-normal">Capital Goods</td>
<td class="data-td data last">5.85</td>
<td class="data-td data last">5.80</td>
<td class="data-td data last" style="border-right: outset;">5.94</td>
<td class="data-td data last">200</td>
<td class="data-td data last">227</td>
<td class="data-td data last" style="border-right: outset;">186</td>
<td class="data-td data last">97.34</td>
<td class="data-td data last">96.20</td>
<td class="data-td data last" style="border-right: outset;">96.18</td>
<td class="data-td data last">0.42</td>
</tr>
<tr class="tbl-data">
<td class="data-td last font-weight-normal">Consumer Goods</td>
<td class="data-td data last">4.33</td>
<td class="data-td data last">4.28</td>
<td class="data-td data last" style="border-right: outset;">4.37</td>
<td class="data-td data last">230</td>
<td class="data-td data last">284</td>
<td class="data-td data last" style="border-right: outset;">262</td>
<td class="data-td data last">94.29</td>
<td class="data-td data last">92.59</td>
<td class="data-td data last" style="border-right: outset;">92.08</td>
<td class="data-td data last">-0.04</td>
</tr>
<tr class="tbl-data">
<td class="data-td last font-weight-normal">Energy</td>
<td class="data-td data last">14.75</td>
<td class="data-td data last">14.17</td>
<td class="data-td data last" style="border-right: outset;">13.08</td>
<td class="data-td data last">259</td>
<td class="data-td data last">260</td>
<td class="data-td data last" style="border-right: outset;">245</td>
<td class="data-td data last">92.49</td>
<td class="data-td data last">92.37</td>
<td class="data-td data last" style="border-right: outset;">91.99</td>
<td class="data-td data last">0.09</td>
</tr>
<tr class="tbl-data">
<td class="data-td last font-weight-normal">Financial Services</td>
<td class="data-td data last">1.14</td>
<td class="data-td data last">1.08</td>
<td class="data-td data last" style="border-right: outset;">1.13</td>
<td class="data-td data last">378</td>
<td class="data-td data last">416</td>
<td class="data-td data last" style="border-right: outset;">364</td>
<td class="data-td data last">86.41</td>
<td class="data-td data last">84.44</td>
<td class="data-td data last" style="border-right: outset;">85.80</td>
<td class="data-td data last">2.14</td>
</tr>
<tr class="tbl-data">
<td class="data-td last font-weight-normal">Healthcare</td>
<td class="data-td data last">4.10</td>
<td class="data-td data last">4.16</td>
<td class="data-td data last" style="border-right: outset;">4.24</td>
<td class="data-td data last">270</td>
<td class="data-td data last">247</td>
<td class="data-td data last" style="border-right: outset;">239</td>
<td class="data-td data last">88.73</td>
<td class="data-td data last">89.43</td>
<td class="data-td data last" style="border-right: outset;">88.92</td>
<td class="data-td data last">-0.09</td>
</tr>
<tr class="tbl-data">
<td class="data-td last font-weight-normal">Insurance</td>
<td class="data-td data last">1.32</td>
<td class="data-td data last">1.35</td>
<td class="data-td data last" style="border-right: outset;">1.37</td>
<td class="data-td data last">323</td>
<td class="data-td data last">270</td>
<td class="data-td data last" style="border-right: outset;">259</td>
<td class="data-td data last">94.10</td>
<td class="data-td data last">96.46</td>
<td class="data-td data last" style="border-right: outset;">95.49</td>
<td class="data-td data last">-0.48</td>
</tr>
<tr class="tbl-data">
<td class="data-td last font-weight-normal">Leisure</td>
<td class="data-td data last">7.90</td>
<td class="data-td data last">8.00</td>
<td class="data-td data last" style="border-right: outset;">4.96</td>
<td class="data-td data last">228</td>
<td class="data-td data last">205</td>
<td class="data-td data last" style="border-right: outset;">196</td>
<td class="data-td data last">93.21</td>
<td class="data-td data last">93.98</td>
<td class="data-td data last" style="border-right: outset;">94.28</td>
<td class="data-td data last">0.24</td>
</tr>
<tr class="tbl-data">
<td class="data-td last font-weight-normal">Real Estate</td>
<td class="data-td data last">9.07</td>
<td class="data-td data last">10.73</td>
<td class="data-td data last" style="border-right: outset;">9.83</td>
<td class="data-td data last">675</td>
<td class="data-td data last">575</td>
<td class="data-td data last" style="border-right: outset;">525</td>
<td class="data-td data last">82.72</td>
<td class="data-td data last">83.95</td>
<td class="data-td data last" style="border-right: outset;">81.71</td>
<td class="data-td data last">-2.31</td>
</tr>
<tr class="tbl-data">
<td class="data-td last font-weight-normal">Retail</td>
<td class="data-td data last">14.38</td>
<td class="data-td data last">14.41</td>
<td class="data-td data last" style="border-right: outset;">17.20</td>
<td class="data-td data last">242</td>
<td class="data-td data last">230</td>
<td class="data-td data last" style="border-right: outset;">203</td>
<td class="data-td data last">86.39</td>
<td class="data-td data last">87.10</td>
<td class="data-td data last" style="border-right: outset;">87.45</td>
<td class="data-td data last">0.11</td>
</tr>
<tr class="tbl-data">
<td class="data-td last font-weight-normal">Services</td>
<td class="data-td data last">0.64</td>
<td class="data-td data last" style="border-right: outset;">0.64</td>
<td class="data-td data last">243</td>
<td class="data-td data last">219</td>
<td class="data-td data last" style="border-right: outset;">222</td>
<td class="data-td data last">94.78</td>
<td class="data-td data last">95.80</td>
<td class="data-td data last" style="border-right: outset;">94.13</td>
<td class="data-td data last">-1.30</td>
</tr>
<tr class="tbl-data">
<td class="data-td last font-weight-normal">Technology &amp; Electronics</td>
<td class="data-td data last">6.22</td>
<td class="data-td data last">5.50</td>
<td class="data-td data last" style="border-right: outset;">5.58</td>
<td class="data-td data last">194</td>
<td class="data-td data last">220</td>
<td class="data-td data last" style="border-right: outset;">206</td>
<td class="data-td data last">94.14</td>
<td class="data-td data last">92.81</td>
<td class="data-td data last" style="border-right: outset;">92.08</td>
<td class="data-td data last">-0.34</td>
</tr>
<tr class="tbl-data">
<td class="data-td last font-weight-normal">Telecommunications</td>
<td class="data-td data last">13.00</td>
<td class="data-td data last">12.96</td>
<td class="data-td data last" style="border-right: outset;">13.18</td>
<td class="data-td data last">366</td>
<td class="data-td data last">370</td>
<td class="data-td data last" style="border-right: outset;">357</td>
<td class="data-td data last">92.22</td>
<td class="data-td data last">91.68</td>
<td class="data-td data last" style="border-right: outset;">90.77</td>
<td class="data-td data last">-0.36</td>
</tr>
<tr class="tbl-data">
<td class="data-td last font-weight-normal">Transportation</td>
<td class="data-td data last">2.09</td>
<td class="data-td data last">2.10</td>
<td class="data-td data last" style="border-right: outset;">2.15</td>
<td class="data-td data last">209</td>
<td class="data-td data last">210</td>
<td class="data-td data last" style="border-right: outset;">187</td>
<td class="data-td data last">94.92</td>
<td class="data-td data last">94.86</td>
<td class="data-td data last" style="border-right: outset;">94.35</td>
<td class="data-td data last">-0.10</td>
</tr>
<tr class="tbl-data">
<td class="data-td last font-weight-normal">Utility</td>
<td class="data-td data last">8.71</td>
<td class="data-td data last">8.63</td>
<td class="data-td data last" style="border-right: outset;">8.67</td>
<td class="data-td data last">139</td>
<td class="data-td data last">146</td>
<td class="data-td data last" style="border-right: outset;">140</td>
<td class="data-td data last">92.18</td>
<td class="data-td data last">91.72</td>
<td class="data-td data last" style="border-right: outset;">90.29</td>
<td class="data-td data last">-1.18</td>
</tr>
<tr class="tbl-data">
<td class="data-td last font-weight-normal">Total</td>
<td class="data-td data last">100</td>
<td class="data-td data last" style="border-right: outset;">100</td>
<td class="data-td data last">285</td>
<td class="data-td data last">283</td>
<td class="data-td data last" style="border-right: outset;">260</td>
<td class="data-td data last">91.20</td>
<td class="data-td data last">91.10</td>
<td class="data-td data last" style="border-right: outset;">90.33</td>
<td class="data-td data last">-0.40</td>
</tr>
</tbody>
</table>
</div>
<br />
<p class="chart-disclosure">Source: ICE Data Services, VanEck. Returns are based on partial period data. Fallen Angels: ICE US Fallen Angel High Yield 10% Constrained Index. Not intended as a recommendation to invest or divest in any of the sectors mentioned herein. Index performance is not representative of fund performance. It is not possible to invest in an index.</p>
<p><strong><u>Fallen Angels Performance by Rating:</u></strong> Within the fallen angel index, single-Bs outperformed BBs and CCCs, but we continue to pay close attention to the single-B price as the gap to BBs has increased due to the lower duration experienced by lower credits. There have only been two other times where the price of single-B fallen angels was much higher than BBs: January 2009 and March 2020.</p>
<div class="wrapped-div">
<table style="width: 100%;">
<tbody>
<tr class="tbl-data">
<td class="tbl-header last text-center">&nbsp;</td>
<td class="tbl-header last text-center" style="border-right: outset;" colspan="3">Wgt (%)</td>
<td class="tbl-header last text-center" style="border-right: outset;" colspan="3">OAS</td>
<td class="tbl-header last text-center" style="border-right: outset;" colspan="3">Price</td>
<td class="tbl-header last text-center">Total Return</td>
</tr>
<tr class="tbl-data">
<td class="data-td data last">&nbsp;</td>
<td class="data-td data last">12/31/2023</td>
<td class="data-td data last">1/31/2024</td>
<td class="data-td data last" style="border-right: outset;">2/29/2024</td>
<td class="data-td data last">12/31/2023</td>
<td class="data-td data last">1/31/2024</td>
<td class="data-td data last" style="border-right: outset;">2/29/2024</td>
<td class="data-td data last">12/31/2023</td>
<td class="data-td data last">1/31/2024</td>
<td class="data-td data last" style="border-right: outset;">2/29/2024</td>
<td class="data-td data last">MTD</td>
</tr>
<tr class="tbl-data">
<td class="data-td last font-weight-normal">BB</td>
<td class="data-td data last">80.55</td>
<td class="data-td data last" style="border-right: outset;">82.31</td>
<td class="data-td data last">219</td>
<td class="data-td data last">221</td>
<td class="data-td data last" style="border-right: outset;">209</td>
<td class="data-td data last">92.44</td>
<td class="data-td data last">92.34</td>
<td class="data-td data last" style="border-right: outset;">91.60</td>
<td class="data-td data last">-0.37</td>
</tr>
<tr class="tbl-data">
<td class="data-td last font-weight-normal">B</td>
<td class="data-td data last">13.43</td>
<td class="data-td data last">13.42</td>
<td class="data-td data last" style="border-right: outset;">12.44</td>
<td class="data-td data last">317</td>
<td class="data-td data last">318</td>
<td class="data-td data last" style="border-right: outset;">308</td>
<td class="data-td data last">96.46</td>
<td class="data-td data last">96.31</td>
<td class="data-td data last" style="border-right: outset;">95.62</td>
<td class="data-td data last">-0.07</td>
</tr>
<tr class="tbl-data">
<td class="data-td last font-weight-normal">CCC</td>
<td class="data-td data last">5.44</td>
<td class="data-td data last">6.04</td>
<td class="data-td data last" style="border-right: outset;">5.25</td>
<td class="data-td data last">1,130</td>
<td class="data-td data last">1,022</td>
<td class="data-td data last" style="border-right: outset;">949</td>
<td class="data-td data last">69.40</td>
<td class="data-td data last">70.01</td>
<td class="data-td data last" style="border-right: outset;">66.80</td>
<td class="data-td data last">-1.57</td>
</tr>
<tr class="tbl-data">
<td class="data-td last font-weight-normal">CC</td>
<td class="data-td data last">0.58</td>
<td class="data-td data last">-</td>
<td class="data-td data last" style="border-right: outset;">-</td>
<td class="data-td data last">809</td>
<td class="data-td data last">-</td>
<td class="data-td data last" style="border-right: outset;">-</td>
<td class="data-td data last">76.82</td>
<td class="data-td data last">-</td>
<td class="data-td data last" style="border-right: outset;">-</td>
<td class="data-td data last">-</td>
</tr>
<tr class="tbl-data">
<td class="data-td last font-weight-normal">Total</td>
<td class="data-td data last">100</td>
<td class="data-td data last" style="border-right: outset;">100</td>
<td class="data-td data last">285</td>
<td class="data-td data last">283</td>
<td class="data-td data last" style="border-right: outset;">260</td>
<td class="data-td data last">91.20</td>
<td class="data-td data last">91.10</td>
<td class="data-td data last" style="border-right: outset;">90.33</td>
<td class="data-td data last">-0.40</td>
</tr>
</tbody>
</table>
</div>
<br />
<p class="chart-disclosure">Source: ICE Data Services, VanEck. Returns are based on partial period data. Fallen Angels: ICE US Fallen Angel High Yield 10% Constrained Index. Not intended as a recommendation to invest or divest in any of the sectors mentioned herein. Index performance is not representative of fund performance. It is not possible to invest in an index. BB index: ICE BofA BB US High Yield Index; Single-B index: ICE BofA Single-B US High Yield Index; CCC &amp; Lower rated index ICE BofA CCC &amp; Lower US High Yield Index.</p>
<p>To receive more <strong><a href="https://www.vaneck.com/us/en/insights/income-investing/" title="Income Investing Insights">Income Investing</a></strong> insights, <strong><a href="https://www.vaneck.com/us/en/subscribe/" title="Subscription Center">sign up in our subscription center</a></strong>.</p>
<style>
    .data-td.data {
        padding-right: 5px !important;
    }

    .wrapped-div {
        max-width: 100%;
    }

    @media (max-width: 1240px) {
        .wrapped-div {
            overflow-x: scroll;
        }
    }

    .wrapped-div-sector {
        max-width: 100%;
        overflow-x: scroll;
    }
</style>
]]></content:encoded>
</item><item rdf:about="https://www.vaneck.com/us/en/blogs/gold-investing/ima-casanova-gold-miners-are-digging-in-despite-your-disinterest/">
  <title>Gold Miners are Digging In (Despite Your Disinterest)></title>
  <link>https://www.vaneck.com/us/en/blogs/gold-investing/ima-casanova-gold-miners-are-digging-in-despite-your-disinterest/</link>
  <description><![CDATA[Gold was little-changed in February; gold equities are poised to benefit from the recent upswing in gold prices.]]></description>
  <dc:creator>Imaru Casanova</dc:creator>
  <dc:date>03/13/2024 06:30:00</dc:date>
<content:encoded><![CDATA[

<p>Monthly gold market and economic insights from Imaru Casanova, Portfolio Manager, featuring her unique views on mining and gold&rsquo;s portfolio benefits. <a href="/us/en/blogs/gold-investing/ima-casanova-gold-miners-are-digging-in-despite-your-disinterest/gold-monthly-commentary-february-2024.pdf" target="_blank" rel="noopener" title="Gold Miners are Digging In (Despite Your Disinterest)"><strong>An expanded PDF version of this commentary, including fund specific information can be downloaded here.</strong></a></p>
<h2>Little love for gold (and even less for the miners)</h2>
<p>Gold was little-changed in February, closing below $2,000 per ounce on February 13 and 14 before moving back and holding above this level for the remainder of the month. Gold eventually settled at $2,044 per ounce on February 29, up 0.23% for the month. U.S. core and headline Consumer Price Index (CPI) readings for January were above consensus expectations, pushing out the likelihood of a U.S. Federal Reserve (Fed) rate cut to later in the year and putting pressure on gold by mid-month. Gold later found support to establish an average closing price of $2,029 per ounce so far this year &ndash; not too bad, considering that, over the same time period, the U.S. dollar (as measured by the DXY Index<sup>1</sup>) is up 2.8% and gold bullion investment demand (as gauged by holdings in gold-backed ETFs) is down 3.7%.</p>
<p>While gold bullion was seemingly unloved this past month, gold stocks basically had their heart broken. The NYSE Arca Gold Miners Index (GDMNTR)<sup>2</sup>&nbsp;and the MVIS Global Juniors Gold Miners Index (MVGDXJTR)<sup>3</sup>&nbsp;were down 6.10% and 6.84%, respectively, in February, further widening the already significant valuation gap against the metal. The first days of March have brought some relief to gold equity investors, though, with gold mining stocks strongly outperforming gold bullion as gold reaches new all time-highs. This could be the beginning of a reversion-to-the-mean trend that sees gold mining equities once again display their leverage to the gold price and outperform bullion when gold prices are rising. For reference, GDMNTR would have to more than double from current levels to reach its peak of August 2011&mdash;so there still appears to be a fair amount of potential runway just based on historical performance.</p>
<h2>Gold miners are really digging in</h2>
<p>We attended the BMO Global Metals, Mining and Critical Minerals Conference last month. We met with the management of more than 40 gold and precious metal companies. This conference provides an excellent opportunity to take the pulse of the sector, identify trends and themes, and get updates from the individual companies, while potentially discovering new investment ideas. Here are some of our key takeaways:</p>
<ul class="content-list">
<li class="mt-2"><strong>Location, location, location &mdash;</strong> It is no secret that mining companies face many risks related to the regions where they operate. However, it is important (and necessary if you want to invest in the sector) to differentiate between broader jurisdictional risk and risks to mining operations, specifically. We met with companies with projects in regions/jurisdictions considered geopolitically risky &ndash; including in countries like Peru, Ecuador, Guyana, Nicaragua, Papua New Guinea and Ethiopia &ndash; yet with managements seemingly enjoying operational stability within these places. Ivory Coast and Guinea appear to be considered pockets of stability in the complex West African region. West Africa, a challenging jurisdiction due to the geopolitical landscape, continues to be one of the best regions to discover and develop gold resources from an exploration, permitting, labor and capital efficiency point of view. While companies seem more cautious about ongoing changes and developments taking places within countries such as Argentina, Colombia and Mexico, the general outlook with respects to mine operation and investment appears to be optimistic.</li>
<li class="mt-2"><strong>Setting expectations &mdash;</strong> Companies are well aware of the importance of delivering against announced targets. We communicated the urgent need to develop detailed methodologies that allow companies to do this successfully, given the complexities and many variables involved in projecting production, operating and capital costs for operations and projects. Those companies with advanced and conservative processes for guidance setting should benefit from the significantly higher valuation multiples that come with meeting or beating expectations.</li>
<li class="mt-2"><strong>Refocusing on cost control &mdash;</strong> Following a wave of inflation that increased operating and capital costs significantly over the past couple of years (mostly outside of the control of the mining companies) there is a renewed focus on implementing cost control and reduction initiatives. Anecdotally, we also heard that Australian labor inflation is easing after 2 years. It appears that inflationary pressures have abated which, combined with companies&rsquo; efforts to reduce costs, should keep average costs for the industry contained around current levels.</li>
<li class="mt-2"><strong>Free cash flow abounds &mdash;</strong> While rising costs of production have pressured margins, at current gold prices companies are generating a lot of cash. For example, one of our mid-tier holdings, with a $1.5 billion market cap, holds in excess of $640 million in cash with zero debt. The company pays a dividend and is trying to make acquisitions to put some cash to work. However, with an operating cash flow of more than $400 million annually, it seems set to continue to build its treasury. This bodes well for dividend seeking investors as companies are committed to establishing sustainable base dividends with potential for bonus or special dividends as free cash flow expands.</li>
<li class="mt-2"><strong>Acquisitions come with challenges &mdash;</strong> Whether at the asset- or at the company-level, the integration of new projects and operations comes with risks and challenges. Acquiring companies must provide updated strategies, restructuring plans, operating and financial forecasts. This increases risks for these companies and creates uncertainty in the markets. Companies must be able to manage these risks in their pursuit of growth and value creation. Over the long-term, acquisitions will bear fruit for strong management teams. However, in the short-term, these acquisitions can create overhang on their stocks.</li>
</ul>
<p>The gold mining industry is without a doubt a very challenging business. We spent most of our time at the conference discussing with management their strategies and how they are tackling what we believe are the biggest risks for each company. We are encouraged to see gold mining companies focus their efforts on de-risking their businesses; reducing costs; enhancing shareholder returns; and targeting disciplined growth with the participation, support and for the benefit of host countries and communities in an environmentally responsible and ethical manner.</p>
<p>To receive more <strong><a href="https://www.vaneck.com/us/en/insights/gold-investing/" title="Gold Investing Insights">Gold Investing</a></strong> insights, <strong><a href="https://www.vaneck.com/us/en/subscribe/" title="Subscription Center">sign up in our subscription center</a></strong>.</p>
]]></content:encoded>
</item><item rdf:about="https://www.vaneck.com/us/en/blogs/municipal-bonds/itm-etf-question-and-answer/">
  <title>ITM ETF: Question &amp; Answer></title>
  <link>https://www.vaneck.com/us/en/blogs/municipal-bonds/itm-etf-question-and-answer/</link>
  <description><![CDATA[This blog addresses frequently asked questions on investment grade municipal bonds and the VanEck Intermediate Muni ETF (ITM).]]></description>
  <dc:creator>Dylan  Desai</dc:creator>
  <dc:date>03/12/2024 06:30:00</dc:date>
<content:encoded><![CDATA[

<ul class="content-list">
<li><a href="#point-one"><strong>What are investment grade municipal bonds, and how big is the market?</strong></a></li>
<li><a href="#point-two"><strong>What makes municipal bonds attractive relative to other types of bonds?</strong></a></li>
<li><a href="#point-three"><strong>What is the VanEck Intermediate Muni ETF?</strong></a></li>
<li><a href="#point-four"><strong>How is the fund&rsquo;s index constructed?</strong></a></li>
<li><a href="#point-five"><strong>Why might investors be interested in intermediate duration munis?</strong></a></li>
<li><a href="#point-six"><strong>What is roll yield?</strong></a></li>
<li><a href="#point-seven"><strong>How do munis compare in the risk/reward profile?</strong></a></li>
<li><a href="#point-eight"><strong>How does the portfolio management team decide which bonds in the index to own?</strong></a></li>
<li><a href="#point-nine"><strong>Where can investors buy VanEck Intermediate Muni ETF?</strong></a></li>
</ul>
<h2 id="point-one" class="jump-link-nav anchored-block" data-jumplink-title="What are IG Munis?">What are investment grade municipal bonds, and how big is the market?</h2>
<p>Investment-grade municipal bonds are a type of debt security issued by a state, municipality, county, or other local government with credit ratings of Baa3/BBB&mdash;or above.</p>
<p>These bonds are issued to raise capital for various types of public infrastructure and public benefit projects. Investment grade municipals can be issued as either general obligation bonds or revenue bonds. General obligation bonds are backed by the full faith, credit, and taxing power of the issuer. In contrast, revenue bonds are secured by the revenue generated by a specific project that is being financed.</p>
<p>As of the third quarter of 2023, SIFMA estimated that roughly $4.04 trillion worth of municipal bonds are currently outstanding.</p>
<h2 id="point-two" class="anchored-block">What makes municipal bonds attractive relative to other types of bonds?</h2>
<ul class="content-list">
<li>Potential for Higher Yields: Compared to taxable fixed income securities, municipal bonds may offer investors higher taxable equivalent yields, especially for investors in a high tax bracket.</li>
<li>Tax Advantages: the interest income generated by municipal bonds is generally exempt from federal income tax and, in some cases, exempt from state and local taxes, as well. Investors in higher tax brackets can see the benefits of investing in municipal securities when comparing a municipal bond&rsquo;s taxable equivalent yield to the yield on a taxable bond.</li>
</ul>
<h3>Capitalize on Higher Tax-Equivalent Yield</h3>
<p><img loading="lazy" class="img-responsive w-100" src="https://www.vaneck.com/contentassets/f4df9a3659704a448dcf4a8b08f756f0/4207_itm-faq-blog_chart-1_2023.03_blog.svg" alt="Capitalize on Higher Tax-Equivalent Yield" /></p>
<p class="chart-disclosure">Source: ICE Data Services. Data as of 2/29/2024. Please see important index definitions at the end of this content. Index performance is not illustrative of fund performance. It is not possible to invest directly in an index.</p>
<h2 id="point-three" class="jump-link-nav anchored-block" data-jumplink-title="What is ITM?">What is the VanEck Intermediate Muni ETF?</h2>
<p>The VanEck Intermediate Muni ETF is an exchange-traded fund that seeks to track the performance of an index composed of investment-grade municipal bonds with intermediate-term maturities.</p>
<div class="epi-contentfragment">faq-banner-cta</div>
<h2 id="point-four" class="anchored-block">How is the fund&rsquo;s index constructed?</h2>
<p><a href="/link/34b93d6c4ba74006913a58769f7e7e77.aspx" title="ITM - VanEck Intermediate Muni ETF - Overview"><strong>VanEck Intermediate Muni ETF (ITM)</strong></a> seeks to track the ICE Intermediate AMT-Free Broad National Municipal Index (&ldquo;Intermediate Index&rdquo;). The Intermediate Index tracks the overall performance of the U.S. dollar-denominated intermediate-term tax-exempt bond market. Securities must have at least 6 years but less than 17 years remaining in the term to final maturity, a fixed coupon schedule, and an investment grade rating. Qualifying securities must have at least $10 million currently outstanding face value and must be part of a deal with an original offering size of at least $100 million. Limited offering securities are included in the Intermediate Index; primary and secondarily insured securities qualify for inclusion based on the insured rating. Private placement, variable rate demand obligations, securities in legal default, floating rate debt, municipal commercial paper, and debt issued under the Municipal Liquidity Facility are excluded from the index. The Intermediate Index is rebalanced monthly on the last calendar day of the month, and constituents are market cap weighted.</p>
<h2 id="point-five" class="anchored-block">Why might investors be interested in intermediate duration munis?</h2>
<p>The muni yield curve is an important indicator of the health of the municipal bond market and the broader economy. Traditionally, the intermediate part of the curve remains positively sloped and steep, providing attractive roll yield for investors who target these maturities. Steepness refers to the degree of absolute difference between yields of different maturities. This part of the curve makes for a compelling entry to invest due to the higher yield spreads.</p>
<p>Additionally, yields are currently well above historical levels. The recent rate hiking cycle has produced the highest yields in over a decade and presents an attractive income opportunity.</p>
<h3>Advantage Steepness in AAA Muni Curve</h3>
<p><img loading="lazy" class="img-responsive w-100" src="https://www.vaneck.com/contentassets/f4df9a3659704a448dcf4a8b08f756f0/4207_itm-faq-blog_chart-2_2023.03_blog.svg" alt="Advantage Steepness in AAA Muni Curve" /></p>
<p class="chart-disclosure">Source: Bloomberg. Data as of 2/29/2024.</p>
<h2 id="point-six" class="anchored-block">What is roll yield?</h2>
<p>As bonds move closer to final maturity, they typically will have a lower yield each year as they roll down the curve. When a bond&rsquo;s yield drops, its price increases (yield and price move in the opposite direction). Roll yield refers to the amount of price appreciation that occurs as its maturity ages. A strategy targeting the steepest part of the curve may benefit by accessing this roll-yield effect and the inherent price boost that occurs as bonds age. Despite an inverted curve at the short end of the curve, much of the intermediate section remains steep.</p>
<h3>Capture High Roll Yield</h3>
<p><img loading="lazy" class="img-responsive w-100" src="https://www.vaneck.com/contentassets/f4df9a3659704a448dcf4a8b08f756f0/4207_itm-faq-blog_chart-3_2023.03_blog.svg" alt="Capture High Roll Yield" /></p>
<p class="chart-disclosure">Source: Bloomberg. Data as of 2/29/2024.</p>
<h2 id="point-seven" class="anchored-block">How do munis compare in the risk/reward profile?</h2>
<p>Munis make a compelling case from a risk/reward perspective. They feature less risk than corporate bonds and typically have a higher return compared to government bonds. Their tax-exempt status enhances these returns.</p>
<p>From a credit perspective, the Intermediate Index only includes municipal bonds with an investment grade rating. Credit agencies designate these as having a low risk of default. Historically, investment-grade municipal bonds have had very few defaults, with only one in 2022. Since 2013, the average five-year default rate for municipal bonds, including non-investment grade, has been just 0.08%, significantly lower than the 7.8% rate for global corporate bonds, underscoring municipal bonds as a safer investment option.</p>
<p>From a risk standpoint, for investors looking to minimize risk while not compromising on returns, intermediate investment-grade municipal bonds have a strong investment case.</p>
<h3>Investment Grade Municipal Bond Taxable-Equivalent Risk/Return</h3>
<p><strong>2/28/2019 - 2/29/2024</strong></p>
<p><img loading="lazy" class="img-responsive w-100" src="https://www.vaneck.com/contentassets/f4df9a3659704a448dcf4a8b08f756f0/4207_itm-faq-blog_chart-4_2023.03_blog.svg" alt="Investment Grade Municipal Bond Taxable-Equivalent Risk/Return" /></p>
<p class="chart-disclosure">Source: Factset. Data as of 2/29/2024. For illustrative purposes only. Taxable-equivalent return represents the return a taxable bond would have to earn to match &ndash; after federal taxes &ndash; the return available on a tax-exempt municipal bond (excluding AMT). Municipal bonds may be subject to state and local taxes as well as to federal taxes on gains and may be subject to alternative minimum tax. The chart displays the returns of the ICE BofA US Municipal Securities Index on a tax-equivalent return basis and compares such returns to other asset classes as represented by the indexes described at the end of this blog. Municipal, corporate, agency and mortgage-backed bonds are not guaranteed by the full faith and credit of the United States and carry the credit risk of the issuer. Municipal bonds are exempt from federal taxes and often state and local taxes. U.S. Treasuries are exempt from state and local taxes, but subject to federal taxes. Other securities listed are subject to federal, state and local taxes. <strong>Standard deviation</strong> is the statistical measure of the historical volatility of a portfolio. <strong>Historical information is not indicative of future results; current data may differ from data quoted.</strong> The listed indices are unmanaged and are not securities in which an investment can be made. <strong>Past performance is not a guarantee of future results.</strong> Please see important index definitions at the end of this content. Index performance is not illustrative of fund performance.</p>
<h2 id="point-eight" class="anchored-block">How does the portfolio management team decide which bonds in the index to own?</h2>
<p>The Fund, using a &ldquo;passive&rdquo; or indexing investment approach, attempts to approximate the investment performance of the Intermediate Index. Unlike many investment companies that try to &ldquo;beat&rdquo; the performance of a benchmark index, the Fund does not try to &ldquo;beat&rdquo; the Intermediate Index and does not take temporary defensive positions inconsistent with its investment objective of seeking to replicate the Intermediate Index. Because of the practical difficulties and expense of purchasing all the securities in the Intermediate Index, the Fund does not purchase all the securities in the Intermediate Index. Instead, the Adviser utilizes a &ldquo;sampling&rdquo; methodology in seeking to achieve the Fund&rsquo;s objective. As such, the Fund may purchase a subset of the bonds in the Intermediate Index to hold a portfolio of bonds with generally the same risk and return characteristics of the Intermediate Index. The graphic below illustrates this process.</p>
<p><img loading="lazy" class="img-responsive w-100" src="https://www.vaneck.com/contentassets/f4df9a3659704a448dcf4a8b08f756f0/4207_itm-faq-blog_infographic_2023.03_blog.svg" alt="ITM Adjust Constraint Filters Index" /></p>
<p class="chart-disclosure"><sup>*</sup>&nbsp;International Data Corporation (third-party pricing service). The municipal income ETF investment process is subject to change at any time. For illustration purposes only.</p>
<h2 id="point-nine" class="jump-link-nav anchored-block" data-jumplink-title="How to Buy VanEck ETFs?">Where can investors buy VanEck Intermediate Muni ETF?</h2>
<p><a href="https://www.vaneck.com/us/en/investments/intermediate-muni-etf-itm/overview/" title="ITM - VanEck Intermediate Muni ETF - Overview"><strong>Learn more here.</strong></a></p>
<p class="d-none d-lg-block"><a href="mailto:askvaneck@vaneck.com" title="Have More Questions? - Ask VanEck" rel="noopener"><img loading="lazy" class="img-responsive" src="https://www.vaneck.com/globalassets/home/us/insights/blogs/bm-blog-images/cta-faq_desktop-02.svg" alt="Have More Questions? - Ask VanEck" /></a></p>
<p class="d-lg-none"><a href="mailto:askvaneck@vaneck.com" title="Have More Questions? - Ask VanEck" rel="noopener"><img loading="lazy" class="img-responsive" src="https://www.vaneck.com/globalassets/home/us/insights/blogs/bm-blog-images/cta-faq_mobile-01.svg" alt="Have More Questions? - Ask VanEck" /></a></p>
<p>To receive more <a href="https://www.vaneck.com/us/en/insights/municipal-bonds/" title="Municipal Bonds Insights"><strong>Municipal Bonds</strong></a> insights, <a href="https://www.vaneck.com/us/en/subscribe/" title="Subscription Center"><strong>sign up in our subscription center</strong></a>.</p>
]]></content:encoded>
</item><item rdf:about="https://www.vaneck.com/us/en/blogs/digital-assets/matthew-sigel-vaneck-crypto-monthly-recap-for-february-2024/">
  <title>VanEck Crypto Monthly Recap for February 2024></title>
  <link>https://www.vaneck.com/us/en/blogs/digital-assets/matthew-sigel-vaneck-crypto-monthly-recap-for-february-2024/</link>
  <description><![CDATA[In February, Ethereum surpassed Bitcoin, rallying 48% compared to Bitcoin's 45% gain&mdash;Bitcoin's best monthly performance since December 2020 and its largest monthly candle ever in dollar terms.]]></description>
  <dc:creator>Matthew  Sigel</dc:creator>
  <dc:date>03/06/2024 06:30:00</dc:date>
<content:encoded><![CDATA[

<p><strong>Please note that VanEck may have a position(s) in the digital asset(s) described below.</strong></p>
<p>Bitcoin rallied 45%, its best monthly performance since December 2020 and its largest monthly candle ever in dollar terms. The new U.S. spot bitcoin ETFs have bought more than 5 times new Bitcoin supply since their January 10th launch and more than 10 times new supply in the last week of February. Even Marathon, the largest publicly traded U.S. miner, announced in an earnings call that the company bought the ETF with spare cash on a dip. The ETF wrapper, akin to an API connection from TradFi to Bitcoin, makes it much easier to purchase and custody the asset in an affordable and compliant fashion. Among new entrants to the space, Reddit announced it had bought Bitcoin and Ethereum for its balance sheet in an IPO filing, Ethiopia revealed its state-sponsored foray into bitcoin mining, and Merrill Lynch and Wells Fargo rolled out access to the bitcoin ETFs to select wealth management clients with brokerage accounts.</p>
<ul class="content-list">
<li><a href="#smart-contract-platforms"><strong>Smart Contract Platforms: February Update</strong></a></li>
<li><a href="#bitcoin-l2s"><strong>Bitcoin L2s: February Update</strong></a></li>
<li><a href="#notable-performer"><strong>Notable Performer: February Update for Ethereum</strong></a></li>
<li><a href="#notable-laggard"><strong>Notable Laggard: February Update for Arbitrum</strong></a></li>
</ul>
<p>We acknowledge that bitcoin is overbought on technical terms, with the 14-day Relative Strength Index (RSI) at 88 and funding rates above 100% for many altcoins. Still, we stay aggressively positioned to capitalize on the historic pattern for bitcoin, which may suggest the most significant gains during the halving year and subsequent 12 months. Our medium-term price target for BTC is $325k, half the market cap of gold, which also corresponds to the minimum trough-to-peak cycle for the asset, which was 16x in 2020-2021.</p>
<div class="wrapped-div">
<table style="width: 750px;">
<tbody>
<tr class="tbl-data">
<td class="tbl-header last text-center">&nbsp;</td>
<td class="tbl-header last text-center">February</td>
<td class="tbl-header last text-center">1 Year</td>
</tr>
<tr class="tbl-data">
<td class="data-td last">Coinbase</td>
<td class="data-td data last">58%</td>
<td class="data-td data last">212%</td>
</tr>
<tr class="tbl-data">
<td class="data-td last">MarketVector Infrastructure Application Leaders Index</td>
<td class="data-td data last">49%</td>
<td class="data-td data last">98%</td>
</tr>
<tr class="tbl-data">
<td class="data-td last">Ethereum</td>
<td class="data-td data last">48%</td>
<td class="data-td data last">109%</td>
</tr>
<tr class="tbl-data">
<td class="data-td last">Bitcoin</td>
<td class="data-td data last">45%</td>
<td class="data-td data last">166%</td>
</tr>
<tr class="tbl-data">
<td class="data-td last">MarketVector Decentralized Finance Leaders Index</td>
<td class="data-td data last">40%</td>
<td class="data-td data last">48%</td>
</tr>
<tr class="tbl-data">
<td class="data-td last ">MarketVector Media &amp; Entertainment Leaders Index</td>
<td class="data-td data last">38%</td>
<td class="data-td data last">-23%</td>
</tr>
<tr class="tbl-data">
<td class="data-td last">MarketVector Smart Contract Leaders Index</td>
<td class="data-td data last">31%</td>
<td class="data-td data last">109%</td>
</tr>
<tr class="tbl-data">
<td class="data-td last">MarketVector Centralized Exchanges Index</td>
<td class="data-td data last">31%</td>
</tr>
<tr class="tbl-data">
<td class="data-td last">Nasdaq Index</td>
<td class="data-td data last">6%</td>
<td class="data-td data last">40%</td>
</tr>
<tr class="tbl-data">
<td class="data-td last ">S&amp;P 500 Index</td>
<td class="data-td data last ">5%</td>
<td class="data-td data last">28%</td>
</tr>
</tbody>
</table>
</div>
<br />
<p class="chart-disclosure">Source: Bloomberg, as of 2/29/2024. <strong>Past performance is no guarantee of future results. Not intended as a recommendation to buy or sell any securities named herein.</strong></p>
<style>
    .wrapped-div {
        max-width: 100%;
    }

    @media (max-width: 768px) {
        .wrapped-div {
            overflow-x: scroll;
        }
    }

    .wrapped-div-sector {
        max-width: 100%;
        overflow-x: scroll;
    }
</style>

<h2 id="smart-contract-platforms" class="jump-link-nav anchored-block" data-jumplink-title="SCPs Update">Smart Contract Platforms Updates</h2>
<h3>Smart Contract Platforms (SCP) Revenues vs. Daily Active Users</h3>
<p><img class="img-responsive w-100" src="https://www.vaneck.com/contentassets/9e39b092482a4f4db50b8c2472f34709/4195_scl-chart1_2024-03_v1_blog.svg" alt="Smart Contract Platforms Revenues vs. Daily Active Users" /></p>
<p class="chart-disclosure">Source: Artemis XYZ as of 2/27/2024. <strong>Past performance is no guarantee of future results. Not intended as a recommendation to buy or sell any securities named herein.</strong></p>
<p>After tepid price performance in January, February 2024 was an absolute blockbuster month for Smart Contract Platform (SCPs) tokens as the market capitalization of SCPs increased (+33%) from $1.27T to $1.72T were $829M, and as of writing, total revenues generated by SCPs was $829M and on pace to exceed December 2023&rsquo;s revenue total of $838M. Unfortunately, we must dampen our excitement over the revenue figures because <strong>Starknet</strong>, who recently launched its native STRK token, accounted for over (47%) of February&rsquo;s revenue total, or around $391M. Starknet&rsquo;s total for February exceeded Ethereum&rsquo;s by $100M and is very atypical as Starknet has only earned $36M in total revenues since June 2022. Regardless, if February 2024&rsquo;s fee total crests that of January&rsquo;s, it would make it the most profitable month for smart contract blockchains since January 2022.</p>
<p>One extremely positive trend for all SCPs is that the average daily active users of SCPs reached a new high in February 2024 with an average of 7.5M DAUs. Curiously, average daily DEX volumes across all SCPs were lower in February than in January or December. Thematically, February was characterized by jubilation over airdrops, new use cases for Bitcoin, and the potential of decentralized social media applications. In auspicious news for on-chain liquidity, stablecoin supply increased ~$10B in the month of February, moving from $131B to $141B.</p>
<p>As we noted in our <a href="https://www.vaneck.com/us/en/blogs/digital-assets/matthew-sigel-vaneck-crypto-monthly-recap-for-january-2024/" title="VanEck Crypto Monthly Recap for January 2024"><strong>last monthly</strong></a>, one of crypto's most interesting and useful attributes is the ability to market a project by giving users an ownership stake in that project&rsquo;s network. This is called &ldquo;airdropping&rdquo; tokens because users&rsquo; addresses are sent tokens programmatically. In airdrops, applications hand out portions of their limited token allocation to users whose on-chain activity qualifies them as targeted future users of that application&rsquo;s product or service. Often, the ideal type of activity that applications target is the usage of its application before it announces its token. However, other types of on-chain actions are also targeted, and these may include addresses that use a similar category of apps and even users of a direct competitor&rsquo;s application. The most prominent airdrops in February were:</p>
<div class="wrapped-div">
<table style="width: 750px;">
<tbody>
<tr class="tbl-data">
<td class="tbl-header last">Project</td>
<td class="tbl-header last text-center">Token</td>
<td class="tbl-header last text-center"># of Tokens</td>
<td class="tbl-header last text-center">Current Price</td>
<td class="tbl-header last text-center">Total Value</td>
</tr>
<tr class="tbl-data">
<td class="data-td last">Starknet</td>
<td class="data-td data last">STRK</td>
<td class="data-td data last">700,000,000</td>
<td class="data-td data last">$1.83</td>
<td class="data-td data last">$1,281,000,000</td>
</tr>
<tr class="tbl-data">
<td class="data-td last">Dymension</td>
<td class="data-td data last">DYM</td>
<td class="data-td data last">70,000,000</td>
<td class="data-td data last">$5.56</td>
<td class="data-td data last">$389,200,000</td>
</tr>
<tr class="tbl-data">
<td class="data-td last">AltLayer</td>
<td class="data-td data last">ALT</td>
<td class="data-td data last">300,000,000</td>
<td class="data-td data last">$0.48</td>
<td class="data-td data last">$144,300,000</td>
</tr>
</tbody>
</table>
</div>
<br />
<p class="chart-disclosure">Source: Coingecko as of 2/28/2024. <strong>Past performance is no guarantee of future results. Not intended as a recommendation to buy or sell any securities named herein.</strong></p>
<p>Many other projects are rumored to be considering airdrops, and these are Blast, Tensor, Wormhole, LayerZero, Magic Eden, Pixels, Drift Protocol, Saga, Aevo, Parcl, Bluefin, and Ethena.</p>
<h2 id="bitcoin-l2s" class="jump-link-nav anchored-block" data-jumplink-title="Bitcoin L2s Update">Bitcoin L2 Updates</h2>
<p>An emerging narrative that re-surfaced in February is the creation of protocols that make Bitcoin more useful. Since Bitcoin&rsquo;s scripting language is Non-Turing complete by design, it lacks the runtime logic to allow smart contract applications to function on Bitcoin. The result is that Bitcoin has long been considered to be a payments-only application chain. That understanding of Bitcoin changed with the emergence of ordinals, enabled through upgrading the Bitcoin core software that allows users to post arbitrary data to Bitcoin. Thereafter, once pioneering &ldquo;hackers&rdquo; called the Taproot Wizards began uploading NFTs, others rushed to create token standards for NFTs on Bitcoin. The interest in doing more with the Bitcoin blockchain has orthogonally catalyzed renewed interest in also doing more with Bitcoin&rsquo;s value.</p>
<p>Currently, Bitcoin&rsquo;s value can be &ldquo;bridged&rdquo; off Bitcoin by varying means that rely upon different levels of trust. For example, on Ethereum, you can create WBTC or &ldquo;wrapped Bitcoin&rdquo; by sending Bitcoin, on the Bitcoin blockchain, to a trusted third party who mints a representation of the escrowed Bitcoin as the WBTC token. By contrast, a bridging protocol called LayerZero creates a representation of &ldquo;locked&rdquo; Bitcoin on the <strong>Avalanche</strong> blockchain called BTC.B by locking the value of BTC on Bitcoin&rsquo;s blockchain through a consensus network of validators. Other schemes, like <strong>Stacks</strong>, allow Bitcoin to be &ldquo;trustlessly&rdquo; used on the Stacks network because Stacks posts proof of its transactions to Bitcoin&rsquo;s blockchain. Each of these solutions has tradeoffs with respect to safety, convenience, and functionality. More recently, in February, the Bitcoin L2 roll-up <strong>Citrea</strong> launched what it claims to be the first Bitcoin zero-knowledge L2 that will use zero-knowledge cryptography to secure its Bitcoin interactions.</p>
<p>In February, there was a strong bid in the private markets for Bitcoin L2 solutions, which carried over into the public markets. For example, the token powering the Stacks blockchain saw its value increase (+98%) in the month of February. Additionally, glomming on to the airdrop narrative, a shadowy Bitcoin L2 called <strong>Merlin&rsquo;s Seal</strong> was launched and, by the end of the month, had amassed nearly $1.6B in TVL.</p>
<h3>Merlin Seal Total Value Locked (TVL) by Blockchain</h3>
<p><img class="img-responsive w-100" src="https://www.vaneck.com/contentassets/9e39b092482a4f4db50b8c2472f34709/4195_scl-chart6_2024-03_v1_blog.svg" alt="Smart Contract Platforms Revenues vs. Daily Active Users" /></p>
<p class="chart-disclosure">Source: Defillama as of 2/28/2024. <strong>Past performance is no guarantee of future results. Not intended as a recommendation to buy or sell any securities named herein.</strong></p>
<p>One interesting Bitcoin project to watch is <strong>Babylon</strong> by Standford professor David Tse. In February, Babylon announced a partnership with the <strong>Cosmos Hub (ATOM)</strong> to bring trustless BTC security to Cosmos blockchains. The stated purpose of this endeavor is to allow Bitcoin holders to receive a yield on their Bitcoin by non-custodial staking of Cosmos blockchain validators. Essentially, this means that a Bitcoin holder can lock his BTC on Bitcoin through a Babylon blockchain smart contract to lend out the value of the BTC. Babylon claims that this is all made possible through a series of cryptographic primitives that allow native &ldquo;slashing&rdquo; of BTC in the event a BTC-backed validator acts maliciously. If Babylon is thriving and widely adopted, it could be a powerful competitor to both WBTC and the other BTC L2s due to its more trustless reliance on cryptography for security. The result is that Babylon, and by extension, the Cosmos Hub, could prove to be a competitor to Ethereum&rsquo;s Eigenlayer for securing Actively Validated Services.</p>
<h3>Smart Contract Platform (SCP) Share of Crypto Market Cap</h3>
<p><img class="img-responsive w-100" src="https://www.vaneck.com/contentassets/9e39b092482a4f4db50b8c2472f34709/4195_scl-chart2_2024-03_v1_blog.svg" alt="Smart Contract Platform Share of Crypto Market Cap" /></p>
<p class="chart-disclosure">Source: Coingecko, Artemis XYZ as of 2/27/2024. <strong>Past performance is no guarantee of future results. Not intended as a recommendation to buy or sell any securities named herein.</strong></p>
<p>One of the forgotten topics of crypto that began to re-emerge in February is a discussion over the long-term value split between applications launched on smart contract blockchains and the smart contract blockchains themselves. This debate was typified by the posts <a href="https://www.usv.com/writing/2016/08/fat-protocols/" target="_blank" title="Fat Protocols" rel="noopener"><strong>Fat Protocols</strong></a> in 2016 and the follow-up post <a href="https://www.placeholder.vc/blog/2020/1/30/thin-applications" target="_blank" title="Thin Applications" rel="noopener"><strong>Thin Applications</strong></a> in 2020. The basic idea is that smart contract blockchains should take most of the value in Web 3.0 because open-source smart contract code, the shared data layer, and the difficulty in differentiation would prevent applications from combining networks with business moats. The result would be that infrastructure rather than applications would accrue most of the business value in contrast to internet Web 2.0 companies.</p>
<p>Curiously, as the above chart demonstrates, this thesis began to sag as a bevy of new applications launched on Ethereum and other SCPs beginning in 2020 and 2021. While DeFi summer unleashed a new category of applications to take advantage of crypto speculation, the market cap of those apps eventually sank relative to SCPs in the bear market. This is because most crypto apps, as Fat Protocols asserts, were non-differentiated and mostly forked copies of one another. The result has been that after reaching a low in the mid-60s, the percentage of crypto market cap that is SCPs has risen during this latest bull market to float in the mid-70s. While February saw this trend of Fat Protocol continue, there was a renewed interest in applications that may reverse that trend.</p>
<p>Currently, there are few applications in crypto that have substantial value relative to SCPs, and, quite frankly, there are few applications that are interesting enough to attract the interest to give them higher valuations. While the category of DePIN holds substantial potential, particularly in apps like <strong>DIMO</strong>, <strong>Hivemapper</strong>, and Helium, outside of this area, there are few applications with the potential to attract 50M+ users.</p>
<p>However, many speculated that this dynamic was changing quickly in February with the rekindled interest in <a href="https://docs.farcaster.xyz/learn/what-is-farcaster/frames" target="_blank" title="Frames" rel="noopener"><strong>Farcaster</strong></a>. Hosted on <strong>Optimism</strong>, Farcaster is a decentralized social media platform that allows anyone to create their own social media application that taps into the open-source social media graph hosted on Farcaster. The most important application on Farcaster was a Twitter clone called Warpcast. At the time of writing, Farcaster had reached nearly 375k total users and around 16k DAUs after peaking at 40k DAUs on February 7. The aspect of Farcaster that attracted particular interest was a core part of its application called &ldquo;<a href="https://docs.farcaster.xyz/learn/what-is-farcaster/frames" target="_blank" title="Frames" rel="noopener"><strong>Frames</strong></a>.&rdquo;</p>
<p>Frames allow anyone to turn any &ldquo;cast&rdquo; or social media post into an interactive application. People are excited about Frames because it enables application creators the ability to cut down on the number of steps for someone to use their application. In essence, you can create applications and posts that can compose with each other. Frames and Farcaster also enable a better attribution engine that allows people to monetize their content better while creating an open-source, immutable graph that allows any party to analyze that user behavior. By contrast, it is challenging to allow applications to coordinate with each other on Web 2.0 platforms like Facebook. Facebook must approve the creation and deployment of applications to Facebook, and Facebook owns and hoards all the collected data.</p>
<h3>Farcaster Revenue and Casts</h3>
<p><img class="img-responsive w-100" src="https://www.vaneck.com/contentassets/9e39b092482a4f4db50b8c2472f34709/4195_scl-chart3_2024-03_v1_blog.svg" alt="Farcaster Revenue and Casts" /></p>
<p class="chart-disclosure">Source: Dune @pixelhack as of 2/27/2024.<strong> Past performance is no guarantee of future results. Not intended as a recommendation to buy or sell any securities named herein.</strong></p>
<h2>Decentralized Exchange (DEX) Updates</h2>
<p>Outside of the major themes of the month, we saw renewed interest in DEXes and value accrual to their tokens. This is due to a proposal being posted to the <strong>Uniswap</strong> governance forum that would grant Uniswap token holders a portion of the fees from trading on Uniswap&rsquo;s DEX. Long rumored to be non-desirable to pass due to legal issues, the fact that a value accrual proposal was posted led many to contend that the legal environment for crypto was on the cusp of rapidly changing. Some even attributed the perception of this legal shift to the late February push of the BTC price from the low 50s towards the ~63.6K peak it reached on February 28. Another major news item for the month was the 5-hour outage of <strong>Solana </strong>on February 6th that was caused by an issue with Solana BPF. While Solana secured 100k pre-orders for its Chapter 2 mobile phone, the outage and its outsized rally over the preceding months kept its price appreciation somewhat subdued compared to other chains (+28%).</p>
<p>Continuing around the horn of notable events, <strong>Blast</strong>, an NFT-focused L2 by the famous developer named &ldquo;Pacman,&rdquo; reached $2B in TVL amid airdrop rumors. <strong>Avalanche</strong>&rsquo;s long-awaited FPS game Shrapnel was listed on the Epic Games store. Meanwhile, <strong>Polygon</strong> laid off 19% of its staff while announcing the Elderberry upgrade to its zkEVM, which sets it on the path to becoming a Type I Prover that can prove any EVM chain. Polygon also unveiled more details surrounding its Aggregation Layer roadmap, where it would act as a unified settlement and proof layer to make L2 bridging more efficient and settlement cheaper. Open AI launched a preview of its video rendering generative AI, spurring a rally in AI names, including WorldCoin, whose WLD coin increased 236% in the month of February. Meanwhile, the highly controversial &ldquo;stablecoin&rdquo; project, Ethena, which can be more accurately characterized as a basis trade yield-bearing strategy, raised its vault size to $200M. Finally, outside of the echo chamber of crypto Twitter, the fork of Ripple called Stellar has announced the phased rollout of smart contracts through its Sorobon upgrade.</p>
<h2 id="notable-performer" class="jump-link-nav anchored-block" data-jumplink-title="Notable Performer Update">February&rsquo;s Notable Winner</h2>
<p><strong>Ethereum (+48%)</strong></p>
<h3>Ethereum Revenues vs. Market Share of SCP Revenues</h3>
<p><img class="img-responsive w-100" src="https://www.vaneck.com/contentassets/9e39b092482a4f4db50b8c2472f34709/4195_scl-chart4_2024-03_v1_blog.svg" alt="Ethereum Revenues vs. Market Share of SCP Revenues" /></p>
<p class="chart-disclosure">Source: Artemis XYZ as of 2/28/2024.<strong> Past performance is no guarantee of future results. Not intended as a recommendation to buy or sell any securities named herein.</strong></p>
<p>Finally in February, Ethereum broke its curse of always being the bridesmaid during the crypto rally and never the bride, as it became the belle of the February&rsquo;s crypto ball with returns of (+48%). This made it the second most performant SCP token in the month of February behind Stacks. While Ethereum did not generate enough revenues to exceed its December figures ($284M in February), it was able to continue to take market share of the SCP market (once removing Starknet&rsquo;s highly aberrant surges in revenue). This could mark a turning point for Ethereum as it would represent the highest revenue market share, (65.1%), since July 2023. With respect to Ethereum fundamental metrics, Ethereum&rsquo;s DAU was up only 1%. Over the past 12 months, Ethereum&rsquo;s DAU count is up only 12% and has been mostly flat on a month-to-month basis. Perhaps Ethereum has reached the limit of its daily active users due to gas constraints?</p>
<p>We attribute Ethereum&rsquo;s outperformance in February to several factors. First, Solana&rsquo;s outage redirected attention towards more reliable chains like Ethereum who have never experienced downtime. Second, the creation of the ERC-404 standard, which allows for divisible NFTs, resulted in renewed interest in Ethereum NFTs in February. Additionally, speculation over a potential spot ETH ETF as well as enthusiasm around Ethereum&rsquo;s important ETH Denver Conference beginning at the end of February also boosted ETH&rsquo;s price. Another interesting narrative contributing to the ETH rally is the idea of gaining yield on re-staked ETH by backing Eigenlayer&rsquo;s AVS and even decentralized sequencers. On the first point, many ETH holders are participating in ETH restaking as Eigenlayer&rsquo;s TVL sits at 2.78M ETH worth $9.8B. With respect to decentralized sequencers, referred to as Based Sequencers, ETH would be used to guarantee the honesty of a set of sequencers that would operate on Ethereum L2s. In return, those ETH holders backing those sequencers would receive transaction fees. Finally, there is a good deal of anticipation in the Ethereum community around the upcoming Dencun upgrade with the key Ethereum software improvement to allow data blobs on Ethereum. These data blobs will help Ethereum scale by making L2 transactions cheaper.</p>
<h2 id="notable-laggard" class="jump-link-nav anchored-block" data-jumplink-title="Notable Laggard Update">February&rsquo;s Notable Laggard</h2>
<p><strong>Arbitrum (+13.3%)</strong></p>
<h3>Arbitrum Market Share of L2 Daily Active Users</h3>
<p><img class="img-responsive w-100" src="https://www.vaneck.com/contentassets/9e39b092482a4f4db50b8c2472f34709/4195_scl-chart5_2024-03_v1_blog.svg" alt="Arbitrum Market Share of L2 Daily Active Users" /></p>
<p class="chart-disclosure">Source: Artemis XYZ s of 2/28/2024. <strong>Past performance is no guarantee of future results. Not intended as a recommendation to buy or sell any securities named herein.</strong></p>
<p>In February, Arbitrum&rsquo;s ARB token was a victim of its competitors, generating more excitement combined with Arbitrum&rsquo;s token unlocks. Currently, the most powerful force fueling token price appreciation is narrative, and Arbitrum seems to have lost the plot as Bitcoin L2s, Blast, Optimism (through Farcaster and Worldcoin), and Polygon gain attention for each&rsquo;s respective vision. This narrative fumble bled into fundamental metrics for Arbitrum as its market share of usership amongst L2s declined from (13%) at the start of 2024 to roughly (9%) at the end of February. While Arbitrum was able to maintain its market share of revenues amongst L2s, its relative DEX volumes status, and Arbitrum&rsquo;s its TVL, its average DAU actually declined (-0.91%) in February compared to January.</p>
<p>The most bearish news facing Arbitrum is that 1.1B ARB ($2.2B) tokens will be unlocked to investors and the Arbitrum team on March 16. This would increase Arbitrum&rsquo;s circulating supply of ARB tokens by (+74%). Additionally, as other L2s for Bitcoin gain traction and purpose-built blockchains like Blast and Optimism&rsquo;s OP stack chains promise innovative new applications, Arbitrum appears to be simply treading water as its competitors advance. Likewise, there remain unanswered questions with the viability of Arbitrum&rsquo;s L3 scaling strategy given capital inefficiency of 14-day challenge periods as well as dependability concerns given Arbitrum&rsquo;s reliance on a sole sequencer. Finally, security concerns persist around Arbitrum&rsquo;s fraud proofs because currently only 14 whitelisted entities are enabled to spot on-chain malicious activity by Arbitrum&rsquo;s sequencer. While any one of these entities could prevent fraud, until fraud proofs are opened to the broader crypto community, concerns over security will endure. While Arbitrum&rsquo;s fraud-proof system is vastly superior to that of its optimistic L2 roll-up (ORUs) competitors, it lags behind the stronger trust assumptions of zk L2 roll-ups (ZKUs). As it stands right now, while Arbitrum and other ORUs have a &ldquo;trust me&rdquo; approach to preventing fraud by each of their sequencers, ZKUs provide direct evidence through cryptography of untampered activity.</p>
<p><strong>Links to third party websites are provided as a convenience and the inclusion of such links does not imply any endorsement, approval, investigation, verification or monitoring by us of any content or information contained within or accessible from the linked sites. By clicking on the link to a non-VanEck webpage, you acknowledge that you are entering a third-party website subject to its own terms and conditions. VanEck disclaims responsibility for content, legality of access or suitability of the third-party websites.</strong></p>
<p>To receive more <strong><a href="https://www.vaneck.com/us/en/insights/digital-assets/" title="Digital Assets Insights">Digital Assets</a></strong> insights, <strong><a href="https://www.vaneck.com/us/en/subscribe/" title="Subscription Center">sign up in our subscription center</a></strong>.</p>
<style>
    .wrapped-div {
        max-width: 100%;
    }

    @media (max-width: 768px) {
        .wrapped-div {
            overflow-x: scroll;
        }
    }

    .wrapped-div-sector {
        max-width: 100%;
        overflow-x: scroll;
    }
</style>
]]></content:encoded>
</item><item rdf:about="https://www.vaneck.com/us/en/blogs/thematic-investing/semiconductor-stronghold-competitive-advantages-create-collective-success/">
  <title>Semiconductor Stronghold: Competitive Advantages Create Collective Success></title>
  <link>https://www.vaneck.com/us/en/blogs/thematic-investing/semiconductor-stronghold-competitive-advantages-create-collective-success/</link>
  <description><![CDATA[The VanEck Semiconductor ETF (SMH) has assembled a &ldquo;team of winners,&rdquo; where companies bolstered by competitive advantages are poised to benefit from the surging demand for semiconductors.]]></description>
  <dc:creator>Nick Frasse</dc:creator>
  <dc:date>03/01/2024 06:30:00</dc:date>
<content:encoded><![CDATA[

<p>Semiconductors stand at the forefront of modern technology, driving the functionality of electronic devices across various industries. These tiny components play a vital role in powering everything from smartphones to cloud computing servers to artificial intelligence (AI).</p>
<p>The continued adoption of digital technologies across various sectors, including healthcare, automotive, consumer electronics, and industrial automation, is expected to drive demand for semiconductors moving forward. As we continue to ride the wave of technological advancement, semiconductors and artificial intelligence stand at the forefront of this evolution. Together, they drive each other's growth, propelling us into an unprecedented era of technological revolution. The future of AI is anchored in the creation of new, AI-optimized semiconductor chips&mdash;a dynamic we believe is poised to fuel significant growth in the next half-decade.</p>
<h2>Semiconductors Come with Wide Moats</h2>
<p>Morningstar's approach to assessing economic moats provides valuable insight into the semiconductor landscape. Economic moats are sustainable competitive advantages that are expected to allow companies to fend off competition and sustain profitability into the future. Wide moat companies in the semiconductor space include those specializing in peripheral chips, chip equipment, and graphics processors. These companies demonstrate strong competitive positions and are likely to maintain their market dominance for decades.</p>
<h3>SMH ETF "Moat" Exposures</h3>
<p><img class="img-responsive w-100" src="https://www.vaneck.com/contentassets/65b0e016d86d4925a111042e2eb72fe9/4166_smh_chart-1_2024-2_v2_blog.svg" alt="SMH ETF 'Moat' Exposures" /></p>
<h2>Strong Competitive Advantages in SMH&rsquo;s Two Largest Holdings<sup>1</sup></h2>
<ul class="content-list">
<li><strong>NVIDIA (NVDA) &ndash; Moat Rating: Wide: </strong>Nvidia's competitive advantage in the GPU market stems from its pioneering role in graphics processing technology, continuous innovation, and deep expertise in parallel computing. The company enjoys a wide economic moat due to its extensive portfolio of patents, cutting-edge research and development, and strong ecosystem of software and developer tools, which have solidified its dominance in gaming, professional visualization, and, notably, the burgeoning field of artificial intelligence. Nvidia's GPUs are highly preferred for deep learning and AI applications, creating a virtuous cycle where increased usage in AI drives demand for its products, further entrenching its market leadership. This advantage is compounded by high barriers to entry in the GPU market, including significant capital expenditure and technological know-how, deterring potential competitors and securing Nvidia's position at the forefront of the industry.
<div class="d-flex justify-content-center">
<div class="row">
<div class="col-6 text-center"><img class="img-responsive w-100" src="https://www.vaneck.com/globalassets/home/us/education/investment-ideas/moat-campaign-page/intangible-assets-icon.png" alt="Intangible Assets" />
<p class="mt-2"><strong>Intangible Assets</strong></p>
</div>
<div class="col-6 text-center"><img class="img-responsive w-100" src="https://www.vaneck.com/globalassets/home/us/education/investment-ideas/moat-campaign-page/13a4tl.switching-costs-icon.png" alt="Switching Costs" />
<p class="mt-2"><strong>Switching Costs</strong></p>
</div>
</div>
</div>
</li>
<li><strong>Taiwan Semiconductor Manufacturing Company Limited (TSM) &ndash; Moat Rating: Wide: </strong>TSM enjoys a significant competitive advantage due to its advanced technological capabilities, scale, and efficiency in producing logic chips. As the world&rsquo;s largest outsourced semiconductor foundry for logic chips, the company&rsquo;s services are irreplaceable for customers that include vertically integrated original-equipment manufacturers and fabless semiconductor companies. TSM's wide economic moat is further bolstered by the substantial capital investment and technical expertise required to compete in this space, creating high barriers to entry. Moreover, the company's focus on research and development, coupled with its reputation for reliability, quality, and timely delivery, cements its critical position in the global semiconductor supply chain, making it indispensable to industry leaders and maintaining its market dominance.
<div class="d-flex justify-content-center">
<div class="row">
<div class="col-6 text-center"><img class="img-responsive w-100" src="https://www.vaneck.com/globalassets/home/us/education/investment-ideas/moat-campaign-page/cost-advantage-icon.png" alt="Cost Advantages" />
<p class="mt-2"><strong>Cost Advantage</strong></p>
</div>
<div class="col-6 text-center"><img class="img-responsive w-100" src="https://www.vaneck.com/globalassets/home/us/education/investment-ideas/moat-campaign-page/intangible-assets-icon.png" alt="Intangible Assets" />
<p class="mt-2"><strong>Intangible Assets</strong></p>
</div>
</div>
</div>
</li>
</ul>
<style type="text/css">
    .wrapped-div {
        max-width: 100%;
    }

    @media (max-width: 1240px) {
        .wrapped-div {
            overflow-x: scroll;
        }


    }
</style>

<div class="d-flex justify-content-center">
<div class="row">
<div class="col-6 text-center">

</div>
</div>
</div>
<br />
<h2>Accessing a Team of Winners</h2>
<p>We believe the <a href="https://www.vaneck.com/us/en/investments/semiconductor-etf-smh/overview/" title="SMH - VanEck Semiconductor ETF - Overview"><strong>VanEck Semiconductor ETF (SMH)</strong></a> is an attractive way for investors to access the growth potential of semiconductor companies. Rather than attempting to pick individual stock winners in the ever-evolving semiconductor sector, SMH provides exposure to the top 25 most liquid U.S.-listed semiconductor companies, spanning the entire industry value chain from chip design and fabrication to manufacturing machinery.</p>
<p>SMH holds a broad array of companies, each a leader within the semiconductor ecosystem with its own economic moat and specialized niche, from AI players to hardware. This diversification uniquely creates a "team of winners,&rdquo; which face low competition with each other because the top players &ldquo;win together&rdquo; and collectively benefit as demand for semiconductors grows.</p>
<div class="wrapped-div">
<table style="width: 800px;">
<tbody>
<tr class="tbl-data">
<td class="tbl-header last " colspan="4">VanEck Semiconductor ETF (SMH) Holdings as of 2/26/2024</td>
</tr>
<tr class="tbl-data">
<td class="data-td last">Name</td>
<td class="data-head last">Ticker</td>
<td class="data-head last">Portfolio Weight %</td>
<td class="data-head last">Economic Moat<sup>2</sup></td>
</tr>
<tr class="tbl-data">
<td class="data-td last font-weight-normal">NVIDIA Corp</td>
<td class="data-td data last">NVDA</td>
<td class="data-td data last">25.89%</td>
<td class="data-td data last">Wide</td>
</tr>
<tr class="tbl-data">
<td class="data-td last font-weight-normal">Taiwan Semiconductor Manufacturing Co Ltd ADR</td>
<td class="data-td data last">TSM</td>
<td class="data-td data last">9.45%</td>
<td class="data-td data last">Wide</td>
</tr>
<tr class="tbl-data">
<td class="data-td last font-weight-normal">Broadcom Inc</td>
<td class="data-td data last">AVGO</td>
<td class="data-td data last">5.93%</td>
<td class="data-td data last">Wide</td>
</tr>
<tr class="tbl-data">
<td class="data-td last font-weight-normal">Advanced Micro Devices Inc</td>
<td class="data-td data last">AMD</td>
<td class="data-td data last">5.61%</td>
<td class="data-td data last">Narrow</td>
</tr>
<tr class="tbl-data">
<td class="data-td last font-weight-normal">ASML Holding NV ADR</td>
<td class="data-td data last">ASML</td>
<td class="data-td data last">5.10%</td>
<td class="data-td data last">Wide</td>
</tr>
<tr class="tbl-data">
<td class="data-td last font-weight-normal">Applied Materials Inc</td>
<td class="data-td data last">AMAT</td>
<td class="data-td data last">4.71%</td>
<td class="data-td data last">Wide</td>
</tr>
<tr class="tbl-data">
<td class="data-td last font-weight-normal">Lam Research Corp</td>
<td class="data-td data last">LRCX</td>
<td class="data-td data last">4.53%</td>
<td class="data-td data last">Wide</td>
</tr>
<tr class="tbl-data">
<td class="data-td last font-weight-normal">Qualcomm Inc</td>
<td class="data-td data last">QCOM</td>
<td class="data-td data last">4.05%</td>
<td class="data-td data last">Narrow</td>
</tr>
<tr class="tbl-data">
<td class="data-td last font-weight-normal">Intel Corp</td>
<td class="data-td data last">INTC</td>
<td class="data-td data last">3.88%</td>
<td class="data-td data last">None</td>
</tr>
<tr class="tbl-data">
<td class="data-td last font-weight-normal">Texas Instruments Inc</td>
<td class="data-td data last">TXN</td>
<td class="data-td data last">3.53%</td>
<td class="data-td data last">Wide</td>
</tr>
<tr class="tbl-data">
<td class="data-td last font-weight-normal">KLA Corp</td>
<td class="data-td data last">KLAC</td>
<td class="data-td data last">3.52%</td>
<td class="data-td data last">Wide</td>
</tr>
<tr class="tbl-data">
<td class="data-td last font-weight-normal">Analog Devices Inc</td>
<td class="data-td data last">ADI</td>
<td class="data-td data last">3.51%</td>
<td class="data-td data last">Wide</td>
</tr>
<tr class="tbl-data">
<td class="data-td last font-weight-normal">Micron Technology Inc</td>
<td class="data-td data last">MU</td>
<td class="data-td data last">3.40%</td>
<td class="data-td data last">None</td>
</tr>
<tr class="tbl-data">
<td class="data-td last font-weight-normal">Synopsys Inc</td>
<td class="data-td data last">SNPS</td>
<td class="data-td data last">3.39%</td>
<td class="data-td data last">Narrow</td>
</tr>
<tr class="tbl-data">
<td class="data-td last font-weight-normal">Cadence Design Systems Inc</td>
<td class="data-td data last">CDNS</td>
<td class="data-td data last">3.05%</td>
<td class="data-td data last">Narrow</td>
</tr>
<tr class="tbl-data">
<td class="data-td last font-weight-normal">NXP Semiconductors NV</td>
<td class="data-td data last">NXPI</td>
<td class="data-td data last">2.09%</td>
<td class="data-td data last">Narrow</td>
</tr>
<tr class="tbl-data">
<td class="data-td last font-weight-normal">Marvell Technology Inc</td>
<td class="data-td data last">MRVL</td>
<td class="data-td data last">1.72%</td>
<td class="data-td data last">Narrow</td>
</tr>
<tr class="tbl-data">
<td class="data-td last font-weight-normal">Microchip Technology Inc</td>
<td class="data-td data last">MCHP</td>
<td class="data-td data last">1.64%</td>
<td class="data-td data last">Wide</td>
</tr>
<tr class="tbl-data">
<td class="data-td last font-weight-normal">STMicroelectronics NV ADR</td>
<td class="data-td data last">STM</td>
<td class="data-td data last">1.09%</td>
<td class="data-td data last">Narrow</td>
</tr>
<tr class="tbl-data">
<td class="data-td last font-weight-normal">Monolithic Power Systems Inc</td>
<td class="data-td data last">MPWR</td>
<td class="data-td data last">1.07%</td>
<td class="data-td data last">Wide</td>
</tr>
<tr class="tbl-data">
<td class="data-td last font-weight-normal">ON Semiconductor Corp</td>
<td class="data-td data last">ON</td>
<td class="data-td data last">1.02%</td>
<td class="data-td data last">Narrow</td>
</tr>
<tr class="tbl-data">
<td class="data-td last font-weight-normal">Skyworks Solutions Inc</td>
<td class="data-td data last">SWKS</td>
<td class="data-td data last">0.61%</td>
<td class="data-td data last">Narrow</td>
</tr>
<tr class="tbl-data">
<td class="data-td last font-weight-normal">Teradyne Inc</td>
<td class="data-td data last">TER</td>
<td class="data-td data last">0.48%</td>
<td class="data-td data last">Wide</td>
</tr>
<tr class="tbl-data">
<td class="data-td last font-weight-normal">Qorvo Inc</td>
<td class="data-td data last">QRVO</td>
<td class="data-td data last">0.40%</td>
<td class="data-td data last">None</td>
</tr>
<tr class="tbl-data">
<td class="data-td last font-weight-normal">Universal Display Corp</td>
<td class="data-td data last">OLED</td>
<td class="data-td data last">0.29%</td>
<td class="data-td data last">Not Covered</td>
</tr>
</tbody>
</table>
</div>
<br />
<p>To receive more <a href="https://www.vaneck.com/us/en/insights/thematic-investing/" title="Thematic Investing Insights"><strong>Thematic Investing</strong></a> insights, <a href="https://www.vaneck.com/us/en/subscribe/" title="Subscription Center"><strong>sign up in our subscription center</strong></a>.</p>
<style type="text/css">
    .wrapped-div {
        max-width: 100%;
    }

    @media (max-width: 1240px) {
        .wrapped-div {
            overflow-x: scroll;
        }


    }
</style>
]]></content:encoded>
</item><item rdf:about="https://www.vaneck.com/us/en/blogs/emerging-markets-equity/indias-garp-investing-edge-overcome-valuation-hurdles/">
  <title>India’s GARP Investing Edge: Overcome Valuation Hurdles></title>
  <link>https://www.vaneck.com/us/en/blogs/emerging-markets-equity/indias-garp-investing-edge-overcome-valuation-hurdles/</link>
  <description><![CDATA[India is an emerging economic powerhouse, and equity valuations are near record highs. We believe GARP investing may be key to accessing its growth while navigating soaring valuations.]]></description>
  <dc:creator>Sunny  Bokhari</dc:creator>
  <dc:date>02/29/2024 06:30:00</dc:date>
<content:encoded><![CDATA[

<p>With India on track to become the world&rsquo;s third-largest economy with a projected GDP of $5T by 2027<sup>1</sup>, this emerging economic powerhouse has been stealing <strong><a href="https://www.vaneck.com/us/en/blogs/investment-outlook/jan-van-eck-top-investment-picks-for-2024-india-and-bitcoin/" title="Top Investment Picks for 2024: India and Bitcoin">the investment spotlight</a></strong>&mdash;and with good reason. Its stock market has consistently outperformed major benchmarks over the past two decades, and its $4.33T market capitalization has already surpassed Hong Kong's<sup>2</sup>&nbsp;stock market, reflecting its strong economic fundamentals. Soaring valuations may be raising eyebrows, but we believe <a href="/link/775af929d69741efa7729872dda2bfa5.aspx?epsremainingpath=three-reasons-to-invest-in-india-now" title="Three Reasons to Invest in India Now"><strong>India remains an attractive investment destination</strong></a> among emerging markets. To manage valuation concerns, Growth at a Reasonable Price (GARP) investing offers an approach that helps investors gain exposure to India&rsquo;s economic momentum while keeping a disciplined eye on valuation.</p>
<h2>India&rsquo;s 20-Year Winning Streak</h2>
<p>Over the last 20 years, India's stock market has outperformed both the S&amp;P 500 and the MSCI Emerging Markets Index. This outperformance is a testament to India's strong economic fundamentals, vibrant entrepreneurial ecosystem, and investor confidence in its long term growth. India&rsquo;s stock market could remain attractive to global investors given the country&rsquo;s strong macro-economic position relative to other emerging markets.</p>
<h3>India&rsquo;s Stock Market: A Strong Track Record of Performance</h3>
<p><img class="img-responsive w-100" src="https://www.vaneck.com/contentassets/46aeaa42fbd94a5b950debc2c51bfe3d/4162_glin_chart-1_2024-2-v1_blog.svg" alt="India's Stock Market: A Strong Track Record of Performance" /></p>
<p class="chart-disclosure">Source: Morningstar, data as of 1/31/2024.</p>
<h2>India Valuations Near Record Highs</h2>
<p>Despite strong stock performance and macro tailwinds, Indian equity valuations may give pause to some investors who are considering an allocation. Current valuations are rich compared to historical averages over the past 10 years.</p>
<h3>MSCI India P/E: 12/31/2013 - 1/31/2024</h3>
<p><img class="img-responsive w-100" src="https://www.vaneck.com/contentassets/46aeaa42fbd94a5b950debc2c51bfe3d/4162_glin-chart-2_2024-02_v1_blog.svg" alt="India Valuations Near Record Highs: MSCI India P/E, 12/31/2013 - 1/31/2024" /></p>
<p class="chart-disclosure">Source: Factset, data as of 1/31/2024.</p>
<p>Even with reservations around valuations, <strong><a href="https://www.vaneck.com/us/en/blogs/emerging-markets-equity/indias-economic-rise-demands-investor-attention/" title="India's Economic Rise Demands Investor Attention">India's investment case remains strong</a></strong>. The country's growth trajectory is compelling, and the geopolitical factors at play could potentially fuel another rally, especially following India's general election in May 2024.</p>

<style type="text/css">
    .wrapped-div {
        max-width: 100%;
    }

    @media (max-width: 768px) {
        .wrapped-div {
            overflow-x: scroll;
        }
    }

    .data-td.data {
        padding-right: 5px !important;
    }

    .wrapped-div-sector {
        max-width: 100%;
        overflow-x: scroll;
    }
</style>


<h2>Sidestep Valuation Concerns Using GARP</h2>
<p>GARP investing is all about striking the right balance. It aims to capture the upside potential of growth stocks while avoiding the pitfalls of overvaluation. GARP stocks exhibit strong earnings per share (EPS) and sales growth but are priced reasonably compared to the broader market. A GARP approach allows investors to capture growth in their portfolio while managing downside risk.</p>
<p>The characteristics of a GARP approach focused on Indian equities, represented by the MarketGrader India Growth Leaders Index, are shown below. GARP focuses on companies with robust growth metrics, leading to higher sales and EPS growth compared to the broader market. What sets it apart is its emphasis on value, resulting in lower valuation metrics like the price-to-earnings (P/E) ratio. This translates to a Price/Earnings to Growth (PEG) ratio that's almost half that of the broader market index. A lower PEG ratio indicates that investors are paying less for each unit of expected earnings growth.</p>
<p>By concentrating on GARP stocks, investors gain consistent exposure to companies that are not just growing, but are also attractively valued. As shown below, focusing on GARP stocks provides consistent exposure to more attractively valued companies versus the broad market index as measured by forward P/E.</p>
<h3>MarketGrader India Growth Leader&rsquo;s Index Characteristics</h3>
<div class="wrapped-div">
<table style="width: 100%;">
<tbody>
<tr class="tbl-data">
<td class="tbl-header last">&nbsp;</td>
<td class="tbl-header last text-center">MarketGrader India Growth Leaders Index</td>
<td class="tbl-header last text-center">MSCI India Index</td>
</tr>
<tr class="tbl-data">
<td class="data-td last">Sales Growth</td>
<td class="data-td data last">28.1</td>
<td class="data-td data last">22.8</td>
</tr>
<tr class="tbl-data">
<td class="data-td last">EPS Growth</td>
<td class="data-td data last">57.2</td>
<td class="data-td data last">30.3</td>
</tr>
<tr class="tbl-data">
<td class="data-td last">PEG</td>
<td class="data-td data last" style="font-weight: bold;">0.7</td>
<td class="data-td data last">1.3</td>
</tr>
<tr class="tbl-data">
<td class="data-td last">Forward P/E</td>
<td class="data-td data last">18.0</td>
<td class="data-td data last">22.9</td>
</tr>
<tr class="tbl-data">
<td class="data-td last">P/B</td>
<td class="data-td data last">4.1</td>
<td class="data-td data last">4.3</td>
</tr>
<tr class="tbl-data">
<td class="data-td last">Negative Sales Growth (% of index)</td>
<td class="data-td data last">2.6</td>
<td class="data-td data last">4.6</td>
</tr>
<tr class="tbl-data">
<td class="data-td last">Negative EPS Growth (% of index)</td>
<td class="data-td data last" style="font-weight: bold;">4.7</td>
<td class="data-td data last">19.1</td>
</tr>
</tbody>
</table>
</div>
<br />
<p class="chart-disclosure">Data as of 12/31/2023, source: Bloomberg.</p>
<h2>Intelligent Index Construction Yields Results</h2>
<p>The GARP approach has delivered outperformance relative to the broad market index. As of January 31, 2024 MarketGrader India Growth Leaders Index has outperformed the broad market index in trailing 1-3 years of live index performance history.</p>
<h3>Smart Indexing Delivers Outperformance vs. Broad Market</h3>
<p><img class="img-responsive w-100" src="https://www.vaneck.com/contentassets/d78003b19dc544fbbab2c26e78d7be3f/4162_glin-chart-3_2024-02_v1_blog.svg" alt="Smart Indexing Delivers Outperformance vs. Broad Market" /></p>
<div class="wrapped-div">
<table style="width: 100%;">
<tbody>
<tr class="tbl-data">
<td class="tbl-header last">&nbsp;</td>
<td class="tbl-header last text-center">YTD</td>
<td class="tbl-header last text-center">1 Year</td>
<td class="tbl-header last text-center">2 Years</td>
<td class="tbl-header last text-center">3 Years</td>
<td class="tbl-header last text-center">2/21/2020 - 1/31/2024</td>
</tr>
<tr class="tbl-data">
<td class="data-td last">MarketGrader Growth Leaders Index</td>
<td class="data-td data last">4.15</td>
<td class="data-td data last">42.92</td>
<td class="data-td data last">9.39</td>
<td class="data-td data last">14.43</td>
<td class="data-td data last">15.03</td>
</tr>
<tr class="tbl-data">
<td class="data-td last">MSCI India Index</td>
<td class="data-td data last">2.41</td>
<td class="data-td data last">27.53</td>
<td class="data-td data last">7.46</td>
<td class="data-td data last">13.76</td>
<td class="data-td data last">13.50</td>
</tr>
</tbody>
</table>
</div>
<br />
<p class="chart-disclosure">Source: Morningstar. Data as of 1/31/2024. The table and chart show live performance history of MarketGrader India Growth Leaders Index since inception of 2/21/2020 relative to the broad market index.</p>
<h2>Access GARP Investing in India</h2>
<p>The MarketGrader India Growth Leaders Index is an all cap index that selects fundamentally strong Indian firms with attractive growth potential at reasonable prices. <a href="https://www.vaneck.com/us/en/investments/india-growth-leaders-etf-glin/overview/" title="GLIN - VanEck India Growth Leaders ETF - Overview"><strong>VanEck India Growth Leaders ETF (GLIN)</strong></a> seeks to replicate as closely as possible, before fees and expenses, the price and yield performance of the MarketGrader India All-Cap Growth Leaders Index.</p>
<p>To receive more <a href="/us/en/insights/emerging-markets-equity/" title="Emerging Markets Equity Insights"><strong>Emerging Markets Equity</strong></a> insights, <a href="/us/en/subscribe/" title="Subscription Center"><strong>sign up in our subscription center</strong></a>.</p>
<style type="text/css">
    .wrapped-div {
        max-width: 100%;
    }

    @media (max-width: 768px) {
        .wrapped-div {
            overflow-x: scroll;
        }
    }

    .data-td.data {
        padding-right: 5px !important;
    }

    .wrapped-div-sector {
        max-width: 100%;
        overflow-x: scroll;
    }
</style>
]]></content:encoded>
</item><item rdf:about="https://www.vaneck.com/us/en/blogs/digital-assets/matthew-sigel-vaneck-monthly-bitcoin-chaincheck-feb-24/">
  <title>VanEck Monthly Bitcoin ChainCheck></title>
  <link>https://www.vaneck.com/us/en/blogs/digital-assets/matthew-sigel-vaneck-monthly-bitcoin-chaincheck-feb-24/</link>
  <description><![CDATA[VanEck Monthly Bitcoin ChainCheck presents on-chain indicators for investors to directly assess Bitcoin blockchain's health and adoption.]]></description>
  <dc:creator>Matthew  Sigel</dc:creator>
  <dc:date>02/27/2024 06:30:00</dc:date>
<content:encoded><![CDATA[

<p><strong>Please note that VanEck has exposure to bitcoin.</strong></p>
<p>We noticed some divergence between prices and on-chain activity in February, indicating that speculative forces drove Bitcoin&rsquo;s action this month.</p>
<ul class="content-list">
<li><a href="#price-action"><strong>Bitcoin&rsquo;s Price Action</strong></a></li>
<li><a href="#network-activity"><strong>Bitcoin&rsquo;s Network Activity, Adoption, and Fees</strong></a></li>
<li><a href="#market-health"><strong>Bitcoin Market Health and Profitability</strong></a></li>
<li><a href="#miners"><strong>Bitcoin Miners</strong></a></li>
<li><a href="#monthly-dashboard"><strong>Bitcoin ChainCheck Monthly Dashboard</strong></a></li>
</ul>
<p>Some takeaways for February 2024:</p>
<h2 id="price-action" class="jump-link-nav anchored-block" data-jumplink-title="Price Action">Bitcoin&rsquo;s Price Action</h2>
<ul class="content-list">
<li class="mt-2"><strong>Market sentiment:</strong> Bitcoin dominance rose slightly in February from 51% to 52%. For perspective, Bitcoin dominance rose from 52% to 62% in the 1-year prior to the 2020 halving before bottoming out at 39% at the end of the 2021 bull market.</li>
<li class="mt-2"><strong>Regional trading:</strong> U.S. traders continued to dominate bullish price action, but the gap narrowed in February as the Chinese New Year brought out typically constructive seasonal patterns.</li>
</ul>
<p><img class="img-responsive w-100" src="https://www.vaneck.com/contentassets/0830c9b6d9ec48419f1c264e8803311e/4161_bitcoin-monthly-feb-2024_table-1_2024-2_v1.svg" alt="Regional Trading" /></p>
<p class="chart-disclosure">Source: Glassnode, VanEck research as of 2/26/24. <strong>Past performance is no guarantee of future results.</strong></p>
<ul class="content-list">
<li class="mt-2"><strong>Funding rates:</strong> Bitcoin futures annualized basis (funding costs) rose sharply to 12% as traders re-gained some appetite for leverage. ETF flows absorbed more than the Bitcoin network&rsquo;s daily issuance for all of February.</li>
</ul>

<h2 id="network-activity" class="jump-link-nav anchored-block" data-jumplink-title="Network Activity">Bitcoin&rsquo;s Network Activity, Adoption, and Fees</h2>
<ul class="content-list">
<li class="mt-2"><a href="#monthly-dashboard"><strong>Daily transactions:</strong></a> in a divergence from price action, on-chain activity fell 7% in February and is now flat y/y. Tough comps arrive in May as we lap the first Ordinals (NFT) wave.</li>
<li class="mt-2"><strong><a href="#monthly-dashboard">New addresses</a></strong> fell 25% m/m and 7% y/y. It is fair to say that February was driven by ETF flows rather than on-chain activity.</li>
<li class="mt-2"><strong><a href="#monthly-dashboard">Ordinal inscriptions:</a></strong> Daily inscriptions plummeted 62% m/m. As a percentage of total transactions, inscriptions represent 40%.</li>
<li class="mt-2"><a href="#monthly-dashboard"><strong>Total transfer volume:</strong></a> $40B in value was transferred across the Bitcoin network daily, up 3% m/m and +118% y/y. Such activity puts February in the 85th percentile of all time.</li>
<li class="mt-2"><strong><a href="#monthly-dashboard">Average transaction fees:</a></strong> The average user paid $6.13 in fees to send a Bitcoin transaction in February, down 26% m/m but still in the 90th percentile of recorded history.</li>
<li class="mt-2"><strong><a href="#monthly-dashboard">% Supply last active, last 180 days:</a></strong> Only 18% of Bitcoin has moved in the last 180 days, in the 3rd percentile of all-time inactive short-term supply.</li>
<li class="mt-2"><strong><a href="#monthly-dashboard">% Supply last active, last 3+ years:</a></strong> 44% of Bitcoin has not moved in 3+ years. This reading has never been higher.</li>
</ul>
<h2 id="market-health" class="jump-link-nav anchored-block" data-jumplink-title="Market Health">Bitcoin Market Health and Profitability</h2>
<ul class="content-list">
<li class="mt-2"><strong><a href="#monthly-dashboard">Percent of addresses in profit:</a></strong> 90% of Bitcoin addresses are now in profit. Historically, this metric approaches 100% once it has hit 90% and can linger for a year or more.</li>
<li class="mt-2"><strong><a href="#monthly-dashboard">Net unrealized profit/loss:</a></strong> The net unrealized profit/loss ratio reached 0.52 in February, a level characterized as optimistic but not euphoric. Above 0.70 generally marks peaks.</li>
</ul>
<h2 id="miners" class="jump-link-nav anchored-block" data-jumplink-title="Miners ">Bitcoin Miners</h2>
<ul class="content-list">
<li class="mt-2"><strong><a href="#monthly-dashboard">Total daily BTC miner revenues: </a></strong> Bitcoin miners rallied sharply (+27%) in February as the spot price exceeded many miners&rsquo; post-halving costs. Total miner revenues reached $46M per day, in the 95% percentile of recorded history.</li>
<li class="mt-2"><strong><a href="#monthly-dashboard">Transfers from miners to exchanges: </a></strong> Miners sent an average of $5M a day in Bitcoin to exchanges, likely for sale. Such activity represents a 2% increase m/m. Miners may be better prepared for the halving than in previous cycles if BTC can sustain these levels.</li>
</ul>
<h3>Chart of the Month: Percent of Bitcoin addresses in profit. Once this number hits 90%, it tends to hit 100%.</h3>
<p><img class="img-responsive w-100" src="https://www.vaneck.com/contentassets/02747054f20d4acab493362f7aa14542/4161_bitcoin-monthly-feb-2024_chart-1_2024-2_v1.svg" alt="Chart of the Month: Percent of Bitcoin addresses in profit. Once this number hits 90%, it tends to hit 100%." /></p>
<p class="chart-disclosure">Source: Glassnode, VanEck research as of 2/26/24. <strong>Past performance is no guarantee of future results.</strong></p>
<h3 id="monthly-dashboard" class="anchored-block">Bitcoin ChainCheck Monthly Dashboard</h3>
<p><img class="img-responsive w-100" src="https://www.vaneck.com/contentassets/02747054f20d4acab493362f7aa14542/4161_bitcoin-monthly-feb-2024_table-2_2024-2_v1.svg" alt="Bitcoin ChainCheck Monthly Dashboard" /></p>
<p class="chart-disclosure">Source: Glassnode, VanEck research as of 2/25/24. <strong>Past performance is no guarantee of future results.</strong></p>
<p><strong>Notes:</strong></p>
<p>Net unrealized profit/loss ratio (NUPL) can be calculated by subtracting the realized market cap from the market cap and dividing the result by the market cap. When a high percentage of Bitcoin&rsquo;s market cap consists of unrealized profits, it can be interpreted that investors are greedy. Background reading <strong><a href="https://medium.com/@adamant_capital/a-primer-on-bitcoin-investor-sentiment-and-changes-in-saving-behavior-a5fb70109d32" target="_blank" rel="noopener" title="A Primer on Bitcoin Investor Sentiment and Changes in Saving Behavior">here</a></strong>.</p>
<p><strong>Links to third party websites are provided as a convenience and the inclusion of such links does not imply any endorsement, approval, investigation, verification or monitoring by us of any content or information contained within or accessible from the linked sites. By clicking on the link to a non-VanEck webpage, you acknowledge that you are entering a third-party website subject to its own terms and conditions. VanEck disclaims responsibility for content, legality of access or suitability of the third-party websites.</strong></p>
<p>To receive more <strong><a href="https://www.vaneck.com/us/en/insights/digital-assets/" title="Digital Assets Insights">Digital Assets</a></strong> insights, <strong><a href="https://www.vaneck.com/us/en/subscribe/" title="Subscription Center">sign up in our subscription center</a></strong>.</p>
]]></content:encoded>
</item><item rdf:about="https://www.vaneck.com/us/en/blogs/economic-trends/the-resilient-bull-dissecting-the-markets-strengths-and-vulnerabilities/">
  <title>The Resilient Bull: Dissecting the Market’s Strengths and Vulnerabilities></title>
  <link>https://www.vaneck.com/us/en/blogs/economic-trends/the-resilient-bull-dissecting-the-markets-strengths-and-vulnerabilities/</link>
  <description><![CDATA[Since the beginning of 2023, equity markets have ripped despite the presence of what appeared to be multiple headwinds&mdash;the question now is, what could go wrong?]]></description>
  <dc:creator>Patrick Schramm</dc:creator>
  <dc:date>02/26/2024 06:30:00</dc:date>
<content:encoded><![CDATA[

<p>In my numerous conversations with clients to start off 2024, one common theme sticks out&mdash;people want to talk about the resilient U.S. economy and surprisingly strong equity market performance in 2023 (which has continued into 2024 thus far). Most of my clients are quick to point out the many factors that made this strong equity rally unlikely, including an inverted yield curve and a 20 year high in interest rates.</p>
<p>While everyone is hoping that the Federal Reserve can pull off a soft economic landing, I have been advocating for the need to prepare for a range of potential scenarios as 2024 unfolds. Here we&rsquo;ll break down why market participants have been optimistic, but also highlight the risk factors that could knock stocks off track.</p>
<h2>Why Have Markets Been Optimistic?</h2>
<p>Amid ongoing economic challenges and global uncertainties, market participants have found reasons for optimism. Several key factors have contributed to this positive sentiment:</p>
<p><strong><i>Financial Conditions Improved</i></strong></p>
<p>Despite past volatility and uncertainties, financial conditions are currently more accommodating than they have been in the past two years:</p>
<ul class="content-list">
<li>Strong S&amp;P 500 earnings: The resilience of S&amp;P 500 earnings has supported high equity multiples and contributed to tight credit spreads in both investment-grade and high-yield markets.</li>
<li>Lower real yields: Real yields have notably declined over the past six months, dropping from 3.4% to 2.1%. This reduction signifies improved borrowing conditions and lower financing costs for businesses and consumers.</li>
</ul>
<p><strong><i>Resilient Economic Data</i></strong></p>
<p>Economic data has shown remarkable resilience, boosting confidence in the economy's underlying strength. The key indicators I have discussed with clients include:</p>
<ul class="content-list">
<li>Low unemployment: U.S. unemployment stands at 3.7%, lower than the anticipated 4.6% in Q4 2023. This strong labor market supports consumer spending and overall economic activity.</li>
<li>Inflation approaching target: Inflationary pressures have been gradually aligning with target levels, indicating a balanced approach to price stability and economic growth.</li>
<li>Strong consumer activity: The consumer sector (a key driver of U.S. GDP growth) has also shown resilience, reflecting underlying economic strength and consumer confidence.</li>
</ul>
<p><strong><i>Expectations of Rate Cuts</i></strong></p>
<p>Anticipation of central bank easing in 2024 has further fueled market optimism, driven by expectations of reduced funding costs and a flatter yield curve. Regardless of the exact timing, most market participants broadly expect central bank easing in 2024, which is expected to stimulate economic growth and support equity market expansion.</p>
<p><strong><i>Artificial Intelligence Fuels a Rally in Mega Cap Stocks</i></strong></p>
<p>You couldn&rsquo;t go anywhere in 2023 without hearing about AI and the related boom it caused in the stock market. In fact, I spent much of last year educating clients on the sources of return in the stock market. Many of the advisors I spoke with were surprised to see that the majority of 2023&rsquo;s strong equity market performance came from the rally in the <strong><a href="https://www.vaneck.com/us/en/blogs/moat-investing/investing-beyond-the-magnificent-7/" title="Investing Beyond the Magnificent 7">&ldquo;Magnificent 7&rdquo; stocks</a></strong>.</p>
<p>While the productivity enhancements from AI are expected to be a new structural growth driver of the U.S. economy,&nbsp;the market&rsquo;s lofty expectations for growth are already reflected into current valuations. This, of course, leads us to the risks in the current market.</p>
<h2>What Could Go Wrong?</h2>
<p>Despite prevailing optimism in the current market landscape, several challenges stand on the horizon, jeopardizing the sustainability of the current upward trend. Understanding these challenges is vital for advisors aiming to navigate potential obstacles and effectively manage risks. Here&rsquo;s how I have positioned risks in the current market environment in my conversations with advisors:</p>
<p><strong><i>Don&rsquo;t Become Complacent: Financial Conditions Are Unlikely to Remain Easy</i></strong></p>
<p>While inflation is certainly heading in the right direction, there&rsquo;s the possibility it starts to rear its ugly head again. Federal Reserve Chair Jerome Powell has hinted at the necessity to keep rates high (or even raise them more) in the face of persistent growth and inflation. This could create a self-reinforcing feedback loop towards tighter financial conditions via higher rates for longer than the market expects.</p>
<p>In general, the market may have been overly optimistic about rate cuts, as many investors are starting to rachet back their expectations for lower rates. In previous periods, this right sizing of the market&rsquo;s expectations for future rate movements has caused significant equity volatility.</p>
<p><strong><i>Are Markets Priced for Perfection?</i></strong></p>
<p>Corporate earnings have been strong. However, as companies and analysts ratchet up their forecasts for future growth, it&rsquo;s very difficult for companies to continue delivering upside surprises. In addition, it&rsquo;s important to realize just how much of the equity market&rsquo;s recent performance has come from the Magnificent 7. The S&amp;P 500 returned 24% in 2023, but the equal-weighted S&amp;P 500 Index returned just 11%. The last time that happened? That would be the dotcom bubble of 1998.</p>
<h2>How Should You think About Portfolio Positioning?</h2>
<p>While the overall trend in economic conditions has been positive, many corners of the equity and credit markets are priced for this reality. We have continued to steer investors toward quality and relative value, while looking for corners of the market with attractive risk-reward setups. Within fixed income I have been emphasizing the need to get paid an attractive coupon per unit of risk. Here are a few ideas to bolster your strategic asset allocation amid the current market risks:</p>
<p><strong><i>Ideas for Equity Portfolios</i></strong></p>
<p>The <strong><a href="https://www.vaneck.com/us/en/investments/morningstar-wide-moat-etf-moat/overview/" title="MOAT - VanEck Morningstar Wide Moat ETF - Overview">VanEck Morningstar Wide Moat ETF (MOAT)</a></strong> is currently <strong><a href="https://www.vaneck.com/us/en/blogs/moat-investing/bloated-index-returns-no-match-for-moat/" title="Bloated Index Returns No Match for MOAT">underweight the Magnificent 7 stocks</a></strong>, the technology sector and growth as a style. We think MOAT offers strong diversification potential particularly for portfolios with significant exposure to these areas. Last mile inflation challenges and a higher for longer narrative should also benefit the current cyclical positioning. MOAT also checks the quality, relative value and attractive risk-reward boxes.</p>
<p><a href="https://www.vaneck.com/us/en/blogs/moat-investing/uncover-big-opportunities-in-smaller-companies/" title="Uncover Big Opportunities in Smaller Companies"><strong>Small- and mid-cap companies</strong></a> also represent attractive relative value, trading at steep discounts to their large-cap peers. Small- and mid-cap (SMID-cap) exposure is particularly appealing for advisors in the soft landing camp and would be well positioned in a scenario where rates decline in 2024. The <strong><a href="https://www.vaneck.com/us/en/investments/morningstar-smid-moat-etf-smot/overview/" title="SMOT - VanEck Morningstar SMID Moat ETF - Overview">VanEck Morningstar SMID Moat ETF (SMOT)</a></strong> screens for companies with long term competitive advantages that can sustainably out earn their cost of capital over time. This focus on earnings durability could help investors both capture the opportunity in SMID-caps and also keep a keen eye on one of the primary risk factors that have driven underperformance in the space during this cycle.</p>
<p><strong><i>Ideas for Fixed Income Portfolios</i></strong></p>
<p>On the fixed income side, we have been advocating for a barbell approach. Historically it makes sense to extend duration into an easing cycle to benefit from a re-steepening of the yield curve. However, there remains ample opportunity to capture attractive front-end yields.</p>
<p><a href="https://www.vaneck.com/us/en/blogs/income-investing/income-investing/the-power-of-clos-higher-yields-and-built-in-risk-protection/" title="The Power of CLOs: Higher Yields and Built-In Risk Protection"><strong>Collateralized loan obligations (CLOs)</strong></a> offer yield pickup over short-dated Treasuries and investment grade corporate bonds and have near zero interest rate duration. CLOs are also negatively correlated with intermediate and long-term Treasuries, which makes them a great diversifier, particularly if the path to lower interest rates is a bumpy one. With cuts getting priced out of the market already, the higher for longer camp will want to pay particular attention to CLOs.</p>
<p>The <strong><a href="https://www.vaneck.com/us/en/investments/clo-etf-cloi/overview/" title="CLOI - VanEck CLO ETF - Overview">VanEck CLO ETF (CLOI)</a></strong>, subadvised by PineBridge Investments, provides access to <strong><a href="https://www.vaneck.com/us/en/blogs/income-investing/clos-uncover-opportunity-beyond-aaas/" title="CLOs: Uncover Opportunity Beyond AAAs">investment grade floating-rate CLOs</a></strong>. CLOI benefits from PineBridge&rsquo;s decades of <a href="/link/775af929d69741efa7729872dda2bfa5.aspx?epsremainingpath=meet-pinebridge-portfolio-manager-laila-kollmorgen" title="Meet PineBridge Portfolio Manager Laila Kollmorgen"><strong>CLO market experience</strong></a>, both as a CLO manager and CLO tranche investor, and deep leveraged finance expertise.</p>
<p>To receive more <strong><a href="https://www.vaneck.com/us/en/insights/economic-trends/" title="Economic Trends Insights">Economic Trends</a></strong> insights, <strong><a href="https://www.vaneck.com/us/en/subscribe/" title="Subscription Center">sign up in our subscription center</a></strong>.</p>
]]></content:encoded>
</item><item rdf:about="https://www.vaneck.com/us/en/blogs/model-portfolios/hanging-with-the-soft-crowd-for-now/">
  <title>Hanging with the Soft Crowd—For Now></title>
  <link>https://www.vaneck.com/us/en/blogs/model-portfolios/hanging-with-the-soft-crowd-for-now/</link>
  <description><![CDATA[Lower rates and combat a likely recession, or keep up the battle with inflation? As uncertainty lingers, we&rsquo;ll clip coupons with the soft-landing crowd and keep gold in case of trouble.]]></description>
  <dc:creator>David Schassler</dc:creator>
  <dc:date>02/22/2024 06:30:00</dc:date>
<content:encoded><![CDATA[

<p>There are people that have successfully predicted recessions. But few have done it twice. Does the inability to time market cycles stop Wall Street from trying? Of course not! Will that stop us? Definitely not.</p>
<p>We believe that a mild recession in the first half of the year is likely. The chart below demonstrates that, on average, recessions typically start six months after interest rates peak. The Fed Funds rate topped out at 5.3% in August 2023, which puts a recession on track for either the first or second quarter.</p>
<h3>Recessions Follow 6 Months After Interest Rates Peak</h3>
<p><img class="img-responsive w-100" src="https://www.vaneck.com/contentassets/5d9edd09452544ca9a4fc2187c3c1b15/4147_asset-allocation_chart-1_2024-02_v1_blog.svg" alt="Fed Fund Peak vs. U.S. Recessions 1954-2022" /></p>
<p class="chart-disclosure">Source: Bloomberg.</p>


<p>The depth of the next recession is more difficult to predict. We have front row seats to the collision of higher interest rates, inflation, slowing growth, geopolitical chaos, and massive technological innovation (e.g., AI). The <strong><a href="/us/en/blogs/thematic-investing/semiconductor-outlook-2024-investor-guide/" title="potential of AI">potential of AI</a></strong> cannot be ignored. This technology, similarly, to the creation of the internet, has the potential to truly disrupt society and drive efficiencies and innovation throughout the economy. We were in the <strong><a href="https://www.vaneck.com/us/en/blogs/guided-allocation/inflation-fight-night-fed-chair-vs-the-senator/" title="Inflation Fight Night: Fed Chair vs. The Senator">hard landing camp</a></strong> last year and expected the recession to have already started. We are happy to have been wrong about that. The resiliency of the U.S. economy has been surprising. We&rsquo;ll be optimists and side with the soft-landing crowd for now, but a hard landing is still a real possibility.</p>
<p>A soft landing, in our view, is a contraction in GDP of less than 1%. The level of interest rates is the largest factor determining the timing and severity of the next recession. We believe that, when pushed, the Fed will pivot and lower interest rates. Better the devil you know (fight the recession) than the devil you don&rsquo;t (keep fighting inflation that may or may not materialize). Besides, the soft-landing crowd is a livelier and more fun group of people. The no-landing crowd nailed it last year, but the clock is ticking. Recessions eventually occur and are a healthy part of the economic cycle.</p>
<p>Jerome Powell is in a pickle. If he takes his foot off the brakes of the economy too soon and inflation re-emerges, then his face will appear on the wall of shame next to Arthur Burns &ndash; the last Fed chair who failed to stop inflation. Alternatively, if Mr. Powell were to become the first to curb inflation without engineering a hard landing, then history will likely forgive his previous transgressions and look kindly at his time as Chair.</p>
<p>We have <strong><a href="/link/9dc0306f791f4f9e845d21f065c50da0.aspx?epsremainingpath=high-inflation-is-likely-here-to-stay" title="High Inflation is Likely Here to Stay">studied</a></strong> and <strong><a href="https://www.vaneck.com/us/en/blogs/guided-allocation/feds-gambit-inflation-fighting-to-recession-fighting/" title="Fed's Gambit: Inflation-Fighting to Recession-Fighting?">written</a> <a href="https://www.vaneck.com/us/en/blogs/guided-allocation/avoid-the-inflation-penalty-box/" title="Avoid the Inflation Penalty Box">extensively</a></strong> on <a href="https://www.vaneck.com/us/en/blogs/guided-allocation/still-early-innings-for-inflation/" title="Still Early Innings for Inflation"><strong>inflation</strong></a>. The good news about inflation is that it doesn&rsquo;t occur often. The bad news about inflation is that once it does occur, it is very hard to control. We are in the camp that inflation will remain <a href="/link/9dc0306f791f4f9e845d21f065c50da0.aspx?epsremainingpath=get-used-to-higher-rates-and-inflation-focus-on-these-assets" title="Get Used to Higher Rates and Inflation. Focus on These Assets"><strong>persistently elevated</strong></a> (3-5%), on average, for an extended period (think in terms of years, not months) and re-accelerate (above 5%) once the Fed loosens its policies. The Labor Department reported that consumer prices rose 3.1% in January. Economists surveyed by FactSet were expecting an increase of 2.9%. This was unwelcome news for the market, which has been hoping for a quick pivot in rates. Inflation is a problem. Hope is not a solution.</p>
<h2>Equities: Narrow Leadership Unlikely to Last in Long Run</h2>
<p>We are neutral on equities. Recent strength in equity prices, high interest rates and a looming recession are typically not the stuff of which strong equity markets are made. However, the resiliency of the consumer and the strength of corporate earnings growth, particularly in the technology sector, should caution against betting that this bull will stop running.</p>
<p>The narrow leadership of the Magnificent Seven (MSFT, META, AAPL, AMSN, GOOG, NVDA, and TSLA) is the talk of the town. Will these stocks continue to lead the market higher? To answer that question, we studied the top 10 performing stocks in decade long windows to ascertain whether they typically continue to outperform. Historically, the answer is a lot like flipping a coin, or slightly less than 50% to be exact.</p>
<h3>Do Top 10 S&amp;P 500 Performers in a Decade Outperform Over the Next Decade? Flip a Coin</h3>
<p><img class="img-responsive w-100" src="https://www.vaneck.com/contentassets/20c7ae0c7290432a9b8afae3484b45c1/4147_asset-allocation_chart-2_2024-02_v1_blog.svg" alt="% of Top 10 S&amp;P 500 Performers (by Decade) that Outperforms (S and P 500) Over the Next Decade" /></p>
<p class="chart-disclosure">Source: Bloomberg.</p>
<p>Back to the original question: do we think that the <a href="https://www.vaneck.com/us/en/blogs/moat-investing/bloated-index-returns-no-match-for-moat/" title="Bloated Index Returns No Match for MOAT"><strong>Magnificent Seven</strong></a> are likely to continue to outperform? Short-term: maybe. Long-term: unlikely. Investors with significant exposure to these individual holdings should consider recycling some of those recent gains into a more diversified approach. Check out the <a href="https://www.vaneck.com/us/en/investments/morningstar-wide-moat-etf-moat/overview/" title="MOAT - VanEck Morningstar Wide Moat ETF - Overview"><strong>VanEck Morningstar Wide Moat ETF (MOAT)</strong></a> and the <strong><a href="/link/39c8d235748b4c26a5930c31d3ac0160.aspx" title="VanEck Semiconductor ETF (SMH)">VanEck Semiconductor ETF (SMH)</a></strong>. Please excuse the shameless plugs. It was too easy.</p>
<h2>Fixed Income: Take the Money and Run</h2>
<p>We are bullish on <strong><a href="https://www.vaneck.com/us/en/blogs/income-investing/income-investing-playbook/" title="Income Investing Playbook 2024: Navigating the New Interest Rate Regime">fixed income</a></strong>. A bird in the hand (current yield) is worth two in the bush (potential price appreciation on equities). Investors are finally getting compensated to lend money again, so let&rsquo;s take advantage of it!</p>
<p>The chart below demonstrates that, historically, when the yields on non-investment grade bonds are 7.6% or higher (current rate levels based on yield-to-worst), investors have earned significantly above average returns (11% versus the long-term return of 8.5%) in a highly consistent fashion (83.5% of rolling 12 month windows experienced positive returns).</p>
<h3>High Yield Bond Returns Elevated Above 7.6% Yield Threshold</h3>
<p><strong>Bloomberg U.S. Corporate High Yield Bond Index</strong></p>
<p><img class="img-responsive w-100" src="https://www.vaneck.com/contentassets/20c7ae0c7290432a9b8afae3484b45c1/4147_asset-allocation_chart-3_2024-02_v1_blog.svg" alt="Bloomberg US Corporate High Yield Bond Index" /></p>
<p class="chart-disclosure">Source: Bloomberg. Index performance is not illustrative of fund performance. It is not possible to invest directly in an index.</p>
<p>Fixed income is not without its risks. That is especially true for high yield. However, yields are juicy and that offers a lot of protection against credit and duration risk factors.</p>
<h2>Real Assets: Gold&rsquo;s Time to Shine</h2>
<p>We are bullish on <strong><a href="https://www.vaneck.com/us/en/blogs/guided-allocation/hedging-against-inflation-with-raax/" title="Hedging Against Inflation with RAAX">real assets</a></strong>. More specifically, we are bullish on <a href="https://www.vaneck.com/us/en/education/investment-ideas/physical-gold/" title="OUNZ - The Gold ETF that Delivers"><strong>gold bullion</strong></a>. What role does gold play in a portfolio? It acts as a hedge against inflation and volatility. Do we expect persistently elevated inflation and higher volatility? Absolutely!</p>
<p>The future path of interest rates is a hotly debated topic. As you can see in the chart below, big moves in interest rates, both upward and downward, have historically been good for gold prices. This makes intuitive sense because interest rates have risen significantly during inflationary spikes and fallen during recessions &ndash; both of which cause uncertainty and increase the relative attractiveness of gold.</p>
<h3>Interest Rate Fluctuations Boost Gold Prices Amid Uncertainty</h3>
<p><strong>Gold Performance Across Interest Rate Regimes: 1974-Present</strong></p>
<p><img class="img-responsive w-100" src="https://www.vaneck.com/contentassets/20c7ae0c7290432a9b8afae3484b45c1/4147_asset-allocation_chart-4_2024-02_v1_blog.svg" alt="Gold Performance Across Interest Rate Regimes: 1974-Present" /></p>
<p class="chart-disclosure">Source: Bloomberg. Past performance is no guarantee of future results.</p>
<h2>Conclusion: Consider HY Fixed Income and Gold</h2>
<p>This has been a challenging period to manage money. The economy has shifted from one extreme to another and, as a result, we now find ourselves in a high interest rate regime relative to recent history. The impact of higher interest rates has not been fully realized and that adds to the cloud of uncertainty. And, to compound the frustration, the relative performance of equities can be explained by the weightings of a handful of mega cap growth stocks.</p>
<p>The good news is that extreme environments create opportunities. In our view, higher yielding fixed income and gold are two such opportunities.&nbsp;</p>
<p>Stay diversified and wait for the fat pitches.</p>
<p>To receive more <strong><a href="https://www.vaneck.com/us/en/insights/guided-allocation/" title="Model Portfolio Insights">Model Portfolio</a></strong> insights, <strong><a href="https://www.vaneck.com/us/en/subscribe/" title="Subscription Center">sign up in our subscription center</a></strong>.</p>
]]></content:encoded>
</item><item rdf:about="https://www.vaneck.com/us/en/blogs/emerging-markets-equity/vietnams-economic-journey-toward-prosperity/">
  <title>Vietnam’s Economic Journey Toward Prosperity></title>
  <link>https://www.vaneck.com/us/en/blogs/emerging-markets-equity/vietnams-economic-journey-toward-prosperity/</link>
  <description><![CDATA[Vietnam&rsquo;s resilient economy and reforms have led to remarkable growth. Investors looking to diversify their emerging markets allocation should consider Vietnam.]]></description>
  <dc:creator>John Patrick Lee, CFA</dc:creator>
  <dc:date>02/21/2024 06:30:00</dc:date>
<content:encoded><![CDATA[

<p>As Vietnam's economy rapidly expands, outpacing their ASEAN peers, it presents a unique opportunity for investors. This growth is underpinned by diverse sectors, from high-tech manufacturing to natural resources, and bolstered by significant trade relationships, especially with the United States and China. However, Vietnam's increasing importance in global trade obscures its robust domestic market, fueled by a growing middle class and favorable demographics. We will explore Vietnam's transition from a frontier to an emerging market, its resilient domestic economy, and how the country's reforms to liberalize its economy have led to remarkable growth, offering a compelling case for investors looking to diversify their emerging markets allocation.</p>
<div class="row">
<div class="col-md-4 col-xs-12"><a href="https://www.youtube.com/embed/gbsaejbkS88" data-video="https://youtu.be/gbsaejbkS88" class="popup-youtube" title="Watch Video"><img class="img-responsive" style="margin-right: 15px; margin-top: 0px;" src="https://www.vaneck.com/contentassets/e0064c0d36304d1db4f5b9045235fa68/3938_vietnam-commentary-jp-lee_steven-schoenfeld_thumbnail_2024-2_v1.jpg/Download/" alt="Watch Video" align="left" /></a></div>
<div class="col-md-8 col-xs-12"><br /><strong><a href="https://www.youtube.com/embed/gbsaejbkS88" data-video=" https://youtu.be/gbsaejbkS88" class="popup-youtube" title="Watch Video">Watch Video</a><br /></strong><a href="https://www.youtube.com/embed/gbsaejbkS88" data-video="https://youtu.be/gbsaejbkS88" class="popup-youtube" title="Watch Video" style="font-size: 16px; font-weight: bold; padding: 10px 0px 0px; margin-right: 20px; width: 202px;">Unlocking Vietnam: Investing in a Modernizing Economy</a></div>
</div>
<br />
<h2>From Poverty to Prosperity</h2>
<p>In 2022, Vietnam exported roughly $371.4 billion in goods and services. This figure represents a striking turnaround for a country that experienced limited economic activity and a low standard of living just forty years ago.</p>
<h3>Export and Import Growth Surged Since Economic Reforms</h3>
<p><img class="img-responsive w-100" src="https://www.vaneck.com/contentassets/75366c4bf2b841c4a85f5aab74db22a1/3887_vnm-blog_chart-1_2023-12_v1_blog.svg" alt="Vietnam Export and Imports have Surged over the last decade" /></p>
<p class="chart-disclosure">Source: Macrotrends.com as of 12/31/2021.</p>
<style type="text/css">
    .wrapped-div {
    max-width: 100%;
    }
   
    @media (max-width: 1024px) {
    .wrapped-div {
    overflow-x: scroll;
    }
    }
   
    .wrapped-div-sector {
    max-width: 100%;
    overflow-x: scroll;
    }
   </style>


<p>Vietnam's journey towards economic prosperity over the past few decades has been driven largely by sweeping economic reforms known as "Đổi Mới", initiated in 1986. These reforms marked a radical shift from a centrally planned economy to a market-oriented one, laying the groundwork for Vietnam's increased exports and deeper integration into the global economy.</p>
<p>Before Đổi Mới, Vietnam's economy was isolated and heavily reliant on Soviet support. The reforms ushered in policies that encouraged private enterprise, deregulated state-owned industries, and opened the country to foreign trade and investment. One of the most significant changes was the shift in agricultural policy, moving away from collectivization to allow private ownership of farms. This change boosted agricultural productivity and turned Vietnam into one of the world's leading exporters of rice.</p>
<p>The liberalization of trade policies under Đổi Mới was instrumental in attracting foreign direct investment (FDI). Major multinational corporations were enticed to set up manufacturing and export-oriented units in Vietnam, benefiting from its strategic location, competitive labor costs, and increasingly skilled workforce. This led to a surge in exports, particularly in textiles, footwear, and electronics, propelling Vietnam into a significant player in the global supply chain.</p>
<p>Vietnam's accession to the World Trade Organization (WTO) in 2007 marked another milestone, further integrating it into the global economy. The country has since been a part of numerous free trade agreements, including the Comprehensive and Progressive Agreement for Trans-Pacific Partnership (CPTPP) and the EU-Vietnam Free Trade Agreement, enhancing its export potential.</p>
<p>This export-led growth, in turn, has fueled domestic demand. As exports grew, so did the economy, resulting in increased incomes and a burgeoning middle class. This new wealth has translated into higher consumer spending within Vietnam. The growth in domestic demand is evident in the rising consumption of goods and services, increased urbanization, and the expansion of the retail sector.</p>
<p>Vietnam's economic reforms have created a virtuous cycle: reforms spurred exports, which in turn drove economic growth, leading to increased domestic demand. This trajectory has positioned Vietnam as a dynamic and integral part of the global economy, with a domestic market that continues to show robust growth potential.</p>
<h2>Demographics and Domestic Demand</h2>
<p>Vietnam's demographic profile is also helping to drive strong domestic demand. Vietnam's population has grown nearly 200% in the last sixty years and boasts one of the youngest populations in the world. Over 60% of its population is under the age of 30, meaning there is a long runway for these young citizens to grow and help to contribute to Vietnam's economy. Additionally, the population is relatively well-educated, with a literacy rate of over 90%. Vietnam's growing middle class is expected to enjoy high disposable income, which will in turn fuel domestic demand and growth.</p>
<p>When compared with other emerging markets countries, Vietnam sits in the middle of the pack, with a higher private consumption ratio to GDP than Saudi Arabia and China, but lower than Brazil and the Philippines. This strong domestic demand component provides a buffer to external forces such as an increasingly protectionist trade partner (U.S.) and a slow-growing one (China).</p>
<h3>Vietnam&rsquo;s Growing Middle Class is Fueling Consumption</h3>
<p><strong>Private Consumption as a % of GDP</strong></p>
<p><img class="img-responsive w-100" src="https://www.vaneck.com/contentassets/06bd07cf362240adafc04362b5d017a4/3887_vnm-blog_chart-2_2023-12_v1_blog.svg" alt="Vietnam's Growing Middle Class is Fueling Consumption" /></p>
<p class="chart-disclosure">Source: CEIC as of June 2023.<sup>*</sup>China data is as of December 2021.</p>
<h2>Benefits of a Domestically Driven Economy</h2>
<p>The benefits of a domestically focused economy cannot be ignored. Instead of relying on external forces like global market conditions, foreign demand and trade policy, domestically driven economies bring a slew of benefits for those countries which can transition away from primarily relying on exports. These include:</p>
<ul class="content-list">
<li><strong>Stability and resilience:</strong> Economies driven by domestic demand are typically more stable because they are less affected by international market conditions and political tensions.</li>
<li><strong>Diverse economic structure:</strong> Domestically driven economies are typically more diversified than their exporter counterparts, who often rely on cyclical exports such as commodities.</li>
<li><strong>Independence from external factors:</strong> These economies are less reliant on external factors like foreign demand, currency fluctuations, trade policies and commodity prices.</li>
<li><strong>Strengthening of local industries:</strong> When domestic demand is strong, local companies provide more and more services, which leads to a positive feedback loop of increased innovation and competitiveness.</li>
</ul>
<p>Domestically focused economies do have some drawbacks, including vulnerability to economic cycles, limited diversification and susceptibility to inflationary pressures. However, the argument stands that Vietnam has grown into a well-diversified economy that strikes an attractive balance between export-led growth and growing domestic demand that enjoys robust exports in addition to a growing domestic consumer base.</p>
<h2>Local Vietnamese Equity Exposure and Performance</h2>
<p>Vietnam's public equity opportunity set is heavily weighted towards Financials, Real Estate and Consumer Staples. In the MarketVector Vietnam Local Index, the top ten holdings are skewed towards these sectors, and are also heavily dependent on domestic revenues. This also lends credence to the argument that the Vietnamese economy enjoys robust domestic demand.</p>
<div class="wrapped-div">
<table style="width: 100%;">
<tbody>
<tr class="tbl-data">
<td class="tbl-header last">Company</td>
<td class="tbl-header last text-center">Index Weight (%)</td>
<td class="tbl-header last text-center">Sector</td>
<td class="tbl-header last text-center">Domestic Revenues (%)</td>
</tr>
<tr class="tbl-data">
<td class="data-td last font-weight-normal">Vietnam Dairy Products</td>
<td class="data-td data last">7.7</td>
<td class="data-td data last">Consumer Staples</td>
<td class="data-td data last">84.6</td>
</tr>
<tr class="tbl-data">
<td class="data-td last font-weight-normal">Bank for Foreign Trade of Vietnam</td>
<td class="data-td data last">7.5</td>
<td class="data-td data last">Financials</td>
<td class="data-td data last">99.7</td>
</tr>
<tr class="tbl-data">
<td class="data-td last font-weight-normal">Vinhomes</td>
<td class="data-td data last">7.2</td>
<td class="data-td data last">Real Estate</td>
<td class="data-td data last">100</td>
</tr>
<tr class="tbl-data">
<td class="data-td last font-weight-normal">Vingroup</td>
<td class="data-td data last">6.8</td>
<td class="data-td data last">Real Estate</td>
<td class="data-td data last">100</td>
</tr>
<tr class="tbl-data">
<td class="data-td last font-weight-normal">Hoa Phat Group</td>
<td class="data-td data last">6.7</td>
<td class="data-td data last">Materials</td>
<td class="data-td data last">100</td>
</tr>
<tr class="tbl-data">
<td class="data-td last font-weight-normal">SSI Securities</td>
<td class="data-td data last">5.4</td>
<td class="data-td data last">Financials</td>
<td class="data-td data last">100</td>
</tr>
<tr class="tbl-data">
<td class="data-td last font-weight-normal">VNDirect Securities</td>
<td class="data-td data last">3.9</td>
<td class="data-td data last">Financials</td>
<td class="data-td data last">100</td>
</tr>
<tr class="tbl-data">
<td class="data-td last font-weight-normal">Masan Group</td>
<td class="data-td data last">3.1</td>
<td class="data-td data last">Consumer Staples</td>
<td class="data-td data last">79.6</td>
</tr>
<tr class="tbl-data">
<td class="data-td last font-weight-normal">No Va Land Investment Group</td>
<td class="data-td data last">3.1</td>
<td class="data-td data last">Real Estate</td>
<td class="data-td data last">100</td>
</tr>
<tr class="tbl-data">
<td class="data-td last font-weight-normal">Duc Giang Chemicals</td>
<td class="data-td data last">2.9</td>
<td class="data-td data last">Materials</td>
<td class="data-td data last">18.1</td>
</tr>
</tbody>
</table>
</div>
<br />
<p class="chart-disclosure">Source: Factset as of 10/31/23. Index performance is not illustrative of fund performance. It is not possible to invest directly in an index. Please visit vaneck.com/vnm for a complete list of fund holdings.</p>
<p>Despite macro shocks including the Covid pandemic and economic problems in China, local Vietnamese stocks have outperformed broad emerging markets benchmarks since 2018. We believe that given Vietnam's economic and market-structure progress over the past decade, investors should look closely at this emerging opportunity.</p>
<h3>Outperforming Emerging Markets Since 2018</h3>
<p><img class="img-responsive w-100" src="https://www.vaneck.com/contentassets/06bd07cf362240adafc04362b5d017a4/3887_vnm-blog_chart-3_2023-12_v1_blog.svg" alt="Vietnam has outperformed the Emerging Markets since 2018" /></p>
<p class="chart-disclosure">Source: Morningstar as of 11/29/23. Index performance is not illustrative of fund performance. It is not possible to invest directly in an index.</p>
<h2>How to Invest</h2>
<p><a href="https://www.vaneck.com/us/en/investments/vietnam-etf-vnm/overview/" title="VNM VanEck Vietnam ETF"><strong>VanEck Vietnam ETF (VNM)</strong></a> provides access to the growth story of Vietnam and could be an appealing investment for investors seeking growth exposure outside of traditional emerging markets. VNM, the largest and most liquid U.S. - listed Vietnam ETF provides investors one trade access to the Vietnamese market.</p>
<p>To receive more <a href="/us/en/insights/emerging-markets-equity/" title="Emerging Markets Equity Insights"><strong>Emerging Markets Equity</strong></a> insights, <a href="/us/en/subscribe/" title="Subscription Center"><strong>sign up in our subscription center</strong></a>.</p>
<style type="text/css">
    .wrapped-div {
    max-width: 100%;
    }
   
    @media (max-width: 1024px) {
    .wrapped-div {
    overflow-x: scroll;
    }
    }
   
    .wrapped-div-sector {
    max-width: 100%;
    overflow-x: scroll;
    }
   </style>
]]></content:encoded>
</item><item rdf:about="https://www.vaneck.com/us/en/blogs/municipal-bonds/muni-trends-to-watch-in-2024/">
  <title>Muni Trends to Watch in 2024></title>
  <link>https://www.vaneck.com/us/en/blogs/municipal-bonds/muni-trends-to-watch-in-2024/</link>
  <description><![CDATA[We explore trends in the municipal bond market, including supply, performance, what sectors to watch, and how to plan for anticipated tax changes.]]></description>
  <dc:creator>Tamara  Lowin</dc:creator>
  <dc:date>02/21/2024 06:30:00</dc:date>
<content:encoded><![CDATA[

<p>Each year brings unique opportunities to the municipal market. In 2024, we expect the U.S. economic environment, individual state laws, and the challenges facing municipal sectors to offer favorable investment conditions.</p>
<h2>Muni Supply Expected to Increase</h2>
<p>We expect muni issuance in 2024 to outstrip the $380 billion in 2023. Municipal borrowers have had time to adjust to higher borrowing rates and the higher cost of project construction. As a result, the deal size of the many projects shelved over the past few years will not only come to market, but they will be larger. The need for infrastructure maintenance continues to be high, and the uptick in transportation-related revenues will lower the hurdle to entering the market. In addition to the pent-up demand and real needs, presidential election years usually see a spike in issuance. For a market that has long demanded more paper, 2024 should provide some relief.</p>
<h2>Performance</h2>
<p>As growth decelerates, inflation stabilizes, and the possibility of rate cuts looms, we urge investors to take advantage of the current elevated yield environment. We foresee a downward trend in yields for 2024, pointing to a potential total return opportunity. Between these current measures by the Fed and its recently expressed views, the second half of 2024 should produce returns consistent with other historical periods of ebbing inflation and healthy economic activity.</p>
<p>Absent anything but a modest increase in supply, we anticipate investment grade spreads to hover between 70 and 85 basis points (bps), capturing mostly normal relationships. Any trend towards capturing more duration spread (long demand) for greater returns will be on the heels of lower-rate moves. Muni high yield spreads will likely be held hostage to building credit concerns. A median benchmark of 250 bps might be challenged by 300+ bps in this sector if credits deteriorate. Lower issuance and an increase in demand for yield will follow a move lower in rates and can still give the high yield products a boost in total return because of the embedded longer duration bonds from all sectors.</p>
<h2>Sector Watch</h2>
<p>Local government borrowers find themselves in a strong position in 2024. As home values escalate, inflation drives up the cost of goods and services, and median income increases, the related property, sales, and income tax revenues grow commensurately. Cities and counties are in a better position to keep up with the higher expenses they face as well as refill their rainy-day funds this year.</p>
<p>On the other end of the spectrum, there is currently no better example of credit sector disparity than healthcare. A confluence of workforce labor shortages and increased costs of supplies and drug prices has resulted in most hospitals seeing double-digit increases in expenses between 2019 and 2022<sup>1</sup>&nbsp;with continued increases in costs in 2023. Combine this with slower increases in Medicare reimbursement, and the unwinding of the COVID Medicaid expansion in May 2023, and the overall fiscal deterioration is grave.</p>
<p>As we continue to invest in hospitals, we search for the organizations that show the most resiliency. Strong management, competitive markets that increase merger potential, and a sustainable payor mix are current focuses as we mine for the best opportunities.</p>
<h2>Tax Changes on the Horizon</h2>
<p>Many of the Tax Cuts and Jobs Act changes expire at the end of 2025, so 2024 is the time to start planning for anticipated changes and contingencies. Democrats and Republicans have both indicated interest in extending some or all the provisions, but a final package and its ramifications are ambiguous.</p>
<p>The two expiring provisions that most directly impacted the demand for municipal bonds are the change in personal income tax brackets and the AMT, Alternative Minimum Tax. In 2018, the top personal income tax bracket decreased to 37%. Without an extension of this provision, the highest personal income tax rate will return to 39.6% on January 1, 2026. As a tax-exempt investment vehicle, the attraction of the bonds and their price is correlated to the level of tax exemption. The impact of the AMT was significantly reduced by the Tax Cuts and Jobs Act. The changes reduced the number of AMT taxpayers to 200,000 from over 5 million in one year.<sup>2</sup>&nbsp;Changes, and anticipated changes, to the tax code will be felt in the market. Municipal debt continues to be a good investment vehicle in the face of tax uncertainty.</p>
<p>To receive more <a href="https://www.vaneck.com/us/en/insights/municipal-bonds/" title="Municipal Bonds Insights"><strong>Municipal Bonds</strong></a> insights, <a href="https://www.vaneck.com/us/en/subscribe/" title="Subscription Center"><strong>sign up in our subscription center</strong></a>.</p>
]]></content:encoded>
</item><item rdf:about="https://www.vaneck.com/us/en/blogs/emerging-markets-bonds/four-looming-risks-that-could-bolster-em-bonds/">
  <title>Four Looming Risks That Could Bolster EM Bonds></title>
  <link>https://www.vaneck.com/us/en/blogs/emerging-markets-bonds/four-looming-risks-that-could-bolster-em-bonds/</link>
  <description><![CDATA[Many investors are not pricing in four risks in their portfolios. Each of these risks hurts DM bonds and currencies, but helps emerging markets bonds and currencies.]]></description>
  <dc:creator>Eric Fine</dc:creator>
  <dc:date>02/20/2024 06:30:00</dc:date>
<content:encoded><![CDATA[

<p id="fund-performance" class="jump-link-nav anchored-block" data-jumplink-title="Fund Performance">In January, the VanEck Emerging Markets Bond Fund was down 0.84% in January, compared to -1.27% for its benchmark, the 50% J.P. Morgan Government Bond Index-Emerging Markets (GBI-EM) Global Diversified and 50% J.P. Morgan Emerging Markets Bond Index (EMBI). China was by far the biggest outperformer for the Fund, with Chile the largest underperformer. We increased exposure to Mexico and Poland local currency, covering an underweight exposure, and reduced our South Africa local exposure (where we now have zero exposure). We ended January with carry of 7.0%, yield to worst of 8.7%, duration of 5.8, and 52.7% of the Fund in local currency. Our biggest exposures are Mexico (local and hard), Brazil (primarily local), China (primarily hard), Colombia (primarily local), and Indonesia (primarily local). <a href="/us/en/blogs/emerging-markets-bonds/four-looming-risks-that-could-bolster-em-bonds/four-looming-risks-that-could-bolster-em-bonds.pdf" target="_blank" rel="noopener" title="Four Looming Risks That Could Bolster EM Bonds"><strong>View here for a PDF version of this blog.</strong></a></p>
<div class="wrapped-div">
<table style="width: 100%;">
<tbody>
<tr class="tbl-data">
<td class="tbl-header last" colspan="8">Average Annual Total Returns<sup>*</sup>&nbsp; (%) as of January 31, 2024</td>
</tr>
<tr class="tbl-data">
<td class="data-td last">&nbsp;</td>
<td class="data-head last">1 Month</td>
<td class="data-head last">3 Month</td>
<td class="data-head last">YTD</td>
<td class="data-head last">1 Year</td>
<td class="data-head last">3 Year</td>
<td class="data-head last">5 Year</td>
<td class="data-head last">10 Year</td>
</tr>
<tr class="tbl-data">
<td class="data-td last">Class A: NAV (Inception 07/09/12)</td>
<td class="data-td data last">-1.03</td>
<td class="data-td data last">8.81</td>
<td class="data-td data last">-1.03</td>
<td class="data-td data last">4.51</td>
<td class="data-td data last">-0.88</td>
<td class="data-td data last">2.91</td>
<td class="data-td data last">1.90</td>
</tr>
<tr class="tbl-data">
<td class="data-td last">Class A: Maximum 5.75% load</td>
<td class="data-td data last">-6.72</td>
<td class="data-td data last">2.55</td>
<td class="data-td data last">-6.72</td>
<td class="data-td data last">-1.50</td>
<td class="data-td data last">-2.82</td>
<td class="data-td data last">1.70</td>
<td class="data-td data last">1.29</td>
</tr>
<tr class="tbl-data">
<td class="data-td last">Class I: NAV (Inception 07/09/12)</td>
<td class="data-td data last">-0.84</td>
<td class="data-td data last">8.88</td>
<td class="data-td data last">-0.84</td>
<td class="data-td data last">5.01</td>
<td class="data-td data last">-0.53</td>
<td class="data-td data last">3.21</td>
<td class="data-td data last">2.22</td>
</tr>
<tr class="tbl-data">
<td class="data-td last">Class Y: NAV (Inception 07/09/12)</td>
<td class="data-td data last">-1.02</td>
<td class="data-td data last">8.65</td>
<td class="data-td data last">-1.02</td>
<td class="data-td data last">4.66</td>
<td class="data-td data last">-0.67</td>
<td class="data-td data last">3.13</td>
<td class="data-td data last">2.13</td>
</tr>
<tr class="tbl-data">
<td class="data-td last">50% GBI-EM/50% EMBI</td>
<td class="data-td data last">-1.27</td>
<td class="data-td data last">8.27</td>
<td class="data-td data last">-1.27</td>
<td class="data-td data last">6.56</td>
<td class="data-td data last">-3.37</td>
<td class="data-td data last">0.23</td>
<td class="data-td data last">1.85</td>
</tr>
</tbody>
</table>
</div>
<br />
<div class="wrapped-div">
<table style="width: 100%;">
<tbody>
<tr class="tbl-data">
<td class="tbl-header last" colspan="8">Average Annual Total Returns<sup>*</sup>&nbsp;(%) as of December 31, 2023</td>
</tr>
<tr class="tbl-data">
<td class="data-td last">&nbsp;</td>
<td class="data-head last">1 Month</td>
<td class="data-head last">3 Month</td>
<td class="data-head last">YTD</td>
<td class="data-head last">1 Year</td>
<td class="data-head last">3 Year</td>
<td class="data-head last">5 Year</td>
<td class="data-head last">10 Year</td>
</tr>
<tr class="tbl-data">
<td class="data-td last">Class A: NAV (Inception 07/09/12)</td>
<td class="data-td data last">3.88</td>
<td class="data-td data last">8.36</td>
<td class="data-td data last">10.91</td>
<td class="data-td data last">-0.79</td>
<td class="data-td data last">4.14</td>
<td class="data-td data last">1.80</td>
</tr>
<tr class="tbl-data">
<td class="data-td last">Class A: Maximum 5.75% load</td>
<td class="data-td data last">-2.09</td>
<td class="data-td data last">2.13</td>
<td class="data-td data last">4.53</td>
<td class="data-td data last">-2.73</td>
<td class="data-td data last">2.92</td>
<td class="data-td data last">1.20</td>
</tr>
<tr class="tbl-data">
<td class="data-td last">Class I: NAV (Inception 07/09/12)</td>
<td class="data-td data last">3.81</td>
<td class="data-td data last">8.43</td>
<td class="data-td data last">10.97</td>
<td class="data-td data last">-0.49</td>
<td class="data-td data last">4.46</td>
<td class="data-td data last">2.10</td>
</tr>
<tr class="tbl-data">
<td class="data-td last">Class Y: NAV (Inception 07/09/12)</td>
<td class="data-td data last">3.80</td>
<td class="data-td data last">8.40</td>
<td class="data-td data last">11.03</td>
<td class="data-td data last">-0.57</td>
<td class="data-td data last">4.39</td>
<td class="data-td data last">2.03</td>
</tr>
<tr class="tbl-data">
<td class="data-td last">50% GBI-EM/50% EMBI</td>
<td class="data-td data last">3.97</td>
<td class="data-td data last">8.63</td>
<td class="data-td data last">11.95</td>
<td class="data-td data last">-3.31</td>
<td class="data-td data last">1.46</td>
<td class="data-td data last">1.71</td>
</tr>
</tbody>
</table>
</div>
<br />
<p class="chart-disclosure"><sup>*</sup>&nbsp;Returns less than one year are not annualized.</p>
<p class="chart-disclosure"><strong>Expenses: Class A: Gross 2.55%, Net 1.22%; Class I: Gross 2.51%, Net 0.87%; Class Y: Gross 2.91%, Net 0.97%.</strong> Expenses are capped contractually until 05/01/24 at 1.25% for Class A, 0.95% for Class I, 1.00% for Class Y. Caps excluding acquired fund fees and expenses, interest, trading, dividends, and interest payments of securities sold short, taxes, and extraordinary expenses.</p>
<p class="chart-disclosure"><strong>The performance data quoted represents past performance. Past performance is not a guarantee of future results. Investment return and principal value of an investment will fluctuate so that an investor&rsquo;s shares, when redeemed, may be worth more or less than their original cost. Performance may be lower or higher than performance data quoted. Please call 800.826.2333 or visit vaneck.com for performance current to the most recent month ended.</strong></p>
<p class="chart-disclosure">The &ldquo;Net Asset Value&rdquo; (NAV) of a Fund is determined at the close of each business day, and represents the dollar value of one share of the fund; it is calculated by taking the total assets of the fund, subtracting total liabilities, and dividing by the total number of shares outstanding. The NAV is not necessarily the same as the ETF&rsquo;s intraday trading value. Investors should not expect to buy or sell shares at NAV.</p>
<p id="looming-risks" class="jump-link-nav anchored-block" data-jumplink-title="Looming Risks"><strong>There are four unpriced risks to the bulk of investor portfolios, and each of these risks hurts developed markets (DM) bonds and currencies while helping emerging markets (EM) bonds and currencies.</strong> The four risks are the Fed/global rates, fiscal policy, geopolitics, and US politics. Markets historically tend to ignore three of these risks &ndash; fiscal, geopolitics, and US politics. Fiscal concerns (our <a href="https://www.vaneck.com/us/en/investments/emerging-markets-bond-fund/fiscal-dominance-the-clarifying-lens-for-em-and-dm-bonds.pdf" title="Fiscal Dominance:  The Clarifying Lens for  EM (and DM) Bonds" target="_blank" rel="noopener"><strong>&ldquo;fiscal dominance&rdquo; thesis</strong></a>, for example) are considered an almost heterodox worry. Geopolitics are considered unanalyzable. And analyzing US politics as having risky implications for the world is just not done (at most the investment conclusion redounds to defense stocks versus health care stocks). Our key conclusion is that emerging markets are on the <i>winning</i> side of these risks, as EM clearly has already-high real policy rates, good fiscal policy, is globalizing geopolitically (not de-globalizing), and is home to some of the most popular governments in the world (China, India, Mexico, Indonesia are a few examples of popular governments implementing orthodox policies).</p>
<p><strong>Risk 1: Global interest rates (&ldquo;the Fed&rdquo;, if you will). Either way, EM wins and DM loses.</strong> When and if the Fed starts cutting its policy rate, EM bonds should perform better than most bond categories. In local-currency EM bonds (one half of our benchmark), this is because EM central banks raised their policy rates earlier and by more than the US. And also because the US dollar should start to decline as the Fed cuts rates, supporting EM currencies (i.e., not just their bonds). In hard-currency EM bonds, especially high yield sovereigns (the other half of our benchmark), the carry is so superior that it absorbs &ldquo;sideways&rdquo; or even weakness in risk-free rates. Put simply, if the Fed cuts don&rsquo;t materialize, EM carry wins the day, and if they do materialize, EM will see bigger rates rallies than those in risk-free bonds.</p>
<p><strong>Risk 2: Fiscal risks in developed markets &ndash; DM is highly indebted, while EM is not.</strong> Our recent white paper, <strong><a href="https://www.vaneck.com/us/en/blogs/emerging-markets-bonds/fiscal-dominance-the-clarifying-lens-for-em-and-dm-bonds/" title="Fiscal Dominance: The Clarifying Lens for EM (and DM) Bonds">Fiscal Dominance: The Clarifying Lens for EM (and DM) Bonds</a></strong> goes through the full argument. In short, low debt levels in EM governments allow their central banks to solely focus on inflation, while high debt levels in DM governments force their central banks to focus on multiple objectives (not just inflation). This is no longer a theoretical point as popular media now regularly focus on US debt sustainability and the US&rsquo;s rating by Fitch was cut to below AAA late in 2023 (S&amp;P already had the US below AAA), and Moody&rsquo;s has a negative credit outlook on its only AAA rating. Exhibit 1 shows the returns of two bond market, EM sovereign bonds (local- and hard-currency) versus DM sovereign bonds. This chart goes back 20 years. We also showed how the best within EM on fiscal metrics &ndash; Asian EM &ndash; actually became a flight-to-quality asset class during the past three years. The exhibit simply shows how superior EM government bond returns were compared to DM government bond returns. The argument we make in our white paper on the topic of &ldquo;fiscal dominance&rdquo; is that persistently good EM fiscal policy compared to persistently bad DM fiscal policy is the root of this big performance divergence. There are no indications that this is changing, if anything fiscal policy and anchored inflation expectations seem more labile than they&rsquo;ve ever been. In any case, the premia in EM bonds more than reflects the real or perceived risks.</p>
<h3>Exhibit 1 &ndash; EM Government Bonds Outperform DM</h3>
<p><strong>Bonds Performance EM Sovereign vs. DM Sovereign (total return, %)</strong></p>
<p><img class="img-responsive w-100" src="https://www.vaneck.com/contentassets/386351f46ded433195befb7d7f8103be/4143_emb_feb-chart1-2024-02_v1_blog.svg" alt="EM Government Bonds Outperform DM" /></p>
<p class="chart-disclosure">Source: VanEck Research, JP Morgan As of December 2023.</p>
<p><strong>Risk 3: Geopolitics favor an EM that is deepening globalization and a DM that is isolating.</strong> We also touched on this in our fiscal dominance white paper. Geopolitics have economic implications for EM and DM, and economics (in particular fiscal dominance) has implications for geopolitics. We&rsquo;ve discussed particular phenomena in our previous monthlies. In general, the implications are:</p>
<ul class="content-list">
<li>Higher defense spending in the DM, adding to fiscal pressure. DM defense spending looks set to increase due to geopolitical pressures. These add to the fiscal stresses in DM. If accompanied by higher inflation (often a symptom of war) and interest rates, the DM debt dynamic could begin to fray. U.S. deficits were forecast by the IMF to be in the 6%-8% range (above) <i>before </i> geopolitical risks became obvious to most forecasters.</li>
<li>The Chinese renminbi (CNY) market share in international trade is low (at below 5%), but is in the top 4 (approaching the British pound) and rising. EMs are further integrating their economies, with finance a key focus. Saudi Arabia now conducts oil sales to China in CNY, India in Indian rupees (INR) with UAE, Saudi, and China with Brazil in Brazilian real (BRL), etc. Purchases of these EM currencies by central banks in the long run results in the purchase of EM bonds in these currencies (just as Saudi and Chinese reserves were accumulated in U.S. Treasuries because sales generated USD).</li>
<li>Look for increased use of EM bonds as reserve assets, decreased use of DM bonds as reserve assets, prospectively. U.S./E.U./Japan, etc. (i.e., DM) sanctions freezing the Central Bank of Russia&rsquo;s reserves of Treasuries (and Japanese Government Bond, etc.) has forced all EM central banks to reconsider their reserve holdings in light of this new fact. Reserves should not be subject to sanctions risk from the perspective of EM reserve managers, for whom reserves are a nation&rsquo;s safety net that should by definition should be &ldquo;risk-free&rdquo;.</li>
<li>&ldquo;Stagflation&rdquo; that helps EM and hurts DM appears to be a real long-term scenario. Supply risks and greater economic integration in EM mean that rising commodity prices are likelier, and have a differential impact &ndash; India and China paying a different (and unknown) price for oil than do the DM is a glaring example. EM (defined by EM bond indices) include many commodity exporters, which can benefit in this scenario. DM are largely commodity-importing.</li>
</ul>
<p>These implications will take many years to play out, but they represent a long-term tailwind for EM local-currency bonds. As we showed at the outset, <i>it is the deficit-producing DMs that need financing from the surplus-producing EMs</i>, whether the situation is understood that way yet, or not. The fact that EM and DM are increasingly in geopolitical disagreement represents an obvious global market risk. <i>It is risky to depend on adversaries for one&rsquo;s financing is a sentence that shouldn&rsquo;t need to be written, but here we are.</i> EM central banks will increasingly want reserve assets backed by high real yields and debt sustainability, with zero sanctions risk. Central bank purchases of gold are by now well-reported and known, especially the fact that now both EM <i>and now</i> DM central banks are buyers. Gold is the easiest first-reaction from central banks. But, bonds with yield and currencies with use in trade are the ultimate desire for reserve managers and they will find these in EM local-currency bonds. As noted earlier, this is a long-term tailwind, not translating into a straight line. In particular, the USD has a key structural support &ndash; most global debt is denominated in USD. This means that &ldquo;risk-off&rdquo; translates into USD-up. This is less-and-less the case, as we show above with Asian EM local currencies rallying during the U.S.&rsquo;s fiscal and banking issues in 2023, for example. There, countries that proved their fiscal and monetary rectitude over decades <i>rallied</i> as DM bond markets suffered. Put differently, the USD-up is increasingly only up against the other DM currencies and the riskiest EM currencies, not against the best EM currencies. Anyway, our general point is that even geopolitical developments that are getting increased attention support our fiscal dominance thesis.</p>
<h3>Exhibit 2 &ndash; Central Banks Hold Fewer Treasuries</h3>
<p><strong>Foreign Exchange Holdings in U.S. Dollars, % of allocated reserves</strong></p>
<p><img class="img-responsive w-100" src="https://www.vaneck.com/contentassets/386351f46ded433195befb7d7f8103be/4143_emb_feb-chart2-2024-02_v1_blog.svg" alt="Central Banks Hold Fewer Treasuries" /></p>
<p><strong>Risk 4: US politics.</strong> Market participants are especially loath to discuss politics given obvious fractiousness in DM societies. And this is on top of the normal bias in DM markets that politics simply don&rsquo;t matter. We saw glaring examples of this in Brexit and President Trump&rsquo;s election in 2016, both of which the &ldquo;cool kids&rdquo; said would never happen. The key takeaway here is that US (and European, for that matter) politics are becoming important market drivers for DM. Former UK Prime Minister Truss lost her job after 90 days due to a fiscal/bond market crisis created by the UK&rsquo;s fiscal dominance (and her policies&rsquo; inability to comfort the market) less than two years ago! Ignoring things you don&rsquo;t like or don&rsquo;t want to talk about is unacceptable in risk management, of course. The flip side is that politics have normalized in most of EM, with voters more-or-less seeking to optimize economic outcomes in a disciplined policy context. This is arguably the case in large countries including Indonesia and most of Asia, Mexico, Colombia, China, Poland and many others. This is quite different from the constraint-free policy environment in the US where &ldquo;deficits don&rsquo;t matter&rdquo;. With sanctions against countries&rsquo; holdings of US treasuries a policy tool, it should not be hard to imagine what happens after sanctioning one&rsquo;s lenders, especially when one runs big deficits (see Exhibit 2).</p>
<h2 id="exposure-types-and-significant-changes" class="jump-link-nav anchored-block" data-jumplink-title="Exposure Types and Significant Changes">EXPOSURE TYPES AND SIGNIFICANT CHANGES</h2>
<p>The changes to our top positions are summarized below. Our largest positions in January were Mexico, Brazil, Colombia, Indonesia, and Poland:</p>
<ul class="content-list">
<li class="mt-2">We increased our local currency exposure in Mexico and Poland. Poland&rsquo;s strong institutions providing protection against political noise. Poland&rsquo;s central bank is currently on hold giving the new government space to sort out its post-election fiscal priorities. Mexico&rsquo;s bonds are even more attractively priced. Mexico&rsquo;s central bank is also on hold &ndash; waiting for inflation to get closer to the target range (and for the pre-election fiscal plans to get clearer) before starting its easing cycle. These considerations improved the policy test scores for both countries.</li>
<li class="mt-2">We also increased our local currency exposure Brazil, and hard currency corporate exposure in Brazil and Thailand. Brazil&rsquo;s local bonds are among the most attractively priced in major EMs. The central bank&rsquo;s easing pace is cautious and steady (-50 bps per meeting), as there are some residual concerns about the 2024 fiscal outcomes. The reason for adding corporate exposure in Thailand was meeting our risk limits in a situation when local bonds do not look attractive.</li>
<li class="mt-2">Finally, we increased our hard currency sovereign exposure in Bolivia and local currency exposure in Uganda. Uganda&rsquo;s valuations look very attractive, inflation is low and the central bank is not in a hurry to ease. There was also more progress in the oil sector, especially as regards the refinery construction after the government signed a memorandum of understanding with the UAE, improving the economic test score for the country. In Bolivia, a lot of risks appear to be priced in, while the government&rsquo;s external debt is low and a big part of it is official. The political noise will persist going forward, but some risks moderated following the constitutional court&rsquo;s decision to ban indefinite re-elections, improving the policy test score for the country.</li>
<li class="mt-2">We reduced our hard currency sovereign exposure in Chile, Malaysia, and Egypt. Stretched valuations played a big part in our decisions regarding Chile and Malaysia. In Egypt, our main concern was the impact of the Red Sea shipping disruptions on Egypt&rsquo;s FX revenue/inflows, which worsened the economic test score for the country.</li>
<li class="mt-2">We also reduced our hard currency sovereign and local currency exposure in South Africa, and hard currency corporate exposure in Burkina Faso. The company CEO&rsquo;s questionable activity was the main reason in Burkina Faso. In South Africa, political noise is bound to intensify in the run up to the elections, potentially affecting domestic sentiment, growth, and as a result the fiscal performance, worsening the country&rsquo;s economic and policy test scores.</li>
<li class="mt-2">Finally, we reduced our hard currency sovereign exposure in Qatar, Bahrain, Oman, and Cote d&rsquo;Ivoire. Cote d&rsquo;Ivoire valuations look stretched, worsening the technical test score for the country. In Bahrain, we are concerned about the impact of weaker hydrocarbon production and the Red Sea disruptions on growth, which worsen the economic test score against the backdrop of significant external debt obligations. Oman&rsquo;s trade balance is supportive, but a lot of good news (such as a potential upgrade to Investment Grade) appear to be priced in. Qatar valuations look less attractive after the rating upgrade.</li>
</ul>
<p>To receive more <a href="https://www.vaneck.com/us/en/insights/emerging-markets-bonds/" title="Emerging Markets Bonds Insights"><strong>Emerging Markets Bonds</strong></a> insights, <a href="https://www.vaneck.com/us/en/subscribe/" title="Subscription Center"><strong>sign up in our subscription center</strong></a>.</p>
<style>
    .wrapped-div {
        max-width: 100%;
    }

    @media (max-width: 768px) {
        .wrapped-div {
            overflow-x: scroll;
        }
    }

    .wrapped-div-sector {
        max-width: 100%;
        overflow-x: scroll;
    }
</style>
]]></content:encoded>
</item><item rdf:about="https://www.vaneck.com/us/en/blogs/emerging-markets-bonds/em-government-bonds-reap-the-rewards-of-fiscal-responsibility/">
  <title>EM Government Bonds Reap the Rewards of Fiscal Responsibility></title>
  <link>https://www.vaneck.com/us/en/blogs/emerging-markets-bonds/em-government-bonds-reap-the-rewards-of-fiscal-responsibility/</link>
  <description><![CDATA[Over the last five years, EM local currency debt has outperformed G7 government debt despite COVID, unprecedented Fed tightening, a strong dollar rally, wars in Ukraine and Gaza, and a slowing China.]]></description>
  <dc:creator>William Sokol</dc:creator>
  <dc:date>02/16/2024 06:30:00</dc:date>
<content:encoded><![CDATA[

<p>Even a cursory examination of emerging markets (EM) local currency sovereign debt performance over the past few years relative to developed markets (DM) counterparts reveals some interesting observations. This period has been characterized by extreme volatility across all fixed income asset classes, and EM debt investors were not insulated from this despite the high yields offered by the asset class. However, many investors may be surprised that EM local debt outperformed DM government bonds in this period - which includes the onset of COVID, unprecedented Fed tightening, a very strong dollar rally, the war in Ukraine, and a slowdown in Chinese economic growth.</p>
<h3>EM vs DM Government Debt: 12/31/2018 &ndash; 1/31/2024</h3>
<p><img class="img-responsive w-100" src="https://www.vaneck.com/contentassets/921a1f0073c4483f93164aac8725ce30/4138_em-government-bonds-2024-02_v1_blog.svg" alt="EM versus DM government debt" /></p>
<p class="chart-disclosure">Source: J.P. Morgan and ICE Data Indices. EM Local Currency Debt represented by J.P. Morgan GBI-EM Global Divresified Index; G7 Government Debt represented by ICE BofA G7 Government Index. Past performance is no guarantee of future results. Index performance is not representative of fund performance. It is not possible to invest directly in an index.</p>
<p>Hard currency EM debt has outperformed both DM government bonds and EM local currency bonds by a much greater degree over the past two decades, and we believe that the same outperformance drivers have now begun to benefit local currency debt - in particular, the absence of &ldquo;fiscal dominance.&rdquo; It is notable that EM local currency bonds outperformed DM government bonds in 2022, an extremely bad year for most fixed income asset classes, as well as 2023 when all bonds rallied, <strong><a href="https://www.vaneck.com/us/en/blogs/emerging-markets-bonds/bull-or-bear-emerging-markets-bonds-outperform-in-both/" title="Bull or Bear? Emerging Markets Bonds Outperform in Both">as discussed in Bull or Bear? Emerging Markets Bonds Outperform in Both</a></strong>. In other words, it was not simply the U.S. economic trajectory that has been driving returns. Superior fundamentals may explain this divergence in performance in both bull and bear markets.</p>
<p>Low debt and deficits have allowed emerging markets monetary authorities to conduct inflation-focused monetary policy, while high debt and deficits in developed markets have diluted central bank independence and their focus on inflation. Global bond markets are now beginning to recognize the risks embedded in DM government debt and reward the responsible fiscal and monetary policies that have been pursued by many emerging markets over the past several decades. We explore these dynamics and what is means for global bond investors going forward in <a href="https://www.vaneck.com/us/en/blogs/emerging-markets-bonds/fiscal-dominance-the-clarifying-lens-for-em-and-dm-bonds/" title="Fiscal Dominance: The Clarifying Lens for EM (and DM) Bonds"><strong>Fiscal Dominance: The Clarifying Lens for EM (and DM) Bonds</strong></a>.</p>
<h2>Investing in EM Bonds with VanEck</h2>
<p>The <a href="https://www.vaneck.com/us/en/investments/emerging-markets-bond-fund-embax/overview/" title="EMBAX - Emerging Markets Bond Fund - Class A - Overview"><strong>VanEck Emerging Markets Bond Fund</strong></a> is a high active share emerging market bond investment solution with the flexibility to invest across sovereigns, corporates, USD and local currency bonds. The fund is managed using a consistent approach across markets to find the best opportunities across the EM debt universe. The <a href="https://www.vaneck.com/us/en/investments/jp-morgan-em-local-currency-bond-etf-emlc/overview/" title="EMLC - VanEck J.P. Morgan EM Local Currency Bond ETF - Overview"><strong>VanEck J.P. Morgan EM Local Currency Bond ETF</strong></a> provides access to bonds issued by emerging market governments and denominated in the local currency of the issuer, and may be attractive to investors seeking passive exposure to the broad EM local currency sovereign bond market.</p>
<p>To receive more <a href="https://www.vaneck.com/us/en/insights/emerging-markets-bonds/" title="Emerging Markets Bonds Insights"><strong>Emerging Markets Bonds</strong></a> insights, <a href="https://www.vaneck.com/us/en/subscribe/" title="Subscription Center"><strong>sign up in our subscription center</strong></a>.</p>
]]></content:encoded>
</item><item rdf:about="https://www.vaneck.com/us/en/blogs/thematic-investing/buzz-investing-semiconductor-surge-leads-market-rise/">
  <title>BUZZ Investing: Semiconductor Surge Leads Market Rise></title>
  <link>https://www.vaneck.com/us/en/blogs/thematic-investing/buzz-investing-semiconductor-surge-leads-market-rise/</link>
  <description><![CDATA[U.S. domestic markets saw gains, the S&amp;P 500 rising, the Nasdaq gaining, driven by upbeat semiconductor earnings, boosting investor confidence amid lower rate cut expectations.]]></description>
  <dc:creator> </dc:creator>
  <dc:date>02/16/2024 06:30:00</dc:date>
<content:encoded><![CDATA[

<p>U.S. domestic markets gained during the recent period between Index selection dates (January 10, 2024 to February 8, 2024, the &ldquo;Period&rdquo;). The S&amp;P 500 Index rose by 5.7%, and the Nasdaq Composite Index, known for its technology focus, gained 4.6%. The BUZZ NextGen AI US Sentiment Leaders Index (the &ldquo;BUZZ Index&rdquo;) gained 5.7% during the Period, particularly driven by gains in stocks from the semiconductor sector following upbeat earnings reports. Impressively, the MVIS US Listed Semiconductor 25 Index (the &ldquo;MVIS Index&rdquo;) surged 15.6% during the Period. Since the beginning of 2023, the MVIS Index has seen an extraordinary increase of 98.6%, primarily driven by investor enthusiasm for the growing demand for semiconductors, especially for AI applications. This sustained upward trajectory of the MVIS Index has positively influenced investor confidence in domestic equity markets and potentially played a key role in offsetting the effects of reduced expectations for interest rate cuts.</p>
<h3>MVIS US Listed Semiconductor 25 Index | January 1, 2023 - February 8, 2024</h3>
<p><img class="img-responsive w-100" src="https://www.vaneck.com/contentassets/0acb390e5ae341b68ffa3f0f9796665c/4136_buzz-blog-2024-02_v1_blog.svg" alt="MVIS US Listed Semiconductor 25 Index | January 1, 2023 - February 8, 2024" /></p>
<p class="chart-disclosure">Source: Bloomberg as of 2/8/2024. Past performance is no guarantee of future results. Index performance is not representative of fund performance. It is not possible to invest directly in an index.</p>
<p>Investors lowered expectations for the timing and pace of interest rate cuts following comments from several Federal Reserve officials, notably Fed Board of Governor member Christopher Waller, who stated he saw <i>"no reason"</i> for the Fed to move quickly on rate cuts. The Federal Open Market Committee (FOMC) reinforced Waller&rsquo;s view, maintaining the upper bound of their target rate at 5.5% in their January 31st meeting while noting in their policy statement that <i>&ldquo;the Committee does not expect it will be appropriate to reduce the target range until it has gained greater confidence that inflation is moving sustainably toward 2 percent.&rdquo;</i> During his post-meeting news conference, Fed Chair Jerome Powell further stated, <i>&ldquo;I don&rsquo;t think it's likely that the committee will reach a level of confidence by the time of the March meeting to identify March as the time to .&rdquo;</i> Reflecting this shift in investor outlook, the CME FedWatch tool showed a significant decrease in the likelihood of a 25 bps rate cut by the FOMC in March 2024, which at the end of the Period stood at approximately 19%, down from about 73% at the end of 2023.</p>
<p>The BUZZ Index returned -3.60% during the month of January compared to a return of 1.68% for the S&amp;P 500 Index during the same period.</p>
<h2>Shares of Palantir Technology Pace Advancing Stocks within the BUZZ Index</h2>
<p>Palantir Technologies Inc. (NYSE: PLTR) paced gains in the BUZZ Index during the recent Period. The AI-driven data analytics company saw its shares surge 46% during the Period after projecting higher-than-expected 2024 profits due to strong demand for its AI technology. The company announced it anticipates adjusted operational income between $834 million and $850 million for the year, surpassing analysts' average estimate of $760.3 million. In 2023, Palantir reported its first profitable year with a net income of $210 million, exceeding the analyst forecast of $194.5 million. CEO Alex Karp highlighted the overwhelming commercial demand they're facing, noting during the company&rsquo;s earnings call that<i> &ldquo;we don&rsquo;t know what to do with the onslaught of demand.&rdquo;</i>&nbsp; Other notable contributors to BUZZ Index performance during the period include semiconductor and related industry companies, including Super Micro Computer Inc (NASD: SMCI), NVIDIA Corp (NASD: NVDA), and Advanced Micro Devices Inc (NASD: AMD), whose shares rose 103.9%, 28.1% and 14% respectively during the Period amid positive earnings and continued investor enthusiasm for the market segment.</p>
<div class="wrapped-div">
<table style="width: 750px;">
<tbody>
<tr class="tbl-data">
<td class="tbl-header last " colspan="4">Top BUZZ Index Contributors: January 10, 2024 &ndash; February 8, 2024</td>
</tr>
<tr class="tbl-data">
<td class="data-td  last">Company</td>
<td class="data-head last">Ticker</td>
<td class="data-head last">Average Weight (%)</td>
<td class="data-head last">Return Contribution (%)</td>
</tr>
<tr class="tbl-data">
<td class="data-td last font-weight-normal">Palantir Technologies Inc</td>
<td class="data-td data last">PLTR</td>
<td class="data-td data last">3.08</td>
<td class="data-td data last">1.41</td>
</tr>
<tr class="tbl-data">
<td class="data-td last font-weight-normal">Super Micro Computer Inc</td>
<td class="data-td data last">SMCI</td>
<td class="data-td data last">1.20</td>
<td class="data-td data last">0.98</td>
</tr>
<tr class="tbl-data">
<td class="data-td last font-weight-normal">NVIDIA Corp</td>
<td class="data-td data last">NVDA</td>
<td class="data-td data last">3.53</td>
<td class="data-td data last">0.90</td>
</tr>
<tr class="tbl-data">
<td class="data-td last font-weight-normal">Meta Platforms Inc</td>
<td class="data-td data last">META</td>
<td class="data-td data last">3.24</td>
<td class="data-td data last">0.82</td>
</tr>
<tr class="tbl-data">
<td class="data-td last font-weight-normal">Marathon Digital Holdings Inc</td>
<td class="data-td data last">MARA</td>
<td class="data-td data last">1.45</td>
<td class="data-td data last">0.66</td>
</tr>
<tr class="tbl-data">
<td class="data-td last font-weight-normal">MicroStrategy Inc</td>
<td class="data-td data last">MSTR</td>
<td class="data-td data last">1.88</td>
<td class="data-td data last">0.54</td>
</tr>
<tr class="tbl-data">
<td class="data-td last font-weight-normal">Advanced Micro Devices Inc</td>
<td class="data-td data last">AMD</td>
<td class="data-td data last">3.50</td>
<td class="data-td data last">0.48</td>
</tr>
<tr class="tbl-data">
<td class="data-td last font-weight-normal">Walt Disney Co/The</td>
<td class="data-td data last">DIS</td>
<td class="data-td data last">1.99</td>
<td class="data-td data last">0.40</td>
</tr>
<tr class="tbl-data">
<td class="data-td last font-weight-normal">DraftKings Inc</td>
<td class="data-td data last">DKNG</td>
<td class="data-td data last">1.43</td>
<td class="data-td data last">0.37</td>
</tr>
<tr class="tbl-data">
<td class="data-td last font-weight-normal">Amazon.com Inc</td>
<td class="data-td data last">AMZN</td>
<td class="data-td data last">3.20</td>
<td class="data-td data last">0.33</td>
</tr>
</tbody>
</table>
<p class="chart-disclosure">Source: BUZZ Holdings ULC, Bloomberg. Past performance is no guarantee of future results. Index performance is not illustrative of fund performance. Not intended as a recommendation to buy or to sell any of the securities mentioned herein.</p>
<p>Electric vehicle (&ldquo;EV&rdquo;) manufacturer Tesla Inc (NASD: TSLA) led the top detractors to performance during the recent Period. TSLA&rsquo;s recent financial performance revealed weaker-than-expected results for the fourth quarter, with a profit of 71 cents per share on $25.17 billion revenue, falling short of Wall Street predictions. This occurred despite a record delivery of 484,507 vehicles in the quarter. The company did not provide detailed guidance on its strategy regarding ongoing price cuts, margin structure, and fluctuating demand. A key point of interest was Tesla's profit margins, which are closely monitored by analysts. These margins narrowed to 17.6% in the December quarter, down from 23.8% in the same period in 2022 and below the anticipated 18.3%. Shares of fellow EV manufacturer Rivian Automotive Inc (NASD: RIVN) were also featured in the top detractors to BUZZ Index performance during the period. The company faces ongoing challenges in meeting production targets and experiencing declining profit margins. These issues are exacerbated by persistent industry-wide price pressures, significantly influenced by larger competitors like Tesla.</p>
<div class="wrapped-div">
<table style="width: 750px;">
<tbody>
<tr class="tbl-data">
<td class="tbl-header last " colspan="4">Bottom BUZZ Index Contributors: January 10, 2024 &ndash; February 8, 2024</td>
</tr>
<tr class="tbl-data">
<td class="data-td  last">Company</td>
<td class="data-head last">Ticker</td>
<td class="data-head last">Average Weight (%)</td>
<td class="data-head last">Return Contribution (%)</td>
</tr>
<tr class="tbl-data">
<td class="data-td last font-weight-normal">Tesla Inc</td>
<td class="data-td data last">TSLA</td>
<td class="data-td data last">2.59</td>
<td class="data-td data last">-0.58</td>
</tr>
<tr class="tbl-data">
<td class="data-td last font-weight-normal">Coinbase Global Inc</td>
<td class="data-td data last">COIN</td>
<td class="data-td data last">2.59</td>
<td class="data-td data last">-0.40</td>
</tr>
<tr class="tbl-data">
<td class="data-td last font-weight-normal">Snap Inc</td>
<td class="data-td data last">SNAP</td>
<td class="data-td data last">0.95</td>
<td class="data-td data last">-0.37</td>
</tr>
<tr class="tbl-data">
<td class="data-td last font-weight-normal">Rivian Automotive Inc</td>
<td class="data-td data last">RIVN</td>
<td class="data-td data last">1.74</td>
<td class="data-td data last">-0.31</td>
</tr>
<tr class="tbl-data">
<td class="data-td last font-weight-normal">Robinhood Markets Inc</td>
<td class="data-td data last">HOOD</td>
<td class="data-td data last">2.11</td>
<td class="data-td data last">-0.29</td>
</tr>
<tr class="tbl-data">
<td class="data-td last font-weight-normal">GameStop Corp</td>
<td class="data-td data last">GME</td>
<td class="data-td data last">0.75</td>
<td class="data-td data last">-0.26</td>
</tr>
<tr class="tbl-data">
<td class="data-td last font-weight-normal">PayPal Holdings Inc</td>
<td class="data-td data last">PYPL</td>
<td class="data-td data last">2.95</td>
<td class="data-td data last">-0.23</td>
</tr>
<tr class="tbl-data">
<td class="data-td last font-weight-normal">Moderna Inc</td>
<td class="data-td data last">MRNA</td>
<td class="data-td data last">0.83</td>
<td class="data-td data last">-0.17</td>
</tr>
<tr class="tbl-data">
<td class="data-td last font-weight-normal">DocuSign Inc</td>
<td class="data-td data last">DOCU</td>
<td class="data-td data last">0.69</td>
<td class="data-td data last">-0.17</td>
</tr>
<tr class="tbl-data">
<td class="data-td last font-weight-normal">Intel Corp</td>
<td class="data-td data last">INTC</td>
<td class="data-td data last">1.42</td>
<td class="data-td data last">-0.16</td>
</tr>
</tbody>
</table>
</div>
<br />
<p class="chart-disclosure">Source: BUZZ Holdings ULC, Bloomberg. Past performance is no guarantee of future results. Index performance is not illustrative of fund performance. Not intended as a recommendation to buy or to sell any of the securities mentioned herein.</p>
<h2>BUZZ Index February 2024 Rebalance Highlights</h2>
<p><strong><u>ASML Holding N.V.</u></strong></p>
<p>In 2023, a key investment trend emerged with the rise of Artificial Intelligence (AI), highlighted by OpenAI's introduction of ChatGPT and the significant investment influx into large language models. AI transitioned from a futuristic concept to a prevalent aspect of everyday life for many. This shift sparked an exponential increase in demand for semiconductor chips, essential for powering this AI revolution. NVIDIA (NASD: NVDA), a leading company in this domain, has seen its stock soar by over 70% since November 2023. Investors who missed out on NVDA's surge are now turning to alternative semiconductor stocks like Advanced Micro Devices (NASD: AMD), Super Micro Computer (NASD: SMCI), and ASML Holding (NASD: ASML). ASML, a lesser-known semiconductor equipment manufacturer, is gaining traction among investors. It's seen by some as a more affordable option to invest in the AI chip market. Despite limited mainstream media coverage, ASML's potential is being recognized on online platforms. This month, ASML makes its debut in the BUZZ Index, with a 0.47% weight.</p>
<p><strong><u>Archer-Daniels-Midland Company</u></strong></p>
<p>Archer-Daniels-Midland Company (NYSE: ADM), established in 1902, is a prominent agricultural firm specializing in producing and processing food products and ingredients globally. It ranks among the top 50 U.S. companies by revenue. ADM's journey, however, is as notable for its controversies as its achievements, having been embroiled in various scandals, including price fixing, antitrust violations, and tax crimes. Its notoriety even inspired the book "The Informant" in 2000 and a subsequent film, focusing on its involvement in the lysine price-fixing scandal during the 1990s. Recently, ADM was back in the spotlight due to a Department of Justice investigation into its accounting practices, causing its stock to fall 25% the next day. Paradoxically, investor sentiment has risen since the announcement, possibly because the price drop is seen as an investment opportunity in a company with a proven track record of weathering scandals. Reflecting this interest, ADM is making its first appearance in the BUZZ Index this month, holding a 0.56% weight.</p>
<p>For more on rebalancing results and a full breakdown of index constituents added and removed for the month, view the <a href="https://www.vaneck.com/us/en/blogs/thematic-investing/buzz-investing-semiconductor-surge-leads-market-rise/buzz-reconstitution-february-2024.pdf" title="BUZZ VanEck Social Sentiment ETF" target="_blank" rel="noopener"><strong>BUZZ Index reconstitution</strong></a> report.</p>
<p>To receive more <a href="https://www.vaneck.com/us/en/insights/thematic-investing/" title="Thematic Investing Insights"><strong>Thematic Investing</strong></a> insights, <a href="https://www.vaneck.com/us/en/subscribe/" title="Subscription Center"><strong>sign up in our subscription center</strong></a>.</p>
</div>
</div>
<style>
    .wrapped-div {
        max-width: 100%;
    }

    @media (max-width: 1240px) {
        .wrapped-div {
            overflow-x: scroll;
        }
    }

    .wrapped-div-sector {
        max-width: 100%;
        overflow-x: scroll;
    }
</style>
]]></content:encoded>
</item><item rdf:about="https://www.vaneck.com/us/en/blogs/income-investing/fallen-angels-a-preponderance-of-reits/">
  <title>Fallen Angels: A Preponderance of REITs></title>
  <link>https://www.vaneck.com/us/en/blogs/income-investing/fallen-angels-a-preponderance-of-reits/</link>
  <description><![CDATA[The &ldquo;January effect&rdquo; continues into 2024, as fallen angels outperformed broad high yield; real estate exposure in the Index grows as the sector continues to struggle.]]></description>
  <dc:creator>Nicolas  Fonseca, CFA</dc:creator>
  <dc:date>02/15/2024 06:30:00</dc:date>
<content:encoded><![CDATA[

<p>The positive momentum gained by fallen angels (as represented by the ICE US Fallen Angel High Yield 10% Constrained Index, &ldquo;H0CF&rdquo;) in the final quarter of 2023 carried over into January, surpassing broad high yield (as represented by the ICE BofA US High Yield Index, &ldquo;H0A0&rdquo;) by 56bps (0.58% vs 0.02%). This outperformance can be attributed primarily to the unique security and sector exposure offered by fallen angels, with Real Estate, Retail, Telecom and lack of Media, contributing almost 100% of the 56bps. In our January note from last year, we <strong><a href="https://www.vaneck.com/us/en/blogs/income-investing/a-flying-start-for-fallen-angel-bonds/" title="A Flying Start for Fallen Angel Bonds">highlighted</a></strong> the remarkable track record of the January effect for fallen angels. This trend has persisted, now with 17 out of the last 20 calendar years showing a positive total return in January, and of those 17, 15 concluded the calendar year with positive total returns. Amid a mix of factors such as benign inflation news, resilient growth data, the U.S. Federal Reserve (Fed) signaling reluctance towards a potential rate cut in March and an exceptionally strong jobs report, 2024 has commenced on a robust note for fallen angels.</p>
<p><strong><u>Fallen Angels and Rising Stars Scenarios:</u></strong> JP Morgan has provided insights into prospective candidates for fallen angels and rising stars in the coming months. Key takeaways are as follows:</p>
<p>A significant amount of bonds, totaling $1.05tn, are currently rated BBB- by at least one of the three rating agencies; a sizeable amount relative to the $1.3 US HY market. $111bn of BBB- bonds are currently on negative watch by at least one rating agency, $38bn in bonds one or two negative rating action away from becoming fallen angels and $101bn of BBB- non-financials were trading with a spread above the BB average spread.</p>
<p>Within HY, there is a total of $263bn rated BB+ by at least one of the three rating agencies, with approximately 21% on positive watch. $27bn of bonds are one or two positive rating actions away from becoming rising stars and $115bn of BB issuers were trading with spreads that were tighter than the BB average spread.</p>
<p>In short, the list of near-term fallen angels remains limited, and we expect most of the downgrade volume in the coming months to be idiosyncratic in nature. Sector-specific weakness (e.g., Real Estate) may continue to manifest in downgrades, and even a modest slowdown in growth could lead to a meaningful increase in fallen angel volume given the high level of BBB- debt outstanding. Overall, we expect to see more fallen angels than rising stars this year.</p>
<p>According to Citi, High Yield ETFs experienced approximately $2.8bn in inflows, but it was IG Corporates that brought in the most, at $9bn. In terms of duration, Intermediate duration strategies saw the highest inflows, at $19.2bn, while Ultrashort experienced $2.1bn in outflows.</p>
<p><strong><u>Fallen Angels Overall Statistics:</u></strong> Yields and spreads were relatively flat for fallen angels while both saw an uptick in broad HY. Fallen angels market value, despite a new fallen angel adding $1,650mn in par amount, was flat for the month as some bonds were removed due to their impending maturity within the next 12 months. Broad HY had one issuer default (Audacy Capital Corp, the second-largest U.S. radio company) to start the year with $994m par outstanding.</p>
<div class="wrapped-div">
<table style="width: 100%;">
<tbody>
<tr class="tbl-data">
<td class="tbl-header last text-center">&nbsp;</td>
<td class="tbl-header last text-center" style="border-right: outset;" colspan="2">Fallen Angels</td>
<td class="tbl-header last text-center" colspan="2">Broad HY</td>
</tr>
<tr class="tbl-data">
<td class="data-head last">&nbsp;</td>
<td class="data-head last">12/31/23</td>
<td class="data-head last" style="border-right: outset;">1/31/24</td>
<td class="data-head last">12/31/23</td>
<td class="data-head last">1/31/24</td>
</tr>
<tr class="tbl-data">
<td class="data-td last">Yield to Worst</td>
<td class="data-td data last">6.99</td>
<td class="data-td data last" style="border-right: outset;">6.96</td>
<td class="data-td data last">7.69</td>
<td class="data-td data last">7.84</td>
</tr>
<tr class="tbl-data">
<td class="data-td last">Effective Duration</td>
<td class="data-td data last">5.41</td>
<td class="data-td data last" style="border-right: outset;">5.43</td>
<td class="data-td data last">3.31</td>
<td class="data-td data last">3.33</td>
</tr>
<tr class="tbl-data">
<td class="data-td last">Full Market Value ($mn)</td>
<td class="data-td data last">67,821</td>
<td class="data-td data last" style="border-right: outset;">67,726</td>
<td class="data-td data last">1,237,721</td>
<td class="data-td data last">1,245,514</td>
</tr>
<tr class="tbl-data">
<td class="data-td last">OAS</td>
<td class="data-td data last">285</td>
<td class="data-td data last" style="border-right: outset;">283</td>
<td class="data-td data last">339</td>
<td class="data-td data last">359</td>
</tr>
<tr class="tbl-data">
<td class="data-td last">No. of Issues</td>
<td class="data-td data last">143</td>
<td class="data-td data last" style="border-right: outset;">143</td>
<td class="data-td data last">1,837</td>
<td class="data-td data last">1,847</td>
</tr>
</tbody>
</table>
</div>
<br />
<p class="chart-disclosure">Source: ICE Data Services, VanEck. Fallen Angels: ICE US Fallen Angel High Yield 10% Constrained Index. Broad HY: ICE BofA US High Yield Index. OAS refers to &ldquo;option-adjusted spread.&rdquo; Please see definition for this and other terms referenced herein in the disclosures and definitions portion of this blog. Past performance is no guarantee of future results. Index performance is not representative of fund performance. It is not possible to invest in an index.</p>
<p><strong><u>New Fallen Angels:</u></strong> In January, Hudson Pacific Properties (HPP) became the newest addition to the index, marking the third Real Estate Investment Trust (REIT) inclusion in the last five months. Moody's originally downgraded HPP in July 2023 which was driven by its anticipation of a decline in the REIT's leverage and coverage metrics throughout 2023, with a projection of continued weakness into 2024. HPP was further downgraded to BB+ from BBB- by S&amp;P in mid-January, making it the latest fallen angel. S&amp;P echoed similar views to Moody&rsquo;s, noting that HPP is under sustained pressure due to lease expirations, which could lead to further deterioration in occupancy levels. This is particularly relevant in the commercial property market, where office vacancies persist below pre-COVID levels. The challenges in the commercial property sector are exacerbated by the fact that there is over $2.2tn in U.S. commercial property loans set to mature by 2027. Most of these loans will need to be refinanced at higher rates, adding additional financial strain to the sector.</p>
<div class="wrapped-div">
<table style="width: 100%;">
<tbody>
<tr class="tbl-data">
<td class="tbl-header last">Month-end Addition</td>
<td class="tbl-header last text-center">Name</td>
<td class="tbl-header last text-center">Rating</td>
<td class="tbl-header last text-center">Sector</td>
<td class="tbl-header last text-center">Industry</td>
<td class="tbl-header last text-center">% Mkt Value</td>
<td class="tbl-header last text-center">Price</td>
</tr>
<tr class="tbl-data">
<td class="data-td last font-weight-normal">January</td>
<td class="data-td data last">Hudson Pacific Properties LP</td>
<td class="data-td data last">BB1</td>
<td class="data-td data last">Real Estate</td>
<td class="data-td data last">REITs</td>
<td class="data-td data last">2.18</td>
<td class="data-td data last">88.05</td>
</tr>
</tbody>
</table>
</div>
<br />
<p class="chart-disclosure">Source: ICE Data Services, VanEck. Fallen Angels: ICE US Fallen Angel High Yield 10% Constrained Index. Past performance is no guarantee of future results. Not a recommendation to buy or sell any of the names/securities mentioned herein. Index performance is not representative of fund performance. It is not possible to invest in an index.</p>
<p><strong><u>Rising Stars:</u></strong> None.</p>
<p><strong><u>Fallen Angels Performance by Sector:</u></strong> With the addition of HPP, the Real Estate sector's representation in the index has now reached double digits, alongside Energy, Retail and Telecom. Retail has emerged as the sector with the highest exposure, surpassing Energy, which experienced a reduction as a Southwest Energy issue was removed due to its imminent maturity within the next 12 months. While spreads across sectors remained largely stable, the Real Estate sector witnessed a significant tightening of spreads by 100bps. Despite this improvement, Real Estate continues to have the widest spreads, exceeding 500 bps. In terms of attribution relative to broad high yield, the outperformance in January was notably influenced by the Real Estate sector (benefiting from fallen angels overweight), Media (with no exposure in the fallen angels index and wider spreads in broad high-yield, possibly due to a default), Retail (fallen angels overweight) and Telecom (fallen angels overweight). These sectors collectively played a significant role in driving outperformance during the month.</p>
<div class="wrapped-div-full">
<table style="width: 100%;">
<tbody>
<tr class="tbl-data">
<td class="tbl-header last text-center">&nbsp;</td>
<td class="tbl-header last text-center" style="border-right: outset;" colspan="2">Wgt (%)</td>
<td class="tbl-header last text-center" style="border-right: outset;" colspan="2">OAS</td>
<td class="tbl-header last text-center" style="border-right: outset;" colspan="2">Price</td>
<td class="tbl-header last text-center">Total Return (%)</td>
</tr>
<tr class="tbl-data">
<td class="data-head last">&nbsp;</td>
<td class="data-head last">12/31/23</td>
<td class="data-head last" style="border-right: outset;">1/31/24</td>
<td class="data-head last">12/31/23</td>
<td class="data-head last" style="border-right: outset;">1/31/24</td>
<td class="data-head last">12/31/23</td>
<td class="data-head last" style="border-right: outset;">1/31/24</td>
<td class="data-head last">MTD</td>
</tr>
<tr class="tbl-data">
<td class="data-td last">Banking</td>
<td class="data-td data last">4.79</td>
<td class="data-td data last" style="border-right: outset;">4.47</td>
<td class="data-td data last">231</td>
<td class="data-td data last" style="border-right: outset;">217</td>
<td class="data-td data last">97.91</td>
<td class="data-td data last" style="border-right: outset;">99.24</td>
<td class="data-td data last">1.71</td>
</tr>
<tr class="tbl-data">
<td class="data-td last">Basic Industry</td>
<td class="data-td data last">1.70</td>
<td class="data-td data last" style="border-right: outset;">1.73</td>
<td class="data-td data last">171</td>
<td class="data-td data last" style="border-right: outset;">151</td>
<td class="data-td data last">97.24</td>
<td class="data-td data last" style="border-right: outset;">98.06</td>
<td class="data-td data last">1.23</td>
</tr>
<tr class="tbl-data">
<td class="data-td last">Capital Goods</td>
<td class="data-td data last">5.85</td>
<td class="data-td data last" style="border-right: outset;">5.80</td>
<td class="data-td data last">200</td>
<td class="data-td data last" style="border-right: outset;">227</td>
<td class="data-td data last">97.34</td>
<td class="data-td data last" style="border-right: outset;">96.20</td>
<td class="data-td data last">-0.72</td>
</tr>
<tr class="tbl-data">
<td class="data-td last">Consumer Goods</td>
<td class="data-td data last">4.33</td>
<td class="data-td data last" style="border-right: outset;">4.28</td>
<td class="data-td data last">230</td>
<td class="data-td data last" style="border-right: outset;">284</td>
<td class="data-td data last">94.29</td>
<td class="data-td data last" style="border-right: outset;">92.59</td>
<td class="data-td data last">-1.29</td>
</tr>
<tr class="tbl-data">
<td class="data-td last">Energy</td>
<td class="data-td data last">14.75</td>
<td class="data-td data last" style="border-right: outset;">14.17</td>
<td class="data-td data last">259</td>
<td class="data-td data last" style="border-right: outset;">260</td>
<td class="data-td data last">92.49</td>
<td class="data-td data last" style="border-right: outset;">92.37</td>
<td class="data-td data last">0.62</td>
</tr>
<tr class="tbl-data">
<td class="data-td last">Financial Services</td>
<td class="data-td data last">1.14</td>
<td class="data-td data last" style="border-right: outset;">1.08</td>
<td class="data-td data last">378</td>
<td class="data-td data last" style="border-right: outset;">416</td>
<td class="data-td data last">86.41</td>
<td class="data-td data last" style="border-right: outset;">84.44</td>
<td class="data-td data last">-1.72</td>
</tr>
<tr class="tbl-data">
<td class="data-td last">Healthcare</td>
<td class="data-td data last">4.10</td>
<td class="data-td data last" style="border-right: outset;">4.16</td>
<td class="data-td data last">270</td>
<td class="data-td data last" style="border-right: outset;">247</td>
<td class="data-td data last">88.73</td>
<td class="data-td data last" style="border-right: outset;">89.43</td>
<td class="data-td data last">1.26</td>
</tr>
<tr class="tbl-data">
<td class="data-td last">Insurance</td>
<td class="data-td data last">1.32</td>
<td class="data-td data last" style="border-right: outset;">1.35</td>
<td class="data-td data last">323</td>
<td class="data-td data last" style="border-right: outset;">270</td>
<td class="data-td data last">94.10</td>
<td class="data-td data last" style="border-right: outset;">96.46</td>
<td class="data-td data last">3.00</td>
</tr>
<tr class="tbl-data">
<td class="data-td last">Leisure</td>
<td class="data-td data last">7.90</td>
<td class="data-td data last" style="border-right: outset;">8.00</td>
<td class="data-td data last">228</td>
<td class="data-td data last" style="border-right: outset;">205</td>
<td class="data-td data last">93.21</td>
<td class="data-td data last" style="border-right: outset;">93.98</td>
<td class="data-td data last">1.20</td>
</tr>
<tr class="tbl-data">
<td class="data-td last">Real Estate</td>
<td class="data-td data last">9.07</td>
<td class="data-td data last" style="border-right: outset;">10.73</td>
<td class="data-td data last">675</td>
<td class="data-td data last" style="border-right: outset;">575</td>
<td class="data-td data last">82.72</td>
<td class="data-td data last" style="border-right: outset;">83.95</td>
<td class="data-td data last">1.75</td>
</tr>
<tr class="tbl-data">
<td class="data-td last">Retail</td>
<td class="data-td data last">14.38</td>
<td class="data-td data last" style="border-right: outset;">14.41</td>
<td class="data-td data last">242</td>
<td class="data-td data last" style="border-right: outset;">230</td>
<td class="data-td data last">86.39</td>
<td class="data-td data last" style="border-right: outset;">87.10</td>
<td class="data-td data last">1.14</td>
</tr>
<tr class="tbl-data">
<td class="data-td last">Services</td>
<td class="data-td data last">0.64</td>
<td class="data-td data last" style="border-right: outset;">0.64</td>
<td class="data-td data last">243</td>
<td class="data-td data last" style="border-right: outset;">219</td>
<td class="data-td data last">94.78</td>
<td class="data-td data last" style="border-right: outset;">95.80</td>
<td class="data-td data last">1.50</td>
</tr>
<tr class="tbl-data">
<td class="data-td last">Technology &amp; Electronics</td>
<td class="data-td data last">6.22</td>
<td class="data-td data last" style="border-right: outset;">5.50</td>
<td class="data-td data last">194</td>
<td class="data-td data last" style="border-right: outset;">220</td>
<td class="data-td data last">94.14</td>
<td class="data-td data last" style="border-right: outset;">92.81</td>
<td class="data-td data last">-0.32</td>
</tr>
<tr class="tbl-data">
<td class="data-td last">Telecommunications</td>
<td class="data-td data last">13.00</td>
<td class="data-td data last" style="border-right: outset;">12.96</td>
<td class="data-td data last">366</td>
<td class="data-td data last" style="border-right: outset;">370</td>
<td class="data-td data last">92.22</td>
<td class="data-td data last" style="border-right: outset;">91.68</td>
<td class="data-td data last">0.03</td>
</tr>
<tr class="tbl-data">
<td class="data-td last">Transportation</td>
<td class="data-td data last">2.09</td>
<td class="data-td data last" style="border-right: outset;">2.10</td>
<td class="data-td data last">209</td>
<td class="data-td data last" style="border-right: outset;">210</td>
<td class="data-td data last">94.92</td>
<td class="data-td data last" style="border-right: outset;">94.86</td>
<td class="data-td data last">0.36</td>
</tr>
<tr class="tbl-data">
<td class="data-td last">Utility</td>
<td class="data-td data last">8.71</td>
<td class="data-td data last" style="border-right: outset;">8.63</td>
<td class="data-td data last">139</td>
<td class="data-td data last" style="border-right: outset;">146</td>
<td class="data-td data last">92.18</td>
<td class="data-td data last" style="border-right: outset;">91.72</td>
<td class="data-td data last">-0.13</td>
</tr>
<tr class="tbl-data">
<td class="data-td last">Total</td>
<td class="data-td data last">100</td>
<td class="data-td data last" style="border-right: outset;">100</td>
<td class="data-td data last">285</td>
<td class="data-td data last" style="border-right: outset;">283</td>
<td class="data-td data last">91.20</td>
<td class="data-td data last" style="border-right: outset;">91.10</td>
<td class="data-td data last">0.58</td>
</tr>
</tbody>
</table>
</div>
<br />
<p class="chart-disclosure">Source: ICE Data Services, VanEck. Returns are based on partial period data. Fallen Angels: ICE US Fallen Angel High Yield 10% Constrained Index. Not intended as a recommendation to invest or divest in any of the sectors mentioned herein. Index performance is not representative of fund performance. It is not possible to invest in an index.</p>
<p><strong><u>Fallen Angels Performance by Rating:</u></strong> The CC bucket, led by one issuer, Diversified Healthcare Trust (a REIT), posted the best performance in terms of rating categories. Other than this single issuer, higher quality fallen angels outperformed lower quality in the first month of the year.</p>
<div class="wrapped-div">
<table style="width: 100%;">
<tbody>
<tr class="tbl-data">
<td class="tbl-header last text-center">&nbsp;</td>
<td class="tbl-header last text-center" style="border-right: outset;" colspan="2">Wgt (%)</td>
<td class="tbl-header last text-center" style="border-right: outset;" colspan="2">OAS</td>
<td class="tbl-header last text-center" style="border-right: outset;" colspan="2">Price</td>
<td class="tbl-header last text-center">Total Return (%)</td>
</tr>
<tr class="tbl-data">
<td class="data-head last">&nbsp;</td>
<td class="data-head last">12/31/23</td>
<td class="data-head last" style="border-right: outset;">1/31/24</td>
<td class="data-head last">12/31/23</td>
<td class="data-head last" style="border-right: outset;">1/31/24</td>
<td class="data-head last">12/31/23</td>
<td class="data-head last" style="border-right: outset;">1/31/24</td>
<td class="data-head last">MTD</td>
</tr>
<tr class="tbl-data">
<td class="data-td last">BB</td>
<td class="data-td data last">80.55</td>
<td class="data-td data last" style="border-right: outset;">80.55</td>
<td class="data-td data last">219</td>
<td class="data-td data last" style="border-right: outset;">221</td>
<td class="data-td data last">92.44</td>
<td class="data-td data last" style="border-right: outset;">92.34</td>
<td class="data-td data last">0.61</td>
</tr>
<tr class="tbl-data">
<td class="data-td last">B</td>
<td class="data-td data last">13.43</td>
<td class="data-td data last" style="border-right: outset;">13.42</td>
<td class="data-td data last">317</td>
<td class="data-td data last" style="border-right: outset;">318</td>
<td class="data-td data last">96.46</td>
<td class="data-td data last" style="border-right: outset;">96.31</td>
<td class="data-td data last">0.37</td>
</tr>
<tr class="tbl-data">
<td class="data-td last">CCC</td>
<td class="data-td data last">5.44</td>
<td class="data-td data last" style="border-right: outset;">6.04</td>
<td class="data-td data last">1,130</td>
<td class="data-td data last" style="border-right: outset;">1,022</td>
<td class="data-td data last">69.40</td>
<td class="data-td data last" style="border-right: outset;">70.01</td>
<td class="data-td data last">0.42</td>
</tr>
<tr class="tbl-data">
<td class="data-td last">CC</td>
<td class="data-td data last">0.58</td>
<td class="data-td data last" style="border-right: outset;">&nbsp;</td>
<td class="data-td data last">809</td>
<td class="data-td data last" style="border-right: outset;">&nbsp;</td>
<td class="data-td data last">76.82</td>
<td class="data-td data last" style="border-right: outset;">&nbsp;</td>
<td class="data-td data last">2.47</td>
</tr>
<tr class="tbl-data">
<td class="data-td last">Total</td>
<td class="data-td data last">100</td>
<td class="data-td data last" style="border-right: outset;">100</td>
<td class="data-td data last">285</td>
<td class="data-td data last" style="border-right: outset;">283</td>
<td class="data-td data last">91.20</td>
<td class="data-td data last" style="border-right: outset;">91.10</td>
<td class="data-td data last">0.58</td>
</tr>
</tbody>
</table>
</div>
<br />
<p class="chart-disclosure">Source: ICE Data Services, VanEck. Returns are based on partial period data. Fallen Angels: ICE US Fallen Angel High Yield 10% Constrained Index. Not intended as a recommendation to invest or divest in any of the sectors mentioned herein. Index performance is not representative of fund performance. It is not possible to invest in an index. BB index: ICE BofA BB US High Yield Index; Single-B index: ICE BofA Single-B US High Yield Index; CCC &amp; Lower rated index ICE BofA CCC &amp; Lower US High Yield Index.</p>
<p>To receive more <strong><a href="https://www.vaneck.com/us/en/insights/income-investing/" title="Income Investing Insights">Income Investing</a></strong> insights, <strong><a href="https://www.vaneck.com/us/en/subscribe/" title="Subscription Center">sign up in our subscription center</a></strong>.</p>
<style>
   .data-td.data {
	 padding-right: 5px !important;
}
    .wrapped-div {
        max-width: 100%;
    }

    @media (max-width: 1240px) {
        .wrapped-div {
            overflow-x: scroll;
        }
    }

    .wrapped-div-sector {
        max-width: 100%;
        overflow-x: scroll;
    }
</style>
]]></content:encoded>
</item><item rdf:about="https://www.vaneck.com/us/en/blogs/digital-assets/matthew-sigel-vanecks-crypto-ai-revenue-predictions-by-2030/">
  <title>VanEck&#39;s Crypto AI Revenue Predictions by 2030></title>
  <link>https://www.vaneck.com/us/en/blogs/digital-assets/matthew-sigel-vanecks-crypto-ai-revenue-predictions-by-2030/</link>
  <description><![CDATA[We outline AI crypto revenue scenarios by 2030, highlighting a base case of $10.2B, and emphasize the crucial role of public blockchains in driving AI adoption through essential features.]]></description>
  <dc:creator>Patrick Bush</dc:creator>
  <dc:date>02/14/2024 06:30:00</dc:date>
<content:encoded><![CDATA[

<p><strong>Please note that VanEck may have a position(s) in the digital asset(s) described below.</strong></p>
<h2>Key takeaways:</h2>
<ul class="content-list">
<li>Crypto AI revenues projected to reach $10.2B by 2030 in our base case</li>
<li>Blockchain technology may become a critical driver for AI adoption and advancements in decentralized AI solution</li>
<li>Integration with crypto incentives may enhance security and efficiency in AI models</li>
<li>Blockchain may emerge as a solution for AI identity verification and data integrity challenges</li>
</ul>
<p>There is a significant chance that public blockchains are the key to unlocking the widespread adoption of artificial intelligence (AI) and that AI applications will be crypto&rsquo;s <i>raison d'&ecirc;tre</i>. This is because crypto provides important foundational elements AI needs, such as transparency, immutability, clearly defined ownership properties, and an adversarial testing environment. We believe these properties will prove instrumental in allowing AI to reach its full potential. Based upon estimates of AI growth, we assert the base case for AI-focused crypto projects to collect $<strong><i>10.2B</i></strong> in annual revenues by 2030. In this piece, we speculate on crypto's roles in facilitating the adoption of AI and the value that crypto will derive from AI businesses:</p>
<p><a href="/us/en/blogs/digital-assets/matthew-sigel-vanecks-crypto-ai-revenue-predictions-by-2030/vanecks-crypto-ai-revenue-predictions-by-2030.pdf" target="_blank" rel="noopener" title="VanEck's Crypto AI Revenue 
Predictions by 2030"><strong>View here</strong></a> for a PDF version of this blog.</p>
<ul class="content-list">
<li><a href="#2030-crypto-ai-revenues"><strong>2030 Projected Crypto AI Revenues</strong></a></li>
<li><a href="#bitcoin-miners-and-ai"><strong>Diversification of Bitcoin Miners into AI</strong></a></li>
<li><a href="#decentralized-cloud"><strong>Implementing a Decentralized Cloud for AI</strong></a></li>
<li><a href="#crypto-and-ai-models"><strong>Enhancing AI Models Through Crypto Incentives</strong></a></li>
<li><a href="#zero-knowledge-proofs"><strong>Verifying Through Zero-Knowledge (zk) Proofs</strong></a></li>
<li><a href="#blockchain-based-identity"><strong>Establishing Humanness with Blockchain-Based Identity</strong></a></li>
</ul>
<p>We find that the best applications of crypto to AI to be:</p>
<ul class="content-list">
<li>Provision of decentralized compute resources</li>
<li>Model testing, fine-tuning, and verification</li>
<li>Copyright protection and data integrity</li>
<li>AI safety</li>
<li>Identity</li>
</ul>
<style>
    .wrapped-div {
        max-width: 100%;
    }

    @media (max-width: 768px) {
        .wrapped-div {
            overflow-x: scroll;
        }
    }

    .wrapped-div-sector {
        max-width: 100%;
        overflow-x: scroll;
    }
</style>

<p>Crypto will be extraordinarily useful to AI because it is already solving many current and future challenges confronting AI. At its core, crypto solves coordination problems. Crypto bonds people, compute, and monetary resources together to run open-source software. It accomplishes this by offering rewards, in the form of tokens tied to each network&rsquo;s value, to those who create, support, and use each blockchain&rsquo;s network. This reward system can be applied to bootstrap different components of the AI value stack. One significant implication of integrating crypto with AI lies in leveraging cryptocurrency incentives to develop essential physical infrastructure, such as GPU clusters, dedicated to training, fine-tuning, and enabling the usage of generative models. Since crypto is an adversarial environment that employs cryptocurrencies to reward desired user behavior, it is the optimal ground to test and fine-tune AI models to optimize output that conforms to some quality standard.</p>
<p>Blockchains also bring transparency to digital ownership rights, which could help solve some of the open-source software problems that AI will face in the courts, already notable in the NYTimes vs. OpenAI and Microsoft <strong><a href="https://nytco-assets.nytimes.com/2023/12/NYT_Complaint_Dec2023.pdf" title="NYT Complaint - December 2023" target="_blank" rel="noopener">lawsuit</a></strong>. Namely, crypto can transparently prove ownership and copyright protection for data owners, model builders, and model users. This transparency will also extend to having mathematical proof of model effectiveness posted to public blockchains. Finally, due to unforgeable digital signatures and data integrity, we believe that public blockchains will help allay identification and safety issues that would otherwise blunt AI effectiveness.</p>
<h2 id="2030-crypto-ai-revenues" class="jump-link-nav anchored-block" data-jumplink-title="2030 Crypto AI Revenues">Defining Cryptocurrency's Role in AI Enterprises</h2>
<h3>2030 Projected Crypto AI Revenues: Bear, Base, Bull Case Scenarios</h3>
<div class="wrapped-div">
<table style="width: 75%;">
<tbody>
<tr class="tbl-data">
<td class="tbl-header last text-left">TAM Market Size ($B)</td>
<td class="tbl-header last text-center">Bear</td>
<td class="tbl-header last text-center">Base</td>
<td class="tbl-header last text-center">Bull</td>
</tr>
<tr class="tbl-data">
<td class="data-td data last" style="text-align: left;">Gen AI Productivity Gains 2030 (TAM)</td>
<td class="data-td data last">$2,930</td>
<td class="data-td data last">$5,851</td>
<td class="data-td data last">$8,494</td>
</tr>
<tr class="tbl-data">
<td class="data-td data last" style="text-align: left;">&nbsp;</td>
<td class="data-td data last">&nbsp;</td>
</tr>
<tr class="tbl-data">
<td class="data-td data last" style="text-align: left;">AI Business Adoption 2030</td>
<td class="data-td data last">10.00%</td>
<td class="data-td data last">33.00%</td>
<td class="data-td data last">50.00%</td>
</tr>
<tr class="tbl-data">
<td class="data-td data last" style="text-align: left;">Business AI TAM</td>
<td class="data-td data last">$293</td>
<td class="data-td data last">$1,931</td>
<td class="data-td data last">$4,247</td>
</tr>
<tr class="tbl-data">
<td class="data-td data last" style="text-align: left;">&nbsp;</td>
<td class="data-td data last">&nbsp;</td>
</tr>
<tr class="tbl-data">
<td class="data-td data last" style="text-align: left;">AI Stack Value Capture</td>
<td class="data-td data last">6.00%</td>
<td class="data-td data last">13.00%</td>
<td class="data-td data last">20.00%</td>
</tr>
<tr class="tbl-data">
<td class="data-td data last" style="text-align: left; font-weight: bold;">Total Business AI Spend</td>
<td class="data-td data last" style="font-weight: bold;">$17.58</td>
<td class="data-td data last" style="font-weight: bold;">$251.00</td>
<td class="data-td data last" style="font-weight: bold;">$849.44</td>
</tr>
<tr class="tbl-data">
<td class="data-td data last" style="text-align: left;">&nbsp;</td>
<td class="data-td data last">&nbsp;</td>
</tr>
<tr class="tbl-data">
<td class="data-td data last" style="text-align: left; font-weight: bold;">AI Stack Share ($B)</td>
<td class="data-td data last" style="font-weight: bold;">Bear</td>
<td class="data-td data last" style="font-weight: bold;">Base</td>
<td class="data-td data last" style="font-weight: bold;">Bull</td>
</tr>
<tr class="tbl-data">
<td class="data-td data last" style="text-align: left;">Software</td>
<td class="data-td data last">50.00%</td>
</tr>
<tr class="tbl-data">
<td class="data-td data last" style="text-align: left;">AI infrastructure as a Service</td>
<td class="data-td data last">18.90%</td>
</tr>
<tr class="tbl-data">
<td class="data-td data last" style="text-align: left;">Identity</td>
<td class="data-td data last">3.50%</td>
</tr>
<tr class="tbl-data">
<td class="data-td data last" style="text-align: left;">Safety</td>
<td class="data-td data last">8.90%</td>
</tr>
<tr class="tbl-data">
<td class="data-td data last" style="text-align: left;">&nbsp;</td>
<td class="data-td data last">&nbsp;</td>
</tr>
<tr class="tbl-data">
<td class="data-td data last" style="text-align: left; font-weight: bold;">AI Stack Annual Revenues ($B)</td>
<td class="data-td data last" style="font-weight: bold;">Bear</td>
<td class="data-td data last" style="font-weight: bold;">Base</td>
<td class="data-td data last" style="font-weight: bold;">Bull</td>
</tr>
<tr class="tbl-data">
<td class="data-td data last" style="text-align: left;">Software</td>
<td class="data-td data last">$8.79</td>
<td class="data-td data last">$125.50</td>
<td class="data-td data last">$424.72</td>
</tr>
<tr class="tbl-data">
<td class="data-td data last" style="text-align: left;">AI infrastructure as a Service</td>
<td class="data-td data last">$3.32</td>
<td class="data-td data last">$47.44</td>
<td class="data-td data last">$160.54</td>
</tr>
<tr class="tbl-data">
<td class="data-td data last" style="text-align: left;">Identity</td>
<td class="data-td data last">$0.62</td>
<td class="data-td data last">$8.78</td>
<td class="data-td data last">$29.73</td>
</tr>
<tr class="tbl-data">
<td class="data-td data last" style="text-align: left;">Safety</td>
<td class="data-td data last">$1.56</td>
<td class="data-td data last">$22.34</td>
<td class="data-td data last">$75.60</td>
</tr>
<tr class="tbl-data">
<td class="data-td data last" style="text-align: left;">&nbsp;</td>
<td class="data-td data last">&nbsp;</td>
</tr>
<tr class="tbl-data">
<td class="data-td data last" style="text-align: left; font-weight: bold;">Crypto Market Share</td>
<td class="data-td data last" style="font-weight: bold;">Bear</td>
<td class="data-td data last" style="font-weight: bold;">Base</td>
<td class="data-td data last" style="font-weight: bold;">Bull</td>
</tr>
<tr class="tbl-data">
<td class="data-td data last" style="text-align: left;">Software</td>
<td class="data-td data last">2.50%</td>
<td class="data-td data last">5.00%</td>
<td class="data-td data last">7.50%</td>
</tr>
<tr class="tbl-data">
<td class="data-td data last" style="text-align: left;">IaaS</td>
<td class="data-td data last">2.00%</td>
<td class="data-td data last">4.00%</td>
<td class="data-td data last">6.00%</td>
</tr>
<tr class="tbl-data">
<td class="data-td data last" style="text-align: left;">Identity</td>
<td class="data-td data last">5.00%</td>
<td class="data-td data last">10.00%</td>
<td class="data-td data last">15.00%</td>
</tr>
<tr class="tbl-data">
<td class="data-td data last" style="text-align: left;">Safety</td>
<td class="data-td data last">2.50%</td>
<td class="data-td data last">5.00%</td>
<td class="data-td data last">7.50%</td>
</tr>
<tr class="tbl-data">
<td class="data-td data last" style="text-align: left;">&nbsp;</td>
<td class="data-td data last">&nbsp;</td>
</tr>
<tr class="tbl-data">
<td class="data-td data last" style="text-align: left; font-weight: bold;">Crypto AI Revenues ($B)</td>
<td class="data-td data last" style="font-weight: bold;">Bear</td>
<td class="data-td data last" style="font-weight: bold;">Base</td>
<td class="data-td data last" style="font-weight: bold;">Bull</td>
</tr>
<tr class="tbl-data">
<td class="data-td data last" style="text-align: left;">Software</td>
<td class="data-td data last">$0.22</td>
<td class="data-td data last">$6.27</td>
<td class="data-td data last">$31.85</td>
</tr>
<tr class="tbl-data">
<td class="data-td data last" style="text-align: left;">IaaS</td>
<td class="data-td data last">$0.07</td>
<td class="data-td data last">$1.90</td>
<td class="data-td data last">$9.63</td>
</tr>
<tr class="tbl-data">
<td class="data-td data last" style="text-align: left;">Identity</td>
<td class="data-td data last">$0.03</td>
<td class="data-td data last">$0.88</td>
<td class="data-td data last">$4.46</td>
</tr>
<tr class="tbl-data">
<td class="data-td data last" style="text-align: left;">Safety</td>
<td class="data-td data last">$0.04</td>
<td class="data-td data last">$1.12</td>
<td class="data-td data last">$5.67</td>
</tr>
<tr class="tbl-data">
<td class="data-td data last" style="text-align: left; font-weight: bold;">Total AI Crypto Revenues 2030</td>
<td class="data-td data last" style="font-weight: bold;">$0.36</td>
<td class="data-td data last" style="font-weight: bold;">$10.17</td>
<td class="data-td data last" style="font-weight: bold;">$51.62</td>
</tr>
</tbody>
</table>
</div>
<br />
<p class="chart-disclosure">Sources: Morgan Stanley, Bloomberg Intelligence, VanEck Research as of 1/29/2024. <strong>Past performance is no guarantee of future results. The information, valuation scenarios and price targets presented in this blog are not intended as financial advice or any call to action, a recommendation to buy or sell, or as a projection of how AI businesses will perform in the future. Actual future performance of is unknown and may differ significantly from the hypothetical results depicted here. There may be risks or other factors not accounted for in the scenarios presented that may impede the performance. These are solely the results of a simulation based on our research and are for illustrative purposes only. Please conduct your own research and draw your own conclusions.</strong></p>
<p>To forecast the market for crypto AI, we first estimate the total addressable market (TAM) of the commercial productivity gains enabled by AI and our baseline for this figure is derived from <strong><a href="https://www.mckinsey.com/capabilities/mckinsey-digital/our-insights/the-economic-potential-of-generative-ai-the-next-productivity-frontier#/" title="The economic potential of generative AI: The next productivity frontier" target="_blank" rel="noopener">McKinsey</a></strong> assumptions for 2022. We then apply economic and productivity growth assumptions to McKinsey&rsquo;s figures to find a base case, year 2030 TAM of $5.85T. In this base case we assume that AI productivity gains are 50% higher than GDP growth and GDP grows at 3%. We then project market penetration for AI into global businesses, 33% in the base case, and apply it to our initial TAM to reach an estimated $1.93T in productivity gains for businesses from AI. To arrive at the revenues of all AI businesses, we assume that 13% of these productivity gains are captured by AI businesses (or spent by corporate consumers) as revenues. We ballpark the AI revenue take rate by applying the average revenue share of the labor costs of S&amp;P 500 enterprises and assume AI expenditures should be similar. The next part of our analysis applies forecasts of the AI value stack distribution from Bloomberg Intelligence to arrive at estimates of each AI business cohort&rsquo;s annual revenues. Finally, we apply specific estimates of crypto market share of each of those AI business to arrive at each case and each market&rsquo;s final figure.</p>
<p>We envision a future where decentralized AI models built from open-sourced public repos are harnessed to every use case imaginable. And in many cases, these open-source models outcompete centralized AI creations. The base of this supposition stems from the assumption that open-source communities bring together hobbyists and enthusiasts who are uniquely motivated to improve things. We have already seen open source internet projects shatter traditional businesses. The best examples of this phenomenon are Wikipedia effectively ending the commercial encyclopedia business and Twitter disrupting news outlets. These open-source communities succeed where traditional businesses fail because open-source groups coordinate and motivate people to provide value through a combination of social clout, ideology and group unity. In short, these open-source communities succeed because their members <i>care</i>.</p>
<p>Integrating open-source AI models with crypto incentives expands these emerging communities' influence, empowering them with financial capabilities to create the necessary infrastructure for attracting new participants. Applying this premise to AI will be a fascinating combination of passion and monetary resources. AI models will undergo testing in crypto-incentivized competitions, establishing a landscape where the evaluation of models becomes benchmarked. Within this environment, the most effective models and evaluation criteria emerge victorious, as the value of each model is explicitly quantified. Consequently, in our base case we anticipate that blockchain-produced AI models will represent 5% of all AI software revenues. This estimate includes hardware, software, services, ads, gaming and more, reflecting a transformation of how many businesses operate. Of the total revenues of AI software, we expect this to be about half of all AI revenues, or around $125.50B. The 5% market share we expect for open-source models thus corresponds to <strong>$6.27B</strong> in revenues going to crypto token-backed AI models.</p>
<p>We project that the TAM for the provision of compute&mdash;or AI infrastructure as a service&mdash;for fine-tuning, training, and inference may reach $47.44B by 2030. As widespread adoption leads AI to become integral to many functions of the world&rsquo;s economy, the provisioning of compute and storage may be envisaged as a public utility akin to power generation and distribution. In this dynamic, the vast majority of the &ldquo;base load&rdquo; will come from GPU cloud Hyperscalers like Amazon and Google, and their market share will approximate a <a href="https://en.wikipedia.org/wiki/Pareto_distribution#:~:text=The%20Pareto%20distribution%2C%20named%20after,phenomena%3B%20the%20principle%20originally%20applied" title="Pareto Distribution" target="_blank" rel="noopener"><strong>Pareto Distribution</strong></a> of 80%. We see blockchain-apportioned back-end server infrastructure catering to specialized needs and acting as a &ldquo;peaking&rdquo; provider during high network demand. For producers of bespoke AI models, providers of crypto storage and computing offer benefits such as on-demand service delivery, shorter SLA lock-in periods, more customized compute environments, and heightened latency sensitivity. Furthermore, decentralized GPUs can seamlessly integrate with decentralized AI models within smart contracts, enabling permissionless use cases where AI agents scale their own compute needs. Conceiving blockchain-provisioned GPUs as the Uber/Lyft equivalent of AI compute infrastructure, we posit that blockchain-provided compute and storage will capture 20% of the non-Hyperscaler market for AI infrastructure, potentially yielding revenues of <strong>$1.90B </strong>by 2030.</p>
<p>Defining &ldquo;identity&rdquo; in the context of AI agents and models through provable on-chain humanness can be viewed as a Sybil defense mechanism for the world&rsquo;s computer networks. We can estimate the cost of this service by examining the expenses associated with defending different blockchain networks. In 2023, these costs for Bitcoin, Ethereum, and Solana were around <a href="https://ycharts.com/indicators/bitcoin_supply" title="Bitcoin Supply" target="_blank" rel="noopener"><strong>1.71%</strong></a>, <a href="https://dune.com/queries/" title="Dune" target="_blank" rel="noopener"><strong>4.3%</strong></a>, and 5.57%, respectively, of each network&rsquo;s value in inflationary issuance. Conservatively, we can infer that Identity should comprise around 3.5% of the AI market. Given a TAM of $125.5B for AI software, this corresponds to $8.78B of annual topline. Since we believe that crypto provides an optimal solution to identity issues, we believe it will hold a 10% market share of this end market, which ballparks its yearly revenue figure of around <strong>$878M</strong>.</p>
<p>AI safety is poised to emerge as another important component of AI devices, with a fundamental requirement to verify running the correct model using uncorrupted, relevant, up-to-date data. As AI expands into applications where human lives are at risk, such as self-driving cars, factory robotics, and healthcare systems, the tolerance for failure becomes minimal. The need for accountability in the event of accidents will drive an insurance market that demands concrete proof of safety. Public blockchains are ideal for fulfilling this function because they can post &ldquo;proofs of safety&rdquo; on unalterable ledgers that anyone can see. This business can be thought of as akin to compliance for financial institutions. Considering that U.S. <a href="https://fred.stlouisfed.org/series/REVEF52211ALLEST" title="Total Revenue for Commercial Banking, All Establishments, Employer Firms" target="_blank" rel="noopener"><strong>commercial</strong></a> and <strong><a href="https://fred.stlouisfed.org/series/REVEF52311ALLEST" title="Total Revenue for Investment Banking and Securities Dealing, All Establishments, Employer Firms" target="_blank" rel="noopener">investment</a></strong> banks generate $660B in revenue while spending $58.75B in compliance costs (8.9% of revenues), we project that AI safety should account for around $22.34B of the $251B AI TAM. Despite the potential for crypto to enhance AI safety, given the U.S. government&rsquo;s focus on AI, we believe the majority of compliance for AI will be centralized. As such, we estimate that crypto will make up around 5% of that market or around <strong>$1.12B</strong>.</p>
<h2>Organizing Decentralized Compute Resources</h2>
<p>Crypto can apply its considerable social and financial coordination benefits to the democratization of access to compute, thereby addressing current pain points afflicting AI developers. In addition to the high costs and limited access to quality GPUs, AI model builders currently confront other nagging issues. These include vendor lock-in, lack of security, limited compute availability, poor latency, and geo-fencing due to national laws.</p>
<p>Crypto&rsquo;s ability to satiate AI&rsquo;s hunger for GPUs stems from crypto&rsquo;s ability to bring together resources through token incentives. The Bitcoin network&rsquo;s $850B in token value and $20B in equity value demonstrate this ability. As such, there is potential for both current Bitcoin miners and promising decentralized GPU marketplaces to add substantial value to AI by provisioning decentralized compute.</p>
<p>A helpful analogy for understanding the provision of GPUs through blockchain is the power generation business. To simplify, there are entities operating large, expensive plants that steadily generate power to meet most electricity grid demands. These &ldquo;base load&rdquo; plants experience consistent demand but require substantial capital investments for construction, resulting in relatively low but guaranteed returns on capital. Complimenting the base load is another category known as &ldquo;peaking power&rdquo; generators. These businesses provide power when electricity demand exceeds the capabilities of baseload generation. This involves high-cost, small-scale energy production that is strategically positioned close to the demand for that energy. We anticipate a similar dynamic unfolding in the realm of &ldquo;compute-on-demand.&rdquo;</p>
<h2 id="bitcoin-miners-and-ai" class="jump-link-nav anchored-block" data-jumplink-title="Bitcoin Miners and AI">Diversification of Bitcoin Miners into AI</h2>
<p>Bitcoin and other proof-of-work cryptocurrencies share with AI a high appetite for energy. This energy must be created, sourced, transported, and broken down into useable electricity to power mining rigs and compute clusters. This supply chain necessitates substantial investments from miners into power plants, electricity purchase agreements, grid infrastructure, and data center provisions. The monetary incentives stemming from mining PoW cryptocurrencies have led to the emergence of many globally dispersed bitcoin miners that own energy and electricity rights and integrated grid architecture. Much of this energy is derived from lower-cost, socially shunned carbon-intensive sources. As such, the most compelling value proposition that bitcoin miners can offer is lower-cost energy infrastructure to power AI backend infrastructure.</p>
<p>Hyperscale compute providers like AWS and Microsoft have pursued a strategy of investing in vertically integrated operations and establishing their own energy ecosystems. Big Tech has moved upstream, designing their own silicon and sourcing their own energy, largely the renewable variety. Data centers now consume two-thirds of the renewable power available to corporations in the U.S. Microsoft and Amazon have both committed to 100% renewable energy supply by 2025. However, if the anticipated compute needs exceed expectations, as some suggest, the electricity needs of AI-focused data centers may double by 2027 with CAPEX potentially tripling current estimates. Already, Big Tech pays $0.06-0.10/kWh for power, much more expensive than what competitive Bitcoin miners generally pay ($0.03-0.05kWh). If demand for energy from AI exceeds current infrastructure plans by Big Tech, the bitcoin miner's electricity cost advantage over the Hyperscalers could significantly multiply. Miners are increasingly drawn to higher-margin AI businesses associated with GPU provision. Notably, Hive <strong><a href="https://hivedigitaltechnologies.com/news/hive-digital-provides-update-on-gpu-infrastructure-for-ai-and-hpc/" title="HIVE DIGITAL PROVIDES UPDATE ON GPU INFRASTRUCTURE FOR AI AND HPC" target="_blank" rel="noopener">reported</a></strong> in October that its HPC and AI operations are generating 15x more revenue than bitcoin mining on a per-megawatt basis. Other bitcoin miners seizing the AI opportunity are Hut 8 and Applied Digital.</p>
<p>Bitcoin miners have experienced growth in this new market, which has helped diversify revenue and strengthened earnings reports. In Hut 8&rsquo;s Q3 2023 analyst call, CEO Jaime Leverton stated, &ldquo;In our HPC business, we created some momentum in Q3 with new customer additions and growth among existing customers. Last week, we launched our on-demand cloud service for customers seeking HPC services from our GPUs with Kubernetes-based applications that can support artificial intelligence, machine learning, visual effects, and rendering workloads. This service puts the control in our clients' hands while reducing provisioning time from days to minutes, which is particularly compelling for those seeking shorter-term HPC projects. Hut 8 <a href="https://hut8.com/wp-content/uploads/2023/11/Hut-8-Discusses-Q3-2023-Results.pdf" title="HUT 8 Mining Corp (Q3 2023 Results)  November 14, 2023 " target="_blank" rel="noopener"><strong>realized</strong></a> $4.5M in revenue from its Q3 2023 HPC operations, constituting over 25% of the firm&rsquo;s revenue for the period. The rising demand for HPC services and new offerings should contribute to the future growth of this business line, and with Bitcoin halving around the corner, HPC revenue could soon exceed that of mining, depending on market conditions.</p>
<p>Though their operations sound promising, bitcoin miners pivoting to AI could stumble due to a lack of skills in data center construction or an inability to scale power supply. These miners may also find challenges related to operating overhead due to the costs of hiring a new data center-focused salesforce. Additionally, current mining operations do not have ample network latency or bandwidth because their optimization for cheap energy causes them to be located in remote places, often lacking high-speed fiber connections.</p>
<h2 id="decentralized-cloud" class="jump-link-nav anchored-block" data-jumplink-title="Decentralized Cloud">Implementing a Decentralized Cloud for AI</h2>
<p>We also see a long tail of compute-focused crypto projects that will capture a small but substantial portion of the AI server resource market. These entities will coordinate clusters of compute outside of Hyperscalers to deliver a value proposition tailored to the needs of upstart AI builders. The benefits of decentralized compute include customizability, open access, and better contract terms. These blockchain-based compute firms allow small AI players to avoid the substantial expense and general unavailability of high-end GPUs like H100s and A100s. Crypto AI ventures will satiate demand by creating a network of physical infrastructure built around crypto-token incentives while offering proprietary IP that creates the software infrastructure to optimize the compute&rsquo;s usage for AI applications. Blockchain compute projects will use a marketplace approach alongside crypto rewards to uncover cheaper compute from independent data centers, entities with excess compute, and former PoW miners. A few projects providing decentralized compute for AI models include <a href="https://akash.network/" title="Akash Network - Decentralized Compute Marketplace" target="_blank" rel="noopener"><strong>Akash</strong></a>, <a href="https://rendernetwork.com/" title="Render Network" target="_blank" rel="noopener"><strong>Render</strong></a> and <a href="https://developers.io.net/docs/overview" title="Overview" target="_blank" rel="noopener"><strong>io.net</strong></a>.</p>
<h3>Daily Revenue Akash</h3>
<p><img class="img-responsive w-100" src="https://www.vaneck.com/contentassets/0296ec8cbb064575a2eb34e06c189272/4047_akash_daily_revenue_chart-2024-01_v2_blog.svg" alt="Daily Revenue Akash" /></p>
<p class="chart-disclosure">Akash Daily Revenue. Source: Cloudmos as of 1/30/2024. <strong>Past performance is no guarantee of future results.</strong></p>
<p>Akash, a Cosmos-based project, can be considered a general-purpose decentralized &ldquo;<strong><a href="http://supercloud.cs.cornell.edu/" title="Supercloud" target="_blank" rel="noopener">Supercloud</a></strong>&rdquo; that offers CPU, GPU, Memory, and Storage. Effectively, it is a two-sided marketplace connecting users of cloud services with those supplying them. Akash&rsquo;s software is designed to coordinate compute supply with demand while creating the tooling to facilitate AI model training, fine-tuning, and running. Akash also ensures both marketplace buyers and sellers honestly fulfill their obligations. Akash is coordinated through its $AKT tokens, which can be used to pay for cloud services at a discount. $AKT is also given out as an incentive mechanism for GPU compute providers and other network participants. On the supply side, Akash has made great strides in adding compute suppliers as there are 65 different providers on Akash&rsquo;s marketplace. While the demand for compute had been lackluster until Akash&rsquo;s AI Supercloud debuted on August 31, 2023, $138k has been spent by compute buyers after the launch date.</p>
<p>Render, who recently migrated to Solana, was initially focused on connecting artists to decentralized groups that would provide GPU power to render images and videos. However, Render has begun to focus its decentralized GPU fleet on satisfying machine-learning workloads to support deep-learning models. Through network improvement proposal <a href="https://github.com/rendernetwork/RNPs/blob/main/RNP-004.md" title="RNPs/RNP-004.md" target="_blank" rel="noopener"><strong>RNP-004</strong></a>, Render now has an API to connect external networks like io.net that will utilize Render&rsquo;s network of GPUs for machine learning. Subsequent proposals by the Render community were passed to allow its GPUs to be accessed through <a href="https://www.beam.cloud/" title="Serverless Infrastructure for Generative AI" target="_blank" rel="noopener"><strong>Beam</strong></a> and <strong><a href="https://www.fedml.ai/" title="FEDML - The Generative AI Platform and Foundation Models for Production" target="_blank" rel="noopener">FEDML</a></strong> to fulfill machine learning tasks. As such, Render has become a decentralized facilitator of GPU workloads coordinated by $RNDR payments to providers and $RNDR incentives to entities running the network's backend infrastructure.</p>
<p><img class="img-responsive w-100" src="https://www.vaneck.com/contentassets/0296ec8cbb064575a2eb34e06c189272/4047_crypto--ai-blog-chart-2_2024-02-v1_blog.jpg" alt="GPU Price Comparison" /></p>
<p class="chart-disclosure">Io.net GPU Price Comparison. Source: <strong><a href="https://io.net/" title="The Internet of GPUs" target="_blank" rel="noopener">io.net</a></strong> as of 1/4/2024.</p>
<p>Another interesting project that sits on Solana, considered a DePIN or Decentralized Physical Infrastructure Network, is io.net. The purpose of io.net is also the provision of GPUs, but its focus is exclusively on applying GPUs to power AI models. Io.net adds more services to its core stack besides simply coordinating compute. Its system claims to handle all components of AI, including creation, usage, and fine-tuning, to facilitate and troubleshoot AI workloads across its network properly. The project also taps into other decentralized GPU networks like Render and Filecoin and its own sourced GPUs. Though io.net currently lacks a token, one is planned for launch in 1Q2024.</p>
<h2>Overcoming Bottlenecks of Decentralized Compute</h2>
<p>Utilizing this distributed compute, however, remains a challenge due to the networking demands imposed by the typical <strong><a href="https://the-decoder.com/gpt-jt-is-an-open-source-gpt-3-alternative-with-a-decentralized-approach/" title="GPT-JT is an open source GPT-3 alternative with a decentralized approach" target="_blank" rel="noopener">633TB+</a></strong> of data necessary to train deep learning models. Computer systems geo-located across the globe also present novel obstacles for parallelizing model training due to the latencies and differences in computer capabilities. One company attacking the open-source foundation model market with gusto is Together, which is building a decentralized cloud to host open-source artificial intelligence models. Together will enable researchers, developers, and companies to leverage and improve artificial intelligence with an intuitive platform combining data, models, and computation, widening AI accessibility and empowering the next generation of tech companies. In partnership with leading academic research institutions, Together has built the Together Research Computer, allowing labs to pool their computing for AI research. The company has also worked with the Stanford Research Center for Research on Foundational Models (CRFM) to create the Holistic Evaluation of Language Models (HELM). HELM is a &ldquo;living benchmark&rdquo; that aims to improve the transparency of AI by providing a standardized framework for evaluating such foundation models.</p>
<p>Since Together&rsquo;s founding, founder Vipul Ved Prakash has spearheaded the launch of several projects including 1) GPT-JT, an open LLM with a 6B parameter model trained over &lt;1Gbps link, 2) OpenChatKit, a powerful, open-source base to create both specialized and general purpose chatbots, and 3) RedPajama, a project to create leading open-source models, with the goal of it being a foundation for research and commercial applications. The Together Platform is a foundation model composed of open models on commodity hardware, decentralized cloud, and a comprehensive developer cloud, pooling together different compute sources including consumer miners, crypto mining farms, T2-T4 cloud providers, and academic compute.</p>
<h3>HELM (RAFT) Score</h3>
<p><img class="img-responsive w-100" src="https://www.vaneck.com/contentassets/0296ec8cbb064575a2eb34e06c189272/4047_crypto--ai-blog-chart-1_2024-02-v1_blog.svg" alt="HELM (RAFT) SCORE" /></p>
<p class="chart-disclosure">GPT-JT Performance. Source: <strong><a href="https://the-decoder.com/gpt-jt-is-an-open-source-gpt-3-alternative-with-a-decentralized-approach/" title="GPT-JT is an open source GPT-3 alternative with a decentralized approach" target="_blank" rel="noopener">The Decoder</a></strong> as of 1/4/2024.</p>
<p>We believe decentralized and democratized cloud compute solutions like Together could significantly slash the costs of building new models, potentially disrupting and competing with established giants such as Amazon Web Services, Google Cloud and Azure. For context, Together can provide pricing approximately 4x lower than AWS, comparing AWS Capacity Blocks and AWS p5.48xlarge instances to Together GPU clusters configured with an equal number of H100 SXM5 GPUs.</p>
<p>As open LLMs become increasingly accurate and thus more widely adopted, Together could become the industry standard for open-source models, akin to Red Hat was for Linux. Competitors in this space include Stability A and HuggingFace as model providers and Gensyn and Coreweave as AI cloud providers.</p>
<h2 id="crypto-and-ai-models" class="jump-link-nav anchored-block" data-jumplink-title="Crypto &amp; AI Models">Enhancing AI Models Through Crypto Incentives</h2>
<p>Blockchains and crypto incentives prove that network effects and rewards tied to the size of that network effect compel people to perform <i>useful work</i>. In the context of bitcoin mining, that task is to secure the Bitcoin network by employing expensive banks of electricity, technical manpower, and ASIC machines. This concert of economic resources provides a Sybil attack defense mechanism preventing economic attacks on Bitcoin. In exchange, the miners orchestrating these resources receive $BTC. However, the green space for useful work for AI is much larger, and some projects are already pushing AI and machine learning models to improve.</p>
<p>The most primitive of these projects is <a href="https://numer.ai/home" title="Numerai" target="_blank" rel="noopener"><strong>Numerai</strong></a>. Currently, Numerai can be considered a decentralized data science tournament to identify the best machine learning models that optimize financial returns by building a portfolio of stocks. In each epoch, anonymous Numerai participants are granted access to masked raw data and asked to harness that data to build the best-performing equities portfolio. To participate, users are not only asked to submit predictions but also compelled to stake NMR tokens behind their models&rsquo; predictions to attest to the value of those models. Other users are also allowed to stake tokens on the models they believe will perform the best. Each staked, submitted model&rsquo;s outputs are then fed into a machine learning algorithm to create a meta-model that informs the investment decisions of the Numerai One hedge fund. Users who submit the &ldquo;inferences&rdquo; with the best information coefficients or effectiveness are rewarded with NMR tokens. At the same time, those who staked the worst models have their tokens slashed (seized and re-purposed for rewards to winners).</p>
<p><img class="img-responsive w-100" src="https://www.vaneck.com/contentassets/0296ec8cbb064575a2eb34e06c189272/4047_crypto--ai-blog-chart-3_2024-02-v1_blog.jpg" alt="Subnets and Use Case on Bittensor" /></p>
<p class="chart-disclosure">Subnets and Use Case on Bittensor. Source: <a href="https://taostats.io/api/" title="Taostats" target="_blank" rel="noopener"><strong>https://taostats.io/api/</strong></a> as of 1/2/2024.</p>
<p>A similar project that massively expands Numerai&rsquo;s core concepts is <strong><a href="https://bittensor.com/about" title="Bittensor" target="_blank" rel="noopener">Bittensor</a></strong>. Bittensor can be thought of as &ldquo;Bitcoin for Machine Intelligence&rdquo; as it is a network that provides economic incentives for AI/ML models. This is accomplished by entities called &ldquo;miners,&rdquo; who build AI models, and &ldquo;validators,&rdquo; who assess the quality of outputs from those models. Bittensor's architecture is that of a base network and many smaller subnetworks (Subnets). Each subnetwork focuses on a different domain of machine intelligence. Miners on these subnets are queried by validators with various questions or requests to assess the quality of their AI models.</p>
<p>The best-performing models receive the highest rewards of TAO tokens, while the validators are compensated for accurate assessments of the miners. On a higher level, both validators and miners have to stake tokens to participate in each subnet, and each subnet&rsquo;s proportion of total stake determines how many TAO tokens it receives from all Bittensor total inflation. Thus, each miner has an incentive not only to optimize its model to win the most rewards but also to focus their model on the best AI domain subnet. Additionally, since miners and validators must maintain funds to participate, each must exceed cost of capital hurdles, or they drop out of the system.</p>
<p>As of January 2024, there were 32 different subnets, each dedicated to a specific domain of machine learning or AI. For example, Subnet 1 is a text prompting LLM similar to ChatGPT. On this subnet, the miners operate various tweaked versions of LLMs to best respond to prompts by validators who assess the quality of responses. On Subnet 8, called Taoshi, miners submit short-term forecasts for the price of bitcoin and various financial assets. Bittensor also has subnets dedicated to human language translation, storage, audio, web scraping, machine translation, and image generation. Subnet creation is permissionless, and anyone with 200 TAO can create a subnet. Subnet operators are responsible for creating the assessment and reward mechanisms for each subnet&rsquo;s activity. For example, Opentensor, the foundation behind Bittensor, runs Subnet 1 and recently released a model in concert with <a href="https://www.cerebras.net/" title="Cerebras" target="_blank" rel="noopener"><strong>Cerebras</strong></a> to assess the miners' LLM outputs on that subnet.</p>
<p>While these subnets are all initially subsidized in full by the inflationary rewards, each subnet will eventually have to sustain itself economically. As such, subnet operators and validators must coordinate to create tooling to allow outside users to pay to access the services of each subnet. As inflationary TAO rewards diminish, each subnet will become increasingly dependent upon outside revenue to sustain itself. In this competitive environment, there is direct economic pressure to create the best models and incentives for others to create profitable <i>real-world</i> applications for those models. Bittensor is unlocking the potential of AI using scrappy, small enterprises to identify and monetize AI models. As well-known Bittensor evangelist MogMachine puts it, this dynamic can be thought of as &ldquo;Darwinian competition for AI.&rdquo;</p>
<p>Another interesting cohort of projects is one that employs crypto to incentivize the creation of AI agents who are programmed to autonomously accomplish tasks on behalf of humans or other computer programs. These entities are essentially adaptive computer programs aimed at solving specific problems. Agents is an all-encompassing term for chatbots, automated trading strategies, gaming characters, and even metaverse assistants. One notable project in this domain is <a href="https://www.alteredstatemachine.xyz/" title="Altered State Machine - Non Fungible Intelligence" target="_blank" rel="noopener"><strong>Altered State Machine</strong></a>, a platform for creating AI agents that are owned, powered, and trained using NFTs. In Altered State Machine, users create their &ldquo;agents&rdquo; and then &ldquo;train&rdquo; them using decentralized GPU clusters. These agents are optimized for specific use cases. Another project, <strong><a href="http://fetch.ai/" target="_blank" title="Fetch.ai" rel="noopener">Fetch.ai</a></strong>, is a platform for creating agents that are customized for each user&rsquo;s needs. Fetch.ai is also a SaaS business that allows the registration and lease or sale of agents.</p>
<h3>Returns of AI Tokens Since 1/1/2023</h3>
<p><img class="img-responsive w-100" src="https://www.vaneck.com/contentassets/0296ec8cbb064575a2eb34e06c189272/4047_ai-token-returns-2024-01_chart_v1_blog.svg" alt="Returns of AI Tokens Since 1/1/2023" /></p>
<p class="chart-disclosure">Source: <a href="https://the-decoder.com/gpt-jt-is-an-open-source-gpt-3-alternative-with-a-decentralized-approach/" title="GPT-JT is an open source GPT-3 alternative with a decentralized approach" target="_blank" rel="noopener"><strong>Artemis</strong></a> XYZ as of 1/10/2024. <strong>Past performance is no guarantee of future results.</strong></p>
<h2 id="zero-knowledge-proofs" class="anchored-block">Verifying Through Zero-Knowledge (zk) Proofs</h2>
<p>2023 was a banner year for new AI models with the unveiling of ChatGPT by OpenAI, LLAMA-2 by Meta, and BERT by Google. Due to the promise of deep learning, there are more than <strong><a href="https://tracxn.com/d/explore/artificial-intelligence-startups-in-united-states/__8hhT66RA16YeZhW3QByF6cGkAjrM6ertfKJuKbQIiJg/companies" title="Artificial Intelligence Startups in United States" target="_blank" rel="noopener">18,563</a></strong> AI-related start-ups in the United States as of June 2023. These start-ups and others have produced thousands of new base and fine-tuned models. However, the proliferation of many new entities in a space where <strong><a href="https://news.crunchbase.com/ai-robotics/us-startup-funding-doubled-openai-anthropic-2023/" title="AI's Share Of US Startup Funding Doubled In 2023" target="_blank" rel="noopener">1 in every 4 VC dollars</a></strong> is invested in AI-related companies should raise serious concerns.</p>
<ul class="content-list">
<li>Who actually created and owns each model?</li>
<li>Was the output actually produced from the specified model?</li>
<li>Is the model actually as effective as it is advertised?</li>
<li>What was the data source for each model and who owns that data?</li>
<li>Did training, fine-tuning and/or inference infringe on any copyrights or data rights?</li>
</ul>
<p>Both investors and users of these models alike should have 100% certainty they can address these questions. Currently, many benchmarking tests exist for different components of LLM outputs, like <strong><a href="https://arxiv.org/pdf/2107.03374v2.pdf" title="Evaluating Large Language Models Trained on Code" target="_blank" rel="noopener">HumanEval</a></strong> for code generation, <strong><a href="https://arena.lmsys.org/" title="Chat with Open Large Language Models" target="_blank" rel="noopener">Chatbot Arena</a></strong> for LLM assistance tasks, and <strong><a href="https://arxiv.org/abs/1803.05457" title="Think you have Solved Question Answering? Try ARC, the AI2 Reasoning Challenge" target="_blank" rel="noopener">ARC Benchmark</a></strong> for LLM reasoning ability. However, despite attempts at model transparency like Hugging Face&rsquo;s <strong><a href="https://huggingface.co/spaces/HuggingFaceH4/open_llm_leaderboard?source=post_page-----b5d061cc8679--------------------------------" title="Open LLM Leaderboard" target="_blank" rel="noopener">Open LLM Leaderboard</a></strong>, there is no concrete proof of a model&rsquo;s effectiveness, ultimate provenance, or the source of its training/inference data. Not only can benchmarks be gamed, but there is also no certainty that a specific model was actually run (as opposed to using an API connecting to another model), nor is there any assurance that the leaderboards themselves are honest.</p>
<p>Herein lies the unification of public blockchains, AI, and a bleeding-edge field of mathematics called <strong><a href="https://ethereum.org/en/zero-knowledge-proofs/" title="ZERO-KNOWLEDGE PROOFS" target="_blank" rel="noopener">zero-knowledge (zk) proofs</a></strong>. zk proofs are an application of cryptography that allows someone to prove, with mathematical certainty to a desired level, that a statement they make about data is correct without revealing the underlying data to anyone. Statements could include simple declarations like rankings but can be extended to complex mathematical calculations. For example, not only could someone prove he or she knows the relative wealth of a sample of individuals without revealing that wealth to another party, but he or she could also prove the correct calculation of the mean and standard deviation of the group. In essence, you can prove you know data and/or you made truthful assertions using that data without revealing either the specifics of that data or how you made that calculation. Outside of AI, zk proofs are already being applied to scale Ethereum, allowing transactions to occur off-chain on layer-2 blockchains. Recently, zk proofs have been applied to deep learning models to prove:</p>
<ul class="content-list">
<li>Specific data was used to generate a model or provide an inference output (also, what data/sources <i>were not</i> used)</li>
<li>A certain model was used to generate an inference</li>
<li>An inference output was not doctored</li>
</ul>
<p>zk proofs can be posted to the public, permanent blockchains, and verified by smart contracts. The result is that blockchains can publicly and irrefutably prove important properties of AI models. Two cutting-edge projects applying ZK to AI referred to as &ldquo;Zero-Knowledge Machine Learning&rdquo; (ZKML), are <strong><a href="https://ezkl.xyz/" title="EZKL" target="_blank" rel="noopener">EZKL</a></strong> and <strong><a href="https://www.modulus.xyz/" title="Modulus" target="_blank" rel="noopener">Modulus</a></strong>. EZKL uses the <strong><a href="https://zcash.github.io/halo2/concepts/proofs.html" title="Proof systems" target="_blank" rel="noopener">Halo2</a></strong> proof system to generate zk-snarks, a type of zero-knowledge proof, which can then be publicly verified on Ethereum&rsquo;s EVM. While the model sizes that EZKL can currently prove are relatively small, around 100M parameters compared to 175B for ChatGPT 4, EZKL&rsquo;s CEO <a href="https://twitter.com/jasonmorton?lang=en" title="Jason Morton" target="_blank" rel="noopener"><strong>Jason Morton</strong></a> believes they are looking at an &ldquo;engineering problem&rdquo; rather than an issue of &ldquo;technological limitations&rdquo;. EZKL believes they can surmount proving issues by <strong><a href="https://blog.ezkl.xyz/post/splitting/" title="Splitting and Parallelizing Proofs" target="_blank" rel="noopener">splitting</a></strong> up proofs to be executed parallel to cut down on memory limitations and compute time. In fact, Jason Morton believes that one day, &ldquo;verifying a model will be as easy as signing a blockchain transaction.&rdquo;</p>
<p>The application of ZKML proofs to AI can solve important pain points of AI implementation, including copyright issues and AI safety. As the recent lawsuit by the New York Times against Open AI and Microsoft demonstrates, copyright law will be applied to data ownership, and AI projects will be pressed to provide proof of their data sources. ZKML tech can be employed to settle courtroom disputes over models and data ownership quickly. In fact, one of the best applications of ZKML is to allow data/model marketplaces like <strong><a href="https://oceanprotocol.com/" title="Meet Ocean: Tokenized AI and Data" target="_blank" rel="noopener">Ocean Protocol</a></strong> and <strong><a href="https://beta.singularitynet.io/aimarketplace" title="SingularityNET" target="_blank" rel="noopener">SingularityNet</a></strong> to prove the authenticity and efficacy of their listings.</p>
<p>AI models will eventually spread to domains where certainty of accuracy and safety will be of paramount importance. It is estimated that there will be <strong><a href="https://www.linkedin.com/pulse/edge-artificial-intelligence-ai-chip-market-outlook/" title="Edge Artificial Intelligence (AI) Chip Market Outlook 2023-2030: Latest Business Strategies with Development Insights" target="_blank" rel="noopener">5.8B</a></strong> AI edge devices by 2027, and these could potentially include heavy machinery, robotics, and autonomous drones and vehicles. As machine intelligence is applied to things that can hurt and kill people, it will be important to prove that a reputable model was run on that device using high-quality data from a reliable source. Though constructing and posting continuous live proofs from these edge devices to blockchain will likely be economically and technically challenging, certifying the models upon activation or periodic postings to the blockchain may be more feasible. However, Zupass who comes from the <strong><a href="https://0xparc.org/about" title="OxPARC" target="_blank" rel="noopener">0xPARC</a></strong> Foundation, has already established primitive proofs derived from &ldquo;<strong><a href="https://eprint.iacr.org/2020/1618" title="Proof-Carrying Data without Succinct Arguments" target="_blank" rel="noopener">Proof Carrying Data</a></strong>&rdquo; that can inexpensively establish proofs of <i>facts</i> that occur on edge devices. Currently, this pertains to event attendance, but one could foresee this shortly migrating to other areas like identity or even <strong><a href="https://ethglobal.com/showcase/zkdoctor-jyqmd" title="zkDoctor" target="_blank" rel="noopener">healthcare</a></strong>.</p>
<h3>How good is your robot surgeon&rsquo;s AI model?</h3>
<p><img class="img-responsive w-100" src="https://www.vaneck.com/contentassets/0296ec8cbb064575a2eb34e06c189272/4047_crypto--ai-blog-image_2024-02-v1_blog.jpg" alt="Robot Assisted Surgery" /></p>
<p class="chart-disclosure">Robot Assisted Surgery. Source: <strong><a href="https://www.technologyreview.com/2020/02/11/844866/robot-assisted-high-precision-surgery-has-passed-its-first-test-in-humans/" title="Robot-assisted high-precision surgery has passed its first test in humans" target="_blank" rel="noopener">MIT Technology Review</a></strong> as of 1/30/2024.</p>
<p>From the standpoint of businesses that may incur liabilities from malfunctioning devices, it would seem ideal to have verifiable evidence that their model was not the source of a costly accident. Likewise, from an insurance standpoint, verifying and proving the usage of reliable models trained on realistic data may become financially necessary. Similarly, in a world of AI deepfakes, utilizing blockchain-verified and attested <strong><a href="https://arxiv.org/abs/2211.04775" title="ZK-IMG: Attested Images via Zero-Knowledge Proofs to Fight Disinformation" target="_blank" rel="noopener">cameras</a></strong>, phones, and computers to perform various actions may become the norm. Of course, proofs of authenticity and accuracy of these devices should be posted to public, open-source ledgers that prevent tampering and fraud.</p>
<p>Despite the immense promise of these proofs, they are currently limited by gas expense and computational overhead. At current ETH prices, submitting a proof on chain costs around 300-500k gas (~$35-$58 at current ETH prices). From a computational standpoint, Sreeram Kennan of Eigenlayer estimates that &ldquo;proving computation that costs $50 to be run on AWS would cost ~1,000,000x more using current ZK proving technology.&rdquo; The consequence is that zk proofs, which have evolved substantially faster than anyone anticipated a few years ago, have far to go before opening up practical use cases. Suppose one is curious to see ZKML applied. In that case, they can participate in a decentralized <strong><a href="https://cryptoidol.tech/" title="Crypto Idol" target="_blank" rel="noopener">singing</a></strong> contest judged by an attested on-chain, smart contract model, with their results uploaded to the blockchain forever.</p>
<h2 id="blockchain-based-identity" class="anchored-block">Establishing Humanness with Blockchain-Based Identity</h2>
<p>A likely consequence of widespread, advanced machine intelligence is that autonomous agents will become the most prolific users of the internet. There is a significant chance that the unleashing of AI agents will lead to disruptions across the web from purposeful bot-generated spam and even innocuous task-based agents clogging networks (&ldquo;<strong><a href="https://www.vanityfair.com/news/tech/2014/10/elon-musk-artificial-intelligence-fear" title="Elon Musk: a Machine Tasked with Getting Rid of Spam Could End Humanity" target="_blank" rel="noopener">Get Rid of Junk Email</a></strong>&rdquo;). <strong><a href="https://www.coindesk.com/tech/2022/05/01/solana-goes-dark-for-7-hours-as-bots-swarm-candy-machine-nft-minting-tool/" title="Solana Goes Dark for 7 Hours as Bots Swarm 'Candy Machine' NFT Minting Tool" target="_blank" rel="noopener">Solana</a></strong> saw 100 gigabits in data traffic per second when bots competed for perhaps $100k worth of arbitrage opportunities. Imagine the torrent of web traffic that will launch when AI agents can ransom millions of corporate websites for billions of dollars. This points to a future internet with limits imposed on non-human traffic. One of the best ways to limit these types of attacks is to impose economic taxes on the overuse of poorly-priced resources. But how do we determine the optimal framework for spam charges, and how do we determine humanness?</p>
<p>Luckily, there is already a built-in defense employed by blockchains to prevent AI-bot-style Sybil attacks. The combination of metering non-human users alongside tolls for non-human usership would be an ideal implementation alongside slightly taxing computation, like <strong><a href="http://www.hashcash.org/" title="Hashcash" target="_blank" rel="noopener">Hashcash</a></strong>, that would inhibit bots. With respect to proofs of humanity, blockchains have long grappled with <strong><a href="https://papers.ssrn.com/sol3/papers.cfm?abstract_id=4105763" title="Decentralized Society: Finding Web3's Soul" target="_blank" rel="noopener">overcoming anonymity</a></strong> to unlock activities such as undercollateralized lending and other reputation-based activities.</p>
<p>One approach to gaining steam to demonstrate identity is to employ <a href="https://developers.google.com/identity/protocols/oauth2/service-account" title="Using OAuth 2.0 for Server to Server Applications" target="_blank" rel="noopener"><strong>JSON</strong></a> web tokens (JWTs). JWTs are &ldquo;0Auth&rdquo; credentials, similar to &ldquo;cookies,&rdquo; generated when you sign on to a website like Google. They allow you to demonstrate your Google identity when visiting various websites on the internet while you are signed into Google. <a href="https://docs.sui.io/concepts/cryptography/zklogin" title="zkLogin" target="_blank" rel="noopener"><strong>zkLogin</strong></a>, created by L1 blockchain <strong><a href="https://sui.io/" title="Sui delivers the benefits of Web3 with the ease of Web2" target="_blank" rel="noopener">Sui</a></strong>, allows users to link their wallet private keys and actions to their Google or Facebook accounts that generate JWTs. <strong><a href="https://zkp2p.xyz/" title="ZKP2P" target="_blank" rel="noopener">zkP2P</a></strong> extends this concept further to employ JWTs to permissionlessly allow users to exchange fiat for crypto on the Base blockchain. This is accomplished by confirming peer-to-peer cash transfers through the payment app Venmo that, when confirmed through email JWTs, unlock smart contract escrowed USDC tokens. The consequence of both projects is that they establish firm connections to off-chain identities. For example, whereas zkLogin connects wallet addresses to Google identities, zkP2P is only available to KYC users of Venmo. Though both lack the robust guarantees to make them reliable enough for on-chain identity, they create important building blocks that others can employ.</p>
<p>While many projects are trying to confirm the human identity of blockchain users, the most audacious is <strong><a href="https://worldcoin.org/" title="For every human" target="_blank" rel="noopener">WorldCoin</a></strong>, founded by OpenAI CEO <strong><a href="https://twitter.com/sama" title="Sam Altman" target="_blank" rel="noopener">Sam Altman</a></strong>. Though highly controversial because users must scan their <strong><a href="https://www.reuters.com/technology/scrutiny-iris-scanning-crypto-project-worldcoin-grows-2023-09-01/" title="Scrutiny of iris-scanning crypto project Worldcoin grows" target="_blank" rel="noopener">irises</a></strong> using the dystopian &ldquo;Orb&rdquo; machine, WorldCoin is moving towards an immutable system of identity that cannot be easily faked or overwhelmed by machine intelligence. This is because WorldCoin creates an encrypted identifier based on each human&rsquo;s unique eye &ldquo;fingerprint&rdquo; that can be sampled for uniqueness and authenticity. Once verified, the user receives a digital passport called the World ID on the Optimism blockchain, allowing that user to prove their humanity on the blockchain. Most importantly, a person&rsquo;s unique signature is never revealed, nor can it be tracked because it is encrypted. World ID simply asserts that a blockchain address belongs to a human. Projects like Checkmate are already linking World ID to social media profiles to ensure users are unique and genuine. In a future internet dominated by AI, it may become commonplace to prove humanity definitively in every single online interaction. When the limitations of Captchas have been overwhelmed by AI, blockchain applications can prove identity cheaply, quickly, and concretely.</p>
<h2>Contributing to AI via Blockchain Technology</h2>
<p>Without question, we are in the early innings of the AI revolution. However, if the growth trajectory of machine intelligence will match the <strong><a href="https://www.pwc.com/gx/en/issues/data-and-analytics/publications/artificial-intelligence-study.html" title="PwC&rsquo;s Global Artificial Intelligence Study: Exploiting the AI Revolution" target="_blank" rel="noopener">boldest</a></strong> of forecasts, AI must be challenged to excel while having its potential for harm tamed. We believe that crypto is the ideal trellis to properly &ldquo;train&rdquo; the bountiful fruiting but potentially insidious plant that is AI. Blockchain&rsquo;s solution set for AI can boost the output of creators of machine intelligence by supplying them with more responsive, flexible, and potentially cheaper decentralized compute. It also incentivizes builders who can create better models while supplying economic impetus to others to build useful businesses from those AI models. Just as importantly, model owners can prove their models' effectiveness while demonstrating that protected data sources were not used. For AI users, crypto applications can confirm the models they run to comply with safety standards and are probably useful. For everyone else, blockchain and crypto may be the tangle of penalties and rewards that bind down the Gulliver that artificial intelligence is certain to become.</p>
<div class="wrapped-div">
<table style="width: 100%;">
<tbody>
<tr class="tbl-data">
<td class="tbl-header last text-left">Provider</td>
<td class="tbl-header last text-center">Description</td>
<td class="tbl-header last text-center">Service Category</td>
<td class="tbl-header last text-center">Fully Diluted Market Cap (M)</td>
<td class="tbl-header last text-center">Usage</td>
</tr>
<tr class="tbl-data">
<td class="data-td data last" style="text-align: left;">io.net</td>
<td class="data-td data last">Decentralized computing network for accessing distributed cloud clusters.</td>
<td class="data-td data last">Compute</td>
<td class="data-td data last">Series A Completed</td>
<td class="data-td data last">GPUs on io.net have served over 17k compute hours and earned $190k.</td>
</tr>
<tr class="tbl-data">
<td class="data-td data last" style="text-align: left;">Together</td>
<td class="data-td data last">Decentralized cloud platform for open-source AI models.</td>
<td class="data-td data last">Pooled Compute</td>
<td class="data-td data last">Series A Completed</td>
<td class="data-td data last">Together's first service, Forge, is on pace to generate $20 million in annual revenue.</td>
</tr>
<tr class="tbl-data">
<td class="data-td data last" style="text-align: left;">Worldcoin</td>
<td class="data-td data last">Online identity project started by Sam Altman that verifies personhood via scanning users' irises.</td>
<td class="data-td data last">Identity</td>
<td class="data-td data last">$27,508</td>
<td class="data-td data last">World App has attracted 5 million users in its first 6 months.</td>
</tr>
<tr class="tbl-data">
<td class="data-td data last" style="text-align: left;">Bittensor</td>
<td class="data-td data last">Decentralized incentive network built to reward the most useful AI models with $TAO.</td>
<td class="data-td data last">Model Optimization</td>
<td class="data-td data last">$5,677</td>
<td class="data-td data last">Bittensor has grown to 80k accounts with 89% of the circulating $TAO staked.</td>
</tr>
<tr class="tbl-data">
<td class="data-td data last" style="text-align: left;">Render</td>
<td class="data-td data last">Decentralized GPU network on Solana facilitating rendering and machine learning work.</td>
<td class="data-td data last">Compute</td>
<td class="data-td data last">$1,558</td>
<td class="data-td data last">Render network employs 600 GPU node operators which has rendered 1.3 million scenes.</td>
</tr>
<tr class="tbl-data">
<td class="data-td data last" style="text-align: left;">Akash</td>
<td class="data-td data last">Cosmos-based decentralized supercloud marketplace for CPU, GPU, memory, and storage.</td>
<td class="data-td data last">Compute</td>
<td class="data-td data last">$1,103</td>
<td class="data-td data last">Akash facilitates ~$2000 of daily revenue for GPU suppliers on the network.</td>
</tr>
<tr class="tbl-data">
<td class="data-td data last" style="text-align: left;">Hut 8</td>
<td class="data-td data last">Digital asset miner and HPC infrastructure provider.</td>
<td class="data-td data last">Compute</td>
<td class="data-td data last">$855</td>
<td class="data-td data last">Hut 8 generated $4.5 million of revenue from its HPC business in Q3 2023.</td>
</tr>
<tr class="tbl-data">
<td class="data-td data last" style="text-align: left;">Fetch.ai</td>
<td class="data-td data last">AI agent creation, customization, and monetization platform.</td>
<td class="data-td data last">Agent Tooling</td>
<td class="data-td data last">$780</td>
<td class="data-td data last">59k unique wallets holding $FET.</td>
</tr>
<tr class="tbl-data">
<td class="data-td data last" style="text-align: left;">Applied Digital</td>
<td class="data-td data last">Bitcoin miner supporting AI operations through its subisdiary, Sai Computing, which hosts an AI Cloud Service.</td>
<td class="data-td data last">Compute</td>
<td class="data-td data last">$587</td>
<td class="data-td data last">Applied Digital has 400 MW of capacity in development to support HPC applications.</td>
</tr>
<tr class="tbl-data">
<td class="data-td data last" style="text-align: left;">Hive</td>
<td class="data-td data last">Bitcoin miner providing HPC services.</td>
<td class="data-td data last">Compute</td>
<td class="data-td data last">$313</td>
<td class="data-td data last">Hive's HPC business had 4,800 GPUs active at the end of 2023 with a target of 38,000 GPU-based cards committed to cloud service.</td>
</tr>
<tr class="tbl-data">
<td class="data-td data last" style="text-align: left;">Altered State Machine</td>
<td class="data-td data last">Decentralized protocol for training and trading AI agents that can be used with NFTs.</td>
<td class="data-td data last">Agent Tooling</td>
<td class="data-td data last">$110</td>
<td class="data-td data last">Over 27k unique wallets holding NFTs that can be powered by Altered State Machine AI agents.</td>
</tr>
</tbody>
</table>
</div>
<br />
<p class="chart-disclosure">Source: VanEck Research, project websites, as of 1/15/24.</p>
<p><strong>Links to third party websites are provided as a convenience and the inclusion of such links does not imply any endorsement, approval, investigation, verification or monitoring by us of any content or information contained within or accessible from the linked sites. By clicking on the link to a non-VanEck webpage, you acknowledge that you are entering a third-party website subject to its own terms and conditions. VanEck disclaims responsibility for content, legality of access or suitability of the third-party websites.</strong></p>
<p><strong><i>Disclosure: VanEck has a position in Together via our strategic partnership with early-stage venture manager Cadenza, who was kind enough to contribute to the</i> &ldquo;Overcoming the Bottlenecks of Decentralized Compute&rdquo; <i>section</i></strong>.</p>
<p><strong><i>Special Thanks to:</i></strong></p>
<p><strong><i>Jason Morton, CEO of ZKML</i></strong></p>
<p><strong><i>Ala Shaabana, Co-Founder of Bittensor</i></strong></p>
<p><strong><i>Arrash Yasavolian, Founder of Bittensor&rsquo;s Taoshi Subnet</i></strong></p>
<p><strong><i>Greg Osuri, CEO and Founder of Akash</i></strong></p>
<p><strong><i>Richard Liang, CEO of zkP2P</i></strong></p>
<p><strong><i>Key Members of the Sui Blockchain Team &ndash; Sam Blackshear, Nihar Shah, Sina Nader, Alonso Gortari</i></strong></p>
<p>To receive more <strong><a href="https://www.vaneck.com/us/en/insights/digital-assets/" title="Digital Assets Insights">Digital Assets</a></strong> insights, <strong><a href="https://www.vaneck.com/us/en/subscribe/" title="Subscription Center">sign up in our subscription center</a></strong>.</p>
<style>
    .wrapped-div {
        max-width: 100%;
    }

    @media (max-width: 768px) {
        .wrapped-div {
            overflow-x: scroll;
        }
    }

    .wrapped-div-sector {
        max-width: 100%;
        overflow-x: scroll;
    }
</style>
]]></content:encoded>
</item><item rdf:about="https://www.vaneck.com/us/en/blogs/gold-investing/ima-casanova-silvers-golden-outlook/">
  <title>Silver’s Golden Outlook></title>
  <link>https://www.vaneck.com/us/en/blogs/gold-investing/ima-casanova-silvers-golden-outlook/</link>
  <description><![CDATA[Fed uncertainty leaves gold range-bound in January; industrial uses for silver may add luster to the metal&rsquo;s outlook.]]></description>
  <dc:creator>Imaru Casanova</dc:creator>
  <dc:date>02/13/2024 06:30:00</dc:date>
<content:encoded><![CDATA[

<p>Monthly gold market and economic insights from Imaru Casanova, Portfolio Manager, featuring her unique views on mining and gold&rsquo;s portfolio benefits. <a href="/us/en/blogs/gold-investing/ima-casanova-silvers-golden-outlook/gold-monthly-commentary-january-2024.pdf" target="_blank" rel="noopener" title="Silver's Golden Outlook"><strong>An expanded PDF version of this commentary, including fund specific information can be downloaded here.</strong></a></p>
<h2>Gold pauses on rate outlook</h2>
<p>Gold traded in a tight range in the first month of 2024, reaching a low of $2,006 per ounce on January 17 as the market reassessed the odds of a U.S. Federal Reserve (Fed) cut in March. The implied probability of the March rate cut dropped from 81.5% at the beginning of the year to 35% at the end of January. Gold found support above $2,000 per ounce even as the U.S. dollar strengthened (DXY index<sup>1</sup>&nbsp;was up 1.92%) and yields rose, bouncing back from its lows to close at $2,039.52 per ounce on January 31, down $23.36 or 1.14% for the month.</p>
<h2>Miners see further dislocation</h2>
<p>Gold stocks had a rough start to the year, once again significantly underperforming the metal. NYSE Arca Gold Miners Index (GDMNTR)<sup>2</sup>&nbsp;and MVIS Global Juniors Gold Miners Index (MVGDXJTR)<sup>3</sup>&nbsp;were down 9.8% and 10.6%, respectively, in January. The reason behind the amplified losses in gold stocks relative to gold bullion, we believe, was a disappointing set of preliminary 2023 year-end operating results and 2024 guidance for an already-unloved sector. Poor sentiment towards gold stocks has translated into what we generally consider overselling of the companies&rsquo; shares following the announcement of any weak or even slightly unexpected results.</p>
<p>Barrick Gold (5.77% of Strategy net assets) is a perfect example. The company announced 2023 fourth quarter and full-year production results that were below market consensus and company guidance. The company also noted that all-in-sustaining costs for 2023, although not reported, would also be higher than expected. The direct impact of these results to the company&rsquo;s valuation is minimal, but the markets, rightfully so, appeared to have revised their forecasts to reflect a more negative operating outlook. We think this is reasonable, as clearly the negative results for 2023 could indicate weakness in 2024. However, the 9% drop in Barrick&rsquo;s share price looks overdone to us based on our estimates. In addition, most analysts (Barrick is well covered) kept their targets for Barrick&rsquo;s shares unchanged after the announcement.</p>
<p>To be clear, we are not making excuses for the companies. As challenging as it may be, companies must make it a priority to inform the markets with annual operating and financial guidance, expectations and targets that they can meet or beat. Misses are severely penalized. However, it really does appear to us that negative sentiment for the gold sector, as a whole, could be intensifying punishment more recently.</p>
<h2>Physical demand shines bright</h2>
<p>The World Gold Council reported total gold demand in 2023 of 4,899 tonnes, the highest on record and 3% above demand in 2022. Excluding what they refer to as OTC (over the counter) or off-exchange transactions (an estimate that captures the difference between gold supply and demand) 2023 demand was a bit (-5%) below 2022, but still very strong. The changing gold demand dynamics we have been highlighting remain at play: Strong central bank buying as a dominant driver of gold prices in 2023, with demand from the official sector representing over 20% of total gold demand for the year. Net purchases of 1,037 tonnes in 2023 fell just short of the record 1,082 tonnes central banks purchased in 2022, and it is more than double the pre-2022 annual average net purchases of about 500 tonnes of gold per year. This is an impressive trend, expected to continue in the longer-term. In contrast, holdings of global gold bullion ETFs continued to see outflows in 2023, dropping by 244 tonnes, and driving total investment demand to a 10-year low, another reflection of investor&rsquo;s apathy towards gold as an asset class.<sup>*</sup></p>
<h3>Annual gold demand by sector</h3>
<p><img class="img-responsive w-100" src="https://www.vaneck.com/contentassets/d8042b300ba6457e9de4c33b85f62c25/4116_gold_chart-1_2024-02_blog.svg" alt="Bar chart showing annual gold demand by sector" /></p>
<p class="chart-disclosure">Source: World Gold Council. Data as of December 2023.</p>
<h2>Solar silver lining?</h2>
<p>A lack of investor interest hasn&rsquo;t been reserved for gold only. Silver, gold&rsquo;s less expensive cousin, has been hit even harder, underperforming gold over the last several years. The gold-to-silver ratio (the number of ounces of silver required to buy one ounce of gold) of approximately 90 at present, is well above the 20-year average of approximately 68. Silver, like gold, is a precious metal and, historically, a safe haven asset, driven by the same fundamentals that drive gold. However, silver is also an industrial metal used in a wide range of applications in electronics, medicine, automobiles, appliances, chemical catalysts, and, importantly, silver plays a vital role in the production of solar cells.</p>
<p>The Silver Institute estimates 2023 demand from silver used in photovoltaics (PV) at around 161 million ounces, up from 140 million ounces in 2022, and representing about 13% of total global silver demand.<sup>&dagger;</sup>&nbsp;This demand is, of course, expected to continue to increase to reflect the growth of solar installations as one of the main sources of renewable energy globally. By 2028, International Energy Agency estimates that solar photovoltaics (PV) will account for about 13% of total global electricity capacity, up from approximately 5% of capacity today.<sup>&Dagger;</sup>&nbsp;The implications for silver are clear, with increasing solar PV demand over the next five years and beyond unlikely to be matched by an increase in supply.</p>
<p>Some rough numbers may help put this in context. A more than doubling of solar PV capacity by 2028 should translate to more than twice the PV demand for silver in 2023, or more than 300 million ounces of silver. Annual global supply of silver has been relatively unchanged over the past 10 years at approximately 1 billion ounces. Thus, this growing demand from solar applications is substantial to an industry that is very inelastic when it comes to the supply side.</p>
<p>Not only are primary silver deposits hard to find, but very few are waiting to be developed, and even when a development decision is made the technical, economic, environmental and social studies, permitting and government regulatory requirements can take as long as a decade or more to complete. Silver, already undervalued relative to gold, could benefit not just from a bounce back to reflect multiples more in line with the historical average, but also from the additional and growing boost from solar.</p>
<h3>2023 Performance Gold vs Silver</h3>
<p><img class="img-responsive w-100" src="https://www.vaneck.com/contentassets/d8042b300ba6457e9de4c33b85f62c25/4116_gold_chart-2_2024-02_blog.svg" alt="Bar chart showing Performance of Gold vs Silver in 2023" /></p>
<p class="chart-disclosure">Source: Bloomberg. Data as of December 2023.</p>
<p>To receive more <strong><a href="https://www.vaneck.com/us/en/insights/gold-investing/" title="Gold Investing Insights">Gold Investing</a></strong> insights, <strong><a href="https://www.vaneck.com/us/en/subscribe/" title="Subscription Center">sign up in our subscription center</a></strong>.</p>
]]></content:encoded>
</item><item rdf:about="https://www.vaneck.com/us/en/blogs/digital-assets/bitcoin-volatility/">
  <title>Why is Bitcoin Volatile? An Overview of Bitcoin Price Fluctuations></title>
  <link>https://www.vaneck.com/us/en/blogs/digital-assets/bitcoin-volatility/</link>
  <description><![CDATA[Explore the drivers of Bitcoin's volatility, from market trends to regulatory impacts, and understand the future of its price fluctuations.]]></description>
  <dc:creator>Denis   Zinoviev</dc:creator>
  <dc:date>02/08/2024 06:30:00</dc:date>
<content:encoded><![CDATA[

<h2>Introduction: Understanding Bitcoin's Price Volatility</h2>
<p>Bitcoin, since its inception, has been synonymous with volatility. Its prices can swing wildly over short periods, drawing in traders and investors attracted by the potential for significant returns but also exposing them to substantial risk. Understanding Bitcoin's price volatility is not just a curiosity but a necessity for cryptocurrency market participants. The cryptocurrency's unpredictable price movements can have wide-reaching implications, from influencing investment strategies to affecting the broader financial market's stability.</p>
<h2>Background of Bitcoin: A New Era of Digital Currency</h2>
<p><a href="https://www.vaneck.com/us/en/blogs/digital-assets/the-latest-on-bitcoinwithout-the-jargon/" rel="noopener" title="Bitcoin Simplified"><strong>Bitcoin</strong></a> marked the beginning of a new era in digital currency when it was introduced in 2009. As the first decentralized cryptocurrency, it operates on <strong><a href="https://www.vaneck.com/us/en/blogs/digital-assets/blockchain-basics/" rel="noopener" title="What is Blockchain Technology?">blockchain technology</a></strong>&mdash;a digital ledger that records all transactions across a network of computers. This backbone of Bitcoin's structure is what gives it its unique value proposition: security, transparency, and independence from traditional banking systems.</p>
<ul class="content-list">
<li><a href="#why-is-bitcoin-volatile"><strong>Why is Bitcoin Volatile?</strong></a></li>
<li><a href="#market-movements"><strong>Market Movements</strong></a></li>
<li><a href="#bitcoin-history"><strong>Bitcoin History</strong></a></li>
<li><a href="#current-trends"><strong>Current Trends</strong></a></li>
<li><a href="#prediction-challenges"><strong>Prediction Challenges</strong></a></li>
<li><a href="#conclusion"><strong>Conclusion</strong></a></li>
</ul>
<h2 id="why-is-bitcoin-volatile" class="jump-link-nav anchored-block" data-jumplink-title="Why is Bitcoin Volatile?">Why Is Bitcoin's Price So Volatile?</h2>
<p>To fully grasp Bitcoin's price movements, one must consider various factors that can influence its value. Below are key dynamics that contribute to Bitcoin's notorious price volatility.</p>
<h3>Supply and Demand Dynamics</h3>
<p>Bitcoin's design comes with a fixed supply, capped at 21 million coins, making it a deflationary asset. This limitation can lead to significant price swings as demand fluctuates. The process of reaching the 21 million bitcoin cap is governed by a mechanism called halving. Approximately every four years, the reward for mining a block of Bitcoin transactions is halved. Initially, miners received 50 bitcoins per block. This reward has halved several times and will continue to do so until the last fraction of a bitcoin is mined. There are approximately 19.6 million bitcoins in circulation today, and the cap of 21 million is not expected to be hit until 2140.</p>
<p>Increased demand from investors, particularly during times of economic uncertainty, often leads to price surges, while lower demand can quickly result in price declines.</p>
<h3>Market Sentiment</h3>
<p>The influence of media and news on investor sentiment cannot be overstated. Positive news can lead to hype, driving up prices, while negative news can trigger panic selling. This cycle of news and investor reaction contributes to the high volatility seen in Bitcoin trading.</p>
<h3>Regulatory Impact</h3>
<p>Regulatory announcements from various parts of the world have historically triggered immediate and often unpredictable effects on Bitcoin's price. While some regulatory news can create short-term volatility, it's important to consider the broader, more constructive impact of these developments. Globally, regulatory frameworks are evolving to accommodate and govern the use of Bitcoin and other cryptocurrencies, reflecting a growing recognition of their potential.</p>
<p>In the European Union, for instance, the introduction of the Fifth Anti-Money Laundering Directive (5AMLD) has brought cryptocurrency exchanges and custodian wallet providers into the fold of regulated entities. This has enhanced the legitimacy of Bitcoin, encouraging mainstream financial institutions to engage with cryptocurrency markets and products.</p>
<p>Similarly, in Canada, the regulatory environment has become more conducive to cryptocurrency innovation and investment. The Ontario Securities Commission (OSC) has approved several Bitcoin exchange-traded funds (ETFs), making it easier and more secure for Canadians to invest in Bitcoin.</p>
<p>These regulatory milestones have significantly contributed to the increasing adoption of Bitcoin worldwide. They provide a legal framework that protects consumers, combats illegal activities, and establishes cryptocurrency as a legitimate financial asset. As regulatory clarity improves, more investors&mdash;from retail to institutional&mdash;are likely to participate in the market, potentially leading to greater stability and a reduction in speculative trading.</p>
<h2>Bitcoin Volatility Index: Gauging Market Movements</h2>
<p>The Bitcoin Volatility Index (BVIX) serves as a measure of Bitcoin's expected volatility based on options market data. It's an essential tool for investors, as it provides insights into market sentiment and risk. Understanding the BVIX is crucial for anyone looking to gauge Bitcoin's market movements accurately.</p>
<h2 id="market-movements" class="jump-link-nav anchored-block" data-jumplink-title="Market Movements">Investor Behavior and Market Dynamics</h2>
<p>Bitcoin's market is influenced by a mix of individual and institutional investors, each bringing different behaviors and impacts on price. The emergence of various investment platforms has made trading Bitcoin more accessible, adding to market liquidity and, consequently, volatility.</p>
<h2>Bitcoin's Price Fluctuation: A Technical Analysis</h2>
<p>Using charts and historical data can help identify trends and patterns in Bitcoin's price. However, the limitations of technical analysis become apparent given Bitcoin's volatile nature, which often defies traditional market expectations:</p>
<p><img class="img-responsive w-100" src="https://www.vaneck.com/contentassets/0ccfb660dedc4b2d92435c2acf9db86e/4059_bitcoin-volatility-seo-blog_chart-1_2024-01_v1.svg" alt="Bitcoin's Price Fluctuation: A Technical Analysis" /></p>
<p class="chart-disclosure">Source: Bloomberg January 2024. Index performance is not illustrative of fund performance. It is not possible to invest directly in an index. Past performance is no guarantee of future results.</p>
<h2 id="bitcoin-history" class="jump-link-nav anchored-block" data-jumplink-title="Bitcoin History">Historical Perspective: Bitcoin Volatility Over Time</h2>
<p>VanEck has been bullish on Bitcoin since 2017 when the price of Bitcoin was $3,000. Since the beginning, we've said that Bitcoin is an internet-enabled, limited-supply asset.</p>
<p>In the volatile yet vibrant history of Bitcoin, we've witnessed a financial phenomenon morph from a nascent digital token to a burgeoning asset class. Bitcoin's journey has been nothing short of a roller coaster ride, marked by meteoric rises, steep falls, and a resilience that continues to intrigue and reward its believers. For investors, Bitcoin has offered not just a new avenue for potential returns but a front-row seat to the evolution of an asset that has challenged traditional notions of value and investment. The maturation of an asset can provide additional returns that might be available once the opportunity has matured. With Bitcoin, there is more growing up to do.</p>
<p><strong>Bitcoin 1.0 - Early days (2011-2017)</strong></p>
<p>From 2011 to 2017, Bitcoin was in its proof of technology phase. It was establishing the blockchain as a workable force and was just beginning to have network effects. The volatility was immense; the swings in value were wild and unpredictable. Yet, those who recognized the underlying promise of this technology and invested in it, even amidst the uncertainty, found themselves on the cusp of a revolution.</p>
<p><strong>Bitcoin 2.0 - Awkward growth spurt (2017-2021)</strong></p>
<p>As Bitcoin entered its toddler years, from 2017 to 2021, it began to mature. What was once known to a few tech enthusiasts was now being adopted by millions worldwide and withstanding political bans and threats. Despite maintaining its volatile nature, Bitcoin showed us proof of principle in 2021 by reaching new all-time highs, demonstrating that it wasn't just a one-time bubble. This phase, to us, was a testament to Bitcoin's staying power, solidifying its role as more than just a digital curiosity but a genuine asset class.</p>
<h2 id="current-trends" class="jump-link-nav anchored-block" data-jumplink-title="Current Trends">Current Trends in Bitcoin's Market Behavior</h2>
<p>Recent market conditions have both stabilized and destabilized Bitcoin's price. Analyzing these trends can provide insights into what drives Bitcoin's volatility and offer some predictive understanding of future movements.</p>
<p><strong>Bitcoin 3.0 - Tests of adolescence (2021-2024)</strong></p>
<p>The current journey is when technological development continues, and the asset is valued by a wider circle of investors. The beginnings of institutional adoption started to surface, although the expected smaller drawdowns turned out to be larger than anticipated. Bitcoin's resilience through these tests has been a critical part of its growth story, a phase of toughening up and proving its mettle.</p>
<p><strong>Bitcoin 4.0 &ndash; Coming of age (2024-TBD)</strong></p>
<p>As we approach 2024, we anticipate the advent of Bitcoin 4.0. With potential regulatory clarity and broader acceptance, we believe Bitcoin stands on the brink of its coming-of-age story. The expectation is that with the approval of a Bitcoin ETF and other investment vehicles, Bitcoin will transition to a more stable and accepted member of the financial community. This era is where we may see an influx of retail and institutional investors acknowledging the legitimacy and potential of Bitcoin as a cornerstone of modern portfolios.</p>
<h2 id="prediction-challenges" class="jump-link-nav anchored-block" data-jumplink-title="Prediction Challenges">Challenges in Predicting Bitcoin's Volatility</h2>
<p>The very nature of Bitcoin's market is enigmatic, characterized by rapid shifts that often seem detached from the traditional market indicators used in other asset classes. Analysts and investors alike grapple with an array of sophisticated models and analytical tools in an effort to predict its next move, but the accuracy of such forecasts is notoriously elusive.</p>
<p>One of the primary challenges is the relative infancy of the cryptocurrency market. Unlike stocks and commodities, which have decades or even centuries of historical data to draw upon, Bitcoin has just over a decade. The limited historical context makes it difficult to apply time-tested models based on long-term data.</p>
<p>Furthermore, Bitcoin operates within a market that is highly sentiment-driven. The sentiment is influenced by a diverse set of factors, ranging from geopolitical developments and regulatory changes to technological advancements and market manipulation. Each of these factors can have a disproportionate impact on price movement.</p>
<p>Adding to the complexity is the decentralized nature of Bitcoin. With no central authority or governing body, movements in the market are often the result of decentralized actions by individuals across the globe, making collective mood and behavior difficult to gauge.</p>
<p>Algorithmic trading, which uses complex models to predict price movements and execute trades at high speed, has added to the volatility. Bots can act on triggers too subtle for human analysts to detect or on pre-emptive strategies designed to capitalize on anticipated market movements, thus potentially leading to self-fulfilling prophecies.</p>
<p>Finally, the influx of institutional investors, each with their own strategies and thresholds for buying and selling, further complicates prediction models. These entities can move the market significantly, and their actions are often based on a mixture of proprietary signals and broader economic indicators, which are not always transparent or predictable.</p>
<p>In this dynamic and uncertain landscape, even the most advanced predictive analytics must contend with the reality that Bitcoin's market is influenced by a complex web of unpredictable human behaviors, emerging technologies, and global events. The result is an environment where certainty is scarce, and the ability to adapt to rapid change is among the most valuable of skills.</p>
<h2 id="conclusion" class="jump-link-nav anchored-block" data-jumplink-title="Conclusion">Conclusion: Navigating Bitcoin's Future Volatility</h2>
<p>Demand for Bitcoin is a key driver of its returns. In its early years, Bitcoin was largely used by a small group of tech enthusiasts. It was difficult and cumbersome to obtain with limited use cases, and very few merchants accepted it as a form of payment. In 2023, Bitcoin adoption has grown substantially as it has become more mainstream. Now, more than ever, merchants and businesses are accepting Bitcoin as a form of payment, and infrastructure has been built to make it more convenient for the average person to use. The development of user-friendly wallets, exchanges, and marketplaces has removed the technical barriers to entry that existed in Bitcoin's early years.</p>
<p>Bitcoin interest among institutional investors has also increased. Hedge funds, asset management firms, and endowments are increasingly recognizing Bitcoin's potential as a store of value and as an effective portfolio diversifier, specifically when looking through the lens of an uncorrelated asset that has the potential to hedge against inflation. Approximately $50B worth of Bitcoin is now held by ETFs, countries, and public and private companies.</p>
<p><a href="https://www.vaneck.com/us/en/blogs/digital-assets/the-investment-case-for-bitcoin/" rel="noopener" title="The Investment Case for Bitcoin"><strong>Importantly, there will only ever be 21 million Bitcoin in existence</strong></a>. This supply cap was designed intentionally and is one of the primary characteristics of Bitcoin. Furthermore, Bitcoin has "halvings" programmed into it. A halving is defined as a 50% block reward cut to the Bitcoin production rate, and they occur roughly every four years. This means that the rate at which new Bitcoins are introduced into circulation slows down over time until it eventually reaches zero (estimated to occur around the year 2140).</p>
<h3>Bitcoin Halvings are Typically Associated with Explosive Returns</h3>
<p><img class="img-responsive w-100" src="https://www.vaneck.com/contentassets/0ccfb660dedc4b2d92435c2acf9db86e/4059_bitcoin-volatility-seo-blog_chart-2_2024-01_v1.svg" alt="Bitcoin Halvings are Typically Associated with Explosive Returns" /></p>
<p class="chart-disclosure">Source: VanEck Research December 2023. Not intended as a forecast or prediction of future results, or as any call to action. Estimates shown are for illustrative purposes only. Please see below for disclosures regarding hypothetical performance.</p>
<p>These halvings increase the difficulty of mining Bitcoin and will occur until the supply cap is reached. In addition, the built-in finite supply of Bitcoin means that it is not subject to inflation in the same manner that fiat currencies are. Central banks around the world have ushered in unprecedented growth in money supply, effectively eroding the purchasing value of their currencies. In comparison, Bitcoin's limited supply and increased mining difficulty over time may support the idea of Bitcoin as a long-term store of value and as an alternative to gold.</p>
<p>The next halving is expected to occur in April 2024. Historically, the price of Bitcoin has rallied leading up to and following a halving.</p>
<p>Learn more about Bitcoin and digital assets in our <a href="/link/343cf2f03fec405589c8319433a957f6.aspx" rel="noopener" title="Investing in Bitcoin and Digital Assets"><strong>Bitcoin education center</strong></a>.</p>
<p>To receive more <strong><a href="https://www.vaneck.com/us/en/insights/digital-assets/" title="Digital Assets Insights">Digital Assets</a></strong> insights, <strong><a href="https://www.vaneck.com/us/en/subscribe/" title="Subscription Center">sign up in our subscription center</a></strong>.</p>
]]></content:encoded>
</item><item rdf:about="https://www.vaneck.com/us/en/blogs/investment-outlook/jan-van-eck-2024-macro-predictions-sideways-2-0/">
  <title>2024 Macro Predictions: Sideways 2.0></title>
  <link>https://www.vaneck.com/us/en/blogs/investment-outlook/jan-van-eck-2024-macro-predictions-sideways-2-0/</link>
  <description><![CDATA[Let&rsquo;s look at what to expect this year from the three major forces impacting the markets: monetary policy, government spending and global economic growth.]]></description>
  <dc:creator>Jan van Eck</dc:creator>
  <dc:date>02/08/2024 06:30:00</dc:date>
<content:encoded><![CDATA[

<a href="/us/en/blogs/investment-outlook/jan-van-eck-q2-2026-outlook-the-reset-is-your-entry-point/" title="Jan van Eck's Latest Outlook"><strong>Looking for the latest outlook? Read the Q2 2026 Outlook.</strong></a>
<p>Dear Fellow Investors,</p>
<p>Our outlook for financial markets in 2023 was &ldquo;sideways&rdquo; and &ldquo;40/60,&rdquo; or overweight bonds. This strategy worked well until November 2023, when the market suddenly rallied aggressively and priced in Federal Reserve (Fed) interest rate cuts, which were expected to happen in 2024. It is one of the wonders of the market that it can price in its view of the future so quickly.</p>
<p>In this sense, it could be that 2024 has already happened. One could imagine that the three macro factors&mdash;monetary policy, government spending and global economic growth&mdash;will not change much in 2024. Let&rsquo;s review those three major forces on markets, as well as some risks and trends worth noting.</p>
<h2>Monetary Policy: Not Very Stimulative</h2>
<p>To recap this cycle: stocks and bonds historically do not perform well when the Fed tightens monetary conditions, and that&rsquo;s just what the Fed announced it would be doing at the end of 2021. This would include raising rates and changing its balance sheet actions, which doesn&rsquo;t create a great environment for financial assets.</p>
<p>A second, modern component to monetary policy is the Fed balance sheet. After buying bonds during the pandemic, the Fed has now started shrinking the balance sheet&mdash;from a high of almost $9T in early 2022, assets dropped to $7.8T toward the end of December 2023.<sup>1</sup></p>
<p>Our favorite inflation is wage inflation, not food or gas prices. This is the kind of inflation that is endemic and hard to manage once it takes hold. And wage inflation is above 4%, not near the Fed&rsquo;s 2% target, so we don&rsquo;t see a big Fed stimulus. And the silent Fed action of reducing its bond holdings (&ldquo;quantitative tightening&rdquo;), continues.</p>
<h2>Government Spending: Also Muted</h2>
<p>A second bearish factor is that government spending is unlikely to increase next year. The Republicans, in control of the House of Representatives, continue to look to slow government spending. While we probably didn&rsquo;t sufficiently appreciate the amount of some of the Biden Administration&rsquo;s spending, like with the environmental IRA act, any such upside surprises are very unlikely in 2024.</p>
<h2>Global Growth at Low Levels</h2>
<p>Over the last 20 years, the U.S. and China have been the two main pillars of global growth. But while there are bright spots, China is remarkable now for its economic weakness. The property market recession has helped pull Chinese prices lower year over year, and that deflationary force affects the world economy. Other centers of growth like India, Indonesia and Africa, are not big enough yet to drive global growth.</p>
<h2>Notable Opportunities for 2024</h2>
<ol class="content-list">
<li class="mt-2"><strong>Bonds:</strong> While interest rates whipsawed investors in 2023 with a net positive result, our outlook favoring bonds hasn&rsquo;t changed. They offer attractive risk-adjusted returns compared to equities given the headwinds discussed above. After the 2022 and 2023 losses, bond investments are now offering attractive yields. This has been our favorite asset class to buy and remains our preference. (See <a href="https://www.vaneck.com/us/en/blogs/investment-outlook/jan-van-eck-what-to-buy-bonds-when-now/" title="What to Buy? Bonds. When? Now."><strong>What to Buy? Bonds. When? Now</strong></a>.) As a reference, bonds offered attractive total returns in the 1970s, even though that decade was the worst for interest rates in the last 100 years.</li>
<li class="mt-2"><strong>Yield curve:</strong> We like to look for market distortions, and the most notable one is &ldquo;yield curve inversion&rdquo;&mdash;long-term interest rates being lower than short-term rates. If, and it&rsquo;s a big &ldquo;if&rdquo;, government entities like the Fed are stepping back from the bond markets, then it makes sense for long-term rates to be higher, because with greater risk should come greater return. Yield curve inversion is present only about 10% of the time. It&rsquo;s unusual.</li>
<li class="mt-2"><strong>India/emerging markets</strong>: With the newfound ubiquity and affordability of mobile phones in India, the internet sector there is well primed to do as well as it has in the U.S., China, and other major markets. <a href="https://www.vaneck.com/us/en/blogs/emerging-markets-equity/indias-economic-rise-demands-investor-attention/" title="India's Economic Rise Demands Investor Attention"><strong>Digital India</strong></a> seems like a good tactical play, despite higher price/earnings ratios. Emerging markets in general have lagged for so many years that most investors have given up. So many, that 2024 may be their year. (Please note that India is a multi-year trend and that we are most bullish Brazil/LatAm in our active funds as of the date of this letter.)</li>
<li class="mt-2"><strong>Stores of value/real assets</strong>: In March 2023, I &ldquo;pounded the table&rdquo; on gold and bitcoin in a CNBC interview While those assets have rallied hard since then&mdash;again, the market likes to anticipate!&mdash;I don&rsquo;t think this trend is over.</li>
<li class="mt-2"><strong>Value stocks</strong>: Growth stocks had a shockingly good 2023. Stocks in banks and financials have been beaten up. They are definitely worth a close look. This outlook is discussed in a recent podcast, <a href="https://www.vaneck.com/us/en/offsite-disclaimer/?id=254267&amp;button=no&amp;url=https://www.youtube.com/watch?v=F8oH6BaWPao%26t%3D1255s" title="The Compound and Friends Ep. 113 - The New Kings of Wall Street" target="_blank" rel="noopener"><strong>The Compound and Friends</strong></a>, Episode 113, released on October 13, 2023.</li>
</ol>
<p>One thing missing above is that the U.S. economy and its labor market are near perfection. Now, profit growth is returning for the big technology stocks and the market overall, giving the stock market a life. Be invested!</p>
<p>Sincerely,<br />Jan</p>
<p>To receive more <a href="/us/en/insights/investment-outlook" title="Investment Outlook Insights"><strong>Investment Outlook</strong></a> insights, <a href="https://www.vaneck.com/us/en/subscribe/" title="Subscription Center"><strong>sign up in our subscription center</strong></a>.</p>
]]></content:encoded>
</item><item rdf:about="https://www.vaneck.com/us/en/blogs/digital-assets/matthew-sigel-vaneck-monthly-bitcoin-chaincheck/">
  <title>VanEck Monthly Bitcoin ChainCheck></title>
  <link>https://www.vaneck.com/us/en/blogs/digital-assets/matthew-sigel-vaneck-monthly-bitcoin-chaincheck/</link>
  <description><![CDATA[Bitcoin on-chain indicators and top takeaways for January 2024.]]></description>
  <dc:creator>Matthew  Sigel</dc:creator>
  <dc:date>02/08/2024 06:30:00</dc:date>
<content:encoded><![CDATA[

<p><strong>Please note that VanEck has exposure to bitcoin.</strong></p>
<p>Welcome to the first version of the VanEck Monthly Bitcoin ChainCheck where we present on-chain indicators for investors to directly assess Bitcoin blockchain's health and adoption.</p>
<ul class="content-list">
<li><a href="#price-action"><strong>Bitcoin&rsquo;s Price Action</strong></a></li>
<li><a href="#network-activity"><strong>Bitcoin&rsquo;s Network Activity, Adoption, and Fees</strong></a></li>
<li><a href="#market-health"><strong>Bitcoin Market Health and Profitability</strong></a></li>
<li><a href="#miners"><strong>Bitcoin Miners</strong></a></li>
<li><a href="#monthly-dashboard"><strong>Bitcoin ChainCheck Monthly Dashboard</strong></a></li>
</ul>
<p>Some takeaways for January 2024:</p>
<h2 id="price-action" class="jump-link-nav anchored-block" data-jumplink-title="Price Action">Bitcoin&rsquo;s Price Action</h2>
<ul class="content-list">
<li class="mt-2"><strong>Market sentiment:</strong> Bitcoin dominance stayed flattish at 51% as BTC&rsquo;s 30-day average price fell 3% in January.</li>
<li class="mt-2"><strong>Regional trading:</strong> US traders stayed more bullish than EU and Asia participants, as the price of BTC rose during US trading hours but was negative in EU and Asia trading. This dynamic represents a continuation of a long-standing trend in which Bitcoin is generally mined and sold in Asia and purchased during US hours.</li>
</ul>
<p><img class="img-responsive w-100" src="https://www.vaneck.com/contentassets/f3fa5fd892ae4e0e839b9aaf56f99cb2/4102_bitcoin-monthly-1_2024-02_v1_blog.svg" alt="Regional Trading" /></p>
<p class="chart-disclosure">Source: Glassnode, as of 2/2/24. <strong>Past performance is no guarantee of future results.</strong></p>
<ul class="content-list">
<li class="mt-2"><strong>Funding rates:</strong> Bitcoin futures annualized basis (funding costs) fell sharply to 11% as traders lost their appetite for leverage after the Bitcoin ETFs launched.</li>
</ul>

<h2 id="network-activity" class="jump-link-nav anchored-block" data-jumplink-title="Network Activity">Bitcoin&rsquo;s Network Activity, Adoption, and Fees</h2>
<ul class="content-list">
<li class="mt-2"><strong>Daily transactions: <a href="#monthly-dashboard">Daily transactions are down 18%</a></strong> in the last 30 days, but the overall adoption and network activity remain extremely strong, in the 97th percentile of all-time.</li>
<li class="mt-2"><strong>Ordinal inscriptions: <a href="#monthly-dashboard">Daily inscriptions (aka ordinals)</a></strong> activity fell 34% in the last month.</li>
<li class="mt-2"><strong>Total transfer volume:</strong> However, <strong><a href="#monthly-dashboard"> total transfer volume</a></strong> has increased by 10% in the last 30 days, reaching $39.6 billion. This divergence may reflect larger institutional participation in the wake of the spot ETF launches.</li>
<li class="mt-2"><strong>Average transaction fees: <a href="#monthly-dashboard">Average transaction fees,</a></strong> both in USD and BTC, have experienced a significant 70% decrease in the last 30 days as inscription activity has cooled.</li>
</ul>
<h2 id="market-health" class="jump-link-nav anchored-block" data-jumplink-title="Market Health">Bitcoin Market Health and Profitability</h2>
<ul class="content-list">
<li class="mt-2"><strong>Percent of addresses in profit: <a href="#monthly-dashboard">85% of Bitcoin addresses</a></strong> are currently in profit, although there has been a slight 5% decrease in the last month. Such levels are not typically associated with a very frothy market.</li>
<li class="mt-2"><strong>Net unrealized profit/loss:</strong> Likewise, a <strong><a href="#monthly-dashboard">net unrealized profit/loss ratio (NUPL)</a></strong> of 0.48 suggests that network participants are optimistic about the future but not euphoric.</li>
</ul>
<h2 id="miners" class="jump-link-nav anchored-block" data-jumplink-title="Miners ">Bitcoin Miners</h2>
<ul class="content-list">
<li class="mt-2"><strong>Total daily BTC miner revenues: <a href="#monthly-dashboard">Total daily BTC miner revenues</a></strong> fell by 19%, with heavy competition for hash rate ahead of the Bitcoin halving. Miners&rsquo; BTC transfers to exchanges fell somewhat from December&rsquo;s very high levels but still remain high (87% percentile) vs. history as miner balance sheets must be fortified ahead of the halving. Crypto equities&rsquo; market cap fell 14% m/m vs. the avg BTC price -3%.</li>
</ul>
<h3>Chart of the Month: January BTC Transfer Volume Rises Despite 3% Drop in Average Price</h3>
<p><strong>Total Transfer Volume (USD) </strong></p>
<p><img class="img-responsive w-100" src="https://www.vaneck.com/contentassets/f2432cd670a5454fa766c8f7457a7a52/4102_bitcoin-monthly-2024-02_v1_blog.svg" alt="Chart of the Month: January BTC Transfer Volume Rises Despite 3% Drop in Average Price" /></p>
<p class="chart-disclosure">Source: Glassnode as of 1/31/24. <strong>Past performance is no guarantee of future results.</strong></p>
<h3 id="monthly-dashboard" class="anchored-block">Bitcoin ChainCheck Monthly Dashboard</h3>
<p><img class="img-responsive w-100" src="https://www.vaneck.com/contentassets/f2432cd670a5454fa766c8f7457a7a52/4102_bitcoin-monthly-2_2024-02_v2_blog.svg" alt="Bitcoin ChainCheck Monthly Dashboard" /></p>
<p class="chart-disclosure">Source: Glassnode, VanEck research as of 2/2/24. <strong>Past performance is no guarantee of future results.</strong></p>
<p><strong>Notes:</strong></p>
<p>Net unrealized profit/loss ratio (NUPL) can be calculated by subtracting the realized market cap from the market cap and dividing the result by the market cap. When a high percentage of Bitcoin&rsquo;s market cap consists of unrealized profits, it can be interpreted that investors are greedy. Background reading <strong><a href="https://medium.com/@adamant_capital/a-primer-on-bitcoin-investor-sentiment-and-changes-in-saving-behavior-a5fb70109d32" target="_blank" rel="noopener" title="A Primer on Bitcoin Investor Sentiment and Changes in Saving Behavior">here</a></strong>.</p>
<p><strong>Links to third party websites are provided as a convenience and the inclusion of such links does not imply any endorsement, approval, investigation, verification or monitoring by us of any content or information contained within or accessible from the linked sites. By clicking on the link to a non-VanEck webpage, you acknowledge that you are entering a third-party website subject to its own terms and conditions. VanEck disclaims responsibility for content, legality of access or suitability of the third-party websites.</strong></p>
<p>To receive more <strong><a href="https://www.vaneck.com/us/en/insights/digital-assets/" title="Digital Assets Insights">Digital Assets</a></strong> insights, <strong><a href="https://www.vaneck.com/us/en/subscribe/" title="Subscription Center">sign up in our subscription center</a></strong>.</p>
]]></content:encoded>
</item><item rdf:about="https://www.vaneck.com/us/en/blogs/emerging-markets-bonds/technical-and-fundamental-factors-paint-a-rosy-picture-for-em-bonds/">
  <title>Technical and Fundamental Factors Paint a Rosy Picture></title>
  <link>https://www.vaneck.com/us/en/blogs/emerging-markets-bonds/technical-and-fundamental-factors-paint-a-rosy-picture-for-em-bonds/</link>
  <description><![CDATA[A favorable technical picture, combined with the attractive fundamental profile of emerging markets debt could lead to another year of potential outperformance versus developed markets bonds.]]></description>
  <dc:creator>Fran Rodilosso</dc:creator>
  <dc:date>02/08/2024 06:30:00</dc:date>
<content:encoded><![CDATA[

<p>Emerging markets (EM) debt, in various forms, posted admirable returns in 2023. The most commonly cited form &ndash; US dollar denominated sovereign debt &ndash; benefited from the late year rate rally and posted a total return of +11.1% for the year. That was more than 550 basis points (bps) better than US aggregate investment grade bonds, 270 bps better than investment grade US corporates, and approximately 700 bps better than intermediate Treasuries. EM local currency sovereign bonds did even better than dollar-denominated sovereigns, outpacing the other asset classes listed above by an additional 160 bps, and without the benefit of a sustained EM currency rally. EM US dollar denominated corporate bonds did not fare as well as sovereigns overall, and both the investment grade and high yield components lagged their US corporate counterparts, but both still enhanced returns as satellite additions to core bond allocations.<sup>1</sup></p>
<p>Given the higher yields available in EM and, in aggregate, stronger debt fundamentals versus DM counterparts, the overall outperformance in 2023 (and over the entire two-year period of 2022 and 2023) is not surprising. What might be surprising is that EM debt funds suffered consistent outflows throughout both 2022 and 2023. Flows <em>out of</em> dedicated hard currency EM debt funds were $45 billion in 2022 and $25 billion in 2023, while dedicated local currency debt funds saw outflows of $45 billion in 2022 and $9.0 billion in 2023. At the same time, net supply of EM dollar denominated sovereign and corporate debt shrank as well. Net new issuance in EM dollar sovereigns was only $21 billion in 2023, after registering -$28.6 billion in 2022. For EM dollar denominated corporates the numbers were -$157 billion in 2023 and -$259 billion in 2022. As the EM debt universe continues to mature in a variety of ways, apparently another important development is that outperformance is no longer driven exclusively by &ldquo;hot money&rdquo; flows. In fact, 2023 appears to have been a year of outperformance that was also characterized by an improving technical picture.</p>
<h3>EM Debt Dedicated Cumulative Flows (US$, bn)</h3>
<p><img class="img-responsive w-100" src="https://www.vaneck.com/contentassets/b616cabe24454a6797bdc23bb96003b4/4109_em-bond_2024-02_v1_blog.svg" alt="Cumulative flows for emerging markets bonds" /></p>
<p class="chart-disclosure">Source: EPFR, Morgan Stanley Research.</p>
<p>Both US high yield and municipal bond asset classes also witnessed net outflows in 2023, but US Treasury and Aggregate funds experienced significant inflows, particularly into ETFs, representing the majority of some $220 billion that came into taxable bond funds. That number does not include money market funds, which took in nearly $1 trillion in 2023! We believe that the favorable technical picture, combined with the attractive fundamental profile of EM debt, sets the stage for another year of potential outperformance versus DM bonds. Investors who are under-allocated to the asset class may want to consider increasing their exposure within their global bond portfolio.</p>
<p>To receive more <a href="https://www.vaneck.com/us/en/insights/emerging-markets-bonds/" title="Emerging Markets Bonds Insights"><strong>Emerging Markets Bonds</strong></a> insights, <a href="https://www.vaneck.com/us/en/subscribe/" title="Subscription Center"><strong>sign up in our subscription center</strong></a>.</p>
]]></content:encoded>
</item><item rdf:about="https://www.vaneck.com/us/en/blogs/moat-investing/moat-stocks-hit-pause-following-strong-year/">
  <title>Moat Stocks Hit Pause Following Strong Year></title>
  <link>https://www.vaneck.com/us/en/blogs/moat-investing/moat-stocks-hit-pause-following-strong-year/</link>
  <description><![CDATA[Moat stocks fell by 1.75% in January as earnings-related volatility impacted some of the index&rsquo;s underlying holdings. However, as was the case after the Q3 earnings season, Morningstar analysts expect these names to recover strongly in the year ahead.]]></description>
  <dc:creator>Coulter Regal, CFA</dc:creator>
  <dc:date>02/08/2024 06:30:00</dc:date>
<content:encoded><![CDATA[

<p>Equity markets started the year with a cautious tone following the blistering rally seen in the final quarter of 2023.Large caps regained their leadership position in January with the S&amp;P 500 Index up slightly on the month, while small caps slid nearly 4%. Much of the negative price action of smaller companies came on the back of hawkish language during the January Fed meeting that pushed back expectations for interest rate cuts. However, strong performance by the familiar mega caps helped buoy the market but has also reignited concerns around narrow market leadership.</p>
<p>After outperforming the S&amp;P 500 Index by more than 6% in 2023, the <a href="https://www.vaneck.com/us/en/investments/morningstar-wide-moat-etf-moat/index/" title="MOAT - VanEck Morningstar Wide Moat ETF - Overview"><strong>Morningstar Wide Moat Focus Index</strong></a> (the &ldquo;Moat Index&rdquo;) returned some of that relative outperformance to begin the new year. The Moat Index fell 1.75% during January, compared to the S&amp;P 500 which returned 1.68%. The Equal Weight S&amp;P 500 Index was also down during month, nearly 1%, highlighting the continued dominance of the mega cap &ldquo;Magnificent Seven&rdquo; cohort.</p>
<p>Smaller-cap companies gave back some relative performance versus their large-cap peers after having outperformed during the fourth quarter rally of last year. The <a href="https://www.vaneck.com/us/en/investments/morningstar-smid-moat-etf-smot/index/" title="SMOT - VanEck Morningstar SMID Moat ETF - Overview"><strong>Morningstar US Small-Mid Cap Moat Focus Index</strong></a> (the &ldquo;SMID Moat Index&rdquo;) fell 2.77% in January, landing squarely in between the performance of the pure small and mid cap broad benchmarks.</p>
<h3>U.S. Equities Cautious After 4Q 2023 Rally | As of 1/31/2023</h3>
<p><img class="img-responsive w-100" src="https://www.vaneck.com/contentassets/5a0a9b4d48344a9fa7a6742b34632e91/4113_moat-monthly_2024-02_v1_blog.svg" alt="Moat and Smot Indexes underperformed in January." /></p>
<p class="chart-disclosure"><strong>Source: Morningstar. As of 1/31/2024</strong>. Past performance is no guarantee of future results. Index performance is not representative of fund performance. It is not possible to invest directly in an index. Fund performance current to the most recent month end is available by visiting vaneck.com or by calling 800.826.2333.</p>
<h2>Moat Index Top Contributors and Detractors</h2>
<p>Underperformance of the Moat Index was in part due the Index&rsquo;s equal-weight methodology, which leads to structural under-exposure to mega caps, but stock selection and earnings-related volatility also proved impactful during the month. Volatility around earnings results was also a theme that impacted the Moat Index last year during the third quarter as well. However, many of those companies went on to rebounded in the subsequent quarter. <a href="https://www.vaneck.com/us/en/blogs/moat-investing/moat-stocks-show-grit-in-november-rally/" title="Moat Stocks Show Grit in November Rally"><strong>TransUnion (TRU) was one such example of this.</strong></a></p>
<p><strong>MarketAxess (MKTX)</strong></p>
<p>This month MarketAxess was the largest detractor to performance and the primary example of the above mentioned earnings-related volatility. MKTX released their fourth-quarter earnings results on January 31st with shares of the company down nearly 18% on the day. Despite the disappointing earnings, Morningstar analyst Michael Miller did not anticipate any material change to his $305 fair value estimate for MarketAxess and viewed the company as undervalued following the news.</p>
<p style="margin-left: 20px;"><strong>Morningstar Analyst Comments | by Michael Miller, CFA - January 31, 2024</strong><br /><i>Wide-moat-rated MarketAxess reported decent fourth-quarter results that were largely in line with our expectations as the firm benefited from higher trading volume industrywide. The firm's uninspiring market share performance, however, remains a concern. Fourth-quarter revenue increased 10.9% to $197.2 million, or 6.6% when adjusted for the acquisition of Pragma. Meanwhile, earnings per share increased 16.5% to $1.84 from $1.58 last year, although the company did benefit from an unusually low provision for income taxes in the quarter. As we incorporate these results, we do not plan to materially alter our $305 per share fair value estimate for MarketAxess, and we see the shares as undervalued at current prices.</i></p>
<p><strong>RTX Corp (RTX)</strong></p>
<p>On the more positive side of the earnings releases this month was aerospace and defense company RTX which beat expectations leading to an 8% share price gain in January. This price action landed RTX in the top slot in terms of contribution to performance for the Moat Index during the month. Morningstar analyst Nicolas Owens maintained his $112 per share fair value estimate following the release and noting that company is well positioned for secular growth in commercial aerospace.</p>
<h3>Top Contributors and Detractors from Moat Index - January 2024</h3>
<div class="wrapped-div">
<table style="width: 750px;">
<tbody>
<tr class="tbl-data">
<td class="tbl-header last" colspan="5">Leading Contributors</td>
</tr>
<tr class="tbl-data">
<td class="data-td  last">Company</td>
<td class="data-head last">Ticker</td>
<td class="data-head last">Sector</td>
<td class="data-head last">Avg. Weight (%)</td>
<td class="data-head last">Contribution (%)</td>
</tr>
<tr class="tbl-data">
<td class="data-td last" style="font-weight: normal;">RTX Corp</td>
<td class="data-td data last">RTX</td>
<td class="data-td data last">Industrials</td>
<td class="data-td data last">2.46</td>
<td class="data-td data last">0.20</td>
</tr>
<tr class="tbl-data">
<td class="data-td last" style="font-weight: normal;">Salesforce Inc</td>
<td class="data-td data last">CRM</td>
<td class="data-td data last">Information Technology</td>
<td class="data-td data last">2.65</td>
<td class="data-td data last">0.18</td>
</tr>
<tr class="tbl-data">
<td class="data-td last" style="font-weight: normal;">Veeva Systems Inc</td>
<td class="data-td data last">VEEV</td>
<td class="data-td data last">Health Care</td>
<td class="data-td data last">2.32</td>
<td class="data-td data last">0.18</td>
</tr>
<tr class="tbl-data">
<td class="data-td last" style="font-weight: normal;">Comcast Corp</td>
<td class="data-td data last">CMCSA</td>
<td class="data-td data last">Communication Services</td>
<td class="data-td data last">2.34</td>
<td class="data-td data last">0.16</td>
</tr>
<tr class="tbl-data">
<td class="data-td last" style="font-weight: normal;">The Walt Disney Co</td>
<td class="data-td data last">DIS</td>
<td class="data-td data last">Communication Services</td>
<td class="data-td data last">2.36</td>
<td class="data-td data last">0.15</td>
</tr>
</tbody>
</table>
</div>
<br />
<div class="wrapped-div">
<table style="width: 750px;">
<tbody>
<tr class="tbl-data">
<td class="tbl-header last" colspan="5">Leading Detractors</td>
</tr>
<tr class="tbl-data">
<td class="data-td  last">Company</td>
<td class="data-head last">Ticker</td>
<td class="data-head last">Sector</td>
<td class="data-head last">Avg. Weight (%)</td>
<td class="data-head last">Contribution (%)</td>
</tr>
<tr class="tbl-data">
<td class="data-td last" style="font-weight: normal;">MarketAxess Holdings Inc</td>
<td class="data-td data last">MKTX</td>
<td class="data-td data last">Financials</td>
<td class="data-td data last">2.74</td>
<td class="data-td data last">-0.63</td>
</tr>
<tr class="tbl-data">
<td class="data-td last" style="font-weight: normal;">Etsy Inc</td>
<td class="data-td data last">ETSY</td>
<td class="data-td data last">Consumer Discretionary</td>
<td class="data-td data last">2.66</td>
<td class="data-td data last">-0.48</td>
</tr>
<tr class="tbl-data">
<td class="data-td last" style="font-weight: normal;">Teradyne Inc</td>
<td class="data-td data last">TER</td>
<td class="data-td data last">Information Technology</td>
<td class="data-td data last">2.70</td>
<td class="data-td data last">-0.30</td>
</tr>
<tr class="tbl-data">
<td class="data-td last" style="font-weight: normal;">The Estee Lauder</td>
<td class="data-td data last">EL</td>
<td class="data-td data last">Consumer Staples</td>
<td class="data-td data last">2.35</td>
<td class="data-td data last">-0.23</td>
</tr>
<tr class="tbl-data">
<td class="data-td last" style="font-weight: normal;">Charles Schwab Corp</td>
<td class="data-td data last">SCHW</td>
<td class="data-td data last">Financials</td>
<td class="data-td data last">2.65</td>
<td class="data-td data last">-0.23</td>
</tr>
</tbody>
</table>
</div>
<br />
<p class="chart-disclosure"><strong>Source: Morningstar, January 2024</strong>. Past performance is no guarantee of future results. Index performance is not illustrative of fund performance. Not intended as a recommendation to buy or to sell any of the securities mentioned herein.</p>
<h2>SMID Moat Index Top Contributors and Detractors</h2>
<p>The smaller cap SMID Moat Index also experienced a bit of turbulence from earnings related volatility this month. Beyond MarketAxess, which was already covered above, diversified global specialty chemicals company DuPont (DD) was also under pressure following disappointing earnings and lower 2024 guidance. While Morningstar analyst Seth Goldstein, CFA reduced his fair value estimate from $90 to $85, he still views DuPont shares as undervalued.</p>
<p style="margin-left: 20px;"><strong>Morningstar Analyst Comments | by Seth Goldstein, CFA - January 24, 2024</strong><br /><i>At current prices, we view DuPont shares as undervalued, with the stock trading in 4-star territory. We point to the recovery of the electronics business as a catalyst for shares throughout the year. In the release, management said the semiconductor technology business generated sequential revenue growth. This is in line with our long-term view that DuPont should benefit from solid demand for its products that are used to make semiconductors and interconnected solutions. A return to growth in the electronics business, which generates the majority of profits, should support the stock.</i></p>
<p>Names that positively contributed to the SMID Moat Index performance during the month include news and sports focused broadcast network Fox Corp (FOXA) and life sciences cloud-based software solutions company Veeva Systems (VEEV). The Financials sector was also well represented within the top contributors with Bank of New York Mellon (BK) and Interactive Brokers Group (IBKR) both up over 7% in January.</p>
<h3>Top Contributors and Detractors from SMID Moat Index - January 2024</h3>
<div class="wrapped-div">
<table style="width: 750px;">
<tbody>
<tr class="tbl-data">
<td class="tbl-header last" colspan="5">Leading Contributors</td>
</tr>
<tr class="tbl-data">
<td class="data-td last">Company</td>
<td class="data-head last">Ticker</td>
<td class="data-head last">Sector</td>
<td class="data-head last">Avg. Weight (%)</td>
<td class="data-head last">Contribution (%)</td>
</tr>
<tr class="tbl-data">
<td class="data-td last" style="font-weight: normal;">Fox Corp</td>
<td class="data-td data last">FOXA</td>
<td class="data-td data last">Communication Services</td>
<td class="data-td data last">1.20</td>
<td class="data-td data last">0.11</td>
</tr>
<tr class="tbl-data">
<td class="data-td last" style="font-weight: normal;">Bank of New York Mellon</td>
<td class="data-td data last">BK</td>
<td class="data-td data last">Financials</td>
<td class="data-td data last">1.39</td>
<td class="data-td data last">0.10</td>
</tr>
<tr class="tbl-data">
<td class="data-td last" style="font-weight: normal;">Veeva Systems Inc</td>
<td class="data-td data last">VEEV</td>
<td class="data-td data last">Health Care</td>
<td class="data-td data last">1.23</td>
<td class="data-td data last">0.09</td>
</tr>
<tr class="tbl-data">
<td class="data-td last" style="font-weight: normal;">Marvell Technology Inc</td>
<td class="data-td data last">MRVL</td>
<td class="data-td data last">Information Technology</td>
<td class="data-td data last">0.73</td>
<td class="data-td data last">0.09</td>
</tr>
<tr class="tbl-data">
<td class="data-td last" style="font-weight: normal;">Interactive Brokers Group</td>
<td class="data-td data last">IBKR</td>
<td class="data-td data last">Financials</td>
<td class="data-td data last">1.18</td>
<td class="data-td data last">0.08</td>
</tr>
</tbody>
</table>
</div>
<br />
<div class="wrapped-div">
<table style="width: 750px;">
<tbody>
<tr class="tbl-data">
<td class="tbl-header last" colspan="5">Leading Detractors</td>
</tr>
<tr class="tbl-data">
<td class="data-td last">Company</td>
<td class="data-head last">Ticker</td>
<td class="data-head last">Sector</td>
<td class="data-head last">Avg. Weight (%)</td>
<td class="data-head last">Contribution (%)</td>
</tr>
<tr class="tbl-data">
<td class="data-td last" style="font-weight: normal;">MarketAxess Holdings Inc</td>
<td class="data-td data last">MKTX</td>
<td class="data-td data last">Financials</td>
<td class="data-td data last">1.45</td>
<td class="data-td data last">-0.34</td>
</tr>
<tr class="tbl-data">
<td class="data-td last" style="font-weight: normal;">DuPont de Nemours Inc</td>
<td class="data-td data last">DD</td>
<td class="data-td data last">Materials</td>
<td class="data-td data last">1.30</td>
<td class="data-td data last">-0.21</td>
</tr>
<tr class="tbl-data">
<td class="data-td last" style="font-weight: normal;">Brunswick Corp</td>
<td class="data-td data last">BC</td>
<td class="data-td data last">Consumer Discretionary</td>
<td class="data-td data last">1.48</td>
<td class="data-td data last">-0.15</td>
</tr>
<tr class="tbl-data">
<td class="data-td last" style="font-weight: normal;">Zebra Technologies Corp</td>
<td class="data-td data last">ZBRA</td>
<td class="data-td data last">Information Technology</td>
<td class="data-td data last">1.38</td>
<td class="data-td data last">-0.19</td>
</tr>
<tr class="tbl-data">
<td class="data-td last" style="font-weight: normal;">Teradyne Inc</td>
<td class="data-td data last">TER</td>
<td class="data-td data last">Information Technology</td>
<td class="data-td data last">1.43</td>
<td class="data-td data last">-0.18</td>
</tr>
</tbody>
</table>
</div>
<br />
<p class="chart-disclosure"><strong>Source: Morningstar, January 2024</strong>. Past performance is no guarantee of future results. Index performance is not illustrative of fund performance. Not intended as a recommendation to buy or to sell any of the securities mentioned herein.</p>
<h2>Accessing Moat Stocks</h2>
<p><a href="/link/9e43dd198c5f4e419f13220685081895.aspx" title="MOAT - VanEck Morningstar Wide Moat ETF - Overview"><strong>VanEck Morningstar Wide ETF (MOAT)</strong></a> seeks to replicate as closely as possible, before fees and expenses the price and yield performance of the Morningstar Wide Moat Focus Index.</p>
<p><a href="/link/166321dbcfec440590fb51cf0ad629aa.aspx" title="SMOT - VanEck Morningstar SMID Moat ETF - Overview"><strong>VanEck Morningstar SMID Moat ETF (SMOT)</strong></a> seeks to track as closely as possible, before fees and expenses, the price and yield performance of the Morningstar US Small-Mid Cap Moat Focus Index.</p>
<p>To receive more <strong><a href="https://www.vaneck.com/us/en/insights/moat-investing/" title="Moat Investing Insights">Moat Investing</a></strong> insights, <strong><a href="https://www.vaneck.com/us/en/subscribe/" title="Preference Center">sign up in our subscription center</a></strong>.</p>
<style>
    .wrapped-div {
        max-width: 100%;
    }

    @media (max-width: 1240px) {
        .wrapped-div {
            overflow-x: scroll;
        }
    }

    .wrapped-div-sector {
        max-width: 100%;
        overflow-x: scroll;
    }
</style>
]]></content:encoded>
</item><item rdf:about="https://www.vaneck.com/us/en/blogs/digital-assets/3-reasons-advisors-should-consider-bitcoin/">
  <title>3 Reasons Advisors Should Consider Bitcoin></title>
  <link>https://www.vaneck.com/us/en/blogs/digital-assets/3-reasons-advisors-should-consider-bitcoin/</link>
  <description><![CDATA[Why should you, as a financial advisor, consider Bitcoin as an investment option for your clients? In this blog, we'll explore three compelling reasons.]]></description>
  <dc:creator> </dc:creator>
  <dc:date>02/07/2024 06:30:00</dc:date>
<content:encoded><![CDATA[

<p>How does the internet work? For most people, it's a bit like magic. We use it every day, but the intricate science behind it remains a mystery. Yet, if you ever wanted to dive deep into the inner workings of the internet, you could unravel its secrets through dedicated study. In some ways, Bitcoin is a lot like that &ndash; a complex phenomenon with a scientific foundation. If you're curious, start with <strong><a href="/link/343cf2f03fec405589c8319433a957f6.aspx" title="Investing in Bitcoin and Digital Assets">VanEck&rsquo;s Bitcoin and Digital Assets Education Center</a></strong> and explore Satoshi Nakamoto's white paper to understand the technical intricacies.</p>
<p>While Bitcoin may be younger than the internet, having emerged in 2009, it has now firmly embedded itself in mainstream financial conversations. But why should you, as a financial advisor, consider Bitcoin as an investment option for your clients? In this blog, we'll explore three compelling reasons:</p>
<h2>Historical Performance: A Decade of Remarkable Gains</h2>
<p>Investors often seek assets with a history of robust performance, and Bitcoin doesn't disappoint. Despite its infamous volatility, Bitcoin has managed to outshine other asset classes over the past decade. In fact, it has been the best-performing asset class for eight out of the past eleven years.</p>
<p>Let's take a closer look at Bitcoin's historical returns for various holding periods (as of December 31, 2023)<sup>1</sup>:</p>
<ul class="content-list">
<li>1 year: 156.62% return</li>
<li>3 years: 50.00% return</li>
<li>5 years: 999.77% return</li>
<li>7 years: 5,147.10% return</li>
<li>10 years: 6,172.12% return</li>
</ul>
<p>These figures underscore the incredible growth potential that Bitcoin has exhibited over time, making it an attractive option for investors seeking high returns.</p>


<h3>Bitcoin Has Been the Best Performing Asset Class in 8 Out of the Past 11 Years</h3>
<p><img class="img-responsive w-100" src="https://www.vaneck.com/contentassets/a03398c1dcea4502ab6f304ebd210c72/3999_3-reasons_table_2024-01_v1.svg" alt="Bitcoin has been the best performing asset class over the past decade." /></p>
<p class="chart-disclosure">Source: Morningstar, as of December 31, 2023. Bitcoin is represented by MarketVector Bitcoin PR USD; US Equities are represented by the S&amp;P 500 TR USD; Gold is represented by the S&amp;P GSCI Gold Spot; Emerging Markets is represented by Fidelity Emerging Markets TR; Real Estate is represented by the NASDAQ Global Real Estate TR USD; US Bonds are represented by Bloomberg US Aggregate Bond USD; Treasuries are represented by the Bloomberg Aggregate Bond Treasury TR USD; Commodities are represented by the Bloomberg Commodity TR USD.</p>
<h2>Bitcoin&rsquo;s Scarce Supply May Increase Its Value Over Time</h2>
<p>There will only ever be 21 million Bitcoin in existence.<sup>2</sup>&nbsp;This supply cap was designed intentionally and is one of the primary characteristics of Bitcoin.</p>
<p>The price of Bitcoin has rallied leading up to and following a phenomenon known as &ldquo;halving&rdquo;, which occurs about every four years, reducing the reward miners receive for validating transactions by 50%. So far, halvings have occurred in 2012, 2016, 2020, with the next one set for around April 2024. If history is any guide, Bitcoin has the potential to perform well through 2025.<sup>3</sup></p>
<h2>Store of Value: A Digital Gold</h2>
<p>Bitcoin's allure as a store of value is grounded in a fundamental economic concept &ndash; supply and demand. Unlike traditional fiat currencies, Bitcoin has a fixed supply capped at 21 million coins. As time goes on, the mining process becomes increasingly difficult, making it more challenging to produce new coins. This scarcity mirrors the appeal of precious metals like gold, often considered a long-term store of value. As a result, Bitcoin has garnered attention as a potential digital alternative to traditional safe-haven assets. So, Bitcoin may be a good fit for clients looking to hedge against inflation, preserve wealth over the long term, and diversify their portfolio.</p>
<h2>The Future of Bitcoin</h2>
<p>Bitcoin, like any established asset, is subject to demand dynamics. In 2023, Bitcoin adoption has grown substantially as it has become more mainstream. Now, more than ever, merchants and businesses are accepting Bitcoin as a form of payment and infrastructure has been built to make it more convenient for the average person to use. The development of user-friendly wallets, exchanges, and marketplaces has removed the technical barriers to entry that existed in Bitcoin&rsquo;s early years.</p>
<p>Bitcoin interest among institutional investors has also increased. Hedge funds, asset management firms, and endowments are increasingly recognizing Bitcoin&rsquo;s potential as a store of value and as an effective portfolio diversifier, specifically, when looking through the lens of an uncorrelated asset that has the potential to hedge against inflation. Approximately $50B worth of Bitcoin are now held by ETFs, countries, public and private companies and the approval of spot Bitcoin ETFs only adds to Bitcoin&rsquo;s allure.</p>
<p>To receive more <strong><a href="https://www.vaneck.com/us/en/insights/digital-assets/" title="Digital Assets Insights">Digital Assets</a></strong> insights, <strong><a href="https://www.vaneck.com/us/en/subscribe/" title="Subscription Center">sign up in our subscription center</a></strong>.</p>
]]></content:encoded>
</item><item rdf:about="https://www.vaneck.com/us/en/blogs/digital-assets/matthew-sigel-vaneck-crypto-monthly-recap-for-january-2024/">
  <title>VanEck Crypto Monthly Recap for January 2024></title>
  <link>https://www.vaneck.com/us/en/blogs/digital-assets/matthew-sigel-vaneck-crypto-monthly-recap-for-january-2024/</link>
  <description><![CDATA[Bitcoin's volatility surged with $30B cumulative volumes in new US ETFs, countered by dwindling futures and ETN outflows, suggesting potential market growth amid varied sector performance.]]></description>
  <dc:creator>Matthew  Sigel</dc:creator>
  <dc:date>02/07/2024 06:30:00</dc:date>
<content:encoded><![CDATA[

<p><strong>Please note that VanEck may have a position(s) in the digital asset(s) described below.</strong></p>
<p>Bitcoin&rsquo;s 30-day volatility reached its highest level since April 2023 in January after the approval and listing of 10 new spot bitcoin ETFs in the US, which attracted more than $30B in cumulative volumes and $1.5B+ in net inflows as of month-end. It has been gratifying to observe the bid/ask spread and the premium/discount to NAV of these ETFs trend lower such that these products can often be purchased at 1bps spreads and less than 30bps premium or discount to NAV. Such liquidity proves the use case of ETFs which we believe will drive transaction costs lower and thus take some market share from centralized exchanges.</p>
<p>Offsetting these US ETF inflows, however, futures activity (OI) on the CME dropped by $2B from an early January peak to $4.4B at the end of the month, while European bitcoin ETNs also experienced modest outflows, as investors &ldquo;sold the news.&rdquo; The consequence of this tug-of-war between futures and spot is that funding costs to hold futures and other leveraged positions fell dramatically in January. For example, the cost to hold a perpetual bitcoin futures position on Binance reached 21% on January 1st before falling sharply to 6% by month-end. We believe such a collapse in demand for leverage may set the market up for another leg higher if ETF inflows continue at the current pace, which exceeds the new Bitcoin supply.</p>
<ul class="content-list">
<li><a href="#smart-contract-platforms"><strong>Smart Contract Platforms: January Updates</strong></a></li>
<li><a href="#notable-performer"><strong>Notable Performer: January Update</strong></a></li>
<li><a href="#notable-laggard"><strong>Notable Laggard: January Update</strong></a></li>
</ul>
<p>Amidst the sideways bitcoin price, large-caps (+1%) outperformed small-caps (-9%), Ethereum (flat) outperformed Layer 1s (-6%), while Coinbase (-26%) and Bitcoin miners (-28%) lagged.</p>
<div class="wrapped-div">
<table style="width: 750px;">
<tbody>
<tr class="tbl-data">
<td class="tbl-header last text-center">&nbsp;</td>
<td class="tbl-header last text-center">January</td>
<td class="tbl-header last text-center">1 Year</td>
</tr>
<tr class="tbl-data">
<td class="data-td last">Coinbase</td>
<td class="data-td data last">-26%</td>
<td class="data-td data last">91%</td>
</tr>
<tr class="tbl-data">
<td class="data-td last">Bitcoin</td>
<td class="data-td data last">2%</td>
<td class="data-td data last">82%</td>
</tr>
<tr class="tbl-data">
<td class="data-td last">MarketVector Infrastructure Application Leaders Index</td>
<td class="data-td data last">-9%</td>
<td class="data-td data last">58%</td>
</tr>
<tr class="tbl-data">
<td class="data-td last ">MarketVector Smart Contract Leaders Index</td>
<td class="data-td data last">-6%</td>
<td class="data-td data last">57%</td>
</tr>
<tr class="tbl-data">
<td class="data-td last">Ethereum</td>
<td class="data-td data last">0%</td>
<td class="data-td data last">41%</td>
</tr>
<tr class="tbl-data">
<td class="data-td last">Nasdaq Index</td>
<td class="data-td data last">1%</td>
<td class="data-td data last">28%</td>
</tr>
<tr class="tbl-data">
<td class="data-td last">MarketVector Decentralized Finance Leaders Index</td>
<td class="data-td data last">-7%</td>
<td class="data-td data last">19%</td>
</tr>
<tr class="tbl-data">
<td class="data-td last">S&amp;P 500 Index</td>
<td class="data-td data last">2%</td>
<td class="data-td data last">18%</td>
</tr>
<tr class="tbl-data">
<td class="data-td last ">MarketVector Centralized Exchanges Index</td>
<td class="data-td data last ">-4%</td>
<td class="data-td data last">-2%</td>
</tr>
<tr class="tbl-data">
<td class="data-td last">MarketVector Media &amp; Entertainment Leaders Index</td>
<td class="data-td data last">-16%</td>
<td class="data-td data last">-49%</td>
</tr>
</tbody>
</table>
</div>
<br />
<p class="chart-disclosure">Source: Bloomberg, as of 1/31/2024. <strong>Past performance is no guarantee of future results. Not intended as a recommendation to buy or sell any securities named herein.</strong></p>
<style>
    .wrapped-div {
        max-width: 100%;
    }

    @media (max-width: 768px) {
        .wrapped-div {
            overflow-x: scroll;
        }
    }

    .wrapped-div-sector {
        max-width: 100%;
        overflow-x: scroll;
    }
</style>

<h2 id="smart-contract-platforms" class="jump-link-nav anchored-block" data-jumplink-title="Smart Contract Platforms">Smart Contract Platforms</h2>
<h3>Monthly DEX Volume vs. Average DAUs</h3>
<p><img class="img-responsive w-100" src="https://www.vaneck.com/contentassets/659d4516d80842e88086ba64cc189263/4089_scl-monthly-chart-4_2024-02_v1_blog.svg" alt="Monthly DEX Volume vs. Average DAUs" /></p>
<p class="chart-disclosure">Source: Artemis XYZ as of 1/31/2024. <strong>Past performance is no guarantee of future results. Not intended as a recommendation to buy or sell any securities named herein.</strong></p>
<p>Airdrops and anticipated airdrops were all the rage in January following the blockbuster releases of the $PYTH ($77M <strong><a href="https://decrypt.co/207719/solana-token-pyth-pumps-77-million-airdrop#:~:text=The%20anticipated%20Pyth%20airdrop%20happened,be%20worth%20%24105%20million%20today." title="Solana Token Pyth Pumps Following $77 Million Airdrop for DeFi Users" target="_blank" rel="noopener">airdropped</a></strong> to 90k wallets) and the $JTO ($165M <strong><a href="https://blockworks.co/news/jito-airdrop-value" title="What to know about Jito's $165M JTO airdrop" target="_blank" rel="noopener">airdropped</a></strong> to 10k wallets) tokens in November and December. The most anticipated of these airdrops, also on Solana like $PYTH and $JTO, was Jupiter&rsquo;s $JUP. Jupiter, a DEX aggregator, rewarded its users with 10% of the token supply in the first series of yearly airdrops, achieving a fully diluted market cap of $6B. In the Cosmos blockchain universe, the Dymension airdrop promised to airdrop 70M <strong><a href="https://airdrops.io/dymension/" title="Dymension Airdrop" target="_blank" rel="noopener">tokens</a></strong>, 7% of network supply, that are estimated to be worth $280M (~$4 per <a href="https://app.aevo.xyz/perpetual/dym" title="DYM-USD" target="_blank" rel="noopener"><strong>token</strong></a>) at the time of writing. Another token airdrop that occurred was the former Polkadot privacy project, which turned Ethereum zk L2 $MANTA was worth $156M. This brings us to the key question &ndash; what is an airdrop, and why are people getting <i>lots of free money</i>?</p>
<p>An airdrop can be thought of as marketing spend to bootstrap a user base. Rather than laboring over a target market and wading through various mechanisms to incentivize them to use your product, blockchains allow app builders to simply target current or potential users with an ownership share in that application&rsquo;s network. This is accomplished by giving these target users tokens that accrue value from usage of the application&rsquo;s service or product. Often, the optimal people to target are the ones who consistently utilize the application. In other cases, applications that want to do an airdrop look for users who would appear to be ideal customers for their businesses. This is easily achieved on the blockchain, where all user activity is perfectly transparent, and customer potential can be quantified. The theory behind these airdrops is simple &ndash; incentivize usage by potentially making people who patronize your business <i>rich</i> by giving them a share of the network&rsquo;s future value in the form of token distributions. In turn, these new token holders each have a financial incentive to remain loyal to that application while also encouraging others to use the application as well.</p>
<p>A more cynical take on airdrops is to view them as unofficial token auctions. This is believed to be true, particularly in cases where user activity of that application, which costs money, may be targeted for retroactive airdrops in the future. This is because the user activity costs fees which accrue to the application and the fees were generated in a base currency, like USDC or ETH, in exchange for an indeterminate amount of future application tokens. As such, a project can effectively offboard tokens of whatever value they choose in exchange for user-generated revenues. Of course, there is a fine line for projects to walk, and being stingy with token allocations could crater their users, while overallocation could mean market dumping of a project&rsquo;s tokens.</p>
<p>As users have been airdropped massive amounts of money over the past few months, many are looking to future airdrops as a source of return. Some of the most anticipated airdrops include Blast - an NFT-focused Ethereum L2, Starknet &ndash; an Ethereum zk roll-up, Magic Eden &ndash; a Solana based NFT marketplace, and AltLayer &ndash; a decentralized roll-up service. However, the granddaddy of all anticipated airdrops that is driving user behavior is <strong><a href="https://www.eigenlayer.xyz/" title="EigenLayer" target="_blank" rel="noopener">Eigenlayer</a></strong>.</p>
<h3>Eigenlayer TVL</h3>
<p><img class="img-responsive w-100" src="https://www.vaneck.com/contentassets/659d4516d80842e88086ba64cc189263/4089_scl-monthly-chart-1_2024-02_v1_blog.svg" alt="Eigenlayer TVL" /></p>
<p class="chart-disclosure">Source: <a href="https://defillama.com/protocol/eigenlayer" title="EigenLayer - DefiLlama" target="_blank" rel="noopener"><strong>Defillama</strong></a> as of 1/31/2024. <strong>Past performance is no guarantee of future results. Not intended as a recommendation to buy or sell any securities named herein.</strong></p>
<p>Anticipation has been building for months about the upcoming launch of Eigenlayer. Eigenlayer can be thought of as a service that escrows liquid staking tokens (LSTs), redeemable/tradable certificates of deposits for staked ETH, and leases out the value of those in exchange for fees. In essence, Eigenlayer is similar to a bank that lends out ETH LSTs that other applications can use to back faith in their business services. In exchange for the &ldquo;repo&rdquo; of this ETH, these collateralized services remit ETH, or other tokens as rewards. Eigenlayer is a middleman in this operation that will facilitate and standardize these agreements while also enforcing the contractual obligations of the agreements. The business services that may need this collateral ETH include Oracles, other blockchains, bridges and businesses that must post an economic bond that can compensate users if those businesses&rsquo; services fail. The consequence of all this is that Eigenlayer unlocks new business types for blockchain while also allowing ETH holders additional yield on ETH by supplying it to Eigenlayer.</p>
<p>Eigenlayer and some of the initial businesses that will use Eigenlayer have promised uncertain rewards to users that &ldquo;re-stake&rdquo; ETH LSTs by supplying them to Eigenlayer. The result is that there has been a mad dash by less cautious users to &ldquo;ape&rdquo; Eigenlayer to garner these potential rewards. On the other end, businesses have cropped up that allow users to speculate on the value of potential rewards or offer new LSTs with the promise of even more rewards. As there is enormous uncertainty with the outcomes of Eigenlayer rewards and the ecosystem surrounding it, many ETH users have been betting according to their views of the value of these potential rewards. One of these re-staking protocol, EtherFi, reached over <strong><a href="https://twitter.com/ether_fi/status/1748026807889072268" title="ether.fi on X" target="_blank" rel="noopener">100k</a></strong> of ETH deposits by mid-January.</p>
<p>Ethereum&rsquo;s January price action was characterized by concern over initial drops in the percentage of ETH supply being staked. The validator queue for Ethereum actually turned net negative early in the month as Figment and Celsius <a href="https://www.theblock.co/post/270578/ethereum-validator-exit-queue-celsius-figment" title="Ethereum validator exit queue spikes as Celsius, Figment withdraw stakes" target="_blank" rel="noopener"><strong>withdrew</strong></a> stake. The result was that over several days, ETH stake figures declined from 28.7M to 28.5M. Despite this initial setback, Ethereum ended the month with over 28.8M in <strong><a href="https://www.validatorqueue.com/" title="Ethereum Validator Queue" target="_blank" rel="noopener">staked</a></strong> ETH. While this displays the confidence investors have in Ethereum&rsquo;s future, the yield for staking ETH reached an all-time low of around 3.47% APY, not accounting for the expected boost from Eigenlayer re-staking activity.</p>
<p><img class="img-responsive w-100" src="https://www.vaneck.com/contentassets/659d4516d80842e88086ba64cc189263/4089_scl-monthly-chart-3_2024-02_v1_blog.jpg" alt="ETH Staking Pool" /></p>
<p class="chart-disclosure">Source: <a href="https://clientdiversity.org/#distribution" title="Client Distribution" target="_blank" rel="noopener"><strong>Enter Alpha</strong></a> as of 1/31/2024. <strong>Past performance is no guarantee of future results. Not intended as a recommendation to buy or sell any securities named herein.</strong></p>
<p>Another catalyst for Ethereum price action was the debate over the distribution of validators who run various versions of Ethereum&rsquo;s core software. Ethereum validators run two types of software, an execution client and a consensus client. While there are 5 major consensus clients with a somewhat even distribution across them, there are 4 major execution clients and one client, GETH, is run by 78% of all validators. As Ethereum seeks to be a reliable smart contract platform with 100% uptime, this presents an issue because a bug in GETH could cause the network to have downtime. Worse yet, the consensus mechanism of Ethereum might treat a GETH bug as indistinguishable from a coordinated attack, meaning that non-responsive validators could see their ETH slashed until 66% of the network&rsquo;s ETH staked is responsive. That could be catastrophic. While this GETH dominance has been an ongoing issue, it came to a head in January when a bug in the Nethermind client caused 8% of Ethereum&rsquo;s validator set to go <a href="https://news.bitcoin.com/critical-bug-in-ethereums-nethermind-client-highlights-risks-of-low-client-diversity/" title="Critical Bug in Ethereum's Nethermind Client Highlights Risks of Low Client Diversity" target="_blank" rel="noopener"><strong>offline</strong></a>. While Ethereum did not have any issues as a result, it raised concerns in the Ethereum community. Some proposed solutions to add economic incentives and penalties to get more validators to use different clients but at the time of writing, there was no concrete solution to the dilemma.</p>
<p><strong>Solana</strong> (-4%) held up relatively well vs. other high beta L1s in January, thanks to a series of exciting announcements and improving fundamentals. Among the most exciting was news that Solana would be unveiling a new phone called Saga 2. 30k preorders for the phone, to be priced at $450, were <a href="https://techcrunch.com/2024/01/18/solana-mobiles-second-phone-announcement-drives-buying-frenzy/" target="_blank" rel="noopener" title="Buying frenzy for Solana Mobile&rsquo;s second phone drives preorders sky-high"><strong>recorded</strong></a> in the first 30 hours. Solana also released &ldquo;extensions&rdquo; for the SPL token standard. The SPL token standard is a library of code that projects can use to create coins. The new upgrade - called &ldquo;extensions&rdquo; - will allow new transaction types such as confidential transfers, augmented token interactions, token fees for transferred tokens, interest-earning tokens, and more. These customizations should help projects make novel products and better monetize existing ones. One early adopter is Japanese fintech GMO Payments (3769 JP, mkt cap $5B), who just announced two new stablecoins, the first regulated Japanese Yen stablecoin and a USD stablecoin, both on the Solana network. These stablecoins will use transfer hooks and permanent delegate authority, new extension features. Lastly, the Jupiter airdrop for Solana was successful, as more than 368k wallets claimed tokens, and Solana did not suffer an outage.</p>
<p>To round out the news for the month, <strong>Binance</strong> completed its monthly token burn worth $636M of BNB tokens. Binance does quarterly token burns as a consequence of usage to reduce BNB supply. Meanwhile, <strong>Monad</strong>, a parallelized EVM blockchain, announced it will use LayerZero for bridging. <strong>Aevo</strong>, a burgeoning options L2 on Ethereum recently declared it will be using Celestia for Data Availability. <strong>NEAR</strong> Foundation, which recently pushed into becoming a Data Availability layer, confirmed that it would lay off 40% of its workforce. In the Cosmos, the <strong>Cosmos Hub</strong> is considering liquidity incentive campaign to compel users to stake ATOM in exchange for voting rights to direct the Cosmos Hub&rsquo;s future. Also in the Cosmos, Berachain is launching its much-anticipated EVM testnet which will employ the novel &ldquo;Proof of Liquidity&rdquo; consensus mechanism.</p>
<h2 id="notable-performer" class="jump-link-nav anchored-block" data-jumplink-title="Notable Performer">January&rsquo;s Notable Performer</h2>
<p><strong>Sui (+105.9%)</strong></p>
<h3>Monthly Fees Generated</h3>
<p><img class="img-responsive w-100" src="https://www.vaneck.com/contentassets/659d4516d80842e88086ba64cc189263/4089_scl-monthly-chart-6_2024-02_v1_blog.svg" alt="Monthly Fees Generated" /></p>
<p class="chart-disclosure">Source: Artemis XYZ as of 1/31/2024. <strong>Past performance is no guarantee of future results. Not intended as a recommendation to buy or sell any securities named herein.</strong></p>
<p>Sui was the top performer among smart contract platforms, as it more than doubled its price over the course of a month. Though month-to-month daily active user count was down (-11%), Sui saw a monstrous (+66.7%) uptick in TVL to reach $444M in total value locked and an (+88.8%) increase in DEX volume. Sui&rsquo;s DEX volume and TVL in January ranked ahead of Coinbase&rsquo;s Base blockchain&rsquo;s metrics. Sui is a fascinating, relatively new entrant to the alternate layer-1 blockchain race that saw its Mainnet go live in May 2023. Created by former Facebook blockchain project Diem developers and built around Diem&rsquo;s cutting-edge Move blockchain language, Sui boasts an impressive set of capabilities. We find Sui to be a compelling project because:</p>
<ol class="content-list">
<li>Attractive Developer Funnel
<ul class="content-list">
<li>Faster developer time &ndash; projects claim 1/5th of developer time versus similar Solana project; one-<strong><a href="https://medium.com/@kklas/smart-contract-development-move-vs-rust-4d8f84754a8f" title="Smart Contract Development - Move vs. Rust" target="_blank" rel="noopener">half</a></strong> of the coding lines to accomplish the same task</li>
<li>Language that prevents errors while making mental overhead for developers lower</li>
<li>Assets on chain are treated intuitively as &ldquo;objects&rdquo; that can be owned, shared and mutated</li>
</ul>
</li>
<li>Vastly Improve User Experience
<ul class="content-list">
<li>Using zkLogin, users can permissionlessly control their funds using a Google or Facebook sign in</li>
<li>Object-based programming language and account abstraction allows users to understanding <i>in plain English</i> what each transaction they sign will accomplish</li>
</ul>
</li>
<li>Blockchain Safety
<ul class="content-list">
<li>Bytecode verifier rejects faulty or unsafe smart contract when loaded onto Sui</li>
<li>Object-based coding language system that prevents many types of blockchain attacks</li>
<li>Ownership</li>
</ul>
</li>
<li>High Throughput (how many txs are processed per second)
<ul class="content-list">
<li>Recorded a record <strong><a href="https://app.artemis.xyz/chains" title="Chains - Artemis Terminal" target="_blank" rel="noopener">65M</a></strong> transactions in one day</li>
<li>Unique modular architecture for scaling that allows workers servers to be added to increase throughput rather than validators having to buy a better server</li>
<li>Transactions can perform up to 2048 different functions at once; the equivalent on Solana is 64</li>
</ul>
</li>
<li>Fast Latency (how fast a user gets confirmation of a transaction being recorded)
<ul class="content-list">
<li>Soft confirmations as quick as 30ms</li>
<li>Full finality as fast as 2 network roundtrips (300ms) for &ldquo;owned objects&rdquo;</li>
<li>Full finality for &ldquo;shared objects&rdquo; as fast as (600ms)</li>
</ul>
</li>
<li>Talented Developer Team
<ul class="content-list">
<li>Blockchain architected from the ground up to take advantage of the Move language</li>
</ul>
</li>
</ol>
<p>While Sui has quite a bit of potential, it is very nascent and has not found a core identity or a very differentiated application ecosystem. Having a culture and a community often stems from personalities within the broader team. While Sui&rsquo;s team is exceptionally bright, they have yet to assert a positive online presence to resemble that of successful chains like Ethereum or Solana. Social capital is very important in crypto, as is building an interesting community that appeals to the typical crypto user. While projects like <strong><a href="https://twitter.com/AftermathFi" title="Aftermath Finance" target="_blank" rel="noopener">Aftermath</a></strong> Finance have begun a grassroots movement of culture on Sui, it&rsquo;s too early to tell if it can become sticky. Also, Sui&rsquo;s daily active user count is low, putting it in the usership size cohorts with projects like MultiverseX, Fantom, and the Cosmos Hub, which each have far lower valuations than Sui. Finally, it is likely that much of the activity on Sui relates to the high level of rewards offered within Sui DeFI.</p>
<h2 id="notable-laggard" class="jump-link-nav anchored-block" data-jumplink-title="Notable Laggard">January&rsquo;s Notable Laggard</h2>
<p><strong>Polygon (-17.4%)</strong></p>
<h3>Average DAUs vs. Average TVL, Last 30 Days</h3>
<p><img class="img-responsive w-100" src="https://www.vaneck.com/contentassets/659d4516d80842e88086ba64cc189263/4089_scl-monthly-chart-2_2024-02_v1_blog.svg" alt="Average DAUs vs. Average TVL, Last 30 Days" /></p>
<p class="chart-disclosure">Source: Artemis XYZ as of 1/31/2024. <strong>Past performance is no guarantee of future results. Not intended as a recommendation to buy or sell any securities named herein.</strong></p>
<p>Polygon&rsquo;s MATIC token price once again had a very discouraging month. Though usership like daily active users was positive on the month, up (+39.2%) compared to December, the more important fundamental indicators of activity like DEX Volume and TVL were down (-21%) and (-1.8%) month to month. From a fee standpoint, MATIC was also down (-55.3%) in January compared to December. One catalyst for the negative price action is that Polygon is accused of intentionally misallocating <a href="https://cointelegraph.com/magazine/mystery-polygon-missing-matic-everyone-doing-it-chainargos/" title="Mystery of Polygon's missing MATIC: Everyone's doing it, says ChainArgos" target="_blank" rel="noopener"><strong>400M</strong></a> in tokens that were supposedly reserved for staking rewards. Instead, some claim that those tokens were <a href="https://medium.datadriveninvestor.com/poly-gone-400-million-matic-missing-42daff508495+" title="Medium" target="_blank" rel="noopener">sold</a> on Binance to generate funds for Polygon. While it is not unusual for projects to change token tokenomics, typically they do so in an open, transparent manner. All else equal, this token shifting, especially when done almost 3 years ago, is considered an issue but not a price killer. However, Polygon suffers from a somewhat unfair reputation for <a href="https://www.forbes.com/sites/stevenehrlich/2022/04/22/polygon-pledges-100-million-to-bootstrap-growth-but-co-founder-also-expresses-caution-about-crypto-projects-having-too-much-money/" title=" FORBESFORBES DIGITAL ASSETS EDITORS' PICK Polygon Pledges $100 Million To Bootstrap Growth, But Co-Founder Also Expresses Caution About Crypto Projects Having Too Much Money" target="_blank" rel="noopener"><strong>making</strong></a> <a href="https://www.cryptotimes.io/polygon-labs-contests-seis-parallel-evm-breakthrough-claim/" title="Polygon Labs Contests Sei's Parallel EVM Breakthrough Claim" target="_blank" rel="noopener"><strong>dubious</strong></a> <strong><a href="https://cryptoslate.com/is-polygon-safu-critics-multisig-isnt-secure-enough-5b-in-jeopardy/" title="Is Polygon safu? Critics: Multisig isn't secure enough, $5B in jeopardy" target="_blank" rel="noopener">claims</a></strong>. Generally, market sentiment for Polygon is weak due to a confusion about Polygon&rsquo;s long-term vision, its differentiation from other L2s, and the allocation of its tokens business <a href="https://www.google.com/search?q=polygon+business+partnerships&amp;rlz=1C1CHBF_enUS999US999&amp;oq=polygon+business+partnerships&amp;gs_lcrp=EgZjaHJvbWUyCQgAEEUYORifBTIHCAEQIRifBTIHCAIQIRifBTIHCAMQIRifBdIBCDM3MzBqMWo0qAIAsAIA&amp;sourceid=chrome&amp;ie=UTF-8" title="Polygon Business Partnerships" target="_blank" rel="noopener"><strong>partnerships</strong></a>, many of which have yet to generate meaningful fees on-chain.</p>
<p>However, there is ample reason to think Polygon is underpriced relative to its potential. Polygon still has the 7th largest DAU base in all crypto, ~571k over the last 30 days, and this usership is nearly 4x is that of the closest L2 blockchain competitors. Additionally, there are many interesting differentiated projects building on Polygon including a game focused blockchain called <a href="https://www.immutable.com/" title="Immutable - Powering The Next Generation Of Web3 Games" target="_blank" rel="noopener"><strong>ImmutableX</strong></a>, a automotive data project called <strong><a href="https://dimo.zone/" title="DIMO - Connect Your Car and Earn Rewards" target="_blank" rel="noopener">Dimo</a></strong> and GPS improvement entity called <strong><a href="https://geodnet.com/" title="GEODNET" target="_blank" rel="noopener">GEODNET</a></strong>. Most importantly, Polygon has a fascinating zk scaling approach and is moving towards becoming an aggregation layer for L2 blockchains.</p>
<p>In their vision, Polygon would earn revenue by operating a proving systems as well as a settlement layer for zk rollup blockchains built using the Polygon CDK. This would enable Polygon to connect these chains through trustless bridging, a major pain point for L2s, to unite siloed liquidity while earning fee revenue. Additionally, Polygon recently announced an interesting partnership with Fox Corporation to launch <strong><a href="https://www.theblock.co/post/271288/fox-corporation-polygon-labs-verify" target="_blank" rel="noopener" title="Fox Corporation collaborates with Polygon Labs to launch blockchain-based media platform Verify">Verify</a></strong> which will enable Fox to post proofs of authenticity of its media content to Polygon&rsquo;s blockchain. Like anything else in crypto, Polygon&rsquo;s MATIC token will likely be the beneficiary of a narrative. In Polygon&rsquo;s case that market story will likely revolve around difficulties of bridging funds between L2s and other pain points associated with non-zk roll ups L2s. While there is no certainty of if or when that positive narrative will form for Polygon, what is certain is that its aggregation layer is launching in February, and many will be watching to see how it performs.</p>
<p><strong>Links to third party websites are provided as a convenience and the inclusion of such links does not imply any endorsement, approval, investigation, verification or monitoring by us of any content or information contained within or accessible from the linked sites. By clicking on the link to a non-VanEck webpage, you acknowledge that you are entering a third-party website subject to its own terms and conditions. VanEck disclaims responsibility for content, legality of access or suitability of the third-party websites.</strong></p>
<p>To receive more <strong><a href="https://www.vaneck.com/us/en/insights/digital-assets/" title="Digital Assets Insights">Digital Assets</a></strong> insights, <strong><a href="https://www.vaneck.com/us/en/subscribe/" title="Subscription Center">sign up in our subscription center</a></strong>.</p>
<style>
    .wrapped-div {
        max-width: 100%;
    }

    @media (max-width: 768px) {
        .wrapped-div {
            overflow-x: scroll;
        }
    }

    .wrapped-div-sector {
        max-width: 100%;
        overflow-x: scroll;
    }
</style>
]]></content:encoded>
</item><item rdf:about="https://www.vaneck.com/us/en/blogs/municipal-bonds/municipal-bond-market-outlook/">
  <title>Municipal Bond Market Outlook for 2024></title>
  <link>https://www.vaneck.com/us/en/blogs/municipal-bonds/municipal-bond-market-outlook/</link>
  <description><![CDATA[Find out how municipal bonds are projected to perform in 2024 in this market outlook report from the experts at VanEck.]]></description>
  <dc:creator>James Colby</dc:creator>
  <dc:date>02/02/2024 06:30:00</dc:date>
<content:encoded><![CDATA[

<p>The benefits of municipal bonds are well known. Amid economic uncertainties, these bonds provide a reliable source of income, making them attractive for risk-averse investors seeking some added security for their fixed-income portfolios. Additionally, municipalities' essential role in infrastructure development further solidifies the attractiveness of investing in municipal bonds. The tax benefits associated with municipal bonds (such as interest income being exempt from federal taxes) always attract investors to the sector.</p>
<p>In 2024, Van Eck expects municipal bonds will offer a solid opportunity for total return correlating with our anticipated decline in yields for the year 2024. However, it is crucial to act swiftly, to take advantage of the expected changes in the market.</p>
<h2>Key Takeaways:</h2>
<p>In 2023, municipal ETFs, mutual funds and SMA platforms experienced notable outflows, though ETFs and SMAs ultimately ended the year with net positive flows. In 2024, there is promising opportunity for positive performance. The expectation is that more cash from these outflows will return to tax-exempt bonds, presenting opportunities for investors as market conditions improve.</p>
<p>The current market backdrop for municipal bonds is positive, with significant improvements compared to the recent past. Inflationary pressures have eased, attributed to the Federal Reserve's successful tightening efforts, leading to a shift in positive sentiment back to fixed-income investing.</p>
<p>Municipal bonds stand out due to their attractive yields, which have not been witnessed since the 2008 financial crisis, making them appealing for investors looking for competitive taxable equivalent yields.</p>
<h3>Yield History of ICE US Broad Municipal Index</h3>
<p><img class="img-responsive w-100" src="https://www.vaneck.com/contentassets/4e5857d39e2c4e02a1bc64b83e90b8a8/4086_muni_outlook_chart-1_2024-01_v1.svg" alt="Yield History of ICE US Broad Municipal Index" /></p>
<p class="chart-disclosure">Source: ICE Data Services. As of 12/31/2023.</p>
<h2>HOW DID MUNICIPAL BONDS PERFORM IN 2023</h2>
<p>The string of successive rate increases in 2023 had a decidedly negative impact on all tax-free assets. As rates rose to match the increases by the Fed, the interest rate risk, as measured by duration, accelerated the price declines in fixed-income portfolios. Bonds were sold to avoid further losses, and the resulting cash ended up in money market equivalent vehicles. By October, most portfolios and indexes registered negative returns. However, in November, the Fed began to respond to signals suggesting that inflationary pressures were abating and that an end to higher rate moves might be at hand. The November fixed-income rally of 100 basis points was only matched by the rally of November 1982. The end-of-the-year performance numbers of municipal bonds evidenced an extraordinary turnaround. From short- to long-term portfolios, returns ended decidedly positive. The ICE US Broad Municipal Index (MUNI) ended the year up 5.99%, and the ICE Core High Yield and Unrated Municipal Index (MHLD) was up 8.83%.</p>
<h3>2023 Municipal Bond Index Performance</h3>
<p><img class="img-responsive w-100" src="https://www.vaneck.com/contentassets/4e5857d39e2c4e02a1bc64b83e90b8a8/4086_muni_outlook_chart-2_2024-01_v1.svg" alt="2023 Municipal Bond Index Performance" /></p>
<p class="chart-disclosure">Source: Morningstar. As of 12/31/2023.</p>
<h2>MUNICIPAL BOND OPPORTUNITIES IN 2024</h2>
<p>The general market backdrop for municipal bonds has improved as we enter 2024. For example, the Fed's indication of a gradual easing this year and a potential move towards lower rates should help reduce market volatility, aligning with longer-term trends observed during periods of lower inflation. In addition, despite the enormous rally of November, fund outflows in 2023 dwarf the inflows at the end of 2023, although notably ETFs and SMAs ended the year net positive for the year. As a result, the stage is set for a more optimistic outlook for 2024, underscored by two primary components: attractive yield and reduced volatility.</p>
<h3>Attractive Yields</h3>
<p>Like all fixed income, yields for municipal bonds have reset higher after a decade-long run of extraordinarily low rates. Entering 2024, yields across all municipal sectors and parts of the municipal yield curve have not been this attractive since the 2008 financial crisis. If investors have heretofore been reluctant to add to fixed income, they should turn their attention to municipals in 2024, which offer taxable equivalent yields that easily compete with other asset classes.</p>
<h3>Reduced Volatility</h3>
<p>Although the Fed has recently expressed the view that higher rate moves may no longer be needed, it has also signaled that it continues to monitor the need to move rates lower to forestall an economic contraction. The historic one-month move to lower rates in November likely means that any Fed initiative to push short rates lower will not trigger sharp moves of the November magnitude. We should anticipate a gradual easing by the Fed along with a similar response by the municipal market to normalize the yield curve and head to lower rates. The ensuing more modest market volatility will be consistent with longer-term trends observed in past periods of lower inflation, allowing investors to pursue municipal investment strategies with more confidence.</p>
<h3>Potential Performance Ranges for Municipal Bonds</h3>
<p>Between these current measures by the Fed and its recently expressed views, 2024 should produce returns consistent with other historical periods of ebbing inflation and healthy economic activity. We expect the return state and local governments to the municipal capital markets to fund their programs and offer asset managers a broader variety of products for their clients. For investment-grade portfolios, this anticipated stability should offer a slight premium return above the coupon income rate of 5%. For the high-yield investor, returns of 2-3% above investment grade are certainly possible, but with new issue supply still at sub-normal levels, and overall default experience remaining low the continued healthy demand will make significantly higher rates more difficult to achieve.</p>
<h2>MUNICIPAL BOND RISKS IN 2024</h2>
<p>While the outlook for municipal bonds has certainly improved, this does not mean the market is without risks. Without consensus on rate movement in 2024, investor trading strategies will be more diverse. Combined with continued post-COVID struggles in many sectors and an increase in supply that will not sufficiently feed the demand, these are the factors investors should monitor as potential catalysts for pockets of volatility in the municipal space:</p>
<h3>Sectors to Monitor</h3>
<p>Sectors pressured in 2023 are unlikely to see relief in 2024 as the stressors on industrial development and health-related (over 55% of 2023 defaults) continue. Hospitals, not typically considered as risky a sector as their senior living counterparts, remained challenged with inflation, staffing shortages, and insufficient Medicaid reimbursement levels in select states. As a sector, hospitals are relying heavily on historically high reserves to unsustainable levels. As reserves decline and margins are squeezed, hospitals at all rating levels will show signs of distress as they miss covenants. While we do not expect mass defaults from hospital borrowers, the strain will continue in 2024, and we expect restructurings to increase.</p>
<h3>Slowing Economy</h3>
<p>As the Fed attempts to thread the needle and orchestrate the so-called &ldquo;soft landing,&rdquo; investors should consider the prospects for municipal bonds if economic growth slows. Historically, municipal credit quality is not immediately impacted by a slowing economy. Although job losses result in declines in tax receipts, like income and sales taxes, most bonds secured by these revenue streams can withstand significant declines before experiencing an impact on credit quality. Overall, airports are one of the first sectors to feel the fiscal pinch of slower economic growth, and local governments relying upon property taxes are the last. But note that both sectors rarely see impairments.</p>
<p>Further, by the time property taxes are impacted, the economy is usually on an upswing, and both business and recreational travel have fully recovered. Established credits can usually withstand a slowing economy. For new projects and expansions, careful scrutiny is appropriate on an individual basis.</p>
<h4>Keep an Eye on Municipal Issuance</h4>
<p>Overall, we expect municipal issuance to increase this year. As borrowers run out of COVID funds and become more comfortable with the higher borrowing rates, deferred projects will come to market. Any increase in new issuance will likely be concentrated in investment-grade borrowers, with high yield seeing a more modest rise.</p>
<p>While we expect refundings to increase somewhat, the added volume will be concentrated in sectors and credits that are valued over the long term despite current struggles. For example, with more mergers and continued struggles in healthcare and hospitals, new debt will reflect an affiliation and/or reduce the near-term debt service burden. These bonds are more likely for facilities in need of additional cash now but expected to regain stability in the longer term. Regardless of the sector though, we anticipate demand still outpacing supply.</p>
<h2>ARE MUNICIPAL BONDS A GOOD INVESTMENT IN 2024</h2>
<p>In 2023, persistent volatility and pervasive negative sentiment posed challenges. Despite this, bonds have performed well, exceeding initial expectations with positive returns across the yield curve as well as in high yield. Reflecting on the year, we acknowledge the positive performance in 2023 but anticipate a narrowing window of opportunity. As growth decelerates, inflation stabilizes, and the possibility of rate cuts looms, we urge investors to seize the current elevated yield environment. We predict a downward trend in yields for 2024, pointing to a potential total return opportunity. Time is of the essence, and we advocate for proactive measures to capitalize on the anticipated market shifts.</p>
<p>To receive more <strong><a href="https://www.vaneck.com/us/en/insights/municipal-bonds/" title="Municipal Bonds Insights">Municipal Bonds</a></strong> insights, <strong><a href="https://www.vaneck.com/us/en/subscribe/" title="Subscription Center">sign up in our subscription center</a></strong>.</p>
]]></content:encoded>
</item><item rdf:about="https://www.vaneck.com/us/en/blogs/moat-investing/moti-question-and-answer/">
  <title>MOTI ETF: Question &amp; Answer></title>
  <link>https://www.vaneck.com/us/en/blogs/moat-investing/moti-question-and-answer/</link>
  <description><![CDATA[Rather than a broad-based approach to international companies, we prefer Morningstar&rsquo;s selective approach to identifying quality international companies.]]></description>
  <dc:creator> </dc:creator>
  <dc:date>02/01/2024 06:30:00</dc:date>
<content:encoded><![CDATA[

<p>Leveraging Morningstar&rsquo;s forward-looking, rigorous equity research process, <strong><a href="/link/f178b77e7fb54bb88cd5377ffe6bcd94.aspx" title="MOTI - VanEck Morningstar International Moat ETF - Overview">VanEck Morningstar International Moat ETF (MOTI)</a></strong> provides a focus on international companies that possess sustainable competitive advantages (&ldquo;moats&rdquo;). This blog is intended to address frequently asked questions about investing in international stocks, Morningstar&rsquo;s forward-looking research and <strong><a href="/link/f178b77e7fb54bb88cd5377ffe6bcd94.aspx" title="MOTI - VanEck Morningstar International Moat ETF - Overview">MOTI</a></strong>.</p>
<ul class="content-list">
<li><strong><a href="#point-one">Why should investors consider investing in international stocks?</a></strong></li>
<li><strong><a href="#point-two">What is the benefit of leveraging Morningstar&rsquo;s equity research team in international markets?</a></strong></li>
<li><strong><a href="#point-three">Why does the International Moat Index include narrow moat rated companies in addition to wide moat companies?</a></strong></li>
<li><strong><a href="#point-four">How frequently does the International Moat Index rebalance?</a></strong></li>
<li><strong><a href="#point-five">How does MOTI&rsquo;s geographic exposure vary from broad market indexes?</a></strong></li>
<li><strong><a href="#point-six">How can MOTI fit within a portfolio?</a></strong></li>
<li><strong><a href="#point-seven">How can investors buy VanEck ETFs?</a></strong></li>
</ul>
<h2 id="point-one" class="anchored-block">Why should investors consider investing in international stocks?</h2>
<p>International companies allow investors to access the potential for growth in foreign economies, including emerging markets. Because of U.S. investors&rsquo; home country investing bias, foreign stocks are often considered risky, but they may also come with promising growth potential. Furthermore, international companies have historically performed well, as the dollar weakens. A well-diversified portfolio including both domestic and foreign equity exposure can allow investors to participate broadly through market cycles and diversify single country and/or regional risks.</p>
<h2 id="point-two" class="anchored-block">What is the benefit of leveraging Morningstar&rsquo;s equity research team in international markets?</h2>
<p>Investing in foreign markets can be intimidating. Many investors do not have access to company data or a full grasp of the geopolitical risks present in each market.</p>
<p><strong><a href="/link/f178b77e7fb54bb88cd5377ffe6bcd94.aspx" title="MOTI - VanEck Morningstar International Moat ETF - Overview">MOTI</a></strong> seeks to track the<a href="/link/f783dff26bc742c8bcc55236a14fdbde.aspx" title="MOTI - VanEck Morningstar International Moat ETF - Index"><strong>Morningstar<sup>&reg;</sup>&nbsp;Global Markets ex-US Wide Moat Focus Index<sup>SM</sup></strong></a>&nbsp;(&ldquo;International Moat Index&rdquo;), which is intended to track the overall performance of attractively priced companies outside of the U.S. with sustainable competitive advantages and attractive valuations. The Index is fueled by Morningstar&rsquo;s forward-looking, rigorous equity research process driven by over 100 analysts globally.</p>
<p>Morningstar has analysts on the ground in major markets globally, and they all apply Morningstar&rsquo;s singular, consistent economic moat rating process to each company they cover. This informed view on markets and companies allows <strong><a href="/link/f178b77e7fb54bb88cd5377ffe6bcd94.aspx" title="MOTI - VanEck Morningstar International Moat ETF - Overview">MOTI</a></strong>&nbsp;investors to invest internationally with confidence.</p>
<h2 id="point-three" class="anchored-block">Why does the International Moat Index include narrow moat rated companies in addition to wide moat companies?</h2>
<p>Unlike Morningstar&rsquo;s flagship<a href="/link/9f629c73a31846bb9e480b95e2c7f330.aspx" title="MOAT - VanEck Morningstar Wide Moat ETF - Index"><strong> Wide Moat Focus Index</strong></a>, the International Moat Index includes narrow moat rated companies in addition to wide moat rated companies. Both ratings, narrow and wide, signify strong competitive advantages. The key difference is driven by the conviction each Morningstar analyst has in a company&rsquo;s ability to maintain that advantage. Wide moat rated companies are often expected to maintain their advantage for 20 or more years into the future. For narrow moat rated companies, the time horizon is up to 10 years into the future.</p>
<p>Including narrow moat rated companies, of which there are more, allows the index to better take advantage of valuation opportunities in the international markets and offers greater diversification and exposure to various markets.</p>
<div class="epi-contentfragment">faq-banner-cta</div>
<h2 id="point-four" class="anchored-block">How frequently does the International Moat Index rebalance?</h2>
<p>The Index employs a staggered rebalance methodology whereby the Index is divided into two equally-weighted sub-portfolios, and each is reconstituted and rebalanced semi-annually on alternating quarters. Adjustments to one sub-portfolio are performed on the third Friday of March and September, and adjustments for the other sub-portfolio are performed on the third Friday of June and December. Due to the staggered rebalance methodology, Index constituents and weights may vary between sub-portfolios.</p>
<h2 id="point-five" class="anchored-block">How does MOTI&rsquo;s geographic exposure vary from broad market indexes?</h2>
<p>In order to qualify for the International Moat Index, a company must be covered by a Morningstar analyst. Therefore, Morningstar&rsquo;s coverage profile can dictate exposures. For example, their coverage of Japanese equities is smaller than Japan&rsquo;s representation in a typical broad international market index. Because of this, there is often a structural underweight to Japan.</p>
<p>Conversely, Morningstar has robust coverage of Australian companies and many of them find their way into the International Moat Index. Monthly portfolio exposures are available on <a href="/link/fe9bc226219e4246a63761b3584611cd.aspx" title="MOTI - VanEck Morningstar International Moat ETF - Portfolio Analytics"><strong>VanEck&rsquo;s website</strong></a>.</p>
<h2 id="point-six" class="anchored-block">How can MOTI fit within a portfolio?</h2>
<p><strong><a href="/link/f178b77e7fb54bb88cd5377ffe6bcd94.aspx" title="MOTI - VanEck Morningstar International Moat ETF - Overview">MOTI</a></strong>&nbsp;offers investors a diversified portfolio of international equities that can serve as a core portfolio building block. International investing allows for investors to distribute investment risk between markets and global companies. Investors should consider <strong><a href="/link/f178b77e7fb54bb88cd5377ffe6bcd94.aspx" title="MOTI - VanEck Morningstar International Moat ETF - Overview">MOTI</a></strong>&nbsp;for long-term exposure as it targets companies with sustainable competitive advantages and attractive valuations.</p>
<h2 id="point-seven" class="anchored-block">How can investors buy VanEck ETFs?</h2>
<p><a href="/link/973ee43f7890447a9b74c6e2836d1068.aspx#how-to-buy-etf&amp;utm=MOTI-Blog" title="How to buy VanEck ETFs?"><strong>Learn more here</strong></a>.</p>
<p class="d-none d-lg-block"><a href="mailto:askvaneck@vaneck.com" title="Have More Questions? - Ask VanEck" rel="noopener"><img loading="lazy" class="img-responsive" src="https://www.vaneck.com/globalassets/home/us/insights/blogs/bm-blog-images/cta-faq_desktop-02.svg" alt="Have More Questions? - Ask VanEck" /></a></p>
<p class="d-lg-none"><a href="mailto:askvaneck@vaneck.com" title="Have More Questions? - Ask VanEck" rel="noopener"><img loading="lazy" class="img-responsive" src="https://www.vaneck.com/globalassets/home/us/insights/blogs/bm-blog-images/cta-faq_mobile-01.svg" alt="Have More Questions? - Ask VanEck" /></a></p>
<p>To receive more <a href="https://www.vaneck.com/us/en/insights/moat-investing/" title="Moat Investing Insights"><strong>Moat Investing</strong></a> insights, <a href="https://www.vaneck.com/us/en/subscribe/" title=" Subscription Center"><strong>sign up in our subscription center</strong></a>.</p>
]]></content:encoded>
</item><item rdf:about="https://www.vaneck.com/us/en/blogs/emerging-markets-equity/continued-confidence-in-brazilian-equities/">
  <title>Continued Confidence in Brazilian Equities></title>
  <link>https://www.vaneck.com/us/en/blogs/emerging-markets-equity/continued-confidence-in-brazilian-equities/</link>
  <description><![CDATA[We believe the Brazilian market faces a favorable environment in 2024 due to factors such as continued rate cuts, GDP growth, and attractive valuations.]]></description>
  <dc:creator>Patricia Gonzalez</dc:creator>
  <dc:date>02/01/2024 06:30:00</dc:date>
<content:encoded><![CDATA[

<p>In 2023, Brazilian equities experienced significant growth, with the Bovespa Index rising by 22.3% for the year, approaching its all-time high. This performance is notable given the initial challenges faced at the start of the year, including a new political cycle, a weak economic outlook, and fiscal risks. However, these concerns did not materialize to the extent anticipated by the market. This perspective was supported by the EME equity team's findings during their Q1 2023 visit to Brazil. Contrary to the local sentiment, their interactions with companies indicated strong fundamentals and positive forward guidance. Additionally, valuations were at historical lows, influenced by domestic political and fiscal uncertainty.</p>
<h2>Key Factors Behind the Positive Performance in 2023:</h2>
<ul class="content-list">
<li><strong>Economic Improvement:</strong> The economic outlook improved more than expected. GDP growth, initially forecasted at 0.8%, was revised upwards to over 2.5%, driven by a resilient economy and a robust agricultural sector. Reforms implemented since 2016 have been instrumental in supporting this growth.</li>
<li><strong>Political and Fiscal Stability:</strong> The concerns regarding economic policies and political changes at the start of the year were allayed. Government spending was managed effectively, and the independence of the Central Bank was maintained.</li>
<li><strong>Monetary Policy and Inflation Control:</strong> The disinflation process that began early in the year allowed the Central Bank to initiate interest rate cuts in August 2023. This action placed Brazil ahead of its global counterparts, bringing the year-end inflation to 4.62%, within the target range.</li>
</ul>
<h3>Headline and Core IPCA Forecasts</h3>
<p><img class="img-responsive w-100" src="https://www.vaneck.com/contentassets/ee9d0c8725d84ad494788e11e4e76268/4072_brazil-blog_chart-ipca-forecasts_2024-01_v1_blog.svg" alt="Headline and Core IPCA Forecasts" /></p>
<p class="chart-disclosure">Source: IBGE, BGB and J.P. Morgan. Data as of November 2023. Any forecasts shown are for illustrative purposes only and not intended as a prediction of future results.</p>
<h2>Why We&rsquo;re Optimistic in 2024:</h2>
<ul class="content-list">
<li><strong>Monetary Policy:</strong> Continuation of interest rate cuts is anticipated, with the terminal rate expected in the single digits. This is likely to have a positive impact on equities.</li>
<li><strong>GDP Growth:</strong> The GDP growth forecast for 2024 is around 1.8%. Despite a lower contribution from agriculture, the easing monetary cycle and a resilient labor market are expected to support growth.</li>
<li><strong>Valuations:</strong> The Bovespa Index continues to trade at attractive valuations, with a forward P/E of 8x, below the 15-year average, indicating growth potential. Brazil stands out for its P/E and PEG ratios. In bull markets Bovespa has traded at 14-15x and in bear markets at 6-7x, so current valuations are pricing a bear case scenario which is not what recent indicators and showing.</li>
</ul>
<h3>Brazilian Equities Remain Undervalued After 2023 Rally</h3>
<p><img class="img-responsive w-100" src="https://www.vaneck.com/contentassets/ee9d0c8725d84ad494788e11e4e76268/4072_brazil-blog_chart-brazillian_equities_2024-01_v1_blog.svg" alt="Brazilian Equities Remain Undervalued After 2023 Rally" /></p>
<p class="chart-disclosure">Source: Bloomberg as of 12/31/23.</p>
<h2>Top Performing Brazilian Companies:</h2>
<ul class="content-list">
<li><strong>JSL (3.58% of Fund net assets<sup>*</sup>),</strong> standing as Brazil's largest logistics platform and quintuple the size of its nearest competitor, showcased impressive growth and enhanced operational efficiencies throughout the year. Despite its substantial size, JSL holds just 1% of the market share, highlighting the significant potential for further expansion in this highly fragmented sector. This year, the company made notable strides in improving cross-selling opportunities with its existing client base, indicating ample scope for continued growth. With years of experience in logistics and effective pricing models that distinguish it from its competitors, JSL is well-positioned in a market with considerable untapped potential. Since its IPO, JSL has doubled in size, presenting a substantial opportunity to further compound its growth in the coming years.</li>
<li><strong>MercadoLibre (&ldquo;MELI&rdquo;, 5.27% of Fund net assets<sup>*</sup>),</strong> Latin America's leading e-commerce platform, is also making significant strides in the fintech sector. In the past year, it saw substantial growth, especially in Mexico and Brazil, consistently increasing its market share even amidst new competition. The company's robust ecosystem, which includes efficient logistics, a diverse product range, and strong credit services, has created a unique network effect, ensuring continued growth across the region. Additionally, there's notable potential in advertising, where MELI is approaching 2% of its Gross Merchandise Volume, suggesting room for expansion compared to larger players like Amazon. This momentum is expected to carry forward into 2024, highlighting MELI&rsquo;s continued growth trajectory.</li>
</ul>
<h2>Emerging Markets Fund Positioning</h2>
<p>In 2023, <strong><a href="https://www.vaneck.com/us/en/investments/emerging-markets-fund-gbfax/overview/" title="GBFAX - Emerging Markets Fund - Class A - Overview">the Emerging Markets Fund</a></strong> adopted a strategic approach by being overweight in Brazilian equities, a decision that played out favorably. Brazil emerged as the Fund&rsquo;s largest relative contributor to performance by country, with both allocation and stock selection boosting returns. In other words, both our overweight to Brazil and our stock selection within Brazil significantly helped returns.</p>
<h3>Top 10 Country Over/Underweights vs Benchmark</h3>
<p><img class="img-responsive w-100" src="https://www.vaneck.com/contentassets/ee9d0c8725d84ad494788e11e4e76268/4072_brazil-blog_eme-overweights_2024-01_v1_blog.svg" alt="Top 10 Country Over/Underweights vs Benchmark" /></p>
<p class="chart-disclosure">Source: FactSet as of 12/31/23.</p>
<p>As we move into 2024, we continue to demonstrate confidence in Brazil's growth trajectory. It remains our largest overweight position compared to the benchmark, reflecting our belief in the sustained momentum of the Brazilian economy and the relative discount that companies like JSL and MELI represent. These companies embody our S-GARP philosophy, showing strong structural growth at a reasonable price.</p>
<h2>Conclusion</h2>
<p>Despite initial uncertainties, 2023 was a year of significant achievement for Brazilian equities, and the outlook for 2024 remains positive. Factors such as continued rate cuts, GDP growth, and attractive valuations present a favorable environment for the Brazilian market. Companies like JSL and MercadoLibre exemplify this growth potential, and, combined with their reasonable valuations, are prime candidates for investment for our S-GARP strategy.</p>
<p>To receive more <a href="/us/en/insights/emerging-markets-equity/" title="Emerging Markets Equity Insights"><strong>Emerging Markets Equity</strong></a> insights, <a href="/us/en/subscribe/" title="Subscription Center"><strong>sign up in our subscription center</strong></a>.</p>
]]></content:encoded>
</item><item rdf:about="https://www.vaneck.com/us/en/blogs/income-investing/ig-corporates-be-selective/">
  <title>IG Corporates: Be Selective></title>
  <link>https://www.vaneck.com/us/en/blogs/income-investing/ig-corporates-be-selective/</link>
  <description><![CDATA[Investment grade bonds rebounded strongly in 2023. Looking ahead, we believe being selective within the investment grade corporate bond market may provide a better outcome in 2024.]]></description>
  <dc:creator>Nicolas  Fonseca, CFA</dc:creator>
  <dc:date>02/01/2024 06:30:00</dc:date>
<content:encoded><![CDATA[

<p>Attractive yields and a rally in credit spreads made 2023 a solid year for investment grade bond investors after two consecutive years of negative returns. With expectations that the Fed may achieve its goal of a &ldquo;soft landing&rdquo; and could cut rates in 2024, recent flows indicate that fixed income investors have begun to add back credit and duration risk into their portfolios. We believe being selective within the investment grade corporate bond market may provide a better outcome in 2024, just like it did in 2023 and prior years.</p>
<p>In particular, focusing on attractively valued bonds has historically provided significant outperformance. The market is not homogenous and there is significant dispersion of credit risk pricing within the corporate bond market. This offers the ability to build diversified portfolios with alpha potential, without taking excessive risk. Using Moody&rsquo;s Analytics proprietary credit metrics allows us to assess the fair value of every bond in the U.S. corporate bond market and compare that value against market pricing. We define attractively valued bonds as those offering a significant excess spread above their fair value, meaning their market spread is overcompensating versus what it is needed based on the actual embedded risk.</p>
<h3>Deviation from Fair Value Creates Opportunity &ndash; Investment Grade Bond Universe (As of 12/31/2023)</h3>
<p><img class="img-responsive w-100" src="https://www.vaneck.com/contentassets/89ee32a991984dabad90eacbf93bddee/4080_investment-grade_chart-1_2024-01_blog.svg" alt="Deviation from Fair Value Creates Opportunity - Investment Grade Bond Universe" /></p>
<p class="chart-disclosure">Source: Moody&rsquo;s Analytics, ICE Data Services and VanEck, as of 12/31/2023. Past performance is no guarantee of future results.</p>
<p>Focusing on high excess spread does not simply mean selecting bonds with the highest yield. Fair value considers factors including the probability of default, expected recovery rate, sector-specific considerations, and the level of systematic risk in the market. It also considers bond-specific factors, including the bond&rsquo;s price, maturity, and seniority. Further, a bond&rsquo;s credit rating is not enough to determine whether a bond may provide attractive value. Ratings are not forward-looking or responsive to market-based information, as they tend to lag the market and current economic developments, so they don&rsquo;t provide an adequate basis to base all security selection decisions on.</p>
<p>By focusing on bonds with the most attractive valuations relative to their risk has provided attractive total returns driven by both greater price and income returns versus the broad market.</p>
<h3>Attractive Price and Income Returns</h3>
<div class="wrapped-div">
<table style="width: 100%;">
<tbody>
<tr class="tbl-data">
<td class="tbl-header last">&nbsp;</td>
<td class="tbl-header last" style="text-align: center;" colspan="3">1-Year</td>
<td class="tbl-header last" style="text-align: center;" colspan="3">3-Year</td>
</tr>
<tr class="tbl-data">
<td class="data-td last">&nbsp;</td>
<td class="data-td last" style="text-align: center;">Price</td>
<td class="data-td last" style="text-align: center;">Income</td>
<td class="data-td last" style="text-align: center;">Total</td>
<td class="data-td last" style="text-align: center;">Price</td>
<td class="data-td last" style="text-align: center;">Income</td>
<td class="data-td last" style="text-align: center;">Total</td>
</tr>
<tr class="tbl-data">
<td class="data-td last">MarketVector IG Index</td>
<td class="data-td data last">4.94</td>
<td class="data-td data last">4.61</td>
<td class="data-td data last">9.55</td>
<td class="data-td data last">-17.44</td>
<td class="data-td data last">10.61</td>
<td class="data-td data last">-6.83</td>
</tr>
<tr class="tbl-data">
<td class="data-td last">US IG Benchmark</td>
<td class="data-td data last">3.88</td>
<td class="data-td data last">4.52</td>
<td class="data-td data last">8.40</td>
<td class="data-td data last">-18.98</td>
<td class="data-td data last">9.76</td>
<td class="data-td data last">-9.22</td>
</tr>
<tr class="tbl-data">
<td class="data-td last">Difference</td>
<td class="data-td data last">1.06</td>
<td class="data-td data last">0.09</td>
<td class="data-td data last">1.15</td>
<td class="data-td data last">1.54</td>
<td class="data-td data last">0.85</td>
<td class="data-td data last">2.39</td>
</tr>
<tr class="tbl-data">
<td class="data-td last" colspan="7">&nbsp;</td>
</tr>
<tr class="tbl-data">
<td class="data-td last">MarketVector BBB Index</td>
<td class="data-td data last">5.59</td>
<td class="data-td data last">4.92</td>
<td class="data-td data last">10.51</td>
<td class="data-td data last">-17.62</td>
<td class="data-td data last">11.24</td>
<td class="data-td data last">-6.38</td>
</tr>
<tr class="tbl-data">
<td class="data-td last">US BBB Benchmark</td>
<td class="data-td data last">4.54</td>
<td class="data-td data last">4.92</td>
<td class="data-td data last">9.46</td>
<td class="data-td data last">-18.81</td>
<td class="data-td data last">10.73</td>
<td class="data-td data last">-8.08</td>
</tr>
<tr class="tbl-data">
<td class="data-td last">Difference</td>
<td class="data-td data last">1.05</td>
<td class="data-td data last">0.00</td>
<td class="data-td data last">1.05</td>
<td class="data-td data last">1.19</td>
<td class="data-td data last">0.51</td>
<td class="data-td data last">1.70</td>
</tr>
</tbody>
</table>
</div>
<br />
<p class="chart-disclosure">Source: ICE Data Services, as of 12/31/2023. The MarketVector IG Index represented by the MVIS Moody&rsquo;s Analytics US Investment Grade Corporate Bond Index. The US IG Benchmark is represented by the ICE BofA US Corporate Bond Index. The MarketVector BBB Index represented by the MVIS Moody&rsquo;s Analytics US BBB Corporate Bond Index. The US BBB Benchmark is represented by the ICE BofA BBB US Corporate Bond Index.</p>
<p>Instead of traditional measures like credit ratings, we rely on the industry-leading credit model developed by Moody&rsquo;s Analytics to identify attractively valued bonds that may provide upside potential. We illustrate below how a key output of the model, the fair value spread, is used to identify relative value opportunities in the marketplace as they arise. In the below example, four bonds with several common traits are highlighted: all are rated BBB-, all have approximately five years to maturity, and all have at least $1 billion of par amount outstanding. From a rating, duration and liquidity perspective, these bonds are all very similar. However, there is clear differentiation from a risk perspective when viewed in the context of their excess spreads (the difference between fair value and market price).</p>
<p>Differences in sectors account for some of the difference, but the different fair values are also driven by the underlying credit risk of the bonds. In this example, the Charter Communications bond issue, the Enbridge and the PG&amp;E are offering attractive value, meaning that these bonds are undervalued by the market, and investors are earning more compensation for the lower level of risk being taken. Over time, if the market recognizes this mispricing and market spreads begin to tighten towards fair value spreads, bond prices will move upwards, all else equal, providing additional upside to investors.</p>
<h3>Value Not Drive Only by Rating, Size or Maturity &ndash; Selected BBB3, &gt;$1 billion Bonds 5 Year Bonds (as of 12/31/2023)</h3>
<p><img class="img-responsive w-100" src="https://www.vaneck.com/contentassets/89ee32a991984dabad90eacbf93bddee/4080_investment-grade_chart-2_2024-01_blog.svg" alt="Value Not Drive Only by Rating, Size or Maturity &ndash; Selected BBB3, &gt;$1 billion Bonds 5 Year Bonds" /></p>
<p class="chart-disclosure">Source: Moody&rsquo;s Analytics, ICE Data Services and VanEck. This is not an offer to buy or sell, or a solicitation of any offer to buy or sell any of the securities mentioned herein.</p>
<p>On the other hand, bonds such as the one issued by Boeing are overpriced. The market price is not compensating investors for the risk being taken, based on the model&rsquo;s assessment of risk and value. Analyzing bonds through the lens of fair value allows investors to buy undervalued bonds and avoid overpriced bonds, which have demonstrated a better risk/reward profile than the broad markets. As we look ahead, we believe yield curve normalization and quantitative tightening may drive continued volatility, resulting in increased relative value opportunities that a value-oriented strategy can benefit from.</p>
<h3>Risk/Reward (11/13/2020 &ndash; 12/31/2023)</h3>
<p><img class="img-responsive w-100" src="https://www.vaneck.com/contentassets/89ee32a991984dabad90eacbf93bddee/4080_investment-grade_chart-3_2024-01_blog.svg" alt="Risk/Reward" /></p>
<p class="chart-disclosure">Source: Morningstar. The MarketVector IG Index is represented by the MVIS Moody&rsquo;s Analytics US Investment Grade Corporate Bond Index. The US IG Benchmark is represented by the ICE BofA US Corporate Bond Index. The MarketVector BBB Index represented by the MVIS Moody&rsquo;s Analytics US BBB Corporate Bond Index. The US BBB Benchmark is represented by the ICE BofA BBB US Corporate Bond Index.</p>
<p>The <a href="https://www.vaneck.com/us/en/investments/moodys-analytics-ig-corporate-bond-etf-mig/overview/" title="MIG - VanEck Moody's Analytics IG Corporate Bond ETF - Overview"><strong>VanEck Moody&rsquo;s Analytics IG Corporate Bond ETF (MIG)</strong></a> seeks to track, as closely as possible, before fees and expenses, the price and yield performance of the MVIS<sup>&reg;</sup>&nbsp;Moody&rsquo;s Analytics<sup>&reg;</sup>&nbsp;US Investment Grade Corporate Bond Index while the <a href="https://www.vaneck.com/us/en/investments/moodys-analytics-bbb-corporate-bond-etf-mbbb/overview/" title="MBBB - VanEck Moody's Analytics BBB Corporate Bond ETF - Overview"><strong>VanEck Moody&rsquo;s Analytics BBB Corporate Bond ETF (MBBB)</strong></a> seeks to track, as closely as possible, before fees and expenses, the price and yield performance of the MVIS<sup>&reg;</sup>&nbsp;Moody&rsquo;s Analytics<sup>&reg;</sup>&nbsp;US BBB Corporate Bond Index. These indices focus on the most attractively valued bonds based on their market spread relative to their fair value, based on metrics calculated by Moody&rsquo;s Analytics. Both funds ranked within the Top-14% of the Morningstar US Fund Corporate Bond Category as of 12/31/2023.</p>
<p>To receive more <strong><a href="https://www.vaneck.com/us/en/insights/income-investing/" title="Income Investing Insights">Income Investing</a></strong> insights, <strong><a href="https://www.vaneck.com/us/en/subscribe/" title="Subscription Center">sign up in our subscription center</a></strong>.</p>
<style>
    .wrapped-div {
        max-width: 100%;
    }

    @media (max-width: 1240px) {
        .wrapped-div {
            overflow-x: scroll;
        }
    }

    .wrapped-div-sector {
        max-width: 100%;
        overflow-x: scroll;
    }
</style>
]]></content:encoded>
</item><item rdf:about="https://www.vaneck.com/us/en/blogs/thematic-investing/bitcoin-miners-in-2024-impact-of-bitcoin-etfs-halving/">
  <title>Bitcoin Miners in 2024: Impact of Bitcoin ETFs &amp; Halving></title>
  <link>https://www.vaneck.com/us/en/blogs/thematic-investing/bitcoin-miners-in-2024-impact-of-bitcoin-etfs-halving/</link>
  <description><![CDATA[Bitcoin turned positive YTD by January 29th after an initial drop, while miners are still down 20%, hinting at potential opportunities.]]></description>
  <dc:creator>Nick Frasse</dc:creator>
  <dc:date>01/31/2024 06:30:00</dc:date>
<content:encoded><![CDATA[

<p>Bitcoin is now positive YTD as of January 29th after initially dropping 20% in the aftermath of the Bitcoin ETF launches. Most Bitcoin miners, on the other hand, are still down 20% year-to-date. Is this an opportunity?</p>
<h2>Impact of the New Spot Bitcoin ETFs</h2>
<p>The recent launch of multiple spot bitcoin ETFs has brought a dual effect to the asset. They've democratized access to bitcoin, allowing a wider range of investors to participate without direct digital asset ownership. However, this created a headwind for the price of bitcoin due to increased market liquidity and one-way investor sentiment leading into the event.</p>
<p>Historically, there has been a strong correlation between the price of bitcoin and the valuations of bitcoin mining companies. Bull market cycles in bitcoin typically provide a tailwind for mining companies as their margins increase on every mined coin. However, the opposite is true when prices become depressed, leading to more limited profitability. This pattern outlines the high beta between the asset itself and the companies who mine it.</p>
<p>If past patterns hold and Bitcoin rallies after the halving and the US election, the miners&rsquo; recent underperformance could be an opportunity.</p>

<h2>The Bitcoin Halving Effect: Historical Analysis</h2>
<p>The anticipated Bitcoin halving, likely to take place around April 20th, is a pivotal event. Previous halvings in 2012, 2016, and 2020 preceded significant bull runs in bitcoin's price, as Bitcoin&rsquo;s new issuance is cut by 50% After the 2016 halving, bitcoin's price surged from around $650 to approximately $20,000 by the end of 2017. Similarly, post the 2020 halving, bitcoin witnessed a climb from about $8,800 to an all-time high near $69,000 in November 2021. This historical pattern suggests that the halving could lead to a decrease in supply and potential price appreciation.</p>
<h3>Bitcoin Price and Timing of Previous Halvings</h3>
<p><img class="img-responsive w-100" src="https://www.vaneck.com/contentassets/f2196fd296ba412895ae36bb5b35438a/4051_bitcoin_miners_in_2024_chart-01_v1_blog.svg" alt="Bitcoin Price and Timing of Previous Halvings" /></p>
<p class="chart-disclosure">Source: VanEck research as of 1/22/2024. <strong>Past performance is not indicative of future results. Not intended as a recommendation to buy or sell any of the names mentioned herein.</strong></p>
<h2>Opportunity in the Volatility</h2>
<p>Considering the historical data and Bitcoin miners&rsquo; high volatility, the oversold equities may draw buyers looking for beta to Bitcoin&rsquo;s recovery. As of the last quarter, bitcoin mining companies reported increased operational efficiency and growth in mining capacity, yet their valuations did not reflect these improvements, largely due to the top-down market sentiment and concerns about post-halving profitability. In the 2020 cycle, the largest publicly traded Bitcoin miners underperformed the Bitcoin price materially in the year prior to the halving, bottomed in relative terms the week before the event, and then rallied more than 5000% vs. Bitcoin&rsquo;s ~660% for the rest of the cycle.</p>
<h3>MVDAPPTR Holding's Revenues and Market Cap Over Time</h3>
<p><img class="img-responsive w-100" src="https://www.vaneck.com/contentassets/f2196fd296ba412895ae36bb5b35438a/4051_bitcoin_miners_in_2024_chart-02_v1.svg" alt="MVDAPPTR Holding's Revenues and Market Cap Over Time" /></p>
<p class="chart-disclosure">Source: Factset as of 12/2023. <strong>Past performance is not indicative of future results. Not intended as a recommendation to buy or sell any of the names mentioned herein.</strong></p>
<p>After the Bitcoin halving in April, it is likely that clarity will emerge about which miners will be profitable. But stocks often move in advance of fundamentals. One way for investors to access this opportunity in a diversified way is with <a href="https://www.vaneck.com/us/en/investments/digital-transformation-etf-dapp/overview/" title="VanEck Digital Transformation ETF - DAPP - Overview"><strong>VanEck Digital Transformation ETF (DAPP)</strong></a>. DAPP is a passive product that tracks the MVIS Global Digital Assets Equity Index. The index targets the 25 largest, most liquid companies in the industry that drive 50% or more of their revenue from digital assets operations.&nbsp;</p>
<p>To receive more <strong><a href="https://www.vaneck.com/us/en/insights/digital-assets/" title="Digital Assets Insights">Digital Assets</a></strong> and <a href="https://www.vaneck.com/us/en/insights/thematic-investing/" title="Thematic Investing Insights"><strong>Thematic Investing</strong></a> insights, <strong><a href="https://www.vaneck.com/us/en/subscribe/" title="Subscription Center">sign up in our subscription center</a></strong>.</p>
]]></content:encoded>
</item><item rdf:about="https://www.vaneck.com/us/en/blogs/thematic-investing/semiconductor-outlook-2024-investor-guide/">
  <title>Semiconductor Outlook: 2024 Investor Guide></title>
  <link>https://www.vaneck.com/us/en/blogs/thematic-investing/semiconductor-outlook-2024-investor-guide/</link>
  <description><![CDATA[Through 2024, we expect further semiconductor industry growth driven by broad industry demand.]]></description>
  <dc:creator>Nick Frasse</dc:creator>
  <dc:date>01/31/2024 06:30:00</dc:date>
<content:encoded><![CDATA[

<h2>Overview</h2>
<ul class="content-list">
<li>We believe the semiconductor industry is expected to continue to rebound significantly at a notable growth rate in 2024.</li>
<li>The resurgence is driven by increasing demand from various industries and applications.</li>
<li>While general optimism about the industry's growth potential exists, concerns exist around workforce scaling, R&amp;D efforts, and managing high inventory levels.</li>
</ul>
<p>As we head further into 2024, the semiconductor industry is gearing up for what can be best described as a significant rebound from the <strong><a href="https://www.vaneck.com/us/en/blogs/thematic-investing/vaneck-semiconductor-etf-smh-holdings-and-performance-recap/" title="VanEck Semiconductor ETF (SMH) Holdings and Performance Recap">headwinds of Q3 2023</a></strong>. According to IDC (International Data Corporation) analysts, there is an opportunity for a substantial increase in growth rate over the next year. This optimism is a welcome shift from the recent ups and downs and is primarily driven by a few key trends:</p>
<ul class="content-list">
<li><strong>AI Chips Continue to Dominate:</strong> The demand for AI chips keeps growing. These chips are crucial for a wide array of advanced technologies and services. As AI continues to weave into various sectors, from big data to smart devices, the need for these chips has the potential to increase dramatically.</li>
<li><strong>Renewed Interest in Smartphones:</strong> The smartphone market is witnessing a revival, partly thanks to advancements like 5G and new AI functionalities. This resurgence is a significant boost for the semiconductor sector, as smartphones remain a major consumer of these chips.</li>
<li><strong>Advancements in Automotive Technology:</strong> The automotive industry increasingly relies on semiconductor technology. With developments in Advanced Driver Assistance Systems (ADAS) and enhanced infotainment systems, cars are becoming more technology-centric. This shift is creating a substantial demand for automotive semiconductors.</li>
</ul>
<p>While the outlook is generally optimistic, there are points of caution and risk. An annual survey done by KPMG highlights a positive sentiment among industry executives, with a majority expecting revenue growth. However, there are concerns regarding the scaling up of the workforce, research and development efforts, and the pace of capital expenditures.</p>
<p>In collaboration with TechInsights, SEMI also notes that despite the recovery trajectory, the industry faces some ongoing challenges. One of the key issues is managing high inventory levels, which affects the utilization rates of fabrication plants. However, there are positive signs of stabilization, such as improvements in memory IC (Integrated Circuits) sales and a steady growth in electronics sales.</p>
<p>Overall, we believe the semiconductor industry in 2024 has the potential for growth and resurgence, driven by technological advancements and a renewed demand in key sectors. However, this positive trend is tempered with a degree of caution as the industry navigates workforce and investment challenges alongside managing existing inventories. The year ahead looks promising but will require strategic navigation to capitalize on these emerging opportunities fully.</p>
<p>From an SMH-specific standpoint on performance and valuation outlook, I have compiled some takeaways from 2023 and a broad outlook on some top holdings and the portfolio as a whole.</p>
<p>We believe <strong><a href="https://www.vaneck.com/us/en/investments/semiconductor-etf-smh/overview/" title="SMH - VanEck Semiconductor ETF - Overview">the VanEck Semiconductor ETF (SMH)</a></strong> may potentially display a promising outlook, particularly with its significant holdings in key semiconductor companies. Here's a breakdown of some of the analyses on SMH and its top holdings:</p>
<ul class="content-list">
<li><strong>NVIDIA (NVDA):</strong> NVIDIA, a heavyweight in SMH's portfolio, demonstrated remarkable growth in 2023, with its share price returning 73%. The company is ambitiously looking to triple its AI production and expand globally, including a partnership in Vietnam and Malaysia to increase production and infrastructure. NVIDIA's year-over-year revenue growth of 57% and EBITDA growth of 154% position it for continued acceleration into 2024.</li>
<li><strong>Taiwan Semiconductor Manufacturing Company Limited (TSM):</strong> As the second-largest holding in SMH, TSM is at the forefront of semiconductor manufacturing, producing advanced 3-nanometer chips. TSM stands out with a 57% gross profit margin and a 41% net income margin. It&rsquo;s valued with a forward P/E GAAP 28% below its sector median, indicating a potentially favorable valuation.</li>
<li><strong>ASML Holding N.V. (ASML):</strong> ASML, a top 10 holding in SMH, is critical in the semiconductor manufacturing process, particularly for its lithography systems used in chip circuitry. The company has a 28% net income margin and a 38% return on total capital, and it aims to achieve revenues of upwards of $35 billion with a gross margin of up to 55% by 2025.</li>
</ul>
<p>Other Key Holdings Analysis: Companies like Qualcomm, Intel, Lam Research, and Texas Instruments also form part of SMH's portfolio. Qualcomm's recent earnings have surpassed estimates, and Intel has provided optimistic revenue guidance. Lam Research exceeded revenue and earnings estimates, whereas Texas Instruments showed some shortfall in its earnings compared to estimates.</p>
<p>While the semiconductor industry faced challenges in the 2021-2022 period, we believe there are strong growth and profitability indicators for 2024 and beyond. SMH's diversified portfolio, including strong players like NVDA, TSM, and ASML, positions it well for potential growth, albeit with associated market and geopolitical risks.</p>
<p>For more information on the <a href="https://www.vaneck.com/us/en/investments/semiconductor-etf-smh/overview/" title="SMH - VanEck Semiconductor ETF - Overview"><strong>VanEck Semiconductor ETF (SMH)</strong></a>, please read the <a href="https://www.vaneck.com/us/en/blogs/thematic-investing/smh-question-and-answer/" title="SMH ETF: Question and Answer"><strong>Fund FAQ</strong></a>.</p>
<p>To receive more <a href="https://www.vaneck.com/us/en/insights/thematic-investing/" title="Thematic Investing Insights"><strong>Thematic Investing</strong></a> insights, <a href="https://www.vaneck.com/us/en/subscribe/" title="Subscription Center"><strong>sign up in our subscription center</strong></a>.</p>
]]></content:encoded>
</item><item rdf:about="https://www.vaneck.com/us/en/blogs/moat-investing/bloated-index-returns-no-match-for-moat/">
  <title>Bloated Index Returns No Match for MOAT></title>
  <link>https://www.vaneck.com/us/en/blogs/moat-investing/bloated-index-returns-no-match-for-moat/</link>
  <description><![CDATA[In a calendar year dominated by the &ldquo;Magnificent 7,&rdquo; the Morningstar Wide Moat Focus Index not only kept pace with the broader market, it outperformed.]]></description>
  <dc:creator>Brandon Rakszawski</dc:creator>
  <dc:date>01/31/2024 06:30:00</dc:date>
<content:encoded><![CDATA[

<h2>Strong 2023 Results Enhanced Long-Term Outperformance</h2>
<p>For equity markets, 2023 was the year of the &ldquo;Magnificent 7.&rdquo; As of December 31, 2023, these 7 mega-cap stocks accounted for 22.52% of the broad-based Morningstar US Market Index. And in 2023, they were responsible <strong><i>for more than 50%</i></strong> of the index&rsquo;s total calendar year return.</p>
<div class="wrapped-div">
<table style="width: 100%; height: 270px;">
<tbody>
<tr class="tbl-data">
<td class="tbl-header last text-center">&nbsp;</td>
<td class="tbl-header last text-center" colspan="3">Weight %</td>
<td class="tbl-header last text-center">&nbsp;</td>
<td class="tbl-header last text-center" colspan="2">Contribution %</td>
<td class="tbl-header last text-center">&nbsp;</td>
</tr>
<tr class="tbl-data">
<td class="data-td last">Company</td>
<td class="data-head last">Index</td>
<td class="data-head last">Benchmark</td>
<td class="data-head last">+/-</td>
<td class="data-head last">Total Return %</td>
<td class="data-head last">Index</td>
<td class="data-head last">Benchmark</td>
<td class="data-head last">Active Return %</td>
</tr>
<tr class="tbl-data">
<td class="data-td last">Apple Inc</td>
<td class="data-td data last">&nbsp;</td>
<td class="data-td data last">6.22</td>
<td class="data-td data last">-6.22</td>
<td class="data-td data last">49.00</td>
<td class="data-td data last">&nbsp;</td>
<td class="data-td data last">2.58</td>
<td class="data-td data last">-1.21</td>
</tr>
<tr class="tbl-data">
<td class="data-td last">Microsoft Corp</td>
<td class="data-td data last">1.98</td>
<td class="data-td data last">5.65</td>
<td class="data-td data last">-3.67</td>
<td class="data-td data last">58.19</td>
<td class="data-td data last">1.23</td>
<td class="data-td data last">2.83</td>
<td class="data-td data last">-0.88</td>
</tr>
<tr class="tbl-data">
<td class="data-td last">Alphabet Inc</td>
<td class="data-td data last">2.59</td>
<td class="data-td data last">3.17</td>
<td class="data-td data last">-0.58</td>
<td class="data-td data last">58.58</td>
<td class="data-td data last">1.36</td>
<td class="data-td data last">1.58</td>
<td class="data-td data last">-0.14</td>
</tr>
<tr class="tbl-data">
<td class="data-td last">Amazon.com Inc</td>
<td class="data-td data last">1.94</td>
<td class="data-td data last">2.60</td>
<td class="data-td data last">-0.66</td>
<td class="data-td data last">80.88</td>
<td class="data-td data last">1.50</td>
<td class="data-td data last">1.67</td>
<td class="data-td data last">-0.08</td>
</tr>
<tr class="tbl-data">
<td class="data-td last">NVIDIA Corp</td>
<td class="data-td data last">0.40</td>
<td class="data-td data last">2.12</td>
<td class="data-td data last">-1.71</td>
<td class="data-td data last">239.02</td>
<td class="data-td data last">1.21</td>
<td class="data-td data last">2.36</td>
<td class="data-td data last">-0.85</td>
</tr>
<tr class="tbl-data">
<td class="data-td last">Tesla Inc</td>
<td class="data-td data last">&nbsp;</td>
<td class="data-td data last">1.42</td>
<td class="data-td data last">-1.42</td>
<td class="data-td data last">101.72</td>
<td class="data-td data last">&nbsp;</td>
<td class="data-td data last">0.92</td>
<td class="data-td data last">-0.67</td>
</tr>
<tr class="tbl-data">
<td class="data-td last">Meta Platforms Inc</td>
<td class="data-td data last">2.04</td>
<td class="data-td data last">1.36</td>
<td class="data-td data last">0.68</td>
<td class="data-td data last">194.13</td>
<td class="data-td data last">3.25</td>
<td class="data-td data last">1.43</td>
<td class="data-td data last">-1.89</td>
</tr>
<tr class="tbl-data">
<td class="data-td last">Total</td>
<td class="data-td data last font-weight-bold">8.95</td>
<td class="data-td data last font-weight-bold">22.52</td>
<td class="data-td data last font-weight-bold">-13.57</td>
<td class="data-td data last font-weight-bold">&nbsp;</td>
<td class="data-td data last font-weight-bold">8.55</td>
<td class="data-td data last font-weight-bold">13.37</td>
<td class="data-td data last font-weight-bold">-1.95</td>
</tr>
<tr class="tbl-data">
<td class="data-td last text-right" colspan="5">2023 Total Return %:</td>
<td class="data-td data last">32.41</td>
<td class="data-td data last">26.43</td>
<td class="data-td data last">&nbsp;</td>
</tr>
<tr class="tbl-data">
<td class="data-td last text-right" colspan="5">% of 2023 Total Return From "Magnificent 7":</td>
<td class="data-td data last">26.38</td>
<td class="data-td data last">50.59</td>
<td class="data-td data last">&nbsp;</td>
</tr>
</tbody>
</table>
</div>
<br />
<p class="chart-disclosure">Source: Morningstar, as of December 2023. Data Time Period: 1/1/2023 to 12/31/2023. Index performance is not illustrative of fund performance. It is not possible to invest directly in an index.</p>
<p>However, these 7 mega-cap stocks only represent an 8.95% weighting in the Morningstar Wide Moat Focus Index (as of December 31, 2023). Yet, despite the performance headwind of nearly 2% from this 13.57% underweight to the Magnificent 7, the Morningstar Wide Moat Focus Index (the Moat Index) posted strong absolute returns in 2023 and handily outperformed the Morningstar US Market Index by 5.97% in 2023.</p>
<p>The Moat Index employs an equally-weighted index methodology which makes it&rsquo;s 2023 success even more impressive. In a year dominated by mega cap stocks, equal-weighted indexes generally lagged their market capitalization-weighted equivalent. Despite this second headwind, the Moat Index&rsquo;s process shined.</p>
<div class="wrapped-div">
<table style="width: 100%;">
<tbody>
<tr class="tbl-data">
<td class="tbl-header last">Index Name</td>
<td class="tbl-header last" style="text-align: center;">Trailing 1-Year</td>
<td class="tbl-header last" style="text-align: center;">Trailing 3-Year</td>
<td class="tbl-header last" style="text-align: center;">Trailing 5-Year</td>
<td class="tbl-header last" style="text-align: center;">Trailing 10-Year</td>
<td class="tbl-header last" style="text-align: center;">Live Inception</td>
</tr>
<tr class="tbl-data">
<td class="data-td last">Morningstar Wide Moat Focus Index</td>
<td class="data-td data last">32.41</td>
<td class="data-td data last">12.84</td>
<td class="data-td data last">17.53</td>
<td class="data-td data last">13.48</td>
<td class="data-td data last">12.68</td>
</tr>
<tr class="tbl-data">
<td class="data-td last">Morningstar US Market Index</td>
<td class="data-td data last">26.43</td>
<td class="data-td data last">8.62</td>
<td class="data-td data last">15.25</td>
<td class="data-td data last">11.60</td>
<td class="data-td data last">9.41</td>
</tr>
<tr class="tbl-data">
<td class="data-td last">+/-</td>
<td class="data-td data last">5.97</td>
<td class="data-td data last">4.22</td>
<td class="data-td data last">2.28</td>
<td class="data-td data last">1.88</td>
<td class="data-td data last">3.27</td>
</tr>
</tbody>
</table>
</div>
<br />
<div class="wrapped-div">
<table style="width: 100%;">
<tbody>
<tr class="tbl-data">
<td class="tbl-header last">Index Name</td>
<td class="tbl-header last" style="text-align: center;">2007</td>
<td class="tbl-header last" style="text-align: center;">2008</td>
<td class="tbl-header last" style="text-align: center;">2009</td>
<td class="tbl-header last" style="text-align: center;">2010</td>
<td class="tbl-header last" style="text-align: center;">2011</td>
<td class="tbl-header last" style="text-align: center;">2012</td>
<td class="tbl-header last" style="text-align: center;">2013</td>
<td class="tbl-header last" style="text-align: center;">2014</td>
<td class="tbl-header last" style="text-align: center;">2015</td>
<td class="tbl-header last" style="text-align: center;">2016</td>
<td class="tbl-header last" style="text-align: center;">2017</td>
<td class="tbl-header last" style="text-align: center;">2018</td>
<td class="tbl-header last" style="text-align: center;">2019</td>
<td class="tbl-header last" style="text-align: center;">2020</td>
<td class="tbl-header last" style="text-align: center;">2021</td>
<td class="tbl-header last" style="text-align: center;">2022</td>
<td class="tbl-header last" style="text-align: center;">2023</td>
</tr>
<tr class="tbl-data">
<td class="data-td last">Morningstar Wide Moat Focus Index</td>
<td class="data-td data last">-5.39</td>
<td class="data-td data last">-19.58</td>
<td class="data-td data last">46.93</td>
<td class="data-td data last">8.57</td>
<td class="data-td data last">6.61</td>
<td class="data-td data last">24.50</td>
<td class="data-td data last">31.46</td>
<td class="data-td data last">9.68</td>
<td class="data-td data last">-4.28</td>
<td class="data-td data last">22.37</td>
<td class="data-td data last">23.79</td>
<td class="data-td data last">-0.74</td>
<td class="data-td data last">35.65</td>
<td class="data-td data last">15.09</td>
<td class="data-td data last">24.81</td>
<td class="data-td data last">-13.08</td>
<td class="data-td data last">32.41</td>
</tr>
<tr class="tbl-data">
<td class="data-td last">Morningstar US Market Index</td>
<td class="data-td data last">2.47</td>
<td class="data-td data last">-37.03</td>
<td class="data-td data last">28.45</td>
<td class="data-td data last">16.80</td>
<td class="data-td data last">1.58</td>
<td class="data-td data last">16.27</td>
<td class="data-td data last">33.13</td>
<td class="data-td data last">12.85</td>
<td class="data-td data last">0.69</td>
<td class="data-td data last">12.44</td>
<td class="data-td data last">21.47</td>
<td class="data-td data last">-5.05</td>
<td class="data-td data last">31.22</td>
<td class="data-td data last">20.90</td>
<td class="data-td data last">25.78</td>
<td class="data-td data last">-19.43</td>
<td class="data-td data last">26.43</td>
</tr>
<tr class="tbl-data">
<td class="data-td last">+/-</td>
<td class="data-td data last">-7.85</td>
<td class="data-td data last">17.46</td>
<td class="data-td data last">18.48</td>
<td class="data-td data last">-8.23</td>
<td class="data-td data last">5.03</td>
<td class="data-td data last">8.24</td>
<td class="data-td data last">-1.68</td>
<td class="data-td data last">-3.17</td>
<td class="data-td data last">-4.97</td>
<td class="data-td data last">9.93</td>
<td class="data-td data last">2.32</td>
<td class="data-td data last">4.31</td>
<td class="data-td data last">4.43</td>
<td class="data-td data last">-5.81</td>
<td class="data-td data last">-0.98</td>
<td class="data-td data last">6.35</td>
<td class="data-td data last">5.97</td>
</tr>
</tbody>
</table>
</div>
<br />
<p class="chart-disclosure">Source: Morningstar, December 2023. Data Time Period: 2/14/2007 &ndash; 12/31/2023. Index performance is not illustrative of fund performance. It is not possible to invest directly in an index.</p>
<p>Longer term, the Moat Index&rsquo;s focus on identifying companies with wide economic moat ratings has paid off. The Morningstar Wide Moat Focus Index has now outperformed the Morningstar US Market Indexover six of the last eight years. Equally as impressive, the Moat Index has outperformed the Morningstar US Market Index in 66% of the 12-month rolling periods since it&rsquo;s 2007 inception.</p>
<p>The Morningstar equity research team recently conducted a detailed analysis of the Wide Moat Focus Index&rsquo;s 2023 performance and positioning. In addition to the performance breakdown outlined above, highlights of this analysis include:</p>
<ul class="content-list">
<li><strong>Attribution analysis</strong>: Both sector positioning and stock selection proved favorable in 2023.</li>
<li><strong>Valuation analysis</strong>: Despite recent outperformance, the index continues to offer an attractive discount to fair value.</li>
<li><strong>Sector positioning</strong>: Sector weightings drifted toward a more defensive posture in 2023.</li>
<li><strong>Style &amp; market cap analysis</strong>: The index migrated toward a value style bias and smaller on the market cap spectrum.</li>
<li><strong>Holdings highlights</strong>: Meta Platforms, Salesforce and MarketAxess stood out as strong performers in 2023.</li>
</ul>
<p><a href="/us/en/blogs/moat-investing/bloated-index-returns-no-match-for-moat/morningstar-wide-moat-focus-index-2023-year-in-review.pdf" title="Morningstar Wide Moat Focus Index: 2023 Year in Review
" target="_blank" rel="noopener"><strong>Click here to read the full report from Morningstar</strong></a> and visit the <a href="https://www.vaneck.com/us/en/investments/morningstar-wide-moat-etf-moat/overview/" title="VanEck Morningstar Wide Moat ETF - MOAT - Overview"><strong>VanEck Morningstar Wide Moat ETF</strong></a> overview page to learn more about MOAT.</p>
<p>To receive more <strong><a href="https://www.vaneck.com/us/en/insights/moat-investing/" title="Moat Investing Insights">Moat Investing</a></strong> insights, <strong><a href="https://www.vaneck.com/us/en/subscribe/" title="Preference Center">sign up in our subscription center</a></strong>.</p>
<style>
    .wrapped-div {
        max-width: 100%;
    }

    @media (max-width: 1440px){
        .wrapped-div {
            overflow-x: scroll;
        }
    }

    .wrapped-div-sector {
        max-width: 100%;
        overflow-x: scroll;
    }
</style>
]]></content:encoded>
</item><item rdf:about="https://www.vaneck.com/us/en/blogs/income-investing/get-to-know-clos-with-william-sokol/">
  <title>Get to Know CLOs with William Sokol></title>
  <link>https://www.vaneck.com/us/en/blogs/income-investing/get-to-know-clos-with-william-sokol/</link>
  <description><![CDATA[With CLOI&rsquo;s two-year anniversary approaching next year, we take a closer look at why this ETF is drawing so much interest.]]></description>
  <dc:creator>William Sokol</dc:creator>
  <dc:date>01/30/2024 06:30:00</dc:date>
<content:encoded><![CDATA[

<p><i>Given their higher relative yields, &ldquo;built-in&rdquo; risk protection and historical outperformance in periods of rising rates, collateralized loan obligations (CLOs) are becoming an increasingly important component of broader fixed income portfolios. Like we have done in other asset classes, VanEck, in partnership with PineBridge, is proud to have brought the power of CLOs to more investors with the creation of the <a href="https://www.vaneck.com/us/en/investments/clo-etf-cloi/overview/" title="CLOI - VanEck CLO ETF - Overview "><strong>VanEck CLO ETF (CLOI)</strong></a>. In this Q&amp;A, William Sokol will answer top-of-mind questions from investors on our CLOI ETF.</i></p>
<ul class="content-list">
<li><a href="#what-sparked-the-idea-of-creating-a-clo-etf"><strong>What sparked the idea of creating a CLO ETF?</strong></a></li>
<li><a href="#who-stands-to-benifit-from-cloi"><strong>Who stands to benefit from CLOI?</strong></a></li>
<li><a href="#what-is-clos-investment-focus"><strong>What is CLOI&rsquo;s investment focus within the CLO spectrum?</strong></a></li>
<li><a href="#how-has-cloi-performed"><strong>How has CLOI performed in the current market environment?</strong></a></li>
<li><a href="#how-will-cloi-performed"><strong>How will CLOs perform if the Fed lowers rates in 2024?</strong></a></li>
<li><a href="#what-are-the-benefits"><strong>What are the benefits of an actively managed CLO fund?</strong></a></li>
<li><a href="#how-do-you-address-liquidity-concerns"><strong>How do you address liquidity concerns in stressful market conditions?</strong></a></li>
<li><a href="#has-cloi-experienced-any-defaults"><strong>Has CLOI experienced any defaults?</strong></a></li>
<li><a href="#why-do-you-think-there-is such-a-significant-interest-in-clos"><strong>Why do you think there is such a significant interest in CLOs currently?</strong></a></li>
</ul>
<h2 id="what-sparked-the-idea-of-creating-a-clo-etf" class="anchored-block">What sparked the idea of creating a CLO ETF?</h2>
<p>We began exploring the CLO ETF concept following a regulatory shift in the U.S., which made it feasible to consider strategies with greater exposure to securitized asset classes like CLOs. More importantly, this regulatory change coincided with the significant growth of the CLO market, which had expanded to a global size of over $1 trillion. Additionally, the changing rate environment and the attractive yields offered by CLOs, especially when compared to traditional corporate bonds, further fueled the interest in this strategy.</p>
<h2 id="who-stands-to-benifit-from-cloi" class="anchored-block">Who stands to benefit from CLOI?</h2>
<p>We believe all types of investors stand to benefit from accessing CLOs through an ETF. Until recently, it has been difficult for most investors to add exposure to CLOs. The market is largely institutional, and investors such as banks, insurance companies and hedge funds often purchase CLOs directly or invest through institutional separate accounts, which can carry a minimum investment of $50M to $100M. Actively managed multi-sector or core bond funds may include an allocation to CLOs, but investors cannot control the level of exposure and it may vary significantly over time.</p>
<p>Our CLOI ETF presents a compelling option for institutional investors who are currently already investing in investment grade CLO tranches, providing a way to access this asset class with greater liquidity and transparency. We also believe CLOI is attractive to a whole new set of non-institutional investors who have never been able to access CLOs. CLOI allows retail investors and their financial advisors to incorporate the benefits of investment grade CLOs that institutional investors have long enjoyed: <a href="https://www.vaneck.com/us/en/blogs/income-investing/income-investing/the-power-of-clos-higher-yields-and-built-in-risk-protection/" title="The Power of CLOs: Higher Yields and Built-In Risk Protection"><strong>attractive yields relative to similarly rated bonds and loans, and a high degree of safety thanks to their built-in risk protections</strong></a>.</p>
<h2 id="what-is-clos-investment-focus" class="anchored-block">What is CLOI&rsquo;s investment focus within the CLO spectrum?</h2>
<p>The ETF invests primarily in investment-grade CLO tranches, ensuring high-quality exposure. However, it maintains the flexibility to invest a small portion of the portfolio in BB-rated tranches if there is value in lower rated tranches.</p>
<p>We partnered with PineBridge on CLOI as they bring decades of experience in the CLO market and have been managing a strategy similar to CLOI for their institutional clients for many years. They take an active approach, and in addition to rigorous bottom-up security selection they also aim to add value from a top-down perspective by adding exposure to lower rated tranches when appropriate, and scaling back risk as needed by concentrating more in AAAs and AAs based on market conditions and their outlook. Currently, the portfolio is conservatively aligned, with the majority invested in AAA-rated CLOs.</p>
<h2 id="how-has-cloi-performed" class="anchored-block">How has CLOI performed in the current market environment?</h2>
<p>CLOI&rsquo;s year-to-date return is 8.64%<sup>1</sup>, outperforming many other fixed income classes in 2023. Looking ahead, we believe high carry and fairly robust credit conditions can continue to support this strong performance. If the Fed maintains rates or even if they cut a few times in 2024, we believe the carry that investors are earning will remain very attractive. Even if CLO spreads were to widen to levels that we saw in March 2020 with COVID, CLO investors could still have a positive year in 2023 because of the high level of carry. But this is a dynamic strategy that can adapt to changing credit fundamentals and interest rate scenarios.</p>
<h2 id="how-will-cloi-performed" class="anchored-block">How will CLOs perform if the Fed lowers rates in 2024?</h2>
<p>Investors should understand that <a href="https://www.vaneck.com/us/en/blogs/income-investing/clos-not-just-for-rising-rates/" title="CLOs: Not Just For Rising Rates"><strong>CLOs are not just a hedge against rising rates</strong></a>. They also have historically provided higher levels of income for a lower level of risk &ndash; making a clear case for a strategic allocation, regardless of Fed policy. They&rsquo;ve consistently provided a significant spread pickup against similarly rated corporates. The majority of the current yield pickup right now is coming from that spread pickup rather than the high level of short-term rates. And CLOs have very low correlation to the broad U.S. investment grade market, so there are significant diversification benefits from a strategic allocation.</p>
<p>If the Fed ends up cutting more aggressively in 2024 than the market is expecting, we would expect that to coincide with a risk-off environment. That could push value into lower rated CLO tranches, and allow investors to capture high absolute yields as well as attractive upside opportunities. But in order to take advantage of that scenario, you need an active approach that can invest across the CLO cap stack.</p>
<h2 id="what-are-the-benefits" class="anchored-block">What are the benefits of an actively managed CLO fund?</h2>
<p>CLOs are one asset class that we feel is crucial for investors to take an active approach. Replicating an index of CLOs is incredibly difficult. In addition, the asset class is not homogenous and there are significant opportunities to add value through security selection and top-down positioning. But you need specialized knowledge and experience to identify these opportunities. Keep in mind that just one single CLO can have over 300 underlying loans. You need a manager who can drill down and analyze the portfolio at the individual loan-level, in addition to analyzing the CLO manager and understanding and stress-testing the structure itself.</p>
<h2 id="how-do-you-address-liquidity-concerns" class="anchored-block">How do you address liquidity concerns in stressful market conditions?</h2>
<p>Given the ability for investors to redeem daily in an ETF, liquidity is absolutely a key consideration in structuring the portfolio.</p>
<p>The CLO market has grown significantly and is now over $1.2 trillion in size, which is similar in size to the U.S. high yield market. There is a very active secondary market, and we see a high degree of liquidity particularly in senior tranches. The market has been tested several times in recent years, including COVID and just last year when U.K. liability driven investment (LDI) strategies became forced sellers. In that instance, LDI managers chose to sell senior tranches in size because that&rsquo;s where they were able to get liquidity, and they found plenty of demand from other investors. Accordingly, we have confidence that there is sufficient liquidity in the CLO market and our focus on investment grade tranches means we are focusing on the most liquid part of the capital structure.</p>
<h2 id="has-cloi-experienced-any-defaults" class="anchored-block">Has CLOI experienced any defaults?</h2>
<p>No, the portfolio has not experienced any defaults, and the risk of default losses when investing in senior CLO tranches is very low due to structural protections and the nature of the underlying loans. The strong historical performance of CLOs is a testament to the built-in risk protections of CLOs, which starts with the nature of its underlying collateral. Leveraged loans (the underlying collateral of CLOs) are senior secured, meaning they have the senior-most claim on all the issuer&rsquo;s assets in the event of a bankruptcy. Historically, leveraged loans&rsquo; senior secured status has resulted in lower loss rates compared to unsecured high-yield bonds.</p>
<p>In addition to the attractive risk profile and active management of its underlying collateral, the structure of CLOs helps mitigate risk. For example, investment grade tranches benefit from subordination provided by more junior tranches, and various collateral tests help to ensure high overall credit quality of the portfolio and that more senior tranches get paid before junior tranches if the underlying loan portfolio deteriorates in quality.</p>
<p>As a result, default risk is not the primary concern when investing in senior CLO tranches. You would need to experience default rates in the underlying loan portfolio that are several multiples of the long-term average for multiple consecutive years in a row to have a first-dollar loss even in BBB rated CLOs. That being said, investors need to understand that there is spread risk and downgrade risk which can be driven by deterioration in the underlying loan portfolio, which can result in mark-to-market losses in periods of volatility. This can be mitigated by scrutinizing the underlying loan portfolio to make sure there is comfort with the underlying issuers and sector exposures, and through careful manager selection.</p>
<h2 id="why-do-you-think-there-is such-a-significant-interest-in-clos" class="anchored-block">Why do you think there is such a significant interest in CLOs currently?</h2>
<p>The combination of high yields, absence of rate risk, and structural features providing insulation against deteriorating credit fundamentals makes CLOs highly attractive. Their performance as a fixed income asset class, especially considering risk-adjusted returns, has piqued investor interest.</p>
<p>We believe income investors can benefit from a portfolio that provides a diversified income stream that provides an attractive return relative to the degree of risk taken. <a href="https://www.vaneck.com/us/en/blogs/income-investing/why-we-like-clos-amid-a-fed-pause/" title="Why We Like CLOs Amid a Fed Pause"><strong>As we have written about previously</strong></a>, CLOs are not simply a hedge against rising rates, although like all floating rate asset classes, investors have benefited in the current environment. Because they provide higher spreads than similarly rated corporates and provide built-in risk protections, they have historically provided high levels of income for a lower level of risk. As a result, more investors are considering a strategic position in CLOs within a core bond portfolio &ndash; not just in times of rising interest rates.</p>
<div class="wrapped-div">
<table style="width: 100%;">
<tbody>
<tr class="tbl-data">
<td class="tbl-header last" colspan="9">Average Annual Total Returns<sup>*</sup>&nbsp;(%) as of December 31, 2023</td>
</tr>
<tr class="tbl-data">
<td class="data-td last">&nbsp;</td>
<td class="data-head last">1 Month</td>
<td class="data-head last">3 Month</td>
<td class="data-head last">YTD</td>
<td class="data-head last">1 Year</td>
<td class="data-head last">3 Year</td>
<td class="data-head last">5 Year</td>
<td class="data-head last">10 Year</td>
<td class="data-head last">LIFE 6/21/2022</td>
</tr>
<tr class="tbl-data">
<td class="data-td last">CLOI (NAV)</td>
<td class="data-td data last">0.81</td>
<td class="data-td data last">2.06</td>
<td class="data-td data last">9.37</td>
<td class="data-td data last">-</td>
<td class="data-td data last">8.28</td>
</tr>
<tr class="tbl-data">
<td class="data-td last">CLOI (Share Price)</td>
<td class="data-td data last">0.66</td>
<td class="data-td data last">1.81</td>
<td class="data-td data last">8.93</td>
<td class="data-td data last">-</td>
<td class="data-td data last">8.20</td>
</tr>
<tr class="tbl-data">
<td class="data-td last">J.P. Morgan Collateralized Loan Obligation Index</td>
<td class="data-td data last">1.09</td>
<td class="data-td data last">2.69</td>
<td class="data-td data last">10.54</td>
<td class="data-td data last">-</td>
<td class="data-td data last">8.65</td>
</tr>
</tbody>
</table>
</div>
<br />
<p class="chart-disclosure"><sup>*</sup>&nbsp;Returns less than one year are not annualized.</p>
<p class="chart-disclosure"><strong>The performance data quoted represents past performance. Past performance is not a guarantee of future results. Investment return and principal value of an investment will fluctuate so that an investor's shares, when redeemed, may be worth more or less than their original cost. Performance may be lower or higher than performance data quoted. Please call 800.826.2333 or visit vaneck.com for performance current to the most recent month ended.</strong></p>
<p class="chart-disclosure"><strong>The gross expense ratio for CLOI is 0.4%. CLOI Fees &amp; Expenses: Van Eck Associates Corporation (the &ldquo;Adviser&rdquo;) will pay all expenses of the Fund, except for the fee payment under the investment management agreement, acquired fund fees and expenses, interest expense, offering costs, trading expenses, taxes and extraordinary expenses. Notwithstanding the foregoing, the Adviser has agreed to pay the offering costs until at least May 1, 2024.</strong></p>
<p class="chart-disclosure"><strong>The net expense ratio for CLOI is 0.4%.</strong></p>
<p class="chart-disclosure">The "Net Asset Value" (NAV) of a Fund is determined at the close of each business day, and represents the dollar value of one share of the fund; it is calculated by taking the total assets of the fund, subtracting total liabilities, and dividing by the total number of shares outstanding. The NAV is not necessarily the same as the ETF 's intraday trading value. Investors should not expect to buy or sell shares at NAV.</p>
<p>To receive more <a href="https://www.vaneck.com/us/en/insights/income-investing/" title="Income Investing insights"><strong>Income Investing</strong></a> insights, <a href="https://www.vaneck.com/us/en/subscribe/" title=" Subscription Center"><strong>sign up in our subscription center</strong></a>.</p>
<style type="text/css">
    .wrapped-div {
    max-width: 100%;
    }
   
    @media (max-width: 1024px) {
    .wrapped-div {
    overflow-x: scroll;
    }
    }
   
    .wrapped-div-sector {
    max-width: 100%;
    overflow-x: scroll;
    }
   </style>
]]></content:encoded>
</item><item rdf:about="https://www.vaneck.com/us/en/blogs/natural-resources/beyond-the-trees-documentary-film-festival-success/">
  <title>Beyond the Trees Documentary: Film Festival Success></title>
  <link>https://www.vaneck.com/us/en/blogs/natural-resources/beyond-the-trees-documentary-film-festival-success/</link>
  <description><![CDATA[Hear about exciting updates for the <i>Beyond the Trees</i> documentary, including film festival awards and upcoming events.]]></description>
  <dc:creator>Tom Butcher</dc:creator>
  <dc:date>01/30/2024 06:30:00</dc:date>
<content:encoded><![CDATA[

<h2>Looking Back</h2>
<p>In April last year, I wrote about being <a href="https://www.vaneck.com/us/en/blogs/sustainable-investing/beyond-the-trees-behind-the-scenes-with-tom-butcher/" title="Beyond the Trees: Behind the Scenes"><strong>behind the scenes</strong></a> during the making of a new documentary, <a href="https://beyondthetrees.org/" title="Beyond The Trees" target="_blank" rel="noopener"><i><strong>Beyond the Trees</strong></i></a>, a film that tells the story of the <a href="/link/fa91f1ee7fb547f693b4f4c078f5834e.aspx" title="The Forest Project"><strong>van Eck Forests</strong></a> in northern California and Oregon. I started by saying that the film was soon to &ldquo;hit the big screens at a number of film festivals&rdquo; and ended by saying, &ldquo;I believe <i>Beyond the Trees</i> achieves everything we set out to accomplish.&rdquo; I still believe this. And so do others, it appears. We hit those film festival screens in a pretty big way!</p>
<h2>Film Festival Success</h2>
<p>At the time of writing in January 2024, the film&rsquo;s latest success is its nomination for the Best of the Festival Award at the Paramount Film Festival Los Angeles. Our friends and colleagues at <strong><a href="https://imaginaryforces.com/" title="Imaginary Forces" target="_blank" rel="noopener">Imaginary Forces</a></strong> (IF) will be there on Saturday, February 24, to see if we have won an award.</p>
<p>This nomination is just the latest in a line of awards and recognition we&rsquo;ve been honored to receive over the last year since my colleague, Naomi Zimmermann, started assiduously entering us in select film festivals here in the U.S.</p>
<p>The Paramount Film Festival aside, these are the laurels we have won:</p>
<div class="wrapped-div">
<table style="width: 75%;">
<tbody>
<tr class="tbl-data">
<td class="tbl-header last">Festival</td>
<td class="tbl-header last">Recognition</td>
</tr>
<tr class="tbl-data">
<td class="data-td data last" style="text-align: left;">Big Sur Film Festival</td>
<td class="data-td data last" style="text-align: left;">Winner for Best Documentary Short - February 2023</td>
</tr>
<tr class="tbl-data">
<td class="data-td data last" style="text-align: left;">Los Angeles Documentary Film Festival</td>
<td class="data-td data last" style="text-align: left;">Winner for Best Environmental Film</td>
</tr>
<tr class="tbl-data">
<td class="data-td data last" style="text-align: left;">Documentary Feedback Film Festival</td>
<td class="data-td data last" style="text-align: left;">Official Selection</td>
</tr>
<tr class="tbl-data">
<td class="data-td data last" style="text-align: left;">Nature Now Film Festival</td>
<td class="data-td data last" style="text-align: left;">Official Selection</td>
</tr>
<tr class="tbl-data">
<td class="data-td data last" style="text-align: left;">Oregon Documentary Film Festival</td>
<td class="data-td data last" style="text-align: left;">Official Selection</td>
</tr>
<tr class="tbl-data">
<td class="data-td data last" style="text-align: left;">Silicon Beach Film Festival</td>
<td class="data-td data last" style="text-align: left;">Official Selection</td>
</tr>
<tr class="tbl-data">
<td class="data-td data last" style="text-align: left;">Venice Shorts</td>
<td class="data-td data last" style="text-align: left;">Official Selection</td>
</tr>
</tbody>
</table>
</div>
<br />
<p><img loading="lazy" class="img-responsive w-100" src="https://www.vaneck.com/contentassets/7a240eb3c791479abe1c6fe12395fb72/2024.01-tn-bytt-awards-960x540px.jpg" alt="Laurels" /></p>
<h2>Private Screenings</h2>
<p>Whilst the festivals have been busy screening <i>Beyond the Trees</i>, so too have we. <strong><a href="https://www.pacificforest.org/" title="Pacific Forest Trust" target="_blank" rel="noopener">Pacific Forest Trust</a></strong> (PFT) kicked off our screenings in May last year in San Francisco in a cool and well-known caf&eacute; and event space called Manny&rsquo;s in the Mission. As with subsequent screenings mentioned below, there was a Q&amp;A session with Laurie Wayburn (President of PFT), Anthony Gibbs (the film&rsquo;s director from IF) and me. The film was greeted warmly and appreciatively, many questions were answered and, overall, a great time was had by all. This seems to have been the story ever since.</p>
<p>Amongst other screenings, IF (and IMAX) hosted a wonderful showing of the film at the private movie theatre at IMAX&rsquo;s headquarters in Playa Vista in Los Angeles. Although not shot in IMAX format, the film was truly breathtaking on the big screen with superb quality, as testimony to IF&rsquo;s work (as if we needed it). There were absolutely <i>no</i> pixilation issues, even with the screen being so huge. The film further made its way around California in September when it was shown at Future Proof Festival, a wealth management conference, in Huntington Beach. In October, on our home turf in New York, we at VanEck hosted our own screening, on a <i>much</i> smaller screen, at a venue down in Chelsea.</p>
<p><img loading="lazy" class="img-responsive w-100" src="https://www.vaneck.com/contentassets/7a240eb3c791479abe1c6fe12395fb72/2023-bytt-sanfran-event.jpg" alt="Chip Houghton (IF), Anthony Gibbs (IF), Laurie Wayburn (PFT), and Tom Butcher (VanEck) answer questions following a screening in San Francisco, CA, in May 2023." /></p>
<p class="chart-disclosure">Chip Houghton (IF), Anthony Gibbs (IF), Laurie Wayburn (PFT), and Tom Butcher (VanEck) answer questions following a screening in San Francisco, CA, in May 2023.</p>
<p><img loading="lazy" class="img-responsive w-100" src="https://www.vaneck.com/contentassets/7a240eb3c791479abe1c6fe12395fb72/2023-bytt-huntington-beach-ca.jpg" alt="Jan van Eck (VanEck), Tom Butcher (VanEck), and Laurie Wayburn (PFT) host a Q and A at Future Proof Festival in Huntington Beach, CA, in September 2023." /></p>
<p class="chart-disclosure">Jan van Eck (VanEck), Tom Butcher (VanEck), and Laurie Wayburn (PFT) host a Q&amp;A at Future Proof Festival in Huntington Beach, CA, in September 2023.</p>
<p><img loading="lazy" class="img-responsive w-100" src="https://www.vaneck.com/contentassets/7a240eb3c791479abe1c6fe12395fb72/2023-bytt-gallowgreen-event.jpg" alt="Anthony Gibbs (IF), Laurie Wayburn (PFT), and Tom Butcher (VanEck) at the documentary screening in New York, NY, in October 2023." /></p>
<p class="chart-disclosure">Anthony Gibbs (IF), Laurie Wayburn (PFT), and Tom Butcher (VanEck) at the documentary screening in New York, NY, in October 2023.</p>
<h2>Upcoming Event: London, March 2024</h2>
<p>For anyone who may be in London in March and can make it, Economist Impact is hosting its 9th annual Sustainability Week from Monday, March 4, to Wednesday, March 6. On Wednesday afternoon, we will be closing the three-day event at its final plenary session with both a screening of <i>Beyond the Trees</i> and a short Q&amp;A session. Laurie, Anthony and I will all be there. So, see if you can make it too!</p>
<h2>Going Forward</h2>
<p>Whilst we continue to submit <i>Beyond the Trees</i> to relevant documentary film festivals, we are also looking at providing it publicly on or soon after Earth Day on April 22, 2024.</p>
<p>The trailer of <i>Beyond the Trees</i> can be found <a href="https://beyondthetrees.org/" title="Beyond The Trees" target="_blank" rel="noopener"><strong>here</strong></a>.</p>
<style type="text/css">
    .wrapped-div {
        max-width: 100%;
    }

    @media (max-width: 1240px) {
        .wrapped-div {
            overflow-x: scroll;
        }
    }

    .wrapped-div-sector {
        max-width: 100%;
        overflow-x: scroll;
    }
</style>
<p>To receive more <a href="/us/en/insights/natural-resources/" title="Natural Resources Insights"><strong>Natural Resources</strong></a> insights, <a href="https://www.vaneck.com/us/en/subscribe/" title="Subscription Center"><strong>sign up in our subscription center</strong></a>.</p>
]]></content:encoded>
</item><item rdf:about="https://www.vaneck.com/us/en/blogs/income-investing/fallen-angels-watching-sectors-quality-and-carry-in-2024/">
  <title>Fallen Angels: Watching Sectors, Quality and Carry in 2024></title>
  <link>https://www.vaneck.com/us/en/blogs/income-investing/fallen-angels-watching-sectors-quality-and-carry-in-2024/</link>
  <description><![CDATA[2024 returns will likely be driven by carry, with sector and quality differences driving potential outperformance versus broad high yield. An uptick in fallen angels may provide further support.]]></description>
  <dc:creator>Nicolas  Fonseca, CFA</dc:creator>
  <dc:date>01/29/2024 06:30:00</dc:date>
<content:encoded><![CDATA[

<p>Despite a resurgence in the fourth quarter, fallen angels (as represented by the ICE US Fallen Angel High Yield 10% Constrained Index, &ldquo;H0CF&rdquo;) lagged the broader high-yield market (as represented by the ICE BofA US High Yield Index, &ldquo;H0A0&rdquo;) by 0.22% in 2023, posting returns of 13.24% compared to 13.46%. The Q4 rebound can be primarily linked to the decline in U.S. bond yields by the end of December, which was accompanied by a sharp rally in credit spreads. Despite this late-stage recovery, the year-to-date underperformance of fallen angels was largely due to their limited exposure to lower quality bonds that offered higher carry throughout the year. The CCC &amp; Lower rated index posted a return of 20.36%, the Single-B Index recorded 13.96%, and the BB index registered 11.44% for the entire calendar year.</p>
<h3>2023 Returns</h3>
<p><img class="img-responsive w-100" src="https://www.vaneck.com/contentassets/85bc28e9e16942d58d4cd3684e229103/4008_angl_chart_1_blog_2024-01_v1.svg" alt="Bar chart comparing 2023 total returns of Fallen Angels and Broad HY" /></p>
<p class="chart-disclosure">Source: ICE Data Services, VanEck. Past performance is no guarantee of future results.</p>
<p>According to Citi, credit ETFs experienced approximately $14.4bn in inflows while U.S. Government ETFs saw $5.9bn in outflows in December. High Yield corporate ETFs experienced another $4.3bn in inflows, matching November&rsquo;s figure. There continues to be a shift into Intermediate and Long durations ETFs as they both attracted approximately $25bn, while Ultra-Short and Short duration strategies saw another month of outflows of approximately $5bn. These flows indicate a recent shift among investors towards adding credit and duration risk back into their portfolios.</p>
<p id="2023-in-review" class="jump-link-nav anchored-block" data-jumplink-title="2023 Year in Review"><strong><u>2023 in Review:</u></strong> We were not off when writing <a href="https://www.vaneck.com/us/en/blogs/income-investing/can-fallen-angels-soar-again-in-2023/" title="Can Fallen Angels Soar Again in 2023?"><strong>last year</strong></a> that the 2023 story was going to be the U.S. Federal Reserve (Fed), spreads and rating upgrades.</p>
<p>In 2023, Fallen angels delivered a 13.24% return for the year, marking the 7th best performance in the last 20 calendar years. Over the past two decades, fallen angels have outperformed the broad high-yield market in 14 out of 20 calendar years, including seven out of 11 years with significant interest rate increases. However, they experienced underperformance in the last two calendar years, although they built some momentum over Q4.</p>
<p>Growth expectations and the impact on the yield curve were crucial, especially after the Fed's presumed pause in the second part of the year. Despite an inverted curve in 2023, signs indicate that the likelihood of a &ldquo;soft landing&rdquo; may have increased. Interestingly, the 10-year yield was flat for the year at 3.88% despite significant volatility, fluctuating between its lows of 3.30% in April and highs of 4.98% in mid-October. As the Fed Funds rate increased from approximately 0.25% to approximately 5.50% from March 2022 through July 2023, the 10-year yield changed by 1.65% (from 2.32% to 3.97%), with fallen angels underperforming by 1.17% (-1.76% vs -0.59%), driven largely by the higher interest rate duration of fallen angels. Fallen angel spreads were relatively flat throughout this period, increasing by just 18bps to 280, however, they oscillated between 248 (lows in April 2022) and 442 (highs in July 2022).</p>
<p>Rating migrations contributed to the fallen angel index market value decreasing to approximately $67bn. 14 rising stars, constituting 45.88% of market value, were removed while 13 fallen angels added 21.24% to the index market value. Sector exposures shifted significantly with Energy, Retail and Telecom now comprising the top-3 (42.14%) while the Auto sector was removed following Ford&rsquo;s upgrade.</p>
<p>Although rating exposure remains concentrated in BBs at 81%, there was a small decrease from 87%; Single-B and CCC and lower-rated exposures increased to 19% from 13%.</p>
<p id="2024-story" class="jump-link-nav anchored-block" data-jumplink-title="2024 Story"><strong><u>2024 Story: Rate Cuts, Rating Migrations and Returns Post Fed Pause:</u></strong> The strong rally at year-end pulled some of this year&rsquo;s total return potential into last year, and we believe further price appreciation from rates or spreads is limited for now. Accordingly, we expect returns to be driven primarily by carry. Relative performance versus broad high yield will likely be driven by quality and sector differences until we see a material impact from new fallen angels. We think the increase in Real Estate sector downgrades is notable and could continue, and there is potential for idiosyncratic downgrades in coming quarters.</p>
<p>Investors will continue to keep a close eye on the Fed and the timing of potential rate cuts. While the Fed indicated the likelihood of cuts in 2024 during their December meeting, the path forward is still uncertain, and rates will remain restrictive for some time. We anticipate continued scrutiny of data such as personal consumption expenditures (PCE), inflation, growth outlook, labor market indicators and unemployment rates before any adjustments are made. The market continues to price in more aggressive and faster rate cuts than what the Fed&rsquo;s &ldquo;dot plot&rdquo; indicates, and upside inflation surprises or continued strength in wages and employment could result in sharp adjustments in market yields. We expect volatility to continue.</p>
<p>After the year-end rally in spreads (and rates), we see few catalysts for much lower levels. At the same time, it is hard to identify imminent drivers of significantly wider spreads, although we do expect some widening as corporate balance sheets slowly reflect the impact of higher funding costs. But that may take several quarters to materialize. We do not necessarily think long-term yields have much more room to decline based on current economic data. This year&rsquo;s returns may generally be in line with current (and still historically elevated) yield levels, although we do anticipate bouts of volatility.</p>
<p>However, a sharper pivot than expected, either driven by an economic shock or geopolitical events, would likely be accompanied by a spike in credit spreads as recessionary concerns increase. In such a scenario, fallen angels could outperform broad high yield due to both their higher quality and the tailwind of a longer duration. A recession would also increase the likelihood of a meaningful increase in new fallen angels, which has historically been a driver of outperformance.</p>
<p>We expect a lower level of rising stars as the reversal of the 2020 downgrade wave appears to be behind us. Credit migration forecasts generally call for fallen angels outpacing rising stars in 2024. Despite the strength of balance sheets for high-yield issuers, there are signs of weakening fundamentals and a significant amount of investment grade debt on the cusp of high yield. Per JP Morgan, there was approximately $800bn of BBB- rated debt at the end of 2023 with approximately 23% one notch away from high yield.</p>
<p>Last, we looked at how HY has performed post a Fed pause and believe fallen angels are poised for positive returns as they are approximately 81% BBs, which tend to outperform the lower rated buckets on average, over the following 3 months, 6 months and 1-year periods. Since December 1996, the Fed has paused its hiking cycle on five occasions: March 1997, May 2000, June 2006, December 2018 and July 2023. On average, the pause lasted approximately 12 months which was then followed by a rate cut. During the year following a Fed pause, BBs have posted double digits three out of four times and have never posted a negative return.</p>
<div class="wrapped-div">
<table style="width: 75%;">
<tbody>
<tr class="tbl-data">
<td class="tbl-header last">Cumulative Forward Returns Avg</td>
<td class="tbl-header last" style="text-align: center;">BB</td>
<td class="tbl-header last" style="text-align: center;">Single-B</td>
<td class="tbl-header last" style="text-align: center;">CCC &amp; Lower</td>
</tr>
<tr class="tbl-data">
<td class="data-td last">3m</td>
<td class="data-td data last">3.69%</td>
<td class="data-td data last">3.59%</td>
<td class="data-td data last">2.65%</td>
</tr>
<tr class="tbl-data">
<td class="data-td last">6m</td>
<td class="data-td data last">7.48%</td>
<td class="data-td data last">5.07%</td>
<td class="data-td data last">4.24%</td>
</tr>
<tr class="tbl-data">
<td class="data-td last">1Y</td>
<td class="data-td data last">13.38%</td>
<td class="data-td data last">10.31%</td>
<td class="data-td data last">8.88%</td>
</tr>
</tbody>
</table>
</div>
<br />
<p class="chart-disclosure">Source: , ICE Data Services, VanEck. Past performance is no guarantee of future results.</p>
<p id="fallen-angel-statistic" class="jump-link-nav anchored-block" data-jumplink-title="Fallen Angels Statistics"><strong><u>Fallen Angels Overall Statistics:</u></strong> In 2023, fallen angels' yield declined by 46 basis points in December and 159 basis points from late October highs, ending the year at 6.99%. Spreads for both indices decreased, remaining approximately 175 basis points below their all-time averages. Duration for fallen angels decreased until Q4, when it increased due to the exit of Ford and the addition of Walgreens. Longer duration could potentially be advantageous if rates continue to decline. The market value of the fallen angel index increased in December, with the addition of the two new fallen angels. Broad HY saw another issuer default (ASP AMC) this past month. with $500m par outstanding, adding to 15 issuer defaults in 2023 accounting for approximately $16bn in par, compared to only just one issuer default in the fallen angel index (Bed Bath and Beyond) with $628m par amount in the index.</p>
<div class="wrapped-div">
<table style="width: 100%;">
<tbody>
<tr class="tbl-data">
<td class="tbl-header last text-center">&nbsp;</td>
<td class="tbl-header last text-center" style="border-right: outset;" colspan="5">Fallen Angel</td>
<td class="tbl-header last text-center" colspan="5">Broad HY</td>
</tr>
<tr class="tbl-data">
<td class="data-head last">&nbsp;</td>
<td class="data-head last">12/31/22</td>
<td class="data-head last">3/31/23</td>
<td class="data-head last">6/30/23</td>
<td class="data-head last">9/30/23</td>
<td class="data-head last" style="border-right: outset;">12/31/23</td>
<td class="data-head last">12/31/22</td>
<td class="data-head last">3/31/23</td>
<td class="data-head last">6/30/23</td>
<td class="data-head last">9/30/23</td>
<td class="data-head last">12/31/23</td>
</tr>
<tr class="tbl-data">
<td class="data-td last">Yield to Worst</td>
<td class="data-td data last">7.49</td>
<td class="data-td data last">7.08</td>
<td class="data-td data last">7.35</td>
<td class="data-td data last">8.02</td>
<td class="data-td data last" style="border-right: outset;">6.99</td>
<td class="data-td data last">8.98</td>
<td class="data-td data last">8.49</td>
<td class="data-td data last">8.56</td>
<td class="data-td data last">8.94</td>
<td class="data-td data last">7.69</td>
</tr>
<tr class="tbl-data">
<td class="data-td last">Effective Duration</td>
<td class="data-td data last">5.45</td>
<td class="data-td data last">5.30</td>
<td class="data-td data last">4.98</td>
<td class="data-td data last">4.90</td>
<td class="data-td data last" style="border-right: outset;">5.41</td>
<td class="data-td data last">4.04</td>
<td class="data-td data last">3.83</td>
<td class="data-td data last">3.65</td>
<td class="data-td data last">3.64</td>
<td class="data-td data last">3.31</td>
</tr>
<tr class="tbl-data">
<td class="data-td last">Full Market Value ($mn)</td>
<td class="data-td data last">112,854</td>
<td class="data-td data last">114,776</td>
<td class="data-td data last">84,590</td>
<td class="data-td data last">78,279</td>
<td class="data-td data last" style="border-right: outset;">67,821</td>
<td class="data-td data last">1,199,909</td>
<td class="data-td data last">1,234,319</td>
<td class="data-td data last">1,218,316</td>
<td class="data-td data last">1,201,541</td>
<td class="data-td data last">1,237,721</td>
</tr>
<tr class="tbl-data">
<td class="data-td last">OAS</td>
<td class="data-td data last">337</td>
<td class="data-td data last">325</td>
<td class="data-td data last">297</td>
<td class="data-td data last">314</td>
<td class="data-td data last" style="border-right: outset;">285</td>
<td class="data-td data last">481</td>
<td class="data-td data last">458</td>
<td class="data-td data last">405</td>
<td class="data-td data last">403</td>
<td class="data-td data last">339</td>
</tr>
<tr class="tbl-data">
<td class="data-td last">No. of Issues</td>
<td class="data-td data last">212</td>
<td class="data-td data last">206</td>
<td class="data-td data last">163</td>
<td class="data-td data last">159</td>
<td class="data-td data last" style="border-right: outset;">143</td>
<td class="data-td data last">1,927</td>
<td class="data-td data last">1,916</td>
<td class="data-td data last">1,870</td>
<td class="data-td data last">1,872</td>
<td class="data-td data last">1,837</td>
</tr>
</tbody>
</table>
</div>
<br />
<p class="chart-disclosure">Source: ICE Data Services, VanEck. Fallen Angels: ICE US Fallen Angel High Yield 10% Constrained Index. Broad HY: ICE BofA US High Yield Index. OAS refers to &ldquo;option-adjusted spread.&rdquo; Please see definition for this and other terms referenced herein in the disclosures and definitions portion of this blog. Past performance is no guarantee of future results. Index performance is not representative of fund performance. It is not possible to invest in an index.</p>
<p><strong><u>New Fallen Angels:</u></strong> Two new fallen angels: Vornado Realty &ndash; the second REIT of the year &ndash; and Walgreens entered the index in December, making 2023 a year with 13 fallen angels and adding 21.24% to the index. Vornado Realty was downgraded by Moody&rsquo;s to Ba1 from Baa3 in early December following Fitch&rsquo;s downgrade in August, reflecting the challenges related to the leasing and financing markets. Walgreens was also downgraded by Moody&rsquo;s to Ba2 from Baa3, reflecting its high financial leverage and the elevated risk that it faces as it implements initiatives to try and reverse the loss of its U.S. healthcare segment. The market value for all 13 issues was $21bn, which was double the 2022 and 2021 figures (approximate $10bn), making it a good year in terms of volume, however, it was overshadowed by the large number of rising stars.</p>
<div class="wrapped-div">
<table style="width: 100%;">
<tbody>
<tr class="tbl-data">
<td class="tbl-header last">Month-end Addition</td>
<td class="tbl-header last text-center">Name</td>
<td class="tbl-header last text-center">Rating</td>
<td class="tbl-header last text-center">Sector</td>
<td class="tbl-header last text-center">Industry</td>
<td class="tbl-header last text-center">% Mkt Value</td>
<td class="tbl-header last text-center">Price</td>
</tr>
<tr class="tbl-data">
<td class="data-td last font-weight-normal">February</td>
<td class="data-td data last">Entegris Escrow Corp</td>
<td class="data-td data last">BB1</td>
<td class="data-td data last">Technology &amp; Electronics</td>
<td class="data-td data last">Electronics</td>
<td class="data-td data last">1.39</td>
<td class="data-td data last">90.92</td>
</tr>
<tr class="tbl-data">
<td class="data-td last font-weight-normal">March</td>
<td class="data-td data last">First Republic Bank</td>
<td class="data-td data last">B3</td>
<td class="data-td data last">Banking</td>
<td class="data-td data last">0.40</td>
<td class="data-td data last">54.63</td>
</tr>
<tr class="tbl-data">
<td class="data-td last font-weight-normal">March</td>
<td class="data-td data last">Nissan Motor Acceptance</td>
<td class="data-td data last">BB1</td>
<td class="data-td data last">Automotive</td>
<td class="data-td data last">Auto Loans</td>
<td class="data-td data last">2.57</td>
<td class="data-td data last">87.19</td>
</tr>
<tr class="tbl-data">
<td class="data-td last font-weight-normal">March</td>
<td class="data-td data last">Nissan Motor</td>
<td class="data-td data last">BB1</td>
<td class="data-td data last">Automotive</td>
<td class="data-td data last">Automakers</td>
<td class="data-td data last">5.49</td>
<td class="data-td data last">92.98</td>
</tr>
<tr class="tbl-data">
<td class="data-td last font-weight-normal">April</td>
<td class="data-td data last">Crane NXT</td>
<td class="data-td data last">BB3</td>
<td class="data-td data last">Capital Goods</td>
<td class="data-td data last">Diversified Capital Goods</td>
<td class="data-td data last">0.24</td>
<td class="data-td data last">70.99</td>
</tr>
<tr class="tbl-data">
<td class="data-td last font-weight-normal">April</td>
<td class="data-td data last">Rogers Communications</td>
<td class="data-td data last">BB2</td>
<td class="data-td data last">Telecommunications</td>
<td class="data-td data last">Telecom - Wireless</td>
<td class="data-td data last">0.65</td>
<td class="data-td data last">90.35</td>
</tr>
<tr class="tbl-data">
<td class="data-td last font-weight-normal">April</td>
<td class="data-td data last">Western Alliance Bancorporation</td>
<td class="data-td data last">BB1</td>
<td class="data-td data last">Banking</td>
<td class="data-td data last">0.44</td>
<td class="data-td data last">76.39</td>
</tr>
<tr class="tbl-data">
<td class="data-td last font-weight-normal">August</td>
<td class="data-td data last">Associated Banc-Corp</td>
<td class="data-td data last">BB1</td>
<td class="data-td data last">Banking</td>
<td class="data-td data last">0.33</td>
<td class="data-td data last">95.69</td>
</tr>
<tr class="tbl-data">
<td class="data-td last font-weight-normal">August</td>
<td class="data-td data last">Valley National Bancorp</td>
<td class="data-td data last">BB1</td>
<td class="data-td data last">Banking</td>
<td class="data-td data last">0.33</td>
<td class="data-td data last">79.84</td>
</tr>
<tr class="tbl-data">
<td class="data-td last font-weight-normal">September</td>
<td class="data-td data last">Brandywine Operating Partnership L.P.</td>
<td class="data-td data last">BB1</td>
<td class="data-td data last">Real Estate</td>
<td class="data-td data last">REITs</td>
<td class="data-td data last">1.86</td>
<td class="data-td data last">87.29</td>
</tr>
<tr class="tbl-data">
<td class="data-td last font-weight-normal">September</td>
<td class="data-td data last">Port of Newcastle Investments Financing Pty Limited</td>
<td class="data-td data last">BB1</td>
<td class="data-td data last">Transportation</td>
<td class="data-td data last">Transport Infrastructure/Services</td>
<td class="data-td data last">0.36</td>
<td class="data-td data last">82.79</td>
</tr>
<tr class="tbl-data">
<td class="data-td last font-weight-normal">December</td>
<td class="data-td data last">Vornado Realty Lp</td>
<td class="data-td data last">BB1</td>
<td class="data-td data last">Real Estate</td>
<td class="data-td data last">REITs</td>
<td class="data-td data last">1.59</td>
<td class="data-td data last">88.99</td>
</tr>
<tr class="tbl-data">
<td class="data-td last font-weight-normal">December</td>
<td class="data-td data last">Walgreens Boots Alliance Inc.</td>
<td class="data-td data last">BB1</td>
<td class="data-td data last">Retail</td>
<td class="data-td data last">Food &amp; Drug Retailers</td>
<td class="data-td data last">5.59</td>
<td class="data-td data last">85.58</td>
</tr>
</tbody>
</table>
</div>
<br />
<p class="chart-disclosure">Source: ICE Data Services, VanEck. Fallen Angels: ICE US Fallen Angel High Yield 10% Constrained Index. Past performance is no guarantee of future results. Not a recommendation to buy or sell any of the names/securities mentioned herein. Index performance is not representative of fund performance. It is not possible to invest in an index.</p>
<p><strong><u>Rising Stars:</u></strong> No rising stars in December, but in 2023 there were 14 issuers, totaling 45.88% of market value, that were removed from the fallen angel index due to upgrades to investment grade. This figure was much higher than the previous two years, as 2022 saw only eight issuers (18.36% removed) while 2021 had 12 issuers (12.13% removed). The expectation for the new year is a much lighter pipeline for upgrades, as much of the rising star wave appears to be behind us.</p>
<div class="wrapped-div">
<table style="width: 100%;">
<tbody>
<tr class="tbl-data">
<td class="tbl-header last">Month-end Exit</td>
<td class="tbl-header last text-center">Name</td>
<td class="tbl-header last text-center">Rating</td>
<td class="tbl-header last text-center">Sector</td>
<td class="tbl-header last text-center">Industry</td>
<td class="tbl-header last text-center">% Mkt Value</td>
<td class="tbl-header last text-center">Price</td>
</tr>
<tr class="tbl-data">
<td class="data-td last font-weight-normal">February</td>
<td class="data-td data last">Autopistas Metropolitanas de Puerto Rico LLC</td>
<td class="data-td data last">BB1</td>
<td class="data-td data last">Transportation</td>
<td class="data-td data last">Transport Infrastructure/Services</td>
<td class="data-td data last">0.35</td>
<td class="data-td data last">100.49</td>
</tr>
<tr class="tbl-data">
<td class="data-td last font-weight-normal">February</td>
<td class="data-td data last">Nokia Corp</td>
<td class="data-td data last">BB1</td>
<td class="data-td data last">Technology &amp; Electronics</td>
<td class="data-td data last">Tech Hardware &amp; Equipment</td>
<td class="data-td data last">0.47</td>
<td class="data-td data last">97.50</td>
</tr>
<tr class="tbl-data">
<td class="data-td last font-weight-normal">March</td>
<td class="data-td data last">Western Midstream</td>
<td class="data-td data last">BB1</td>
<td class="data-td data last">Energy</td>
<td class="data-td data last">Gas Distribution</td>
<td class="data-td data last">5.27</td>
<td class="data-td data last">90.44</td>
</tr>
<tr class="tbl-data">
<td class="data-td last font-weight-normal">April</td>
<td class="data-td data last">Sprint Capital Corp</td>
<td class="data-td data last">BB1</td>
<td class="data-td data last">Telecommunications</td>
<td class="data-td data last">Telecom - Wireless</td>
<td class="data-td data last">4.70</td>
<td class="data-td data last">114.25</td>
</tr>
<tr class="tbl-data">
<td class="data-td last font-weight-normal">May</td>
<td class="data-td data last">Mattel Inc.</td>
<td class="data-td data last">BB2</td>
<td class="data-td data last">Consumer Goods</td>
<td class="data-td data last">Personal &amp; Household Products</td>
<td class="data-td data last">0.45</td>
<td class="data-td data last">85.32</td>
</tr>
<tr class="tbl-data">
<td class="data-td last font-weight-normal">May</td>
<td class="data-td data last">Nissan Motor Acceptance</td>
<td class="data-td data last">BB1</td>
<td class="data-td data last">Automotive</td>
<td class="data-td data last">Auto Loans</td>
<td class="data-td data last">2.67</td>
<td class="data-td data last">85.12</td>
</tr>
<tr class="tbl-data">
<td class="data-td last font-weight-normal">May</td>
<td class="data-td data last">Nissan Motor</td>
<td class="data-td data last">BB1</td>
<td class="data-td data last">Automotive</td>
<td class="data-td data last">Automakers</td>
<td class="data-td data last">5.57</td>
<td class="data-td data last">88.49</td>
</tr>
<tr class="tbl-data">
<td class="data-td last font-weight-normal">May</td>
<td class="data-td data last">Occidental Petroleum Corp</td>
<td class="data-td data last">BB1</td>
<td class="data-td data last">Energy</td>
<td class="data-td data last">Energy - Exploration &amp; Production</td>
<td class="data-td data last">8.69</td>
<td class="data-td data last">93.82</td>
</tr>
<tr class="tbl-data">
<td class="data-td last font-weight-normal">June</td>
<td class="data-td data last">APA Corp</td>
<td class="data-td data last">BB1</td>
<td class="data-td data last">Energy</td>
<td class="data-td data last">Energy - Exploration &amp; Production</td>
<td class="data-td data last">3.84</td>
<td class="data-td data last">82.69</td>
</tr>
<tr class="tbl-data">
<td class="data-td last font-weight-normal">July</td>
<td class="data-td data last">Western Digital Corp</td>
<td class="data-td data last">BB1</td>
<td class="data-td data last">Technology &amp; Electronics</td>
<td class="data-td data last">Tech Hardware &amp; Equipment</td>
<td class="data-td data last">0.99</td>
<td class="data-td data last">76.97</td>
</tr>
<tr class="tbl-data">
<td class="data-td last font-weight-normal">August</td>
<td class="data-td data last">Howmet Aerospace Inc</td>
<td class="data-td data last">BB1</td>
<td class="data-td data last">Capital Goods</td>
<td class="data-td data last">Aerospace/Defense</td>
<td class="data-td data last">2.04</td>
<td class="data-td data last">99.55</td>
</tr>
<tr class="tbl-data">
<td class="data-td last font-weight-normal">September</td>
<td class="data-td data last">Patterson-UTI Energy Inc.</td>
<td class="data-td data last">BB1</td>
<td class="data-td data last">Energy</td>
<td class="data-td data last">Oil Field Equipment &amp; Services</td>
<td class="data-td data last">1.07</td>
<td class="data-td data last">90.37</td>
</tr>
<tr class="tbl-data">
<td class="data-td last font-weight-normal">November</td>
<td class="data-td data last">Ford Motor Company</td>
<td class="data-td data last">BB1</td>
<td class="data-td data last">Automotive</td>
<td class="data-td data last">Automakers</td>
<td class="data-td data last">4.29</td>
<td class="data-td data last">90.34</td>
</tr>
<tr class="tbl-data">
<td class="data-td last font-weight-normal">November</td>
<td class="data-td data last">Ford Motor Credit Company</td>
<td class="data-td data last">BB1</td>
<td class="data-td data last">Automotive</td>
<td class="data-td data last">Auto Loans</td>
<td class="data-td data last">5.49</td>
<td class="data-td data last">95.26</td>
</tr>
</tbody>
</table>
</div>
<br />
<p class="chart-disclosure">Source: ICE Data Services, VanEck. Fallen Angels: ICE US Fallen Angel High Yield 10% Constrained Index. Past performance is no guarantee of future results. Not a recommendation to buy or sell any of the names/securities mentioned herein. Index performance is not representative of fund performance. It is not possible to invest in an index.</p>
<p><strong><u>Fallen Angels Performance by Sector:</u></strong> All sectors registered positive returns for the year, with Telecom leading at 20.58% year-to-date, while Banking had the lowest return at 4.00%. Throughout the year, rating migrations reshaped the sector composition of the fallen angel index. Auto was removed from the index due to removal of Ford. Energy reduced its exposure from approximately 28% to approximately 15% due to several rising stars. Real Estate increased from approximately 5% to approximately 9% as two REITs were downgraded, making it a sector worth monitoring, given continued pressures in the commercial real estate sector. Retail now stands as the second-largest industry with a 14.38% exposure after Walgreens entered the index, while Telecom remains a substantial exposure. Real Estate is the only sector with a notably wide spread (greater than 500bps), reflecting continued concerns in commercial real estate. The index finished the year with an average price of $91.20.</p>
<div class="wrapped-div-full">
<table style="width: 100%;">
<tbody>
<tr class="tbl-data">
<td class="tbl-header last text-center">&nbsp;</td>
<td class="tbl-header last text-center" style="border-right: outset;" colspan="5">Wgt (%)</td>
<td class="tbl-header last text-center" style="border-right: outset;" colspan="5">OAS</td>
<td class="tbl-header last text-center" style="border-right: outset;" colspan="5">Price</td>
<td class="tbl-header last text-center" colspan="2">Total Return (%)</td>
</tr>
<tr class="tbl-data">
<td class="data-head last">&nbsp;</td>
<td class="data-head last">12/31/21</td>
<td class="data-head last">3/31/23</td>
<td class="data-head last">6/30/23</td>
<td class="data-head last">9/30/23</td>
<td class="data-head last" style="border-right: outset;">12/31/23</td>
<td class="data-head last">12/31/21</td>
<td class="data-head last">3/31/23</td>
<td class="data-head last">6/30/23</td>
<td class="data-head last">9/30/23</td>
<td class="data-head last" style="border-right: outset;">12/31/23</td>
<td class="data-head last">12/31/21</td>
<td class="data-head last">3/31/23</td>
<td class="data-head last">6/30/23</td>
<td class="data-head last">9/30/23</td>
<td class="data-head last" style="border-right: outset;">12/31/23</td>
<td class="data-head last">YTD</td>
<td class="data-head last">MTD</td>
</tr>
<tr class="tbl-data">
<td class="data-td last">Automotive<sup>*</sup></td>
<td class="data-td data last">10.00</td>
<td class="data-td data last">18.06</td>
<td class="data-td data last">10.00</td>
<td class="data-td data last" style="border-right: outset;">&nbsp;</td>
<td class="data-td data last">262</td>
<td class="data-td data last">246</td>
<td class="data-td data last">211</td>
<td class="data-td data last">206</td>
<td class="data-td data last" style="border-right: outset;">&nbsp;</td>
<td class="data-td data last">91.35</td>
<td class="data-td data last">92.21</td>
<td class="data-td data last">92.99</td>
<td class="data-td data last">91.16</td>
<td class="data-td data last" style="border-right: outset;">&nbsp;</td>
<td class="data-td data last">6.31</td>
<td class="data-td data last">&nbsp;</td>
</tr>
<tr class="tbl-data">
<td class="data-td last">Banking</td>
<td class="data-td data last">3.81</td>
<td class="data-td data last">3.99</td>
<td class="data-td data last">3.20</td>
<td class="data-td data last">4.34</td>
<td class="data-td data last" style="border-right: outset;">4.79</td>
<td class="data-td data last">302</td>
<td class="data-td data last">415</td>
<td class="data-td data last">376</td>
<td class="data-td data last">279</td>
<td class="data-td data last" style="border-right: outset;">231</td>
<td class="data-td data last">96.85</td>
<td class="data-td data last">87.61</td>
<td class="data-td data last">88.57</td>
<td class="data-td data last">92.02</td>
<td class="data-td data last" style="border-right: outset;">97.91</td>
<td class="data-td data last">4.00</td>
<td class="data-td data last">5.37</td>
</tr>
<tr class="tbl-data">
<td class="data-td last">Basic Industry</td>
<td class="data-td data last">1.36</td>
<td class="data-td data last">1.33</td>
<td class="data-td data last">1.93</td>
<td class="data-td data last">1.92</td>
<td class="data-td data last" style="border-right: outset;">1.70</td>
<td class="data-td data last">226</td>
<td class="data-td data last">227</td>
<td class="data-td data last">168</td>
<td class="data-td data last">178</td>
<td class="data-td data last" style="border-right: outset;">171</td>
<td class="data-td data last">92.17</td>
<td class="data-td data last">93.85</td>
<td class="data-td data last">94.44</td>
<td class="data-td data last">93.53</td>
<td class="data-td data last" style="border-right: outset;">97.24</td>
<td class="data-td data last">10.33</td>
<td class="data-td data last">2.10</td>
</tr>
<tr class="tbl-data">
<td class="data-td last">Capital Goods</td>
<td class="data-td data last">5.12</td>
<td class="data-td data last">5.10</td>
<td class="data-td data last">7.66</td>
<td class="data-td data last">5.86</td>
<td class="data-td data last" style="border-right: outset;">5.85</td>
<td class="data-td data last">279</td>
<td class="data-td data last">240</td>
<td class="data-td data last">195</td>
<td class="data-td data last">250</td>
<td class="data-td data last" style="border-right: outset;">200</td>
<td class="data-td data last">95.01</td>
<td class="data-td data last">98.54</td>
<td class="data-td data last">96.85</td>
<td class="data-td data last">92.44</td>
<td class="data-td data last" style="border-right: outset;">97.34</td>
<td class="data-td data last">11.83</td>
<td class="data-td data last">2.71</td>
</tr>
<tr class="tbl-data">
<td class="data-td last">Consumer Goods</td>
<td class="data-td data last">3.07</td>
<td class="data-td data last">3.00</td>
<td class="data-td data last">3.62</td>
<td class="data-td data last">3.82</td>
<td class="data-td data last" style="border-right: outset;">4.33</td>
<td class="data-td data last">275</td>
<td class="data-td data last">255</td>
<td class="data-td data last">298</td>
<td class="data-td data last">271</td>
<td class="data-td data last" style="border-right: outset;">230</td>
<td class="data-td data last">88.90</td>
<td class="data-td data last">91.27</td>
<td class="data-td data last">89.31</td>
<td class="data-td data last">88.24</td>
<td class="data-td data last" style="border-right: outset;">94.29</td>
<td class="data-td data last">11.85</td>
<td class="data-td data last">3.14</td>
</tr>
<tr class="tbl-data">
<td class="data-td last">Energy</td>
<td class="data-td data last">27.93</td>
<td class="data-td data last">22.16</td>
<td class="data-td data last">15.28</td>
<td class="data-td data last">14.45</td>
<td class="data-td data last" style="border-right: outset;">14.75</td>
<td class="data-td data last">293</td>
<td class="data-td data last">303</td>
<td class="data-td data last">297</td>
<td class="data-td data last">288</td>
<td class="data-td data last" style="border-right: outset;">259</td>
<td class="data-td data last">88.13</td>
<td class="data-td data last">90.05</td>
<td class="data-td data last">88.74</td>
<td class="data-td data last">87.48</td>
<td class="data-td data last" style="border-right: outset;">92.49</td>
<td class="data-td data last">14.67</td>
<td class="data-td data last">3.99</td>
</tr>
<tr class="tbl-data">
<td class="data-td last">Financial Services</td>
<td class="data-td data last">0.65</td>
<td class="data-td data last">0.64</td>
<td class="data-td data last">0.94</td>
<td class="data-td data last">0.98</td>
<td class="data-td data last" style="border-right: outset;">1.14</td>
<td class="data-td data last">540</td>
<td class="data-td data last">506</td>
<td class="data-td data last">459</td>
<td class="data-td data last">420</td>
<td class="data-td data last" style="border-right: outset;">378</td>
<td class="data-td data last">77.20</td>
<td class="data-td data last">80.27</td>
<td class="data-td data last">80.92</td>
<td class="data-td data last">79.51</td>
<td class="data-td data last" style="border-right: outset;">86.41</td>
<td class="data-td data last">18.63</td>
<td class="data-td data last">4.60</td>
</tr>
<tr class="tbl-data">
<td class="data-td last">Healthcare</td>
<td class="data-td data last">3.02</td>
<td class="data-td data last">3.03</td>
<td class="data-td data last">4.33</td>
<td class="data-td data last">4.62</td>
<td class="data-td data last" style="border-right: outset;">4.10</td>
<td class="data-td data last">362</td>
<td class="data-td data last">304</td>
<td class="data-td data last">281</td>
<td class="data-td data last">299</td>
<td class="data-td data last" style="border-right: outset;">270</td>
<td class="data-td data last">83.56</td>
<td class="data-td data last">86.47</td>
<td class="data-td data last">86.82</td>
<td class="data-td data last">84.72</td>
<td class="data-td data last" style="border-right: outset;">88.73</td>
<td class="data-td data last">13.75</td>
<td class="data-td data last">2.30</td>
</tr>
<tr class="tbl-data">
<td class="data-td last">Insurance</td>
<td class="data-td data last">0.85</td>
<td class="data-td data last">0.82</td>
<td class="data-td data last">1.15</td>
<td class="data-td data last">1.20</td>
<td class="data-td data last" style="border-right: outset;">1.32</td>
<td class="data-td data last">347</td>
<td class="data-td data last">364</td>
<td class="data-td data last">358</td>
<td class="data-td data last">366</td>
<td class="data-td data last" style="border-right: outset;">323</td>
<td class="data-td data last">92.10</td>
<td class="data-td data last">92.99</td>
<td class="data-td data last">91.39</td>
<td class="data-td data last">87.81</td>
<td class="data-td data last" style="border-right: outset;">94.10</td>
<td class="data-td data last">8.73</td>
<td class="data-td data last">3.74</td>
</tr>
<tr class="tbl-data">
<td class="data-td last">Leisure</td>
<td class="data-td data last">7.88</td>
<td class="data-td data last">7.79</td>
<td class="data-td data last">10.42</td>
<td class="data-td data last">7.87</td>
<td class="data-td data last" style="border-right: outset;">7.90</td>
<td class="data-td data last">325</td>
<td class="data-td data last">243</td>
<td class="data-td data last">182</td>
<td class="data-td data last">257</td>
<td class="data-td data last" style="border-right: outset;">228</td>
<td class="data-td data last">89.95</td>
<td class="data-td data last">93.25</td>
<td class="data-td data last">93.34</td>
<td class="data-td data last">89.37</td>
<td class="data-td data last" style="border-right: outset;">93.21</td>
<td class="data-td data last">13.86</td>
<td class="data-td data last">2.65</td>
</tr>
<tr class="tbl-data">
<td class="data-td last">Real Estate</td>
<td class="data-td data last">5.13</td>
<td class="data-td data last">4.72</td>
<td class="data-td data last">6.22</td>
<td class="data-td data last">8.37</td>
<td class="data-td data last" style="border-right: outset;">9.07</td>
<td class="data-td data last">697</td>
<td class="data-td data last">701</td>
<td class="data-td data last">602</td>
<td class="data-td data last">660</td>
<td class="data-td data last" style="border-right: outset;">675</td>
<td class="data-td data last">79.46</td>
<td class="data-td data last">80.72</td>
<td class="data-td data last">80.99</td>
<td class="data-td data last">80.86</td>
<td class="data-td data last" style="border-right: outset;">82.72</td>
<td class="data-td data last">12.77</td>
<td class="data-td data last">1.07</td>
</tr>
<tr class="tbl-data">
<td class="data-td last">Retail</td>
<td class="data-td data last">5.67</td>
<td class="data-td data last">5.49</td>
<td class="data-td data last">7.79</td>
<td class="data-td data last">7.98</td>
<td class="data-td data last" style="border-right: outset;">14.38</td>
<td class="data-td data last">471</td>
<td class="data-td data last">474</td>
<td class="data-td data last">354</td>
<td class="data-td data last">368</td>
<td class="data-td data last" style="border-right: outset;">242</td>
<td class="data-td data last">73.75</td>
<td class="data-td data last">74.72</td>
<td class="data-td data last">82.35</td>
<td class="data-td data last">78.48</td>
<td class="data-td data last" style="border-right: outset;">86.39</td>
<td class="data-td data last">17.84</td>
<td class="data-td data last">5.10</td>
</tr>
<tr class="tbl-data">
<td class="data-td last">Services</td>
<td class="data-td data last">0.38</td>
<td class="data-td data last">0.37</td>
<td class="data-td data last">0.53</td>
<td class="data-td data last">0.57</td>
<td class="data-td data last" style="border-right: outset;">0.64</td>
<td class="data-td data last">388</td>
<td class="data-td data last">368</td>
<td class="data-td data last">356</td>
<td class="data-td data last">309</td>
<td class="data-td data last" style="border-right: outset;">243</td>
<td class="data-td data last">87.11</td>
<td class="data-td data last">89.89</td>
<td class="data-td data last">88.62</td>
<td class="data-td data last">88.75</td>
<td class="data-td data last" style="border-right: outset;">94.78</td>
<td class="data-td data last">14.72</td>
<td class="data-td data last">3.73</td>
</tr>
<tr class="tbl-data">
<td class="data-td last">Technology &amp; Electronics</td>
<td class="data-td data last">4.20</td>
<td class="data-td data last">4.67</td>
<td class="data-td data last">6.21</td>
<td class="data-td data last">5.57</td>
<td class="data-td data last" style="border-right: outset;">6.22</td>
<td class="data-td data last">327</td>
<td class="data-td data last">287</td>
<td class="data-td data last">269</td>
<td class="data-td data last">262</td>
<td class="data-td data last" style="border-right: outset;">194</td>
<td class="data-td data last">85.47</td>
<td class="data-td data last">88.19</td>
<td class="data-td data last">86.89</td>
<td class="data-td data last">87.23</td>
<td class="data-td data last" style="border-right: outset;">94.14</td>
<td class="data-td data last">14.29</td>
<td class="data-td data last">3.92</td>
</tr>
<tr class="tbl-data">
<td class="data-td last">Telecommunications</td>
<td class="data-td data last">11.91</td>
<td class="data-td data last">11.68</td>
<td class="data-td data last">10.61</td>
<td class="data-td data last">11.53</td>
<td class="data-td data last" style="border-right: outset;">13.00</td>
<td class="data-td data last">423</td>
<td class="data-td data last">433</td>
<td class="data-td data last">475</td>
<td class="data-td data last">418</td>
<td class="data-td data last" style="border-right: outset;">366</td>
<td class="data-td data last">90.04</td>
<td class="data-td data last">91.39</td>
<td class="data-td data last">84.92</td>
<td class="data-td data last">84.95</td>
<td class="data-td data last" style="border-right: outset;">92.22</td>
<td class="data-td data last">20.58</td>
<td class="data-td data last">4.38</td>
</tr>
<tr class="tbl-data">
<td class="data-td last">Transportation</td>
<td class="data-td data last">2.10</td>
<td class="data-td data last">1.78</td>
<td class="data-td data last">2.59</td>
<td class="data-td data last">3.14</td>
<td class="data-td data last" style="border-right: outset;">2.09</td>
<td class="data-td data last">279</td>
<td class="data-td data last">231</td>
<td class="data-td data last">150</td>
<td class="data-td data last">203</td>
<td class="data-td data last" style="border-right: outset;">209</td>
<td class="data-td data last">90.49</td>
<td class="data-td data last">92.69</td>
<td class="data-td data last">94.75</td>
<td class="data-td data last">91.70</td>
<td class="data-td data last" style="border-right: outset;">94.92</td>
<td class="data-td data last">16.30</td>
<td class="data-td data last">2.76</td>
</tr>
<tr class="tbl-data">
<td class="data-td last">Utility</td>
<td class="data-td data last">6.93</td>
<td class="data-td data last">5.38</td>
<td class="data-td data last">7.52</td>
<td class="data-td data last">7.77</td>
<td class="data-td data last" style="border-right: outset;">8.71</td>
<td class="data-td data last">213</td>
<td class="data-td data last">206</td>
<td class="data-td data last">165</td>
<td class="data-td data last">175</td>
<td class="data-td data last" style="border-right: outset;">139</td>
<td class="data-td data last">89.95</td>
<td class="data-td data last">90.19</td>
<td class="data-td data last">89.90</td>
<td class="data-td data last">86.28</td>
<td class="data-td data last" style="border-right: outset;">92.18</td>
<td class="data-td data last">9.27</td>
<td class="data-td data last">3.24</td>
</tr>
<tr class="tbl-data">
<td class="data-td last">Total</td>
<td class="data-td data last">100</td>
<td class="data-td data last" style="border-right: outset;">100</td>
<td class="data-td data last">337</td>
<td class="data-td data last">325</td>
<td class="data-td data last">297</td>
<td class="data-td data last">314</td>
<td class="data-td data last" style="border-right: outset;">285</td>
<td class="data-td data last">87.91</td>
<td class="data-td data last">89.51</td>
<td class="data-td data last">88.78</td>
<td class="data-td data last">86.69</td>
<td class="data-td data last" style="border-right: outset;">91.20</td>
<td class="data-td data last">13.24</td>
<td class="data-td data last">3.51</td>
</tr>
</tbody>
</table>
</div>
<p class="chart-disclosure">Source: ICE Data Services, VanEck.&nbsp;<sup>*</sup>Does not have securities for all months of selected periods. Returns are based on partial period data. Fallen Angels: ICE US Fallen Angel High Yield 10% Constrained Index. Not intended as a recommendation to invest or divest in any of the sectors mentioned herein. Index performance is not representative of fund performance. It is not possible to invest in an index.</p>
<p><strong><u>Fallen Angels Performance by Rating:</u></strong> In 2023, CCC-rated fallen angels outperformed its higher rated peers, posting a 33.88% return, followed by Single-Bs (15.52%) and BBs (12.19%). Broad HY saw comparable results with lower quality high yield bonds outperforming its highly rated peers which, with a higher exposure, outperformed fallen angels for the year. We are keeping an eye on Single-Bs, as the price is above its all-time average of $92.28.</p>
<div class="wrapped-div">
<table style="width: 100%;">
<tbody>
<tr class="tbl-data">
<td class="tbl-header last text-center">&nbsp;</td>
<td class="tbl-header last text-center" style="border-right: outset;" colspan="5">Wgt (%)</td>
<td class="tbl-header last text-center" style="border-right: outset;" colspan="5">OAS</td>
<td class="tbl-header last text-center" style="border-right: outset;" colspan="5">Price</td>
<td class="tbl-header last text-center" colspan="2">Total Return (%)</td>
</tr>
<tr class="tbl-data">
<td class="data-head last">&nbsp;</td>
<td class="data-head last">12/31/22</td>
<td class="data-head last">3/31/23</td>
<td class="data-head last">6/30/23</td>
<td class="data-head last">9/30/23</td>
<td class="data-head last" style="border-right: outset;">12/31/23</td>
<td class="data-head last">12/31/22</td>
<td class="data-head last">3/31/23</td>
<td class="data-head last">6/30/23</td>
<td class="data-head last">9/30/23</td>
<td class="data-head last" style="border-right: outset;">12/31/23</td>
<td class="data-head last">12/31/22</td>
<td class="data-head last">3/31/23</td>
<td class="data-head last">6/30/23</td>
<td class="data-head last">9/30/23</td>
<td class="data-head last" style="border-right: outset;">12/31/23</td>
<td class="data-head last">YTD</td>
<td class="data-head last">MTD</td>
</tr>
<tr class="tbl-data">
<td class="data-td last">BB</td>
<td class="data-td data last">87.00</td>
<td class="data-td data last">87.08</td>
<td class="data-td data last">83.01</td>
<td class="data-td data last">81.02</td>
<td class="data-td data last" style="border-right: outset;">80.55</td>
<td class="data-td data last">284</td>
<td class="data-td data last">281</td>
<td class="data-td data last">256</td>
<td class="data-td data last">257</td>
<td class="data-td data last" style="border-right: outset;">219</td>
<td class="data-td data last">90.02</td>
<td class="data-td data last">91.51</td>
<td class="data-td data last">89.83</td>
<td class="data-td data last">87.94</td>
<td class="data-td data last" style="border-right: outset;">92.44</td>
<td class="data-td data last">12.19</td>
<td class="data-td data last">3.00</td>
</tr>
<tr class="tbl-data">
<td class="data-td last">B</td>
<td class="data-td data last">10.95</td>
<td class="data-td data last">10.37</td>
<td class="data-td data last">13.31</td>
<td class="data-td data last">15.03</td>
<td class="data-td data last" style="border-right: outset;">13.43</td>
<td class="data-td data last">608</td>
<td class="data-td data last">500</td>
<td class="data-td data last">406</td>
<td class="data-td data last">493</td>
<td class="data-td data last" style="border-right: outset;">317</td>
<td class="data-td data last">82.50</td>
<td class="data-td data last">85.35</td>
<td class="data-td data last">89.55</td>
<td class="data-td data last">86.37</td>
<td class="data-td data last" style="border-right: outset;">96.45</td>
<td class="data-td data last">15.52</td>
<td class="data-td data last">2.21</td>
</tr>
<tr class="tbl-data">
<td class="data-td last">CCC</td>
<td class="data-td data last">1.98</td>
<td class="data-td data last">2.50</td>
<td class="data-td data last">3.68</td>
<td class="data-td data last">3.43</td>
<td class="data-td data last" style="border-right: outset;">5.44</td>
<td class="data-td data last">1,020</td>
<td class="data-td data last">1,014</td>
<td class="data-td data last">852</td>
<td class="data-td data last">810</td>
<td class="data-td data last" style="border-right: outset;">1,130</td>
<td class="data-td data last">60.88</td>
<td class="data-td data last">64.60</td>
<td class="data-td data last">68.55</td>
<td class="data-td data last">67.01</td>
<td class="data-td data last" style="border-right: outset;">69.40</td>
<td class="data-td data last">33.88</td>
<td class="data-td data last">6.71</td>
</tr>
<tr class="tbl-data">
<td class="data-td last">CC<sup>*</sup></td>
<td class="data-td data last">&nbsp;</td>
<td class="data-td data last">0.52</td>
<td class="data-td data last" style="border-right: outset;">0.58</td>
<td class="data-td data last">&nbsp;</td>
<td class="data-td data last">835</td>
<td class="data-td data last" style="border-right: outset;">809</td>
<td class="data-td data last">&nbsp;</td>
<td class="data-td data last">72.91</td>
<td class="data-td data last" style="border-right: outset;">76.82</td>
<td class="data-td data last">6.88</td>
<td class="data-td data last">5.88</td>
</tr>
<tr class="tbl-data">
<td class="data-td last">C<sup>*</sup></td>
<td class="data-td data last">&nbsp;</td>
<td class="data-td data last">0.04</td>
<td class="data-td data last">&nbsp;</td>
<td class="data-td data last" style="border-right: outset;">&nbsp;</td>
<td class="data-td data last">&nbsp;</td>
<td class="data-td data last">6,713</td>
<td class="data-td data last">&nbsp;</td>
<td class="data-td data last" style="border-right: outset;">&nbsp;</td>
<td class="data-td data last">&nbsp;</td>
<td class="data-td data last">7.16</td>
<td class="data-td data last">&nbsp;</td>
<td class="data-td data last" style="border-right: outset;">&nbsp;</td>
<td class="data-td data last">-17.77</td>
<td class="data-td data last">&nbsp;</td>
</tr>
<tr class="tbl-data">
<td class="data-td last">D<sup>*</sup></td>
<td class="data-td data last">0.07</td>
<td class="data-td data last">&nbsp;</td>
<td class="data-td data last" style="border-right: outset;">&nbsp;</td>
<td class="data-td data last">4,726</td>
<td class="data-td data last">&nbsp;</td>
<td class="data-td data last" style="border-right: outset;">&nbsp;</td>
<td class="data-td data last">10.00</td>
<td class="data-td data last">&nbsp;</td>
<td class="data-td data last" style="border-right: outset;">&nbsp;</td>
<td class="data-td data last">-62.06</td>
<td class="data-td data last">&nbsp;</td>
</tr>
<tr class="tbl-data">
<td class="data-td last">Total</td>
<td class="data-td data last">100</td>
<td class="data-td data last" style="border-right: outset;">100</td>
<td class="data-td data last">337</td>
<td class="data-td data last">325</td>
<td class="data-td data last">297</td>
<td class="data-td data last">314</td>
<td class="data-td data last" style="border-right: outset;">285</td>
<td class="data-td data last">87.91</td>
<td class="data-td data last">89.51</td>
<td class="data-td data last">88.78</td>
<td class="data-td data last">86.69</td>
<td class="data-td data last" style="border-right: outset;">91.20</td>
<td class="data-td data last">13.24</td>
<td class="data-td data last">3.51</td>
</tr>
</tbody>
</table>
</div>
<br />
<p class="chart-disclosure">Source: ICE Data Services, VanEck.&nbsp;<sup>*</sup>Does not have securities for all months of selected periods. Returns are based on partial period data. Fallen Angels: ICE US Fallen Angel High Yield 10% Constrained Index. Not intended as a recommendation to invest or divest in any of the sectors mentioned herein. Index performance is not representative of fund performance. It is not possible to invest in an index. BB index: ICE BofA BB US High Yield Index; Single-B index: ICE BofA Single-B US High Yield Index; CCC &amp; Lower rated index ICE BofA CCC &amp; Lower US High Yield Index.</p>
<p>To receive more <a href="https://www.vaneck.com/us/en/insights/income-investing/" title="Income Investing insights"><strong>Income Investing</strong></a> insights, <a href="/link/5f45412c2143400497908cea2897f7d3.aspx" title=" Subscription Center"><strong>sign up in our subscription center</strong></a>.</p>
<style type="text/css">
     .wrapped-div {
     max-width: 100%;
     }
    
     @media (max-width: 1024px) {
     .wrapped-div {
     overflow-x: scroll;
     }
     }
    
        .wrapped-div-full {
     overflow-x: scroll;
     }
     
     .wrapped-div-sector {
     max-width: 100%;
     overflow-x: scroll;
     }
    </style>
]]></content:encoded>
</item><item rdf:about="https://www.vaneck.com/us/en/blogs/economic-trends/ten-investment-themes-to-kick-off-2024/">
  <title>Ten Investment Themes to Kick Off 2024></title>
  <link>https://www.vaneck.com/us/en/blogs/economic-trends/ten-investment-themes-to-kick-off-2024/</link>
  <description><![CDATA[Dive into 2024 with an analysis of ten key investment themes that will drive strategic asset allocation decisions in the year ahead.]]></description>
  <dc:creator>Patrick Schramm</dc:creator>
  <dc:date>01/29/2024 06:30:00</dc:date>
<content:encoded><![CDATA[

<p>As the calendar turns to 2024, we stand at the cusp of a financial landscape that promises both challenges and opportunities in equal measure. Across many conversations with financial advisors, I've taken the pulse of these factors to craft a detailed map of the current investment environment. Here&rsquo;s my take on the ten themes that will have the most impact on portfolios in 2024:</p>
<h2>1. The Revenge of the Dots</h2>
<p>As the adage goes, the only certainty is uncertainty. In 2023, the Fed&rsquo;s dot plots led us on a merry dance of rate expectations, swinging from cuts to hikes and back again. This back-and-forth has seen policy expectations diverge by over 200bps in just a year. In my conversations, I&rsquo;ve advised people to approach the dot plot with a dose of healthy skepticism, given their spotty track record. Despite the market&rsquo;s current bet on rate cuts in 2024, it&rsquo;s better to stay focused on economic indicators, especially around inflation, unemployment, and liquidity conditions, to preempt any reactive policy shifts.</p>
<h2>2. Soft Landing or Turbulence Ahead?</h2>
<p>The debate over the economic trajectory of the U.S. is a hot topic in my meetings. Although the 'soft landing' scenario seems to be in favor as we start the year, I remind advisors that the stubbornness of the Fed in its inflation battle could change the narrative. The 3 P's &mdash; Positioning, Profits, and Policy &mdash; are what I&rsquo;m stressing as the indicators that could signal a shift back to risk assets. Against this backdrop, areas to consider include corporate credit (investment grade and high yield) and emerging markets, as well as cyclicals and small and mid-cap companies.</p>
<h2>3. MOVE to the VIX</h2>
<p>In 2023, bond market volatility was the headline act, but I&rsquo;m preparing advisors for a role reversal in 2024. Equity volatility is likely to step into the spotlight, driven by the uncertainties around growth, inflation, and corporate earnings. On the bond side of the equation rates are likely to be a bigger driver of total return in 2024 relative to spreads. I'm advising a strategic pivot towards high-quality assets with moderate duration as we anticipate a flatter interest rate environment.</p>
<h2>4. High Yield Bonds &ndash; Spread Offense</h2>
<p>Despite the sell-off in high yield bonds this year, I've been encouraging advisors to look deeper. With yields at historically high levels and quality on the rise, I believe that BB-rated bonds represent an opportunity for measured exposure in the high yield space. With yields in the high 90th percentile of their historical range and prices around $90, these starting points have historically signaled double-digit returns over the next year. Over half of the issuers in this space are BB-rated, signaling higher quality and larger capitalization, with robust fundamental drivers. We're encouraging advisors to consider the 550-700 bps spread range as a strategic entry point and a rotation up quality towards BB rated bonds for strategic high yield allocators.</p>
<h2>5. Discovering Value in the &ldquo;Other 493&rdquo;</h2>
<p>The overwhelming influence of the &ldquo;magnificent 7&rdquo; stocks skewed S&amp;P 500 returns in 2023, with &gt;70% of the broad market index&rsquo;s total return being explained by these 7 companies. In fact, just 10 stocks are responsible for nearly the entire positive return of the S&amp;P 500 in 2023. While the disproportionate impact of a few large caps on the S&amp;P 500 returns has been stark, investors should not lose sight of small and mid-cap stocks, which tend to lead in an economic recovery. Small and mid-sized companies should also benefit from more stable and potentially downward biased interest rates in 2024. Outside of small caps, cyclicals (value) should be on investors&rsquo; radars for 2024 as well, given their higher level of economic sensitivity and relatively attractive valuations.</p>
<h2>6. Digital Assets Get a Seat at the Grownup Table</h2>
<p>Over the past several years, I&rsquo;ve had in-depth conversations about the maturation of digital assets. 2023 was no exception, especially as we anticipate the launch of Spot Bitcoin ETFs in 2024. I believe this will be a significant milestone, potentially integrating digital assets into traditional investment portfolios. As this unfolds, we should begin to see a large-scale adoption of this exciting asset class into traditional model portfolios and predict a multibillion-dollar bitcoin ETF market by the end of 2024. I&rsquo;m excited about the prospects and am working with advisors to appropriately position for this evolution.</p>
<h2>7. Political &ndash; Geopolitical Soup</h2>
<p>For advisors, it&rsquo;s crucial to differentiate between meaningful trends and mere noise. With a slew of global elections on the horizon, I&rsquo;m focusing on the potential market impacts without getting caught up in the political fray. We&rsquo;re keeping an eye on debt, deficits, and global conflicts, assessing how they might influence investment decisions. As political noise ebbs and flows throughout the year, it&rsquo;s important to remember that political change and geopolitical conflict have had more temporary than lasting impacts on asset prices.</p>
<h2>8. King Dollar Gives Up the Throne</h2>
<p>The dollar's strength has historically been tied to interest rates, and as we've seen some softening as markets anticipate lower rates in the U.S., a trend that could continue into 2024. This could herald a period of opportunity for emerging markets and select G10 currencies, along with gold. We're examining these areas for potential diversification opportunities.</p>
<h2>9. China: The Bull in the Global Shop</h2>
<p>Investor sentiment towards China remains decidedly bearish, influenced by the country's slower-than-anticipated recovery from the COVID-19 pandemic, distress within its real estate sector, stringent technology and intellectual property regulations, a global shift towards domestic production, and broadly negative views on its geopolitical actions. However, there's a silver lining: much of the current skepticism appears to be factored into market prices. Chinese stocks are trading at compelling valuations not seen in years, and the corporate debt sector is showing signs of having weathered the worst, particularly in real estate. Simultaneously, other emerging market nations, including India, Brazil, Mexico, Saudi Arabia, and Vietnam, have gained from China's difficulties, experiencing both developmental progress and improved investor sentiment. My advice: while continuing to capitalize on the strong performance of these &ldquo;new&rdquo; emerging markets, it's prudent not to dismiss China entirely. The current valuations present potential opportunities for strategic investment, especially as the market may have already absorbed the impact of China's recent challenges.</p>
<h2>10. Pain in the Real Asset</h2>
<p>The commodities market has been a source of both opportunity and frustration. The inflation trade roared back in 2022 and went into divergence mode in 2023 with energy and precious metals posting positive returns, while areas such as soft commodities and industrial metals lagged. This left many commodity investors frustrated by getting the call right but the allocation wrong in many cases. Looking ahead, continued divergence in commodity fundamentals, momentum and trend should create a better setup for active real asset allocations relative to passive in 2024.</p>
<p>To receive more <strong><a href="https://www.vaneck.com/us/en/insights/economic-trends/" title="Economic Trends Insights">Economic Trends</a></strong> insights, <strong><a href="https://www.vaneck.com/us/en/subscribe/" title="Subscription Center">sign up in our subscription center</a></strong>.</p>
]]></content:encoded>
</item><item rdf:about="https://www.vaneck.com/us/en/blogs/income-investing/will-clos-continue-to-rally-in-2024/">
  <title>Will CLOs Continue to Rally in 2024?></title>
  <link>https://www.vaneck.com/us/en/blogs/income-investing/will-clos-continue-to-rally-in-2024/</link>
  <description><![CDATA[CLOs rallied strongly in December, ending 2023 with a 10.54% return. The current backdrop suggests CLOs are well positioned to start 2024.]]></description>
  <dc:creator> </dc:creator>
  <dc:date>01/25/2024 06:30:00</dc:date>
<content:encoded><![CDATA[

<p><a href="https://www.vaneck.com/us/en/investments/clo-etf-cloi/overview/" title="CLOI - VanEck CLO ETF - Overview"><strong>The VanEck CLO ETF (CLOI)</strong></a> returned 2.06% in the fourth quarter, and 9.37% for the year, outperforming investment-grade bonds and AAA-rated CLOs, but underperforming the broad CLO market due to its lower risk exposure during the period. CLOI remains conservatively positioned but has modestly increased exposure to AA CLOs in Q4. CLOI had approximately 70% exposure to AAA rated CLOs and 28% to AA CLOs in December vs 70%/12% in the benchmark. Security selection continues to be a key source of return given tighter valuations and risks tilted to the downside. CLOI remains positioned higher in the capital stack but has begun seeing attractive entry points in lower-rated tranches. Should the backdrop begin to improve within the next six months as we currently anticipate, we would begin to add BBB and below investment grade rated classes to the Fund.</p>
<h2>Market Update</h2>
<p>CLOs continued to rally to end the year, along with nearly all other risk asset classes, as bullish investor sentiment from November continued and accelerated into December. The combination of tighter spreads and lower Treasury rates led to strong total returns for most fixed income asset classes. The Fed strengthened its pivot language, with Fed Chair Powell&rsquo;s press conference incorporating more reminders of its dual mandate. This unexpected pull forward in the Fed&rsquo;s assessment of inflation from sticky to mission accomplished, subject only to a couple more months of confirmation, alters the conditions under which rate cuts may now occur. If the Fed is correct in its assessment that sticky core inflation has been broken, it opens the door for a more constructive 2024, with the possibility of a strong US economy alongside rate cuts.</p>
<p>CLOs generated strong total returns across the capital stack in 2023. However, CLOs underperformed bank loans as well as fixed-rate high yield bonds during the year as Treasury yields declined, but outperformed investment grade corporates.</p>
<div class="wrapped-div">
<table style="width: 100%;">
<tbody>
<tr class="tbl-data">
<td class="tbl-header last">Asset class</td>
<td class="tbl-header last">2023 Calendar Year Return (%)</td>
<td class="tbl-header last">Q4 2023 Return (%)</td>
<td class="tbl-header last">Yield to Worst (%)</td>
<td class="tbl-header last">Spreads (bps)</td>
</tr>
<tr class="tbl-data">
<td class="data-td last font-weight-normal">CLOs</td>
<td class="data-td data last">10.54</td>
<td class="data-td data last">2.69</td>
<td class="data-td data last">6.33</td>
<td class="data-td data last">219</td>
</tr>
<tr class="tbl-data">
<td class="data-td last font-weight-normal pl-3">AAA</td>
<td class="data-td data last">8.68</td>
<td class="data-td data last">2.18</td>
<td class="data-td data last">5.74</td>
<td class="data-td data last">148</td>
</tr>
<tr class="tbl-data">
<td class="data-td last font-weight-normal pl-3">AA</td>
<td class="data-td data last">10.86</td>
<td class="data-td data last">2.60</td>
<td class="data-td data last">6.00</td>
<td class="data-td data last">215</td>
</tr>
<tr class="tbl-data">
<td class="data-td last font-weight-normal pl-3">A</td>
<td class="data-td data last">13.35</td>
<td class="data-td data last">2.89</td>
<td class="data-td data last">6.57</td>
<td class="data-td data last">271</td>
</tr>
<tr class="tbl-data">
<td class="data-td last font-weight-normal pl-3">BBB</td>
<td class="data-td data last">17.66</td>
<td class="data-td data last">4.65</td>
<td class="data-td data last">8.04</td>
<td class="data-td data last">409</td>
</tr>
<tr class="tbl-data">
<td class="data-td last font-weight-normal pl-3">BB</td>
<td class="data-td data last">24.52</td>
<td class="data-td data last">7.33</td>
<td class="data-td data last">12.41</td>
<td class="data-td data last">850</td>
</tr>
<tr class="tbl-data">
<td class="data-td last font-weight-normal">Investment Grade Corporates</td>
<td class="data-td data last">8.40</td>
<td class="data-td data last">7.91</td>
<td class="data-td data last">5.15</td>
<td class="data-td data last">104</td>
</tr>
<tr class="tbl-data">
<td class="data-td last font-weight-normal">U.S. Agg</td>
<td class="data-td data last">5.39</td>
<td class="data-td data last">6.58</td>
<td class="data-td data last">4.60</td>
<td class="data-td data last">45</td>
</tr>
<tr class="tbl-data">
<td class="data-td last font-weight-normal">Leveraged Loans</td>
<td class="data-td data last">13.17</td>
<td class="data-td data last">2.79</td>
<td class="data-td data last">8.93</td>
<td class="data-td data last">354</td>
</tr>
<tr class="tbl-data">
<td class="data-td last font-weight-normal">High Yield Bonds</td>
<td class="data-td data last">13.46</td>
<td class="data-td data last">7.06</td>
<td class="data-td data last">7.69</td>
<td class="data-td data last">339</td>
</tr>
</tbody>
</table>
</div>
<br />
<p class="chart-disclosure">Source: JP Morgan and ICE Data Indices as of 12/31/2023. CLOs represented by J.P. Morgan Collateralized Loan Obligation Index, AAA Rated CLOs represented by J.P. Morgan CLO AAA Index, AA Rated CLOs represented by J.P. Morgan CLO AA Index, A Rated CLOs represented by J.P. Morgan CLO A Index, BBB Rated CLOs represented by J.P. Morgan CLO BBB Index, BB Rated CLOs represented by J.P. Morgan CLO BB Index, Investment Grade Corporates represented by ICE BofA US Corporate Index, US Agg is represented by the ICE BofA US Broad Market, Leveraged Loans represented by JP Morgan Leveraged Loan Index and High Yield Bonds represented by ICE BofA US High Yield Index.</p>
<p>CLO new issue supply decreased by over two-thirds month-over-month, with $4.9bn pricing during the month, following $15.6bn in November. New issuance volume ended 2023 at $116bn, down 10% from 2022. Refinancing (refi) and reset activity picked up in December to the highest combined level since February 2022, with $7.5bn pricing, after $4.2bn in November. 2023 total refi and reset volumes were 3% lower compared to 2022, with refi volumes outpacing 2022 by 5%.</p>
<p>In the secondary market, TRACE supply was slightly lower at $18.2bn from $18.4bn in November. Investment grade volumes decreased to $14.3bn from $15.1bn, while below investment grade volumes increased to $3.9bn from $3.3bn in November. Total BWIC volumes decreased to $4.9bn in December from $5.2bn in November.</p>
<p>The trailing twelve-month default rate within the Morningstar US Leveraged Loan Index increased to 1.53% in December, up from 1.48% in November, with one new default. We anticipate the default rate to remain below historical averages in the near term for the leveraged loan market. However, our expectations are that defaults will increase to 3-4% later in the year, above the long-term historical average of ~3%.</p>
<p>CLO fundamentals were mostly flat to improved month-over-month and US CLO spreads were tighter or flat across the capital stack over the month.</p>
<h2>Portfolio Strategy</h2>
<p>The borrowing rate for leveraged loan borrowers has risen alongside rate increases from central banks over the last two years. Higher interest rates have yet to drive a material deterioration in credit metrics within the loan market or undercut economic growth. However, with expectations for rates to remain higher for longer, increased coupon payments for borrowers means that interest coverage ratios will decline as the lagged effect of rate increases takes hold. Ultimately, the result will be higher leverage and lower interest coverage ratios, leading to the risk of downgrade if companies are unable to refinance outstanding debt as maturities come due. However, futures markets are now pricing in 5-6 rate cuts from the Fed for 2024 following recent dovish comments. Were this to come to fruition, it could provide relief to more stressed loan borrowers.</p>
<p>Throughout 2023, we looked to benefit from continued increases in interest rates, allowing for increased coupon income. Given expectations for the pace of downgrades to pick up into 2024, we continue to position portfolios conservatively with the ability to shift into lower rated tranches when spreads widen. The positioning in the top part of the capital stack in CLOs (AAA/AA/A) buffers investors from lower tranche downgrades or losses at the equity tranche level.</p>
<p>Buying in the primary market allows for wider spreads compared to the secondary market, with the value proposition moving even more in favor of primary issues as the secondary tightened materially since the end of the third quarter. While our preference is currently for primary issuance, we continue to find attractive opportunities in the secondary market, where purchases below par provide attractive positive convexity.</p>
<h3>CLOI Total Return and Credit Allocation</h3>
<p><img class="img-responsive w-100" src="https://www.vaneck.com/contentassets/fdd1822001e94aa89c4926779eab5c82/cloi-january-2024_chart_blog_v1.svg" alt="CLOI total return continues to surge, while we continue to position the Fund conservatively." /></p>
<p class="chart-disclosure"><strong>Source: FactSet, JPMorgan, VanEck, As of December 31, 2023.</strong> Index performance is not representative of Fund performance. It is not possible to invest directly in an index.</p>
<h2>Outlook Ahead</h2>
<p>The economic outlook in the United States appears more promising than most expected at the beginning of 2023. A resilient consumer, tight labor market, and moderating inflation have bolstered economic conditions. Issuer fundamentals are still solid but with expectations for a deterioration as the lagged effects of restrictive monetary policy take hold. The Fed has signaled the end of its tightening cycle but will likely maintain higher rates during 2024.</p>
<p>A key trend emerging as we head into 2024 is a pickup in tail risks. In the US, these include concerns that if the Fed keeps rates higher for longer than we think prudent, it may create an unexpected &ldquo;break&rdquo; in the economy or markets, and history has shown that easing cycles rarely follow a smooth downward glidepath. The US also faces the risk that a fiscal policy impasse or political gridlock will dial up uncertainty and volatility in markets. In other areas of the world, risks are emanating from the ongoing geopolitical conflicts. The potential for regional spillover and unforeseen fall-on effects adds considerable uncertainty to the global outlook.</p>
<p>Within the CLO market, new issuance picked up significantly in the last few months of 2023 bringing issuance to $116bn for the year, as managers looked to take advantage of tightening liability spreads, a trend we expect to continue to start the year given current spread levels. Despite the higher-than-expected supply, CLOs continue to see strong demand given high all-in yields and spreads are now at or near the tights of 2023. There was also a material pickup in refinancing and reset activity as portfolios constructed with purchases in the secondary market took advantage of the recovery in the loan market and tighter CLO spreads. Should the loan and CLO markets continue to rally, we would expect to see more portfolios benefit from the significant redemption optionality in CLOs. However, given the dispersion seen in the loan market, certain CLO portfolios holding weaker credits may eventually experience impairments to the lowest rated debt tranches, even if the majority of the loan market continues to rally. As a result, vintage, portfolio, and manager selection remains key.</p>
<p>We anticipate CLO spreads to trade in a range for the next 3-6 months and see spreads and yields attractive under most market scenarios over the next twelve months. We also expect the CLO market to continue to be supported by the technical backdrop. New issuance is likely to remain lower than prior years given the arbitrage challenges, although this pressure has lessened materially over the past several months. This should limit the potential for any extreme spread widening in the near term. Given tighter valuations and risks tilted to the downside, we remain positioned higher in the capital stack. However, we are beginning to see attractive entry points lower in the capital stack. Should the backdrop begin to improve within the next six months as we currently anticipate, we would begin to add BBB and below investment grade rated classes to portfolios.</p>
<div class="wrapped-div">
<table style="width: 100%;">
<tbody>
<tr class="tbl-data">
<td class="tbl-header last" colspan="9">Average Annual Total Returns<sup>*</sup>&nbsp;(%) as of December 31, 2023</td>
</tr>
<tr class="tbl-data">
<td class="data-td last">&nbsp;</td>
<td class="data-head last">1 Month</td>
<td class="data-head last">3 Month</td>
<td class="data-head last">YTD</td>
<td class="data-head last">1 Year</td>
<td class="data-head last">3 Year</td>
<td class="data-head last">5 Year</td>
<td class="data-head last">10 Year</td>
<td class="data-head last">LIFE 6/21/2022</td>
</tr>
<tr class="tbl-data">
<td class="data-td last">CLOI (NAV)</td>
<td class="data-td data last">0.81</td>
<td class="data-td data last">2.06</td>
<td class="data-td data last">9.37</td>
<td class="data-td data last">-</td>
<td class="data-td data last">8.28</td>
</tr>
<tr class="tbl-data">
<td class="data-td last">CLOI (Share Price)</td>
<td class="data-td data last">0.66</td>
<td class="data-td data last">1.81</td>
<td class="data-td data last">8.93</td>
<td class="data-td data last">-</td>
<td class="data-td data last">8.20</td>
</tr>
<tr class="tbl-data">
<td class="data-td last">J.P. Morgan Collateralized Loan Obligation Index</td>
<td class="data-td data last">1.09</td>
<td class="data-td data last">2.69</td>
<td class="data-td data last">10.54</td>
<td class="data-td data last">-</td>
<td class="data-td data last">8.65</td>
</tr>
</tbody>
</table>
</div>
<br />
<p class="chart-disclosure"><sup>*</sup>&nbsp;Returns less than one year are not annualized.</p>
<p class="chart-disclosure"><strong>The performance data quoted represents past performance. Past performance is not a guarantee of future results. Investment return and principal value of an investment will fluctuate so that an investor's shares, when redeemed, may be worth more or less than their original cost. Performance may be lower or higher than performance data quoted. Please call 800.826.2333 or visit vaneck.com for performance current to the most recent month ended.</strong></p>
<p class="chart-disclosure"><strong>The gross expense ratio for CLOI is 0.4%. CLOI Fees &amp; Expenses: Van Eck Associates Corporation (the &ldquo;Adviser&rdquo;) will pay all expenses of the Fund, except for the fee payment under the investment management agreement, acquired fund fees and expenses, interest expense, offering costs, trading expenses, taxes and extraordinary expenses. Notwithstanding the foregoing, the Adviser has agreed to pay the offering costs until at least May 1, 2024.</strong></p>
<p class="chart-disclosure"><strong>The net expense ratio for CLOI is 0.4%.</strong></p>
<p class="chart-disclosure">The "Net Asset Value" (NAV) of a Fund is determined at the close of each business day, and represents the dollar value of one share of the fund; it is calculated by taking the total assets of the fund, subtracting total liabilities, and dividing by the total number of shares outstanding. The NAV is not necessarily the same as the ETF 's intraday trading value. Investors should not expect to buy or sell shares at NAV.</p>
<p>To receive more <a href="https://www.vaneck.com/us/en/insights/income-investing/" title="Income Investing insights"><strong>Income Investing</strong></a> insights, <a href="/link/5f45412c2143400497908cea2897f7d3.aspx" title=" Subscription Center"><strong>sign up in our subscription center</strong></a>.</p>
<style type="text/css">
     .wrapped-div {
     max-width: 100%;
     }
    
     @media (max-width: 1024px) {
     .wrapped-div {
     overflow-x: scroll;
     }
     }
    
        .wrapped-div-full {
     overflow-x: scroll;
     }
     
     .wrapped-div-sector {
     max-width: 100%;
     overflow-x: scroll;
     }
    </style>
]]></content:encoded>
</item><item rdf:about="https://www.vaneck.com/us/en/blogs/emerging-markets-bonds/fiscal-dominance-the-clarifying-lens-for-em-and-dm-bonds/">
  <title>Fiscal Dominance: The Clarifying Lens for EM (and DM) Bonds></title>
  <link>https://www.vaneck.com/us/en/blogs/emerging-markets-bonds/fiscal-dominance-the-clarifying-lens-for-em-and-dm-bonds/</link>
  <description><![CDATA[In this analysis, we explore emerging markets' superior fiscal and monetary policy stance and why it is leading to outperformance over their developed markets counterparts.]]></description>
  <dc:creator>Eric Fine</dc:creator>
  <dc:date>01/23/2024 06:30:00</dc:date>
<content:encoded><![CDATA[


<p><strong><i>&ldquo;It ain&rsquo;t what you don&rsquo;t know that gets you into trouble. It&rsquo;s what you know for sure that just ain&rsquo;t so&rdquo;</i> &mdash; Mark Twain</strong></p>
<p>The absence of &ldquo;fiscal dominance&rdquo; in emerging markets (EM) helps explain why EM hard-currency bonds outperformed their developed markets (DM) counterparts for the past 20 years. In this white paper we will look at emerging markets&rsquo; superior fiscal and monetary policy stance and why it is also beginning to generate better risk/return statistics in EM local-currency bonds. In fact, low debt and deficits have allowed emerging markets monetary authorities to conduct inflation-focused monetary policy, while high debt and deficits in developed markets have diluted central bank independence and their focus on inflation. In this paper, we will show that the result of developed markets&rsquo; &ldquo;fiscal dominance&rdquo; has, in recent decades, meant that <i>all</i> financial crises since 1998 basically involve the large developed markets. The result, we will show, is also <i>declining</i> inflation risks in emerging markets, but <i>rising</i> inflation risks in developed markets. The deficit-producing developed markets need financing from the surplus-producing emerging markets, but the emerging markets are increasingly geopolitical rivals with developed markets, increasing risks to developed markets. Finally, with its strongest policy track record and the strongest results in terms of historic bond performance and anchored inflation, we will discuss why Asia is the first beneficiary within emerging markets, of this regime change.</p>
<h2 id="emerging-markets-outperformance" class="jump-link-nav anchored-block" data-jumplink-title="Emerging Markets Outperformance">Why have emerging markets (EM) bonds outperformed their developed markets (DM) counterparts for the past 20 years?</h2>
<p>Over the past 20 years, EM debt generated return/volatility ratios that warrant much higher investor allocations than exist (<strong><a href="https://www.vaneck.com/us/en/blogs/emerging-markets-bonds/the-investment-case-for-emerging-markets-debt/" title="The Case for Emerging Markets Debt: Why Invest in EMD?">see our white paper in which we run an efficient frontier model on fixed income, here</a></strong>). In fact, EM bonds were the only categories actually <i>on</i> the frontier itself, other than U.S. Treasuries and U.S. high yield. But to many, emerging markets are synonymous with perceived risk: the Latin debt crises of the 1980s, Mexico&rsquo;s Tequila crisis in 1994, Asia&rsquo;s 1997 crises, and Russia&rsquo;s 1998 crisis. These crises were resolved <i>decades</i> ago, yet linger as memories to market participants who are often &ldquo;tourists&rdquo; in emerging markets, despite its size, liquidity, and this historical performance (often leading to &ldquo;chasing&rdquo; performance at exactly the wrong moment). The reality is that much changed after 1998, as emerging markets started generating domestic savings and thus consistent and large (external) surpluses. This was the result of a &ldquo;Washington consensus&rdquo; on economic policy which we discussed on RealClearPolitics <i>way</i> back in 2012.</p>
<p><i>&ldquo;During Asia&rsquo;s crisis (and during all other emerging market crises that I&rsquo;ve been involved in) U.S. authorities gave the precise opposite advice (to Asian governments) that those same U.S. authorities are now giving themselves. That advice (to Asian governments) involved fiscal austerity, structural reforms, and tight monetary policy to anchor inflation expectations. And, if banking systems were over-levered, only protect depositors and congratulate bank debtors as equity holders in newly well-capitalized banks. This advice worked, which is why Asia is home to so many of our creditors, not to mention higher growth rates.&rdquo;</i> &mdash; Eric Fine, RealClearPolitics, 2012</p>
<p>We show this history graphically, below. The bottom line is that external surpluses (represented by central bank reserve accumulation) grew, and this led to a reduction in the level and volatility of credit spreads on EM sovereigns.</p>
<h3>Exhibit 1 &ndash; When EMs Generated External Surpluses, Crises Abated</h3>
<p><strong>Emerging Markets Reserves and Spreads </strong></p>
<p><img class="img-responsive w-100" src="https://www.vaneck.com/contentassets/dedcb314c76c4635add3a9f1f53f3e8f/4006_emerging-markets-bond-fiscal-dominance_chart-1_blog_2024-1_v1.svg" alt="When emerging markets generated high external surpluses, crises have been abated." /></p>
<p class="chart-disclosure">Source: Bloomberg LP, as of December 23, 2023.</p>
<p><strong>EMs&rsquo; orthodox policy stance was behind these superior risk/return statistics in EM hard currency bonds, and the stance is beginning to generate superior risk/return statistics in EM <i>local</i> currency bonds as well.</strong> We argue herein that EMs&rsquo; economic policy orthodoxy over the past 20+ years, that was obvious in the performance of its hard-currency bonds, is now supporting returns of <i>local</i> currency bonds (which performed poorly in the previous 20 years from an efficient-frontier perspective). Obviously, when markets realize the broadening implications of these strong economic foundations for all EM bonds, the investment thesis will be concluded; this is a hypothesis. EM local currency bonds have not performed well in the past 20 years (again from the perspective of the efficient frontier), and we see this as having changed in recent years.</p>
<p><strong>A critical &ldquo;other side of the coin&rdquo; is that DM bond markets have generated <i>disappointing</i> performance in the past 20 years, and DMs are the economies that fit the &ldquo;fiscal dominance&rdquo; criteria of high debt and debt servicing costs impinging on monetary policy. </strong>This is the &ldquo;it&rsquo;s what you know for sure that just ain&rsquo;t so&rdquo; part of our argument. EM bonds outperformed the Global Bond Aggregate for the past 20 years, as just a headline example (again, <a href="ttps://www.vaneck.com/us/en/blogs/emerging-markets-bonds/the-investment-case-for-emerging-markets-debt/" title="The Case for Emerging Markets Debt: Why Invest in EMD?"><strong>see our white paper for the full analysis</strong></a>). The chart below tracks external surpluses of the DM (and EM), showing DM external deficits dominating recently. Could DM bond markets that are stalwarts of investor portfolios be less attractive than investors expect? We think so.</p>
<h3>Exhibit 2 &ndash; DM Now Has Persistent External Deficits and Crises</h3>
<p><strong>EM and DM Current Account Balances, % GDP</strong></p>
<p><img class="img-responsive w-100" src="https://www.vaneck.com/contentassets/dedcb314c76c4635add3a9f1f53f3e8f/4006_emerging-markets-bond-fiscal-dominance_chart-2_blog_2024-1_v1.svg" alt="Since 2008, developed markets have had persistent external deficits and crises." /></p>
<p class="chart-disclosure">Source: Bloomberg LP, As of December 2023.</p>
<p><strong>What has been the outcome of DMs&rsquo; &ldquo;fiscal dominance&rdquo; of recent decades? - <i>all</i> financial crises since 1998 basically involve the large DMs.</strong> The 2008 Global Financial Crisis originated in the United States and euro zone, and was derivative-centered. The two proceeding euro zone crises (2011 and 2013) both highlighted over-indebted European governments that paid virtually no interest rate on their bonds. Looking back at those 20 years, the result has been that EM debt performance was superior to DM&rsquo;s. And it doesn&rsquo;t look set to change, if anything EM&rsquo;s outperformance is showing deeper strengths. Just look at 2023, a year during which the U.S. faced two fiscal crises, a banking crisis, the U.K. faced a fiscal crisis, and Japan is engaging on a challenging exit from experimental monetary policy. All of these are highly indebted economies. As we wrote in many of our monthly publications especially during the beginning of the year, much of EM (particularly EM Asian local markets) behaved as a flight-to-safety asset. And EM bonds again outperformed the Global Bond Aggregate in 2023. <strong>We see &ldquo;fiscal dominance&rdquo; as the clarifying lens of this past 1-, 3- and 20-years of fixed income performance.</strong></p>
<h3>Exhibit 3 &ndash; EM Asia Rates Rallied During Tumultuous 2020s</h3>
<p><strong>EM Regions - GBI-EM/5Y UST Yield Differentials, bps </strong></p>
<p><img class="img-responsive w-100" src="https://www.vaneck.com/contentassets/dedcb314c76c4635add3a9f1f53f3e8f/4006_emerging-markets-bond-fiscal-dominance_chart-3_blog_2024-1_v1.svg" alt="EM Asia rates rallied against U.S. rates to new all-time lows during tumultuous 2020s." /></p>
<p class="chart-disclosure">Source: VanEck Research; Bloomberg LP, as of December 31, 2023.</p>
<h2 id="fiscal-dominance" class="jump-link-nav anchored-block" data-jumplink-title="Fiscal Dominance">Fiscal Dominance</h2>
<p><strong>Fiscal dominance is an economic condition that arises when debts and deficits are so high that monetary policy loses traction.</strong> This is because as debt service costs rise beyond a certain level, fiscal deficits obviously rise, but their main policy implication is that they create the need for more monetary financing. The main driver of money creation becomes fiscal policy (&ldquo;fiscal dominance&rdquo;), and traditional tools like higher policy rates only <i>feed</i> inflation and inflation expectations (by increasing debt servicing costs), rather than starve them. Of course, there should be a scale applied to the degree of fiscal dominance characterizing an economy, and the description above is the extreme end-result of the fiscal dominance condition, and there are intermediary stages. Also, these crises play out differently in each situation, with the financial system a key mediator. Another key fact to keep in mind is that experience with governments with unsustainable debt is almost exclusively in the hands of EM debt practitioners &ndash; DM policymakers and investors don&rsquo;t have experience in this area.</p>
<p><strong>Fiscal dominance appears to characterize DM, not EM. </strong>The topic of fiscal dominance is relevant for many reasons, and is discussed from various angles in popular media (all those articles headlining debt service or interest costs in the U.S. and U.K., or the Bank of Japan&rsquo;s exit from yield curve control are all ultimately about fiscal dominance).</p>
<ul class="content-list">
<li>First, the greater and more persistent post-Covid fiscal stimulus from the U.S. and many DMs appears to be a more important inflation driver now, certainly more than is the case for EMs that had weaker and less persistent post-Covid fiscal stimulus.</li>
<li>Second, EMs&rsquo; fixed income asset price performance is <i>superior</i> to DMs&rsquo;, with EMs&rsquo; low debts and deficits a key explanation.</li>
<li>Third, DMs&rsquo; fixed income asset price performance has been characterized by multiple recent &ldquo;crises&rdquo; (since the GFC in 2008), driven by high debts and deficits and the relaxation of monetary traction that resulted.</li>
<li>Fourth, the world&rsquo;s biggest DM central banks embarked on monetary experimentation with the quantity of money, greatly facilitating fiscal deficits in their countries, watching the results of that experiment are important to predicting future asset-price outcomes.</li>
<li>DMs engaging in monetary experimentation <i>because</i> normal monetary policy (i.e., setting the price of money, not its quantity) didn&rsquo;t have traction, a hallmark of &ldquo;fiscal dominance&rdquo; (that was tried and failed in EMs in previous decades).</li>
</ul>
<p><strong>DM hard-currency government bond markets have not delivered attractive risk-adjusted returns compared to EM hard-currency government bond markets, and local-currency bonds look set to benefit next</strong>. As theory would predict, economic policy orthodoxy over decades should result in lower inflation and inflation expectations, and that&rsquo;s what we are seeing (details below). The neutral real rate (R*) appears to be declining in EM, supporting its local-currency fixed income markets, while rising in DM. Below, we argue that the lens of fiscal dominance explains these likely continued outcomes. If this is correct, it will mean yet another category of EM debt will be subject to supportive secular tailwinds.</p>
<h2 id="debt-and-deficits" class="jump-link-nav anchored-block" data-jumplink-title="Debt and Deficits">Debt and Deficits</h2>
<p><strong>EM has much lower levels of government debt than DM.</strong> This is clear in Exhibit 4. What&rsquo;s also interesting to us is that <i>within</i> EM, Asia (ex-China) has been a leader in maintaining low debt levels, with South America lagging this improvement. This is a pattern you will see throughout &ndash; EM has better fiscal outcomes than DM, and within EM, Asia (ex-China) is the leader in fiscal rectitude. We mention these <i>two</i> outcomes because not only has EM outperformed DM, but Asian EM local-currency has performed exceptionally well within EM.</p>
<h3>Exhibit 4 &ndash; EM Debt Lower than DM, Asia Lowest in EM</h3>
<p><strong>General Government Gross Debt, % GDP</strong></p>
<p><img class="img-responsive w-100" src="https://www.vaneck.com/contentassets/dedcb314c76c4635add3a9f1f53f3e8f/4006_emerging-markets-bond-fiscal-dominance_chart-4_a_blog_2024-1_v1.svg" alt="Emerging markets debt is lower than developed markets government debt." /></p>
<p><strong>EM Regions - General Government Gross Debt, % GDP </strong></p>
<p><img class="img-responsive w-100" src="https://www.vaneck.com/contentassets/dedcb314c76c4635add3a9f1f53f3e8f/4006_emerging-markets-bond-fiscal-dominance_chart-4_b_blog_2024-1_v1.svg" alt="Asia has the lowest debt out of emerging markets regions." /></p>
<p class="chart-disclosure">Source: IMF via Bloomberg LP; VanEck Research, as of December 2023.</p>
<p><strong>EM has much lower fiscal deficits than DM.</strong> This shows in Exhibit 5. EM deficits are consistently lower than DM&rsquo;s, and are forecast by the IMF to continue to be so. And again, within EM, Asia&rsquo;s deficits are consistently the lowest on a historical and forecast basis. We added Exhibit 6 to show net interest outlays in EM (ex-China) compared to the U.S., again using IMF forecasts. This shows the U.S.&rsquo; growing fiscal dominance going forward, relative to the EMs (defined here as bond index components, not economies), as initial debt conditions translate into debt servicing cost. Low interest rates, whether sustainable or not, can&rsquo;t compensate for an excessive debt stock in DM. Conversely, a low debt stock can see debt sustainability preserved even through periods of high interest rates that EM sometimes experienced. And, inside the forecasts, Asia is also the leader.</p>
<h3>Exhibit 5 &ndash; EM Deficits Low, Especially Asia, U.S. Deficits High</h3>
<p><strong>General Government Balance, % GDP (inverted) </strong></p>
<p><img class="img-responsive w-100" src="https://www.vaneck.com/contentassets/dedcb314c76c4635add3a9f1f53f3e8f/4006_emerging-markets-bond-fiscal-dominance_chart-5_a_blog_2024-1_v1.svg" alt="Emerging markets deficits are low, while U.S. deficits are high." /></p>
<p><strong>EM Regions - General Government Balance, % GDP </strong></p>
<p><img class="img-responsive w-100" src="https://www.vaneck.com/contentassets/dedcb314c76c4635add3a9f1f53f3e8f/4006_emerging-markets-bond-fiscal-dominance_chart-5_b_blog_2024-1_v1.svg" alt="Asia debt is especially low relative to other emerging markets regions." /></p>
<p class="chart-disclosure">Source: IMF via Bloomberg LP; VanEck Research, As of December 2023.</p>
<h3>Exhibit 6 &ndash; U.S. Interest Outlays Keep Rising, EM Stable</h3>
<p><strong>Net Interest Outlays, % GDP </strong></p>
<p><img class="img-responsive w-100" src="https://www.vaneck.com/contentassets/dedcb314c76c4635add3a9f1f53f3e8f/4006_emerging-markets-bond-fiscal-dominance_chart-6_blog_2024-1_v1.svg" alt="U.S. interest net oulays as a percent of GDP keep rising, while emerging markets remain stable." /></p>
<p class="chart-disclosure">Source: VanEck Research, IMF via Bloomberg LP, as of December 2023.</p>
<p class="chart-disclosure">Note: EM x-China - Indonesia, Malaysia, Philippines, Thailand, Poland, Hungary, Czech Republic, South Africa, Brazil, Mexico, Chile, Colombia, Peru.</p>
<h2 id="monetary-policy" class="jump-link-nav anchored-block" data-jumplink-title="Monetary Policy">Monetary Policy</h2>
<p><strong>Theory would say that EMs&rsquo; superior fiscal stance gives greater freedom to central banks to pursue independent monetary policy, in particular the maintenance of high real interest rates, and this is exactly what materialized. </strong>Exhibit 7 below shows the real policy rate of EM (using the IMF definition of EM economies, not bond index components) compared to DM over the past couple decades. EM central bank policy rates were consistently higher, and EM central banks were earlier to the latest global hiking cycle. This evidence suggests that lower debts and deficits are allowing monetary authorities to concentrate policy on anchoring inflation and inflation expectations, and government financing isn&rsquo;t diluting this concentration. We add Exhibit 8 to show that within EM, it is the Asian central banks that have been able to maintain the lowest real policy rate relative to DM. This indicates that markets are rewarding Asia&rsquo;s economic progress relative to other EMs.</p>
<h3>Exhibit 7 &ndash; EM Real Policy Rates Higher Than DM</h3>
<p><strong>Ex-Post Real Policy Rates in EM and DM, %</strong></p>
<p><img class="img-responsive w-100" src="https://www.vaneck.com/contentassets/dedcb314c76c4635add3a9f1f53f3e8f/4006_emerging-markets-bond-fiscal-dominance_chart-7_blog_2024-1_v1.svg" alt="Emerging markets real policy rates are higher than those in developed markets." /></p>
<p class="chart-disclosure">Source: Bloomberg LP, as of December 2023.</p>
<h3>Exhibit 8 &ndash; Market Respects Asian Policy Mix - EM Asian Policy Rates Don&rsquo;t Need to Be <i>Too</i> High</h3>
<p><strong>Real Policy Rates in EM and DM </strong></p>
<p><img class="img-responsive w-100" src="https://www.vaneck.com/contentassets/dedcb314c76c4635add3a9f1f53f3e8f/4006_emerging-markets-bond-fiscal-dominance_chart-8_blog_2024-1_v1.svg" alt="Within EM, Asian central banks have been able to maintain the lowest real policy rates relative to DM. This indicates that markets are rewarding Asia&rsquo;s economic progress relative to other EMs." /></p>
<p class="chart-disclosure">Source: VanEck Research; Bloomberg LP, as of December 2023.</p>
<h2>So what?</h2>
<p><strong>First, we now have a possible explanation behind the past few decades of both EM bonds&rsquo; outperformance relative to DM, but also of Asia&rsquo;s strong position within EM.</strong> <a href="/us/en/blogs/emerging-markets-bonds/the-investment-case-for-emerging-markets-debt/" title="The Case for Emerging Markets Debt: Why Invest in EMD?"><strong>Our white paper on asset prices reviews our efficient frontier analysis in detail</strong></a>. Here, we simply produce a volatility-adjusted return profile for key fixed income categories over the past 1-, 3-, and 20-year periods. In the 20-year period, EM hard- and local-currency debt outperformed the Global Aggregate and only U.S. Treasuries were competitive. In all periods the EM hard-currency bonds outperformed the Global Aggregate Index. In recent periods (1- and 3-year) local-currency bonds also started outperforming the Global Aggregate. (Keep in mind that our white paper using the efficient frontier agrees with this &ndash; local-currency doesn&rsquo;t look awesome on a 20-year lookback; but, our point is that local-currency should begin to exhibit some of the performance characteristics generated by hard-currency). And within EM local-currency bonds, Asia (ex-China) outperformed in the 20-year and 3-year periods. In the past 3 years defined by DM banking and fiscal issues, EM clearly did &ldquo;best&rdquo; or &ldquo;least bad&rdquo;. And in the past 20 years, EM hard-currency and local-currency bonds beat the Global Aggregate with only U.S. Treasuries providing competition for EM local-currency bonds (but not Asian local-currency bonds).</p>
<h3>Exhibit 9 &ndash; Average Annual Total Return Adjusted by Volatility</h3>
<p><img class="img-responsive w-100" src="https://www.vaneck.com/contentassets/dedcb314c76c4635add3a9f1f53f3e8f/4006_emerging-markets-bond-fiscal-dominance_chart-9_blog_2024-1_v1.svg" alt="Emerging markets performance, adjusted for volatility, is very strong relative to developed markets bonds." /></p>
<p class="chart-disclosure">Source: VanEck Research; Bloomberg LP, As of December 2023.</p>
<p><strong>Second, theory would say that EMs&rsquo; superior fiscal and monetary stances should anchor inflation and inflation expectations, and that looks to be happening - R* appears to be declining in EM, while rising in DM. </strong>EM&rsquo;s presumed policy/macroeconomic &ldquo;inferiority&rdquo; was a likely factor that stopped EM real interest rates from falling in line with their DM counterparts after the global financial crisis of 2008-09. And Asian policy rates were allowed to get closer to their DM counterparts due to an appreciation of their more advanced state within EM. Of course, there were other common factors behind the divergence between EM R* and DM R*, including DM&rsquo;s aging population and slowing productivity growth. Global liquidity flows, unconventional monetary policy in DM, and the recycling of EM&rsquo;s &ldquo;excess&rdquo; savings into &ldquo;safer&rdquo; assets and also helped to push DM real rates and the natural rate of interest down. The natural rate of interest might be a theoretical construct that is defined as the real interest rate that neither stimulates nor contracts the economy &ndash; but it nevertheless informs central banks&rsquo; decisions, and as such it is very relevant for our discussion. Below, in Exhibit 10, is the IMF&rsquo;s simulated path for the natural rate of interest. What stands out is the convergence of EM rates to DM, as well as the output that the U.S. rate stays sideways.</p>
<h3>Exhibit 10 &ndash; Where are Global Interest Rates Headed?</h3>
<p><strong>Simulated Path for Natural Rate of Interest: Baseline and Scenarios</strong></p>
<p><img class="img-responsive w-100" src="https://www.vaneck.com/contentassets/dedcb314c76c4635add3a9f1f53f3e8f/4006_emerging-markets-bond-fiscal-dominance_chart-10_blog_2024-1_v1.svg" alt="This chart shows IMF&rsquo;s simulated path for the natural rate of interest. What stands out is the convergence of EM rates to DM, as well as the output that the U.S. rate stays sideways." /></p>
<p class="chart-disclosure">Source: IMF, as of December 2023.</p>
<p><strong>One last point about banking systems, which often mediate these initial economic conditions &ndash; DM banks appear much riskier than EM banks.</strong> Banking systems usually absorb the shocks presented by economic outcomes. According to our calculations, DM banks&rsquo; common-equity-to-assets ratios are about 2 standard deviations <i>weaker</i> than the global mean, and EM banks are superior to the global mean. The IMF, which has recently been sounding warnings about fiscal dominance (they use the term &ldquo;financial dominance&rdquo;) is highlighting DM banking systems&rsquo; vulnerability in adverse scenarios. In particular, they noted DM banks&rsquo; vulnerability to a &ldquo;stagflation&rdquo; scenario and produced the chart below. What it says is that DM banks may see significant hits to capital, while DM banks should not. We make this point to emphasize that there is not a &ldquo;silver bullet&rdquo; to solve policy mistakes, though DM policy makers have been conditioned to assume their banking systems are stable and strong. In particular, the IMF ran global bank stress tests that incorporate a stagflationary scenario of higher-for-longer interest rates, a scenario U.S. stress tests overlooked, and the results were particularly troubling for the DM banking sector (plus China). CET1 ratios fall below 7% for 27% of developed market banks and 50% of Chinese banks. EM banks, in contrast, fared well with just 10% falling below 7%. To quote Mark Twain again, <i>&ldquo;It ain&rsquo;t what you don&rsquo;t know that gets you into trouble. It&rsquo;s what you know for sure that just ain&rsquo;t so.&rdquo;</i></p>
<h3>Exhibit 11 &ndash; IMF Says DM Banks Vulnerable to &ldquo;Stagflation&rdquo; Scenario</h3>
<p><strong>Shares of Total Assets by Region (Banks with CET1 below 7%) </strong></p>
<p><img class="img-responsive w-100" src="https://www.vaneck.com/contentassets/dedcb314c76c4635add3a9f1f53f3e8f/4006_emerging-markets-bond-fiscal-dominance_chart-11_blog_2024-1_v1.svg" alt="IMF data suggests that DM Banks vulnerable to &ldquo;stagflation&rdquo; scenario." /></p>
<p class="chart-disclosure">Source: IMF, as of December 2023.</p>
<h2 id="geopolitics-and-economic-implications" class="jump-link-nav anchored-block" data-jumplink-title="Geopolitics and Economic Implications">Geopolitics and fiscal dominance</h2>
<p>Geopolitics have economic implications for EM and DM, and economics (in particular fiscal dominance) has implications for geopolitics. We discuss particular phenomena in our monthlies and other publications in more detail. In general, the implications are:</p>
<ul class="content-list">
<li>Higher defense spending in the DM, adding to fiscal pressure. DM defense spending looks set to increase due to geopolitical pressures. These add to the fiscal stresses in DM. If accompanied by higher inflation (often a symptom of war) and interest rates, the DM debt dynamic could begin to fray. U.S. deficits were forecast by the IMF to be in the 6%-8% range (above) <i>before</i> geopolitical risks became obvious to most forecasters.</li>
<li>CNY market share in international trade is low (at below 5%), but is in the top-4 (approaching GBP) and rising. EMs are further integrating their economies, with finance a key focus. Saudi Arabia now conducts oil sales to China in CNY, India in INR with UAE, Saudi and China with Brazil in BRL, etc. Purchases of these EM currencies by central banks in the long run results in the their purchase of EM bonds in these currencies (just as Saudi and Chinese reserves were accumulated in U.S. Treasuries because sales generated USD).</li>
<li>Look for increased use of EM bonds as reserve assets, decreased use of DM bonds as reserve assets, prospectively. US/EU/Japan, etc. (i.e., DM) sanctions freezing the Central Bank of Russia&rsquo;s reserves of Treasuries (and JGBs, etc.) has forced all EM central banks to reconsider their reserve holdings in light of this new fact. Reserves should not be subject to sanctions risk from the perspective of EM reserve managers, for whom reserves are a nation&rsquo;s safety net that should by definition should be &ldquo;risk-free&rdquo;.</li>
<li>&ldquo;Stagflation&rdquo; that helps EM and hurts DM appears to be a real long-term scenario. Supply risks and greater economic integration in EM mean that rising commodity prices are likelier, and have a differential impact &ndash; India and China paying a different (and unknown) price for oil than do the DM is a glaring example. EM (defined by EM bond indices) include many commodity exporters, which can benefit in this scenario. DM are largely commodity-importing.</li>
</ul>
<p><strong>These implications will take many years to play out, but they represent a long-term tailwind for EM local-currency bonds.</strong> As we showed at the outset, <i>it is the deficit-producing DMs that need financing from the surplus-producing EMs</i>, whether the situation is understood that way yet, or not. The fact that EM and DM are increasingly in geopolitical disagreement represents an obvious global market risk. <i>It is risky to depend on adversaries for one&rsquo;s financing is a sentence that shouldn&rsquo;t need to be written, but here we are.</i> EM central banks will increasingly want reserve assets backed by high real yields and debt sustainability, with zero sanctions risk. Central bank purchases of gold are by now well-reported and known, especially the fact that now both EM <i>and now </i>DM central banks are buyers. Gold is the easiest first-reaction from central banks. But, bonds with yield and currencies with use in trade are the ultimate desire for reserve managers and they will find these in EM local-currency bonds. Like we said above, this is a long-term tailwind, not translating into a straight line. In particular, the USD has a key structural support &ndash; most global debt is denominated in USD. This means that &ldquo;risk-off&rdquo; translates into USD-up. This is less-and-less the case, as we show above with Asian EM local currencies rallying during the U.S.&rsquo;s fiscal and banking issues in 2023 for example. There, countries that proved their fiscal and monetary rectitude over decades <i>rallied</i> as DM bond markets suffered. Put differently, the USD-up is increasingly only up against the other DM currencies and the riskiest EM currencies, not against the best EM currencies. <strong>Anyway, our general point is that even geopolitical developments that are getting increased attention support our fiscal dominance thesis.</strong></p>
<h3>Exhibit 12 &ndash; Global Central Bank Gold Purchases and U.S. Treasuries in Global Reserves</h3>
<p><strong>Reserve Gold Holdings (2000-2023), mln Troy oz </strong></p>
<p><img class="img-responsive w-100" src="https://www.vaneck.com/contentassets/dedcb314c76c4635add3a9f1f53f3e8f/4006_emerging-markets-bond-fiscal-dominance_chart-12-a_blog_2024-1_v1.svg" alt="EM Central Banks have been purchasing a lot of gold for their reserves." /></p>
<p><strong>Foreign Exchange Holdings in U.S. Dollars, % of allocated reserves </strong></p>
<p><img class="img-responsive w-100" src="https://www.vaneck.com/contentassets/dedcb314c76c4635add3a9f1f53f3e8f/4006_emerging-markets-bond-fiscal-dominance_chart-12-b_blog_2024-1_v1.svg" alt="Foreign exchange holding in U.S. dollar have declined steadily since 2000." /></p>
<p class="chart-disclosure">Source: Bloomberg LP, source as of December 2023.</p>
<h2>A note on methodology</h2>
<p>In some cases, categories such as &ldquo;emerging markets&rdquo; and &ldquo;developed markets&rdquo; above are not consistent. First and foremost, when we use the term EM we are referring either to the IMF (and sometimes Bloomberg) category based on economic considerations, or the bond index categorization (but never to an equity index categorization, though the economic definition comes closer). For example, when using IMF data sources, a broader number of EM countries is included to measure their <i>economic</i> importance, whereas when we display market-oriented data the &ldquo;emerging markets&rdquo; are based on bond index components when possible. Similarly, for &ldquo;emerging markets&rdquo; and &ldquo;developed markets&rdquo; real policy interest rates, we use Bloomberg as our data source, and the sub-components of Bloomberg&rsquo;s metric won&rsquo;t precisely fit the sub-components of the popular bond indices. Another example, when we compare EM sovereign credit spreads to reserves, the reserves data is for &ldquo;emerging markets&rdquo; as defined by the IMF in <i>economic</i> terms, whereas the credit spreads are for the sovereign bond index components. We also use the U.S. as a stand-alone, as well as the G-7, as proxies for DM, and we ex-China in some cases. In all cases, custom-adjusting the data (to have the economic measure adjusted to reflect only countries with bonds in indices) didn&rsquo;t change the points we intended.</p>
<p>To receive more <a href="https://www.vaneck.com/us/en/insights/emerging-markets-bonds/" title="Emerging Markets Bonds Insights"><strong>Emerging Markets Bonds</strong></a> insights, <a href="https://www.vaneck.com/us/en/subscribe/" title="Subscription Center"><strong>sign up in our subscription center</strong></a>.</p>
]]></content:encoded>
</item><item rdf:about="https://www.vaneck.com/us/en/blogs/natural-resources/resources-regroup-for-2024/">
  <title>Resources Regroup for 2024></title>
  <link>https://www.vaneck.com/us/en/blogs/natural-resources/resources-regroup-for-2024/</link>
  <description><![CDATA[While global economic growth and inflation continue to influence commodities and resource equities, we believe the factors that propelled resource companies to their 2022 highs still exist.]]></description>
  <dc:creator>Shawn Reynolds</dc:creator>
  <dc:date>01/22/2024 06:30:00</dc:date>
<content:encoded><![CDATA[

<p>Quarterly insights from Global Resources Portfolio Manager Shawn Reynolds, featuring his unique views on natural resources and commodities. <a href="/us/en/blogs/natural-resources/resources-regroup-for-2024/grf-quarterly-commentary-4q-2023.pdf" rel="noopener" target="_blank" title="GRF Quarterly Commentary - 3Q 2023"><strong><em>An expanded PDF version of this commentary, including fund specific information can be downloaded here.</em></strong> </a></p>
<h2>Mixed Performance on the Quarter</h2>
<p>Performance of resource equities was mixed on the quarter. Broadly speaking, the sector&rsquo;s most respectable gains were concentrated in mining, including within the sub-sectors of Base &amp; Industrial Metals and Gold &amp; Precious Metals. Sub-sectors such as Renewable &amp; Alternative Energy and Industrials &amp; Utilities saw modest rallies to end the year, though mostly off of recent lows. Meanwhile, a majority of the Oil &amp; Gas sub-sector experienced losses, marking a notable pullback from their mid-year peak.</p>
<h2>Landmark M&amp;A in Oil &amp; Gas</h2>
<p>Oil price declines in the fourth quarter were highlighted by weakening demand growth paired with stronger-than-anticipated output&mdash;particularly out of the U.S. In its December 2023 Oil Market Report, IEA noted how U.S. oil supply growth &ldquo;continues to defy expectations, with output shattering the 20 mb/d  mark.&rdquo;<sup>i</sup>&nbsp;OPEC+&rsquo;s announced plans to extend oil production cuts through the first quarter of 2024 appeared to have little impact on halting crude&rsquo;s slide. WTI crude prices dropped some $25/bbl from the end of September into early December before eventually settling at around $72/bbl to end the year (a 10% decline from end-2022).</p>
<p>Mergers and acquisition activity within the U.S. exploration and production (E&amp;P) industry reached a zenith in the fourth quarter with ExxonMobil&rsquo;s (2.48% of Strategy net assets<sup>*</sup>) announced all-stock purchase of Pioneer Natural Resources (1.07% of Strategy net assets<sup>*</sup>) and Chevron&rsquo;s (0.99% of Strategy net assets<sup>*</sup>) similarly-structured agreement to purchase Hess (0.51% of Strategy net assets<sup>*</sup>). The deals, both valued above $50 billion, capped off a reported $250 billion spending spree in the industry for 2023.<sup>ii</sup></p>
<h2>Hope for Renewables Heading Into 2024?</h2>
<p>Solar module prices hit new lows during the quarter, with supply still vastly outstripping demand. Global imbalances remained largely fueled by excess capacity in China, where the cost to produce a panel fell by over 40% in the last year.<sup>iii</sup>&nbsp;Declining industry costs, as well as government-fueled subsidies from the Inflation Reduction Act, are believed to have aided with a record 33 gigawatts of installed solar capacity in the U.S., and 413 gigawatts worldwide, in 2023.<sup>iv</sup></p>
<p>Investor sentiment around renewable and alternative energy companies saw a marked improvement during the quarter. Higher borrowing costs have been a significant contributor to a more muted outlook for the space &ndash; particularly for companies such as renewable energy project financier, Hannon Armstrong (2.05% of Strategy net assets<sup>*</sup>) &ndash; and U.S. Federal Reserve (Fed)-telegraphed rate cuts in 2024 helped restore some optimism beginning in October.</p>
<h2>Much-Needed Boost for Base Metals</h2>
<p>Base and industrial metals markets limped into the fourth quarter as concerns over China&rsquo;s real estate sector weighed on prices for much of the year. &ldquo;Green&rdquo; metals and minerals &ndash; such as lithium, nickel, cobalt and graphite &ndash; contended with projected supply overhangs, in part due to disappointing EV sales in the U.S and ongoing supply-chain bottlenecks in clean energy markets. Copper and iron ore were spared before year-end with reported inventory declines in China and at the London Metal Exchange, as well as with a slew of ongoing disruptions at major production sites around the world.</p>
<p>First Quantum (0.48% of Strategy net assets<sup>*</sup>) was among those most significantly impacted by disruptions to its mine operations. In November, Panamanian government officials ordered the closure of First Quantum&rsquo;s Cobre Panama mine which, according to Bloomberg, accounted for approximately 1.5% of copper supply in 2022.<sup>v</sup>&nbsp;While certainly less dramatic, in October, Vale (2.86% of Strategy net assets<sup>*</sup>) announced a two-million-ton impact to its iron ore production&mdash;occurring in the third quarter&mdash;due to vital equipment failure at its norther Brazilian mining complex.<sup>vi</sup></p>
<h2>Gold&rsquo;s Still Shining</h2>
<p>Gold reached a new all-time high in December. Reported strength in central bank purchases, rising global geopolitical tensions and forecasted rate cuts in 2024 outweighed otherwise-lackluster investment demand for physical gold through most of the second half of 2023.</p>
<p>Gold miners, who largely underperformed the metal heading into the fourth quarter, showcased their ability to outperform. In November, Newmont (1.70% of Strategy net assets<sup>*</sup>) announced its successful, $15 billion bid for Newcrest (not held by Strategy). The acquisition is estimated to bring Newmont&rsquo;s net value to approximately $50 billion while also adding several highly-attractive, non-core assets to its mining portfolio.<sup>vii</sup></p>
<h2>Ags Still Seeking a Near-Term Catalyst</h2>
<p>Nearly the whole of the agriculture complex added to its year-to-date losses during the fourth quarter. U.S. stocks of wheat and corn ended the year higher while usage remained fairly flat on slowing exports and lower demand for animal feed. Fertilizer prices continued to stabilize with European supplies of natural gas (a key input for nitrogen fertilizers) appearing less precarious than a year ago. Proteins were mixed; cattle prices retreated from all-time highs on record imports while chicken broiler prices spiked on reports of a resurgence in avian flu.</p>
<p>Modest share price gains of protein producers and farm equipment manufacturers were the lone standouts among agriculture companies during the final months of 2023. However, on the whole, the agriculture sub-sector struggled to find firm footing.</p>
<h2>Looking Ahead to 2024</h2>
<p>From a macroeconomic perspective, commodities and resource equities continue to be most strongly influenced by the perceived trajectory of global economic growth and inflation. As such, the health of economies in China, United States, Europe and, increasingly so, India, remain a critical area of focus for us, for now. We are closely monitoring indications that the era of interest rate hikes may have concluded and that a global recession may have been successfully avoided. Such a case would prove, in our view, generally constructive for the operating environments of a number of our portfolio companies, with any incremental measures likely to be stimulative for demand.</p>
<p>Inflation has come down but remains above most key targets, implying, to us, a &ldquo;higher-for-longer&rdquo; outlook. The risk that inflation trends reverse or that inflation remains at current levels, while regarded as negative for economic growth, would likely still prove somewhat beneficial for inflation-hedging assets such as commodities and resource equities. A recession, even if mild, would certainly be considered a worst-case-scenario, as this would likely lessen the perceived importance of these assets significantly.</p>
<p>Macroeconomics aside, clear to us is that many of the other major, fundamentally-driven factors propelling resource companies to their 2022 highs still remain the same today. Supply for a number of commodities continues to be constrained due to a lack of capital investment, operational limitations and aligned executive compensation schemes. Resource companies, bolstered by structural advantages and years of efficiency-focused operations, remain uniquely positioned to benefit. Their tangible assets, strong financial health, commitment to shareholder value and attractive valuations still make them compelling investment opportunities, in our view.</p>
<p>To receive more <strong><a href="https://www.vaneck.com/us/en/insights/natural-resources/" title="Natural Resources Insights">Natural Resources</a> </strong>insights, <strong><a href="https://www.vaneck.com/us/en/subscribe/" title="Subscription Center">sign up in our subscription center</a>.</strong></p>
]]></content:encoded>
</item><item rdf:about="https://www.vaneck.com/us/en/blogs/emerging-markets-bonds/bull-or-bear-emerging-markets-bonds-outperform-in-both/">
  <title>Bull or Bear? Emerging Markets Bonds Outperform in Both></title>
  <link>https://www.vaneck.com/us/en/blogs/emerging-markets-bonds/bull-or-bear-emerging-markets-bonds-outperform-in-both/</link>
  <description><![CDATA[Emerging markets bonds once again outperformed DM bonds, this time in a bond bull market year.]]></description>
  <dc:creator>Eric Fine</dc:creator>
  <dc:date>01/18/2024 06:30:00</dc:date>
<content:encoded><![CDATA[

<p>The <strong><a href="https://www.vaneck.com/us/en/investments/emerging-markets-bond-fund-embax/overview/" title="EMBAX - Emerging Markets Bond Fund - Class A - Overview">VanEck Emerging Markets Bond Fund</a></strong> was up 3.88% in December, compared to 4.12% for its benchmark. Egypt (dollar-denominated) was the biggest outperformer, along with Chile (local- and hard-currency) and Colombia (local-currency). Thailand, Indonesia, and Romania (all local-currency) were the underperformers. We increased exposure to some Asian local markets that lagged in late 2023 such as Indonesia and Malaysia. In Latin America we are set to increase our exposures in local-currency, particularly Chile and Brazil. We intend to keep duration in line with the benchmarks. The Fund ended December with carry of 7.0%, yield to worst of 8.9%, duration of 6.2, and nearly 50% of the Fund in local currency. Our biggest exposures are Mexico (local and hard), China (primarily hard), and Malaysia (primarily local). <a href="/us/en/blogs/emerging-markets-bonds/bull-or-bear-emerging-markets-bonds-outperform-in-both/bull-or-bear-emerging-markets-bonds-outperform-in-both.pdf" target="_blank" rel="noopener" title="Bull or Bear? Emerging Markets Bonds Outperform in Both."><strong>View here for PDF version of this blog.</strong></a></p>
<div class="wrapped-div">
<table style="width: 100%;">
<tbody>
<tr class="tbl-data">
<td class="tbl-header last" colspan="8">Average Annual Total Returns<sup>*</sup>&nbsp;(%) as of December 31, 2023</td>
</tr>
<tr class="tbl-data">
<td class="data-td last">&nbsp;</td>
<td class="data-head last">1 Month</td>
<td class="data-head last">3 Month</td>
<td class="data-head last">YTD</td>
<td class="data-head last">1 Year</td>
<td class="data-head last">3 Year</td>
<td class="data-head last">5 Year</td>
<td class="data-head last">10 Year</td>
</tr>
<tr class="tbl-data">
<td class="data-td last">Class A: NAV (Inception 07/09/12)</td>
<td class="data-td data last">3.88</td>
<td class="data-td data last">8.36</td>
<td class="data-td data last">10.91</td>
<td class="data-td data last">-0.79</td>
<td class="data-td data last">4.14</td>
<td class="data-td data last">1.80</td>
</tr>
<tr class="tbl-data">
<td class="data-td last">Class A: Maximum 5.75% load</td>
<td class="data-td data last">-2.09</td>
<td class="data-td data last">2.13</td>
<td class="data-td data last">4.53</td>
<td class="data-td data last">-2.73</td>
<td class="data-td data last">2.92</td>
<td class="data-td data last">1.20</td>
</tr>
<tr class="tbl-data">
<td class="data-td last">Class I: NAV (Inception 07/09/12)</td>
<td class="data-td data last">3.81</td>
<td class="data-td data last">8.43</td>
<td class="data-td data last">10.97</td>
<td class="data-td data last">-0.49</td>
<td class="data-td data last">4.46</td>
<td class="data-td data last">2.10</td>
</tr>
<tr class="tbl-data">
<td class="data-td last">Class Y: NAV (Inception 07/09/12)</td>
<td class="data-td data last">3.80</td>
<td class="data-td data last">8.40</td>
<td class="data-td data last">11.03</td>
<td class="data-td data last">-0.57</td>
<td class="data-td data last">4.39</td>
<td class="data-td data last">2.03</td>
</tr>
<tr class="tbl-data">
<td class="data-td last">50% GBI-EM/50% EMBI</td>
<td class="data-td data last">3.97</td>
<td class="data-td data last">8.63</td>
<td class="data-td data last">11.95</td>
<td class="data-td data last">-3.31</td>
<td class="data-td data last">1.46</td>
<td class="data-td data last">1.71</td>
</tr>
</tbody>
</table>
</div>
<br />
<p class="chart-disclosure"><sup>*</sup>&nbsp;Returns less than one year are not annualized.</p>
<p class="chart-disclosure"><strong>Expenses: Class A: Gross 2.55%, Net 1.22%; Class I: Gross 2.51%, Net 0.87%; Class Y: Gross 2.91%, Net 0.97%.</strong> Expenses are capped contractually until 05/01/24 at 1.25% for Class A, 0.95% for Class I, 1.00% for Class Y. Caps excluding acquired fund fees and expenses, interest, trading, dividends, and interest payments of securities sold short, taxes, and extraordinary expenses.</p>
<p class="chart-disclosure"><strong>The performance data quoted represents past performance. Past performance is not a guarantee of future results. Investment return and principal value of an investment will fluctuate so that an investor&rsquo;s shares, when redeemed, may be worth more or less than their original cost. Performance may be lower or higher than performance data quoted. Please call 800.826.2333 or visit vaneck.com for performance current to the most recent month ended.</strong></p>
<p class="chart-disclosure">The &ldquo;Net Asset Value&rdquo; (NAV) of a Fund is determined at the close of each business day, and represents the dollar value of one share of the fund; it is calculated by taking the total assets of the fund, subtracting total liabilities, and dividing by the total number of shares outstanding. The NAV is not necessarily the same as the ETF&rsquo;s intraday trading value. Investors should not expect to buy or sell shares at NAV.</p>
<p><strong>The Fed-pause-induced rally appears overdone &ndash; be cautious on duration.</strong> Fed fund futures are pricing in about double the amount of 2024 cuts than the median of the Fed&rsquo;s &ldquo;dot plot&rdquo;. This remains the key challenge going into 2024 &ndash; an easing cycle is already priced. That it all &ldquo;happened&rdquo; in just the last two months of 2023 underlines the vulnerability of this goldilocks scenario. Because of the centrality of US interest rates to global asset prices, &ldquo;everything&rdquo; rallied in November and December following the stronger dovish turn in the US bond market. Especially emerging markets (EM) local currency, whose central banks generally hiked interest rates earlier and more than their developed markets (DM) counterparts.</p>
<p><strong>Nothing about the US fiscal stance looks likely to adjust &ndash; the path of annual fiscal deficits around 6%-8% for the next several years appears set-in-stone, regardless of political outcomes.</strong> Fed Chair Powell, unusually, raised the &ldquo;unsustainability&rdquo; of US finances as a challenge for monetary policy, allowing the market to actually consider the implications rather than ignore them. At the least, this cautions us against duration &ndash; neutral to our benchmark is about as high as we see appropriate. This is of course especially true for investment-grade/low-spread/high-quality bonds that are much more like US Treasury proxies following the end-of-2023 rally.</p>
<p>Speaking of debt sustainability, look out for our upcoming white paper entitled &ldquo;Fiscal Dominance: The Clarifying Lens&rdquo;, in which we conclude that the perceived-to-be-safe DM bond markets face much more challenging headwinds than do the perceived-to-be-risky EM bond markets.</p>
<p><strong>Seeing Red &ndash; the Israel/Hamas conflict is only contained temporarily; expect steady escalation and increasing focus on a global &ldquo;stagflation&rdquo; scenario.</strong> What was most unusual about the market reaction to the October 7 attacks was the collapse in oil prices. Underneath that market reaction was a successful effort on the part of the US and its regional allies to prevent conflict expansion (though not to prevent escalation, to our eye). It was why we held our noses (because Egypt has serious long-term debt-sustainability issues) and accumulated positions in Egypt&rsquo;s dollar-denominated bonds after they sold off on back of the conflict &ndash; financial support for Egypt from the IMF and bilateral lenders would be <i>increased</i> as a result of the conflict, we surmised. The bonds have rallied, discounting this erstwhile (to us) stability. Note that the position in Egypt was not especially material, it&rsquo;s in our benchmark, and we are citing it only to be very precise about our reasoning.</p>
<p><strong>This absence of conflict expansion was anomalous.</strong> Following reported attacks on shipping by Houthi forces in Yemen (which specifically referenced the Israel/Hamas conflict), we now see the conflict as expanding and escalating. The US&rsquo;s Operation Prosperity Guardian represents to most actors direct US support for Israel (whether that perception is correct or not is irrelevant to our point), which greatly complicates US plans. First, US regional allies find it hard to position their US-guided foreign policy stances with their own populations (part of the reasoning behind increased support from US and regional allies for Egypt going into recent elections). More important, US Central Command communications now include &ldquo;Iran-backed&rdquo; descriptors of Houthi forces. Again, the true degree of Iranian involvement is irrelevant for our point &ndash; from a game theory standpoint, the descriptor means it is a fact for US planners and Iran, by definition, has to accept the label. The actuality that a Maersk ship was reportedly attacked <i>after </i> Operation Prosperity Guardian is also obviously even more destabilizing.</p>
<p><strong>All of this is a good reminder that while most asset prices are linked to US economic developments (recession risk in particular), EM issuers are often commodities exporters and thus have an additional argument (against US High Yield or US Investment Grade, for example) in 2024 if a &ldquo;stagflation&rdquo; scenario materializes.</strong> Crudely, US high yield is a function of US recession risk, while EM is less of a function. More specifically, to us the above translates into caution on duration and attraction to curated carry, which can cushion a bumpy year and may still generate returns. Even more specifically, we are looking at reducing exposure to high-rated, long-duration dollar-denominated bonds (in Chile, Poland, and the Gulf) and increasing exposure to higher-carry, shorter-duration bonds (in Chile and Poland). Many of the higher-rated, long-duration dollar-denominated bonds are US Treasury proxies right now. Many of the high-carry, neutral-duration local-currency denominated bonds are supported (or not) by more than just the US economic trajectory.</p>
<p><strong>What a difference a perspective-change can make.</strong> Everyone is focused on the magical 365-day period that ends December 31 because&hellip;astronomy! This obviously masks non-astronomical cycles and phenomena so we thought we&rsquo;d compare 2023 to the past two years (2022 and 2023). A lot jumps out. Initially, one could look at 2023 and note that all bonds performed well, with EM happening to perform best. But if you include 2022, one sees that over the entire period EM bonds also performed better. So, the key conclusion seems to us to be not that all bonds simply rallied in 2023 with EM happening to be the highest beta winner. In down markets, like the one experienced in 2022 EM also outperformed (see Exhibit 1). Something else (i.e., something other than pure beta) is driving returns. We argue in our white paper on fiscal dominance (which will be published later this month) that what is driving EM returns is superior fundamentals relative to their bond premia.</p>
<h3>Exhibit 1 &ndash; EM Bonds Performed Better in Both Bond Bull and Bear Markets</h3>
<p><img class="img-responsive w-100" src="https://www.vaneck.com/contentassets/cb6d2faabc77413b975519be8ecf62d3/4013_emb-monthly-jan-2024_infographic_blog_2024-01_v1.svg" alt="EM Bonds Outperformed DM in Bonds in the 2022 Bear Market and 2023 Bull Market" /></p>
<p class="chart-disclosure">Source: J.P. Morgan and ICE Data Indices. Local Currency EM is represented by J.P. Morgan GBI-EM Global Diversified Index; Hard Currency EM is represented by J.P. Morgan EMBI Global Diversified Index; Treasuries represented by ICE BofA US Treasury Index; Bunds represented by ICE BofA German Government Index; Global Agg represented by ICE BofA Global Broad Market Index; JGBs represented by ICE BofA Japan Government Index; Gilts represented by ICE BofA UK Gilt Index.</p>
<h2>EXPOSURE TYPES AND SIGNIFICANT CHANGES</h2>
<p>The changes to our top positions are summarized below. Our largest positions in December were Mexico, Brazil, Malaysia, Colombia, and Indonesia:</p>
<ul class="content-list">
<li>We increased our local currency exposure in Malaysia and Indonesia. The key factors in both countries were successful disinflation, FX correlation with China&rsquo;s rebound, and the currencies lagged reaction to the Fed&rsquo;s dovish pivot. In terms of our investment process, this improved the technical test score for both countries.</li>
<li class="mt-2">We also increased our hard currency sovereign exposure in Suriname. The country successfully completed the debt restructuring process (both with the official and private sectors), delivering the new bonds to investors. In addition, the IMF completed the fourth review of its Extended Fund Facility program with Suriname. In terms of our investment process, both developments improved the policy test score for the country.</li>
<li class="mt-2">We reduced our local currency exposure in South Africa, Mexico, and Brazil. Brazil&rsquo;s reduction mostly reflected the monthly price action, but in Mexico we became concerned about stretched positioning (it was a very popular long both in rates and FX), as well as the country&rsquo;s exposure to the US election cycle. This worsened Mexico&rsquo;s technical test score. As regards South Africa, the key reasons were domestic political (elections) and fiscal issues, as well as the country&rsquo;s exposure to China&rsquo;s growth hiccups. These factors worsened the country&rsquo;s technical, economic, and policy test scores.</li>
<li class="mt-2">We also reduced our hard currency sovereign exposure in Bahrain and Angola. The main negatives in Bahrain (especially as regards the technical test score) were the US growth downturn and its negative impact on oil demand to which Bahrain is very sensitive at these spread levels. In Angola, we noted less attractive valuations, and no obvious positive market catalysts (including a lack of upside in oil prices), which worsened the country&rsquo;s technical test score. It also has a high breakeven oil price.</li>
<li class="mt-2">Finally, we reduced our hard currency corporate exposure in Israel. Geopolitical tensions in the region show no signs of abating. Israel&rsquo;s policy framework is rock solid, but local assets might be exposed to geopolitical hiccups for many months to come. The bonds were priced for perfection.</li>
</ul>
<p>To receive more <a href="https://www.vaneck.com/us/en/insights/emerging-markets-bonds/" title="Emerging Markets Bonds Insights"><strong>Emerging Markets Bonds</strong></a> insights, <a href="https://www.vaneck.com/us/en/subscribe/" title="Subscription Center"><strong>sign up in our subscription center</strong></a>.</p>
<style>
    .wrapped-div {
        max-width: 100%;
    }

    @media (max-width: 768px) {
        .wrapped-div {
            overflow-x: scroll;
        }
    }

    .wrapped-div-sector {
        max-width: 100%;
        overflow-x: scroll;
    }
</style>
]]></content:encoded>
</item><item rdf:about="https://www.vaneck.com/us/en/blogs/emerging-markets-equity/emerging-markets-brazil-ends-the-year-on-a-high-note/">
  <title>Brazil Ends the Year on a High Note></title>
  <link>https://www.vaneck.com/us/en/blogs/emerging-markets-equity/emerging-markets-brazil-ends-the-year-on-a-high-note/</link>
  <description><![CDATA[Emerging markets equities saw positive performance in 4Q 2023, driven by valuation re-rating and currency strength.]]></description>
  <dc:creator>David Semple</dc:creator>
  <dc:date>01/17/2024 06:30:00</dc:date>
<content:encoded><![CDATA[

<p>Quarterly emerging markets equity insights from David Semple, Portfolio Manager and Ola El-Shawarby, Deputy Portfolio Manager, featuring their unique views on emerging markets. <a href="/us/en/blogs/emerging-markets-equity/emerging-markets-brazil-ends-the-year-on-a-high-note/eme-quarterly-commentary-q4-2023.pdf" rel="noopener" target="_blank" title="VanEck Emerging Markets Fund Manager Commentary"><strong>An expanded PDF version of this commentary, including fund specific information can be downloaded here.</strong></a></p>
<p>In the fourth quarter of 2023, emerging markets equities largely extended trends seen throughout the year. Taiwan Region, India and South Korea boosted benchmark returns, while China underperformed.</p>
<p>On the whole, emerging markets equities saw positive performance driven by valuation re-rating and currency strength. As noted in prior commentaries, emerging markets valuations remain a focus. Price-to-book values for emerging markets equities did tick up in the fourth quarter and sits just below 15-year averages, but the valuation differential between emerging markets and developed markets remains well below its historical range.</p>
<p>The U.S. Federal Reserve (Fed) continues to remain on pause for future hikes, with the December meeting leaning decidedly dovish. An accommodative Fed potentially bodes well for emerging markets equities, which would benefit from currency tailwinds if the dollar continues to slide. The dollar fell throughout the fourth quarter and is expected to continue lower if the Fed begins to implement potential cuts in 2024.</p>
<h2>Strategy Performance</h2>
<p>Brazil remains the Strategy&rsquo;s largest country overweight (14.1% for Strategy, 5.5% for Benchmark average weight over the quarter). The Strategy&rsquo;s allocation and stock selection in Brazil were the biggest contributors to relative performance for both Q4 and the entire year.</p>
<p>The Strategy&rsquo;s largest country exposure, China, contributed negatively on both an absolute and relative basis for Q4.</p>
<h2>Strategy Review</h2>
<p>On a sector level, Industrials, Financials and Real Estate contributed to relative performance, while Information Technology, Consumer Discretionary and Health Care detracted. On a country level, Brazil, Mexico and the Philippines contributed to relative performance, while Taiwan Region, Turkey and South Africa detracted.</p>
<h2>Top Contributors</h2>
<p>Top contributors to Strategy return on an absolute basis during the quarter:</p>
<ul class="content-list">
<li><strong>JSL S.A. (&ldquo;JSL&rdquo;) (3.6% of Strategy net assets<sup>*</sup>):</strong> As Brazil's largest logistics platform, JSL showed strong performance this quarter, marked by operational improvements and successful repricing efforts. Its acquisition of IC Transportes and effective management of inflation contributed positively to its financials. With new contracts continually being secured, JSL is solidifying its market leadership. The recent acquisitions present significant opportunities for margin improvements, and the company is expected to maintain its momentum following its impressive quarterly results.</li>
<li class="mt-2"><strong>MercadoLibre (&ldquo;MELI&rdquo;) (5.3% of Strategy net assets<sup>*</sup>):</strong> MELI, the leading e-commerce platform in Latin America, is also making significant strides in fintech. The company's performance this quarter exceeded expectations, with significant market share gains in Brazil and rapid revenue growth in Mexico, despite new competitors. Contrary to expectations of margin pressure due to heavy investments, strong sales volumes have led to substantial operating leverage, diluting costs. MELI continues to invest in logistics, and the Black Friday sales figures from 4Q23 indicate sustained growth.</li>
<li class="mt-2"><strong>Taiwan Semiconductor Manufacturing Co. (&ldquo;TSMC&rdquo;) (7.1% of Strategy net assets<sup>*</sup>):</strong> After a period of downward earnings revisions, TSMC reported better-than-expected results in 4Q (3Q FY23). Forward-looking guidance suggests a rebound in demand, with strong unit sales growth anticipated for 2024 and 2025. TSMC, with its focus on advanced edge lithography and AI chips, is expected to regain its competitive edge, particularly against Intel. The company&rsquo;s growth prospects remain strong, justifying its significant portfolio position.</li>
</ul>
<h2>Top Detractors</h2>
<p>Top detractors to Strategy return on an absolute basis during the quarter:</p>
<ul class="content-list">
<li><strong>China Education Group (1.8% of Strategy net assets<sup>*</sup>):</strong> While still demonstrating solid revenue growth from a combination of organic growth in the number of students and tuition increases, the growth has been modestly below consensus. Additionally, the absence of M&amp;A news negatively impacted the share price.</li>
<li class="mt-2"><strong>Wuxi Biologics (0.9 % of Strategy net assets<sup>*</sup>):</strong> The company revised its revenue growth expectations downward due to weaker funding for its clients and regulatory delays. However, the long-term outlook for outsourcing in biologics research remains positive.</li>
<li class="mt-2"><strong>Chroma Ate (1.1% of Strategy net assets<sup>*</sup>):</strong> Faced with demand pressures in key industries such as EV batteries and solar inverters, Chroma&rsquo;s share price declined. The company, operating in a niche market, is affected by factors like EV manufacturers&rsquo; backward integration and geopolitical pressures on solar modules.</li>
</ul>
<h2>Top Buys &amp; Sells</h2>
<p>During the period, we established new positions in the following:</p>
<ul class="content-list">
<li><strong>Galaxy Entertainment Group (0.4% of Strategy net assets<sup>*</sup>):</strong> We have reinitiated our investment in Galaxy Entertainment Group, one of the six gaming concessionaires in Macau. The company's prospects look promising due to a robust recovery in visitor and gaming revenue, which recently surpassed expectations. Galaxy Entertainment is well-positioned to increase its market share, supported by an expansion in capacity and a proven track record of successful operations.</li>
<li class="mt-2"><strong>BYD Co (0.5% of Strategy net assets<sup>*</sup>):</strong> As the world's leading manufacturer of battery-operated electric vehicles by volume, BYD Co has faced share price challenges from pricing pressures and increased inventory. Despite these issues, we believe the company's current low valuation adequately reflects these concerns. Furthermore, BYD is expected to benefit from its new product cycle launching this year.</li>
</ul>
<p>During the period, we exited the following positions:</p>
<ul class="content-list">
<li><strong>Zhejiang Huayou Cobalt Co, Ganfeng Lithium Group, Hoyuan Green Energy Co (not held by Strategy):</strong> We significantly reduced our investment in these companies, which are focused on upstream renewable materials. We anticipate ongoing pressure on their share prices due to cyclical overcapacity in the market. While we foresee potential recovery in their share prices in the future, our current strategy is to remain on the sidelines.</li>
<li class="mt-2"><strong>Doosan Fuel Cell Co (not held by Strategy):</strong> Our decision to divest from Doosan Fuel Cell Co was influenced by delays in the advancement of hydrogen energy projects. Despite the company's advantageous position to benefit from sector developments, the uncertain economic prospects compared to other energy sources, challenging project financing conditions and high valuation prompted us to exit this investment.</li>
</ul>
<h2>Emerging Markets Opportunities</h2>
<p>We're currently watching several promising developments that could benefit the broad emerging markets asset class:</p>
<p><strong>Declining Inflation Trends:</strong> Globally, inflation has been on a notable decline, impacting both emerging and developed markets. A continued decrease in U.S. inflation could prompt the Fed to adopt a more dovish stance. This might lead to more significant interest rate cuts and a softer dollar, positively influencing emerging markets currencies and U.S.-dollar-based returns in EM equities. Interestingly, emerging markets often precede the Fed in monetary policy trends, and we've already seen rate cuts in several EM countries during the latter half of 2023.</p>
<p><strong>China's Economic Recovery:</strong> Over the past two years, China's domestic economy has been a drag on the broader emerging markets segment due to various factors such as high consumer savings rates, geopolitical tensions, declining demand for its manufacturing and real estate challenges. However, there's potential for improvement. If China successfully stimulates consumer spending and reduces its dependence on the real estate sector, it could provide a significant boost to the largest player in the emerging markets sphere.</p>
<p><strong>Stabilizing Geopolitical Climate:</strong> The past couple of years have been turbulent geopolitically, with events like the Russia-Ukraine conflict, tensions between China and Taiwan Region and renewed conflicts in the Middle East. Any resolution or de-escalation of these issues could greatly enhance investor confidence in emerging markets. Additionally, elections in key emerging markets such as India, Taiwan Region and Mexico in 2024 could lead to market-friendly outcomes, potentially driving positive market movements.</p>
<h2>Emerging Markets Risks</h2>
<p>We're currently monitoring several risks that could hurt the broad emerging markets asset class:</p>
<p><strong>Delay or reversal of anticipated rate easing cycle in the U.S. and/or EM. </strong> While the U.S. is currently on pause, and some EM countries have begun to ease, it&rsquo;s possible that the interest rate cuts that the market is predicting will fail to materialize. This could happen if inflation begins to trend higher in the U.S. or abroad and would most likely lead to a 2022 scenario: a strong U.S dollar and weak EM equity returns.</p>
<p><strong>Geopolitical Tensions and Elections.</strong> Should these situations escalate or remain unresolved, it could adversely affect investor confidence in emerging markets. Heightened geopolitical risks can lead to market volatility, impacting investments in these regions. Upcoming elections in key emerging markets, notably India and Mexico in 2024, bring a degree of uncertainty. If the elections result in less market-friendly policies or administrations, this could lead to negative market reactions. Political shifts can significantly influence economic policies, regulatory environments, and foreign investment flows, all of which are critical to the health and stability of emerging markets.</p>
<p><strong>U.S. and China Tension Escalates.</strong> The U.S.-China relationship, marked by trade and technology disputes, plays a significant role in shaping global economic dynamics, with the issue of Taiwan Region adding a critical dimension to this complex scenario. Taiwan Region, as a major technology player and a strategic point of contention between the U.S. and China, is central to these tensions. The repercussions of this strained relationship are far-reaching, impacting supply chains and causing market volatility that extends to emerging markets, particularly in Asia. These markets, often intricately linked to the economies of the U.S. and China, face the risks of supply chain disruptions, policy shifts and currency fluctuations. The uncertainty surrounding U.S.-China relations, especially concerning Taiwan Region, heightens investor caution, leading to potential capital outflows and volatility in emerging markets, underscoring the importance for investors to remain vigilant and informed about these international dynamics.</p>
<h2>Strategy Positioning and Outlook</h2>
<p>We remain grounded by our investment process and our positioning reflects our convictions from a bottom-up basis heading into the new year. Our process has created some positioning differentials versus the benchmark. Brazil remains overweight to start the quarter (15.1% Strategy weight versus 5.8% Index weight), as does the Philippines (5.0% versus 0.6% Index weight).</p>
<p>South Korea, Taiwan Region and China are underweight versus the benchmark.</p>
<p>The Strategy&rsquo;s objective is to find long-term structural growth companies at fair prices (S-GARP). Investments are chosen based on individual company analysis, focusing on quality, governance, innovative business models and low disruption risk, with active management and detailed research guiding our selection process.</p>
<p>To receive more <a href="/us/en/insights/emerging-markets-equity/" title="Emerging Markets Equity Insights"><strong>Emerging Markets Equity</strong></a> insights, <a href="/us/en/subscribe/" title="Subscription Center"><strong>sign up in our subscription center</strong></a>.</p>
]]></content:encoded>
</item><item rdf:about="https://www.vaneck.com/us/en/blogs/natural-resources/commodities-back-on-track-in-2024/">
  <title>Commodities Back on Track in 2024></title>
  <link>https://www.vaneck.com/us/en/blogs/natural-resources/commodities-back-on-track-in-2024/</link>
  <description><![CDATA[Last year, CMCITR outperformed BCOM, its primary competitor. We believe a longer-term commodities bull market could resume in 2024 as they act as a hedge against global conflict and inflation.]]></description>
  <dc:creator>Roland Morris</dc:creator>
  <dc:date>01/16/2024 06:30:00</dc:date>
<content:encoded><![CDATA[

<h2>CMCITR&rsquo;s Roll Methodology Helped Temper Commodity Losses</h2>
<p>Commodity index products were down in general for 2023. However, the UBS Constant Maturity Commodity Index (CMCITR) outperformed its primary competitor, the Bloomberg Commodity Index (BCOM) by a wide margin. CMCITR returned -1.41% while BCOM returned -7.91%, as of 12/31/23. CMCITR&rsquo;s roll methodology, monthly rebalancing, and commodity weightings all contributed to the outperformance in 2023.</p>
<p>Two important things offset the overall decline in commodities last year: continued positive roll yield and positive returns on collateral. CMCITR continues to invest collateral in 3- and 6-month Treasury Bills, which yielded over 5% for most of the year. CMCITR&rsquo;s constant maturity roll methodology generated slightly positive roll yields, while BCOM had slightly negative roll yields.</p>
<p>Most of the roll outperformance came from the energy sector. The WTI crude oil and Brent crude oil forward curves were upward-sloping (Contango) in the first 3 months and downward-sloping (Backwardation) from 3 months to 3 years. CMCITR&rsquo;s curve positioning from 3 months out to 3 years generated positive roll yield while BCOM lost money rolling its front-month crude oil position. Positioning in the energy sector also helped relative performance vs BCOM. CMCITR uses commodity consumption in its weighting methodology which results in a smaller U.S. natural gas allocation. U.S. natural gas fell sharply last year, declining by over 50%.</p>
<p>Commodity weightings also helped CMCITR&rsquo;s outperformance in the agriculture sector. Cocoa and sugar were the best performers in the agriculture sector; London cocoa was up over 100%, U.S. cocoa was up 70%, and sugar was up 30%. BCOM was not invested in cocoa and had a smaller investment in sugar. Finally, CMCITR&rsquo;s monthly rebalancing reduced overall volatility.</p>
<h2>Precious Metals and Agriculture Rallied; All Others Struggled</h2>
<p>The precious metals sector was the best-performing sector, rising an estimated 11% for the year due to strong gains in gold. Most of the gains came late in the year when interest rates declined as the Federal Reserve&rsquo;s (Fed) signaled the end of the tightening cycle. The U.S. dollar also declined on the Fed&rsquo;s signal late in the year, which coupled with falling interest rates, helped gold finish the year up 13%. Rising geopolitical tensions following the October 7th Hamas attack on Israel also helped gold rally as a safety asset in the 4th quarter.</p>
<p>The agriculture sector posted an estimated 2.5% return led by gains in cocoa, sugar, and coffee. However, the sizeable gains in these commodities were offset by a large decline in corn (-19%) and wheat (-24%). A better-than-expected crop in Brazil caused the decline in corn prices.</p>
<p>The energy sector fell an estimated 5.7%, led by a 50% decline in U.S. natural gas prices. The demand for natural gas was reduced due to the mild winter and summer weather which was concurrent to the increase in U.S. production. Starting in 2025, the U.S. is expected to have more LNG (liquid natural gas) export capacity, which should help offset the continued strong U.S. production. CMCITR&rsquo;s smaller allocation to natural gas was the biggest factor in its outperformance versus BCOM; CMCITR&rsquo;s allocation was 3.5% while BCOM&rsquo;s was 8.5%.</p>
<p>CMCITR had a small gain in both WTI and Brent crude oil despite declines in both commodities. The U.S. surprised the market by producing more than 1 million barrels of crude oil per day than estimated in early 2023. The stronger-than-expected production came from U.S. shale oil in Texas, some of which was due to completing drilled but uncompleted oil wells, known as DUCs. The inventory of DUCs has fallen sharply so U.S. shale oil production is less likely to surprise on the upside this year. The positive roll yield offset small declines in both crude oil positions.</p>
<p>The industrial metals sector declined by an estimated 4%, led by a 44% drop in nickel prices. China&rsquo;s disappointing economic growth was the main reason for the decline in industrial metals prices. Copper prices rallied late in the year to finish up 7%. However, the future of the global supply of copper seems uncertain and may not meet the expected growing demand over the next few years. Panama&rsquo;s closure of a very large copper mine due to environmental concerns adds to the potential future supply constraints. Overall, supply disruptions and security are becoming a major concern in the industrial metals sector.</p>
<p>The livestock sector declined by 8% due to a sharp decline of 27% in lean hog prices. Cattle prices remained strong, gaining 6% on the year.</p>
<h2>Outlook: Political Conflicts are Paving the Way for Higher Global Commodity Demand</h2>
<p>The longer-term bull market in commodities could resume in 2024. Supply will continue to be challenging as the world transitions away from traditional energy to more renewable sources of energy. Global geopolitical conflict is slowing the transition and increasing both supply and resource security risks. As we enter 2024, global shipping is being disrupted by conflict in the Red Sea and reduced capacity through the Panama Canal. Both shipping bottlenecks are causing delays due to longer shipping routes and causing higher fuel consumption. Both the Russian-Ukraine and Israel-Hamas conflicts are continuing and could escalate. Additionally, if the Fed starts another easing cycle the U.S. dollar is likely to decline and global growth outside the U.S. could reaccelerate, leading to higher global commodity demand. Commodity index products are true portfolio diversifiers and a hedge against global conflict and inflation.</p>
<h3>2023 Index Sector Weightings</h3>
<p><img class="img-responsive w-100" src="https://www.vaneck.com/contentassets/e8ba36f6e9c5461aa319050948ac0c6c/4001_cmci-blog-and-email_blog-chart_1_2024-01_v1.svg" alt="2023 Index Sector Weightings" /></p>
<p class="chart-disclosure"><strong>Source: Bloomberg. Data as of December 2023.</strong> Past performance is no guarantee of future results. Index performance is not illustrative of fund performance. It is not possible to invest in an index.</p>
<h3>Estimated Roll Yield Contribution 2023</h3>
<p><img class="img-responsive w-100" src="https://www.vaneck.com/contentassets/e8ba36f6e9c5461aa319050948ac0c6c/4001_cmci-blog-and-email_blog-chart_2_2024-01_v1.svg" alt="Estimated Roll Yield Contribution 2023" /></p>
<p class="chart-disclosure"><strong>Source: VanEck, Bloomberg. Data as of December 2023.</strong></p>
<p>Learn more about the <strong><a href="https://www.vaneck.com/us/en/investments/cm-commodity-index-fund-cmcax/overview/" title="CMCAX - CM Commodity Index Fund - Class A - Overview">VanEck CM Commodity Index Fund</a></strong> and the recently launched <a href="https://www.vaneck.com/us/en/investments/cmci-commodity-strategy-etf-cmci/overview/" title="CMCI - VanEck CMCI Commodity Strategy ETF - Overview"><strong>VanEck CMCI Commodity Strategy ETF (CMCI)</strong></a>, which seek to track, before fees and expenses, the CMCITR.</p>
<p>To receive more <a href="/us/en/insights/natural-resources/" title="Natural Resources Insights"><strong>Natural Resources</strong></a> insights, <a href="https://www.vaneck.com/us/en/subscribe/" title="Subscription Center"><strong>sign up in our subscription center</strong></a>.</p>
]]></content:encoded>
</item><item rdf:about="https://www.vaneck.com/us/en/blogs/digital-assets/this-is-how-you-explain-crypto-to-your-clients/">
  <title>This is How You Explain Crypto to Your Clients></title>
  <link>https://www.vaneck.com/us/en/blogs/digital-assets/this-is-how-you-explain-crypto-to-your-clients/</link>
  <description><![CDATA[Whether your clients are looking to invest, transact, or simply learn, it's crucial they have a grasp of the basics&mdash;brought to you here using language and concepts they will quickly understand.]]></description>
  <dc:creator> </dc:creator>
  <dc:date>01/12/2024 06:30:00</dc:date>
<content:encoded><![CDATA[

<p><strong>Please note that VanEck has exposure to Bitcoin.</strong></p>
<p>From the gold standard to paper money and now to digital assets, the means by which we transact and invest is constantly changing. Among the latest additions to the financial landscape are cryptocurrencies. While they may have seemed like a futuristic idea just a few years ago, cryptocurrencies are quickly becoming a mainstay in the world of investing. For many, they represent a fresh and potentially lucrative opportunity. However, with new opportunities come new questions and challenges. Where does one start? What are the basics? As a financial advisor, this is your guide to help your clients answer these questions and navigate uncharted waters, providing them with the necessary knowledge and resources.</p>
<h2><strong>What is Blockchain?</strong></h2>
<p>Imagine a book. Every page of this book records a list of transactions, like a ledger. Now, imagine that thousands of people have this exact book and are always updating it simultaneously. Whenever someone wants to add a new page (or block of transactions), everyone with a copy of the book has to agree that the new page is correct. Once they agree, this new page is added to the book, and everyone updates their copies. This entire book is called a <strong><a href="https://www.vaneck.com/us/en/blogs/digital-assets/blockchain-basics/" title="What is Blockchain Technology?">"blockchain," and it's like a shared digital ledger</a></strong>.</p>
<p>The power of blockchain lies in its transparency and security. Because so many people have copies and they always verify new pages together, it's incredibly difficult for someone to cheat or make false entries.</p>
<h2><strong>What are Cryptocurrencies?</strong></h2>
<p>Cryptocurrencies are a digital means of exchange that use cryptography for security and exist on the blockchain. Blockchain ensures the integrity and transparency of cryptocurrency transactions. Every time someone sends or receives a cryptocurrency, that transaction is recorded on a block. Once enough transactions are recorded on a block, it's added to a chain of previous blocks&mdash;hence the term "blockchain." The decentralization of this ledger&mdash;meaning it's simultaneously maintained by numerous participants globally&mdash;ensures its security. If someone tries to alter transaction data on one block, it would conflict with the information held by others, causing the alteration to be rejected. This feature is what allows cryptocurrencies to operate without a central authority and makes them resistant to fraud.</p>
<h2><strong>Bitcoin: The Pioneer</strong></h2>
<p><strong><a href="https://www.vaneck.com/us/en/blogs/digital-assets/the-investment-case-for-bitcoin/" title="The Investment Case for Bitcoin">Bitcoin</a></strong>, the first and most well-known cryptocurrency, operates on its own blockchain. People can send or receive Bitcoins (much like money) to make purchases or as an investment.</p>
<p>Bitcoin, introduced in 2009, was the first cryptocurrency and remains the most widely recognized. Think of it as the "gold standard" of crypto. Its decentralized nature &ndash; meaning it's not controlled by any government or central bank &ndash; has made it especially attractive to a broad audience.</p>
<h2><strong>Ethereum and Smart Contracts</strong></h2>
<p>While Bitcoin introduced the world to blockchain and cryptocurrencies, <strong><a href="https://www.vaneck.com/us/en/blogs/digital-assets/what-are-smart-contracts/" title="What are Smart Contracts?">Ethereum brought in a revolutionary concept: smart contracts</a></strong>.</p>
<p>Let&rsquo;s think of a traditional contract, like an agreement to buy a car. Usually, you'd involve third parties like banks or lawyers to ensure everyone keeps their promises. Now, imagine a digital contract that automatically does what it's supposed to when certain conditions are met, without needing a middleman. That's a smart contract!</p>
<p>Ethereum is a platform that allows these smart contracts to operate. It has its own cryptocurrency called Ether, which powers these contracts and ensures they run smoothly.</p>
<h2><strong>Applications of Cryptocurrencies and Blockchain Technology in Everyday Life</strong></h2>
<p>The world of cryptocurrencies can seem complex, but at its core, it&rsquo;s about using technology to enhance trust and simplify transactions. With these expanded use cases, the potential and versatility of blockchain and cryptocurrencies become more evident. They're not just tech buzzwords; they're tools with the potential to revolutionize industries and daily life.</p>
<p>The concept of blockchain as a shared digital ledger has opened up a plethora of opportunities:</p>
<ul class="content-list">
<li>Supply Chain Management: Companies can track products from their origin to the store shelves. This transparency ensures the authenticity of products and reduces the chances of fraud.</li>
<li>Voting Systems: Elections can be conducted on blockchains to prevent vote tampering, ensuring transparency and integrity in the voting process.</li>
<li>Health Records: Patients' health data can be securely stored on blockchains, giving medical professionals quick access when needed and ensuring data privacy.</li>
<li>Real Estate: Property deeds and ownership transfers can be recorded on a blockchain, making processes more efficient and reducing fraud.</li>
</ul>
<p>The advantage of blockchain is its decentralized nature. When information is stored across multiple nodes, it becomes tamper-resistant. Any malicious activity or inconsistency can be quickly detected and corrected. Ethereum expands the scope of blockchain through its smart contracts:</p>
<ul class="content-list">
<li>Decentralized Apps (DApps): Developers can build applications on Ethereum that inherit the security and decentralized features of its blockchain.</li>
<li>Decentralized Autonomous Organizations (DAOs): These are like digital companies or organizations where decisions are made based on predefined rules in smart contracts, without centralized control.</li>
<li>Digital Identity: Individuals can have a digital identity on the Ethereum blockchain, ensuring personal data is secure and giving control back to the user.</li>
<li>Licensing and Royalties: Artists and creators can use Ethereum to ensure they get paid their dues every time their work is used or sold.</li>
</ul>
<p>Bitcoin's decentralized nature has made it attractive for several use cases:</p>
<ul class="content-list">
<li>Decentralized Finance (DeFi): Bitcoin can be used in lending platforms, interest-bearing accounts, and other financial services without the need for traditional banks.</li>
<li>Peer-to-peer Transactions: People can transact directly without the need for intermediaries, leading to quicker and sometimes cheaper transactions.</li>
</ul>
<h2><strong>Bitcoin Education Resources</strong></h2>
<p>VanEck is continuing to play a role in educating investors about Bitcoin and how to participate in the Bitcoin investment story. For more resources, visit our <strong><a href="/link/343cf2f03fec405589c8319433a957f6.aspx" title="Investing in Bitcoin and Digital Assets">Bitcoin education center</a></strong> and catch up on the latest <strong><a href="https://www.vaneck.com/us/en/insights/digital-assets/">digital assets insights and market analysis</a></strong> from our investment team.</p>
<p>To receive more <strong><a href="https://www.vaneck.com/us/en/insights/digital-assets/" title="Digital Assets Insights">Digital Assets</a></strong> insights, <strong><a href="https://www.vaneck.com/us/en/subscribe/" title="Subscription Center">sign up in our subscription center</a></strong>.</p>
]]></content:encoded>
</item><item rdf:about="https://www.vaneck.com/us/en/blogs/digital-assets/bitcoin-101-what-does-hodl-mean/">
  <title>Bitcoin 101: What Does HODL Mean?></title>
  <link>https://www.vaneck.com/us/en/blogs/digital-assets/bitcoin-101-what-does-hodl-mean/</link>
  <description><![CDATA[Read about the meaning and origin of the term 'HODL' in just 30 seconds.]]></description>
  <dc:creator> </dc:creator>
  <dc:date>01/11/2024 06:30:00</dc:date>
<content:encoded><![CDATA[

<p>'HODL,' a term now central to the crypto world, began as a simple misspelling of 'HOLD' by a user named 'GameKyuubi' in a 2013 Bitcoin forum post titled 'I AM HODLING.' This playful error has since evolved into a widely recognized acronym for 'Hold on for Dear Life,' symbolizing a 'buy and hold' investment philosophy.</p>
<p>HODLers are investors who maintain their bitcoin through market fluctuations, firmly believing that bitcoin's long-term potential significantly outweighs short-term volatility, thus transforming HODL into a strategy for steadfast investment amid the ups and downs in bitcoin&rsquo;s price.</p>
<p>To receive more <strong><a href="https://www.vaneck.com/us/en/insights/digital-assets/" title="Digital Assets Insights">Digital Assets</a></strong> insights, <strong><a href="https://www.vaneck.com/us/en/subscribe/" title="Subscription Center">sign up in our subscription center</a></strong>.</p>

]]></content:encoded>
</item><item rdf:about="https://www.vaneck.com/us/en/blogs/gold-investing/ima-casanova-new-highs-propel-gold-into-2024/">
  <title>New Highs Propel Gold into 2024></title>
  <link>https://www.vaneck.com/us/en/blogs/gold-investing/ima-casanova-new-highs-propel-gold-into-2024/</link>
  <description><![CDATA[<p>Spot gold climbs to a record high in 2023; the main drivers behind last year&rsquo;s gold rally should continue to support gold in 2024.</p>]]></description>
  <dc:creator>Imaru Casanova</dc:creator>
  <dc:date>01/11/2024 06:30:00</dc:date>
<content:encoded><![CDATA[

<p>Monthly gold market and economic insights from Imaru Casanova, Portfolio Manager, featuring her unique views on mining and gold&rsquo;s portfolio benefits. <a href="/us/en/blogs/gold-investing/ima-casanova-new-highs-propel-gold-into-2024/gold-monthly-commentary-december-2023.pdf" target="_blank" rel="noopener" title="New Highs Propel Gold into 2024"><strong>An expanded PDF version of this commentary, including fund specific information can be downloaded here.</strong></a></p>
<h2>Look who&rsquo;s made new all-time highs&hellip;</h2>
<p>Some market participants look at closing prices, others prefer to look at intraday prices for more detailed price action. No matter how you slice it, spot gold prices set new highs in 2023. Gold recorded a new intraday, all-time high of $2,135/oz in early December during overseas trading hours. Gold also managed to establish a new at-the-close all-time high of $2,077/oz on December 27, and ended 2023 at $2,063/oz, up 13.1% for the year.</p>
<p>Gold equities ended the year strong as well, outperforming gold bullion in the last two months of the year. However, gold equity has yet to fully close the valuation gap against the metal. In 2023, NYSE Arca Gold Miners Index (GDMNTR)<sup>1</sup>&nbsp;and MVIS Global Juniors Gold Miners Index (MVGDXJTR)<sup>2</sup>&nbsp;were up 10.60% and 8.59%, respectively, compared to gold&rsquo;s 13.10% gain.</p>
<h2>Recapping key drivers</h2>
<p>The main drivers behind gold&rsquo;s rally to new all-time highs were:</p>
<ul class="content-list">
<li><strong>Heightened global financial risk</strong> &ndash; gold closed at a yearly low of $1,811/oz at the end of February, bouncing back and trending above $2,000/oz as markets tried to digest the news and assess the ripple effects of the rapid collapse of Silicon Valley Bank and Signature Bank over the course of a weekend in March. Gold found further support as the risks spread to Europe, with major bank Credit Suisse ultimately needing a rescue.</li>
<li><strong>Record central bank net gold purchases</strong> &ndash; investment demand, as gauged by the holdings of gold bullion ETFs, persistently declined in the second half of the year. However, this was offset by strong buying from the official sector, with gold purchases from central banks around the world potentially set to beat the record levels reported for 2022. This kept gold well supported above the $1,900/oz level throughout most of the year, leading to highest annual average gold price in record of $1,943/oz in 2023.</li>
<li><strong>Heightened geopolitical risk globally</strong> &ndash; most notably, as a result of the ongoing war in Ukraine and the tragic developments in the Middle East in early October. Gold closed at $1,820/oz on October 5, and demonstrated, once again, its historically proven role as a safe haven, climbing above $2,000/oz after Hamas&rsquo; attacks on Israel.</li>
<li><strong>Federal reserve policy</strong> &ndash; changing expectations around the U.S. Federal Reserve&rsquo;s (Fed&rsquo;s) monetary policy path were a major driver of gold prices in 2023. The Fed&rsquo;s projections for rate cuts in 2024, released at the conclusion of their December 13 Federal Open Market Committee meeting, sent gold prices to record levels at year end.</li>
</ul>
<p>Gold seems to have established strong support at around the $1,900 to $2,000/oz level, and at present, we see real opportunity for it to test new all-time highs this year. The four main drivers highlighted above should continue to support gold in 2024. More significantly, increasing western investment demand as a result of a rising need to hedge portfolios this year could once again become a dominant and positive driver of gold prices.</p>
<h3>Slowing outflows in gold-backed ETFs</h3>
<p><img class="img-responsive w-100" src="https://www.vaneck.com/contentassets/3b47c58697c94f12b8cdf07f1b5213db/3995_gold-commentary-december_2024-01_v1_blog.svg" alt="Slowing outflows in gold-backed ETFs" /></p>
<p class="chart-disclosure">Source: World Gold Council. Data as of December 2023.</p>
<h2>Making a case for miners</h2>
<p>It is important that investors consider not just gold bullion but also gold equities when they look at gold as an asset class. We think gold miners are favorably positioned to benefit from sustained, record-high gold prices as investors seek leveraged, diversified exposure to gold. Gold prices will clearly continue to have a meaningful impact on the performance of the gold equities, with a rising gold price environment providing opportunity for gold equities to outperform the metal.</p>
<p>A declining gold price, in contrast, would typically lead to weak share price performance by the miners relative to gold. We view gold equities, at present, as generally undervalued, trading at low multiples both historically for the industry and relative to gold. We believe this valuation gap provides an opportunity for gold equities to outperform gold even in a sideways gold price environment, especially if that price action develops around the $2,000/oz level.</p>
<p>Industry cost inflation has mostly subsided, and operating costs appear to be contained, with all-in sustaining costs on average at around $1,300/oz. While we reiterate our outlook for higher gold prices in 2024, we want to highlight that at current spot gold prices of around $2,040/oz, gold miners, as a group, should be able to enjoy margin expansion and enhanced free cash flow generation this year.</p>
<p>We expect gold companies to have the ability to produce solid operating and financial results that can withstand the volatility of the gold price and demonstrate that they can sustainably operate profitable businesses throughout the cycles. We believe consistently proving this resilience to the markets should lead to increased incorporation of gold equities as an asset class in the broader investment universe, and lead to a rerating of the gold mining sector.</p>
<p>To receive more <strong><a href="https://www.vaneck.com/us/en/insights/gold-investing/" title="Gold Investing Insights">Gold Investing</a></strong> insights, <strong><a href="https://www.vaneck.com/us/en/subscribe/" title="Subscription Center">sign up in our subscription center</a></strong>.</p>
]]></content:encoded>
</item><item rdf:about="https://www.vaneck.com/us/en/blogs/digital-assets/how-does-bitcoin-fit-in-your-portfolio/">
  <title>How Does Bitcoin Fit in Your Portfolio?></title>
  <link>https://www.vaneck.com/us/en/blogs/digital-assets/how-does-bitcoin-fit-in-your-portfolio/</link>
  <description><![CDATA[The age-old 60/40 portfolio model has served investors well, but data indicates that portfolios with a Bitcoin component have the potential to outperform purely traditional ones.]]></description>
  <dc:creator> </dc:creator>
  <dc:date>01/10/2024 22:30:00</dc:date>
<content:encoded><![CDATA[

<p>As a financial advisor, you likely encounter clients eager to dip their toes in the cryptocurrency waters, particularly bitcoin. But how much of their portfolio should be devoted to this digital asset? To help you answer this question, we explore the integration of bitcoin into a traditional 60/40 portfolio.</p>
<h2>Enhancing the 60/40 Portfolio with Bitcoin</h2>
<p>The age-old 60/40 portfolio model has served investors well, offering a balance of equity growth and bond stability. However, data indicates that portfolios with a bitcoin component have the potential to outperform purely traditional ones. As illustrated in the chart below, adding bitcoin to a traditional portfolio enhanced returns from February 2012 to December 2023.</p>


<div class="epi-contentfragment">bitcoin-historical-returns-60-40-chart</div>
<p>Based on your individual client&rsquo;s risk tolerance and investment objectives, the addition of bitcoin, even in small increments like 0.5%, 1.0%, and 3%, has the potential to alter the dynamics of the traditional 60/40 portfolio.</p>
<h2>What Should Bitcoin Replace in an Investor&rsquo;s Portfolio?</h2>
<p>For now, we recommend investors replace a portion of their &ldquo;Real Assets&rdquo; allocation with bitcoin. Bitcoin has a capped supply of 21 million bitcoin as well as a fixed new issuance schedule of which the number of new bitcoin issued is halved roughly every four years. These properties demonstrate its role as a store of value asset.</p>
<h2>The Benefits of Accessing Bitcoin through a Spot ETF</h2>
<ul class="content-list">
<li><strong>Familiar Platforms</strong>. Investing in Bitcoin directly can be complex and intimidating, with hurdles like creating a crypto wallet and navigating the unregulated terrain of crypto exchanges. A spot bitcoin ETF simplifies the process by lowering the barriers to entry, <strong><a href="https://www.vaneck.com/us/en/blogs/digital-assets/this-is-how-you-explain-crypto-to-your-clients/" title="This is How You Explain Crypto to Your Clients">allowing for easier access through familiar investment platforms and providing greater control and oversight over crypto assets</a></strong>.</li>
<li><strong>More Transparency</strong>. With regulation, auditing, and SEC monitoring, spot bitcoin ETFs provide a level of safety and transparency that direct cryptocurrency investments lack. Accessing the cryptocurrency through a spot ETF could make Bitcoin a more attractive and trustworthy option for risk-averse investors.</li>
<li><strong>Familiar Tax Treatment</strong>. A spot bitcoin ETF also simplifies the potentially complex tax landscape of cryptocurrencies by providing a traditional investment vehicle for a non-traditional asset. Spot bitcoin ETFs are treated as grantor trusts for U.S. tax purposes, similar to other gold and commodity ETFs. For clients, this translates to a potentially more straightforward and familiar tax filing experience, reducing the uncertainty and administrative burden that can accompany direct cryptocurrency investments.</li>
</ul>
<p>To receive more <strong><a href="https://www.vaneck.com/us/en/insights/digital-assets/" title="Digital Assets Insights">Digital Assets</a></strong> insights, <strong><a href="https://www.vaneck.com/us/en/subscribe/" title="Subscription Center">sign up in our subscription center</a></strong>.</p>
]]></content:encoded>
</item><item rdf:about="https://www.vaneck.com/us/en/blogs/emerging-markets-equity/active-emerging-markets-portfolio-manager-transition-plans-faq/">
  <title>Active Emerging Markets Portfolio Manager Transition Plans FAQ></title>
  <link>https://www.vaneck.com/us/en/blogs/emerging-markets-equity/active-emerging-markets-portfolio-manager-transition-plans-faq/</link>
  <description><![CDATA[We address questions investors may have about recent developments for the VanEck Emerging Markets Equity investment team.]]></description>
  <dc:creator> </dc:creator>
  <dc:date>01/10/2024 06:30:00</dc:date>
<content:encoded><![CDATA[

<ul class="content-list">
<li><a href="#point-one"><strong>Is David Semple retiring?</strong></a></li>
<li><a href="#point-two"><strong>Who will serve as the Fund&rsquo;s new portfolio manager?</strong></a></li>
<li><a href="#point-three"><strong>Who is on the Investment Team and what are their roles before and after the change?</strong></a></li>
<li><a href="#point-four"><strong>How does Ms. El-Shawarby&rsquo;s promotion to Portfolio Manager change her role or her responsibilities? </strong></a></li>
<li><a href="#point-five"><strong>How will elements of the Fund&rsquo;s investment process differ with Ms. El-Shawarby as Portfolio Manager?</strong></a></li>
<li><a href="#point-six"><strong>What is the succession plan for the VanEck Emerging Markets Equity Strategy? </strong></a></li>
<li><a href="#point-seven"><strong>What are your immediate resourcing plans, given these changes? </strong></a></li>
</ul>
<h2 id="point-one" class="anchored-block">Is David Semple retiring?</h2>
<p>No. David Semple is stepping down from his role as Portfolio Manager for the <a href="https://www.vaneck.com/us/en/investments/emerging-markets-fund-gbfax/overview/" title="Emerging Markets Fund - Class A - Overview"><strong>VanEck Emerging Markets Fund</strong></a> (the Fund) and related strategies, effective on May 1, 2024. He will serve as Strategic Adviser after this transition.</p>
<h2 id="point-two" class="anchored-block">Who will serve as the Fund&rsquo;s new portfolio manager?</h2>
<p>Effective May 1, 2024, the Fund&rsquo;s current Deputy Portfolio Manager Ola El-Shawarby, CFA will replace David Semple as the Portfolio Manager. Angus Shillington, current Deputy Portfolio Manager, will remain as Deputy Portfolio Manager.</p>
<p>Ola&rsquo;s transition to Portfolio Manager is a natural progression in her career, reflecting her deepening involvement and expanding responsibilities in guiding the Fund's strategic direction. Her leadership is expected to continue to enrich the Fund&rsquo;s performance and align with investor goals.</p>
<p>Ola has been an integral part of the emerging markets equity investment team since 2017, starting as a Senior Analyst with a focus on the Eastern Europe, Middle East, and Africa (EEMEA) region. She has nearly 20 years of industry experience, including previous roles as a Director and Investment Analyst at Caravel Management and experience as a local Portfolio Manager in the Middle East and North Africa region. These responsibilities as well as her academic credentials, including an MBA from Harvard Business School and several undergraduate degrees, reinforce her portfolio management abilities and knowledge.</p>
<p>Her unique insights, drawn from her upbringing in Egypt and Saudi Arabia, experiences as a local portfolio manager, and extensive travels, have greatly influenced her understanding of the dynamic economic, cultural, and technological trends in emerging markets. During her tenure as Deputy Portfolio Manager, Ola expanded her scope, delving deeper into diverse areas of investment across emerging markets.</p>
<p>For a more in-depth look at Ola&rsquo;s market perspectives and investment philosophy, we invite you to <a href="/link/f98f0ec11c0043b3803f14238bacfd2d.aspx" title="Ola El-Shawarby &mdash; Deputy Portfolio Manager, Emerging Markets Equity "><strong>visit Ola&rsquo;s thought leadership page</strong></a>, where you can access her latest investment insights and analyses and <strong><a href="/link/775af929d69741efa7729872dda2bfa5.aspx?epsremainingpath=/meet-ola-el-shawarby/" title="Meet Deputy Portfolio Manager Ola El-Shawarby">watch a short Meet Ola video</a></strong>.</p>
<h2 id="point-three" class="anchored-block">Who is on the Investment Team and what are their roles before and after the change?</h2>
<div class="wrapped-div">
<table style="width: 75%;">
<tbody>
<tr class="tbl-data">
<td class="tbl-header last">Team Member</td>
<td class="tbl-header last text-center">Role in 2023</td>
<td class="tbl-header last text-center">Role as of May 2024</td>
</tr>
<tr class="tbl-data">
<td class="data-td data last text-left">David Semple</td>
<td class="data-td data last">Portfolio Manager</td>
<td class="data-td data last">Strategic Adviser</td>
</tr>
<tr class="tbl-data">
<td class="data-td data last text-left">Ola El-Shawarby</td>
<td class="data-td data last">Deputy Portfolio Manager</td>
<td class="data-td data last">Portfolio Manager</td>
</tr>
<tr class="tbl-data">
<td class="data-td data last text-left">Angus Shillington</td>
<td class="data-td data last">Deputy Portfolio Manager</td>
</tr>
<tr class="tbl-data">
<td class="data-td data last text-left">Patricia Gonzalez</td>
<td class="data-td data last">Senior Research Analyst</td>
</tr>
<tr class="tbl-data">
<td class="data-td data last text-left">Yi Rong</td>
<td class="data-td data last">Senior Research Analyst</td>
</tr>
<tr class="tbl-data">
<td class="data-td data last text-left">Janet Hong</td>
<td class="data-td data last">N/A<sup>*</sup></td>
<td class="data-td data last">Analyst</td>
</tr>
</tbody>
</table>
</div>
<br />
<p class="chart-disclosure"><sup>*</sup>Ms. Hong joined VanEck in 2024.</p>
<h2 id="point-four" class="anchored-block">How does Ola&rsquo;s promotion to Portfolio Manager change her role and responsibilities?</h2>
<p>Ola El-Shawarby's promotion to Portfolio Manager significantly expands her responsibilities:</p>
<ul class="content-list">
<li><strong>Team Management</strong>: Ola leads the investment team, aligning their efforts with Fund goals.</li>
<li><strong>Portfolio Construction</strong>: She will assume final authority in key investment choices.</li>
<li><strong>Company Research and Stock Selection</strong>: Ola directs the team's research process and strategic stock selection.</li>
<li><strong>Risk Management:</strong> Ola oversees strategies to mitigate financial risks.</li>
<li><strong>Stakeholder Communication:</strong> Ola is the primary communicator with investors.</li>
</ul>
<p>In essence, her role has shifted from support to leading the Fund's strategic direction and operations.</p>
<h2 id="point-five" class="anchored-block">How will elements of the Fund&rsquo;s investment process differ with Ms. El-Shawarby as Portfolio Manager?</h2>
<p><strong>There are no proposed changes to the Fund&rsquo;s principal investment strategies.</strong></p>
<ul class="content-list">
<li>The Fund will continue to seek long-term capital appreciation by investing in equity securities in emerging markets around the world.</li>
<li>The Fund &ndash; supported by a seasoned team who lived or worked in the areas they cover &ndash; will continue to seek to achieve its investment objective through active, bottom-up, fundamental research.</li>
<li>The Fund will continue to invest in high-quality, structural growth companies at a reasonable price that are poised to represent future development and growth of emerging markets.</li>
</ul>
<h2 id="point-six" class="anchored-block">What is the succession plan for the VanEck Emerging Markets Equity Strategy?</h2>
<p>Should Portfolio Manager Ola El-Shawarby become unavailable due to an unforeseen event, Deputy Portfolio Manager Angus Shillington would initially manage the portfolio under the guidance and supervision of the Active Investment Committee. While VanEck has seen remarkable stability in its bench of senior investment personnel, it has managed several transitions since its founding in 1955 and recognizes that each strategy requires succession planning. In particular, the VanEck Emerging Markets Equity team has worked together for a long time, and the Firm is committed to maintaining the stability across its investment teams.</p>
<p>VanEck constantly monitors its bench of backup staff and resources to operate short or long term, in the event of any investment or executive management team unavailability.</p>
<h2 id="point-seven" class="anchored-block">What are your immediate resourcing plans, given these changes?</h2>
<p>The Emerging Markets Equity team recently onboarded a research analyst (Janet Hong) with experience as a global EM generalist as well as a personal background in Asia, including Mandarin and Korean language skills to support the strategy&rsquo;s research efforts, particularly in Asia. As Ola assumes the role of Portfolio Manager and expands her responsibilities, she will be gradually passing on direct coverage of EEMEA companies to other team members.</p>
<style type="text/css">
    .wrapped-div {
        max-width: 100%;
    }

    @media (max-width: 768px) {
        .wrapped-div {
            overflow-x: scroll;
        }
    }

    .wrapped-div-sector {
        max-width: 100%;
        overflow-x: scroll;
    }
</style>
]]></content:encoded>
</item><item rdf:about="https://www.vaneck.com/us/en/blogs/digital-assets/we-celebrate-bitcoin-builders-not-tourists/">
  <title>We Celebrate Bitcoin Builders—Not Tourists></title>
  <link>https://www.vaneck.com/us/en/blogs/digital-assets/we-celebrate-bitcoin-builders-not-tourists/</link>
  <description><![CDATA[Many bitcoin ETFs are coming to market. One way to decide which to invest in is to consider the commitment of the fund sponsors.]]></description>
  <dc:creator>Jan van Eck</dc:creator>
  <dc:date>01/10/2024 06:00:00</dc:date>
<content:encoded><![CDATA[

<p><strong> We use the generic term &ldquo;ETF&rdquo; to refer to exchange-traded investment vehicles, including those that are required to register under the Investment Company Act of 1940, as amended (the &ldquo;40 Act&rdquo;), as well as other exchange-traded products which are not subject to the registration of the &lsquo;40 Act. </strong></p>
<p><strong>An investment in the VanEck Bitcoin ETF involves significant risk, and may not be suitable for all investors. The Trust is not an investment company registered under the Investment Company Act of 1940 (&ldquo;1940 Act&rdquo;) or a commodity pool for the purposes of the Commodity Exchange Act (&ldquo;CEA&rdquo;). Shares of the Trust are not subject to the same regulatory requirements as mutual funds. As a result, shareholders of HODL do not have the protections associated with ownership of shares in an investment company registered under the 1940 Act or the protections afforded by the CEA.</strong></p>
<p>We at VanEck are not tourists to bitcoin. For seven years&mdash;since 2017&mdash;we have been advocating for the approval of an ETF for investors to gain bitcoin exposure without the need for self-custody. In anticipation of this day, we have focused on educating the market through breakfast seminars in our midtown office, research papers, one-on-one meetings and more. <strong><a href="/link/343cf2f03fec405589c8319433a957f6.aspx" title="Investing in Bitcoin and Digital Assets">We want clients to be as prepared as we are.</a></strong></p>

<p>Neither have we badmouthed the concept of decentralized, opensource software. Bitcoin and blockchain technology are public goods. That&rsquo;s why we&rsquo;re donating 5% of our profits to Bitcoin core developers.</p>
<p>We understand to our core that investors need a hedge in their portfolios if and when governments lose control over the money supply. When U.S. spending was out of control in the 1960&rsquo;s, my father launched the first gold share fund in the U.S., even though gold had been pegged against the dollar for about 190 years. Investing in gold bullion was illegal at the time. Three years later, the peg broke.</p>
<p>We also know that investing in bitcoin is difficult due to its newness and volatility, among other risks. This is why we scream for investors to dollar cost average&mdash;start right away (small) but dollar cost average over time and Hold On for Dear Life. Last, we put our money where our mouth is, by providing the biggest seed capital of any exchange-traded product&mdash;about $72 million at the time.<sup>1</sup></p>
<p>I would like to personally thank the crypto community for its warmth and creativity. From the whales to the youngest coders to anonymous posters, most have been genuine and sincere--and willing to educate me. Yes, there are scammers, too, but they are far outnumbered.</p>
<p>We ETF sponsors also stand on the shoulders of giants. We didn&rsquo;t laugh, but listened, when Tyler and Cameron Winklevoss explained Bitcoin in 2013. And other ETF sponsors like Fidelity, Grayscale, Bitwise and Valkyrie have been contributors, not to mention regulators like former CFTC Chairman Chris Giancarlo, former acting Comptroller of the Currency Brian Brooks and SEC Commissioner Hester Pierce, who moved the bureaucracy.</p>
<p>Thank you, Satoshi, for launching this important financial freedom technology.</p>
<p>We celebrate Bitcoin builders&mdash;not tourists.</p>
]]></content:encoded>
</item><item rdf:about="https://www.vaneck.com/us/en/blogs/digital-assets/matthew-sigel-vaneck-crypto-monthly-recap-for-december-2023/">
  <title>VanEck Crypto Monthly Recap for December 2023></title>
  <link>https://www.vaneck.com/us/en/blogs/digital-assets/matthew-sigel-vaneck-crypto-monthly-recap-for-december-2023/</link>
  <description><![CDATA[In 2023, Bitcoin had its best year since 2020 with a 154% increase.]]></description>
  <dc:creator>Matthew  Sigel</dc:creator>
  <dc:date>01/08/2024 06:30:00</dc:date>
<content:encoded><![CDATA[

<p>In December, Bitcoin outperformed the S&amp;P 500 for the fourth straight month (+9% vs. +4%) to end 2023 +154%, its best year since 2020 when BTC rose 305%. While Bitcoin ETN inflows slowed to $300M for the month, a significant deceleration from November&rsquo;s $1B+, investors recycled previous BTC gains into more speculative alt-coins, especially Layer 1 smart contract platforms as represented by the MVIS Smart Contract Leaders Index, which rose 44% in December for its best month since mid-2021.</p>
<p>Simultaneously, the US dollar experienced another 2% decline for December following November&rsquo;s 3% fall, after the Jerome Powell-led FOMC signaled US rate cuts as soon as Q1 and the BRICS group expanded to include Saudi Arabia, the UAE, Iran, Egypt and Ethiopia. The market also took cues from significant crypto policy support outside the US, where Bitcoin adoption is more apparent. For example, the Nigerian Central Bank made a major policy change in December by reversing the ban prohibiting banks from servicing virtual asset service providers. An influential 90-year-old Saudi cleric acknowledged Bitcoin as permissible (not haram) in a new fatwah. Argentina&rsquo;s libertarian President Javier Milei&rsquo;s new foreign minister said that contracts settled in Bitcoin would be legal under certain conditions. With 50% of the world population voting in national presidential or legislative elections in 2024, we see the prospect for more significant, pro-crypto policies to emerge.</p>
<p>Continuing the notable shift that began in November, small-cap tokens (+27%) dramatically outperformed large-caps (+12%) as crypto natives drove meme coins and less liquid tokens in the Solana ecosystem, particularly to outsized gains. However, as of January 2nd, funding rates are now quite elevated across many digital assets, driving an emerging &ldquo;sell the news&rdquo; narrative around the Bitcoin ETFs, which we are reluctant to embrace.</p>
<div class="wrapped-div">
<table style="width: 750px;">
<tbody>
<tr class="tbl-data">
<td class="tbl-header last text-center">&nbsp;</td>
<td class="tbl-header last text-center">December</td>
<td class="tbl-header last text-center">2023</td>
</tr>
<tr class="tbl-data">
<td class="data-td last">Coinbase</td>
<td class="data-td data last">39%</td>
<td class="data-td data last">391%</td>
</tr>
<tr class="tbl-data">
<td class="data-td last">Bitcoin</td>
<td class="data-td data last">11%</td>
<td class="data-td data last">154%</td>
</tr>
<tr class="tbl-data">
<td class="data-td last">MarketVector<sup>TM</sup>&nbsp;Smart Contract Leaders Index</td>
<td class="data-td data last font-weight-normal">44%</td>
<td class="data-td data last font-weight-normal">149%</td>
</tr>
<tr class="tbl-data">
<td class="data-td last ">MarketVector<sup>TM</sup>&nbsp;Infrastructure Application Leaders Index</td>
<td class="data-td data last">25%</td>
<td class="data-td data last">136%</td>
</tr>
<tr class="tbl-data">
<td class="data-td last">MarketVector<sup>TM</sup>&nbsp;Decentralized Finance Leaders Index</td>
<td class="data-td data last">11%</td>
<td class="data-td data last">94%</td>
</tr>
<tr class="tbl-data">
<td class="data-td last">Ethereum</td>
<td class="data-td data last">13%</td>
<td class="data-td data last">92%</td>
</tr>
<tr class="tbl-data">
<td class="data-td last">Nasdaq Index</td>
<td class="data-td data last">6%</td>
<td class="data-td data last">44%</td>
</tr>
<tr class="tbl-data">
<td class="data-td last">MarketVector<sup>TM</sup>&nbsp;Centralized Exchanges Index</td>
<td class="data-td data last">32%</td>
<td class="data-td data last">30%</td>
</tr>
<tr class="tbl-data">
<td class="data-td last ">S&amp;P 500 Index</td>
<td class="data-td data last ">4%</td>
<td class="data-td data last">24%</td>
</tr>
<tr class="tbl-data">
<td class="data-td last">MarketVector<sup>TM</sup>&nbsp;Media &amp; Entertainment Leaders Index</td>
<td class="data-td data last">27%</td>
<td class="data-td data last">-41%</td>
</tr>
</tbody>
</table>
</div>
<br />
<p class="chart-disclosure">Source: Bloomberg, as of 12/31/2023.<strong> Past performance is no guarantee of future results. Not intended as a recommendation to buy or sell any securities named herein.</strong></p>
<ul class="content-list">
<li><a href="#smart-contract-platforms"><strong>Smart Contract Platforms: December Updates</strong></a></li>
<li><a href="#notable-winner"><strong>Notable Winner: December Updates</strong></a></li>
<li><a href="#notable-laggard"><strong>Notable Lagard: December Updates</strong></a></li>
<li><a href="#defi"><strong>DeFi: December Updates</strong></a></li>
<li><a href="#metaverse"><strong>Metaverse: December Updates</strong></a></li>
</ul>
<h2 id="smart-contract-platforms" class="jump-link-nav anchored-block" data-jumplink-title="SCP: December Updates">Smart Contract Platforms</h2>
<p>The speculative scramble that gripped the crypto markets in November 2023 continued to unfold in December 2023. The fervor was unbound by fundamentals as speculators focused on memecoins and inscriptions across most smart contract platforms. The consequence of this activity is that L1 tokens ex BTC rose 44% in December. Despite the extremely positive price action, important fundamental metrics like daily active users and stablecoins did not increase in the aggregate. While usership is roughly flat compared to six months ago, stablecoins on-chain are up only +2% from six months ago and down -6% from a year ago. It is also difficult to attribute this broader rally to any new applications or killer use cases despite incrementally positive developments in DePIN and useability. But crypto prices are highly reflexive, and the rockets of mooning tokens often shine light on projects that were overlooked during negative price periods. It is also important to note that higher prices create positive feedback loops not only because they bring in new users looking to speculate or utilize crypto apps but also because they give teams the financial firepower to build the vision of their projects. In crypto, if enough people believe in something and are willing to financially back their beliefs, far-flung ideas can blossom into functioning, widely-used applications.</p>
<h3>Smart Contract Platform + Bitcoin Daily Active Users</h3>
<p><img class="img-responsive w-100" src="https://www.vaneck.com/contentassets/abd18a5b75184bf8aaf9bdda9348e1be/3971_scl-december_chart-1-2024-01_v1_blog.svg" alt="Smart Contract Platform + Bitcoin Daily Active Users" /></p>
<p class="chart-disclosure">Source: Artemis XYZ as of 12/28/2023. <strong>Past performance is no guarantee of future results. Not intended as a recommendation to buy or sell any securities named herein.</strong></p>
<p>Memecoins drove price action in early December, particularly on <strong>Solana</strong>, but they mostly crested in mid-December. However, the butterfly wings of memecoin activity on Solana led to a hurricane of inscriptions that raged on Bitcoin and popped up elsewhere. In tandem with Bitcoin, many other chains also saw a squall of inscriptions that caused a massive increase in fees and congestion. <strong>Arbitrum</strong> was a notable casualty on Friday, December 15th when its sequencer <a href="https://www.coindesk.com/tech/2023/12/15/arbitrum-hit-by-partial-outage-due-to-traffic-surge/" title="Arbitrum Hit by 'Partial Outage' Due to Traffic Surge" target="_blank" rel="noopener"><strong>went</strong></a> down for several hours. Inscriptions are a mini hack within blockchain transactions that allow users to write any data within on top of a transaction that will be committed to the blockchain forever. The result is that images and other data pieces that could be considered collectible have been inscribed and this has spurned users to create and speculate on the inscriptions. The smart contract platform most affected by inscription activity, in terms of fee generation, was <strong>Avalanche</strong> where inscription activity resulted in a total of $39.9M spent on gas. That figure represents 76% of all the Avalanche fees in December. As a result of inscriptions activity, Avalanche&rsquo;s AVAX token was one of the top performers in December, +79%.</p>
<h3>Daily Amount of Gas Spent on Inscriptions by Blockchain</h3>
<p><img class="img-responsive w-100" src="https://www.vaneck.com/contentassets/abd18a5b75184bf8aaf9bdda9348e1be/3971_scl-december_chart-2-2024-01_v1_blog.svg" alt="Daily Amount of Gas Spent on Inscriptions by Blockchain" /></p>
<p class="chart-disclosure">Source: Dune @ hildobby as of 12/28/2023. <strong>Past performance is no guarantee of future results. Not intended as a recommendation to buy or sell any securities named herein.</strong></p>
<p>Of course, no chain matched Bitcoin&rsquo;s inscriptions activity which is estimated to have resulted in <a href="https://dune.com/dataalways/ordinals" title="Ordinals - Inscriptions on Bitcoin" target="_blank" rel="noopener"><strong>$81M</strong></a> in transaction fees for Bitcoin in December 2023. As a result of inscriptions activity on Bitcoin, the project <strong>$ORDI</strong> reached $1.6B in market cap at its peak on December 25th. At the same time, congestion clogging the Bitcoin network has spurred interest in scaling solutions such as <strong>Stacks</strong> whose STX token had an exceptional December (+81%). Because of spillover from activity on Bitcoin to Stacks, fees on Stacks exploded in December moving from a daily average of $261 to $15,640 per day. With the stand-up of Stack&rsquo;s Neon testnet which enable 5-second block times, Stacks may continue to be a beneficiary of Bitcoin congestion since it is one of top Bitcoin L2s. Curiously, the massive pick-up in activity on the Bitcoin network has even spurred a team called GFX to fork and <a href="https://www.coindesk.com/tech/2023/12/11/decentralized-exchange-uniswap-arrives-on-bitcoin-sidechain-rootstock/" title="Decentralized Exchange Uniswap Expands to Bitcoin Sidechain Rootstock" target="_blank" rel="noopener"><strong>deploy</strong></a> <strong>Uniswap</strong> V3 onto Bitcoin scaling solution RootStock to trade inscriptions and other memecoins within Bitcoin.</p>
<p>One of the most interesting occurrences in December was the continued momentum of the Blur-related L2 chain <strong>Blast</strong>. While there is no mainnet, no testnet and Blast consists of a series of smart contracts that re-stake user deposited funds, it has been able to attract $1.14B in TVL. Most alarmingly, the developer, known only as Pacman, has access to move all the funds that users deposit. This puzzling phenomenon is attributed almost entirely to the notoriety of Pacman who is considered one of the most capable programmers in the blockchain space and the supposition that Blast will be dispersing high value token rewards. Others are so bold as to speculate that this type of model where user funds are re-hypothecated to earn yield while locked, will be replicated by other emerging Layer-2 blockchains.</p>
<p>Another big winner on TVL in December was <strong>Eigenlayer</strong> who increased the maximum of its re-staking contract to 500k ETH. As a result, Eigenlayer&rsquo;s TVL increased from 114.5k ETH to 452k ETH (~$1B) in 10 days.</p>
<p>In December, many Ethereum L2 projects reported noteworthy news items amid speculation of airdrops and partnership deals. <strong>Starkware</strong>, who will release its token on January 22, 2024, <a href="https://www.theblock.co/post/267180/starknet-fees-devonomics" title="Starknet developers to receive slice of network operator fees under devonomics program" target="_blank" rel="noopener"><strong>announced</strong></a> that 10% of fees generated on chain will go to developers of Starkware dApps as well as Starkware&rsquo;s team (80% to dApps, 20% to Starkware). Protocol-shared revenue is nothing new -- Canto has experimented with it since late 2022 -- but the topic is still contentious as some suppose this incentivizes developers to create less efficient contracts. <strong>Polygon</strong>, who is building towards an L2 chain of chains employing zero-knowledge tech, announced that it will be using <strong>Celestia</strong> for <a href="https://polygon.technology/blog/celestias-high-throughput-out-of-the-box-data-availability-layer-to-integrate-with-polygon-cdk" title="Celestia's High-Throughput, Modular DA Layer to Integrate With Polygon CDK in Crypto's Broadband Moment" target="_blank" rel="noopener"><strong>Data Availability</strong></a> (DA). This move by Polygon is intriguing given that Polygon recently spun out of its company a DA project called <strong>Avail</strong>. Polygon has also announced that <strong>Immutable</strong> X, who is building a Polygon zk L2 chain using the Polygon CDK, will be launching <a href="https://www.immutable.com/?utm_source=google&amp;utm_campaign=20288087680&amp;utm_medium=cpc&amp;utm_content=662729166658&amp;utm_term=immutable%20x%20passport&amp;gclid=Cj0KCQiA1rSsBhDHARIsANB4EJbJHXr_qbSiTrIvqpuem_P6U0wazw7wNpzRER4Den2XAk1b4n3GuucaArF3EALw_wcB" title="The Future of Gaming Awaits" target="_blank" rel="noopener"><strong>Passport</strong></a> which will allow users to port both assets and identities across many different blockchain-based games. <strong>Arbitrum</strong>, a strong competitor in the L2 space, has also announced that its L3 program called Orbit will be utilizing Celestia for DA. <strong>Manta</strong> network, a privacy-focused former Polkadot project, also announced it will be using Celestia for Data Availability.</p>
<h3>TVL of Sui and Aptos</h3>
<p><img class="img-responsive w-100" src="https://www.vaneck.com/contentassets/abd18a5b75184bf8aaf9bdda9348e1be/3971_scl-december_chart-3-2024-01_v1_blog.svg" alt="TVL of Sui and Aptos" /></p>
<p class="chart-disclosure">Source: Artemis XYZ as of 12/28/2023. <strong>Past performance is no guarantee of future results. Not intended as a recommendation to buy or sell any securities named herein.</strong></p>
<p>Rounding out the Alt-L1 chains, Solana&rsquo;s SOL token had another impressive month by increasing (+56%). Amid the flurry of speculation on Solana including memecoins involving dogs with hats and dogs being bonked by bats, there were several important developments from more savory projects. Dominant re-staking and MEV project <strong>Jito</strong> airdropped tokens worth $160M to just under 10k users while DEX aggregator with 80% market share <strong>Jupiter</strong> <a href="https://dailyhodl.com/2023/12/17/1000000000-jupiter-jup-tokens-to-be-airdropped-to-solana-wallets-in-january-according-to-founder/" title="1,000,000,000 Jupiter (JUP) Tokens To Be Airdropped to Solana Wallets in January, According to Founder" target="_blank" rel="noopener"><strong>announced</strong></a> its $JUP token airdrop for January 2024. Additionally, <strong>Trezor</strong> announced support for Solana and the SPL token. Also notable in December was that Solana&rsquo;s mobile phone Saga sold out its initial run of 20k units. The move-language based systems, <strong>Sui</strong> and <strong>Aptos</strong>, have also been performing well in attracting TVL as Sui broke $200M in TVL while Aptos has surged to $120M. <strong>NEAR&rsquo;s</strong> token also had a solid December (+90%) as NEAR partnered with Eigenlayer to create a finality layer for Ethereum L2s. This will be accomplished by transitioning the NEAR-Ethereum Rainbow bridge into an Eigenlayer actively validated service that will rely upon re-staked Ethereum for security. In concert with this new capability, NEAR is also targeting Ethereum L2s by unveiling its <a href="https://medium.com/nearprotocol/near-foundation-launches-near-da-to-offer-secure-cost-effective-data-availability-for-eth-rollups-2d26beeb4cd8" title="NEAR Foundation Launches NEAR DA to Offer Secure, Cost-Effective Data Availability for ETH Rollups and Ethereum Developers" target="_blank" rel="noopener"><strong>Data Availability</strong></a> layer to attract Ethereum L2 transaction data. NEAR&rsquo;s DA project already boasts an impressive assortment of rollups including Fluent, Movement Labs, Caldera and Dymension. NEAR claims that its DA layer will be 8000x cheaper than Ethereum and combined with its new finality layer, may pose a challenge to Ethereum&rsquo;s settlement business model going forward.</p>
<h2 id="notable-winner" class="jump-link-nav anchored-block" data-jumplink-title="Notable Winner: December Updates">Notable Winner</h2>
<p><strong>OP (+111%)</strong></p>
<h3>Optimism DEX Volume vs. TVL</h3>
<p><img class="img-responsive w-100" src="https://www.vaneck.com/contentassets/abd18a5b75184bf8aaf9bdda9348e1be/3971_scl-december_chart-4-2024-01_v1_blog.svg" alt="Optimism DEX Volume vs. TVL" /></p>
<p class="chart-disclosure">Source: Artemis XYZ as of 12/28/2023. <strong>Past performance is no guarantee of future results. Not intended as a recommendation to buy or sell any securities named herein.</strong></p>
<p>The best performing smart contract platform token for the month of December was OP token that governs the <strong>Optimism </strong>layer-2 blockchain. Optimism&rsquo;s outperformance does not appear to be caused by the improvement of fundamental metrics as these were relatively weak for Optimism. Though fees generated by Optimism increased (+54%) month-to-month, TVL only increased +20%, and users were actually down -20.4%. This compares to chief competitor Arbitrum showing fees, TVL and usership changes of (+98.2%), (+17.2%) and (-9.7%) respectively. Earlier in the month, however, Optimism finished voting for its public good funding which has typically been a price catalyst in the past as users vie to gain access to some of the funding. Also, Optimism was able to gain adherents to its superchain in December with legacy project LISK announcing it will be building an Optimism chain. Another positive development is the release of Clearpool&rsquo;s KYC pool on Optimism Mainnet which aims to bring private credit markets on-chain. Kraken also enabled the transfer of Tether USDT to Optimism and the upcoming post-Bedrock upgrade called Canyon. The <a href="https://blog.oplabs.co/canyon-hardfork/" title="Introducing the Canyon Hardfork" target="_blank" rel="noopener"><strong>Canyon</strong></a> release improves gas efficiency on chain under high transaction loads while also addressing many minor bugs that plagued Optimism. Though fundamental metrics of Optimism&rsquo;s adoption look weak at the moment, <strong>Worldcoin</strong> who is building on Optimism, has <a href="https://www.coindesk.com/tech/2023/12/13/sam-altmans-retina-scanning-orb-to-become-more-useful-with-world-id-20/" title="Sam Altman Is Bringing Worldcoin's Controversial Eye-Scanning Orb to Reddit and Microsoft" target="_blank" rel="noopener"><strong>integrated</strong></a> its World ID 2.0 &ldquo;proof of personhood&rdquo; with <strong>Shopify</strong>, <strong>Minecraft</strong>, <strong>Telegram</strong> and <strong>Reddit</strong>. World ID may spur usership on Optimism as it enables the companies that integrate it to add an identification layer that will separate real active users from bots. Bot activity alongside scams, have plagued social networks and video games and Worldcoin ID may offer a tangible solution to substantially curbing bot activity. This solution may become particularly important once AI bot start to make it difficult to distinguish real users from fakes ones.</p>
<p>Optimism, despite its performance, is still far away from its goals of decentralization. Vitalik Buterin, co- founder of Ethereum, has classified the stages of decentralization for Ethereum L2s and Optimism currently sits at the lowest level. Optimism is a Stage 0 rollup which means there is no validity proof system on Optimism chains nor a decentralized security committee to override potential chain issues. In practice, Optimism is still highly centralized with its founding team governing core functions and running its sequencer. This amounts to users of Optimism&rsquo;s blockchain trusting Optimism&rsquo;s team with user funds and hoping that Optimism&rsquo;s team does not act maliciously. Though Optimism&rsquo;s team is working diligently to reach Stage 1, it has not indicated when that threshold will be reached. Instead, Optimism focused on building the OP stack and Bedrock to enable others to build OP chains to join Optimism&rsquo;s superchain. While uncertainty over decentralization is far from ideal, it is also a potential set of catalysts that could bring positive price action to the $OP in the future.&nbsp;</p>
<h2 id="notable-laggard" class="jump-link-nav anchored-block" data-jumplink-title="Notable Lagard: December Updates">December&rsquo;s Notable Laggard</h2>
<p><strong>Ethereum (+10%)</strong></p>
<p>With the exception of <strong>Tron</strong>&rsquo;s TRX, ETH was outperformed by every major smart contract platform&rsquo;s token in December. The bear case for Ethereum is not new, but it is convincing and December&rsquo;s price action demonstrates that many crypto investors are allocating away from ETH. Many have asserted that Ethereum&rsquo;s roadmap has become divorced from the needs of Ethereum&rsquo;s everyday users as the Ethereum Foundation focuses on esoteric concerns that do not scale Ethereum. Another common criticism is that Ethereum is discarding its primary use-case and business model, execution of user transactions, and moving towards the unproven and uncertain data availability and settlement &ldquo;businesses.&rdquo; To ETH bears, Ethereum&rsquo;s new focus is a poor financial decision that pulls Ethereum away from blockchain&rsquo;s most compelling value accrual mechanisms &ndash; execution of user transactions and MEV (ordering of those transactions). As a result, ETH has been plagued with sagging performance throughout the year. For example, ETH is down 24% against Bitcoin&rsquo;s performance in 2023 and -80% versus Solana&rsquo;s. To air more grievances, another concern is the growing threat to Ethereum&rsquo;s credible neutrality posed by validators, blockbuilders and relays sanctioning certain addresses. In December, relay provider bloXroute noted that it will start rejecting non-OFAC compliant transactions. The accumulation of issues surrounding validators, blockbuilders and relays potentially throttling transactions is extremely concerning if we are to suppose that Ethereum is credibly neutral, and that ETH is truly a permissionless asset.</p>
<p>Ethereum also underperformed in December due to comparatively lukewarm fundamentals. Average daily active users on Ethereum were up +10%, Solana and Avalanche usership was up +102% and +68.1% respectively. While Ethereum average daily fees were up 49% month-to-month, Ethereum&rsquo;s fee growth ranks 11th of the 22 major blockchains we track and this ranking puts Ethereum behind fee growth of four of its own L2 blockchains. For monthly DEX volume growth, Ethereum was 15th, TVL growth has Ethereum placing 16th, and in stablecoin growth Ethereum ranks 11th.</p>
<p>Despite the demoralizing price action of ETH, we think Ethereum and ETH&rsquo;s future is bright. ETH&rsquo;s use cases are expanding with many more L2s being spun up that will require ETH for gas. Additionally, Eigenlayer is set to export ETH&rsquo;s security to enable a flood of novel crypto services. Likewise, EIP 4844 and a host of other upgrades could prove material to Ethereum&rsquo;s usage as a DA platform. Ethereum also retains the largest development and research community of any blockchain, and has grown their share of active developers from 38% in August 2022 to 50% at the end of December 2023. Ethereum intellectual leader Vitalik has also recently directed the discussion towards needed improvements to scale Ethereum&rsquo;s execution environment. Finally, there is serious discussion about an ETH ETF on the horizon and the high-growth tech asset with yield narrative could prove convincing to many non-crypto investors.</p>
<h3>Smart Contract Platform Developer Count</h3>
<p><img class="img-responsive w-100" src="https://www.vaneck.com/contentassets/abd18a5b75184bf8aaf9bdda9348e1be/3971_scl-december_chart-5-2024-01_v2_blog.svg" alt="Smart Contract Platform Developer Count" /></p>
<p class="chart-disclosure">Source: Artemis XYZ as of 12/28/2023.<strong> Past performance is no guarantee of future results. Not intended as a recommendation to buy or sell any securities named herein.</strong></p>
<h2 id="defi" class="anchored-block">DeFi</h2>
<p>The MarketVector Decentralized Finance Leaders index (MVDFLE) returned 11% in December, slightly underperforming $ETH due to the large drawdown in <strong>$RUNE</strong>, which fell 18% following its massive rally in previous months. Of the index components, $UNI showed the most strength in December returning an impressive 30% as investors sought to get more exposure to the largest decentralized exchange. The majority of the index performed more or less in-line with major tokens with <strong>$LDO, $AAVE</strong>, and <strong>$CRV</strong> returning 19%, 14%, and 15%, respectively. $MKR underperformed $ETH and $BTC, only rising 1% potentially due to investors favoring pure crypto exposure as the market has turned risk-on and <strong>MakerDAO</strong>&rsquo;s decision to acquire real world assets (RWA) has limited its exposure to crypto assets.</p>
<h3>Ethereum DeFi Returns</h3>
<p><img class="img-responsive w-100" src="https://www.vaneck.com/contentassets/abd18a5b75184bf8aaf9bdda9348e1be/3971_scl-december_chart-6_2024.01_blog.svg" alt="Ethereum DeFi Returns" /></p>
<p class="chart-disclosure">Source: Coingecko as of 12/29/23. <strong>Past performance is no guarantee of future results. Not intended as a recommendation to buy or sell any securities named herein.</strong></p>
<p>DeFi activity accelerated in December as the crypto rally continued, with decentralized exchange (DEX) volume rising 25%, thanks to the massive increase in activity on Solana. DEXs on Solana facilitated $29B of volume, representing a 256% increase from November, and established Solana as the second most active blockchain by DEX volume according to DefiLlama. The boost for Solana DeFi came as a result of $SOL&rsquo;s outperformance and on-chain users seeking to participate in the many upcoming airdrops expected for DeFi protocols on Solana that have not yet released a token. This activity was catalyzed by the $JITO airdrop which saw the second largest liquid staking protocol on Solana distribute 90 million of its governance tokens to early users, worth over $200 million at time of writing.</p>
<h3>Solana DEX Volume</h3>
<p><img class="img-responsive w-100" src="https://www.vaneck.com/contentassets/abd18a5b75184bf8aaf9bdda9348e1be/3971_scl-december_chart-7_2024.01_blog.svg" alt="Solana DEX Volume" /></p>
<p class="chart-disclosure">Source: DefiLlama as of 12/31/23. <strong>Past performance is no guarantee of future results. Not intended as a recommendation to buy or sell any securities named herein.</strong></p>
<h2 id="metaverse" class="anchored-block">Metaverse Tokens Outperform</h2>
<p>Metaverse and gaming tokens had a strong month, with the MarketVector Media and Entertainment Leaders index (MVMELE) rising 26%, significantly outperforming $ETH and $BTC. <strong>$AXS</strong> and <strong>$SAND</strong> drove the index&rsquo;s performance with each appreciating 43% and 40%, respectively. The massive returns these tokens experienced can be attributed to rising investor sentiment that blockchain gaming will have a breakout year in 2024 and that Axie Infinity and The Sandbox have established themselves as leaders in the space. Despite blockchain gaming&rsquo;s low usership, these projects could see an increase in traffic as the rising crypto market gains the attention of the broader public.</p>
<p><strong>NFT Market Speculation Increasing</strong></p>
<p>NFT volume in December rose a staggering 81%, mainly due to rising BRC-20 trading on Bitcoin and a 328% increase in NFT volume on Solana, according to Cryptoslam!. Solana&rsquo;s massive increase in NFT volume is representative of how drastically investor sentiment in the Solana ecosystem has shifted. In fact, December was the first month where Solana NFT volume exceeded that of Ethereum. Similar to the increase in DeFi activity on Solana, on-chain investors are hoping that acquiring the leading Solana NFT collections could result in them being included in future airdrops that occur. Additionally, since Solana NFTs are priced in $SOL, investors are hoping to generate increased returns by purchasing the most coveted collections, such as Mad Lads and Tensorians, which could outperform the market significantly if Solana&rsquo;s momentum continues.</p>
<p>Despite the impressive growth in Bitcoin and Solana NFTs, Ethereum NFT volume only rose 1% in December. <strong>Blur</strong> maintained its position as the leading NFT exchange on Ethereum by volume, facilitating 74% of NFT volume on the chain. Blur&rsquo;s governance token, $BLUR, underperformed the market significantly, falling 3% while the amount of $BLUR tokens staked rose to 373 million, representing 12.4% of the total supply. Deposits to Blur&rsquo;s upcoming layer 2 network, <strong>Blast</strong>, continued to rise and the Blast contract achieved a TVL exceeding $1 billion this month. In a hypothetical scenario where the network is operational, it would rank as the second-largest Ethereum layer 2 platform by value locked. However, it is likely that a significant portion of this capital will be withdrawn following the $BLAST airdrop and the launch of the network as airdrop farmers collect their rewards and seek other opportunities.</p>
<h3>December NFT Volume by Blockchain</h3>
<p><img class="img-responsive w-100" src="https://www.vaneck.com/contentassets/abd18a5b75184bf8aaf9bdda9348e1be/3971_scl-december_chart-8_2024.01_blog.svg" alt="December NFT Volume by Blockchain" /></p>
<p class="chart-disclosure">Source: CryptoSlam! As of 12/31/23. <strong>Past performance is no guarantee of future results. Not intended as a recommendation to buy or sell any securities named herein.</strong></p>
<p><strong>Links to third party websites are provided as a convenience and the inclusion of such links does not imply any endorsement, approval, investigation, verification or monitoring by us of any content or information contained within or accessible from the linked sites. By clicking on the link to a non-VanEck webpage, you acknowledge that you are entering a third-party website subject to its own terms and conditions. VanEck disclaims responsibility for content, legality of access or suitability of the third-party websites.</strong></p>
<p>To receive more <strong><a href="https://www.vaneck.com/us/en/insights/digital-assets/" title="Digital Assets Insights">Digital Assets</a></strong> insights, <strong><a href="https://www.vaneck.com/us/en/subscribe/" title="Subscription Center">sign up in our subscription center</a></strong>.</p>
]]></content:encoded>
</item><item rdf:about="https://www.vaneck.com/us/en/blogs/moat-investing/moat-stocks-reign-over-the-s-and-p-500-continues/">
  <title>Moat Stocks’ Reign Over the S&amp;P 500 Continues></title>
  <link>https://www.vaneck.com/us/en/blogs/moat-investing/moat-stocks-reign-over-the-s-and-p-500-continues/</link>
  <description><![CDATA[Moat stocks once again dominated the S&amp;P 500 in 2023, as the Moat Index surged 32.41% versus the S&amp;P 500&rsquo;s 26.3% gain in 2023.]]></description>
  <dc:creator>Coulter Regal, CFA</dc:creator>
  <dc:date>01/05/2024 06:30:00</dc:date>
<content:encoded><![CDATA[

<p>U.S. equity markets ended 2023 on a high note in December with a year-end rally that led major U.S. stock indexes to their ninth positive week in a row. The S&amp;P 500 gained 4.5% in December and closed out the year up 26.3%, just short of setting a new all-time high. The Federal Reserve helped fuel much of this upward move with a dovish policy pivot during their last meeting of the year. At the December 13th meeting, Fed Chair Jerome Powell communicated that the tightening cycle was complete and, furthermore, indicated that the start of a rate-cutting cycle would begin in 2024, sending stocks on a tear to end the year.</p>
<p>The <strong><a href="https://www.vaneck.com/us/en/investments/morningstar-wide-moat-etf-moat/index/" title="MOAT - VanEck Morningstar Wide Moat ETF - Overview">Morningstar Wide Moat Focus Index</a></strong> (the &ldquo;Moat Index&rdquo;) surged by 7.87% in December outpacing the S&amp;P 500 by over 300 basis points during the month, and ended the 2023 calendar year up 32.41%, or 600 basis points above the S&amp;P 500. The performance of the Moat Index is particularly notable this year, as it came amid a top-heavy market where the mega-cap Magnificent Seven was responsible for much of the market&rsquo;s overall gains. Illustrating this is the S&amp;P 500 Equal Weighted Index which only gained about 14% in 2023. The Moat Index outperformed despite this challenging environment for equal-weighted strategies, bearing testament to the moat investing philosophy and the rigorous Morningstar equity research that underpins the index.</p>
<p>Small- and mid-caps were beneficiaries of market breadth expansion in December, leading to a continuation of their rebound that began in November and outperformance relative to large-caps in the final month of the year. The <strong><a href="https://www.vaneck.com/us/en/investments/morningstar-smid-moat-etf-smot/index/" title="SMOT - VanEck Morningstar SMID Moat ETF - Overview">Morningstar US Small-Mid Cap Moat Focus Index</a></strong> (the &ldquo;SMID Moat Index&rdquo;) returned 9.72% in December, outpacing the broad mid-cap benchmark but lagging pure small caps. However, for the full year, the SMID Moat Index gained 17.93%, outperforming both pure small- and mid-cap benchmarks by over 100 basis points.</p>
<h3>U.S. Equities Finish the Year Strong | As of 12/31/2023</h3>
<p><img class="img-responsive w-100" src="https://www.vaneck.com/contentassets/1d00804fba97462e8596bcdb262a919a/3982_moat-monthly_chart-1-2024-01_v1_blog.svg" alt="U.S. Large and SMID Cap Equities Finish the Year Strong" /></p>
<p class="chart-disclosure"><strong>Source: Morningstar. As of 12/31/2023</strong>. Past performance is no guarantee of future results. Index performance is not representative of fund performance. It is not possible to invest directly in an index. Fund performance current to the most recent month end is available by visiting vaneck.com or by calling 800.826.2333.</p>
<h2>Positioning Heading into 2024</h2>
<p>Both the Moat and SMID Moat Indexes underwent quarterly reviews on December 15, 2023. Each quarter they systematically target the most attractively priced, high quality U.S. companies within their respective universes. Below are a few takeaways from the reviews and how the indexes are positioned to start the new year. Full results of the most recent quarterly reviews are available here: <strong><a href="https://www.vaneck.com/us/en/investments/morningstar-wide-moat-etf-moat/moat-reconstitution.pdf" title="MOAT Reconstitution" target="_blank" rel="noopener">Moat Index</a></strong> and <strong><a href="https://www.vaneck.com/us/en/investments/morningstar-smid-moat-etf-smot/smot-reconstitution.pdf" title="SMOT Reconstitution" target="_blank" rel="noopener">SMID Moat Index</a></strong>.</p>
<p>Additionally, make sure to join our moat investing webinar on January 9 for more information on current positioning, recent performance, and to hear directly from Morningstar&rsquo;s equity research team for their perspective on market trends and the companies they cover. <strong><a href="https://www.vaneck.com/us/en/webinar-registration/?id=94241573506&amp;utm_source=vaneck&amp;utm_medium=calendar" title="Conviction Pays Off for Moat Investing">Register for and view the webinar here</a></strong>.</p>
<h2>Moat Index Review Highlights</h2>
<p><strong>Growth and Technology Remain Underweights</strong></p>
<p>The Moat Index saw its technology exposure increase to the largest overweight in quite some time at the beginning of 2023, following the extreme declines in valuations for the sector in 2022. However, throughout 2023, the Index migrated away from growthy tech and toward value stocks as shares prices of tech names rebounded. This trend continued at the December review with the index shifting further from tech and growth. Exposure to more defensive sectors such as health care, consumer staples and industrials all increased this quarter, while technology now sits at a 13% underweight relative to the S&amp;P 500.</p>
<p><strong>Opportunity Drives Smaller Cap Tilt</strong></p>
<p>The equal weighting methodology of the Moat Index introduces a structural bias away from mega cap companies relative to the market-cap weighted benchmarks like the S&amp;P 500. However, throughout 2023 the Moat Index has tilted more toward smaller sized moat companies then is typically the case. Attractive valuations of smaller companies that have lagged much of the year is a primary force behind this shift. The Index&rsquo;s market-cap size profile is about as small as it has been in the last ten years now, however in aggregate it still remains within the large-cap segment.</p>
<p><strong>Attractive Valuation</strong></p>
<p>The weighted average price-to-fair value of the Moat Index fell from 0.85 to 0.83 following the December review, signaling a 17% discount to Morningstar&rsquo;s fair value estimate. This is in contrast to the price/fair value ratio of the S&amp;P 500 Index which currently sits at 1.0, implying that the companies in the S&amp;P 500 are, overall, fairly valued according to Morningstar.</p>
<h2>SMID Moat Index Highlights</h2>
<p><strong>Consumer Discretionary and Auto Industry Retain Overweight&rsquo;s</strong></p>
<p>This quarterly review the SMID Moat Index saw the removal of several specialty retailers, including Williams-Sonoma (WSM) and Burlington Stores (BURL). Despite these removals, the consumer discretionary sector remains the largest overweight within the index. Automobile dealers and suppliers, a top contributing industry in 2023, account for the largest portion of this discretionary exposure with a roughly 9% weighting. At the December review, additional auto industry names were added indicating that there is still opportunity within that segment of the market. Companies added include Lithia Motors (LAD), CarMax (KMX), AutoNation (AN), and Lear Corp (LEA).</p>
<p><strong>Mid Cap Remains Largest Exposure; However Small Caps Saw an Increase</strong></p>
<p>Companies with a moat are typically larger, more-established entities, leading to a general skew towards mid caps within the SMID Moat Index relative to broad SMID benchmarks like the Russell 2500 Index. However, the December quarterly review saw a slight shift, about 3% in weight, from mid caps to small caps. Small-cap exposure increased to roughly 1/3rd within the Index while mid-cap accounts for the remaining 2/3rds. Attractive valuations within the smallest cohort of the eligible universe are a primary factor for this shift.</p>
<p><strong>Core and Value Remain Primary Style Exposures </strong></p>
<p>Style exposure within the SMID Moat Index moved slightly toward value this quarter with the shift coming entirely at the expense of core. Core and value both remain the primary style exposures, while the change in growth was negligible with the style representing a notable underweight relative to the Russel 2500 Index.</p>
<div class="wrapped-div">
<table style="width: 750px;">
<tbody>
<tr class="tbl-data">
<td class="tbl-header last">Index Style Exposure</td>
<td class="tbl-header last text-center">Current Exposure</td>
<td class="tbl-header last text-center">Rebalance Change</td>
<td class="tbl-header last text-center">Relative to Russell 2500 Index</td>
</tr>
<tr class="tbl-data">
<td class="data-td last font-weight-normal">Value</td>
<td class="data-td data last">34.8%</td>
<td class="data-td data last">+3.3%</td>
<td class="data-td data last">+4.7%</td>
</tr>
<tr class="tbl-data">
<td class="data-td last font-weight-normal">Core</td>
<td class="data-td data last">51.4%</td>
<td class="data-td data last">-3.7%</td>
<td class="data-td data last">+9.7%</td>
</tr>
<tr class="tbl-data">
<td class="data-td last font-weight-normal">Growth</td>
<td class="data-td data last">13.8%</td>
<td class="data-td data last">+0.4%</td>
<td class="data-td data last">-14.4%</td>
</tr>
</tbody>
</table>
</div>
<br />
<p class="chart-disclosure"><strong>Source: Morningstar. As of 12/15/2023.</strong> Index performance is not representative of fund performance. It is not possible to invest directly in an index.</p>
<p><strong>Valuation Opportunity within SMID Moats</strong></p>
<p>The weighted average price-to-fair value of the SMID Moat Index fell to 0.81 following the December review, signaling a 19% discount to Morningstar&rsquo;s fair value estimate. The broad-based Russell 2500 Index, featured a weighted average price-to-fair value ratio of 1.00 as of the same date.</p>
<h2>Accessing Moat Stocks</h2>
<p><strong><a href="https://www.vaneck.com/us/en/investments/morningstar-wide-moat-etf-moat/overview/" title="MOAT - VanEck Morningstar Wide Moat ETF - Overview">VanEck Morningstar Wide ETF (MOAT)</a></strong> seeks to replicate as closely as possible, before fees and expenses the price and yield performance of the Morningstar Wide Moat Focus Index.</p>
<p><strong><a href="https://www.vaneck.com/us/en/investments/morningstar-smid-moat-etf-smot/overview/" title="SMOT - VanEck Morningstar SMID Moat ETF - Overview">VanEck Morningstar SMID Moat ETF (SMOT)</a></strong> seeks to track as closely as possible, before fees and expenses, the price and yield performance of the Morningstar US Small-Mid Cap Moat Focus Index.</p>
<p>To receive more <strong><a href="https://www.vaneck.com/us/en/insights/moat-investing/" title="Moat Investing Insights">Moat Investing</a></strong> insights, <strong><a href="https://www.vaneck.com/us/en/subscribe/" title="Preference Center">sign up in our subscription center</a></strong>.</p>
<style>
    .wrapped-div {
        max-width: 100%;
    }

    @media (max-width: 1240px) {
        .wrapped-div {
            overflow-x: scroll;
        }
    }

    .wrapped-div-sector {
        max-width: 100%;
        overflow-x: scroll;
    }
</style>
]]></content:encoded>
</item><item rdf:about="https://www.vaneck.com/us/en/blogs/economic-trends/time-to-chill-on-tbills/">
  <title>Time to Chill on Tbills?></title>
  <link>https://www.vaneck.com/us/en/blogs/economic-trends/time-to-chill-on-tbills/</link>
  <description><![CDATA[Discover why savvy investors are starting to cool on Tbills and where they're turning next for greater returns in a market poised for change.]]></description>
  <dc:creator>Patrick Schramm</dc:creator>
  <dc:date>01/04/2024 06:30:00</dc:date>
<content:encoded><![CDATA[

<p>2023 was quite a year for advisors. I've been in discussions with my clients about the massive shift we've witnessed &mdash; over $1 trillion has poured into money markets, short-term Treasuries, and related funds. Now, balances across short-term cash and equivalents in the U.S. have surpassed an astounding $10 trillion. To put this into perspective, that's more than the GDP of over 190 countries.</p>
<p>Many of my clients are quick to point out the appeal of these investments. After all, the last time yields were this attractive was over two decades ago, and when you factor in the economic and geopolitical uncertainties, not to mention the unusual bond market volatility, it's clear why there's been a rush towards these high-quality, short-duration assets.</p>
<p>In my recent conversations about interest rates, I've shared with my clients that, despite growing market calls for a reversal in rates early in 2024, <strong><a href="https://www.youtube.com/watch?v=F8oH6BaWPao&amp;t=1255s" title="The New Kings of Wall Street I TCAF 113" target="_blank" rel="noopener">we continue to maintain that short rates will stay elevated into 2024</a></strong>. But that doesn&rsquo;t mean investors should &ldquo;Tbill and chill&rdquo; forever. Looking ahead, we believe it is prudent to start exploring opportunities beyond short-term treasuries, money markets, and cash equivalents. From what we've seen, diversifying into other areas of fixed income near or at the end of a Fed tightening cycle has often resulted in better outcomes for investors.</p>
<p>I often explain to my clients that treasury securities, which carry zero credit risk, offer a straightforward investment: the coupon you receive is likely to mirror your annualized total return for the chosen maturity. But when it comes to corporate credit, there's an added layer of risk and, consequently, a higher yield to compensate for that risk. Bond prices and yields move inversely, and given the sharp rate increases, bond prices have been trading lower. This represents an opportunity for the price component of total return to work in our favor, as bonds are 'pulled to par' at maturity.</p>
<h3>Bonds Are Well-positioned to Benefit from Higher Yields</h3>
<p><img class="img-responsive w-100" src="https://www.vaneck.com/contentassets/16ab313b1f68491181415d438e0d21a3/3964_create-economics-trends-blog_chart-1-2024-01_v1_blog.svg" alt="Line chart comparing the Fed Funds rate with the ICE BofA U.S. Broad Market Index price" /></p>
<p class="chart-disclosure">Source: Bloomberg. Past performance is no guarantee of future results. Index performance is not illustrative of fund performance. It is not possible to invest directly in an index.</p>
<p>The starting yields in fixed income are currently high, which allows for the absorption of potential interest rate hikes without principal loss. If rates fall, there's a dual benefit: the pull to par and a positive effect from duration, contributing to total return.</p>
<p>At VanEck, we&rsquo;re trained to be discerning students of history. History doesn&rsquo;t always repeat, but when it comes to patterns in the market, it certainly rhymes. Using history as a guide, looking back at the last four hiking cycles, we can see that the average returns across various areas of core fixed income outperformed US Treasury Bills in the 12 and 24 months following the end of a tightening cycle.</p>
<h2>Learning from History: Fixed Income Performance Post-Hiking Cycles</h2>
<h3>Following 12 month returns</h3>
<p><img class="img-responsive w-100" src="https://www.vaneck.com/contentassets/16ab313b1f68491181415d438e0d21a3/3964_create-economics-trends-blog_chart-2-2024-01_v1_blog.svg" alt="Bar chart showing returns of different fixed income instruments 12 months post-hiking cycles" /></p>
<h3>Following 24 month returns</h3>
<p><img class="img-responsive w-100" src="https://www.vaneck.com/contentassets/16ab313b1f68491181415d438e0d21a3/3964_create-economics-trends-blog_chart-3-2024-01_v1_blog.svg" alt="Bar chart showing returns of different fixed income instruments 24 months post-hiking cycles" /></p>
<p class="chart-disclosure">Source: Bloomberg. US TBills: ICE BofA US Treasury Bill Index; US IG Corps: Bloomberg US Corporate Index; Muni Bonds: Bloomberg Municipal Index; US HY Corps: ICE BofA High Yield Index; US MBS: Bloomberg Agency Mortgage Backed Securities Index. Past performance is no guarantee of future results. Index performance is not illustrative of fund performance. It is not possible to invest directly in an index.</p>
<h2>Spotlight on Quality: BBB and BB Rated Bonds</h2>
<p>Looking forward, if we're to benefit from potential declines in interest rates, it's important to weigh the risk/reward of extending duration with credit. I've been advising my clients that while corporate credit stands fairly strong &mdash; with high interest coverage, low leverage ratios, and support from low issuance &mdash; after a period of high-interest rates, stress indicators tend to surface. 'Maturity walls' pose refinancing risks, and corporate credit can be subject to downgrade risks when economic conditions weaken.</p>
<p>This is why, for 2024, I'm advocating for a focus on higher quality credit. We've looked at BBB and BB rated bonds as a 'sweet spot' for both relative value and quality. BB rated bonds, in particular, have historically offered the highest Sharpe ratio of all rating categories, benefiting from both discounted bonds moving into high yield and premium bonds returning to investment grade.</p>
<p>For exposure to these market segments, I've been discussing options like the <strong><a href="https://www.vaneck.com/us/en/investments/moodys-analytics-bbb-corporate-bond-etf-mbbb/overview/" title="MBBB - VanEck Moody's Analytics BBB Corporate Bond ETF - Overview">VanEck Moody's Analytics BBB Corporate Bond ETF (MBBB)</a></strong> and the <strong><a href="https://www.vaneck.com/us/en/investments/angel-high-yield-bond-etf-angl/overview/" title="ANGL - VanEck Fallen Angel High Yield Bond ETF - Overview">VanEck Fallen Angel High Yield Bond ETF (ANGL)</a></strong>. MBBB offers exposure to BBB-rated corporate bonds with attractive valuations and a lower probability of being downgraded to high yield compared to other BBB-rated bonds. ANGL provides access to high yield bonds that were originally issued as investment grade bonds. Fallen angel bonds have historically had higher average credit quality than the broad high yield bond universe.<sup>1</sup></p>
<p>For those interested in the municipal bond market, the <strong><a href="https://www.vaneck.com/us/en/etf-mutual-fund-finder/etfs/income/municipal-bond/overview/?InvType=etf&amp;AssetClass=mb&amp;Funds=emf,esf,grf,iigf,mwmf,emlf,embf,ccif&amp;ShareClass=a,c,i,y,z&amp;tab=ov&amp;Sort=name&amp;SortDesc=true" title="ETF and Mutual Fund Finder">VanEck Municipal Bond ETF Suite</a></strong> offers a range of choices. The <strong><a href="https://www.vaneck.com/us/en/investments/intermediate-muni-etf-itm/overview/" title="ITM - VanEck Intermediate Muni ETF - Overview">VanEck Intermediate Muni ETF (ITM)</a></strong> is a solid pick for core investment-grade exposure with near benchmark-neutral duration risk. Meanwhile, for those looking to extend duration further in anticipation of long rates coming down, the <a href="https://www.vaneck.com/us/en/investments/long-muni-etf-mln/overview/" title="MLN - VanEck Long Muni ETF - Overview"><strong>VanEck Long Muni ETF (MLN)</strong></a> could be a compelling option.</p>
<p>To receive more <strong><a href="https://www.vaneck.com/us/en/insights/economic-trends/" title="Economic Trends Insights">Economic Trends</a></strong> insights, <strong><a href="https://www.vaneck.com/us/en/subscribe/" title="Subscription Center">sign up in our subscription center</a></strong>.</p>
]]></content:encoded>
</item><item rdf:about="https://www.vaneck.com/us/en/blogs/municipal-bonds/hyd-etf-question-and-answer/">
  <title>HYD ETF: Question &amp; Answer></title>
  <link>https://www.vaneck.com/us/en/blogs/municipal-bonds/hyd-etf-question-and-answer/</link>
  <description><![CDATA[<p>This blog addresses frequently asked questions on high-yield municipal bonds and the VanEck High Yield Muni ETF (HYD).</p>]]></description>
  <dc:creator>Dylan  Desai</dc:creator>
  <dc:date>12/22/2023 06:30:00</dc:date>
<content:encoded><![CDATA[

<p>This blog is intended to answer frequently asked questions on high-yield municipal bonds and, more specifically, <a href="/link/63e99d0ce68b47e79eae26e1c163fd09.aspx" title="HYD VanEck High Yield Muni ETF - Overview"><strong>the VanEck High Yield Muni ETF (HYD)</strong></a>.</p>
<ul class="content-list">
<li><a href="#point-one"><strong>What are high-yield municipal bonds, and how big is this market?</strong></a></li>
<li><a href="#point-two"><strong>What makes high-yield municipal bonds attractive relative to other types of bonds?</strong></a></li>
<li><a href="#point-three"><strong>Are high-yield municipal bonds safer than high-yield corporate bonds?</strong></a></li>
<li><a href="#point-four"><strong>What makes HYD unique?</strong></a></li>
<li><a href="#point-five"><strong>How is the fund&rsquo;s index constructed?</strong></a></li>
<li><a href="#point-six"><strong>Why does the fund include investment grade bonds?</strong></a></li>
<li><a href="#point-seven"><strong>Why does the index cap its exposure to not-rated bonds?</strong></a></li>
<li><a href="#point-eight"><strong>Why could slippage be higher in this asset class?</strong></a></li>
<li><a href="#point-nine"><strong>How does the portfolio management team decide which bonds in the index to own?</strong></a></li>
<li><a href="#point-ten"><strong>How to buy VanEck ETFs?</strong></a></li>
</ul>
<h2 id="point-one" class="jump-link-nav anchored-block" data-jumplink-title="What are high-yield munis?">1. What are high-yield municipal bonds, and how big is the market?</h2>
<p>High-yield municipal bonds are a type of debt security issued by a state, municipality, county, or other local government with credit ratings that are below investment grade. Investors in high-yield securities are compensated with higher interest payments for taking on additional credit risk.</p>
<p>These bonds are issued to raise capital for various types of public infrastructure and public benefit projects. High-yield municipals can be issued as either general obligation bonds or revenue bonds. General obligation bonds are backed by the full faith, credit, and taxing power of the issuer. In contrast, revenue bonds are secured by the revenue generated by a specific project that is being financed.</p>
<p>At the end of the second quarter of 2023, SIFMA estimated that over $4.04 trillion worth of municipal bonds are currently outstanding. Of those, approximately $258.3 billion are high-yield and non-rated bonds.</p>
<h2 id="point-two" class="anchored-block">2. What makes high-yield municipal bonds attractive relative to other types of bonds?</h2>
<ul class="content-list">
<li><strong>Potential for Higher Yields:</strong> relative to investment grade bonds, non-investment grade bonds can potentially offer lenders higher yields in exchange for taking on the additional risk associated with lower credit quality.</li>
<li><strong>Tax advantages:</strong> the interest income generated by municipal bonds is generally exempt from federal income tax and, in some cases, exempt from state and local taxes, as well. Investors in higher tax brackets can see the benefits of investing in municipal securities when comparing a municipal bond&rsquo;s taxable equivalent yield to the yield on a taxable bond.</li>
</ul>
<h3>Asset Class Yield Comparison - 11/30/2023</h3>
<p><img loading="lazy" class="img-responsive w-100" src="https://www.vaneck.com/contentassets/4936f10040a24d2380fe28b18d80b0d9/3943_hyd-qa_chart-1_2023-12_v1_blog.svg" alt="Asset Class Yield Comparison" width="960" height="625" /></p>
<p class="chart-disclosure"><strong>Source:</strong> ICE Data Services as of 11/30/2023. Please see below for definitions of all indices referenced herein.</p>
<ul class="content-list">
<li><strong>General Stability of Municipal Issuers:</strong> Municipal bonds are issued by state and local governments, which may be considered more stable than corporate entities. This perception of stability can be appealing to investors seeking a balance between income generation and capital preservation.</li>
<li><strong>Economic Development Projects:</strong> High-yield municipal bonds are often issued to finance economic development projects, such as infrastructure improvements, housing projects, or other initiatives aimed at stimulating local economies. Some investors may find the prospect of contributing to community development appealing.</li>
<li><strong>Diversification:</strong> Adding high-yield municipal bonds to an investment portfolio can enhance diversification, spreading risk across various asset classes and potentially lower the portfolio's overall risk.</li>
</ul>
<h2 id="point-three" class="anchored-block">3. Are high-yield municipal bonds safer than high-yield corporate bonds?</h2>
<p>It is broadly understood that municipal bonds have key characteristics that cause differences in their credit profile relative to debt instruments issued by corporations.</p>
<p>In many instances, municipal bonds are backed by the full faith, credit, and taxing authority of a government entity. Because of this, many investors perceive municipal bonds to be higher in credit quality than many corporate securities. Data also support this thesis.</p>
<p>According to Moody&rsquo;s, the average cumulative default rate (CDR) in the municipal bond market has been stable or has fallen over the past five years. The same study indicates that since 1970, the average CDR for the high-yield municipal sector has been 1.19%. The corporate bond market tells a vastly different story. High-yield global corporate bonds have an average CDR of 4.03% since 1970.</p>
<p>While no debt security is safe from default or loss of principal, it can be concluded that municipal bonds have historically observed a materially lower default rate than global corporate bonds.</p>
<div class="epi-contentfragment">faq-banner-cta</div>
<h2 id="point-four" class="jump-link-nav anchored-block" data-jumplink-title="What makes HYD unique?">4. What makes HYD unique?</h2>
<ul>
<li><strong>Smart Exposure:</strong> <a href="/link/63e99d0ce68b47e79eae26e1c163fd09.aspx" title="HYD VanEck High Yield Muni ETF - Overview"><strong>HYD</strong></a>&rsquo;s index is designed with intention. It offers broad exposure to the high-yield municipal bond market with unique features to enhance the credit and liquidity profile of the portfolio.</li>
<li><strong>Cost Efficiency:</strong> <a href="/link/63e99d0ce68b47e79eae26e1c163fd09.aspx" title="HYD VanEck High Yield Muni ETF - Overview"><strong>HYD</strong></a>&nbsp;has the lowest fees in the peer group, which includes other high-yield muni ETFs.<sup>1</sup>&nbsp;The fund&rsquo;s low fees can potentially enhance investors&rsquo; total returns.</li>
<li><strong>Attractive Yield:</strong> The fund has historically offered an attractive taxable equivalent yield compared to other high-yield municipal funds and other fixed income offerings.</li>
<li><strong>Enhanced Liquidity:</strong> When evaluating the fund&rsquo;s average daily trading volume (ADTV), investors will find that <a href="/link/63e99d0ce68b47e79eae26e1c163fd09.aspx" title="HYD VanEck High Yield Muni ETF - Overview"><strong>HYD</strong></a>&nbsp;generally trades at relatively high volumes and narrow spreads than trading individual high-yield bonds. This may reduce transaction costs.</li>
<li><strong>Credit Quality:</strong> The fund&rsquo;s index includes specific mechanisms to improve the underlying credit in the portfolio. This credit-enhancing feature may contribute to decreased volatility and illiquidity.</li>
<li><strong>Fund Management:</strong> A dedicated municipal bond portfolio management team with a proven track record tracks <a href="/link/63e99d0ce68b47e79eae26e1c163fd09.aspx" title="HYD VanEck High Yield Muni ETF - Overview"><strong>HYD</strong></a>&rsquo;s index via a robust optimization process.</li>
</ul>
<h2 id="point-five" class="anchored-block">5. How is the fund&rsquo;s index constructed?</h2>
<p><a href="/link/63e99d0ce68b47e79eae26e1c163fd09.aspx" title="HYD - VanEck High Yield Muni ETF - Overview"><strong>VanEck&rsquo;s High Yield Muni ETF (HYD)</strong></a> seeks to track the ICE Broad High Yield Crossover Municipal Index. This index tracks the performance of lower-rated and unrated U.S. dollar-denominated tax-exempt debt publicly issued by U.S. states and territories and their political subdivisions in the U.S. domestic market.</p>
<p>The index&rsquo;s exposure can be broken down as such:</p>
<ul class="content-list">
<li>70% core high yield and unrated municipals.</li>
<li>25% core BBB municipals.</li>
<li>5% core A municipals.</li>
</ul>
<p>Additionally, the index implements the following constraints:</p>
<ul class="content-list">
<li>30% cap on unrated securities.</li>
<li>10% cap on U.S. territories.</li>
<li>5% cap on zero-coupon securities.</li>
</ul>
<h2 id="point-six" class="anchored-block">6. Why does the fund include investment grade bonds?</h2>
<p>The index&rsquo;s inclusion of investment grade (IG) municipal bonds provides a liquidity-enhancing feature. High-yield municipal bonds generally trade less frequently than their investment grade equivalents. The IG allocation helps the fund reduce slippage in the instances where the underlying securities are being traded.</p>
<h2 id="point-seven" class="anchored-block">7. Why does the index cap its exposure to not-rated bonds?</h2>
<p>Bonds that are not rated by an established credit rating agency are generally considered to be riskier, and it can be difficult to derive a correct valuation or price. The fund&rsquo;s index caps its exposure to these seemingly riskier investments to mitigate the potential volatility, illiquidity, and credit concerns associated with not-rated securities.</p>
<h2 id="point-eight" class="anchored-block">8. Why could slippage be higher in this asset class?</h2>
<p>The high-yield section of the municipal bond market generally trades less frequently than other fixed-income securities, as previously discussed. These wider spreads cause difficulties for traders to reach the best price obtained by the index when trading to replicate the index.</p>
<p>Additionally, prevailing market conditions have limited issuers&rsquo; willingness to borrow, which has subsequently muted the supply of new municipal issuance. As this is ongoing on the supply side of the equation, the demand for the newly issued bonds persists. This limited supply and exceptional demand story leads to very competitive pricing once the bonds hit the open market.</p>
<h2 id="point-nine" class="anchored-block">9. How does the portfolio management team decide which bonds in the index to own?</h2>
<p>The portfolio management team&rsquo;s optimization process allows the portfolio to track the index without holding every constituent security. The graphic below illustrates this process.</p>
<p><img loading="lazy" class="img-responsive w-100" src="https://www.vaneck.com/contentassets/4936f10040a24d2380fe28b18d80b0d9/3943_hyd-qa_chart-2_2023-12_v1_blog.svg" alt="Portfolio Selection Process" /></p>
<p class="chart-disclosure"><sup>*</sup>&nbsp;International Data Corporation (third-party pricing service.) The municipal income ETF investment process is subject to change at any time. For illustration purposes only.</p>
<h2 id="point-ten" class="jump-link-nav anchored-block" data-jumplink-title="How to buy VanEck ETFs?">10. How to buy VanEck ETFs?</h2>
<p><strong><a href="/link/a0dc6259e9ed4ebeb8045ccad48dd31a.aspx#how-to-buy-etf&amp;utm=HYD-Blog" title="How to buy VanEck ETFs?">Learn more here.</a></strong></p>
<p class="d-none d-lg-block"><a href="mailto:askvaneck@vaneck.com" title="Have More Questions? - Ask VanEck" rel="noopener"><img loading="lazy" class="img-responsive" src="https://www.vaneck.com/globalassets/home/us/insights/blogs/bm-blog-images/cta-faq_desktop-02.svg" alt="Have More Questions? - Ask VanEck" /></a></p>
<p class="d-lg-none"><a href="mailto:askvaneck@vaneck.com" title="Have More Questions? - Ask VanEck" rel="noopener"><img loading="lazy" class="img-responsive" src="https://www.vaneck.com/globalassets/home/us/insights/blogs/bm-blog-images/cta-faq_mobile-01.svg" alt="Have More Questions? - Ask VanEck" /></a></p>
<p>To receive more <a href="https://www.vaneck.com/us/en/insights/municipal-bonds/" title="Municipal Bonds Insights"><strong>Municipal Bonds</strong></a> insights, <a href="https://www.vaneck.com/us/en/subscribe/" title="Subscription Center"><strong>sign up in our subscription center</strong></a>.</p>
]]></content:encoded>
</item><item rdf:about="https://www.vaneck.com/us/en/blogs/thematic-investing/buzz-investing-stock-markets-rally-as-fed-signals-end-to-rate-hikes/">
  <title>BUZZ Investing: Stock Markets Rally as Fed Signals End to Rate Hikes></title>
  <link>https://www.vaneck.com/us/en/blogs/thematic-investing/buzz-investing-stock-markets-rally-as-fed-signals-end-to-rate-hikes/</link>
  <description><![CDATA[Stock markets rallied due to the Federal Reserve's steady interest rates, with major U.S. indices rising amidst a new correlation between stocks and U.S. Treasury bonds.]]></description>
  <dc:creator> </dc:creator>
  <dc:date>12/22/2023 06:30:00</dc:date>
<content:encoded><![CDATA[

<p>Domestic stock markets experienced a significant rally during the recent period between Index selection dates (November 9, 2023, to December 21, 2023, the &ldquo;Period&rdquo;), largely driven by the Federal Open Market Committee's (FOMC) continued stance to maintain steady interest rates as reinforced during their recent meeting on December 13th. During his press conference, Fed Chair Jerome Powell all but declared &lsquo;mission accomplished&rsquo; on the battle against inflation, noting &ldquo;real progress in core inflation&rdquo; as the economy averted a recession during the recent rate hike cycle. Market participants are increasingly factoring in the likelihood that the current series of rate hikes have concluded, with the Fed &lsquo;dot plot&rsquo; of forward policy rate projections reinforcing that view and forecasting 75 bps of interest rate cuts in 2024.</p>
<p>During the Period, the BUZZ NextGen AI US Sentiment Leaders Index (the &ldquo;BUZZ Index&rdquo;) surged 20.7%, the S&amp;P 500 index rallied 8.8%, and the technology-focused Nasdaq Composite Index gained 9.3%. A notable shift in market dynamics occurred during the Period, with risk assets, like stocks, showing a positive correlation with US Treasury bonds. This trend contrasts with the previous 'risk-on' attitude, where safe-haven assets like government bonds and the US dollar typically moved inversely to equities and other risk-oriented investments. Additionally, key indicators of market risk decreased substantially during the Period. Both the Markit CDX North America High Yield Index, a measure of credit risk, and the Chicago Board Options Exchange Volatility Index (VIX) dropped toward their lowest levels of the year.</p>
<h3>A New 'Risk-on' Paradigm</h3>
<p><strong>(December Selection Period Returns)</strong></p>
<p><img class="img-responsive w-100" src="https://www.vaneck.com/contentassets/070a4770516045ff92fd3af70215ef22/3947_buzz-blog_chart-1_2023-12_v3_blog-copy.svg" alt="A New Risk-On Paradigm" /></p>
<p class="chart-disclosure">Source: Bloomberg/Periscope Capital.</p>
<p>The BUZZ Index returned 16.35% during the month of November compared to a return of 9.13% for the S&amp;P 500 Index during the same period. Year-to-date, the BUZZ Index leads the S&amp;P 500 with returns of 38.65% and 20.80%, respectively, as of the end of November.</p>
<h2>Shares of Coinbase Global Pace Advancing Stocks within the BUZZ Index</h2>
<p>Ninety-percent of BUZZ Index constituents exhibited gains during the recent Period with shares of Coinbase Global Inc (NASDAQ: COIN) pacing advancing stocks within the BUZZ Index for the second Period in a row. COIN surged 65.4% during the Period to its highest level in nearly two years. COIN&rsquo;s surging stock reflects continued optimism in the cryptocurrency market. Bitcoin's value has soared above $42,000, a peak not seen since April 2022, driven by a surge in market optimism. This upswing is primarily attributed to expectations of impending interest rate reductions in the United States and growing anticipation that the U.S. will soon greenlight the launch of Bitcoin-focused exchange-traded funds, sparking increased trader activity and bullish sentiment in the cryptocurrency market. Moreover, Coinbase Global, Inc. has gained traction as a prominent player in the cryptocurrency space, particularly following the downfall of FTX and the challenges faced by Binance, its main competitor.</p>
<div class="wrapped-div">
<table style="width: 750px;">
<tbody>
<tr class="tbl-data">
<td class="tbl-header last " colspan="4">Top BUZZ Index Contributors: November 9, 2023 &ndash; December 21, 2023</td>
</tr>
<tr class="tbl-data">
<td class="data-td  last">Company</td>
<td class="data-head last">Ticker</td>
<td class="data-head last">Average Weight (%)</td>
<td class="data-head last">Return Contribution (%)</td>
</tr>
<tr class="tbl-data">
<td class="data-td last font-weight-normal">Coinbase Global Inc</td>
<td class="data-td data last">COIN</td>
<td class="data-td data last">3.49</td>
<td class="data-td data last">1.95</td>
</tr>
<tr class="tbl-data">
<td class="data-td last font-weight-normal">SoFi Technologies Inc</td>
<td class="data-td data last">SOFI</td>
<td class="data-td data last">2.86</td>
<td class="data-td data last">1.13</td>
</tr>
<tr class="tbl-data">
<td class="data-td last font-weight-normal">Rivian Automotive Inc</td>
<td class="data-td data last">RIVN</td>
<td class="data-td data last">2.41</td>
<td class="data-td data last">1.06</td>
</tr>
<tr class="tbl-data">
<td class="data-td last font-weight-normal">Robinhood Markets Inc</td>
<td class="data-td data last">HOOD</td>
<td class="data-td data last">1.77</td>
<td class="data-td data last">0.98</td>
</tr>
<tr class="tbl-data">
<td class="data-td last font-weight-normal">Lucid Group Inc</td>
<td class="data-td data last">LCID</td>
<td class="data-td data last">2.97</td>
<td class="data-td data last">0.98</td>
</tr>
<tr class="tbl-data">
<td class="data-td last font-weight-normal">Carvana Co</td>
<td class="data-td data last">CVNA</td>
<td class="data-td data last">1.36</td>
<td class="data-td data last">0.84</td>
</tr>
<tr class="tbl-data">
<td class="data-td last font-weight-normal">Block Inc</td>
<td class="data-td data last">SQ</td>
<td class="data-td data last">1.94</td>
<td class="data-td data last">0.83</td>
</tr>
<tr class="tbl-data">
<td class="data-td last font-weight-normal">Enphase Energy Inc</td>
<td class="data-td data last">ENPH</td>
<td class="data-td data last">1.85</td>
<td class="data-td data last">0.81</td>
</tr>
<tr class="tbl-data">
<td class="data-td last font-weight-normal">Snap Inc</td>
<td class="data-td data last">SNAP</td>
<td class="data-td data last">1.46</td>
<td class="data-td data last">0.68</td>
</tr>
<tr class="tbl-data">
<td class="data-td last font-weight-normal">Advanced Micro Devices Inc</td>
<td class="data-td data last">AMD</td>
<td class="data-td data last">3.01</td>
<td class="data-td data last">0.66</td>
</tr>
</tbody>
</table>
</div>
<br />
<p class="chart-disclosure">Source: BUZZ Holdings ULC, Bloomberg. Past performance is no guarantee of future results. Index performance is not illustrative of fund performance. Not intended as a recommendation to buy or to sell any of the securities mentioned herein.</p>
<p>Just seven stocks within BUZZ Index constituents posted negative returns during the recent Period. Pfizer Inc's (NYSE: PFE) stock significantly underperformed during the recent Period, dropping 12% to reach its lowest point in over a decade. The pharmaceutical giant has seen its valuation plunge by $140 billion, a 50% decrease from its peak during the COVID-19 pandemic in 2021. This downturn is largely due to an overestimation of demand for its pandemic-related products, a quicker than anticipated decline in sales post-pandemic, and its other products' inability to bridge the revenue gap. In response to these challenges, Pfizer has initiated layoffs and other cost-cutting strategies, while simultaneously shifting its focus towards the development of new products and strategic acquisitions to navigate the competitive landscape and mitigate revenue losses.</p>
<div class="wrapped-div">
<table style="width: 750px;">
<tbody>
<tr class="tbl-data">
<td class="tbl-header last " colspan="4">Bottom BUZZ Index Contributors: November 9, 2023 &ndash; December 21, 2023</td>
</tr>
<tr class="tbl-data">
<td class="data-td  last">Company</td>
<td class="data-head last">Ticker</td>
<td class="data-head last">Average Weight (%)</td>
<td class="data-head last">Return Contribution (%)</td>
</tr>
<tr class="tbl-data">
<td class="data-td last font-weight-normal">Pfizer Inc</td>
<td class="data-td data last">PEE</td>
<td class="data-td data last">1.36</td>
<td class="data-td data last">-0.18</td>
</tr>
<tr class="tbl-data">
<td class="data-td last font-weight-normal">Celsius Holdings Inc</td>
<td class="data-td data last">CELH</td>
<td class="data-td data last">0.82</td>
<td class="data-td data last">-0.08</td>
</tr>
<tr class="tbl-data">
<td class="data-td last font-weight-normal">Transocean Ltd</td>
<td class="data-td data last">RIG</td>
<td class="data-td data last">0.47</td>
<td class="data-td data last">-0.03</td>
</tr>
<tr class="tbl-data">
<td class="data-td last font-weight-normal">Cisco Systems Inc</td>
<td class="data-td data last">CSCO</td>
<td class="data-td data last">0.09</td>
<td class="data-td data last">-0.03</td>
</tr>
<tr class="tbl-data">
<td class="data-td last font-weight-normal">Starbucks Corp</td>
<td class="data-td data last">SBUX</td>
<td class="data-td data last">0.54</td>
<td class="data-td data last">-0.02</td>
</tr>
<tr class="tbl-data">
<td class="data-td last font-weight-normal">Eli Lilly &amp; Co</td>
<td class="data-td data last">LLY</td>
<td class="data-td data last">0.78</td>
<td class="data-td data last">-0.02</td>
</tr>
<tr class="tbl-data">
<td class="data-td last font-weight-normal">Occidental Petroleum Corp</td>
<td class="data-td data last">OXY</td>
<td class="data-td data last">0.62</td>
<td class="data-td data last">-0.02</td>
</tr>
<tr class="tbl-data">
<td class="data-td last font-weight-normal">Dollar General Corp</td>
<td class="data-td data last">DG</td>
<td class="data-td data last">0.22</td>
<td class="data-td data last">0.00</td>
</tr>
<tr class="tbl-data">
<td class="data-td last font-weight-normal">Exxon Mobil Corp</td>
<td class="data-td data last">XOM</td>
<td class="data-td data last">0.87</td>
<td class="data-td data last">0.00</td>
</tr>
<tr class="tbl-data">
<td class="data-td last font-weight-normal">Devon Energy Corp</td>
<td class="data-td data last">DVN</td>
<td class="data-td data last">0.09</td>
<td class="data-td data last">0.00</td>
</tr>
</tbody>
</table>
</div>
<br />
<p class="chart-disclosure">Source: BUZZ Holdings ULC, Bloomberg. Past performance is no guarantee of future results. Index performance is not illustrative of fund performance. Not intended as a recommendation to buy or to sell any of the securities mentioned herein.</p>
<h2>Sentiment Stock Highlight &ndash; Robinhood Markets</h2>
<p>Robinhood (NASDAQ: HOOD) has consistently been one of the most discussed stocks online, with much of its popularity coming from the meme stock mania of 2021. As one of the first brokers to market zero-commission trading to its customers, HOOD is a popular online brokerage platform among younger demographics, with the company's foray into crypto trading further increasing its appeal. The past two years have been difficult for the stock, with rising interest rates ending the bull market and suppressing crypto prices. The last month has seen the tide change, as the expectation that the rate hike cycle has peaked has driven both stock and crypto prices higher. The price of Bitcoin has broken above $42,000 USD once again, with many crypto tokens gaining upside momentum. The effects have flowed through to HOOD, fueled by a report that cited a 75% increase in cryptocurrency trading and a notable $1.4 billion net deposits, indicating heightened customer engagement and activity. This month, sentiment on HOOD jumped, pushing its weight in the BUZZ Index to a maximum of 3%.</p>
<h3>Robinhood Markets Stock Price | January 2023 &ndash; December 2023</h3>
<p><img class="img-responsive w-100" src="https://www.vaneck.com/contentassets/070a4770516045ff92fd3af70215ef22/3947_buzz-blog_chart-2_2023-12_v1_blog.svg" alt="Robinhood Markets Stock Price January 2023 - December 2023" /></p>
<p class="chart-disclosure">Source: BUZZ Holdings ULC, Bloomberg. Past performance is no guarantee of future results. Index performance is not illustrative of fund performance. Not intended as a recommendation to buy or to sell any of the securities mentioned herein.</p>
<h2>BUZZ Index December 2023 Rebalance Highlights</h2>
<p><strong>Walt Disney Co.</strong></p>
<p>Despite Bob Iger's return as CEO of Walt Disney Co (NYSE: DIS) in November 2022, the company continues to face significant challenges. Iger, who initially retired in early 2020, came back following a series of operational missteps and the profound impact of the pandemic, which led to massive layoffs and the closure of theme parks. This period also saw a strategic shift towards the Disney+ streaming service. However, the company's ongoing struggles have prompted its largest shareholder, activist investor Nelson Peltz, to initiate a proxy battle for three board seats. DIS shares have experienced a downturn, briefly reaching pandemic lows in October, and falling 60% from their peak. Despite these challenges, investor sentiment remains guardedly positive. Value-focused investors appear to increasingly recognize the potential upside in shares of DIS, considering the company's longstanding brand appeal as a strong foundation for future growth. This month, DIS climbed to a maximum 3% weight in the BUZZ Index.</p>
<p>For more on rebalancing results and a full breakdown of index constituents added and removed for the month, view the <a href="https://www.vaneck.com/us/en/blogs/thematic-investing/buzz-investing-stock-markets-rally-as-fed-signals-end-to-rate-hikes/buzz-reconstitution-december-2023.pdf" title="BUZZ VanEck Social Sentiment ETF" target="_blank" rel="noopener"><strong>BUZZ Index reconstitution</strong></a> report.</p>
<p>To receive more <a href="https://www.vaneck.com/us/en/insights/thematic-investing/" title="Thematic Investing Insights"><strong>Thematic Investing</strong></a> insights, <a href="https://www.vaneck.com/us/en/subscribe/" title="Subscription Center"><strong>sign up in our subscription center</strong></a>.</p>
<style>
    .wrapped-div {
        max-width: 100%;
    }

    @media (max-width: 1240px) {
        .wrapped-div {
            overflow-x: scroll;
        }
    }

    .wrapped-div-sector {
        max-width: 100%;
        overflow-x: scroll;
    }
</style>
]]></content:encoded>
</item><item rdf:about="https://www.vaneck.com/us/en/blogs/moat-investing/investing-beyond-the-magnificent-7/">
  <title>Investing Beyond the Magnificent 7></title>
  <link>https://www.vaneck.com/us/en/blogs/moat-investing/investing-beyond-the-magnificent-7/</link>
  <description><![CDATA[The Moat Index underwent its quarterly review on December 15, resulting in a continued underweight to Magnificent 7 stocks and a value bias with a slight small cap tilt.]]></description>
  <dc:creator>Brandon Rakszawski</dc:creator>
  <dc:date>12/20/2023 06:30:00</dc:date>
<content:encoded><![CDATA[

<p>The Morningstar<sup>&reg;</sup>&nbsp;Wide Moat Focus Index<sup>SM</sup>&nbsp;(the &ldquo;Moat Index&rdquo; or &ldquo;Index&rdquo;) underwent its quarterly review on December 15, 2023. The Index&rsquo;s review process systematically targets attractively priced, high quality U.S. companies. Below are some key takeaways from the December review and how the Moat Index is positioned as we enter 2024. The full review results are available here: <a href="/us/en/blogs/moat-investing/investing-beyond-the-magnificent-7/moat-reconstitution-4q-2023.pdf" title="Morningstar Wide Moat Focus Index Reconstitution" target="_blank" rel="noopener"><strong>4Q2023 Index Reconstitution</strong></a>.</p>
<h2>Key Takeaways:</h2>
<ul class="content-list">
<li><strong>You Already Own a Ton of the Magnificent 7; The Moat Index Doesn&rsquo;t</strong></li>
</ul>
<p>The S&amp;P 500 Index, widely owned by investors of all types by way of index funds, was also reconstituted and rebalanced last week. The result: more Magnificent 7 exposure. The &ldquo;magnificent&rdquo; seven companies that have dominated U.S. market returns in 2023 now account for the top eight holdings in the S&amp;P 500 Index and approximately 28% of its weight (Alphabet (both share classes), Amazon, Apple, Meta, Microsoft, Nvidia, and Tesla). The Moat Index represents only 4.9% by way of Alphabet, Amazon, and Microsoft. In fact, the Moat Index has been consistently underweight these seven companies &ndash; even more impressive considering the Index&rsquo;s stellar track record vs. the Magnificent 7-dominated S&amp;P 500 Index.</p>
<ul class="content-list">
<li><strong>Value Bias with a Slight Smaller Cap Tilt</strong></li>
</ul>
<p>The Moat Index started the year with an overweight position in the tech sector following a particularly difficult 2022 for tech and growth stocks in general. Throughout 2023, the Index has migrated away from growth toward value stocks as valuations have signaled green pastures away from tech in more defensive sectors such as industrials, health care, and financials. Those trends continued with a modest shift further from tech and growth last week. The Index&rsquo;s size profile is about as small as it has been in the last ten years. The equal weighting of the Moat Index introduces a structure market cap bias away from mega cap companies, but valuations have also pushed the Index slightly lower in the large cap segment throughout 2023.</p>
<ul class="content-list">
<li><strong>Identifying Pockets of Opportunity</strong></li>
</ul>
<p>The price/fair value ratio of the S&amp;P 500 Index currently sits at 1.0. This implies that the companies in the S&amp;P 500 are, overall, fairly valued according to Morningstar. This presents a challenge for investors with cash positions seeking an opportunity to invest in U.S. markets that have appreciated by more than 20% already this year. The Moat Index represents high quality companies currently mispriced by the market, in Morningstar&rsquo;s view. It allows investors to consider a mix of well-positioned companies with upside potential. Currently, the Morningstar price/fair value ratio of the Moat Index is 0.83 implying a 17% discount to fair value.</p>
<h2>4Q2023 Index Review Results</h2>
<h3>Moat Index Sector Shifts</h3>
<p><img class="img-responsive w-100" src="https://www.vaneck.com/contentassets/5bd70632ceb141bcb60b43b221ae1f70/3942_moat-recon-blog_chart-1_2023-12_v1_blog.svg" alt="Moat Index Sector Shifts in the fourth quarter" /></p>
<h3>Moat Index Sector Exposure Relative to S&amp;P 500 Index</h3>
<p><img class="img-responsive w-100" src="https://www.vaneck.com/contentassets/5bd70632ceb141bcb60b43b221ae1f70/3942_moat-recon-blog_chart-2_2023-12_v1_blog.svg" alt="Moat Index Sector Exposure Relative to S&amp;P 500 Index shows less tech exposure" /></p>
<h3>Moat Index Style Exposure Relative to S&amp;P 500 Index</h3>
<p><img class="img-responsive w-100" src="https://www.vaneck.com/contentassets/5bd70632ceb141bcb60b43b221ae1f70/3942_moat-recon-blog_chart-3_2023-12_v1_blog.svg" alt="Moat Index has a value tilt" /></p>
<p class="chart-disclosure">Source: Morningstar. As of 12/15/2023 unless otherwise noted.</p>
<h2>Access Quality Companies and Attractive Valuations</h2>
<p><a href="https://www.vaneck.com/us/en/investments/morningstar-wide-moat-etf-moat/index/" title="MOAT - VanEck Morningstar Wide Moat ETF - Overview"><strong>VanEck Morningstar Wide Moat ETF (MOAT)</strong></a> and <a href="https://www.vaneck.com/us/en/investments/morningstar-wide-moat-fund-mwmzx/overview/" title="MWMZX - VanEck Morningstar Wide Moat Fund - Class Z"><strong>VanEck Morningstar Wide Moat Fund</strong></a> seek to replicate as closely as possible, before fees and expenses the price and yield performance of the Morningstar Wide Moat Focus Index.</p>
<p>To receive more <strong><a href="https://www.vaneck.com/us/en/insights/moat-investing/" title="Moat Investing Insights">Moat Investing</a></strong> insights, <strong><a href="https://www.vaneck.com/us/en/subscribe/" title="Preference Center">sign up in our subscription center</a></strong>.</p>
]]></content:encoded>
</item><item rdf:about="https://www.vaneck.com/us/en/blogs/investment-outlook/2024-outlook-qa-rates-landing-and-where-to-invest/">
  <title>2024 Investment Outlook: Rates, Landing and Where to Invest></title>
  <link>https://www.vaneck.com/us/en/blogs/investment-outlook/2024-outlook-qa-rates-landing-and-where-to-invest/</link>
  <description><![CDATA[As investors prepare their portfolios for 2024, our investment professionals share insights on what to expect in their respective asset classes.]]></description>
  <dc:creator> </dc:creator>
  <dc:date>12/19/2023 06:30:00</dc:date>
<content:encoded><![CDATA[

<a href="/us/en/blogs/investment-outlook/jan-van-eck-q2-2026-outlook-the-reset-is-your-entry-point/" title="Jan van Eck's Latest Outlook"><strong>Looking for the latest outlook? Read the Q2 2026 Outlook.</strong></a>
<p>Looking at the world through a longer-term lens, <a href="https://www.vaneck.com/us/en/news-and-insights/thought-leaders/jan-van-eck/" title="Jan van Eck - Chief Executive Officer"><strong>CEO Jan van Eck</strong></a> recently broke down the <a href="https://www.vaneck.com/us/en/blogs/investment-outlook/jan-van-eck-top-investment-picks-for-2024-india-and-bitcoin/" title="Top Investment Picks for 2024: India and Bitcoin"><strong>secular trends shaping the next wave of exponential growth potential</strong></a>. Standing on the precipice of 2024, Jan explored where we think investors&mdash;several years from now&mdash;may wish they had invested today. In this more granular discussion, portfolio managers from across VanEck come together to share insights on what to expect in their respective asset classes and highlight areas of the market that investors should consider allocating to now.</p>
<ul class="content-list">
<li><a href="#what-to-watch"><strong>What key factors will shape your asset class forecast through the end of the year and for 2024?</strong></a></li>
<li><a href="#risks-opportunities"><strong>What do you view as the biggest risks and opportunities in your asset class in 2024?</strong></a></li>
<li><a href="#why-invest"><strong>Why should investors be considering your asset class in 2024?</strong></a></li>
</ul>
<h2 id="what-to-watch" class="jump-link-nav anchored-block" data-jumplink-title="What to Watch">What key factors will shape your asset class forecast through the end of the year and for 2024?</h2>
<h3>Asset Allocation/Model Portfolio Outlook</h3>
<p><a href="https://www.vaneck.com/us/en/news-and-insights/thought-leaders/david-schassler/" title="David Schassler - Head of Multi-Asset Solutions"><strong>DAVID SCHASSLER, HEAD OF MULTI-ASSET SOLUTIONS</strong></a><strong>:</strong> We have an <a href="https://www.vaneck.com/us/en/blogs/natural-resources/inflation-is-here-time-to-get-real-with-real-assets/" title="Inflation Is Here: Time to Get Real with Real Assets"><strong>inflation playbook</strong></a> that was developed by studying history. It separates inflationary regimes into two distinct periods. What do you view as the biggest risks and opportunities in your asset class in 2024?</p>
<p>The first half:</p>
<ul class="content-list">
<li>Extreme money supply expansion leads to inflation.</li>
<li>Inflation sends assets with scarcity, such as real assets, higher.</li>
<li>The government responds by increasing interest rates.</li>
</ul>
<p>The second half:</p>
<ul class="content-list">
<li>Higher interest rates and inflationary cost pressures weigh heavily on the economy and traditional assets.</li>
<li>Investors seek protection in gold and other real assets.</li>
<li>Inflation gradually declines, with periods of deceleration and reacceleration, while staying elevated, on average, for an extended period.</li>
</ul>
<p>We&rsquo;re now in the second half. As such, we are very bullish on gold and other real assets.</p>
<h3>Fixed Income Investing Outlook</h3>
<p><a href="https://www.vaneck.com/us/en/news-and-insights/thought-leaders/fran-rodilosso/" title="Fran Rodilosso - Head of Fixed Income ETF Portfolio Management"><strong>FRAN RODILOSSO, HEAD OF FIXED INCOME ETF PORTFOLIO MANAGEMENT</strong></a><strong>:</strong> Most market participants are laser focused on Federal Reserve (Fed) policy and the prospect of rate cuts for next year. However, we are more focused on marginal drivers of growth, inflation, and global economic and political stability. More specifically, we believe markets will be driven by larger shifts in the U.S. growth outlook as the 2024 election cycle evolves. We also believe that a victory by either party (or any combination of executive and legislative wins) will not lead to meaningful fiscal tightening. Longer term, the U.S. fiscal situation is negative for Treasury bonds, and we believe will receive increasing attention from bond investors in 2024.</p>
<p>Meanwhile, China&rsquo;s growth outlook is even more critical to many of the resource driven economies in our emerging markets (EM) portfolios. The manner and extent to which China's economy manages to rebound from the property sector's critical downturn will have repercussions beyond its borders, potentially reshaping the global economic landscape and carrying significant geopolitical consequences. As we move into 2024, leaving behind a year marked by dual conflicts and strained international relations among major world powers, geopolitics emerges as a crucial factor influencing the future.</p>
<h3>Emerging Markets Debt Outlook</h3>
<p><a href="https://www.vaneck.com/us/en/news-and-insights/thought-leaders/eric-fine/" title="Eric Fine - Portfolio Manager, Head of Active EM Debt"><strong>ERIC FINE, PORTFOLIO MANAGER, HEAD OF ACTIVE EM DEBT</strong></a><strong>:</strong> The impact of a potential U.S. recession on emerging markets bonds will be a defining factor in 2024. If the U.S. experiences a mild downturn&mdash;a &ldquo;soft-landing&rdquo; where inflation eases and leads to lower policy and market interest rates&mdash;<a href="/link/dbb866e8704049c784a0bdf9299143ea.aspx" title="Emerging Markets Bond Fund - Class A"><strong>EM bonds</strong></a> are likely to benefit in two ways. Firstly, lower interest rates in the U.S. generally boost all bond values. Secondly, a reduction in U.S. policy rates could diminish the U.S. dollar's strength internationally, potentially allowing EM currencies to strengthen. Such currency strength may further drive down EM local interest rates, creating a self-reinforcing cycle. Conversely, should we encounter a &ldquo;stagflation&rdquo; scenario, where economic stagnation combines with inflation, EM bonds could still come out ahead. Many EM bonds, particularly those outside of Asia, are tied to economies that are major commodity exporters. These would profit from sustained high export revenues coupled with stable, elevated interest rates.</p>
<h3>Municipal Bonds Outlook</h3>
<p><a href="https://www.vaneck.com/us/en/news-and-insights/thought-leaders/james-colby/" title="James Colby - Portfolio Manager and Strategist, Municipal Bonds"><strong>JIM COLBY, PORTFOLIO MANAGER AND STRATEGIST, MUNICIPAL BONDS</strong></a><strong>:</strong> The Fed's monetary policy and interest rate decisions will have the most profound influence on municipal bond performance in 2024. The key factor will be the Federal Reserve's interpretation of economic indicators. If the Fed concludes that its policies have effectively curbed inflationary pressures, leading to improved bond performance, we may see a positive impact. Conversely, if inflation remains stubbornly high, the Fed may opt to maintain elevated interest rates, which could inhibit a market rally.</p>
<h3>Digital Assets &amp; Crypto Outlook</h3>
<p><a href="https://www.vaneck.com/us/en/news-and-insights/thought-leaders/matthew-sigel/?utm_source=pr&amp;utm_medium=pressrelease" title="Matthew Sigel - Head of Digital Assets Research"><strong>MATTHEW SIGEL, HEAD OF DIGITAL ASSETS RESEARCH</strong></a><strong>:</strong> In assessing the outlook for Bitcoin and digital assets adoption in 2024, we identify several key tailwinds:</p>
<ol class="content-list">
<li><strong>Fiscal scrutiny during the election year</strong>: The G7's fiscal challenges will come to the fore as these nations confront the need to refinance approximately $2.1T in sovereign debt, amidst widespread critique over the use of these funds. With a trend of foreign central banks divesting from U.S. Treasuries in favor of gold, we anticipate a renewed narrative that positions Bitcoin as a refuge against expansive monetary policies.<br /><br /></li>
<li><strong>Introduction of Spot Bitcoin ETFs</strong>: The anticipated release of spot Bitcoin ETFs is expected to generate significant investment from regulated institutions, building on the momentum from global Bitcoin ETNs, which have already seen substantial inflows. We believe the U.S. spot Bitcoin ETF, offering enhanced governance and custody, could unlock over $2B in new investments in the first quarter alone.<br /><br /></li>
<li><strong>Policy endorsement in Argentina</strong>: With the libertarian Javier Milei at the helm, who has signaled support for Bitcoin's integration into the financial system, we may see state-backed initiatives, including Bitcoin mining.<br /><br /></li>
<li><strong>Supply dynamics from &ldquo;the halving&rdquo;</strong>: Bitcoin's scheduled algorithm change in April 2024 will halve the rate at which new coins are produced, potentially increasing production costs and, historically, driving up prices, provided demand remains constant.<br /><br /></li>
<li><strong>Political influence</strong>: The ascent of presidential candidates favoring digital assets could significantly alter the regulatory outlook. For example, Donald Trump reported $5M+ in Ethereum holdings on his campaign&rsquo;s most recent financial disclosure.<br /><br /></li>
<li><strong>Coinbase vs. SEC litigation outcome</strong>: Should Coinbase emerge victorious against SEC allegations of selling unregistered securities, it could precipitate a leadership change within the agency, given its series of legal setbacks.<br /><br /></li>
<li><strong>Energy narrative shift</strong>: As the &ldquo;Net Zero&rdquo; initiative faces legal and political pushback, public opinion may shift towards a greater acceptance of energy consumption. This could be a positive for Bitcoin, which has faced misinformation regarding its energy intensity (which we see as a feature rather than a bug).</li>
</ol>
<h3>Gold Outlook</h3>
<p><a href="https://www.vaneck.com/us/en/news-and-insights/thought-leaders/imaru-casanova/" title="Imaru Casanova - Portfolio Manager, Gold and Precious Metals"><strong>IMARU CASANOVA, PORTFOLIO MANAGER, GOLD AND PRECIOUS METALS</strong></a><strong>:</strong> Gold prices should continue to have a meaningful impact on our outlook for the miners through the end of this year and into next. With respect to gold, specifically, we view the following factors as most relevant for now:</p>
<ul class="content-list">
<li><strong>Demand</strong>: Central bank net purchases of gold have been strong this year and may even exceed record levels reported in 2022. In contrast, investment demand&mdash;historically, the main driver behind a gold price rally&mdash;has been declining. In our view, any type of reversal in investment demand in the coming months should provide a significant boost for gold, just given the fundamental support provided by the former.<br /><br /></li>
<li><strong>Fed Rates/inflation</strong>: We believe that the probability of an economic slowdown in the U.S., under the stress imposed by higher interest rates, is increasing day-by-day. Inflation has eased; however, it still remains above the Fed&rsquo;s 2% target and continues to impact businesses and households. Risk of the Fed struggling to bring inflation back down to 2% seems very real to us and, likely, underappreciated. In our view, gold should be well-positioned to benefit as these risks become more visible to the market over the next three to six months.</li>
</ul>
<h3>Commodity Markets Outlook</h3>
<p><a href="https://www.vaneck.com/us/en/investments/cm-commodity-index-fund-cmcax/team/?utm_source=google&amp;utm_medium=cpc&amp;utm_campaign=commodities" title="CMCAX - CM Commodity Index Fund - Class A - Investment Team"><strong>ROLAND MORRIS, PORTFOLIO MANAGER AND STRATEGIST, COMMODITIES</strong></a><strong>:</strong> The value of the U.S. dollar and the strength of the global economy will likely be the most important factors affecting the performance of commodity index products next year. It looks like the final interest rate hike in this Fed tightening cycle was July 26, 2023. This, combined with a softer U.S. economy in early 2024, should set the stage for a declining U.S. dollar. This should be a positive environment for commodities because a weaker U.S. dollar should stimulate global growth and commodity demand.</p>
<h3>Natural Resources Market Outlook</h3>
<p><a href="https://www.vaneck.com/us/en/news-and-insights/thought-leaders/shawn-reynolds/" title="Shawn Reynolds - Portfolio Manager, Global Resources, Environmental Sustainability"><strong>SHAWN REYNOLDS, PORTFOLIO MANAGER, GLOBAL RESOURCES </strong></a><strong>:</strong> The primary factor influencing our outlook is the trajectory of global economic growth and its implications for inflation expectations. We are closely monitoring indications that the era of interest rate hikes may have concluded, and that a global recession may have been successfully avoided. Economic developments in China, the U.S., the European Union, and increasingly India, will also be closely monitored.</p>
<h3>Emerging Markets Equity Outlook</h3>
<p><a href="https://www.vaneck.com/us/en/news-and-insights/thought-leaders/david-semple/" title="David Semple - Portfolio Manager, Emerging Markets Equity"><strong>DAVID SEMPLE, PORTFOLIO MANAGER, EMERGING MARKETS EQUITY</strong></a><strong> &amp; </strong><a href="/link/f98f0ec11c0043b3803f14238bacfd2d.aspx" title="Ola El-Shawarby - Deputy Portfolio Manager, Emerging Markets Equity"><strong>OLA EL-SHAWARBY, DEPUTY PORTFOLIO MANAGER, EMERGING MARKETS EQUITY</strong></a><strong>:</strong> As we approach 2024, the timing and extent of potential U.S. interest rate reductions will be critical, along with their effects on the U.S. dollar and the broader global economic landscape&mdash;factors that traditionally influence emerging markets' performance. Notably, some emerging markets, especially in Latin America, have already initiated monetary easing, with additional rate cuts expected next year as inflation shows signs of abating. We also continue to track geopolitical developments closely to assess implications on our markets. We anticipate key elections in 2024 in the U.S., Taiwan, India, and Mexico, each of which may present opportunities or pose risks. Furthermore, we are closely observing the situation in China. While the country&rsquo;s economic recovery has no doubt been disappointing, we believe policy support has been increasing and leaves room for better performance if consumer and business confidence starts to pick up.</p>
<h2 id="risks-opportunities" class="jump-link-nav anchored-block" data-jumplink-title="Risks/Opportunities">What do you view as the biggest risks and opportunities in your asset class in 2024?</h2>
<h3>Asset Allocation/Model Portfolio Risks &amp; Opportunities</h3>
<p><strong>SCHASSLER:</strong> Let&rsquo;s start with the opportunities. In a world of fiat currency abundance, investors should focus on assets with scarcity. I favor commodities and gold. The near-term bull case for commodities are attractive prices, tight supply and demand dynamics, positive implied roll yields, and interest on collateral of over 5%. The long-term bull case for commodities is based on the same structural supply and demand imbalances, the result of increasing demand and underinvestment. Gold is a store of value asset that should be owned, especially during periods of economic weakness and geopolitical chaos.</p>
<p>The biggest risk is an economic downturn, and the most overvalued assets would be the most vulnerable. The prices of the top five large cap growth stocks have decoupled from fundamentals. MSFT, AAPL, AMZN, NVDA and GOOG were up, on average, nearly 100% in 2023. These stocks account for approximately 25% of the S&amp;P 500 Index. Investors should diversify into real assets. The long-term history of economic contractions demonstrates that commodities, and in particular gold, are one of the more durable components of an asset allocation framework. This is due, primarily, to the relative inelasticity of demand for many commodities.</p>
<h3>Gold Investing: Risks &amp; Opportunities</h3>
<p><strong>CASANOVA:</strong> In our view, three of the greatest risks for gold miners in 2024 are:</p>
<ol class="content-list">
<li>Industry cost inflation.</li>
<li>Geopolitics.</li>
<li>Equity market exposure.</li>
</ol>
<p>While industry cost inflation has mostly subsided, operating costs are still higher than last year and markets seems to be relatively dissatisfied with the impact this had on margin expansion for the miners in 2023. In terms of geopolitics, recent news of more restrictive mining laws and revised mining codes in countries such as Panama and Burkina Faso have the potential to deepen negative sentiment towards the gold mining space. Lastly, generally weak equity markets may weigh on the stocks of gold miners&mdash;particularly in the earliest stages of a broader sell-off (should one manifest in the coming months).</p>
<p>As for opportunities, success in the gold mining space is currently being measured by effective cost control, portfolio optimization and disciplined capital allocation. We believe that this approach, when replicated across the industry, should maximize companies&rsquo; return potential, improve share price performance and, eventually, help regain market confidence and renewed interest in the space.</p>
<h3>Emerging Markets Bonds: Risks &amp; Opportunities</h3>
<p><strong>FINE:</strong> The biggest risk is that the global economy faces a harsh recession and aren&rsquo;t able to sufficiently cut interest rates in response. Such a sharp drop in demand (that can&rsquo;t be addressed by monetary policy) could result in weaker commodity prices. This would weaken support for many commodity-exporting EM local currency markets. However, the Fed would likely be maintaining very low policy rates in this environment, supporting EM currencies.</p>
<p>The biggest opportunity is that EM bonds have strong fundamentals that are in high demand from investors. First, EM countries have low debt levels, not the high debt levels in DM that have been driving global market crises for the past decade-plus. Second, EM central banks maintain consistently high real policy rates, keeping inflation contained and currencies more stable, and EM countries pay more on their dollar-denominated bonds than similarly-rated DM bonds. Third, EM countries are winners from the new emerging economic order, characterized by supply risk to commodities and increased use by global central banks of EM local-currency bonds as reserve assets at the expense of DM bonds.</p>
<h3>Fixed Income Investing: Risks &amp; Opportunities</h3>
<p><strong>RODILOSSO:</strong> In fixed income, credit and duration are key risks. We began 2023 more concerned about duration than credit, but the fixed income rally has diminished the scope for falling long-term yields that might be caused by a mild recession, a soft landing with lower inflation, geopolitical chaos or other events. While rate cuts are certainly on the table for 2024, in all but a hard landing scenario we believe the U.S. Treasury curve is poised to continue steepening. Long end rates have been anchored in recent years by several factors that are effectively evaporating: lower yields globally, demand from foreign investors and central banks, and quantitative easing. Meanwhile, the Fed's inflation control remains uncertain.</p>
<p>Credit spreads could widen next year, yet we still believe that current levels offer fair risk compensation in various parts of the credit spectrum, particularly in CLOs and investment-grade floating rate notes, which provide attractive carry. High yield bonds are well-positioned despite potential refinancing challenges for lower-rated credits in the coming years. We also acknowledge that both investment grade and high yield credit spreads, while justifiable based on current fundamentals, do not factor in a hard landing or various tail risks. Patient investors should as a result see opportunities to enter credit positions at more attractive spreads in 2024, just as they did in 2023. For strategic holders, however, we still believe current yields can protect total returns against bouts of spread widening.</p>
<p>Another risk that could become more palpable in 2024, however, is liquidity. The movement towards private credit is perhaps a necessary replacement for the lending capacity of banks that has been lost to more stringent capital rules. Structurally this rapidly growing system could be put to the test by either the high costs for small and middle market borrowers of carrying floating rate debt, or a more severe than expected downturn in the economy, or both. Problems in this market could remain beneath the surface, however, until end investors pull back capital.</p>
<h3>Municipal Bonds: Risks &amp; Opportunities</h3>
<p><strong>COLBY:</strong> Risk and impact are parallel to each other. The risk of trying to guess or estimate the direction of rate moves can put investors on the wrong side of a rally or sell-off. In the municipal high yield market, a key concern is the ongoing shortage of new bond issues. Should the market not generate a robust supply of new bonds, it increases the difficulty of fully diversifying a portfolio, and raising concentrations in sectors where supply is plentiful.</p>
<h3>Commodities: Risks &amp; Opportunities</h3>
<p><strong>MORRIS:</strong> The biggest risk to the outlook for commodities in 2024 is the performance of the U.S. economy. A hard landing or deep U.S. recession would be a big demand shock and create downside risk to the price outlook for commodities. Most economists are looking for a soft landing or a very mild U.S. recession. That environment would be negative for the dollar, stimulate emerging market economies and create an opportunity for commodities to resume their longer-term bull market.</p>
<h3>Natural Resources: Risks &amp; Opportunities</h3>
<p><strong>REYNOLDS:</strong> A recession, even if mild, could lessen the perceived importance of resources. Furthermore, increased tendencies toward resource nationalism and expropriation could lead to a reevaluation of companies significantly exposed to regions where these practices are occurring.</p>
<p>On the positive side, many of the major factors propelling resource companies to their highs in 2022 remain the same despite broader macroeconomic headwinds. Commodity prices are mostly still above their decade-long averages, with persistent supply constraints across a number of key resources. Likewise, companies&rsquo; capital expenditures are still hovering at or near decades-long lows as they continue to improve their balance sheets.</p>
<h3>Emerging Markets Equities: Risks &amp; Opportunities</h3>
<p><strong>SEMPLE &amp; EL-SHAWARBY:</strong> In emerging markets equities, a key risk is a potential delay or reversal in the expected rate easing cycle within the U.S. and emerging markets, which could disrupt market stability. An uptick in the strength of the U.S. dollar is another risk factor that could negatively affect emerging market equities. Political risks are also a concern, with less favorable outcomes in upcoming elections and continued geopolitical tensions potentially creating an uncertain investment climate. Additionally, an escalation in the economic conflict between the U.S. and China could further strain international relations and market sentiment.</p>
<p>On the opportunity side, emerging markets could benefit from lower-than-anticipated inflation in the U.S., which might lead to more aggressive interest rate cuts and a subsequent weakening of the dollar, making emerging market equities more attractive. Signs of recovery in Chinese domestic growth are also a positive indicator, offering a potential boost to global market confidence. Lastly, a calming of geopolitical tensions and favorable outcomes in key upcoming elections could provide a conducive environment for market growth.</p>
<h3>Digital Assets &amp; Crypto: Risks &amp; Opportunities</h3>
<p><strong>SIGEL:</strong> The risks for Bitcoin specifically appear to be receding, given the long list of tailwinds at its back and the resolution of legal overhangs, including the fates of Binance (which will continue operating) and Sam Bankman-Fried (who will not). Smart contract and hacking risk, legal uncertainty, and a lack of product-market-fit for many decentralized applications remain considerable barriers to adoption for many users and investors alike. Eventually, we believe that recent Ethereum upgrades enabling a better and cheaper user experience will lead to a breakout hit. Regarding policy risk, we believe that a second term for President Biden and specifically, the continuation of Gary Gensler&rsquo;s term as Chairman of the SEC is a negative risk for those who want digital assets to flourish in the U.S.</p>
<h2 id="why-invest" class="jump-link-nav anchored-block" data-jumplink-title="Why Invest?">Why should investors be considering your asset class in 2024?</h2>
<h3>Fixed Income Investing Benefits</h3>
<p><strong>RODILOSSO:</strong> Short-term bonds are likely to benefit from interest rate easing, with high-yield credit performing well in a soft landing scenario. Investment grade credit, at longer duration, should still see attractive returns as well, but should lag high yield due to lower carry and could experience some additional volatility due to higher duration.</p>
<p>After the November rally, we favor fixed income opportunities that assume moderate credit or duration risk, with investment-grade CLOs and floating rate notes offering the best yield-to-risk ratios.</p>
<p>More broadly, fixed income is returning to its traditional role in portfolios, providing predictable income and lower volatility compared to equities. Over time, the normalization of yields should restore the negative correlation between high-quality bonds and equities, enhancing portfolio diversification. However, this shift doesn't imply that all bonds are without risk, particularly in the sovereign debt space.</p>
<h3>Emerging Markets Bonds Benefits</h3>
<p><strong>FINE:</strong> The Fed looks like it has stopped raising its policy rate. This is generating a lot of interest in bond markets. EM looks like the most attractive of all bond markets because it pays more and has strong fundamentals.</p>
<p>However, investors largely have zero to low allocations to EM bonds. Much of that can be explained by two reasons: perceived risk and the fact that bonds have been unexciting (in any positive way) for many years.</p>
<p>So, what will this army of investors see, when they decide take a deeper look at bonds? Here are a few items to consider if you&rsquo;re under-allocated to EM bonds:</p>
<ul class="content-list">
<li>Over the past 20 years, EM bonds (along with USHY and US Treasuries) are the only bonds on the efficient frontier.</li>
<li>Diversification of EM bonds and their varying cycles creates significant alpha opportunities.</li>
<li>Perceived risk is just that: perceived.</li>
</ul>
<h3>Emerging Markets Equity Benefits</h3>
<p><strong>SEMPLE &amp; EL-SHAWARBY:</strong> While acknowledging potential challenges ahead, the outlook for emerging markets is increasingly promising. The growth differential is tilting in favor of emerging markets compared to developed ones. Additionally, emerging markets are trading at a discount not only relative to their historical averages but also in comparison to their developed market counterparts. This is a positive sign for the equities in these regions, which is further bolstered by the light positioning of investors and the commencement of an easing cycle across various emerging markets.</p>
<h3>Municipal Bonds Benefits</h3>
<p><strong>COLBY:</strong> Municipal bonds, along with other fixed income assets, have seen yields decline over the past decade. Currently, yields across the municipal bond market are at levels not seen since the financial crisis, making them quite appealing. For investors who have been hesitant to invest in fixed income, 2024 presents an opportunity to consider municipal bonds, which now offer taxable equivalent yields competitive with other asset classes.</p>
<h3>Asset Allocation/Model Portfolio Benefits</h3>
<p><strong>SCHASSLER: </strong>The second half of the inflation regime is expected to favor assets with scarcity. The <a href="https://www.vaneck.com/us/en/investments/inflation-allocation-etf-raax/overview/" title="VanEck Real Assets ETF - Overview"><strong>VanEck Real Assets ETF (RAAX)</strong></a> is an active fund that provides dynamic exposure to the key segments of the real asset universe, including resource assets (commodities and natural resource equities), gold (bullion and miners) and income-generating real assets (infrastructure, MLPs and REITs). In my opinion, RAAX is a great way to hedge, diversify and enhance your portfolio.</p>
<h3>Gold Investing Benefits</h3>
<p><strong>CASANOVA: </strong>We are positive on the outlook for gold in 2024 (and beyond). Gold seems to have established strong support at around the $1,900 to $2,000 per ounce level, and at present, we see real opportunity for it to test new all-time highs in the next year. Perhaps more importantly, we view gold miners as extremely well-positioned to benefit from sustained, record-high gold prices as investors look for leveraged, diversified exposure to gold.</p>
<h3>Natural Resources Benefits</h3>
<p><strong>REYNOLDS: </strong>The rate hiking cycle is over, and any incremental new measures are or should be stimulative, suggesting demand for resources continues to grow. Supply will continue to be constrained due to lack of capital investment, operational limitations and aligned executive compensation schemes. Inflation has come down but remains above targets implying a higher for longer outlook.</p>
<p>Resource companies, bolstered by structural advantages and years of efficiency-focused operations, are uniquely positioned. Their valuable assets, strong financial health, commitment to shareholder value and attractive valuations make them compelling investment opportunities, in our view.</p>
<h3>Commodity Investing Benefits</h3>
<p><strong>MORRIS: </strong>There are two important factors that make holding commodity index investments attractive now. First is the high real risk-free return on collateral posted to hold the futures exposure. Currently, risk-free U.S. T-Bills are yielding over 5%&mdash; the <a href="https://www.vaneck.com/us/en/investments/cmci-commodity-strategy-etf-cmci/overview/" title="VanEck CMCI Commodity Strategy ETF - Overview"><strong>VanEck CMCI Commodity Strategy ETF (CMCI)&rsquo;s</strong></a> collateral is held in U.S. T-Bills. Second the current roll yield is slightly positive and CMCI&rsquo;s curve positioning is earning more than the BCOM benchmark. VanEck also believes we are entering into a long period of resource scarcity following a long period of resource abundance. Energy transition will be difficult and likely lead to higher energy prices for both traditional energy and renewable energy technologies. Additionally, an escalation in the Russian-Ukraine war and/or the Middle East war could also limit trade flows and the supply of important commodities.</p>
<p>To receive more <a href="/us/en/insights/investment-outlook" title="Investment Outlook Insights"><strong>Investment Outlook</strong></a> insights, <a href="https://www.vaneck.com/us/en/subscribe/" title="Subscription Center"><strong>sign up in our subscription center</strong></a>.</p>
]]></content:encoded>
</item><item rdf:about="https://www.vaneck.com/us/en/blogs/thematic-investing/the-tax-consideration-you-may-be-overlooking/">
  <title>The Tax Consideration You May be Overlooking></title>
  <link>https://www.vaneck.com/us/en/blogs/thematic-investing/the-tax-consideration-you-may-be-overlooking/</link>
  <description><![CDATA[How does passive foreign investment company (PFIC) income impact your taxes? In short, shareholders must treat them as ordinary income taxable at their maximum tax rate.]]></description>
  <dc:creator> </dc:creator>
  <dc:date>12/14/2023 17:30:00</dc:date>
<content:encoded><![CDATA[<h2>PFIC, ETFs and Mutual Funds</h2>
<p>Tax considerations are beginning to take center stage for investors and financial advisor as we approach year end. Capital gains management and tax loss harvesting are common topics of conversation, but there is a unique and often overlooked tax consideration for many U.S. investors: passive foreign investment company (PFIC) income.</p>
<h2>What is a PFIC?</h2>
<p>A PFIC is a foreign corporation having 50% or more of their assets invested in cash or securities, or having 75% or more of their gross income originating from passive sources, including but not limited to interest, dividends and rents. In other words, these foreign companies primarily derive their revenue streams from investments (rather than operations).</p>
<p>Generally speaking, foreign companies that are in start-up mode or investing heavily in early stage projects may be considered a PFIC.</p>
<h2>How do PFICs Impact Investors?</h2>
<p>Under U.S. tax code, income and gains associated with PFICs are not eligible for advantageous capital gains or qualified dividend income treatment. This means that income and gains from PFIC investments are subject to ordinary income rates. Moreover, PFIC gains cannot be offset by losses.</p>
<p>The tax requirements of owning individual PFICs can differ from owning a mutual fund or exchange-traded fund (ETF) that holds PFICs. Owning individual PFICs may require an annual election and subject shareholders to complicated tax scenarios. Most mutual funds and ETFs that hold PFICs will pass through income and, often more impactful, mark-to-market unrealized gains of those PFICs and distribute them to shareholders in the form of ordinary income.</p>
<p>In other words, mutual funds and ETFs must assess their PFIC exposure and raise cash in order to distribute any applicable gain or income for the tax year to investors. If shareholders reinvest dividends paid from PFIC gains in additional fund shares, their cost basis in those shares is equal to the dividend they include in income. If they receive the dividend in cash, their cost basis is not impacted. Bottom line is that shareholders must treat dividends from PFIC income and gains as ordinary income taxable at their maximum tax rate.</p>
<h2>How Common are Mutual Fund and ETF PFIC Income Distributions?</h2>
<p>PFIC income distributions are more common than many investors realize. Broad-based funds that offer exposure to foreign companies often pay PFIC distributions but, because many tend to be concentrated in larger, revenue-generating companies, PFIC exposure tends to be small. In turn, PFIC income distributions tend to be a small percentage of those funds&rsquo; annual distributions.</p>
<p>Some areas of the equity market are more prone to PFIC tax treatment. Commodity producers, for example, often begin as exploratory companies and are considered a more speculative investments. There are many gold miners that invest heavily in locating gold and/or beginning the extraction process but do not yet generate revenue from the production of gold. Furthermore, many gold reserves are located around the world and therefore funds that invest in these &ldquo;junior&rdquo; gold miners may have significant exposure to PFICs.</p>
<p>Market performance also impacts PFIC tax treatment. Because funds mark-to-market unrealized gains of PFICs annually in order to distribute as income to shareholders, those funds with significant exposure to PFICs in a strong performing market may be required to distribute a significant amount of income to shareholders.</p>
<h2>How Can Investors Plan for PFIC Income Distributions?</h2>
<p>It is difficult to estimate PFIC exposure in a mutual fund or ETF. Funds work closely with auditors and tax accountants to determine PFIC exposure and issue distributions each year. But many investors may not learn of a PFIC income distribution until they are announced. Because of the complexity of this area of tax code, it is important to consult your tax advisor.</p>]]></content:encoded>
</item><item rdf:about="https://www.vaneck.com/us/en/blogs/emerging-markets-equity/boots-on-the-ground-mexicos-burgeoning-economy-shines/">
  <title>Boots on the Ground: Mexico’s Burgeoning Economy Shines></title>
  <link>https://www.vaneck.com/us/en/blogs/emerging-markets-equity/boots-on-the-ground-mexicos-burgeoning-economy-shines/</link>
  <description><![CDATA[Within the dynamic world of emerging markets, Mexico's burgeoning economy stands out, especially with the rising trend of nearshoring.]]></description>
  <dc:creator>Ola  El-Shawarby, CFA</dc:creator>
  <dc:date>12/14/2023 06:30:00</dc:date>
<content:encoded><![CDATA[

<p><i>During the week of November 6th, Patricia Gonzalez and Ola El-Shawarby from VanEck&rsquo;s Emerging Markets Equity team traveled to Mexico for a conference and to meet with local companies.</i></p>
<p>The timing of our trip to Mexico was perfect, aligning with the country&rsquo;s current upswing due to nearshoring. At the Merrill Lynch Mexico Conference, we gained insights from government officials, state governors, the Mexican banking association, and industrial real estate companies. There's noticeable acceleration in Mexico's economic activity, positively impacting various sectors like real estate, banking, consumer goods, and education. Our discussions with companies reinforced this upbeat outlook.</p>
<p>We returned feeling optimistic, particularly about holdings in our <a href="https://www.vaneck.com/us/en/investments/emerging-markets-fund-gbfax/overview/" title="GBFAX - Emerging Markets Fund - Class A - Overview"><strong>VanEck Emerging Markets Fund</strong></a> like Regional (2.5% weight in the Fund) and Qualitas (0.5% weight in the Fund). We also see promising prospects in consumer and real estate sectors. We believe Mexico is exceptionally well-placed to capitalize on geopolitical shifts, offering intriguing opportunities for investors like us.</p>
<p><img class="img-responsive w-100" src="https://www.vaneck.com/contentassets/7f2ba9df31ee4fb98ebc4cd7ea996abc/3913_eme-mexico-trip-dec_image-1_2023-12_v1.jpg" alt="Patricia Gonzalez and Ola El-Shawarby, pictured here, from VanEck's Emerging Markets Equity team traveled to Mexico for a conference and to meet with local companies." /></p>
<p class="chart-disclosure">Deputy Portfolio Manager Ola El-Shawarby and Senior Analyst Patricia Gonzalez in Mexico City, Mexico.</p>
<h2>Nearshoring and Mexico&rsquo;s Rise in Trade</h2>
<p>Nearshoring, the practice of transferring a company's operations to nearby countries, is a pivotal strategy for Mexico, given its numerous benefits in terms of geography, economics, and trade. While Mexico has historically enjoyed a strong trade relationship with the U.S., in recent years, Mexico has grown to become the U.S.&rsquo;s largest trading partner, bypassing both Canada and China.</p>
<h3>Mexico is Now the United States&rsquo; Largest Trading Partner</h3>
<p><img class="img-responsive w-100" src="https://www.vaneck.com/contentassets/7f2ba9df31ee4fb98ebc4cd7ea996abc/3913_eme-mexico-trip-dec_2023-12_v1_blog.svg" alt="Mexico has grown to become the U.S.'s largest trading partner, bypassing both Canada and China." /></p>
<p class="chart-disclosure">Source: Financial Times analysis of US Census Bureau data. As of September 2023.</p>
<p>Here are some of the key benefits of nearshoring that are having an impact on Mexico&rsquo;s economy. We have compiled these after attending the conference and from our own research.</p>
<ul class="content-list">
<li><strong>Economic growth and job creation:</strong> Nearshoring has directly led to increased economic growth for the Mexican economy, creating numerous employment opportunities. According to the Mexican Institute of Executive Finance, Mexico will create roughly 577,000 jobs in 2023, with the unemployment rate at 2.9%.</li>
<li><strong>Increased foreign investment:</strong> Mexico has seen tremendous growth in foreign direct investment (FDI). In March 2023, Tesla announced plans to build a factory in Nuevo Leon, with costs estimated at $5 billion. This is just one example of foreign companies investing in local operations in Mexico.</li>
<li><strong>Competitive labor market:</strong> With labor costs considerably lower than other export countries like China, Mexico&rsquo;s labor market has become very attractive relatively speaking. According to speakers at the Merrill Lynch conference, China&rsquo;s wages are now roughly twice as high as Mexico ($2.80 for Mexico and $6.00 for China). This has led to a positive feedback loop of more jobs, which then leads to a better-trained, increasingly-skilled workforce.</li>
<li><strong>Fiscal incentives and government support: </strong>To provide continued support for the near-shoring trend, the Mexican government has been proactively investing in the local economy. For example, the government announced it would spend more than $130 million on infrastructure to support the construction of the Tesla plant in Nuevo Leon.</li>
</ul>
<p>In summary, nearshoring in Mexico is boosting its economy through increased job creation, substantial foreign investment like Tesla's $5 billion factory, a competitive labor market, and strong government support including significant infrastructure investments.</p>
<h2>Mexico in the VanEck Emerging Markets Fund</h2>
<p>The VanEck Emerging Markets Fund seeks to identify companies with sustainable, long-term growth potential at a fair price, using a thorough selection process that emphasizes active management and focuses on high-quality, well-governed businesses with clear business models, innovative practices, and minimal risk of disruption. In doing so, the Fund will often deviate from its benchmark (MSCI Emerging Markets IMI Index), and hold companies that reflect the future opportunities that exist in emerging markets countries.</p>
<p>With that in mind, the Fund is slightly overweight Mexico versus the benchmark (2.9% for the Fund vs. 2.6% for the Index). The two Mexico names held in the Fund are not held in the index, underscoring the bottom-up, active approach that the Fund employs.</p>
<h2>Regional, S.A.B. (2.5% Fund weight vs 0% Index weight)</h2>
<p>Regional is a bank based in Monterrey, Mexico, focusing primarily on financial services for small- and medium-sized enterprises (SMEs). It stands out for its significant presence in Northern Mexico, the hub of nearshoring activities. This strategic position allows Regional to capitalize on the opportunities arising from this trend. The bank is already benefiting from nearshoring, evident through its investments in commercial bankers and infrastructure enhancements.</p>
<p>Regional leads in SME lending in Northern Mexico, holding the largest market share in this segment. They anticipate double-digit loan growth, surpassing the sector average, buoyed by the positive business climate and economic activities tied to nearshoring. Expectations include continued double-digit earnings growth, stable net interest margins (NIM), and improved return on equity (ROE), supported by an advantageous funding mix and a growing retail presence. Their digital branch, Hey Bank, further strengthens their position as Mexico's first comprehensive digital bank with a substantial client base of 650,000.</p>
<h2>Qualitas (0.5% Fund weight vs 0% index weight)</h2>
<p>Qualitas is Mexico's largest car insurance provider, commanding a 32% market share. For the past 15 years, it has led the market, consistently driving value creation. The company's strong performance is attributed to its focus on cost control, high-quality service, and a decentralized model. It offers exposure to Mexico's underpenetrated insurance industry, where insurance premiums account for only 2.4% of the country's GDP.</p>
<p>Qualitas distinguishes itself by concentrating exclusively on auto insurance in Mexico and Latin America, a strategy that has established its strong competitive advantage. The management team's history of profitable growth has resulted in a surplus capital position, which is directed towards organic growth. The company's extensive distribution network in Mexico is another critical advantage. In 2023, Qualitas' performance exceeded expectations, benefiting from increased auto sales, lower costs, higher pricing, and favorable financial results. It is projected to achieve a combined ratio close to 90%, outperforming competitors due to its scale, distribution network, and integration. Qualitas is poised to maintain high profitability and premium growth, leveraging its dominance in a market with low penetration rates.</p>
<h2>Exploring Mexico's Economic Opportunities</h2>
<p>In this blog, we've taken a close look at Mexico's investment landscape, focusing on how the country is leveraging nearshoring and geopolitical changes to drive growth in several key sectors. Our insights from the Merrill Lynch Mexico Conference and our own research have highlighted important growth areas like the rise of nearshoring, growth in the financial sector, and the strengthening of consumer and real estate markets. The <a href="https://www.vaneck.com/us/en/investments/emerging-markets-fund-gbfax/overview/" title="GBFAX - Emerging Markets Fund - Class A - Overview"><strong>VanEck Emerging Markets Fund (GBFAX)</strong></a> offers a way for investors to tap into these exciting opportunities in Mexico, as part of a wider emerging markets portfolio. Our in-depth research and hands-on investment approach make the Fund a great choice for investors looking to access unique growth opportunities in emerging markets. Our recent visit to Mexico has reinforced our confidence in the country's growth story, making it an attractive option for investors ready to explore and benefit from these new trends.</p>
<p>To receive more <a href="/us/en/insights/emerging-markets-equity/" title="Emerging Markets Equity Insights"><strong>Emerging Markets Equity</strong></a> insights, <a href="/us/en/subscribe/" title="Subscription Center"><strong>sign up in our subscription center</strong></a>.</p>
]]></content:encoded>
</item><item rdf:about="https://www.vaneck.com/us/en/blogs/thematic-investing/vaneck-semiconductor-etf-smh-holdings-and-performance-recap/">
  <title>VanEck Semiconductor ETF (SMH) Holdings and Performance Recap></title>
  <link>https://www.vaneck.com/us/en/blogs/thematic-investing/vaneck-semiconductor-etf-smh-holdings-and-performance-recap/</link>
  <description><![CDATA[The SMH ETF had weaker performance in Q3 - Review the top contributors and detractors, and updated holdings data.]]></description>
  <dc:creator>Nick Frasse</dc:creator>
  <dc:date>12/13/2023 06:30:00</dc:date>
<content:encoded><![CDATA[

<h2>SMH Performance Overview for Q3 2023</h2>
<p><strong><a href="#smh-q2-update">View Q2 2023 SMH performance overview here.</a></strong></p>
<p>VanEck Semiconductor ETF had a weaker performance in Q3 of 2023 versus the prior quarters, down -5.5% over that time period. Performance was largely down for the majority of the portfolio, with exposure to NVIDIA Corp. ($NVDA) being one of the few positive contributors over the quarter. Semiconductors continue to be a primary driver of technological innovation globally, whether it's complex systems on a chip or basic memory and components, we believe the sector is a long-term trend that investors should consider.</p>
<h3>SMH Top Holdings</h3>
<div class="wrapped-div">
<table style="width: 750px;">
<tbody>
<tr class="tbl-data">
<td class="tbl-header last" colspan="8">Daily Holdings (%) as of 09/30/2023</td>
</tr>
<tr class="tbl-data">
<td class="data-td  last">Ticker</td>
<td class="data-head last">Holding Name</td>
<td class="data-head last">% of Net Assets</td>
<td class="data-head last">Identifier (FIGI)</td>
<td class="data-head last">Shares</td>
<td class="data-head last">Asset Class</td>
<td class="data-head last">Market Value (US$)</td>
<td class="data-head last">Notional Value</td>
</tr>
<tr class="tbl-data">
<td class="data-td data last">NVDA US</td>
<td class="data-td data last">Nvidia Corp</td>
<td class="data-td data last">18.65</td>
<td class="data-td data last">BBG000BBJQV0</td>
<td class="data-td data last">4,310,691</td>
<td class="data-td data last">Stock</td>
<td class="data-td data last">2,054,346,010</td>
<td class="data-td data last">--</td>
</tr>
<tr class="tbl-data">
<td class="data-td data last">TSM US</td>
<td class="data-td data last">Taiwan Semiconductor Manufacturing Co L</td>
<td class="data-td data last">12.70</td>
<td class="data-td data last">BBG000BD8ZK0</td>
<td class="data-td data last">13,772,001</td>
<td class="data-td data last">Stock</td>
<td class="data-td data last">1,399,235,302</td>
<td class="data-td data last">--</td>
</tr>
<tr class="tbl-data">
<td class="data-td data last">AVGO US</td>
<td class="data-td data last">Broadcom Inc</td>
<td class="data-td data last">7.26</td>
<td class="data-td data last">BBG00KHY5S69</td>
<td class="data-td data last">746,128</td>
<td class="data-td data last">Stock</td>
<td class="data-td data last">800,058,132</td>
<td class="data-td data last">--</td>
</tr>
<tr class="tbl-data">
<td class="data-td data last">ASML US</td>
<td class="data-td data last">Asml Holding Nv</td>
<td class="data-td data last">6.03</td>
<td class="data-td data last">BBG000K6MRN4</td>
<td class="data-td data last">922,444</td>
<td class="data-td data last">Stock</td>
<td class="data-td data last">664,676,249</td>
<td class="data-td data last">--</td>
</tr>
<tr class="tbl-data">
<td class="data-td data last">AMD US</td>
<td class="data-td data last">Advanced Micro Devices Inc</td>
<td class="data-td data last">5.80</td>
<td class="data-td data last">BBG000BBQCY0</td>
<td class="data-td data last">4,640,964</td>
<td class="data-td data last">Stock</td>
<td class="data-td data last">638,643,056</td>
<td class="data-td data last">--</td>
</tr>
<tr class="tbl-data">
<td class="data-td data last">QCOM US</td>
<td class="data-td data last">Qualcomm Inc</td>
<td class="data-td data last">4.94</td>
<td class="data-td data last">BBG000CGC1X8</td>
<td class="data-td data last">3,980,173</td>
<td class="data-td data last">Stock</td>
<td class="data-td data last">544,010,046</td>
<td class="data-td data last">--</td>
</tr>
<tr class="tbl-data">
<td class="data-td data last">INTC US</td>
<td class="data-td data last">Intel Corp</td>
<td class="data-td data last">4.94</td>
<td class="data-td data last">BBG000C0G1D1</td>
<td class="data-td data last">12,343,058</td>
<td class="data-td data last">Stock</td>
<td class="data-td data last">543,588,274</td>
<td class="data-td data last">--</td>
</tr>
<tr class="tbl-data">
<td class="data-td data last">AMAT US</td>
<td class="data-td data last">Applied Materials Inc</td>
<td class="data-td data last">4.25</td>
<td class="data-td data last">BBG000BBPFB9</td>
<td class="data-td data last">2,979,843</td>
<td class="data-td data last">Stock</td>
<td class="data-td data last">468,490,916</td>
<td class="data-td data last">--</td>
</tr>
<tr class="tbl-data">
<td class="data-td data last">LRCX US</td>
<td class="data-td data last">Lam Research Corp</td>
<td class="data-td data last">4.03</td>
<td class="data-td data last">BBG000BNFLM9</td>
<td class="data-td data last">606,574</td>
<td class="data-td data last">Stock</td>
<td class="data-td data last">443,551,172</td>
<td class="data-td data last">--</td>
</tr>
<tr class="tbl-data">
<td class="data-td data last">ADI US</td>
<td class="data-td data last">Analog Devices Inc</td>
<td class="data-td data last">3.95</td>
<td class="data-td data last">BBG000BB6G37</td>
<td class="data-td data last">2,280,969</td>
<td class="data-td data last">Stock</td>
<td class="data-td data last">435,596,650</td>
<td class="data-td data last">--</td>
</tr>
<tr class="tbl-data">
<td class="data-td data last">TXN US</td>
<td class="data-td data last">Texas Instruments Inc</td>
<td class="data-td data last">3.89</td>
<td class="data-td data last">BBG000BVV7G1</td>
<td class="data-td data last">2,716,129</td>
<td class="data-td data last">Stock</td>
<td class="data-td data last">428,931,092</td>
<td class="data-td data last">--</td>
</tr>
<tr class="tbl-data">
<td class="data-td data last">SNPS US</td>
<td class="data-td data last">Synopsys Inc</td>
<td class="data-td data last">3.37</td>
<td class="data-td data last">BBG000BSFRF3</td>
<td class="data-td data last">654,182</td>
<td class="data-td data last">Stock</td>
<td class="data-td data last">370,960,445</td>
<td class="data-td data last">--</td>
</tr>
</tbody>
</table>
</div>
<br />
<p class="chart-disclosure">These are not recommendations to buy or to sell any security. Securities and holdings may vary. For a complete list of fund holdings, please visit vaneck.com/smh.</p>
<h2>Top Two Contributors for SMH in Q3 2023</h2>
<p><strong>NVIDIA Corp. (NVDA) &ndash; 18.65% Weight | 0.49% Contribution to return</strong></p>
<p>In Q3 2023, NVIDIA reported earnings per share (EPS) of $4.02, reflecting a significant increase from the corresponding period in the previous year. The company's total revenue for the quarter was $18.12 billion, a 206% increase year-over-year and a 34% rise from the previous quarter. This growth was primarily attributed to the Data Center sector, which reported a record revenue of $14.51 billion, marking a 279% increase from the previous year. The Gaming sector also showed substantial growth, with revenue rising to $2.86 billion, an 81% increase year-over-year. Additionally, the Professional Visualization and Automotive sectors reported revenues of $416 million and $261 million, respectively.</p>
<p>For the upcoming quarter, NVIDIA projects revenues of around $20 billion. This forecast reflects the company's strong performance across various sectors, particularly in Data Centers and Gaming. NVIDIA's focus on accelerated computing and generative AI, as discussed by CEO Jensen Huang, is in line with the current trends in the industry. This strategic direction positions NVIDIA for continued growth in the context of the global economic environment.</p>
<p><strong>Intel Corporation (INTC) &ndash; 4.71% Weight | 0.24% Contribution to return</strong></p>
<p>In the third quarter of 2023, Intel Corporation reported a revenue of $14.2 billion, marking an 8% decrease from the same period in the previous year. The non-GAAP earnings per share (EPS) for the quarter was $0.41, showcasing an upward trend from the previous year's figures. This revenue decline reflects challenges across various business units, with the Client Computing Group (CCG) seeing a 3% decrease in revenue, the Data Center and AI (DCAI) unit experiencing a 10% drop, and the Network and Edge (NEX) unit facing a significant 32% decrease. However, there were positive developments as well, with Mobileye's revenue increasing by 18% and Intel Foundry Services (IFS) achieving an impressive 299% increase in revenue year-over-year.</p>
<h2>Top Two Detractors for SMH in Q3</h2>
<p><strong>Taiwan Semiconductor Manufacturing Co. (TSM) &ndash; 11.02% Weight | -1.71% Contribution to return</strong></p>
<p>Following Q3 reporting of 2023, Taiwan Semiconductor Manufacturing Company Limited (TSMC) reported a revenue of $17.28 billion, which was a 14.6% decrease year-over-year but a 10.2% increase from the previous quarter. The company's net income for the quarter increased by 16.1% quarter-over-quarter to $6.521 billion, and the gross margin for the quarter was 54.3%.</p>
<p>Despite the year-over-year revenue decline, TSMC's performance in advanced technology segments remained strong. The 3-nanometer process technology contributed 6% of wafer revenue, while 5-nanometer and 7-nanometer technologies accounted for 37% and 16%, respectively. In terms of revenue contribution by platform, High-Performance Computing (HPC) increased by 6% quarter-over-quarter to account for 42% of TSMC's third-quarter revenue. The smartphone segment also saw a significant increase, growing 33% to account for 39% of the revenue.</p>
<p>Looking forward to the fourth quarter of 2023, TSMC expects revenue to be $19.6 billion. Gross margins are anticipated to be between 51.5% and 53.5%, with operating margins expected to be between 39.5% and 41.5%. Analysts project that TSMC will return to 22% EPS growth in 2024, despite the current challenges, based on the company's historical performance and potential demand recovery.</p>
<p><strong>ASML Holdings (ASML) &ndash; 4.91% Weight | -0.98 Contribution to return</strong></p>
<p>In Q3 2023, ASML Holding N.V. reported mixed financial results. The company's earnings per share (EPS) of &euro;4.81 exceeded expectations by &euro;0.12, but its revenue of &euro;6.67 billion fell short of the consensus estimate of &euro;6.96 billion. This discrepancy was largely due to ongoing supply chain challenges and uncertainty in customer demand for semiconductors. These issues have impacted ASML's ability to deliver products timely, increasing costs and creating demand uncertainty. In response, ASML is investing in new manufacturing capacity and working closely with suppliers and customers to improve component lead times and production schedule visibility.</p>
<p>Despite these near-term challenges, ASML's outlook remains positive, with the company on track to achieve a 30% growth for the entire year, in line with its guidance and historical seasonality. However, while there was a slight improvement in margins compared to Q3 2022, these gains were not sufficient to offset the current headwinds, preventing a significant improvement in overall margins. The company's long-term investment thesis remains robust, but the near to mid-term challenges suggest a cautious approach for the immediate future.</p>
<h3>Standardized Performance</h3>
<div class="wrapped-div">
<table style="width: 750px;">
<tbody>
<tr class="tbl-data">
<td class="tbl-header last" colspan="10">Quarter End Returns as of 9/30/2023</td>
</tr>
<tr class="tbl-data">
<td class="data-td  last">&nbsp;</td>
<td class="data-head last">&nbsp;</td>
<td class="data-head last">1 Yr</td>
<td class="data-head last">5 Yr</td>
<td class="data-head last">10 Yr</td>
<td class="data-head last">Since Inception</td>
<td class="data-head last">Inception Date</td>
<td class="data-head last">Expense Ratio</td>
</tr>
<tr class="tbl-data">
<td class="data-td last font-weight-normal" rowspan="2">VanEck Semiconductor ETF</td>
<td class="data-td data last" rowspan="2">SMH</td>
<td class="data-td data last"><i>NAV</i></td>
<td class="data-td data last">42.78</td>
<td class="data-td data last">23.61</td>
<td class="data-td data last">23.50</td>
<td class="data-td data last">22.79</td>
<td class="data-td data last" rowspan="2">12/20/2011</td>
<td class="data-td data last"><i>Gross</i><sup>*</sup></td>
<td class="data-td data last">0.35%</td>
</tr>
<tr class="tbl-data">
<td class="data-td data last"><i>Mkt Price</i></td>
<td class="data-td data last">42.88</td>
<td class="data-td data last">19.45</td>
<td class="data-td data last">23.50</td>
<td class="data-td data last">22.76</td>
<td class="data-td data last"><i>Net</i><sup>*</sup></td>
<td class="data-td data last">0.35%</td>
</tr>
</tbody>
</table>
</div>
<br />
<p class="chart-disclosure"><strong>The performance data quoted represents past performance. Past performance is not a guarantee of future results. Investment return and principal value of an investment will fluctuate so that an investor's shares, when redeemed, may be worth more or less than their original cost. Performance may be lower or higher than performance data quoted. Please call 800.826.2333 or visit vaneck.com for performance current to the most recent month ended.</strong></p>
<p class="chart-disclosure">The "Net Asset Value" (NAV) of a Fund is determined at the close of each business day, and represents the dollar value of one share of the fund; it is calculated by taking the total assets of the fund, subtracting total liabilities, and dividing by the total number of shares outstanding. The NAV is not necessarily the same as the ETF's intraday trading value. Investors should not expect to buy or sell shares at NAV.</p>
<p class="chart-disclosure"><sup>*</sup>&nbsp;Van Eck Associates Corporation (the &ldquo;Adviser&rdquo;) will pay all expenses of the Fund, except for the fee payment under the investment management agreement, acquired fund fees and expenses, interest expense, offering costs, trading expenses, taxes and extraordinary expenses. Notwithstanding the foregoing, the Adviser has agreed to pay the offering costs until at least February 1, 2024. &ldquo;Other Expenses&rdquo; have been restated to reflect current fees.</p>
<h2 id="smh-q2-update" class="jump-link-nav anchored-block" data-jumplink-title="SMH Q2 Update">Q2 2023 VanEck Semiconductor ETF (SMH) Holdings and Performance Recap</h2>
<p>Review the top contributors and detractors that led to the SMH ETF&rsquo;s strong performance in Q2 2023.</p>
<h2>SMH Performance Overview for Q2 2023</h2>
<p><a href="/link/39c8d235748b4c26a5930c31d3ac0160.aspx" title="SMH - VanEck Semiconductor ETF - Holdings and Performance"><strong>VanEck Semiconductor ETF</strong></a> has had strong performance in Q2 of 2023, up 15.78% over that time period. Performance was largely due to exposure to NVIDIA Corp. ($NVDA) and their exposure to the growing GPU demand for Artificial Intelligence models. Semiconductors continue to be a primary driver of technological innovation globally, whether its complex systems on a chip or basic memory and components, we believe the sector is a long term trend that investors should consider.</p>
<h3>SMH Top Holdings</h3>
<div class="wrapped-div">
<table style="width: 750px;">
<tbody>
<tr class="tbl-data">
<td class="tbl-header last" colspan="8">Daily Holdings (%) as of 06/30/2023</td>
</tr>
<tr class="tbl-data">
<td class="data-td  last">Ticker</td>
<td class="data-head last">Holding Name</td>
<td class="data-head last">% of Net Assets</td>
<td class="data-head last">Identifier (FIGI)</td>
<td class="data-head last">Shares</td>
<td class="data-head last">Asset Class</td>
<td class="data-head last">Market Value (US$)</td>
<td class="data-head last">Notional Value</td>
</tr>
<tr class="tbl-data">
<td class="data-td data last">NVDA US</td>
<td class="data-td data last">Nvidia Corp</td>
<td class="data-td data last">21.63</td>
<td class="data-td data last">BBG000BBJQV0</td>
<td class="data-td data last">4,476,165</td>
<td class="data-td data last">Stock</td>
<td class="data-td data last">2,209,211,236</td>
<td class="data-td data last">--</td>
</tr>
<tr class="tbl-data">
<td class="data-td data last">TSM US</td>
<td class="data-td data last">Taiwan Semiconductor Manufacturing Co L</td>
<td class="data-td data last">10.25</td>
<td class="data-td data last">BBG000BD8ZK0</td>
<td class="data-td data last">11,183,469</td>
<td class="data-td data last">Stock</td>
<td class="data-td data last">1,046,437,194</td>
<td class="data-td data last">--</td>
</tr>
<tr class="tbl-data">
<td class="data-td data last">AVGO US</td>
<td class="data-td data last">Broadcom Inc</td>
<td class="data-td data last">5.47</td>
<td class="data-td data last">BBG00KHY5S69</td>
<td class="data-td data last">605,864</td>
<td class="data-td data last">Stock</td>
<td class="data-td data last">559,145,827</td>
<td class="data-td data last">--</td>
</tr>
<tr class="tbl-data">
<td class="data-td data last">LRCX US</td>
<td class="data-td data last">Lam Research Corp</td>
<td class="data-td data last">4.79</td>
<td class="data-td data last">BBG000BNFLM9</td>
<td class="data-td data last">695,940</td>
<td class="data-td data last">Stock</td>
<td class="data-td data last">488,828,256</td>
<td class="data-td data last">--</td>
</tr>
<tr class="tbl-data">
<td class="data-td data last">AMAT US</td>
<td class="data-td data last">Applied Materials Inc</td>
<td class="data-td data last">4.71</td>
<td class="data-td data last">BBG000BBPFB9</td>
<td class="data-td data last">3,148,449</td>
<td class="data-td data last">Stock</td>
<td class="data-td data last">480,957,069</td>
<td class="data-td data last">--</td>
</tr>
<tr class="tbl-data">
<td class="data-td data last">INTC US</td>
<td class="data-td data last">Intel Corp</td>
<td class="data-td data last">4.68</td>
<td class="data-td data last">BBG000C0G1D1</td>
<td class="data-td data last">13,589,266</td>
<td class="data-td data last">Stock</td>
<td class="data-td data last">477,526,807</td>
<td class="data-td data last">--</td>
</tr>
<tr class="tbl-data">
<td class="data-td data last">ASML US</td>
<td class="data-td data last">Asml Holding Nv</td>
<td class="data-td data last">4.55</td>
<td class="data-td data last">BBG000K6MRN4</td>
<td class="data-td data last">702,784</td>
<td class="data-td data last">Stock</td>
<td class="data-td data last">464,209,916</td>
<td class="data-td data last">--</td>
</tr>
<tr class="tbl-data">
<td class="data-td data last">TXN US</td>
<td class="data-td data last">Texas Instruments Inc</td>
<td class="data-td data last">4.52</td>
<td class="data-td data last">BBG000BVV7G1</td>
<td class="data-td data last">2,745,990</td>
<td class="data-td data last">Stock</td>
<td class="data-td data last">461,491,079</td>
<td class="data-td data last">--</td>
</tr>
<tr class="tbl-data">
<td class="data-td data last">ADI US</td>
<td class="data-td data last">Analog Devices Inc</td>
<td class="data-td data last">4.17</td>
<td class="data-td data last">BBG000BB6G37</td>
<td class="data-td data last">2,356,637</td>
<td class="data-td data last">Stock</td>
<td class="data-td data last">426,362,766</td>
<td class="data-td data last">--</td>
</tr>
<tr class="tbl-data">
<td class="data-td data last">AMD US</td>
<td class="data-td data last">Advanced Micro Devices Inc</td>
<td class="data-td data last">4.15</td>
<td class="data-td data last">BBG000BBQCY0</td>
<td class="data-td data last">4,008,364</td>
<td class="data-td data last">Stock</td>
<td class="data-td data last">423,764,242</td>
<td class="data-td data last">--</td>
</tr>
</tbody>
</table>
</div>
<br />
<p class="chart-disclosure">These are not recommendations to buy or to sell any security. Securities and holdings may vary. For a complete list of fund holdings, please visit vaneck.com/smh.</p>
<h2>Top Two Contributors for SMH in Q2 2023</h2>
<p><strong>NVIDIA Corp. (NVDA) &ndash; 15.86% Weight | 7.57% Contribution to return</strong></p>
<p>In the second quarter, Nvidia exceeded expectations, achieving an EPS of $2.70 (surpassing predictions by 62 cents) and recording total sales of $13.51 billion, significantly surpassing anticipated figures. This notable success was driven by robust sales in data centers, which outperformed expert estimates by almost 30%, alongside elevated sales in the Gaming and ProViz sectors.</p>
<p>Their forthcoming quarter forecasts appear promising, with anticipated sales reflecting a 27% increase, augmented profitability per sale, and prudent operational spending. Market analysts responded favorably to these outcomes, revising their forward expectations for Nvidia upwards. Acknowledging Nvidia's adept performance in data centers and enhancing the gaming domain, they highlighted the company's strategic efforts to meet escalating demand by diversifying its product portfolio. However, a degree of caution was expressed due to potential challenges related to chip sales in China and subdued performance in the automotive sector.</p>
<p><strong>Broadcom Inc. (AVGO) &ndash; 5.07% Weight | 1.72% Contribution to return</strong></p>
<p>In Q2, Broadcom exceeded expectations with revenue up 3.5% and earnings per share (EPS) beating forecasts by 2.0% or $0.30. Analysts were upbeat about strong Networking growth driven by AI demand, boosting the Semi business before the iPhone refresh. Positive factors include an Apple deal, projected AI revenue increase, and optimism about deal closures. This led to raised estimates and a higher average price target of $847.31.</p>
<h2>Top Two Detractors for SMH in Q2</h2>
<p><strong>QUALCOMM Inc. (QCOM) &ndash; 4.41% Weight | -0.58% Contribution to return</strong></p>
<p>Following Qualcomm's Q3 report, shares fell broadly. The company's revenue of $8.44 billion was 0.8% below expectations, while EPS of $1.87 exceeded predictions by $0.06. Across its segments, QCT's (technology business) revenue was below target but EBT (earnings before taxes) was in line, while QTL (licensing business) missed on both revenue and EBT. The management's Q4 guidance indicates that the midpoint of their revenue and EPS goals is below the previous consensus. Analysts have generally labeled the Q3 results and outlook as disappointing, citing challenges from China, Huawei, and inventory adjustments that had a greater impact than anticipated. Despite this, some analysts find the valuation favorable and remain optimistic about the company's longer-term prospects.</p>
<p><strong>STMicroelectronics (STM) &ndash; 2.03% Weight | -0.33 Contribution to return</strong></p>
<p>STMicroelectronics reported strong earnings and guidance, the company anticipates gross margin pressures in the second half of 2023, with a full-year gross margin guidance of 47-48%. During their quarterly earnings call, management highlighted three key factors contributing to this pressure: increased manufacturing input costs, less optimized production levels in consumer and personal electronics, which is expected to be a $0.5 billion headwind in the second half, and the impact from the ramp-up of 300-millimeter graph as it enters the cost of goods sold. However, the company expects a positive contribution to the gross margin in 2024. Additionally, by the end of 2023, the company anticipates its number of days of inventory to be between 105-110 days, which is slightly higher than the year-end 2022 figures.</p>
<h3>Standardized Performance</h3>
<div class="wrapped-div">
<table style="width: 750px;">
<tbody>
<tr class="tbl-data">
<td class="tbl-header last" colspan="10">Quarter End Returns as of 6/30/2023</td>
</tr>
<tr class="tbl-data">
<td class="data-td  last">&nbsp;</td>
<td class="data-head last">&nbsp;</td>
<td class="data-head last">1 Yr</td>
<td class="data-head last">5 Yr</td>
<td class="data-head last">10 Yr</td>
<td class="data-head last">Since Inception</td>
<td class="data-head last">Inception Date</td>
<td class="data-head last">Expense Ratio</td>
</tr>
<tr class="tbl-data">
<td class="data-td last font-weight-normal" rowspan="2">VanEck Semiconductor ETF</td>
<td class="data-td data last" rowspan="2">SMH</td>
<td class="data-td data last"><i>NAV</i></td>
<td class="data-td data last">51.36</td>
<td class="data-td data last">25.77</td>
<td class="data-td data last">24.83</td>
<td class="data-td data last">23.87</td>
<td class="data-td data last" rowspan="2">12/20/2011</td>
<td class="data-td data last"><i>Gross</i><sup>*</sup></td>
<td class="data-td data last">0.35%</td>
</tr>
<tr class="tbl-data">
<td class="data-td data last"><i>Mkt Price</i></td>
<td class="data-td data last">51.23</td>
<td class="data-td data last">25.72</td>
<td class="data-td data last">24.81</td>
<td class="data-td data last">23.87</td>
<td class="data-td data last"><i>Net</i><sup>*</sup></td>
<td class="data-td data last">0.35%</td>
</tr>
<tr class="tbl-data">
<td class="data-td last font-weight-normal">MVSMHTR</td>
<td class="data-td data last">Index</td>
<td class="data-td data last">&nbsp;</td>
<td class="data-td data last">50.43</td>
<td class="data-td data last">25.83</td>
<td class="data-td data last">24.84</td>
<td class="data-td data last">23.86</td>
<td class="data-td data last">&nbsp;</td>
</tr>
</tbody>
</table>
</div>
<br />
<p class="chart-disclosure"><strong>The performance data quoted represents past performance. Past performance is not a guarantee of future results. Investment return and principal value of an investment will fluctuate so that an investor's shares, when redeemed, may be worth more or less than their original cost. Performance may be lower or higher than performance data quoted. Please call 800.826.2333 or visit vaneck.com for performance current to the most recent month ended. </strong></p>
<p class="chart-disclosure">The "Net Asset Value" (NAV) of a Fund is determined at the close of each business day, and represents the dollar value of one share of the fund; it is calculated by taking the total assets of the fund, subtracting total liabilities, and dividing by the total number of shares outstanding. The NAV is not necessarily the same as the ETF's intraday trading value. Investors should not expect to buy or sell shares at NAV.</p>
<p class="chart-disclosure"><sup>*</sup>&nbsp;Van Eck Associates Corporation (the &ldquo;Adviser&rdquo;) will pay all expenses of the Fund, except for the fee payment under the investment management agreement, acquired fund fees and expenses, interest expense, offering costs, trading expenses, taxes and extraordinary expenses. Notwithstanding the foregoing, the Adviser has agreed to pay the offering costs until at least February 1, 2024. &ldquo;Other Expenses&rdquo; have been restated to reflect current fees.</p>
<p>For more information on the <a href="/link/39c8d235748b4c26a5930c31d3ac0160.aspx" title="SMH - VanEck Semiconductor ETF - Overview"><strong>VanEck Semiconductor ETF (SMH)</strong></a> please read the <a href="https://www.vaneck.com/us/en/blogs/thematic-investing/smh-question-and-answer/" title="SMH ETF: Question and Answer"><strong>Fund FAQ</strong></a>.</p>
<p>To receive more <a href="https://www.vaneck.com/us/en/insights/thematic-investing/" title="Thematic Investing Insights"><strong>Thematic Investing</strong></a> insights, <a href="https://www.vaneck.com/us/en/subscribe/" title="Subscription Center"><strong>sign up in our subscription center</strong></a>.</p>
<style type="text/css">
    .wrapped-div {
        max-width: 100%;
    }

    @media (max-width: 1240px) {
        .wrapped-div {
            overflow-x: scroll;
        }
    }

    .wrapped-div-sector {
        max-width: 100%;
        overflow-x: scroll;
    }
</style>
]]></content:encoded>
</item><item rdf:about="https://www.vaneck.com/us/en/blogs/income-investing/fallen-angels-outshine-high-yield/">
  <title>Fallen Angels Outshine High Yield></title>
  <link>https://www.vaneck.com/us/en/blogs/income-investing/fallen-angels-outshine-high-yield/</link>
  <description><![CDATA[Favorable rate trends in November drove Fallen Angel Index outperformance; Automotive sector removed from Index upon Ford&rsquo;s elevation to rising star.]]></description>
  <dc:creator>Nicolas  Fonseca, CFA</dc:creator>
  <dc:date>12/12/2023 06:30:00</dc:date>
<content:encoded><![CDATA[

<p>In November, fallen angels (as represented by the ICE US Fallen Angel High Yield 10% Constrained Index, &ldquo;H0CF&rdquo;) demonstrated superior performance, surpassing the broad high-yield market (as represented by the ICE BofA US High Yield Index, &ldquo;H0A0&rdquo;) by 1.22% (5.77% vs 4.55%). This success can be primarily attributed to favorable rate trends, particularly as the 10-year yield declined throughout the month, benefiting long-duration bonds. The 5.77% return achieved by fallen angels represents their most robust monthly performance since November 2020. Currently, fallen angels are mounting a late-stage effort to potentially outpace the broad high-yield market for the year. If successful, this would mark 15 out of the last 20 calendar years of such achievement and notably, 8 out of 11 years of outperformance during periods of significant interest rate increases. Instances where fallen angels lagged behind broad high yield while rates rose occurred in 2005, 2018, and 2022.</p>
<p>Following lower-than-anticipated U.S. inflation figures, marginally softer jobless statistics and personal consumption expenditures (PCE) in line with expectations, the market's implied likelihood of another rate hike has declined to nearly 0%, with some anticipating multiple cuts in 2024. The direction of longer-term yields is more uncertain, but over the past month have declined sharply, benefitting longer duration strategies and providing a tailwind to fallen angels given their somewhat higher duration compared to the broad high yield market. High-yield corporate ETFs experienced approximately $11bn in inflows, contrasting with Treasuries and Inflation-Protected ETFs, which witnessed approximately $6bn in outflows. Notably, there's a noticeable shift as Intermediate and Long durations collectively attracted approximately $32bn, while Ultra-Short and Short duration strategies saw outflows of approximately $8bn, indicative of investors incorporating both credit and duration risk into their portfolios.</p>
<h3>Cumulative Total Return</h3>
<p><img class="img-responsive w-100" src="https://www.vaneck.com/contentassets/5c06b90c159c46a894e0d06f313a6456/3910_angl-december_2023-12_v1_blog.svg" alt="Line chart comparing cumulative total returns of Fallen Angel Index, Broad HY Index and 10 Year Treasuries" /></p>
<p class="chart-disclosure">Source: US Treasury, ICE Data Services, VanEck. Past performance is no guarantee of future results.</p>
<p><strong><u>Fallen Angels Overall Statistics:</u></strong> Fallen angel yields decreased by 89bps to 7.45% and spreads tightened by 42bps to 285. Broad HY saw similar changes, with yields decreasing 98bps to 8.50% and spreads tightening by 58bps to 384. The fallen angel market value declined with the exit of Ford, a redemption of a Royal Caribbean bond and a Murphy Oil Corp bond that no longer qualified for index inclusion, dropping the market value from $74bn to $62bn. Fallen angel duration increased slightly with these changes. Broad HY saw another issuer default this past month &ndash; WeWork &ndash; although it was a minimal size, $525m face value, and not part of the fallen angel index.</p>
<div class="wrapped-div">
<table style="width: 100%;">
<tbody>
<tr class="tbl-data">
<td class="tbl-header last text-center">&nbsp;</td>
<td class="tbl-header last text-center" style="border-right: outset;" colspan="6">Fallen Angel</td>
<td class="tbl-header last text-center" colspan="6">Broad HY</td>
</tr>
<tr class="tbl-data">
<td class="data-head last">&nbsp;</td>
<td class="data-head last">12/31/22</td>
<td class="data-head last">3/31/23</td>
<td class="data-head last">6/30/23</td>
<td class="data-head last">9/30/23</td>
<td class="data-head last">10/31/23</td>
<td class="data-head last" style="border-right: outset;">11/30/23</td>
<td class="data-head last">12/31/22</td>
<td class="data-head last">3/31/23</td>
<td class="data-head last">6/30/23</td>
<td class="data-head last">9/30/23</td>
<td class="data-head last">10/31/23</td>
<td class="data-head last">11/30/23</td>
</tr>
<tr class="tbl-data">
<td class="data-td last">Yield to Worst</td>
<td class="data-td data last">7.49</td>
<td class="data-td data last">7.08</td>
<td class="data-td data last">7.35</td>
<td class="data-td data last">8.02</td>
<td class="data-td data last">8.34</td>
<td class="data-td data last" style="border-right: outset;">7.45</td>
<td class="data-td data last">8.98</td>
<td class="data-td data last">8.49</td>
<td class="data-td data last">8.56</td>
<td class="data-td data last">8.94</td>
<td class="data-td data last">9.48</td>
<td class="data-td data last">8.50</td>
</tr>
<tr class="tbl-data">
<td class="data-td last">Effective Duration</td>
<td class="data-td data last">5.45</td>
<td class="data-td data last">5.30</td>
<td class="data-td data last">4.98</td>
<td class="data-td data last">4.90</td>
<td class="data-td data last">4.93</td>
<td class="data-td data last" style="border-right: outset;">5.16</td>
<td class="data-td data last">4.04</td>
<td class="data-td data last">3.83</td>
<td class="data-td data last">3.65</td>
<td class="data-td data last">3.64</td>
<td class="data-td data last">3.67</td>
<td class="data-td data last">3.49</td>
</tr>
<tr class="tbl-data">
<td class="data-td last">Full Market Value ($mn)</td>
<td class="data-td data last">112,854</td>
<td class="data-td data last">114,776</td>
<td class="data-td data last">84,590</td>
<td class="data-td data last">78,279</td>
<td class="data-td data last">74,096</td>
<td class="data-td data last" style="border-right: outset;">62,275</td>
<td class="data-td data last">1,199,909</td>
<td class="data-td data last">1,234,319</td>
<td class="data-td data last">1,218,316</td>
<td class="data-td data last">1,201,541</td>
<td class="data-td data last">1,174,212</td>
<td class="data-td data last">1,189,484</td>
</tr>
<tr class="tbl-data">
<td class="data-td last">OAS</td>
<td class="data-td data last">337</td>
<td class="data-td data last">325</td>
<td class="data-td data last">297</td>
<td class="data-td data last">314</td>
<td class="data-td data last">327</td>
<td class="data-td data last" style="border-right: outset;">285</td>
<td class="data-td data last">481</td>
<td class="data-td data last">458</td>
<td class="data-td data last">405</td>
<td class="data-td data last">403</td>
<td class="data-td data last">442</td>
<td class="data-td data last">384</td>
</tr>
<tr class="tbl-data">
<td class="data-td last">No. of Issues</td>
<td class="data-td data last">212</td>
<td class="data-td data last">206</td>
<td class="data-td data last">163</td>
<td class="data-td data last">159</td>
<td class="data-td data last">153</td>
<td class="data-td data last" style="border-right: outset;">136</td>
<td class="data-td data last">1,927</td>
<td class="data-td data last">1,916</td>
<td class="data-td data last">1,870</td>
<td class="data-td data last">1,872</td>
<td class="data-td data last">1,854</td>
<td class="data-td data last">1,827</td>
</tr>
</tbody>
</table>
</div>
<br />
<p class="chart-disclosure">Source: ICE Data Services, VanEck. Fallen Angels: ICE US Fallen Angel High Yield 10% Constrained Index. Broad HY: ICE BofA US High Yield Index. OAS refers to &ldquo;option-adjusted spread.&rdquo; Please see definition for this and other terms referenced herein in the disclosures and definitions portion of this blog. Past performance is no guarantee of future results. Index performance is not representative of fund performance. It is not possible to invest in an index.</p>
<p><strong><u>New Fallen Angels:</u></strong> None in November.</p>
<div class="wrapped-div">
<table style="width: 100%;">
<tbody>
<tr class="tbl-data">
<td class="tbl-header last">Month-end Addition</td>
<td class="tbl-header last text-center">Name</td>
<td class="tbl-header last text-center">Rating</td>
<td class="tbl-header last text-center">Sector</td>
<td class="tbl-header last text-center">Industry</td>
<td class="tbl-header last text-center">% Mkt Value</td>
<td class="tbl-header last text-center">Price</td>
</tr>
<tr class="tbl-data">
<td class="data-td last font-weight-normal">February</td>
<td class="data-td data last">Entegris Escrow Corp</td>
<td class="data-td data last">BB1</td>
<td class="data-td data last">Technology &amp; Electronics</td>
<td class="data-td data last">Electronics</td>
<td class="data-td data last">1.39</td>
<td class="data-td data last">90.92</td>
</tr>
<tr class="tbl-data">
<td class="data-td last font-weight-normal">March</td>
<td class="data-td data last">First Republic Bank</td>
<td class="data-td data last">B3</td>
<td class="data-td data last">Banking</td>
<td class="data-td data last">0.40</td>
<td class="data-td data last">54.63</td>
</tr>
<tr class="tbl-data">
<td class="data-td last font-weight-normal">March</td>
<td class="data-td data last">Nissan Motor Acceptance</td>
<td class="data-td data last">BB1</td>
<td class="data-td data last">Automotive</td>
<td class="data-td data last">Auto Loans</td>
<td class="data-td data last">2.57</td>
<td class="data-td data last">87.19</td>
</tr>
<tr class="tbl-data">
<td class="data-td last font-weight-normal">March</td>
<td class="data-td data last">Nissan Motor</td>
<td class="data-td data last">BB1</td>
<td class="data-td data last">Automotive</td>
<td class="data-td data last">Automakers</td>
<td class="data-td data last">5.49</td>
<td class="data-td data last">92.98</td>
</tr>
<tr class="tbl-data">
<td class="data-td last font-weight-normal">April</td>
<td class="data-td data last">Crane NXT</td>
<td class="data-td data last">BB3</td>
<td class="data-td data last">Capital Goods</td>
<td class="data-td data last">Diversified Capital Goods</td>
<td class="data-td data last">0.24</td>
<td class="data-td data last">70.99</td>
</tr>
<tr class="tbl-data">
<td class="data-td last font-weight-normal">April</td>
<td class="data-td data last">Rogers Communications</td>
<td class="data-td data last">BB2</td>
<td class="data-td data last">Telecommunications</td>
<td class="data-td data last">Telecom - Wireless</td>
<td class="data-td data last">0.65</td>
<td class="data-td data last">90.35</td>
</tr>
<tr class="tbl-data">
<td class="data-td last font-weight-normal">April</td>
<td class="data-td data last">Western Alliance Bancorporation</td>
<td class="data-td data last">BB1</td>
<td class="data-td data last">Banking</td>
<td class="data-td data last">0.44</td>
<td class="data-td data last">76.39</td>
</tr>
<tr class="tbl-data">
<td class="data-td last font-weight-normal">August</td>
<td class="data-td data last">Associated Banc-Corp</td>
<td class="data-td data last">BB1</td>
<td class="data-td data last">Banking</td>
<td class="data-td data last">0.33</td>
<td class="data-td data last">95.69</td>
</tr>
<tr class="tbl-data">
<td class="data-td last font-weight-normal">August</td>
<td class="data-td data last">Valley National Bancorp</td>
<td class="data-td data last">BB1</td>
<td class="data-td data last">Banking</td>
<td class="data-td data last">0.33</td>
<td class="data-td data last">79.84</td>
</tr>
<tr class="tbl-data">
<td class="data-td last font-weight-normal">September</td>
<td class="data-td data last">Brandywine Operating Partnership L.P.</td>
<td class="data-td data last">BB1</td>
<td class="data-td data last">Real Estate</td>
<td class="data-td data last">REITs</td>
<td class="data-td data last">1.86</td>
<td class="data-td data last">87.29</td>
</tr>
<tr class="tbl-data">
<td class="data-td last font-weight-normal">September</td>
<td class="data-td data last">Port of Newcastle Investments Financing Pty Limited</td>
<td class="data-td data last">BB1</td>
<td class="data-td data last">Transportation</td>
<td class="data-td data last">Transport Infrastructure/Services</td>
<td class="data-td data last">0.36</td>
<td class="data-td data last">82.79</td>
</tr>
</tbody>
</table>
</div>
<br />
<p class="chart-disclosure">Source: ICE Data Services, VanEck. Fallen Angels: ICE US Fallen Angel High Yield 10% Constrained Index. Past performance is no guarantee of future results. Not a recommendation to buy or sell any of the names/securities mentioned herein. Index performance is not representative of fund performance. It is not possible to invest in an index.</p>
<p><strong><u>Rising Stars:</u></strong> As<strong><a href="https://www.vaneck.com/us/en/blogs/income-investing/fallen-angel-yields-at-post-covid-highs-major-rising-star-expected/" title="Fallen Angel Yields at Post-COVID highs; Major Rising Star Expected"> expected</a></strong>, Ford was removed from the fallen angel index during the November month-end rebalance at $93.05 after having entered in April 2020 at $86.87. Over the last 12 months in the index, Ford price returned 1.10%, lagging both fallen angels (3.31%) and broad high yield (1.78%).</p>
<div class="wrapped-div">
<table style="width: 100%;">
<tbody>
<tr class="tbl-data">
<td class="tbl-header last">Month-end Exit</td>
<td class="tbl-header last text-center">Name</td>
<td class="tbl-header last text-center">Rating</td>
<td class="tbl-header last text-center">Sector</td>
<td class="tbl-header last text-center">Industry</td>
<td class="tbl-header last text-center">% Mkt Value</td>
<td class="tbl-header last text-center">Price</td>
</tr>
<tr class="tbl-data">
<td class="data-td last font-weight-normal">February</td>
<td class="data-td data last">Autopistas Metropolitanas de Puerto Rico LLC</td>
<td class="data-td data last">BB1</td>
<td class="data-td data last">Transportation</td>
<td class="data-td data last">Transport Infrastructure/Services</td>
<td class="data-td data last">0.35</td>
<td class="data-td data last">100.49</td>
</tr>
<tr class="tbl-data">
<td class="data-td last font-weight-normal">February</td>
<td class="data-td data last">Nokia Corp</td>
<td class="data-td data last">BB1</td>
<td class="data-td data last">Technology &amp; Electronics</td>
<td class="data-td data last">Tech Hardware &amp; Equipment</td>
<td class="data-td data last">0.47</td>
<td class="data-td data last">97.50</td>
</tr>
<tr class="tbl-data">
<td class="data-td last font-weight-normal">March</td>
<td class="data-td data last">Western Midstream</td>
<td class="data-td data last">BB1</td>
<td class="data-td data last">Energy</td>
<td class="data-td data last">Gas Distribution</td>
<td class="data-td data last">5.27</td>
<td class="data-td data last">90.44</td>
</tr>
<tr class="tbl-data">
<td class="data-td last font-weight-normal">April</td>
<td class="data-td data last">Sprint Capital Corp</td>
<td class="data-td data last">BB1</td>
<td class="data-td data last">Telecommunications</td>
<td class="data-td data last">Telecom - Wireless</td>
<td class="data-td data last">4.70</td>
<td class="data-td data last">114.25</td>
</tr>
<tr class="tbl-data">
<td class="data-td last font-weight-normal">May</td>
<td class="data-td data last">Mattel Inc.</td>
<td class="data-td data last">BB2</td>
<td class="data-td data last">Consumer Goods</td>
<td class="data-td data last">Personal &amp; Household Products</td>
<td class="data-td data last">0.45</td>
<td class="data-td data last">85.32</td>
</tr>
<tr class="tbl-data">
<td class="data-td last font-weight-normal">May</td>
<td class="data-td data last">Nissan Motor Acceptance</td>
<td class="data-td data last">BB1</td>
<td class="data-td data last">Automotive</td>
<td class="data-td data last">Auto Loans</td>
<td class="data-td data last">2.67</td>
<td class="data-td data last">85.12</td>
</tr>
<tr class="tbl-data">
<td class="data-td last font-weight-normal">May</td>
<td class="data-td data last">Nissan Motor</td>
<td class="data-td data last">BB1</td>
<td class="data-td data last">Automotive</td>
<td class="data-td data last">Automakers</td>
<td class="data-td data last">5.57</td>
<td class="data-td data last">88.49</td>
</tr>
<tr class="tbl-data">
<td class="data-td last font-weight-normal">May</td>
<td class="data-td data last">Occidental Petroleum Corp</td>
<td class="data-td data last">BB1</td>
<td class="data-td data last">Energy</td>
<td class="data-td data last">Energy - Exploration &amp; Production</td>
<td class="data-td data last">8.69</td>
<td class="data-td data last">93.82</td>
</tr>
<tr class="tbl-data">
<td class="data-td last font-weight-normal">June</td>
<td class="data-td data last">APA Corp</td>
<td class="data-td data last">BB1</td>
<td class="data-td data last">Energy</td>
<td class="data-td data last">Energy - Exploration &amp; Production</td>
<td class="data-td data last">3.84</td>
<td class="data-td data last">82.69</td>
</tr>
<tr class="tbl-data">
<td class="data-td last font-weight-normal">July</td>
<td class="data-td data last">Western Digital Corp</td>
<td class="data-td data last">BB1</td>
<td class="data-td data last">Technology &amp; Electronics</td>
<td class="data-td data last">Tech Hardware &amp; Equipment</td>
<td class="data-td data last">0.99</td>
<td class="data-td data last">76.97</td>
</tr>
<tr class="tbl-data">
<td class="data-td last font-weight-normal">August</td>
<td class="data-td data last">Howmet Aerospace Inc</td>
<td class="data-td data last">BB1</td>
<td class="data-td data last">Capital Goods</td>
<td class="data-td data last">Aerospace/Defense</td>
<td class="data-td data last">2.04</td>
<td class="data-td data last">99.55</td>
</tr>
<tr class="tbl-data">
<td class="data-td last font-weight-normal">September</td>
<td class="data-td data last">Patterson-UTI Energy Inc.</td>
<td class="data-td data last">BB1</td>
<td class="data-td data last">Energy</td>
<td class="data-td data last">Oil Field Equipment &amp; Services</td>
<td class="data-td data last">1.07</td>
<td class="data-td data last">90.37</td>
</tr>
<tr class="tbl-data">
<td class="data-td last font-weight-normal">November</td>
<td class="data-td data last">Ford Motor Company</td>
<td class="data-td data last">BB1</td>
<td class="data-td data last">Automotive</td>
<td class="data-td data last">Automakers</td>
<td class="data-td data last">4.29</td>
<td class="data-td data last">90.34</td>
</tr>
<tr class="tbl-data">
<td class="data-td last font-weight-normal">November</td>
<td class="data-td data last">Ford Motor Credit Company</td>
<td class="data-td data last">BB1</td>
<td class="data-td data last">Automotive</td>
<td class="data-td data last">Auto Loans</td>
<td class="data-td data last">5.49</td>
<td class="data-td data last">95.26</td>
</tr>
</tbody>
</table>
</div>
<br />
<p class="chart-disclosure">Source: ICE Data Services, VanEck. Fallen Angels: ICE US Fallen Angel High Yield 10% Constrained Index. Past performance is no guarantee of future results. Not a recommendation to buy or sell any of the names/securities mentioned herein. Index performance is not representative of fund performance. It is not possible to invest in an index.</p>
<p><strong><u>Fallen Angels Performance by Sector:</u></strong> All 17 sectors posted positive returns for November with Financial Services (although only comprised of two issuers, thus low exposure) taking the lead with an 11.08% return, as its price jumped from $74.92 to $82.94, while Basic Industry posted the worst return at 3.63%. The two largest sectors, Energy and Telecom, posting 5.79% and 7.54% respectively, were two sectors that contributed positively to outperformance vs broad high yield, mainly due to their long duration/rates effect. The removal of Ford and the Automotive sector from the fallen angel index did not result in significant changes to the 16 remaining sectors.</p>
<div class="wrapped-div-full">
<table style="width: 100%;">
<tbody>
<tr class="tbl-data">
<td class="tbl-header last text-center">&nbsp;</td>
<td class="tbl-header last text-center" style="border-right: outset;" colspan="6">Wgt (%)</td>
<td class="tbl-header last text-center" style="border-right: outset;" colspan="6">OAS</td>
<td class="tbl-header last text-center" style="border-right: outset;" colspan="6">Price</td>
<td class="tbl-header last text-center">Total Return (%)</td>
</tr>
<tr class="tbl-data">
<td class="data-head last">&nbsp;</td>
<td class="data-head last">12/31/21</td>
<td class="data-head last">3/31/23</td>
<td class="data-head last">6/30/23</td>
<td class="data-head last">9/30/23</td>
<td class="data-head last">10/31/23</td>
<td class="data-head last" style="border-right: outset;">11/30/23</td>
<td class="data-head last">12/31/21</td>
<td class="data-head last">3/31/23</td>
<td class="data-head last">6/30/23</td>
<td class="data-head last">9/30/23</td>
<td class="data-head last">10/31/23</td>
<td class="data-head last" style="border-right: outset;">11/30/23</td>
<td class="data-head last">12/31/21</td>
<td class="data-head last">3/31/23</td>
<td class="data-head last">6/30/23</td>
<td class="data-head last">9/30/23</td>
<td class="data-head last">10/31/23</td>
<td class="data-head last" style="border-right: outset;">11/30/23</td>
<td class="data-head last">MTD</td>
</tr>
<tr class="tbl-data">
<td class="data-td last">Automotive</td>
<td class="data-td data last">10.00</td>
<td class="data-td data last">18.06</td>
<td class="data-td data last">10.00</td>
<td class="data-td data last" style="border-right: outset;">&nbsp;</td>
<td class="data-td data last">262</td>
<td class="data-td data last">246</td>
<td class="data-td data last">211</td>
<td class="data-td data last">206</td>
<td class="data-td data last">205</td>
<td class="data-td data last" style="border-right: outset;">&nbsp;</td>
<td class="data-td data last">91.35</td>
<td class="data-td data last">92.21</td>
<td class="data-td data last">92.99</td>
<td class="data-td data last">91.16</td>
<td class="data-td data last">89.95</td>
<td class="data-td data last" style="border-right: outset;">&nbsp;</td>
<td class="data-td data last">3.84</td>
</tr>
<tr class="tbl-data">
<td class="data-td last">Banking</td>
<td class="data-td data last">3.81</td>
<td class="data-td data last">3.99</td>
<td class="data-td data last">3.20</td>
<td class="data-td data last">4.34</td>
<td class="data-td data last">4.54</td>
<td class="data-td data last" style="border-right: outset;">5.05</td>
<td class="data-td data last">302</td>
<td class="data-td data last">415</td>
<td class="data-td data last">376</td>
<td class="data-td data last">279</td>
<td class="data-td data last">301</td>
<td class="data-td data last" style="border-right: outset;">274</td>
<td class="data-td data last">96.85</td>
<td class="data-td data last">87.61</td>
<td class="data-td data last">88.57</td>
<td class="data-td data last">92.02</td>
<td class="data-td data last">89.88</td>
<td class="data-td data last" style="border-right: outset;">93.15</td>
<td class="data-td data last">4.05</td>
</tr>
<tr class="tbl-data">
<td class="data-td last">Basic Industry</td>
<td class="data-td data last">1.36</td>
<td class="data-td data last">1.33</td>
<td class="data-td data last">1.93</td>
<td class="data-td data last">1.92</td>
<td class="data-td data last">2.03</td>
<td class="data-td data last" style="border-right: outset;">2.23</td>
<td class="data-td data last">226</td>
<td class="data-td data last">227</td>
<td class="data-td data last">168</td>
<td class="data-td data last">178</td>
<td class="data-td data last">194</td>
<td class="data-td data last" style="border-right: outset;">144</td>
<td class="data-td data last">92.17</td>
<td class="data-td data last">93.85</td>
<td class="data-td data last">94.44</td>
<td class="data-td data last">93.53</td>
<td class="data-td data last">92.45</td>
<td class="data-td data last" style="border-right: outset;">95.49</td>
<td class="data-td data last">3.63</td>
</tr>
<tr class="tbl-data">
<td class="data-td last">Capital Goods</td>
<td class="data-td data last">5.12</td>
<td class="data-td data last">5.10</td>
<td class="data-td data last">7.66</td>
<td class="data-td data last">5.86</td>
<td class="data-td data last">5.60</td>
<td class="data-td data last" style="border-right: outset;">6.26</td>
<td class="data-td data last">279</td>
<td class="data-td data last">240</td>
<td class="data-td data last">195</td>
<td class="data-td data last">250</td>
<td class="data-td data last" style="border-right: outset;">198</td>
<td class="data-td data last">95.01</td>
<td class="data-td data last">98.54</td>
<td class="data-td data last">96.85</td>
<td class="data-td data last">92.44</td>
<td class="data-td data last">91.34</td>
<td class="data-td data last" style="border-right: outset;">95.11</td>
<td class="data-td data last">4.53</td>
</tr>
<tr class="tbl-data">
<td class="data-td last">Consumer Goods</td>
<td class="data-td data last">3.07</td>
<td class="data-td data last">3.00</td>
<td class="data-td data last">3.62</td>
<td class="data-td data last">3.82</td>
<td class="data-td data last">4.04</td>
<td class="data-td data last" style="border-right: outset;">4.57</td>
<td class="data-td data last">275</td>
<td class="data-td data last">255</td>
<td class="data-td data last">298</td>
<td class="data-td data last">271</td>
<td class="data-td data last">326</td>
<td class="data-td data last" style="border-right: outset;">264</td>
<td class="data-td data last">88.90</td>
<td class="data-td data last">91.27</td>
<td class="data-td data last">89.31</td>
<td class="data-td data last">88.24</td>
<td class="data-td data last">86.98</td>
<td class="data-td data last" style="border-right: outset;">91.83</td>
<td class="data-td data last">6.06</td>
</tr>
<tr class="tbl-data">
<td class="data-td last">Energy</td>
<td class="data-td data last">27.93</td>
<td class="data-td data last">22.16</td>
<td class="data-td data last">15.28</td>
<td class="data-td data last">14.45</td>
<td class="data-td data last">14.63</td>
<td class="data-td data last" style="border-right: outset;">15.93</td>
<td class="data-td data last">293</td>
<td class="data-td data last">303</td>
<td class="data-td data last">297</td>
<td class="data-td data last">288</td>
<td class="data-td data last">294</td>
<td class="data-td data last" style="border-right: outset;">252</td>
<td class="data-td data last">88.13</td>
<td class="data-td data last">90.05</td>
<td class="data-td data last">88.74</td>
<td class="data-td data last">87.48</td>
<td class="data-td data last">85.20</td>
<td class="data-td data last" style="border-right: outset;">89.48</td>
<td class="data-td data last">5.79</td>
</tr>
<tr class="tbl-data">
<td class="data-td last">Financial Services</td>
<td class="data-td data last">0.65</td>
<td class="data-td data last">0.64</td>
<td class="data-td data last">0.94</td>
<td class="data-td data last">0.98</td>
<td class="data-td data last">1.00</td>
<td class="data-td data last" style="border-right: outset;">1.18</td>
<td class="data-td data last">540</td>
<td class="data-td data last">506</td>
<td class="data-td data last">459</td>
<td class="data-td data last">420</td>
<td class="data-td data last">527</td>
<td class="data-td data last" style="border-right: outset;">395</td>
<td class="data-td data last">77.20</td>
<td class="data-td data last">80.27</td>
<td class="data-td data last">80.92</td>
<td class="data-td data last">79.51</td>
<td class="data-td data last">74.92</td>
<td class="data-td data last" style="border-right: outset;">82.94</td>
<td class="data-td data last">11.08</td>
</tr>
<tr class="tbl-data">
<td class="data-td last">Healthcare</td>
<td class="data-td data last">3.02</td>
<td class="data-td data last">3.03</td>
<td class="data-td data last">4.33</td>
<td class="data-td data last">4.62</td>
<td class="data-td data last">4.88</td>
<td class="data-td data last" style="border-right: outset;">5.49</td>
<td class="data-td data last">362</td>
<td class="data-td data last">304</td>
<td class="data-td data last">281</td>
<td class="data-td data last">299</td>
<td class="data-td data last">298</td>
<td class="data-td data last" style="border-right: outset;">223</td>
<td class="data-td data last">83.56</td>
<td class="data-td data last">86.47</td>
<td class="data-td data last">86.82</td>
<td class="data-td data last">84.72</td>
<td class="data-td data last">83.31</td>
<td class="data-td data last" style="border-right: outset;">88.56</td>
<td class="data-td data last">6.63</td>
</tr>
<tr class="tbl-data">
<td class="data-td last">Insurance</td>
<td class="data-td data last">0.85</td>
<td class="data-td data last">0.82</td>
<td class="data-td data last">1.15</td>
<td class="data-td data last">1.20</td>
<td class="data-td data last">1.25</td>
<td class="data-td data last" style="border-right: outset;">1.42</td>
<td class="data-td data last">347</td>
<td class="data-td data last">364</td>
<td class="data-td data last">358</td>
<td class="data-td data last">366</td>
<td class="data-td data last">375</td>
<td class="data-td data last" style="border-right: outset;">334</td>
<td class="data-td data last">92.10</td>
<td class="data-td data last">92.99</td>
<td class="data-td data last">91.39</td>
<td class="data-td data last">87.81</td>
<td class="data-td data last">86.20</td>
<td class="data-td data last" style="border-right: outset;">91.08</td>
<td class="data-td data last">6.14</td>
</tr>
<tr class="tbl-data">
<td class="data-td last">Leisure</td>
<td class="data-td data last">7.88</td>
<td class="data-td data last">7.79</td>
<td class="data-td data last">10.42</td>
<td class="data-td data last">7.87</td>
<td class="data-td data last">8.32</td>
<td class="data-td data last" style="border-right: outset;">8.39</td>
<td class="data-td data last">325</td>
<td class="data-td data last">243</td>
<td class="data-td data last">182</td>
<td class="data-td data last">257</td>
<td class="data-td data last">276</td>
<td class="data-td data last" style="border-right: outset;">242</td>
<td class="data-td data last">89.95</td>
<td class="data-td data last">93.25</td>
<td class="data-td data last">93.34</td>
<td class="data-td data last">89.37</td>
<td class="data-td data last">88.79</td>
<td class="data-td data last" style="border-right: outset;">91.12</td>
<td class="data-td data last">4.30</td>
</tr>
<tr class="tbl-data">
<td class="data-td last">Real Estate</td>
<td class="data-td data last">5.13</td>
<td class="data-td data last">4.72</td>
<td class="data-td data last">6.22</td>
<td class="data-td data last">8.37</td>
<td class="data-td data last">7.15</td>
<td class="data-td data last" style="border-right: outset;">8.07</td>
<td class="data-td data last">697</td>
<td class="data-td data last">701</td>
<td class="data-td data last">602</td>
<td class="data-td data last">660</td>
<td class="data-td data last">775</td>
<td class="data-td data last" style="border-right: outset;">643</td>
<td class="data-td data last">79.46</td>
<td class="data-td data last">80.72</td>
<td class="data-td data last">80.99</td>
<td class="data-td data last">80.86</td>
<td class="data-td data last">76.74</td>
<td class="data-td data last" style="border-right: outset;">80.96</td>
<td class="data-td data last">5.91</td>
</tr>
<tr class="tbl-data">
<td class="data-td last">Retail</td>
<td class="data-td data last">5.67</td>
<td class="data-td data last">5.49</td>
<td class="data-td data last">7.79</td>
<td class="data-td data last">7.98</td>
<td class="data-td data last">7.99</td>
<td class="data-td data last" style="border-right: outset;">9.13</td>
<td class="data-td data last">471</td>
<td class="data-td data last">474</td>
<td class="data-td data last">354</td>
<td class="data-td data last">368</td>
<td class="data-td data last">352</td>
<td class="data-td data last" style="border-right: outset;">288</td>
<td class="data-td data last">73.75</td>
<td class="data-td data last">74.72</td>
<td class="data-td data last">82.35</td>
<td class="data-td data last">78.48</td>
<td class="data-td data last">77.36</td>
<td class="data-td data last" style="border-right: outset;">83.02</td>
<td class="data-td data last">7.75</td>
</tr>
<tr class="tbl-data">
<td class="data-td last">Services</td>
<td class="data-td data last">0.38</td>
<td class="data-td data last">0.37</td>
<td class="data-td data last">0.53</td>
<td class="data-td data last">0.57</td>
<td class="data-td data last">0.61</td>
<td class="data-td data last" style="border-right: outset;">0.68</td>
<td class="data-td data last">388</td>
<td class="data-td data last">368</td>
<td class="data-td data last">356</td>
<td class="data-td data last">309</td>
<td class="data-td data last">307</td>
<td class="data-td data last" style="border-right: outset;">272</td>
<td class="data-td data last">87.11</td>
<td class="data-td data last">89.89</td>
<td class="data-td data last">88.62</td>
<td class="data-td data last">88.75</td>
<td class="data-td data last">88.12</td>
<td class="data-td data last" style="border-right: outset;">91.67</td>
<td class="data-td data last">4.42</td>
</tr>
<tr class="tbl-data">
<td class="data-td last">Technology &amp; Electronics</td>
<td class="data-td data last">4.20</td>
<td class="data-td data last">4.67</td>
<td class="data-td data last">6.21</td>
<td class="data-td data last">5.57</td>
<td class="data-td data last">5.82</td>
<td class="data-td data last" style="border-right: outset;">6.55</td>
<td class="data-td data last">327</td>
<td class="data-td data last">287</td>
<td class="data-td data last">269</td>
<td class="data-td data last">262</td>
<td class="data-td data last">260</td>
<td class="data-td data last" style="border-right: outset;">204</td>
<td class="data-td data last">85.47</td>
<td class="data-td data last">88.19</td>
<td class="data-td data last">86.89</td>
<td class="data-td data last">87.23</td>
<td class="data-td data last">85.84</td>
<td class="data-td data last" style="border-right: outset;">90.93</td>
<td class="data-td data last">6.31</td>
</tr>
<tr class="tbl-data">
<td class="data-td last">Telecommunications</td>
<td class="data-td data last">11.91</td>
<td class="data-td data last">11.68</td>
<td class="data-td data last">10.61</td>
<td class="data-td data last">11.53</td>
<td class="data-td data last">12.00</td>
<td class="data-td data last" style="border-right: outset;">13.65</td>
<td class="data-td data last">423</td>
<td class="data-td data last">433</td>
<td class="data-td data last">475</td>
<td class="data-td data last">418</td>
<td class="data-td data last">432</td>
<td class="data-td data last" style="border-right: outset;">378</td>
<td class="data-td data last">90.04</td>
<td class="data-td data last">91.39</td>
<td class="data-td data last">84.92</td>
<td class="data-td data last">84.95</td>
<td class="data-td data last">82.99</td>
<td class="data-td data last" style="border-right: outset;">88.81</td>
<td class="data-td data last">7.54</td>
</tr>
<tr class="tbl-data">
<td class="data-td last">Transportation</td>
<td class="data-td data last">2.10</td>
<td class="data-td data last">1.78</td>
<td class="data-td data last">2.59</td>
<td class="data-td data last">3.14</td>
<td class="data-td data last">1.98</td>
<td class="data-td data last" style="border-right: outset;">2.22</td>
<td class="data-td data last">279</td>
<td class="data-td data last">231</td>
<td class="data-td data last">150</td>
<td class="data-td data last">203</td>
<td class="data-td data last">241</td>
<td class="data-td data last" style="border-right: outset;">202</td>
<td class="data-td data last">90.49</td>
<td class="data-td data last">92.69</td>
<td class="data-td data last">94.75</td>
<td class="data-td data last">91.70</td>
<td class="data-td data last">88.14</td>
<td class="data-td data last" style="border-right: outset;">92.75</td>
<td class="data-td data last">5.65</td>
</tr>
<tr class="tbl-data">
<td class="data-td last">Utility</td>
<td class="data-td data last">6.93</td>
<td class="data-td data last">5.38</td>
<td class="data-td data last">7.52</td>
<td class="data-td data last">7.77</td>
<td class="data-td data last">8.17</td>
<td class="data-td data last" style="border-right: outset;">9.18</td>
<td class="data-td data last">213</td>
<td class="data-td data last">206</td>
<td class="data-td data last">165</td>
<td class="data-td data last">175</td>
<td class="data-td data last">173</td>
<td class="data-td data last" style="border-right: outset;">133</td>
<td class="data-td data last">89.95</td>
<td class="data-td data last">90.19</td>
<td class="data-td data last">89.90</td>
<td class="data-td data last">86.28</td>
<td class="data-td data last">85.08</td>
<td class="data-td data last" style="border-right: outset;">89.58</td>
<td class="data-td data last">5.61</td>
</tr>
<tr class="tbl-data">
<td class="data-td last">Total</td>
<td class="data-td data last">100</td>
<td class="data-td data last" style="border-right: outset;">100</td>
<td class="data-td data last">337</td>
<td class="data-td data last">325</td>
<td class="data-td data last">297</td>
<td class="data-td data last">314</td>
<td class="data-td data last">327</td>
<td class="data-td data last" style="border-right: outset;">285</td>
<td class="data-td data last">87.91</td>
<td class="data-td data last">89.51</td>
<td class="data-td data last">88.78</td>
<td class="data-td data last">86.69</td>
<td class="data-td data last">84.94</td>
<td class="data-td data last" style="border-right: outset;">88.95</td>
<td class="data-td data last">5.77</td>
</tr>
</tbody>
</table>
</div>
<br />
<p class="chart-disclosure">Source: ICE Data Services, VanEck. Fallen Angels: ICE US Fallen Angel High Yield 10% Constrained Index. Not intended as a recommendation to invest or divest in any of the sectors mentioned herein. Index performance is not representative of fund performance. It is not possible to invest in an index.</p>
<p><strong><u>Fallen Angels Performance by Rating:</u></strong> Single-B outperformed as its priced increased by 7.42% in November. Digging deeper into the rating attribution of fallen angels vs broad high yield, it was the BB1 and BB2 buckets that contributed to more than 100% of the outperformance. Something worth noting is that the BB-rated bucket has fallen below 80%, which has not occurred since January 2020, when the fallen angel exposure to BBs was 77.36%.</p>
<div class="wrapped-div-full">
<table style="width: 100%;">
<tbody>
<tr class="tbl-data">
<td class="tbl-header last text-center">&nbsp;</td>
<td class="tbl-header last text-center" style="border-right: outset;" colspan="6">Wgt (%)</td>
<td class="tbl-header last text-center" style="border-right: outset;" colspan="6">OAS</td>
<td class="tbl-header last text-center" style="border-right: outset;" colspan="6">Price</td>
<td class="tbl-header last text-center">Total Return (%)</td>
</tr>
<tr class="tbl-data">
<td class="data-head last">&nbsp;</td>
<td class="data-head last">12/31/22</td>
<td class="data-head last">3/31/23</td>
<td class="data-head last">6/30/23</td>
<td class="data-head last">9/30/23</td>
<td class="data-head last">10/31/23</td>
<td class="data-head last" style="border-right: outset;">11/30/23</td>
<td class="data-head last">12/31/22</td>
<td class="data-head last">3/31/23</td>
<td class="data-head last">6/30/23</td>
<td class="data-head last">9/30/23</td>
<td class="data-head last">10/31/23</td>
<td class="data-head last" style="border-right: outset;">11/30/23</td>
<td class="data-head last">12/31/22</td>
<td class="data-head last">3/31/23</td>
<td class="data-head last">6/30/23</td>
<td class="data-head last">9/30/23</td>
<td class="data-head last">10/31/23</td>
<td class="data-head last" style="border-right: outset;">11/30/23</td>
<td class="data-head last">MTD</td>
</tr>
<tr class="tbl-data">
<td class="data-td last">BB</td>
<td class="data-td data last">87.00</td>
<td class="data-td data last">87.08</td>
<td class="data-td data last">83.01</td>
<td class="data-td data last">81.02</td>
<td class="data-td data last">81.82</td>
<td class="data-td data last" style="border-right: outset;">79.38</td>
<td class="data-td data last">284</td>
<td class="data-td data last">281</td>
<td class="data-td data last">256</td>
<td class="data-td data last">257</td>
<td class="data-td data last">266</td>
<td class="data-td data last" style="border-right: outset;">226</td>
<td class="data-td data last">90.02</td>
<td class="data-td data last">91.51</td>
<td class="data-td data last">89.83</td>
<td class="data-td data last">87.94</td>
<td class="data-td data last">86.40</td>
<td class="data-td data last" style="border-right: outset;">90.28</td>
<td class="data-td data last">5.46</td>
</tr>
<tr class="tbl-data">
<td class="data-td last">B</td>
<td class="data-td data last">10.95</td>
<td class="data-td data last">10.37</td>
<td class="data-td data last">13.31</td>
<td class="data-td data last">15.03</td>
<td class="data-td data last">14.08</td>
<td class="data-td data last" style="border-right: outset;">16.12</td>
<td class="data-td data last">608</td>
<td class="data-td data last">500</td>
<td class="data-td data last">406</td>
<td class="data-td data last">493</td>
<td class="data-td data last">530</td>
<td class="data-td data last" style="border-right: outset;">433</td>
<td class="data-td data last">82.50</td>
<td class="data-td data last">85.35</td>
<td class="data-td data last">89.55</td>
<td class="data-td data last">86.37</td>
<td class="data-td data last">83.70</td>
<td class="data-td data last" style="border-right: outset;">89.91</td>
<td class="data-td data last">7.85</td>
</tr>
<tr class="tbl-data">
<td class="data-td last">CCC</td>
<td class="data-td data last">1.98</td>
<td class="data-td data last">2.50</td>
<td class="data-td data last">3.68</td>
<td class="data-td data last">3.43</td>
<td class="data-td data last">3.55</td>
<td class="data-td data last" style="border-right: outset;">3.90</td>
<td class="data-td data last">1,020</td>
<td class="data-td data last">1,014</td>
<td class="data-td data last">852</td>
<td class="data-td data last">810</td>
<td class="data-td data last">841</td>
<td class="data-td data last" style="border-right: outset;">797</td>
<td class="data-td data last">60.88</td>
<td class="data-td data last">64.60</td>
<td class="data-td data last">68.55</td>
<td class="data-td data last">67.01</td>
<td class="data-td data last">64.84</td>
<td class="data-td data last" style="border-right: outset;">67.84</td>
<td class="data-td data last">5.33</td>
</tr>
<tr class="tbl-data">
<td class="data-td last">CC</td>
<td class="data-td data last">&nbsp;</td>
<td class="data-td data last">0.52</td>
<td class="data-td data last">0.55</td>
<td class="data-td data last" style="border-right: outset;">0.60</td>
<td class="data-td data last">&nbsp;</td>
<td class="data-td data last">835</td>
<td class="data-td data last">846</td>
<td class="data-td data last" style="border-right: outset;">900</td>
<td class="data-td data last">&nbsp;</td>
<td class="data-td data last">72.91</td>
<td class="data-td data last">72.53</td>
<td class="data-td data last" style="border-right: outset;">72.83</td>
<td class="data-td data last">0.92</td>
</tr>
<tr class="tbl-data">
<td class="data-td last">Total</td>
<td class="data-td data last">100</td>
<td class="data-td data last" style="border-right: outset;">100</td>
<td class="data-td data last">337</td>
<td class="data-td data last">325</td>
<td class="data-td data last">297</td>
<td class="data-td data last">314</td>
<td class="data-td data last">327</td>
<td class="data-td data last" style="border-right: outset;">285</td>
<td class="data-td data last">87.91</td>
<td class="data-td data last">89.51</td>
<td class="data-td data last">88.78</td>
<td class="data-td data last">86.69</td>
<td class="data-td data last">84.94</td>
<td class="data-td data last" style="border-right: outset;">88.96</td>
<td class="data-td data last">5.77</td>
</tr>
</tbody>
</table>
</div>
<br />
<p class="chart-disclosure">Source: ICE Data Services, VanEck. Fallen Angels: ICE US Fallen Angel High Yield 10% Constrained Index. Not intended as a recommendation to invest or divest in any of the sectors mentioned herein. Index performance is not representative of fund performance. It is not possible to invest in an index.</p>
<p>To receive more <a href="https://www.vaneck.com/us/en/insights/income-investing/" title="Income Investing insights"><strong>Income Investing</strong></a> insights, <a href="/link/5f45412c2143400497908cea2897f7d3.aspx" title=" Subscription Center"><strong>sign up in our subscription center</strong></a>.</p>
<style type="text/css">
     .wrapped-div {
     max-width: 100%;
     }
    
     @media (max-width: 1024px) {
     .wrapped-div {
     overflow-x: scroll;
     }
     }
    
        .wrapped-div-full {
     overflow-x: scroll;
     }
     
     .wrapped-div-sector {
     max-width: 100%;
     overflow-x: scroll;
     }
    </style>
]]></content:encoded>
</item><item rdf:about="https://www.vaneck.com/us/en/blogs/emerging-markets-bonds/em-bonds-guideposts-for-2024/">
  <title>EM Bonds Guideposts for 2024></title>
  <link>https://www.vaneck.com/us/en/blogs/emerging-markets-bonds/em-bonds-guideposts-for-2024/</link>
  <description><![CDATA[The economic backdrop appears supportive for emerging markets bonds headed into 2024. In this blog, we discuss five guideposts that are all largely supportive for the asset class.]]></description>
  <dc:creator>Eric Fine</dc:creator>
  <dc:date>12/11/2023 06:30:00</dc:date>
<content:encoded><![CDATA[

<p id="performance-overview" class="jump-link-nav anchored-block" data-jumplink-title="Performance Overview">In November, the <a href="https://www.vaneck.com/us/en/investments/emerging-markets-bond-fund-embax/overview/" title="Emerging Markets Bond Fund"><strong>VanEck Emerging Markets Bond Fund</strong></a> was up 5.83%, compared to 5.47% for its benchmark, the 50% J.P. Morgan Government Bond Index-Emerging Markets (GBI-EM) Global Diversified and 50% J.P. Morgan Emerging Markets Bond Index (EMBI). China (corporate exposure in hard currency) was the big winner for the month, as were Brazil, Mexico, and Colombia (all in local currency). We&rsquo;ve made few changes. Our duration remains near our benchmark&rsquo;s, having been very low through most of 2023. We end November with carry of 7.4%, yield to worst of 9.4%, duration of 5.7, and 50% of the fund in local currency. Our biggest exposures are Mexico (local and hard), China (local and hard), South Africa (local and hard), Brazil (local and hard), and Colombia (local and hard). <a href="/us/en/blogs/emerging-markets-bonds/em-bonds-guideposts-for-2024/em-bonds-guideposts-for-2024.pdf" target="_blank" rel="noopener" title="EM Bonds Guideposts for 2024."><strong>View here for a PDF version of this blog.</strong></a></p>
<div class="wrapped-div">
<table style="width: 100%;">
<tbody>
<tr class="tbl-data">
<td class="tbl-header last" colspan="8">Average Annual Total Returns (%) as of November 30, 2023</td>
</tr>
<tr class="tbl-data">
<td class="data-td last">&nbsp;</td>
<td class="data-head last">1 Month<sup>&dagger;</sup></td>
<td class="data-head last">3 Month<sup>&dagger;</sup></td>
<td class="data-head last">YTD</td>
<td class="data-head last">1 Year</td>
<td class="data-head last">3 Year</td>
<td class="data-head last">5 Year</td>
<td class="data-head last">10 Year</td>
</tr>
<tr class="tbl-data">
<td class="data-td last">Class A: NAV (Inception 07/09/12)</td>
<td class="data-td data last">5.83</td>
<td class="data-td data last">1.93</td>
<td class="data-td data last">6.76</td>
<td class="data-td data last">9.78</td>
<td class="data-td data last">-0.97</td>
<td class="data-td data last">3.43</td>
<td class="data-td data last">1.46</td>
</tr>
<tr class="tbl-data">
<td class="data-td last">Class A: Maximum 5.75% load</td>
<td class="data-td data last">-0.25</td>
<td class="data-td data last">-3.93</td>
<td class="data-td data last">0.62</td>
<td class="data-td data last">3.46</td>
<td class="data-td data last">-2.90</td>
<td class="data-td data last">2.21</td>
<td class="data-td data last">0.87</td>
</tr>
<tr class="tbl-data">
<td class="data-td last">Class I: NAV (Inception 07/09/12)</td>
<td class="data-td data last">5.78</td>
<td class="data-td data last">1.92</td>
<td class="data-td data last">6.90</td>
<td class="data-td data last">10.03</td>
<td class="data-td data last">-0.65</td>
<td class="data-td data last">3.76</td>
<td class="data-td data last">1.78</td>
</tr>
<tr class="tbl-data">
<td class="data-td last">Class Y: NAV (Inception 07/09/12)</td>
<td class="data-td data last">5.76</td>
<td class="data-td data last">1.89</td>
<td class="data-td data last">6.97</td>
<td class="data-td data last">9.98</td>
<td class="data-td data last">-0.72</td>
<td class="data-td data last">3.69</td>
<td class="data-td data last">1.72</td>
</tr>
<tr class="tbl-data">
<td class="data-td last">50% GBI-EM/50% EMBI</td>
<td class="data-td data last">5.47</td>
<td class="data-td data last">1.37</td>
<td class="data-td data last">7.68</td>
<td class="data-td data last">9.02</td>
<td class="data-td data last">-3.71</td>
<td class="data-td data last">0.94</td>
<td class="data-td data last">1.31</td>
</tr>
</tbody>
</table>
</div>
<br />
<div class="wrapped-div">
<table style="width: 100%;">
<tbody>
<tr class="tbl-data">
<td class="tbl-header last" colspan="8">Average Annual Total Returns (%) as of September 30, 2023</td>
</tr>
<tr class="tbl-data">
<td class="data-td last">&nbsp;</td>
<td class="data-head last">1 Month<sup>&dagger;</sup></td>
<td class="data-head last">3 Month<sup>&dagger;</sup></td>
<td class="data-head last">YTD</td>
<td class="data-head last">1 Year</td>
<td class="data-head last">3 Year</td>
<td class="data-head last">5 Year</td>
<td class="data-head last">10 Year</td>
</tr>
<tr class="tbl-data">
<td class="data-td last">Class A: NAV (Inception 07/09/12)</td>
<td class="data-td data last">-2.28</td>
<td class="data-td data last">-3.37</td>
<td class="data-td data last">2.35</td>
<td class="data-td data last">12.91</td>
<td class="data-td data last">-0.83</td>
<td class="data-td data last">2.07</td>
<td class="data-td data last">1.18</td>
</tr>
<tr class="tbl-data">
<td class="data-td last">Class A: Maximum 5.75% load</td>
<td class="data-td data last">-7.90</td>
<td class="data-td data last">-8.93</td>
<td class="data-td data last">-3.53</td>
<td class="data-td data last">6.42</td>
<td class="data-td data last">-2.77</td>
<td class="data-td data last">0.87</td>
<td class="data-td data last">0.58</td>
</tr>
<tr class="tbl-data">
<td class="data-td last">Class I: NAV (Inception 07/09/12)</td>
<td class="data-td data last">-2.43</td>
<td class="data-td data last">-3.46</td>
<td class="data-td data last">2.34</td>
<td class="data-td data last">13.01</td>
<td class="data-td data last">-0.56</td>
<td class="data-td data last">2.39</td>
<td class="data-td data last">1.48</td>
</tr>
<tr class="tbl-data">
<td class="data-td last">Class Y: NAV (Inception 07/09/12)</td>
<td class="data-td data last">-2.44</td>
<td class="data-td data last">-3.49</td>
<td class="data-td data last">2.43</td>
<td class="data-td data last">12.95</td>
<td class="data-td data last">-0.62</td>
<td class="data-td data last">2.32</td>
<td class="data-td data last">1.42</td>
</tr>
<tr class="tbl-data">
<td class="data-td last">50% GBI-EM/50% EMBI</td>
<td class="data-td data last">-2.98</td>
<td class="data-td data last">-2.78</td>
<td class="data-td data last">3.00</td>
<td class="data-td data last">11.55</td>
<td class="data-td data last">-3.60</td>
<td class="data-td data last">-0.13</td>
<td class="data-td data last">0.86</td>
</tr>
</tbody>
</table>
</div>
<br />
<p class="chart-disclosure"><sup>&dagger;</sup>&nbsp;Returns less than one year are not annualized.</p>
<p class="chart-disclosure"><strong>Expenses: Class A: Gross 2.55%, Net 1.22%; Class I: Gross 2.51%, Net 0.87%; Class Y: Gross 2.91%, Net 0.97%.</strong> Expenses are capped contractually until 05/01/24 at 1.25% for Class A, 0.95% for Class I, 1.00% for Class Y. Caps excluding acquired fund fees and expenses, interest, trading, dividends, and interest payments of securities sold short, taxes, and extraordinary expenses.</p>
<p class="chart-disclosure"><strong>The performance data quoted represents past performance. Past performance is not a guarantee of future results. Investment return and principal value of an investment will fluctuate so that an investor&rsquo;s shares, when redeemed, may be worth more or less than their original cost. Performance may be lower or higher than performance data quoted. Please call 800.826.2333 or visit vaneck.com for performance current to the most recent month ended.</strong></p>
<p class="chart-disclosure">The &ldquo;Net Asset Value&rdquo; (NAV) of a Fund is determined at the close of each business day, and represents the dollar value of one share of the fund; it is calculated by taking the total assets of the fund, subtracting total liabilities, and dividing by the total number of shares outstanding. The NAV is not necessarily the same as the ETF&rsquo;s intraday trading value. Investors should not expect to buy or sell shares at NAV.</p>
<h2 id="the-fed-is-likely-to-cut-its-policy-rate-in-2024" class="jump-link-nav anchored-block" data-jumplink-title="Five Guideposts for 2024">1. The Fed is likely to cut its policy rate in 2024, supporting EM local currency debt.</h2>
<p>Fed Funds are pricing in greater-than-50% odds of a rate cut in March, and over 70% odds of cuts in subsequent meetings. By itself, this reduces support for the US dollar against EM currencies, and lasts through 2024. This looks to be a key fact of 2024, and currencies are the most direct winner, to our eye. Our mantra remains &ldquo;the turn in policy rates is not the turn in risk&rdquo;, and we advise against chasing long-duration assets on the assumption that long-end rates will follow suit with a high degree of confidence. The mix of quantitative tightening plus 6+% fiscal deficits from the US (and rising ones in China) plus the rising perceived risk of central bank holdings of US Treasuries generate a cautious stance on duration, in our opinion. As we&rsquo;ve noted repeatedly in our writing, EM central banks have by-and-large maintained much higher real policy rates, and their bond markets exhibit steepness (not the inversion of the US yield curve). This sets EM bonds up very positively not just for currency strength, but for rallies on the longer end of their curves even if the US duration story remains indeterminate. One final point: EM currency strength tends to be self-fulfilling. Stronger EM currencies will further depress inflation, making policy and market rates that much higher in real terms. This boost to currencies can support declining yields, even if US yields aren&rsquo;t cooperating. This is a scenario very few are anticipating, we think.</p>
<h2 id="em-debt-should-perform-very-well">2. EM debt should perform very well in a &ldquo;soft landing&rdquo; scenario, but also in &ldquo;hard landing&rdquo; scenarios if they are &ldquo;stagflationary&rdquo;.</h2>
<p>The nature of any US recession will clearly be an important determinant of asset price outcomes. As we imply above, the only clear conclusion one can draw from any &ldquo;landing&rdquo; is that the US policy rate will decline. Further out the curve, we are less certain. Popular discourse posits a &ldquo;soft&rdquo; and &ldquo;hard&rdquo; landing, which is a useful framework. A &ldquo;soft&rdquo; landing, in which rates decline but due to a gentle and non-inflationary decline in demand, is an ideal scenario for emerging markets. Global demand is acceptable and rates and EM currencies should rally. This scenario is not much-disputed (rightly so), other than the argument that it might already be priced in (which we&rsquo;ll leave aside in this monthly letter, other than saying offshore exposure to emerging markets is low historically). What about a &ldquo;hard&rdquo; landing, though, in which final global demand falls more sharply? Well, two things should be said about that scenario. First, the US policy rate is likely to fall more sharply in that scenario, maintaining the support for EM currencies. Second, if any coming recession is &ldquo;stagflationary&rdquo; and characterized by sticky and elevated prices for less demand-elastic commodities, emerging markets perform well in that scenario, too, in our view. EM debt markets are filled with commodity exporters (unlike EM equities, which though they produce external surpluses they are not due to commodity exports). The new geopolitical configuration, in which key commodity producers (now including Russia, Saudi Arabia, and Iran) are increasingly aligned against the key DM importers, would support the odds of a &ldquo;stagflation&rdquo; scenario, as would ongoing Chinese commodity-intensive recover policy for its property sector.</p>
<h2 id="no-quick-policy-fixes-in-china">3. No quick policy &ldquo;fixes&rdquo; in China.</h2>
<p>Property prices are too high, but also too integrated in Chinese wealth, production, and social health to adjust without control. Targeted policies encouraging consolidation in the property sector, coupled with bank and official support for lending and debt workouts are happening. Housing is becoming central to social policy, too, with a one-trillion yuan urban housing project that includes conversion of under-construction units to social housing. A &ldquo;white list&rdquo; of property companies that is guiding the market as to who will operate in the future has been established. Even fiscal policy has been activated with an additional 0.8% of GDP in spending announced recently. But, the bulk of the work in the property sector will depend on structural reform. And, previous attempts didn&rsquo;t see great traction, so implementation remains a risk. Moreover, the adjustment in real estate prices required to restore equilibrium is monumental, so a decade should be a baseline expectation for that timeline. What does this mean to us? We still see no value in Chinese local-currency government bonds (rates are close to US rates, true in much of Asia). But we did gain exposure to Chinese corporate bonds <i>after</i> this year&rsquo;s collapse in bond prices (a follow-on from last year&rsquo;s collapse, which we also bought and sold). So, we&rsquo;re viewing the situation as an opportunity, but one where it&rsquo;s all about the details, upcoming catalysts (like debt workouts and new lending), with no big takeaways for broader markets. Other than that the policies we are seeing are commodities-intensive. And, that our opportunism is strengthened by our observation that it is almost impossible to find investors with a positive attitude toward anything Chinese.</p>
<h2 id="commodities-supply-risks-contained-not-eliminated">4. Commodities supply risks contained, not eliminated.</h2>
<p>The decline in oil prices following Hamas&rsquo; attack on Israel on October 7th gives an impression that geopolitical risks are overstated. Our take is different. We see the lack of a bullish response in oil markets as a reflection of major and regional powers&rsquo; agreement to prevent expansion of the conflict. This includes the US&rsquo;s Sunni allies as well as Iran. If that&rsquo;s the correct framing, then the key question is how long regional escalation can be prevented. We&rsquo;re not sure, consistent with the great uncertainty that characterizes popular media descriptions. Our point, therefore, is that what the oil market is pricing is a lack of regional escalation, but whether that containment continues is a bit of a toss-up. We&rsquo;ll use uranium as an example of our framework in action. For years, we noted that as the producer of 40% of the world&rsquo;s uranium, Kazakhstan was in a strong position and uranium would be highly subject to geopolitical risk. As it turned out, France&rsquo;s main supplier, Niger, was one of several west African nations subjected to coups. France goes shopping in Kazakhstan as a result, with uranium prices up 50% in the early part of this year. Our point is that one can focus on which particular termite will bring a chair down, or one can simply notice that there are termites and avoid the chair altogether. We prefer the latter framing. We did not predict a spike in uranium prices in March of 2023 following political events in Africa; instead, we simply said there are a lot of risks pointing in the direction of supply risk and that we don&rsquo;t know which particular bite of the termite makes it obvious. Geopolitical termites are present, be aware. The biggest challenge to this view is global demand &ndash; any sharp fall should be expected to reduce commodities demand.</p>
<h2 id="fiscal-dominance-will-remain-a-key-market-driver">5. Fiscal dominance will remain a key market driver. Over-indebted economies (mostly in the developed markets) will continue to drive market crises, and EM bond markets will continue to weather these crises smoothly.</h2>
<p>Do you remember the two fiscal crises and one banking crisis in the US this year? How about the budget crisis in the UK that led to a 15% gilt bill being printed and the resignation of a Prime Minister after just 90 days? Do you remember the struggles in the Japanese Government Bond market as the Bank of Japan exited its experimental monetary policies by allowing interest rates to rise (and the currency to weaken)? What do they have in common? They are all DM countries suffering from excess debt, or &ldquo;fiscal dominance&rdquo;. And their bond markets were the biggest sufferers this year as a result. At its most basic level, in situations of &ldquo;fiscal dominance&rdquo;, central banks can&rsquo;t credibly target inflation (as government bankruptcy will constrain rate hikes). This initial condition, and the absence of any likely solutions (we note above US and Chinese fiscal deficits appear large indefinitely) is an additional reason to be concerned about duration, at least. Whether duration sell offs are attributed to credit risk or to the term premium might lag reality, but to some extent reflect the same diminution in perceived US credit quality.</p>
<h2 id="exposure-types-and-significant-changes" class="jump-link-nav anchored-block" data-jumplink-title="Exposure Types and Significant Changes">Exposure Types and Significant Changes</h2>
<p>The changes to our top positions are summarized below. Our largest positions in November were Mexico, China, South Africa, Brazil, and Colombia:</p>
<ul class="content-list">
<li>We increased our local currency and hard currency sovereign exposure in South Africa and Chile. A prospect of China&rsquo;s (eventual) rebound improves the outlook for commodity prices in both countries, strengthening their technical test scores. South Africa&rsquo;s disinflation and the end of the hiking cycle, as well as realistic fiscal plans gave an extra boost to the country&rsquo;s policy test score. In Chile, it looks like most of negative developments are already priced in, whereas the central bank is getting less dovish having frontloaded a lot of rate cuts. In addition, the central bank also suspended its FX buying program, which should improve support for the Chilean peso.</li>
<li>We also increased our local currency exposure in Mexico and the Czech Republic. Mexico&rsquo;s increase mostly reflected the favorable price action, but we also must note the hawkish central bank and the stronger than expected growth outlook. Bonds&rsquo; valuations also remain attractive against this backdrop, improving the technical test score for the country. The Czech National Bank is also on the hawkish side, albeit we think it is getting closer to policy easing as economic growth remains very soft.</li>
<li>Finally, we increased our hard currency corporate exposure in China, as well as hard currency sovereign exposure in Qatar, Mongolia, and Cote d&rsquo;Ivoire. China&rsquo;s position reflected significant price appreciation, as authorities announced new measures to support real estate developers. We also added one particular bond following the announcement that a credible government official was promoted to a vice chairman position. In terms of our investment process, this improved the policy test score for the country. As regards Qatar, the country&rsquo;s geopolitical importance is an asset given the latest spike in the Middle East turbulence, and it can also benefit from higher oil prices. Higher commodity prices &ndash; in this case copper &ndash; is a boost to Mongolian assets. In addition, the country might be nearing a rating upgrade, which would reflect its prudent debt management, decreasing dependence on energy imports, and the rapid development of tourism industry. All these factors improved Mongolia&rsquo;s policy, technical, and economic test scores. Cote d&rsquo;Ivoire&rsquo;s bonds have good valuations, and there is potential for further spread compression on a soft landing/U.S. Fed is done scenario.</li>
<li>We reduced our hard currency sovereign and quasi-sovereign exposure in Argentina, and hard currency corporate exposure in Indonesia. Our move in Argentina reflects the post-election uncertainty about the new policy agenda, the speed of policy adjustment, and the transition period which can worsen the macro implosion, making it more difficult to fix the existing problems. In terms of our investment process, this worsened the policy test score for Argentina. In Indonesia, we participated in a tender and took profits on one of our corporate positions, hoping to employ the proceeds elsewhere.</li>
<li>We also reduced our local currency exposure in Brazil and Romania. Brazil&rsquo;s move was due to portfolio rebalancing, as well as the fact that the position outperformed a lot. In Romania, there is a great deal of uncertainty surrounding the new pension bill, which might affect the fiscal outcomes, bond issuance, and potential EU disbursements. In terms of our investment process, this worsened the policy test score for the country.</li>
<li>Finally, we reduced our hard currency sovereign exposure in Jordan and local currency exposure in Sri Lanka. Sri Lanka&rsquo;s debt restructuring remains noisy, with more concerns about transparency from bondholders, which worsens the policy test score for the country. Jordan&rsquo;s economy is very exposed to the Middle East turmoil, especially as the conflict&rsquo;s resolution remains elusive, worsening the technical and economic test scores for the country.</li>
</ul>
<p>To receive more <a href="https://www.vaneck.com/us/en/insights/emerging-markets-bonds/" title="Emerging Markets Bonds Insights"><strong>Emerging Markets Bonds</strong></a> insights, <a href="https://www.vaneck.com/us/en/subscribe/" title="Subscription Center"><strong>sign up in our subscription center</strong></a>.</p>
<style>
    .wrapped-div {
        max-width: 100%;
    }

    @media (max-width: 768px) {
        .wrapped-div {
            overflow-x: scroll;
        }
    }

    .wrapped-div-sector {
        max-width: 100%;
        overflow-x: scroll;
    }
</style>
]]></content:encoded>
</item><item rdf:about="https://www.vaneck.com/us/en/blogs/moat-investing/moat-stocks-show-grit-in-november-rally/">
  <title>Moat Stocks Show Grit in November Rally></title>
  <link>https://www.vaneck.com/us/en/blogs/moat-investing/moat-stocks-show-grit-in-november-rally/</link>
  <description><![CDATA[The S&amp;P 500 registered its best month in nearly a year and a half, but still could not keep pace with the Moat Index in November. The Moat Index has now outpaced the S&amp;P 500 by nearly 200 bps for the year, with one month to go.]]></description>
  <dc:creator>Brandon Rakszawski</dc:creator>
  <dc:date>12/11/2023 06:30:00</dc:date>
<content:encoded><![CDATA[

<p>After three straight negative months, U.S. equity markets snapped back in November with blockbuster gains that offset the overall declines from August through October. The S&amp;P 500 gained 9% in November, which marks its best month in nearly a year and a half, and its sixth-best monthly return in the last 20 years. Positive remarks by Federal Reserve members, inflation that continues to cool, and an economy that remains stronger than expected all supported the rally which moved the S&amp;P 500 within about 5% of its January 2022 all-time high.</p>
<p>The <a href="https://www.vaneck.com/us/en/investments/morningstar-wide-moat-etf-moat/index/" title="MOAT - VanEck Morningstar Wide Moat ETF - Overview"><strong>Morningstar Wide Moat Focus Index</strong></a> (the &ldquo;Moat Index&rdquo;) gained 9.92% in November, outpacing the benchmark S&amp;P 500 Index by about 80 basis points during the month. The outperformance was the result of strong stock selection with several previously beaten-down names from the industrial and financial sectors as leading contributors. More on these names later. Year to date, the Moat Index continues to lead the S&amp;P 500 by nearly 200 basis points as of the end of the month.</p>
<p>Smaller-cap companies breathed signs of life this month after having underperformed relative to their large-cap peers for much of the year. The <strong><a href="https://www.vaneck.com/us/en/investments/morningstar-smid-moat-etf-smot/index/" title="SMOT - VanEck Morningstar SMID Moat ETF - Overview">Morningstar US Small-Mid Cap Moat Focus Index</a></strong> (the &ldquo;SMID Moat Index&rdquo;) returned 10.01% in November, outpacing both the broad small- and mid-cap benchmarks by about 150 basis points each. Notably, the SMID Moat Index also outperformed the S&amp;P 500 as well as its larger-cap sister Moat Index during the month. However, year to date, small- and mid-caps still remain significant laggards versus large-caps which have been the dominate players in equity markets this year.</p>
<h3>U.S. Equities Rebound in End of Year Rally</h3>
<p><strong>As of 11/30/2023</strong></p>
<p><img class="img-responsive w-100" src="https://www.vaneck.com/contentassets/303cda9871484d6a9aaa96976d69d044/3903_moat-smot-blog_chart-1_2023-12_v1_blog.svg" alt="US Equities rebounded strongly in November" /></p>
<p class="chart-disclosure"><strong>Source: Morningstar. As of 11/30/2023.</strong> Past performance is no guarantee of future results. Index performance is not representative of fund performance. It is not possible to invest directly in an index. Fund performance current to the most recent month end is available by visiting vaneck.com or by calling 800.826.2333.</p>
<h2>Moat Investing: A Disciplined Long-Term Approach</h2>
<p>November's banner rally, which offset losses from the previous three months and propelled equites back toward a 2023 high, underscores the importance of remaining disciplined as an investor. Maintaining commitment to a well-defined and proven strategy can help reduce temptation to react emotionally during short-term market fluctuations. Morningstar&rsquo;s moat investing philosophy, centering on high-quality companies with attractive prices, has demonstrated its mettle across numerous market environments. The Moat Index, which has a more than 15-year track record, may not beat the market every month, but its history of outperformance over longer holding periods is clear.</p>
<p>One of the key ingredients to finding success as it relates to moat investing, is time. It's important to recognize that the moat philosophy is best viewed as a long-term approach. The full potential of the valuation opportunities identified by the strategy may not materialize in just one month. Patience is crucial for investors, as it allows time for the market to recognize the intrinsic value of these high-quality companies with fortified business models.</p>
<h3>Percent of Time the Moat Index Outperforms the S&amp;P 500 Index</h3>
<p><strong>March 2007 &ndash; November 2023</strong></p>
<p><img class="img-responsive w-100" src="https://www.vaneck.com/contentassets/303cda9871484d6a9aaa96976d69d044/3903_moat-smot-blog_chart-2_2023-12_v1_blog.svg" alt="The Moat Index Outperforms the S and P 500 100% of the time over 10-year rolling periods" /></p>
<div class="wrapped-div">
<table style="width: 100%;">
<tbody>
<tr class="tbl-data">
<td class="tbl-header last" style="font-weight: normal;">Total Periods</td>
<td class="tbl-header last" style="font-weight: normal;">201</td>
<td class="tbl-header last" style="font-weight: normal;">190</td>
<td class="tbl-header last" style="font-weight: normal;">166</td>
<td class="tbl-header last" style="font-weight: normal;">142</td>
<td class="tbl-header last" style="font-weight: normal;">82</td>
</tr>
<tr class="tbl-data">
<td class="data-td data last" style="text-align: left;">Total Outperformed</td>
<td class="data-td data last" style="text-align: left;">101</td>
<td class="data-td data last" style="text-align: left;">124</td>
<td class="data-td data last" style="text-align: left;">141</td>
<td class="data-td data last" style="text-align: left;">135</td>
<td class="data-td data last" style="text-align: left;">82</td>
</tr>
<tr class="tbl-data">
<td class="data-td data last" style="font-weight: bold; text-align: left;">Batting Average</td>
<td class="data-td data last" style="font-weight: bold; text-align: left;">50%</td>
<td class="data-td data last" style="font-weight: bold; text-align: left;">65%</td>
<td class="data-td data last" style="font-weight: bold; text-align: left;">85%</td>
<td class="data-td data last" style="font-weight: bold; text-align: left;">95%</td>
<td class="data-td data last" style="font-weight: bold; text-align: left;">100%</td>
</tr>
</tbody>
</table>
</div>
<br />
<p class="chart-disclosure"><strong>Source: Morningstar. As of 11/30/2023.</strong> Past performance is no guarantee of future results. Index performance is not illustrative of fund performance. Not intended as a recommendation to buy or to sell any of the securities mentioned herein. Batting Average is measured by dividing the number of periods a portfolio or investment strategy outperforms a benchmark by the total number of periods.</p>
<h2>Moat Index Top Contributors and Detractors</h2>
<p>The outperformance of the Moat Index was once again driven largely by stock selection as opposed to an overweight (or underweight) to any particular sector. Several previously beaten-down names, which were detractors to performance in preceding months, rebounded in November to lead as top contributors to performance for the month.</p>
<p><strong>TransUnion (TRU)</strong></p>
<p>TransUnion, <strong><a href="https://www.vaneck.com/us/en/blogs/moat-investing/stage-set-for-moat-stocks-rebound/" title="Stage Set for Moat Stocks Rebound?">highlighted in last month&rsquo;s blog as the leading detractor</a></strong>, saw its share price punished in October following disappointing third-quarter earnings and outlook. At the time, Morningstar equity analyst Rajiv Bhatia believed the sharp decline was an overreaction by the market and viewed TRU an attractive valuation opportunity. That view quickly proved correct with shares of TRU rebounding 34% in November as market participants came to the same realization. Today shares of TRU are trading around $60, representing about a 30% discount to Morningstar&rsquo;s current $91 fair value estimate.</p>
<p><strong>U.S. Bancorp (USB)</strong></p>
<p>U.S. Bancorp is another beaten-down name that finds itself as a top performer in November. Early in the year, the banking crisis that saw the collapse of Silicon Valley Bank, and others, led to indiscriminate selling pressure on share prices of all regional banks. Wide moat U.S. Bancorp did not escape the negative sentiment, seeing its share price decline over 20% in March of this year. USB saw its position in the Moat Index increase to a full weight that quarter due to attractive valuation. This month shares of the company rallied over 19% making it a top contributor to performance in November. USB shares are currently trading at about a 25% discount to Morningstar&rsquo;s $52 fair value estimate.</p>
<h3>Top Contributors and Detractors from Moat Index - November 2023</h3>
<div class="wrapped-div">
<table style="width: 750px;">
<tbody>
<tr class="tbl-data">
<td class="tbl-header last" colspan="5">Leading Contributors</td>
</tr>
<tr class="tbl-data">
<td class="data-td  last">Company</td>
<td class="data-head last">Ticker</td>
<td class="data-head last">Sector</td>
<td class="data-head last">Avg. Weight (%)</td>
<td class="data-head last">Contribution (%)</td>
</tr>
<tr class="tbl-data">
<td class="data-td last" style="font-weight: normal;">Salesforce Inc.</td>
<td class="data-td data last">CRM</td>
<td class="data-td data last">Information Technology</td>
<td class="data-td data last">2.55</td>
<td class="data-td data last">0.65</td>
</tr>
<tr class="tbl-data">
<td class="data-td last" style="font-weight: normal;">Equifax Inc.</td>
<td class="data-td data last">EFX</td>
<td class="data-td data last">Industrials</td>
<td class="data-td data last">2.17</td>
<td class="data-td data last">0.62</td>
</tr>
<tr class="tbl-data">
<td class="data-td last" style="font-weight: normal;">Agilent Technologies Inc.</td>
<td class="data-td data last">A</td>
<td class="data-td data last">Health Care</td>
<td class="data-td data last">2.40</td>
<td class="data-td data last">0.57</td>
</tr>
<tr class="tbl-data">
<td class="data-td last" style="font-weight: normal;">TransUnion</td>
<td class="data-td data last">TRU</td>
<td class="data-td data last">Industrials</td>
<td class="data-td data last">1.53</td>
<td class="data-td data last">0.52</td>
</tr>
<tr class="tbl-data">
<td class="data-td last" style="font-weight: normal;">U.S. Bancorp</td>
<td class="data-td data last">USB</td>
<td class="data-td data last">Financials</td>
<td class="data-td data last">2.55</td>
<td class="data-td data last">0.50</td>
</tr>
</tbody>
</table>
</div>
<br />
<div class="wrapped-div">
<table style="width: 750px;">
<tbody>
<tr class="tbl-data">
<td class="tbl-header last" colspan="5">Leading Detractors</td>
</tr>
<tr class="tbl-data">
<td class="data-td  last">Company</td>
<td class="data-head last">Ticker</td>
<td class="data-head last">Sector</td>
<td class="data-head last">Avg. Weight (%)</td>
<td class="data-head last">Contribution (%)</td>
</tr>
<tr class="tbl-data">
<td class="data-td last" style="font-weight: normal;">Veeva Systems Inc</td>
<td class="data-td data last">VEEV</td>
<td class="data-td data last">Health Care</td>
<td class="data-td data last">2.51</td>
<td class="data-td data last">-0.24</td>
</tr>
<tr class="tbl-data">
<td class="data-td last" style="font-weight: normal;">Corteva Inc</td>
<td class="data-td data last">CTVA</td>
<td class="data-td data last">Materials</td>
<td class="data-td data last">2.49</td>
<td class="data-td data last">-0.14</td>
</tr>
<tr class="tbl-data">
<td class="data-td last" style="font-weight: normal;">Fortinet Inc</td>
<td class="data-td data last">FTNT</td>
<td class="data-td data last">Information Technology</td>
<td class="data-td data last">1.28</td>
<td class="data-td data last">-0.10</td>
</tr>
<tr class="tbl-data">
<td class="data-td last" style="font-weight: normal;">Gilead Sciences Inc</td>
<td class="data-td data last">GILD</td>
<td class="data-td data last">Health Care</td>
<td class="data-td data last">2.86</td>
<td class="data-td data last">-0.07</td>
</tr>
<tr class="tbl-data">
<td class="data-td last" style="font-weight: normal;">Polaris Inc</td>
<td class="data-td data last">PII</td>
<td class="data-td data last">Consumer Discretionary</td>
<td class="data-td data last">1.00</td>
<td class="data-td data last">-0.04</td>
</tr>
</tbody>
</table>
</div>
<br />
<p class="chart-disclosure"><strong>Source: Morningstar, November 2023.</strong> Past performance is no guarantee of future results. Index performance is not illustrative of fund performance. Not intended as a recommendation to buy or to sell any of the securities mentioned herein.</p>
<h2>SMID Moat Index Top Contributors and Detractors</h2>
<p>The smaller-cap SMID Moat Index also saw much of its outperformance this month come from stock selection rather than sector allocation effect. Notably though, two sectors do stand out in terms of representation within top contributors for the month. From consumer discretionary, both Williams-Sonoma (WSM) and DoorDash (DASH) find themselves as top performers with shares of each company increasing roughly 25% in November. Healthcare was also well represented with DaVita (DVA) and Agilent Technologies (A) both posting impressive 20%+ returns during the month.</p>
<p>Names detracting from the SMID Moat Index performance during the month include payroll and human capital management software company Paycom Software (PAYC), life sciences cloud-based software solutions company Veeva Systems (VEEV), and auto-parts supplier BorgWarner (BWA).</p>
<h3>Top Contributors and Detractors from SMID Moat Index - November 2023</h3>
<div class="wrapped-div">
<table style="width: 750px;">
<tbody>
<tr class="tbl-data">
<td class="tbl-header last" colspan="5">Leading Contributors</td>
</tr>
<tr class="tbl-data">
<td class="data-td last">Company</td>
<td class="data-head last">Ticker</td>
<td class="data-head last">Sector</td>
<td class="data-head last">Avg. Weight (%)</td>
<td class="data-head last">Contribution (%)</td>
</tr>
<tr class="tbl-data">
<td class="data-td last" style="font-weight: normal;">Williams-Sonoma Inc</td>
<td class="data-td data last">WSM</td>
<td class="data-td data last">Consumer Discretionary</td>
<td class="data-td data last">1.74</td>
<td class="data-td data last">0.43</td>
</tr>
<tr class="tbl-data">
<td class="data-td last" style="font-weight: normal;">DoorDash Inc</td>
<td class="data-td data last">DASH</td>
<td class="data-td data last">Consumer Discretionary</td>
<td class="data-td data last">1.47</td>
<td class="data-td data last">0.37</td>
</tr>
<tr class="tbl-data">
<td class="data-td last" style="font-weight: normal;">DaVita Inc</td>
<td class="data-td data last">DVA</td>
<td class="data-td data last">Health Care</td>
<td class="data-td data last">1.17</td>
<td class="data-td data last">0.37</td>
</tr>
<tr class="tbl-data">
<td class="data-td last" style="font-weight: normal;">Equifax Inc</td>
<td class="data-td data last">EFX</td>
<td class="data-td data last">Industrials</td>
<td class="data-td data last">1.18</td>
<td class="data-td data last">0.34</td>
</tr>
<tr class="tbl-data">
<td class="data-td last" style="font-weight: normal;">Agilent Technologies Inc</td>
<td class="data-td data last">A</td>
<td class="data-td data last">Health Care</td>
<td class="data-td data last">1.31</td>
<td class="data-td data last">0.31</td>
</tr>
</tbody>
</table>
</div>
<br />
<div class="wrapped-div">
<table style="width: 750px;">
<tbody>
<tr class="tbl-data">
<td class="tbl-header last" colspan="5">Leading Detractors</td>
</tr>
<tr class="tbl-data">
<td class="data-td last">Company</td>
<td class="data-head last">Ticker</td>
<td class="data-head last">Sector</td>
<td class="data-head last">Avg. Weight (%)</td>
<td class="data-head last">Contribution (%)</td>
</tr>
<tr class="tbl-data">
<td class="data-td last" style="font-weight: normal;">Paycom Software Inc</td>
<td class="data-td data last">PAYC</td>
<td class="data-td data last">Industrials</td>
<td class="data-td data last">0.58</td>
<td class="data-td data last">-0.15</td>
</tr>
<tr class="tbl-data">
<td class="data-td last" style="font-weight: normal;">Veeva Systems Inc</td>
<td class="data-td data last">VEEV</td>
<td class="data-td data last">Health Care</td>
<td class="data-td data last">1.37</td>
<td class="data-td data last">-0.13</td>
</tr>
<tr class="tbl-data">
<td class="data-td last" style="font-weight: normal;">BorgWarner Inc</td>
<td class="data-td data last">BWA</td>
<td class="data-td data last">Consumer Discretionary</td>
<td class="data-td data last">1.26</td>
<td class="data-td data last">-0.11</td>
</tr>
<tr class="tbl-data">
<td class="data-td last" style="font-weight: normal;">HF Sinclair Corp</td>
<td class="data-td data last">DINO</td>
<td class="data-td data last">Energy</td>
<td class="data-td data last">1.64</td>
<td class="data-td data last">-0.07</td>
</tr>
<tr class="tbl-data">
<td class="data-td last" style="font-weight: normal;">Aptiv PLC</td>
<td class="data-td data last">APTV</td>
<td class="data-td data last">Consumer Discretionary</td>
<td class="data-td data last">1.30</td>
<td class="data-td data last">-0.06</td>
</tr>
</tbody>
</table>
</div>
<br />
<p class="chart-disclosure"><strong>Source: Morningstar, November 2023.</strong> Past performance is no guarantee of future results. Index performance is not illustrative of fund performance. Not intended as a recommendation to buy or to sell any of the securities mentioned herein.</p>
<h2>Accessing Moat Stocks</h2>
<p><strong><a href="/link/9e43dd198c5f4e419f13220685081895.aspx" title="MOAT - VanEck Morningstar Wide Moat ETF - Overview">VanEck Morningstar Wide ETF (MOAT)</a></strong> seeks to replicate as closely as possible, before fees and expenses the price and yield performance of the Morningstar Wide Moat Focus Index.</p>
<p><a href="/link/166321dbcfec440590fb51cf0ad629aa.aspx" title="SMOT - VanEck Morningstar SMID Moat ETF - Overview"><strong>VanEck Morningstar SMID Moat ETF (SMOT)</strong></a> seeks to track as closely as possible, before fees and expenses, the price and yield performance of the Morningstar US Small-Mid Cap Moat Focus Index.</p>
<p>To receive more <a href="https://www.vaneck.com/us/en/insights/moat-investing/" title="Moat Investing Insights"><strong>Moat Investing</strong></a> insights, <a href="https://www.vaneck.com/us/en/subscribe/" title=" Subscription Center"><strong>sign up in our subscription center</strong></a>.</p>
<style type="text/css">
.wrapped-div {
    max-width: 100%;
}
@media (max-width: 768px) {
    .wrapped-div {
        overflow-x: scroll;
    }
}
.wrapped-div-sector {
    max-width: 100%;
    overflow-x: scroll;
}
</style>
]]></content:encoded>
</item><item rdf:about="https://www.vaneck.com/us/en/blogs/gold-investing/ima-casanova-as-gold-hits-highs-miners-step-up/">
  <title>As Gold Hits Highs, Miners Step Up></title>
  <link>https://www.vaneck.com/us/en/blogs/gold-investing/ima-casanova-as-gold-hits-highs-miners-step-up/</link>
  <description><![CDATA[Gold sets a new intraday all-time high on December 4. We believe Gold equities will benefit from sustained, record high gold prices as investors look for leveraged and diversified exposure to gold.]]></description>
  <dc:creator>Imaru Casanova</dc:creator>
  <dc:date>12/11/2023 06:30:00</dc:date>
<content:encoded><![CDATA[

<p>Monthly gold market and economic insights from Imaru Casanova, Portfolio Manager, featuring her unique views on mining and gold&rsquo;s portfolio benefits.<a href="/us/en/blogs/gold-investing/ima-casanova-as-gold-hits-highs-miners-step-up/gold-monthly-commentary-november-2023.pdf" target="_blank" rel="noopener" title="As Gold Hits Highs, Miners Step Up"><strong> An expanded PDF version of this commentary, including fund specific information can be downloaded here.</strong></a></p>
<h2>Crossing the threshold</h2>
<p>Gold crossed the important $2,000 level and closed November at $2,036.41 per ounce, a gain of $52.53 or 2.65% for the month. It went on to set a new intraday all-time high of $2,135 in overseas trading ahead of the Monday, December 4 U.S. opening, before sliding back down to previous levels.</p>
<p>After underperforming gold significantly in October, gold equities did what we expect them to do in November. The NYSE Arca Gold Miners Index (GDMNTR)<sup>1</sup>&nbsp;and the MVIS Global Juniors Gold Miners Index (MVGDXJTR)<sup>2</sup>&nbsp;were up 11.3% and 14.7% respectively during the month, narrowing the valuation gap against the metal.</p>
<h2>To new highs and beyond (...hopefully)</h2>
<p>Gold is being supported by expectations that the U.S. Federal Reserve (Fed) may soon begin cutting rates, with markets implying a more than 50% chance of a rate reduction in March 2024, and a 68% chance of a cut in May 2024. Gold is also likely benefiting from continued safe haven buying as heightened global geopolitical risk persists.</p>
<p>We are positive on the outlook for the gold price in 2024 and beyond. Gold seems to have established strong support at around the $1,900 to $2,000 level. This is especially remarkable when we consider that investment demand, as gauged by the holdings of gold bullion ETFs, has been persistently declining. Daily, markets are trying to decide if a soft landing is still a possibility. We think we may be getting closer to a point where the U.S. and global economy begin to slow down more significantly under the stress imposed by high interest rates, and the strain of not one, but tragically now, two wars. These factors should lead to a drop in corporate earnings followed by a correction in equity markets and a weaker jobs market and higher unemployment rate.</p>
<p>Inflation has eased, but it remains above the Fed&rsquo;s 2% target, and continues to impact businesses and households. There is risk that bringing inflation back down to 2% could be a long process; historically that has been the case. We believe that when these risks become more apparent to markets and even more likely to generate poor outcomes for the financial system, gold is positioned to benefit. In 2024, we see opportunity for gold to test and break through the all-time highs of $2,075 in 2020 and $2,135 more recently, on December 4.</p>
<p>Perhaps more importantly, we view gold equities as well positioned to benefit from sustained, record high gold prices as investors look for leveraged and diversified exposure to gold.</p>
<h2>Gold equities may be the true beneficiaries</h2>
<p>We have been calling attention to the low valuation metrics of the gold mining sector at present, both historically for the industry and relative to gold. We contrast depressed market valuations and negative sentiment towards the sector, with gold companies that, as a group, financially and operationally are in good health today. We also have been highlighting the companies&rsquo; disciplined approach to growth with a focus on value creation by optimizing their portfolios, reducing costs, increasing mine lives and finding and developing new deposits, all while maximizing returns for stakeholders.</p>
<p>At approximately $1,935 per ounce, the average gold price so far this year is the highest ever annual average. Gold companies on average are producing gold at all-in sustaining costs of approximately $1,300 per ounce. While high inflation definitely hit margins these last couple of years, costs appear to be under control, and gold companies are generating a lot of free cash flow.</p>
<p>Yet, on the whole, they remain disciplined, unwilling to chase production or reserve growth at any cost. Mergers and Acquisition (M&amp;A) activity in the sector remains relatively muted. Instead, much of the more traditional M&amp;A activity has been replaced with creative transactions transforming companies into better businesses. A prime example of this is with AngloGold Ashanti (1.00% of Strategy net assets).</p>
<h2>Turning over a new leaf</h2>
<p>We recently met with the management of AngloGold Ashanti (AngloGold), one of the largest gold producers in the world. AngloGold produces about 2.5 million ounces of gold annually.<sup>*</sup>&nbsp;For decades, it has traded at a discount relative to its North American and Australian peers, in great part due to its South African asset base, primary stock listing and domicile, but also due to a large, complex and high-cost portfolio of mines. However, the company has been focused on streamlining its portfolio over the last several years.</p>
<p>In brief:</p>
<ul class="content-list">
<li>2020:
<ul class="content-list">
<li>Completed the sale of all its remaining South African assets.</li>
</ul>
</li>
<li>2022:
<ul class="content-list">
<li>Acquired junior developer Corvus Gold as well as some additional Nevada properties from Coeur Mining to increase its footprint in Nevada and further consolidate the Beatty District.</li>
<li>Achieved the restart of one its flagship assets, the Obuasi mine in Ghana, marking what is expected to be the beginning of a new era for this Tier 1 asset.<sup>&dagger;</sup></li>
</ul>
</li>
<li>2023:
<ul class="content-list">
<li>Continued its value creation and portfolio optimization journey, announcing the proposed combination of its Iduapriem mine in Ghana with Gold Field&rsquo;s adjacent Tarkwa mine. </li>
</ul>
</li>
</ul>
<p>The culmination of AngloGold&rsquo;s efforts over the last several years was the completion of its corporate restructuring on September 25, 2023, with a primary listing of its ordinary shares on the New York Stock Exchange, and a corporate domicile in the UK. The company, which now has its group headquarters in Denver, retains secondary listings on the Johannesburg and Ghana Stock Exchanges.</p>
<h2>Blueprint for success?</h2>
<p>Today, we view AngloGold as a transformed, significantly better, lower risk company. The company&rsquo;s strategy is well articulated by management and is now clear to us that AngloGold has a:</p>
<ul class="content-list">
<li>Healthy balance sheet (low net debt; more than $2 billion in liquidity).</li>
<li>Asset base made up of five Tier 1 assets, four Tier 2 assets and a growth pipeline supported by projects in the Americas (U.S. and Colombia).</li>
<li>Successful track record of increasing reserves (up 26% since 2017).</li>
<li>Commitment to safety, reducing costs and delivering on their promises.</li>
</ul>
<p>AngloGold is well-positioned to achieve what it has long been working towards in obtaining a market re-rating and closing the historical valuation gap relative to its peers. We believe this type of approach, mirrored by others in the industry, should lead to regained market confidence and interest in the space, as well as improved share price performance for gold mining companies, generally.</p>
<p>To receive more <strong><a href="https://www.vaneck.com/us/en/insights/gold-investing/" title="Gold Investing Insights">Gold Investing</a></strong> insights, <strong><a href="https://www.vaneck.com/us/en/subscribe/" title="Subscription Center">sign up in our subscription center</a></strong>.</p>
]]></content:encoded>
</item><item rdf:about="https://www.vaneck.com/us/en/blogs/income-investing/can-record-global-green-bond-issuance-drive-us-market/">
  <title>Can Record Global Green Bond Issuance Drive U.S. Market?></title>
  <link>https://www.vaneck.com/us/en/blogs/income-investing/can-record-global-green-bond-issuance-drive-us-market/</link>
  <description><![CDATA[Global green bond issuance has hit record levels despite a drop in issuance from U.S. corporations, signaling strong demand for sustainable finance.]]></description>
  <dc:creator>Sunny  Bokhari</dc:creator>
  <dc:date>12/08/2023 06:30:00</dc:date>
<content:encoded><![CDATA[

<p>This year&rsquo;s record-breaking green bond issuance is an indication of not only strong demand for sustainable fixed income investments among investors but also growing interest from issuers to tap into this market to finance their transition strategies. With a global push towards renewable energy, electric vehicles, and the broader transition to net-zero, green bonds have gained prominence as a way to fund projects that contribute to environmental objectives.</p>
<h2>Global Landscape and U.S. Green Bond Issuance</h2>
<p>Global green bond issuance has soared, reaching an impressive $436.99 billion year-to-date (YTD)<sup>1</sup>, according to data compiled by the Climate Bond Initiative.</p>
<p>However, corporations in the U.S. have scaled back their issuance of green bonds this year. A variety of factors may help to explain this, including significantly higher U.S. interest rates and political resistance from some quarters against sustainable investment strategies.</p>
<h3>Green Bond Issuance 2023 and Entities Issuing Green Bonds in U.S.</h3>
<p><img loading="lazy" class="img-responsive w-100" src="https://www.vaneck.com/contentassets/4720cd06f2d34f27a7c049c5e7bae414/3884_grnb-dec_chart-4_2023-12_v1_blog.svg" alt="Pie charts showing green bond issuance in 2023 by country and entities issuing green bonds in the U.S." /></p>
<p class="chart-disclosure">Source: Climate Bond Initiative, as of Nov 13, 2023.</p>
<h2>U.S. Green Bond Market: Key Players and Trends</h2>
<p>U.S. government-related entities issued around $18.2 billion in green bonds in 2023, accounting for about 35% of total U.S. issuance YTD. California Community Choice Financing Authority ($4.9 billion), New York Metropolitan Transport Authority ($2.5 billion), Fannie Mae ($2.3 billion), Freddie Mac ($1.3 billion) and Washington Metropolitan Area Transit Authority ($1.2 billion) accounted for the bulk of this issuance. Asset-backed securities issuance stood at $7.0 billion, primarily consisting of home solar loans and E.V. vehicle loans. U.S. corporations have issued $50.7 billion worth of green bonds in 2023, accounting for approximately 50% of the U.S. total issuance.<sup>1</sup></p>
<p>Below we take a closer look at a few notable U.S. green bond issuers in 2023:</p>
<p><strong>JPMorgan Chase<sup>2</sup>:</strong> In 2023, the largest U.S. bank raised $7.25 billion through three parts, including a $2 billion green bond. The funds will finance eligible green projects, spanning green buildings, renewable energy, and sustainable transportation, in alignment with the bank's sustainable bond framework. The bank&rsquo;s previous green bonds have financed solar and wind renewable energy projects across the United States adding around 666 MW of renewable capacity, generating 2,523 GWh of renewable energy and helping to avoid around $2 million tons of carbon dioxide emissions.<sup>3</sup></p>
<p><strong>MidAmerican Energy Company<sup>4</sup>:</strong> MidAmerican Energy, a repeat issuer, issued $1.35 billion in green bonds this year to finance new renewable energy projects. MidAmerican serves the energy needs of more than 1.6 million customers in Iowa, Illinois, Nebraska and South Dakota. MidAmerican has invested nearly $15 billion in renewable energy projects across Iowa and financed around $5.75 billion of these via green bonds. The company has more wind generation capacity than any other investor-owned utility in the U.S. With its commitment to renewable energy generation, MidAmerican has retired five of its 11 coal units and has reduced its CO<sub>2</sub>&nbsp;emissions by 41% since 2005.<sup>5</sup></p>
<p><strong>PNC Financial Services Group<sup>6</sup>:</strong> In 2023, PNC closed its latest green bond issuance, raising $1.25 billion to fund projects including renewable energy, energy efficiency, green buildings, and clean transportation.</p>
<p><strong>PacifiCorp<sup>7</sup>:</strong> PacifiCorp, the largest grid operator in the western U.S., holds renewable energy assets in Wyoming, Montana, Oregon and Utah. The company&rsquo;s investments through its green bond program have helped generate around 15,843 GWh of renewable energy<sup>8</sup>&nbsp;so far. With its latest issuance of $1.2 billion in green bonds, the company plans to deploy funds to its wind or solar energy generation development or transmission development program to make its grids more energy efficient.</p>
<p><strong>Comcast Corporation<sup>9</sup>:</strong> Comcast issued a $1 billion 10-year green bond earlier this year to help the company&rsquo;s efforts to reduce its carbon footprint and support its goal to be carbon neutral by 2035. The bond will help finance renewable energy, energy efficiency, green buildings, clean transportation, and circular economy initiatives.<sup>10</sup></p>
<p><strong>Verizon Communications<sup>11</sup>:</strong> Verizon was the first U.S. telecom company to issue a green bond in 2019. Verizon has issued four additional $1 billion green bonds including its latest green bond offering issued in May 2023. Verizon plans to allocate the net proceeds to renewable energy investments.<sup>12</sup>&nbsp;The company expects to source 50% of its annual electricity usage from renewable energy by 2025 and 100% by 2030. It is also developing on-site green energy generation at its facilities. Since 2013, Verizon has installed 37.6 MW of on-site green energy.</p>
<h2>Challenges and Opportunities on the Horizon</h2>
<p>Despite continued headwinds to U.S. market growth, the rebound in global green bond issuance signals a positive trajectory for sustainable finance. The U.S. political landscape may continue to pose challenges in the near term for sustainable investment strategies, but we believe this year&rsquo;s record-breaking issuance globally signals strong demand.</p>
<p>Green bonds can appeal to investors who may be skeptical or critical of broader ESG investment strategies. Because they focus on a bond&rsquo;s use of proceeds rather than the broader activities of the issuer, evaluation is more straightforward and objective. Security selection does not rely on backward looking and sometimes incomplete data, but rather projects that can bring positive environmental benefits going forward. An investment in green bonds has a direct impact on financing environmentally friendly projects.</p>
<p>Lastly, from an investment perspective, green bonds have the same risk and reward as conventional bonds, all else equal, allowing investors to invest sustainably in their core fixed income portfolios without materially changing the overall risk and return characteristics of their portfolio. These features have contributed to the market&rsquo;s significant growth over the past decade, and the global push towards sustainability suggests that the green bond market will continue to play a pivotal role in financing the transition to a more environmentally aware future.</p>
<p>The <a href="https://www.vaneck.com/us/en/investments/green-bond-etf-grnb/overview/" title="GRNB - VanEck Green Bond ETF - Overview"><strong>VanEck Green Bond ETF (GRNB)</strong></a> seeks to replicate, as closely as possible, before fees and expenses, the price and yield performance of the S&amp;P Green Bond U.S. Dollar Select Index. The index is comprised of U.S. dollar-denominated green bonds that are issued to finance environmentally friendly projects and includes bonds issued by supranational, government and corporate issuers globally.</p>
<p>To receive more <a href="/us/en/blogs/income-investing/" title="Income Investing Insights"><strong>Income Investing</strong></a> insights, <a href="/link/5f45412c2143400497908cea2897f7d3.aspx" title=" Subscription Center"><strong>sign up in our subscription center</strong></a>.</p>
]]></content:encoded>
</item><item rdf:about="https://www.vaneck.com/us/en/blogs/emerging-markets-bonds/em-bonds-are-in-good-shape-for-2024/">
  <title>EM Bonds Are In Good Shape for 2024></title>
  <link>https://www.vaneck.com/us/en/blogs/emerging-markets-bonds/em-bonds-are-in-good-shape-for-2024/</link>
  <description><![CDATA[Conditions for emerging markets bonds remain supportive headed in 2024, thanks to a substantial yield cushion and the potential for a Fed orchestrated soft landing.]]></description>
  <dc:creator>Fran Rodilosso</dc:creator>
  <dc:date>12/08/2023 06:30:00</dc:date>
<content:encoded><![CDATA[

<p>Compared to U.S. core fixed income asset classes, emerging markets (EM) fixed income has had a relatively strong 2023. High carry has driven returns, and less exposure to U.S. duration risk has continued to be a positive contributor. Looking to 2024, slowing growth, the Fed&rsquo;s policy direction and geopolitical risk are sources of uncertainty. However, with yields providing substantial cushion amid the possibility that the Fed can orchestrate a soft landing, we expect conditions to remain supportive for various segments within EM debt.</p>
<h3>Emerging Markets Fixed Income Has Had a Relatively Strong 2023</h3>
<p><strong>Yield &amp; Duration as of 11/30/2023</strong></p>
<p><img class="img-responsive w-100" src="https://www.vaneck.com/contentassets/ba381e0a6dbc4950962174e9cdb09e49/3898_emlc_chart-1_2023-12_blog.svg" alt="Emerging Markets Bonds Have Had a Relatively Strong 2023" /></p>
<p class="chart-disclosure">Source: J.P. Morgan and ICE Data Indices as of 11/30/2023. EM HY Corporates is represented by ICE BofA Diversified High Yield US Emerging Markets Corporate Plus Index; EM USD Sovereigns is represented by the J.P. Morgan EMBI Global Diversified Index; US HY Corporates is represented by the ICE BofA US High Yield Index; EM Local Currency Sovereign is represented by the J.P. Morgan GBI-EM Global Core Index; US IG Corporates is represented by the ICE BofA US Corporate Index; US Broad Market is represented by the ICE BofA US Broad Market Index; US Treasuries is represented by the ICE BofA US Treasury Index.</p>
<h2>Local Currency Sovereigns:</h2>
<p>The U.S. macro and rate environment, and how that impacts Fed policy, may have a significant impact on emerging markets local currency sovereign bonds in 2024. If the market consensus for a soft landing materializes we expect a fairly benign environment for the asset class. Continued declines in U.S. inflation may lead to rate cuts by the Fed at some point next year, and could keep longer term U.S. yields from rising significantly (although we do not expect significant declines from current levels). This may benefit EM currencies (EMFX) as dollar weakness continues, but EMFX has rarely been the key driver of positive returns in EM local debt. For instance, EMFX has rallied over the past two months as U.S. bond yields have declined, but has contributed only approximately +1.3% to a total return of approximately +8.4% this year. We believe a similar dynamic could play out next year, with EMFX supported but carry being the primary driver of total return. Although there is certainly a case for a more bearish view on the U.S. dollar, EMFX strength may be tempered by rate cuts by many EM central banks. If the Fed cuts rates sooner or deeper than expected, we would expect that to be accompanied by a sell-off in risk assets, which may not favor EMFX.</p>
<p>Another rationale for an EM allocation is that sovereign fundamentals remain in good shape. EM inflation has continued to moderate and will likely hit target levels in many countries next year. EM central banks have remained vigilant, providing support for currencies and generating attractive real interest rates. Although the rate differential versus U.S. rates has declined below historical averages, we believe the fundamental story in EM versus DM make such comparisons less relevant.</p>
<h2>High Yield Corporates:</h2>
<p>Within EM corporates, high yield bonds may be an attractive alternative or complement to U.S. high yield in 2024 in a soft landing scenario. With yields currently over 10%, we believe they offer attractive income potential given the higher quality of universe compared to U.S. high yield in terms of credit quality exposure. The asset class also enters 2024 with less exposure to the troubled Chinese property sector compared to prior years, with 1.3% exposure as of 11/30/2023 versus nearly 7% at the beginning of 2022. Similar to most credit asset classes, spreads are currently tighter than their historical average, although to a much lesser degree than U.S. high yield. With resilient fundamentals and net issuance that is expected to remain muted next year, we see continued support for spreads which may help balance against macro uncertainty. Notably, although most U.S. investment grade bond indexes include emerging markets borrowers, U.S. high yield bond indexes and associated products do not and so EM high yield bond allocations can add significant diversifications at the borrower level.</p>
<p>To receive more <a href="https://www.vaneck.com/us/en/insights/emerging-markets-bonds/" title="Emerging Markets Bonds Insights"><strong>Emerging Markets Bonds</strong></a> insights, <a href="https://www.vaneck.com/us/en/subscribe/" title="Subscription Center"><strong>sign up in our subscription center</strong></a>.</p>
]]></content:encoded>
</item><item rdf:about="https://www.vaneck.com/us/en/blogs/digital-assets/matthew-sigel-vanecks-15-crypto-predictions-for-2024/">
  <title>VanEck’s 15 Crypto Predictions for 2024></title>
  <link>https://www.vaneck.com/us/en/blogs/digital-assets/matthew-sigel-vanecks-15-crypto-predictions-for-2024/</link>
  <description><![CDATA[We outline our top 15 Crypto Predictions for 2024.]]></description>
  <dc:creator>Matthew  Sigel</dc:creator>
  <dc:date>12/07/2023 06:30:00</dc:date>
<content:encoded><![CDATA[

<p><strong>Please note that VanEck may have a position(s) in the digital asset(s) described below.</strong></p>
<p>Step into the realm of speculation with us as we embark on a whimsical journey into the future of crypto in 2024. In the ever-evolving landscape of digital assets, where imagination is not just a luxury but a necessary locomotive for investors, predicting a path feels akin to navigating through a galaxy of possibilities. We understand the skepticism that often surrounds predictions&mdash;after all, foreseeing the twists and turns of the crypto cosmos can feel as elusive as catching stardust in your hands. Yet, here we are, ready to peer into the crystal ball with a twinkle in our eyes, saluting the challenge. Because in the world of cryptocurrencies, where coins and tokens are born from the void, imagination has always been the catalyst for innovation. So, fasten your seatbelts, stow away your doubts, and join us in this speculative expedition as we attempt these first tracks in 2024's crypto terrain&hellip;with a few potential money-making ideas along the way, we ho-ho-hope! Here are our 15 crypto predictions for 2024, <a href="https://www.vaneck.com/us/en/webinar-registration/?id=93812799786&amp;utm_source=vaneck&amp;utm_medium=calendar" title="Why Bitcoin Will Soar in 2024&hellip;Plus More Crypto Predictions"><strong>which we will dive into more on an upcoming webinar</strong></a>:</p>
<ol class="content-list" style="font-weight: bold;">
<li><a href="#us-recession-arrival-and-debut-of-spot-bitcoin-etfs">U.S. Recession Arrival and Debut of Spot Bitcoin ETFs</a></li>
<li><a href="#uneventful-fourth-bitcoin-halving">Uneventful Fourth Bitcoin Halving</a></li>
<li><a href="#bitcoins-all-time-high-in-q4-of-2024">Bitcoin's All-Time High in Q4 of 2024</a></li>
<li><a href="#ethereums-market-position-behind-bitcoin-in-2024">Ethereum's Market Position Behind Bitcoin in 2024</a></li>
<li><a href="#dominance-of-eth-layer-2s-post-eip-4844">Dominance of ETH Layer 2s Post-EIP-4844</a></li>
<li><a href="#nft-activity-peaks-to-new-heights">NFT Activity Peaks to New Heights</a></li>
<li><a href="#binance-relinquishes-top-position-in-spot-trading">Binance Relinquishes Top Position in Spot Trading</a></li>
<li><a href="#stablecoin-market-cap-hits-record-high-with-usdc-market-share-recovery">Stablecoin Market Cap Hits Record High with USDC Market Share Recovery</a></li>
<li><a href="#decentralized-exchanges-attain-record-spot-trading-market-share">Decentralized Exchanges Attain Record Spot Trading Market Share</a></li>
<li><a href="#bitcoin-yield-opportunities-driven-by-remittances-and-smart-contract-platforms">Bitcoin Yield Opportunities Driven by Remittances and Smart Contract Platforms</a></li>
<li><a href="#emergence-of-a-leading-blockchain-game">Emergence of a Leading Blockchain Game</a></li>
<li><a href="#solana-outperforms-ethereum-with-resurging-defi-tvl">Solana Outperforms Ethereum with Resurging DeFi TVL</a></li>
<li><a href="#meaningful-adoption-of-depin-networks">Meaningful Adoption of DePin Networks</a></li>
<li><a href="#corporate-crypto-holdings-boosted-by-new-accounting-standards">Corporate Crypto Holdings Boosted by New Accounting Standards</a></li>
<li><a href="#defis-reconciliation-with-kyc-regulations">DeFi's Reconciliation with KYC Regulations</a></li>
</ol>
<h2 id="us-recession-arrival-and-debut-of-spot-bitcoin-etfs" class="jump-link-nav anchored-block" data-jumplink-title="Bitcoin ETF Predictions">1. The long-awaited U.S. recession will finally arrive, but so will the first spot Bitcoin ETFs!</h2>
<p>The U.S. economy will finally succumb to recession in the first half of the year. Economic momentum has been slowing for months, and inflation has cooled along, creating an economy more vulnerable to shocks. U.S. leading indicators are now in recessionary territory after 19 months of consecutive declines, close to a record. Shares of retailers are struggling, commodities are weak, employment is softening, corporate bankruptcy filings are back to early COVID levels, and the yield curve is inverted but steepening in recent weeks- all are very late-cycle dynamics. "Soft landing" mentions in the media have spiked, as they often do before an official recession is called. Bitcoin has only experienced one official US recession, from January to April 2020, during which it fell 60% peak-to-trough before rallying sharply once the Fed provided sufficient liquidity. Gold also tends to decline in the early periods of a recession - it fell 12% in two weeks in March 2020. Still, its recent breakout confirms strong demand for hard money that is not cancellable by U.S. authorities, a characteristic shared with Bitcoin. As debt levels are more concerning at the sovereign than corporate or household levels, we expect more than $2.4B will flow into newly approved US spot Bitcoin ETFs in Q1 2024 to keep the Bitcoin price elevated. Notwithstanding the possibility of significant volatility, the Bitcoin price is unlikely to fall below $30k in Q1 2024.</p>
<p>We approximate the inflows into Bitcoin ETFs by examining the relative ratios of the SPDR Gold Shares (GLD) ETF and adjusting it to 2023 dollars. The GLD ETF launched on November 18, 2004, and it saw inflows of around $1B in the first few days of launch, and by the end of Q1 2005, around $2.26B was in GLD. At that date, the total physical gold supply stood at around 152k metric tons, with each ton worth around $15.6M, which implies a total market value of $2.36T. The initial dollar inflows into GLD in those first few days post-launch were around 0.04% of the total gold market. Around one quarter later, on March 31, 2005, GLD reached inflows of $2.26B, and after accounting for supply growth and gold price changes, GLD had become 0.1% of the global gold supply. If we apply these figures to the Bitcoin spot market, we arrive at inflows of $310M in the first few days of BTC spot ETF and ~$750M within a quarter.</p>
<p>However, that was the era of higher interest rates and a far lower money supply. In 2023, we are no longer in the &ldquo;Dead Ball&rdquo; era of finance but are careening through the HGH/Steroid era. As measured by the New York Federal Reserve Bank, the supply of M2 in November 2004 was 6.4T dollars compared to $20.7T in October 2023. As such, we believe it is logical to apply that ratio, 3.23x, to possible inflows, bringing us to around $1B in the first few days of a spot Bitcoin ETF and $2.4B within a quarter. Extending our logic further, a more mature state of the BTC ETF may approximate around 1.7%, the approximate amount of gold&rsquo;s total supply held in gold ETFs, of the total spot market for BTC. This initial sum stands at around $12.5B. As we assume that Bitcoin is taking significant market share from Gold among the hard money crowd and expect 2024 to be a peak year of voter understanding of debt-driven money printing, we apply our 3.23x multiple based on M2 outstanding, to arrive at a medium-term estimate of $40.4B inflows over the first two years of trading.</p>
<p>Lastly, we note that Coinbase charges retail traders all-in transaction fees of ~2.5%. We believe spot Bitcoin ETFs will likely trade at ~10bps spreads, with zero commission at many brokerages. When was the last time a 10x cost reduction didn't catalyze MUCH higher penetration for new tech?</p>
<h2 id="uneventful-fourth-bitcoin-halving" class="anchored-block">2. The 4th Bitcoin halving will occur with minimal drama.</h2>
<p>The four-year Bitcoin halving will proceed without a major fork or missed blocks in April 2024. As the new coin issuance gets cut in half, unprofitable miners will disconnect, ceding shares to those with low-cost power. Still, the public markets will see little distress thanks to much-improved balance sheets among listed miners, who currently control a record % global hash rate (~25%). After a brief (several days to several weeks) period of consolidation post-halving, as the market digests the additional selling pressure from unprofitable miners, Bitcoin will rise above $48k, the neckline of the head-and-shoulder pattern completed in April 2022. Bitcoin miners, in aggregate, will underperform the Bitcoin price before the halving, although the low-cost miners CLSK and RIOT will outperform the field. After the halving, we expect at least one publicly traded miner to be 10x by the end of the year.</p>
<h3>Days Since Bitcoin Cycle Peak</h3>
<p><img class="img-responsive w-100" src="https://www.vaneck.com/contentassets/d2f1f34bab734265bf492a8bf2fb44c7/3882_crypto-prediction_chart-2_2023-12_v1_blog.svg" alt="Days Since Bitcoin Cycle Peak" /></p>
<p class="chart-disclosure">Source: Bloomberg, VanEck research as of 11/30/23. <strong>Past performance is not indicative of future results. Not intended as a recommendation to buy or sell any of the names mentioned herein.</strong></p>
<h2 id="bitcoins-all-time-high-in-q4-of-2024" class="anchored-block">3. Bitcoin will make an all-time high in Q4.</h2>
<p>In the second half of 2024, Bitcoin will climb a Presidential-sized wall of worry. The percentage of the global population voting in legislative and presidential elections will hit an all-time high above 45% in 2024. This high level of important elections augurs high volatility and the prospect of significant changes. More specifically, we see mounting evidence that voters and courts are rejecting the anti-growth agenda of the Green lobby. Thus, after a combative election that saw Donald Trump win 290 electoral votes and regain the Presidency, raising optimism that the SEC's hostile regulatory approach will be dismantled, we think the Bitcoin price will reach an all-time high on November 9th, exactly 3 years to the day from its last all-time high. (Recall that Bitcoin&rsquo;s breakout in November 2020 also came exactly three years to the day from its November 2017 top). If Bitcoin reaches $100k by December, we make a long-shot call that Satoshi Nakamoto will be named Time Magazine's "Man of the Year."</p>
<p><img class="img-responsive w-100" src="https://www.vaneck.com/contentassets/d2f1f34bab734265bf492a8bf2fb44c7/3882_crypto-prediction_chart-3_2023-12_v1_blog.svg" alt="Bitcoin Cycle Returns" /></p>
<p class="chart-disclosure">Source: Bloomberg, VanEck research as of 11/30/23. <strong>Past performance is not indicative of future results. The information, valuation scenarios and price targets presented on Bitcoin in this blog are not intended as financial advice or any call to action, a recommendation to buy or sell Bitcoin, or as a projection of how Bitcoin will perform in the future. Actual future performance of Bitcoin is unknown, and may differ significantly from the hypothetical results depicted here. There may be risks or other factors not accounted for in the scenarios presented that may impede the performance of Bitcoin. These are solely the results of a simulation based on our research, and are for illustrative purposes only. Please conduct your own research and draw your own conclusions.</strong></p>
<h2 id="ethereums-market-position-behind-bitcoin-in-2024" class="jump-link-nav anchored-block" data-jumplink-title="Ethereum Predictions">4. Ethereum won&rsquo;t flip Bitcoin in 2024</h2>
<p>Ethereum will fail to flip Bitcoin in 2024, but it will outperform every mega-cap tech stock. Bitcoin&rsquo;s more apparent regulatory status and energy intensity will attract interest from quasi-state entities in Latin America, the Middle East, and Asia. Argentina will join El Salvador, the UAE, Oman, and Bhutan as the fifth country to sponsor Bitcoin mining at the state level, as Argentina&rsquo;s state-owned energy giant YPF may indicate interest in mining digital assets with stranded methane and gas. Like past cycles, Bitcoin will lead the market to rally, and the value will flow into smaller tokens just after the halving. ETH won&rsquo;t begin outperforming Bitcoin until post-halving and may outperform for the year, but there will be no &ldquo;flippening.&rdquo; Despite a strong performance in 2024, ETH will lose market share to other smart contract platforms with less uncertainty surrounding their scalability roadmap, such as Solana.</p>
<h3>Bitcoin Mining Investments ($'m) By Country, GDP</h3>
<p><img class="img-responsive w-100" src="https://www.vaneck.com/contentassets/d2f1f34bab734265bf492a8bf2fb44c7/3882_crypto-prediction_chart-4_2023-12_v1_blog.svg" alt="Bitcoin Mining Investments" /></p>
<p class="chart-disclosure">Source: Bloomberg Intelligence as of 8/31/23. <strong>Past performance is not indicative of future results. Not intended as a recommendation to buy or sell any of the names mentioned herein.</strong></p>
<h3>ETH: BTC Ratio</h3>
<p><img class="img-responsive w-100" src="https://www.vaneck.com/contentassets/d2f1f34bab734265bf492a8bf2fb44c7/3882_crypto-prediction_chart-5_2023-12_v1_blog.svg" alt="ETH: BTC Ratio" /></p>
<p class="chart-disclosure">Source: Coingecko as of 11/28/2023. <strong>Past performance is not indicative of future results. Not intended as a recommendation to buy or sell any of the names mentioned herein.</strong></p>
<h2 id="dominance-of-eth-layer-2s-post-eip-4844" class="anchored-block">5. ETH L2s will capture the majority of EVM-compatible TVL and volume post-EIP-4844</h2>
<p>Ethereum will implement EIP-4844 (proto-danksharding), which will reduce transaction fees and improve scalability for layer 2 chains such as Polygon, Arbitrum, Optimism, and others. Within 1 year of the upgrade, Ethereum L2s will consolidate down to 2-3 dominant players as measured by value and usage. One will achieve higher monthly DEX volume/TVL than Ethereum for the first time. Collectively, these chains may accumulate 2x the DEX volume of Ethereum (currently 0.8x) by Q4 of 2024 and 10x the number of transactions.</p>
<p>One of them will achieve higher monthly DEX volume/TVL (total valued locked) than Ethereum for the first time. This is because cheaper transaction fees enable tighter bid/ask spreads due to the high cost of DEX transactions on Ethereum. With stricter bid/ask spreads, there exists a greater number of arbitrage opportunities, which leads to more trading. Additionally, faster block times, only 0.25 seconds on chains like Arbitrum, enable more transaction throughput and more prospects for CEX/DEX and DEX/DEX arbitrage. As a result, DEXes and L2s should attract more volume due to the trading opportunities they enable. Collectively, these chains may accumulate 2x the DEX volume of Ethereum (currently 0.8x) by Q4 of 2024 and 10x the number of transactions.</p>
<p>Within 1 year of the upgrade, Ethereum L2s will consolidate down to 2-3 dominant players as measured by value and usage. This is due to the fact that liquidity fragmentation will accelerate the dominance of the dominant L2s. This has already occurred in DEXes, where the exchanges Uniswap, Pancake Swap, and Curve accounted for 78% of DEX volumes in 2023. The same market consolidation on will occur across L2s, with Arbitrum and Optimism looking to be the main contenders.</p>
<h3>Ethereum Share of DEX Volume</h3>
<p><img class="img-responsive w-100" src="https://www.vaneck.com/contentassets/d2f1f34bab734265bf492a8bf2fb44c7/3882_crypto-prediction_chart-6_2023-12_v1_blog.svg" alt="Ethereum Share of DEX Volume" /></p>
<p class="chart-disclosure">Source: Artemis.xyz as of 12/3/23. <strong>Past performance is not indicative of future results. Not intended as a recommendation to buy or sell any of the names mentioned herein.</strong></p>
<h2 id="nft-activity-peaks-to-new-heights" class="jump-link-nav anchored-block" data-jumplink-title="NFT Predictions">6. NFT activity will rebound to an all-time high.</h2>
<p>Monthly NFT volumes will approach a new all-time high as speculators return to crypto and gravitate toward top NFT collections on Ethereum, improved crypto games, and new Bitcoin-based offerings. Despite ETH's nearly 50-1 ratio vs. Bitcoin in primary NFT sales since inception, Bitcoin's Ordinals protocol and emerging layer 2 chains on Bitcoin will drive a continued rebirth in Bitcoin network fees. The ratio of ETH-to-BTC primary NFT issuance will end in 2024 closer to 3-1. Stacks (STX), a smart contract platform secured by Bitcoin, will become a top-30 coin by market cap (currently #54).</p>
<h3>Bitcoin &amp; ETH NFT Volume</h3>
<p><img class="img-responsive w-100" src="https://www.vaneck.com/contentassets/d2f1f34bab734265bf492a8bf2fb44c7/3882_crypto-prediction_chart-7_2023-12_v1_blog.svg" alt="Bitcoin and ETH NFT Volume" /></p>
<p class="chart-disclosure">Source: Cryptoslam! as of 11/28/2023. <strong>Past performance is not indicative of future results. Not intended as a recommendation to buy or sell any of the names mentioned herein.</strong></p>
<h2 id="binance-relinquishes-top-position-in-spot-trading" class="anchored-block">7. Binance will lose the #1 position for spot trading.</h2>
<p>Binance will lose its throne as the #1 centralized exchange by volumes after the company's $4B settlement with US regulators. OKX, Bybit, Coinbase, and Bitget will emerge as well-funded competitors with the potential to grab the #1 spot. Crypto exchanges' pricing inclusion in regulated indices, such as those administered by VanEck subsidiary MarketVectors, will become a critical variable in determining whether certain centralized exchanges are eligible to provide liquidity for ETF-authorized participants and sponsors. With Binance now facing a 3-year DOJ colonoscopy, Coinbase's international futures market will gain share and surpass $1B/day volume, up from ~$200M/day in November 2023.</p>
<h2 id="stablecoin-market-cap-hits-record-high-with-usdc-market-share-recovery" class="anchored-block">8. Stablecoin market cap will reach a new all-time high as USDC reverses share losses.</h2>
<p>The total value of stablecoins on the chain will reach an all-time high above $200B (currently $128B) as Markets in Crypto Assets <strong>(MiCA)</strong> regulated stablecoins launch in Europe, yield-bearing stablecoins proliferate, and trading volumes continue to rebound. More controversially, USDC will flip USDT, as more institutional adoption will reveal a preference for USDC already evident on newer L2 chains. Tether&rsquo;s market share losses may finally materialize after the U.S. U.S. Department of Justice (DOJ) takes enforcement against Justin Sun &amp; Tron for Know Your Customer (KYC) infractions, terror financing, and/or market manipulation.</p>
<h3>Monthly Change in Crypto USD Liquidity</h3>
<p><img class="img-responsive w-100" src="https://www.vaneck.com/contentassets/d2f1f34bab734265bf492a8bf2fb44c7/3882_crypto-prediction_chart-9_2023-12_v1_blog.svg" alt="Monthly Change in Crypto USD Liquidity" /></p>
<p class="chart-disclosure">Source: Coingecko as of 11/27/2023. <strong>Past performance is not indicative of future results. Not intended as a recommendation to buy or sell any of the names mentioned herein.</strong></p>
<h2 id="decentralized-exchanges-attain-record-spot-trading-market-share" class="anchored-block">9. DEX market share of spot trading will reach new all-time highs.</h2>
<h3>DEX: CEX Spot Trade Volume</h3>
<p><img class="img-responsive w-100" src="https://www.vaneck.com/contentassets/d2f1f34bab734265bf492a8bf2fb44c7/3882_crypto-prediction_chart-10_2023-12_v1_blog.svg" alt="DEX: CEX Spot Trade Volume" /></p>
<p class="chart-disclosure">Source: The Block, The Graph, Coingecko as of 11/28/2023. <strong>Past performance is not indicative of future results. Not intended as a recommendation to buy or sell any of the names mentioned herein.</strong></p>
<p>Decentralized Exchange (DEX) market share of spot crypto trading will rise to an all-time high as high-throughput chains like Solana improve the on-chain trading experience for users. Meanwhile, much-improved wallets - incorporating "account abstraction," a critical feature in enabling automated payments -- will push more users on-chain and into self-custody solutions. As BTC and ETH dominance likely declines after the Bitcoin halving, the long tail of assets may grow faster, skewing trading activity towards decentralized exchanges that list coins earlier in their lifecycle.</p>
<h2 id="bitcoin-yield-opportunities-driven-by-remittances-and-smart-contract-platforms" class="anchored-block">10. Remittances and smart contract platforms will power a new Bitcoin yield opportunity</h2>
<p>Remittances will emerge as a killer blockchain use case as easier off-ramping and spending of stablecoins make recipient payouts cheap and useful in emerging markets. Given the use of the Bitcoin and layer 2 Lightning (LN) network in some remittance corridors, "Bitcoin Staking" will become a narrative in 2024. With transaction costs rising on the Bitcoin blockchain, BTC maximalists will start spreading the news that you can stake on the BTC network and earn a yield. Staking to Lightning Nodes happens today but is risky and has low return as your BTC is used for payment settlements on the Lightning network. With the proliferation protocols that abstract the technical nuances of managing a Lightning node, such as Amboss, along with federated self-custody solutions like Fedi, users will be able to participate in the remittance market from cold wallets and earn some yield. In addition, Bitcoin holders will be given a new business opportunity in 2024 as a provider of security to Proof of Stake blockchains. Utilizing projects like Cosmos-based Babylon, which will enable BTC holders to earn yield by offering non-custodial staking of PoS chains, Bitcoin holders will be able to earn yield on their Bitcoin and potentially participate in an array of other productive use cases for their BTC.</p>
<h2 id="emergence-of-a-leading-blockchain-game" class="anchored-block">11. A breakout blockchain game will finally arrive.</h2>
<h3>Web3 Gaming Investment</h3>
<p><img class="img-responsive w-100" src="https://www.vaneck.com/contentassets/d2f1f34bab734265bf492a8bf2fb44c7/3882_crypto-prediction_chart-11_2023-12_v1_blog.svg" alt="Web3 Gaming Investment" /></p>
<p class="chart-disclosure">Source: DappRadar as of 10/12/2023. <strong>Past performance is not indicative of future results. Not intended as a recommendation to buy or sell any of the names mentioned herein.</strong></p>
<p>Blockchain gaming will see at least one title surpass 1 million+ daily active users, demonstrating the long-awaited potential. Among candidates to achieve this milestone, IMX is most likely to become a top 25 coin by market cap (currently #42) with the release of Illuvium, Guild of Guardians, and other high-budget games in 2024 and a well-designed token that aligns interests better than most. According to a recent report from DappRadar, the WAX blockchain currently leads the gaming sector with 406k daily unique active wallets, of which ~100k are playing Alien Worlds, a metaverse with multiple simple games that reward players with the Trillium token. However, many of these players are likely bots farming the tokens due to the simplicity of the games. On the other hand, Immutable has multiple AAA games building on their platform that implement token models that cannot be simply farmed and are truly fun games to play. These titles, which have been building for years and received $100m+ in funding, are being released in 2024. They could attract players at the scale of traditional AAA games like Starfield, which was released earlier this year and reached 10 million players within its first two weeks.</p>
<p>Additionally, Immutable has been working to resolve many of the technical pain points that have inhibited the success of Web3 gaming so far, such as wallet management. Immutable&rsquo;s &ldquo;Passport&rdquo; allows users to log in to games and manage their blockchain-based game items through a familiar single sign-on process while abstracting away blockchain interaction. The increased simplicity that Immutable provides gamers combined with large distribution partners such as the Epic Games Store and GameStop could finally allow a blockchain-based game to become a mainstream hit.</p>
<h2 id="solana-outperforms-ethereum-with-resurging-defi-tvl" class="jump-link-nav anchored-block" data-jumplink-title="Solana Predictions">12. Solana will continue to outperform ETH as DeFi TVL returns.</h2>
<h3>Solana Total Value Locked</h3>
<p><img class="img-responsive w-100" src="https://www.vaneck.com/contentassets/d2f1f34bab734265bf492a8bf2fb44c7/3882_crypto-prediction_chart-12_2023-12_v1_blog.svg" alt="Solana Total Value Locked" /></p>
<p class="chart-disclosure">Source: DefiLlama as of 11/28/2023. <strong>Past performance is not indicative of future results. Not intended as a recommendation to buy or sell any of the names mentioned herein.</strong></p>
<p>Solana will become a top 3 blockchain by market cap, Total Value Locked (TVL), and active users. Fueled by this rise, Solana will join the spot ETF wars thanks to a flurry of asset managers submitting filings. Related to Solana's continued market share gains, we see a legitimate possibility that Solana-based price oracle Pyth flips Chainlink in Total Value Secured (&ldquo;TVS&rdquo;). For reference, Chainlink today stands at ~$15bn TVS vs. Pyth&rsquo;s &lt;$2bn, with that dominance driven primarily by blue-chip DeFi protocols on Ethereum mainnet. As TVL continues to grow across high-throughput chains (like Solana) and Chainlink struggles to find institutional adoption of its LINK token, we expect Pyth to gain meaningful market share on the back of several genuine innovations, including its "pull" architecture and confidence interval system.</p>
<h2 id="meaningful-adoption-of-depin-networks" class="anchored-block">13. DePin networks see meaningful adoption.</h2>
<h3>Hivemapper Unique Km Mapped</h3>
<p><img class="img-responsive w-100" src="https://www.vaneck.com/contentassets/d2f1f34bab734265bf492a8bf2fb44c7/3882_crypto-prediction_chart-13_2023-12_v1_blog.svg" alt="Hivemapper Unique Km Mapped" /></p>
<p class="chart-disclosure">Source: Hivemapper, as of 12/1/2023. <strong>Past performance is not indicative of future results. Not intended as a recommendation to buy or sell any of the names mentioned herein.</strong></p>
<p>Multiple decentralized physical infrastructure (DePin) networks will see meaningful adoption that captures the public's attention.</p>
<p>Hivemapper, the decentralized mapping protocol aiming to bootstrap a community-owned competitor to Google Streetview, will map its 10 millionth unique KM, surpassing 15% of global roads capacity. Hivemapper uses its native token, $HONEY, to incentivize thousands of drivers worldwide to mount dashboards to their cars and contribute to its growing database. This global network of permissionless contributors may give Hivemapper a meaningful speed and cost-of-capital advantage relative to the incumbent Google. Google Maps is projected to make more than $11bn in revenue in 2023, representing a meaningful opportunity for Hivemapper if the experiment is successful.</p>
<p>Helium, the decentralized network of wireless hotspots, will reach 100k paying subscribers for its nationwide US 5G plan, up from 5k currently. Hotspots can be set up by anyone, and hotspot operators are paid through crypto rails in Helium&rsquo;s native tokens. This powerful system of incentives gives Helium some key advantages relative to incumbent wireless infrastructure:</p>
<ul class="content-list">
<li>It is capital-light (from Helium&rsquo;s perspective).</li>
<li>It turns hotspot providers into advocates &amp; supporters (given their ongoing stake in the network).</li>
<li>It gives Helium the ability to respond to real-time data &amp; improve the network by adjusting its incentives (i.e., boosting rewards in areas with poor coverage).</li>
</ul>
<p>Wireless infrastructure is a $200B, relatively mature market. We see significant scope for disintermediating legacy providers (Towers) as end-users tend towards low-cost solutions with a differentiated brand (&ldquo;user-owned&rdquo;). Helium claims they can deliver data at less than 50% of the cost of legacy networks. As crypto adoption becomes more mainstream, and if that claim is true, they will likely join a significant share.</p>
<h2 id="corporate-crypto-holdings-boosted-by-new-accounting-standards" class="anchored-block">14. New accounting treatment will rejuvenate the case for corporate crypto holdings.</h2>
<h3>Base Weekly Fees</h3>
<p><img class="img-responsive w-100" src="https://www.vaneck.com/contentassets/d2f1f34bab734265bf492a8bf2fb44c7/3882_crypto-prediction_chart-14_2023-12_v1_blog.svg" alt="Base Weekly Fees" /></p>
<p class="chart-disclosure">Source: DefiLlama as of 11/28/2023. <strong>Past performance is not indicative of future results. Not intended as a recommendation to buy or sell any of the names mentioned herein.</strong></p>
<p>Coinbase will become the first publicly traded company to break out and report Layer 2 blockchain revenues in its quarterly filings as its Base Protocol crosses $100M+ in annualized revenues and becomes a meaningful contributor to the business. The additional disclosure may be catalyzed by corporate adoption of new FASB guidelines that allow corporates to book mark-to-market gains on crypto, which will favorably impact corporate preference for holding Bitcoin and other crypto as treasury assets. Due to these accounting changes, which take effect in 2025 but can be adopted by corporates earlier, a major, non-crypto financial entity (bank, exchange) may announce the creation of a quasi-public blockchain like an L2, with the possible bridging capability to public blockchains by authorized participants.</p>
<h2 id="defis-reconciliation-with-kyc-regulations" class="anchored-block">15. DeFi Reconciles with Know Your Customer (KYC)</h2>
<p>KYC-enabled and walled garden apps like those using Ethereum Attestation Service or Uniswap Hooks will gain significant traction, approaching or even flipping non-KYC applications in user base and fees. Uniswap will lead other protocols in enabling this functionality, which will drive institutional liquidity and volume to the protocol. The additional volume from KYC-gated hooks will significantly bolster protocol fees by allowing new entrants to participate in DeFi without the fear of interacting with OFAC-sanctioned entities. The addition of hooks will help Uniswap reinforce its moat and competitiveness, which should drive token appreciation, especially once the DAO finally votes in favor of turning on the Uniswap Protocol fee switch to allow value to accrue to the token. If so, we expect such fees to be no higher than 10bps.</p>
<h3>Decentralized Exchange Market Share</h3>
<p><img class="img-responsive w-100" src="https://www.vaneck.com/contentassets/d2f1f34bab734265bf492a8bf2fb44c7/3882_crypto-prediction_chart-15_2023-12_v1_blog.svg" alt="Decentralized Exchange Market Share" /></p>
<p class="chart-disclosure">Source: DefiLlama as of 11/28/23. <strong>Past performance is not indicative of future results. Not intended as a recommendation to buy or sell any of the names mentioned herein.</strong></p>
<p><strong>Links to third party websites are provided as a convenience and the inclusion of such links does not imply any endorsement, approval, investigation, verification or monitoring by us of any content or information contained within or accessible from the linked sites. By clicking on the link to a non-VanEck webpage, you acknowledge that you are entering a third-party website subject to its own terms and conditions. VanEck disclaims responsibility for content, legality of access or suitability of the third-party websites.</strong></p>
<p>To receive more <strong><a href="https://www.vaneck.com/us/en/insights/digital-assets/" title="Digital Assets Insights">Digital Assets</a></strong> insights, <strong><a href="https://www.vaneck.com/us/en/subscribe/" title="Subscription Center">sign up in our subscription center</a></strong>.</p>
<!-- Hide alreat promo banner. Make height 0 to account for the HeaderHeightCalculation scripts -->
<style>
header.site-header .alert-bar {
    display:none!important;
    height: 0!important;
    overflow:hidden!important;
}
</style>
]]></content:encoded>
</item><item rdf:about="https://www.vaneck.com/us/en/blogs/investment-outlook/jan-van-eck-top-investment-picks-for-2024-india-and-bitcoin/">
  <title>Top Investment Picks for 2024: India and Bitcoin></title>
  <link>https://www.vaneck.com/us/en/blogs/investment-outlook/jan-van-eck-top-investment-picks-for-2024-india-and-bitcoin/</link>
  <description><![CDATA[Wish you had bought the &ldquo;Magnificent 7&rdquo; stocks 10 years ago? Standing on the precipice of 2024, we explore where we think investors&mdash;several years from now&mdash;may wish they had invested today.]]></description>
  <dc:creator>Jan van Eck</dc:creator>
  <dc:date>12/06/2023 06:30:00</dc:date>
<content:encoded><![CDATA[

<a href="/us/en/blogs/investment-outlook/jan-van-eck-q2-2026-outlook-the-reset-is-your-entry-point/" title="Jan van Eck's Latest Outlook"><strong>Looking for the latest outlook? Read the Q2 2026 Outlook.</strong></a>
<p>The biggest driving force into next year will still be the monetary policy of the Federal Reserve&mdash;and we&rsquo;re expecting a normalizing yield curve&mdash;but here I&rsquo;m focusing on the secular trends that should make you rethink your portfolio&rsquo;s asset allocation. My two strongest conviction &ldquo;screaming buys&rdquo; for 2024 are India and Bitcoin, both manifestations of the rise of the Internet.</p>
<h2>Emerging Markets Equities: The Secular Growth Story of India</h2>
<p>First up is India and the &ldquo;new&rdquo; cohort of leading emerging markets. While China remains a dominant market and has been a major global growth driver, its post-COVID rebound has stalled. Looking beyond China, the three rising emerging market countries are <a href="https://www.vaneck.com/us/en/blogs/emerging-markets-equity/indias-economic-rise-demands-investor-attention/" title="India's Economic Rise Demands Investor Attention"><strong>India</strong></a>, <a href="https://www.vaneck.com/us/en/blogs/emerging-markets-equity/brazil-beckons-with-low-valuations-and-growth-potential/" title="Brazil Beckons with Low Valuations and Growth Potential"><strong>Brazil</strong></a> and <a href="https://www.vaneck.com/us/en/blogs/emerging-markets-equity/saudi-arabia-a-rising-investment-destination/" title="Saudi Arabia: A Rising Investment Destination"><strong>Saudi Arabia</strong></a>. These three countries are leaders in their respective regions, all benefiting from economic reforms and digitization initiatives.</p>
<h3>These Regional Leaders will Pass the EU in 10 years</h3>
<p><img class="img-responsive w-100" src="https://www.vaneck.com/contentassets/821e031d8ddf4c2995ae869c1c46eeb2/3890_jve-outlook-blogemail_chart-1_2023-12_v1_blog.svg" alt="Bar chart showing share of GDP for India, Brazil and Saudi Arabia vs. the EU" /></p>
<p class="chart-disclosure">Source: VanEck Research; IMF; Bloomberg as of 6/30/2023. Any projections shown are for illustrative purpose only and are not intended as predictions of future results or events.</p>
<p>While all three countries are well positioned, India's rapid digitization, thriving equity market and demographic trends will create compelling investment opportunities that we believe investors should be exploring. Many investors wish they had bought the Magnificent 7, or the FAANG stocks, 10 years ago. In India, I think you essentially have two FAANG company equivalents in the two largest providers of cell phone service&mdash;or more importantly, internet access&mdash;in India: Jio Platforms and Bharti Airtel.</p>
<p>A dramatic drop in cell phone cost has resulted in the vast majority of the population now using cell phones for internet access. This <a href="https://www.vaneck.com/us/en/blogs/emerging-markets-equity/indias-digital-gold-rush-the-rise-of-digitization-and-e-commerce/" title="India's Digital Gold Rush: The Rise of Digitization and E-commerce"><strong>digital revolution in India</strong></a> has driven growth across various sectors, including e-commerce, digital payments and online entertainment. This trend is also being facilitated in a major way by the government, which has created initiatives and put support programs in place that are facilitating innovation and creating private sector structural growth opportunities.</p>
<p>India's demographics also make the country well-positioned for unique expansion opportunities. With a median age of 28 years, India has one of the youngest populations in the world. This young workforce is large and English-proficient, providing a competitive edge over other countries. According to the International Monetary Fund (IMF), India is on track to become the third-largest country by GDP within the next five years.</p>
<h2>Are India's Valuations Really a Negative? Microsoft Was Once Also Considered Overvalued</h2>
<p>In the words of the late Charlie Munger, &ldquo;A great business at a fair price is superior to a fair business at a great price.&rdquo; Consumers pay more for Mercedes versus a Kia, because the product and user experience are fundamentally better. The same logic should be applied to India. Higher multiples in India versus other EM countries are justified by quality companies and relatively lower risk versus other emerging markets economies.</p>
<h3>Valuations Are Often a Question in India</h3>
<p><strong>Valuations Have Come Down from Recent Highs</strong></p>
<p><img class="img-responsive w-100" src="https://www.vaneck.com/contentassets/821e031d8ddf4c2995ae869c1c46eeb2/3890_jve-outlook-blogemail_chart-2_2023-12_v1_blog.svg" alt="Line chart showing valutions of Indian stocks" /></p>
<p class="chart-disclosure">Source: Bloomberg as of September 2023. The BSE SENSEX (also known as the S&amp;P Bombay Stock Exchange Sensitive Index or simply SENSEX) is a free float market weighted stock market index of 30 well established and financially sound companies listed on the Bombay Stock Exchange. The 30 constituent companies which are some of the largest and most actively traded stocks, are representative of various industrial sectors of the Indian economy.</p>
<p>India is rapidly transforming into a <a href="https://www.vaneck.com/us/en/blogs/emerging-markets-equity/indias-opportunities-impossible-to-ignore/" title="India's Opportunities: Impossible to Ignore"><strong>powerhouse investment hub</strong></a>. Its booming digital sector, combined with a strong equity market, is drawing global attention. Simply put, we believe India's strong economic foundations and massive market potential make it an irresistible destination for investments. If you don&rsquo;t have adequate exposure, you may consider a multi-year tactical overlay.</p>
<p>For further analysis, download the presentation: <a href="https://www.vaneck.com/us/en/blogs/emerging-markets-equity/indias-economic-rise-demands-investor-attention/positioning-india-for-the-next-ten-years.pdf" target="_blank" title="Positioning India for the Next Ten Years" rel="noopener"><strong>Positioning India for the Next Ten Years</strong>.</a></p>
<h2>Bitcoin, Finance&rsquo;s &ldquo;Moody Teenager&rdquo; Starts to Grow Up</h2>
<p>VanEck has been bullish on Bitcoin since 2017, when the price of Bitcoin was $3,000. Since the beginning, we&rsquo;ve said that Bitcoin is an internet-enabled, limited supply asset.</p>
<p>In the volatile yet vibrant history of Bitcoin, we've witnessed a financial phenomenon morph from a nascent digital token to a burgeoning asset class. Bitcoin's journey has been nothing short of a roller coaster ride, marked by meteoric rises, steep falls and a resilience that continues to intrigue and reward its believers. For investors, Bitcoin has offered not just a new avenue for potential returns, but a front-row seat to the evolution of an asset that has challenged traditional notions of value and investment. The maturation of an asset can provide additional returns that might be available once the opportunity has matured. With Bitcoin, there is more growing up to do.</p>
<h3>Tremendous Returns in Bitcoin As It Matures</h3>
<p><img class="img-responsive w-100" src="https://www.vaneck.com/contentassets/821e031d8ddf4c2995ae869c1c46eeb2/3890_jve-outlook-blogemail_chart-3_2023-12_v1_blog.svg" alt="Line chart showing Bitcoin returns as it matures" /></p>
<p class="chart-disclosure">Source: Morningstar. Data as of 11/20/2023. Investors cannot invest directly in an index. Please see index descriptions at the end of the presentation. Past performance is no guarantee of future results. MarketVector Bitcoin Index measures the performance of a digital assets portfolio which invests in Bitcoin.</p>
<p><i>Bitcoin 1.0 - Early days (2011-2017)</i></p>
<p>From 2011 to 2017, Bitcoin was in its proof of technology phase. It was establishing the blockchain as a workable force, and was just beginning to have network effects. The volatility was immense; the swings in value were wild and unpredictable. Yet, those who recognized the underlying promise of this technology and invested in it, even amidst the uncertainty, found themselves on the cusp of a revolution.</p>
<p><i>Bitcoin 2.0 - Awkward growth spurt (2017-2021)</i></p>
<p>As Bitcoin entered its toddler years, from 2017 to 2021, it began to mature. What was once known to a few tech enthusiasts was now being adopted by millions worldwide and withstanding political bans and threats. Despite maintaining its volatile nature, Bitcoin showed us proof of principle in 2021 by reaching new all-time highs, demonstrating that it wasn't just a one-time bubble. This phase, to us, was a testament to Bitcoin's staying power, solidifying its role as more than just a digital curiosity but a genuine asset class.</p>
<p><i>Bitcoin 3.0 - Tests of adolescence (2021-____)</i></p>
<p>The current journey is when technological development continues and the asset is valued by a wider circle of investors. The beginnings of institutional adoption started to surface, although the expected smaller drawdowns turned out to be larger than anticipated. Bitcoin's resilience through these tests has been a critical part of its growth story, a phase of toughening up and proving its mettle.</p>
<p><i>Bitcoin 4.0 &ndash; Coming of age (2024-____)</i></p>
<p>As we approach 2024, we anticipate the advent of Bitcoin 4.0. With potential regulatory clarity and broader acceptance, we believe Bitcoin stands on the brink of its coming-of-age story. The expectation is that with the approval of a Bitcoin ETF and other investment vehicles, Bitcoin will transition to a more stable and accepted member of the financial community. This era is where we may see an influx of investors, both retail and institutional, acknowledging the legitimacy and potential of Bitcoin as a cornerstone of modern portfolios.</p>
<p><i>Bitcoin 5.0 - Prime of life (-)</i></p>
<p>Looking further ahead, Bitcoin 5.0 represents the final phase of its evolution. Here, it is envisioned to achieve half the market cap of gold. In this mature stage, we think Bitcoin will exhibit less volatility and gain widespread adoption by institutions. It will have established itself as a limited supply asset, a digital store of value for the internet age. Bitcoin 5.0 will be the culmination of years of development, resilience and gradual acceptance, positioned as a mature and stable asset class in the eyes of the world&mdash;a &ldquo;quality&rdquo; asset.</p>
<p>In our view, the story of Bitcoin is far from over. It's a narrative of growth, challenges and potential. By understanding the challenges and growth that this software network has already achieved, the industry is realizing that Bitcoin is just an asset powered by the Internet and can appreciate the long-term potential it holds. Of course, it could have been another token or asset, but the crowd seems to have selected Bitcoin.</p>
<p>For the full webinar, including an overview of small caps and how to pick through the rubble in U.S. value stocks, watch the replay here: <a href="https://www.vaneck.com/us/en/webinar-registration/?id=98060039862&amp;utm_source=vaneck&amp;utm_medium=calendar" title="Screaming Buys for 2024"><strong>Screaming Buys for 2024</strong></a>.</p>
<p>To receive more <a href="/us/en/insights/investment-outlook" title="Investment Outlook Insights"><strong>Investment Outlook</strong></a> insights, <a href="https://www.vaneck.com/us/en/subscribe/" title="Subscription Center"><strong>sign up in our subscription center</strong></a>.</p>
]]></content:encoded>
</item><item rdf:about="https://www.vaneck.com/us/en/blogs/digital-assets/matthew-sigel-vaneck-crypto-monthly-recap-for-november-2023/">
  <title>VanEck Crypto Monthly Recap for November 2023></title>
  <link>https://www.vaneck.com/us/en/blogs/digital-assets/matthew-sigel-vaneck-crypto-monthly-recap-for-november-2023/</link>
  <description><![CDATA[In November, Bitcoin outperformed the S&amp;P 500 due to investor interest and potential US Bitcoin ETFs, while Ethereum's growth also outstripped Bitcoin's.]]></description>
  <dc:creator>Matthew  Sigel</dc:creator>
  <dc:date>12/05/2023 06:30:00</dc:date>
<content:encoded><![CDATA[

<p><strong>Please note that VanEck may have a position(s) in the digital asset(s) described below.</strong></p>
<p>In November, Bitcoin outperformed the S&amp;P for the third consecutive month, surging by 9% to reach an 18-month high. This uptrend was fueled by investors acquiring over $1 billion in EU-listed crypto ETNs and MicroStrategy adding another $600 million in spot Bitcoin. Notably, the imminent possibility of approval for various spot US Bitcoin ETFs in January is generating significant client interest and inquiries.</p>
<p>Simultaneously, the US dollar experienced its most significant decline (-3%) since November 2022, prompted by evident signs of weakness in the Q3 earnings reports of major retailers like Wal-Mart and Target and a softer labor market. This weakness in the US consumer sector raised expectations that the Fed might implement rate cuts as early as Q1. Separately, concerns about a disorderly wind-down of Binance diminished after the largest crypto exchange reached a settlement with the US DOJ, ensuring its continued operation.</p>
<p>In a notable shift, Ethereum outpaced Bitcoin with a 12% increase, marking the first time since July. The MVIS Digital Assets small-cap token (MVDASC) experienced a remarkable turnaround, soaring from negative year-to-date returns in mid-October to a year-end gain of +55%, although still trailing behind the +85% YTD gains of large-cap cryptocurrencies. Notable performers in the space included Coinbase equity (+62%), DeFi tokens (+41%), and layer 1 smart contract platforms like Solana (+54%) and Avalanche (+89%). Centralized exchange tokens such as BNB lagged.</p>
<p>Reflecting our ho-ho- hopes and expectations for a very strong 2024 for Bitcoin and other decentralized smart contract platforms, we are releasing separately our Crypto Predictions for 2024 blog.</p>
<div class="wrapped-div">
<table style="width: 750px;">
<tbody>
<tr class="tbl-data">
<td class="tbl-header last text-center">&nbsp;</td>
<td class="tbl-header last text-center">November</td>
<td class="tbl-header last text-center">YTD</td>
<td class="tbl-header last text-center">1-Year</td>
</tr>
<tr class="tbl-data">
<td class="data-td last">Coinbase</td>
<td class="data-td data last">63%</td>
<td class="data-td data last">254%</td>
<td class="data-td data last">89%</td>
</tr>
<tr class="tbl-data">
<td class="data-td last">MarketVector<sup>TM</sup>&nbsp;Decentralized Finance Leaders Index</td>
<td class="data-td data last font-weight-normal">41%</td>
<td class="data-td data last font-weight-normal">75%</td>
<td class="data-td data last font-weight-normal">18%</td>
</tr>
<tr class="tbl-data">
<td class="data-td last ">MarketVector<sup>TM</sup>&nbsp;Smart Contract Leaders Index</td>
<td class="data-td data last">28%</td>
<td class="data-td data last">72%</td>
<td class="data-td data last">8%</td>
</tr>
<tr class="tbl-data">
<td class="data-td last">MarketVector<sup>TM</sup>&nbsp;Infrastructure Application Leaders Index</td>
<td class="data-td data last">22%</td>
<td class="data-td data last">89%</td>
<td class="data-td data last">35%</td>
</tr>
<tr class="tbl-data">
<td class="data-td last">MarketVector<sup>TM</sup>&nbsp;Media &amp; Entertainment Leaders Index</td>
<td class="data-td data last">18%</td>
<td class="data-td data last">-17%</td>
<td class="data-td data last">-53%</td>
</tr>
<tr class="tbl-data">
<td class="data-td last ">Ethereum</td>
<td class="data-td data last ">13%</td>
<td class="data-td data last">70%</td>
<td class="data-td data last ">31%</td>
</tr>
<tr class="tbl-data">
<td class="data-td last ">Nasdaq 100 Index</td>
<td class="data-td data last ">10%</td>
<td class="data-td data last ">35%</td>
<td class="data-td data last ">27%</td>
</tr>
<tr class="tbl-data">
<td class="data-td last ">Bitcoin</td>
<td class="data-td data last ">9%</td>
<td class="data-td data last ">128%</td>
<td class="data-td data last ">85%</td>
</tr>
<tr class="tbl-data">
<td class="data-td last ">S&amp;P 500 Index</td>
<td class="data-td data last ">8%</td>
<td class="data-td data last ">18%</td>
<td class="data-td data last ">17%</td>
</tr>
<tr class="tbl-data">
<td class="data-td last">MarketVector<sup>TM</sup>&nbsp;Centralized Exchanges Index</td>
<td class="data-td data last">5%</td>
<td class="data-td data last">-1%</td>
<td class="data-td data last">-29%</td>
</tr>
</tbody>
</table>
</div>
<br />
<p class="chart-disclosure">Source: Bloomberg, as of 11/30/2023. <strong>Past performance is no guarantee of future results. Not intended as a recommendation to buy or sell any securities named herein.</strong></p>
<ul class="content-list">
<li><a href="#smart-contract-platforms-november-updates"><strong>Smart Contract Platforms: November Updates</strong></a></li>
<li><a href="#avax-november-updates"><strong>AVAX: November Updates</strong></a></li>
<li><a href="#solana-november-updates"><strong>Solana: November Updates</strong></a></li>
<li><a href="#bnb-november-updates"><strong>BNB: November Updates</strong></a></li>
<li><a href="#apt-november-updates"><strong>APT: November Updates</strong></a></li>
<li><a href="#defi-november-updates"><strong>DeFi: November Updates</strong></a></li>
<li><a href="#metaverse-and-gaming-november-updates"><strong>Metaverse and Gaming: November Updates</strong></a></li>
<li><a href="#nfts-november-updates"><strong>NFTs: November Updates</strong></a></li>
</ul>
<h2 id="smart-contract-platforms-november-updates" class="jump-link-nav anchored-block" data-jumplink-title="SCP: November Updates">Smart Contract Platforms</h2>
<h3>Blockchain Share of Daily Fees</h3>
<p><img class="img-responsive w-100" src="https://www.vaneck.com/contentassets/69b3849f423f45079b8614410d9aade5/3881_scl-november_chart-1_2023-12_blog.svg" alt="Blockchain Share of Daily Fees" /></p>
<p class="chart-disclosure">Source: Artemis.xyz as 11/30/2023. <strong>Past performance is no guarantee of future results. Not intended as a recommendation to buy or sell any securities named herein.</strong></p>
<p>After a strong October (+21%), layer 1 blockchain tokens rose another 28% in November. Activity on blockchains and prices tend to be reflexive, resulting in a spike in fees for nearly all blockchains. As prices go up, speculators increase their activity, leading to more on-chain fees and increased demand to buy blockchain tokens to pay for gas. The principal winner in fee-generating usage was Bitcoin, whose fee share increased from 12.5% to 27.5%, with fees averaging around $4.5m per day. Ethereum maintained its market share of fees month-to-month, averaging around $7.6M.</p>
<p>Ethereum activity was high enough in November that, once again, Ethereum became deflationary. In November, around 46k ETH were burned, and this ETH was worth $93M at the time of writing. Ethereum also saw an interesting blog post by a co-founder and spiritual leader, Vitalik Buterin, where he discussed resurrecting the Ethereum scaling solution Plasma and incorporating ZK-proofs to make Plasma more functional. While an informative post, Vitalik&rsquo;s writing seems to correspond to an uptick in interest in alt-L1s with execution scaling embedded in their roadmaps, whereas Ethereum does not. Additionally, Ethereum validator entity Bitcoin Suisse saw 100 of its validators slashed for 1 ETH on November 14 due to inactivity, and this has catalyzed Ethereum community discussion. Most of the Ethereum community expressed concern on social media that there is a need to ensure slashing is applied to validators who act maliciously, not those who suffer outages outside their control.</p>
<h3>November L2 Daily Average Fees</h3>
<p><img class="img-responsive w-100" src="https://www.vaneck.com/contentassets/69b3849f423f45079b8614410d9aade5/3881_scl-november_chart-2_2023-12_blog.svg" alt="November L2 Daily Average Fees" /></p>
<p class="chart-disclosure">Source: Artemis.xyz as 11/30/2023. <strong>Past performance is no guarantee of future results. Not intended as a recommendation to buy or sell any securities named herein.</strong></p>
<p>Ethereum L2s had an interesting month as increased activity translated to higher fees across the board. Notably, the top fees producing L2 of November was Starknet, who averaged $199k in daily fees, barely surpassing Arbitrum at $191k and ZKSync at $178k. Part of the driver for Starknet is renewed speculation of a coming $STARK token airdrop that would accrue pro-rata for usage of Starknet. Interestingly, fees on Linea exceeded both Base and Optimism.</p>
<p>A controversial addition to the L2 space is a project called Blast, which has attracted over $612M in just over a week. Blast, a project created by the Blur team, is contentious because it lacks a functioning chain or even a testnet. Blast is simply a 3/5 multisig wallet whose only functionality is to take deposits and stake them on Ethereum yield-generating projects like Lido. This is interesting because it brings up the fact that L2s, with ~$14B in deposits, are capital inefficient as those funds effectively sit on their bridges without earning any yield. This could spark an interesting movement to make those idle funds more dynamic in earning fees. Amid the uptick in L2 activity, OKX announced it will launch its own L2 to Ethereum built using the Polygon CDK. Kraken noted publicly that it is considering launching its own L2 like Coinbase&rsquo;s Base. Polygon also made headlines by partnering with Ethereum-rival NEAR to build zkWASM technology and announced a $90M incentive program called Polygon Village for developers to build on Polygon.</p>
<p>Outside of Ethereum, the Cosmos community experienced further drama as controversial Prop 848 passed. The proposition, which cuts ATOM&rsquo;s maximum inflation from 20% to 10%, received great pushback from both the Cosmos validator community and Cosmos co-founder Jae Kwon. In a post on Twitter, Jae Kwon threatened to hard-fork the Cosmos and airdrop a new Cosmos token to community members. This new Hub would effectively compete with Cosmos and cleave the community into separate projects. Hopefully, sparking renewed interest in the Cosmos amongst traders, the dYdX chain went live with perpetual futures trading on its beta release. To support dYdX, CCTP has finally arrived on Noble, allowing Ethereum USDC holders to bridge their USDC to Noble and receive native USDC, which could be moved to dYdX.</p>
<h2 id="avax-november-updates" class="anchored-block">AVAX (+85.9%)</h2>
<h3>Avalanche Daily Fees vs Daily Active Addresses</h3>
<p><img class="img-responsive w-100" src="https://www.vaneck.com/contentassets/69b3849f423f45079b8614410d9aade5/3881_scl-november_chart-3_2023-12_blog.svg" alt="Avalanche Daily Fees vs Daily Active Addresses" /></p>
<p class="chart-disclosure">Source: Artemis.xyz as 11/30/2023. <strong>Past performance is no guarantee of future results. Not intended as a recommendation to buy or sell any securities named herein.</strong></p>
<p>Avalanche&rsquo;s AVAX token was a top performer in November, having a mammoth (+85.9%) rally. Avalanche has made major efforts to attract financial entities to use its blockchain of blockchains and focused on the tokenization of off-chain assets. In November, those efforts partially paid off as Ava Labs partnered with JP Morgan&rsquo;s Onyx and Apollo Global to build a proof of concept with the Monetary Authority of Singapore using Avalanche Evergreen Subnets. This will allow Onyx Digital Asset to access WisdomTree funds tokenized on an Avalanche subnet blockchain. Adding fuel to this price momentum for AVAX, Republic, a crypto-focused investment firm, will launch a tokenized fund called Republic Note on Avalanche. Republic Note attracted more than $30M in investment at launch. Other positive news for Avalanche included the launch of blockchain game Shrapnel&rsquo;s token $SHRAP, which many speculate could be the first blockbuster crypto game.</p>
<p>In November, Avalanche also saw a spike in fees that resulted in a 600% month-to-month increase in blockchain fees as transactions on Avalanche&rsquo;s C-chain increased as much as 20x on several days. Most of this activity, over 95%, was due to ASC-20 inscriptions. Like Bitcoin inscriptions, these allow users to add any data to AVAX tokens using the extra data space in each transaction referred to as Call Data. While the flurry of activity was substantial, it was short-lived as transactions and fees reverted to their average after about a week. Remarkably, the spike in fee activity did not translate into a substantial increase in usership as daily active addresses peaked around 79k, which is just over double Avalanche&rsquo;s average over the past two months.</p>
<h2 id="solana-november-updates" class="jump-link-nav anchored-block" data-jumplink-title="Solana: November Updates">Solana (+51.2%)</h2>
<h3>Solana DEX Volume</h3>
<p><img class="img-responsive w-100" src="https://www.vaneck.com/contentassets/69b3849f423f45079b8614410d9aade5/3881_scl-november_chart-4_2023-12_blog.svg" alt="Solana DEX Volume" /></p>
<p class="chart-disclosure">Source: Artemis.xyz as 11/30/2023. <strong>Past performance is no guarantee of future results. Not intended as a recommendation to buy or sell any securities named herein.</strong></p>
<p>The month of November began amid Solana&rsquo;s annual developer conference, where several fascinating announcements and technology demonstrations took place. The founder of Solana, Anatoly Yakovenko, re-asserted Solana&rsquo;s competitive positioning as a low-latency, high-throughput chain that would scale to meet the needs of hundreds of millions of users. To meet this vision, Kevin Bowers of Jump Trading introduced his team&rsquo;s new Solana client, Firedancer, which was capable of processing more than 6M TPS using Solana&rsquo;s existing network. To take advantage of this broad leap in capabilities, Sling Money, Backpack NFT, and Star Atlas discussed each project&rsquo;s respective potential for payments, verified decentralized exchanges, and gaming.</p>
<p>Token releases from several important Solana projects also helped Solana&rsquo;s price. These included dominant MEV staking entity Jito ($JTO), 80% market share DEX aggregate Jupiter ($JUP), and price oracle with nearly total market share of Solana price feeds, Pyth ($PYTH). Due to the price performance of Solana and the anticipated launch of these tokens, a positive feedback loop of price and volume occurred on Solana, which surged DEX volumes by 320% month-to-month and resulted in Solana fees increasing 100% and usership up 50% compared to October.</p>
<h2 id="bnb-november-updates" class="anchored-block">BNB (+1.0%)</h2>
<h3>Layer 1 Daily Users, Market Share</h3>
<p><img class="img-responsive w-100" src="https://www.vaneck.com/contentassets/69b3849f423f45079b8614410d9aade5/3881_scl-november_chart-5_2023-12_blog.svg" alt="Layer 1 Daily Users, Market Share" /></p>
<p class="chart-disclosure">Source: Artemis.xyz as 11/30/2023. <strong>Past performance is no guarantee of future results. Not intended as a recommendation to buy or sell any securities named herein.</strong></p>
<p>BNB price action for November was not encouraging, but this is primarily due to the announcement of the DOJ settlement against Binance and Binance&rsquo;s CEO Changpeng Zhao (CZ). Though the price of BNB initially rallied in relief after the news came out, the token began a downward spiral once it became clear that the charismatic and highly capable CZ would be leaving Binance, which may be a negative for the BNB chain&rsquo;s future growth. Likewise, speculation is bouncing around crypto circles that the DOJ or the regulators in the US may push new allegations against the highly centralized BNB chain. The popular sentiment is that the US government will pursue a similar path in this case against Binance and BNB to what it did with BitMex. In the BitMex case, after presenting the entity&rsquo;s founders with criminal charges, the US Government pressured the regulatory bodies in other countries to pursue action against BitMex. This supposition was partially confirmed on November 29 when the Philippines&rsquo; SEC argued that Binance was running an unregulated exchange and blocked access within the country to Binance.</p>
<p>BNB&rsquo;s on-chain metrics further demonstrate a deterioration in usage. Unlike most smart contract platforms in November, BNB saw usership decline (-4%). Another negative statistic for BNB is that its TVL increased only (+6%), making it one of the worst among smart contract platforms in November. Additionally, from the standpoint of market share of usership, BNB has been losing since early 2023, when it held 23%, and now it is down to around 16%.</p>
<h2 id="apt-november-updates" class="anchored-block">APT (-0.4%)</h2>
<p>Aptos once again has struggled to find its footing amid the broader bull market despite the enormous potential of its technology. This has translated into very poor activity on its blockchain in November as daily active addresses are down (-44%) month-to-month, and fees have decreased (-16%) since October. This performance may be explained by the possibility that Aptos&rsquo;s reputation is recovering from a 5-hour blockchain outage on October 18. Indicative of the tepid perception of Aptos, it only gained 19% in TVL compared to its main Move-based rival, Sui, who gained 129%.</p>
<p>Going forward, Aptos&rsquo; major challenge is attracting a strong developer and user community. While Move is a fascinating, high-potential programming language for smart contracts, its growth has been stunted by the general crypto developer exodus and a lack of community on Aptos. Additionally, Move lacks the deep pool of developer libraries and tooling available on Ethereum and even Solana. As such, it will be an uphill climb for Aptos to get people excited about its ecosystem because it has not yet demonstrated that people will build applications that attract organic usage.</p>
<h2 id="defi-november-updates" class="jump-link-nav anchored-block" data-jumplink-title="DeFi: November Updates">DeFi</h2>
<h3>Uniswap, Thorchain, &amp; Curve 2023 Volume</h3>
<p><img class="img-responsive w-100" src="https://www.vaneck.com/contentassets/69b3849f423f45079b8614410d9aade5/3881_scl-november_chart-6_2023-12_blog.svg" alt="Uniswap, Thorchain, and Curve 2023 Volume" /></p>
<p class="chart-disclosure">Source: DeFiLlama as 11/30/2023. <strong>Past performance is no guarantee of future results. Not intended as a recommendation to buy or sell any securities named herein.</strong></p>
<p>The MarketVector Decentralized Finance Leaders index (MVDFLE) markedly outperformed $ETH in November, returning 41% as investors positioned themselves into tokens that will benefit from an increase in on-chain trading. Of the index components, Thorchain ($RUNE) had the most impressive performance this month, +122%. $RUNE&rsquo;s outperformance can be attributed to the significant increase in activity that has occurred on the protocol, as the decentralized native asset settlement chain saw new yearly highs in volume for the second month in a row. The increase in volume has rocketed the protocol up the decentralized exchange rankings, with Thorchain now recording the third most volume of any protocol, behind Pancake Swap and Uniswap. Similarly, $UNI saw an outsized return of 44% this month as the protocol maintained its strong market share. $MKR, $LDO, and $AAVE returned 13%, 29%, and 21%, respectively. $CRV lagged behind the other decentralized exchanges, appreciating only 15% this month. $CRV&rsquo;s underperformance can be explained by the protocol&rsquo;s declining market share as the decentralized exchange saw only a slight increase in volume of 11%, significantly underperforming its peers Uniswap and Thorchain, which experienced increases in volume of 51% and 84%, respectively.</p>
<h2 id="metaverse-and-gaming-november-updates" class="anchored-block">Metaverse and Gaming</h2>
<p>The MarketVector Media and Entertainment Leaders index (MVMELE) returned 19% in November, slightly outperforming $ETH but seeing nowhere near the returns in DeFi, likely due to the continued lack of usage of metaverse ecosystems and value accrual to their respective tokens. Of the top metaverse tokens, $APE, $MANA, and $SAND returned 19.3%, 19.4%, and 20% in November. While MVMELE didn't see jaw-dropping returns this month relative to $ETH, many tokens in the gaming/metaverse sector performed extremely well. This was likely a result of investors favoring smaller &ldquo;moonshot&rdquo; tokens that could have significantly more upside in a bull market than the higher-valued tokens that the index is composed of. This price action can be observed in tokens like $PRIME, $AURY, and $ATLAS, valued significantly lower than the mainstream metaverse tokens and rallied an impressive 181%, 200%, and 223%, respectively.</p>
<h2 id="nfts-november-updates" class="anchored-block">NFTs</h2>
<p>The NFT market experienced a notable surge in activity this month, with the total NFT volume witnessing a substantial growth of almost 200%, reaching $906 million. This uptick can be attributed primarily to heightened speculation of Bitcoin inscriptions, which rose by an impressive 2300% to $373 million, surpassing Ethereum NFT volume for the first time. Simultaneously, NFTs on Solana demonstrated a robust increase in volume, rising by 165% to $76.5 million. Solana NFT investors mainly acquired Mad Lads and Tensorians in anticipation of these collections establishing themselves as the blue-chip NFTs on Solana.</p>
<p>On the Ethereum side, $BLUR, the governance token of the leading NFT exchange by volume, observed a significant rally of 117%, reaching $0.50. This substantial movement can be attributed to the resurgence of NFT speculation and the unveiling of Blast, a new NFT-centric Layer 2 under development by the Blur team. Blast is set to focus on launching NFT-specific decentralized applications (dApps), such as NFT perpetual markets, and have low transaction fees to drive NFT trading. Furthermore, Blast intends to conduct an airdrop of the $BLAST token to participants in Blur Season 3. Notably, Blur Season 3 will deviate from past seasons, as rewards will be evenly distributed between NFT traders and Blur stakers, departing from the previous practice of exclusively benefiting NFT traders on the Blur platform. Since the announcement, approximately 362 million $BLUR have been staked, constituting roughly 33% of the circulating supply. Additionally, Blast garnered over $600 million in deposits to the contract within its initial week post-deployment, with these assets unable to be withdrawn until February. Distinguishing itself from other Layer 2 rollups on Ethereum, Blast introduces a unique mechanism whereby deposited assets earn yield through rehypothecation on the backend. Specifically, $ETH is exchanged into Lido's $stETH, and stablecoins are swapped into MakerDAO's yield-bearing $sDAI, with the yield produced from these tokens automatically blasted to user&rsquo;s wallets.</p>
<p><strong>Links to third party websites are provided as a convenience and the inclusion of such links does not imply any endorsement, approval, investigation, verification or monitoring by us of any content or information contained within or accessible from the linked sites. By clicking on the link to a non-VanEck webpage, you acknowledge that you are entering a third-party website subject to its own terms and conditions. VanEck disclaims responsibility for content, legality of access or suitability of the third-party websites.</strong></p>
<p>To receive more <strong><a href="https://www.vaneck.com/us/en/insights/digital-assets/" title="Digital Assets Insights">Digital Assets</a></strong> insights, <strong><a href="https://www.vaneck.com/us/en/subscribe/" title="Subscription Center">sign up in our subscription center</a></strong>.</p>
<style type="text/css">
    .wrapped-div {
        max-width: 100%;
    }

    @media (max-width: 1240px) {
        .wrapped-div {
            overflow-x: scroll;
        }
    }

    .wrapped-div-sector {
        max-width: 100%;
        overflow-x: scroll;
    }
</style>
]]></content:encoded>
</item><item rdf:about="https://www.vaneck.com/us/en/blogs/thematic-investing/buzz-investing-us-stocks-fluctuate-amid-fed-policy-predictions/">
  <title>BUZZ Investing: U.S. Stocks Fluctuate Amid Fed Policy Predictions></title>
  <link>https://www.vaneck.com/us/en/blogs/thematic-investing/buzz-investing-us-stocks-fluctuate-amid-fed-policy-predictions/</link>
  <description><![CDATA[Equities rebounded after the Fed hinted at easing its tightening cycle, which led to lower Treasury yields and risk indicators.]]></description>
  <dc:creator> </dc:creator>
  <dc:date>11/22/2023 06:30:00</dc:date>
<content:encoded><![CDATA[

<p>Domestic equities were little changed during the recent period between Index selection dates (October 12, 2023 to November 9, 2023, the &ldquo;Period&rdquo;). The recent Period was marked by two distinct market phases. Initially, market caution prevailed, driven by the Federal Reserve's firm stance on maintaining high-interest rates and concerns over U.S. fiscal health. This sentiment pushed the benchmark 10-year Treasury yield to its highest since 2007, at 5%. The S&amp;P 500 index experienced a downturn, extending its decline to over 10% below its late-July peak. The technology-focused Nasdaq Composite Index also fell, influenced by disappointing earnings from major technology companies like Tesla Inc (NASD: TSLA), Alphabet Inc (NASD: GOOGL), and NVIDIA Corp (NASD: NVDA), leading to a reassessment of their valuations and growth prospects. Additionally, rising geopolitical tensions from the Israel-Hamas war further weighed on investor sentiment as the conflict threatens to draw in others from the region and beyond.</p>
<p>The latter part of the recent Period witnessed a significant shift in these trends. After the November 1st meeting of the U.S. Federal Reserve (Fed) Open Market Committee, Federal Reserve Chair Jerome Powell's remarks hinted at an end to the intense tightening cycle, as the Committee refrained from raising interest rates for a second consecutive meeting. This development was positively received by investors, resulting in a drop in Treasury yields and a decrease in other financial market risk indicators. Relative to levels observed prior to the FOMC meeting, the Markit CDX North America High Yield Index, a measure of credit risk, fell by about 75 basis points, and the Chicago Board Options Exchange Volatility Index, known as the "fear gauge," decreased by over 4 points.</p>
<h3>VIX Index &amp; CDX HY Index</h3>
<p><strong>(Recent Period between BUZZ Index selection dates)</strong></p>
<p><img class="img-responsive w-100" src="https://www.vaneck.com/contentassets/f7de33db088a488396668c2226659b5d/3857_buzz-nov-2023-blog_chart-1_2023-11_v1_blog.svg" alt="VIX Index and CDX HY Index" /></p>
<p class="chart-disclosure">Source: Bloombreg / Periscope Capital.</p>
<p>The BUZZ NextGen AI US Sentiment Leaders Index (the &ldquo;BUZZ Index&rdquo; or &ldquo;Index&rdquo;) returned -6.22% during the month of October compared to a return of -2.10% for the S&amp;P 500 Index during the same period. Year-to-date, the BUZZ Index leads the S&amp;P 500 with returns of 19.16% and 10.69%, respectively, as of the end of October.</p>
<h2>Shares of Coinbase Global Pace Advancing Stocks within the BUZZ Index</h2>
<p>Shares of Coinbase Global Inc (NASD: COIN) paced advancing stocks within the BUZZ Index during the recent Period. COIN&rsquo;s surging stock reflects increased optimism in the cryptocurrency market. This optimism stems from a federal appeals court instructing the SEC to reevaluate Grayscale Investments' Bitcoin ETF proposal. The potential approval of Bitcoin ETFs is seen as a positive development for the crypto market, promising to enhance trading volumes and increase broader interest in Bitcoin and other cryptocurrencies. As a major cryptocurrency exchange, many may be of the view that Coinbase stands to gain from this heightened activity.</p>
<p>Shares of Netflix Inc (NASD: NFLX) also positively contributed to BUZZ Index performance during the recent Period. The digital streaming giant released its third-quarter earnings on October 19 which exceeded most analyst expectations. Key takeaways from the Q3 report were the addition of almost 9 million new subscribers and a revised upward full-year cash flow projection. Further enhancing investor sentiment were management's initiatives on a new advertising tier, stricter controls on password sharing, and upcoming price hikes. These factors collectively propelled Netflix's stock to an impressive gain of over 20% during the Period.</p>
<div class="wrapped-div">
<table style="width: 750px;">
<tbody>
<tr class="tbl-data">
<td class="tbl-header last " colspan="4">Top BUZZ Index Contributors: October 12, 2023 &ndash; November 9, 2023</td>
</tr>
<tr class="tbl-data">
<td class="data-td  last">Company</td>
<td class="data-head last">Ticker</td>
<td class="data-head last">Average Weight (%)</td>
<td class="data-head last">Return Contribution (%)</td>
</tr>
<tr class="tbl-data">
<td class="data-td last font-weight-normal">Coinbase Global Inc</td>
<td class="data-td data last">COIN</td>
<td class="data-td data last">2.62</td>
<td class="data-td data last">0.54</td>
</tr>
<tr class="tbl-data">
<td class="data-td last font-weight-normal">Netflix Inc</td>
<td class="data-td data last">NFLX</td>
<td class="data-td data last">2.18</td>
<td class="data-td data last">0.37</td>
</tr>
<tr class="tbl-data">
<td class="data-td last font-weight-normal">Affirm Holdings Inc</td>
<td class="data-td data last">AFRM</td>
<td class="data-td data last">0.74</td>
<td class="data-td data last">0.33</td>
</tr>
<tr class="tbl-data">
<td class="data-td last font-weight-normal">Microsoft Corp</td>
<td class="data-td data last">MSFT</td>
<td class="data-td data last">2.98</td>
<td class="data-td data last">0.27</td>
</tr>
<tr class="tbl-data">
<td class="data-td last font-weight-normal">Snap Inc</td>
<td class="data-td data last">SNAP</td>
<td class="data-td data last">1.20</td>
<td class="data-td data last">0.26</td>
</tr>
<tr class="tbl-data">
<td class="data-td last font-weight-normal">Block Inc</td>
<td class="data-td data last">SQ</td>
<td class="data-td data last">1.66</td>
<td class="data-td data last">0.25</td>
</tr>
<tr class="tbl-data">
<td class="data-td last font-weight-normal">Amazon.com Inc</td>
<td class="data-td data last">AMZN</td>
<td class="data-td data last">3.05</td>
<td class="data-td data last">0.21</td>
</tr>
<tr class="tbl-data">
<td class="data-td last font-weight-normal">Walt Disney Co/The</td>
<td class="data-td data last">DIS</td>
<td class="data-td data last">3.09</td>
<td class="data-td data last">0.21</td>
</tr>
<tr class="tbl-data">
<td class="data-td last font-weight-normal">DraftKings Inc</td>
<td class="data-td data last">DKNG</td>
<td class="data-td data last">1.37</td>
<td class="data-td data last">0.20</td>
</tr>
<tr class="tbl-data">
<td class="data-td last font-weight-normal">Chewy Inc</td>
<td class="data-td data last">CHWY</td>
<td class="data-td data last">1.05</td>
<td class="data-td data last">0.18</td>
</tr>
</tbody>
</table>
</div>
<br />
<p class="chart-disclosure">Source: BUZZ Holdings ULC, Bloomberg. Past performance is no guarantee of future results. Index performance is not illustrative of fund performance. Not intended as a recommendation to buy or to sell any of the securities mentioned herein.</p>
<p>Shares of EV manufacturers were featured in the top detractors to BUZZ Index performance for the third consecutive Period. EV upstarts including Rivian Automotive Inc. (NASD: RIVN) and Lucid Group Inc. (NASD: LCID) had been previously featured within the segment, shares of industry leader Tesla Inc. (NASD: TSLA) led the segment lower during the recent Period. TSLA missed third-quarter profit and sales forecasts due to challenges from rising interest rates and shifting consumer spending. TSLA&rsquo;s margins have dropped significantly amidst an aggressive price cut strategy attempted to spur demand. CEO Elon Musk expressed concern about economic uncertainties, and TSLA shares stock fell nearly 10% following its Q3 earnings report.</p>
<div class="wrapped-div">
<table style="width: 750px;">
<tbody>
<tr class="tbl-data">
<td class="tbl-header last " colspan="4">Bottom BUZZ Index Contributors: October 12, 2023 &ndash; November 9, 2023</td>
</tr>
<tr class="tbl-data">
<td class="data-td  last">Company</td>
<td class="data-head last">Ticker</td>
<td class="data-head last">Average Weight (%)</td>
<td class="data-head last">Return Contribution (%)</td>
</tr>
<tr class="tbl-data">
<td class="data-td last font-weight-normal">Rivian Automotive Inc</td>
<td class="data-td data last">RIVN</td>
<td class="data-td data last">2.23</td>
<td class="data-td data last">-0.55</td>
</tr>
<tr class="tbl-data">
<td class="data-td last font-weight-normal">GameStop Corp</td>
<td class="data-td data last">GME</td>
<td class="data-td data last">2.65</td>
<td class="data-td data last">-0.48</td>
</tr>
<tr class="tbl-data">
<td class="data-td last font-weight-normal">Lucid Group Inc</td>
<td class="data-td data last">LCID</td>
<td class="data-td data last">2.59</td>
<td class="data-td data last">-0.42</td>
</tr>
<tr class="tbl-data">
<td class="data-td last font-weight-normal">PayPal Holdings Inc</td>
<td class="data-td data last">PYPL</td>
<td class="data-td data last">2.95</td>
<td class="data-td data last">-0.39</td>
</tr>
<tr class="tbl-data">
<td class="data-td last font-weight-normal">Plug Power Inc</td>
<td class="data-td data last">PLUG</td>
<td class="data-td data last">1.43</td>
<td class="data-td data last">-0.32</td>
</tr>
<tr class="tbl-data">
<td class="data-td last font-weight-normal">Coinbase Global Inc</td>
<td class="data-td data last">COIN</td>
<td class="data-td data last">2.85</td>
<td class="data-td data last">-0.29</td>
</tr>
<tr class="tbl-data">
<td class="data-td last font-weight-normal">Unity Software Inc</td>
<td class="data-td data last">U</td>
<td class="data-td data last">1.09</td>
<td class="data-td data last">-0.28</td>
</tr>
<tr class="tbl-data">
<td class="data-td last font-weight-normal">Amazon.com Inc</td>
<td class="data-td data last">AMZN</td>
<td class="data-td data last">2.91</td>
<td class="data-td data last">-0.27</td>
</tr>
<tr class="tbl-data">
<td class="data-td last font-weight-normal">SoFi Technologies Inc</td>
<td class="data-td data last">SOFI</td>
<td class="data-td data last">2.85</td>
<td class="data-td data last">-0.23</td>
</tr>
<tr class="tbl-data">
<td class="data-td last font-weight-normal">Shopify Inc</td>
<td class="data-td data last">SHOP</td>
<td class="data-td data last">1.82</td>
<td class="data-td data last">-0.23</td>
</tr>
</tbody>
</table>
</div>
<br />
<p class="chart-disclosure">Source: BUZZ Holdings ULC, Bloomberg. Past performance is no guarantee of future results. Index performance is not illustrative of fund performance. Not intended as a recommendation to buy or to sell any of the securities mentioned herein.</p>
<h2>Sentiment Stock Highlight &ndash; RTX Corp.</h2>
<p>One of the most notable additions to the BUZZ Index this month is aerospace defense company RTX Corp (NYSE: RTX), formerly known as Raytheon. In addition to manufacturing engines and aircraft components for commercial customers, RTX is well known for its defense division, which produces fighter jets and air weapons systems for militaries. Since July, RTX has been mired in a downtrend, declining as much as 30% until Oct 7, when Hamas launched a widely condemned surprise attack in Israel. It marks the first major geopolitical conflict since Russia's invasion of Ukraine in 2022 and has kicked off what looks to be a prolonged period of fighting in the region. The US increased its presence in the region, directing multiple aircraft carriers to Israel&rsquo;s coast as tensions with several neighboring nations escalated. The turmoil has boosted shares of defense stocks such as RTX and Lockheed Martin (NYSE: LMT), and positive investor sentiment increased commensurately. RTX joins the BUZZ Index this month with a 1.29% weight.</p>
<h3>RTX Corp Stock Price | January 2022 &ndash; November 2023</h3>
<p><img class="img-responsive w-100" src="https://www.vaneck.com/contentassets/f7de33db088a488396668c2226659b5d/3857_buzz-nov-2023-blog_chart-2_2023-11_v1_blog_blog.svg" alt="RTX Corp Stock Price" /></p>
<p class="chart-disclosure">Source: BUZZ Holdings ULC, Bloomberg. Past performance is no guarantee of future results. Index performance is not illustrative of fund performance. Not intended as a recommendation to buy or to sell any of the securities mentioned herein.</p>
<h2>BUZZ Index November 2023 Rebalance Highlights</h2>
<p><strong>Bill Holdings Inc.</strong></p>
<p>It has been a wild month for shares of Bill Holdings Inc. (NYSE: BILL). The payroll management service company, which completed its IPO just months before the onset of the COVID-19 pandemic, recently reported Q1 earnings, announcing disappointing results and lowering revenue guidance. The macro picture has been challenging for many companies outside of the top mega-cap stocks, as the effects of rising interest rates and increasing costs have eaten into many companies&rsquo; margins, while reducing demand for BILL's services. Shares of BILL fell 30% after the earnings release. The story was not finished there however, as speculative reports spread the following week that BILL was close to acquiring Melio Payments for $1.95B. Shares of BILL opened lower by another 15% on the speculation; however, the company subsequently released a statement denying the takeover news, stating that it was not pursuing any acquisitions at the time. BILL instantly jumped 10% following its announcement, prompting a trading halt in its stock. Investors appear undeterred by the volatility, as sentiment has recently been rising. This month, BILL enters the BUZZ Index for the first time ever, with a 0.7% weight.</p>
<p>For more on rebalancing results and a full breakdown of index constituents added and removed for the month, view the <strong><a href="https://www.vaneck.com/us/en/investments/social-sentiment-etf-buzz/buzz-reconstitution.pdf" title="BUZZ VanEck Social Sentiment ETF" target="_blank" rel="noopener">BUZZ Index reconstitution</a></strong> report.</p>
<p>To receive more <a href="https://www.vaneck.com/us/en/insights/thematic-investing/" title="Thematic Investing Insights"><strong>Thematic Investing</strong></a> insights, <a href="https://www.vaneck.com/us/en/subscribe/" title="Subscription Center"><strong>sign up in our subscription center</strong></a>.</p>
<style>
    .wrapped-div {
        max-width: 100%;
    }

    @media (max-width: 1240px) {
        .wrapped-div {
            overflow-x: scroll;
        }
    }

    .wrapped-div-sector {
        max-width: 100%;
        overflow-x: scroll;
    }
</style>
]]></content:encoded>
</item><item rdf:about="https://www.vaneck.com/us/en/blogs/moat-investing/mid-cap-stocks-the-overlooked-sweet-spot/">
  <title>Mid-Cap Stocks: The Overlooked Sweet Spot></title>
  <link>https://www.vaneck.com/us/en/blogs/moat-investing/mid-cap-stocks-the-overlooked-sweet-spot/</link>
  <description><![CDATA[Mid-caps offer an attractive mix of characteristics from both larger and smaller cap stocks and are currently valued at a near 30% discount to their long-term average and an even greater relative discount to where large caps sit today.]]></description>
  <dc:creator>Coulter Regal, CFA</dc:creator>
  <dc:date>11/22/2023 06:30:00</dc:date>
<content:encoded><![CDATA[

<p>In the vast landscape of investment opportunities, mid-cap stocks often find themselves overshadowed by their larger and smaller counterparts. Large-cap stocks, with their stability and market dominance, tend to steal the limelight, while small-cap stocks offer potential for rapid growth but come with higher risk. However, mid-caps may be an overlooked sweet spot in the market, offering an attractive mix of characteristics from both larger and smaller stocks. Current multi-decade low valuations are further driving allure for mid-caps.</p>
<h2>Where Growth Potential Meets Stability</h2>
<p>Mid-cap stocks represent a unique segment in the U.S. equity market, striking a balance between potential for business growth and relative stability. Differing from small-cap stocks, mid-cap companies have typically advanced beyond their most unpredictable growth phases. But unlike many larger companies, they still possess greater potential for expansion and scalability. This unique positioning allows mid-caps to offer a distinct risk/return profile, which is particularly noticeable when compared to the overall underperformance of the smallest sized cohort of stocks over the past decade plus.</p>
<p>As illustrated in the accompanying chart, mid-cap stocks have delivered higher returns than large-cap stocks over the past two decades, a testament to their potential for business growth and scalability. Concurrently, they have exhibited lower volatility than small-caps, reflecting a greater level of stability due to more developed business models. The inclusion of mid-cap stocks in an investment portfolio can be a strategic decision. When combined with small-caps, mid-caps can provide balance, enhancing the potential for return within a portfolio while simultaneously helping temper volatility.</p>
<h3>20 Year Risk/Return by Market Capitalization</h3>
<p><strong>As of 10/31/2023</strong></p>
<p><img class="img-responsive w-100" src="https://www.vaneck.com/contentassets/0fe27320d92b4c65831a87d6cc414b2d/3861_smot-november-2023-mid-cap-blog-_chart-1_2023-11_v1_blog.svg" alt="Mid-caps have exhibited lower volatility than small-caps, reflecting a greater level of stability" /></p>
<p class="chart-disclosure">Source: Morningstar. Total return and standard deviation are annualized. Large-cap represented by the Morningstar Large Cap Index, Mid-cap represented by the Morningstar Mid Cap Index, Small-cap represented by the Morningstar Small Cap Index. Index performance is not illustrative of fund performance. It is not possible to invest directly in an index. Past performance is no guarantee of future results. See disclaimers and descriptions at bottom of page.</p>
<h2>Distinct Sector and Growth Drivers</h2>
<p>Another attractive characteristic of mid-caps is differentiated sector exposures relative to large-caps, providing diversification and distinct drivers of growth. In particular, technology names tend to be much less prevalent in the mid-cap segment of the U.S. equity market, accounting for less than 15% of the universe. In contrast, the technology sector makes up an astonishing 31.5% of the large-cap segment. This difference is especially important today given the concerns that the increasing dominance of technology companies within large-caps is creating concentration risk for investors.</p>
<p>Beyond less tech, mid-caps also feature notable exposure to both the industrials and materials sectors, which are underrepresented in the large-cap universe. These are sectors that may be poised for growth in the coming years as the U.S. government has passed stimulus bills aimed at building-out U.S. manufacturing capabilities. This stimulus spending has come in the form of the $1 trillion Infrastructure Investment and Jobs Act, the nearly $400 billion in clean energy spending in the Inflation Reduction Act, and the $280 billion CHIPS and Science Act. These stimulus measures are expected to bring growth to manufacturing hubs across the nation, benefiting companies in the industrials and materials space, and mid-caps are positioned to capture a considerable portion of this expansion.</p>
<p>Small-caps also exhibit much of these same differentiated sector exposures; however, the greater stability of mid-caps leads to them as the less volatile medium to pursue the above opportunity given today&rsquo;s uncertain economic environment and recessionary risks.</p>
<h3>Technology Sector Dominates Large-caps</h3>
<p><strong>As of 10/31/2023</strong></p>
<p><img class="img-responsive w-100" src="https://www.vaneck.com/contentassets/0fe27320d92b4c65831a87d6cc414b2d/3861_smot-november-2023-mid-cap-blog-_chart-2_2023-11_v1_blog.svg" alt="Mid-caps have different sector exposure than large-cap stocks." /></p>
<p class="chart-disclosure">Source: Morningstar. Large-cap represented by the Morningstar Large Cap Index, Mid-cap represented by the Morningstar Mid Cap Index, Small-cap represented by the Morningstar Small Cap Index. Index performance is not illustrative of fund performance. It is not possible to invest directly in an index. Past performance is no guarantee of future results. See disclaimers and descriptions at bottom of page.</p>
<h2>Valuations Not Seen in Decades</h2>
<p>One of the most compelling reasons to consider allocating to mid-caps is their extremely low valuations on a both historical and relative measure. Hawkish monetary policy, economic uncertainty and fears of recession have had an outsized impact on the share prices of smaller companies relative to those at the top of the market cap spectrum. Mid-cap stocks are now trading at valuations not seen in decades when compared to their large-cap counterparts.</p>
<p>To put this valuation opportunity into perspective, as of October 31, 2023, mid-caps were trading at 12.9 times earnings, well <u>below</u> their long-term 20-year average of 18.3 times. In contrast, large-caps were trading at 19.1 times earnings, well <u>above</u> their 20-year average of 17.5 times earnings.<sup>1</sup>&nbsp;Based on those numbers, mid-caps are trading at nearly a 30% discount to their long-term average and an even greater relative discount to where large caps sit today. This presents a valuation opportunity not seen in over 20 years.</p>
<h3>Mid-Cap P/E Ratio Relative to Large-Cap P/E Ratio</h3>
<p><strong>Jan.1997 &ndash; Oct. 2023</strong></p>
<p><img class="img-responsive w-100" src="https://www.vaneck.com/contentassets/0fe27320d92b4c65831a87d6cc414b2d/3861_smot-november-2023-mid-cap-blog-_chart-3_2023-11_v1_blog.svg" alt="Mid-caps are trading at nearly a 30% discount to their long-term average" /></p>
<p class="chart-disclosure">Source: Bloomberg. Mid-cap represented by the S&amp;P Midcap 400 Index. Large-cap represented by the S&amp;P 500 Index. Index performance is not illustrative of fund performance. It is not possible to invest directly in an index. Past performance is no guarantee of future results. See disclaimers and descriptions at bottom of page.</p>
<p>While small- and mid-cap stocks often bear the brunt of recessionary fears, they also <strong><a href="https://www.vaneck.com/us/en/blogs/moat-investing/bucking-the-trend-why-smid-caps-are-poised-for-a-comeback/" title="Bucking the Trend: Why SMID Caps are Poised for a Comeback">tend to bounce back as the storm clouds clear</a></strong>. Now may be an opportune time to allocate capital to attractively priced mid-caps, especially at a time when large-cap valuations could be considered stretched.</p>
<h2>Access Quality Mid-Cap Companies with Attractive Prices</h2>
<p>While the allure of large-cap stability and the growth potential of small-cap is undeniable, investors should not overlook the often-underappreciated mid-cap segment. Mid-cap stocks offer a unique combination of growth potential, stability, differentiated sector exposure, and are trading at very attractive valuations. A tilt toward mid-cap equities can provide a complement to the traditional large- and small-cap barbell.</p>
<p>For investors looking to access mid-cap equities, the <strong><a href="https://www.vaneck.com/us/en/investments/morningstar-smid-moat-etf-smot/smot-reconstitution.pdf" title="SMOT - VanEck Morningstar SMID Moat ETF" target="_blank" rel="noopener">VanEck Morningstar SMID Moat ETF (SMOT)</a></strong> is a viable option offering exposure that emphasizes both quality and valuation. SMOT seeks to track the <a href="https://www.vaneck.com/us/en/investments/morningstar-smid-moat-etf-smot/index/" title="SMOT - VanEck Morningstar SMID Moat ETF - Overview"><strong>Morningstar<sup>&reg;</sup>&nbsp;US Small-Mid Cap Moat Focus Index<sup>SM</sup></strong></a>, which targets small- and mid-cap companies that possess <strong><a href="https://www.vaneck.com/us/en/blogs/moat-investing/how-a-moat-stock-gets-its-economic-moat/" title="How a Moat Stock Gets Its Economic Moat">long-term competitive advantages, known as moats</a></strong>, and that are trading at attractive prices. Because companies with a moat are typically larger, more-established entities, the strategy tends to skew towards mid-caps. While small-cap companies are still eligible for inclusion, the hurtle of developing a moat acts as a quality screen, limiting exposure to only those select small-caps able to do so.</p>
<p>To receive more <a href="https://www.vaneck.com/us/en/insights/moat-investing/" title="Moat Investing Insights"><strong>Moat Investing</strong></a> insights, <a href="https://www.vaneck.com/us/en/subscribe/" title=" Subscription Center"><strong>sign up in our subscription center</strong></a>.</p>
]]></content:encoded>
</item><item rdf:about="https://www.vaneck.com/us/en/blogs/emerging-markets-bonds/what-happens-after-a-santa-rally-in-rates/">
  <title>What Happens After a Santa Rally in Rates?></title>
  <link>https://www.vaneck.com/us/en/blogs/emerging-markets-bonds/what-happens-after-a-santa-rally-in-rates/</link>
  <description><![CDATA[The Fed is done hiking, and there are plenty of reasons to think that rates further out the yield curve &ndash; perhaps after a Santa rally in rates that could last through year-end &ndash; could continue to push higher.]]></description>
  <dc:creator>Eric Fine</dc:creator>
  <dc:date>11/20/2023 06:30:00</dc:date>
<content:encoded><![CDATA[

<p id="Summary" class="jump-link-nav anchored-block" data-jumplink-title="Summary">In October, the <a href="https://www.vaneck.com/us/en/investments/emerging-markets-bond-fund-embax/overview/" title="EMBAX - Emerging Markets Bond Fund - Class A - Overview"><strong>VanEck Emerging Markets Bond Fund</strong></a> declined 1.25% versus a 0.94% decline for its benchmark, the 50% J.P. Morgan Government Bond Index-Emerging Markets (GBI-EM) Global Diversified and 50% J.P. Morgan Emerging Markets Bond Index (EMBI), underperforming by 31 basis points (bps),. We leaned into the recent sell-off in US rates by increasing our below-benchmark duration and by increasing exposure to higher-beta emerging markets (EM) local currency markets. Duration had been around 3, it&rsquo;s now around 4 (and heading to 5), and we added in Mexico, Hungary, South Africa, and Czechia, all in local markets. We end October with carry of 7.0%, Yield to worst of 10.6%, duration around 4, and 47% of the fund in local currency. Our biggest exposures are Mexico (local and hard), Brazil (local and hard), China (local and hard), Malaysia (local), and Colombia (local and hard). <strong><a href="/us/en/blogs/emerging-markets-bonds/what-happens-after-a-santa-rally-in-rates/emb-manager-commentary-11-2023.pdf" target="_blank" rel="noopener" title="VanEck Emerging Markets Bond Fund Monthly Manager Commentary - November 2023">View here for a PDF version of this blog</a>.</strong></p>
<div class="wrapped-div">
<table style="width: 100%;">
<tbody>
<tr class="tbl-data">
<td class="tbl-header last" colspan="8">Average Annual Total Returns (%) as of October 31, 2023</td>
</tr>
<tr class="tbl-data">
<td class="data-td last">&nbsp;</td>
<td class="data-head last">1 Month<sup>&dagger;</sup></td>
<td class="data-head last">3 Month<sup>&dagger;</sup></td>
<td class="data-head last">YTD</td>
<td class="data-head last">1 Year</td>
<td class="data-head last">3 Year</td>
<td class="data-head last">5 Year</td>
<td class="data-head last">10 Year</td>
</tr>
<tr class="tbl-data">
<td class="data-td last">Class A: NAV (Inception 07/09/12)</td>
<td class="data-td data last">-1.44</td>
<td class="data-td data last">-6.29</td>
<td class="data-td data last">0.88</td>
<td class="data-td data last">14.15</td>
<td class="data-td data last">-1.29</td>
<td class="data-td data last">2.00</td>
<td class="data-td data last">0.69</td>
</tr>
<tr class="tbl-data">
<td class="data-td last">Class A: Maximum 5.75% load</td>
<td class="data-td data last">-7.11</td>
<td class="data-td data last">-11.68</td>
<td class="data-td data last">-4.92</td>
<td class="data-td data last">7.59</td>
<td class="data-td data last">-3.22</td>
<td class="data-td data last">0.80</td>
<td class="data-td data last">0.09</td>
</tr>
<tr class="tbl-data">
<td class="data-td last">Class I: NAV (Inception 07/09/12)</td>
<td class="data-td data last">-1.24</td>
<td class="data-td data last">-6.20</td>
<td class="data-td data last">1.07</td>
<td class="data-td data last">14.52</td>
<td class="data-td data last">-0.97</td>
<td class="data-td data last">2.32</td>
<td class="data-td data last">1.00</td>
</tr>
<tr class="tbl-data">
<td class="data-td last">Class Y: NAV (Inception 07/09/12)</td>
<td class="data-td data last">-1.25</td>
<td class="data-td data last">-6.21</td>
<td class="data-td data last">1.14</td>
<td class="data-td data last">14.35</td>
<td class="data-td data last">-1.08</td>
<td class="data-td data last">2.25</td>
<td class="data-td data last">0.93</td>
</tr>
<tr class="tbl-data">
<td class="data-td last">50% GBI-EM/50% EMBI</td>
<td class="data-td data last">-0.94</td>
<td class="data-td data last">-5.89</td>
<td class="data-td data last">2.09</td>
<td class="data-td data last">10.97</td>
<td class="data-td data last">-3.95</td>
<td class="data-td data last">0.10</td>
<td class="data-td data last">0.50</td>
</tr>
</tbody>
</table>
</div>
<br />
<div class="wrapped-div">
<table style="width: 100%;">
<tbody>
<tr class="tbl-data">
<td class="tbl-header last" colspan="8">Average Annual Total Returns (%) as of September 30, 2023</td>
</tr>
<tr class="tbl-data">
<td class="data-td last">&nbsp;</td>
<td class="data-head last">1 Month<sup>&dagger;</sup></td>
<td class="data-head last">3 Month<sup>&dagger;</sup></td>
<td class="data-head last">YTD</td>
<td class="data-head last">1 Year</td>
<td class="data-head last">3 Year</td>
<td class="data-head last">5 Year</td>
<td class="data-head last">10 Year</td>
</tr>
<tr class="tbl-data">
<td class="data-td last">Class A: NAV (Inception 07/09/12)</td>
<td class="data-td data last">-2.28</td>
<td class="data-td data last">-3.37</td>
<td class="data-td data last">2.35</td>
<td class="data-td data last">12.91</td>
<td class="data-td data last">-0.83</td>
<td class="data-td data last">2.07</td>
<td class="data-td data last">1.18</td>
</tr>
<tr class="tbl-data">
<td class="data-td last">Class A: Maximum 5.75% load</td>
<td class="data-td data last">-7.90</td>
<td class="data-td data last">-8.93</td>
<td class="data-td data last">-3.53</td>
<td class="data-td data last">6.42</td>
<td class="data-td data last">-2.77</td>
<td class="data-td data last">0.87</td>
<td class="data-td data last">0.58</td>
</tr>
<tr class="tbl-data">
<td class="data-td last">Class I: NAV (Inception 07/09/12)</td>
<td class="data-td data last">-2.43</td>
<td class="data-td data last">-3.46</td>
<td class="data-td data last">2.34</td>
<td class="data-td data last">13.01</td>
<td class="data-td data last">-0.56</td>
<td class="data-td data last">2.39</td>
<td class="data-td data last">1.48</td>
</tr>
<tr class="tbl-data">
<td class="data-td last">Class Y: NAV (Inception 07/09/12)</td>
<td class="data-td data last">-2.44</td>
<td class="data-td data last">-3.49</td>
<td class="data-td data last">2.43</td>
<td class="data-td data last">12.95</td>
<td class="data-td data last">-0.62</td>
<td class="data-td data last">2.32</td>
<td class="data-td data last">1.42</td>
</tr>
<tr class="tbl-data">
<td class="data-td last">50% GBI-EM/50% EMBI</td>
<td class="data-td data last">-2.98</td>
<td class="data-td data last">-2.73</td>
<td class="data-td data last">3.06</td>
<td class="data-td data last">11.61</td>
<td class="data-td data last">-3.58</td>
<td class="data-td data last">-0.12</td>
<td class="data-td data last">0.87</td>
</tr>
</tbody>
</table>
</div>
<br />
<p class="chart-disclosure"><sup>&dagger;</sup>&nbsp;Returns less than one year are not annualized.</p>
<p class="chart-disclosure"><strong>Expenses: Class A: Gross 2.55%, Net 1.27%; Class I: Gross 2.51%, Net 0.97%; Class Y: Gross 2.91%, Net 1.02%.</strong> Expenses are capped contractually until 05/01/24 at 1.25% for Class A, 0.95% for Class I, 1.00% for Class Y. Caps excluding acquired fund fees and expenses, interest, trading, dividends, and interest payments of securities sold short, taxes, and extraordinary expenses.</p>
<p class="chart-disclosure"><strong>The performance data quoted represents past performance. Past performance is not a guarantee of future results. Investment return and principal value of an investment will fluctuate so that an investor&rsquo;s shares, when redeemed, may be worth more or less than their original cost. Performance may be lower or higher than performance data quoted. Please call 800.826.2333 or visit vaneck.com for performance current to the most recent month ended.</strong></p>
<p class="chart-disclosure">The &ldquo;Net Asset Value&rdquo; (NAV) of a Fund is determined at the close of each business day, and represents the dollar value of one share of the fund; it is calculated by taking the total assets of the fund, subtracting total liabilities, and dividing by the total number of shares outstanding. The NAV is not necessarily the same as the ETF&rsquo;s intraday trading value. Investors should not expect to buy or sell shares at NAV.</p>
<p id="PeakFed?AndOtherTakeaways" class="jump-link-nav anchored-block" data-jumplink-title="Peak Fed? And Other Takeaways"><strong>Peak Fed = Peak Dollar? The clearest implication of the pause in US policy rates is a weaker dollar.</strong> An end to Fed hikes is now clearer following US CPI data released on October 14. Disagreement is now mainly about how long it will take for cuts to materialize and their magnitude, not the general sequencing and direction of the next year. To us, the main point is that the Fed appears to be done hiking, but not done talking about it. Whether this &ldquo;pause&rdquo; at the front end of the yield curve translates into a rally in the long end (which would at least need support from further favorable inflation data in the coming months, if not a recession), or whether the pause at the front end translates into a sell-off in the long end (which could happen for a variety of reasons including poor inflation data, weak market demand for duration, US credit risk, and others), the pause at the front end is the clearest observation. Our mantra remains &ldquo;the turn in rates is not the turn in risk.&rdquo; An end to hikes is <i>not</i> the cue to buy 30-year bonds or high yield, any more than it&rsquo;s the cue to buy the Nasdaq. The pause should anchor front-end rates, and thus the only clear asset price implication is that it freezes support for the US dollar. When/if the Fed takes it further and stops jawboning in this direction, we reckon that more policy rate cuts will be priced. Whether long-end yields will be higher or lower, on the other hand, will be largely a function of US inflation data and recession risk. Policy rates, less so. As a result, we see the only and key market implication to be bullish for EM currencies against the US dollar.</p>
<p><strong>Peak Fed = Peak Duration? &ldquo;The turn in rates is not the turn in risk&rdquo;, we&rsquo;ve been saying. Our view on duration is now neutral, having been bearish for most of this year. The Fund had duration of around 3 for most of the year going into September, was around 4 at the end of October, and is approaching 5, as of mid-November. We have taken profits on our low duration view, and have brought the Fund&rsquo;s duration close to benchmark duration (of around 5.6). The turn in policy rates is only the turn in policy rates.</strong> As we argue above, there are plenty of reasons to think that rates further out the curve &ndash; perhaps after a Santa Claus rally in rates that could last through year-end &ndash; could continue to push higher. For reasons we&rsquo;ve written about, ranging from ongoing QT, high and relentless treasury borrowing and credit concerns. But, these are reasons to concentrate on the more durable driver &ndash; policy rates. Anchored policy rates are the stronger conclusion from recent developments. As a result, the Fund had increased EM currency exposure, including to higher-beta Brazil, South Africa, Mexico, and Colombia&hellip;but only took our duration underweight closer to neutral. The turn in policy rates is only the turn in policy rates.</p>
<p><strong>Peak Fed = Peak geopolitical stability? There is still commodity supply risk, despite oil&rsquo;s decline in the wake of the surprise October 7 attacks on Israel. We think this price decline reflects major powers&rsquo; efforts to keep the conflict from escalating, but it does not mark the end of geopolitical risk.</strong> Since the October 7 attacks on Israel by Hamas, oil prices are down over 10%, contrary to a knee-jerk expectation of $100 oil following this spike in geopolitical risk. To us, oil&rsquo;s underperformance relative to the geopolitical &ldquo;noise&rdquo; is almost entirely a reflection of the US and key regional powers&rsquo; efforts to keep the conflict from spilling into a broader one. Given the obvious capacity for this conflict to escalate, our flashlight only goes out a few months on this topic, but it seems to us that the intent and interest of the US, its Sunni allies, Iran, Saudi Arabia, and China point in the direction of stability. Israel and events may not cooperate, of course, but Israeli Prime Minister Benjamin Netanyahu&rsquo;s political vulnerability at home is also appearing to be a constraint on escalation for now. Looking further out, this conflict has much that could easily spill into a conflict with more serious market implications. Sunni nations need to avoid looking like vassals and Israel&rsquo;s actions need to be modulated to reduce the risk of a rising &ldquo;Arab street&rdquo;, but is this likely? For now, containment of the crisis is actually happening. It might not continue, of course. But, our point is that oil&rsquo;s weakness in the wake of October 7 is the result of a common front against escalation against key powers surrounding the actual conflict, which looks fragile. Supply risk to commodities, generally speaking, is still the key long-term fact. The example of uranium is instructive. Uranium spiked following the coup in Niger, a heretofore important supplier to France. Like a number of commodities, uranium supply can be very concentrated, and Kazakhstan happens to produce 40% of global uranium. In any case, our point is that geopolitics still point to supply risk, but this doesn&rsquo;t mean there&rsquo;s a catalyzing event every quarter. The chart below shows that one simply has to be ready for it. As such, we&rsquo;re chalking up oil&rsquo;s weakness in the wake of October 7 to a configuration of restraint and containment. The geopolitical risk is still there, just contained.</p>
<h3>Exhibit 1 &ndash; Uranium Reacts to Geopolitical Risk</h3>
<p><img class="img-responsive w-100" src="https://www.vaneck.com/contentassets/e767c1f24d2f43b5bcb576249f723166/3852_em-bonds-november_chart-1_2023.11_v1_blog.svg" alt="Uranium prices have surged this year due to increased geopolitical risks." /></p>
<p class="chart-disclosure">Source: Bloomberg As of November 15, 2023.</p>
<p><strong>Nobody is giving China credit.</strong> In addition to a litany of what could add up to a &ldquo;stimulus package&rdquo; (including housing-focused spending, encouragements to reschedule domestic liabilities), the government just announced an outright 0.8% of GDP pure fiscal stimulus. And yet, we found surveys at recent IMF meetings showing that nobody was receptive to good news about China, with less than 5% of respondents indicating any interest in investing in China in 2024. This is too extreme a position, in our opinion, regardless of the long-term trajectory of US/China relations. And, in corporate bonds there are plenty of prices that reflect this extreme bearishness (this is important because the Chinese Government Bond market shows no signs of stress and no signs of value). We continue to be constructive on selective Chinese corporate bonds, which we accumulated during this year&rsquo;s sell-off.</p>
<p><strong>In October, the Fund underperformed by 31 bps, declining 1.25%, compared to a 0.94% decline for its benchmark.</strong> We leaned into the recent sell-off in US rates by increasing our below-benchmark duration and by increasing exposure to higher-beta EM local currency markets. Duration had been around 3, it&rsquo;s now around 4 (and heading to 5), and we added in Mexico, Hungary, South Africa, and Czechia, all in local markets. We end October with carry of 7.0%, YTW of 10.6%, duration around 4, and 47% of the fund in local currency. Our biggest exposures are Mexico (local and hard), Brazil (local and hard), China (local and hard), Malaysia (local), and Colombia (local and hard).</p>
<h2 id="EXPOSURETYPESANDSIGNIFICANTCHANGES" class="jump-link-nav anchored-block" data-jumplink-title="EXPOSURE TYPES AND SIGNIFICANT CHANGES">EXPOSURE TYPES AND SIGNIFICANT CHANGES</h2>
<p>The changes to our top positions are summarized below. Our largest positions in October were Mexico, Brazil, China, Malaysia, and Colombia.</p>
<ul class="content-list">
<li>We increased our local currency exposure in Mexico, Chile, Hungary, and the Czech Republic. Mexico&rsquo;s local rates are still closely correlated with U.S. Treasuries, and as such should be expected to benefit from the Fed&rsquo;s perceived dovish tilt. On the other hand, Mexico&rsquo;s central bank is unlikely to rush into rate hikes, providing a fundamental backstop for the currency. In terms of our investment process, this improved Mexico&rsquo;s technical and policy test scores. The Chilean central bank adjusted the pace of easing in response to the global uncertainty, improving the policy test score for the country. The Czech national bank remains the most hawkish in the region, supporting the country&rsquo;s policy test score. Hungary&rsquo;s growth outlook is expected to improve in 2024 on the back of lower inflation, benefitting the currency, whereas the central bank should still be able to cut the policy rate safely.</li>
<li class="mt-2">We also increased our local currency and sovereign exposure in South Africa, and sovereign exposure in Qatar and Angola. South Africa&rsquo;s central bank is among the most credible in EM, which means no running ahead of the curve with policy easing &ndash; especially as the government&rsquo;s debt trajectory might be higher and the deficit a bit wider than expected. A good thing is that the government&rsquo;s medium-term fiscal projections are based on reasonable economic assumptions, which should keep issuance under control. In terms of our investment process, this improved the policy test score for the country. Qatar and Angola should be expected to benefit from higher oil prices as China continues to rebound and the Middle East tensions might put a floor under the price of oil. Further, our sovereign exposure in Qatar is long-dated, and as such should be expected piggyback on the downside move in U.S. Treasury yields.</li>
<li class="mt-2">Finally, we increased our sovereign exposure in Egypt and Nigeria. The pace of reforms in Nigeria is accelerating again (including the exchange rate unification), and it looks like the government was able to secure a decent pipeline of multinational loans to support the policy transition. In terms of our investment process, this improves the policy test score for the country. Egypt&rsquo;s pivotal role in the Middle Eastern conflict might result in large multinational and bi-lateral inflows, as well as potentially some positive news on the debt forgiveness front, strengthening the policy test score for the country.</li>
<li class="mt-2">We reduced our local currency exposure in Malaysia and Thailand. These are low-yielding assets, and they might not benefit as much from a rally in U.S. rates. It also remains to be seen when these countries would feel the positive spillovers from China&rsquo;s rebound, as the progress is bumpy and might be slower than expected.</li>
<li class="mt-2">We also reduced our local currency exposure in Israel. The escalation of political tensions in the region means a greater risk premium for most assets against the backdrop of downside growth risks and missed fiscal targets. In terms of our investment process, this worsened Israel&rsquo;s policy test score.</li>
<li class="mt-2">Finally, we reduced our sovereign exposure in Ecuador. Even though President-elect Noboa is generally considered a business-friendly politician, the country is now in a wait-n-see mode, as the cabinet is being formed and the reform agenda formulated. In terms of our investment process, this worsened the policy test score for the country.</li>
</ul>
<p>To receive more <a href="https://www.vaneck.com/us/en/insights/emerging-markets-bonds/" title="Emerging Markets Bonds Insights"><strong>Emerging Markets Bonds</strong></a> insights, <a href="https://www.vaneck.com/us/en/subscribe/" title="Subscription Center"><strong>sign up in our subscription center</strong></a>.</p>
<style>
    .wrapped-div {
        max-width: 100%;
    }

    @media (max-width: 768px) {
        .wrapped-div {
            overflow-x: scroll;
        }
    }

    .wrapped-div-sector {
        max-width: 100%;
        overflow-x: scroll;
    }
</style>
]]></content:encoded>
</item><item rdf:about="https://www.vaneck.com/us/en/blogs/thematic-investing/thematic-investing-question-and-answer/">
  <title>Thematic Investing: Question &amp; Answer></title>
  <link>https://www.vaneck.com/us/en/blogs/thematic-investing/thematic-investing-question-and-answer/</link>
  <description><![CDATA[The blog responds to frequently asked questions about thematic investing by detailing what it is and major thematic trends.]]></description>
  <dc:creator> </dc:creator>
  <dc:date>11/15/2023 06:30:00</dc:date>
<content:encoded><![CDATA[

<ul class="content-list">
<li><strong><a href="#point-one">What is thematic investing?</a></strong></li>
<li><strong><a href="#point-two">Why should advisors and investors consider thematic investing?</a></strong></li>
<li><strong><a href="#point-three">What is VanEck&rsquo;s approach to thematic investing?</a></strong></li>
<li><strong><a href="#point-four">What are some misconceptions about thematic investing?</a></strong></li>
<li><strong><a href="#point-five">What are some of the significant thematic trends?</a></strong></li>
<li><strong><a href="#point-six">How can investors use ETFs to get access to market themes?</a></strong></li>
<li><strong><a href="#point-seven">How can investors learn more about thematic investing?</a></strong></li>
</ul>
<h2 id="point-one" class="anchored-block">What is thematic investing?</h2>
<p>Thematic investing is an investment strategy that focuses on specific themes or trends in the market rather than traditional asset classes or sectors. It involves selecting investments in companies or assets expected to benefit from a particular theme or trend. These themes can be broad, such as clean energy or technology innovation, or more specific, like e-commerce or cybersecurity. Thematic investing allows investors to align their portfolios with their beliefs, values, or expectations about the future, and it can provide diversification and potential growth opportunities. Thematic investing has become very popular in recent years, with the potential for themes to provide outperformance to the broad market.</p>
<h2 id="point-two" class="anchored-block">Why should advisors and investors consider thematic investing?</h2>
<p>Investors may consider thematic investing for several reasons.</p>
<ul class="content-list">
<li>Diversification: Thematic investing can provide diversification beyond traditional asset classes, potentially reducing risk by spreading investments across a range of companies or assets connected to a specific theme. Growth potential: Themes and trends can lead to high-growth opportunities. Investing in sectors or technologies expected to expand rapidly can offer the potential for attractive returns.</li>
<li>Alignment with values: Thematic investing allows investors to align their portfolios with their beliefs and values. For example, those concerned about environmental issues can invest in clean energy themes.</li>
<li>Innovation exposure: Thematic investing often involves emerging industries and disruptive technologies, offering exposure to innovation and potentially benefiting from market shifts.</li>
<li>Tailored portfolios: Investors can customize their portfolios based on their outlook and convictions about specific themes, which may lead to more personalized and focused investment strategies.</li>
</ul>
<p>Investing in themes can benefit both clients and advisers. By learning and investing in specific themes, advisers can become more engaged with clients by helping them understand what&rsquo;s driving the market and news cycles.</p>
<h2 id="point-three" class="anchored-block">What is VanEck&rsquo;s approach to thematic investing?</h2>
<p>A unique attribute of VanEck&rsquo;s thematic suite is our focus on what we see as long-term secular trends among industries that we believe are likely to drive long-term performance. VanEck approaches thematic ETFs with a focus on pure-play exposures, meaning that companies included in most of our portfolios must derive 50% of revenues from the specific theme on which they are focused.</p>
<h2 id="point-four" class="anchored-block">What are some misconceptions about thematic investing?</h2>
<p>Some of the biggest misconceptions about thematic investing are that it is simply chasing fads or you only get exposure to large tech companies like Apple, Nvidia, or Microsoft. Thematic investing involves selecting investments based on specific themes or trends rather than traditional factors like sectors or geographic regions. Here are some common misconceptions about thematic investing:</p>
<ul class="content-list">
<li>It's only for niche or speculative themes: Thematic investing can cover many themes, from technology and healthcare to sustainability and demographics. It's not limited to niche or speculative ideas.</li>
<li>It's a short-term strategy: Thematic investing can be short-term and long-term, depending on the theme and the investor's goals. Some themes may play out over many years, making them suitable for long-term investment.</li>
<li>It's risk-free: Thematic investments can be riskier than broad-market investments. If a theme doesn't materialize as expected or faces regulatory challenges, it can result in losses.</li>
<li>It's always a high cost: While some thematic ETFs and funds may have higher expense ratios, not all thematic investments are costly. Investors can choose cost-effective options and tailor their thematic strategy to their budget.</li>
<li>It's incompatible with diversification: Thematic investing can be diversified within the chosen theme. Investors can select multiple companies or assets within a theme to spread risk while focusing on the desired trend.</li>
<li>It's purely based on trends, not fundamentals: Successful thematic investing combines a thematic approach with fundamental analysis. It's important to assess the companies' or assets' financial health and growth potential within the chosen theme.</li>
<li>It's primarily for retail investors: Institutional investors also engage in thematic investing, recognizing the long-term potential of specific themes in their portfolios.</li>
<li>It's the same as sector investing: While thematic investing may overlap with sector investing, it's distinct. Thematic investing focuses on broader, cross-sector trends that may cut across multiple industries.</li>
</ul>
<h2 id="point-five" class="anchored-block">What are some of the significant thematic trends?</h2>
<ul>
<li>Clean Energy and Renewable Technologies: With a growing emphasis on combating climate change, investments in clean energy sources like solar, wind, and electric vehicles rose.</li>
<li>Technology and Innovation: Themes like artificial intelligence, automation, and cybersecurity continued to attract investment due to their transformative potential.</li>
<li>Healthcare and Biotechnology: Healthcare innovation, biotech research, and telemedicine investments were driven by an aging population and the ongoing pandemic.</li>
<li>Digital Assets and Fintech: The digitalization of financial services and the rise of cryptocurrencies were significant themes in investing.</li>
<li>Genomics and Precision Medicine: Advances in genomics and personalized medicine were gaining attention for their potential to revolutionize healthcare.</li>
<li>Infrastructure and Urbanization: As cities expanded and aging infrastructure required upgrades, investments in smart cities, transportation, and infrastructure development were growing.</li>
<li>Water and Resource Scarcity: As water resources became scarcer in some regions, investments in water-related technologies and resource management gained importance.</li>
<li>Aging Population: Investing in companies addressing the needs of the aging population, including healthcare, senior living, and retirement solutions.</li>
<li>Cybersecurity: With the increasing reliance on digital technology, investments in companies providing cybersecurity solutions were in demand.</li>
<li>ESG (Environmental, Social, and Governance) Investing: Investors increasingly focus on companies with strong sustainability practices and ethical governance.</li>
</ul>
<h2 id="point-six" class="anchored-block">How can investors use ETFs to get access to market themes?</h2>
<p>ETFs can be valuable tools for investors seeking to participate in specific and targeted economic opportunities. Often, these are referred to as &ldquo;themes, " which may be based on advancements such as technology or can be solution-driven&mdash;solutions investors seek to combat particular market conditions, like inflation. While ETFs that target themes generally tend to be concentrated, their addition to a portfolio is intended to add value from a return perspective and aid with diversification and overall risk. VanEck has purpose-built various ETFs for accessing timely and relevant trends shaping the modern investment landscape.</p>
<div class="wrapped-div">
<table style="width: 100%;">
<tbody>
<tr class="tbl-data">
<td class="tbl-header last">Fund</td>
<td class="tbl-header last">Demographics</td>
<td class="tbl-header last">Automation</td>
<td class="tbl-header last">Energy</td>
<td class="tbl-header last">Disruptive Technology</td>
<td class="tbl-header last">Healthcare Innovation</td>
<td class="tbl-header last">Infrastructure</td>
<td class="tbl-header last">Reshoring</td>
<td class="tbl-header last">Resource Scarcity</td>
<td class="tbl-header last">Sustainability</td>
</tr>
<tr class="tbl-data">
<td class="data-td last"><strong><a href="https://www.vaneck.com/us/en/investments/agribusiness-etf-moo/overview/" title="MOO - VanEck Agribusiness ETF">Agribusiness ETF MOO</a></strong></td>
<td class="data-td data last">&nbsp;</td>
<td class="data-td data last">■</td>
<td class="data-td data last">&nbsp;</td>
<td class="data-td data last">■</td>
<td class="data-td data last">&nbsp;</td>
<td class="data-td data last">■</td>
<td class="data-td data last">&nbsp;</td>
</tr>
<tr class="tbl-data">
<td class="data-td last"><strong><a href="https://www.vaneck.com/us/en/investments/biotech-etf-bbh/overview/" title="BBH - VanEck Biotech ETF">Biotech ETF BBH</a></strong></td>
<td class="data-td data last">■</td>
<td class="data-td data last">&nbsp;</td>
<td class="data-td data last">■</td>
<td class="data-td data last">&nbsp;</td>
</tr>
<tr class="tbl-data">
<td class="data-td last"><strong><a href="/us/en/investments/bitcoin-trust-hodl/overview/" title="HODL - VanEck Bticoin ETF">Bitcoin ETF HODL</a></strong></td>
<td class="data-td data last">■</td>
<td class="data-td data last">&nbsp;</td>
<td class="data-td data last">■</td>
<td class="data-td data last">&nbsp;</td>
<td class="data-td data last">■</td>
<td class="data-td data last">&nbsp;</td>
</tr>
<tr class="tbl-data">
<td class="data-td last"><strong><a href="https://www.vaneck.com/us/en/investments/commodity-strategy-etf-pit/overview/" title="PIT - VanEck Commodity Strategy ETF">Commodity Strategy ETF PIT</a></strong></td>
<td class="data-td data last">&nbsp;</td>
<td class="data-td data last">■</td>
<td class="data-td data last">&nbsp;</td>
</tr>
<tr class="tbl-data">
<td class="data-td last"><strong><a href="https://www.vaneck.com/us/en/investments/digital-india-etf-dgin/overview/" title="DGIN - VanEck Digital India ETF">Digital India ETF DGIN</a></strong></td>
<td class="data-td data last">■</td>
<td class="data-td data last">&nbsp;</td>
<td class="data-td data last">■</td>
<td class="data-td data last">&nbsp;</td>
<td class="data-td data last">■</td>
<td class="data-td data last">&nbsp;</td>
</tr>
<tr class="tbl-data">
<td class="data-td last"><strong><a href="https://www.vaneck.com/us/en/investments/digital-transformation-etf-dapp/overview/" title="DAPP - VanEck Digital Transformation ETF">Digital Transformation ETF DAPP</a></strong></td>
<td class="data-td data last">■</td>
<td class="data-td data last">&nbsp;</td>
<td class="data-td data last">■</td>
<td class="data-td data last">&nbsp;</td>
</tr>
<tr class="tbl-data">
<td class="data-td last"><strong><a href="https://www.vaneck.com/us/en/investments/energy-income-etf-einc/overview/" title="EINC - VanEck Energy Income ETF">Energy Income ETF EINC</a></strong></td>
<td class="data-td data last">&nbsp;</td>
<td class="data-td data last">■</td>
<td class="data-td data last">&nbsp;</td>
<td class="data-td data last">■</td>
<td class="data-td data last">&nbsp;</td>
</tr>
<tr class="tbl-data">
<td class="data-td last"><strong><a href="https://www.vaneck.com/us/en/investments/enviromental-services-etf-evx/overview/" title="EVX - VanEck Environmental Services ETF">Environmental Services ETF EVX</a></strong></td>
<td class="data-td data last">&nbsp;</td>
<td class="data-td data last">■</td>
<td class="data-td data last">&nbsp;</td>
<td class="data-td data last">■</td>
<td class="data-td data last">&nbsp;</td>
</tr>
<tr class="tbl-data">
<td class="data-td last"><strong><a href="/link/bc13e94806954f2da2fab526cace351b.aspx" title="GENZ - Digital Native Economy ETF">Digital Native Economy ETF GENZ</a></strong></td>
<td class="data-td data last">■</td>
<td class="data-td data last">&nbsp;</td>
</tr>
<tr class="tbl-data">
<td class="data-td last"><strong><a href="https://www.vaneck.com/us/en/investments/gold-miners-etf-gdx/overview/" title="GDX - VanEck Gold Miners ETF">Gold Miners Equity ETF GDX</a></strong></td>
<td class="data-td data last">&nbsp;</td>
<td class="data-td data last">■</td>
<td class="data-td data last">&nbsp;</td>
</tr>
<tr class="tbl-data">
<td class="data-td last"><strong><a href="https://www.vaneck.com/us/en/investments/green-bond-etf-grnb/overview/" title="GRNB - VanEck Green Bond ETF">Green Bond ETF GRNB</a></strong></td>
<td class="data-td data last">&nbsp;</td>
<td class="data-td data last">■</td>
</tr>
<tr class="tbl-data">
<td class="data-td last"><strong><a href="https://www.vaneck.com/us/en/investments/green-metals-etf-gmet/overview/" title="EMET - VanEck Copper and Green Metals ETF ">Copper and Green Metals ETF EMET</a></strong></td>
<td class="data-td data last">&nbsp;</td>
<td class="data-td data last">■</td>
<td class="data-td data last">&nbsp;</td>
<td class="data-td data last">■</td>
<td class="data-td data last">&nbsp;</td>
<td class="data-td data last">■</td>
</tr>
<tr class="tbl-data">
<td class="data-td last"><strong>HIP Sustainable Muni ETF SMI</strong></td>
<td class="data-td data last">&nbsp;</td>
<td class="data-td data last">■</td>
<td class="data-td data last">&nbsp;</td>
<td class="data-td data last">■</td>
</tr>
<tr class="tbl-data">
<td class="data-td last"><strong><a href="https://www.vaneck.com/us/en/investments/inflation-allocation-etf-raax/overview/" title="RAAX - VanEck Real Assets ETF">Real Assets ETF RAAX</a></strong></td>
<td class="data-td data last">&nbsp;</td>
<td class="data-td data last">■</td>
<td class="data-td data last">&nbsp;</td>
</tr>
<tr class="tbl-data">
<td class="data-td last"><strong><a href="https://www.vaneck.com/us/en/investments/junior-gold-miners-etf-gdxj/overview/" title="GDXJ - VanEck Junior Gold Miners ETF">Junior Gold Miners ETF GDXJ</a></strong></td>
<td class="data-td data last">&nbsp;</td>
<td class="data-td data last">■</td>
<td class="data-td data last">&nbsp;</td>
</tr>
<tr class="tbl-data">
<td class="data-td last"><strong><a href="https://www.vaneck.com/us/en/investments/low-carbon-energy-etf-smog/overview/" title="SMOG - VanEck Low Carbon Energy ETF">Low Carbon Energy ETF SMOG</a></strong></td>
<td class="data-td data last">&nbsp;</td>
<td class="data-td data last">■</td>
<td class="data-td data last">&nbsp;</td>
<td class="data-td data last">■</td>
<td class="data-td data last">&nbsp;</td>
<td class="data-td data last">■</td>
</tr>
<tr class="tbl-data">
<td class="data-td last"><strong><a href="https://www.vaneck.com/us/en/investments/office-and-commercial-reit-desk/overview/" title="DESK - VanEck Office and Commercial REIT ETF">Office and Commercial REIT ETF DESK</a></strong></td>
<td class="data-td data last">■</td>
<td class="data-td data last">&nbsp;</td>
<td class="data-td data last">■</td>
<td class="data-td data last">&nbsp;</td>
</tr>
<tr class="tbl-data">
<td class="data-td last"><strong><a href="https://www.vaneck.com/us/en/investments/oil-refiners-etf-crak/overview/" title="CRAK - VanEck Oil Refiners ETF">Oil Refiners ETF CRAK</a></strong></td>
<td class="data-td data last">&nbsp;</td>
<td class="data-td data last">■</td>
<td class="data-td data last">&nbsp;</td>
</tr>
<tr class="tbl-data">
<td class="data-td last"><strong><a href="https://www.vaneck.com/us/en/investments/oil-services-etf-oih/overview/" title="OIH - VanEck Oil Services ETF">Oil Services ETF OIH</a></strong></td>
<td class="data-td data last">&nbsp;</td>
<td class="data-td data last">■</td>
<td class="data-td data last">&nbsp;</td>
</tr>
<tr class="tbl-data">
<td class="data-td last"><strong><a href="https://www.vaneck.com/us/en/investments/pharmaceutical-etf-pph/overview/" title="PPH - VanEck Pharmaceutical ETF">Pharmaceutical ETF PPH</a></strong></td>
<td class="data-td data last">■</td>
<td class="data-td data last">&nbsp;</td>
<td class="data-td data last">■</td>
<td class="data-td data last">&nbsp;</td>
</tr>
<tr class="tbl-data">
<td class="data-td last"><strong><a href="https://www.vaneck.com/us/en/investments/rare-earth-strategic-metals-etf-remx/overview/" title="REMX - VanEck Rare Earth/Strategic Metals ETF">Rare Earth/Strategic Metals ETF REMX</a></strong></td>
<td class="data-td data last">&nbsp;</td>
<td class="data-td data last">■</td>
<td class="data-td data last">&nbsp;</td>
<td class="data-td data last">■</td>
<td class="data-td data last">&nbsp;</td>
</tr>
<tr class="tbl-data">
<td class="data-td last"><strong><a href="https://www.vaneck.com/us/en/investments/retail-etf-rth/overview/" title="RTH - VanEck Retail ETF">Retail ETF RTH</a></strong></td>
<td class="data-td data last">■</td>
<td class="data-td data last">&nbsp;</td>
<td class="data-td data last">■</td>
<td class="data-td data last">&nbsp;</td>
</tr>
<tr class="tbl-data">
<td class="data-td last"><strong><a href="https://www.vaneck.com/us/en/investments/robotics-etf-ibot/overview/" title="IBOT - VanEck Robotics ETF">Robotics ETF IBOT</a></strong></td>
<td class="data-td data last">■</td>
<td class="data-td data last">&nbsp;</td>
<td class="data-td data last">■</td>
<td class="data-td data last">&nbsp;</td>
</tr>
<tr class="tbl-data">
<td class="data-td last"><strong><a href="https://www.vaneck.com/us/en/investments/semiconductor-etf-smh/overview/" title="SMH - VanEck Semiconductor ETF">Semiconductor ETF SMH</a></strong></td>
<td class="data-td data last">&nbsp;</td>
<td class="data-td data last">■</td>
<td class="data-td data last">&nbsp;</td>
<td class="data-td data last">■</td>
<td class="data-td data last">&nbsp;</td>
</tr>
<tr class="tbl-data">
<td class="data-td last"><strong><a href="https://www.vaneck.com/us/en/investments/steel-etf-slx/overview/" title="SLX - VanEck Steel ETF">Steel ETF SLX</a></strong></td>
<td class="data-td data last">&nbsp;</td>
<td class="data-td data last">■</td>
<td class="data-td data last">&nbsp;</td>
</tr>
<tr class="tbl-data">
<td class="data-td last"><strong><a href="/https://www.vaneck.com/us/en/investments/uranium-nuclear-energy-etf-nlr/overview/" title="NLR - VanEck Uranium+Nuclear Energy ETF">Uranium+Nuclear Energy ETF NLR</a></strong></td>
<td class="data-td data last">&nbsp;</td>
<td class="data-td data last">■</td>
<td class="data-td data last">&nbsp;</td>
<td class="data-td data last">■</td>
<td class="data-td data last">&nbsp;</td>
</tr>
<tr class="tbl-data">
<td class="data-td last"><strong><a href="https://www.vaneck.com/us/en/investments/video-gaming-esports-etf-espo/overview/" title="ESPO - VanEck Video Gaming and eSports ETF">Video Gaming and eSports ETF ESPO</a></strong></td>
<td class="data-td data last">■</td>
<td class="data-td data last">&nbsp;</td>
<td class="data-td data last">■</td>
<td class="data-td data last">&nbsp;</td>
</tr>
<tr class="tbl-data">
<td class="data-td last"><strong><a href="https://www.vaneck.com/us/en/investments/onchain-economy-etf-node/overview/" title="VanEck Onchain Economy ETF - NODE">VanEck Onchain Economy ETF NODE</a></strong></td>
<td class="data-td data last">■</td>
<td class="data-td data last">&nbsp;</td>
<td class="data-td data last">■</td>
<td class="data-td data last">&nbsp;</td>
<td class="data-td data last">■</td>
<td class="data-td data last">&nbsp;</td>
</tr>
</tbody>
</table>
</div>
<br />
<h2 id="point-seven" class="anchored-block">How can investors learn more about thematic investing?</h2>
<p>Investors who subscribe to VanEck&rsquo;s thematic investing insights can expect timely updates on the new and evolving discoveries and innovations potentially driving future performance across various industries.</p>
<p class="d-none d-lg-block"><a href="mailto:askvaneck@vaneck.com" title="Have More Questions? - Ask VanEck" rel="noopener"><img loading="lazy" class="img-responsive" src="https://www.vaneck.com/globalassets/home/us/insights/blogs/bm-blog-images/cta-faq_desktop-02.svg" alt="Have More Questions? - Ask VanEck" /></a></p>
<p class="d-lg-none"><a href="mailto:askvaneck@vaneck.com" title="Have More Questions? - Ask VanEck" rel="noopener"><img loading="lazy" class="img-responsive" src="https://www.vaneck.com/globalassets/home/us/insights/blogs/bm-blog-images/cta-faq_mobile-01.svg" alt="Have More Questions? - Ask VanEck" /></a></p>
<p>To receive more <a href="/us/en/insights/thematic-investing/" title="Income Investing Insights"><strong>Thematic Investing</strong></a> insights, <a href="/link/5f45412c2143400497908cea2897f7d3.aspx" title="Subscription Center"><strong>sign up in our subscription center</strong></a>.</p>
<style type="text/css">
    .wrapped-div {
        max-width: 100%;
    }

    @media (max-width: 768px) {
        .wrapped-div {
            overflow-x: scroll;
        }
    }

    .wrapped-div-sector {
        max-width: 100%;
        overflow-x: scroll;
    }
</style>
]]></content:encoded>
</item><item rdf:about="https://www.vaneck.com/us/en/blogs/thematic-investing/the-aging-population-robotics-as-the-long-term-play/">
  <title>The Aging Population: Robotics as the Long-Term Play></title>
  <link>https://www.vaneck.com/us/en/blogs/thematic-investing/the-aging-population-robotics-as-the-long-term-play/</link>
  <description><![CDATA[The demographic shift toward an aging population heralds labor shortages, pressing the need for robotic solutions to sustain global economic stability.]]></description>
  <dc:creator>Drew  Anderson</dc:creator>
  <dc:date>11/15/2023 06:30:00</dc:date>
<content:encoded><![CDATA[

<p>The aging population crisis casts a shadow over the global economic future. The world is going through a significant demographic shift. Declining birth rates and increased lifespans bring several challenges for governments and businesses worldwide.</p>
<p>A core issue is the growing gap between retirement age and the number of young individuals entering the workforce. By 2040, 40 percent of adults will be older than 65 in high-income countries like the United States. More people are living long into their retirement years. The pipeline of new labor entrants is dwindling. Labor shortages will be widespread across various sectors of the global economy. The growing number of dependents on the shrinking labor force will severely strain economies.</p>
<h3>Percentage of Working Age vs. Retirement Age</h3>
<p><img class="img-responsive w-100" src="https://www.vaneck.com/contentassets/229b09f14df34b37a148b51d963751d7/3832_ibot_chart-1_2023.11_blog.svg" alt="Percentage of Working Age vs. Retirement Age" /></p>
<p class="chart-disclosure">Source: United Nations as of July 2022.<sup>1</sup></p>
<h2>Japan and China: Aging Crisis</h2>
<p>In nations like Japan and China, the population is aging and shrinking. China&rsquo;s population will decline by over 100 million over the next 30 years.<sup>2</sup>&nbsp;In 2022, Japan had double the amount of deaths compared to births.<sup>3</sup>&nbsp;This demographic contraction places immense stress on social security and pension systems while posing a significant challenge for businesses to find skilled workers.</p>
<p>Plummeting fertility rates are also playing a crucial factor in the aging problem. The fertility rate is the average lifetime childbearing rate of women in a population in a specific year. In 2020, the U.S. recorded a rate of 1.64 births, its lowest level ever recorded.<sup>4</sup>&nbsp;Fewer births translate into more young workers needing to replace the aging workforce. There will become a tipping point where the workforce can no longer sustain the rest of the population.</p>
<h2>Global Labor Shortage: Looming Threat</h2>
<p>The looming inevitability of a global labor shortage will affect the industrial landscape. In a shortage, companies struggle to find and retain talent, and wages face upward pressure in a market dealing with a lack of skilled labor. The coming &ldquo;elder era&rdquo; presents a formidable set of challenges for governments and businesses.</p>
<p>Robotics emerges as a promising solution for the challenges an aging population poses. The ability of robots to automate tasks currently carried out by humans can alleviate labor shortages, boost productivity, and reduce operational costs.</p>
<p>In an era of labor shortages, robots prove indispensable. They are perfect at taking over mundane tasks from manufacturing to healthcare and logistics. By assuming these responsibilities, robots ease labor scarcities and ensure the smooth operation of businesses that a shortage of human workers would otherwise hamper.</p>
<p>Labor shortages already plague healthcare. An aging population will add more strain to the industry. Introducing robots into the sector can ease the labor strain and provide better care. Intuitive's da Vinci Systems surgical robot has already revolutionized modern surgery with its minimally invasive surgeries. The robot&rsquo;s precision and safety reduce risks and promote faster patient recoveries. Since the widespread use of da Vinci Systems, highly competitive surgical robots have emerged, characterized by increased user-friendliness and affordability. Beyond surgery, robots can administer medications, monitor vital signs, and even conduct physical therapy. This will relieve healthcare professionals of routine tasks, allowing nurses and doctors to focus their expertise on more intricate responsibilities, such as diagnosing ailments and devising treatment plans.</p>
<p><img class="img-responsive w-100" src="https://www.vaneck.com/contentassets/229b09f14df34b37a148b51d963751d7/3832_ibot_image_2023.11.jpg" alt="Robotic-Assisted Surgery with da Vinci Systems. Intuitive Surgical" /></p>
<p class="chart-disclosure">Robotic-Assisted Surgery with da Vinci Systems. Intuitive Surgical.</p>
<h2>Automation's Silver Lining: Skilled Job Creation</h2>
<p>Robots will not only fill the labor shortage from an aging population but also create highly skilled jobs. Contrary to concerns about automation leading to job losses, less than 10% of jobs are fully automatable.<sup>5</sup>&nbsp;The industry is already emerging as a generator of new employment opportunities. Roles in engineering, design, manufacturing, and maintenance are growing within this field, which would help counterbalance the job losses experienced in other sectors due to automation. Robotics and automation enable humans to concentrate on more skilled, higher-quality, and better-paying tasks.</p>
<p>The integration of robotics presents a compelling answer to the challenges of an aging population. With the potential to mitigate labor shortages, lower healthcare costs, and create new jobs, robots are a transformative force that holds the key to ensuring a more sustainable and efficient future in the face of demographic change.</p>
<p>The robotics industry is poised to capture the growing demand that changing demographics will bring. <a href="https://www.vaneck.com/us/en/investments/robotics-etf-ibot/overview/" title="IBOT - VanEck Robotics ETF"><strong>The VanEck Robotics ETF (IBOT)</strong></a> is one way to provide investors the opportunity to benefit from the industry&rsquo;s potential growth. This ETF tracks the performance of the robotics industry with companies focused on everything from automation to surgical robots.</p>
<p>To receive more <a href="https://www.vaneck.com/us/en/insights/thematic-investing/" title="Thematic Investing Insights"><strong>Thematic Investing</strong></a> and <strong><a href="https://www.vaneck.com/us/en/insights/digital-assets/" title="Digital Assets Insights">Digital Assets</a></strong> insights, <a href="https://www.vaneck.com/us/en/subscribe/" title="Subscription Center"><strong>sign up in our subscription center</strong></a>.</p>
]]></content:encoded>
</item><item rdf:about="https://www.vaneck.com/us/en/blogs/municipal-bonds/muni-defaults-just-one-in-2022/">
  <title>Muni Defaults: Just One in 2022></title>
  <link>https://www.vaneck.com/us/en/blogs/municipal-bonds/muni-defaults-just-one-in-2022/</link>
  <description><![CDATA[Resilient and liquid: Moody's annual report offers an overall picture of strength and stability for munis. We explore the key findings.]]></description>
  <dc:creator>Tom Butcher</dc:creator>
  <dc:date>11/14/2023 06:30:00</dc:date>
<content:encoded><![CDATA[

<p>Toward the end of July, Moody&rsquo;s Investors Service released its annual municipal bond market snapshot, <i>US municipal bond defaults and recoveries, 1970-2022</i>, with updates through 2022. In addition to noting that the muni sector remained resilient and strongly liquid in 2022, the report continued to affirm two hallmark benefits muni bonds offer. First, defaults and bankruptcies remain rare overall: just one in 2022. Second, municipal credits continue to be highly rated compared to corporates, and, indeed, in 2022, in general, the sector saw ratings continue to &ldquo;drift up,&rdquo; and global corporates&rsquo; ratings drift down. And according to Moody&rsquo;s: &ldquo;The five-year average defaulter position was 97% for municipals and 84% for global corporates.&rdquo;</p>
<p>An important observation, noted, once again, in this year&rsquo;s report, was that over the 53-year study period: &ldquo;Any one default may only reflect the idiosyncrasies of that individual credit, and may not represent a general sector trend.&rdquo;</p>
<p>Continuing a theme noted in the previous year&rsquo;s report, in relation to the effects of the pandemic, Moody&rsquo;s observed that, in addition to &ldquo;lingering effects with downstream credit consequences including escalating inflation&rdquo; and the acceleration of remote learning and work, there are not only &ldquo;potential longer-term effects for K-12, higher education and the mass transit sector&hellip;&rdquo;, but also changes &ldquo;in municipal revenue structures from shifts in commercial real estate or other consumer preferences.&rdquo; An eye should be kept on all of these in the context of the municipal bond market.</p>
<h2>Muni Bond Defaults Remain Rare</h2>
<p>The report illustrated the fundamental difference between municipal and corporate credits and drew attention to the sector&rsquo;s &ldquo;infrequent rated defaults&rdquo; and its &ldquo;extraordinary stability.&rdquo;</p>
<p>While the average five-year municipal default rate since 2013 has been 0.08%, this figure also matches that for the <i>entire</i> 53-year study period from 1970 to 2022. In contrast, the comparable figures for global corporates were 7.8% since 2013 and 6.9% since 1970, respectively.</p>
<p>Puerto Rico remains &ldquo; &hellip; a reminder of the power of credit fundamentals, such as leverage, operational balance, and economic capacity, over ostensible security features written on paper. While legal security will influence recovery, credit fundamentals drive defaults.&rdquo;</p>
<p>This year&rsquo;s report once again notes that &ldquo; &hellip; we have yet to see a rated default due to natural disasters.&rdquo; And that, although the small town of Paradise in California was nearly destroyed, it has continued to make its bond payments.</p>
<h2>Continuing Stability for Muni Bonds</h2>
<p>In 2022, in addition to rating upgrades outnumbering rating downgrades, there was less rating volatility and were fewer rating changes than in prior years. And, when compared to that of global corporate bonds, rating volatility has been &ldquo;significantly lower.&rdquo; (The stability and strength of the municipal sector&rsquo;s credit quality in the last 10 years has benefited from &ldquo; &hellip; accelerated economic recovery and growth across many parts of the US over the two years leading into 2020&rdquo; and after that from a combination of federal stimulus support and an influx of liquidity.)</p>
<p>According to the report, municipal credits remain, typically, very strong, and &ldquo;their rating distribution is substantially skewed toward the investment-grade, where ratings tend to be more stable.&rdquo;</p>
<p>The report added that the municipal sector overall remained highly rated, with approximately 91% of all Moody&rsquo;s-rated municipal credits falling into the A category or higher as of the end of 2022, the same as in both 2020 and 2021. Further, at the end of 2022 (as in 2021 and 2020), the median rating for U.S. municipal credits remained at Aa3. This continued to stand in stark contrast to the median rating for global corporates, which was, once again, at Baa3 (2021: Baa3).</p>
<h2>Muni Bond Market Exhibits Soundness and Resilience</h2>
<p>As we mentioned last year, while we continue to argue that municipal bonds still offer a fiscally sound vehicle for generating an income stream free from federal and some state taxes, it remains challenging to obtain the same level of timely disclosure from issuers as one sees in other asset classes. Despite this, the muni market&rsquo;s behavior not only during the COVID crisis in 2020 and 2021 but also after that is <i>prima facie</i> evidence of both its (and muni bonds&rsquo;) solidity and resilience.</p>
<p>According to Moody's report, there were only 115 distinct Moody's-rated defaults, representing a little over $72 billion, across the whole universe of more than 50,000 different state, local, and other issuing authorities between 1970 and 2022.</p>
<p>As Moody&rsquo;s states, while the U.S. public finance sector remains remarkably stable and experiences infrequent rated defaults, there remain caveats, especially as a result of how it has evolved. In the first instance: &ldquo;There is a growing evidence that legal security, while important in recovery, is a weak shield against default when credit fundamentals are poor.&rdquo;</p>
<p>In the second, as noted last year, the challenges associated with demographic shifts (aging and relocating populations&mdash;affecting tax receipts), substantial increases in pension and retirement healthcare leverage, and &ldquo;the associated heightened exposures to equity markets.&rdquo;</p>
<p>Finally, it is important to note that, with reference to both this study and Moody&rsquo;s ratings in general, its rated universe is, actually, exceeded by that of the U.S. municipal debt market: the company estimates it covers around a third of municipal bond issuers, &ldquo;but a substantially larger proportion of outstanding debt.&rdquo;</p>
<p>Looking at the rated and unrated market together, Moody&rsquo;s noted that: &ldquo;Disclosures reveal that much of the risk in the US municipal debt market after Puerto Rico's defaults lurks in two sectors: senior living and local government special districts. These two sectors represented nearly 60% of the 191 missed payments we observed in 2022, with Puerto Rico representing much of the remainder.&rdquo; Going forward, therefore, it will be interesting to monitor both these sectors.</p>
<p>Despite this, we still believe that municipal bonds remain important to the core strategy of constructing an individual portfolio.</p>
<p>Learn more about <a href="https://www.vaneck.com/us/en/insights/municipal-bonds/" title="Municipal Bonds Insights"><strong>VanEck&rsquo;s suite of municipal bond ETFs</strong></a>.</p>
<p>To receive more <a href="https://www.vaneck.com/us/en/insights/municipal-bonds/" title="Municipal Bonds Insights"><strong>Municipal Bonds</strong></a> insights, <a href="https://www.vaneck.com/us/en/subscribe/" title="Subscription Center"><strong>sign up in our subscription center</strong></a>.</p>
]]></content:encoded>
</item><item rdf:about="https://www.vaneck.com/us/en/blogs/income-investing/fallen-angel-yields-at-post-covid-highs-major-rising-star-expected/">
  <title>Fallen Angel Yields at Post-COVID highs; Major Rising Star Expected></title>
  <link>https://www.vaneck.com/us/en/blogs/income-investing/fallen-angel-yields-at-post-covid-highs-major-rising-star-expected/</link>
  <description><![CDATA[Fallen angels outperformed the broad high yield market in October; though there were no new fallen angels or rising stars in October, Ford is expected to be removed from the index in November.]]></description>
  <dc:creator>Nicolas  Fonseca, CFA</dc:creator>
  <dc:date>11/14/2023 04:30:00</dc:date>
<content:encoded><![CDATA[

<p>Fallen angels (as represented by the ICE US Fallen Angel High Yield 10% Constrained Index, &ldquo;H0CF&rdquo;) outperformed the broad high yield market (as represented by the ICE BofA US High Yield Index, &ldquo;H0A0&rdquo;) by 0.26% in October (-0.98% vs -1.24%) primarily due to spread movements, as lower rated issuers saw greater spread widening than higher quality bonds. Yields continued moving upwards amid continued strong U.S. economic growth and concerns around fiscal spending and U.S. debt issuance, with the 10Y finishing the month at 4.88%. In early November, the U.S. Federal Reserve (Fed) kept the target range for the Fed Funds at 5.25% to 5.50% for the second time in a row, potentially indicating that the current hiking may be over but leaving their options open if needed, as the economy grew at strong pace during Q3.</p>
<p>In terms of flows, high yield U.S. listed corporate ETFs saw approximately $5.4bn in outflows in October, bringing the 3-months net outflows to approximately $8bn. Treasury ETFs continued to see large inflows with $21.1bn this past month; ultrashort funds continued to see the most inflows, but there were some inflows into intermediate and long duration products, as well. With the Fed keeping rates unchanged, there is potential for the mid/long end of the curve to continue picking up more inflows, although investors betting on declining long-term yields did not fare well over the past six months.</p>
<p><strong><u>Recap of Large Rising Stars: Occidental Petroleum and Ford</u></strong></p>
<p>This year we have seen a boost in rising stars ($34,250m in market value), most of which were downgraded in 2020. The two largest rising stars have been Occidental Petroleum and Ford, which is expected to be removed from the index next month.</p>
<p><i>Occidental Petroleum (OXY):</i></p>
<ul class="content-list">
<li>Downgraded April 2020 as part of the energy downgrade due to the sharp drop in oil prices; entered the index with a price of $71.76, adding $25,844 of par.</li>
<li>Upgraded May 2023 with improvement in credit metrics, stemming from the combination of incremental de-leveraging, along with anticipated improvements in earnings in the chemicals and midstream segments, and exiting the index with a price of $93.82, removing $9,975 of par.</li>
<li>During its time in the index, OXY provided a cumulative total return of approximately 43% and price return of approximately 23%, vs the fallen angel index total return of approximately 1% and price return of approximately 19%.</li>
</ul>
<p><i>Ford:</i></p>
<ul class="content-list">
<li>Downgraded April 2020 as operations in most regions were shut down; entered the index with a price of $85.87, adding $21,520 of par.</li>
<li>Upgraded the last day of October, which, due to the selection of underlying constituents for month end rebalance being three business days before the last day of the month, is expected to be removed from the fallen angel index on November 30, 2023.</li>
<li>As of October 31, 2023, Ford&rsquo;s price was $89.95, par $8,106m, providing a cumulative total return of approximately 24% and price return of approximately 5% since index entry vs the fallen angel index total return of approximately 20% and price return of approximately -1%.</li>
</ul>
<p class="chart-disclosure"><img class="img-responsive w-100" src="https://www.vaneck.com/contentassets/176db8997f1148509d4a7f17ceb7c1b8/3823_angl_chart-01_2023.11_blog.svg" alt="Cumulative Price Return" /></p>
<p class="chart-disclosure">Source: ICE Data Services, VanEck.</p>
<p><strong><u>Fallen Angels Overall Statistics:</u></strong> Fallen angel yields increased by 32bps to 8.34%, surpassing by 1bp the elevated level seen at the end of March 2020, however, spreads were 447bps higher than they are currently (327 vs 774). Broad HY saw an increase in yield of 27bps, from 8.94 to 9.48. Broad HY spreads widened 10% while fallen angels only widened by 4%, which was the main contributor to fallen angel outperformance this past month. Fallen angel market value decreased despite no fallen angels, rising stars or defaults, as six issues were removed due to their maturity being less than 12 months away. Broad HY did see two issuers default in October (Rite Aid and Akumin, with par amount of $2,019m), totaling thirteen issuers that have defaulted so far this year with par amount of $15,391m. Ride Aid and Akumin were not part of the fallen angel index, resulting in Bed Bath &amp; Beyond being the only issuer in the fallen angel index that has defaulted so far this year.</p>
<div class="wrapped-div">
<table style="width: 100%;">
<tbody>
<tr class="tbl-data">
<td class="tbl-header last text-center">&nbsp;</td>
<td class="tbl-header last text-center" style="border-right: outset;" colspan="5">Fallen Angel</td>
<td class="tbl-header last text-center" colspan="5">Broad HY</td>
</tr>
<tr class="tbl-data">
<td class="data-head last">&nbsp;</td>
<td class="data-head last">12/31/22</td>
<td class="data-head last">3/31/23</td>
<td class="data-head last">6/30/23</td>
<td class="data-head last">9/30/23</td>
<td class="data-head last" style="border-right: outset;">10/31/23</td>
<td class="data-head last">12/31/22</td>
<td class="data-head last">3/31/23</td>
<td class="data-head last">6/30/23</td>
<td class="data-head last">9/30/23</td>
<td class="data-head last">10/31/23</td>
</tr>
<tr class="tbl-data">
<td class="data-td last">Yield to Worst</td>
<td class="data-td data last">7.49</td>
<td class="data-td data last">7.08</td>
<td class="data-td data last">7.35</td>
<td class="data-td data last">8.02</td>
<td class="data-td data last" style="border-right: outset;">8.34</td>
<td class="data-td data last">8.98</td>
<td class="data-td data last">8.49</td>
<td class="data-td data last">8.56</td>
<td class="data-td data last">8.94</td>
<td class="data-td data last">9.48</td>
</tr>
<tr class="tbl-data">
<td class="data-td last">Effective Duration</td>
<td class="data-td data last">5.45</td>
<td class="data-td data last">5.30</td>
<td class="data-td data last">4.98</td>
<td class="data-td data last">4.90</td>
<td class="data-td data last" style="border-right: outset;">4.93</td>
<td class="data-td data last">4.04</td>
<td class="data-td data last">3.83</td>
<td class="data-td data last">3.65</td>
<td class="data-td data last">3.64</td>
<td class="data-td data last">3.67</td>
</tr>
<tr class="tbl-data">
<td class="data-td last">Full Market Value ($mn)</td>
<td class="data-td data last">112,854</td>
<td class="data-td data last">114,776</td>
<td class="data-td data last">84,590</td>
<td class="data-td data last">78,279</td>
<td class="data-td data last" style="border-right: outset;">74,096</td>
<td class="data-td data last">1,199,909</td>
<td class="data-td data last">1,234,319</td>
<td class="data-td data last">1,218,316</td>
<td class="data-td data last">1,201,541</td>
<td class="data-td data last">1,174,212</td>
</tr>
<tr class="tbl-data">
<td class="data-td last">OAS</td>
<td class="data-td data last">337</td>
<td class="data-td data last">325</td>
<td class="data-td data last">297</td>
<td class="data-td data last">314</td>
<td class="data-td data last" style="border-right: outset;">327</td>
<td class="data-td data last">481</td>
<td class="data-td data last">458</td>
<td class="data-td data last">405</td>
<td class="data-td data last">403</td>
<td class="data-td data last">442</td>
</tr>
<tr class="tbl-data">
<td class="data-td last">No. of Issues</td>
<td class="data-td data last">212</td>
<td class="data-td data last">206</td>
<td class="data-td data last">163</td>
<td class="data-td data last">159</td>
<td class="data-td data last" style="border-right: outset;">153</td>
<td class="data-td data last">1,927</td>
<td class="data-td data last">1,916</td>
<td class="data-td data last">1,870</td>
<td class="data-td data last">1,872</td>
<td class="data-td data last">1,854</td>
</tr>
</tbody>
</table>
</div>
<br />
<p class="chart-disclosure">Source: ICE Data Services, VanEck. Fallen Angels: ICE US Fallen Angel High Yield 10% Constrained Index. Broad HY: ICE BofA US High Yield Index. OAS refers to &ldquo;option-adjusted spread.&rdquo; Please see definition for this and other terms referenced herein in the disclosures and definitions portion of this blog. Past performance is no guarantee of future results. Index performance is not representative of fund performance. It is not possible to invest in an index.</p>
<p><strong><u>New Fallen Angels:</u></strong> None in October.</p>
<div class="wrapped-div">
<table style="width: 100%;">
<tbody>
<tr class="tbl-data">
<td class="tbl-header last">Month-end Addition</td>
<td class="tbl-header last text-center">Name</td>
<td class="tbl-header last text-center">Rating</td>
<td class="tbl-header last text-center">Sector</td>
<td class="tbl-header last text-center">Industry</td>
<td class="tbl-header last text-center">% Mkt Value</td>
<td class="tbl-header last text-center">Price</td>
</tr>
<tr class="tbl-data">
<td class="data-td last font-weight-normal">February</td>
<td class="data-td data last">Entegris Escrow Corp</td>
<td class="data-td data last">BB1</td>
<td class="data-td data last">Technology &amp; Electronics</td>
<td class="data-td data last">Electronics</td>
<td class="data-td data last">1.39</td>
<td class="data-td data last">90.92</td>
</tr>
<tr class="tbl-data">
<td class="data-td last font-weight-normal">March</td>
<td class="data-td data last">First Republic Bank</td>
<td class="data-td data last">B3</td>
<td class="data-td data last">Banking</td>
<td class="data-td data last">0.40</td>
<td class="data-td data last">54.63</td>
</tr>
<tr class="tbl-data">
<td class="data-td last font-weight-normal">March</td>
<td class="data-td data last">Nissan Motor Acceptance</td>
<td class="data-td data last">BB1</td>
<td class="data-td data last">Automotive</td>
<td class="data-td data last">Auto Loans</td>
<td class="data-td data last">2.57</td>
<td class="data-td data last">87.19</td>
</tr>
<tr class="tbl-data">
<td class="data-td last font-weight-normal">March</td>
<td class="data-td data last">Nissan Motor</td>
<td class="data-td data last">BB1</td>
<td class="data-td data last">Automotive</td>
<td class="data-td data last">Automakers</td>
<td class="data-td data last">5.49</td>
<td class="data-td data last">92.98</td>
</tr>
<tr class="tbl-data">
<td class="data-td last font-weight-normal">April</td>
<td class="data-td data last">Crane NXT</td>
<td class="data-td data last">BB3</td>
<td class="data-td data last">Capital Goods</td>
<td class="data-td data last">Diversified Capital Goods</td>
<td class="data-td data last">0.24</td>
<td class="data-td data last">70.99</td>
</tr>
<tr class="tbl-data">
<td class="data-td last font-weight-normal">April</td>
<td class="data-td data last">Rogers Communications</td>
<td class="data-td data last">BB2</td>
<td class="data-td data last">Telecommunications</td>
<td class="data-td data last">Telecom - Wireless</td>
<td class="data-td data last">0.65</td>
<td class="data-td data last">90.35</td>
</tr>
<tr class="tbl-data">
<td class="data-td last font-weight-normal">April</td>
<td class="data-td data last">Western Alliance Bancorporation</td>
<td class="data-td data last">BB1</td>
<td class="data-td data last">Banking</td>
<td class="data-td data last">0.44</td>
<td class="data-td data last">76.39</td>
</tr>
<tr class="tbl-data">
<td class="data-td last font-weight-normal">August</td>
<td class="data-td data last">Associated Banc-Corp</td>
<td class="data-td data last">BB1</td>
<td class="data-td data last">Banking</td>
<td class="data-td data last">0.33</td>
<td class="data-td data last">95.69</td>
</tr>
<tr class="tbl-data">
<td class="data-td last font-weight-normal">August</td>
<td class="data-td data last">Valley National Bancorp</td>
<td class="data-td data last">BB1</td>
<td class="data-td data last">Banking</td>
<td class="data-td data last">0.33</td>
<td class="data-td data last">79.84</td>
</tr>
<tr class="tbl-data">
<td class="data-td last font-weight-normal">September</td>
<td class="data-td data last">Brandywine Operating Partnership L.P.</td>
<td class="data-td data last">BB1</td>
<td class="data-td data last">Real Estate</td>
<td class="data-td data last">REITs</td>
<td class="data-td data last">1.86</td>
<td class="data-td data last">87.29</td>
</tr>
<tr class="tbl-data">
<td class="data-td last font-weight-normal">September</td>
<td class="data-td data last">Port of Newcastle Investments Financing Pty Limited</td>
<td class="data-td data last">BB1</td>
<td class="data-td data last">Transportation</td>
<td class="data-td data last">Transport Infrastructure/Services</td>
<td class="data-td data last">0.36</td>
<td class="data-td data last">82.79</td>
</tr>
</tbody>
</table>
</div>
<br />
<p class="chart-disclosure">Source: ICE Data Services, VanEck. Fallen Angels: ICE US Fallen Angel High Yield 10% Constrained Index. Past performance is no guarantee of future results. Not a recommendation to buy or sell any of the names/securities mentioned herein. Index performance is not representative of fund performance. It is not possible to invest in an index.</p>
<p><strong><u>Rising Stars:</u></strong> None in October.</p>
<div class="wrapped-div">
<table style="width: 100%;">
<tbody>
<tr class="tbl-data">
<td class="tbl-header last">Month-end Exit</td>
<td class="tbl-header last text-center">Name</td>
<td class="tbl-header last text-center">Rating</td>
<td class="tbl-header last text-center">Sector</td>
<td class="tbl-header last text-center">Industry</td>
<td class="tbl-header last text-center">% Mkt Value</td>
<td class="tbl-header last text-center">Price</td>
</tr>
<tr class="tbl-data">
<td class="data-td last font-weight-normal">February</td>
<td class="data-td data last">Autopistas Metropolitanas de Puerto Rico LLC</td>
<td class="data-td data last">BB1</td>
<td class="data-td data last">Transportation</td>
<td class="data-td data last">Transport Infrastructure/Services</td>
<td class="data-td data last">0.35</td>
<td class="data-td data last">100.49</td>
</tr>
<tr class="tbl-data">
<td class="data-td last font-weight-normal">February</td>
<td class="data-td data last">Nokia Corp</td>
<td class="data-td data last">BB1</td>
<td class="data-td data last">Technology &amp; Electronics</td>
<td class="data-td data last">Tech Hardware &amp; Equipment</td>
<td class="data-td data last">0.47</td>
<td class="data-td data last">97.50</td>
</tr>
<tr class="tbl-data">
<td class="data-td last font-weight-normal">March</td>
<td class="data-td data last">Western Midstream</td>
<td class="data-td data last">BB1</td>
<td class="data-td data last">Energy</td>
<td class="data-td data last">Gas Distribution</td>
<td class="data-td data last">5.27</td>
<td class="data-td data last">90.44</td>
</tr>
<tr class="tbl-data">
<td class="data-td last font-weight-normal">April</td>
<td class="data-td data last">Sprint Capital Corp</td>
<td class="data-td data last">BB1</td>
<td class="data-td data last">Telecommunications</td>
<td class="data-td data last">Telecom - Wireless</td>
<td class="data-td data last">4.70</td>
<td class="data-td data last">114.25</td>
</tr>
<tr class="tbl-data">
<td class="data-td last font-weight-normal">May</td>
<td class="data-td data last">Mattel Inc.</td>
<td class="data-td data last">BB2</td>
<td class="data-td data last">Consumer Goods</td>
<td class="data-td data last">Personal &amp; Household Products</td>
<td class="data-td data last">0.45</td>
<td class="data-td data last">85.32</td>
</tr>
<tr class="tbl-data">
<td class="data-td last font-weight-normal">May</td>
<td class="data-td data last">Nissan Motor Acceptance</td>
<td class="data-td data last">BB1</td>
<td class="data-td data last">Automotive</td>
<td class="data-td data last">Auto Loans</td>
<td class="data-td data last">2.67</td>
<td class="data-td data last">85.12</td>
</tr>
<tr class="tbl-data">
<td class="data-td last font-weight-normal">May</td>
<td class="data-td data last">Nissan Motor</td>
<td class="data-td data last">BB1</td>
<td class="data-td data last">Automotive</td>
<td class="data-td data last">Automakers</td>
<td class="data-td data last">5.57</td>
<td class="data-td data last">88.49</td>
</tr>
<tr class="tbl-data">
<td class="data-td last font-weight-normal">May</td>
<td class="data-td data last">Occidental Petroleum Corp</td>
<td class="data-td data last">BB1</td>
<td class="data-td data last">Energy</td>
<td class="data-td data last">Energy - Exploration &amp; Production</td>
<td class="data-td data last">8.69</td>
<td class="data-td data last">93.82</td>
</tr>
<tr class="tbl-data">
<td class="data-td last font-weight-normal">June</td>
<td class="data-td data last">APA Corp</td>
<td class="data-td data last">BB1</td>
<td class="data-td data last">Energy</td>
<td class="data-td data last">Energy - Exploration &amp; Production</td>
<td class="data-td data last">3.84</td>
<td class="data-td data last">82.69</td>
</tr>
<tr class="tbl-data">
<td class="data-td last font-weight-normal">July</td>
<td class="data-td data last">Western Digital Corp</td>
<td class="data-td data last">BB1</td>
<td class="data-td data last">Technology &amp; Electronics</td>
<td class="data-td data last">Tech Hardware &amp; Equipment</td>
<td class="data-td data last">0.99</td>
<td class="data-td data last">76.97</td>
</tr>
<tr class="tbl-data">
<td class="data-td last font-weight-normal">August</td>
<td class="data-td data last">Howmet Aerospace Inc</td>
<td class="data-td data last">BB1</td>
<td class="data-td data last">Capital Goods</td>
<td class="data-td data last">Aerospace/Defense</td>
<td class="data-td data last">2.04</td>
<td class="data-td data last">99.55</td>
</tr>
<tr class="tbl-data">
<td class="data-td last font-weight-normal">September</td>
<td class="data-td data last">Patterson-UTI Energy Inc.</td>
<td class="data-td data last">BB1</td>
<td class="data-td data last">Energy</td>
<td class="data-td data last">Oil Field Equipment &amp; Services</td>
<td class="data-td data last">1.07</td>
<td class="data-td data last">90.37</td>
</tr>
</tbody>
</table>
</div>
<br />
<p class="chart-disclosure">Source: ICE Data Services, VanEck. Fallen Angels: ICE US Fallen Angel High Yield 10% Constrained Index. Past performance is no guarantee of future results. Not a recommendation to buy or sell any of the names/securities mentioned herein. Index performance is not representative of fund performance. It is not possible to invest in an index.</p>
<p><strong><u>Fallen Angels Performance by Sector:</u></strong> Only the Retail sector posted a positive return for October (+0.39%) but it was not enough to offset the negative performance of the other sixteen sectors, despite having the sixth largest exposure in the fallen angel index. There were only small changes to sector exposure with the lack of fallen angels and rising stars, however, the Transportation and Real Estate sectors saw a decrease of more than 1% due to some relatively large issues from Delta and Service Properties Trust being removed from the index due to their maturity being less than 12 months away. The continuous volatility on the long part of the curve keeps driving bond prices lower. The fallen angel index now has 16% in the $70s (up from 9% last month), 76% in the $80s (up from 66%) and just 8% (down from 25%) in the $90s, allowing for a potential higher price appreciation if rates decrease.</p>
<div class="wrapped-div">
<table style="width: 100%;">
<tbody>
<tr class="tbl-data">
<td class="tbl-header last text-center">&nbsp;</td>
<td class="tbl-header last text-center" style="border-right: outset;" colspan="5">Wgt (%)</td>
<td class="tbl-header last text-center" style="border-right: outset;" colspan="5">OAS</td>
<td class="tbl-header last text-center" style="border-right: outset;" colspan="5">Price</td>
<td class="tbl-header last text-center">Total Return (%)</td>
</tr>
<tr class="tbl-data">
<td class="data-head last">&nbsp;</td>
<td class="data-head last">12/31/21</td>
<td class="data-head last">3/31/23</td>
<td class="data-head last">6/30/23</td>
<td class="data-head last">9/30/23</td>
<td class="data-head last" style="border-right: outset;">10/31/23</td>
<td class="data-head last">12/31/21</td>
<td class="data-head last">3/31/23</td>
<td class="data-head last">6/30/23</td>
<td class="data-head last">9/30/23</td>
<td class="data-head last" style="border-right: outset;">10/31/23</td>
<td class="data-head last">12/31/21</td>
<td class="data-head last">3/31/23</td>
<td class="data-head last">6/30/23</td>
<td class="data-head last">9/30/23</td>
<td class="data-head last" style="border-right: outset;">10/31/23</td>
<td class="data-head last">MTD</td>
</tr>
<tr class="tbl-data">
<td class="data-td last">Automotive</td>
<td class="data-td data last">10.00</td>
<td class="data-td data last">18.06</td>
<td class="data-td data last">10.00</td>
<td class="data-td data last" style="border-right: outset;">10.00</td>
<td class="data-td data last">262</td>
<td class="data-td data last">246</td>
<td class="data-td data last">211</td>
<td class="data-td data last">206</td>
<td class="data-td data last" style="border-right: outset;">205</td>
<td class="data-td data last">91.35</td>
<td class="data-td data last">92.21</td>
<td class="data-td data last">92.99</td>
<td class="data-td data last">91.16</td>
<td class="data-td data last" style="border-right: outset;">89.95</td>
<td class="data-td data last">-0.87</td>
</tr>
<tr class="tbl-data">
<td class="data-td last">Banking</td>
<td class="data-td data last">3.81</td>
<td class="data-td data last">3.99</td>
<td class="data-td data last">3.20</td>
<td class="data-td data last">4.34</td>
<td class="data-td data last" style="border-right: outset;">4.54</td>
<td class="data-td data last">302</td>
<td class="data-td data last">415</td>
<td class="data-td data last">376</td>
<td class="data-td data last">279</td>
<td class="data-td data last" style="border-right: outset;">301</td>
<td class="data-td data last">96.85</td>
<td class="data-td data last">87.61</td>
<td class="data-td data last">88.57</td>
<td class="data-td data last">92.02</td>
<td class="data-td data last" style="border-right: outset;">89.88</td>
<td class="data-td data last">-1.79</td>
</tr>
<tr class="tbl-data">
<td class="data-td last">Basic Industry</td>
<td class="data-td data last">1.36</td>
<td class="data-td data last">1.33</td>
<td class="data-td data last">1.93</td>
<td class="data-td data last">1.92</td>
<td class="data-td data last" style="border-right: outset;">2.03</td>
<td class="data-td data last">226</td>
<td class="data-td data last">227</td>
<td class="data-td data last">168</td>
<td class="data-td data last">178</td>
<td class="data-td data last" style="border-right: outset;">194</td>
<td class="data-td data last">92.17</td>
<td class="data-td data last">93.85</td>
<td class="data-td data last">94.44</td>
<td class="data-td data last">93.53</td>
<td class="data-td data last" style="border-right: outset;">92.45</td>
<td class="data-td data last">-0.75</td>
</tr>
<tr class="tbl-data">
<td class="data-td last">Capital Goods</td>
<td class="data-td data last">5.12</td>
<td class="data-td data last">5.10</td>
<td class="data-td data last">7.66</td>
<td class="data-td data last">5.86</td>
<td class="data-td data last" style="border-right: outset;">5.60</td>
<td class="data-td data last">279</td>
<td class="data-td data last">240</td>
<td class="data-td data last">195</td>
<td class="data-td data last">250</td>
<td class="data-td data last" style="border-right: outset;">250</td>
<td class="data-td data last">95.01</td>
<td class="data-td data last">98.54</td>
<td class="data-td data last">96.85</td>
<td class="data-td data last">92.44</td>
<td class="data-td data last" style="border-right: outset;">91.34</td>
<td class="data-td data last">-0.18</td>
</tr>
<tr class="tbl-data">
<td class="data-td last">Consumer Goods</td>
<td class="data-td data last">3.07</td>
<td class="data-td data last">3.00</td>
<td class="data-td data last">3.62</td>
<td class="data-td data last">3.82</td>
<td class="data-td data last" style="border-right: outset;">4.04</td>
<td class="data-td data last">275</td>
<td class="data-td data last">255</td>
<td class="data-td data last">298</td>
<td class="data-td data last">271</td>
<td class="data-td data last" style="border-right: outset;">326</td>
<td class="data-td data last">88.90</td>
<td class="data-td data last">91.27</td>
<td class="data-td data last">89.31</td>
<td class="data-td data last">88.24</td>
<td class="data-td data last" style="border-right: outset;">86.98</td>
<td class="data-td data last">-0.89</td>
</tr>
<tr class="tbl-data">
<td class="data-td last">Energy</td>
<td class="data-td data last">27.93</td>
<td class="data-td data last">22.16</td>
<td class="data-td data last">15.28</td>
<td class="data-td data last">14.45</td>
<td class="data-td data last" style="border-right: outset;">14.63</td>
<td class="data-td data last">293</td>
<td class="data-td data last">303</td>
<td class="data-td data last">297</td>
<td class="data-td data last">288</td>
<td class="data-td data last" style="border-right: outset;">294</td>
<td class="data-td data last">88.13</td>
<td class="data-td data last">90.05</td>
<td class="data-td data last">88.74</td>
<td class="data-td data last">87.48</td>
<td class="data-td data last" style="border-right: outset;">85.20</td>
<td class="data-td data last">-1.74</td>
</tr>
<tr class="tbl-data">
<td class="data-td last">Financial Services</td>
<td class="data-td data last">0.65</td>
<td class="data-td data last">0.64</td>
<td class="data-td data last">0.94</td>
<td class="data-td data last">0.98</td>
<td class="data-td data last" style="border-right: outset;">1.00</td>
<td class="data-td data last">540</td>
<td class="data-td data last">506</td>
<td class="data-td data last">459</td>
<td class="data-td data last">420</td>
<td class="data-td data last" style="border-right: outset;">527</td>
<td class="data-td data last">77.20</td>
<td class="data-td data last">80.27</td>
<td class="data-td data last">80.92</td>
<td class="data-td data last">79.51</td>
<td class="data-td data last" style="border-right: outset;">74.92</td>
<td class="data-td data last">-5.15</td>
</tr>
<tr class="tbl-data">
<td class="data-td last">Healthcare</td>
<td class="data-td data last">3.02</td>
<td class="data-td data last">3.03</td>
<td class="data-td data last">4.33</td>
<td class="data-td data last">4.62</td>
<td class="data-td data last" style="border-right: outset;">4.88</td>
<td class="data-td data last">362</td>
<td class="data-td data last">304</td>
<td class="data-td data last">281</td>
<td class="data-td data last">299</td>
<td class="data-td data last" style="border-right: outset;">298</td>
<td class="data-td data last">83.56</td>
<td class="data-td data last">86.47</td>
<td class="data-td data last">86.82</td>
<td class="data-td data last">84.72</td>
<td class="data-td data last" style="border-right: outset;">83.31</td>
<td class="data-td data last">-1.17</td>
</tr>
<tr class="tbl-data">
<td class="data-td last">Insurance</td>
<td class="data-td data last">0.85</td>
<td class="data-td data last">0.82</td>
<td class="data-td data last">1.15</td>
<td class="data-td data last">1.20</td>
<td class="data-td data last" style="border-right: outset;">1.25</td>
<td class="data-td data last">347</td>
<td class="data-td data last">364</td>
<td class="data-td data last">358</td>
<td class="data-td data last">366</td>
<td class="data-td data last" style="border-right: outset;">375</td>
<td class="data-td data last">92.10</td>
<td class="data-td data last">92.99</td>
<td class="data-td data last">91.39</td>
<td class="data-td data last">87.81</td>
<td class="data-td data last" style="border-right: outset;">86.20</td>
<td class="data-td data last">-1.24</td>
</tr>
<tr class="tbl-data">
<td class="data-td last">Leisure</td>
<td class="data-td data last">7.88</td>
<td class="data-td data last">7.79</td>
<td class="data-td data last">10.42</td>
<td class="data-td data last">7.87</td>
<td class="data-td data last" style="border-right: outset;">8.32</td>
<td class="data-td data last">325</td>
<td class="data-td data last">243</td>
<td class="data-td data last">182</td>
<td class="data-td data last">257</td>
<td class="data-td data last" style="border-right: outset;">276</td>
<td class="data-td data last">89.95</td>
<td class="data-td data last">93.25</td>
<td class="data-td data last">93.34</td>
<td class="data-td data last">89.37</td>
<td class="data-td data last" style="border-right: outset;">88.79</td>
<td class="data-td data last">-0.20</td>
</tr>
<tr class="tbl-data">
<td class="data-td last">Real Estate</td>
<td class="data-td data last">5.13</td>
<td class="data-td data last">4.72</td>
<td class="data-td data last">6.22</td>
<td class="data-td data last">8.37</td>
<td class="data-td data last" style="border-right: outset;">7.15</td>
<td class="data-td data last">697</td>
<td class="data-td data last">701</td>
<td class="data-td data last">602</td>
<td class="data-td data last">660</td>
<td class="data-td data last" style="border-right: outset;">775</td>
<td class="data-td data last">79.46</td>
<td class="data-td data last">80.72</td>
<td class="data-td data last">80.99</td>
<td class="data-td data last">80.86</td>
<td class="data-td data last" style="border-right: outset;">76.74</td>
<td class="data-td data last">-0.85</td>
</tr>
<tr class="tbl-data">
<td class="data-td last">Retail</td>
<td class="data-td data last">5.67</td>
<td class="data-td data last">5.49</td>
<td class="data-td data last">7.79</td>
<td class="data-td data last">7.98</td>
<td class="data-td data last" style="border-right: outset;">7.99</td>
<td class="data-td data last">471</td>
<td class="data-td data last">474</td>
<td class="data-td data last">354</td>
<td class="data-td data last">368</td>
<td class="data-td data last" style="border-right: outset;">352</td>
<td class="data-td data last">73.75</td>
<td class="data-td data last">74.72</td>
<td class="data-td data last">82.35</td>
<td class="data-td data last">78.48</td>
<td class="data-td data last" style="border-right: outset;">77.36</td>
<td class="data-td data last">0.39</td>
</tr>
<tr class="tbl-data">
<td class="data-td last">Services</td>
<td class="data-td data last">0.38</td>
<td class="data-td data last">0.37</td>
<td class="data-td data last">0.53</td>
<td class="data-td data last">0.57</td>
<td class="data-td data last" style="border-right: outset;">0.61</td>
<td class="data-td data last">388</td>
<td class="data-td data last">368</td>
<td class="data-td data last">356</td>
<td class="data-td data last">309</td>
<td class="data-td data last" style="border-right: outset;">307</td>
<td class="data-td data last">87.11</td>
<td class="data-td data last">89.89</td>
<td class="data-td data last">88.62</td>
<td class="data-td data last">88.75</td>
<td class="data-td data last" style="border-right: outset;">88.12</td>
<td class="data-td data last">-0.22</td>
</tr>
<tr class="tbl-data">
<td class="data-td last">Technology &amp; Electronics</td>
<td class="data-td data last">4.20</td>
<td class="data-td data last">4.67</td>
<td class="data-td data last">6.21</td>
<td class="data-td data last">5.57</td>
<td class="data-td data last" style="border-right: outset;">5.82</td>
<td class="data-td data last">327</td>
<td class="data-td data last">287</td>
<td class="data-td data last">269</td>
<td class="data-td data last">262</td>
<td class="data-td data last" style="border-right: outset;">260</td>
<td class="data-td data last">85.47</td>
<td class="data-td data last">88.19</td>
<td class="data-td data last">86.89</td>
<td class="data-td data last">87.23</td>
<td class="data-td data last" style="border-right: outset;">85.84</td>
<td class="data-td data last">-1.11</td>
</tr>
<tr class="tbl-data">
<td class="data-td last">Telecommunications</td>
<td class="data-td data last">11.91</td>
<td class="data-td data last">11.68</td>
<td class="data-td data last">10.61</td>
<td class="data-td data last">11.53</td>
<td class="data-td data last" style="border-right: outset;">12.00</td>
<td class="data-td data last">423</td>
<td class="data-td data last">433</td>
<td class="data-td data last">475</td>
<td class="data-td data last">418</td>
<td class="data-td data last" style="border-right: outset;">432</td>
<td class="data-td data last">90.04</td>
<td class="data-td data last">91.39</td>
<td class="data-td data last">84.92</td>
<td class="data-td data last">84.95</td>
<td class="data-td data last" style="border-right: outset;">82.99</td>
<td class="data-td data last">-1.60</td>
</tr>
<tr class="tbl-data">
<td class="data-td last">Transportation</td>
<td class="data-td data last">2.10</td>
<td class="data-td data last">1.78</td>
<td class="data-td data last">2.59</td>
<td class="data-td data last">3.14</td>
<td class="data-td data last" style="border-right: outset;">1.98</td>
<td class="data-td data last">279</td>
<td class="data-td data last">231</td>
<td class="data-td data last">150</td>
<td class="data-td data last">203</td>
<td class="data-td data last" style="border-right: outset;">241</td>
<td class="data-td data last">90.49</td>
<td class="data-td data last">92.69</td>
<td class="data-td data last">94.75</td>
<td class="data-td data last">91.70</td>
<td class="data-td data last" style="border-right: outset;">88.14</td>
<td class="data-td data last">-0.31</td>
</tr>
<tr class="tbl-data">
<td class="data-td last">Utility</td>
<td class="data-td data last">6.93</td>
<td class="data-td data last">5.38</td>
<td class="data-td data last">7.52</td>
<td class="data-td data last">7.77</td>
<td class="data-td data last" style="border-right: outset;">8.17</td>
<td class="data-td data last">213</td>
<td class="data-td data last">206</td>
<td class="data-td data last">165</td>
<td class="data-td data last">175</td>
<td class="data-td data last" style="border-right: outset;">173</td>
<td class="data-td data last">89.95</td>
<td class="data-td data last">90.19</td>
<td class="data-td data last">89.90</td>
<td class="data-td data last">86.28</td>
<td class="data-td data last" style="border-right: outset;">85.08</td>
<td class="data-td data last">-0.97</td>
</tr>
<tr class="tbl-data">
<td class="data-td last">Total</td>
<td class="data-td data last">100</td>
<td class="data-td data last" style="border-right: outset;">100</td>
<td class="data-td data last">337</td>
<td class="data-td data last">325</td>
<td class="data-td data last">297</td>
<td class="data-td data last">314</td>
<td class="data-td data last" style="border-right: outset;">327</td>
<td class="data-td data last">87.91</td>
<td class="data-td data last">89.51</td>
<td class="data-td data last">88.78</td>
<td class="data-td data last">86.69</td>
<td class="data-td data last" style="border-right: outset;">84.94</td>
<td class="data-td data last">-0.98</td>
</tr>
</tbody>
</table>
</div>
<br />
<p class="chart-disclosure">Source: ICE Data Services, VanEck. Fallen Angels: ICE US Fallen Angel High Yield 10% Constrained Index. Not intended as a recommendation to invest or divest in any of the sectors mentioned herein. Index performance is not representative of fund performance. It is not possible to invest in an index.</p>
<p><strong><u>Fallen Angels Performance by Rating:</u></strong> Higher quality outperformed in October, aside from the CC- rated bucket and one issuer (Diversified Healthcare Trust). October marks the second month so far this year where higher quality (BB-rated bucket within the fallen angel index) outperformed. The CCC bucket has outperformed over 5 months while Single-B has done so over 3 months to date.</p>
<div class="wrapped-div">
<table style="width: 100%;">
<tbody>
<tr class="tbl-data">
<td class="tbl-header last text-center">&nbsp;</td>
<td class="tbl-header last text-center" style="border-right: outset;" colspan="5">Wgt (%)</td>
<td class="tbl-header last text-center" style="border-right: outset;" colspan="5">OAS</td>
<td class="tbl-header last text-center" style="border-right: outset;" colspan="5">Price</td>
<td class="tbl-header last text-center">Total Return (%)</td>
</tr>
<tr class="tbl-data">
<td class="data-head last">&nbsp;</td>
<td class="data-head last">12/31/21</td>
<td class="data-head last">3/31/23</td>
<td class="data-head last">6/30/23</td>
<td class="data-head last">9/30/23</td>
<td class="data-head last" style="border-right: outset;">10/31/23</td>
<td class="data-head last">12/31/21</td>
<td class="data-head last">3/31/23</td>
<td class="data-head last">6/30/23</td>
<td class="data-head last">9/30/23</td>
<td class="data-head last" style="border-right: outset;">10/31/23</td>
<td class="data-head last">12/31/21</td>
<td class="data-head last">3/31/23</td>
<td class="data-head last">6/30/23</td>
<td class="data-head last">9/30/23</td>
<td class="data-head last" style="border-right: outset;">10/31/23</td>
<td class="data-head last">MTD</td>
</tr>
<tr class="tbl-data">
<td class="data-td last">BB</td>
<td class="data-td data last">87.00</td>
<td class="data-td data last">87.08</td>
<td class="data-td data last">83.01</td>
<td class="data-td data last">81.02</td>
<td class="data-td data last" style="border-right: outset;">81.82</td>
<td class="data-td data last">284</td>
<td class="data-td data last">281</td>
<td class="data-td data last">256</td>
<td class="data-td data last">257</td>
<td class="data-td data last" style="border-right: outset;">266</td>
<td class="data-td data last">90.02</td>
<td class="data-td data last">91.51</td>
<td class="data-td data last">89.83</td>
<td class="data-td data last">87.94</td>
<td class="data-td data last" style="border-right: outset;">86.40</td>
<td class="data-td data last">-0.91</td>
</tr>
<tr class="tbl-data">
<td class="data-td last">B</td>
<td class="data-td data last">10.95</td>
<td class="data-td data last">10.37</td>
<td class="data-td data last">13.31</td>
<td class="data-td data last">15.03</td>
<td class="data-td data last" style="border-right: outset;">14.08</td>
<td class="data-td data last">608</td>
<td class="data-td data last">500</td>
<td class="data-td data last">405</td>
<td class="data-td data last">493</td>
<td class="data-td data last" style="border-right: outset;">530</td>
<td class="data-td data last">82.50</td>
<td class="data-td data last">85.35</td>
<td class="data-td data last">89.55</td>
<td class="data-td data last">86.37</td>
<td class="data-td data last" style="border-right: outset;">83.70</td>
<td class="data-td data last">-1.12</td>
</tr>
<tr class="tbl-data">
<td class="data-td last">CCC</td>
<td class="data-td data last">1.98</td>
<td class="data-td data last">2.50</td>
<td class="data-td data last">3.68</td>
<td class="data-td data last">3.43</td>
<td class="data-td data last" style="border-right: outset;">3.55</td>
<td class="data-td data last">1,020</td>
<td class="data-td data last">1,014</td>
<td class="data-td data last">852</td>
<td class="data-td data last">810</td>
<td class="data-td data last" style="border-right: outset;">841</td>
<td class="data-td data last">60.88</td>
<td class="data-td data last">64.60</td>
<td class="data-td data last">68.55</td>
<td class="data-td data last">67.01</td>
<td class="data-td data last" style="border-right: outset;">64.84</td>
<td class="data-td data last">-2.31</td>
</tr>
<tr class="tbl-data">
<td class="data-td last">CC</td>
<td class="data-td data last">&nbsp;</td>
<td class="data-td data last">0.52</td>
<td class="data-td data last" style="border-right: outset;">0.55</td>
<td class="data-td data last">&nbsp;</td>
<td class="data-td data last">835</td>
<td class="data-td data last" style="border-right: outset;">846</td>
<td class="data-td data last">&nbsp;</td>
<td class="data-td data last">72.91</td>
<td class="data-td data last" style="border-right: outset;">72.53</td>
<td class="data-td data last">0.03</td>
</tr>
<tr class="tbl-data">
<td class="data-td last">Total</td>
<td class="data-td data last">100</td>
<td class="data-td data last" style="border-right: outset;">100</td>
<td class="data-td data last">337</td>
<td class="data-td data last">325</td>
<td class="data-td data last">297</td>
<td class="data-td data last">314</td>
<td class="data-td data last" style="border-right: outset;">327</td>
<td class="data-td data last">87.91</td>
<td class="data-td data last">89.51</td>
<td class="data-td data last">88.78</td>
<td class="data-td data last">86.69</td>
<td class="data-td data last" style="border-right: outset;">84.94</td>
<td class="data-td data last">-0.98</td>
</tr>
</tbody>
</table>
</div>
<br />
<p class="chart-disclosure">Source: ICE Data Services, VanEck. Fallen Angels: ICE US Fallen Angel High Yield 10% Constrained Index. Past performance is no guarantee of future results. Index performance is not representative of fund performance. It is not possible to invest in an index.</p>
<p>To receive more <a href="https://www.vaneck.com/us/en/insights/income-investing/" title="Income Investing insights"><strong>Income Investing</strong></a> insights, <a href="/link/5f45412c2143400497908cea2897f7d3.aspx" title=" Subscription Center"><strong>sign up in our subscription center</strong></a>.</p>
<style type="text/css">
     .wrapped-div {
     max-width: 100%;
     }
    
     @media (max-width: 1024px) {
     .wrapped-div {
     overflow-x: scroll;
     }
     }
    
     .wrapped-div-sector {
     max-width: 100%;
     overflow-x: scroll;
     }
    </style>
]]></content:encoded>
</item><item rdf:about="https://www.vaneck.com/us/en/blogs/emerging-markets-equity/unlocking-vietnams-economic-potential/">
  <title>Unlocking Vietnam’s Economic Potential></title>
  <link>https://www.vaneck.com/us/en/blogs/emerging-markets-equity/unlocking-vietnams-economic-potential/</link>
  <description><![CDATA[Vietnam is becoming an increasingly attractive investment destination thanks to its sturdy GDP growth, strides in its high-tech manufacturing capabilities, and strong US ties.]]></description>
  <dc:creator>Sunny  Bokhari</dc:creator>
  <dc:date>11/13/2023 06:30:00</dc:date>
<content:encoded><![CDATA[

<p>Vietnam's resilience shines as its GDP steadily grows despite global challenges. The nation is drawing foreign investment and making strides in high-tech manufacturing, particularly semiconductors, positioning itself in the global supply chain. With a booming rare earths industry and strong US ties, Vietnam is set to play a pivotal role in various sectors. This blog explores what makes Vietnam an attractive investment destination.</p>
<h2>Economic Resilience</h2>
<p>Vietnam&rsquo;s GDP grew by 8.0% in 2022 as the country&rsquo;s economy benefited from exports of goods during the COVID-19 pandemic. This year Vietnam&rsquo;s economy has stabilized at a GDP growth of 5.3% year-over-year (YoY) in 3Q 2023.<sup>1</sup>&nbsp;The country&rsquo;s economy has been fairly resilient despite headwinds from higher commodity prices resulting from the Russia-Ukraine war and a slowdown in China, which happens to be one of Vietnam&rsquo;s largest trading partner.</p>
<h2>Climbing the Value Chain Ladder</h2>
<p>Vietnam's trade faced some headwinds this year due to reduced demand from major trade partners. Exports fell 10% YoY<sup>2</sup>&nbsp;in the first eight months of 2023 and finally turned positive in September. Vietnam&rsquo;s manufacturing sector's contribution to the economy is growing, but the value it adds has remained relatively flat, despite declining by 0.37% in 2023 compared to 2022.<sup>3</sup>&nbsp;This means that although Vietnam is producing more, it's not capturing more of the value within its borders. This is partly due to fragmented supply chains, revealing Vietnam's import-dependent status.</p>
<p>Vietnam&rsquo;s government is keenly aware of this challenge and is actively trying to lure foreign investments in high tech manufacturing particularly in the semiconductor sector. The country has signed multiple Free Trade Agreements (FTAs) to encourage foreign cooperation with its local industries. Policy makers are also offering supportive measures such as tax incentives, preferential loan rates, waived import duties and preferential land use fees for high tech factories. Strong government support appears to be yielding some early results. The country has achieved impressive growth in electronics exports, notably to the United States. From virtually zero, Vietnam now accounts for around 10% of all U.S. electronics imports.<sup>4</sup></p>
<h3>Sharp rise in electronic, computer, and phone manufacturing has driven Vietnam&rsquo;s export growth</h3>
<p><img class="img-responsive w-100" src="https://www.vaneck.com/contentassets/c528f9ab90324efc8785732c6c225831/3818_vietnman-november-2023_chart-1_2023.11_v1_blog.svg" alt="A look at FDI in Vietnam over the years" /></p>
<p class="chart-disclosure">Source: JP Morgan Research.</p>
<h2>Strong Foreign Investment in Vietnam Continues</h2>
<p>Despite facing a challenging environment characterized by sluggish growth and lackluster export performance throughout the year. Vietnam has managed to attract $15.9 billion in Foreign Direct Investment (FDI) YTD.<sup>5</sup>&nbsp;The manufacturing sector maintained its position as the primary attraction for FDI, with investments exceeding $14 billion YTD, reflecting a substantial gain of 15.5% YoY. This achievement is significant given the prevailing uncertainty, inflationary pressures, and waning confidence in the global economic landscape. Key Apple suppliers such as Foxconn Technology Group, GoerTek Inc, Luxshare Precision Industry Co. and Pegatron Corp have set up factories in Vietnam; bringing electronics industry share of total exports to 32% in 2022.<sup>6</sup></p>
<h3>Vitenam: Foreign Direct Investment (Realized Capital) Flows</h3>
<p><img class="img-responsive w-100" src="https://www.vaneck.com/contentassets/c528f9ab90324efc8785732c6c225831/3818_vietnman-november-2023_chart-2_2023.11_v1_blog.svg" alt="A sharp rise in electronic, computer, and phone manufacturing has driven Vietnam's export growth" /></p>
<p class="chart-disclosure">Disbursed foreign direct investment flows into Vietnam. Graphics by UOB.</p>
<h2>Strategic Materials, Semiconductors and Friend-shoring,</h2>
<p>Vietnam has the world&rsquo;s second largest reserves of rare earths, estimated at 22 million tonnes second only to China.<sup>7</sup>&nbsp;Its rare earths industry is booming with 2022 production of 4,300 tonnes up about 11 times relative to its 2021 production of only 400 tonnes.<sup>7</sup>&nbsp;The country aims to raise its rare earths production to 2.02 million tonnes a year by 2030.</p>
<p>Foreign companies including Korean and Chinese magnet firms, which include an Apple supplier are set to open factories in Vietnam to diversify supply chains away from China. China currently holds a dominant position in the production of magnets and the essential rare earth metals used in their manufacturing. These magnets are crucial components in various products, including electric vehicles, wind turbines, weapons, and smartphones, making this sector of significant strategic importance. Vietnam has begun developing a processing industry in this field and has the potential to emerge as a substantial competitor in the rare earth metals and magnets sector.<sup>8</sup></p>
<p>Vietnam has emerged as a beneficiary of U.S. -China decoupling and the U.S. is Vietnam&rsquo;s largest trading partner accounting for 33% of its exports.<sup>9</sup>&nbsp;The U.S. recently signed the U.S.-Vietnam Comprehensive Economic Partnership agreement to enhance cooperation between the two countries in a wide range of industries.</p>
<p>One specific partnership to note is the U.S. - Vietnam pledge to actively support the rapid development of Vietnam's semiconductor ecosystem. The U.S. is committing seed funding of $2 million to kickstart the semiconductor workforce development initiatives in Vietnam. Semiconductors are a critical component in various technologies, and this collaboration aims to improve Vietnam's position in the global supply chain for semiconductors, indicating the significant role Vietnam is poised to play in the industry's growth. A bilateral Memorandum of Understanding was also agreed to secure critical mineral supply chains, including technical cooperation to help develop Vietnam's rare earths industry.</p>
<p>Vietnam&rsquo;s government has been courting key players in internal circuit design and semiconductor industries in order to encourage more investment into the country. These firms include industry leaders such as Nvidia, Synopsys, Qualcomm, Marvell, and Cadence Design System. These are all positive developments for Vietnam and speak to the country&rsquo;s future technological potential.</p>
<p>In conclusion, Vietnam stands at the threshold of an exciting economic transformation. The nation has demonstrated impressive resilience, attracting foreign investments and fostering growth in high-value sectors. With substantial rare earth reserves and a growing semiconductor sector, Vietnam is poised to become a vital player in global supply chains. The strong partnership between the U.S. and Vietnam further solidifies the nation's position in the global economic landscape. Investors looking for growth opportunities should keep an eye on Vietnam as it climbs the value chain and expands its presence in strategic sectors, making it a compelling investment destination.</p>
<p>Broad based indices have also aptly captured the dynamic changes in Vietnam&rsquo;s economy. The average weight of materials sector in the MarketVector Vietnam-based indices increased over 70%, while the average weight of industrials sectors increased 20% since the index&rsquo;s inception in August, 2009.<sup>10</sup>&nbsp;The current geopolitical environment could boost growth in Vietnamese companies operating in materials, industrials, and information technology sectors. These favorable trends shaping the Vietnamese economy could likely benefit investors with exposure to Vietnamese equities.</p>
<h2>How to Invest</h2>
<p><a href="https://www.vaneck.com/us/en/investments/vietnam-etf-vnm/overview/" title="VNM - VanEck Vietnam ETF"><strong>VanEck Vietnam ETF (VNM)</strong></a>&nbsp;provides access to the growth story of Vietnam and could be an appealing investment for investors seeking growth exposure outside of traditional emerging markets. VNM, the largest and most liquid<sup>11</sup>&nbsp;U.S. - listed Vietnam ETF provides investors one trade access to the Vietnamese market.</p>
<p>To receive more <a href="/us/en/insights/emerging-markets-equity/" title="Emerging Markets Equity Insights"><strong>Emerging Markets Equity</strong></a> insights, <a href="/us/en/subscribe/" title="Subscription Center"><strong>sign up in our subscription center</strong></a>.</p>
]]></content:encoded>
</item><item rdf:about="https://www.vaneck.com/us/en/blogs/gold-investing/ima-casanova-sector-re-rating-a-boon-for-gold-stocks/">
  <title>Sector Re-Rating a Boon for Gold Stocks?></title>
  <link>https://www.vaneck.com/us/en/blogs/gold-investing/ima-casanova-sector-re-rating-a-boon-for-gold-stocks/</link>
  <description><![CDATA[Gold had a strong October, trading above $2,000 per ounce. While gold stocks continued to lag gold, we believe a possible sector re-rating may reverse course and provide support to gold companies.]]></description>
  <dc:creator>Imaru Casanova</dc:creator>
  <dc:date>11/13/2023 06:30:00</dc:date>
<content:encoded><![CDATA[

<p>Monthly gold market and economic insights from Imaru Casanova, Portfolio Manager, featuring her unique views on mining and gold&rsquo;s portfolio benefits.<a href="/us/en/blogs/gold-investing/ima-casanova-sector-re-rating-a-boon-for-gold-stock/gold-monthly-commentary-october-2023.pdf" title="Sector Re-Rating a Boon for Gold Stocks?" target="_blank" rel="noopener"><strong> An expanded PDF version of this commentary, including fund specific information can be downloaded here.</strong></a></p>
<h2>Gold rallies on geopolitical uncertainty</h2>
<p>Gold had a strong October. Following tragic developments in the Middle East earlier in the month, gold demonstrated, once again, its historically-proven role as a safe haven investment, a hedge against market uncertainty, volatility and geopolitical risk, and as an asset offering protection when there is a heightened level of peril and fear. Gold traded at a monthly low of $1,820 per ounce on October 5, before rallying above $1,900 a week later and, finally, above $2,000 on October 27. The price of gold eventually settled at $1,983.88 by the end of October, posting a 7.32% gain (up $135.26 per ounce) for the month.</p>
<p>Gold stocks kept pace with gold in the first part of the rally; however, just as gold was approaching $2,000, surprisingly, they lost steam and gave back half of their earlier gains. NYSE Arca Gold Miners Index (GDMNTR)<sup>1</sup>&nbsp;and the MVIS Global Juniors Gold Miners Index (MVGDXJTR)<sup>2</sup>&nbsp;were up 4.2% and 3.8% during the month, respectively. Gold stocks&rsquo; significant underperformance further widens the valuation gap between gold stocks and gold.</p>
<h2>Why do we even own gold stocks?</h2>
<p>Historically, gold stocks have a strong correlation to the price of gold. Despite experiencing a significant de-rating after the last gold bull market, gold mining stocks have outperformed gold during the current gold bull market (the beginning of which we place around the end of 2015).</p>
<h3>Gold Stocks vs. Gold: Annualized Total Return Since Start of Current Gold Bull Market (Dec 2015)</h3>
<p><img class="img-responsive w-100" src="https://www.vaneck.com/contentassets/1a004019d79f4775921d2ef2f40784be/3817_gold-october-blog_chart-1_2023.11_v1_blog.svg" alt="Bar chart illustrating Gold Stocks vs. Gold: Annualized Total Return Since Start of Current Gold Bull Market (Dec 2015)" /></p>
<p class="chart-disclosure">Source: Bloomberg. Data as of October 2023.</p>
<p>This makes sense. Gold stocks are supposed to outperform the metal when gold&rsquo;s price is rising. Their leverage to gold justifies outperformance. For any given move in the price of gold, operating cash flow generated by these companies increases (or decreases) by a much greater percentage.</p>
<p>Take Alamos (8.06% of Strategy net assets), for example. The company estimates that a 5% increase in the price of gold (about a +$100/oz move), would translate into an increase of almost 30% in their free cash flow in 2024.</p>
<h3>Alamos Consolidated Free Cash Flow Outlook</h3>
<p><img class="img-responsive w-100" src="https://www.vaneck.com/contentassets/1a004019d79f4775921d2ef2f40784be/3817_gold-october-blog_chart-2_2023.11_v1_blog.svg" alt="Bar chart showing Alamos Consolidated Free Cash Flow Outlook" /></p>
<p class="chart-disclosure">Source: Alamos Gold. Data as of May 2023.</p>
<p>This is why, despite the risks associated with mining operations, investors choose to add gold stocks to their portfolios&mdash;the potential for amplified returns during a sustained gold rally.</p>
<p>So, we are surprised and disappointed to see gold stocks underperform this year. To be clear, gold stocks also underperformed gold last year. However, in 2022, gold was down slightly on the year (-0.28%) and rampant cost inflation not only ate away at profit margins but also caught the sector by surprise, causing most companies to miss cost guidance issued earlier in the year. The market penalized gold stocks severely, both for shrinking margins and for failing to meet expectations. GDMNTR, for example, was down 8.9% in 2022.</p>
<p>This year, things are a bit different. Gold is up almost 9% and, so far, companies&rsquo; 2023 results don&rsquo;t point to guidance revisions (if any) nearly as punitive as last year. So, what could be causing this performance gap?</p>
<h2>Potential causes for the growing gap between gold stocks and gold</h2>
<p>Here are a few factors we think could be at play:</p>
<ol class="content-list">
<li><i>Central Bank demand</i> &ndash; One of the main drivers of gold prices this year has been strong central bank net purchases&mdash;potentially set to even beat record levels reported for 2022.
<h3>Central Bank Net Purchases of Gold</h3>
<p><img class="img-responsive w-100" src="https://www.vaneck.com/contentassets/1a004019d79f4775921d2ef2f40784be/3817_gold-october-blog_chart-3_2023.11_v1_blog.svg" alt="Bar chart showing Central Bank Net Purchases of Gold from 2010 - 2023" /></p>
<p class="chart-disclosure">Source: World Gold Council. Data as of September 2023.</p>
<p>In contrast, investment demand, usually the main driver behind a gold price rally, has actually declined significantly this year (down 7% year-to-date), as measured by ETF holdings of gold bullion. Without another center of demand for gold stocks to offset the lack of investment demand, poor market sentiment and apathy towards gold has impacted the gold stocks to a much greater extent. In other words, central banks buy gold they don&rsquo;t buy gold stocks, if they did, perhaps the stocks would also be finding more support in this environment.</p>
</li>
<li><i>Industry operating cost inflation</i> &ndash; While industry cost inflation has subsided, operating costs guided for 2023 are still higher than in 2022. Analysts&rsquo; estimates for the sector&rsquo;s average all-in sustaining costs in 2023 vary from about 5-8% higher relative to 2022. While the gold price has helped sustain margins relative to last year, the market seems to be dissatisfied with the lack of significant margin expansion. These concerns were likely exacerbated in October, following negative 2023 guidance revisions by Newmont (3.64% of Strategy net assets), the largest gold mining company in the world.</li>
<li><i>General equity market exposure</i> &ndash; The broader equity markets were down during the month. The S&amp;P 500 and the NASDAQ were down 2.10% and 2.8%, respectively, in October, with particularly weak performance in the latter part of the month when the gold equities also fell. At times, in the early stages of a broader market sell-off, gold stocks also sell off.</li>
<li><i>Country-specific risks</i> &ndash; Two country specific news items at the end of October may have also impacted perception of sector risk and further deepened negative sentiment towards gold mining stocks. The Panamanian government announced that a recently enacted law is being challenged, effectively putting at risk a revised and approved contract for the Cobre Panama copper mine operated by First Quantum Minerals (not held in Strategy), Separately, Bloomberg reported, on October 27, that Burkina Faso had revised its mining code, increasing the top end of its sliding scale royalty scheme from 5% for gold prices above $1,300/oz, to 7% for gold prices above $2,000/oz.</li>
</ol>
<h2>Concerns may be overblown</h2>
<p>While, no doubt, all of these concerns are valid &ndash; especially as they relate to operating costs &ndash; at present, we see gold companies as greatly undervalued. Historically, the sector has never traded at lower valuation multiples. The companies&rsquo; continued focus on cost control, portfolio optimization and disciplined capital allocation to drive growth and maximize returns, responsibly and sustainably, along with our outlook for higher gold prices, support our expectations for a re-rating of the sector. Gold stocks are outperforming in the first few days of November; perhaps the re-rating has already begun.</p>
<h3>Gold Stocks: Premium/Discount to Gold Price</h3>
<p><img class="img-responsive w-100" src="https://www.vaneck.com/contentassets/1a004019d79f4775921d2ef2f40784be/3817_gold-october-blog_chart-4_2023.11_v1_blog.svg" alt="Line chart showing Gold Stocks: Premium/Discount to Gold Price from 2008 - 2023" /></p>
<p class="chart-disclosure">Source: Scotiabank. Data as of September 2023.</p>
<p>To receive more <strong><a href="https://www.vaneck.com/us/en/insights/gold-investing/" title="Gold Investing Insights">Gold Investing</a></strong> insights, <strong><a href="https://www.vaneck.com/us/en/subscribe/" title="Subscription Center">sign up in our subscription center</a></strong>.</p>
]]></content:encoded>
</item><item rdf:about="https://www.vaneck.com/us/en/blogs/moat-investing/stage-set-for-moat-stocks-rebound/">
  <title>Stage Set for Moat Stocks Rebound?></title>
  <link>https://www.vaneck.com/us/en/blogs/moat-investing/stage-set-for-moat-stocks-rebound/</link>
  <description><![CDATA[Despite a rough October for equities, there is optimism heading into yearend. In particular, moat stocks have a history of rebounding, so this may be an opportune time to invest in them.]]></description>
  <dc:creator>Coulter Regal, CFA</dc:creator>
  <dc:date>11/09/2023 08:30:00</dc:date>
<content:encoded><![CDATA[

<p>October was a punishing month for U.S. equity markets. Stocks capped off their worst October performance in five years, while clinching a third-straight monthly loss, the longest such streak since March 2020. Increasing Treasury yields and the outbreak of war between Israel and Hamas continue to undermine demand for riskier assets like stocks. A volatile third quarter earnings season, among other factors, also weighed on the U.S. equity markets during the month. Despite the challenges faced in October, there remains a sense of seasonal optimism looking toward the year's end, a period which has traditionally exhibited some of the best performance for the stock market.</p>
<p>In October, the <a href="https://www.vaneck.com/us/en/investments/morningstar-wide-moat-etf-moat/index/" title="MOAT - VanEck Morningstar Wide Moat ETF"><strong>Morningstar Wide Moat Focus Index</strong></a> (the "Moat Index") trailed the S&amp;P 500 by about 2.5% (-4.69% compared to -2.10%, respectively), which was buoyed some by its tilt towards the mega-cap Magnificent Seven<sup>1</sup>. Comparing the S&amp;P 500 to its equal weighted variant, the S&amp;P 500 Equal Weighted Index, which returned -4.08% in October, illustrates the bifurcation of the market, which has been a story-line in recent months. However, despite a series of challenging months for equal-weighted strategies, the Moat Index remains ahead of the S&amp;P 500 year-to-date, posting an 11.67% return through October, compared to the S&amp;P 500's 10.69%.</p>
<p>Looking to smaller-cap companies, the performance was more negative in October for this segment of the market compared to large-caps. Mid-cap companies, as represented by the S&amp;P MidCap 400 Index, dropped by 5.34%, and the S&amp;P SmallCap 600 Index decreased by 5.74%, both ending the month further into negative territory relative to larger companies. Echoing the Moat Index's struggles, the <a href="https://www.vaneck.com/us/en/investments/morningstar-smid-moat-etf-smot/index/" title="SMOT - VanEck Morningstar SMID Moat ETF "><strong>Morningstar US Small-Mid Cap Moat Focus Index</strong></a> (the "SMID Moat Index") also had a tough October, recording a return of -7.53% for the month. Year-to-date, through October, the -2.30% return of SMID Moat Index falls between the pure small- and mid-cap segments.</p>
<h3>Risk-Off Environment Leads to Punishing October for U.S. Equities</h3>
<p><strong>As of 10/31/2023</strong></p>
<p><img class="img-responsive w-100" src="https://www.vaneck.com/contentassets/24d560401c674b90a09f5b2dd05d8fcb/3814_moatsmot-monthly_chart-1_2023.11_v1_blog.svg" alt="Bar chart showing performance of equity market indexes in October and year-to-date through October" width="960" height="540" /></p>
<p class="chart-disclosure"><strong>Source: Morningstar. As of 10/31/2023</strong>. Past performance is no guarantee of future results. Index performance is not representative of fund performance. It is not possible to invest directly in an index. Fund performance current to the most recent month end is available by visiting vaneck.com or by calling 800.826.2333.</p>
<h2>Weathering Storms Has Led to Long-Term Outperformance</h2>
<p>While the Moat Index still remains ahead of the S&amp;P 500 year-to-date, the last few months have been challenging. Its lead over the market has narrowed by about 400 basis points in the last six months. While it can be tough to weather periods of underperformance, patrons of the Moat Investing philosophy have often been rewarded on the other side of the storm. Historically, the Moat Index has had its <strong><a href="https://www.vaneck.com/us/en/etf/moat/moat-strong-performance-after-market-declines.pdf" title="Wide Moat Focus Index: Strong Performance After Market Declines" target="_blank" rel="noopener">strongest relative performance following periods of notable underperformance</a></strong>.</p>
<p>During the more than 15 years of live history for the Moat Index, when it has underperformed the S&amp;P 500 by more than 2.5% in any six-month period, the Index has gone on to substantially outperform in the following 1- and 3-year periods. In fact, the Moat Index has outperformed the S&amp;P 500 by an average of 4.50% annually in the 3 years following six-month periods with greater than -5% relative performance. Given this historical pattern, now may be an opportune moment to consider allocating to moat stocks, potentially capitalizing on the rebound strength that has been shown in past cycles.</p>
<h3>Outperformance Historically Followed Underperformance</h3>
<p><strong>2/28/2007 &ndash; 9/30/2023</strong></p>
<p><img class="img-responsive w-100" src="https://www.vaneck.com/contentassets/24d560401c674b90a09f5b2dd05d8fcb/3814_moatsmot-monthly_chart-2_2023.11_v1_blog.svg" alt="Chart showing forward 1- and 3-year returns for Morningstar's Moat Index following periods of underperformance vs. the S and P 500" /></p>
<div class="wrapped-div">
<table style="width: 100%;">
<tbody>
<tr class="tbl-data">
<td class="tbl-header last" colspan="7">Number of Occurrences</td>
</tr>
<tr class="tbl-data">
<td class="data-td data last" style="text-align: left;">1 Year Periods</td>
<td class="data-td data last" style="text-align: center;">12</td>
<td class="data-td data last" style="text-align: center;">23</td>
<td class="data-td data last" style="text-align: center;">43</td>
<td class="data-td data last" style="text-align: center;">42</td>
<td class="data-td data last" style="text-align: center;">27</td>
<td class="data-td data last" style="text-align: center;">34</td>
</tr>
<tr class="tbl-data">
<td class="data-td data last" style="text-align: left;">3 Year Periods</td>
<td class="data-td data last" style="text-align: center;">8</td>
<td class="data-td data last" style="text-align: center;">20</td>
<td class="data-td data last" style="text-align: center;">38</td>
<td class="data-td data last" style="text-align: center;">39</td>
<td class="data-td data last" style="text-align: center;">22</td>
<td class="data-td data last" style="text-align: center;">30</td>
</tr>
</tbody>
</table>
</div>
<br />
<p class="chart-disclosure"><strong>Source: Morningstar, September 2023</strong>. Past performance is no guarantee of future results. Index performance is not illustrative of fund performance. Effective 6/20/2016, Morningstar implemented several changes to the Morningstar Wide Moat Focus Index construction rules. Among other changes, the index increased its constituent count from 20 stocks to at least 40 stocks and modified its rebalance and reconstitution methodology. These changes may result in more diversified exposure, lower turnover and longer holding periods for index constituents than under the rules in effect prior to this date.</p>
<h2>Moat Stock Selection Drives Performance</h2>
<p>As is customary, the prospects of the Moat Index were once again driven largely by stock selection as opposed to an overweight (or underweight) to any particular sector. One name in particular, TransUnion, was an outsized contributor to negative absolute returns in October.</p>
<p><strong>TransUnion (TRU)</strong></p>
<p>TransUnion struggled tremendously in October following its disappointing third-quarter earnings and outlook. Its -38.9% return for the month placed it squarely at the bottom within the Moat Index. Morningstar equity analyst Rajiv Bhatia, who covers custody banks, credit bureaus, and life insurers, believes the sharp decline was an overreaction by the market and views TRU an attractive valuation opportunity.</p>
<p style="margin-left: 20px;"><strong>Morningstar Analyst Comments</strong> | by Rajiv Bhatia, CFA - October 24, 2023<br /><i>Wide-moat TransUnion reported disappointing third-quarter results as well as a disappointing fourth-quarter outlook. Third-quarter revenue, adjusted EBITDA, and adjusted EPS were respectively 2%, 3%, and 4% below the FactSet consensus estimates. TransUnion saw a really weak September and meaningfully took down its full-year outlook as a result. Making matters worse, it took a write-down of goodwill from its U.K. business (Callcredit) amid a challenging economy and regulatory environment there. A key debate, in our view, is if the firm is taking a big bath and thus resetting expectations, which sets up the stock favorably, or if a worsening macroeconomic environment with student loan payments resuming and interest rates spiking will result in further revenue misses. We take the former view. We expect to reduce our fair value estimate by about 10%, but we view the shares, trading at a five-year low, as cheap and offering a positive risk/reward profile.</i></p>
<p>Top contributors in October included fixed-income trading and data platform Tradeweb Markets (TW), the popular footwear and apparel brand Nike (NKE), as well as aerospace and defense industrial company RTX Corp. (RTX).</p>
<h3>Top Contributors and Detractors from Moat Index - October 2023</h3>
<div class="wrapped-div">
<table style="width: 750px;">
<tbody>
<tr class="tbl-data">
<td class="tbl-header last" colspan="5">Leading Contributors</td>
</tr>
<tr class="tbl-data">
<td class="data-td  last">Company</td>
<td class="data-head last">Ticker</td>
<td class="data-head last">Sector</td>
<td class="data-head last">Avg. Weight (%)</td>
<td class="data-head last">Contribution (%)</td>
</tr>
<tr class="tbl-data">
<td class="data-td last" style="font-weight: normal;">Tradeweb Markets Inc.</td>
<td class="data-td data last">TW</td>
<td class="data-td data last">Financials</td>
<td class="data-td data last">1.50</td>
<td class="data-td data last">0.18</td>
</tr>
<tr class="tbl-data">
<td class="data-td last" style="font-weight: normal;">Nike Inc.</td>
<td class="data-td data last">NKE</td>
<td class="data-td data last">Consumer Discretionary</td>
<td class="data-td data last">2.37</td>
<td class="data-td data last">0.18</td>
</tr>
<tr class="tbl-data">
<td class="data-td last" style="font-weight: normal;">RTX Corp.</td>
<td class="data-td data last">RTX</td>
<td class="data-td data last">Industrials</td>
<td class="data-td data last">1.14</td>
<td class="data-td data last">0.15</td>
</tr>
<tr class="tbl-data">
<td class="data-td last" style="font-weight: normal;">Gilead Sciences Inc.</td>
<td class="data-td data last">GILD</td>
<td class="data-td data last">Health Care</td>
<td class="data-td data last">2.59</td>
<td class="data-td data last">0.12</td>
</tr>
<tr class="tbl-data">
<td class="data-td last" style="font-weight: normal;">Microsoft Corp.</td>
<td class="data-td data last">MCHP</td>
<td class="data-td data last">Information Technology</td>
<td class="data-td data last">1.25</td>
<td class="data-td data last">0.09</td>
</tr>
</tbody>
</table>
</div>
<br />
<div class="wrapped-div">
<table style="width: 750px;">
<tbody>
<tr class="tbl-data">
<td class="tbl-header last" colspan="5">Leading Detractors</td>
</tr>
<tr class="tbl-data">
<td class="data-td  last">Company</td>
<td class="data-head last">Ticker</td>
<td class="data-head last">Sector</td>
<td class="data-head last">Avg. Weight (%)</td>
<td class="data-head last">Contribution (%)</td>
</tr>
<tr class="tbl-data">
<td class="data-td last" style="font-weight: normal;">TransUnion</td>
<td class="data-td data last">TRU</td>
<td class="data-td data last">Industrials</td>
<td class="data-td data last">2.39</td>
<td class="data-td data last">-0.93</td>
</tr>
<tr class="tbl-data">
<td class="data-td last" style="font-weight: normal;">Teradyne Inc.</td>
<td class="data-td data last">TER</td>
<td class="data-td data last">Information Technology</td>
<td class="data-td data last">2.45</td>
<td class="data-td data last">-0.42</td>
</tr>
<tr class="tbl-data">
<td class="data-td last" style="font-weight: normal;">Medtronic PLC</td>
<td class="data-td data last">MDT</td>
<td class="data-td data last">Health Care</td>
<td class="data-td data last">2.43</td>
<td class="data-td data last">-0.24</td>
</tr>
<tr class="tbl-data">
<td class="data-td last" style="font-weight: normal;">The Estee Lauder Co.</td>
<td class="data-td data last">EL</td>
<td class="data-td data last">Consumer Staples</td>
<td class="data-td data last">2.18</td>
<td class="data-td data last">-0.24</td>
</tr>
<tr class="tbl-data">
<td class="data-td last" style="font-weight: normal;">Polaris Inc.</td>
<td class="data-td data last">PII</td>
<td class="data-td data last">Consumer Discretionary</td>
<td class="data-td data last">1.15</td>
<td class="data-td data last">-0.19</td>
</tr>
</tbody>
</table>
</div>
<br />
<p class="chart-disclosure"><strong>Source: Morningstar, October 2023</strong>. Past performance is no guarantee of future results. Index performance is not illustrative of fund performance. Not intended as a recommendation to buy or to sell any of the securities mentioned herein.</p>
<h2>Market Downturn Hits Smaller Caps Hardest</h2>
<p>In October, larger-cap firms held their ground better compared to their smaller counterparts, with mid-caps faltering more than large caps, and small-caps faring the poorest. The composition of moat-rated firms typically includes larger, well-established entities, leading to a tendency for the SMID Moat Index to skew towards mid-cap preferences when compared to other SMID-cap indices. This characteristic, along with the Moat Index&rsquo;s unconstrained approach, can result in some commonalities between these indices at times. This is particularly evident this month, as we again find TransUnion (TRU) as the largest contributor to negative returns in October, this time for the SMID Moat Index. Other negative contributors this month include motorcycle manufacturer Harley-Davidson (HOG) and medical care facilities company DaVita (DVA).</p>
<p>On the accretive side, October top contributors included online product and commerce platform Pinterest (PINS), fixed-income trading and data platform Tradeweb Markets (TW) and credit services company Capital One Financial Corp. (COF).</p>
<h3>Top Contributors and Detractors from SMID Moat Index - October 2023</h3>
<div class="wrapped-div">
<table style="width: 750px;">
<tbody>
<tr class="tbl-data">
<td class="tbl-header last" colspan="5">Leading Contributors</td>
</tr>
<tr class="tbl-data">
<td class="data-td last">Company</td>
<td class="data-head last">Ticker</td>
<td class="data-head last">Sector</td>
<td class="data-head last">Avg. Weight (%)</td>
<td class="data-head last">Contribution (%)</td>
</tr>
<tr class="tbl-data">
<td class="data-td last" style="font-weight: normal;">Pinterest Inc.</td>
<td class="data-td data last">PINS</td>
<td class="data-td data last">Communication Services</td>
<td class="data-td data last">1.46</td>
<td class="data-td data last">0.15</td>
</tr>
<tr class="tbl-data">
<td class="data-td last" style="font-weight: normal;">Tradeweb Markets Inc.</td>
<td class="data-td data last">TW</td>
<td class="data-td data last">Financials</td>
<td class="data-td data last">0.80</td>
<td class="data-td data last">0.10</td>
</tr>
<tr class="tbl-data">
<td class="data-td last" style="font-weight: normal;">Capital One Financial Corp.</td>
<td class="data-td data last">COF</td>
<td class="data-td data last">Financials</td>
<td class="data-td data last">1.28</td>
<td class="data-td data last">0.06</td>
</tr>
<tr class="tbl-data">
<td class="data-td last" style="font-weight: normal;">Roblox Corp.</td>
<td class="data-td data last">RBLX</td>
<td class="data-td data last">Communication Services</td>
<td class="data-td data last">0.48</td>
<td class="data-td data last">0.05</td>
</tr>
<tr class="tbl-data">
<td class="data-td last" style="font-weight: normal;">Electronic Arts Inc.</td>
<td class="data-td data last">EA</td>
<td class="data-td data last">Communication Services</td>
<td class="data-td data last">0.70</td>
<td class="data-td data last">0.02</td>
</tr>
</tbody>
</table>
</div>
<br />
<div class="wrapped-div">
<table style="width: 750px;">
<tbody>
<tr class="tbl-data">
<td class="tbl-header last" colspan="5">Leading Detractors</td>
</tr>
<tr class="tbl-data">
<td class="data-td last">Company</td>
<td class="data-head last">Ticker</td>
<td class="data-head last">Sector</td>
<td class="data-head last">Avg. Weight (%)</td>
<td class="data-head last">Contribution (%)</td>
</tr>
<tr class="tbl-data">
<td class="data-td last" style="font-weight: normal;">TransUnion</td>
<td class="data-td data last">TRU</td>
<td class="data-td data last">Industrials</td>
<td class="data-td data last">1.26</td>
<td class="data-td data last">-0.49</td>
</tr>
<tr class="tbl-data">
<td class="data-td last" style="font-weight: normal;">Harley-Davidson Inc.</td>
<td class="data-td data last">HOG</td>
<td class="data-td data last">Consumer Discretionary</td>
<td class="data-td data last">1.32</td>
<td class="data-td data last">-0.25</td>
</tr>
<tr class="tbl-data">
<td class="data-td last" style="font-weight: normal;">DaVita Inc.</td>
<td class="data-td data last">DVA</td>
<td class="data-td data last">Health Care</td>
<td class="data-td data last">1.33</td>
<td class="data-td data last">-0.24</td>
</tr>
<tr class="tbl-data">
<td class="data-td last" style="font-weight: normal;">Asbury Automotive Group Inc.</td>
<td class="data-td data last">ABG</td>
<td class="data-td data last">Consumer Discretionary</td>
<td class="data-td data last">1.44</td>
<td class="data-td data last">-0.24</td>
</tr>
<tr class="tbl-data">
<td class="data-td last" style="font-weight: normal;">Boston Beer Co Inc.</td>
<td class="data-td data last">SAM</td>
<td class="data-td data last">Consumer Staples</td>
<td class="data-td data last">1.56</td>
<td class="data-td data last">-0.22</td>
</tr>
</tbody>
</table>
</div>
<br />
<p class="chart-disclosure"><strong>Source: Morningstar, October 2023</strong>. Past performance is no guarantee of future results. Index performance is not illustrative of fund performance. Not intended as a recommendation to buy or to sell any of the securities mentioned herein.</p>
<h2>Accessing Moat Stocks</h2>
<p><strong><a href="https://www.vaneck.com/us/en/investments/morningstar-wide-moat-etf-moat/overview/" title="MOAT - VanEck Morningstar Wide Moat ETF" rel="noopener">VanEck Morningstar Wide ETF (MOAT)</a></strong> seeks to replicate as closely as possible, before fees and expenses the price and yield performance of the Morningstar Wide Moat Focus Index.</p>
<p><strong><a href="/link/166321dbcfec440590fb51cf0ad629aa.aspx" title="SMOT - VanEck Morningstar SMID Moat ETF - Overview">VanEck Morningstar SMID Moat ETF (SMOT)</a></strong> seeks to track as closely as possible, before fees and expenses, the price and yield performance of the Morningstar US Small-Mid Cap Moat Focus Index.</p>
<p>To receive more <a href="https://www.vaneck.com/us/en/insights/moat-investing/" title="Moat Investing Insights"><strong>Moat Investing</strong></a> insights, <a href="https://www.vaneck.com/us/en/subscribe/" title=" Subscription Center"><strong>sign up in our subscription center</strong></a>.</p>
<style type="text/css">
    .wrapped-div {
        max-width: 100%;
    }

    @media (max-width: 1240px) {
        .wrapped-div {
            overflow-x: scroll;
        }


    }
</style>
]]></content:encoded>
</item><item rdf:about="https://www.vaneck.com/us/en/blogs/municipal-bonds/muni-bonds-tax-loss-harvesting-low-cost-strategy/">
  <title>Muni Bonds Tax Loss Harvesting: Low-Cost Strategy></title>
  <link>https://www.vaneck.com/us/en/blogs/municipal-bonds/muni-bonds-tax-loss-harvesting-low-cost-strategy/</link>
  <description><![CDATA[Municipal bonds typically dip in September and October but rebound in November and December, presenting a potential low-cost entry for tax-efficient investing as the year concludes.]]></description>
  <dc:creator>Michael Cohick</dc:creator>
  <dc:date>11/09/2023 06:30:00</dc:date>
<content:encoded><![CDATA[

<p>Municipal bonds have historically seen negative performance in September and October, only to historically rebound in November and December. Muni bonds&rsquo; Fall pullback could offer investors an attractive entry point as we finish the last two months of the fourth quarter.</p>
<p>Investors looking to go on a muni bond holiday buying spree may want to consider the <a href="https://www.vaneck.com/us/en/investments/short-muni-etf-smb/literature/" title="SMB - VanEck Short Muni ETF - Literature"><strong>VanEck Short Muni ETF (SMB)</strong></a>, which offers one of the lowest fees (0.07% expense ratio) in the short-term municipal bond peer group. In addition, SMB could be a good strategy for tax loss harvesting season, as investors can consider locking in their losses while they ride out 2023 with attractive tax-exempt income.</p>
<h3>SMB Costs 70% less than the Average Expense Ratio of ETFs in the Muni National Short Morningstar Category</h3>
<p><img class="img-responsive w-100" src="https://www.vaneck.com/contentassets/abbf0c7bd6be4583950c1b1e436a4f50/3807_muni_chart-01_2023.10_blog.svg" alt="SMB Costs 70% less than the Average Expense Ratio of ETFs in the Muni National Short Morningstar Category" /></p>
<p class="chart-disclosure">Source: Morningstar Direct. As of 10/31/2023.</p>
<h2>What is Tax Loss Harvesting?</h2>
<p>Tax loss harvesting is a strategy investors use to minimize their annual tax liability. The basic idea is to sell investments that have lost value to offset capital gains from other investments. Let's say you own an ETF that has decreased in value by $2,000 since you purchased it. You can sell the ETF and use the $2,000 loss to offset any capital gains you may have realized during the year.</p>
<p>Selling an asset disrupts the balance of a portfolio. After tax-loss harvesting, investors with carefully constructed portfolios can replace the asset sold with a similar alternative to maintain the portfolio's asset allocation and expected risk and return profile. Investors should avoid buying the same asset they just sold at a loss, which may help them avoid the IRS wash-sale rule. Alternatively, SMB, with its low expense ratio and high correlation to other short-duration or short-maturity-focused ETFs, makes it an ideal option for investors considering implementing such a tax strategy.</p>
<h3>High Correlation Among Short-Maturity Focused ETFs Makes for Ideal Tax Lost Harvest Opportunity</h3>
<div class="wrapped-div">
<table style="width: 100%;">
<tbody>
<tr class="tbl-data">
<td class="tbl-header last">Ticker</td>
<td class="tbl-header last text-center">Name</td>
<td class="tbl-header last text-center">SMB</td>
<td class="tbl-header last text-center">SUB</td>
<td class="tbl-header last text-center">DFNM</td>
<td class="tbl-header last text-center">JMST</td>
<td class="tbl-header last text-center">SHM</td>
<td class="tbl-header last text-center">MEAR</td>
<td class="tbl-header last text-center">TAFI</td>
<td class="tbl-header last text-center">SMMU</td>
<td class="tbl-header last text-center">FUMB</td>
<td class="tbl-header last text-center">FSMB</td>
</tr>
<tr class="tbl-data">
<td class="data-td last">SMB</td>
<td class="data-td data last">VanEck Short Muni ETF</td>
<td class="data-td last">1.00</td>
<td class="data-td data last">&nbsp;</td>
</tr>
<tr class="tbl-data">
<td class="data-td last">SUB</td>
<td class="data-td data last">iShares Short-Term National Muni Bd ETF</td>
<td class="data-td data last">0.95</td>
<td class="data-td last">1.00</td>
<td class="data-td data last">&nbsp;</td>
</tr>
<tr class="tbl-data">
<td class="data-td last">DFNM</td>
<td class="data-td data last">Dimensional National Municipal Bond ETF</td>
<td class="data-td data last">0.94</td>
<td class="data-td data last">0.98</td>
<td class="data-td last">1.00</td>
<td class="data-td data last">&nbsp;</td>
</tr>
<tr class="tbl-data">
<td class="data-td last">JMST</td>
<td class="data-td data last">JPMorgan Ultra-Short Municipal Inc ETF</td>
<td class="data-td data last">0.86</td>
<td class="data-td data last">0.90</td>
<td class="data-td data last">0.91</td>
<td class="data-td last">1.00</td>
<td class="data-td data last">&nbsp;</td>
</tr>
<tr class="tbl-data">
<td class="data-td last">SHM</td>
<td class="data-td data last">SPDR<sup>&reg;</sup>&nbsp;Nuveen Blmbg ST MunBd ETF</td>
<td class="data-td data last">0.96</td>
<td class="data-td data last">0.98</td>
<td class="data-td data last">0.91</td>
<td class="data-td last">1.00</td>
<td class="data-td data last">&nbsp;</td>
</tr>
<tr class="tbl-data">
<td class="data-td last">MEAR</td>
<td class="data-td data last">iShares Short Maturity Municipal Bd ETF</td>
<td class="data-td data last">0.85</td>
<td class="data-td data last">0.86</td>
<td class="data-td data last">0.91</td>
<td class="data-td data last">0.92</td>
<td class="data-td data last">0.89</td>
<td class="data-td last">1.00</td>
<td class="data-td data last">&nbsp;</td>
</tr>
<tr class="tbl-data">
<td class="data-td last">TAFI</td>
<td class="data-td data last">AB Tax-Aware Short Duration ETF</td>
<td class="data-td data last">0.96</td>
<td class="data-td data last">0.98</td>
<td class="data-td data last">0.93</td>
<td class="data-td data last">0.92</td>
<td class="data-td data last">0.82</td>
<td class="data-td last">1.00</td>
<td class="data-td data last">&nbsp;</td>
</tr>
<tr class="tbl-data">
<td class="data-td last">SMMU</td>
<td class="data-td data last">PIMCO Short Term Municipal Bond Actv ETF</td>
<td class="data-td data last">0.95</td>
<td class="data-td data last">0.97</td>
<td class="data-td data last">0.99</td>
<td class="data-td data last">0.88</td>
<td class="data-td data last">0.96</td>
<td class="data-td data last">0.88</td>
<td class="data-td data last">0.98</td>
<td class="data-td last">1.00</td>
<td class="data-td data last">&nbsp;</td>
</tr>
<tr class="tbl-data">
<td class="data-td last">FUMB</td>
<td class="data-td data last">First Trust Ultra Short Dur Muncpl ETF</td>
<td class="data-td data last">0.88</td>
<td class="data-td data last">0.92</td>
<td class="data-td data last">0.88</td>
<td class="data-td data last">0.90</td>
<td class="data-td data last">0.86</td>
<td class="data-td data last">0.95</td>
<td class="data-td data last">0.89</td>
<td class="data-td last">1.00</td>
<td class="data-td data last">&nbsp;</td>
</tr>
<tr class="tbl-data">
<td class="data-td last">FSMB</td>
<td class="data-td data last">First Trust Short Dur Mgd Muncpl ETF</td>
<td class="data-td data last">0.93</td>
<td class="data-td data last">0.96</td>
<td class="data-td data last">0.99</td>
<td class="data-td data last">0.86</td>
<td class="data-td data last">0.96</td>
<td class="data-td data last">0.85</td>
<td class="data-td data last">0.98</td>
<td class="data-td data last">0.89</td>
<td class="data-td last">1.00</td>
</tr>
</tbody>
</table>
</div>
<br />
<p class="chart-disclosure">Source: Morningstar Direct. As of 10/31/2023. Correlation is based on 3-year returns.</p>
<div class="wrapped-div">
<table style="width: 100%;">
<tbody>
<tr class="tbl-data">
<td class="tbl-header last" colspan="13">Quarter End Returns (%) as of 9/30/2023</td>
</tr>
<tr class="tbl-data">
<td class="data-td  last">Ticker</td>
<td class="data-head last">&nbsp;</td>
<td class="data-head last">Investment Objective</td>
<td class="data-head last">Fund Type (Active/Passive)</td>
<td class="data-head last">&nbsp;</td>
<td class="data-head last">1 Yr</td>
<td class="data-head last">3 Yr</td>
<td class="data-head last">5 Yr</td>
<td class="data-head last">10 Yr</td>
<td class="data-head last">Since Inception</td>
<td class="data-head last">Inception Date</td>
<td class="data-head last" colspan="2">Expense Ratio</td>
</tr>
<tr class="tbl-data">
<td class="data-td last font-weight-normal" rowspan="2">SMB</td>
<td class="data-td data last" rowspan="2">VanEck Short Muni ETF</td>
<td class="data-td data last" rowspan="2">Seeks to replicate as closely as possible, before fees and expenses, the price and yield performance of the ICE Short AMT-Free Broad National Municipal Index (MBNS).</td>
<td class="data-td data last" rowspan="2">Passive</td>
<td class="data-td data last"><i>NAV</i></td>
<td class="data-td data last">2.05</td>
<td class="data-td data last">-1.19</td>
<td class="data-td data last">0.84</td>
<td class="data-td data last">0.87</td>
<td class="data-td data last">1.68</td>
<td class="data-td data last" rowspan="2">02/22/2008</td>
<td class="data-td data last"><i>Gross</i></td>
<td class="data-td data last">0.07</td>
</tr>
<tr class="tbl-data">
<td class="data-td data last"><i>Market Price</i></td>
<td class="data-td data last">2.04</td>
<td class="data-td data last">-1.21</td>
<td class="data-td data last">0.91</td>
<td class="data-td data last">0.87</td>
<td class="data-td data last">1.68</td>
<td class="data-td data last"><i>Net</i></td>
<td class="data-td data last">0.07</td>
</tr>
<tr class="tbl-data">
<td class="data-td last font-weight-normal" rowspan="2">SUB</td>
<td class="data-td data last" rowspan="2">iShares Short-Term National Muni Bd ETF</td>
<td class="data-td data last" rowspan="2">Seeks to track the investment results of an index composed of investment-grade U.S. municipal bonds with remaining maturities between one month and five years.</td>
<td class="data-td data last" rowspan="2">Passive</td>
<td class="data-td data last"><i>NAV</i></td>
<td class="data-td data last">1.98</td>
<td class="data-td data last">-0.52</td>
<td class="data-td data last">0.89</td>
<td class="data-td data last">0.75</td>
<td class="data-td data last">1.26</td>
<td class="data-td data last" rowspan="2">11/05/2008</td>
<td class="data-td data last"><i>Gross</i></td>
<td class="data-td data last">0.07</td>
</tr>
<tr class="tbl-data">
<td class="data-td data last"><i>Market Price</i></td>
<td class="data-td data last">1.72</td>
<td class="data-td data last">-0.52</td>
<td class="data-td data last">0.89</td>
<td class="data-td data last">0.75</td>
<td class="data-td data last">1.26</td>
<td class="data-td data last"><i>Net</i></td>
<td class="data-td data last">0.07</td>
</tr>
<tr class="tbl-data">
<td class="data-td last font-weight-normal" rowspan="2">DFNM</td>
<td class="data-td data last" rowspan="2">Dimensional National Municipal Bond ETF</td>
<td class="data-td data last" rowspan="2">Seeks to provide current income that is expected to be exempt from federal personal income tax.</td>
<td class="data-td data last" rowspan="2">Active</td>
<td class="data-td data last"><i>NAV</i></td>
<td class="data-td data last">1.68</td>
<td class="data-td data last">--</td>
<td class="data-td data last">-2.54</td>
<td class="data-td data last" rowspan="2">11/15/2021</td>
<td class="data-td data last"><i>Gross</i></td>
<td class="data-td data last">0.19</td>
</tr>
<tr class="tbl-data">
<td class="data-td data last"><i>Market Price</i></td>
<td class="data-td data last">1.78</td>
<td class="data-td data last">--</td>
<td class="data-td data last">-2.54</td>
<td class="data-td data last"><i>Net</i></td>
<td class="data-td data last">0.17</td>
</tr>
<tr class="tbl-data">
<td class="data-td last font-weight-normal" rowspan="2">JMST</td>
<td class="data-td data last" rowspan="2">JPMorgan Ultra-Short Municipal Inc ETF</td>
<td class="data-td data last" rowspan="2">Seeks to deliver current income exempt from federal income taxes while managing risk.</td>
<td class="data-td data last" rowspan="2">Active</td>
<td class="data-td data last"><i>NAV</i></td>
<td class="data-td data last">2.88</td>
<td class="data-td data last">0.84</td>
<td class="data-td data last">--</td>
<td class="data-td data last">1.45</td>
<td class="data-td data last" rowspan="2">10/16/2018</td>
<td class="data-td data last"><i>Gross</i></td>
<td class="data-td data last">0.18</td>
</tr>
<tr class="tbl-data">
<td class="data-td data last"><i>Market Price</i></td>
<td class="data-td data last">2.94</td>
<td class="data-td data last">0.84</td>
<td class="data-td data last">--</td>
<td class="data-td data last">1.45</td>
<td class="data-td data last"><i>Net</i></td>
<td class="data-td data last">0.18</td>
</tr>
<tr class="tbl-data">
<td class="data-td last font-weight-normal" rowspan="2">SHM</td>
<td class="data-td data last" rowspan="2">SPDR<sup>&reg;</sup>&nbsp;Nuveen Blmbg ST MunBd ETF</td>
<td class="data-td data last" rowspan="2">Seeks to provide investment results that, before fees and expenses, correspond generally to the price and yield performance of the Bloomberg Managed Money Municipal Short Term Index.</td>
<td class="data-td data last" rowspan="2">Passive</td>
<td class="data-td data last"><i>NAV</i></td>
<td class="data-td data last">1.41</td>
<td class="data-td data last">-1.58</td>
<td class="data-td data last">0.47</td>
<td class="data-td data last">0.60</td>
<td class="data-td data last">1.51</td>
<td class="data-td data last" rowspan="2">10/10/2007</td>
<td class="data-td data last"><i>Gross</i></td>
<td class="data-td data last">0.20</td>
</tr>
<tr class="tbl-data">
<td class="data-td data last"><i>Market Price</i></td>
<td class="data-td data last">1.27</td>
<td class="data-td data last">-1.58</td>
<td class="data-td data last">0.47</td>
<td class="data-td data last">0.60</td>
<td class="data-td data last">1.51</td>
<td class="data-td data last"><i>Net</i></td>
<td class="data-td data last">0.20</td>
</tr>
<tr class="tbl-data">
<td class="data-td last font-weight-normal" rowspan="2">MEAR</td>
<td class="data-td data last" rowspan="2">iShares Short Maturity Municipal Bd ETF</td>
<td class="data-td data last" rowspan="2">Seeks to maximize tax-free current income.</td>
<td class="data-td data last" rowspan="2">Active</td>
<td class="data-td data last"><i>NAV</i></td>
<td class="data-td data last">3.12</td>
<td class="data-td data last">0.88</td>
<td class="data-td data last">1.24</td>
<td class="data-td data last">--</td>
<td class="data-td data last">1.07</td>
<td class="data-td data last" rowspan="2">03/03/2015</td>
<td class="data-td data last"><i>Gross</i></td>
<td class="data-td data last">0.25</td>
</tr>
<tr class="tbl-data">
<td class="data-td data last"><i>Market Price</i></td>
<td class="data-td data last">3.04</td>
<td class="data-td data last">0.88</td>
<td class="data-td data last">1.24</td>
<td class="data-td data last">--</td>
<td class="data-td data last">1.07</td>
<td class="data-td data last"><i>Net</i></td>
<td class="data-td data last">0.25</td>
</tr>
<tr class="tbl-data">
<td class="data-td last font-weight-normal" rowspan="2">TAFI</td>
<td class="data-td data last" rowspan="2">AB Tax-Aware Short Duration ETF</td>
<td class="data-td data last" rowspan="2">Seeks to provide relative stability of principal and a moderate rate of after-tax return and income.</td>
<td class="data-td data last" rowspan="2">Active</td>
<td class="data-td data last"><i>NAV</i></td>
<td class="data-td data last">3.01</td>
<td class="data-td data last">--</td>
<td class="data-td data last">1.22</td>
<td class="data-td data last" rowspan="2">09/13/2022</td>
<td class="data-td data last"><i>Gross</i></td>
<td class="data-td data last">0.27</td>
</tr>
<tr class="tbl-data">
<td class="data-td data last"><i>Market Price</i></td>
<td class="data-td data last">3.08</td>
<td class="data-td data last">--</td>
<td class="data-td data last">1.22</td>
<td class="data-td data last"><i>Net</i></td>
<td class="data-td data last">0.27</td>
</tr>
<tr class="tbl-data">
<td class="data-td last font-weight-normal" rowspan="2">SMMU</td>
<td class="data-td data last" rowspan="2">PIMCO Short Term Municipal Bond Actv ETF</td>
<td class="data-td data last" rowspan="2">Seeks attractive tax-exempt income, consistent with preservation of capital.</td>
<td class="data-td data last" rowspan="2">Active</td>
<td class="data-td data last"><i>NAV</i></td>
<td class="data-td data last">2.89</td>
<td class="data-td data last">-0.10</td>
<td class="data-td data last">1.21</td>
<td class="data-td data last">1.03</td>
<td class="data-td data last">1.05</td>
<td class="data-td data last" rowspan="2">02/01/2010</td>
<td class="data-td data last"><i>Gross</i></td>
<td class="data-td data last">0.35</td>
</tr>
<tr class="tbl-data">
<td class="data-td data last"><i>Market Price</i></td>
<td class="data-td data last">2.74</td>
<td class="data-td data last">-0.10</td>
<td class="data-td data last">1.21</td>
<td class="data-td data last">1.03</td>
<td class="data-td data last">1.05</td>
<td class="data-td data last"><i>Net</i></td>
<td class="data-td data last">0.35</td>
</tr>
<tr class="tbl-data">
<td class="data-td last font-weight-normal" rowspan="2">FUMB</td>
<td class="data-td data last" rowspan="2">First Trust Ultra Short Dur Muncpl ETF</td>
<td class="data-td data last" rowspan="2">Seeks to provide federally tax-exempt income consistent with capital preservation.</td>
<td class="data-td data last" rowspan="2">Active</td>
<td class="data-td data last"><i>NAV</i></td>
<td class="data-td data last">2.57</td>
<td class="data-td data last">0.71</td>
<td class="data-td data last">--</td>
<td class="data-td data last">1.14</td>
<td class="data-td data last" rowspan="2">11/01/2018</td>
<td class="data-td data last"><i>Gross</i></td>
<td class="data-td data last">0.45</td>
</tr>
<tr class="tbl-data">
<td class="data-td data last"><i>Market Price</i></td>
<td class="data-td data last">2.63</td>
<td class="data-td data last">0.71</td>
<td class="data-td data last">--</td>
<td class="data-td data last">1.14</td>
<td class="data-td data last"><i>Net</i></td>
<td class="data-td data last">0.45</td>
</tr>
<tr class="tbl-data">
<td class="data-td last font-weight-normal" rowspan="2">FSMB</td>
<td class="data-td data last" rowspan="2">First Trust Short Dur Mgd Muncpl ETF</td>
<td class="data-td data last" rowspan="2">Seeks to provide federally tax-exempt income consistent with capital preservation.</td>
<td class="data-td data last" rowspan="2">Active</td>
<td class="data-td data last"><i>NAV</i></td>
<td class="data-td data last">1.89</td>
<td class="data-td data last">-0.41</td>
<td class="data-td data last">--</td>
<td class="data-td data last">1.17</td>
<td class="data-td data last" rowspan="2">11/01/2018</td>
<td class="data-td data last"><i>Gross</i></td>
<td class="data-td data last">0.55</td>
</tr>
<tr class="tbl-data">
<td class="data-td data last"><i>Market Price</i></td>
<td class="data-td data last">1.74</td>
<td class="data-td data last">-0.41</td>
<td class="data-td data last">--</td>
<td class="data-td data last">1.17</td>
<td class="data-td data last"><i>Net</i></td>
<td class="data-td data last">0.55</td>
</tr>
</tbody>
</table>
</div>
<br />
<p class="chart-disclosure">Source: Morningstar as of 9/30/2023.</p>
<p class="chart-disclosure"><strong>The performance data quoted represents past performance. Past performance is not a guarantee of future results. Investment return and principal value of an investment will fluctuate so that an investor's shares, when redeemed, may be worth more or less than their original cost. Performance may be lower or higher than performance data quoted. Please call 800.826.2333 or visit vaneck.com for performance current to the most recent month ended.</strong></p>
<p class="chart-disclosure">Van Eck Associates Corporation (the &ldquo;Adviser&rdquo;) will pay all expenses of SMB, except for the fee payment under the investment management agreement, acquired fund fees and expenses, interest expense, offering costs, trading expenses, taxes and extraordinary expenses. Notwithstanding the foregoing, the Adviser has agreed to pay the offering costs until at least September 1, 2024. &ldquo;Other Expenses&rdquo; have been restated to reflect current fees.</p>
<p><a href="https://www.vaneck.com/us/en/investments/short-muni-etf-smb/literature/" title="SMB - VanEck Short Muni ETF - Literature"><strong>The VanEck Short Muni ETF (SMB)</strong></a> seeks to replicate as closely as possible, before fees and expenses, the price and yield performance of the ICE Short AMT-Free Broad National Municipal Index (MBNS), which is intended to track the overall performance of the U.S. dollar-denominated short-term tax-exempt bond market.</p>
<p>SMB offers:</p>
<ul class="content-list">
<li>Income exempt from federal taxes.</li>
<li>Focus on short-duration municipal bonds.</li>
<li>Investment-grade exposure with high credit quality.</li>
</ul>
<p>To receive more <a href="https://www.vaneck.com/us/en/insights/municipal-bonds/" title="Municipal Bonds Insights"><strong>Municipal Bonds</strong></a> insights, <a href="https://www.vaneck.com/us/en/subscribe/" title="Subscription Center"><strong>sign up in our subscription center</strong></a>.</p>
<style>
    .wrapped-div {
        max-width: 100%;
    }

    @media (max-width: 768px) {
        .wrapped-div {
            overflow-x: scroll;
        }
    }

    .wrapped-div-sector {
        max-width: 100%;
        overflow-x: scroll;
    }
</style>
]]></content:encoded>
</item><item rdf:about="https://www.vaneck.com/us/en/blogs/digital-assets/matthew-sigel-vaneck-crypto-monthly-recap-for-october-2023/">
  <title>VanEck Crypto Monthly Recap for October 2023></title>
  <link>https://www.vaneck.com/us/en/blogs/digital-assets/matthew-sigel-vaneck-crypto-monthly-recap-for-october-2023/</link>
  <description><![CDATA[In October, Bitcoin experienced its most significant surge since January, witnessing increased flows into its ETNs and ETFs, partly driven by investor anticipation of upcoming Bitcoin ETF launches in the U.S.]]></description>
  <dc:creator>Matthew  Sigel</dc:creator>
  <dc:date>11/06/2023 06:30:00</dc:date>
<content:encoded><![CDATA[

<p><strong>Please note that VanEck may have a position(s) in the digital asset(s) described below.</strong></p>
<p>Bitcoin surged by the most since January, +28% in October, as digital assets outpaced the Nasdaq (-2%) for the second month in a row. Large-caps (+21%) again beat small-caps (+4%), even as the ETH-to-BTC ratio fell below the levels set during the 3AC liquidation in June 2022. Demand for on-chain leverage remained somewhat muted, with DeFi TVL growth merely keeping pace with the incremental rise in ETH prices, hardly an impressive feat. Rather, the activity came from the regulated space: flows into Bitcoin ETNs and ETFs globally reached $412M in the month compared to $630M total YTD, while the Chicago Mercantile Exchange (CME&rsquo;s) share of Bitcoin futures activity reached record levels (23%). We attribute this surge to astute investors positioning themselves ahead of the impending wave of roughly a dozen or so spot Bitcoin ETFs gearing to launch on U.S. securities exchanges by mid-January 2024.</p>
<div class="wrapped-div">
<table style="width: 750px;">
<tbody>
<tr class="tbl-data">
<td class="tbl-header last text-center">&nbsp;</td>
<td class="tbl-header last text-center">October</td>
<td class="tbl-header last text-center">YTD</td>
<td class="tbl-header last text-center">365 days</td>
</tr>
<tr class="tbl-data">
<td class="data-td last">Bitcoin</td>
<td class="data-td data last">28%</td>
<td class="data-td data last">109%</td>
<td class="data-td data last">73%</td>
</tr>
<tr class="tbl-data">
<td class="data-td last">MarketVector<sup>TM</sup>&nbsp;Infrastructure Application Leaders Index</td>
<td class="data-td data last font-weight-normal">28%</td>
<td class="data-td data last font-weight-normal">56%</td>
<td class="data-td data last font-weight-normal">15%</td>
</tr>
<tr class="tbl-data">
<td class="data-td last ">MarketVector<sup>TM</sup>&nbsp;Smart Contract Leaders Index</td>
<td class="data-td data last">20%</td>
<td class="data-td data last">-9%</td>
</tr>
<tr class="tbl-data">
<td class="data-td last">MarketVector<sup>TM</sup>&nbsp;Media &amp; Entertainment Leaders Index</td>
<td class="data-td data last">16%</td>
<td class="data-td data last">-29%</td>
<td class="data-td data last">-58%</td>
</tr>
<tr class="tbl-data">
<td class="data-td last">Ethereum</td>
<td class="data-td data last">9%</td>
<td class="data-td data last">51%</td>
<td class="data-td data last">19%</td>
</tr>
<tr class="tbl-data">
<td class="data-td last ">MarketVector<sup>TM</sup>&nbsp;Decentralized Finance Leaders Index</td>
<td class="data-td data last ">6%</td>
<td class="data-td data last">25%</td>
<td class="data-td data last ">-11%</td>
</tr>
<tr class="tbl-data">
<td class="data-td last ">Coinbase</td>
<td class="data-td data last ">0%</td>
<td class="data-td data last ">119%</td>
<td class="data-td data last ">17%</td>
</tr>
<tr class="tbl-data">
<td class="data-td last ">MarketVector<sup>TM</sup>&nbsp;Centralized Exchanges Index</td>
<td class="data-td data last ">0%</td>
<td class="data-td data last ">-4%</td>
<td class="data-td data last ">-30%</td>
</tr>
<tr class="tbl-data">
<td class="data-td last ">S&amp;P 500 Index</td>
<td class="data-td data last ">-1%</td>
<td class="data-td data last ">10%</td>
</tr>
<tr class="tbl-data">
<td class="data-td last">Nasdaq 100 Index</td>
<td class="data-td data last">-3%</td>
<td class="data-td data last">23%</td>
<td class="data-td data last">18%</td>
</tr>
</tbody>
</table>
</div>
<br />
<p class="chart-disclosure">Source: Bloomberg, as of 10/31/2023. <strong>Past performance is no guarantee of future results. Not intended as a recommendation to buy or sell any securities named herein.</strong></p>
<ul class="content-list">
<li><a href="#layer-1-scps-october-updates"><strong>Layer-1 SCPs: October Updates</strong></a></li>
<li><a href="#solana-october-updates"><strong>Solana: October Updates</strong></a></li>
<li><a href="#stacks-october-updates"><strong>Stacks: October Updates</strong></a></li>
<li><a href="#sui-october-updates"><strong>Sui: October Updates</strong></a></li>
<li><a href="#atom-october-updates"><strong>ATOM: October Updates</strong></a></li>
<li><a href="#defi-october-updates"><strong>DeFi: &lsquo;Uptober&rsquo; Rally Updates</strong></a></li>
<li><a href="#aave-october-updates"><strong>Aave: October Updates</strong></a></li>
<li><a href="#uniswap-october-updates"><strong>Uniswap: October Updates</strong></a></li>
<li><a href="#frax-october-updates"><strong>FRAX: October Updates</strong></a></li>
<li><a href="#nft-volume-october-updates"><strong>NFT Volume: October Updates</strong></a></li>
<li><a href="#sofi-october-updates"><strong>SoFi: October Updates</strong></a></li>
<li><a href="#gaming-and-metaverse-october-updates"><strong>Gaming &amp; Metaverse: October Updates</strong></a></li>
<li><a href="#circle-partners-with-bitoGroup-taiwan-familymart"><strong>Circle Partners with BitoGroup, Taiwan FamilyMart</strong></a></li>
</ul>
<p>Amidst the sharp sell-off in U.S. government debt, Bitcoin&rsquo;s performance is gaining newfound attention from potential clients who shunned digital assets a year ago. Significantly, the TLT (iShares 20+ Year Treasuries, mkt cap $40B) ETF has fallen further, peak-to-now, than Bitcoin. Even the AGG (iShares Core U.S. Bond, mkt cap $90B) ETF now has a negative return over 5 years! Foreign central banks have been selling U.S. Treasuries and buying gold. Clients are increasingly asking if Bitcoin will be next.</p>
<p>US taxpayers are navigating a complex web of potentially indirectly funding via deficit spending, both sides of the Israeli war through direct aid to Israel, tax incentives for prestigious universities fostering radical leftist ideologies, and recent sanctions relief to Iran coupled with aid to Gaza. Amidst this hypocrisy, a compelling narrative touting &ldquo;Bitcoin as a safe haven&rdquo; is taking shape, championed by figures such as BlackRock&rsquo;s Larry Fink, PIMCO advisor Mohamed El-Erian, and legendary hedge fund investor Stanley Druckenmiller. As the implications of G7 over-indebtedness become increasingly apparent to the average citizen and to America&rsquo;s growing number of adversaries, we anticipate Bitcoin will thrive. Our observations in October revealed that crypto again demonstrated its strongest price performance during Asian trading hours.</p>
<p>As a personal aside, it is a sad irony that part of Bitcoin&rsquo;s initial allure to this Jewish portfolio manager was the idea that it might be easier to memorize a 12-word seed phrase rather than try to insert diamonds in my derriere in the case of an extermination attempt or another Jewish diaspora. And while it is true that after viewing Hamas&rsquo; barbaric butchery on October 7th, I wonder if my passphrase would probably be extricated by some novel form of torture, my hope remains: that by introducing a harder standard of energy-backed money to the world, Bitcoin might absorb some of the entropy that alienates so many amidst so many polarizing issues. Indeed, even as I debated one particularly irksome pro-Hamas opponent on X, I found myself hours later liking one of her tweets, which read: &ldquo;<i>Separating money and state. Forget all else, this is the mission of Bitcoin.</i>&rdquo; Whatever facts we disagree on, and there appears to be a greater number of them now, we both trust the next Bitcoin block in ten minutes. I find that agreement profoundly valuable right now.</p>
<p><img class="img-responsive w-100" src="https://www.vaneck.com/contentassets/dd602fc88dd94efeb60ce96c4a2fcb91/3793_scl_image_2023.11.jpg" alt="Tax Dollars" /></p>
<p>Regrettably, many G7 administrations&rsquo; approach to tech innovation diverges significantly from certain fundamental principles core to free speech. President Biden's executive order on AI, reportedly influenced by his viewing of the Tom Cruise film 'Mission Impossible &ndash; Dead Reckoning Part I,' which features a sentient and rogue AI causing submarine havoc, seeks to regulate the act of solving mathematical problems in public, necessitating government registration beyond a certain threshold. In a parallel effort, Senator Elizabeth Warren is striving to introduce provisions into the essential National Defense Authorization Act that would subject crypto miners, validators, and wallet providers to the Bank Secrecy Act and KYC requirements, a proposition that many entities deem an impractical endeavor. Recent regulations in the EU, Canada, and the UK have placed considerable strain on the open internet, compelling platforms like Meta and others to curtail free news content and implement subscription models. Some of these regulations impose considerable fines for 'misinformation,&rdquo; an infraction determined by diktat. Opposing such trends, many crypto investors look forward to a potential victory by pro-Bitcoin candidate Javier Milei in Argentina&rsquo;s Presidential run-off on November 19th as a potential catalyst to remind the world that self-sovereign currencies can play a role at the sovereign level, too.</p>
<h2 id="layer-1-scps-october-updates" class="jump-link-nav anchored-block" data-jumplink-title="Layer-1 SCPs">Layer 1 Smart Contract Platforms</h2>
<p>Smart contract platform tokens rallied 11.1% in October, and the total market cap (ex Bitcoin) grew from $268B to $298B. The top performers were Solana (+79%) and Stacks (+30%), while the laggards for the month were Sui (-6%) and ATOM (+9%).</p>
<h3>October SCP DAU Gains</h3>
<p><img class="img-responsive w-100" src="https://www.vaneck.com/contentassets/dd602fc88dd94efeb60ce96c4a2fcb91/3793_scl-october-commentary_chart-1_2023.11_v1_blog.svg" alt="October SCP DAU Gains" /></p>
<p class="chart-disclosure">Source: Artemis XYZ as of 10/31/2023 . <strong>Past performance is no guarantee of future results. Not intended as a recommendation to buy or sell any securities named herein.</strong></p>
<h3>Market Capitalization of SCPs</h3>
<p><img class="img-responsive w-100" src="https://www.vaneck.com/contentassets/dd602fc88dd94efeb60ce96c4a2fcb91/3793_scl-october-commentary_chart-2_2023.11_v1_blog.svg" alt="Market Capitalization of SCPs" /></p>
<p class="chart-disclosure">Source: Artemis XYZ as of 10/31/2023. <strong>Past performance is no guarantee of future results. Not intended as a recommendation to buy or sell any securities named herein.</strong></p>
<p>The Ethereum ecosystem, including its L2 smart contract platforms, was again front and center in the October news cycle. On October 11, Ethereum saw its validator queue empty, indicating that there was no waiting line for new entities to stake ETH and become a validator for Ethereum. Although more than 14k validators joined the network in October, demand was insufficient to create a queue, and this is the first time since the Merge in September 2022 that this has occurred. Consequently, the Ethereum annualized staking rate reached its lowest level since the Merge on October 15th at 3.5% before rallying to end the month at 4.12% as prices rebounded.</p>
<p>Meanwhile, the focus on L2 technology is heating up as zero-knowledge (ZK) L2 Zk Scroll launched on October 17th and has amassed $10.5M in TVL at the time of writing. Scroll joins existing zero knowledge L2 players Polygon zkEVM, Starkware, and ZkSync Era. To many in the crypto space, zk Layer-2s are a massive improvement over existing optimistic L2s like Arbitrum, Optimism, and Base. Layer-2s that use zk technology post proofs of the transactions that occur on their L2 directly to Ethereum. By contrast, optimistic L2s post a batch of transactions to an L2 without proof of authenticity. As a result, another party can challenge the authenticity of optimistic L2 batches and force the L2 to reverse them if they are incorrect. The advantage of zk L2s is that they enable faster bridging back to Ethereum which can be accomplished in as little as 15 minutes. By contrast, optimistic L2s force a withdrawer to wait 7 days, the challenge period where someone can prove fraud, before they can move their assets off an L2. The tradeoff is that zk Layer-2s cost slightly more to users to transact upon due to the cost of posting large proofs to Ethereum. Long term, zk L2s believe transactions costs will be cheaper as the per-transaction cost will scale down with an increase in the volume of transactions.</p>
<h3>Daily Active Users zk Layer-2s</h3>
<p><img class="img-responsive w-100" src="https://www.vaneck.com/contentassets/dd602fc88dd94efeb60ce96c4a2fcb91/3793_scl-october-commentary_chart-3_2023.11_v1_blog.svg" alt="Daily Active Users zk Layer-2s" /></p>
<p class="chart-disclosure">Source: Artemis XYZ as of 10/31/2023. <strong>Past performance is no guarantee of future results. Not intended as a recommendation to buy or sell any securities named herein.</strong></p>
<p>Another interesting development for zk Layer-2s was the news that popular blockchains Canto and Astar will launch new networks through Polygon&rsquo;s network of zk chains. Polygon also saw the stand-up of its new token to replace the MATIC token called POL. The token is part of Polygon&rsquo;s shift to a zk-centric network, and the POL token, unlike the garishly named MATIC, will have inflation, which will be 2% per year. According to the Polygon team, half of the inflation will be used to invest in projects building on Polygon, while the other half will be allocated towards securing the network through validator payments. At its core. Polygon&rsquo;s new zk approach is a fascinating new direction that could prove sagacious depending upon adoption of its new approach. Like Ethereum, Polygon is moving away from simply being a transaction execution environment and becoming a settlement layer. Additionally, though Starkware does not have a live token, the Israeli team announced in October that they would delay token unlocks for the future token from 11/29/2023 until 4/15/2024. Clearly, Starkware will be releasing its token in the near future.</p>
<p>Not to be left behind, L2 Arbitrum came out with several announcements, including the anticipated launch of their Orbit project. This would allow Arbitrum to scale to more users by enabling developers to create L3 chains that settle their activity to Arbitrum. This would make Arbitrum into a settlement and execution layer similar to Ethereum. Arbitrum also announced its L3s would use Celestia as a data availability layer. Finally, Arbitrum concluded voting on its Short-Term Incentive Program (STIP) that allocates $50M worth of ARB tokens to various projects on Arbitrum&rsquo;s chain. Big winners included Camelot, GMX, Dopex, Jones, and Galxe.</p>
<p>Other Interesting News Items:</p>
<ul class="content-list">
<li>Uniswap charging 0.15% on its frontend for trades.</li>
<li>dYdX launching an app chain in the Cosmos.</li>
<li>Shrapnel, a game on Arbitrum, raising $20M.</li>
<li>BNB launches a data storage competitor to Filecoin called Greenfield.</li>
<li>Polkadot V2 which increases the number of parachains (Polkadot L2s), improved tokenomics, and a lower cost of security for projects building on Polkadot.</li>
<li>Circle partnering with Family Mart in Taiwan to allow Family Mart customers to trade in their frequent shopper points for USDC on the BitoPro crypto exchange.</li>
<li>Frax stablecoin issuer expanding to offer access to T-Bills on chain through its v3 upgrade.</li>
</ul>
<h2 id="solana-october-updates" class="anchored-block">Solana (+79%)</h2>
<h3>Solana 30-Day MA of DEX Volumes vs TVL</h3>
<p><img class="img-responsive w-100" src="https://www.vaneck.com/contentassets/dd602fc88dd94efeb60ce96c4a2fcb91/3793_scl-october-commentary_chart-4_2023.11_v1_blog.svg" alt="Solana 30 Day MA of DEX Volumes vs TVL" /></p>
<p class="chart-disclosure">Source: Artemis XYZ as of 10/31/2023.<strong>Past performance is not indicative of future results. Not intended as a recommendation to buy or sell any of the names mentioned herein.</strong></p>
<p>Solana&rsquo;s SOL (79.3+%) token washed away almost a year of bearish vibes with a much-welcome rally in October. In the aftermath of FTX immolation in November 2022, SOL&rsquo;s price nosedived from the mid-$30 range in early November 2022 to trade as low as $8 on December 29, 2022. After FTX collapsed, the chief backer of Solana was consigned to the glue factory, and with Solana facing a flood of token unlocks, it was assumed that Solana would be joining FTX in the afterlife. Solana was seemingly left with an ecosystem in shambles as many projects lost funding while others saw their on-chain activity dwindle below economic sustainability. As a result of the death of these ventures, individuals, and entities who used Solana pulled their stablecoins that were on Solana, and the total market cap of stablecoins fell from $1.85B on Jan 1, 2023, to a low of $1.44B on October 17, 2023.</p>
<p>Despite the flurry of bad news and languishing SOL price, Solana continued to innovate, as did projects in the Solana ecosystem. Interesting projects we like, including consumer-relevant applications such as Hivemapper, Render, and Helium, continue to attract users. Additionally, the Solana Foundation launched a programming interface for developers to create mobile phone applications for Solana called the Solana Mobile Stack, and Solana even launched its own phone. Coming into October, many investors were lukewarm on Solana due to the overhang of the FTX estate liquidating large chunks of tokens, investor token unlocks, and the popularity of Ethereum L2s that had TVLs surpass that of Solana&rsquo;s.</p>
<p>In mid-October, however, it was noticed that the FTX estate had staked 5.5M (out of the 58.9M they hold or will receive) Solana tokens worth $122M that many feared would be sold to pay be creditors. The positive news for Solana continued from there with the core Solana project called Squads, a multi-sig, inking a $5.7M VC raise, ensuring it ample runway to continue to provide its pivotal services on Solana. Activity for Solana also significantly picked up as usership increased, surging Solana fees by more than 18%. This uptick in activity helped drive Solana DeFi TVL to advance by 6%. At the same time, the narrative for yield generation from on-chain activity, including MEV using Solana liquid staking tokens (LSTs), also accelerated. Popular liquid staking and MEV facilitator Jito was the chief beneficiary of SOL LSTs, attracting a 70% increase in SOL. Another positive development for Solana in October included the introduction of an encrypted token standard that allows anyone to obscure balances of these tokens from other users. Given that Solana&rsquo;s ecosystem is still recovering, it was also encouraging to see Solana Labs introduce a new incubator program for nascent Solana projects.</p>
<p>For more on the potential of Solana, please see <a href="https://www.vaneck.com/us/en/blogs/digital-assets/matthew-sigel-vanecks-base-bear-bull-case-solana-valuation-by-2030/" title="VanEck's Base, Bear, Bull Case: Solana Valuation by 2030"><strong>our recent deep-dive</strong></a>, including a financial model that anticipates up to $8B in revenues to SOL token-holders by 2030.</p>
<h3>Total SOL Deposited at Jito</h3>
<p><img class="img-responsive w-100" src="https://www.vaneck.com/contentassets/dd602fc88dd94efeb60ce96c4a2fcb91/3793_scl-october-commentary_chart-5_2023.11_v1_blog.svg" alt="Total SOL Deposited at Jito" /></p>
<p class="chart-disclosure">Source: Dune as of 10/31/2023. <strong>Past performance is not indicative of future results. Not intended as a recommendation to buy or sell any of the names mentioned herein.</strong></p>
<h2 id="stacks-october-updates" class="anchored-block">Stacks (+34%)</h2>
<p>Stacks, a smart contract platform that rests upon the Bitcoin network and utilizes BTC, was the other largest winner in October, gaining (+34%). Part of this is undoubtedly because it is a leveraged play to the price of BTC, which had a blockbuster month (+24%), outperforming Ethereum. Curiously, activity on Stacks did not change much from September, measured by DEX volumes, daily transactions, or daily active addresses. However, while daily fees did increase by 60%, the average daily fee for October was only $200. TVL did grow meaningfully on Stacks as it rose from $13.8M at the beginning of the month to $25M as of October 27. Positive news included Digital asset custody firm Copper stating that it would integrate support for Stacks for Copper customers.</p>
<p>Part of STX&rsquo;s price fortune stems from the misfortunes of Stack&rsquo;s competitors. In mid-October, a security researcher for the Lightning Network announced he had uncovered an attack vector for the Lightning Network that could cause the network to be halted. As a result, the researcher named Antoine Riard declared he would stop his work on the Lightning Network. However, others contend that the Lighting Network is safe, and as of October 27, BTC locked on the Lightning Network was at 5,920, which was up from 4,420 at the start of October.</p>
<h2 id="sui-october-updates" class="anchored-block">Sui (-6%)</h2>
<h3>Sui DAUs vs TVL</h3>
<p><img class="img-responsive w-100" src="https://www.vaneck.com/contentassets/dd602fc88dd94efeb60ce96c4a2fcb91/3793_scl-october-commentary_chart-6_2023.11_v1_blog.svg" alt="Sui DAUs vs TVL" /></p>
<p class="chart-disclosure">Source: Artemis XYZ as of 10/31/2023. <strong>Past performance is not indicative of future results. Not intended as a recommendation to buy or sell any of the names mentioned herein.</strong></p>
<p>Sui (-6%), despite initial early potential, has continued to languish as it fails to attract developers and users to its ecosystem. Compared to the month of September, the daily active users on Sui have fallen by (-55%). Though DEX volumes have increased by 240% and TVL has jumped by 87%, the increase in activity is overshadowed by high rewards inflation and investor token unlocks. The increase in floating tokens was 7.3% just for the month of October, as more than 67M tokens were added to the supply. This brings the total number of tokens to 906M. However, the token dilution becomes worse as time progresses due to an aggressive unlock schedule for early investors and team members. By this time next year, there will be 2.7B Sui tokens in circulation. Of that, around 1.05B will be in the hands of early investors of Sui. Facing a 3x supply overhang over the next year is a substantial burden that anyone token holder must reconcile no matter how vibrant Sui&rsquo;s ecosystem becomes. In October, the token dilution issue came to a head as South Korean regulators accused the Sui Foundation of manipulating the supply of tokens. Though Sui denies the rumors of doing anything illegal, the South Korean Financial Supervisory Service announced that it would be launching an investigation into the distribution of the Sui token.</p>
<p>Amid the negative news, Sui awarded over $1M in grants to programs building in its ecosystem. Additionally, they announced a new $51.3M ecosystem fund to support DeFi projects building on Sui. This development is particularly important given the lack of adoption by developers. Sui&rsquo;s is programmed using Move, which is the same language as Aptos and very similar, because Move is based on Rust, to the language that Solana employs. The result is that Sui is directly competing with those other two ecosystems for developers. Solana, as an incumbent with a strong community identity, continues to maintain its developer share, but Sui could potentially catch up if its ecosystem stirs development interest.</p>
<h3>Sui Developer Market Share - SCP Monolithic Chains</h3>
<p><img class="img-responsive w-100" src="https://www.vaneck.com/contentassets/dd602fc88dd94efeb60ce96c4a2fcb91/3793_scl-october-commentary_chart-7_2023.11_v1_blog.svg" alt="Sui Developer Market Share -  SCP Monolithic Chains" /></p>
<p class="chart-disclosure">Source: Artemis XYZ as of 10/31/2023. <strong>Past performance is not indicative of future results. Not intended as a recommendation to buy or sell any of the names mentioned herein.</strong></p>
<h2 id="atom-october-updates" class="anchored-block">ATOM (+9%)</h2>
<p>Despite a mid-month rally alongside the rest of the SCP market, ATOM ended the month up only (+9%) amid continued concerns with its business model and how it will capture revenue from its ecosystem&rsquo;s success. The key issue going forward is going to be the willingness of projects to come into the ATOM Economic Zone (AEZ) to lease security from ATOM&rsquo;s Cosmos Hub blockchain. Though some important projects will be using ATOM for security, including Neutron, Stride, and Noble (eventually), many of the most vibrant projects in the Cosmos contend they will not use the Cosmos Hub. Though lack of Hub business success is not something new in October, it is a serious condition that is limiting Cosmos and could prove terminal to ATOM if things do not improve. Though the Cosmos ecosystem attracts the third most developers in crypto behind Polkadot and Ethereum, those figures are irrelevant to the Cosmos ATOM token until the Cosmos Hub is able to get other projects aligned with its needs. Another longstanding issue weighing on the ATOM&rsquo;s price is concern over inflation. The ATOM token inflation rate is very high at 16.5% per year, and this is one of the highest among SCPs. Until these issues are resolved, ATOM will have great difficulty matching the performance of the Cosmos ecosystem or competitor blockchains.</p>
<p>Despite the negative news for ATOM, there are some positive trends. Surprisingly, Cosmos had one of the best gains of users in October compared to September, with (+90%) in daily active users. Additionally, the Blockworks team and others are working on proposals to change ATOM&rsquo;s tokenomics. These plans include focusing the Cosmos Hub&rsquo;s business approach to other blockchains and reducing inflation of the Cosmos Hub. At the same time, two important projects launched in the Cosmos in October, and they could attract more interest in the Cosmos Hub. Celestia, the first of the new Data Availability blockchains, and dYdX, the dominant derivative DEX, both launched their mainets in October. Finally, earlier in the month, the Cosmos chain Noble launched native USDC in the Cosmos which will allow anyone to mint native USDC through the Noble chain and transport across the 64 active Cosmos chains.</p>
<h2 id="defi-october-updates" class="jump-link-nav anchored-block" data-jumplink-title="DeFi">DeFi Volume Rising with the &lsquo;Uptober&rsquo; Rally</h2>
<h3>DEX Volume by Chain</h3>
<p><img class="img-responsive w-100" src="https://www.vaneck.com/contentassets/dd602fc88dd94efeb60ce96c4a2fcb91/3793_scl-october-commentary_chart-8_2023.11_v1_blog.svg" alt="DFX Volume by Chain" /></p>
<p class="chart-disclosure">Source: DeFi Llama as of 10/31/2023. <strong>Past performance is not indicative of future results. Not intended as a recommendation to buy or sell any of the names mentioned herein.</strong></p>
<p>The MarketVector Decentralized Finance Leaders index (MVDFLE) recorded a 5.8% increase during the month, underperforming the rally in Bitcoin and Ethereum. Among the index components, UNI, MKR, and CRV underperformed significantly, returning -9%, -12%, and -9%, respectively. In contrast, AAVE, RUNE, and LDO rallied 19%, 47%, and 5%.</p>
<p>The underperformance of DeFi as a whole is not surprising, considering the rally in digital assets was led by Bitcoin, and DeFi tokens typically trade better when ETH leads the market. Notably, the top-performing tokens in the index have established substantial dominance in their respective areas of the crypto market, with Aave being the largest lending market, Lido a clear winner in ETH liquid staking, and Thorchain (RUNE) as the dominant decentralized exchange for native BTC and ETH swaps. Decentralized exchange (DEX) volume and the total value locked (TVL) in DeFi experienced significant reversals this month, with DeFi trading volume jumping 26% to $55.7 billion and the TVL across DeFi rising 8% to $41.7 billion. Arbitrum, Thorchain, and Solana experienced the largest surges in DEX volume, rising 53%, 146%, and 115%, respectively. The relative outperformance in DEX volumes across these chains suggests that they are becoming the preferred chains for trading digital assets outside of Ethereum.</p>
<p>Thorchain (RUNE) performed exceptionally well this month due to its dominant position as the most decentralized protocol for swapping native BTC and ETH. The decentralized exchange saw its volume more than double from September to $2.46 billion as investors flocked to acquire Bitcoin, anticipating the tailwinds from a potential U.S. spot Bitcoin ETF and the upcoming Bitcoin halving. While Thorchain&rsquo;s decentralization comes with a few regulatory concerns, such as the FTX exploiter using the protocol to exchange stolen funds, investors seemed ultimately unconcerned as they rushed to buy RUNE this month.</p>
<h3>AAVE Monthly Revenue</h3>
<p><img class="img-responsive w-100" src="https://www.vaneck.com/contentassets/dd602fc88dd94efeb60ce96c4a2fcb91/3793_scl_chart-09_2023.10_blog.svg" alt="AAVE Monthly Revenue" /></p>
<p class="chart-disclosure">Source: Token Terminal as of 10/31/2023. <strong>Past performance is not indicative of future results. Not intended as a recommendation to buy or sell any of the names mentioned herein.</strong></p>
<h2 id="aave-october-updates" class="anchored-block">Aave Surges on Increased Demand for Leverage and Rising Revenue</h2>
<p>Aave outperformance this month was driven by a short squeeze on centralized exchanges that led to the liquidation of over $2 million in short positions within a span of three days, alongside positive fundamental growth. Moreover, investors may be strategically positioning themselves in AAVE due to several fundamental factors favoring the protocol. With the recent upsurge in crypto market volatility, Aave is poised to bolster its daily revenue through the liquidation of overleveraged users and the heightened demand for stablecoins, often signaling the onset of a cryptocurrency bull market.</p>
<p>As the predominant lending protocol in DeFi, the borrow rate for USDC on Aave serves as a valuable indicator of the market's appetite for leverage. Users typically deposit their favorite digital assets as collateral and borrow USDC to increase their exposure. During the bear market, the borrow rate for USDC on Aave remained at approximately 4%. However, it has surged to 12% on the V3 market and 19% on V2, signifying that on-chain investors are leveraging their exposure to volatile digital assets in anticipation of a bull market. Aave's daily revenue has surged in tandem with higher borrow rates. According to Token Terminal, Aave's monthly revenue has more than doubled since the start of the year, rising to $1.8 million this month.</p>
<h2 id="uniswap-october-updates" class="anchored-block">Uniswap Labs Implements Frontend Fee</h2>
<h3>Uniswap Labs Interface Fee</h3>
<p><img class="img-responsive w-100" src="https://www.vaneck.com/contentassets/dd602fc88dd94efeb60ce96c4a2fcb91/3793_scl_chart-10_2023.10_blog.svg" alt="Uniswap Labs Interface Fee" /></p>
<p class="chart-disclosure">Source: The Block as of 10/30/2023. <strong>Past performance is not indicative of future results. Not intended as a recommendation to buy or sell any of the names mentioned herein.</strong></p>
<p>In the middle of the month, Uniswap Labs made the decision to impose a 0.15% swap fee on transactions conducted via their Uniswap front end and within the Uniswap Wallet. This fee applies to swaps involving ETH, USDC, WETH, USDT, DAI, WBTC, agEUR, GUSD, LUSD, EUROC, and XSGD as both the input and output tokens, excluding swaps between stablecoins. Since its introduction, the frontend has collected $631k in fees, indicating a potential annual revenue of over $15 million for Uniswap Labs. This move has generated discontent within the community, as some perceive it as a signal that Uniswap Labs prioritizes enhancing the value of their equity over promoting value accrual to the Uniswap token. The reason why Uniswap Labs could want to do this despite owning a large amount of UNI is that driving value to the token could be accompanied with regulatory scrutiny if it leads to the UNI token being deemed an unregistered security. The community's dissatisfaction is rooted in a prolonged debate spanning several years regarding the activation of the "fee switch" to generate revenue from liquidity provider earnings on the Uniswap protocol. Back in June, the Uniswap DAO nearly voted to activate the fee switch, but the vote ultimately failed due to regulatory apprehensions from venture capital teams holding significant UNI tokens and Uniswap Labs equity. The contentious nature of this debate contributed to the underperformance of the UNI token during crypto&rsquo;s rally in October.</p>
<h3>$FRAX Market Capitalization</h3>
<p><img class="img-responsive w-100" src="https://www.vaneck.com/contentassets/dd602fc88dd94efeb60ce96c4a2fcb91/3793_scl_chart-11_2023.10_blog.svg" alt="$FRAX Market Capitalization" /></p>
<p class="chart-disclosure">Source: Coingecko as of 10/31/2023. <strong>Past performance is not indicative of future results. Not intended as a recommendation to buy or sell any of the names mentioned herein.</strong></p>
<h2 id="frax-october-updates" class="anchored-block">sFRAX: Bringing Real World Asset Yield to the Frax Protocol</h2>
<p>Frax Finance is following in the footsteps of MakerDAO by introducing a staking product for their FRAX stablecoin, known as sFRAX. Utilizing the non-profit entity established by the DAO, FinResPBC, the Frax DAO can now custody Real World Assets (RWAs) off-chain and offer users a yield on sFRAX just below the Interest Rate on Reserve Balances (IORB). Currently, sFRAX has seen a decent amount of adoption, with the amount of FRAX deposited surpassing 44 million. While the strong early growth is a good sign for sFRAX, it is still only a fraction of the amount that Maker has seen deposited into sDAI, which boosted DAI&rsquo;s market capitalization by 20% and stands today at around $1.5 billion in deposits.</p>
<p>While sFRAX shares similarities with sDAI, there are key distinctions. Notably, MakerDAO's governance dictates the yield earned by sDAI holders via the Enhanced DAI Savings Rate (DSR), which decreases the effective yield for depositors as the DSR utilization increases. Currently, Maker's DSR has a utilization rate of around 30%, meaning nearly one-third of all DAI is deposited in the DSR and receiving yield payouts from MakerDAO. However, once the utilization rate reaches 35%, the yield for depositors will decline to 4.32% and remain at that level even if utilization decreases back to below 35%. In contrast, the yield for sFRAX depositors is solely based on the IORB rate, adjusted slightly lower (0.05%-0.1%) to account for fees related to capital movement between RWAs and on-chain assets. Notably, this ensures that the yield for sFRAX depositors remains unaffected by the actions of other investors but only by fluctuations in short-term interest rates. Consequently, it's likely that sFRAX will become a more capital-efficient means of capturing yield over the long term compared to sDAI. If Maker's rates decrease and the benefits of switching from sDAI to sFRAX become more apparent, we may witness a transition of investors towards holding sFRAX.</p>
<h2 id="nft-volume-october-updates" class="jump-link-nav anchored-block" data-jumplink-title="NFT">Blur Captures Market Share as NFT Volume Stagnates</h2>
<h3>Monthly NFT Volume Stagnates While Crypto Rallies</h3>
<p><img class="img-responsive w-100" src="https://www.vaneck.com/contentassets/dd602fc88dd94efeb60ce96c4a2fcb91/3793_scl_chart-12_2023.10_blog.svg" alt="Monthly NFT Volume Stagnates While Crypto Rallies" /></p>
<p class="chart-disclosure">Source: Cryptoslam as of 10/31/2023. <strong>Past performance is not indicative of future results. Not intended as a recommendation to buy or sell any of the names mentioned herein.</strong></p>
<p>NFT volume saw a small but insignificant increase this month, rising only $7 million to $306 million. Despite the poor volume of the overall NFT market, Blur made strides in market share, with volume this month growing to $132 million, excluding wash sales and its share of the Ethereum NFT exchange marketplace rising to over 60% from 55%. The rise in volume on Blur was influenced by the upcoming end of season 2 farming rewards on November 20th, which will see over 300 million Blur airdropped to users of the protocol. The airdrop gained significant value this month as the price of BLUR rallied 31% on the announcement of a governance proposal to enable a fee on the exchange&rsquo;s volume. After some discussion by the community, it appears that the DAO will likely vote on whether or not to enable a 0.5% fee on volume. Additionally, the fee would likely be accompanied by a locking mechanism, which would help to sink many of the tokens that will be distributed in the season 2 airdrop and dissuade farmers from dumping them on the market. Those who have voiced their opinions against the proposal have indicated that it could lead to Blur losing its dominant market share, while community members in support have highlighted that there is no utility or value accrual to BLUR and progress on this front needs to be made to support the token valuation. After BLUR&rsquo;s strong rally this month, it would appear that the market agrees with the latter. For context, if this fee had been applied to both Blur&rsquo;s exchange and lending volume over the last month, it would have generated just under $2 million in cash flow for the DAO, which could then be used for token buybacks and distributed to owners who lock their tokens.</p>
<h2 id="sofi-october-updates" class="jump-link-nav anchored-block" data-jumplink-title="SoFi">SoFi: Friend.Tech Maintains Market Dominance as Whale Dumps Keys and Top Competitor Suffers Exploit</h2>
<h3>Volume Share Among SoFi Platforms</h3>
<p><img class="img-responsive w-100" src="https://www.vaneck.com/contentassets/dd602fc88dd94efeb60ce96c4a2fcb91/3793_scl_chart-13_2023.10_blog.svg" alt="Volume Share Among SoFi Platforms" /></p>
<p class="chart-disclosure">Source: DUNE: @Cryptokoryo as of 10/29/23. <strong>Past performance is not indicative of future results. Not intended as a recommendation to buy or sell any of the names mentioned herein.</strong></p>
<p>Friend.Tech continued to capture the majority of Social Finance (SoFi) volume this month while competitors suffered from exploits and lack of usership. At the start of the month, StarsArena was exploited for ~$3 million AVAX due to a re-entrancy bug. However, the team was able to recoup the funds from the exploiter (minus a 10% whitehat bounty) and relaunch the platform by mid-month. Upon relaunch, StarsArena was able to gain back some market share from Friend.Tech, but it has consistently receded since and never exceeded its all-time high market share of volume that it achieved on its initial launch.</p>
<p>In previous recaps, we have mentioned how the illiquidity of Friend.Tech keys will lead to substantial price movements as users exit the protocol. This was made evident this month when one of the top accounts on the platform, Vombatus.eth, dumped 176 of their own keys for 851 ETH, or about $1.5 million. This sent the price of Vombatus.eth keys from around 8.3 ETH each to 1.7 ETH, an 80% drawdown. We believe that there is a high possibility that the same heightened volatility that initially attracted users to Friend.Tech could also catalyze their exit as users look to capitalize on the massive appreciation many of the Friend.Tech keys have experienced. As it stands today, Friend.Tech has been able to onboard 832k unique buyers who have traded over $23 million of keys on the protocol. Friend.Tech&rsquo;s continued dominance in the SoFi market suggests that its ability to capture a large number of users early and promises of a future airdrop have provided a strong enough moat to retain users at least until the airdrop has commenced.</p>
<h2 id="gaming-and-metaverse-october-updates" class="anchored-block">Gaming and Metaverse Tokens Outperform Despite Low Adoption</h2>
<p>The MarketVector Media and Entertainment Leaders index (MVMELE) finished the month up 14.8%, slightly underperforming Bitcoin but outperforming ETH by a considerable margin as investors speculated on the low market capitalization tokens, which can provide higher upside in a bull market rally. Of the index components, GALA, AXS, and MANA received the most attention, returning 32%, 17%, and 16%, respectively. APE and SAND underperformed the rest of the index, returning only 5.6% and 9% throughout the month. While GALA and MANA had no clear catalysts this month to explain their performance, the AXS rally was likely supported by Game Jam 2023, an event where independent game developers were invited to create and submit games to be included in the Axie Infinity universe. Axie Infinity currently attracts about 300k monthly active players, which is still only a fraction of the ~3 million monthly active users it boasted in the bull market before being hacked. While the outperformance of metaverse and gaming tokens was impressive, keep in mind that GALA, AXS, and MANA are still down from their peaks of 98%, 96%, and 93%, respectively.</p>
<h3>Web3 Gaming Investment</h3>
<p><img class="img-responsive w-100" src="https://www.vaneck.com/contentassets/dd602fc88dd94efeb60ce96c4a2fcb91/3793_scl_chart-14_2023.10_blog.svg" alt="Web3 Gaming Investment" /></p>
<p class="chart-disclosure">Source: DappRadar as of 10/31/2023. <strong>Past performance is not indicative of future results. Not intended as a recommendation to buy or sell any of the names mentioned herein.</strong></p>
<p>The outperformance of metaverse and gaming tokens indicates that investors still believe in the potential of a blockchain-based metaverse in the future, which is supported by a report from DappRadar indicating that $600m in investment flowed into Web3 gaming in Q3. However, the Web3 gaming space has continued to see lackluster adoption throughout the bear market as multiple AAA games were promised in 2023 but have not yet been released, such as Illuvium and Shrapnel. Additionally, the top metaverse platforms continue to see low monthly usership, with The Sandbox and Decentraland only attracting 12.5k and 3.2k unique users in October. With this in mind, it would appear that the outperformance was likely due to traders speculating ahead of a potential bull market run rather than any real fundamental change in value. Gaming and metaverse tokens have historically been highly speculative, and since the move was not supported by any large fundamental improvements in the tokenomics of these projects, we think it is likely they will underperform during consolidation periods with brief spikes in outperformance until greater adoption is seen and clear winners emerge.</p>
<h2 id="circle-partners-with-bitoGroup-taiwan-familymart" class="anchored-block">Circle Partners with FamilyMart and BitoGroup to launch &ldquo;Points-to-Crypto&rdquo; in Taiwan</h2>
<h3>USDC Market Capitalization</h3>
<p><img class="img-responsive w-100" src="https://www.vaneck.com/contentassets/dd602fc88dd94efeb60ce96c4a2fcb91/3793_scl_chart-15_2023.10_blog.svg" alt="USDC Market Capitalization" /></p>
<p class="chart-disclosure">Source: Coingecko as of 10/31/2023. <strong>Past performance is not indicative of future results. Not intended as a recommendation to buy or sell any of the names mentioned herein.</strong></p>
<p>Near the end of the month, Circle (the company that issues USDC) announced a partnership with the second-largest convenience store chain in Taiwan, FamilyMart, and the leading cryptocurrency exchange in Taiwan BitoGroup, to provide FamilyMart customers with the ability to exchange loyalty points for USDC. According to the announcement, Taiwan has one of the highest densities of convenience stores, making loyalty points at these shops extremely significant for the daily consumer. By providing the ability to redeem loyalty points for USDC, consumers will be able to avoid the depreciation of loyalty points and use their rewards to purchase a much wider range of goods as they are no longer limited to accessing the value of their points purely through items sold by FamilyMart. Additionally, the partnership should help bolster the circulating supply of USDC, which has been hammered during the bear market and is down 55% from the all-time high. Circle previously announced a partnership with Grab App, a super-app in Southeast Asia with over 130 million users. The latest partnership with FamilyMart highlights Circle&rsquo;s continued effort to get their stablecoin integrated with more retail-facing applications, as well as the growing adoption of Web3 technology in Asia.</p>
<p><strong>Links to third party websites are provided as a convenience and the inclusion of such links does not imply any endorsement, approval, investigation, verification or monitoring by us of any content or information contained within or accessible from the linked sites. By clicking on the link to a non-VanEck webpage, you acknowledge that you are entering a third-party website subject to its own terms and conditions. VanEck disclaims responsibility for content, legality of access or suitability of the third-party websites.</strong></p>
<p>To receive more <strong><a href="https://www.vaneck.com/us/en/insights/digital-assets/" title="Digital Assets Insights">Digital Assets</a></strong> insights, <strong><a href="https://www.vaneck.com/us/en/subscribe/" title="Subscription Center">sign up in our subscription center</a></strong>.</p>
<style type="text/css">
    .wrapped-div {
        max-width: 100%;
    }

    @media (max-width: 1240px) {
        .wrapped-div {
            overflow-x: scroll;
        }
    }

    .wrapped-div-sector {
        max-width: 100%;
        overflow-x: scroll;
    }
</style>
]]></content:encoded>
</item><item rdf:about="https://www.vaneck.com/us/en/blogs/natural-resources/nlr-etf-question-answer/">
  <title>NLR ETF: Question &amp; Answer></title>
  <link>https://www.vaneck.com/us/en/blogs/natural-resources/nlr-etf-question-answer/</link>
  <description><![CDATA[This blog answers commonly asked questions about the NLR ETF and explores how the global shift towards clean energy is impacting the uranium and nuclear energy industries.]]></description>
  <dc:creator>Coulter Regal, CFA</dc:creator>
  <dc:date>11/02/2023 06:30:00</dc:date>
<content:encoded><![CDATA[

<p>Accelerating global power demands and an intensifying drive for clean energy solutions are fueling a resurgence in nuclear energy, and uranium and nuclear energy stocks are gaining traction with investors. This blog aims to address common inquiries regarding the <strong><a href="/link/49acb0d4174146e9a0269c9cb81c02bb.aspx" title="NLR VanEck Uranium and Nuclear ETF - Overview">VanEck Uranium and Nuclear ETF (NLR)</a></strong>, which offers an efficient means for investors to access nuclear stocks. Through this nuclear energy ETF, investors can gain exposure to the uranium and nuclear energy market, tapping into the rising demand for nuclear power within a diversified strategy.</p>
<ul class="content-list">
<li class="mt-2"><strong><a href="#point-one">How is increasing electricity demand and the emergence of artificial intelligence (AI) revitalizing the nuclear energy industry?</a></strong></li>
<li class="mt-2"><strong><a href="#point-two">What is the VanEck Uranium and Nuclear Energy ETF (NLR)?</a></strong></li>
<li class="mt-2"><strong><a href="#point-three">How is the portfolio composition determined for NLR?</a></strong></li>
<li class="mt-2"><strong><a href="#point-four">How has the global shift towards clean energy impacted the nuclear energy industry?</a></strong></li>
<li class="mt-2"><strong><a href="#point-five">How much exposure does NLR have to uranium miners?</a></strong></li>
<li class="mt-2"><strong><a href="#point-six">What are the risks associated with investing in uranium and nuclear energy?</a></strong></li>
<li class="mt-2"><strong><a href="#point-seven">Where does NLR fit into a portfolio?</a></strong></li>
<li class="mt-2"><strong><a href="#point-eight">Does NLR generate Schedule K-1 tax statements? </a></strong></li>
<li class="mt-2"><strong><a href="#point-nine">How can investors buy VanEck ETFs?</a></strong></li>
</ul>
<div class="row mb-3">
<div class="col-md-4 col-xs-12"><a href="https://www.youtube.com/embed/OBlurZwfvJE" data-video="https://youtu.be/OBlurZwfvJE" class="popup-youtube" title="Watch Video"><img loading="lazy" class="img-responsive" style="margin-right: 15px; margin-top: 0px;" src="https://www.vaneck.com/contentassets/cc160292f3b24471ac76ea81351e5c0b/4958_nlr-video-30sec-ad_thumbnail_2024-10_v1.jpg" alt="Watch Video" align="left" /></a></div>
<div class="col-md-8 col-xs-12"><br /><strong><a href="https://www.youtube.com/embed/OBlurZwfvJE" data-video=" https://youtu.be/OBlurZwfvJE" class="popup-youtube" title="Watch Video">Watch Video</a><br /></strong><a href="https://www.youtube.com/embed/OBlurZwfvJE" data-video="https://youtu.be/OBlurZwfvJE" class="popup-youtube" title="Watch Video" style="font-size: 16px; font-weight: bold; padding: 10px 0px 0px; margin-right: 20px; width: 202px;">The VanEck Uranium and Nuclear ETF: Powering Up AI, Powering Up Your Portfolio</a></div>
</div>
<h2 id="point-one" class="anchored-block">How is increasing electricity demand and the emergence of artificial intelligence (AI) revitalizing the nuclear energy industry?</h2>
<p>The nuclear energy industry is experiencing a significant resurgence driven by growing global demand for electricity and the rapid emergence of artificial intelligence (AI). As the world increasingly shifts towards technologies like electric vehicles and AI, the need for stable, high-capacity clean energy sources has become more acute. Nuclear power, known for its ability to generate large amounts of reliable and low carbon electricity, is uniquely suited to meet these demands. Furthermore, technological advancements within the nuclear sector, such as the development of small modular reactors (SMRs), are making nuclear energy a more flexible and economically viable option. Coupled with supportive governmental policies aimed at decarbonization, these factors are positioning nuclear energy as a key player in the global transition to a more sustainable energy future. This synergy of AI-driven energy needs, global decarbonization initiatives and nuclear power's capabilities, is not only revitalizing the industry but also making it a critical component in meeting future energy requirements sustainably. For more insights on these dynamics, read our <a href="https://www.vaneck.com/us/en/blogs/natural-resources/three-forces-powering-the-nuclear-energy-surge/" title="Three Forces Powering the Nuclear Energy Surge"><strong>Three Forces Powering the Nuclear Energy Surge</strong></a> and <a href="https://www.vaneck.com/us/en/blogs/natural-resources/ai-and-nuclear-power/" title="AI's Impact on the Surge of Nuclear Investments: Everything You Need to Know"><strong>AI's Impact on the Surge of Nuclear Investments: Everything You Need to Know</strong></a> blogs.</p>
<h2 id="point-two" class="anchored-block">What is the VanEck Uranium and Nuclear Energy ETF (NLR)?</h2>
<p>The <strong><a href="/link/49acb0d4174146e9a0269c9cb81c02bb.aspx" title="NLR VanEck Uranium and Nuclear ETF - Overview">VanEck Uranium and Nuclear ETF (NLR)</a></strong> is an exchange-traded fund that provides investors with comprehensive exposure to companies operating within the nuclear energy and uranium industries. By investing in <strong><a href="/link/49acb0d4174146e9a0269c9cb81c02bb.aspx" title="NLR VanEck Uranium and Nuclear ETF - Overview">NLR</a></strong>, individuals can tap into the broad nuclear energy industry which encompasses activities such as uranium mining, nuclear power generation, and the provision of equipment and services related to nuclear energy. Additionally, <strong><a href="/link/49acb0d4174146e9a0269c9cb81c02bb.aspx" title="NLR VanEck Uranium and Nuclear ETF - Overview">NLR</a></strong>&nbsp;offers global exposure as it includes companies from various regions, thereby allowing investors to benefit from the nuclear energy sector's growth and advancements worldwide.</p>
<h2 id="point-three" class="anchored-block">How is the portfolio composition determined for NLR?</h2>
<p>The portfolio composition of <strong><a href="/link/49acb0d4174146e9a0269c9cb81c02bb.aspx" title="NLR VanEck Uranium and Nuclear ETF - Overview">NLR</a></strong>&nbsp;is determined based on a passive management strategy, seeking to replicate the performance of the MVIS Global Uranium &amp; Nuclear Energy Index. This is a market cap weighted index that is designed to track the overall performance of companies involved in the nuclear energy and uranium industries. This includes companies engaged in uranium mining, the construction, engineering, and maintenance of nuclear power facilities and nuclear reactors, the production of electricity from nuclear sources, and providing equipment, technology, and/or services to the nuclear power industry. To be eligible for inclusion, a company must generate, or be expected to generate, at least 50% of its revenues from these business activities resulting in comprehensive and pure-play exposure to the industry.</p>
<h2 id="point-four" class="anchored-block">How has the global shift towards clean energy impacted the nuclear energy industry?</h2>
<p>The global shift towards clean energy has cast a spotlight on the nuclear energy and uranium industries as potential, or even necessary, contributors to a low-carbon energy future. Nuclear power is seen as a viable alternative to fossil fuels as it generates a substantial amount of electricity with minimal greenhouse gas emissions. This perspective has fostered a renewed interest in nuclear energy leading to new nuclear power projects, research into advanced nuclear technologies, and the exploration and development of new uranium mining sites to meet anticipated demand.</p>
<p>Additionally, there have been positive shifts on the policy front. More and more, governments are revisiting their nuclear energy policies to align with their carbon reduction goals. There is a growing recognition of the role nuclear power can play in achieving a low-carbon energy mix, especially as part of a balanced energy portfolio that includes renewables, like wind and solar, which can be intermittent in their ability to deliver energy. International collaborations and agreements are also emerging to promote nuclear energy development and to establish a global framework for nuclear safety and security.</p>
<p>In short, the global shift towards clean energy is fostering a conducive environment for the growth and development of the nuclear energy complex that is expected to be supportive of the companies operating within the industry.</p>
<div class="epi-contentfragment">faq-banner-cta</div>
<h2 id="point-five" class="anchored-block">How much exposure does NLR have to uranium miners?</h2>
<p>The <strong><a href="/link/49acb0d4174146e9a0269c9cb81c02bb.aspx" title="NLR VanEck Uranium and Nuclear ETF - Overview">VanEck Uranium and Nuclear ETF (NLR)</a></strong> provides exposure to a variety of companies within the nuclear energy industry, which includes uranium mining companies, among others. <strong><a href="/link/49acb0d4174146e9a0269c9cb81c02bb.aspx" title="NLR VanEck Uranium and Nuclear ETF - Overview">NLR</a></strong>&nbsp;tracks a passive market-cap weighted index that reflects the broader industry, providing a balanced exposure to various facets of the nuclear energy value chain. Generally, companies operating within the uranium mining segment have accounted for roughly half of <strong><a href="/link/49acb0d4174146e9a0269c9cb81c02bb.aspx" title="NLR VanEck Uranium and Nuclear ETF - Overview">NLR</a></strong>&rsquo;s exposure. However, the degree of this exposure to uranium miners can vary based on factors including market conditions and the performance of companies within the sector.</p>
<p>For current information on the exposure to uranium miners and other segments of the nuclear energy sector, please visit <a href="/link/dfdd5b72eef349fdbf20efa8656da78f.aspx" title="NLR - VanEck Uranium and Nuclear ETF"><strong>NLR's product page</strong></a> where up-to-date holdings are available.</p>
<h2 id="point-six" class="anchored-block">What are the risks associated with investing in uranium and nuclear energy?</h2>
<p>Investing in nuclear energy brings forth a mix of opportunities and challenges. While advancements in nuclear technologies and energy policy reformation present promising investment prospects, there are also inherent risks. Companies operating in the industry may face developmental hurdles such as unforeseen costs or delays in nuclear reactor projects due to technical complexities, stringent regulatory compliance, or public opposition. The sector is also highly susceptible to policy shifts, which can be triggered by major incidents or the emergence of alternative energy technologies, thereby altering the regulatory and investment landscape. Additionally, volatility in uranium prices, driven by supply-demand dynamics and geopolitical factors, can directly impact the revenues of mining companies and the nuclear fuel costs that power generators must ultimately pay.</p>
<h2 id="point-seven" class="anchored-block">Where does NLR fit into a portfolio?</h2>
<p><strong><a href="/link/49acb0d4174146e9a0269c9cb81c02bb.aspx" title="NLR VanEck Uranium and Nuclear ETF - Overview">NLR</a></strong>&nbsp;can be integrated into an investment portfolio as a long-term strategic allocation providing both diversification benefits and access to the potential growth opportunity amidst the global push towards clean energy. Additionally, because of its targeted exposure, <strong><a href="/link/49acb0d4174146e9a0269c9cb81c02bb.aspx" title="NLR VanEck Uranium and Nuclear ETF - Overview">NLR</a></strong>&nbsp;can be used more tactically by investors to express a shorter-term view of the nuclear energy industry in an efficient and low-cost way.</p>
<h2 id="point-eight" class="anchored-block">Does NLR generate Schedule K-1 tax statements?</h2>
<p>No. Unlike an investment in many commodity strategies, the equities of uranium miners and other nuclear energy companies do not generate burdensome K-1 tax statements.</p>
<h2 id="point-nine" class="anchored-block">How can investors buy VanEck ETFs?</h2>
<p><a href="/link/49acb0d4174146e9a0269c9cb81c02bb.aspx#how-to-buy-etf&amp;amp;utm=NLR-Blog" title="How to buy VanEck ETFs?"><strong>Learn more here.</strong></a></p>
<p class="d-none d-lg-block"><a href="mailto:askvaneck@vaneck.com" title="Have More Questions? - Ask VanEck" rel="noopener"><img loading="lazy" class="img-responsive" src="https://www.vaneck.com/globalassets/home/us/insights/blogs/bm-blog-images/cta-faq_desktop-02.svg" alt="Have More Questions? - Ask VanEck" /></a></p>
<p class="d-lg-none"><a href="mailto:askvaneck@vaneck.com" title="Have More Questions? - Ask VanEck" rel="noopener"><img loading="lazy" class="img-responsive" src="https://www.vaneck.com/globalassets/home/us/insights/blogs/bm-blog-images/cta-faq_mobile-01.svg" alt="Have More Questions? - Ask VanEck" /></a></p>
<p>To receive more <a href="/us/en/insights/natural-resources/" title="Natural Resources Insights"><strong>Natural Resources</strong></a> insights, <a href="https://www.vaneck.com/us/en/subscribe/" title="Subscription Center"><strong>sign up in our subscription center</strong></a>.</p>
]]></content:encoded>
</item><item rdf:about="https://www.vaneck.com/us/en/blogs/natural-resources/outstanding-investor-questions-from-outstanding-energy-transition-experts/">
  <title>Outstanding Investor Questions From Outstanding Energy Transition Experts></title>
  <link>https://www.vaneck.com/us/en/blogs/natural-resources/outstanding-investor-questions-from-outstanding-energy-transition-experts/</link>
  <description><![CDATA[Industry experts discuss the supply of green metals, the Inflation Reduction Act, how investors can access the space and answer some lingering questions of which you might not have been not aware.]]></description>
  <dc:creator>Tom Butcher</dc:creator>
  <dc:date>10/30/2023 06:30:00</dc:date>
<content:encoded><![CDATA[

<p>When it comes to assessing the scope of the energy transition, perspectives vary. However, there is one element over which there is seemingly no dispute&mdash;its overall complexity, which requires participation and coordination across public and private stakeholders.</p>
<p>This served as the backdrop for a special event hosted by VanEck which brought together nearly 100 attendees across a mix of portfolio companies, leading investment consultants and allocators.</p>
<p>Joining VanEck's Natural Resources Investment Team, including <a href="/link/9311a5fea3d2442595af73a74b71c357.aspx" title="Charl Malan"><strong>Charl Malan</strong></a>, Natural Resource Equity Strategy team&rsquo;s Senior Research Analyst for Base and Industrial Metals, were Prakash Patel, Chief Strategy Officer at Stem, Inc., a company at the core of which is an AI platform; Drew Petit, Director - U.S. Equity Strategy at Citi; Mark Raskopf, Head of Tactical Trading Strategies and Commodities and fund portfolio manager at Russell; and Ben Steinberg, Executive Vice President at government affairs firm Venn Strategies.</p>
<p>What happens when you bring together such a diverse lineup of experts? A collaborative, open dialogue spanning many topics, including supply of green metals, the Inflation Reduction Act (IRA), and how investors can participate and access the space, some interesting, lingering questions arose about which either you might not be not aware or the importance of which may not have fully registered.</p>
<h2>Where&rsquo;s the IRA?</h2>
<p>The introduction of the IRA was clearly a milestone, but in this regard, Mr. Pettit made two particularly noteworthy observations. The first was that when looking at how investors may consider clean energy, the theme is not &ldquo;dead,&rdquo; but just requires some context.</p>
<p>The second was that, while IRA might be a catalyst for the energy transition, he didn&rsquo;t know whether we&rsquo;d even reached the &ldquo;starting gate.&rdquo; He sees tax season next year as when things will really start. Many companies are positioning in preparation for it and factoring it into investments. However, what they are <i>not</i> doing is putting IRA in guidance. What The Street <i>isn&rsquo;t</i> doing is putting it in estimates. And, finally, what the market&rsquo;s <i>not</i> doing is putting it in valuations. Among other things, this has led to clean energy and infrastructure names with premium growth expectations (likely lowballed) that are still trading in line with peers because the market is not pricing these factors in yet. Not least because they&rsquo;ve not finished their tax work yet and don&rsquo;t want to put it in the numbers.</p>
<h2>What is the Federal Government doing to Support Industry?</h2>
<p>Mr. Steinberg noted the importance of the mixture of public and private finance to the energy transition for getting through the next few years and that public financing could not have come at a more challenging but more important time. He also provided some fascinating insights into what funds different U.S. federal agencies are being allocated for the energy transition (and for what), as well as giving example of how dysfunctional the process can be.</p>
<h3>U.S. federal agencies&rsquo;/departments&rsquo; mobilization to help secure a reliable and sustainable supply of critical minerals used for the electrification economy</h3>
<div class="wrapped-div">
<table style="width: 400px;">
<tbody>
<tr class="tbl-data">
<td class="tbl-header last">Department/Agency</td>
<td class="tbl-header last text-center">Involvement</td>
</tr>
<tr class="tbl-data">
<td class="data-td last">Energy</td>
<td class="data-td data last">BIL Funding/R&amp;D</td>
</tr>
<tr class="tbl-data">
<td class="data-td last">Treasury</td>
<td class="data-td data last">Tax Credits</td>
</tr>
<tr class="tbl-data">
<td class="data-td last ">Defense</td>
<td class="data-td data last">DPA/R&amp;D/DIB</td>
</tr>
<tr class="tbl-data">
<td class="data-td last">EPA</td>
<td class="data-td data last">BIL Funding/Standards</td>
</tr>
<tr class="tbl-data">
<td class="data-td last">Interior</td>
<td class="data-td data last">Permitting/Mineral Info</td>
</tr>
<tr class="tbl-data">
<td class="data-td last">Commerce</td>
<td class="data-td data last">International Commerce</td>
</tr>
<tr class="tbl-data">
<td class="data-td last">State</td>
<td class="data-td data last">Minerals Security Partnership</td>
</tr>
<tr class="tbl-data">
<td class="data-td last">USTR<sup>*</sup></td>
<td class="data-td data last">Tariffs/Trade</td>
</tr>
<tr class="tbl-data">
<td class="data-td last">EXIM Bank<sup>&dagger;</sup></td>
<td class="data-td data last">Project Finance</td>
</tr>
<tr class="tbl-data">
<td class="data-td last">DFC<sup>&Dagger;</sup></td>
<td class="data-td data last">Project Finance in Developing Nations</td>
</tr>
<tr class="tbl-data">
<td class="data-td last">Labor</td>
<td class="data-td data last">Child/Forced Labor Tracking</td>
</tr>
</tbody>
</table>
</div>
<p class="chart-disclosure">Source: Venn Strategies.</p>
<p class="chart-disclosure"><sup>*</sup>&nbsp;Office of the U.S. Trade Representative,<sup>&dagger;</sup>&nbsp;Export-Import Bank of the United States,<sup>&Dagger;</sup>&nbsp;U.S. International Development Finance Corporation.</p>
<p>For a start, in the U.S., there is, now, not just one list of &ldquo;critical materials,&rdquo; but <i>three</i>. One each at: the Department of the Interior (&ldquo;Interior&rdquo;), the Department of Energy (&ldquo;Energy&rdquo;) and, finally, the Department of Defense.</p>
<p>While copper may, recently, have joined Energy&rsquo;s list, it is <i>not</i> on Interior&rsquo;s list. This is relevant because, when legislation is written, much of the time it will tie funding and policies to these lists. However, this can lead to confusion. As an example, on the one hand, a lot of support has been given to the mining sector. On the other, however, there&rsquo;s also been much more discussion around inclusivity, community engagement and NIMBY<sup>1</sup>-ism. In the case of copper, the metal is on Energy&rsquo;s list, but even though it is now tied to the 48C<sup>2</sup>&nbsp;tax credit for the first time, it will probably never get on Interior&rsquo;s list because the administration has now blocked three very substantial copper projects in the U.S.</p>
<p>That said, it was, though, very interesting to learn that, with its remit on mining policy (especially on federal land), the Department of the Interior is seeking to change the General Mining Act of 1872, incredibly the last time federal mining law was written!</p>
<h2>Where are the Commodities Researchers?</h2>
<p>Despite the growing complexity of the production universe, the changing supply chain and commodities&rsquo; analysis getting more and more complex every day, Mr. Raskopf doesn&rsquo;t see new people starting commodities research companies to profit from this complexity. He felt that currently there is an unusually low number of professionals in the space, particularly commodity traders. And this despite the space being &ldquo;super-attractive.&rdquo;</p>
<p>He also noted that, sadly, he&rsquo;s not seeing a lot of pension investors adding to the inflation-sensitive portions of their traditional portfolios. He thinks this is probably linked to the green transition narrative and, maybe, some people taking out commodities altogether. He certainly doesn&rsquo;t think now is a good time to do so.</p>
<h2>Some Important Goals Reached, but How Much More to Go?</h2>
<p>While it may be well known that the sums needed to reach global &ldquo;Net Zero&rdquo; targets by 2050 are huge, when the amount&mdash;at least $150 trillion&mdash;was contextualized as being the equivalent of creating <i>six</i> U.S. economies, the magnitude of the challenge truly hit home. Another fun fact that Ms. Zhang again mentioned, was that while EV penetration of approximately 25% in China is the highest in the world (in Europe it is 20%-22%), in the U.S., only earlier this year did 10 states cross the 10% benchmark. (This is commonly accepted as the tipping point after which EV sales accelerate rapidly.)</p>
<h3>EV Share of New Passenger Car Sales in Select States in 1H 2023</h3>
<p><img loading="lazy" class="img-responsive w-100" src="https://www.vaneck.com/contentassets/bc147b89d5d54a5293f7574eca72799a/3772_create-sustainable-institutional-day_chart-1_2023.10_v1_blog.svg" alt="Bar chart of the electric vehicle share of new passenger car sales in select states in the first half of 2023." /></p>
<p class="chart-disclosure">Source: Experian Automotive, BNEF.</p>
<p>Based on 2023 projections, reaching the Net Zero goals by 2050 requires more than $5 trillion of spending a year. Currently, since they are considered, relatively, as the most mature technologies, this is being driven by renewable energy and EVs/electrified transport, each of which has grown significantly over the last five years. However, there is quite a way to go yet before real, meaningful, adoption. On an absolute level and as part of meeting the Net Zero challenge, the U.S. hasn&rsquo;t even started to touch other technologies, such as hydrogen and carbon capture, which she sees as definitely being at an inflection point for commercialization in the next couple of years.</p>
<h2>Free Power?</h2>
<p>In addition to some fascinating insights about his own firm, when talking of the role of technology in the energy transition, Mr. Patel wanted us to note that in many geographies today, the capex of new renewables is cheaper than operating existing conventional generation assets. He sees this as the result of the incredible pace of innovation we have seen in the solar and wind spaces, together with the energy storage sector. Many market analysts are even projecting that, in many geographies, the cost of generation is going to be effectively free in this decade.</p>
<h2>Key Takeaways</h2>
<p>As investors continue to consider the overall impact of the energy transition and where opportunities exist today and going forward, very briefly below are some of the takeaways:</p>
<ul class="content-list">
<li>The energy transition is astonishingly complex but therein can lie the opportunities.</li>
<li>The agendas of different U.S. federal agencies can often clash and lead to confusion.</li>
<li>The sums required to reach Net Zero goals by 2050 are huge and we&rsquo;re not even off the starting blocks yet with some technologies.</li>
<li>The IRA is not yet being factored into guidances, estimates or valuations.</li>
<li>As renewables become cheaper, the cost of power generation could, effectively, be free within this decade.</li>
<li>Commodity traders are in high demand, but their numbers are limited.</li>
</ul>
<p>The exceptional caliber of the speakers and the depth, breadth and range of their viewpoints helped to shape the energy transition discussion and outlook. Our thanks to them for making this event possible.</p>
<p>For more information, please see <a href="https://www.vaneck.com/us/en/blogs/natural-resources/no-energy-transition-without-green-metals/" title="No Energy Transition without Green Metals"><strong>No Energy Transition without Green Metals</strong></a> and <a href="https://www.vaneck.com/us/en/blogs/natural-resources/the-unspoken-supply-constraint-no-miners-no-metals-no-energy-transition/" title="The Unspoken Supply Constraint: No Miners, No Metals, No Energy Transition"><strong>The Unspoken Supply Constraint: No Miners, No Metals, No Energy Transition</strong></a>.</p>
<style type="text/css">
    .wrapped-div {
        max-width: 100%;
    }

    @media (max-width: 1240px) {
        .wrapped-div {
            overflow-x: scroll;
        }
    }

    .wrapped-div-sector {
        max-width: 100%;
        overflow-x: scroll;
    }
</style>
<p>To receive more <a href="/us/en/insights/natural-resources/" title="Natural Resources Insights"><strong>Natural Resources</strong></a> insights, <a href="https://www.vaneck.com/us/en/subscribe/" title="Subscription Center"><strong>sign up in our subscription center</strong></a>.</p>
]]></content:encoded>
</item><item rdf:about="https://www.vaneck.com/us/en/blogs/emerging-markets-bonds/imf-2023-fall-meetings-the-world-begins-to-worry-about-the-us-fiscal-deficit/">
  <title>IMF 2023 Fall Meetings: The World Begins to Worry about the U.S. Fiscal Deficit></title>
  <link>https://www.vaneck.com/us/en/blogs/emerging-markets-bonds/imf-2023-fall-meetings-the-world-begins-to-worry-about-the-us-fiscal-deficit/</link>
  <description><![CDATA[Deputy Portfolio Manager David Austerweil and Chief Economist Natalia Gurushina spent a week in Marrakech, Morocco attending the IMF Fall meetings.]]></description>
  <dc:creator>David Austerweil</dc:creator>
  <dc:date>10/27/2023 06:30:00</dc:date>
<content:encoded><![CDATA[

<p>Deputy Portfolio Manager David Austerweil and Chief Economist Natalia Gurushina spent a week in Marrakech, Morocco attending the International Monetary Funds (IMF) Fall meetings where they met with official sector creditors, policy makers, and other investors. The local authorities did an amazing job hosting the meetings without any issues, especially in light of Morocco&rsquo;s recent earthquake. <a href="/us/en/blogs/emerging-markets-bonds/imf-2023-fall-meetings-the-world-begins-to-worry-about-the-us-fiscal-deficit/imf-2023-fall-meetings-the-world-begins-to-worry-about-the-us-fiscal-deficit.pdf" rel="noopener" target="_blank" title="IMF 2023 Fall Meetings: The World Begins to Worry about the US Fiscal Deficit"><strong>View PDF version of this blog.</strong></a></p>
<p id="GlobalOutlook" class="jump-link-nav anchored-block" data-jumplink-title="Global Outlook"><strong>Global growth outlook is mediocre, with only the U.S. and China characterized by exceptionalism.</strong> When excluding U.S. growth, developed market growth is forecasted to be just 1% for 2023. The U.S. growth outlook was revised upwards by 0.3% to 2.1% from the Spring meetings, when most expected the U.S. to enter a recession this year. In contrast, the remainder of developed economies saw their growth forecasts revised downwards. Similarly, in emerging markets (ex-China) growth is forecasted at just 3% in 2023. China is still expected to achieve a 5% growth rate, which makes it the second fastest growing economy in the world after India.</p>
<p><strong>Global inflation is falling, with U.S. inflation far from its target.</strong> U.S. inflation is not expected to return to the Fed&rsquo;s target rate of 2% until 2025. Forecasts for core inflation were revised upwards. Labor markets remain tight, not just in the United States but across Europe and many emerging markets. The lack of a more convincing global disinflation process makes it very difficult for credible central banks to ease policy and those that believe policy rates are sufficiently restrictive are likely to hold them there for longer than markets are pricing. Even in a country, like Brazil, where inflation has converged to its target, cutting interest rates too quickly would lead to currency depreciation and imported inflation. The &ldquo;higher for longer&rdquo; narrative was pervasive throughout all meetings. For as long as the Federal Reserve maintains that stance, the rest of the world will remain under its spell.</p>
<p><strong>Rapidly rising long-term U.S. real yields are sucking up global capital and raising global borrowing costs.</strong> There was tremendous focus and criticism of U.S. fiscal policy and the resulting borrowing needs. The 2023 U.S. budget deficit of $1.7tn is inconsistent with the current economic expansion in the U.S. and is mostly the result of structural factors stemming from large tax cut packages, increased entitlement spending and growing interest expenditures. Additionally, the Fed&rsquo;s quantitative tightening (QT) of $900bn means $2.7tn of annual borrowing needs. These large borrowing requirements are putting upward pressure on U.S. long-term real yields. When the U.S. finally enters a recession, these borrowing needs will only increase. The Fed will cut interest rates to help the economy and this will relieve some pressure on government interest expenditure, but the Fed will still not stop QT as it seeks to bring its balance sheet back to a size that no longer stimulates the economy.</p>
<h3>Net U.S. Treasury Duration Supply</h3>
<p><img class="img-responsive w-100" src="https://www.vaneck.com/contentassets/d0bca4ad88df46d68d17c9f8c8a2bf61/3760_imf-spring-meetings-october_chart-1_2023.10_v1_blog.svg" alt="The Fed will still not stop QT as it seeks to bring its balance sheet back to a size that no longer stimulates the economy." /></p>
<p class="chart-disclosure">Source: International Monetary Fund; October 2023. Not intended as a prediction of future results. For illustrative purposes only.</p>
<p><strong>Global savings are needed to finance increased U.S. borrowing, but price sensitive private sector savings are not being properly compensated to increase their holdings.</strong> Countries with large current account surpluses, like China, Russia, and Saudi Arabia are no longer interested in financing U.S. borrowing. By sanctioning Russian holdings of U.S. reserve assets, the U.S. sent the message that U.S. Treasuries were no longer a safe investment for central banks that were not in the &ldquo;U.S. friend zone&rdquo;. China realized the mistake it made in hoarding U.S. dollar reserves to protect against a financial crisis and instead is switching to holding strategic resources such as commodities as reserves instead for national security interests. Without price insensitive central bank buyers, more of the burden falls on private sector lenders, both domestic and foreign, who are highly price sensitive buyers.</p>
<h3>History of U.S. Treasury curve shape for 10y - 2y (2s10s) and 30y - 2y (2s30s)</h3>
<p><img class="img-responsive w-100" src="https://www.vaneck.com/contentassets/d0bca4ad88df46d68d17c9f8c8a2bf61/3760_imf-spring-meetings-october_chart-2_2023.10_v2_blog.svg" alt="The yield of both 10-year and 30-year US treasuries are still below the yield on 2-year US treasuries, meaning investors get paid less to take more risk." /></p>
<p class="chart-disclosure">Source: VanEck Research, Bloomberg LP; October 2023. Past performance is no guarantee of future results.</p>
<p>U.S. government duration risk is still not adequately priced to compensate for the risk of ownership. The yield of both 10-year and 30-year U.S. treasuries are still below the yield on 2-year U.S. treasuries, meaning investors get paid less to take more risk! Historically, there was an average of 50 basis points (bps) of compensation paid for taking this additional duration risk. This repricing of duration risk, which is necessary to restore value, has been a violent and painful adjustment recently: most investors are already long duration, and expected yields to be lower due to a U.S. recession that never materialized. In addition, Treasury market liquidity is not functioning well as dealers cannot warehouse risk from large Treasury auctions, and the banking sector already owns too much interest rate risk. Additionally, there are discussions of a capital charge for U.S. banks for interest rate risk that would consequently lead to higher yields.</p>
<p>There was a lot of discussion about the U.S. neutral real interest rate now being higher than post global financial crisis (GFC) levels, with a return to either 2% (former NY Fed President, William Dudley&rsquo;s estimate) or 2.5% (Former U.S. Secretary of the Treasury, Larry Summer&rsquo;s estimate). Using a 2.5% real yield, adding in a 2.5% annual inflation rate and a 50 bps term premium, the fair value for real long-term U.S. interest rate comes to 5.5%. For the structural reasons just listed, it seems reasonable to think that a 5.5% nominal interest rate is closer to a market clearing level.</p>
<p><strong>As real yields rise to attract new price sensitive buyers, it reduces the pool of savings available to other borrowers and increases the risk of financial accidents.</strong> The U.S. and the IMF want to incentivize the private sector to finance an ambitious global transition to green energy. The call to action has largely been ignored as the borrowing requirements of up to 50% of domestic GDP in financing costs over the life of investment is unrealistic when the concern is just financing the world&rsquo;s current borrowing needs. To put current borrowing needs in context, China and the U.S.&rsquo;s deficits combine to 2.5% of world GDP! China is one of the few countries that can afford to finance its green transition with its own savings.</p>
<h3>Cyclically-Adjusted Primary General Government Balances of China and U.S., % world GDP</h3>
<p><img class="img-responsive w-100" src="https://www.vaneck.com/contentassets/d0bca4ad88df46d68d17c9f8c8a2bf61/3760_imf-spring-meetings-october_chart-3_2023.10_v1_blog.svg" alt="China and the US's deficits combine to 2.5% of world GDP." /></p>
<p class="chart-disclosure">Source: VanEck Research; International Monetary Fund; Bloomberg LP; October 2023.</p>
<h3>U.S. Cyclically-Adjusted Primary General Government Balance and Selected Current Account Surpluses (bn USD)</h3>
<p><img class="img-responsive w-100" src="https://www.vaneck.com/contentassets/d0bca4ad88df46d68d17c9f8c8a2bf61/3760_imf-spring-meetings-october_chart-4_2023.10_v1_blog.svg" alt="The US deficit dwarfs the world's largest current account surpluses; global investment needs to fall and savings needs to grow to finance it." /></p>
<p class="chart-disclosure">Source: VanEck Research; International Monetary Fund; Bloomberg LP; October 2023.</p>
<p>The U.S. deficit dwarfs the world&rsquo;s largest current account surpluses; global investment needs to fall and savings needs to grow to finance it. The structural need to attract more and more global savings is the main reason to expect interest rates to remain higher for longer, and the main reason the risk of a financial accident rises as there will be fewer savings available to lend to less creditworthy borrowers. The IMF ran global bank stress tests that incorporate a stagflationary scenario of higher for longer interest rates, a scenario U.S. stress tests overlooked, and the results were particularly troubling for the developed market banking sector plus China. Common Equity Tier 1 (CET1) ratios, which measures liquid bank holdings such as cash and stock, fall below 7% for 27% of developed market banks and 50% of Chinese banks. Emerging market banks, in contrast, fared well with just 10% falling below 7%.</p>
<p id="EmergingMarketsPolicy" class="jump-link-nav anchored-block" data-jumplink-title="Emerging Markets Policy"><strong>Pessimism on the outlook for China&rsquo;s growth was pervasive but China has policy options.</strong> Only 4% of investors were willing to add risk to Chinese assets! It is hard to imagine a more pessimistic survey. The collapse in the property market and the subsequent risk of local government financing vehicle (LGFV) defaults that could cascade into banking sector insolvencies was a major concern. There is reason to be worried. Over 50% of LGFVs are unable to service debt when interest costs rise above 3%. But there is also domestic awareness of the issue and the Chinese government has the tools and fiscal space needed to avoid a debt crisis. The main issue is that so far there has not been a policy bazooka to resolutely solve the problem. The government is keen to avoid moral hazard issues but also given the centralization of decision making under President Xi, there may be some policy paralysis at lower levels of government. The other main investor concern is what China&rsquo;s growth model will be going forward as investors would like to see a rebalancing of the economy away from investment and toward consumption. One key event to watch for is setting a date for the Third Plenum where the economic policy strategy would normally be set. It typically takes place in November, but so far no date has been announced. If the government were to move more resolutely on tackling debt issues and addressing the country&rsquo;s future growth model, there could be a more sustained recovery in asset prices that are currently trading at very depressed valuations.</p>
<p><strong>Against this concerning backdrop, the resilience of emerging markets economies shone though.</strong> There was an abundance of praise for emerging markets policy making across all geographies. Most emerging markets central banks hiked interest rates early to levels high enough to begin the disinflation process before inflation expectations could deteriorate. For the most part, they have been consolidated fiscal policy after the extraordinary spending during the COVID-19 era. Since emerging markets economies have not been able to rely consistently on portfolio flows post 2013&rsquo;s taper tantrum, domestic institutions have filled the space to channel domestic savings to fund government borrowings. By doing so, it has greatly reduced the volatility and sensitivity of government bond yields to U.S. bond yields.</p>
<h3>Local Currency Government Bond Ownership for the Eight Largest Emerging Market Economies, by Institutions</h3>
<p><img class="img-responsive w-100" src="https://www.vaneck.com/contentassets/d0bca4ad88df46d68d17c9f8c8a2bf61/3760_imf-spring-meetings-october_chart-5_2023.10_v2_blog.svg" alt="Since emerging markets economies have not been able to rely consistently on portfolio flows post 2013's taper tantrum, domestic institutions have filled the space to channel domestic savings to fund government borrowings." /></p>
<p class="chart-disclosure">Source: International Monetary Fund; October 2023.</p>
<p><strong>The &ldquo;higher for longer&rdquo; message has been digested by most emerging markets central banks who have adjusted expectations around the terminal policy rate and future rate cutting cycles to include it.</strong> Colombia will cut less, Brazil will not increase the pace of rate cuts, and countries like the Philippines and Thailand are considering additional rate hikes. Indonesia just unexpectedly hiked interest rates to protect the exchange rate from higher U.S. interest rates. VanEck&rsquo;s Emerging Markets Debt team finds it useful to consider which emerging markets central bank policy paths are closely aligned to the U.S. policy path as a step 2 overlay in screening local currency markets. The chart below illustrates our valuation model for 2-year real yields on the x-axis plotted against real 2-year interest rates on the y-axis. The upper right corner of the graph shows the countries with the most attractive short-term interest rates. Each country has a color code indicating the policy stance of the central bank: the darker red the more aligned to U.S. policy and the lighter blue the more aligned to domestic policy needs.</p>
<h3>2Y Real Local Yields vs. Valuation (Rich(-) / Cheap(+))</h3>
<p><img class="img-responsive w-100" src="https://www.vaneck.com/contentassets/d0bca4ad88df46d68d17c9f8c8a2bf61/3760_imf-spring-meetings-october_chart-6_2023.10_v1_blog.svg" alt="our valuation model for 2-year real yields on the x-axis plotted against real 2-year interest rates on the y-axis. The upper right corner of the graph shows the countries with the most attractive short-term interest rates." /></p>
<p class="chart-disclosure">Source: VanEck Research; Moody&rsquo;s; World Bank; International Monetary Fund; Bloomberg LP; October 2023. Past performance is no guarantee of future results.</p>
<p>Emerging markets countries that stand out are Mexico, Colombia, South Africa, Hungary, the Philippines, and Thailand. The Emerging Markets Debt team has allocations to these local markets, except for Mexico, where the team has concerns over the valuation of the exchange rate and fiscal policy around the election.</p>
<p><strong>The government of Turkey deserves a special mention for the impressive showing given by both Economy Minister Simsek and Central Bank Governor Erkan.</strong> Minister Simsek is well known by foreign investors and he made a compelling case that Turkey has credibly changed policy course by reducing the fiscal deficit, reducing the quantity of subsidized credit and tightening standards, allowing an exchange-rate depreciation to restore competitiveness, begin rebuilding reserves and hike interest rates to levels restrictive enough to bring inflation lower. Governor Erkan, however, was not known to investors and she made a very good first impression. It was clear she had a mandate to hike interest rates to levels where monetary policy would be restrictive. The meeting with them was the most packed one of the conferences and some major investment banks are recommending an overweight in Turkish Lira for the first time in recent memory.</p>
<p id="CountrySpecificMeetings" class="jump-link-nav anchored-block" data-jumplink-title="Country-Specific Meetings"><strong>In addition to Turkey, there were many memorable country specific meetings:</strong></p>
<p><strong>Hungary&rsquo;s</strong> inflation is finally heading for single digits, which can become the most important growth driver in 2024, boosting both consumption and investments. Higher growth should be associated with better fiscal outcomes, reducing the country&rsquo;s borrowing needs. A major uncertainty is the disbursement of the EU funds &ndash; both the timing and the size. But in the meantime, the country is benefitting from sizable foreign direct investment (FDI) inflows, especially in EV battery manufacturing.</p>
<p>The <strong>Czech Republic&rsquo;s</strong> overall policy framework is probably the strongest in emerging markets, but it is often traded &ldquo;in sympathy&rdquo; with the rest of the region. The latest fiscal consolidation proposal was a gutsy move and will help offset somewhat lower real interest rates than regional peers Hungary and Romania.</p>
<p><strong>Poland&rsquo;s</strong> general election results were well received by the market, but the government formation, the policy agenda, the fiscal outcomes (both parties promised a lot before the elections), and geopolitical considerations would be just as important going forward.</p>
<p><strong>Brazil</strong> is one of emerging market&rsquo;s poster kids for successful policy tightening, which did not kill growth (past reforms might be to &ldquo;blame&rdquo;) and opened room for gradual rate cuts. The focus now increasingly shifts to Brazil&rsquo;s ability to maintain fiscal discipline &ndash; a credible fiscal plan will keep inflation expectations and real interest rates under control and avoid &ldquo;twin de-anchoring&rdquo; (high inflation and uncertain fiscal results).</p>
<p><strong>Chile&rsquo;s</strong> disinflation progress shows that the monetary policy transmission mechanism and the flexible exchange rate are working as intended. The central bank is now transitioning towards the policy rate&rsquo;s &ldquo;normality&rdquo; and continues to accumulate reserves, which can weigh on the Chilean peso, especially if there is more political noise associated with the new constitutional referendum.</p>
<p><strong>Colombia</strong> is moving in the right direction&hellip; slowly. Inflation has finally peaked, but the tight labor market, rising wages, and the El Nino phenomenon pose additional upside risks, keeping the central bank on the defensive.</p>
<p>The market&rsquo;s key concern in the <strong>Philippines</strong> is the government&rsquo;s ability to reduce its fiscal gap. Plans look good, but the adjustment is expected to spread over many years. The central bank might need to tighten more to cool domestic demand, but the government is determined to maintain its pro-growth fiscal stance.</p>
<p><strong>Indonesia</strong> remains a bright spot in EM Asia. Domestic activity, fiscal discipline, and the inflation outlook argue against additional policy tightening, while elevated trade surplus (buoyed by strong exports) provides fundamental support for the currency.</p>
<p><strong>South Africa&rsquo;s</strong> inflation was more persistent than expected, with fiscal policy posing additional inflation risks. Multiple domestic and especially global risks make it difficult to simply look through them, keeping the central bank on the cautious side. South Africa&rsquo;s private energy generation is a potential positive for the country&rsquo;s assets, but it might take longer to play out.</p>
<p><strong>Morocco</strong> remains a structural and economic success story in Northern Africa. The improving equilibrium current account balance is a major new positive that can help reducing Morocco&rsquo;s external financing needs from now on.</p>
<p><strong>Angola</strong> continues to benefit from past reforms, and it continues to target greater diversification and the reduction of its debt burden. However, the economy remains too dependent on the price of oil &ndash; against the backdrop of stalling oil production and the end of the debt suspension agreement.</p>
<p><strong>Kenya&rsquo;s</strong> growth story is still strong, and the IMF program remains a good policy anchor, but the market is frustrated about a lack of clarity about the maturing 2024 Eurobond, fearing that they will end up tapping into international reserves to make the payment.</p>
<p>To receive more <a href="https://www.vaneck.com/us/en/insights/emerging-markets-bonds/" title="Emerging Markets Bonds Insights"><strong>Emerging Markets Bonds</strong></a> insights, <a href="https://www.vaneck.com/us/en/subscribe/" title="Subscription Center"><strong>sign up in our subscription center</strong></a>.</p>
]]></content:encoded>
</item><item rdf:about="https://www.vaneck.com/us/en/blogs/digital-assets/matthew-sigel-vanecks-base-bear-bull-case-solana-valuation-by-2030/">
  <title>VanEck’s Base, Bear, Bull Case: Solana Valuation by 2030></title>
  <link>https://www.vaneck.com/us/en/blogs/digital-assets/matthew-sigel-vanecks-base-bear-bull-case-solana-valuation-by-2030/</link>
  <description><![CDATA[By 2030, our Solana valuation scenarios project a SOL price ranging from a bearish $9.81 to a bullish $3,211.28, anchored by varied market shares and revenue estimations across key sectors.]]></description>
  <dc:creator>Patrick Bush</dc:creator>
  <dc:date>10/27/2023 06:30:00</dc:date>
<content:encoded><![CDATA[

<p><strong>Please note that VanEck may have a position(s) in the digital asset(s) described below.</strong></p>
<ul class="content-list">
<li>In this note, we model a scenario in which Solana is the first blockchain to host an application that onboards 100M+ users.</li>
<li>We assume SOL monetizes at only 20% of ETH's take rate and achieves less than half of ETH's market shares due to a fundamental difference in community philosophy.</li>
<li>We see a credible path to $8B in revenues for SOL token holders by 2030.</li>
</ul>
<ul class="content-list">
<li><strong><a href="#solanas-approach-usability">Solana's Approach: Usability</a></strong></li>
<li><strong><a href="#solana-vs-ethereum-contrasting-philosophies">Solana vs. Ethereum: Contrasting Philosophies</a></strong></li>
<li><strong><a href="#solanas-cost-vs-revenue-challenge">Solana's Cost vs. Revenue Challenge</a></strong></li>
<li><strong><a href="#solana-valuation-scenarios-overview-by-2030">Solana Valuation Scenarios Overview by 2030</a></strong></li>
<li><strong><a href="#solanas-projected-transaction-landscape-by-2030">Solana's Projected Transaction Landscape by 2030</a></strong></li>
<li><strong><a href="#solanas-potential-risks-and-rewards">Solana's Potential: Risks and Rewards</a></strong></li>
</ul>
<p>The purpose of smart contract platforms (SCPs) is to host applications that offer their users the ability to engage in efficient, uncensorable economic activity while minimizing rent extraction on those economic activities by third parties. While many blockchains exist today, the user base of all blockchains is tiny compared to those who engage in commerce off-chain. Roughly 5.5M unique addresses are active each day on SCPs, and around 44M each month. However, it is likely these figures dramatically overstate usership because many users control multiple addresses. Even if we take them at face value, these figures compare poorly to the 2B users who interact with Facebook each day and the 431M who use PayPal every month. The reason why blockchain adoption hasn't been faster already is because blockchains are clunky to use, and there is little to do on the chain besides exchange value and speculation. For crypto to achieve widespread adoption and grow its $1.3T market cap, it needs to have a so-what for people and businesses who are not decentralization maxis or libertarian zealots. It needs a killer application. And the chain that hosts that killer application stands to benefit immensely from the activity generated by that app. In this note, we model a scenario in which Solana is the first blockchain to host a single application that onboards 100M+ users.</p>
<h3>Monthly Active Users of SCPs</h3>
<p><img class="img-responsive w-100" src="https://www.vaneck.com/contentassets/f491bcbc9b4b4e51bdf2b23667f7f930/3769_solana-blog_chart-1_2023.10_v1_blog.svg" alt="Monthly Active Users of SCPs" /></p>
<p class="chart-disclosure">Source: Token Terminal, Dune, as of 10/25/2023. <strong>Past performance is no guarantee of future results. Not intended as a recommendation to buy or sell any securities named herein.</strong></p>
<p>Solana's potential begins with its founding team's success in blending radical experimentation with applied science to monumentally improve blockchain scaling. While other chains have chosen scaling paths that cleverly circumnavigate the limitations of distributed ledgers, Solana has instead chosen to push to the limits of technological feasibility problems and work backward from there. The Ethereum ecosystem and many others have chosen a modular vision where different blockchains specialize in the core functions of a layer 1 chain. On the other hand, Solana has plowed ahead, trying to wring greater transaction throughput by optimizing every component of its own blockchain to be hyper-efficient. Consequently, Solana is vastly more capable than any of its legacy competitors regarding blockchain processing capabilities. Parallel to this, but much more importantly, Solana has translated its pioneering spirit into an ecosystem philosophy of risk-taking and techno-optimism. Solana has spawned a variety of fascinating experiments that include blockchain-optimized mobile phones, NFTs that contain applications, and consumer-focused products like decentralized mapping and automobile data collection. More so than any other ecosystem, people building projects in Solana are creating things that may provide a tangible impact on everyday life.</p>
<h2 id="solanas-approach-usability" class="jump-link-nav anchored-block" data-jumplink-title="Solana's Approach">Solana's Approach: Usability</h2>
<p>The probability of a blockchain network hosting the next &ldquo;killer apps&rdquo; hinges upon that chain's ability to make using that application fast, convenient, and accessible. The more capable the blockchain, the better the environment for a user. The key question is measuring blockchain ability and understanding how that translates into useability. A popular metric, transactions per second (TPS), is an inadequate measurement that is easily manipulated. Realistically, blockchain teams can improve this metric by many tricks, including changing the amount of data each transaction contains, forgoing the ordering of transactions, and limiting what parts of a ledger a transaction can change. In fact, the best metric to truly measure blockchain capacity is not transactions per second (TPS) but is instead data throughput.</p>
<p>Data throughput involves a blockchain ingesting, processing, and ordering data and then agreeing on that data's impact on the blockchain's ledger. Data throughput is determined by measuring the amount of data that can be received and applied by a blockchain over a given time period. The more data a blockchain can translate into ledger updates over a time increment, the better. As it stands, Solana's data throughput exceeds that of any other blockchain in existence. In fact, Solana's data capacity exceeds that of most planned blockchains, and Solana's next significant software upgrade called the <strong><a href="https://jumpcrypto.com/firedancer/" title="A Second Solana Validator" target="_blank" rel="noopener">Firedancer</a></strong> upgrade, promises to exceed Solana's current capacity by a factor of 10. While we do not pretend to know how much data the next killer application's blockchain needs to ingest and process, we imagine that 100M+ users doing anything on-chain will push blockchain scalability to its limits.</p>
<h3>Data Throughput Comparisons MB/S</h3>
<p><img class="img-responsive w-100" src="https://www.vaneck.com/contentassets/f491bcbc9b4b4e51bdf2b23667f7f930/3769_solana-blog_chart-2_2023.10_v1_blog.svg" alt="Data Throughput Comparisons MB/S" /></p>
<p class="chart-disclosure">Source: Frictionless Capital, SCP Home Pages as of 10/25/2023.</p>
<p>Solana translates this data throughput capability into solving problems that users care about. Solana enables quicker feedback to the user than most other chains because it offers continuous processing of transactions. For example, Ethereum works by pooling incoming transactions from users in essentially a waiting room called the mempool. Ethereum validators (block builders in the new paradigm) then pick transactions from the pool based on the price offered by each transaction and order them. Every 12 seconds, transactions are then executed, and the block containing the transactions is beamed to the rest of the Ethereum network. Consequently, Ethereum processes transactions at discrete intervals. This is a substantially slower way of processing transactions than Solana's which leads to longer wait times for the user. On Ethereum, users must wait for this entire process to unfold before they know their transaction is complete. Often, this is measured in minutes. Solana, by contrast, begins working on processing the transaction instantly, and the turnaround is approximately 2 seconds.</p>
<h2>Apps on Solana</h2>
<p>To make the user experience even better, Solana has also created a novel feature called Local Fee Markets. If a blockchain is a data pipeline from users to the blockchain's ledger, Solana's Local Fee Markets are essentially internal sub-pipelines that allow information to flow from different users to multiple parts of the ledger simultaneously. This solves a core problem of Ethereum and other blockchains, as overuse of one application on Ethereum's pipeline slows down all other applications. For example, if many users are trying to mint an NFT on Ethereum, the resulting congestion prevents other users from borrowing on AAVE. In the context of a killer application, users need to be able to consistently interact with the blockchain. By contrast, Solana can segment those different pipelines using Local Fee Markets to charge different prices based on demand. This allows for many applications to have access to Solana even when one application is experiencing heavy usage. This is particularly important because the functionality of a killer application could depend upon simultaneous interaction with many different applications. Additionally, being able to adjust local fee markets to price different types of transactions may be the key to Solana adjusting its price based on the use case. This may allow Solana to price transactions differently based on each's economic value. Local Fee Markets may give the killer application developers greater precision in assessing its costs.</p>
<h2 id="solana-vs-ethereum-contrasting-philosophies" class="jump-link-nav anchored-block" data-jumplink-title="Solana vs. Ethereum">Solana vs. Ethereum: Contrasting Philosophies</h2>
<p>Solana was built by Qualcomm engineers who applied their expertise in enhancing mobile network capacity to build a highly performant blockchain. The foundational principle of the Solana team is to build a network that assumes consumer-grade computing power grows with Moore's Law and networking bandwidth expands alongside it. As a result, Solana is engineered to take advantage of hardware advancements more directly than competitors.</p>
<p>We see this as the mindset of optimism that believes in a future of abundance and progress. The core belief of the Solana team is that blockchains should make blockspace, or the amount of data that fits onto a chain in a time frame, very inexpensive. In their view, this unlocks the ability of software engineers and entrepreneurs to cheaply test new use cases for blockchain. This <em>sharply </em>contrasts with the view that Ethereum has evolved its business from that of selling cheap blockspace every day to that peddling expensive blockspace that secures consumer-facing blockchains. In the Ethereum paradigm, success hinges upon ETH being the principal (and only) collateral to secure all blockchains. The initial pitch for Solana was for it to become a &ldquo;Decentralized Nasdaq.&rdquo; Though that narrative still has potential, the launch of fascinating non-financial consumer applications such as Hivemapper, Render, and Helium has expanded the perception of Solana's capabilities.</p>
<p>The Solana team, to their credit, has been open-minded in use cases for Solana's ground-breaking technology. They've attempted to bring blockchain to the mobile phone through their <strong><a href="https://solana.com/news/solana-mobile-stack-reveal" title="A Second Solana Validator" target="_blank" rel="noopener">SMS</a></strong> or Solana Mobile Stack, which allows developers to create blockchain applications for cell phones. Solana's experimentation has even led them to create their own <a href="https://solanamobile.com/" title="Web3 like never before" target="_blank" rel="noopener"><strong>mobile phone</strong></a> that is optimized to use blockchain. Though Solana Mobile was criticized as a distraction from Solana's core mission, It demonstrates Solana's desire to solve basic core user problems. It is this dedication to the consumer that has helped Solana ink partnerships with Shopify, Visa, and Google to explore new use cases for Solana and boost its ecosystem.</p>
<h3>Solana Developer Market Share &ndash; SCP Monolithic Chains</h3>
<p><img class="img-responsive w-100" src="https://www.vaneck.com/contentassets/f491bcbc9b4b4e51bdf2b23667f7f930/3769_solana-blog_chart-3_2023.10_v1_blog.svg" alt="Solana Developer Market Share" /></p>
<p class="chart-disclosure">Solana Developer Share. Source: Artemis XYZ as of 10/25/2023. <strong>Past performance is no guarantee of future results. Not intended as a recommendation to buy or sell any securities named herein.</strong></p>
<h2 id="solanas-cost-vs-revenue-challenge" class="anchored-block">Solana's Cost vs. Revenue Challenge</h2>
<p>Solana's focus on cheap blockspace, experimentation, and vanguard technology has not been without drawbacks. While providing cheap blockspace encourages ecosystem growth by giving projects and users a nearly costless (<em>to them</em>) sandbox, it is important to remember that supplying that blockspace still has costs. Though Solana has generated $1.26M in revenue fees over the previous 30 days, Solana's cost of securing its blockchain by paying validators using SOL inflation was $52.78M over the same time period. While Solana is not a business that is in danger of collapsing due to this lack of &ldquo;profitability&rdquo; in the near term, long-term the cost of security must be met by organic SOL demand to use the Solana blockchain. This is because Solana validators sell some portion of their token inflation to cover their overhead costs, which include hardware, labor, and connectivity costs (we omit voting costs in this calculation).</p>
<h3>Solana Revenue Fees vs. Expenses</h3>
<p><img class="img-responsive w-100" src="https://www.vaneck.com/contentassets/f491bcbc9b4b4e51bdf2b23667f7f930/3769_solana-blog_chart-4_2023.10_v1_blog.svg" alt="Solana Revenue Fees vs. Expenses" /></p>
<p class="chart-disclosure">Source: Token Terminal as of 10/25/2023. <strong>Past performance is no guarantee of future results. Not intended as a recommendation to buy or sell any securities named herein.</strong></p>
<p>We estimate that the total non-blockchain costs for running all of Solana&rsquo;s 1,977 validator nodes is ~$11.8M per year even before labor is included. As a result, we ballpark this figure as the minimum estimate of Solana&rsquo;s yearly SOL token sell pressure. On the revenue side, half of the revenue fees, $7.56M, are burned and this represents buy pressure of the SOL token (the other half of tokens are remitted to validators and stakers and are offset by potential selling). Applying this simplified summary of buy pressure and sell pressure, we calculate a net imbalance of -$4.24M which represents buy pressure that has to offset collective validator sell pressure. In practice, these token sales by Solana validators has been offset with capital from speculators. Thus, until fee revenue of Solana improves, Solana is an ecosystem whose ability to function in its current state depends upon the consistent introduction of new speculative capital.</p>
<p>Long-term pricing of Solana's blockspace and how much it costs to utilize Solana is another thorny issue. The chief problem of a monolithic chain like Solana is that it is difficult to extract value from users and remit that back to token holders. This paradigm exists because Solana prices its transactions based on the required compute, total demand for compute, and congestion of the area where that compute is applied. While resource pricing is economically logical from the standpoint of pricing the Solana network's ability to allocate its network resources, it is illogical from the standpoint of pricing various user actions effectively.</p>
<p>For example, sending a trade order to the Chicago Mercantile Exchange (CME) is essentially free. However, the CME and other similar exchanges charge that trader a fee when that trade executes and may even change the amount charged based upon whether that trade executes after it &ldquo;actively takes&rdquo; another order or another order &ldquo;takes it.&rdquo; Likewise, with something like Twitter, while it costs nothing to make a post if a user chooses to promote that post or target other users with that post, it will cost a lot. In a vacuum, this pricing, while suboptimal from a value extraction standpoint, is irrelevant. However, in the context of there being tens of thousands of blockchains, each tailored to a specific use case, each of these blockchains may be able to capture value more effectively for token holders. This may threaten the economic sustainability of Solana if weakening SOL prices cause Solana's security budget to fall below its needs. Likewise, from a resource's perspective, a blockchain will want to make sure to allocate its finite resources to economically beneficial activities. If resources are priced inadequately, a blockchain could become saturated with economically detrimental activities regardless of if those activities are segmented by Solana's Local Fee Markets. This has already <strong><a href="https://blockworks.co/news/solana-and-ethereum-suffer-weekend-disruptions-thanks-to-nft-mints" title="NFT Buying Frenzies Disrupt Solana and Ethereum Blockchains" target="_blank" rel="noopener">happened</a></strong> and resulted in more disruption of more legitimate use cases. Likewise, while Solana is performing hundreds of transactions per second, many of these are low-<strong><a href="https://solanafm.medium.com/what-problems-are-we-facing-in-solana-a-deep-dive-with-solanafm-9887a0eb2b1d" title="What Problems Are We Facing in Solana? A Deep Dive with SolanaFM" target="_blank" rel="noopener">value, arbitrage transactions</a></strong> spamming the network. Through Local Fees Markets may mitigate the issue, it is yet to be seen if this improvement will be sufficiently adaptable if Solana's usage meaningfully accelerates.</p>
<p>We give Solana and its team immense credit for their vision and desire to experiment, but its architecture has led to undesirable outcomes that have affected Solana's technical stability. While Solana has had 100% uptime since March 2023 after a series of important network upgrades, previous to that, it has experienced unpredictable downtimes that completely halted network function. Between January 2022 and February 2023, Solana had occasions in 7 out of those 13 months with outages. The most recent of these outages, on February 25, 2023, lasted nearly 19 hours. The core issue of this outage and others in the past stems from the fact that Solana is running an experimental system. There is no formal verification of the Solana consensus mechanism, nor is there the ability to predict future failures in Solana's design because of the colossal data volumes that the system processes. Though Solana has implemented numerous improvements to mitigate past issues, Solana's design may make it impossible to understand future complications until they happen. As a result, the Solana team still considers the chain to be in &ldquo;Beta&rdquo; because future network failures could result from unforeseen causes. And because of the complexity of Solana and the amount of data it processes, resolving these issues might take substantial periods of time to fix.</p>
<p>Clearly, this dynamic is unacceptable to serious financial and non-financial businesses that may want to deploy to Solana. The unpredictability of uptime is partly responsible for Solana's low TVL (total valued locked) in decentralized finance relative to its peers. While the Solana team has implemented what they believe are important fixes, network fragility will remain an issue for the foreseeable future, and the roll-out of the new design Firedancer may even increase the potential for irreconcilable problems.</p>
<h3>SCL Weekly Active Developer Market Share</h3>
<p><img class="img-responsive w-100" src="https://www.vaneck.com/contentassets/f491bcbc9b4b4e51bdf2b23667f7f930/3769_solana-blog_chart-5_2023.10_v1_blog.svg" alt="SCL Weekly Active Developer Market Share" /></p>
<p class="chart-disclosure">Source: Artemis XYZ as of 10/25/2023. <strong>Past performance is no guarantee of future results. Not intended as a recommendation to buy or sell any securities named herein. </strong></p>
<p>Finally, we take some issue with Solana's ability to attract developers to its ecosystem. Because of the complexities of Solana's virtual machine (SVM) and Solana's complex design, creating applications on Solana is a challenging task. In fact, building is difficult for developers, that the founder of Solana Anatoly has likened it to &ldquo;<a href="https://solana.com/validated/episodes/chewing-glass-cronos" title="Chewing Glass - Cronos" target="_blank" rel="noopener"><strong>Chewing Glass</strong></a>.&rdquo; This is partly due to the need for Solana developers to be familiar with Rust, a language with <strong><a href="https://www.statista.com/statistics/1241923/worldwide-software-developer-programming-language-communities/#:~:text=According%20to%20the%20survey%2C%20the,programming%20language%20in%20the%20world." title="Size of programming language communities worldwide as of 2022" target="_blank" rel="noopener">2.2M</a></strong> active developers, compared to Ethereum which can draw from the <strong><a href="https://www.statista.com/statistics/1241923/worldwide-software-developer-programming-language-communities/#:~:text=According%20to%20the%20survey%2C%20the,programming%20language%20in%20the%20world." title="Size of programming language communities worldwide as of 2022" target="_blank" rel="noopener">17.4M</a></strong> JavaScript developers. Though Solana has made great strides in creating the tooling to make development simpler, its high bar for programming proficiency has resulted in Solana accounting for roughly 6-7% of weekly active crypto developers over the last 18 months. While this consistent share is remarkable given that Solana lost one of its biggest backers in FTX/Alameda in November 2022, it needs to increase its total developer count as well as its market share of developers to increase the probability of hosting the tomorrow's blockbuster application. Though it may be likely that the average Solana developer is better than the average Polkadot (DOT) developer, building a widely adopted consumer application may be analogous to the Infinite Monkey Theorem (IFM). In the IFM, the greater the number of monkeys one employs randomly hitting keys on a typewriter, the shorter the time (measured in eons) frame it takes for them to randomly write out the complete works of William Shakespeare. In the context of building an application that brings the next 100M users to the blockchain, the more developers working on the problem, the higher the likelihood of one of them randomly banging out the next Instagram.</p>
<h3 id="solana-valuation-scenarios-overview-by-2030" class="jump-link-nav anchored-block" data-jumplink-title="Solana Valuation Scenarios Overview by 2030">Solana Valuation Scenarios Overview by 2030</h3>
<p><img class="img-responsive w-100" src="https://www.vaneck.com/contentassets/f491bcbc9b4b4e51bdf2b23667f7f930/3769_solana-blog_chart-6_2023.10_v1_blog.svg" alt="Solana Valuation Scenarios by 2030" /></p>
<p class="chart-disclosure">Source: VanEck Research as of Oct 25th 2023. <strong>Past performance is no guarantee of future results. The information, valuation scenarios and price targets presented on Solana in this blog are not intended as financial advice or any call to action, a recommendation to buy or sell Solana, or as a projection of how Solana will perform in the future. Actual future performance of Solana is unknown, and may differ significantly from the hypothetical results depicted here. There may be risks or other factors not accounted for in the scenarios presented that may impede the performance of Solana. These are solely the results of a simulation based on our research, and are for illustrative purposes only. Please conduct your own research and draw your own conclusions.</strong></p>
<p>We apply VanEck's standardized valuation framework to Solana to achieve a token valuation of $335 in our 2030 Base. The estimate is based upon projecting a terminal valuation multiple on Solana's SOL tokens derived from a predicted real rate of return. This real rate of return is calculated from estimated cash flow remittance to SOL token holders. This multiple is then applied to the terminal year's FCF (free cash flow) to the token and divided by the expected number of tokens in the terminal year.</p>
<div class="wrapped-div">
<table style="width: 750px;">
<tbody>
<tr class="tbl-data">
<td class="tbl-header last " colspan="5">Solana Revenue Breakdown</td>
</tr>
<tr class="tbl-data">
<td class="data-head last">&nbsp;</td>
<td class="data-head last">Today</td>
<td class="data-head last">Base 2030</td>
<td class="data-head last">Bear 2030</td>
<td class="data-head last">Bull 2030</td>
</tr>
<tr class="tbl-data">
<td class="data-td last font-weight-normal"><strong>Solana Total Revenue</strong></td>
<td class="data-td data last"><strong>$28</strong></td>
<td class="data-td data last"><strong>$8,869</strong></td>
<td class="data-td data last"><strong>$454</strong></td>
<td class="data-td data last"><strong>$54,283</strong></td>
</tr>
<tr class="tbl-data">
<td class="data-td last font-weight-normal pl-3"><strong>Transactions</strong></td>
<td class="data-td data last"><strong>$12</strong></td>
<td class="data-td data last"><strong>$2,882</strong></td>
<td class="data-td data last"><strong>$19</strong></td>
<td class="data-td data last"><strong>$29,312</strong></td>
</tr>
<tr class="tbl-data">
<td class="data-td last font-weight-normal pl-5">Finance, Banking, Payments</td>
<td class="data-td data last">$9</td>
<td class="data-td data last">$984</td>
<td class="data-td data last">$8</td>
<td class="data-td data last">$13,117</td>
</tr>
<tr class="tbl-data">
<td class="data-td last font-weight-normal pl-5">Metaverse, Social and Gaming</td>
<td class="data-td data last">$3</td>
<td class="data-td data last">$1,339</td>
<td class="data-td data last">$11</td>
<td class="data-td data last">$11,220</td>
</tr>
<tr class="tbl-data">
<td class="data-td last font-weight-normal pl-5">Infrastructure</td>
<td class="data-td data last">$0</td>
<td class="data-td data last">$560</td>
<td class="data-td data last">$0</td>
<td class="data-td data last">$4,975</td>
</tr>
<tr class="tbl-data">
<td class="data-td last font-weight-normal pl-3"><strong>MEV - Block Builder Revenue</strong></td>
<td class="data-td data last"><strong>$16</strong></td>
<td class="data-td data last"><strong>$5,987</strong></td>
<td class="data-td data last"><strong>$435</strong></td>
<td class="data-td data last"><strong>$24,971</strong></td>
</tr>
</tbody>
</table>
</div>
<br />
<p class="chart-disclosure">Source: VanEck Research as of Oct 25th 2023. <strong>Past performance is no guarantee of future results. The information, valuation scenarios and price targets presented on Solana in this blog are not intended as financial advice or any call to action, a recommendation to buy or sell Solana, or as a projection of how Solana will perform in the future. Actual future performance of Solana is unknown, and may differ significantly from the hypothetical results depicted here. There may be risks or other factors not accounted for in the scenarios presented that may impede the performance of Solana. These are solely the results of a simulation based on our research, and are for illustrative purposes only. Please conduct your own research and draw your own conclusions.</strong></p>
<p>More specifically, on revenues and cashflows, our framework begins by examining the different revenue items for Solana. First is a take rate on end market activity. We begin this exercise by identifying end markets that will utilize public blockchains, such as Ethereum and Solana. The three main categories for this are Finance, Banking and Payments (FBP), Metaverse and Gaming (MG), and Infrastructure (I). Depending upon the scenario, we then assume a certain portion of businesses and their revenues will be derived from blockchain activities or employ blockchain in some capacity to find customers, create new products, reduce costs, or simplify back-end business functions. Since public blockchains are analogous to Web 2.0 platforms like Amazon, the Apple App Store, and Uber, we then suppose that public blockchains will have an effective take rate of the GMV of their end markets' revenues. In our Base Case, we find a take rate that is 1/5th of the Ethereum equivalent take rate on blockchain activity. Thus, the total revenue to Solana from end-market transactions is $2.88B. Additionally, we also factor in MEV as a revenue item that is effectively waterfalled from trader entities to validators to token holders. We calculate MEV by estimating the total number of assets locked in Solana DeFi and multiply it by an annual take rate. Our Base Case finds revenue from MEV in 2030 to be $5.99B. Once we have the raw revenue figures, we deduct an assumed tax rate as well as an approximation of the validators' cost to the ecosystem.</p>
<h3 id="solanas-projected-transaction-landscape-by-2030" class="anchored-block">Base Case 2030 Transaction Revenue Estimate Assumptions</h3>
<p><img class="img-responsive w-100" src="https://www.vaneck.com/contentassets/f491bcbc9b4b4e51bdf2b23667f7f930/3769_solana-blog_chart-8_2023.10_v1_blog.svg" alt="Base Case 2030 Transaction Revenue Estimate Assumptions" /></p>
<p class="chart-disclosure">Source: VanEck Research as of Oct 2023. <strong>Past performance is no guarantee of future results. The information, valuation scenarios and price targets presented on Solana in this blog are not intended as financial advice or any call to action, a recommendation to buy or sell Solana, or as a projection of how Solana will perform in the future. Actual future performance of Solana is unknown, and may differ significantly from the hypothetical results depicted here. There may be risks or other factors not accounted for in the scenarios presented that may impede the performance of Solana. These are solely the results of a simulation based on our research, and are for illustrative purposes only. Please conduct your own research and draw your own conclusions.</strong></p>
<p>Despite its potential, we believe Solana's likelihood of hosting the majority of the world's crypto transactions by 2030 is lower than Ethereum's. While Solana's network and execution engine enables higher throughput and unlock greater potential, it lacks adoption momentum by the majority of crypto users and developers. Solana currently retains a substantially lower share of crypto TVL $408M out of $46B, and a similarly small percentage of daily active users, with 184K out of 5.5M. We also believe that new developers entering the space during widespread public blockchains may not be wedded to existing ecosystems nor be decentralization maximalists. As a result, future inbound new developers may become enamored with the next generation of blockchains that offer novel developer frameworks, features, and capabilities, as has been the case in prior crypto cycles As a result, in our base case, we see Solana adoption nearing 30% - a substantial jump from today's figures, but far lower than Ethereum's base case of 70%. This comparison is apt due to the blackhole-like effect of the Ethereum ecosystem growth by swallowing and absorbing ideas while increasing its share of blockchain developers. For context, our $11.8k price target for Ethereum was based on the ETH network achieving a 70% market share of value transmitted across open-source blockchains. Were Solana to avoid Ethereum's event horizon and achieve Ethereum-like dominance, our bull case reveals $51.8B in revenues and a $3,211 price target in 2030.</p>
<p><img class="img-responsive w-100" src="https://www.vaneck.com/contentassets/f491bcbc9b4b4e51bdf2b23667f7f930/3769_solana-blog_image_2023.10_v1.jpg" alt="Ethereum Blackhole Graphic" /></p>
<p class="chart-disclosure">Source: Space.com as of Oct 2023.</p>
<p>In terms of value capture of end-market revenues that employ blockchain, we believe Solana has less potential for value capture than Ethereum. In our base case, we believe that Solana's value capture of GMV will be 20% of that of Ethereum's. We make this assertion based upon the simplicity of Solana's value capture stack and the philosophical assertions of the founder Anatoly Yakovenko that favor abundance over scarcity. The result of abundance over scarcity means that blockspace will remain inexpensive, and the result will be extremely cheap transactions. Putting this into mathematical terms, this ballparks Solana's &ldquo;take rate&rdquo; on GMV at 0.60% of FBP, 2.00% of MSG, and 1.00% of I.</p>
<h3>Average Fee Per Transaction Last 30 Days</h3>
<p><img class="img-responsive w-100" src="https://www.vaneck.com/contentassets/f491bcbc9b4b4e51bdf2b23667f7f930/3769_solana-blog_chart-10_2023.10_v1_blog.svg" alt="Average Fee Per Transaction Last 30 Days" /></p>
<p class="chart-disclosure">Source: Artemis XYZ as of October 25th, 2023. <strong>Past performance is no guarantee of future results. Not intended as a recommendation to buy or sell any securities named herein.</strong></p>
<p>The key question is, &ldquo;given its low transaction pricing, how will Solana make money over the long term?&rdquo; Currently, transaction prices are so minuscule that it will take an immense amount of activity to bring up Solana's revenue figures. In our base model, we assume roughly 600B in yearly transactions by 2030, and we deduce that transaction figure from an expectation of 534M monthly active users given Solana's market share of end markets and an assumption of the number of transactions each user will perform. While MEV will be the most important value capture mechanism of Solana, accounting for 67.5% of all revenues in our base case, we believe there is a possibility that Solana can pull other levers to make its token more valuable even if usage does not appreciate to our base case estimates.</p>
<p>As we noted earlier, blockchains must price activity in such a way as to be cheap enough to encourage widespread usage while still ensuring that its validators get paid enough to validate the network. Blockchains like Solana bootstrap this security budget, the money paid to validators, by building in inflation that dilutes existing token holders to compensate validators. Paying a security budget solely out of Inflation is not sustainable indefinitely if there is no economic activity or if economic activity on the chain is priced too cheaply.</p>
<p>Long run, even if Solana is not able to attract 600B transactions per annum, they have ample levers to pull that could increase the token's value. The first of which is simply to raise transaction prices. While Solana will almost certainly see less transaction throughput if they raise prices, if there are economically valuable activities, it stands to reason that Solana should be able to effectively capture some of that value. Furthermore, Solana could also decrease the effective supply of its token by increasing the amount it charges programs (applications), crypto wallets, NFTs, and tokens to store data on the chain. On Solana, all entities that deploy code to Solana or operate a wallet must pay fees in SOL based on the size of their storage. Anyone using Solana also has the option to forgo this fee by keeping enough SOL in their account to pay for 2 years of rent. With storage fees at 0.00000348 SOL per byte and wallet data size of 372 bytes, each active wallet holder must maintain 0.0026 SOL. Similarly, applications and token smart contracts have to maintain these storage fees as well. A program like Serum which has around 340KB will need to keep a balance of 2.4 SOL to avoid paying rent. If Solana chooses to do so, it could dramatically increase these balances and effectively reduce the supply of floating SOL.</p>
<p>Of course, these rent and transaction cost changes would violate the current principles of the Solana founding team, which controls the protocol. At the same time, there is no governance on Solana to mediate these decisions but recently some validators have brought up <strong><a href="https://forum.solana.com/t/a-framework-for-governance-introduction/484" title="A Framework for Governance - Introduction" target="_blank" rel="noopener">proposals</a></strong> to introduce token-voting governance on Solana. By the year 2030, we believe that Solana will already be practicing governance using token-voting and we believe this will enhance the economics of the SOL token if the Solana blockchain has a vibrant ecosystem of activity.</p>
<h2 id="solanas-potential-risks-and-rewards" class="anchored-block">Solana's Potential: Risks and Rewards</h2>
<p>Solana is an endlessly fascinating project that is committed to improving the user experience by pushing the edge of what is possible on a blockchain. As a result, it offers the cradle with the right features that have the best opportunity of growing the next killer application. Additionally, the Solana team are titans of the space whose non-consensus thinking has birthed in the most capable blockchain in existence. As they continue to innovate, their philosophy of experimentation and optimism has infused a small yet creative ecosystem of consumer-focused applications. Most importantly, Solana's community has a strong identity that allowed it to remain resilient despite immense setbacks that would have destroyed many other blockchain ecosystems.</p>
<p>That said, Solana is surfing in currents that are far different from the consensus view of established names in the space, like Ethereum. Rather than specializing in modular blockchain components as Ethereum and its supplicants are building, they are cutting a course to develop an integrated blockchain that combines these components into an integrated data throughput machine. This is a monumental task, and the Solana team is starting from a position of relative weakness &ndash; they have fewer developers, TVL, VC funds and foundation capital to build their vision than EVM-compatible chains. Likewise, they still face tremendous questions over the long-term stability of their blockchain's technical approach. Still, even using terminal market share and take-rate assumptions well below that which we use for Ethereum, our model produces more upside in our base case for the SOL token. Thus, we believe a meaningful weight for SOL in investor portfolios is justified.</p>
<p><strong>Disclosure: The VanEck team owns SOL tokens and stakes in other Solana-based applications such as Hive mapper, Helium, and Render.</strong></p>
<div class="wrapped-div">
<table style="width: 750px;">
<tbody>
<tr class="tbl-data">
<td class="tbl-header last " colspan="4">Solana Valuation Scenarios</td>
</tr>
<tr class="tbl-data">
<td class="data-head last">&nbsp;</td>
<td class="data-head last">Base</td>
<td class="data-head last">Bear</td>
<td class="data-head last">Bull</td>
</tr>
<tr class="tbl-data">
<td class="data-td last font-weight-normal"><strong>SOL Price Estimate</strong></td>
<td class="data-td data last">&nbsp;</td>
</tr>
<tr class="tbl-data">
<td class="data-td last font-weight-normal pl-3">Solana Terminal Smart Contract Market Share</td>
<td class="data-td data last">30.00%</td>
<td class="data-td data last">5.00%</td>
<td class="data-td data last">80.00%</td>
</tr>
<tr class="tbl-data">
<td class="data-td last font-weight-normal pl-3">Estimated Revenue 2030 (M)</td>
<td class="data-td data last">$8,271</td>
<td class="data-td data last">$410</td>
<td class="data-td data last">$51,786</td>
</tr>
<tr class="tbl-data">
<td class="data-td last font-weight-normal pl-3">Global Tax Rate on Crypto</td>
<td class="data-td data last">15.00%</td>
</tr>
<tr class="tbl-data">
<td class="data-td last font-weight-normal pl-3">Validator Cut</td>
<td class="data-td data last">1.00%</td>
</tr>
<tr class="tbl-data">
<td class="data-td last font-weight-normal pl-3">FCF to Tokenholders in 2030 (M)</td>
<td class="data-td data last">$6,960</td>
<td class="data-td data last">$345</td>
<td class="data-td data last">$43,578</td>
</tr>
<tr class="tbl-data">
<td class="data-td last font-weight-normal pl-3">FCF Terminal Multiple</td>
<td class="data-td data last">33</td>
<td class="data-td data last">20</td>
<td class="data-td data last">50</td>
</tr>
<tr class="tbl-data">
<td class="data-td last font-weight-normal pl-3">SOL FDV (M)</td>
<td class="data-td data last">$231,991</td>
<td class="data-td data last">$6,904</td>
<td class="data-td data last">$2,178,894</td>
</tr>
<tr class="tbl-data">
<td class="data-td last font-weight-normal pl-3">SOL Supply in 2030 (M)</td>
<td class="data-td data last">693.12</td>
<td class="data-td data last">703.88</td>
<td class="data-td data last">678.51</td>
</tr>
<tr class="tbl-data" style="border-top: 2px solid #b2b3b2; ; border-bottom: 2px solid #b2b3b2;">
<td class="data-td last font-weight-normal"><em><strong>SOL Price 2030</strong></em></td>
<td class="data-td data last"><em><strong>$334.70</strong></em></td>
<td class="data-td data last"><em><strong>$9.81</strong></em></td>
<td class="data-td data last"><em><strong>$3,211.28</strong></em></td>
</tr>
<tr class="tbl-data">
<td class="data-td last font-weight-normal"><strong>Crypto Terminal Market Share</strong></td>
<td class="data-td data last">&nbsp;</td>
</tr>
<tr class="tbl-data">
<td class="data-td last font-weight-normal pl-3">Finance, Banking, Payments</td>
<td class="data-td data last">5.00%</td>
<td class="data-td data last">1.00%</td>
<td class="data-td data last">15.00%</td>
</tr>
<tr class="tbl-data">
<td class="data-td last font-weight-normal pl-3">Metaverse, Social and Gaming</td>
<td class="data-td data last">20.00%</td>
<td class="data-td data last">5.00%</td>
<td class="data-td data last">50.00%</td>
</tr>
<tr class="tbl-data">
<td class="data-td last font-weight-normal pl-3">Infrastructure</td>
<td class="data-td data last">10.00%</td>
<td class="data-td data last">1.00%</td>
<td class="data-td data last">20.00%</td>
</tr>
<tr class="tbl-data">
<td class="data-td last font-weight-normal">&nbsp;</td>
<td class="data-td data last">&nbsp;</td>
</tr>
<tr class="tbl-data">
<td class="data-td last font-weight-normal"><strong>Solana Market Share of&nbsp;</strong><strong>Crypto</strong></td>
<td class="data-td data last">30.00%</td>
<td class="data-td data last">5.00%</td>
<td class="data-td data last">80.00%</td>
</tr>
<tr class="tbl-data">
<td class="data-td last font-weight-normal">&nbsp;</td>
<td class="data-td data last">&nbsp;</td>
</tr>
<tr class="tbl-data">
<td class="data-td last font-weight-normal"><strong>Solana Value Capture of End Market Revenue</strong></td>
<td class="data-td data last">&nbsp;</td>
</tr>
<tr class="tbl-data">
<td class="data-td last font-weight-normal pl-3">Finance, Banking, Payments</td>
<td class="data-td data last">0.60%</td>
<td class="data-td data last">0.15%</td>
<td class="data-td data last">1.00%</td>
</tr>
<tr class="tbl-data">
<td class="data-td last font-weight-normal pl-3">Metaverse, Social and Gaming</td>
<td class="data-td data last">2.00%</td>
<td class="data-td data last">0.50%</td>
<td class="data-td data last">3.33%</td>
</tr>
<tr class="tbl-data">
<td class="data-td last font-weight-normal pl-3">Infrastructure</td>
<td class="data-td data last">1.00%</td>
<td class="data-td data last">0.25%</td>
<td class="data-td data last">1.67%</td>
</tr>
<tr class="tbl-data">
<td class="data-td last font-weight-normal">&nbsp;</td>
<td class="data-td data last">&nbsp;</td>
</tr>
<tr class="tbl-data">
<td class="data-td last font-weight-normal"><strong>MEV Revenue</strong></td>
<td class="data-td data last">&nbsp;</td>
</tr>
<tr class="tbl-data">
<td class="data-td last font-weight-normal pl-3">MEV LT Take Rate</td>
<td class="data-td data last">0.10%</td>
</tr>
<tr class="tbl-data">
<td class="data-td last font-weight-normal pl-3">MEV Value Accrual to Token</td>
<td class="data-td data last">90.00%</td>
</tr>
</tbody>
</table>
</div>
<br />
<p class="chart-disclosure">Source: VanEck Research as of Oct 2023. <strong>Past performance is no guarantee of future results. The information, valuation scenarios and price targets presented on Solana in this blog are not intended as financial advice or any call to action, a recommendation to buy or sell Solana, or as a projection of how Solana will perform in the future. Actual future performance of Solana is unknown, and may differ significantly from the hypothetical results depicted here. There may be risks or other factors not accounted for in the scenarios presented that may impede the performance of Solana. These are solely the results of a simulation based on our research, and are for illustrative purposes only. Please conduct your own research and draw your own conclusions.</strong></p>
<div class="wrapped-div">
<table style="width: 750px;">
<tbody>
<tr class="tbl-data">
<td class="tbl-header last " colspan="3">Top Five Gas-Guzzling dApps on Solana</td>
</tr>
<tr class="tbl-data">
<td class="data-td last">Name</td>
<td class="data-head last">Category</td>
<td class="data-head last">% of Gas (90d)</td>
</tr>
<tr class="tbl-data">
<td class="data-td last font-weight-normal">Pyth Price Oracle</td>
<td class="data-td data last">Infrastructure</td>
<td class="data-td data last">21.5</td>
</tr>
<tr class="tbl-data">
<td class="data-td last font-weight-normal">Magic Eden</td>
<td class="data-td data last">NFT Exchange</td>
<td class="data-td data last">5.2</td>
</tr>
<tr class="tbl-data">
<td class="data-td last font-weight-normal">Chainlink Data Storage</td>
<td class="data-td data last">Infrastructure</td>
<td class="data-td data last">3.6</td>
</tr>
<tr class="tbl-data">
<td class="data-td last font-weight-normal">Mango Markets</td>
<td class="data-td data last">DeFi</td>
<td class="data-td data last">2.5</td>
</tr>
<tr class="tbl-data">
<td class="data-td last font-weight-normal">Zeta</td>
<td class="data-td data last">DeFi</td>
<td class="data-td data last">2.1</td>
</tr>
</tbody>
</table>
</div>
<br />
<div class="wrapped-div">
<table style="width: 750px;">
<tbody>
<tr class="tbl-data">
<td class="tbl-header last" colspan="4">Five Promising dApps on Solana</td>
</tr>
<tr class="tbl-data">
<td class="data-td last">Name</td>
<td class="data-head last">Category</td>
<td class="data-head last">Usage</td>
<td class="data-head last">YTD Change</td>
</tr>
<tr class="tbl-data">
<td class="data-td last font-weight-normal">Backpack xNFTs</td>
<td class="data-td data last">Wallet</td>
<td class="data-td data last">55,000+ Users</td>
<td class="data-td data last">3.02</td>
</tr>
<tr class="tbl-data">
<td class="data-td last font-weight-normal">Render</td>
<td class="data-td data last">Decentralized Compute</td>
<td class="data-td data last">117,900<sup>*</sup></td>
<td class="data-td data last">7.67</td>
</tr>
<tr class="tbl-data">
<td class="data-td last font-weight-normal">Hivemapper</td>
<td class="data-td data last">DePIN</td>
<td class="data-td data last">23,756 Mappers</td>
<td class="data-td data last">4.88</td>
</tr>
<tr class="tbl-data">
<td class="data-td last font-weight-normal">Helium</td>
<td class="data-td data last">DePIN</td>
<td class="data-td data last">907<sup>**</sup></td>
<td class="data-td data last">0.85</td>
</tr>
<tr class="tbl-data">
<td class="data-td last font-weight-normal">Star Atlas</td>
<td class="data-td data last">Gaming</td>
<td class="data-td data last">1.9M Daily Txns</td>
<td class="data-td data last">10.89</td>
</tr>
</tbody>
</table>
</div>
<br />
<p class="chart-disclosure"><sup>*</sup>&nbsp;Number of scenes rendered monthly.</p>
<p class="chart-disclosure"><sup>**</sup>&nbsp;Average daily Data Credits burned ($).</p>
<p class="chart-disclosure">Source: chrome-stats.com, Dune, Flipside Crypto, Hivemapper, VanEck as of October 25th, 2023.</p>
<p>Thank you to all who contributed perspective to this article including Eugene Chen from Ellipsis Labs, Edgar Xi from Jito Labs, Matt Sorg from Solana, and 0xkrane.</p>
<p><strong>Links to third party websites are provided as a convenience and the inclusion of such links does not imply any endorsement, approval, investigation, verification or monitoring by us of any content or information contained within or accessible from the linked sites. By clicking on the link to a non-VanEck webpage, you acknowledge that you are entering a third-party website subject to its own terms and conditions. VanEck disclaims responsibility for content, legality of access or suitability of the third-party websites.</strong></p>
<p>To receive more <strong><a href="https://www.vaneck.com/us/en/insights/digital-assets/" title="Digital Assets Insights">Digital Assets</a></strong> insights, <strong><a href="https://www.vaneck.com/us/en/subscribe/" title="Subscription Center">sign up in our subscription center</a></strong>.</p>
<style type="text/css">
    .wrapped-div {
        max-width: 100%;
    }

    @media (max-width: 1240px) {
        .wrapped-div {
            overflow-x: scroll;
        }
    }

    .wrapped-div-sector {
        max-width: 100%;
        overflow-x: scroll;
    }
</style>
]]></content:encoded>
</item><item rdf:about="https://www.vaneck.com/us/en/blogs/emerging-markets-bonds/india-bonds-set-to-join-em-bond-index/">
  <title>India Bonds Set to Join EM Bond Index></title>
  <link>https://www.vaneck.com/us/en/blogs/emerging-markets-bonds/india-bonds-set-to-join-em-bond-index/</link>
  <description><![CDATA[India, one of the world&rsquo;s fastest growing economies and currently benefitting from rapid digitization, will join the EM local currency benchmark in 2024.]]></description>
  <dc:creator>Fran Rodilosso</dc:creator>
  <dc:date>10/26/2023 06:30:00</dc:date>
<content:encoded><![CDATA[

<p>The most widely followed emerging markets (EM) local currency benchmark will undergo its biggest reconstitution since China's inclusion in 2020, when India joins the index next year. After several years of discussions about possible inclusion, J.P. Morgan announced that certain local currency bonds issued by the Indian government will begin to be added to the GBI-EM suite of indices at the end of June 2024. In the GBI-EM Global Core Index, India's weight will increase by 1% each month until it reaches a 10% weight, where it will be capped.</p>
<p>India's bonds would increase the index yield by 5 basis points, based on September 29, 2023 prices and assuming full inclusion. The duration would increase by approximately 0.04. Regional exposure will become more tilted towards Asia, with Latin American country exposure being reduced slightly more than EMEA exposure.</p>
<h3>Impact of India Inclusion</h3>
<p><img class="img-responsive w-100" src="https://www.vaneck.com/contentassets/8d73edba13ff43b4a347939a5be80247/3759_emlc-october-2023_chart-1_2023.10_v1_blog.svg" alt="India Inclusion will Impact the EM Bond Index" /></p>
<p class="chart-disclosure">Source: J.P. Morgan. As of September 29, 2023.</p>
<p>India has the second largest bond market among emerging markets, second only to China, and is rated investment grade by all major rating agencies. The reason for its lack of inclusion until now has primarily been the operational hurdles and investment restrictions that made access to the market by foreigners prohibitive. In particular, account opening procedures, trading operations and timely currency repatriation have been cited as concerns. J.P. Morgan&rsquo;s index only includes countries that are accessible to foreign investors without restrictions. India does impose a withholding tax, however tax hurdles alone, if reasonable, do not make a country ineligible.</p>
<p>India introduced "Foreign Accessible Route" ("FAR") bonds in 2020, which are only available to foreign investors and can be invested in without investment limits, and since then has made substantive reforms to address operational hurdles to foreign investment. Only FAR bonds that meet liquidity criteria and have an amount outstanding of at least the equivalent of $1.0 billion are eligible for inclusion. Currently, there are 23 bonds with an aggregate market value of $330 billion that are eligible.</p>
<p>India enters the index against a positive fundamental backdrop. In 2Q 2023, the economy grew at a 7.8% growth rate, driven by increased domestic demand. After improving earlier this year, inflation has recently increased due to higher food prices. However, inflation is expected to drift back to within the Reserve Bank of India&rsquo;s target range and the central bank is expected to maintain rates for now. India has a strong demographic profile, and as the world&rsquo;s most populous democracy benefits from political stability and a growth-friendly policy agenda. In particular, the economy has undergone rapid digitalization in recent years, propelled by government investment including a digital identification system, national payments network, and a buildout of infrastructure that provides the population with access to low cost data. These investments are driving economic growth, as well as higher tax revenues, benefiting the country's fiscal position. A more digitalized economy can also encourage more efficient spending, both in the private and public sectors. In equities, India has seen significant foreign inflows this year thanks to the impact of these tailwinds on corporate profits, and according to Goldman Sachs, the country is the biggest overweight in Asia portfolios among EM money managers.</p>
<p>Index inclusion is expected to result in $20-$40 billion of inflows in the near term, and $180 billion over the next decade, according to S&amp;P. Currently, foreign investment in India's bond market is very low at less than 2% due to the historical obstacles that existed. Foreign ownership will increase from this low base, providing the government with a new source of financing and potentially support for further development of the domestic market. These inflows may also result in lower borrowing costs. Given the relatively high level of government debt, the country's budget deficit and high investment needs, this would be welcome. Lastly, foreign inflows may provide support for the local currency.</p>
<p>To receive more <a href="https://www.vaneck.com/us/en/insights/emerging-markets-bonds/" title="Emerging Markets Bonds Insights"><strong>Emerging Markets Bonds</strong></a> insights, <a href="https://www.vaneck.com/us/en/subscribe/" title="Subscription Center"><strong>sign up in our subscription center</strong>.</a></p>
]]></content:encoded>
</item><item rdf:about="https://www.vaneck.com/us/en/blogs/thematic-investing/buzz-investing-stock-markets-fall-amidst-higher-for-longer/">
  <title>BUZZ Investing: Stock Markets Fall Amidst &#39;Higher for Longer&#39;></title>
  <link>https://www.vaneck.com/us/en/blogs/thematic-investing/buzz-investing-stock-markets-fall-amidst-higher-for-longer/</link>
  <description><![CDATA[Equity markets took a hit due to the 'higher for longer' interest rate scenario, alongside a hawkish outlook from the Fed which plans reduce only twice in 2024.]]></description>
  <dc:creator> </dc:creator>
  <dc:date>10/24/2023 06:30:00</dc:date>
<content:encoded><![CDATA[

<p>Domestic equities fell during the recent period between Index selection dates (September 14, 2023 to October 12, 2023, the &ldquo;Period&rdquo;). Investors increasingly adjusted forward expectations to reflect the prospect that interest rates will remain &lsquo;higher for longer&rsquo; &ndash; an outcome many had failed to anticipate. During the Period, the S&amp;P 500 Index fell 3.4% while the BUZZ NextGen AI US Sentiment Leaders Index (the &ldquo;BUZZ Index&rdquo; or &ldquo;Index&rdquo;) fell 5.5%. As expected, the U.S. Federal Reserve (&ldquo;the Fed&rdquo;) temporarily paused its interest rate increase initiative at the Federal Open Market Committee meeting held on September 20th. Despite the pause, the committee signaled its intention to raise interest rates one additional time during 2023. The signaling underlines their hawkish outlook, further evident in the committee's updated dot plot projections. The new projections now forecast only two reductions in 2024, a decrease from the four projected in the June 2023 update. The yield curve flattened on the events as longer-dated treasuries sold off and yields rallied, with the 10-year note closing the Period yielding 4.70%, up 41bps, while the 2-year note gained just 6bps to yield 5.07%.</p>
<p>The table below presents the Federal Reserve's dot plot of projected midpoint levels for the Fed Funds Target Rate at the end of 2024, as outlined after the June 2023 and September 2023 meetings. It reveals an increase in the median projected midpoint levels of the Fed Funds Target Rate for 2024, from 4.375% to 5.125%. This shift indicates that fewer FOMC voting members anticipate rate cuts in 2024.</p>
<h3>FED Dot Plot &ndash; 2024 Year-End Projected Levels<sup>*</sup></h3>
<p><img class="img-responsive w-100" src="https://www.vaneck.com/contentassets/86fc717ba68143158933009a1516038e/3754_buzz-oct-2023-blog_table_2023.10_v1_blog.svg" alt="FED dot plot 2024 projections" width="960" height="653" /></p>
<p class="chart-disclosure"><i>Source: BUZZ Holdings ULC as of September 2023.</i></p>
<p class="chart-disclosure"><sup>*</sup>&nbsp;The Fed dot plot depicts each Fed official&rsquo;s projection of the appropriate midpoint of the Fed Target Rate at the end of a calendar year.</p>
<p>The BUZZ Index returned -5.68% during the month of September compared to a return of -4.77% for the S&amp;P 500 Index during the same period. Year-to-date, the BUZZ Index leads the S&amp;P 500 with returns of 27.07% and 13.07%, respectively, as of the end of September.</p>
<h2>Shares of Palantir Technologies Inc Pace Advancing Stocks within the BUZZ Index</h2>
<p>Shares of Palantir Technologies Inc (NYSE: PLTR) paced advancing stocks within the BUZZ Index during the recent Period. Amidst the ongoing Middle East conflict, PLTR&rsquo;s shares have been on an upward trend. On October 7th, Israel officially declared war on Hamas in response to a coordinated attack by the Islamist militant group, which has led to over 1,400 primarily civilian Israeli casualties. Given PLTR&rsquo;s contracts with various global government and defense agencies, investors anticipate increased demand for the company's data software products due to heightened geopolitical tensions. Furthermore, PLTR recently announced a new contract with the U.S. Department of Defense worth up to $250 million through 2026. This contract aims to support artificial intelligence (AI) and machine learning (ML) capabilities for Combatant Commands, Armed Services, the Intelligence Community, and Special Forces. PLTR has had a partnership with the US Army since 2018.</p>
<div class="wrapped-div">
<table style="width: 750px;">
<tbody>
<tr class="tbl-data">
<td class="tbl-header last " colspan="4">Top BUZZ Index Contributors: September 14, 2023 &ndash; October 12, 2023</td>
</tr>
<tr class="tbl-data">
<td class="data-td  last">Company</td>
<td class="data-head last">Ticker</td>
<td class="data-head last">Average Weight (%)</td>
<td class="data-head last">Return Contribution (%)</td>
</tr>
<tr class="tbl-data">
<td class="data-td last font-weight-normal">Palantir Technologies Inc</td>
<td class="data-td data last">PLTR</td>
<td class="data-td data last">3.15</td>
<td class="data-td data last">0.42</td>
</tr>
<tr class="tbl-data">
<td class="data-td last font-weight-normal">ROBLOX Corp</td>
<td class="data-td data last">RBLX</td>
<td class="data-td data last">1.01</td>
<td class="data-td data last">0.16</td>
</tr>
<tr class="tbl-data">
<td class="data-td last font-weight-normal">Palo Alto Networks Inc</td>
<td class="data-td data last">PANW</td>
<td class="data-td data last">0.68</td>
<td class="data-td data last">0.12</td>
</tr>
<tr class="tbl-data">
<td class="data-td last font-weight-normal">Meta Platforms Inc</td>
<td class="data-td data last">META</td>
<td class="data-td data last">3.07</td>
<td class="data-td data last">0.12</td>
</tr>
<tr class="tbl-data">
<td class="data-td last font-weight-normal">Advanced Micro Devices Inc</td>
<td class="data-td data last">AMD</td>
<td class="data-td data last">3.03</td>
<td class="data-td data last">0.09</td>
</tr>
<tr class="tbl-data">
<td class="data-td last font-weight-normal">Apple Inc</td>
<td class="data-td data last">AAPL</td>
<td class="data-td data last">3.16</td>
<td class="data-td data last">0.09</td>
</tr>
<tr class="tbl-data">
<td class="data-td last font-weight-normal">Crowdstrike Holdings Inc</td>
<td class="data-td data last">CRWD</td>
<td class="data-td data last">0.67</td>
<td class="data-td data last">0.08</td>
</tr>
<tr class="tbl-data">
<td class="data-td last font-weight-normal">Walgreens Boots Alliance Inc</td>
<td class="data-td data last">WBA</td>
<td class="data-td data last">0.53</td>
<td class="data-td data last">0.08</td>
</tr>
<tr class="tbl-data">
<td class="data-td last font-weight-normal">NVIDIA Corp</td>
<td class="data-td data last">NVDA</td>
<td class="data-td data last">3.11</td>
<td class="data-td data last">0.08</td>
</tr>
<tr class="tbl-data">
<td class="data-td last font-weight-normal">NU Holdings Ltd/Cayman Islands</td>
<td class="data-td data last">NU</td>
<td class="data-td data last">0.50</td>
<td class="data-td data last">0.08</td>
</tr>
</tbody>
</table>
</div>
<br />
<p class="chart-disclosure"><i>Source: BUZZ Holdings ULC, Bloomberg. Past performance is no guarantee of future results. Index performance is not illustrative of fund performance. Not intended as a recommendation to buy or to sell any of the securities mentioned herein.</i></p>
<p>Shares of EV manufacturers were featured in the top detractors to BUZZ Index performance for the second consecutive Period. Rivian Automotive Inc. (NASD: RIVN) and Lucid Group Inc. (NASD: LCID) fell 19.8% and 15.6%, respectively, during the Period. Shares of Rivian (NASDAQ: RIVN) plummeted over 22% on October 5th following its announcement of a $1.5 billion convertible bond offering. While RIVN concluded Q2, 2023 with positive production results, it remains vulnerable to the market's aversion to unprofitable high-growth stocks, as it has recorded over $1 billion in losses this year against revenues of $1.2 billion while maintaining an ambitious goal of delivering 52,000 EVs in 2023. LCID&rsquo;s stock dipped during the Period as it introduced the more affordable Air Pure variant of its luxury electric sedan to boost demand. Concerns about the sustained demand for its flagship Air model have weighed on Lucid's shares throughout 2023. The luxury sedan's premium pricing, along with rising consumer borrowing costs and recent price reductions from rivals like Tesla Inc (NASD: TSLA), have raised investor apprehensions about the company&rsquo;s near-term prospects.</p>
<div class="wrapped-div">
<table style="width: 750px;">
<tbody>
<tr class="tbl-data">
<td class="tbl-header last " colspan="4">Bottom BUZZ Index Contributors: September 14,2023 &ndash; October 12, 2023</td>
</tr>
<tr class="tbl-data">
<td class="data-td  last">Company</td>
<td class="data-head last">Ticker</td>
<td class="data-head last">Average Weight (%)</td>
<td class="data-head last">Return Contribution (%)</td>
</tr>
<tr class="tbl-data">
<td class="data-td last font-weight-normal">Rivian Automotive Inc</td>
<td class="data-td data last">RIVN</td>
<td class="data-td data last">2.23</td>
<td class="data-td data last">-0.55</td>
</tr>
<tr class="tbl-data">
<td class="data-td last font-weight-normal">GameStop Corp</td>
<td class="data-td data last">GME</td>
<td class="data-td data last">2.65</td>
<td class="data-td data last">-0.48</td>
</tr>
<tr class="tbl-data">
<td class="data-td last font-weight-normal">Lucid Group Inc</td>
<td class="data-td data last">LCID</td>
<td class="data-td data last">2.59</td>
<td class="data-td data last">-0.42</td>
</tr>
<tr class="tbl-data">
<td class="data-td last font-weight-normal">PayPal Holdings Inc</td>
<td class="data-td data last">PYPL</td>
<td class="data-td data last">2.95</td>
<td class="data-td data last">-0.39</td>
</tr>
<tr class="tbl-data">
<td class="data-td last font-weight-normal">Plug Power Inc</td>
<td class="data-td data last">PLUG</td>
<td class="data-td data last">1.43</td>
<td class="data-td data last">-0.32</td>
</tr>
<tr class="tbl-data">
<td class="data-td last font-weight-normal">Coinbase Global Inc</td>
<td class="data-td data last">COIN</td>
<td class="data-td data last">2.85</td>
<td class="data-td data last">-0.29</td>
</tr>
<tr class="tbl-data">
<td class="data-td last font-weight-normal">Unity Software Inc</td>
<td class="data-td data last">U</td>
<td class="data-td data last">1.09</td>
<td class="data-td data last">-0.28</td>
</tr>
<tr class="tbl-data">
<td class="data-td last font-weight-normal">Amazon.com Inc</td>
<td class="data-td data last">AMZN</td>
<td class="data-td data last">2.91</td>
<td class="data-td data last">-0.27</td>
</tr>
<tr class="tbl-data">
<td class="data-td last font-weight-normal">SoFi Technologies Inc</td>
<td class="data-td data last">SOFI</td>
<td class="data-td data last">2.85</td>
<td class="data-td data last">-0.23</td>
</tr>
<tr class="tbl-data">
<td class="data-td last font-weight-normal">Shopify Inc</td>
<td class="data-td data last">SHOP</td>
<td class="data-td data last">1.82</td>
<td class="data-td data last">-0.23</td>
</tr>
</tbody>
</table>
</div>
<br />
<p class="chart-disclosure"><i>Source: BUZZ Holdings ULC, Bloomberg. Past performance is no guarantee of future results. Index performance is not illustrative of fund performance. Not intended as a recommendation to buy or to sell any of the securities mentioned herein.</i></p>
<h2>Sentiment Stock Highlight &ndash; Carvana Co.</h2>
<p>Returning to the BUZZ Index this month is Carvana Co. (NYSE: CVNA); once a thriving used-car retailer, CVNA saw a significant boost in its business during the disruptions caused by the COVID lockdowns in 2020, primarily due to the surge in used car prices. However, as the world gradually returned to normalcy and used vehicle prices began to decline, CVNA found itself burdened with a substantial inventory of cars it had acquired at higher prices.</p>
<p>Adding to its challenges, the aggressive increase in interest rates over the past two years resulted in a sharp decline in used car sales, further exacerbating CVNA's financial woes. This downward spiral led to a staggering 90% decline in the company's stock between August 2021 and August 2022, pushing CVNA perilously close to bankruptcy earlier this year.</p>
<p>However, in a turn of events, CVNA successfully restructured its debt with creditors and raised fresh capital in July. Since then, CVNA's share price has staged a remarkable comeback, surging by over 500% from its lows. This resurgence in performance has rekindled positive investor sentiment towards the stock. This month, CVNA is the largest new addition to the BUZZ Index, with a 1.54% weight.</p>
<h3>Carvana Co Stock Price | April 2017 &ndash; October 2023</h3>
<p><img class="img-responsive w-100" src="https://www.vaneck.com/contentassets/86fc717ba68143158933009a1516038e/3754_buzz-oct-2023-blog_chart-1_2023.10_v1_blog.svg" alt="Carvana Stock Price" width="960" height="540" /></p>
<p class="chart-disclosure"><i>Source: BUZZ Holdings ULC, Bloomberg. Past performance is no guarantee of future results. Index performance is not illustrative of fund performance. Not intended as a recommendation to buy or to sell any of the securities mentioned herein.</i></p>
<h2>BUZZ Index October 2023 Rebalance Highlights</h2>
<p><strong>NextEra Energy Inc.</strong></p>
<p>Making its debut in the BUZZ Index this month is NextEra Energy (NYSE: NEE), a notable player in the energy utility sector in the United States. Founded with roots tracing back to the 1920s, NextEra has evolved into the third-largest utility company in the country, primarily operating in the state of Florida. Distinguished by its commitment to clean energy, the company currently sources approximately 40% of its energy from non-fossil fuel alternatives like wind and solar. Over the years, it has earned the distinction of being the world's largest renewable energy generator.</p>
<p>NextEra's impressive journey has mirrored its stock performance, which has soared by a remarkable 800% since the Global Financial Crisis. However, on September 27th, the company's management surprised the market by revising its downward growth outlook. This unexpected move led to a cascade of analyst downgrades and a subsequent 30% decline in the stock over the following two weeks.</p>
<p>Interestingly, this drop in stock price has sparked a surge in investor sentiment, as some may perceive the correction as an excessive reaction and a compelling buying opportunity. Consequently, NextEra Energy made its entrance into the BUZZ Index this month, carrying a weight of 0.65%.</p>
<p>For more on rebalancing results and a full breakdown of index constituents added and removed for the month, view the <strong><a href="https://www.vaneck.com/us/en/investments/social-sentiment-etf-buzz/buzz-reconstitution.pdf" title="BUZZ VanEck Social Sentiment ETF" target="_blank" rel="noopener">BUZZ Index reconstitution</a></strong> report.</p>
<p>To receive more <a href="https://www.vaneck.com/us/en/insights/thematic-investing/" title="Thematic Investing Insights"><strong>Thematic Investing</strong></a> insights, <a href="https://www.vaneck.com/us/en/subscribe/" title="Subscription Center"><strong>sign up in our subscription center</strong></a>.</p>
<style>
    .wrapped-div {
        max-width: 100%;
    }

    @media (max-width: 1240px) {
        .wrapped-div {
            overflow-x: scroll;
        }
    }

    .wrapped-div-sector {
        max-width: 100%;
        overflow-x: scroll;
    }
</style>
]]></content:encoded>
</item><item rdf:about="https://www.vaneck.com/us/en/blogs/income-investing/clos-gain-amid-surge-in-yields/">
  <title>CLOs Gain Amid Surge in Yields></title>
  <link>https://www.vaneck.com/us/en/blogs/income-investing/clos-gain-amid-surge-in-yields/</link>
  <description><![CDATA[CLOs outperformed investment-grade and high yield bonds in September as fixed-rate debt continues to face headwinds in rising Treasury yields.]]></description>
  <dc:creator> </dc:creator>
  <dc:date>10/23/2023 06:30:00</dc:date>
<content:encoded><![CDATA[

<p><a href="https://www.vaneck.com/us/en/investments/clo-etf-cloi/overview/" title="CLOI - VanEck CLO ETF"><strong>The VanEck CLO ETF</strong></a> (the &ldquo;Fund&rdquo;) remains conservatively positioned relative to its benchmark, the J.P. Morgan CLO Index, as we expect downgrades to increase into 2024 as the impact of higher interest rates materializes. The Fund had approximately 90% exposure to AAA rated CLOs in September, versus under 70% in the benchmark. However, riskier tranches outperformed in the quarter, resulting in underperformance versus benchmark. Security selection is key in this environment, and the asset class&rsquo;s high all-in yields and near zero interest rate sensitivity have driven outperformance versus other fixed income asset classes as rates have increased sharply across the curve. Against this backdrop with risks tilted to the downside amid tight valuations, we continue to position the Fund conservatively with the ability to shift into lower rated tranches when spreads widen.</p>
<h2>Market Update</h2>
<p>CLOs generated positive total returns across the capital stack in September, the sixth straight month of positive returns, with returns primarily driven by positive carry. The technical backdrop remained supportive as the strong levels of new issuance and a return of refinance and reset transactions. US Treasury rates traded sharply higher during the month with 5- and 10-year Treasury rates increasing 35 basis points (bps) and 46 bps, respectively. The move higher in longer-term Treasury yields extended into the third month, bringing the cumulative increase to 100 bps for both the 10- and 30-year US Treasuries relative to recent mid-July lows, with 10-year US Treasuries ending the month at the highest level since 2007. The move was less pronounced on the front-end of the yield curve with rates increasing 40 bps during this period for the 2-year yield.</p>
<p>The Consumer Price Index (CPI) recorded a 3.7% year-over-year increase in September and August compared to a 3.2% pace in July. The Federal Reserve kept interest rates unchanged at its meeting in September with dot-plot projections pointing to interest rates that are expected to stay above 5% through the end of next year. The move to a hawkish stance, relative to June, kept pressures on interest rates to move higher.</p>
<p>CLOs underperformed bank loans, but outperformed investment grade credit and high yield bonds during the month as fixed-rate debt continues to face headwinds from the rise in Treasury yields.</p>
<div class="wrapped-div">
<table style="width: 600px;">
<tbody>
<tr class="tbl-data">
<td class="tbl-header last">Asset class</td>
<td class="tbl-header last">Q3 2023 Return (%)</td>
<td class="tbl-header last">Yield to Worst (%)</td>
<td class="tbl-header last">Spreads (bps)</td>
</tr>
<tr class="tbl-data">
<td class="data-td last font-weight-normal">CLOs</td>
<td class="data-td data last">3.06</td>
<td class="data-td data last">7.45</td>
<td class="data-td data last">243</td>
</tr>
<tr class="tbl-data">
<td class="data-td last font-weight-normal pl-3">AAA</td>
<td class="data-td data last">2.43</td>
<td class="data-td data last">6.49</td>
<td class="data-td data last">168</td>
</tr>
<tr class="tbl-data">
<td class="data-td last font-weight-normal pl-3">AA</td>
<td class="data-td data last">3.05</td>
<td class="data-td data last">6.92</td>
<td class="data-td data last">233</td>
</tr>
<tr class="tbl-data">
<td class="data-td last font-weight-normal pl-3">A</td>
<td class="data-td data last">4.09</td>
<td class="data-td data last">7.50</td>
<td class="data-td data last">292</td>
</tr>
<tr class="tbl-data">
<td class="data-td last font-weight-normal pl-3">BBB</td>
<td class="data-td data last">5.83</td>
<td class="data-td data last">9.20</td>
<td class="data-td data last">461</td>
</tr>
<tr class="tbl-data">
<td class="data-td last font-weight-normal pl-3">BB</td>
<td class="data-td data last">6.99</td>
<td class="data-td data last">14.16</td>
<td class="data-td data last">946</td>
</tr>
<tr class="tbl-data">
<td class="data-td last font-weight-normal">Investment Grade Corporates</td>
<td class="data-td data last">-2.70</td>
<td class="data-td data last">6.08</td>
<td class="data-td data last">125</td>
</tr>
<tr class="tbl-data">
<td class="data-td last font-weight-normal">U.S. Agg</td>
<td class="data-td data last">-3.18</td>
<td class="data-td data last">5.44</td>
<td class="data-td data last">56</td>
</tr>
<tr class="tbl-data">
<td class="data-td last font-weight-normal">Leveraged Loans</td>
<td class="data-td data last">3.34</td>
<td class="data-td data last">10.01</td>
<td class="data-td data last">451</td>
</tr>
<tr class="tbl-data">
<td class="data-td last font-weight-normal">High Yield Bonds</td>
<td class="data-td data last">0.53</td>
<td class="data-td data last">8.94</td>
<td class="data-td data last">403</td>
</tr>
</tbody>
</table>
</div>
<br />
<p class="chart-disclosure">Source: JP Morgan and ICE Data Indices as of 9/30/202232. CLOs represented by J.P. Morgan Collateralized Loan Obligation Index, AAA Rated CLOs represented by J.P. Morgan CLO AAA Index, AA Rated CLOs represented by J.P. Morgan CLO AA Index, A Rated CLOs represented by J.P. Morgan CLO A Index, BBB Rated CLOs represented by J.P. Morgan CLO BBB Index, BB Rated CLOs represented by J.P. Morgan CLO BB Index, Investment Grade Corporates represented by ICE BofA US Corporate Index, US Agg is represented by the ICE BofA US Broad Market, Leveraged Loans represented by JP Morgan Leveraged Loan Index and High Yield Bonds represented by ICE BofA US High Yield Index.</p>
<p>CLO new issue supply decreased month-over-month, but remained robust overall, with $9.6bn pricing during the month, following $11.5bn in August. Year-to-date new issuance of $83.9bn is now trailing year-to-date activity in 2022 by 21%. Refi and reset activity continued in September with $3.1bn pricing, after $4.0bn in August. Compared to the first three quarters of 2022, year-to-date refi and reset volumes are 43% lower and 63% lower, respectively.</p>
<p>In the secondary market, TRACE supply was higher at $20.2bn from $19.7bn in August, the highest volume of the year. Investment grade volumes increased to $15.9bn from $15.7bn and below investment grade volumes increased to $4.3bn from $4.0bn. Total BWIC volumes increased to the highest level of the year at $5.7bn in September, up from $5.6bn in August.</p>
<p>The trailing twelve-month default rate within the Morningstar US Leveraged Loan Index fell to 1.27% in September, down from 1.55% in August, in the absence of new defaults. We anticipate the default rate to remain below historical averages in the near-term for the leveraged loan market, notwithstanding ongoing interest rate increases and indications that the Fed will maintain higher interest rates throughout 2023. However, our expectations are that defaults will increase in 2024 to 3%-4%, above the long-term historical average of roughly 3%.</p>
<p>CLO fundamentals were mixed month-over-month. CCC buckets ticked higher month-over-month while the exposure to loans pricing below $90 and $80 decreased alongside the rally in the loan market. US CLO spreads were tighter at the AAA level, while the rest of the cap stack was flat to slightly wider over the month.</p>
<h2>Portfolio Strategy</h2>
<p>As central banks increased interest rates in 2022 and thus far in 2023, the borrowing rate for leveraged loan borrowers has risen. Higher interest rates have yet to drive a material deterioration in credit metrics within the loan market or undercut economic growth. However, with expectations for rates to remain higher for longer, increased coupon payments for borrowers means that interest coverage ratios will decline as the lagged effect of rate increases takes hold. Ultimately, the result will be higher leverage and lower interest coverage ratios, leading to the risk of downgrade.</p>
<p>Thus far in 2023, we have looked to benefit from continued increases in interest rates, allowing for increased coupon income. Given expectations for the pace of downgrades to pick up to end 2023 and into 2024, we continue to position the Fund conservatively with the ability to shift into lower rated tranches when spreads widen. The positioning in the top part of the capital stack in CLOs (AAA/AA/A) buffers investors from lower tranche downgrades or losses at the equity tranche level.</p>
<p>Buying in the primary market allows for wider spreads compared to the secondary market, although primary issuance continues to trail the pace from the last two years and is expected to remain muted given challenges to CLO creation, although the arbitrage has improved with lower liability costs. While spreads tightened materially since May, we continue to find attractive opportunities in both the primary and secondary markets, where purchases in the secondary market below par provide for attractive positive convexity.</p>
<h3>CLOI Total Return and Credit Allocation</h3>
<p><img class="img-responsive w-100" src="https://www.vaneck.com/contentassets/dd6a2913a46b4a809f51e0c21d65361d/3752_cloi-october-2023_chart-1_2023.10_v1_blog.svg" alt="CLOI total return continues to surge, while we continue to position the Fund conservatively." /></p>
<p class="chart-disclosure"><strong>Source: FactSet, JPMorgan, VanEck, As of September 30, 2023.</strong> Index performance is not representative of Fund performance. It is not possible to invest directly in an&nbsp;index.</p>
<h2>Outlook Ahead</h2>
<p>While the end of the tightening cycle is welcome news for many, tighter conditions for longer could create additional stress in the market, particularly for weaker borrowers. In addition, some cracks are showing in the economic backdrop. Job openings have decreased, indicating companies are pulling back from hiring new workers, consumer confidence has fallen amid nascent employment concerns, and credit card losses are rising at the fastest pace in nearly 30 years as the benefit of increased savings from Covid-era policies fades. Investors also must consider the impact of auto strikes, the end of student loan forbearance, and a potential government shutdown in November at expiration of the recently enacted 45-day spending bill.</p>
<p>Despite these downside risks, the macro outlook continues to be resilient enough to support our modestly increasing, but not spiking, default outlook, as the most extreme downside scenarios no longer seem as likely. Issuer default rates have ticked higher off historic lows but still remain below longer-term averages. Also of note, defaulting issuers continue to come from all but the most cyclical sectors which leads us to believe that macro conditions are not yet necessarily driving defaults. We are still cautious about the path of earnings in the face of restrictive monetary policy, while acknowledging the current level of fundamental strength.</p>
<p>Against this backdrop, the CLO market continued to rally since the lows in May. New issuance picked up significantly in recent months as managers looked to take advantage of tightening liability spreads. Despite the higher-than-expected supply, AAA and AA secondary spreads ended the month back down near Q1 levels while A-BB spreads are at or near the tights of the year as CLOs continue to see strong demand given high all-in yields. There was also a continuation in refinancing and reset activity as portfolios constructed with purchases in the secondary market took advantage of the recovery in the loan market and tighter CLO spreads. Should the loan and CLO markets continue to rally, we would expect to see more portfolios benefit from the significant redemption optionality in CLOs.</p>
<p>We expect earnings dispersion for underlying issuers heading into 2024 which means manager selection remains key. We anticipate CLO spreads to trade in a range for the next 3-6 months and see spreads and yields attractive under most market scenarios over the next twelve months. We also expect the CLO market to continue to be supported by the technical backdrop. Given tighter valuations and risks tilted to the downside, we continue to position the Fund in investment grade tranches. We expect that the backdrop will begin to improve within the next six months, at which point we would begin to add BBB and below investment grade rated classes to the Fund.</p>
<div class="wrapped-div">
<table style="width: 100%;">
<tbody>
<tr class="tbl-data">
<td class="tbl-header last" colspan="9">Average Annual Total Returns (%) as of September 30, 2023</td>
</tr>
<tr class="tbl-data">
<td class="data-td last">&nbsp;</td>
<td class="data-head last">1 Month<sup>*</sup></td>
<td class="data-head last">3 Month<sup>*</sup></td>
<td class="data-head last">YTD</td>
<td class="data-head last">1 Year</td>
<td class="data-head last">3 Year</td>
<td class="data-head last">5 Year</td>
<td class="data-head last">10 Year</td>
<td class="data-head last">LIFE 6/21/2022</td>
</tr>
<tr class="tbl-data">
<td class="data-td last">CLOI (NAV)</td>
<td class="data-td data last">0.69</td>
<td class="data-td data last">2.48</td>
<td class="data-td data last">7.16</td>
<td class="data-td data last">10.55</td>
<td class="data-td data last">-</td>
<td class="data-td data last">8.26</td>
</tr>
<tr class="tbl-data">
<td class="data-td last">CLOI (Share Price)</td>
<td class="data-td data last">0.62</td>
<td class="data-td data last">2.42</td>
<td class="data-td data last">6.99</td>
<td class="data-td data last">9.35</td>
<td class="data-td data last">-</td>
<td class="data-td data last">8.36</td>
</tr>
<tr class="tbl-data">
<td class="data-td last">J.P. Morgan Collateralized Loan Obligation Index</td>
<td class="data-td data last">0.60</td>
<td class="data-td data last">3.06</td>
<td class="data-td data last">7.64</td>
<td class="data-td data last">10.91</td>
<td class="data-td data last">-</td>
<td class="data-td data last">8.17</td>
</tr>
</tbody>
</table>
</div>
<br />
<p class="chart-disclosure"><sup>*</sup>&nbsp;Returns less than one year are not annualized.</p>
<p class="chart-disclosure"><strong>The performance data quoted represents past performance. Past performance is not a guarantee of future results. Investment return and principal value of an investment will fluctuate so that an investor's shares, when redeemed, may be worth more or less than their original cost. Performance may be lower or higher than performance data quoted. Please call 800.826.2333 or visit vaneck.com for performance current to the most recent month ended.</strong></p>
<p class="chart-disclosure"><strong>The gross expense ratio for CLOI is 0.4%. CLOI Fees &amp; Expenses: Van Eck Associates Corporation (the &ldquo;Adviser&rdquo;) will pay all expenses of the Fund, except for the fee payment under the investment management agreement, acquired fund fees and expenses, interest expense, offering costs, trading expenses, taxes and extraordinary expenses. Notwithstanding the foregoing, the Adviser has agreed to pay the offering costs until at least May 1, 2024.</strong></p>
<p class="chart-disclosure"><strong>The net expense ratio for CLOI is 0.4%.</strong></p>
<p class="chart-disclosure">The "Net Asset Value" (NAV) of a Fund is determined at the close of each business day, and represents the dollar value of one share of the fund; it is calculated by taking the total assets of the fund, subtracting total liabilities, and dividing by the total number of shares outstanding. The NAV is not necessarily the same as the ETF 's intraday trading value. Investors should not expect to buy or sell shares at NAV.</p>
<p>To receive more <a href="https://www.vaneck.com/us/en/insights/income-investing/" title="Income Investing insights"><strong>Income Investing</strong></a> insights, <a href="/link/5f45412c2143400497908cea2897f7d3.aspx" title=" Subscription Center"><strong>sign up in our subscription center</strong></a>.</p>
<style type="text/css">
     .wrapped-div {
     max-width: 100%;
     }
    
     @media (max-width: 1024px) {
     .wrapped-div {
     overflow-x: scroll;
     }
     }
    
     .wrapped-div-sector {
     max-width: 100%;
     overflow-x: scroll;
     }
    </style>
]]></content:encoded>
</item><item rdf:about="https://www.vaneck.com/us/en/blogs/natural-resources/can-fundamentals-outweigh-uncertainties/">
  <title>Can Fundamentals Outweigh Uncertainties?></title>
  <link>https://www.vaneck.com/us/en/blogs/natural-resources/can-fundamentals-outweigh-uncertainties/</link>
  <description><![CDATA[Resource companies, bolstered by structural advantages and years of efficiency-focused operations, may be uniquely positioned to fill supply gaps facing the global energy landscape.]]></description>
  <dc:creator>Shawn Reynolds</dc:creator>
  <dc:date>10/23/2023 06:30:00</dc:date>
<content:encoded><![CDATA[

<h2>Oil companies extend their gains</h2>
<p>The third quarter of 2023 largely extended trends seen in the second quarter. The Oil &amp; Gas sector continued its dominance within the resource equity landscape while most other sectors faced challenges.</p>
<p>U.S. exploration &amp; production (E&amp;P) companies approached their November 2019 monthly crude oIl production record in July, achieving an output of 12.99 million barrels per day. Remarkably, this growth was realized with fewer rigs than in 2019, underscoring the increased efficiencies of these companies. Furthermore, their reinvestment rates, which denote capital expenditures in relation to operational cash flow, remained below 2020 levels, reflecting a cautious stance on capital spending to prioritize shareholder value.<sup>i</sup></p>
<p>Despite the conservative spending by E&amp;Ps, oil servicers held their ground. Stable oil prices and industry-wide cost inflation have enabled these servicers to maintain pricing, especially in offshore services like deepwater drilling. Cash-rich integrated oil companies intensified their exploration efforts in these areas. However, a point of concern emerges from dwindling conventional oil discoveries, which hit a five-year low during the first half of the year.<sup>ii</sup></p>
<h3>Valuation Total Conventional Discoveries (January - June)</h3>
<p><img class="img-responsive w-100" src="https://www.vaneck.com/contentassets/c60bd751efc141caaac454ae033f2d07/3743_create-3q-2023-grf_chart-1_2023.10_v1_blog.svg" alt="line/bar chart showing Total Conventional Discoveries of Liquids and Gas" /></p>
<p class="chart-disclosure">Source: Rystad Energy. Data as of August 2023.</p>
<h2>Continued pressure on all things green</h2>
<p>Battery metal companies, chiefly lithium producers, faced headwinds this quarter. The combination of rising competition and the lingering effects of elevated lithium prices from 2021/2022 led to concerns about potential market oversupply in 2024 and beyond. These apprehensions were manifested in significant price reductions, with lithium hydroxide experiencing a drop of over 50% during the quarter.</p>
<p>Battery manufacturers confronted challenges due to increased input costs and capital expenditures and research &amp; development (R&amp;D) efforts, aimed at staying ahead of competitors. Additionally, solar and wind equipment producers continue to grapple with the impacts of prolonged high-interest rates, resulting in subdued earnings growth forecasts. Growing backlogs for grid connections in renewable projects have further dampened investor optimism.</p>
<p>The agricultural sector presented a varied performance landscape this quarter. Fertilizer producers faced a divide in demand, with dwindling interest in potash contrasted by an uptick in nitrogen-based fertilizers, largely attributed to ongoing natural gas shortages. Grain processors remain optimistic, balancing concerns about potential margin reductions from declining corn and soy prices with a bullish outlook for the latter half of the year. <a href="/us/en/blogs/natural-resources/can-fundamentals-outweigh-uncertainties/grf-quarterly-commentary-3q-2023.pdf" title="bar chart showing Valuation Metrics Comparisons between Global Equities and Resource Equities" target="_blank" rel="noopener"><strong>(An expanded PDF version of this commentary, including fund specific information can be downloaded here)</strong></a>.</p>
<h2>Looking ahead: fundamentals should outweigh uncertainties</h2>
<p>From a broader perspective, our positive long-term stance on resource equities remains unchanged. The evolving global energy landscape hints at potential supply gaps across several commodities. As countries grapple with the complexities of transitioning to renewables, geopolitical tensions pose threats to the supply chain for vital clean energy materials.</p>
<p>Resource companies, bolstered by structural advantages and years of efficiency-focused operations, are uniquely positioned. Their valuable assets, strong financial health, commitment to shareholder value and attractive valuations make them compelling investment opportunities, in our view.</p>
<h3>Valuation Metrics Comparison (10-Year Average vs. Current)</h3>
<p><img class="img-responsive w-100" src="https://www.vaneck.com/contentassets/c60bd751efc141caaac454ae033f2d07/3743_create-3q-2023-grf_chart-2_2023.10_v1_blog.svg" alt="Valuation Metrics Comparison (10-Year Average vs. Current)" /></p>
<p class="chart-disclosure">Source: FactSet, VanEck. Data as of September 30, 2023. "Global Equities" represented by the MSCI All-Country World Index (ACWI). "Resource Equities" represented by the S&amp;P Global Natural Resources Index. Data definitions included at the end of this commentary.</p>
<p>However, resource equities might still face near-term macroeconomic uncertainties that have influenced returns intermittently over recent years. Fluctuations in inflation, interest rates and the U.S. dollar's strength, combined with varying investor risk appetites, are critical factors. These challenges may persist given the current limited visibility on long-term economic growth.</p>
<p>Our investment approach remains rooted in thorough company evaluations, helping us pinpoint businesses that can navigate these immediate challenges and align with our broader, optimistic long-term vision.</p>
<p>To receive more <strong><a href="https://www.vaneck.com/us/en/insights/natural-resources/" title="Natural Resources Insights">Natural Resources</a> </strong>insights,<strong><a href="https://www.vaneck.com/us/en/subscribe/" title="Subscription Center">sign up in our subscription center</a>.</strong></p>
]]></content:encoded>
</item><item rdf:about="https://www.vaneck.com/us/en/blogs/emerging-markets-bonds/the-often-overlooked-and-misunderstood-bond-buy/">
  <title>The Often Overlooked and Misunderstood Bond Buy></title>
  <link>https://www.vaneck.com/us/en/blogs/emerging-markets-bonds/the-often-overlooked-and-misunderstood-bond-buy/</link>
  <description><![CDATA[Rising rates and emerging risks in developed markets could spell trouble for bond portfolios. As such, we believe investors need to take another look at this often-overlooked bond buy.]]></description>
  <dc:creator>Eric Fine</dc:creator>
  <dc:date>10/20/2023 16:01:38</dc:date>
<content:encoded><![CDATA[


<p>Many U.S. investors, in general, tend to shrug off global markets, particularly when it comes to bonds. After nearly a decade and a half of declining yields and low volatility for developed markets, the past few years have been characterized by rising rates and emerging risks in global bond markets. As such, we believe investors may hold a number of misconceptions and need to take another look at an often overlooked asset class, emerging markets bonds, as we believe they may add resilience to an overall bond portfolio.</p>
<p>Below we explore three reasons investors should consider allocating to emerging market bonds in the current market environment. <a href="/us/en/blogs/emerging-markets-bonds/the-often-overlooked-and-misunderstood-bond-buy.pdf" title="The Often Overlooked and Misunderstood Bond Buy" target="_blank" rel="noopener"><strong>View here for a PDF version of this blog</strong></a>.</p>
<h2>1. Emerging markets have Stronger Fundamentals Than Developed Markets</h2>
<p>The age-old debate between Emerging Markets and Developed Markets has taken an intriguing twist. Contrary to the historical norm, EMD showcases stronger fundamentals than the developed markets. While developed markets grapple with a higher debt-to-GDP ratio of 124.3%, emerging markets have a moderate 69.9% debt-to-GDP ratio. Emerging market fundamentals look compelling relative to developed markets across a range of additional metrics, including fiscal deficits and current account deficits. Emerging market debt (EMD) also boasts higher yields ranging from 5.74% to 8.26%* and significantly outpacing developed markets. This shift underscores a pivotal narrative: In a world wary of escalating debt in developed markets, EMD is emerging as a beacon of fiscal responsibility.</p>
<p><strong>Key Points:</strong></p>
<ul class="content-list">
<li class="mt-2">While developed markets grapple with a higher debt-to-GDP ratio of 124.3%, emerging markets have a moderate 69.9% debt-to-GDP ratio</li>
<li class="mt-2">EMD also has higher yields, ranging from 5.74% to 8.26% and significantly outpacing developed markets, even the U.S.</li>
<li class="mt-2">In a world wary of escalating developed market debts, EMD is emerging as a beacon of fiscal responsibility.</li>
</ul>
<h3>The Market Has Rewarded Responsible Policies</h3>
<p><img loading="lazy" class="img-responsive w-100" src="https://www.vaneck.com/contentassets/31117a7b4e2f404ba37e3884b5c89310/4995_update-emb_chart-1_2024.10_v1_blog.svg" alt="EM Bonds Have Weathered the Storm Better" /></p>
<p class="chart-disclosure">Source: VanEck as of 03/31/2022 - 09/30/2024. The performance data quoted represents past performance. Past performance is not a guarantee of future results. EM represents 50% J.P. Morgan GBI-EM Global Diversifi ed Index/50% J.P. Morgan EMBI Global Diversifi ed Index. DM is represented by the ICE BofA Global Broad Market Index. U.S Broad Market is represented by the ICE BofA US Broad Market Index.</p>
<h2>2. Emerging Markets Have Lower Debt</h2>
<p>Notwithstanding China&rsquo;s more recent policy direction,<a href="https://www.vaneck.com/us/en/blogs/emerging-markets-bonds/meeting-demand-for-income-in-a-year-of-rising-rates/" title="Meeting Demand for Income in a Year of Rising Rates"><strong> emerging markets, in general, have moved much more quickly to increase interest rates compared to the U.S. </strong></a> and other developed markets in order to stay ahead of inflation. For investors, this fundamental backdrop means less issuance and rolling over of debt, a favorable supply/demand dynamic that should help support EM bonds. In addition, if needed, EM central banks can hike interest rates without bankrupting the government (unlike the challenges we saw in the United Kingdom or even the U.S. during its budget showdowns).</p>
<h3>Debt Levels of EM Countries Are Relatively Attractive</h3>
<p><strong>General Government Gross Debt, % GDP </strong></p>
<p><img loading="lazy" class="img-responsive w-100" src="https://www.vaneck.com/contentassets/31117a7b4e2f404ba37e3884b5c89310/4995_update-emb_chart-2_2024.10_v1_blog.svg" alt="Debt Levels of EM Countries Are Relatively Attractive" /></p>
<p class="chart-disclosure"><strong>Source: </strong>VanEck Research; Bloomberg LP. Data as of September 2024.<br />Past performance is not indicative of future results. Please see important disclosures and definitions at the end of the blog.</p>
<h2>3. EM Has Independent Central Banks</h2>
<p>The primary focus of EM central banks is to focus on controlling inflation, and they do this by maintaining high real interest rates. For investors, the result has been not only higher nominal yields but higher real yields. The benefits to EM local currency investors are a more substantial level of income that is not eroded by the loss of purchasing power (through a potentially weaker currency). Additionally, if the central bank's actions are successful in controlling inflation, it can lead to a stronger and more stable economy.</p>
<h3>EM Central Banks&rsquo; Focus on Inflation Means Higher Income for Investors</h3>
<p><strong>Real Policy Rates in 12 Months if Inflation and Rates Expectations Materialize (%)</strong></p>
<p><img loading="lazy" class="img-responsive w-100" src="https://www.vaneck.com/contentassets/31117a7b4e2f404ba37e3884b5c89310/4995_update-emb_chart-3_2024.10_v1_blog.svg" alt="Real Policy Rates in EM and DM (%), 12m from now if current expectations for rates and inflation materialize" /></p>
<p class="chart-disclosure"><strong>Source: </strong>VanEck Research; Bloomberg LP. Data as of September, 2024.</p>
<h3>Real Policy Rates (adjusted by trailing CPI) in EM and DM, (%)</h3>
<p><img loading="lazy" class="img-responsive w-100" src="https://www.vaneck.com/contentassets/31117a7b4e2f404ba37e3884b5c89310/4995_update-emb_chart-4_2024.10_v1_blog.svg" alt="Real Policy Rates in EM and DM, %" /></p>
<p class="chart-disclosure"><strong>Source: </strong>VanEck Research; Bloomberg LP. Data as of August 2024.<br />Past performance is not indicative of future results. Please see important disclosures and definitions at the end of the blog.</p>
<p>The VanEck Emerging Markets Bond Fund was one of the first blended emerging markets bond strategies in the market. The Fund is actively managed with the flexibility to invest in sovereign and corporate debt in hard and local-currency. The Fund&rsquo;s broad universe and bottom-up, high active share approach drives the opportunity to potentially outperform the benchmark over a market cycle.</p>
<p>To receive more <a href="https://www.vaneck.com/us/en/insights/emerging-markets-bonds/" title="Emerging Markets Bonds Insights"><strong>Emerging Markets Bonds</strong></a> insights, <a href="https://www.vaneck.com/us/en/subscribe/" title="Subscription Center"><strong>sign up in our subscription center</strong></a></p>
]]></content:encoded>
</item><item rdf:about="https://www.vaneck.com/us/en/blogs/emerging-markets-equity/emerging-markets-turkey-shines-brazil-falters/">
  <title>Emerging Markets - Turkey Shines, Brazil Falters></title>
  <link>https://www.vaneck.com/us/en/blogs/emerging-markets-equity/emerging-markets-turkey-shines-brazil-falters/</link>
  <description><![CDATA[Allocation and stock selection in Turkey, Georgia and Kazakhstan outperformed, while Brazil allocation resulted in an overall negative quarterly performance for the Fund.]]></description>
  <dc:creator>David Semple</dc:creator>
  <dc:date>10/18/2023 06:30:00</dc:date>
<content:encoded><![CDATA[

<p>The VanEck Emerging Markets Fund (the &ldquo;Fund&rdquo;) slightly outperformed the MSCI Emerging Markets Investable Market Index (&ldquo;MSCI EM IMI&rdquo; or the &ldquo;Index&rdquo;) on the quarter-to-date basis ending September 30, 2023 (-1.96% for Fund vs -2.12% for Index). This outperformance was principally driven by allocation (weighting) and stock selection in Turkey, Georgia and Kazakhstan. After a strong first half of the year, the Fund&rsquo;s overweight to Brazil contributed negatively to its performance last quarter.</p>
<p>Bank of Georgia, not held in the benchmark index (+21.1% quarterly return with an average Fund weight of 3.7%*), continues to be a standout performer. Kaspi.kz, a leading payments platform in Kazakhstan, also boosted relative performance (+23.7% quarterly return with an average Fund weight of 3.7%*), and is another name not held in the benchmark index.</p>
<p>Both of these examples underscore the Fund's objective, which is to find long-term structural growth companies at a reasonable price (S-GARP). Our process is driven by stock selection conducted through rigorous due diligence with a focus on active management interaction and quality, governance and business models with visibility, innovation and low disruption risk.</p>
<div class="wrapped-div">
<table width="100%">
<tbody>
<tr class="tbl-data">
<td class="tbl-header last" colspan="7">Average Annual Total Returns (%) as of September 30, 2023</td>
</tr>
<tr class="tbl-data">
<td class="data-head last">&nbsp;</td>
<td class="data-head last">3Q23<sup>&dagger;</sup></td>
<td class="data-head last">YTD</td>
<td class="data-head last">1 Yr</td>
<td class="data-head last">3 Yr</td>
<td class="data-head last">5 Yr</td>
<td class="data-head last">10 Yr</td>
</tr>
<tr class="tbl-data">
<td class="data-td last">Class A: NAV (Inception 12/20/93)</td>
<td class="data-td data last">-1.96</td>
<td class="data-td data last">2.20</td>
<td class="data-td data last">17.82</td>
<td class="data-td data last">-7.97</td>
<td class="data-td data last">-1.37</td>
<td class="data-td data last">0.76</td>
</tr>
<tr class="tbl-data">
<td class="data-td last">Class A: Maximum 5.75% load</td>
<td class="data-td data last">-7.60</td>
<td class="data-td data last">-3.67</td>
<td class="data-td data last">11.04</td>
<td class="data-td data last">-9.77</td>
<td class="data-td data last">-2.53</td>
<td class="data-td data last">0.17</td>
</tr>
<tr class="tbl-data">
<td class="data-td last">Class I: NAV (Inception 12/31/07)</td>
<td class="data-td data last">-1.83</td>
<td class="data-td data last">2.68</td>
<td class="data-td data last">18.61</td>
<td class="data-td data last">-7.48</td>
<td class="data-td data last">-0.86</td>
<td class="data-td data last">1.28</td>
</tr>
<tr class="tbl-data">
<td class="data-td last">MSCI EM IMI</td>
<td class="data-td data last">-2.12</td>
<td class="data-td data last">3.38</td>
<td class="data-td data last">13.21</td>
<td class="data-td data last">-0.29</td>
<td class="data-td data last">1.28</td>
<td class="data-td data last">2.39</td>
</tr>
<tr class="tbl-data">
<td class="data-td last">MSCI EM Index</td>
<td class="data-td data last">-2.93</td>
<td class="data-td data last">1.82</td>
<td class="data-td data last">11.70</td>
<td class="data-td data last">-1.73</td>
<td class="data-td data last">0.55</td>
<td class="data-td data last">2.07</td>
</tr>
</tbody>
</table>
</div>
<br />
<p class="chart-disclosure"><strong>The table presents past performance which is no guarantee of future results and which may be lower or higher than current performance. Returns reflect applicable fee waivers and/or expense reimbursements. Had the Fund incurred all expenses and fees, investment returns would have been reduced. Investment returns and Fund shares values will fluctuate so that investor's shares, when redeemed, may be worth more or less than their original cost. Fund returns assume that dividends and capital gains distributions have been reinvested in the Fund at net asset value (NAV). Index returns assume that dividends of the Index constituents in the Index have been reinvested. Performance information current to the most recent month end is available by calling 800.826.2333 or by visiting vaneck.com.</strong></p>
<p class="chart-disclosure"><strong>Expenses: Class A: Gross 1.54%; Net 1.54%; Class I: Gross 1.19%; Net 1.01%. Expenses are capped contractually until 5/1/24 at 1.60% for Class A and 1.00% for Class I. Caps exclude acquired fund fees and expenses, interest, trading, dividends, interest payments of securities sold short, taxes and extraordinary expenses.</strong></p>
<h2 id="MarketReview" class="jump-link-nav anchored-block" data-jumplink-title="Market Review">Market Review</h2>
<p>The MSCI EM IMI returned -2.12% during the third quarter of 2023. Below we highlight the main developments that we believe affected the asset class:</p>
<p><strong>Emerging Markets (&ldquo;EM&rdquo;) Equities Fell Slightly, but Outperformed Developed Markets (&ldquo;DM&rdquo;):</strong> The third quarter of 2023 saw negative performance from most of the large weights in the benchmark index. India and Turkey notched positive performance quarters, while Taiwan Region, South Korea and China contributed negatively. After a strong start to the year, Brazil fell in Q3, but Brazil&rsquo;s performance remains decidedly up year-to-date.</p>
<p><strong>EM Central Banks Have Begun Cutting Rates, with LatAm Leading:</strong> Although EM central banks are leading the rate cutting cycle, and reaping the benefits of falling core inflation, the current narrative of higher rates for longer in DM has been unhelpful for valuations and has spurred a dollar rally which is typically negative for EM. Chile and Brazil have already cut their benchmark rates, while Peru has indicated that cuts are possible. Keep in mind that LatAm countries usually lead in both ways &ndash; tightening and easing &ndash; so as we see the first LatAm countries begin to cut, we would expect other EM countries to follow suit but a little later than originally expected.</p>
<p><strong>Macro Environment Supportive of Continued EM-DM Growth Differential:</strong> After falling sharply post-pandemic, the spread between EM and DM growth has rebounded sharply and is estimated to continue upwards. Historically, EM equities have performed well during cycles when GDP is rising and rates are easing. This could potentially set the stage for stronger EM performance going forward compared to DM. However, much depends on the ability of the Chinese economy to develop better momentum.</p>
<p><strong>Valuation Differentials Point to Wide Historical Comparative Discount:</strong> Across multiple time-frames and metrics, EM valuations are comparatively cheap versus their domestic counterparts. When combined with the growth differentials highlighted above, this presents a compelling valuation-based case for investing in EM. One underappreciated facet is the increasing dividend payments coming from EM companies, which is expected to continue as balance sheets and free cash flow are all generally in very good shape.</p>
<p><strong>Global Investors are Under-Positioned in EM:</strong> Compared to historical weightings, global investors are currently under-positioned in their allocations to EM exposure. In particular, managers in aggregate are very underweighted in China. While EM countries represent just over 10% of the MSCI ACWI Index, global investors hold only 6% of their weights positioned in EM. This indicates that there is money on the sidelines for this asset class, and could also indicate favorable timing from a contrarian investor perspective.</p>
<h2>Fund Review</h2>
<p>On a sector level, Consumer Staples, Financials and Health Care contributed to relative performance, while Materials, Consumer Discretionary and Industrials detracted. On a country level, Turkey, Georgia and Kazakhstan contributed to relative performance, while India, Brazil and South Korea detracted.</p>
<h2 id="TopContributors" class="jump-link-nav anchored-block" data-jumplink-title="Top Contributors">Top Contributors</h2>
<p>Top contributors to return on an absolute basis during the quarter:</p>
<ul class="content-list">
<li><strong>MLP Saglik Hizmetleri AS Class B (&ldquo;MLP&rdquo;)</strong> (2.3% of Fund net assets*) is the largest private hospital group in Turkey. The group also has a sizable medical tourism business to capitalize on the high-quality and cost-competitive care offered by its hospitals. This business line has shown very strong performance in 2022 and year to date, driven by growing international demand and increasing MLP&rsquo;s foreign currency revenues against a weakening Turkish lira. Management&rsquo;s successful efforts to deleverage and strengthen its balance sheet have also positioned MLP very favorably for further inorganic expansion and share buybacks. After very strong share price performance in 2022, the company continued to show solid operational performance this year. We continue to be excited about the growth outlook for MLP and the upcoming expansion plans within Turkey as well as its recent foray into select international markets. The company is well positioned to potentially be the consolidator of Turkey&rsquo;s private healthcare market.</li>
<li class="mt-2"><strong>Kaspi.kz JSC</strong> (4.0% of Fund net assets*) is the leading payments, marketplace and fintech platform in Kazakhstan. Kaspi&rsquo;s business model is highly profitable and leverages a well-integrated ecosystem that supports growth across all three of its business segments. The company has consistently beaten market expectations since its listing a few years ago and continues to demonstrate an impressive ability to leverage its scale and ecosystem to find new avenues for growth including online grocery and travel, which maintains our excitement about the prospects of the company.</li>
<li class="mt-2"><strong>Bank of Georgia Group Plc</strong> (3.9% of Fund net assets*) is one of the two largest banks, dominating the Georgian banking system, with more than 33% market share. During the quarter, the bank outperformed on the back of stronger than expected earnings delivered in the first half of 2023 on top of an already strong base in 2022, with return on equity remaining well above 25%. Bank of Georgia&rsquo;s management has undergone significant digitization efforts, resulting in higher efficiency and a superior customer experience.</li>
</ul>
<h2 id="TopDetractors" class="jump-link-nav anchored-block" data-jumplink-title="Top Detractors">Top Detractors</h2>
<p>Top detractors to return on an absolute basis during the quarter:</p>
<ul class="content-list">
<li><strong>Taiwan Semiconductor Manufacturing Co (&ldquo;TSMC&rdquo;)</strong> (6.2% of Fund net assets<sup>*</sup>) is the largest and global leader in integrated circuit (IC) manufacturing. As a build-to-order foundry, it provides a wide range of value-add activities: IC manufacturing, mask-making, IC design services, turnkey solutions and process development. We attribute its success to its proven, winning business model, unparalleled scale advantage, optimized execution and technology scope and depth. Our investment thesis believes that ongoing growth in mobile, rise of artificial intelligence (AI) and proliferation of Internet of Things (IoT) should result in a sustainable upside in aggregate computing power globally. TSMC, as the leading contract manufacturer of semiconductor chips, is in a good position to capitalize. Current share price weakness can be attributed, we believe, to a slightly stretched valuation as well as some negative news about capital expenditure plans and slower opening of its new foundries in the U.S.</li>
<li class="mt-2"><strong>Vamos Locacao de Caminhoes, Maquinas e Equipamentos SA (&ldquo;Vamos&rdquo;)</strong> (2.7% of Fund net assets<sup>*</sup>) is the leader in the truck, machinery and equipment rental in Brazil. They offer customized solutions to clients with long term contracts. Vamos is the largest player with 70% market share and operate in a very underpenetrated market. The primary reason for the disappointing results has been a more challenging macro scenario that has forced the company to focus from accelerating its fleet allocation to be more selective in providing contracts. The company will continue growing, but not at the pace it did in the past. However, we see a more consistent pace going forward. On the other hand, the dealership division has been very weak, due primarily to a delay by the government to provide the subsidies to farmers (&ldquo;Plano Safra&rdquo;) to buy trucks. That disbursement usually occurs in May/June, and farmers wait for the subsidies to buy their trucks, but this year it didn&rsquo;t occur until the end of August. This is a temporary impact, as there was a big rebound in September, and the business should normalize in the next quarter. We believe the issues that Vamos is experiencing are not structural and are mostly temporary. Vamos will continue to remain the consolidators on a very low penetrated truck rental market, grabbing most of the incremental market due to its competitive advantages on truck purchase and scale. We expect a recovery in Q4 23 with a positive year in 2025.</li>
<li class="mt-2"><strong>LG Chem Ltd. (&ldquo;LG&rdquo;)</strong> (1.3% of Fund net assets<sup>*</sup>) is an integrated chemical manufacturer based in Korea. Its main business domains include petrochemicals, advanced materials and energy solutions (batteries). Our investment case centers on the long-term developing strength in EV batteries, where LG&rsquo;s customers include most of the major global EV original equipment manufacturers (OEMs). LG&rsquo;s rapid capacity expansion in both South Korea and North America is expected to further build on its leadership position in non-China produced battery and cathode solutions. We anticipate growth vectors of customer and consumer transition to EVs and fast-growing demand in large scale energy storage solutions &ndash; especially for renewable energy generation needs. The shares came under pressure this quarter following some savage price cuts by the Chinese manufacturers and concerns about LG&rsquo;s decision to supply cathodes only to Tesla.</li>
</ul>
<h2 id="TopBuysSells" class="jump-link-nav anchored-block" data-jumplink-title="Top Buys &amp; Sells">Top Buys &amp; Sells</h2>
<p>During the period, we established new positions in the following:</p>
<ul class="content-list">
<li><strong>Jio Financial Services (JFS)</strong> (0.6% of Fund net assets<sup>*</sup>) is a spinoff from Reliance Industries. The fund was allocated shares pro rata to its position in Reliance. JFS is a new digital consumer financial services company. Given regulatory requirements in India, JFS was required to be separately listed and we are excited to be shareholders. The business model is to lend small sums to customers to finance purchases of items such as electronics, vehicles and furniture. Right now, the business is in its infancy but we estimate considerable value creation over time. JFS is set to benefit from customer access of the Reliance Group &ndash; over 500mm customers in the Jio Cellular Network and several hundred million customers of Reliance Retail and Reliance Media. The newly assembled management bench is known to our research team, access to capital is clear and we believe this business will scale quickly with attractive margins.</li>
<li class="mt-2"><strong>Baidu</strong> (0.5% of Fund net assets<sup>*</sup>) is a leading search engine and information feed application in China; a similar business model to Google in the USA. Baidu provides several other services including autonomous driving taxis and IQ, a short video app &ndash; a kind of YouTube/Netflix mashup in China. Our investment thesis focuses on 3 components. First is their enterprise Cloud, and AI foundational model/data solutions, which has now been officially approved for use in China, and consequently, puts Baidu in a position of category leadership to all &gt;500mm customers. The second value driver is iQiyi, the short video app that has recently turned profitable. It is positioned to grow strongly and is no longer a margin drag on the core search business. The third point in the investment case is our proprietary modeling of forecast growth and share price multiples. We are confident in higher numeric values as compared to what the share price currently implies.</li>
</ul>
<p>During the period, we exited the following positions:</p>
<ul class="content-list">
<li><strong>Humansoft</strong> (not held by Fund at end of period) is a leading higher education company in Kuwait. During the quarter, we exited our position. While the company continues to show solid execution and high profitability, we are seeing signs that growth in slowing down and the story is shifting from growth to capital return, and as a result, we prefer to reallocate capital to higher structural growth stories that better fit our strategy.</li>
<li class="mt-2"><strong>Ming Yang</strong> (not held by Fund at end of period) is a Chinese company which mainly designs and produces wind turbines, both offshore and onshore. Our concern about heightened competition, particularly in the onshore category, as well as the elevated prices of some components, led us to anticipate weaker margins than originally forecasted. Having sold down the position, the remaining portion was sold.</li>
<li class="mt-2"><strong>Shandong Head</strong> (not held by Fund at end of period) is an international cellulose ether manufacturer. The two main divisions of the business were not performing as had been expected. Vegetarian capsules which are used in pill and vitamin manufacture, saw poor volume numbers. The other division, cellulose ether, is used in a variety of industries, but the building sector is a prominent user. Given the ongoing issues in the property sector, which is constraining building activity, the short-term outlook does not appear positive.</li>
<li class="mt-2"><strong>Westwing</strong> (not held by Fund at end of period) is a Brazilian marketplace specializing in the home and decoration segment with a differentiated sales format. Although they have niche positioning, the market where they operate has been very challenging, with a difficult demand scenario and inflation impacting Selling, General and Administrative Expenses. They have also been impacted by higher rates. We had a small position and the stock is very illiquid, so given the change in the outlook, we decided to exit the name.</li>
</ul>
<h2 id="Outlook" class="jump-link-nav anchored-block" data-jumplink-title="Outlook">Outlook</h2>
<p>We remain grounded by our investment process and our positioning reflects our convictions from a bottom-up basis heading into the last quarter of the year. Our process has created some positioning differentials versus the benchmark. Brazil remains overweight to start the fourth quarter (14% Fund weight versus 5% Index weight), as does Georgia (5% Fund weight versus 0% Index weight).</p>
<p>China and Taiwan Region are significantly underweighted versus the benchmark, which does not reflect a bearish macro view on the region, but is a reflection of the opportunities we see. Currently, approximately one third of the portfolio is allocated to China and Taiwan Region, focused specifically on those companies which pass our due diligence process.</p>
<p>The Fund also is also significantly underweighted versus the benchmark in South Korea, Saudia Arabia and South Africa.</p>
<p>The Fund&rsquo;s objective is to find long-term structural growth companies at a reasonable price (S-GARP). Country weightings are driven by the analysis of individual companies: our process is driven by stock selection conducted through rigorous due diligence with a focus on active management interaction and quality, governance and business models with visibility, innovation and low disruption risk.</p>
<p><a href="/us/en/blogs/emerging-markets-equity/emerging-markets-turkey-shines-brazil-falters/eme-quarterly-commentary-q3-2023.pdf" rel="noopener" target="_blank" title="VanEck Emerging Markets Fund Manager Commentary"><strong>Download Commentary PDF with Fund specific information and performance.</strong></a></p>
<p>To receive more <a href="/us/en/insights/emerging-markets-equity/" title="Emerging Markets Equity Insights"><strong>Emerging Markets Equity</strong></a> insights, <a href="/us/en/subscribe/" title="Subscription Center"><strong>sign up in our subscription center</strong></a>.</p>
<style type="text/css">
    .wrapped-div {
        max-width: 100%;
    }

    @media (max-width: 768px) {
        .wrapped-div {
            overflow-x: scroll;
        }
    }

    .wrapped-div-sector {
        max-width: 100%;
        overflow-x: scroll;
    }
</style>
]]></content:encoded>
</item><item rdf:about="https://www.vaneck.com/us/en/blogs/natural-resources/strong-3rd-quarter-for-commodities/">
  <title>Strong 3rd Quarter for Commodities></title>
  <link>https://www.vaneck.com/us/en/blogs/natural-resources/strong-3rd-quarter-for-commodities/</link>
  <description><![CDATA[The energy sector&rsquo;s rally led to a strong quarter for commodities, and curve positioning contributed to the performance of the UBS Constant Maturity Commodity Index.]]></description>
  <dc:creator>Roland Morris</dc:creator>
  <dc:date>10/17/2023 06:30:00</dc:date>
<content:encoded><![CDATA[

<h2>Macro Outlook: Roll Yield Heats up in Energy and Agriculture</h2>
<p>Commodity indexes had a strong 3rd quarter, led by the energy sector. The UBS Constant Maturity Commodity Index (CMCITR) had strong relative performance versus the Bloomberg Commodity Index (BCOM). CMCITR returned 7.18% versus BCOM&rsquo;s 4.71%. Some outperformance was related to roll yield spread across the energy and agriculture sectors. CMCITR&rsquo;s roll mythology continues to outperform BCOM generating slightly positive yield (+0.3%) during the quarter, while BCOM&rsquo;s roll yield was negative (-0.8%).</p>
<h2>Sector Review: Energy Led Gains While Curve Positioning Attributed to Outperformance</h2>
<p>The energy sector rallied sharply during the quarter led by strong gains in gasoil and heating oil. There is a global shortage of diesel refining capacity that impacts both gasoil and heating oil. Interestingly, unleaded gas lagged due to the refineries running full steam to produce diesel. Unleaded gas as a byproduct was slightly over supplied during the quarter. WTI crude oil and Brent crude oil both rallied close to 20% during the quarter. Natural gas was down for the quarter but is projected to have a sharp rally early in the 4th quarter as we approach the heating season.</p>
<p>The industrial metals sector was up a little over 3% for the quarter and CMCITR&rsquo;s larger exposure to the sector allowed for slightly improved relative performance versus BCOM. Gains in the sector were led by aluminum (+8%) and zinc (+12%). Disappointing growth in China continues to be a concern for the sector as China is the largest consumer of industrial metals by a wide margin.</p>
<p>The agriculture sector was mixed with large gains for sugar, cocoa, and cotton, while wheat fell around 15%. Soybeans, soy meal and bean oil all fell marginally. Curve positioning of CMCITR for the agriculture sector added to relative performance versus BCOM.</p>
<p>The livestock sector gained 2.5% during the quarter, led by continued gains in live cattle. It is currently trading at all-time historic highs. Lean hogs steered BCOM&rsquo;s outperformance in the livestock sector ahead of CMCITR; however, the small sector weight in both indexes (CMCITR: 4.5%; BCOM: 6.15%) contributed minimally to absolute performance. This is evidenced in the Roll Yield chart below.</p>
<p>The precious metals sector was the only sector down during the quarter, falling around 3.6%. This was led by a 4% drop in gold prices. CMCITR&rsquo;s smaller exposure to this sector versus BCOM added to the relative outperformance.</p>
<h2>End of Year Outlook: Commodities Should Expect to Face Supply Shortages</h2>
<p>The near-term outlook for commodities continues to be uncertain as U.S. interest rates and the U.S. Dollar continue to rise. The sharp rise in 10-year U.S. treasury yields late in the 3rd quarter was a headwind for growth and commodity demand. Over the longer term, we still believe commodity supplies will be tight, which will likely lead to higher prices and continued positive roll yield. Interest rates are also likely to remain higher for longer times, which will continue to provide positive returns on collateral.</p>
<h3>Estimated Roll Yield Contribution</h3>
<p><img class="img-responsive w-100" src="https://www.vaneck.com/contentassets/c40c42e088a2418d979c1a218eaced84/3719_cmci_chart-1_2023.10_blog.svg" alt="Chart showing estimated roll yield contribution for CMCITR and BCOM both YTD and QTD" /></p>
<p class="chart-disclosure"><strong>Source: Bloomberg. Data as of September 2023.</strong> Past performance is no guarantee of future results. Index performance is not illustrative of fund performance. It is not possible to invest in an index.</p>
<p>Learn more about the <strong><a href="https://www.vaneck.com/us/en/investments/cm-commodity-index-fund-cmcax/overview/" title="CMCAX - CM Commodity Index Fund - Class A - Overview ">VanEck CM Commodity Index Fund</a></strong> and the recently launched <strong><a href="https://www.vaneck.com/us/en/investments/cmci-commodity-strategy-etf-cmci/overview/" title="CMCI - VanEck CMCI Commodity Strategy ETF - Overview">VanEck CMCI Commodity Strategy ETF (CMCI)</a></strong> which seek to track, before fees and expenses, the CMCITR.</p>
<p>To receive more <strong><a href="https://www.vaneck.com/us/en/insights/natural-resources/" title="Natural Resources Insights">Natural Resources</a></strong> insights, <strong><a href="https://www.vaneck.com/us/en/subscribe/" title="Subscription Center">sign up in our subscription center</a></strong>.</p>
]]></content:encoded>
</item><item rdf:about="https://www.vaneck.com/us/en/blogs/income-investing/yields-at-8-percent-while-rising-stars-outpace-fallen-angels/">
  <title>Yields at 8% while Rising Stars Outpace Fallen Angels></title>
  <link>https://www.vaneck.com/us/en/blogs/income-investing/yields-at-8-percent-while-rising-stars-outpace-fallen-angels/</link>
  <description><![CDATA[Increased yields drove underperformance of fallen angels in September; two new fallen angels (Real Estate and Transportation sectors) entered the Index while the Energy sector saw a rising star.]]></description>
  <dc:creator>Nicolas  Fonseca, CFA</dc:creator>
  <dc:date>10/17/2023 06:30:00</dc:date>
<content:encoded><![CDATA[

<p>Fallen angels (as represented by the ICE US Fallen Angel High Yield 10% Constrained Index, &ldquo;H0CF&rdquo;) underperformed the broad high yield market (as represented by the ICE BofA US High Yield Index, &ldquo;H0A0&rdquo;) by 0.51% in September (-1.67% vs -1.16%) as the 10Y Treasury Rate increased to 4.59 from 4.09 at the end of August, causing longer duration assets to take a hit. Fallen angels have a longer duration than broad HY as they are more reflective of the longer maturities found in the investment grade (IG) space. In September, the change in rates explains more than 100% of the difference in returns, only slightly offset by the spread effects. The story, year to date, is similar as rates have generally increased, especially since March when the 10Y was hovering at 3.50 but is now close to 4.60, as illustrated in the chart below. Carry has also been a negative contributor to fallen angel underperformance, as fallen angels have a lower average yield versus the broad high yield market due to their significantly higher credit quality. However, sector exposures and selection within sectors have both been positive contributors to relative performance, somewhat offsetting the impact of higher rates. In terms of flows, high yield corporates saw another approximate 1.5bn in outflows during September following the approximate $1bn in August. Treasury and ultrashort funds continue to see inflows as the short end of the curve is where investors can find high yields with very low duration and credit risk, amid volatility in rates.</p>
<h3>US Treasury Curve</h3>
<p><img class="img-responsive w-100" src="https://www.vaneck.com/contentassets/8558de3e4404429fa2b43baffb49fe46/3727_create-angl-october-2023_chart-1_2023.10_v1_blog.svg" alt="Line chart showing U.S. Treasury Curve" /></p>
<p class="chart-disclosure">Source: US Treasury.</p>
<h2>Rising Stars continue to outpace Fallen Angels</h2>
<br />
<p>This year, the fallen angel index has decreased by approximately 36% due to rising stars, compared to an increase of 14% due to new fallen angels. For context, in 2022 there were 18% of rising stars vs 8% of new fallen angels. The largest rising star this year was OXY (8.69% or approximately $9,975m in face value at the time of exit in May) while the largest fallen angel (excluding Nissan, as it entered in March and exited May) was Brandywine Operating Partnership (1.87% or approximately $1,655m in face value) this past month. Looking forward, JP Morgan estimate that rising stars will continue to exceed fallen angels in 2024, although to a lesser extent.</p>
<div class="wrapped-div">
<table style="width: 400px;">
<tbody>
<tr class="tbl-data">
<td class="tbl-header last">Rising Star Candidates<br />Timeframe</td>
<td class="tbl-header last text-center">Total Debt<br />Outstanding ($bn)</td>
</tr>
<tr class="tbl-data">
<td class="data-td last font-weight-normal">2023</td>
<td class="data-td data last">54.27</td>
</tr>
<tr class="tbl-data">
<td class="data-td last font-weight-normal">2024</td>
<td class="data-td data last">39.41</td>
</tr>
<tr class="tbl-data">
<td class="data-td last font-weight-normal">2025</td>
<td class="data-td data last">3.55</td>
</tr>
<tr class="tbl-data">
<td class="tbl-header last">Fallen Angel Candidates<br />Timeframe</td>
<td class="tbl-header last text-center">Total Debt<br />Outstanding ($bn)</td>
</tr>
<tr class="tbl-data">
<td class="data-td last font-weight-normal">2023</td>
<td class="data-td data last">21.70</td>
</tr>
<tr class="tbl-data">
<td class="data-td last font-weight-normal">2024</td>
<td class="data-td data last">29.71</td>
</tr>
</tbody>
</table>
</div>
<br />
<p class="chart-disclosure">Source: JP Morgan.</p>
<ul class="content-list">
<li>Ford could be the biggest rising star before the year is over. S&amp;P is expected to review its rating in November with most sell side analysts expecting a rating upgrade (currently capped at 10% of the index).</li>
<li>The high yield universe is expected to contract with more upgrades than downgrades, although the upward ratings (rising stars plus upgrades within the IG bucket) are losing some steam.</li>
<li>There is approximately $10bn of BBB- debt with at least one high yield rating and negative outlook, half of which are in the technology sector. while there is approximately $72bn of BBB- without a high yield rating, but with a negative outlook.</li>
</ul>
<p><strong><u>Fallen Angels Overall Statistics:</u></strong> Fallen angels average yield increased by 57bps to 8.02, the highest yield since March 2020, only surpassed by the Global Financial Crisis and briefly in early 2016 when oil price declined amid concerns about China&rsquo;s economic growth. Fallen angels yield is 95bps above the all-time average while broad HY saw an increase of 46bps, to 8.94, which is near what it was at the beginning of the year and 137bps above the average since December 2003. Credit spreads widened in September after a rather pronounced tightening cycle that began in March following the mini-banking crisis. Fallen angel spreads reached 314 (an increase of 21bps), while broad HY surpassed the 400 mark to 403 (an increase of 18bps), but both spreads are still more than 100bps below their long time average and in line with the short-term averages. The fallen angel market value has continued to decline this year due to rising stars. There were no defaults in September for both indices, however, S&amp;P&rsquo;s latest Default, Transition and Recovery report states that the number of global corporate defaults jumped to 107 as of August 31, 2023 with the U.S. accounting for 69 defaults. There were 16 defaults in August, the highest August monthly tally since 2009.</p>
<div class="wrapped-div">
<table style="width: 100%;">
<tbody>
<tr class="tbl-data">
<td class="tbl-header last text-center">&nbsp;</td>
<td class="tbl-header last text-center" style="border-right: outset;" colspan="4">Fallen Angel</td>
<td class="tbl-header last text-center" colspan="4">Broad HY</td>
</tr>
<tr class="tbl-data">
<td class="data-head last">&nbsp;</td>
<td class="data-head last">12/31/22</td>
<td class="data-head last">3/31/23</td>
<td class="data-head last">6/30/23</td>
<td class="data-head last" style="border-right: outset;">9/30/23</td>
<td class="data-head last">12/31/22</td>
<td class="data-head last">3/31/23</td>
<td class="data-head last">6/30/23</td>
<td class="data-head last">9/30/23</td>
</tr>
<tr class="tbl-data">
<td class="data-td last">Yield to Worst</td>
<td class="data-td data last">7.49</td>
<td class="data-td data last">7.08</td>
<td class="data-td data last">7.35</td>
<td class="data-td data last" style="border-right: outset;">8.02</td>
<td class="data-td data last">8.98</td>
<td class="data-td data last">8.49</td>
<td class="data-td data last">8.56</td>
<td class="data-td data last">8.94</td>
</tr>
<tr class="tbl-data">
<td class="data-td last">Effective Duration</td>
<td class="data-td data last">5.45</td>
<td class="data-td data last">5.30</td>
<td class="data-td data last">4.98</td>
<td class="data-td data last" style="border-right: outset;">4.90</td>
<td class="data-td data last">4.04</td>
<td class="data-td data last">3.83</td>
<td class="data-td data last">3.65</td>
<td class="data-td data last">3.64</td>
</tr>
<tr class="tbl-data">
<td class="data-td last">Full Market Value ($mn)</td>
<td class="data-td data last">112,854</td>
<td class="data-td data last">114,776</td>
<td class="data-td data last">84,590</td>
<td class="data-td data last" style="border-right: outset;">78,279</td>
<td class="data-td data last">1,199,909</td>
<td class="data-td data last">1,234,319</td>
<td class="data-td data last">1,218,316</td>
<td class="data-td data last">1,201,541</td>
</tr>
<tr class="tbl-data">
<td class="data-td last">OAS</td>
<td class="data-td data last">337</td>
<td class="data-td data last">325</td>
<td class="data-td data last">297</td>
<td class="data-td data last" style="border-right: outset;">314</td>
<td class="data-td data last">481</td>
<td class="data-td data last">458</td>
<td class="data-td data last">405</td>
<td class="data-td data last">403</td>
</tr>
<tr class="tbl-data">
<td class="data-td last">No. of Issues</td>
<td class="data-td data last">212</td>
<td class="data-td data last">206</td>
<td class="data-td data last">163</td>
<td class="data-td data last" style="border-right: outset;">159</td>
<td class="data-td data last">1,927</td>
<td class="data-td data last">1,916</td>
<td class="data-td data last">1,870</td>
<td class="data-td data last">1,872</td>
</tr>
</tbody>
</table>
</div>
<br />
<p class="chart-disclosure">Source: ICE Data Services, VanEck. Fallen Angels: ICE US Fallen Angel High Yield 10% Constrained Index. Broad HY: ICE BofA US High Yield Index. OAS refers to &ldquo;option-adjusted spread.&rdquo; Please see definition for this and other terms referenced herein in the disclosures and definitions portion of this blog. Past performance is no guarantee of future results. Index performance is not representative of fund performance. It is not possible to invest in an index.</p>
<p><u><strong>New Fallen Angels:</strong></u> Two fallen angels were added in September, adding 2.22% to the Index market value. Brandywine Operating Partnership was downgraded by Moody&rsquo;s to Ba1 from Baa3, on the expectation that coverage ratios will remain weak as commercial real estate has seen some difficulties over the past few months. This is the first fallen angel REIT so far this year, and given pressures in commercial real estate due to tighter financial conditions, rising office vacancies and stress in the regional banking sector, it will be interesting to see if more follow. The other fallen angel, Port of Newcastle Investments, is in the transportation sector. It was downgraded by S&amp;P to BB+ from BBB- reflecting elevated levels of debt compared to S&amp;Ps earning projections for the next few years. Despite the Port of Newcastle Investments looking for plans to improve their earnings, S&amp;P believes that the timing of those is very unclear. Over the last six months, Brandywine Operating Partnership posted price returns of approximately +6% while Port of Newcastle Investments posted -5%.</p>
<div class="wrapped-div">
<table style="width: 100%;">
<tbody>
<tr class="tbl-data">
<td class="tbl-header last">Month-end Addition</td>
<td class="tbl-header last text-center">Name</td>
<td class="tbl-header last text-center">Rating</td>
<td class="tbl-header last text-center">Sector</td>
<td class="tbl-header last text-center">Industry</td>
<td class="tbl-header last text-center">% Mkt Value</td>
<td class="tbl-header last text-center">Price</td>
</tr>
<tr class="tbl-data">
<td class="data-td last font-weight-normal">February</td>
<td class="data-td data last">Entegris Escrow Corp</td>
<td class="data-td data last">BB1</td>
<td class="data-td data last">Technology &amp; Electronics</td>
<td class="data-td data last">Electronics</td>
<td class="data-td data last">1.39</td>
<td class="data-td data last">90.92</td>
</tr>
<tr class="tbl-data">
<td class="data-td last font-weight-normal">March</td>
<td class="data-td data last">First Republic Bank</td>
<td class="data-td data last">B3</td>
<td class="data-td data last">Banking</td>
<td class="data-td data last">0.40</td>
<td class="data-td data last">54.63</td>
</tr>
<tr class="tbl-data">
<td class="data-td last font-weight-normal">March</td>
<td class="data-td data last">Nissan Motor Acceptance</td>
<td class="data-td data last">BB1</td>
<td class="data-td data last">Automotive</td>
<td class="data-td data last">Auto Loans</td>
<td class="data-td data last">2.57</td>
<td class="data-td data last">87.19</td>
</tr>
<tr class="tbl-data">
<td class="data-td last font-weight-normal">March</td>
<td class="data-td data last">Nissan Motor</td>
<td class="data-td data last">BB1</td>
<td class="data-td data last">Automotive</td>
<td class="data-td data last">Automakers</td>
<td class="data-td data last">5.49</td>
<td class="data-td data last">92.98</td>
</tr>
<tr class="tbl-data">
<td class="data-td last font-weight-normal">April</td>
<td class="data-td data last">Crane NXT</td>
<td class="data-td data last">BB3</td>
<td class="data-td data last">Capital Goods</td>
<td class="data-td data last">Diversified Capital Goods</td>
<td class="data-td data last">0.24</td>
<td class="data-td data last">70.99</td>
</tr>
<tr class="tbl-data">
<td class="data-td last font-weight-normal">April</td>
<td class="data-td data last">Rogers Communications</td>
<td class="data-td data last">BB2</td>
<td class="data-td data last">Telecommunications</td>
<td class="data-td data last">Telecom - Wireless</td>
<td class="data-td data last">0.65</td>
<td class="data-td data last">90.35</td>
</tr>
<tr class="tbl-data">
<td class="data-td last font-weight-normal">April</td>
<td class="data-td data last">Western Alliance Bancorporation</td>
<td class="data-td data last">BB1</td>
<td class="data-td data last">Banking</td>
<td class="data-td data last">0.44</td>
<td class="data-td data last">76.39</td>
</tr>
<tr class="tbl-data">
<td class="data-td last font-weight-normal">August</td>
<td class="data-td data last">Associated Banc-Corp</td>
<td class="data-td data last">BB1</td>
<td class="data-td data last">Banking</td>
<td class="data-td data last">0.33</td>
<td class="data-td data last">95.69</td>
</tr>
<tr class="tbl-data">
<td class="data-td last font-weight-normal">August</td>
<td class="data-td data last">Valley National Bancorp</td>
<td class="data-td data last">BB1</td>
<td class="data-td data last">Banking</td>
<td class="data-td data last">0.33</td>
<td class="data-td data last">79.84</td>
</tr>
<tr class="tbl-data">
<td class="data-td last font-weight-normal">September</td>
<td class="data-td data last">Brandywine Operating Partnership L.P.</td>
<td class="data-td data last">BB1</td>
<td class="data-td data last">Real Estate</td>
<td class="data-td data last">REITs</td>
<td class="data-td data last">1.86</td>
<td class="data-td data last">87.29</td>
</tr>
<tr class="tbl-data">
<td class="data-td last font-weight-normal">September</td>
<td class="data-td data last">Port of Newcastle Investments Financing Pty Limited</td>
<td class="data-td data last">BB1</td>
<td class="data-td data last">Transportation</td>
<td class="data-td data last">Transport Infrastructure/Services</td>
<td class="data-td data last">0.36</td>
<td class="data-td data last">82.79</td>
</tr>
</tbody>
</table>
</div>
<br />
<p class="chart-disclosure">Source: ICE Data Services, VanEck. Fallen Angels: ICE US Fallen Angel High Yield 10% Constrained Index. Past performance is no guarantee of future results. Not a recommendation to buy or sell any of the names/securities mentioned herein. Index performance is not representative of fund performance. It is not possible to invest in an index.</p>
<p><u><strong>Rising Stars:</strong></u> One issuer exited the index in September, another energy issuer, Patterson UTI Energy, as S&amp;P upgraded it to BBB- from BB+ and Fitch assigned a assigned a BBB- rating. Both agencies&rsquo; IG rating status is based on the financial profile of Patterson UTI Energy following the merger of NexTier Oilfields Solutions, as it creates a leading company in the oil field services with a strong presence in the U.S. Patterson UTI Energy was an energy fallen angel in March 2021, posting -6.00% price return and 5.76% total return over its time in the fallen angel index. Over the last 12 months, it posted a price return of 9.61% vs 3.29% for the broad high yield market. Despite a Patterson ITU Energy upgrade this past month, all eyes are on Ford for the rest of the year as it was upgraded by Fitch in early September to BBB-, as in their view, supply change issues over the past few years are resolved. The ongoing United Auto Workers (UAW) strike has created uncertainty over the short term, but Fitch expects that the Union will reach an agreement soon. More importantly, S&amp;P is expected to review its Ford rating in November of this year, with most sell side analysts expecting a rating upgrade and thus, it&rsquo;s removal from the fallen angel index, reducing the Auto sector&rsquo;s exposure to 0%.</p>
<div class="wrapped-div">
<table style="width: 100%;">
<tbody>
<tr class="tbl-data">
<td class="tbl-header last">Month-end Exit</td>
<td class="tbl-header last text-center">Name</td>
<td class="tbl-header last text-center">Rating</td>
<td class="tbl-header last text-center">Sector</td>
<td class="tbl-header last text-center">Industry</td>
<td class="tbl-header last text-center">% Mkt Value</td>
<td class="tbl-header last text-center">Price</td>
</tr>
<tr class="tbl-data">
<td class="data-td last font-weight-normal">February</td>
<td class="data-td data last">Autopistas Metropolitanas de Puerto Rico LLC</td>
<td class="data-td data last">BB1</td>
<td class="data-td data last">Transportation</td>
<td class="data-td data last">Transport Infrastructure/Services</td>
<td class="data-td data last">0.35</td>
<td class="data-td data last">100.49</td>
</tr>
<tr class="tbl-data">
<td class="data-td last font-weight-normal">February</td>
<td class="data-td data last">Nokia Corp</td>
<td class="data-td data last">BB1</td>
<td class="data-td data last">Technology &amp; Electronics</td>
<td class="data-td data last">Tech Hardware &amp; Equipment</td>
<td class="data-td data last">0.47</td>
<td class="data-td data last">97.50</td>
</tr>
<tr class="tbl-data">
<td class="data-td last font-weight-normal">March</td>
<td class="data-td data last">Western Midstream</td>
<td class="data-td data last">BB1</td>
<td class="data-td data last">Energy</td>
<td class="data-td data last">Gas Distribution</td>
<td class="data-td data last">5.27</td>
<td class="data-td data last">90.44</td>
</tr>
<tr class="tbl-data">
<td class="data-td last font-weight-normal">April</td>
<td class="data-td data last">Sprint Capital Corp</td>
<td class="data-td data last">BB1</td>
<td class="data-td data last">Telecommunications</td>
<td class="data-td data last">Telecom - Wireless</td>
<td class="data-td data last">4.70</td>
<td class="data-td data last">114.25</td>
</tr>
<tr class="tbl-data">
<td class="data-td last font-weight-normal">May</td>
<td class="data-td data last">Mattel Inc.</td>
<td class="data-td data last">BB2</td>
<td class="data-td data last">Consumer Goods</td>
<td class="data-td data last">Personal &amp; Household Products</td>
<td class="data-td data last">0.45</td>
<td class="data-td data last">85.32</td>
</tr>
<tr class="tbl-data">
<td class="data-td last font-weight-normal">May</td>
<td class="data-td data last">Nissan Motor Acceptance</td>
<td class="data-td data last">BB1</td>
<td class="data-td data last">Automotive</td>
<td class="data-td data last">Auto Loans</td>
<td class="data-td data last">2.67</td>
<td class="data-td data last">85.12</td>
</tr>
<tr class="tbl-data">
<td class="data-td last font-weight-normal">May</td>
<td class="data-td data last">Nissan Motor</td>
<td class="data-td data last">BB1</td>
<td class="data-td data last">Automotive</td>
<td class="data-td data last">Automakers</td>
<td class="data-td data last">5.57</td>
<td class="data-td data last">88.49</td>
</tr>
<tr class="tbl-data">
<td class="data-td last font-weight-normal">May</td>
<td class="data-td data last">Occidental Petroleum Corp</td>
<td class="data-td data last">BB1</td>
<td class="data-td data last">Energy</td>
<td class="data-td data last">Energy - Exploration &amp; Production</td>
<td class="data-td data last">8.69</td>
<td class="data-td data last">93.82</td>
</tr>
<tr class="tbl-data">
<td class="data-td last font-weight-normal">June</td>
<td class="data-td data last">APA Corp</td>
<td class="data-td data last">BB1</td>
<td class="data-td data last">Energy</td>
<td class="data-td data last">Energy - Exploration &amp; Production</td>
<td class="data-td data last">3.84</td>
<td class="data-td data last">82.69</td>
</tr>
<tr class="tbl-data">
<td class="data-td last font-weight-normal">July</td>
<td class="data-td data last">Western Digital Corp</td>
<td class="data-td data last">BB1</td>
<td class="data-td data last">Technology &amp; Electronics</td>
<td class="data-td data last">Tech Hardware &amp; Equipment</td>
<td class="data-td data last">0.99</td>
<td class="data-td data last">76.97</td>
</tr>
<tr class="tbl-data">
<td class="data-td last font-weight-normal">August</td>
<td class="data-td data last">Howmet Aerospace Inc</td>
<td class="data-td data last">BB1</td>
<td class="data-td data last">Capital Goods</td>
<td class="data-td data last">Aerospace/Defense</td>
<td class="data-td data last">2.04</td>
<td class="data-td data last">99.55</td>
</tr>
<tr class="tbl-data">
<td class="data-td last font-weight-normal">September</td>
<td class="data-td data last">Patterson-UTI Energy Inc.</td>
<td class="data-td data last">BB1</td>
<td class="data-td data last">Energy</td>
<td class="data-td data last">Oil Field Equipment &amp; Services</td>
<td class="data-td data last">1.07</td>
<td class="data-td data last">90.37</td>
</tr>
</tbody>
</table>
</div>
<br />
<p class="chart-disclosure">Source: ICE Data Services, VanEck. Fallen Angels: ICE US Fallen Angel High Yield 10% Constrained Index. Past performance is no guarantee of future results. Not a recommendation to buy or sell any of the names/securities mentioned herein. Index performance is not representative of fund performance. It is not possible to invest in an index.</p>
<p><u><strong>Fallen Angels Performance by Sector:</strong></u> Only the services sector posted a positive return for September (+0.81%), but with a small exposure (0.56%), it was not enough to offset the negative performance of the others 16 sectors that compose the fallen angel index. Year to date, the banking sector is the only sector (aside from a -0.01% return of the insurance sector) that posted negative returns, reflective of the stress experienced in that sector this year. Changes in sector exposures has been a theme this year, in particular the decrease in Energy exposure, driven by rising star activity. In September, the real estate sector saw an increase with a new fallen angel, while energy continued its downward trend to below 15%. As of month-end, 9% is trade in the $70s, 66% of fallen angels (up from 63% last month) are now trading in the $80s, 25% (down from 37%) in the $90s and no sector continues to be above par.</p>
<div class="wrapped-div">
<table style="width: 100%;">
<tbody>
<tr class="tbl-data">
<td class="tbl-header last text-center">&nbsp;</td>
<td class="tbl-header last text-center" style="border-right: outset;" colspan="4">Wgt (%)</td>
<td class="tbl-header last text-center" style="border-right: outset;" colspan="4">OAS</td>
<td class="tbl-header last text-center" style="border-right: outset;" colspan="4">Price</td>
<td class="tbl-header last text-center" style="border-right: outset;">Total<br />Return<br />(%)</td>
<td class="tbl-header last text-center">Total<br />Return<br />(%)</td>
</tr>
<tr class="tbl-data">
<td class="data-head last">&nbsp;</td>
<td class="data-head last">12/31/21</td>
<td class="data-head last">3/31/23</td>
<td class="data-head last">6/30/23</td>
<td class="data-head last" style="border-right: outset;">9/30/23</td>
<td class="data-head last">12/31/21</td>
<td class="data-head last">3/31/23</td>
<td class="data-head last">6/30/23</td>
<td class="data-head last" style="border-right: outset;">9/30/23</td>
<td class="data-head last">12/31/21</td>
<td class="data-head last">3/31/23</td>
<td class="data-head last">6/30/23</td>
<td class="data-head last" style="border-right: outset;">9/30/23</td>
<td class="data-head last" style="border-right: outset;">YTD</td>
<td class="data-head last">MTD</td>
</tr>
<tr class="tbl-data">
<td class="data-td last">Automotive</td>
<td class="data-td data last">10.00</td>
<td class="data-td data last">18.06</td>
<td class="data-td data last">10.00</td>
<td class="data-td data last" style="border-right: outset;">10.00</td>
<td class="data-td data last">262</td>
<td class="data-td data last">246</td>
<td class="data-td data last">211</td>
<td class="data-td data last" style="border-right: outset;">206</td>
<td class="data-td data last">91.35</td>
<td class="data-td data last">92.21</td>
<td class="data-td data last">92.99</td>
<td class="data-td data last" style="border-right: outset;">91.16</td>
<td class="data-td data last" style="border-right: outset;">3.27</td>
<td class="data-td data last">-0.41</td>
</tr>
<tr class="tbl-data">
<td class="data-td last">Banking</td>
<td class="data-td data last">3.81</td>
<td class="data-td data last">3.99</td>
<td class="data-td data last">3.20</td>
<td class="data-td data last" style="border-right: outset;">4.34</td>
<td class="data-td data last">302</td>
<td class="data-td data last">415</td>
<td class="data-td data last">376</td>
<td class="data-td data last" style="border-right: outset;">279</td>
<td class="data-td data last">96.85</td>
<td class="data-td data last">87.61</td>
<td class="data-td data last">88.57</td>
<td class="data-td data last" style="border-right: outset;">92.02</td>
<td class="data-td data last" style="border-right: outset;">-3.40</td>
<td class="data-td data last">-0.52</td>
</tr>
<tr class="tbl-data">
<td class="data-td last">Basic Industry</td>
<td class="data-td data last">1.36</td>
<td class="data-td data last">1.33</td>
<td class="data-td data last">1.93</td>
<td class="data-td data last" style="border-right: outset;">1.92</td>
<td class="data-td data last">226</td>
<td class="data-td data last">227</td>
<td class="data-td data last">168</td>
<td class="data-td data last" style="border-right: outset;">178</td>
<td class="data-td data last">92.17</td>
<td class="data-td data last">93.85</td>
<td class="data-td data last">94.44</td>
<td class="data-td data last" style="border-right: outset;">93.53</td>
<td class="data-td data last" style="border-right: outset;">5.06</td>
<td class="data-td data last">-0.88</td>
</tr>
<tr class="tbl-data">
<td class="data-td last">Capital Goods</td>
<td class="data-td data last">5.12</td>
<td class="data-td data last">5.10</td>
<td class="data-td data last">7.66</td>
<td class="data-td data last" style="border-right: outset;">5.86</td>
<td class="data-td data last">279</td>
<td class="data-td data last">240</td>
<td class="data-td data last">195</td>
<td class="data-td data last" style="border-right: outset;">250</td>
<td class="data-td data last">95.01</td>
<td class="data-td data last">98.54</td>
<td class="data-td data last">96.85</td>
<td class="data-td data last" style="border-right: outset;">92.44</td>
<td class="data-td data last" style="border-right: outset;">4.35</td>
<td class="data-td data last">-1.41</td>
</tr>
<tr class="tbl-data">
<td class="data-td last">Consumer Goods</td>
<td class="data-td data last">3.07</td>
<td class="data-td data last">3.00</td>
<td class="data-td data last">3.62</td>
<td class="data-td data last" style="border-right: outset;">3.82</td>
<td class="data-td data last">275</td>
<td class="data-td data last">255</td>
<td class="data-td data last">298</td>
<td class="data-td data last" style="border-right: outset;">271</td>
<td class="data-td data last">88.90</td>
<td class="data-td data last">91.27</td>
<td class="data-td data last">89.31</td>
<td class="data-td data last" style="border-right: outset;">88.24</td>
<td class="data-td data last" style="border-right: outset;">3.16</td>
<td class="data-td data last">-3.23</td>
</tr>
<tr class="tbl-data">
<td class="data-td last">Energy</td>
<td class="data-td data last">27.93</td>
<td class="data-td data last">22.16</td>
<td class="data-td data last">15.28</td>
<td class="data-td data last" style="border-right: outset;">14.45</td>
<td class="data-td data last">293</td>
<td class="data-td data last">303</td>
<td class="data-td data last">297</td>
<td class="data-td data last" style="border-right: outset;">288</td>
<td class="data-td data last">88.13</td>
<td class="data-td data last">90.05</td>
<td class="data-td data last">88.74</td>
<td class="data-td data last" style="border-right: outset;">87.48</td>
<td class="data-td data last" style="border-right: outset;">6.08</td>
<td class="data-td data last">-1.56</td>
</tr>
<tr class="tbl-data">
<td class="data-td last">Financial Services</td>
<td class="data-td data last">0.65</td>
<td class="data-td data last">0.64</td>
<td class="data-td data last">0.94</td>
<td class="data-td data last" style="border-right: outset;">0.98</td>
<td class="data-td data last">540</td>
<td class="data-td data last">506</td>
<td class="data-td data last">459</td>
<td class="data-td data last" style="border-right: outset;">420</td>
<td class="data-td data last">77.20</td>
<td class="data-td data last">80.27</td>
<td class="data-td data last">80.92</td>
<td class="data-td data last" style="border-right: outset;">79.51</td>
<td class="data-td data last" style="border-right: outset;">7.65</td>
<td class="data-td data last">-2.50</td>
</tr>
<tr class="tbl-data">
<td class="data-td last">Healthcare</td>
<td class="data-td data last">3.02</td>
<td class="data-td data last">3.03</td>
<td class="data-td data last">4.33</td>
<td class="data-td data last" style="border-right: outset;">4.62</td>
<td class="data-td data last">362</td>
<td class="data-td data last">304</td>
<td class="data-td data last">281</td>
<td class="data-td data last" style="border-right: outset;">299</td>
<td class="data-td data last">83.56</td>
<td class="data-td data last">86.47</td>
<td class="data-td data last">86.82</td>
<td class="data-td data last" style="border-right: outset;">84.72</td>
<td class="data-td data last" style="border-right: outset;">5.51</td>
<td class="data-td data last">-1.55</td>
</tr>
<tr class="tbl-data">
<td class="data-td last">Insurance</td>
<td class="data-td data last">0.85</td>
<td class="data-td data last">0.82</td>
<td class="data-td data last">1.15</td>
<td class="data-td data last" style="border-right: outset;">1.20</td>
<td class="data-td data last">347</td>
<td class="data-td data last">364</td>
<td class="data-td data last">358</td>
<td class="data-td data last" style="border-right: outset;">366</td>
<td class="data-td data last">92.10</td>
<td class="data-td data last">92.99</td>
<td class="data-td data last">91.39</td>
<td class="data-td data last" style="border-right: outset;">87.81</td>
<td class="data-td data last" style="border-right: outset;">-0.01</td>
<td class="data-td data last">-1.22</td>
</tr>
<tr class="tbl-data">
<td class="data-td last">Leisure</td>
<td class="data-td data last">7.88</td>
<td class="data-td data last">7.79</td>
<td class="data-td data last">10.42</td>
<td class="data-td data last" style="border-right: outset;">7.87</td>
<td class="data-td data last">325</td>
<td class="data-td data last">243</td>
<td class="data-td data last">182</td>
<td class="data-td data last" style="border-right: outset;">257</td>
<td class="data-td data last">89.95</td>
<td class="data-td data last">93.25</td>
<td class="data-td data last">93.34</td>
<td class="data-td data last" style="border-right: outset;">89.37</td>
<td class="data-td data last" style="border-right: outset;">6.56</td>
<td class="data-td data last">-1.28</td>
</tr>
<tr class="tbl-data">
<td class="data-td last">Real Estate</td>
<td class="data-td data last">5.13</td>
<td class="data-td data last">4.72</td>
<td class="data-td data last">6.22</td>
<td class="data-td data last" style="border-right: outset;">8.37</td>
<td class="data-td data last">697</td>
<td class="data-td data last">701</td>
<td class="data-td data last">602</td>
<td class="data-td data last" style="border-right: outset;">660</td>
<td class="data-td data last">79.46</td>
<td class="data-td data last">80.72</td>
<td class="data-td data last">80.99</td>
<td class="data-td data last" style="border-right: outset;">80.86</td>
<td class="data-td data last" style="border-right: outset;">6.26</td>
<td class="data-td data last">-3.23</td>
</tr>
<tr class="tbl-data">
<td class="data-td last">Retail</td>
<td class="data-td data last">5.67</td>
<td class="data-td data last">5.49</td>
<td class="data-td data last">7.79</td>
<td class="data-td data last" style="border-right: outset;">7.98</td>
<td class="data-td data last">471</td>
<td class="data-td data last">474</td>
<td class="data-td data last">354</td>
<td class="data-td data last" style="border-right: outset;">368</td>
<td class="data-td data last">73.75</td>
<td class="data-td data last">74.72</td>
<td class="data-td data last">82.35</td>
<td class="data-td data last" style="border-right: outset;">78.48</td>
<td class="data-td data last" style="border-right: outset;">3.65</td>
<td class="data-td data last">-3.26</td>
</tr>
<tr class="tbl-data">
<td class="data-td last">Services</td>
<td class="data-td data last">0.38</td>
<td class="data-td data last">0.37</td>
<td class="data-td data last">0.53</td>
<td class="data-td data last" style="border-right: outset;">0.57</td>
<td class="data-td data last">388</td>
<td class="data-td data last">368</td>
<td class="data-td data last">356</td>
<td class="data-td data last" style="border-right: outset;">309</td>
<td class="data-td data last">87.11</td>
<td class="data-td data last">89.89</td>
<td class="data-td data last">88.62</td>
<td class="data-td data last" style="border-right: outset;">88.75</td>
<td class="data-td data last" style="border-right: outset;">6.14</td>
<td class="data-td data last">0.81</td>
</tr>
<tr class="tbl-data">
<td class="data-td last">Technology &amp; Electronics</td>
<td class="data-td data last">4.20</td>
<td class="data-td data last">4.67</td>
<td class="data-td data last">6.21</td>
<td class="data-td data last" style="border-right: outset;">5.57</td>
<td class="data-td data last">327</td>
<td class="data-td data last">287</td>
<td class="data-td data last">269</td>
<td class="data-td data last" style="border-right: outset;">262</td>
<td class="data-td data last">85.47</td>
<td class="data-td data last">88.19</td>
<td class="data-td data last">86.89</td>
<td class="data-td data last" style="border-right: outset;">87.23</td>
<td class="data-td data last" style="border-right: outset;">4.62</td>
<td class="data-td data last">-2.06</td>
</tr>
<tr class="tbl-data">
<td class="data-td last">Telecommunications</td>
<td class="data-td data last">11.91</td>
<td class="data-td data last">11.68</td>
<td class="data-td data last">10.61</td>
<td class="data-td data last" style="border-right: outset;">11.53</td>
<td class="data-td data last">423</td>
<td class="data-td data last">433</td>
<td class="data-td data last">475</td>
<td class="data-td data last" style="border-right: outset;">418</td>
<td class="data-td data last">90.04</td>
<td class="data-td data last">91.39</td>
<td class="data-td data last">84.92</td>
<td class="data-td data last" style="border-right: outset;">84.95</td>
<td class="data-td data last" style="border-right: outset;">9.16</td>
<td class="data-td data last">-1.01</td>
</tr>
<tr class="tbl-data">
<td class="data-td last">Transportation</td>
<td class="data-td data last">2.10</td>
<td class="data-td data last">1.78</td>
<td class="data-td data last">2.59</td>
<td class="data-td data last" style="border-right: outset;">3.14</td>
<td class="data-td data last">279</td>
<td class="data-td data last">231</td>
<td class="data-td data last">150</td>
<td class="data-td data last" style="border-right: outset;">203</td>
<td class="data-td data last">90.49</td>
<td class="data-td data last">92.69</td>
<td class="data-td data last">94.75</td>
<td class="data-td data last" style="border-right: outset;">91.70</td>
<td class="data-td data last" style="border-right: outset;">7.46</td>
<td class="data-td data last">-1.70</td>
</tr>
<tr class="tbl-data">
<td class="data-td last">Utility</td>
<td class="data-td data last">6.93</td>
<td class="data-td data last">5.38</td>
<td class="data-td data last">7.52</td>
<td class="data-td data last" style="border-right: outset;">7.77</td>
<td class="data-td data last">213</td>
<td class="data-td data last">206</td>
<td class="data-td data last">165</td>
<td class="data-td data last" style="border-right: outset;">175</td>
<td class="data-td data last">89.95</td>
<td class="data-td data last">90.19</td>
<td class="data-td data last">89.90</td>
<td class="data-td data last" style="border-right: outset;">86.28</td>
<td class="data-td data last" style="border-right: outset;">1.19</td>
<td class="data-td data last">-2.04</td>
</tr>
<tr class="tbl-data">
<td class="data-td last">Total</td>
<td class="data-td data last">100</td>
<td class="data-td data last" style="border-right: outset;">100</td>
<td class="data-td data last">337</td>
<td class="data-td data last">325</td>
<td class="data-td data last">297</td>
<td class="data-td data last" style="border-right: outset;">314</td>
<td class="data-td data last">87.91</td>
<td class="data-td data last">89.51</td>
<td class="data-td data last">88.78</td>
<td class="data-td data last" style="border-right: outset;">86.69</td>
<td class="data-td data last" style="border-right: outset;">4.46</td>
<td class="data-td data last">-1.67</td>
</tr>
</tbody>
</table>
</div>
<br />
<p class="chart-disclosure">Source: ICE Data Services, VanEck. Fallen Angels: ICE US Fallen Angel High Yield 10% Constrained Index. Not intended as a recommendation to invest or divest in any of the sectors mentioned herein. Index performance is not representative of fund performance. It is not possible to invest in an index.</p>
<p><u><strong>Fallen Angels Performance by Rating:</strong></u> Single-B rated issuers outperform BB and CCC &amp; lower rated issuers in September. As we wrote last month, CCC &amp; lower rated issuers have outperformed YTD due to robust U.S. growth data and better-than-expected earnings. Diversified Healthcare Trust (DHT), a REIT, is the CC rated issuer (upon Moody&rsquo;s downgrade to Ca in early September) following the notice that the merger between DHT and Office Properties Income Trust was cancelled.</p>
<div class="wrapped-div">
<table style="width: 100%;">
<tbody>
<tr class="tbl-data">
<td class="tbl-header last text-center">&nbsp;</td>
<td class="tbl-header last text-center" style="border-right: outset;" colspan="4">Wgt (%)</td>
<td class="tbl-header last text-center" style="border-right: outset;" colspan="4">OAS</td>
<td class="tbl-header last text-center" style="border-right: outset;" colspan="4">Price</td>
<td class="tbl-header last text-center" style="border-right: outset;">Total<br />Return<br />(%)</td>
<td class="tbl-header last text-center">Total<br />Return<br />(%)</td>
</tr>
<tr class="tbl-data">
<td class="data-head last">&nbsp;</td>
<td class="data-head last">12/31/21</td>
<td class="data-head last">3/31/23</td>
<td class="data-head last">6/30/23</td>
<td class="data-head last" style="border-right: outset;">9/30/23</td>
<td class="data-head last">12/31/21</td>
<td class="data-head last">3/31/23</td>
<td class="data-head last">6/30/23</td>
<td class="data-head last" style="border-right: outset;">9/30/23</td>
<td class="data-head last">12/31/21</td>
<td class="data-head last">3/31/23</td>
<td class="data-head last">6/30/23</td>
<td class="data-head last" style="border-right: outset;">9/30/23</td>
<td class="data-head last" style="border-right: outset;">YTD</td>
<td class="data-head last">MTD</td>
</tr>
<tr class="tbl-data">
<td class="data-td last">BB</td>
<td class="data-td data last">87.00</td>
<td class="data-td data last">87.08</td>
<td class="data-td data last">83.01</td>
<td class="data-td data last" style="border-right: outset;">81.02</td>
<td class="data-td data last">284</td>
<td class="data-td data last">281</td>
<td class="data-td data last">256</td>
<td class="data-td data last" style="border-right: outset;">257</td>
<td class="data-td data last">90.02</td>
<td class="data-td data last">91.51</td>
<td class="data-td data last">89.83</td>
<td class="data-td data last" style="border-right: outset;">87.94</td>
<td class="data-td data last" style="border-right: outset;">3.62</td>
<td class="data-td data last">-1.75</td>
</tr>
<tr class="tbl-data">
<td class="data-td last">B</td>
<td class="data-td data last">10.95</td>
<td class="data-td data last">10.37</td>
<td class="data-td data last">13.31</td>
<td class="data-td data last" style="border-right: outset;">15.03</td>
<td class="data-td data last">608</td>
<td class="data-td data last">500</td>
<td class="data-td data last">405</td>
<td class="data-td data last" style="border-right: outset;">493</td>
<td class="data-td data last">82.50</td>
<td class="data-td data last">85.35</td>
<td class="data-td data last">89.55</td>
<td class="data-td data last" style="border-right: outset;">86.37</td>
<td class="data-td data last" style="border-right: outset;">5.99</td>
<td class="data-td data last">-0.88</td>
</tr>
<tr class="tbl-data">
<td class="data-td last">CCC</td>
<td class="data-td data last">1.98</td>
<td class="data-td data last">2.50</td>
<td class="data-td data last">3.68</td>
<td class="data-td data last" style="border-right: outset;">3.43</td>
<td class="data-td data last">1,020</td>
<td class="data-td data last">1,014</td>
<td class="data-td data last">852</td>
<td class="data-td data last" style="border-right: outset;">810</td>
<td class="data-td data last">60.88</td>
<td class="data-td data last">64.60</td>
<td class="data-td data last">68.55</td>
<td class="data-td data last" style="border-right: outset;">67.01</td>
<td class="data-td data last" style="border-right: outset;">21.94</td>
<td class="data-td data last">-2.88</td>
</tr>
<tr class="tbl-data">
<td class="data-td last">CC</td>
<td class="data-td data last">&nbsp;</td>
<td class="data-td data last" style="border-right: outset;">0.52</td>
<td class="data-td data last">&nbsp;</td>
<td class="data-td data last" style="border-right: outset;">835</td>
<td class="data-td data last">&nbsp;</td>
<td class="data-td data last" style="border-right: outset;">72.91</td>
<td class="data-td data last" style="border-right: outset;">&nbsp;</td>
<td class="data-td data last">&nbsp;</td>
</tr>
<tr class="tbl-data">
<td class="data-td last">C<sup>*</sup></td>
<td class="data-td data last">&nbsp;</td>
<td class="data-td data last">0.04</td>
<td class="data-td data last">&nbsp;</td>
<td class="data-td data last" style="border-right: outset;">&nbsp;</td>
<td class="data-td data last">&nbsp;</td>
<td class="data-td data last">6,713</td>
<td class="data-td data last">&nbsp;</td>
<td class="data-td data last" style="border-right: outset;">&nbsp;</td>
<td class="data-td data last">&nbsp;</td>
<td class="data-td data last">7.16</td>
<td class="data-td data last">&nbsp;</td>
<td class="data-td data last" style="border-right: outset;">&nbsp;</td>
<td class="data-td data last" style="border-right: outset;">-17.77</td>
<td class="data-td data last">&nbsp;</td>
</tr>
<tr class="tbl-data">
<td class="data-td last">D<sup>*</sup></td>
<td class="data-td data last">0.07</td>
<td class="data-td data last">&nbsp;</td>
<td class="data-td data last" style="border-right: outset;">&nbsp;</td>
<td class="data-td data last">4,726</td>
<td class="data-td data last">&nbsp;</td>
<td class="data-td data last" style="border-right: outset;">&nbsp;</td>
<td class="data-td data last">10.00</td>
<td class="data-td data last">&nbsp;</td>
<td class="data-td data last" style="border-right: outset;">&nbsp;</td>
<td class="data-td data last" style="border-right: outset;">-62.06</td>
<td class="data-td data last">&nbsp;</td>
</tr>
<tr class="tbl-data">
<td class="data-td last">Total</td>
<td class="data-td data last">100</td>
<td class="data-td data last" style="border-right: outset;">100</td>
<td class="data-td data last">337</td>
<td class="data-td data last">325</td>
<td class="data-td data last">297</td>
<td class="data-td data last" style="border-right: outset;">314</td>
<td class="data-td data last">87.91</td>
<td class="data-td data last">89.51</td>
<td class="data-td data last">88.78</td>
<td class="data-td data last" style="border-right: outset;">86.69</td>
<td class="data-td data last" style="border-right: outset;">4.46</td>
<td class="data-td data last">-1.67</td>
</tr>
</tbody>
</table>
</div>
<br />
<p class="chart-disclosure">Source: ICE Data Services, VanEck.&nbsp;<sup>*</sup>Does not have securities for all months of selected period. Returns are based on partial period data. Fallen Angels: ICE US Fallen Angel High Yield 10% Constrained Index. Past performance is no guarantee of future results. Index performance is not representative of fund performance. It is not possible to invest in an index.</p>
<p>To receive more <a href="https://www.vaneck.com/us/en/insights/income-investing/" title="Income Investing insights"><strong>Income Investing</strong></a> insights, <a href="/link/5f45412c2143400497908cea2897f7d3.aspx" title=" Subscription Center"><strong>sign up in our subscription center</strong></a>.</p>
<style type="text/css">
 .wrapped-div {
 max-width: 100%;
 }

 @media (max-width: 1024px) {
 .wrapped-div {
 overflow-x: scroll;
 }
 }

 .wrapped-div-sector {
 max-width: 100%;
 overflow-x: scroll;
 }
</style>
]]></content:encoded>
</item><item rdf:about="https://www.vaneck.com/us/en/blogs/thematic-investing/big-pharmas-billion-dollar-weight-loss-drug-market/">
  <title>Big Pharma&#39;s Billion-Dollar Weight Loss Drug Market></title>
  <link>https://www.vaneck.com/us/en/blogs/thematic-investing/big-pharmas-billion-dollar-weight-loss-drug-market/</link>
  <description><![CDATA[The market for weight loss drugs, projected to hit $77 billion by 2030, signals a convergence of lucrative investment opportunities and critical healthcare solutions for the global obesity crisis.]]></description>
  <dc:creator>Dylan  Desai</dc:creator>
  <dc:date>10/16/2023 06:30:00</dc:date>
<content:encoded><![CDATA[

<p>The introduction of weight management and obesity-targeting drugs has induced excitement from Wall Street to Main Street. This enthusiasm is rooted in the pressing global health concern of obesity and its associated conditions, such as cardiovascular diseases, diabetes, and certain cancers. Weight management drugs represent a promising avenue for addressing this multifaceted health crisis. Additionally, these drugs offer the potential for more effective and sustainable weight loss solutions than conventional weight mitigation methods.</p>
<p>In this blog, we discuss the market opportunity these drugs bring, how <a href="https://www.vaneck.com/us/en/investments/pharmaceutical-etf-pph/overview/" title="PPH - VanEck Pharmaceutical ETF - Overview"><strong>VanEck&rsquo;s Pharmaceutical ETF</strong></a> (NYSE: PPH) stood above its peers in providing exposure to these developments, and how the portfolio is positioned for the next major advancement in the pharmaceutical sector.</p>
<h2>Weight-Loss Drugs Present a Lucrative Market Opportunity</h2>
<p>Weight loss drugs have garnered attention due to their efficiency in addressing major health conditions and improved outcomes for individuals simply seeking to lose weight. In addition to solving some of the world&rsquo;s largest health concerns, these medications have created a new market and revenue stream for the pharmaceutical companies that manufacture them.</p>
<p>Morgan Stanley Research estimates that the market for obesity drugs will reach $77 billion by 2030.<sup>1</sup>&nbsp;The FDA shows roughly 70% of American adults are obese or overweight.<sup>2</sup>&nbsp;Globally, 750 million people are living with obesity, which causes 5% of deaths, according to the WHO.<sup>3</sup>&nbsp;These staggering statistics largely contribute to the incredible projections released by Morgan Stanley, as illustrated below.</p>
<h3>Morgan Stanley Expects the Market for Obesity Drugs to Reach $77 Billion by 2030</h3>
<p><img class="img-responsive w-100" src="https://www.vaneck.com/contentassets/2bee6896d2724dadbba8930ac133018a/3717_pph-weight-loss-blog_chart-1_2023.10_v1_blog.svg" alt="Market for Obesity Drugs to Reach $77 Billion by 2030" /></p>
<p class="chart-disclosure">Source: Morgan Stanley Research. Data as of 9/6/2023.</p>
<p>The Danish company Novo Nordisk was the first major pharmaceutical company to receive FDA approval for their weight-loss drug, Wegovy. Novo Nordisk also developed Ozempic to address diabetes, but it is also being used for weight management. The American firm Eli Lily released Mounjaro, which is currently approved for treating diabetes but is also being used to manage weight. As positive news broke on the efficacy of these drugs, both companies&rsquo; stock soared.</p>
<h3>NVO and LLY Up 2.7X and 3.7X Respectfully, Outperforming the S&amp;P</h3>
<p><img class="img-responsive w-100" src="https://www.vaneck.com/contentassets/2bee6896d2724dadbba8930ac133018a/3717_pph-weight-loss-blog_chart-2_2023.10_v1_blog.svg" alt="NVO and LLY Outperforming the S and P" /></p>
<p class="chart-disclosure">Source: FactSet. Data as of 9/30/2023. The performance data quoted represents past performance. Past performance is not a guarantee of future results. Performance may be lower or higher than the performance data quoted.</p>
<h2>PPH&rsquo;s Diversification Has Enhanced the Portfolio</h2>
<p>The VanEck Pharmaceutical ETF is the only ETF in its peer group that offers investors access to global, U.S.-listed companies that derive at least 50% of their revenues from pharmaceutical products and services. The fund&rsquo;s international exposure has significantly contributed to the ETF&rsquo;s outperformance. Year-to-date, the S&amp;P 1500 Health Care Index is down 4.33%. Over the same period, the VanEck Pharmaceutical ETF is up +4.02%.</p>
<p>When broken down by country, the U.S.-domiciled companies in the portfolio contributed -0.90% to the returns of the fund, and the companies domiciled in the United Kingdom, Denmark, Switzerland, France, Japan, and Israel had positive returns individually and collectively contributed +4.89% to the ETF. This breakdown is illustrated below.</p>
<h3>Foreign Pharmaceutical Companies Drive Positive Returns YTD</h3>
<p><img class="img-responsive w-100" src="https://www.vaneck.com/contentassets/2bee6896d2724dadbba8930ac133018a/3717_pph-weight-loss-blog_chart-3_2023.10_v1_blog.svg" alt="Foreign Pharmaceutical Companies Drive Positive Returns YTD" /></p>
<p class="chart-disclosure">Source: FactSet. Data as of 9/30/2023. The performance data quoted represents past performance. Past performance is not a guarantee of future results. Performance may be lower or higher than the performance data quoted.</p>
<p>When analyzing the fund against competitors in the space, it&rsquo;s evident that including international companies has positively contributed to returns. Over the past 3 years, PPH has boasted a higher annual return, sharpe ratio, up-capture ratio, and alpha than the other ETFs highlighted below, which offer exposure to the pharmaceutical sector.</p>
<h3>3-Year Return Metrics</h3>
<div class="wrapped-div">
<table style="width: 100%;">
<tbody>
<tr class="tbl-data">
<td class="tbl-header last">&nbsp;</td>
<td class="tbl-header last text-center">Return</td>
<td class="tbl-header last text-center">Sharpe Ratio</td>
<td class="tbl-header last text-center">Up Capture Ratio</td>
<td class="tbl-header last text-center">Down Capture Ratio</td>
<td class="tbl-header last text-center">Alpha</td>
</tr>
<tr class="tbl-data">
<td class="data-td last">PPH</td>
<td class="data-td data last">10.73</td>
<td class="data-td data last">0.64</td>
<td class="data-td data last">70.19</td>
<td class="data-td data last">55.41</td>
<td class="data-td data last">3.81</td>
</tr>
<tr class="tbl-data">
<td class="data-td last">Competitor Pharma ETF A</td>
<td class="data-td data last">5.27</td>
<td class="data-td data last">0.29</td>
<td class="data-td data last">50.77</td>
<td class="data-td data last">51.04</td>
<td class="data-td data last">-0.61</td>
</tr>
<tr class="tbl-data">
<td class="data-td last">Competitor Pharma ETF B</td>
<td class="data-td data last">4.49</td>
<td class="data-td data last">0.24</td>
<td class="data-td data last">56.02</td>
<td class="data-td data last">62.13</td>
<td class="data-td data last">-1.52</td>
</tr>
<tr class="tbl-data">
<td class="data-td last">S&amp;P 500</td>
<td class="data-td data last">-1.78</td>
<td class="data-td data last">-0.17</td>
<td class="data-td data last">42.52</td>
<td class="data-td data last">71.42</td>
<td class="data-td data last">-7.73</td>
</tr>
</tbody>
</table>
</div>
<br />
<p class="chart-disclosure">Source: Morningstar. Data as of 9/30/2023. The performance data quoted represents past performance. Past performance is not a guarantee of future results. Performance may be lower or higher than the performance data quoted.</p>
<h2>PPH Continues to be Well Positioned</h2>
<p><a href="https://www.vaneck.com/us/en/investments/pharmaceutical-etf-pph/overview/" title="PPH - VanEck Pharmaceutical ETF - Overview"><strong>The VanEck Pharmaceutical ETF</strong></a> (PPH) exhibits a distinct advantage in its investment strategy due to its robust international exposure. This characteristic positions PPH favorably within the context of a diversified portfolio. The fund's international holdings grant investors access to a broader spectrum of global markets and economies, thereby potentially mitigating risks associated with regional economic fluctuations or geopolitical events that may disproportionately affect domestic investments.</p>
<p>Furthermore, the fund&rsquo;s international exposure enables it to proactively capture emerging drug discoveries and medical advancements originating beyond the United States. This international orientation is a potent catalyst for capitalizing on global innovation in the pharmaceutical and healthcare sectors. Thus, PPH's international diversification allows investors to access a broader and more dynamic landscape of medical innovation, potentially enhancing the fund's long-term performance and resilience in the rapidly evolving healthcare industry.</p>
<div class="wrapped-div">
<table style="width: 100%;">
<tbody>
<tr class="tbl-data">
<td class="tbl-header last">&nbsp;</td>
<td class="tbl-header last text-center">1 Mo</td>
<td class="tbl-header last text-center">3 Mo</td>
<td class="tbl-header last text-center">YTD</td>
<td class="tbl-header last text-center">1 Yr</td>
<td class="tbl-header last text-center">3 Yr</td>
<td class="tbl-header last text-center">5 Yr</td>
<td class="tbl-header last text-center">10 Yr</td>
<td class="tbl-header last text-center">Since Inception</td>
</tr>
<tr class="tbl-data">
<td class="data-td last">PPH NAV</td>
<td class="data-td data last">-2.52</td>
<td class="data-td data last">1.77</td>
<td class="data-td data last">4.02</td>
<td class="data-td data last">21.14</td>
<td class="data-td data last">10.72</td>
<td class="data-td data last">6.31</td>
<td class="data-td data last">7.24</td>
<td class="data-td data last">9.17</td>
</tr>
<tr class="tbl-data">
<td class="data-td last">PPH Mkt Price</td>
<td class="data-td data last">-2.49</td>
<td class="data-td data last">1.90</td>
<td class="data-td data last">4.11</td>
<td class="data-td data last">21.22</td>
<td class="data-td data last">10.69</td>
<td class="data-td data last">6.33</td>
<td class="data-td data last">7.26</td>
<td class="data-td data last">9.26</td>
</tr>
<tr class="tbl-data">
<td class="data-td last">S&amp;P 1500 Health Care Index</td>
<td class="data-td data last">-3.23</td>
<td class="data-td data last">-3.19</td>
<td class="data-td data last">-4.33</td>
<td class="data-td data last">7.38</td>
<td class="data-td data last">7.95</td>
<td class="data-td data last">7.65</td>
<td class="data-td data last">11.69</td>
<td class="data-td data last">13.79</td>
</tr>
<tr class="tbl-data">
<td class="data-td last">S&amp;P 500</td>
<td class="data-td data last">-4.77</td>
<td class="data-td data last">-3.27</td>
<td class="data-td data last">13.07</td>
<td class="data-td data last">21.62</td>
<td class="data-td data last">10.16</td>
<td class="data-td data last">9.92</td>
<td class="data-td data last">11.92</td>
<td class="data-td data last">9.92</td>
</tr>
</tbody>
</table>
</div>
<br />
<p class="chart-disclosure">Source: VanEck, Morningstar. Data as of 9/30/2023.</p>
<p class="chart-disclosure">PPH&rsquo;s Gross Expense Ratio is 0.35%, and its Total Expense Ratio is 0.36%. Van Eck Associates Corporation (the &ldquo;Adviser&rdquo;) will pay all expenses of the Fund, except for the fee payment under the investment management agreement, acquired fund fees and expenses, interest expense, offering costs, trading expenses, taxes and extraordinary expenses. Notwithstanding the foregoing, the Adviser has agreed to pay the offering costs until at least February 1, 2024. &ldquo;Other Expenses&rdquo; have been restated to reflect current fees.</p>
<p class="chart-disclosure">Returns less than one year are not annualized.</p>
<p class="chart-disclosure"><strong>The performance data quoted represents past performance. Past performance is not a guarantee of future results. Investment return and principal value of an investment will fluctuate so that an investor's shares, when redeemed, may be worth more or less than their original cost. Performance may be lower or higher than performance data quoted. Please call 800.826.2333 or visit vaneck.com for performance current to the most recent month ended.</strong></p>
<p class="chart-disclosure">An investor cannot invest directly in an index. The table presents past performance which is no guarantee of future results and which may be lower or higher than current performance. Returns reflect temporary contractual fee waivers and/or expense reimbursements. Had the ETF incurred all expenses and fees, investment returns would have been reduced. Investment returns and ETF share values will fluctuate so that investors' shares, when redeemed, may be worth more or less than their original cost. ETF returns assume that dividends and capital gains distributions have been reinvested in the Fund at NAV.</p>
<p class="chart-disclosure">The S&amp;P 500 Index is a product of S&amp;P Dow Jones Indices LLC and/or its affiliates and has been licensed for use by Van Eck Associates Corporation. Copyright &copy; 2023 S&amp;P Dow Jones Indices LLC, a division of S&amp;P Global, Inc., and/or its affiliates. All rights reserved. Redistribution or reproduction in whole or in part are prohibited without written permission of S&amp;P Dow Jones Indices LLC. For more information on any of S&amp;P Dow Jones Indices LLC&rsquo;s indices please visit https://www.spglobal.com/spdji/en/. S&amp;P<sup>&reg;</sup>&nbsp;is a registered trademark of S&amp;P Global and Dow Jones<sup>&reg;</sup>&nbsp;is a registered trademark of Dow Jones Trademark Holdings LLC. Neither S&amp;P Dow Jones Indices LLC, Dow Jones Trademark Holdings LLC, their affiliates nor their third party licensors make any representation or warranty, express or implied, as to the ability of any index to accurately represent the asset class or market sector that it purports to represent and neither S&amp;P Dow Jones Indices LLC, Dow Jones Trademark Holdings LLC, their affiliates nor their third party licensors shall have any liability for any errors, omissions, or interruptions of any index or the data included therein.</p>
<p class="chart-disclosure">The S&amp;P 500 Index consists of 500 widely held common stocks covering industrial, utility, financial and transportation sector; as an Index, it is unmanaged and is not a security in which investments can be made.</p>
<p>To receive more <a href="https://www.vaneck.com/us/en/insights/thematic-investing/" title="Thematic Investing Insights"><strong>Thematic Investing</strong></a> insights, <a href="https://www.vaneck.com/us/en/subscribe/" title="Subscription Center"><strong>sign up in our subscription center</strong></a>.</p>
<style>
    .wrapped-div {
        max-width: 100%;
    }

    @media (max-width: 768px) {
        .wrapped-div {
            overflow-x: scroll;
        }
    }

    .wrapped-div-sector {
        max-width: 100%;
        overflow-x: scroll;
    }
</style>
]]></content:encoded>
</item><item rdf:about="https://www.vaneck.com/us/en/blogs/economic-trends/em-resilience-early-action-is-key/">
  <title>EM Resilience - Early Action Is Key></title>
  <link>https://www.vaneck.com/us/en/blogs/economic-trends/em-resilience-early-action-is-key/</link>
  <description><![CDATA[We are at the IMF annual meetings this week, and EM resiliency to external shocks is a permanent thread in many discussions.]]></description>
  <dc:creator>Natalia  Gurushina</dc:creator>
  <dc:date>10/12/2023 14:00:00</dc:date>
<content:encoded><![CDATA[

<p>There are still many questions about the wider economic impact of the Middle East escalation (including oil), and there are calls for EMs (especially more fragile EMs) to be more proactive policy-wise before things get really bad. FX adjustment plays an important role here &ndash; EMs that allowed their currencies to absorb external shocks are now seeing better current account outcomes, which puts them in a stronger position to deal with global uncertainties. Digitization and AI-leapfrogging potential was mentioned more than once in the context of economic discussions about Africa&rsquo;s growth potential and investability.</p>
<p><strong>Inflation</strong> is on everybody&rsquo;s mind after this week&rsquo;s releases in the U.S. A tiny upside surprise in headline inflation &ndash; or rather a lack of downside surprises &ndash; pushed U.S. rates higher across the board, with the curve bear-flattening once again (=shorter rates rising more than long ones). The release <strong>was not completely U.S. Federal Reserve (Fed)-unfriendly</strong> though, and the market-implied probability of the Fed&rsquo;s November hike was still below 15% at the time of the note. But &ldquo;higher-for-longer&rdquo; remains the baseline scenario, raising concerns about developed markets (DM) ability to deal with potential financial stability risks and rising debt-service costs. As one (very credible) EM central bank Governor said this morning, <strong>if you do not like high borrowing costs, reduce the amount you borrow.</strong> Wise advice!</p>
<p>A common theme here at the IMF is that falling inflation can improve growth prospects in EM by boosting real incomes and creating more transparency for investment decisions. We are already seeing some evidence of this happening in Brazil, and Hungary is hoping for a similar outcome in 2024. Turkish inflation will continue to re-accelerate for a while (see chart below), but &ldquo;<strong>Team Turkey&rdquo; presentations at the IMF meetings are consistently good</strong>, strengthening the market&rsquo;s conviction that the policy U-turn is for real.</p>
<h3>Chart at a Glance: Turkey Annual Inflation Expected To Peak Above 70%</h3>
<p><img class="img-responsive w-100" src="https://www.vaneck.com/contentassets/385512d7ce134b4e9470f7bf7ebf4f94/emdd-10-12-23.png" alt="Chart at a Glance: Turkey Annual Inflation Expected To Peak Above 70%" /></p>
<p class="chart-disclosure">Source: Bloomberg L.P.</p>
]]></content:encoded>
</item><item rdf:about="https://www.vaneck.com/us/en/blogs/moat-investing/moat-etf-quarterly-reconstitution-3q2023/">
  <title>MOAT ETF Quarterly Reconstitution 3Q2023></title>
  <link>https://www.vaneck.com/us/en/blogs/moat-investing/moat-etf-quarterly-reconstitution-3q2023/</link>
  <description><![CDATA[See which index constituents have been added/removed, reasons for removal, potential upcoming constituent additions, and the current weightings of index holdings.]]></description>
  <dc:creator>Brandon Rakszawski</dc:creator>
  <dc:date>10/12/2023 06:30:00</dc:date>
<content:encoded><![CDATA[

<p>The Morningstar<sup>&reg;</sup>&nbsp;Wide Moat Focus Index<sup>SM</sup>&nbsp;(the &ldquo;Moat Index&rdquo;) underwent its quarterly review on September 15, 2023 in which it systematically targets attractively priced, high quality U.S. companies. Below are some key takeaways from the September review and how the Moat Index is positioned as we enter the last quarter of the year. The full review results are available here: <strong><a href="/us/en/blogs/moat-investing/moat-etf-quarterly-reconstitution-3q2023/moat-reconstitution-3q-2023.pdf" title="Morningstar Wide Moat Focus Index Reconstitution" target="_blank" rel="noopener">3Q2023 Index Reconstitution</a></strong>.</p>
<br />
<h2>Key Takeaways:</h2>
<ul class="content-list">
<li><strong>Growth Exodus Led by Tech</strong></li>
</ul>
<p>The Index continued its shift away from growth stocks, which began in June 2023, to more of a blend/value posture. The tech sector saw the largest reduction in exposure, signaling growth as an overvalued segment of the US market. Tech stocks are now the largest underweight in the Moat Index, about 12% relative to the S&amp;P 500 Index.</p>
<ul class="content-list">
<li><strong>Value Fills the Void</strong></li>
</ul>
<p>The Moat Index&rsquo;s tech sector void was filled by companies from value-oriented sectors such as industrials (Honeywell, TRX Corp), financials (Charles Schwab, MarketAxess) and consumer staples (Estee Lauder, Campbell Soup).</p>
<ul class="content-list">
<li><strong>Only Three of the Magnificent 7 </strong></li>
</ul>
<p>The market has taken a liking to a new moniker representing the seven companies driving the vast majority of U.S. market returns: Alphabet, Amazon, Apple, Meta, Microsoft, Nvidia, and Tesla. Amid stretched valuations this quarter, the Moat Index removed Meta Platforms leaving only Alphabet, Amazon, and Microsoft in the Moat Index at around a 5.3% weighting relative to nearly 28% exposure for the Magnificent 7 in the S&amp;P 500 Index.</p>
<h2>Access Quality Companies and Attractive Valuations</h2>
<p><a href="https://www.vaneck.com/us/en/investments/morningstar-wide-moat-etf-moat/overview/" title="MOAT - VanEck Morningstar Wide Moat ETF - Holdings and Performance  "><strong>VanEck Morningstar Wide Moat ETF (MOAT)</strong></a> and <strong><a href="https://www.vaneck.com/us/en/investments/morningstar-wide-moat-fund-mwmzx/overview/" title="MWMZX - VanEck Morningstar Wide Moat Fund - Class Z ">VanEck Morningstar Wide Moat Fund</a></strong> follow a simple philosophy: find quality companies, buy them when they&rsquo;re undervalued and sell them when they&rsquo;re overvalued.</p>
<p>To receive more <strong><a href="https://www.vaneck.com/us/en/insights/moat-investing/" title="Moat Investing">Moat Investing</a></strong> insights, <strong><a href="https://www.vaneck.com/us/en/subscribe/" title="Preference Center">sign up in our subscription center</a></strong>.</p>
]]></content:encoded>
</item><item rdf:about="https://www.vaneck.com/us/en/blogs/emerging-markets-bonds/emerging-markets-debt-hold-steady-until-bonds-stabilize/">
  <title>Emerging Markets Debt: Hold Steady, Until Bonds Stabilize></title>
  <link>https://www.vaneck.com/us/en/blogs/emerging-markets-bonds/emerging-markets-debt-hold-steady-until-bonds-stabilize/</link>
  <description><![CDATA[September was a tough month for bonds, and more follow on weakness is expected in October. We are largely staying out of the way of the sell off until global bonds stabilize. We are very slowly buying selected longer duration corporates.]]></description>
  <dc:creator>Eric Fine</dc:creator>
  <dc:date>10/12/2023 06:30:00</dc:date>
<content:encoded><![CDATA[

<p>In September, <strong><a href="https://www.vaneck.com/us/en/investments/emerging-markets-bond-fund-embax/overview/" title="EMBAX - Emerging Markets Bond Fund - Class A">the VanEck Emerging Markets Bond Fund</a></strong> outperformed its benchmark, the 50% J.P. Morgan Government Bond Index-Emerging Markets (GBI-EM) Global Diversified and 50% J.P. Morgan Emerging Markets Bond Index (EMBI), by 55 basis points (bps), being down 2.43%, compared to 2.98% for its benchmark. This outperformance is despite a last-day-in-September rally in high-beta risk, which we have been avoiding. We are largely staying out of the way of the sell off until global bonds stabilize. We are very slowly buying selected longer duration corporates. We are also looking at emerging markets (EM) local markets that we like for fundamental reasons, but whose beta makes them very vulnerable currently. Long-duration investment grade is also on our radar. But nothing is flashing buy yet. We ended September with carry of 6.2%, yield to worst (YTW) of 10.54%, duration of 3.9, and roughly 35% of the fund in local currency. Cash is an unusually high 10% as the fund braced for September (and early October). Our biggest exposures are Brazil (local), Mexico (hard), South Africa (local), Indonesia (local), and Colombia (local).</p>
<div class="wrapped-div">
<table style="width: 100%;">
<tbody>
<tr class="tbl-data">
<td class="tbl-header last" colspan="8">Average Annual Total Returns (%) as of September 30, 2023</td>
</tr>
<tr class="tbl-data">
<td class="data-td last">&nbsp;</td>
<td class="data-head last">1 Month<sup>&dagger;</sup></td>
<td class="data-head last">3 Month<sup>&dagger;</sup></td>
<td class="data-head last">YTD</td>
<td class="data-head last">1 Year</td>
<td class="data-head last">3 Year</td>
<td class="data-head last">5 Year</td>
<td class="data-head last">10 Year</td>
</tr>
<tr class="tbl-data">
<td class="data-td last">Class A: NAV (Inception 07/09/12)</td>
<td class="data-td data last">-2.28</td>
<td class="data-td data last">-3.37</td>
<td class="data-td data last">2.35</td>
<td class="data-td data last">12.91</td>
<td class="data-td data last">-0.83</td>
<td class="data-td data last">2.07</td>
<td class="data-td data last">1.18</td>
</tr>
<tr class="tbl-data">
<td class="data-td last">Class A: Maximum 5.75% load</td>
<td class="data-td data last">-7.90</td>
<td class="data-td data last">-8.93</td>
<td class="data-td data last">-3.53</td>
<td class="data-td data last">6.42</td>
<td class="data-td data last">-2.77</td>
<td class="data-td data last">0.87</td>
<td class="data-td data last">0.58</td>
</tr>
<tr class="tbl-data">
<td class="data-td last">Class I: NAV (Inception 07/09/12)</td>
<td class="data-td data last">-2.43</td>
<td class="data-td data last">-3.46</td>
<td class="data-td data last">2.34</td>
<td class="data-td data last">13.01</td>
<td class="data-td data last">-0.56</td>
<td class="data-td data last">2.39</td>
<td class="data-td data last">1.48</td>
</tr>
<tr class="tbl-data">
<td class="data-td last">Class Y: NAV (Inception 07/09/12)</td>
<td class="data-td data last">-2.44</td>
<td class="data-td data last">-3.49</td>
<td class="data-td data last">2.43</td>
<td class="data-td data last">12.95</td>
<td class="data-td data last">-0.62</td>
<td class="data-td data last">2.32</td>
<td class="data-td data last">1.42</td>
</tr>
<tr class="tbl-data">
<td class="data-td last">50% GBI-EM/50% EMBI</td>
<td class="data-td data last">-2.98</td>
<td class="data-td data last">-2.78</td>
<td class="data-td data last">3.00</td>
<td class="data-td data last">11.55</td>
<td class="data-td data last">-3.60</td>
<td class="data-td data last">-0.13</td>
<td class="data-td data last">0.86</td>
</tr>
</tbody>
</table>
</div>
<br />
<p class="chart-disclosure"><sup>&dagger;</sup>&nbsp;Returns less than one year are not annualized.</p>
<p class="chart-disclosure"><strong>Expenses: Class A: Gross 2.55%, Net 1.27%; Class I: Gross 2.51%, Net 0.97%; Class Y: Gross 2.91%, Net 1.02%.</strong> Expenses are capped contractually until 05/01/24 at 1.25% for Class A, 0.95% for Class I, 1.00% for Class Y. Caps excluding acquired fund fees and expenses, interest, trading, dividends, and interest payments of securities sold short, taxes, and extraordinary expenses.</p>
<p class="chart-disclosure"><strong>The performance data quoted represents past performance. Past performance is not a guarantee of future results. Investment return and principal value of an investment will fluctuate so that an investor&rsquo;s shares, when redeemed, may be worth more or less than their original cost. Performance may be lower or higher than performance data quoted. Please call 800.826.2333 or visit vaneck.com for performance current to the most recent month ended.</strong></p>
<p class="chart-disclosure">The &ldquo;Net Asset Value&rdquo; (NAV) of a Fund is determined at the close of each business day, and represents the dollar value of one share of the fund; it is calculated by taking the total assets of the fund, subtracting total liabilities, and dividing by the total number of shares outstanding. The NAV is not necessarily the same as the ETF&rsquo;s intraday trading value. Investors should not expect to buy or sell shares at NAV.</p>
<p><strong>The 30-year US Treasury crossed above 5% (in early October); US and global rates are driving EM debt as well as global markets weaker. Our biggest view has been to avoid duration, and that remains our view for now as this continues to play out in markets.</strong> September was a tough month for all bonds, with UST 10-year US Treasury down 3.5%, the Global Agg down 3.0%, and EM Blend down 3.0%.<sup>1</sup>&nbsp;Within EM, local markets&rsquo; appearance of acceptable performance in September is very misleading as the last day of the month saw a massive technical rally in all markets (which faded the very next market open in October), so keep that in mind. (September was looking to be an even better month of outperformance for the fund, if it were not for the last day of trading.)</p>
<p><strong>What&rsquo;s next/catalysts? After the early October Non-Farm Payroll (NFP) report, the next catalyst is probably another hike from the Fed. This is not priced in and is the next new hill to climb. More follow-on weakness seems likely in October. Outflows from bonds, generally, is a clear risk. Market strategists are entering a bit of panic-mode, hoping for a stock market crash. To which we respond: &ldquo;the turn in rates is not the turn in risk&rdquo;.</strong> Prior to the latest bond panic, investors were by-and-large betting that the Fed was done hiking. We&rsquo;ve said many times that &ldquo;<em>the turn in rates is not the turn in risk&rdquo;</em>, but who listens to us? Anyway, investors embraced this view that the Fed was done (with which we are very sympathetic), and turned it into bullish duration, bullish EMFX, and bullish risk positions. &ldquo;Higher for longer&rdquo; and data (GDP, PMIs are strong, labor seems tight, October NFP was a blow-out, etc.) was a punch in the nose to that view. Our adverse view towards duration has been pronounced and remains, but it is slowly getting priced in by markets, so we have to start thinking about adjusting our underweight in duration. (Getting ready would be a better description &ndash; finding bonds, levels, and catalysts that are meaningful to our process, which is what we&rsquo;re doing).</p>
<p><strong>Again, one of our big themes has been <i>&ldquo;the turn in rates is not the turn in risk&rdquo;</i></strong>. Too many, in our view, have rigid reaction functions that say something along the lines of &ldquo;buy investment grade, or buy high yield, or buy stocks, even, when the Fed is done&rdquo;. The problem is that the Fed being done could involve recession risks, which would be adverse for still-tight investment grade bonds and always-illiquid high yield corporates. It is not obvious that one is supposed to jump in now. And, perhaps more importantly, <strong>the Fed is not done.</strong> With the first NFP print in early October we see a still-hot US economy and a Fed that probably isn&rsquo;t done hiking, yet alone pausing and cutting. All of this is consistent with our stance of staying out of the way, letting the market find its levels, and keeping an eye on valuations.</p>
<h3>Exhibit 1 &ndash; Catalysts? <i>The Turn in Rates is Not the Turn in Risk!</i></h3>
<div class="wrapped-div">
<table style="width: 100%;">
<tbody>
<tr class="tbl-data">
<td class="tbl-header last">Catalyst</td>
<td class="tbl-header last text-center">Status</td>
</tr>
<tr class="tbl-data">
<td class="data-td last font-weight-normal">Fed done hiking</td>
<td class="data-td data last">Not so fast. NFP shows ongoing strength and market may need to price more hikes.</td>
</tr>
<tr class="tbl-data">
<td class="data-td last font-weight-normal">2/30 steepness</td>
<td class="data-td data last">Still inverted. Need steepness as a minimal condition. The premium is insufficient and G-10 economists face an analytical block when trying to assign credit risk to the US. Their models will always show US term premium as too high.</td>
</tr>
<tr class="tbl-data">
<td class="data-td last font-weight-normal">USD rally</td>
<td class="data-td data last">The big dollar (DXY) has lagged the sell off in Treasuries. More dollar strength to come. This is a challenge for high-beta EMFX, even if it is attractive fundamentally.</td>
</tr>
<tr class="tbl-data">
<td class="data-td last font-weight-normal">EM rates selloff</td>
<td class="data-td data last">Asian and European rates minus US rates are at record lows. EMEA is challenged by inflation. If these central banks have to change course and hike, that will be a hiccup at least.</td>
</tr>
<tr class="tbl-data">
<td class="data-td last font-weight-normal">Powell put?</td>
<td class="data-td data last">We hear many placing the bar for a bottom as the Powell put being re-stated. It is way too early to be thinking about this and the data just aren&rsquo;t there.</td>
</tr>
<tr class="tbl-data">
<td class="data-td last font-weight-normal text-nowrap">Stock market crash?</td>
<td class="data-td data last">This is good news? That may be a turning point for US rates and even the long end of the yield curve. But, how is this good for US credit spreads? And, if economic growth is challenged globally, even EM fundamentals could be challenged.</td>
</tr>
</tbody>
</table>
</div>
<br />
<p class="chart-disclosure">Source: VanEck.</p>
<p><strong>Amid the panic, we are getting more constructive &ndash; yet again EM debt is being battered by DM problems, not EM problems, and for the past decade that has been a buying opportunity for us. EM debt has outperformed the Global Agg this year and for the past three years. We think it&rsquo;s possible the only catalysts required are for markets to find their levels and the likelihood that the Fed is done hiking to settle in. </strong>VanEck&rsquo;s Emerging Markets Bond portfolio manager has been in markets for 30 years. Very superficially, the global macro story of the last 30 years is as follows. For the first 15 of those years, all global crises were EM-generated. But for the past 15 years, all global crises were DM-generated.</p>
<p><strong>Where to go? </strong>Is local currency attractive? Look at the exhibit below, which shows US rates markets pricing in much more policy tightening than in EM in the recent period. EMs were rightly rewarded by their tight policy stances, but starting around May, the US started pricing in much more tightness that was not met with tightness in EM markets. This is consistent with our reductions in EM local currency this year. The next exhibit shows that within EM, only Latin America offers cheapness. But there we are faced with the big benchmark names&rsquo; (Brazil, Mexico, Colombia, Chile) beta. Remember, &ldquo;the turn in rates is not the turn in risk&rdquo;, so staying out of the way and our eyes on the radar remain the stance. Staying with that regional rates chart, look at Asia. Rates are at all-time lows. These were stalwarts in our portfolio last year, but we&rsquo;ve avoided them largely and still do. We&rsquo;ve shown this chart focusing only on China&rsquo;s currency, and it paints a similar picture (though China&rsquo;s interventions to stabilize the yuan are meaningful and credible). And charts we&rsquo;ve produced in previous monthlies show that investment grade spreads are tight, as are high yield corporate spreads, especially given their potentially illiquidity, if outflows are on the way. <strong>Where to go is the right question, we&rsquo;re not seeing answers yet.</strong></p>
<h3>Exhibit 2 &ndash; EM Market Pricing of Policy Rates Lagging US Now</h3>
<p><img class="img-responsive w-100" src="https://www.vaneck.com/contentassets/d6e5c2ed41844d2e90e8216e722ee59f/3715_emb_chart-1_2023.10_blog.svg" alt="Exhibit 2 - EM Market Pricing of Policy Rates Lagging US Now" /></p>
<p class="chart-disclosure">Source: J.P. Morgan, Bloomberg Finance L.P.&nbsp;<sup>*</sup>Excludes China, Russia, and Turkiye.</p>
<h3>Exhibit 3 &ndash; Asian and European Rates Minus US Rates at All-Time Lows</h3>
<p><img class="img-responsive w-100" src="https://www.vaneck.com/contentassets/d6e5c2ed41844d2e90e8216e722ee59f/3715_emb_chart-2_2023.10_blog.svg" alt="Exhibit 3 - Asian and European Rates Minus US Rates at All-Time Lows" /></p>
<p class="chart-disclosure">Source: J.P. Morgan.</p>
<p><strong>In September, the fund outperformed by 55 bps, being down 2.43%, compared to 2.98% for its benchmark. This outperformance is despite a last-day-in-September rally in high-beta risk which we have been avoiding. </strong>We are largely staying out of the way of the sell off until global bonds stabilize. We are very slowly buying selected longer duration corporates. We are also looking at EM local markets that we like for fundamental reasons, but whose beta makes them very vulnerable currently. Long-duration investment grade is also on our radar. We end September with carry of 6.2%, YTW of 10.54%, duration of 3.9, and roughly 35% of the fund in local currency. Cash is an unusually high 10% as the fund braced for September (and early October). Our biggest exposures are Brazil (local), Malaysia (local), Mexico (hard), Colombia (local), and Indonesia (local).</p>
<h2>EXPOSURE TYPES AND SIGNIFICANT CHANGES</h2>
<p>The changes to our top positions are summarized below. Our largest positions in September were: Brazil, Mexico, South Africa, Indonesia, and Colombia.</p>
<ul>
<li>We increased our local currency exposure in Thailand and Malaysia. Both countries are expected to benefit from China&rsquo;s growth rebound as authorities stepped up policy support in recent weeks. Thailand&rsquo;s technical test score looks particularly strong as the baht underperformed most regional peers, in part because the expected increase in tourist arrivals from China was pushed forward by several months.</li>
<li class="mt-2">We also increase our hard currency quasi-sovereign and corporate exposure in China. China&rsquo;s data flow improved lately as the past policy stimulus is filtering through, including real estate developers. Our exposure is to a very selected group of corporate names, which had exceptionally attractive valuations and stand to benefit the most from the recent support package (and as a result, from the improved policy test score).</li>
<li class="mt-2">Finally, we increased our hard currency corporate exposure in Turkey and hard currency sovereign and quasi-sovereign exposure in Oman. Oman continues to benefit from higher oil prices, using this windfall to implement fiscal consolidation and other structural reforms. This resulted in Oman&rsquo;s sovereign rating upgrade by Fitch and S&amp;P. In terms of our investment process, these developments improved Oman&rsquo;s economic and policy test scores for the country.</li>
<li class="mt-2">We reduced our local currency exposure in South Africa and the Czech Republic. Unlike its Central European peers, the Czech national bank remains hawkish - keeping its policy rate on hold at the last meeting - but we are concerned that the market will not be able/willing to discriminate, and Czech bonds will be swept away with the rest of the region if the market sentiment continues to deteriorate on the back of the greater global uncertainty. In terms of our investment process, this worsened the country&rsquo;s technical test score. As regards South Africa, it is difficult to find new catalysts to support a large local position there, especially as the stronger Q2 growth narrative is wearing out. We think that South Africa&rsquo;s energy production story might become such a catalyst later in the year, in which case we will revisit our local exposure there.</li>
<li class="mt-2">We also reduced our local currency exposure in Indonesia and Brazil. Bonds in both countries performed well so far this year, and valuations now look less attractive. In the environment, when EM local debt&rsquo;s sell off is often driven by factors that have nothing to do with specific countries or credits - worsening the technical test scores - we thought it prudent to take profits and reduce exposure for now.</li>
<li class="mt-2">Finally, we reduced our hard currency sovereign exposure in Mexico. Mexico&rsquo;s external position remains solid, and remittances are exceptionally strong. However, we are concerned about the government&rsquo;s pre-election spending plans and their impact on the budget deficit&rsquo;s size - and as a result, on the country&rsquo;s policy test score.</li>
</ul>
<p>To receive more <a href="https://www.vaneck.com/us/en/insights/emerging-markets-bonds/" title="Emerging Markets Bonds Insights"><strong>Emerging Markets Bonds</strong></a> insights, <a href="https://www.vaneck.com/us/en/subscribe/" title="Subscription Center"><strong>sign up in our subscription center</strong></a>.</p>
<style>
    .wrapped-div {
        max-width: 100%;
    }

    @media (max-width: 768px) {
        .wrapped-div {
            overflow-x: scroll;
        }
    }

    .wrapped-div-sector {
        max-width: 100%;
        overflow-x: scroll;
    }
</style>
]]></content:encoded>
</item><item rdf:about="https://www.vaneck.com/us/en/blogs/natural-resources/no-energy-transition-without-green-metals/">
  <title>No Energy Transition without Green Metals></title>
  <link>https://www.vaneck.com/us/en/blogs/natural-resources/no-energy-transition-without-green-metals/</link>
  <description><![CDATA[We believe the energy transition can only happen with green metals and minerals. Therefore, availability and security of supply are critical.]]></description>
  <dc:creator>Charl Malan</dc:creator>
  <dc:date>10/11/2023 06:30:00</dc:date>
<content:encoded><![CDATA[

<p>The energy transition offers potentially exciting and unprecedented investment opportunities that may be historic in terms of both the impact on the global economy and potential returns. However, we firmly believe that there will be <strong>no successful energy transition without successful development of green metals and minerals</strong>. Investments across several green commodities and those companies engaged in exploring, developing, producing, processing and recycling them, are a necessity and could be compelling. In this white paper, we explore the investment opportunity in green metals.</p>
<p>We believe the &ldquo;energy trilemma&rdquo; that the world is facing - that is, delivering secure, clean and affordable energy &ndash; can only be successfully addressed by effectively developing secure, clean and affordable green metals and minerals. Some of the most prominent among the metals and minerals we group as green are cobalt, copper, graphite, lithium, nickel, manganese and the rare earth elements.</p>
<p>Topics in this white paper include:</p>
<ul class="content-list">
<li>Clean energy technologies are dependent on the use of green metals and their concentration in those technologies is highly intensive.</li>
<li>Supply of these minerals and metals will struggle to keep up with burgeoning demand associated with the inevitable energy transition.</li>
<li>Security of supply concerns are driving major geopolitical concerns.</li>
</ul>

<p>To receive more <strong><a href="https://www.vaneck.com/us/en/insights/natural-resources/" title="Natural Resources">Natural Resources</a></strong> insights, <strong><a href="https://www.vaneck.com/us/en/subscribe/" title="Subscription Center">sign up in our subscription center</a></strong>.</p>
]]></content:encoded>
</item><item rdf:about="https://www.vaneck.com/us/en/blogs/natural-resources/a-resurgence-of-nuclear-energy/">
  <title>A Resurgence of Nuclear Energy?></title>
  <link>https://www.vaneck.com/us/en/blogs/natural-resources/a-resurgence-of-nuclear-energy/</link>
  <description><![CDATA[The global energy landscape is undergoing a paradigm shift as nations ardently pursue a low-carbon future. Nuclear energy, a frequently overlooked component, is central to this transition.]]></description>
  <dc:creator>Andrew Musgraves</dc:creator>
  <dc:date>10/11/2023 06:30:00</dc:date>
<content:encoded><![CDATA[

<h2>The crucial role of nuclear energy</h2>
<p>As of 2022, nuclear power was responsible for 9% of global electricity generation and nearly 25% of global, low-carbon electricity generation.<sup>1</sup>&nbsp;Per the International Energy Agency (IEA), in the last 50 years, nuclear energy has averted over 60 gigatonnes of CO2 emissions&mdash;approximately equal to two years&rsquo; worth of total energy-related emissions worldwide.<sup>2</sup>&nbsp;Nuclear energy&rsquo;s consistent power output offers an efficient alternative to traditional fossil fuels and a solution to escalating energy demands, especially in rural regions where access to electricity remains sparse.</p>
<p>Moreover, nuclear plants, unlike intermittent renewables such as wind and solar, maintain nearly full capacity operations. This ensures power delivery even during extreme weather conditions &mdash; an increasing concern given that 2023 has been the hottest year on record since the 1890s.</p>
<h3>Global Electricity Generation by Fuel (2022)</h3>
<p><img class="img-responsive w-100" src="https://www.vaneck.com/contentassets/d10569aba8354c3084734abc98d593a4/3702_nlr_chart-1_2023.10_blog.svg" alt="Low Carbon Based sources account for 39% of Electricity Generation" /></p>
<p class="chart-disclosure">Source: Energy Institute. Data as of December 2022.</p>
<h2>The price of moving away from nuclear</h2>
<p>The world's nuclear infrastructure is aging, with many reactors nearing their design end-of-life. The premature decommissioning of these reactors might disrupt energy transition plans, potentially leading to an additional 4 billion tonnes of CO2 emissions, per the IEA.<sup>3</sup>&nbsp;Substituting nuclear capacity with renewables like wind or solar would demand an unparalleled deployment pace. The decline in nuclear power could also require an extra $1.6 trillion in investments from advanced economies, translating to higher consumer electricity prices.<sup>4</sup>&nbsp;Importantly, in many scenarios &ndash; on a levelized cost basis over several decades &ndash; prolonging a reactor's lifespan is estimated to be more economical than constructing new renewable energy infrastructures.<sup>5</sup></p>
<h2>Innovations in nuclear technologies</h2>
<p>The nuclear sector is far from static; it's evolving. The spotlight on technology development in the space is currently on Small Modular Reactors (SMRs) which promise heightened efficiency, affordability, and flexibility. Their compact size and enhanced safety attributes make them highly adaptable, even holding the potential to replace older fossil fuel units. The market for SMRs, at present, is projected to grow to around $6.8 billion by 2030 (around a 2.3% compound annual growth rate), with companies like NuScale Power and BWXT Advanced Technologies at the forefront.<sup>6</sup></p>
<p>Certain SMR designs have the capability to recycle existing nuclear waste as fuel. Additionally, nuclear fusion, the energy source of the sun and stars, is undergoing intensive research. Companies like Helion Energy and Nucor are collaborating to harness this immense power. And on the tech frontier, giants like Microsoft are exploring nuclear energy to power energy-intensive operations like artificial intelligence.</p>
<h2>The current dynamics of uranium pricing</h2>
<p>Uranium prices have seen considerable fluctuations recently. Factors like long lead times for mining projects, reduced capital expenditure on new sources, existing supply deficits, and geopolitical tensions, notably in Europe, have driven prices upward.<sup>7</sup>&nbsp;These dynamics are influencing the broader industry. Utility companies are grappling with escalating costs, whereas uranium miners are poised to gain, attracting increased investor interest.</p>
<h3>Uranium Exploration Budgets ($M)</h3>
<p><img class="img-responsive w-100" src="https://www.vaneck.com/contentassets/d10569aba8354c3084734abc98d593a4/3702_nlr_chart-2_2023.10_blog.svg" alt="Uranium exploration budgets have declined" /></p>
<p class="chart-disclosure">Source: S&amp;P Global Market Intelligence. Data as of October 2022.</p>
<h3>Uranium Supply Surpluses and Deficits</h3>
<p><img class="img-responsive w-100" src="https://www.vaneck.com/contentassets/d10569aba8354c3084734abc98d593a4/3702_nlr_chart-3_2023.10_blog.svg" alt="Uranium supply deficits continue to decrease" /></p>
<p class="chart-disclosure">Source: S&amp;P Global Market Intelligence. Data as of October 2022.</p>
<h2>The path forward</h2>
<p>A glance at Japan provides a lens into the evolving nuclear narrative. After the Fukushima disaster, Japan curtailed its nuclear operations. However, faced with the global energy crisis and geopolitical tensions, such as the Russia-Ukraine war, Japan is reviving its nuclear reactors, marking a significant policy pivot. Other nations like Germany, Belgium, and India are also re-evaluating their nuclear strategies. As countries grapple with energy security and decarbonization, nuclear energy, with its promise of reliability and zero emissions, is regaining prominence.</p>
<h2>Bottom line</h2>
<p>The drive towards decarbonization, coupled with geopolitical shifts, has elevated nuclear energy's significance in the energy transition narrative. Despite the promising investment prospects, especially with advancements in nuclear technologies and energy policy reformation, the sector is not without its challenges, such as:</p>
<ul class="content-list">
<li><i>Uranium Price Volatility</i>: Miners must navigate fluctuating uranium prices which directly impact revenues.</li>
<li><i>Developmental Hurdles</i>: Utility companies could face unforeseen costs and delays in reactor projects.</li>
<li><i>Policy Shifts</i>: Regulatory changes, particularly after major events or the emergence of alternative technologies, can transform the industry.</li>
</ul>
<p>Given these challenges and the evident opportunities, particularly with nuclear technological advancements and policy transformations, investors should tread carefully, measuring potential rewards against the inherent risks.</p>
<h2>VanEck Uranium and Nuclear ETF (NLR)</h2>
<p><a href="https://www.vaneck.com/us/en/investments/uranium-nuclear-energy-etf-nlr/overview/" title="NLR - VanEck Uranium and Nuclear ETF - Overview"><strong>VanEck Uranium and Nuclear ETF (NLR)</strong></a> offers exposure to a pivotal segment of the clean energy sector, addressing the growing demands associated with combating climate change. This passively managed fund tracks the MVIS<sup>&reg;</sup>&nbsp;Global Uranium &amp; Nuclear Energy Index (MVNLRTR). It encompasses companies throughout the uranium and nuclear energy spectrum, from uranium mining to electricity production, as well as suppliers and service providers. By doing so, the Index balances the stability of utility companies with the dynamism of uranium mining entities.</p>
<p>To receive more <strong><a href="https://www.vaneck.com/us/en/insights/natural-resources/" title="Natural Resources Insights">Natural Resources</a></strong> insights, <strong><a href="https://www.vaneck.com/us/en/subscribe/" title="Subscription Center">sign up in our subscription center</a></strong>.</p>
]]></content:encoded>
</item><item rdf:about="https://www.vaneck.com/us/en/blogs/natural-resources/the-unspoken-supply-constraint-no-miners-no-metals-no-energy-transition/">
  <title>The Unspoken Supply Constraint: No Miners, No Metals, No Energy Transition></title>
  <link>https://www.vaneck.com/us/en/blogs/natural-resources/the-unspoken-supply-constraint-no-miners-no-metals-no-energy-transition/</link>
  <description><![CDATA[Mining companies struggle to recruit talent amidst the energy transition, of which the success is so dependent on the availability of mined materials.]]></description>
  <dc:creator>Tom Butcher</dc:creator>
  <dc:date>10/10/2023 06:30:00</dc:date>
<content:encoded><![CDATA[

<p>August 16, 2023, marked the first anniversary of President Biden&rsquo;s signature of the Inflation Reduction Act (the &ldquo;IRA&rdquo; or &ldquo;Act&rdquo;). One of the Act&rsquo;s specific areas of focus is critical minerals, especially supply. In our forthcoming white (green?) paper on green metals, we at VanEck will outline the importance of the supply narrative and the factors affecting it (security, together with dependency and intensity). We still believe there will be no energy transition without green metals.</p>
<p>Recently, another, potentially quite serious, threat to supply has, once again, reared its ugly head: a dearth of talent available to mining companies. This may not be a new story, but the problem is now even more acute. While the IRA may seek to secure the supply of critical minerals in any number of ways, if there isn&rsquo;t anybody to dig them out of the ground, then that really <i>is</i> a problem. Irrespective of whether the result of a shrinking pool of suitable young talent or a rapidly aging (and, consequently, retiring) workforce.</p>
<p>The figures illustrate just what a huge problem this is. In a recent article on Mining.com, Walter Copan, VP, Research and Technology Transfer at Colorado School of Mines, noted that in the U.S. alone, in a &ldquo;gray tsunami,&rdquo; some 221,000 workers, or more than half the country&rsquo;s mining workforce is expected to retire by 2029.<sup>1</sup>&nbsp;If we are going to see that number in the U.S. resulting just from retirement, what about the likes of Canada and Australia? By 2030, Canada will be facing an estimated shortage of between 80,000 and 120,000 workers, while, by 2026, Australia will need some 24,400 new workers.<sup>2</sup></p>
<p>To put things bluntly: There will be <i>no</i> energy transition without green metals. And <i>no</i> green metals without miners.</p>
<p>With input from mining industry leaders and other authorities, we at VanEck have been tracking this issue for well over a decade.</p>
<h2>Some Background</h2>
<p>Back in November of 2010, following the spat over rare earths between China and Japan, my friend (retired Air Force Major General) Dr. Robert Latiff (then chairman of the National Materials Advisory Board of the National Academies here in the U.S.) and I penned an OpEd piece for <i>DefenseNews</i> entitled &ldquo;Strategic Materials and the West: Solve the Right Problem.&rdquo;<sup>3</sup>&nbsp;We noted, &ldquo;When China acted as an export cornucopia for raw strategic materials and many goods manufactured from them, domestic processing and production of those products dwindled or ceased. In many instances, the ability to manufacture domestically has been lost.&rdquo; Furthermore, &ldquo;The problem is even worse when one considers that along with the retreat from processing and manufacturing, the U.S. and its allies lost much of their materials and manufacturing education and know-how.&rdquo;</p>
<p>Fast forward nine years later to June of 2019. During the VanEck Natural Resources Conference near Pittsburgh, I discussed the whole issue of education and innovation with (amongst others) Mark Bristow, President and CEO of Barrick Gold Corporation, and the then SVP, Finance and CFO of Teck Resources Limited, Ron Millos. The same message came through loud and clear from both. Dr. Bristow saw the mining industry as being not only &ldquo;bureaucratic,&rdquo; but also bad at both recruiting and developing human resource assets and, hence, there being a real problem with skills. And Mr. Millos talked about the challenges of convincing young people about the opportunities to be found in mining.<sup>4</sup></p>
<h2>Where We Stand Now</h2>
<p>Now, in 2023, amidst the energy transition, of which the success is <i>so</i> dependent on the availability of mined materials, the problem appears only to have gotten worse. In a recent piece, &ldquo;Has mining lost its luster? Why talent is moving elsewhere and how to bring them back,&rdquo;<sup>5</sup>&nbsp;McKinsey &amp; Company paints a bleak picture of where things currently stand.</p>
<p>The piece notes that &ldquo;mining companies are experiencing a talent squeeze: 71 percent of mining leaders are finding the talent shortage is holding them back from delivering on production targets and strategic objectives&rdquo; and &ldquo;86 percent of mining executives said it was &ldquo;harder to recruit and retain the talent they need versus two years ago.&rdquo;<sup>6</sup></p>
<p>This is not surprising when you look at enrollment and graduation figures for mining-related degrees. In Australia, according to McKinsey, mining engineering enrollment has fallen 63% since 2014. In the U.S., &ldquo;mining graduations&rdquo; have fallen 39% since 2016, according to the Wall Street Journal. In Canada in 2020, &ldquo;geology and earth-sciences graduates were nearly 25% less than in 2015&rdquo; and its &ldquo;mining and mineral-engineering enrollment was down 10% in 2020 compared with 2016.&rdquo;<sup>7</sup></p>
<p>Determined to find out more, I spoke with both colleagues and some of our friends in the industry. The first person I spoke with was John Gladston, Director Corporate Affairs at the mining company First Quantum Minerals, one of the world&rsquo;s top copper producers. Did the McKinsey story ring true? He replied that it really did: &ldquo;There is a shrinking pool across the board, in all jurisdictions, of appropriately motivated and qualified STEM graduates.&rdquo; He illustrated this with a chart.</p>
<h3>Mining-Graduate Numbers</h3>
<p><strong>Number of graduates from four-year mineral and mining engineering degrees</strong></p>
<p><img class="img-responsive w-100" src="https://www.vaneck.com/contentassets/b49785a5643443a896d300fe98ac1c21/3688_mining-talent-blog_chart-1_2023.10_v1_blog.svg" alt="Chart showing the number of graduates from four-year mineral and mining engineering degrees in Australia, Canada, and the U.S." /></p>
<p class="chart-disclosure">Source: Mining Journal; July 2023.</p>
<p>He went on to say, &ldquo;There <i>are</i> top-level graduates out there, but you have got to put more effort into finding them,&rdquo; and, when you do find them, <i>then</i>, there&rsquo;s the competition for them. However, encouragingly, when asked whether current STEM graduates were any better, or worse than their predecessors, he replied, &ldquo;<i>When</i> you can get them, they are as good as they have ever been. There has been no depletion in their standard. There are just fewer of them!&rdquo;</p>
<h2>First-hand Experience Shapes VanEck&rsquo;s Perspective</h2>
<p>Since its founding in 1955, VanEck has always sought investment team members (whether portfolio managers or analysts) with relevant industry experience. This has been true particularly for our Global Resources Strategy and Gold Strategy teams in which we have both qualified geologists <i>and</i> engineers.</p>
<p>In our Gold Strategy team, I chatted with <a href="/link/775af929d69741efa7729872dda2bfa5.aspx?epsremainingpath=meet-ima-casanova" title="Meet Ima Casanova, Portfolio Manager, Gold and Precious Metals"><strong>Portfolio Manager Ima Casanova</strong></a>, Gold Strategist Joe Foster and Senior Analyst Adam Graf. While Ima trained as a mechanical engineer, Joe and Adam were both trained as geologists (with Adam working in the copper industry in the &lsquo;90s and Joe in the gold mining industry). All of them expressed little surprise at the pass in which the mining companies are finding themselves.</p>
<p>Following up on something that both John Gladston of First Quantum Minerals and Adam Graf said about mining schools closing and the number of mining engineering graduates falling, I discovered that the number of mining engineering graduates has decreased by around 43% since 2015 in the U.S. alone.</p>
<h3>Mining Engineering Program Graduates by Year</h3>
<p><img class="img-responsive w-100" src="https://www.vaneck.com/contentassets/b49785a5643443a896d300fe98ac1c21/3688_mining-talent-blog_chart-2_2023.10_v1_blog.svg" alt="Chart showing mining engineering program graduates from 1974 to 2020." /></p>
<p class="chart-disclosure">Source: SME 2021 - B.S. and M.S. degrees conferred.</p>
<p>Also, concurrently, &ldquo;the number of accredited mining engineering programs has decreased from 25 in 1982 to 14 in 2020,&rdquo;<sup>8</sup>&nbsp;with most of those remaining also experiencing a decrease in state funding. In addition, 12 schools have closed their mining programs. Amongst these was Columbia University, which, in the &lsquo;50s, had received some $16 million from mining magnate Henry Krumb to &lsquo;&ldquo;make the School of Mines one of the best known and largest schools of its kind in the world.&rdquo;&rsquo;<sup>9</sup>&nbsp;According to David L Kanagy, executive director and CEO of the Society for Mining, Metallurgy, and Exploration, &ldquo;This corresponds with a decline in the U.S. faculty, to about 112 in mining engineering in 2020.&rdquo;<sup>10</sup></p>
<div class="wrapped-div">
<table style="width: 100%;">
<tbody>
<tr class="tbl-data">
<td class="tbl-header last " colspan="4">ABET Accredited Programs in Mining, Metallurgical and Geological Engineering in 2020.</td>
</tr>
<tr class="tbl-data">
<td class="data-td last">&nbsp;</td>
<td class="data-head last">Mining</td>
<td class="data-head last">Metallurgy</td>
<td class="data-head last">Geological</td>
</tr>
<tr class="tbl-data">
<td class="data-td last font-weight-normal">Alabama, The University of</td>
<td class="data-td data last">&nbsp;</td>
<td class="data-td data last">✓</td>
<td class="data-td data last">&nbsp;</td>
</tr>
<tr class="tbl-data">
<td class="data-td last font-weight-normal">Alaska Fairbanks, University of</td>
<td class="data-td data last">✓</td>
<td class="data-td data last">&nbsp;</td>
<td class="data-td data last">✓</td>
</tr>
<tr class="tbl-data">
<td class="data-td last font-weight-normal">Arizona, The University of</td>
<td class="data-td data last">✓</td>
<td class="data-td data last">&nbsp;</td>
</tr>
<tr class="tbl-data">
<td class="data-td last font-weight-normal">Colorado School of Mines</td>
<td class="data-td data last">✓</td>
</tr>
<tr class="tbl-data">
<td class="data-td last font-weight-normal">Kentucky, University of</td>
<td class="data-td data last">✓</td>
<td class="data-td data last">&nbsp;</td>
</tr>
<tr class="tbl-data">
<td class="data-td last font-weight-normal">Michigan Technological University</td>
<td class="data-td data last">✓</td>
<td class="data-td data last">&nbsp;</td>
<td class="data-td data last">✓</td>
</tr>
<tr class="tbl-data">
<td class="data-td last font-weight-normal">Minnesota - Twin Cities, University of</td>
<td class="data-td data last">&nbsp;</td>
<td class="data-td data last">✓</td>
</tr>
<tr class="tbl-data">
<td class="data-td last font-weight-normal">Mississippi, University of</td>
<td class="data-td data last">&nbsp;</td>
<td class="data-td data last">✓</td>
</tr>
<tr class="tbl-data">
<td class="data-td last font-weight-normal">Missouri University of Science and Technology</td>
<td class="data-td data last">✓</td>
</tr>
<tr class="tbl-data">
<td class="data-td last font-weight-normal">Montana Tech of the University of Montana</td>
<td class="data-td data last">✓</td>
</tr>
<tr class="tbl-data">
<td class="data-td last font-weight-normal">Nevada, Reno, University of</td>
<td class="data-td data last">✓</td>
</tr>
<tr class="tbl-data">
<td class="data-td last font-weight-normal">New Mexico Institute of Mining and Technology</td>
<td class="data-td data last">✓</td>
<td class="data-td data last">&nbsp;</td>
</tr>
<tr class="tbl-data">
<td class="data-td last font-weight-normal">North Dakota, University of</td>
<td class="data-td data last">&nbsp;</td>
<td class="data-td data last">✓</td>
</tr>
<tr class="tbl-data">
<td class="data-td last font-weight-normal">Pennsylvania State University</td>
<td class="data-td data last">✓</td>
<td class="data-td data last">&nbsp;</td>
</tr>
<tr class="tbl-data">
<td class="data-td last font-weight-normal">South Dakota School of Mines and Technology</td>
<td class="data-td data last">✓</td>
</tr>
<tr class="tbl-data">
<td class="data-td last font-weight-normal">Texas at Austin, University of</td>
<td class="data-td data last">&nbsp;</td>
<td class="data-td data last">✓</td>
</tr>
<tr class="tbl-data">
<td class="data-td last font-weight-normal">Texas at El Paso, University of</td>
<td class="data-td data last">&nbsp;</td>
<td class="data-td data last">✓</td>
<td class="data-td data last">&nbsp;</td>
</tr>
<tr class="tbl-data">
<td class="data-td last font-weight-normal">Utah, The University of</td>
<td class="data-td data last">✓</td>
</tr>
<tr class="tbl-data">
<td class="data-td last font-weight-normal">Virginia Polytechnic Institute and State University</td>
<td class="data-td data last">✓</td>
<td class="data-td data last">&nbsp;</td>
</tr>
<tr class="tbl-data">
<td class="data-td last font-weight-normal">West Virginia University</td>
<td class="data-td data last">✓</td>
<td class="data-td data last">&nbsp;</td>
</tr>
<tr class="tbl-data">
<td class="data-td last font-weight-normal">University of Wisconsin - Madison</td>
<td class="data-td data last">&nbsp;</td>
<td class="data-td data last">✓</td>
</tr>
<tr class="tbl-data">
<td class="data-td last font-weight-normal"><strong>Totals</strong></td>
<td class="data-td data last"><strong>14</strong></td>
<td class="data-td data last"><strong>8</strong></td>
<td class="data-td data last"><strong>13</strong></td>
</tr>
</tbody>
</table>
</div>
<br />
<p class="chart-disclosure">Source: SME &amp; ABET (formerly Accreditation Board for Engineering and Technology).</p>
<p>This contrasts strikingly with China which boasts &ldquo;over 38 mineral processing schools and upwards of 44 mining engineering programs&rdquo;<sup>11</sup>&nbsp;and whose China University of Mining and Technology alone has &ldquo;more engineering students than all U.S. mining engineering programs combined.&rdquo;<sup>12</sup></p>
<p>Echoing what Mr. Gladston said, both Ima and Joe said that many young graduates and post-graduates appear just not to be interested in going off into the wilds to work in a mine, preferring the bright lights and proximity to other people. The same could not be said for either of them: Ima, who said she &ldquo;loved the challenge&rdquo; worked on an offshore oil rig in her native country Venezuela and Joe spent quite some time in the &ldquo;depths&rdquo; of Nevada&mdash;not Las Vegas!</p>
<p>All three also talked about the fact that far fewer universities are now offering geology or mining engineering courses. Adam explained that, in both the &lsquo;80s and &lsquo;90s, such institutions just didn&rsquo;t get the industry backing that they needed.</p>
<p>As to further reasons why there&rsquo;s currently such an obvious dearth of talent available, both Adam and Joe mentioned two in particular: 1) a lack of job security (tied in with the cyclicality of the industry; and 2) Historically poor pay&mdash;except in &ldquo;boom&rdquo; times (this <i>may</i> have changed a bit recently.)</p>
<p>Finally, there is always the issue of ignorance. In some respects, the mining industry has only itself to blame; it has been, and remains, woefully inept not only at &ldquo;selling itself,&rdquo; but also at explaining how vital mining is to the success of energy transition. As Mr. Gladston succinctly put it, &ldquo;There is a fundamental lack of understanding of what the extractive industries are about. And their value: everything is either farmed, fished, or mined!&rdquo;</p>
<h2>Possible Ways Forward</h2>
<p>It could be argued that things aren&rsquo;t all that bad and that more automation is the answer. As Adam pointed out, &ldquo;some skilled labor is being replaced/thrifted by technology.&rdquo; But the operative word here is &ldquo;some.&rdquo; - certainly not all. There will always be a need for humans who <i>think</i>, not machines that just <i>do</i>.</p>
<p>First Quantum has taken the approach of creating courses at their universities&mdash;something it has done in Panama&mdash;to help develop skills locally, particularly in jurisdictions without a mining legacy.&rdquo; For example, it has created a master&rsquo;s program that can turn a civil engineer into a mining engineer.</p>
<p>If mining companies are to attract the talent they seek, they need to do at least four things:</p>
<ol class="content-list">
<li>Pay competitively</li>
<li>Provide job security</li>
<li>Recognize the importance of training&mdash;and provide it</li>
<li>Better convey their narrative and dispel the misinformation around the &ldquo;evils&rdquo; of mining and the extractive industries</li>
</ol>
<p>In his commentary for the Center for Strategic &amp; International Studies, Thomas Hale mentions several further considerations. He offers the following three sensible suggestions.</p>
<p>&ldquo;First, there must be an emphasis on early education and the way young people engage with natural resources and mining.&rdquo;</p>
<p>&ldquo;Second, there needs to be an investment in developing new mineral-security courses and training throughout government and international affairs programs across the country, especially in Washington.&rdquo;</p>
<p>&ldquo;Third, civil society will be critical for connecting with current voters and communities across the country.&rdquo;</p>
<p>The good news on this front is that at least some people in government are thinking about the problem. Back on March 22, 2023. U.S. Senators Joe Manchin (D-WV), Chairman of the Senate Energy and Natural Resources (ENR) Committee, and John Barrasso (R-WY), Ranking Member of the ENR Committee, introduced the Mining Schools Act of 2023.</p>
<p>&ldquo;This bipartisan legislation will increase and improve opportunities for university and college mining and geological programs, like those at West Virginia University, to prepare students to meet America&rsquo;s future energy needs.&rdquo;<sup>13</sup></p>
<p>According to the release from The Senate Committee on Energy &amp; Natural Resources, &ldquo;he Mining Schools Act of 2023 would:</p>
<ol class="content-list">
<li>Establish a grant program for mining schools to receive funds in order to recruit students and carry out studies, research projects, or demonstration projects related to the production of minerals; and</li>
<li>Establish the Mining Professional Development Advisory Board to evaluate applications and recommend recipients to the Secretary of Energy, as well as conduct oversight to ensure that grant funds are appropriately used.&rdquo;<sup>14</sup></li>
</ol>
<p>Finally, it&rsquo;s back to the IRA. Perhaps a useful adjunct to the Act and a precursor to the Mining Schools Act of 2023 might be some government-funded research into just what mining-related tertiary education is currently available and what needs to be offered to provide us with the skills we want.</p>
<p>To receive more <strong><a href="https://www.vaneck.com/us/en/insights/natural-resources/" title="Natural Resources">Natural Resources</a></strong> insights, <strong><a href="https://www.vaneck.com/us/en/subscribe/" title="Subscription Center">sign up in our subscription center</a></strong>.</p>
<style type="text/css">
    .wrapped-div {
        max-width: 100%;
    }

    @media (max-width: 1240px) {
        .wrapped-div {
            overflow-x: scroll;
        }


    }
</style>
]]></content:encoded>
</item><item rdf:about="https://www.vaneck.com/us/en/blogs/gold-investing/ima-casanova-gold-falls-victim-to-market-dislocation/">
  <title>Gold Falls Victim to Market Dislocation></title>
  <link>https://www.vaneck.com/us/en/blogs/gold-investing/ima-casanova-gold-falls-victim-to-market-dislocation/</link>
  <description><![CDATA[Gold succumbed to the pressures of rising yields and a strong U.S. dollar in September, but is positioned to benefit when market dislocation reverses.]]></description>
  <dc:creator>Imaru Casanova</dc:creator>
  <dc:date>10/10/2023 06:30:00</dc:date>
<content:encoded><![CDATA[

<p>Monthly gold market and economic insights from Imaru Casanova, Portfolio Manager, featuring her unique views on mining and gold&rsquo;s portfolio benefits. <a href="/us/en/blogs/gold-investing/ima-casanova-gold-falls-victim-to-market-dislocation/gold-monthly-commentary-september-2023.pdf" rel="noopener" target="_blank" title="Gold Monthly Commentary - September 2023"><strong>An expanded PDF version of this commentary, including fund specific information can be downloaded here.</strong></a></p>
<h2>Gold finally gives way to dollar strength</h2>
<p>Gold fell below $1,900 per ounce in the final week of September. Gold tested the $1,900 level at the end of June, and again in August, but found support and bounced above it. However, this time, it failed to find support, dropping to $1,849 per ounce on September 29, a $92 loss (-4.7%) for the month. Most of gold&rsquo;s gains for 2023 have now evaporated. After resilient performance in the first half of the year, gold finally succumbed to the pressure of rising yields and an ever-so-strong U.S. dollar in the third quarter of the year.</p>
<p>U.S. 10-year and 30-year treasury yields are just shy of 5% at present and the U.S. dollar (as measured by the U.S. Dollar Index, or DXY<sup>1</sup>) managed to climb a whopping 6.4% from its mid-July lows to the end of September. The historically-strong, inverse correlation between gold and the U.S. dollar was on full display, with gold dropping 5.7% during the same period. What was expected to be a U.S. Federal Reserve (Fed) pause at its September 20 meeting instead turned into a skip and hold; this, after the Fed chairman (and, subsequently, other members) made it clear to markets that they were prepared to hike again if needed and hold policy rates at a restrictive level to continue their fight against inflation. Gold and gold equities sold off along with the rest of the U.S. equity markets and bonds. The NYSE Arca Gold Miners Index (GDMNTR)<sup>2</sup>&nbsp;and the MVIS Global Juniors Gold Miners Index (MVGDXJTR)<sup>3</sup>&nbsp;were down 8.1% and 10.3%, respectively, during the month.</p>
<h2>Demand from the East lends support to the West</h2>
<p>The gold price in China also dropped, reducing what had been a record $120 per ounce premium over the international spot price to just around $10. Demand out of China has so far been very strong in 2023, with Bloomberg reporting a year-on-year increase of 30% in the domestic sales of gold bars and coins as of last week.<sup>*</sup>&nbsp;This pickup in demand from China, as well as from Turkey &ndash; together, representing two of the largest gold consumers in the East &ndash; has helped filled the gap left by declining western investment demand, as reflected by persistent outflows from gold-bullion-backed ETFs. Strong central bank gold buying has also supported gold prices.</p>
<p>Investors in China and Turkey are using gold to hedge against economic risks and weakening currencies. Turkey has been experiencing hyperinflation due to unconventional monetary policies. Since the presidential elections in May, the government has taken steps to restore confidence; however, there remains a high level of uncertainty. In China, the slowing economy, along with fallout from its real estate bust and government crackdown on the tech sector, has also created financial uncertainty. Central banks are buying gold to diversify away from the U.S. dollar and as a hedge against market volatility. Its performance during times of crisis, its role as a long-term store of value, and its high liquidity make it an asset of choice.</p>
<h2>Well-positioned vs. &ldquo;consensus&rdquo; with gold?</h2>
<p>In contrast, Western investors have yet to find a reason to seek shelter in what has been a very robust year for equity markets and, in particular, tech stocks. A &ldquo;soft landing&rdquo; now appears more within reach, and with inflation decreasing, markets seem to think there isn&rsquo;t a need for gold. However, equity valuations are very rich, and the prospect of sustained, elevated interest rates poses a significant risk to most sectors and the entire economic and financial system. British pension funds, Credit Suisse, Silicon Valley Bank and Signature Bank were all victims of rising rates. Who is next? Is there another crisis looming?</p>
<p>The weakness in gold markets in these past couple of weeks comes precisely at a time when these risks appear to be front and center for investors, which, to us, creates a notable market dislocation. If or when tides turn &ndash; i.e., when markets are hit with a drop in corporate earnings, a deep correction in equity markets, a weaker jobs market or significantly higher unemployment, along with sustained, high interest rates under the stress of above-target inflation &ndash; we think gold is well positioned to benefit. In our view, gold equities should benefit to an even greater extent as victims of their own market dislocation. Currently trading at historically low valuation multiples, and significantly lagging gold bullion, the gold mining sector&rsquo;s balance sheets, cash flow generation and capital allocation strategies are as strong as they have ever been.</p>
<h2>Stepping out: gold conference recap</h2>
<p>Last month, we attended two of the sector&rsquo;s major conferences, both in Colorado: Precious Metals Summit, in Beaver Creek, focused on explorers, developers and emerging producers; and Gold Forum Americas, in Colorado Springs, which showcases seven-eighths of the world&rsquo;s publicly traded gold and silver companies when measured by production or reserves. We held meetings with the management teams of more than 50 companies during the two conferences.</p>
<p>The mood at Gold Forum Americas was quiet and reflective&mdash;perhaps not surprisingly given the recent lack of investor appetite for gold equities and the resulting poor share price performance of many of the companies. However, the message continues to be generally upbeat, with a focus on portfolio optimization, disciplined growth, cost control and delivering against expectations. The companies understand that to achieve a rerating and attract a broad investor base they need to consistently demonstrate to the markets that this sector is investable throughout the metal price cycles, with a strategy that focuses on value creation by reducing costs, increasing mine lives and finding and developing new deposits all while maximizing returns for stakeholders. Build it, and they will come. Markets are efficient; if there is indeed a dislocation between equity prices and the implied value of the gold mining sector based on its sustainable profitability (as we believe), then it shouldn&rsquo;t last too long.</p>
<p>At Precious Metals Summit, one CEO commented that this market feels like the bottom of the bear market in 2015 when gold fell to $1,050. However, the gold price is now in a bull market trend, with gold recently near record highs, and internal rates of return on many projects ranging between 20% and 50% or more. Talk about dislocation! As a result of the strong gold market and weak gold equity market, we are seeing development stage companies fall into one of three categories:</p>
<ol class="content-list">
<li>Those with strong financial backing willing to raise capital to develop their projects at depressed equity valuations;</li>
<li>Those who are bootstrapping their developments &ndash; starting smaller projects with less capital and using operating cash flow to expand production in years two or three; and</li>
<li>Those with little access to capital who are either going dormant or looking for a buyer with better funding.</li>
</ol>
<p>Our Strategy carries all three types of developers. We look at the quality and scale of projects along with geopolitical risks and management capabilities. Value and performance will ultimately be realized in high-quality, well-run companies. However, it seems that current conditions will certainly require some extra patience!</p>
<p>To receive more <strong><a href="https://www.vaneck.com/us/en/insights/gold-investing/" title="Gold Investing Insights">Gold Investing</a></strong> insights, <strong><a href="https://www.vaneck.com/us/en/subscribe/" title="Subscription Center">sign up in our subscription center</a></strong>.</p>
]]></content:encoded>
</item><item rdf:about="https://www.vaneck.com/us/en/blogs/moat-investing/moat-investing-rises-above-magnificent-seven-dominance/">
  <title>Moat Investing Rises Above Magnificent Seven Dominance></title>
  <link>https://www.vaneck.com/us/en/blogs/moat-investing/moat-investing-rises-above-magnificent-seven-dominance/</link>
  <description><![CDATA[The &ldquo;Magnificent Seven<sup>*</sup>&rdquo; mega-cap stocks have driven over 70% of the S&amp;P 500&rsquo;s YTD returns. Despite being underweight these stocks, Morningstar&rsquo;s Moat Index has outperformed the S&amp;P 500 YTD.]]></description>
  <dc:creator>Coulter Regal, CFA</dc:creator>
  <dc:date>10/09/2023 06:30:00</dc:date>
<content:encoded><![CDATA[

<p>Once again, September lived up to its historical standing as the worst month of the year for markets, with U.S. equities seeing one of their biggest monthly pullbacks of 2023. Investors faced a long list of worries during the month, including a more hawkish than expected tone from Federal Reserve Chair Jerome Powell, soaring oil prices, narrow equity market leadership of mega-cap tech, and the United Auto Workers union strike. Then on the final trading day of the month, concerns about a government shutdown weighed on the market even further.</p>
<p>The <strong><a href="https://www.vaneck.com/us/en/investments/morningstar-wide-moat-etf-moat/overview/" title="MOAT - VanEck Morningstar Wide Moat ETF - Overview">Morningstar Wide Moat Focus Index</a></strong> (the &ldquo;Moat Index&rdquo;) was not resistant to market troubles, finishing down 5.44% in September, while the S&amp;P 500 Index declined 4.77%. However, year-to-date the Moat Index continues to lead the S&amp;P 500 by over 400 basis points. Smaller-cap companies also saw a modest decline during the month, yet the <a href="https://www.vaneck.com/us/en/investments/morningstar-smid-moat-etf-smot/index/" title="SMOT - VanEck Morningstar SMID Moat ETF - Overview"><strong>Morningstar US Small-Mid Cap Moat Focus Index</strong></a> (the &ldquo;SMID Moat Index&rdquo;) weathered the storm better than both the small- and mid-cap broad benchmark indexes.</p>
<h3>Moat Indexes Maintain YTD Lead</h3>
<p><img class="img-responsive w-100" src="https://www.vaneck.com/contentassets/cd0e487b72c04a949d5817dc56b672ec/3699_moatsmot-monthly_2023.10_v1_blog_blog.svg" alt="Bar chart comparing September and YTD performance of Morningstar's Moat Index and SMID Moat index vs broad benchmark indexes" /></p>
<p class="chart-disclosure"><strong>Source: Morningstar. As of 9/30/2023.</strong> Past performance is no guarantee of future results. Index performance is not representative of fund performance. It is not possible to invest directly in an index. Fund performance current to the most recent month end is available by visiting vaneck.com or by calling 800.826.2333.</p>
<h2>The Growing Magnificent Seven Concentration Problem</h2>
<p>The expanding dominance of the "Magnificent Seven" mega-cap technology stocks has raised eyebrows in financial circles, leading to growing concerns about concentration risk in the U.S. equity market. These behemoths, which include Apple, Amazon, Microsoft, Google, Nvidia, Tesla, and Meta have seen their market values soar, making them pivotal players in the stock market's performance. Today, the Magnificent Seven make up over 25% of the S&amp;P 500 Index and have contributed more than 70% of the index&rsquo;s YTD returns<sup>1</sup>.</p>
<p>While their spectacular rise underscores the transformative power and profitability of technology in today's digital age, it also poses a potential risk. If any of these companies were to falter, the ripple effect on the broader market could be significant. Diversification is a cornerstone of risk management in investing, and the increasing reliance on a handful of stocks for market returns challenges this foundational principle.</p>
<p>The equal-weighted Moat and SMID Moat strategies offers investors a potential solution to this growing concentration risk. By allocating equal importance to each stock, these approaches inherently reduce the influence of mega-cap tech giants, promoting diversification and potentially offering a buffer against the volatility of a few dominant players. And investors shouldn&rsquo;t take this to mean reduced return potential either, as the Moat Index has actually outperformed the S&amp;P 500 so far this year&mdash;despite its structural underweight to the Magnificent Seven.</p>
<h2>September Index Reconstitution</h2>
<p>Both the Moat and SMID Moat Indexes underwent quarterly reviews on September 15, 2023. Each quarter they systematically target the most attractively priced U.S. moat companies within their respective universes. Below are a few takeaways from the September reviews and how the indexes are positioned heading into the remainder of the year. Full results of the most recent quarterly reviews are available here: <strong><a href="https://www.vaneck.com/us/en/investments/morningstar-wide-moat-etf-moat/moat-reconstitution.pdf" title="MOAT - VanEck Morningstar Wide Moat ETF" target="_blank" rel="noopener">Moat Index</a></strong> and <a href="https://www.vaneck.com/us/en/investments/morningstar-smid-moat-etf-smot/smot-reconstitution.pdf" title="SMOT - VanEck Morningstar SMID Moat ETF" target="_blank" rel="noopener"><strong>SMID Moat Index</strong></a>.</p>
<h2>Moat Index Highlights</h2>
<p><strong>Growth Exodus Led by Technology</strong></p>
<p>The Moat Index saw its technology exposure increase to the largest overweight in quite some time at the end of 2022, following the drastic declines in valuations for the sector that year. Now, with the incredible rally that many of these companies experienced in the first half of the year, their valuations have become less attractive. During the September review, the Moat Index continued its shift away from growth stocks, which began in June 2023, to more of a blend/value posture.</p>
<p>The technology sector saw the largest reduction in exposure, signaling growth as an overvalued segment of the U.S. market. Tech stocks are now the largest underweight in the Moat Index, about 12% relative to the S&amp;P 500 Index. This technology sector void was filled by companies from more value-oriented sectors such as industrials (Honeywell, RTX Corp.), financials (Charles Schwab, MarketAxess) and consumer staples (Estee Lauder, Campbell Soup).</p>
<div class="wrapped-div">
<table style="width: 100%;">
<tbody>
<tr class="tbl-data">
<td class="tbl-header last">Index Style Exposure</td>
<td class="tbl-header last text-center">Current Exposure</td>
<td class="tbl-header last text-center">Rebalance Change</td>
<td class="tbl-header last text-center">Relative to S&amp;P 500</td>
</tr>
<tr class="tbl-data">
<td class="data-td data last text-left">Value</td>
<td class="data-td data last">29.0%</td>
<td class="data-td data last">+4.1%</td>
<td class="data-td data last">+7.3%</td>
</tr>
<tr class="tbl-data">
<td class="data-td data last text-left">Core</td>
<td class="data-td data last">46.8%</td>
<td class="data-td data last">+3.2%</td>
<td class="data-td data last">+6.1%</td>
</tr>
<tr class="tbl-data">
<td class="data-td data last text-left">Growth</td>
<td class="data-td data last">24.2%</td>
<td class="data-td data last">-7.3%</td>
<td class="data-td data last">-13.4%</td>
</tr>
</tbody>
</table>
</div>
<br />
<p class="chart-disclosure"><strong>Source: Morningstar. As of 9/15/2023</strong>.Not intended as a recommendation to buy or sell any securities mentioned herein. Index performance is not representative of fund performance. It is not possible to invest directly in an index.</p>
<p><strong>Moat Index&rsquo;s Magnificent Seven Exposure</strong></p>
<p>The market has taken a liking to the new moniker representing the seven companies driving the vast majority of U.S. market returns: Alphabet, Amazon, Apple, Meta, Microsoft, Nvidia, and Tesla. Amid stretched valuations this quarter, the Moat Index removed Meta Platforms leaving only Alphabet, Amazon, and Microsoft in the Moat Index at around a 5% weighting. Meanwhile, the Magnificent Seven have more than 25% exposure in the S&amp;P 500 Index.</p>
<p><strong>Valuations Remain Attractive</strong></p>
<p>The weighted average price-to-fair value of the Moat Index fell from 0.81 to 0.77 following the September review, signaling a 23% discount to Morningstar&rsquo;s fair value estimate. This is in contrast to the S&amp;P 500 Index, which featured a weighted average price-to-fair value ratio of 0.96 as of the same date.</p>
<h2>SMID Moat Index Highlights</h2>
<p><strong>Technology Companies Lead in Removals</strong></p>
<p>This quarterly review the SMID Moat Index saw the removal of a number of technology companies. In all, seven technology names were removed, including Crane NXT, Blackbaud, Guidewire Software, Monolithic Power Systems, Verisign, and WorkDay. Nearly all of these removals were due to the Index&rsquo;s valuation screen. However, Morningstar still sees some opportunity within the technology sector, as there were also a few new tech names added this quarter as well. These companies include the global IT services provider Cognizant Tech Solutions and Tyler Technologies, which provides a full suite of software solutions and services that address the needs of cities, schools, courts and other local government entities.</p>
<p><strong>Value Exposure Decreased in Favor of Growth</strong></p>
<p>Despite the SMID Moat Index&rsquo;s removal of several technology companies, the style exposure within the Index still shifted slightly toward growth this quarter. The shift came primarily at the cost of value, which saw a reduction in exposure this quarter. This is in contrast to the larger-cap Moat Index, which saw the reserve shift in these exposures. Total growth exposure for the SMID Moat Index now stands at about 26%, but remains a minor underweight of about 3% relative to the broad SMID-cap universe.</p>
<div class="wrapped-div">
<table style="width: 100%;">
<tbody>
<tr class="tbl-data">
<td class="tbl-header last">Index Style Exposure</td>
<td class="tbl-header last text-center">Current Exposure</td>
<td class="tbl-header last text-center">Rebalance Change</td>
<td class="tbl-header last text-center">Relative to Broad SMID Index</td>
</tr>
<tr class="tbl-data">
<td class="data-td data last text-left">Value</td>
<td class="data-td data last">29.0%</td>
<td class="data-td data last">-4.4%</td>
<td class="data-td data last">+2.5%</td>
</tr>
<tr class="tbl-data">
<td class="data-td data last text-left">Core</td>
<td class="data-td data last">45.2%</td>
<td class="data-td data last">+1.7%</td>
<td class="data-td data last">+0.3%</td>
</tr>
<tr class="tbl-data">
<td class="data-td data last text-left">Growth</td>
<td class="data-td data last">25.8%</td>
<td class="data-td data last">+2.7%</td>
<td class="data-td data last">-2.8%</td>
</tr>
</tbody>
</table>
</div>
<br />
<p class="chart-disclosure"><strong>Source: Morningstar. As of 9/15/2023.</strong> Not intended as a recommendation to buy or sell any securities mentioned herein. Broad SMID Index refers to the Morningstar US Small-Mid Cap Index, is a broad-based index intended to track the overall performance of U.S. small- and mid-cap companies according to Morningstar. Index performance is not representative of fund performance. It is not possible to invest directly in an index.</p>
<p><strong>Consumer Discretionary and Health Care Additions</strong></p>
<p>Companies belonging to the consumer discretionary and health care sectors were notable additions this quarter with 12 names between the two sectors added to the Index. DoorDash, Harley-Davidson and Wynn Resorts were among the consumer discretionary additions, while health care saw names added like Veeva Systems, DaVita, and Agilent Technologies. Both sectors are overweights in the SMID Moat Index relative to the broad SMID-cap universe.</p>
<p><strong>SMID Moat Valuations Remain Attractive</strong></p>
<p>The weighted average price-to-fair value of the SMID Moat Index fell from 0.77 to 0.75 following the September review, signaling a 25% discount to Morningstar&rsquo;s fair value estimate. This is in contrast to the broad based Morningstar US Small-Mid Cap Index, which featured a weighted average price-to-fair value ratio of 0.96 as of the same date.</p>
<h2>Accessing Moat Stocks</h2>
<p><a href="https://www.vaneck.com/us/en/investments/morningstar-wide-moat-etf-moat/moat-reconstitution.pdf" title="MOAT - VanEck Morningstar Wide Moat ETF" target="_blank" rel="noopener"><strong>VanEck Morningstar Wide ETF (MOAT)</strong></a> seeks to replicate as closely as possible, before fees and expenses the price and yield performance of the Morningstar Wide Moat Focus Index.</p>
<p><a href="https://www.vaneck.com/us/en/investments/morningstar-smid-moat-etf-smot/overview/" title="SMOT - VanEck Morningstar SMID Moat ETF - Overview"><strong>VanEck Morningstar SMID Moat ETF (SMOT)</strong></a> seeks to track as closely as possible, before fees and expenses, the price and yield performance of the Morningstar US Small-Mid Cap Moat Focus Index.</p>
<p>To receive more <a href="https://www.vaneck.com/us/en/insights/moat-investing/" title="Moat Investing Insights"><strong>Moat Investing</strong></a> insights, <a href="https://www.vaneck.com/us/en/subscribe/" title=" Subscription Center"><strong>sign up in our subscription center</strong></a>.</p>
<style type="text/css">
    .wrapped-div {
        max-width: 100%;
    }

    @media (max-width: 1240px) {
        .wrapped-div {
            overflow-x: scroll;
        }


    }
</style>
]]></content:encoded>
</item><item rdf:about="https://www.vaneck.com/us/en/blogs/thematic-investing/rth-etf-question-and-answer/">
  <title>RTH ETF: Question &amp; Answer></title>
  <link>https://www.vaneck.com/us/en/blogs/thematic-investing/rth-etf-question-and-answer/</link>
  <description><![CDATA[In this blog, we answer frequently asked questions about the VanEck Retail ETF (RTH), including the current outlook for the retail sector.]]></description>
  <dc:creator>Dylan  Desai</dc:creator>
  <dc:date>10/06/2023 06:30:00</dc:date>
<content:encoded><![CDATA[

<p>This blog is intended to answer frequently asked questions regarding the retail sector and more specifically, <strong><a href="https://www.vaneck.com/us/en/investments/retail-etf-rth/overview/" title="RTH - VanEck Retail ETF - Overview">VanEck&rsquo;s Retail ETF (RTH)</a></strong>.</p>
<ul class="content-list">
<li><strong><a href="#point-one">What is the current outlook for the retail sector?</a></strong></li>
<li><strong><a href="#point-two">Why is the retail sector performing well despite market conditions?</a></strong></li>
<li><strong><a href="#point-three">What advantages does the VanEck Retail ETF have over its peers?</a></strong></li>
<li><strong><a href="#point-four">Why are the larger companies in this sector outperforming smaller companies?</a></strong></li>
<li><strong><a href="#point-five">What is the investible universe for the index?</a></strong></li>
<li><strong><a href="#point-six">How is the fund&rsquo;s index constructed?</a></strong></li>
<li><strong><a href="#point-seven">How frequently is the index rebalanced and reconstituted?</a></strong></li>
<li><strong><a href="#point-eight">How can investors buy VanEck ETFs?</a></strong></li>
</ul>
<h2 id="point-one" class="anchored-block">What is the current outlook for the retail sector?</h2>
<p>The retail sector, a vital component of the modern economy, has undergone significant transformation in recent years, driven by technological advancements and shifting consumer preferences. In the wake of these transformative forces, the outlook for the retail sector remains dynamic and complex.</p>
<p>One prominent trend that has emerged is the continued growth of e-commerce. Consumers increasingly prefer the convenience of online shopping, which has led to a surge in digital retail sales. Retailers have responded by investing in their online infrastructure, creating omnichannel shopping experiences seamlessly integrating their physical and digital platforms. As a result, the online retail market is poised to continue to expand, presenting opportunities for those retailers that can adapt to the evolving landscape.</p>
<p>This opportunity set does not come without uncertainties and risks. Supply chain disruptions, labor shortages, and inflationary pressures pose ongoing challenges to the retail industry. Additionally, consumers' environmental and ethical considerations are driving demand for sustainable and socially responsible practices, requiring retailers to rethink their supply chains and business models.</p>
<p>It's reasonable to conclude that the outlook for the retail sector is a mixed landscape of opportunities and challenges. E-commerce is expected to continue its growth trajectory, but traditional retailers must innovate to remain competitive. The sector must also navigate ongoing uncertainties related to supply chain disruptions and changing consumer preferences. Sustainability and social responsibility are becoming increasingly important factors in consumer decision-making, further emphasizing the need for retailers to adapt to these evolving trends. Overall, the retail sector's future hinges on its ability to embrace digital transformation, resilience, and adaptability to meet the changing demands of the modern consumer.</p>
<h2 id="point-two" class="anchored-block">Why is the retail sector performing well despite market conditions?</h2>
<p>The recent growth of the retail sector can largely be attributed to the aggregate consumer strength, precisely the strength of the U.S. consumer. As of late, consumers have been bombarded by record-breaking inflation and interest rates. Even with these headwinds, American consumers have remained resilient. Discretionary spending on more miniature retail goods remains robust. This could be at least partially due to the integration of technology.</p>
<p>The retail sector is defined by innovation and technology. Companies that have embraced e-commerce and an omnichannel retail strategy have enhanced the customer experience and brand loyalty. Additionally, the retailers that have implemented point-of-sale installment loans via BNPL platforms can convert more sales and smooth a portion of their positive cash flows.</p>
<h2 id="point-three" class="anchored-block">What advantages does the VanEck Retail ETF have over its peers?</h2>
<p>The companies that dominate the <a href="https://www.vaneck.com/us/en/investments/retail-etf-rth/performance/" title="RTH - VanEck Retail ETF - Performance"><strong>VanEck Retail ETF (RTH)</strong></a> are those that have led the pack in retaining customer loyalty, created a seamless, omnichannel customer experience, led the market in international expansion, and inspired new and existing workforce to stick with them throughout ever-shifting market conditions.</p>
<p>The index&rsquo;s free-float market capitalization weighting methodology has been the primary reason the fund has generated superior returns relative to other retail-oriented funds. By market cap weighting the portfolio, the largest companies in the sector receive a heavier-handed weight when the portfolio is rebalanced. This index construction offers investors enhanced access to the companies that have successfully implemented technology and an omnichannel retail strategy.</p>
<p>These trends are evident in the chart below, where the fund&rsquo;s performance is illustrated, outpacing both the broad consumer discretionary sector and the S&amp;P 500 since its inception in 2011.</p>
<h3>RTH Outperforms the S&amp;P and Consumer Discretionary Sector Since Its Inception</h3>
<p><img class="img-responsive w-100" src="https://www.vaneck.com/contentassets/58b08a39881f43d588f8877900de6980/3686_rth-qa-blog_2023.10_v1_blog.svg" alt="RTH Outperforms the S and P and Consumer Discretionary Sector Since Its Inception" /></p>
<p class="chart-disclosure"><strong>Source: Morningstar. As of 9/30/2023.</strong> The performance data quoted represents past performance. Past performance is not a guarantee of future results. Performance may be lower or higher than the performance data quoted.</p>
<div class="wrapped-div">
<table style="width: 100%;">
<tbody>
<tr class="tbl-data">
<td class="tbl-header last" colspan="10">Returns (%) as of 9/30/2023<sup>*</sup></td>
</tr>
<tr class="tbl-data">
<td class="data-td  last">&nbsp;</td>
<td class="data-head last">Ticker</td>
<td class="data-head last">&nbsp;</td>
<td class="data-head last">1 Mo</td>
<td class="data-head last">1 Yr</td>
<td class="data-head last">5 Yr</td>
<td class="data-head last">10 Yr</td>
<td class="data-head last">Since Inception<br />12/20/11</td>
<td class="data-head last" colspan="2">Expense Ratio</td>
</tr>
<tr class="tbl-data">
<td class="data-td last font-weight-normal" rowspan="2">VanEck Retail ETF</td>
<td class="data-td data last" rowspan="2">RTH</td>
<td class="data-td data last"><i>NAV</i></td>
<td class="data-td data last">-4.87</td>
<td class="data-td data last">9.58</td>
<td class="data-td data last">9.51</td>
<td class="data-td data last">13.02</td>
<td class="data-td data last">14.91</td>
<td class="data-td data last"><i>Gross</i></td>
<td class="data-td data last">0.35%</td>
</tr>
<tr class="tbl-data">
<td class="data-td data last"><i>Mkt Price</i></td>
<td class="data-td data last">-4.72</td>
<td class="data-td data last">9.47</td>
<td class="data-td data last">9.52</td>
<td class="data-td data last">13.02</td>
<td class="data-td data last">15.02</td>
<td class="data-td data last"><i>Net</i></td>
<td class="data-td data last">0.35%</td>
</tr>
<tr class="tbl-data">
<td class="data-td  last">&nbsp;</td>
<td class="data-head last">&nbsp;</td>
<td class="data-head last">1 Mo</td>
<td class="data-head last">1 Yr</td>
<td class="data-head last">5 Yr</td>
<td class="data-head last">10 Yr</td>
<td class="data-head last">Since Inception<br />12/20/11</td>
<td class="data-head last" colspan="2">&nbsp;</td>
</tr>
<tr class="tbl-data">
<td class="data-td last font-weight-normal">The S&amp;P Composite 1500 Consumer Discretionary Index</td>
<td class="data-td data last">&nbsp;</td>
<td class="data-td data last">Total Return</td>
<td class="data-td data last">-5.99</td>
<td class="data-td data last">14.29</td>
<td class="data-td data last">7.14</td>
<td class="data-td data last">11.12</td>
<td class="data-td data last">13.94</td>
<td class="data-td data last">-</td>
</tr>
<tr class="tbl-data">
<td class="data-td last font-weight-normal">S&amp;P 500 Index</td>
<td class="data-td data last">&nbsp;</td>
<td class="data-td data last">Total Return</td>
<td class="data-td data last">-4.77</td>
<td class="data-td data last">21.62</td>
<td class="data-td data last">9.92</td>
<td class="data-td data last">11.92</td>
<td class="data-td data last">13.28</td>
<td class="data-td data last">-</td>
</tr>
</tbody>
</table>
</div>
<br />
<p class="chart-disclosure">Source: Morningstar.</p>
<p class="chart-disclosure"><sup>*</sup>&nbsp;Returns less than one year are not annualized.</p>
<p class="chart-disclosure"><strong>The performance data quoted represents past performance. Past performance is not a guarantee of future results. Investment return and principal value of an investment will fluctuate so that an investor's shares, when redeemed, may be worth more or less than their original cost. Performance may be lower or higher than performance data quoted. Please call 800.826.2333 or visit vaneck.com for performance current to the most recent month ended.</strong></p>
<p class="chart-disclosure">An investor cannot invest directly in an index. The table presents past performance which is no guarantee of future results and which may be lower or higher than current performance. Returns reflect temporary contractual fee waivers and/or expense reimbursements. Had the ETF incurred all expenses and fees, investment returns would have been reduced. Investment returns and ETF share values will fluctuate so that investors' shares, when redeemed, may be worth more or less than their original cost. ETF returns assume that dividends and capital gains distributions have been reinvested in the Fund at NAV.</p>
<p class="chart-disclosure">The S&amp;P 500 Index is a product of S&amp;P Dow Jones Indices LLC and/or its affiliates and has been licensed for use by Van Eck Associates Corporation. Copyright &copy;&nbsp;2023 S&amp;P Dow Jones Indices LLC, a division of S&amp;P Global, Inc., and/or its affiliates. All rights reserved. Redistribution or reproduction in whole or in part are prohibited without written permission of S&amp;P Dow Jones Indices LLC. For more information on any of S&amp;P Dow Jones Indices LLC&rsquo;s indices please visit https://www.spglobal.com/spdji/en/. S&amp;P<sup>&reg;</sup>&nbsp;is a registered trademark of S&amp;P Global and Dow Jones<sup>&reg;</sup>&nbsp;is a registered trademark of Dow Jones Trademark Holdings LLC. Neither S&amp;P Dow Jones Indices LLC, Dow Jones Trademark Holdings LLC, their affiliates nor their third party licensors make any representation or warranty, express or implied, as to the ability of any index to accurately represent the asset class or market sector that it purports to represent and neither S&amp;P Dow Jones Indices LLC, Dow Jones Trademark Holdings LLC, their affiliates nor their third party licensors shall have any liability for any errors, omissions, or interruptions of any index or the data included therein.</p>
<p class="chart-disclosure">The S&amp;P 500 Index consists of 500 widely held common stocks covering industrial, utility, financial and transportation sector; as an Index, it is unmanaged and is not a security in which investments can be made.</p>
<p class="chart-disclosure">Van Eck Associates Corporation (the &ldquo;Adviser&rdquo;) will pay all expenses of the Fund, except for the fee payment under the investment management agreement, acquired fund fees and expenses, interest expense, offering costs, trading expenses, taxes and extraordinary expenses. Notwithstanding the foregoing, the Adviser has agreed to pay the offering costs until at least February 1, 2024. &ldquo;Other Expenses&rdquo; have been restated to reflect current fees.</p>
<div class="epi-contentfragment">faq-banner-cta</div>
<h2 id="point-four" class="anchored-block">Why are the larger companies in this sector outperforming smaller companies?</h2>
<p>The largest retailers hold a competitive edge over smaller counterparts primarily due to economies of scale. Their ability to purchase goods in bulk at lower unit costs enables them to offer more competitive prices to consumers. This cost-efficiency bolsters profit margins and is a significant entry barrier for smaller competitors.</p>
<p>Brand recognition and trust play a pivotal role in the success of larger retailers. Established brands with a history of quality products and services tend to attract a larger customer base, while smaller retailers must work harder to establish and maintain consumer trust.</p>
<p>More significant financial resources allow larger retailers to invest in research and development, marketing, technology infrastructure, and expansion into new markets or product lines. These investments enhance operational efficiency and support innovation, providing a further advantage.</p>
<p>Negotiating power with suppliers is another benefit enjoyed by larger retailers. They can secure better terms, lower prices, and exclusive deals, positively impacting their cost structure and profitability.</p>
<p>Lastly, their resources and infrastructure facilitate larger retailers' ability to adapt to changing consumer preferences and market trends. They can quickly pivot their strategies to accommodate shifts in the market, providing them with a distinct advantage over smaller retailers.</p>
<h2 id="point-five" class="anchored-block">What is the investible universe for the index?</h2>
<p>The MVIS<sup>&reg;</sup>&nbsp;US Listed Retail 25 Index includes U.S. exchange-listed companies that derive at least 50% (25% for current holdings) from retail.<sup>1</sup>&nbsp;This includes companies engaged primarily in retail distribution, wholesalers, online, direct mail retailers, multi-line retailers, and specialty retailers, such as apparel, automotive, computer and electronics, drug, home improvement, home furnishing retailers, and food and other staples retailers.</p>
<h2 id="point-six" class="anchored-block">How is the fund&rsquo;s index constructed?</h2>
<p>The MVIS<sup>&reg;</sup>&nbsp;US Listed Retail 25 Index is comprised of 25 components, which are weighted by their free-float market capitalization. The index provider categorizes the companies that exceed an individual weight of 4.5% as &ldquo;large weights.&rdquo; At least 5 companies, but no more than 10, constitute the large weights category. The total weighting of these large weights is capped at 50% of the portfolio.<sup>2</sup></p>
<h2 id="point-seven" class="anchored-block">How frequently is the index rebalanced and reconstituted?</h2>
<p>The index is rebalanced every quarter in March, June, September, and December. The review occurs on a semi-annual basis in March and September.</p>
<h2 id="point-eight" class="anchored-block">How can investors buy VanEck ETFs?</h2>
<p><strong><a href="/link/9d3cdfd6c51f487ba0e8cf3f81ed5123.aspx#how-to-buy-etf&amp;utm=RTH-Blog" title="How to buy VanEck ETFs?">Learn more here.</a></strong></p>
<p class="d-none d-lg-block"><a href="mailto:askvaneck@vaneck.com" title="Have More Questions? - Ask VanEck" rel="noopener"> <img class="img-responsive" src="https://www.vaneck.com/globalassets/home/us/insights/blogs/bm-blog-images/cta-faq_desktop-02.svg" alt="Have More Questions? - Ask VanEck" /></a></p>
<p class="d-lg-none"><a href="mailto:askvaneck@vaneck.com" title="Have More Questions? - Ask VanEck" rel="noopener"> <img class="img-responsive" src="https://www.vaneck.com/globalassets/home/us/insights/blogs/bm-blog-images/cta-faq_mobile-01.svg" alt="Have More Questions? - Ask VanEck" /></a></p>
<p>To receive more <a href="/us/en/insights/thematic-investing/" title="Income Investing Insights"><strong>Thematic Investing</strong></a> insights, <a href="/link/5f45412c2143400497908cea2897f7d3.aspx" title="Subscription Center"><strong>sign up in our subscription center</strong></a>.</p>
<style type="text/css">
    .wrapped-div {
        max-width: 100%;
    }

    @media (max-width: 768px) {
        .wrapped-div {
            overflow-x: scroll;
        }
    }

    .wrapped-div-sector {
        max-width: 100%;
        overflow-x: scroll;
    }
</style>
]]></content:encoded>
</item><item rdf:about="https://www.vaneck.com/us/en/blogs/digital-assets/matthew-sigel-vaneck-monthly-crypto-recap-for-september-2023/">
  <title>VanEck Monthly Crypto Recap for September 2023></title>
  <link>https://www.vaneck.com/us/en/blogs/digital-assets/matthew-sigel-vaneck-monthly-crypto-recap-for-september-2023/</link>
  <description><![CDATA[In September, digital assets, especially Bitcoin and Ethereum, performed better than traditional market indices. Large-cap tokens excelled due to decreased on-chain activities, and market hopes tied to ETF approvals.]]></description>
  <dc:creator>Matthew  Sigel</dc:creator>
  <dc:date>10/06/2023 06:30:00</dc:date>
<content:encoded><![CDATA[

<p><strong>Please note that VanEck may have a position(s) in the digital asset(s) described below.</strong></p>
<p>Digital assets outperformed other risk assets in September for the first time since May, as Bitcoin rose +3% and Ethereum +1% vs. the S&amp;P -5% and the Nasdaq Composite -6%. Among tokens, large-caps&rsquo; outperformance surged to all-time highs vs. small-caps as dwindling on-chain volumes and lackluster blockchain fees prompted market participants to defend BTC and ETH weakness on ETF approval hopes rather than take risk on more speculative coins with less valuation support. The exception was DeFi, which outperformed materially (+13%) in the month thanks to AAVE &amp; MKR essentially capturing yield income from US Treasuries (&ldquo;real world assets&rdquo;), a trend to be discussed further below.</p>
<div class="wrapped-div">
<table style="width: 500px;">
<tbody>
<tr class="tbl-data">
<td class="tbl-header last text-center">&nbsp;</td>
<td class="tbl-header last text-center">September</td>
<td class="tbl-header last text-center">YTD</td>
</tr>
<tr class="tbl-data">
<td class="data-td last">Coinbase</td>
<td class="data-td data last">-6%</td>
<td class="data-td data last">112%</td>
</tr>
<tr class="tbl-data">
<td class="data-td last">Bitcoin</td>
<td class="data-td data last">3%</td>
<td class="data-td data last">63%</td>
</tr>
<tr class="tbl-data">
<td class="data-td last">Ethereum</td>
<td class="data-td data last">1%</td>
<td class="data-td data last">39%</td>
</tr>
<tr class="tbl-data">
<td class="data-td last">Nasdaq 100 Index</td>
<td class="data-td data last">-6%</td>
<td class="data-td data last">27%</td>
</tr>
<tr class="tbl-data">
<td class="data-td last">MarketVector&trade; Infrastructure Application Leaders Index</td>
<td class="data-td data last">11%</td>
<td class="data-td data last">22%</td>
</tr>
<tr class="tbl-data">
<td class="data-td last">MarketVector&trade; Decentralized Finance Leaders Index</td>
<td class="data-td data last">13%</td>
<td class="data-td data last">17%</td>
</tr>
<tr class="tbl-data">
<td class="data-td last">S&amp;P 500 Index</td>
<td class="data-td data last">-5%</td>
<td class="data-td data last">12%</td>
</tr>
<tr class="tbl-data">
<td class="data-td last">MarketVector&trade; Smart Contract Leaders Index</td>
<td class="data-td data last">0%</td>
<td class="data-td data last">12%</td>
</tr>
<tr class="tbl-data">
<td class="data-td last">MarketVector&trade; Centralized Exchanges Index</td>
<td class="data-td data last">-1%</td>
<td class="data-td data last">-11%</td>
</tr>
<tr class="tbl-data">
<td class="data-td last">MarketVector&trade; Media &amp; Entertainment Leaders Index</td>
<td class="data-td data last">-6%</td>
<td class="data-td data last">-39%</td>
</tr>
</tbody>
</table>
</div>
<br />
<p class="chart-disclosure">Source: Bloomberg, VanEck research as of 9/30/2023. <strong>Past performance is not indicative of future results. Not intended as a recommendation to buy or sell any of the names mentioned herein.</strong></p>
<ul class="content-list">
<li><strong><a href="#bitcoin-transaction-soar">Bitcoin: Transaction Soar</a></strong></li>
<li><strong><a href="#layer-1s-september-update">Layer 1s: September Update</a></strong></li>
<li><strong><a href="#atom-september-updates">ATOM: September Updates</a></strong></li>
<li><strong><a href="#tron-september-updates">TRON: September Updates</a></strong></li>
<li><strong><a href="#avax-september-updates">AVAX: September Updates</a></strong></li>
<li><strong><a href="#sui-september-updates">SUI: September Updates</a></strong></li>
<li><strong><a href="#defi-september-updates">DeFi: September Updates</a></strong></li>
<li><strong><a href="#friend-tech-september-updates">Friend.Tech: September Updates</a></strong></li>
<li><strong><a href="#metaverse-september-updates">Metaverse: September Updates</a></strong></li>
<li><strong><a href="#nft-volume-september-updates">NFT Volume: September Updates</a></strong></li>
<li><strong><a href="#pudgy-penguins-walmart-partnership">Pudgy Penguins: Walmart Partnership</a></strong></li>
<li><strong><a href="#parallel-tcg-game-on-base-blockchain">Parallel TCG: Game on Base Blockchain</a></strong></li>
<li><strong><a href="#web-3-singapore-leads-charge">Web 3: Singapore Leads Charge</a></strong></li>
</ul>
<p><img class="img-responsive w-100" src="https://www.vaneck.com/contentassets/25ba58367abc4e6f9edcf09c054c4a5a/3691_scl-september_chart-1_blog.svg" alt="MVIS Digital Assets Ratio" /></p>
<p class="chart-disclosure">Source: Bloomberg, MarketVector, VanEck, as of 10/2/23. <strong>Past performance is not indicative of future results. Not intended as a recommendation to buy or sell any of the names mentioned herein.</strong></p>


<p>A curious development in the month involved Bitcoin active addresses making all-time highs in September even as the median transfer value made multi-year lows. One explanation is the emerging dominance of Bitcoin &ldquo;Inscriptions,&rdquo; which encode images, files, or text into the Bitcoin blockchain&rsquo;s data structure, similar to NFTs. Such transactions are low value, but inscribers have been &ldquo;buyers of last resort&rdquo; of Bitcoin blockspace, and that trend continued in September. Another explanation is that Binance has been making many unusual wallet movements, possibly ahead of a DOJ action. A third reason for the animated address activity is that while overall crypto trading volumes have dwindled, Asia and Latin America (where transactions are smaller) have outperformed Europe or the US.</p>
<h3 id="bitcoin-transaction-soar" class="jump-link-nav anchored-block" data-jumplink-title="Bitcoin: Transaction Soar">Bitcoin Transactions Soar Amidst Dwindling Transaction Values</h3>
<p><img class="img-responsive w-100" src="https://www.vaneck.com/contentassets/2c430ff2bbc2496fb7ae2fa7ba529a94/3691_scl-september_chart-2_blog.png" alt="Bitcoin transactions soar amidst dwindling transaction values" /></p>
<p class="chart-disclosure">Source: Bloomberg, as of 9/27/23. <strong>Past performance is not indicative of future results. Not intended as a recommendation to buy or sell any of the names mentioned herein.</strong></p>
<p>Another encouraging development of late is the narrative shift around Bitcoin&rsquo;s energy intensity. First, in August, the University of Cambridge Center for Alternative Finance (CCAF) slashed its estimate of Bitcoin&rsquo;s total energy usage by 14% to account for the higher efficiency of newer mining machines. Then the Bitcoin Mining Council, in its most recent quarterly release, announced that more than 50% of the network is now powered from renewable energy sources (recall that Elon Musk previously tweeted that Tesla would resume accepting Bitcoin once more than half of the network was powered by sustainable electricity). PWC then wrote a <strong><a href="https://www.pwc.ch/en/insights/disclose/33/bitcoin-mining-as-an-esg-strategy.html" title="Bitcoin mining as an ESG strategy" target="_blank" rel="noopener">long piece</a></strong> explicitly calling Bitcoin &ldquo;ESG,&rdquo; and Bloomberg published a long article and accompanying video (<em>&ldquo;</em><strong><a href="https://www.bloomberg.com/news/articles/2023-08-30/bitcoin-btc-miners-like-bit-digital-draw-from-iceland-s-renewable-energy-surplus#xj4y7vzkg" title="Bitcoin Miners Draw From Iceland's Surplus of Renewable Energy" target="_blank" rel="noopener"><em>Bitcoin Miners Draw from Iceland&rsquo;s Surplus of Renewable Energy</em></a></strong><em>&rdquo;) </em>touting Iceland&rsquo;s &ldquo;carbon-free&rdquo; Bitcoin mining. Finally, on September 25th, Argentina&rsquo;s largest private oil &amp; gas company, Tecpetrol, accounting for roughly 15% of the country&rsquo;s oil &amp; gas production, announced it would start mining digital assets with gas power leftovers like vented methane in a bid to increase production and safeguard the environment. Argentina could play an even more crucial role in the global adoption of Bitcoin as soon as October 22nd, when the final round of Argentina&rsquo;s Presidential Election could catapult the libertarian and pro-Bitcoin Javier Milei into the top job, based on recent polling.</p>
<p>The evolving story around Bitcoin&rsquo;s energy intensity and its role in powering the transition to renewables is particularly welcome alongside other pivots in the energy transition story, which we believe may have positive ramifications for Bitcoin in the longer term. The UK&rsquo;s Prime Minister Rishi Sunak walked back net zero targets; Kansas opted to leave a coal-fired power plant open to supply power to a $4B Panasonic EV battery factory; and Microsoft posted a job listing for a nuclear engineer to help implement its small modular reactor (SMR) strategy amidst a dizzying rally in spot uranium prices. We believe the more the world pivots to a &ldquo;more is more&rdquo; mindset with regard to energy consumption, the better for Bitcoin.</p>
<p>Of course, the opposite is still possible. The UK&rsquo;s just-passed privacy laws make internet platforms &ndash; including metaverse protocols - liable for user speech. This development has prompted Whatsapp, Signal, and Apple to threaten to withdraw from the UK market if the law is not amended to protect end-to-end encryption. There are also legitimate questions about how decentralized exchanges and protocols could even possibly comply with such monitoring requests, let alone satisfy GPDR requirements to delete customer data, which is immutable on open-source blockchains. If and as crypto-enabled social apps like Friend.tech become more relevant, this debate could heat up further. To put a point on these additional friction &ldquo;taxes&rdquo; that crypto &amp; other encrypting intermediaries are facing in some jurisdictions, Chase Bank just started banning transfers to crypto exchanges in the UK, presumably to comply with the new consumer protection regulations just recently enacted. And anti-AI luddites are starting to measure ChatGPT queries regarding water &amp; electricity consumption. So far, the US has avoided such legislation along with other &ldquo;progressive&rdquo; proposals that seek to define digital asset node operators and validators as &ldquo;brokers.&rdquo; That could change.</p>
<p>Still, we have recently observed Bitcoin&rsquo;s correlation with Donald Trump&rsquo;s odds of winning the presidency (as measured by PredictIt) rising. We think such a heightened relationship currently reflects the markets&rsquo; optimism that the US can avoid Senator Elizabeth Warren&rsquo;s setting White House financial policy in a Biden second term via a strong Republican showing at the ballot box next November. The stakes are high and rising.</p>
<h2 id="layer-1s-september-update" class="anchored-block">Layer 1s</h2>
<p>Smart contract platforms ended the month flat after a month characterized by fears of FTX asset liquidation, continued regulatory limbo, low DEX volumes, and substantial reductions in total SCP fees. For the month, Notable outperformers among layer 1 coins were TRON (+12%) and ATOM (+2%), while major losers were AVAX (-9%) and SUI (-11%). On-chain activity fell sharply in September as DEX trading fees and crypto volatility continued their downward trend, making life tough for market makers and exchanges. Ethereum fees fell -32% month-to-month, while other chains like Polygon&rsquo;s ZK chain are down 70% vs. August.</p>
<p>FTX news was a major negative catalyst as on September 13, FTX&rsquo;s liquidation estate was permitted to sell up to <strong><a href="https://www.reuters.com/technology/ftx-gets-court-approval-sell-crypto-assets-2023-09-13/" title="FTX gets court approval to sell crypto assets" target="_blank" rel="noopener">$100M per week</a></strong> of its cryptocurrencies. Initially, they were authorized to liquidate $50M weekly, but with the new approval, they are now allowed to sell $100M weekly. FTX owns over $3.4B in digital assets, of which $1.16B is in SOL, $560M is in BTC, and $192M is in ETH. The SOL tokens represent nearly 15% of floating SOL, which represents between 3-6 days of total SOL trading volume. However, 67% of those SOL tokens are locked until 2025, which will limit the immediate price impact of those sales on spot markets.</p>
<h3>SCP Daily Fees vs Daily DEX Volume</h3>
<p><img class="img-responsive w-100" src="https://www.vaneck.com/contentassets/2c430ff2bbc2496fb7ae2fa7ba529a94/3691_scl-september_chart-3_blog.svg" alt="SCP Daily Fees vs Daily DEX Volume" /></p>
<p class="chart-disclosure">Source: Artemis XYZ as of 10/1/2023. <strong>Past performance is not indicative of future results. Not intended as a recommendation to buy or sell any of the names mentioned herein.</strong></p>
<p>Implied 30-day volatility for ETH fell back to 29%, just a few notches above its low of 26% reached on August 13, 2023. Falling volatility has been a trend across all markets, with call-selling ETFs like JEPI (JPMorgan Equity Premium ETF) attracting $12B inflows this year alone and attracting copycats like BALI (Blackrock Advantage Large-cap Income ETF), which just launched last week. Thus, it&rsquo;s unclear how much of the falling volatility in the space is due to structural vs. cyclical and crypto-specific reasons.</p>
<h3>Implied 30 Day Volatility - Stocks, Bonds, Crypto</h3>
<p><img class="img-responsive w-100" src="https://www.vaneck.com/contentassets/2c430ff2bbc2496fb7ae2fa7ba529a94/3691_scl-september_chart-4_blog.svg" alt="Implied 30 Day Volatility for Stocks, Bonds, Crypto" /></p>
<p class="chart-disclosure">Source: Artemis XYZ as of 9/28/2023.<strong> Past performance is not indicative of future results. Not intended as a recommendation to buy or sell any of the names mentioned herein.</strong></p>
<p>However, under the surface bubbled more positive news from corporations announcing crypto endeavors, interesting project developments, and new incentivized marketing campaigns. The most important development for crypto from the corporate world came on September 7 when Visa announced it would be using Solana to supplement Visa&rsquo;s <strong><a href="https://usa.visa.com/solutions/crypto/deep-dive-on-solana.html" title="A deep dive on Solana, a high performance blockchain network" target="_blank" rel="noopener">payment network</a></strong>. In the new offering, Visa is running a pilot with important acquirers Nuvei and Worldpay to settle USDC on the Solana blockchain in under 0.5 seconds at the price of $0.00025 each. The pilot would follow the success of Visa&rsquo;s similar <strong><a href="https://usa.visa.com/content/dam/VCOM/regional/na/us/Solutions/documents/visa-crypto.com-usdc-case-study.pdf" title="By settling in USDC, Crypto.com is setting a new course" target="_blank" rel="noopener">blockchain initiative</a></strong> using Ethereum with Crypto.com. The potential of Visa&rsquo;s new arrangement could be immensely beneficial to Solana by bringing a new source of transactions, users, and application developers and necessitating entities to buy SOL tokens to use the Solana network.</p>
<h3>Total Payments Revenue Opportunity, Less China</h3>
<p><img class="img-responsive w-100" src="https://www.vaneck.com/contentassets/2c430ff2bbc2496fb7ae2fa7ba529a94/3691_scl-september_chart-5_blog.svg" alt="Total Payments Revenue Opportunity, Less China" /></p>
<p class="chart-disclosure">Source: Federal Reserve, VanEck Estimates as of 9/28/2023. <strong>Past performance is not indicative of future results. Not intended as a recommendation to buy or sell any of the names mentioned herein.</strong></p>
<p>To unpack Solana's potential, we estimate the number of annual payments across all mediums. Using data from the US Federal Reserve (Fed), we calculate that the total number of payments made across the globe each year is ~1T transactions or 629B less China. Therefore, we estimate the TAM revenue opportunity for payments on Solana will be between $666M and $3.3B, as the average fee on Solana will likely be between $0.005 and $0.001. However, this figure vastly understates the potential benefits to Solana because the impact on Solana&rsquo;s ecosystem will transcend the payment revenue opportunity alone. With the introduction of payments will come many new users, application developers, and institutional attention. As a result, businesses can deploy value-added services to payments, such as banking, asset management, identity, marketing, and social media. If Solana replicates Ethereum&rsquo;s distribution of revenues from payments and associated services, payments would only represent around 5% of Solana&rsquo;s revenues. Extrapolating this, we find that the total revenue opportunity for Solana could be between $13B and $66B vs. our base case for ETH revenues of <strong><a href="https://www.vaneck.com/us/en/blogs/digital-assets/matthew-sigel-ethereum-price-target-118k-by-2030/" title="Ethereum Price Target: $11.8k by 2030" rel="noopener">$50B by 2030</a></strong>.</p>
<h3>Ethereum Revenue by Business Line</h3>
<p><img class="img-responsive w-100" src="https://www.vaneck.com/contentassets/2c430ff2bbc2496fb7ae2fa7ba529a94/3691_scl-september_chart-6_blog.svg" alt="Ethereum Revenue by Business Line" /></p>
<p class="chart-disclosure">Source: Artemis XYZ as of 9/19/2023.<strong> Past performance is not indicative of future results. Not intended as a recommendation to buy or sell any of the names mentioned herein.</strong></p>
<p>Another way to consider the impact on Solana is to assess the value unlocked for merchants switching to payments using Solana-hosted stablecoins over credit cards. While the credit card experience is simple and costless for many consumers, it is grossly expensive to those who accept it. Ideally, the merchant would prefer as many customers as possible away from credit cards to avoid substantial merchant charges. Merchants currently pay around 2-3% of their GMV of sales to the ecosystem of credit card businesses. At the same time, the consumer receives around 1% of the GMV back in the form of credit card points and benefits. In a new system where Solana USDC payments are used in lieu of credit card payments, merchants could work with Circle (the USDC stablecoin issuer) to rebate a portion of the savings to consumers through a new points system or even using direct payments in USDC. And because this would all be accomplished on Solana, those funds would be instantly received right after purchasing the product or service. We will expand on this potential in an upcoming payments piece to further underline the potential stablecoins have for merchants, blockchains, and consumers.</p>
<p>In terms of important technical developments for open-source blockchain protocols, the most important in the month of September may have been Circle&rsquo;s blitz to enable native USDC on five blockchains and Google Cloud&rsquo;s expansion of blockchain support to include Polygon, Tron, Arbitrum, and Bitcoin Ordinals. After Circle&rsquo;s new integrations, USDC is now natively available on Base, Polkadot, NEAR, Cosmos, and Optimism. Before this development, USDC was only available as a wrapped bridge asset where a user had to lock USDC on smart contracts on Ethereum and mint a representation of it on another blockchain. This presented many issues as each blockchain has dozens of bridges with different levels of security. This means that each bridge mints a different version of USDC, which is not interchangeable. In some ecosystems, like Polkadot, there were nearly a dozen versions of USDC &ndash; each belonging to a different bridge. Most critically, in this wrapped asset arrangement, many hacks could and did happen of the bridges, which allowed hackers to unlock and steal the locked USDC on Ethereum, which rendered wrapped assets on other blockchains worthless. Native USDC is a substantial development for all blockchains that host. It enables users to bridge stable liquidity and traders the ability to enhance market-making activities.</p>
<h2 id="atom-september-updates" class="anchored-block">ATOM (+3.13%)</h2>
<h3>Cosmos Developer Market Share</h3>
<p><img class="img-responsive w-100" src="https://www.vaneck.com/contentassets/2c430ff2bbc2496fb7ae2fa7ba529a94/3691_scl-september_chart-7_blog.svg" alt="Cosmos Developer Market Share" /></p>
<p class="chart-disclosure">Source: Artemis XYZ as of 9/27/2023.<strong> Past performance is not indicative of future results. Not intended as a recommendation to buy or sell any of the names mentioned herein.</strong></p>
<p>After persistent monthly underperformance over the past few months, ATOM was able to find footing in a down market to provide a positive return for the month of September (+3.13%). The biggest news for the ecosystem was one that is evolving in tandem. First, the launch of USDC occurred with Noble chain integrating into Circle. This will allow Noble to mint USDC and send it across IBC, a very secure form of interchain asset transfer, to the <strong><a href="https://www.mintscan.io/" title="MINTSCAN" target="_blank" rel="noopener">58 blockchains</a></strong> that make up the Cosmos. Native USDC issuance is the precipitating cause of dYdX chain moving to the Cosmos. Until native USDC was live in the Cosmos, dYdX would not upgrade to v4, which is its standalone blockchain in the Cosmos. The dYdX migration will now occur, which is massively positive for the Cosmos ecosystem. It is the most important decentralized derivatives exchange and will bring its $343M in liquidity to the Cosmos. A third dimension to this positive news for the Cosmos is that Noble is speculated to be joining the Cosmos Hub, which would provide direct value accrual of Noble&rsquo;s financial activities to the ATOM token.</p>
<p>Another important development in the introduction was the announcement of MetaMask snaps integrating Cosmos blockchains. Previously, Cosmos blockchains would need to use Cosmos-specific wallets and could not use Ethereum wallets like Metamask. As a result, Cosmos usage was illusive to users of MetaMask, who were wedded to its application experience. With snaps, Metamask&rsquo;s <strong><a href="https://dune.com/ambalika/metamask-growth-dashboard" title="metamask-growth-dashboard" target="_blank" rel="noopener">9M</a></strong> monthly active users can now use Metamask in the Cosmos. Other positive news for the Cosmos included the creation of a liquid staking module on the Cosmos Hub, the announcement of a Celestia airdrop, and the announcement of a roadmap to introduce IBC to new blockchains through initiatives such as integration in the <strong><a href="https://twitter.com/cosmos/status/1703709988709970012" title=" Cosmos - Internet of Blockchains - Twitter" target="_blank" rel="noopener">OP Stack</a></strong>. Finally, another positive development is an increased usage of ATOM to pay for transactions on blockchains in the Cosmos. For example, in September, 14% of all transactions on Osmosis were paid for using ATOM.</p>
<h2 id="tron-september-updates" class="anchored-block">Tron (+12.42%)</h2>
<h3>stUSDT</h3>
<p><img class="img-responsive w-100" src="https://www.vaneck.com/contentassets/2c430ff2bbc2496fb7ae2fa7ba529a94/3691_scl-september_chart-8_blog.svg" alt="stUSDT" /></p>
<p class="chart-disclosure">Source: DefiLlama as of 9/28/2023.<strong> Past performance is not indicative of future results. Not intended as a recommendation to buy or sell any of the names mentioned herein.</strong></p>
<p>Tron had another stellar month despite seeing a (+4%) drop in daily active users amid a roughly flat month-to-month reading on fees at (+0.4%). The total value locked on Tron continues to inch up, up around (+8%), as other blockchains like Ethereum (-8%) and BNB (-7%) reported down figures. Tron also continues to see an average USDT of around <strong><a href="https://tronscan.org/#/data/charts/tokens" title="Tronscan - Tokens" target="_blank" rel="noopener">$10B per day</a></strong>. This $10B figure compares to Ethereum, which averages $14.5B daily in stablecoin volumes. Tron continues to demonstrate a strong product market fit for payments using stablecoins.</p>
<p>A big driver of the TVL increases is the stUSDT application, which accepts USDT in return for a fixed yield denominated in USDT. After only 11 weeks of operation, stUSDT has grown to $1.8B in USDT locked. While this clearly demonstrates demand for its project, details on how and where the funds are invested are scant. While the protocol claims to invest in real-world assets that produce yield, little is known about its risk exposure other than cryptic releases claiming to <strong><a href="https://medium.com/@stusdt/stusdt-daily-rebase-september-28th-2023-ad18b95fd5d3" title="stUSDT Daily Rebase - September 28th, 2023" target="_blank" rel="noopener">show maturities and interest rates</a></strong> where it is invested, but not precise CUSIPs nor who custodies those assets. According to its site, USDT &ldquo;staked&rdquo; USDT yields 4.6% per year, corresponding to the yield on a US Treasury 10-year Note.</p>
<h2 id="avax-september-updates" class="anchored-block">AVAX (-7%)</h2>
<h3>DEX Volume 30 Day MA vs DAUs</h3>
<p><img class="img-responsive w-100" src="https://www.vaneck.com/contentassets/2c430ff2bbc2496fb7ae2fa7ba529a94/3691_scl-september_chart-9_blog.svg" alt="DEX Volume 30 Day MA vs DAUs" /></p>
<p class="chart-disclosure">Source: Artemis XYZ as of 9/27/2023.<strong> Past performance is not indicative of future results. Not intended as a recommendation to buy or sell any of the names mentioned herein.</strong></p>
<p>Avalanche continues to demonstrate a collapse in usership and activity on all its blockchains. Avalanche lost the third most DAUs among SCPs as it churned (-34%) of its daily active user base in September compared to August. In terms of fees, Avalanche earned (-45%) less fees, which was the second worst decline among the SCPs we track. Weekly active developers on Avalanche have dropped to 28, compared to 165 for Solana and 125 for Polygon. Avalanche&rsquo;s active developer count is down (-34%) month to month and down (-70%) from September 2022. Of Avalanche&rsquo;s 53 chains, the only mildly successful subnet is the JEWEL DFK Subnet, which earns around $1k-$3k daily in fees on 300-500k transactions.</p>
<p>Despite poor on-chain activity, Avalanche recently released upgrades to its software development kit, called the &ldquo;Hyper SDK,&rdquo; that enables users to create blockchains capable of 143k TPS. This monumental figure compares well to Solana&rsquo;s 50k TPS claims and dwarfs Ethereum&rsquo;s current estimated 200-300 TPS. In September, Avalanche also announced the launch of Firewood, which claims to revolutionize blockchain storage. Storage, or the ability to keep a record of historical transactions of a blockchain, will increasingly become an issue as blockchain persists. The longer blockchain&rsquo;s exist, the more data it takes to hold all blockchain records. This record is important because if a new node wants to join the network, it needs to sync to the current state of the blockchain by downloading the entire history. As networks grow, this could become a multi-day or multi-month activity. A solution is needed to enable new nodes to join a blockchain network. In September, Avalanche also quietly acknowledged that its developer ecosystem is terminally ill and, to address this, has launched an academy to teach programmers how to become blockchain application creators.</p>
<p>Avalanche&rsquo;s long-term strategy is to create a multi-blockchain network whose value is secured by the AVAX token. This was premised on creating a framework for others to build blockchains, an SDK, that would bring new ideas, users, and fees to Avalanche&rsquo;s growing blockchain web. It was also supposed that Ava Labs, the entity that developed the software that runs Avalanche, would be paid consulting fees to build these Avalanche blockchains for outside parties. When Avalanche launched in September 2020, it was staffed with some of the sharpest academic minds in blockchain protocols and marketed itself as a faster version of Ethereum.</p>
<p>Avalanche&rsquo;s blockchain eventually became a financial success in the fall of 2021 on its in-house developed EVM blockchain, called the C-Chain. At its peak, the C-Chain held more than $10B TVL locked in its smart contracts, boasted $1M in fees per day, and consistently held over 100K DAUs. In September 2023, those figures had dwindled to $500M in TVL, $11k per day in fees, and 34k daily active users.</p>
<p>The reason for this decline is manifold but mostly relates to the implosion of Avalanche&rsquo;s chief backers, the dastardly Three Arrows Capital, and Avalanche&rsquo;s lack of product differentiation becoming painfully clear in a bear market. Avalanche has never been able to capitalize on its unique architecture, and many of the projects that were built during Avalanche&rsquo;s early days were shoddy copies of Ethereum projects (that were often copies of other projects). Avalanche&rsquo;s initial user base came mostly from the more financially adventurous and curious Ethereum user base. At its peak, $6B, around 60% of Avalanche&rsquo;s peak TVL of $10B, came directly from Ethereum users. As the bear market gripped crypto amid the implosion of Three Arrows Capital and Luna, it became clear that Avalanche usage was geared to speculation on use cases that never materialized and developers who abandoned their projects once Three Arrows Capital and related VC funding dried up. At the same time, the explosion in usership amongst Ethereum L2s like Arbitrum, Base, and Optimism has taken away many users and much capital from Avalanche.</p>
<p>Though we have great confidence in the technical abilities of Avalanche, we are unsure if Avalanche will be able to use its strong marketing talent to bring in the enterprise customers needed to revitalize Avalanche&rsquo;s chain of chains, additionally, with a rapidly vaporizing developer base and a crop of VC capital migrating away from all but the top projects in crypto, its hard to be bullish on the long term prospects of Avalanche. Avalanche does not have the sticky coder base nor the backing of Jump Capital to create a 1M TPS chain, and it also lacks the thriving ecosystem of developers and capital that Ethereum retains. That said, anything could happen in a bull market, and we continue to see Avalanche announce fascinating technical solutions to complex blockchain problems. But until it gets applications that bring in new users, AVAX will suffer accordingly.</p>
<h2 id="sui-september-updates" class="anchored-block">SUI (-15.4%)</h2>
<h3>SUI TVL and Daily Active Users</h3>
<p><img class="img-responsive w-100" src="https://www.vaneck.com/contentassets/2c430ff2bbc2496fb7ae2fa7ba529a94/3691_scl-september_chart-10_blog.svg" alt="SUI TVL and Daily Active Users" /></p>
<p class="chart-disclosure">Source: Artemis XYZ as of 9/30/2023.<strong> Past performance is not indicative of future results. Not intended as a recommendation to buy or sell any of the names mentioned herein.</strong></p>
<p>SUI was the weakest token amongst SCP tokens in September, and this decline resulted from sagging on-chain activity and persistent, substantial token unlocks. SUI&rsquo;s blockchain saw the third worst decline in users (-36%) and the highest drop in transactions (-42%) among SCPs.</p>
<p>From the standpoint of unlocks, the current floating supply of SUI is worth roughly $352M, and in the month of September, 70M tokens worth ~$36M were unlocked. Going forward, a further 70M tokens will be unlocked monthly between June and August 2024 when unlocks of over 1B tokens occur. As a result, the token supply will grow 197% over that period of time. While some would contend that the market prices in these supply inflows and that much of the supply will not be sold for years, even if only 10% of this supply is sold, it would amount to multiples of the current daily active volume for the SUI token. Most likely, that selling would cause substantial price declines.</p>
<p>While SUI has enormous transaction throughput potential, which was as high as 60M transactions per day in late July, its financial viability is premised on tremendous blockchain usage. Currently, transactions cost roughly $0.0004. This implies that the current revenue of the chain is approximately $200-$400 per day. While it is not uncommon for start-ups to lack revenues, it is quite uncommon to see them command fully diluted valuations of $4.5B.</p>
<p>SUI&rsquo;s focus has been on creating a blockchain to enable high throughput to enable consumer use cases that demand lots of transactions per second. To that end, SUI claims to be able to process up to 297k TPS, which should be more than enough blockspace supply to satisfy most use cases. This technical feat is accomplished by a combination of SUI's unique programming language, Move, and a more computationally efficient virtual machine. Unlink Ethereum enables SUI to parallelize the processing of many transactions simultaneously, which massively speeds up throughput.</p>
<p>As a result of SUI&rsquo;s consumer focus, it has sought to simplify the user experience for both the account holder and the developer. In September, SUI announced zkLogin, eliminating the need for account holders to maintain private keys. The new setup allows SUI users to log into Web3 dApps with their Google, Twitch, and Facebook credentials. This is a massive user improvement over that offered by Ethereum and others, where users have to maintain seed phrases to keep backups of their accounts. Sui has also formed important partnerships with gaming companies, and in September, SUI announced partnerships with NHN, an important mobile game developer out of South Korea. Going forward, SUI will need to see these initiatives blossom into substantial usage of its chain, or it will wither due to selling pressure.</p>
<h2 id="defi-september-updates" class="jump-link-nav anchored-block" data-jumplink-title="DeFi: September Updates">DeFi</h2>
<p>The Market Vector Decentralized Finance Leaders index displayed remarkable resilience in September, +13%, surpassing ETH&rsquo;s 1% gain as investors gravitated towards assets such as MKR and AAVE, which returned 40% and 14% respectively. These protocols have spearheaded the drive to bring Real World Assets (RWA) onto the blockchain, a narrative which, with T-bills at 5%, continues to attract investors across the space. The RWA narrative has ignited enthusiasm among DeFi enthusiasts, who view it as the first big step in bringing traditional financial instruments on-chain since the inception of stablecoins and potentially paving the way for a composable financial world in the future. Notably, the establishment of the Tokenized Asset Coalition, comprising Aave, Centrifuge, Circle, Coinbase, Base, Credix, Goldfinch, and RWA.xyz, represents a groundbreaking partnership encompassing both centralized and decentralized actors with a collective mission to integrate traditional financial assets into the realm of DeFi.</p>
<p>Centrifuge, notably, demonstrated remarkable performance this month, with CFG rallying 42%. This surge followed an announcement at the Real World Asset Summit that Centrifuge would build infrastructure for an RWA lending market on Aave. This market will enable DAOs to acquire tokenized short-duration U.S. treasury bills through Centrifuge&rsquo;s permissioned liquidity pools and deposit the assets into Aave, allowing DAOs to borrow USDC against their interest-bearing deposits. The initial funding for tokenized RWA pools will come from the Aave treasury, providing access to the ~5% yield generated by overnight financing of U.S. treasury assets. Furthermore, adopting RWAs on Aave could potentially boost the utilization of Aave's stablecoin GHO. This should be top of mind for Aave governance as GHO has witnessed lackluster adoption since its inception earlier this year, with a market capitalization of only $22 million despite its relatively low borrow APR of 2.5%. These emerging markets should also allow MakerDAO the capability to borrow stablecoins against their RWA deposits.</p>
<p><img class="img-responsive w-100" src="https://www.vaneck.com/contentassets/2c430ff2bbc2496fb7ae2fa7ba529a94/3691_scl-september_chart-11_blog.svg" alt="MakerDao Estimated Revenue" /></p>
<p class="chart-disclosure">Source: Makerburn.com, VanEck research as of 9/29/23. <strong>Past performance is not indicative of future results. Not intended as a recommendation to buy or sell any of the names mentioned herein.</strong></p>
<p>Towards the end of the month, MakerDAO initiated a poll to raise the debt ceiling for their two most extensive U.S. treasury bill vaults, Monetalis Clydesdale and Blocktower Andromeda, from $1.2 billion to $3 billion each. If this poll garners approval, passes a governance vote, and the vaults are fully utilized, the annual revenue for MakerDAO could see a staggering 84% increase, amounting to $159 million. Subsequently, these funds are slated to be used to buy back and deposit $MKR into the Uniswap V2 MKR-DAI pool. The potential expansion of on-chain liquidity and constant buy pressure played a pivotal role in driving MKR's rally over the course of the month.</p>
<p>The amount of DAI deposited in Maker&rsquo;s DAI Savings Rate (DSR), which pays depositors 5% APR, rose 23% to $1.65 billion. This boosted DAI&rsquo;s supply to a 6-month high of 5.5 billion, potentially indicating that the bottom is in for DAI as it continues its supply trend reversal from its bear market low in August of 4.4 billion. Additionally, Spark protocol voted to raise the DAI borrow limit on the platform 100% to $400 million after demand for borrowing DAI reached its governance-approved $200 million ceiling.</p>
<h3>DAI Market Capitalization Growth Continues</h3>
<p><img class="img-responsive w-100" src="https://www.vaneck.com/contentassets/2c430ff2bbc2496fb7ae2fa7ba529a94/3691_scl-september_chart-12_blog.svg" alt="DAI Market Capitalization Growth Continues" /></p>
<p class="chart-disclosure">Source: Makerburn.com, VanEck research as of 9/29/23. <strong>Past performance is not indicative of future results. Not intended as a recommendation to buy or sell any of the names mentioned herein.</strong></p>
<p>While the RWA narrative has acted as a favorable tailwind for major DeFi assets in this sector, on-chain economic activity has struggled overall. Decentralized exchange volume dwindled this month, experiencing a decline of 30% to $40 billion. Meanwhile, the total value locked in DeFi slightly grew, rising 1.7% to $38.46 billion. However, with the strides made to bring tokenized RWAs on-chain, we foresee significant consolidation in the space, with Maker and Aave expected to capture most of these assets and see their share of the total value locked in DeFi rise accordingly.</p>
<h3>Ethereum DeFi TVL: Further Consolidation Expected</h3>
<p><img class="img-responsive w-100" src="https://www.vaneck.com/contentassets/2c430ff2bbc2496fb7ae2fa7ba529a94/3691_scl-september_chart-13_blog.svg" alt="Ethereum DeFi TVL" /></p>
<p class="chart-disclosure">Source: Artemis, VanEck Research as of 9/29/2023.<strong> Past performance is not indicative of future results. Not intended as a recommendation to buy or sell any of the names mentioned herein.</strong></p>
<p><strong>CRV Rallies After Egorov Repays Aave Debt and Whale Locks CRV on Convex</strong></p>
<p>The Decentralized Finance Leaders index also received a significant boost from the robust rally of CRV, which rebounded by 15% during the month. This resurgence comes after CRV faced a downturn in the aftermath of the Vyper compiler exploit in July. The rally in CRV was further facilitated by Michael Egorov's decision to fully settle his debts on Aave and transfer his assets to other lending platforms, where he anticipates a less aggressive approach to managing his position. The move was prompted by Aave governance's decision to freeze the CRV market and initiate discussions on how to liquidate his position safely due to the bad debt risk it posed to the platform. Egorov's most substantial position now resides on Silo. Finance, where he has deposited $55 million worth of CRV and borrowed $17 million in crvUSD. Following this development, Silo's governance token, SILO, experienced an impressive rally of 76%, surging from $0.025 to $0.044. Furthermore, on the 21st of the month, a fresh wallet was deployed, withdrawing 19.9 million CRV from Binance and using it to acquire Convex's liquid-locker product, cvxCRV. At the time of this purchase, cvxCRV had been trading at a discount relative to its peg, and this purchase signaled strong conviction from the whale that CRV would continue to play a pivotal role in DeFi.</p>
<p><strong>DeFi Protocols Facing CFTC Scrutiny</strong></p>
<p>Opyn, Inc., Deridex, Inc., and ZeroEx, Inc. (0x) were accused by the Commodities and Futures Trading Commission (CFTC) of unlawfully providing leveraged and margined retail commodity transactions in digital assets through their DeFi protocols. Opyn and Deridex are also facing charges for functioning as unregistered swap execution facilities, undertaking activities restricted to registered futures commission merchants (FCMs), and neglecting to carry out know-your-customer (KYC) due diligence. The entities did not confess to or dispute the accusations; however, they have consented to settle by paying fines of $250,000 (Opyn), $100,000 (Deridex), and $200,000 (0x).</p>
<p>The case involving 0x carries potentially broader implications within the DeFi space. Unlike the other projects that faced regulatory actions, it is essential to note that the assets in question were not issued by 0x but rather by a third party. This underscores the regulatory stance taken by the CFTC, which seeks to establish accountability for DeFi projects in relation to the assets traded on their platforms, irrespective of whether these projects exercise direct control over the assets in question. Within this regulatory framework, protocols such as Uniswap may find themselves subject to scrutiny. Notably, the deployment of liquidity pools on the Uniswap platform is characterized by its permissionless nature. Consequently, should these pools involve assets that the CFTC deems necessitate KYC verification, Uniswap Labs could potentially face similar allegations from the CFTC. This highlights the increasing regulatory landscape within the DeFi sector, which investors should closely monitor, especially considering DeFi&rsquo;s latest push to bring more tokenized securities on-chain.</p>
<h2 id="friend-tech-september-updates" class="jump-link-nav anchored-block" data-jumplink-title="Friend.Tech: September Updates">Friend Tech &amp; Clones Drive the SoFi Frenzy</h2>
<h3>Friend.Tech Protocol Fees Dominates Clones</h3>
<p><img class="img-responsive w-100" src="https://www.vaneck.com/contentassets/2c430ff2bbc2496fb7ae2fa7ba529a94/3691_scl-september_chart-14_blog.svg" alt="Friend.Tech Protocol Fees Dominates Clones" /></p>
<p class="chart-disclosure">Source: Dune: @Cryptokoryo as of 9/29/2023.<strong> Past performance is not indicative of future results. Not intended as a recommendation to buy or sell any of the names mentioned herein.</strong></p>
<p>Friend.Tech, the social-finance (SoFi) app on Base, continued to see accelerated adoption this month, with unique users growing from 128k to 284k throughout the month. The impressive user growth has caused developers to create clones of the SoFi app on other chains in hopes of seeing a similar uptake in adoption. Post.Tech, Star Shares, Friendzy.gg, and Friend3.group were deployed this month on Arbitrum, Avalanche, Solana, and BNB Chain with slightly tweaked features, but all essentially doing the same thing as Friend.Tech. However, of the Friend.Tech clones, only Post.Tech has seen significant usage. Friend. Tech demonstrates the importance of being the first to market and the moat it creates, as it commands a 96% share of the protocol fees generated by SoFi platforms.</p>
<h3>Friend.Tech Key Volume Outpaces Ethereum NFT Volume</h3>
<p><img class="img-responsive w-100" src="https://www.vaneck.com/contentassets/2c430ff2bbc2496fb7ae2fa7ba529a94/3691_scl-september_chart-15_blog.svg" alt="Friend.Tech Key Volume Outpaces Ethereum NFT Volume" /></p>
<p class="chart-disclosure">Source: Dune: @21co, VanEck Research as of 9/29/2023.<strong> Past performance is not indicative of future results. Not intended as a recommendation to buy or sell any of the names mentioned herein.</strong></p>
<p>Impressively, the volume generated by trading of Friend.Tech shares exceeded NFT volume on Ethereum for most of the month due to the illiquidity of the Friend.Tech key market. Friend.Tech allows traders to flip their key purchases for a profit much faster than in NFT markets because a pricing curve dictates the price. For example, if one were to buy a key from a user that had 100 keys, this would change the price per key by ~2%. This differs from the NFT market, where most projects have a multitude of NFTs sitting at the floor price, meaning it would take significantly more purchases on average to cause a meaningful change in the floor price. For this reason, we theorize many NFT traders have transitioned to the Friend.Tech market due to the drastically higher volatility.</p>
<h3>Friend.Tech Key Pricing Curve</h3>
<p><img class="img-responsive w-100" src="https://www.vaneck.com/contentassets/2c430ff2bbc2496fb7ae2fa7ba529a94/3691_scl-september_chart-16_blog.svg" alt="Friend.Tech Key Pricing Curve" /></p>
<p class="chart-disclosure">Source: Dune: @21co, VanEck Research as of 9/29/2023.<strong> Past performance is not indicative of future results. Not intended as a recommendation to buy or sell any of the names mentioned herein.</strong></p>
<h2 id="metaverse-september-updates" class="anchored-block">Metaverse</h2>
<p>The Market Vector Media and Entertainment Leaders index declined 6% in September, continuing to underperform ETH and BTC. APE had the worst performance of the index components, falling 18%, while SAND only declined 5%. MANA was the only index component that saw positive price action this month, rising a mild 1.5%. APE&rsquo;s underperformance comes despite an 8% rally at the end of the month after Yuga Labs released Legends of the Mara, an idle trading card game set in Yuga&rsquo;s metaverse, The Otherside. The Mara NFTs are also only tradeable on the X2Y2 marketplace, a result of OpenSea&rsquo;s decision to sunset their operator filter contract in February, allowing creators to have royalties enforced on the platform. In the days following the launch, X2Y2 rocketed 30% but finished the month down 24%.</p>
<h3>NFT Volume Continues to Collapse</h3>
<p><img class="img-responsive w-100" src="https://www.vaneck.com/contentassets/2c430ff2bbc2496fb7ae2fa7ba529a94/3691_scl-september_chart-17_blog.svg" alt="NFT Volume Continues to Collapse" /></p>
<p class="chart-disclosure">Source: Cryptoslam! as of 9/29/2023.<strong> Past performance is not indicative of future results. Not intended as a recommendation to buy or sell any of the names mentioned herein.</strong></p>
<h3 id="nft-volume-september-updates" class="anchored-block">Top NFT Collections in September by Volume</h3>
<p><img class="img-responsive w-100" src="https://www.vaneck.com/contentassets/2c430ff2bbc2496fb7ae2fa7ba529a94/3691_scl-september_chart-18_blog.svg" alt="Top NFT Collections in September by Volume" /></p>
<p class="chart-disclosure">Source: Cryptoslam! as of 9/29/2023. <strong>Past performance is not indicative of future results. Not intended as a recommendation to buy or sell any of the names mentioned herein.</strong></p>
<p>NFT volumes have continued their descent, experiencing a decline of 32% to $285 million. This drop marks the lowest levels observed in over two years, reflecting a waning appetite among investors in the sector. Blur has maintained its position as the top NFT exchange by volume traded with $125 million of volume, while OpenSea followed with $58 million of volume. Despite its continued dominance, due to the lack of any value accrual mechanism, $BLUR price still declined X% this month. This is also likely driven by investors speculating that successful NFT collections will only let their NFTs trade on platforms where they can still collect royalties on their sales, as was the case with Yuga&rsquo;s Legends of the Mara collection.</p>
<p>However, amidst this general decline, specific areas within the market continue to exhibit bullish sentiment. Notably, select gaming NFTs have managed to sustain significant attention. This trend is evident in gaming NFT collections consistently dominating the NFT volume rankings. Collections such as Mythical Games' NFL Rivals, DraftKings Reignmakers, Sorare, and Gods Unchained have consistently secured positions within the top 5 NFT collections by volume. It's worth noting that these NFTs typically have lower price points, so they do not generate massive volumes from just a few high-value sales. But what they may lack in high prices, they more than compensate for in user retention and ongoing expenditure.</p>
<p>Given their speculative nature, the key takeaway is that high-priced NFTs with no utility beyond use as a profile picture rely on bull markets to maintain high sales volumes. In contrast, gaming NFTs derive utility from their integration into gameplay, making them more akin to a purchase for entertainment value rather than purely an investment. Users appreciate these NFTs for their ability to enhance competitive outcomes in their games, and this utility-driven demand contributes to their sustained popularity.</p>
<h3 id="pudgy-penguins-walmart-partnership" class="jump-link-nav anchored-block" data-jumplink-title="Pudgy Penguins: Walmart Partnership">Pudgy Penguins Walmart Partnership Leads to Price Floor Rally</h3>
<p><img class="img-responsive w-100" src="https://www.vaneck.com/contentassets/2c430ff2bbc2496fb7ae2fa7ba529a94/3691_scl-september_chart-19_blog.svg" alt="Pudgy Penguins Walmart Partnership Leads to Price Floor Rally" /></p>
<p class="chart-disclosure">Source: VanEck Research as of 9/29/2023. <strong>Past performance is not indicative of future results. Not intended as a recommendation to buy or sell any of the names mentioned herein.</strong></p>
<p>This month, the Pudgy Penguins NFT collection announced that they would launch their plush toys in 2,000 Walmart stores nationwide. Each plush toy comes with a unique QR code, allowing the owner to claim a free NFT trait that can be utilized in the Pudgy World, an online social platform where users can engage with penguin avatars. This launch marks one of the first major partnerships between an NFT collection and a major retailer. The proceeds from the plush toy sales will go to LSLTTT Holdings, Inc., the company behind the Pudgy Penguins brand, run by Luca Netz. Some NFT holders showed dismay at the fact that they would not receive a portion of the revenue, while others noted that it&rsquo;s a much better alternative than fundraising via dilution, as was done by the Azuki team.</p>
<p>Additionally, if an NFT bull market returns, having the Pudgy brand in one of the largest retailers could attract an outsized proportion of NFT buyers as investors will likely seek out NFTs with the strongest IP. The success of this collaboration will provide valuable insights into the ability of NFT brands to leverage their intellectual property and community to attract new users through NFT rewards tied to physical goods. At present, it is evident that this launch has revitalized investor interest in the NFT collection. The collection's floor price has surged by 18% this month, a noteworthy achievement, especially considering the prevailing trend of declining floor prices across the majority of NFTs.</p>
<h2>NFT Enthusiasts Cashing Out Big on Zynga&rsquo;s Free Sugartown Mint</h2>
<p>Sugartown Oras, the inaugural NFT mint from Zynga, a renowned name in casual gaming, was distributed via a free mint on the 13th of the month on the Ethereum blockchain. This move stirred excitement among NFT enthusiasts, who promptly claimed Zynga's initial venture into the web3 realm within the first hour of launch. Their enthusiasm was well-placed, as these free NFTs are currently trading at a floor price of 0.25 ETH, equivalent to $400. Zynga has intentionally maintained a shroud of secrecy around their upcoming Sugartown IP, revealing minimal details to create an aura of intrigue surrounding the project. This strategy seems effective, evident in the considerable prices that NFT traders are willing to pay for these digital assets. In two weeks, the Oras NFTs have recorded trading volumes exceeding $4 million, with this exclusive collection of 6,000 NFTs distributed among 2,374 distinct wallets.</p>
<h2 id="parallel-tcg-game-on-base-blockchain" class="anchored-block">Parallel TCG: A Potential Breakout Game on Base</h2>
<p>Parallel TCG, a recently launched game on the Base blockchain, has piqued the interest of many since its beta launch in August. This sci-fi-themed trading card game allows players to align with different factions and engage in PvP battles. Notably, Parallel TCG marks the debut of the Echelon Prime ecosystem, powered by the $PRIME token, which rallied an impressive 14%, finishing the month with a $93 million market capitalization. In previous newsletters, we emphasized the importance of Web3 games, providing players with the flexibility to enjoy the game without the intricacies of blockchain management. Parallel TCG aligns with this perspective. Players seeking pure enjoyment without dealing with NFTs and web3 wallets can utilize apparition decks, which are not tradable as NFTs. However, they still enable participation in ranked games and progression through the monthly battle pass.</p>
<h3>$PRIME Performance</h3>
<p><img class="img-responsive w-100" src="https://www.vaneck.com/contentassets/2c430ff2bbc2496fb7ae2fa7ba529a94/3691_scl-september_chart-20_blog.png" alt="$PRIME Performance" /></p>
<p class="chart-disclosure">Source: Coingecko as of 9/29/2023. <strong>Past performance is not indicative of future results. Not intended as a recommendation to buy or sell any of the names mentioned herein.</strong></p>
<p>For players who opt to acquire their cards as NFTs, there's an opportunity to earn $PRIME by achieving victories in ranked matches. This incentive scales with the number of NFT cards in their deck, allowing for up to 5 wins per day. To foster a thriving ecosystem that rewards players, $PRIME is sunk into gameplay pools through various player actions, such as purchasing Glints, the non-crypto in-game currency for Parallel, which has already seen substantial user investment, exceeding $100k during the beta phase.</p>
<p>The pivotal factor for the success of $PRIME lies in ensuring that gameplay mechanics necessitate the sinking of $PRIME at a rate higher than the distribution rate awarded to players for winning ranked matches. Impressively, early results suggest that the team has achieved this balance. In the private beta phase, with approximately 2500 players, around 1.5 million $PRIME (equivalent to 6% of circulating supply) has been sunk, while only approximately 1000 $PRIME has been distributed to players as rewards for ranked victories. With an impressive queue of over 250k players awaiting entry into the TCG beta and support from industry giants like Paradigm, we eagerly anticipate the growth of this ecosystem in the coming months.</p>
<p>Additionally, Parallel Studios, the creator of Parallel TCG, has a significantly more captivating project in the pipeline. Parallel Colony, set to launch in beta within the $PRIME ecosystem by year-end or early next year, introduces AI-powered characters that players can instruct to undertake various tasks to achieve specific objectives. Utilizing ERC-6551 accounts, these AI characters can engage in economic activities, exchanging $PRIME and other digital assets to fulfill their assigned missions. We perceive this development as a groundbreaking leap in gaming, potentially capturing the broader gaming audience's attention and demonstrating the innovative possibilities that blockchain games can offer.</p>
<h2 id="web-3-singapore-leads-charge" class="anchored-block">Singapore Leads the Charge in Web3 Adoption</h2>
<p>In contrast to the challenging landscape for Web3 adoption in the United States, where regulatory battles with innovators persist, other jurisdictions have shown the way in accelerating the adoption of consumer-facing applications built on blockchain technology. Notably, two significant developments emerged this month in Singapore, illustrating how progressive policy approaches can foster innovation and deliver consumer cost savings.</p>
<p>The launch of KaiKai, a retail shopping app developed by Cosmose AI, offering cashback rewards in their Kai-ching stablecoin, generated a significant surge in daily active users (DAUs) on the Near blockchain when it was introduced in Singapore this month. This user surge was so substantial that Near now boasts more DAUs than Ethereum, Arbitrum, and Optimism combined. This development underscores the untapped potential of the global market when it comes to onboarding users onto blockchain platforms. It also highlights the immense user traffic that consumer-facing apps can channel into blockchains, mainly when they offer a seamless, user-friendly experience without requiring extensive blockchain knowledge and provide integrated wallet functionality. Over time, the increased usage should contribute positively to $NEAR economics, as 70% of the gas fees paid on the network are burned. However, despite the increased user base, NEAR still experienced a notable underperformance compared to ETH this month, with a price decline of 9%.</p>
<h3>NEAR DAUs Surpasses Ethereum Optimism &amp; Arbitrium Combined</h3>
<p><img class="img-responsive w-100" src="https://www.vaneck.com/contentassets/2c430ff2bbc2496fb7ae2fa7ba529a94/3691_scl-september_chart-21_blog.svg" alt="NEAR DAUs Surpasses Ethereum Optimism and Arbitrium Combined" width="960" height="540" /></p>
<p class="chart-disclosure">Source: Artemis, VanEck Research as of 9/27/2023. <strong>Past performance is not indicative of future results. Not intended as a recommendation to buy or sell any of the names mentioned herein.</strong></p>
<p>The positive news for Web3 in Singapore didn't end there. Grab, a popular app known for its ride-hailing, food delivery, and digital payment services, announced the pilot launch of its app-based wallet experience on September 17th. Grab claims a user base of over 180 million users and offers services akin to Uber in Southeast Asia. The wallet will be powered by Circle and deployed on Polygon. Notably, the app incorporates NFTs as vouchers that users can redeem for rewards within the app. This move signals ongoing support in Singapore for consumer-facing Web3 products and demonstrates the growing interest in integrating blockchain technology into everyday consumer experiences.</p>
<p><strong>Links to third party websites are provided as a convenience and the inclusion of such links does not imply any endorsement, approval, investigation, verification or monitoring by us of any content or information contained within or accessible from the linked sites. By clicking on the link to a non-VanEck webpage, you acknowledge that you are entering a third-party website subject to its own terms and conditions. VanEck disclaims responsibility for content, legality of access or suitability of the third-party websites.</strong></p>
<p>To receive more <strong><a href="https://www.vaneck.com/us/en/insights/digital-assets/" title="Digital Assets Insights">Digital Assets</a></strong> insights, <strong><a href="https://www.vaneck.com/us/en/subscribe/" title="Subscription Center">sign up in our subscription center</a></strong>.</p>
]]></content:encoded>
</item><item rdf:about="https://www.vaneck.com/us/en/blogs/investment-outlook/jan-van-eck-how-jan-van-eck-redefines-success-and-honors-his-fathers-legacy/">
  <title>How Jan van Eck Redefines Success and Honors His Father’s Legacy></title>
  <link>https://www.vaneck.com/us/en/blogs/investment-outlook/jan-van-eck-how-jan-van-eck-redefines-success-and-honors-his-fathers-legacy/</link>
  <description><![CDATA[From launching the first gold fund in 1968 to pioneering ETFs, delve into the journey of Jan van Eck and the legacy of a family that has helped shape the investment landscape for decades.]]></description>
  <dc:creator>Jan van Eck</dc:creator>
  <dc:date>10/05/2023 06:30:00</dc:date>
<content:encoded><![CDATA[

<a href="/us/en/blogs/investment-outlook/jan-van-eck-q2-2026-outlook-the-reset-is-your-entry-point/" title="Jan van Eck's Latest Outlook"><strong>Looking for the latest outlook? Read the Q2 2026 Outlook.</strong></a>
<p>Diving into the intricate tapestry of VanEck's storied history, from its inception during the Nixon era to its modern-day focus on ETFs, the van Eck family has remained at the forefront of financial innovation. In an extensive profile of <a href="https://www.vaneck.com/us/en/news-and-insights/thought-leaders/jan-van-eck/" title="Jan van Eck - Chief Executive Officer"><strong>CEO Jan van Eck</strong></a>, <em>Real Assets Adviser</em> explores his personal journey, the firm's evolution, and VanEck&rsquo;s forward-thinking investment philosophy. As the investment world ebbs and flows with the changing tides of global events, Jan's perspective serves as a beacon for those looking to navigate the future.</p>
<p>Here are highlights from the article:</p>
<h2>The Nixon Era and Gold</h2>
<p>In 1971, President Nixon unhooked the dollar from the gold standard. Jan&rsquo;s father and the firm&rsquo;s founder, John van Eck, saw this move coming and had already jumped into the gold market. His gold fund (known today as the <a href="https://www.vaneck.com/us/en/investments/international-investors-gold-fund-inivx/overview/" title="INIVX - International Investors Gold Fund - Class A"><strong>VanEck International Investors Gold Fund</strong></a>), the first of its kind, skyrocketed as gold prices soared from $35 to $800 per ounce, making it the industry's top performer.</p>
<h2>VanEck's Evolution: From Gold to ETFs</h2>
<p>While John was passionate about gold, his son, Jan van Eck, realized the firm's over-reliance on gold was a vulnerability. Jan shifted the firm's focus, pioneering in ETFs. Today, ETFs account for 90% of VanEck's business, and the firm expects this sector to drive its growth for the foreseeable future.</p>
<h2>Taking a Global Perspective</h2>
<p>Founded in 1955, VanEck was originally focused on leveraging post-WWII investment opportunities in Asia and Europe. Today, Jan keeps an eye on emerging markets, technological innovations like blockchain, and the evolution of private finance in countries like Brazil and India.</p>
<h2>Investment Philosophies and Forward Thinking</h2>
<p>Jan believes in contrarian investing, seeing potential in assets like office real estate and cryptocurrencies. He's bullish on Bitcoin as a competitor to gold and has been pushing for Bitcoin ETFs since 2017. Jan's investments reflect his beliefs, with allocations in fintech startups and a digital assets fund.</p>
<h2>A Changing Financial Landscape</h2>
<p>For Jan, finance is intertwined with current events, making every day in the industry intellectually stimulating. He delves into alternative media for insights and research, emphasizing the importance of staying updated. He's particularly intrigued by global demographic changes, such as China's shrinking population.</p>
<h2>Jan van Eck: Redefining Success</h2>
<p>With a rich legacy behind him and a dynamic world ahead, Jan continues to reshape the definition of success in the investment world.</p>
<p>Read the full profile here: <a href="/us/en/blogs/investment-outlook/jan-van-eck-real-assets-adviser-profile-on-jan-van-eck-honor-thy-father/real-assets-adviser-jan-van-eck-october-2023.pdf" title="Real Assets Adviser Profile of VanEck CEO Jan van Eck: Honor Thy Father" target="_blank" rel="noopener"><strong>Real Assets Advisor &ndash; Honor Thy Father</strong></a></p>
<p>To receive more <a href="/us/en/insights/investment-outlook" title="Investment Outlook Insights"><strong>Investment Outlook</strong></a> insights, <a href="https://www.vaneck.com/us/en/subscribe/" title="Subscription Center"><strong>sign up in our subscription center</strong></a>.</p>
]]></content:encoded>
</item><item rdf:about="https://www.vaneck.com/us/en/blogs/thematic-investing/desk-etf-question-and-answer/">
  <title>DESK ETF: Question &amp; Answer></title>
  <link>https://www.vaneck.com/us/en/blogs/thematic-investing/desk-etf-question-and-answer/</link>
  <description><![CDATA[In this blog, we address frequently asked questions about investing in the real estate market and specifically the VanEck Office and Commercial REIT ETF (DESK).]]></description>
  <dc:creator>Coulter Regal, CFA</dc:creator>
  <dc:date>10/05/2023 06:30:00</dc:date>
<content:encoded><![CDATA[

<p>In today's investment landscape, investors are constantly seeking opportunities to generate income beyond traditional corporate or government debt. Real estate investment trusts, or REITs, have long attracted the attention of those looking to gain exposure to the real estate market without the challenges of owning property directly. This blog aims to address frequently asked questions about REITs and provide insights into the <a href="https://www.vaneck.com/us/en/investments/office-and-commercial-reit-desk/overview/" title="DESK - VanEck Office and Commercial REIT ETF"><strong>VanEck Office and Commercial REIT ETF (DESK).</strong></a></p>
<ul class="content-list">
<li><strong><a href="#point-one">What are Real Estate Investment Trusts?</a></strong></li>
<li><strong><a href="#point-two">DESK&rsquo;s Exposure to the REIT Market</a></strong></li>
<li><strong><a href="#point-three">Do REITs Pay Dividends to Investors?</a></strong></li>
<li><strong><a href="#point-four">DESK Dividend Payment Frequency</a></strong></li>
<li><strong><a href="#point-five">DESK&rsquo;s Distribution of Return of Capital</a></strong></li>
<li><strong><a href="#point-six">DESK&rsquo;s Fit Within a Portfolio</a></strong></li>
<li><strong><a href="#point-seven">How to buy VanEck ETFs?</a></strong></li>
</ul>
<h2 id="point-one" class="anchored-block">What are Real Estate Investment Trusts?</h2>
<p>A real estate investment trust, or REIT, is a type of security that invests in real estate or real estate-related assets and typically trades on major market exchanges similar to stocks. REITs provide a way for investors to gain exposure to the real estate sector, benefiting from potential dividends and property appreciation, without the need to directly purchase, manage, or finance properties. There are two primary types of REITs: Equity REITs and Mortgage REITs.</p>
<p>Equity REITs are the most common type of REIT. They own and manage income-producing real estate properties, such as apartment buildings, office buildings, shopping centers, hotels, and warehouses. Income is mainly derived from the rent received from these properties. They might also generate income from the appreciation of properties when they are sold.</p>
<p>Mortgage REITs, or mREITs, generally do not own real estate properties. Instead, they finance real estate, meaning they provide capital to real estate owners and operators either directly through mortgages and loans or indirectly through the acquisition of mortgage-backed securities (MBS). Their income is generated primarily from the interest on these loans or securities.</p>
<h2 id="point-two" class="anchored-block">What area of the REIT market does DESK provide exposure to?</h2>
<p>The <a href="https://www.vaneck.com/us/en/investments/office-and-commercial-reit-desk/overview/" title="DESK - VanEck Office and Commercial REIT ETF"><strong>VanEck Office and Commercial REIT ETF (DESK)</strong></a> provides concentrated exposure to U.S. office property REITs by seeking to replicate the MarketVector US Listed Office and Commercial REITs Index, which tracks the overall performance of U.S. exchange-listed REITs operating in the office and commercial real estate markets. To be eligible for inclusion in the Index, a REIT must generate at least 50% of its revenues from the office, industrial, or retail real estate sectors.</p>
<p>Office REITs are those real estate investment trusts that specialize in owning and operating office properties. These properties can range from skyscrapers to office parks, allowing individual investors to tap into large-scale office real estate markets without direct property ownership. Other commercial property segments, specifically the industrial and retail segments, are also eligible for inclusion in <a href="https://www.vaneck.com/us/en/investments/office-and-commercial-reit-desk/overview/" title="DESK - VanEck Office and Commercial REIT ETF"><strong>DESK</strong></a>&rsquo;s underlying Index. Industrial REITs specialize in owning and managing industrial facilities, such as warehouses, distribution centers, and manufacturing plants. Retail REITs own and manage retail properties like shopping malls, strip centers, and standalone stores.</p>
<p>The rules of the MarketVector US Listed Office and Commercial REITs Index prioritize exposure to office REITs, with exposure to Industrial and Retail REITs limited to a maximum of 20%.</p>
<h2 id="point-three" class="anchored-block">Do REITs pay dividends to investors?</h2>
<p>Yes, REITs are specifically designed to provide income. REITs are required to distribute at least 90% of their taxable income to shareholders annually in the form of dividends. This structure ensures that a significant portion of the profits generated by REITs, whether from rental incomes in the case of equity REITs or interest incomes for mortgage REITs, is passed on to the investors. This income-generating feature makes REITs especially popular among income-focused investors. However, as with any investment, the level of income or dividend yield varies depending on the REIT's performance, property occupancy rates, and market conditions.</p>
<p><a href="https://www.vaneck.com/us/en/investments/office-and-commercial-reit-desk/distributions/" title="DESK - VanEck Office and Commercial REIT ETF - Distribution"><strong><strong>Learn more about the yield potential of DESK here.</strong></strong></a></p>
<div class="epi-contentfragment">faq-banner-cta</div>
<h2 id="point-four" class="anchored-block">How often does DESK distribute dividends?</h2>
<p>The <a href="https://www.vaneck.com/us/en/investments/office-and-commercial-reit-desk/overview/" title="DESK - VanEck Office and Commercial REIT ETF"><strong>VanEck Office and Commercial REIT ETF (DESK)</strong></a> distributes dividends on a quarterly frequency.</p>
<h2 id="point-five" class="anchored-block">Does DESK distribute return of capital?</h2>
<p>Return of capital (ROC) is a payment received from an investment that is not considered taxable income, but instead reduces a shareholder's cost basis and may be recognized as a capital gain at the final sale of the investment. Real estate investment trusts (REITs) are one type of investment that typically have distributions containing a component of ROC. This is due to special tax treatments for REITs, like depreciation adjustments, that reduce taxable income without reducing the amount of cash available for distribution. Due to <a href="https://www.vaneck.com/us/en/investments/office-and-commercial-reit-desk/overview/" title="DESK - VanEck Office and Commercial REIT ETF"><strong>DESK</strong></a>&rsquo;s underlying exposure to REITs, a portion of the fund&rsquo;s distribution may be considered ROC as the fund distributes all of its net cash received from investments (including ROC) to investors. Investors may receive a &ldquo;Section 19 notice&rdquo; accompanying a distribution that estimates the portion of <a href="https://www.vaneck.com/us/en/investments/office-and-commercial-reit-desk/overview/" title="DESK - VanEck Office and Commercial REIT ETF"><strong>DESK</strong></a>&rsquo;s current and fiscal year-to-date distribution comprising return of capital. Please view DESK&rsquo;s Tax Documents and visit <a href="https://www.vaneck.com/us/en/resources/tax-information/" title="ETF Tax Information"><strong>VanEck&rsquo;s Tax Center</strong></a> for more information on the portion of return of capital paid by <a href="https://www.vaneck.com/us/en/investments/office-and-commercial-reit-desk/overview/" title="DESK - VanEck Office and Commercial REIT ETF"><strong>DESK</strong></a>.</p>
<h2 id="point-six" class="anchored-block">How can DESK fit within a portfolio?</h2>
<p>The <a href="https://www.vaneck.com/us/en/investments/office-and-commercial-reit-desk/overview/" title="DESK - VanEck Office and Commercial REIT ETF"><strong>VanEck Office and Commercial REIT ETF (DESK)</strong></a> provides concentrated exposure to U.S. office REITs and offers investors an efficient way to express a view on this area of the market. DESK can be used by investors tactically to place a short-term targeted bet or strategically as a long-term exposure. <a href="https://www.vaneck.com/us/en/investments/office-and-commercial-reit-desk/overview/" title="DESK - VanEck Office and Commercial REIT ETF"><strong>DESK</strong></a>&nbsp;can also fit as an allocation within an income portfolio as REITs can offer an attractive source of dividend income.</p>
<h2 id="point-seven" class="anchored-block">How to buy VanEck ETFs?</h2>
<p><strong><a href="https://www.vaneck.com/us/en/investments/office-and-commercial-reit-desk/overview/#how-to-buy-etf&amp;utm=DESK-Blog" title="How to buy VanEck ETFs?">Learn more here.</a></strong></p>
<p class="d-none d-lg-block"><a href="mailto:askvaneck@vaneck.com" title="Have More Questions? - Ask VanEck" rel="noopener"><img loading="lazy" class="img-responsive" src="https://www.vaneck.com/globalassets/home/us/insights/blogs/bm-blog-images/cta-faq_desktop-02.svg" alt="Have More Questions? - Ask VanEck" /></a></p>
<p class="d-lg-none"><a href="mailto:askvaneck@vaneck.com" title="Have More Questions? - Ask VanEck" rel="noopener"><img loading="lazy" class="img-responsive" src="https://www.vaneck.com/globalassets/home/us/insights/blogs/bm-blog-images/cta-faq_mobile-01.svg" alt="Have More Questions? - Ask VanEck" /></a></p>
<p>To receive more <strong><a href="https://www.vaneck.com/us/en/insights/thematic-investing/" title="Thematic Investing Insights">Thematic Investing</a></strong> and <a href="https://www.vaneck.com/us/en/insights/income-investing/" title="Income Investing insights"><strong>Income Investing</strong></a> insights, <strong><a href="https://www.vaneck.com/us/en/subscribe/" title="Subscription Center">sign up in our subscription center</a></strong>.</p>
]]></content:encoded>
</item><item rdf:about="https://www.vaneck.com/us/en/blogs/digital-assets/crypto-faq-for-rias/">
  <title>Crypto FAQ for RIAs></title>
  <link>https://www.vaneck.com/us/en/blogs/digital-assets/crypto-faq-for-rias/</link>
  <description><![CDATA[In this FAQ, we share insights on how RIAs can help track and advise on their clients&rsquo; digital assets portfolios.]]></description>
  <dc:creator>Matthew Bartlett</dc:creator>
  <dc:date>10/05/2023 06:30:00</dc:date>
<content:encoded><![CDATA[

<p>Amid an unprecedented wealth transfer, young investors are embracing cryptocurrencies, while advisors grapple with the unknown. The expertise RIAs have in portfolio construction, risk understanding, and client alignment holds immense value.</p>
<p>RIAs may now extend this value to include the world of crypto, ensuring that their clients&rsquo; financial journeys remain seamless and comprehensive in an evolving landscape. We&rsquo;ve pulled together answers to several frequently asked questions from RIAs about crypto. Topics include:</p>
<ul class="content-list">
<li>Charging fees on self-custodied assets.</li>
<li>Types of products/services advisors can make recommendations on.</li>
<li>Whether tokens are considered securities.</li>
<li>Certifications for digital assets advisory.</li>
<li>How solutions like the L1 Advisors platform can help with tracking and advising on clients&rsquo; digital assets.</li>
</ul>

<p>To receive more <strong><a href="https://www.vaneck.com/us/en/insights/digital-assets/" title="Digital Assets Insights">Digital Assets</a></strong> insights, <strong><a href="https://www.vaneck.com/us/en/subscribe/" title="Subscription Center">sign up in our subscription center</a></strong>.</p>
]]></content:encoded>
</item><item rdf:about="https://www.vaneck.com/us/en/blogs/digital-assets/sorting-out-the-crypto-world/">
  <title>Sorting Out the Crypto World></title>
  <link>https://www.vaneck.com/us/en/blogs/digital-assets/sorting-out-the-crypto-world/</link>
  <description><![CDATA[In the crypto world, with over 22,000 coins, there is an increasing need for a rigorous classification system to help structure investment decisions.]]></description>
  <dc:creator>Kyle DaCruz</dc:creator>
  <dc:date>09/29/2023 06:30:00</dc:date>
<content:encoded><![CDATA[

<p><strong>Please note that VanEck may have a position(s) in the digital asset(s) described below.</strong></p>
<p>Detecting patterns is an ability we develop early in infancy and refine by experience throughout human life. Categorization is an important part of how humans learn and make optimized decisions when faced with multiple data points. In the crypto world, with over 22,000 coins, there is an increasing need for a rigorous classification system to structure investment decisions.</p>
<p>MarketVector, a VanEck subsidiary, develops, monitors and markets the MarketVector Indexes, a focused selection of pure-play and investable indices. In 2017, MarketVector in partnership with CryptoCompare&mdash;an established London-based digital assets data provider&mdash;became the first regulated index provider to launch a series of digital assets indices designed to most accurately track the performance of the otherwise fragmented global digital assets markets. These indices were the first to meet investment industry benchmarking standards by providing a public rulebook, industry-wide data distribution, proper identifiers and further standard index governance requirements. Today, MarketVector is regulated under the EU Benchmark regulation directive and is the first index provider with such regulatory status to offer transparent and industry standard digital asset indices.</p>
<p>MarketVector introduces a categorization of digital asset coins into distinct, non-overlapping categories that form the building blocks for a new crypto classification scheme. Categories capture the value and use case related to a coin. Using a qualitative process, each coin is categorized into one category. Coins may change categories over time and new categories may emerge. The MarketVector"Leaders" investable category indices capture the largest and most liquid coins within a category which are also supported by major US crypto exchanges and custodians.</p>
<p>Categories allow investors to group similar digital assets into groups to analyze and proxy targeted exposures. They enable deeper analysis into peers and aggregated performance review. As the basis for investable indices, they provide the underlying components to build an investment solution aimed at capturing the performance of the coins within the category. They allow users to measure, benchmark and capture the performance and characteristics of targeted categories. MarketVector categories will help make digital assets digestible to traditional finance investors while giving crypto native funds additional benchmarking capabilities.</p>
<div class="wrapped-div">
<table style="width: 100%;">
<tbody>
<tr class="tbl-data">
<td class="tbl-header last" style="width: 100%;" colspan="4">MarketVector Digital Asset Categories</td>
</tr>
<tr class="tbl-data">
<td class="data-td last">Category</td>
<td class="data-head last">Definition</td>
<td class="data-head last">Examples</td>
</tr>
<tr class="tbl-data">
<td class="data-td last" style="font-weight: normal;">DeFi</td>
<td class="data-td data last" style="text-align: left;">Financial services built on top of distributed networks with no central intermediaries</td>
<td class="data-td data last">Uniswap, Aave, dYdX</td>
</tr>
<tr class="tbl-data">
<td class="data-td last" style="font-weight: normal;">Exchange</td>
<td class="data-td data last" style="text-align: left;">Tokens owned and operated by a centralized cryptocurrency exchange</td>
<td class="data-td data last">Binance Coin, Huobi Token, KuCoin Token</td>
</tr>
<tr class="tbl-data">
<td class="data-td last" style="font-weight: normal;">Infrastructure Applications</td>
<td class="data-td data last" style="text-align: left;">A decentralized computer program designed to perform specific tasks</td>
<td class="data-td data last">Helium, Chainlink, Render</td>
</tr>
<tr class="tbl-data">
<td class="data-td last" style="font-weight: normal;">Media &amp; Entertainment</td>
<td class="data-td data last" style="text-align: left;">Used to reward users for content, games, gambling or social media</td>
<td class="data-td data last">Axie Infinity, Basic Attention Token, Audius</td>
</tr>
<tr class="tbl-data">
<td class="data-td last" style="font-weight: normal;">Payments</td>
<td class="data-td data last" style="text-align: left;">Digital, non-stable money for use in distributed network</td>
<td class="data-td data last">Stellar, XRP, Litecoin</td>
</tr>
<tr class="tbl-data">
<td class="data-td last" style="font-weight: normal;">Smart Contract Platforms</td>
<td class="data-td data last" style="text-align: left;">Blockchain protocol designed to host variety of self-developed and 3rd party applications</td>
<td class="data-td data last">Ethereum, Optimism, Solana</td>
</tr>
<tr class="tbl-data">
<td class="data-td last" style="font-weight: normal;">Stablecoins</td>
<td class="data-td data last" style="text-align: left;">Designed to minimize volatility by pegging to a more stable asset</td>
<td class="data-td data last">Tether, US Dollar Coin, Dai</td>
</tr>
<tr class="tbl-data">
<td class="data-td last" style="font-weight: normal;">Store of Value</td>
<td class="data-td data last" style="text-align: left;">Designed to hold or increase purchasing power over time</td>
<td class="data-td data last">Bitcoin</td>
</tr>
</tbody>
</table>
</div>
<br />
<p class="chart-disclosure">Source: MarketVector Indexes. Data as of 9/18/2023.</p>
<p>For a closer look at several of these digital assets categories, visit:</p>
<ul class="content-list">
<li><a href="https://www.vaneck.com/us/en/blogs/digital-assets/matthew-sigel-crypto-categories-smart-contracts-explained/" title="Crypto Categories: Smart Contracts Explained"><strong>Smart Contracts Explained</strong></a></li>
<li><a href="https://www.vaneck.com/us/en/blogs/digital-assets/matthew-sigel-crypto-categories-enter-the-metaverse/" title="Crypto Categories: Enter the Metaverse"><strong>Enter the Metaverse</strong></a></li>
<li><a href="https://www.vaneck.com/us/en/blogs/digital-assets/matthew-sigel-crypto-categories-defining-defi/" title="Crypto Categories: Defining DeFi"><strong>Defining DeFi</strong></a></li>
<li><a href="https://www.vaneck.com/us/en/blogs/digital-assets/matthew-sigel-crypto-categories-identifying-infrastructure-applications/" title="Crypto Categories: Identifying Infrastructure Applications"><strong>Identifying Infrastructure Applications</strong></a></li>
</ul>
<p>To receive more <a href="/us/en/blogs/digital-assets/" title="Digital Assets Blog Posts"><strong>Digital Assets</strong></a> insights, <a href="https://www.vaneck.com/us/en/subscribe/" title="Subscription Center"><strong>sign up in our subscription center</strong></a>.</p>
<style type="text/css">.wrapped-div {    max-width: 100%;}@media (max-width: 1240px) {    .wrapped-div {        overflow-x: scroll;    }}.wrapped-div-sector {    max-width: 100%;    overflow-x: scroll;}
</style>
]]></content:encoded>
</item><item rdf:about="https://www.vaneck.com/us/en/blogs/moat-investing/smot-etf-quarterly-reconstitution-3q2023/">
  <title>SMOT ETF Quarterly Reconstitution 3Q2023></title>
  <link>https://www.vaneck.com/us/en/blogs/moat-investing/smot-etf-quarterly-reconstitution-3q2023/</link>
  <description><![CDATA[See which index constituents have been added/removed, reasons for removal, potential upcoming constituent additions, and the current weightings of index holdings.]]></description>
  <dc:creator>Brandon Rakszawski</dc:creator>
  <dc:date>09/27/2023 06:30:00</dc:date>
<content:encoded><![CDATA[

<p>The Morningstar<sup>&reg;</sup>&nbsp;US Small-Mid Cap Moat Focus Index<sup>SM</sup>&nbsp;(the &ldquo;SMID Moat Index&rdquo;) underwent its quarterly review on September 15, 2023 in which it systematically targets attractively priced, high quality small- and mid-cap U.S. companies. Below are some key takeaways from the September review and how the SMID Moat Index is positioned as we enter the last quarter of the year. The full review results are available here: <a href="https://www.vaneck.com/us/en/investments/morningstar-smid-moat-etf-smot/smot-reconstitution.pdf" title="SMOT - VanEck Morningstar SMID Moat ETF" target="_blank" rel="noopener"><strong>3Q2023 Index Reconstitution</strong></a></p>
<h2>Key Takeaways:</h2>
<ul class="content-list">
<li><strong>Technology Companies Lead in Removals</strong></li>
</ul>
<p>The Index removed a notable number of technology companies during this quarter&rsquo;s review. In all, seven technology names were removed, including Crane NXT, Blackbaud, Guidewire Software, Monolithic Power Systems, Verisign, and WorkDay. Almost all of these removals were due to the Index&rsquo;s valuation screen, signaling that this segment of the U.S. market may be overvalued.</p>
<ul class="content-list">
<li><strong>Value Exposure Decreased in Favor of Growth</strong></li>
</ul>
<p>Despite the SMID Moat Index&rsquo;s removal of several technology companies, the style exposure within the Index still shifted slightly toward growth this quarter. The shift came primarily at the cost value which saw a reduction in exposure this quarter. Total growth exposure for the Index now stands at about 26%, but remains a minor underweight of about 3% relative to the broad SMID-cap universe<sup>1</sup>.</p>
<ul class="content-list">
<li><strong>Consumer Discretionary and Health Care Additions</strong></li>
</ul>
<p>Companies belonging to the consumer discretionary and health care sectors were notable additions this quarter with twelve names between the two sectors added to the Index. DoorDash, Harley-Davidson and Wynn Resorts, among others accounted for the consumer discretionary additions, while health care saw names added like Veeva Systems, DaVita, and Agilent Technologies cycle. Both sectors are overweights in the SMID Moat Index relative to the broad SMID-cap universe<sup>1</sup>.</p>
<h2>Access Quality Companies and Attractive Valuations</h2>
<p><a href="https://www.vaneck.com/us/en/investments/morningstar-smid-moat-etf-smot/overview/" title="SMOT - VanEck Morningstar SMID Moat ETF | Overview "><strong>VanEck Morningstar SMID Moat ETF (SMOT)</strong></a> seeks to track as closely as possible, before fees and expenses the price and yield performance of the Morningstar US Small-Mid Cap Moat Focus Index.</p>
<p>To receive more <strong><a href="https://www.vaneck.com/us/en/insights/moat-investing/" title="Moat Investing">Moat Investing</a></strong> insights, <strong><a href="https://www.vaneck.com/us/en/subscribe/" title="Preference Center">sign up in our subscription center</a></strong>.</p>
]]></content:encoded>
</item><item rdf:about="https://www.vaneck.com/us/en/blogs/thematic-investing/buzz-investing-higher-for-longer-weighs-on-sentiment/">
  <title>BUZZ Investing: Higher for Longer Weighs on Sentiment></title>
  <link>https://www.vaneck.com/us/en/blogs/thematic-investing/buzz-investing-higher-for-longer-weighs-on-sentiment/</link>
  <description><![CDATA[Domestic equities remained stable, but rising bond yields and inflation impacted sentiment, with evolving investor expectations about the Fed's interest rate policy for March 2024.]]></description>
  <dc:creator> </dc:creator>
  <dc:date>09/27/2023 06:30:00</dc:date>
<content:encoded><![CDATA[

<p>Domestic equities were little changed during the recent period between Index selection dates (August 10, 2023 to September 14, 2023, the &ldquo;Period&rdquo;). Rising bond yields and persistent inflationary pressures continue to weigh on investor sentiment. Stronger-than-expected readings across several domestic economic indicators pushed interest rates higher across the yield curve, leading some to claim the US Federal Reserve (the &ldquo;Fed&rdquo;) may successfully achieve a &lsquo;soft landing,&rsquo; avoiding a recession. While the narrative has gained traction, most market participants failed to predict the &lsquo;higher-for-longer&rsquo; scenario for interest rates and continue to adjust their forecasts to reflect the central bank's views, which has maintained a hawkish stance, hesitant to lower interest rates too soon.</p>
<p>As seen in the chart below, longer-term interest rate expectations have shifted materially since the beginning of the year when investors assigned a greater than 50% probability of the Fed setting its target rate between 4.0% &ndash; 4.5%, while only a 1.5% probability of its target rate being set above 5%, at its scheduled March 2024 policy meeting. As of the September Index selection date, investors had shifted expectations materially, with the odds of an interest rate <strong><i><u>hike</u></i></strong> of at least 25 bps from the current 5.5% level set at 28%.</p>
<h3>Target Rate Probabilities for March 2024 FED Meeting</h3>
<p><img class="img-responsive w-100" src="https://www.vaneck.com/contentassets/829f2d0ad82141a5b223f35b1d9486e0/3655_create-buzz-blog_2023.09_chart-1_v1_blog.svg" alt="Chart of Target Rate Probabilities for March 2024 FED Meeting" /></p>
<p class="chart-disclosure">Source: CME FedWatch Tool as of September 14,2023.</p>
<p>The BUZZ NextGen AI US Sentiment Leaders Index (the &ldquo;BUZZ Index&rdquo; or &ldquo;Index&rdquo;) returned -9.04% during the month of August compared to a return of -1.59% for the S&amp;P 500 Index during the same period. Year-to-date, the BUZZ Index leads the S&amp;P 500 with returns of 34.72% and 18.73%, respectively, as of the end of August.</p>
<h2>Shares of Tesla Inc &amp; Rivian Automotive Inc Pace Advancing Stocks within the BUZZ Index</h2>
<p>Shares of Tesla Inc (NASD: TSLA) and Rivian Automotive Inc (NASD: RIVN) paced advancing stocks within the BUZZ Index during the recent Period. Several factors have influenced positive performance over the past month. One of the key drivers has been the ability of both TSLA and RIVN to meet or exceed production targets and deliver vehicles to customers. Additionally, investor sentiment towards electric vehicle (EV) companies has improved, further contributing positively to stock performance. DraftKings Inc (NASD: DKNG) was another notable contributor to performance during the recent Period. Shares of the fantasy contest and sports betting company have risen nearly three-fold during 2023 as sentiments toward the segment have improved while the company has exceeded earnings expectations throughout the year. The start of the NFL season may further provide a tailwind for shares of DKNG as increased sports betting volume during the NFL season may boost online betting stocks in the short term.</p>
<div class="wrapped-div">
<table style="width: 750px;">
<tbody>
<tr class="tbl-data">
<td class="tbl-header last" colspan="4">Top BUZZ Index Contributors: August 10, 2023 &ndash; September 14, 2023</td>
</tr>
<tr class="tbl-data">
<td class="data-td  last">Company</td>
<td class="data-head last">Ticker</td>
<td class="data-head last">Average Weight (%)</td>
<td class="data-head last">Return Contribution (%)</td>
</tr>
<tr class="tbl-data">
<td class="data-td last font-weight-normal">Tesla Inc</td>
<td class="data-td data last">TSLA</td>
<td class="data-td data last">3.01</td>
<td class="data-td data last">0.40</td>
</tr>
<tr class="tbl-data">
<td class="data-td last font-weight-normal">Rivian Automotive Inc</td>
<td class="data-td data last">RIVN</td>
<td class="data-td data last">3.01</td>
<td class="data-td data last">0.32</td>
</tr>
<tr class="tbl-data">
<td class="data-td last font-weight-normal">DraftKings Inc</td>
<td class="data-td data last">DKNG</td>
<td class="data-td data last">1.99</td>
<td class="data-td data last">0.30</td>
</tr>
<tr class="tbl-data">
<td class="data-td last font-weight-normal">NVIDIA Corp</td>
<td class="data-td data last">NVDA</td>
<td class="data-td data last">3.3</td>
<td class="data-td data last">0.24</td>
</tr>
<tr class="tbl-data">
<td class="data-td last font-weight-normal">Alphabet Inc</td>
<td class="data-td data last">GOOGL</td>
<td class="data-td data last">3.11</td>
<td class="data-td data last">0.20</td>
</tr>
<tr class="tbl-data">
<td class="data-td last font-weight-normal">Shopify Inc</td>
<td class="data-td data last">SHOP</td>
<td class="data-td data last">1.29</td>
<td class="data-td data last">0.17</td>
</tr>
<tr class="tbl-data">
<td class="data-td last font-weight-normal">Microsoft Corp</td>
<td class="data-td data last">MSFT</td>
<td class="data-td data last">2.98</td>
<td class="data-td data last">0.16</td>
</tr>
<tr class="tbl-data">
<td class="data-td last font-weight-normal">AT&amp;T Inc</td>
<td class="data-td data last">T</td>
<td class="data-td data last">1.89</td>
<td class="data-td data last">0.15</td>
</tr>
<tr class="tbl-data">
<td class="data-td last font-weight-normal">PayPal Holdings Inc</td>
<td class="data-td data last">PYPL</td>
<td class="data-td data last">2.87</td>
<td class="data-td data last">0.13</td>
</tr>
<tr class="tbl-data">
<td class="data-td last font-weight-normal">Amazon.com Inc</td>
<td class="data-td data last">AMZN</td>
<td class="data-td data last">3.08</td>
<td class="data-td data last">0.12</td>
</tr>
</tbody>
</table>
</div>
<br />
<p class="chart-disclosure">Source: BUZZ Holdings ULC, Bloomberg. Past performance is no guarantee of future results. Index performance is not illustrative of fund performance. Not intended as a recommendation to buy or to sell any of the securities mentioned herein.</p>
<p>While shares of TSLA and RIVN were featured as the top contributors to BUZZ Index performance during the Period, another EV manufacturer, Lucid Group Inc (NASD: LCID), was the top detractor to performance during the Period. Shares of the luxury EV maker have stumbled throughout 2023, despite the rebound in the broader EV segment, as the company that many hailed as the &lsquo;next TSLA&rsquo; consistently failed to meet expectations relating to earnings, production, and deliveries. Many market participants questioned the company&rsquo;s strategy as it remains fixed within the luxury segment with no prospects for lower-priced vehicles on the horizon. News that the company&rsquo;s CEO, Peter Rawlinson, received a total compensation of $379MM during 2022, second only to that of Jen-Hsun Huang of highflyer NVIDIA Corp (NASD: NVDA), left many market observers frustrated and led to TSLA CEO Elon Musk warning investors to &ldquo;Beware any company where leadership compensation is not linked to performance."</p>
<div class="wrapped-div">
<table style="width: 750px;">
<tbody>
<tr class="tbl-data">
<td class="tbl-header last" colspan="4">Bottom BUZZ Index Contributors: August 10, 2023 &ndash; September 14, 2023</td>
</tr>
<tr class="tbl-data">
<td class="data-td  last">Company</td>
<td class="data-head last">Ticker</td>
<td class="data-head last">Average Weight (%)</td>
<td class="data-head last">Return Contribution (%)</td>
</tr>
<tr class="tbl-data">
<td class="data-td last font-weight-normal">Lucid Group Inc</td>
<td class="data-td data last">LCID</td>
<td class="data-td data last">2.81</td>
<td class="data-td data last">-0.35</td>
</tr>
<tr class="tbl-data">
<td class="data-td last font-weight-normal">GameStop Corp</td>
<td class="data-td data last">GME</td>
<td class="data-td data last">2.24</td>
<td class="data-td data last">-0.26</td>
</tr>
<tr class="tbl-data">
<td class="data-td last font-weight-normal">Walt Disney Co/The</td>
<td class="data-td data last">DIS</td>
<td class="data-td data last">2.86</td>
<td class="data-td data last">-0.26</td>
</tr>
<tr class="tbl-data">
<td class="data-td last font-weight-normal">Carnival Corp</td>
<td class="data-td data last">CCL</td>
<td class="data-td data last">1</td>
<td class="data-td data last">-0.21</td>
</tr>
<tr class="tbl-data">
<td class="data-td last font-weight-normal">Boeing Co/The</td>
<td class="data-td data last">BA</td>
<td class="data-td data last">1.26</td>
<td class="data-td data last">-0.17</td>
</tr>
<tr class="tbl-data">
<td class="data-td last font-weight-normal">Enphase Energy Inc</td>
<td class="data-td data last">ENPH</td>
<td class="data-td data last">1.23</td>
<td class="data-td data last">-0.13</td>
</tr>
<tr class="tbl-data">
<td class="data-td last font-weight-normal">Warner Bros Discovery Inc</td>
<td class="data-td data last">WBD</td>
<td class="data-td data last">0.51</td>
<td class="data-td data last">-0.12</td>
</tr>
<tr class="tbl-data">
<td class="data-td last font-weight-normal">Block Inc</td>
<td class="data-td data last">SQ</td>
<td class="data-td data last">0.84</td>
<td class="data-td data last">-0.12</td>
</tr>
<tr class="tbl-data">
<td class="data-td last font-weight-normal">Netflix Inc</td>
<td class="data-td data last">NFLX</td>
<td class="data-td data last">2.24</td>
<td class="data-td data last">-0.12</td>
</tr>
<tr class="tbl-data">
<td class="data-td last font-weight-normal">Advanced Micro Devices Inc</td>
<td class="data-td data last">AMD</td>
<td class="data-td data last">2.98</td>
<td class="data-td data last">-0.11</td>
</tr>
</tbody>
</table>
</div>
<br />
<p class="chart-disclosure">Source: BUZZ Holdings ULC, Bloomberg. Past performance is no guarantee of future results. Index performance is not illustrative of fund performance. Not intended as a recommendation to buy or to sell any of the securities mentioned herein.</p>
<h2>BUZZ Index September 2023 Rebalance Highlights</h2>
<p><strong>NU Holdings Ltd.</strong></p>
<p>Entering the BUZZ Index for just the second time is NU Holdings Ltd (NYSE: NU), the fintech financial services company based in Latin America. Founded in 2013, NU started by providing traditional banking services in Brazil before rapidly expanding into credit cards, loyalty programs, and personal loans, all with a focus on being accessible digitally. Over the years, the company has attracted capital from several well-known entities, including Sequoia Capital, Tencent, and Berkshire Hathaway. NU has become highly regarded in Latin America and consistently ranks among the top local banks in customer satisfaction surveys. The stock went public in late 2021 and proceeded to decline 67% from its IPO price during 2022 amidst a flurry of macro headwinds. So far, during 2023, NU has nearly doubled, and investor focus has shifted away from the impact of the current interest rate environment towards the company's growth prospects as it pushes into global markets. Investor sentiment has been steadily climbing, and this month, NU enters the Index with a 0.65% weight.</p>
<p><strong>Apellis Pharmaceuticals Inc.</strong></p>
<p>The past three months have been a roller coaster for shares of Apellis Pharmaceuticals Inc. (NASD: APLS), a biotech company focused on treatments for autoimmune diseases. After years of progress on its core drug, Syfovre, which treats age-related macular degeneration (AMD), the stock abruptly crashed nearly 80% after reports that eight patients had experienced eye inflammation following their first injections. Since then, shares have steadily recovered as further investigations by the company pinpointed the cause to be the syringes used to extract the drug from the vials, which led to increased contamination risks. With seemingly isolated cases, investors have returned to the stock, which has bounced nearly 150% off its lows yet remains trading nearly 50% below its pre-crash price. Sentiment spiked after the initial decline as investors viewed the selling may be overdone, especially as recent news has alleviated safety concerns surrounding Syfovre itself. This month, APLS enters the BUZZ Index with a 0.78% weight.</p>
<p>For more on rebalancing results and a full breakdown of index constituents added and removed for the month, view the <a href="https://www.vaneck.com/us/en/investments/social-sentiment-etf-buzz/buzz-reconstitution.pdf" title="BUZZ Vaneck Social Sentiment ETF" target="_blank" rel="noopener"><strong>BUZZ Index reconstitution</strong></a> report.</p>
<p>To receive more <strong><a href="https://www.vaneck.com/us/en/insights/thematic-investing/" title="Thematic Investing Insights">Thematic Investing</a></strong> insights, <strong><a href="https://www.vaneck.com/us/en/subscribe/" title="Subscription Center">sign up in our subscription center</a></strong>.</p>
<style type="text/css">
    .wrapped-div {
        max-width: 100%;
    }

    @media (max-width: 1240px) {
        .wrapped-div {
            overflow-x: scroll;
        }
    }

    .wrapped-div-sector {
        max-width: 100%;
        overflow-x: scroll;
    }
</style>
]]></content:encoded>
</item><item rdf:about="https://www.vaneck.com/us/en/blogs/income-investing/floating-rate-notes-a-high-yielding-cash-complement/">
  <title>Floating Rate Notes: A High Yielding Cash Complement></title>
  <link>https://www.vaneck.com/us/en/blogs/income-investing/floating-rate-notes-a-high-yielding-cash-complement/</link>
  <description><![CDATA[In the current &ldquo;higher for longer&rdquo; environment, investment grade corporate floating rate notes may continue to offer an attractive combination of enhanced yields and safety.]]></description>
  <dc:creator>Nicolas  Fonseca, CFA</dc:creator>
  <dc:date>09/25/2023 06:30:00</dc:date>
<content:encoded><![CDATA[

<p>The U.S. Federal Reserve&rsquo;s (Fed&rsquo;s) hawkish pause last week underscores that we remain in a &ldquo;higher for longer&rdquo; environment, and investors looking for yield and safety may continue to find attractive opportunities at the front-end of the yield curve. Although the policy rate was maintained at the most recent meeting, the Fed remains very focused on bringing inflation back to 2% and has proven that it is willing to keep monetary conditions tight as long as needed to achieve that objective. Amid a strong growth and employment outlook, Federal Open Market Committee (FOMC) members increased their predictions for where rates will be next year by 50 basis points. Although many investors have bet against what has been the most clearly telegraphed hiking cycle in memory, we continue to believe in the old mantra of &ldquo;don&rsquo;t fight the Fed,&rdquo; and believe that investment grade floating rate notes may be an attractive option for investors in this environment.</p>
<p>Floating rate notes (FRNs) offer investors a coupon that is equal to a fixed spread over a short-term reference rate that adjusts each period.&nbsp; Because the coupon adjusts with prevailing interest rates, FRNs have near zero sensitivity to changes in interest rates, unlike fixed coupon bonds which decline in price as rates move up. In addition, the spread on corporate FRNs allow investors to earn additional yield above the risk free rate. With short-term rates expected to remain high and an increased likelihood of a &ldquo;soft landing,&rdquo; investment grade corporate FRNs may continue to offer an attractive combination of enhanced yields and safety versus other ultrashort options as well as longer duration fixed income.</p>
<p>Investment grade corporate FRNs, as measured by the MVIS US Investment Grade Floating Rate Index, currently provide a higher yield compared to T-bills and FRNs issued by the U.S. Treasury, longer duration Treasuries and investment grade corporates. Only non-investment grade fixed income, aside from CLOs, currently offers higher yields, but with substantially higher credit risk in addition to duration risk. To achieve similar yield levels within investment grade corporates, investors currently need to take substantial duration risk.</p>
<h3>Yield vs. Duration</h3>
<p><img class="img-responsive w-100" src="https://www.vaneck.com/contentassets/2aec1c7106a2442c805960e84420aa52/3648_fltr-sepember-2023_2023.09_v1_blog.svg" alt="bar chart showing yield versus duration" /></p>
<p class="chart-disclosure">Source: ICE Data Services, JP Morgan and VanEck as of 9/19/23.</p>
<p>The lack of interest rate sensitivity means that investment grade FRNs strongly outperformed most fixed income over the past two years as rates have increased substantially. Their higher carry, due to the spread above the risk-free rate they provide, has resulted in significantly better returns versus 3-month T-Bills since March 2022 when the Fed began its current hiking cycle with over 100 basis points of outperformance through 8/31/2023. Although corporate FRNs do have price sensitivity to changes in credit spreads and can underperform in periods of credit stress, they still provided a higher risk adjusted return versus 3-month T-bills due to their higher yield. Further, the high carry provided by the asset class has provided insulation against more volatile periods in the credit market, as seen in their performance through the mini-banking crisis earlier this year.</p>
<div class="wrapped-div">
<table style="width: 100%;">
<tbody>
<tr class="tbl-data">
<td class="tbl-header last text-center">&nbsp;</td>
<td class="tbl-header last text-center" style="border-right: outset;" colspan="5">Trailing Returns</td>
<td class="tbl-header last text-center" colspan="3">3/31/2022 - 8/31/2023</td>
</tr>
<tr class="tbl-data">
<td class="data-head last">&nbsp;</td>
<td class="data-td data last">YTD</td>
<td class="data-td data last">1 Year</td>
<td class="data-td data last">3 Years</td>
<td class="data-td data last">5 Years</td>
<td class="data-td data last" style="border-right: outset;">10 Years</td>
<td class="data-td data last">Return</td>
<td class="data-td data last">Std Dev</td>
<td class="data-td data last">Sharpe Ratio</td>
</tr>
<tr class="tbl-data">
<td class="data-head last">IG Corporate FRN</td>
<td class="data-td data last">5.14</td>
<td class="data-td data last">6.41</td>
<td class="data-td data last">2.31</td>
<td class="data-td data last">2.52</td>
<td class="data-td data last" style="border-right: outset;">2.21</td>
<td class="data-td data last">4.32</td>
<td class="data-td data last">2.00</td>
<td class="data-td data last">0.22</td>
</tr>
<tr class="tbl-data">
<td class="data-head last">3m Treasury</td>
<td class="data-td data last">3.13</td>
<td class="data-td data last">4.25</td>
<td class="data-td data last">1.55</td>
<td class="data-td data last">1.66</td>
<td class="data-td data last" style="border-right: outset;">1.07</td>
<td class="data-td data last">3.22</td>
<td class="data-td data last">0.54</td>
<td class="data-td data last">-3.78</td>
</tr>
<tr class="tbl-data">
<td class="data-head last">10Y Treasury</td>
<td class="data-td data last">-0.04</td>
<td class="data-td data last">-4.71</td>
<td class="data-td data last">-7.47</td>
<td class="data-td data last">-0.14</td>
<td class="data-td data last" style="border-right: outset;">0.89</td>
<td class="data-td data last">-7.36</td>
<td class="data-td data last">9.76</td>
<td class="data-td data last">-1.14</td>
</tr>
<tr class="tbl-data">
<td class="data-head last">1-3Y US Corporate</td>
<td class="data-td data last">2.57</td>
<td class="data-td data last">2.49</td>
<td class="data-td data last">-0.29</td>
<td class="data-td data last">1.74</td>
<td class="data-td data last" style="border-right: outset;">1.69</td>
<td class="data-td data last">1.14</td>
<td class="data-td data last">2.67</td>
<td class="data-td data last">-1.05</td>
</tr>
<tr class="tbl-data">
<td class="data-head last">3-5Y US Corporate</td>
<td class="data-td data last">2.82</td>
<td class="data-td data last">2.08</td>
<td class="data-td data last">-1.61</td>
<td class="data-td data last">2.02</td>
<td class="data-td data last" style="border-right: outset;">2.34</td>
<td class="data-td data last">-0.34</td>
<td class="data-td data last">5.76</td>
<td class="data-td data last">-0.72</td>
</tr>
<tr class="tbl-data">
<td class="data-head last">US Corporate</td>
<td class="data-td data last">2.97</td>
<td class="data-td data last">0.95</td>
<td class="data-td data last">-3.96</td>
<td class="data-td data last">1.51</td>
<td class="data-td data last" style="border-right: outset;">2.64</td>
<td class="data-td data last">-4.01</td>
<td class="data-td data last">9.94</td>
<td class="data-td data last">-0.76</td>
</tr>
</tbody>
</table>
</div>
<br />
<p class="chart-disclosure">Source: Morningstar Direct, as of 8/31/2023. Past performance is no guarantee of future results.</p>
<p>The MVIS US Investment Grade Floating Rate Index is designed to provide a higher yield versus the broader FRN market by tilting the index to longer maturity bonds and by focusing on corporate bonds that offer a spread above the risk-free rate. In general, credit spreads are typically higher as maturity increases, allowing investors to benefit from a higher average spread without assuming any additional interest rate risk. This results in greater spread sensitivity versus floating rate Treasuries or agencies or shorter duration corporate FRNs. However, the sensitivity of the index to credit spreads is less than that of 1-5 year corporate bonds.</p>
<p>High interest rates may act to bring inflation down, but will also slow economic growth and potentially have a negative impact on riskier borrowers in particular. Default rates have already started rising among leveraged borrowers, and market expectations are for a continued increase (albeit from very low levels) as the lagged impact of rising rates continues to be felt. Investment grade FRNs allow investors to gain high quality floating rate exposure, minimizing default risk and potentially with lower volatility versus leveraged loans if spreads do widen substantially. For investors looking for the higher yielding ultrashort exposure that loans provide without direct exposure to potential defaults, we believe CLOs are another attractive option as they provide significantly greater spreads with built-in risk protections. Investment grade FRNs, on the other hand are a more conservative option and provide exposure to a completely different set of issuers. As a result, both can be suitable in a high-quality credit portfolio.</p>
<h2>Investing in the Ultrashort Investment Grade space with VanEck</h2>
<p><a href="https://www.vaneck.com/us/en/investments/ig-floating-rate-etf-fltr/overview/" title="FLTR - VanEck IG Floating Rate ETF - Overview"><strong>VanEck IG Floating Rate ETF</strong></a> offers exposure to investment grade corporate as it seeks to track the MVIS<sup>&reg;</sup>&nbsp;US Investment Grade Floating Rate Index, which consists of U.S. dollar denominated floating rate notes issued by corporate issuers and rated investment grade that has a higher biased to longer maturity FRNs.</p>
<p><a href="https://www.vaneck.com/us/en/investments/clo-etf-cloi/overview/" title="CLOI - VanEck CLO ETF - Overview"><strong>VanEck CLO ETF</strong></a> is an actively managed ETF, sub advised by PineBridge Investments, offering exposure to primarily investment grade-rated tranches of collateralized loan obligations (&ldquo;CLOs&rdquo;) of any maturity.</p>
<p>To receive more <a href="https://www.vaneck.com/us/en/insights/income-investing/" title="Income Investing insights"><strong>Income Investing</strong></a> insights, <a href="https://www.vaneck.com/us/en/subscribe/" title=" Subscription Center"><strong>sign up in our subscription center</strong></a>.</p>
<style type="text/css">.wrapped-div {
        max-width: 100%;
    }

    @media (max-width: 1024px) {
        .wrapped-div {
            overflow-x: scroll;
        }
    }

    .wrapped-div-sector {
        max-width: 100%;
        overflow-x: scroll;
    }
</style>
]]></content:encoded>
</item><item rdf:about="https://www.vaneck.com/us/en/blogs/moat-investing/investors-guide-to-network-effect/">
  <title>The Investor’s Guide to Network Effect></title>
  <link>https://www.vaneck.com/us/en/blogs/moat-investing/investors-guide-to-network-effect/</link>
  <description><![CDATA[Unlock the power of network effect investing. VanEck's investor guide explores strategies, case studies, and metrics for successful investments.]]></description>
  <dc:creator>Brandon Rakszawski</dc:creator>
  <dc:date>09/25/2023 06:30:00</dc:date>
<content:encoded><![CDATA[

<p><i>The term &ldquo;economic moat&rdquo; describes a company&rsquo;s ability to maintain its competitive advantages and defend its long-term profitability. This moat investing education series explores the five primary sources of moat, according to Morningstar: 1) <a href="https://www.vaneck.com/us/en/blogs/moat-investing/switching-costs-build-moats" title="Switching Costs Build Moats and Retain Customers"><strong>switching costs</strong></a>; 2) <a href="https://www.vaneck.com/us/en/blogs/moat-investing/intangible-assets-source-of-moats" title="Intangible Assets: The Leading Source of Moats"><strong>intangible assets</strong></a>; 3) network effect; 4) <a href="https://www.vaneck.com/us/en/blogs/moat-investing/cost-leadership-creates-moats" title="Cost Leadership Provides Market Control"><strong>cost advantage</strong></a>; 5) <a href="https://www.vaneck.com/us/en/blogs/moat-investing/efficient-scale-moats-natural-monopoly" title="Efficient Scale: Moats with Natural Monopoly"><strong>efficient scale</strong></a>. Here we explore the concept of network effect.</i></p>
<h2>Introduction: What is Network Effect?</h2>
<p>In the dynamic landscape of business and investing, the term "network effect" holds profound significance. At its core, the network effect is the embodiment of a company's ability to elevate its worth exponentially as its network expands&mdash;a phenomenon that reshapes industries and redefines market dynamics.</p>
<p>Network effect is a crucial consideration for investors seeking to navigate the complex world of companies and industries. A strong network effect can infuse a company's operations with resilience and differentiation, erecting formidable barriers that make replication by competitors a daunting task. This very attribute, the building of a formidable moat around a company's business, is what captures the attention of investors. Our aim in this article is to illuminate the mechanics and implications of the network effect, shedding light on its potential to be a harbinger of competitive advantage and sustainable growth. By unravelling the layers of this concept, we empower investors with insights that enable them to make more informed decisions in their pursuit of investment success.</p>
<h2>Understanding Network Effect</h2>
<p>Imagine a scenario where each additional participant in a network, whether individuals, businesses, or even devices, contributes not only to its scale but also to its inherent value. This is the crux of the network effect&mdash;a force that magnifies the allure and functionality of a product, service, or platform with every new member. As more users or participants join the network, the overall utility and attractiveness of the offering intensify. This, in turn, encourages more individuals to join, creating a self-reinforcing cycle of growth. Consider the example of social media platforms: the more users they attract, the more valuable they become to existing users and new users alike, fostering a virtuous cycle of increased engagement.</p>
<p>For investors, comprehending the network effect is paramount due to its direct influence on a company's competitive advantage and potential for sustainable growth. A strong network effect can lead to formidable barriers for competitors attempting to replicate the same level of engagement and value. As a result, companies leveraging this effect can develop a powerful moat that shields them from market challenges and reinforces their market position. In this article, we embark on an exploration of the intricacies of the network effect, shedding light on its mechanics, implications, and real-world applications. By understanding this pivotal concept, investors can make more informed decisions that align with their long-term investment objectives.</p>
<h2>How Network Effect Helps to Create Economic Moats</h2>
<p>The &ldquo;network effect" moat source has become more relevant as our world has grown more digital. It describes the phenomenon where the value of a product or service increases as the number of its users grows.</p>
<p>Network Effect: As more people use a company&rsquo;s product or service, the value of that product or service increases for both new and existing users.</p>
<p>The internet is a good example. It originally had few users outside the military and research science spheres, but its expanding user base exploded its reach and impact. More recently, companies like Facebook and Google have been labeled network effect paragons. Morningstar posits that a network effect can help a company to increase its advantages over competitors, and is often an important source of a company's moat.</p>
<p>The term "critical mass" is often used in connection with the network effect. In game theory, this means that not all game participants need to be convinced for a strategy to succeed, just a very specific portion of them. If this participation threshold is exceeded, the strategy is likely to succeed of its own accord. The network effect works in similar fashion. If the user base for a product or service reaches a critical mass, the network is likely to expand under its own power. Ultimately, however, a company&rsquo;s ability to monetize a network is also important to consider before network effect can be assigned as a moat source.</p>
<h2>Examples of Network Effect in Action</h2>
<h3>Visa</h3>
<p>Visa (V) dominates the global electronic payments industry and has reached essentially universal acceptance in most developed markets. According to the Nilson Report, Visa holds over 50% market share (by purchase volume) in the U.S., Europe, Latin America, and the Middle East/Africa. It is a great example of how the network effect can create a powerful competitive advantage. According to Morningstar, &ldquo;Visa has about 14,500 financial institution partners and over 50 million merchants accepting Visa.&rdquo;</p>
<h3>Meta Platforms Inc.</h3>
<p>Meta Platforms Inc. (META) has scale in the social media business that is staggering. Almost 4 billion people use at least one of its applications each month. According to Morningstar, &ldquo;Meta&rsquo;s ad-targeting and content recommendation algorithms improve as more users give it their data by using its applications. This dynamic creates a potent network effect with the value of its application ecosystem increasing as more people use it.&rdquo;</p>
<h2>Evaluating Network Effect in Investments</h2>
<p>Understanding the network effect is not just a theoretical exercise; it holds tangible implications for investors seeking to identify and capitalize on opportunities in the market. As the allure of the network effect expands, it becomes imperative to discern the industries and businesses that possess the potential to harness its power.</p>
<p>Morningstar identifies the network effect as one of the five primary sources of economic moats, which define a company's competitive advantage. Morningstar highlights industries and businesses where a growing user base elevates the product's worth, thus establishing a powerful moat. According to Morningstar, the network effect is instrumental in shaping the company's long-term profitability and its ability to withstand market challenges. In this section, we embark on a journey of evaluation, exploring key factors that investors should consider when assessing the network effect's influence on investments.</p>
<p><strong>Identifying Industries and Businesses with Network Effect Potential</strong></p>
<p>The journey begins with the recognition that not all industries are equally primed for the network effect. Certain sectors inherently lend themselves to the amplification of value through the engagement of an increasing number of participants. Industries like social media, e-commerce, and telecommunications serve as classic examples, where the participation of more users results in a richer experience and higher overall value. Recognizing these sectors is the foundational step to identifying potential network effect opportunities.</p>
<p><strong>Key Factors to Consider When Assessing Network Effect</strong></p>
<p>Size and Growth of the User Base: One of the fundamental determinants of the network effect's potency is the size and growth rate of the user base. The larger the network, the greater the potential for value amplification. Investors should gauge not only the current user count but also the trajectory of growth, which could signal the network's potential to reinforce its competitive edge.</p>
<p>Interconnectivity and Compatibility: For a network effect to flourish, the interconnectivity and compatibility among participants are vital. A network's value soars when it can seamlessly integrate with various devices, platforms, and participants. Compatibility opens doors to synergistic collaborations, ultimately augmenting the value proposition.</p>
<p>Lock-in and Switching Costs: A robust network effect is often fortified by factors that discourage participants from switching to alternatives. High switching costs or complexities associated with moving to a different platform can create a "lock-in" effect, strengthening the network's position and enhancing its durability.</p>
<p>Network Effect Sustainability: Investors must assess whether the network effect is sustainable over time. The network's value should not be easily eroded by competitors or technological shifts. Evaluating the barriers to entry for new entrants helps gauge the network's staying power.</p>
<h2>Risks and Challenges in Network Effect Investments</h2>
<p>While the network effect presents enticing opportunities, it's essential for investors to acknowledge the challenges that can emerge in this dynamic landscape. As investors assess potential investments, a comprehensive understanding of the hurdles associated with the network effect is paramount. In this segment, we delve into the intricacies of navigating challenges that may arise when investing in network effect-driven businesses.</p>
<p><strong>Market Saturation and Diminishing Returns</strong></p>
<p>As a network matures and attracts a substantial user base, the potential for market saturation and diminishing returns looms. At a certain point, the addition of new participants might yield reduced incremental value. Investors should be mindful of this saturation point, as it could hinder further exponential growth. Recognizing the signs of diminishing returns becomes crucial in anticipating potential shifts in growth trajectories.</p>
<p><strong>Technological Disruptions and Emerging Competitors</strong></p>
<p>The landscape of technology is ever-evolving, and disruptions can emerge swiftly. New innovations or emerging competitors armed with disruptive technologies can swiftly alter the dynamics of a network effect-driven industry. Investors need to anticipate such disruptions and assess whether the company's network effect can withstand technological shifts or if it might be susceptible to being supplanted by new entrants.</p>
<p><strong>Regulatory and Legal Challenges</strong></p>
<p>The network effect often involves the exchange of data, engagement of participants, and intricate interactions. This complexity can attract regulatory scrutiny and legal challenges. Investors must evaluate whether the network's operations align with regulatory frameworks and whether the company has the resilience to navigate legal hurdles. Regulatory changes or legal actions can quickly reshape the landscape, impacting both the network's value and its competitive position.</p>
<p>In the realm of network effect investments, foresight into potential challenges is as vital as recognizing opportunities. By understanding the nuanced interplay of market saturation, technological disruptions, and regulatory landscapes, investors can make informed decisions that account for both the allure and the risks associated with this potent phenomenon. In essence, the journey toward investment success requires a comprehensive perspective&mdash;one that integrates the potential rewards of the network effect with the foresight to mitigate its potential challenges.</p>
<h2>Conclusion</h2>
<p>The network effect is a phenomenon where a company's value grows exponentially as its user base expands, and this article seeks to demystify its significance, importance to investors, and application in investment decisions.</p>
<p>Understanding the network effect is crucial due to its direct influence on a company's competitive edge and growth potential. A strong network effect erects formidable barriers that deter competitors, effectively creating an economic moat. By magnifying a product's value with each new participant, the network effect fosters a cycle of self-reinforcing growth. It is a pivotal consideration for investors as it not only enriches a company's offerings but also differentiates it in a crowded market landscape.</p>
<p>Investors are advised to evaluate key factors when assessing the influence of the network effect on investments. Industries like social media, e-commerce, and telecommunications are fertile ground for the network effect's impact. The size and growth of the user base, interconnectivity, lock-in effects, and the sustainability of the network effect are essential factors to consider. While the network effect can create an economic moat, it also poses risks such as market saturation, technological disruptions, and regulatory challenges. A holistic perspective is needed to navigate these potential pitfalls.</p>
<p>By understanding the mechanics, implications, and challenges related to the network effect, investors can make informed decisions aligned with their investment goals and risk tolerance.</p>
<p>To receive more <a href="https://www.vaneck.com/us/en/insights/moat-investing/" title="Moat Investing Insights"><strong>Moat Investing</strong></a> insights, <a href="https://www.vaneck.com/us/en/subscribe/" title=" Subscription Center"><strong>sign up in our subscription center</strong></a>.</p>
]]></content:encoded>
</item><item rdf:about="https://www.vaneck.com/us/en/blogs/thematic-investing/meet-the-collaborative-robots/">
  <title>Meet the Collaborative Robots></title>
  <link>https://www.vaneck.com/us/en/blogs/thematic-investing/meet-the-collaborative-robots/</link>
  <description><![CDATA[Cobots offer safe, versatile automation in manufacturing. With unique features and minimal programming, they're championed by industry leaders like ABB and Fanuc, presenting a lucrative investment avenue.]]></description>
  <dc:creator>Drew  Anderson</dc:creator>
  <dc:date>09/20/2023 06:30:00</dc:date>
<content:encoded><![CDATA[

<p>Collaborative robots, or cobots, are transforming manufacturing by offering safe and cost-effective automation solutions. Unlike traditional industrial robots, cobots are designed to work alongside humans, providing a wide range of applications with ease of use that improves the efficiency and safety of the workplace.</p>
<h2>What are Cobots?</h2>
<p>Cobots represent a new generation of robots with distinctive features that closely resemble those found in octopuses. The adaptive and flexible nature of cobots is notable. They can be easily reprogrammed or reconfigured to perform different tasks, enhancing their versatility. One characteristic commonly found is suction-based gripping mechanisms. This mechanism allows them to handle delicate objects and materials with precision. These attributes establish cobots as a pioneering force in robotics, drawing inspiration from nature&rsquo;s own master of adaptability and resourcefulness.</p>
<p>Cobots are also designed to work harmoniously with human operators. Highly intuitive and teachable, they require minimal programming skills, which makes them easy to use. This makes them accessible to a broader range of users, including those without extensive technical expertise. The most important feature cobots offer is safety. Safety is paramount, and cobots are built with advanced safety features that allow them to operate safely in close proximity to humans. Human-friendly design fosters a collaborative work environment, reducing the need for physical barriers.</p>
<h2>How Do Cobots Differ from Traditional Robots?</h2>
<p>Compared to traditional industrial robots, cobots offer a range of advantages. First, they exhibit remarkable versatility, capable of executing diverse tasks. This adaptability renders them suitable for a broad spectrum of applications spanning various industries. Cobots present an affordability factor that sets them apart. In contrast to their conventional counterparts, cobots come with a more budget-friendly price tag. This cost-effectiveness empowers smaller businesses to embrace automation without bearing significant upfront expenses.</p>
<p>Cobots are also designed to integrate with human workers seamlessly. This results in safer collaboration, minimizing the need for physical barriers. The work environment becomes more harmonious and productive as cobots coexist with their human counterparts. Another notable advantage is space efficiency. Their compact footprint allows them to fit comfortably within constrained production spaces or conveniently relocate across the factory floor. This contrasts with traditional robots that might demand larger dedicated work areas, thereby increasing infrastructure costs and limiting spatial flexibility.</p>
<h3>Forecast for Global Cobot Market &ndash; Shipments</h3>
<p><img class="img-responsive w-100" src="https://www.vaneck.com/contentassets/7eace83b4d6646b78714a23076d3b9fd/3621_ibot-blog-sep_2023.09_v1_blog.svg" alt="Forecast for Global Cobot Market Shipments" /></p>
<p class="chart-disclosure">Source: Interact Analysis 2023.</p>
<p>The cobot market is witnessing significant growth thanks to the continuous efforts of industry leaders who invest heavily in research and development. Several notable companies are at the forefront of driving this revolution. ABB, for instance, is renowned for introducing the YuMi cobot, celebrated for its versatility and affordability. This particular cobot has found application in diverse contexts, including the remote Amazon Rainforest, where it aids in the fight against deforestation. Similarly, Fanuc, a global automation leader, stands out with its cobots that excel in precision and cutting-edge applications.</p>
<p>A prime example is the CR-35iB model, engineered to lift heavy loads exceeding 100 pounds effortlessly. Yaskawa also has made a name for itself through its robust and high-performance cobots. Noteworthy is the MOTOMAN-HC series, specifically designed to endure even the harshest working environments with its dust- and drip-proof features.</p>
<p><img class="img-responsive w-100" src="https://www.vaneck.com/contentassets/7eace83b4d6646b78714a23076d3b9fd/3621_ibot-blog-sep_2023.09_image-3_2023.09_v12.jpg" alt="Image of ABB YuMi automating seed planting" /></p>
<p class="chart-disclosure">ABB&rsquo;s YuMi<sup>&reg;</sup>&nbsp;automates seed planting, making reforestation in the Amazon faster, more efficient, and scalable.</p>
<h2>How Profitable and Revenue-Generating are Cobots?</h2>
<p>Cobots are cheaper and more versatile than industrial robots, making them a more attractive option for businesses of all sizes. A standard one with accessories costs about $50,000, while a traditional industrial robot can cost upwards of $75,000 (RobotIQ). Cobots can also provide a longer useful life due to their versatility, rather than industrial robots that typically only perform one function. As labor costs continue to rise, the demand for automation in manufacturing is driving their adoption. Cobots are likely a more profitable choice for manufacturers than traditional industrial robots. They are more affordable, versatile, and flexible. As labor costs continue to rise, the demand for cobots will grow.</p>
<h2>How Can You Invest in Cobots?</h2>
<p>Collaborative robots are reshaping the manufacturing landscape with their safety, versatility, and cost-effectiveness. Leading companies are at the forefront of cobot innovation, contributing to the industry's growth and profitability. <strong><a href="https://www.vaneck.com/us/en/investments/robotics-etf-ibot/overview/" title="IBOT - VanEck Robotics ETF">The VanEck Robotics ETF (IBOT)</a></strong> is one way to embrace the cobot revolution as the automation trend continues to shape the future of manufacturing. This ETF tracks the performance of the robotics industry, including manufacturers of cobots and companies engaged in developing related software and technologies.</p>
<p>To receive more <a href="https://www.vaneck.com/us/en/insights/thematic-investing/" title="Thematic Investing Insights"><strong>Thematic Investing</strong></a> insights, <a href="https://www.vaneck.com/us/en/subscribe/" title="Subscription Center"><strong>sign up in our subscription center</strong></a>.</p>
]]></content:encoded>
</item><item rdf:about="https://www.vaneck.com/us/en/blogs/thematic-investing/play-the-return-to-office-trade-with-an-office-reit-etf/">
  <title>Play the Return-to-Office Trade with an Office REIT ETF></title>
  <link>https://www.vaneck.com/us/en/blogs/thematic-investing/play-the-return-to-office-trade-with-an-office-reit-etf/</link>
  <description><![CDATA[Office properties and commercial real estate faced challenges due to the shift to remote work. However, is the emerging return-to-office trend a sign that tides are changing?]]></description>
  <dc:creator> </dc:creator>
  <dc:date>09/20/2023 06:30:00</dc:date>
<content:encoded><![CDATA[

<p>The pandemic has been a watershed moment for many industries, but perhaps none more so than the office space and commercial real estate sectors. As the world grappled with lockdowns and health concerns, the very concept of a traditional office underwent a seismic shift. The rapid adoption and persistence of the work-from-home trend have left marks on the commercial real estate landscape. However, as with most market disruptions, there are usually two sides to the coin. While the immediate outlook might seem bleak, there may also be potential for opportunity for investors in office REITs.</p>
<h2>What are Office REITs?</h2>
<p>Real Estate Investment Trusts (REITs) are companies that invest in all aspects of real estate, and office REITs are those that specialize in office properties. Those properties can range from skyscrapers to office parks, allowing individual investors to tap into large-scale office real estate markets without direct property ownership. REITs offer the dual benefit of capital appreciation and regular dividend income, as they are mandated by law to distribute a significant portion of their earnings to shareholders. This structure provides an approach for those looking to gain exposure to the office real estate market without the challenges of owning property directly.</p>
<h2>Changing Currents in Office Real Estate</h2>
<p>The pandemic forced businesses to prioritize the safety of their employees, leading to an unprecedented surge in the adoption of the work-from-home model. Companies that had never considered remote work viable were suddenly thrust into a situation where it was the only option. Tools like Zoom and Microsoft Teams became household names overnight, and technology giants like Twitter and Facebook were among the first to announce work-from-home policies, setting a trend that many others followed.</p>
<p>This shift had a cascading effect on the office property sector. The immediate consequence of this shift was reduced demand for office spaces. Companies started to re-evaluate their needs, leading to a decline in lease renewals and even the termination of existing leases. Vacancy rates in prime office locations soared, and rental prices plummeted, leading to a decline in property values. Today, the valuations for U.S. office properties remain depressed and vacancy rates stand at a record high of 13.1%, as of the end of last quarter, up from a pre-pandemic 9.4% in Q2 2019, according to the National Association of Realtors<sup>1</sup>. This burden can be seen in the poor performance of U.S. office property REITs in recent years.</p>
<h3>U.S. Office REITs in Decline | January 2018 &ndash; August 2023</h3>
<p><img class="img-responsive w-100" src="https://www.vaneck.com/contentassets/77b9b9de88ac4c14b97f63ac4361b49f/3615_desk-launch-blog_2023.09_v1_blog.svg" alt="Line chart showing historical performance of U.S. office REITs" /></p>
<p class="chart-disclosure">Source: Morningstar, 8/31/2023. Past performance is no guarantee of future results. Not intended as a recommendation to buy or to sell any of the securities mentioned herein.</p>
<p>However, while uncertainty in office space real estate remains, signs are emerging that the work-from-home trend is starting to reverse. Many of the largest U.S. companies, including Amazon, BlackRock, and JPMorgan, are now requiring employees to return to the office full or part-time. Even Zoom, the company that powered the remote work revolution during the pandemic, is asking its employees to come back to the office. It is clear that businesses still recognize the importance of physical office spaces for fostering collaboration, creativity, and corporate culture. This emerging return-to-office trend could be an indication that the tides are changing for office space, creating a potential investment opportunity for those with a long-term perspective.</p>
<h2>Retail's Resilient Return</h2>
<p>The ripple effects of the pandemic have not been limited to just office property; other commercial real estate sectors were significantly impacted as well, notably retail. The retail sector, already grappling with challenges from e-commerce giants, faced further strain as lockdowns and social distancing norms took hold. Many brick-and-mortar stores, especially those without a strong online presence, struggled to stay afloat, leading to increased vacancies in prime retail locations.</p>
<p>However, retail real estate has since bounced back and is surprisingly enjoying its biggest revival in years. Retailers are on track to open 1,000 net new stores in the U.S. this year as retail availability hits record lows<sup>2</sup>. Demand for retail space has remained robust this year, defying inflation pressures and high interest rates. In fact, the retail property segment currently has the lowest vacancy rate among all commercial real estate sectors at 4.2% as of the end of last quarter<sup>1</sup>.</p>
<p>While some of this strength in vacancy is partially the result of reduced retail construction following the 2008-09 financial crisis, much of the rush for retail space can also be attributed to healthy consumer demand and failed predictions that internet sales would wipe out physical retail locations. Some digitally native companies are even beginning to open brick-and-mortar locations to expand customer acquisition beyond online-only avenues. More so, this demand for retail space is expected to remain robust according to the latest commercial real estate research from the National Association of Realtors<sup>1</sup>.</p>
<h2>VanEck Office and Commercial REIT ETF</h2>
<p>While office properties, and commercial real estate more broadly, have undoubtedly faced challenges due to the pandemic and the shift to remote work, it's crucial to view these challenges in the broader context of market cycles and long-term trends. For the discerning investor, the current situation might just be the contrarian opportunity they've been waiting for.</p>
<p>For investors looking to gain exposure to this segment of the real estate market, the <strong><a href="/link/ff206b19c5d74486a3de5397e69db659.aspx" title="DESK - VanEck Office and Commercial REIT ETF">VanEck Office and Commercial REIT ETF (DESK)</a></strong> can be an efficient vehicle to do so. DESK seeks to track the MarketVector US Listed Office and Commercial REITs Index, which tracks the overall performance of U.S. exchange-listed REITs operating in the office and commercial real estate markets, and can be used to express a view on the future of office properties in a single trade.</p>
<p>To receive more <a href="https://www.vaneck.com/us/en/insights/thematic-investing/" title="Thematic Investing Insights"><strong>Thematic Investing</strong></a> and <a href="https://www.vaneck.com/us/en/insights/income-investing/" title="Income Investing insights"><strong>Income Investing</strong></a> insights, <a href="https://www.vaneck.com/us/en/subscribe/" title=" Subscription Center"><strong>sign up in our subscription center</strong></a>.</p>
]]></content:encoded>
</item><item rdf:about="https://www.vaneck.com/us/en/blogs/investment-outlook/jan-van-eck-meet-ceo-jan-van-eck-from-macro-investor-to-crypto-bull/">
  <title>Meet CEO Jan van Eck: From Macro Investor to Crypto Bull></title>
  <link>https://www.vaneck.com/us/en/blogs/investment-outlook/jan-van-eck-meet-ceo-jan-van-eck-from-macro-investor-to-crypto-bull/</link>
  <description><![CDATA[CEO Jan van Eck has always said the firm takes a macro approach to investing. Learn more about what he means by this and how this perspective led him to cryptocurrencies.]]></description>
  <dc:creator>Jan van Eck</dc:creator>
  <dc:date>09/20/2023 06:30:00</dc:date>
<content:encoded><![CDATA[

<p>VanEck's rich history, grounded in macro investing and a unique investment philosophy, has shaped the company over the years. In this Q&amp;A, CEO Jan van Eck shares his perspective on the firm&rsquo;s journey, its investment strategies, and its foray into the world of cryptocurrencies.</p>
<ul class="content-list">
<li><strong><a href="#point-one">What do you think differentiates VanEck from other investment managers?</a></strong></li>
<li><strong><a href="#point-two">What can investors learn from market history and how does your understanding of history shape your investment philosophy?</a></strong></li>
<li><strong><a href="#point-three">When did you first notice Bitcoin?</a></strong></li>
<li><strong><a href="#point-four">How should investors think about cryptocurrencies in their broader portfolio allocations?</a></strong></li>
<li><strong><a href="#point-five">How will cryptocurrencies impact finance?</a></strong></li>
</ul>
<h2 id="point-one" class="anchored-block">What do you think differentiates VanEck from other investment managers?</h2>
<p><a href="https://www.vaneck.com/us/en/news-and-insights/thought-leaders/jan-van-eck/" title="Jan van Eck - Chief Executive Officer"><strong>JAN VAN ECK:</strong></a> Our investment approach revolves around macro trends that impact financial markets. Unlike many investment firms that focus on specific stocks or sectors, we take a broader view, examining global trends such as wars, political instability, and technological advancements.</p>
<p>In a nutshell, we examine big global trends and evaluate how they will impact financial markets, as well as the potential opportunities and risks they create for investment portfolios. For example, the firm was founded on the premise that, particularly after World War II, international stocks &mdash; specifically from Europe, Germany, and Japan, as well as Asia &mdash; were growing at a faster rate. So there was significant growth potential in this area that had not fully entered the mainstream of traditional markets and therefore, was not a part of most investor portfolios.</p>
<p>But as macro investors we also have to make sure we&rsquo;re looking at pervasive risks that might be under the radar. In 1968, the U.S. was performing well economically, but there were concerns about its large government spending policies and the rapid expansion of its money supply. My father, John van Eck, foresaw the risk of inflation in the U.S. and started looking for ways to hedge against that risk&mdash;one unusual option at that time, given its fixed price, was investing in gold.</p>
<p>One point to remember is how different the future can look from what you might imagine. No one thought the price of gold could reach anywhere close to today&rsquo;s levels. This kind of dramatic change is often not on people's radar unless they have a historical perspective that allows them to entertain a wide range of possibilities.</p>
<h2 id="point-two" class="anchored-block">Speaking of historical perspective, we know you are a big history buff. What can investors learn from market history and how does your understanding of history shape your investment philosophy?</h2>
<p><strong>VAN ECK:</strong> Predicting the future is difficult, but articulating potential outcomes and likelihood is a reasonable exercise. History can suggest an array of government policies and economic outcomes that may not be obvious at a point in time. History can also tell us a lot about the path of current trends.</p>
<p>For example, railroads, a vital technology of their time, were essentially complete around the 1860s in the U.S. However, there was a substantial increase in the market cap and stock prices of these companies before their full implementation. Investors correctly anticipated the potential profits from this new technology, but there&rsquo;s risk in being too early. Even if your fundamental premise is correct, you can still experience significant losses. Railroad stocks peaked before 1860 and subsequently fell by over 50 percent, despite the continued development of the technology.</p>
<p>I reference this history when discussing cryptocurrencies, as a lesson from the past that holds relevance even today. Like railroads, cryptocurrencies could potentially be highly disruptive. However, being cautious of the volatile investment cycles is essential. Even if your investment thesis is correct, you could still lose money as an investor, making it a cautionary tale worth remembering.</p>
<h2 id="point-three" class="anchored-block">When did you first notice Bitcoin?</h2>
<p><strong>VAN ECK:</strong> In 2017, I dove deep into the world of Bitcoin. As you can imagine, even in 2017, there were plenty of skeptics. I sought opinions from my colleagues, but they didn't have much insight into this emerging asset at the time. By listening to podcasts and reading white papers, I was able to develop a solid understanding of the technology behind cryptocurrencies. Although I'm not a computer scientist, I am familiar with how computers and databases are structured, which helped.</p>
<p>Following this research, I concluded that Bitcoin indeed had the potential to rival gold. That was when we embarked on the project to file for one of the first Bitcoin ETFs in the U.S.</p>
<h2 id="point-four" class="anchored-block">How should investors think about cryptocurrencies in their broader portfolio allocations?</h2>
<p><strong>VAN ECK:</strong> I believe there a different facets of cryptocurrencies overall and depending on what specifically is being discussed can fit into different parts of an investor&rsquo;s portfolio. It's crucial to clarify that what I'm about to share cannot be empirically proven, because we can't predict the future. This is more of a mental model that guides my thinking.</p>
<p>Firstly, Bitcoin acts as a competitor or companion to gold. This is due to its scarcity value, which mirrors that of gold&mdash;indestructible not because of physical limits (like the finite amount of gold in the ground) but because of the algorithms underlying Bitcoin. So, it represents a store of value and offers protection against inflation.</p>
<p>Secondly, beyond Bitcoin, other cryptocurrencies represent applications akin to any other type of growth or technology investment. Be it healthcare, science, databases, cloud computing, 5G or 6G, these cryptocurrencies play a similar role. Say you own 50 stocks, with a split of 25 for growth and 25 for value. I would include a small allocation to these crypto related applications in that overall growth exposure.</p>
<p>In both cases, I believe you need it as a hedge to your financials and technology equity exposure. So, in a sense, similar to how Argentinians would rather hold U.S. dollar-linked stablecoins than the Argentinian peso that has almost 100% inflation, in your growth portfolio you'd like to have some allocation to a technology that could be a significant disruptor.</p>
<h2 id="point-five" class="anchored-block">How will cryptocurrencies impact finance?</h2>
<p><strong>VAN ECK:</strong> The financial ecosystem has transitioned from being run by paper in the 1950s to programmed mainframe computers in the 1970s. Now, we&rsquo;re facing the question of whether a decentralized financial ecosystem can be built.</p>
<p>My main concern is around the fragmentation of the financial system. Major financial institutions are working on blockchain applications, but private blockchains would be no different than having private mainframes. Also, regulatory bodies are moving at different speeds. Europe and Brazil, for instance, are advancing towards adopting tokenization and blockchain technologies to reduce costs for investors, while other countries like the U.S. are at a standstill.</p>
<p>Things are changing, and we need to recognize that. We can't predict how they will evolve, but we must stay aware and open to these developments.</p>
<p>To receive more <a href="/us/en/insights/investment-outlook" title="Investment Outlook Insights"><strong>Investment Outlook</strong></a> insights, <a href="https://www.vaneck.com/us/en/subscribe/" title="Subscription Center"><strong>sign up in our subscription center</strong></a>.</p>
]]></content:encoded>
</item><item rdf:about="https://www.vaneck.com/us/en/blogs/emerging-markets-bonds/bad-bonds-plus-uncertain-china-em-bond-opportunities/">
  <title>Bad Bonds Plus Uncertain China = EM Bond Opportunities></title>
  <link>https://www.vaneck.com/us/en/blogs/emerging-markets-bonds/bad-bonds-plus-uncertain-china-em-bond-opportunities/</link>
  <description><![CDATA[Risks to bonds, including higher US interest rates, are multiplying &ndash; but given emerging markets uncorrelated economies and asset prices, we are still finding attractive opportunities.]]></description>
  <dc:creator>Eric Fine</dc:creator>
  <dc:date>09/18/2023 06:30:00</dc:date>
<content:encoded><![CDATA[

<p>In August, the Emerging Markets Bond Fund returned -2.70% compared to -2.08% for its benchmark (50% J.P. Morgan Government Bond Index-Emerging Markets (GBI-EM) Global Diversified and 50% J.P. Morgan Emerging Markets Bond Index (EMBI)). Year-to-date as of August 31, 2023, the Fund is up 4.74%, compared to 6.17% for its benchmark. Malaysia and Thailand, where we had significant underweights in local currency, were the big winners for the month. We are looking to cover our significant underweight there in September. China, where we have been accumulating corporate bonds at very low prices, was the biggest detractor for the month. We are looking to keep accumulating in China, which remains our biggest winner year-to-date. We end August with carry of 6.63%, a yield-to-worst of 9.95%, duration of 4.5, and roughly 45% of the Fund in local currency. We have no Mexico local currency, which strikes us as very vulnerable, and are looking to reduce our already low exposure to Eastern European local markets. Our biggest exposures are Brazil (local), Mexico (hard), South Africa (local), Indonesia (local), and Colombia (local). <strong><a href="/us/en/blogs/emerging-markets-bonds/bad-bonds-plus-uncertain-china-em-bond-opportunities/emb-manager-commentary-09-2023.pdf" target="_blank" rel="noopener" title="VanEck Emerging Markets Bond Fund Monthly Manager Commentary - September 2023">View here for a PDF version of this blog</a>.</strong></p>
<div class="wrapped-div">
<table style="width: 100%;">
<tbody>
<tr class="tbl-data">
<td class="tbl-header last" colspan="8">Average Annual Total Returns (%) as of August 31, 2023</td>
</tr>
<tr class="tbl-data">
<td class="data-td last">&nbsp;</td>
<td class="data-head last">1 Month<sup>&dagger;</sup></td>
<td class="data-head last">3 Month<sup>&dagger;</sup></td>
<td class="data-head last">YTD</td>
<td class="data-head last">1 Year</td>
<td class="data-head last">3 Year</td>
<td class="data-head last">5 Year</td>
<td class="data-head last">10 Year</td>
</tr>
<tr class="tbl-data">
<td class="data-td last">Class A: NAV (Inception 07/09/12)</td>
<td class="data-td data last">-2.70</td>
<td class="data-td data last">1.52</td>
<td class="data-td data last">4.74</td>
<td class="data-td data last">8.26</td>
<td class="data-td data last">-0.71</td>
<td class="data-td data last">2.85</td>
<td class="data-td data last">1.75</td>
</tr>
<tr class="tbl-data">
<td class="data-td last">Class A: Maximum 5.75% load</td>
<td class="data-td data last">-8.29</td>
<td class="data-td data last">-4.32</td>
<td class="data-td data last">-1.28</td>
<td class="data-td data last">2.03</td>
<td class="data-td data last">-2.65</td>
<td class="data-td data last">1.64</td>
<td class="data-td data last">1.15</td>
</tr>
<tr class="tbl-data">
<td class="data-td last">Class I: NAV (Inception 07/09/12)</td>
<td class="data-td data last">-2.65</td>
<td class="data-td data last">1.77</td>
<td class="data-td data last">4.89</td>
<td class="data-td data last">8.90</td>
<td class="data-td data last">-0.32</td>
<td class="data-td data last">3.17</td>
<td class="data-td data last">2.07</td>
</tr>
<tr class="tbl-data">
<td class="data-td last">Class Y: NAV (Inception 07/09/12)</td>
<td class="data-td data last">-2.66</td>
<td class="data-td data last">1.73</td>
<td class="data-td data last">4.98</td>
<td class="data-td data last">8.77</td>
<td class="data-td data last">-0.44</td>
<td class="data-td data last">3.09</td>
<td class="data-td data last">2.01</td>
</tr>
<tr class="tbl-data">
<td class="data-td last">50% GBI-EM/50% EMBI</td>
<td class="data-td data last">-2.08</td>
<td class="data-td data last">2.96</td>
<td class="data-td data last">6.17</td>
<td class="data-td data last">8.52</td>
<td class="data-td data last">-3.25</td>
<td class="data-td data last">0.88</td>
<td class="data-td data last">1.51</td>
</tr>
</tbody>
</table>
</div>
<br />
<div class="wrapped-div">
<table style="width: 100%;">
<tbody>
<tr class="tbl-data">
<td class="tbl-header last" colspan="8">Average Annual Total Returns (%) as of June 30, 2023</td>
</tr>
<tr class="tbl-data">
<td class="data-td last">&nbsp;</td>
<td class="data-head last">1 Month<sup>&dagger;</sup></td>
<td class="data-head last">3 Month<sup>&dagger;</sup></td>
<td class="data-head last">YTD</td>
<td class="data-head last">1 Year</td>
<td class="data-head last">3 Year</td>
<td class="data-head last">5 Year</td>
<td class="data-head last">10 Year</td>
</tr>
<tr class="tbl-data">
<td class="data-td last">Class A: NAV (Inception 07/09/12)</td>
<td class="data-td data last">2.66</td>
<td class="data-td data last">2.27</td>
<td class="data-td data last">5.93</td>
<td class="data-td data last">14.28</td>
<td class="data-td data last">2.09</td>
<td class="data-td data last">3.12</td>
<td class="data-td data last">1.74</td>
</tr>
<tr class="tbl-data">
<td class="data-td last">Class A: Maximum 5.75% load</td>
<td class="data-td data last">-3.24</td>
<td class="data-td data last">-3.61</td>
<td class="data-td data last">-0.16</td>
<td class="data-td data last">7.71</td>
<td class="data-td data last">0.10</td>
<td class="data-td data last">1.90</td>
<td class="data-td data last">1.14</td>
</tr>
<tr class="tbl-data">
<td class="data-td last">Class I: NAV (Inception 07/09/12)</td>
<td class="data-td data last">2.85</td>
<td class="data-td data last">2.51</td>
<td class="data-td data last">6.01</td>
<td class="data-td data last">14.78</td>
<td class="data-td data last">2.40</td>
<td class="data-td data last">3.44</td>
<td class="data-td data last">2.07</td>
</tr>
<tr class="tbl-data">
<td class="data-td last">Class Y: NAV (Inception 07/09/12)</td>
<td class="data-td data last">2.84</td>
<td class="data-td data last">2.46</td>
<td class="data-td data last">6.13</td>
<td class="data-td data last">14.79</td>
<td class="data-td data last">2.36</td>
<td class="data-td data last">3.38</td>
<td class="data-td data last">2.00</td>
</tr>
<tr class="tbl-data">
<td class="data-td last">50% GBI-EM/50% EMBI</td>
<td class="data-td data last">2.75</td>
<td class="data-td data last">2.36</td>
<td class="data-td data last">5.95</td>
<td class="data-td data last">9.43</td>
<td class="data-td data last">-2.22</td>
<td class="data-td data last">0.48</td>
<td class="data-td data last">1.18</td>
</tr>
</tbody>
</table>
</div>
<br />
<p class="chart-disclosure"><sup>&dagger;</sup>&nbsp;Returns less than one year are not annualized.</p>
<p class="chart-disclosure"><strong>Expenses: Class A: Gross 2.55%, Net 1.27%; Class I: Gross 2.51%, Net 0.97%; Class Y: Gross 2.91%, Net 1.02%.</strong> Expenses are capped contractually until 05/01/24 at 1.25% for Class A, 0.95% for Class I, 1.00% for Class Y. Caps excluding acquired fund fees and expenses, interest, trading, dividends, and interest payments of securities sold short, taxes, and extraordinary expenses.</p>
<p class="chart-disclosure"><strong>The performance data quoted represents past performance. Past performance is not a guarantee of future results. Investment return and principal value of an investment will fluctuate so that an investor&rsquo;s shares, when redeemed, may be worth more or less than their original cost. Performance may be lower or higher than performance data quoted. Please call 800.826.2333 or visit vaneck.com for performance current to the most recent month ended.</strong></p>
<p class="chart-disclosure">The &ldquo;Net Asset Value&rdquo; (NAV) of a Fund is determined at the close of each business day, and represents the dollar value of one share of the fund; it is calculated by taking the total assets of the fund, subtracting total liabilities, and dividing by the total number of shares outstanding. The NAV is not necessarily the same as the ETF&rsquo;s intraday trading value. Investors should not expect to buy or sell shares at NAV.</p>
<p><strong>Much of this piece is a re-run from last month, as its key point about the challenge of higher rates globally now seems more confirmed by market action. </strong> After a relief rally off the 4.40%ish high to just above 4.10%ish, the 10-year US Treasury has sold off. &ldquo;Higher for longer&rdquo; and the need for all risk markets to discount that scenario are now more clearly beginning to dominate. Most went into this summer and the presumed end of the Fed hiking cycle long duration, to our eye, whether in bonds directly or risk more generally (i.e., infinite-duration equites). And, the market also seems to understand the impact of the Bank of Japan&rsquo;s ability to choose how to manage liquidity &ndash; by reducing either Japanese government bonds (JGBs) <i>or </i>US Treasuries, the latter obviously having an impact on US and global duration. The same goes for the People&rsquo;s Bank of China&rsquo;s interventions, though those are focused on managing the currency. Either way, they are sellers of US duration.</p>
<p><strong>Risks to bonds are multiplying.</strong> A Fed declaring victory on inflation too soon, a US Treasury accelerating borrowing in 2023, a Bank of Japan allowing yields to rise in a market known to fund offshore carry trades, &ldquo;fiscal dominance&rdquo; in the US, UK, and other developed markets (DMs), and geopolitical facts (to which we continue to see great market denial) &ndash; all conspire toward higher yields. We&rsquo;ll start with the Fed. At its latest FOMC meeting, it paused rate hikes just after Fed Funds poked its head above its favored inflation measure (core PCE), when normally pauses happen several hundred basis points above core PCE. And this pause, even though since the previous meeting commodity and oil prices in particular had risen. In fact, the bulk of the inflation decline the Fed is declaring victory on might not only not yet be over, but was dominated by goods prices, not wages or services. Watch labor prices, particularly with labor unions activated and supported largely by both the left and right.</p>
<p>We won&rsquo;t say much about Treasury borrowing because we were early adopters of the &ldquo;fiscal dominance&rdquo; framework applied to DMs. We will re-emphasize that policymakers and market participants will be unable to accommodate this thinking because it doesn&rsquo;t fit their frameworks and humans in groups just don&rsquo;t change those until they explode, in our opinion. Because US Treasuries are assumed, <i>a priori</i>, to be &ldquo;risk-free&rdquo;, any curve steepness must be attributed to &ldquo;term premium&rdquo; (i.e., basically related to inflation), and not related to credit risk. Many will be looking at a radar screen that is no longer the guide it was, also a favorite of human groupings going back millennia. Good luck. And we know the sellers! The Bank of Japan is in a great position because it can sterilize, or not, its bond market interventions &ndash; it can sell JGBs, but if that pressures the yen or yields too much, they can just sell US treasuries. China can, too, by the way. Good luck, again.</p>
<p><strong>Good policy in emerging markets is an independent driver.</strong> As always, EM has plenty of uncorrelated economies and asset prices. High real interest rates in commodity-exporting countries like Colombia and Brazil, and low inflation in countries like most of EM Asia, remind how EM has generally been weathering these ongoing DM-led adverse scenarios. There are a lot of strong EM setups in the current environment. A Brazil beginning an overdue easing cycle while its balance-of-payments accounts continue to be a juggernaut is an obvious one. The country has lower inflation than the UK and Australia, and near-10%-positive real interest rates. Unfortunately, a lot of the other EM &ldquo;majors&rdquo; don&rsquo;t pass our tests, but we have found right-sized positions in Peru and Indonesia for other &ldquo;majors&rdquo; and in Uruguay, Dominican Republic, Zambia, and Sri Lanka for &ldquo;minors&rdquo;. Colombia could be a &ldquo;major&rdquo; that wins, too, and we increased exposure there in August. It&rsquo;s basically the only pure oil-beta among the &ldquo;majors&rdquo;. Whatever you think about the Fed, they aren&rsquo;t thinking about it in Sri Lanka and shouldn&rsquo;t. Talk about uncorrelated. If you want to get a sense of how un-anchored the core EM currencies and Chinese renminbi, could become, look at the chart below. With the US in &ldquo;higher for longer&rdquo; and China in &ldquo;stimulus mode&rdquo;, there are serious risks to China&rsquo;s currency.</p>
<h3>China&rsquo;s Interest Rate Differential with US Means Pressure on CNH and Related EM Currencies</h3>
<p><img class="img-responsive w-100" src="https://www.vaneck.com/contentassets/aa72f17b77ff4cb6a5587230761711c7/3615_emb-monthly-blog_2023.09_v1_blog.svg" alt="The exhibit charts China&rsquo;s Interest Rate Differential with US, which Means Pressure on CNH" /></p>
<p class="chart-disclosure">Source: VanEck, August 2023. Past performance is no guarantee of future results.</p>
<p><strong><i>Quid nos facere?</i> Everyone got long carry and went on their summer holidays&hellip; and now rates are at risk of breaking big levels (4.4% on the 10-year Treasury is our level) to the upside.</strong> To us, this means big risks to bonds, especially duration, and extreme curation on EM local currency markets that are correlated with US rates. Mexico local currency looks very vulnerable to us. Cash should be well above average, until the tilt is priced or rejected. &ldquo;Sheep gotta do what sheep do and cannot do otherwise&rdquo;, and that is follow the other sheep while the hyenas make their plans. But even the hyenas have to fear the lion. And the lion is walking about. That lion is rising rates.</p>
<h2>EXPOSURE TYPES AND SIGNIFICANT CHANGES</h2>
<p>The changes to our top positions are summarized below. Our largest positions in August were Brazil, Mexico, South Africa, Indonesia, and Colombia:</p>
<ul class="content-list">
<li>We increased our local currency exposure in the Czech Republic and Brazil, and hard currency corporate exposure in Brazil. The Czech National Bank is probably the only central bank in the region that is unlikely to engage in premature policy easing &ndash; a factor that improves the country&rsquo;s policy test score within our investment process. Brazil&rsquo;s real interest rate cushion is still among the highest in EM, and the central bank clearly signaled that it will not be accelerating the pace of rate cuts, keeping an eye on both the inflation target (as the base effect became a headwind) and the government&rsquo;s fiscal performance. This also supports the policy test score for the country. The corporate bond in Brazil is one of the lower-cost producers globally of steel and iron ore, which might benefit from China&rsquo;s stimulus with its emphasis on supply-side measures.</li>
<li class="mt-2">We also increased our local currency exposure in Malaysia, South Korea, and Indonesia. Disinflation is still on track in all three countries, central banks are not in a hurry to cut, and we also think that currencies can benefit if China&rsquo;s renewed policy stimulus improves the growth outlook, giving a boost to the countries&rsquo; technical test scores.</li>
<li class="mt-2">Finally, we increased our hard currency corporate exposure in South Africa, Burkina Faso, and India, as well as hard currency sovereign exposure in Ecuador. Ecuador&rsquo;s assets sold-off too much after the assassination of a leading presidential candidate, while fundamentals/structural factors did not look nearly as bad as the price correction implied. In terms of our investment process, this improved the technical test score for the country. The gold-mining company in Burkina Faso is one of the strongest operators in the world, which is also actively diversifying its country exposure. In India, we bought a new issue, which is consistent with our investments in India&rsquo;s renewables.</li>
<li class="mt-2">We reduced our local currency exposure in Chile, and hard currency corporate exposure in Thailand. While some EM assets can benefit from a moderate growth rebound in China, high-beta currencies in countries where central banks are aggressively frontloading rate cuts (Chile) might not be that lucky. Thailand was expected to be among the major beneficiaries of China&rsquo;s post-pandemic reopening, but these benefits take a longer time to materialize, and this worsened the technical test score for the country.</li>
<li class="mt-2">We also reduced our hard currency sovereign exposure in Nigeria and Egypt, as well as hard currency sovereign and local exposure in Uzbekistan. We see no additional near-term catalysts in Uzbekistan, while the impact of the relatively uneventful elections is waning off. In regards to Nigeria and Egypt, our main concerns are reforms rollback, the uncertain policy direction, and inability to stick to ambitious structural programs. This explains why the initial market euphoria that accompanied catchy headlines was short-lived, as authorities failed to deliver on execution. In terms of our investment process, this worsened the policy test score for both countries.</li>
<li class="mt-2">Finally, we reduced our hard currency sovereign exposure in Hungary, Romania, Serbia, and Morocco. The Euro zone&rsquo;s growth outlook remains gloomy &ndash; a major headwind for small open Central European economies, which also affects the technical test score for these countries. As regards Morocco, our main concern is that valuations are getting stretched, limiting upside if global sentiment continues to deteriorate.</li>
</ul>
<p>To receive more <a href="https://www.vaneck.com/us/en/insights/emerging-markets-bonds/" title="Emerging Markets Bonds Insights"><strong>Emerging Markets Bonds</strong></a> insights, <a href="https://www.vaneck.com/us/en/subscribe/" title="Subscription Center"><strong>sign up in our subscription center</strong></a>.</p>
<style>
    .wrapped-div {
        max-width: 100%;
    }

    @media (max-width: 768px) {
        .wrapped-div {
            overflow-x: scroll;
        }
    }

    .wrapped-div-sector {
        max-width: 100%;
        overflow-x: scroll;
    }
</style>
]]></content:encoded>
</item><item rdf:about="https://www.vaneck.com/us/en/blogs/municipal-bonds/municipal-bonds-and-the-tax-tug-of-war/">
  <title>Municipal Bonds and the Tax Tug-of-War></title>
  <link>https://www.vaneck.com/us/en/blogs/municipal-bonds/municipal-bonds-and-the-tax-tug-of-war/</link>
  <description><![CDATA[While recent headlines suggest municipal bonds are in danger of losing their federal tax exemption, we have seen this show before and believe the asset class will retain its tax-exempt status.]]></description>
  <dc:creator>Tamara  Lowin</dc:creator>
  <dc:date>09/15/2023 06:30:00</dc:date>
<content:encoded><![CDATA[

<p>Every so often, whispers grow louder in financial circles about the potential end of the federal tax exemption for municipal bonds. These conversations have emerged, especially when concerns regarding federal spending come to the forefront, as was seen in the 1980s, 2009, and more recently in 2017. Now, once again, media headlines are warning that municipal bonds may be at risk of losing their federal tax exemption.</p>
<h2>A Brief History of Municipal Bonds&rsquo; Tax Exemption</h2>
<p>The federal tax exemption for municipal bonds has been a mainstay of the U.S. financial system for over a century, tracing its roots back to the Revenue Act of 1913. This Act, which reintroduced the federal income tax following the ratification of the 16th Amendment, specifically excluded interest from state and local bonds from an individual's gross income. This exemption essentially allows state and local governments to issue bonds at relatively lower interest rates, as the investors receiving the bond income are not taxed at the federal level.</p>
<h2>Keeping Borrowing Rates Low</h2>
<p>One of the primary benefits of the municipal bond tax exemption is that it makes borrowing cheaper for state and local governments. Over the decades, tax-exempt municipal bonds have financed a multitude of essential public projects, from schools, roads, and bridges to water treatment facilities and hospitals.</p>
<p>Contrast this with other developed countries, many of which do not have such exemptions in place. These countries often resort to direct federal financing for their infrastructure projects, leading to different borrowing dynamics and a potential strain on centralized fiscal policies. In the United States, the tax exemption provides a degree of fiscal independence to state and local governments. This independence allows them to prioritize projects that cater to the unique needs of their communities without an over-reliance on the federal government. In addition, municipal bond projects often lead to the creation of jobs in various sectors, from construction to administration, thereby stimulating local economies.</p>
<h2>Understanding the Concerns</h2>
<p>Tax exemption cannot be taken for granted. All tax exemptions are considered a budget expense, and from that viewpoint, municipal bonds cost the federal government about $40 billion a year. This amount increases as interest rates and federal income tax rates increase. Pre-refunded bonds lost their tax exemption in 2017, showing that municipal bonds are not immune.</p>
<p>Further, the current pressure on U.S. fiscal policy, punctuated by the recent rating downgrade, will push the budget office to find novel long-term cost savings, which will raise the consideration of expense lines once considered sacred cows, like the creation of the cap on state income tax in 2017. For newer politicians keen on making an immediate impact, the repeal or limitation of the tax exemption presents a seemingly straightforward method to increase federal revenue. At a surface level, eliminating the exemption could redirect billions into federal coffers. However, like previous periods where the tax exemption was called into question, we believe municipal bonds will ultimately retain their tax-exempt status.</p>
<h2>Why Municipal Bonds Will Likely Retain Their Exempt Status</h2>
<p>While the appeal of revisiting the municipal bond tax exemption might seem evident to politicians eager to make their mark, a deeper understanding reveals a more nuanced picture. Municipal bonds play a crucial role in stimulating local economies, and several compelling reasons suggest the continuation of this exemption:</p>
<ul class="content-list">
<li>Active Lobbying: Lobbyists have consistently educated legislative staffers about the benefits of this exemption, ensuring its value isn't lost amidst political changeovers. While many initially see the exemption as a tax break for the wealthy, the benefits to all levels of government are explained.</li>
<li>Strain on Local Governments: Removing this exemption would place undue stress on state and local governments, making them more reliant on federal aid, especially as infrastructure deteriorates.</li>
<li>Relatively Small Budget Impact: Though $40 billion is significant, it accounts for only about 2.5% of the budget gap. Its removal won't drastically alter the federal fiscal landscape.</li>
<li>Bipartisanship: The benefits of this exemption cut across party lines, making it a non-partisan issue. Both blue and red states and their voters reap the advantages, unlike the state income tax cap or the reduction of the mortgage interest cap Federal income tax deductions.</li>
</ul>
<h2>What Would Happen if Municipal Bonds Lost Their Federal Tax Exemption?</h2>
<p>While it is an unlikely event, should there ever be a change in the tax exemption status of municipal bonds, it's essential to understand its implications:</p>
<ul class="content-list">
<li>We would not expect existing tax-exempt bonds to suddenly become taxable, and back taxes won't be owed.</li>
<li>The demand for tax-exempt debt would likely surge, pressuring yields.</li>
<li>State and local tax exemptions would still appeal to current buyers, and the altered tax status would attract new entrants to the market.</li>
</ul>
<p>That said, while it's essential to remain vigilant about potential policy changes, the history, benefits, and bipartisan nature of the municipal bond tax exemption make a compelling case for its continued existence. Municipal bonds remain a cornerstone for infrastructure financing and, by extension, serve as a key catalyst for economic growth and job creation.</p>
<p>From an investment perspective, most investors seek stable and secure investment options in the face of economic decline marked by intense market volatility and wavering consumer confidence. With their strong credit ratings, lower volatility, and historically positive performance during economic downturns, <strong><a href="https://www.vaneck.com/us/en/blogs/municipal-bonds/slowing-economy-3-reasons-municipal-bonds-make-sense/" title="Slowing Economy: 3 Reasons Municipal Bonds Make Sense">municipal bonds can be a compelling way for investors to diversify their portfolio while also getting attractive tax-free income</a></strong>.</p>
<p><strong><a href="https://www.vaneck.com/us/en/blogs/municipal-bonds/municipal-bond-etfs-expect-more-from-your-munis/" title="Municipal Bond ETFs - Expect More from Your Munis">Learn more about VanEck&rsquo;s municipal bond ETFs.</a></strong></p>
<p>To receive more <a href="https://www.vaneck.com/us/en/insights/municipal-bonds/" title="Municipal Bonds Insights"><strong>Municipal Bonds</strong></a> insights, <a href="https://www.vaneck.com/us/en/subscribe/" title="Subscription Center"><strong>sign up in our subscription center</strong></a>.</p>
]]></content:encoded>
</item><item rdf:about="https://www.vaneck.com/us/en/blogs/income-investing/what-can-drive-fallen-angel-performance-from-here/">
  <title>What Can Drive Fallen Angel Performance From Here?></title>
  <link>https://www.vaneck.com/us/en/blogs/income-investing/what-can-drive-fallen-angel-performance-from-here/</link>
  <description><![CDATA[Several potential scenarios may reignite price performance as a driver of fallen angel outperformance, driven by their higher quality and the technical effect of buying oversold downgraded bonds.]]></description>
  <dc:creator>Nicolas  Fonseca, CFA</dc:creator>
  <dc:date>09/13/2023 06:30:00</dc:date>
<content:encoded><![CDATA[

<p>Fallen angels (as represented by the ICE US Fallen Angel High Yield 10% Constrained Index, &ldquo;H0CF&rdquo;) underperformed the broader high yield market (as represented by the ICE BofA US High Yield Index, &ldquo;H0A0&rdquo;) by 0.25% in August (0.04% vs 0.29%). Year-to-date, fallen angels are lagging by 0.99% (6.23% vs 7.22%). Lower credit quality issuers continue to outperform due to robust U.S. growth data and better-than-expected earnings with the CCC &amp; Lower US HY Index returning 13.62% YTD. Goldman Sachs has reduced its 12-month U.S. recession probability to 15%, crediting the positive inflation news and labor market data. As a higher quality strategy with a significantly greater tilt to BB rated bonds versus the broad market, fallen angels have not participated in the recent rally to the same extent as the lower quality broad high yield market.</p>
<br />
<h3>High Yield YTD Total Return</h3>
<p><img class="img-responsive w-100" src="https://www.vaneck.com/contentassets/610536f21cb94ada94a90563e8780a03/3596_angl_chart-01_2023.09_blog.svg" alt="High Yield YTD Total Return" /></p>
<p class="chart-disclosure">Source: ICE Data Services, VanEck. ICE BofA BB US High Yield Index, ICE BofA Single-B US High Yield Index and ICE BofA CCC &amp; Lower US High Yield Index. Please see definition for these and other terms referenced herein in the disclosures and definitions portion of this blog. Past performance is no guarantee of future results. Index performance is not representative of fund performance. It is not possible to invest in an index.</p>
<p>In terms of fund flows, high yield corporates have experienced approximately $1bn in outflows while Treasury products added approximately $9bn just in August. Short duration saw outflows, but the other categories (Floating, Ultra Short, Intermediate and Long) registered inflows.</p>
<h2>Can price returns drive outperformance going forward?</h2>
<p>The price return of fallen angels has been a key differentiator versus broad HY from a total return perspective, driven by the systematic purchases of oversold/undervalued bonds that have been downgraded to high yield and have tended to recover in the months after being downgraded.</p>
<p>Price return this year, however, has been a detractor. Two primary factors contributing to this decline are the scarcity of fallen angels and their longer duration. For instance, even though rising stars have historically boosted performance during periods of low downgrade volumes, the extended duration of rising stars in 2023 (accounting for 35% of the year's starting index value) has meant that they have not been additive to performance this year. With an average price of $88.75, fallen angels now have a lower average price compared to the broader high-yield market.</p>
<p>We believe there are several potential related scenarios that could reignite price performance as a driver of outperformance, as seen historically. First, corporate profits and financial positions might weaken due to rising debt costs and the possibility of an economic slowdown, leading to wider credit spreads. Lower-quality issuers, with limited capacity to refinance and sustain higher interest costs, may be particularly vulnerable. Given that credit spreads are currently near their tightest levels of the year, there's room for significant widening if a less favorable economic environment materializes. In a scenario where credit quality deteriorates and spreads widen, higher-quality bonds may outperform, potentially favoring fallen angels on a relative basis.</p>
<p>Similarly, in a more risk-averse environment, bond yields are likely to decrease from their current elevated levels, which could benefit longer-duration fallen angels compared to the broader high-yield market, all else equal. More importantly, a scenario of credit weakness could lead to a higher volume of new fallen angels. While we haven't witnessed a significant wave of downgrades since 2020, credit rating downgrades tend to lag behind changes in fundamentals. Although the overall credit market remains relatively robust, it's worth noting that credit metrics are beginning to reflect lower profits and increased funding costs, and defaults among highly leveraged borrowers are on the rise. According to J.P. Morgan, the value of defaults and distressed exchanges year-to-date is already approaching the eighth highest annual amount on record, with the potential to become the third-largest annual total by year-end. While it's impossible to predict the exact timing, given these broader dynamics, it's difficult to envision a scenario where downgrades do not increase. Historically, fallen angel price returns have been at their strongest, and their outperformance against the broader high-yield market has been most pronounced when a significant number of downgraded bonds, typically deeply discounted, enter the market.</p>
<p><strong><u>Fallen Angels Overall Statistics:</u></strong> Fallen angels yields increased by 20bps to 7.45 and broad HY yields by 12bps to 8.48 in August. The 10Y yield increased by 12bps to 4.09 but it saw a dip at the end of the month from 4.34. Spreads saw some widening while duration was almost unchanged. The fallen angel market value has declined with almost 3 times more rising stars than fallen angels so far this year. Defaults in the high yield market have begun to pick up and fallen angels have seen 0.50% default par (approx. $628m in par amount for just one issuer) vs 0.97% default par (approx. $13,368m in par amount for 11 issuers) in broad HY.</p>
<div class="wrapped-div">
<table style="width: 100%;">
<tbody>
<tr class="tbl-data">
<td class="tbl-header last text-center">&nbsp;</td>
<td class="tbl-header last text-center" style="border-right: outset;" colspan="5">Fallen Angel</td>
<td class="tbl-header last text-center" colspan="5">Broad HY</td>
</tr>
<tr class="tbl-data">
<td class="data-head last">&nbsp;</td>
<td class="data-head last">12/31/22</td>
<td class="data-head last">3/31/23</td>
<td class="data-head last">6/30/23</td>
<td class="data-head last">7/31/23</td>
<td class="data-head last" style="border-right: outset;">8/31/23</td>
<td class="data-head last">12/31/22</td>
<td class="data-head last">3/31/23</td>
<td class="data-head last">6/30/23</td>
<td class="data-head last">7/31/23</td>
<td class="data-head last">8/31/23</td>
</tr>
<tr class="tbl-data">
<td class="data-td last">Yield to Worst</td>
<td class="data-td data last">7.49</td>
<td class="data-td data last">7.08</td>
<td class="data-td data last">7.35</td>
<td class="data-td data last">7.25</td>
<td class="data-td data last" style="border-right: outset;">7.45</td>
<td class="data-td data last">8.89</td>
<td class="data-td data last">8.49</td>
<td class="data-td data last">8.56</td>
<td class="data-td data last">8.36</td>
<td class="data-td data last">8.48</td>
</tr>
<tr class="tbl-data">
<td class="data-td last">Effective Duration</td>
<td class="data-td data last">5.45</td>
<td class="data-td data last">5.30</td>
<td class="data-td data last">4.98</td>
<td class="data-td data last">4.97</td>
<td class="data-td data last" style="border-right: outset;">4.99</td>
<td class="data-td data last">4.04</td>
<td class="data-td data last">3.83</td>
<td class="data-td data last">3.65</td>
<td class="data-td data last">3.60</td>
</tr>
<tr class="tbl-data">
<td class="data-td last">Full Market Value ($mn)</td>
<td class="data-td data last">112,854</td>
<td class="data-td data last">114,776</td>
<td class="data-td data last">84,590</td>
<td class="data-td data last">83,904</td>
<td class="data-td data last" style="border-right: outset;">80,256</td>
<td class="data-td data last">1,199,909</td>
<td class="data-td data last">1,234,319</td>
<td class="data-td data last">1,218,316</td>
<td class="data-td data last">1,227,780</td>
<td class="data-td data last">1,219,310</td>
</tr>
<tr class="tbl-data">
<td class="data-td last">OAS</td>
<td class="data-td data last">337</td>
<td class="data-td data last">325</td>
<td class="data-td data last">297</td>
<td class="data-td data last">280</td>
<td class="data-td data last" style="border-right: outset;">293</td>
<td class="data-td data last">481</td>
<td class="data-td data last">458</td>
<td class="data-td data last">405</td>
<td class="data-td data last">379</td>
<td class="data-td data last">385</td>
</tr>
<tr class="tbl-data">
<td class="data-td last">No. of Issues</td>
<td class="data-td data last">212</td>
<td class="data-td data last">206</td>
<td class="data-td data last">163</td>
<td class="data-td data last">161</td>
<td class="data-td data last" style="border-right: outset;">158</td>
<td class="data-td data last">1,927</td>
<td class="data-td data last">1,916</td>
<td class="data-td data last">1,870</td>
<td class="data-td data last">1,869</td>
<td class="data-td data last">1,865</td>
</tr>
</tbody>
</table>
</div>
<br />
<p class="chart-disclosure">Source: ICE Data Services, VanEck. Fallen Angels: ICE US Fallen Angel High Yield 10% Constrained Index. Broad HY: ICE BofA US High Yield Index. OAS refers to &ldquo;option-adjusted spread.&rdquo; Please see definition for this and other terms referenced herein in the disclosures and definitions portion of this blog. Past performance is no guarantee of future results. Index performance is not representative of fund performance. It is not possible to invest in an index.</p>
<p><strong><u>New Fallen Angels:</u></strong> Two fallen angels were added in August, both in the banking sector: Associated Banc-Corp and Valley National Bancorp Tier 2 notes. These two were part of the broader banking sector downgrade by the rating agencies warning that funding risks and commercial real estate exposure may bring weaker profitability amid higher for longer interest rates. Over the last 12 and six months, Associated Banc-Corp posted price returns of -1.34% and -3.25%, respectively, while Valley National Bancorp posted -9.76% and -11.87%, respectively. With these latest additions, fallen angels account for 11.84% of index weight YTD.</p>
<div class="wrapped-div">
<table style="width: 100%;">
<tbody>
<tr class="tbl-data">
<td class="tbl-header last">Month-end Addition</td>
<td class="tbl-header last text-center">Name</td>
<td class="tbl-header last text-center">Rating</td>
<td class="tbl-header last text-center">Sector</td>
<td class="tbl-header last text-center">Industry</td>
<td class="tbl-header last text-center">% Mkt Value</td>
<td class="tbl-header last text-center">Price</td>
</tr>
<tr class="tbl-data">
<td class="data-td last">February</td>
<td class="data-td data last">Entegris Escrow Corp</td>
<td class="data-td data last">BB1</td>
<td class="data-td data last">Technology &amp; Electronics</td>
<td class="data-td data last">Electronics</td>
<td class="data-td data last">1.39</td>
<td class="data-td data last">90.92</td>
</tr>
<tr class="tbl-data">
<td class="data-td last">March</td>
<td class="data-td data last">First Republic Bank</td>
<td class="data-td data last">B3</td>
<td class="data-td data last">Banking</td>
<td class="data-td data last">0.40</td>
<td class="data-td data last">54.63</td>
</tr>
<tr class="tbl-data">
<td class="data-td last">March</td>
<td class="data-td data last">Nissan Motor Acceptance</td>
<td class="data-td data last">BB1</td>
<td class="data-td data last">Automotive</td>
<td class="data-td data last">Auto Loans</td>
<td class="data-td data last">2.57</td>
<td class="data-td data last">87.19</td>
</tr>
<tr class="tbl-data">
<td class="data-td last">March</td>
<td class="data-td data last">Nissan Motor</td>
<td class="data-td data last">BB1</td>
<td class="data-td data last">Automotive</td>
<td class="data-td data last">Automakers</td>
<td class="data-td data last">5.49</td>
<td class="data-td data last">92.98</td>
</tr>
<tr class="tbl-data">
<td class="data-td last">April</td>
<td class="data-td data last">Crane NXT</td>
<td class="data-td data last">BB3</td>
<td class="data-td data last">Capital Goods</td>
<td class="data-td data last">Diversified Capital Goods</td>
<td class="data-td data last">0.24</td>
<td class="data-td data last">70.99</td>
</tr>
<tr class="tbl-data">
<td class="data-td last">April</td>
<td class="data-td data last">Rogers Communications</td>
<td class="data-td data last">BB2</td>
<td class="data-td data last">Telecommunications</td>
<td class="data-td data last">Telecom - Wireless</td>
<td class="data-td data last">0.65</td>
<td class="data-td data last">90.35</td>
</tr>
<tr class="tbl-data">
<td class="data-td last">April</td>
<td class="data-td data last">Western Alliance Bancorporation</td>
<td class="data-td data last">BB1</td>
<td class="data-td data last">Banking</td>
<td class="data-td data last">0.44</td>
<td class="data-td data last">76.39</td>
</tr>
<tr class="tbl-data">
<td class="data-td last">August</td>
<td class="data-td data last">Associated Banc-Corp</td>
<td class="data-td data last">BB1</td>
<td class="data-td data last">Banking</td>
<td class="data-td data last">0.33</td>
<td class="data-td data last">95.69</td>
</tr>
<tr class="tbl-data">
<td class="data-td last">August</td>
<td class="data-td data last">Valley National Bancorp</td>
<td class="data-td data last">BB1</td>
<td class="data-td data last">Banking</td>
<td class="data-td data last">0.33</td>
<td class="data-td data last">79.84</td>
</tr>
</tbody>
</table>
</div>
<br />
<p class="chart-disclosure">Source: ICE Data Services, VanEck. Fallen Angels: ICE US Fallen Angel High Yield 10% Constrained Index. Past performance is no guarantee of future results. Not a recommendation to buy or sell any of the names/securities mentioned herein. Index performance is not representative of fund performance. It is not possible to invest in an index.</p>
<p><strong><u>Rising Stars:</u></strong> One issuer exited the index in August, Howmet Aerospace (Howmet), as Fitch upgraded it to &lsquo;BBB&rsquo;. Howmet has been steadily improving its profitability, which is supported by the company's leading and defensible market position and differentiated technology portfolio. Howmet Aerospace was part of the Covid wave of downgrades in April 2020, entering the index at $97.24 with a 1.30% exposure; it now exits at $99.55 and 2.04%. Over the last 12 months, Howmet Aerospace posted a price return -0.02% vs 1.82% for the broad high yield market, however, during its time in the fallen angel index, it posted price return of 2.38% vs 0.30% for broad high yield. Rising stars continue to be one of the main topics this year, even as their outperformance over broad HY before exiting the fallen angel index has been lower than the historical average as mentioned above.</p>
<div class="wrapped-div">
<table style="width: 100%;">
<tbody>
<tr class="tbl-data">
<td class="tbl-header last ">Month-end Exit</td>
<td class="tbl-header last text-center">Name</td>
<td class="tbl-header last text-center">Rating</td>
<td class="tbl-header last text-center">Sector</td>
<td class="tbl-header last text-center">Industry</td>
<td class="tbl-header last text-center">% Mkt Value</td>
<td class="tbl-header last text-center">Price</td>
</tr>
<tr class="tbl-data">
<td class="data-td last">February</td>
<td class="data-td data last">Autopistas Metropolitanas de Puerto Rico LLC</td>
<td class="data-td data last">BB1</td>
<td class="data-td data last">Transportation</td>
<td class="data-td data last">Transport Infrastructure/Services</td>
<td class="data-td data last">0.35</td>
<td class="data-td data last">100.49</td>
</tr>
<tr class="tbl-data">
<td class="data-td last">February</td>
<td class="data-td data last">Nokia Corp</td>
<td class="data-td data last">BB1</td>
<td class="data-td data last">Technology &amp; Electronics</td>
<td class="data-td data last">Tech Hardware &amp; Equipment</td>
<td class="data-td data last">0.47</td>
<td class="data-td data last">97.50</td>
</tr>
<tr class="tbl-data">
<td class="data-td last">March</td>
<td class="data-td data last">Western Midstream</td>
<td class="data-td data last">BB1</td>
<td class="data-td data last">Energy</td>
<td class="data-td data last">Gas Distribution</td>
<td class="data-td data last">5.27</td>
<td class="data-td data last">90.44</td>
</tr>
<tr class="tbl-data">
<td class="data-td last">April</td>
<td class="data-td data last">Sprint Capital Corp</td>
<td class="data-td data last">BB1</td>
<td class="data-td data last">Telecommunications</td>
<td class="data-td data last">Telecom - Wireless</td>
<td class="data-td data last">4.70</td>
<td class="data-td data last">114.25</td>
</tr>
<tr class="tbl-data">
<td class="data-td last">May</td>
<td class="data-td data last">Mattel Inc.</td>
<td class="data-td data last">BB2</td>
<td class="data-td data last">Consumer Goods</td>
<td class="data-td data last">Personal &amp; Household Products</td>
<td class="data-td data last">0.45</td>
<td class="data-td data last">85.32</td>
</tr>
<tr class="tbl-data">
<td class="data-td last">May</td>
<td class="data-td data last">Nissan Motor Acceptance</td>
<td class="data-td data last">BB1</td>
<td class="data-td data last">Automotive</td>
<td class="data-td data last">Auto Loans</td>
<td class="data-td data last">2.67</td>
<td class="data-td data last">85.12</td>
</tr>
<tr class="tbl-data">
<td class="data-td last">May</td>
<td class="data-td data last">Nissan Motor</td>
<td class="data-td data last">BB1</td>
<td class="data-td data last">Automotive</td>
<td class="data-td data last">Automakers</td>
<td class="data-td data last">5.57</td>
<td class="data-td data last">88.49</td>
</tr>
<tr class="tbl-data">
<td class="data-td last">May</td>
<td class="data-td data last">Occidental Petroleum Corp</td>
<td class="data-td data last">BB1</td>
<td class="data-td data last">Energy</td>
<td class="data-td data last">Energy - Exploration &amp; Production</td>
<td class="data-td data last">8.69</td>
<td class="data-td data last">93.82</td>
</tr>
<tr class="tbl-data">
<td class="data-td last">June</td>
<td class="data-td data last">APA Corp</td>
<td class="data-td data last">BB1</td>
<td class="data-td data last">Energy</td>
<td class="data-td data last">Energy - Exploration &amp; Production</td>
<td class="data-td data last">3.84</td>
<td class="data-td data last">82.69</td>
</tr>
<tr class="tbl-data">
<td class="data-td last">July</td>
<td class="data-td data last">Western Digital Corp</td>
<td class="data-td data last">BB1</td>
<td class="data-td data last">Technology &amp; Electronics</td>
<td class="data-td data last">Tech Hardware &amp; Equipment</td>
<td class="data-td data last">0.99</td>
<td class="data-td data last">76.97</td>
</tr>
<tr class="tbl-data">
<td class="data-td last">August</td>
<td class="data-td data last">Howmet Aerospace Inc</td>
<td class="data-td data last">BB1</td>
<td class="data-td data last">Capital Goods</td>
<td class="data-td data last">Aerospace/Defense</td>
<td class="data-td data last">2.04</td>
<td class="data-td data last">99.55</td>
</tr>
</tbody>
</table>
</div>
<br />
<p class="chart-disclosure">Source: ICE Data Services, VanEck. Fallen Angels: ICE US Fallen Angel High Yield 10% Constrained Index. Past performance is no guarantee of future results. Not a recommendation to buy or sell any of the names/securities mentioned herein. Index performance is not representative of fund performance. It is not possible to invest in an index.</p>
<p><strong><u>Fallen Angels Performance by Sector:</u></strong> There were no significant sector composition changes in August. The top three performers were Telecom (+2.83%), Consumer Goods (+1.39%) and Real Estate (1.33%) which were also the only sectors to see price increases in August, while the worst performers were Retail (-1.52%), Capital Goods (-1.22%) and Insurance (-1.15%). Leisure saw its exposure decreased as a large Las Vegas Sand issue was removed due to its maturity being shorter than 12 months away. Spreads widened in most sectors and prices decreased in all but three sectors, which were the same as the top three performers mentioned above. As of month-end, 63% of fallen angels are now trading in the $80s, 37% in the $90s and no sector is above par.</p>
<div class="wrapped-div">
<table style="width: 100%;">
<tbody>
<tr class="tbl-data">
<td class="tbl-header last text-center">&nbsp;</td>
<td class="tbl-header last text-center" style="border-right: outset;" colspan="5">Wgt (%)</td>
<td class="tbl-header last text-center" style="border-right: outset;" colspan="5">OAS</td>
<td class="tbl-header last text-center" style="border-right: outset;" colspan="5">Price</td>
<td class="tbl-header last text-center">Total<br />Return<br />(%)</td>
</tr>
<tr class="tbl-data">
<td class="data-td last">&nbsp;</td>
<td class="data-head last">12/31/22</td>
<td class="data-head last">3/31/23</td>
<td class="data-head last">6/30/23</td>
<td class="data-head last">7/31/23</td>
<td class="data-head last" style="border-right: outset;">8/31/23</td>
<td class="data-head last">12/31/22</td>
<td class="data-head last">3/31/23</td>
<td class="data-head last">4/30/23</td>
<td class="data-head last">7/31/23</td>
<td class="data-head last" style="border-right: outset;">8/31/23</td>
<td class="data-head last">12/31/22</td>
<td class="data-head last">3/31/23</td>
<td class="data-head last">4/30/23</td>
<td class="data-head last">7/31/23</td>
<td class="data-head last" style="border-right: outset;">8/31/23</td>
<td class="data-head last">MTD</td>
</tr>
<tr class="tbl-data">
<td class="data-td last">Automotive</td>
<td class="data-td data last">10.00</td>
<td class="data-td data last">18.06</td>
<td class="data-td data last">10.00</td>
<td class="data-td data last" style="border-right: outset;">10.00</td>
<td class="data-td data last">262</td>
<td class="data-td data last">246</td>
<td class="data-td data last">280</td>
<td class="data-td data last">192</td>
<td class="data-td data last" style="border-right: outset;">215</td>
<td class="data-td data last">91.35</td>
<td class="data-td data last">92.21</td>
<td class="data-td data last">91.08</td>
<td class="data-td data last">93.61</td>
<td class="data-td data last" style="border-right: outset;">92.21</td>
<td class="data-td data last">-1.06</td>
</tr>
<tr class="tbl-data">
<td class="data-td last">Banking</td>
<td class="data-td data last">3.81</td>
<td class="data-td data last">3.99</td>
<td class="data-td data last">3.20</td>
<td class="data-td data last">3.45</td>
<td class="data-td data last" style="border-right: outset;">4.29</td>
<td class="data-td data last">302</td>
<td class="data-td data last">415</td>
<td class="data-td data last">402</td>
<td class="data-td data last">279</td>
<td class="data-td data last" style="border-right: outset;">293</td>
<td class="data-td data last">96.85</td>
<td class="data-td data last">87.61</td>
<td class="data-td data last">82.73</td>
<td class="data-td data last">95.04</td>
<td class="data-td data last" style="border-right: outset;">92.92</td>
<td class="data-td data last">-0.48</td>
</tr>
<tr class="tbl-data">
<td class="data-td last">Basic Industry</td>
<td class="data-td data last">1.36</td>
<td class="data-td data last">1.33</td>
<td class="data-td data last">1.93</td>
<td class="data-td data last">1.98</td>
<td class="data-td data last" style="border-right: outset;">1.92</td>
<td class="data-td data last">226</td>
<td class="data-td data last">227</td>
<td class="data-td data last">232</td>
<td class="data-td data last">145</td>
<td class="data-td data last" style="border-right: outset;">174</td>
<td class="data-td data last">92.17</td>
<td class="data-td data last">93.85</td>
<td class="data-td data last">94.21</td>
<td class="data-td data last">95.35</td>
<td class="data-td data last" style="border-right: outset;">94.74</td>
<td class="data-td data last">-0.13</td>
</tr>
<tr class="tbl-data">
<td class="data-td last">Capital Goods</td>
<td class="data-td data last">5.12</td>
<td class="data-td data last">5.10</td>
<td class="data-td data last">7.66</td>
<td class="data-td data last">7.72</td>
<td class="data-td data last" style="border-right: outset;">5.88</td>
<td class="data-td data last">279</td>
<td class="data-td data last">240</td>
<td class="data-td data last">243</td>
<td class="data-td data last">187</td>
<td class="data-td data last" style="border-right: outset;">230</td>
<td class="data-td data last">95.01</td>
<td class="data-td data last">98.54</td>
<td class="data-td data last">97.31</td>
<td class="data-td data last">97.21</td>
<td class="data-td data last" style="border-right: outset;">94.19</td>
<td class="data-td data last">-1.22</td>
</tr>
<tr class="tbl-data">
<td class="data-td last">Consumer Goods</td>
<td class="data-td data last">3.07</td>
<td class="data-td data last">3.00</td>
<td class="data-td data last">3.62</td>
<td class="data-td data last">3.74</td>
<td class="data-td data last" style="border-right: outset;">3.99</td>
<td class="data-td data last">275</td>
<td class="data-td data last">255</td>
<td class="data-td data last">307</td>
<td class="data-td data last">258</td>
<td class="data-td data last" style="border-right: outset;">225</td>
<td class="data-td data last">88.90</td>
<td class="data-td data last">91.27</td>
<td class="data-td data last">90.39</td>
<td class="data-td data last">90.82</td>
<td class="data-td data last" style="border-right: outset;">91.68</td>
<td class="data-td data last">1.39</td>
</tr>
<tr class="tbl-data">
<td class="data-td last">Energy</td>
<td class="data-td data last">27.93</td>
<td class="data-td data last">22.16</td>
<td class="data-td data last">15.28</td>
<td class="data-td data last">15.64</td>
<td class="data-td data last" style="border-right: outset;">16.10</td>
<td class="data-td data last">293</td>
<td class="data-td data last">303</td>
<td class="data-td data last">293</td>
<td class="data-td data last">271</td>
<td class="data-td data last" style="border-right: outset;">272</td>
<td class="data-td data last">88.13</td>
<td class="data-td data last">90.05</td>
<td class="data-td data last">91.04</td>
<td class="data-td data last">90.27</td>
<td class="data-td data last" style="border-right: outset;">89.88</td>
<td class="data-td data last">0.25</td>
</tr>
<tr class="tbl-data">
<td class="data-td last">Financial Services</td>
<td class="data-td data last">0.65</td>
<td class="data-td data last">0.64</td>
<td class="data-td data last">0.94</td>
<td class="data-td data last" style="border-right: outset;">0.99</td>
<td class="data-td data last">540</td>
<td class="data-td data last">506</td>
<td class="data-td data last">512</td>
<td class="data-td data last">402</td>
<td class="data-td data last" style="border-right: outset;">407</td>
<td class="data-td data last">77.20</td>
<td class="data-td data last">80.27</td>
<td class="data-td data last">80.68</td>
<td class="data-td data last">82.64</td>
<td class="data-td data last" style="border-right: outset;">82.01</td>
<td class="data-td data last">-0.23</td>
</tr>
<tr class="tbl-data">
<td class="data-td last">Healthcare</td>
<td class="data-td data last">3.02</td>
<td class="data-td data last">3.03</td>
<td class="data-td data last">4.33</td>
<td class="data-td data last">4.40</td>
<td class="data-td data last" style="border-right: outset;">4.63</td>
<td class="data-td data last">362</td>
<td class="data-td data last">304</td>
<td class="data-td data last">303</td>
<td class="data-td data last">274</td>
<td class="data-td data last" style="border-right: outset;">282</td>
<td class="data-td data last">83.56</td>
<td class="data-td data last">86.47</td>
<td class="data-td data last">87.63</td>
<td class="data-td data last">86.98</td>
<td class="data-td data last" style="border-right: outset;">86.48</td>
<td class="data-td data last">-0.11</td>
</tr>
<tr class="tbl-data">
<td class="data-td last">Insurance</td>
<td class="data-td data last">0.85</td>
<td class="data-td data last">0.82</td>
<td class="data-td data last">1.15</td>
<td class="data-td data last" style="border-right: outset;">1.19</td>
<td class="data-td data last">347</td>
<td class="data-td data last">364</td>
<td class="data-td data last">375</td>
<td class="data-td data last">358</td>
<td class="data-td data last" style="border-right: outset;">374</td>
<td class="data-td data last">92.10</td>
<td class="data-td data last">92.99</td>
<td class="data-td data last">93.01</td>
<td class="data-td data last">90.97</td>
<td class="data-td data last" style="border-right: outset;">89.41</td>
<td class="data-td data last">-1.15</td>
</tr>
<tr class="tbl-data">
<td class="data-td last">Leisure</td>
<td class="data-td data last">7.88</td>
<td class="data-td data last">7.79</td>
<td class="data-td data last">10.42</td>
<td class="data-td data last">10.11</td>
<td class="data-td data last" style="border-right: outset;">7.88</td>
<td class="data-td data last">325</td>
<td class="data-td data last">243</td>
<td class="data-td data last">244</td>
<td class="data-td data last">182</td>
<td class="data-td data last" style="border-right: outset;">231</td>
<td class="data-td data last">89.95</td>
<td class="data-td data last">93.25</td>
<td class="data-td data last">93.67</td>
<td class="data-td data last">93.24</td>
<td class="data-td data last" style="border-right: outset;">90.96</td>
<td class="data-td data last">-0.28</td>
</tr>
<tr class="tbl-data">
<td class="data-td last">Real Estate</td>
<td class="data-td data last">5.13</td>
<td class="data-td data last">4.72</td>
<td class="data-td data last">6.22</td>
<td class="data-td data last">6.31</td>
<td class="data-td data last" style="border-right: outset;">6.68</td>
<td class="data-td data last">697</td>
<td class="data-td data last">701</td>
<td class="data-td data last">716</td>
<td class="data-td data last">594</td>
<td class="data-td data last" style="border-right: outset;">573</td>
<td class="data-td data last">79.46</td>
<td class="data-td data last">80.72</td>
<td class="data-td data last">80.39</td>
<td class="data-td data last">81.47</td>
<td class="data-td data last" style="border-right: outset;">82.22</td>
<td class="data-td data last">1.33</td>
</tr>
<tr class="tbl-data">
<td class="data-td last">Retail</td>
<td class="data-td data last">5.67</td>
<td class="data-td data last">5.49</td>
<td class="data-td data last">7.79</td>
<td class="data-td data last">7.91</td>
<td class="data-td data last" style="border-right: outset;">8.18</td>
<td class="data-td data last">471</td>
<td class="data-td data last">474</td>
<td class="data-td data last">429</td>
<td class="data-td data last">324</td>
<td class="data-td data last" style="border-right: outset;">343</td>
<td class="data-td data last">73.75</td>
<td class="data-td data last">74.72</td>
<td class="data-td data last">80.16</td>
<td class="data-td data last">83.32</td>
<td class="data-td data last" style="border-right: outset;">81.62</td>
<td class="data-td data last">-1.52</td>
</tr>
<tr class="tbl-data">
<td class="data-td last">Services</td>
<td class="data-td data last">0.38</td>
<td class="data-td data last">0.37</td>
<td class="data-td data last">0.53</td>
<td class="data-td data last">0.52</td>
<td class="data-td data last" style="border-right: outset;">0.55</td>
<td class="data-td data last">388</td>
<td class="data-td data last">368</td>
<td class="data-td data last">401</td>
<td class="data-td data last">355</td>
<td class="data-td data last" style="border-right: outset;">352</td>
<td class="data-td data last">87.11</td>
<td class="data-td data last">89.89</td>
<td class="data-td data last">89.00</td>
<td class="data-td data last">88.54</td>
<td class="data-td data last" style="border-right: outset;">88.43</td>
<td class="data-td data last">0.36</td>
</tr>
<tr class="tbl-data">
<td class="data-td last">Technology &amp; Electronics</td>
<td class="data-td data last">4.20</td>
<td class="data-td data last">4.67</td>
<td class="data-td data last">6.21</td>
<td class="data-td data last">5.30</td>
<td class="data-td data last" style="border-right: outset;">5.58</td>
<td class="data-td data last">327</td>
<td class="data-td data last">287</td>
<td class="data-td data last">320</td>
<td class="data-td data last">245</td>
<td class="data-td data last" style="border-right: outset;">245</td>
<td class="data-td data last">85.47</td>
<td class="data-td data last">88.19</td>
<td class="data-td data last">87.26</td>
<td class="data-td data last">89.70</td>
<td class="data-td data last" style="border-right: outset;">89.50</td>
<td class="data-td data last">0.22</td>
</tr>
<tr class="tbl-data">
<td class="data-td last">Telecommunications</td>
<td class="data-td data last">11.91</td>
<td class="data-td data last">11.68</td>
<td class="data-td data last">10.61</td>
<td class="data-td data last">10.66</td>
<td class="data-td data last" style="border-right: outset;">11.54</td>
<td class="data-td data last">423</td>
<td class="data-td data last">433</td>
<td class="data-td data last">533</td>
<td class="data-td data last">467</td>
<td class="data-td data last" style="border-right: outset;">437</td>
<td class="data-td data last">90.04</td>
<td class="data-td data last">91.39</td>
<td class="data-td data last">83.60</td>
<td class="data-td data last">84.54</td>
<td class="data-td data last" style="border-right: outset;">86.41</td>
<td class="data-td data last">2.83</td>
</tr>
<tr class="tbl-data">
<td class="data-td last">Transportation</td>
<td class="data-td data last">2.10</td>
<td class="data-td data last">1.78</td>
<td class="data-td data last">2.59</td>
<td class="data-td data last">2.63</td>
<td class="data-td data last" style="border-right: outset;">2.78</td>
<td class="data-td data last">279</td>
<td class="data-td data last">231</td>
<td class="data-td data last">199</td>
<td class="data-td data last">147</td>
<td class="data-td data last" style="border-right: outset;">126</td>
<td class="data-td data last">90.49</td>
<td class="data-td data last">92.69</td>
<td class="data-td data last">93.73</td>
<td class="data-td data last">94.96</td>
<td class="data-td data last" style="border-right: outset;">94.93</td>
<td class="data-td data last">0.31</td>
</tr>
<tr class="tbl-data">
<td class="data-td last">Utility</td>
<td class="data-td data last">6.93</td>
<td class="data-td data last">5.38</td>
<td class="data-td data last">7.52</td>
<td class="data-td data last">7.54</td>
<td class="data-td data last" style="border-right: outset;">7.83</td>
<td class="data-td data last">213</td>
<td class="data-td data last">206</td>
<td class="data-td data last">180</td>
<td class="data-td data last">165</td>
<td class="data-td data last" style="border-right: outset;">175</td>
<td class="data-td data last">89.95</td>
<td class="data-td data last">90.19</td>
<td class="data-td data last">91.99</td>
<td class="data-td data last">89.61</td>
<td class="data-td data last" style="border-right: outset;">88.44</td>
<td class="data-td data last">-0.91</td>
</tr>
<tr class="tbl-data">
<td class="data-td last">Total</td>
<td class="data-td data last">100</td>
<td class="data-td data last" style="border-right: outset;">100</td>
<td class="data-td data last">337</td>
<td class="data-td data last">325</td>
<td class="data-td data last">332</td>
<td class="data-td data last">280</td>
<td class="data-td data last" style="border-right: outset;">293</td>
<td class="data-td data last">87.91</td>
<td class="data-td data last">89.51</td>
<td class="data-td data last">89.07</td>
<td class="data-td data last">89.61</td>
<td class="data-td data last" style="border-right: outset;">88.75</td>
<td class="data-td data last">0.04</td>
</tr>
</tbody>
</table>
</div>
<br />
<p class="chart-disclosure">Source: ICE Data Services, VanEck. Fallen Angels: ICE US Fallen Angel High Yield 10% Constrained Index. Not intended as a recommendation to invest or divest in any of the sectors mentioned herein. Index performance is not representative of fund performance. It is not possible to invest in an index.</p>
<p><strong><u>Fallen Angels Performance by Rating:</u></strong> The BB-rated bucket was the only ratings category that saw spreads widen and price fall, thus the negative return.</p>
<div class="wrapped-div">
<table style="width: 100%;">
<tbody>
<tr class="tbl-data">
<td class="tbl-header last text-center">&nbsp;</td>
<td class="tbl-header last text-center" style="border-right: outset;" colspan="5">Wgt (%)</td>
<td class="tbl-header last text-center" style="border-right: outset;" colspan="5">OAS</td>
<td class="tbl-header last text-center" style="border-right: outset;" colspan="5">Price</td>
<td class="tbl-header last text-center">Total<br />Return<br />(%)</td>
</tr>
<tr class="tbl-data">
<td class="data-head last">&nbsp;</td>
<td class="data-head last">12/31/22</td>
<td class="data-head last">3/31/23</td>
<td class="data-head last">6/30/23</td>
<td class="data-head last">7/31/23</td>
<td class="data-head last" style="border-right: outset;">8/31/23</td>
<td class="data-head last">12/31/22</td>
<td class="data-head last">3/31/23</td>
<td class="data-head last">6/30/23</td>
<td class="data-head last">7/31/23</td>
<td class="data-head last" style="border-right: outset;">8/31/23</td>
<td class="data-head last">12/31/22</td>
<td class="data-head last">3/31/23</td>
<td class="data-head last">6/30/23</td>
<td class="data-head last">7/31/23</td>
<td class="data-head last" style="border-right: outset;">8/31/23</td>
<td class="data-head last">MTD</td>
</tr>
<tr class="tbl-data">
<td class="data-head last">BB</td>
<td class="data-td data last">87.00</td>
<td class="data-td data last">87.08</td>
<td class="data-td data last">83.01</td>
<td class="data-td data last">82.72</td>
<td class="data-td data last" style="border-right: outset;">81.56</td>
<td class="data-td data last">284</td>
<td class="data-td data last">281</td>
<td class="data-td data last">256</td>
<td class="data-td data last">238</td>
<td class="data-td data last" style="border-right: outset;">255</td>
<td class="data-td data last">90.02</td>
<td class="data-td data last">91.51</td>
<td class="data-td data last">89.83</td>
<td class="data-td data last">90.71</td>
<td class="data-td data last" style="border-right: outset;">89.47</td>
<td class="data-td data last">-0.36</td>
</tr>
<tr class="tbl-data">
<td class="data-head last">B</td>
<td class="data-td data last">10.95</td>
<td class="data-td data last">10.37</td>
<td class="data-td data last">13.31</td>
<td class="data-td data last">13.46</td>
<td class="data-td data last" style="border-right: outset;">14.40</td>
<td class="data-td data last">608</td>
<td class="data-td data last">500</td>
<td class="data-td data last">405</td>
<td class="data-td data last">396</td>
<td class="data-td data last" style="border-right: outset;">370</td>
<td class="data-td data last">82.50</td>
<td class="data-td data last">85.35</td>
<td class="data-td data last">89.55</td>
<td class="data-td data last">89.82</td>
<td class="data-td data last" style="border-right: outset;">91.18</td>
<td class="data-td data last">2.27</td>
</tr>
<tr class="tbl-data">
<td class="data-head last">CCC</td>
<td class="data-td data last">1.98</td>
<td class="data-td data last">2.50</td>
<td class="data-td data last">3.68</td>
<td class="data-td data last">3.82</td>
<td class="data-td data last" style="border-right: outset;">4.04</td>
<td class="data-td data last">1,020</td>
<td class="data-td data last">1,014</td>
<td class="data-td data last">852</td>
<td class="data-td data last">783</td>
<td class="data-td data last" style="border-right: outset;">785</td>
<td class="data-td data last">60.88</td>
<td class="data-td data last">64.60</td>
<td class="data-td data last">68.55</td>
<td class="data-td data last">70.35</td>
<td class="data-td data last" style="border-right: outset;">70.37</td>
<td class="data-td data last">0.79</td>
</tr>
<tr class="tbl-data">
<td class="data-head last">Total</td>
<td class="data-td data last">100</td>
<td class="data-td data last" style="border-right: outset;">100</td>
<td class="data-td data last">337</td>
<td class="data-td data last">325</td>
<td class="data-td data last">297</td>
<td class="data-td data last">280</td>
<td class="data-td data last" style="border-right: outset;">293</td>
<td class="data-td data last">87.91</td>
<td class="data-td data last">89.51</td>
<td class="data-td data last">88.78</td>
<td class="data-td data last">89.61</td>
<td class="data-td data last" style="border-right: outset;">88.75</td>
<td class="data-td data last">0.04</td>
</tr>
</tbody>
</table>
</div>
<br />
<p class="chart-disclosure">Source: ICE Data Services, VanEck. Does not have securities for all months of selected period. Returns are based on partial period data. Fallen Angels: ICE US Fallen Angel High Yield 10% Constrained Index. Past performance is no guarantee of future results. Index performance is not representative of fund performance. It is not possible to invest in an index.</p>
<p>To receive more <a href="https://www.vaneck.com/us/en/insights/income-investing/" title="Income Investing insights"><strong>Income Investing</strong></a> insights, <a href="https://www.vaneck.com/us/en/subscribe/" title=" Subscription Center"><strong>sign up in our subscription center</strong></a>.</p>
<style type="text/css">.wrapped-div {
        max-width: 100%;
    }

    @media (max-width: 1024px) {
        .wrapped-div {
            overflow-x: scroll;
        }
    }

    .wrapped-div-sector {
        max-width: 100%;
        overflow-x: scroll;
    }
</style>
<div class="row">
<div class="col-md-4 col-xs-12"><a href="https://www.youtube.com/embed/x1Y82ulooxw" data-video="https://youtu.be/x1Y82ulooxw" class="popup-youtube" title="Watch Video"><img class="img-responsive" style="margin-right: 15px; margin-top: 0px;" src="https://www.vaneck.com/contentassets/610536f21cb94ada94a90563e8780a03/3596_angl-august-video-update_thumbnail_2023.09_v1.jpg" alt="Watch Video" align="left" /></a></div>
<div class="col-md-8 col-xs-12"><br /><strong><a href="https://www.youtube.com/embed/x1Y82ulooxw" data-video=" https://youtu.be/x1Y82ulooxw" class="popup-youtube" title="Watch Video">Watch Video</a><br /></strong><a href="https://www.youtube.com/embed/x1Y82ulooxw" data-video="https://youtu.be/x1Y82ulooxw" class="popup-youtube" title="Watch Video" style="font-size: 16px; font-weight: bold; padding: 10px 0px 0px; margin-right: 20px; width: 202px;">Looking Ahead to Potential Fallen Angel Drivers</a></div>
</div>
<br />
<h3>High Yield YTD Total Return</h3>
<p><img class="img-responsive w-100" src="https://www.vaneck.com/contentassets/610536f21cb94ada94a90563e8780a03/3596_angl_chart-01_2023.09_blog.svg" alt="High Yield YTD Total Return" /></p>
<p class="chart-disclosure">Source: ICE Data Services, VanEck. ICE BofA BB US High Yield Index, ICE BofA Single-B US High Yield Index and ICE BofA CCC &amp; Lower US High Yield Index. Please see definition for these and other terms referenced herein in the disclosures and definitions portion of this blog. Past performance is no guarantee of future results. Index performance is not representative of fund performance. It is not possible to invest in an index.</p>
<p>In terms of fund flows, high yield corporates have experienced approximately $1bn in outflows while Treasury products added approximately $9bn just in August. Short duration saw outflows, but the other categories (Floating, Ultra Short, Intermediate and Long) registered inflows.</p>
<h2>Can price returns drive outperformance going forward?</h2>
<p>The price return of fallen angels has been a key differentiator versus broad HY from a total return perspective, driven by the systematic purchases of oversold/undervalued bonds that have been downgraded to high yield and have tended to recover in the months after being downgraded.</p>
<p>Price return this year, however, has been a detractor. Two primary factors contributing to this decline are the scarcity of fallen angels and their longer duration. For instance, even though rising stars have historically boosted performance during periods of low downgrade volumes, the extended duration of rising stars in 2023 (accounting for 35% of the year's starting index value) has meant that they have not been additive to performance this year. With an average price of $88.75, fallen angels now have a lower average price compared to the broader high-yield market.</p>
<p>We believe there are several potential related scenarios that could reignite price performance as a driver of outperformance, as seen historically. First, corporate profits and financial positions might weaken due to rising debt costs and the possibility of an economic slowdown, leading to wider credit spreads. Lower-quality issuers, with limited capacity to refinance and sustain higher interest costs, may be particularly vulnerable. Given that credit spreads are currently near their tightest levels of the year, there's room for significant widening if a less favorable economic environment materializes. In a scenario where credit quality deteriorates and spreads widen, higher-quality bonds may outperform, potentially favoring fallen angels on a relative basis.</p>
<p>Similarly, in a more risk-averse environment, bond yields are likely to decrease from their current elevated levels, which could benefit longer-duration fallen angels compared to the broader high-yield market, all else equal. More importantly, a scenario of credit weakness could lead to a higher volume of new fallen angels. While we haven't witnessed a significant wave of downgrades since 2020, credit rating downgrades tend to lag behind changes in fundamentals. Although the overall credit market remains relatively robust, it's worth noting that credit metrics are beginning to reflect lower profits and increased funding costs, and defaults among highly leveraged borrowers are on the rise. According to J.P. Morgan, the value of defaults and distressed exchanges year-to-date is already approaching the eighth highest annual amount on record, with the potential to become the third-largest annual total by year-end. While it's impossible to predict the exact timing, given these broader dynamics, it's difficult to envision a scenario where downgrades do not increase. Historically, fallen angel price returns have been at their strongest, and their outperformance against the broader high-yield market has been most pronounced when a significant number of downgraded bonds, typically deeply discounted, enter the market.</p>
<p><strong><u>Fallen Angels Overall Statistics:</u></strong> Fallen angels yields increased by 20bps to 7.45 and broad HY yields by 12bps to 8.48 in August. The 10Y yield increased by 12bps to 4.09 but it saw a dip at the end of the month from 4.34. Spreads saw some widening while duration was almost unchanged. The fallen angel market value has declined with almost 3 times more rising stars than fallen angels so far this year. Defaults in the high yield market have begun to pick up and fallen angels have seen 0.50% default par (approx. $628m in par amount for just one issuer) vs 0.97% default par (approx. $13,368m in par amount for 11 issuers) in broad HY.</p>
<div class="wrapped-div">
<table style="width: 100%;">
<tbody>
<tr class="tbl-data">
<td class="tbl-header last text-center">&nbsp;</td>
<td class="tbl-header last text-center" style="border-right: outset;" colspan="5">Fallen Angel</td>
<td class="tbl-header last text-center" colspan="5">Broad HY</td>
</tr>
<tr class="tbl-data">
<td class="data-head last">&nbsp;</td>
<td class="data-head last">12/31/22</td>
<td class="data-head last">3/31/23</td>
<td class="data-head last">6/30/23</td>
<td class="data-head last">7/31/23</td>
<td class="data-head last" style="border-right: outset;">8/31/23</td>
<td class="data-head last">12/31/22</td>
<td class="data-head last">3/31/23</td>
<td class="data-head last">6/30/23</td>
<td class="data-head last">7/31/23</td>
<td class="data-head last">8/31/23</td>
</tr>
<tr class="tbl-data">
<td class="data-td last">Yield to Worst</td>
<td class="data-td data last">7.49</td>
<td class="data-td data last">7.08</td>
<td class="data-td data last">7.35</td>
<td class="data-td data last">7.25</td>
<td class="data-td data last" style="border-right: outset;">7.45</td>
<td class="data-td data last">8.89</td>
<td class="data-td data last">8.49</td>
<td class="data-td data last">8.56</td>
<td class="data-td data last">8.36</td>
<td class="data-td data last">8.48</td>
</tr>
<tr class="tbl-data">
<td class="data-td last">Effective Duration</td>
<td class="data-td data last">5.45</td>
<td class="data-td data last">5.30</td>
<td class="data-td data last">4.98</td>
<td class="data-td data last">4.97</td>
<td class="data-td data last" style="border-right: outset;">4.99</td>
<td class="data-td data last">4.04</td>
<td class="data-td data last">3.83</td>
<td class="data-td data last">3.65</td>
<td class="data-td data last">3.60</td>
</tr>
<tr class="tbl-data">
<td class="data-td last">Full Market Value ($mn)</td>
<td class="data-td data last">112,854</td>
<td class="data-td data last">114,776</td>
<td class="data-td data last">84,590</td>
<td class="data-td data last">83,904</td>
<td class="data-td data last" style="border-right: outset;">80,256</td>
<td class="data-td data last">1,199,909</td>
<td class="data-td data last">1,234,319</td>
<td class="data-td data last">1,218,316</td>
<td class="data-td data last">1,227,780</td>
<td class="data-td data last">1,219,310</td>
</tr>
<tr class="tbl-data">
<td class="data-td last">OAS</td>
<td class="data-td data last">337</td>
<td class="data-td data last">325</td>
<td class="data-td data last">297</td>
<td class="data-td data last">280</td>
<td class="data-td data last" style="border-right: outset;">293</td>
<td class="data-td data last">481</td>
<td class="data-td data last">458</td>
<td class="data-td data last">405</td>
<td class="data-td data last">379</td>
<td class="data-td data last">385</td>
</tr>
<tr class="tbl-data">
<td class="data-td last">No. of Issues</td>
<td class="data-td data last">212</td>
<td class="data-td data last">206</td>
<td class="data-td data last">163</td>
<td class="data-td data last">161</td>
<td class="data-td data last" style="border-right: outset;">158</td>
<td class="data-td data last">1,927</td>
<td class="data-td data last">1,916</td>
<td class="data-td data last">1,870</td>
<td class="data-td data last">1,869</td>
<td class="data-td data last">1,865</td>
</tr>
</tbody>
</table>
</div>
<br />
<p class="chart-disclosure">Source: ICE Data Services, VanEck. Fallen Angels: ICE US Fallen Angel High Yield 10% Constrained Index. Broad HY: ICE BofA US High Yield Index. OAS refers to &ldquo;option-adjusted spread.&rdquo; Please see definition for this and other terms referenced herein in the disclosures and definitions portion of this blog. Past performance is no guarantee of future results. Index performance is not representative of fund performance. It is not possible to invest in an index.</p>
<p><strong><u>New Fallen Angels:</u></strong> Two fallen angels were added in August, both in the banking sector: Associated Banc-Corp and Valley National Bancorp Tier 2 notes. These two were part of the broader banking sector downgrade by the rating agencies warning that funding risks and commercial real estate exposure may bring weaker profitability amid higher for longer interest rates. Over the last 12 and six months, Associated Banc-Corp posted price returns of -1.34% and -3.25%, respectively, while Valley National Bancorp posted -9.76% and -11.87%, respectively. With these latest additions, fallen angels account for 11.84% of index weight YTD.</p>
<div class="wrapped-div">
<table style="width: 100%;">
<tbody>
<tr class="tbl-data">
<td class="tbl-header last">Month-end Addition</td>
<td class="tbl-header last text-center">Name</td>
<td class="tbl-header last text-center">Rating</td>
<td class="tbl-header last text-center">Sector</td>
<td class="tbl-header last text-center">Industry</td>
<td class="tbl-header last text-center">% Mkt Value</td>
<td class="tbl-header last text-center">Price</td>
</tr>
<tr class="tbl-data">
<td class="data-td last">February</td>
<td class="data-td data last">Entegris Escrow Corp</td>
<td class="data-td data last">BB1</td>
<td class="data-td data last">Technology &amp; Electronics</td>
<td class="data-td data last">Electronics</td>
<td class="data-td data last">1.39</td>
<td class="data-td data last">90.92</td>
</tr>
<tr class="tbl-data">
<td class="data-td last">March</td>
<td class="data-td data last">First Republic Bank</td>
<td class="data-td data last">B3</td>
<td class="data-td data last">Banking</td>
<td class="data-td data last">0.40</td>
<td class="data-td data last">54.63</td>
</tr>
<tr class="tbl-data">
<td class="data-td last">March</td>
<td class="data-td data last">Nissan Motor Acceptance</td>
<td class="data-td data last">BB1</td>
<td class="data-td data last">Automotive</td>
<td class="data-td data last">Auto Loans</td>
<td class="data-td data last">2.57</td>
<td class="data-td data last">87.19</td>
</tr>
<tr class="tbl-data">
<td class="data-td last">March</td>
<td class="data-td data last">Nissan Motor</td>
<td class="data-td data last">BB1</td>
<td class="data-td data last">Automotive</td>
<td class="data-td data last">Automakers</td>
<td class="data-td data last">5.49</td>
<td class="data-td data last">92.98</td>
</tr>
<tr class="tbl-data">
<td class="data-td last">April</td>
<td class="data-td data last">Crane NXT</td>
<td class="data-td data last">BB3</td>
<td class="data-td data last">Capital Goods</td>
<td class="data-td data last">Diversified Capital Goods</td>
<td class="data-td data last">0.24</td>
<td class="data-td data last">70.99</td>
</tr>
<tr class="tbl-data">
<td class="data-td last">April</td>
<td class="data-td data last">Rogers Communications</td>
<td class="data-td data last">BB2</td>
<td class="data-td data last">Telecommunications</td>
<td class="data-td data last">Telecom - Wireless</td>
<td class="data-td data last">0.65</td>
<td class="data-td data last">90.35</td>
</tr>
<tr class="tbl-data">
<td class="data-td last">April</td>
<td class="data-td data last">Western Alliance Bancorporation</td>
<td class="data-td data last">BB1</td>
<td class="data-td data last">Banking</td>
<td class="data-td data last">0.44</td>
<td class="data-td data last">76.39</td>
</tr>
<tr class="tbl-data">
<td class="data-td last">August</td>
<td class="data-td data last">Associated Banc-Corp</td>
<td class="data-td data last">BB1</td>
<td class="data-td data last">Banking</td>
<td class="data-td data last">0.33</td>
<td class="data-td data last">95.69</td>
</tr>
<tr class="tbl-data">
<td class="data-td last">August</td>
<td class="data-td data last">Valley National Bancorp</td>
<td class="data-td data last">BB1</td>
<td class="data-td data last">Banking</td>
<td class="data-td data last">0.33</td>
<td class="data-td data last">79.84</td>
</tr>
</tbody>
</table>
</div>
<br />
<p class="chart-disclosure">Source: ICE Data Services, VanEck. Fallen Angels: ICE US Fallen Angel High Yield 10% Constrained Index. Past performance is no guarantee of future results. Not a recommendation to buy or sell any of the names/securities mentioned herein. Index performance is not representative of fund performance. It is not possible to invest in an index.</p>
<p><strong><u>Rising Stars:</u></strong> One issuer exited the index in August, Howmet Aerospace (Howmet), as Fitch upgraded it to &lsquo;BBB&rsquo;. Howmet has been steadily improving its profitability, which is supported by the company's leading and defensible market position and differentiated technology portfolio. Howmet Aerospace was part of the Covid wave of downgrades in April 2020, entering the index at $97.24 with a 1.30% exposure; it now exits at $99.55 and 2.04%. Over the last 12 months, Howmet Aerospace posted a price return -0.02% vs 1.82% for the broad high yield market, however, during its time in the fallen angel index, it posted price return of 2.38% vs 0.30% for broad high yield. Rising stars continue to be one of the main topics this year, even as their outperformance over broad HY before exiting the fallen angel index has been lower than the historical average as mentioned above.</p>
<div class="wrapped-div">
<table style="width: 100%;">
<tbody>
<tr class="tbl-data">
<td class="tbl-header last ">Month-end Exit</td>
<td class="tbl-header last text-center">Name</td>
<td class="tbl-header last text-center">Rating</td>
<td class="tbl-header last text-center">Sector</td>
<td class="tbl-header last text-center">Industry</td>
<td class="tbl-header last text-center">% Mkt Value</td>
<td class="tbl-header last text-center">Price</td>
</tr>
<tr class="tbl-data">
<td class="data-td last">February</td>
<td class="data-td data last">Autopistas Metropolitanas de Puerto Rico LLC</td>
<td class="data-td data last">BB1</td>
<td class="data-td data last">Transportation</td>
<td class="data-td data last">Transport Infrastructure/Services</td>
<td class="data-td data last">0.35</td>
<td class="data-td data last">100.49</td>
</tr>
<tr class="tbl-data">
<td class="data-td last">February</td>
<td class="data-td data last">Nokia Corp</td>
<td class="data-td data last">BB1</td>
<td class="data-td data last">Technology &amp; Electronics</td>
<td class="data-td data last">Tech Hardware &amp; Equipment</td>
<td class="data-td data last">0.47</td>
<td class="data-td data last">97.50</td>
</tr>
<tr class="tbl-data">
<td class="data-td last">March</td>
<td class="data-td data last">Western Midstream</td>
<td class="data-td data last">BB1</td>
<td class="data-td data last">Energy</td>
<td class="data-td data last">Gas Distribution</td>
<td class="data-td data last">5.27</td>
<td class="data-td data last">90.44</td>
</tr>
<tr class="tbl-data">
<td class="data-td last">April</td>
<td class="data-td data last">Sprint Capital Corp</td>
<td class="data-td data last">BB1</td>
<td class="data-td data last">Telecommunications</td>
<td class="data-td data last">Telecom - Wireless</td>
<td class="data-td data last">4.70</td>
<td class="data-td data last">114.25</td>
</tr>
<tr class="tbl-data">
<td class="data-td last">May</td>
<td class="data-td data last">Mattel Inc.</td>
<td class="data-td data last">BB2</td>
<td class="data-td data last">Consumer Goods</td>
<td class="data-td data last">Personal &amp; Household Products</td>
<td class="data-td data last">0.45</td>
<td class="data-td data last">85.32</td>
</tr>
<tr class="tbl-data">
<td class="data-td last">May</td>
<td class="data-td data last">Nissan Motor Acceptance</td>
<td class="data-td data last">BB1</td>
<td class="data-td data last">Automotive</td>
<td class="data-td data last">Auto Loans</td>
<td class="data-td data last">2.67</td>
<td class="data-td data last">85.12</td>
</tr>
<tr class="tbl-data">
<td class="data-td last">May</td>
<td class="data-td data last">Nissan Motor</td>
<td class="data-td data last">BB1</td>
<td class="data-td data last">Automotive</td>
<td class="data-td data last">Automakers</td>
<td class="data-td data last">5.57</td>
<td class="data-td data last">88.49</td>
</tr>
<tr class="tbl-data">
<td class="data-td last">May</td>
<td class="data-td data last">Occidental Petroleum Corp</td>
<td class="data-td data last">BB1</td>
<td class="data-td data last">Energy</td>
<td class="data-td data last">Energy - Exploration &amp; Production</td>
<td class="data-td data last">8.69</td>
<td class="data-td data last">93.82</td>
</tr>
<tr class="tbl-data">
<td class="data-td last">June</td>
<td class="data-td data last">APA Corp</td>
<td class="data-td data last">BB1</td>
<td class="data-td data last">Energy</td>
<td class="data-td data last">Energy - Exploration &amp; Production</td>
<td class="data-td data last">3.84</td>
<td class="data-td data last">82.69</td>
</tr>
<tr class="tbl-data">
<td class="data-td last">July</td>
<td class="data-td data last">Western Digital Corp</td>
<td class="data-td data last">BB1</td>
<td class="data-td data last">Technology &amp; Electronics</td>
<td class="data-td data last">Tech Hardware &amp; Equipment</td>
<td class="data-td data last">0.99</td>
<td class="data-td data last">76.97</td>
</tr>
<tr class="tbl-data">
<td class="data-td last">August</td>
<td class="data-td data last">Howmet Aerospace Inc</td>
<td class="data-td data last">BB1</td>
<td class="data-td data last">Capital Goods</td>
<td class="data-td data last">Aerospace/Defense</td>
<td class="data-td data last">2.04</td>
<td class="data-td data last">99.55</td>
</tr>
</tbody>
</table>
</div>
<br />
<p class="chart-disclosure">Source: ICE Data Services, VanEck. Fallen Angels: ICE US Fallen Angel High Yield 10% Constrained Index. Past performance is no guarantee of future results. Not a recommendation to buy or sell any of the names/securities mentioned herein. Index performance is not representative of fund performance. It is not possible to invest in an index.</p>
<p><strong><u>Fallen Angels Performance by Sector:</u></strong> There were no significant sector composition changes in August. The top three performers were Telecom (+2.83%), Consumer Goods (+1.39%) and Real Estate (1.33%) which were also the only sectors to see price increases in August, while the worst performers were Retail (-1.52%), Capital Goods (-1.22%) and Insurance (-1.15%). Leisure saw its exposure decreased as a large Las Vegas Sand issue was removed due to its maturity being shorter than 12 months away. Spreads widened in most sectors and prices decreased in all but three sectors, which were the same as the top three performers mentioned above. As of month-end, 63% of fallen angels are now trading in the $80s, 37% in the $90s and no sector is above par.</p>
<div class="wrapped-div">
<table style="width: 100%;">
<tbody>
<tr class="tbl-data">
<td class="tbl-header last text-center">&nbsp;</td>
<td class="tbl-header last text-center" style="border-right: outset;" colspan="5">Wgt (%)</td>
<td class="tbl-header last text-center" style="border-right: outset;" colspan="5">OAS</td>
<td class="tbl-header last text-center" style="border-right: outset;" colspan="5">Price</td>
<td class="tbl-header last text-center">Total<br />Return<br />(%)</td>
</tr>
<tr class="tbl-data">
<td class="data-td last">&nbsp;</td>
<td class="data-head last">12/31/22</td>
<td class="data-head last">3/31/23</td>
<td class="data-head last">6/30/23</td>
<td class="data-head last">7/31/23</td>
<td class="data-head last" style="border-right: outset;">8/31/23</td>
<td class="data-head last">12/31/22</td>
<td class="data-head last">3/31/23</td>
<td class="data-head last">4/30/23</td>
<td class="data-head last">7/31/23</td>
<td class="data-head last" style="border-right: outset;">8/31/23</td>
<td class="data-head last">12/31/22</td>
<td class="data-head last">3/31/23</td>
<td class="data-head last">4/30/23</td>
<td class="data-head last">7/31/23</td>
<td class="data-head last" style="border-right: outset;">8/31/23</td>
<td class="data-head last">MTD</td>
</tr>
<tr class="tbl-data">
<td class="data-td last">Automotive</td>
<td class="data-td data last">10.00</td>
<td class="data-td data last">18.06</td>
<td class="data-td data last">10.00</td>
<td class="data-td data last" style="border-right: outset;">10.00</td>
<td class="data-td data last">262</td>
<td class="data-td data last">246</td>
<td class="data-td data last">280</td>
<td class="data-td data last">192</td>
<td class="data-td data last" style="border-right: outset;">215</td>
<td class="data-td data last">91.35</td>
<td class="data-td data last">92.21</td>
<td class="data-td data last">91.08</td>
<td class="data-td data last">93.61</td>
<td class="data-td data last" style="border-right: outset;">92.21</td>
<td class="data-td data last">-1.06</td>
</tr>
<tr class="tbl-data">
<td class="data-td last">Banking</td>
<td class="data-td data last">3.81</td>
<td class="data-td data last">3.99</td>
<td class="data-td data last">3.20</td>
<td class="data-td data last">3.45</td>
<td class="data-td data last" style="border-right: outset;">4.29</td>
<td class="data-td data last">302</td>
<td class="data-td data last">415</td>
<td class="data-td data last">402</td>
<td class="data-td data last">279</td>
<td class="data-td data last" style="border-right: outset;">293</td>
<td class="data-td data last">96.85</td>
<td class="data-td data last">87.61</td>
<td class="data-td data last">82.73</td>
<td class="data-td data last">95.04</td>
<td class="data-td data last" style="border-right: outset;">92.92</td>
<td class="data-td data last">-0.48</td>
</tr>
<tr class="tbl-data">
<td class="data-td last">Basic Industry</td>
<td class="data-td data last">1.36</td>
<td class="data-td data last">1.33</td>
<td class="data-td data last">1.93</td>
<td class="data-td data last">1.98</td>
<td class="data-td data last" style="border-right: outset;">1.92</td>
<td class="data-td data last">226</td>
<td class="data-td data last">227</td>
<td class="data-td data last">232</td>
<td class="data-td data last">145</td>
<td class="data-td data last" style="border-right: outset;">174</td>
<td class="data-td data last">92.17</td>
<td class="data-td data last">93.85</td>
<td class="data-td data last">94.21</td>
<td class="data-td data last">95.35</td>
<td class="data-td data last" style="border-right: outset;">94.74</td>
<td class="data-td data last">-0.13</td>
</tr>
<tr class="tbl-data">
<td class="data-td last">Capital Goods</td>
<td class="data-td data last">5.12</td>
<td class="data-td data last">5.10</td>
<td class="data-td data last">7.66</td>
<td class="data-td data last">7.72</td>
<td class="data-td data last" style="border-right: outset;">5.88</td>
<td class="data-td data last">279</td>
<td class="data-td data last">240</td>
<td class="data-td data last">243</td>
<td class="data-td data last">187</td>
<td class="data-td data last" style="border-right: outset;">230</td>
<td class="data-td data last">95.01</td>
<td class="data-td data last">98.54</td>
<td class="data-td data last">97.31</td>
<td class="data-td data last">97.21</td>
<td class="data-td data last" style="border-right: outset;">94.19</td>
<td class="data-td data last">-1.22</td>
</tr>
<tr class="tbl-data">
<td class="data-td last">Consumer Goods</td>
<td class="data-td data last">3.07</td>
<td class="data-td data last">3.00</td>
<td class="data-td data last">3.62</td>
<td class="data-td data last">3.74</td>
<td class="data-td data last" style="border-right: outset;">3.99</td>
<td class="data-td data last">275</td>
<td class="data-td data last">255</td>
<td class="data-td data last">307</td>
<td class="data-td data last">258</td>
<td class="data-td data last" style="border-right: outset;">225</td>
<td class="data-td data last">88.90</td>
<td class="data-td data last">91.27</td>
<td class="data-td data last">90.39</td>
<td class="data-td data last">90.82</td>
<td class="data-td data last" style="border-right: outset;">91.68</td>
<td class="data-td data last">1.39</td>
</tr>
<tr class="tbl-data">
<td class="data-td last">Energy</td>
<td class="data-td data last">27.93</td>
<td class="data-td data last">22.16</td>
<td class="data-td data last">15.28</td>
<td class="data-td data last">15.64</td>
<td class="data-td data last" style="border-right: outset;">16.10</td>
<td class="data-td data last">293</td>
<td class="data-td data last">303</td>
<td class="data-td data last">293</td>
<td class="data-td data last">271</td>
<td class="data-td data last" style="border-right: outset;">272</td>
<td class="data-td data last">88.13</td>
<td class="data-td data last">90.05</td>
<td class="data-td data last">91.04</td>
<td class="data-td data last">90.27</td>
<td class="data-td data last" style="border-right: outset;">89.88</td>
<td class="data-td data last">0.25</td>
</tr>
<tr class="tbl-data">
<td class="data-td last">Financial Services</td>
<td class="data-td data last">0.65</td>
<td class="data-td data last">0.64</td>
<td class="data-td data last">0.94</td>
<td class="data-td data last" style="border-right: outset;">0.99</td>
<td class="data-td data last">540</td>
<td class="data-td data last">506</td>
<td class="data-td data last">512</td>
<td class="data-td data last">402</td>
<td class="data-td data last" style="border-right: outset;">407</td>
<td class="data-td data last">77.20</td>
<td class="data-td data last">80.27</td>
<td class="data-td data last">80.68</td>
<td class="data-td data last">82.64</td>
<td class="data-td data last" style="border-right: outset;">82.01</td>
<td class="data-td data last">-0.23</td>
</tr>
<tr class="tbl-data">
<td class="data-td last">Healthcare</td>
<td class="data-td data last">3.02</td>
<td class="data-td data last">3.03</td>
<td class="data-td data last">4.33</td>
<td class="data-td data last">4.40</td>
<td class="data-td data last" style="border-right: outset;">4.63</td>
<td class="data-td data last">362</td>
<td class="data-td data last">304</td>
<td class="data-td data last">303</td>
<td class="data-td data last">274</td>
<td class="data-td data last" style="border-right: outset;">282</td>
<td class="data-td data last">83.56</td>
<td class="data-td data last">86.47</td>
<td class="data-td data last">87.63</td>
<td class="data-td data last">86.98</td>
<td class="data-td data last" style="border-right: outset;">86.48</td>
<td class="data-td data last">-0.11</td>
</tr>
<tr class="tbl-data">
<td class="data-td last">Insurance</td>
<td class="data-td data last">0.85</td>
<td class="data-td data last">0.82</td>
<td class="data-td data last">1.15</td>
<td class="data-td data last" style="border-right: outset;">1.19</td>
<td class="data-td data last">347</td>
<td class="data-td data last">364</td>
<td class="data-td data last">375</td>
<td class="data-td data last">358</td>
<td class="data-td data last" style="border-right: outset;">374</td>
<td class="data-td data last">92.10</td>
<td class="data-td data last">92.99</td>
<td class="data-td data last">93.01</td>
<td class="data-td data last">90.97</td>
<td class="data-td data last" style="border-right: outset;">89.41</td>
<td class="data-td data last">-1.15</td>
</tr>
<tr class="tbl-data">
<td class="data-td last">Leisure</td>
<td class="data-td data last">7.88</td>
<td class="data-td data last">7.79</td>
<td class="data-td data last">10.42</td>
<td class="data-td data last">10.11</td>
<td class="data-td data last" style="border-right: outset;">7.88</td>
<td class="data-td data last">325</td>
<td class="data-td data last">243</td>
<td class="data-td data last">244</td>
<td class="data-td data last">182</td>
<td class="data-td data last" style="border-right: outset;">231</td>
<td class="data-td data last">89.95</td>
<td class="data-td data last">93.25</td>
<td class="data-td data last">93.67</td>
<td class="data-td data last">93.24</td>
<td class="data-td data last" style="border-right: outset;">90.96</td>
<td class="data-td data last">-0.28</td>
</tr>
<tr class="tbl-data">
<td class="data-td last">Real Estate</td>
<td class="data-td data last">5.13</td>
<td class="data-td data last">4.72</td>
<td class="data-td data last">6.22</td>
<td class="data-td data last">6.31</td>
<td class="data-td data last" style="border-right: outset;">6.68</td>
<td class="data-td data last">697</td>
<td class="data-td data last">701</td>
<td class="data-td data last">716</td>
<td class="data-td data last">594</td>
<td class="data-td data last" style="border-right: outset;">573</td>
<td class="data-td data last">79.46</td>
<td class="data-td data last">80.72</td>
<td class="data-td data last">80.39</td>
<td class="data-td data last">81.47</td>
<td class="data-td data last" style="border-right: outset;">82.22</td>
<td class="data-td data last">1.33</td>
</tr>
<tr class="tbl-data">
<td class="data-td last">Retail</td>
<td class="data-td data last">5.67</td>
<td class="data-td data last">5.49</td>
<td class="data-td data last">7.79</td>
<td class="data-td data last">7.91</td>
<td class="data-td data last" style="border-right: outset;">8.18</td>
<td class="data-td data last">471</td>
<td class="data-td data last">474</td>
<td class="data-td data last">429</td>
<td class="data-td data last">324</td>
<td class="data-td data last" style="border-right: outset;">343</td>
<td class="data-td data last">73.75</td>
<td class="data-td data last">74.72</td>
<td class="data-td data last">80.16</td>
<td class="data-td data last">83.32</td>
<td class="data-td data last" style="border-right: outset;">81.62</td>
<td class="data-td data last">-1.52</td>
</tr>
<tr class="tbl-data">
<td class="data-td last">Services</td>
<td class="data-td data last">0.38</td>
<td class="data-td data last">0.37</td>
<td class="data-td data last">0.53</td>
<td class="data-td data last">0.52</td>
<td class="data-td data last" style="border-right: outset;">0.55</td>
<td class="data-td data last">388</td>
<td class="data-td data last">368</td>
<td class="data-td data last">401</td>
<td class="data-td data last">355</td>
<td class="data-td data last" style="border-right: outset;">352</td>
<td class="data-td data last">87.11</td>
<td class="data-td data last">89.89</td>
<td class="data-td data last">89.00</td>
<td class="data-td data last">88.54</td>
<td class="data-td data last" style="border-right: outset;">88.43</td>
<td class="data-td data last">0.36</td>
</tr>
<tr class="tbl-data">
<td class="data-td last">Technology &amp; Electronics</td>
<td class="data-td data last">4.20</td>
<td class="data-td data last">4.67</td>
<td class="data-td data last">6.21</td>
<td class="data-td data last">5.30</td>
<td class="data-td data last" style="border-right: outset;">5.58</td>
<td class="data-td data last">327</td>
<td class="data-td data last">287</td>
<td class="data-td data last">320</td>
<td class="data-td data last">245</td>
<td class="data-td data last" style="border-right: outset;">245</td>
<td class="data-td data last">85.47</td>
<td class="data-td data last">88.19</td>
<td class="data-td data last">87.26</td>
<td class="data-td data last">89.70</td>
<td class="data-td data last" style="border-right: outset;">89.50</td>
<td class="data-td data last">0.22</td>
</tr>
<tr class="tbl-data">
<td class="data-td last">Telecommunications</td>
<td class="data-td data last">11.91</td>
<td class="data-td data last">11.68</td>
<td class="data-td data last">10.61</td>
<td class="data-td data last">10.66</td>
<td class="data-td data last" style="border-right: outset;">11.54</td>
<td class="data-td data last">423</td>
<td class="data-td data last">433</td>
<td class="data-td data last">533</td>
<td class="data-td data last">467</td>
<td class="data-td data last" style="border-right: outset;">437</td>
<td class="data-td data last">90.04</td>
<td class="data-td data last">91.39</td>
<td class="data-td data last">83.60</td>
<td class="data-td data last">84.54</td>
<td class="data-td data last" style="border-right: outset;">86.41</td>
<td class="data-td data last">2.83</td>
</tr>
<tr class="tbl-data">
<td class="data-td last">Transportation</td>
<td class="data-td data last">2.10</td>
<td class="data-td data last">1.78</td>
<td class="data-td data last">2.59</td>
<td class="data-td data last">2.63</td>
<td class="data-td data last" style="border-right: outset;">2.78</td>
<td class="data-td data last">279</td>
<td class="data-td data last">231</td>
<td class="data-td data last">199</td>
<td class="data-td data last">147</td>
<td class="data-td data last" style="border-right: outset;">126</td>
<td class="data-td data last">90.49</td>
<td class="data-td data last">92.69</td>
<td class="data-td data last">93.73</td>
<td class="data-td data last">94.96</td>
<td class="data-td data last" style="border-right: outset;">94.93</td>
<td class="data-td data last">0.31</td>
</tr>
<tr class="tbl-data">
<td class="data-td last">Utility</td>
<td class="data-td data last">6.93</td>
<td class="data-td data last">5.38</td>
<td class="data-td data last">7.52</td>
<td class="data-td data last">7.54</td>
<td class="data-td data last" style="border-right: outset;">7.83</td>
<td class="data-td data last">213</td>
<td class="data-td data last">206</td>
<td class="data-td data last">180</td>
<td class="data-td data last">165</td>
<td class="data-td data last" style="border-right: outset;">175</td>
<td class="data-td data last">89.95</td>
<td class="data-td data last">90.19</td>
<td class="data-td data last">91.99</td>
<td class="data-td data last">89.61</td>
<td class="data-td data last" style="border-right: outset;">88.44</td>
<td class="data-td data last">-0.91</td>
</tr>
<tr class="tbl-data">
<td class="data-td last">Total</td>
<td class="data-td data last">100</td>
<td class="data-td data last" style="border-right: outset;">100</td>
<td class="data-td data last">337</td>
<td class="data-td data last">325</td>
<td class="data-td data last">332</td>
<td class="data-td data last">280</td>
<td class="data-td data last" style="border-right: outset;">293</td>
<td class="data-td data last">87.91</td>
<td class="data-td data last">89.51</td>
<td class="data-td data last">89.07</td>
<td class="data-td data last">89.61</td>
<td class="data-td data last" style="border-right: outset;">88.75</td>
<td class="data-td data last">0.04</td>
</tr>
</tbody>
</table>
</div>
<br />
<p class="chart-disclosure">Source: ICE Data Services, VanEck. Fallen Angels: ICE US Fallen Angel High Yield 10% Constrained Index. Not intended as a recommendation to invest or divest in any of the sectors mentioned herein. Index performance is not representative of fund performance. It is not possible to invest in an index.</p>
<p><strong><u>Fallen Angels Performance by Rating:</u></strong> The BB-rated bucket was the only ratings category that saw spreads widen and price fall, thus the negative return.</p>
<div class="wrapped-div">
<table style="width: 100%;">
<tbody>
<tr class="tbl-data">
<td class="tbl-header last text-center">&nbsp;</td>
<td class="tbl-header last text-center" style="border-right: outset;" colspan="5">Wgt (%)</td>
<td class="tbl-header last text-center" style="border-right: outset;" colspan="5">OAS</td>
<td class="tbl-header last text-center" style="border-right: outset;" colspan="5">Price</td>
<td class="tbl-header last text-center">Total<br />Return<br />(%)</td>
</tr>
<tr class="tbl-data">
<td class="data-head last">&nbsp;</td>
<td class="data-head last">12/31/22</td>
<td class="data-head last">3/31/23</td>
<td class="data-head last">6/30/23</td>
<td class="data-head last">7/31/23</td>
<td class="data-head last" style="border-right: outset;">8/31/23</td>
<td class="data-head last">12/31/22</td>
<td class="data-head last">3/31/23</td>
<td class="data-head last">6/30/23</td>
<td class="data-head last">7/31/23</td>
<td class="data-head last" style="border-right: outset;">8/31/23</td>
<td class="data-head last">12/31/22</td>
<td class="data-head last">3/31/23</td>
<td class="data-head last">6/30/23</td>
<td class="data-head last">7/31/23</td>
<td class="data-head last" style="border-right: outset;">8/31/23</td>
<td class="data-head last">MTD</td>
</tr>
<tr class="tbl-data">
<td class="data-head last">BB</td>
<td class="data-td data last">87.00</td>
<td class="data-td data last">87.08</td>
<td class="data-td data last">83.01</td>
<td class="data-td data last">82.72</td>
<td class="data-td data last" style="border-right: outset;">81.56</td>
<td class="data-td data last">284</td>
<td class="data-td data last">281</td>
<td class="data-td data last">256</td>
<td class="data-td data last">238</td>
<td class="data-td data last" style="border-right: outset;">255</td>
<td class="data-td data last">90.02</td>
<td class="data-td data last">91.51</td>
<td class="data-td data last">89.83</td>
<td class="data-td data last">90.71</td>
<td class="data-td data last" style="border-right: outset;">89.47</td>
<td class="data-td data last">-0.36</td>
</tr>
<tr class="tbl-data">
<td class="data-head last">B</td>
<td class="data-td data last">10.95</td>
<td class="data-td data last">10.37</td>
<td class="data-td data last">13.31</td>
<td class="data-td data last">13.46</td>
<td class="data-td data last" style="border-right: outset;">14.40</td>
<td class="data-td data last">608</td>
<td class="data-td data last">500</td>
<td class="data-td data last">405</td>
<td class="data-td data last">396</td>
<td class="data-td data last" style="border-right: outset;">370</td>
<td class="data-td data last">82.50</td>
<td class="data-td data last">85.35</td>
<td class="data-td data last">89.55</td>
<td class="data-td data last">89.82</td>
<td class="data-td data last" style="border-right: outset;">91.18</td>
<td class="data-td data last">2.27</td>
</tr>
<tr class="tbl-data">
<td class="data-head last">CCC</td>
<td class="data-td data last">1.98</td>
<td class="data-td data last">2.50</td>
<td class="data-td data last">3.68</td>
<td class="data-td data last">3.82</td>
<td class="data-td data last" style="border-right: outset;">4.04</td>
<td class="data-td data last">1,020</td>
<td class="data-td data last">1,014</td>
<td class="data-td data last">852</td>
<td class="data-td data last">783</td>
<td class="data-td data last" style="border-right: outset;">785</td>
<td class="data-td data last">60.88</td>
<td class="data-td data last">64.60</td>
<td class="data-td data last">68.55</td>
<td class="data-td data last">70.35</td>
<td class="data-td data last" style="border-right: outset;">70.37</td>
<td class="data-td data last">0.79</td>
</tr>
<tr class="tbl-data">
<td class="data-head last">Total</td>
<td class="data-td data last">100</td>
<td class="data-td data last" style="border-right: outset;">100</td>
<td class="data-td data last">337</td>
<td class="data-td data last">325</td>
<td class="data-td data last">297</td>
<td class="data-td data last">280</td>
<td class="data-td data last" style="border-right: outset;">293</td>
<td class="data-td data last">87.91</td>
<td class="data-td data last">89.51</td>
<td class="data-td data last">88.78</td>
<td class="data-td data last">89.61</td>
<td class="data-td data last" style="border-right: outset;">88.75</td>
<td class="data-td data last">0.04</td>
</tr>
</tbody>
</table>
</div>
<br />
<p class="chart-disclosure">Source: ICE Data Services, VanEck. Does not have securities for all months of selected period. Returns are based on partial period data. Fallen Angels: ICE US Fallen Angel High Yield 10% Constrained Index. Past performance is no guarantee of future results. Index performance is not representative of fund performance. It is not possible to invest in an index.</p>
<p>To receive more <a href="https://www.vaneck.com/us/en/insights/income-investing/" title="Income Investing insights"><strong>Income Investing</strong></a> insights, <a href="https://www.vaneck.com/us/en/subscribe/" title=" Subscription Center"><strong>sign up in our subscription center</strong></a>.</p>
<style type="text/css">.wrapped-div {
        max-width: 100%;
    }

    @media (max-width: 1024px) {
        .wrapped-div {
            overflow-x: scroll;
        }
    }

    .wrapped-div-sector {
        max-width: 100%;
        overflow-x: scroll;
    }
</style>
]]></content:encoded>
</item><item rdf:about="https://www.vaneck.com/us/en/blogs/gold-investing/ima-casanova-gold-opportunities-in-the-outback/">
  <title>Gold Opportunities in the Outback></title>
  <link>https://www.vaneck.com/us/en/blogs/gold-investing/ima-casanova-gold-opportunities-in-the-outback/</link>
  <description><![CDATA[A stronger dollar and higher bond yields pressured gold prices in August. Emphases on technology, mining techniques and efficiencies and ESG-related subjects create opportunities in Australia.]]></description>
  <dc:creator>Imaru Casanova</dc:creator>
  <dc:date>09/12/2023 06:30:00</dc:date>
<content:encoded><![CDATA[

<p>Monthly gold market and economic insights from Imaru Casanova, Portfolio Manager, featuring her unique views on mining and gold&rsquo;s portfolio benefits. <a href="/us/en/blogs/gold-investing/ima-casanova-gold-opportunities-in-the-outback/gold-monthly-commentary-august-2023.pdf" rel="noopener" target="_blank" title="Gold Monthly Commentary - August 2023"><strong>An expanded PDF version of this commentary, including fund specific information can be downloaded here.</strong></a></p>
<h2>Gold reacts to Fed, dollar strength</h2>
<p>Gold gave back some of its July gains during the month of August. The markets continue to focus on the U.S. Federal Reserve&rsquo;s (Fed&rsquo;s) path. Indications that Fed policy may remain tighter for longer, with the potential for another hike this year, supported a stronger dollar and higher bond yields, putting pressure on gold prices. The U.S. Dollar Index (DXY)<sup>1</sup>&nbsp;was up 1.7% in August, and the U.S. 10-year treasury yield touched a high of 4.34%, its highest level since 2007. Gold fell below $1,900 per ounce, trading at a low of $1,889 on August 18, with persistent outflows out of gold bullion exchange traded funds during the month. But once again, gold showed resilience climbing back above $1,900 only a week later. Towards month-end, reported declines in U.S. consumer confidence and job openings reduced the implied probability of a Fed hike this year. With treasury yields and the dollar easing, gold found some support to close at $1,940 per ounce on August 31, posting a loss of $25 per ounce (-1.3%) for the month.</p>
<h2>Gap remains for gold miners</h2>
<p>The NYSE Arca Gold Miners Index (GDMNTR)<sup>2</sup>&nbsp;and the MVIS Global Juniors Gold Miners Index (MVGDXJTR)<sup>3</sup>&nbsp;were down 6.1% and 3.7% respectively during the month. The smaller gold companies outperformed their larger peers; however, the valuation gap between gold equities and gold bullion widened further. Gold prices are up 6.4% year to date, yet the GDMNTR is up only 3.1%. We have been stressing both that the equities are trading at a discount relative to gold, and that they are trading at historically low multiples. An analysis by Paradigm Capital for a universe of large and intermediate gold producers, found that based on consensus expectations, gold miners are trading at a 2024 EV/EBITDA<sup>*</sup>&nbsp;ratio representing about a 35% discount to their 10-year historical average.<sup>&dagger;</sup>&nbsp;For reference, the S&amp;P 500 Index<sup>4</sup>&nbsp;is trading at a 2023 EV/EBITDA ratio that is over 10% above its 10-year average, and even with estimates coming down for next year, 2024 EV/EBITDA consensus ratio is right in line with the 10-year average. With gold prices near all-time highs, we think investors should take a hard look at gold mining equities and consider the sector&rsquo;s potential for future stock price appreciation, as compared to other industries.</p>
<h2>On the road in Australia</h2>
<p>We recently had the opportunity to travel across the continent of Australia. Given the distance travelled, we made sure to maximize the trip by visiting as many operations and meeting with as many companies as we could fit in. We met with the management teams of eight companies and toured six major gold mining operations, including open pit and underground mines. We could not help but be impressed with the size and scale of some operations (e.g., Boddington), and the richness in grade of others (e.g., Bellevue and Fosterville). Across the board we noticed a focus on the latest technology, mining techniques and efficiencies, as well as a laser-like focus on Environmental, Social and Governance (ESG)-related subjects. In our view, Australia remains a leading mining jurisdiction, both in terms of potential and investability (currently, based on company reserves, Australia represents approximately 15% of the portfolio&rsquo;s total exposure). Key issues that we discussed with management teams include: the focus on de-carbonizing energy usage; skilled labor shortages; and the role of technology in mining to reduce costs, improve efficiency and make mining safer for workers.</p>
<p>For context, Australia was the second (tied with Russia, and only slightly behind China) largest producer of gold in 2022 &ndash; mining over 10% of the world&rsquo;s annual supply according to the United States Geological Survey.<sup>&Dagger;</sup>&nbsp;On a reserve basis, the country is reported to have over 16% of the world&rsquo;s in-ground gold. During our trip, we visited mines representing approximately 22% of Australia&rsquo;s annual gold output. Increased exploration efforts, regional consolidation leading to efficiencies of scale, continued focus on optimization and cost control along with historically high gold prices should contribute to a vibrant gold mining industry for the foreseeable future.</p>
<p>Here are some of the key takeaways from our trip:</p>
<ul class="content-list">
<li><strong>While raw material input prices now appear to be receding, skilled labor shortages in Australia continue to impact both costs and volumes, despite the reversal of COVID-related impacts last year.</strong></li>
<ul class="content-list">
<li>High bulk material prices (iron ore, coal, lithium) and government funded project stimulus have sharply increased competition for skilled labor. This has led to higher wages in the mining industry as companies raise salaries to retain or attract talent, including for those candidates coming right out of university. Anecdotally, we heard that a salary of A$150,000 for a junior engineer is not uncommon.</li>
<li>Fly-In-Fly-Out operations, largely in Western Australia (e.g., Bellevue and Gruyere), facilitate &lsquo;mercenary&rsquo; type labor behavior. For example, miners, mechanics and engineers based near Perth, can chase the highest compensation without having to move or relocate their families.</li>
<li>Operations located within driving distance of major population centers (e.g., Boddington, Fosterville) benefit both from lower labor rates and lower turnover.</li>
<li>Gold miners are attempting to meet this labor challenge through aggressive recruiting/hiring, training of recent university graduates in adjacent fields (such as civil engineering) and through automation and technology.</li>
</ul>
</ul>
<ul class="content-list">
<li><strong>Australia leads the industry in technology, with remote control and automated vehicle adoption set to drive continuous improvement in costs, production and safety.</strong></li>
<ul class="content-list">
<li>At Fosterville and Cowal, we had the opportunity to visit the control room and observe above-ground operators controlling vehicles operating underground. This technology is deployed when ground conditions present a safety concern for workers and utilized during shift changes to smooth operations and maximize volumes.</li>
<li>The most striking technology adoption we witnessed was at Newmont&rsquo;s (3.60% of Strategy net assets) Boddington operations. There, we saw the largest automated haul fleet in the gold industry. Boddington is currently operating 35 fully automated Cat<sup>&reg;</sup>&nbsp;793 (400 ton) haul trucks and expects to increase the fleet to 40. The full benefits realized by Boddington&rsquo;s automated fleet compared to a conventional fleet have yet to be quantified, but we expect the gains to be significant.</li>
<li>At Gruyere, a 50/50 Joint Venture between Gold Fields (0.41% of Strategy net assets) and Gold Road (not held in Strategy), management is considering automating their drill fleet to both gain efficiencies and to reduce labor costs. Operations have been recently hampered by a lack of drilling capacity.</li>
<li>At Fosterville and Boddington, vehicles are monitored and tracked at all times, including vehicles operating underground, which is something we have not seen before. While this should clearly benefit safety performance, we would also expect improved operating performance and longer equipment life.</li>
</ul>
</ul>
<ul class="content-list">
<li><strong>Throughout Australia, we noticed an emphasis on ESG, and specifically, on the mandate to reduce greenhouse gas (GHG) emissions. Gold producers are aggressively pursuing energy efficiency and alternative power generation (largely solar and wind) to achieve near-term 2030 targets using currently available technology.</strong></li>
<ul class="content-list">
<li>The Australian mining industry is generally well positioned to invest in these non-petroleum sources of power due to remote operations currently relying on self-owned, high-cost diesel power generation. The existing diesel power (a sunk cost) has the benefit of supplementing alternative, but intermittent solar and wind generation.</li>
<li>Power investment decisions benefit from the generally long lives of mining operations, low-cost land availability, declining cost of solar, availability and increasing size of battery storage capacity.</li>
<li>During our recent trips to both Australia and West Africa, we witnessed current or soon to be installed solar power capacity - incentivized by a combination of diesel price volatility and falling cost of alternative energy projects, as well as the low reliability and/or high cost of grid power.</li>
<li>We visited a fully operational solar farm at Gold Fields&rsquo; Gruyere joint venture. The company appears to be emerging as a leading player in this area, with existing or planned solar and/or wind power generation across its Australian and South African operations.</li>
<li>Longer-term full de-carbonization challenges remain, as electrification solutions do not yet exist for large haul trucks and long hauls. In addition, battery storage capacity, both mobile and stationary, is insufficient to operate at the required utilization rates.</li>
</ul>
</ul>
<p>To receive more <strong><a href="https://www.vaneck.com/us/en/insights/gold-investing/" title="Gold Investing Insights">Gold Investing</a></strong> insights, <strong><a href="https://www.vaneck.com/us/en/subscribe/" title="Subscription Center">sign up in our subscription center</a></strong>.</p>
]]></content:encoded>
</item><item rdf:about="https://www.vaneck.com/us/en/blogs/digital-assets/matthew-sigel-vaneck-monthly-crypto-recap-for-august-2023/">
  <title>VanEck Monthly Crypto Recap for August 2023></title>
  <link>https://www.vaneck.com/us/en/blogs/digital-assets/matthew-sigel-vaneck-monthly-crypto-recap-for-august-2023/</link>
  <description><![CDATA[In August, digital assets experienced a 2-year low in trading volume, historic lows in volatility, and a slowdown in VC fund deployment into blockchain projects.]]></description>
  <dc:creator>Matthew  Sigel</dc:creator>
  <dc:date>09/11/2023 06:30:00</dc:date>
<content:encoded><![CDATA[

<p><strong>Please note that VanEck may have a position(s) in the digital asset(s) described below.</strong></p>
<p>Digital assets&rsquo; trading volumes &amp; volatility made 2-year and all-time lows, respectively, in August as investor interest dwindled amidst the lure of the beach and the US 10-year treasury bond, the yield on which reached its highest levels in 15 years. Venture capital funds deployed into blockchain projects totaled just $500M in August 2023, compared to $1.9B in August 2022 and $2.7B in August 2021, respectively, while crypto ETPs saw large redemptions.</p>
<p>For the month, Bitcoin &amp; Ethereum fell 9% and 10%, respectively, underperforming the Nasdaq Composite&rsquo;s 2% decline for the 2nd straight month.</p>
<div class="wrapped-div">
<table style="width: 500px; height: 211px;">
<tbody>
<tr class="tbl-data" style="height: 18px;">
<td class="tbl-header last text-center" style="height: 18px; width: 387.453px;">&nbsp;</td>
<td class="tbl-header last text-center" style="height: 18px; width: 48.7656px;">August</td>
<td class="tbl-header last text-center" style="height: 18px; width: 41.7812px;">YTD</td>
</tr>
<tr class="tbl-data" style="height: 18px;">
<td class="data-td last" style="height: 18px; width: 387.453px;">S&amp;P 500 Index</td>
<td class="data-td data last" style="height: 18px; width: 48.7656px;">-2%</td>
<td class="data-td data last" style="height: 18px; width: 41.7812px;">18%</td>
</tr>
<tr class="tbl-data" style="height: 18px;">
<td class="data-td last" style="height: 18px; width: 387.453px;">Nasdaq 100 Index</td>
<td class="data-td data last" style="height: 18px; width: 48.7656px;">-2%</td>
<td class="data-td data last" style="height: 18px; width: 41.7812px;">34%</td>
</tr>
<tr class="tbl-data" style="height: 18px;">
<td class="data-td last" style="height: 18px; width: 387.453px;">Bitcoin</td>
<td class="data-td data last" style="height: 18px; width: 48.7656px;">-9%</td>
<td class="data-td data last" style="height: 18px; width: 41.7812px;">60%</td>
</tr>
<tr class="tbl-data" style="height: 18px;">
<td class="data-td last" style="height: 18px; width: 387.453px;">Ethereum</td>
<td class="data-td data last" style="height: 18px; width: 48.7656px;">-10%</td>
<td class="data-td data last" style="height: 18px; width: 41.7812px;">39%</td>
</tr>
<tr class="tbl-data" style="height: 21px;">
<td class="data-td last" style="height: 21px; width: 387.453px;">MarketVector<sup>TM</sup>&nbsp;Smart Contract Leaders Index</td>
<td class="data-td data last" style="height: 21px; width: 48.7656px;">-14%</td>
<td class="data-td data last" style="height: 21px; width: 41.7812px;">12%</td>
</tr>
<tr class="tbl-data" style="height: 21px;">
<td class="data-td last" style="height: 21px; width: 387.453px;">MarketVector<sup>TM</sup>&nbsp;Decentralized Finance Leaders Index</td>
<td class="data-td data last" style="height: 21px; width: 48.7656px;">-17%</td>
<td class="data-td data last" style="height: 21px; width: 41.7812px;">5%</td>
</tr>
<tr class="tbl-data" style="height: 40px;">
<td class="data-td last" style="height: 40px; width: 387.453px;">MarketVector<sup>TM</sup>&nbsp;Infrastructure Application Leaders Index</td>
<td class="data-td data last" style="height: 40px; width: 48.7656px;">-18%</td>
<td class="data-td data last" style="height: 40px; width: 41.7812px;">10%</td>
</tr>
<tr class="tbl-data" style="height: 18px;">
<td class="data-td last" style="height: 18px; width: 387.453px;">Coinbase</td>
<td class="data-td data last" style="height: 18px; width: 48.7656px;">-18%</td>
<td class="data-td data last" style="height: 18px; width: 41.7812px;">128%</td>
</tr>
<tr class="tbl-data" style="height: 21px;">
<td class="data-td last" style="height: 21px; width: 387.453px;">MarketVector<sup>TM</sup>&nbsp;Media &amp; Entertainment Leaders Index</td>
<td class="data-td data last" style="height: 21px; width: 48.7656px;">-21%</td>
<td class="data-td data last" style="height: 21px; width: 41.7812px;">-34%</td>
</tr>
</tbody>
</table>
</div>
<br />
<p class="chart-disclosure">Source: Bloomberg, as of 8/31/2023. Past performance is no guarantee of future results. Not intended as a recommendation to buy or sell any securities named herein.</p>
<ul class="content-list">
<li><strong><a href="#Layer-1s">Layer 1s: August Updates</a></strong></li>
<li><strong><a href="#point-one">Solana: Neon Glow Coming</a></strong></li>
<li><strong><a href="#point-two">Layer-2: August Updates</a></strong></li>
<li><strong><a href="#Friend-Tech-An-Overview">Friend.Tech: An Overview</a></strong></li>
<li><strong><a href="#point-three">Ethereum: August Updates</a></strong></li>
<li><strong><a href="#Ethereum-Catalyst-EIP-4844">Ethereum Catalyst: EIP 4844</a></strong></li>
<li><strong><a href="#point-four">TRON: August Updates</a></strong></li>
<li><strong><a href="#point-five">Cosmos: August Updates</a></strong></li>
<li><strong><a href="#point-six">Polygon: August Updates</a></strong></li>
<li><strong><a href="#point-seven">Avalanche: August Updates</a></strong></li>
<li><strong><a href="#DeFi-Decline-in-Economic-Activity">DeFi: Decline in Economic Activity</a></strong></li>
<li><strong><a href="#Uniswap-Victory-in-Lawsuit">Uniswap: Victory in Lawsuit</a></strong></li>
<li><strong><a href="#point-eight">MakerDAO: Boosting DAI Adoption</a></strong></li>
<li><strong><a href="#point-nine">Curve: August Update</a></strong></li>
<li><strong><a href="#point-ten">Stablecoins: Headwinds from High Interest Rates</a></strong></li>
<li><strong><a href="#point-eleven">Metaverse: Dip in Development &amp; Usership</a></strong></li>
<li><strong><a href="#point-twelve">Zynga: Enters Crypto Gaming</a></strong></li>
<li><strong><a href="#point-thirteen">NFT Volume: Hits 2.5-Year Low</a></strong></li>
</ul>
<h2 id="Layer-1s" class="jump-link-nav anchored-block" data-jumplink-title="Layer 1s">Layer 1s</h2>
<p>August was a typical month in the tempestuous snow globe of digital assets as a blizzard of volatility and uncertainty swirled around crypto markets. Regulatory decisions, smart contract exploits, solvency rumors, and potential liquidation fears all contributed to a substantial decline in prices. The 30-day performance of Smart Contract Platforms (SCPs) was (-10.7%).</p>
<p>The sector was ripe with hope at the end of July after Ripple&rsquo;s partial victory against the U.S. Securities and Exchange Commission (SEC) when a federal judge ruled that Ripple's programmatic sales to retail investors through exchanges were not securities. It was expected that further regulatory catalysts would materialize in August, including Grayscale winning the right to convert its Bitcoin investment trust into a spot BTC ETF, the potential of other spot BTC ETFs winning approval, and the SEC signaling a potential green light for the launch of Ethereum Futures ETFs. However, prices soured with no approval for any of the ETFs and the SEC announcing its intention to appeal the Ripple ruling.</p>
<p>Additional issues that contributed to negative price action were:</p>
<ul class="content-list">
<li>Questions about the solvency of Binance.</li>
<li>The liquidation of a $200M position by a BNB exploiter on BNB DEX Venus.</li>
<li>Exploits of staple Ethereum DeFi applications Balance and Curve.</li>
<li>Concerns that the hacking of Curve might lead to the liquidation of Michael Egorov's $168M CRV position, representing 34% of all CRV supply.</li>
<li>Rumors about the arrests of Huobi&rsquo;s executives in China and the potential insolvency of the Huobi exchange.</li>
<li>Bitstamp's decision to suspend trading of altcoins for US users.</li>
<li>Outflows totaling $260M from crypto ETPs in August.</li>
</ul>
<p>While none of the SCPs had a token whose price increased in August, the top performers were ETH (-11.3%) and Tron (-1.6%). Meanwhile, the worst monthly laggers were ATOM (-21.9%), MATIC (-19.3%) and AVAX (-22.1%).</p>

<style type="text/css">
    .wrapped-div {
        max-width: 100%;
    }

    @media (max-width: 1240px) {
        .wrapped-div {
            overflow-x: scroll;
        }
    }

    .wrapped-div-sector {
        max-width: 100%;
        overflow-x: scroll;
    }
</style>


<h2 id="point-one" class="anchored-block">The Neon Glow Coming from Solana</h2>
<p>Despite the cascade of negative headlines, the value proposition of blockchain technology to non-crypto native users made some large strides. On August 23, Shopify integrated Solana Pay into Shopify&rsquo;s online retailer platform&mdash;this new addition will allow Shopify&rsquo;s 1+ million retailers to accept payments in the USDC stablecoins. Solana&rsquo;s blockchain will be used to execute these transactions, and each payment will cost only $0.00025 per transaction while settling in under one second. This allows online businesses to avoid credit card fees, which range from 1-3%, and international currency interchange fees, which can be higher. Instant access to USDC also improves the working capital position of small businesses by allowing them to forgo revolving credit options and even earn interest on their funds. This new development follows the path of Solana&rsquo;s drive to smooth consumer adoption by focusing on user experience improvements like cheap NFT minting technology, the Solana Phone, the Solana Mobile Stack, and Solana Pay.</p>
<h2 id="point-two" class="anchored-block">Ethereum&rsquo;s Layer-2 Performance</h2>
<h3>Layer-2 Daily Active Users</h3>
<p><img class="img-responsive w-100" src="https://www.vaneck.com/contentassets/1d6fd4f2755f48f9b190d17188f3d50c/3577_scl-blog_chart-1_2023.09_v1_blog.svg" alt="Graph of Layer-2 Daily Active Users" /></p>
<p class="chart-disclosure">Source: Artemis.xyz, VanEck Research as of 9/4/2023. Past performance is no guarantee of future results. Not intended as a recommendation to buy or sell any securities named herein.</p>
<p>The long-term roadmap of Ethereum is to alter its business model to become a settlement layer while offboarding the transaction processing to Layer-2 (L2s). This drastic change stems from the technological limitations imposed by Ethereum&rsquo;s focus on &ldquo;credible neutrality.&rdquo; The Ethereum Foundation (EF), the entity that maintains and updates Ethereum&rsquo;s software, contends that Ethereum&rsquo;s users must believe Ethereum to be inviolably fair for it to replace the existing financial system. The EF concludes that the best way to achieve this impartiality is through decentralizing the network by enabling millions of people to host Ethereum&rsquo;s open-source software on inexpensive servers across the globe. However, due to internet bandwidth limitations and computer processing costs, Ethereum&rsquo;s network is handicapped to process only 14 TPS. By contrast, the Visa network can process tens of thousands of transactions per second.</p>
<p>The technical limitations of the Ethereum network spawned Layer-2 blockchains, which execute transactions in a less technically constrained environment than Ethereum&rsquo;s. In turn, L2s settle these transactions to Ethereum in large blobs of data representing a batch or &ldquo;roll-up&rdquo; of transactions. These data blobs use up Ethereum&rsquo;s limited blockspace, and Ethereum assesses L2s hosting fees for this data. The effect of this arrangement is that many more transactions can take place in the &ldquo;modular&rdquo; ecosystem of Ethereum. The total amount of transactions in Ethereum with L2s is expected to scale to 220 TPS, with EIP 4844 coming in 4Q2023. Over the month of August, Ethereum&rsquo;s full ecosystem averaged around 26.5 TPS. However, these Layer-2s are each a siloed ecosystem. This means that smart contracts and stored value cannot cross Layer-2s. In essence, each L2 is like a distinct excel sheet containing the ledger entries and functions for only that L2.</p>
<p>The consequence of this arrangement is that dozens of Layer-2s have been created to compete for the most important smart contracts (blockchain businesses), total value locked, and users. Over the past 12 months, numerous L2s have become consistent cashflow-generating entities, including Arbitrum, Optimism, Polygon, Starknet, and ZkSync Era. Currently, these blockchains only generate cash for their parent entities and not any of their own tokens. The daily average revenue of all L2s combined for the last 30 days is $680k, which compares to Ethereum&rsquo;s revenue of $6.4M. L2s also have margins that fluctuate between 20-50% depending upon the L2 and the price of blockspace on Ethereum. The market share of all Ethereum L2 has grown to 9% of all SCP fees generated. From a usership standpoint, the userbase of all L2s has averaged roughly 3-4x that of Ethereum&rsquo;s, and both the absolute number of users and the ratio of L2/Ethereum users have been growing over time. Consequently, the amount of Ethereum blockspace used by L2s has climbed to between 10-14%.</p>
<h3>Total Combined SCP Fees and L2 Market Share of Fees</h3>
<p><img class="img-responsive w-100" src="https://www.vaneck.com/contentassets/1d6fd4f2755f48f9b190d17188f3d50c/3577_scl-blog_chart-2_2023.09_v1_blog.svg" alt="Graph of Total Combined SCP Fees and L2 Market Share of Fees" /></p>
<p class="chart-disclosure">Source: Artemis.xyz, VanEck Research as of 8/28/2023. Past performance is no guarantee of future results. Not intended as a recommendation to buy or sell any securities named herein.</p>
<p>August was a strong month for L2 adoption amid negative price action. Optimism's OP token was the best performer of the bunch, which only lost (-14%) of its value over the past 30 days. The price of OP was buoyed by strong usage driven by Worldcoin and its registry of new users through its Worldcoin Wallet. Every time Worldcoin registers a new user on Optimism, a Gnosis SAFE wallet is created. As a result of the onboarding of <strong><a href="https://dune.com/oplabspbc/worldcoin-on-op-mainnet-activity" title="Worldcoin on OP Mainnet Activity" target="_blank" rel="noopener">600k new users to Optimism</a></strong> through Worldcoin, Worldcoin generated 26% of all fees on Optimism.</p>
<p>Additionally, Optimism&rsquo;s ecosystem and the OP token have been aided by the launch of BASE. BASE is a Layer-2 built using the Optimism software development stack by Coinbase. While BASE is its own L2, separate from Optimism&rsquo;s L2, Coinbase has promised to remit a portion of its profits to Optimism. BASE, launched on August 9, has averaged an impressive $143k in fees per day or around $4.6M since launch. This amounts to a market share of L2 fees of approximately 20-30%, and BASE&rsquo;s fees have only been second to ZKSync over the past 30 days.</p>
<h3>L2 Share of Ethereum Activity 30 Day MA</h3>
<p><img class="img-responsive w-100" src="https://www.vaneck.com/contentassets/1d6fd4f2755f48f9b190d17188f3d50c/3577_scl-blog_chart-3_2023.09_v1_blog.svg" alt="Graph of L2 Share of Ethereum Activity 30 Day MA" /></p>
<p class="chart-disclosure">Source: Dune, Etherscan, VanEck Research as of 8/27/2023. Past performance is no guarantee of future results. Not intended as a recommendation to buy or sell any securities named herein.</p>
<h2 id="Friend-Tech-An-Overview" class="jump-link-nav anchored-block" data-jumplink-title="Friend.Tech: An Overview">Friend.Tech Overview</h2>
<p>One of the most interesting applications on BASE is Friend.Tech. Friend.Tech is a social media application that allows users to access private chat rooms with gated content from famous social media personalities. This access is sold on the open market as &ldquo;keys,&rdquo; and users can trade the keys. The content creators get some secondary market key trading fees as revenue. The result has been a flurry of activity that has generated <a href="https://dune.com/cryptokoryo/friendtech" title="Friend.Tech" target="_blank" rel="noopener"><strong>$4.2M in fees</strong></a> and 183k unique users since its launch on August 9. Friend.Tech has also catalyzed interest in a new type of application design that allows applications to navigate around the 30% fees imposed by Android and Apple&rsquo;s app stores. With Friend.Tech, users install the application by adding a website to their phone's home screen rather than downloading an application through a web store. The smooth, simple onboarding process will likely spawn similar application distribution approaches that will be fascinating to see unfold.</p>
<p>Friend.tech&rsquo;s long-term success will ultimately hinge on whether or not they can attract non-crypto influencers who then return value to their key holders in the form of exclusive content, giveaways, etc. However, based on the &ldquo;pump &amp; dump&rdquo; price action of most Friend.Tech keys: it appears that early platform usage has mainly been driven by speculation rather than users acquiring keys for the content they unlock.</p>
<p>Another juggernaut of the L2 space is ZkSync Era, which is a zero-knowledge (Zk) roll-up. ZkSync has been earning around $200k in fees per day since July and has earned $6.5M in fees over the past 30 days. ZkSync is the most profitable, widely used Zk roll-up with over <strong><a href="https://l2beat.com/scaling/projects/zksync-era?selectedChart=activity" title="zkSync Era" target="_blank" rel="noopener">$411M</a></strong> in bridged value. Unlike Arbitrum and Optimism, which are optimistic roll-ups that post transactions that cannot settle for 7 days until the passing of a challenge period, Zk roll-up transactions are finalized once they are posted to Ethereum. This is because the rolled-up batch of transactions posted to Ethereum includes a zero-knowledge cryptographic proof of their authenticity. As a result, Zk roll-ups provide a much better user experience that allows users to withdraw funds faster. The downside is that Zk roll-ups have higher settlement costs on Ethereum because they include the data-expensive proof of authenticity.</p>
<h2 id="point-three" class="anchored-block">Ethereum Update</h2>
<h3>Monthly Blockchain Fees vs. Ethereum Market Share</h3>
<p><img class="img-responsive w-100" src="https://www.vaneck.com/contentassets/1d6fd4f2755f48f9b190d17188f3d50c/3577_scl-blog_chart-4_2023.09_v1_blog.svg" alt="Graph of Monthly Blockchain Fees vs. Ethereum Market Share" /></p>
<p class="chart-disclosure">Source: Artemis.xyz, VanEck Research as of 8/31/2023. Past performance is no guarantee of future results. Not intended as a recommendation to buy or sell any securities named herein.</p>
<p>Ethereum maintained its key position as one of the safest digital assets during periods of volatility and saw a slight uptick in users (+3.44%) while seeing its fees drop (-23%) compared to the previous 30 days. Indicative of this decline is Ethereum&rsquo;s daily transaction fees falling on Sunday, August 27, to their lowest level since December 2022. However, Ethereum retains a greater than 70% market share of all smart contract platform fees, and its dominance persisted in the month of August. Ethereum staking continues to grow with 26M ETH staked, around 22% of the total ETH supply, with 815k validators. Part of Ethereum&rsquo;s success, despite its fee decline, is that it is no longer simply an execution layer. Ethereum has begun to reap the benefits of also being a settlement layer that generates revenue from hosting L2 transaction data. This business arrangement results in Ethereum benefiting from the success of projects like Coinbase&rsquo;s BASE.</p>
<p>Another contributing factor to Ethereum&rsquo;s success is the slow evolution of ETH as a collateral asset. Launched in June, Eigenlayer enables holders of ETH and ETH LSTs to deposit their funds into Eigenlayer and opt into backing various projects that employ the value of those funds. This value can be used to collateralize new protocols, applications, and financial arrangements. Projects like oracles, bridges, or on-chain insurance businesses could back their projects&rsquo; trust models with Eigenlayer staked assets. This enhances the potential for new projects to leverage the value rented from Eigenlayer stakers to create novel, trust-based businesses. The result is that ETH is molting from its core use case as the base asset for securing and transacting on Ethereum to being an important collateral asset. This will establish new, permanent demand channels for ETH that make it substantially more useful. Eigenlayer recently upped the limit on the total amount of locked ETH it would accept to 141k ETH worth $23.3M, which will grow again as Eigenlayer becomes more mature.</p>
<h2 id="Ethereum-Catalyst-EIP-4844" class="jump-link-nav anchored-block" data-jumplink-title="Ethereum Catalyst: EIP 4844">Ethereum Upcoming Catalyst: EIP 4844</h2>
<p>EIP 4844 is an upgrade to Ethereum that will improve Ethereum&rsquo;s scalability and is slated to occur in 4Q2023. Called Proto-Danksharding, the EIP will allow Ethereum to settle L2 transaction batches in a separate memory storage scheme called a &ldquo;side car.&rdquo; The result of this upgrade will be the ability of Layer-2s to settle more transactions to Ethereum and do so with less cost. These data side cars will not be permanently stored on Ethereum but will persist for only about a month. Ethereum will also have more blockspace for its native transactions previously occupied by L2 settlements.</p>
<p>As a direct consequence of EIP 4844, L2 settlement costs to Ethereum will drop significantly. Unless more L2 settlements occur or more transactions happen on Ethereum to make up for the cost difference, Ethereum&rsquo;s revenue may decline. Another potential side-effect is that more users may migrate to transacting on L2s because the cost of doing so should drop significantly. Interestingly, because L2 businesses costs are mainly settlement fees paid to Ethereum, L2 profit margins may increase if they can successfully capture some of the saved costs.</p>
<p>In EIP 4844, the variable cost of settling transactions will be around 90% cheaper for L2s. With current margin estimates of 30% for an L2 like Optimism, if Optimism captures all of the cost savings as profits, it will see margins jump to 93%. However, competition for L2 power users will likely drive transaction prices lower across all L2s, and where margins will end up is uncertain. Unless Ethereum can find new sources of blockspace demand vacated by L2s in the EIP 4844 upgrade, it could see 10-14% of its revenue derived from L2 settlements decline by 90%. We will discuss EIP 4844 in more detail in an upcoming Ethereum piece.</p>
<h2 id="point-four" class="anchored-block">TRON Update</h2>
<p>The fundamentals for Tron continue to be relatively strong amid the backdrop of greater crypto weakness. Tron has been averaging around $1M in fees per day in August, with around $5.27B in TVL, 1.35M daily active users (DAUs), and $44B in on-chain stablecoins (almost entirely USDT). Despite a dramatic 30% loss in DAUs from July, Tron still boasts the highest amount of DAUs among all smart contract platforms, including Bitcoin. Tron&rsquo;s main use case is the utilization of USDT for payments among developing countries, and Tron averages around $9B transferred each day. While Tron has a functioning DeFi ecosystem, it is not decentralized, as its top applications are controlled by Justin Sun, who seems compelled to add his name to everything he touches. JustLend, JustStables, SUNswap, and the mysterious stUSDT collectively control 99.7% of all chain TVL. Additionally, TRON&rsquo;s fees exhibit a peculiar seasonality as the majority of fees, and by proxy on-chain volume, occur during the week while weekends see remarkably consistent lulls in activity.</p>
<h3>TRX Fees</h3>
<p><img class="img-responsive w-100" src="https://www.vaneck.com/contentassets/1d6fd4f2755f48f9b190d17188f3d50c/3577_scl-blog_chart-5_2023.09_v1_blog.svg" alt="Graph of TRX Fees" /></p>
<p class="chart-disclosure">Source: Tronscan as of 8/31/2023. Past performance is no guarantee of future results. Not intended as a recommendation to buy or sell any securities named herein.</p>
<p>Tron&rsquo;s activity consistently declines on weekends.</p>
<h2 id="point-five" class="anchored-block">Cosmos Update</h2>
<h3>Cosmos Developer Market Share</h3>
<p><img class="img-responsive w-100" src="https://www.vaneck.com/contentassets/1d6fd4f2755f48f9b190d17188f3d50c/3577_scl-blog_chart-6_2023.09_v1_blog.svg" alt="Graph of Cosmos Developer Market Share" /></p>
<p class="chart-disclosure">Source: Artemis.xyz, VanEck Research As of 8/14/2023. Past performance is no guarantee of future results. Not intended as a recommendation to buy or sell any securities named herein.</p>
<p>The month of August was not kind to ATOM as its price fell (-21.9%) and was one of the worst performers among smart contract platforms. ATOM, which we wrote a <strong><a href="https://www.vaneck.com/us/en/blogs/digital-assets/matthew-sigel-why-we-are-bullish-on-atom/" title="Why We're Bullish on ATOM">deep-dive</a></strong> on in August 2022, was grabbing the market share of the crypto developer base. Cosmos&rsquo; app-chain thesis was attracting adherents amongst important financial players in crypto. After last September&rsquo;s Cosmos conference, many were excited to see Cosmos' core contributors finally unveil a value accrual business model for the ATOM token.</p>
<p>This business was termed Interchain Security (ICS), and its economics centered around utilizing the value of the ATOM tokens to back a blockchain called the Cosmos Hub that would lend security to nascent blockchains. This would be accomplished by having each Cosmos Hub validator, all 175 of them, run each security consumer blockchain&rsquo;s software. If the Cosmos Hub validators reported transactions honestly and provided server uptime, they would receive payments from the consumer chain for running consumer chain software. Effectively, this would allow each consumer chain to piggyback off the security of the staked ATOM because if the Cosmos Hub validators tried to cheat or steal funds, the staked ATOM behind those validators would be seized. In turn, to attract ATOM stakers, the Cosmos Hub validators would reward the stakers with some portion of the revenue from consumer chains.</p>
<p>However, progression towards building this vision has been incredibly slow. At the time of writing, only three chains had been onboarded to the Cosmos Hub, and many of the most important chains by TVL, such as Kava, Osmosis, and Axelar, have opted away from joining the Cosmos Hub. Likewise, the Cosmos ecosystem has been marred by negative sentiment generated by the glacial launch pace of native USDC launch, dwindling user interest in anticipated novel Cosmos DeFi chains such as Sei, Injective, and Bera, and community disagreement on the Cosmos Hub business model. At this point, there are currently several ATOM-funded proposals to change the economics of the Cosmos Hub. While Cosmos has been gaining the market share of developers, it is uncertain if that will contribute to ATOM&rsquo;s value. Until the economics of ATOM change and more chains opt into the ATOM security model, ATOM would appear to be a token without an economic purpose to justify its $2.1B market capitalization.</p>
<h2 id="point-six" class="anchored-block">Polygon Update</h2>
<p>Polygon&rsquo;s MATIC token continued its underperformance for the month of August, losing (-19.3%) of its value. While MATIC did not see a significant decline in usership (-4.7%) amid a greater crypto drawdown of (-10.3%), it did see the third largest month-to-month fee decline (-29%) among SCPs. Part of the decline in Polygon&rsquo;s token price can be attributed to the continued underperformance of Polygon&rsquo;s business development initiatives. Over the past 18 months, Polygon has spent hundreds of millions of MATIC tokens securing partnerships with Nike, Adidas, Starbucks, and Reddit. Despite these initiatives, the spent funds&rsquo; contribution to Polygon&rsquo;s bottom line has dwindled immensely. While usership has increased over 6-, 12-, and 18-month intervals on Polygon, fees are down (-2%) over the past year and (-18%) lower than 18 months ago. Polygon&rsquo;s chief applications, Planet IX, Chainlink, and Uniswap, have seen their usage, as measured by gas fees, decline (-37.1%), (-28.8%), and (-50.2%) month to month. Part of this decline is strong competition by L2s, attracting new and interesting projects. Another significant portion is due to useability issues with Polygon&rsquo;s blockchain, including chain re-organizations, network outages, and security concerns. Though there is a substantial upgrade in the works that will address these issues, the timing of the releases is slower than needed. For example, the first upgrade of Polygon&rsquo;s Mainnet to Validiums is not expected until late 1Q2024. Additionally, there is concern that the SEC may deem Polygon&rsquo;s MATIC token a security. An indicator of this fear is the Bitstamp exchange delisting Polygon&rsquo;s MATIC in early August.</p>
<h3>Polygon Fees vs. DAU 30 Day Moving Average</h3>
<p><img class="img-responsive w-100" src="https://www.vaneck.com/contentassets/1d6fd4f2755f48f9b190d17188f3d50c/3577_scl-blog_chart-7_2023.09_v1_blog.svg" alt="Graph of Polygon Fees vs. DAU 30 Day Moving Average" /></p>
<p class="chart-disclosure">Source: Artemis.xyz, VanEck Research as of 8/28/2023. Past performance is no guarantee of future results. Not intended as a recommendation to buy or sell any securities named herein.</p>
<p>The Polygon team is currently addressing the issues plaguing its technical architecture and redesigning its MATIC token's economic model. To prevent Polygon blockchain from having periodic re-org, Polygon will transition its Mainnet, called PoS, to a Validium-based system. A knock-on effect of this move will be that Polygon&rsquo;s gas fees paid on Ethereum will also decline and make transactions on Polygon. This move is a stop-gap measure before Polygon converts to a true zero-knowledge (zk) ecosystem.</p>
<p>Furthermore, Polygon also introduced a revamped token design that centers around Polygon&rsquo;s lead in zero-knowledge (zk) scaling technology. In the future set-up of Polygon, the MATIC token will be replaced by the POL token, which will accrue value by backing entities performing &ldquo;useful work.&rdquo; The MATIC token will be 1:1 convertible to the new POL token. The new design of Polygon will revolve around a series of bridges connecting various blockchains that will be secured under the aegis of a validator set backed by the POL token. Polygon will provide the tooling and support for entities that want to build their own Polygon blockchains, called &ldquo;supernets.&rdquo;</p>
<p>Additionally, a new agent, the zk prover, will play a pivotal role in the system by generating and verifying zk authenticity proofs of Polygon blockchains. The POL token will be used to back these provers as well. The result of Polygon&rsquo;s design improvements is a host of new token sinks that perform important ecosystem functions for Polygon while providing value for the tokenholders. Finally, to create a sustainable ecosystem fund and security budget for validators, the POL token will implement a 2% inflation, unlike the capped supply MATIC token.</p>
<h2 id="point-seven" class="anchored-block">Avalanche Update</h2>
<h3>Avalanche Gas Usage by Application Category</h3>
<p><img class="img-responsive w-100" src="https://www.vaneck.com/contentassets/1d6fd4f2755f48f9b190d17188f3d50c/3577_scl-blog_chart-8_2023.09_v1_blog.svg" alt="Graph of Avalanche Gas Usage by Application Category" /></p>
<p class="chart-disclosure">Source: Artemis.xyz, VanEck Research as of 8/29/2023 Past performance is no guarantee of future results. Not intended as a recommendation to buy or sell any securities named herein.</p>
<p>The price performance of AVAX in the month of August is poor, around (-22.1%), but is better than expected given Avalanche&rsquo;s dismal fundamental metrics. According to some important measurements of a blockchain&rsquo;s health, including fees, daily active users, DEX volume, and TVL, Avalanche is dramatically ailing. Compared to its peers, Avalanche saw the largest month-to-month decline in Daily Active Users (-28.5%) and the second worst decline in fees (-40%), DEX Volume (-46.9%), and TVL (-14.1%). The monthly transaction volume on Avalanche is the lowest since August 2022, while TVL is smaller than it has been at any point since August 2021.</p>
<p>While the decline in activity on Avalanche is dismal on a month-to-month basis, it follows a late spring 2023 surge in usage. However, this bump in activity was not organic but resulted from several large traders gaming an airdrop from the LayerZero project. The evidence to support this contention is that much of the activity on Avalanche has revolved around utilizing the LayerZero products such as the LayerZero bridge, the Stargate DeFi application, and BTC.b (bridged Bitcoin using LayerZero). In fact, since May 2023, bridging applications on Avalanche, almost exclusively the LayerZero-associated products, have accounted for 50-60% of all gas fees on Avalanche, 30-35% of all active wallets, and 25% of all transactions. Before the surge, bridging-related applications ranged around 5% of gas fees on Avalanche. However, the most concerning aspect of this decline in activity is that Layer-Zero airdrop-related activity has remained constant as a percentage of gas fees and usership. This implies that the total figures for Avalanche have been declining as a whole, not just from airdrop farmers' pairing back activity.</p>
<h2 id="DeFi-Decline-in-Economic-Activity" class="jump-link-nav anchored-block" data-jumplink-title="DeFi: Decline in Economic Activity">DeFi: Economic Activity Continues to Decline</h2>
<p>The MarketVector Decentralized Finance Leaders Index underperformed BTC and ETH, falling 21% in August as on-chain economic activity dwindled. The underperformance was exacerbated by UNI, representing ~30% of the index, declining 33.5% as investors sold tokens to capture gains from its outperformance in July. Other major index components fared slightly better, with MKR, AAVE, and LDO returning -6%, -14%, and -15%, respectively. The total value locked (TVL) across DeFi fell 8% in August, from $40.8 billion to $37.5 billion, slightly outperforming Ethereum&rsquo;s 10% pullback. Decentralized exchange volume experienced a more severe decline to $52.8 billion in August, 15.5% lower than in July. While DeFi tokens had a lackluster performance in August, many of the core DeFi protocols experienced positive developments. Uniswap Labs won a class action lawsuit, and Maker and Curve saw TVL growth in their stablecoins.</p>
<h3>August DeFi Volume Falls 15%</h3>
<p><img class="img-responsive w-100" src="https://www.vaneck.com/contentassets/1d6fd4f2755f48f9b190d17188f3d50c/3577_scl-blog_chart-9_2023.09_v1_blog.svg" alt="Chart of August DeFi Volume" /></p>
<p class="chart-disclosure">Source: DefiLlama as of 8/31/2023. Past performance is no guarantee of future results. Not intended as a recommendation to buy or sell any securities named herein.</p>
<h2 id="Uniswap-Victory-in-Lawsuit" class="jump-link-nav anchored-block" data-jumplink-title="Uniswap: Victory in Lawsuit">Uniswap Wins Lawsuit, Sets Precedent for Decentralized Protocols</h2>
<p>While the UNI token underperformed its peers in August, the leading decentralized exchange celebrated a major victory when the Southern District Court of New York dismissed a class action lawsuit. The lawsuit alleged that Uniswap contributors, including Uniswap Labs, Uniswap Foundation, Hayden Adams, and multiple venture investors, had violated securities laws by selling unregistered securities on the platform. The court ruled that Uniswap cannot be held liable for any damage caused by third parties misusing the protocol because Uniswap is a decentralized exchange. As such, it does not have control over how its protocol is used. Judge Katherine Failla, who is also presiding over the SEC v. Coinbase case, wrote in her decision that "this case is more like an effort to hold a developer of self-driving cars liable for a third party's use of the car to commit a traffic violation or to rob a bank." The ruling is a huge win for Uniswap and other decentralized protocols, as it sets a precedent that could be used to defend other open-source crypto developers and contributors from unfounded lawsuits.</p>
<h2 id="point-eight" class="anchored-block">MakerDAO Drives DAI Adoption by Increasing the DAI Savings Rate (DSR)</h2>
<h3>DAI Market Capitalization Reverses Trend</h3>
<p><img class="img-responsive w-100" src="https://www.vaneck.com/contentassets/1d6fd4f2755f48f9b190d17188f3d50c/3577_scl-blog_chart-10_2023.09_v1_blog.svg" alt="DAI Market Capitalization Reverses Trend" /></p>
<p class="chart-disclosure">Source: VanEck Research as of 8/31/2023. Past performance is no guarantee of future results.</p>
<p>In August, the amount of DAI deposited in MakerDAO&rsquo;s DAI Savings Rate (DSR) contract increased 278%, settling at ~1.3 billion DAI following the interest rate increase from 3% to 8%. Rune Christensen, the founder of MakerDAO, lauded the success of the rate increase, which grew DAI&rsquo;s total market capitalization by 19% to $5.35 billion over the course of the month. However, many in the MakerDAO community were uneasy with the results of the rate change due to whales being able to borrow large amounts of DAI at an interest rate below the 8% deposit interest they received for depositing in the DSR. This effectively allowed whales to fill up the DSR by arbitraging the borrow and deposit rates, resulting in a situation where MakerDAO&rsquo;s treasury was essentially paying whales the difference. To alleviate this, Rune proposed the DAO lower the DSR to 5% and raise DAI borrow rates to match the DSR to disincentivize users from depositing borrowed DAI in the DSR. To prevent capital departure upon lowering the deposit interest rate, MakerDAO implemented the SPK pre-farming airdrop, which will reward Spark protocol borrowers in an upcoming airdrop of the SPK token. The goal here is to attract as much TVL as possible to boost market trust in the product while mitigating the expense of funding the DSR, which, at the current rate and level of deposits, is costing MakerDAO $65 million annually to fund. While this expense should be covered by the revenue generated from Maker&rsquo;s U.S. Treasury Bond holdings, other stablecoins, such as USDC and USDT, have developed much larger market share without providing high yield to holders, calling into question the long-term sustainability of the DSR, especially once the Spark airdrop concludes. By the end of the month, Spark&rsquo;s TVL had grown to $455 million, representing a monthly increase in deposits of 712%, with wstETH constituting 78% of deposits.</p>
<h2 id="point-nine" class="anchored-block">Curve Update: Recovering from July&rsquo;s Exploit</h2>
<h3>Curve Revenue by Source</h3>
<p><img class="img-responsive w-100" src="https://www.vaneck.com/contentassets/1d6fd4f2755f48f9b190d17188f3d50c/3577_scl-blog_chart-11_2023.09_v1_blog.svg" alt="Curve Revenue by Source" /></p>
<p class="chart-disclosure">Source: VanEck Research, Curvemonitor as of 8/30/2023. Past performance is no guarantee of future results. Not intended as a recommendation to buy or sell any securities named herein.</p>
<p>Curve has begun to show signs of recovery from the Vyper compiler exploit last month that caused Curve&rsquo;s TVL to fall 48% to $1.68 billion. In the first week of August, about $750 million of TVL returned as Frax redeposited its base pool liquidity, and other investors regained confidence in the platform's security. Additionally, crvUSD saw significant growth this month and achieved a new all-time high of $114 million borrowed. The growth of crvUSD has allowed it to become a significant contributor of revenue for the platform, with crvUSD fees exceeding fees collected from all non-mainnet liquidity pools in 3 of the 4 last weeks. Curve&rsquo;s governance token, however, has not seen promising signs of recovery, with its price falling 24% in August to $0.45. Due to the price decline, investors who bought CRV OTC from Michael Egorov last month are now only 12.5% above the water on their investment, with 5 months left until they can sell. If crvUSD can continue to grow to the point that it offsets the drop in exchange revenue caused by decreasing DeFi volume, CRV price may see some relief. Still, until then, declining DeFi volume remains a solid headwind for CRV appreciation.</p>
<h2 id="point-ten" class="anchored-block">High-Interest Rates: A Strong Headwind to Stablecoin Market Growth</h2>
<h3>Stablecoin Market Capitalization</h3>
<p><img class="img-responsive w-100" src="https://www.vaneck.com/contentassets/1d6fd4f2755f48f9b190d17188f3d50c/3577_scl-blog_chart-12_2023.09_v1_blog.svg" alt="Stablecoin Market Capitalization" /></p>
<p class="chart-disclosure">Source: Artemis as of 8/31/2023. Past performance is no guarantee of future results. Not intended as a recommendation to buy or sell any securities named herein.</p>
<p>Despite Maker and Curve&rsquo;s success in expanding the supply of their respective stablecoins, the aggregate market capitalization of stablecoins continued to trend down, falling 2% in August to $119.5 billion, according to data from Artemis. This is mainly a result of elevated interest rates in traditional finance, which have incentivized investors to dump their stablecoins and move into money market funds where they can receive ~5% risk-free yield. With U.S. Federal Reserve (Fed) chair Jerome Powell noting that further interest rate increases in 2023 may be necessary, we think it is unlikely the stablecoin trend will reverse in the near term. Until interest rates begin to recede or a stablecoin provider finds a seamless way to bring this yield on-chain, as MakerDAO attempts to do, the risk and opportunity cost of holding stablecoins will continue to drive out capital. PayPal&rsquo;s launch of their first stablecoin, PYUSD, could also bolster stablecoin adoption. While PYUSD doesn&rsquo;t offer yield to holders, it could garner broader adoption if it introduces additional utility not offered by other stablecoins, such as the ability to conduct e-commerce payments.</p>
<h2 id="point-eleven" class="anchored-block">Lack of Metaverse Development &amp; Usership Stifle Performance</h2>
<p>In August, the MarketVector Media and Entertainment Leaders Index fell 23.4% as metaverse tokens continued to underperform ETH. APE fell 23%, while MANA and SAND fell 22.5% and 27%, respectively. The selling pressure results from continued token unlock, causing inflation and increasing investor doubt that metaverse platforms can deliver on the vision they promised. Throughout the bear market, data analytics platforms DCL-Metrics and DappRadar have reported declining usership metrics in both The Sandbox and Decentraland, which have 3,600 and 4,500 monthly active users, respectively. Meanwhile, APE&rsquo;s feature product, the Otherside metaverse, is still developing while token staking rewards continue to inflate supply and drive sell pressure. However, Yuga Labs announced that its Legends of the Mara strategy game will be released in open beta in September, presenting a potential tailwind for APE. We believe these tokens will continue to underperform ETH until there is a strong reversal in the usership trend brought about by significant product enhancements or new releases.</p>
<h2 id="point-twelve" class="anchored-block">Zynga Enters Crypto Gaming as Usership Stagnates</h2>
<p>Zynga, a notorious Web2 casual game developer, announced the launch of their first Web3 gaming platform, Sugartown. Not much information was released about Sugartown as an attempt to bolster interest by maintaining a veil of mystery and slowly releasing information to the public. However, we know there will be an upcoming free mint for &ldquo;Ora&rdquo; NFTs, potentially having governance powers within the Sugartown platform. Additionally, Zynga made clear that Sugartown will not be a standalone game. Zynga described the nature of Sugartown as a transmedia IP and a gaming and community-building platform. Since other Web3 products have struggled to create compelling IP to attract gamers, Zynga has leveraged its existing IP by featuring 3 of its Farmville characters in Sugartown. The announcement of Sugartown comes as crypto gaming continues to struggle to bring in new users. In August, the user count amongst the top crypto games increased by 1.6% but is down about 35% compared to the same period a year ago. As a well-established game developer with a strong track record of success, we believe Zynga has the expertise to develop and market Web3 IP that could bring Web3 gaming to the masses.</p>
<h2 id="point-thirteen" class="anchored-block">NFT Volume Hits 2.5-Year Low as SEC Files Enforcement Action &amp; Recur Shuts Down</h2>
<h3>Monthly NFT Volume Hits 2.5-Year Low</h3>
<p><img class="img-responsive w-100" src="https://www.vaneck.com/contentassets/1d6fd4f2755f48f9b190d17188f3d50c/3577_scl-blog_chart-13_2023.09_v1_blog.svg" alt="Graph of Monthly NFT Volume" /></p>
<p class="chart-disclosure">Source: Cryptoslam! as of 8/31/2023. Past performance is no guarantee of future results. Not intended as a recommendation to buy or sell any securities named herein.</p>
<p>August was a brutal month for NFT enthusiasts, as negative news for the market continued to outpace positive developments. NFT volume fell again in August, marking 6 months straight of declining volume. Cryptoslam! reported that NFT secondary sales in August generated only $390 million of volume, marking the lowest monthly volume for NFTs since January 2021. The 23% drop in monthly volume highlights the growing apathy in NFT markets, where little product improvement has occurred, and a lack of new entrants has inhibited the sector&rsquo;s ability to drive speculation. Blur continued facilitating most Ethereum NFT volume in August, commanding a 65% market share of total volume and 37% of trades. Meanwhile, OpenSea retained its majority share of NFT trades, conducting 61% of trades and driving 21% of Ethereum NFT volume. Despite Blur&rsquo;s success in dethroning OpenSea as the leading NFT marketplace by volume, the continued lack of investor interest in the NFT market creates major headwinds for BLUR, which fell 30% in August.</p>
<p>Not only has there been a lack of new entrants to the NFT scene, but existing franchises expected to drive development and adoption are running out of cash. Notably, Recur announced they would close shop over the coming months due to the NFT winter. Recur raised $50 million in Sept. 2021 at a $333 million valuation and garnered market-wide attention after announcing NFT collections for several big brands, including Hello Kitty and Nickelodeon. As part of the winddown process, Recur will migrate all media and attributes for the &gt;380k NFTs minted by the platform to IPFS by November 22, with NFT deposits and other platform actions being disabled in the weeks preceding the IPFS migration. The closure of Recur shows that even well-funded companies are struggling to survive in the current environment.</p>
<p>Furthermore, the SEC launched their first enforcement action against NFTs in August, alleging that L.A.-based Impact Theory sold unregistered securities in their $30 million sale of Founder&rsquo;s Key NFTs. The SEC alleged that Impact Theory marketed the NFTs as assets that would appreciate with the success project, constituting an investment contract. In a dissent on the Commission&rsquo;s decision, Commissioner Peirce and Uyeda emphasized that while they worry about people buying NFTs without knowing how their funds will be used, the statements made by Impact Theory were not indicative of an investment contract just as an artist&rsquo;s commitment to build their brand doesn&rsquo;t justify labeling their paintings as investment contracts. Impact Theory agreed to settle with the SEC, requiring the team to destroy any NFTs they possess, set up a fund to reimburse investors, and pay more than $6.1 million in penalties.</p>
<p>One NFT-based game that recently found a clear product-market fit is DraftKings&rsquo; Reignmakers, which merges card collecting with fantasy sports using NFTs on the Polygon blockchain. Over the next four quarters, we estimate the Reignmakers franchise (an NFT-based fantasy sports game on Polygon) will generate $70M+ in high-margin revenues, accounting for 3% of DraftKing&rsquo;s top line and 5% of 2022 full-year profits. Please check out our recent deep dive on the platform <a href="https://www.vaneck.com/us/en/blogs/digital-assets/matthew-sigel-the-nft-game-thats-almost-5-of-draftkings-earnings/" title="The NFT Game That's Almost 5% of DraftKings' Earnings"><strong>here</strong></a>.</p>
<p><strong>Links to third party websites are provided as a convenience and the inclusion of such links does not imply any endorsement, approval, investigation, verification or monitoring by us of any content or information contained within or accessible from the linked sites. By clicking on the link to a non-VanEck webpage, you acknowledge that you are entering a third-party website subject to its own terms and conditions. VanEck disclaims responsibility for content, legality of access or suitability of the third-party websites.</strong></p>
<p>To receive more <strong><a href="https://www.vaneck.com/us/en/insights/digital-assets/" title="Digital Assets Insights">Digital Assets</a></strong> insights, <strong><a href="https://www.vaneck.com/us/en/subscribe/" title="Subscription Center">sign up in our subscription center</a></strong>.</p>
<style type="text/css">
    .wrapped-div {
        max-width: 100%;
    }

    @media (max-width: 1240px) {
        .wrapped-div {
            overflow-x: scroll;
        }
    }

    .wrapped-div-sector {
        max-width: 100%;
        overflow-x: scroll;
    }
</style>
]]></content:encoded>
</item><item rdf:about="https://www.vaneck.com/us/en/blogs/moat-investing/charting-the-moat-indexs-long-term-track-record/">
  <title>Charting the Moat Index’s Long-Term Track Record></title>
  <link>https://www.vaneck.com/us/en/blogs/moat-investing/charting-the-moat-indexs-long-term-track-record/</link>
  <description><![CDATA[The strength of Morningstar&rsquo;s moat indexes lies in its forward-looking approach to selecting quality companies, as shown by its history of outperforming the S&amp;P 500 over long holding periods.]]></description>
  <dc:creator>Brandon Rakszawski</dc:creator>
  <dc:date>09/08/2023 06:30:00</dc:date>
<content:encoded><![CDATA[

<p>August was a volatile month for U.S. equity markets. The S&amp;P 500 Index finished the month in negative territory for the first time since February 2023. Several market forces impacted companies during the month. Fitch downgraded the U.S. government&rsquo;s long-term credit rating from AAA to AA+; the U.S. Department of Labor released data reinforcing the perception of a robust labor market, which could potentially allow the Fed to more easily prolong their tightening policy; and corporate earnings continue to come in lower than prior quarters, although not quite as low as predicted. These and other factors led to increased uncertainty in the equity markets in August.</p>
<p>The <a href="/link/9e43dd198c5f4e419f13220685081895.aspx" title="MOAT - VanEck Morningstar Wide Moat ETF - Holdings and Performance "><strong>Morningstar Wide Moat Focus Index (the &ldquo;Moat Index&rdquo;)</strong></a> trailed the S&amp;P 500 by 2% in August (-3.59% vs. -1.59%, respectively). This sizable underperformance month is generally uncharacteristic, as the Moat Index has only trailed the S&amp;P 500 by more than 2% in five of the last 60 months. As is typically the case, the underperformance was driven by stock selection rather than sector overweights or underweights. Despite the difficult month, the Moat Index remains more than 500 basis points ahead of the S&amp;P 500 for the year with a 23.90% return through August versus the S&amp;P 500&rsquo;s return of 18.73%.</p>
<p>Looking to smaller-cap companies, the market returns were more negative in August for smaller companies. Mid cap stocks, as represented by the S&amp;P MidCap 400 Index (-2.89%) and the S&amp;P SmallCap 600 Index (-4.14%) both finished increasingly more in the red. The <strong><a href="https://www.vaneck.com/us/en/investments/morningstar-smid-moat-etf-smot/index/" title="SMOT - VanEck Morningstar SMID Moat ETF - Overview ">Morningstar US Small-Mid Cap Moat Focus Index</a></strong> (the &ldquo;SMID Moat Index&rdquo;), like the Moat Index, struggled relatively in August with a return of -4.16%. Because there is some overlap in the two moat indexes, many of the same companies were key contributors to negative performance.</p>
<h2>More to the Moat Story than One Month</h2>
<p>No investors want to see their strategy underperform a broad market benchmark. But, despite all of the success the Moat Index has had over its more than 15-year history, it has only outperformed the S&amp;P 500 in any given calendar month 50% of the time. Stated differently, the Moat Index has outperformed the S&amp;P 500 by 3.25% annually since its February 14, 2007 launch but has underperformed the S&amp;P 500 Index in nearly half of the months along the way.</p>
<p>The key with this long-term, core strategy is Morningstar&rsquo;s <strong><a href="https://www.vaneck.com/us/en/blogs/moat-investing/moat-delivers-quality-with-a-forward-looking-edge/" title="MOAT Delivers Quality with a Forward-Looking Edge">forward-looking perspective in selecting quality companies</a></strong>. Looking beyond the coin toss that is one-month success allows you to see the Moat Index&rsquo;s clear long-term history of outperformance over long holding periods, increasing to a staggering 100% success rate, or batting average, over all 79 of the Moat Index&rsquo;s 10-year rolling periods since its 2007 inception.</p>
<h3>Consistent Long-Term Relative Performance</h3>
<p><strong>3/2007 &ndash; 8/31/2023</strong></p>
<p><img class="img-responsive w-100" src="https://www.vaneck.com/contentassets/b337a8b7f10b4001a1e1cd162f953354/3585_moat_chart-1_2023.09_blog.svg" alt="Bar chart showing the consistent long-term relative performance of the Morningstar Wide Moat Focus Index vs. the S and P 500 Index" /></p>
<div class="wrapped-div">
<table style="width: 100%;">
<tbody>
<tr class="tbl-data">
<td class="tbl-header last">&nbsp;</td>
<td class="tbl-header last" style="text-align: center;">1 Month Rolling Periods</td>
<td class="tbl-header last" style="text-align: center;">1 Year Rolling Periods</td>
<td class="tbl-header last" style="text-align: center;">3 Year Rolling Periods</td>
<td class="tbl-header last" style="text-align: center;">5 Year Rolling Periods</td>
<td class="tbl-header last" style="text-align: center;">10 Year Rolling Periods</td>
</tr>
<tr class="tbl-data">
<td class="data-td data last" style="text-align: left;">Total Periods</td>
<td class="data-td data last" style="text-align: center;">198</td>
<td class="data-td data last" style="text-align: center;">187</td>
<td class="data-td data last" style="text-align: center;">163</td>
<td class="data-td data last" style="text-align: center;">139</td>
<td class="data-td data last" style="text-align: center;">79</td>
</tr>
<tr class="tbl-data">
<td class="data-td data last" style="text-align: left;">Total Outperformed</td>
<td class="data-td data last" style="text-align: center;">100</td>
<td class="data-td data last" style="text-align: center;">121</td>
<td class="data-td data last" style="text-align: center;">138</td>
<td class="data-td data last" style="text-align: center;">132</td>
<td class="data-td data last" style="text-align: center;">79</td>
</tr>
<tr class="tbl-data">
<td class="data-td data last" style="text-align: left;">Batting Average</td>
<td class="data-td data last" style="text-align: center;">51%</td>
<td class="data-td data last" style="text-align: center;">65%</td>
<td class="data-td data last" style="text-align: center;">85%</td>
<td class="data-td data last" style="text-align: center;">95%</td>
<td class="data-td data last" style="text-align: center;">100%</td>
</tr>
</tbody>
</table>
</div>
<br />
<p class="chart-disclosure"><strong>Source: Morningstar, July 2023</strong>. Past performance is no guarantee of future results. Index performance is not illustrative of fund performance. Not intended as a recommendation to buy or to sell any of the securities mentioned herein. Batting Average is measured by dividing the number of periods a portfolio or investment strategy outperforms a benchmark by the total number of periods.</p>
<h2>Moat Stock Selection Drives Performance</h2>
<p>As is customary, the prospects of the Moat Index were once again driven largely by stock selection as opposed to an overweight (or underweight) to any particular sector. A handful of names were outsized contributors to negative absolute returns in August, several from the consumer discretionary sector.</p>
<p><strong>Etsy (ETSY)</strong></p>
<p>Etsy struggled mightily in August compared to the rest of the market. It&rsquo;s -27% return for the month placed it squarely at the bottom within the Moat Index. The title of Morningstar&rsquo;s latest equity research report tells it all: Etsy's Near-Term Prospects Soft, but Platform Investments Should Bear Fruit as Macro Pressure Eases. Etsy has faced significant headwinds since entering the Moat Index, but Morningstar stands by its wide moat rating and recognition of Etsy&rsquo;s unique network effect. Its fair value estimate was lowered from $151 per share to $145 in late August to reflect an increase in both cost of capital assumptions and long-term tax rate.</p>
<p><strong>Polaris (PII)</strong></p>
<p>Polaris finished August trading at a 33% discount to Morningstar&rsquo;s fair value estimate. That was despite a slight decrease from $175 per share to $171 in late July to incorporate the company&rsquo;s second-quarter results into Morningstar&rsquo;s model. The 70-year-old recreational vehicle power house continues to benefit from its powerful intangible assets, robust R&amp;D budget, and low-cost production, according to Morningstar.</p>
<p>Top contributors in August included automation equipment and services company Emerson Electric (EMR), biopharma firm Amgen (AMGN) and Comcast Corp. (CMCSA).</p>
<h3>Top Contributors and Detractors from Moat Index - August 2023</h3>
<div class="wrapped-div">
<table style="width: 750px;">
<tbody>
<tr class="tbl-data">
<td class="tbl-header last" colspan="5">Leading Contributors</td>
</tr>
<tr class="tbl-data">
<td class="data-td  last">Company</td>
<td class="data-head last">Ticker</td>
<td class="data-head last">Sector</td>
<td class="data-head last">Avg. Weight (%)</td>
<td class="data-head last">Contribution (%)</td>
</tr>
<tr class="tbl-data">
<td class="data-td last" style="font-weight: normal;">Emerson Electric Co.</td>
<td class="data-td data last">EMR</td>
<td class="data-td data last">Industrials</td>
<td class="data-td data last">2.68</td>
<td class="data-td data last">0.20</td>
</tr>
<tr class="tbl-data">
<td class="data-td last" style="font-weight: normal;">Amgen Inc.</td>
<td class="data-td data last">AMGN</td>
<td class="data-td data last">Health Care</td>
<td class="data-td data last">1.40</td>
<td class="data-td data last">0.13</td>
</tr>
<tr class="tbl-data">
<td class="data-td last" style="font-weight: normal;">Comcast Corp.</td>
<td class="data-td data last">CMCSA</td>
<td class="data-td data last">Communications Services</td>
<td class="data-td data last">2.74</td>
<td class="data-td data last">0.09</td>
</tr>
<tr class="tbl-data">
<td class="data-td last" style="font-weight: normal;">Intuit Inc.</td>
<td class="data-td data last">INTU</td>
<td class="data-td data last">Technology</td>
<td class="data-td data last">1.42</td>
<td class="data-td data last">0.08</td>
</tr>
<tr class="tbl-data">
<td class="data-td last" style="font-weight: normal;">Tradeweb Markets Inc.</td>
<td class="data-td data last">TW</td>
<td class="data-td data last">Financials</td>
<td class="data-td data last">1.46</td>
<td class="data-td data last">0.08</td>
</tr>
</tbody>
</table>
</div>
<br />
<div class="wrapped-div">
<table style="width: 750px;">
<tbody>
<tr class="tbl-data">
<td class="tbl-header last" colspan="5">Leading Detractors</td>
</tr>
<tr class="tbl-data">
<td class="data-td  last">Company</td>
<td class="data-head last">Ticker</td>
<td class="data-head last">Sector</td>
<td class="data-head last">Avg. Weight (%)</td>
<td class="data-head last">Contribution (%)</td>
</tr>
<tr class="tbl-data">
<td class="data-td last" style="font-weight: normal;">Etsy Inc.</td>
<td class="data-td data last">ETSY</td>
<td class="data-td data last">Consumer Discretionary</td>
<td class="data-td data last">1.93</td>
<td class="data-td data last">-0.66</td>
</tr>
<tr class="tbl-data">
<td class="data-td last" style="font-weight: normal;">Polaris Inc.</td>
<td class="data-td data last">PII</td>
<td class="data-td data last">Consumer Discretionary</td>
<td class="data-td data last">2.48</td>
<td class="data-td data last">-0.45</td>
</tr>
<tr class="tbl-data">
<td class="data-td last" style="font-weight: normal;">International Flavors &amp; Fragrances Inc.</td>
<td class="data-td data last">IFF</td>
<td class="data-td data last">Materials</td>
<td class="data-td data last">1.96</td>
<td class="data-td data last">-0.38</td>
</tr>
<tr class="tbl-data">
<td class="data-td last" style="font-weight: normal;">Zimmer Biomet</td>
<td class="data-td data last">ZBH</td>
<td class="data-td data last">Health Care</td>
<td class="data-td data last">2.17</td>
<td class="data-td data last">-0.32</td>
</tr>
<tr class="tbl-data">
<td class="data-td last" style="font-weight: normal;">Fortinet Inc.</td>
<td class="data-td data last">FTNT</td>
<td class="data-td data last">Technology</td>
<td class="data-td data last">1.14</td>
<td class="data-td data last">-0.31</td>
</tr>
</tbody>
</table>
</div>
<br />
<p class="chart-disclosure"><strong>Source: Morningstar, August 2023</strong>. Past performance is no guarantee of future results. Index performance is not illustrative of fund performance. Not intended as a recommendation to buy or to sell any of the securities mentioned herein.</p>
<div class="wrapped-div">
<table style="width: 750px;">
<tbody>
<tr class="tbl-data">
<td class="tbl-header last" colspan="3">Top 10 MOAT Holdings</td>
</tr>
<tr class="tbl-data">
<td class="data-td  last">Holding Name</td>
<td class="data-head last" style="text-align: center;">Ticker</td>
<td class="data-head last" style="text-align: center;">% of Net Assets</td>
</tr>
<tr class="tbl-data">
<td class="data-td last" style="font-weight: normal;">Domino's Pizza Inc.</td>
<td class="data-td data last">DPZ</td>
<td class="data-td data last">2.97%</td>
</tr>
<tr class="tbl-data">
<td class="data-td last" style="font-weight: normal;">Alphabet Inc.</td>
<td class="data-td data last">GOOGL</td>
<td class="data-td data last">2.87%</td>
</tr>
<tr class="tbl-data">
<td class="data-td last" style="font-weight: normal;">Veeva Systems Inc.</td>
<td class="data-td data last">VEEV</td>
<td class="data-td data last">2.86%</td>
</tr>
<tr class="tbl-data">
<td class="data-td last" style="font-weight: normal;">Transunion</td>
<td class="data-td data last">TRU</td>
<td class="data-td data last">2.82%</td>
</tr>
<tr class="tbl-data">
<td class="data-td last" style="font-weight: normal;">Emerson Electric Co.</td>
<td class="data-td data last">EMR</td>
<td class="data-td data last">2.71%</td>
</tr>
<tr class="tbl-data">
<td class="data-td last" style="font-weight: normal;">Comcast Corp.</td>
<td class="data-td data last">CMCSA</td>
<td class="data-td data last">2.67%</td>
</tr>
<tr class="tbl-data">
<td class="data-td last" style="font-weight: normal;">Salesforce.Com Inc.</td>
<td class="data-td data last">CRM</td>
<td class="data-td data last">2.63%</td>
</tr>
<tr class="tbl-data">
<td class="data-td last" style="font-weight: normal;">Intercontinental Exchange Inc.</td>
<td class="data-td data last">ICE</td>
<td class="data-td data last">2.58%</td>
</tr>
<tr class="tbl-data">
<td class="data-td last" style="font-weight: normal;">Tyler Technologies Inc.</td>
<td class="data-td data last">TYL</td>
<td class="data-td data last">2.56%</td>
</tr>
<tr class="tbl-data">
<td class="data-td last" style="font-weight: normal;">Ecolab Inc.</td>
<td class="data-td data last">ECL</td>
<td class="data-td data last">2.54%</td>
</tr>
</tbody>
</table>
</div>
<br />
<p class="chart-disclosure">Data as of 9/5/2023. These are not recommendations to buy or sell any security. Security holdings may vary.</p>
<h2>Smaller Caps Bear Brunt of Pull Back</h2>
<p>Smaller-cap companies underperformed their larger cap peers on the downside in August. Mid-cap stocks performed worse than large caps and small-cap companies performed even worse. Because moat-rated companies tend to be larger, more established companies, the SMID Moat Index tends to feature a mid-cap bias relative to other SMID-cap indexes. Because of this and the Moat Index&rsquo;s unconstrained approach, there can be some overlap between the two indexes. In August, several overlapping companies happened to be some of the key drivers of underperformance. The SMID Moat Index also held Etsy (ETSY), Polaris (PII) and Zimmer Biomet (ZBH).</p>
<p>August top contributors included financial market intelligence company Broadridge Financial Solutions (BR), Global Payments Inc. (GPN) and cloud software company Splunk (SPLK).</p>
<h3>Top Contributors and Detractors from SMID Moat Index - August 2023</h3>
<div class="wrapped-div">
<table style="width: 750px;">
<tbody>
<tr class="tbl-data">
<td class="tbl-header last" colspan="5">Leading Contributors</td>
</tr>
<tr class="tbl-data">
<td class="data-td last">Company</td>
<td class="data-head last">Ticker</td>
<td class="data-head last">Sector</td>
<td class="data-head last">Avg. Weight (%)</td>
<td class="data-head last">Contribution (%)</td>
</tr>
<tr class="tbl-data">
<td class="data-td last" style="font-weight: normal;">Broadridge Financial Solutions Inc.</td>
<td class="data-td data last">BR</td>
<td class="data-td data last">Industrials</td>
<td class="data-td data last">1.58</td>
<td class="data-td data last">0.15</td>
</tr>
<tr class="tbl-data">
<td class="data-td last" style="font-weight: normal;">Global Payments Inc.</td>
<td class="data-td data last">GPN</td>
<td class="data-td data last">Financials</td>
<td class="data-td data last">0.78</td>
<td class="data-td data last">0.10</td>
</tr>
<tr class="tbl-data">
<td class="data-td last" style="font-weight: normal;">Splunk Inc.</td>
<td class="data-td data last">SPLK</td>
<td class="data-td data last">Technology</td>
<td class="data-td data last">0.77</td>
<td class="data-td data last">0.09</td>
</tr>
<tr class="tbl-data">
<td class="data-td last" style="font-weight: normal;">HF Sinclair Corp.</td>
<td class="data-td data last">DINO</td>
<td class="data-td data last">Energy</td>
<td class="data-td data last">1.52</td>
<td class="data-td data last">0.09</td>
</tr>
<tr class="tbl-data">
<td class="data-td last" style="font-weight: normal;">Warner Music Group</td>
<td class="data-td data last">WMG</td>
<td class="data-td data last">Communication Services</td>
<td class="data-td data last">1.52</td>
<td class="data-td data last">0.09</td>
</tr>
</tbody>
</table>
</div>
<br />
<div class="wrapped-div">
<table style="width: 750px;">
<tbody>
<tr class="tbl-data">
<td class="tbl-header last" colspan="5">Leading Detractors</td>
</tr>
<tr class="tbl-data">
<td class="data-td last">Company</td>
<td class="data-head last">Ticker</td>
<td class="data-head last">Sector</td>
<td class="data-head last">Avg. Weight (%)</td>
<td class="data-head last">Contribution (%)</td>
</tr>
<tr class="tbl-data">
<td class="data-td last" style="font-weight: normal;">ResMed Inc.</td>
<td class="data-td data last">RMD</td>
<td class="data-td data last">Health Care</td>
<td class="data-td data last">1.10</td>
<td class="data-td data last">-0.37</td>
</tr>
<tr class="tbl-data">
<td class="data-td last" style="font-weight: normal;">Etsy Inc.</td>
<td class="data-td data last">ETSY</td>
<td class="data-td data last">Consumer Discretionary</td>
<td class="data-td data last">1.06</td>
<td class="data-td data last">-0.36</td>
</tr>
<tr class="tbl-data">
<td class="data-td last" style="font-weight: normal;">Paycom Software Inc</td>
<td class="data-td data last">PAYC</td>
<td class="data-td data last">Industrials</td>
<td class="data-td data last">1.31</td>
<td class="data-td data last">-0.31</td>
</tr>
<tr class="tbl-data">
<td class="data-td last" style="font-weight: normal;">Tapestry Inc.</td>
<td class="data-td data last">TPR</td>
<td class="data-td data last">Consumer Discretionary</td>
<td class="data-td data last">1.10</td>
<td class="data-td data last">-0.28</td>
</tr>
<tr class="tbl-data">
<td class="data-td last" style="font-weight: normal;">Polaris Inc.</td>
<td class="data-td data last">PII</td>
<td class="data-td data last">Consumer Discretionary</td>
<td class="data-td data last">1.37</td>
<td class="data-td data last">-0.25</td>
</tr>
</tbody>
</table>
</div>
<br />
<p class="chart-disclosure"><strong>Source: Morningstar, August 2023</strong>. Past performance is no guarantee of future results. Index performance is not illustrative of fund performance. Not intended as a recommendation to buy or to sell any of the securities mentioned herein.</p>
<div class="wrapped-div">
<table style="width: 750px;">
<tbody>
<tr class="tbl-data">
<td class="tbl-header last" colspan="3">Top 10 SMOT Holdings</td>
</tr>
<tr class="tbl-data">
<td class="data-td  last">Holding Name</td>
<td class="data-head last" style="text-align: center;">Ticker</td>
<td class="data-head last" style="text-align: center;">% of Net Assets</td>
</tr>
<tr class="tbl-data">
<td class="data-td last" style="font-weight: normal;">Equitrans Midstream Corp.</td>
<td class="data-td data last">ETRN</td>
<td class="data-td data last">1.82%</td>
</tr>
<tr class="tbl-data">
<td class="data-td last" style="font-weight: normal;">Broadridge Financial Solutions Inc.</td>
<td class="data-td data last">BR</td>
<td class="data-td data last">1.67%</td>
</tr>
<tr class="tbl-data">
<td class="data-td last" style="font-weight: normal;">Warner Music Group Corp.</td>
<td class="data-td data last">WMG</td>
<td class="data-td data last">1.56%</td>
</tr>
<tr class="tbl-data">
<td class="data-td last" style="font-weight: normal;">Hf Sinclair Corp.</td>
<td class="data-td data last">DINO</td>
<td class="data-td data last">1.54%</td>
</tr>
<tr class="tbl-data">
<td class="data-td last" style="font-weight: normal;">Itt Inc.</td>
<td class="data-td data last">ITT</td>
<td class="data-td data last">1.53%</td>
</tr>
<tr class="tbl-data">
<td class="data-td last" style="font-weight: normal;">Gentex Corp.</td>
<td class="data-td data last">GNTX</td>
<td class="data-td data last">1.52%</td>
</tr>
<tr class="tbl-data">
<td class="data-td last" style="font-weight: normal;">Tradeweb Markets Inc.</td>
<td class="data-td data last">TW</td>
<td class="data-td data last">1.51%</td>
</tr>
<tr class="tbl-data">
<td class="data-td last" style="font-weight: normal;">Evercore Inc.</td>
<td class="data-td data last">EVR</td>
<td class="data-td data last">1.51%</td>
</tr>
<tr class="tbl-data">
<td class="data-td last" style="font-weight: normal;">Fortive Corp.</td>
<td class="data-td data last">FTV</td>
<td class="data-td data last">1.48%</td>
</tr>
<tr class="tbl-data">
<td class="data-td last" style="font-weight: normal;">Williams-Sonoma Inc.</td>
<td class="data-td data last">WSM</td>
<td class="data-td data last">1.47%</td>
</tr>
</tbody>
</table>
</div>
<br />
<p class="chart-disclosure">Data as of 9/5/2023. These are not recommendations to buy or sell any security. Security holdings may vary.</p>
<h2>Accessing Moat Stocks</h2>
<p><strong><a href="https://www.vaneck.com/us/en/investments/morningstar-wide-moat-etf-moat/moat-reconstitution.pdf" title="MOAT - VanEck Morningstar Wide Moat ETF" target="_blank" rel="noopener">VanEck Morningstar Wide ETF (MOAT)</a></strong> seeks to replicate as closely as possible, before fees and expenses the price and yield performance of the Morningstar Wide Moat Focus Index.</p>
<p><strong><a href="/link/166321dbcfec440590fb51cf0ad629aa.aspx" title="SMOT - VanEck Morningstar SMID Moat ETF - Overview">VanEck Morningstar SMID Moat ETF (SMOT)</a></strong> seeks to track as closely as possible, before fees and expenses, the price and yield performance of the Morningstar US Small-Mid Cap Moat Focus Index.</p>
<p>To receive more <a href="https://www.vaneck.com/us/en/insights/moat-investing/" title="Moat Investing Insights"><strong>Moat Investing</strong></a> insights, <a href="https://www.vaneck.com/us/en/subscribe/" title=" Subscription Center"><strong>sign up in our subscription center</strong></a>.</p>
<style type="text/css">
    .wrapped-div {
        max-width: 100%;
    }

    @media (max-width: 1240px) {
        .wrapped-div {
            overflow-x: scroll;
        }


    }
</style>
]]></content:encoded>
</item><item rdf:about="https://www.vaneck.com/us/en/blogs/digital-assets/matthew-sigel-how-depins-can-upend-centralized-industries-giant-protocol/">
  <title>How DePINs Can Upend Centralized Industries: GIANT Protocol></title>
  <link>https://www.vaneck.com/us/en/blogs/digital-assets/matthew-sigel-how-depins-can-upend-centralized-industries-giant-protocol/</link>
  <description><![CDATA[Decentralized physical infrastructure (DePINs) protocols are on the rise. GIANT Protocol targets a mobile bandwidth market, eyeing a potential $5.4B+ revenue from 1% global MVNO share.]]></description>
  <dc:creator>Patrick Bush</dc:creator>
  <dc:date>08/31/2023 06:30:00</dc:date>
<content:encoded><![CDATA[

<p><a><strong>Please note that VanEck may have a position(s) in the digital asset(s) described below.</strong></a></p>
<h2>Key takeaways</h2>
<ul class="content-list">
<li>Decentralized physical infrastructure projects are proliferating.</li>
<li>GIANT Protocol aims to bootstrap a marketplace for mobile bandwidth.</li>
<li>VanEck analysis reveals a $5.4B+ revenue opportunity at 1% global MVNO market share.</li>
</ul>
<h2 id="WhatareDePINs" class="jump-link-nav anchored-block" data-jumplink-title="What are DePINs?">What are DePINs?</h2>
<p>A new and potentially groundbreaking concept has emerged in the ever-evolving landscape of blockchain and decentralized technologies: "decentralized physical infrastructure" (DePIN) protocols. These networks use tokenization to coordinate and incentivize their bootstrapping phase, allowing individuals to build up the supply of the infrastructure in a decentralized manner and get rewarded with token incentives. This flips the traditional model - where corporations in telecommunications or energy invest a lot of time and money into building and maintaining infrastructure &ndash; on its head. With DePINs, Web3 companies try to outsource this build-up and maintenance process to a token-incentivized army of volunteers and monetize later once the coverage rate is high enough. DePIN protocols can empower individuals and small entities to participate, transact, and even compete with traditional centralized infrastructure giants by redefining how we think about and utilize physical infrastructures such as communication networks and energy grids. It's a shift from monopolistic and centralized control to a more democratized and distributed model, ensuring greater access, flexibility, and transparency for users worldwide.</p>
<h2 id="WhatisGIANTProtocol" class="jump-link-nav anchored-block" data-jumplink-title="What is GIANT Protocol?">What is GIANT Protocol?</h2>
<p>One such recent entry into this space is GIANT Protocol, which is creating a decentralized internet access layer (DIAL) that allows users and service providers to connect on a two-sided marketplace to buy and sell data plans. In its initial offering, GIANT focuses on cell phone data service and allows mobile phone users to purchase eSIMs that enable access to cellular networks across the globe. To fill in the marketplace, providers of mobile data services offer prepaid, time-based data plans. Anyone can be a provider so long as they can create an eSIM that a buyer of a data plan can use. Initially, the two providers on the network are Airola and GIANT, who both operate as Mobile Virtual Network Operators (MVNOs) and buy network coverage from Mobile Network Operators (MNOs) such as AT&amp;T, Verizon, and others.</p>
<p><img class="img-responsive w-100" src="https://www.vaneck.com/contentassets/1d48d8267eac44f0bb1dc6db04584d0e/3551_giant-protocol-blog_image-1_2023.08_blog.jpg" alt="Screenshot from the GIANT Protocol website of provider and network plans" /></p>
<p class="chart-disclosure">Source: GIANT Protocol&rsquo;s <a href="https://app.giantprotocol.org/shop" title="GIANT Protocol" target="_blank" rel="noopener"><strong>Website as of 8/24/2023</strong></a>.</p>
<p>The plans offered on the marketplace are inexpensive, easy to use, and available across the globe. All that a user needs to do is buy a plan, download the application and open it up, select a plan, purchase it, and start their plan by utilizing a QR code that links their eSIM-capable smartphone. To sweeten the deal, users can trade unused portions of their plan by listing it on a marketplace for others to purchase. While GIANT is created on a substrate-built blockchain (the same tooling that builds Polkadot blockchains), credit card payments are also accepted alongside crypto to simplify the user experience. To bootstrap the ecosystem, both providers and plan purchasers are currently being reimbursed in GIANT tokens for 40% of the value of each plan&rsquo;s purchase price. The stated target market for these plans is travelers because eSIM technology allows quick connections to any cellular network globally.</p>
<h3>How Does GIANT Work?</h3>
<p><img class="img-responsive w-100" src="https://www.vaneck.com/contentassets/1d48d8267eac44f0bb1dc6db04584d0e/3551_giant-protocol-blog_image-2_2023.08_blog.jpg" alt="Screenshot from the GIANT Protocol White Paper on How GIANT Works " /></p>
<p class="chart-disclosure">Source: GIANT Protocol <a href="https://giantprotocol.org/giant-protocol-releases-its-whitepaper-dive-into-the-tokenomics-of-giants-connectivity-economy/" title="GIANT Protocol Releases Its Whitepaper - Dive into the Tokenomics of GIANT's Connectivity Economy - GIANT Protocol" target="_blank" rel="noopener"><strong>White Paper as of 8/24/2023</strong></a>.</p>
<p>On the back end, GIANT&rsquo;s eSIMs are powered by tokenized data contracts (DCTs) created by cellular service providers. Each DCT must contain all the data within it to access each network that is offered. To sell DCTs on Giant&rsquo;s marketplace, service providers must back their offerings with GIANT tokens to ensure the DCT&rsquo;s data service obligations are fulfilled. To further insulate service plan buyers, the payments for DCTs are held in an escrow account. Providers can access the account&rsquo;s funds over time relative to the remaining time on their DCTs, their assessed &ldquo;quality of service,&rdquo; and the value of GIANT they stake behind their DCTs. If the service provider of a DCT meets the specifications of the data contract, the escrowed funds used to purchase the DCT and the backing GIANT can be seized. That &ldquo;slashed&rdquo; value will be returned to the data plan purchaser, ensuring the buyer has an ironclad economic recourse to poor service or fraud.</p>
<p>If a service provider does not want to deal with tokens or is short of GIANT tokens, it can borrow GIANT from a pool funded by token stakers at an interest rate relative to supply and demand.&nbsp;Consequently, holders of GIANT tokens can earn yield by lending their currency to providers. As both the providers of data services and users of data plans receive GIANT tokens, each party can utilize their excess tokens to lend to providers or stake the protocol to secure the network to receive additional rewards. Suppliers and purchasers are each allocated 5% of the total supply of GIANT tokens, and the emission of tokens will decrease over time. It is expected that GIANT token holders will gradually be rewarded with increasing cashflows from the growth of platform users as token rewards decline. This is because the cashflow split of DCT sales is 5% to the GIANT protocol, 5% to staking token holders, and 90% to the provider.</p>
<h2>Problems GIANT Protocol Solves</h2>
<ol class="content-list">
<li>Create cheaper internet access</li>
<li>Allow consumers to participate financially in data provision</li>
<li>Improve lack of trust with internet access providers fulfilling consumer obligations</li>
</ol>
<p>The ultimate aim of GIANT is to create cheaper internet connectivity for consumers while providing a system where the consumers can financially benefit from the provision of internet services. GIANT plans to accomplish this by creating a token incentive structure that drives users to utilize GIANT&rsquo;s platform while incentivizing connectivity providers to offload excess capacity through GIANT&rsquo;s marketplace. At the same time, GIANT believes the new incentives will bring marginal users to data service providers by offsetting their usage and provision costs with GIANT tokens remitted to the user and the provider. Thus, providers will be incentivized to expand their networks to reach a new base of users.</p>
<p>To say achieving GIANT&rsquo;s goals will be an ambitious endeavor is an understatement. However, as we did work on the initial business model, we got some conviction that the project&rsquo;s vision may be achievable. If so, the value accrual to token-holders could be significant. However, GIANT Protocol is an early stage project and the value of its tokens is highly speculative.</p>
<h3>Opening the MNVO Business</h3>
<p><img class="img-responsive w-100" src="https://www.vaneck.com/contentassets/1d48d8267eac44f0bb1dc6db04584d0e/3551_giant-protocol-blog_image-3_2023.08_blog.jpg" alt="How Mobile Virtual Network Operators Work" /></p>
<p class="chart-disclosure">Source: <a href="https://www.cartesian.com/wp-content/uploads/2021/05/MVNO-Performance-Evolution-Business-Models-and-Optimization_Cartesian.pdf" title="MVNO Performance" target="_blank" rel="noopener"><strong>Cartesian as of 8/24/2023</strong></a>.</p>
<p>GIANT&rsquo;s initial target is the data plan market for cellular phones, and GIANT is currently best described as a Mobile Virtual Network Operators (MVNOs) platform. MVNOs buy unused, inexpensive cellular capacity from MNOs to re-market that cellular capacity through cheaper user plans. This entails offering consumers price tradeoffs where users get less roaming coverage, slower download speeds, or specific geographic coverage (within a regional area). MVNOs will typically create a brand image to appeal to a target demographic - students, travelers, urban users, etc. Essentially, they are stripping away the frills of a one-size-fits-all, expensive mobile network operator like AT&amp;T and repackaging limited service through marketing and advertising to appeal to a new customer base with a la carte pricing. The initial focus of GIANT is the travel market, and to accomplish this, it has partnered with MVNO Airola, which has data plans with hundreds of MNOs across 200 countries and regions. At the time of writing, GIANT has sold <a href="https://app.giantprotocol.org/earn" title="GIANT Protocol" target="_blank" rel="noopener"><strong>822 DCTs</strong></a> worth $12.9k on its <a href="https://app.giantprotocol.org/shop" title="GIANT Protocol" target="_blank" rel="noopener"><strong>online platform</strong></a>.</p>
<p><img class="img-responsive w-100" src="https://www.vaneck.com/contentassets/1d48d8267eac44f0bb1dc6db04584d0e/3551_giant-protocol-blog_image-4_2023.08_blog.jpg" alt="MNVOs Launch Services to Target Segment of International Audience" /></p>
<p class="chart-disclosure">Source: <a href="https://www.cartesian.com/wp-content/uploads/2021/05/MVNO-Performance-Evolution-Business-Models-and-Optimization_Cartesian.pdf" title="MVNO Performance" target="_blank" rel="noopener"><strong>Cartesian as of 8/24/2023</strong></a>.</p>
<p>Anyone can list data plans on GIANT&rsquo;s marketplace so long as they can guarantee network access. This opens up the MVNO business space to new firms and individuals who can find unique ways to corral users. In 2019, Ryan Reynolds became an <a href="http://mintmobile.com/ryan-reynolds-announcement/" title="Ryan Reynolds is Now an Owner - Mint Mobile" target="_blank" rel="noopener"><strong>equity owner</strong></a> in Mint Mobile and used his fame to boost the company to a $1.35B <a href="https://www.nytimes.com/2023/03/16/business/ryan-reynolds-mint-t-mobile.html" title="T-Mobile to Buy Ryan Reynolds' Mint Mobile - The New York Times" target="_blank" rel="noopener"><strong>sale </strong></a>in 2023. Now, using GIANT, today&rsquo;s influencers could set up their own MNVOs and resell network coverage through their own entity.</p>
<p><img class="img-responsive w-100" src="https://www.vaneck.com/contentassets/1d48d8267eac44f0bb1dc6db04584d0e/3551_giant-protocol-blog_image-5_2023.08_blog.jpg" alt="Emma Chamberlain holding Chamberlain Coffee" /></p>
<p class="chart-disclosure">Source: Blazar Capital, Emma Chamberlain&rsquo;s Chamberlain Coffee Raised $7M in funding in June 2023.</p>
<p>This harkens back to the mid-2000s era of non-telecom-related entities becoming MVNOs, such as Disney Mobile and ESPN MVP, to cross-sell their customer bases. Today, however, the realities of information saturation combined with the explosion in cult-like following of influencers and overall media fragmentation have motivated young consumers to patronize influencer businesses like KKW Beauty/SKKN (Kim Kardashian), Chamberlain Coffee (Emma Chamberlain), and MrBeast Burgers (MrBeast). We could see one of them entering the mobile market, perhaps using smart contracts to offer unique pricing and access to superfans.</p>
<h2 id="HowGIANTTokensIncentivize" class="jump-link-nav anchored-block" data-jumplink-title="How GIANT Tokens Incentivize">How GIANT Tokens Incentivize</h2>
<p>The key innovation enabled by crypto-economic protocols like GIANT is to give users and providers of services in the two-sided marketplace a stake in the platform's success. This is accomplished by providing rewards of GIANT tokens to providers and consumers. In turn, GIANT token holders not only receive additional token rewards by participating in network security or provider financing but also cash flows from the network. The GIANT token captures value from the protocol, and as activity on GIANT&rsquo;s platform grows, the users&rsquo; tokens also appreciate. Imagine if Uber offered equity shares to both the drivers and the users for participating in Uber&rsquo;s ride-share economy. In such a dynamic, system users would be incentivized to bring in new participants as it increases the value of their Uber stock. The same concept applies to the GIANT Protocol and its GIANT token.</p>
<p>Furthermore, providers can now attract users by sharing their GIANT tokens with users of their cellular services. As the heart of the MVNO business is targeted marketing, the most effective mechanism for persuading the onboard of user-generated content (UGC). What better way to incentivize consumers to create media than to give service providers the means and mechanism to award grassroots marketers?</p>
<p><img class="img-responsive w-100" src="https://www.vaneck.com/contentassets/1d48d8267eac44f0bb1dc6db04584d0e/3551_giant-protocol-blog_image-6_2023.08_blog.jpg" alt="Graphic Showing UGC Marketing Preference from Younger Generations " /></p>
<p class="chart-disclosure">Source: <a href="https://www.nosto.com/wp-content/uploads/2021/08/Stackla-Post-Pandemic-Shifts-in-Consumer-Shopping-Habits-Data-Report_FINAL_compressed.pdf" target="_blank" title="Stackla - Shifts in Consumer Shopping Habits: Authenticity, Personalization and the Power of UGC" rel="noopener"><strong>Stackla as of 8/24/2023</strong></a>.</p>
<h3>Reducing Data Providers Churn</h3>
<p><img class="img-responsive w-100" src="https://www.vaneck.com/contentassets/1d48d8267eac44f0bb1dc6db04584d0e/3551_giant-protocol-blog_image-7_2023.08_blog.jpg" alt="MVNO business model and reducing data provider churn" /></p>
<p class="chart-disclosure">Source: VanEck Research, <a href="https://www.cartesian.com/wp-content/uploads/2021/05/MVNO-Performance-Evolution-Business-Models-and-Optimization_Cartesian.pdf" target="_blank" title="MVNO Performance" rel="noopener"><strong>Cartesian as of 8/24/2023</strong></a>.</p>
<p>One of the most important metrics of success for data providers like MVNOs is churn. Customer churn rate, or the likelihood of customers leaving a business, is a lever on profitability for all data provision businesses, particularly MVNOs. Compared to MNO customers, the churn rate for MNVO customers is around <a href="https://www.cartesian.com/wp-content/uploads/2021/05/MVNO-Performance-Evolution-Business-Models-and-Optimization_Cartesian.pdf" target="_blank" title="MVNO Performance" rel="noopener"><strong>2-4x higher</strong></a>, averaging about 3% per month. As the above graphic demonstrates, reducing the customer attrition rate by just 50bps to 2.5% increases the customer lifetime profits by 33%, which translates directly into firm equity. One of the key methods to reduce churn is to drive user stickiness by enhancing an offering or introducing financial incentives. Many telecom firms accomplish this by giving users access to higher quality phones at discount prices. Some go further, such as MVNO operators FreedomPop and Giffgaff, who offer customers additional data allowances or $5 bonuses for customer referrals. T-Mobile even tries to bundle cellular plans with bank accounts to tap into the low churn rate of the banking industry by offering a demand deposit bank account with interest rates as high as 4% in a product called T-Mobile MONEY. In the hypercompetitive cellular data provider market, anything that can better attract and retain customers is a massive competitive advantage. GIANT&rsquo;s token inventive model is an entirely novel paradigm. After all, it gives users a reason to not only remain in the system but bring in new customers because its awards are proportional to the business's success. As a result, telecommunications providers who onboard to GIANT may sport customer acquisition cost and churn advantages over competitors.</p>
<h2 id="SizingGIANTProtocolsOpportunity" class="jump-link-nav anchored-block" data-jumplink-title="Sizing GIANT Protocol&rsquo;s Opportunity">Sizing GIANT Protocol&rsquo;s Opportunity</h2>
<h3>Global Past and Projected International Trips</h3>
<p><strong>2015 - 2030 (Ms)</strong></p>
<p><img class="img-responsive w-100" src="https://www.vaneck.com/contentassets/1d48d8267eac44f0bb1dc6db04584d0e/3551_giant-protocol-blog_chart-1_2023.08_blog.svg" alt="Global Past and Projected International Trips 2015-2030 " /></p>
<p class="chart-disclosure">Source: <a href="https://www.unwto.org/un-tourism-news-tourism-bounces-back" target="_blank" title="UN TOURISM NEWS #60: Tourism Bounces Back" rel="noopener"><strong>UNTWO</strong></a>, VanEck Research as of 8/24/2023.</p>
<p>To find the initial opportunity, we examine the market for international data plans for travelers. In 2022, the number of global overnight international traveler trips was ~<a href="https://www.unwto.org/tourism-statistics/key-tourism-statistics" target="_blank" title="145 key tourism statistics" rel="noopener"><strong>550M,</strong></a> which was down which is down from <a href="https://www.unwto.org/tourism-statistics/key-tourism-statistics" target="_blank" title="U145 key tourism statistics" rel="noopener"><strong>1.3B</strong></a> in 2019. Before 2020, the number had grown at a <a href="https://www.unwto.org/tourism-statistics/key-tourism-statistics" target="_blank" title="145 key tourism statistics" rel="noopener"><strong>4.5%</strong></a> CAGR between 2014 and 2019. If this trend re-emerges, this projects to 2.1B yearly trips by 2030. It is suggested that the average international traveler needs <a href="https://esim.holafly.com/how-to/how-much-data-for-travel/" target="_blank" title="How much data do I need when I travel? - Holafly" rel="noopener"><strong>5GB</strong></a> to cover the average international trip of <a href="https://www.expedia.com/stories/american-travel-habits-revealed/#:~:text=Length%20of%20international%20trips&amp;text=Certain%20factors%2C%20such%20as%20level,weeks%20or%20more%20per%20year." target="_blank" title="American travel habits revealed - Expedia" rel="noopener"><strong>18 days</strong></a>. Currently, a 5G international data plan is <strong><a href="https://www.airalo.com/europe-esim" target="_blank" title="UN TOURISM NEWS #60: Tourism Bounces Back" rel="noopener">$20</a></strong> or $4 per GB. Since cellular data needs are growing at a <a href="https://www.ericsson.com/en/reports-and-papers/mobility-report/dataforecasts/mobile-traffic-forecast" target="_blank" title="Mobile data traffic forecast &ndash; Mobility Report - Ericsson" rel="noopener"><strong>20% CAGR</strong></a>, the average user will require around 20GB of data in 2030. If data price trends persist as they did from 2018-2023, the cost of data will fall around <a href="https://www.statista.com/statistics/994913/average-cellular-data-price-per-gigabyte-in-the-us/" target="_blank" title="Cellular data average price in US 2018-2023 | Statista" rel="noopener"><strong>-10%</strong></a> per year, and by 2030, the cost of an international data plan will be $1.32 per GB. If each traveler purchases a 20GB plan, which costs $26.4, the market for traveler international data plans will be $76B in 2030.</p>
<p><img class="img-responsive w-100" src="https://www.vaneck.com/contentassets/1d48d8267eac44f0bb1dc6db04584d0e/3551_giant-protocol-blog_chart-2_2023.08_blog.svg" alt="Key Markets Comparison of Total Non Network Market Share and Number of Non Networks " /></p>
<p class="chart-disclosure">Source: <a href="https://www.mckinsey.com/~/media/mckinsey/dotcom/client_service/telecoms/pdfs/february%202015%20-%20recall%20papers/virtually_mobile_2014-06.ashx#:~:text=Depending%20on%20its%20current%20situation,of%20up%20to%2020%20percent." target="_blank" title="Virtually mobile: What drives 
MVNO success - McKinsey" rel="noopener"><strong>McKinsey as of 8/24/2023</strong></a>.</p>
<p>In 2020, the global MVNO market&rsquo;s revenue was estimated to be around <a href="https://www.mobiliseglobal.com/wp-content/uploads/2020/03/Mobilise-Insights-The-Rise-of-Super-MVNO.pdf" target="_blank" title="The Rise of the 
&lsquo;Super&rsquo; MVNO? - Mobilise" rel="noopener"><strong>$63B</strong></a>, growing at roughly <a href="https://www.mobiliseglobal.com/wp-content/uploads/2020/03/Mobilise-Insights-The-Rise-of-Super-MVNO.pdf" target="_blank" title="The Rise of the 
&lsquo;Super&rsquo; MVNO? - Mobilise" rel="noopener"><strong>10%</strong></a> each year. Based upon this data, the world&rsquo;s MVNO businesses will generate $160B in annual revenue. These figures compare to <a href="https://www.grandviewresearch.com/industry-analysis/mobile-data-market-report" target="_blank" title="Mobile Data Market Size and Share Report, 2028" rel="noopener"><strong>$565B</strong></a> in MNO revenue, which grew at an annual rate of <a href="https://www.grandviewresearch.com/industry-analysis/mobile-data-market-report" target="_blank" title="Mobile Data Market Size and Share Report, 2028" rel="noopener"><strong>6.9%</strong></a>.</p>
<h2 id="GIANTValuationFramework" class="jump-link-nav anchored-block" data-jumplink-title="GIANT Valuation Framework">GIANT Valuation Framework</h2>
<p>While the GIANT Protocol has greater ambitions than the mobile data services, MVNO comparisons are currently the best valuation proxies. Typically, these firms average around <a href="https://www.mobiliseglobal.com/wp-content/uploads/2020/03/Mobilise-Insights-The-Rise-of-Super-MVNO.pdf" target="_blank" title="The Rise of the 
&lsquo;Super&rsquo; MVNO? - Mobilise" rel="noopener"><strong>5-60%</strong></a> EBITDA margin depending upon the value-added differentiation of services. When firm value is measured on a per-user basis, it similarly varies from <a href="https://www.mobiliseglobal.com/telecoms-ma-teardown-10-key-acquisitions-2020/" target="_blank" title="Telecoms M&amp;A Teardown &ndash; 10 Key Acquisitions From 2020" rel="noopener"><strong>$155 to $930</strong></a> per user. However, public comparisons are hard to find, so we will estimate MNVO multiples based on recent transactions and industry data points. In the recent acquisition of Mint Mobile, it's estimated that Mint had <a href="https://www.fiercewireless.com/wireless/t-mobile-acquire-mint-ultra-brands-135-billion#:~:text=Roger%20Entner%2C%20founder%20of%20Recon,2%20would%20be%20my%20guess.%E2%80%9D" target="_blank" title="T-Mobile to acquire Mint, Ultra brands for up to $1.35 billion | Fierce Wireless" rel="noopener"><strong>2-3M subscribers</strong></a>. With an industry average annual revenue per user of around <a href="https://www.bloomberg.com/" target="_blank" title="Bloomberg.com" rel="noopener"><strong>$313.80</strong></a>, Mint would have $627M - $941.4M in yearly revenue. The $1.35B acquisition price implies that Mint is valued around 1.43 - 2.15,x trailing twelve-month sales. As Mint lies between a &ldquo;Branded Reseller&rdquo; and an &ldquo;Intermediate MVNO,&rdquo; it should have around a 15-25% EBITDA margin, which implies a 6-14x valuation. As Wireless Telecom EV/EBITDA multiples sit around <a href="https://pages.stern.nyu.edu/~adamodar/New_Home_Page/datafile/vebitda.html" target="_blank" title="Value to Operating Income" rel="noopener"><strong>9x</strong></a>, this would appear to be a reasonable multiple estimate for Mint Mobile. Conversely, considering GIANT&rsquo;s valuation from an internet marketplace vantage, we find an<a href="https://www.statista.com/statistics/1039566/leading-online-marketplaces-ev-ebitda/" target="_blank" title="Top online marketplaces EV/EBITDA 2021-2023 | Statista" rel="noopener"><strong> EV/EBITDA </strong></a>range from 6.1x (Lyft) to 16.9x (Opendoor).</p>
<p><img class="img-responsive w-100" src="https://www.vaneck.com/contentassets/1d48d8267eac44f0bb1dc6db04584d0e/3551_giant-protocol-blog_image-8_2023.08_blog.jpg" alt="Differing specific economic impact on margin capture on a commercial basis" /></p>
<p class="chart-disclosure">Source: <a href="https://www.mobiliseglobal.com/wp-content/uploads/2020/03/Mobilise-Insights-The-Rise-of-Super-MVNO.pdf" target="_blank" title="The Rise of the 
&lsquo;Super&rsquo; MVNO? - Mobilise" rel="noopener"><strong>Mobilise Global as of 8/24/2023</strong></a>.</p>
<p>When boiled down, GIANT is a platform for telecom data services providers to list their offers and should trade at a blend of internet platform and MVNO valuations. To be conservative, we will choose an EV/EBITDA of 6x. Since GIANT token holders take 5% of the flow of GIANT platform revenue, we could count that as EBITDA. However, that is not actually EBITDA but rather free cash flow remitted directly to tokenholders. Therefore, before applying the EV multiples to GIANT&rsquo;s token valuation, we must adjust the multiples to reflect the percentage of EBITDA remitted to shareholders. Since 2015, the ratio of free cashflows to EBITDA for the top 3 wireless carriers was <a href="https://www.ubs.com/global/en/our-firm/what-we-do/research.html" target="_blank" title="Research | UBS Global" rel="noopener"><strong>32.6%</strong></a>.</p>
<p>Consequently, we adjust our EV/EBITDA multiple by ~3x to bring it to 18x TTM free cashflows (FCF) to tokenholders. Furthermore, the average payout ratio of dividends and buybacks to shareholders was roughly <a href="https://pages.stern.nyu.edu/~adamodar/New_Home_Page/datafile/divfcfe.html" target="_blank" title="Dividends and FCFE" rel="noopener"><strong>50%</strong></a> of FCF for wireless telecommunication enterprises 2023. Therefore, we will further adjust our enterprise value multiple to around 36x TTM cashflows, as 100% of the cash flows go to token holders, which implies a cashflow yield of 2.77%.</p>
<p>As a result, if GIANT captures just 1% of the global MVNO market and 5% of the international travel data market in the year 2030, its platform&rsquo;s revenue will be $5.4B. This equates to a $270M in cashflows to tokenholders and, based upon a 36x multiple, would put the value of the Giant protocol around $9.7B in 2030. Today, the token GIANT token does not freely trade on any exchange or DEX as the project is in an early stage of development. As a result, it has no public market price and cannot be bought by investors outside of an OTC deal with an early investor or the GIANT team. <strong>Note: VanEck has no position in this company.</strong></p>
<h2>GIANT&rsquo;s Next Steps and Catalysts</h2>
<h3>Data Consumed (in GB)</h3>
<p><img class="img-responsive w-100" src="https://www.vaneck.com/contentassets/1d48d8267eac44f0bb1dc6db04584d0e/3551_giant-protocol-blog_chart-3_2023.08_blog.svg" alt="Graph Showing GIANT Protocol data consumed to access the internet " /></p>
<p class="chart-disclosure">Source: <a href="https://twitter.com/giantprotocol/status/1677917282691891201/photo/1" target="_blank" title="GIANT Protocol - Twitter" rel="noopener"><strong>Giant Protocol</strong></a>, GIANT Data Network Data Plan Sales as of 7/09/2023</p>
<p>GIANT Protocol is an immature protocol that has marginal revenue on its platform. As of August 24, 2023, there have been 822 DCTs minted, amounting to 4.51TB in data, which corresponds to around $18k in revenue and around $900 to tokenholders. While GIANT&rsquo;s progress in launching its blockchain and inking a deal with the unicorn MNVO Airalo is commendable, it must take key steps before it can fulfill its promise as an MVNO platform. To do this, the future goals for GIANT should be to smooth the token experience for both consumers and data providers while also targeting high-potential early adopters.</p>
<p><img class="img-responsive w-100" src="https://www.vaneck.com/contentassets/1d48d8267eac44f0bb1dc6db04584d0e/3551_giant-protocol-blog_image-11_2023.08_blog.jpg" alt="Giant Protocol Total DCTs Minted" /></p>
<p class="chart-disclosure">Source: <a href="https://app.giantprotocol.org/earn" target="_blank" title="GIANT Protocol" rel="noopener"><strong>GIANT Protocol</strong></a>, GIANT Protocol Network Statistics as of 8/24/2022.</p>
<p>The greatest obstacle to the mass adoption of GIANT is the inability of data consumers and providers to manage their token exposure. Currently, the GIANT application has no embedded trading method between GIANT tokens and fiat currencies. At the same time, no entity provides GIANT token liquidity through market-making. In fact, GIANT is not listed on any major crypto exchange where users can access fiat on/off-ramps. As a result, there is no public trading price for the GIANT token, and GIANT does not have an informational listing on Coingecko or CoinMarketCap. Additionally, there is neither a blockchain explorer for the GIANT Protocol&rsquo;s network nor a dashboard to track the GIANT Protocol&rsquo;s usage. To begin the journey to widespread usership, GIANT needs to have in-app token trading, an entity dedicated to GIANT token liquidity facilitation, several marketplaces to transact the GIANT token, and basic informational tooling.</p>
<p>Beyond token management and liquidity issues, GIANT needs to find its target user base for purchasing data plans. The simplest way for GIANT to achieve greater awareness and uptake is to target the employees of cryptocurrency entities. Besides this being a tech-savvy group of early adopters, people working in crypto travel extensively to conferences and other events across the globe. EthCC, a conference in Paris, had over <strong><a href="https://www.altcoinbuzz.io/cryptocurrency-news/top-crypto-annoucements-from-ethcc-2023/#:~:text=The%20Paris%2Dbased%20Ethereum%20Community,350%20speakers%20and%205%2C000%20attendees." title="Top Crypto Announcements from EthCC 2023 - Altcoin Buzz" target="_blank" rel="noopener">5k attendees</a></strong> in 2023. There are dozens of other crypto conferences, with some attracting thousands of international participants. A clear partnership opportunity would also be with Helium, a blockchain-based protocol for providing IoT and cellular data services. Helium has recently launched a <strong><a href="https://blog.hellohelium.com/hi5unlimited/" title="It&rsquo;s Time for a Change: The $5 Unlimited Plan Is Here, Starting in Miami" target="_blank" rel="noopener">$5 unlimited data plan</a></strong> for residents of Miami-Dade County, and adding this plan to GIANT&rsquo;s platform as part of Helium&rsquo;s regional expansion strategy would be mutually beneficial.</p>
<p>The best place to follow KPIs for the project is on GIANT's Twitter <strong><a href="https://twitter.com/giantprotocol/status/1677917282691891201/photo/1" title="GIANT Protocol - Twitter" target="_blank" rel="noopener">profile</a></strong> or through GIANT&rsquo;s <strong><a href="https://app.giantprotocol.org/mypage" title="GIANT Protocol" target="_blank" rel="noopener">website,</a></strong> which lists a few metrics like the total size of data plans sold and the value of the secondary market for DCTs. To track GIANT, we are also monitoring GIANT&rsquo;s chat application presence on platforms like Discord and Telegram for activity. Important catalysts going forward relate to network activity and the ability to attract new data providers to GIANT&rsquo;s ecosystem. Partnership announcements, upticks in usership measured by total data purchased, and secondary data sales trading are all important KPIs that will indicate GIANT&rsquo;s success.</p>
<h2>GIANT&rsquo;s Contribution to DePIN</h2>
<p>DePIN is a compelling use case for public blockchain because cryptocurrencies can be employed to incentivize the creation of real-world infrastructure for non-blockchain activities. This has typically worked by tying token rewards, whose value increases as the number of participants scales, to hosting and running pieces of infrastructure that power each off-chain use case. The best example of this is Helium, which scaled to over <strong><a href="https://explorer.helium.com/stats" title="explorer.helium.com/stats" target="_blank" rel="noopener">1M radio transmitters</a></strong> for its IoT data network and <strong><a href="https://explorer.helium.com/stats" title="explorer.helium.com/stats" target="_blank" rel="noopener">7k hotspots</a></strong> for its 5G mobile network covering <strong><a href="https://explorer.helium.com/stats" title="explorer.helium.com/stats" target="_blank" rel="noopener">thousands</a></strong> of cities across the world. To create this ecosystem of hotspots, Helium focuses its ecosystem rewards on network builders rather than individuals who use the infrastructure. The result for Helium has been that data service providers have spent over <strong><a href="https://emrit.io/helium-network-how-much-does-a-helium-miner-cost/" title="Helium Network: How much does a Helium Miner Cost? - Emrit" target="_blank" rel="noopener">$500M</a></strong> buying wireless hotspots but <strong><a href="https://dune.com/helium-foundation/helium-data-credits" title="Helium Data Credits" target="_blank" rel="noopener">few active</a></strong> users of the network.</p>
<h3>Helium&rsquo;s Network Presence in Europe</h3>
<p><img class="img-responsive w-100" src="https://www.vaneck.com/contentassets/1d48d8267eac44f0bb1dc6db04584d0e/3551_giant-protocol-blog_image-9_2023.08_blog.jpg" alt="Map showcasing Helium&rsquo;s network presence in Europe" /></p>
<p class="chart-disclosure">Source: <a href="https://explorer.helium.com/stats" title="explorer.helium.com/stats" target="_blank" rel="noopener"><strong>Helium as of 8/23/23.</strong></a></p>
<p>Similarly, Hivemapper credits drivers with HONEY tokens, which provide road image mapping data, while DIMO gives crypto to car owners who upload vehicle operating data to the DIMO network. In each of these cases, the principal participant earning the crypto rewards is the network services or data provider. In these DePIN examples, token rewards were not allocated to the end users of the physical infrastructure. In each case, a novel physical infrastructure or a data generation network is created from scratch by promising a share of future network value through token distribution. Essentially, this subsidizes infrastructure costs, translating to end-user services and products that would otherwise be more expensive or impossible to create without the token reward mechanism.</p>
<p><img class="img-responsive w-100" src="https://www.vaneck.com/contentassets/1d48d8267eac44f0bb1dc6db04584d0e/3551_giant-protocol-blog_image-10_2023.08_blog.jpg" alt="Recent DIMO vehicle data " /></p>
<p class="chart-disclosure">Source: <strong><a href="https://explorer.dimo.zone/" title="DIMO Explorer" target="_blank" rel="noopener">DIMO</a></strong>, Dimo Network Statistics as of 8/22/2023.</p>
<p>By contrast, GIANT&rsquo;s DePIN strategy distributes token incentives to attract end users and network providers (each data plan&rsquo;s offeror). This is possible because GIANT is not bootstrapping an entirely new network like Helium but instead seeking to offer a platform for operators to list existing spare data bandwidth. GIANT banks on the premise that many networks overbuild their capacities and would be willing to part with it at a discount. As such, GIANT does not need to spend most of its tokens rewarding infrastructure (COGS). Instead, it drives those tokens to onboarding new users and enhancing existing customer stickiness. GIANT&rsquo;s secret sauce is to onboard end-users by promising them participation in the rewards of the business services that those users purchase. The consequence of this dynamic is a customer focus that provides incentives for data consumers to remain on the platform and invite others to join it. Effectively, GIANT outsources customer acquisition and retention functions from data services providers and harnesses these functions' effectiveness to the platform's overall success. As a result, GIANT has an interesting approach to customer onboarding that could result in a positive feedback loop driving customers to its platform and its data service providers. It's essential to note that this project is in its nascent stages, and while promising, our assumptions carry a speculative element that warrants cautious optimism.</p>
<p><strong>Links to third party websites are provided as a convenience and the inclusion of such links does not imply any endorsement, approval, investigation, verification or monitoring by us of any content or information contained within or accessible from the linked sites. By clicking on the link to a non-VanEck webpage, you acknowledge that you are entering a third-party website subject to its own terms and conditions. VanEck disclaims responsibility for content, legality of access or suitability of the third-party websites.</strong></p>
<p>To receive more <strong><a href="https://www.vaneck.com/us/en/insights/digital-assets/" title="Digital Assets Insights">Digital Assets</a></strong> insights, <strong><a href="https://www.vaneck.com/us/en/subscribe/" title="Subscription Center">sign up in our subscription center</a></strong>.</p>
]]></content:encoded>
</item><item rdf:about="https://www.vaneck.com/us/en/blogs/income-investing/clos-not-just-for-rising-rates/">
  <title>CLOs:  Not Just For Rising Rates></title>
  <link>https://www.vaneck.com/us/en/blogs/income-investing/clos-not-just-for-rising-rates/</link>
  <description><![CDATA[CLOs are not just a hedge against rising rates. They also have historically provided higher levels of income for a lower level of risk &ndash; making a clear case for a strategic allocation.]]></description>
  <dc:creator>William Sokol</dc:creator>
  <dc:date>08/30/2023 06:30:00</dc:date>
<content:encoded><![CDATA[

<p>Investors have poured approximately $110 billion into long-term &ldquo;core&rdquo; bond categories this year after pulling $80 billion last year as rates rose.<sup>1</sup>&nbsp;Adding duration risk likely appeared attractive to those who expected that Fed rate cuts sometime this year may also result in lower long-term bond yields, or at least to lock in yields that were high relative to what we&rsquo;ve experienced in the last few years. These expectations, so far, have not played out. The Fed has maintained its aggressive stance and continues to indicate no intention to reduce the Fed funds rate this year, while the 10-year U.S. Treasury yield recently hit its highest level since 2007.</p>
<p>From a yield perspective, the best opportunity has continued to be at the short end of the curve, and we expect this to continue amid a &ldquo;higher for longer&rdquo; rate environment. Collateralized loan obligation (CLO) investors do not take interest rate duration risk, and therefore do not get paid for it. However, CLOs have performed very well this year compared to other fixed income asset classes because of the high carry they have provided, which is driven by both high short-term rates as well as spread levels that are above their historical average. The latter point is notable, because other areas of the credit market continue to provide compensation for credit risk that is at or below historical averages, despite widespread expectations of some degree of an economic slowdown. The current high yield on fixed-rate corporate bonds, therefore, has been driven by higher risk-free interest rates. Although overall yields matter greatly, by providing higher levels of income and providing a cushion against still-higher rates or spread widening (a particular concern right now, in our opinion), investors need to consider whether the compensation they are getting is adequate for the risk they are taking. Although investors in long-term corporates, for example, can benefit from declining interest rates, that would simply reflect movements in the Treasury market, leaving investors exposed to a potential decline in credit quality which current spread levels are not compensating them for. Is there a better way to express a view on duration?</p>
<p>Although we do not necessarily believe now is the time to add duration to a portfolio, and there are reasons to believe long-term rates can continue to climb, many investors may disagree. More broadly, we believe income investors can benefit from a portfolio that provides a diversified income stream that provides an attractive return relative to the degree of risk taken. <a href="https://www.vaneck.com/us/en/blogs/income-investing/why-we-like-clos-amid-a-fed-pause/" title="Why We Like CLOs Amid a Fed Pause"><strong>As we have written about previously</strong></a>, CLOs are not simply a hedge against rising rates, although like all floating rate asset classes, investors have benefited in the current environment. Because they provide higher spreads than similarly rated corporates and provide built-in risk protections, they have historically provided higher levels of income for a lower level of risk. As a result, we believe investors should consider a strategic position in CLOs within a core bond portfolio &ndash; not just in times of rising interest rates.</p>
<p>Below we illustrate the yield, spread, and duration profiles of CLOs, investment grade corporate bonds, and an equally weighted average of CLOs and U.S. Treasuries of various durations. We use indices to represent these broad asset classes, however investors cannot invest directly in an index. Our main takeaways are below:</p>
<ul class="content-list">
<li>The overall yield CLOs provided has historically been significantly greater than U.S. corporates (due to their higher spread).</li>
<li>The average yield of CLOs and broad U.S. Treasuries together currently provides an overall yield approximately in line with U.S. Corporates. Historically, a 50% weight to long-term Treasuries and CLOs exhibited a higher yield than U.S. Corporates, although with higher interest rate duration.</li>
<li>An equal weight to CLOs and broad U.S. Treasuries has a lower interest rate duration than U.S. Corporates, and this has been true historically because CLOs do not have price sensitivity to the level of interest rates.</li>
<li>Although CLOs do not have any meaningful interest rate duration, they are sensitive to changes in credit spreads. Given that the yield advantage of CLOs is driven by their high spread, this is important to remember. However, the sensitivity to spreads, as measured by spread duration, is lower than U.S. Corporates. An equal weight to CLOs and U.S. Treasuries also has a lower spread duration to U.S. Corporates (the spread duration of an equal weight to broad and long-term U.S. Treasuries is the same, given that the spread sensitivity is completely driven by CLOs).</li>
<li>CLOs have exhibited less volatility and a lower drawdown historically, indicating that interest rates have been the primary risk drivers of fixed rate bonds over the past decade. The CLO and Treasury combinations have performed better than U.S. Corporates over the past decade from a risk perspective, although relative returns depend on the degree of duration risk taken. CLOs by themselves, however, exhibited the most favorable returns from both an absolute and risk-adjusted perspective.</li>
</ul>
<h3>Yield to Worst</h3>
<p><img class="img-responsive w-100" src="https://www.vaneck.com/contentassets/5bda43a0a984474880025c201fd842ac/3555_cloi-august-2023_chart-1_2023.08_v1_blog.svg" alt="Yield to worst for CLOs vs. U.S. Corporates, vs. CLO and Broad U.S. Treasury, and CLO and Long US Treasury" /></p>
<h3>Spread</h3>
<p><img class="img-responsive w-100" src="https://www.vaneck.com/contentassets/5bda43a0a984474880025c201fd842ac/3555_cloi-august-2023_chart-2_2023.08_v1_blog.svg" alt="Spreads of CLOs vs. U.S. Corporates, vs. CLO and Broad U.S. Treasury, and CLO and Long US Treasury" /></p>
<h3>Interest Rate Duration</h3>
<p><img class="img-responsive w-100" src="https://www.vaneck.com/contentassets/5bda43a0a984474880025c201fd842ac/3555_cloi-august-2023_chart-3_2023.08_v1_blog.svg" alt="Interest rate duration of U.S. Corporates, vs. CLO and Broad U.S. Treasury, and CLO and Long U.S. Treasury" /></p>
<h3>Spread Duration</h3>
<p><img class="img-responsive w-100" src="https://www.vaneck.com/contentassets/5bda43a0a984474880025c201fd842ac/3555_cloi-august-2023_chart-4_2023.08_v1_blog.svg" alt="Spread Duration of CLOs vs. US Corporates, vs. CLO and Broad U.S. Treasury, and CLO and Long U.S. Treasury" /></p>
<br />
<div class="wrapped-div">
<table style="width: 100%;">
<tbody>
<tr class="tbl-data">
<td class="tbl-header last" style="text-align: center;">&nbsp;</td>
<td class="tbl-header last" style="text-align: center; border-right: outset;" colspan="4">Annual Returns (%)</td>
<td class="tbl-header last" style="text-align: center;" colspan="3">10 Yr Risk</td>
</tr>
<tr class="tbl-data">
<td class="data-head last">&nbsp;</td>
<td class="data-head last">1 Yr</td>
<td class="data-head last">3 Yrs</td>
<td class="data-head last">5 Yrs</td>
<td class="data-head last" style="border-right: outset;">10 Yrs</td>
<td class="data-head last">Std Dev</td>
<td class="data-head last">Sharpe</td>
<td class="data-head last">Max Drawdown</td>
</tr>
<tr class="tbl-data">
<td class="data-td last">CLO</td>
<td class="data-td data last">8.6</td>
<td class="data-td data last">4.1</td>
<td class="data-td data last">3.4</td>
<td class="data-td data last" style="border-right: outset;">3.2</td>
<td class="data-td data last">3.7</td>
<td class="data-td data last">0.6</td>
<td class="data-td data last">(8.7)</td>
</tr>
<tr class="tbl-data">
<td class="data-td last">Broad U.S. Treasury</td>
<td class="data-td data last">(4.4)</td>
<td class="data-td data last">(5.5)</td>
<td class="data-td data last">0.4</td>
<td class="data-td data last" style="border-right: outset;">1.0</td>
<td class="data-td data last">4.6</td>
<td class="data-td data last">-</td>
<td class="data-td data last">(18.4)</td>
</tr>
<tr class="tbl-data">
<td class="data-td last">Long U.S. Treasury</td>
<td class="data-td data last">(13.0)</td>
<td class="data-td data last">(14.4)</td>
<td class="data-td data last">(1.4)</td>
<td class="data-td data last" style="border-right: outset;">1.7</td>
<td class="data-td data last">12.4</td>
<td class="data-td data last">0.2</td>
<td class="data-td data last">(41.3)</td>
</tr>
<tr class="tbl-data">
<td class="data-td last">U.S. Corporates</td>
<td class="data-td data last">(1.1)</td>
<td class="data-td data last">(4.1)</td>
<td class="data-td data last">1.8</td>
<td class="data-td data last" style="border-right: outset;">2.6</td>
<td class="data-td data last">6.2</td>
<td class="data-td data last">0.3</td>
<td class="data-td data last">(20.1)</td>
</tr>
<tr class="tbl-data">
<td class="data-td last">CLO and Broad U.S. Treasury</td>
<td class="data-td data last">2.0</td>
<td class="data-td data last">(0.7)</td>
<td class="data-td data last">2.0</td>
<td class="data-td data last" style="border-right: outset;">2.1</td>
<td class="data-td data last">2.7</td>
<td class="data-td data last">0.4</td>
<td class="data-td data last">(9.0)</td>
</tr>
<tr class="tbl-data">
<td class="data-td last">CLO &amp; Long U.S. Treasury</td>
<td class="data-td data last">(2.4)</td>
<td class="data-td data last">(5.4)</td>
<td class="data-td data last">1.3</td>
<td class="data-td data last" style="border-right: outset;">2.7</td>
<td class="data-td data last">6.3</td>
<td class="data-td data last">0.3</td>
<td class="data-td data last">(21.6)</td>
</tr>
</tbody>
</table>
</div>
<br />
<p class="chart-disclosure">Source: J.P. Morgan and ICE as of 7/31/2023. CLO represented by J.P. Morgan CLO Index; Corporate represented by ICE BofA US Corporate Index; Broad US Treasury represented by ICE BofA US Treasury Index; Long US Treasury represented by ICE BofA 20+ Year US Treasury Index; CLO &amp; UST represented by 50% J.P. Morgan CLO Index and 50% ICE BofA US Treasury Index; CLO &amp; UST represented by 50% J.P. Morgan CLO Index and 50% ICE BofA 20+ Year US Treasury Index. Past performance is no guarantee of future results.</p>
<p>Duration and credit risk are the two primary drivers of risk and return in fixed income. This is why we highlighted the CLO and U.S. Treasury combinations compared to investment grade corporate bonds, as they have similar levels of credit risk as well as interest rate duration exposure. CLOs can play a role in a core bond portfolio because of their yield, spread and duration profile, and although particularly attractive right now, we believe this is true in any rate environment. In contrast, the current level of spreads are currently not attractive in the broad investment grade and high yield markets relative to historical averages. However, we believe that there is still a case for these asset classes in a long-term portfolio due to their currently high overall yields and from a diversification perspective, as Treasuries, high yield markets, investment corporates, and CLOs all behave differently in different market environments . As such, we believe an income portfolio should include diversified sources of risk and return, and that CLOs deserve a strategic allocation through varying rate and credit cycles.</p>
<p>To receive more <a href="https://www.vaneck.com/us/en/insights/income-investing/" title="Income Investing insights"><strong>Income Investing</strong></a> insights, <a href="/link/5f45412c2143400497908cea2897f7d3.aspx" title=" Subscription Center"><strong>sign up in our subscription center</strong></a>.</p>
<style type="text/css">.wrapped-div {
        max-width: 100%;
    }

    @media (max-width: 1024px) {
        .wrapped-div {
            overflow-x: scroll;
        }
    }

    .wrapped-div-sector {
        max-width: 100%;
        overflow-x: scroll;
    }
</style>
]]></content:encoded>
</item><item rdf:about="https://www.vaneck.com/us/en/blogs/digital-assets/matthew-sigel-the-nft-game-thats-almost-5-of-draftkings-earnings/">
  <title>The NFT Game That’s Almost 5% of DraftKings’ Earnings></title>
  <link>https://www.vaneck.com/us/en/blogs/digital-assets/matthew-sigel-the-nft-game-thats-almost-5-of-draftkings-earnings/</link>
  <description><![CDATA[DraftKing's Reignmakers, an NFT game on Polygon, is set to generate $70M in high-margin revenue over the next year &amp; boost profits 5% vs. 2022 levels; its design showcases the perks of blockchain use in gaming.]]></description>
  <dc:creator>Matthew  Sigel</dc:creator>
  <dc:date>08/30/2023 06:30:00</dc:date>
<content:encoded><![CDATA[

<h2>TLDR:</h2>
<ul class="content-list">
<li>Over the next four quarters, we estimate DraftKing&rsquo;s <em>Reignmakers</em> franchise (an NFT-based fantasy sports game on Polygon) can generate $70M+ in high-margin revenues, accounting for 3% of DraftKing&rsquo;s top line and 5% of 2022 full-year profits.</li>
<li>In their inaugural year, NFL, PGA, and UFC <em>Reignmakers</em> games collectively generated $52 million in revenue for DraftKings, representing 2% of DKNG's top line over the same period.</li>
<li>DraftKings' Reignmakers introduced their 2023 NFL collection on August 8th, marking the second year of production.</li>
<li>Reignmakers' success showcases the advantages of minimizing blockchain components within a game, enabling developers to target wider audiences while optimizing economic factors, such as marketplace fees.</li>
<li>DraftKings strategically prioritized fantasy sports, leveraging existing user passion to enhance game enjoyment and user benefits without the need for extensive creation of valuable IP.</li>
</ul>
<p><img class="img-responsive w-100" src="https://www.vaneck.com/contentassets/8ffe7b62b9d94d9e99ce73d94588ab99/3549_draftkings-nft-blog_image_2023.08_v1.jpg" alt="Reign Makers Homepage" /></p>
<h2 id="Intro" class="jump-link-nav anchored-block" data-jumplink-title="Intro">Intro</h2>
<p>As enthusiasts and developers eagerly anticipated the marriage of blockchain technology with gaming, the initial results have left many questioning its feasibility. Concerns surrounding scalability, user experience, and the complexities of integrating blockchain have cast shadows over the potential success of Web3 games. However, amidst this atmosphere of uncertainty, DraftKings Reignmakers has emerged as an example that not only navigates these challenges but also redefines the path to success. With over 2 million unique monthly paying customers, DraftKings utilizes its platform to streamline sports bettors and avid fantasy sports fans into seasonal <em>Reignmakers</em> gaming products. By removing direct blockchain interaction, DraftKings made it exceptionally easy for their growing user base to participate in their new, NFT-enabled fantasy sports games.</p>
<h2 id="WhatIsReignmakers" class="jump-link-nav anchored-block" data-jumplink-title="What is Reignmakers?">What is Reignmakers?</h2>
<p>Reignmakers by DraftKings merges card collecting with fantasy sports, using NFTs on the Polygon blockchain. While the DraftKings website does provide info on what NFTs are and how to send them to your Web3 wallet, there is no mention of blockchains, NFTs, or any other crypto jargon in their advertising. Cards are acquired via purchasing packs or on the DraftKings Marketplace and used to create athlete lineups, competing for rewards. Reignmakers&rsquo; NFL variant has outperformed their UFC and PGA versions due to a consistent schedule and broader card selection, fostering diverse contests and an engaged user base. All payments are made with a credit/debit card or DK dollars if the user already has an account, simplifying the purchasing process to just a few familiar clicks. DraftKings offers card packs priced from $20 to $2,999.99, driving revenue through primary sales and a 10% fee levied on marketplace transactions. Reignmakers facilitated about $170 million of secondary sales<sup>1</sup>&nbsp;in its first year of operation, generating $17 million in revenue. These secondary sales accounted for ~33% of Reignmakers' total first-year revenue and approximately 0.8% of DKNG top line over the same period.</p>
<h2 id="IndustryData" class="jump-link-nav anchored-block" data-jumplink-title="Industry Data">Industry Data</h2>
<p>The U.S. online sports betting (OSB) gross gaming revenue grew from $0.5 billion in 2019 to $6.8 billion in 2022, representing a 139% CAGR<sup>2</sup>. Despite the massive growth, in-game betting has only achieved ~15-35% penetration in U.S. markets versus the 70-80% average in European markets<sup>3</sup>. Under a bullish scenario, penetration of in-game OSB within the United States could reach ~50% over the coming years, driving an estimated 25% increase in the OSB TAM<sup>2</sup>. The expected increase can be attributed to the frequent breaks in action during popular American sports like Football and Basketball, providing a favorable environment for in-game betting opportunities<sup>2</sup>. The increasing prevalence of in-game betting augurs favorably for Draftkings&rsquo; Reignmakers, enabling them to harness this flourishing market by introducing in-game contests and innovative betting options centered around player inventories.</p>
<h3>U.S. Online Sports Betting Gross Gaming Revenue</h3>
<p><img class="img-responsive w-100" src="https://www.vaneck.com/contentassets/8ffe7b62b9d94d9e99ce73d94588ab99/3549_draftkings-nft-blog_chart-1_2023.08_v1_blog.svg" alt="U.S. Online Sports Betting Gross Gaming Revenue Graph" /></p>
<p class="chart-disclosure">Source: Stifel Research as of 1/23/2023.</p>
<p>As the #2 player in the U.S. by gross gaming revenue, with an existing user base of over 6 million paying customers through its sportsbook, casino, and daily fantasy sports verticals<sup>2</sup>, we see DraftKings as well-positioned to re-invest some of their scale advantage into a new, NFT-based business line that is likely accretive to DKNG&rsquo;s gross margins, which have declined 500bps to 39% since the company went public. Additionally, Reignmakers contests are purposefully designed so that they aren&rsquo;t pay-to-win. While more expensive cards can allow players to enter more contests or higher-paying contests, winning is still mainly dependent upon the player's knowledge of sports and their skill in choosing successful lineups for each contest. This ensures that the user experience for casual players isn&rsquo;t significantly affected by the fact that they aren&rsquo;t willing to spend as much as power users.</p>
<p>In contrast to other games and the broader NFT market, Reignmakers uniquely benefits from an inherent value proposition tied to its cards. Users can readily assess the value of these cards based on their potential to enhance competitive outcomes. This intrinsic link between card utility and competition success sets Reignmakers apart, facilitating a more tangible understanding of NFT worth. Notably, sports-oriented NFTs consistently maintain high standings in NFT collection sales rankings on <em>Cryptoslam!</em>. Unlike games that require novel storylines to entice players, Reignmakers, Sorare, and NFL Rivals leverage established sports interests, resonating with a broader audience. Partnering with existing, evergreen IP derived from live sports eliminates the challenge of generating interest from scratch, ensuring relevance and appeal.</p>
<h3>Sports NFTs Represent 50% of Top 6 Collections by 30 Day Sales</h3>
<p><img class="img-responsive w-100" src="https://www.vaneck.com/contentassets/8ffe7b62b9d94d9e99ce73d94588ab99/3549_draftkings-nft-blog_chart-2_2023.08_v1_blog.svg" alt="Sports NFTs Represent 50% of Top 6 Collections by 30 Day Sales Graph" /></p>
<p class="chart-disclosure">Source: VanEck Research, Cryptoslam! as of 8/18/23.</p>
<h3>NFT Marketplace Fees</h3>
<p><img class="img-responsive w-100" src="https://www.vaneck.com/contentassets/8ffe7b62b9d94d9e99ce73d94588ab99/3549_draftkings-nft-blog_chart-3_2023.08_v1_blog.svg" alt="NFT Marketplace Fees Graph Comparison" /></p>
<p class="chart-disclosure">Source: VanEck Research as of 8/24/2023.</p>
<h2 id="RevenueandImpacttoTopLine" class="jump-link-nav anchored-block" data-jumplink-title="Revenue and Impact to Top-Line">Revenue &amp; Impact to Top-Line</h2>
<p>DraftKings generates revenue from Reignmakers through both primary sales and a 10% fee on secondary transactions. While this fee is higher compared to OpenSea and Blur's 2.5% and 0.5% fees, its impact is mitigated by Reignmakers' distinct nature. Unlike speculative NFT assets, Reignmakers serve a dual purpose as NFTs are used for competitive endeavors, such as vying for cash prizes. This sets it apart from traditional NFT trading, where speculation and profit are paramount, forcing marketplace fee compression. This difference in utility renders marketplace fees less profound, as the focus remains on enhancing the competitiveness of fantasy teams.</p>
<p>Furthermore, Reignmakers' design caters to mainstream sports enthusiasts, not crypto-savvy individuals. This strategic alignment allowed DraftKings to build its platform to target the 63 million global fantasy sports players<sup>4</sup>&nbsp;and avoid competition with the on-chain low-fee NFT marketplaces. This approach contrasts with the 5 million on-chain users that most Web3 games end up targeting due to including too many blockchain elements.</p>
<h3>2023 Reignmakers Revenue Estimate</h3>
<p><img class="img-responsive w-100" src="https://www.vaneck.com/contentassets/8ffe7b62b9d94d9e99ce73d94588ab99/3549_draftkings-nft-blog_chart-4_2023.08_v1_blog.svg" alt="2023 Reignmakers Revenue Estimate Graph" /></p>
<p class="chart-disclosure">Source: VanEck Research as of 8/24/2023.</p>
<p>According to our base case, from Q3 &lsquo;23 to Q3 &lsquo;24, we estimate that DKNG&rsquo;s Reignmakers franchise could generate over $75m in revenue. In our model, we assume Reignmakers sells all play-action card packs for each sport and generates $50m/$300m/$500m in secondary transaction volume for the bear/base/bull scenarios. With DraftKings taking a 10% fee on all secondary transactions, our base case indicates that Reignmakers&rsquo; revenue could drive just over 3% of DKNG&rsquo;s top line. While we don&rsquo;t have access to the data showing the cost of this revenue, we assume the margins to be about 90% as there is basically no cost of production, and customer acquisition costs can be mitigated via cross-selling opportunities. In our base case, we estimate that the profits from the Reignmakers business line could boost DKNG EPS by ~$0.15, representing 5% of their 2022 EPS of -$3.16.</p>
<h2>Conclusion</h2>
<p>While Reignmakers doesn't fully embody the decentralized values crypto-enthusiasts desire from Web3 games, we think it&rsquo;s a step closer to finding the happy medium for blockchain integration in games. Suppose Web3-enabled games continue to burden users with interacting with the blockchain. In that case, they will continue to appeal to only crypto users, with a small chance of capturing a significant portion of traditional gamers. However, if game developers focus on building Web3-integrated games for existing fanbases (such as sports) and utilize platforms where all blockchain interaction is entirely abstracted, Web3 games could drive many users on-chain without them knowing. In its current form, Reignmakers isn't likely to drive significant on-chain activity due to its limited interaction with the blockchain. This ensures that the underlying tech doesn&rsquo;t complicate user experience and also opens the door for deeper integration with decentralized systems as the user experience on blockchains improves. If Reignmakers moved more of their game mechanics to the blockchain, such as requiring contest lineups to be posted to the chain before starting, it could materially impact gas usage over time.</p>
<p>To receive more <strong><a href="https://www.vaneck.com/us/en/insights/digital-assets/" title="Digital Assets Insights">Digital Assets</a></strong> insights, <strong><a href="https://www.vaneck.com/us/en/subscribe/" title="Subscription Center">sign up in our subscription center</a></strong>.</p>
<style type="text/css">
    .wrapped-div {
        max-width: 100%;
    }

    @media (max-width: 1240px) {
        .wrapped-div {
            overflow-x: scroll;
        }
    }

    .wrapped-div-sector {
        max-width: 100%;
        overflow-x: scroll;
    }


 }
</style>
]]></content:encoded>
</item><item rdf:about="https://www.vaneck.com/us/en/blogs/investment-outlook/jan-van-eck-where-to-invest-now-rising-emerging-markets-and-bitcoin/">
  <title>Where to Invest Now: Rising Emerging Markets and Bitcoin></title>
  <link>https://www.vaneck.com/us/en/blogs/investment-outlook/jan-van-eck-where-to-invest-now-rising-emerging-markets-and-bitcoin/</link>
  <description><![CDATA[Here are the areas we believe offer the best investment opportunities right now: emerging markets like India, Brazil, and Saudi Arabia, and Bitcoin.]]></description>
  <dc:creator>Jan van Eck</dc:creator>
  <dc:date>08/29/2023 06:30:00</dc:date>
<content:encoded><![CDATA[

<p>As we ushered in 2023, our outlook was shaped by the constriction of monetary supply, tight government spending and weaker corporate profits. Do recent events change our high-level view? Not really. So far, it has paid to be invested and we continue to believe inflation will keep rates higher for longer than the market expects.</p>
<p>Today, our macroeconomic outlook remains steadfast. Yet, amid these broader market dynamics, two areas stand out.</p>
<p>Based on current market conditions, we believe the <strong>best markets to invest in right now</strong> are <strong>emerging markets like India, Brazil, and Saudi Arabia,</strong> and <strong>Bitcoin.</strong></p>
<p>Below, we&rsquo;ll explore what&rsquo;s driving each of these markets and what makes them such strong opportunities for investment.</p>
<br />
<h2>Emerging Markets to Invest in Right Now: India, Brazil, and Saudi Arabia</h2>
<p>Demographics, technology and the rising middle class have transformed emerging markets (EM), where 87% of the world&rsquo;s population live.<sup>1</sup>&nbsp;77% of the world&rsquo;s &ldquo;Gen Z&rdquo; contingent resides in emerging markets as well. Emerging markets are estimated to be responsible for ~60% of the world&rsquo;s GDP by 2026,<sup>2</sup>&nbsp;yet their equity markets only represent 13% of the market capitalization of all international equities.<sup>3</sup>&nbsp;This mismatch creates a once-in-a-lifetime, long-term opportunity for global investors &ndash; as emerging markets grow, evolve and transform, the size of their capital markets will become more prominent over time as well.</p>
<p>While China remains a dominant market and has been a major global growth driver, its post-COVID rebound has stalled. Looking beyond China, we explore below the three rising emerging market countries where we see particularly compelling investment opportunities. <a href="https://www.vaneck.com/us/en/blogs/emerging-markets-equity/indias-economic-rise-demands-investor-attention/" title="India's Economic Rise Demands Investor Attention"><strong>India</strong></a>, <a href="https://www.vaneck.com/us/en/blogs/emerging-markets-equity/brazil-beckons-with-low-valuations-and-growth-potential/" title="Brazil Beckons with Low Valuations and Growth Potential"><strong>Brazil</strong> </a>and <a href="https://www.vaneck.com/us/en/blogs/emerging-markets-equity/saudi-arabia-a-rising-investment-destination/" title="Saudi Arabia: A Rising Investment Destination"><strong>Saudi Arabia</strong></a> are leaders in their respective regions, all benefiting from economic reforms and digitization initiatives.</p>
<h3>India, Brazil, and Saudi Arabia Will Pass the EU in 10 Years</h3>
<p><strong>Share of Global GDP (PPP basis, %)</strong></p>
<p><img class="img-responsive w-100" src="https://www.vaneck.com/contentassets/f6976a1eacbc479b80ade46115307a7b/3486_jve-investment-outlook_chart-01_2023.08_blog_blog.svg" alt="Share of Global GDP (PPP basis, %)" /></p>
<p class="chart-disclosure">Source: VanEck Research; IMF; Bloomberg LP, as of July 2023.</p>
<h2>Where to Invest in India: Digital Gold Rush Fuels Economic Rise</h2>
<p><i><strong>Bottom Line:</strong> Robust digitization, initiatives in fintech, strong equity market, and attractive valuations make India one of the best emerging markets for investment today.</i></p>
<p>India's digitization journey is revolutionizing multiple sectors, and economic reforms and demographic trends provide further tailwinds to its growth. India&rsquo;s 800 million smartphone users and rapidly growing population presents growth opportunities across the digital sector, including e-commerce, digital payments and online entertainment.</p>
<h3>India&rsquo;s Smartphone Penetration Fuels Digital Revolution</h3>
<p><img class="img-responsive w-100" src="https://www.vaneck.com/contentassets/f6976a1eacbc479b80ade46115307a7b/3486_jve-investment-outlook_chart-02_2023.08_blog.svg" alt="India's Smartphone Penetration Fuels Digital Revolution" /></p>
<p class="chart-disclosure">Source: TRAI, CLSA, World Economic Forums &ldquo;Future of Consumption in Fast-Growth Consumer Markets: India&rdquo; as of June 2023.</p>
<p>India&rsquo;s government has also launched initiatives to promote financial inclusion and fintech. The rapidly spreading adoption of digital financial services is helping to create an environment more conducive to investment. In addition, the country&rsquo;s demographic &ldquo;dividend&rdquo; may provide it a competitive edge in the global landscape. Its workforce is relatively young, large and English-proficient&mdash;particularly compared to China&mdash;and combined with a growing consumer base, we believe India is an attractive market for both businesses and investors.</p>
<p><i>Learn more about how digital growth is fueling <strong><a href="https://www.vaneck.com/us/en/blogs/emerging-markets-equity/indias-economic-rise-demands-investor-attention/" title="India's Economic Rise Demands Investor Attention">India as an emerging market</a></strong> in 2023.</i></p>
<h3>India&rsquo;s Equity Market Surpasses China</h3>
<p><img class="img-responsive w-100" src="https://www.vaneck.com/contentassets/f6976a1eacbc479b80ade46115307a7b/3486_jve-investment-outlook_chart-03_2023.08_blog.svg" alt="India's Equity Market Surpasses China" /></p>
<p class="chart-disclosure">Source: Morningstar as of 6/30/23. Past performance is no guarantee of future results.</p>
<p>The equity market in India is also thriving, significantly outperforming China over the last three years, and its corporate earnings growth outpaces China. We believe this reflects strong economic fundamentals and positive investor outlook towards India&rsquo;s economic prospects. A look at valuations also reinforce why we believe India presents a compelling opportunity now. After a period of overvaluation during the COVID-19 pandemic, valuations are back within a more normal range.</p>
<h3>Valuations in India Back to Normal</h3>
<p><img class="img-responsive w-100" src="https://www.vaneck.com/contentassets/f6976a1eacbc479b80ade46115307a7b/3486_jve-investment-outlook_chart-04_2023.08_blog.svg" alt="Valuations in India Back to Normal" /></p>
<p class="chart-disclosure">Source: Bloomberg as of 6/30/2023.</p>
<h2>Where to Invest in Brazil: Booming Investment Potential</h2>
<p><i><strong>Bottom Line:</strong> Brazil's ambitious financial reforms and ongoing efforts to reduce the fiscal deficit could create a tailwind for Brazilian equities and international investors.</i></p>
<p>The Central Bank of Brazil has embarked on an ambitious journey to modernize its financial landscape. These financial reforms are creating a friendlier environment for both domestic and foreign investors, which in turn is pushing the economic engine of the country forward.</p>
<p>In addition, the Brazilian Central Bank is fiercely independent, and sticks to orthodox policies. By employing an inflation-targeting regime and not hesitating to raise the policy rate to combat price pressures the bank is maintaining a lower and stable inflation rate. This offers a sense of reliability and creates a credible policy backdrop&mdash;essential factors for investors. By striving to keep inflation within the target range, Brazil is ensuring the preservation of purchasing power, thereby safeguarding the value of investments.</p>
<p>Brazil&rsquo;s challenge is to make sure that a new fiscal framework stabilizes and reduces the public debt-to-GDP ratio over time. Finance minister Hadad&rsquo;s economic measures to reduce the primary fiscal deficit for 2023 in half from the expected $46 billion or 2.1% of GDP to $20 billion or 1% of GDP appears to be a net positive for the stock market.<sup>4</sup>&nbsp;If successful, these factors could create a positive tailwind for Brazil equities and strengthen the fundamental support for BRL that could add to the real rates of return for international investors.</p>
<p>We are particularly excited about the prospects of structural growth opportunities for companies that appear to benefit from improving the valuation of Brazilian equities.</p>
<p><i>Learn more about <strong><a href="https://www.vaneck.com/us/en/blogs/emerging-markets-equity/emerging-markets-brazil-snaps-back/" title="Emerging Markets - Brazil Snaps Back">Brazil&rsquo;s performance as an emerging market</a></strong> in 2023.</i></p>
<h2>Where to Invest in Saudi Arabia: Progressive Economic and Social Leaps</h2>
<p><i><strong>Bottom Line:</strong> Saudi Arabia's transformative social and economic reforms offer a dynamic and promising landscape for investment in Q3 and Q4 2023, with strong potential for accelerated growth.</i></p>
<p>Saudi Arabia is at the epicenter of transformative economic and social changes. From empowering women to diversifying its economy and enhancing capital discipline, this Middle Eastern powerhouse is making headway. A potential peace pact with Iran further underscores the country's commitment to stability. As a result, Saudi Arabia is beckoning global investors to capitalize on its progressive reforms and to partake in the country's growth story.</p>
<p>Saudi Arabia's liberalization of women's rights is a historic milestone that not only impacts the social fabric of the nation but also its economic vitality. Women have become increasingly involved in the workforce and entrepreneurial ventures, contributing significantly to the nation's GDP and enhancing the diversity and competitiveness of the business landscape. This socio-economic transformation opens doors for potential investors looking for emerging markets primed for accelerated growth.</p>
<h3>Saudi Arabia: Women in the Workforce &ndash; Female Participation Ratio</h3>
<p><img class="img-responsive w-100" src="https://www.vaneck.com/contentassets/f6976a1eacbc479b80ade46115307a7b/3486_jve-investment-outlook_chart-05_2023.08_blog_blog.svg" alt="Saudi Arabia: Women in the Workforce - Female Participation Ratio" /></p>
<p class="chart-disclosure">Source: World Bank as of 12/30/2022.</p>
<p>The Saudi Vision 2030 marks a pivotal point in the country's economic history. At its core, the strategic roadmap aims to shift the Saudi economy away from its dependence on oil. Instead, it encourages investment in diverse sectors such as technology, tourism, entertainment, and renewable energy. For investors, this indicates an array of opportunities in rapidly expanding and innovative sectors.</p>
<p>Saudi Arabia's renewable energy sector, in particular, is a notable area of growth, as the country aims to become a global powerhouse in this field. This aligns with the global transition towards sustainable energy sources and provides investors with long-term, socially responsible investment opportunities.</p>
<p>Saudi Arabia's increasing reliance on capital markets has introduced a new dynamism into its economic environment. The country has encouraged competition, enhanced capital discipline, and facilitated an environment conducive for investors. In a region often marred by geopolitical tensions, the potential Saudi-Iran peace pact is a bright spot. By reducing regional tensions and encouraging stability, the pact could significantly de-risk investment in the country.</p>
<p><i>Learn more about <a href="https://www.vaneck.com/us/en/blogs/emerging-markets-equity/saudi-arabia-a-rising-investment-destination/" title="Saudi Arabia: A Rising Investment Destination"><strong>Saudi Arabia&rsquo;s long-term investment potential</strong></a>.</i></p>
<h2>Emerging Asset: Why Now Is the Right Time to Invest in Bitcoin</h2>
<p><i><strong>Bottom Line:</strong> Given Bitcoin&rsquo;s historical performance leading up to and following halving events, we remain bullish on Bitcoin as an investment through the end of 2023.</i></p>
<p>In 2017, we identified Bitcoin&rsquo;s potential to rival gold and were one of the first to file for a Bitcoin ETF in the U.S. We have maintained an unwavering commitment to embracing Bitcoin as an emerging asset class with a role to play in investor portfolios. Our advocacy is deeply rooted in the firm&rsquo;s mission to offer forward-looking intelligently designed products&mdash;which began with our launch of the first gold stock fund in the U.S. in 1968.</p>
<p>Due to its scarcity value, Bitcoin can act as a competitor or companion to gold, representing a store of value and hedge against inflation. We are approaching the next Bitcoin &ldquo;halving&rdquo;&mdash;which is a 50% block reward cut to the Bitcoin production rate that occurs roughly every four years. This slows the rate that new Bitcoins are introduced into circulation. Historically, Bitcoin has rallied leading up to and following a halving. Bitcoin rallied in the first half of 2023, and we remain bullish for the remainder of the year.</p>
<p><i>Learn more about the <strong><a href="https://www.vaneck.com/us/en/blogs/digital-assets/the-investment-case-for-bitcoin/" title="The Investment Case for Bitcoin">investment case for Bitcoin</a></strong>.</i></p>
<h3>Prior Cycles Suggest Bitcoin May Rally Around Next Halving</h3>
<p><img class="img-responsive w-100" src="https://www.vaneck.com/contentassets/f6976a1eacbc479b80ade46115307a7b/3486_jve-investment-outlook_chart-06_2023.08_blog.svg" alt="Prior Cycles Suggest Bitcoin May Rally Around Next Halving" /></p>
<p class="chart-disclosure">Source: Arcana. Data as of 2/4/2023. Past performance is not indicative of future results. Not a recommendation to buy or sell any of the names mentioned herein.</p>
<p>To receive more <a href="/us/en/insights/investment-outlook" title="Investment Outlook Insights"><strong>Investment Outlook</strong></a> insights, <a href="https://www.vaneck.com/us/en/subscribe/" title="Subscription Center"><strong>sign up in our subscription center</strong></a>.</p>
]]></content:encoded>
</item><item rdf:about="https://www.vaneck.com/us/en/blogs/emerging-markets-bonds/em-vs-dm-bonds-a-diverging-landscape/">
  <title>EM vs. DM Bonds: A Diverging Landscape></title>
  <link>https://www.vaneck.com/us/en/blogs/emerging-markets-bonds/em-vs-dm-bonds-a-diverging-landscape/</link>
  <description><![CDATA[The diverging performance of emerging markets local currency bonds in 2023 versus those in developed markets reflects the changing fundamental reality for fixed income investors.]]></description>
  <dc:creator>Fran Rodilosso</dc:creator>
  <dc:date>08/25/2023 06:30:00</dc:date>
<content:encoded><![CDATA[

<p>U.S. bond yields have been on an upwards trajectory in recent weeks, with the 10-year Treasury yield up nearly 100 basis points (bps) from its lowest level of the year and reaching its highest level in approximately 16 years, as of August 15, 2023. With multiple forces keeping U.S. rates high, and potentially pushing them higher, emerging markets (EM) bond investors may be assessing potential impacts. It is notable that in this environment, EM local currency sovereign bonds have strongly outperformed other fixed income asset classes such as U.S. Treasuries (+700 bps), U.S. investment grade corporates (+500 bps) and even U.S. high yield corporate bonds this year (+38 bps).</p>
<h3>Year-to-date Returns (as of 8/15/2023)</h3>
<p><img class="img-responsive w-100" src="https://www.vaneck.com/contentassets/b46b0230cbf44cf492e079104cf0a86a/3546_emb-fran-blog-august_2023.08_v1_blog.svg" alt="Year-to-date returns for EM and DM bonds" /></p>
<p class="chart-disclosure">Source: Morningstar Direct as of 8/15/2023. EM Local Currency Sovereign is represented by the J.P. Morgan GBI-EM Global Core Index. US HY Corporates is represented by the ICE BofA US High Yield Index; EM USD Sovereign is represented by the J.P. Morgan EMBI Global Diversified Index; US IG Corporates is represented by the ICE BofA US Corporate Index; US Agg is represented by the ICE BofA US Broad Market Index; US Treasuries is represented by the ICE BofA US Treasury Index. Past performance does not guarantee future results.</p>
<p>Higher U.S. rates are generally positive for the U.S. dollar, and the dollar has rallied approximately 3.7% against its developed market trading partners since mid-July. However, for the year the dollar is flat against this same group of currencies while EM currencies (EMFX) are up by a modest 0.4% versus the dollar. The 6.8% return on EM local currency bonds, therefore, has been driven primarily by local interest rates rather than currency movements. Such has been the case in many past years of EM local outperformance. The YTD return has come from both high carry and a general decrease in emerging markets bond yields, in stark contrast to the upwards trend in developed markets rates. This recent behavior is a good example of the potential diversification benefits emerging markets local currency bonds can provide within a global fixed income allocation.</p>
<p>Given the diverging paths of U.S. and emerging markets bonds yields, the yield differential is now below the historical average. However, we believe EM local currency bonds remain attractive relative to developed markets fixed income because of the starkly different fundamental landscape. Most emerging markets raised rates aggressively following the onset of COVID-19 in order to get ahead of inflation, and many have been successful in doing so. The result has been both high nominal yields and high real yields, allowing investors to benefit from both high levels of carry as well as support to the local currency.</p>
<p>Brazil, for example, has seen inflation drop from over 9% in 2022 to a year-over-year rate of 4% as of July. Rates have come down significantly this year, with the 10-year government yield dropping by approximately 130 bps, but remain high even after adjusting for current and expected inflation. In fact, Brazil&rsquo;s 10-year nominal bonds still yield more than 11%. Meanwhile, the Brazilian real has appreciated against the U.S. dollar by 6% this year. Policy reforms and the potential to benefit from elevated commodity prices provide further support for the country&rsquo;s local fixed bonds. Although each country is unique and there are certainly exceptions to the generally positive fundamentals in emerging markets (e.g. China and Turkey), we believe Brazil provides an interesting contrast to developed markets. The Fitch Ratings downgrade of the U.S. credit rating earlier this month highlighted the long-term impact that lack of fiscal discipline and political uncertainty can have on any country&rsquo;s credit risk. The experience in the United Kingdom last year provided an even more dramatic example. We believe the diverging performance of emerging markets local currency bonds this year versus those in developed markets reflects this changing fundamental reality for fixed income investors.</p>
<p>To receive more <a href="https://www.vaneck.com/us/en/insights/emerging-markets-bonds/" title="Emerging Markets Bonds Insights"><strong>Emerging Markets Bonds</strong></a> insights, <a href="https://www.vaneck.com/us/en/subscribe/" title="Subscription Center"><strong>sign up in our subscription center</strong></a>.</p>
]]></content:encoded>
</item><item rdf:about="https://www.vaneck.com/us/en/blogs/natural-resources/investing-in-commodities-intelligently-question-and-answer/">
  <title>Investing in Commodities Intelligently: Question and Answer></title>
  <link>https://www.vaneck.com/us/en/blogs/natural-resources/investing-in-commodities-intelligently-question-and-answer/</link>
  <description><![CDATA[Commodities may offer a hedge against inflation and portfolio diversification. This Q&amp;A explores our passive strategies that track the UBS Constant Maturity Commodity Index.]]></description>
  <dc:creator> </dc:creator>
  <dc:date>08/22/2023 13:00:00</dc:date>
<content:encoded><![CDATA[

<p>Commodities can enhance portfolio diversification and provide access to global growth. Historically, commodities have also acted as a hedge against inflation, outperforming U.S. stocks and bonds. Even in periods of modest inflation (2-6%) commodities have historically outperformed U.S. stocks. This blog intends to answer frequently asked questions about the <a href="/link/218468eae2b54f8989eda6f3f557770d.aspx" title="CMCAX - CM Commodity Index Fund - Class A - Overview"><strong>VanEck CM Commodity Index Fund</strong></a> and <a href="/link/b517b8245a934e7bb2908053bfd688db.aspx" title="CMCI - VanEck CMCI Commodity Strategy ETF - Overview "><strong>VanEck CMCI Commodity Strategy ETF</strong></a>, passively managed strategies that track the UBS Constant Maturity Commodity Index (CMCITR)<sup>1</sup>. These funds offer &ldquo;pure&rdquo; commodity exposure by investing in commodity-linked derivative instruments and more conservative fixed income securities, such as short-term U.S. treasuries.</p>
<ul>
<li><strong><a href="#point-one">How does the UBS Constant Maturity Commodity Index (CMCITR or the &ldquo;Index&rdquo;) represent exposure to commodities?</a></strong></li>
<li><strong><a href="#point-two">What does roll yield mean?</a></strong></li>
<li><strong><a href="#point-three">What are the benefits of the index&rsquo;s &ldquo;constant maturity&rdquo;?</a></strong></li>
<li><strong><a href="#point-four">How can investors access exposure to CMCITR?</a></strong></li>
<li><strong><a href="#point-five">How do the VanEck funds gain exposure to the underlying commodity positions in order to track CMCITR?</a></strong></li>
<li><strong><a href="#point-six">What is the tax treatment of the VanEck funds?</a></strong></li>
<li><strong><a href="#point-seven">How can investors buy VanEck&rsquo;s Commodity Mutual Fund and ETFs?</a></strong></li>
</ul>
<h2 id="point-one" class="anchored-block">How does the UBS Constant Maturity Commodity Index (CMCITR or the &ldquo;Index&rdquo;) represent exposure to commodities?</h2>
<p>CMCITR represents 29 commodity components across five sectors: energy, agriculture, industrial metals, precious metals and livestock. The Index is designed to reflect the economic significance and market liquidity of each commodity as opposed to a traditional global production approach, which often results in significant energy commodity exposure.</p>
<p>The selection and weightings of the commodity components are reviewed annually in July when new target weights are set. The Index is rebalanced monthly to target weights throughout the remainder of the year.</p>
<p>The Index represents futures contracts tied to each commodity component with several maturities ranging from one month to three years, effectively spreading exposure to each commodity component along the futures curve.</p>
<h2 id="point-two" class="anchored-block">What does roll yield mean?</h2>
<p>Roll yield refers to the profit or loss that can be generated when investing in the futures market due to the price difference between futures contracts with different expiration dates. For example, when traditional commodity indices roll their future contracts from month to month, instances may occur where the next month&rsquo;s futures contract is purchased for more than what expiring front-month futures contracts sold for. This creates a roll loss and results in &ldquo;negative&rdquo; roll yield. Roll yield is positive when a futures contract trades at a higher price than future dated contracts as it approaches expiration.</p>
<h2 id="point-three" class="anchored-block">What are the benefits of the index&rsquo;s &ldquo;constant maturity&rdquo;?</h2>
<p>With CMCITR, the maturity of each commodity component remains fixed at a predefined time interval from the current date at all times. The &ldquo;constant maturity&rdquo; concept is achieved by a continuous rolling process, where a weighted percentage of contracts are swapped for longer-dated contracts on a daily basis. This procedure produces a more continuous form of &ldquo;pure&rdquo; commodity exposure and provides a better balance of forward price behavior than traditional commodity indices, such as the Bloomberg Commodity Index (BCOM) or the S&amp;P GSCI (GSCI). Additionally, this feature of CMCITR can minimize exposure to the negative effects of roll yield, making the index more representative of the underlying market price&nbsp;movements.</p>
<p>To avoid the &ldquo;contango trap&rdquo; that occurs when front-month contracts approach expiration and must be sold below the purchase price of longer-dated contracts, CMCITR&rsquo;s methodology expands the range of index components beyond short-dated contracts, resulting in increased diversification across a range of contract prices and expiration dates. Rather than roll all contracts within a monthly window of just a few predictable days, CMCITR employs a daily rolling mechanism. Each day, the index rolls a small portion of its futures contracts to longer-dated maturities, based on a rules-driven formula designed to capitalize on the most attractively priced longer-term contracts. This method has the potential to reduce negative roll yield in futures contracts that are in contango and enhance positive roll yield in contracts that are in backwardation. Monthly rebalancing of contracts back to target weights helps to avoid market-driven concentrations of assets in any given&nbsp;contract.</p>
<div class="epi-contentfragment">faq-banner-cta</div>
<h2 id="point-four" class="anchored-block">How can investors access exposure to CMCITR?</h2>
<p>VanEck offers two investments to access the returns of CMCITR. The <a href="/link/218468eae2b54f8989eda6f3f557770d.aspx" title="CMCAX - CM Commodity Index Fund - Class A - Overview"><strong>VanEck CM Commodity Index Fund</strong></a> has been available to investors since 2010 and allows for daily investment at the mutual fund&rsquo;s net asset value and is offered in several share classes. VanEck also recently listed an exchange-traded fund (ETF), <a href="/link/b517b8245a934e7bb2908053bfd688db.aspx" title="CMCI - VanEck CMCI Commodity Strategy ETF - Overview "><strong>VanEck CMCI Commodity Strategy ETF (CMCI)</strong></a>, that allows investors to access this intelligent approach to commodity investing throughout the day on exchange. Both funds seek to track, before fees and expenses, the performance of CMCITR.</p>
<h2 id="point-five" class="anchored-block">How do the VanEck funds gain exposure to the underlying commodity positions in order to track CMCITR?</h2>
<p>Because of the complexity of the Index, such as the daily roll process, it is currently more practical for the funds to gain exposure via a total return swap agreement than to invest in the Index&rsquo;s individual futures contracts. The funds engage with UBS, currently the sole swap counterparty of the funds, and enter into swap agreements in which the funds receive the return of the Index in exchange for a fee to the swap provider. This arrangement can result in slightly higher tracking error relative to the Index than may occur when investing in futures contracts directly due to the fee associate with the total return swap.</p>
<h2 id="point-six" class="anchored-block">What is the tax treatment of the VanEck funds?</h2>
<p>The&nbsp;<a href="/link/218468eae2b54f8989eda6f3f557770d.aspx" title="CMCAX - CM Commodity Index Fund - Class A - Overview"><strong>VanEck CM Commodity Index Fund</strong></a> and <a href="/link/b517b8245a934e7bb2908053bfd688db.aspx" title="CMCI - VanEck CMCI Commodity Strategy ETF - Overview "><strong>VanEck CMCI Commodity Strategy ETF</strong></a> provide access to commodities without burdensome K-1 tax reporting. In order to provide K-1 free exposure to commodities, the funds distribute of all their net investment income to shareholders as dividends annually, and distribute any net capital gains, at least annually, in December. These distributions are generally taxable as ordinary income or capital gains, unless being invested through a tax advantaged retirement account, such as a 401K or IRA, which if distributed, may be taxed as ordinary income when withdrawn. Years in which commodities perform well may result in larger income distributions from the funds than in years with muted performance. Please consult your tax professional to determine how these distributions affect your individual tax situation.</p>
<h2 id="point-seven" class="anchored-block">How can investors buy VanEck&rsquo;s Commodity Mutual Fund and ETFs?</h2>
<p>Learn more here: <a href="/link/218468eae2b54f8989eda6f3f557770d.aspx" title="CMCAX - CM Commodity Index Fund - Class A - Overview"><strong>VanEck CM Commodity Index Fund</strong></a>&nbsp;and <a href="/link/b517b8245a934e7bb2908053bfd688db.aspx" title="CMCI - VanEck CMCI Commodity Strategy ETF - Overview "><strong>VanEck CMCI Commodity Strategy ETF</strong></a>.</p>
<p class="d-none d-lg-block"><a href="mailto:askvaneck@vaneck.com" title="Have More Questions? - Ask VanEck" rel="noopener"><img loading="lazy" class="img-responsive" src="https://www.vaneck.com/globalassets/home/us/insights/blogs/bm-blog-images/cta-faq_desktop-02.svg" alt="Have More Questions? - Ask VanEck" /></a></p>
<p class="d-lg-none"><a href="mailto:askvaneck@vaneck.com" title="Have More Questions? - Ask VanEck" rel="noopener"><img loading="lazy" class="img-responsive" src="https://www.vaneck.com/globalassets/home/us/insights/blogs/bm-blog-images/cta-faq_mobile-01.svg" alt="Have More Questions? - Ask VanEck" /></a></p>
<p>To receive more <a href="/us/en/insights/natural-resources/" title="Natural Resources Insights"><strong>Natural Resources</strong></a> insights, <a href="https://www.vaneck.com/us/en/subscribe/" title="Subscription Center"><strong>sign up in our subscription center</strong></a>.</p>
<style type="text/css">
 .wrapped-div {
 max-width: 100%;
 }

 @media (max-width: 768px) {
 .wrapped-div {
 overflow-x: scroll;
 }
 }

 .wrapped-div-sector {
 max-width: 100%;
 overflow-x: scroll;
 }
</style>
]]></content:encoded>
</item><item rdf:about="https://www.vaneck.com/us/en/blogs/natural-resources/smarter-commodities-investing-overcome-concentration-and-roll-yield/">
  <title>Smarter Commodities Investing: Overcome Concentration and Roll Yield></title>
  <link>https://www.vaneck.com/us/en/blogs/natural-resources/smarter-commodities-investing-overcome-concentration-and-roll-yield/</link>
  <description><![CDATA[UBS Constant Maturity Commodity Index provides diversified exposure to commodities and helps mitigate negative roll yield. Long available as a mutual fund, this strategy is now available as an ETF.]]></description>
  <dc:creator> </dc:creator>
  <dc:date>08/22/2023 06:30:00</dc:date>
<content:encoded><![CDATA[

<p>Commodity investing can be overwhelming. Despite all of its attractive characteristics, from diversification and inflation protection to participation in global growth, the complexities of investing in commodities often prevent some from considering the asset class. Add to that the fact that commodities can be volatile and investors can be left wondering how to approach the space.</p>
<p>The UBS Constant Maturity Commodity Index (CMCITR or the &ldquo;Index&rdquo;) addresses several drawbacks associated with commodity investing:</p>
<ol class="content-list">
<li>Concentration in individual commodities or commodity sectors.</li>
<li>The deteriorating effects of &ldquo;rolling&rdquo; futures contracts.</li>
</ol>
<h2>Economically Significant and Diversified Exposure to Commodities</h2>
<p>CMCITR represents a broad basket of 29 commodity components across five sectors: energy, agriculture, industrial metals, precious metals and livestock. The comprehensive Index considers economic indicators such as global consumer price indexes, producer price indexes, and gross domestic product along with global consumption data to provide exposure to commodities with liquidity-informed economic significance. The result is diversified exposure across sectors without the significant overweights that exist in other major commodity indexes.</p>
<p>For example, the S&amp;P GSCI (GSCI), a first-generation commodity index, selects commodity components based on global production, which results in significant energy exposure. The Bloomberg Commodity Index (BCOM), which was among the first indexes to cap exposures and consider liquidity in its weighting scheme, has generally contained significantly more precious metal exposure than other indexes. Its 2023 target weights include almost 20% exposure to gold and silver alone.</p>
<h3>Comprehensive, Diversified Commodity Exposure</h3>
<p><img class="img-responsive w-100" src="https://www.vaneck.com/contentassets/cecbcbf1bf67432187c9b4979021c153/3520_cmci-etf-launch-blog_chart-1_2023.08_v2_option-2_blog.svg" alt="Comprehensive, Diversified Commodity Exposure: Chart showing the percentage of livestock, precious metals, industrial metals, agriculture, and energy in CMCITR compared to BCOM and GSCI." /></p>
<p class="chart-disclosure"><strong>Source: VanEck, Bloomberg. Data as of 6/30/2023.</strong></p>
<h2>Mitigate the Perils of Roll Yield</h2>
<p>&ldquo;Roll yield&rdquo; is generated when a futures contract approaching expiration is replaced by a contract that expires further into the future, or &ldquo;rolling&rdquo; of futures positions. Roll yield can be positive, or accretive, when near term contracts trade at prices above longer-term contracts. In other words, an investor can establish a longer-dated futures position at a lower price than they can close out their near-term position, rendering the difference a positive roll yield. Commodities in this scenario are considered in &ldquo;backwardation.&rdquo;</p>
<p>On the flip side, a negative roll yield can deteriorate an investor&rsquo;s return in a scenario when prices for longer-term contracts are higher than they are for expiring contracts. Commodities in this scenario are considered in &ldquo;backwardation.&rdquo; Many commodities often trade in a state of backwardation, which can detract from overall investor return, particularly in strategies, index-based or active, that regularly roll expiring contracts to the next available contract at the front of the futures curve.</p>
<p>The UBS Constant Maturity Commodity Index targets commodity futures positions along the maturity curve for each commodity component and repositions exposure daily in order to maintain a constant exposure to a target maturity over time. This has allowed the Index to mitigate the long-term effects of negative roll yield on its return profile historically.</p>
<h3>Mitigated Negative Roll Yield</h3>
<p><img class="img-responsive w-100" src="https://www.vaneck.com/contentassets/cecbcbf1bf67432187c9b4979021c153/3520_cmci-etf-launch-blog_chart-2_2023.08_v2_option-2_blog.svg" alt="Mitigated Negative Roll Yield: Chart showing the 10 year annualized roll yield impact in percentage of CMCITR, GSCI, and BCOM." /></p>
<p class="chart-disclosure"><strong>Source: VanEck, Bloomberg. Data as of 6/30/2023.</strong> Past performance is no guarantee of future results. Index performance is not representative of fund performance. It is not possible to invest directly in an index. Fund performance current to the most recent month end is available by visiting vaneck.com or by calling 800.826.2333.</p>
<h2>Proven Strategy Now Available as an ETF</h2>
<p>The recently listed<strong> <a href="/link/b517b8245a934e7bb2908053bfd688db.aspx" title="CMCI - VanEck CMCI Commodity Strategy ETF - Overview">VanEck CMCI Commodity Strategy ETF (CMCI)</a></strong> joins the long-standing <a href="/link/218468eae2b54f8989eda6f3f557770d.aspx" title="CMCAX - CM Commodity Index Fund - Class A - Overview "><strong>VanEck CM Commodity Index Fund</strong></a> to provide investors with exposure to this intelligently designed commodity strategy. Both funds seek to track, before fees and expenses, the performance of the UBS Constant Maturity Commodity Total Return Index. Though the VanEck CM Commodity Index Fund was launched in 2010, the Index dates to 2007, providing investors with over 15 years of live track record that speaks for itself.</p>
<h2>Powerful Long-Term Track Record of Excess Returns in Commodities</h2>
<p>The Index has long provided well-diversified exposure to commodities while addressing the roll yield dilemma. This has resulted in an impressive track record highlighted by strong relative returns, impressive volatility statistics, and an attractive participation rate in both up and down markets.</p>
<h3>Consistent Outperformance</h3>
<p><strong>1/2007 &ndash; 7/2023</strong></p>
<p><img class="img-responsive w-100" src="https://www.vaneck.com/contentassets/cecbcbf1bf67432187c9b4979021c153/3520_cmci-etf-launch-blog_chart-3_2023.08_v2_option-2_blog.svg" alt="Consistent Outperformance: LIne chart showing rolling 5-year annualized return in percentage of CMCITR, BCOM, and GSCI from 2012 to 2023." /></p>
<p class="chart-disclosure"><strong>Source: Morningstar.</strong> Past performance is no guarantee of future results. Index performance is not representative of fund performance. It is not possible to invest directly in an index. Fund performance current to the most recent month end is available by visiting vaneck.com or by calling 800.826.2333.</p>
<p>Risk and volatility are equally as important to many commodity investors as total returns, and CMCITR has managed to post impressive excess returns with an attractive volatility profile. The Index&rsquo;s risk-adjusted returns, as measured by Sharpe ratio, have also been consistently greater than other common commodity indexes. CMCITR&rsquo;s participation in broad commodity upside has been stronger than the Bloomberg Commodity Index, and it has also participated less on the downside &ndash; the holy grail of investing, greater upside and less downside.</p>
<h3>Higher Risk-Adjusted Returns</h3>
<p><strong> 1/2007 &ndash; 7/2023</strong></p>
<p><img class="img-responsive w-100" src="https://www.vaneck.com/contentassets/cecbcbf1bf67432187c9b4979021c153/3520_cmci-etf-launch-blog_chart-4_2023.08_v2_option-2_blog.svg" alt="Higher Risk-Adjusted Returns: Line chart showing rolling 5-year annualized sharpe ratio in percentage of CMCITR, BCOM, and GSCI from January 2007 to July 2023." /></p>
<p class="chart-disclosure"><strong>Source: Morningstar.</strong> Past performance is no guarantee of future results. Index performance is not representative of fund performance. It is not possible to invest directly in an index. Fund performance current to the most recent month end is available by visiting vaneck.com or by calling 800.826.2333.</p>
<h3>Impressive Up and Down Capture</h3>
<p><strong>1/2007 &ndash; 7/2023</strong></p>
<div class="wrapped-div">
<table class="w-100">
<tbody>
<tr class="tbl-data">
<td class="tbl-header last">Index</td>
<td class="tbl-header last" style="text-align: center;">Ann.<br />Return</td>
<td class="tbl-header last" style="text-align: center;">Ann. Standard<br />Deviation</td>
<td class="tbl-header last" style="text-align: center;">Sharpe<br />Ratio</td>
<td class="tbl-header last" style="text-align: center;">Max<br />Drawdown</td>
<td class="tbl-header last" style="text-align: center;">Upside<br />Capture</td>
<td class="tbl-header last" style="text-align: center;">Downside<br />Capture</td>
</tr>
<tr class="tbl-data">
<td class="data-td last">CMCITR</td>
<td class="data-td data last">2.55</td>
<td class="data-td data last">16.76</td>
<td class="data-td data last">0.17</td>
<td class="data-td data last">-59.14</td>
<td class="data-td data last">106.22</td>
<td class="data-td data last">87.76</td>
</tr>
<tr class="tbl-data">
<td class="data-td last">GSCI</td>
<td class="data-td data last">-2.57</td>
<td class="data-td data last">23.58</td>
<td class="data-td data last">-0.03</td>
<td class="data-td data last">-87.22</td>
<td class="data-td data last">127.26</td>
<td class="data-td data last">128.36</td>
</tr>
<tr class="tbl-data">
<td class="data-td last">BCOM</td>
<td class="data-td data last">-1.61</td>
<td class="data-td data last">16.74</td>
<td class="data-td data last">-0.07</td>
<td class="data-td data last">-72.02</td>
<td class="data-td data last">100.00</td>
</tr>
</tbody>
</table>
</div>
<br />
<p class="chart-disclosure"><strong>Source: Morningstar.</strong> Calculated using monthly returns. Past performance is no guarantee of future results. Index performance is not representative of fund performance. It is not possible to invest directly in an index. Fund performance current to the most recent month end is available by visiting vaneck.com or by calling 800.826.2333.</p>
<p><strong><a href="/link/b517b8245a934e7bb2908053bfd688db.aspx" title="CMCI - VanEck CMCI Commodity Strategy ETF - Overview">VanEck CMCI Commodity Strategy ETF (CMCI)</a></strong> seeks to track, before fees and expenses, the performance of the UBS Constant Maturity Commodity Total Return Index (CMCITR). CMCITR is a next-generation commodity index diversified across maturities, minimizing its exposure to the front end of the futures curves.</p>
<ul class="content-list">
<li>Seeks to minimize exposure to front end of the futures curve and mitigate the impacts of negative roll yield</li>
<li>Diversified across five commodity sectors and 29 commodity components</li>
<li>No K-1s &ndash; Access to commodities without burdensome K-1 tax reporting</li>
</ul>
<p>To receive more <strong><a href="https://www.vaneck.com/us/en/insights/natural-resources/" title="Natural Resources">Natural Resources</a></strong> insights, <strong><a href="https://www.vaneck.com/us/en/subscribe/" title="Subscription Center">sign up in our subscription center</a></strong>.</p>
<style type="text/css">
    .wrapped-div {
        max-width: 100%;
    }

    @media (max-width: 1240px) {
        .wrapped-div {
            overflow-x: scroll;
        }
    }

    .wrapped-div-sector {
        max-width: 100%;
        overflow-x: scroll;
    }
</style>
]]></content:encoded>
</item><item rdf:about="https://www.vaneck.com/us/en/blogs/emerging-markets-equity/from-cash-to-clicks-the-unstoppable-rise-of-digital-payments-in-india/">
  <title>From Cash to Clicks: The Unstoppable Rise of Digital Payments in India></title>
  <link>https://www.vaneck.com/us/en/blogs/emerging-markets-equity/from-cash-to-clicks-the-unstoppable-rise-of-digital-payments-in-india/</link>
  <description><![CDATA[India's audacious leap from a cash-centric economy to a pioneering digital payments powerhouse is revolutionizing the financial landscape.]]></description>
  <dc:creator>John Patrick Lee, CFA</dc:creator>
  <dc:date>08/22/2023 06:30:00</dc:date>
<content:encoded><![CDATA[

<p>India's digitization journey has<strong> <a href="/link/3cbe063c10314466ab24e1ab03967c5a.aspx" title="India's Digital Gold Rush: The Rise of Digitization and E-commerce">revolutionized multiple sectors and transformed the lives of its citizens.</a></strong> With a particular focus on digital payments, India has ushered in a new era of financial accessibility, convenience, and security. However, while impressive strides have been made, India's digital payment ecosystem represents a colossal market with vast potential, teeming with opportunities for innovative fintech startups and tech giants alike. Recognizing this, the Indian government is actively fostering an environment conducive to growth, focusing on initiatives aimed at digital literacy, cybersecurity, and regulatory frameworks. The evolution of this sector will undeniably play a crucial role in defining the trajectory of India's broader digitization journey, driving economic growth, and creating a more inclusive financial landscape.</p>
<h2>Remember when Cash was King?</h2>
<p>India's informal economy is estimated to be a staggering 43.1%<sup>1</sup>&nbsp;of the nation's GDP PPP (purchasing power parity), which translates to approximately $4,272 billion. Until recently, cash was king, accounting for 72% of all consumer purchase spending in 2017. However, that dynamic has decisively shifted in favor of digital payments&mdash;and this shift is in large part to the government&rsquo;s efforts to digitize its economy.</p>
<h3>India&rsquo;s Market Share of Payment Methods at Point of Sale (POS)</h3>
<div class="wrapped-div">
<table style="width: 100%;">
<tbody>
<tr class="tbl-data">
<td class="tbl-header last">Characteristic</td>
<td class="tbl-header last" style="text-align: center;">2017</td>
<td class="tbl-header last" style="text-align: center;">2019</td>
<td class="tbl-header last" style="text-align: center;">2020</td>
<td class="tbl-header last" style="text-align: center;">2021</td>
<td class="tbl-header last" style="text-align: center;">2022</td>
</tr>
<tr class="tbl-data">
<td class="data-td last">E-wallet, Digital/mobile wallet</td>
<td class="data-td data last">6%</td>
<td class="data-td data last">5%</td>
<td class="data-td data last">22%</td>
<td class="data-td data last">25%</td>
<td class="data-td data last">35%</td>
</tr>
<tr class="tbl-data">
<td class="data-td last">Cash</td>
<td class="data-td data last">72%</td>
<td class="data-td data last">71%</td>
<td class="data-td data last">34%</td>
<td class="data-td data last">37%</td>
<td class="data-td data last">27%</td>
</tr>
<tr class="tbl-data">
<td class="data-td last">Debit</td>
<td class="data-td data last">11%</td>
<td class="data-td data last">12%</td>
<td class="data-td data last">20%</td>
<td class="data-td data last">18%</td>
<td class="data-td data last">19%</td>
</tr>
<tr class="tbl-data">
<td class="data-td last">Credit card (incl. "charge card" since 2021)*</td>
<td class="data-td data last">9%</td>
<td class="data-td data last">12%</td>
<td class="data-td data last">18%</td>
<td class="data-td data last">17%</td>
</tr>
</tbody>
</table>
</div>
<br />
<p class="chart-disclosure">Source: Statista, Market share of cash, credit cards, and other payment methods at point of sale (POS) in India in 2017, 2019, 2020, 2021, and 2022: <strong><a href="https://www.statista.com/statistics/1296697/preferred-payment-methods-india/" target="blank" title="India payment methods share 2022">https://www.statista.com/statistics/1296697/preferred-payment-methods-india/.</a></strong></p>
<h2>The Government&rsquo;s Effort to Formalize the Economy</h2>
<p>The government has encouraged the introduction of payment acceptance systems in an effort to formalize more of the economy and increase tax compliance. It recently instituted policies to reduce the supply of cash and set standards to make it easy for third-party mobile wallets to connect with bank accounts and transfer money between parties, referred to as Unified Payments Interface (or UPI) wallets.</p>
<p>Through the establishment of UPI, third-party mobile wallets can now seamlessly connect with bank accounts and facilitate money transfers. The interoperability of the UPI system has further accelerated digital payments, with payment apps facilitating billions of transactions monthly. With the highest digital payments adoption rate of 87% among the public compared to the global average of 64%, India has gained the third place in digital payments, after US and China, attesting to India&rsquo;s untapped market.<sup>2</sup></p>
<h2>India UPI Monthly Transactions</h2>
<p><img class="img-responsive w-100" src="https://www.vaneck.com/contentassets/830899dcadef48e4a18002e75865559a/3521_dgin_chart_2023.08_blog.svg" alt="India UPI Monthly Transactions have surged over the past three years" /></p>
<p class="chart-disclosure">Source: National Payments Corporation of India (NPCI).</p>
<p>A closer look at the government's initiative reveals strategies aimed at formalizing the economy and promoting digital payments to enhance financial inclusion, transparency, and economic growth. Noteworthy steps include the demonetization in 2016 aimed at curbing corruption, the introduction of the Goods and Services Tax (GST) in 2017 for streamlined tax compliance, the Direct Benefit Transfer (DBT) system to eliminate subsidy leakages, and the Jan Dhan Yojana in 2014 for financial inclusion. Furthermore, the Aadhaar biometric identification system has significantly contributed to enhancing the efficiency and effectiveness of various government schemes and services.</p>
<h2>Companies Capitalizing on Digital Payments Opportunities</h2>
<p>Several businesses in India are capitalizing on the enormous potential offered by digital payments, and Tata Consultancy Services (TCS) is at the forefront. As a leading global IT services, consulting, and business solutions organization, TCS has been instrumental in leveraging its technology prowess to make a significant impact in the digital payments realm.</p>
<p>Notably, TCS's Merchant Solutions have been revolutionizing how businesses accept digital payments. The firm provides comprehensive solutions, including point-of-sale (POS) systems, mobile payment acceptance, and e-commerce payment integration. This initiative not only streamlines businesses' payment processes but also elevates customer experience by providing them with more flexible payment options.</p>
<p>Furthermore, TCS has showcased its expertise in developing Mobile Wallet Solutions. These platforms have been pivotal in promoting digital payments, as they allow customers to transact using their smartphones. From peer-to-peer transfers and bill payments to mobile recharges and banking services, TCS's mobile wallet solutions serve as an all-in-one digital payments hub.</p>
<p>Another significant player making waves in the digital payments landscape is Bharti Airtel Ltd, commonly known as Airtel. As one of India's largest telecommunications companies, Airtel has expanded beyond its core business and established a strong foothold in the digital payments sector.</p>
<p>Airtel's foray into digital payments started with the introduction of Airtel Payments Bank. This venture allows customers to open a savings account with minimal documentation and transact directly through a mobile app, making money transfers, bill payments, and recharges a breeze.</p>
<p>To further its commitment to digital payments, Airtel introduced the Airtel Money Wallet, a digital wallet service that enables users to store money digitally and make payments for a vast array of services. Whether it's paying bills, recharging mobile plans, booking tickets, or shopping at partner merchants, the Airtel Money Wallet has it covered.</p>
<p>Recognizing the widespread adoption of the Unified Payments Interface (UPI), Airtel integrated its payment services with the UPI platform. This strategic move allows users to link their Airtel Payments Bank accounts and execute seamless peer-to-peer transactions. With UPI, Airtel's customers can send and receive money with ease, and also make payments to merchants.</p>
<p>The ingenuity and dynamism shown by companies like TCS and Airtel highlights the exciting opportunities in India's digital payments landscape.</p>
<h2>Investing in India with VanEck</h2>
<p>India's audacious leap from a cash-centric economy to a pioneering digital payments powerhouse is revolutionizing the financial landscape. India is rapidly transforming into an<a href="/link/ea7f76cf9741463cb092a050177508cd.aspx" title="India's Opportunities: Impossible to Ignore"><strong> investment hub</strong></a><strong> that can&rsquo;t be overlooked</strong> with its booming digital sector, combined with a strong equity market drawing global attention and fueling this interest.</p>
<p><a href="/link/979eec17b7274fcb9dd954ab832450cc.aspx" title="DGIN - VanEck Digital India ETF - Overview"><strong>VanEck Digital India ETF (DGIN)</strong></a> offers exposure to companies involved in the digitization of the Indian economy.</p>
<p>To receive more <a href="/us/en/insights/emerging-markets-equity/" title="Emerging Markets Equity Insights"><strong>Emerging Markets Equity</strong></a> insights, <a href="/us/en/subscribe/" title="Subscription Center"><strong>sign up in our subscription center</strong></a>.</p>
<style type="text/css">
    .wrapped-div {
        max-width: 100%;
    }

    @media (max-width: 768px) {
        .wrapped-div {
            overflow-x: scroll;
        }
    }

    .wrapped-div-sector {
        max-width: 100%;
        overflow-x: scroll;
    }
</style>
]]></content:encoded>
</item><item rdf:about="https://www.vaneck.com/us/en/blogs/income-investing/green-bonds-an-answer-to-em-sustainability-financing/">
  <title>Green Bonds: An Answer to EM Sustainability Financing></title>
  <link>https://www.vaneck.com/us/en/blogs/income-investing/green-bonds-an-answer-to-em-sustainability-financing/</link>
  <description><![CDATA[The green bond market offers emerging markets an opportunity to fund ambitious sustainability goals, and some countries are already leading the way.]]></description>
  <dc:creator> </dc:creator>
  <dc:date>08/22/2023 06:30:00</dc:date>
<content:encoded><![CDATA[

<p>Emerging markets will require annual investments to more than triple from $770 billion in 2022 to $2.8 trillion by the early 2030s in order to meet rising energy needs while fulfilling climate goals set by the Paris Agreement<sup>1</sup>. We believe that the global emerging markets debt market can play a crucial role in satisfying this financing need. With a <strong><a href="https://www.vaneck.com/us/en/blogs/emerging-markets-bonds/the-investment-case-for-emerging-markets-debt/" title="The Investment Case for Emerging Markets Debt">strong fundamental investment case</a></strong> for emerging markets debt and the asset class demonstrating relatively strong returns over the last two years versus developed markets fixed income, there is an opportunity for emerging markets to tap into the growing green bond market, in our view. Green bonds have proven themselves to be an attractive solution for both sovereign issuers and fixed income investors; They have the same characteristics as a traditional bond, and thus a similar risk/return profile all else equal, but only finance environmentally friendly projects.</p>
<h2>Annual EM Investment to Reach Net Zero Emissions by 2050</h2>
<p><img loading="lazy" class="img-responsive w-100" src="https://www.vaneck.com/contentassets/ac433ec75fb042c98118540189e4b8b0/3533_grnb-em-blog_2023.08_v1.svg" alt="Bar chart showing the annual investment (USD in billions) in emerging markets to reach net zero emissions by 2050, specifically the historical investments for 2015 and 2022 and the required investment for 2026 thorough 2030 and for 2031 through 2035." /></p>
<p class="chart-disclosure">Source: International Energy Association.</p>
<h2>Green Bonds May Satisfy Financing Needs</h2>
<p>Green bond issuance is currently on an upward trajectory and on pace for a record year. As of January 2023, total green bonds have raised $2.5 trillion globally to support environmentally friendly projects,<sup>2</sup>&nbsp;and issuance this year has exceeded the first half of any other year, with over $350 billion of new green bonds issued as of June 30, 2023.<sup>3</sup></p>
<p>Since 2016, 19 emerging market governments have issued green, social and sustainability bonds to help fund sustainable investment domestically.<sup>4</sup>&nbsp;However, emerging market governments only represent 2% of total green and sustainable bonds issued globally with $74 billion raised as of January 2023.<sup>5</sup>&nbsp;Emerging market sovereign issuers in the S&amp;P Green Bond U.S. Dollar Select Index only accounted for 2.6% of the index market value as of July 31, 2023.</p>
<h2>Green Bond Issuance Case Studies</h2>
<p>Given the need to transition emerging economies to become low/zero carbon and aligned with global climate goals, green financing directed towards these countries must grow substantially. Fortunately, a handful of emerging market sovereign issuers have already provided several case studies of successful and innovative green bond issuances that can serve as a benchmark for other emerging markets. By partnering with multi-lateral development banks for both technical assistance and credit enhancements to broaden the investor base, the below examples demonstrate how emerging markets can use the green bond market to help satisfy their domestic green agendas while taking advantage of the strong and growing demand for green investments.</p>
<p><i>Chile</i></p>
<p>In 2019, Chile issued the first sovereign green bond in the Americas, and in total has issued $6.3 billion equivalent in green bonds through two deals. The initial demand for the country&rsquo;s first green bond issue was nearly 13 times oversubscribed,<sup>6</sup>&nbsp;revealing the strong demand for emerging market green bond issuance. The 3.53% yield was the lowest ever obtained by Chile for a similar tenor.</p>
<p>The government of Chile has applied the proceeds to multiple categories of green investment. The 2019 green bond focused on clean transportation, renewable energy, green buildings, and water management. The 2020 green bond directed proceeds to solely clean transportation. These investments are intended to build a low carbon, climate-resilient and sustainable economy as set forth under Chile&rsquo;s 2030 Agenda commitments and its Nationally Determined Contributions (NDCs) under the Paris Agreement.</p>
<p>Multiple organizations provided support to Chile&rsquo;s successful green bond issuances, helping to expand the investor base and provide assurance of its green bona fides to investors. The bond was certified under the Climate Bonds Standard and verified by Vigeo-Eiris, and the Inter-American Development Bank supported Chile with technical assistance programs, risk mitigation instruments and guarantees, and anchor investments.<sup>7</sup></p>
<p><i>Ecuador</i></p>
<p>In May 2023, Ecuador tapped the sustainable fixed income market with the &ldquo;Galapagos bond,&rdquo; which will finance conservation efforts and sustainable development in the Galapagos Islands. This is an example of an innovative &ldquo;debt-for-nature&rdquo; swap in which a portion of a country&rsquo;s debt is reduced in exchange for a commitment to fund environmentally friendly projects. This was part of the largest debt-for-nature swap to date. $1.6 billion of three Ecuador bond issues maturing between 2030 and 2040 was bought back at prices ranging from 30.5 cents to 53.25 cents on the dollar, and a new $656 million bond maturing in 2041 was issued,<sup>8</sup>&nbsp;which allowed Ecuador to cut its debt servicing costs. The savings will be used for conservation efforts in the Galapagos islands as well as sustainable economic development to benefit the local community.<sup>9</sup>&nbsp;The goal is to protect enough areas to have similar results to an 11,500-square mile (30,000-sq km) reserve set up last year that protected migratory species including sharks, whales, sea turtles and manta rays.</p>
<p>Once the $450 million of total conservation spending is considered, the Galapagos bond will cut Ecuador&rsquo;s debt by over $1 billion.<sup>10</sup>&nbsp;Ecuador will dedicate $12 million a year from the interest savings realized into the conservation of the Galapagos islands. Ecuador received an $85 million guarantee from the Inter-American Development Bank and $656 million political risk insurance from the U.S. International Development Finance Corporation helping to reduce investment risk and broaden the bond&rsquo;s appeal to investors.</p>
<p>This Ecuador transaction has an innovative structure that benefits both the issuer from a fiscal perspective and helps to achieve the country&rsquo;s sustainability goals. This sovereign bond is not classified as a green bond by the Climate Bonds Initiative because more than 5% of the proceeds are earmarked as economic development rather than green projects, resulting in a &ldquo;sustainable&rdquo; designation (which is a combination of green and social use of proceeds) rather than a pure &ldquo;green&rdquo; designation.<sup>11</sup>&nbsp;Nevertheless, we believe this innovative structure provides a useful case study that could be replicated by other emerging markets using the green bond format to finance environmentally friendly projects.</p>
<p><i>Egypt</i></p>
<p>In September 2020, Egypt became the first country in the Middle East and North Africa to issue a sovereign green bond. The five-year green bond was originally planned as a $500 million issuance size with a 5.75% interest rate, but due to overwhelming demand, it was increased to $750 million at a rate of 5.25% -- lower than Egypt&rsquo;s benchmark conventional bonds. With the participation of 16 new investors in the country&rsquo;s U.S. dollar-denominated bond issuances, there was clear evidence of strong investor demand. The bond&rsquo;s proceeds align with Egypt&rsquo;s Vision 2030, aiming to increase the proportion of green projects in the government&rsquo;s investment budget. Egypt&rsquo;s green bond will finance clean transportation, renewable energy, pollution prevention and control, sustainable water and water management, energy efficiency and climate change adaptation. In particular, investments aimed at increasing access to potable water through seawater desalination, increasing crop production through wastewater reuse for irrigation and a safer and more affordable commute through Cairo Monorail will be financed.</p>
<p>The Egyptian Ministry of Finance received assistance for its green bond issuance and reporting framework from the World Bank and IFC, and was verified by Vigeo Eiris.<sup>12</sup>&nbsp;The World Bank equipped Egypt with expertise in debt-management strategies and government policies for their green bond issuance.</p>
<p><i>Indonesia</i></p>
<p>Indonesia issued the world&rsquo;s first sovereign Green Sukuk in 2018 and was oversubscribed, signaling strong investor interest. A sukuk is an instrument that generates returns to investors without infringing the principles of Islamic law, or Shariah. Indonesia is the fourth largest sukuk market globally. This green sukuk dedicates 100% of the proceeds to green projects and was verified by Cicero. Indonesia reached as much as 29% more investors with its first two issuances, as compared to normal sukuk issuances.<sup>13</sup></p>
<p>In 2021, Indonesia issued a 30-year green sukuk, a record in the green sukuk market, which was more than three times oversubscribed. Together, Indonesia&rsquo;s activity in the green bond market demonstrates the opportunity to tap into strong demand from the Islamic finance market to fund sustainability initiatives.</p>
<p>Indonesia used the proceeds of its green sukuk to fund its commitment to achieving its Nationally Determined Contributions (NDCs) under the Paris Agreement. The NDCs envision a low carbon and climate resilient future as well as biodiversity preservation as Indonesia is home to extensive rainforests. More specifically, the proceeds have been used for investment in sustainable transport such as the double track railway project on the North Java Line and renewable energy, including solar power plant projects, and the management of water retention facilities.</p>
<h2>Transitioning to a Low Carbon Economy Through Green Bonds</h2>
<p>As the need for investments in climate solutions continue to increase, emerging markets may not have the fiscal resources needed to achieve ambitious sustainability goals. We believe the green bond market provides an attractive option, and emerging markets sovereign issuers can leverage the strong investment case for EM fixed income along with the rise of the global green bond market to fund their green agendas. Several notable green bond issuances provide a roadmap for other emerging markets issuers who have yet to enter the market, demonstrating how innovative structures and strategic partnerships can be utilized to successfully fund the transition to a low carbon economy. Accordingly, we believe there is significant room for growth in the emerging markets sovereign green bond segment of the market.</p>
<p>The <a href="https://www.vaneck.com/us/en/investments/green-bond-etf-grnb/overview/" title="GRNB - VanEck Green Bond ETF - Overview"><strong>VanEck Green Bond ETF (GRNB)</strong></a> seeks to replicate, as closely as possible, before fees and expenses, the price and yield performance of the S&amp;P Green Bond U.S. Dollar Select Index. The index is comprised of U.S. dollar-denominated green bonds that are issued to finance environmentally friendly projects and includes bonds issued by supranational, government and corporate issuers globally.</p>
<p>To receive more <a href="/us/en/blogs/income-investing/" title="Income Investing Insights"><strong>Income Investing</strong></a> insights, <a href="/link/5f45412c2143400497908cea2897f7d3.aspx" title=" Subscription Center"><strong>sign up in our subscription center</strong></a>.</p>
]]></content:encoded>
</item><item rdf:about="https://www.vaneck.com/us/en/blogs/thematic-investing/buzz-investing-a-shift-in-market-leadership/">
  <title>BUZZ Investing: A Shift in Market Leadership></title>
  <link>https://www.vaneck.com/us/en/blogs/thematic-investing/buzz-investing-a-shift-in-market-leadership/</link>
  <description><![CDATA[Mega-cap stocks underperform while macroeconomic trends bolster investor confidence.]]></description>
  <dc:creator> </dc:creator>
  <dc:date>08/18/2023 06:30:00</dc:date>
<content:encoded><![CDATA[

<p>Domestic equities were modestly lower during the recent period between Index selection dates (July 13, 2023 to August 10, 2023, the &ldquo;Period&rdquo;). The recent upward trajectory in markets, which over the past few months was led by excitement surrounding AI technologies, shifted during the recent Period as mega-cap stocks which drove performance through much of 2023 underperformed, with the increasing narrow breadth of their leadership discussed in the <a href="https://www.vaneck.com/us/en/blogs/thematic-investing/buzz-investing-new-bull-market/" title="BUZZ Investing: New Bull Market"><strong>July BUZZ Investing update</strong></a> having proven to foretell a pending reversal for stocks.</p>
<p>Investors, however, drew confidence from several positive macroeconomic trends during the Period. First, there is growing anticipation that The Federal Reserve (Fed) and other central banks around the globe may soon conclude their cycle of interest rate hikes. Second, inflationary pressures are showing signs of gradual moderation. Lastly, economic growth continues to demonstrate resilience. Positive investor sentiments toward the current economic landscape resulted in the diversification of leadership within equity markets during the Period. In particular, economically sensitive segments such as small-cap stocks and cyclical sectors have recently been outperforming, indicating to some market analysts that equity markets may have further upside in the coming months.</p>
<p>The BUZZ NextGen AI US Sentiment Leaders Index (the &ldquo;BUZZ Index&rdquo; or &ldquo;Index&rdquo;) returned 9.40% during the month of July compared to a return of 3.21% for the S&amp;P 500 Index during the same period. Year-to-date, the BUZZ Index leads the S&amp;P 500 with returns of 48.12% and 20.65%, respectively, as of the end of July.</p>
<h2>Shares of Alphabet Inc. Pace Advancing Stocks within the BUZZ Index</h2>
<p>Shares of Alphabet Inc (NASD: GOOGL) paced advancing stocks within the BUZZ Index during the recent Period as the tech giant reported second-quarter earnings on July 25th that topped most analysts&rsquo; estimates. Though some analysts had expressed concerns in the preceding months that large language models (&ldquo;LLMs&rdquo;) like ChatGPT might challenge Google's supremacy in search, the company's Q2 performance was marked by better-than-anticipated results from its primary search division. Shares of GOOGL, which gained 4.1% during the Period, contrasted sharply with its mega-cap peers, including Apple Inc (NASD: AAPL), Microsoft Corp (NASD: MSFT), NVIDIA Corp (NASD: NVDA), and Tesla Inc (NASD: TSLA) which each fell by over 5% during the recent Period between Index selection dates.</p>
<div class="wrapped-div">
<table style="width: 750px;">
<tbody>
<tr class="tbl-data">
<td class="tbl-header last" colspan="4">Top BUZZ Index Contributors: July 13, 2023 &ndash; August 10, 2023</td>
</tr>
<tr class="tbl-data">
<td class="data-td  last">Company</td>
<td class="data-head last">Ticker</td>
<td class="data-head last">Average Weight (%)</td>
<td class="data-head last">Return Contribution (%)</td>
</tr>
<tr class="tbl-data">
<td class="data-td last font-weight-normal">Alphabet Inc</td>
<td class="data-td data last">GOOGL</td>
<td class="data-td data last">2.51</td>
<td class="data-td data last">0.14</td>
</tr>
<tr class="tbl-data">
<td class="data-td last font-weight-normal">Boeing Co/The</td>
<td class="data-td data last">BA</td>
<td class="data-td data last">1.30</td>
<td class="data-td data last">0.12</td>
</tr>
<tr class="tbl-data">
<td class="data-td last font-weight-normal">Amazon.com Inc</td>
<td class="data-td data last">AMZN</td>
<td class="data-td data last">2.98</td>
<td class="data-td data last">0.10</td>
</tr>
<tr class="tbl-data">
<td class="data-td last font-weight-normal">Walt Disney Co/The</td>
<td class="data-td data last">DIS</td>
<td class="data-td data last">2.82</td>
<td class="data-td data last">0.07</td>
</tr>
<tr class="tbl-data">
<td class="data-td last font-weight-normal">KeyCorp</td>
<td class="data-td data last">KEY</td>
<td class="data-td data last">0.61</td>
<td class="data-td data last">0.06</td>
</tr>
<tr class="tbl-data">
<td class="data-td last font-weight-normal">Charles Schwab Corp/The</td>
<td class="data-td data last">SCHW</td>
<td class="data-td data last">0.64</td>
<td class="data-td data last">0.06</td>
</tr>
<tr class="tbl-data">
<td class="data-td last font-weight-normal">Warner Bros Discovery Inc</td>
<td class="data-td data last">WBD</td>
<td class="data-td data last">0.69</td>
<td class="data-td data last">0.06</td>
</tr>
<tr class="tbl-data">
<td class="data-td last font-weight-normal">Intel Corp</td>
<td class="data-td data last">INTC</td>
<td class="data-td data last">1.52</td>
<td class="data-td data last">0.05</td>
</tr>
<tr class="tbl-data">
<td class="data-td last font-weight-normal">Costco Wholesale Corp</td>
<td class="data-td data last">COST</td>
<td class="data-td data last">0.84</td>
<td class="data-td data last">0.05</td>
</tr>
<tr class="tbl-data">
<td class="data-td last font-weight-normal">Walmart Inc</td>
<td class="data-td data last">WMT</td>
<td class="data-td data last">1.02</td>
<td class="data-td data last">0.04</td>
</tr>
</tbody>
</table>
</div>
<br />
<p class="chart-disclosure">Source: BUZZ Holdings ULC, Bloomberg. Past performance is no guarantee of future results. Index performance is not illustrative of fund performance. Not intended as a recommendation to buy or to sell any of the securities mentioned herein.</p>
<p>The top ten detractors to performance featured shares of several stocks that had rebounded significantly during 2023 following the high-growth, thematic-oriented selloff of 2022 that left many once high-flying stocks significantly below their all-time highs. The top ten detractors of Index performance fell an average of 16.9% during the Period, while the cohort remains up an average of 38.9% during 2023. Shares of Shopify Inc (NYSE: SHOP) were representative of the group, as, despite the company reporting Q2 earnings featuring strong revenue growth and free cash flow profitability, which beat most analysts&rsquo; forecasts, its shares sank as investors remain skittish on the company&rsquo;s longer-term growth prospects in the context of the current market environment.</p>
<div class="wrapped-div">
<table style="width: 750px;">
<tbody>
<tr class="tbl-data">
<td class="tbl-header last" colspan="4">Bottom BUZZ Index Contributors: July 13, 2023 &ndash; August 10, 2023</td>
</tr>
<tr class="tbl-data">
<td class="data-td  last">Company</td>
<td class="data-head last">Ticker</td>
<td class="data-head last">Average Weight (%)</td>
<td class="data-head last">Return Contribution (%)</td>
</tr>
<tr class="tbl-data">
<td class="data-td last font-weight-normal">Coinbase Global Inc</td>
<td class="data-td data last">COIN</td>
<td class="data-td data last">3.30</td>
<td class="data-td data last">-0.77</td>
</tr>
<tr class="tbl-data">
<td class="data-td last font-weight-normal">Rivian Automotive Inc</td>
<td class="data-td data last">RIVN</td>
<td class="data-td data last">2.68</td>
<td class="data-td data last">-0.45</td>
</tr>
<tr class="tbl-data">
<td class="data-td last font-weight-normal">Plug Power Inc</td>
<td class="data-td data last">PLUG</td>
<td class="data-td data last">1.54</td>
<td class="data-td data last">-0.44</td>
</tr>
<tr class="tbl-data">
<td class="data-td last font-weight-normal">GameStop Corp</td>
<td class="data-td data last">GME</td>
<td class="data-td data last">2.84</td>
<td class="data-td data last">-0.41</td>
</tr>
<tr class="tbl-data">
<td class="data-td last font-weight-normal">Tesla Inc</td>
<td class="data-td data last">TSLA</td>
<td class="data-td data last">2.94</td>
<td class="data-td data last">-0.35</td>
</tr>
<tr class="tbl-data">
<td class="data-td last font-weight-normal">Robinhood Markets Inc</td>
<td class="data-td data last">HOOD</td>
<td class="data-td data last">1.85</td>
<td class="data-td data last">-0.33</td>
</tr>
<tr class="tbl-data">
<td class="data-td last font-weight-normal">PayPal Holdings Inc</td>
<td class="data-td data last">PYPL</td>
<td class="data-td data last">2.61</td>
<td class="data-td data last">-0.33</td>
</tr>
<tr class="tbl-data">
<td class="data-td last font-weight-normal">Enphase Energy Inc</td>
<td class="data-td data last">ENPH</td>
<td class="data-td data last">0.94</td>
<td class="data-td data last">-0.27</td>
</tr>
<tr class="tbl-data">
<td class="data-td last font-weight-normal">Palantir Technologies Inc</td>
<td class="data-td data last">PLTR</td>
<td class="data-td data last">3.15</td>
<td class="data-td data last">-0.26</td>
</tr>
<tr class="tbl-data">
<td class="data-td last font-weight-normal">Shopify Inc</td>
<td class="data-td data last">SHOP</td>
<td class="data-td data last">1.15</td>
<td class="data-td data last">-0.25</td>
</tr>
</tbody>
</table>
</div>
<br />
<p class="chart-disclosure">Source: BUZZ Holdings ULC, Bloomberg. Past performance is no guarantee of future results. Index performance is not illustrative of fund performance. Not intended as a recommendation to buy or to sell any of the securities mentioned herein.</p>
<h2>Sentiment Stock Highlight &ndash; Healthcare Stocks</h2>
<p>In August, the BUZZ Index recorded a notable increase in the weighting of the healthcare sector, jumping from 2% to 4.4%. New additions to the index include Agilent Technologies Inc (NYSE: A), Johnson &amp; Johnson (NYSE: JNJ), Moderna Inc (NASD: MRNA), and Eli Lilly &amp; Co (NYSE: LLY). Eli Lilly has been the sector's standout, as the company recently reported impressive Q2 earnings that exceeded most analyst expectations and subsequently raised its full-year guidance. Shares of LLY soared almost 15% following the announcement, fueled by the success of its latest diabetes drug, Mounjaro, which competes with the wildly popular Ozempic, a drug created to help manage type 2 diabetes, but more commonly is being hailed as a new miracle weight loss drug. LLY also benefits from growing consumer interest in its new experimental weight-loss pill, Retatrutide. Separately within the healthcare sector, shares of COVID-19 vaccine manufacturers have largely struggled year-to-date as waning demand has weighed on the group; however, with increasing hospitalizations attributed to the latest COVID-19 variant, sentiment towards the cohort is on the rise, as analysts forecast increasing demand for further booster shots to protect against new strains. Overall, the latest developments within the healthcare sector have resulted in increased positive investor sentiment toward the segment&rsquo;s prospects.</p>
<h3>Eli Lilly and Co Stock Price | January 2017 &ndash; August 2023</h3>
<p><img class="img-responsive w-100" src="https://www.vaneck.com/contentassets/6752a5d3ed864e95a347f72196e82c0e/3528_buzz-blog_chart_2023.08_v3_blog-v3.svg" alt="Eli Lilly and Co Stock Price | January 2017 - August 2023" /></p>
<p class="chart-disclosure">Source: BUZZ Holdings ULC, Bloomberg. Past performance is no guarantee of future results. Index performance is not illustrative of fund performance. Not intended as a recommendation to buy or to sell any of the securities mentioned herein.</p>
<h2>BUZZ Index August 2023 Rebalance Highlights</h2>
<p><strong>Super Micro Computer Inc</strong></p>
<p>The rise of Artificial Intelligence (AI) has dominated discussions in the markets this year, propelling a significant uptick in the technology sector. Almost every tech-reliant company now integrates AI into its growth strategy. Notably, firms producing processors and chips essential for AI computations, like Advanced Micro Devices Inc (NASD: AMD) and NVIDIA Corp (NASD: NVDA), have seen immense benefits. Other tech-infrastructure manufacturers have also experienced an AI-driven boost. Super Micro Computer Inc (NASD: SMCI), a company specializing in computer and server components, largely flew under the radar until this year. The AI boom has catalyzed a surge in demand for their products, leading to record profits, new partnerships, and expansion plans. Shares of SMCI have more than tripled this year, even following a recent 22% drop after the company released Q4 earnings that surpassed most analyst expectations and included promising forward guidance. After joining the BUZZ Index two months ago, SMCI has witnessed growing positive investor sentiment, even with the recent share price dip. As of the current August reconstitution and rebalance, SMCI now carries a 0.79% weight in the BUZZ index.</p>
<p>For more on rebalancing results and a full breakdown of index constituents added and removed for the month, view the <a href="https://www.vaneck.com/us/en/investments/social-sentiment-etf-buzz/buzz-reconstitution.pdf" title="BUZZ Vaneck Social Sentiment ETF" target="_blank" rel="noopener"><strong>BUZZ Index reconstitution</strong></a> report.</p>
<p>To receive more <strong><a href="https://www.vaneck.com/us/en/insights/thematic-investing/" title="Thematic Investing Insights">Thematic Investing</a></strong> insights, <strong><a href="https://www.vaneck.com/us/en/subscribe/" title="Subscription Center">sign up in our subscription center</a></strong>.</p>
<style type="text/css">
    .wrapped-div {
        max-width: 100%;
    }

    @media (max-width: 1240px) {
        .wrapped-div {
            overflow-x: scroll;
        }
    }

    .wrapped-div-sector {
        max-width: 100%;
        overflow-x: scroll;
    }
</style>
]]></content:encoded>
</item><item rdf:about="https://www.vaneck.com/us/en/blogs/emerging-markets-bonds/risks-to-bonds-multiply/">
  <title>Risks to DM Bonds Multiply></title>
  <link>https://www.vaneck.com/us/en/blogs/emerging-markets-bonds/risks-to-bonds-multiply/</link>
  <description><![CDATA[Multiple factors may continue to push U.S. interest rates higher and increase risk to bond investors, but select emerging markets have generally been weathering these ongoing DM-led adverse scenarios.]]></description>
  <dc:creator>Eric Fine</dc:creator>
  <dc:date>08/17/2023 06:30:00</dc:date>
<content:encoded><![CDATA[

<p>In July, the <strong><a href="https://www.vaneck.com/us/en/investments/emerging-markets-bond-fund-embax/overview/" title="EMBAX - Emerging Markets Bond Fund - Class A - Overview">VanEck Emerging Markets Bond Fund</a></strong> was up 1.63% compared to up 2.34% for its benchmark (50% J.P. Morgan Government Bond Index-Emerging Markets (GBI-EM) Global Diversified and 50% J.P. Morgan Emerging Markets Bond Index (EMBI)). Year-to-date as of July 31, 2023, the Fund is up 7.65%, compared to 8.43% for its benchmark. The Fund ended July with carry of 6.84%, a duration of 5.9, and roughly 38% allocation in local currency. We are reducing duration even further in August, while reducing exposure to Asian emerging markets currencies (EMFX) and high-beta EMFX (no Thailand or Mexico local-currency, for example), and have even raised cash while global bond markets sort themselves out. Our biggest exposures are Mexico, Indonesia (local), South Africa (local), Brazil (local), and Colombia (local). <strong><a href="/us/en/blogs/emerging-markets-bonds/risks-to-bonds-multiply/emb-manager-commentary-08-2023.pdf" target="_blank" rel="noopener">View here for a PDF version of this blog</a>.</strong></p>
<div class="wrapped-div">
<table style="width: 100%;">
<tbody>
<tr class="tbl-data">
<td class="tbl-header last" colspan="8">Average Annual Total Returns (%) as of July 31, 2023</td>
</tr>
<tr class="tbl-data">
<td class="data-td last">&nbsp;</td>
<td class="data-head last">1 Month<sup>&dagger;</sup></td>
<td class="data-head last">3 Month<sup>&dagger;</sup></td>
<td class="data-head last">YTD</td>
<td class="data-head last">1 Year</td>
<td class="data-head last">3 Year</td>
<td class="data-head last">5 Year</td>
<td class="data-head last">10 Year</td>
</tr>
<tr class="tbl-data">
<td class="data-td last">Class A: NAV (Inception 07/09/12)</td>
<td class="data-td data last">1.63</td>
<td class="data-td data last">3.34</td>
<td class="data-td data last">7.65</td>
<td class="data-td data last">12.90</td>
<td class="data-td data last">1.03</td>
<td class="data-td data last">2.77</td>
<td class="data-td data last">1.71</td>
</tr>
<tr class="tbl-data">
<td class="data-td last">Class A: Maximum 5.75% load</td>
<td class="data-td data last">-4.22</td>
<td class="data-td data last">-2.60</td>
<td class="data-td data last">1.46</td>
<td class="data-td data last">6.41</td>
<td class="data-td data last">-0.94</td>
<td class="data-td data last">1.56</td>
<td class="data-td data last">1.11</td>
</tr>
<tr class="tbl-data">
<td class="data-td last">Class I: NAV (Inception 07/09/12)</td>
<td class="data-td data last">1.64</td>
<td class="data-td data last">3.38</td>
<td class="data-td data last">7.74</td>
<td class="data-td data last">13.36</td>
<td class="data-td data last">1.36</td>
<td class="data-td data last">3.10</td>
<td class="data-td data last">2.02</td>
</tr>
<tr class="tbl-data">
<td class="data-td last">Class Y: NAV (Inception 07/09/12)</td>
<td class="data-td data last">1.62</td>
<td class="data-td data last">3.34</td>
<td class="data-td data last">7.85</td>
<td class="data-td data last">13.39</td>
<td class="data-td data last">1.30</td>
<td class="data-td data last">3.05</td>
<td class="data-td data last">1.95</td>
</tr>
<tr class="tbl-data">
<td class="data-td last">50% GBI-EM/50% EMBI</td>
<td class="data-td data last">2.40</td>
<td class="data-td data last">4.08</td>
<td class="data-td data last">8.49</td>
<td class="data-td data last">10.29</td>
<td class="data-td data last">-2.52</td>
<td class="data-td data last">0.51</td>
<td class="data-td data last">1.39</td>
</tr>
</tbody>
</table>
</div>
<br />
<div class="wrapped-div">
<table style="width: 100%;">
<tbody>
<tr class="tbl-data">
<td class="tbl-header last" colspan="8">Average Annual Total Returns (%) as of June 30, 2023</td>
</tr>
<tr class="tbl-data">
<td class="data-td last">&nbsp;</td>
<td class="data-head last">1 Month<sup>&dagger;</sup></td>
<td class="data-head last">3 Month<sup>&dagger;</sup></td>
<td class="data-head last">YTD</td>
<td class="data-head last">1 Year</td>
<td class="data-head last">3 Year</td>
<td class="data-head last">5 Year</td>
<td class="data-head last">10 Year</td>
</tr>
<tr class="tbl-data">
<td class="data-td last">Class A: NAV (Inception 07/09/12)</td>
<td class="data-td data last">2.66</td>
<td class="data-td data last">2.27</td>
<td class="data-td data last">5.93</td>
<td class="data-td data last">14.28</td>
<td class="data-td data last">2.09</td>
<td class="data-td data last">3.12</td>
<td class="data-td data last">1.74</td>
</tr>
<tr class="tbl-data">
<td class="data-td last">Class A: Maximum 5.75% load</td>
<td class="data-td data last">-3.24</td>
<td class="data-td data last">-3.61</td>
<td class="data-td data last">-0.16</td>
<td class="data-td data last">7.71</td>
<td class="data-td data last">0.10</td>
<td class="data-td data last">1.90</td>
<td class="data-td data last">1.14</td>
</tr>
<tr class="tbl-data">
<td class="data-td last">Class I: NAV (Inception 07/09/12)</td>
<td class="data-td data last">2.85</td>
<td class="data-td data last">2.51</td>
<td class="data-td data last">6.01</td>
<td class="data-td data last">14.78</td>
<td class="data-td data last">2.40</td>
<td class="data-td data last">3.44</td>
<td class="data-td data last">2.07</td>
</tr>
<tr class="tbl-data">
<td class="data-td last">Class Y: NAV (Inception 07/09/12)</td>
<td class="data-td data last">2.84</td>
<td class="data-td data last">2.46</td>
<td class="data-td data last">6.13</td>
<td class="data-td data last">14.79</td>
<td class="data-td data last">2.36</td>
<td class="data-td data last">3.38</td>
<td class="data-td data last">2.00</td>
</tr>
<tr class="tbl-data">
<td class="data-td last">50% GBI-EM/50% EMBI</td>
<td class="data-td data last">2.75</td>
<td class="data-td data last">2.36</td>
<td class="data-td data last">5.95</td>
<td class="data-td data last">9.43</td>
<td class="data-td data last">-2.22</td>
<td class="data-td data last">0.48</td>
<td class="data-td data last">1.18</td>
</tr>
</tbody>
</table>
</div>
<br />
<p class="chart-disclosure"><sup>&dagger;</sup>&nbsp;Returns less than one year are not annualized.</p>
<p class="chart-disclosure"><strong>Expenses: Class A: Gross 2.55%, Net 1.27%; Class I: Gross 2.51%, Net 0.97%; Class Y: Gross 2.91%, Net 1.02%.</strong> Expenses are capped contractually until 05/01/24 at 1.25% for Class A, 0.95% for Class I, 1.00% for Class Y. Caps excluding acquired fund fees and expenses, interest, trading, dividends, and interest payments of securities sold short, taxes, and extraordinary expenses.</p>
<p class="chart-disclosure"><strong>The performance data quoted represents past performance. Past performance is not a guarantee of future results. Investment return and principal value of an investment will fluctuate so that an investor&rsquo;s shares, when redeemed, may be worth more or less than their original cost. Performance may be lower or higher than performance data quoted. Please call 800.826.2333 or visit vaneck.com for performance current to the most recent month ended.</strong></p>
<p class="chart-disclosure">The &ldquo;Net Asset Value&rdquo; (NAV) of a Fund is determined at the close of each business day, and represents the dollar value of one share of the fund; it is calculated by taking the total assets of the fund, subtracting total liabilities, and dividing by the total number of shares outstanding. The NAV is not necessarily the same as the ETF&rsquo;s intraday trading value. Investors should not expect to buy or sell shares at NAV.</p>
<p><strong>Risks to bonds are multiplying.</strong> A Federal Reserve declaring victory on inflation too soon, a US Treasury accelerating borrowing in 2023, a Bank of Japan allowing yields to rise in a market known to fund offshore carry trades, &ldquo;fiscal dominance&rdquo; in the US, UK, and other developed markets (DM), and geopolitical facts (to which we continue to see great market denial) &ndash; all conspire toward higher yields.</p>
<p>We&rsquo;ll start with the Fed. At its latest FOMC meeting, it paused rate hikes just after Fed Funds poked its head above its favored inflation measure (core PCE), when normally pauses happen several hundred basis points (bps) above core PCE. And this pause occurred even though commodity and oil prices had risen since the previous meeting. In fact, the bulk of the inflation decline the Fed is declaring victory on might not only not yet be over, but was dominated by goods prices rather than wages or services. Investors should watch labor prices, particularly with labor unions activated and supported largely by the left and right. Regarding Treasury borrowing, we won&rsquo;t say much because we were early adopters of the &ldquo;fiscal dominance&rdquo; framework applied to developed markets. We want to re-emphasize that policymakers and market participants will be unable to accommodate this thinking because it doesn&rsquo;t fit their frameworks, and humans in groups just don&rsquo;t change those until they explode, in our opinion. Because US treasuries are assumed, <i>a priori</i>, to be &ldquo;risk-free&rdquo;, any curve steepness <u>must</u> be attributed to &ldquo;term premium&rdquo; (i.e., basically related to inflation), and <u>not</u> related to credit risk. Many will be looking at a radar screen that is no longer the guide it was, also a favorite of human groupings going back millennia. Good luck. And we know the sellers! The Bank of Japan is in a great position because it can sterilize, or not, its bond market interventions &ndash; it can sell Japanese Government Bond (JGBs), but if that pressures the yen or yields too much, they can just sell US Treasuries. China can, too, by the way. Good luck, again.</p>
<p id="GoodPolicyinEM" class="jump-link-nav anchored-block" data-jumplink-title="Good Policy in EM"><strong>Good policy in emerging markets generally is an independent driver.</strong> As always, EM has plenty of uncorrelated economics and asset prices. High real interest rates in commodity-exporting countries like Brazil, and low inflation in countries like China, remind how EM has generally been weathering these ongoing DM-led adverse scenarios. There are a lot of strong EM setups in the current environment. Brazil is an obvious example. The country is beginning an overdue easing cycle while its balance-of-payments accounts continue to be a juggernaut. Brazil has lower inflation than the UK and Australia, and near 10% positive real interest rates. Unfortunately, a lot of the other EM &ldquo;majors&rdquo; don&rsquo;t pass our tests, but we have found right-sized positions in Peru and Indonesia for other &ldquo;majors&rdquo; and in Uruguay, Dominican Republic, Zambia, and Sri Lanka for &ldquo;minors&rdquo;. Colombia could be a &ldquo;major&rdquo; that wins, too, and we are likely to increase in August. Whatever you think about the Fed, they aren&rsquo;t thinking about it in Sri Lanka and shouldn&rsquo;t. Talk about uncorrelated.</p>
<p><strong><i>Quid nos facere</i>? Everyone got long carry and went on their summer holidays&hellip; and now rates are at risk of breaking big levels (4.4% on the 10 year Treasury is our level) to the upside.</strong> To us, this means big risks to bonds, especially duration, and extreme duration on EM local currency markets that are correlated with US rates. Mexican local currency looks very vulnerable to us. Cash should be well above average, until the tilt is priced or rejected. &ldquo;Sheep gotta do what sheep do and cannot do otherwise&rdquo;, and that is to follow the other sheep while the hyenas make their plans. But even the hyenas have to fear the lion. And the lion is walking about. That lion is rising rates.</p>
<h3>10-Year UST Yield and Moving Averages, %</h3>
<p><img class="img-responsive w-100" src="https://www.vaneck.com/contentassets/5ad8cb06bcf142a79ba7c6000e470431/3517_emb-monthly-blog_8.2023_v1_blog.svg" alt="A chart of the 10-year US Treasury versus the 55 and 200 day moving averages" /></p>
<p class="chart-disclosure">Source: VanEck Research. As of August 11, 2023.</p>
<h2 id="ExposureTypes" class="jump-link-nav anchored-block" data-jumplink-title="Exposure Types">Exposure Types and Significant Changes</h2>
<p>The changes to our top positions are summarized below. Our largest positions in July were Mexico, South Africa, Indonesia, Brazil, and Colombia:</p>
<ul class="content-list">
<li>We increased our local currency exposure in South Africa and Chile. South Africa&rsquo;s disinflation progress now looks more established, and this should allow the central bank to end its tightening cycle safely. South Africa should also be expected to benefit from the potential revival of China&rsquo;s reflation trade. Chile is well positioned to policy easing after the inaugural rate cut in July, and the impressive current account adjustment should strengthen the fundamental support for the peso. In terms of our investment process, this strengthened the economic, policy, and technical test scores for both countries.</li>
<li class="mt-2">We also increased our hard currency sovereign exposure in Mexico and hard currency corporate exposure in China. Our main concern in Mexico is that it is a very popular EM long, however we added to our position in Pemex after the government indicated it was not going to withdraw its support. This improved the policy test score for the country. In China, we focused on tactical longs in selected developer companies, which can benefit from the latest round of the government's targeted support.</li>
<li class="mt-2">Finally, we increased our hard currency sovereign exposure in Nigeria, Uzbekistan, Israel, and Mongolia, as well as local currency exposure in Israel. Nigeria is fast-tracking some reforms, including FX unification, and this should reduce pressure on international reserves, benefiting sovereign bonds. In terms of our investment process, this improved the policy test score for the country. Mongolia&rsquo;s exposure is an expression of a possible revival of the China reflation trade (as authorities are stepping up policy support). In Uzbekistan, we were comfortable to increase exposure after the July elections went smoothly. In Israel, there is still a lot of uncertainty on the legislative front, but the political crisis might be getting closer to the resolution. In addition, disinflation is progressing nicely, pointing to the end of the hiking cycle. In terms of our investment process, we saw improvements in the policy test scores in Nigeria, Israel, and Uzbekistan, and in the technical test score in Mongolia.</li>
<li class="mt-2">We reduced our hard currency sovereign exposure in Malaysia and local currency exposure in Indonesia. We continue to like Malaysia&rsquo;s fundamentals, but we are concerned about high correlations with China&rsquo;s growth and currency outlooks. In Indonesia, we decided to take partial profits after a good rally on the back of concerns that external surprises might decline due to downside pressure on exports to China (while domestic demand, and hence, demand for imports) remains solid. These considerations worsened the technical test scores for both countries.</li>
<li class="mt-2">We also reduced our local currency exposure in the Czech Republic and hard currency sovereign exposure in Romania. Stretched valuations &ndash; and hence the deteriorating technical test score &ndash; was our main concern in Romania. In the Czech Republic, there is a risk that the national bank will be too hawkish for too long, leading to a policy mistake. This worsened the policy test score for the country.</li>
<li class="mt-2">Finally, we reduced our hard currency sovereign exposure in Angola, Qatar, Oman, and the United Arab Emirates (UAE). Angola&rsquo;s bonds were getting quite &ldquo;rich&rdquo;, just as the country will be facing higher external amortizations, while still being highly dependent on global oil prices and China&rsquo;s growth outlook. This worsened the technical test score for the country. The oil &ldquo;channel&rdquo; was the primary reason in the remaining countries, in addition to persistent concerns about global duration. This also worsened the technical test score for these countries.</li>
</ul>
<p>To receive more <a href="https://www.vaneck.com/us/en/insights/emerging-markets-bonds/" title="Emerging Markets Bonds Insights"><strong>Emerging Markets Bonds</strong></a> insights, <a href="https://www.vaneck.com/us/en/subscribe/" title="Subscription Center"><strong>sign up in our subscription center</strong></a>.</p>
<style>
    .wrapped-div {
        max-width: 100%;
    }

    @media (max-width: 768px) {
        .wrapped-div {
            overflow-x: scroll;
        }
    }

    .wrapped-div-sector {
        max-width: 100%;
        overflow-x: scroll;
    }
</style>
]]></content:encoded>
</item><item rdf:about="https://www.vaneck.com/us/en/blogs/income-investing/yields-remain-attractive-even-as-spreads-grind-tighter/">
  <title>Yields Remain Attractive Even as Spreads Grind Tighter></title>
  <link>https://www.vaneck.com/us/en/blogs/income-investing/yields-remain-attractive-even-as-spreads-grind-tighter/</link>
  <description><![CDATA[While growing confidence in better-than-expected corporate earnings, resilient U.S. growth and a moderation in inflation have led to tighter fallen angel spreads, yields remain attractive.]]></description>
  <dc:creator>Nicolas  Fonseca, CFA</dc:creator>
  <dc:date>08/16/2023 06:30:00</dc:date>
<content:encoded><![CDATA[

<p>Fallen angels (as represented by the ICE US Fallen Angel High Yield 10% Constrained Index, &ldquo;H0CF&rdquo;) slightly underperformed the broader high yield market (as represented by the ICE BofA US High Yield Index, &ldquo;H0A0&rdquo;) by 0.16% in July (1.26% vs 1.42%). Year-to-date, fallen angels are lagging by 0.73%, (6.19% vs 6.92%). This marks a significant shift from a year ago when fallen angels had a return of -12.35% for the first seven months of 2022. Underperformance was driven by a rally in lower quality bonds amid a rally in riskier credit, which have lower representation among fallen angels.</p>
<p>In July, fallen angel spreads tightened by 17bps, dipping below the 300 mark, a level that hadn&rsquo;t been seen since March 2022 when spreads reached a low of 262bps. This tightening can be attributed to investors' growing confidence in better-than-expected earnings, resilient growth in the U.S., and a moderation in inflation. The U.S. Federal Reserve (Fed) raised rates by 0.25% in July, resulting a target rate of 5.25% to 5.50%, and government bond yields increased; however, this was offset by spread tightening.</p>
<p>In terms of fund flows, high yield corporates witnessed approximately $1 billion in inflows. , There was also notable movement along the yield curve, with over $9 billion flowing into intermediate duration and approximately $6 billion into long duration bonds.</p>
<h2>Rates dominating spreads?</h2>
<p>Historically, spreads have played a more prominent role in high yield investments, with a long-term average of 500 basis points &ndash; a very meaningful contributor to overall yield. However, the recent increase in rates (from 0% to 5.5%, based on Fed Funds) has driven overall yields to historically high levels (fallen angels yielding 7.25%, above the all-time average and median), making rates a more significant contributor to overall yields (and thus, returns) relative to history. As a percentage of yield, spreads are notably low, at 39% compared to the longer-term average of 64%.</p>
<p>Although overall yields are high, currently tighter than average spreads makes spread widening a potential concern if the U.S. economy experiences a slowdown in growth and a weakening credit environment. However, investor confidence in the concept of a soft landing has grown, supported by positive economic data highlighting a robust labor market and cooling inflation. This optimism is boosting interest in high carry/high yield trades. Despite relatively low spreads, the high overall yield helps mitigate potential losses from spread widening through a high level of carry. In addition, investors would generally expect interest rates to decline in a spread widening environment where they may flock to the safety of government bonds. In such an environment, and given the current valuations in high yield, we believe higher quality bonds may fare better than lower quality bonds. Currently, spreads between BB and Single-B rated bonds have compressed and are now below their 3-year, 5-year and 10-year respective averages. This suggests that in a deteriorating spread environment, lower quality bonds have a greater scope for underperformance.</p>
<p>We also note that high overall yields have resulted in an attractive payoff profile, as measured by the convexity of the fallen angle index. In other words, fallen angels have a higher potential for upside than downside, and to a greater degree than they have historically. This is due to the influence of rates on returns. The convexity of fallen angels is at its lowest point since July 2008, making a decrease in rates more impactful on price increases than an increase in rates on price decreases.</p>
<p>Overall, the prevailing factors influencing the market dynamics suggest that while rates are currently in the driver's seat for bond returns, the potential for spread widening cannot be disregarded. However, overall yield levels are undoubtedly attractive relative to history and provide significant downside protection against a spread widening scenario.</p>
<h3>Fallen Angel Spread as % to Yield</h3>
<p><img class="img-responsive w-100" src="https://www.vaneck.com/contentassets/23c83b0f00144750b19d37dd937bf87d/3513---angl-july_2023.08_chart-1_v1_blog.svg" alt="Bar chart showing fallen angel spread as percentage to yield" /></p>
<p class="chart-disclosure">Source: ICE Data Services, VanEck. OAS = Option-Adjusted Spread (OAS); YTW = Yield-to-Worst (YTW). Please see definition for these and other terms referenced herein in the disclosures and definitions portion of this blog. Past performance is no guarantee of future results. Index performance is not representative of fund performance. It is not possible to invest in an index.</p>
<p><strong><u>Fallen Angels Overall Statistics:</u>&nbsp;</strong>Fallen angels yields decreased in July by 10bps to 7.25 and broad HY yields by 20bps to 8.36, while the 10Y yield increased by 16bps to 3.97. Spreads for both tightened in July and the fallen angel market value declined as another issuer exited the index during the month.&nbsp;</p>
<div class="wrapped-div">
<table style="width: 100%;">
<tbody>
<tr class="tbl-data">
<td class="tbl-header last text-center">&nbsp;</td>
<td class="tbl-header last text-center" style="border-right: outset;" colspan="4">Fallen Angel</td>
<td class="tbl-header last text-center" colspan="4">Broad HY</td>
</tr>
<tr class="tbl-data">
<td class="data-head last">&nbsp;</td>
<td class="data-head last">12/31/2022</td>
<td class="data-head last">3/31/2023</td>
<td class="data-head last">6/30/2023</td>
<td class="data-head last" style="border-right: outset;">7/31/2023</td>
<td class="data-head last">12/31/2022</td>
<td class="data-head last">3/31/2023</td>
<td class="data-head last">6/30/2023</td>
<td class="data-head last">7/31/2023</td>
</tr>
<tr class="tbl-data">
<td class="data-td last">Yield to Worst</td>
<td class="data-td data last">7.49</td>
<td class="data-td data last">7.08</td>
<td class="data-td data last">7.35</td>
<td class="data-td data last" style="border-right: outset;">7.25</td>
<td class="data-td data last">8.89</td>
<td class="data-td data last">8.49</td>
<td class="data-td data last">8.56</td>
<td class="data-td data last">8.36</td>
</tr>
<tr class="tbl-data">
<td class="data-td last">Effective Duration</td>
<td class="data-td data last">5.45</td>
<td class="data-td data last">5.30</td>
<td class="data-td data last">4.98</td>
<td class="data-td data last" style="border-right: outset;">4.97</td>
<td class="data-td data last">4.04</td>
<td class="data-td data last">3.83</td>
<td class="data-td data last">3.65</td>
<td class="data-td data last">3.60</td>
</tr>
<tr class="tbl-data">
<td class="data-td last">Full Market Value ($mn)</td>
<td class="data-td data last">112,854</td>
<td class="data-td data last">114,776</td>
<td class="data-td data last">84,590</td>
<td class="data-td data last" style="border-right: outset;">83,904</td>
<td class="data-td data last">1,199,909</td>
<td class="data-td data last">1,234,319</td>
<td class="data-td data last">1,218,316</td>
<td class="data-td data last">1,227,780</td>
</tr>
<tr class="tbl-data">
<td class="data-td last">OAS</td>
<td class="data-td data last">337</td>
<td class="data-td data last">325</td>
<td class="data-td data last">297</td>
<td class="data-td data last" style="border-right: outset;">280</td>
<td class="data-td data last">481</td>
<td class="data-td data last">458</td>
<td class="data-td data last">405</td>
<td class="data-td data last">379</td>
</tr>
<tr class="tbl-data">
<td class="data-td last">No. of Issues</td>
<td class="data-td data last">212</td>
<td class="data-td data last">206</td>
<td class="data-td data last">163</td>
<td class="data-td data last" style="border-right: outset;">161</td>
<td class="data-td data last">1,927</td>
<td class="data-td data last">1,916</td>
<td class="data-td data last">1,870</td>
<td class="data-td data last">1,869</td>
</tr>
</tbody>
</table>
</div>
<br />
<p class="chart-disclosure">Source: ICE Data Services, VanEck. Fallen Angels: ICE US Fallen Angel High Yield 10% Constrained Index. Broad HY: ICE BofA US High Yield Index. OAS refers to &ldquo;option-adjusted spread.&rdquo; Please see definition for this and other terms referenced herein in the disclosures and definitions portion of this blog. Past performance is no guarantee of future results. Index performance is not representative of fund performance. It is not possible to invest in an index.</p>
<p><strong><u>New Fallen Angels</u>:</strong> No new fallen angels in July.</p>
<div class="wrapped-div">
<table style="width: 100%;">
<tbody>
<tr class="tbl-data">
<td class="tbl-header   last  ">Month-end Addition</td>
<td class="tbl-header last text-center">Name</td>
<td class="tbl-header last text-center">Rating</td>
<td class="tbl-header last text-center">Sector</td>
<td class="tbl-header last text-center">Industry</td>
<td class="tbl-header last text-center">% Mkt Value</td>
<td class="tbl-header last text-center">Price</td>
</tr>
<tr class="tbl-data">
<td class="data-td last">February</td>
<td class="data-td data last">Entegris Escrow Corp</td>
<td class="data-td data last">BB1</td>
<td class="data-td data last">Technology &amp; Electronics</td>
<td class="data-td data last">Electronics</td>
<td class="data-td data last">1.39</td>
<td class="data-td data last">90.92</td>
</tr>
<tr class="tbl-data">
<td class="data-td last">March</td>
<td class="data-td data last">First Republic Bank</td>
<td class="data-td data last">B3</td>
<td class="data-td data last">Banking</td>
<td class="data-td data last">0.40</td>
<td class="data-td data last">54.63</td>
</tr>
<tr class="tbl-data">
<td class="data-td last">March</td>
<td class="data-td data last">Nissan Motor Acceptance</td>
<td class="data-td data last">BB1</td>
<td class="data-td data last">Automotive</td>
<td class="data-td data last">Auto Loans</td>
<td class="data-td data last">2.57</td>
<td class="data-td data last">87.19</td>
</tr>
<tr class="tbl-data">
<td class="data-td last">March</td>
<td class="data-td data last">Nissan Motor</td>
<td class="data-td data last">BB1</td>
<td class="data-td data last">Automotive</td>
<td class="data-td data last">Automakers</td>
<td class="data-td data last">5.49</td>
<td class="data-td data last">92.98</td>
</tr>
<tr class="tbl-data">
<td class="data-td last">April</td>
<td class="data-td data last">Crane NXT</td>
<td class="data-td data last">BB3</td>
<td class="data-td data last">Capital Goods</td>
<td class="data-td data last">Diversified Capital Goods</td>
<td class="data-td data last">0.24</td>
<td class="data-td data last">70.99</td>
</tr>
<tr class="tbl-data">
<td class="data-td last">April</td>
<td class="data-td data last">Rogers Communications</td>
<td class="data-td data last">BB2</td>
<td class="data-td data last">Telecommunications</td>
<td class="data-td data last">Telecom - Wireless</td>
<td class="data-td data last">0.65</td>
<td class="data-td data last">90.35</td>
</tr>
<tr class="tbl-data">
<td class="data-td last">April</td>
<td class="data-td data last">Western Alliance Bancorporation</td>
<td class="data-td data last">BB1</td>
<td class="data-td data last">Banking</td>
<td class="data-td data last">0.44</td>
<td class="data-td data last">76.39</td>
</tr>
</tbody>
</table>
</div>
<br />
<p class="chart-disclosure">Source: ICE Data Services, VanEck. Fallen Angels: ICE US Fallen Angel High Yield 10% Constrained Index. Past performance is no guarantee of future results. Not a recommendation to buy or sell any of the names/securities mentioned herein. Index performance is not representative of fund performance. It is not possible to invest in an index.</p>
<p><strong><u>Rising Stars:</u></strong>&nbsp;One issuer exited the index in July, Western Digital Corporation, as S&amp;P upgraded its senior secured notes from BB to BBB- following an amendment to its credit agreement which resulted in the notes becoming secured by substantially all of the assets of the issuer. It entered the index in November 2022 at $76.91 and weight of 0.99% and for the eight months in the index, its total return was 2.07%, which lagged the Tech&rsquo;s sector total return (6.36%) for the same period. The Tech sector within the fallen angel index outperformed broad high yield and the fallen angel index for the same eight months (6.21% for fallen angels and 6.11% for broad high yield). Approximately one-third of the index has exited as rising stars this year.</p>
<div class="wrapped-div">
<table style="width: 100%;">
<tbody>
<tr class="tbl-data">
<td class="tbl-header last ">Month-end Exit</td>
<td class="tbl-header last text-center">Name</td>
<td class="tbl-header last text-center">Rating</td>
<td class="tbl-header last text-center">Sector</td>
<td class="tbl-header last text-center">Industry</td>
<td class="tbl-header last text-center">% Mkt Value</td>
<td class="tbl-header last text-center">Price</td>
</tr>
<tr class="tbl-data">
<td class="data-td last">February</td>
<td class="data-td data last">Autopistas Metropolitanas de Puerto Rico LLC</td>
<td class="data-td data last">BB1</td>
<td class="data-td data last">Transportation</td>
<td class="data-td data last">Transport Infrastructure/Services</td>
<td class="data-td data last">0.35</td>
<td class="data-td data last">100.49</td>
</tr>
<tr class="tbl-data">
<td class="data-td last">February</td>
<td class="data-td data last">Nokia Corp</td>
<td class="data-td data last">BB1</td>
<td class="data-td data last">Technology &amp; Electronics</td>
<td class="data-td data last">Tech Hardware &amp; Equipment</td>
<td class="data-td data last">0.47</td>
<td class="data-td data last">97.50</td>
</tr>
<tr class="tbl-data">
<td class="data-td last">March</td>
<td class="data-td data last">Western Midstream</td>
<td class="data-td data last">BB1</td>
<td class="data-td data last">Energy</td>
<td class="data-td data last">Gas Distribution</td>
<td class="data-td data last">5.27</td>
<td class="data-td data last">90.44</td>
</tr>
<tr class="tbl-data">
<td class="data-td last">April</td>
<td class="data-td data last">Sprint Capital Corp</td>
<td class="data-td data last">BB1</td>
<td class="data-td data last">Telecommunications</td>
<td class="data-td data last">Telecom - Wireless</td>
<td class="data-td data last">4.70</td>
<td class="data-td data last">114.25</td>
</tr>
<tr class="tbl-data">
<td class="data-td last">May</td>
<td class="data-td data last">Mattel Inc.</td>
<td class="data-td data last">BB2</td>
<td class="data-td data last">Consumer Goods</td>
<td class="data-td data last">Personal &amp; Household Products</td>
<td class="data-td data last">0.45</td>
<td class="data-td data last">85.32</td>
</tr>
<tr class="tbl-data">
<td class="data-td last">May</td>
<td class="data-td data last">Nissan Motor Acceptance</td>
<td class="data-td data last">BB1</td>
<td class="data-td data last">Automotive</td>
<td class="data-td data last">Auto Loans</td>
<td class="data-td data last">2.67</td>
<td class="data-td data last">85.12</td>
</tr>
<tr class="tbl-data">
<td class="data-td last">May</td>
<td class="data-td data last">Nissan Motor</td>
<td class="data-td data last">BB1</td>
<td class="data-td data last">Automotive</td>
<td class="data-td data last">Automakers</td>
<td class="data-td data last">5.57</td>
<td class="data-td data last">88.49</td>
</tr>
<tr class="tbl-data">
<td class="data-td last">May</td>
<td class="data-td data last">Occidental Petroleum Corp</td>
<td class="data-td data last">BB1</td>
<td class="data-td data last">Energy</td>
<td class="data-td data last">Energy - Exploration &amp; Production</td>
<td class="data-td data last">8.69</td>
<td class="data-td data last">93.82</td>
</tr>
<tr class="tbl-data">
<td class="data-td last">June</td>
<td class="data-td data last">APA Corp</td>
<td class="data-td data last">BB1</td>
<td class="data-td data last">Energy</td>
<td class="data-td data last">Energy - Exploration &amp; Production</td>
<td class="data-td data last">3.84</td>
<td class="data-td data last">82.69</td>
</tr>
<tr class="tbl-data">
<td class="data-td last">July</td>
<td class="data-td data last">Western Digital Corp</td>
<td class="data-td data last">BB1</td>
<td class="data-td data last">Technology &amp; Electronics</td>
<td class="data-td data last">Tech Hardware &amp; Equipment</td>
<td class="data-td data last">0.99</td>
<td class="data-td data last">76.97</td>
</tr>
</tbody>
</table>
</div>
<br />
<p class="chart-disclosure">Source: ICE Data Services, VanEck. Past performance is no guarantee of future results. Not a recommendation to buy or sell any of the names/securities mentioned herein. Index performance is not representative of fund performance. It is not possible to invest in an index.</p>
<p><u><strong>Fallen Angels Performance by Sector:</strong></u> July was the first month in a while with limited sector changes. The Tech sector saw the largest change, decreasing 0.91% from June, as it had the rising star. Other sectors with significant changes include Energy (+0.36%) and Banking (+0.25%). No sector saw wider spreads in July, three were unchanged and the remaining 14 saw tightening compared to June. Banking tightened the most (0.97%), followed by the Financial Services sector (0.57%), both of which were the top performing sectors in July (7.73% for Banking; 2.56% for Financial Services). The Banking sector return was due to PacWest Bancorp and recent fallen angel Western Alliance Bancorp, as their spreads tightened by 806bps and 152bps, respectively, and prices increased by 64% and 10%, respectively. Both issuers were part of the banking mini-crisis earlier in the year with bond prices trading in the low $30s for PacWest and mid-to-low $40s for Western Alliance at the beginning of April. In terms of sector attribution vs broad HY, the Banking and Energy sectors within fallen angels were the top two contributors.</p>
<div class="wrapped-div">
<table style="width: 100%;">
<tbody>
<tr class="tbl-data">
<td class="tbl-header last text-center">&nbsp;</td>
<td class="tbl-header last text-center" style="border-right: outset;" colspan="4">Wgt (%)</td>
<td class="tbl-header last text-center" style="border-right: outset;" colspan="4">OAS</td>
<td class="tbl-header last text-center" style="border-right: outset;" colspan="4">Price</td>
<td class="tbl-header last text-center">Total<br />Return<br />(%)</td>
</tr>
<tr class="tbl-data">
<td class="data-td last">&nbsp;</td>
<td class="data-head last">12/31/22</td>
<td class="data-head last">3/31/23</td>
<td class="data-head last">6/30/23</td>
<td class="data-head last" style="border-right: outset;">7/31/23</td>
<td class="data-head last">12/31/22</td>
<td class="data-head last">3/31/23</td>
<td class="data-head last">6/30/23</td>
<td class="data-head last" style="border-right: outset;">7/31/23</td>
<td class="data-head last">12/31/22</td>
<td class="data-head last">3/31/23</td>
<td class="data-head last">6/30/23</td>
<td class="data-head last" style="border-right: outset;">7/31/23</td>
<td class="data-head last">MTD</td>
</tr>
<tr class="tbl-data">
<td class="data-td last">Automotive</td>
<td class="data-td data last">10.00</td>
<td class="data-td data last">18.06</td>
<td class="data-td data last">10.00</td>
<td class="data-td data last" style="border-right: outset;">10.00</td>
<td class="data-td data last">1262</td>
<td class="data-td data last">1246</td>
<td class="data-td data last">1211</td>
<td class="data-td data last" style="border-right: outset;">192</td>
<td class="data-td data last">91.35</td>
<td class="data-td data last">92.21</td>
<td class="data-td data last">92.99</td>
<td class="data-td data last" style="border-right: outset;">93.61</td>
<td class="data-td data last">1.10</td>
</tr>
<tr class="tbl-data">
<td class="data-td last">Banking</td>
<td class="data-td data last">3.81</td>
<td class="data-td data last">3.99</td>
<td class="data-td data last">3.20</td>
<td class="data-td data last" style="border-right: outset;">3.45</td>
<td class="data-td data last">1302</td>
<td class="data-td data last">1415</td>
<td class="data-td data last">1376</td>
<td class="data-td data last" style="border-right: outset;">279</td>
<td class="data-td data last">96.85</td>
<td class="data-td data last">87.61</td>
<td class="data-td data last">88.57</td>
<td class="data-td data last" style="border-right: outset;">95.04</td>
<td class="data-td data last">7.73</td>
</tr>
<tr class="tbl-data">
<td class="data-td last">Basic Industry</td>
<td class="data-td data last">1.36</td>
<td class="data-td data last">1.33</td>
<td class="data-td data last">1.93</td>
<td class="data-td data last" style="border-right: outset;">1.98</td>
<td class="data-td data last">1226</td>
<td class="data-td data last">1227</td>
<td class="data-td data last">1168</td>
<td class="data-td data last" style="border-right: outset;">145</td>
<td class="data-td data last">92.17</td>
<td class="data-td data last">93.85</td>
<td class="data-td data last">94.44</td>
<td class="data-td data last" style="border-right: outset;">95.35</td>
<td class="data-td data last">1.32</td>
</tr>
<tr class="tbl-data">
<td class="data-td last">Capital Goods</td>
<td class="data-td data last">5.12</td>
<td class="data-td data last">5.10</td>
<td class="data-td data last">7.66</td>
<td class="data-td data last" style="border-right: outset;">7.72</td>
<td class="data-td data last">1279</td>
<td class="data-td data last">1240</td>
<td class="data-td data last">1195</td>
<td class="data-td data last" style="border-right: outset;">187</td>
<td class="data-td data last">95.01</td>
<td class="data-td data last">98.54</td>
<td class="data-td data last">96.85</td>
<td class="data-td data last" style="border-right: outset;">97.21</td>
<td class="data-td data last">0.79</td>
</tr>
<tr class="tbl-data">
<td class="data-td last">Consumer Goods</td>
<td class="data-td data last">3.07</td>
<td class="data-td data last">3.00</td>
<td class="data-td data last">3.62</td>
<td class="data-td data last" style="border-right: outset;">3.74</td>
<td class="data-td data last">1275</td>
<td class="data-td data last">1255</td>
<td class="data-td data last">1298</td>
<td class="data-td data last" style="border-right: outset;">258</td>
<td class="data-td data last">88.90</td>
<td class="data-td data last">91.27</td>
<td class="data-td data last">89.31</td>
<td class="data-td data last" style="border-right: outset;">90.82</td>
<td class="data-td data last">2.12</td>
</tr>
<tr class="tbl-data">
<td class="data-td last">Energy</td>
<td class="data-td data last">27.93</td>
<td class="data-td data last">22.16</td>
<td class="data-td data last">15.28</td>
<td class="data-td data last" style="border-right: outset;">15.64</td>
<td class="data-td data last">1293</td>
<td class="data-td data last">1303</td>
<td class="data-td data last">1297</td>
<td class="data-td data last" style="border-right: outset;">271</td>
<td class="data-td data last">88.13</td>
<td class="data-td data last">90.05</td>
<td class="data-td data last">88.74</td>
<td class="data-td data last" style="border-right: outset;">90.27</td>
<td class="data-td data last">2.17</td>
</tr>
<tr class="tbl-data">
<td class="data-td last">Financial Services</td>
<td class="data-td data last">0.65</td>
<td class="data-td data last">0.64</td>
<td class="data-td data last">0.94</td>
<td class="data-td data last" style="border-right: outset;">0.94</td>
<td class="data-td data last">1540</td>
<td class="data-td data last">1506</td>
<td class="data-td data last">1459</td>
<td class="data-td data last" style="border-right: outset;">402</td>
<td class="data-td data last">77.20</td>
<td class="data-td data last">80.27</td>
<td class="data-td data last">80.92</td>
<td class="data-td data last" style="border-right: outset;">82.64</td>
<td class="data-td data last">2.56</td>
</tr>
<tr class="tbl-data">
<td class="data-td last">Healthcare</td>
<td class="data-td data last">3.02</td>
<td class="data-td data last">3.03</td>
<td class="data-td data last">4.33</td>
<td class="data-td data last" style="border-right: outset;">4.40</td>
<td class="data-td data last">1362</td>
<td class="data-td data last">1304</td>
<td class="data-td data last">1281</td>
<td class="data-td data last" style="border-right: outset;">274</td>
<td class="data-td data last">83.56</td>
<td class="data-td data last">86.47</td>
<td class="data-td data last">86.82</td>
<td class="data-td data last" style="border-right: outset;">86.98</td>
<td class="data-td data last">0.61</td>
</tr>
<tr class="tbl-data">
<td class="data-td last">Insurance</td>
<td class="data-td data last">0.85</td>
<td class="data-td data last">0.82</td>
<td class="data-td data last">1.15</td>
<td class="data-td data last" style="border-right: outset;">1.15</td>
<td class="data-td data last">1347</td>
<td class="data-td data last">1364</td>
<td class="data-td data last">1358</td>
<td class="data-td data last" style="border-right: outset;">358</td>
<td class="data-td data last">92.10</td>
<td class="data-td data last">92.99</td>
<td class="data-td data last">91.39</td>
<td class="data-td data last" style="border-right: outset;">90.97</td>
<td class="data-td data last">0.08</td>
</tr>
<tr class="tbl-data">
<td class="data-td last">Leisure</td>
<td class="data-td data last">7.88</td>
<td class="data-td data last">7.79</td>
<td class="data-td data last">10.42</td>
<td class="data-td data last" style="border-right: outset;">10.11</td>
<td class="data-td data last">1325</td>
<td class="data-td data last">1243</td>
<td class="data-td data last">1182</td>
<td class="data-td data last" style="border-right: outset;">182</td>
<td class="data-td data last">89.95</td>
<td class="data-td data last">93.25</td>
<td class="data-td data last">93.34</td>
<td class="data-td data last" style="border-right: outset;">93.24</td>
<td class="data-td data last">0.79</td>
</tr>
<tr class="tbl-data">
<td class="data-td last">Real Estate</td>
<td class="data-td data last">5.13</td>
<td class="data-td data last">4.72</td>
<td class="data-td data last">6.22</td>
<td class="data-td data last" style="border-right: outset;">6.31</td>
<td class="data-td data last">1697</td>
<td class="data-td data last">1701</td>
<td class="data-td data last">1602</td>
<td class="data-td data last" style="border-right: outset;">594</td>
<td class="data-td data last">79.46</td>
<td class="data-td data last">80.72</td>
<td class="data-td data last">80.99</td>
<td class="data-td data last" style="border-right: outset;">81.47</td>
<td class="data-td data last">0.99</td>
</tr>
<tr class="tbl-data">
<td class="data-td last">Retail</td>
<td class="data-td data last">5.67</td>
<td class="data-td data last">5.49</td>
<td class="data-td data last">7.79</td>
<td class="data-td data last" style="border-right: outset;">7.91</td>
<td class="data-td data last">1471</td>
<td class="data-td data last">1474</td>
<td class="data-td data last">1354</td>
<td class="data-td data last" style="border-right: outset;">324</td>
<td class="data-td data last">73.75</td>
<td class="data-td data last">74.72</td>
<td class="data-td data last">82.35</td>
<td class="data-td data last" style="border-right: outset;">83.32</td>
<td class="data-td data last">1.62</td>
</tr>
<tr class="tbl-data">
<td class="data-td last">Services</td>
<td class="data-td data last">0.38</td>
<td class="data-td data last">0.37</td>
<td class="data-td data last">0.53</td>
<td class="data-td data last" style="border-right: outset;">0.52</td>
<td class="data-td data last">1388</td>
<td class="data-td data last">1368</td>
<td class="data-td data last">1356</td>
<td class="data-td data last" style="border-right: outset;">355</td>
<td class="data-td data last">87.11</td>
<td class="data-td data last">89.89</td>
<td class="data-td data last">88.62</td>
<td class="data-td data last" style="border-right: outset;">88.54</td>
<td class="data-td data last">0.37</td>
</tr>
<tr class="tbl-data">
<td class="data-td last">Technology &amp; Electronics</td>
<td class="data-td data last">4.20</td>
<td class="data-td data last">4.67</td>
<td class="data-td data last">6.21</td>
<td class="data-td data last" style="border-right: outset;">5.30</td>
<td class="data-td data last">1327</td>
<td class="data-td data last">1287</td>
<td class="data-td data last">1269</td>
<td class="data-td data last" style="border-right: outset;">245</td>
<td class="data-td data last">85.47</td>
<td class="data-td data last">88.19</td>
<td class="data-td data last">86.89</td>
<td class="data-td data last" style="border-right: outset;">89.70</td>
<td class="data-td data last">0.95</td>
</tr>
<tr class="tbl-data">
<td class="data-td last">Telecommunications</td>
<td class="data-td data last">11.91</td>
<td class="data-td data last">11.68</td>
<td class="data-td data last">10.61</td>
<td class="data-td data last" style="border-right: outset;">10.66</td>
<td class="data-td data last">1423</td>
<td class="data-td data last">1433</td>
<td class="data-td data last">1475</td>
<td class="data-td data last" style="border-right: outset;">467</td>
<td class="data-td data last">90.04</td>
<td class="data-td data last">91.39</td>
<td class="data-td data last">84.92</td>
<td class="data-td data last" style="border-right: outset;">84.54</td>
<td class="data-td data last">0.12</td>
</tr>
<tr class="tbl-data">
<td class="data-td last">Transportation</td>
<td class="data-td data last">2.10</td>
<td class="data-td data last">1.78</td>
<td class="data-td data last">2.59</td>
<td class="data-td data last" style="border-right: outset;">2.63</td>
<td class="data-td data last">1279</td>
<td class="data-td data last">1231</td>
<td class="data-td data last">1150</td>
<td class="data-td data last" style="border-right: outset;">147</td>
<td class="data-td data last">90.49</td>
<td class="data-td data last">92.69</td>
<td class="data-td data last">94.75</td>
<td class="data-td data last" style="border-right: outset;">94.96</td>
<td class="data-td data last">0.54</td>
</tr>
<tr class="tbl-data">
<td class="data-td last">Utility</td>
<td class="data-td data last">6.93</td>
<td class="data-td data last">5.38</td>
<td class="data-td data last">7.52</td>
<td class="data-td data last" style="border-right: outset;">7.54</td>
<td class="data-td data last">1213</td>
<td class="data-td data last">1206</td>
<td class="data-td data last">1165</td>
<td class="data-td data last" style="border-right: outset;">165</td>
<td class="data-td data last">89.95</td>
<td class="data-td data last">90.19</td>
<td class="data-td data last">89.90</td>
<td class="data-td data last" style="border-right: outset;">89.61</td>
<td class="data-td data last">0.03</td>
</tr>
<tr class="tbl-data">
<td class="data-td last">Total</td>
<td class="data-td data last">100</td>
<td class="data-td data last" style="border-right: outset;">100</td>
<td class="data-td data last">1337</td>
<td class="data-td data last">1325</td>
<td class="data-td data last">1297</td>
<td class="data-td data last" style="border-right: outset;">280</td>
<td class="data-td data last">87.91</td>
<td class="data-td data last">89.51</td>
<td class="data-td data last">88.78</td>
<td class="data-td data last" style="border-right: outset;">89.61</td>
<td class="data-td data last">1.26</td>
</tr>
</tbody>
</table>
</div>
<br />
<p class="chart-disclosure">Source: ICE Data Services, VanEck. Fallen Angels: ICE US Fallen Angel High Yield 10% Constrained Index. Not intended as a recommendation to invest or divest in any of the sectors mentioned herein. Index performance is not representative of fund performance. It is not possible to invest in an index.</p>
<p><strong><u>Fallen Angels Performance by Rating:</u></strong> No major changes in ratings composition in July. In terms of attribution vs broad high yield in July, higher quality (BB) has positively contributed, but single-B and CCC &amp; lower rated bonds have detracted from performance. It is worth noting that broad high yield has approximately 50% allocated to single-B and lower rated bonds so far this year while that figure is close to 15% for fallen angels.</p>
<div class="wrapped-div">
<table style="width: 100%;">
<tbody>
<tr class="tbl-data">
<td class="tbl-header last text-center">&nbsp;</td>
<td class="tbl-header last text-center" style="border-right: outset;" colspan="4">Wgt (%)</td>
<td class="tbl-header last text-center" style="border-right: outset;" colspan="4">OAS</td>
<td class="tbl-header last text-center" style="border-right: outset;" colspan="4">Price</td>
<td class="tbl-header last text-center">Total<br />Return<br />(%)</td>
</tr>
<tr class="tbl-data">
<td class="data-head last">&nbsp;</td>
<td class="data-td data last">12/31/22</td>
<td class="data-td data last">3/31/23</td>
<td class="data-td data last">6/30/23</td>
<td class="data-td data last" style="border-right: outset;">7/31/23</td>
<td class="data-td data last">12/31/22</td>
<td class="data-td data last">3/31/23</td>
<td class="data-td data last">6/30/23</td>
<td class="data-td data last" style="border-right: outset;">7/31/23</td>
<td class="data-td data last">12/31/22</td>
<td class="data-td data last">3/31/23</td>
<td class="data-td data last">6/30/23</td>
<td class="data-td data last" style="border-right: outset;">7/31/23</td>
<td class="data-td data last">MTD</td>
</tr>
<tr class="tbl-data">
<td class="data-head last">BB</td>
<td class="data-td data last">87.00</td>
<td class="data-td data last">87.08</td>
<td class="data-td data last">83.01</td>
<td class="data-td data last" style="border-right: outset;">182.72</td>
<td class="data-td data last">284</td>
<td class="data-td data last">281</td>
<td class="data-td data last">256</td>
<td class="data-td data last" style="border-right: outset;">1238</td>
<td class="data-td data last">90.02</td>
<td class="data-td data last">91.51</td>
<td class="data-td data last">89.83</td>
<td class="data-td data last" style="border-right: outset;">190.71</td>
<td class="data-td data last">1.25</td>
</tr>
<tr class="tbl-data">
<td class="data-head last">B</td>
<td class="data-td data last">10.95</td>
<td class="data-td data last">10.37</td>
<td class="data-td data last">13.31</td>
<td class="data-td data last" style="border-right: outset;">13.46</td>
<td class="data-td data last">608</td>
<td class="data-td data last">500</td>
<td class="data-td data last">405</td>
<td class="data-td data last" style="border-right: outset;">1396</td>
<td class="data-td data last">82.50</td>
<td class="data-td data last">85.35</td>
<td class="data-td data last">89.55</td>
<td class="data-td data last" style="border-right: outset;">89.82</td>
<td class="data-td data last">0.81</td>
</tr>
<tr class="tbl-data">
<td class="data-head last">CCC</td>
<td class="data-td data last">1.98</td>
<td class="data-td data last">2.50</td>
<td class="data-td data last">3.68</td>
<td class="data-td data last" style="border-right: outset;">13.82</td>
<td class="data-td data last">1,020</td>
<td class="data-td data last">1,014</td>
<td class="data-td data last">852</td>
<td class="data-td data last" style="border-right: outset;">1783</td>
<td class="data-td data last">60.88</td>
<td class="data-td data last">64.60</td>
<td class="data-td data last">68.55</td>
<td class="data-td data last" style="border-right: outset;">170.35</td>
<td class="data-td data last">3.24</td>
</tr>
<tr class="tbl-data">
<td class="data-head last">Total</td>
<td class="data-td data last">100</td>
<td class="data-td data last" style="border-right: outset;">100</td>
<td class="data-td data last">337</td>
<td class="data-td data last">325</td>
<td class="data-td data last">297</td>
<td class="data-td data last" style="border-right: outset;">1280</td>
<td class="data-td data last">87.91</td>
<td class="data-td data last">89.51</td>
<td class="data-td data last">88.78</td>
<td class="data-td data last" style="border-right: outset;">189.61</td>
<td class="data-td data last">1.26</td>
</tr>
</tbody>
</table>
</div>
<br />
<p class="chart-disclosure">Source: ICE Data Services, VanEck. *Does not have securities for all months of selected period. Returns are based on partial period data. Fallen Angels: ICE US Fallen Angel High Yield 10% Constrained Index. Past performance is no guarantee of future results. Index performance is not representative of fund performance. It is not possible to invest in an index.</p>
<p>To receive more <a href="https://www.vaneck.com/us/en/insights/income-investing/" title="Income Investing insights"><strong>Income Investing</strong></a> insights, <a href="/link/5f45412c2143400497908cea2897f7d3.aspx" title=" Subscription Center"><strong>sign up in our subscription center</strong></a>.</p>
<style type="text/css">
    .wrapped-div {
        max-width: 100%;
    }

    @media (max-width: 1024px) {
        .wrapped-div {
            overflow-x: scroll;
        }
    }

    .wrapped-div-sector {
        max-width: 100%;
        overflow-x: scroll;
    }
</style>
]]></content:encoded>
</item><item rdf:about="https://www.vaneck.com/us/en/blogs/gold-investing/ima-casanova-focus-on-gold-miners-cash-flow-not-earnings/">
  <title>Focus on Gold Miners’ Cash Flow—Not Earnings></title>
  <link>https://www.vaneck.com/us/en/blogs/gold-investing/ima-casanova-focus-on-gold-miners-cash-flow-not-earnings/</link>
  <description><![CDATA[Gold ends July higher; we believe free cash flow generation, not earnings, is a better way to assess the value and investment appeal of a gold mining company.]]></description>
  <dc:creator>Imaru Casanova</dc:creator>
  <dc:date>08/14/2023 06:30:00</dc:date>
<content:encoded><![CDATA[

<p>Monthly gold market and economic insights from Imaru Casanova, Portfolio Manager, featuring her unique views on mining and gold&rsquo;s portfolio benefits. <a href="/us/en/blogs/gold-investing/ima-casanova-focus-on-gold-miners-cash-flow-not-earnings/gold-monthly-commentary-july-2023.pdf" rel="noopener" target="_blank" title="Gold Monthly Commentary - July 2023"><strong>An expanded PDF version of this commentary, including fund specific information can be downloaded here.</strong></a></p>
<h2>Gold steadies on mixed economic outlook</h2>
<p>Economic data releases in July fueled expectations that the U.S. Federal Reserve (Fed) is nearing the end of its hiking cycle, supporting gold prices which were up 2.4% during the month, and putting pressure on the U.S. dollar (down 1.03%, as measured by the U.S. Dollar Index (DXY<sup>1</sup>)). Gold climbed back above $1,950 per ounce on July 12, following the release of June U.S. Consumer Price Index<sup>2</sup>&nbsp;figures showing a 3% year-on-year increase, compared to 4% in May. Gold advanced further, reaching a monthly high of $1,978.72 on July 18, as U.S. retail sales for June came in below expectations. The yellow metal held on to most of its gains as the markets digested another interest rate hike by the Fed on July 26, and a 3% yearly increase in the June U.S. Personal Consumption Expenditures Price Index<sup>3</sup>(the Fed&rsquo;s preferred inflation gauge). Gold closed at $1,965.09 on July 31.</p>
<p>NYSE Arca Gold Miners Index (GDMNTR)<sup>4</sup>&nbsp;and MVIS Global Juniors Gold Miners Index (MVGDXJTR)<sup>5</sup>&nbsp;outperformed gold, up 4.54% and 5.86% respectively, during the month. Q2 2023 financial and operating results for the gold sector have been mixed. Many of the producers had flagged a weaker first half of the year, and most of them have maintained their full year 2023 guidance. Thus, we expect an improvement in the second half of 2023. The market is very focused on companies meeting expectations, so any significant misses are likely to lead to poor share price performance.</p>
<h2>Why forecasting earnings for gold miners is hard</h2>
<p>While we agree that companies must meet their guided targets to gain market confidence in their ability to deliver consistent results, we also understand the unique challenges of the mining industry. As long-term investors looking for value creation, we are less obsessed with quarterly earnings and much more focused on companies&rsquo; outlook for free cash flow generation over the next 10 to 20 years. From decades of experience covering this sector, including sell-side experience which entailed issuing earnings-per-share (EPS) estimates every quarter for all companies under coverage, we can comfortably say it is nearly impossible to forecast a precious metals company&rsquo;s earnings for any given quarter. The challenges come from different sources, most relevantly:</p>
<ol>
<li>The fact that these companies are issuing forecasts based on only estimates of the properties of the gold deposits they are mining. Clearly, we expect that these estimates are a good representation of the gold deposit over the life of the mine. Quarter-over-quarter, it is also very reasonable to expect variations from those estimates that could certainly impact earnings, while generally having no material impact in the net asset value of the mine or the company.</li>
<li>Companies issue full-year guidance which tries to account for quarter-to-quarter fluctuations, but analysts must issue quarterly guidance that cannot predict these variations. It is these quarterly estimates that the markets gauge companies against.</li>
<li>Earnings are based on complex accounting and reporting standards, including one-off and non-cash items, that make it very difficult to reconcile reported earnings to estimates.</li>
<li>Other factors, including the variations in the realized price of gold and other produced metals. While analysts may be able to account for spot price fluctuations during the quarter, predicting the timing of sales and the impact of provisionally priced sales (which later need to be adjusted) is nearly impossible.</li>
</ol>
<h2>Focusing on the longer-term</h2>
<p>In our view, focusing on free cash flow generation not just over the current quarter but over the long term, is a much better way to assess the value and investment appeal of a gold mining company. In fact, our internal models generate an in-house metric which we created to capture our approach. We refer to it as &ldquo;free cash flow per ounce&rdquo;, and it is the total, undiscounted free cash flow the company generates over its operating horizon, divided by all the gold (or gold equivalent) ounces we estimate it will mine during that period. It is a simple, yet transparent measure that allows us to assess the relative valuations of the companies in our universe.</p>
<h2>Enterprise Value/oz vs. Free-Cash-Flow/oz</h2>
<p><img src="https://www.vaneck.com/contentassets/14813efd9fbb444784efb79c4909b02e/3500_gold-commentary_chart-1_2023.08_v1_blog.svg" alt="Enterprise Value/oz vs. Free-Cash-Flow/oz" /></p>
<p class="chart-disclosure"><strong>Source</strong>: VanEck. For illustrative purposes only. Enterprise value (EV) per ounce (EV/oz) is the ratio of a company's enterprise value vs the total amount of mineral resources in the ground. FCF = Free-Cash-Flow.</p>
<p>During earning season, EPS headlines move stock prices. We track and continuously assess a company&rsquo;s record of delivering against expectations/guidance. And we do make changes to our portfolio based on this track record and its potential impact on future share price performance. However, we do not rush to buy or sell a stock because it beat or missed earnings until we assess the impact of these results in our free cash flow forecast of the company over the long term. We believe gold equity investors should demand that companies deliver against their operational targets, while focusing less on quarterly earnings and more on the outlook for good old free cash over the next decade or two. It is also helpful to remember that any gold not mined (or sold) this quarter is not lost, it will still be there the next quarter or year, ready to meet the world&rsquo;s historical need for the shiny metal, potentially at even higher prices.</p>
<p>To receive more <strong><a href="https://www.vaneck.com/us/en/insights/gold-investing/" title="Gold Investing Insights">Gold Investing</a></strong> insights, <strong><a href="https://www.vaneck.com/us/en/subscribe/" title="Subscription Center">sign up in our subscription center</a></strong>.</p>
]]></content:encoded>
</item><item rdf:about="https://www.vaneck.com/us/en/blogs/municipal-bonds/can-states-surpass-us-government-in-credit-ratings/">
  <title>Can States Surpass U.S. Government in Credit Ratings?></title>
  <link>https://www.vaneck.com/us/en/blogs/municipal-bonds/can-states-surpass-us-government-in-credit-ratings/</link>
  <description><![CDATA[In light of the U.S. credit rating downgrade by Fitch, we believe that states can sustain, their credit ratings bolstered by the unique strengths of municipal borrowers.]]></description>
  <dc:creator>Tamara  Lowin</dc:creator>
  <dc:date>08/10/2023 06:30:00</dc:date>
<content:encoded><![CDATA[

<p>On August 1st, Fitch downgraded the U.S. credit rating from AAA to AA+. Among other concerns, the rating agency cited eroding confidence in fiscal management as illustrated by repeated debt-limit standoffs.</p>
<p>Current ratings of the U.S. now stand at AAA by Moody&rsquo;s, AA+ by S&amp;P (who downgraded the US in 2011), and Fitch at AA+. These three independent companies evaluate the financial strength of borrowers on a scale where the highest rating is AAA, the second highest is AA+, and so on, all the way down to D. The lower the rating, the higher the potential for default.</p>
<p>The question arises: can a state&rsquo;s rating be higher than the country&rsquo;s? While a state can feel stress when its Country experiences fiscal weakness, we do not believe state and local government defaults will increase, nor will municipal borrowers become ambivalent towards maintaining their ratings.</p>
<p>The federal government&rsquo;s strengths as a borrower include willingness to pay and an ability to print money. While municipal borrowers do not have the latter, unique attributes to tax-exempt debt enhance their securities. This feels like a good time to remind everyone of what they are.</p>
<h2>Cashflow vs. Projects</h2>
<p>The purpose of federal debt is often cash flow. It is one of the federal government&rsquo;s mandates, and we point out this difference not as a censure of federal operations but as a meaningful difference in how debt is used. The U.S. government often meets its annual operating expenses through newly issued debt. Conversely, municipal debt is issued mainly for capital projects which require a higher level of budget discipline and justification.</p>
<h2>Local Voters Rein in Borrowing</h2>
<p>Many local government bonds are issued only after a successful vote. Residents approve a project like a new school building, community hospital, or repaving program and dedicate a specific revenue stream to repay the debt. In addition, many states and municipalities have limits not just on the amount of debt that can be borrowed but also on repayment terms, ensuring stable long-term planning.</p>
<h2>Municipalities Lead: Low Debt Service</h2>
<p>Healthy states and local governments have manageable annual debt service payments. If expenses are out of line, it is unlikely due to debt-carrying costs, and the ramifications of nonpayment are much larger than cutting other line items, as painful as they can be. Decreasing library hours, reducing per-student spending, or increasing a tax rate are all easier to reverse than a poor credit history.</p>
<p>The above comments underscore the unique strengths of municipal debt issuers and why we believe a state or city can pierce the U.S.&rsquo;s rating ceiling. While ratings measure the likelihood of distress, the criteria measured differ from a sovereign. Still, federal weakness will impact the municipal market. State and local governments will experience higher borrowing costs as municipal bonds strongly reflect Treasury pricing. The silver lining is the higher borrowing cost penalty for weaker borrowers incentivizing rating maintenance. While we see the potential for increased pressure on states and local governments, we do not expect municipal default rates to be affected by this downgrade.</p>
<p>To receive more <a href="https://www.vaneck.com/us/en/insights/municipal-bonds/" title="Municipal Bonds Insights"><strong>Municipal Bonds</strong></a> insights and <a href="https://www.vaneck.com/us/en/insights/income-investing/" title="Income Investing Insights"><strong>Income Investing</strong></a> insights , <a href="https://www.vaneck.com/us/en/subscribe/" title="Subscription Center"><strong>sign up in our subscription center</strong></a>.</p>
]]></content:encoded>
</item><item rdf:about="https://www.vaneck.com/us/en/blogs/moat-investing/investors-guide-to-intangible-assets/">
  <title>An Investor&#39;s Guide to Intangible Assets></title>
  <link>https://www.vaneck.com/us/en/blogs/moat-investing/investors-guide-to-intangible-assets/</link>
  <description><![CDATA[Although not always easy to quantify, intangible assets are one of the primary sources of strong competitive advantages for businesses and a key source of economic moats.]]></description>
  <dc:creator>Brandon Rakszawski</dc:creator>
  <dc:date>08/10/2023 06:30:00</dc:date>
<content:encoded><![CDATA[

<p><i>The term &ldquo;economic moat&rdquo; describes a company&rsquo;s ability to maintain its competitive advantages and defend its long-term profitability. This moat investing education series explores the five primary sources of moat, according to Morningstar: 1) <strong><a title="Switching Costs Build Moats and Retain Customers
    " href="https://www.vaneck.com/us/en/blogs/moat-investing/switching-costs-build-moats">switching costs</a></strong>; 2) intangible assets; 3) <strong><a title="Network Effect: A Proven Way to Create a Moat" href="https://www.vaneck.com/us/en/blogs/moat-investing/network-effect-proven-way-create-moat">network effect</a></strong>; 4) <strong><a title="Cost Leadership Provides Market Control" href="https://www.vaneck.com/us/en/blogs/moat-investing/cost-leadership-creates-moats">cost advantage</a></strong>; 5) <a title="Efficient Scale: Moats with Natural Monopoly" href="https://www.vaneck.com/us/en/blogs/moat-investing/efficient-scale-moats-natural-monopoly"><strong>efficient scale</strong></a>. Here we explore the concept of intangible assets. </i></p>
<h2>Introduction to Intangible Assets</h2>
<p>Intangible assets are non-physical assets that bring value to a company but lack a physical presence. Unlike tangible assets, intangible assets are not easily quantifiable and can be more challenging to evaluate.</p>
<p>Intangible assets play a crucial role in driving many companies&rsquo; success and establishing their competitive advantage. While tangible assets like machinery and inventory are easily quantifiable, intangible assets are more intangible in nature and often overlooked. In this guide, we will explore the significance of intangible assets and their impact on a company's long-term prosperity.</p>
<h2>Types of Intangible Assets</h2>
<p>Examples of intangible assets include intellectual property, brand equity, customer relationships, and proprietary technology.</p>
<p><strong>Intellectual Property (IP)</strong></p>
<p>Intellectual property refers to creations of the mind that have commercial value and are protected by law. This includes patents, trademarks, copyrights, and trade secrets. IP assets safeguard a company's innovations, inventions, designs, and creative works, granting exclusive rights and preventing unauthorized use. Companies like pharmaceutical giant Eli Lilly rely heavily on their patent portfolio to protect their groundbreaking drugs and maintain a dominant market position.</p>
<p><strong>Brand Equity</strong></p>
<p>Brand equity represents the value and reputation associated with a company's brand. It encompasses brand awareness, customer perception, brand loyalty, and the overall market position of the brand. Strong brand equity provides a competitive edge by influencing customer purchasing decisions and fostering trust and loyalty. For example, Starbuck&rsquo;s brand equity is a key driver of its success, enabling the company to command premium prices for its products and maintain a dedicated customer base.</p>
<p><strong>Customer Relationships</strong></p>
<p>Customer relationships are intangible assets that result from a company's efforts to establish and maintain strong connections with its customers. These relationships are built on trust, customer satisfaction, and a personalized experience. Customer relationships lead to repeat business, customer loyalty, positive word-of-mouth referrals, and increased customer lifetime value.</p>
<p><strong>Proprietary Technology</strong></p>
<p>Proprietary technology refers to unique and exclusive technology developed by a company that provides a competitive advantage. It can include software systems, algorithms, innovative manufacturing processes, or specialized tools.</p>
<p>In today's business landscape, intangible assets have gained increasing importance. They are key drivers of competitive advantage, revenue generation, and market positioning. Companies that effectively manage and leverage their intangible assets can differentiate themselves from competitors, build customer loyalty, attract investment, and establish long-term success.</p>
<h2>Investing in Intangible Assets</h2>
<p>Intangible assets can provide a company with a sustainable competitive advantage in the market. Strong brand recognition, customer loyalty, and reputation built over time create barriers for competitors to replicate.</p>
<p>Intangible assets can also be significant sources of revenue for a company. Patents and proprietary technology grant exclusive rights and enable companies to monetize their innovations. Intellectual property, such as software or creative works, can generate licensing fees or royalties. These revenue streams contribute to a company's profitability and long-term growth.</p>
<p>Intangible assets also influence investor perception and confidence. Investors often consider a company's intangible assets, such as brand value and intellectual property, when assessing its potential for future growth and profitability. Strong intangible assets can enhance a company's reputation, attract investment, and support higher valuation in the financial markets.</p>
<h2>How Intangible Assets Help Build Strong, Identifiable Advantages</h2>
<p>The term &ldquo;economic moat&rdquo; describes a company&rsquo;s ability to maintain its competitive advantages and defend its long-term profitability. Although not always easy to quantify, intangible assets are one of the primary sources of strong competitive advantages for businesses and a key source of economic moats. Intangible assets can include corporate intellectual property, such as patents, trademarks, copyrights, government licenses, and business methodologies that help companies generate economic profits. Patents are a legal barrier to entry that protect companies from unauthorized commercial usage of their products by competitors. Similarly, government licenses may raise the entry hurdles for new competitors. Additionally, brands equity can increase a customer&rsquo;s willingness to pay for a product or service.&nbsp; These are examples of what Morningstar refers to as &ldquo;intangible assets.&rdquo;</p>
<p>In the examples below, we demonstrate how companies use intangible assets to their advantage and grow over time.</p>
<h2>Examples of Intangible Assets in Action</h2>
<h3>Starbucks</h3>
<p>Starbucks Corp. (SBUX) is one of the few operators in Morningstar&rsquo;s coverage of the restaurant industry to boast a wide economic moat. According to Morningstar, Starbucks has &ldquo;brand strength evidenced by pricing power, attractive unit-level economics, successful international replication, and strong results in the retail channel underpinning a durable brand intangible asset.&rdquo; Morningstar adds, &ldquo;The firm&rsquo;s ability to generate excitement and traffic, evidenced by impressive comparable sales growth in the core U.S. market, while spending less on marketing than category peers, reinforces the importance of the brand and its impact on results.&rdquo;</p>
<h3>Eli Lilly and Co.</h3>
<p>Eli Lilly and Co. (LLY) is a pharmaceutical company that focuses on neuroscience, endocrinology, oncology and immunology. Patents are critical in preventing competitors from duplicating its drugs. Morningstar notes that &ldquo;patents, economies of scale, and a powerful distribution network support Eli Lilly&rsquo;s wide moat. Lilly&rsquo;s patent-protected drugs carry strong pricing power, which enables the firm to generate returns on invested capital in excess of its cost of capital.&rdquo;</p>
<h2>Conclusion</h2>
<p>Intangible assets play a crucial role in a company's success, establishing competitive advantages and economic moats. They include intellectual property, brand equity, customer relationships, and proprietary technology.. By recognizing these attributes, investors can identify companies built to last and with the potential to remain profitable well into the future.</p>
<p>To receive more <a href="https://www.vaneck.com/us/en/insights/moat-investing/" title="Moat Investing Insights"><strong>Moat Investing</strong></a> insights, <a href="https://www.vaneck.com/us/en/subscribe/" title=" Subscription Center"><strong>sign up in our subscription center</strong></a>.</p>
]]></content:encoded>
</item><item rdf:about="https://www.vaneck.com/us/en/blogs/model-portfolios/the-not-so-curious-case-for-commodities-in-slowdowns/">
  <title>The Not So Curious Case for Commodities in Slowdowns></title>
  <link>https://www.vaneck.com/us/en/blogs/model-portfolios/the-not-so-curious-case-for-commodities-in-slowdowns/</link>
  <description><![CDATA[We expect oil to hold its value due to significant supply-demand imbalances, with the anticipated risk from economic downturns overstated despite investor apprehension from past recessions.]]></description>
  <dc:creator>David Schassler</dc:creator>
  <dc:date>08/09/2023 06:30:00</dc:date>
<content:encoded><![CDATA[

<p>We have been super vocal about the opportunities available in commodities. There are significant and structural supply and demand imbalances across the commodity markets that, we believe, will result in higher prices for an extended period of time.</p>
<p>On July 11, we were invited on <strong><a href="https://www.vaneck.com/us/en/offsite-disclaimer/?id=237089&amp;button=no&amp;url=https://www.bloomberg.com/news/audio/2023-07-11/microsoft-inflation-banks-tmt-and-prime-day-podcast" title="Bloomberg.com - The Tape Podcast" target="_blank" rel="noopener">Bloomberg Radio to discuss commodities</a></strong>. We laid out our bullish call on energy prices and how that will put upward pressure on inflation.</p>
<p><a href="https://www.vaneck.com/us/en/offsite-disclaimer/?id=237089&amp;button=no&amp;url=https://www.bloomberg.com/news/audio/2023-07-11/microsoft-inflation-banks-tmt-and-prime-day-podcast" title="Bloomberg.com - The Tape Podcast" target="_blank" rel="noopener"><strong>Here's the link to the recording</strong></a>; skip to the 9-minute mark.</p>
<p>Oil prices have strengthened considerably lately. We&rsquo;ve been calling for this for a while now. Here are some key reasons why we think oil prices will remain strong:</p>
<ul class="content-list">
<li>Supply is tightening as oil companies adjust to weaker prices, higher costs, and returning cash to shareholders. The chart below illustrates rig counts in the U.S. As you can see, energy firms have consistently cut the number of oil rigs in operation. This is a forward gauge of future output, and it tells us that supply will fall.</li>
</ul>
<h3>US Crude Oil Rig Count</h3>
<p><img class="img-responsive w-100" src="https://www.vaneck.com/contentassets/176b21140b5948909c133efc48c2b961/3500_qis-aug-commentary_chart-1_2023.08_blog_v1.svg" alt="US Crude Oil Rig Count" /></p>
<p class="chart-disclosure">Source: Bloomberg. As of 8/1/2023.</p>
<ul class="content-list">
<li>OPEC+ has agreed to cut oil production in an effort to support oil prices. In July, Saudi Arabia and Russia, the world&rsquo;s largest oil exporters, announced further cuts to support prices.</li>
<li>Oil prices have been under pressure from the draining of the strategic petroleum reserve to 40-year lows. While we do not know how the near term will unfold, it is more than evident that, at best, this is not a long-term solution to higher energy prices, and we should not rely on the government to tame energy prices in perpetuity.</li>
</ul>
<p>The risk to oil and other commodities, in the short term, is the economy. But&mdash;given the broad expectations of a shallow recession&mdash;we think that risk is severely overstated. The chart below demonstrates that commodities have historically fared well during recessions, with the exception of the unusually deep recession caused by the 2008 Global Financial Crisis (&ldquo;GFC&rdquo;). And, when high inflation is present during a recession, as we experienced in the 1970s, commodities performed very well. The COVID-19 commodity correction does not show in the chart because it was a short-term price shock that quickly recovered.</p>
<h3>Annualized Returns During Recession</h3>
<p><img class="img-responsive w-100" src="https://www.vaneck.com/contentassets/176b21140b5948909c133efc48c2b961/3500_qis-aug-commentary_chart-2_2023.08_blog_v1.svg" alt="Annualized Returns During Recession" /></p>
<p class="chart-disclosure">Source: Bloomberg &amp; NBER. As of 6/2023.</p>
<p>To understand why commodity prices have generally performed well during the &ldquo;typical&rdquo; recession, let&rsquo;s look at the historical demand for oil. The chart below demonstrates that the oil demand is relatively inelastic. Meaning that, with the exception of truly extreme events, such as 2008 and COVID-19, oil demand is relatively unchanged. We love to complain about high gas prices, but that doesn&rsquo;t stop us from driving.</p>
<h3>World Oil Demand</h3>
<p><img class="img-responsive w-100" src="https://www.vaneck.com/contentassets/176b21140b5948909c133efc48c2b961/3500_qis-aug-commentary_chart-3_2023.08_blog_v1.svg" alt="World Oil Demand" /></p>
<p class="chart-disclosure">Source: OPEC. As of 4/2023.</p>
<p>So&mdash;what&rsquo;s up with the narrative that commodities are particularly vulnerable during economic contractions? Recency bias is when we look at recent events and assume they will happen again. In this case, investors are still scarred from the commodity corrections of the Financial Crisis and COVID-19 and are assuming that the next recession will bring a similar result.</p>
<p>The point here is that unless you are calling for a super draconian recession, and very few that we meet are, then, in our view, commodities offer the potential for significant diversification and performance benefits.</p>
<p>Commodities were not the place to be in the first half of 2023. Year-to-date, through June 30, the S&amp;P 500<sup>&reg;</sup>&nbsp;Index returned over +20% while commodities were virtually flat. During this period, the <a href="https://www.vaneck.com/us/en/investments/commodity-strategy-etf-pit/overview/" title="PIT - VanEck Commodity Strategy ETF - Overview"><strong>VanEck Commodity Strategy ETF (&ldquo;PIT&rdquo;)</strong></a> returned +2.51%, and the Bloomberg Commodity Index (&ldquo;BCOM&rdquo;) returned -2.02%. And investors have noticed. As of June 30, there have been net outflows of $5 billion from broad commodity ETFs and mutual funds.</p>
<p>We expect the second half of the year to look nothing like the first half, and with commodities far outpacing stocks in July, it is already starting to work out that way. In July, PIT returned +9.71% and outpaced the +6.26% return of BCOM. This brings the year-to-date performance of PIT and BCOM to +2.51% and -2.02%, respectively.</p>
<div class="wrapped-div">
<table style="width: 100%;">
<tbody>
<tr class="tbl-data">
<td class="tbl-header last">&nbsp;</td>
<td class="tbl-header last">1Mo</td>
<td class="tbl-header last">2Mo</td>
<td class="tbl-header last">YTD</td>
<td class="tbl-header last">1Yr</td>
<td class="tbl-header last">3Yr</td>
<td class="tbl-header last">5Yr</td>
<td class="tbl-header last">10Yr</td>
<td class="tbl-header last">Since Inception (12/20/2022)</td>
</tr>
<tr class="tbl-data">
<td class="data-td last">PIT (NAV)</td>
<td class="data-td data last">9.71</td>
<td class="data-td data last">7.35</td>
<td class="data-td data last">2.51</td>
<td class="data-td data last">--</td>
<td class="data-td data last">3.77</td>
</tr>
<tr class="tbl-data">
<td class="data-td last">PIT (Share Price)</td>
<td class="data-td data last">9.74</td>
<td class="data-td data last">7.46</td>
<td class="data-td data last">1.35</td>
<td class="data-td data last">--</td>
<td class="data-td data last">3.80</td>
</tr>
<tr class="tbl-data">
<td class="data-td last">Bloomberg Commodity Index (BCOM)</td>
<td class="data-td data last">6.26</td>
<td class="data-td data last">4.32</td>
<td class="data-td data last">-2.02</td>
<td class="data-td data last">--</td>
<td class="data-td data last">-1.11</td>
</tr>
</tbody>
</table>
</div>
<br />
<p class="chart-disclosure"><strong>PIT Gross Expense Ratio: 0.60%</strong></p>
<p class="chart-disclosure">Source: VanEck. As of 7/31/2023. <strong>The performance data quoted represents past performance. Past performance is not a guarantee of future results. Investment return and principal value of an investment will fluctuate so that an investor's shares, when redeemed, may be worth more or less than their original cost. Performance may be lower or higher than performance data quoted. Please call 800.826.2333 or visit vaneck.com for performance current to the most recent month ended.</strong></p>
<h2>What is the PIT ETF, and why has it outperformed?</h2>
<p><strong><a href="https://www.vaneck.com/us/en/investments/commodity-strategy-etf-pit/overview/" title="PIT - VanEck Commodity Strategy ETF - Overview">VanEck Commodity Strategy ETF (PIT)</a></strong> was created because we believe that this asset class offers an ideal environment for active management to succeed. Commodity prices are volatile, differentiated, and have repeatable patterns. If approached with a well-disciplined and risk-controlled framework&mdash;there are many levers to pull in pursuit of outperformance.</p>
<p>PIT is an active commodity strategy that invests based on a quantitatively driven process. Each day, armed with our quantitative investment tools, the investment team hunts out perceived opportunities across a wide range of liquid commodities. More specifically, it allocates across energy, agriculture, industrial metal, and precious metal commodities based on: (1) the relative risk and returns of each commodity; (2) the shape of the commodity curves; and (3) mean reversion. Additionally, across each commodity, the roll methodology aims to profit from inefficiencies in the futures curves by allocating to the point on the curve with the highest implied yield.</p>
<h3>PIT vs. BCOM Return Contribution</h3>
<p><img class="img-responsive w-100" src="https://www.vaneck.com/contentassets/176b21140b5948909c133efc48c2b961/3500_qis-aug-commentary_chart-4_2023.08_v1_blog.svg" alt="PIT vs. BCOM Return Contribution" /></p>
<p class="chart-disclosure">Source: Bloomberg. As of 7/31/2023.</p>
<p>PIT is a new fund with a short track record. It launched in December of 2022 and is off to a strong start. There are many reasons why PIT is ahead of BCOM. PIT has outperformed in energy, agriculture, and industrial metals. Precious metals, due to an underweight to gold bullion, were a modest detractor from performance. The individual commodities that contributed the most to relative performance were:</p>
<ul class="content-list">
<li>Overweight sugar: +38% return</li>
<li>Overweight gasoline: +12.72%</li>
<li>Underweight natural gas: -53%</li>
</ul>
<p>Thank you for reading our latest commentary. Our goal is to provide investors with a timely assessment of current risks, opportunities, and actionable investment ideas. This month we highlighted the attractive opportunity in commodities and encourage investors to look into PIT!</p>

<style type="text/css">
    .wrapped-div {
        max-width: 100%;
    }

    @media (max-width: 1240px) {
        .wrapped-div {
            overflow-x: scroll;
        }
    }

    .wrapped-div-sector {
        max-width: 100%;
        overflow-x: scroll;
    }


 }
</style>
<p>To receive more <strong><a href="https://www.vaneck.com/us/en/insights/guided-allocation/" title="Model Portfolio Insights">Model Portfolio</a></strong> insights, <strong><a href="https://www.vaneck.com/us/en/subscribe/" title="Subscription Center">sign up in our subscription center</a></strong>.</p>
]]></content:encoded>
</item><item rdf:about="https://www.vaneck.com/us/en/blogs/moat-investing/investors-guide-to-switching-costs/">
  <title>An Investor&#39;s Guide to Switching Costs></title>
  <link>https://www.vaneck.com/us/en/blogs/moat-investing/investors-guide-to-switching-costs/</link>
  <description><![CDATA[Powerful moats can be built on switching costs, which lock customers into a company&rsquo;s unique ecosystem and make it expensive to move.]]></description>
  <dc:creator>Brandon Rakszawski</dc:creator>
  <dc:date>08/09/2023 06:30:00</dc:date>
<content:encoded><![CDATA[

<p><i>The term &ldquo;economic moat&rdquo; describes a company&rsquo;s ability to maintain its competitive advantages and defend its long-term profitability. This moat investing education series explores the five primary sources of moat, according to Morningstar: 1) switching costs; 2) <strong><a title="Intangible Assets: The Leading Source of Moats" href="https://www.vaneck.com/us/en/blogs/moat-investing/intangible-assets-source-of-moats">intangible assets</a></strong>; 3) <strong><a title="Network Effect: A Proven Way to Create a Moat" href="https://www.vaneck.com/us/en/blogs/moat-investing/network-effect-proven-way-create-moat">network effect</a></strong>; 4) <strong><a title="Cost Leadership Provides Market Control" href="https://www.vaneck.com/us/en/blogs/moat-investing/cost-leadership-creates-moats">cost advantage</a></strong>; 5) <a title="Efficient Scale: Moats with Natural Monopoly" href="https://www.vaneck.com/us/en/blogs/moat-investing/efficient-scale-moats-natural-monopoly"><strong>efficient scale</strong></a>. Here we explore the concept of switching costs.</i></p>
<h2>Introduction: What Are Switching Costs?</h2>
<p>Switching costs refer to the financial and non-financial factors that deter customers from switching to alternatives. Switching costs can include termination fees, setup expenses, additional charges, time-consuming tasks like data transfer, retraining, and the risk of a new product falling short of expectations. In other words, switching costs are present when a customer&rsquo;s cost of switching to a new supplier exceeds the value they would enjoy from making the switch. Switching costs endow the incumbent supplier or provider with pricing power that can, in turn, lead to economic profits.</p>
<p>From an investment perspective, understanding switching costs is important because they can provide a company with the leverage to increase prices and deliver hefty profits over time. Switching costs also create barriers to entry in certain industries, making it difficult for new competitors to gain ground. This stability can offer more secure and promising investment prospects.</p>
<h2>Why Switching Costs Matter for Investors</h2>
<p>Analyzing switching costs helps investors evaluate the stickiness of a product or service within its target market. Higher switching costs indicate greater customer retention, reducing the likelihood of customer churn. This stability provides insights into the sustainability and profitability of an investment.</p>
<p>Investors should also consider the impact of switching costs on market dynamics. Industries with substantial switching costs give companies a competitive advantage. Customer retention due to high switching costs leads to reduced price sensitivity and increased customer lifetime value.</p>
<p>By understanding the factors influencing switching costs, investors are in a better position to evaluate market opportunities and identify investments with competitive advantages. Incorporating switching costs into investment strategies provides a comprehensive perspective and enhances the potential for long-term investment success.</p>
<h2>How Companies Use Switching Costs Build Moats</h2>
<p>The term &ldquo;economic moat&rdquo; describes a company&rsquo;s ability to maintain its competitive advantages and defend its long-term profitability. Powerful moats can be built on switching costs, which lock customers into a company&rsquo;s unique ecosystem and make it expensive to move. In the examples below, we demonstrate how companies use switching costs to their advantage and grow over time.</p>
<h3>Customers Get Locked-In by Switching Costs</h3>
<p>Switching costs are present when a customer&rsquo;s cost of switching to a new supplier exceeds the value they would enjoy from making the switch. Switching costs endow the incumbent supplier or provider with pricing power that can, in turn, lead to economic profits.</p>
<p>Switching Costs: When it would be too expensive or troublesome to switch away from a company's products, that company often enjoys pricing power.</p>
<p>Not just monetary in nature, switching costs can also be measured by the effort, time, and psychological toll it takes to switch to a competitor.</p>
<p>Switching costs provide a company with the leverage to increase prices and deliver hefty profits over time. They are a key competitive advantage and are evident in a range of industries, from banks, to computer software/hardware, to telecoms, among others.</p>
<h3>Examples of Switching Costs in Action</h3>
<h3>Gillette Razor Blades &ndash; Designed to Create Brand Attachment</h3>
<p>King Camp Gillette, the inventor of the first mass produced safety razor, was one of the first entrepreneurs to optimize the switching cost approach to lock in customers. In 1902, Gillette developed and began selling inexpensive razors with disposable blades that he had patented. This ensured Gillette a constant high demand for blades, as customers who considered other blades quickly realized that they would incur the cost of a new razor as well.</p>
<h3>Stryker Corp (SYK)</h3>
<p>Stryker Corp. (SYK) is a top-tier competitor in a number of medical markets. These include orthopedic implants, surgical equipment, endoscopy, and neurovascular devices. Since switching costs can be significant for surgeons when it comes to orthopedic implants, this is, according to Morningstar, one of Stryker&rsquo;s &ldquo;moatiest divisions&rdquo; in support of the company&rsquo;s wide economic moat. Morningstar adds, &ldquo;Relative to other specialists, an orthopedic surgeon&rsquo;s skill and experience can play an outsize role in the clinical outcome for the patient. These factors leave surgeons reluctant to train and master multiple instrumentation systems.&rdquo;</p>
<h3>Salesforce</h3>
<p>Salesforce.com Inc. (CRM) is a leader in software solutions for both client relationship management and customer service industries. According to Morningstar, its salesforce automation application is &ldquo;mission critical to business users in that they drive the selling and servicing processes, contain all known information on the customer base, and are tied to a variety of other back-end systems.&rdquo; Morningstar notes the high organizational risk of moving away from the platform, as well as the time, expense, and lost productivity associated with the implementation of a new application.</p>
<h2>Conclusion</h2>
<p>Understanding and capitalizing on switching costs is essential for investors seeking to identify companies with sustainable competitive advantages and long-term profitability. Switching costs act as barriers that deter customers from switching to alternatives, providing companies with pricing power and customer retention. By analyzing switching costs, investors can evaluate the stability and sustainability of investments, identify companies with strong market positions, and recognize industries with high barriers to entry.</p>
<p>Recognizing and understanding switching costs empowers investors to evaluate market opportunities, identify companies with competitive advantages, and make informed investment decisions. Incorporating the concept of switching costs into investment strategies can lead to long-term success and capitalize on the value created by companies with strong customer loyalty and high barriers to entry.</p>
<p>To receive more <a href="https://www.vaneck.com/us/en/insights/moat-investing/" title="Moat Investing Insights"><strong>Moat Investing</strong></a> insights, <a href="https://www.vaneck.com/us/en/subscribe/" title=" Subscription Center"><strong>sign up in our subscription center</strong></a>.</p>
]]></content:encoded>
</item><item rdf:about="https://www.vaneck.com/us/en/blogs/moat-investing/regional-bank-us-bancorp-tops-moat-stocks-in-july/">
  <title>Regional Bank U.S. Bancorp Tops Moat Stocks in July></title>
  <link>https://www.vaneck.com/us/en/blogs/moat-investing/regional-bank-us-bancorp-tops-moat-stocks-in-july/</link>
  <description><![CDATA[While U.S. equities extended their rally, Morningstar&rsquo;s Moat Index extended its year-to-date lead over the S&amp;P 500 to nearly 800 basis points. U.S. Bancorp stood out as the top contributor.]]></description>
  <dc:creator>Coulter Regal, CFA</dc:creator>
  <dc:date>08/08/2023 06:30:00</dc:date>
<content:encoded><![CDATA[

<p>U.S. equity markets continued their rally in July with the S&amp;P 500 and Nasdaq logging a fifth month in the green, the longest winning streak for either since 2021. Positive market sentiment was attributed to moderating inflation and resilient economic data, raising hopes for a soft landing. The July market gains came despite another quarter of a percentage point rate hike by the U.S. Federal Reserve late in the month.</p>
<p>The<strong> <a href="https://www.vaneck.com/us/en/investments/morningstar-wide-moat-etf-moat/index/" title="MOAT - VanEck Morningstar Wide Moat ETF - Overview">Morningstar Wide Moat Focus Index</a></strong> (the &ldquo;Moat Index&rdquo;) gained 4.38% in July, outpacing the benchmark S&amp;P 500 Index by over 100 basis points during the month and extending its year-to-date lead to nearly 800 basis points. The rebound in smaller-cap companies that began last month continued in July, with both small- and mid-caps outpacing their large-cap peers. The <strong><a href="https://www.vaneck.com/us/en/investments/morningstar-smid-moat-etf-smot/index/" title="SMOT - VanEck Morningstar SMID Moat ETF - Overview">Morningstar US Small-Mid Cap Moat Focus Index</a> </strong>(the &ldquo;SMID Moat Index&rdquo;) returned 4.32% in July, ahead of mid-caps but trailing pure small-caps during the month. However, year-to-date the SMID Moat Index leads both small- and mid-cap broad benchmarks by roughly 300 and 200 basis points, respectively.</p>
<h3>Moat Indexes Maintain Lead Over Broad Equity Markets</h3>
<p><img class="img-responsive w-100" src="https://www.vaneck.com/contentassets/c0bfc6558cb640019f17f82a21de33d0/3498_moat-smot_chart_2023.08_blog.svg" alt="Bar chart showing Morningstar's Moat Indexes Ahead of Broad Equity Market Indexes YTD in 2023" /></p>
<p class="chart-disclosure"><strong>Source: Morningstar. As of 7/31/2023</strong>. Past performance is no guarantee of future results. Index performance is not representative of fund performance. It is not possible to invest directly in an index. Fund performance current to the most recent month end is available by visiting vaneck.com or by calling 800.826.2333.</p>
<h2>Uncovering Quality Opportunity Amid Turmoil: U.S. Bancorp</h2>
<p>U.S. Bancorp (USB), one of the nation's largest regional banks with branches in roughly 26 states, was the top contributor to performance in July for the Moat Index with shares of USB up over 20% during the month. The recent positive performance for USB comes after months of negative sentiment in the banking sector following the turmoil that saw the collapse of several U.S. regional banks, including Silicon Valley Bank, back in March of this year. Morningstar analyst Eric Compton, who covers the banking sector, believed much of the selloff in banks at that time was overdone and that valuation opportunities existed. Eric&rsquo;s conviction helped contribute to U.S. Bancorp&rsquo;s inclusion in the Moat Index, and Eric&rsquo;s latest comments indicate that there may still be opportunity left to capture.</p>
<p><strong>Morningstar Analyst Comments</strong> | by Eric Compton July 19, 2023</p>
<p><i>Wide-moat-rated U.S. Bancorp reported what we consider to be another average quarter. However, we believe the shares have been materially undervalued, and when they are as cheap as they have been, sometimes it only takes an average quarter to encourage some rerating by the market. We think the market is most excited about management&rsquo;s increased specificity and guidance with regard to the capital build process. As we incorporate the latest results and slightly lower our net interest income forecast, we do not expect a material change to our $53 fair value estimate. We continue to view the shares as materially undervalued.</i></p>
<p>Other top contributors in July include the restaurant operator and franchiser Domino&rsquo;s Pizza Inc. (DPZ) and e-commerce marketplace operator Etsy Inc (ETSY). On the opposite side, detractors to Moat Index July performance included credit bureau Equifax (EFX) and medical device company Zimmer Biomet (ZBH).</p>
<h3>Top Contributors and Detractors from Moat Index - July 2023</h3>
<div class="wrapped-div">
<table style="width: 750px;">
<tbody>
<tr class="tbl-data">
<td class="tbl-header last" colspan="5">Leading Contributors</td>
</tr>
<tr class="tbl-data">
<td class="data-td  last">Company</td>
<td class="data-head last">Ticker</td>
<td class="data-head last">Sector</td>
<td class="data-head last">Avg. Weight (%)</td>
<td class="data-head last">Contribution (%)</td>
</tr>
<tr class="tbl-data">
<td class="data-td last" style="font-weight: normal;">U.S. Bancorp</td>
<td class="data-td data last">USB</td>
<td class="data-td data last">Financials</td>
<td class="data-td data last">2.28</td>
<td class="data-td data last">0.46</td>
</tr>
<tr class="tbl-data">
<td class="data-td last" style="font-weight: normal;">Domino's Pizza Inc</td>
<td class="data-td data last">DPZ</td>
<td class="data-td data last">Consumer Cyclical</td>
<td class="data-td data last">2.56</td>
<td class="data-td data last">0.45</td>
</tr>
<tr class="tbl-data">
<td class="data-td last" style="font-weight: normal;">Etsy Inc</td>
<td class="data-td data last">ETSY</td>
<td class="data-td data last">Consumer Cyclical</td>
<td class="data-td data last">2.08</td>
<td class="data-td data last">0.42</td>
</tr>
<tr class="tbl-data">
<td class="data-td last" style="font-weight: normal;">Polaris Inc</td>
<td class="data-td data last">PII</td>
<td class="data-td data last">Consumer Cyclical</td>
<td class="data-td data last">2.47</td>
<td class="data-td data last">0.31</td>
</tr>
<tr class="tbl-data">
<td class="data-td last" style="font-weight: normal;">Alphabet Inc</td>
<td class="data-td data last">GOOGL</td>
<td class="data-td data last">Communication Services</td>
<td class="data-td data last">2.53</td>
<td class="data-td data last">0.27</td>
</tr>
</tbody>
</table>
</div>
<br />
<div class="wrapped-div">
<table style="width: 750px;">
<tbody>
<tr class="tbl-data">
<td class="tbl-header last" colspan="5">Leading Detractors</td>
</tr>
<tr class="tbl-data">
<td class="data-td  last">Company</td>
<td class="data-head last">Ticker</td>
<td class="data-head last">Sector</td>
<td class="data-head last">Avg. Weight (%)</td>
<td class="data-head last">Contribution (%)</td>
</tr>
<tr class="tbl-data">
<td class="data-td last" style="font-weight: normal;">Equifax Inc</td>
<td class="data-td data last">EFX</td>
<td class="data-td data last">Industrials</td>
<td class="data-td data last">2.56</td>
<td class="data-td data last">-0.34</td>
</tr>
<tr class="tbl-data">
<td class="data-td last" style="font-weight: normal;">Zimmer Biomet Holdings Inc</td>
<td class="data-td data last">ZBH</td>
<td class="data-td data last">Healthcare</td>
<td class="data-td data last">2.58</td>
<td class="data-td data last">-0.13</td>
</tr>
<tr class="tbl-data">
<td class="data-td last" style="font-weight: normal;">Tyler Technologies Inc</td>
<td class="data-td data last">TYL</td>
<td class="data-td data last">Technology</td>
<td class="data-td data last">2.72</td>
<td class="data-td data last">-0.13</td>
</tr>
<tr class="tbl-data">
<td class="data-td last" style="font-weight: normal;">Biogen Inc</td>
<td class="data-td data last">BIIB</td>
<td class="data-td data last">Healthcare</td>
<td class="data-td data last">2.30</td>
<td class="data-td data last">-0.11</td>
</tr>
<tr class="tbl-data">
<td class="data-td last" style="font-weight: normal;">The Estee Lauder Companies Inc</td>
<td class="data-td data last">EL</td>
<td class="data-td data last">Consumer Defensive</td>
<td class="data-td data last">1.31</td>
<td class="data-td data last">-0.10</td>
</tr>
</tbody>
</table>
</div>
<br />
<p class="chart-disclosure"><strong>Source: Morningstar, July 2023</strong>. Past performance is no guarantee of future results. Index performance is not illustrative of fund performance. Not intended as a recommendation to buy or to sell any of the securities mentioned herein.</p>
<h2>Are the Tides Turning for Small Caps?</h2>
<p>Small- and mid-cap companies have been in a rout for much of the year, underperforming relative to large- and mega-cap companies. The sour sentiment around small-caps has been due to the threat of a recession, which typically has a greater negative impact on the performance of smaller companies. Recently, small- and mid-caps have begun to bounce back, outperforming large-caps for the second month in row. Given that valuations for these smaller sized companies remain below historical averages, and the hopes for a soft landing are on the rise, we believe <strong><a href="https://www.vaneck.com/us/en/blogs/moat-investing/bucking-the-trend-why-smid-caps-are-poised-for-a-comeback/" title="Bucking the Trend: Why SMID Caps are Poised for a Comeback">SMID-caps could be poised for a comeback.</a></strong></p>
<p>Within the SMID Moat Index, market breadth of the July top contributors was wide, with each of the top five contributors representing a different sector. Global record label Warner Music Group (WMG) and Boston Beer Co. (SAM), a top player in high-end malt beverages, were each up just over 20% in July, representing the two largest contributors to performance for the month. Companies detracting the most from the SMID Moat Index performance during the month were industrial names Equifax (EFX) and Stericycle (SRCL) as well as payment network provider Discover Financial (DFS).</p>
<h3>Top Contributors and Detractors from SMID Moat Index - July 2023</h3>
<div class="wrapped-div">
<table style="width: 750px;">
<tbody>
<tr class="tbl-data">
<td class="tbl-header last" colspan="5">Leading Contributors</td>
</tr>
<tr class="tbl-data">
<td class="data-td  last">Company</td>
<td class="data-head last">Ticker</td>
<td class="data-head last">Sector</td>
<td class="data-head last">Avg. Weight (%)</td>
<td class="data-head last">Contribution (%)</td>
</tr>
<tr class="tbl-data">
<td class="data-td last" style="font-weight: normal;">Warner Music Group</td>
<td class="data-td data last">WMG</td>
<td class="data-td data last">Communication Services</td>
<td class="data-td data last">1.21</td>
<td class="data-td data last">0.25</td>
</tr>
<tr class="tbl-data">
<td class="data-td last" style="font-weight: normal;">Boston Beer Co Inc</td>
<td class="data-td data last">SAM</td>
<td class="data-td data last">Consumer Defensive</td>
<td class="data-td data last">1.22</td>
<td class="data-td data last">0.25</td>
</tr>
<tr class="tbl-data">
<td class="data-td last" style="font-weight: normal;">Tradeweb Markets Inc</td>
<td class="data-td data last">TW</td>
<td class="data-td data last">Financial Services</td>
<td class="data-td data last">1.20</td>
<td class="data-td data last">0.23</td>
</tr>
<tr class="tbl-data">
<td class="data-td last" style="font-weight: normal;">Etsy Inc</td>
<td class="data-td data last">ETSY</td>
<td class="data-td data last">Consumer Cyclical</td>
<td class="data-td data last">1.14</td>
<td class="data-td data last">0.23</td>
</tr>
<tr class="tbl-data">
<td class="data-td last" style="font-weight: normal;">Paycom Software Inc</td>
<td class="data-td data last">PAYC</td>
<td class="data-td data last">Technology</td>
<td class="data-td data last">1.42</td>
<td class="data-td data last">0.21</td>
</tr>
</tbody>
</table>
</div>
<br />
<div class="wrapped-div">
<table style="width: 750px;">
<tbody>
<tr class="tbl-data">
<td class="tbl-header last" colspan="5">Leading Detractors</td>
</tr>
<tr class="tbl-data">
<td class="data-td  last">Company</td>
<td class="data-head last">Ticker</td>
<td class="data-head last">Sector</td>
<td class="data-head last">Avg. Weight (%)</td>
<td class="data-head last">Contribution (%)</td>
</tr>
<tr class="tbl-data">
<td class="data-td last" style="font-weight: normal;">Equifax Inc</td>
<td class="data-td data last">EFX</td>
<td class="data-td data last">Industrials</td>
<td class="data-td data last">1.41</td>
<td class="data-td data last">-0.19</td>
</tr>
<tr class="tbl-data">
<td class="data-td last" style="font-weight: normal;">Discover Financial Services</td>
<td class="data-td data last">DFS</td>
<td class="data-td data last">Financial Services</td>
<td class="data-td data last">1.45</td>
<td class="data-td data last">-0.14</td>
</tr>
<tr class="tbl-data">
<td class="data-td last" style="font-weight: normal;">Stericycle Inc</td>
<td class="data-td data last">SRCL</td>
<td class="data-td data last">Industrials</td>
<td class="data-td data last">1.35</td>
<td class="data-td data last">-0.11</td>
</tr>
<tr class="tbl-data">
<td class="data-td last" style="font-weight: normal;">Asbury Automotive Group Inc</td>
<td class="data-td data last">ABG</td>
<td class="data-td data last">Consumer Cyclical</td>
<td class="data-td data last">1.40</td>
<td class="data-td data last">-0.09</td>
</tr>
<tr class="tbl-data">
<td class="data-td last" style="font-weight: normal;">Livent Corp</td>
<td class="data-td data last">LTHM</td>
<td class="data-td data last">Basic Materials</td>
<td class="data-td data last">0.83</td>
<td class="data-td data last">-0.09</td>
</tr>
</tbody>
</table>
</div>
<br />
<p class="chart-disclosure"><strong>Source: Morningstar, July 2023</strong>. Past performance is no guarantee of future results. Index performance is not illustrative of fund performance. Not intended as a recommendation to buy or to sell any of the securities mentioned herein.</p>
<h2>Accessing Moat Stocks</h2>
<p><a href="https://www.vaneck.com/us/en/investments/morningstar-wide-moat-etf-moat/moat-reconstitution.pdf" title="MOAT - VanEck Morningstar Wide Moat ETF" target="_blank" rel="noopener"><strong>VanEck Morningstar Wide ETF (MOAT)</strong></a> seeks to replicate as closely as possible, before fees and expenses the price and yield performance of the Morningstar Wide Moat Focus Index.</p>
<p><a href="https://www.vaneck.com/us/en/investments/morningstar-smid-moat-etf-smot/overview/" title="SMOT - VanEck Morningstar SMID Moat ETF - Overview"><strong>VanEck Morningstar SMID Moat ETF (SMOT)</strong></a> seeks to track as closely as possible, before fees and expenses, the price and yield performance of the Morningstar US Small-Mid Cap Moat Focus Index.</p>
<p>To receive more <a href="https://www.vaneck.com/us/en/insights/moat-investing/" title="Moat Investing Insights"><strong>Moat Investing</strong></a> insights, <a href="https://www.vaneck.com/us/en/subscribe/" title=" Subscription Center"><strong>sign up in our subscription center</strong></a>.</p>
<style type="text/css">
    .wrapped-div {
        max-width: 100%;
    }

    @media (max-width: 1240px) {
        .wrapped-div {
            overflow-x: scroll;
        }


    }
</style>
]]></content:encoded>
</item><item rdf:about="https://www.vaneck.com/us/en/blogs/income-investing/pfxf-question-and-answer/">
  <title>PFXF ETF Q&amp;A: Understanding Preferred Securities></title>
  <link>https://www.vaneck.com/us/en/blogs/income-investing/pfxf-question-and-answer/</link>
  <description><![CDATA[This blog answers commonly asked questions about the PFXF ETF and explores why Preferred Securities are becoming a preferred alternative income source among investors.]]></description>
  <dc:creator>Coulter Regal, CFA</dc:creator>
  <dc:date>08/07/2023 06:30:00</dc:date>
<content:encoded><![CDATA[

<p>Many investors have expanded their search for income to opportunities beyond traditional debt. Preferred Securities (preferreds) have been an alternative income source of growing attention. This blog intends to answer frequently asked questions on preferreds and <a href="/link/90451e6acf204dae87d1c8a31d9db407.aspx" title="PFXF - VanEck Preferred Securities ex Financials ETF - Overview"><strong>VanEck&rsquo;s Preferred Securities ex Financials ETF (PFXF)</strong></a>.</p>
<ul class="content-list">
<li><a href="#point-one"><strong>Preferred Securities Background</strong></a></li>
<li><a href="#point-two"><strong>Preferred Securities Benefits</strong></a></li>
<li><a href="#point-three"><strong>Preferred Securities Ratings</strong></a></li>
<li><a href="#point-four"><strong>Preferreds' Impact from Interest Rate Changes</strong></a></li>
<li><a href="#point-five"><strong>PFXF Overview</strong></a></li>
<li><a href="#point-six"><strong>Exclusion of Financial Preferreds</strong></a></li>
<li><a href="#point-seven"><strong>PFXF Dividend Payment Frequency</strong></a></li>
<li><a href="#point-eight"><strong>PFXF's Qualification for Dividend Income</strong></a></li>
<li><a href="#point-nine"><strong>PFXF's Distribution of Return of Capital</strong></a></li>
<li><a href="#point-ten"><strong>PFXF&rsquo;s Real Estate Exposure</strong></a></li>
<li><a href="#point-eleven"><strong>How can investors buy VanEck ETFs?</strong></a></li>
</ul>
<h2 id="point-one" class="anchored-block">What are Preferred Securities?</h2>
<p>Preferred securities are a type of hybrid financial asset that blends the characteristics of both traditional debt and equity instruments. They represent an ownership stake in a company, but their holders do not have the same voting rights as common stockholders. Preferred stockholders are, however, typically entitled to distributions payments before any dividends can be paid to common stockholders. This "preference" in dividend distribution lends to their name.</p>
<p>Another unique feature of preferred shares is that preferred shareholders rank above common shareholders, but below debt holders, in the capital stack or priority of claims. Hence, if a company goes bankrupt and its assets are liquidated, preferred shareholders will receive any proceeds from the liquidation before holders of the company&rsquo;s common stock.</p>
<h2 id="point-two" class="anchored-block">Benefits of Preferred Securities</h2>
<p>Preferred securities can offer several advantages for investors:</p>
<ul class="content-list">
<li><strong>Higher Dividend Payments:</strong> Preferred securities typically provide higher dividends than common stocks, usually paid out before dividends to common shareholders.</li>
<li><strong>Reduced Risk:</strong> Compared to common stocks, preferred securities can be less volatile. This is because preferred shareholders have a higher claim on a company's assets and earnings.</li>
<li><strong>Potential for Fixed Income:</strong> The dividends of preferred shares are often fixed, which means they can provide a steady income stream. This can be particularly beneficial to income-focused investors, such as retirees.</li>
<li><strong>Convertible Features:</strong> Some preferred securities can convert into common shares, which can provide the potential for capital appreciation if the company&rsquo;s common stock price rises.</li>
</ul>
<h2 id="point-three" class="anchored-block">Why are Many Preferreds Not Rated?</h2>
<p>One characteristic that many investors notice when researching the preferred securities market is that much of the universe is not rated by the major credit rating agencies like Moody&rsquo;s or Standard &amp; Poor&rsquo;s. This is mainly because many preferred issuers simply chose not to pay rating agencies to rate their preferred/hybrid issues. There are a number of reasons that a company will decide not to have its preferreds rated that have nothing to do with the company's well-being, including they may already have a credit rating on much of their debt or their primary investors just don&rsquo;t demand the ratings. Whatever the reason, choosing not to have a credit rating doesn&rsquo;t necessarily mean the company's well-being is in jeopardy or that the preferred issue is a bad risk. However, like any debt instrument, the potential for default or delayed payment is still a risk that investors should weigh when considering an allocation to preferreds.</p>
<div class="epi-contentfragment">faq-banner-cta</div>
<h2 id="point-four" class="anchored-block">Are Preferreds Sensitive to Interest Rate Changes?</h2>
<p>Preferred securities typically feature long-term maturities, typically greater than 30 years, or are even perpetual, meaning they have no maturity. For this reason, preferred securities exhibit some sensitivity to changes in interest rates. Notably, preferreds issued by financial companies tend to feature perpetual maturities more so than preferreds issued by non-financials. Excluding financial preferreds generally results in a lower portion of perpetual issues which may help lower overall maturity and reduce the impact of interest rate changes. Additionally, the portion of a preferred portfolio that is callable or convertible and the timing of the call and conversion features can impact its interest rate sensitivity.</p>
<h2 id="point-five" class="anchored-block">What is PFXF?</h2>
<p>The <a href="/link/90451e6acf204dae87d1c8a31d9db407.aspx" title="PFXF - VanEck Preferred Securities ex Financials ETF - Overview"><strong>VanEck&rsquo;s Preferred Securities ex Financials ETF (PFXF)</strong></a> offers investors differentiated exposure to the U.S.-listed preferred securities market by tracking an index that excludes securities issued by financial companies, which historically have dominated broad-based preferred indices. Excluding preferreds securities from the financial sector allows for greater sector diversification and lower concentration risk without sacrificing yield potential. For more information on <a href="/link/90451e6acf204dae87d1c8a31d9db407.aspx" title="PFXF - VanEck Preferred Securities ex Financials ETF - Overview"><strong>PFXF</strong></a>, visit the product webpage <a href="/link/90451e6acf204dae87d1c8a31d9db407.aspx" title="PFXF - VanEck Preferred Securities ex Financials ETF - Overview"><strong>here</strong></a>.</p>
<h2 id="point-six" class="anchored-block">Why Exclude Financial Preferreds?</h2>
<p>After the financial crisis of 2008, banks began issuing a significant amount of preferred stock to meet the higher capital levels required by regulators. This proliferation of preferreds issuance by financials has led to an overconcentration of the sector, which now makes up over 75% of the listed U.S. preferreds market.<sup>1</sup><a href="/link/90451e6acf204dae87d1c8a31d9db407.aspx" title="PFXF - VanEck Preferred Securities ex Financials ETF - Overview"><strong>PFXF</strong></a>&nbsp;helps limit this unnecessary sector concentration by targeting preferred securities issued by companies outside the financial sector, offering differentiated exposure, without sacrificing yield potential, compared to most broad-based preferred strategies. Beyond increased sector diversification, ex-financial preferreds also display a few other notable features, including an increased proportion of preferreds paying cumulative distributions and a lower proportion of preferreds with a call feature relative to financial preferreds.</p>
<h2 id="point-seven" class="anchored-block">How Often Does PFXF Pay Dividends?</h2>
<p>The <a href="/link/90451e6acf204dae87d1c8a31d9db407.aspx" title="PFXF - VanEck Preferred Securities ex Financials ETF - Overview"><strong>VanEck&rsquo;s Preferred Securities ex Financials ETF (PFXF)</strong></a> distributes payments to its shareholders every month.</p>
<h2 id="point-eight" class="anchored-block">Does PFXF Pay Qualified Dividend Income?</h2>
<p>Yes. Some preferred securities pay dividends that are treated as qualified income by the Internal Revenue Service, meaning they are taxed at the more favorable rate of long-term capital gains instead of ordinary income. Any qualified income <a href="/link/90451e6acf204dae87d1c8a31d9db407.aspx" title="PFXF - VanEck Preferred Securities ex Financials ETF - Overview"><strong>PFXF</strong></a>&nbsp;receives from its underlying holdings will pass through to shareholders as qualified income. The portion of the fund&rsquo;s dividend considered qualified income will vary as the fund&rsquo;s underlying holdings change over time, but has generally ranged between&nbsp;<strong>approximately 15% and 25% in recent years</strong>. Please visit <a href="https://www.vaneck.com/us/en/resources/tax-information/" title="Tax Information and Distributions"><strong>VanEck&rsquo;s Tax Center</strong></a> for more information on the portion of qualified dividend income paid by <a href="/link/90451e6acf204dae87d1c8a31d9db407.aspx" title="PFXF - VanEck Preferred Securities ex Financials ETF - Overview"><strong>PFXF</strong></a>.</p>
<h2 id="point-nine" class="anchored-block">Does PFXF Distribute Return of Capital?</h2>
<p>Yes. Return of capital (ROC) is a payment received from an investment that is not considered taxable income, but instead reduces a shareholder's cost basis and may be recognized as a capital gain at the final sale of the investment. Real estate investment trusts (REITs) are one type of investment that typically have distributions containing a component of ROC. This is due to special tax treatments for REITs, like depreciation adjustments, that reduce taxable income without reducing the amount of cash available for distribution. Due to <a href="/link/90451e6acf204dae87d1c8a31d9db407.aspx" title="PFXF - VanEck Preferred Securities ex Financials ETF - Overview"><strong>PFXF</strong></a>&rsquo;s underlying exposure to REIT securities, a portion of the fund&rsquo;s distribution may be considered ROC as it distributes all of its net cash received from investments (including ROC) to investors. Investors may receive a &ldquo;Section 19 notice&rdquo; accompanying a distribution from <a href="/link/90451e6acf204dae87d1c8a31d9db407.aspx" title="PFXF - VanEck Preferred Securities ex Financials ETF - Overview"><strong>PFXF</strong></a>, which estimates the portion of PFXF&rsquo;s current and fiscal year-to-date distribution comprising a return of capital. Please view <a href="https://www.vaneck.com/us/en/investments/preferred-securities-ex-financials-etf-pfxf/literature/" title="PFXF - VanEck Preferred Securities ex Financials ETF - Literature"><strong>PFXF&rsquo;s Tax Documents</strong></a> and visit <a href="https://www.vaneck.com/us/en/resources/tax-information/" title="Tax Information and Distributions"><strong>VanEck&rsquo;s Tax Center</strong></a> for more information on the portion of return of capital paid by <a href="/link/90451e6acf204dae87d1c8a31d9db407.aspx" title="PFXF - VanEck Preferred Securities ex Financials ETF - Overview"><strong>PFXF</strong></a>.</p>
<h2 id="point-ten" class="anchored-block">What type of Real Estate Exposure is in PFXF?</h2>
<p>The real estate exposure in <a href="/link/90451e6acf204dae87d1c8a31d9db407.aspx" title="PFXF - VanEck Preferred Securities ex Financials ETF - Overview"><strong>PFXF </strong></a>typically comes from REITs. This includes equity REITs which own and operate property and mortgage REITs which invest in mortgage securities and are involved in real estate financing. From a sector perspective, the REIT exposure is in <a href="/link/90451e6acf204dae87d1c8a31d9db407.aspx" title="PFXF - VanEck Preferred Securities ex Financials ETF - Overview"><strong>PFXF</strong></a>&nbsp;tends to be well diversified across both residential and commercial real estate. In recent years, mortgage REITs providing exposure to residential and commercial real estate, as well as storage REITs provided the majority of the real estate exposure in <a href="/link/90451e6acf204dae87d1c8a31d9db407.aspx" title="PFXF - VanEck Preferred Securities ex Financials ETF - Overview"><strong>PFXF</strong></a>&nbsp;which, in total, generally accounts for approximately 20% of the Fund&rsquo;s assets.</p>
<h2 id="point-eleven" class="anchored-block">How can investors buy VanEck ETFs?</h2>
<p><a href="/link/5eee0d78a5514abb9d58e9200739d896.aspx#how-to-buy-etf&amp;amp;utm=PFXF-Blog" title="How to buy VanEck ETFs?"><strong>Learn more here.</strong></a></p>
<p class="d-none d-lg-block"><a href="mailto:askvaneck@vaneck.com" title="Have More Questions? - Ask VanEck" rel="noopener"><img loading="lazy" class="img-responsive" src="https://www.vaneck.com/globalassets/home/us/insights/blogs/bm-blog-images/cta-faq_desktop-02.svg" alt="Have More Questions? - Ask VanEck" /></a></p>
<p class="d-lg-none"><a href="mailto:askvaneck@vaneck.com" title="Have More Questions? - Ask VanEck" rel="noopener"><img loading="lazy" class="img-responsive" src="https://www.vaneck.com/globalassets/home/us/insights/blogs/bm-blog-images/cta-faq_mobile-01.svg" alt="Have More Questions? - Ask VanEck" /></a></p>
<p>To receive more <a href="/us/en/blogs/income-investing/" title="Income Investing Blog Posts"><strong>Income Investing</strong></a> insights, <a href="/us/en/subscribe/" title=" Subscription Center"><strong>sign up in our subscription&nbsp;center</strong></a>.</p>
<style type="text/css">
    .wrapped-div {
        max-width: 100%;
    }

    @media (max-width: 768px) {
        .wrapped-div {
            overflow-x: scroll;
        }
    }

    .wrapped-div-sector {
        max-width: 100%;
        overflow-x: scroll;
    }
</style>
]]></content:encoded>
</item><item rdf:about="https://www.vaneck.com/us/en/blogs/digital-assets/matthew-sigel-cracking-the-crypto-adoption-code/">
  <title>Cracking the Crypto Adoption Code></title>
  <link>https://www.vaneck.com/us/en/blogs/digital-assets/matthew-sigel-cracking-the-crypto-adoption-code/</link>
  <description><![CDATA[Crypto evolution, from Bitcoin to crypto-linked debit cards, struggles with adoption due to technological complexities and infrastructures - Gnosis Pay (GNO) aims to solve key issues.]]></description>
  <dc:creator>Matthew  Sigel</dc:creator>
  <dc:date>08/04/2023 06:30:00</dc:date>
<content:encoded><![CDATA[

<p><strong>Please note that VanEck may have a position(s) in the digital asset(s) described below.</strong></p>
<i>&ldquo;The defense against the substitution of sovereign currencies is the maintenance of robust, trusted, and credible domestic institutions.&rdquo; &ndash; IMF Blog, July 2023</i>
<p>After 6 months of dramatic BTC &amp; ETH outperformance, many so-called &ldquo;altcoins&rdquo; rallied in July, especially those that had been designated securities in recent SEC lawsuits like SOL (+24%), MATIC (+5%), and ADA (+9%), following Ripple&rsquo;s victory vs. the SEC on the matter of whether XRP the token (+51%) is a security when traded on centralized crypto exchanges.</p>
<p>For the month, Bitcoin &amp; Ethereum fell (both down 3%), while nearly every other crypto sector we track posted gains, except for the long-suffering Metaverse coins.</p>
<p>In our view, one major challenge for digital asset investors is balancing the winner-take-all characteristics historically evident among digital platforms with the extreme price performance disparity already evident year-to-date. Historically, Bitcoin dominance rises in the early part of a bull market and then fades as investors borrow against those gains to speculate on riskier assets. This time, however, leverage is less available, and the regulatory environment in the US is much more severe. Meanwhile, the Bitcoin halving is still ahead of us, as we explained in a <strong><a href="https://www.vaneck.com/us/en/webinar-registration/?id=91432633164&amp;utm_source=vaneck&amp;utm_medium=calendar" title="Why Bitcoin Is Up 83% YTD: Five Big Changes" rel="noopener">recent webinar</a></strong>.</p>
<div class="wrapped-div">
<table style="width: 500px;">
<tbody>
<tr class="tbl-data">
<td class="tbl-header last text-center">&nbsp;</td>
<td class="tbl-header last text-center">July</td>
<td class="tbl-header last text-center">YTD</td>
</tr>
<tr class="tbl-data">
<td class="data-td last">Coinbase</td>
<td class="data-td data last">32%</td>
<td class="data-td data last">168%</td>
</tr>
<tr class="tbl-data">
<td class="data-td last">MarketVector<sup>TM</sup>&nbsp;Infrastructure Application Leaders Index</td>
<td class="data-td data last">9%</td>
<td class="data-td data last">37%</td>
</tr>
<tr class="tbl-data">
<td class="data-td last">MarketVector<sup>TM</sup>&nbsp;Smart Contract Leaders Index</td>
<td class="data-td data last">4%</td>
<td class="data-td data last">32%</td>
</tr>
<tr class="tbl-data">
<td class="data-td last">Nasdaq 100 Index</td>
<td class="data-td data last">4%</td>
<td class="data-td data last">37%</td>
</tr>
<tr class="tbl-data">
<td class="data-td last">MarketVector<sup>TM</sup>&nbsp;Decentralized Finance Leaders Index</td>
<td class="data-td data last">3%</td>
<td class="data-td data last">32%</td>
</tr>
<tr class="tbl-data">
<td class="data-td last">S&amp;P 500 Index</td>
<td class="data-td data last">3%</td>
<td class="data-td data last">19%</td>
</tr>
<tr class="tbl-data">
<td class="data-td last">MarketVector<sup>TM</sup>&nbsp;Centralized Exchanges Index</td>
<td class="data-td data last">1%</td>
</tr>
<tr class="tbl-data">
<td class="data-td last">MarketVector<sup>TM</sup>&nbsp;Media &amp; Entertainment Leaders Index</td>
<td class="data-td data last">-3%</td>
<td class="data-td data last">-14%</td>
</tr>
<tr class="tbl-data">
<td class="data-td last">Ethereum</td>
<td class="data-td data last">-3%</td>
<td class="data-td data last">55%</td>
</tr>
<tr class="tbl-data">
<td class="data-td last">Bitcoin</td>
<td class="data-td data last">-3%</td>
<td class="data-td data last">77%</td>
</tr>
</tbody>
</table>
</div>
<br />
<p class="chart-disclosure">Source: Bloomberg, VanEck research as of 7/31/2023. Past performance is not indicative of future results. Not a recommendation to buy or sell any of the names mentioned herein.</p>
<h2 id="Layer1sUpdates" class="jump-link-nav anchored-block" data-jumplink-title="Layer 1s Updates">Layer 1s</h2>
<p>Layer 1 smart contract platforms (SCPs) rose 4% in July, while the sector (MVSCLE) 30-day annualized volatility fell to 34%, the lowest of the 4 major categories we track. Falling volatility has been a trend for much of the past year despite extreme events, including the collapse of FTX, Luna, and 3AC. At the same time, the market cap of stablecoins has moved in lockstep with the falling volatility. This makes sense to us because as opportunities for trading decline due to decreased vol, stablecoin yields should also fall, reducing demand for stablecoins. We think a new leverage cycle is a precondition for the type of absolute returns and volatility that have characterized past cycles. But so far, there is little evidence of rising demand or supply for leverage. Anyway, among the SCPs we track, the best performers of the month were Solana (SOL), up 24%, and Optimism (OP), +23%. This month's laggards included Stacks (STX), down 14%, Fantom (FTM), down 23%, and Ethereum -4%.</p>
<h3>Smart Contract Platform Annualized Vol vs Stablecoin MC</h3>
<p><img class="img-responsive w-100" src="https://www.vaneck.com/contentassets/6e1453b829474b1f83c07b4387d1d75a/3480_scl-blog_chart-01_2023.08_blog.svg" alt="3480_SCL Blog_Chart 01_2023.08_Blog.svg" /></p>
<p class="chart-disclosure">Source: Artemis.xyz, as of 7/26/2023. Past performance is no guarantee of future results. Not intended as a recommendation to buy or sell any securities named herein. Index performance is not representative of fund performance. It is not possible to invest directly in an index.</p>
<p>In July, <strong>Solana</strong> yet again proved its resilience by rebounding from major ecosystem FUD. In early June, the SEC labeled Solana a security in its lawsuit vs. Coinbase, and this catalyzed a 25% decline in the price of SOL. Since then, Solana has seen its fundamental metrics improve as ecosystem participants grew amid the rebirth of Solana DeFI. Though daily active users on Solana only saw a slight increase, around 3.5%, Solana applications like MarginFi, Hxro, and Drift catalyzed on-chain activity and caused a 31% bump in DEX volume and a 12.5% increase in TVL. As a result of the increase in usership on Solana, fees increased by 30% compared to the month of June. One interesting announcement in the Solana ecosystem was the concurrent announcements from both Neon, a Solana infrastructure project, and the Solana Foundation. Both entities launched compilers that would enable Solana to run Solidity smart contracts. As a result, Solana now has two credible offerings that will make it simpler for Ethereum developers to move over to Solana without making major changes to their coding language. Such offerings may bolster Solana&rsquo;s ability to vie for the pie of blockchain developers. Another positive development for the Solana ecosystem was the listing of <strong>Helium (HNT)</strong> tokens on Coinbase after a successful move to the Solana blockchain. Helium is a decentralized cellphone and wireless communication network which originally ran a purpose-built layer 1 blockchain but migrated to Solana to save development costs and boost performance. Also helping Solana this month was the verdict in the Ripple case, which stipulated that tokens like SOL could be considered both securities and commodities &ndash; thus removing the probability that the SOL token would be proven through litigation to be a security under all circumstances.</p>
<h3>Share of Fees: Optimism vs Arbitrum vs. Polygon</h3>
<p><img class="img-responsive w-100" src="https://www.vaneck.com/contentassets/6e1453b829474b1f83c07b4387d1d75a/3480_scl-blog_chart-02_2023.08_blog.svg" alt="Share of Fees: Optimism vs Arbitrum vs. Polygon" /></p>
<p class="chart-disclosure">Source: Artemis as of 7/31/2023. Past performance is no guarantee of future results. Not intended as a recommendation to buy or sell any securities named herein.</p>
<p>Despite increasing competition in the Layer-2 sub-sector of smart contract platform market, with <strong>Starknet</strong> announcing a major software improvement to enable more throughput, <strong>Mantle</strong> launching their mainnet Layer-2, and <strong>Polygon</strong> asserting a compelling multi-chain vision alongside a token revamp, <strong>Optimism&rsquo;s OP</strong> token was a top performer in July. Regarding fundamental metrics, daily active addresses were up 23%, fees were up 29%, and daily transactions on Optimism surpassed <strong>Abitrum</strong>&rsquo;s for the last few days of the month. Important catalysts came from increased interest in decentralized perpetual futures platforms like <strong>Kwenta</strong> and the launch of Sam Altman&rsquo;s (OpenAi founder) <strong>Worldcoin</strong>, which runs on Optimism. (Colleague Pranav Kanade wrote about the Worldcoin project <strong><a href="https://killerapps.substack.com/p/world-app" title="World App" target="_blank" rel="noopener">here</a></strong>.)</p>
<p>For background, Worldcoin is a decentralized identity protocol with 2.1M accounts created. With each user onboarded, WorldCoin must create a wallet to hold that user&rsquo;s identification credentials. Over the last week, WorldCoin employed Gnosis&rsquo; Safe product (see more on Gnosis below) to create a new wallet for each newly onboarded user. A significant percentage of these will likely begin using crypto assets on Optimism. The result is that Worldcoin may become a robust onboarding mechanism for cryptocurrency in general and the Optimism network in particular.</p>
<p>Optimism in July asserted its vision for its Optimism Superchain internet of blockchains governance structure and community norms while hinting at potential value accrual pathways. In a post that Optimism titled <strong><a href="https://optimism.mirror.xyz/JfVOJ1Ng2l5H6JbIAtfOcYBKa4i9DyRTUJUuOqDpjIs" title="Introducing the Law of Chains" target="_blank" rel="noopener">&ldquo;Law of Chains&rdquo;</a></strong>, the Optimism Collective (a band of companies, communities, and citizens working on the protocol) hinted that social norms should drive all blockchains and that those built using Optimism code should opt into Optimism&rsquo;s future sequencer set which will be staked with OP tokens. While this declaration is non-binding, it sets the table for increasing community and builder cohesion around driving value back to the OP token to pay the OP team developing Optimism&rsquo;s open-source software.</p>
<h2>Stacks</h2>
<p>Stacks (STX) fell 14% in July, underperforming most L1s and L2s. The most telling metric of Stacks&rsquo; decline is the significant drop in the token&rsquo;s daily trading volumes. During the month of June, the STX token averaged $55 million in daily trading volumes, with a monthly high of $120 million traded on June 22nd, coinciding with a local maximum for the token price at $0.82. Conversely, this past month, the average daily trading volume plunged to around $23 million. On the surface level, it appears the underperformance this month is a simple mean reversion back to similar price levels before the few isolated days in June, with the token sitting just under $0.60. In the months of June and May, Stacks had emerged as among the most credible of the Bitcoin L2s, on which Ordinals might be traded. As the narrative dried up, trading volumes and general interest in Stacks also evaporated.</p>
<p>Diving deeper into Stacks&rsquo; on-chain data, we notice the number of daily active addresses has continuously declined since the start of the year. In fact, daily active addresses hovered around 1,000 since the beginning of July, which marks the longest consecutive period this year in that range. Whether we are measuring market cap-to-TVL or price-to-active addresses. STX appears to be discounting a high probability of exponential growth in users and deposits. Stacks&rsquo; market cap to active address ratio is among the highest since late spring, ahead of the protocol&rsquo;s &ldquo;Nakamoto&rdquo; consensus upgrade scheduled for November, which may increase the usability of the chain.</p>
<h3>Stacks Price vs Trading Volume</h3>
<p><img class="img-responsive w-100" src="https://www.vaneck.com/contentassets/6e1453b829474b1f83c07b4387d1d75a/3480_scl-blog_chart-03_2023.08_blog.svg" alt="Stacks Price vs Trading Volume" /></p>
<p class="chart-disclosure">Source: Coingecko as of 7/27/2023. Past performance is no guarantee of future results. Not intended as a recommendation to buy or sell any securities named herein.</p>
<h3>Stacks Daily Active Addresses YTD</h3>
<p><img class="img-responsive w-100" src="https://www.vaneck.com/contentassets/6e1453b829474b1f83c07b4387d1d75a/3480_scl-blog_chart-04_2023.08_blog.svg" alt="Stacks Daily Active Addresses YTD" /></p>
<p class="chart-disclosure">Source: Artemis as of 7/26/2023. Past performance is no guarantee of future results. Not intended as a recommendation to buy or sell any securities named herein.</p>
<h3>Stacks Users Dropping Faster than Market Capitalization</h3>
<p><img class="img-responsive w-100" src="https://www.vaneck.com/contentassets/6e1453b829474b1f83c07b4387d1d75a/3480_scl-blog_chart-05_2023.08_blog.svg" alt="Stacks Users Dropping Faster than Market Capitalization" /></p>
<p class="chart-disclosure">Source: Artemis as of 7/26/2023. Past performance is no guarantee of future results. Not intended as a recommendation to buy or sell any securities named herein.</p>
<p><strong>Fantom (FTM</strong>) suffered immensely this month with the hacking of the <strong>Multichain bridge</strong>, Fantom&rsquo;s most important bridge to Ethereum, taking centerstage. TVL of Fantom dropped from $200 million to $67 million following the exploit, during which $126 million was drained from its Ethereum liquidity pools, rendering the wrapped representation of these assets on Fantom worthless. This is because Multichain holds assets on one end of the bridge and mints a backed representation of each asset on the other end. When Multichain was attacked, the hacker took the locked assets on the Ethereum side, which caused the minted representations on Fantom to become worthless. Since Fantom has no native stablecoins, all the value in popular stablecoins on its chain, including USDC, USDT, and TUSD, were bridged representations, with Multichain dominating 80% of this market.</p>
<p>While the actual Fantom token itself was not exposed to the Multichain hack, the hack represents a loss of trust in the chain. As a result of the hack, Fantom saw its most popular lending protocol, Geist, halted and then abandoned as the value of its tokens became zero. While transactions, users, and fees increased for the month, this can be attributed to uncertainty-induced volatility and the rush to exit the Fantom ecosystem.</p>
<h3>Fantom TVL</h3>
<p><img class="img-responsive w-100" src="https://www.vaneck.com/contentassets/6e1453b829474b1f83c07b4387d1d75a/3480_scl-blog_chart-06_2023.08_blog.svg" alt="Fantom TVL" /></p>
<p class="chart-disclosure">Source: Artemis as of 7/26/2023. Past performance is no guarantee of future results. Not intended as a recommendation to buy or sell any securities named herein.</p>
<h2 id="GnosisPayDeepDive" class="jump-link-nav anchored-block" data-jumplink-title="Gnosis Pay Deep Dive">Stablecoins as Payments Infrastructure: Gnosis Pay Deep Dive</h2>
<p>The founding vision of cryptocurrency was to create a medium of exchange whose value was unalterable by central authorities who could depreciate the currency, censor what it could be used for, and restrict who could use it. While the first successful cryptocurrency, Bitcoin, fulfills much of the original vision, it fails to be practical for most people. This is because the Bitcoin network lacks the responsiveness, scalability, and simplicity necessary for mass consumer audiences. Also, its volatile value and lack of deep liquidity made it costly to hold and difficult to exchange.</p>
<p>To solve these problems, the next solution was stablecoins which are tokens whose value was pegged to a fiat currency by an algorithm or by being backed by off-chain assets. Stablecoins solve the issue of the risks of holding BTC and the challenges of hedging price exposure. Furthermore, more advanced blockchain designs solved time constraints that enabled payments to be settled in seconds rather than minutes. However, adopting cryptocurrencies for payments has remained elusive because most people simply do not want to deal with the blockchain. Users and merchants did not want to go through the added hassle of learning how to use wallets or the time commitment of exchanging crypto and fiat. Instead, merchants and consumers remained wedded to existing digital payments infrastructure using things like point-of-sale card station devices and credit cards.</p>
<p>The next attempt to solve the payments problem was to tie cryptocurrencies to debit cards. Thus emerged centralized exchanges like Binance, Coinbase, and Crypto.com, each offering debit cards that were linked to user exchange accounts. While users could deposit stablecoins, other digital assets, and fiat into their exchange accounts to be used by these debit cards, users were still shackled to centralized service providers who held custody over the users&rsquo; digital assets. At the same time, there was no direct link to a user&rsquo;s on-chain account.</p>
<p>Now, Gnosis Pay (GNO) has established an innovative product to solve some of these issues. Gnosis Pay is a decentralized payment network that allows someone to pay at any merchant who accepts Visa with the cryptocurrency in their on-chain account. Gnosis Pay can accomplish this feat through its partnership with <strong><a href="https://monerium.com/" title="Monerium" target="_blank" rel="noopener">Monerium</a></strong> and their &ldquo;EURe: which is a 1:1 Euro-backed stablecoin. On the backend, Monerium creates IBANs (international bank account numbers) for each card which links to each Gnosis Pay user&rsquo;s on-chain account. Because Monerium is connected to the Euro area&rsquo;s SEPA (Single Euro Payments Area) payment system, it can accept EURe tokens from Gnosis Pay users&rsquo; blockchain accounts, convert them into fiat and transmit them across SEPA to merchants at the point of sale. As a result, any user with EURe stablecoins in their on-chain wallet can use the Gnosis Pay debit card to pay at any merchant that accepts Visa. On the flip side, because each Gnosis Pay account has an associated IBAN, payments remitted in Euros are converted by Monerium into EURe stablecoins and sent to each account holder's blockchain wallet. All a user has to do is to have a balance of EURe stablecoins in their blockchain account linked to their Gnosis Pay debit card.</p>
<h3>EURe Supply ($USD)</h3>
<p><img class="img-responsive w-100" src="https://www.vaneck.com/contentassets/6e1453b829474b1f83c07b4387d1d75a/3480_scl-blog_chart-07_2023.08_blog.svg" alt="EURe Supply ($USD)" /></p>
<p class="chart-disclosure">Source: Defillama.com as of 7/28.2023. Past performance is no guarantee of future results. Not intended as a recommendation to buy or sell any securities named herein.</p>
<p>To use Gnosis Pay, each user will have to have an account on Gnosis Pay&rsquo;s Layer-2 blockchain of the Gnosis network. In practice, Gnosis Pay users must port token value from other blockchains, such as Ethereum, BSC, Gnosis, and Polygon, using the <strong><a href="https://l2beat.com/bridges/projects/omni" title="Omnibridge" target="_blank" rel="noopener">Gnosis Omnibridge</a></strong> to Gnosis Pay before the Gnosis debit card can use it. Or, they can send fiat payments to their Gnosis Pay IBAN, which will be converted into EURe stablecoins and deposited into their accounts.</p>
<p>When a user sends funds to the Gnosis Pay Layer-2, they are screened for AML behavior and given KYC/KYB check by an identity verification company called <a href="https://web.fractal.id/" title="Fractal ID" target="_blank" rel="noopener"><strong>Fractal</strong></a>. Once authorized and an account is created, a user authorizes the card to automatically draw from her or her blockchain account by linking it with the Gnosis Pay Application. The gas required for the transactions on the blockchain is taken care of by Gnosis Pay. In the future<strong>, MakerDAO&rsquo;s Spark Protocol</strong> could enable users to borrow EURe stablecoins against their wallet&rsquo;s non-stablecoin assets to make off-chain payments. Over time, Gnosis Pay will be available to other geographic regions like North America and Asia. Additionally, other stablecoins will be integrated into Gnosis Pay beginning in 4Q2023. Currently, the sign-up cost is &euro;30, and another &euro;10 for minting the card. There is a physical card, and eventually, a mobile card will be offered.</p>
<h3>Capabilities of Gnosis Pay's Architecture</h3>
<p><img class="desktop-image img-responsive" src="https://www.vaneck.com/contentassets/6e1453b829474b1f83c07b4387d1d75a/3480_scl_infography_blog_2023.08.svg" alt="Capabilities of Gnosis Pay's Architecture" /></p>
<p><img class="mobile-image img-responsive" src="https://www.vaneck.com/contentassets/6e1453b829474b1f83c07b4387d1d75a/3480_scl_infography_commentary_2023.08.svg" alt="Capabilities of Gnosis Pay's Architecture" /></p>
<p class="chart-disclosure">Source: Gnosis ETHCC Presentation.</p>
<p>We believe Gnosis Pay has made a substantial step forward that unlocks payments for everyday crypto users and Decentralized Autonomous Organizations (DAOs). DAOs, which are blockchain-based entities that often govern the business operations of on-chain applications, can now seamlessly pay for off-chain services in fiat, including vendor fees, employee wages, advertising, etc. Gnosis Pay has a high potential for adoption because many DAOs use Gnosis&rsquo;s Safe multi-signature wallet to secure their on-chain treasuries. Collectively, Gnosis SAFE products secure more than<a href="https://safe.global/" title="Safe" target="_blank" rel="noopener"><strong> $58B</strong></a> in value on blockchains for DAOs, and converting a significant fraction of those entities to Gnosis Pay appears probable.</p>
<p>At this stage, the biggest impediments to mass adoption are Gnosis&rsquo;s Pay&rsquo;s limited geographic scope, the necessity of using the Gnosis Pay L2, the low float of EURe, and the lack of support for USD-based stablecoins like USDT and USDC. From the standpoint of usability, the ability to tap into the US financial system will be the biggest ongoing hurdle for Gnosis Pay growing widespread usage. From a regulatory perspective, it will be difficult for them to get partners, but it is almost certainly a top priority for the project&rsquo;s team.</p>
<p>Another impediment to the greater success of Gnosis Pay is that it requires funds to be on the Gnosis Pay L2. The experience of bridging to Gnosis Pay is risky and time-consuming, and it exposes users to the risks of Gnosis Pay&rsquo;s L2. Furthermore, because the supply of EURe is small at only $12M, there is not enough liquidity to feed a rapidly growing user base. This relatively small asset base makes it challenging for users to swap other assets for EURe without significantly moving the EURe price away from its peg.</p>
<p>Gnosis Pay is not alone in its non-custodial crypto debit cards, as the competitive marketplace is growing quickly. Some top constituents include <strong><a href="https://holyheld.com/" title="Holyheld" target="_blank" rel="noopener">Holyheld</a></strong>, <strong><a href="https://basedapp.io/" title="BasedApp" target="_blank" rel="noopener">BasedApp</a></strong>, <strong><a href="https://support.stables.money/en/" title="Stables" target="_blank" rel="noopener">Stables</a></strong>, and <a href="https://suberra.com/blog/meet-the-suberra-card" title="Meet the Suberra Card" target="_blank" rel="noopener"><strong>Suberra</strong></a>. While each of these competitors has shown potential, each is currently limited to its geographical areas due to banking system challenges and regulatory constraints. Holyheld is limited to EU residents, BasedApp is relegated to Singaporeans, and Stables is accessible only to Australians. On the other hand, Suberra, which has yet to launch its card, will be available to users in the US. The biggest drawback of the competing offerings is user experience. In the case of BasedApp, Stables, and Holyhold, users must manually convert stablecoins to fiat currencies to &ldquo;top-up&rdquo; their fiat bank accounts to have funds to spend on the card. Gnosis Pay, by contrast, automatically pulls EURe balances when using a debit card. Additionally, the debit card holder must manually convert the fiat from their bank account into crypto to have the value back on the blockchain.</p>
<p>Currently, the fee structure for Gnosis Pay is unknown, as is Suberra&rsquo;s, but the other competitive products have public fee structures that vary widely. BasedApp charges no fees on transfers but a card create fee and foreign transaction fees. It seems their monetization model relies upon the interest generated by holding the SGD that backs SGD stablecoins. Holyheld, on the other hand, has a deep menu of different types of charges for its product. It tells users to create new cards and charges them for crypto to fiat conversions at 0.75% for topping up the card or exchanging fiat for crypto. Additionally, Holyheld charges for a litany of other account actions, including outgoing fiat payments, fair usage charges, and account pin number change fees. By contrast, Stables does not charge for transfers or card usage but instead charges users a 1.5% fee when they swap between fiat and crypto to &ldquo;top up&rdquo; or withdraw from their fiat account.</p>
<p>Going forward, Gnosis has many different pathways it can choose to take that could lead to mass adoption. The chief obstacle it faces today is the strong user experience of the credit card ecosystem. While users love the simplicity of paying for things using credit cards and the rewards generated, merchants dislike the process of obfuscating credit card fees in higher consumer prices and/or paying for credit card charges themselves. Point of Sale devices like Stripe create even more costly overhead for consumer businesses. For example, Strip takes 2.7% on each transaction and a $0.05 fee. Gnosis Pay&rsquo;s success could be found by unrooting this merchant-imposed, odious high fee structure that credit cards impose on the exchange of goods and services.</p>
<p>Gnosis could cut into this financial services racket by pushing merchants to charge lower fees for users of its cards through discounts to consumers (whether by lower prices for debit card purchases or higher prices for credit card purchases). This is not only because Gnosis would circumvent the credit card fees but also because Gnosis could send merchants rewards for charge activities using Gnosis Pay. This program could be paid for by Gnosis making an agreement with Monerium to remit some of the interest received from the Euros that back the EURe stablecoins to the merchants. While this would decrease Monerium's margin on the EURe business, it could be a catalyst that massively expands the market potential for EURe due to ardent merchant zest for Gnosis&rsquo;s economical solution. However, this pathway would be the first step towards getting both the merchant and consumer off existing expensive, card-based point-of-sale infrastructure. In the long term, Gnosis will likely push both the consumer and the merchant to accept blockchain payments using wallet-based services, most likely embedded in cell phones. Regardless of the outcome, this initial entry point by Gnosis Pay is genuinely exciting and, if it lives up to its promise, could ultimately spur legislation in the United States on stablecoins. Additionally, the Gnosis architecture could help a &ldquo;super-app,&rdquo; such as X.com (formerly Twitter), launch a self-custody-based digital asset payment platform. In July, Twitter received its first three state money service business (MSB) licenses.</p>
<h2 id="DeFiUpdates" class="jump-link-nav anchored-block" data-jumplink-title="DeFi Updates">DeFi</h2>
<p>The MarketVector Decentralized Finance Leaders Index (MVDFLE) ended July +3%, outperforming Ether&rsquo;s 3% price decline. The performance was mainly supported by <strong>Uniswap (UNI)</strong>, which rallied 20% this month and represented ~33% of the index. <strong>DYDX</strong> and <strong>AAVE</strong> both notched gains this month, rising 6% and 1%, respectively, while <strong>LDO</strong> and <strong>CRV</strong> held the index back, falling 11% and 21%, respectively. MakerDAO stood out this month as its token, MKR, rallied an impressive 48% after the founder purchased more MKR, and the DAO&rsquo;s estimated annual profit rose from real-world asset acquisition. Defi TVL dropped from $45.2b to $40.9b in July, driven by the falling price of Ether and the Curve exploit, resulting in many users withdrawing their assets from the protocol. Additionally, overall lending protocol TVL has now surpassed that of decentralized exchanges. This can be attributed to the growing adoption of Ether LSD products and the ease with which users can create negative-interest loans. Such creation is facilitated by the yield-bearing properties of LSD tokens, making them an attractive option for users seeking efficient debt management solutions.</p>
<p>Over the last three months, MakerDAO has undertaken a significant transition in its asset composition. The platform has gradually reduced its reliance on USDC as the main asset backing DAI, decreasing it from 50% to approximately 9%. Instead, MakerDAO has adopted yield-bearing real-world assets (RWA), which now constitute over 50% of its assets, amounting to approximately $2.4 billion, according to data from a Dune dashboard by @SebVentures. This strategic shift has resulted in a remarkable surge in MakerDAO's estimated annual profit. Since the beginning of May, the estimated profit has nearly quadrupled, rising from $23 million to an impressive $86 million, as reported on makerburn.com.</p>
<h3>MakerDAO Monthly Profits</h3>
<p><img class="img-responsive w-100" src="https://www.vaneck.com/contentassets/6e1453b829474b1f83c07b4387d1d75a/3480_scl-blog_chart-08_2023.08_blog.svg" alt="MakerDAO Monthly Profits" /></p>
<p class="chart-disclosure">Source: VanEck Research, makerburn.com as of 7/31/23.</p>
<p>Furthermore, MakerDAO successfully passed the Enhanced DAI Savings Rate proposal. This new development allows DAI holders to earn up to 8% interest by depositing their DAI into the DAI Savings Rate (DSR). The elevated rate will remain in effect until 20% of DAI is deposited into the DSR, providing a very attractive earning opportunity for DeFi users. Currently, just over $300 million of DAI has been deposited into the DSR, about 6.5% of the circulating supply. MakerDao also introduced the Smart Burn Engine, designed to utilize DAI from the Surplus Buffer. This initiative aims to purchase MKR tokens and pair them with DAI, depositing them into the Uniswap V2 DAI-MKR liquidity pool, providing alternative methods for managing MKR tokens. Despite MakerDAO's remarkable growth, DAI's market capitalization still experienced a decline, falling by approximately $90 million in July to $4.56 billion, as stablecoin liquidity dried up, given the lack of volatility and leverage available to borrowers.</p>
<p>On top of the positive fundamental developments at MakerDAO, Rune Christensen, the co-founder of MakerDAO, sold about 13 million LDO tokens and subsequently purchased 32,637 MKR tokens at an average price of $734. This move has already proven advantageous, with Rune's trade up over 50% based on the current price of MKR. Conversely, observations by anonymous Twitter user @0xSisyphus pointed out that A16Z and Paradigm, two prominent venture capital firms, are potentially selling MKR tokens. This speculation arose as both firms withdrew MKR from the governance contract and transferred it to Coinbase. It's worth noting that A16Z acquired 6% of the Maker supply in 2018 at a fully diluted value (FDV) of $250 million, and Paradigm acquired 5.5% of the Maker supply in 2019 at a $500 million FDV, meaning both investments have underperformed Ethereum significantly over the same period.</p>
<h2>Curve &amp; Conic Exploit</h2>
<p>The crvUSD market cap briefly rose over $100m in July but retreated below $90m following a ~$5 million exploit of Conic Finance. Then, on the 30th of the month, some liquidity pools using ETH were exploited due to a compiler reentrancy vulnerability in the version of Vyper used to code the smart contracts. The pools impacted included alETH/ETH, msETH/ETH, pETH/ETH, and CRV/ETH. Teams attempted to whitehack as many pools as they could before they were exploited, and at the time of writing, it would appear that ~$50 million was lost. For context, these pools combined held a fraction of Curve&rsquo;s TVL, but many users and protocols removed liquidity out of fear, and Curve&rsquo;s TVL fell ~50%. Hopefully, this liquidity will return as things normalize.</p>
<h2>LSDFi (Liquid Staked DeFi)</h2>
<p>The LSDFi narrative is witnessing a significant surge as the staking of ETH to the beacon chain continues. Users are actively depositing their liquid-staked ETH into protocols that allow them to capture higher yields or unlock new utility. The growing amount of staked Ether &ndash; 22M ETH staked across 700k validators, representing 19% of total supply and growing - is expected to yield benefits for these protocols, as they allow users to earn more ETH or create negative interest rate loans with their LSDs. Notably, <strong>Pendle, Lybra,</strong> and <strong>Origin</strong> protocols saw significant TVL growth last month. Moreover, the introduction of Yearn into the LSD scene has generated anticipation for the full launch of their st-yETH vault. We count $600M+ in TVL across these LSDFi protocols, up from $200M in May. We share details on three strong competitors below.</p>
<h2>Pendle</h2>
<p>In July, Pendle introduced Pendle Earn, a streamlined version of their yield trading platform. This new offering allows users to earn an upfront fixed yield on their yield-bearing assets. While retaining the option for speculative and directional trading on variable yield, the protocol now enables users to toggle between <i>Trade</i> and <i>Earn</i> mode on their browser to access either the more comprehensive platform or, the newer simplified version. The rebranding of Pendle Earn has proven highly successful, evident in the significant increase in total value locked, which surged by approximately $30 million to reach $154M million this month, marking an impressive 24% growth.</p>
<p>Furthermore, Pendle has been granted support from ETH L2 <strong>Mantle Network</strong>, a strong signal of recognition and endorsement for Pendle as a new DeFi primitive. This grant incentivizes Pendle to expand its presence to the newly launched chain, showcasing the platform's growing reputation and appeal within the DeFi space. Pendle's achievements underscore the importance of simplifying user experiences in DeFi, as it often plays a pivotal role in driving user adoption of new innovative financial products in DeFi.</p>
<h3>Pendle TVL Growth YTD</h3>
<p><img class="img-responsive w-100" src="https://www.vaneck.com/contentassets/6e1453b829474b1f83c07b4387d1d75a/3480_scl-blog_chart-09_2023.08_blog.svg" alt="Pendle TVL Growth YTD" /></p>
<p class="chart-disclosure">Source: VanEck Research, DefiLlama as of 7/31/23.</p>
<h2>Lybra</h2>
<p>Lybra Finance, who launched their yield-bearing stablecoin, eUSD, continued to grow in July from $276 million TVL to over $380 million. The lion&rsquo;s share of this growth came from the continued adoption of eUSD, which saw a $56 million increase in market cap from $136 million to $192 million at the time of writing. Additionally, Lybra released their v2 documentation, which will allow for new LSD products to be used as collateral and see LBR and peUSD deployed as LayerZero Omnichain Fungible Tokens (OFT) to be used on Arbitrum, among other protocol enhancements. This should only continue to bolster the protocol&rsquo;s growth as more LSD liquidity is bridged to layer 2 blockchains to avoid the high transaction costs of Ethereum.</p>
<h2>Origin</h2>
<p>Origin Protocol saw significant growth in their liquid staked ether product, Origin Ether, which nearly doubled its TVL in July from $44m to $84m. This was mainly a result of the $110k incentive given to vlCVX holders to vote for CRV emissions to be distributed to the ETH+oETH pool on Curve. Additionally, 20% of protocol fees will go to lock CVX so the protocol can continue to incentivize the liquidity of their LSD product. Origin&rsquo;s success this month highlights how protocols can leverage the existing DeFi ecosystem to incentivize protocol growth. By making it economically worthwhile for vlCVX holders to direct CRV emissions to the ETH-oETH pool, Origin can begin to create a flywheel effect. Users provide liquidity to earn CRV rewards, which grows the oETH TVL and allows Origin to lock more CVX, resulting in more incentives directed toward the ETH-oETH pool.</p>
<h2>Yearn</h2>
<p>Yearn has commenced bootstrapping its yETH product this month in preparation for its full-scale launch. Following the closure of deposits last weekend, the product is set to launch with a Total Value Locked (TVL) of $3.9 million, having attracted ~$9,500 in monthly incentives from various LSD protocols and centralized exchanges offering LSD products. These entities are vying for significant allocations of the yETH LSD basket. Notably, Swell Network's largest incentive of ~$3,600 has been allocated to bolster swETH's initial weight in the vault, bolstering the product's appeal and potential yield generation. Based on the current proportion of incentives to deposits, it is estimated that the yETH product will provide an approximate annual percentage yield (APY) of ~3% on top of the yield derived from the underlying LSDs. Furthermore, with the inclusion of swap yields, the yETH vault is poised to be highly competitive compared to traditional LSDs.</p>
<h2 id="NFTsUpdates" class="jump-link-nav anchored-block" data-jumplink-title="NFTs Updates">NFTs</h2>
<p>In the month of July, the NFT market experienced its fifth consecutive monthly decline in volume. Blur maintained its position as the leading NFT exchange by volume, accounting for over 70% of the total NFT volume. However, it's essential to recognize that despite its dominance in volume, OpenSea still outpaced Blur significantly in terms of users and trades, indicating that Blur's primary user base still consists mainly of NFT power users. Blur's peer-to-peer NFT lending platform, Blend, also remained a driving force in NFT loan markets, enabling nearly 94% of loan volume in July. However, there was a noticeable decline in NFT loans throughout the month, with the weekly average loan volume dropping from approximately $180 million in June to around $102 million.</p>
<h3>NFT Volume: Blue vs. OpenSea</h3>
<p><img class="img-responsive w-100" src="https://www.vaneck.com/contentassets/6e1453b829474b1f83c07b4387d1d75a/3480_scl-blog_chart-10_2023.08_blog.svg" alt="NFT Volume: Blue vs. OpenSea" /></p>
<p class="chart-disclosure">Source: VanEck Research, @Hildobby as of 07/31/23.</p>
<p class="chart-disclosure">Past performance is no guarantee of future results. Not intended as a recommendation to buy or sell any securities named herein.</p>
<h2 id="MetaverseandWeb3GamingUpdates" class="jump-link-nav anchored-block" data-jumplink-title="Metaverse &amp; Web3 Gaming Updates">Metaverse &amp; Gaming: Performance &amp; Fundamentals</h2>
<p>The Market Vector Media and Entertainment Leaders Index returned -2% for the month of July, nearly matching ETH&rsquo;s price decline. APE continued to sell off throughout the month, falling 16%, while its peers, SAND and MANA, recorded losses of only 2.5% and 4%, respectively. APE&rsquo;s underperformance is magnified by its staking program, which rewards APE holders an unsustainable 49% APY for staking their tokens. Meanwhile, on the Web3 gaming front, active users across the top Web3 games we track fell by 2%, a symptom of the lackluster IP produced and the failure to address the needs of Web2 gamers.</p>
<h2>Web3 Gaming: Understanding Gamer Preferences and Industry Trends</h2>
<p>In the Web3 gaming industry, a significant problem has become clear: an overestimation of additional features that truly resonate with gamers. The status quo indicates a strong preference among gamers for marketplaces that facilitate the buying and selling of in-game items, as exemplified by the thriving gray markets for trading Counter-Strike skins. We believe contemporary Web3 games must adopt a more focused approach, deploying smart contracts solely for elements that add tangible value to the gamer&rsquo;s experience. Key aspects include representing valuable in-game items as NFTs on the backend and providing a web2-like interface for seamless item trading on the front end.</p>
<p>At the forefront of utilizing blockchain to deliver value to gamers, <strong>ImmutableX</strong> has been lauded for its emphasis on aggregating NFT liquidity, creating an intuitive wallet management experience through the Immutable Passport, and leveraging established online gaming marketplaces such as the Epic Game Store and Gamestop NFT marketplace. <strong>Mythical Games</strong> has also emerged as a prominent competitor by challenging the notion of needing the blockchain for anything other than NFTs representing in-game items. They have adopted a different strategy than many other games, launching their apps on major app stores despite Apple and Google's egregious 30% tax levied on in-app purchases while simultaneously establishing their marketplace, DMarket. This approach allows them to reach a broader audience and naturally incentivizes users to engage with DMarket due to more favorable pricing. Notably, DMarket has executed an impressive $162 million in NFT sales since its inception, as reported by Cryptoslam! Despite this success, the MYTH token has underperformed the broader crypto market.</p>
<p>Another noteworthy trend observed in the Web3 gaming space is the significance of valuable Intellectual Property (IP) tied to existing user interests. Successful games tend to center around popular sports themes, exemplified by Sorare, NBA TopShot, and NFL All Day. Mythical Games follows this trend with their NFL Rivals game, boasting over 1 million players and earning the prestigious position of being ranked as the #1 Sports game on the Apple app store, currently maintaining a strong position at #4.</p>
<p>As the Web3 gaming industry continues to evolve, staying attuned to gamer preferences and industry trends remains crucial for sustained success. Currently, we think the teams that address the most direct concerns from gamers and create games that appeal to things people already have a passion for (such as sports, fashion, and social experiences) will be the most successful. Given the lack of widespread adoption and the less robust monetization models of current gaming tokens, we have limited our investments in the space.</p>
<p><strong>Links to third party websites are provided as a convenience and the inclusion of such links does not imply any endorsement, approval, investigation, verification or monitoring by us of any content or information contained within or accessible from the linked sites. By clicking on the link to a non-VanEck webpage, you acknowledge that you are entering a third-party website subject to its own terms and conditions. VanEck disclaims responsibility for content, legality of access or suitability of the third-party websites.</strong></p>
<p>To receive more <strong><a href="https://www.vaneck.com/us/en/insights/digital-assets/" title="Digital Assets Insights">Digital Assets</a></strong> insights, <strong><a href="https://www.vaneck.com/us/en/subscribe/" title="Subscription Center">sign up in our subscription center</a></strong>.</p>
<style type="text/css">
    .wrapped-div {
        max-width: 100%;
    }

    @media (max-width: 1240px) {
        .wrapped-div {
            overflow-x: scroll;
        }
    }

    .wrapped-div-sector {
        max-width: 100%;
        overflow-x: scroll;
    }


 }
</style>
<style>
 .widgetBody .desktop-image {
 display: block;
 }

 .widgetBody .mobile-image {
 display: none;
 }

 @media screen and (max-width: 425px) {
 .widgetBody .desktop-image {
 display: none;
 }

 .widgetBody .mobile-image {
 display: block;
 }
 }
</style>
]]></content:encoded>
</item><item rdf:about="https://www.vaneck.com/us/en/blogs/income-investing/clos-continue-to-climb-as-spreads-tighten-and-coupons-rise/">
  <title>CLOs Continue to Climb As Spreads Tighten and Coupons Rise></title>
  <link>https://www.vaneck.com/us/en/blogs/income-investing/clos-continue-to-climb-as-spreads-tighten-and-coupons-rise/</link>
  <description><![CDATA[CLOs generated strong returns in June, with a hawkish Fed driving coupons higher and a rally in spreads. CLOI continues to outperform its benchmark in 2023.]]></description>
  <dc:creator> </dc:creator>
  <dc:date>07/28/2023 06:30:00</dc:date>
<content:encoded><![CDATA[

<p>The <strong><a href="/link/e090deaddc774ac699a04b959d9254c6.aspx" title="CLOI - VanEck CLO ETF - Overview">VanEck CLO ETF (the &ldquo;Fund&rdquo;)</a></strong> has outperformed its benchmark, the J.P. Morgan CLO Index year-to-date through June 30, 2023 and since the fund launched in June 2022. In the second quarter, however, the Fund&rsquo;s more conservative positioning detracted from performance amid a rally in risk asset classes. Security selection, however, added to performance and has been the main contributor to outperformance since the Fund launched. Relative value opportunities from security and manager selection remain the focus, while the Fund stays higher in quality. When the market backdrop improves, we expect to add exposure further down the capital stack.</p>
<h2 id="MarketUpdate" class="jump-link-nav anchored-block" data-jumplink-title="Market Update">Market Update</h2>
<p>CLOs generated the strongest monthly total returns since January, alongside strong performance across most risk asset classes, as investor sentiment improved markedly in June. This came despite a Fed narrative that was more hawkish than many investors&rsquo; expectations. Specifically, despite the rate hike pause at their June meeting, the median interest rate dot for 2023 was revised higher to show two more hikes this year with this projection widely held among FOMC participants. On the positive side, the Fed&rsquo;s preferred measure of inflation came in lower than expected in May. Core PCE rose 4.6% year-over-year, down from 4.7% in April and below economists&rsquo; median estimates. The technical backdrop remained supportive as lower new issuance was met by higher TRACE supply, helping to drive secondary CLO spreads tighter. US Treasury rates increased in June, with 5- and 10-year Treasury rates trading 40 bps and 19 bps higher during the month, respectively.</p>
<p>CLOs outperformed investment grade and high yield corporate bonds, as well as core U.S. bonds, during the quarter but underperformed leveraged loans.</p>
<div class="wrapped-div">
<table style="width: 750px;">
<tbody>
<tr class="tbl-data">
<td class="tbl-header last">Asset Class</td>
<td class="tbl-header last" style="text-align: center;">Q2 2023 Return (%)</td>
<td class="tbl-header last" style="text-align: center;">Yield to Worst (%)</td>
<td class="tbl-header last" style="text-align: center;">Spreads (bps)</td>
</tr>
<tr class="tbl-data">
<td class="data-td last" style="font-weight: normal;">CLOs</td>
<td class="data-td data last">2.43</td>
<td class="data-td data last">7.11</td>
<td class="data-td data last">276</td>
</tr>
<tr class="tbl-data">
<td class="data-td last" style="font-weight: normal; padding-left: 15px;">AAA</td>
<td class="data-td data last">2.04</td>
<td class="data-td data last">6.43</td>
<td class="data-td data last">197</td>
</tr>
<tr class="tbl-data">
<td class="data-td last" style="font-weight: normal; padding-left: 15px;">AA</td>
<td class="data-td data last">2.46</td>
<td class="data-td data last">6.74</td>
<td class="data-td data last">261</td>
</tr>
<tr class="tbl-data">
<td class="data-td last" style="font-weight: normal; padding-left: 15px;">A</td>
<td class="data-td data last">3.62</td>
<td class="data-td data last">7.48</td>
<td class="data-td data last">340</td>
</tr>
<tr class="tbl-data">
<td class="data-td last" style="font-weight: normal; padding-left: 15px;">BBB</td>
<td class="data-td data last">3.84</td>
<td class="data-td data last">9.36</td>
<td class="data-td data last">532</td>
</tr>
<tr class="tbl-data">
<td class="data-td last" style="font-weight: normal; padding-left: 15px;">BB</td>
<td class="data-td data last">4.70</td>
<td class="data-td data last">14.58</td>
<td class="data-td data last">1024</td>
</tr>
<tr class="tbl-data">
<td class="data-td last" style="font-weight: normal;">Investment Grade Corporates</td>
<td class="data-td data last">-0.21</td>
<td class="data-td data last">5.56</td>
<td class="data-td data last">130</td>
</tr>
<tr class="tbl-data">
<td class="data-td last" style="font-weight: normal;">U.S. Agg</td>
<td class="data-td data last">-0.82</td>
<td class="data-td data last">4.85</td>
<td class="data-td data last">54</td>
</tr>
<tr class="tbl-data">
<td class="data-td last" style="font-weight: normal;">Leveraged Loans</td>
<td class="data-td data last">3.17</td>
<td class="data-td data last">10.19</td>
<td class="data-td data last">476</td>
</tr>
<tr class="tbl-data">
<td class="data-td last" style="font-weight: normal;">High Yield Bonds</td>
<td class="data-td data last">1.63</td>
<td class="data-td data last">8.56</td>
<td class="data-td data last">405</td>
</tr>
</tbody>
</table>
</div>
<br />
<p class="chart-disclosure"><strong>Source: JP Morgan and ICE Data Indices as of 6/30/2023.</strong> CLOs represented by J.P. Morgan Collateralized Loan Obligation Index, AAA Rated CLOs represented by J.P. Morgan CLO AAA Index, AA Rated CLOs represented by J.P. Morgan CLO AA Index, A Rated CLOs represented by J.P. Morgan CLO A Index, BBB Rated CLOs represented by J.P. Morgan CLO BBB Index, BB Rated CLOs represented by J.P. Morgan CLO BB Index, Investment Grade Corporates represented by ICE BofA US Corporate Index, US Agg is represented by the ICE BofA US Broad Market, Leveraged Loans represented by JP Morgan Leveraged Loan Index and High Yield Bonds represented by ICE BofA US High Yield Index. Index performance is not representative of Fund performance. It is not possible to invest directly in an index.</p>
<p>Per Barclays Research, CLO new issue supply decreased over 50% month-over-month, with $4.3 bn pricing during the month compared to $10.5bn in May, the lightest level of primary issuance since August 2020. Year-to-date new issuance of $54.8bn is now trailing year-to-date activity in 2022 by 25%. The first reset since March priced during the month for $0.4bn. Year-to-date refinance and reset volumes of $0.8bn is 97% lower than the first half of 2022.</p>
<p>In the secondary market, TRACE supply was higher at $15.9bn from $14.3bn in May, per Morgan Stanley. Investment grade volumes increased to $12.4bn from $11.8bn and below investment grade volumes increased to $3.5bn from $2.5bn. Total BWIC volumes increased to $4.3bn in June from $4.0bn in May.</p>
<p>There were six defaults in the Morningstar U.S. Leveraged Loan Index this month, increasing the trailing 12-month default rate by par outstanding to 1.71%, from 1.58% in May. We anticipate the default rate to remain below historical averages in the near-term for the leveraged loan market, notwithstanding ongoing interest rate increases and indications that the Fed will maintain higher interest rates throughout 2023. However, our expectations are that defaults will increase in 2023-2024 period to 3-4%, above the long-term historical average of about 3%.</p>
<p>CLO fundamentals were mixed month-over-month.</p>
<h2 id="PortfolioStrategy" class="jump-link-nav anchored-block" data-jumplink-title="Portfolio Strategy">Portfolio Strategy</h2>
<p>The Fund returned 2.07% in the second quarter of the year, underperforming its benchmark, the J.P. Morgan CLO Index by 0.36%. The Fund became more conservatively positioned through the quarter, with approximately 85% of the Fund in AAA rated CLOs as of 6/30/2023, which is a 16% overweight versus the benchmark. Similarly, with no exposure to CLOs rated BBB and below, the Fund is underweight lower rated tranches. Although this more conservative positioning detracted from performance during the quarter amid a rally in risk assets, this was partially offset by security selection.</p>
<p>As central banks increased rates in 2022 and have continued to increase thus far in 2023, the borrowing rate for leveraged loan borrowers has risen. However, following the interest rate increase in May, the Fed left the target rate unchanged in June and recent economic releases have created additional uncertainty about the path forward. That said, rating agencies are vigilant and increased coupon payments for borrowers means that interest coverage ratios have declined and will continue to do so during the second half of the year as the lagged effect of rate increases takes hold. As companies report pressures on earnings, borrowers&rsquo; financial positions will continue to weaken. The result will be higher leverage and lower interest coverage ratios, leading to the risk of downgrade.</p>
<p>For the start of 2023, we looked to benefit from continued increases in interest rates, allowing for increased coupon income. While below investment grade tranches now seem attractive on an historical basis, the coupon pickup relative to AAA&rsquo;s doesn&rsquo;t appear as attractive on a risk-adjusted basis given expectations for the pace of downgrades to pick up during the second half of 2023. As a result, we continue to position portfolios conservatively with the ability to shift into lower rated tranches later in the year when spreads widen. The positioning in the top part of the capital stack in CLOs (AAA/AA/A) buffers investors from lower tranche downgrades or losses at the equity tranche level. Buying in the primary market allows for wider spreads compared to the secondary market, although primary issuance has been low and is expected to remain muted given challenges to the equity arbitrage. We continue to find much of the secondary market attractive as spreads widened over the second quarter, near levels from the fourth quarter of 2022, and purchases below par provides for attractive positive convexity.</p>
<h3>CLOI Total Return and Credit Allocation</h3>
<p><img class="img-responsive w-100" src="https://www.vaneck.com/contentassets/5e34946fc29c452998e80533775507b6/3464_cloi-2q-blog_chart-1_2023.07_v2_blog.svg" alt="CLOI Total Return and Credit Allocation" /></p>
<p class="chart-disclosure"><strong>Source: FactSet, JPMorgan, VanEck, As of June 30, 2023.</strong> Index performance is not representative of Fund performance. It is not possible to invest directly in an index.</p>
<h2 id="Outlook" class="jump-link-nav anchored-block" data-jumplink-title="Outlook">Outlook</h2>
<p>Labor markets and consumer spending remain strong despite persistent, albeit declining, inflation. While there have been improvements in inflation data, the speed to normalization remains a key question. We believe the Fed&rsquo;s focus will be on addressing lapses in regulatory supervision and reversing the latest temporary surge in its balance sheet. We expect to see Fed balance sheet declines through quantitative tightening despite seeking to pause policy rate hikes. Ultimately, we expect to see higher inflation and yields compared to the last cycle (albeit lower than at present), stemming from tighter labor markets and the splitting of global supply chains as companies address rising geopolitical tensions. However, current Treasury yields now offer a positive real yield, and as inflation belatedly fades from current high levels, a more attractive risk/reward profile for fixed income investors will emerge.</p>
<p>First quarter earnings season started off strong, but lagged as we got into private filers, increasing volatility as earnings season progressed. We expect the economy and corporate profits to slow as the lagged impact of restrictive monetary policy takes hold. We expect default rates to peak in the 3-4% range and then likely stay around that level for some time. We also believe volatility will persist given the likely slowing of the economy in Q4 2023/Q1 2024, which should manifest itself in earnings dispersion for underlying issuers. As a result, manager selection remains key. We expect CLO spreads to trade in a range for the next 3-6 months and see spreads and yields attractive under most market scenarios over the next twelve months. We also expect the CLO market to be supported by the technical backdrop, as we anticipate new issuance to remain muted given the arbitrage challenges. This should limit the potential for any extreme spread widening in the near term.</p>
<p>At some point, central banks will pause or pivot, with the Fed already holding rates steady at their June meeting, and interest rates will decline at some future period, likely Q4 2023 or 2024. At that time, we anticipate credit spreads to tighten. This will allow for portfolios constructed with purchases in the secondary market to benefit from the significant redemption optionality in CLOs, which will be refinanced, reset, or outright called once the leveraged loan market recovers in price and CLO spreads tighten. As CLO tranches are priced to worst, the yield to maturity, spread, and convexity are underpriced given the optionality to be redeemed prior to maturity.</p>
<p>Against this backdrop, we continue to position portfolios in investment grade tranches, purchasing attractively priced credits in the secondary market and looking to add relative value at the security and manager selection level. We expect that the backdrop will begin to improve during the second half of the year, at which point we would begin to add BBB and below investment grade rated classes to portfolios.</p>
<div class="wrapped-div">
<table style="width: 100%;">
<tbody>
<tr class="tbl-data">
<td class="tbl-header last" colspan="9">Average Annual Total Returns (%) as of June 30, 2023</td>
</tr>
<tr class="tbl-data">
<td class="data-head last">&nbsp;</td>
<td class="data-head last">1 Month*</td>
<td class="data-head last">3 Month*</td>
<td class="data-head last">YTD</td>
<td class="data-head last">1 Year</td>
<td class="data-head last">3 Year</td>
<td class="data-head last">5 Year</td>
<td class="data-head last">10 Year</td>
<td class="data-head last">LIFE<br />6/21/2022</td>
</tr>
<tr class="tbl-data">
<td class="data-td last" style="font-weight: normal;">CLOI (NAV)</td>
<td class="data-td data last">0.89</td>
<td class="data-td data last">2.07</td>
<td class="data-td data last">4.57</td>
<td class="data-td data last">7.89</td>
<td class="data-td data last">--</td>
<td class="data-td data last">7.78</td>
</tr>
<tr class="tbl-data">
<td class="data-td last" style="font-weight: normal;">CLOI (Share Price)</td>
<td class="data-td data last">0.89</td>
<td class="data-td data last">2.13</td>
<td class="data-td data last">4.46</td>
<td class="data-td data last">7.70</td>
<td class="data-td data last">--</td>
<td class="data-td data last">7.97</td>
</tr>
<tr class="tbl-data">
<td class="data-td last" style="font-weight: normal;">J.P. Morgan Collateralized Loan Obligation Index</td>
<td class="data-td data last">0.99</td>
<td class="data-td data last">2.43</td>
<td class="data-td data last">4.45</td>
<td class="data-td data last">7.50</td>
<td class="data-td data last">--</td>
<td class="data-td data last">7.08</td>
</tr>
</tbody>
</table>
</div>
<br />
<p class="chart-disclosure"><sup>*</sup>&nbsp;Returns less than one year are not annualized.</p>
<p class="chart-disclosure"><strong>The performance data quoted represents past performance. Past performance is not a guarantee of future results. Investment return and principal value of an investment will fluctuate so that an investor's shares, when redeemed, may be worth more or less than their original cost. Performance may be lower or higher than performance data quoted. Please call 800.826.2333 or visit vaneck.com for performance current to the most recent month ended.</strong></p>
<p class="chart-disclosure"><strong>The gross expense ratio for CLOI is 0.4%. CLOI Fees &amp; Expenses: Van Eck Associates Corporation (the &ldquo;Adviser&rdquo;) will pay all expenses of the Fund, except for the fee payment under the investment management agreement, acquired fund fees and expenses, interest expense, offering costs, trading expenses, taxes and extraordinary expenses. Notwithstanding the foregoing, the Adviser has agreed to pay the offering costs until at least May 1, 2024.</strong></p>
<p class="chart-disclosure">The "Net Asset Value" (NAV) of a Fund is determined at the close of each business day, and represents the dollar value of one share of the fund; it is calculated by taking the total assets of the fund, subtracting total liabilities, and dividing by the total number of shares outstanding. The NAV is not necessarily the same as the ETF 's intraday trading value. Investors should not expect to buy or sell shares at NAV.</p>
<p>To receive more <a href="https://www.vaneck.com/us/en/insights/income-investing/" title="Income Investing insights"><strong>Income Investing</strong></a> insights, <a href="https://www.vaneck.com/us/en/subscribe/" title=" Subscription Center"><strong>sign up in our subscription center</strong></a>.</p>
<style type="text/css">
    .wrapped-div {
        max-width: 100%;
    }

    @media (max-width: 1024px) {
        .wrapped-div {
            overflow-x: scroll;
        }
    }

    .wrapped-div-sector {
        max-width: 100%;
        overflow-x: scroll;
    }
</style>
]]></content:encoded>
</item><item rdf:about="https://www.vaneck.com/us/en/blogs/digital-assets/hivemapper-why-we-are-bullish/">
  <title>Hivemapper: Why We&#39;re Bullish></title>
  <link>https://www.vaneck.com/us/en/blogs/digital-assets/hivemapper-why-we-are-bullish/</link>
  <description><![CDATA[Hivemapper's crowdsourced, crypto-based mapping could disrupt the market, with its token $HONEY's value derived from factors including market size, share, token velocity, and circulation.]]></description>
  <dc:creator>Pranav Kanade</dc:creator>
  <dc:date>07/27/2023 06:30:00</dc:date>
<content:encoded><![CDATA[

<p><strong>Please note that VanEck may have a position(s) in the digital asset(s) described below.</strong></p>
<p>Please note, VanEck has made its first side pocket investment in Hivemapper's HONEY token. This investment was made through a transaction directly with Hivemapper, Inc. Post purchase, VanEck owns less than 75 bps of the fully diluted token supply. Our investment comes with a 1 year lock up.</p>
<p>Hivemapper presents a unique opportunity utilizing cryptocurrency to crowdsource contributions toward building a decentralized mapping network. In the short term, Hivemapper has proven crypto is a transformative means of incentivizing a global network of actors to work toward a common goal. In the long term, Hivemapper may be able to take market share away from incumbent mapping players by offering a better, cheaper product to its clients.</p>
<ul class="content-list">
<li><strong><a href="#HowitWorks">How it Works</a></strong></li>
<li><strong><a href="#KeyPerformanceIndicators">Key Performance Indicators</a></strong></li>
<li><strong><a href="#KeyIssuesBeingSolved">Key Issues Being Solved</a></strong></li>
<li><strong><a href="#InterestingUseCases">Interesting Use Cases</a></strong></li>
<li><strong><a href="#HONEYValuationFramework">HONEY Valuation Framework</a></strong></li>
<li><strong><a href="#KeyRisks">Key Risks</a></strong></li>
</ul>
<p><img class="img-responsive w-100" src="https://www.vaneck.com/contentassets/5db44bc8a5594e2199013c429ee3f5d1/3465_hivemapper-blog_image-1_2023.07_v1.jpg" alt="Woman in car with Hivemapper" /></p>
<p>Hivemapper&rsquo;s goal is to create a decentralized and permissionless global map that anyone can contribute to and utilize however they want. They aim to have more global, street-level coverage than existing players while providing higher-quality data, all for a lower cost.</p>
<h2 id="HowitWorks" class="jump-link-nav anchored-block" data-jumplink-title="How it Works">How it Works</h2>
<p>Drivers worldwide can purchase and install a 4k dashcam into their vehicles to record their daily routes. In return for providing constant real-time and high-quality global map data, drivers are rewarded with $HONEY token. Additionally, if you don&rsquo;t have a vehicle or the cost of the dashcam is prohibitively expensive, you can still contribute to the network as an Annotator. Annotators play a machine learning model training game, labeling traffic lights, speed limits, and other street signs. This is similar to how Google uses Captcha for ML training, except these participants get paid. They too earn $HONEY for bettering the mapping data and training the machine learning model, which will eventually be able to annotate map data itself. These contributors are crucial to the supply side of the Hivemapper ecosystem.</p>
<p><img class="img-responsive w-100" src="https://www.vaneck.com/contentassets/5db44bc8a5594e2199013c429ee3f5d1/3465_hivemapper-blog_image-2_2023.07_v1.jpg" alt="Hivemapper for Navigation" /></p>
<p class="chart-disclosure">Source: Hivemapper.</p>
<p>The demand side network participants consist of consumers, such as enterprises or developers, who want to purchase the street-level data the Hivemapper suppliers have aggregated. Consumers who may be particularly interested in digital mapping data could include location-based service applications, logistics companies, and automotive manufacturers who require accurate navigation systems.</p>
<p>Interested consumers can purchase Hivemapper Map API services via Map Credits. Credits are purchased in fiat, priced at $0.02/map credit. 50 map credits provide access to 1 kilometer worth of map data. For example, if a customer wanted all of NYC&rsquo;s map data, it would be 7,837,650 map credits or $156,753. After the consumer purchases map credits, $HONEY tokens are burned equal to the fiat amount of the contract. The burned tokens are then reallocated toward a new rewards pool for contributors. Under this<strong> <a href="https://www.geeksforgeeks.org/burn-and-minting-equilibrium-in-blockchain/" title="Burn and Minting Equilibrium in Blockchain" target="_blank" rel="noopener">burn and mint</a></strong> token structure, the supply of $HONEY stays fixed at 10 billion tokens.</p>
<p><img class="img-responsive w-100" src="https://www.vaneck.com/contentassets/5db44bc8a5594e2199013c429ee3f5d1/3465_hivemapper-blog_image-3_2023.07_v1.jpg" alt="Hivemapper industry and use cases" /></p>
<p class="chart-disclosure">Source: Hivemapper.</p>
<h2 id="KeyPerformanceIndicators" class="jump-link-nav anchored-block" data-jumplink-title="Key Performance Indicators">Key Performance Indicators</h2>
<p>Global map coverage is the foundation upon which Hivemapper needs to build for long-term success. Hivemapper must have just as much, if not more, coverage to compete with centralized tech offerings. Since launching in November &rsquo;22, Hivemapper&rsquo;s network has grown dramatically with coverage across 3.6 million unique road kilometers. For reference, <strong><a href="https://blog.google/products/maps/google-maps-101-how-imagery-powers-our-map/" title="Google Maps 101: how imagery powers our map" target="_blank" rel="noopener">it took Google Maps 12 years to collect 16 million km</a></strong>. If unique road coverage continues to grow at its current pace, Hivemapper could reach 10 million km by 2024.</p>
<p><img class="img-responsive w-100" src="https://www.vaneck.com/contentassets/5db44bc8a5594e2199013c429ee3f5d1/3465_hivemapper-blog_image-4_2023.07_v1.jpg" alt="Hivemapper contributors and consumers" /></p>
<p class="chart-disclosure">Source: <strong><a href="https://hivemapper.com/explorer/unique-km-mapped" title="Unique Km Mapped - Hivemapper" target="_blank" rel="noopener">Hivemapper</a>.</strong></p>
<p>Another KPI we can observe is the total number of contributors to the network. As more contributors come aboard, they further map coverage as well as data quality and freshness, increasing value and thus demand from end clients.</p>
<p><img class="img-responsive w-100" src="https://www.vaneck.com/contentassets/5db44bc8a5594e2199013c429ee3f5d1/3465_hivemapper-blog_image-5_2023.07_v1.jpg" alt="Hivemapper cost effective solution to mapping" /></p>
<p class="chart-disclosure">Source: <a href="https://dune.com/murathan/hivemapper" title="Hivemapper Analytics Dashboard" target="_blank" rel="noopener"><strong>Dune Analytics</strong></a> as of 7/3/2023.</p>
<p>Lastly, we can track Token Burn, which provides insight into the demand for Map Credits and, thereby, a measure of Revenue generated by the network. Currently, there are significantly more tokens being newly emitted as rewards for contributing than tokens being burned for map credits. We expect that to change over time as fresher, cheaper, and broader coverage will increase demand for map credits.</p>
<p><img class="img-responsive w-100" src="https://www.vaneck.com/contentassets/5db44bc8a5594e2199013c429ee3f5d1/3465_hivemapper-blog_image-6_2023.07_v1.jpg" alt="Hivemapper weekly active contributors" /></p>
<p class="chart-disclosure">Source: <a href="https://dune.com/murathan/hivemapper" title="Hivemapper Analytics Dashboard" target="_blank" rel="noopener"><strong>Dune Analytics</strong></a> as of 7/3/2023.</p>
<h2 id="KeyIssuesBeingSolved" class="jump-link-nav anchored-block" data-jumplink-title="Key Issues Being Solved">Key Issues Being Solved</h2>
<p>Many issues stem from centralized tech giants&rsquo; approach to building digital mapping networks. Namely:</p>
<ol class="content-list">
<li>Price Gouging: Existing offerings upcharge their customers because comparable alternatives largely do not exist. Many customers, especially SMEs, can <strong><a target="_blank" rel="noopener" href="https://www.gadgets360.com/apps/features/google-maps-apis-new-pricing-impact-1907242" title="Google Maps API Price Hike Is Threatening the Future of Some Companies">no longer afford their services with rampant price hikes</a></strong>.</li>
<li>Maps are not up to date: Company street-view vehicles can only reach most locations on an infrequent basis. Data collection is especially sparce and outdated in emerging market areas where firms believe they will not receive as much economic benefit for providing up-to-date coverage.</li>
<li>OpEx and CapEx Heavy: Mapping the world is capital and human resource intensive. Gathering data through centralized company vehicles can cost ~$500k each to build and deploy. It is costly to gather mass coverage without deep pockets.</li>
<li>Freely uses our data: Users are not compensated for data collection.</li>
</ol>
<p><img class="img-responsive w-100" src="https://www.vaneck.com/contentassets/5db44bc8a5594e2199013c429ee3f5d1/3465_hivemapper-blog_image-7_2023.07_v1.jpg" alt="Hivemapper total mint over burns" /></p>
<p class="chart-disclosure">Source: Messari.</p>
<p>Hivemapper aims to solve these issues. The network&rsquo;s costs to the end consumer are significantly cheaper because they do not have the high operational or capital expenditures to collect the mapping data. Hivemapper&rsquo;s data is fresh and up to date as the global network of vehicle dashcams are constantly recording while drivers go about their normal routes. Furthermore, the $HONEY token can incentivize coverage of areas less frequently traveled. $HONEY not only incentivizes and manages behavior on the network, but it also allows for contributors to be compensated for their data as well as be financially aligned in the success of the network.</p>
<p><img class="img-responsive w-100" src="https://www.vaneck.com/contentassets/5db44bc8a5594e2199013c429ee3f5d1/3465_hivemapper-blog_image-8_2023.07_v1.jpg" alt="Hivemapper total unique km mapped" /></p>
<p class="chart-disclosure">Source: Hivemapper.</p>
<h2 id="InterestingUseCases" class="jump-link-nav anchored-block" data-jumplink-title="Interesting Use Cases">Interesting Use Cases</h2>
<p>Currently, Hivemapper focuses on navigational use cases, of which there are many. Advanced Driver Assistance Systems (ADAS) are being implemented into new vehicles for high-level autonomous driving. Up-to-date mapping data is critical to the ADAS system as knowing detailed road object information such as lane definitions, debris, traffic lights, and signage is paramount.</p>
<p>Logistics companies may want to have visuals of loading docks and parking restrictions before delivery, as knowing can save them time and money. Governments want to know where road maintenance is necessary, have traffic intelligence, or the fastest routes available for emergency response times.</p>
<p><img class="img-responsive w-100" src="https://www.vaneck.com/contentassets/5db44bc8a5594e2199013c429ee3f5d1/3465_hivemapper-blog_image-9_2023.07_v1.jpg" alt="Hivemapper coverage" /></p>
<p class="chart-disclosure">Source: Hivemapper.</p>
<h2 id="HONEYValuationFramework" class="jump-link-nav anchored-block" data-jumplink-title="HONEY Valuation Framework">HONEY Valuation Framework</h2>
<p>Based on Hivemapper&rsquo;s Burn and Mint tokenomic model, whereby $HONEY is emitted to contributors for participating in the network and $HONEY is burned as a receipt for consumer map credit purchases, we can use an <strong><a href="https://medium.com/@cburniske/cryptoasset-valuations-ac83479ffca7#:~:text=The%20equation%20of%20exchange%20is%20MV%20%3D%20PQ%2C%20and%20when%20applied,the%20digital%20resource%20being%20provisioned" title="Cryptoasset Valuations" target="_blank" rel="noopener">Equation of Exchange</a></strong> framework to derive its value. The equation used is MV=PQ. M, the size of the asset base, V, the velocity of the token, and PQ, the yearly transaction value. We start by estimating the Total Addressable Market Size for the Digital Mapping Market. Then we need to estimate Hivemapper&rsquo;s take rate of that market to get an implied revenue (PQ). In Hivemapper&rsquo;s case, revenue is a product of map credits sold multiplied by the fiat cost of map credits. We envision Hivemapper&rsquo;s data being integrated into multiple incumbent map players&rsquo; offerings as it could lead to 50%+ in cost savings for them and offer fresher, higher quality data to their customers. Due to the cost savings they could provide to their competitors and a superior product offering, we believe Hivemapper will have a considerable market share. Next, we need to estimate $HONEY&rsquo;s velocity or how often the token exchanges hands each year. As a utility token in the Hivemapper ecosystem, its velocity will be greater than store-of-value assets like Bitcoin but less than a stablecoin which has no speculation over its future value. We can use an average velocity of a basket of utility tokens for this (V). Estimating $HONEY&rsquo;s Revenue (PQ) and Velocity (V), we can back into its implied market cap (M). Lastly, we must estimate the number of $HONEY tokens circulating, which is a product of emissions to contributors for global map coverage progress as well as token unlocks. Dividing the market cap by the number of tokens circulating, we can come up with an implied value for $HONEY.</p>
<h2 id="KeyRisks" class="jump-link-nav anchored-block" data-jumplink-title="Key Risks">Key Risks</h2>
<p>Hivemapper certainly doesn&rsquo;t come without its risks and concerns. The cost of the dashcams, $299, may be prohibitively expensive for many to join on a global scale. However, this could be alleviated as third party dashcam providers come to market offering cheaper solutions. Our other concern lies in the fact that map data collection is only half the battle. The other half is marketing and sourcing clients to sell this data to. While we believe Hivemapper is on the path towards building a superior product, they must compete with the tech giants&rsquo; sales teams, who have robust pipelines and headcount. However, we envision a world in which Hivemapper&rsquo;s data could be integrated into the backend of existing map players&rsquo; offerings as it can provide more real-time, street-level data and cut their costs significantly.</p>
<p><img class="img-responsive w-100" src="https://www.vaneck.com/contentassets/5db44bc8a5594e2199013c429ee3f5d1/3465_hivemapper-blog_image-10_2023.07_v1.jpg" alt="Hivemapper map " /></p>
<p class="chart-disclosure">Source: <strong><a href="https://hivemapper.com/explorer/regions" title="Regions - Hivemapper" target="_blank" rel="noopener">Hivemapper</a>.</strong></p>
<h2>Closing Thoughts</h2>
<p>Hivemapper takes an interesting bottom-up approach to building a mapping infrastructure network traditionally built top-down by centralized tech players with deep pockets. By using a token incentive model, contributors are compensated for their data and are willing to continue to provide coverage to the network as they have an economic motivation to share in its success. With the potential for broader, fresher, and higher quality coverage than existing offerings and lower costs to the end clients, we believe Hivemapper will gain traction and market share over the coming years.</p>
<p>To receive more <strong> <a href="https://www.vaneck.com/us/en/insights/digital-assets/" title="Digital Assets Insights">Digital Assets</a> </strong> insights, <strong> <a href="https://www.vaneck.com/us/en/subscribe/" title="Subscription Center">sign up in our subscription center</a></strong>.</p>
]]></content:encoded>
</item><item rdf:about="https://www.vaneck.com/us/en/blogs/natural-resources/eyeing-opportunity-for-rebound-in-resources/">
  <title>Eyeing Opportunity for Rebound in Resources></title>
  <link>https://www.vaneck.com/us/en/blogs/natural-resources/eyeing-opportunity-for-rebound-in-resources/</link>
  <description><![CDATA[Despite the recent lackluster performance of resource equities, it is important to note that historically, overall cumulative returns tend to rebound effectively during periods of high inflation.]]></description>
  <dc:creator>Shawn Reynolds</dc:creator>
  <dc:date>07/26/2023 06:30:00</dc:date>
<content:encoded><![CDATA[

<p>Recent underperformance of resource equities amid uncharacteristically high inflation has been somewhat perplexing, yet is not entirely without precedence. In the 2000s&rsquo; bull market rally, for example (where inflation averaged just above 3%), there were five periods of greater than 10% decline lasting over a minimum of three months. Declines over these periods averaged around -15% and lasted for five months. Similar incidences also occurred in the 1970s when year-over-year inflation averaged just above 7%. U.S.-listed energy and mining stocks experienced (again) around five of these same types of declines, with an average loss of approximately -17% and -19%, respectively, over a length of around four months.</p>
<p>What is perhaps more important to consider here, though, is that, despite these brief periods of underperformance, cumulative returns of resource equities over both of these ten-year stretches landed north of +250% (or around +13% on an annualized basis).</p>
<p>We continue to monitor several key themes shaping the fundamental outlook for resource equities over both the near- and longer-term <a href="/us/en/blogs/natural-resources/eyeing-opportunity-for-rebound-in-resources/grf-quarterly-commentary-2q-2023.pdf" target="_blank" title="Global Resources Fund: Quarterly Commentary" rel="noopener"><strong>(An expanded PDF version of this commentary, including fund specific information can be downloaded here)</strong></a>:</p>
<ul class="content-list">
<li><strong>Exploration spending &ndash;</strong> The impact of capital expenditures reductions&mdash;particularly in sectors such as Oil &amp; Gas and Base &amp; Industrial Metals&mdash;appears to have taken hold. Though reported spending is on the rise in 2023, it is likely insufficient to offset any type of major supply deficiencies already baked-in as a result of multi-year underinvestment. We believe companies focused on capital discipline may benefit from stronger returns and cash flow generation in the months or years to come should fundamentals drive commodity prices even higher.</li>
<li><strong>Supply security &ndash;</strong> China continues to maintain a firm grip over the extraction and processing of a vast array of critical metals and minerals. This fact has underpinned efforts by clean energy technology manufacturers and metals producers to seek alternate sources of supply or, where possible, onshore or &ldquo;friend-shore&rdquo; (i.e., to neighboring, allied countries) certain parts of their processing operations. Companies successful in executing on this strategy may stand to benefit should trade tensions increase in the near-term and/or should resource competition become more challenging in the future.</li>
<li><strong>Shape and pace of the ongoing resources transition &ndash;</strong> Recent policy in the U.S. and Europe has been highly supportive of the development of renewable energy technologies. However, it is not clear yet exactly which industries or companies stand to benefit the most as a result. As well, the pace of renewable energy adoption and overall amount of capital investment required to meet most climate objectives, remains well below what is currently needed. From a portfolio positioning standpoint, we continue to seek out companies in the space that offer compelling, longer-term structural growth opportunity.</li>
</ul>
<p>To receive more <a href="https://www.vaneck.com/us/en/insights/natural-resources/" title="Natural Resources Insights"><strong>Natural Resources</strong></a> insights, <a href="https://www.vaneck.com/us/en/subscribe/" title="Subscription Center"><strong>sign up in our subscription center</strong></a>.</p>
]]></content:encoded>
</item><item rdf:about="https://www.vaneck.com/us/en/blogs/thematic-investing/buzz-investing-new-bull-market/">
  <title>BUZZ Investing: New Bull Market></title>
  <link>https://www.vaneck.com/us/en/blogs/thematic-investing/buzz-investing-new-bull-market/</link>
  <description><![CDATA[Seven tech stocks accounted for almost 75% of the S&amp;P 500's year-to-date gains, marking the technical start of a new bull market, even as investors raised concerns about narrow market breadth.]]></description>
  <dc:creator> </dc:creator>
  <dc:date>07/25/2023 06:30:00</dc:date>
<content:encoded><![CDATA[

<p>Domestic equities extended their year-to-date gains during the recent period between Index selection dates (June 8, 2023, to July 13, 2023, the &ldquo;Period&rdquo;). Growth was led by shares of technology-oriented companies, reflecting investors&rsquo; continued enthusiasm toward AI-driven narratives. Notably, the S&amp;P 500 Index surpassed a 20% increase from its October 12th closing low, signaling the technical start of a new bull market. Some investors raised concerns about the narrow breadth exhibited in the market, cautioning that it may indicate an impending reversal for stocks. Historical instances of market breadth acting as a leading indicator may lend credence to their viewpoint. Interestingly, most of the gains in the S&amp;P 500 Index this year can be attributed to just seven stocks: Apple Inc (NASD: AAPL), Microsoft Corp (NASD: MSFT), NVIDIA Corp (NASD: NVDA), Amazon.com Inc (NASD: AMZN), Meta Platforms Inc (NASD: META), Tesla Inc (NASD: TSLA), and Alphabet Inc (NASD: GOOGL/GOOL). These stocks have accounted for almost 75% of the index&rsquo;s year-to-date gains and now comprise nearly 25% of the index&rsquo;s total market capitalization.</p>
<p>The BUZZ NextGen AI US Sentiment Leaders Index (the &ldquo;BUZZ Index&rdquo; or &ldquo;Index&rdquo;) returned 6.77% during the month of June compared to a return of 6.61% for the S&amp;P 500 Index during the same period. Year-to-date, the BUZZ Index leads the S&amp;P 500 with returns of 35.39% and 16.89%, respectively, as of the end of June.</p>
<h2>Shares of Coinbase Global Pace Advancing Stocks within the BUZZ Index</h2>
<p>Shares of Coinbase Global Inc (NASD: COIN) paced advancing stocks within the BUZZ Index during the recent Period. COIN, which operates a platform to buy and sell cryptocurrencies and serves clients worldwide, saw its shares rise 94.9% during the Period. COIN's extraordinary performance is primarily attributed to a range of factors, including Bitcoin and other cryptos bouncing back from a 2022 downturn, Wall Street giant BlackRock and other firms filing for &lsquo;spot&rsquo; Bitcoin ETFs, boosting investor morale, and a critical legal victory for Ripple Labs against an SEC suit alleging their XRP should be considered a security for regulatory purposes. The Ripple Labs victory was viewed by many as a positive precedent for similar cases, including Coinbase's, further propelling sentiment across the crypto sector. A range of other technology and AI-related companies continued to positively contribute to index performance, as the prospects for growth within the segment continue to be a primary focus for many investors.</p>
<div class="wrapped-div">
<table style="width: 750px;">
<tbody>
<tr class="tbl-data">
<td class="tbl-header last" colspan="4">Top BUZZ Index Contributors: June 8, 2023&ndash; July 13, 2023</td>
</tr>
<tr class="tbl-data">
<td class="data-td  last">Company</td>
<td class="data-head last">Ticker</td>
<td class="data-head last">Average Weight (%)</td>
<td class="data-head last">Return Contribution (%)</td>
</tr>
<tr class="tbl-data">
<td class="data-td last font-weight-normal">Coinbase Global Inc</td>
<td class="data-td data last">COIN</td>
<td class="data-td data last">3.39</td>
<td class="data-td data last">2.82</td>
</tr>
<tr class="tbl-data">
<td class="data-td last font-weight-normal">Rivian Automotive Inc</td>
<td class="data-td data last">RIVN</td>
<td class="data-td data last">1.28</td>
<td class="data-td data last">0.84</td>
</tr>
<tr class="tbl-data">
<td class="data-td last font-weight-normal">NVIDIA Corp</td>
<td class="data-td data last">NVDA</td>
<td class="data-td data last">3.28</td>
<td class="data-td data last">0.65</td>
</tr>
<tr class="tbl-data">
<td class="data-td last font-weight-normal">Tesla Inc</td>
<td class="data-td data last">TSLA</td>
<td class="data-td data last">3.37</td>
<td class="data-td data last">0.62</td>
</tr>
<tr class="tbl-data">
<td class="data-td last font-weight-normal">Meta Platforms Inc</td>
<td class="data-td data last">META</td>
<td class="data-td data last">3.11</td>
<td class="data-td data last">0.56</td>
</tr>
<tr class="tbl-data">
<td class="data-td last font-weight-normal">Carnival Corp</td>
<td class="data-td data last">CCL</td>
<td class="data-td data last">1.30</td>
<td class="data-td data last">0.45</td>
</tr>
<tr class="tbl-data">
<td class="data-td last font-weight-normal">Palantir Technologies Inc</td>
<td class="data-td data last">PLTR</td>
<td class="data-td data last">3.18</td>
<td class="data-td data last">0.42</td>
</tr>
<tr class="tbl-data">
<td class="data-td last font-weight-normal">PayPal Holdings Inc</td>
<td class="data-td data last">PYPL</td>
<td class="data-td data last">2.95</td>
<td class="data-td data last">0.36</td>
</tr>
<tr class="tbl-data">
<td class="data-td last font-weight-normal">Snap Inc</td>
<td class="data-td data last">SNAP</td>
<td class="data-td data last">1.12</td>
<td class="data-td data last">0.36</td>
</tr>
<tr class="tbl-data">
<td class="data-td last font-weight-normal">Lucid Group Inc</td>
<td class="data-td data last">LCID</td>
<td class="data-td data last">2.64</td>
<td class="data-td data last">0.36</td>
</tr>
</tbody>
</table>
</div>
<br />
<p class="chart-disclosure">Source: BUZZ Holdings ULC, Bloomberg. Past performance is no guarantee of future results. Index performance is not illustrative of fund performance. Not intended as a recommendation to buy or to sell any of the securities mentioned herein.</p>
<p>The top ten detractors to performance combined for just 82 basis points of negative returns within the index during the Period. The top detractors to performance were observed from stocks across a range of industry sectors, including Communication Services, Consumer Discretionary, Consumer Staples, Financials, Health Care, and Information Technology. Notable among detractors were shares of Advanced Micro Devices Inc (NASD: AMD), which has failed to keep pace among AI-related chipmakers within the industry. While shares of AMD were up an impressive 79% year-to-date, the gains pale in comparison to industry leader NVIDIA Corp (NASD: NVDA), whose shares have gained nearly 215% during 2023.</p>
<div class="wrapped-div">
<table style="width: 750px;">
<tbody>
<tr class="tbl-data">
<td class="tbl-header last" colspan="4">Bottom BUZZ Index Contributors: June 8, 2023&ndash; July 13, 2023</td>
</tr>
<tr class="tbl-data">
<td class="data-td  last">Company</td>
<td class="data-head last">Ticker</td>
<td class="data-head last">Average Weight (%)</td>
<td class="data-head last">Return Contribution (%)</td>
</tr>
<tr class="tbl-data">
<td class="data-td last font-weight-normal">SoFi Technologies Inc</td>
<td class="data-td data last">SOFI</td>
<td class="data-td data last">2.43</td>
<td class="data-td data last">-0.15</td>
</tr>
<tr class="tbl-data">
<td class="data-td last font-weight-normal">Advanced Micro Devices Inc</td>
<td class="data-td data last">AMD</td>
<td class="data-td data last">2.86</td>
<td class="data-td data last">-0.12</td>
</tr>
<tr class="tbl-data">
<td class="data-td last font-weight-normal">Target Corp</td>
<td class="data-td data last">TGT</td>
<td class="data-td data last">2.33</td>
<td class="data-td data last">-0.12</td>
</tr>
<tr class="tbl-data">
<td class="data-td last font-weight-normal">Pfizer Inc</td>
<td class="data-td data last">PFE</td>
<td class="data-td data last">0.99</td>
<td class="data-td data last">-0.10</td>
</tr>
<tr class="tbl-data">
<td class="data-td last font-weight-normal">Micron Technology Inc</td>
<td class="data-td data last">MU</td>
<td class="data-td data last">0.93</td>
<td class="data-td data last">-0.08</td>
</tr>
<tr class="tbl-data">
<td class="data-td last font-weight-normal">Walt Disney Co/The</td>
<td class="data-td data last">DIS</td>
<td class="data-td data last">2.70</td>
<td class="data-td data last">-0.07</td>
</tr>
<tr class="tbl-data">
<td class="data-td last font-weight-normal">Crowdstrike Holdings Inc</td>
<td class="data-td data last">CRWD</td>
<td class="data-td data last">0.69</td>
<td class="data-td data last">-0.06</td>
</tr>
<tr class="tbl-data">
<td class="data-td last font-weight-normal">GameStop Corp</td>
<td class="data-td data last">GME</td>
<td class="data-td data last">2.78</td>
<td class="data-td data last">-0.05</td>
</tr>
<tr class="tbl-data">
<td class="data-td last font-weight-normal">AT&amp;T Inc</td>
<td class="data-td data last">T</td>
<td class="data-td data last">0.79</td>
<td class="data-td data last">-0.04</td>
</tr>
<tr class="tbl-data">
<td class="data-td last font-weight-normal">Snowflake Inc</td>
<td class="data-td data last">SNOW</td>
<td class="data-td data last">1.37</td>
<td class="data-td data last">-0.03</td>
</tr>
</tbody>
</table>
</div>
<br />
<p class="chart-disclosure">Source: BUZZ Holdings ULC, Bloomberg. Past performance is no guarantee of future results. Index performance is not illustrative of fund performance. Not intended as a recommendation to buy or to sell any of the securities mentioned herein.</p>
<h2>Sentiment Stock Highlight &ndash; Cryptocurrency Related Stocks</h2>
<p>Investor sentiment for the crypto industry has taken a positive turn in recent months, highlighted by Blackrock&rsquo;s filing for a spot Bitcoin ETF on June 15th, which, if approved, may potentially allow billions of dollars of capital to be invested in the popular cryptocurrency. Other companies have made numerous attempts at a &lsquo;spot&rsquo; Bitcoin ETF in the past, with no success. Blackrock&rsquo;s status as the world&rsquo;s largest asset manager makes its attempt the most prominent potential entrant, and many market commentators are hopeful its efforts will succeed. Crypto exchanges such as Coinbase Global Inc (NASDAQ: COIN), and trading platforms that offer crypto trading, such as Robinhood Markets, Inc. (NASDAQ: HOOD), may stand to benefit from regulatory approval of a &lsquo;spot&rsquo; Bitcoin ETF. Further tailwinds in the cryptocurrency space emerged when a judge from the Southern District of New York declared Ripple Labs&rsquo; XRP token was not a security for regulatory purposes. The announcement was a surprise and sent prices of many crypto-related assets soaring across the board. COIN jumped 30% on the news, bringing its total gain over the Period nearly 95%. HOOD, a popular stock amongst the &lsquo;Reddit&rsquo; investment community, had the most notable sentiment increase last month, as investors are betting on the stock as a proxy for the improving boarder crypto landscape. HOOD shares are up over 30% in the recent period between Index selection dates, and the boost in sentiment pushed its weight up to 2.15% in the July Index rebalance, up from 0.88% last month.</p>
<h3>Robinhood Markets Stock Price | July 2022 &ndash; July 2023</h3>
<p><img class="img-responisve w-100" src="https://www.vaneck.com/contentassets/d5466c7c6225497c93545e61010af3ea/3452_buzz_chart-01_2023.07_blog_v2.svg" alt="Robinhood Markets Stock Price | July 2022 - July 2023" /></p>
<p class="chart-disclosure">Source: BUZZ Holdings ULC, Bloomberg. Past performance is no guarantee of future results. Index performance is not illustrative of fund performance. Not intended as a recommendation to buy or to sell any of the securities mentioned herein.</p>
<h2>BUZZ Index July 2023 Rebalance Highlights</h2>
<p><strong>Joby Aviation</strong></p>
<p>2020 was the year the SPAC market was thrust into the spotlight for the broad investor community. Many investors had been previously unaware of the asset class until several companies were brought public via qualifying transactions (de-SPACs) and surged in price. Beginning in 2021, the market lost steam amidst the rising interest rate environment. Many of the most popular de-SPACs, including Virgin Galactic (NYSE: SPCE), DraftKings (NASDAQ: DKNG), and Nikola Corp (NASDAQ: NKLA), declined over 80%. Many de-SPAC stocks are still down significantly; however, a few have begun to rebound. The most notable in recent months has been Joby Aviation (NYSE: JOBY), the &ldquo;flying electric taxi&rdquo; company that went public via a merger with Reinvent Technology Partners, a SPAC led by the co-founder of LinkedIn, Reid Hoffman, and the founder of Zynga, Mark Pincus. On June 28th, Joby announced that it had completed its first production prototype and received FAA approval for test flights, along with a further $100MM investment from SK Telecom, an existing investor. The news sent shares of JOBY up over 40%. Investor sentiment on the stock has been rising in recent months and surged following the company&rsquo;s latest developments. This month, JOBY entered the BUZZ Index for the first time ever, with a 0.85% weight.</p>
<p>For more on rebalancing results and a full breakdown of index constituents added and removed for the month, view the <strong><a href="https://www.vaneck.com/us/en/investments/social-sentiment-etf-buzz/buzz-reconstitution.pdf" rel="noopener" target="_blank" title="BUZZ VanEck Social Sentiment ETF">BUZZ Index reconstitution</a></strong> report.</p>
<p>To receive more <strong><a href="https://www.vaneck.com/us/en/insights/thematic-investing/" title="Thematic Investing Insights">Thematic Investing</a></strong> insights, <strong><a href="https://www.vaneck.com/us/en/subscribe/" title="Subscription Center">sign up in our subscription center</a></strong>.</p>
<style type="text/css">
    .wrapped-div {
        max-width: 100%;
    }

    @media (max-width: 1240px) {
        .wrapped-div {
            overflow-x: scroll;
        }
    }

    .wrapped-div-sector {
        max-width: 100%;
        overflow-x: scroll;
    }
</style>
]]></content:encoded>
</item><item rdf:about="https://www.vaneck.com/us/en/blogs/thematic-investing/semiconductor-equipment-manufacturers-driving-the-digital-revolution/">
  <title>Semiconductor Equipment Manufacturers Driving the Digital Revolution></title>
  <link>https://www.vaneck.com/us/en/blogs/thematic-investing/semiconductor-equipment-manufacturers-driving-the-digital-revolution/</link>
  <description><![CDATA[Semiconductor equipment manufacturers, with their cutting-edge technology and continual growth, are pivotal to semiconductor advancement.]]></description>
  <dc:creator>Nick Frasse</dc:creator>
  <dc:date>07/24/2023 06:30:00</dc:date>
<content:encoded><![CDATA[

<p>The semiconductor industry, a cornerstone of modern digital technology, is heavily reliant on semiconductor equipment manufacturing. These companies provide the machinery that enables the creation of integrated devices, often housed within fabrication facilities or &lsquo;fabs&rsquo;. The diverse range of equipment includes wafer manufacturing and processing, mask/reticle equipment, thermal processing equipment, inspection measurement, as well as assembly and packaging equipment.</p>
<p>These manufacturers are important due to their large contribution to industry growth. Global semiconductor equipment billings have recently reached an industry record of $107.6 billion in 2022, demonstrating a 9% growth year-over-year in Q1 2023<sup>1</sup>.This growth is driven by demand for more advanced and efficient integrated circuits, with companies like ASML leading the charge.</p>
<p>ASML (ASML),<sup>2</sup>&nbsp;a Dutch-based company, is renowned for producing machines that are essential in creating the world's most advanced chips. ASML's sales rose on average over 19% annually from 2020 through 2022<sup>3</sup>. Despite economic uncertainties and chip export restrictions, ASML forecasts a promising jump in revenue for 2023.</p>
<h3>ASML system sales revenue worldwide 2017-2022, by technology</h3>
<p><img class="img-responsive w-100" src="https://www.vaneck.com/contentassets/52581d58f6164cbb9e6cbdda27d3c338/3445_smh_chart-1_2022.07_blog.svg" alt="ASML System Sales Revenue Worldwide 2017-2022" /></p>
<p class="chart-disclosure">Source: ASML. Data as of February 2023.</p>
<p>Intel (INTC)<sup>4</sup>&nbsp;and Taiwan Semiconductor Manufacturing Co. (TSM)<sup>5</sup>&nbsp;are just two of the many companies that purchase ASML's machines to manufacture the chips found in end products such as laptops and smartphones. Even with fluctuating consumer demand, these companies remain confident in the value and necessity of ASML's offerings, with no cancellations of orders reported.</p>
<p>ASML has a unique position as the sole producer of the extreme ultraviolet (EUV) lithography machine, a critical tool for making the most advanced chips globally. These chips find their way into products like Apple's iPhones and have significant implications for military and advanced artificial intelligence applications.</p>
<p>Two additional prominent players in the equipment space are Applied Materials (AMAT)<sup>6</sup>&nbsp;and Lam Research Corp. (LRCX).<sup>7</sup>&nbsp;They are known for their advanced technology and expertise and play a vital role in the semiconductor equipment manufacturing industry. Applied Materials offers a wide range of equipment, including wafer fabrication systems and inspection systems, while Lam Research Corp. specializes in wafer fabrication equipment and services. Both companies have seen over a 20% increase in sales on average over the last three years.</p>
<p>The success of semiconductor equipment manufacturers like ASML is essential to the continuation of Moore's law. This law, proposed by Intel executive David House, suggests that the number of transistors on integrated circuits doubles about every two years, leading to a doubling in chip performance. It's the innovation and continual improvement of manufacturing equipment that allows this trend to persist, enabling increasingly powerful and efficient devices.</p>
<p><img class="img-responsive w-100" src="https://www.vaneck.com/contentassets/52581d58f6164cbb9e6cbdda27d3c338/3445_smh_chart-2_2022.07_blog.svg" alt="Microchip transistor count vs. year" /></p>
<p class="chart-disclosure">Source: CircuitBread as of 2023.</p>
<p>Overall, the importance of semiconductor equipment manufacturing companies to the sector and the broader digital world cannot be overstated. The contributions of companies like ASML enable the ongoing march of digital progress, pushing the limits of what's possible in technology. Investing in the <a href="/link/39c8d235748b4c26a5930c31d3ac0160.aspx" title="SMH - VanEck Semiconductor ETF - Overview"><strong>VanEck Semiconductor ETF (SMH)</strong></a> is one way to access this opportunity. SMH offers broad exposure to the semiconductor industry, helping to diversify risk while capitalizing on the industry's overall growth potential.</p>
<p>To receive more <a href="https://www.vaneck.com/us/en/insights/thematic-investing/" title="Thematic Investing Insights"><strong>Thematic Investing</strong></a> insights, <a href="https://www.vaneck.com/us/en/subscribe/" title="Subscription Center"><strong>sign up in our subscription center</strong></a>.</p>
]]></content:encoded>
</item><item rdf:about="https://www.vaneck.com/us/en/blogs/emerging-markets-equity/emerging-markets-brazil-snaps-back/">
  <title>Emerging Markets – Brazil Snaps Back></title>
  <link>https://www.vaneck.com/us/en/blogs/emerging-markets-equity/emerging-markets-brazil-snaps-back/</link>
  <description><![CDATA[Allocation and stock selection in Brazil and Georgia lead to fund outperformance in Q2 2023.]]></description>
  <dc:creator>David Semple</dc:creator>
  <dc:date>07/21/2023 06:30:00</dc:date>
<content:encoded><![CDATA[

<p>The VanEck Emerging Markets Fund slightly outperformed the MSCI EM IMI Index on the QTD basis ending June 30, 2023 (+2.24% for Fund vs +1.62% for Index). This outperformance was principally driven by allocation (weighting) and stock selection in Brazil and Georgia. Heading into Q2, we were positioned overweight in Brazil (10.5% Fund weight versus 5.2% index weight<sup>*</sup>), based on the opportunities we saw in individual companies there. JSL, which the Fund held at just over 2% weight over the quarter, rallied over 40%, and is not held in the benchmark index. Another notable performer was Bank of Georgia, which rallied approximately 15% over the quarter with a 3.8% weight in the Fund. Bank of Georgia is another high-performing name that our Fund held, which is not in the benchmark index.</p>
<p>Both of these examples underscore the Fund's objective, which is to find long-term structural growth companies at a reasonable price (S-GARP). Our process is driven by stock selection conducted through rigorous due diligence with a focus on active management interaction and quality, governance and business models with visibility, innovation and low disruption risk.</p>
<div class="wrapped-div">
<table width="100%">
<tbody>
<tr class="tbl-data">
<td class="tbl-header last" colspan="7">Average Annual Total Returns (%) as of June 30, 2023</td>
</tr>
<tr class="tbl-data">
<td class="data-head last">&nbsp;</td>
<td class="data-head last">2Q23<sup>&dagger;</sup></td>
<td class="data-head last">YTD</td>
<td class="data-head last">1 Yr</td>
<td class="data-head last">3 Yr</td>
<td class="data-head last">5 Yr</td>
<td class="data-head last">10 Yr</td>
</tr>
<tr class="tbl-data">
<td class="data-td last">Class A: NAV (Inception 12/20/93)</td>
<td class="data-td data last">2.24</td>
<td class="data-td data last">4.24</td>
<td class="data-td data last">9.55</td>
<td class="data-td data last">-4.89</td>
<td class="data-td data last">-2.92</td>
<td class="data-td data last">1.21</td>
</tr>
<tr class="tbl-data">
<td class="data-td last">Class A: Maximum 5.75% load</td>
<td class="data-td data last">-3.64</td>
<td class="data-td data last">-1.75</td>
<td class="data-td data last">3.25</td>
<td class="data-td data last">-6.75</td>
<td class="data-td data last">-4.07</td>
<td class="data-td data last">0.61</td>
</tr>
<tr class="tbl-data">
<td class="data-td last">Class I: NAV (Inception 12/31/07)</td>
<td class="data-td data last">2.47</td>
<td class="data-td data last">4.59</td>
<td class="data-td data last">10.27</td>
<td class="data-td data last">-4.39</td>
<td class="data-td data last">-2.42</td>
<td class="data-td data last">1.72</td>
</tr>
<tr class="tbl-data">
<td class="data-td last">MSCI EM IMI</td>
<td class="data-td data last">1.62</td>
<td class="data-td data last">5.62</td>
<td class="data-td data last">3.19</td>
<td class="data-td data last">3.60</td>
<td class="data-td data last">1.42</td>
<td class="data-td data last">3.16</td>
</tr>
<tr class="tbl-data">
<td class="data-td last">MSCI EM Index</td>
<td class="data-td data last">0.90</td>
<td class="data-td data last">4.89</td>
<td class="data-td data last">1.75</td>
<td class="data-td data last">2.32</td>
<td class="data-td data last">0.93</td>
<td class="data-td data last">2.95</td>
</tr>
</tbody>
</table>
</div>
<br />
<p class="chart-disclosure"><strong>The table presents past performance which is no guarantee of future results and which may be lower or higher than current performance. Returns reflect applicable fee waivers and/or expense reimbursements. Had the Fund incurred all expenses and fees, investment returns would have been reduced. Investment returns and Fund shares values will fluctuate so that investor's shares, when redeemed, may be worth more or less than their original cost. Fund returns assume that dividends and capital gains distributions have been reinvested in the Fund at net asset value (NAV). Index returns assume that dividends of the Index constituents in the Index have been reinvested. Performance information current to the most recent month end is available by calling 800.826.2333 or by visiting vaneck.com.</strong></p>
<p class="chart-disclosure"><strong>Expenses: Class A: Gross 1.54%; Net 1.54%; Class I: Gross 1.19%; Net 1.01%. Expenses are capped contractually until 5/1/24 at 1.60% for Class A and 1.00% for Class I. Caps exclude acquired fund fees and expenses, interest, trading, dividends, interest payments of securities sold short, taxes and extraordinary expenses.</strong></p>
<h2 id="MarketReview" class="jump-link-nav anchored-block" data-jumplink-title="Market Review">Market Review</h2>
<p>The MSCI Emerging Markets Investable Market Index (&ldquo;MSCI EM IMI&rdquo;) returned 1.62% during the second quarter of 2023. Below we highlight the main developments that we believe affected the asset class:</p>
<p><strong><em>Uneven Emerging Markets Rebound Continues (but still underperforming developed markets): </em></strong>The second quarter of 2023 saw mostly positive performance from the largest weights in the benchmark index. Taiwan Region, India, South Korea and Brazil all notched positive performance quarters, while China contributed negatively. In Brazil, stocks rallied in the second quarter off of multi-year valuation lows, while Chinese stocks fell on weaker-than-expected consumer spending and slowing home sales.</p>
<p><strong><em>Emerging-Developed Markets Growth Differential Accelerating: </em></strong>After falling sharply after the pandemic, the spread between emerging and developed markets growth has rebounded sharply and is estimated to continue upwards. This growth differential could potentially set the stage for stronger emerging markets performance going forward compared to developed markets.</p>
<p><strong><em>Central Banks on Course to Start Easing in 2023; LatAm First: </em></strong>With inflation rolling over, and the U.S. Federal Reserve (Fed) potentially on pause as of Q2 2023, emerging markets countries are now positioned to begin lowering benchmark rates in the second half of the year. LatAm is expected to begin cutting rates after aggressively (and effectively) hiking to combat inflation post-pandemic. Chile, Colombia, Peru and Brazil are all expected to cut by at least 100 basis points by year-end. India is also expected to begin easing, although to a smaller degree.</p>
<p><strong><em>Valuation Differentials Point to Wide Historical Comparative Discount: </em></strong>Across multiple time-frames and metrics, emerging markets valuations are comparatively cheap versus their domestic counterparts. Forward Price to Earnings (P/E) and Price to Book Value (P/BV) are trading near 1-standard deviation below 15-year historical means compared to developed markets. When combined with the growth differentials highlighted above, this presents a compelling valuation-based case for investing in emerging markets.</p>
<p><strong><em>Global Investors are Under-Positioned in Emerging Markets: </em></strong>Compared to historical weightings, global investors are currently under-positioned in their allocations to emerging markets exposure. While emerging markets countries represent just over 10% of the MSCI ACWI Index, global investors hold only 6% of their weights positioned in emerging markets. This indicates that there is money on the sidelines for this asset class, and could also indicate favorable timing from a contrarian investor perspective.</p>
<h2>Fund Review</h2>
<p>On a sector level, Financials, Communication Services and Energy contributed to relative performance, while Consumer Discretionary, Health Care and Materials detracted. On a country level, Brazil, Georgia and Germany (Delivery Hero) contributed to relative performance, whereas Argentina, Turkey and South Korea detracted.</p>
<h2 id="TopContributors" class="jump-link-nav anchored-block" data-jumplink-title="Top Contributors">Top Contributors</h2>
<p>Top contributors to return on an absolute basis during the quarter:</p>
<ul class="content-list">
<li><strong>JSL </strong>(2.56% of Fund net assets<sup>*</sup>) is the leading company in the Brazilian logistic sector with long expertise (60 years) operating in the asset heavy and asset light business. The company continues reporting strong results backed by positive dynamics in the industry. They have been able to expand their client base and increase prices as well as control costs, which has been reflected in strong net income growth. The company continues to leverage its cross-selling opportunities. JSL also completed an acquisition of IC Transportes which was accretive to the numbers. Despite being three times larger than its closest competitor, JSL has a market share of only 1% with plenty of organic and inorganic growth opportunities ahead. The company&rsquo;s expertise in M&amp;A (7 acquisitions since 4Q20) could continue to enhance growth going forward.</li>
</ul>
<ul class="content-list">
<li><strong>Bank of Georgia Group Plc </strong>(3.51% of Fund net assets<sup>*</sup>) is one of the two largest banks, dominating the Georgian banking system, with more than 33% market share. During the quarter, the bank outperformed on the back of stronger than expected earnings delivered in 1Q23 on top of an already strong base in 2022, with return on equity remaining well above 25%. Bank of Georgia&rsquo;s management has undergone significant digitization efforts, resulting in higher efficiency and a superior customer experience.</li>
</ul>
<ul class="content-list">
<li><strong>Movida</strong> (1.45% of Fund net assets<sup>*</sup>) is one of the largest car rental companies in Brazil, operating three primary lines of business: car rental, fleet rental and used car sales (Seminovos). During the quarter, the company had some important changes including the announcement of a new CEO. They also changed the focus of the company for the next few quarters with 3 new important pillars: 1) liability management (repaying expensive debt and reducing cost); 2) resizing the company; and 3) new governance. The company has now entered a level of maturity where it will focus on value generation and ROIC. All these changes were reflected in the results, with an overall improvement in utilization rates and revenue generation. Movida also continues to see increase in volumes of daily rentals, better tariffs and a very resilient fleet division. On the Seminovos division, there was a normalization of margins and peak of depreciation has passed with a much better car purchase condition. The company has managed to reduce debt levels, however leverage is still high, so it is a big beneficiary in an scenario of lower rates.</li>
</ul>
<h2 id="TopDetractors" class="jump-link-nav anchored-block" data-jumplink-title="Top Detractors">Top Detractors</h2>
<p>Top detractors to return on an absolute basis during the quarter:</p>
<ul class="content-list">
<li><strong>China Education Group Holdings Limited</strong> (2.03% of Fund net assets<sup>*</sup>) is a private higher education provider focused on tertiary education in China. The company operates universities and a vocational college and enrolls students across all provinces in mainland China. China Education provides bachelor's degree programs, junior college diploma programs and vocational education programs. We believe that the company should provide approximately 15% annual organic growth from its existing campuses and, once private valuations adjust, some upside from M&amp;A. We have patience in the process of finding suitable (and suitably priced acquisition targets), but the market appears to have expected some quicker results after recent fundraising. In addition, there is some opacity in the process and consequences of conversion of their assets to full &ldquo;for profit&rdquo; status. Whilst the settling of the regulatory landscape in this regard has been frustrating, we believe that the ultimate effect will be benign.</li>
</ul>
<ul class="content-list">
<li><strong>MercadoLibre, Inc.</strong> (4.16% of Fund net assets<sup>*</sup>) has underperformed despite reporting earnings beats in both Q1 and Q2 2023. The underperformance was driven by a combination of profit taking after a strong run YTD and investors rotating into rate sensitive consumer names in Brazil. In addition, there are concerns around MELI Argentina&rsquo;s exposure and more recently higher competition from cross border players. We believe fundamentals remain strong with continued growth in GMV, market share gains and better margins. MELI continues to present a unique combination of leadership in e-commerce with accelerating growth in fintech.</li>
</ul>
<ul class="content-list">
<li><strong>MLP Saglik Hizmetleri AS Class B (&ldquo;MLP&rdquo;) </strong>(1.38% of Fund net assets<sup>*</sup>) is the largest private hospital group in Turkey. The group also has a sizable medical tourism business to capitalize on the high-quality and cost-competitive care offered by its hospitals. This business line has shown very strong performance in 2022 and year to date, driven by growing international demand and increasing MLP&rsquo;s foreign currency revenues against a weakening Turkish lira. Management&rsquo;s successful efforts to deleverage and strengthen its balance sheet have also positioned MLP very favorably for further inorganic expansion and share buybacks. After very strong share price performance in 2022, the company continued to show solid operational performance in 1Q23 results, which were partially overshadowed by a one-off earthquake related tax expense and somewhat weighed down on share price performance this quarter. We continue to be excited about the growth outlook for MLP and the upcoming expansion plans and the potential to be the consolidator of Turkey&rsquo;s private healthcare market.</li>
</ul>
<h2 id="TopBuysSells" class="jump-link-nav anchored-block" data-jumplink-title="Top Buys &amp; Sells">Top Buys &amp; Sells</h2>
<p>During the period, we established new positions in the following:</p>
<ul class="content-list">
<li><strong>MINISO Group</strong> (0.79% of Fund net assets<sup>*</sup>) is engaged in the retail and wholesale business of value-for-money products in categories such as household, toys, cosmetics and snacks. It operates in China and many other countries around the world as an asset light model, with retail partners selecting and operating stores. The company has expanded rapidly, offering a retail experience which lends itself to impulse shopping in physical stores. We believe their business model has a good cash cycle and is more immune to consumer sentiment than other retailers.</li>
</ul>
<ul class="content-list">
<li><strong>Full Truck Alliance </strong>(0.69% of Fund net assets<sup>*</sup>) is the largest digital freight platform globally &ndash; connecting privately owned truck capacity with freight shippers. It dominates China's digital freight market with over 70% market share. Considering the ongoing cost reduction efforts and efficiency enhancement trends within China's logistics industry, we expect FTA to be the largest beneficiary of the increasing demand for digital freight platforms. The proven online transaction service business model is the key long-term growth driver in our thesis.</li>
</ul>
<p>During the period, we exited the following positions:</p>
<ul class="content-list">
<li><strong>Pharmaron Beijing</strong> (0.00% of Fund net assets<sup>*</sup>), which provides research and manufacturing services for a wide range of pharmaceutical entities, has disappointed investors with its operating results. Margins have been worse than expected, in part due to challenges in ramping up facilities overseas. We have also had concerns about the funding environment for early stage clinical projects, which Pharmaron is particularly exposed to.</li>
</ul>
<ul class="content-list">
<li><strong>A-Living Smart City Services</strong> (0.00% of Fund net assets<sup>*</sup>) is a property management company partly owned by the Agile group. The parent company has been struggling with liquidity issues, and there are question marks about receivable from the parent. In addition, competition for non-parent private real estate, commercial and governmental contracts has been fierce, depressing margins</li>
</ul>
<h2 id="Outlook" class="jump-link-nav anchored-block" data-jumplink-title="Outlook">Outlook</h2>
<p>We remain grounded by our investment process and our positioning reflects our convictions from a bottom-up basis heading into the second half of the year. Our process has created some positioning differentials versus the benchmark. Brazil remains overweight to start the quarter (11.1% Fund weight versus 5.6% index weight<sup>*</sup>), as does Georgia (4.5% Fund weight versus 0% Index weight<sup>*</sup>). Again, these weights are reflective of our company research and are not macro-based.</p>
<p>China and Taiwan Region are significantly underweight versus the benchmark, which does not reflect a bearish macro view on the region, but is a reflection of the opportunities we see. The China weighting is slightly larger than it first appears because we have a holding in Prosus (4.97% Fund weight<sup>*</sup>) whose principle asset is their holding in Tencent. Excluding this, we are currently allocated roughly 33% weight between China and Taiwan Region, focused specifically on those companies that pass our due diligence process.</p>
<p><a href="/us/en/blogs/emerging-markets-equity/emerging-markets-brazil-snaps-back/eme-quarterly-commentary-q2-2023.pdf" rel="noopener" target="_blank" title="VanEck Emerging Markets Fund Manager Commentary"><strong>Download Commentary PDF with Fund specific information and performance.</strong></a></p>
<p>To receive more <a href="/us/en/insights/emerging-markets-equity/" title="Emerging Markets Equity Insights"><strong>Emerging Markets Equity</strong></a> insights, <a href="/us/en/subscribe/" title="Subscription Center"><strong>sign up in our subscription center</strong></a>.</p>
<style type="text/css">
    .wrapped-div {
        max-width: 100%;
    }

    @media (max-width: 768px) {
        .wrapped-div {
            overflow-x: scroll;
        }
    }

    .wrapped-div-sector {
        max-width: 100%;
        overflow-x: scroll;
    }
</style>
]]></content:encoded>
</item><item rdf:about="https://www.vaneck.com/us/en/blogs/emerging-markets-bonds/what-investors-need-to-know-about-emerging-markets-debt/">
  <title>What Investors Need to Know About Emerging Markets Debt></title>
  <link>https://www.vaneck.com/us/en/blogs/emerging-markets-bonds/what-investors-need-to-know-about-emerging-markets-debt/</link>
  <description><![CDATA[VanEck&rsquo;s Eric Fine discusses the market opportunity in emerging markets debt and explains its key benefits in the current macroeconomic environment on the Excess Returns podcast.]]></description>
  <dc:creator>Eric Fine</dc:creator>
  <dc:date>07/18/2023 06:30:00</dc:date>
<content:encoded><![CDATA[

<p>In a recent episode of the <strong><a href="https://www.vaneck.com/us/en/offsite-disclaimer/?id=236164&amp;button=no&amp;url=https://www.youtube.com/watch/?v%3daKDT6DaC0jE" title="Excess Returns - What Investors Need to Know About Emerging Market Debt with VanEck's Eric Fine" target="_blank" rel="noopener">Excess Returns podcast</a></strong>, Eric Fine explains how growing up as the son of two U.S. diplomats and his experience building the first clearing system in Russia led him to a career in emerging markets debt. Eric also breaks down the current investment opportunity in the asset class. Emerging markets (EM) countries have lower debt than their developed country counterparts, and the asset class offers higher real yields. In addition, emerging markets countries are better positioned to navigate changes in the global supply chain, as ongoing geopolitical turmoil continues to impact the flow of goods, especially commodities.</p>
<h2>EM Countries Have Lower Debt</h2>
<p><a href="https://www.vaneck.com/us/en/blogs/emerging-markets-bonds/meeting-demand-for-income-in-a-year-of-rising-rates/" title="Meeting Demand for Income in a Year of Rising Rates"><strong>Emerging markets in general have moved much more quickly to increase interest rates</strong></a> compared to the U.S. and other developed markets in order to stay ahead of inflation. For investors, this fundamental backdrop means less issuance and rolling over of debt, a favorable supply/demand dynamic that should help support EM bonds. Additionally, if needed, EM central banks can hike interest rates without bankrupting the government (like we saw in the UK).</p>
<h2>EM Debt Has Higher Yields</h2>
<p>The primary focus of EM central banks is to focus on controlling inflation, and they do this by maintaining high real interest rates. For investors, the result has been not only higher nominal yields but higher real yields. The benefits to EM local currency investors are a more substantial level of income that is not eroded by loss of purchasing power (through a potentially weaker currency).</p>
<h2>EM Debt Benefits from New Supply Chain Dynamics</h2>
<p>Unlike developed markets, which experience higher commodity prices as a price shock, emerging markets export more commodities than they import, which means they benefit from higher prices.</p>
<h2>Highlights of the Discussion Include:</h2>
<p>02:13 - Eric's background as the son of diplomats and how he ended up designing weapons systems<br />13:44 - The overall emerging markets debt landscape<br />16:23 - The benefits of emerging markets debt for the U.S. investor<br />21:12 - Some of the unique issues in emerging markets debt relative to developed markets<br />25:37 - Eric's investment process<br />30:08 - Sovereign vs. corporate emerging markets debt<br />32:02 - Eric's views on country concentration<br />44:28 - The overall growth of emerging markets<br />53:01 - Political risk in emerging markets<br />58:41 - The one lesson Eric would teach the average investor</p>
<p>Listen to the full podcast <strong><a href="https://www.vaneck.com/us/en/offsite-disclaimer/?id=236164&amp;button=no&amp;url=https://www.youtube.com/watch/?v%3daKDT6DaC0jE" title="Excess Returns - What Investors Need to Know About Emerging Market Debt with VanEck's Eric Fine" target="_blank" rel="noopener">here</a></strong>.</p>
<p>To receive more <a href="https://www.vaneck.com/us/en/insights/emerging-markets-bonds/" title="Emerging Markets Bonds Insights"><strong>Emerging Markets Bonds</strong></a> insights, <a href="https://www.vaneck.com/us/en/subscribe/" title="Subscription Center"><strong>sign up in our subscription center</strong></a>.</p>
]]></content:encoded>
</item><item rdf:about="https://www.vaneck.com/us/en/blogs/natural-resources/encouraging-commodity-demand-expectations-for-second-half/">
  <title>Encouraging Commodity Demand Expectations for Second Half></title>
  <link>https://www.vaneck.com/us/en/blogs/natural-resources/encouraging-commodity-demand-expectations-for-second-half/</link>
  <description><![CDATA[The second half of 2023 could be positive for most commodities after a down first half-year as China takes stronger policy actions to reignite its economy.]]></description>
  <dc:creator>Roland Morris</dc:creator>
  <dc:date>07/17/2023 06:30:00</dc:date>
<content:encoded><![CDATA[

<h2>Macro Outlook: China&rsquo;s Poor Economic Trends Continue to Affect Commodities</h2>
<p>The UBS Constant Maturity Commodity Index (CMCI) underperformed the Bloomberg Commodity Index (BCOM) in the second quarter (Q2) by 0.5% but continues to outperform year-to-date by over 3.5%. Year-to-date outperformance is mostly due to CMCI&rsquo;s lower exposure to natural gas which declined sharply in the first half of 2023. CMCI also outperformed BCOM in the agricultural sector due to owning both London and U.S. cocoa. BCOM does not own cocoa, which is up about 35% year-to-date.</p>
<p>CMCI&rsquo;s underperformance in the second quarter was partly due to BCOM&rsquo;s better roll yield capture in the energy and agricultural sectors. Front-month exposure helped BCOM in Q2 but over the longer term, it has hurt BCOM&rsquo;s performance relative to CMCI. Additionally, CMCI has a higher exposure to the industrial metals sector which declined by about 10% in Q2 due to very disappointing economic news from China. The declines in all commodity indexes during Q2 2023 was mostly due to the poor economic trends in China. We anticipate changes in the second half of 2023, however, as China takes stronger monetary and fiscal policy actions to reignite its economy. More than any other economy, China&rsquo;s is a command economy driven by policy. The second half of 2023 could be positive for most commodities after a down first half-year. U.S. interest rates will likely peak as the U.S. Federal Reserve completes this tightening cycle which we believe, could trigger new declines in the U.S. dollar. Combined with some stronger policy-driven Chinese growth, commodity demand expectations could improve.</p>
<h2>Sector Review: Industrial Metals Slump; Live Cattle Price Rally Led Significant Livestock Jump</h2>
<p>The energy sector declined about 2% in the quarter. BCOM benefited from a larger natural gas exposure and front-month exposure in both natural gas and unleaded gas.</p>
<p>The agricultural sector was mostly unchanged in Q2 but wheat and corn fell sharply and cocoa rallied by about 20%. Soybeans were close to unchanged but soy meal was down 6% while bean oil was up about 10%.</p>
<p>Industrial metals fell sharply in Q2. China&rsquo;s weaker-than-expected economic performance dampened demand expectations for industrial metals. China is the largest buyer of industrial metals by a wide margin, representing more than 40% of global consumption for several metals. Aluminum, zinc, nickel and copper all fell in Q2.</p>
<p>The precious metals sector fell slightly in Q2; Gold declined 2.4% and silver dropped 5.0%.</p>
<p>The livestock sector was up for Q2 led by a 10% rally in live cattle prices. Live cattle prices continue to trade near all-time highs of $180.</p>
<h3>Roll Yield Estimates YTD - June 2023</h3>
<p><img class="img-responsive w-100 " src="https://www.vaneck.com/contentassets/0d3bffd7618c485b992457b837066ca0/3429_cmci_chart-01_2023.07_v1_blog_blog.svg" alt="Roll Yield Estimates YTD - June 2023" /></p>
<p class="chart-disclosure"><strong>Source: Bloomberg. Data as of June 2023.</strong> Past performance is no guarantee of future results. Index performance is not illustrative of fund performance. It is not possible to invest in an index.</p>
<p><strong><a href="/link/9cc454bdc12d49638c0a22783d5a26cf.aspx" title="CMCAX - CM Commodity Index Fund - Class A">Learn more about the VanEck CM Commodity Index Fund</a></strong>, which seeks to track, before fees and expenses, the CMCI.</p>
<p>To receive more <a href="https://www.vaneck.com/us/en/insights/natural-resources/" title="Natural Resources Insights"><strong>Natural Resources</strong></a> insights, <a href="https://www.vaneck.com/us/en/subscribe/" title="Subscription Center"><strong>sign up in our subscription center</strong></a>.</p>
]]></content:encoded>
</item><item rdf:about="https://www.vaneck.com/us/en/blogs/emerging-markets-bonds/what-does-a-hawkish-fed-mean-for-emerging-markets-bonds/">
  <title>What Does A Hawkish Fed Mean For Emerging Markets Bonds?></title>
  <link>https://www.vaneck.com/us/en/blogs/emerging-markets-bonds/what-does-a-hawkish-fed-mean-for-emerging-markets-bonds/</link>
  <description><![CDATA[A hawkish Fed and subsequent rising U.S. recession risk are clearly bullish for risk-free assets like U.S. Treasuries, but USD-denominated EM bonds also look favorable in the current environment.]]></description>
  <dc:creator>Eric Fine</dc:creator>
  <dc:date>07/17/2023 06:30:00</dc:date>
<content:encoded><![CDATA[

<ul class="content-list">
<li>Big levels everywhere: Apple has $3tn market capitalization, US Treasury 10-year and 30-year are yielding 4%, and the 2-year is yielding 5%, and every chart from EUR to ZAR looks poised&hellip;for something. What something might that be?</li>
<li>A hawkish Fed and resultant rising recession risk are the thing. This should be bullish for risk-free market rates (like the US 10-year), and bearish for &ldquo;risk&rdquo;. EM US dollar-denominated bonds now look very attractive. EM local-currency denominated bonds now look unattractive.</li>
<li>China cuts two ways. On one side, higher US rates relative to Chinese rates puts downward pressure on CNY, which is a risk to EMFX (while also exporting disinflation and a US rates rally). On the other side, Chinese stimulus, however targeted and modulated, could support commodities markets and thus specific EMs.</li>
</ul>
<p>In June, the VanEck Emerging Markets Bond Fund was up 2.66% compared to up 2.75% for its benchmark (50% J.P. Morgan Government Bond Index-Emerging Markets (GBI-EM) Global Diversified and 50% J.P. Morgan Emerging Markets Bond Index (EMBI)). Year to date as of 6/30/2023, the Fund is up 5.93%, in line with its benchmark, which is up 5.95%.We continue to increase duration and exposure to US dollar-denominated EM bonds, while reducing exposure to Asian currencies (EMFX) and high-beta EMFX (no Thailand, South Africa, or Mexico local-currency, for example) with the exception of Brazil (and selected others), which appears very attractive following its weakness. We end June with carry of 5.88%, yield-to-worst of 7.71%, duration of 5.6, and roughly 48% in local currency. The risk we worry about is that ongoing/excessive exuberance could boost high-beta/high-risk local-currency markets to which we have limited exposure. We are now defensively positioned. <a href="/us/en/blogs/emerging-markets-bonds/what-does-a-hawkish-fed-mean-for-emerging-markets-bonds.pdf" rel="noopener" target="_blank" title="What Does A Hawkish Fed Mean For Emerging Markets Bonds?"><strong>View here for a PDF version of this blog</strong></a>.</p>
<div class="wrapped-div">
<table style="width: 100%;">
<tbody>
<tr class="tbl-data">
<td class="tbl-header last" colspan="8">Average Annual Total Returns (%) as of June 30, 2023</td>
</tr>
<tr class="tbl-data">
<td class="data-td last">&nbsp;</td>
<td class="data-head last">1 Month<sup>&dagger;</sup></td>
<td class="data-head last">3 Month<sup>&dagger;</sup></td>
<td class="data-head last">YTD</td>
<td class="data-head last">1 Year</td>
<td class="data-head last">3 Year</td>
<td class="data-head last">5 Year</td>
<td class="data-head last">10 Year</td>
</tr>
<tr class="tbl-data">
<td class="data-td last">Class A: NAV (Inception 07/09/12)</td>
<td class="data-td data last">2.66</td>
<td class="data-td data last">2.27</td>
<td class="data-td data last">5.93</td>
<td class="data-td data last">14.28</td>
<td class="data-td data last">2.09</td>
<td class="data-td data last">3.12</td>
<td class="data-td data last">1.74</td>
</tr>
<tr class="tbl-data">
<td class="data-td last">Class A: Maximum 5.75% load</td>
<td class="data-td data last">-3.24</td>
<td class="data-td data last">-3.61</td>
<td class="data-td data last">-0.16</td>
<td class="data-td data last">7.71</td>
<td class="data-td data last">0.10</td>
<td class="data-td data last">1.90</td>
<td class="data-td data last">1.14</td>
</tr>
<tr class="tbl-data">
<td class="data-td last">Class I: NAV (Inception 07/09/12)</td>
<td class="data-td data last">2.85</td>
<td class="data-td data last">2.51</td>
<td class="data-td data last">6.01</td>
<td class="data-td data last">14.78</td>
<td class="data-td data last">2.40</td>
<td class="data-td data last">3.44</td>
<td class="data-td data last">2.07</td>
</tr>
<tr class="tbl-data">
<td class="data-td last">Class Y: NAV (Inception 07/09/12)</td>
<td class="data-td data last">2.84</td>
<td class="data-td data last">2.46</td>
<td class="data-td data last">6.13</td>
<td class="data-td data last">14.79</td>
<td class="data-td data last">2.36</td>
<td class="data-td data last">3.38</td>
<td class="data-td data last">2.00</td>
</tr>
<tr class="tbl-data">
<td class="data-td last">0% GBI-EM/50% EMBI</td>
<td class="data-td data last">2.75</td>
<td class="data-td data last">2.36</td>
<td class="data-td data last">5.95</td>
<td class="data-td data last">9.43</td>
<td class="data-td data last">-2.22</td>
<td class="data-td data last">0.48</td>
<td class="data-td data last">1.18</td>
</tr>
</tbody>
</table>
</div>
<br />
<div class="wrapped-div">
<table style="width: 100%;">
<tbody>
<tr class="tbl-data">
<td class="tbl-header last" colspan="8">Average Annual Total Returns (%) as of March 31, 2023</td>
</tr>
<tr class="tbl-data">
<td class="data-td last">&nbsp;</td>
<td class="data-head last">1 Month<sup>&dagger;</sup></td>
<td class="data-head last">3 Month<sup>&dagger;</sup></td>
<td class="data-head last">YTD</td>
<td class="data-head last">1 Year</td>
<td class="data-head last">3 Year</td>
<td class="data-head last">5 Year</td>
<td class="data-head last">10 Year</td>
</tr>
<tr class="tbl-data">
<td class="data-td last">Class A: NAV (Inception 07/09/12)</td>
<td class="data-td data last">1.50</td>
<td class="data-td data last">3.58</td>
<td class="data-td data last">-0.38</td>
<td class="data-td data last">8.30</td>
<td class="data-td data last">0.85</td>
<td class="data-td data last">0.33</td>
</tr>
<tr class="tbl-data">
<td class="data-td last">Class A: Maximum 5.75% load</td>
<td class="data-td data last">-4.34</td>
<td class="data-td data last">-2.38</td>
<td class="data-td data last">-6.11</td>
<td class="data-td data last">6.19</td>
<td class="data-td data last">-0.34</td>
<td class="data-td data last">-0.26</td>
</tr>
<tr class="tbl-data">
<td class="data-td last">Class I: NAV (Inception 7/9/12)</td>
<td class="data-td data last">1.52</td>
<td class="data-td data last">3.42</td>
<td class="data-td data last">-0.04</td>
<td class="data-td data last">8.60</td>
<td class="data-td data last">1.14</td>
<td class="data-td data last">0.63</td>
</tr>
<tr class="tbl-data">
<td class="data-td last">Class Y: NAV (Inception 7/9/12)</td>
<td class="data-td data last">1.49</td>
<td class="data-td data last">3.58</td>
<td class="data-td data last">-0.16</td>
<td class="data-td data last">8.54</td>
<td class="data-td data last">1.08</td>
<td class="data-td data last">0.57</td>
</tr>
<tr class="tbl-data">
<td class="data-td last">50 GBI-EM GD / 50% EMBI GD</td>
<td class="data-td data last">2.54</td>
<td class="data-td data last">3.51</td>
<td class="data-td data last">-3.81</td>
<td class="data-td data last">0.48</td>
<td class="data-td data last">-1.43</td>
<td class="data-td data last">0.29</td>
</tr>
</tbody>
</table>
</div>
<br />
<p class="chart-disclosure"><sup>&dagger;</sup>&nbsp;Returns less than one year are not annualized.</p>
<p class="chart-disclosure"><strong>Expenses: Class A: Gross 2.55%, Net 1.27%; Class I: Gross 2.51%, Net 0.97%; Class Y: Gross 2.91%, Net 1.02%.</strong> Expenses are capped contractually until 05/01/24 at 1.25% for Class A, 0.95% for Class I, 1.00% for Class Y. Caps excluding acquired fund fees and expenses, interest, trading, dividends, and interest payments of securities sold short, taxes, and extraordinary expenses.</p>
<p class="chart-disclosure"><strong>The performance data quoted represents past performance. Past performance is not a guarantee of future results. Investment return and principal value of an investment will fluctuate so that an investor&rsquo;s shares, when redeemed, may be worth more or less than their original cost. Performance may be lower or higher than performance data quoted. Please call 800.826.2333 or visit vaneck.com for performance current to the most recent month ended.</strong></p>
<p class="chart-disclosure">The &ldquo;Net Asset Value&rdquo; (NAV) of a Fund is determined at the close of each business day, and represents the dollar value of one share of the fund; it is calculated by taking the total assets of the fund, subtracting total liabilities, and dividing by the total number of shares outstanding. The NAV is not necessarily the same as the ETF&rsquo;s intraday trading value. Investors should not expect to buy or sell shares at NAV.</p>
<p><strong>Big levels everywhere: Apple has $3tn market capitalization, US Treasury 10-year and 30-year are yielding 4%, and the 2-year is yielding 5%, and every chart from EUR to ZAR looks poised&hellip;for something. What something might that be?</strong></p>
<p>Well, the latest FOMC could be it. In it, the Fed accepted staff recession forecasts, while remaining hawkish. Clearly, the Fed is willing to &ldquo;bring it on&rdquo; and will use this opportunity to correct it&rsquo;s mistaken initial expectation of &ldquo;transitory&rdquo; inflation. The next several months could see improved inflation outcomes in the U.S. and a handle-change to 3% from 4% on CPI. Yields at current levels could be fighting the inflation tape for months. Keep in mind that big rate moves tend to happen very quickly. Now is the time to at least prepare intellectually.</p>
<p><strong>A hawkish Fed and resultant rising recession risk are the thing. This should be bullish for risk-free market rates (like the US 10-year), and bearish for &ldquo;risk&rdquo;. EM US dollar-denominated bonds now look very attractive. EM local-currency denominated bonds now look unattractive.</strong> This marks a big change for us. For the past year we&rsquo;ve been attracted to the high real rates of Asian and some Latin local-currency markets. And this stance paid off with outperformance. But now EM local rates have simply rallied too much and don&rsquo;t offer obvious cheapness. Exhibit 1 below gives a superficial version of this. On the left graph, we show US treasury yields with their volatility bands. These yields now deviate well over 1 standard-deviation from trend. The graph on the right, though, shows EM local currency yields minus US treasury yields. These yield differentials are now over 2 standard-deviations <i>lower</i> than trend yield differentials. UD dollar-denominated bonds look attractive, EM local-currency-denominated bonds appear unattractive.</p>
<h3>Exhibit 1 &ndash; USD Rates Look Like a Buy, EM Local Rates Look Like a Sell</h3>
<p><strong>10Y UST Yield with Volatility Bands, %</strong></p>
<p><img class="img-responsive w-100" src="https://www.vaneck.com/contentassets/8e231388211f4687a3d585f85a71d84c/3435_emb-monthly-blog-july_chart-1_blog_2023.07_v1.svg" alt="10Y UST Yield with Volatility Bands, %" /></p>
<p><strong>GBI-EM/5Y UST Yield Differential vs. Trend and Volatility Bands, bsp</strong></p>
<p><img class="img-responsive w-100" src="https://www.vaneck.com/contentassets/8e231388211f4687a3d585f85a71d84c/3435_emb-monthly-blog-july_chart-2_blog_2023.07_v1.svg" alt="GBI-EM/5Y UST Yield Differential vs. Trend and Volatility Bands, bsp" /></p>
<p class="chart-disclosure">Source: VanEck Research. Data as of June 30, 2023. Past performance does not guarantee future results.</p>
<p><strong>China cuts two ways. On one side, higher US rates relative to Chinese rates puts downward pressure on CNY, which is a risk to EMFX (while also exporting disinflation and a US rates rally argued for above). On the other side, Chinese stimulus, however targeted and modulated, could support commodities markets and thus specific EMs.</strong> China is a relatively mature country that does not need to be a stimulus-junkie due to its low inflation, low government debt, and very high domestic credibility/popularity. As a result, a firehose of economic support should not be expected. But, tailored projects could easily be part of the policy mix. What this means is that we need to be wary of potential renminbi (CNY) weakness. CNY has followed Chinese yield differentials with the US, and EMFX has high correlation and beta with CNY. Moreover, CNY weakness would export disinflation, further supporting our constructive view on US rates. But this also means we need to be on the watch for potential winners of any tailored Chinese policy responses. These could be very &ldquo;commodities supportive&rdquo;, so countries like copper-exporting Chile (as one example) could be specific winners. Exhibit 2 below shows that CNY has weakened along with the interest rate differential between China and the US. The US looks to be relatively more hawkish than a China contemplating shades of stimulation, and this could present risks for a lot of EM local-currency markets.</p>
<h3>Exhibit 2 &ndash; Chinese Currency Declined as Chinese Interest Rate Differential with US Declined</h3>
<p><img class="img-responsive w-100" src="https://www.vaneck.com/contentassets/8e231388211f4687a3d585f85a71d84c/3435_emb-monthly-blog-july_chart-3_blog_2023.07_v1.svg" alt="Chinese Currency Declined as Chinese Interest Rate Differential with US Declined" /></p>
<p class="chart-disclosure">Source: VanEck Research. Data as of June 30, 2023. Past performance does not guarantee future results.</p>
<p><strong>In June, the fund was up 2.66% compared to up 2.75% for its benchmark</strong> (50% J.P. Morgan Government Bond Index-Emerging Markets (GBI-EM) Global Diversified and 50% J.P. Morgan Emerging Markets Bond Index (EMBI)). <strong>Year-to-date as of 6/30/2023, the Fund was up 5.93%, in line with its benchmark which is up 5.95%.</strong> We continue to increase duration and exposure to US dollar-denominated EM bonds, while reducing exposure to Asian EMFX and high-beta EMFX (no Thailand, South Africa, or Mexico local-currency, for example) with the exception of Brazil (and selected others), which appears very attractive following its weakness. We end June with carry of 5.88%, YTW of 7.71%, duration of 5.6, and roughly 48% in local currency. The risk we worry about is that ongoing/excessive exuberance could boost high-beta/high-risk local-currency markets to which we have limited exposure. We are now defensively positioned.</p>
<h2>EXPOSURE TYPES AND SIGNIFICANT CHANGES</h2>
<p>The changes to our top positions are summarized below. Our largest positions in June were Indonesia, Brazil, Mexico, Colombia, and Peru:</p>
<ul class="content-list">
<li class="mb-3">We increased our hard currency sovereign exposure in Nigeria and Egypt, as well as hard currency corporate exposure in Nigeria. Nigeria&rsquo;s post-election policy U-turn was much faster than expected, with ambitious announcements about the exchange-rate unification and the elimination of fuel subsidies. The new administration has a very long &ldquo;to do&rdquo; list and there are numerous implementation risks, but at the very least the measures should reduce pressure on international reserves. The main drivers in Egypt were indications of faster-than-expected privatization and more substantial support from the Gulf. In terms of our investment process, these developments improved the policy test scores for the two countries.</li>
<li class="mb-3">We also increased our hard currency exposure in Mexico and Colombia, and local currency exposure in the Dominican Republic. The Dominican Republic&rsquo;s disinflation progress improves the country&rsquo;s economic test score and leaves room for yield compression. Colombia&rsquo;s current account adjustment eases pressure on the international reserves (and also improves the economic test score). The market positioning in Mexico&rsquo;s local bonds and FX is getting stretched, but sovereign bonds&rsquo; valuations remain attractive (the solid technical test score), and there are no glaring external imbalances.</li>
<li class="mb-3">Finally, we increased our local currency exposure in Sri Lanka, and hard currency sovereign exposure in Qatar and Morocco. Changes in Sri Lanka&rsquo;s exposure mostly reflected price appreciation, following a series of encouraging announcements about debt restructuring. Morocco is a solid sovereign credit with low beta to China, which improved the country&rsquo;s technical test score in the current environment. Qatar was the best candidate to meet our risk limits in the region, as there are increasing concerns about Saudi Arabia&rsquo;s fiscal situation against the prospect of softer oil prices.</li>
<li class="mb-3">We reduced our hard currency sovereign exposure in Pakistan and Guatemala. The main driver in Pakistan was the country&rsquo;s ability to meet the IMF program&rsquo;s benchmarks, which worsened its policy test score. Guatemala&rsquo;s presidential elections raised legitimacy concerns, as the frontrunner was excluded from the polls shortly before the elections. In terms of our investment process, this worsened the country&rsquo;s policy test score.</li>
<li class="mb-3">We also reduced our local currency exposure in Malaysia and Thailand. The key motivating factor was potential contagion from China&rsquo;s soft growth patch &ndash; both in terms of economic impact and currencies&rsquo; beta to the Chinese renminbi. In terms of our investment process, this worsened the technical test score for these countries.</li>
<li class="mb-3">Finally, we reduced our local currency exposure in Brazil, despite several seemingly supportive factors such as very successful disinflation, a less bad fiscal outlook, and no changes in the official inflation target that opened room for policy rate cuts before the year-end. These positives, however, are mostly priced in, and the market positioning both in rates and FX is very elevated. Brazil&rsquo;s technical test score has weakened as a result, but we are open to revisiting this trade if valuations start to look more attractive in the coming months.</li>
</ul>
<p>To receive more <a href="https://www.vaneck.com/us/en/insights/emerging-markets-bonds/" title="Emerging Markets Bonds Insights"><strong>Emerging Markets Bonds</strong></a> insights, <a href="https://www.vaneck.com/us/en/subscribe/" title="Subscription Center"><strong>sign up in our subscription center</strong></a>.</p>
<style>
    .wrapped-div {
        max-width: 100%;
    }

    @media (max-width: 768px) {
        .wrapped-div {
            overflow-x: scroll;
        }
    }

    .wrapped-div-sector {
        max-width: 100%;
        overflow-x: scroll;
    }
</style>
]]></content:encoded>
</item><item rdf:about="https://www.vaneck.com/us/en/blogs/income-investing/higher-yields-and-tighter-spreads-drive-monthly-outperformance/">
  <title>Higher Yields and Tighter Spreads Drive Monthly Outperformance></title>
  <link>https://www.vaneck.com/us/en/blogs/income-investing/higher-yields-and-tighter-spreads-drive-monthly-outperformance/</link>
  <description><![CDATA[Fallen angels outperformed broad HY in June driven by bond selection and tighter spreads. An additional rising star adds to an already busy year of upgrades and further reduces Energy sector exposure.]]></description>
  <dc:creator>Nicolas  Fonseca, CFA</dc:creator>
  <dc:date>07/17/2023 06:30:00</dc:date>
<content:encoded><![CDATA[

<p>Fallen angels (as represented by the ICE US Fallen Angel High Yield 10% Constrained Index, &ldquo;H0CF&rdquo;) outperformed broad HY (as represented by the ICE BofA US High Yield Index, &ldquo;H0A0&rdquo;) by 0.15% (1.78% vs 1.63%) in June and are now lagging by 0.55% year-to-date (YTD) (4.86% vs 5.42%). In June, bond selection and tighter spreads drove outperformance versus the broad high yield market. More broadly, CCC &amp; lower rated bonds have continued to outperform higher rated peers as spreads have again tightened, and yields have increased. Although credit spreads rallied in June, forecasts for defaults in high yield have started to rise as the U.S. Federal Reserve (Fed) continues to maintain high interest rates while signaling additional tightening may be on the horizon.</p>
<h2>Where to Now?</h2>
<p>Amid strong economic data, the risk of a hard landing or recession appears to continue to be pushed further into the future than what the market anticipated earlier in the year. This has been reflected in high overall yields even though spreads have tightened. How have fallen angels performed historically when yields were at these levels?</p>
<ul class="content-list">
<li>There have been 235 months since December 2003.</li>
<li>The fallen angel yield has been above seven with spreads below 300 only 17 times during the 235 months since December 2003. The most recent two times was in February and June of this year.</li>
<li>The remaining 15 times were in 2005 (twice), 2006 (seven) and 2007 (six).
<ul class="content-list">
<li>The average forward 1Y returns in those 15 months saw fallen angels underperform broad high yield by 1.10% (2.76% vs 3.85%)</li>
<li>3Y forward basis, fallen angels outperformed by 1.52% (5.55% vs 4.03%, annualized)</li>
<li>5Y forward basis, fallen angels outperformed 1.77% (9.67% vs 7.91%, annualized)</li>
<li>10Y forward basis, fallen angels outperformed by 2.74% (10.12% vs 7.38%, annualized)</li>
</ul>
</li>
</ul>
<p><img class="img-responsive w-100" src="https://www.vaneck.com/contentassets/ffcd44efb77c4c15b3114412d4057b86/3433_angl_chart-01_2023.07_blog.svg" alt="Cumulative Total Return (base =100)" /></p>
<p class="chart-disclosure"><strong>Source: ICE Data Services, VanEck. Data as of June 30, 2023</strong>. Fallen Angels: ICE US Fallen Angel High Yield 10% Constrained Index. Broad HY: ICE BofA US High Yield Index. OAS refers to &ldquo;option-adjusted spread.&rdquo; Please see definition for this and other terms referenced herein in the disclosures and definitions portion of this blog. Past performance is no guarantee of future results. Index performance is not representative of fund performance. It is not possible to invest in an index.</p>
<p><strong><u>Fallen Angels Overall Statistics:</u> </strong>Fallen angels yields decreased in June by 20bps, to 7.35, while broad HY yields decreased by 27bps to 8.56 and the 10Y yield increased by 17bps to 3.81. Fallen angels current yield has been in the 30th percentile since December 2003, while spreads are only in the 16th percentile, demonstrating that yields are high while spreads are very tight. With the exit of some large issuers over Q2, the Index market value has shrunk over the year.</p>
<div class="wrapped-div">
<table style="width: 960px;">
<tbody>
<tr class="tbl-data">
<td class="tbl-header last text-center">&nbsp;</td>
<td class="tbl-header last text-center" style="border-right: outset;" colspan="3">Fallen Angel</td>
<td class="tbl-header last text-center" colspan="3">Broad HY</td>
</tr>
<tr class="tbl-data">
<td class="data-td last">&nbsp;</td>
<td class="data-head last">12/31/2022</td>
<td class="data-head last">3/31/2023</td>
<td class="data-head last" style="border-right: outset;">6/30/2023</td>
<td class="data-head last">12/31/2022</td>
<td class="data-head last">3/31/2023</td>
<td class="data-head last">6/30/2023</td>
</tr>
<tr class="tbl-data">
<td class="data-td last">Yield to Worst</td>
<td class="data-td data last">7.49</td>
<td class="data-td data last">7.08</td>
<td class="data-td data last" style="border-right: outset;">7.35</td>
<td class="data-td data last">8.89</td>
<td class="data-td data last">8.49</td>
<td class="data-td data last">8.56</td>
</tr>
<tr class="tbl-data">
<td class="data-td last">Effective Duration</td>
<td class="data-td data last">5.45</td>
<td class="data-td data last">5.30</td>
<td class="data-td data last" style="border-right: outset;">4.98</td>
<td class="data-td data last">4.04</td>
<td class="data-td data last">3.83</td>
<td class="data-td data last">3.65</td>
</tr>
<tr class="tbl-data">
<td class="data-td last">Full Market Value ($mn)</td>
<td class="data-td data last">112,854</td>
<td class="data-td data last">114,776</td>
<td class="data-td data last" style="border-right: outset;">84,590</td>
<td class="data-td data last">1,199,909</td>
<td class="data-td data last">1,234,319</td>
<td class="data-td data last">1,218,316</td>
</tr>
<tr class="tbl-data">
<td class="data-td last">OAS</td>
<td class="data-td data last">337</td>
<td class="data-td data last">325</td>
<td class="data-td data last" style="border-right: outset;">297</td>
<td class="data-td data last">481</td>
<td class="data-td data last">458</td>
<td class="data-td data last">405</td>
</tr>
<tr class="tbl-data">
<td class="data-td last">No. of Issues</td>
<td class="data-td data last">212</td>
<td class="data-td data last">206</td>
<td class="data-td data last" style="border-right: outset;">163</td>
<td class="data-td data last">1,927</td>
<td class="data-td data last">1,916</td>
<td class="data-td data last">1,870</td>
</tr>
</tbody>
</table>
</div>
<br />
<p class="chart-disclosure"><strong>Source: ICE Data Services, VanEck</strong> Fallen Angels: ICE US Fallen Angel High Yield 10% Constrained Index. Broad HY: ICE BofA US High Yield Index. OAS refers to &ldquo;option-adjusted spread.&rdquo; Please see definition for this and other terms referenced herein in the disclosures and definitions portion of this blog. Past performance is no guarantee of future results. Index performance is not representative of fund performance. It is not possible to invest in an index.</p>
<p><u><strong>New Fallen Angels:</strong></u> Seven issuers were downgraded in the first six months of the year, accounting for 11.18% of the Index. Per JP Morgan research, the &ldquo;BBB-&ldquo; universe is $1.13 trillion with $131 billion on negative watch or outlook by at least one rating agency. Research on certain scenarios (an issuer with an already high yield rating by one agency; same issuer with at least one of the other agencies rating it on negative watch/outlook) determined that only $6.7 billion may be downgraded in the near term. However, the research also identified the number of non-financials &ldquo;BBB-&ldquo; rated bonds trading above a spread of 250, and determined that there are $138bn worth of bonds trading at near high yield levels, potentially indicating the market&rsquo;s outlook that these could become fallen angels in the near future.</p>
<div class="wrapped-div">
<table style="width: 960px;">
<tbody>
<tr class="tbl-data">
<td class="tbl-header last">Month-end Addition</td>
<td class="tbl-header last text-center">Name</td>
<td class="tbl-header last text-center">Rating</td>
<td class="tbl-header last text-center">Sector</td>
<td class="tbl-header last text-center">Industry</td>
<td class="tbl-header last text-center">% Mkt Value</td>
<td class="tbl-header last text-center">Price</td>
</tr>
<tr class="tbl-data">
<td class="data-td last font-weight-normal">February</td>
<td class="data-td data last">Entegris Escrow Corp</td>
<td class="data-td data last">BB1</td>
<td class="data-td data last">Technology &amp; Electronics</td>
<td class="data-td data last">Electronics</td>
<td class="data-td data last">1.39</td>
<td class="data-td data last">90.92</td>
</tr>
<tr class="tbl-data">
<td class="data-td last font-weight-normal">March</td>
<td class="data-td data last">First Republic Bank</td>
<td class="data-td data last">B3</td>
<td class="data-td data last">Banking</td>
<td class="data-td data last">0.40</td>
<td class="data-td data last">54.63</td>
</tr>
<tr class="tbl-data">
<td class="data-td last font-weight-normal">March</td>
<td class="data-td data last">Nissan Motor Acceptance</td>
<td class="data-td data last">BB1</td>
<td class="data-td data last">Automotive</td>
<td class="data-td data last">Auto Loans</td>
<td class="data-td data last">2.57</td>
<td class="data-td data last">87.19</td>
</tr>
<tr class="tbl-data">
<td class="data-td last font-weight-normal">March</td>
<td class="data-td data last">Nissan Motor</td>
<td class="data-td data last">BB1</td>
<td class="data-td data last">Automotive</td>
<td class="data-td data last">Automakers</td>
<td class="data-td data last">5.49</td>
<td class="data-td data last">92.98</td>
</tr>
<tr class="tbl-data">
<td class="data-td last font-weight-normal">April</td>
<td class="data-td data last">Crane NXT</td>
<td class="data-td data last">BB3</td>
<td class="data-td data last">Capital Goods</td>
<td class="data-td data last">Diversified Capital Goods</td>
<td class="data-td data last">0.24</td>
<td class="data-td data last">70.99</td>
</tr>
<tr class="tbl-data">
<td class="data-td last font-weight-normal">April</td>
<td class="data-td data last">Rogers Communications</td>
<td class="data-td data last">BB2</td>
<td class="data-td data last">Telecommunications</td>
<td class="data-td data last">Telecom - Wireless</td>
<td class="data-td data last">0.65</td>
<td class="data-td data last">90.35</td>
</tr>
<tr class="tbl-data">
<td class="data-td last font-weight-normal">April</td>
<td class="data-td data last">Western Alliance Bancorporation</td>
<td class="data-td data last">BB1</td>
<td class="data-td data last">Banking</td>
<td class="data-td data last">0.44</td>
<td class="data-td data last">76.39</td>
</tr>
</tbody>
</table>
</div>
<br />
<p class="chart-disclosure"><strong>Source: ICE Data Services, VanEck</strong>. Fallen Angels: ICE US Fallen Angel High Yield 10% Constrained Index. Past performance is no guarantee of future results. Not a recommendation to buy or sell any of the names/securities mentioned herein. Index performance is not representative of fund performance. It is not possible to invest in an index.</p>
<p><strong><u>Rising Stars:</u></strong> A new issuer exited the Index in June, APA Corp. (APA), as Moody&rsquo;s upgraded it to Baa3 from Ba1, reflecting the company&rsquo;s strong financial results, improving balance sheet and stronger credit metrics. Moody&rsquo;s believes that APA&rsquo;s ongoing debt reduction (since 2020), will continue to improve its balance sheet and provide a more resilient financial profile. APA was downgraded in June 2020, entering the Index at a price of $83.79 and weight of 2.86%, and now exits the Index at $82.69/3.84%. During its two years in the Index, it returned -1.31% vs -6.40% (in price terms) for the broad high yield market. APA is the third Energy sector issue to be upgraded this year, reducing the sector exposure from close to 30% at the beginning of the year to 15% now. Upgrades to investment grade have accounted for 32.01% of the Index market value, making 2023 a very significant year in terms of rising stars volume. JP Morgan research conducted the same analysis for upgrades to investment grade and concluded that of the $299 billion bonds rated BB+, $24.3 could be upgraded in the near term.</p>
<div class="wrapped-div">
<table style="width: 960px;">
<tbody>
<tr class="tbl-data">
<td class="tbl-header last">Month-end Exit</td>
<td class="tbl-header last text-center">Name</td>
<td class="tbl-header last text-center">Rating</td>
<td class="tbl-header last text-center">Sector</td>
<td class="tbl-header last text-center">Industry</td>
<td class="tbl-header last text-center">% Mkt Value</td>
<td class="tbl-header last text-center">Price</td>
</tr>
<tr class="tbl-data">
<td class="data-td last font-weight-normal">February</td>
<td class="data-td data last">Autopistas Metropolitanas de Puerto Rico LLC</td>
<td class="data-td data last">BB1</td>
<td class="data-td data last">Transportation</td>
<td class="data-td data last">Transport Infrastructure/Services</td>
<td class="data-td data last">0.35</td>
<td class="data-td data last">100.49</td>
</tr>
<tr class="tbl-data">
<td class="data-td last font-weight-normal">February</td>
<td class="data-td data last">Nokia Corp</td>
<td class="data-td data last">BB1</td>
<td class="data-td data last">Technology &amp; Electronics</td>
<td class="data-td data last">Tech Hardware &amp; Equipment</td>
<td class="data-td data last">0.47</td>
<td class="data-td data last">97.50</td>
</tr>
<tr class="tbl-data">
<td class="data-td last font-weight-normal">March</td>
<td class="data-td data last">Western Midstream</td>
<td class="data-td data last">BB1</td>
<td class="data-td data last">Energy</td>
<td class="data-td data last">Gas Distribution</td>
<td class="data-td data last">5.27</td>
<td class="data-td data last">90.44</td>
</tr>
<tr class="tbl-data">
<td class="data-td last font-weight-normal">April</td>
<td class="data-td data last">Sprint Capital Corp</td>
<td class="data-td data last">BB1</td>
<td class="data-td data last">Telecommunications</td>
<td class="data-td data last">Telecom - Wireless</td>
<td class="data-td data last">4.70</td>
<td class="data-td data last">114.25</td>
</tr>
<tr class="tbl-data">
<td class="data-td last font-weight-normal">May</td>
<td class="data-td data last">Mattel Inc.</td>
<td class="data-td data last">BB2</td>
<td class="data-td data last">Consumer Goods</td>
<td class="data-td data last">Personal &amp; Household Products</td>
<td class="data-td data last">0.45</td>
<td class="data-td data last">85.32</td>
</tr>
<tr class="tbl-data">
<td class="data-td last font-weight-normal">May</td>
<td class="data-td data last">Nissan Motor Acceptance</td>
<td class="data-td data last">BB1</td>
<td class="data-td data last">Automotive</td>
<td class="data-td data last">Auto Loans</td>
<td class="data-td data last">2.67</td>
<td class="data-td data last">85.12</td>
</tr>
<tr class="tbl-data">
<td class="data-td last font-weight-normal">May</td>
<td class="data-td data last">Nissan Motor</td>
<td class="data-td data last">BB1</td>
<td class="data-td data last">Automotive</td>
<td class="data-td data last">Automakers</td>
<td class="data-td data last">5.57</td>
<td class="data-td data last">88.49</td>
</tr>
<tr class="tbl-data">
<td class="data-td last font-weight-normal">May</td>
<td class="data-td data last">Occidental Petroleum Corp</td>
<td class="data-td data last">BB1</td>
<td class="data-td data last">Energy</td>
<td class="data-td data last">Energy - Exploration &amp; Production</td>
<td class="data-td data last">8.69</td>
<td class="data-td data last">93.82</td>
</tr>
<tr class="tbl-data">
<td class="data-td last font-weight-normal">June</td>
<td class="data-td data last">APA Corp</td>
<td class="data-td data last">BB1</td>
<td class="data-td data last">Energy</td>
<td class="data-td data last">Energy - Exploration &amp; Production</td>
<td class="data-td data last">3.84</td>
<td class="data-td data last">82.69</td>
</tr>
</tbody>
</table>
</div>
<br />
<p class="chart-disclosure"><strong>Source: ICE Data Services, VanEck</strong>. Past performance is no guarantee of future results. Not a recommendation to buy or sell any of the names/securities mentioned herein. Index performance is not representative of fund performance. It is not possible to invest in an index.</p>
<p><u><strong>Fallen Angels Performance by Sector:</strong></u> Sector exposures continue changing with the exit of APA in June. The Energy sector dropped to 15.28% from 18.34% in May, which is approximately 50% of what it was a year ago. The Energy sector currently has 11 issuers, with only three of them being part of the 2020 wave of downgrades (EQM, Methanex and Rockies Express, with a total exposure of 6.75%). The other sector that saw a decrease in its exposure was Banking, to 3.20% from 5.32% in May, as an Intesa Sanpaolo issue with a weight of 2.30% was removed due to its maturity being less than 12 months. In terms of performance, only the Insurance sector posted a negative return (-0.06%) in June while the top performing sector was Financial Services (+7.91%). YTD, all sectors, except Banking, have so far posted positive performance, with Transportation, Financial Services and Leisure in the top three. Regarding spreads, all sectors except Banking saw tightening in June with the overall spread ending the month very close to the low level in February (295).</p>
<div class="wrapped-div">
<table style="width: 960px;">
<tbody>
<tr class="tbl-data">
<td class="tbl-header last text-center">&nbsp;</td>
<td class="tbl-header last text-center" style="border-right: outset;" colspan="3">Wgt (%)</td>
<td class="tbl-header last text-center" style="border-right: outset;" colspan="3">OAS</td>
<td class="tbl-header last text-center" style="border-right: outset;" colspan="3">Price</td>
<td class="tbl-header last text-center">Total Return (%)</td>
</tr>
<tr class="tbl-data">
<td class="data-td last">&nbsp;</td>
<td class="data-head last">12/31/2021</td>
<td class="data-head last">3/31/2023</td>
<td class="data-head last" style="border-right: outset;">6/30/2023</td>
<td class="data-head last">12/31/2021</td>
<td class="data-head last">3/31/2023</td>
<td class="data-head last" style="border-right: outset;">6/30/2023</td>
<td class="data-head last">12/31/2021</td>
<td class="data-head last">3/31/2023</td>
<td class="data-head last" style="border-right: outset;">6/30/2023</td>
<td class="data-head last">YTD</td>
</tr>
<tr class="tbl-data">
<td class="data-td last">Automotive</td>
<td class="data-td data last">10.00</td>
<td class="data-td data last">18.06</td>
<td class="data-td data last" style="border-right: outset;">10.00</td>
<td class="data-td data last">262</td>
<td class="data-td data last">246</td>
<td class="data-td data last" style="border-right: outset;">211</td>
<td class="data-td data last">91.35</td>
<td class="data-td data last">92.21</td>
<td class="data-td data last" style="border-right: outset;">92.99</td>
<td class="data-td data last">3.68</td>
</tr>
<tr class="tbl-data">
<td class="data-td last">Banking</td>
<td class="data-td data last">3.81</td>
<td class="data-td data last">3.99</td>
<td class="data-td data last" style="border-right: outset;">3.20</td>
<td class="data-td data last">302</td>
<td class="data-td data last">415</td>
<td class="data-td data last" style="border-right: outset;">376</td>
<td class="data-td data last">96.85</td>
<td class="data-td data last">87.61</td>
<td class="data-td data last" style="border-right: outset;">88.57</td>
<td class="data-td data last">-9.43</td>
</tr>
<tr class="tbl-data">
<td class="data-td last">Basic Industry</td>
<td class="data-td data last">1.36</td>
<td class="data-td data last">1.33</td>
<td class="data-td data last" style="border-right: outset;">1.93</td>
<td class="data-td data last">226</td>
<td class="data-td data last">227</td>
<td class="data-td data last" style="border-right: outset;">168</td>
<td class="data-td data last">92.17</td>
<td class="data-td data last">93.85</td>
<td class="data-td data last" style="border-right: outset;">94.44</td>
<td class="data-td data last">4.74</td>
</tr>
<tr class="tbl-data">
<td class="data-td last">Capital Goods</td>
<td class="data-td data last">5.12</td>
<td class="data-td data last">5.10</td>
<td class="data-td data last" style="border-right: outset;">7.66</td>
<td class="data-td data last">279</td>
<td class="data-td data last">240</td>
<td class="data-td data last" style="border-right: outset;">195</td>
<td class="data-td data last">95.01</td>
<td class="data-td data last">98.54</td>
<td class="data-td data last" style="border-right: outset;">96.85</td>
<td class="data-td data last">6.31</td>
</tr>
<tr class="tbl-data">
<td class="data-td last">Consumer Goods</td>
<td class="data-td data last">3.07</td>
<td class="data-td data last">3.00</td>
<td class="data-td data last" style="border-right: outset;">3.62</td>
<td class="data-td data last">275</td>
<td class="data-td data last">255</td>
<td class="data-td data last" style="border-right: outset;">298</td>
<td class="data-td data last">88.90</td>
<td class="data-td data last">91.27</td>
<td class="data-td data last" style="border-right: outset;">89.31</td>
<td class="data-td data last">2.95</td>
</tr>
<tr class="tbl-data">
<td class="data-td last">Energy</td>
<td class="data-td data last">27.93</td>
<td class="data-td data last">22.16</td>
<td class="data-td data last" style="border-right: outset;">15.28</td>
<td class="data-td data last">293</td>
<td class="data-td data last">303</td>
<td class="data-td data last" style="border-right: outset;">297</td>
<td class="data-td data last">88.13</td>
<td class="data-td data last">90.05</td>
<td class="data-td data last" style="border-right: outset;">88.74</td>
<td class="data-td data last">5.22</td>
</tr>
<tr class="tbl-data">
<td class="data-td last">Financial Services</td>
<td class="data-td data last">0.65</td>
<td class="data-td data last">0.64</td>
<td class="data-td data last" style="border-right: outset;">0.94</td>
<td class="data-td data last">540</td>
<td class="data-td data last">506</td>
<td class="data-td data last" style="border-right: outset;">459</td>
<td class="data-td data last">77.20</td>
<td class="data-td data last">80.27</td>
<td class="data-td data last" style="border-right: outset;">80.92</td>
<td class="data-td data last">7.91</td>
</tr>
<tr class="tbl-data">
<td class="data-td last">Healthcare</td>
<td class="data-td data last">3.02</td>
<td class="data-td data last">3.03</td>
<td class="data-td data last" style="border-right: outset;">4.33</td>
<td class="data-td data last">362</td>
<td class="data-td data last">304</td>
<td class="data-td data last" style="border-right: outset;">281</td>
<td class="data-td data last">83.56</td>
<td class="data-td data last">86.47</td>
<td class="data-td data last" style="border-right: outset;">86.82</td>
<td class="data-td data last">6.64</td>
</tr>
<tr class="tbl-data">
<td class="data-td last">Insurance</td>
<td class="data-td data last">0.85</td>
<td class="data-td data last">0.82</td>
<td class="data-td data last" style="border-right: outset;">1.15</td>
<td class="data-td data last">347</td>
<td class="data-td data last">364</td>
<td class="data-td data last" style="border-right: outset;">358</td>
<td class="data-td data last">92.10</td>
<td class="data-td data last">92.99</td>
<td class="data-td data last" style="border-right: outset;">91.39</td>
<td class="data-td data last">2.32</td>
</tr>
<tr class="tbl-data">
<td class="data-td last">Leisure</td>
<td class="data-td data last">7.88</td>
<td class="data-td data last">7.79</td>
<td class="data-td data last" style="border-right: outset;">10.42</td>
<td class="data-td data last">325</td>
<td class="data-td data last">243</td>
<td class="data-td data last" style="border-right: outset;">182</td>
<td class="data-td data last">89.95</td>
<td class="data-td data last">93.25</td>
<td class="data-td data last" style="border-right: outset;">93.34</td>
<td class="data-td data last">7.40</td>
</tr>
<tr class="tbl-data">
<td class="data-td last">Real Estate</td>
<td class="data-td data last">5.13</td>
<td class="data-td data last">4.72</td>
<td class="data-td data last" style="border-right: outset;">6.22</td>
<td class="data-td data last">697</td>
<td class="data-td data last">701</td>
<td class="data-td data last" style="border-right: outset;">602</td>
<td class="data-td data last">79.46</td>
<td class="data-td data last">80.72</td>
<td class="data-td data last" style="border-right: outset;">80.99</td>
<td class="data-td data last">7.30</td>
</tr>
<tr class="tbl-data">
<td class="data-td last">Retail</td>
<td class="data-td data last">5.67</td>
<td class="data-td data last">5.49</td>
<td class="data-td data last" style="border-right: outset;">7.79</td>
<td class="data-td data last">471</td>
<td class="data-td data last">474</td>
<td class="data-td data last" style="border-right: outset;">354</td>
<td class="data-td data last">73.75</td>
<td class="data-td data last">74.72</td>
<td class="data-td data last" style="border-right: outset;">82.35</td>
<td class="data-td data last">7.07</td>
</tr>
<tr class="tbl-data">
<td class="data-td last">Services</td>
<td class="data-td data last">0.38</td>
<td class="data-td data last">0.37</td>
<td class="data-td data last" style="border-right: outset;">0.53</td>
<td class="data-td data last">388</td>
<td class="data-td data last">368</td>
<td class="data-td data last" style="border-right: outset;">356</td>
<td class="data-td data last">87.11</td>
<td class="data-td data last">89.89</td>
<td class="data-td data last" style="border-right: outset;">88.62</td>
<td class="data-td data last">4.53</td>
</tr>
<tr class="tbl-data">
<td class="data-td last">Technology &amp; Electronics</td>
<td class="data-td data last">4.20</td>
<td class="data-td data last">4.67</td>
<td class="data-td data last" style="border-right: outset;">6.21</td>
<td class="data-td data last">327</td>
<td class="data-td data last">287</td>
<td class="data-td data last" style="border-right: outset;">269</td>
<td class="data-td data last">85.47</td>
<td class="data-td data last">88.19</td>
<td class="data-td data last" style="border-right: outset;">86.89</td>
<td class="data-td data last">5.58</td>
</tr>
<tr class="tbl-data">
<td class="data-td last">Telecommunications</td>
<td class="data-td data last">11.91</td>
<td class="data-td data last">11.68</td>
<td class="data-td data last" style="border-right: outset;">10.61</td>
<td class="data-td data last">423</td>
<td class="data-td data last">433</td>
<td class="data-td data last" style="border-right: outset;">475</td>
<td class="data-td data last">90.04</td>
<td class="data-td data last">91.39</td>
<td class="data-td data last" style="border-right: outset;">84.92</td>
<td class="data-td data last">7.10</td>
</tr>
<tr class="tbl-data">
<td class="data-td last">Transportation</td>
<td class="data-td data last">2.10</td>
<td class="data-td data last">1.78</td>
<td class="data-td data last" style="border-right: outset;">2.59</td>
<td class="data-td data last">279</td>
<td class="data-td data last">231</td>
<td class="data-td data last" style="border-right: outset;">150</td>
<td class="data-td data last">90.49</td>
<td class="data-td data last">92.69</td>
<td class="data-td data last" style="border-right: outset;">94.75</td>
<td class="data-td data last">8.40</td>
</tr>
<tr class="tbl-data">
<td class="data-td last">Utility</td>
<td class="data-td data last">6.93</td>
<td class="data-td data last">5.38</td>
<td class="data-td data last" style="border-right: outset;">7.52</td>
<td class="data-td data last">213</td>
<td class="data-td data last">206</td>
<td class="data-td data last" style="border-right: outset;">165</td>
<td class="data-td data last">89.95</td>
<td class="data-td data last">90.19</td>
<td class="data-td data last" style="border-right: outset;">89.90</td>
<td class="data-td data last">4.22</td>
</tr>
<tr class="tbl-data">
<td class="data-td last">Total</td>
<td class="data-td data last">100</td>
<td class="data-td data last" style="border-right: outset;">100.00</td>
<td class="data-td data last">337</td>
<td class="data-td data last">325</td>
<td class="data-td data last" style="border-right: outset;">297</td>
<td class="data-td data last">87.91</td>
<td class="data-td data last">89.51</td>
<td class="data-td data last" style="border-right: outset;">88.78</td>
<td class="data-td data last">4.86</td>
</tr>
</tbody>
</table>
</div>
<br />
<p class="chart-disclosure"><strong>Source: ICE Data Services, VanEck</strong>. Fallen Angels: ICE US Fallen Angel High Yield 10% Constrained Index. Not intended as a recommendation to invest or divest in any of the sectors mentioned herein. Index performance is not representative of fund performance. It is not possible to invest in an index.</p>
<p><strong><u>Fallen Angels Performance by Rating:</u></strong> The Index continues to decrease its BB-rated exposure to the low 80s. The lower rated issuers continued outperforming their higher rated peers in June and YTD. The BB rated bucket is now above the Single-B rated bucket, which was noted last month as an indicator that BB-rated bonds may begin displaying better prices than lower rated issuers, which, outside of the small exposure to CCC-rated bonds, was the case in June.</p>
<div class="wrapped-div">
<table style="width: 960px;">
<tbody>
<tr class="tbl-data">
<td class="tbl-header last text-center">&nbsp;</td>
<td class="tbl-header last text-center" style="border-right: outset;" colspan="3">Wgt (%)</td>
<td class="tbl-header last text-center" style="border-right: outset;" colspan="3">OAS</td>
<td class="tbl-header last text-center" style="border-right: outset;" colspan="3">Price</td>
<td class="tbl-header last text-center">Total Return (%)</td>
</tr>
<tr class="tbl-data">
<td class="data-td last">&nbsp;</td>
<td class="data-head last">12/31/2022</td>
<td class="data-head last">3/31/2023</td>
<td class="data-head last" style="border-right: outset;">6/30/2023</td>
<td class="data-head last">12/31/2022</td>
<td class="data-head last">3/31/2023</td>
<td class="data-head last" style="border-right: outset;">6/30/2023</td>
<td class="data-head last">12/31/2022</td>
<td class="data-head last">3/31/2023</td>
<td class="data-head last" style="border-right: outset;">6/30/2023</td>
<td class="data-head last">YTD</td>
</tr>
<tr class="tbl-data">
<td class="data-td last">BB</td>
<td class="data-td data last">87.00</td>
<td class="data-td data last">87.08</td>
<td class="data-td data last" style="border-right: outset;">83.01</td>
<td class="data-td data last">284</td>
<td class="data-td data last">281</td>
<td class="data-td data last" style="border-right: outset;">256</td>
<td class="data-td data last">90.02</td>
<td class="data-td data last">91.51</td>
<td class="data-td data last" style="border-right: outset;">89.83</td>
<td class="data-td data last">4.55</td>
</tr>
<tr class="tbl-data">
<td class="data-td last">B</td>
<td class="data-td data last">10.95</td>
<td class="data-td data last">10.37</td>
<td class="data-td data last" style="border-right: outset;">13.31</td>
<td class="data-td data last">608</td>
<td class="data-td data last">500</td>
<td class="data-td data last" style="border-right: outset;">405</td>
<td class="data-td data last">82.50</td>
<td class="data-td data last">85.35</td>
<td class="data-td data last" style="border-right: outset;">89.55</td>
<td class="data-td data last">3.71</td>
</tr>
<tr class="tbl-data">
<td class="data-td last">CCC</td>
<td class="data-td data last">1.98</td>
<td class="data-td data last">2.50</td>
<td class="data-td data last" style="border-right: outset;">3.68</td>
<td class="data-td data last">1,020</td>
<td class="data-td data last">1,014</td>
<td class="data-td data last" style="border-right: outset;">852</td>
<td class="data-td data last">60.88</td>
<td class="data-td data last">64.60</td>
<td class="data-td data last" style="border-right: outset;">68.55</td>
<td class="data-td data last">20.66</td>
</tr>
<tr class="tbl-data">
<td class="data-td last">CC*</td>
<td class="data-td data last">&nbsp;</td>
<td class="data-td data last">0.04</td>
<td class="data-td data last" style="border-right: outset;">&nbsp;</td>
<td class="data-td data last">&nbsp;</td>
<td class="data-td data last">6,713</td>
<td class="data-td data last" style="border-right: outset;">&nbsp;</td>
<td class="data-td data last">&nbsp;</td>
<td class="data-td data last">7.16</td>
<td class="data-td data last" style="border-right: outset;">&nbsp;</td>
<td class="data-td data last">-17.77</td>
</tr>
<tr class="tbl-data">
<td class="data-td last">D*</td>
<td class="data-td data last">0.07</td>
<td class="data-td data last">&nbsp;</td>
<td class="data-td data last" style="border-right: outset;">&nbsp;</td>
<td class="data-td data last">4,726</td>
<td class="data-td data last">&nbsp;</td>
<td class="data-td data last" style="border-right: outset;">&nbsp;</td>
<td class="data-td data last">10.00</td>
<td class="data-td data last">&nbsp;</td>
<td class="data-td data last" style="border-right: outset;">&nbsp;</td>
<td class="data-td data last">-62.06</td>
</tr>
<tr class="tbl-data">
<td class="data-td last">Total</td>
<td class="data-td data last">100</td>
<td class="data-td data last" style="border-right: outset;">100</td>
<td class="data-td data last">337</td>
<td class="data-td data last">325</td>
<td class="data-td data last" style="border-right: outset;">297</td>
<td class="data-td data last">87.91</td>
<td class="data-td data last">89.51</td>
<td class="data-td data last" style="border-right: outset;">88.78</td>
<td class="data-td data last">4.86</td>
</tr>
</tbody>
</table>
</div>
<br />
<p class="chart-disclosure"><strong>Source: ICE Data Services, VanEck</strong>. *Does not have securities for all months of selected period. Returns are based on partial period data. Fallen Angels: ICE US Fallen Angel High Yield 10% Constrained Index. Past performance is no guarantee of future results. Index performance is not representative of fund performance. It is not possible to invest in an index.</p>
<p>To receive more <a href="https://www.vaneck.com/us/en/insights/income-investing/" title="Income Investing insights"><strong>Income Investing</strong></a> insights, <a href="/link/5f45412c2143400497908cea2897f7d3.aspx" title=" Subscription Center"><strong>sign up in our subscription center</strong></a>.</p>
<style type="text/css">
    .wrapped-div {
        max-width: 100%;
    }

    @media (max-width: 1024px) {
        .wrapped-div {
            overflow-x: scroll;
        }
    }

    .wrapped-div-sector {
        max-width: 100%;
        overflow-x: scroll;
    }
</style>
]]></content:encoded>
</item><item rdf:about="https://www.vaneck.com/us/en/blogs/municipal-bonds/slowing-economy-3-reasons-municipal-bonds-make-sense/">
  <title>Slowing Economy: 3 Reasons Municipal Bonds Make Sense></title>
  <link>https://www.vaneck.com/us/en/blogs/municipal-bonds/slowing-economy-3-reasons-municipal-bonds-make-sense/</link>
  <description><![CDATA[In a slowing economy, municipal bonds may be an attractive investment for the 3 reasons outlined.]]></description>
  <dc:creator>Michael Cohick</dc:creator>
  <dc:date>07/14/2023 06:30:00</dc:date>
<content:encoded><![CDATA[

<p>Most investors seek stable and secure investment options in the face of economic decline marked by intense market volatility and wavering consumer confidence. With their strong credit ratings, favorable credit conditions, and historically positive performance during recessions, municipal bonds emerge as an attractive choice. Here are 3 reasons municipal bonds may be a good investment if we face an economic slowdown.</p>
<h2>Reason #1: Higher Credit Ratings for Municipal Bonds</h2>
<p>Municipal bonds tend to have higher credit ratings compared to corporate bonds. Approximately 70% of bonds in the Bloomberg Municipal Bond Index hold the two highest credit rating categories, contrasting with only 8% in the Bloomberg Corporate Bond Index. Factors contributing to these robust ratings include the absence of competition for many muni issuers, durable revenue sources such as taxes, and the rarity of defaults, even during recessionary periods. In the 2007-2009 financial crisis, <strong>only 12 rated muni issuers defaulted, in contrast to 414 corporate bond issuers of similar credit quality.</strong></p>
<h2>Reason #2: Improved Municipal Bond Credit Conditions</h2>
<p>Most state and local governments have benefited from strong fiscal conditions due to substantial federal government support during the pandemic and surging tax revenues. Rainy-day funds, intended to address unexpected deficits, have reached near-record levels. Even the lowest-rated state in the muni market, Illinois, has significantly increased its rainy-day fund balance, providing added financial stability. Tax revenues typically do not decline until the later stages of a recession, allowing states time to adjust expenses and recover quickly.</p>
<h3>Total Balances (in millions of dollars) 50-State Median</h3>
<p><img class="img-responsive w-100" src="https://www.vaneck.com/contentassets/aa97fd8d9c50493eb12b4672536e81ec/3427_muni_chart-01_2023.07_blog.svg" alt="Total Balances (in millions of dollars) 50-State Median" /></p>
<p class="chart-disclosure">Source: The Pew Charitable Trusts. Gray bars represent U.S. recessionary periods. Data is reported by each state for its fiscal year, which ends June 30 in all but four states: New York (March 31), Texas (Aug. 31), and Alabama and Michigan (both Sept. 30). Past performance is no guarantee of future results. Index performance is not illustrative of fund performance. It is not possible to invest directly in an index.</p>
<h2>Reason #3: Positive Municipal Bond Historical Performance Post Recession</h2>
<p>Investment grade municipal bonds have shown positive total returns in the 12 months following the start of a recession in 5 out of the past five, showing they have been resilient during economic downturns. Only during the 2007-2009 recession, which saw a global credit crisis, did munis post a negative return. Performance during recessions is influenced by various market dynamics, with each downturn having unique characteristics. Historical examples, such as the 1981 recession driven by aggressive interest rate hikes and the 1990 and 2001 recessions characterized by yields moving lower, demonstrate the potential for positive muni returns during economic slowdowns. It is important to consider the current market conditions, as muni yields are presently at their highest levels in over a decade.</p>
<h3>Bloomberg Municipal Bond Index 12-Month Total Return</h3>
<p><img class="img-responsive w-100" src="https://www.vaneck.com/contentassets/aa97fd8d9c50493eb12b4672536e81ec/3427_muni_chart-02_2023.07_blog.svg" alt="Bloomberg Municipal Bond Index 12-Month Total Return" /></p>
<p class="chart-disclosure">Source: Bloomberg as of July 10, 2023. Past performance is no guarantee of future results. Index performance is not illustrative of fund performance. It is not possible to invest directly in an index.</p>
<p>Regardless of the economy's direction, municipal bonds are appealing, given their tax-advantaged income. Investors should focus on highly rated issuers known for their resilience during economic declines, which can provide insulation for their bond portfolios if a recession occurs. While past performance can offer insights, it is crucial to recognize that each recession is distinct and influenced by different factors. However, the combination of strong credit ratings, favorable credit conditions, and historically positive performance make municipal bonds a compelling choice for investors amid a slowing economy.</p>
<p>To receive more <a href="https://www.vaneck.com/us/en/insights/municipal-bonds/" title="Municipal Bonds Insights"><strong>Municipal Bonds</strong></a> insights, <a href="https://www.vaneck.com/us/en/subscribe/" title="Subscription Center"><strong>sign up in our subscription center</strong></a>.</p>
]]></content:encoded>
</item><item rdf:about="https://www.vaneck.com/us/en/blogs/digital-assets/jan-van-eck-what-is-bitcoin-software/">
  <title>What is Bitcoin?></title>
  <link>https://www.vaneck.com/us/en/blogs/digital-assets/jan-van-eck-what-is-bitcoin-software/</link>
  <description><![CDATA[To understand bitcoin, investors need to know who controls the bitcoin software, the importance of its limited supply, and the developments that are on the horizon.]]></description>
  <dc:creator>Jan van Eck</dc:creator>
  <dc:date>07/13/2023 06:30:00</dc:date>
<content:encoded><![CDATA[

<p><strong>Please note that VanEck has exposure to Bitcoin.</strong></p>
<p><i>To explain bitcoin to investors, we are offering a series of blogs and podcasts. This blog is the second in a series that covers topics that are important to investors. For more on this topic, please listen to the </i><a href="https://www.vaneck.com/us/en/blogs/trends-with-benefits/44-no-jargon-bitcoin-ep-1-getting-to-know-bitcoin-with-pierre-rochard/" title="Trends with Benefits #44:  - What is Bitcoin with Pierre Rochard"><strong><em>related podcast</em></strong></a><strong><em>.</em></strong></p>
<p>The question &ldquo;What is bitcoin?&rdquo; can be answered in many ways. I don&rsquo;t think investors need to know how bitcoin works technically, but they need to be able to assess the opportunities and risks of <strong><a href="https://www.vaneck.com/us/en/blogs/digital-assets/the-investment-case-for-bitcoin/" title="The Investment Case for Bitcoin">investing in bitcoin</a></strong>. So let us examine the two biggest questions that investors care about. First, how sure are we that bitcoin&rsquo;s supply won&rsquo;t increase beyond what is planned? And second, will the technology continue to work?</p>
<p>I think the best way to answer these questions is to understand that bitcoin is software.</p>
<p>But let&rsquo;s stay away from the technical jargon. Most people already know that bitcoin is a thing of value, a type of electronic money and that anyone can create a wallet, buy, send, or receive bitcoin. They know that a password (or &ldquo;key&rdquo;) is needed to access their wallet and shouldn&rsquo;t be lost. This blog will not explain how these things happen&mdash;encryption, hashing, mining, double spend, etc.</p>
<p>And let&rsquo;s dispose of one bitcoin critique. Some investors, like Warren Buffett, don&rsquo;t care about store of value assets like gold and disregard assets that don&rsquo;t generate income streams. But some investors do care about stores of value. They will tell you that all paper currencies, backed by nothing, like the current U.S. dollar, eventually become worthless. This blog is meant for the latter group of investors.</p>
<h2>Who&rsquo;s in Control of Bitcoin Software?</h2>
<p>If bitcoin is software, the starting point is to understand who controls the bitcoin software, or Bitcoin Core. Actually, no one is in charge of bitcoin per se. Bitcoin is free, open-source software run by the community on personal computers and servers.</p>
<p>Can software be developed by connected, non-controlling groups? Clearly, yes, there are precedents for this. Linux is shareware that runs smartphones, cars, most of the internet, all of the world&rsquo;s top 500 supercomputers and the world&rsquo;s stock exchanges.<sup>1</sup>&nbsp;In fact, open-source software is a trend. Conceptually, open source makes sense when there are many potential users and the number of developers who can review and refine the software is greater than what any single company can reasonably afford. The more developers, the more reliable the software.</p>
<h2>Developing and Upgrading Bitcoin Software</h2>
<p>So, who develops bitcoin software? In the first stage of bitcoin, Satoshi Nakamoto was the lead developer. There have been subsequent lead developers and some important changes. For example, there was a decision to implement a voluntary upgrade in late 2011 and early 2012. Developers wanted to address the issue that bitcoin was being stolen&mdash;not hacked&mdash;due to security vulnerabilities. In order to do this, they needed confirmation that the upgraded code didn&rsquo;t have bugs that would crash the network, and the community, a majority of developers and miners, needed to agree to do it.</p>
<p>The argument was not about the desirability of the solution, but rather about what the best technical approach was. The solution ended up being a &ldquo;soft fork,&rdquo; an upgrade such that the network would continue to operate whether nodes/processors upgraded to the new software or not.</p>
<p>This story highlights various vulnerabilities, including bugs and getting agreement around upgrades.</p>
<p>Another aspect of bitcoin upgrades is that bitcoin is run on thousands of computers. Users need to accept the software upgrade for it to take effect, which creates an interesting dynamic. Developers don&rsquo;t want to work on upgrades that users don&rsquo;t want. In a way, the users are the ones who accept the upgrades by downloading and using the new versions of the software.</p>
<p>The SegWit decision, an upgrade in August 2017, was also contentious. Again, it was a technical decision about how to allow the processing of more data&mdash;something generally desirable. Again, there were different technical paths. The resolution again was a soft fork. Bitcoin&rsquo;s price rose significantly after this upgrade, perhaps a sign of confidence. I would argue that the community is learning how to deal with upgrades.</p>
<p>In 2021, the Bitcoin Taproot update marked the most significant upgrade the cryptocurrency has experienced since 2017 when Segregated Witness (SegWit) was activated. The Taproot upgrade encourages the implementation of smart contracts in the Bitcoin network. Like SegWit, the Taproot upgrade aims to improve the privacy and efficiency of the network but on a larger scale.</p>
<h2>Is Bitcoin&rsquo;s Supply Really Limited?</h2>
<p>Now let&rsquo;s get to the question of bitcoin&rsquo;s limited supply. Developers could theoretically code an upgrade that expands supply, but users would have absolutely no reason to install such an upgrade. With the explosion of bitcoin community ownership to hundreds of millions of people, it&rsquo;s almost impossible to imagine that they would damage their own economic interests to increase the supply of bitcoin. So, theoretically possible, but completely unrealistic.</p>
<h2>Who Are the Developers?</h2>
<p>Let&rsquo;s discuss the people who work on the software, the developers. Why do developers work on upgrading bitcoin software? Developers do it for free or are sponsored by companies or individuals. Not everyone is driven purely by money! There are not many core developers. Roughly 335 people at any time are working on the code on a weekly basis (Artemis as of 7/11/23). Bitcoin Core lead maintainer Wladimir van der Laan has led many of the recent upgrades. Adam Back, proof of work inventor and Blockstream CEO, leads the largest bitcoin-focused development group. Pieter Wuille and ChainCodeLabs are also working on some of the new developments. John Newbery at Brink (non-profit development group), Marco Falke, Samuel Dobson and Luke Dashjr are other names that do not come up in investment conversations but are crucial to bitcoin development.</p>
<h2>Bitcoin Development Continues</h2>
<p>Last, investors should know that additional upgrades to the Bitcoin network are likely to continue. In addition, second layer solutions such as the Lightning Network continue to be refined and developed. In the future, by around 2140, no more bitcoins will be produced. Right now, transactions are verified by miners. Miners are profitable when the cost of electricity to run the computers used to approve transactions is less than the price of the new bitcoin earned. When new bitcoins run out, these transaction-confirmers will need to be paid by transaction fees (not new bitcoin) and that will need to be enough to make the network operate but not too expensive to make it impractical.</p>
<p>In sum, bitcoin has both the resiliency and risks associated with open-source software development. But bitcoin also has a sincere community with very high alignment of interests as well as encryption and processing logic that has met every challenge of growth that it has faced so far. It is probably as sturdy as the other important technologies in your life&mdash;the internet, bank software, etc. So, in my view, bitcoin is very likely to maintain its limited supply and the technology is very likely to keep working.</p>
<p>To learn more about bitcoin and what investors should understand about the digital currency, listen to the first episode of our special Trends With Benefits No Jargon Bitcoin series, featuring Pierre Rochard, Bitcoin Strategist for Kraken: <a href="https://www.vaneck.com/us/en/blogs/trends-with-benefits/44-no-jargon-bitcoin-ep-1-getting-to-know-bitcoin-with-pierre-rochard/" title="Trends with Benefits #44:  - What is Bitcoin with Pierre Rochard"><strong>What Is Bitcoin with Pierre Rochard.</strong></a></p>
<p>To receive more <strong><a href="https://www.vaneck.com/us/en/insights/digital-assets/" title="Digital Assets Insights">Digital Assets</a></strong> insights, <strong><a href="https://www.vaneck.com/us/en/subscribe/" title="Subscription Center">sign up in our subscription center</a></strong>.</p>
]]></content:encoded>
</item><item rdf:about="https://www.vaneck.com/us/en/blogs/moat-investing/the-moat-show-ep-3-are-semiconductor-stocks-overvalued/">
  <title>The Moat Show Ep.3: Are Semiconductor Stocks Overvalued?></title>
  <link>https://www.vaneck.com/us/en/blogs/moat-investing/the-moat-show-ep-3-are-semiconductor-stocks-overvalued/</link>
  <description><![CDATA[Even with this year's run-up, certain semiconductor stocks with AI exposure may be undervalued.]]></description>
  <dc:creator>Chelsea  Cines</dc:creator>
  <dc:date>07/12/2023 06:30:00</dc:date>
<content:encoded><![CDATA[

<script>
    //Temporary script
    $(function () {
        $(".popup-youtube, .popup-vimeo, .popup-gmaps").on("click", function (e) {
            e.preventDefault();
            var width = $(window).width();
            if (width > 768) {
                openSimpleIframeModalDialog($(this).attr('href'), "video-modal");
            } else if ($(this).is('.popup-youtube')) {
                var target = $(this).attr('data-video');
                self.location = target;
            }
        });
    });
</script>
<style>
    .modal.fade.video-modal div.modal-dialog {
        margin: 7% auto !important;
    }

    .modal-simple-iframe .close span {
        font-size: 35px;
        line-height: 1;
    }
</style>
<p>In 2022, the semiconductor industry and the wider tech sector underwent a significant market pullback. Almost as the proclamations of 'tech is dead' reached a crescendo, OpenAI released the debut of its large language model (LLM) and consumer-facing generative AI, ChatGPT. And now, Silicon Valley&mdash;aptly nicknamed in the 1970s for the companies in the region&rsquo;s pivotal role in semiconductor production, is back in the limelight, and the innovation narratives around artificial intelligence and semiconductors seem ubiquitous.</p>
<p>This year, semiconductors are up a whopping 48%, represented by the MVIS<sup>&reg;</sup>&nbsp;US Listed Semiconductor 25 Index. So, is the chip sector back in boom times, or is it mostly an AI-fueled bubble? The answer is always nuanced, but on this week&rsquo;s episode of <a href="/link/775af929d69741efa7729872dda2bfa5.aspx?epsremainingpath=the-moat-show-ep-3-semiconductors-with-morningstars-brian-colello" title="The Moat Show Ep. 3: Semiconductors with Morningstar's Brian Colello"><strong>The Moat Show: Are Semiconductor Stocks Overvalued?</strong></a> Brian Colello, Morningstar's Director of Technology Equity, <strong>tells us there are still quality companies at attractive prices in the semiconductor space </strong> This blog includes a recap of our full conversation with Brian.</p>
<ul class="content-list">
<li><strong><a href="#point-one">In the semiconductor industry, what types of economic moats exist?</a></strong></li>
<li><strong><a href="#point-two">Is the semiconductor industry at fair value, overvalued, or undervalued in June 2023?</a></strong></li>
<li><strong><a href="#point-three">Are there still attractive opportunities in semiconductors that are directly exposed to AI?</a></strong></li>
<li><strong><a href="#point-four">What risks should investors be aware of in the semiconductor industry?</a></strong></li>
<li><strong><a href="#point-five">How will the U.S. CHIPs Act impact the semiconductor industry?</a></strong></li>
</ul>
<div class="row">
<div class="col-md-4 col-xs-12"><a href="https://www.youtube.com/embed/ln8NdcrHInA" data-video="https://youtu.be/ln8NdcrHInA" class="popup-youtube" title="Watch Video"><img class="img-responsive" style="margin-right: 15px; margin-top: 0px;" src="https://www.vaneck.com/contentassets/110222f8f02e40759dbc7f61572787c0/3313_the-moat-show-brian-colello-semiconductors_thumbnail_2023.07_v1.jpg/Download/" alt="Watch Video" align="left" /></a></div>
<div class="col-md-8 col-xs-12"><br /><strong><a href="https://www.youtube.com/embed/ln8NdcrHInA" data-video=" https://youtu.be/0n_j9c4z0UU" class="popup-youtube" title="Watch Video">Watch Video</a><br /></strong><a href="https://www.youtube.com/embed/ln8NdcrHInA" data-video="https://youtu.be/ln8NdcrHInA" class="popup-youtube" title="Watch Video" style="font-size: 16px; font-weight: bold; padding: 10px 0px 0px; margin-right: 20px; width: 202px;">The Moat Show Ep. 3: Semiconductors with Morningstar's Brian Colello</a></div>
</div>
<br />
<h2>Show Notes</h2>
<p>00:00 Introduction</p>
<p>01:00 Different Types of Semiconductor Chips</p>
<p>03:23 Emerging Technology and Themes in the Semiconductor Industry</p>
<p>05:35 Types of Economic Moats in the Semiconductor Industry</p>
<p>09:05 Morningstar's Valuation of Semiconductor Space Today</p>
<p>11:26 Attractive Opportunities in Semi Stocks with Direct AI Exposure</p>
<p>14:01 Risks to the Semiconductor Industry Today</p>
<p>16:58 How Does the U.S. CHIPs Act Impact the Semiconductor Industry?</p>
<h2 id="point-one" class="anchored-block">In the semiconductor industry, what types of economic moats exist?</h2>
<p>"Economic moat&rdquo; refers to a company's sustainable competitive advantage that shields it from competition. In the semiconductor industry, such moats are hard-earned due to the rapid evolution of technology, but a few companies manage to create and maintain them. A company with a "wide moat," Morningstar&rsquo;s highest rating, is one Morningstar expects to generate excess returns for a decade and, more often, over 20 years.</p>
<p>In the semiconductor space, several companies fit the wide moat criteria. Texas Instruments Inc (Ticker: TXN), Analog Devices Inc. (Ticker: ADI), and Microchip Technology (Ticker: MCHP), for instance, are companies that produce peripheral chips used in a wide array of applications. These companies have tens of thousands, if not hundreds of thousands, of customers, and their products are used in almost every conceivable device. The low cost and high volume of these products create a high barrier to entry for potential competitors, making these companies virtually unassailable in their market segment.</p>
<p>Chip equipment manufacturers form another category of wide moat businesses. The highly complex and technologically advanced equipment necessary to produce processors and analog chips is not easily replicated, presenting a significant barrier to entry.</p>
<p>Companies like NVIDIA Corp (Ticker: NVDA), known for their dominance in graphics processors units (GPUs), also have a wide economic moat. Not only do they excel in hardware, but they've also built a robust software ecosystem. This dual expertise makes it difficult for competitors to match Nvidia, even if they could build comparable Central Processing Units (CPUs) in terms of transistor count or speed. Nvidia's graphics processors are a core component in gaming and artificial intelligence technologies, making them a tough act to follow.</p>
<p>However, not all well-known companies receive a wide moat rating. Companies like Intel Corporation (Ticker: INTC), Advanced Micro Devices, Inc. (Ticker: AMD), Qualcomm Inc (QCOM), and Marvell Technology Inc (Ticker: MRVL), for example, are rated as "narrow moat&rdquo; by Morningstar. This is due to the uncertainty about the direction of their businesses over the next decade, among other reasons. Therefore, the wide moat rating represents a level of business stability and sustainability that's even higher than what many renowned tech companies achieve.</p>
<h2 id="point-two" class="anchored-block">Is the semiconductor industry at fair value, overvalued, or undervalued in June 2023?</h2>
<p><strong>Morningstar believes the semiconductor industry appears slightly undervalued, although not significantly.</strong> There was a surge in the tech sector in 2023, providing more of a margin of safety earlier in the year. Morningstar is particularly interested in the automotive chip space, with companies such as NXP Semiconductors NV (Ticker: NXPI), Infineon Technologies AG (Ticker: IFNNY), and STMicroelectronics NV (Ticker: STM) appearing somewhat undervalued. These companies have benefited from a chip shortage in the automotive sector over the past couple of years, which has positively affected pricing and sales. However, this shortage appears to be nearing its end, making the short-term outlook less favorable than it was a year ago. Despite some investors exiting due to this change, it may be a worthwhile investment for the long term.</p>
<p>Conversely, Nvidia has seen a spectacular run recently, reporting an impressive quarter and outstanding guidance. However, <strong><a href="https://www.vaneck.com/us/en/blogs/moat-investing/is-nvidias-wide-moat-worth-the-price/" title="Is Nvidia's Wide Moat Worth the Price?">Morningstar currently views it as overvalued</a></strong>. Justifying its trillion-dollar valuation would require not just a great year but the assumption of massive, continuous growth for a decade. As a result, the risk/reward balance for Nvidia appears less appealing at this time.</p>
<h2 id="point-three" class="anchored-block">Are there still attractive opportunities in semiconductors that are directly exposed to AI?</h2>
<p>Yes, but in the realm of AI, certain semiconductor companies are more directly exposed than others. Notably, Nvidia has emerged as a leader, experiencing strong demand for its graphics processing units (GPUs). However, while the market has recognized this, it may have overvalued the company, leading to hesitation to buy in at its current valuation. Nvidia was a more attractive opportunity six to nine months ago during the crypto crash, and a similar drop in the future could present another chance to invest.</p>
<p><strong>However, to bet against Nvidia, one must place faith in a competitor.</strong> With Nvidia reaping significant profits from the AI trend, every major tech player &ndash; from Microsoft Corporation (Ticker: MSFT) to Amazon.com, Inc (Ticker: AMZN) to Alphabet Inc (Ticker: GOOGL) - and competing chip makers are keen to enter this space. AMD is stepping up, producing a competitive GPU, and while the company's software isn't currently on par with Nvidia's, this gap will likely close over time. As the tech giants seek alternatives to Nvidia's GPUs and software, AMD may emerge as a strong contender, making it a possible undervalued bet for the future.</p>
<p>Intel, another player in the AI space, is considered fairly valued but isn't generating significant enthusiasm as an AI investment. <strong>Other investment opportunities may arise from companies linked to Nvidia's supply chain. Taiwan Semiconductor (Ticker: TSM), a key supplier to Nvidia, is an undervalued wide-moat company that could present an attractive opportunity</strong>. As the supplier for a market leader like Nvidia, TSMC is well-positioned for success. This suggests that looking beyond the direct players to those indirectly involved in the Nvidia ecosystem could yield fruitful investment opportunities.</p>
<h2 id="point-four" class="anchored-block">What risks should investors be aware of in the semiconductor industry?</h2>
<p>While the semiconductor industry has promising opportunities and tailwinds, it is vital to recognize the potential risks and headwinds in this space. These include geopolitical tensions, trade disputes, and the intricacies of the global supply chain, which all should be concerns for investors.</p>
<p>One of the risks recognized during the COVID-19 pandemic was the industry's reliance on overseas manufacturing, particularly in Taiwan. TSMC, a foundry, produces approximately half of the world's semiconductor chips. The U.S. government, <strong>realizing that 90% of semiconductors are built overseas,</strong> enacted the U.S. Chips Act to bring some of this manufacturing back onshore.</p>
<p>However, transitioning semiconductor manufacturing is not a straightforward process. TSMC&rsquo;s advanced manufacturing processes are not easily replicated by injecting capital into the problem. This task remains challenging despite Intel's efforts to carve out its share and catch up. It is a widespread desire, not just from the U.S. but also from Europe, to bring more chip manufacturing within their regions. This desire is leading to increased investment in semiconductor fabrication plants, or 'fabs,' which are highly expensive and can cost tens of billions of dollars each.</p>
<p>A further issue is that once a fab is built, ensuring it produces the best chips is another challenge. This complexity is part of the risk. Even leading companies like Nvidia or Apple Inc (Ticker: APPL) rely on TSMC for their processors, which depend on EUV (extreme ultraviolet) lithography machines from ASML Holding NV (Ticker: ASML) based in the Netherlands. <strong>This interconnectedness creates a "three-headed monster," where the failure of any one part could be detrimental to the whole tech sector due to the highly interwoven nature of the global supply chain.</strong></p>
<p>The geopolitical implications are significant too. For instance, if China were to invade Taiwan or if any conflict disrupted TSMC&rsquo;s operations, it would be catastrophic for the global supply chain. <strong>Even if a company had no direct relationship with TSMC, its products likely sit on the same electronic board as another chip produced by TSMC.</strong></p>
<p>This was evidenced during the recent automotive chip shortage, where an inability to obtain a single necessary chip (the "golden screw" problem) could halt car shipment. This disruption could occur again, <strong>underlining the industry's vulnerability to potential global crises.</strong></p>
<h2 id="point-five" class="anchored-block">How will the U.S. CHIPs Act impact the semiconductor industry?</h2>
<p>The recent passing of the chip act in the U.S. aims to increase the domestic supply of semiconductors, a shift that could have both positive and negative effects on the industry.</p>
<p>Chip equipment manufacturers are likely winners as they stand to benefit from constructing new fabrication plants (fabs). Most chip manufacturing has traditionally been concentrated in Taiwan due to efficiencies in running large, fully occupied fabs. Idle or partially filled fabs are seen as a waste of capital, hence the limited number of such facilities globally. With the U.S. trying to build and fill these fabs, the growing demand for semiconductors may help ensure their capacity utilization over time.</p>
<p>However, the shift poses questions for companies like TSMC and Intel. Building fabs involves high costs, and it's uncertain whether these companies will generate enough demand to fill their fabs and justify these costs. Making chips in the U.S. and Europe is expected to be more expensive than in Taiwan, leading to potential pricing challenges.</p>
<p>The effects on customers could also be mixed. Companies like Apple, for example, might have preferred the status quo of having all their chips made efficiently in Taiwan. The move to build factories in the U.S. and elsewhere <strong>could result in higher processor costs, which may eventually be passed on to consumers.</strong></p>
<p>The shift reflects a global trade-off between efficiency and risk diversification. The world had previously leaned towards efficiency, potentially leaving it vulnerable to geopolitical disruptions. The realization that semiconductors are vital for commercial purposes and national defense has prompted a global awakening. Whether it's artificial intelligence, cybersecurity, or processors used in missile systems, controlling the production of these key components has become an issue of national importance for countries like the U.S., China, and Europe. The CHIPs Act and resulting industry changes underscore the growing recognition of this issue.</p>
<p>To receive more <strong><a href="/us/en/insights/moat-investing" title="Moat Investing Insights">Moat Investing</a></strong> insights, <strong><a href="https://www.vaneck.com/us/en/subscribe/" title="Subscription Center">sign up in our subscription center</a></strong>.</p>
<style>
    .widgetBody .desktop-image {
        display: block;
    }
    
    .widgetBody .mobile-image {
        display: none;
    }
    
    @media screen and (max-width: 425px) {
        .widgetBody .desktop-image {
            display: none;
        }
        .widgetBody .mobile-image {
            display: block;
        }
    }
</style>
<style type="text/css">
    .wrapped-div {
        max-width: 100%;
    }
    
    @media (max-width: 1240px) {
        .wrapped-div {
            overflow-x: scroll;
        }
    }
    
    .wrapped-div-sector {
        max-width: 100%;
        overflow-x: scroll;
    }
</style>
]]></content:encoded>
</item><item rdf:about="https://www.vaneck.com/us/en/blogs/moat-investing/half-time-heroes-moat-stocks-lead-as-second-half-kicks-off/">
  <title>Half-Time Heroes: Moat Stocks Lead as Second Half Kicks Off></title>
  <link>https://www.vaneck.com/us/en/blogs/moat-investing/half-time-heroes-moat-stocks-lead-as-second-half-kicks-off/</link>
  <description><![CDATA[Morningstar&rsquo;s strategy of focusing on quality companies at attractive prices has powered its Moat Index to its strongest first-half performance since 2007, putting it ahead of the S&amp;P 500.]]></description>
  <dc:creator>Coulter Regal, CFA</dc:creator>
  <dc:date>07/12/2023 06:30:00</dc:date>
<content:encoded><![CDATA[

<p>The first half of the year is officially complete, and this lopsided tech rally is possibly becoming one of the most hated bull markets in history. U.S. equities have refused to slow down despite debt ceiling angst, regional banking fears, continued tightening credit conditions, and a commercial real estate market teetering on the edge. In the face of these concerns, the Nasdaq registered its strongest first-half performance in 40 years with a gain of over 31%. Additionally, Apple, the world's most valuable company, closed above the $3 trillion market capitalization mark for the first time.</p>
<p>The <strong><a href="https://www.vaneck.com/us/en/investments/morningstar-wide-moat-etf-moat/overview/" title="MOAT - VanEck Morningstar Wide Moat ETF - Overview">Morningstar Wide Moat Focus Index</a></strong> (the &ldquo;Moat Index&rdquo;) has also recorded a strong first half&mdash;its strongest since its inception in 2007&mdash;gaining over 23% year-to-date as of the end of June. This performance puts it ahead of the S&amp;P 500 Index by more than 600 basis points. While smaller-cap companies rebounded in June, they still remain behind large caps in terms of year-to-date performance. However, the <a href="https://www.vaneck.com/us/en/investments/morningstar-smid-moat-etf-smot/overview/overview/" title="SMOT - VanEck Morningstar SMID Moat ETF - Overview"><strong>Morningstar US Small-Mid Cap Moat Focus Index</strong></a> (the &ldquo;SMID Moat Index&rdquo;) ended June ahead of both the small- and mid-cap broad benchmark indexes for the month- and year-to-date periods.</p>
<h3>Moat Indexes Lead Broad Equity Markets at the Half</h3>
<p><img class="img-responsive w-100" src="https://www.vaneck.com/contentassets/7d51a11217304a719bbf359f233964ba/3420_moat_chart_2023.07_blog_1.svg" alt="Moat Indexes Lead Broad Equity Markets at the Half" /></p>
<p class="chart-disclosure"><strong>Source: Morningstar. As of 6/30/2023</strong>. Past performance is no guarantee of future results. Index performance is not representative of fund performance. It is not possible to invest directly in an index. Fund performance current to the most recent month end is available by visiting vaneck.com or by calling 800.826.2333.</p>
<h2>MOAT ETF Stands Out Among Peers Thanks to Quality Stock Selection</h2>
<p>Over its 11+ year history, the <strong><a href="https://www.vaneck.com/us/en/investments/morningstar-wide-moat-etf-moat/overview/" title="MOAT - VanEck Morningstar Wide Moat ETF - Overview">VanEck Morningstar Wide Moat ETF (MOAT)</a></strong>, which seeks to track the Moat Index, has delivered historical outperformance, versus both broad market indexes and actively managed strategies, through various market environments and across investing styles. According to Morningstar, MOAT ranks in the top 1% for 5- and 10-year periods and the top decile for 1- and 3-year periods among Large Blend funds<sup>*</sup>(please see Morningstar ratings disclosures below).The key to this success has been Morningstar&rsquo;s robust equity research process and a disciplined approach that targets <strong><a href="https://www.vaneck.com/us/en/blogs/moat-investing/moat-delivers-quality-with-a-forward-looking-edge/" title="MOAT Delivers Quality with a Forward-Looking Edge">quality companies</a></strong> with attractive valuations through a forward-looking approach. Additionally, MOAT has provided access to this time-tested investment philosophy for a cost well below the typical fee charged by large blend fund managers.</p>
<p><a href="https://www.vaneck.com/us/en/investments/moat-standing-out-among-peers.pdf" target="_blank" title="MOAT VanEck Morningstar Wide Moat ETF" rel="noopener"><strong>Learn more about how MOAT stands out among peers</strong></a>.</p>
<h2>June Index Reconstitution</h2>
<p>Both the Moat and SMID Moat Indexes underwent quarterly reviews on June 16, 2023. Each quarter they systematically target the most attractively priced U.S. moat companies within their respective universes. Below are a few takeaways from the June reviews and how the indexes are positioned heading into the second half of the year. Full results of the most recent quarterly reviews are available here: <strong><a href="https://www.vaneck.com/us/en/investments/morningstar-wide-moat-etf-moat/moat-reconstitution.pdf" target="_blank" title="MOAT - VanEck Morningstar Wide Moat ETF" rel="noopener">Moat Index</a></strong> and<strong> <a href="https://www.vaneck.com/us/en/investments/morningstar-smid-moat-etf-smot/smot-reconstitution.pdf" target="_blank" title="SMOT - VanEck Morningstar SMID Moat ETF" rel="noopener">SMID Moat Index</a></strong>.</p>
<h2>Moat Index Highlights</h2>
<p><strong>So Long Tech, Until We Meet Again</strong></p>
<p>The Moat Index saw its technology exposure increase to the largest overweight in quite some time at the end of 2022, following the drastic declines in valuations for the sector. Now, with the incredible rally that many of these companies experienced in the first half of the year, their valuations have become too lofty. Similar to the tech profit taking during the March review, the Moat Index continued that trend this quarter, locking in further gains in tech and shifting exposure to other areas of the market with more attractive valuations. The reduced exposure this review came by way of software companies and <strong><a href="https://www.vaneck.com/us/en/blogs/moat-investing/is-nvidias-wide-moat-worth-the-price/" title="Is Nvidia's Wide Moat Worth the Price?">semiconductor companies</a></strong>. Technology exposure in the Moat Index moved from market weight to a notable underweight, about 7%, relative to the S&amp;P 500 Index.</p>
<p><strong>Hello Heath Care and Financials</strong></p>
<p>Health care and financials were the primary beneficiaries from the above-mentioned valuation driven shift away from technology names. From the health care sector, the new additions are from the biotech, pharmaceutical, and life sciences sub-industries. These additions include Gilead Sciences (GILD), Pfizer (PFE) and Agilent Technologies (A), among others. On the financials side, names added to the index include Bank of America (BAC), Charles Schwab (SCHW), The Bank of New York Mellon (BK), and MarketAxess (MKTX). Health care and financial exposures now represent slight overweight&rsquo;s relative to the S&amp;P 500 Index.</p>
<p><strong>Growth Exposure Pared by More than 10%</strong></p>
<p>The Moat Index&rsquo;s shift away from tech, to traditional value-oriented sectors like financials and health care, resulted in a notable reduction to growth exposure. Value and core companies equally picked up exposure within the index. Core stock exposure is the largest in the Index followed by growth and then value. Value is now slightly overweight relative to the S&amp;P 500 Index, core is notably overweight and growth exposure is more than a 13% underweight.</p>
<div class="wrapped-div">
<table style="width: 100%;">
<tbody>
<tr class="tbl-data">
<td class="tbl-header last">Index Style Exposure</td>
<td class="tbl-header last" style="text-align: center;">Current Exposure</td>
<td class="tbl-header last" style="text-align: center;">Rebalance Change</td>
<td class="tbl-header last" style="text-align: center;">Relative to S&amp;P 500</td>
</tr>
<tr class="tbl-data">
<td class="data-td data last" style="text-align: left;">Value</td>
<td class="data-td data last" style="text-align: center;">26.4%</td>
<td class="data-td data last" style="text-align: center;">+4.9%</td>
<td class="data-td data last" style="text-align: center;">+2.8%</td>
</tr>
<tr class="tbl-data">
<td class="data-td data last" style="text-align: left;">Core</td>
<td class="data-td data last" style="text-align: center;">46.3%</td>
<td class="data-td data last" style="text-align: center;">+5.6%</td>
<td class="data-td data last" style="text-align: center;">+10.7%</td>
</tr>
<tr class="tbl-data">
<td class="data-td data last" style="text-align: left;">Growth</td>
<td class="data-td data last" style="text-align: center;">27.3%</td>
<td class="data-td data last" style="text-align: center;">-10.5%</td>
<td class="data-td data last" style="text-align: center;">-13.5%</td>
</tr>
</tbody>
</table>
</div>
<br />
<p class="chart-disclosure"><strong>Source: Morningstar. As of 6/16/2023</strong>.Not intended as a recommendation to buy or sell any securities mentioned herein. Index performance is not representative of fund performance. It is not possible to invest directly in an index.</p>
<p><strong>Valuations Remain Attractive</strong></p>
<p>The weighted average price-to-fair value of the Moat Index fell from 0.85 to 0.81 following the June review, signaling a 19% discount to Morningstar&rsquo;s fair value estimate. This is in contrast to the S&amp;P 500 Index, which featured a weighted average price-to-fair value ratio of 0.98 as of the same date.</p>
<h2>SMID Moat Index Highlights</h2>
<p><strong>The Rise of the Consumer</strong></p>
<p>This quarterly review the SMID Moat Index saw a notable increase to consumer discretionary names with the addition of nine companies from the sector. Many of these additions are beaten down retail names including Bath &amp; Body Works (BBWI), Etsy Inc. (ETSY), Williams-Sonoma (WSM), Burlington Store (BURL) and Best Buy Co. (BBY). The remaining consumer discretionary names added were a mix of hotel, restaurant, and automobile companies like Domino&rsquo;s Pizza (DPZ), Harley-Davidson (HOG), DoorDash (DASH) and Aptiv (APTV). Many of these names were among those with the lowest price-to-fair value entering the index this quarter, signaling potential deep valuation opportunities.</p>
<p>The consumer discretionary sector is now the largest overweight in the SMID Moat Index, about +10%, relative to the broad Morningstar US SMID Index (the &ldquo;Broad SMID Index&rdquo;). Other over weights include the communication services (+4%) and the industrials (+2.5%) sectors. On the other end of the spectrum, the real estate and utilities sectors account for the largest under weights with exposures both about 6% less relative to the Broad SMID Index.</p>
<p><strong>Growth Exposure Increases, But Remains an Underweight</strong></p>
<p>Contrary to the Moat index, which saw growth exposure pared back by more than 10% this quarter, the SMID Moat Index&rsquo;s review led to a slight increase to growth exposure. Despite the increase, the SMID Moat Index still remains underweight growth compared to the broad SMID universe. It is worth noting that growth is much less dominant in the broader small-mid cap universe compared to the large cap space. Growth only makes up about 28% of Morningstar&rsquo;s broad SMID index while making up about 40% of the S&amp;P 500 Index.</p>
<div class="wrapped-div">
<table style="width: 100%;">
<tbody>
<tr class="tbl-data">
<td class="tbl-header last">Index Style Exposure</td>
<td class="tbl-header last" style="text-align: center;">Current Exposure</td>
<td class="tbl-header last" style="text-align: center;">Rebalance Change</td>
<td class="tbl-header last" style="text-align: center;">Relative to Broad SMID Index</td>
</tr>
<tr class="tbl-data">
<td class="data-td data last" style="text-align: left;">Growth</td>
<td class="data-td data last" style="text-align: center;">19.7%</td>
<td class="data-td data last" style="text-align: center;">+2.1%</td>
<td class="data-td data last" style="text-align: center;">-7.8%</td>
</tr>
<tr class="tbl-data">
<td class="data-td data last" style="text-align: left;">Core</td>
<td class="data-td data last" style="text-align: center;">54.8%</td>
<td class="data-td data last" style="text-align: center;">+2.5%</td>
<td class="data-td data last" style="text-align: center;">+5.2%</td>
</tr>
<tr class="tbl-data">
<td class="data-td data last" style="text-align: left;">Value</td>
<td class="data-td data last" style="text-align: center;">25.5%</td>
<td class="data-td data last" style="text-align: center;">-4.6%</td>
<td class="data-td data last" style="text-align: center;">+2.6%</td>
</tr>
</tbody>
</table>
</div>
<br />
<p class="chart-disclosure"><strong>Source: Morningstar. As of 6/16/2023</strong>.Not intended as a recommendation to buy or sell any securities mentioned herein. Broad SMID Index refers to the Morningstar US Small-Mid Cap Index, is a broad-based index intended to track the overall performance of U.S. small- and mid-cap companies according to Morningstar. Index performance is not representative of fund performance. It is not possible to invest directly in an index.</p>
<p><strong>SMID Moat Valuations Remain Attractive</strong></p>
<p>The weighted average price-to-fair value of the SMID Moat Index fell from 0.78 to 0.76 following the June review, signaling a 24% discount to Morningstar&rsquo;s fair value estimate. This is in contrast to the Morningstar US Small-Mid Cap Index, which featured a weighted average price-to-fair value ratio of 0.97 as of the same date.</p>
<h2>Accessing Moat Stocks</h2>
<p><a href="https://www.vaneck.com/us/en/investments/morningstar-wide-moat-etf-moat/overview/" title="MOAT - VanEck Morningstar Wide Moat ETF - Overview"><strong>VanEck Morningstar Wide ETF (MOAT)</strong></a> seeks to replicate as closely as possible, before fees and expenses the price and yield performance of the Morningstar Wide Moat Focus Index.</p>
<p><strong><a href="https://www.vaneck.com/us/en/investments/morningstar-smid-moat-etf-smot/overview/" title="SMOT - VanEck Morningstar SMID Moat ETF - Overview">VanEck Morningstar SMID Moat ETF (SMOT)</a></strong> seeks to track as closely as possible, before fees and expenses, the price and yield performance of the Morningstar US Small-Mid Cap Moat Focus Index.</p>
<p>To receive more <a href="https://www.vaneck.com/us/en/insights/moat-investing/" title="Moat Investing Insights"><strong>Moat Investing</strong></a> insights, <a href="https://www.vaneck.com/us/en/subscribe/" title=" Subscription Center"><strong>sign up in our subscription center</strong></a>.</p>
<style type="text/css">
    .wrapped-div {
        max-width: 100%;
    }

    @media (max-width: 1240px) {
        .wrapped-div {
            overflow-x: scroll;
        }
    }

    .wrapped-div-sector {
        max-width: 100%;
        overflow-x: scroll;
    }
</style>
]]></content:encoded>
</item><item rdf:about="https://www.vaneck.com/us/en/blogs/gold-investing/ima-casanova-gold-wavers-amid-market-euphoria/">
  <title>Gold Wavers Amid Market Euphoria></title>
  <link>https://www.vaneck.com/us/en/blogs/gold-investing/ima-casanova-gold-wavers-amid-market-euphoria/</link>
  <description><![CDATA[Gold, pressured by the relentless strength of the U.S. equity markets in June, ended the month lower. Our outlook for higher gold prices in the longer term remains unchanged.]]></description>
  <dc:creator>Imaru Casanova</dc:creator>
  <dc:date>07/11/2023 06:30:00</dc:date>
<content:encoded><![CDATA[

<p>Monthly gold market and economic insights from Imaru Casanova, Portfolio Manager, featuring her unique views on mining and gold&rsquo;s portfolio benefits. <a href="/us/en/blogs/gold-investing/ima-casanova-gold-wavers-amid-market-euphoria/gold-monthly-commentary-june-2023.pdf" rel="noopener" target="_blank" title="Gold Monthly Commentary - June 2023"><strong>An expanded PDF version of this commentary, including fund specific information can be downloaded here.</strong></a></p>
<h2>Not the dollar this time&hellip;</h2>
<p>Gold was down $43.38 per ounce or 2.2% for the month, closing at $1,919.35 on June 30. Two- and ten-year treasury yields climbed higher in June, but the U.S. dollar was not to be blamed for gold&rsquo;s drop this time. The U.S. dollar index (DXY)<sup>1</sup>&nbsp;was also down in June (-1.4%).</p>
<p>Instead, gold was pressured by the relentless strength of the U.S. equity markets, which were undeterred by the outlook for more rate hikes this year, or by the recession signals sent by the most deeply inverted treasury yield curve in decades. The S&amp;P 500<sup>2</sup>&nbsp;and the NASDAQ 100<sup>3</sup>&nbsp;were both up more than 6.5% in June, posting double digit gains for the year with the tech-heavy NASDAQ up a whopping 39% in the first half of 2023. Apple closed the month at a milestone $3 trillion market cap, the world&rsquo;s first company ever to reach such valuation.</p>
<p>A notable revision to first-quarter GDP annualized growth to 2% from 1.3%, along with other better-than-expected economic releases (e.g., U.S. May retail sales, housing starts, jobless claims, consumer sentiment), slowing inflation and comments from the U.S. Federal Reserve (Fed) chairman and Treasury Secretary downplaying the risk of a recession, likely fueled the optimism.</p>
<p>The NYSE Arca Gold Miners Index (GDMNTR)<sup>4</sup>&nbsp;and the MVIS Global Juniors Gold Miners Index (MVGDXJTR)<sup>5</sup>&nbsp;felt the pressure of a declining gold price, down 2.5% and 3.9% respectively during the month of June. Following what was a dreadful month for gold equities in May, we were pleased to see the equities performing much more in line with our expectations in June. We expect strong gold mining sector fundamentals in a year when average gold prices are at record highs ($1,934 in the first half of 2023), will lead to a progressive contraction of the valuation gap between the metal and the stocks.</p>
<h2>Gold&rsquo;s drivers still remain the same</h2>
<p>Our outlook for higher gold prices in the longer term is unchanged, supported by the risks imposed by sustained elevated interest rates, sticky inflation, continued global geopolitical tensions, a trend by countries around the world to diversify away from the U.S. dollar and increase their gold reserves, and the pending risk of a U.S. and/or global economic recession. Investors continue to stay on the sidelines of the gold market. Global gold bullion ETF holdings, our proxy for investment demand, declined 1.64% during the month of June, leading to net outflows year-to-date of 1.21%.</p>
<p>Gold failed to hold above $1,950 per ounce. It may now trade sideways around the $1,900 level, until a new catalyst emerges. A Fed skip, signaling the nearing of the end of the tightening cycle, failed to provide impetus for gold and attract investors. But as the end of the hiking cycle approaches, the reasons for a pause (fear to launch the economy into a recession or into a deeper recession) and the implications on inflation, could become important gold price drivers.</p>
<h2>SPECIAL &ndash; Walking on Gold: Junior Miners in the Alaska/Yukon Region</h2>
<p>VanEck&rsquo;s active gold strategy has always maintained a significant allocation to juniors. We divide our junior investments into producers, with mine production of up to 300,000 ounces per year, and developers, with properties under development that we believe can reach an economic reserve of at least two million ounces. We don&rsquo;t invest in junior exploration stocks because we find them too speculative. While most explorers claim they&rsquo;ve made a discovery, very few will ever meet our two-million-ounce threshold.</p>
<p>We often travel to exploration and development sites to help determine whether a property has the potential to meet our investment criterion. We recently spent time in the Yukon and Alaska to visit several promising projects in the Tintina Gold Province (yellow on map), where most of the gold deposits occur in and around Cretaceous (145 to 66 million years old) granitic intrusions scattered throughout the Tombstone Plutonic Belt (pink on map). The Tombstone Belt is about 70 miles wide and trends west-northwest through the Yukon. It is offset along the Tintina Fault, a major strike-slip fault that carried the western portion of the belt 300 miles to the northwest into Alaska during the Eocene Age (55.8 to 33.9 million years ago).</p>
<p><img class="img-responsive w-100" src="https://www.vaneck.com/contentassets/e02e1bc26b124be782171dc0d9582d55/3416_gold_image-1_2022.07.jpg" alt="Map of Alaska's Tintina Gold Province (yellow) and Tombstone Belt (pink)" /></p>
<p class="chart-disclosure">Map of Alaska&rsquo;s Tintina Gold Province (yellow) and Tombstone Belt (pink). Source: Apex Geoscience Ltd. (May 2016).</p>
<p>Kinross&rsquo; Fort Knox mine is located in the Fairbanks gold district, Alaska in the western-most portion of the Tombstone Belt. Since 1996, Fort Knox has produced over 8 million ounces of gold from low-grade ores. We visited the Fairbanks district where Freegold Ventures (0.00% of Strategy net assets) is drilling its Golden Summit project. In February, Freegold announced a resource of 20.6 million ounces.<sup>i</sup>&nbsp;We also visited Banyan Gold&rsquo;s (0.00% of Strategy net assets) AurMac property in the Mayo Gold district, Yukon. Banyan announced a 6.2-million-ounce resource in May.<sup>ii</sup>&nbsp;Both of these properties have good infrastructure with roads and power. However, both are low grade with resources under one gram per tonne (0.029 ounces per ton). The companies are working to further define the resources and their metallurgy (gold process/recoveries) in order to fully assess the economics.</p>
<p>At the eastern end of the Tombstone Belt we visited Snowline Gold&rsquo;s (0.52% of Strategy net assets) Rogue property. Snowline announced the discovery of the Valley deposit in January 2022. While Snowline has yet to publish a maiden resource, drilling so far indicates that Valley is a multi-million-ounce deposit that crops out on surface. The photo shows Valley core drilled through a granodiorite intrusive that is riddled with gold-bearing sheeted quartz veins. This is classic Tombstone belt mineralization.</p>
<p><img class="img-responsive w-100" src="https://www.vaneck.com/contentassets/e02e1bc26b124be782171dc0d9582d55/3416_gold_image-2_2022.jpg" alt="Gold-bearing core samples from Snowline's Rogue property" /></p>
<p class="chart-disclosure">Gold-bearing core samples from Snowline&rsquo;s Rogue property. Source: VanEck (June 2023).</p>
<p>Unlike Golden Summit and AurMac, Valley is remote. The camp is accessed by fixed wing aircraft and the Valley deposit is accessed via helicopter from there.</p>
<p><img class="img-responsive w-100" src="https://www.vaneck.com/contentassets/e02e1bc26b124be782171dc0d9582d55/3416_gold_image-3_2022.jpg" alt="One of several small aircraft required to visit Snowline's remote Valley deposit" /></p>
<p class="chart-disclosure">One of several small aircraft required to visit Snowline&rsquo;s remote Valley deposit. Source: VanEck (June 2023).</p>
<p>Valley carries higher grades than most Tombstone belt deposits, but getting roads and power to the site will be a challenge. Snowline is working on the challenges while continuing to delineate Valley and explore other targets on the Rogue properties.</p>
<p>We reckon we walked over roughly 30 million ounces of undeveloped gold on our trip. Junior explorers and developers are the life blood of the gold industry. Explorers take the risks and developers do the work of taking a deposit from discovery to reserve and from permitting to production. Quality projects are often acquired by a larger producer along the way. Junior producer Victoria Gold (0.00% of Strategy net assets) and mid-tier producer B2Gold (4.32% of Strategy net assets) have taken strategic equity stakes in Banyan and Snowline respectively. This trip convinced us that there will surely be another major mine built along the Tombstone Belt.</p>
<p>To receive more insights to <strong><a href="https://www.vaneck.com/us/en/insights/gold-investing/" title="Gold Investing Insights">Gold Investing</a></strong> insights, <strong><a href="https://www.vaneck.com/us/en/subscribe/" title="Subscription Center">sign up in our subscription center</a></strong>.</p>
]]></content:encoded>
</item><item rdf:about="https://www.vaneck.com/us/en/blogs/emerging-markets-equity/indias-digital-gold-rush-the-rise-of-digitization-and-e-commerce/">
  <title>India’s Digital Gold Rush: The Rise of Digitization and E-commerce></title>
  <link>https://www.vaneck.com/us/en/blogs/emerging-markets-equity/indias-digital-gold-rush-the-rise-of-digitization-and-e-commerce/</link>
  <description><![CDATA[India's digitization journey creates a favorable environment for structural growth. We explore India&rsquo;s robust digital infrastructure and the companies that stand to benefit.]]></description>
  <dc:creator>Sunny  Bokhari</dc:creator>
  <dc:date>07/10/2023 06:30:00</dc:date>
<content:encoded><![CDATA[

<p>India's digitization journey has revolutionized multiple sectors and transformed the lives of its citizens. Through initiatives like the India Stack and Open Network for Digital Commerce (ONDC) India has created a robust digital infrastructure. The Indian government has put support programs in place that are facilitating innovation and creating private sector structural growth opportunities in multiple industries ranging from financial services, e-commerce, food delivery and logistics.</p>
<p>This blog explores:</p>
<ul class="content-list">
<li>The key aspects of India's digitization efforts and their transformative impact on the country&rsquo;s growth trajectory.</li>
<li>Companies at the intersection of digitalization, increased e-commerce and rising incomes that are shaping a mobile-first economy.</li>
</ul>
<h2>Democratization of Data</h2>
<p>India&rsquo;s government has been leading the push in digitization with its &ldquo;Digital India&rdquo; reforms since 2015. Smartphone adoption has taken off in India and most of the country&rsquo;s population accesses the internet via their phones using low priced data. The government&rsquo;s vision has been to democratize access to data, financial services and e-commerce using a mobile-first approach.</p>
<h3>Smartphone Adoption in India Has Surged While Costs Have Plummeted</h3>
<p><strong>Smartphones have become more common in India &ndash; and cheaper to use</strong></p>
<p><img class="img-responsive w-100" src="https://www.vaneck.com/contentassets/05ac2011c68449f5a6649855fd4cf26b/dgin_chart-01_2023.07_blog.svg" alt="Smartphones have become more common in India - and cheaper to use" /></p>
<p class="chart-disclosure">Source: IMF: Pai and Vats. As of December 31, 2022.</p>
<h2>The India Stack: The Foundation of Digital India</h2>
<p>At the center of this digitalization effort lies &lsquo;The India Stack&rsquo;. A government-backed initiative, which provides seamless integration of application programming interfaces (APIs) enabling third-party developers to build software with access to government IDs, payment networks, and data. Comprising layers such as the Aadhaar digital ID scheme, the Unified Payment Interface (UPI) payments system, and a data layer for document storage, the India Stack forms the backbone of India's digital infrastructure. Infosys Limited (portfolio holdings weight 7.44%)* played a pivotal role in advising the government on setting up the Aadhaar digital ID program and setting up &lsquo;India Stack&rsquo;. The company&rsquo;s chairman Nandan Nilekani is also advising the government on Open Network for Digital Commerce (ONDC) initiative. India has plans to launch an India stack 2.0 that will be powered by artificial intelligence (AI) by using the large data sets collected as part of the program enabling more nuanced solutions across multiple industries.</p>
<h2>How Digital Payments in India could Benefit Financial Inclusion</h2>
<p>India's digitization efforts have achieved remarkable progress in financial inclusion. India using digital means has achieved financial inclusion for 80% of the population in 6 years compared to the projected figure of 46 years.<sup>1</sup>&nbsp;The Aadhaar digital ID scheme facilitates cost-effective customer identity verification, reducing barriers to banking services. The interoperability of the UPI system has further accelerated digital payments, with payment apps facilitating billions of transactions monthly. With the highest digital payments adoption rate of 87% among the public compared to the global average of 64%, India has gained the third place in digital payments, after US and China, attesting to India&rsquo;s untapped market.<sup>2</sup></p>
<h3>India UPI Monthly Transactions</h3>
<p><img class="img-responsive w-100" src="https://www.vaneck.com/contentassets/05ac2011c68449f5a6649855fd4cf26b/dgin_chart-02_2023.07_blog.svg" alt="India UPI Monthly Transactions" /></p>
<p class="chart-disclosure">Source: National Payments Corporation of India (NPCI).</p>
<p>One 97 Communications Ltd. (portfolio holdings weight 2.04%)<sup>*</sup>&nbsp;is a direct beneficiary of these trends. It provides a digital payments and financial services platform for consumers to make digital payments to merchants across industries using the UPI. Its services span from hotel booking, data processing, games, mobile content, bill payments to opening up a savings account and investing in the stock market all through the Paytm app. The company&rsquo;s Buy Now Pay Later (BNPL) loan segment has seen significant growth and could become a major revenue stream for it.</p>
<h2>E-commerce Trends in India</h2>
<p>E-commerce in India is just 7% of the overall market and has considerable room to grow.<sup>3</sup>&nbsp;The Indian government&rsquo;s digitization efforts extend to e-commerce, exemplified by initiatives like the Open Network for Digital Commerce (ONDC), which is a government-backed ecommerce network aiming to create a level playing field in online commerce by putting the Indian family businesses on an even footing with the online giants. ONDC presents an alternative to platform-centric models such as Amazon that manage everything from sellers to the customers. ONDC promotes interoperability, allowing buyers to seamlessly make purchases from different apps and platforms.</p>
<p>For example, using ONDC a buyer can order groceries on JioMart, pay for them using digital payments service like Paytm and another app like Dunzo can deliver the order. ONDC intends to democratize online commerce with an open network that includes small and micro vendors. With a record transaction volume of 2 lakh crore (worth approximately $25 billion in US dollar terms) FY22, the e-commerce platform has overtaken the top two privately operated counterparts. Over the next few years, it is expected to hit 3 lakh crores rupees (approximately $37 billion USD) of e-commerce transactions.<sup>4</sup></p>
<p>Delhivery Limited (portfolio holdings weight 1.23%)<sup>*</sup>, which is India&rsquo;s largest and fastest growing logistics operator by revenue supports the country&rsquo;s leading e-commerce marketplaces, direct-to-consumer e-tailers, consumer brands and enterprises across diverse sectors, is a part of ONDC and has a leading 40% volume share among the third-party logistics(3PL) players and about 20% of the overall parcel delivery market.<sup>5</sup>&nbsp;The company could emerge as a direct beneficiary of digitization of small offline merchants via ONDC.</p>
<h3>Delhivery is at the cross-section of several growth drivers</h3>
<p><img class="img-responsive w-100" src="https://www.vaneck.com/contentassets/05ac2011c68449f5a6649855fd4cf26b/dgin_chart-03_2023.07_v2.svg" alt="Delhivery is at the cross-section of several growth drivers" /></p>
<p class="chart-disclosure">Source: VanEck Research, Delhivery Company data.</p>
<h2>India's Leadership in AI Adoption</h2>
<p>According to a report by Peak, a decision intelligence company based in the UK, Indian businesses lead the US and UK in AI adoption. While 84% of the businesses in India have adopted AI, the number drops to 68% in the US and just 46% in the UK.<sup>6</sup>&nbsp;India also produces 16% of the world&rsquo;s AI talent pool placing it among the top three talent markets in the world.<sup>7</sup>&nbsp;Reliance Industries Ltd. (portfolio holdings weight 7.78%)* is at the forefront of AI adoption and digitalization in India. Reliance is focusing on end to end data connectivity solutions and building digital eco-systems across industries. The company has enacted its digital strategy by setting aside $2 billion for transforming itself into a technology powerhouse focusing on in house technology development and global acquisitions in the fields of AI, machine learning, blockchain, augmented reality, Internet of Things, robotics, and Big Data analytics, among other emerging technologies.<sup>8</sup></p>
<p>Moreover, AI adoption in India and abroad could boost demand for AI solutions to integrate enterprise data sources real-time. Information Technology industry(portfolio sector weight 59.6%)<sup>*</sup>&nbsp;could benefit from this trend and further lift India&rsquo;s technology industry.</p>
<h2>Future Outlook of Digitization &amp; E-commerce in India</h2>
<p>India's digitization journey has transformed the nation, creating a thriving digital ecosystem that creates a favorable environment for structural growth. Companies positioned at the convergence of increasing disposable incomes, a mobile-first economy, rapid growth of e-commerce, and the expansion of fintech and digital payment platforms stand to benefit from the digitalization underway. Through initiatives like the India Stack and ONDC India is harnessing the power of digital platforms to drive financial inclusion, foster innovation, and position itself as a global leader in the digital landscape.</p>
<p><a href="/link/979eec17b7274fcb9dd954ab832450cc.aspx" title="DGIN - VanEck Digital India ETF - Overview"><strong>VanEck Digital India ETF (DGIN)</strong></a> offers access to the structural digital growth story of India and could be an appealing investment opportunity for investors looking to seek technology or growth exposure in emerging markets.</p>
<p>To receive more <a href="/us/en/insights/emerging-markets-equity/" title="Emerging Markets Equity Insights"><strong>Emerging Markets Equity</strong></a> insights, <a href="/us/en/subscribe/" title="Subscription Center"><strong>sign up in our subscription center</strong></a>.</p>
]]></content:encoded>
</item><item rdf:about="https://www.vaneck.com/us/en/blogs/digital-assets/matthew-sigel-25-top-tokens-may-be-commodities-vaneck-analysis-reveals/">
  <title>25 Top Tokens May Be Commodities, VanEck Analysis Reveals></title>
  <link>https://www.vaneck.com/us/en/blogs/digital-assets/matthew-sigel-25-top-tokens-may-be-commodities-vaneck-analysis-reveals/</link>
  <description><![CDATA[Bitcoin rose 12% in June as other cryptos sectors' fell, influenced by a new legislation proposal, SEC lawsuits against exchanges, and BlackRock's Bitcoin ETF filing.]]></description>
  <dc:creator>Matthew  Sigel</dc:creator>
  <dc:date>07/07/2023 06:30:00</dc:date>
<content:encoded><![CDATA[

<p><strong>Please note that VanEck may have a position(s) in the digital asset(s) described below.</strong></p>
<p>Digital assets price dispersion reached extreme levels in June as Bitcoin gained 12% while every crypto sector we track fell in the month. Two principal events catalyzed the performance gap, in our view. First, on June 2nd, Patrick McHenry, Chairman of the House Financial Services Committee, released <em>the Digital Asset Market Structure Proposal</em> to establish clear guidelines for cryptocurrencies to be classified as either a security or commodity. Then, on June 5th and 6th, the SEC sued Binance and Coinbase, respectively, alleging that both operated as unregistered national securities exchanges and brokerages, that Binance commingled customer assets and named at least 13 crypto assets made available to customers that qualify as "crypto asset securities."</p>
<div class="wrapped-div">
<table style="width: 500px;">
<tbody>
<tr class="tbl-data">
<td class="tbl-header last text-center">&nbsp;</td>
<td class="tbl-header last text-center">June</td>
<td class="tbl-header last text-center">YTD</td>
</tr>
<tr class="tbl-data">
<td class="data-td last">Coinbase</td>
<td class="data-td data last">15%</td>
<td class="data-td data last">101%</td>
</tr>
<tr class="tbl-data">
<td class="data-td last">Bitcoin</td>
<td class="data-td data last">12%</td>
<td class="data-td data last">83%</td>
</tr>
<tr class="tbl-data">
<td class="data-td last">Nasdaq 100 Index</td>
<td class="data-td data last">7%</td>
<td class="data-td data last">32%</td>
</tr>
<tr class="tbl-data">
<td class="data-td last">S&amp;P 500 Index</td>
<td class="data-td data last">6%</td>
<td class="data-td data last">16%</td>
</tr>
<tr class="tbl-data">
<td class="data-td last">Ethereum</td>
<td class="data-td data last">3%</td>
<td class="data-td data last">61%</td>
</tr>
<tr class="tbl-data">
<td class="data-td last">MarketVector<sup>TM</sup>&nbsp;Decentralized Finance Leaders Index</td>
<td class="data-td data last">1%</td>
<td class="data-td data last">29%</td>
</tr>
<tr class="tbl-data">
<td class="data-td last">MarketVector<sup>TM</sup>&nbsp;Smart Contract Leaders Index</td>
<td class="data-td data last">-8%</td>
<td class="data-td data last">28%</td>
</tr>
<tr class="tbl-data">
<td class="data-td last">MarketVector<sup>TM</sup>&nbsp;Infrastructure Application Leaders Index</td>
<td class="data-td data last">-15%</td>
<td class="data-td data last">26%</td>
</tr>
<tr class="tbl-data">
<td class="data-td last">MarketVector<sup>TM</sup>&nbsp;Centralized Exchanges Index</td>
<td class="data-td data last">-20%</td>
<td class="data-td data last">0%</td>
</tr>
<tr class="tbl-data">
<td class="data-td last">MarketVector<sup>TM</sup>&nbsp;Media &amp; Entertainment Leaders Index</td>
<td class="data-td data last">-22%</td>
<td class="data-td data last">-12%</td>
</tr>
</tbody>
</table>
</div>
<br />
<p class="chart-disclosure">Source: Bloomberg, MarketVector, VanEck research as of 6/30/2023. Past performance is not indicative of future results. Not a recommendation to buy or sell any of the names mentioned herein.</p>
<h3>AltSeason - % Assets Outperforming BTC 90 Day Return</h3>
<p><img class="img-responsive w-100" src="https://www.vaneck.com/contentassets/8fb2867c698348a494d1348fa1e36fe2/3404_scl-blog_chart-01_2023.07_blog.svg" alt="AltSeason - % Assets Outperforming BTC 90 Day Return 7.00" /></p>
<p class="chart-disclosure">Source: Coingecko as of 6/30/2023. Past performance is no guarantee of future results. Not intended as a recommendation to buy or sell any securities named herein. Index performance is not representative of fund performance. It is not possible to invest directly in an index.</p>
<ul class="content-list">
<li><strong><a href="#point-one">Analyzing the House Financial Services&rsquo; Digital Asset Market Structure Proposal</a></strong></li>
<li><strong><a href="#point-two">Layer 1s June 2023 Performance Overview: Best and Worst Tokens</a></strong></li>
<li><strong><a href="#point-three">DeFi June 2023 Updates: Ethereum Claims Larger Share in Volume</a></strong></li>
<li><strong><a href="#point-four">NFTs June 2023 Updates: Overall Decline in Volume</a></strong></li>
</ul>
<p>These legislative and judicial clarifications are important because blockchains whose tokens are classified as securities under US law may struggle to attract developers, many of whom expect censorship resistance and decentralization. Indeed, several exchanges and market makers delisted some of the 13 coins named in the SEC suits, including large-caps <strong>Solana, Cardano,</strong> and <strong>Polygon,</strong> all of which fell more than 20% in June. Further illustrating the potential market share losses by &ldquo;security&rdquo; token projects, the ratio of open-source &ldquo;commits&rdquo; in the Ethereum ecosystem made a 12-month high relative to competing smart contract platforms, even as overall open-source blockchain developer activity plunged to yearly lows.</p>
<h3>Total Smart Contract Platform Ecosystem GitHub Commits</h3>
<p><img class="img-responsive w-100" src="https://www.vaneck.com/contentassets/8fb2867c698348a494d1348fa1e36fe2/3404_scl-blog_chart-02_2023.07_blog.svg" alt="Total Smart Contract Platform Ecosystem GitHub Commits" /></p>
<p class="chart-disclosure">Source: Github as of 6/30/2023. Past performance is no guarantee of future results. Not intended as a recommendation to buy or sell any securities named herein.</p>
<h2 id="point-one" class="anchored-block">Analyzing the House Financial Services&rsquo; Digital Asset Market Structure Proposal</h2>
<p>Many open-source blockchain project participants have argued that decentralization is not binary but a spectrum comprising a handful of fluid factors, including network architecture, team makeup, and tokenomics. But the spectrum claim only applies until one faces a lawsuit. At this point, more specific distinctions are acquired. With that in mind, we took a close look at the House Financial Services&rsquo; <em>Digital Assets</em><em> Market Structure Proposal</em>, proposed legislation which posits that if a token meets the four guidelines below, the digital asset can be considered &lsquo;sufficiently decentralized&rsquo; and fall under the CFTC&rsquo;s oversight as a digital commodity.</p>
<ol class="content-list">
<li>No issuer or affiliated persons can prevent anyone from using the digital asset or operating computational infrastructure related to the blockchain network (applies to the past 12 months)</li>
<li>No issuer or affiliated person owns or has voting rights to 20% or more of the circulating supply (past 12 months, excludes fully decentralized DAOS)</li>
<li>No issuer or affiliated person has marketed to the public the digital asset or blockchain network (past 3 months)</li>
<li>All issuances of digital assets have been end-user distributions (past 12 months)</li>
</ol>
<p>To clarify the legal jargon regarding the first stipulation, we interpret computational infrastructure as applied to operating nodes, validators, or anything related to blockchain architecture that requires hardware. An affiliated person is anyone who directly or indirectly controls 5% or more of the circulating supply. End User distributions refer to the process of how tokens are issued or earned. Essentially, tokens must be distributed in a non-discretionary manner that can be satisfied by any participant in the network for activities directly related to the operation of the network. This means absolutely no exchange of cash or other assets in exchange for the token.</p>
<p>In response to the proposed legislation, we applied these guidelines to classify the top 100 tokens by market cap as either securities or commodities. We excluded stablecoins and did not consider the marketing rule since the courts could argue that any network with a Twitter account is &lsquo;marketing.&rsquo; <strong>From our analysis, just 25 of the top 100 tokens could potentially be considered &lsquo;sufficiently decentralized&rsquo; to avoid the disclosure requirements of the proposed law.</strong></p>
<p>We then analyzed the simple average and market-cap-weighted returns for the 30- and 365-days ending on June 28th. <strong>The data reveal a clear pattern: tokens classified as 'sufficiently decentralized' digital commodities exhibit superior returns and lower volatility, particularly when weighted by their market cap. We are happy to share our specific token analysis upon request.</strong></p>
<div class="wrapped-div">
<table style="width: 750px;">
<tbody>
<tr class="tbl-data">
<td class="tbl-header">Token Classification</td>
<td class="tbl-header last text-center">Digital Commodity</td>
<td class="tbl-header last text-center">Digital Security</td>
<td class="tbl-header last text-center">Digital Commodity<br />(ex- BTC/ETH)</td>
</tr>
<tr class="tbl-data">
<td class="data-td last font-weight-normal"><strong>Avg 30 day Return</strong></td>
<td class="data-td data last"><strong>-2%</strong></td>
<td class="data-td data last">-12%</td>
<td class="data-td data last">-3%</td>
</tr>
<tr class="tbl-data">
<td class="data-td last font-weight-normal"><strong>Market Weighted 30 day Return</strong></td>
<td class="data-td data last">7%</td>
<td class="data-td data last">-13%</td>
<td class="data-td data last"><strong>15%</strong></td>
</tr>
<tr class="tbl-data">
<td class="data-td last font-weight-normal"><strong>Avg 365 day Return</strong></td>
<td class="data-td data last">9%</td>
<td class="data-td data last"><strong>21%</strong></td>
<td class="data-td data last">4%</td>
</tr>
<tr class="tbl-data">
<td class="data-td last font-weight-normal"><strong>Market Weighted 365 day Return</strong></td>
<td class="data-td data last"><strong>50%</strong></td>
<td class="data-td data last">7%</td>
<td class="data-td data last">33%</td>
</tr>
<tr class="tbl-data">
<td class="data-td last font-weight-normal"><strong>Annualized volatility</strong></td>
<td class="data-td data last"><strong>89%</strong></td>
<td class="data-td data last">95%</td>
<td class="data-td data last">92%</td>
</tr>
<tr class="tbl-data">
<td class="data-td last font-weight-normal"><strong>Market Weighted Annualized Volatility</strong></td>
<td class="data-td data last"><strong>59%</strong></td>
<td class="data-td data last">78%</td>
<td class="data-td data last">91%</td>
</tr>
</tbody>
</table>
</div>
<br />
<p class="chart-disclosure">Source: VanEck as of 6/28/2023. Past performance is no guarantee of future results. Not intended as a recommendation to buy or sell any securities named herein.</p>
<h2 id="point-two" class="anchored-block">Layer 1s June 2023 Performance Overview: Best and Worst Tokens</h2>
<p>For the fourth consecutive year, the &ldquo;June Witch&rdquo; emerged from the swirling waters of the cryptocurrency markets and <em>&ldquo;rekt&rdquo;</em> countless financial mariners. After the melee and subsequent decline in meme coin trading in May, June began with record low crypto volatility as Bitcoin&rsquo;s implied vol sunk into the high 20s, on par. As is typical in the space, that lull did not last long, and by June 15th the total market cap of all layer 1s smart contract platforms (SCPs) had fallen 16% to $289B. After that, the market recovered somewhat, thanks to momentum generated by Blackrock Bitcoin ETF filing, but SCPs still ended the month down 6%. For June, the best-performing tokens were <strong>Arbitrum (+3%), ETH (+3%)</strong>, and <strong>Polkadot (-4%)</strong>. On the flipside, <strong>Polygon (-26%), Cardano (-26%)</strong>, and <strong>Solana (-8%) </strong>fell the most.</p>
<h3>SCP June Monthly Returns: 2020 - 2023</h3>
<p><img class="img-responsive w-100" src="https://www.vaneck.com/contentassets/8fb2867c698348a494d1348fa1e36fe2/3404_scl-blog_chart-03_2023.07_blog.svg" alt="SCP June Monthly Returns: 2020 - 2023" /></p>
<p class="chart-disclosure">Source: Artemis.xyz as of 6/30/2023. Past performance is no guarantee of future results. Not intended as a recommendation to buy or sell any securities named herein.</p>
<p><strong>Arbitrum</strong></p>
<p>Arbitrum set a new high with 2.7 million monthly unique active addresses, becoming so popular that the chain <strong><a href="https://www.coindesk.com/tech/2023/06/07/arbitrum-temporarily-stopped-processing-due-to-software-bug/" rel="noopener" target="_blank" title="Arbitrum Temporarily Stopped Processing Due to Software Bug">halted</a></strong> for an hour on June 7th. The halt occurred when the centrally controlled sequencer ran out of ETH necessary to pay the gas fees required to post updates to Ethereum. Whether due to increased user traffic or a lack of oversight from the team, the halt was negligible, and Arbitrum experienced one of its most profitable months to date, with monthly profits of +38% to $1.29M, even as revenues (fees paid by users) declined by 54%. This is an interesting dynamic that relates to how Layer-2s business economics work. Layer-2s host separate transaction environments from Ethereum. Applications and value, in the form of tokens, operate on the L2s, and the L2s then post the history of activity to Ethereum. Because most blockchains tend to experience usership at the same time, revenues and profits for L2s can diverge. While revenues may increase because of increased activity on an L2, profit margins and even total profits can decrease. That is because the main cost to L2s, posting to Ethereum, can also increase substantially with more activity on Ethereum. In the month of June, gas fees on Ethereum were lower due to decreased activity, so the profit margins of L2 should logically increase, all else equal, because their main cost of revenue has declined. However, Arbitrum did not just have higher profit margins in June; they actually saw profits increase, meaning that the margin surge more than compensated for the decrease in revenues. This implies that there was high demand for users to transact on Arbitrum. On a relative basis, Arbitrum distinguished itself as a hub of activity versus its main competitor, Optimism. Optimism's profits and revenues decreased by 24% and 50%, respectively.</p>
<h3>Arbitrum vs Optimism Profit Margins</h3>
<p><img class="img-responsive w-100" src="https://www.vaneck.com/contentassets/8fb2867c698348a494d1348fa1e36fe2/3404_scl-blog_chart-04_2023.07_blog.svg" alt="Arbitrum vs Optimism Profit Margins" /></p>
<p class="chart-disclosure">Source: Token Terminal as of 6/30/2023. Past performance is no guarantee of future results. Not intended as a recommendation to buy or sell any securities named herein.</p>
<p>Thus, the Arbitrum ecosystem has seen a positive feedback loop, with both user base and profits rising faster than the competition. Despite announcements that Coinbase's layer 2, <strong><a href="https://decrypt.co/121992/coinbase-ethereum-layer-2-base" rel="noopener" target="_blank" title="Coinbase Is Building Its Own Ethereum Layer-2 Network Called 'Base'">Base</a>,</strong> and BNB chain's native layer 2, <strong><a href="https://cointelegraph.com/news/binance-bnb-chain-introduce-optimism-layer-2-testnet-opbnb" rel="noopener" target="_blank" title="Binance's BNB Chain introduces layer-2 testnet powered by Optimism">opBNB</a>,</strong> will be built on the Optimism tech stack, Arbitrum has managed to increase its Total Value Locked (TVL) at a pace significantly faster than Optimism. While starting the year with roughly twice the TVL, it reached 3x OP&rsquo;s TVL by July, thanks to a much more developed DeFi ecosystem. Popular Arbitrum-based DeFi projects GMX and Radiant have attracted roughly the same TVL as the Optimism ecosystem combined. The success of these applications in Arbitrum can be attributed to the generation of yield from substantial usage, which in turn attracts higher-value users in a positive flywheel.</p>
<h3><strong>Arbitrum vs Optimism Growth</strong></h3>
<p><strong><img class="img-responsive w-100" src="https://www.vaneck.com/contentassets/8fb2867c698348a494d1348fa1e36fe2/3404_scl-blog_chart-05_2023.07_blog.svg" alt="Arbitrum vs Optimism Growth" /></strong></p>
<p class="chart-disclosure">Source: Artemis.xyz as of 6/30/2023. Past performance is no guarantee of future results. Not intended as a recommendation to buy or sell any securities named herein.</p>
<p><strong>Ethereum</strong></p>
<p>As the base asset by which all other tokens are compared, ETH tends to outperform in bear markets. The month of June was no exception to this general rule as ETH rose 3% while the broader index of SCPs lost just over -6%. The biggest story of the month for Ethereum was the SEC&rsquo;s conspicuous omission of ETH from its list of securities in both the Binance and Coinbase lawsuits. Additionally, ETH supply dynamics have vastly improved, with supply of ETH on exchanges falling to an all-time low of 13% of total supply. Likewise, ETH staking has climbed to nearly 20% while ETH locked in smart contracts has surpassed 30%. While the ETH staking growth can be attributed to greater comfort spurred by the Shapella upgrade that allows staking withdrawals, smart contract locking can be attributed to the proliferation of yield-generating protocols using ETH and stETH (liquid token given to ETH stakers by liquid staking providers). On the horizon, many more use cases for ETH are emerging, like Eigenlayer, which will allow ETH holders to stake both on-chain and off-chain protocols with ETH. This may include things like oracles, blockchains, computation networks, bridges, and more. These new use cases will likely draw yield-seekers to lock more ETH into smart contracts, which will further diminish liquid supply. As a reminder, we tackled all of these revenue drivers in our <strong><a href="https://www.vaneck.com/us/en/blogs/digital-assets/matthew-sigel-ethereum-price-target-118k-by-2030/#point-eight" title="Ethereum Price Target: $11.8k by 2030">deep-dive $11k price target</a></strong> for ETH.</p>
<h3>ETH Supply Dynamics</h3>
<p><img class="img-responsive w-100" src="https://www.vaneck.com/contentassets/8fb2867c698348a494d1348fa1e36fe2/3404_scl-blog_chart-06_2023.07_blog.svg" alt="ETH Supply Dynamics" /></p>
<p class="chart-disclosure">Source: Etherscan.io as of 6/30/2023. Past performance is no guarantee of future results. Not intended as a recommendation to buy or sell any securities named herein.</p>
<h3>Total Monthly Fees SCPs vs ETH Market Share of Fees</h3>
<p><img class="img-responsive w-100" src="https://www.vaneck.com/contentassets/8fb2867c698348a494d1348fa1e36fe2/3404_scl-blog_chart-07_2023.07_blog.svg" alt="Total Monthly Fees SCPs vs ETH Market Share of Fees" /></p>
<p class="chart-disclosure">Source: Artemis.xyz as of 6/30/2023. Past performance is no guarantee of future results. Not intended as a recommendation to buy or sell any securities named herein.</p>
<p>While blockchain activity on Ethereum remained robust, average ETH gas prices (gwei) sunk to their lowest level since January, 26.33 gwei, which was 64% less than May&rsquo;s average, which was unusually high due to some memecoins (PEPE &ldquo;the most memeable memecoins&rdquo; according to its website, peaked at $1.6B market cap in May before falling to $333M in June). Still, Ethereum increased its monthly average daily active user count by 10.5%, from 328k to 363k, while maintaining its share of the layer 1 fee market above 70%.</p>
<h3>Ethereum Gas Price (gwei) vs Transaction Costs in USD</h3>
<p><img class="img-responsive w-100" src="https://www.vaneck.com/contentassets/8fb2867c698348a494d1348fa1e36fe2/3404_scl-blog_chart-08_2023.07_blog.svg" alt="Ethereum Gas Price (gwei) vs Transaction Costs in USD" /></p>
<p class="chart-disclosure">Source: Etherscan.io as of 6/30/2023. Past performance is no guarantee of future results. Not intended as a recommendation to buy or sell any securities named herein.</p>
<p><strong>Polkadot</strong></p>
<p>Breaking a long streak of monthly underperformance, Polkadot (-4%) was able to weather the June Witch a bit better than its peers. As a refresher, Polkadot is a specific type of smart contract platform, called a Layer-0, that does not directly host any smart contracts on its platform. Instead, it is called a sharded blockchain, where the functionalities of smart contracts are outsourced to other blockchains that connect to Polkadot. In return for connecting to Polkadot, these blockchains tap into the security of Polkadot and gain the ability to securely trade messages and assets with other connecting chains. This vision, which pre-dates Ethereum, essentially has solved all the current pain points experienced by Ethereum &ndash; high fees, low throughput, messaging between blockchains, and state management. Despite its promise, Polkadot has lost momentum since 2021 as network issues emerged, Polkadot&rsquo;s Web3 Foundation failed to implement pro-growth policies, and a <strong><a href="https://www.halborn.com/blog/post/explained-the-nomad-hack-august-2022" rel="noopener" target="_blank" title="EXPLAINED: THE NOMAD HACK (AUGUST 2022)">$200M</a></strong> bridge hack destroyed its nascent community. As a result, Polkadot, though a top 7 asset by market capitalization, is down -90% from all-time highs, while its most successful parachains tokens are down as much as -98.5%. However, despite poor price action, Polkadot still has enormous potential as it retains the second largest full-time developer community, at 775, outside of Ethereum, representing 21% of all blockchain developers.</p>
<p>Polkadot&rsquo;s outperformance in June can be partly attributed to its exclusion from the SEC&rsquo;s securities lists. In mid-January, the foundation behind Polkadot, the Web3 Foundation, declared publicly that DOT was <strong><a href="https://cointelegraph.com/news/polkadot-restates-its-case-that-dot-has-morphed-away-from-security-status" rel="noopener" target="_blank" title="Polkadot restates its case that DOT has 'morphed' away from security status">not</a></strong> a security. Then, at Polkadot&rsquo;s annual conference in June called &ldquo;<a href="https://polkadot.network/ecosystem/events/decoded-2023/" rel="noopener" target="_blank" title="JOIN THE WORLD'S LARGEST WEB3 MULTICHAIN ECOSYSTEM"><strong>Polkadot Decoded</strong></a>,&rdquo; Founder Gavin Wood laid out a blockspace-centric vision for Polkadot, including: increasing transaction output capabilities by 10x, creating pay-as-you-go parachains, constructing an active blockspace market, and creating novel low-latency parachains. Another important development was Polkadot's massive change to its governing bodies called &ldquo;<strong><a href="https://twitter.com/Polkadot/status/1669331660125478912" rel="noopener" target="_blank" title=" Polkadot - Twitter">Open Governance</a></strong>,&rdquo; which democratizes and decentralizes control of Polkadot&rsquo;s business, software, and economic update processes. Also contributing to the relative positive sentiment for Polkadot was the recent raise of $37M by <a href="https://cointelegraph.com/news/mythical-games-raises-37m-for-in-game-marketplace-in-series-c" rel="noopener" target="_blank" title="Mythical Games raises $37M for in-game marketplace in Series C round"><strong>Mythical Games</strong></a>, who is building a Polkadot blockchain for gaming and NFTs.</p>
<p><strong>Polygon</strong></p>
<p>Polygon (MATIC), which lost -26% in the month of June, was the worst performer amongst smart contract blockchains. The price action of Polygon was not encouraging before the month of June, as it was already one of the weakest performers YTD. Despite a slew of positive partnerships with prominent partnerships over the last year with entities like <strong><a href="https://cointelegraph.com/news/reddit-deploys-gen-3-nft-avatar-contracts-on-polygon" rel="noopener" target="_blank" title="Reddit deploys Gen 3 NFT avatar contracts on Polygon">Reddit</a></strong>, <a href="https://www.google.com/search?q=starbucks+and+polygon&amp;rlz=1C1CHBF_enUS999US999&amp;oq=starbucks+and+polygon&amp;gs_lcrp=EgZjaHJvbWUqBwgAEAAYgAQyBwgAEAAYgAQyCAgBEAAYFhgeMggIAhAAGBYYHjIICAMQABgWGB4yCAgEEAAYFhgeMggIBRAAGBYYHjIICAYQABgWGB4yCAgHEAAYFhgeMggICBAAGBYYHjIICAkQABgWGB7SAQg1NTAzajBqNKgCALACAA&amp;sourceid=chrome&amp;ie=UTF-8" rel="noopener" target="_blank" title="Starbucks and Polygon - Google"><strong>Starbucks</strong></a>, <strong><a href="https://www.draftkings.com/about/news/2021/10/polygon-and-draftkings-enter-into-a-strategic-blockchain-agreement/" rel="noopener" target="_blank" title="DraftKings ">Draftkings</a></strong>, <a href="https://www.coindesk.com/business/2022/01/20/prada-adidas-launch-nft-project-on-polygon/" rel="noopener" target="_blank" title="Prada, Adidas Launch NFT Project on Polygon"><strong>Prada, Adidas</strong></a>, and <strong><a href="https://www.blockchain-council.org/blockchain/polygon-technology-top-10-partnerships-depicting-the-rise-of-layer-2-ethereum-scaling-solution/" rel="noopener" target="_blank" title="Polygon Technology: Top 10 Partnerships Depicting The Rise Of Layer-2 Ethereum Scaling Solution">others</a></strong>, Polygon has not seen the follow-through to its bottom line. While Polygon&rsquo;s userbase, in terms of daily active users, has increased 40% since June 2022, its 3-month moving average for fees has decreased by 13%. This implies that the value of its users has simultaneously reduced, and the costs of running the chain, as Polygon must post data to Ethereum, have increased.</p>
<h3>Polygon Daily Active Users vs. Monthly Fees</h3>
<p><img class="img-responsive w-100" src="https://www.vaneck.com/contentassets/8fb2867c698348a494d1348fa1e36fe2/3404_scl-blog_chart-09_2023.07_blog.svg" alt="Polygon Daily Active Users vs. Monthly Fees" /></p>
<p class="chart-disclosure">Source: Artemis.xyz as of 6/30/2023. Past performance is no guarantee of future results. Not intended as a recommendation to buy or sell any securities named herein.</p>
<p>Polygon&rsquo;s issues increased in June when the SEC cited it as a security in the cases against Binance and Coinbase. Exacerbating matters, Polygon Labs, the entity that designed Polygon, did not directly deny the SEC&rsquo;s <strong><a href="https://twitter.com/0xPolygonLabs/status/1667643925232852996" rel="noopener" target="_blank" title=" Polygon (Labs) - Twiter">assertions</a></strong> by curiously contending that they &ldquo;did not target the US at any time.&rdquo; As a result of the SEC action, both <strong><a href="https://www.investopedia.com/robinhood-to-delist-cardano-polygon-and-solana-7510331" rel="noopener" target="_blank" title="Robinhood To Delist Cardano, Polygon, and Solana Tokens">Robinhood</a></strong> and ICE&rsquo;s <strong><a href="https://coingape.com/bakkt-delists-cardano-polygon-and-solana-on-regulatory-grounds/" rel="noopener" target="_blank" title="Bakkt Delists Cardano, Polygon and Solana on Regulatory Grounds">Bakkt</a></strong> exchange announced they would delist MATIC. Furthermore, Robinhood announced that any MATIC left on its platform after June 27 would be market-sold and the customers refunded in USD. eToro also followed suit in <strong><a href="https://www.theblock.co/post/234404/etoro-delists-algo-dash-mana-matic-on-us-platform" rel="noopener" target="_blank" title="eToro to delist Polygon, Decentraland, Dash and Algorand on US platform">delisting</a></strong> MATIC. Amid the flurry of bad news and price declines, a large MATIC holder unstaked and liquidated 115.27M MATIC ($95.71). Finally, Polygon&rsquo;s future for scaling, its Layer-2 zero-knowledge project called zkEVM, is showing extremely tepid adoption compared to its main competitor zkSync Era. Polygon&rsquo;s zkEVM has only 1/17th of the TVL of zkSync&rsquo;s Era.</p>
<h3>TVL: Polygon zkEVM vs zkSync Era</h3>
<p><img class="img-responsive w-100" src="https://www.vaneck.com/contentassets/8fb2867c698348a494d1348fa1e36fe2/3404_scl-blog_chart-10_2023.07_blog.svg" alt="TVL: Polygon zkEVM vs zkSync Era" /></p>
<p class="chart-disclosure">Source: Dune @tomanhh, @0vix_wizards as of 6/30/2023. Past performance is no guarantee of future results. Not intended as a recommendation to buy or sell any securities named herein.</p>
<p>To stem the longer-term token price decline and refresh the Polygon network, Polygon has launched what it calls <strong><a href="https://twitter.com/0xPolygonLabs/status/1668312620649127936" rel="noopener" target="_blank" title=" Polygon (Labs) - Twitter">Polygon 2.0</a></strong>. In their official blog posting, on June 12, they announced a series of upgrades that create &ldquo;the value layer of the internet.&rdquo; Implementation would consist of addressing tokenomics issues with MATIC while increasing network throughput and efficiency. The first step was announced on June 19, which was the revamp of Polygon&rsquo;s main network, called Polygon PoS, to improve transaction throughput and prevent <a href="https://protos.com/polygon-hit-by-157-block-reorg-despite-hard-fork-to-reduce-reorgs/" rel="noopener" target="_blank" title="Polygon hit by 157-block 'reorg' despite hard-fork to reduce reorgs"><strong>network issues</strong></a> that have plagued Polygon. Going forward, Polygon is set to announce changes to its token structure and new developments for its planned network of blockchains it calls Polygon &ldquo;Supernets.&rdquo;</p>
<p><strong>BNB</strong></p>
<p>BNB had its worst month to date this year, marked by a 23% drop in token price. This decrease was primarily driven by a combination of funds exiting the ecosystem and reduced fees generated. Over the past 30 days, the Total Value Locked (TVL) on the BNB chain declined by nearly $1B, settling at just $3.4B. This latest June TVL figure contrasts starkly with last year's figure of $5.3B and represents a 36% YoY drop. Compared to other ecosystems, in percentage terms, the decline in BNB chain&rsquo;s TVL was twice as much as Optimism's and 14x as much as Ethereum's. The key trigger for the abrupt decrease in TVL was multiple government enforcement actions against the associated Binance exchange.</p>
<h3>TVL Drawdown: June 2023</h3>
<p><img class="img-responsive w-100" src="https://www.vaneck.com/contentassets/8fb2867c698348a494d1348fa1e36fe2/3404_scl-blog_chart-11_2023.07_blog.svg" alt="TVL Drawdown: June 2023" /></p>
<p class="chart-disclosure">Source: Artemis.xyz as of 6/30/2023. Past performance is no guarantee of future results. Not intended as a recommendation to buy or sell any securities named herein.</p>
<p>Earlier in the month, the SEC filed a <strong><a href="https://www.sec.gov/news/press-release/2023-101" rel="noopener" target="_blank" title="SEC Files 13 Charges Against Binance Entities and Founder Changpeng Zhao">lawsuit</a></strong> against the Binance exchange and its founder, Changpeng Zhao, for listing unregulated securities, including BNB. After the lawsuit, it also received a <strong><a href="https://www.reuters.com/legal/sec-files-motion-restraining-order-freeze-binance-us-assets-2023-06-06/" rel="noopener" target="_blank" title="SEC files motion for restraining order to freeze Binance US assets">motion</a></strong> to freeze Binance's US customer assets. In Europe, Binance failed to acquire an operating license from <a href="https://www.coindesk.com/business/2023/06/16/binance-to-quit-netherlands-after-failing-to-acquire-license/#:~:text=Binance%2C%20the%20world's%20largest%20cryptocurrency,money%20laundering%20(AML)%20guidelines." rel="noopener" target="_blank" title="Binance to Quit Netherlands After Failing to Acquire License"><strong>Dutch regulators</strong></a> and was ordered to stop all operations in <strong><a href="https://www.reuters.com/technology/binance-ordered-stop-all-digital-currency-services-belgium-2023-06-23/" rel="noopener" target="_blank" title="Binance ordered to stop all digital currency services in Belgium">Belgium</a></strong>. Moreover, the number of daily active addresses has remained relatively stable over the past two months. This suggests that the decrease in TVL is not due to a collection of smaller retail users but rather larger holders managing their risk due to the close connection with Binance. Alongside the outflow of user funds, transaction-related fees and revenue have dropped by 25% over the past 30 days. Currently, 10% of BNB gas fees are burned and removed from the circulating supply, so this reduction in fees generated is a significant factor driving the recent depreciation of the token.</p>
<p>As the price of BNB has declined, it has approached the <strong><a href="https://news-bitcoin-com.webpkgcache.com/doc/-/s/news.bitcoin.com/potential-venus-protocol-liquidation-raises-concerns-in-bnb-community/" rel="noopener" target="_blank" title="Potential Venus Protocol Liquidation Raises Concerns in BNB Community">liquidation</a></strong> point of a levered trader with $236M worth of BNB on Venus protocol, the top lending platform on the BNB chain. If the price of BNB drops to $218, the position will fall below its collateral requirement and can be liquidated. This would lead to a market-sell order and almost certainly trigger a large drop in the token price. Luckily for BNB holders, the situation has been alleviated with a governance proposal passing that enables the BNB ecosystem team to execute the liquidation spread over a period of time rather than one immediate transaction.</p>
<p><strong>Cardano</strong></p>
<p>Cardano, whose ADA token fell 25% in June, suffered gravely from June Witch&rsquo;s wrath. The SEC lawsuit against Binance hit Cardano especially hard due to follow-on effects, including Robinhood selling off all ADA, MATIC, and SOL by June 27th. Simultaneously, Celsius also <strong><a href="https://u.today/cardano-community-alarmed-as-robinhood-and-celsius-poised-to-dump-millions-in-ada" rel="noopener" target="_blank" title="Cardano Community Alarmed as Robinhood and Celsius Poised to Dump Millions in ADA">began liquidating</a></strong> various customer altcoins, including Cardano, by converting them into Bitcoin and Ethereum. The combined $56 million ADA held by Celsius and <strong><a href="https://cryptonews.com/news/cardano-price-prediction-as-50-million-celsius-and-robinhood-sell-off-approaches-will-ada-dump.htm" rel="noopener" target="_blank" title="Cardano Price Prediction as $50 Million Celsius and Robinhood Sell-Off Approaches &ndash; Will ADA Dump?">Robinhood</a></strong> represent 25% of the daily average volume for ADA (though it can be sold over a years-long winddown). Likewise, the citation by the SEC enhances the possibility of direct action by the agency against Cardano. Adding further to the downward pressure was the <strong><a href="https://www.coindesk.com/business/2023/06/12/cardano-developer-iog-restructures-to-venture-studio-model-lays-off-some-staff/" rel="noopener" target="_blank" title="Cardano Developer IOG Restructures to Venture Studio Model, Lays Off Some Staff">restructuring</a></strong> and layoff of staff from Cardano developer entity IOG.</p>
<p>Coming into the month, Cardano, though buoyed by the charismatic leader Charles Hoskinson who has cultivated a diehard Cardano community, had been beset by the slow pace of functionality improvements on its platform, resulting in a lack of user share growth vs. competing blockchains. For example, Cardano has fallen below 2% of all SCP users. And while Cardano&rsquo;s TVL has grown enormously since the start of the year, from $49M to $153M, it has lagged mightily behind ETH layer 2s like OP &amp; ARB, whose combined TVL has surged by more than $1.4B. Similarly, the lack of development pace has also stunted the growth of Cardano&rsquo;s DEX ecosystem, as Cardano hosts about 50% of the volumes of Optimism and about 8.5% of the activity of Arbitrum.</p>
<h3>Cardano Fails to Grow Share of Total Users</h3>
<p><img class="img-responsive w-100" src="https://www.vaneck.com/contentassets/8fb2867c698348a494d1348fa1e36fe2/3404_scl-blog_chart-12_2023.07_blog.svg" alt="Cardano Fails to Grow Share of Total Users" /></p>
<p class="chart-disclosure">Source: Artemis.xyz as of 6/30/2023. Past performance is no guarantee of future results. Not intended as a recommendation to buy or sell any securities named herein.</p>
<p>Though prices declined, Cardano has positive developments as its DEX activity, though small and lagging, continue to grow amid contract upgrades. DEX volume on Cardano increased DEX volume by 20% in June compared to May, which was the highest increase amongst comparable blockchains, as most others were negative. This activity increase resulted from Cardano&rsquo;s 8.1.1 <strong><a href="https://cryptoslate.com/cardano-node-upgrade-to-boost-performance-amid-rising-defi-interest/" rel="noopener" target="_blank" title="Cardano node upgrade to boost performance amid rising DeFi interest">Node</a></strong> Upgrade, which offered significant performance improvements, enabling more DEX transaction throughput.</p>
<h2 id="point-three" class="anchored-block">DeFi June 2023 Updates: Ethereum Claims Larger Share in Volume</h2>
<p>The Market Vector Decentralized Finance Leaders Index fell 1% in June. The total value locked in DeFi protocols dropped 4%, with Curve and Convex recording slightly larger drops than other protocols with more than $1B TVL. MKR led DeFi tokens with a 30% end-of-month rally while UNI and AAVE each rose about 10%, YFI gained 2%, and CRV fell nearly 7% as shorts piled in mid-month to try and liquidate the founder&rsquo;s CRV position on Aave.</p>
<h3>June DeFi Protocol TVL &amp; Price Movement</h3>
<p><img class="img-responsive w-100" src="https://www.vaneck.com/contentassets/8fb2867c698348a494d1348fa1e36fe2/3404_scl-blog_chart-13_2023.07_blog.svg" alt="June DeFi Protocol TVL and Price Movement" /></p>
<p class="chart-disclosure">Source: Artemis.xyz as of 6/30/2023. Past performance is no guarantee of future results. Not intended as a recommendation to buy or sell any securities named herein.</p>
<p>Decentralized exchange volume fell slightly, but Ethereum&rsquo;s share rose about 6% in June, according to DeFiLlama. Arbitrum and BNB are the only chains other than Ethereum enabling over 10% of decentralized exchange volume (14.5% &amp; 16.5% in June). Next is Polygon with 5.5%. Solana, Arbitrum, and Polygon are the best chains to provide liquidity, supporting more volume relative to liquidity than other chains. But when controlling for liquidity, Arbitrum appears to be still the preferred chain to trade on, supporting about 1/3 of the weekly volume of Ethereum with only 1/6 the liquidity.</p>
<div class="wrapped-div">
<table style="width: 750px;">
<tbody>
<tr class="tbl-data">
<td class="tbl-header last" colspan="4">June Decentralized Exchange Efficiency by Chain</td>
</tr>
<tr class="tbl-data">
<td class="data-td  last">&nbsp;</td>
<td class="data-head last">Dex Volume (B)</td>
<td class="data-head last">Dex TVL (B)</td>
<td class="data-head last">Liquidity Efficiency</td>
</tr>
<tr class="tbl-data">
<td class="data-td last">Ethereum</td>
<td class="data-td data last">35.8</td>
<td class="data-td data last">8.6</td>
<td class="data-td data last">4.2</td>
</tr>
<tr class="tbl-data">
<td class="data-td last">Arbitrum</td>
<td class="data-td data last">11.5</td>
<td class="data-td data last">1.3</td>
<td class="data-td data last">8.8</td>
</tr>
<tr class="tbl-data">
<td class="data-td last">BNB</td>
<td class="data-td data last">10.1</td>
<td class="data-td data last">1.9</td>
<td class="data-td data last">5.4</td>
</tr>
<tr class="tbl-data">
<td class="data-td last">Polygon</td>
<td class="data-td data last">3.9</td>
<td class="data-td data last">0.5</td>
<td class="data-td data last">8.6</td>
</tr>
<tr class="tbl-data">
<td class="data-td last">Avalanche</td>
<td class="data-td data last">1.3</td>
<td class="data-td data last">0.3</td>
<td class="data-td data last">4.7</td>
</tr>
<tr class="tbl-data">
<td class="data-td last">Optimism</td>
<td class="data-td data last">1.2</td>
<td class="data-td data last">0.4</td>
<td class="data-td data last">3.4</td>
</tr>
<tr class="tbl-data">
<td class="data-td last">Solana</td>
<td class="data-td data last">1.06</td>
<td class="data-td data last">0.1</td>
<td class="data-td data last">10.6</td>
</tr>
</tbody>
</table>
</div>
<br />
<p class="chart-disclosure">Source: DefiLlama, VanEck research, as of 6/30/2023. Past performance is no guarantee of future results. Not intended as a recommendation to buy or sell any securities named herein. Dex Volume refers to the total decentralized exchange volume for the respective blockchain. Dex TVL refers to the Total Value Locked in decentralized exchanges. Liquidity Efficiency refers to Dex volume/Dex TVL.</p>
<p>Some notable Defi events in June included:</p>
<ul class="content-list">
<li>Uniswap Foundation released details regarding the functionality and vision of Uniswap V4. Specifically, the plans laid out a vision for programmable liquidity strategies via &ldquo;hooks&rdquo; and their new singleton contract, consolidating much of the repetitive code in deploying liquidity to standardize the ecosystem development that will undoubtedly occur on top of the Uniswap framework. This could lead to increased business lines for protocols that thrive on providing users with advanced yield strategies, such as Yearn and Beefy Finance. That being said, we expect that a plethora of new applications for this framework will be discovered as the top minds in smart contract development audit the code and brainstorm the products they can build from hooks.</li>
<li>Halfway through the month, Tether&rsquo;s USDT depegged by almost 50 bps as investors feared continued SEC enforcements could eventually lead to Tether or its largest users being criminally indicted. This fear led to the Curve 3pool USDT concentration rising above 70% as investors sold their USDT. However, it soon returned to normal as investors regained conviction and arbitraged the pool back to normal. The USDT concentration in the 3pool is 34% at the time of writing.</li>
</ul>
<p><strong>Important Governance Activity:</strong></p>
<p>Aave:</p>
<ul class="content-list">
<li>ARFC: GHO Mainnet Launch - receiving final feedback before an AIP can be voted on by the DAO</li>
<li>Temperature check on Integrating MakerDAO&rsquo;s DSR into Aave V3 Ethereum pool - results!</li>
</ul>
<p>Uniswap:</p>
<ul class="content-list">
<li>Temperature check to deploy V3 on Fantom and Filecoin&rsquo;s FVM - both passed.</li>
</ul>
<p>Yearn:</p>
<ul class="content-list">
<li>Activate veYFI rewards with oYFI gauges - in discussion.</li>
</ul>
<p>Synthetix:</p>
<ul class="content-list">
<li>Add stETH/USD to synthetic perps - passed.</li>
</ul>
<p><strong>Stablecoins</strong></p>
<p><strong>crvUSD</strong> supply grew 340% throughout the month, from $10M to $44M at the time of writing. Additionally, fees generated from crvUSD have surpassed $125k in just a month and a half since launch. The growth can mainly be attributed to the addition of <strong>wstETH, wBTC</strong>, and <strong>wETH</strong> debt markets and the incentivized crvUSD liquidity pools that essentially allow users to be paid to take out loans. For example, many users have deposited interest-bearing collateral such as <strong>sfrxETH</strong> or <strong>wstETH,</strong> which yield 4-5% APR intrinsically, borrow crvUSD at 7-8% and deposit it in Conic Finance&rsquo;s crvUSD omnipool to earn 13% from the compounded CRV emissions. Beyond incentivization, crvUSD also provides value to users through the soft liquidation method that reduces volatile asset exposure as price declines, and collateral is called and increases exposure as price moves retraces up.</p>
<p>With the final comments rolling in on <strong>Aave</strong>&rsquo;s proposed <strong>GHO</strong> launch, we expect an AIP to be proposed and passed in July, approving GHO&rsquo;s mainnet launch. Meanwhile, MakerDAO increased the DAI savings rate to 3.49% to provide <strong>DAI</strong> holders a higher risk-fee yield and the ability to hold yield-bearing DAI via the new ERC-4626 vault token, <strong>sDAI</strong>. The change prompted a reversal in DAI&rsquo;s market capitalization from its mid-month low of $4.59 billion to $4.69 billion at the time of writing. Borrows on Spark increased 50% to $15m, lagging behind the growth of crvUSD partially due to less incentivization and having only a $20m debt limit.</p>
<p><strong>Reserve protocol (RSP)</strong> initiated a $20 million acquisition of Curve assets, a process that will span the summer and serve as an incentive for liquidity in their tokens. The protocol facilitates the decentralized creation of asset-backed stablecoins known as "RTokens." By investing in Curve assets, the Reserve team demonstrates their confidence in the long-term significance of the Curve ecosystem within the decentralized finance (DeFi) landscape. The acquired SDT, CVX, and CRV will be locked and utilized to direct emissions toward their respective RTokens' pools. Noteworthy early investors in Reserve include Sam Altman and Peter Thiel.</p>
<p>As the end of the month neared, <strong>stablecoin TUSD</strong> lost its peg on Binance.US, falling briefly to $0.80, and grew to over 70% concentration in its Curve liquidity pool as investors feared TUSD&rsquo;s exposure to Prime Trust could make it insolvent. The reserve reports later stated a mere $26k of TUSD assets were impacted. Unlike USDT, however, the TUSD Curve pools still remain imbalanced, with the TUSD 3pool at 65% TUSD concentration at the time of writing, indicating investor fear still hasn't fully subsided.</p>
<p><strong>Metaverse, Gaming, &amp; Web3</strong></p>
<p>Investors had hoped for an upward trend in metaverse tokens during June due to the unveiling of Apple's latest headset, Apple Vision Pro. However, their expectations were left unfulfilled as numerous prominent metaverse tokens were classified as securities due to the SEC lawsuits targeting Coinbase and Binance within the same week. Consequently, the Market Vector Media and Entertainment Leaders Index (MVMELE) fell 22% in June, primarily driven by 4 out of 5 index components, accounting for 76% of the index's weight, being designated as unregistered securities in the SEC's latest enforcement actions (<strong>MANA, CHZ, SAND, &amp; AXS</strong>).</p>
<p><strong>APE </strong>was the sole token in MVMELE not designated an unregistered security in SEC lawsuits. However, in June, the Yuga Labs ecosystem encountered challenges when MachiBigBrother conducted a market dump of over $1 million worth of BAYC NFTs via Blur. Moreover, Machi initiated a defamation lawsuit against well-known on-chain investigator @zachxbt for an article published in June 2022, which garnered negative reactions within the crypto community. This incident underscores the concentrated ownership of even the largest NFT collections and their influence on market movements. Additionally, the APE token staking rewards, which commenced in December and were previously highlighted in an article, likely intensified selling pressure. APE fell 28% in June.</p>
<p>Unique active wallets interacting with the top Web3 games remained fairly stagnant in June, decreasing about 3%. Still, despite the overall lackluster activity, venture investors continue to fund projects at relatively high valuations, with <strong>Mythical Games</strong> successfully securing $37 million in funding through a Series C1 extension round. The funding was led by Scytale Digital, with participation from ARK Invest, Animoca Brands, MoonPay, and existing investors. This recent investment follows the company's previous $150 million Series C round in November 2021, led by Andreessen Horowitz, which valued Mythical Games as a "unicorn" at $1.25 billion. Since its launch, Mythos Chain has been steadily climbing the CryptoSlam NFT volume rankings and currently holds the 4th position in monthly NFT sales, with a total volume of $30 million. Due to the established user acquisition channels and strong investor conviction demonstrated in the recent investment round, the Mythos web3 gaming ecosystem could be web3&rsquo;s breakout gaming chain.</p>
<p>Meanwhile, as the crypto community continues to try to build decentralized social media alternatives to web 2.0 giants, one leading contender encountered a familiar obstacle in June: <strong>Damus</strong>, an emerging decentralized social media application built on Jack Dorsey's NOSTR protocol, faced the possibility of being removed from the Apple app store unless its BTC tipping functionality was eliminated. The inclusion of this tipping feature had raised concerns during Apple's App Store review process. Apple perceives these tips as in-app purchases for digital content, thereby requiring them to be processed exclusively through Apple's in-app purchase system. This action by Apple reflects their ongoing commitment to regulating user access unless they can obtain a share of economic activity through their in-app purchase system. This potential &ldquo;delisting&rdquo; from the app store illustrates the challenges web3 apps face in gaining adoption while further reinforcing the justification for social media apps to be built on decentralized networks in the first place.</p>
<h2 id="point-four" class="anchored-block">NFTs June 2023 Updates: Overall Decline in Volume</h2>
<p>In June, the aggregate volume of NFTs experienced a decline of approximately 4.5% to $706 million, as reported by CryptoSlam! Bitcoin Ordinals activity continuously declined throughout June, with volume dropping nearly 50% to $100 million. Despite reduced buying activity overall, Bitcoin remains the second-highest chain in terms of NFT volume over the past 30 days.</p>
<p>Within the Ethereum NFT market, Blur's market share in volume grew from 69% to 75%, while Blend maintained its dominant position in the NFT lending sector with over 90% market share. BLUR investors eagerly await August 14th, when they can vote on implementing a fee for the protocol's services, which will determine Blur's ability to sustain its dominance and generate revenue. Notably, Azuki and Bored Ape Yacht Club (BAYC) NFTs have accumulated significantly higher outstanding debts as collateral, with 6.4k ETH and 5.9k ETH outstanding, respectively.</p>
<h3>June NFT Volume</h3>
<p><img class="img-responsive w-100" src="https://www.vaneck.com/contentassets/8fb2867c698348a494d1348fa1e36fe2/3404_scl-blog_chart-14_2023.07_blog.svg" alt="June NFT Volume" /></p>
<p class="chart-disclosure">Source: CryptoSlam, as of 6/30/23. Past performance is no guarantee of future results. Not intended as a recommendation to buy or sell any securities named herein.</p>
<p>The Azuki Elementals NFT mint tripled the original Azuki supply, adding 20,000 NFTs to the existing 10,000. The collection drew criticism due to its disproportionately large supply and the lack of uniqueness in the revealed NFTs, leading many on crypto Twitter to view it as a dilutive mechanism. Consequently, the Azuki floor price plummeted by 50% following the reveal and has since stabilized around 8.5E, with Azuki Elementals trading well below their mint price of 2E at around 1.5E.</p>
<p><strong>Links to third party websites are provided as a convenience and the inclusion of such links does not imply any endorsement, approval, investigation, verification or monitoring by us of any content or information contained within or accessible from the linked sites. By clicking on the link to a non-VanEck webpage, you acknowledge that you are entering a third-party website subject to its own terms and conditions. VanEck disclaims responsibility for content, legality of access or suitability of the third-party websites.</strong></p>
<p>To receive more <strong><a href="https://www.vaneck.com/us/en/insights/digital-assets/" title="Digital Assets Insights">Digital Assets</a></strong> insights, <strong><a href="https://www.vaneck.com/us/en/subscribe/" title="Subscription Center">sign up in our subscription center</a></strong>.</p>
<style type="text/css">
    .wrapped-div {
        max-width: 100%;
    }

    @media (max-width: 1240px) {
        .wrapped-div {
            overflow-x: scroll;
        }
    }

    .wrapped-div-sector {
        max-width: 100%;
        overflow-x: scroll;
    }
</style>
]]></content:encoded>
</item><item rdf:about="https://www.vaneck.com/us/en/blogs/gold-investing/ounz-etf-question-and-answer/">
  <title>OUNZ ETF: Question and Answer></title>
  <link>https://www.vaneck.com/us/en/blogs/gold-investing/ounz-etf-question-and-answer/</link>
  <description><![CDATA[VanEck<sup>&reg;</sup>&nbsp;Merk<sup>&reg;</sup>&nbsp;Gold ETF allows investors to redeem their shares for physical gold. Learn more in this Q&amp;A.]]></description>
  <dc:creator> </dc:creator>
  <dc:date>07/06/2023 06:30:00</dc:date>
<content:encoded><![CDATA[

<p>For centuries, gold has served as a form of exchange, a safe haven investment (in times of financial market turmoil) as well as a hedge against severe&nbsp;inflation. As an investment, gold delivers the ability to enhance portfolio diversification, acts as store of value, and hedges against systemic risk. This blog intends to answer frequently asked questions about the <strong><a href="https://www.vaneck.com/us/en/investments/merk-gold-trust-etf-ounz/overview/" title="OUNZ - VanEck Merk Gold ETF  - Overview">VanEck Merk<sup>&reg;</sup>&nbsp;Gold ETF (OUNZ)</a></strong>, which allows investors to redeem their shares for physical gold.</p>
<ul class="content-list">
<li><a href="#point-one"><strong>What is the VanEck Merk Gold ETF (OUNZ)?</strong></a></li>
<li><a href="#point-two"><strong>Who is Merk Investments LLC?</strong></a></li>
<li><a href="#point-three"><strong>When I own OUNZ, do I own gold?</strong></a></li>
<li><a href="#point-four"><strong>What type of gold does OUNZ hold?</strong></a></li>
<li><a href="#point-five"><strong>Can I take delivery of the gold I own through the OUNZ?</strong></a></li>
<li><a href="#point-six"><strong>What type of gold can I receive?</strong></a></li>
<li><a href="#point-seven"><strong>Where and how can I have my gold delivered?</strong></a></li>
<li><a href="#point-eight"><strong>When will I receive my gold?</strong></a></li>
<li><a href="#point-nine"><strong>What is the Exchange Fee?</strong></a></li>
<li><a href="#point-ten"><strong>Is there a Delivery Fee?</strong></a></li>
<li><a href="#point-eleven"><strong>What is the Processing Fee?</strong></a></li>
<li><a href="#point-twelve"><strong>How can investors buy VanEck ETFs?</strong></a></li>
</ul>
<h2 id="point-one" class="anchored-block">What is the VanEck Merk Gold ETF (OUNZ)?</h2>
<p><strong><a href="https://www.vaneck.com/us/en/investments/merk-gold-trust-etf-ounz/overview/" title="OUNZ - VanEck Merk Gold ETF  - Overview">OUNZ</a></strong>&nbsp;seeks to provide investors with a convenient and cost-efficient way to buy and hold gold through an exchange traded product with the option to take physical delivery of gold. For the purpose of facilitating delivery, Merk Investments LLC has developed a proprietary process for the conversion of London Bars into gold coins and bars in denominations investors may desire. Another benefit of this approach is that taking delivery of gold is not a taxable event as investors merely take possession of what they already own: the gold.</p>
<h2 id="point-two" class="anchored-block">Who is Merk Investments LLC?</h2>
<p>Merk Investments LLC is the sponsor of <strong><a href="https://www.vaneck.com/us/en/investments/merk-gold-trust-etf-ounz/overview/" title="OUNZ - VanEck Merk Gold ETF  - Overview">OUNZ</a></strong>&nbsp;and arranged for the creation of the Trust and listing of shares of the Trust on the NYSE Arca. Merk interacts with the Trust&rsquo;s service providers and will also facilitate the review of Delivery Applications and the delivery of physical gold to Delivery Applicants.</p>
<h2 id="point-three" class="anchored-block">When I own OUNZ, do I own gold?</h2>
<p>Yes. Each investor owns a pro-rata share of <strong><a href="https://www.vaneck.com/us/en/investments/merk-gold-trust-etf-ounz/overview/" title="OUNZ - VanEck Merk Gold ETF  - Overview">OUNZ</a></strong>, and as such holds pro-rata ownership of the Trust's gold holdings, corresponding to the number of shares held.</p>
<div class="epi-contentfragment">ready-to-invest-banner</div>
<h2 id="point-four" class="anchored-block">What type of gold does OUNZ hold?</h2>
<p><strong><a href="https://www.vaneck.com/us/en/investments/merk-gold-trust-etf-ounz/overview/" title="OUNZ - VanEck Merk Gold ETF  - Overview">OUNZ</a></strong>&nbsp;holds London Bars. The Trust holds its London Bars in allocated form with the Custodian. The physical gold is held in a segregated fashion in the name of the Trust, and is never commingled with other depositor funds or assets. The Trust has full title to the gold with the Custodian holding it on the Trust&rsquo;s behalf. Each investor owns a pro-rata share of the Trust, and as such holds pro-rata ownership of the Trust assets, corresponding to the number of shares held. Trust holdings are identified in a weight list of bars published on the Trust&rsquo;s website showing the unique bar number, gross weight, the assay or fineness of each bar and its fine weight. Credits or debits to the holding will be affected by physical movements of bars to or from the Trust&rsquo;s physical holding. The Trust&rsquo;s gold holdings are subject to periodic audits.</p>
<p>The Trust may further hold up to a maximum of 430 ounces of unallocated gold.</p>
<p>To facilitate the ability to exchange shares into physical gold for delivery, Merk may convert the Trust&rsquo;s gold into gold of different specifications. All gold obtained by the Trust must be without numismatic value and have a minimum fineness (or purity) of 995 parts per 1,000 (99.5%). The only exception is that the Trust may also obtain American Gold Eagle Coins (with a minimum fineness of 91.67%) solely for delivery to a Delivery Applicant. While Delivery Applicants may always request London Bars, market conditions may cause Merk to limit other types of physical gold made available for delivery.</p>
<h2 id="point-five" class="anchored-block">Can I take delivery of the gold I own through the OUNZ?</h2>
<p>Yes, investors have the option to take delivery of physical gold in exchange for their shares.</p>
<h2 id="point-six" class="anchored-block">What type of gold can I receive?</h2>
<p>Investors may take delivery of the London Bars the Trust holds, and may also take delivery of 1-ounce coins and bars, as well as 10-ounce bars, such as:</p>
<div class="wrapped-div">
<table style="width: 500px;">
<tbody>
<tr class="tbl-data">
<td class="tbl-header last">Type</td>
<td class="tbl-header last" style="text-align: center;">Purity</td>
</tr>
<tr class="tbl-data">
<td class="data-td data last" style="text-align: left;">1 oz American Gold Eagle coins</td>
<td class="data-td data last">91.67%</td>
</tr>
<tr class="tbl-data">
<td class="data-td data last" style="text-align: left;">1 oz American Gold Buffalo coins</td>
<td class="data-td data last">99.99%</td>
</tr>
<tr class="tbl-data">
<td class="data-td data last" style="text-align: left;">1 oz Australian Gold Kangaroo coins</td>
<td class="data-td data last">99.99%</td>
</tr>
<tr class="tbl-data">
<td class="data-td data last" style="text-align: left;">1 oz Canadian Gold Maple Leaf coins</td>
<td class="data-td data last">99.99%</td>
</tr>
<tr class="tbl-data">
<td class="data-td data last" style="text-align: left;">1 oz or 10 oz Australian bars</td>
<td class="data-td data last">99.99%</td>
</tr>
</tbody>
</table>
</div>
<br />
<p>The latest coin and bar availability can be found <strong><a href="https://www.merkgold.com/fees.html" title="VanEck Merk Gold Trust (OUNZ) - Fees" target="_blank" rel="noopener">here</a></strong>.</p>
<h2 id="point-seven" class="anchored-block">Where and how can I have my gold delivered?</h2>
<p>The Trust will ship physical gold fully insured to a Delivery Applicant by a conventional shipping carrier, such as the U.S. Postal Service, Federal Express, United Parcel Service or armored transportation service.</p>
<p>Delivery Applicants should be aware that the gold delivered is likely to represent a substantial U.S. dollar value:</p>
<ul class="content-list">
<li>Shipments may be broken down into multiple smaller amounts and possibly shipped on different days to meet the insurance requirements of the shipping carrier. A Delivery Applicant can utilize a shipping carrier only if insurance and delivery destination requirements can be met. A conventional shipping carrier may deliver gold to residential addresses.</li>
<li>Armored Transportation Service will only deliver to certain trusted locations, and please note that an Armored Transportation Service does not deliver to residential addresses. A Delivery Applicant can utilize an armored truck service only if the Delivery Applicant and the Armored Transportation Service agree on an acceptable delivery destination. London Bars will only be transported using Armored Transportation Service.</li>
</ul>
<p>Delivery Applicants should contact Merk Investments LLC to discuss delivery method and location.</p>
<p>A Delivery Application may be declined if no delivery method and location is agreed upon.</p>
<h2 id="point-eight" class="anchored-block">When will I receive my gold?</h2>
<p>For coins and bars other than London Bars, Delivery Applications can be processed fastest when investors have their gold delivered to the address stated on their brokerage account. This way, gold coins and bars may be delivered with UPS next-day delivery service to your home address (this does not include London Bars). For example:</p>
<ul class="content-list">
<li>After shares are accepted by the Trustee, Merk will be notified of the successful share submission later that business day. Typically the next day, Merk will engage in an over the counter transaction with the precious metals dealer to facilitate an exchange of the Trust's gold into coins and bars specified in the Delivery Application. The completion of this exchange typically takes 2 business days. This means gold coins and bars (other than London Bars) might be handed over to UPS for next day delivery on the third business day after a share submission, allowing the Delivery Applicant to receive their gold on the fourth business day after share submission.</li>
<li>Note that this timeline may be faster or slower, in part due to the availability of the Delivery Applicant to receive packages.</li>
</ul>
<p>Investors requesting London Bars need to be aware that London Bars are only delivered with an Armored Transportation Service that does not deliver to residential addresses. Armored Transportation Services only deliver to trusted addresses. Delivery Applications can be processed faster when the Delivery Address is a familiar address, such as a precious metals depository. For new destinations, a security survey first has to be conducted to ensure the safety of the crew and vehicle. The legwork to agree on a suitable delivery location takes place before Merk pre-approves a Delivery Application. A Delivery Application may be declined if no delivery method and location is agreed upon.</p>
<h2 id="point-nine" class="anchored-block">What is the Exchange Fee?</h2>
<p>The Exchange Fee covers the cost of exchanging <strong><a href="https://www.vaneck.com/us/en/investments/merk-gold-trust-etf-ounz/overview/" title="OUNZ - VanEck Merk Gold ETF  - Overview">OUNZ</a></strong>&nbsp;shares into gold bars in the form of London Bars, which the Trust holds in the vault. The Exchange Fee also covers the cost of converting London Bars into the gold coins or smaller gold bars that investors may prefer for delivery. The Exchange Fee for gold coins and bars, outside of London Bars, reflects the premium such coins and bars are trading at relative to the spot price of gold.</p>
<p>All fees are subject to change upon notice; we may waive or reduce the Exchange Fees from time to time.</p>
<h2 id="point-ten" class="anchored-block">Is there a Delivery Fee?</h2>
<p>No Delivery Fee is charged for the delivery of physical gold to destinations in the lower 48 States.</p>
<p>There may be a Delivery Fee to Alaska and Hawaii as well as to countries outside of the U.S. This fee covers the cost of preparing and transporting physical gold from the Custodian or the precious metals dealer to the location specified by a Delivery Applicant in its Delivery Application.</p>
<h2 id="point-eleven" class="anchored-block">What is the Processing Fee?</h2>
<p>The Processing Fee consists of the Exchange Fee and the Delivery Fee (if applicable). The Processing Fees must be wired by the Delivery Applicant at the time the Delivery Application is submitted; the fee is fully reimbursable until the Delivery Applicant submits his or her shares to the Trustee.</p>
<h2 id="point-twelve" class="anchored-block">How can investors buy VanEck ETFs?</h2>
<p><a href="/link/7870ff5f9864408f86a28549f1b2dfbb.aspx#how-to-buy-etf&amp;utm=OUNZ-Blog" title="How to buy VanEck ETFs?"><strong>Learn more here.</strong></a></p>
<p class="d-none d-lg-block"><a href="mailto:askvaneck@vaneck.com" title="Have More Questions? - Ask VanEck" rel="noopener"><img loading="lazy" class="img-responsive" src="https://www.vaneck.com/globalassets/home/us/insights/blogs/bm-blog-images/cta-faq_desktop-02.svg" alt="Have More Questions? - Ask VanEck" /></a></p>
<p class="d-lg-none"><a href="mailto:askvaneck@vaneck.com" title="Have More Questions? - Ask VanEck" rel="noopener"><img loading="lazy" class="img-responsive" src="https://www.vaneck.com/globalassets/home/us/insights/blogs/bm-blog-images/cta-faq_mobile-01.svg" alt="Have More Questions? - Ask VanEck" /></a></p>
<p>To receive more insights to <strong><a href="https://www.vaneck.com/us/en/insights/gold-investing/" title="Gold Investing Insights">Gold Investing</a></strong> insights, <strong><a href="https://www.vaneck.com/us/en/subscribe/" title="Subscription Center">sign up in our subscription center</a></strong>.</p>

]]></content:encoded>
</item><item rdf:about="https://www.vaneck.com/us/en/blogs/moat-investing/moat-delivers-quality-with-a-forward-looking-edge/">
  <title>MOAT Delivers Quality with a Forward-Looking Edge></title>
  <link>https://www.vaneck.com/us/en/blogs/moat-investing/moat-delivers-quality-with-a-forward-looking-edge/</link>
  <description><![CDATA[Want quality exposure? Explore how the Morningstar Wide Moat Focus Index combines quality, valuations and a forward-looking perspective to historically outperform quality and factor indexes.]]></description>
  <dc:creator>Brandon Rakszawski</dc:creator>
  <dc:date>06/29/2023 06:30:00</dc:date>
<content:encoded><![CDATA[

<p>This year, investors have poured over $14B into U.S. equity ETFs that target exposure to the quality factor, according to Morningstar. Much of that investment coincided with the weeks following the failure of Silicon Valley Bank, but notable inflows continued in April and May. As uncertainty abounds, investors appear to be seeking well-positioned companies that can withstand market turmoil.</p>

<p>This is not that surprising. The S&amp;P 500 Index is notably difficult for U.S. large-cap active managers to outperform in both strong and weak markets. Therefore, logically, investors may look to index-based strategies targeting specific factors that may provide a desired return profile in the current environment. A similar thought process led low volatility strategies to become very popular in the years following the 2008 Global Financial Crisis, and more recently drew investors to value-oriented strategies as those companies finally proved attractive relative to growth companies for the first time in many years.</p>
<p>But are investors getting what they want from quality equity ETFs? More to the point, what is it that investors are actually looking for from these strategies?</p>
<h2>What Is Quality?</h2>
<p>Measuring the quality of a company from an equity investor perspective can be nuanced. Most academics and practitioners agree that quality is the least agreed-upon factor. Generally, however, several characteristics are commonly associated with quality:</p>
<ol class="content-list">
<li>High and/or Stable Profitability: Profitable companies are typically considered to have well-run business models and control of their costs. Common measures of profitability are return on equity, cash flow returns on investment or free cash flow yield.</li>
<li>Profitability Growth: Better yet, companies that are increasing their profitability can signal improving demand, economies of scale or lack of suitable competition. Earnings per share growth is often the go-to metric for measuring profit growth.</li>
<li>Low Leverage: Companies with lower debt burdens may correlate with stronger balance sheets and lower macroeconomic risks. Debt to capital is a common measure of leverage.</li>
</ol>
<h2>What Is a Quality Outcome?</h2>
<p>From an outcome perspective, these quality characteristics would be expected to facilitate upside participation when markets are appreciating, as well as to help mitigate losses when markets enter a rough patch. That hasn&rsquo;t always been the case, as seen in recent periods of market turmoil. In 2022, when many investors were seeking quality company exposure, many were left with more downside and lower overall returns. Similarly, in late 2018 as geopolitical turmoil pushed markets negative, so-called quality companies underperformed.</p>
<div class="wrapped-div">
<table style="width: 750px;">
<tbody>
<tr class="tbl-data">
<td class="tbl-header last" colspan="5">Quality Downside Risk Mitigation Notably Lacking</td>
</tr>
<tr class="tbl-data">
<td class="data-head last">&nbsp;</td>
<td class="data-head last" colspan="2">2022</td>
<td class="data-head last" colspan="2">2018</td>
</tr>
<tr class="tbl-data">
<td class="data-td last">&nbsp;</td>
<td class="data-td data last">Total Return</td>
<td class="data-td data last">Max Drawdown</td>
<td class="data-td data last">Total Return</td>
<td class="data-td data last">Max Drawdown</td>
</tr>
<tr class="tbl-data">
<td class="data-td last">MSCI USA Sector Neutral Quality Index</td>
<td class="data-td data last">-20.28%</td>
<td class="data-td data last">-27.78%</td>
<td class="data-td data last">-5.64%</td>
<td class="data-td data last">-20.51%</td>
</tr>
<tr class="tbl-data">
<td class="data-td last">S&amp;P 500 Index</td>
<td class="data-td data last">-18.11%</td>
<td class="data-td data last">-24.49%</td>
<td class="data-td data last">-4.38%</td>
<td class="data-td data last">-19.36%</td>
</tr>
<tr class="tbl-data">
<td class="data-td last">Difference</td>
<td class="data-td data last">-2.17%</td>
<td class="data-td data last">-3.29%</td>
<td class="data-td data last">-1.25%</td>
<td class="data-td data last">-1.14%</td>
</tr>
</tbody>
</table>
</div>
<br />
<p class="chart-disclosure"><strong>Source: Morningstar</strong>. Max drawdown represents the largest decline within the stated time period. Past performance is no guarantee of future results.</p>
<p>Similarly, quality stocks have been inconsistent in rising markets. Their strong financial health and profitability profile hasn&rsquo;t always benefited investors relative to the S&amp;P 500 Index. The MSCI USA Sector Neutral Quality Index has an upside capture ratio of less than 100, indicating that it participated less in periods when S&amp;P 500 returns were positive.</p>
<p>This means that many investors seeking quality companies via factor indexes may not experience the protection they desire and also may potentially miss out on market recoveries. Factor investing can be a powerful tool, but it is constructed through a backward-looking lens and factors can be extremely difficult to time.</p>
<h2>Forward Looking Approach to Quality Investing</h2>
<p>I would argue Morningstar&rsquo;s <strong><a href="https://www.vaneck.com/us/en/blogs/moat-investing/moat-investing-powered-by-morningstar/" title="Ditch Style Biases. Choose Stock Selection">moat investing philosophy</a></strong> represents a more practical approach to identifying high quality companies. Their economic moat framework considers quantitative inputs&mdash;such as returns on invested capital and costs of capital&mdash;to determine the staying power of a company&rsquo;s competitive advantages, but it also relies heavily on forward-looking qualitative assessments by analysts. Morningstar&rsquo;s equity research team can reflect, in real time, their view on which companies possess the most sustainable advantage&mdash;those with true staying power. Their moat framework looks out decades into the future to make that determination. Conversely, factor-based strategies will use historical inputs from a company&rsquo;s balance sheet and income statement to assemble a portfolio. Morningstar has created the Morningstar Wide Moat Focus Index to capture those companies that are high quality today and expected to remain high quality many years into the future.</p>
<p>Equally important to the Morningstar Wide Moat Focus Index&rsquo;s success is getting valuations right. Remember, factors are very difficult to time. A single factor ETF may perform very well in certain environments, but not others. The same can be said about wide moat companies. The Morningstar Wide Moat Focus Index uses Morningstar&rsquo;s forward-looking valuation process to determine what moat-rated companies to own each quarter. The Index selects the most attractively priced relative to Morningstar analysts&rsquo; fair value estimate for the company. This focus on paying a fair price for exposure to high quality companies has allowed the Index to provide risk mitigation in difficult markets and exploit mispricing in order to participate in the upside.</p>
<h3>Moat Investing: Quality Outcomes in Drawdowns and Recoveries</h3>
<p><strong><img class="img-responsive w-100" src="https://www.vaneck.com/contentassets/de813afda0e043f3a1c84caa13a1fa53/3380_moat_chart_02_2023.06_v1_blog.svg" alt="Moat Investing: Quality Outcomes in Drawdowns and Recoveries" /></strong></p>
<p class="chart-disclosure"><strong>Source: Morningstar</strong>. Max drawdown represents the largest decline within the stated time period. Past performance is no guarantee of future results.</p>
<p>Looking at more than 15 years of data, the Morningstar Wide Moat Focus Index has offered the long-term high-quality outcomes expected by investors seeking out financially strong businesses. Its use of valuations to select among high quality companies with moats has resulted in impressive risk-adjusted returns, while offering both higher participation on the upside and buffering on the downside.</p>
<div class="wrapped-div">
<table style="width: 960px;">
<tbody>
<tr class="tbl-data">
<td class="tbl-header last" colspan="7">High-Quality Risk/Reward Profile (4/2007 &ndash; 3/31/2023)</td>
</tr>
<tr class="tbl-data">
<td class="data-head last">&nbsp;</td>
<td class="data-head last">Return</td>
<td class="data-head last">Standard Deviation</td>
<td class="data-head last">Sharpe Ratio</td>
<td class="data-head last">Sortino Ratio</td>
<td class="data-head last">Up Capture</td>
<td class="data-head last">Down Capture</td>
</tr>
<tr class="tbl-data">
<td class="data-td last">Morningstar Wide Moat Focus Index</td>
<td class="data-td data last">12.59</td>
<td class="data-td data last">18.77</td>
<td class="data-td data last">0.68</td>
<td class="data-td data last">1.16</td>
<td class="data-td data last">109.29</td>
<td class="data-td data last">85.70</td>
</tr>
<tr class="tbl-data">
<td class="data-td last">MSCI USA Sector Neutral Quality Index</td>
<td class="data-td data last">9.83</td>
<td class="data-td data last">16.55</td>
<td class="data-td data last">0.60</td>
<td class="data-td data last">0.93</td>
<td class="data-td data last">98.73</td>
<td class="data-td data last">91.03</td>
</tr>
<tr class="tbl-data">
<td class="data-td last">S&amp;P 500 Index</td>
<td class="data-td data last">9.04</td>
<td class="data-td data last">17.27</td>
<td class="data-td data last">0.54</td>
<td class="data-td data last">0.81</td>
<td class="data-td data last">100.00</td>
</tr>
</tbody>
</table>
</div>
<br />
<p class="chart-disclosure"><strong>Source: Morningstar</strong>. Data calculated with quarterly returns. Past performance is no guarantee of future results.</p>
<h2>Morningstar&rsquo;s Moat Investing Outperforms Factors</h2>
<p>Quality is certainly not the only single factor investment strategy out there. Many others have been identified in an academic setting and further developed into commercial applications by way of indexing. Again, timing these factors is very difficult. Morningstar&rsquo;s systematic process of identifying high quality companies at attractive prices has allowed it to outperform the major style factors over many time periods, short-term and long.</p>
<h3>Moat Investing Outpaces Factors Over Many Time Periods</h3>
<p><strong><img class="img-responsive w-100" src="https://www.vaneck.com/contentassets/de813afda0e043f3a1c84caa13a1fa53/3380_moat_chart_01_2023.06_v1_blog.svg" alt="Moat Investing Outpaces Factors Over Many Time Periods" /></strong></p>
<p class="chart-disclosure"><strong>Source: Morningstar. Data as of 6/20/2023</strong>. Minimum Volatility represents the MSCI USA Minimum Volatility Index; Momentum represents the MSCI USA Momentum SR Variant Index; Quality represents the MSCI USA Sector Neutral Quality Index; Size represents the MSCI USA Low Size Index; Value represents the MSCI USA Enhanced Value Index. Past performance is no guarantee of future results.</p>
<h2>Moat Investing: A Better Approach to Quality</h2>
<p>The turbulence of the last year has led to a discernible emphasis on quality as a beacon in uncertain markets. The effectiveness of these strategies, however, is up for debate. While traditional quality factor strategies offer some allure, they have often underperformed in the face of market stress and recovery due to their retrospective nature.</p>
<p>A potentially more viable alternative is Morningstar&rsquo;s moat investing philosophy which, by incorporating both quantitative and qualitative forward-looking evaluations, redefines the approach to quality investing. The Morningstar Wide Moat Focus Index stands out in this realm, delivering impressive risk-adjusted returns by centering on attractively priced, high-quality companies. Consequently, investors seeking an effective blend of market protection and performance may find this strategy an optimal tool for their investing toolkit. (For more on how this approach has performed vs. the S&amp;P 500 over the past decade, read: <strong><a href="https://www.vaneck.com/us/en/blogs/moat-investing/decade-of-dominance-the-etf-that-quietly-beats-the-s-and-p-500/" title="Decade of Dominance: The ETF that Quietly Beats the S and P 500">Decade of Dominance: The ETF that Quietly Beats the S&amp;P 500</a></strong>.)</p>
<p>Investors can access Morningstar&rsquo;s moat investing strategy through the <strong><a href="https://www.vaneck.com/us/en/investments/morningstar-wide-moat-etf-moat/overview/" title="MOAT - VanEck Morningstar Wide Moat ETF - Overview">VanEck Morningstar Wide Moat ETF (MOAT)</a></strong>. MOAT seeks to replicate as closely as possible, before fees and expenses the price and yield performance of the Morningstar Wide Moat Focus Index.</p>
<p>To receive more <a href="https://www.vaneck.com/us/en/insights/moat-investing/" title="Moat Investing Insights"><strong>Moat Investing</strong></a> insights, <a href="https://www.vaneck.com/us/en/subscribe/" title=" Subscription Center"><strong>sign up in our subscription center</strong></a>.</p>
<style type="text/css">
    .wrapped-div {
        max-width: 100%;
    }

    @media (max-width: 1240px) {
        .wrapped-div {
            overflow-x: scroll;
        }
    }

    .wrapped-div-sector {
        max-width: 100%;
        overflow-x: scroll;
    }
</style>
]]></content:encoded>
</item><item rdf:about="https://www.vaneck.com/us/en/blogs/thematic-investing/buzz-investing-ai-stocks-are-saving-the-market/">
  <title>BUZZ Investing: AI Stocks are Saving the Market></title>
  <link>https://www.vaneck.com/us/en/blogs/thematic-investing/buzz-investing-ai-stocks-are-saving-the-market/</link>
  <description><![CDATA[With the utility of AI no longer up for debate, semiconductor chip companies emerge as the early beneficiaries of the ongoing &lsquo;AI revolution.&rsquo;]]></description>
  <dc:creator> </dc:creator>
  <dc:date>06/28/2023 06:30:00</dc:date>
<content:encoded><![CDATA[

<p>Technology-oriented equities gained during the recent period between Index selection dates (May 11, 2023 - June 8, 2023, the &ldquo;Period&rdquo;), driven by growth prospects fueled by optimistic expectations related to the ongoing &lsquo;AI revolution.&rsquo; The narrative gained momentum after Nvidia Corp (NASD: NVDA) reported Q1 results that easily surpassed most analyst estimates, propelling the stock to new highs and making it the ninth company, and the first chipmaker, to achieve a valuation exceeding $1 trillion. Positively shifting investor sentiments overshadowed concerns about a potential US default as debt ceiling negotiations escalated between Democratic President Joe Biden and Republican House Speaker Kevin McCarthy, who together announced the framework for a resolution just before the June 5th deadline for a deal.</p>
<p>The BUZZ NextGen AI US Sentiment Leaders Index (the &ldquo;BUZZ Index&rdquo; or &ldquo;Index&rdquo;) returned 7.36% during the month of May compared to a return of 0.43% for the S&amp;P 500 Index during the same period. Year-to-date, the BUZZ Index leads the S&amp;P 500 with returns of 26.80% and 9.65%, respectively, as of the end of May.</p>
<h2>Shares of Palantir Technologies Inc. Pace Advancing Stocks within the BUZZ Index</h2>
<p>Technology-oriented shares that focus on Artificial Intelligence applications paced advancing stocks within the BUZZ Index during the recent Period. Seven of the ten top contributors to performance came from stocks that carried a full 3% maximum weight following the most recent May 2023 BUZZ Index rebalance and reconstitution, including <strong>Palantir Technologies Inc (NYSE: PLTR)</strong>, <strong>NVIDIA Corp (NASD: NVDA)</strong>, <strong>Tesla Inc (NASD: TSLA)</strong>, <strong>Advanced Micro Devices Inc (NASD: AMD)</strong>, <strong>Netflix Inc (NASD: NFLX)</strong>, <strong>Meta Platforms Inc (NASD: META)</strong>, and <strong>Amazon.com Inc (NASD: AMZN)</strong>. PLTR's shares demonstrated an impressive surge of 53.7% during the Period, reflecting growing investor confidence in the company's leading position within the generative AI sector. Some market observers noted that PLTR is uniquely positioned to capitalize on its strong relationships with both government agencies, which account for 56% of its revenue, and commercial customers, which contribute the remaining 44%. Notably, PLTR's recently introduced Artificial Intelligence Platform (AIP) empowers customers to harness the power of large language models (LLMs) on their proprietary data, seamlessly delivered through an interactive chatbot interface to enhance their user experience.</p>
<div class="wrapped-div">
<table style="width: 750px;">
<tbody>
<tr class="tbl-data">
<td class="tbl-header last" colspan="4">Top BUZZ Index Contributors: May 11, 2023 &ndash; June 8, 2023</td>
</tr>
<tr class="tbl-data">
<td class="data-td  last">Company</td>
<td class="data-head last">Ticker</td>
<td class="data-head last">Average Weight (%)</td>
<td class="data-head last">Return Contribution (%)</td>
</tr>
<tr class="tbl-data">
<td class="data-td last font-weight-normal">Palantir Technologies Inc</td>
<td class="data-td data last">PLTR</td>
<td class="data-td data last">3.54</td>
<td class="data-td data last">1.53</td>
</tr>
<tr class="tbl-data">
<td class="data-td last font-weight-normal">NVIDIA Corp</td>
<td class="data-td data last">NVDA</td>
<td class="data-td data last">3.53</td>
<td class="data-td data last">1.10</td>
</tr>
<tr class="tbl-data">
<td class="data-td last font-weight-normal">Tesla Inc</td>
<td class="data-td data last">TSLA</td>
<td class="data-td data last">3.14</td>
<td class="data-td data last">1.07</td>
</tr>
<tr class="tbl-data">
<td class="data-td last font-weight-normal">Advanced Micro Devices Inc</td>
<td class="data-td data last">AMD</td>
<td class="data-td data last">3.37</td>
<td class="data-td data last">0.79</td>
</tr>
<tr class="tbl-data">
<td class="data-td last font-weight-normal">Netflix Inc</td>
<td class="data-td data last">NFLX</td>
<td class="data-td data last">2.75</td>
<td class="data-td data last">0.45</td>
</tr>
<tr class="tbl-data">
<td class="data-td last font-weight-normal">Charles Schwab Corp/The</td>
<td class="data-td data last">SCHW</td>
<td class="data-td data last">2.76</td>
<td class="data-td data last">0.42</td>
</tr>
<tr class="tbl-data">
<td class="data-td last font-weight-normal">Meta Platforms Inc</td>
<td class="data-td data last">META</td>
<td class="data-td data last">3.16</td>
<td class="data-td data last">0.39</td>
</tr>
<tr class="tbl-data">
<td class="data-td last font-weight-normal">Amazon.com Inc</td>
<td class="data-td data last">AMZN</td>
<td class="data-td data last">3.11</td>
<td class="data-td data last">0.34</td>
</tr>
<tr class="tbl-data">
<td class="data-td last font-weight-normal">Enphase Energy Inc</td>
<td class="data-td data last">ENPH</td>
<td class="data-td data last">2.39</td>
<td class="data-td data last">0.33</td>
</tr>
<tr class="tbl-data">
<td class="data-td last font-weight-normal">Carnival Corp</td>
<td class="data-td data last">CCL</td>
<td class="data-td data last">1.21</td>
<td class="data-td data last">0.31</td>
</tr>
</tbody>
</table>
</div>
<br />
<p class="chart-disclosure">Source: BUZZ Holdings ULC, Bloomberg. Past performance is no guarantee of future results. Index performance is not illustrative of fund performance. Not intended as a recommendation to buy or to sell any of the securities mentioned herein.</p>
<p>The top detractors to performance were led by <strong>Lucid Group Inc (NASD LCID),</strong> whose shares fell 11% during the Period. The maker of luxury electric vehicles announced plans for a public stock offering and a separate private placement to raise about $3.0 billion in gross proceeds. Shares of LCID were down over 8% on a year-to-date basis as of the selection date for the June BUZZ Index rebalance and reconstitution, a stark contrast to rival TSLA, whose shares have gained over 90% during the same period.</p>
<div class="wrapped-div">
<table style="width: 750px;">
<tbody>
<tr class="tbl-data">
<td class="tbl-header last" colspan="4">Bottom BUZZ Index Contributors: May 11, 2023 &ndash; June 8, 2023</td>
</tr>
<tr class="tbl-data">
<td class="data-td  last">Company</td>
<td class="data-head last">Ticker</td>
<td class="data-head last">Average Weight (%)</td>
<td class="data-head last">Return Contribution (%)</td>
</tr>
<tr class="tbl-data">
<td class="data-td last font-weight-normal">Lucid Group Inc</td>
<td class="data-td data last">LCID</td>
<td class="data-td data last">2.69</td>
<td class="data-td data last">-0.34</td>
</tr>
<tr class="tbl-data">
<td class="data-td last font-weight-normal">Agilent Technologies Inc</td>
<td class="data-td data last">A</td>
<td class="data-td data last">1.75</td>
<td class="data-td data last">-0.29</td>
</tr>
<tr class="tbl-data">
<td class="data-td last font-weight-normal">Coinbase Global Inc</td>
<td class="data-td data last">COIN</td>
<td class="data-td data last">2.73</td>
<td class="data-td data last">-0.26</td>
</tr>
<tr class="tbl-data">
<td class="data-td last font-weight-normal">Shopify Inc</td>
<td class="data-td data last">SHOP</td>
<td class="data-td data last">1.51</td>
<td class="data-td data last">-0.09</td>
</tr>
<tr class="tbl-data">
<td class="data-td last font-weight-normal">AT&amp;T Inc</td>
<td class="data-td data last">T</td>
<td class="data-td data last">0.77</td>
<td class="data-td data last">-0.05</td>
</tr>
<tr class="tbl-data">
<td class="data-td last font-weight-normal">SoFi Technologies Inc</td>
<td class="data-td data last">SOFI</td>
<td class="data-td data last">0.64</td>
<td class="data-td data last">-0.04</td>
</tr>
<tr class="tbl-data">
<td class="data-td last font-weight-normal">Verizon Communications Inc</td>
<td class="data-td data last">VZ</td>
<td class="data-td data last">0.45</td>
<td class="data-td data last">-0.04</td>
</tr>
<tr class="tbl-data">
<td class="data-td last font-weight-normal">First Solar Inc</td>
<td class="data-td data last">FSLR</td>
<td class="data-td data last">0.33</td>
<td class="data-td data last">-0.03</td>
</tr>
<tr class="tbl-data">
<td class="data-td last font-weight-normal">Starbucks Corp</td>
<td class="data-td data last">SBUX</td>
<td class="data-td data last">0.55</td>
<td class="data-td data last">-0.03</td>
</tr>
<tr class="tbl-data">
<td class="data-td last font-weight-normal">Visa Inc</td>
<td class="data-td data last">V</td>
<td class="data-td data last">0.67</td>
<td class="data-td data last">-0.03</td>
</tr>
</tbody>
</table>
</div>
<br />
<p class="chart-disclosure">Source: BUZZ Holdings ULC, Bloomberg. Past performance is no guarantee of future results. Index performance is not illustrative of fund performance. Not intended as a recommendation to buy or to sell any of the securities mentioned herein.</p>
<h2>Sentiment Stock Highlight &ndash; Target Corp</h2>
<p><strong>Target Corp (NYSE: TGT)</strong> has been at the center of a socio-political controversy in recent weeks, with a clash between left and right-wing ideologies on full display. The retailer, a long-time celebrater of Pride month, rolled out its collection of Pride-themed merchandise across its stores in the US earlier in May. This year's rollout was met with strong opposition, particularly in areas that lean right-wing conservative, with incidents of employees feeling threatened by customer complaints. In response, Target pulled certain products and relocated others to stores' backs, prompting backlash from left-wing advocate groups. The stock has been punished amid the controversy, declining more than 20% over the past month. On the other hand, sentiment on the stock has jumped significantly as investors appear to be looking past the publicity generated from the incident with a view that the stock may recover once the controversy subsides. This month, TGT re-enters the BUZZ Index with a maximum of 3% weight.</p>
<h3>Target Inc Stock Price | January 2017 &ndash; June 2023</h3>
<p><img src="https://www.vaneck.com/contentassets/2c0932c2140d402ba848f63fdc5b091f/3378_buzz_chart_01_2023.06_v1_blog.svg" alt="Target Inc Stock Price | January 2017 - June 2023" width="960" height="540" /></p>
<p class="chart-disclosure">Source: BUZZ Holdings ULC, Bloomberg. Past performance is no guarantee of future results. Index performance is not illustrative of fund performance. Not intended as a recommendation to buy or to sell any of the securities mentioned herein.</p>
<h2>BUZZ Index June 2023 Rebalance Highlights</h2>
<p><strong>Semiconductor Companies</strong></p>
<p>Recently, the hottest narrative in the markets has been the emergence of Artificial Intelligence (AI). Like the Blockchain craze in recent years, the hype around the new technology has led to a surge in AI-related stocks. However, unlike Blockchain, AI has either been already integrated or is close to being deployed in the products of the tech industry&rsquo;s largest companies. Within months of OpenAI releasing ChatGPT to the world, many companies have already begun building it into mainstream applications and software. Alphabet<strong> (NASD: GOOGL)</strong> even released its own version, Google Bard. With more real-life applications constantly being discovered and transformed, the utility of AI is no longer up for debate. Chip manufacturers such as <strong>NVIDIA (NASD: NVDA)</strong> and Advanced Micro Devices <strong>(NASD: AMD)</strong> have been the biggest beneficiaries, with NVDA establishing itself at the forefront of delivering AI-specific chips. Shares of NVDA have erased all of their 2022 losses and are making new all-time highs. <strong>Broadcom (NASD: AVGO)</strong> and <strong>Marvell Technology (NASD: MRVL)</strong>, two lesser-discussed semiconductors producers, have also greatly benefited. This month, both AVGO and MRVL are among the top new entrants in the BUZZ Index, with each entering at a 1.33% weight.</p>
<p>For more on rebalancing results and a full breakdown of index constituents added and removed for the month, view the <strong><a href="https://www.vaneck.com/us/en/investments/social-sentiment-etf-buzz/buzz-reconstitution.pdf" rel="noopener" target="_blank" title="BUZZ VanEck Social Sentiment ETF">BUZZ Index reconstitution</a></strong> report.</p>
<p>To receive more <strong><a href="https://www.vaneck.com/us/en/insights/thematic-investing/" title="Thematic Investing Insights">Thematic Investing</a></strong> insights, <strong><a href="https://www.vaneck.com/us/en/subscribe/" title="Subscription Center">sign up in our subscription center</a></strong>.</p>
<style type="text/css">
    .wrapped-div {
        max-width: 100%;
    }

    @media (max-width: 1240px) {
        .wrapped-div {
            overflow-x: scroll;
        }
    }

    .wrapped-div-sector {
        max-width: 100%;
        overflow-x: scroll;
    }
</style>
]]></content:encoded>
</item><item rdf:about="https://www.vaneck.com/us/en/blogs/emerging-markets-bonds/em-currencies-remain-resilient-as-us-rates-stay-high/">
  <title>EM Currencies Remain Resilient As US Rates Stay High></title>
  <link>https://www.vaneck.com/us/en/blogs/emerging-markets-bonds/em-currencies-remain-resilient-as-us-rates-stay-high/</link>
  <description><![CDATA[Emerging markets local currencies have been resilient in 2023 despite surging U.S. rates, with 19 out of 20 countries in the index having positive local returns this year.]]></description>
  <dc:creator>Fran Rodilosso</dc:creator>
  <dc:date>06/27/2023 06:30:00</dc:date>
<content:encoded><![CDATA[

<p>The U.S. Federal Reserve&rsquo;s decision this month to keep rates steady came after 500 basis points (bps) of tightening since early 2022. Regardless of whether this reflects a &ldquo;pause&rdquo; or a &ldquo;skip,&rdquo; we expect rates to stay higher for longer, and recent comments and projections from the Fed support that view. Despite significantly higher rates for the foreseeable future, however, the U.S. dollar has exhibited weakness since the third quarter of 2022against emerging markets currencies (EMFX). Through June 16, 2023, EMFX has provided a year-to-date return of 2.5%, with 13 of the 20 countries in the J.P. Morgan GBI-EM Global Core Index providing a positive return from a currency perspective. Asian countries, primarily China, have been the EMFX underperformers this year. Unlike broad EM equity benchmarks, emerging markets local debt indexes are more diversified geographically, and returns are not nearly as dependent on China and other Asian economies.</p>
<h3>EMFX Resilience as U.S. Rates Increase</h3>
<p><img class="img-responsive w-100" src="https://www.vaneck.com/contentassets/d199940dbe2e43138cb92382fbb76d0c/3371_emlc_chart-01_2023.06_blog.svg" alt="EMFX Resilience as U.S. Rates Increase" /></p>
<p class="chart-disclosure"><strong>Source: J.P. Morgan as of 6/16/2023 and Bloomberg.</strong> EMFX is represented by the currency return of the J.P. Morgan GBI-EM Global Core Index. Past performance is no guarantee of future results.</p>
<p>This resilience is perhaps surprising, as one might typically expect EMFX to suffer against the U.S. dollar in a period of increasing real interest rates in the U.S. We believe there are a few factors that explain EMFX&rsquo;s resilience. First, emerging markets central banks hiked rates far before the Fed and other developed markets central banks, and many have already gotten inflation under control. This means that real rates, which on average are well in positive territory, are also increasing in these countries. Second, on average emerging markets have maintained both monetary and fiscal discipline, and exhibit better fundamentals than developed markets overall in terms of growth and indebtedness. Lastly, EMFX remains undervalued versus long-term historical averages, despite the recent modest recovery.</p>
<p>Although EMFX has provided a positive return for the year, the majority of the 7.8% year-to-date return on emerging markets local currency bonds has come from local interest rates, driven by high carry. In fact, 19 out of 20 countries in the index have positive local returns this year. This dynamic is not uncommon; in prior years where emerging markets local currency bonds have performed well, local rates (duration and carry) have explained the majority of the return. We believe this year may follow that same pattern, with the tailwind of a weaker dollar. Even if the dollar does not weaken significantly and remains relatively stable, emerging markets local currency bonds can still provide attractive income given the substantial yields the asset class currently provides.</p>
<p>To receive more <a href="https://www.vaneck.com/us/en/insights/emerging-markets-bonds/" title="Emerging Markets Bonds Insights"><strong>Emerging Markets Bonds</strong></a> insights, <a href="https://www.vaneck.com/us/en/subscribe/" title="Subscription Center"><strong>sign up in our subscription center</strong></a>.</p>
]]></content:encoded>
</item><item rdf:about="https://www.vaneck.com/us/en/blogs/emerging-markets-equity/is-china-a-new-sustainability-and-healthcare-leader/">
  <title>Is China A New Sustainability and Healthcare Leader?></title>
  <link>https://www.vaneck.com/us/en/blogs/emerging-markets-equity/is-china-a-new-sustainability-and-healthcare-leader/</link>
  <description><![CDATA[Members of our Emerging Markets Equity team share their insights from a recent trip to China, including a look at the underlying investment opportunities in the post-pandemic era.]]></description>
  <dc:creator>Ola  El-Shawarby, CFA</dc:creator>
  <dc:date>06/26/2023 06:30:00</dc:date>
<content:encoded><![CDATA[

<p>In the wake of China&rsquo;s reopening after a prolonged period of COVID-19 related lockdowns, members of our VanEck Emerging Markets Equity team embarked on a research trip spanning several Chinese cities. Our aim was to deepen our understanding of the evolving macroeconomic landscape and to further explore the underlying investment opportunities in the post-pandemic recovery era.</p>
<p>While we recognize that the recovery momentum has disappointed compared with initial expectations, we believe the country currently offers reasonable prospects of economic acceleration in a world where growth is more challenged, as interest rate hikes start to bite and inflation remains stickier. We are very mindful of some longer-term structural top-down challenges, but remain excited about several pockets of growth in China including green energy, industrial automation, healthcare and quality consumption. This is aligned with our perception, reinforced by this visit, that China&rsquo;s policy makers are currently prioritizing more gradual higher quality growth over rapid broad-based expansion, which suggests that the recovery will be uneven across sectors with some sectors expected to experience a faster pace of growth over others.</p>
<p>In this context, our investment approach becomes even more critical. We focus on careful selection, long-term trends, and bottom-up structural growth stories. Our trip confirmed that these strategies are crucial for identifying the best investment opportunities in the rapidly growing sectors and our meetings with company leaders, industry experts, and local investors only strengthened our understanding of China&rsquo;s evolving landscape.</p>
<p>In this blog, we:</p>
<ul class="content-list">
<li>Highlight the significance of our investment approach that focuses on careful selection, long-term gains, and bottom-up growth stories, especially in this evolving economic landscape.</li>
<li>Explore the budding opportunities in rapidly-growing sectors like green energy, industrial automation, and healthcare, all being buoyed by policy support and demographic trends.</li>
<li>Provide insights into the future of consumption in China, including the challenges and potential presented by evolving consumption patterns, income distribution, and strengthening social safety nets.</li>
</ul>
<h2>China's Green Energy Revolution</h2>
<p>One striking observation from our journey through China's growth sectors was the impressive advancement towards green energy. Renewable energy projects and new energy vehicles (NEVs) are on the rise, particularly in top-tier cities. In these top-tier cities, NEVs make up nearly 50% of new sales, a development fostered by government policies, tech improvements, a well-established infrastructure, and evolving consumer preferences.<sup>i</sup></p>
<p>Chinese homegrown brands such as BYD, Li Auto, and Nio have not only kept pace, but have also carved their niche in the NEV market. These brands have captured consumer interest with their technological advancements and are often preferred over global brands like Tesla. Consequently, China has surpassed Germany and Japan to become the world's largest car exporter. This bustling market, however, is highly competitive. Yet, we continue to look for lucrative, long-term opportunities within the renewable supply chain.</p>
<h3>Global passenger EV sales by market</h3>
<p><img class="img-responsive w-100" src="https://www.vaneck.com/contentassets/3f580f79bfee47b0b84bef10825ca8c6/3367_eme_chart_01_2023.06_v1_blog.svg" alt="Global passenger EV sales by market" /></p>
<p class="chart-disclosure"><strong>Source: Bloomberg; As of December 31, 2022.</strong> Past performance is no guarantee of future results.</p>
<p>In the realm of green energy, China's investments in solar power have surged dramatically, boasting a year-on-year increase of about 204%.<sup>ii</sup>&nbsp;This surge aligns with China's aim to achieve energy self-sufficiency and net-zero emissions by 2060. With more than 70% of its oil and 40% of its natural gas being imported, China is determined to trim down its dependency on external energy sources and mitigate pollution.<sup>iii</sup></p>
<p>This commitment to sustainability has resulted in an ambitious target for solar and wind energy: China aims to reach a capacity of 3.3 terawatts by 2030, substantially exceeding its current goal of 1.2 terawatts.<sup>iv</sup>&nbsp;One company that stands to profit from this upward trend is Sungrow Power Supply Co. Ltd., a component of our investment portfolio (portfolio weight of 1.6%*). Sungrow, a leading global manufacturer of solar PV inverters and wind power converters, is predicted to secure 39% of the global solar inverter market share by year-end.<sup>v</sup></p>
<p>Despite temporary price headwinds, we believe in Sungrow's potential for long-term growth. As a leading global inverter solution supplier, it is well-positioned in the era of increasing clean energy adoption and the global march towards a sustainable future.</p>
<h2>Embracing the Future: Industrial Automation, Digitization, and Robotics</h2>
<p>In the pursuit of high-quality growth, China is shifting its focus to areas like industrial automation, digitization, and robotics. This direction aligns well with the country's demographic trends, and the government is supporting the effort by providing subsidies and potential tax breaks to domestic high-end manufacturing companies. This support encourages technological innovation, fostering a favorable growth environment for companies active in the fields of industrial automation, robotics, semiconductors, and software development.</p>
<p>One such beneficiary of these trends is our portfolio holding, Shanghai Baosight Software Co. (portfolio weight 1.26%*). Baosight is a software company listed on the China A-Share market. Their primary focus is to bring efficiency to China&rsquo;s steel sector through digitization and software-enabled processes. Born out of Baowu Steel, the country's largest steel producer, Baosight's largest customer remains its parent group company.</p>
<p>Currently, there's a significant emphasis on state-owned enterprise (SOE) reforms (Baowu is an SOE). The aim of these reforms is to enhance efficiency and transparency. This calls for further automation and digitization, which bodes well for companies like Baosight. Industry consolidation trends are strengthening Baosight&rsquo;s dominant position, increasing its economic moat.</p>
<p>Another key player in our portfolio is Shenzhen Inovance Technology (portfolio weight of 0.59%*). Inovance is a domestic leader in industrial automation, robotics, and NEV components. Despite a challenging environment, the company is well-positioned to grow across multiple sectors, with management aiming for 20%-40% growth this year.</p>
<p>Looking ahead, we believe that industrial automation is vital for pushing China up the value creation curve. This is crucial to overcome challenges associated with the middle-income trap and demographic shifts.</p>
<p><img class="img-responsive w-100" src="https://www.vaneck.com/contentassets/3f580f79bfee47b0b84bef10825ca8c6/3367_eme_image_1_2_2023.06_v1.jpg" alt="Deputy Portfolio Manager Ola El-Shawarby along with Senior Analyst Yi Rong at Inovance facility" /></p>
<p class="chart-disclosure"><strong>Source: VanEck.</strong> Left: Deputy Portfolio Manager Ola El-Shawarby at Inovance facility.<br />Right: Deputy Portfolio Manager Ola El-Shawarby along with Senior Analyst Yi Rong at Inovance facility.</p>
<h2>The Evolving Healthcare Sector and Rise of Innovative Therapies</h2>
<p>In light of the growing discussion around China&rsquo;s shifting demographics and aging population, we anticipate a surge in demand for healthcare services, bolstered by an increase in healthcare spending. This trend is expected to drive considerable growth within China's healthcare sector. Although the public sector continues to dominate certain healthcare areas, we're optimistic about the potential presented by the burgeoning demand for innovative therapies.</p>
<p>For instance, Wuxi Biologics (portfolio weight 1.06%*) stands as a formidable player in this sector. As a leading Contract Development and Manufacturing Organization (CDMO), Wuxi Biologics offers outsourcing services to biopharma companies worldwide. The company, which has been expanding its research and manufacturing capabilities domestically and abroad, is predicted to have a compounded annual growth rate of over 25% in the next two years. Thanks to its successful execution track record and expanding customer and drug portfolio, Wuxi Biologics is primed to capitalize on the escalating demand for biologics.</p>
<p>Another company set to benefit from increased healthcare spending is Yifeng Pharmacy (portfolio weight 0.56%*), a growing retail pharmacy chain. Thanks to increased demand for prescription drugs and market share gains, Yifeng has enjoyed steady growth. This trend is reinforced by the move to transition prescription drug sales away from hospitals.</p>
<h2>The Future of Consumption and Consumer Behavior in China</h2>
<p>As we look towards the evolving consumption landscape in China, we see an opportunity for long-term growth despite a weaker than expected near-term recovery. Chinese households reportedly saved a record $2.6 trillion in 2022, reflecting an 80% increase from 2021, according to the People&rsquo;s Bank of China.<sup>vi</sup>&nbsp;While it was initially predicted that consumer spending would surge once COVID-19 restrictions were lifted, factors such as an unsettled property market and weaker employment conditions have dampened consumer confidence and stifled 'revenge spending'.</p>
<h3>China's consumer spending is increasing, especially in high-income households</h3>
<p><img class="img-responsive w-100" src="https://www.vaneck.com/contentassets/3f580f79bfee47b0b84bef10825ca8c6/3367_eme_chart_02_2023.06_v1_blog_option_1.svg" alt="China's consumer spending is increasing, especially in high-income households" /></p>
<p class="chart-disclosure"><strong>Source: HSBC Research, As of April 2023.</strong> Past performance is no guarantee of future results. Not intended as a forecast or prediction of future results. Actual future consumer spending in China is unknown.</p>
<p>However, we remain optimistic. Over time, as consumer confidence begins to recover, we expect China's consumption-to-GDP ratio, which currently lags behind the global average, to reveal its immense potential. This potential is tied to improving income distribution and the strengthening of social safety nets.</p>
<h2>Shaping Investment Around Evolving Consumer Preferences</h2>
<p>Changes in consumer preferences underscore the need for selective stock picking, focusing on companies that stand to benefit from China's evolving consumption patterns. For example, the Chinese food service industry is projected to grow at a compounded annual growth rate of 7.9%, putting Yum China (portfolio weight 0.69%), an operator of chain restaurants in China, in an excellent position for growth.<sup>vii</sup></p>
<p>Yum China has demonstrated resilience amid COVID-19 challenges and successfully expanded its store base by leveraging the growing demand for delivery and takeout services. We're enthusiastic about the continued improvement in profitability and margin trends, along with the high potential for expansion and scalability in new cities across China. With a robust digital presence and a focus on customer engagement, Yum China appears well-positioned to capture more market share while maintaining strong profitability trends in the future.</p>
<h2>Navigating China's Evolving Economic Landscape</h2>
<p>In this blog, we delved into the landscape of investment opportunities in China, with a spotlight on how the country's focus on high-quality growth and structural changes is creating myriad opportunities in diverse sectors. From our on-ground research and macro outlook, we've identified three key areas: green energy transition and NEV growth, industrial automation and digitization, and the evolving consumption and healthcare landscapes. Amid these shifts, the <strong><a href="/link/d3bbfae5899e4b0dbbb596fad4befa1a.aspx" title="GBFAX - Emerging Markets Fund - Class A - Overview">VanEck Emerging Markets Fund (GBFAX)</a></strong> offers access to these structural growth opportunities in China, in addition to the broader emerging markets opportunity set. With a nuanced understanding of the market and a bottom-up investment approach, the Fund provides a potential avenue for investors looking for idiosyncratic growth exposure in emerging markets. Ultimately, the trip underscored our conviction that China's selective and curated growth story remains robust, favoring discerning investors who can navigate the uneven pace of sectoral recovery.</p>
<p>To receive more <a href="/us/en/insights/emerging-markets-equity/" title="Emerging Markets Equity Insights"><strong>Emerging Markets Equity</strong></a> insights, <a href="/us/en/subscribe/" title="Subscription Center"><strong>sign up in our subscription center</strong></a>.</p>
]]></content:encoded>
</item><item rdf:about="https://www.vaneck.com/us/en/blogs/digital-assets/the-latest-on-bitcoinwithout-the-jargon/">
  <title>Bitcoin Simplified></title>
  <link>https://www.vaneck.com/us/en/blogs/digital-assets/the-latest-on-bitcoinwithout-the-jargon/</link>
  <description><![CDATA[If you&rsquo;re struggling to understand bitcoin, we break down why it&rsquo;s been rallying, bitcoin developments over time, and how these might transform Wall Street.]]></description>
  <dc:creator>Jan van Eck</dc:creator>
  <dc:date>06/22/2023 06:30:00</dc:date>
<content:encoded><![CDATA[

<p><strong>Please note that VanEck has exposure to Bitcoin.</strong></p>
<p>I personally did a deep dive on bitcoin in early 2017, determined it was &ldquo;real&rdquo; and then stopped paying close attention to the industry until 2021&mdash;a little bit of a Rip van Winkle situation. I can&rsquo;t believe how much has changed in the past six years! I tried to communicate this to a friend a couple of weeks ago and recommended a bitcoin podcast to him that I thought was easy to understand. But to him, it was Ancient Greek. So, here&rsquo;s a jargon-free update about recent developments to the best of my abilities.</p>
<h2>What Has Led to Bitcoin&rsquo;s Rise?</h2>
<p>The first answer is that more and more investors are buying bitcoin. Even if you haven&rsquo;t opened an account at a crypto exchange, you can increasingly buy bitcoin on apps that you may already have on your phone. Cash App from Square has over 50 million users<sup>1</sup>, PayPal has 429 million active users<sup>2</sup>, and Venmo now offers a credit card product that lets you earn up to 3% back in Bitcoin. This has broadened access beyond the large crypto exchanges such as Coinbase which has over 100 million users globally.<sup>3</sup></p>
<p>Second, institutional investors have been buying bitcoin. A U.S. public company (MicroStrategy) holds about $4 billion in bitcoin,<sup>4</sup>&nbsp;and Elon Musk&rsquo;s Tesla added Bitcoin to its balance sheet in 2020. Tesla continues to be one of the top Bitcoin holders among publicly traded companies. Well-known investors are speaking in its favor, which facilitates bitcoin&rsquo;s legitimacy.</p>
<p>And if one wants to be bullish, bitcoin&rsquo;s total market value is about $513 billion (almost $27,000 per coin as of June 6, 2023)<sup>5</sup>, compared to Tesla at $694 billion<sup>6</sup>&nbsp;and gold outstanding at $12 trillion.<sup>7</sup></p>
<p>Many of the millions of individual and institutional investors that own bitcoin most likely own it primarily as a store of value or a form of digital gold. They want to own a currency that has limited supply, not &ldquo;paper&rdquo; money, whose supply governments are increasing without limit.</p>
<h2>But What Has Changed Since 2017?</h2>
<p>The first thing worth mentioning is that you can now earn interest on bitcoin and other cryptocurrencies. The ability to lend or stake crypto for a yield will attract many people to the crypto world, as they offer a potentially high-yield alternative to government bonds, bank deposits and gold. Accessing this income stream is technically difficult and not without risks, but it is clear how this can and probably will become available to more investors.</p>
<p>From its early days, crypto enthusiasts believed that Wall Street could be rebuilt better and cheaper using a completely secure technology that wasn&rsquo;t controlled by a single party.</p>
<p>The conceptual building block that would enable the building of a new Wall Street is the ability to build logic into software&mdash;the &ldquo;smart contract.&rdquo; Something like, &ldquo;Pay Jane X if Jane delivers Y to Jack.&rdquo; The delivery of Y would have to be verified independently. &ldquo;If&rdquo; is the key word in that sentence because it means there are several moving parts. &ldquo;If&rdquo; logic has been around since probably the first lines of software&mdash;but making a network that is unhackable and reliable is another thing entirely.</p>
<p>In 2017, there wasn&rsquo;t much built using this concept; The concept of a smart contract was widely celebrated, but no one knew whether it would be actually applied. The only thing happening was people trading bitcoin and other coins on unregulated exchanges, just like one could trade sneakers on eBay, but that activity didn&rsquo;t require smart contracts.</p>
<p>Now there has been progress in the build-out of an independent, reliable data infrastructure to support smart contracts. Remember, using the &ldquo;if&rdquo; logic in finance usually refers to a price. Well, that price better be reliable! And data problems are rife on Wall Street. This data infrastructure isn&rsquo;t fully proven, but a lot of important progress has been made. Firms valued in the billions of dollars are directly addressing this problem.</p>
<p>In sum, I believe the emergence of lending and staking digital assets as an alternative to traditional fixed income and rapidly developing data infrastructure suggest growing chances that a new digital asset Wall Street is being built&mdash;and that we are still in the early days of that.</p>
<p>To receive more <strong><a href="https://www.vaneck.com/us/en/insights/digital-assets/" title="Digital Assets Insights">Digital Assets</a></strong> insights, <strong><a href="https://www.vaneck.com/us/en/subscribe/" title="Subscription Center">sign up in our subscription center</a></strong>.</p>
]]></content:encoded>
</item><item rdf:about="https://www.vaneck.com/us/en/blogs/thematic-investing/silicon-alchemists-and-ai-2023-semiconductors-outlook/">
  <title>Silicon Alchemists &amp; AI: 2023 Semiconductors Outlook></title>
  <link>https://www.vaneck.com/us/en/blogs/thematic-investing/silicon-alchemists-and-ai-2023-semiconductors-outlook/</link>
  <description><![CDATA[A technological revolution is underway, potentially bringing us to the brink of the fourth industrial revolution.]]></description>
  <dc:creator> </dc:creator>
  <dc:date>06/22/2023 06:30:00</dc:date>
<content:encoded><![CDATA[

<p>Semiconductors have emerged as a lynchpin of modern electronic technology, used in almost every modern device, from cell phones to automobiles. The next evolution of artificial intelligence (AI) hinges on developing new semiconductor chips, a dynamic we believe will create a tremendous growth opportunity for investors.</p>
<p>One of our latest papers, <a href="/us/en/investments/semiconductor-etf-smh/silicon-alchemists-and-ai-2023-semiconductors-outlook.pdf" title="Download Whitepaper - Silicon Alchemists and AI: 2023 Semiconductors Outlook" target="_blank" rel="noopener"><strong><i>Silicon Alchemists &amp; AI: 2023 Semiconductors Outlook</i></strong></a>, discusses:</p>
<ul class="content-list">
<li>How the rapid adoption of AI is ushering in a new era of growth for semiconductors, setting up the potential for the sector to deliver outsized long-term returns.</li>
<li>A new wave of innovation due to the deepening relationship between AI and semiconductors.</li>
<li>Economic moats enjoyed by semiconductor companies.</li>
</ul>

<p>To receive more <strong><a href="https://www.vaneck.com/us/en/insights/thematic-investing/" title="Thematic Investing Insights">Thematic Investing</a></strong> insights, <strong><a href="https://www.vaneck.com/us/en/subscribe/" title="Subscription Center">sign up in our subscription center</a></strong>.</p>
]]></content:encoded>
</item><item rdf:about="https://www.vaneck.com/us/en/blogs/income-investing/mort-question-and-answer/">
  <title>MORT ETF: Question &amp; Answer></title>
  <link>https://www.vaneck.com/us/en/blogs/income-investing/mort-question-and-answer/</link>
  <description><![CDATA[Learn why mortgage REITs are garnering attention among investors looking for attractive yields.]]></description>
  <dc:creator>Coulter Regal, CFA</dc:creator>
  <dc:date>06/21/2023 06:30:00</dc:date>
<content:encoded><![CDATA[

<p>In today's dynamic investment landscape, many investors are constantly seeking opportunities to generate income beyond traditional corporate or government debt. Mortgage REITs, a lesser-known income-generating investment, have caught the attention of those looking for attractive yields. This blog aims to address frequently asked questions about mortgage REITs and provide insights into <strong><a href="https://www.vaneck.com/us/en/investments/mortgage-reit-income-mort/overview/" title="MORT - VanEck Mortgage REIT Income ETF - Overview">VanEck's Mortgage REIT Income ETF (MORT)</a></strong>.</p>
<ul class="content-list">
<li><strong><a href="#point-one">What is MORT and what are mortgage REITs?</a></strong></li>
<li><strong><a href="#point-two">Why are yields on mortgage REITs high?</a></strong></li>
<li><strong><a href="#point-three">What type of mREITs does MORT provide exposure to?</a></strong></li>
<li><strong><a href="#point-four">What is the difference between mortgage REITs and equity REITs?</a></strong></li>
<li><strong><a href="#point-five">Does MORT distribute return of capital?</a></strong></li>
<li><strong><a href="#point-six">How do mortgage REITs fit into a portfolio?</a></strong></li>
<li><a href="#point-seven"><strong>How to buy VanEck ETFs?</strong></a></li>
</ul>
<h2 id="point-one" class="anchored-block">What is MORT and what are mortgage REITs?</h2>
<p>A real estate investment trust, or REIT, is a type of security that invests in real estate or real estate related assets and typically trades on major market exchanges similar to stocks. Mortgage REITs, or mREITs, are a type of REIT that provides financing for real estate by buying or originating mortgages and mortgage-backed securities (MBS) and then earns income from the interest on these investments. Mortgage REITs give investors a simple way to tap into the real estate market without having to own, operate, or finance properties themselves. Investors have historically found value in mREITs primarily because of their history of high dividends. <strong><a href="https://www.vaneck.com/us/en/investments/mortgage-reit-income-mort/overview/" title="MORT - VanEck Mortgage REIT Income ETF - Overview">VanEck's Mortgage REIT Income ETF (MORT)</a></strong> offers investor&rsquo;s comprehensive exposure to the U.S. mortgage real estate investment trust market. For more information on <strong><a href="https://www.vaneck.com/us/en/investments/mortgage-reit-income-mort/overview/" title="MORT - VanEck Mortgage REIT Income ETF - Overview">VanEck's Mortgage REIT Income ETF (MORT)</a></strong>, visit the product webpage&nbsp;<strong><a href="/link/261bc48bbcb34c7aa2b5dec6c272bad6.aspx?utm_source=vaneck" title="MORT - VanEck Mortgage REIT Income ETF - Overview">here</a></strong>.</p>
<h2 id="point-two" class="anchored-block">Why are yields on mortgage REITs high?</h2>
<p>Dividend yields offered by mortgage REITs have historically been higher than yields on more traditional income oriented assets like Treasury securities or corporate debt. However, like any high yielding security, the attractive income potential of mREITs is reflective of additional potential risks. Mortgage REITs tend to employ leverage and/or take on credit risk in non-agency MBS and commercial mortgage loans and securities to increase yield. Beyond leverage and credit risks, high sensitivity to changes in interest rates, prepayment risk, and general real estate market risk are all factors embedded in mREITs yields. Investors attracted to the yield potential of mortgage REITs must also weigh the risks associated with such an investment.</p>
<p>Another contributing factor to high yields, is favorable tax treatment and a requirement for REITs to distribute the vast majority of their income to shareholders. To qualify as a REIT, the trust must distribute at least 90% of its taxable income to shareholders. In turn, REITs typically don't pay any corporate income taxes because their earnings have been passed along as dividend payments. The unique structure and tax advantages of REITs, along with the additional risk exposures mentioned above, translates into higher yield potential than what might be earned in traditional fixed-income markets.</p>
<h2 id="point-three" class="anchored-block">What type of mREITs does MORT provide exposure to?</h2>
<p>There are dozens of publicly traded mortgage REITs available in the market all with varying ranges of exposures in terms of residential or commercial and agency or non-agency investments. Some mREITs are focused exclusively on purchasing high credit quality agency mortgage-backed securities while others focus more on commercial mortgage origination or lower credit quality non-agency investments. There are also many mortgage REITs that invest in several, or even all, areas of the mortgage real estate market in non-static portions that fluctuate overtime.</p>
<p>Because of the wide range of exposures and non-uniform reporting metrics, it can be difficult to measure the exact breakdown of these exposures. However, generally <strong><a href="https://www.vaneck.com/us/en/investments/mortgage-reit-income-mort/overview/" title="MORT - VanEck Mortgage REIT Income ETF - Overview">MORT</a></strong>&nbsp;aims to provide broad exposure to mortgage REITs, so investors should expect to gain exposure to most areas of the mREIT market through the fund. Historically, about half of the exposure within&nbsp;<strong><a href="https://www.vaneck.com/us/en/investments/mortgage-reit-income-mort/overview/" title="MORT - VanEck Mortgage REIT Income ETF - Overview">MORT</a></strong>&nbsp;has consisted of residential focused mortgage REITs with the remainder a split between commercial mortgage REITs and multi-type mortgage REITs. Information on current holdings can be found on the fund&rsquo;s&nbsp;<strong><a href="/link/70976a179a294fb5883469e765a7b9ec.aspx" title="MORT - VanEck Mortgage REIT Income ETF - Holdings">product webpage</a></strong>.</p>
<div class="epi-contentfragment">faq-banner-cta</div>
<h2 id="point-four" class="anchored-block">What is the difference between mortgage REITs and equity REITs?</h2>
<p>As mentioned earlier, mortgage REITs invest in and own mortgages or mortgage back-securities and income from the interest on these investments. Equity REITs, on the other hand, acquire and manage actual properties for the purpose of generating rental income. Mortgage REITs and equity REITs are similar in that both are required to distribute at least 90% of their income to shareholders, rather than retain that income for growth. Equity REITs tend to be more common than mortgage REITs, though mortgage REITs have historically offered higher dividend yields than equity REITs.</p>
<h2 id="point-five" class="anchored-block">Does MORT distribute return of capital?</h2>
<p>Return of capital (ROC) is a payment received from an investment that is not considered taxable income, but instead reduces a shareholder's cost basis and may be recognized as a capital gain at the final sale of the investment. Real estate investment trusts (REITs) are one type of investment that typically have distributions containing a component of ROC. This is due to special tax treatments for REITs, like depreciation adjustments, that reduce taxable income without reducing the amount of cash available for distribution. Due to MORT&rsquo;s underlying exposure to REITs, a portion of the fund&rsquo;s distribution may be considered ROC as the fund distributes all of its net cash received from investments (including ROC) to investors. Investors may receive a &ldquo;Section 19 notice&rdquo; accompanying a distribution from <strong><a href="https://www.vaneck.com/us/en/investments/mortgage-reit-income-mort/overview/" title="MORT - VanEck Mortgage REIT Income ETF - Overview">MORT</a></strong>&nbsp;which estimates the portion of MORT&rsquo;s current and fiscal year-to-date distribution comprising return of capital. Please view&nbsp;<strong><a href="/link/e33f77a4dbef4363921ddcf6c21b3700.aspx" title="MORT - VanEck Mortgage REIT Income ETF - Documents">MORT's Tax Documents</a></strong> and visit <strong><a href="/link/d880bec474eb43e2b80bbd5c24787cf7.aspx" title="ETF Supplemental Tax Information">VanEck&rsquo;s Tax Center</a></strong> for more information on the portion of return of capital paid by MORT.</p>
<h2 id="point-six" class="anchored-block">How do mortgage REITs fit into a portfolio?</h2>
<p>Mortgage REITs have unique characteristics that may make them attractive to both income and growth investors. Their high dividend potential may be used to help provide a yield boost for those investors searching for additional income, or in more aggressive long-term growth portfolios for their potential high total return. An allocation to mortgage REITs may also add much desired diversification benefits to a portfolio thanks to historically low correlation to equities and traditional fixed income instruments. However, as mentioned previously, mREITs come with elevated risk compared to other traditional income investments and should be considered in an allocation decision.</p>
<h2 id="point-seven" class="anchored-block">How to buy VanEck ETFs?</h2>
<p><strong><a href="/link/261bc48bbcb34c7aa2b5dec6c272bad6.aspx#how-to-buy-etf&amp;amp;utm=MORT-Blog" title="How to buy VanEck ETFs?">Learn more here.</a></strong></p>
<p class="d-none d-lg-block"><a href="mailto:askvaneck@vaneck.com" title="Have More Questions? - Ask VanEck" rel="noopener"><img loading="lazy" class="img-responsive" src="https://www.vaneck.com/globalassets/home/us/insights/blogs/bm-blog-images/cta-faq_desktop-02.svg" alt="Have More Questions? - Ask VanEck" /></a></p>
<p class="d-lg-none"><a href="mailto:askvaneck@vaneck.com" title="Have More Questions? - Ask VanEck" rel="noopener"><img loading="lazy" class="img-responsive" src="https://www.vaneck.com/globalassets/home/us/insights/blogs/bm-blog-images/cta-faq_mobile-01.svg" alt="Have More Questions? - Ask VanEck" /></a></p>
<p>To receive more <strong><a href="https://www.vaneck.com/us/en/insights/moat-investing/" title="Moat Investing">Moat Investing</a></strong> insights, <strong><a href="https://www.vaneck.com/us/en/subscribe/" title="Preference Center">sign up in our subscription&nbsp;center</a></strong>.</p>
]]></content:encoded>
</item><item rdf:about="https://www.vaneck.com/us/en/blogs/emerging-markets-bonds/the-feds-wind-down-favors-em-bond-duration/">
  <title>The Fed’s Wind Down Favors EM Bond Duration?></title>
  <link>https://www.vaneck.com/us/en/blogs/emerging-markets-bonds/the-feds-wind-down-favors-em-bond-duration/</link>
  <description><![CDATA[Emerging markets bonds continue to outperform developed markets bonds, and could continue to benefit from positive secular tailwinds in the long run.]]></description>
  <dc:creator>Eric Fine</dc:creator>
  <dc:date>06/16/2023 06:30:00</dc:date>
<content:encoded><![CDATA[

<p>In May, the <strong><a href="/link/ff5a2b15f98745488ea4746f117294f2.aspx" title="EMBAX - Emerging Markets Bond Fund - Class A - Overview" rel="noopener">VanEck Emerging Markets Bond Fund</a></strong> returned -0.95%, compared to -1.07% for its benchmark (the 50% J.P. Morgan Government Bond Index-Emerging Markets (GBI-EM) Global Diversified and 50% J.P. Morgan Emerging Markets Bond Index (EMBI)). Year to date, the Fund has returned 3.18%, in line with its benchmark, which has returned 3.12%. We are increasing duration in USD-denominated bonds and reducing exposure to Asian EMFX. We continue to have very low high-beta EMFX exposure (no South Africa or Mexico, for example) with the exception of Brazil, which appears very attractive following recent weakness. The Fund ended May with carry of 6%, duration of 5.6 and roughly 50% in local currency. <a href="/us/en/blogs/emerging-markets-bonds/the-feds-wind-down-favors-em-bond-duration/emb-manager-commentary-06-2023.pdf" rel="noopener" target="_blank" title="VanEck Emerging Markets Bond Fund Monthly Manager Commentary - June 2023"><strong>View here for a PDF version of this blog</strong></a>.</p>
<div class="wrapped-div">
<table style="width: 100%;">
<tbody>
<tr class="tbl-data">
<td class="tbl-header last" colspan="8">Average Annual Total Returns (%) as of May 31, 2023</td>
</tr>
<tr class="tbl-data">
<td class="data-td last">&nbsp;</td>
<td class="data-head last">1 Month<sup>&dagger;</sup></td>
<td class="data-head last">3 Month<sup>&dagger;</sup></td>
<td class="data-head last">YTD</td>
<td class="data-head last">1 Year</td>
<td class="data-head last">3 Year</td>
<td class="data-head last">5 Year</td>
<td class="data-head last">10 Year</td>
</tr>
<tr class="tbl-data">
<td class="data-td last">Class A: NAV (Inception 07/09/12)</td>
<td class="data-td data last">-0.95</td>
<td class="data-td data last">1.11</td>
<td class="data-td data last">3.18</td>
<td class="data-td data last">4.01</td>
<td class="data-td data last">3.49</td>
<td class="data-td data last">2.00</td>
<td class="data-td data last">0.55</td>
</tr>
<tr class="tbl-data">
<td class="data-td last">Class A: Maximum&nbsp;% load</td>
<td class="data-td data last">-6.65</td>
<td class="data-td data last">-4.71</td>
<td class="data-td data last">-2.75</td>
<td class="data-td data last">-1.97</td>
<td class="data-td data last">1.47</td>
<td class="data-td data last">0.80</td>
<td class="data-td data last">-0.04</td>
</tr>
<tr class="tbl-data">
<td class="data-td last">Class I: NAV (Inception 07/09/12)</td>
<td class="data-td data last">-1.11</td>
<td class="data-td data last">1.18</td>
<td class="data-td data last">3.07</td>
<td class="data-td data last">4.42</td>
<td class="data-td data last">3.77</td>
<td class="data-td data last">2.29</td>
<td class="data-td data last">0.84</td>
</tr>
<tr class="tbl-data">
<td class="data-td last">Class Y: NAV (Inception 07/09/12)</td>
<td class="data-td data last">-1.12</td>
<td class="data-td data last">1.12</td>
<td class="data-td data last">3.20</td>
<td class="data-td data last">4.17</td>
<td class="data-td data last">3.68</td>
<td class="data-td data last">2.24</td>
<td class="data-td data last">0.78</td>
</tr>
<tr class="tbl-data">
<td class="data-td last">50% GBI-EM/50% EMBI</td>
<td class="data-td data last">-1.07</td>
<td class="data-td data last">2.15</td>
<td class="data-td data last">3.12</td>
<td class="data-td data last">0.82</td>
<td class="data-td data last">-2.46</td>
<td class="data-td data last">-0.47</td>
<td class="data-td data last">0.44</td>
</tr>
</tbody>
</table>
</div>
<br />
<div class="wrapped-div">
<table style="width: 100%;">
<tbody>
<tr class="tbl-data">
<td class="tbl-header last" colspan="8">Average Annual Total Returns (%) as of March 31, 2023</td>
</tr>
<tr class="tbl-data">
<td class="data-td last">&nbsp;</td>
<td class="data-head last">1 Month<sup>&dagger;</sup></td>
<td class="data-head last">3 Month<sup>&dagger;</sup></td>
<td class="data-head last">YTD</td>
<td class="data-head last">1 Year</td>
<td class="data-head last">3 Year</td>
<td class="data-head last">5 Year</td>
<td class="data-head last">10 Year</td>
</tr>
<tr class="tbl-data">
<td class="data-td last">Class A: NAV (Inception 7/9/12)</td>
<td class="data-td data last">1.50</td>
<td class="data-td data last">3.58</td>
<td class="data-td data last">-0.38</td>
<td class="data-td data last">8.30</td>
<td class="data-td data last">0.85</td>
<td class="data-td data last">0.33</td>
</tr>
<tr class="tbl-data">
<td class="data-td last">Class A: Maximum 5.75% load</td>
<td class="data-td data last">-4.34</td>
<td class="data-td data last">-2.38</td>
<td class="data-td data last">-6.11</td>
<td class="data-td data last">6.19</td>
<td class="data-td data last">-0.34</td>
<td class="data-td data last">-0.26</td>
</tr>
<tr class="tbl-data">
<td class="data-td last">Class I: NAV (Inception 7/9/12)</td>
<td class="data-td data last">1.52</td>
<td class="data-td data last">3.42</td>
<td class="data-td data last">-0.04</td>
<td class="data-td data last">8.60</td>
<td class="data-td data last">1.14</td>
<td class="data-td data last">0.63</td>
</tr>
<tr class="tbl-data">
<td class="data-td last">50 GBI-EM GD / 50% EMBI GD</td>
<td class="data-td data last">2.54</td>
<td class="data-td data last">3.51</td>
<td class="data-td data last">-3.81</td>
<td class="data-td data last">0.48</td>
<td class="data-td data last">-1.43</td>
<td class="data-td data last">0.29</td>
</tr>
</tbody>
</table>
</div>
<br />
<p class="chart-disclosure"><sup>&dagger;</sup>&nbsp;Returns less than one year are not annualized.</p>
<p class="chart-disclosure"><strong>Expenses: Class A: Gross 2.55%, Net 1.27%; Class I: Gross 2.51%, Net 0.97%; Class Y: Gross 2.91%, Net 1.02%.</strong> Expenses are capped contractually until 05/01/24 at 1.25% for Class A, 0.95% for Class I, 1.00% for Class Y. Caps excluding acquired fund fees and expenses, interest, trading, dividends, and interest payments of securities sold short, taxes, and extraordinary expenses.</p>
<p class="chart-disclosure">Expenses are capped contractually until 05/01/24 at 1.25% for Class A, 0.95% for Class I, 1.00% for Class Y. Caps excluding acquired fund fees and expenses, interest, trading, dividends, and interest payments of securities sold short, taxes, and extraordinary expenses.</p>
<p class="chart-disclosure"><strong>The performance data quoted represents past performance. Past performance is not a guarantee of future results. Investment return and principal value of an investment will fluctuate so that an investor&rsquo;s shares, when redeemed, may be worth more or less than their original cost. Performance may be lower or higher than performance data quoted. Please call 800.826.2333 or visit vaneck.com for performance current to the most recent month ended.</strong></p>
<p class="chart-disclosure">The &ldquo;Net Asset Value&rdquo; (NAV) of a Fund is determined at the close of each business day, and represents the dollar value of one share of the fund; it is calculated by taking the total assets of the fund, subtracting total liabilities, and dividing by the total number of shares outstanding. The NAV is not necessarily the same as the ETF&rsquo;s intraday trading value. Investors should not expect to buy or sell shares at NAV.</p>
<p><strong>Duration a winner? Either the Fed has a few more hikes in it, or it is done hiking; either way that boosts the attractiveness of duration, we think. It could also challenge some EM currencies (EMFX). </strong>The Fed decided to &ldquo;skip&rdquo; a rate hike in June and indicated that it might hike further this year with two additional hikes projected in its dot plot, while the market is currently pricing in only one additional hike in this cycle. We believe these conditions favor duration. We&rsquo;d also note that although the 10-year U.S. Treasury yield might be trading in a range, the 30-year yield might be declining.</p>
<p><strong>China uncertainty helps duration, but hurts EMFX. The latest theme to gather steam is Chinese currency weakness. This exports deflation, adding to duration&rsquo;s attractiveness. In addition, it challenges other EMFX, particularly those in Asia. </strong>China&rsquo;s inflows and interest rate differentials with the U.S. have disappointed recently. This has led to Chinese renminbi (CNY) weakness, as well as recent EM currency weakness. The chart below shows CNY versus EMFX and some high beta currencies like the South African rand (ZAR), Mexican peso (MXN), and Malaysian ringgit (MYR).</p>
<h3>CNY Driving EMFX Weaker, and Will ZAR Lead MXN Weaker?</h3>
<p><img class="img-responsive w-100" src="https://www.vaneck.com/contentassets/28af8ae56f584f0897aa10edb23d1f6b/3344_emb_table_01_2023.06_v1.svg" alt="CNY Driving EMFX Weaker, and Will ZAR Lead MXN Weaker?" /></p>
<p class="chart-disclosure"><strong>Source: VanEck Research; Bloomberg As of June 2, 2023.</strong> Past performance is no guarantee of future results.</p>
<p><strong>Our EM bonds over DM bonds thesis is intact. US recession risk that <em>can&rsquo;t </em>be met with stimulus vs. China growth risks that <em>can </em>be met with stimulus are becoming the big wheels turning in coming quarters. This will reinforce our view that over the longer run, many EM local-currency bonds remain subject to positive secular tailwinds. </strong>Emerging markets have been well ahead of developed markets on the inflation fight, and now have more tools at its disposal. If the U.S. enters recession, what will be the policy response? Monetary easing? Fiscal stimulus? It is next to impossible for us to see the political conditions for the latter, which means monetary policy will again need to do the heavy lifting. This implies dollar weakness to us. Whether this manifests by the Fed having to ease rates policy and increase its balance sheet first, and then the dollar starts to suffer, or whether the dollar starts to discount this earlier will be a big part of the market story in the coming quarters.</p>
<h2>EM Inflation Continues to Impress</h2>
<p><strong>Inflation in DM and EM Regions (% year-on-year)</strong></p>
<p><strong><img class="img-responsive w-100" src="https://www.vaneck.com/contentassets/28af8ae56f584f0897aa10edb23d1f6b/3344_emb_chart_01_2023.06_v1_blog.svg" alt="Inflation in DM and EM Regions (% year-on-year)" /></strong></p>
<p class="chart-disclosure">DM - US, UK, Germany, Canada, Japan, Australia.</p>
<p><strong>Headline Inflation in Selected EM and DM (% year-on-year)</strong></p>
<p><strong><img class="img-responsive w-100" src="https://www.vaneck.com/contentassets/28af8ae56f584f0897aa10edb23d1f6b/3344_emb_chart_02_2023.06_v1_blog.svg" alt="Headline Inflation in Selected EM and DM (% year-on-year)" /></strong></p>
<p class="chart-disclosure"><strong>Source: VanEck Research; Bloomberg LP</strong>. Past performance is no guarantee of future results.</p>
<p><strong>In May, the Fund returned -0.95%, compared to -1.02% for its benchmark; YTD, the Fund has returned 3.18%, in line with its benchmark which has returned 3.12%. </strong>Winners were South Africa (not owning it), Peru local currency, and Sri Lanka local currency. Zambia local currency, Turkey hard currency, and Mexico (not owning it) were the key detractors.</p>
<p><strong>We are increasing duration in USD-denominated bonds and reducing exposure to Asian EMFX. </strong>We continue to have very low high-beta EMFX exposure (no exposure to South Africa or Mexico, for example) with the exception of Brazil, which appears very attractive following its weakness. The Fund ended May with carry of 6%, duration of 5.6 and roughly 50% in local currency. Our biggest exposures are to Indonesia, Malaysia and Brazil.</p>
<h2>Exposure Types and Significant Changes</h2>
<p>The changes to the Fund&rsquo;s top positions are summarized below. Our largest positions in May were Indonesia, Malaysia, Brazil, Thailand and Peru:</p>
<ul class="content-list">
<li class="mb-3">We increased our local currency exposure in Brazil and hard currency sovereign exposure in Hungary and Serbia. Brazil&rsquo;s spectacular disinflation progress and a less bad outlook for the new fiscal framework improve the outlook for the policy rate cuts, strengthening the policy and economic text scores for the country. Hungary could benefit from more encouraging EU funding headlines, but the recent measures to support domestic demand for local bonds could reduce their attractiveness for non-resident investors, making sovereign bond exposure a better option. Serbia&rsquo;s sovereign bond is denominated in euro, and it might benefit from the improvements in relative growth expectations for Europe, as well as from the longer tightening cycle vs. the U.S. In terms of our investment process, this improved the technical test score for the country.</li>
<li class="mb-3">We also increased hard currency sovereign exposure in Egypt and Ghana (though only to their minimum limit levels) and local currency exposure in Sri Lanka. The common theme for all countries is the improving policy test score. Sri Lanka and Ghana are seeing further progress in debt restructuring, while the Egyptian government introduced new taxes and raised certain fees to boost government revenue.</li>
<li class="mb-3">Finally, we increased our local currency exposure in Uruguay and Colombia, hard currency quasi-sovereign exposure in Colombia, hard currency sovereign exposure in Oman, and hard currency corporate exposure in Hong Kong. The Hong Kong option might be a less risky way with a better policy test score to get exposure to &ldquo;the China complex&rdquo; with fewer concerns about China&rsquo;s soft growth patch. As regards other regional considerations, Oman is less of a proxy for U.S. Treasuries than Saudi Arabia (=a better technical test score). In Colombia, we liked a combination of better valuations and a significant current account improvements (=stronger technical and economic test scores). Better valuations also drove our decision process in Uruguay, especially against the backdrop of the central bank&rsquo;s more cautious stance on additional policy easing.</li>
<li class="mb-3">We reduced our local currency exposure in Thailand, South Korea, and Chile. We were motivated by negative spillovers from China&rsquo;s soft growth patch &ndash; in terms of regional demand for China&rsquo;s exports, the impact on commodity prices, and currency correlations with the weaker renminbi. In terms of our investment process, this worsened these countries technical test scores.</li>
<li class="mb-3">We also reduced our local currency exposure in Poland and Israel. Poland&rsquo;s new round of political bickering with the EU and the rising tensions in Ukraine worsened the country&rsquo;s policy test score. The worsening policy test score also played a big role in Israel, where domestic political noise might start affecting capital inflows, including the tech sector.</li>
<li class="mb-3">Finally, we reduced our local currency exposure in South Africa, as well as hard currency sovereign exposure in South Africa and Mexico. South Africa&rsquo;s growth concerns are intensifying on the back of electricity blackouts, and this in turn can affect fiscal and debt sustainability targets, worsening the economic and policy test scores. In Mexico, we were alarmed by negative headlines about the state-owned giant PEMEX, including a less reassuring message from the management about government support.</li>
</ul>
<p>To receive more <a href="https://www.vaneck.com/us/en/insights/emerging-markets-bonds/" title="Emerging Markets Bonds Insights"><strong>Emerging Markets Bonds</strong></a> insights, <a href="https://www.vaneck.com/us/en/subscribe/" title="Subscription Center"><strong>sign up in our subscription center</strong></a>.</p>
<style>
    .wrapped-div {
        max-width: 100%;
    }

    @media (max-width: 768px) {
        .wrapped-div {
            overflow-x: scroll;
        }
    }

    .wrapped-div-sector {
        max-width: 100%;
        overflow-x: scroll;
    }
</style>
]]></content:encoded>
</item><item rdf:about="https://www.vaneck.com/us/en/blogs/natural-resources/commodities-market-upturn-ahead-following-slump/">
  <title>Commodities Market Upturn Ahead Following Slump?></title>
  <link>https://www.vaneck.com/us/en/blogs/natural-resources/commodities-market-upturn-ahead-following-slump/</link>
  <description><![CDATA[Commodities declined in May mainly from China&rsquo;s slowed recovery, though the UBS Constant Maturity Commodity Index&rsquo;s positive roll yield YTD highlights its roll methodology and curve positioning.]]></description>
  <dc:creator>Roland Morris</dc:creator>
  <dc:date>06/15/2023 06:30:00</dc:date>
<content:encoded><![CDATA[

<h2>Macro Outlook: China&rsquo;s Lackluster Recovery Triggers Commodities Decline in May</h2>
<p>China&rsquo;s disappointing recovery following the COVID-19 reopening this spring has been the major reason for the declining commodities markets in May. The UBS Constant Maturity Commodity Index (CMCI) declined 5.78% and the Bloomberg Commodity Index (BCOM) declined 5.64%. Additionally, the U.S. Federal Reserve&rsquo;s tightening cycle over the last year is expected to slow the U.S. economy this summer and fall.</p>
<p>All five sectors of CMCI declined during May. The energy and industrial metals sectors both fell about 7%, the agriculture sector was down 4%, the livestock sector fell by 3%, and the precious metals sector declined by 2%. Remarkably, a handful of commodities were up in May: cocoa, HRW (hard red winter) wheat, and live cattle.</p>
<h2>Sector Review: Industrial Metals Were the Weakest Link</h2>
<p>The industrial metals sector was the weakest sector during the month; LME (London Metal Exchange) Nickel and LME Zinc fell by over 14%. The LME launched two consultations recently on possible reforms in the wake of the nickel trading crisis in 2022. Both consultations are due to close in June and July of this year. Zinc&rsquo;s slump is a result of China&rsquo;s post-lockdown bounce-back, which has been lackluster.</p>
<p>The declines in the energy sector were consistent among the respective commodities; unleaded gas fared better than the rest with losses of less than 4%. Macroeconomic concerns were a major driver of crude oil prices as analysts expect oil to trade at around $80 per barrel. However, threats of possible production cuts from OPEC+ (Organization of the Petroleum Exporting Countries) in June will be in place as long as oil stays significantly below $80 per barrel, further impacting future prices.</p>
<p>Although the agriculture sector was down 4%, it was spared from worse losses with cocoa gaining around 4% and HRW wheat around 2%. The looming El Ni&ntilde;o phenomenon has much of the agriculture sector on alert. Anticipated disruptions in the global supply chain of agricultural products due to heavy rainfall or droughts could cause crop losses, shipment delays and/or difficulty harvesting for key crops like wheat, corn and oilseed.</p>
<p>While live cattle climbed around 3%, lean hogs declined by almost 12%. Since the target weight in the index was less than 2%, the losses to the livestock sector were only 3%.</p>
<p>The precious metals sector losses were primarily from silver which was down 6%, while gold was down 1.3%, contributing to the overall loss in the sector by 2%.&nbsp;</p>
<p>Looking at the YTD estimated roll yield below highlights CMCI&rsquo;s superior roll methodology and curve positioning. By maintaining a constant maturity and longer average duration, CMCI is generating positive roll yield and BCOM is generating negative roll yield.</p>
<h3>Roll Yield Estimates YTD - May 2023</h3>
<p><img class="img-responsive w-100" src="https://www.vaneck.com/contentassets/9adaacbdf69d434cb683eaf9e25815d1/3341_cmci_chart-01_2023.06_blog.svg" alt="Roll Yield Estimates YTD - May 2023" /></p>
<p class="chart-disclosure"><strong>Source: Bloomberg. Data as of May 2023.</strong> Past performance is no guarantee of future results. Index performance is not illustrative of fund performance. It is not possible to invest in an index.</p>
<p><strong><a href="/link/9cc454bdc12d49638c0a22783d5a26cf.aspx" title="CMCAX - CM Commodity Index Fund - Class A - Overview">Learn more about the VanEck CM Commodity Index Fund</a></strong>, which seeks to track, before fees and expenses, the CMCI.</p>
<p>To receive more <a href="/us/en/insights/natural-resources/" title="Natural Resources Insights"><strong>Natural Resources</strong></a> insights, <a href="https://www.vaneck.com/us/en/subscribe/" title="Subscription Center"><strong>sign up in our subscription center</strong></a>.</p>
]]></content:encoded>
</item><item rdf:about="https://www.vaneck.com/us/en/blogs/natural-resources/how-ai-is-advancing-the-energy-transition/">
  <title>How AI is Advancing the Energy Transition></title>
  <link>https://www.vaneck.com/us/en/blogs/natural-resources/how-ai-is-advancing-the-energy-transition/</link>
  <description><![CDATA[Explore the wide-ranging applications of AI in the natural resources sector, spanning from mining green metals to deploying renewable energy and managing sustainable agriculture.]]></description>
  <dc:creator>VanEck </dc:creator>
  <dc:date>06/14/2023 06:30:00</dc:date>
<content:encoded><![CDATA[

<p>The recent buzz around artificial intelligence (AI) has largely focused on its applications in consumer technology and e-commerce, but its potential reaches far beyond that.</p>
<h2>Freeport-McMoRan Revolutionizes Green Metals Mining</h2>
<p>Mining green metals efficiently is essential for transitioning to a more sustainable future, and AI is pivotal in achieving this goal. The mining company Freeport-McMoRan has been an early adopter of AI to revolutionize the detection and extraction of green metals.</p>
<p>Freeport-McMoRan utilizes a custom AI model at their copper mill in Bagdad, Arizona. By scanning and analyzing vast amounts of data, the AI model provides recommendations for operational changes that improve mining processes. As a result, Freeport-McMoRan witnessed a 10% increase in copper ore throughput. Copper is a critical metal for energy transition technologies, especially in electric vehicles (EVs) and renewable energy technologies.</p>
<p>Freeport&rsquo;s use of the AI model at Bagdad demonstrates how mining companies can meet the rising demand for green metals as the resource transition accelerates to ensure a sustainable supply of these critical resources.</p>
<h3>AI Model Recommendations Boost Copper Mine Production by 10%</h3>
<p><strong>Average Bagdad mine dry ore miller daily (thousand tons).</strong></p>
<p><img loading="lazy" class="img-responsive w-100" src="https://www.vaneck.com/contentassets/3f484848ff97427a8d75d6a16ee0ca47/3342_ai-resource-transition_chart-1_2023.06_blog.svg" alt="AI Model Recommendations Boost Copper Mine Production by 10%" /></p>
<p class="chart-disclosure"><strong>Source: Freeport-McMoRan, McKinsey.</strong></p>
<h2>SolarEdge Optimizes Renewable Energy</h2>
<p>AI can also be leveraged to improve the deployment and management of renewable energy technologies. SolarEdge, a leading provider of solar inverters and battery energy storage, has developed an AI-powered EV charging platform. The platform employs algorithms and predictive analytics to enhance EV charging efficiency, particularly for projects involving multiple EVs. By incorporating real-time data on current solar production and electricity prices, SolarEdge's AI model orchestrates and optimizes the charging process. This integration ensures that EV charging is efficient and takes advantage of renewable energy sources when supplying energy to the grid.</p>
<h3>SolarEdge&rsquo;s EV Charging Management Solution</h3>
<p><img loading="lazy" class="img-responsive w-100" src="https://www.vaneck.com/contentassets/3f484848ff97427a8d75d6a16ee0ca47/3342_ai-resource-transition_image-1_2023.06.jpg" alt="Solar's EV Charging Management Solution" /></p>
<p class="chart-disclosure"><strong>Source: SolarEdge.</strong></p>
<p>As the demand for EVs continues to soar, solar-attached EV charging facilities are increasingly important. SolarEdge's AI model enables these facilities to operate intelligently, leveraging predictive algorithms to prioritize charging when solar generation is at its peak. This approach maximizes the utilization of renewable energy resources and contributes to a more efficient and sustainable EV charging infrastructure.</p>
<h2>Corteva Enhances Resource Efficiency in Agriculture</h2>
<p>Corteva, a prominent agricultural inputs company, offers AI solutions directly to farmers that enable them to make data-driven decisions, transform crop management practices and enhance resource efficiency.</p>
<p>One of Corteva's notable AI tools, Granular Insights, harnesses the power of AI to compile and analyze data from various sources, including field and crop sensors, drones, and satellites. By integrating and processing this diverse data, Granular Insights provides farmers with valuable insights and recommendations for optimizing their farm management practices.</p>
<p>For instance, Granular Insights analyzes agricultural machinery data, satellite imagery, and financial information regarding crop prices to calculate profitability on a field-by-field basis, allowing farmers to strategically adjust their practices to maximize crop yields and minimize resource costs. These insights also help farmers make precise decisions about water usage, pesticide application, and fertilizer allocation, therefore, reducing their environmental impact and fostering long-term sustainability.</p>
<h3>Corteva&rsquo;s Granular Insights Tool</h3>
<p><img loading="lazy" class="img-responsive w-100" src="https://www.vaneck.com/contentassets/3f484848ff97427a8d75d6a16ee0ca47/3342_ai-resource-transition_image-2_2023.jpg" alt="Corteva's Granular Insights Tool" /></p>
<p class="chart-disclosure"><strong>Source: Corteva.</strong></p>
<p>AI is poised to maximize synergies, minimize risks, and capture upside in the natural resource sectors. Whether mining green metals, deploying renewable energy technologies, or managing agricultural practices, AI has the potential to revolutionize sectors and thereby accelerate the energy transition.</p>
<p>To receive more <a href="/us/en/insights/natural-resources/" title="Natural Resources Insights"><strong>Natural Resources</strong></a> insights, <a href="https://www.vaneck.com/us/en/subscribe/" title="Subscription Center"><strong>sign up in our subscription center</strong></a>.</p>
]]></content:encoded>
</item><item rdf:about="https://www.vaneck.com/us/en/blogs/income-investing/rising-stars-have-liftoff/">
  <title>Rising Stars Have Liftoff></title>
  <link>https://www.vaneck.com/us/en/blogs/income-investing/rising-stars-have-liftoff/</link>
  <description><![CDATA[Significant rising star activity reduced Energy and Automotive sector Index weights in May.]]></description>
  <dc:creator>Nicolas  Fonseca, CFA</dc:creator>
  <dc:date>06/14/2023 06:30:00</dc:date>
<content:encoded><![CDATA[

<p>Fallen angels (as represented by the ICE US Fallen Angel High Yield 10% Constrained Index, &ldquo;H0CF&rdquo;) underperformed broad HY (as represented by the ICE BofA US High Yield Index, &ldquo;H0A0&rdquo;) by 0.21% (-1.16% vs -0.95%) in May and are now lagging by 0.70% YTD (3.03% vs 3.73%). The year&rsquo;s trend of lower quality outperforming higher rated peers continued in May, despite all high yield rating buckets posting negative returns as yield rose and spreads widened, mostly due to the uncertainty about the U.S. debt ceiling which was resolved in the first few days of June.</p>
<p>Fixed income U.S. listed ETFs saw approximately $14bn in inflows during May, with the majority of inflows into Multi-Sector and Treasury products and outflows from High Yield (~$2bn) and Loans. The intermediate duration bucket continues to gather flows with money flowing into the long part of the curve.</p>
<p>The main fallen angel story in May was the upgrades to investment grade, and accompanying exit, of three issuers from the Index (&ldquo;rising stars&rdquo;). The fallen angel Index saw more than $20bn of par value (approximately 17.4% of the market value) exit the Index as Occidental Petroleum (OXY), Nissan and Mattel were upgraded to investment grade over the course of the month.</p>
<ul class="content-list">
<li>Fitch upgraded OXY to investment grade earlier in the month, stating that the main driver was the improvement in midcycle credit metrics, stemming from the combination of incremental de-leveraging, along with anticipated improvements in midcycle earnings in the chemicals and midstream segments. The upgrade was widely expected, as in March, Moody&rsquo;s upgraded OXY alongside Western Midstream on the heels of improved credit metrics. Both upgrades showed the continued efforts from the companies to return to investment grade status after their respective downgrades in April 2020. OXY entered the Index at a par weighted price of $71.76 and exited at $93.82, providing a double-digit price return over the 37 months in the Index. OXY was also the top contributor to outperformance over the broad high yield index over the same time period, approximately double the next closest issuer.</li>
<li>A recent fallen angel &ndash; Nissan &ndash; exited the Index at the end of May. Fitch gave it a BBB- rating in late April after it had withdrawn it back in 2018, resulting in an average investment grade rating. Nissan entered the Index at 8% in March 2023, increasing Auto exposure into the high teens. The removal of Nissan brings the sector back down to 10%, with Ford as the only issuer in the Auto space. Ford, like OXY, is included in many sell side forecasts as a potential rising star. Nissan&rsquo;s return is not as impressive as OXY, as it was only part of the Index for two months. It entered with a $91.05 price and exited at $87.37.</li>
<li>The third issuer that exited the Index in May was Mattel. S&amp;P&rsquo;s upgrade to investment grade was due to Mattel reporting strong underlying fundamentals in the first quarter. Mattel reported market share gains in all three core product categories, outpacing the toy industry. S&amp;P stated that it is confident that Mattel's recovery over the past few years is largely sustainable. Mattel had been in the Consumer Goods sector since November 2017 when it entered at a 1.3% weight and despite posting a negative price return (entered at $97.46; exited at $85.32), it provided higher than average spreads and yields than the Consumer Goods sector as a whole, which meant a 22% cumulative total return (8% higher than the sector).</li>
</ul>
<p><u><strong>Fallen Angels Overall Statistics:</strong></u> Fallen angels yields increased, alongside all fixed income instruments, in May by 41bps while broad HY yields increased by 42bps. The fallen angels yield of 7.55 is the highest it&rsquo;s been since November 2022 and it&rsquo;s approximately 200bps above the 3, 5 and 10-year average, continuing to offer a strong cushion to returns going forward, even in a spread widening environment. Spreads widened by 13bps in May for fallen angels and continue to be just shy of the 5 and 10-year average (by only 14bps and 27bps, respectively) while already above the 3-year average by 17bps. The era of low yields appears to be long gone, which may continue to benefit fixed income investors for the foreseeable future.</p>
<p>Duration shortened by 24bps as the issuers upgraded had, on average, much longer duration (OXY 7.84, Nissan 3.75 and Mattel 10.43) than the Index. The market value of the Index decreased due to these upgrades, dipping below $100bn for the first time. The previous times the Index was close to $100bn, which has occurred twice (November 2008 and September 2019), it increased over the following months as a there were significant downgrades. The forward cumulative total returns for the fallen angel index after those two instances were 85% (1Y), 123% (2Y) and 128% (3Y) after November 2008 and 8% (1Y), 26% (2Y) and 5% (3Y) after September 2019 and it outperformed broad high yield by an average of 27% (November 2008) and 8% (September 2019).</p>
<div class="wrapped-div">
<table style="width: 100%;">
<tbody>
<tr class="tbl-data">
<td class="tbl-header last text-center">&nbsp;</td>
<td class="tbl-header last text-center" style="border-right: outset;" colspan="4">Fallen Angel</td>
<td class="tbl-header last text-center" colspan="4">Broad HY</td>
</tr>
<tr class="tbl-data">
<td class="data-head last">&nbsp;</td>
<td class="data-head last">12/31/22</td>
<td class="data-head last">3/31/23</td>
<td class="data-head last">4/30/23</td>
<td class="data-head last" style="border-right: outset;">5/31/23</td>
<td class="data-head last">12/31/22</td>
<td class="data-head last">3/31/23</td>
<td class="data-head last">4/30/23</td>
<td class="data-head last">5/31/23</td>
</tr>
<tr class="tbl-data">
<td class="data-td last">Yield to Worst</td>
<td class="data-td data last">7.49</td>
<td class="data-td data last">7.08</td>
<td class="data-td data last">7.14</td>
<td class="data-td data last" style="border-right: outset;">7.55</td>
<td class="data-td data last">8.89</td>
<td class="data-td data last">8.49</td>
<td class="data-td data last">8.41</td>
<td class="data-td data last">8.83</td>
</tr>
<tr class="tbl-data">
<td class="data-td last">Effective Duration</td>
<td class="data-td data last">5.45</td>
<td class="data-td data last">5.30</td>
<td class="data-td data last">5.27</td>
<td class="data-td data last" style="border-right: outset;">5.03</td>
<td class="data-td data last">4.04</td>
<td class="data-td data last">3.83</td>
<td class="data-td data last">3.77</td>
<td class="data-td data last">3.74</td>
</tr>
<tr class="tbl-data">
<td class="data-td last">Full Market Value ($mn)</td>
<td class="data-td data last">112,854</td>
<td class="data-td data last">114,776</td>
<td class="data-td data last">110,309</td>
<td class="data-td data last" style="border-right: outset;">89,471</td>
<td class="data-td data last">1,199,909</td>
<td class="data-td data last">1,234,319</td>
<td class="data-td data last">1,234,778</td>
<td class="data-td data last">1,201,971</td>
</tr>
<tr class="tbl-data">
<td class="data-td last">OAS</td>
<td class="data-td data last">337</td>
<td class="data-td data last">325</td>
<td class="data-td data last">332</td>
<td class="data-td data last" style="border-right: outset;">345</td>
<td class="data-td data last">481</td>
<td class="data-td data last">458</td>
<td class="data-td data last">453</td>
<td class="data-td data last">469</td>
</tr>
<tr class="tbl-data">
<td class="data-td last">No. of Issues</td>
<td class="data-td data last">212</td>
<td class="data-td data last">206</td>
<td class="data-td data last">203</td>
<td class="data-td data last" style="border-right: outset;">172</td>
<td class="data-td data last">1,927</td>
<td class="data-td data last">1,916</td>
<td class="data-td data last">1,912</td>
<td class="data-td data last">1,876</td>
</tr>
</tbody>
</table>
</div>
<br />
<p class="chart-disclosure"><strong>Source: ICE Data Services, VanEck.</strong> Fallen Angels: ICE US Fallen Angel High Yield 10% Constrained Index. Broad HY: ICE BofA US High Yield Index. OAS refers to &ldquo;option-adjusted spread.&rdquo; Please see definition for this and other terms referenced herein in the disclosures and definitions portion of this blog. Past performance is no guarantee of future results. Index performance is not representative of fund performance. It is not possible to invest in an index.</p>
<p><u><strong>New Fallen Angels:</strong></u> No new fallen angels in May.</p>
<div class="wrapped-div">
<table style="width: 100%;">
<tbody>
<tr class="tbl-data">
<td class="tbl-header   last  ">Month-end Addition</td>
<td class="tbl-header last text-center">Name</td>
<td class="tbl-header last text-center">Rating</td>
<td class="tbl-header last text-center">Sector</td>
<td class="tbl-header last text-center">Industry</td>
<td class="tbl-header last text-center">% Mkt Value</td>
<td class="tbl-header last text-center">Price</td>
</tr>
<tr class="tbl-data">
<td class="data-td font-weight-normal last">February</td>
<td class="data-td data last">Entegris Escrow Corp</td>
<td class="data-td data last">BB1</td>
<td class="data-td data last">Technology &amp; Electronics</td>
<td class="data-td data last">Electronics</td>
<td class="data-td data last">1.39</td>
<td class="data-td data last">90.92</td>
</tr>
<tr class="tbl-data">
<td class="data-td font-weight-normal last">March</td>
<td class="data-td data last">First Republic Bank</td>
<td class="data-td data last">B3</td>
<td class="data-td data last">Banking</td>
<td class="data-td data last">0.40</td>
<td class="data-td data last">54.63</td>
</tr>
<tr class="tbl-data">
<td class="data-td font-weight-normal last">March</td>
<td class="data-td data last">Nissan Motor Acceptance</td>
<td class="data-td data last">BB1</td>
<td class="data-td data last">Automotive</td>
<td class="data-td data last">Auto Loans</td>
<td class="data-td data last">2.57</td>
<td class="data-td data last">87.19</td>
</tr>
<tr class="tbl-data">
<td class="data-td font-weight-normal last">March</td>
<td class="data-td data last">Nissan Motor</td>
<td class="data-td data last">BB1</td>
<td class="data-td data last">Automotive</td>
<td class="data-td data last">Automakers</td>
<td class="data-td data last">5.49</td>
<td class="data-td data last">92.98</td>
</tr>
<tr class="tbl-data">
<td class="data-td font-weight-normal last">April</td>
<td class="data-td data last">Crane NXT</td>
<td class="data-td data last">BB3</td>
<td class="data-td data last">Capital Goods</td>
<td class="data-td data last">Diversified Capital Goods</td>
<td class="data-td data last">0.24</td>
<td class="data-td data last">70.99</td>
</tr>
<tr class="tbl-data">
<td class="data-td font-weight-normal last">April</td>
<td class="data-td data last">Rogers Communications</td>
<td class="data-td data last">BB2</td>
<td class="data-td data last">Telecommunications</td>
<td class="data-td data last">Telecom - Wireless</td>
<td class="data-td data last">0.65</td>
<td class="data-td data last">90.35</td>
</tr>
<tr class="tbl-data">
<td class="data-td font-weight-normal last">April</td>
<td class="data-td data last">Western Alliance Bancorporation</td>
<td class="data-td data last">BB1</td>
<td class="data-td data last">Banking</td>
<td class="data-td data last">0.44</td>
<td class="data-td data last">76.39</td>
</tr>
</tbody>
</table>
</div>
<br />
<p class="chart-disclosure"><strong>Source: ICE Data Services, VanEck</strong>. Fallen Angels: ICE US Fallen Angel High Yield 10% Constrained Index. Past performance is no guarantee of future results. Not a recommendation to buy or sell any of the names/securities mentioned herein. Index performance is not representative of fund performance. It is not possible to invest in an index.</p>
<p><u><strong>Rising Stars:</strong></u> As mentioned above, multiple rising stars in May removed 17.33% of the Index. OXY and Nissan joined Sprint, Western Midstream and Kraft as the biggest rising stars over the last 2 years. At a 10% weight, Ford remains the largest issuer in the Index and is also expected by many sell side research desks to be upgraded at some point in the future.</p>
<div class="wrapped-div">
<table style="width: 100%;">
<tbody>
<tr class="tbl-data">
<td class="tbl-header last ">Month-end Exit</td>
<td class="tbl-header last text-center">Name</td>
<td class="tbl-header last text-center">Rating</td>
<td class="tbl-header last text-center">Sector</td>
<td class="tbl-header last text-center">Industry</td>
<td class="tbl-header last text-center">% Mkt Value</td>
<td class="tbl-header last text-center">Price</td>
</tr>
<tr class="tbl-data">
<td class="data-td font-weight-normal last">February</td>
<td class="data-td data last">Autopistas Metropolitanas de Puerto Rico LLC</td>
<td class="data-td data last">BB1</td>
<td class="data-td data last">Transportation</td>
<td class="data-td data last">Transport Infrastructure/Services</td>
<td class="data-td data last">0.35</td>
<td class="data-td data last">100.49</td>
</tr>
<tr class="tbl-data">
<td class="data-td font-weight-normal last">February</td>
<td class="data-td data last">Nokia Corp</td>
<td class="data-td data last">BB1</td>
<td class="data-td data last">Technology &amp; Electronics</td>
<td class="data-td data last">Tech Hardware &amp; Equipment</td>
<td class="data-td data last">0.47</td>
<td class="data-td data last">97.50</td>
</tr>
<tr class="tbl-data">
<td class="data-td font-weight-normal last">March</td>
<td class="data-td data last">Western Midstream</td>
<td class="data-td data last">BB1</td>
<td class="data-td data last">Energy</td>
<td class="data-td data last">Gas Distribution</td>
<td class="data-td data last">5.27</td>
<td class="data-td data last">90.44</td>
</tr>
<tr class="tbl-data">
<td class="data-td font-weight-normal last">April</td>
<td class="data-td data last">Sprint Capital Corp</td>
<td class="data-td data last">BB1</td>
<td class="data-td data last">Telecommunications</td>
<td class="data-td data last">Telecom - Wireless</td>
<td class="data-td data last">4.70</td>
<td class="data-td data last">114.25</td>
</tr>
<tr class="tbl-data">
<td class="data-td font-weight-normal last">May</td>
<td class="data-td data last">Mattel Inc.</td>
<td class="data-td data last">BB2</td>
<td class="data-td data last">Consumer Goods</td>
<td class="data-td data last">Personal &amp; Household Products</td>
<td class="data-td data last">0.45</td>
<td class="data-td data last">85.32</td>
</tr>
<tr class="tbl-data">
<td class="data-td font-weight-normal last">May</td>
<td class="data-td data last">Nissan Motor Acceptance</td>
<td class="data-td data last">BB1</td>
<td class="data-td data last">Automotive</td>
<td class="data-td data last">Auto Loans</td>
<td class="data-td data last">2.67</td>
<td class="data-td data last">85.12</td>
</tr>
<tr class="tbl-data">
<td class="data-td font-weight-normal last">May</td>
<td class="data-td data last">Nissan Motor</td>
<td class="data-td data last">BB1</td>
<td class="data-td data last">Automotive</td>
<td class="data-td data last">Automakers</td>
<td class="data-td data last">5.57</td>
<td class="data-td data last">88.49</td>
</tr>
<tr class="tbl-data">
<td class="data-td font-weight-normal last">May</td>
<td class="data-td data last">Occidental Petroleum Corp</td>
<td class="data-td data last">BB1</td>
<td class="data-td data last">Energy</td>
<td class="data-td data last">Energy - Exploration &amp; Production</td>
<td class="data-td data last">8.69</td>
<td class="data-td data last">93.82</td>
</tr>
</tbody>
</table>
</div>
<br />
<p class="chart-disclosure"><strong>Source: ICE Data Services, VanEck</strong>. Past performance is no guarantee of future results. Not a recommendation to buy or sell any of the names/securities mentioned herein. Index performance is not representative of fund performance. It is not possible to invest in an index.</p>
<p><u><strong>Fallen Angels Performance by Sector:</strong></u> Sector exposures continues to change following the shakeups of the last couple of months. With the exit of OXY, Energy sector weight dropped from 23.44% to 18.34%. Energy continues to be the highest exposure in the Index but has been cut almost 50% from its peak. Nissan, a short-lived fallen angel, reduced Auto exposure from 18.24% to 10.00%, resulting in Leisure becoming the second largest exposure with a weight of 10.13%, with Las Vegas Sands at 45% of the sector. In terms of performance, only three sectors posted positive returns in May (Retail, Tech and Transportation) and the Banking sector continues to be the only one with negative YTD returns. First Republic Bank was removed from the Index as rating agencies withdrew their credit rating after the announcement of the Bank&rsquo;s closure by the California Department of Financial Protection and Innovation and appointment of the Federal Deposit Insurance Corporation (FDIC) as receiver. In terms of sector attribution vs broad high yield, underweights Healthcare and Telecom contributed the most while Energy and Banking were top detractors for May. In terms of bond prices, the average Index price dipped down into the mid $80s as the $70s bucket saw an increase from 0% on April 30 to 13.49% on May 31, which is the highest it&rsquo;s been this year.</p>
<div class="wrapped-div">
<table style="width: 100%;">
<tbody>
<tr class="tbl-data">
<td class="tbl-header last text-center">&nbsp;</td>
<td class="tbl-header last text-center" style="border-right: outset;" colspan="4">Wgt (%)</td>
<td class="tbl-header last text-center" style="border-right: outset;" colspan="4">OAS</td>
<td class="tbl-header last text-center" style="border-right: outset;" colspan="4">Price</td>
<td class="tbl-header last text-center">Total<br />Return<br />(%)</td>
</tr>
<tr class="tbl-data">
<td class="data-td last">&nbsp;</td>
<td class="data-head last">12/31/21</td>
<td class="data-head last">3/31/23</td>
<td class="data-head last">4/30/23</td>
<td class="data-head last" style="border-right: outset;">5/31/23</td>
<td class="data-head last">12/31/21</td>
<td class="data-head last">3/31/23</td>
<td class="data-head last">4/30/23</td>
<td class="data-head last" style="border-right: outset;">5/31/23</td>
<td class="data-head last">12/31/21</td>
<td class="data-head last">3/31/23</td>
<td class="data-head last">4/30/23</td>
<td class="data-head last" style="border-right: outset;">5/31/23</td>
<td class="data-head last">MTD</td>
</tr>
<tr class="tbl-data">
<td class="data-td last">Automotive</td>
<td class="data-td data last">10.00</td>
<td class="data-td data last">18.06</td>
<td class="data-td data last">18.29</td>
<td class="data-td data last" style="border-right: outset;">10.00</td>
<td class="data-td data last">262</td>
<td class="data-td data last">246</td>
<td class="data-td data last">280</td>
<td class="data-td data last" style="border-right: outset;">259</td>
<td class="data-td data last">91.35</td>
<td class="data-td data last">92.21</td>
<td class="data-td data last">91.08</td>
<td class="data-td data last" style="border-right: outset;">91.86</td>
<td class="data-td data last">-1.05</td>
</tr>
<tr class="tbl-data">
<td class="data-td last">Banking</td>
<td class="data-td data last">3.81</td>
<td class="data-td data last">3.99</td>
<td class="data-td data last">4.44</td>
<td class="data-td data last" style="border-right: outset;">5.32</td>
<td class="data-td data last">302</td>
<td class="data-td data last">415</td>
<td class="data-td data last">402</td>
<td class="data-td data last" style="border-right: outset;">356</td>
<td class="data-td data last">96.85</td>
<td class="data-td data last">87.61</td>
<td class="data-td data last">82.73</td>
<td class="data-td data last" style="border-right: outset;">90.29</td>
<td class="data-td data last">-6.30</td>
</tr>
<tr class="tbl-data">
<td class="data-td last">Basic Industry</td>
<td class="data-td data last">1.36</td>
<td class="data-td data last">1.33</td>
<td class="data-td data last">1.41</td>
<td class="data-td data last" style="border-right: outset;">1.78</td>
<td class="data-td data last">226</td>
<td class="data-td data last">227</td>
<td class="data-td data last">232</td>
<td class="data-td data last" style="border-right: outset;">221</td>
<td class="data-td data last">92.17</td>
<td class="data-td data last">93.85</td>
<td class="data-td data last">94.21</td>
<td class="data-td data last" style="border-right: outset;">93.25</td>
<td class="data-td data last">-0.64</td>
</tr>
<tr class="tbl-data">
<td class="data-td last">Capital Goods</td>
<td class="data-td data last">5.12</td>
<td class="data-td data last">5.10</td>
<td class="data-td data last">5.59</td>
<td class="data-td data last" style="border-right: outset;">7.09</td>
<td class="data-td data last">279</td>
<td class="data-td data last">240</td>
<td class="data-td data last">243</td>
<td class="data-td data last" style="border-right: outset;">240</td>
<td class="data-td data last">95.01</td>
<td class="data-td data last">98.54</td>
<td class="data-td data last">97.31</td>
<td class="data-td data last" style="border-right: outset;">96.09</td>
<td class="data-td data last">-0.83</td>
</tr>
<tr class="tbl-data">
<td class="data-td last">Consumer Goods</td>
<td class="data-td data last">3.07</td>
<td class="data-td data last">3.00</td>
<td class="data-td data last">3.12</td>
<td class="data-td data last" style="border-right: outset;">3.26</td>
<td class="data-td data last">275</td>
<td class="data-td data last">255</td>
<td class="data-td data last">307</td>
<td class="data-td data last" style="border-right: outset;">381</td>
<td class="data-td data last">88.90</td>
<td class="data-td data last">91.27</td>
<td class="data-td data last">90.39</td>
<td class="data-td data last" style="border-right: outset;">86.69</td>
<td class="data-td data last">-3.84</td>
</tr>
<tr class="tbl-data">
<td class="data-td last">Energy</td>
<td class="data-td data last">27.93</td>
<td class="data-td data last">22.16</td>
<td class="data-td data last">23.44</td>
<td class="data-td data last" style="border-right: outset;">18.34</td>
<td class="data-td data last">293</td>
<td class="data-td data last">303</td>
<td class="data-td data last">293</td>
<td class="data-td data last" style="border-right: outset;">343</td>
<td class="data-td data last">88.13</td>
<td class="data-td data last">90.05</td>
<td class="data-td data last">91.04</td>
<td class="data-td data last" style="border-right: outset;">86.48</td>
<td class="data-td data last">-1.66</td>
</tr>
<tr class="tbl-data">
<td class="data-td last">Financial Services</td>
<td class="data-td data last">0.65</td>
<td class="data-td data last">0.64</td>
<td class="data-td data last">0.68</td>
<td class="data-td data last" style="border-right: outset;">0.84</td>
<td class="data-td data last">540</td>
<td class="data-td data last">506</td>
<td class="data-td data last">512</td>
<td class="data-td data last" style="border-right: outset;">547</td>
<td class="data-td data last">77.20</td>
<td class="data-td data last">80.27</td>
<td class="data-td data last">80.68</td>
<td class="data-td data last" style="border-right: outset;">77.78</td>
<td class="data-td data last">-3.01</td>
</tr>
<tr class="tbl-data">
<td class="data-td last">Healthcare</td>
<td class="data-td data last">3.02</td>
<td class="data-td data last">3.03</td>
<td class="data-td data last">3.23</td>
<td class="data-td data last" style="border-right: outset;">4.02</td>
<td class="data-td data last">362</td>
<td class="data-td data last">304</td>
<td class="data-td data last">303</td>
<td class="data-td data last" style="border-right: outset;">311</td>
<td class="data-td data last">83.56</td>
<td class="data-td data last">86.47</td>
<td class="data-td data last">87.63</td>
<td class="data-td data last" style="border-right: outset;">85.97</td>
<td class="data-td data last">-1.43</td>
</tr>
<tr class="tbl-data">
<td class="data-td last">Insurance</td>
<td class="data-td data last">0.85</td>
<td class="data-td data last">0.82</td>
<td class="data-td data last">0.85</td>
<td class="data-td data last" style="border-right: outset;">1.08</td>
<td class="data-td data last">347</td>
<td class="data-td data last">364</td>
<td class="data-td data last">375</td>
<td class="data-td data last" style="border-right: outset;">375</td>
<td class="data-td data last">92.10</td>
<td class="data-td data last">92.99</td>
<td class="data-td data last">93.01</td>
<td class="data-td data last" style="border-right: outset;">91.88</td>
<td class="data-td data last">-0.67</td>
</tr>
<tr class="tbl-data">
<td class="data-td last">Leisure</td>
<td class="data-td data last">7.88</td>
<td class="data-td data last">7.79</td>
<td class="data-td data last">7.92</td>
<td class="data-td data last" style="border-right: outset;">10.13</td>
<td class="data-td data last">325</td>
<td class="data-td data last">243</td>
<td class="data-td data last">244</td>
<td class="data-td data last" style="border-right: outset;">237</td>
<td class="data-td data last">89.95</td>
<td class="data-td data last">93.25</td>
<td class="data-td data last">93.67</td>
<td class="data-td data last" style="border-right: outset;">93.22</td>
<td class="data-td data last">-0.01</td>
</tr>
<tr class="tbl-data">
<td class="data-td last">Real Estate</td>
<td class="data-td data last">5.13</td>
<td class="data-td data last">4.72</td>
<td class="data-td data last">4.93</td>
<td class="data-td data last" style="border-right: outset;">5.61</td>
<td class="data-td data last">697</td>
<td class="data-td data last">701</td>
<td class="data-td data last">716</td>
<td class="data-td data last" style="border-right: outset;">717</td>
<td class="data-td data last">79.46</td>
<td class="data-td data last">80.72</td>
<td class="data-td data last">80.39</td>
<td class="data-td data last" style="border-right: outset;">78.73</td>
<td class="data-td data last">-0.02</td>
</tr>
<tr class="tbl-data">
<td class="data-td last">Retail</td>
<td class="data-td data last">5.67</td>
<td class="data-td data last">5.49</td>
<td class="data-td data last">5.51</td>
<td class="data-td data last" style="border-right: outset;">7.04</td>
<td class="data-td data last">471</td>
<td class="data-td data last">474</td>
<td class="data-td data last">429</td>
<td class="data-td data last" style="border-right: outset;">413</td>
<td class="data-td data last">73.75</td>
<td class="data-td data last">74.72</td>
<td class="data-td data last">80.16</td>
<td class="data-td data last" style="border-right: outset;">79.89</td>
<td class="data-td data last">0.16</td>
</tr>
<tr class="tbl-data">
<td class="data-td last">Services</td>
<td class="data-td data last">0.38</td>
<td class="data-td data last">0.37</td>
<td class="data-td data last">0.39</td>
<td class="data-td data last" style="border-right: outset;">0.48</td>
<td class="data-td data last">388</td>
<td class="data-td data last">368</td>
<td class="data-td data last">401</td>
<td class="data-td data last" style="border-right: outset;">447</td>
<td class="data-td data last">87.11</td>
<td class="data-td data last">89.89</td>
<td class="data-td data last">89.00</td>
<td class="data-td data last" style="border-right: outset;">86.17</td>
<td class="data-td data last">-2.67</td>
</tr>
<tr class="tbl-data">
<td class="data-td last">Technology &amp; Electronics</td>
<td class="data-td data last">4.20</td>
<td class="data-td data last">4.67</td>
<td class="data-td data last">4.82</td>
<td class="data-td data last" style="border-right: outset;">5.77</td>
<td class="data-td data last">327</td>
<td class="data-td data last">287</td>
<td class="data-td data last">320</td>
<td class="data-td data last" style="border-right: outset;">303</td>
<td class="data-td data last">85.47</td>
<td class="data-td data last">88.19</td>
<td class="data-td data last">87.26</td>
<td class="data-td data last" style="border-right: outset;">86.59</td>
<td class="data-td data last">0.24</td>
</tr>
<tr class="tbl-data">
<td class="data-td last">Telecommunications</td>
<td class="data-td data last">11.91</td>
<td class="data-td data last">11.68</td>
<td class="data-td data last">7.80</td>
<td class="data-td data last" style="border-right: outset;">9.86</td>
<td class="data-td data last">423</td>
<td class="data-td data last">433</td>
<td class="data-td data last">533</td>
<td class="data-td data last" style="border-right: outset;">535</td>
<td class="data-td data last">90.04</td>
<td class="data-td data last">91.39</td>
<td class="data-td data last">83.60</td>
<td class="data-td data last" style="border-right: outset;">82.90</td>
<td class="data-td data last">-0.17</td>
</tr>
<tr class="tbl-data">
<td class="data-td last">Transportation</td>
<td class="data-td data last">2.10</td>
<td class="data-td data last">1.78</td>
<td class="data-td data last">1.85</td>
<td class="data-td data last" style="border-right: outset;">2.38</td>
<td class="data-td data last">279</td>
<td class="data-td data last">231</td>
<td class="data-td data last">199</td>
<td class="data-td data last" style="border-right: outset;">172</td>
<td class="data-td data last">90.49</td>
<td class="data-td data last">92.69</td>
<td class="data-td data last">93.73</td>
<td class="data-td data last" style="border-right: outset;">94.02</td>
<td class="data-td data last">0.64</td>
</tr>
<tr class="tbl-data">
<td class="data-td last">Utility</td>
<td class="data-td data last">6.93</td>
<td class="data-td data last">5.38</td>
<td class="data-td data last">5.76</td>
<td class="data-td data last" style="border-right: outset;">6.99</td>
<td class="data-td data last">213</td>
<td class="data-td data last">206</td>
<td class="data-td data last">180</td>
<td class="data-td data last" style="border-right: outset;">179</td>
<td class="data-td data last">89.95</td>
<td class="data-td data last">90.19</td>
<td class="data-td data last">91.99</td>
<td class="data-td data last" style="border-right: outset;">89.92</td>
<td class="data-td data last">-1.04</td>
</tr>
<tr class="tbl-data">
<td class="data-td last">Total</td>
<td class="data-td data last">100</td>
<td class="data-td data last" style="border-right: outset;">100</td>
<td class="data-td data last">337</td>
<td class="data-td data last">325</td>
<td class="data-td data last">332</td>
<td class="data-td data last" style="border-right: outset;">345</td>
<td class="data-td data last">87.91</td>
<td class="data-td data last">89.51</td>
<td class="data-td data last">89.07</td>
<td class="data-td data last" style="border-right: outset;">87.57</td>
<td class="data-td data last">-1.16</td>
</tr>
</tbody>
</table>
</div>
<br />
<p class="chart-disclosure"><strong>Source: ICE Data Services, VanEck</strong>. Fallen Angels: ICE US Fallen Angel High Yield 10% Constrained Index. Not intended as a recommendation to invest or divest in any of the sectors mentioned herein. Index performance is not representative of fund performance. It is not possible to invest in an index.</p>
<p><u><strong>Fallen Angels Performance by Rating:</strong></u> The Index&rsquo;s BB exposure decreased to the low 80s, and had a lower average price than single B rated bonds. This has only been observed 11 other times historically, and, has never lasted for more than four months (March 2013 thru June 2013). The still high exposure to BB bonds may begin displaying better price returns than lower rated peers. When this scenario last occurred, the 6-month average forward price return had been 3.1% for BBs vs -9.1% for Single-B, and the 12-month average forward price return was 10.9% vs 3.6%.</p>
<div class="wrapped-div">
<table style="width: 100%;">
<tbody>
<tr class="tbl-data">
<td class="tbl-header last text-center">&nbsp;</td>
<td class="tbl-header last text-center" style="border-right: outset;" colspan="4">Wgt (%)</td>
<td class="tbl-header last text-center" style="border-right: outset;" colspan="4">OAS</td>
<td class="tbl-header last text-center" style="border-right: outset;" colspan="4">Price</td>
<td class="tbl-header last text-center">Total<br />Return<br />(%)</td>
</tr>
<tr class="tbl-data">
<td class="data-td last">&nbsp;</td>
<td class="data-head last">12/31/22</td>
<td class="data-head last">3/31/23</td>
<td class="data-head last">4/30/23</td>
<td class="data-head last" style="border-right: outset;">5/31/23</td>
<td class="data-head last">12/31/22</td>
<td class="data-head last">3/31/23</td>
<td class="data-head last">4/30/23</td>
<td class="data-head last" style="border-right: outset;">5/31/23</td>
<td class="data-head last">12/31/22</td>
<td class="data-head last">3/31/23</td>
<td class="data-head last">4/30/23</td>
<td class="data-head last" style="border-right: outset;">5/31/23</td>
<td class="data-head last">MTD</td>
</tr>
<tr class="tbl-data">
<td class="data-td last">BB</td>
<td class="data-td data last">87.00</td>
<td class="data-td data last">87.08</td>
<td class="data-td data last">87.00</td>
<td class="data-td data last" style="border-right: outset;">83.82</td>
<td class="data-td data last">284</td>
<td class="data-td data last">281</td>
<td class="data-td data last">291</td>
<td class="data-td data last" style="border-right: outset;">305</td>
<td class="data-td data last">90.02</td>
<td class="data-td data last">91.51</td>
<td class="data-td data last">90.70</td>
<td class="data-td data last" style="border-right: outset;">88.57</td>
<td class="data-td data last">-1.32</td>
</tr>
<tr class="tbl-data">
<td class="data-td last">B</td>
<td class="data-td data last">10.95</td>
<td class="data-td data last">10.37</td>
<td class="data-td data last">10.25</td>
<td class="data-td data last" style="border-right: outset;">12.88</td>
<td class="data-td data last">608</td>
<td class="data-td data last">500</td>
<td class="data-td data last">480</td>
<td class="data-td data last" style="border-right: outset;">437</td>
<td class="data-td data last">82.50</td>
<td class="data-td data last">85.35</td>
<td class="data-td data last">85.62</td>
<td class="data-td data last" style="border-right: outset;">89.94</td>
<td class="data-td data last">-1.17</td>
</tr>
<tr class="tbl-data">
<td class="data-td last">CCC</td>
<td class="data-td data last">1.98</td>
<td class="data-td data last">2.50</td>
<td class="data-td data last">2.75</td>
<td class="data-td data last" style="border-right: outset;">3.29</td>
<td class="data-td data last">1,020</td>
<td class="data-td data last">1,014</td>
<td class="data-td data last">1,065</td>
<td class="data-td data last" style="border-right: outset;">1,000</td>
<td class="data-td data last">60.88</td>
<td class="data-td data last">64.60</td>
<td class="data-td data last">62.44</td>
<td class="data-td data last" style="border-right: outset;">62.84</td>
<td class="data-td data last">3.90</td>
</tr>
<tr class="tbl-data">
<td class="data-td last">CC</td>
<td class="data-td data last">&nbsp;</td>
<td class="data-td data last">0.04</td>
<td class="data-td data last">&nbsp;</td>
<td class="data-td data last" style="border-right: outset;">&nbsp;</td>
<td class="data-td data last">&nbsp;</td>
<td class="data-td data last">6,713</td>
<td class="data-td data last">&nbsp;</td>
<td class="data-td data last" style="border-right: outset;">&nbsp;</td>
<td class="data-td data last">&nbsp;</td>
<td class="data-td data last">7.16</td>
<td class="data-td data last">&nbsp;</td>
<td class="data-td data last" style="border-right: outset;">&nbsp;</td>
<td class="data-td data last">&nbsp;</td>
</tr>
<tr class="tbl-data">
<td class="data-td last">D</td>
<td class="data-td data last">0.07</td>
<td class="data-td data last">&nbsp;</td>
<td class="data-td data last" style="border-right: outset;">&nbsp;</td>
<td class="data-td data last">4,726</td>
<td class="data-td data last">&nbsp;</td>
<td class="data-td data last" style="border-right: outset;">&nbsp;</td>
<td class="data-td data last">10.00</td>
<td class="data-td data last">&nbsp;</td>
<td class="data-td data last" style="border-right: outset;">&nbsp;</td>
<td class="data-td data last">&nbsp;</td>
</tr>
<tr class="tbl-data">
<td class="data-td last">Total</td>
<td class="data-td data last">100</td>
<td class="data-td data last" style="border-right: outset;">100</td>
<td class="data-td data last">337</td>
<td class="data-td data last">325</td>
<td class="data-td data last">332</td>
<td class="data-td data last" style="border-right: outset;">345</td>
<td class="data-td data last">87.91</td>
<td class="data-td data last">89.51</td>
<td class="data-td data last">89.07</td>
<td class="data-td data last" style="border-right: outset;">87.57</td>
<td class="data-td data last">-1.16</td>
</tr>
</tbody>
</table>
</div>
<br />
<p class="chart-disclosure"><strong>Source: ICE Data Services, VanEck.</strong> Fallen Angels: ICE US Fallen Angel High Yield 10% Constrained Index. Past performance is no guarantee of future results. Index performance is not representative of fund performance. It is not possible to invest in an index.</p>
<p>To receive more <a href="https://www.vaneck.com/us/en/insights/income-investing/" title="Income Investing insights"><strong>Income Investing</strong></a> insights, <a href="/link/5f45412c2143400497908cea2897f7d3.aspx" title=" Subscription Center"><strong>sign up in our subscription center</strong></a>.</p>
<style type="text/css">.wrapped-div {
        max-width: 100%;
    }

    @media (max-width: 1024px) {
        .wrapped-div {
            overflow-x: scroll;
        }
    }

    .wrapped-div-sector {
        max-width: 100%;
        overflow-x: scroll;
    }
</style>
]]></content:encoded>
</item><item rdf:about="https://www.vaneck.com/us/en/blogs/gold-investing/gold-price-target-set-at-2075-record-level/">
  <title>New Levels in Sight for Gold></title>
  <link>https://www.vaneck.com/us/en/blogs/gold-investing/gold-price-target-set-at-2075-record-level/</link>
  <description><![CDATA[Geopolitical tensions, lower U.S. dollar exposure in EM and a possible U.S. recession drive our gold price target. We make the case for gold reaching $2,075 and maintaining a higher floor price.]]></description>
  <dc:creator>Imaru Casanova</dc:creator>
  <dc:date>06/14/2023 06:30:00</dc:date>
<content:encoded><![CDATA[

<h2>Tail risks have aided gold&rsquo;s sidewise rise</h2>
<p>Gold has been in a bull market for over seven years, rising 87% from its secular low in December 2015. However, unlike the steady and predictable bull market of the 2000s, this bull moves up, down and sideways in fits and turns that makes price targeting next to impossible.</p>
<h3>Gold&rsquo;s long and winding path to $2,000</h3>
<p><img class="img-responsive w-100" src="https://www.vaneck.com/contentassets/f31677a2892844368f5d4158ce406e91/3343_gold_chart-01_2023.06_blog.svg" alt="Gold's long and winding path to $2,000" /></p>
<p class="chart-disclosure"><strong>Source: Bloomberg. Data as of June 2023.</strong> Past performance is no guarantee of future results.</p>
<p>The main drivers of past gold bull markets are extraordinary tail risks and a falling dollar. We are living in an age of tail risks as the world goes through sickness, war, social disorder and financial stress that most people thought were relegated to the past. The level of tail risks today are at least as significant as past bull markets.</p>
<p>The key difference in the current bull is the strength of the U.S. dollar. Gold has an inverse correlation with the dollar. The 2000s gold bull market saw the U.S. Dollar Index (DXY)<sup>1</sup>&nbsp;decline 40%, while in the seventies the dollar fell 30%. However, since gold bottomed in 2015, the DXY has risen 6.4%. The gains in gold brought on by increasing risks have been muted by dollar strength.</p>
<h3>Dollar strength hasn&rsquo;t helped</h3>
<p><img class="img-responsive w-100" src="https://www.vaneck.com/contentassets/f31677a2892844368f5d4158ce406e91/3343_gold_chart-02_2023.06_blog.svg" alt="Dollar strength hasn't helped" /></p>
<p class="chart-disclosure"><strong>Source: Bloomberg. Data as of June 2023.</strong> Past performance is no guarantee of future results.</p>
<h2>Gold keeps testing highs again and again (&hellip;and again)</h2>
<p>A pattern has emerged in the gold price chart that reflects these opposing drivers. For over three years gold has traded in a range between $1,700 per ounce and the all-time high of $2,075 per ounce. Gold has tested the high three times, but failed each time. In 2020, the dollar and gold rose and fell in tandem with the COVID outbreak and subsequent massive fiscal and monetary response. Gold retested the high in 2022 during the Russian invasion of Ukraine, but fell back on dollar strength., The high was tested again in 2023 with the Silicon Valley Bank (SVB) banking crisis, but has pulled back recently on dollar strength. Three failed breakouts have damaged investor sentiment towards gold.</p>
<h3>Gold&rsquo;s already attempted several breakouts</h3>
<p><img class="img-responsive w-100" src="https://www.vaneck.com/contentassets/f31677a2892844368f5d4158ce406e91/3343_gold_chart-03_2023.06_blog.svg" alt="Gold's already attempted several breakouts" /></p>
<p class="chart-disclosure"><strong>Source: Bloomberg. Data as of June 2023</strong>. Past performance is no guarantee of future results.</p>
<p>The gold price is currently testing the base of its recent up-trend at around $1,950 per ounce. If the near-term base holds, gold will soon have another chance to make new highs. If it fails, gold will retreat once again to its sideways range.</p>
<h2>The case for $2,075</h2>
<p>There are a number of reasons we believe gold can again test the highs and in the longer term, maintain a higher floor price.</p>
<ul class="content-list">
<li><strong>More risk events are likely.</strong> Geopolitical tensions continue to escalate as countries choose sides between east and west. Meanwhile financial risks are also high. So far, rising rates have exposed black swans in the UK pension system and among mid-tier U.S. banks. The U.S. Federal Reserve (Fed) has indicated rates could remain elevated for an extended period.</li>
<li><strong>There is reason to believe the dollar will be less of a headwind to gold.</strong> The Fed is probably nearing the end of its rate hiking cycle. Many emerging markets countries are increasing their gold reserves and increasing trade in local currencies in an effort to decrease their exposure to the U.S. dollar. The Fed is in the process of reducing its balance sheet, which holds trillions in Treasuries. Central banks globally have also been reducing their Treasury exposure.</li>
<li><strong>Recession.</strong> Lastly, the U.S. entered a manufacturing recession in 2023 and tightening credit markets could push the entire economy into recession.</li>
</ul>
<p>The 2023 banking crisis rally is unique for gold because it occurred without significant inflows to the bullion ETFs. It seems ETF investors remained on the sidelines, fearful of another failed rally, while specs and central banks drove the gold price to its high in May. We believe positive sentiment will return to the gold space once new highs are established and investors regain confidence in the gold market.</p>
<h3>What happens if investment demand picks back up?</h3>
<p><strong>Gold Price ($/oz) vs. Total Known ETF Holdings of Gold (Million oz)</strong></p>
<p><img class="img-responsive w-100" src="https://www.vaneck.com/contentassets/f31677a2892844368f5d4158ce406e91/3343_gold_chart-04_2023.06_blog.svg" alt="What happens if investment demand picks back up?" /></p>
<p class="chart-disclosure"><strong>Source: Bloomberg. Data as of June 2023</strong>.</p>
<p>To receive more insights to <strong><a href="https://www.vaneck.com/us/en/insights/gold-investing/" title="Gold Investing Insights">Gold Investing</a></strong> insights, <strong><a href="https://www.vaneck.com/us/en/subscribe/" title="Subscription Center">sign up in our subscription center</a></strong>.</p>
<!-- Hide alreat promo banner. Make height 0 to account for the HeaderHeightCalculation scripts -->
<style>
header.site-header .alert-bar {
    display:none!important;
    height: 0!important;
    overflow:hidden!important;
}
</style>
]]></content:encoded>
</item><item rdf:about="https://www.vaneck.com/us/en/blogs/gold-investing/ima-casanova-gold-high-remains-in-reach/">
  <title>Gold High Remains In Reach></title>
  <link>https://www.vaneck.com/us/en/blogs/gold-investing/ima-casanova-gold-high-remains-in-reach/</link>
  <description><![CDATA[Gold started May strong, but dipped due, in part, to a strong dollar and market uncertainty. We see a macro backdrop that continues to be supportive of gold in the longer term.]]></description>
  <dc:creator>Imaru Casanova</dc:creator>
  <dc:date>06/13/2023 06:30:00</dc:date>
<content:encoded><![CDATA[

<p>Monthly gold market and economic insights from Imaru Casanova, Portfolio Manager, featuring her unique views on mining and gold&rsquo;s portfolio benefits. <a href="/us/en/blogs/gold-investing/gold-high-remains-in-reach/gold-monthly-commentary-may-2023.pdf" rel="noopener" target="_blank" title="Gold Monthly Commentary - May 2023"><strong>An expanded PDF version of this commentary, including fund specific information can be downloaded here.</strong></a></p>
<h2>Gold overwhelmed by May&rsquo;s market optimism</h2>
<p>Gold showed strength to start the month, climbing to a new yearly high of $2,063 per ounce on May 4, a day after the U.S. Federal Reserve (Fed) took rates another 0.25% higher. Expectations that this past rate hike may be the last one in this tightening cycle supported gold in early May. However, through most of the month, the U.S. dollar gained and gold fell as the narrative shifted to a more hawkish view and the probability of further rate hikes in 2023 increased. Gold breached the important $2,000 per ounce level on May 16. An upwardly-revised, first-quarter U.S. GDP growth figure, an above-expected May U.S. flash PMI composite figure, along with artificial-intelligence-fueled strength in U.S. equity markets put further downward pressure on gold. Market uncertainty brought about by the U.S. debt ceiling debacle, mentions of a potential technical default as soon as June 1 and even a warning of a potential U.S. credit rating downgrade by Fitch failed to become a true catalyst for gold prices from these levels. Gold dropped $27 per ounce (-1.4%) during the month, closing at $1,962.73 on May 31.</p>
<p>The NYSE Arca Gold Miners Index (GDMNTR)<sup>1</sup>&nbsp;and the MVIS Global Juniors Gold Miners Index (MVGDXJTR)<sup>2</sup>&nbsp;significantly underperformed gold, down 8.6% and 7.3% respectively, during the month of May. We always say &ldquo;leverage works both ways&rdquo; so we are not surprised to see gold stocks underperform gold in what was a weak month for the metal. The magnitude of the underperformance is a bit surprising to us, though. We have seen in the past when the effect of a lower gold price gets compounded with poor news for the sector (such as with disappointing earnings results, negative company updates on capital projects, etc.). For example, in 2022, we saw gold stocks oversold due to unanticipated, elevated cost inflation across the sector. In fact, though, May was a relatively good month for gold equities on the news front, with companies reporting first quarter results that were, generally, better than expected. Thus, we view this reaction as overdone and further contributing to the current valuation gap between gold and gold equities.</p>
<h2>Gold&rsquo;s high still seems well within reach</h2>
<p>Gold seems to be forming a new base around the $1,900 level, averaging $1,933 per ounce year to date. It has traded consistently above $1,900 for longer than ever before. Gold is showing resilience despite a strong stock market and recent U.S. dollar strength. Gold bullion exchanged traded products outflows have subsided this year, with net inflows, albeit small, resulting in a 0.38% increase in holdings year to date.</p>
<h3>Total ETF Holdings of Gold vs. Gold Price</h3>
<p><img class="img-responsive w-100" src="https://www.vaneck.com/contentassets/f9f14f69a9b942a0b945b9f8b7ff5ef6/3326_gold_chart_01_2023.06_v1_blog.svg" alt="Total ETF Holdings of Gold vs. Gold Price" /></p>
<p class="chart-disclosure">Source: Bloomberg. Data as of December 31, 2022.</p>
<p>Gold bullion ETF holdings are 8% lower than they were in March 2022, and 13% lower than in August 2020, when gold reached its all-time high. Can a Fed skip or pause this year be the next catalyst for gold, unlocking investment demand that drives gold higher? The $2,075 per ounce all-time high seems well within reach, in our view. We see a macro backdrop that continues to be supportive of gold in the longer term.</p>
<h2>Still waiting on that rerating&hellip;</h2>
<p>Gold producers as a sector continue to demonstrate their commitment to disciplined capital allocation, focused on value accretive growth, enhancing shareholder returns, profitability and maintaining healthy balance sheets. They are also responsible operators, running sustainable businesses aiming to deliver benefits to all stakeholders, while carefully managing the impact on the environment. In our view, a re-rating of the gold mining equities from historically low valuations at present, is well supported by the industry&rsquo;s strong fundamentals.</p>
<p>Our recent visit to Pueblo Viejo mine is a good example of the sector&rsquo;s success in delivering growth and creating value in a sustainable and responsible manner.</p>
<p><strong>***SPECIAL &ndash; On the Road in Pueblo Viejo***</strong></p>
<h2>Visiting one of the world&rsquo;s largest gold mines</h2>
<p>We recently visited the Pueblo Viejo (PV) gold mine in the Dominican Republic. PV&rsquo;s ownership is split 60%/40% between Barrick (5.42% of Strategy assets) and Newmont (3.61% of Strategy assets), respectively, and operated by Barrick. Getting to the site was as easy as it gets: a direct commercial flight from New York to Santo Domingo followed by an under-two-hour coach bus ride to the mine (which may be why so many people were surprised that we were going to the Dominican Republic for a mine tour, and even more surprised to hear that this mine is, in fact, one of the largest gold mines in the world).</p>
<p>PV ranks among the top 5 gold mines, globally; a Tier 1 asset by all measures in terms of production (an average of 800,000 ounces of gold over the life of the mine), reserves (20.6 million ounces), remaining life of mine (over 20 years, until about 2044) and all-in sustaining costs (2023 guidance of $960-1,040 per ounce). PV is currently expanding its operations to deliver this remarkable profile. Due to declining grades, without this major expansion project, production would have progressively declined and PV would have ceased operations by 2031. The processing plant is being expanded to increase its throughput capacity significantly, allowing the mine to sustain production by processing a larger amount of lower grade material. In addition, a new tailings storage facility will be built to support the expansion.</p>
<h2>Key takeaways</h2>
<p>We were very interested in visiting PV given the ongoing expansion and, we have to say, we were very impressed. Here are some of our main takeaways from the visit:</p>
<ul class="content-list">
<li><strong>Onsite visits still provide invaluable insight.</strong> We had read about the project progress and completion status, but the level of advancement we perceived from touring the processing facility, the open pit, the tailings facility, and our discussions with the mine management and technical staff, surpassed our expectations. A lot of the equipment was already up and running, with a noticeable level of knowledge and confidence from the technical leaders&mdash;a very reassuring sign. The mine seems well on track to start the ramp-up of the expanded plant by the second half of 2023.</li>
<li><strong>There continues to be significant benefits to pursuing brownfield (over greenfield) projects.</strong> This expansion is unlocking 20 million ounces of gold reserves; effectively giving PV a second life with much lower risk compared to the building of a new mine. There is no debate here: an asset that can deliver significant growth organically, utilizing existing infrastructure and teams is far more attractive and should command higher valuation multiples than the building of a mine from scratch.</li>
<li><strong>Environmental, social and governance remain a top priority for large producers.</strong></li>
<ul class="content-list">
<li>We highlight the composition of PV&rsquo;s workforce: 98% Dominican; 52% local; 23% women (including the mine&rsquo;s general manager). The mine enjoys an impressive 1.5% turnover rate. The depth of experience and extensive knowledge of the operations displayed by the mine leaders we got to interact with during our visit showed the benefits of talent retention and development, one of Barrick&rsquo;s strategic priorities.</li>
<li>We had the opportunity to visit several of Barrick&rsquo;s sustainability initiatives in the communities around PV, including a primary health care clinic, a sports training program, an agribusiness project for high production and income diversification, as well as a technical job capabilities and competencies development program. We were impressed not only by the programs, but also by the systems Barrick has developed to closely track its involvement, engagement and initiatives, and the impact on the communities.</li>
<li>Barrick has committed $75 million for remediation of historical (pre-Barrick) environmental liabilities. We were able to visit an old tailings dam and a water quality testing point and observe the radical improvements achieved by Barrick&rsquo;s ongoing rehabilitation work.</li>
</ul>
</ul>
<p>We visited a world class gold mine, which is growing and extending its life, and in doing so, it is also without a doubt growing and extending the benefits it delivers to the host country and communities where it operates. It was great to experience this relationship firsthand.</p>
<h3>Pueblo Viejo&rsquo;s Partnership with the Dominican Republic</h3>
<p><img class="img-responsive w-100" src="https://www.vaneck.com/contentassets/f9f14f69a9b942a0b945b9f8b7ff5ef6/3326_gold_infographic_2023.06_v2_blog.svg" alt="Pueblo Viejo's Partnership with the Dominican Republic" /></p>
<p class="chart-disclosure">Source: Barrick. Data as of May 31, 2023.</p>
<p>To receive more insights to <strong><a href="https://www.vaneck.com/us/en/insights/gold-investing/" title="Gold Investing Insights">Gold Investing</a></strong> insights, <strong><a href="https://www.vaneck.com/us/en/subscribe/" title="Subscription Center">sign up in our subscription center</a></strong>.</p>
]]></content:encoded>
</item><item rdf:about="https://www.vaneck.com/us/en/blogs/model-portfolios/chatgpt-can-you-pay-my-inflated-bills/">
  <title>ChatGPT, Can You Pay My Inflated Bills?></title>
  <link>https://www.vaneck.com/us/en/blogs/model-portfolios/chatgpt-can-you-pay-my-inflated-bills/</link>
  <description><![CDATA[It's entirely possible for both of these realities to coexist: AI could have the same transformative impact as the internet, while inflation continues to persist.]]></description>
  <dc:creator>David Schassler</dc:creator>
  <dc:date>06/13/2023 06:30:00</dc:date>
<content:encoded><![CDATA[

<p>Artificial Intelligence (AI) euphoria is hitting the markets HARD. The market cap of Nvidia alone has grown from $350 billion to nearly $1 trillion this year and helped propel the Russell 1000 Growth Index up over 20% over the same period. Nvidia is not alone. Apple, Microsoft, Tesla, Alphabet, and Meta are, on average, up nearly 50% this year. And we&rsquo;re not even midway through June yet!</p>
<p>Recession fears are pressuring economically sensitive real assets and creating, in our view, tremendous opportunities to re-allocate your portfolio. Call us old-fashioned, but we believe purchasing profitable businesses at attractive valuations is the hallmark of successful equity investing. This is our opinion; whether we are in a recession, entering a recession, or avoiding a recession altogether does not change that.</p>
<p>This commentary highlights:</p>
<ul class="content-list">
<li><strong><a href="#point-one">Risks to investing in growth stocks</a></strong></li>
<li><strong><a href="#point-two">Opportunities available in real assets</a></strong></li>
<li><strong><a href="#point-three">A specific investment solution</a></strong></li>
</ul>
<h2 id="point-one" class="jump-link-nav anchored-block" data-jumplink-title="Risks to investing in growth stocks">From Mania to Reality: Growth Stock Risks in 2023</h2>
<p>The interesting thing about manias is that, for most participants, they make total sense until they don&rsquo;t. <em>AI will change every aspect of the economy! Digital Assets will save the financial industry! Social media will change the entire human experience! </em>And so on and so on. However, the hype&mdash;which often meets expectations in terms of societal impacts&mdash;needs to align with reasonable pricing to provide a positive investor experience<strong>. The creation of the Internet more than delivered on its potential, but the investor experience varied greatly, depending on the entry point</strong>. For example, if you invested in the Nasdaq Index in the year 2000, you had to wait until the end of 2015 to make your money back despite massive technological advancements that completely reshaped the world. Fifteen years is a long time to wait to get your money back!</p>
<p>The chart below demonstrates just how expensive the largest growth stocks are by comparing their average earnings yield to the yield on 2-Year Treasuries. This is a measure of corporate earnings against the cost of capital. Positive (negative) values indicate an earnings yield above (below) what can be earned investing in short-term U.S. treasuries. And negative values indicate a negative earnings yield relative to U.S. Treasuries. The current relationship between large-cap growth earnings yields and Treasury yields, which is deeply negative, is unsustainable, at best. These stocks account for nearly 25% of the S&amp;P 500&reg; Index. Proceed with caution!</p>
<h3>Average Earning Yield (MSFT, GOOG, AAPL, AMZN, NVDA)</h3>
<p><strong>US Treasury 2 Year Yield 5/12-6/23</strong></p>
<p><img loading="lazy" class="img-responsive w-100" src="https://www.vaneck.com/contentassets/55165813c1104f2c976faf53eaaeeab7/3332_qis_chart_01_2023.06_v1_blog.svg" alt="Average Earning Yield (MSFT, GOOG, AAPL, AMZN, NVDA) - US Treasury 2 Year Yield 5/12-6/23" /></p>
<p class="chart-disclosure"><strong>Source: Bloomberg as of 6/5/2023</strong>. Past performance is no guarantee of future results. Not intended as a recommendation to buy or sell any of the securities mentioned herein, or as any call to action.</p>
<h2 id="point-two" class="jump-link-nav anchored-block" data-jumplink-title="Opportunities available in real assets">Attractive Opportunities Available: Real Assets in 2023</h2>
<p>Instead, investors should consider real assets. For example, the chart below compares the average earnings yield of the five largest energy stocks (regarding market capitalization) to the yield on 2-year Treasuries. In contrast to the previous chart, there is a substantial earnings yield premium over short-term U.S. Treasuries.</p>
<h3>Average Earning Yield (XOM, CVX, EOG, COP, SLB)</h3>
<p><strong>US Treasury 2 Year Yield 5/12-6/23</strong></p>
<p><img loading="lazy" class="img-responsive w-100" src="https://www.vaneck.com/contentassets/55165813c1104f2c976faf53eaaeeab7/3332_qis_chart_02_2023.06_v1_blog.svg" alt="Average Earning Yield (XOM, CVX, EOG, COP, SLB) - US Treasury 2 Year Yield 5/12-6/23" /></p>
<p class="chart-disclosure"><strong>Source: Bloomberg as of 6/5/2023</strong>. Past performance is no guarantee of future results. Not intended as a recommendation to buy or sell any of the securities mentioned herein, or as any call to action.</p>
<p>Consequently, in our view, as an example of just one real asset, energy stocks offer a rational incentive to invest, while growth stocks do not.</p>
<p>Our assessment of the economy and what we believe it could mean for investors remains unchanged: expect a near-term recession. This view is consistent with the consensus. We recently polled a large number of professional investors, and here are the results:</p>
<h3>Do you believe that there will be a U.S. recession in 2023?</h3>
<p><img loading="lazy" class="img-responsive w-100" src="https://www.vaneck.com/contentassets/55165813c1104f2c976faf53eaaeeab7/3332_qis_chart_03_2023.06_v1_blog.svg" alt="Do you believe that there will be a U.S. recession in 2023?" /></p>
<p class="chart-disclosure"><strong>Source: VanEck, VettaFi as of 5/5/2023</strong>. Not intended as a prediction or forecast of future events.</p>
<p>Our views of inflation remain steadfast as well: we believe we are in a disinflationary pocket in an extended inflationary regime. Our poll reflects, we believe, the broad abandonment of &ldquo;transitory&rdquo; inflation. And in our view, the market is <em>finally</em> beginning to recognize the risks of a protracted inflationary regime.</p>
<h3>When do you think high inflation (above 2%) will dissipate?</h3>
<p><img loading="lazy" class="img-responsive w-100" src="https://www.vaneck.com/contentassets/55165813c1104f2c976faf53eaaeeab7/3332_qis_chart_04_2023.06_v1_blog.svg" alt="When do you think high inflation (above 2%) will dissipate?" /></p>
<p class="chart-disclosure"><strong>Source: VanEck, VettaFi as of 5/5/2023</strong>. Not intended as a prediction or forecast of future events.</p>
<p>Yet, despite our and investors&rsquo; views on growth and inflation, only 18% of those who were surveyed owned enough real assets to diversify against these risks properly.</p>
<h3>How large of an allocation do you have to real assets?</h3>
<p><img loading="lazy" class="img-responsive w-100" src="https://www.vaneck.com/contentassets/55165813c1104f2c976faf53eaaeeab7/3332_qis_chart_05_2023.06_v1_blog.svg" alt="How large of an allocation do you have to real assets?" /></p>
<p class="chart-disclosure"><strong>Source: VanEck, VettaFi. As of 5/5/2023</strong>. Not intended as a recommendation to buy or sell any of the securities mentioned herein, or as any call to action.</p>
<p>Let us summarize our polls&rsquo; results:</p>
<ul class="content-list">
<li>Question: Do you believe that there will be a recession? Answer: Overwhelmingly Yes (~80%)</li>
<li>Question: Do you believe that high inflation will persist? Answer: Overwhelmingly Yes (~70%)</li>
<li>Do you own real assets? These assets have historically protected against the combination of a stagnant economy and inflation&mdash;&ldquo;stagflation.&rdquo; Answer: No (~50% own less than 5%). <em>I&rsquo;ll buy Nvidia. AI to the moon!</em></li>
</ul>
<p>Recessionary concerns have put significant downward pressure on resource assets. It never feels good investing in out-of-favor assets, and fears of a recession have sent investors running from commodities and other real assets. Staying in the herd&mdash;by investing in expensive, growth-heavy U.S. stock market indices&mdash;comes with, in our view, a false sense of safety. Do not be afraid to step out from the herd when the herd is acting irrationally.</p>
<p>Consider real assets. More specifically, consider RAAX.</p>
<h2 id="point-three" class="jump-link-nav anchored-block" data-jumplink-title="A specific investment solution">One-Stop Solution: Protect Yourself from Inflation</h2>
<p><strong><a href="https://www.vaneck.com/us/en/investments/inflation-allocation-etf-raax/overview/" title="RAAX - VanEck Real Assets ETF - Overview">VanEck Real Assets ETF (RAAX)</a></strong> is designed as a one-stop solution to address the current investment regime by solving for 3 key questions:</p>
<ol class="content-list">
<li>What are the &lsquo;right&rsquo; assets to own during high inflation?</li>
<li>How to best allocate these assets?</li>
<li>When to adjust the allocations based on the inflation cycle?</li>
</ol>
<p>The neutral weightings are based on the long-term strategic asset allocation of the strategy that was designed to balance the risk and rewards of the asset class by maintaining strong diversification across assets with significant upside potential.</p>
<h3>Real Assets ETF Exposures</h3>
<p><img loading="lazy" class="img-responsive w-100" src="https://www.vaneck.com/contentassets/55165813c1104f2c976faf53eaaeeab7/3332_qis_chart_06_2023.06_v1_blog.svg" alt="Inflation Allocation ETF Exposures" /></p>
<p class="chart-disclosure"><strong>Source: State Street, VanEck as of 5/31/2023</strong>. Not intended as a recommendation to buy or sell any of the securities mentioned herein, or as any call to action.</p>
<p>The fund invests in three types of real assets, which include financial, resource, and income assets. Currently, financial assets, which are composed of gold bullion and gold equities, account for 27% of the fund&rsquo;s assets. This allocation is expected to hedge against further economic weakness, systemic market shocks, and inflation. The resource assets are currently 42% of the portfolio. These economically sensitive assets, in our view, offer significant upside due to the supply-demand imbalances across commodities and attractive earnings of natural resource equities. And lastly, income assets account for 30% of the portfolio. Income-generating real assets offer attractive portfolio yields and the potential for price appreciation to hedge against inflation and add further diversification benefits to the portfolio.</p>
<p>Thank you for reading our latest commentary. Our goal with each of these commentaries is to provide you with our assessment of market conditions and actionable investment ideas to navigate the current environment.</p>
<p>To receive more <strong><a href="https://www.vaneck.com/us/en/insights/guided-allocation/" title="Model Portfolio Insights">Model Portfolio</a></strong> insights, <strong><a href="https://www.vaneck.com/us/en/subscribe/" title="Subscription Center">sign up in our subscription center</a></strong>.</p>
]]></content:encoded>
</item><item rdf:about="https://www.vaneck.com/us/en/blogs/thematic-investing/democratizing-game-development-through-ai-and-edge-computing/">
  <title>Democratizing Game Development Through AI and Edge Computing></title>
  <link>https://www.vaneck.com/us/en/blogs/thematic-investing/democratizing-game-development-through-ai-and-edge-computing/</link>
  <description><![CDATA[Artificial intelligence and edge computing are advancing gaming by creating new opportunities for growth and consolidation within the industry.]]></description>
  <dc:creator>Nick Frasse</dc:creator>
  <dc:date>06/09/2023 06:30:00</dc:date>
<content:encoded><![CDATA[

<p>The world of video gaming is experiencing an unprecedented transformation. The catalysts? Cutting-edge technologies like artificial intelligence (AI) and edge computing. These technologies are not just revolutionizing the gaming experience but also how games are developed, offering a democratizing effect that's set to reshape the industry landscape.</p>
<h2>Handheld Power Redefined</h2>
<p>Edge computing, which brings computation closer to data sources for real-time interaction and responsiveness, holds massive upside for the gaming industry. Gamers could enjoy faster load times, near-zero latency, and an overall improved gaming experience. But perhaps even more exciting is the possibility of players creating their own games in real time. This potential shift towards player-creators could redefine the boundaries of creativity and player agency, signaling a future where anyone could become a game developer. An example of this is Legend of Zelda: Tears of the Kingdom which leverages user-generated content (UGC) to foster creativity and engage its community. This freedom of creativity coupled with the tangible impact of players&rsquo; actions on the game world has boosted sales, driven engagement and created a viral wave on social media.</p>
<h2>Free Guy is Paid Guy IRL</h2>
<p>Simultaneously, AI advancements are opening innovative avenues in game development. Machine learning and natural language processing are breathing new life into Non-Playable Characters (NPCs), creating advanced AI NPCs that can conversate more naturally and make intelligent decisions. This level of immersion is clearly in high demand, with a recent study revealing that 99% of gamers believe advanced AI NPCs would enhance gameplay.</p>
<p>While these advanced AI NPCs can enrich gameplay, they also present a valuable revenue opportunity for publishers. The same study found that 81% of gamers were willing to pay more for games with advanced AI NPCs, suggesting additional untapped income streams for these features. For aspiring publishers and indie developers, this is an opportunity to meet the growing demand for immersive experiences while driving additional revenue.</p>
<p><img class="img-responsive w-100" src="https://www.vaneck.com/contentassets/eb1173f96a6a461a8328ec47f47b9f4d/3320_gaming-ai-blog_image_2023.06_v1.jpg" alt="Artificial intelligence NPCs" /></p>
<p class="chart-disclosure">Source: Reddit.</p>
<h2>Pac-Man Growth Strategy</h2>
<p>Though AI and edge computing could diversify game development, they also have the potential to influence <a href="https://www.vaneck.com/us/en/blogs/thematic-investing/playing-the-rise-in-video-game-mas/" title="Playing the Rise in Video Game M and As"><strong>M&amp;A activity in the gaming industry</strong></a>. As more non-traditional developers use these technologies to create innovative games, bigger publishers could start focusing their growth strategies on acquiring emerging new titles. This might lead to a surge in M&amp;A activity in the medium to long term, fueling industry growth while also nurturing innovation.</p>
<p>As we continue into this exciting future, it's clear that the boundaries between players and creators are set to blur, paving the way for an industry that is more innovative, inclusive, and dynamic than ever before.</p>
<p>One way for investors to access the space in a diversified way and to capture the future potential of the industry is through the <strong><a href="/link/d41cc1b7916f46e5bb3ee751f311c4f2.aspx" title="ESPO - VanEck Video Gaming and eSports ETF - Overview">VanEck Video Gaming and eSports ETF (ESPO)</a></strong>. ESPO is a passive product that tracks the MVIS Global Video Gaming and eSports Index. The index targets the 25 largest most liquid companies in the industry that drive 50% or more of their revenue from said industry.</p>
<p>To receive more <strong><a href="https://www.vaneck.com/us/en/insights/thematic-investing/" title="Thematic Investing Insights">Thematic Investing</a></strong> insights, <strong><a href="https://www.vaneck.com/us/en/subscribe/" title="Subscription Center">sign up in our subscription center</a></strong>.</p>
]]></content:encoded>
</item><item rdf:about="https://www.vaneck.com/us/en/blogs/digital-assets/matthew-sigel-crypto-update-ethereum-gas-fees-skyrocket-to-yearly-high/">
  <title>Crypto Update: Ethereum Gas Fees Skyrocket to Yearly High></title>
  <link>https://www.vaneck.com/us/en/blogs/digital-assets/matthew-sigel-crypto-update-ethereum-gas-fees-skyrocket-to-yearly-high/</link>
  <description><![CDATA[There have been 16 centralized exchanges that have withdrawn from certain regions, half from the United States.]]></description>
  <dc:creator>Matthew  Sigel</dc:creator>
  <dc:date>06/06/2023 06:30:00</dc:date>
<content:encoded><![CDATA[

<p><strong>Please note that VanEck may have a position(s) in the digital asset(s) described below.</strong></p>
<p>Digital assets underperformed other risk assets in May as trading volumes slumped to a 2-year low, breadth narrowed, and leverage remained muted. For the month, <strong>Bitcoin</strong> fell 8%, and <strong>Ethereum </strong>fell 1.5% vs. the S&amp;P 500 +1% and the Nasdaq + 6%. Bitcoin&rsquo;s annualized 30-day volatility slipped below 30, a 5-month low, while BTC&rsquo;s weekly correlation with the Nasdaq Composite fell to 20%, an 18-month low.</p>
<p>Small and mid-cap coins continued to underperform, down 12% and 11%, respectively, vs. large-caps, down only 4%. We observe a similar &lsquo;consolidation&rsquo; theme in both protocol activity &amp; centralized exchange fundamentals: ETH monthly fees and fee <em>share</em> of all smart contract protocols both hit 12-month highs; meanwhile, Coinbase &amp; Kraken aggregate market share of US centralized exchange trading rose to 83%, a YTD high. We count 16 centralized exchanges closing or exiting certain jurisdictions year-to-date, half of whom are leaving the US. Overall, centralized exchanges&rsquo; aggregate market share fell to an all-time low vs. decentralized exchanges, a topic we will discuss further below. We think this reflects an acute lack of traditional financing available to crypto exchanges, reduced counterparty exposure appetite by speculators, tougher compliance standards, and improved functionality in DeFi.</p>
<ul class="content-list">
<li><strong><a href="#layer1s">Layer 1s</a></strong></li>
<li><strong><a href="#defi">DeFi</a></strong></li>
<li><strong><a href="#metaverse-nft">Metaverse &amp; NFTs</a></strong></li>
</ul>
<h2 id="layer1s" class="jump-link-nav anchored-block" data-jumplink-title="Layer 1s">Layer 1s</h2>
<p>The total market cap for Smart Contract Blockchains (SCB) fell 4% in May from $346B to $333B. <strong>Ethereum</strong> (-1.5%) and <strong>Tron</strong> (+11%) outperformed dramatically. Every other token amongst major SCBs was down between 5-35% for the month. The weakest performers in our coverage zone for the month of March included <strong>Optimism</strong> (-35%) and <strong>Avalanche</strong> (-15%). Still, despite the muted performance of SCB tokens, fundamental usership was strong as daily active addresses across all SCBs grew 8% from 4.3M to 4.7M. <strong>Solana</strong> and <strong>Starknet,</strong> who grew by +75% and 160%, respectively, in May, were the largest relative gainers in daily active users. Likewise, value accrual also showed strong gains, with total fees by SCBs growing 41% from $368M to $518M.</p>
<h3>Average Daily Active Users</h3>
<p><img class="img-responsive w-100" src="https://www.vaneck.com/contentassets/14ada634ae3d4568b681cbb0b616389f/3302_scl_chart-1_2023.06_blog.svg" alt="Average Daily Active Users" /></p>
<p class="chart-disclosure">Source: Token Terminal as of 5/31/2023. Past performance is no guarantee of future results. Not intended as a recommendation to buy or sell any securities named herein.</p>
<p>Ethereum was again a notable outperformer, posting exceptional on-chain usership metrics for the month. Additionally, positive news events materialized that improved the Ethereum supply picture by attracting millions in newly staked ETH. At the same time, Ethereum cemented its status as a usage-driven, deflationary monetary system. On the economic activity side, over $438M in fees were generated on Ethereum in the month of May, and this total represents Ethereum&rsquo;s highest level of fee generation since May 2022. This fee bonanza drove Ethereum&rsquo;s market share of smart contract blockchain fees to 80%, which also happens to be the highest fee share of Ethereum since May 2022. While overall crypto price volatility was muted, most of Ethereum&rsquo;s fee increase resulted from meme coin speculation as Ethereum daily fees surpassed $30M a few days in early May. As a result of the trading melee, the average fee for transactions on Ethereum ballooned from $6.15 in April to $9.79 in May.</p>
<h3>Smart Contract Platform Fees vs Ethereum Market Share of Fees</h3>
<p><img class="img-responsive w-100" src="https://www.vaneck.com/contentassets/14ada634ae3d4568b681cbb0b616389f/3302_scl_chart-2_2023.06_blog.svg" alt="Smart Contract Platform Fees vs Ethereum Market Share of Fees" /></p>
<p class="chart-disclosure">Source: Token Terminal as of 5/31/2023.Past performance is no guarantee of future results. Not intended as a recommendation to buy or sell any securities named herein.</p>
<p>While Ethereum increased its market share of fees and set a yearly high in monthly fees, its usage feats were accomplished amid the inauspicious backdrop of potentially substantial ETH token unlocks. Because <strong>Lido</strong>, the leading liquid staking provider on Ethereum, enabled its validators to both exit their ETH staking positions as well as unlock their stacking rewards, there was tremendous FUD about the potential for over <strong><a href="https://www.miljokes.com/half-a-billion-in-eth-set-to-unlock-lido-date-for-steth-withdrawals-announced/" title="Half a Billion in ETH Set to Unlock: Lido Date for stETH Withdrawals Announced" target="_blank" rel="noopener">half a billion</a></strong> dollars of staked ETH to be withdrawn and sold. There was also concern that Celsius, the troubled crypto lender, would be dumping an additional <a href="https://cointelegraph.com/news/celsius-moves-781m-in-steth-just-as-lido-withdrawals-open" title="Celsius moves $781M in stETH just as Lido withdrawals open" target="_blank" rel="noopener"><strong>428k</strong></a> ETH worth $781M into the public markets.</p>
<p>However, while 949k ETH were withdrawn from staking in the month of May, this figure was dwarfed by the 3.7M ETH that was staked during the same time period. The supply picture in May was further improved by a burn of 200.4k ETH which contributed to an overall reduced total supply of ETH by 140k ETH in the month. If May&rsquo;s pace of ETH burn is maintained, it will result in an annual drop of 1.4% in the total supply of Ethereum. Circulating supply, or ETH, which is not locked in staking contracts like Lido, also decreased in the month of May, moving from 100.64M to 96.85M ETH. At the time of writing, 19.4% of all ETH is locked in staking contracts.</p>
<h3>ETH Supply Dynamics</h3>
<p><img class="img-responsive w-100" src="https://www.vaneck.com/contentassets/14ada634ae3d4568b681cbb0b616389f/3302_scl_chart-3_2023.06_blog.svg" alt="ETH Supply Dynamics" /></p>
<p class="chart-disclosure">Source: Dune as of 5/31/2023. Past performance is no guarantee of future results. Not intended as a recommendation to buy or sell any securities named herein.</p>
<p>Ethereum&rsquo;s month was not without its blemishes as an unusual bug in the consensus software caused network issues causing significant block production lapses, resulting in temporary delays in finality on May 12th. In fact, 47 and 149 blocks were not produced in the two incidents, which caused the validators who would have held those leadership slots to miss out on block rewards. The roots of the problems were traced back to a coding error in one of Ethereum&rsquo;s three consensus clients. But, because Ethereum has three, the network was able to progress past the incidents without terminal consequences for the network requiring drastic intervention by core developers. These issues and their quick resolution may prove to be strong testaments to Ethereum&rsquo;s potential as a global financial settlement system. The existence of multiple clients helped Ethereum remain resilient throughout the issues as no funds were lost, and block production quickly resumed without issue. Bitcoin and Ethereum are the only blockchains with more than one client to run their networks.</p>
<p>In summary, an unforeseen surge in economic activity on Ethereum driven by speculation, coupled with vastly improving tokenomics and removing ETH liquidation FUD, enabled ETH&rsquo;s price to outperform despite technical issues and other SCBs faltering. For more in-depth research on Ethereum, check out our most recent <strong><a href="https://www.vaneck.com/us/en/blogs/digital-assets/matthew-sigel-ethereum-price-prediction-118k-by-2030/" title="Ethereum Price Prediction: $11.8k by 2030">Ethereum valuation</a></strong>.</p>
<h3>Market Share of SCB Fees ex Ethereum</h3>
<p><img class="img-responsive w-100" src="https://www.vaneck.com/contentassets/14ada634ae3d4568b681cbb0b616389f/3302_scl_chart-4_2023.06_blog.svg" alt="Market Share of SCB Fees ex Ethereum" /></p>
<p class="chart-disclosure">Source: Artemis.xyz as of 5/31/2023. Past performance is no guarantee of future results. Not intended as a recommendation to buy or sell any securities named herein.</p>
<p>Tron, the only other major SCB whose token was positive for the month of May, continued its trend of market share gains. For May, Tron grabbed 77.2% of the fees ex-ETH, and this dominance was up from 75% for April and 50% in June 2022. For example, Tron&rsquo;s fees in May were 4.7x those of Tron&rsquo;s most similar competitor &ndash; BNB Chain. Tron appears to have carved out a market niche, particularly in emerging markets, as an inexpensive access point where users can cheaply send and interact with stablecoins like Tether (USDT). At the time of writing, Tron held around <a href="https://tether.to/en/transparency/#usdt" title="Tether Tokens  - Transparency" target="_blank" rel="noopener"><strong>$45B</strong></a> worth of Tether on its blockchain, which is about $9B more USDT than is secured by Ethereum. As a result of growing adoption, Tron hit an all-time high for monthly daily average transactions at 8.58M, which edged out the second-highest total ever, which was April 2023, with 8.47M transactions per day. This makes Tron the second most active blockchain, in terms of transactions, behind Solana. Though, Tron&rsquo;s figures can be considered even more impressive because the vast majority of Solana&rsquo;s transactions are either consensus vote transactions, oracle updates, or arbitrage bot trading orders &ldquo;quote-stuffing&rdquo; to capture arbitrage opportunities.</p>
<h3>Market Share of Transactions of SCB ex Solana</h3>
<p><img class="img-responsive w-100" src="https://www.vaneck.com/contentassets/14ada634ae3d4568b681cbb0b616389f/3302_scl_chart-4_2023.06_blog.svg" alt="Market Share of Transactions of SCB ex Solana" /></p>
<p class="chart-disclosure">Source: Artemis.xyz as of 5/31/2023. Past performance is no guarantee of future results. Not intended as a recommendation to buy or sell any securities named herein.</p>
<p>Additionally, Tron is the most used Smart Contract Platform, by daily active users, with an average daily user base of 1.8M unique users for the month of May. This is also the highest it has ever been in Tron&rsquo;s history, and this number overtakes the previous all-time high set for Tron that was set in the month of April. Additionally, Tron&rsquo;s daily active user base is more than 4x that of Ethereum and around 40% higher than BNB, its closest competitor. Tron&rsquo;s usage is most likely driven by funds transfers between users&rsquo; wallets rather than a more complex financial activity like swaps, trading, and loans. Tron, for example, averages around 50-60% of its transactions as transfers of stablecoin USDT, while 89.7% of all its on-chain activity are simple wallet transfers. Ethereum, by contrast, averages around 8-15% of its transaction volume in stablecoin transfers, and 30-40% of its transactions are wallet transfers. To further highlight the differentiation of Tron&rsquo;s product market fit, despite having $45B in stablecoins to BNB&rsquo;s $5.8B, Tron&rsquo;s DEX volumes average 1/60<sup>th</sup>that of BNB&rsquo;s in 2023.</p>
<p><strong>Optimism</strong> showed dramatic under-performance in the month of May as it was the worst-performing token, not only among our set of smart contract blockchains but also among the top 100 tokens by crypto market capitalization. The biggest dark cloud hanging over Optimism was the substantial token unlock of OP tokens that more than doubled the circulating token supply. On May 31, more than 386.5M tokens were unlocked for investors and core contributors, with some of these early investments up <strong><a href="https://cointelegraph.com/news/optimism-unlock-millions-op-token-may-price-pressure" title="Optimism set to unlock $587M worth of OP tokens, will investors unload?" target="_blank" rel="noopener">10,000%</a></strong>, including seed round funders Paradigm and IDEO. This unlock brings more than $550M worth of OP tokens to the market that can be sold. Additionally, the underperformance of OP can be attributed to decreased on-chain activity and operating income declines. Despite a slight increase in the market share of DEX volume, absolute DEX volume was down 34% between April and May, and the total transaction count was also down 28% for the month of May.</p>
<p>For Ethereum Layer-2s, their net margin before incentives is an important component of their financial picture. While Layer-1 blockchains count transaction fees as a revenue item and security fees, paid to validators, as a cost, Layer-2s have a slightly more complicated setup. Since L2 blockchains do not have validators and consensus mechanisms but instead have sequencers to process and order transactions, they must pay their host Layer-1 security fees to settle transactions. Essentially, they must bundle their transactions into a compressed piece of data and post that as a transaction to Layer-1. This transaction must still compete in the gas auction for blockspace, subjecting it to wildly varying transaction costs. A rough measure of L2 profitability can be termed &ldquo;Operating Income Before Incentives&rdquo; (OIBI) as it is derived as the transaction revenue earned by an L2 less the settlement fees paid to the L1 for posting the rollup data.</p>
<h3>Ethereum L2 OIBI</h3>
<p><img class="img-responsive w-100" src="https://www.vaneck.com/contentassets/14ada634ae3d4568b681cbb0b616389f/3302_scl_chart-6_2023.06_blog.svg" alt="Ethereum L2 OIBI" /></p>
<p class="chart-disclosure">Source: Token Terminal as of 5/31/2023. Past performance is no guarantee of future results. Not intended as a recommendation to buy or sell any securities named herein.</p>
<p>While the fees generated on OP were up in the month of May, the OIBI accruing to Optimism was down 13% month to month. This is because the fees paid to Ethereum spiked as the demand for Ethereum&rsquo;s blockspace surged. When competition for blockspace is high, the cost of settling transactions increases, and L2 OIBI margins will decrease. As the month of May was one of the great demand for Ethereum blockspace, L2s like Optimism saw OIBI drop significantly. Of course, Optimism was not alone in declining profitability due to Ethereum gas costs; Arbitrum&rsquo;s OIBI declined 63%, while <strong>Polygon</strong> saw the same line item decline 33%.</p>
<p>Considering the OIBI margin of these L2s, Optimism margins have historically been slightly lower than those of Arbitrum or Polygon. Because Polygon is not a true L2 but rather a side chain, its settlement fee structure from Ethereum is much lower. Polygon, because it has its own validator set, uses a technique called state sync to send a snapshot of Polygon&rsquo;s blockchain state to Ethereum. On the other hand, Arbitrum has achieved higher margins than Optimism because it uses a better-designed virtual machine to process transactions and a more data-streamlined fraud-proof mechanism. As a result, in its current form, Arbitrum has a slight margin advantage over Optimism. From a cost standpoint, rollups like Optimism and Arbitrum have two costs embedded in their fee structure &ndash; the cost to roll up all the transactions and post to Ethereum and the cost to transact on the L2. More detailed, the cost for transactions on Optimism breaks down as such:</p>
<p>Optimism Transaction Fee =  + </p>
<p>Despite the massive token unlocks, the future for Optimism still looks bright to us. With the announcement of the OP Stack, a software development kit to create Layer-2 blockchains, projects such as Coinbase&rsquo;s <strong><a href="https://www.coinbase.com/blog/introducing-base" title="Introducing Base" target="_blank" rel="noopener">Base</a></strong> and <strong><a href="https://twitter.com/KintoXYZ" title="Twitter - Kinto" target="_blank" rel="noopener">Kinto</a></strong> intend to build using Optimism&rsquo;s technology. While these projects may not directly add value to the OP token, the OP token will act as a governance token of the whole ecosystem, which will govern the progression of the SDK software updates going forward and the process towards a decentralized, shared sequencer. This sequencer set will utilize the tokens for governance and potentially even for staking. Additionally, Optimism is on the cusp of releasing an update called Bedrock which will reduce transaction costs by up to 90% through better data compression to minimize costs. Bedrock also reduces deposit times and enables the separation of the roll-up node and the client to create a modular L2 set-up.</p>
<h3>L2 Monthly Margin</h3>
<p><img class="img-responsive w-100" src="https://www.vaneck.com/contentassets/14ada634ae3d4568b681cbb0b616389f/3302_scl_chart-7_2023.06_blog.svg" alt="L2 Monthly Margin" /></p>
<p class="chart-disclosure">Source: Token Terminal as of 5/31/2023.Past performance is no guarantee of future results. Not intended as a recommendation to buy or sell any securities named herein.</p>
<p><strong>Avalanche </strong>was the other noteworthy underperformer for the month of May, as declining blockchain fundamentals and a large token unlock dragged down AVAX price by 18%.</p>
<p>The fundamentals of Avalanche paint an initially deceptive picture. Though monthly active users posted an all-time high on Avalanche, further inspection of the activity driving that figure suggests that the activity is &ldquo;astroturfed.&rdquo; Of 732k monthly unique active users recorded on Avalanche in the month of May, 470k, or 64% of the total, interacted with Stargate. If these Stargate users were removed, the MAU total would be only 302k Avalanche monthly active users, which would be the lowest number for Avalanche since September 2022. Despite being the second highest in the last twelve months at $1.34M, monthly fees on Avalanche were a 34% decline from April&rsquo;s fee total.</p>
<p>Additionally, though Avalanche's fees were relatively high, over 10% of the fees were incurred by Stargate, and another 29% were incurred by wallet transfers of AVAX. These figures corresponding to Stargate and the wallet transfers are notable, given that there is great speculation of a Stargate token airdrop. As a result, these figures, and, as a result, the topically positive figures for Avalanche on-chain activity, should be looked at with suspicion.</p>
<p>Likewise, there has been a tremendous decline in DEX activity in May compared to April and a drop in TVL. While TVL dropped 11.36%, DEX volume was down a whopping 46%. Avalanche TVL and DEX volume were the lowest monthly figures on record since the doldrums of July 2021 following the Chinese Bitcoin mining ban. The month-to-month drop in DEX volume for Avalanche was the worst among all tracked smart contract blockchains for the month of May, and the TVL decline was the second largest. Additionally, despite all the bridge activity generated by Stargate, bridged tokens to Avalanche fell $65M from $470M to 405M, losing 13.84% of the bridge&rsquo;s value. To add salt to the wound of deteriorating fundamentals, on May 29, 9.5M AVAX, around 3% of supply, was unlocked, of which 6.2M went to the Avalanche Team and the Avalanche Foundation.</p>
<p>Some encouraging developments for Avalanche in the month included the deployment of a Euro stablecoin called EUROC, the announcement of <strong><a href="https://twitter.com/avacloud?lang=en" title="Twitter - AvaCloud" target="_blank" rel="noopener">AvaCloud</a></strong> to enable businesses to build no-code blockchains that launch in minutes, the creation of the GoGoPool, which will reduce the cost of <a href="https://twitter.com/avax/status/1655981742342172674?ref_src=twsrc%5Etfw%7Ctwcamp%5Etweetembed%7Ctwterm%5E1655981742342172674%7Ctwgr%5Ec5f30885e6a84fbc3aea4c95a29483cf484c05f1%7Ctwcon%5Es1_&amp;ref_url=https%3A%2F%2Fambcrypto.com%2Favalanche-avax-growing-subnet-ecosystem-gets-a-boost-in-the-form-of%2F" title="Twitter - Avalanche " target="_blank" rel="noopener"><strong>operating</strong></a> a validator node, and the transition of the Avalanche X-Chain to the blockchain data structure to smooth the way to future exchange and asset integrations.</p>
<h3>Avalanche DEX Volume and TVL</h3>
<p><img class="img-responsive w-100" src="https://www.vaneck.com/contentassets/14ada634ae3d4568b681cbb0b616389f/3302_scl_chart-8_2023.06_v2_blog.svg" alt="Avalanche DEX Volume and TVL" /></p>
<p class="chart-disclosure">Source: Artemis XYZ as of 5/31/2023. Past performance is no guarantee of future results. Not intended as a recommendation to buy or sell any securities named herein.</p>
<h2 id="defi" class="jump-link-nav anchored-block" data-jumplink-title="DeFi">DeFi</h2>
<p>MarketVectors Defi Leaders Index (MVDFLE) fell 9% in May as investors allocated to larger-cap coins amidst weaker overall price performance. Among constituents, UNI fell 3.5%, AAVE -7%, CRV -8%, MKR -9%, and YFI -19%. The total value locked (TVL) in DeFi fell slightly from $48.6B to $47.4B. This decrease can be attributed, in part, to the decline in the price of Ether (ETH), the primary collateral used in many DeFi protocols. As the price of ETH dipped, the overall TVL mirrored the trend.</p>
<p>One of the most developments in DeFi during May was the substantial rise in decentralized exchange volume compared to centralized exchanges. According to data from The Block, decentralized exchanges accounted for only 14.1% of crypto volume in April. However, they witnessed a significant surge in May, capturing just under 22% of the total volume. This shift was driven by a decline of approximately 30% in centralized exchange volumes, juxtaposed with a growth of around 10% in decentralized exchange volume. The increase in volume was mainly captured by PancakeSwap, which saw an 87% increase in volume this month. Despite the volume growth, the price of PancakeSwap&rsquo;s governance token, CAKE, fell 36% in May.</p>
<h3>DEX % of Crypto Spot Volume</h3>
<p><img class="img-responsive w-100" src="https://www.vaneck.com/contentassets/14ada634ae3d4568b681cbb0b616389f/3302_scl_chart-9_2023.06_blog.svg" alt="DEX % of Crypto Spot Volume" /></p>
<p class="chart-disclosure">Source: The Block as of 6/1/2023. Past performance is no guarantee of future results. Not intended as a recommendation to buy or sell any securities named herein.</p>
<p>Lending rates in DeFi remained stagnant throughout the month, with the average stablecoin borrow APR hovering around 3.5%. Despite introducing new decentralized stablecoins, their development has not reached a level catalyzing meaningful increases in leverage across the space. This is primarily because these teams have intentionally limited the size of their initial products as a precautionary measure. For instance, Curve's crvUSD recorded $8.77 million in open loans at a 4.99% APR on $12.93 million of sfrxETH collateral. Similarly, Maker's newly released Spark protocol attracted just over $10 million of wstETH collateral and enabled $5.1 million in loans. As these protocols mature, they are expected to raise deposit caps and incorporate additional collateral types, thereby fostering wider adoption.</p>
<p>One emerging trend we monitor in the DeFi market is the release of liquid-staked ETH-backed stablecoins. This innovation essentially creates a self-repaying loan for investors, as the staked ETH generates yield above that which the investor is paying for their loan. With the growth of liquidity and increased confidence in the peg-resilience of liquid-staked ETH tokens, we think this trend may gain further adoption. We see Yearn (YFI) as one of the best protocols for building interest-bearing collateral due to its unique design. The project&rsquo;s forthcoming yETH vault could capture a significant share of the liquid-staked ETH lending market. A forthcoming blog post will explain this thesis more fully.</p>
<h2 id="metaverse-nft" class="jump-link-nav anchored-block" data-jumplink-title="Metaverse &amp; NFTs">Metaverse &amp; NFTs</h2>
<p>Metaverse tokens lagged severely in May, with the MarketVectors media &amp; entertainment leaders index down 17% and little user traction in most of the projects we track. Leading metaverse tokens experienced notable percent changes in May as <strong>APE</strong> declined by nearly 20%, <strong>MANA</strong> dropped by 13.2%, and <strong>SAND</strong> witnessed a decrease of 5.4%. Usership of the top metaverse platforms remained relatively stagnant throughout the month, indicating the need for further catalysts to drive growth and engagement. On the other hand, Apple's entry into the metaverse space with its upcoming headset has the potential to be a significant catalyst. As the release of Apple's headset draws near, interest in augmented reality (AR) and virtual reality (VR) has re-emerged, and this anticipation could reignite investors' desire to gain exposure to metaverse tokens once again. Apple's recent announcement, encouraging creators to prepare for building new worlds, has reinvigorated metaverse enthusiasts online and, if their product lives up to the rumors, could revive the &ldquo;going to work in the metaverse&rdquo; dream.</p>
<p>Among gaming projects, <strong>Illuvium (ILV)</strong> released its highly anticipated private beta 2, introducing a range of new features that sparked some renewed investor interest. ILV rallied off its mid-month low but still ended the month -3% with no significant increase in NFT trading volumes. We have been monitoring the development of this project for over a year now. While determining its viability is hard to make pre-release, the progress and thoughtfulness that we have seen from the team so far are impressive.</p>
<p>Overall, NFT sales volume rose 4% in May to $730M from $700M in April. Ethereum maintained its lead with $395 million, Bitcoin followed closely with $192 million, while Solana enabled $44 million in NFT sales volume. These figures highlight the continued dominance of Ethereum in the NFT market and signify the increasing interest and adoption of other blockchain platforms, specifically Bitcoin.</p>
<h3>May NFT Sales by Blockchain</h3>
<p><img class="img-responsive w-100" src="https://www.vaneck.com/contentassets/14ada634ae3d4568b681cbb0b616389f/3302_scl_chart-10_2023.06_blog.svg" alt="May NFT Sales by Blockchain" /></p>
<p class="chart-disclosure">Source: VanEck, Cryptoslam! as of 6/1/2023. Past performance is no guarantee of future results. Not intended as a recommendation to buy or sell any securities named herein.</p>
<p>However, the real standout was the booming NFT lending scene, with <strong>Blur&rsquo;s Blend</strong> leading the way. Blend recorded over $335M in borrow volume and $130M in loan repayment volume. Blend's borrows accounted for about 80% of the ETH borrowed on NFT collateral in May. This surge in NFT lending showcases the increasing demand for leveraging NFT assets to unlock liquidity and create new financialization opportunities. In a move to compete with the existing NFT lending platforms, especially Blend, <strong>Binance</strong> announced the development of its own NFT lending marketplace. The platform, launched at the end of May, provides users with an alternative option for utilizing NFT collateral. Binance's entry into the market adds an exciting layer of centralized competition and is expected to bring further innovation and accessibility to the NFT lending space. Specifically, the cost and success of Binance&rsquo;s user incentivization should provide interesting data compared to Blur&rsquo;s airdropped rewards method.</p>
<h3>Blend: First Month Results</h3>
<p><img class="img-responsive w-100" src="https://www.vaneck.com/contentassets/14ada634ae3d4568b681cbb0b616389f/3302_scl_chart-11_2023.06_blog.svg" alt="Blend: First Month Results" /></p>
<p class="chart-disclosure">Source: Dune: @ahkek, VanEck as of 5/29/2023. Past performance is no guarantee of future results. Not intended as a recommendation to buy or sell any securities named herein.</p>
<p>The conclusion of the month brought news of <strong>Kellogg</strong>'s potential expansion efforts into the metaverse, as the renowned American cereal giant filed a dozen trademarks for its portfolio of brands. Documents revealed that Kellogg's has strategic plans to utilize its intellectual property by creating branded NFTs. This move signifies Kellogg's recognition of the growing significance of the metaverse and its intention to leverage its brand assets within this emerging digital landscape.</p>
<p>Overall, the Metaverse &amp; NFT market remains highly dynamic, with Blend's success in NFT lending and Binance's entry into the space demonstrating the industry's drive for innovation and accessibility. And while Ethereum continues to lead in sales volume, other platforms like Bitcoin are carving their own paths in the NFT landscape. We are hopeful that Fortune 500 companies like Kellogg and Apple will eventually catalyze mass adoption of NFTs as a direct-to-consumer loyalty protocol or B2B as a ticket to unlock subscriptions and other services. Ethereum upgrades, such as account abstraction, should help unlock this utility. On the other hand, most gaming &amp; metaverse tokens are plagued by lackluster user traction and still-inflated valuations. We are on the lookout for users before deploying more aggressively into this space.</p>
<p><strong>Links to third party websites are provided as a convenience and the inclusion of such links does not imply any endorsement, approval, investigation, verification or monitoring by us of any content or information contained within or accessible from the linked sites. By clicking on the link to a non-VanEck webpage, you acknowledge that you are entering a third-party website subject to its own terms and conditions. VanEck disclaims responsibility for content, legality of access or suitability of the third-party websites.</strong></p>
<p>To receive more <strong><a href="https://www.vaneck.com/us/en/insights/digital-assets/" title="Digital Assets Insights">Digital Assets</a></strong> insights, <strong><a href="https://www.vaneck.com/us/en/subscribe/" title="Subscription Center">sign up in our subscription center</a></strong>.</p>
]]></content:encoded>
</item><item rdf:about="https://www.vaneck.com/us/en/blogs/moat-investing/bucking-the-trend-why-smid-caps-are-poised-for-a-comeback/">
  <title>Bucking the Trend: Why SMID Caps are Poised for a Comeback></title>
  <link>https://www.vaneck.com/us/en/blogs/moat-investing/bucking-the-trend-why-smid-caps-are-poised-for-a-comeback/</link>
  <description><![CDATA[While small- and mid-cap stocks often bear the brunt of a recession, they also tend to bounce back strongly during the recovery phase.]]></description>
  <dc:creator>Coulter Regal, CFA</dc:creator>
  <dc:date>06/06/2023 06:30:00</dc:date>
<content:encoded><![CDATA[

<p>The recent performance of small- and mid-cap stocks, often referred to as "SMID caps&rdquo;, and why they might be poised for a comeback has become a topic of interest among investors. SMID cap equities, which have traditionally been seen as more volatile and riskier than their large-cap counterparts, have recently underperformed both large-caps and the broad US equity market. This is mostly due to the uncertainty surrounding an economic slowdown and the looming threat of a recession that typically has a greater impact on the performance of smaller companies.</p>
<p>However, taking a closer look, we find that the current valuation of these smaller-cap stocks is becoming increasingly attractive relative to large-caps. This combined with an economic recovery phase possibly on the horizon, where smaller-caps have historically outperformed, supports the case that now may be a good opportunity for investors to allocate to this area of the market.</p>
<h2>Performance Leading into a Recession</h2>
<p>Historically, small- and mid-cap stocks have shown a tendency to underperform large-cap stocks in the period leading up to a recession. This is primarily due to their higher risk profile and greater sensitivity to economic conditions. As uncertainty increases and economic indicators point towards a slowdown, investors often shift their portfolios towards more stable, large-cap companies, which are generally considered safer during turbulent times.</p>
<p>For example, small- and mid-caps, represented by the Russell 2500 Index, have underperformed the S&amp;P 500 during the 12 months preceding recent recessions. On average, the SMID caps underperformed by nearly 700 basis points during these periods. This underperformance of smaller companies can be attributed to their higher volatility and the fact that they are often more exposed to domestic economic conditions. While we are not officially in a recession today, smaller companies have been punished as if we are heading in that direction. As of the end of May, SMID caps have underperformed the S&amp;P 500 by about 700 basis points over the last year.</p>
<h3>SMID Cap Underperformance Preceding Recessions</h3>
<p><img class="img-responsive w-100" src="https://www.vaneck.com/contentassets/c68dc13de944421ca325decf4852c625/3306_smot_chart_01_2023.06_v1_blog.svg" alt="SMID Cap Underperformance Preceding Recessions" /></p>
<p class="chart-disclosure">Source: Morningstar. SMID Cap Stocks represented by the Russell 2500 Index. Cumulative Excess performance relative to the S&amp;P 500 Index. Past performance is no guarantee of future results. See disclaimers and descriptions at the end of this presentation. See disclaimers and descriptions at bottom of page.</p>
<h2>Dominate Performance Following Recessions</h2>
<p>While small- and mid-cap stocks often bear the brunt of a recession, they also tend to bounce back strongly during the recovery phase. Historically, smaller companies have outperformed their larger counterparts 83% of the time in recoveries and saw average annualized returns of 26% during the recovery phase.<sup>1</sup>&nbsp;This is because smaller companies tend to benefit more from fiscal stimulus measures and are often more leveraged to the domestic economy, which usually recovers before the global economy. They are also generally more agile and can adapt more quickly to changing economic conditions.</p>
<p>This outperformance of smaller companies during the recovery phase can also be observed by looking at recent recession cycles. On average, the SMID cap Russell 2500 Index outperformed the S&amp;P 500 by roughly 1000 basis points in the 12 months following the end of recent recessions. Furthermore, data shows that this outperformance extends beyond just the first year. Increasing to five-year post-recession periods, the average annualized return for smaller-cap companies was 14.5% compared to an annualized return of about 12% for large-caps.<sup>2</sup></p>
<h3>SMID Cap Excess Return over S&amp;P 500 Post Recent Recessions</h3>
<p><img class="img-responsive w-100" src="https://www.vaneck.com/contentassets/c68dc13de944421ca325decf4852c625/3306_smot_chart_02_2023.06_v1_blog.svg" alt="SMID Cap Excess Return over S and P 500 Post Recent Recessions" /></p>
<p class="chart-disclosure">Source: Morningstar. SMID Cap Stocks represented by the Russell 2500 Index. Cumulative Excess performance relative to the S&amp;P 500 Index. Past performance is no guarantee of future results. See disclaimers and descriptions at the end of this presentation. See disclaimers and descriptions at bottom of page.</p>
<h2>The Current Opportunity &ndash; Decade Low Valuations Ahead of a Possible Recovery</h2>
<p>Given the recent underperformance of smaller market-cap US equities and the looming threat of an economic slowdown, it might seem counterintuitive to consider allocating to small-caps. However, it's important to remember that markets are forward-looking, and much of the anticipated economic slowdown may already be priced into this segment of the market.</p>
<p>Currently, valuations for SMID cap companies look extremely attractive relative to large-caps, the most attractive in decades actually. As of the end of April, the forward price-to-earnings (P/E) ratio for SMID cap companies are now at 20-year lows relative to large caps. This relative undervaluation could provide a good entry point for investors considering an allocation to smaller cap companies. While the threat of an economic slowdown or recession is still present, the potential upside of these already beaten down stocks in a recovery could be worth the risks.</p>
<h3>SMID Cap Forward P/E Relative to Large Cap Forward P/E</h3>
<p><strong>January 2004 &ndash; April 2023</strong></p>
<p><img class="img-responsive w-100" src="https://www.vaneck.com/contentassets/c68dc13de944421ca325decf4852c625/3306_smot_chart-03_2023.06_v1_blog.svg" alt="SMID Cap Forward P/E Relative to Large Cap Forward P/E" /></p>
<p class="chart-disclosure">Source: Bloomberg. SMID Cap Stocks represented by the Russell 2500 Index. Large Cap Stocks represented by the S&amp;P 500 Index. Past performance is no guarantee of future results. See disclaimers and descriptions at the end of this presentation. See disclaimers and descriptions at bottom of page.</p>
<h2>The VanEck Morningstar SMID Moat ETF</h2>
<p>While the uncertainty of an economic slowdown and possible recession has led to the underperformance of small- and mid-cap US equities recently, their current decade low valuation relative to large-caps and historical outperformance in economic recoveries presents a potentially attractive opportunity for investors.</p>
<p>Given the current economic climate, it may now be an opportune time to consider diversifying your portfolio with SMID cap equities. As we continue to navigate an economic slowdown, or potential recession, and the subsequent recovery, SMID caps may offer a compelling investment opportunity for those looking to capitalize on their historical potential for outperformance on the back side of economic turbulence.</p>
<p>For investors looking to gain exposure to smaller-cap equities, the <strong><a href="https://www.vaneck.com/us/en/investments/morningstar-smid-moat-etf-smot/smot-reconstitution.pdf" title="SMOT - VanEck Morningstar SMID Moat ETF" target="_blank" rel="noopener">VanEck Morningstar SMID Moat ETF (SMOT)</a></strong> could be an attractive option. SMOT seeks to track the <strong><a href="https://www.vaneck.com/us/en/investments/morningstar-smid-moat-etf-smot/overview/" title="SMOT - VanEck Morningstar SMID Moat ETF - Overview">Morningstar<sup>&reg;</sup>&nbsp;US Small-Mid Cap Moat Focus Index<sup>SM</sup></a></strong>, which leverages Morningstar&rsquo;s forward-looking, rigorous research process, driven by over 100 analysts globally. The Index applies much of the same core index methodology principles as Morningstar&rsquo;s flagship <strong><a href="https://www.vaneck.com/us/en/investments/morningstar-wide-moat-etf-moat/overview/" title="MOAT - VanEck Morningstar Wide Moat ETF - Overview">Wide Moat Focus Index</a></strong>, but to a universe of small- and mid-cap companies. The Index targets SMID cap companies with <strong><a href="https://www.vaneck.com/us/en/blogs/moat-investing/how-a-moat-stock-gets-its-economic-moat/" title="How a Moat Stock Gets Its Economic Moat">long-term competitive advantages, known as moats</a></strong>, and attractive valuations.</p>
<p>To receive more <strong><a href="/us/en/insights/moat-investing" title="Moat Investing Insights">Moat Investing</a></strong> insights, <strong><a href="https://www.vaneck.com/us/en/subscribe/" title="Subscription Center">sign up in our subscription center</a></strong>.</p>
]]></content:encoded>
</item><item rdf:about="https://www.vaneck.com/us/en/blogs/thematic-investing/if-you-are-reading-this-semiconductors-and-ai-are-taking-over/">
  <title>If You’re Reading This Semiconductors &amp; AI Are Taking Over></title>
  <link>https://www.vaneck.com/us/en/blogs/thematic-investing/if-you-are-reading-this-semiconductors-and-ai-are-taking-over/</link>
  <description><![CDATA[There's no summertime sadness in the semiconductor industry, thanks in part to chip demand from generative AI applications like OpenAI's ChatGPT.]]></description>
  <dc:creator>Nick Frasse</dc:creator>
  <dc:date>06/01/2023 06:30:00</dc:date>
<content:encoded><![CDATA[

<p>In recent years, the semiconductor industry has experienced a notable departure from its traditional cyclical patterns, embracing a more secular behavior that defies the ups and downs tied closely to economic cycles. This transformation can be attributed to a range of factors, including the ever-expanding presence of technology in our daily lives and the surging demand for semiconductors across diverse sectors. Unlike its past volatility, the semiconductor market now exhibits remarkable resilience, driven by long-term trends such as artificial intelligence, Internet of Things, and cloud computing. This shift reflects the industry's capacity to adapt to evolving market dynamics, sustaining consistent demand and fostering innovation even amidst economic fluctuations.<sup>1</sup></p>
<p>As we continue to ride the wave of technological advancement, semiconductors, and artificial intelligence (AI)&mdash;stand at the forefront of this evolution. Together, they drive each other's growth, propelling us into an unprecedented era of technological revolution. As these two domains deepen their relationship, they're heralding a new surge of innovation. The future of AI is anchored in the creation of new, AI-optimized semiconductor chips&mdash;a dynamic we believe is poised to fuel significant growth in the next half-decade. This blog examines the interdependence of semiconductors and AI, the technological advancements driving their integration, and the future outlook of this thriving industry.</p>
<ul class="content-list">
<li><strong><a href="#point-one">How Are Semiconductors Behind ChatGPT&rsquo;s Success?</a></strong></li>
<li><strong><a href="#point-two">NVIDIA's Q1&rsquo;23 Earnings Highlight AI and Semiconductor Market Capture</a></strong></li>
<li><strong><a href="#point-three">Is AI Accelerating Semiconductor Design and Manufacturing?</a></strong></li>
<li><strong><a href="#point-four">AI Design Tools&rsquo; Growth Rate Projected to Surpass Chip Sales by 3x?</a></strong></li>
<li><strong><a href="#point-five">Semiconductor Industry Interlude: 4 Key Categories of Participants</a></strong></li>
<li><strong><a href="#point-six">How Will US CHIPS Act Benefit Large Semiconductor Producers?</a></strong></li>
</ul>
<h2 id="point-one" class="anchored-block">How Are Semiconductors Behind ChatGPT&rsquo;s Success?</h2>
<p>Machine learning and its insatiable appetite for data heavily rely on semiconductors for processing and storage. The growing complexity and demand of AI applications mean that semiconductors, particularly graphic processing units (GPUs), are increasingly important. With their multitasking capabilities, GPUs are crucial in managing the massive data required for AI model training, ensuring applications like ChatGPT operate efficiently.</p>
<p>As the applications grow increasingly complex, the demand for advanced semiconductor chips will escalate. This growing demand represents a significant and promising opportunity for companies in the semiconductor industry. For instance, graphic processing units (GPUs), are the powerful engines that drive companies like OpenAI and its applications, including ChatGPT, are in high demand. With their capability to handle multiple tasks simultaneously and more importantly proficiently, GPUs are the perfect fit for the heavy-duty processing required by machine learning. These processing engines manage the vast data needed for training generative AI models that use generative pretrained transformers (GPTs), enabling quicker responses and better language understanding. Simply put, semiconductors are the foundational support structure, ensuring the smooth operation of AI applications such as ChatGPT.</p>
<p>GPUs also play a pivotal role in a broad spectrum of AI applications, including:</p>
<ul class="content-list">
<li>Natural language processing: GPUs decode the intricacies of human language, finding their place in applications such as voice assistants and machine translation.</li>
<li>Facial recognition: GPUs identify individuals in images and videos, a tool with applications in sectors from security to marketing.</li>
<li>Autonomous vehicles: GPUs adeptly manage sensor data, guiding vehicles safely through city streets.</li>
</ul>
<h2 id="point-two" class="anchored-block">NVIDIA's Q1&rsquo;23 Earnings Highlight AI and Semiconductor Market Capture</h2>
<p>NVIDIA (NASDAQ: NVDA) recently posted strong earnings, with both revenue and earnings per share surpassing analyst predictions. The rise in demand for NVIDIA's GPUs, used extensively in AI applications, is driving the company's growth. As the demand for AI-powered applications rises, so will the demand for semiconductors and we believe NVIDIA is well-positioned to benefit from this growth. It is a leading GPU supplier for AI applications and is reaping benefits from partnerships with AI companies like OpenAI and Google AI.</p>
<h3>Global Semiconductor Market Growth and Forecast</h3>
<p><img class="img-responsive w-100" src="https://www.vaneck.com/contentassets/428680f9e4f34b45b3ffd912d486e2ee/3295_smh_chart-1_2023.05_blog.svg" alt="Global Semiconductor Market Growth and Forecast" /></p>
<p class="chart-disclosure"><strong>Source: World Semiconductor Trade Statistics and Mckinsey&rsquo;s projected yearly growth</strong>. Past performance is no guarantee of future results. Not intended as a recommendation to buy or sell any securities mentioned herein, or as any call to action. For illustrative purposes only. Actual future semiconductor market growth is unknown.</p>
<p>The need for increased computing power, AI, and digital connectivity has resulted in significant semiconductor market growth. McKinsey estimates that semiconductor revenue could double from $550 million in 2022 to over $1 trillion by 2030.</p>
<h2 id="point-three" class="anchored-block">Is AI Accelerating Semiconductor Design and Manufacturing?</h2>
<p>AI is not just benefiting from semiconductor power; it has emerged as a significant driving force in the evolution of the semiconductor industry. Through its ability to redefine chip designs, identify defects, optimize processes, and predict chip failures, AI is enhancing efficiency and profitability within the sector. And there's more to the story&mdash;AI is catalyzing the creation of a new lineage of chips tailor-made for AI's distinctive requirements and needs. These aren't your regular chips, but one&rsquo;s tailor-made for AI's unique demands. Think of Intel (NASDAQ: INTC) and its pioneering work crafting AI-optimized chips that excel in speed, efficiency, and power management.</p>
<h2>AI Beats a Human at Chess and Go, Now Watch It Design Chips</h2>
<p><strong>Chips have exponentially more configurations than chess or Go<sup>2</sup></strong></p>
<p><img class="img-responsive w-100" src="https://www.vaneck.com/contentassets/428680f9e4f34b45b3ffd912d486e2ee/3295_smh_chart-2_2023.05_blog.svg" alt="AI Beats a Human at Chess and Go, Now Watch It Design Chips" /></p>
<p class="chart-disclosure"><strong>Source: Deloitte Insights adapted from Synopsys, &ldquo;What is Design Space Optimization?&rdquo; as of July 2020.</strong></p>
<p>AI has previously proven its capability by outperforming humans in complex board games like Chess and Go, but now it's stepping into an even more intricate field: chip design. With an astronomical number of potential configurations, far surpassing those in Chess or Go, the ability to optimize and innovate in chip design could be a game-changing application of AI technology. As the relationship of AI and semiconductors deepens, they're paving the way for a fresh surge of technological innovation. The forthcoming progression of AI is heavily dependent on the creation of new semiconductor chips that are specifically designed for AI applications. We believe this trend is likely to fuel significant growth in the next five years.</p>
<h2 id="point-four" class="anchored-block">AI Design Tools&rsquo; Growth Rate Projected to Surpass Chip Sales by 3x?</h2>
<p><strong>5-year CAGR for chips, EDA tools, and advanced AI design tools (2023-2028)<sup>3</sup></strong></p>
<p><img class="img-responsive w-100" src="https://www.vaneck.com/contentassets/428680f9e4f34b45b3ffd912d486e2ee/3295_smh_chart-3_2023.05_blog.svg" alt="AI Design Tools' Growth Rate Projected to Surpass Chip Sales by 3x?" /></p>
<p class="chart-disclosure"><strong>Sources: WSTS; Global Markets Insights; and Deloitte Global as of November 2022.</strong></p>
<p>AI's imminent growth largely hinges on the development of semiconductor chips optimized explicitly for AI functionality. According to Deloitte, it is very plausible that this factor can trigger substantial growth over the next half-decade.</p>
<h2 id="point-five" class="anchored-block">Semiconductor Industry Interlude: 4 Key Categories of Participants</h2>
<p>The semiconductor industry is principally composed of four key categories of participants. The initial category comprises foundry operators, for instance, Taiwan Semiconductor Manufacturing Company (TSMC). These are businesses that undertake the production of semiconductor chips based on the specifications given to them by other companies. They can be thought of as factories crafting chips for different companies. The second category is filled with integrated device manufacturers (IDMs), with companies like Intel serving as examples. IDMs are unique because they handle the entire lifecycle of a semiconductor chip within their own facilities, from the initial design to the final manufacturing phase. The next category includes companies that only design chips also referred to as fabless companies. NVIDIA and Advanced Micro Devices (AMD) fall into this category. Fabless companies concentrate on designing and developing semiconductor chips but outsource the manufacturing to foundry operators since they do not have their own fabrication capabilities. The final and fourth category encompasses equipment manufacturers such as ASML. These businesses are responsible for creating the necessary machinery and equipment used in the manufacturing of semiconductor chips. They supply the crucial tools needed for both foundry operators and integrated device manufacturers to construct the chips.</p>
<h2 id="point-six" class="anchored-block">How Will US CHIPS Act Benefit Large Semiconductor Producers?</h2>
<p>Remember the US CHIPS Act? Since semiconductors are critical for the economy, the U.S. aims to become self-sufficient in semiconductor production and reduce dependence on foreign supply chains. The Covid-19 pandemic highlighted vulnerabilities in the supply chain, often including steps in over five countries and multiple global shipments. The Department of Commerce reports that in 2021, semiconductor shortages cost the U.S. economy nearly a quarter trillion dollars.</p>
<p>To increase domestic manufacturing of semiconductors, the US Chips and Science Act will channel $50 billion in investments into the industry over five years, including $11 billion for advanced semiconductor research and development, and $39 billion to accelerate and drive domestic chip production ($6 billion of which can cover direct loans and loan guarantees).</p>
<h3>Budget To Expand Domestic Manufacturing (Advanced Semiconductor R&amp;D and Chip Production)</h3>
<p><img class="img-responsive w-100" src="https://www.vaneck.com/contentassets/428680f9e4f34b45b3ffd912d486e2ee/3295_smh_chart-4_2023.05_blog.svg" alt="Budget To Expand Domestic Manufacturing (Advanced Semiconductor R and D and Chip Production)" /></p>
<p class="chart-disclosure"><strong>Source: McKinsey<sup>4</sup>&nbsp;as of October 2022.</strong></p>
<p>Among the main beneficiaries of the US CHIPS Act are the U.S.&rsquo;s large semiconductor producers. Instead of trying to pick individual stock winners in the sector, investors can gain exposure to the 25 largest most liquid, U.S. listed semiconductor companies in <a href="/link/39c8d235748b4c26a5930c31d3ac0160.aspx" title="SMH - VanEck Semiconductor ETF - Overview"><strong>The VanEck Semiconductor ETF (SMH)</strong></a>.</p>
<p>In closing, we believe semiconductors are the 'picks and shovels' way to play the AI landscape and present a compelling way to capitalize on the growing AI sector, particularly when direct access to private AI companies is limited for many investors. <a href="/link/39c8d235748b4c26a5930c31d3ac0160.aspx" title="SMH - VanEck Semiconductor ETF - Overview"><strong>The VanEck Semiconductor ETF (SMH)</strong></a> provides a way to invest in the entire value chain of the semiconductor industry, from chip design and fabrication to the machinery used in the manufacturing process. As semiconductors are the essential components that power AI innovation, we believe they are poised to gain value amid the potential deflationary impact of AI's efficiency&mdash;they also provide a unique opportunity to ride the wave of AI's transformative impact.</p>
<p>To receive more <strong><a href="https://www.vaneck.com/us/en/insights/thematic-investing/" title="Thematic Investing Insights">Thematic Investing</a></strong> insights, <strong><a href="https://www.vaneck.com/us/en/subscribe/" title="Subscription Center">sign up in our subscription center</a></strong>.</p>
]]></content:encoded>
</item><item rdf:about="https://www.vaneck.com/us/en/blogs/moat-investing/is-nvidias-wide-moat-worth-the-price/">
  <title>Is Nvidia’s Wide Moat Worth the Price?></title>
  <link>https://www.vaneck.com/us/en/blogs/moat-investing/is-nvidias-wide-moat-worth-the-price/</link>
  <description><![CDATA[Though rising AI demand helped drive the chip firm&rsquo;s Q1 results and staggering Q2 guidance, Nvidia&rsquo;s wide economic moat is strengthened by more than just AI&mdash;but is the stock overvalued?]]></description>
  <dc:creator>Brandon Rakszawski</dc:creator>
  <dc:date>06/01/2023 06:30:00</dc:date>
<content:encoded><![CDATA[

<h2>Nvidia Stock Analysis: More Than Meets the AI</h2>
<p>Nvidia Corp. (Ticker: NVDA) stole the spotlight as its first quarter results and staggering second quarter guidance reverberated through markets in the days following its May 24, 2023 release. The growing demand for and adoption of artificial intelligence (AI), which requires increasingly more processing power, drove a significant boost for the chip firm&rsquo;s business. But Nvidia&rsquo;s wide economic moat is fortified by more than just AI. We take a deep dive here to uncover how this tech fortress maintains its moat, and look at Morningstar&rsquo;s fair value estimate for its stock.</p>
<h2>Nvidia&rsquo;s IP Strength Powers Its Moat</h2>
<p>Morningstar believes Nvidia possesses a wide economic moat from its <a href="https://www.vaneck.com/us/en/blogs/moat-investing/intangible-assets-the-leading-source-of-moats2/" title="Intangible Assets: The Leading Source of Moats"><strong>intangible assets</strong></a> related to the design of graphics processing units (GPUs). Nvidia&rsquo;s current position originated with its popularization of GPUs as far back as 1999. According to Morningstar, GPUs allow graphics processing tasks to be offloaded from the CPU, thereby increasing overall system performance.</p>
<p>Nvidia&rsquo;s roots are in gaming, and its patents related to hardware design has contributed to its market leading position in gaming GPUs, owning as much as 80% share of the market, according to Morningstar. Its dominance of the rapidly growing high-end gaming GPU market has allowed Nvidia to build economies of scale and invest in research and development efforts.</p>
<p>Morningstar&rsquo;s research highlights a classic example of Nvidia&rsquo;s wide economic moat: Nvidia&rsquo;s advanced intellectual property creates barriers to entry so insurmountable that even chip behemoth Intel was unable to develop its own discrete GPUs and opted to license intellectual property from Nvidia.</p>
<h2>Positioning for Growth Earns Nvidia Moat Ratings Upgrade</h2>
<p>Morningstar notes that Nvidia has taken steps to leverage its GPU prowess in emergent areas such as data centers and automotive, which was a driving force behind their decision to upgrade Nvidia&rsquo;s moat rating <a href="https://www.vaneck.com/us/en/blogs/moat-investing/moat-question-and-answer/#point-two" title="MOAT: Question and Answer"><strong>from narrow to wide</strong></a> in June 2021.</p>
<p>Data centers are critical to powering AI systems that can perform complex tasks, including speech recognition, photo recognition, and recommendation engines such as those used by Amazon and Netflix. Nvidia has first mover advantages in many areas of AI adoption, according to Morningstar. Nvidia is pioneering a new class of product: data processing units (DPUs) that can handle certain tasks, allowing CPUs to focus more on core applications. Some expect DPUs to become commonplace in all servers.</p>
<p>Nvidia has also focused on automotive innovation. While it does operate in the highly competitive infotainment solutions market (think tech-heavy digital cockpits), Morningstar notes that Nvidia hopes to carve a dominant position in the self-driving space. Its Drive PX self-driving system has been tested by more than 370 original equipment manufacturers in a research and development setting, but the opportunity is in the early days and Intel represents a formidable opponent, in Morningstar&rsquo;s view.</p>
<h2>Nvidia Stock Priced at a Premium, Despite Fair Value Increase</h2>
<p>Nvidia has traded at or above its Morningstar-assigned fair value estimate for much of the last decade, despite several fair value estimate increases by Morningstar. Most recently, and following Nvidia&rsquo;s May 24 earnings call, Morningstar increased its fair value to $300 per share from $200, a 50% increase. Morningstar Analyst Abhinav Davuluri noted that they have raised their forecast for Nvidia&rsquo;s data center segment revenue to grow at a 30% compound annual growth rate over the next five years, up from 19% prior to Nvidia&rsquo;s updated guidance.</p>
<p>Morningstar equity research analysts use a three-stage discounted cash flow model that considers a company&rsquo;s economic moat to project free cash flow well into the future and arrive at a current per-share intrinsic value.</p>
<h3>NVDA&rsquo;s Consistent Premium to Fair Value</h3>
<p><strong>10 Years as of 5/31/2023</strong></p>
<p><img class="img-responsive w-100" src="https://www.vaneck.com/contentassets/245d6facd95b413fb8f88bb68c201772/3298_moat_chart-01_2023.06_blog.svg" alt="NVDA's Consistent Premium to Fair Value - 10 Years as of 5/31/2023" /></p>
<p class="chart-disclosure"><strong>Source: Morningstar, May 2023.</strong> Past performance is no guarantee of future results. For illustrative purposes only and not representative of Fund performance. Not intended as a recommendation to buy or to sell any of the securities mentioned herein.</p>
<p>The <a href="/link/9f629c73a31846bb9e480b95e2c7f330.aspx" title="MOAT - VanEck Morningstar Wide Moat ETF - Index"><strong>Morningstar<sup>&reg;</sup>&nbsp;Wide Moat Focus Index<sup>SM</sup></strong></a> included Nvidia for two quarters. The Index systematically targets high-quality wide moat companies that are trading at attractive levels relative to their Morningstar-assigned fair value. Nvidia was added in September 2022 shortly after its shares began trading at attractive levels and was removed in March 2023 after rallying 95%. Nvidia is not currently in the Index and, with a share price 30% above fair value at the time of this writing, isn&rsquo;t expected to be added back any time soon&mdash;but only time will tell.</p>
<p><a href="/link/9e43dd198c5f4e419f13220685081895.aspx" title="MOAT - VanEck Morningstar Wide Moat ETF - Overview"><strong>VanEck Morningstar Wide Moat ETF (MOAT)</strong></a> seeks to replicate as closely as possible, before fees and expenses the price and yield performance of the Morningstar Wide Moat Focus Index.</p>
<p>To receive more <a href="https://www.vaneck.com/us/en/insights/moat-investing/" title="Moat Investing Insights"><strong>Moat Investing</strong></a> insights, <a href="https://www.vaneck.com/us/en/subscribe/" title="Subscription Center"><strong>sign up in our subscription center</strong></a>.</p>
]]></content:encoded>
</item><item rdf:about="https://www.vaneck.com/us/en/blogs/thematic-investing/five-dos-and-donts-of-using-artificial-intelligence-for-financial-advisors/">
  <title>Five “Do’s” and Don’ts of Using Artificial Intelligence for Financial Advisors></title>
  <link>https://www.vaneck.com/us/en/blogs/thematic-investing/five-dos-and-donts-of-using-artificial-intelligence-for-financial-advisors/</link>
  <description><![CDATA[With 87% of advisors willing to learn how to incorporate AI into their business, it seems that those who do not may be left behind.]]></description>
  <dc:creator> </dc:creator>
  <dc:date>05/24/2023 06:30:00</dc:date>
<content:encoded><![CDATA[

<p>We all know that artificial intelligence (AI) will change the way we work, if it has not done so already. In fact, 99% of financial advisors surveyed by Accenture said AI will play a role in the future of financial advice.<sup>i</sup>&nbsp;This is not surprising considering that embracing technology has always been an important part of growing an advisory business. Not so long ago, advisors had to call their brokers to get a price for a certain stock or to place an order. Today, these actions are done by simply turning on your computer.</p>
<p>Adapting to new technology is not just about the ease of doing business either &ndash; it actually has an impact on the bottom line. For instance, according to Fidelity&rsquo;s 2022 RIA Benchmarking study, RIAs that consider themselves tech embracers had a higher 3-year CAGR in assets, clients, and revenue compared to those that didn&rsquo;t.<sup>ii</sup>&nbsp;While advisors agree that adopting AI is no longer an option but a requirement for their practices to grow, many do not know where to start.</p>
<p>We skip the sales pitch here on why AI is necessary and jump right to the how, with some introductory &ldquo;do&rsquo;s and don&rsquo;ts&rdquo; of using AI to enhance your practice. Stay tuned for more best practices on this topic in future pieces&mdash;with the help of the bots, of course.</p>
<h2 class="mt-5">AI By The Numbers<sup>iii</sup></h2>

<h2>The &ldquo;Do&rsquo;s&rdquo;: Five Ways Advisors Can Use AI</h2>
<div class="row pt-3 pb-3 align-items-center">
<div class="col-md-2 col-xs-12 col-lg-1"><img class="img-responsive center-image" style="width: 125px;" src="https://www.vaneck.com/contentassets/59a07c7e310e4ba5bc2ad19b3d910f4a/icon_automate-mundane-tasks.svg" alt="Automate Mundane Tasks" /></div>
<div class="col-md-9 col-xs-12 col-lg-10 custom-padding">
<h2 style="font-size: 18px;">1. Automate Mundane Tasks</h2>
<p>Data entry, candidate screening, expense tracking, and email box management can all be easily managed with AI, saving advisors a significant amount of time and resources. With AI handling the mundane tasks, advisors can focus on more strategic projects &ndash; like client relationships and portfolio positioning.</p>
</div>
</div>
<hr style="border: 1px solid #E6E7E8;" />
<div class="row pt-3 pb-3 align-items-center">
<div class="col-md-2 col-xs-12 col-lg-1"><img class="img-responsive center-image" style="width: 125px;" src="https://www.vaneck.com/contentassets/59a07c7e310e4ba5bc2ad19b3d910f4a/icon_client-services.svg" alt="Client Service" /></div>
<div class="col-md-9 col-xs-12 col-lg-10 custom-padding">
<h2 style="font-size: 18px;">2. Client Service</h2>
<p>AI-powered chatbots can be used to answer basic client queries, help clients navigate financial products, provide timely updates on portfolio performance, and schedule appointments. Chatbots can free up advisors to focus on high-value activities, including prospecting and personalized portfolio planning.</p>
</div>
</div>
<hr style="border: 1px solid #E6E7E8;" />
<div class="row pt-3 pb-3 align-items-center">
<div class="col-md-2 col-xs-12 col-lg-1"><img class="img-responsive center-image" style="width: 125px;" src="https://www.vaneck.com/contentassets/59a07c7e310e4ba5bc2ad19b3d910f4a/icon_marketing.svg" alt="Marketing" /></div>
<div class="col-md-9 col-xs-12 col-lg-10 custom-padding">
<h2 style="font-size: 18px;">3. Marketing</h2>
<p>Advisors can use AI to grow their book of business. It can help automate tasks like lead scoring so that advisors can focus more on the prospects that are most likely to become clients.</p>
</div>
</div>
<hr style="border: 1px solid #E6E7E8;" />
<div class="row pt-3 pb-3 align-items-center">
<div class="col-md-2 col-xs-12 col-lg-1"><img class="img-responsive center-image" style="width: 125px;" src="https://www.vaneck.com/contentassets/59a07c7e310e4ba5bc2ad19b3d910f4a/icon_content-brainstorming.svg" alt="Content Brainstorming" /></div>
<div class="col-md-9 col-xs-12 col-lg-10 custom-padding">
<h2 style="font-size: 18px;">4. Content Brainstorming</h2>
<p>AI can be a great place to start when creating ideas for content, so much so that it was used to help brainstorm for this blog. Start with an idea and try a few different prompts, and then use the ideas it generates to help write blogs, video scripts, social posts, and more. While AI can help generate ideas, it should not be used for <a href="#content-creation"><strong>content creation</strong></a> (yet).</p>
</div>
</div>
<hr style="border: 1px solid #E6E7E8;" />
<div class="row pt-3 pb-3 align-items-center">
<div class="col-md-2 col-xs-12 col-lg-1"><img class="img-responsive center-image" style="width: 125px;" src="https://www.vaneck.com/contentassets/59a07c7e310e4ba5bc2ad19b3d910f4a/icon_fraud-detection.svg" alt="Fraud Detection" /></div>
<div class="col-md-9 col-xs-12 col-lg-10 custom-padding">
<h2 style="font-size: 18px;">5. Fraud Detection</h2>
<p>AI can be used to monitor client transactions to identify suspicious activity in real-time. However, we don&rsquo;t suggest advisors use AI with sensitive or <strong><a href="#confidential-client-data">confidential client data</a></strong>, and should consider all security concerns.</p>
</div>
</div>
<hr style="border: 1px solid #E6E7E8;" />
<h2 class="mt-5">The Don&rsquo;ts: Five Ways Advisors Should Not Use AI</h2>
<div class="row pt-3 pb-3 align-items-center">
<div class="col-md-2 col-xs-12 col-lg-1"><img class="img-responsive center-image" style="width: 125px;" src="https://www.vaneck.com/contentassets/59a07c7e310e4ba5bc2ad19b3d910f4a/icon_market-predictions.svg" alt="Market Predictions" /></div>
<div class="col-md-9 col-xs-12 col-lg-10 custom-padding">
<h2 style="font-size: 18px;">1. Market Predictions</h2>
<p>Advisors should avoid using AI for market predictions or decisions. AI is not error-proof and does not consider current market conditions. Relying solely on its recommendations is a huge risk, and could result in significant financial losses.</p>
</div>
</div>
<hr style="border: 1px solid #E6E7E8;" />
<div class="row pt-3 pb-3 align-items-center">
<div class="col-md-2 col-xs-12 col-lg-1"><img class="img-responsive center-image" style="width: 125px;" src="https://www.vaneck.com/contentassets/59a07c7e310e4ba5bc2ad19b3d910f4a/icon_single-source-of-research.svg" alt="Single Source of Research" /></div>
<div class="col-md-9 col-xs-12 col-lg-10 custom-padding">
<h2 style="font-size: 18px;">2. Single Source of Research</h2>
<p>One of the main issues with current AI tools is that they often make things up. When using AI in the research process, it is important to look up other sources and verify results.</p>
</div>
</div>
<hr style="border: 1px solid #E6E7E8;" />
<div class="row pt-3 pb-3 align-items-center">
<div class="col-md-2 col-xs-12 col-lg-1"><img class="img-responsive center-image" style="width: 125px;" src="https://www.vaneck.com/contentassets/59a07c7e310e4ba5bc2ad19b3d910f4a/icon_creative-content-creation.svg" alt="Creative Content Creation" /></div>
<div class="col-md-9 col-xs-12 col-lg-10 custom-padding">
<h2 id="content-creation" class="anchored-block" style="font-size: 18px;">3. Creative Content Creation</h2>
<p>While it sounds nice to be able to enter a prompt and use it for content on your website or social, at this point it is too good to be true. AI may plagiarize other content, use inaccurate sources, and may not match the tone or brand voice of your practice. It is best to use AI to help brainstorm while leaving content creation to the professionals.</p>
</div>
</div>
<hr style="border: 1px solid #E6E7E8;" />
<div class="row pt-3 pb-3 align-items-center">
<div class="col-md-2 col-xs-12 col-lg-1"><img class="img-responsive center-image" style="width: 125px;" src="https://www.vaneck.com/contentassets/59a07c7e310e4ba5bc2ad19b3d910f4a/icon_confidential-tasks.svg" alt="Confidential Tasks" /></div>
<div class="col-md-9 col-xs-12 col-lg-10 custom-padding">
<h2 id="confidential-client-data" class="anchored-block" style="font-size: 18px;">4. Confidential Tasks</h2>
<p>Advisors should not use AI with highly sensitive customer data. If using AI for any customer data, they must ensure that it is secure and complies with all data protection laws and that the data is inaccessible to unauthorized parties. AI systems that use personal data must follow strict security protocols to prevent potential data breaches. Some advisors may find that the risks associated with using AI with customer data are too high.</p>
</div>
</div>
<hr style="border: 1px solid #E6E7E8;" />
<div class="row pt-3 pb-3 align-items-center">
<div class="col-md-2 col-xs-12 col-lg-1"><img class="img-responsive center-image" style="width: 125px;" src="https://www.vaneck.com/contentassets/59a07c7e310e4ba5bc2ad19b3d910f4a/icon_decision-making.svg" alt="Highly Sensitive Decision-Making" /></div>
<div class="col-md-9 col-xs-12 col-lg-10 custom-padding">
<h2 style="font-size: 18px;">5. Highly Sensitive Decision-Making</h2>
<p>AI technology lacks the emotional intelligence and ethical judgment necessary to make certain sensitive business decisions. Areas such as relationship building and managing staff require a human touch to ensure fairness, equity, and compliance with legal requirements.</p>
</div>
</div>
<hr style="border: 1px solid #E6E7E8;" />
<h2 class="mt-5">Two Simple Ways to Get Started</h2>
<p>There are a ton of AI-powered aps, but where should you start? While we will dig deeper into AI tools in the future, here are a few simple ones to help you and your practice now.</p>
<h2 style="font-size: 18px;">1. Never miss something in a meeting again:</h2>
<p style="margin-left: 20px;"><strong>Fireflies</strong><br />This AI tool can help advisors record and transcribe their meetings or calls instantly. The tool can also transcribe existing auto files to help you get going right away. <a href="https://www.vaneck.com/us/en/offsite-disclaimer/?id=232021&amp;button=no&amp;url=https://fireflies.ai/?gr_pk=ZqLO&amp;gr_uid=5xqA" title="Automate your meeting notes" target="_blank" rel="noopener"><strong>Start here</strong></a>.</p>
<h2 style="font-size: 18px;">2. Refresh your website copy, write blogs, or draft personalized email</h2>
<p style="margin-left: 20px;"><strong>COPY.AI</strong><br />This AI tool can help advisors quickly write blogs, emails, or even birthday notes to their clients. Advisors looking to refresh their website can us copy.ai to get started as it offers a number of templates, including &ldquo;An About Us&rdquo; template that can help advisors describe their history and value proposition within minutes. Not only does the tool help you compose investor updates, copy.ai lets you choose the tone of your voice. <a href="https://www.copy.ai/" title="Introducing Chat by Copy.ai: Whatever you need, just ask it." target="_blank" rel="noopener"><strong>Try it here</strong></a>.</p>
<h2>Give It A Try, But Be Cautious</h2>
<p>While AI can be a great tool to help financial advisors run their business it still has many shortcomings. Advisors need to take into account the specifics of their business and how it may impact their clients when considering AI adoption. Importantly, Advisors should check with their firm&rsquo;s compliance and legal departments and review their firm&rsquo;s guidelines and/or restrictions before using any AI tools. With 87% of advisors willing to learn how to incorporate AI into their business, it seems that those who do not may be left behind.<sup>iv</sup></p>
<style type="text/css">
    @media (max-width: 767px) {
        .center-image {
            display: block;
            margin-left: auto;
            margin-right: auto;
            width: 125px !important;
            padding-bottom: 15px;
        }
    }

    @media (min-width: 768px) {
        .custom-padding {
            display: block;
            margin-left: 25px;
            padding-left: 25px;
        }
    }

    @media (min-width: 992px) {
        .custom-padding {
            display: block;
            margin-left: 45px;
            padding-left: 45px;
        }
    }
    
    .disclosure{display: none;}

</style>
<p>To receive more <strong><a href="https://www.vaneck.com/us/en/insights/thematic-investing/" title="Thematic Investing Insights">Thematic Investing</a></strong> insights, <strong><a href="https://www.vaneck.com/us/en/subscribe/" title="Subscription Center">sign up in our subscription center</a></strong>.</p>
]]></content:encoded>
</item><item rdf:about="https://www.vaneck.com/us/en/blogs/digital-assets/matthew-sigel-ethereum-to-redefine-finance-on-the-way-to-118k/">
  <title>Ethereum’s Growth May Redefine Finance></title>
  <link>https://www.vaneck.com/us/en/blogs/digital-assets/matthew-sigel-ethereum-to-redefine-finance-on-the-way-to-118k/</link>
  <description><![CDATA[Ethereum is poised to redefine its value proposition and revenue generation, potentially catapulting its token price to $11.8k by 2030, as it transforms the landscape of blockchain-based applications and services.]]></description>
  <dc:creator>Matthew  Sigel</dc:creator>
  <dc:date>05/22/2023 06:30:00</dc:date>
<content:encoded><![CDATA[

<p><strong>Please note that VanEck has a position(s) in the Ethereum token described below.</strong></p>
<p>Thanks to improving functionality, lower take-rates and an ethos of inclusivity, we are bullish on decentralized software protocols as an alternative to existing intermediaries. Among the contenders to capture a majority of economic value&mdash;as is common in digital platforms&mdash;Ethereum stands out to us as one of the most probable long-term disruptors. According to our recent analysis, we believe Ethereum may emerge as a powerhouse among digital assets, with a predicted token price of $11.8k by 2030. Ethereum's unique approach combines a globally distributed infrastructure, smart contract capabilities, and a digital commerce model that enables trustless transactions.</p>
<h2>Ethereum: The Digital Mall of the Future</h2>
<p>Just as a physical mall is a hub for commercial activity, Ethereum operates as a digital equivalent. It provides a secure platform for internet commerce, with its infrastructure spread across the globe. The network's lifeblood, the ETH token, is used for conducting transactions, rewarding validators, and penalizing dishonest ones.</p>
<p>Ethereum's limited space is managed through fees charged to users for conducting business and value exchange. This software is globally hosted and utilizes a protocol to establish a unified understanding of ownership, commercial activity, and business logic. It enables users to conduct commerce without the need for trust in participants or counterparts. Essentially, Ethereum's core business revolves around selling secure, immutable blockspace that powers internet commerce.</p>
<h2>Revenue Generation: Shifting from Currency to Security as a Service</h2>
<p>Ethereum's revenue is primarily derived from activities where tokens are used in its core operations, such as transaction fees and Miner Extractable Value (MEV). However, the network's evolution beyond a transactional currency has paved the way for the introduction of "Security as a Service" (SaaS). This innovative concept implies that the ETH token's value can be harnessed both within and outside Ethereum to secure applications, protocols, and ecosystems.</p>
<h2>The Road Ahead: Ethereum's Potential for Growth by 2030</h2>
<p>The forecasted growth of Ethereum hinges on its capacity to capture the market of smart contract platforms across various sectors like finance, banking, payments, metaverse, social and gaming, and infrastructure. The shift of off-chain businesses to on-chain platforms for cost reduction and new revenue streams could significantly alter the economic dynamics within the Ethereum network.</p>
<p>In the future, Ethereum's blockchain value capture is likely to pivot away from transaction revenue to &ldquo;blockspace&rdquo;, the actual product sold by smart contract blockchains. We estimate that a 60% annual decline in ETH and layer 2 &ldquo;per-transaction&rdquo; costs will unlock significant demand for decentralized applications. Together with the network's 80% burn rate for transaction fees (akin to a share buyback), we believe the network is poised for a transformative shift in revenue generation.</p>
<p>The potential of MEV is also worth noting. Often referred to as the &ldquo;bogeyman&rdquo; of blockchain, MEV, despite being difficult to predict, is expected to play a crucial role in securing blockchains due to its immense value to market makers and other financial actors.</p>
<p>Looking ahead, we believe Ethereum stands on the precipice of significant growth and evolution. With a base case 2030 price target of $11,848 per token, discounted to $5,359.71 in today's dollars, Ethereum is poised to become one of the world's dominant global settlement networks. It is expected to host a considerable amount of commercial activity from sectors that stand to benefit most from public blockchains. As the digital age continues to evolve, Ethereum is poised to be at the forefront, transforming the financial landscape as we know it.</p>
<p>A more in-depth research report and detailed valuation methodology is available here: <strong><a href="https://www.vaneck.com/us/en/blogs/digital-assets/matthew-sigel-ethereum-price-prediction-118k-by-2030/" title="Ethereum Price Prediction: $11.8k by 2030">Ethereum Price Prediction: $11.8k by 2030</a></strong>.</p>
<p>To receive more <strong><a href="https://www.vaneck.com/us/en/insights/digital-assets/" title="Digital Assets Insights">Digital Assets</a></strong> insights, <strong><a href="https://www.vaneck.com/us/en/subscribe/" title="Subscription Center">sign up in our subscription center</a></strong>.</p>
<!-- Hide alreat promo banner. Make height 0 to account for the HeaderHeightCalculation scripts -->
<style>
header.site-header .alert-bar {
    display:none!important;
    height: 0!important;
    overflow:hidden!important;
}
</style>
]]></content:encoded>
</item><item rdf:about="https://www.vaneck.com/us/en/blogs/thematic-investing/buzz-investing-regional-bank-issues-remain-in-focus/">
  <title>BUZZ Investing: Regional Bank Issues Remain In Focus></title>
  <link>https://www.vaneck.com/us/en/blogs/thematic-investing/buzz-investing-regional-bank-issues-remain-in-focus/</link>
  <description><![CDATA[Domestic equities traded within a narrow range as investors debated the impact of a weakening U.S. economy; mixed Q1 earnings provided no clear outlook for the market.]]></description>
  <dc:creator> </dc:creator>
  <dc:date>05/22/2023 06:30:00</dc:date>
<content:encoded><![CDATA[

<p><strong>Key Points</strong></p>
<ul class="content-list">
<li class="mt-2"><strong>Regional Bank Failures:</strong> First Republic Bank's collapse and concerns over other regional banks have raised market apprehensions.</li>
<li class="mt-2"><strong>Economic Impact:</strong> A weakening U.S. economy is influencing investor sentiment and market performance.</li>
<li class="mt-2"><strong>BUZZ Index Performance:</strong> The BUZZ NextGen AI US Sentiment Leaders Index's performance is affected by these economic and market developments.</li>
</ul>
<p>Domestic equities traded in a narrow range during the recent period between Index selection dates (April 13, 2023, to May 11, 2023, the &ldquo;Period&rdquo;) as investors appeared divided on the impact a weakening US economy will have on broader markets. Recent economic indicators, specifically within labor market conditions, may foretell a coming domestic recession while simultaneously encouraging the U.S. Federal Reserve to pause its rate hike program. U.S. Corporates reported largely mixed Q1 earnings, providing no clear indication of the economy&rsquo;s prospects.</p>
<p>Financials remain in focus following the recent troubles in the regional banking sector. <strong>First Republic Bank (NYSE: FRC)</strong> stood out as the latest casualty within the regional bank segment. The former star private banking platform experienced deposit withdrawals en-masse while floating a plan to sell bonds and raise equity in a last-ditch effort to shore its balance sheet. Investors balked at the plan, and FRC&rsquo;s stock price crumbled. Regulators seized control of FRC following the close of trading for the month of April, formalizing the second-largest bank failure in U.S. history and promptly selling its assets to <strong>JPMorgan Chase &amp; Co. (NYSE: JPM)</strong> to restore confidence.</p>
<p>The BUZZ NextGen AI US Sentiment Leaders Index (the &ldquo;BUZZ Index&rdquo; or &ldquo;Index&rdquo;) returned -3.79% during the month of April compared to a return of 1.56% for the S&amp;P 500 Index during the same period. Year-to-date, the BUZZ Index leads the S&amp;P 500 with returns of 18.11% and 9.17%, respectively, as of the end of April.</p>
<h2>Shares of DraftKings Inc. Pace Advancing Stocks within the BUZZ Index</h2>
<p>Shares of <strong>DraftKings Inc (NASD: DKNG)</strong> paced advancing stocks within the BUZZ Index during the recent Period. The company reported a lower-than-expected first-quarter loss while guiding higher for the remainder of 2023 and indicating a path to profitability by 2024 during its fourth-quarter earnings call. Investors cheered DKNG&rsquo;s renewed focus on expense management and strong customer growth and retention rates, which combined to fuel the better-than-expected results. Shares of Ottawa, Canada-based <strong>Shopify Inc (NASD: SHOP)</strong> soared by over 37% during the Period, the biggest gainer among stocks within the BUZZ Index. The e-commerce company, once viewed as a growing competitor to <strong>Amazon.com Inc (NASD: AMZN)</strong>, shocked investors by announcing during its Q1 earnings call that it is selling the two biggest pieces of its fulfillment network and abandoning its logistics ambitions. The stunning strategic reversal was cheered by investors who view the decision to focus more on its retail business as a positive long-term development.</p>
<div class="wrapped-div">
<table style="width: 750px;">
<tbody>
<tr class="tbl-data">
<td class="tbl-header last" colspan="4">Top BUZZ Index Contributors: April 13, 2023 &ndash; May 11, 2023</td>
</tr>
<tr class="tbl-data">
<td class="data-td  last">Company</td>
<td class="data-head last">Ticker</td>
<td class="data-head last">Average Weight (%)</td>
<td class="data-head last">Return Contribution (%)</td>
</tr>
<tr class="tbl-data">
<td class="data-td last" style="font-weight: normal;">DraftKings Inc</td>
<td class="data-td data last">DKNG</td>
<td class="data-td data last">1.84</td>
<td class="data-td data last">0.49</td>
</tr>
<tr class="tbl-data">
<td class="data-td last" style="font-weight: normal;">Shopify Inc</td>
<td class="data-td data last">SHOP</td>
<td class="data-td data last">1.31</td>
<td class="data-td data last">0.40</td>
</tr>
<tr class="tbl-data">
<td class="data-td last" style="font-weight: normal;">Amazon.com Inc</td>
<td class="data-td data last">AMZN</td>
<td class="data-td data last">3.18</td>
<td class="data-td data last">0.29</td>
</tr>
<tr class="tbl-data">
<td class="data-td last" style="font-weight: normal;">Palantir Technologies Inc</td>
<td class="data-td data last">PLTR</td>
<td class="data-td data last">2.36</td>
<td class="data-td data last">0.28</td>
</tr>
<tr class="tbl-data">
<td class="data-td last" style="font-weight: normal;">Datadog Inc</td>
<td class="data-td data last">DDOG</td>
<td class="data-td data last">0.70</td>
<td class="data-td data last">0.26</td>
</tr>
<tr class="tbl-data">
<td class="data-td last" style="font-weight: normal;">Alphabet Inc</td>
<td class="data-td data last">GOOGL</td>
<td class="data-td data last">3.11</td>
<td class="data-td data last">0.25</td>
</tr>
<tr class="tbl-data">
<td class="data-td last" style="font-weight: normal;">NVIDIA Corp</td>
<td class="data-td data last">NVDA</td>
<td class="data-td data last">3.26</td>
<td class="data-td data last">0.24</td>
</tr>
<tr class="tbl-data">
<td class="data-td last" style="font-weight: normal;">Microsoft Corp</td>
<td class="data-td data last">MSFT</td>
<td class="data-td data last">3.09</td>
<td class="data-td data last">0.22</td>
</tr>
<tr class="tbl-data">
<td class="data-td last" style="font-weight: normal;">Meta Platforms Inc</td>
<td class="data-td data last">META</td>
<td class="data-td data last">3.25</td>
<td class="data-td data last">0.20</td>
</tr>
<tr class="tbl-data">
<td class="data-td last" style="font-weight: normal;">Advanced Micro Devices Inc</td>
<td class="data-td data last">AMD</td>
<td class="data-td data last">2.97</td>
<td class="data-td data last">0.17</td>
</tr>
</tbody>
</table>
</div>
<br />
<p class="chart-disclosure">Source: BUZZ Holdings ULC, Bloomberg. Past performance is no guarantee of future results. Index performance is not illustrative of fund performance. Not intended as a recommendation to buy or to sell any of the securities mentioned herein.</p>
<p>The top detractors of performance were led by <strong>Coinbase Global Inc (NASD COIN),</strong> whose shares fell alongside the cryptocurrency Bitcoin, which slid nearly 11% during the Period. Shares of COIN rallied more than 15% off their lows during the Period following better-than-expected Q1 results, which showed the company losing $0.34 per share, well ahead of consensus analyst estimates which called for a loss of $1.45 per share. Shares of four other Financial sector stocks were featured in the top detractors to performance, including <strong>KeyCorp (NYSE: KEY)</strong>, <strong>Block Inc (NYSE: SQ)</strong>, <strong>Charles Schwab Corp (NYSE: SCHW)</strong>, and <strong>SoFi Technologies Inc (NASD: SOFI)</strong> as the sector remains out of favor with investors who are still cautious following the recent turmoil across US regional banks.</p>
<div class="wrapped-div">
<table style="width: 750px;">
<tbody>
<tr class="tbl-data">
<td class="tbl-header last" colspan="4">Bottom BUZZ Index Contributors: April 13, 2023 &ndash; May 11, 2023</td>
</tr>
<tr class="tbl-data">
<td class="data-td  last">Company</td>
<td class="data-head last">Ticker</td>
<td class="data-head last">Average Weight (%)</td>
<td class="data-head last">Return Contribution (%)</td>
</tr>
<tr class="tbl-data">
<td class="data-td last" style="font-weight: normal;">Plug Power Inc</td>
<td class="data-td data last">PLUG</td>
<td class="data-td data last">0.82</td>
<td class="data-td data last">-0.29</td>
</tr>
<tr class="tbl-data">
<td class="data-td last" style="font-weight: normal;">Block Inc</td>
<td class="data-td data last">SQ</td>
<td class="data-td data last">1.23</td>
<td class="data-td data last">-0.19</td>
</tr>
<tr class="tbl-data">
<td class="data-td last" style="font-weight: normal;">American Airlines Group Inc</td>
<td class="data-td data last">AAL</td>
<td class="data-td data last">0.66</td>
<td class="data-td data last">-0.16</td>
</tr>
<tr class="tbl-data">
<td class="data-td last" style="font-weight: normal;">United Airlines Holdings Inc</td>
<td class="data-td data last">UAL</td>
<td class="data-td data last">0.13</td>
<td class="data-td data last">-0.12</td>
</tr>
<tr class="tbl-data">
<td class="data-td last" style="font-weight: normal;">Caterpillar Inc</td>
<td class="data-td data last">CAT</td>
<td class="data-td data last">0.65</td>
<td class="data-td data last">-0.10</td>
</tr>
<tr class="tbl-data">
<td class="data-td last" style="font-weight: normal;">Alcoa Corp</td>
<td class="data-td data last">AA</td>
<td class="data-td data last">0.10</td>
<td class="data-td data last">-0.09</td>
</tr>
<tr class="tbl-data">
<td class="data-td last" style="font-weight: normal;">Enphase Energy Inc</td>
<td class="data-td data last">ENPH</td>
<td class="data-td data last">0.97</td>
<td class="data-td data last">-0.09</td>
</tr>
<tr class="tbl-data">
<td class="data-td last" style="font-weight: normal;">Goldman Sachs Group Inc/The</td>
<td class="data-td data last">GS</td>
<td class="data-td data last">0.83</td>
<td class="data-td data last">-0.08</td>
</tr>
<tr class="tbl-data">
<td class="data-td last" style="font-weight: normal;">Delta Air Lines Inc</td>
<td class="data-td data last">DAL</td>
<td class="data-td data last">0.11</td>
<td class="data-td data last">-0.07</td>
</tr>
<tr class="tbl-data">
<td class="data-td last" style="font-weight: normal;">Schlumberger NV</td>
<td class="data-td data last">SLB</td>
<td class="data-td data last">0.11</td>
<td class="data-td data last">-0.07</td>
</tr>
</tbody>
</table>
</div>
<br />
<p class="chart-disclosure">Source: BUZZ Holdings ULC, Bloomberg. Past performance is no guarantee of future results. Index performance is not illustrative of fund performance. Not intended as a recommendation to buy or to sell any of the securities mentioned herein.</p>
<h2>Sentiment Stock Highlight &ndash; Chipotle Mexican Grill, Inc.</h2>
<p>Over the past decade, few companies have been as consistent as <strong>Chipotle Mexican Grill (NYSE: CMG)</strong>. As one of the premier &ldquo;fast money&rdquo; stocks coming out of the Global Financial Crisis, CMG was one of the top performers in the market, rising a stunning 1500% between 2008 and 2015. CMG&rsquo;s meteoric rise came at a time when consumers were becoming more health-conscious, and CMG&rsquo;s menu offerings catered to the healthy fast-casual segment. Its strong restaurant-level economics helped it weather the pandemic, with shares of CMG quickly rebounding following the initial COVID-19-related market crash, returning to all-time highs just two months after the March 2020 low. Even with surging inflation and rising interest rates weighing on the markets over the past year, shares of CMG have continued to outperform. Last month the company reported Q1 earnings showing rising same-store sales, double-digit growth in digital sales, and a continued expansion of operating margins. The stock jumped over 12% following the report, and positive investor sentiment increased along with the rally. This month, CMG re-enters the BUZZ Index with a 0.66% weight.</p>
<h3>Chipotle Stock Price | January 2017 &ndash; May 2023</h3>
<p><img class="img-responsive w-100" src="https://www.vaneck.com/contentassets/379c8b96028e40d2823bf53d6a1d352f/3267_buzz_chart_01_2023.05_v1_blog.svg" alt="Chipotle Stock Price | January 2017 - May 2023" /></p>
<p class="chart-disclosure">Source: BUZZ Holdings ULC, Bloomberg as of May 2023. Past performance is no guarantee of future results. Index performance is not illustrative of fund performance. Not intended as a recommendation to buy or to sell any of the securities mentioned herein.</p>
<h2>BUZZ Index May 2023 Rebalance Highlights</h2>
<p><strong>First Solar, Inc.</strong></p>
<p>Following the downturn in the solar sector after 2008, the market underwent over a decade of consolidation. Many smaller solar companies went bankrupt, and investor interest was stagnant. <strong>First Solar (NASDAQ: FSLR)</strong> solidified itself as a leader in the space during this time, with its lower manufacturing costs helping grow its market share relative to its peers. Over the past few years, public attention on the sector has returned as global solar demand has increased and costs have significantly declined. Once heavily reliant on government subsidies and incentives, FSLR has made significant advances in its technology in recent years, allowing it to expand to larger-scale projects and begin growing through acquisitions. The stock has tripled in just the past year on the back of accelerating sales growth, record backlogs, and strong forecasted demand over the next several years. Positive investor sentiment has been climbing as well, and FSLR joins the Index this month with a 0.42% weight.</p>
<p>For more on rebalancing results and a full breakdown of index constituents added and removed for the month, view the <strong><a href="https://www.vaneck.com/us/en/investments/social-sentiment-etf-buzz/buzz-reconstitution.pdf" rel="noopener" target="_blank" title="BUZZ VanEck Social Sentiment ETF">BUZZ Index reconstitution</a></strong> report.</p>
<p>To receive more <strong><a href="https://www.vaneck.com/us/en/insights/thematic-investing/" title="Thematic Investing Insights">Thematic Investing</a></strong> insights, <strong><a href="https://www.vaneck.com/us/en/subscribe/" title="Subscription Center">sign up in our subscription center</a></strong>.</p>
<style type="text/css">
    .wrapped-div {
        max-width: 100%;
    }

    @media (max-width: 1240px) {
        .wrapped-div {
            overflow-x: scroll;
        }
    }

    .wrapped-div-sector {
        max-width: 100%;
        overflow-x: scroll;
    }
</style>
]]></content:encoded>
</item><item rdf:about="https://www.vaneck.com/us/en/blogs/emerging-markets-bonds/time-to-settle-your-tab-president-erdogan/">
  <title>Time to Settle Your Tab, President Erdogan></title>
  <link>https://www.vaneck.com/us/en/blogs/emerging-markets-bonds/time-to-settle-your-tab-president-erdogan/</link>
  <description><![CDATA[Turkey&rsquo;s May elections are the most important in a generation and will have a major impact on its debt market.]]></description>
  <dc:creator>David Austerweil</dc:creator>
  <dc:date>05/19/2023 06:30:00</dc:date>
<content:encoded><![CDATA[

<p><em>(UPDATE as of May 19, 2023)</em> President Erdogan and his Parliamentary coalition significantly outperformed expectations in the first-round electoral vote with Erdogan&rsquo;s vote share of 49.5% coming just 0.5% short of winning the Presidency in the first round. With 322 seats won, Erdogan&rsquo;s People&rsquo;s Alliance coalition won a majority of seats in Parliament. In contrast, Kılı&ccedil;daroğlu won 44.9% of the votes. With 5.2% vote share, Sinan Oğan came in third place. Almost all of Oğan&rsquo;s voters would need to support Kılı&ccedil;daroğlu in the second round vote for him to win. Pre-election polling showed that only 60% of Oğan&rsquo;s voters would support Kılı&ccedil;daroğlu in a second round vote making Erdogan&rsquo;s re-election a near certainty.</p>
<p>The most likely post-election outcome remains an adjustment toward a weaker Turkish lira combined with fiscal consolidation. Turkey is dangerously low on foreign-exchange (FX) reserves and President Erdogan should be aware of this. The only objective of ongoing FX interventions and controls imposed by the central bank is to keep the lira stable before the election. Lira stability, however flimsily achieved, combined with a fiscal expansion that included sharply higher public sector wages and subsidies on energy costs, will help boost voting intentions for Erdogan&rsquo;s ruling party. However, in order to secure future foreign funding for Turkey&rsquo;s persistent current account deficit, the lira needs to become more competitive. After Erdogan secures a new 5-year term on May 28, his incentives will change toward stabilizing the economy in order to avoid a hard economic landing.</p>
<p>The Emerging Markets Debt team still finds value in long dated, low dollar price sovereign bonds. After the first round vote, spreads on Turkey 2047 widened by 150 basis points (bps). Foreign investors had reluctantly covered underweight positions in the months before the vote in order to not underperform the index in the case of an opposition win. The moment that hope faded, they cut their positions aggressively. If Erdogan makes the needed economic adjustment, the recent spread widening can be reversed. In the scenario where Erdogan is too slow to make the necessary economic adjustments, the low dollar price bonds should outperform high dollar price bonds at the front end of the curve where refinancing risk will need to be priced.</p>
<p><em>--<br /><br />(April 13, 2023)&nbsp; Deputy Portfolio Manager David Austerweil recently returned from Istanbul where he met with government officials, multilateral institutions and the private sector.</em></p>
<ul class="content-list">
<li>Turkey faces its most consequential elections in a generation on May 14 with President Erdogan facing the real possibility of losing power after 20 years. Post-election, whoever wins will need to make difficult economic choices to stabilize inflation, improve exchange rate competitiveness and rebuild foreign reserves.</li>
<li>In the most likely electoral outcome, Kemal Kılı&ccedil;daroğlu defeats President Recep Tayyip Erdogan in the second round on May 28 and implements orthodox economic reforms including large interest rate hikes. If his CHP led alliance also wins a majority in parliament, Kılı&ccedil;daroğlu promised to restore the parliamentary system of government in place before the 2017 referendum that created an executive presidency.</li>
<li>The Emerging Markets (EM) Debt team finds the most value in long-dated, low-dollar price Turkish sovereign bonds. In the event the opposition wins, there is room for significant total returns of more than 20%. Additionally, the EM Debt team will look to purchase local currency debt at Turkish lira levels above 30. If Erdogan wins, the low dollar price and limited foreign ownership will provide downside protection in a sell-off of Turkish sovereign debt.</li>
</ul>
<h2>Election Overview</h2>
<p>On May 14, Turkish voters will go to the polls to elect both president and parliament to new 5-year terms. Out of roughly 55 million likely voters, there are 4 million first time voters and an additional 4 million voters who were displaced due to the earthquake, which makes accurate polling more challenging. With inflation currently running somewhere between 55% and 100% per annum, and an incumbent president who has been in power for over 20 years, the range of potential electoral and subsequent market outcomes is large.</p>
<p>The main presidential candidates are current President Recep Tayyip Erdogan, opposition leader Kemal Kılı&ccedil;daroğlu and Muharram Ince. Kılı&ccedil;daroğlu&rsquo;s CHP party formed an alliance with a very diverse group of opposition parties whose main unifying factor is their desire to see President Erdogan out of power. He is a compromise candidate who has lost many previous elections to Erdogan and does not have a passionate base of support. He promises to be a transition president who will move Turkey back to a parliamentary system. Ince, who was CHP&rsquo;s 2018 presidential candidate, broke with the opposition coalition and is likely to capture a sizable youth protest vote who do not feel represented by Kılı&ccedil;daroğlu&rsquo;s candidacy.</p>
<p>In the most recent polls, Kılı&ccedil;daroğlu is polling close to 10 percentage points above Erdogan which, if it were to translate into realized votes, would give Kılı&ccedil;daroğlu a first round victory. However, since Ince is polling between 5% and 10%, he is likely to force a second round vote between Kılı&ccedil;daroğlu and Erdogan. The second round vote would take place on May 28 and the intervening two weeks would give President Erdogan a lot of room to recover lost votes. During this period, the results of the parliamentary elections will be known. If Erdogan&rsquo;s alliance gains control of parliament, he may argue that giving the opposition the presidency would leave the country ungovernable. Alternatively, if the opposition controls parliament, they could try to limit Erdogan&rsquo;s power to govern. Any outcome where the presidency and the parliament are controlled by opposing alliances would be inherently risky and unstable.</p>
<p>Before considering how the many potential electoral outcomes could translate into market scenarios, it is important to review the state of the economy given the large imbalances that have built up over many years. No matter who wins, the next president will need to pay Turkey&rsquo;s deferred economic costs.</p>
<h2>Macroeconomic Overview</h2>
<p>Turkey has a low general government debt stock of just 31.7% of GDP for year-end 2022. In our cross-country analysis, this is over half a standard deviation better than the global average. Fiscal policy has also remained responsible with the government running primary surplus&rsquo; for more than a decade before moving to a modest primary deficit in 2019. This low stock and accumulation of government debt is the major positive when considering Turkey&rsquo;s creditworthiness and gives Turkey room on its balance sheet to pay the cost of years of unorthodox monetary policy and micromanagement of banking regulations that have built up major imbalances.</p>
<p>The main causes of the imbalances are interrelated: ultra-easy monetary policy combined with off balance fiscal spending via state-owned banks helped fuel a large, persistent current account deficit driven by energy imports, domestic overconsumption and dollarization of domestic savings via gold imports. By keeping monetary policy loose and providing state subsidized loans in Turkish lira, the government indirectly increased import demand and allowed inflation expectations to become unanchored. The result of this policy is clear both in the very high level of foreign currency debt service relative to the economy&rsquo;s ability to earn foreign currency (XDS/CAX in the below chart), in the low level of foreign currency reserves relative to imports (RES/IMP), and in the large current account balance relative to GDP (CAB/GDP).</p>
<h3>Turkey Has Worse Than Average Liquidity Measures</h3>
<p><img class="img-responsive w-100" src="https://www.vaneck.com/contentassets/b45bbb4dd7f14405b922a6ec70ab1cc9/3086_turkey-elections-piece_chart-1_blog_2023.04_v1.svg" alt="Turkey Has Worse Than Average Liquidity Measures" /></p>
<p class="chart-disclosure">Source: VanEck; IMF; World Bank; Moody&rsquo;s; Bloomberg, as of December 31, 2022.</p>
<p>The timing of the upcoming election is so important because these imbalances have reached a point where the status quo is no longer sustainable and stark policy choices are required to avoid a balance of payments crisis. Last year, Turkey was able to finance its large current account deficit of 5.5% of GDP and even increase reserves by $12.3bn due to deposits into the banking sector from offshore, including friendly countries such as Qatar and Saudi Arabia but also by large unexplained inflows. However, the current account deficit is starting the year in even worse shape with a $9.8bn deficit for January alone, which was almost entirely financed by spending central bank reserves. Estimates for Turkey&rsquo;s full year current account deficit are as high as $75bn, up from $48.8bn in 2022. Without additional financing from friendly nations and help from unexplained inflows, Turkey does not have enough usable foreign reserves at the central bank to cover the cost. Additionally, there is reason to believe that a lot of the financing received in 2022 was due to Erdogan&rsquo;s geopolitical connections and may not be available heading into an election where he could lose his hold on power.</p>
<p>In that case, Turkey will need to have a more competitive exchange rate to reduce the trade deficit by compressing import demand and making exports more attractive. At current prices, it is more affordable for exporters to produce goods from European Union (EU) members Romania and Hungary than from Turkey.</p>
<h2>Potential Paths for the Turkish Lira</h2>
<p>Based on a real effective exchange rate, which is a measure of the competitiveness of a currency relative to its trading partners, the Turkish Lira has appreciated significantly since the shock depreciation of December 2021. The government was only able to anchor the exchange rate by creating a Turkish Lira deposit scheme that protected depositors from currency devaluation while also paying a high interest rate. Since the FX linked deposits paid higher interest rates than US dollar deposits in the banking sector, there was a large inflow into TRY deposits from US dollar deposits that supported the currency. While successful in stopping the exchange rate devaluation, the deposit scheme hides large costs for government finances should the Turkish Lira devalue.</p>
<h3>The Turkish Lira Has Appreciated Significantly Despite Record Low Interest Rates</h3>
<p><img class="img-responsive w-100" src="https://www.vaneck.com/contentassets/b45bbb4dd7f14405b922a6ec70ab1cc9/3086_turkey-elections-piece_chart-2_blog_2023.04_v1.svg" alt="The Turkish Lira Has Appreciated Significantly Despite Record Low Interest Rates" /></p>
<p class="chart-disclosure">Source: JP Morgan, Bloomberg, as of March 31, 2023. Past performance is no guarantee of future results.</p>
<p>Since August 2022, the government has pursued a relatively stable exchange rate in nominal terms as it attempts to project the image of a strong economy to voters and bring inflation down from extremely high rates of over 50%. The longer this goes on, the costlier it becomes in terms of central bank reserves, and the more difficult it will become to control the devaluation once it finally arrives.</p>
<p>The electoral outcomes map directly into how this exchange rate adjustment will unfold.</p>
<p>If Kılı&ccedil;daroğlu wins the presidency in the first round, the central bank will most likely be unable to enforce the exchange controls recently created as the private sector expects the opposition to remove them and it will also stop selling US dollars to defend a specific rate. There will be a two week period before the opposition will be able fill the central bank&rsquo;s management with their own people. In this temporary power vacuum, the exchange rate could devalue precipitously with price action similar to that of December 2021. The main difference is that once value is restored to the Turkish lira, both local depositors and foreign investors will begin to convert US dollars to lira as the new government will immediately adopt orthodox monetary policy including a large series of interest rate hikes to attract foreign capital to the lira.</p>
<p>If Kılı&ccedil;daroğlu wins the presidency in the second round, the adjustment becomes much riskier because both local depositors and foreign investors will need to wait for at least another two weeks before knowing the results and creating a policy anchor will become costlier. The larger the initial devaluation, the higher the burden to the government for paying the FX-linked deposits and phasing out the scheme.</p>
<p>While Erdogan isn&rsquo;t polling well enough to win in the first round, there is still a clear path for him to win the presidency. If the Erdogan&rsquo;s alliance wins a majority in the parliamentary elections and there is a second round vote for the presidency, Erdogan can argue that it is too risky for Turkey to have a divided government and that voters should switch from Kılı&ccedil;daroğlu. In this scenario, Erdogan&rsquo;s government would most likely attempt to continue down the current policy path with a more gradual approach to release exchange rate pressures which would raise the likelihood of a disorderly adjustment in late 2023 or early 2024.</p>
<h2>Where We See the Most Value</h2>
<p>Due to the overvaluation of the exchange rate, there currently aren&rsquo;t any opportunities to invest in local Turkish assets. If the opposition were to win, we would monitor the devaluation closely and look for levels of Turkish lira above 30 to build long positions in local inflation-linked bonds. The opposition will raise interest rates substantially undoing Erdogan&rsquo;s failed experiment in ultra-easy monetary policy, but we are skeptical they will hike rates enough to create meaningfully positive real interest rates as they do not want to harm the economy and banking sector too much. There is an additional catalyst for inflation-linked bonds if the Turkish government&rsquo;s statistics agency were to restate inflation higher under an opposition government as there are concerns about Erdogan&rsquo;s government manipulating the inflation data to appear lower than reality.</p>
<p>Going into the election, we see the most value in long dated, low dollar price Turkish sovereign bonds. In our investment process, these bonds deserve a high allocation considering Turkey&rsquo;s fundamentals. Additionally, under a win by the opposition, spreads could tighten by 150 basis points (bps) or more as foreign investors are underweight Turkish credit and will need to add positions while the government is undertaking meaningfully positive reforms.</p>
<p>In the scenario where Erdogan wins and there is policy continuity, these bonds should also outperform due to their relatively low US dollar price of 70. In this scenario, we would evaluate if it makes sense to continue to hold the position depending on the future policy stance of the government.</p>
<h3>The Spread on Turkey 5.75 47 Remains High Relative to History and the Price Remains Far Below Par</h3>
<p><img class="img-responsive w-100" src="https://www.vaneck.com/contentassets/b45bbb4dd7f14405b922a6ec70ab1cc9/3086_turkey-elections-piece_chart-3_blog_2023.04_v1.svg" alt="The Spread on Turkey 5.75 47 Remains High Relative to History and the Price Remains Far Below Par" /></p>
<p class="chart-disclosure">Source: JP Morgan, as of April 7, 2023. Past performance is no guarantee of future results.</p>
<p>To receive more <a href="https://www.vaneck.com/us/en/insights/emerging-markets-bonds/" title="Emerging Markets Bonds Insights"><strong>Emerging Markets Bonds</strong></a> insights, <a href="https://www.vaneck.com/us/en/subscribe/" title="Subscription Center"><strong>sign up in our subscription center</strong></a>.</p>
]]></content:encoded>
</item><item rdf:about="https://www.vaneck.com/us/en/blogs/municipal-bonds/xmpt-question-and-answer/">
  <title>XMPT ETF: Question and Answer></title>
  <link>https://www.vaneck.com/us/en/blogs/municipal-bonds/xmpt-question-and-answer/</link>
  <description><![CDATA[A Q&amp;A guide for the VanEck CEF Muni Income ETF (XMPT), a diversified, rules-based, and cost-effective ETF tracking the S-Network Municipal Bond Closed-End Fund Index.]]></description>
  <dc:creator>Michael Cohick</dc:creator>
  <dc:date>05/19/2023 06:30:00</dc:date>
<content:encoded><![CDATA[

<p>This blog aims to answer common questions about the <strong><a href="/link/fc018123f20d4f45aaf6b338189ae326.aspx" title="XMPT VanEck CEF Muni Income ETF - Overview ">VanEck CEF Muni Income ETF (XMPT)</a></strong>, an ETF that seeks to replicate the S-Network Municipal Bond Closed-End Fund Index, offering investors diversified access to U.S. listed municipal closed-end funds. Using a rules-based approach, XMPT adjusts for average premiums and discounts, providing a transparent, tradable, and cost-effective investment option.</p>
<ul class="content-list">
<li><strong><a href="#point-one">What is the methodology behind XMPT?</a></strong></li>
<li><strong><a href="#point-two">What factors influence premiums and discounts in closed-end funds?</a></strong></li>
<li><strong><a href="#point-three">What are the underlying closed-end funds&rsquo; weighted average historical discounts compared to where discounts currently are?</a></strong></li>
<li><strong><a href="#point-four">When do discounts signal attractive entry points for XMPT investors?</a></strong></li>
<li><strong><a href="#point-five">Given the volatility and dividend cuts in municipal closed-end funds year-to-date, why might now be an opportunity for investors?</a></strong></li>
<li><strong><a href="#point-six">Was XMPT being used as a tax swap opportunity for clients' portfolios?</a></strong></li>
<li><strong><a href="#point-seven">How does XMPT fit within a portfolio?</a></strong></li>
<li><strong><a href="#point-eight">How can investors buy VanEck ETFs?</a></strong></li>
</ul>
<h2 id="point-one" class="anchored-block">What is the methodology behind XMPT?</h2>
<p>The <a href="/link/6077bbbc32e845cfb25bc90c4b9c5238.aspx" title="XMPT - VanEck CEF Muni Income ETF - Overview"><strong>VanEck CEF Muni Income ETF</strong></a> (ticker: XMPT or "Exempt") aims to replicate the performance of the S-Network Municipal Bond Closed-End Fund Index (CEFMXTR), which tracks the performance of U.S. listed closed-end funds that invest in U.S. dollar denominated tax-exempt market. The index comprises four muni bond closed-end fund sectors: leveraged and unleveraged investment-grade strategies and leveraged and unleveraged high-yield strategies. It utilizes a weighting methodology based on each fund's total net assets, adjusted for its average premium and discount (difference between the closing price and the net asset value (&ldquo;NAV&rdquo;)) over the past 90 days during quarterly rebalances.</p>
<p>Unlike open-end mutual funds or ETFs, the number of shares of a closed-end fund is fixed, which means that the price of the fund is determined by supply and demand in the secondary market. Unlike ETFs and mutual funds, closed-end funds don&rsquo;t do primary market creations and redemptions to release the pressure of secondary market buying and selling, which, in an ETF helps keep large premiums and/or discounts from occurring. As a result, closed-end funds tend to trade at either a premium or discount to their NAV. <strong><a href="/link/fc018123f20d4f45aaf6b338189ae326.aspx" title="XMPT VanEck CEF Muni Income ETF - Overview ">XMPT</a></strong>&rsquo;s index rules overweight exposure to funds trading at wider discounts and away from funds trading at a premium. By incorporating this modified net asset weighting, the index effectively manages the discount exposure for investors, essentially buying discounted assets and selling overpriced ones in a systematic, rules-based manner.</p>
<p>Closed-end funds must meet the following criteria for inclusion:</p>
<ul class="content-list">
<li>Minimum $100 million in assets under management (AUM)</li>
<li>Minimum monthly trading volume of 250,000 shares in the past six months</li>
<li>Average daily trading volume exceeding $500,000 per day in the past three months</li>
<li>Management fee below 1.25%</li>
</ul>
<p>Approximately 85% of the fund and index are investment-grade, and <strong><a href="/link/fc018123f20d4f45aaf6b338189ae326.aspx" title="XMPT VanEck CEF Muni Income ETF - Overview ">XMPT</a></strong>&nbsp;distributes dividend payments monthly. By investing in <strong><a href="/link/fc018123f20d4f45aaf6b338189ae326.aspx" title="XMPT VanEck CEF Muni Income ETF - Overview ">XMPT</a></strong>, the investor gains diversification across underlying closed-end fund assets (muni bonds) and investment strategies, access to prominent active asset managers through a single trade, with the transparency and tradability of an ETF.</p>
<h2 id="point-two" class="anchored-block">What factors influence premiums and discounts in closed-end funds?</h2>
<p>The closed structure of these funds causes investor sentiment to be the main driver of discounts to NAV. Factors influencing sentiment include credit events, interest rate policies, headlines, liquidity, and changes in distribution rates.</p>
<p>In the U.S., rising interest rates and distribution cuts have been major concerns for muni closed-end fund investors. Several funds announced dividend cuts in the past year, primarily due to increased borrowing costs for leverage usage and the short-end muni yield curve inversion. Short-term rates (the rate at which the funds typically borrow) are currently higher than the middle part of the curve and only slightly lower than the long end of the curve. This means that borrowing in the short term to buy long-dated bonds is no longer a viable strategy to boost the yield in a given portfolio. Portfolio managers are stuck between adding risk by buying long dated lower-quality bonds or accepting a lower yield.</p>
<p>When funds reduce distributions, discounts typically widen. Although predicting distribution changes could help investors stay ahead, the premium/discount weighting in <strong><a href="/link/fc018123f20d4f45aaf6b338189ae326.aspx" title="XMPT VanEck CEF Muni Income ETF - Overview ">XMPT</a></strong>'s underlying index can capitalize on these dislocations. This approach facilitates buying discounted assets and selling those at premiums, offering a strategic advantage.</p>
<h2 id="point-three" class="anchored-block">What are the underlying closed-end funds&rsquo; weighted average historical discounts compared to where discounts currently are?</h2>
<p>Since the fund's inception, the average discount of the underlying funds has been -5.05%, with the current discount hovering at around -12.5%. Throughout most of 2021, the underlying funds were at a slight premium, which began to widen out at the beginning of 2022, when the current rate hike cycle began. We have seen discount volatility since then, and we expect this to continue. But we believe investors may benefit from deploying cash into discounts at these levels.</p>
<div class="epi-contentfragment">faq-banner-cta</div>
<h2 id="point-four" class="anchored-block">When do discounts signal attractive entry points for XMPT investors?</h2>
<p>Potential buying opportunities typically arise when closed-end fund discounts reach the long-term average. However, a particularly attractive total return opportunity has historically emerged when discounts hit or exceed -10%. Out of approximately 3,000 trading days since <strong><a href="/link/fc018123f20d4f45aaf6b338189ae326.aspx" title="XMPT VanEck CEF Muni Income ETF - Overview ">XMPT</a></strong>'s inception in 2011, this has occurred only 109 times, accounting for just over 3% of those days.</p>
<h3>Premium/Discount: CEFs Held by XMPT</h3>
<p><img loading="lazy" class="img-responsive w-100" src="https://www.vaneck.com/contentassets/207d09f5e2c643cfac192a15f76aa889/3255_xmpt_chart_01_2023.05_v1_blog.svg" alt="Premium/Discount: CEFs Held by XMPT" /></p>
<p class="chart-disclosure">Source: VanEck. As of 5/15/2023. Past performance is no guarantee of future results. Not intended as a recommendation to buy or sell any securities mentioned herein.</p>
<p>Before the pandemic, the discount had approached this magnitude only five times. On average, in the 11 months following a 10% discount, the fund experienced an average cumulative total return of 20%.</p>
<h2 id="point-five" class="anchored-block">Given the volatility and dividend cuts in municipal closed-end funds year-to-date, why might now be an opportunity for investors?</h2>
<p>Closed-end funds are inherently volatile, and the current fixed-income environment has made muni closed-end funds even more so. However, volatility seems to have become the new normal for the municipal market over the past five years. In the last year, most of the closed-end funds in the portfolio have cut their dividends, which has helped to widen discounts across the board. It&rsquo;s also important to note that closed-end funds will boost their dividends when possible. A disciplined allocation approach could be appropriate given the historical returns of investing during wide discounts.</p>
<p>Although the current rate hike cycle may not be over, it could conclude before the year's end. Historically, negative performance years for muni closed-end funds have been followed by strong recovery years, which could occur in 2023.</p>
<h2 id="point-six" class="anchored-block">Was XMPT being used as a tax swap opportunity for clients' portfolios?</h2>
<p>We believe that <strong><a href="/link/fc018123f20d4f45aaf6b338189ae326.aspx" title="XMPT VanEck CEF Muni Income ETF - Overview ">XMPT</a></strong>'s diversified, discount-weighted approach offers a smarter investment strategy compared to trying to pick individual winners and avoid losers. Regarding tax swaps, muni-focused ETFs, including <strong><a href="/link/fc018123f20d4f45aaf6b338189ae326.aspx" title="XMPT VanEck CEF Muni Income ETF - Overview ">XMPT</a></strong>, were likely used as tax-loss harvesting tools throughout 2022, capturing at least a portion of the related fund flows.</p>
<h2 id="point-seven" class="anchored-block">How does XMPT fit within a portfolio?</h2>
<p><strong><a href="/link/fc018123f20d4f45aaf6b338189ae326.aspx" title="XMPT VanEck CEF Muni Income ETF - Overview ">XMPT</a></strong>&nbsp;serves as a long-term strategic allocation for investors seeking a high level of tax-exempt income while diversifying away from traditional high-yield (below investment grade) exposures. We believe it complements, rather than replaces, below investment-grade muni bonds or muni bond funds.</p>
<p><strong><a href="/link/fc018123f20d4f45aaf6b338189ae326.aspx" title="XMPT VanEck CEF Muni Income ETF - Overview ">XMPT</a></strong>&nbsp;offers three key benefits:</p>
<ul class="content-list">
<li>High level of tax-exempt income</li>
<li>Diversification by asset, strategy, and manager</li>
<li>Opportunity to capitalize on inefficiencies in the closed-end fund market, enabling the purchase of assets at discounts to NAV</li>
</ul>
<div class="wrapped-div">
<table style="width: 100%;">
<tbody>
<tr class="tbl-data">
<td class="tbl-header last">XMPT Performance (%)</td>
<td class="tbl-header last" style="text-align: center;">YTD</td>
<td class="tbl-header last" style="text-align: center;">1YR</td>
<td class="tbl-header last" style="text-align: center;">3YR</td>
<td class="tbl-header last" style="text-align: center;">5YR</td>
<td class="tbl-header last" style="text-align: center;">10YR</td>
<td class="tbl-header last" style="text-align: center;">LIFE 7/12/2011</td>
<td class="tbl-header last" style="text-align: center;">Gross Expense Ratio</td>
</tr>
<tr class="tbl-data">
<td class="data-td last" style="font-weight: normal;">NAV</td>
<td class="data-head last">1.71</td>
<td class="data-head last">-9.83</td>
<td class="data-head last">-1.09</td>
<td class="data-head last">1.36</td>
<td class="data-head last">2.23</td>
<td class="data-head last">3.72</td>
<td class="data-head last">1.81%</td>
</tr>
<tr class="tbl-data">
<td class="data-td last" style="font-weight: normal;">Share Price</td>
<td class="data-head last">1.72</td>
<td class="data-head last">-10.17</td>
<td class="data-head last">-1.12</td>
<td class="data-head last">1.39</td>
<td class="data-head last">2.19</td>
<td class="data-head last">3.72</td>
<td class="data-head last">&nbsp;</td>
</tr>
</tbody>
</table>
</div>
<br />
<p class="chart-disclosure">Source: VanEck. As of 3/31/2023.</p>
<p class="chart-disclosure">Returns less than one year are not annualized.</p>
<p class="chart-disclosure"><strong>The performance data quoted represents past performance. Past performance is not a guarantee of future results. Investment return and principal value of an investment will fluctuate so that an investor's shares, when redeemed, may be worth more or less than their original cost. Performance may be lower or higher than performance data quoted. Please call 800.826.2333 or visit vaneck.com for performance current to the most recent month&nbsp;ended.</strong></p>
<p class="chart-disclosure">The "Net Asset Value" (NAV) of a Fund is determined at the close of each business day, and represents the dollar value of one share of the fund; it is calculated by taking the total assets of the fund, subtracting total liabilities, and dividing by the total number of shares outstanding. The NAV is not necessarily the same as the ETF 's intraday trading value. Investors should not expect to buy or sell shares at&nbsp;NAV.</p>
<h2 id="point-eight" class="anchored-block">How can investors buy VanEck ETFs?</h2>
<p><strong><a href="/link/6077bbbc32e845cfb25bc90c4b9c5238.aspx#how-to-buy-etf&amp;utm=XMPT-Blog" title="How to buy VanEck ETFs?">Learn more here.</a></strong></p>
<p class="d-none d-lg-block"><a href="mailto:askvaneck@vaneck.com" title="Have More Questions? - Ask VanEck" rel="noopener"><img loading="lazy" class="img-responsive" src="https://www.vaneck.com/globalassets/home/us/insights/blogs/bm-blog-images/cta-faq_desktop-02.svg" alt="Have More Questions? - Ask VanEck" /></a></p>
<p class="d-lg-none"><a href="mailto:askvaneck@vaneck.com" title="Have More Questions? - Ask VanEck" rel="noopener"><img loading="lazy" class="img-responsive" src="https://www.vaneck.com/globalassets/home/us/insights/blogs/bm-blog-images/cta-faq_mobile-01.svg" alt="Have More Questions? - Ask VanEck" /></a></p>
<p>To receive more <a href="/us/en/insights/municipal-bonds/" title="Municipal Bonds Insights"><strong> Municipal Bonds</strong></a> insights, <a href="/link/5f45412c2143400497908cea2897f7d3.aspx" title="Subscription Center"><strong>sign up in our subscription center</strong></a>.</p>
<style> 
      .wrapped-div {
        max-width: 100%;
    }

    @media (max-width: 1024px) {
        .wrapped-div {
            overflow-x: scroll;
        }
    }

    .wrapped-div-sector {
        max-width: 100%;
        overflow-x: scroll;
    }
</style>
]]></content:encoded>
</item><item rdf:about="https://www.vaneck.com/us/en/blogs/thematic-investing/reshoring-with-robotics-and-bridging-the-labor-gap/">
  <title>Reshoring with Robotics &amp; Bridging the Labor Gap></title>
  <link>https://www.vaneck.com/us/en/blogs/thematic-investing/reshoring-with-robotics-and-bridging-the-labor-gap/</link>
  <description><![CDATA[Watch the industrial robotics sector &ndash; tech progress, population trends, and the potential for reviving domestic manufacturing offer a prospect to worldwide labor shortages and aging populations.]]></description>
  <dc:creator>Drew  Anderson</dc:creator>
  <dc:date>05/19/2023 06:30:00</dc:date>
<content:encoded><![CDATA[

<p>The affordability and capabilities of robots have led to their widespread adoption in many different industries, making them an essential part of our daily lives. Robotics technology will continue to revolutionize the way we work by automating mundane and dangerous tasks that previously required humans to perform. As businesses strive to stay competitive and meet the demands of their customers, the need for robotics continues to grow. From manufacturing and healthcare to logistics and agriculture, robots are now an integral part of many industries.</p>
<p>With a growing number of applications, the industrial robotics industry presents a compelling investment opportunity. This industry involves tasks like designing, developing, manufacturing, and selling robots or robotics systems for a wide range of applications. The cost-effectiveness of robots, along with advancements in technology and demographic shifts, have created a favorable environment for investors to consider this rapidly growing sector.</p>
<h2>Robotics Affordability: More Bang, Fewer Bucks</h2>
<p>In recent years, the significant improvement in the cost-effectiveness of robots can be attributed to remarkable technological advancements. These advancements have led to the development of more efficient and affordable robots capable of executing a wide range of tasks with precision and accuracy. This has made automating robotics tasks easier for companies to achieve a return on investment.</p>
<h3>Average Cost of Industrial Robots</h3>
<p><img class="img-responsive w-100" src="https://www.vaneck.com/contentassets/d5478b06246b489183869343bf4ae5db/3254_ibot-blog_chart-1_2023.05_blog.svg" alt="Average Cost of Industrial Robots" /></p>
<p class="chart-disclosure">Source: Statista. As of 2022.</p>
<h2>Reshoring: Can Robotics Revive Domestic Manufacturing?</h2>
<p>Companies can now consider reshoring their manufacturing operations with robots' increased affordability and capability. This trend of bringing production back home from overseas is being fueled by the ability of customized robots to be quickly programmed and integrated into operations, providing greater flexibility and scalability. Despite companies not previously considering reshoring due to high costs and limited robot capabilities, advancements in technology and increased efficiency have made robot installation more feasible. As a result, reshoring has become a viable option for companies, paving the way for a potential shift in manufacturing from offshore to domestic locations.</p>
<h2>New Robotics Tech: Fueling Demand Across Industries</h2>
<p>Rapidly growing technology has strengthened the demand for robotics. Advancements in user-friendly interfaces, programming languages, and sensor technologies have made robots become more intuitive and easier to operate. Keyence Corp&rsquo;s (TYO: 6861) vision-guided robots exemplify this cutting-edge technology through streamlining tasks, boosting productivity, and minimizing changeover delays. These advancements have enhanced production efficiency and broadened the scope of robot implementation across various sectors, including healthcare, logistics, and agriculture.</p>
<h2>Industrial Robotics: Solution to an Aging Population and Labor Shortage</h2>
<p>Demographic factors are playing a role in the growing use of industrial robotics. With many countries seeing a dwindling labor force and declining birth rates, companies struggle to find skilled workers to meet production demands. The aging population in countries such as China has led to higher labor costs and a shortage of workers. To tackle these challenges, businesses are turning to automation and robotics as a solution. Several robotics companies are responding to this demand by expanding operations in China. ABB (NYSE: ABB) opened up a $150M robotics mega factory in Shanghai in December of 2022 solidifying its robotics and automation leadership in the region. It is imperative for robotics companies to continue investing in regions confronting such demographic challenges.</p>
<h3>China&rsquo;s Population is Growing Older by 2050</h3>
<p><img class="img-responsive w-100" src="https://www.vaneck.com/contentassets/d5478b06246b489183869343bf4ae5db/3254_ibot-blog_chart-2_2023.05_blog.svg" alt="China's Population is Growing Older by 2050" /></p>
<p class="chart-disclosure">Source: United Nations. As of 2022.</p>
<p><strong><a href="/link/988caafdd1ac45e8ae52f65d9c7aa60c.aspx" title="IBOT - VanEck Robotics ETF - Overview">VanEck Robotics ETF (IBOT)</a></strong> offers concentrated exposure to the promising investment opportunity in the robotics industry, fueled by the widespread adoption of robots in various industries and sectors. The fund seeks to track a diversified index emphasizing the many subthemes in robotics. Enhanced affordability and advanced capabilities of robots have played a pivotal role in fueling this adoption, making them an attractive option for those seeking long-term growth in the field.</p>
<p>To receive more <strong><a href="https://www.vaneck.com/us/en/insights/thematic-investing/" title="Thematic Investing Insights">Thematic Investing</a></strong> insights, <strong><a href="https://www.vaneck.com/us/en/subscribe/" title="Subscription Center">sign up in our subscription center</a></strong>.</p>
]]></content:encoded>
</item><item rdf:about="https://www.vaneck.com/us/en/blogs/thematic-investing/israel-75-years-of-growth-and-innovation/">
  <title>Israel – 75 Years of Growth and Innovation></title>
  <link>https://www.vaneck.com/us/en/blogs/thematic-investing/israel-75-years-of-growth-and-innovation/</link>
  <description><![CDATA[Israel, celebrating its 75th Anniversary, remains positioned for sustained economic growth due to its demographics, GDP growth, thriving consumer discretionary sector, and cutting-edge technology.]]></description>
  <dc:creator>Sunny  Bokhari</dc:creator>
  <dc:date>05/18/2023 06:30:00</dc:date>
<content:encoded><![CDATA[

<p>Israel will mark its 75th Independence Day on May 14, 2023 and over this time, the country has established its pedigree in innovation and is home to many successful companies in technology, health care and defense industries. However, there is much more to Israel than just being a start-up nation.</p>
<p>One of the key strengths of Israel is its demographics, Israel has one of the youngest and most educated populations amongst developed market countries. In 2022, 28% of the population was under the age of 15 with 60% of the country&rsquo;s population falling within the working age range.<sup>1</sup>&nbsp;This provides a solid foundation for economic growth, as a large and growing workforce is essential for driving productivity and innovation. In addition, younger individuals generally tend to be more optimistic about their financial future and are willing to spend more of their disposable income. This per capita spending drives up consumption growth and gross domestic product (GDP).</p>
<p>Over the past decade, Israel's per capita GDP has been steadily increasing, driven by strong growth in sectors such as technology, healthcare and finance. In 2022, Israel's per capita GDP was $54,847.28, up from $38,327.80 in 2016. Israel&rsquo;s per capita GDP surpassed Germany in 2021, and the country remained amongst the richest countries in Europe in 2022.<sup>2</sup>&nbsp;This growth trajectory is expected to continue in the coming years, making Israel a compelling destination for long-term investors.</p>
<h3>GDP Per Capita of Select European Countries</h3>
<p><img class="img-responsive w-100" src="https://www.vaneck.com/contentassets/f9d0fa0b88104428baa5864f76c05e79/3245_isra_chart_01_2023.05_v1_blog.svg" alt="GDP Per Capita of Select European Countries" /></p>
<p class="chart-disclosure">Source: Ceicdata.com.</p>
<p>Israel's consumer discretionary sector appears to be a direct beneficiary of higher per capita GDP. The consumer discretionary sector includes industries such as retail, entertainment and hospitality, and is driven by consumer spending. In Israel, the consumer discretionary sector has been growing steadily in recent years, thanks to factors including rising disposable incomes, changing consumer preferences and increased tourism. The market capitalization of consumer discretionary sector companies in the MarketVector BlueStar Israel Global Index grew by a factor of eight over the past five years alone, expanding from $1,070M to $9,716M in May 2023.<sup>3</sup>&nbsp;Fox-Wizel Ltd, a manufacturer and designer of clothing, fashion accessories, cosmetics and home fashion experienced tremendous growth over the past five years, with its market cap increasing four times over this period. Maytronics, a producer and distributor of swimming pool equipment experienced a similar growth trajectory with market cap increasing 129% over the past five years.<sup>4</sup></p>
<h3>Market Capitalization of Consumer Discretionary Sector</h3>
<p><img class="img-responsive w-100" src="https://www.vaneck.com/contentassets/f9d0fa0b88104428baa5864f76c05e79/3245_isra_chart_02_2023.05_v1_blog.svg" alt="Market Capitalization of Consumer Discretionary Sector" /></p>
<p class="chart-disclosure">Source: FactSet data for MarketVector BlueStar Israel Global Index as of 5/8/2023.</p>
<p>Israel is also experiencing positive trade momentum as a result of the Abraham Accords (a series of agreements between Israel and several Arab countries that were signed in 2020). The Accords represent a historic breakthrough in the normalization of relations between Israel and Arab countries in the Middle East and aim to promote regional stability and economic cooperation by establishing diplomatic relations, opening up embassies and promoting trade and investment between the countries. Trade between Israel and UAE reached a new record in 2022 at $2.56 billion, up from $700 million in 2020.<sup>5</sup></p>
<p>With its young and growing workforce, strong per capita GDP growth, vibrant consumer discretionary sector and a world-class technology industry, Israel is well-positioned to continue driving economic growth in the coming years. By investing in Israel, investors can gain exposure to a dynamic and innovative economy that offers significant growth potential and long-term opportunities for value creation. Despite a global economic slowdown, Israel is forecasted to achieve at approximate 3.0% GDP growth in 2023 and 3.4% in 2024, as compared to advanced economies that are projected to grow only 1.0% ~ 1.3% over the next two years.<sup>6</sup></p>
<p>Israel received developed market status from leading benchmark providers more than a decade ago. It went from being a medium-sized market within emerging markets (EM) indexes to a miniscule weight in global developed market indexes. The reclassification from MSCI left Israel equities underweight in passive and benchmarked developed market portfolios. We believe investors seeking to build a comprehensive global equity portfolio should consider Israel exposure.</p>
<p>When thinking about how to access the opportunity provided by Israeli companies, a diversified approach utilized by the <strong><a href="/link/d7bbde8118604c1f82b5c6f7330ca82e.aspx" title="ISRA - VanEck Israel ETF - Overview">VanEck Israel ETF (ISRA)</a></strong> may provide investors the opportunity to capitalize on Israel&rsquo;s favorable macroeconomic trends. ISRA provides investors a diversified exposure to the country&rsquo;s broad sectors. On a 10-year look-back as of April 30, 2023, the MarketVector BlueStar Israel Global Index provided favorable returns at an attractive risk premium relative to global developed and emerging markets indexes.</p>
<div class="wrapped-div">
<table style="width: 600px;">
<tbody>
<tr class="tbl-data">
<td class="tbl-header last">Indexes</td>
<td class="tbl-header last">Return</td>
<td class="tbl-header last">Std Dev</td>
<td class="tbl-header last">Sharpe Ratio</td>
</tr>
<tr class="tbl-data">
<td class="data-td data last" style="text-align: left;">MarketVector BlueStar Israel Global Index NR USD</td>
<td class="data-td data last">5.02</td>
<td class="data-td data last">20.72</td>
<td class="data-td data last">0.37</td>
</tr>
<tr class="tbl-data">
<td class="data-td data last" style="text-align: left;">MSCI EM NR USD</td>
<td class="data-td data last">1.93</td>
<td class="data-td data last">19.01</td>
<td class="data-td data last">0.17</td>
</tr>
<tr class="tbl-data">
<td class="data-td data last" style="text-align: left;">MSCI EAFE NR USD</td>
<td class="data-td data last">4.83</td>
<td class="data-td data last">17.40</td>
<td class="data-td data last">0.40</td>
</tr>
<tr class="tbl-data">
<td class="data-td data last" style="text-align: left;">MSCI EM Growth NR USD</td>
<td class="data-td data last">2.90</td>
<td class="data-td data last">20.42</td>
<td class="data-td data last">0.24</td>
</tr>
</tbody>
</table>
</div>
<br />
<p class="chart-disclosure">Time period 5/1/2013 &ndash; 4/30/2023.</p>
<p class="chart-disclosure">Source: Morningstar. Past performance is not indicative of future results.</p>
<h3>MarketVector BlueStar Israel Global Index</h3>
<p><img class="img-responsive w-100" src="https://www.vaneck.com/contentassets/f9d0fa0b88104428baa5864f76c05e79/3245_isra_chart_03_2023.05_v1_blog.svg" alt="MarketVector BlueStar Israel Global Index" /></p>
<p class="chart-disclosure">Source: FactSet data for MarketVector BlueStar Israel Global Index as of 4/30/2023.</p>
<p>To receive more <strong><a href="https://www.vaneck.com/us/en/insights/thematic-investing/" title="Thematic Investing Insights">Thematic Investing</a></strong> insights, <strong><a href="https://www.vaneck.com/us/en/subscribe/" title="Subscription Center">sign up in our subscription center</a></strong>.</p>
<style type="text/css">
    .wrapped-div {
        max-width: 100%;
    }

    @media (max-width: 1240px) {
        .wrapped-div {
            overflow-x: scroll;
        }
    }

    .wrapped-div-sector {
        max-width: 100%;
        overflow-x: scroll;
    }
</style>
]]></content:encoded>
</item><item rdf:about="https://www.vaneck.com/us/en/blogs/income-investing/sector-exposures-continue-to-evolve-with-rating-migrations/">
  <title>Sector Exposures Continue to Evolve with Rating Migrations></title>
  <link>https://www.vaneck.com/us/en/blogs/income-investing/sector-exposures-continue-to-evolve-with-rating-migrations/</link>
  <description><![CDATA[New fallen angels and rising stars continue to impact sector allocations in the fallen angel index. The Telecom sector&rsquo;s weight decreased as a large rising star exited the index.]]></description>
  <dc:creator>Nicolas  Fonseca, CFA</dc:creator>
  <dc:date>05/18/2023 06:30:00</dc:date>
<content:encoded><![CDATA[

<p>Fallen angels underperformed broad HY by 0.45% (0.52% vs 0.97%) in April, and are now lagging by 0.48% YTD (4.24% vs 4.72%), driven by a -70.1% return on First Republic bonds which entered the index in March, and lower carry due to the higher quality tilt versus broad HY. The BB index returned 0.70% for April and 4.09% YTD, Single-B index returned 1.02% for April and 4.87% YTD and CCC &amp; lower rate index returned 1.98% for April and 6.92% YTD.<sup>1</sup>&nbsp;In terms of flows, demand of High Yield ETFs picked up, with inflows of approximately $5.4bn according to Citi, with the majority of flows in the intermediate duration bucket. All of the short end categories had outflows and long duration saw some inflows, which could indicate an interesting rotation ahead of U.S. Federal Reserve (Fed) expectations for the rest of the year.</p>
<h2>What Happens After the Fed Pause?</h2>
<p>After its latest interest rate increase following its early May meeting, the Fed appeared to signal that it may be considering a pause on additional interest rate hikes. Since the fallen angel index inception in December 2003, there have only been two Fed pauses: June 2006 and December 2018. Historically, fallen angels and broad high yield have performed well following a Fed pause. Overall, fallen angels outperformed broad high yield over different time periods. However, these historical pauses occurred amidst very different economic and market conditions compared to each other, and compared to conditions today.</p>
<p>For example, although high yield credit markets provided positive returns in the year following the June 2006 pause, that preceded a massive widening of credit spreads that began about one year after the last hike, signaling the start of the Global Financial Crisis. Although long term high yield investors would have fully recovered and achieved outperformance in fallen angels, that did not come without significant volatility, a 40% drawdown and unsurprisingly, returns that lagged U.S. Treasuries over a three-year period. Notably, the Fed paused rate hikes at a time when spreads were significantly tighter than their historical average. In contrast, the pause that occurred in 2018 was characterized by higher than average credit spreads, and began a multi-year period of outperformance of fallen angels, despite the COVID-related drawdown that occurred in 2020.</p>
<p>Ultimately, every cycle is different and the current environment likely differs from both historical examples. Spreads are tighter than average, but there are few signs of overexuberant lending, while the current hiking cycle was much larger than what occurred from 2016 to 2018 and the Fed&rsquo;s resolve to maintain high rates for longer appears strong. We do believe that these examples further support the case for fallen angels as an attractive way for investors to gain exposure to high yield, due to their higher quality and unique drivers of return that have provided outperformance through various market cycles and in changing economic environments.</p>
<div class="wrapped-div">
<table style="width: 100%;">
<tbody>
<tr class="tbl-data">
<td class="tbl-header last">Month of last hike</td>
<td class="tbl-header last" style="text-align: center;" colspan="2">6/30/2006</td>
<td class="tbl-header last" style="text-align: center;" colspan="2">12/31/2018</td>
<td class="tbl-header last" style="text-align: center;">&nbsp;</td>
</tr>
<tr class="tbl-data">
<td class="data-td  last">Fed Funds Terminal Rate</td>
<td class="data-head last" colspan="2">5.25%</td>
<td class="data-head last" colspan="2">2.50%</td>
<td class="data-head last">&nbsp;</td>
</tr>
<tr class="tbl-data">
<td class="data-td  last">Forward Returns</td>
<td class="data-head last">Fallen Angel</td>
<td class="data-head last">Broad HY</td>
<td class="data-head last">Fallen Angel</td>
<td class="data-head last">Broad HY</td>
<td class="data-head last">Avg Fallen Angels</td>
<td class="data-head last">Avg Broad HY</td>
</tr>
<tr class="tbl-data">
<td class="data-td last" style="font-weight: normal;">6m</td>
<td class="data-td data last">9.22%</td>
<td class="data-td data last">8.44%</td>
<td class="data-td data last">11.23%</td>
<td class="data-td data last">10.16%</td>
<td class="data-td data last">10.23%</td>
<td class="data-td data last">9.30%</td>
</tr>
<tr class="tbl-data">
<td class="data-td last" style="font-weight: normal;">1Y</td>
<td class="data-td data last">11.77%</td>
<td class="data-td data last">11.75%</td>
<td class="data-td data last">17.33%</td>
<td class="data-td data last">14.41%</td>
<td class="data-td data last">14.55%</td>
<td class="data-td data last">13.08%</td>
</tr>
<tr class="tbl-data">
<td class="data-td last" style="font-weight: normal;">2Y</td>
<td class="data-td data last">5.67%</td>
<td class="data-td data last">9.40%</td>
<td class="data-td data last">33.83%</td>
<td class="data-td data last">21.47%</td>
<td class="data-td data last">19.75%</td>
<td class="data-td data last">15.43%</td>
</tr>
<tr class="tbl-data">
<td class="data-td last" style="font-weight: normal;">3Y</td>
<td class="data-td data last">10.35%</td>
<td class="data-td data last">5.53%</td>
<td class="data-td data last">44.16%</td>
<td class="data-td data last">27.98%</td>
<td class="data-td data last">27.25%</td>
<td class="data-td data last">16.76%</td>
</tr>
<tr class="tbl-data">
<td class="data-td last">&nbsp;</td>
<td class="data-head last">Fallen Angel</td>
<td class="data-head last">Broad HY</td>
<td class="data-head last">Fallen Angel</td>
<td class="data-head last">Broad HY</td>
<td class="data-head last">Avg Fallen Angels</td>
<td class="data-head last">Avg Broad HY</td>
</tr>
<tr class="tbl-data">
<td class="data-td last">Spreads at end of hiking cycle</td>
<td class="data-head last">305</td>
<td class="data-head last">335</td>
<td class="data-head last">477</td>
<td class="data-head last">533</td>
<td class="data-head last">391</td>
<td class="data-head last">434</td>
</tr>
<tr class="tbl-data">
<td class="data-td last">Forward Spread Delta</td>
<td class="data-td data last">&nbsp;</td>
</tr>
<tr class="tbl-data">
<td class="data-td last" style="font-weight: normal;">6m</td>
<td class="data-td data last">-55</td>
<td class="data-td data last">-46</td>
<td class="data-td data last">-58</td>
<td class="data-td data last">-126</td>
<td class="data-td data last">-57</td>
<td class="data-td data last">-86</td>
</tr>
<tr class="tbl-data">
<td class="data-td last" style="font-weight: normal;">1Y</td>
<td class="data-td data last">-45</td>
<td class="data-td data last">-37</td>
<td class="data-td data last">-140</td>
<td class="data-td data last">-173</td>
<td class="data-td data last">-93</td>
<td class="data-td data last">-105</td>
</tr>
<tr class="tbl-data">
<td class="data-td last" style="font-weight: normal;">2Y</td>
<td class="data-td data last">488</td>
<td class="data-td data last">395</td>
<td class="data-td data last">-164</td>
<td class="data-td data last">-147</td>
<td class="data-td data last">162</td>
<td class="data-td data last">124</td>
</tr>
<tr class="tbl-data">
<td class="data-td last" style="font-weight: normal;">3Y</td>
<td class="data-td data last">781</td>
<td class="data-td data last">698</td>
<td class="data-td data last">-266</td>
<td class="data-td data last">-223</td>
<td class="data-td data last">258</td>
<td class="data-td data last">238</td>
</tr>
</tbody>
</table>
</div>
<br />
<p class="chart-disclosure">Source: ICE Data Services, VanEck. Returns are not annualized.</p>
<p><strong><u>Fallen Angels Overall Statistics:</u></strong> Fallen angels yields increased by 6bps in April, while broad HY yields decreased by 8bps, which are now 36bps and 57bps tighter, respectively, than the YTD highs of mid-March.</p>
<div class="wrapped-div">
<table style="width: 100%;">
<tbody>
<tr class="tbl-data">
<td class="tbl-header last">&nbsp;</td>
<td class="tbl-header last" style="text-align: center;" colspan="3">Fallen Angel</td>
<td class="tbl-header last" style="text-align: center;" colspan="3">Broad HY</td>
</tr>
<tr class="tbl-data">
<td class="data-td last">&nbsp;</td>
<td class="data-head last">12/31/2022</td>
<td class="data-head last">3/31/2023</td>
<td class="data-head last">4/30/2023</td>
<td class="data-head last">12/31/2022</td>
<td class="data-head last">3/31/2023</td>
<td class="data-head last">4/30/2023</td>
</tr>
<tr class="tbl-data">
<td class="data-td last">Yield to Worst</td>
<td class="data-td data last">7.49</td>
<td class="data-td data last">7.08</td>
<td class="data-td data last">7.14</td>
<td class="data-td data last">8.89</td>
<td class="data-td data last">8.49</td>
<td class="data-td data last">8.41</td>
</tr>
<tr class="tbl-data">
<td class="data-td last">Effective Duration</td>
<td class="data-td data last">5.45</td>
<td class="data-td data last">5.30</td>
<td class="data-td data last">5.27</td>
<td class="data-td data last">4.04</td>
<td class="data-td data last">3.83</td>
<td class="data-td data last">3.77</td>
</tr>
<tr class="tbl-data">
<td class="data-td last">Full Market Value ($mn)</td>
<td class="data-td data last">112,854</td>
<td class="data-td data last">114,776</td>
<td class="data-td data last">110,309</td>
<td class="data-td data last">1,199,909</td>
<td class="data-td data last">1,234,319</td>
<td class="data-td data last">1,234,778</td>
</tr>
<tr class="tbl-data">
<td class="data-td last">OAS</td>
<td class="data-td data last">337</td>
<td class="data-td data last">325</td>
<td class="data-td data last">332</td>
<td class="data-td data last">481</td>
<td class="data-td data last">458</td>
<td class="data-td data last">453</td>
</tr>
<tr class="tbl-data">
<td class="data-td last">No. of Issues</td>
<td class="data-td data last">212</td>
<td class="data-td data last">206</td>
<td class="data-td data last">203</td>
<td class="data-td data last">1,927</td>
<td class="data-td data last">1,916</td>
<td class="data-td data last">1,912</td>
</tr>
</tbody>
</table>
</div>
<br />
<p class="chart-disclosure">Source: ICE Data Services, VanEck.</p>
<p><u><strong>New Fallen Angels:</strong></u> Three new fallen angels were added to the Index, adding 1.33% of market value. Crane NXT was downgraded to high yield after Crane Co. completed a spinoff. Crane Co. now comprises of Aerospace &amp; Electronics and Process Flow Technologies; the spinoff company, Crane NXT, comprises of Payment and Merchandising Technologies. The downgrade reflects the smaller scale, less business diversification and reduced revenues post-spinoff. Rogers Communications subordinated debt was downgraded to BB from BBB- by Fitch and S&amp;P and to Ba2 from Baa3 by Moody&rsquo;s, given the immediate increase in financial leverage following the acquisition of Shaw Communications for approximately C$25m. Western Alliance Bancorporation, a high-profile issuer following the mini banking crisis in March, was downgraded, reflecting the deteriorating operating environment and current condition for U.S. banks.</p>
<div class="wrapped-div">
<table style="width: 100%;">
<tbody>
<tr class="tbl-data">
<td class="tbl-header last">Month-end Addition</td>
<td class="tbl-header last" style="text-align: center;">Name</td>
<td class="tbl-header last" style="text-align: center;">Rating</td>
<td class="tbl-header last" style="text-align: center;">Sector</td>
<td class="tbl-header last" style="text-align: center;">Industry</td>
<td class="tbl-header last" style="text-align: center;">% Mkt Value</td>
<td class="tbl-header last" style="text-align: center;">Price</td>
</tr>
<tr class="tbl-data">
<td class="data-td data last" style="text-align: left;">February</td>
<td class="data-td data last">Entegris Escrow Corp</td>
<td class="data-td data last">BB1</td>
<td class="data-td data last">Technology &amp; Electronics</td>
<td class="data-td data last">Electronics</td>
<td class="data-td data last">1.39</td>
<td class="data-td data last">90.92</td>
</tr>
<tr class="tbl-data">
<td class="data-td data last" style="text-align: left;">March</td>
<td class="data-td data last">First Republic Bank</td>
<td class="data-td data last">B3</td>
<td class="data-td data last">Banking</td>
<td class="data-td data last">0.40</td>
<td class="data-td data last">54.63</td>
</tr>
<tr class="tbl-data">
<td class="data-td data last" style="text-align: left;">March</td>
<td class="data-td data last">Nissan Motor Acceptance</td>
<td class="data-td data last">BB1</td>
<td class="data-td data last">Automotive</td>
<td class="data-td data last">Auto Loans</td>
<td class="data-td data last">2.57</td>
<td class="data-td data last">87.19</td>
</tr>
<tr class="tbl-data">
<td class="data-td data last" style="text-align: left;">March</td>
<td class="data-td data last">Nissan Motor</td>
<td class="data-td data last">BB1</td>
<td class="data-td data last">Automotive</td>
<td class="data-td data last">Automakers</td>
<td class="data-td data last">5.49</td>
<td class="data-td data last">92.98</td>
</tr>
<tr class="tbl-data">
<td class="data-td data last" style="text-align: left;">April</td>
<td class="data-td data last">Crane NXT</td>
<td class="data-td data last">BB3</td>
<td class="data-td data last">Capital Goods</td>
<td class="data-td data last">Diversified Capital Goods</td>
<td class="data-td data last">0.24</td>
<td class="data-td data last">70.99</td>
</tr>
<tr class="tbl-data">
<td class="data-td data last" style="text-align: left;">April</td>
<td class="data-td data last">Rogers Communications</td>
<td class="data-td data last">BB2</td>
<td class="data-td data last">Telecommunications</td>
<td class="data-td data last">Telecom - Wireless</td>
<td class="data-td data last">0.65</td>
<td class="data-td data last">90.35</td>
</tr>
<tr class="tbl-data">
<td class="data-td data last" style="text-align: left;">April</td>
<td class="data-td data last">Western Alliance Bancorporation</td>
<td class="data-td data last">BB1</td>
<td class="data-td data last">Banking</td>
<td class="data-td data last">0.44</td>
<td class="data-td data last">76.39</td>
</tr>
</tbody>
</table>
</div>
<br />
<p class="chart-disclosure">Source: ICE Data Services, VanEck.</p>
<p><strong><u>Rising Stars:</u></strong> One new rising star, Sprint Capital Corporation, exited the index at a weight of 4.70%. Sprint entered the index in the middle of 2008 at $85, posting an approximate 35% price return over the 15-year period. Over the last 12 months, Sprint posted a negative price return of close to -3% but it outperformed the broad HY price return of -4.5% over the same period. Sprint joins Western Midstream and Kraft as the biggest rising stars over the last 2 years.</p>
<div class="wrapped-div">
<table style="width: 100%;">
<tbody>
<tr class="tbl-data">
<td class="tbl-header last">Month-end Exit</td>
<td class="tbl-header last" style="text-align: center;">Name</td>
<td class="tbl-header last" style="text-align: center;">Rating</td>
<td class="tbl-header last" style="text-align: center;">Sector</td>
<td class="tbl-header last" style="text-align: center;">Industry</td>
<td class="tbl-header last" style="text-align: center;">% Mkt Value</td>
<td class="tbl-header last" style="text-align: center;">Price</td>
</tr>
<tr class="tbl-data">
<td class="data-td data last" style="text-align: left;">February</td>
<td class="data-td data last">Autopistas Metropolitanas de Puerto Rico LLC</td>
<td class="data-td data last">BB1</td>
<td class="data-td data last">Transportation</td>
<td class="data-td data last">Transport Infrastructure/Services<br /></td>
<td class="data-td data last">0.35</td>
<td class="data-td data last">100.49</td>
</tr>
<tr class="tbl-data">
<td class="data-td data last" style="text-align: left;">February</td>
<td class="data-td data last">Nokia Corp</td>
<td class="data-td data last">BB1</td>
<td class="data-td data last">Technology &amp; Electronics</td>
<td class="data-td data last">Tech Hardware &amp; Equipment</td>
<td class="data-td data last">0.47</td>
<td class="data-td data last">97.5</td>
</tr>
<tr class="tbl-data">
<td class="data-td data last" style="text-align: left;">March</td>
<td class="data-td data last">Western Midstream</td>
<td class="data-td data last">BB1</td>
<td class="data-td data last">Energy</td>
<td class="data-td data last">Gas Distribution</td>
<td class="data-td data last">5.27</td>
<td class="data-td data last">90.44</td>
</tr>
<tr class="tbl-data">
<td class="data-td data last" style="text-align: left;">April</td>
<td class="data-td data last">Sprint Capital Corp</td>
<td class="data-td data last">BB1</td>
<td class="data-td data last">Telecommunications</td>
<td class="data-td data last">Telecom - Wireless</td>
<td class="data-td data last">4.7</td>
<td class="data-td data last">114.25</td>
</tr>
</tbody>
</table>
</div>
<br />
<p class="chart-disclosure">Source: ICE Data Services, VanEck.</p>
<p><u><strong>Fallen Angels Performance by Sector:</strong></u> Sector composition had some notable changes in April following the shakeup in March. With the exit of Sprint, the Telecom sector weight dropped from 11.68% to 7.80% and now Leisure makes up the third largest exposure with a weight of 7.92%. Energy still has the highest weighting in the index, but its weight has declined YTD, while the Automotive sector weight has increased to approximately 18%.</p>
<p>The Banking sector continues to have a relatively high relative exposure (3.99% on March 31) vs broad HY 0.89%, although a new issuer was added at low weight: Western Alliance Bancorporation at 0.44%. Moody&rsquo;s placed Western Alliance on negative watch when Silicon Valley Bank (SVB) collapsed last month. First Republic Bank, a fallen angel in March, dropped to close to zero following the takeover by regulators and forced sale to JP Morgan.</p>
<p>In terms of performance, the Banking sector continues to be the only sector posting YTD negative returns (-5.54%) after +3.99% in January, +0.33% in February, -5.56% in March and -4.13% in April. In terms of sector attribution vs broad high yield, the Energy sector contributed the most while the Banking sector was the top detractor in April.</p>
<div class="wrapped-div">
<table style="width: 100%;">
<tbody>
<tr class="tbl-data">
<td class="tbl-header last" style="text-align: center;">&nbsp;</td>
<td class="tbl-header last" style="text-align: center; border-right: outset;" colspan="3">Wgt (%)</td>
<td class="tbl-header last" style="text-align: center; border-right: outset;" colspan="3">OAS</td>
<td class="tbl-header last" style="text-align: center; border-right: outset;" colspan="3">Price</td>
<td class="tbl-header last" style="text-align: center;">Total Return (%)</td>
</tr>
<tr class="tbl-data">
<td class="data-head last">&nbsp;</td>
<td class="data-head last">12/31/2021</td>
<td class="data-head last">3/31/2023</td>
<td class="data-head last" style="border-right: outset;">4/30/2023</td>
<td class="data-head last">12/31/2021</td>
<td class="data-head last">3/31/2023</td>
<td class="data-head last" style="border-right: outset;">4/30/2023</td>
<td class="data-head last">12/31/2021</td>
<td class="data-head last">3/31/2023</td>
<td class="data-head last" style="border-right: outset;">4/30/2023</td>
<td class="data-head last">MTD</td>
</tr>
<tr class="tbl-data">
<td class="data-td last">Automotive</td>
<td class="data-td data last">10.00</td>
<td class="data-td data last">18.06</td>
<td class="data-td data last" style="border-right: outset;">18.29</td>
<td class="data-td data last">262</td>
<td class="data-td data last">246</td>
<td class="data-td data last" style="border-right: outset;">280</td>
<td class="data-td data last">91.35</td>
<td class="data-td data last">92.21</td>
<td class="data-td data last" style="border-right: outset;">91.08</td>
<td class="data-td data last">-0.86</td>
</tr>
<tr class="tbl-data">
<td class="data-td last">Banking</td>
<td class="data-td data last">3.81</td>
<td class="data-td data last">3.99</td>
<td class="data-td data last" style="border-right: outset;">4.44</td>
<td class="data-td data last">302</td>
<td class="data-td data last">415</td>
<td class="data-td data last" style="border-right: outset;">402</td>
<td class="data-td data last">96.85</td>
<td class="data-td data last">87.61</td>
<td class="data-td data last" style="border-right: outset;">82.73</td>
<td class="data-td data last">-4.13</td>
</tr>
<tr class="tbl-data">
<td class="data-td last">Basic Industry</td>
<td class="data-td data last">1.36</td>
<td class="data-td data last">1.33</td>
<td class="data-td data last" style="border-right: outset;">1.41</td>
<td class="data-td data last">226</td>
<td class="data-td data last">227</td>
<td class="data-td data last" style="border-right: outset;">232</td>
<td class="data-td data last">92.17</td>
<td class="data-td data last">93.85</td>
<td class="data-td data last" style="border-right: outset;">94.21</td>
<td class="data-td data last">0.78</td>
</tr>
<tr class="tbl-data">
<td class="data-td last">Capital Goods</td>
<td class="data-td data last">5.12</td>
<td class="data-td data last">5.10</td>
<td class="data-td data last" style="border-right: outset;">5.59</td>
<td class="data-td data last">279</td>
<td class="data-td data last">240</td>
<td class="data-td data last" style="border-right: outset;">243</td>
<td class="data-td data last">95.01</td>
<td class="data-td data last">98.54</td>
<td class="data-td data last" style="border-right: outset;">97.31</td>
<td class="data-td data last">0.86</td>
</tr>
<tr class="tbl-data">
<td class="data-td last">Consumer Goods</td>
<td class="data-td data last">3.07</td>
<td class="data-td data last">3.00</td>
<td class="data-td data last" style="border-right: outset;">3.12</td>
<td class="data-td data last">275</td>
<td class="data-td data last">255</td>
<td class="data-td data last" style="border-right: outset;">307</td>
<td class="data-td data last">88.90</td>
<td class="data-td data last">91.27</td>
<td class="data-td data last" style="border-right: outset;">90.39</td>
<td class="data-td data last">-0.48</td>
</tr>
<tr class="tbl-data">
<td class="data-td last">Energy</td>
<td class="data-td data last">27.93</td>
<td class="data-td data last">22.16</td>
<td class="data-td data last" style="border-right: outset;">23.44</td>
<td class="data-td data last">293</td>
<td class="data-td data last">303</td>
<td class="data-td data last" style="border-right: outset;">293</td>
<td class="data-td data last">88.13</td>
<td class="data-td data last">90.05</td>
<td class="data-td data last" style="border-right: outset;">91.04</td>
<td class="data-td data last">1.57</td>
</tr>
<tr class="tbl-data">
<td class="data-td last">Financial Services</td>
<td class="data-td data last">0.65</td>
<td class="data-td data last">0.64</td>
<td class="data-td data last" style="border-right: outset;">0.68</td>
<td class="data-td data last">540</td>
<td class="data-td data last">506</td>
<td class="data-td data last" style="border-right: outset;">512</td>
<td class="data-td data last">77.20</td>
<td class="data-td data last">80.27</td>
<td class="data-td data last" style="border-right: outset;">80.68</td>
<td class="data-td data last">1.06</td>
</tr>
<tr class="tbl-data">
<td class="data-td last">Healthcare</td>
<td class="data-td data last">3.02</td>
<td class="data-td data last">3.03</td>
<td class="data-td data last" style="border-right: outset;">3.23</td>
<td class="data-td data last">362</td>
<td class="data-td data last">304</td>
<td class="data-td data last" style="border-right: outset;">303</td>
<td class="data-td data last">83.56</td>
<td class="data-td data last">86.47</td>
<td class="data-td data last" style="border-right: outset;">87.63</td>
<td class="data-td data last">1.78</td>
</tr>
<tr class="tbl-data">
<td class="data-td last">Insurance</td>
<td class="data-td data last">0.85</td>
<td class="data-td data last">0.82</td>
<td class="data-td data last" style="border-right: outset;">0.85</td>
<td class="data-td data last">347</td>
<td class="data-td data last">364</td>
<td class="data-td data last" style="border-right: outset;">375</td>
<td class="data-td data last">92.10</td>
<td class="data-td data last">92.99</td>
<td class="data-td data last" style="border-right: outset;">93.01</td>
<td class="data-td data last">0.56</td>
</tr>
<tr class="tbl-data">
<td class="data-td last">Leisure</td>
<td class="data-td data last">7.88</td>
<td class="data-td data last">7.79</td>
<td class="data-td data last" style="border-right: outset;">7.92</td>
<td class="data-td data last">325</td>
<td class="data-td data last">243</td>
<td class="data-td data last" style="border-right: outset;">244</td>
<td class="data-td data last">89.95</td>
<td class="data-td data last">93.25</td>
<td class="data-td data last" style="border-right: outset;">93.67</td>
<td class="data-td data last">1.11</td>
</tr>
<tr class="tbl-data">
<td class="data-td last">Real Estate</td>
<td class="data-td data last">5.13</td>
<td class="data-td data last">4.72</td>
<td class="data-td data last" style="border-right: outset;">4.93</td>
<td class="data-td data last">697</td>
<td class="data-td data last">701</td>
<td class="data-td data last" style="border-right: outset;">716</td>
<td class="data-td data last">79.46</td>
<td class="data-td data last">80.72</td>
<td class="data-td data last" style="border-right: outset;">80.39</td>
<td class="data-td data last">0.03</td>
</tr>
<tr class="tbl-data">
<td class="data-td last">Retail</td>
<td class="data-td data last">5.67</td>
<td class="data-td data last">5.49</td>
<td class="data-td data last" style="border-right: outset;">5.51</td>
<td class="data-td data last">471</td>
<td class="data-td data last">474</td>
<td class="data-td data last" style="border-right: outset;">429</td>
<td class="data-td data last">73.75</td>
<td class="data-td data last">74.72</td>
<td class="data-td data last" style="border-right: outset;">80.16</td>
<td class="data-td data last">0.48</td>
</tr>
<tr class="tbl-data">
<td class="data-td last">Services</td>
<td class="data-td data last">0.38</td>
<td class="data-td data last">0.37</td>
<td class="data-td data last" style="border-right: outset;">0.39</td>
<td class="data-td data last">388</td>
<td class="data-td data last">368</td>
<td class="data-td data last" style="border-right: outset;">401</td>
<td class="data-td data last">87.11</td>
<td class="data-td data last">89.89</td>
<td class="data-td data last" style="border-right: outset;">89.00</td>
<td class="data-td data last">-0.50</td>
</tr>
<tr class="tbl-data">
<td class="data-td last">Technology &amp; Electronics</td>
<td class="data-td data last">4.20</td>
<td class="data-td data last">4.67</td>
<td class="data-td data last" style="border-right: outset;">4.82</td>
<td class="data-td data last">327</td>
<td class="data-td data last">287</td>
<td class="data-td data last" style="border-right: outset;">320</td>
<td class="data-td data last">85.47</td>
<td class="data-td data last">88.19</td>
<td class="data-td data last" style="border-right: outset;">87.26</td>
<td class="data-td data last">-0.62</td>
</tr>
<tr class="tbl-data">
<td class="data-td last">Telecommunications</td>
<td class="data-td data last">11.91</td>
<td class="data-td data last">11.68</td>
<td class="data-td data last" style="border-right: outset;">7.80</td>
<td class="data-td data last">423</td>
<td class="data-td data last">433</td>
<td class="data-td data last" style="border-right: outset;">533</td>
<td class="data-td data last">90.04</td>
<td class="data-td data last">91.39</td>
<td class="data-td data last" style="border-right: outset;">83.60</td>
<td class="data-td data last">1.25</td>
</tr>
<tr class="tbl-data">
<td class="data-td last">Transportation</td>
<td class="data-td data last">2.10</td>
<td class="data-td data last">1.78</td>
<td class="data-td data last" style="border-right: outset;">1.85</td>
<td class="data-td data last">279</td>
<td class="data-td data last">231</td>
<td class="data-td data last" style="border-right: outset;">199</td>
<td class="data-td data last">90.49</td>
<td class="data-td data last">92.69</td>
<td class="data-td data last" style="border-right: outset;">93.73</td>
<td class="data-td data last">1.46</td>
</tr>
<tr class="tbl-data">
<td class="data-td last">Utility</td>
<td class="data-td data last">6.93</td>
<td class="data-td data last">5.38</td>
<td class="data-td data last" style="border-right: outset;">5.76</td>
<td class="data-td data last">213</td>
<td class="data-td data last">206</td>
<td class="data-td data last" style="border-right: outset;">180</td>
<td class="data-td data last">89.95</td>
<td class="data-td data last">90.19</td>
<td class="data-td data last" style="border-right: outset;">91.99</td>
<td class="data-td data last">2.37</td>
</tr>
<tr class="tbl-data">
<td class="data-td last">Total</td>
<td class="data-td data last">100</td>
<td class="data-td data last" style="border-right: outset;">100</td>
<td class="data-td data last">337</td>
<td class="data-td data last">325</td>
<td class="data-td data last" style="border-right: outset;">332</td>
<td class="data-td data last">87.91</td>
<td class="data-td data last">89.51</td>
<td class="data-td data last" style="border-right: outset;">89.07</td>
<td class="data-td data last">0.52</td>
</tr>
</tbody>
</table>
</div>
<br />
<p class="chart-disclosure">Source: ICE Data Services, VanEck.</p>
<p><strong><u>Fallen Angels Performance by Rating:</u></strong> Bed, Bad &amp; Beyond (BBBY) filed for bankruptcy this past month after posting -68.57% return in April before exiting the index. It had been under stress for quite some time, so the bankruptcy was not a surprise. BBBY began running low on cash and closing stores in 2022, with spreads widening to over 1000bps during May. BBBY was about to default on its debt in February 2023 as it missed its February 1 payment, but was able to make said payment on February 28, thereby postponing its default for a few more months. The BBBY bonds entered the fallen angel index in October 2018 and had a total return of -73% while in the index. The weight in the index was minimal at the time of exit, at approximately 0.04%, due to the price decline. It is the first issuer to default since July 2021. We anticipate that default rates will pick up (from a very low level) as the impacts of Fed tightening and a slowdown in the economy materializes.</p>
<div class="wrapped-div">
<table style="width: 100%;">
<tbody>
<tr class="tbl-data">
<td class="tbl-header last" style="text-align: center;">&nbsp;</td>
<td class="tbl-header last" style="text-align: center; border-right: outset;" colspan="3">Wgt (%)</td>
<td class="tbl-header last" style="text-align: center; border-right: outset;" colspan="3">OAS</td>
<td class="tbl-header last" style="text-align: center; border-right: outset;" colspan="3">Price</td>
<td class="tbl-header last" style="text-align: center;">Total Return (%)</td>
</tr>
<tr class="tbl-data">
<td class="data-head last">&nbsp;</td>
<td class="data-head last">12/31/2022</td>
<td class="data-head last">3/31/2023</td>
<td class="data-head last" style="border-right: outset;">4/30/2023</td>
<td class="data-head last">12/31/2022</td>
<td class="data-head last">3/31/2023</td>
<td class="data-head last" style="border-right: outset;">4/30/2023</td>
<td class="data-head last">12/31/2022</td>
<td class="data-head last">3/31/2023</td>
<td class="data-head last" style="border-right: outset;">4/30/2023</td>
<td class="data-head last">MTD</td>
</tr>
<tr class="tbl-data">
<td class="data-td last">BB</td>
<td class="data-td data last">87.00</td>
<td class="data-td data last">87.08</td>
<td class="data-td data last" style="border-right: outset;">87.00</td>
<td class="data-td data last">284</td>
<td class="data-td data last">281</td>
<td class="data-td data last" style="border-right: outset;">291</td>
<td class="data-td data last">90.02</td>
<td class="data-td data last">91.51</td>
<td class="data-td data last" style="border-right: outset;">90.70</td>
<td class="data-td data last">0.86</td>
</tr>
<tr class="tbl-data">
<td class="data-td last">B</td>
<td class="data-td data last">10.95</td>
<td class="data-td data last">10.37</td>
<td class="data-td data last" style="border-right: outset;">10.25</td>
<td class="data-td data last">608</td>
<td class="data-td data last">500</td>
<td class="data-td data last" style="border-right: outset;">480</td>
<td class="data-td data last">82.50</td>
<td class="data-td data last">85.35</td>
<td class="data-td data last" style="border-right: outset;">85.62</td>
<td class="data-td data last">-2.14</td>
</tr>
<tr class="tbl-data">
<td class="data-td last">CCC</td>
<td class="data-td data last">1.98</td>
<td class="data-td data last">2.50</td>
<td class="data-td data last" style="border-right: outset;">2.75</td>
<td class="data-td data last">1,020</td>
<td class="data-td data last">1,014</td>
<td class="data-td data last" style="border-right: outset;">1,065</td>
<td class="data-td data last">60.88</td>
<td class="data-td data last">64.60</td>
<td class="data-td data last" style="border-right: outset;">62.44</td>
<td class="data-td data last">0.66</td>
</tr>
<tr class="tbl-data">
<td class="data-td last">CC</td>
<td class="data-td data last">&nbsp;</td>
<td class="data-td data last">0.04</td>
<td class="data-td data last" style="border-right: outset;">&nbsp;</td>
<td class="data-td data last">&nbsp;</td>
<td class="data-td data last">6,713</td>
<td class="data-td data last" style="border-right: outset;">&nbsp;</td>
<td class="data-td data last">&nbsp;</td>
<td class="data-td data last">7.16</td>
<td class="data-td data last" style="border-right: outset;">&nbsp;</td>
<td class="data-td data last">&nbsp;</td>
</tr>
<tr class="tbl-data">
<td class="data-td last">C</td>
<td class="data-td data last">&nbsp;</td>
<td class="data-td data last" style="border-right: outset;">&nbsp;</td>
<td class="data-td data last">&nbsp;</td>
<td class="data-td data last" style="border-right: outset;">&nbsp;</td>
<td class="data-td data last">&nbsp;</td>
<td class="data-td data last" style="border-right: outset;">&nbsp;</td>
<td class="data-td data last">-68.57</td>
</tr>
<tr class="tbl-data">
<td class="data-td last">D</td>
<td class="data-td data last">0.07</td>
<td class="data-td data last">&nbsp;</td>
<td class="data-td data last" style="border-right: outset;">&nbsp;</td>
<td class="data-td data last">4,726</td>
<td class="data-td data last">&nbsp;</td>
<td class="data-td data last" style="border-right: outset;">&nbsp;</td>
<td class="data-td data last">10.00</td>
<td class="data-td data last">&nbsp;</td>
<td class="data-td data last" style="border-right: outset;">&nbsp;</td>
<td class="data-td data last">&nbsp;</td>
</tr>
<tr class="tbl-data">
<td class="data-td last">Total</td>
<td class="data-td data last">100</td>
<td class="data-td data last" style="border-right: outset;">100</td>
<td class="data-td data last">337</td>
<td class="data-td data last">325</td>
<td class="data-td data last" style="border-right: outset;">332</td>
<td class="data-td data last">87.91</td>
<td class="data-td data last">89.51</td>
<td class="data-td data last" style="border-right: outset;">89.07</td>
<td class="data-td data last">0.52</td>
</tr>
</tbody>
</table>
</div>
<br />
<p class="chart-disclosure">Source: ICE Data Services, VanEck.</p>
<p>To receive more <a href="https://www.vaneck.com/us/en/insights/income-investing/" title="Income Investing insights"><strong>Income Investing</strong></a> insights, <a href="/link/5f45412c2143400497908cea2897f7d3.aspx" title=" Subscription Center"><strong>sign up in our subscription center</strong></a>.</p>
<style type="text/css">
    .wrapped-div {
        max-width: 100%;
    }

    @media (max-width: 1024px) {
        .wrapped-div {
            overflow-x: scroll;
        }
    }

    .wrapped-div-sector {
        max-width: 100%;
        overflow-x: scroll;
    }
</style>
]]></content:encoded>
</item><item rdf:about="https://www.vaneck.com/us/en/blogs/emerging-markets-bonds/catch-me-if-you-can-em-bonds-out-run-dm-peers/">
  <title>Catch Me If You Can: EM Bonds Outrun DM Peers></title>
  <link>https://www.vaneck.com/us/en/blogs/emerging-markets-bonds/catch-me-if-you-can-em-bonds-out-run-dm-peers/</link>
  <description><![CDATA[Emerging markets local currency bonds continue to outpace their developed markets counterparts, and appear to be insulated from the regional banking failures in the U.S.]]></description>
  <dc:creator>Fran Rodilosso</dc:creator>
  <dc:date>05/18/2023 06:30:00</dc:date>
<content:encoded><![CDATA[

<p>Since March, investors have been reminded that financial sector stress is unique in its ability to impact broader markets, due to the risk of contagion, impact on the economy through credit availability, and potentially, the costs of a bailout. Such costs often historically have fallen on the public, and the impact to sovereign fiscal positions can be material. The failures of certain regional banks in the U.S., although they appear idiosyncratic and contained so far, have spooked domestic markets, but emerging markets (EM) have appeared insulated.</p>
<p>From a returns perspective, emerging markets local currency bonds have shrugged off these ongoing concerns, indicating that investors do not appear concerned about the banking systems in these countries. Returns have been driven by both local interest rates and currency appreciation, and have been broad based with 17 of the 20 countries in the J.P. Morgan GBI-EM Global Core Index posting positive gains through May 11, 2023.</p>
<h3>EM Local Currency Returns Outpace DM Peers Year to Date</h3>
<p><img class="img-responsive w-100" src="https://www.vaneck.com/contentassets/0e7bb4eca8c847bfb2112dc5aa507760/3253_emlc_chart_01_2023.05_v1_blog.svg" alt="EM Local Currency Returns Outpace DM Peers Year to Date" /></p>
<p class="chart-disclosure">Source: Morningstar Direct as of 5/11/2023. EM Local Currency Sovereign represented by J.P. Morgan GBI-EM Global Core Index; US HY Corporates represented by ICE BofA US High Yield Index; US IG Corporates represented by ICE BofA US Corporate Index; Global Agg represented by ICE BofA Global Broad Market Index; US Agg represented by ICE BofA US Broad Market Index; EM USD Sovereign represented by J.P. Morgan EMBI Global Diversified Index.</p>
<p>Spreads among EM banks also do not appear to indicate stress, and the sector has returned 3.7% within the ICE BofA Diversified High Yield US Emerging Markets Corporate Plus Index this year through April 30, 2023. Over the same period, banks within the ICE BofA US High Yield Index returned 1.6%. According to J.P. Morgan research, fundamentals among EM banks appear resilient, reflecting stable funding profiles and conservative balance sheet management. It helps that the EM banks who have issued in US dollars tend to be the larger, better capitalized &lsquo;local favorites&rsquo; with diversified deposit bases, according to Bank of America&rsquo;s research team. Although the bank sector weighting in EM corporate indices tends to be higher than in US indices, there is very little exposure to non-bank financial companies in EM, and these types of institutions tend to be much more sensitive to turns in the credit cycle.</p>
<p>J.P. Morgan also highlights the performance of additional tier one (&ldquo;AT1&rdquo;) bonds. AT1 bonds are issued by banks and are convertible into ordinary shares, or can be written down on either a permanent or temporary basis to fill holes in a bank&rsquo;s balance sheet in a stressed situation, making them a good indicator of the market&rsquo;s perception of banks&rsquo; ability to maintain capital adequacy. As shown below, EM banks have significantly outperformed their European counterparts (U.S. banks do not issue AT1 bonds).</p>
<h3>EM Bank Bonds Have Outpaced European Bank Bonds</h3>
<p><img class="img-responsive w-100" src="https://www.vaneck.com/contentassets/0e7bb4eca8c847bfb2112dc5aa507760/3253_emlc_chart_02_2023.05_v1_blog.svg" alt="EM Bank Bonds Have Outpaced European Bank Bonds" /></p>
<p class="chart-disclosure">Source: J.P. Morgan as of 5/11/2023.</p>
<p>There are certainly potential risks if the mini-banking crisis continues or spreads. We believe the most likely impact to emerging markets would be from slower growth due to tightening of credit in the U.S. as regional lenders pull back, which is happening in the context of the Fed&rsquo;s ongoing battle against inflation. In addition, general risk aversion and volatility has historically impacted &ldquo;risk-on&rdquo; asset classes such as emerging markets, even though this has not been the case this year.</p>
<p>To receive more <a href="https://www.vaneck.com/us/en/insights/emerging-markets-bonds/" title="Emerging Markets Bonds Insights"><strong>Emerging Markets Bonds</strong></a> insights, <a href="https://www.vaneck.com/us/en/subscribe/" title="Subscription Center"><strong>sign up in our subscription center</strong></a>.</p>
]]></content:encoded>
</item><item rdf:about="https://www.vaneck.com/us/en/blogs/emerging-markets-bonds/us-default-risk-creates-em-tailwinds/">
  <title>U.S. Default Risk Creates EM Tailwinds></title>
  <link>https://www.vaneck.com/us/en/blogs/emerging-markets-bonds/us-default-risk-creates-em-tailwinds/</link>
  <description><![CDATA[Are EM currencies poised to breakout? US default risk and the concern over the USD&rsquo;s reserve currency status conspire against the US dollar and are positive tailwinds for EM debt.]]></description>
  <dc:creator>Eric Fine</dc:creator>
  <dc:date>05/17/2023 06:30:00</dc:date>
<content:encoded><![CDATA[

<p>In April, the <strong><a href="/link/ff5a2b15f98745488ea4746f117294f2.aspx" title="EMBAX - Emerging Markets Bond Fund - Class A - Overview" rel="noopener">VanEck Emerging Markets Bond Fund</a></strong> returned 0.57%, compared to 0.70% for its benchmark. Year to date, the Fund returned 4.17%, in line with its benchmark which returned 4.23%. Fund winners included Zambia in local currency and Egypt (not owning it). Fund detractors included Mexico (not owning Mexico in local currency) and Argentina (the Fund has some exposure which weakened in April). As of end-April, local currency exposure was around 56.01%, duration was 5.58 and carry was around 5.46%. Indonesia, Malaysia, Thailand, South Africa, and Chile remain the Fund&rsquo;s largest exposures, and the Fund has limited exposure to high-beta emerging markets (EM) currencies such as the Mexican peso, South African rand, and Brazilian real. <a href="/us/en/blogs/emerging-markets-bonds/us-default-risk-creates-em-tailwinds/emb-manager-commentary-05-2023.pdf" rel="noopener" target="_blank" title="VanEck Emerging Markets Bond Fund Monthly Manager Commentary - May 2023"><strong>View here for a PDF version of this blog</strong></a>.</p>
<div class="wrapped-div">
<table style="width: 100%;">
<tbody>
<tr class="tbl-data">
<td class="tbl-header last" colspan="9">Average Annual Total Returns (%) as of April 30, 2023</td>
</tr>
<tr class="tbl-data">
<td class="data-td last">&nbsp;</td>
<td class="data-head last">1 Month<sup>&dagger;</sup></td>
<td class="data-head last">3 Month<sup>&dagger;</sup></td>
<td class="data-head last">YTD</td>
<td class="data-head last">1 Year</td>
<td class="data-head last">3 Year</td>
<td class="data-head last">5 Year</td>
<td class="data-head last">10 Year</td>
</tr>
<tr class="tbl-data">
<td class="data-td last">Class A: NAV (Inception 7/9/12)</td>
<td class="data-td data last">0.57</td>
<td class="data-td data last">-0.81</td>
<td class="data-td data last">4.17</td>
<td class="data-td data last">5.48</td>
<td class="data-td data last">7.26</td>
<td class="data-td data last">1.38</td>
<td class="data-td data last">0.19</td>
</tr>
<tr class="tbl-data">
<td class="data-td last">Class A: (Maximum Sales Charge) % load</td>
<td class="data-td data last">-5.21</td>
<td class="data-td data last">-6.52</td>
<td class="data-td data last">-1.82</td>
<td class="data-td data last">-0.59</td>
<td class="data-td data last">5.16</td>
<td class="data-td data last">0.18</td>
<td class="data-td data last">-0.40</td>
</tr>
<tr class="tbl-data">
<td class="data-td last">Class I: NAV (Inception 7/9/12)</td>
<td class="data-td data last">0.78</td>
<td class="data-td data last">-0.53</td>
<td class="data-td data last">4.22</td>
<td class="data-td data last">5.93</td>
<td class="data-td data last">7.64</td>
<td class="data-td data last">1.71</td>
<td class="data-td data last">0.50</td>
</tr>
<tr class="tbl-data">
<td class="data-td last">Class Y: NAV (Inception 7/9/12)</td>
<td class="data-td data last">0.76</td>
<td class="data-td data last">-0.60</td>
<td class="data-td data last">4.36</td>
<td class="data-td data last">5.84</td>
<td class="data-td data last">7.57</td>
<td class="data-td data last">1.65</td>
<td class="data-td data last">0.44</td>
</tr>
<tr class="tbl-data">
<td class="data-td last">50% GBI-EM / 50% EMBI</td>
<td class="data-td data last">0.70</td>
<td class="data-td data last">0.48</td>
<td class="data-td data last">4.23</td>
<td class="data-td data last">2.83</td>
<td class="data-td data last">-0.30</td>
<td class="data-td data last">-0.85</td>
<td class="data-td data last">0.05</td>
</tr>
</tbody>
</table>
</div>
<br />
<div class="wrapped-div">
<table style="width: 100%;">
<tbody>
<tr class="tbl-data">
<td class="tbl-header last" colspan="8">Average Annual Total Returns (%) as of March 31, 2023</td>
</tr>
<tr class="tbl-data">
<td class="data-td last">&nbsp;</td>
<td class="data-head last">1 Month<sup>&dagger;</sup></td>
<td class="data-head last">3 Month<sup>&dagger;</sup></td>
<td class="data-head last">YTD</td>
<td class="data-head last">1 Year</td>
<td class="data-head last">3 Year</td>
<td class="data-head last">5 Year</td>
<td class="data-head last">10 Year</td>
</tr>
<tr class="tbl-data">
<td class="data-td last">Class A: NAV (Inception 7/9/12)</td>
<td class="data-td data last">1.50</td>
<td class="data-td data last">3.58</td>
<td class="data-td data last">-0.38</td>
<td class="data-td data last">8.30</td>
<td class="data-td data last">0.85</td>
<td class="data-td data last">0.33</td>
</tr>
<tr class="tbl-data">
<td class="data-td last">Class A: Maximum 5.75% load</td>
<td class="data-td data last">-4.34</td>
<td class="data-td data last">-2.38</td>
<td class="data-td data last">-6.11</td>
<td class="data-td data last">6.19</td>
<td class="data-td data last">-0.34</td>
<td class="data-td data last">-0.26</td>
</tr>
<tr class="tbl-data">
<td class="data-td last">Class I: NAV (Inception 7/9/12)</td>
<td class="data-td data last">1.52</td>
<td class="data-td data last">3.42</td>
<td class="data-td data last">-0.04</td>
<td class="data-td data last">8.60</td>
<td class="data-td data last">1.14</td>
<td class="data-td data last">0.63</td>
</tr>
<tr class="tbl-data">
<td class="data-td last">50 GBI-EM GD / 50% EMBI GD</td>
<td class="data-td data last">2.54</td>
<td class="data-td data last">3.51</td>
<td class="data-td data last">-3.81</td>
<td class="data-td data last">0.48</td>
<td class="data-td data last">-1.43</td>
<td class="data-td data last">0.29</td>
</tr>
</tbody>
</table>
</div>
<br />
<p class="chart-disclosure"><sup>&dagger;</sup>&nbsp;Returns less than one year are not annualized.</p>
<p class="chart-disclosure"><strong>Expenses: Class A: Gross 2.55%, Net 1.27%; Class I: Gross 2.51%, Net 0.97%; Class Y: Gross 2.91%, Net 1.02%.</strong> Expenses are capped contractually until 05/01/24 at 1.25% for Class A, 0.95% for Class I, 1.00% for Class Y. Caps excluding acquired fund fees and expenses, interest, trading, dividends, and interest payments of securities sold short, taxes, and extraordinary expenses.</p>
<p class="chart-disclosure">Expenses are capped contractually until 05/01/24 at 1.25% for Class A, 0.95% for Class I, 1.00% for Class Y. Caps excluding acquired fund fees and expenses, interest, trading, dividends, and interest payments of securities sold short, taxes, and extraordinary expenses.</p>
<p class="chart-disclosure"><strong>The performance data quoted represents past performance. Past performance is not a guarantee of future results. Investment return and principal value of an investment will fluctuate so that an investor&rsquo;s shares, when redeemed, may be worth more or less than their original cost. Performance may be lower or higher than performance data quoted. Please call 800.826.2333 or visit vaneck.com for performance current to the most recent month ended.</strong></p>
<p class="chart-disclosure">The &ldquo;Net Asset Value&rdquo; (NAV) of a Fund is determined at the close of each business day, and represents the dollar value of one share of the fund; it is calculated by taking the total assets of the fund, subtracting total liabilities, and dividing by the total number of shares outstanding. The NAV is not necessarily the same as the ETF&rsquo;s intraday trading value. Investors should not expect to buy or sell shares at NAV.</p>
<p><strong>The next &ldquo;big thing&rdquo; is US technical default risk, but denial/complacency reign &ndash; the credit default swap (CDS) market is already suggesting that the odds of US default are higher than Guatemala&rsquo;s.</strong> There is now substantial default risk priced in by the 1-year CDS market, which means that anyone who buys Treasury Bills (T-Bills) is not getting paid for that risk. Exhibit 1 shows 1-year CDS spreads for the US versus some EM countries. With the US at around 160 basis points (bps) and Guatemala at 130 bps (and Brazil around 50 bps), the market is suggesting that the chance of default by the US on USD-denominated debt is <i>substantially</i> higher than the chance of default by Guatemala or Brazil on USD-denominated debt. That 160 bps of credit default premium that you are <i>not</i> getting paid for in your T-Bills is almost <i>half</i> of the T-Bill yields. Are you sure you feel safe in T-Bills when an observable market is already telling you that you aren&rsquo;t getting paid enough?</p>
<h3>Exhibit 1: Implied Probability of Default is Higher for US Than for Guatemala</h3>
<p><strong>U.S. vs. EMs - 1-year CDS (bps)</strong></p>
<p><img class="img-responsive w-100" src="https://www.vaneck.com/contentassets/48455d18bb844a03b054475e3a6ef2ae/3247_emb_chart_01_2023.05_v1_blog.svg" alt="Exhibit 1: Implied Probability of Default is Higher for US Than for Guatemala" /></p>
<p class="chart-disclosure">Source: Bloomberg. As of May 12 2023. For illustrative purposes only. Not intended as a forecast of future events. Actual future default events or lack thereof are unknown.</p>
<p><strong>Geopolitics is the other &ldquo;big thing&rdquo;, probably the &ldquo;next&rdquo; market driver, but also met with denial and complacency; the US dollar will also suffer from this. </strong>It was only a year-plus ago that we asked in our monthly commentary why central banks outside the US orbit would own US Treasuries, following sanctions on Russia&rsquo;s central bank. In recent months we have seen concretization of greater use of EM currencies in trade (for example, recent agreements between Saudi Arabia/China, United Arab Emirates (UAE)/India, Brazil/China to conduct purchases of oil or other resources using their own currencies instead of the US dollar). China has been able to reduce about a third of its US Treasuries and it appears that more central banks will go down this path. But, as we&rsquo;ve noted, this is a multi-year process. Nonetheless, the strong performance of EM currencies YTD during a US banking crisis testifies to markets being open to many EMs as safe havens. And, this process of replacing central bank reserves in US Treasuries with reserves in EM bond markets is clearly a tailwind, however many years the various processes.</p>
<h3>Exhibit 2 &ndash; USD Share in International Reserves Declining</h3>
<p><strong>USD Share in Total Allocated International Reserves, %</strong></p>
<p><img class="img-responsive w-100" src="https://www.vaneck.com/contentassets/48455d18bb844a03b054475e3a6ef2ae/3247_emb_chart_02_2023.05_v1_blog.svg" alt="Exhibit 2 - USD Share in International Reserves Declining" /></p>
<p class="chart-disclosure">Source: Bloomberg, IMF. As of April 2023. Past performance does not guarantee future results.</p>
<p><strong>This combination of default risk combined with already-ignited concern over the USD&rsquo;s reserve currency status conspire against the US dollar and make duration questionable.</strong> Now, the first decline in the US dollar may not trigger much of a reaction (other than boosting our p/l) by policymakers. But, after a sustained and significant US dollar drop, and another phase of inflation concern (due to USD weakness), the only recourse will be for the Fed to <i>hike</i> rates. This will be the only tool that can prevent a doom-loop for the US dollar. Given growing recessionary risks as well as the ongoing run on US bank deposits, we continue believe the Fed is in a corner. And, if the Fed is pausing for now and perhaps risking cutting rates, that, too, is good for our EM local currency positions.</p>
<h2>Exposure Types and Significant Changes</h2>
<p>The changes to the Fund&rsquo;s top positions are summarized below. Our largest positions in April were Indonesia, Malaysia, Thailand, South Africa, and Chile:</p>
<ul class="content-list">
<li>We increased our local currency exposure in Poland. The country&rsquo;s inflation had finally peaked, but unlike some regional peers, the central bank is not in a hurry to start easing. Further, the occasional political noise notwithstanding, Poland&rsquo;s relations with the European Union are still good enough to keep the flow of funds going uninterrupted. We are naturally concerned about the elections&rsquo; impact on fiscal performance in 2023, but Poland always managed to surprise to the upside in these situations before. We also keep a very close eye on the geopolitical developments in the region, and we think that China&rsquo;s more vocal position (including the call with Ukraine&rsquo;s President Zelenskyy) might be a positive signal for the entire region and Poland in particular. In terms of our investment process, this improved the policy test score for the country.</li>
</ul>
<ul class="content-list">
<li>We also increased hard currency quasi-sovereign exposure in Colombia and the UAE, and hard currency sovereign exposure in Bahrain. The unified theme here is OPEC&rsquo;s decision to cut the oil output, which is supplemented by Bahrain&rsquo;s move to restore relations with Oman after boycott, and Colombia&rsquo;s bottoming current account balance. Our quasi-sovereign choice in the UAE is a more attractively valued investment opportunity (compared to the sovereign). In terms of our investment process, this improved the technical test score for all three countries.</li>
</ul>
<ul class="content-list">
<li>Finally, our local currency exposure in Zambia also increased, but this reflected sizable appreciation of the Zambian Kwacha. The currency&rsquo;s strength in part reflected technical factors (like tax payments), but also optimism on the debt restructuring progress due to China&rsquo;s greater involvement on the official creditors&rsquo; side.</li>
</ul>
<ul class="content-list">
<li>We reduced our local currency exposure in Brazil and Uruguay &ndash; in part due to concerns about the impact of the growth cliff in the US under an unfavorable debt ceiling scenario (no resolution before the X-date). In terms of our investment process, this meant the deteriorating technical test score for both countries. Brazil&rsquo;s local bonds can also be affected by a lack of clarity on the government&rsquo;s fiscal plans, as well as attempts to modify the minimum wage formula that can boost both spending and inflation expectations. Both factors worsened the policy test score for Brazil.</li>
</ul>
<ul class="content-list">
<li>We also reduced our local currency exposure in South Africa. The US debt ceiling/growth cliff concerns played a part in our decision, but in addition, we also see limited room for additional fiscal improvements due to widespread blackouts. At the same time, near-term inflation pressures might prove stronger than expected, necessitating more policy tightening by the central bank. In terms of our investment process, this worsened the technical and policy test scores for the country.</li>
</ul>
<ul class="content-list">
<li>Finally, we reduced our local currency exposure in Israel due to persistent political noise over judicial reform, which overshadows such positive developments as peaking inflation and the policy rate, healthy growth, and a large current account surplus. A cabinet minister&rsquo;s call to replace the central bank&rsquo;s governor with a robot did not help to improve sentiment. Unresolved political issues also cast a shadow over longer-term foreign direct inflows, and the vibrancy of the country&rsquo;s tech sector.</li>
</ul>
<p>To receive more <a href="https://www.vaneck.com/us/en/insights/emerging-markets-bonds/" title="Emerging Markets Bonds Insights"><strong>Emerging Markets Bonds</strong></a> insights, <a href="https://www.vaneck.com/us/en/subscribe/" title="Subscription Center"><strong>sign up in our subscription center</strong></a>.</p>
<style>
    .wrapped-div {
        max-width: 100%;
    }

    @media (max-width: 768px) {
        .wrapped-div {
            overflow-x: scroll;
        }
    }

    .wrapped-div-sector {
        max-width: 100%;
        overflow-x: scroll;
    }
</style>
]]></content:encoded>
</item><item rdf:about="https://www.vaneck.com/us/en/blogs/municipal-bonds/how-to-target-the-sweet-spot-of-the-muni-yield-curve/">
  <title>How to Target the Sweet Spot of the Muni Yield Curve></title>
  <link>https://www.vaneck.com/us/en/blogs/municipal-bonds/how-to-target-the-sweet-spot-of-the-muni-yield-curve/</link>
  <description><![CDATA[The muni bond market's yield curve is inverted in the short end but positively sloped and steep in the intermediate part, providing attractive roll yield for those who target these maturities.]]></description>
  <dc:creator>John Patrick Lee, CFA</dc:creator>
  <dc:date>05/16/2023 06:30:00</dc:date>
<content:encoded><![CDATA[

<h2>What is Roll Yield?</h2>
<p>Roll yield is a term used to describe the increase in price that an investor can receive as a bond's maturity ages. When a bond gets closer to its final maturity, its yield typically decreases, causing an increase in its price. This price appreciation is known as roll yield and is a desirable feature for investors, especially when targeting intermediate-term bonds with wider yield differentials between maturities. This strategy can potentially generate alpha and enhance an investor's total return.</p>
<h2>How Can I Use Roll Yield to Boost Return?</h2>
<p>The muni yield curve is an important indicator of the health of the municipal bond market and the broader economy. The muni yield curve has recently become inverted in the short end, meaning that yields of some longer-dated municipal bonds are lower than those of shorter-term bonds. However, the intermediate part of the curve remains positively sloped and steep, providing attractive roll yield for investors who target these maturities. Steepness refers to the degree of absolute difference between yields of different maturities.</p>
<h3>Max Roll Yield in the Steepest Part of the Curve</h3>
<p><img class="img-responsive w-100" src="https://www.vaneck.com/contentassets/917278af7a1643af8387959adb6f2062/3240_muni-blog_chart-01_2023.05_blog.svg" alt="Max Roll Yield in the Steepest Part of the Curve" /></p>
<p class="chart-disclosure">Source: VanEck as of 3/31/2023. Past performance is no guarantee of future results.</p>
<p>As bonds move closer to final maturity, they typically will have a lower yield each year as they roll down the curve. When a bond&rsquo;s yield drops, its price increases (yield and price move in the opposite direction). A strategy targeting the steepest part of the curve may benefit by accessing this roll-yield effect and the inherent price boost that occurs as bonds age. Despite an inverted curve at the short end of the curve, the majority of the intermediate section remains steep.</p>
<h2>How do Intermediate-Term Bonds Enhance the Roll Yield Effect?</h2>
<p><strong><a href="/link/671f652a2a72454790e4d20f2c5b7fcc.aspx" title="ITM - VanEck Intermediate Muni ETF - Overview">The VanEck Intermediate Muni ETF (ITM)</a></strong> targets bonds with maturities of 6 through 17 years. Municipal bonds in this maturity range have historically provided a greater roll yield effect due to these wider yield differentials between maturities. Roll yield refers to the amount of price appreciation that occurs as its maturity ages. Intermediate-term bonds&rsquo; higher-than-average spreads between maturities can generate alpha, as the bigger spreads between yields lead to larger price moves. In addition to the benefits of tax-free income, a targeted allocation to this part of the municipal yield curve may help boost an investor&rsquo;s total return due to this enhanced, historically-persistent feature.</p>
<p>To receive more <a href="https://www.vaneck.com/us/en/insights/municipal-bonds/" title="Municipal Bonds Insights"><strong>Municipal Bonds</strong></a> insights, <a href="https://www.vaneck.com/us/en/subscribe/" title="Subscription Center"><strong>sign up in our subscription center</strong></a>.</p>
]]></content:encoded>
</item><item rdf:about="https://www.vaneck.com/us/en/blogs/natural-resources/slight-commodity-losses-overshadow-modest-gains/">
  <title>Slight Commodity Losses Overshadow Modest Gains></title>
  <link>https://www.vaneck.com/us/en/blogs/natural-resources/slight-commodity-losses-overshadow-modest-gains/</link>
  <description><![CDATA[April showed a slight downturn for commodities. The gains of the agriculture and livestock sectors were not enough to offset industrial metals, the weakest sector.]]></description>
  <dc:creator>Roland Morris</dc:creator>
  <dc:date>05/15/2023 06:30:00</dc:date>
<content:encoded><![CDATA[

<h2>Macro Outlook: Economic Growth Concerns Triggered Marginal Commodity Losses</h2>
<p>Lingering economic growth concerns triggered by the March regional banking crisis and bank failures led to small losses for most commodity indexes. The UBS Constant Maturity Commodity Index (CMCI) fell 0.69%, while Bloomberg Commodity Index (BCOM) fell 0.75% in April.</p>
<h2>Sector Review: Agriculture Sector Benefitted From Increased Sugar Prices</h2>
<p>Industrial metals was the weakest sector during the month, falling by over 3%. The banking failures have investors worried about a credit crunch, leading to a weaker economy and falling demand for industrial metals. Zinc and copper each fell around 8%, contributing to greater losses for the sector overall.</p>
<p>There were modest declines in the energy sector, which fell less than 1%. WTI Crude Oil and Brent Crude Oil were slightly higher in April but products and natural gas fell, which offset the small gains of crude oil.</p>
<p>The agriculture and livestock sectors were all slightly higher in April but not enough to offset the losses in the industrial metals sector. Strong gains in sugar prices (an increase of +20% in April and +50% year-to-date), coffee, and cocoa offset losses in corn. Wheat contributed to the higher agricultural sector returns. The livestock sector gained 1% during the month led by a 1.8% rise in cattle prices.</p>
<p>The precious metals sector gained the most during the month with a 1.6% return. Gold increased modestly by 1%, while silver prices jumped 4%.</p>
<h3>Performance by Sector Components</h3>
<p><img class="img-responsive w-100" src="https://www.vaneck.com/contentassets/d87804f194f742f1b545d7214697dc9b/3222_cmci_chart_01_2023.05_v1_blog.svg" alt="Performance by Sector Components" /></p>
<p class="chart-disclosure"><strong>Source: Bloomberg, April 2023</strong>. Past performance is no guarantee of future results. Index performance is not representative of fund performance. It is not possible to invest directly in an index.</p>
<p><strong><a href="/link/9cc454bdc12d49638c0a22783d5a26cf.aspx" title="CMCAX - CM Commodity Index Fund - Class A - Overview">Learn more about the VanEck CM Commodity Index Fund</a></strong>, which seeks to track, before fees and expenses, the CMCI.</p>
<p>To receive more <a href="/us/en/insights/natural-resources/" title="Natural Resources Insights"><strong>Natural Resources</strong></a> insights, <a href="https://www.vaneck.com/us/en/subscribe/" title="Subscription Center"><strong>sign up in our subscription center</strong></a>.</p>
]]></content:encoded>
</item><item rdf:about="https://www.vaneck.com/us/en/blogs/moat-investing/moat-question-and-answer/">
  <title>MOAT ETF: Question &amp; Answer></title>
  <link>https://www.vaneck.com/us/en/blogs/moat-investing/moat-question-and-answer/</link>
  <description><![CDATA[<p>Morningstar&rsquo;s approach to moat investing starts with companies with sustainable competitive advantages and targets those trading at attractive valuations. We explore in this Q&amp;A.</p>]]></description>
  <dc:creator> </dc:creator>
  <dc:date>05/12/2023 06:30:00</dc:date>
<content:encoded><![CDATA[

<p>Moat investing is based on a simple concept: invest in companies with sustainable competitive advantages. Morningstar builds on this philosophy by seeking out moat stocks trading at attractive valuations relative to their equity research team&rsquo;s forward-looking estimate of fair value. This approach has stood the test of time, with the live track record for the<a href="/link/9f629c73a31846bb9e480b95e2c7f330.aspx" title="MOAT - VanEck Morningstar Wide Moat ETF - Index"><strong>Morningstar<sup>&reg;</sup>&nbsp;Wide Moat Focus Index<sup>SM</sup></strong></a>&nbsp;(&ldquo;Moat Index&rdquo;) exceeding 15 years. This blog is intended to address frequently asked questions about Morningstar&rsquo;s moat investing philosophy and the <a href="/link/9e43dd198c5f4e419f13220685081895.aspx" title="MOAT - VanEck Morningstar Wide Moat ETF - Overview"><strong>VanEck Morningstar Wide Moat ETF (MOAT)</strong></a>.</p>
<ul>
<li><strong><a href="#point-one">How is Morningstar&rsquo;s equity research incorporated into the Moat Index?</a></strong></li>
<li><strong><a href="#point-two">How does Morningstar identify moat companies?</a></strong></li>
<li><strong><a href="#point-three">How does Morningstar determine the width of moat and what makes a particular advantage short vs long term?</a></strong></li>
<li><strong><a href="#point-four">Is MOAT an actively managed ETF?</a></strong></li>
<li><strong><a href="#point-five">What has most influenced the Moat Index&rsquo;s performance historically?</a></strong></li>
<li><strong><a href="#point-six">How frequently does the Moat Index rebalance?</a></strong></li>
<li><strong><a href="#point-seven">What style exposure does MOAT offer?</a></strong></li>
<li><strong><a href="#point-eight">Does MOAT pay capital gains?</a></strong></li>
<li><strong><a href="#point-nine">How does MOAT fit in a portfolio?</a></strong></li>
<li><a href="#point-ten"><strong>How can investors buy VanEck ETFs?</strong></a></li>
</ul>
<h2 id="point-one" class="anchored-block">How is Morningstar&rsquo;s equity research incorporated into the Moat Index?</h2>
<p>The Moat Index is fueled by Morningstar&rsquo;s forward-looking, rigorous equity research process, driven by over 100 analysts globally. All of Morningstar&rsquo;s equity analysts follow a single, consistent research methodology. Morningstar&rsquo;s economic moat rating serves as the cornerstone of Morningstar&rsquo;s equity research philosophy. The goal is to determine which companies have competitive advantages that will lead to returns on invested capital in excess of the companies&rsquo; weighted cost of capital. Just as important is determining how long those companies can maintain their advantages. The exclusive group of wide moat rated companies are expected to maintain their competitive advantages for more than 20 years into the future.</p>
<p>Morningstar considers a company&rsquo;s economic moat rating when forecasting future cash flow and discounting those future cash flows to arrive at a current intrinsic per share value for each company. Their valuation process does not take shortcuts, and cash flows are regularly forecasted well into the future.</p>
<p>The Index leverages Morningstar&rsquo;s economic moat ratings and fair value estimates to systematically assemble the Index&rsquo;s portfolio each quarter.</p>
<h2 id="point-two" class="anchored-block">How does Morningstar identify moat companies?</h2>
<p>Morningstar has identified five attributes that may contribute to a company&rsquo;s moat: <strong><a href="https://www.vaneck.com/us/en/blogs/moat-investing/switching-costs-build-moats-and-retain-customers2/" title="Switching Costs Build Moats and Retain Customers">switching costs</a></strong>, <strong><a href="https://www.vaneck.com/us/en/blogs/moat-investing/intangible-assets-the-leading-source-of-moats2/" title="Intangible Assets: The Leading Source of Moats">intangible assets</a></strong>, <a href="https://www.vaneck.com/us/en/blogs/moat-investing/network-effect-a-proven-way-to-create-a-moat/" title="Network Effect: A Proven Way to Create a Moat"><strong>network effect</strong></a>, <strong><a href="https://www.vaneck.com/us/en/blogs/moat-investing/cost-leadership-creates-moats2/" title="Cost Leadership Provides Market Control">cost leadership</a></strong> and <a href="https://www.vaneck.com/us/en/blogs/moat-investing/efficient-scale-moats-with-natural-monopoly/" title="Efficient Scale: Moats with Natural Monopoly"><strong>efficient scale</strong></a>. Companies may demonstrate one or a combination of these five sources of moat. Evaluating companies against these attributes are a key part of how Morningstar&rsquo;s equity research team gauges the strength of a company&rsquo;s competitive advantage. This assessment results in one of three economic moat ratings: none, narrow or wide. A wide moat rating is assigned to a company that is likely to sustain its competitive advantage for at least the next 20 years, while a narrow moat rating means a company is likely to do so for at least 10 years. A company with no moat has either no advantage or one expected to dissipate relatively quickly.</p>
<p>A wide economic moat rating from Morningstar&rsquo;s equity analysts is rare. Morningstar&rsquo;s equity coverage universe skews toward companies with economic moats, yet only 10-15% of those companies receive the elusive wide moat rating. That percentage would likely be far lower for a more comprehensive group of U.S and global companies. Stated differently, it is very difficult to find companies that possess the attributes Morningstar requires to assign a wide moat rating and therefore very few receive that designation.</p>
<h2 id="point-three" class="anchored-block">How does Morningstar determine the width of moat and what makes a particular advantage short vs long term?</h2>
<p>This determination involves a number of considerations, both qualitative and quantitative. From a qualitative perspective, Morningstar consider the nature of the company&rsquo;s competitive advantage and how effectively it will persist given the industry in which the company operates. For example, a tech company may have a strong competitive advantage, but it receives a narrow moat rating because industry in which it operates is subject to a rapid pace of technological change and the risk of disruption is far higher in the tech industry than other industries. Conversely, consider a packaged goods company with an incredible brand that produces unhealthy snack food may receive a wide moat rating. The pace at which this company&rsquo;s brand equity is likely to fade is far slower than the pace of technological change and disruption in the certain areas of the tech space. Ultimately, certain sectors and industries are far more conducive to economic moats than others.</p>
<p>The next consideration is more quantitative in nature. Morningstar looks at a company&rsquo;s current and projected returns on invested capital (ROIC) vs. its weighted average cost of capital (WACC) in order to determine what would have to happen for that ROIC to converge downward with its WACC. Once a company&rsquo;s ROIC and WACC are at parity, economic profits are no longer earned. In some cases, even when a company is in secular decline, its ROIC might be so high that it would take decades for that ROIC to realistically decline down to the company&rsquo;s WACC. This may apply to tobacco companies or possibly the packaged goods company example above. However, when the spread between ROIC and WACC is thinner, Morningstar requires more conviction in the durability of the competitive advantage before assigning a wide moat rating to the company. Ultimately, the durability of economic profits matters far more than the current magnitude of economic profits when determining the &ldquo;width&rdquo; of a company&rsquo;s economic moat. However, a high magnitude of economic profits does leave the company more margin for error before economic profits would realistically disappear.</p>
<p>Each industry has its own &ldquo;economic moat framework&rdquo; each analyst should consider when determining appropriate economic moat ratings.</p>
<div class="epi-contentfragment">faq-banner-cta</div>
<h2 id="point-four" class="anchored-block">Is MOAT an actively managed ETF?</h2>
<p>No, <a href="/link/9e43dd198c5f4e419f13220685081895.aspx" title="MOAT - VanEck Morningstar Wide Moat ETF - Overview"><strong>MOAT</strong></a>&nbsp;is an index-based ETF. <a href="/link/9e43dd198c5f4e419f13220685081895.aspx" title="MOAT - VanEck Morningstar Wide Moat ETF - Overview"><strong>MOAT</strong></a>&nbsp;seeks to replicate, before fees and expenses, the price and yield performance of the Moat Index. The Index is unique in the world of index investing because it leverages Morningstar&rsquo;s 100+ person equity research team to systematically identify what Morningstar equity research analysts considers attractively priced companies with sustainable competitive advantages.</p>
<h2 id="point-five" class="anchored-block">What has most influenced the Moat Index&rsquo;s performance historically?</h2>
<p>This long-term, core investment approach has resulted in excess returns relative to the broad U.S. equity markets since 2007, and often displays excess returns following periods of sizable market declines. The Moat Index&rsquo;s focus on companies with competitive advantages and attractive valuations results in a dynamic portfolio that has potential to outperform on both the upside and down side. Historically, the Index has benefited primarily from strong stock selection as opposed to sector, size or style over/underweights.</p>
<h2 id="point-six" class="anchored-block">How frequently does the Moat Index rebalance?</h2>
<p>The Index employs a staggered rebalance methodology whereby the Index is divided into two equally-weighted sub-portfolios, and each is reconstituted and rebalanced semi-annually on alternating quarters. Adjustments to one sub-portfolio are performed on the third Friday of March and September, and adjustments for the other sub-portfolio are performed on the third Friday of June and December. Due to the staggered rebalance methodology, Index constituents and weights may vary between sub-portfolios.</p>
<h2 id="point-seven" class="anchored-block">What style exposure does MOAT offer?</h2>
<p><a href="/link/9e43dd198c5f4e419f13220685081895.aspx" title="MOAT - VanEck Morningstar Wide Moat ETF - Overview"><strong>MOAT</strong></a>&nbsp;has historically provided a large blend exposure to U.S. equities. Morningstar&rsquo;s valuation methodology allows the Moat Index to target opportunities among wide moat stocks regardless of style exposure. Therefore, both the Index and <a href="/link/9e43dd198c5f4e419f13220685081895.aspx" title="MOAT - VanEck Morningstar Wide Moat ETF - Overview"><strong>MOAT</strong></a>&nbsp;have seen their style exposure drift between growth and value through time.</p>
<h2 id="point-eight" class="anchored-block">Does MOAT pay capital gains?</h2>
<p>As a regulated investment company, <a href="/link/9e43dd198c5f4e419f13220685081895.aspx" title="MOAT - VanEck Morningstar Wide Moat ETF - Overview"><strong>MOAT</strong></a>&nbsp;must pass through income and capital gains to shareholders each year. Despite turnover in excess of typical index-based U.S. equity ETFs, <a href="/link/9e43dd198c5f4e419f13220685081895.aspx" title="MOAT - VanEck Morningstar Wide Moat ETF - Overview"><strong>MOAT</strong></a>&nbsp;has never paid a capital gain distribution. This has held true despite its 2012 launch corresponding with the early years of a sustained bull market in U.S. stocks.</p>
<h2 id="point-nine" class="anchored-block">How does MOAT fit in a portfolio?</h2>
<p><a href="/link/9e43dd198c5f4e419f13220685081895.aspx" title="MOAT - VanEck Morningstar Wide Moat ETF - Overview"><strong>MOAT</strong></a>&nbsp;offers investors a diversified portfolio of U.S. equities that can serve as a core portfolio building block. Investors should consider <a href="/link/9e43dd198c5f4e419f13220685081895.aspx" title="MOAT - VanEck Morningstar Wide Moat ETF - Overview"><strong>MOAT</strong></a>&nbsp;for long-term exposure as opposed to opportunistic tactical market exposure. The Moat Index has historically had more success relative to broad beta indexes over longer-periods of time than short time periods.</p>
<h2 id="point-ten" class="anchored-block">How can investors buy VanEck ETFs?</h2>
<p><a href="/link/635ccc4bf9134cb9a7fcc80919498eec.aspx#how-to-buy-etf&amp;utm=MOAT-Blog" title="How to buy VanEck ETFs?"><strong>Learn more here</strong></a>.</p>
<p class="d-none d-lg-block"><a href="mailto:askvaneck@vaneck.com" title="Have More Questions? - Ask VanEck" rel="noopener"><img loading="lazy" class="img-responsive" src="https://www.vaneck.com/globalassets/home/us/insights/blogs/bm-blog-images/cta-faq_desktop-02.svg" alt="Have More Questions? - Ask VanEck" /></a></p>
<p class="d-lg-none"><a href="mailto:askvaneck@vaneck.com" title="Have More Questions? - Ask VanEck" rel="noopener"><img loading="lazy" class="img-responsive" src="https://www.vaneck.com/globalassets/home/us/insights/blogs/bm-blog-images/cta-faq_mobile-01.svg" alt="Have More Questions? - Ask VanEck" /></a></p>
<p>To receive more <a href="https://www.vaneck.com/us/en/insights/moat-investing/" title="Moat Investing Insights"><strong>Moat Investing</strong></a> insights, <a href="https://www.vaneck.com/us/en/subscribe/" title=" Subscription Center"><strong>sign up in our subscription center</strong></a>.</p>
]]></content:encoded>
</item><item rdf:about="https://www.vaneck.com/us/en/blogs/thematic-investing/how-the-pharmaceutical-industry-is-using-ai/">
  <title>How the Pharmaceutical Industry is Using AI></title>
  <link>https://www.vaneck.com/us/en/blogs/thematic-investing/how-the-pharmaceutical-industry-is-using-ai/</link>
  <description><![CDATA[Pharmaceutical firms are incorporating AI in their operations to drive better patient outcomes, analyze data, and streamline drug development processes.]]></description>
  <dc:creator>Dylan  Desai</dc:creator>
  <dc:date>05/12/2023 06:30:00</dc:date>
<content:encoded><![CDATA[

<p>Industry-leading pharmaceutical firms are adopting artificial intelligence (AI) to drive value for the future of their enterprise. AI is currently being implemented within the industry to reduce human error, streamline processes and analyze data to develop new pharmaceuticals. As a result, AI has the potential to improve patient outcomes, lower costs for industry participants, and revolutionize the pharmaceutical industry.</p>
<p>Several companies in the <strong><a href="/link/20d5a11c03984f719482677b88e5c6c5.aspx" title="PPH - VanEck Pharmaceutical ETF - Overview">VanEck Pharmaceutical ETF (NDQ: PPH)</a></strong> are currently integrating AI into their operations. These companies are at the forefront of the AI revolution. This blog will address how Johnson &amp; Johnson, Novartis, and AstraZeneca implement artificial intelligence and illustrate how they intend to utilize this technology to transform the industry.</p>
<h2>Using AI to Drive Better Patient Outcomes</h2>
<p>The American multinational firm Johnson &amp; Johnson (NYSE: JNJ) is well-known for being one of the largest global suppliers of pharmaceuticals and medical devices. They have been investing in AI to expand their capabilities. Verb Surgical is a project born from a collaboration with Verily Life Sciences LLC that is making strides in integrated robotic surgery. The system gathers and analyzes vast amounts of data to guide surgeons toward better patient outcomes by potentially reducing human error.</p>
<p>Johnson &amp; Johnson is also utilizing AI to enhance their diagnostics abilities. Janssen Research &amp; Development is one of Johnson &amp; Johnson's subsidiaries that has combined forces with WinterLight Labs to develop an audio receptive AI platform designed to analyze speech patterns. This technology has been created to offer patients faster diagnoses of neurogenerative disorders like Dementia and Alzheimer&rsquo;s Disease.</p>
<h2>Using AI to Reduce Drug Development Time and Cut Costs</h2>
<p>Novartis (NYSE: NVS) signaled its commitment to the implementation of artificial intelligence by establishing an in-house AI innovation lab as well as an external partnership with Microsoft. This partnership is intended to leverage Microsoft&rsquo;s AI technology to advance Novartis&rsquo;s capabilities in personalized therapies for macular degeneration, cell and gene therapy, and drug design. By investing in AI, Novartis may be able to streamline its processes and reduce the time it takes to gauge efficacy and feasibility from years to weeks. If effective, this increase in efficiency could cut costs for the firm exponentially.</p>
<h2>The AI Revolution is Underway in the Pharmaceutical Industry</h2>
<p>The global pharmaceutical giant, AstraZeneca (NDQ: AZN), shows promise with their AI implementation strategy in drug development. Their partnership with BenevolentAI has amounted to the identification of several potential patient solutions. By using AI to analyze vast amounts of data, the two may be able to develop new drugs and therapies to treat chronic kidney disease and idiopathic pulmonary fibrosis at record pace and reduced costs. The direction is promising, the two have yet to develop a new drug entirely with AI, but a breakthrough like this could be on the horizon.</p>
<p>Several companies in the <a href="/link/20d5a11c03984f719482677b88e5c6c5.aspx" title="PPH - VanEck Pharmaceutical ETF - Overview"><strong>VanEck Pharmaceutical ETF (PPH)</strong></a> are currently integrating AI into their operations. These companies are the largest in the space and at the forefront of the AI revolution in healthcare. From Johnson &amp; Johnson's AI advancements in robotic surgery and diagnostics to Novartis's AI-enhanced processes and AstraZeneca's AI-powered drug development, AI is being used to improve patient outcomes, reduce overall development costs and revolutionize the industry. As AI technology continues to evolve, we will likely see even more innovative and transformative applications of this technology in healthcare.</p>
<p>VanEck&rsquo;s Pharmaceutical ETF offers exposure to the firms mentioned above and the 25 most prominent names in the space. The fund seeks to track a rigorous index that provides pure-play exposure to the industry (the Fund&rsquo;s index is the MVIS US Listed Pharmaceutical 25 Index, which tracks the overall performance of companies involved in pharmaceuticals, including pharmaceutical research and development as well a production, marketing and sales of pharmaceuticals). The most prominent companies in the sector are the ones that can materially invest in artificial intelligence as early adopters and reap the benefits of innovation.</p>
<p>To receive more <strong><a href="https://www.vaneck.com/us/en/insights/thematic-investing/" title="Thematic Investing Insights">Thematic Investing</a></strong> insights, <strong><a href="https://www.vaneck.com/us/en/subscribe/" title="Subscription Center">sign up in our subscription center</a></strong>.</p>
]]></content:encoded>
</item><item rdf:about="https://www.vaneck.com/us/en/blogs/gold-investing/gold-payday-on-feds-gamble/">
  <title>Gold Payday on Fed’s Gamble></title>
  <link>https://www.vaneck.com/us/en/blogs/gold-investing/gold-payday-on-feds-gamble/</link>
  <description><![CDATA[Gold reached a yearly high in April; a Fed pause may be gold positive, potentially driving gold even higher.]]></description>
  <dc:creator>Imaru Casanova</dc:creator>
  <dc:date>05/10/2023 06:30:00</dc:date>
<content:encoded><![CDATA[

<p>Monthly gold market and economic insights from Imaru Casanova, Portfolio Manager and Joe Foster, Gold Strategist, featuring their unique views on mining and gold&rsquo;s portfolio benefits. <a href="/us/en/blogs/gold-investing/gold-payday-on-feds-gamble/gold-monthly-commentary-april-2023.pdf" rel="noopener" target="_blank" title="Gold Monthly Commentary - April 2023"><strong>An expanded PDF version of this commentary, including fund specific information can be downloaded here.</strong></a></p>
<h2>Gold Moves Higher Heading Into May</h2>
<p>Gold continued its trend higher in April. It reached a yearly high of $2,048 per ounce on April 13, which coincided with the U.S. dollar&rsquo;s (DXY Index)<sup>1</sup>&nbsp;low for the year. It then traded in a tight range at around the $2,000 level, pressured by a bounce back in the U.S. dollar in the second half of April. With the banking crisis &ldquo;under control&rdquo;, markets turned their attention to the U.S. Federal Reserve&rsquo;s (Fed&rsquo;s) next policy meeting, looking at current economic releases for clues. The monthly releases were quite mixed, maintaining market opaqueness. The Consumer Price Index (CPI)<sup>2</sup>&nbsp;reading for March did show inflation declining; however, Core CPI (CPI excluding food and energy items) was up 5.6% from&nbsp;a year ago, above the&nbsp;overall measure, which was up 5%. Meanwhile, the Core Personal Consumption Expenditures (PCE)<sup>3</sup>&nbsp;reading, the Fed&rsquo;s preferred inflation gauge, increased to 4.9% in the first quarter of 2023. Manufacturing and services Purchasing Managers Indexes (PMIs)<sup>4</sup>&nbsp;in the U.S. surprised to the upside, while first quarter GDP for 2023 came in at 1.1%, well below expectations of 1.9%. Gold and the U.S. dollar fluctuated as market participants, and members of the Fed, assessed the data and expressed their views on monetary policy outcomes. Gold closed at $1,990 on April 28, a $20.72 per ounce (1.05%) advance for the month.</p>
<p>The NYSE Arca Gold Miners Index (GDMNTR)<sup>5</sup>&nbsp;outperformed gold, up 3.63%, while the MVIS Global Juniors Gold Miners Index (MVGDXJTR)<sup>6</sup>&nbsp;was up 0.40% during the month of April. The first quarter reporting season of 2023 is off to a good start with gold mining companies so far generally meeting or beating expectations. Gold stocks are outperforming gold this year, following years of underperformance. Consistently meeting expectations is an important driver of what we expect will eventually be a rerating of gold equities. This is supported not only by our outlook of higher gold prices, but also by the companies&rsquo; continued commitment to value creation via cost control, disciplined growth and a focus on returns.</p>
<h2>Banking Crisis: Contained?</h2>
<p>It is likely a bit too early to say whether the banking crisis is contained or over. The collapse and rescue of yet another bank, First Republic Bank, this past weekend, is clear evidence that risks remain. Once again, regulators intervened, and a more catastrophic failure was averted. However, it is another sign of the fragility of the global financial system at present. Even if this was the end of the banking turmoil, which appears unlikely, these recent developments bring to light the significant stress imposed on the economy by higher interest rates and certainly worsen and accelerate the chances of a recession or hard landing. It also makes it very clear that just like the banks, other sectors of the economy may be vulnerable, increasing uncertainty and volatility in the markets. This is supportive of gold prices.</p>
<p>With inflation significantly above the Fed&rsquo;s target, the Fed is stuck between a rock and a hard place. The fight against inflation is clearly not over, but the Fed may be forced to stop its rate hiking program before another crisis develops somewhere else. Historically (think of the 70s), a stop-and-go approach to fighting elevated inflation has not been successful. Unfortunately, controlling inflation without causing significant damage to the economy may not be possible. A Bloomberg article quoted former treasury secretary Lawrence Summers saying that taming inflation will likely lead to a &ldquo;meaningful&rdquo; economic downturn.<sup>i</sup>&nbsp;Some estimate that the effects of the recent banking crisis may be equivalent to one or two 25 basis points rate hikes by the Fed, suggesting that even if the Fed pauses, worsening credit conditions will slow down the economy and cool inflation. This is speculative, of course, as there is no way to quantify these effects. But it does seem logical that lasting ramifications from banking sector turmoil may continue to impact the economy. &ldquo;Under control?&rdquo;, perhaps, &ldquo;Contained?&rdquo;, likely not yet.</p>
<h2>Fed Pause Benefits Gold</h2>
<p>Gold may be in a privileged position at present. A Fed pause raises a flag: the economy is so weak that the Fed is afraid of causing too much damage by increasing rates further; this is gold positive, both because a weak economy sends investors running to gold and because lower rates make gold more attractive to own. The longer-term implications of a Fed pause on inflation expectations could also support gold: will inflation remain elevated? Is there significant risk that it may accelerate again? Gold is considered a hedge against inflation and its historic performance in high inflation periods confirms this role.</p>
<h3>Gold Historically Rallies in Periods of High Inflation</h3>
<p><strong>Gold nominal and real returns in US dollars as a function of annual inflation<sup>*</sup></strong></p>
<p><img class="img-responsive w-100" src="https://www.vaneck.com/contentassets/5fefd609703b4f81999de68be158b64d/3196_gold_chart-1_2023.05_blog.svg" alt="Gold Historically Rallies in Periods of High Inflation" /></p>
<p class="chart-disclosure"><sup>*</sup>&nbsp;As of 31 December 2022. Based on y-o-y changes in US dollars for 'gold': LMBA Gold Price PM and 'inflation': US CPI since January 1971.</p>
<p class="chart-disclosure">Source: World Gold Council, Bloomberg, ICE. Data as of December 31, 2022.</p>
<p>Furthermore, a Fed pause should lead to weakness in the U.S. dollar. The reversal of the strong dollar trend of 2022, we believe, should continue to be an important driver of gold prices in 2023. The U.S. debt ceiling debacle and mentions of a potential technical default as soon as June 1 weigh heavily on the dollar. Needless to say, an actual default would be disastrous. Diversification away from the U.S. dollar and into gold is a topic we have been covering recently in the context of record net purchases of gold by central banks in 2022, with continued strength into 2023. Coverage of the de-dollarization theme has picked up recently. A report by Bank of America highlights research that shows a series of gold technical patterns supporting gold prices in the range of $2,078 all the way to possibly $2,543 per ounce. In that same report, they point to fear of dollar debasement as another driver of gold demand, as other nations look to reduce their reliance on the U.S. dollar by transacting in other currencies.</p>
<h3>Everyone is Talking Down the Dollar</h3>
<p><img class="img-responsive w-100" src="https://www.vaneck.com/contentassets/5fefd609703b4f81999de68be158b64d/3196_gold_chart-2_2023.05_blog.svg" alt="Everyone is Talking Down the Dollar" /></p>
<p class="chart-disclosure">Source: BofA ETF Research, Bloomberg.</p>
<h2>Global De-Dollarization</h2>
<p>Shifting the U.S. dollar&rsquo;s dominance as the world&rsquo;s currency to other currencies, if it happens, is obviously something that would take a long time. However, de-dollarization efforts around the world today are without a doubt negative for the U.S. dollar. A weaker dollar alone is supportive of gold prices. In addition, because gold is so underheld, even a small shift in investment away from the U.S. dollar and into gold would lead to significantly higher demand for gold. Gold have been chosen by central banks; others may follow.</p>
<p>To receive more insights to <strong><a href="https://www.vaneck.com/us/en/insights/gold-investing/" title="Gold Investing Insights">Gold Investing</a></strong> insights, <strong><a href="https://www.vaneck.com/us/en/subscribe/" title="Subscription Center">sign up in our subscription center</a></strong>.</p>
]]></content:encoded>
</item><item rdf:about="https://www.vaneck.com/us/en/blogs/digital-assets/matthew-sigel-ethereum-price-target-118k-by-2030/">
  <title>How High Will Ethereum’s Price Go?></title>
  <link>https://www.vaneck.com/us/en/blogs/digital-assets/matthew-sigel-ethereum-price-target-118k-by-2030/</link>
  <description><![CDATA[We provide an updated Ethereum price target and a detailed valuation methodology using cash flow projections and fully diluted valuation (FDV) calculations.]]></description>
  <dc:creator>Matthew  Sigel</dc:creator>
  <dc:date>05/09/2023 06:30:00</dc:date>
<content:encoded><![CDATA[

<p><strong>Please note that VanEck has a position(s) in the Ethereum token described below.</strong></p>
<p>In light of Ethereum&rsquo;s recent hard fork, which allows users to withdraw staked ETH and, in our view, creates a major new competitor to US T-bills, we revisited our Ethereum estimates with a more rigorous valuation model.</p>
<p>We now see ETH network revenues rising from an annual rate of $2.6B to $51B in 2030. Assuming ETH takes a 70% market among smart contract protocols, this implies a token price of $11.8k in 2030, which we discount to $5.3k today at a 12% cost of capital derived from ETH&rsquo;s recent beta. This analysis offers a clear valuation methodology for Ethereum, considering transaction fees, MEV, and "Security as a Service.&rdquo; We assess market capture across key sectors and explore Ethereum's potential as a store-of-value asset in the evolving crypto landscape.</p>
<p><strong><a href="/us/en/blogs/digital-assets/matthew-sigel-ethereum-price-prediction-118k-by-2030/ethereum-price-prediction-118k-by-2030.pdf" title="Ethereum Price Prediction: $11.8k by 2030" target="_blank" rel="noopener">View here</a></strong> for a PDF version of this blog.</p>
<ul class="content-list">
<li><strong><a href="#point-one">Ethereum Valuation Methodology: Cash Flow Projections &amp; FDV Calculation</a></strong></li>
<li><strong><a href="#point-two">Ethereum&rsquo;s Business Model: A Digital Mall, Validators, &amp; On-Chain Commerce</a></strong></li>
<li><strong><a href="#point-three">Ethereum Revenue Recognition: Exploring Transaction Fees, MEV, and Security as a Service</a></strong></li>
<li><strong><a href="#point-four">Ethereum Transaction Revenue: Assessing Market Capture, Business Categories, &amp; Value Accrual</a></strong></li>
<li><strong><a href="#point-five">MEV Revenue: Exploring Transaction Ordering, On-Chain Activity, &amp; Long-term Projections</a></strong></li>
<li><strong><a href="#point-six">L2 Settlement Dynamics: Scaling Solutions, Revenue Distribution, &amp; Future Margin Projections</a></strong></li>
<li><strong><a href="#point-seven">Ethereum's Emerging Security as a Service Model</a></strong></li>
<li><strong><a href="#point-eight">Ethereum Price and Revenue Targets: Our Base, Bear, &amp; Bull Case Scenarios </a></strong></li>
</ul>
<h2 id="point-one" class="anchored-block">Ethereum Valuation Methodology: Cash Flow Projections &amp; FDV Calculation</h2>
<p>We value Ethereum by estimating cash flows for the year that ended on 4/30/2030. We project Ethereum revenues, deduct a global tax rate and a validator revenue cut and arrive at a cashflow figure. We then apply multiple estimates by applying a long-term estimated cash flow yield of 7% minus the long-term crypto growth rate of 4%. We then arrive at the fully diluted valuation (&ldquo;FDV&rdquo;) in 2030, divide the total by the expected number of tokens in circulation, and then discount the result by 12% to 4/20/2023. You can see our revenue estimates and price targets in the table below with more detailed assumptions in the Ethereum Valuation Scenarios table.</p>
<div class="wrapped-div">
<table style="width: 700px;">
<tbody>
<tr class="tbl-data">
<td class="tbl-header last" colspan="5">Ethereum Revenue and Price Targets</td>
</tr>
<tr class="tbl-data">
<td class="data-head last">&nbsp;</td>
<td class="data-head last">Today</td>
<td class="data-head last">Base 2030</td>
<td class="data-head last">Bear 2030</td>
<td class="data-head last">Bull 2030</td>
</tr>
<tr class="tbl-data">
<td class="data-td last">Ethereum Total Revenue</td>
<td class="data-td data last"><strong>$2,539</strong></td>
<td class="data-td data last"><strong>$50,985</strong></td>
<td class="data-td data last"><strong>$2,564</strong></td>
<td class="data-td data last"><strong>$136,771</strong></td>
</tr>
<tr class="tbl-data">
<td class="data-td last" style="padding-left: 25px;">Transactions</td>
<td class="data-td data last"><strong>$1,991</strong></td>
<td class="data-td data last"><strong>$29,337</strong></td>
<td class="data-td data last"><strong>$1,271</strong></td>
<td class="data-td data last"><strong>$83,839</strong></td>
</tr>
<tr class="tbl-data">
<td class="data-td last" style="font-weight: normal; padding-left: 50px;">Finance, Banking, Payments</td>
<td class="data-td data last">$929</td>
<td class="data-td data last">$10,370</td>
<td class="data-td data last">$444</td>
<td class="data-td data last">$26,666</td>
</tr>
<tr class="tbl-data">
<td class="data-td last" style="font-weight: normal; padding-left: 50px;">Metaverse, Social and Gaming</td>
<td class="data-td data last">$834</td>
<td class="data-td data last">$13,068</td>
<td class="data-td data last">$700</td>
<td class="data-td data last">$42,004</td>
</tr>
<tr class="tbl-data">
<td class="data-td last" style="font-weight: normal; padding-left: 50px;">Infrastructure</td>
<td class="data-td data last">$228</td>
<td class="data-td data last">$5,899</td>
<td class="data-td data last">$126</td>
<td class="data-td data last">$15,170</td>
</tr>
<tr class="tbl-data">
<td class="data-td last" style="padding-left: 25px;">MEV - Block Builder Revenue</td>
<td class="data-td data last"><strong>$497</strong></td>
<td class="data-td data last"><strong>$19,665</strong></td>
<td class="data-td data last"><strong>$1,175</strong></td>
<td class="data-td data last"><strong>$48,078</strong></td>
</tr>
<tr class="tbl-data">
<td class="data-td last" style="padding-left: 25px;">Ethereum Security as a Service</td>
<td class="data-td data last"><strong>$0</strong></td>
<td class="data-td data last"><strong>$1,983</strong></td>
<td class="data-td data last"><strong>$118</strong></td>
<td class="data-td data last"><strong>$4,854</strong></td>
</tr>
<tr class="tbl-data">
<td class="data-td last" style="padding-left: 25px;">ETH Price Target</td>
<td class="data-td data last"><strong>$1,900</strong></td>
<td class="data-td data last"><strong>$11,849</strong></td>
<td class="data-td data last"><strong>$343</strong></td>
<td class="data-td data last"><strong>$51,006</strong></td>
</tr>
</tbody>
</table>
</div>
<br />
<p class="chart-disclosure">Source: VanEck Research as of 4/30/2023. <strong>Past performance is no guarantee of future results. The above is not intended as financial advice, a recommendation to buy or sell Ethereum, or any call to action. There may be risks or other factors not accounted for in the above scenarios that may impede the performance of Ethereum; the actual future performance of Ethereum is unknown, and may differ significantly. Any projections, forecasts or forward-looking statements included herein are the results of a simulation based on our research, are valid as of the date of this communication and subject to change without notice, and are for illustrative purposes only. Please conduct your own research and draw your own conclusions.</strong></p>
<h2 id="point-two" class="anchored-block">Ethereum&rsquo;s Business Model: A Digital Mall, Validators, &amp; On-Chain Commerce</h2>
<p>To properly unpack our valuation approach to Ethereum, it is important first to understand what Ethereum is, how it works, and why it is valuable. At the most basic level, one can think of Ethereum as a mall that lives on the internet and provides a secure place for internet commerce to take place. Users interact inside Ethereum&rsquo;s mall by means of wallets, and Ethereum&rsquo;s mall businesses are made up of batches of smart contract code. The Ethereum software determines the structure and rules of the mall, while validators ensure that the rules are followed, secure the mall, and maintain a ledger of all economic events that occur within the mall. Ethereum also apportions the limited space within the mall by charging users for conducting business and exchanging value.</p>
<p>Ethereum is free software that is hosted on computers distributed throughout the globe. It employs an array of logic, called a protocol, to create a unified understanding of ownership, commercial activity, and business logic. This allows users to engage in commerce without the need to trust any of its participants or counterparties. Ethereum code creates verifiable and unambiguous rules that assign clear, strong property rights to create a platform for unrestrained business formation and free exchange.</p>
<p>The computers that run Ethereum software, called <em>validators</em>, receive inflationary rewards and a portion of the fees remitted by users performing activity on Ethereum. Businesses are created on Ethereum by deploying a series of smart contracts. Smart contracts are computer code libraries that autonomously execute functions when called upon by users without any intermediary. Using smart contracts, developers can build logic that replicates the function of businesses like banks, auction houses, social media companies, video games platforms, cloud computing services, and commodities exchanges. Using Ethereum, a business can keep its treasury entirely on Ethereum and enable smart contract disbursements to employees, vendors, contractors, and suppliers who can also have wallets on Ethereum.</p>
<p>For users to perform on-chain actions to exchange value or interact with on-chain businesses, they incur fees paid to Ethereum. These fees are relative to the computational intensity and spot demand for computation on the Ethereum network. Curiously, unlike most enterprises where businesses pay the overhead of rent, electricity, and the rest, users directly pay the overhead costs of interacting with the on-chain business to that on-chain business&rsquo;s host and chief vendor - Ethereum. Thus, users pay both the costs of hosting the business and the costs of Ethereum computation, on behalf of on-chain businesses, through their transactions.</p>
<p>The principal medium of exchange on the Ethereum network is the ETH token. For users to conduct activity on Ethereum, they must pay for the cost of performing their actions in ETH, just like at Dave &amp; Busters, where one must buy &ldquo;gaming points&rdquo; to play video games. To do anything on Ethereum, a user of Ethereum must utilize ETH tokens. Additionally, validators must post value, in the form of ETH, as collateral against their honesty. If a validator cheats, the ETH is seized. Considering that ETH tokens are the currency used to pay validators (who are selling ETH to cover costs), this marries demand with supply &ndash; Ethereum users buy tokens to use Ethereum, and Ethereum validators sell tokens to &ldquo;supply&rdquo; Ethereum.</p>
<p>What does it mean to &ldquo;supply&rdquo; Ethereum? In essence, it means participating in the consensus mechanism of Ethereum that verifies value transfers, allows for the deployment of smart contract code, or enables calls to Ethereum&rsquo;s software. All business logic and exchange of assets occur as ledger entries on blocks. Blocks are simply the &ldquo;to-do list&rdquo; for the Ethereum computer to complete, and every twelve seconds, the table of actions is executed. The list directs Ethereum to perform an action or a series of actions on behalf of the users. These directions could be as simple as sending value or as complex as buying and selling dozens of tokens simultaneously across dozens of different Ethereum-based token exchanges. Users gain inclusion on the block for their actions by paying a base fee and an inclusion fee. If there is a lot of demand for Ethereum&rsquo;s &ldquo;to-do list,&rdquo; users can increase their inclusion fee, called a &ldquo;tip,&rdquo; to ensure their request is fulfilled. Additionally, Ethereum has created a marketplace to auction off the right to order (and add transactions to) the action list on each of Ethereum&rsquo;s blocks. This is done because there is immense value in ordering the transactions. These two activities currently represent Ethereum&rsquo;s core business &ndash; selling blockspace and selling the right of others to order it. Distilled, Ethereum is selling secure, immutable blockspace that facilitates internet commerce.</p>
<h2 id="point-three" class="anchored-block">Ethereum Revenue Recognition: Exploring Transaction Fees, MEV, and Security as a Service</h2>
<p>Because Ethereum is not really a business, we identify revenue as an activity where tokens are used in Ethereum&rsquo;s core business &ndash; the provision of immutable, decentralized computing through <em>the sale of blockspace</em>. As a result, we count transaction fees, both the base fee and the tip fee, as a revenue line. Other analysts only count the base fee because it is burned, which impacts all ETH holders, while omitting the tip because it only is remitted to each leadership slot validator. In their construct, only staked ETH on validators receives the tip fee. However, we count both tip and base fees in addition to base fees as each reflects economic activity on Ethereum related to the <em>sale of blockspace.</em> Therefore, the economic value of those actions flows through to Ethereum as a business.</p>
<p>Additionally, we subtract ETH burned from the base fee from the ETH total supply and derive token value from the end-year, reduced supply total. Admittedly, unlike other components of our analysis, the yearly trajectory of ETH usage significantly influences today&rsquo;s token valuation through total token supply reduction. Additionally, we do not count inflationary security issuance as a revenue item as it does not relate directly to an outside entity buying blockspace.</p>
<p>Not only do we recognize the transaction fees of the system, but we also recognize MEV as a revenue item to ETH. With entities like Flashbots auctioning off blockspace to builders, a portion of the MEV will accrue to ETH stakers, passed on by validators. Similar to tip fees given to validators, we also believe block-building fees should be included in Ethereum&rsquo;s revenue calculations as they are economic activity related to the sale of blockspace.</p>
<p>Finally, we assert that ETH is evolving beyond a transactional currency or a consumable commodity like oil or natural gas. We believe that ETH, while not a complete store of value like Bitcoin due to Ethereum&rsquo;s demonstrated mutability of code and an evolving social consensus focused on utility, will nevertheless become a store-of-value asset for state actors looking to maximize human capital (vs. Bitcoin, which maximizes for stranded energy). Importantly, in this model update, due to smart contract programmability on Ethereum combined with maturing cross-chain messaging technology, we introduce a novel revenue item called &ldquo;Security as a Service&rdquo; (SaaS).</p>
<p>Conceptually, ETH&rsquo;s value can be used both within Ethereum and outside of it to secure applications, protocols, and ecosystems. Using projects such as Eigenlayer, ETH can be used to back entities such as Oracles, Sequencers, Validators, bridges, contractual agreements, and perhaps novel entities yet to be discovered. The result is that ETH approximates a Layer 0 asset like Bitcoin or Polkadot&rsquo;s DOT and Cosmos&rsquo;s ATOM claim. These Layer 0 assets can be used to back and bootstrap new blockchains. Since ETH is a bearer asset, ETH can be locked behind some business or protocol&rsquo;s guarantees to act honestly. If that honesty is violated, that value can be seized to penalize malicious or irresponsible parties and/or compensate affected parties. This can be thought of as a performance bond or collateral that ensures a damaged party recovers losses while a lousy actor pays for its malice.</p>
<p>Stepping back, this business type relies upon the value of ETH as a token and the safety and persistence of Ethereum&rsquo;s software. Thus, as Ethereum&rsquo;s security can be exported, ETH holders who participate in SaaS should be rewarded at some multiple to the summed value of priority fees, tips, block-building fees, and ETH inflationary issuance &ndash; the ETH holder&rsquo;s opportunity cost multiplied by risk. This multiple reflects the average security risks and investment risks involved in offboarding ETH as a security provision asset.</p>
<h3>Ethereum Daily Fees</h3>
<p><strong><img class="img-responsive w-100" src="https://www.vaneck.com/contentassets/407ba28ae8ca4a879600ec976fcef2bc/3183_scl_chart-1_2023.05_blog.svg" alt="Ethereum Daily Fees" /></strong></p>
<p class="chart-disclosure">Source: VanEck, Token Terminal as of 4/30/2023. <strong>Past performance is no guarantee of future results. Not intended as a recommendation to buy or sell any securities named herein.</strong></p>
<h2 id="point-four" class="anchored-block">Ethereum Transaction Revenue: Assessing Market Capture, Business Categories, &amp; Value Accrual</h2>
<p>The base of our projections comes from the smart contract platform &ldquo;market capture.&rdquo; This is the percentage of each business category&rsquo;s economic activity that we believe will utilize, be derived from, or reside on public smart contract platforms like Ethereum. Our main categories are Finance, Banking, and Payments (FBP), Metaverse, Social and Gaming (MSG), and Infrastructure (I). FBP encompasses financial activity, including consumer and business payments, banking services, and exchanges of value. MSG includes software and internet businesses that revolve around online social media, gathering, gaming, and virtual/online world value creation. Infrastructure encompasses the provision of cloud computing, server space, and distributed storage, as well as telecommunication and the internet. We assume that 5%, 20%, and 10% of finance, metaverse/media, and tech infrastructure activity, respectively, move on-chain. (Our relatively high estimates for metaverse/media contemplate the recent acceleration in information censorship in countries like Brazil, India &amp; Ireland and the high number of open-source social networks currently under development).</p>
<p>Since the precise value accrual from a business deployed to a blockchain is uncertain, we assume a take rate on the business economic activity derived from blockchain deployment. This is not without precedent, as many blockchain-native businesses are currently deployed to smart contract platforms. The businesses themselves do not directly pay fees to Ethereum for the usage of their businesses. The users do. However, over the long run, to simplify the user experience, businesses deployed to blockchain will likely pay fees on behalf of their customers. For example, a coffee roaster whose website is hosted on AWS does not make a customer pay for both the coffee purchase and the roaster&rsquo;s website costs at check out. Instead, the coffee store abstracts those costs and makes the customer only directly pay for the purchase items. In the future, blockchain-reliant and blockchain-based businesses will likely gravitate towards similar dynamics.</p>
<p>Looking at the cost breakdown to the user for using a blockchain business can inform our estimates of blockchain value capture over the long run. Right now, a user who wants to secure a loan using AAVE on Ethereum will pay both fees to AAVE and Ethereum for this business transaction. Of course, on the flip side, these fees to a user represent revenues to AAVE and Ethereum. If such a transaction occurred in real life, it would look like someone going to a Sharper Image at the mall and paying for his &ldquo;laser pointer blowtorch back-scratcher&rdquo; in addition to a portion of the Sharper Images&rsquo; monthly rent at checkout. We can see the breakdown of this ratio by examining the gas costs users pay to interact with an on-chain business&rsquo;s smart contracts (Ethereum&rsquo;s revenue) versus the costs the user pays directly to the business (AAVE&rsquo;s revenues) from the same transaction. These ratios vary greatly depending on the type of on-chain business.</p>
<h3>On-Chain Business Margin as Percentage of Total Fees Paid by Users (annual)</h3>
<p><img class="img-responsive w-100" src="https://www.vaneck.com/contentassets/407ba28ae8ca4a879600ec976fcef2bc/3183_scl_chart-2_2023.05_blog.svg" alt="On-Chain Business Margin as Percentage of Total Fees Paid by Users (annual)" /></p>
<p class="chart-disclosure">Source: VanEck, Token Terminal as of 4/30/2023. <strong>Past performance is no guarantee of future results. Not intended as a recommendation to buy or sell any securities named herein.</strong></p>
<p>We can infer from the above chart that over the past year, the average cost split between platform and business for a user of AAVE is shared 6.98% to the platform (Ethereum) and 93.02% to AAVE (application and its lenders). Drawing back to focus on value accrual to smart contract platforms like Ethereum, we feel this relationship will shift over time as off-chain businesses deploy on-chain to reduce costs and seek new revenue. In our model, we assume application take rates will vary between 90% to 97% of revenue depending on the end market, with ETH share falling between 3% and 10% depending on the business category.</p>
<p>We think approximating this take rate is essential because &ldquo;transactions revenue&rdquo; is not an ideal mechanism to describe future blockchain value capture. Going by our earlier assertion that the transactions are a &ldquo;to-do list&rdquo; of items for Ethereum to compute, many uses of the blockchain cannot be best described as &ldquo;transactions.&rdquo; Blockspace is the more fitting unit of measurement and description of the product sold by smart contract blockchains like Ethereum. It is possible that smart contract blockchains package blockspace into a &ldquo;service level agreement&rdquo; to other parties to guarantee some present or future amount of compute or transaction activity. This activity will create complex, liquid blockspace futures markets that mirror commodities futures dynamics. However, we will stick with &ldquo;Transaction Revenue&rdquo; to keep in line with current conventions.</p>
<p>To deduce future ETH supply reductions from ETH base fee burns that occur from blockspace usage, we begin by applying past Ethereum burn/fee ratios. We employ a figure of 80% for the percent of burned transaction fees. In ETH terms, we then estimate a transaction cost average for both Ethereum and Layer 2 platforms with a very significant cost decline rate of roughly 60%. We speculate that the cost differential for L2s will be 1/100th that of Ethereum. After that, we calculate future MAUs on Ethereum as a function of end-market business MAUs and Ethereum&rsquo;s capture of those MAUs. Ethereum capture rate of those MAUs is determined by Ethereum&rsquo;s take rate of those underlying business categories&rsquo; economic activity (between 5% and 20%, depending on the end market). We do not project transactions and then extrapolate a revenue assumption from them. We simply assume a declining transaction cost in ETH and project a yearly burn amount from the base fee burn. Again, this burn amount is subtracted from the total running supply of Ethereum and significantly impacts token value as Ethereum&rsquo;s FDV is spread across fewer tokens.</p>
<h2 id="point-five" class="anchored-block">MEV Revenue: Exploring Transaction Ordering, On-Chain Activity, &amp; Long-term Projections</h2>
<p>MEV is considered a &ldquo;bogeyman&rdquo; of blockchain that many entities seek to stop, distribute and/or suppress MEV. MEV is simply the profits that can be made by ordering transactions within each produced block. In reality, MEV can be limited but cannot be destroyed. We see MEV playing an integral role in securing (paying the validators and stakers) blockchains over the long run because of MEV&rsquo;s immense value. A corollary of its certain persistence is shelf space at a supermarket. There will always be more valuable shelf space (that at &ldquo;eye level&rdquo;), and someone will be willing to pay to occupy that space at the expense of others. Likewise, there will always be value in ordering transactions, and there is immense value to be gained by monetizing that ordering.</p>
<p>Because MEV is highly correlated with on-chain activity, it is difficult to predict. For our estimate, we assume that MEV is directly related to the value of all assets hosted on Ethereum. This gives us a &ldquo;management fee&rdquo; for keeping value on Ethereum. Currently, we estimate yearly MEV value approximates ~2.0% of on-chain TVL on Ethereum (not the value of all assets on chain) for the past year. Long term, we assume that MEV as a percentage of assets will shrink as protocols and applications act to reduce its impact, the turnover rate of on-chain assets declines, and applications remit some of its value back to users. Therefore, we see the MEV take rate dwindling to 0.15%. We assume the total value of on-chain assets relates to the total value of all hosted assets on the blockchain, and this value is derived from the share of the FBP that blockchains retain and Ethereum&rsquo;s market share.</p>
<h2 id="point-six" class="anchored-block">L2 Settlement Dynamics: Scaling Solutions, Revenue Distribution, &amp; Future Margin Projections</h2>
<p>As L2 settlement represents the long-term scaling solution for executing transactions on Ethereum, it's assumed to be the most important business line for Ethereum going forward. L2 settlement represents the line item of the transaction batches being posted to Ethereum. We predict settlement revenue as a function of L2 revenue and the margin relationship between &ldquo;profits&rdquo; and the cost of security to send batches to Ethereum. In our projections, we assume L2 revenue to be simply composed of MEV and transaction revenues which are both estimated by using the Ethereum framework. We then assume that L2s pay a portion of those revenues as security fees to Ethereum. We have seen the L2 &ldquo;margins&rdquo; fluctuate between 15% - 40% depending upon gas costs of Ethereum. Over the long run, we assert that most revenue from the L2 will still accrue to Ethereum, <em>including MEV on the L2</em>. We assume this to be the case because we project there will be thousands of L2s competing for blockspace on Ethereum and margins. We assert a long-term margin rate of 10% for the L2s versus the current range of 15% - 40%. This estimate is admittedly arbitrary, but we expect that as thousands of competing chains emerge to compete for Ethereum blockspace, margins for L2s will shrink dramatically. In terms of the value split, we assume that 98% of all transactions are executed on the L2s while 50% of the total value of assets rest on L2s. We assert that Ethereum will still host half of the ecosystem's value because some assets and transactions may necessitate extreme security, composability, and atomicity levels.</p>
<h2 id="point-seven" class="anchored-block">Ethereum's Emerging Security as a Service Model</h2>
<p>We define Ethereum&rsquo;s SaaS business as the revenues received from exporting ETH token value to back outside ecosystems, applications, and protocols. This is a burgeoning and uncertain use case for ETH that is hard to predict. To speculate on what percentage of ETH will be exported to gain fees for security provision, we look to current and past examples of bridged assets. Currently, the total percentage of ETH that is bridged off Ethereum is 0.47%, while the total supply of ATOM off-chain is around 0.5%. In the past, BTC wrapped and exported to other chains was as high as 1.7%, and during the peak of bridging activity on Ethereum, more than 15% of Ethereum&rsquo;s USDC supply was bridged off the chain. As a starting point, we assume that 10% of ETH is used to provide security off-chain and that for a risk premium, it should command a 2x premium to ETH on-chain.</p>
<h2 id="point-eight" class="anchored-block">Ethereum Price and Revenue Targets: Our Base, Bear, &amp; Bull Case Scenarios</h2>
<p>In our Base Case, we assume that Ethereum will achieve $51B in annual revenue in the year ending 4/30/2030. We deduct a validator fee from this total, 1%, and a global tax rate of 15%, and we arrive at cash flows of $42.90B to Ethereum. Assuming an FCF multiple of 33x, 120.7M token, we come to a <strong>Base Case 2030 Price Target of $11,848 per token</strong>. To determine a valuation in today&rsquo;s dollars, we discount Ethereum at 12% despite finding, through CAPM, an 8.74%. We use this elevated figure to reflect increased uncertainty around the future of Ethereum. As a result, we find today&rsquo;s discounted price to be $5,359.71 in our Base Case.</p>
<p>We base these estimates on the thesis that Ethereum becomes the dominant open-source global settlement network that hosts substantial portions of the commercial activity of business sectors with the highest potential to gain from moving their business functions to public blockchains. In a portfolio of similar smart contract platforms, we assume to own a collection of call options, with the dominant platform likely to take a majority market share.</p>
<div class="wrapped-div">
<table style="width: 700px;">
<tbody>
<tr class="tbl-data">
<td class="tbl-header last" colspan="4">Ethereum Valuation Scenarios</td>
</tr>
<tr class="tbl-data">
<td class="data-head last">&nbsp;</td>
<td class="data-head last">Base</td>
<td class="data-head last">Bear</td>
<td class="data-head last">Bull</td>
</tr>
<tr class="tbl-data">
<td class="data-td last">ETH Price Estimate</td>
<td class="data-td data last">&nbsp;</td>
</tr>
<tr class="tbl-data">
<td class="data-td last" style="font-weight: normal; padding-left: 25px;">Ethereum Terminal Smart Contract Market Share</td>
<td class="data-td data last">70.00%</td>
<td class="data-td data last">15.00%</td>
<td class="data-td data last">90.00%</td>
</tr>
<tr class="tbl-data">
<td class="data-td last" style="font-weight: normal; padding-left: 25px;">Estimated Revenue 2030 (M)</td>
<td class="data-td data last">$50,985</td>
<td class="data-td data last">$2,564</td>
<td class="data-td data last">$136,771</td>
</tr>
<tr class="tbl-data">
<td class="data-td last" style="font-weight: normal; padding-left: 25px;">Global Tax Rate on Crypto</td>
<td class="data-td data last">15.00%</td>
</tr>
<tr class="tbl-data">
<td class="data-td last" style="font-weight: normal; padding-left: 25px;">Validator Cut</td>
<td class="data-td data last">1.00%</td>
</tr>
<tr class="tbl-data">
<td class="data-td last" style="font-weight: normal; padding-left: 25px;">Value to Tokenholders in 2030 (M)</td>
<td class="data-td data last">$42,904</td>
<td class="data-td data last">$2,157</td>
<td class="data-td data last">$115,093</td>
</tr>
<tr class="tbl-data">
<td class="data-td last" style="font-weight: normal; padding-left: 25px;">FCF Yield</td>
<td class="data-td data last">7.00%</td>
</tr>
<tr class="tbl-data">
<td class="data-td last" style="font-weight: normal; padding-left: 25px;">Real Yield</td>
<td class="data-td data last">6.00%</td>
</tr>
<tr class="tbl-data">
<td class="data-td last" style="font-weight: normal; padding-left: 25px;">Long Term Revenue Growth over GDP</td>
<td class="data-td data last">100.00%</td>
</tr>
<tr class="tbl-data">
<td class="data-td last" style="font-weight: normal; padding-left: 25px;">Long Term GDP Growth</td>
<td class="data-td data last">2.00%</td>
</tr>
<tr class="tbl-data">
<td class="data-td last" style="font-weight: normal; padding-left: 25px;">Long Term Crypto Revenue Growth</td>
<td class="data-td data last">4.00%</td>
<td class="data-td data last">2.00%</td>
<td class="data-td data last">5.00%</td>
</tr>
<tr class="tbl-data">
<td class="data-td last" style="font-weight: normal; padding-left: 25px;">FCF Terminal Multiple</td>
<td class="data-td data last">33</td>
<td class="data-td data last">20</td>
<td class="data-td data last">50</td>
</tr>
<tr class="tbl-data">
<td class="data-td last" style="font-weight: normal; padding-left: 25px;">ETH FDV (M)</td>
<td class="data-td data last">$1,430,118</td>
<td class="data-td data last">$43,146</td>
<td class="data-td data last">$5,754,655</td>
</tr>
<tr class="tbl-data">
<td class="data-td last" style="font-weight: normal; padding-left: 25px;">ETH Supply in 2030 (M)</td>
<td class="data-td data last">120.70</td>
<td class="data-td data last">125.68</td>
<td class="data-td data last">112.82</td>
</tr>
<tr class="tbl-data">
<td class="data-td last" style="font-weight: normal; padding-left: 25px;">Discount Rate</td>
<td class="data-td data last">12.00%</td>
</tr>
<tr class="tbl-data">
<td class="data-td last">ETH Price 2030</td>
<td class="data-td data last"><strong>$11,848.62</strong></td>
<td class="data-td data last"><strong>$343.29</strong></td>
<td class="data-td data last"><strong>$51,006.28</strong></td>
</tr>
<tr class="tbl-data">
<td class="data-td last" style="font-weight: normal;">Discounted Token Price</td>
<td class="data-td data last">$5,359.71</td>
<td class="data-td data last">$155.29</td>
<td class="data-td data last">$23,072.65</td>
</tr>
<tr class="tbl-data">
<td class="data-td last">Crypto Terminal Market Share</td>
<td class="data-td data last">&nbsp;</td>
</tr>
<tr class="tbl-data">
<td class="data-td last" style="font-weight: normal; padding-left: 25px;">Finance, Banking, Payments</td>
<td class="data-td data last">5.00%</td>
<td class="data-td data last">1.00%</td>
<td class="data-td data last">15.00%</td>
</tr>
<tr class="tbl-data">
<td class="data-td last" style="font-weight: normal; padding-left: 25px;">Metaverse, Social, and Gaming</td>
<td class="data-td data last">20.00%</td>
<td class="data-td data last">5.00%</td>
<td class="data-td data last">50.00%</td>
</tr>
<tr class="tbl-data">
<td class="data-td last" style="font-weight: normal; padding-left: 25px;">Infrastructure</td>
<td class="data-td data last">10.00%</td>
<td class="data-td data last">1.00%</td>
<td class="data-td data last">20.00%</td>
</tr>
<tr class="tbl-data">
<td class="data-td last">Ethereum Value Capture of End Market Revenue</td>
<td class="data-td data last">&nbsp;</td>
</tr>
<tr class="tbl-data">
<td class="data-td last" style="font-weight: normal; padding-left: 25px;">Finance, Banking, Payments</td>
<td class="data-td data last">3.00%</td>
</tr>
<tr class="tbl-data">
<td class="data-td last" style="font-weight: normal; padding-left: 25px;">Metaverse, Social, and Gaming</td>
<td class="data-td data last">10.00%</td>
</tr>
<tr class="tbl-data">
<td class="data-td last" style="font-weight: normal; padding-left: 25px;">Infrastructure</td>
<td class="data-td data last">5.00%</td>
</tr>
<tr class="tbl-data">
<td class="data-td last">MEV Revenue</td>
<td class="data-td data last">&nbsp;</td>
</tr>
<tr class="tbl-data">
<td class="data-td last" style="font-weight: normal; padding-left: 25px;">MEV LT Take Rate</td>
<td class="data-td data last">0.10%</td>
</tr>
<tr class="tbl-data">
<td class="data-td last" style="font-weight: normal; padding-left: 25px;">MEV Value Accrual to Token</td>
<td class="data-td data last">90.00%</td>
</tr>
<tr class="tbl-data">
<td class="data-td last">L2 Projections</td>
<td class="data-td data last">&nbsp;</td>
</tr>
<tr class="tbl-data">
<td class="data-td last" style="font-weight: normal; padding-left: 25px;">L2 Usage of Ethereum Block Space</td>
<td class="data-td data last">95.00%</td>
</tr>
<tr class="tbl-data">
<td class="data-td last" style="font-weight: normal; padding-left: 25px;">Transaction Percentage on L2</td>
<td class="data-td data last">98.00%</td>
</tr>
<tr class="tbl-data">
<td class="data-td last" style="font-weight: normal; padding-left: 25px;">Ecosystem TVL Layer 2</td>
<td class="data-td data last">50.00%</td>
</tr>
<tr class="tbl-data">
<td class="data-td last" style="font-weight: normal; padding-left: 25px;">L2 Revenue Capture of Total (split to L2)</td>
<td class="data-td data last">10.00%</td>
</tr>
<tr class="tbl-data">
<td class="data-td last">Ethereum Security as a Service</td>
<td class="data-td data last">&nbsp;</td>
</tr>
<tr class="tbl-data">
<td class="data-td last" style="font-weight: normal; padding-left: 25px;">Percent Supply of ETH</td>
<td class="data-td data last">10.00%</td>
</tr>
<tr class="tbl-data">
<td class="data-td last" style="font-weight: normal; padding-left: 25px;">ETH Opportunity Cost Multiple</td>
<td class="data-td data last">2.00</td>
</tr>
<tr class="tbl-data">
<td class="data-td last">Tokenomics</td>
<td class="data-td data last">&nbsp;</td>
</tr>
<tr class="tbl-data">
<td class="data-td last" style="font-weight: normal; padding-left: 25px;">Burn Ratio</td>
<td class="data-td data last">80.00%</td>
</tr>
<tr class="tbl-data">
<td class="data-td last" style="font-weight: normal; padding-left: 25px;">L2 Transaction Cost</td>
<td class="data-td data last">1.00%</td>
</tr>
<tr class="tbl-data">
<td class="data-td last" style="font-weight: normal; padding-left: 25px;">Terminal Staking Rate of Tokenholders</td>
<td class="data-td data last">30.00%</td>
</tr>
</tbody>
</table>
</div>
<br />
<p class="chart-disclosure">Source: VanEck Research as of 4/30/2023. <strong>Past performance is no guarantee of future results. The above is not intended as financial advice, a recommendation to buy or sell Ethereum, or any call to action. There may be risks or other factors not accounted for in the above scenarios that may impede the performance of Ethereum; the actual future performance of Ethereum is unknown, and may differ significantly. Any projections, forecasts or forward-looking statements included herein are the results of a simulation based on our research, are valid as of the date of this communication and subject to change without notice, and are for illustrative purposes only. Please conduct your own research and draw your own conclusions.</strong></p>
<p>To receive more <strong><a href="https://www.vaneck.com/us/en/insights/digital-assets/" title="Digital Assets Insights">Digital Assets</a></strong> insights, <strong><a href="https://www.vaneck.com/us/en/subscribe/" title="Subscription Center">sign up in our subscription center</a></strong>.</p>
<style type="text/css">
    .wrapped-div {
        max-width: 100%;
    }

    @media (max-width: 1240px) {
        .wrapped-div {
            overflow-x: scroll;
        }
    }
</style>
<!-- Hide alreat promo banner. Make height 0 to account for the HeaderHeightCalculation scripts -->
<style>
header.site-header .alert-bar {
    display:none!important;
    height: 0!important;
    overflow:hidden!important;
}
</style>
]]></content:encoded>
</item><item rdf:about="https://www.vaneck.com/us/en/blogs/moat-investing/meta-platforms-takes-center-stage-among-moat-stocks/">
  <title>Meta Platforms Takes Center Stage Among Moat Stocks></title>
  <link>https://www.vaneck.com/us/en/blogs/moat-investing/meta-platforms-takes-center-stage-among-moat-stocks/</link>
  <description><![CDATA[A punishing 2022 for Meta Platforms created a valuation opportunity&mdash;one that has paid off as it becomes the top contributor year-to-date for the Morningstar Wide Moat Focus Index.]]></description>
  <dc:creator>Coulter Regal, CFA</dc:creator>
  <dc:date>05/09/2023 06:30:00</dc:date>
<content:encoded><![CDATA[

<p>April was a subdued month&mdash;at least relative to the volatility seen in March given the banking crisis&mdash;with U.S. equities as a whole moving mostly sideways. Investors appeared to be awaiting the kick-off to an important earnings season and the latest guidance from the Federal Reserve&rsquo;s early May policy meeting. The benchmark S&amp;P 500 Index was up slightly with a 1.56% return during the month. However, small- and mid-cap companies fared worse as the potential for a recession continued to weigh on the segment. The S&amp;P SmallCap 600 Index and the S&amp;P MidCap 400 Index returned -2.78% and -0.78 in April, respectively.</p>
<p>The <strong><a href="/link/9f629c73a31846bb9e480b95e2c7f330.aspx" title="MOAT - VanEck Morningstar Wide Moat ETF - Index">Morningstar Wide Moat Focus Index</a></strong> (the &ldquo;Moat Index&rdquo;) and the <strong><a href="/link/c0c4da50e177415b9f750d3c0eea4e0a.aspx" title="SMOT - VanEck Morningstar SMID Moat ETF - Index">Morningstar US Small-Mid Cap Moat Focus Index</a></strong> (the &ldquo;SMID Moat Index&rdquo;) both performed in line with their respective areas of the market this month. The Moat Index was up 1.01% while the SMID Moat Index was down 1.39%. Year-to-date, however, both Moat Indexes remain ahead of their benchmarks through the end of April.</p>
<h3>Moat Stocks Outperform in 2023</h3>
<p><strong>Year-to-Date Total Return as of 4/30/2023</strong></p>
<p><img class="img-responsive w-100" src="https://www.vaneck.com/contentassets/86e66e8d82264aad979ce40a0976afda/3206_moat_chart_01_2023.05_v1_blog.svg" alt="Moat Stocks Outperform in 2023" /></p>
<p class="chart-disclosure">Source: Morningstar. As of 4/30/2023. Past performance is no guarantee of future results. Index performance is not illustrative of Fund performance. Fund performance current to the most recent month end is available by visiting vaneck.com or by calling 800.826.2333. Indexes are unmanaged and are not securities in which an investment can be made.</p>
<h2>From Punished to Prosperous: Meta Platforms</h2>
<p>The wide moat rated Meta Platforms Inc. (META) was severely punished in 2022, as CEO Mark Zuckerberg&rsquo;s moonshot metaverse plan was not panning out and the Federal Reserve was just beginning its historically steep rate hike cycle. Many investors lost faith in the company, and the stock tumbled over 60% that year. However, the long-term view and conviction of Morningstar senior equity analyst Ali Mogharabi led to a perceived valuation opportunity that the Moat Index has been able to capture. With its first quarter earnings beat and optimistic guidance, META was up over 13% in April and was the top contributor to performance in the Moat Index during the month as well as year-to-date. Even after its impressive performance so far this year, Morningstar believes that there could still be some room for the stock to run. Below are Ali&rsquo;s comments on META following the earnings release.</p>
<p class="px-5"><strong>Morningstar Analyst Comments</strong> | by Ali Mogharabi April 27, 2023</p>
<p class="px-5"><i>Meta&rsquo;s first-quarter results confirmed our views on Reels monetization, ad conversion improvement, margin potential, and an unharmed network effect moat source. We have increased our revenue projections and continue to expect margin expansion beginning in 2024, pushing our fair value estimate up to $278 per share from $260. While the share price of this wide-moat firm has increased more than 135% from its lows in November 2022, we believe it remains undervalued.</i></p>
<p>To learn more about Meta Platforms and how Morningstar views the company, check out our premiere episode of <strong><a href="/link/775af929d69741efa7729872dda2bfa5.aspx?epsremainingpath=the-moat-show-meta-platforms-with-ali-mogharabi" title="The Moat Show: Meta Platforms with Morningstar's Ali Mogharabi">The Moat Show</a></strong> with Ali Mogharabi, who goes in depth on META&rsquo;s economic moat, valuation, and what may come next for the company.</p>
<p>Other top contributors in April include medical-device company Medtronic (MDT) and leading U.S. credit bureau TransUnion (TRU). On the reverse side, detractors to Moat Index April performance landed primarily within the Technology and Consumer Cyclical sectors.</p>
<h3>Top Contributors and Detractors from Moat Index - April 2023</h3>
<div class="wrapped-div">
<table style="width: 750px;">
<tbody>
<tr class="tbl-data">
<td class="tbl-header last" colspan="5">Leading Contributors</td>
</tr>
<tr class="tbl-data">
<td class="data-td  last">Company</td>
<td class="data-head last">Ticker</td>
<td class="data-head last">Sector</td>
<td class="data-head last">Avg. Weight (%)</td>
<td class="data-head last">Contribution (%)</td>
</tr>
<tr class="tbl-data">
<td class="data-td last" style="font-weight: normal;">Meta Platforms Inc.</td>
<td class="data-td data last">META</td>
<td class="data-td data last">Communication Services</td>
<td class="data-td data last">3.38</td>
<td class="data-td data last">0.45</td>
</tr>
<tr class="tbl-data">
<td class="data-td last" style="font-weight: normal;">Medtronic PLC</td>
<td class="data-td data last">MDT</td>
<td class="data-td data last">Healthcare</td>
<td class="data-td data last">2.45</td>
<td class="data-td data last">0.31</td>
</tr>
<tr class="tbl-data">
<td class="data-td last" style="font-weight: normal;">TransUnion</td>
<td class="data-td data last">TRU</td>
<td class="data-td data last">Industrials</td>
<td class="data-td data last">2.40</td>
<td class="data-td data last">0.26</td>
</tr>
<tr class="tbl-data">
<td class="data-td last" style="font-weight: normal;">Comcast Corp</td>
<td class="data-td data last">CMCSA</td>
<td class="data-td data last">Communication Services</td>
<td class="data-td data last">2.53</td>
<td class="data-td data last">0.25</td>
</tr>
<tr class="tbl-data">
<td class="data-td last" style="font-weight: normal;">Biogen Inc</td>
<td class="data-td data last">BIIB</td>
<td class="data-td data last">Healthcare</td>
<td class="data-td data last">2.39</td>
<td class="data-td data last">0.23</td>
</tr>
</tbody>
</table>
</div>
<br />
<div class="wrapped-div">
<table style="width: 750px;">
<tbody>
<tr class="tbl-data">
<td class="tbl-header last" colspan="5">Leading Detractors</td>
</tr>
<tr class="tbl-data">
<td class="data-td  last">Company</td>
<td class="data-head last">Ticker</td>
<td class="data-head last">Sector</td>
<td class="data-head last">Avg. Weight (%)</td>
<td class="data-head last">Contribution (%)</td>
</tr>
<tr class="tbl-data">
<td class="data-td last" style="font-weight: normal;">Teradyne Inc</td>
<td class="data-td data last">TER</td>
<td class="data-td data last">Technology</td>
<td class="data-td data last">2.59</td>
<td class="data-td data last">-0.39</td>
</tr>
<tr class="tbl-data">
<td class="data-td last" style="font-weight: normal;">Workday Inc</td>
<td class="data-td data last">WDAY</td>
<td class="data-td data last">Technology</td>
<td class="data-td data last">2.72</td>
<td class="data-td data last">-0.27</td>
</tr>
<tr class="tbl-data">
<td class="data-td last" style="font-weight: normal;">Etsy Inc</td>
<td class="data-td data last">ETSY</td>
<td class="data-td data last">Consumer Cyclical</td>
<td class="data-td data last">2.21</td>
<td class="data-td data last">-0.20</td>
</tr>
<tr class="tbl-data">
<td class="data-td last" style="font-weight: normal;">Microchip Technology Inc</td>
<td class="data-td data last">MCHP</td>
<td class="data-td data last">Technology</td>
<td class="data-td data last">1.21</td>
<td class="data-td data last">-0.16</td>
</tr>
<tr class="tbl-data">
<td class="data-td last" style="font-weight: normal;">Tradeweb Markets Inc</td>
<td class="data-td data last">TW</td>
<td class="data-td data last">Financial Services</td>
<td class="data-td data last">1.42</td>
<td class="data-td data last">-0.15</td>
</tr>
</tbody>
</table>
</div>
<br />
<p class="chart-disclosure"><strong>Source: Morningstar, April 2023.</strong> Past performance is no guarantee of future results. Index performance is not illustrative of fund performance. Not intended as a recommendation to buy or to sell any of the securities mentioned herein.</p>
<h2>Recession Fears Weighed on Small- and Mid-Caps</h2>
<p>Small and mid-cap companies kicked off 2023 with impressive performance, benefiting from optimism around the potential for a pause in rate hikes and the possibility of a soft economic landing. However, the U.S. Fed has since continued their hawkish tone, and market views around economic growth have shifted, leading to underperformance as fears of a potential recession grow. Historically, smaller cap companies tend to lag the broader market in performance ahead of a recession, but they often outperform during the recovery phase. This dynamic can be painful for investors in the near term, but it may also set up an attractive entry opportunity for those looking to position for eventual brighter days.</p>
<p>Within the SMID Moat Index, top contributors for April were primarily within the Healthcare sector, including the medical instruments and supplies company ResMed (RMD), the pure-play infusion therapy company ICU Medical Inc (ICUI) and Zimmer Biomet (ZBH), an orthopedic reconstructive implants company. Sectors that detracted the most from SMID Moat Index performance during the month were the Technology and Consumer Cyclical sectors.</p>
<h3>Top Contributors and Detractors from SMID Moat Index - April 2023</h3>
<div class="wrapped-div">
<table style="width: 750px;">
<tbody>
<tr class="tbl-data">
<td class="tbl-header last" colspan="5">Leading Contributors</td>
</tr>
<tr class="tbl-data">
<td class="data-td  last">Company</td>
<td class="data-head last">Ticker</td>
<td class="data-head last">Sector</td>
<td class="data-head last">Avg. Weight (%)</td>
<td class="data-head last">Contribution (%)</td>
</tr>
<tr class="tbl-data">
<td class="data-td last" style="font-weight: normal;">ResMed Inc</td>
<td class="data-td data last">RMD</td>
<td class="data-td data last">Healthcare</td>
<td class="data-td data last">1.34</td>
<td class="data-td data last">0.13</td>
</tr>
<tr class="tbl-data">
<td class="data-td last" style="font-weight: normal;">ICU Medical Inc</td>
<td class="data-td data last">ICUI</td>
<td class="data-td data last">Healthcare</td>
<td class="data-td data last">0.73</td>
<td class="data-td data last">0.11</td>
</tr>
<tr class="tbl-data">
<td class="data-td last" style="font-weight: normal;">Masco Corp</td>
<td class="data-td data last">MAS</td>
<td class="data-td data last">Industrials</td>
<td class="data-td data last">1.33</td>
<td class="data-td data last">0.10</td>
</tr>
<tr class="tbl-data">
<td class="data-td last" style="font-weight: normal;">Zimmer Biomet Holdings</td>
<td class="data-td data last">ZBH</td>
<td class="data-td data last">Healthcare</td>
<td class="data-td data last">1.38</td>
<td class="data-td data last">0.10</td>
</tr>
<tr class="tbl-data">
<td class="data-td last" style="font-weight: normal;">Global Payments Inc</td>
<td class="data-td data last">GPN</td>
<td class="data-td data last">Industrials</td>
<td class="data-td data last">1.38</td>
<td class="data-td data last">0.10</td>
</tr>
</tbody>
</table>
</div>
<br />
<div class="wrapped-div">
<table style="width: 750px;">
<tbody>
<tr class="tbl-data">
<td class="tbl-header last" colspan="5">Leading Detractors</td>
</tr>
<tr class="tbl-data">
<td class="data-td  last">Company</td>
<td class="data-head last">Ticker</td>
<td class="data-head last">Sector</td>
<td class="data-head last">Avg. Weight (%)</td>
<td class="data-head last">Contribution (%)</td>
</tr>
<tr class="tbl-data">
<td class="data-td last" style="font-weight: normal;">Albemarle Corp</td>
<td class="data-td data last">ALB</td>
<td class="data-td data last">Basic Materials</td>
<td class="data-td data last">1.17</td>
<td class="data-td data last">-0.19</td>
</tr>
<tr class="tbl-data">
<td class="data-td last" style="font-weight: normal;">Sensata Technologies</td>
<td class="data-td data last">ST</td>
<td class="data-td data last">Technology</td>
<td class="data-td data last">1.42</td>
<td class="data-td data last">-0.19</td>
</tr>
<tr class="tbl-data">
<td class="data-td last" style="font-weight: normal;">Microchip Technology</td>
<td class="data-td data last">MCHP</td>
<td class="data-td data last">Technology</td>
<td class="data-td data last">1.37</td>
<td class="data-td data last">-0.18</td>
</tr>
<tr class="tbl-data">
<td class="data-td last" style="font-weight: normal;">Littelfuse Inc</td>
<td class="data-td data last">LFUS</td>
<td class="data-td data last">Technology</td>
<td class="data-td data last">1.42</td>
<td class="data-td data last">-0.14</td>
</tr>
<tr class="tbl-data">
<td class="data-td last" style="font-weight: normal;">Adient PLC</td>
<td class="data-td data last">ADNT</td>
<td class="data-td data last">Consumer Cyclical</td>
<td class="data-td data last">1.35</td>
<td class="data-td data last">-0.13</td>
</tr>
</tbody>
</table>
</div>
<br />
<p class="chart-disclosure"><strong>Source: Morningstar, April 2023.</strong> Past performance is no guarantee of future results. Index performance is not illustrative of fund performance. Not intended as a recommendation to buy or to sell any of the securities mentioned herein.</p>
<h2>Accessing Moat Stocks</h2>
<p><a href="https://www.vaneck.com/us/en/investments/morningstar-wide-moat-etf-moat/moat-reconstitution.pdf" title="MOAT - VanEck Morningstar Wide Moat ETF" target="_blank" rel="noopener"><strong>VanEck Morningstar Wide ETF (MOAT)</strong></a> seeks to replicate as closely as possible, before fees and expenses the price and yield performance of the Morningstar Wide Moat Focus Index.</p>
<p><a href="/link/589a2bc95c5d48988a7fd0d679aec241.aspx" title="SMOT - VanEck Morningstar SMID Moat ETF - Overview"><strong>VanEck Morningstar SMID Moat ETF (SMOT)</strong></a> seeks to track as closely as possible, before fees and expenses, the price and yield performance of the Morningstar US Small-Mid Cap Moat Focus Index.</p>
<p>To receive more <a href="https://www.vaneck.com/us/en/insights/moat-investing/" title="Moat Investing Insights"><strong>Moat Investing</strong></a> insights, <a href="https://www.vaneck.com/us/en/subscribe/" title=" Subscription Center"><strong>sign up in our subscription center</strong></a>.</p>
<style type="text/css">
    .wrapped-div {
        max-width: 100%;
    }

    @media (max-width: 1240px) {
        .wrapped-div {
            overflow-x: scroll;
        }


    }
</style>
]]></content:encoded>
</item><item rdf:about="https://www.vaneck.com/us/en/blogs/moat-investing/economic-moats-sustain-tech-leaders-in-turbulent-times/">
  <title>Economic Moats Sustain Tech Leaders in Turbulent Times></title>
  <link>https://www.vaneck.com/us/en/blogs/moat-investing/economic-moats-sustain-tech-leaders-in-turbulent-times/</link>
  <description><![CDATA[Despite volatility in the broader tech sector, companies with robust economic moats remain well-positioned over the long term.]]></description>
  <dc:creator> </dc:creator>
  <dc:date>05/08/2023 06:30:00</dc:date>
<content:encoded><![CDATA[

<p>In recent years, the technology sector has served as a prime example of the power of economic moats, propelling a select few companies to mega-cap status. However, the sector has recently faced challenges that have sent ripples through the industry. Morningstar analysts joined a <strong><a href="https://www.vaneck.com/us/en/webinar-registration/?id=92317034805&amp;utm_source=vaneck&amp;utm_medium=calendar" title="Quality Companies for Any Market">recent VanEck webinar</a></strong> to discuss the importance of economic moats in this increasingly competitive and volatile landscape.</p>
<h2>Moats Stay in Favor Despite Trouble in the Broader Tech Sector</h2>
<p>Over the past decade, a handful of technology companies have evolved into mega-cap behemoths, dominating market returns and solidifying their position in the global economy. Central to their remarkable success has been the strategic implementation of strong economic moats, enabling these companies to maintain a competitive advantage over their rivals and capture unparalleled market share.</p>
<p>While the broader sector has recently struggled, Morningstar believes companies with the strongest moats are well-positioned to outperform. This phenomenon is not limited to the industry's behemoths alone. Several smaller technology firms with well-established competitive advantages are also utilizing economic moats to secure their position in the market. Below, we take a closer look at two technology portfolio holdings in the <strong><a href="/link/635ccc4bf9134cb9a7fcc80919498eec.aspx" title="MOAT - VanEck Morningstar Wide Moat ETF - Overview">VanEck Morningstar Wide Moat ETF (MOAT<sup>&reg;</sup>)</a></strong> and the <strong><a href="/link/589a2bc95c5d48988a7fd0d679aec241.aspx" title="SMOT - VanEck Morningstar SMID Moat ETF - Overview">VanEck Morningstar SMID Moat ETF</a></strong>.</p>
<h2>Intuit Inc.</h2>
<p>Intuit Inc.<sup>1</sup>&nbsp;is the giant behind the U.S. small-business accounting software QuickBooks and the do-it-yourself tax software TurboTax. TurboTax and QuickBooks online sales have eclipsed their respective desktop sales, and Intuit Inc. has transitioned into a cloud-first company. This transition has enabled Intuit Inc. to leverage customer data to streamline the user experience across its disparate product set and natively market its full suite of offerings. As a result, the company scores high on switching costs and network effects. In Morningstar&rsquo;s view, the recent pullback in the stock pushed the discount even farther below their estimate for fair value, as they believe many investors are underestimating the long-term potential of the company&rsquo;s ability to expand its software ecosystem.</p>
<h3>Intuit Inc. / 1 Year Price and Fair Value as of 3/31/2023</h3>
<p><img class="img-responsive w-100" src="https://www.vaneck.com/contentassets/217cb41e7c084c2bb13e89a7ad9e4e2c/3192_moat_chart_01_2023.01_v1_blog.svg" alt="Intuit Inc. 1 Year Price and Fair Value" /></p>
<p class="chart-disclosure">Source: Morningstar. Past performance is not a guarantee of future results.</p>
<h2>Garmin</h2>
<p>Garmin&rsquo;s<sup>2</sup>&nbsp;major revenue sources have shifted to its aviation and marine segments. The company&rsquo;s fitness and outdoor segments are also major sources of revenue as they have benefited from the ascent of the smartwatch market. After shedding much of its auto segment, Morningstar believes the company will uphold excess returns on capital in the long term given its robust operating margins. Garmin&rsquo;s narrow moat stems from the switching costs and intangible asset moat sources found in its aviation, marine, and outdoor segments. Like Intuit Inc., the stock has pulled back with other tech stocks and trades significantly below Morningstar&rsquo;s estimate for fair value.</p>
<h3>Garmin Ltd. / 1 Year Price and Fair Value as of 3/31/2023</h3>
<p><img class="img-responsive w-100" src="https://www.vaneck.com/contentassets/217cb41e7c084c2bb13e89a7ad9e4e2c/3192_moat_chart_02_2023.01_v1_blog.svg" alt="Garmin 1 Year Price and Fair Value" /></p>
<p class="chart-disclosure">Source: Morningstar. Past performance is not a guarantee of future results.</p>
<p>To receive more <a href="https://www.vaneck.com/us/en/insights/moat-investing/" title="Moat Investing Insights"><strong>Moat Investing</strong></a> insights, <a href="https://www.vaneck.com/us/en/subscribe/" title=" Subscription Center"><strong>sign up in our subscription center</strong></a>.</p>
]]></content:encoded>
</item><item rdf:about="https://www.vaneck.com/us/en/blogs/digital-assets/matthew-sigel-ethereums-hard-fork-draws-more-stakers-but-raises-regulatory-stakes/">
  <title>Ethereum’s Hard Fork Draws More Stakers But Raises Regulatory Stakes></title>
  <link>https://www.vaneck.com/us/en/blogs/digital-assets/matthew-sigel-ethereums-hard-fork-draws-more-stakers-but-raises-regulatory-stakes/</link>
  <description><![CDATA[Ethereum's "Shapella" hard fork enabled full withdrawals and, despite decreasing ETH supply and increasing daily fees, staked Ethereum's value reached a $40B all-time high.]]></description>
  <dc:creator>Matthew  Sigel</dc:creator>
  <dc:date>05/04/2023 06:30:00</dc:date>
<content:encoded><![CDATA[

<p><strong>Please note that VanEck may have a position(s) in the digital asset(s) described below.</strong></p>
<ul class="content-list">
<li><a href="#point-one"><strong>Ethereum Valuation Methodology</strong></a></li>
<li><a href="#point-two"><strong>Ethereum&rsquo;s Business Model </strong></a></li>
<li><a href="#point-three"><strong>Revenue Recognition</strong></a></li>
<li><a href="#point-four"><strong>Transaction Revenue</strong></a></li>
<li><a href="#point-five"><strong>MEV Revenue</strong></a></li>
<li><a href="#point-six"><strong>L2 Settlement</strong></a></li>
<li><a href="#point-seven"><strong>Security as a Service</strong></a></li>
<li><a href="#point-eight"><strong>Ethereum Price and Revenue Targets</strong></a></li>
<li><a href="#point-nine"><strong>DeFi</strong></a></li>
<li><a href="#point-ten"><strong>Metaverse &amp; NFTs</strong></a></li>
</ul>
<p>SEC Chair Gary Gensler dominated headlines in April with two appearances on Capitol Hill and multiple enforcement actions in the space, including a Wells Notice served to Coinbase, whose CEO Brian Armstrong vowed to &ldquo;exhaust all avenues&rdquo; to fight. So far, this includes a counter-suit against the SEC for its lack of rule-making and plans to set up offshore trading venues.</p>
<p>However, the bigger story in the month, in our opinion, was Ethereum&rsquo;s &ldquo;Shapella&rdquo; hard fork which enabled full withdrawals from the Ethereum staking smart contract and created a long-term competitor to U.S. T-bills with an equivalent yield but a declining supply. Since the transition to proof-of-stake last September, ETH supply is down 3%, while daily fees have risen from ~$2.5M in August 2022 pre-merge to a ~$7M run-rate in April, implying a $2.6B annual tally according to our estimates (see below). After an initial flurry of staking withdrawals dominated by Kraken, who, in a settlement with the SEC, agreed to end their staking offering in the US, the number of days&rsquo; queue to withdraw staked ETH principal has collapsed from 17 days on April 12<sup>th</sup>to 5 days at the end of the month. The value of all staked Ethereum is now around its $40B all-time high despite an ETH price still down 62% from its peak. We expect liquid-staked Ethereum and a number of DeFi innovations (see below) to eventually catalyze another round of retail leverage as the bull market heats up ahead of Bitcoin&rsquo;s next halving, now a year away.</p>
<h3>Ethereum Daily Fees</h3>
<p><img class="img-responsive w-100" src="https://www.vaneck.com/contentassets/4fb5f00045ff4a8b9cb1e95f7b53df85/3183_scl_chart-1_2023.05_blog.svg" alt="Ethereum Daily Fees" /></p>
<p class="chart-disclosure">Source: VanEck, Token Terminal as of 4/30/2023. Past performance is no guarantee of future results. Not intended as a recommendation to buy or sell any securities named herein.</p>
<p>But first, let&rsquo;s contrast ETH&rsquo;s fundamental momentum to the fundamentals of our debt-based fiat system, underpinned by the almighty USD, whose issuer, the U.S. treasury, reported a <u>year-to-date fiscal deficit in April of $1.1 trillion, +60% y/y</u>. Federal tax revenues are now negative year-over-year, implying a recession is underway. As we write, the FDIC is orchestrating a sale of First Republic Bank using its reserve fund, agreeing to share losses on FRC mortgages and commercial loans with JPMorgan, and providing a $50B credit line made at the discretion of unelected bureaucrats with no skin in the game. We acknowledge that seeing de-dollarization debated on &ldquo;The View&rdquo; is hardly comforting from a positioning perspective, but still: bailing out rich coastal Americans who got below-rate mortgages in exchange for leaving cash at the now-defunct bank, while the U.S. Treasury claimed for weeks that &ldquo;the banking system is sound,&rdquo; is hardly a good look. US trading partners, many of whom are now being sanctioned by the same US Treasury, are clearly observing this treatment of taxpayer funds &amp; continue to unload US treasuries. China&rsquo;s holdings are down 35% from their peak. Japan, who quietly announced a deal to buy Russian energy above the G7 price cap, holds 20% fewer treasuries than just 18 months ago.</p>
<p>Back on the topic of regulation, while it is possible that this SEC may yet go after Ethereum developers for coordinating to fork the chain and &ldquo;promising&rdquo; staking returns to buyers, as has been hinted by Chair Gensler in the past, we were encouraged to hear several Democratic members of congress like Rep Richie Torres (NY-D) take a states-rights approach to regulating the industry in the hearings last month. We also note that according to media reports, Senators Elizabeth Warren (D-MA) &amp; Roger Marshall (R-KS) were forced to delay the reintroduction of their crypto anti-money laundering bill due to a lack of sponsors. This bill is particularly concerning because it requires unhosted wallet providers, validators, and miners to provide identifying information of their &ldquo;customers&rdquo; (which they often don&rsquo;t have). Unless this bill reappears, perhaps the &ldquo;second derivative&rdquo; of proposed legislation in the US may have peaked with the FTX and other bankruptcies in the rear-view mirror, even if the environment is hardly positive. In any case, digital assets returns were again strongest during Asian trading hours in April. We increasingly see crypto as an EM asset class that could attract flows from US entities who see Chinese stocks as uninvestable despite their ~40% weight in EM indices.</p>
<p>One clear consequence of US enforcement actions and the tighter liquidity environment for startups (total VC funding is down 62% y/y with crypto/blockchain down 91% according to JPMorgan) is a strong-get-stronger market dynamic which continued in April, as Bitcoin &amp; Ethereum rose 4% and 3% respectively vs. most crypto categories we track which fell in the month. The MarketVector DA 100 large-cap index has outperformed small-caps by 2000bps since February 1st.</p>
<p>In the rest of this note, we explore Ethereum&rsquo;s valuation in more detail the technical progress made last month, and the recent transaction momentum on layer 2s such as ARB, OP &amp; MATIC, which settle on ETH. <u>After refreshing our model, we see ETH revenues rising from an annual rate of $2.6B to $51B in 2030. Assuming ETH takes a 70% market among smart contract protocols, this implies a token price of $11.8k in 2030, which we discount to $5.3k today at a 12% cost of capital derived from ETH&rsquo;s recent beta. </u></p>
<h2 id="point-one" class="anchored-block">Ethereum Valuation Methodology</h2>
<p>We value Ethereum by estimating cash flows for the year that ended on 4/30/2030. We project Ethereum revenues, deduct a global tax rate and a validator revenue cut and arrive at a cashflow figure. We then apply multiple estimates by applying a long-term estimated cash flow yield of 7% minus the long-term crypto growth rate of 4%. We then arrive at the fully diluted valuation (&ldquo;FDV&rdquo;) in 2030, divide the total by the expected number of tokens in circulation, and then discount the result by 12% to 4/20/2023. You can see our revenue estimates and price targets in the table below with more detailed assumptions in the Ethereum Valuation Scenarios table.</p>
<div class="wrapped-div">
<table style="width: 700px;">
<tbody>
<tr class="tbl-data">
<td class="tbl-header last" colspan="5">Ethereum Revenue and Price Targets</td>
</tr>
<tr class="tbl-data">
<td class="data-head last">&nbsp;</td>
<td class="data-head last">Today</td>
<td class="data-head last">Base 2030</td>
<td class="data-head last">Bear 2030</td>
<td class="data-head last">Bull 2030</td>
</tr>
<tr class="tbl-data">
<td class="data-td last">Ethereum Total Revenue</td>
<td class="data-td data last"><strong>$2,539</strong></td>
<td class="data-td data last"><strong>$50,985</strong></td>
<td class="data-td data last"><strong>$2,564</strong></td>
<td class="data-td data last"><strong>$136,771</strong></td>
</tr>
<tr class="tbl-data">
<td class="data-td last" style="padding-left: 25px;">Transactions</td>
<td class="data-td data last"><strong>$1,991</strong></td>
<td class="data-td data last"><strong>$29,337</strong></td>
<td class="data-td data last"><strong>$1,271</strong></td>
<td class="data-td data last"><strong>$83,839</strong></td>
</tr>
<tr class="tbl-data">
<td class="data-td last" style="font-weight: normal; padding-left: 50px;">Finance, Banking, Payments</td>
<td class="data-td data last">$929</td>
<td class="data-td data last">$10,370</td>
<td class="data-td data last">$444</td>
<td class="data-td data last">$26,666</td>
</tr>
<tr class="tbl-data">
<td class="data-td last" style="font-weight: normal; padding-left: 50px;">Metaverse, Social and Gaming</td>
<td class="data-td data last">$834</td>
<td class="data-td data last">$13,068</td>
<td class="data-td data last">$700</td>
<td class="data-td data last">$42,004</td>
</tr>
<tr class="tbl-data">
<td class="data-td last" style="font-weight: normal; padding-left: 50px;">Infrastructure</td>
<td class="data-td data last">$228</td>
<td class="data-td data last">$5,899</td>
<td class="data-td data last">$126</td>
<td class="data-td data last">$15,170</td>
</tr>
<tr class="tbl-data">
<td class="data-td last" style="padding-left: 25px;">MEV - Block Builder Revenue</td>
<td class="data-td data last"><strong>$497</strong></td>
<td class="data-td data last"><strong>$19,665</strong></td>
<td class="data-td data last"><strong>$1,175</strong></td>
<td class="data-td data last"><strong>$48,078</strong></td>
</tr>
<tr class="tbl-data">
<td class="data-td last" style="padding-left: 25px;">Ethereum Security as a Service</td>
<td class="data-td data last"><strong>$0</strong></td>
<td class="data-td data last"><strong>$1,983</strong></td>
<td class="data-td data last"><strong>$118</strong></td>
<td class="data-td data last"><strong>$4,854</strong></td>
</tr>
<tr class="tbl-data">
<td class="data-td last" style="padding-left: 25px;">ETH Price Target</td>
<td class="data-td data last"><strong>$1,900</strong></td>
<td class="data-td data last"><strong>$11,849</strong></td>
<td class="data-td data last"><strong>$343</strong></td>
<td class="data-td data last"><strong>$51,006</strong></td>
</tr>
</tbody>
</table>
</div>
<br />
<p class="chart-disclosure">Source: VanEck Research as of 4/30/2023. Past performance is no guarantee of future results. The above is not intended as financial advice, a recommendation to buy or sell Ethereum, or any call to action. There may be risks or other factors not accounted for in the above scenarios that may impede the performance of Ethereum; the actual future performance of Ethereum is unknown, and may differ significantly. Any projections, forecasts or forward-looking statements included herein are the results of a simulation based on our research, are valid as of the date of this communication and subject to change without notice, and are for illustrative purposes only. Please conduct your own research and draw your own conclusions.</p>
<h2 id="point-two" class="anchored-block">Ethereum&rsquo;s Business Model</h2>
<p>To properly unpack our valuation approach to Ethereum, it is important first to understand what Ethereum is, how it works, and why it is valuable. At the most basic level, one can think of Ethereum as a mall that lives on the internet and provides a secure place for internet commerce to take place. Users interact inside Ethereum&rsquo;s mall by means of wallets, and Ethereum&rsquo;s mall businesses are made up of batches of smart contract code. The Ethereum software determines the structure and rules of the mall, while validators ensure that the rules are followed, secure the mall, and maintain a ledger of all economic events that occur within the mall. Ethereum also apportions the limited space within the mall by charging users for conducting business and exchanging value.</p>
<p>Ethereum is free software that is hosted on computers distributed throughout the globe. It employs an array of logic, called a protocol, to create a unified understanding of ownership, commercial activity, and business logic. This allows users to engage in commerce without the need to trust any of its participants or counterparties. Ethereum code creates verifiable and unambiguous rules that assign clear, strong property rights to create a platform for unrestrained business formation and free exchange.</p>
<p>The computers that run Ethereum software, called <em>validators</em>, receive inflationary rewards and a portion of the fees remitted by users performing activity on Ethereum. Businesses are created on Ethereum by deploying a series of smart contracts. Smart contracts are computer code libraries that autonomously execute functions when called upon by users without any intermediary. Using smart contracts, developers can build logic that replicates the function of businesses like banks, auction houses, social media companies, video games platforms, cloud computing services, and commodities exchanges. Using Ethereum, a business can keep its treasury entirely on Ethereum and enable smart contract disbursements to employees, vendors, contractors, and suppliers who can also have wallets on Ethereum.</p>
<p>For users to perform on-chain actions to exchange value or interact with on-chain businesses, they incur fees paid to Ethereum. These fees are relative to the computational intensity and spot demand for computation on the Ethereum network. Curiously, unlike most enterprises where businesses pay the overhead of rent, electricity, and the rest, users directly pay the overhead costs of interacting with the on-chain business to that on-chain business&rsquo;s host and chief vendor - Ethereum. Thus, users pay both the costs of hosting the business and the costs of Ethereum computation, on behalf of on-chain businesses, through their transactions.</p>
<p>The principal medium of exchange on the Ethereum network is the ETH token. For users to conduct activity on Ethereum, they must pay for the cost of performing their actions in ETH, just like at Dave &amp; Busters, where one must buy &ldquo;gaming points&rdquo; to play video games. To do anything on Ethereum, a user of Ethereum must utilize ETH tokens. Additionally, validators must post value, in the form of ETH, as collateral against their honesty. If a validator cheats, the ETH is seized. Considering that ETH tokens are the currency used to pay validators (who are selling ETH to cover costs), this marries demand with supply &ndash; Ethereum users buy tokens to use Ethereum, and Ethereum validators sell tokens to &ldquo;supply&rdquo; Ethereum.</p>
<p>What does it mean to &ldquo;supply&rdquo; Ethereum? In essence, it means participating in the consensus mechanism of Ethereum that verifies value transfers, allows for the deployment of smart contract code, or enables calls to Ethereum&rsquo;s software. All business logic and exchange of assets occur as ledger entries on blocks. Blocks are simply the &ldquo;to-do list&rdquo; for the Ethereum computer to complete, and every twelve seconds, the table of actions is executed. The list directs Ethereum to perform an action or a series of actions on behalf of the users. These directions could be as simple as sending value or as complex as buying and selling dozens of tokens simultaneously across dozens of different Ethereum-based token exchanges. Users gain inclusion on the block for their actions by paying a base fee and an inclusion fee. If there is a lot of demand for Ethereum&rsquo;s &ldquo;to-do list,&rdquo; users can increase their inclusion fee, called a &ldquo;tip,&rdquo; to ensure their request is fulfilled. Additionally, Ethereum has created a marketplace to auction off the right to order (and add transactions to) the action list on each of Ethereum&rsquo;s blocks. This is done because there is immense value in ordering the transactions. These two activities currently represent Ethereum&rsquo;s core business &ndash; selling blockspace and selling the right of others to order it. Distilled, Ethereum is selling secure, immutable blockspace that facilitates internet commerce.</p>
<h2 id="point-three" class="anchored-block"><strong>Revenue Recognition</strong></h2>
<p>Because Ethereum is not really a business, we identify revenue as an activity where tokens are used in Ethereum&rsquo;s core business &ndash; the provision of immutable, decentralized computing through <em>the sale of blockspace</em>. As a result, we count transaction fees, both the base fee and the tip fee, as a revenue line. Other analysts only count the base fee because it is burned, which impacts all ETH holders, while omitting the tip because it only is remitted to each leadership slot validator. In their construct, only staked ETH on validators receives the tip fee. However, we count both tip and base fees in addition to base fees as each reflects economic activity on Ethereum related to the <em>sale of blockspace.</em> Therefore, the economic value of those actions flows through to Ethereum as a business.</p>
<p>Additionally, we subtract ETH burned from the base fee from the ETH total supply and derive token value from the end-year, reduced supply total. Admittedly, unlike other components of our analysis, the yearly trajectory of ETH usage significantly influences today&rsquo;s token valuation through total token supply reduction. Additionally, we do not count inflationary security issuance as a revenue item as it does not relate directly to an outside entity buying blockspace.</p>
<p>Not only do we recognize the transaction fees of the system, but we also recognize MEV as a revenue item to ETH. With entities like Flashbots auctioning off blockspace to builders, a portion of the MEV will accrue to ETH stakers, passed on by validators. Similar to tip fees given to validators, we also believe block-building fees should be included in Ethereum&rsquo;s revenue calculations as they are economic activity related to the sale of blockspace.</p>
<p>Finally, we assert that ETH is evolving beyond a transactional currency or a consumable commodity like oil or natural gas. We believe that ETH, while not a complete store of value like Bitcoin due to Ethereum&rsquo;s demonstrated mutability of code and an evolving social consensus focused on utility, will nevertheless become a store-of-value asset for state actors looking to maximize human capital (vs. Bitcoin, which maximizes for stranded energy). Importantly, in this model update, due to smart contract programmability on Ethereum combined with maturing cross-chain messaging technology, we introduce a novel revenue item called &ldquo;Security as a Service&rdquo; (SaaS).</p>
<p>Conceptually, ETH&rsquo;s value can be used both within Ethereum and outside of it to secure applications, protocols, and ecosystems. Using projects such as Eigenlayer, ETH can be used to back entities such as Oracles, Sequencers, Validators, bridges, contractual agreements, and perhaps novel entities yet to be discovered. The result is that ETH approximates a Layer 0 asset like Bitcoin or Polkadot&rsquo;s DOT and Cosmos&rsquo;s ATOM claim. These Layer 0 assets can be used to back and bootstrap new blockchains. Since ETH is a bearer asset, ETH can be locked behind some business or protocol&rsquo;s guarantees to act honestly. If that honesty is violated, that value can be seized to penalize malicious or irresponsible parties and/or compensate affected parties. This can be thought of as a performance bond or collateral that ensures a damaged party recovers losses while a lousy actor pays for its malice.</p>
<p>Stepping back, this business type relies upon the value of ETH as a token and the safety and persistence of Ethereum&rsquo;s software. Thus, as Ethereum&rsquo;s security can be exported, ETH holders who participate in SaaS should be rewarded at some multiple to the summed value of priority fees, tips, block-building fees, and ETH inflationary issuance &ndash; the ETH holder&rsquo;s opportunity cost multiplied by risk. This multiple reflects the average security risks and investment risks involved in offboarding ETH as a security provision asset.</p>
<h2 id="point-four" class="anchored-block">Transaction Revenue</h2>
<p>The base of our projections comes from the smart contract platform &ldquo;market capture.&rdquo; This is the percentage of each business category&rsquo;s economic activity that we believe will utilize, be derived from, or reside on public smart contract platforms like Ethereum. Our main categories are Finance, Banking, and Payments (FBP), Metaverse, Social and Gaming (MSG), and Infrastructure (I). FBP encompasses financial activity, including consumer and business payments, banking services, and exchanges of value. MSG includes software and internet businesses that revolve around online social media, gathering, gaming, and virtual/online world value creation. Infrastructure encompasses the provision of cloud computing, server space, and distributed storage, as well as telecommunication and the internet. We assume that 5%, 20%, and 10% of finance, metaverse/media, and tech infrastructure activity, respectively, move on-chain. (Our relatively high estimates for metaverse/media contemplate the recent acceleration in information censorship in countries like Brazil, India &amp; Ireland and the high number of open-source social networks currently under development).</p>
<p>Since the precise value accrual from a business deployed to a blockchain is uncertain, we assume a take rate on the business economic activity derived from blockchain deployment. This is not without precedent, as many blockchain-native businesses are currently deployed to smart contract platforms. The businesses themselves do not directly pay fees to Ethereum for the usage of their businesses. The users do. However, over the long run, to simplify the user experience, businesses deployed to blockchain will likely pay fees on behalf of their customers. For example, a coffee roaster whose website is hosted on AWS does not make a customer pay for both the coffee purchase and the roaster&rsquo;s website costs at check out. Instead, the coffee store abstracts those costs and makes the customer only directly pay for the purchase items. In the future, blockchain-reliant and blockchain-based businesses will likely gravitate towards similar dynamics.</p>
<p>Looking at the cost breakdown to the user for using a blockchain business can inform our estimates of blockchain value capture over the long run. Right now, a user who wants to secure a loan using AAVE on Ethereum will pay both fees to AAVE and Ethereum for this business transaction. Of course, on the flip side, these fees to a user represent revenues to AAVE and Ethereum. If such a transaction occurred in real life, it would look like someone going to a Sharper Image at the mall and paying for his &ldquo;laser pointer blowtorch back-scratcher&rdquo; in addition to a portion of the Sharper Images&rsquo; monthly rent at checkout. We can see the breakdown of this ratio by examining the gas costs users pay to interact with an on-chain business&rsquo;s smart contracts (Ethereum&rsquo;s revenue) versus the costs the user pays directly to the business (AAVE&rsquo;s revenues) from the same transaction. These ratios vary greatly depending on the type of on-chain business.</p>
<h3>On-Chain Business Margin as Percentage of Total Fees Paid by Users (annual)</h3>
<p><img class="img-responsive w-100" src="https://www.vaneck.com/contentassets/4fb5f00045ff4a8b9cb1e95f7b53df85/3183_scl_chart-2_2023.05_blog.svg" alt="On-Chain Business Margin as Percentage of Total Fees Paid by Users (annual)" /></p>
<p class="chart-disclosure">Source: VanEck, Token Terminal as of 4/30/2023. Past performance is no guarantee of future results. Not intended as a recommendation to buy or sell any securities named herein.</p>
<p>We can infer from the above chart that over the past year, the average cost split between platform and business for a user of AAVE is shared 6.98% to the platform (Ethereum) and 93.02% to AAVE (application and its lenders). Drawing back to focus on value accrual to smart contract platforms like Ethereum, we feel this relationship will shift over time as off-chain businesses deploy on-chain to reduce costs and seek new revenue. In our model, we assume application take rates will vary between 90% to 97% of revenue depending on the end market, with ETH share falling between 3% and 10% depending on the business category.</p>
<p>We think approximating this take rate is essential because &ldquo;transactions revenue&rdquo; is not an ideal mechanism to describe future blockchain value capture. Going by our earlier assertion that the transactions are a &ldquo;to-do list&rdquo; of items for Ethereum to compute, many uses of the blockchain cannot be best described as &ldquo;transactions.&rdquo; Blockspace is the more fitting unit of measurement and description of the product sold by smart contract blockchains like Ethereum. It is possible that smart contract blockchains package blockspace into a &ldquo;service level agreement&rdquo; to other parties to guarantee some present or future amount of compute or transaction activity. This activity will create complex, liquid blockspace futures markets that mirror commodities futures dynamics. However, we will stick with &ldquo;Transaction Revenue&rdquo; to keep in line with current conventions.</p>
<p>To deduce future ETH supply reductions from ETH base fee burns that occur from blockspace usage, we begin by applying past Ethereum burn/fee ratios. We employ a figure of 80% for the percent of burned transaction fees. In ETH terms, we then estimate a transaction cost average for both Ethereum and Layer 2 platforms with a very significant cost decline rate of roughly 60%. We speculate that the cost differential for L2s will be 1/100<sup>th</sup>that of Ethereum. After that, we calculate future MAUs on Ethereum as a function of end-market business MAUs and Ethereum&rsquo;s capture of those MAUs. Ethereum capture rate of those MAUs is determined by Ethereum&rsquo;s take rate of those underlying business categories&rsquo; economic activity (between 5% and 20%, depending on the end market). We do not project transactions and then extrapolate a revenue assumption from them. We simply assume a declining transaction cost in ETH and project a yearly burn amount from the base fee burn. Again, this burn amount is subtracted from the total running supply of Ethereum and significantly impacts token value as Ethereum&rsquo;s FDV is spread across fewer tokens.</p>
<h2 id="point-five" class="anchored-block">MEV Revenue</h2>
<p>MEV is considered a &ldquo;bogeyman&rdquo; of blockchain that many entities seek to stop, distribute and/or suppress MEV. MEV is simply the profits that can be made by ordering transactions within each produced block. In reality, MEV can be limited but cannot be destroyed. We see MEV playing an integral role in securing (paying the validators and stakers) blockchains over the long run because of MEV&rsquo;s immense value. A corollary of its certain persistence is shelf space at a supermarket. There will always be more valuable shelf space (that at &ldquo;eye level&rdquo;), and someone will be willing to pay to occupy that space at the expense of others. Likewise, there will always be value in ordering transactions, and there is immense value to be gained by monetizing that ordering.</p>
<p>Because MEV is highly correlated with on-chain activity, it is difficult to predict. For our estimate, we assume that MEV is directly related to the value of all assets hosted on Ethereum. This gives us a &ldquo;management fee&rdquo; for keeping value on Ethereum. Currently, we estimate yearly MEV value approximates ~2.0% of on-chain TVL on Ethereum (not the value of all assets on chain) for the past year. Long term, we assume that MEV as a percentage of assets will shrink as protocols and applications act to reduce its impact, the turnover rate of on-chain assets declines, and applications remit some of its value back to users. Therefore, we see the MEV take rate dwindling to 0.15%. We assume the total value of on-chain assets relates to the total value of all hosted assets on the blockchain, and this value is derived from the share of the FBP that blockchains retain and Ethereum&rsquo;s market share.</p>
<h2 id="point-six" class="anchored-block">L2 Settlement</h2>
<p>As L2 settlement represents the long-term scaling solution for executing transactions on Ethereum, it's assumed to be the most important business line for Ethereum going forward. L2 settlement represents the line item of the transaction batches being posted to Ethereum. We predict settlement revenue as a function of L2 revenue and the margin relationship between &ldquo;profits&rdquo; and the cost of security to send batches to Ethereum. In our projections, we assume L2 revenue to be simply composed of MEV and transaction revenues which are both estimated by using the Ethereum framework. We then assume that L2s pay a portion of those revenues as security fees to Ethereum. We have seen the L2 &ldquo;margins&rdquo; fluctuate between 15% - 40% depending upon gas costs of Ethereum. Over the long run, we assert that most revenue from the L2 will still accrue to Ethereum, <em>including MEV on the L2</em>. We assume this to be the case because we project there will be thousands of L2s competing for blockspace on Ethereum and margins. We assert a long-term margin rate of 10% for the L2s versus the current range of 15% - 40%. This estimate is admittedly arbitrary, but we expect that as thousands of competing chains emerge to compete for Ethereum blockspace, margins for L2s will shrink dramatically. In terms of the value split, we assume that 98% of all transactions are executed on the L2s while 50% of the total value of assets rest on L2s. We assert that Ethereum will still host half of the ecosystem's value because some assets and transactions may necessitate extreme security, composability, and atomicity levels.</p>
<h2 id="point-seven" class="anchored-block">Security as a Service</h2>
<p>We define Ethereum&rsquo;s SaaS business as the revenues received from exporting ETH token value to back outside ecosystems, applications, and protocols. This is a burgeoning and uncertain use case for ETH that is hard to predict. To speculate on what percentage of ETH will be exported to gain fees for security provision, we look to current and past examples of bridged assets. Currently, the total percentage of ETH that is bridged off Ethereum is 0.47%, while the total supply of ATOM off-chain is around 0.5%. In the past, BTC wrapped and exported to other chains was as high as 1.7%, and during the peak of bridging activity on Ethereum, more than 15% of Ethereum&rsquo;s USDC supply was bridged off the chain. As a starting point, we assume that 10% of ETH is used to provide security off-chain and that for a risk premium, it should command a 2x premium to ETH on-chain.</p>
<h2 id="point-eight" class="anchored-block">Ethereum Price and Revenue Targets</h2>
<p>In our Base Case, we assume that Ethereum will achieve $51B in annual revenue in the year ending 4/30/2030. We deduct a validator fee from this total, 1%, and a global tax rate of 15%, and we arrive at cash flows of $42.90B to Ethereum. Assuming an FCF multiple of 33x, 120.7M token, we come to a <strong>Base Case 2030 Price Target of $11,848 per token</strong>. To determine a valuation in today&rsquo;s dollars, we discount Ethereum at 12% despite finding, through CAPM, an 8.74%. We use this elevated figure to reflect increased uncertainty around the future of Ethereum. As a result, we find today&rsquo;s discounted price to be $5,359.71 in our Base Case.</p>
<p>We base these estimates on the thesis that Ethereum becomes the dominant open-source global settlement network that hosts substantial portions of the commercial activity of business sectors with the highest potential to gain from moving their business functions to public blockchains. In a portfolio of similar smart contract platforms, we assume to own a collection of call options, with the dominant platform likely to take a majority market share.</p>
<div class="wrapped-div">
<table style="width: 700px;">
<tbody>
<tr class="tbl-data">
<td class="tbl-header last" colspan="4">Ethereum Valuation Scenarios</td>
</tr>
<tr class="tbl-data">
<td class="data-head last">&nbsp;</td>
<td class="data-head last">Base</td>
<td class="data-head last">Bear</td>
<td class="data-head last">Bull</td>
</tr>
<tr class="tbl-data">
<td class="data-td last">ETH Price Estimate</td>
<td class="data-td data last">&nbsp;</td>
</tr>
<tr class="tbl-data">
<td class="data-td last" style="font-weight: normal; padding-left: 25px;">Ethereum Terminal Smart Contract Market Share</td>
<td class="data-td data last">70.00%</td>
<td class="data-td data last">15.00%</td>
<td class="data-td data last">90.00%</td>
</tr>
<tr class="tbl-data">
<td class="data-td last" style="font-weight: normal; padding-left: 25px;">Estimated Revenue 2030 (M)</td>
<td class="data-td data last">$50,985</td>
<td class="data-td data last">$2,564</td>
<td class="data-td data last">$136,771</td>
</tr>
<tr class="tbl-data">
<td class="data-td last" style="font-weight: normal; padding-left: 25px;">Global Tax Rate on Crypto</td>
<td class="data-td data last">15.00%</td>
</tr>
<tr class="tbl-data">
<td class="data-td last" style="font-weight: normal; padding-left: 25px;">Validator Cut</td>
<td class="data-td data last">1.00%</td>
</tr>
<tr class="tbl-data">
<td class="data-td last" style="font-weight: normal; padding-left: 25px;">Value to Tokenholders in 2030 (M)</td>
<td class="data-td data last">$42,904</td>
<td class="data-td data last">$2,157</td>
<td class="data-td data last">$115,093</td>
</tr>
<tr class="tbl-data">
<td class="data-td last" style="font-weight: normal; padding-left: 25px;">FCF Yield</td>
<td class="data-td data last">7.00%</td>
</tr>
<tr class="tbl-data">
<td class="data-td last" style="font-weight: normal; padding-left: 25px;">Real Yield</td>
<td class="data-td data last">6.00%</td>
</tr>
<tr class="tbl-data">
<td class="data-td last" style="font-weight: normal; padding-left: 25px;">Long Term Revenue Growth over GDP</td>
<td class="data-td data last">100.00%</td>
</tr>
<tr class="tbl-data">
<td class="data-td last" style="font-weight: normal; padding-left: 25px;">Long Term GDP Growth</td>
<td class="data-td data last">2.00%</td>
</tr>
<tr class="tbl-data">
<td class="data-td last" style="font-weight: normal; padding-left: 25px;">Long Term Crypto Revenue Growth</td>
<td class="data-td data last">4.00%</td>
<td class="data-td data last">2.00%</td>
<td class="data-td data last">5.00%</td>
</tr>
<tr class="tbl-data">
<td class="data-td last" style="font-weight: normal; padding-left: 25px;">FCF Terminal Multiple</td>
<td class="data-td data last">33</td>
<td class="data-td data last">20</td>
<td class="data-td data last">50</td>
</tr>
<tr class="tbl-data">
<td class="data-td last" style="font-weight: normal; padding-left: 25px;">ETH FDV (M)</td>
<td class="data-td data last">$1,430,118</td>
<td class="data-td data last">$43,146</td>
<td class="data-td data last">$5,754,655</td>
</tr>
<tr class="tbl-data">
<td class="data-td last" style="font-weight: normal; padding-left: 25px;">ETH Supply in 2030 (M)</td>
<td class="data-td data last">120.70</td>
<td class="data-td data last">125.68</td>
<td class="data-td data last">112.82</td>
</tr>
<tr class="tbl-data">
<td class="data-td last" style="font-weight: normal; padding-left: 25px;">Discount Rate</td>
<td class="data-td data last">12.00%</td>
</tr>
<tr class="tbl-data">
<td class="data-td last">ETH Price 2030</td>
<td class="data-td data last"><strong>$11,848.62</strong></td>
<td class="data-td data last"><strong>$343.29</strong></td>
<td class="data-td data last"><strong>$51,006.28</strong></td>
</tr>
<tr class="tbl-data">
<td class="data-td last" style="font-weight: normal;">Discounted Token Price</td>
<td class="data-td data last">$5,359.71</td>
<td class="data-td data last">$155.29</td>
<td class="data-td data last">$23,072.65</td>
</tr>
<tr class="tbl-data">
<td class="data-td last">Crypto Terminal Market Share</td>
<td class="data-td data last">&nbsp;</td>
</tr>
<tr class="tbl-data">
<td class="data-td last" style="font-weight: normal; padding-left: 25px;">Finance, Banking, Payments</td>
<td class="data-td data last">5.00%</td>
<td class="data-td data last">1.00%</td>
<td class="data-td data last">15.00%</td>
</tr>
<tr class="tbl-data">
<td class="data-td last" style="font-weight: normal; padding-left: 25px;">Metaverse, Social, and Gaming</td>
<td class="data-td data last">20.00%</td>
<td class="data-td data last">5.00%</td>
<td class="data-td data last">50.00%</td>
</tr>
<tr class="tbl-data">
<td class="data-td last" style="font-weight: normal; padding-left: 25px;">Infrastructure</td>
<td class="data-td data last">10.00%</td>
<td class="data-td data last">1.00%</td>
<td class="data-td data last">20.00%</td>
</tr>
<tr class="tbl-data">
<td class="data-td last">Ethereum Value Capture of End Market Revenue</td>
<td class="data-td data last">&nbsp;</td>
</tr>
<tr class="tbl-data">
<td class="data-td last" style="font-weight: normal; padding-left: 25px;">Finance, Banking, Payments</td>
<td class="data-td data last">3.00%</td>
</tr>
<tr class="tbl-data">
<td class="data-td last" style="font-weight: normal; padding-left: 25px;">Metaverse, Social, and Gaming</td>
<td class="data-td data last">10.00%</td>
</tr>
<tr class="tbl-data">
<td class="data-td last" style="font-weight: normal; padding-left: 25px;">Infrastructure</td>
<td class="data-td data last">5.00%</td>
</tr>
<tr class="tbl-data">
<td class="data-td last">MEV Revenue</td>
<td class="data-td data last">&nbsp;</td>
</tr>
<tr class="tbl-data">
<td class="data-td last" style="font-weight: normal; padding-left: 25px;">MEV LT Take Rate</td>
<td class="data-td data last">0.10%</td>
</tr>
<tr class="tbl-data">
<td class="data-td last" style="font-weight: normal; padding-left: 25px;">MEV Value Accrual to Token</td>
<td class="data-td data last">90.00%</td>
</tr>
<tr class="tbl-data">
<td class="data-td last">L2 Projections</td>
<td class="data-td data last">&nbsp;</td>
</tr>
<tr class="tbl-data">
<td class="data-td last" style="font-weight: normal; padding-left: 25px;">L2 Usage of Ethereum Block Space</td>
<td class="data-td data last">95.00%</td>
</tr>
<tr class="tbl-data">
<td class="data-td last" style="font-weight: normal; padding-left: 25px;">Transaction Percentage on L2</td>
<td class="data-td data last">98.00%</td>
</tr>
<tr class="tbl-data">
<td class="data-td last" style="font-weight: normal; padding-left: 25px;">Ecosystem TVL Layer 2</td>
<td class="data-td data last">50.00%</td>
</tr>
<tr class="tbl-data">
<td class="data-td last" style="font-weight: normal; padding-left: 25px;">L2 Revenue Capture of Total (split to L2)</td>
<td class="data-td data last">10.00%</td>
</tr>
<tr class="tbl-data">
<td class="data-td last">Ethereum Security as a Service</td>
<td class="data-td data last">&nbsp;</td>
</tr>
<tr class="tbl-data">
<td class="data-td last" style="font-weight: normal; padding-left: 25px;">Percent Supply of ETH</td>
<td class="data-td data last">10.00%</td>
</tr>
<tr class="tbl-data">
<td class="data-td last" style="font-weight: normal; padding-left: 25px;">ETH Opportunity Cost Multiple</td>
<td class="data-td data last">2.00</td>
</tr>
<tr class="tbl-data">
<td class="data-td last">Tokenomics</td>
<td class="data-td data last">&nbsp;</td>
</tr>
<tr class="tbl-data">
<td class="data-td last" style="font-weight: normal; padding-left: 25px;">Burn Ratio</td>
<td class="data-td data last">80.00%</td>
</tr>
<tr class="tbl-data">
<td class="data-td last" style="font-weight: normal; padding-left: 25px;">L2 Transaction Cost</td>
<td class="data-td data last">1.00%</td>
</tr>
<tr class="tbl-data">
<td class="data-td last" style="font-weight: normal; padding-left: 25px;">Terminal Staking Rate of Tokenholders</td>
<td class="data-td data last">30.00%</td>
</tr>
</tbody>
</table>
</div>
<br />
<p class="chart-disclosure">Source: VanEck Research as of 4/30/2023. Past performance is no guarantee of future results. The above is not intended as financial advice, a recommendation to buy or sell Ethereum, or any call to action. There may be risks or other factors not accounted for in the above scenarios that may impede the performance of Ethereum; the actual future performance of Ethereum is unknown, and may differ significantly. Any projections, forecasts or forward-looking statements included herein are the results of a simulation based on our research, are valid as of the date of this communication and subject to change without notice, and are for illustrative purposes only. Please conduct your own research and draw your own conclusions.</p>
<h2 id="point-nine" class="anchored-block">DeFi</h2>
<p>DeFi tokens underperformed the broader digital assets universe, down 9% monthly. Among larger caps, only <strong>Maker (MKR)</strong> was up. The total volume of decentralized exchanges decreased in April to $52.5B from the impressive $112.4B seen in March. The total value of digital assets in DeFi (TVL) fell 3% to $48.4B despite Ethereum&rsquo;s slight price appreciation. However, Uniswap's market share of decentralized exchange volume continued to increase, reaching approximately 68%.</p>
<p>Still, April has been a month filled with anticipation for DeFi users. Some of the largest protocols are introducing significant product offerings to the market, indicating an impending competition for capital. <strong>Aave,</strong> Maker<strong>, Curve</strong>, and <strong>Yearn</strong> are among the longest-standing and trusted names in DeFi and are all set to deploy some of the bear market&rsquo;s most eagerly awaited smart contracts. Aave and Maker are deploying smart contracts that directly compete with each other&rsquo;s current core products. Aave will soon release their decentralized stablecoin, GHO, and Maker deploying Spark, a fork of Aave&rsquo;s peer-to-peer lending market. GHO will offer AAVE stakers a cost-effective alternative to Aave's current stablecoin borrowing rates, which hover around 3.6% APR. Meanwhile, Spark will allow DeFi users to borrow Maker's decentralized stablecoin, DAI, at the DAI savings rate of 1% against governance-approved collateral.</p>
<p>We think the ability of Spark to take market share from Aave may be limited, though, as the initial lending cap for the protocol will be set at 200 million DAI. In contrast, Aave&rsquo;s Ethereum market currently supplies over $2B of over-collateralized loans. Additionally, since most of the code for Spark was originally from Aave, Maker has decided that 10% of the protocol&rsquo;s profits will be sent to the AAVE DAO. Separately, Curve is poised to release their eagerly anticipated smart contract for crvUSD, a unique stablecoin with an advanced and intriguing design. Curve, one of the oldest decentralized exchanges, has ~$4.3B in total assets deposited and enabled 6.3% of dex volume in April. crvUSD will be an overcollateralized stablecoin with two primary components: LLAMA and Peg Keeper. LLAMA stands for Lending-Liquidation AMM Algorithm and functions as a liquidation mechanism that gradually liquidates and de-liquidates positions using concentrated LP tokens as collateral. It regularly makes swaps as asset prices fluctuate, which is a departure from traditional AMMs that rebalance liquidity to the less advantageous asset. As a result, collateral will experience permanent loss instead of impermanent loss, which might help protect the borrower&rsquo;s collateral since the algorithm will progressively swap volatile assets for crvUSD as stakeholders approach liquidation levels. This mechanism may lower the risk of being liquidated completely. Either way, The Peg Keeper acts as a stabilizer contract that should maintain the peg by minting and burning crvUSD. If the crvUSD price exceeds $1, the contract mints and deposits crvUSD into pools to stabilize the price. Conversely, if the crvUSD price falls below $1, the contract burns crvUSD from LPs.</p>
<p>Lastly, Yearn recently approved the launch of their new yETH vault, which is akin to a passively managed yield fund tailored to a specific crypto asset. In a forthcoming article, we will analyze how the yETH vault's architecture leverages the success of the yCRV vault, providing a lucrative avenue to gain exposure to liquid staking derivative tokens without relying on any single token. Our conclusion from all these product releases is that technological innovation continues to advance the capital efficiency in DeFi at a rapid pace, and the sector&rsquo;s attractiveness to outside investors may increase as this fact is recognized, assuming a more benign regulatory backdrop.</p>
<h2 id="point-ten" class="anchored-block">Metaverse &amp; NFTs</h2>
<p>Metaverse tokens continued to underperform compared to ETH in April, with <strong>APE&rsquo;s</strong> price down 5% and <strong>MANA</strong> and <strong>SAND</strong> prices down 7% and 8%, respectively. NFT volumes fell 18% compared to March. Despite the decrease in NFT trading, <strong>BLUR's</strong> price rose 8%. In the ongoing competition for NFT volume among NFT exchanges and aggregators, Blur and <strong>OpenSea</strong> continue to dominate the market. Blur lost a small percent of the market share of NFT volume this month but still maintained dominance, with over 60% of April NFT volume settling through the platform. Blur&rsquo;s market share of NFT aggregators also maintained volume dominance, with about 52% of aggregator volume originating via Blur. OpenSea, on the other hand, only saw 18% of NFT exchange volume and about 45% of aggregator volume via OpenSea Pro.</p>
<p>April saw an exceptional increase in <strong>NFT activity on Bitcoin</strong>, with the total number of Ordinal Inscriptions now over 2.3 million and 67% created in April. However, total fees from Inscriptions only increased by 25% despite a surge in number due to a shift in demand towards lighter-weight text-based Inscriptions. As a result, they occupy a smaller share of block size, resulting in lower fees per inscription.</p>
<h3>Daily Bitcoin Transactions (7-day Moving Average)</h3>
<p><img class="img-responsive w-100" src="https://www.vaneck.com/contentassets/4fb5f00045ff4a8b9cb1e95f7b53df85/3183_scl_chart-3_2023.05_blog.svg" alt="Daily Bitcoin Transactions (7-day Moving Average)" /></p>
<p class="chart-disclosure">Source: VanEck, Token Terminal as of 4/30/2023. Past performance is no guarantee of future results. Not intended as a recommendation to buy or sell any securities named herein.</p>
<p>As for gaming, unique active wallets in the top web3 games decreased by 5% MoM and are down 25% since the beginning of the bear market. Despite highly anticipated game releases this year and next, current activity does not warrant a strong conviction in these assets. That being said, we will monitor this market as it develops.</p>
<p>Notable Web3 gaming announcements in April:</p>
<ul class="content-list">
<li>Mythical Games plans to transition the Mythical Chain from Ethereum to the Polkadot ecosystem and launch a Mythos Superchain.</li>
<li>Immutable has yet to announce the third IMX token upgrade, slated for April 20th.</li>
<li>Apple&rsquo;s outside payments ban being ruled unlawful was seen as a win for the NFT industry.</li>
<li>Romania announced its informatics institute would be launching a national NFT marketplace.</li>
<li>Sotheby's set to auction 3AC digital art collection.</li>
<li>New set of Trump NFTs sold out on day one, but the collection&rsquo;s floor price tanked.</li>
<li>BackPack NFT minted their Mad Lads collection and thwarted bots trying to game the mint, boosting the collection&rsquo;s unique holders and treasury.</li>
<li>LooksRare v2 launched, reducing trading fees from 2% to .5%.</li>
</ul>
<p>To receive more <strong><a href="https://www.vaneck.com/us/en/insights/digital-assets/" title="Digital Assets Insights">Digital Assets</a></strong> insights, <strong><a href="https://www.vaneck.com/us/en/subscribe/" title="Subscription Center">sign up in our subscription center</a></strong>.</p>
<style type="text/css">
    .wrapped-div {
        max-width: 100%;
    }

    @media (max-width: 1240px) {
        .wrapped-div {
            overflow-x: scroll;
        }
    }
</style>
<!-- Hide alreat promo banner. Make height 0 to account for the HeaderHeightCalculation scripts -->
<style>
header.site-header .alert-bar {
    display:none!important;
    height: 0!important;
    overflow:hidden!important;
}
</style>
]]></content:encoded>
</item><item rdf:about="https://www.vaneck.com/us/en/blogs/municipal-bonds/muni-bond-upgrades-illinois-improving-credit-quality/">
  <title>Muni Bond Upgrades: Illinois’ Improving Credit Quality></title>
  <link>https://www.vaneck.com/us/en/blogs/municipal-bonds/muni-bond-upgrades-illinois-improving-credit-quality/</link>
  <description><![CDATA[Illinois' improved fiscal responsibility and recent upgrades signal a positive shift for municipal bonds.]]></description>
  <dc:creator>Tamara  Lowin</dc:creator>
  <dc:date>05/04/2023 06:30:00</dc:date>
<content:encoded><![CDATA[

<p>Over the past four years, Illinois&rsquo; improved budgets and fiscal responsibility resulted in several upgrades for Illinois. Long known as the weakest state, initiatives under Governor Pritzker&rsquo;s leadership have put the state on a stronger path. As one of five states whose political subdivisions issue the most municipal bonds year over year, Illinois&rsquo; recent improvements are significant and welcome news for the asset class. These developments demonstrate that the credit quality of municipals will likely remain healthy.</p>
<h2>Balancing Budgets and Restoring the Budget Stabilization Fund</h2>
<p>A key victory for the state, Illinois has achieved near-balanced budgets. This is a departure from its history of using one-time revenues and deferring bills to cover expenses. The new $50 billion budget for fiscal year 2023 anticipates the state pushing off just $1 billion of its bills due&mdash;a significant reduction from the $8 billion backlog the Governor inherited according to Illinois Office of Management and Budget. In addition to a more balanced budget, the state is restoring the Budget Stabilization Fund, a financial cushion, or &ldquo;rainy day fund,&rdquo; that should protect the state from unexpected expenses or revenue shortfalls. In addition to depositing available funds in FY2021 and FY2022, the state has created permanent revenue streams to add to the Fund over time, according to The Illinois Office of Management and Budget.</p>
<div class="wrapped-div">
<table style="width: 600px;">
<tbody>
<tr class="tbl-data">
<td class="tbl-header last">&nbsp;</td>
<td class="tbl-header last" style="text-align: center;">2019</td>
<td class="tbl-header last" style="text-align: center;">FYE 2023</td>
</tr>
<tr class="tbl-data">
<td class="data-td  last">Bills Outstanding</td>
<td class="data-td data last">$8 billion</td>
<td class="data-td data last">$1 billion</td>
</tr>
<tr class="tbl-data">
<td class="data-td  last">Budget Stabilization Fund</td>
<td class="data-td data last">$60,000</td>
<td class="data-td data last">$1.9 billion</td>
</tr>
<tr class="tbl-data">
<td class="data-td  last">Pension Funded Ratio</td>
<td class="data-td data last">40.3%</td>
<td class="data-td data last">43.8%</td>
</tr>
<tr class="tbl-data">
<td class="data-td  last">S&amp;P/Moody&rsquo;s/Fitch</td>
<td class="data-td data last">BBB-/Baa3/BBB</td>
<td class="data-td data last">A-/A3/BBB+ (positive outlook)</td>
</tr>
</tbody>
</table>
</div>
<br />
<p class="chart-disclosure">Source: The Illinois Office of Management and Budget, as of current estimate, FYE 2023.</p>
<h2>Addressing Illinois&rsquo; Pension Fund Challenges</h2>
<p>While Illinois&rsquo; pension challenges are severe and will take decades to fix, we are now witnessing an improvement in the funding levels and concrete plans to reach a sustainable level in 20 years. Success in this area will take consistent discipline.</p>
<p>We are encouraged by the direction the state is forging. To us, the overarching theme is &ldquo;willingness&rdquo;: a virtue the state has struggled with in the past. Now we see excess funds saved instead of spent, a focus on balanced spending, and long-term planning. These factors indicate a state better equipped to navigate its future and provide a strong home for its residents.</p>
<p>To receive more <a href="https://www.vaneck.com/us/en/insights/municipal-bonds/" title="Municipal Bonds Insights"><strong>Municipal Bonds</strong></a> insights, <a href="https://www.vaneck.com/us/en/subscribe/" title="Subscription Center"><strong>sign up in our subscription center</strong></a>.</p>
<style type="text/css">
    .wrapped-div {
        max-width: 100%;
    }

    @media (max-width: 1240px) {
        .wrapped-div {
            overflow-x: scroll;
        }
    }

    .wrapped-div-sector {
        max-width: 100%;
        overflow-x: scroll;
    }
</style>
]]></content:encoded>
</item><item rdf:about="https://www.vaneck.com/us/en/blogs/income-investing/why-we-like-clos-amid-a-fed-pause/">
  <title>Why We Like CLOs Amid a Fed Pause></title>
  <link>https://www.vaneck.com/us/en/blogs/income-investing/why-we-like-clos-amid-a-fed-pause/</link>
  <description><![CDATA[Yields and spreads on CLO debt remain extremely attractive, and a new rate environment could actually bring additional return potential and the opportunity for above-coupon returns.]]></description>
  <dc:creator>William Sokol</dc:creator>
  <dc:date>05/03/2023 20:15:00</dc:date>
<content:encoded><![CDATA[

<p>With the Fed appearing to indicate a possible pause on additional rate increases after its latest hike, and the market still predicting rate cuts later this year, is there still a case for investing in collateralized loan obligations (CLOs)?</p>
<p>We believe the historical spread pickup, low loss rates and diversification potential of CLOs make them attractive as a strategic allocation within a bond portfolio through market cycles. In the current environment, we think CLOs are particularly compelling, even as expectations for further rate hikes diminishes. Yields and spreads on CLO debt remain extremely attractive, and a new rate environment could actually bring additional return potential and the opportunity for above-coupon returns.</p>
<h2>Go Where the Yield is</h2>
<p>A Fed pause means that CLO coupons will likely continue to reset at current high levels for some time, and the yields offered will continue to exceed what can be found in longer duration credit asset classes in the absence of a substantial increase in long-term rates. Currently, CLOs have a yield of approximately 6.5%, versus 5.2% for investment grade corporate bonds and 4.5% on &ldquo;core&rdquo; bonds.<sup>1</sup></p>
<p>The yield on CLOs assumes realization of the forward rates implied by the market, which currently reflects a decline in short-term rates in the near future. In other words, the yield already reflects declining short-term rates and therefore lower coupons in the future, which may or may not actually happen.</p>
<p>Investors today are understandably comparing the yields on short-term, credit-risk free instruments like Treasury bills (T-bills) which are currently attractive for the same reason that CLO coupons are high. Although these rates may be attractive as a cash alternative, such a short horizon introduces reinvestment risk and we believe a longer-term time horizon continues to favor CLOs within a bond portfolio given the long-term yield potential thanks to the significant spread CLOs provide. Although CLOs have coupons that reset periodically, they have an expected life that is longer&ndash;currently 3.8 years. An apples-to-apples comparison to T-bills must therefore assume reinvestment every three months over a 3.8 year period at market implied rates, and as shown below, CLOs currently provide a significant yield pickup over the period.</p>
<h3>CLOs Provide a Significant Yield Pickup compared to T-Bills and IG Corporates</h3>
<p><img class="img-responsive w-100" src="https://www.vaneck.com/contentassets/090b5402f0e54fb4bdaaa1f8ba688a80/3174_cloi_chart-01_2023.05_blog.svg" alt="CLOs Provide a Significant Yield Pickup compared to T-Bills and IG Corporates" /></p>
<p class="chart-disclosure">Source: J.P. Morgan and VanEck Research. CLOs is represented by the J.P. Morgan CLO Index; IG Corporates (Maturity Matched) represents the mid yield of USD denominated US investment grade corporates, interpolated at a maturity of 3.8 years; 3m T-bills (Reinvested) is represented by the return on 3-month T-bills invested on 4/28/2023 and reinvested every 3 months for 3.8 years based on market implied rates.</p>
<h2>Uncertainty is Priced Into CLO Spreads</h2>
<p>The CLO yield advantage comes from the spread, and with that comes the risk of spread widening, even though investment grade CLOs are extremely well insulated from credit loss. But spreads on CLOs are currently very attractive relative to their historical average and seem to be pricing in a higher degree of uncertainty compared to investment grade and high yield corporate bonds, which are actually tight relative to their historical average. We believe that is another reason why the current environment favors CLOs. Spread widening is certainly possible in all credit sensitive asset classes, but we believe investment grade CLO investors are currently well compensated for that risk.</p>
<h3>CLO Yield and Spread</h3>
<p><strong>(12/31/2011 to 4/28/2023)</strong></p>
<p><img class="img-responsive w-100" src="https://www.vaneck.com/contentassets/090b5402f0e54fb4bdaaa1f8ba688a80/3174_cloi_chart-02_2023.05_blog.svg" alt="CLO Yield and Spread" /></p>
<p class="chart-disclosure">Source: J.P. Morgan. Based on J.P. Morgan CLO Index. &ldquo;DM&rdquo; represents developed markets. This is not an offer to buy or sell, or a recommendation to buy or sell any of the securities mentioned herein. See index descriptions at the end of presentation. Past performance not indicative of future results. As of April 28, 2023.</p>
<h2>Changing Rate Environment May Create Opportunity</h2>
<p>In addition to attractive value from both a yield and spread perspective, we believe that if and when we do actually see a Fed pivot, such an environment may actually provide extremely compelling opportunities in the CLO market, particularly for active tranche managers. A cut in rates will likely occur as a result of an economic slowdown, which would likely coincide a general widening of credit spreads. As spreads recover following a Fed pivot, there may be opportunities for outperformance in portfolios that can opportunistically add exposure to lower-rated tranches at attractive entry points.</p>
<p>Further, the embedded optionality in CLO debt tranches also has the potential to add value in this environment. CLO equity holders have the option to to redeem, reset or refinance a deal at par prior to a CLO&rsquo;s final legal maturity after the end of the non-call period, which is typically about two years after issuance.</p>
<h3>CLOs Typically Have a Final Maturity of up to 11-13 Years, but a Shorter Expected Life Due to Loan Amortization</h3>
<p><img class="img-responsive w-100" src="https://www.vaneck.com/contentassets/090b5402f0e54fb4bdaaa1f8ba688a80/3174_cloi_chart-03_2023.05_blog.svg" alt="CLO Typically Have a Final Maturity of up to 11-13 Years, but a Shorter Expected Life Due to Loan Amortization" /></p>
<p class="chart-disclosure">Source: VanEck.</p>
<p>Currently, loan prices are below par and the cost of refinancing a CLO is high (reflecting both the increase in Libor/SOFR and wider spreads over the past year). If a loan portfolio was liquidated, it may not be enough to pay off the CLO debt tranches with adequate return to the equity holders. Therefore, few deals are getting called or refinanced in the current market. A decrease in rates and/or tighter CLO liability spreads, as well as a recovery in loan prices, could all be expected to drive an increase in call activity. As of March 31, 2023, loan prices were in the mid-90s and CLO average prices by rating are shown below.</p>
<div class="wrapped-div">
<table style="width: 600px;">
<tbody>
<tr class="tbl-data">
<td class="tbl-header last">Indices</td>
<td class="tbl-header last" style="text-align: center;">Price</td>
<td class="tbl-header last" style="text-align: center;">Yield to Worst</td>
<td class="tbl-header last" style="text-align: center;">Wtd. Avg. Life (to Worst)</td>
</tr>
<tr class="tbl-data">
<td class="data-td last" style="font-weight: normal;">AAA</td>
<td class="data-td data last">98.5</td>
<td class="data-td data last">5.8</td>
<td class="data-td data last">3.11</td>
</tr>
<tr class="tbl-data">
<td class="data-td last" style="font-weight: normal;">AA</td>
<td class="data-td data last">97.2</td>
<td class="data-td data last">6.2</td>
<td class="data-td data last">4.80</td>
</tr>
<tr class="tbl-data">
<td class="data-td last" style="font-weight: normal;">A</td>
<td class="data-td data last">95.6</td>
<td class="data-td data last">7.0</td>
<td class="data-td data last">5.35</td>
</tr>
<tr class="tbl-data">
<td class="data-td last" style="font-weight: normal;">BBB</td>
<td class="data-td data last">91.7</td>
<td class="data-td data last">8.9</td>
<td class="data-td data last">6.36</td>
</tr>
<tr class="tbl-data">
<td class="data-td last" style="font-weight: normal;">BB</td>
<td class="data-td data last">85.7</td>
<td class="data-td data last">13.8</td>
<td class="data-td data last">6.89</td>
</tr>
<tr class="tbl-data">
<td class="data-td last" style="font-weight: normal;">US Loans</td>
<td class="data-td data last">94.0</td>
<td class="data-td data last">10.9</td>
<td class="data-td data last">n/a</td>
</tr>
</tbody>
</table>
</div>
<br />
<p class="chart-disclosure">Source: J.P. Morgan as of 4/28/2023.</p>
<p>The opportunity to buy tranches at a steep discount, especially in the lower rating categories, and potentially benefit from a call that occurs years before final maturity as market conditions change can provide significant upside potential. For example, a BB tranche purchased at 85 represents a yield of 14% over the life of the deal, currently assumed to be about seven years. Because the tranche is priced under par, &ldquo;to worst&rdquo; measures like yield-to-worst assume no call will occur. If market conditions change and that CLO gets called at par before seven years (and potentially way before that), there is significant upside potential and an investor may ultimately realize a return of much greater than 14%.</p>
<h2>CLOI is Uniquely Positioned to Take Advantage of These Opportunities:</h2>
<p>The key is to find CLOs that are attractively priced, including those more likely to be called, and to have flexibility to invest throughout the CLOs capital structure to find the best opportunities. The ability to understand all of the various drivers of CLO risk is key in assessing the relative value of a tranche. PineBridge has decades of expertise in the CLO market and takes an active, high conviction approach to investing in CLO tranches. The VanEck CLO ETF (CLOI) is actively managed and based on a strategy that PineBridge has managed for years for its institutional clients, and is now available to all investors with the transparency, liquidity and cost benefits of an ETF.</p>
<div class="wrapped-div">
<table style="width: 960px;">
<tbody>
<tr class="tbl-data">
<td class="tbl-header last" colspan="9">
<p>Average Annual Total Returns (%) as of March 31, 2023</p>
</td>
</tr>
<tr class="tbl-data">
<td class="data-head last">&nbsp;</td>
<td class="data-head last">1 Month*</td>
<td class="data-head last">3 Month*</td>
<td class="data-head last">YTD</td>
<td class="data-head last">1 Year</td>
<td class="data-head last">3 Year</td>
<td class="data-head last">5 Year</td>
<td class="data-head last">10 Year</td>
<td class="data-head last">LIFE<br />6/21/2022</td>
</tr>
<tr class="tbl-data">
<td class="data-td last" style="font-weight: normal;">CLOI (NAV)</td>
<td class="data-td data last">-0.08</td>
<td class="data-td data last">2.45</td>
<td class="data-td data last">--</td>
<td class="data-td data last">5.79</td>
</tr>
<tr class="tbl-data">
<td class="data-td last" style="font-weight: normal;">CLOI (Share Price)</td>
<td class="data-td data last">-0.31</td>
<td class="data-td data last">2.28</td>
<td class="data-td data last">--</td>
<td class="data-td data last">5.91</td>
</tr>
<tr class="tbl-data">
<td class="data-td last" style="font-weight: normal;">J.P. Morgan Collateralized Loan Obligation Index</td>
<td class="data-td data last">-0.23</td>
<td class="data-td data last">1.98</td>
<td class="data-td data last">--</td>
<td class="data-td data last">4.72</td>
</tr>
</tbody>
</table>
</div>
<br />
<p class="chart-disclosure">*&nbsp;Returns less than one year are not annualized.</p>
<p class="chart-disclosure"><strong>The performance data quoted represents past performance. Past performance is not a guarantee of future results. Investment return and principal value of an investment will fluctuate so that an investor's shares, when redeemed, may be worth more or less than their original cost. Performance may be lower or higher than performance data quoted. Please call 800.826.2333 or visit vaneck.com for performance current to the most recent month ended.</strong></p>
<p class="chart-disclosure"><strong>The gross expense ratio for CLOI is 0.4%. CLOI Fees &amp; Expenses: Van Eck Associates Corporation (the &ldquo;Adviser&rdquo;) will pay all expenses of the Fund, except for the fee payment under the investment management agreement, acquired fund fees and expenses, interest expense, offering costs, trading expenses, taxes and extraordinary expenses. Notwithstanding the foregoing, the Adviser has agreed to pay the offering costs until at least May 1, 2024.</strong></p>
<p class="chart-disclosure">The "Net Asset Value" (NAV) of a Fund is determined at the close of each business day, and represents the dollar value of one share of the fund; it is calculated by taking the total assets of the fund, subtracting total liabilities, and dividing by the total number of shares outstanding. The NAV is not necessarily the same as the ETF 's intraday trading value. Investors should not expect to buy or sell shares at NAV.</p>
<p>To receive more <a href="https://www.vaneck.com/us/en/insights/income-investing/" title="Income Investing insights"><strong>Income Investing</strong></a> insights, <a href="/us/en/subscribe/" title="Subscription Center"><strong>sign up in our subscription center</strong></a>.</p>
<style type="text/css">
    .wrapped-div {
        max-width: 100%;
    }

    @media (max-width: 1240px) {
        .wrapped-div {
            overflow-x: scroll;
        }


    }
</style>
]]></content:encoded>
</item><item rdf:about="https://www.vaneck.com/us/en/blogs/moat-investing/banks-with-competitive-advantages-show-resilience/">
  <title>Banks with Competitive Advantages Show Resilience></title>
  <link>https://www.vaneck.com/us/en/blogs/moat-investing/banks-with-competitive-advantages-show-resilience/</link>
  <description><![CDATA[Amid ongoing turmoil in the banking industry, Comerica and US Bancorp remain resilient due to their economic moats.]]></description>
  <dc:creator> </dc:creator>
  <dc:date>05/03/2023 06:30:00</dc:date>
<content:encoded><![CDATA[

<p>The term &ldquo;economic moat&rdquo; describes a company&rsquo;s ability to maintain its competitive advantages and defend long-term profitability. Morningstar analysts joined the <strong><a href="https://www.vaneck.com/us/en/webinar-registration/?id=92317034805" title="Quality Companies for Any Market">recent VanEck webinar</a></strong> to discuss how financial firms with strong &ldquo;moats&rdquo; are faring through turmoil in the banking industry.</p>
<h2>Banks Are Put to the Test</h2>
<p>The turmoil in the banking industry, initiated by the collapse of Silicon Valley Bank (SVB), has raised concerns about funding costs and the future profitability of banks. While the banking industry has stabilized, investors remain cautious and have become increasingly selective. In this environment of heightened uncertainty, Morningstar believes banks with well-established economic moats will prove to be more resilient to market fluctuations and funding cost pressures. Their competitive advantages should enable them to maintain profitability, even as their peers struggle. Below, we take a closer look at two bank portfolio holdings in the <strong><a href="/link/635ccc4bf9134cb9a7fcc80919498eec.aspx" title="MOAT - VanEck Morningstar Wide Moat ETF - Overview">VanEck Morningstar Wide Moat ETF (MOAT<sup>&reg;</sup>)</a></strong> and the <strong><a href="/link/589a2bc95c5d48988a7fd0d679aec241.aspx" title="SMOT - VanEck Morningstar SMID Moat ETF - Overview">VanEck Morningstar SMID Moat ETF</a></strong>.</p>
<h2>Comerica</h2>
<p>While Comerica&rsquo;s<sup>1</sup>&nbsp;business model relies heavily on interest rates, Morningstar believes the bank&rsquo;s superior deposit costs and business relationships set the stock up for long-term success through a market cycle. Although the stock may suffer from broader banking concerns in the short term, they believe the company&rsquo;s strong cost advantages will help it outperform over the long term. In Morningstar&rsquo;s view, the recent pullback in the stock pushed the discount even farther below their estimate for fair value. Comerica was added to the <strong><a href="/link/c0c4da50e177415b9f750d3c0eea4e0a.aspx" title="SMOT - VanEck Morningstar SMID Moat ETF - Index">Morningstar US Small-Mid Cap Moat Focus Index</a></strong> in December 2022 and scaled up in March 2023.</p>
<h3>Comerica Inc. 1 Year Price and Fair Value</h3>
<p><img class="img-responsive w-100" src="https://www.vaneck.com/contentassets/81a04f5195194b8496b17984db10fb71/3165_moat_chart_01_2023.05_v1.svg" alt="Comerica Inc. 1 Year Price and Fair Value" /></p>
<h2>US Bancorp</h2>
<p>US Bancorp<sup>2</sup>&nbsp;is the largest non-global systemically important bank in the United States. Few domestic competitors can match its operating efficiency and returns on equity over the past 15 years. US Bancorp&rsquo;s diverse product lineup increases switching costs by locking customers into its unique ecosystem and making it expensive to move. Like Comerica, US Bancorp&rsquo;s stock has pulled back with other banks and trades significantly below Morningstar&rsquo;s estimate for fair value. US Bancorp was added to the <strong><a href="/link/9f629c73a31846bb9e480b95e2c7f330.aspx" title="MOAT - VanEck Morningstar Wide Moat ETF - Index">Morningstar Wide Moat Focus Index</a> </strong>in December 2022 and scaled up in March 2023.</p>
<h3>US Bancorp 1 Year Price and Fair Value</h3>
<p><img class="img-responsive w-100" src="https://www.vaneck.com/contentassets/81a04f5195194b8496b17984db10fb71/3165_moat_chart_02_2023.05_v1.svg" alt="US Bancorp 1 Year Price and Fair Value" /></p>
<p>To receive more <a href="https://www.vaneck.com/us/en/insights/moat-investing/" title="Moat Investing Insights"><strong>Moat Investing</strong></a> insights, <a href="https://www.vaneck.com/us/en/subscribe/" title=" Subscription Center"><strong>sign up in our subscription center</strong></a>.</p>
]]></content:encoded>
</item><item rdf:about="https://www.vaneck.com/us/en/blogs/economic-trends/em-rates-choose-wisely/">
  <title>EM Rates – Choose Wisely></title>
  <link>https://www.vaneck.com/us/en/blogs/economic-trends/em-rates-choose-wisely/</link>
  <description><![CDATA[Most EM central banks are happily on hold. Can policy tails (both cuts and hikes) become &ldquo;fatter&rdquo;?]]></description>
  <dc:creator>Natalia  Gurushina</dc:creator>
  <dc:date>04/28/2023 06:30:00</dc:date>
<content:encoded><![CDATA[

<h2>Exiting EM Tightening Cycles</h2>
<p>The market is gearing for another rate hike by the U.S. Federal Reserve (Fed) next week and more policy tightening in Europe. In the meantime, <strong>emerging markets (EM) central banks</strong> are moving in different directions. <strong>Many opt to stay on hold, despite successful disinflation,</strong> due to widespread concerns about sticky core prices and high inflation expectations. Factors like Brazil&rsquo;s fiscal uncertainty (see chart below) and a potentially larger minimum wage increase can easily contribute to the latter.</p>
<h2>EM Rate Cuts</h2>
<p>Several EMs outside of China are testing the waters with <strong>inaugural rate cuts</strong> &ndash; Uruguay, Costa Rica and Hungary&rsquo;s Lombard rate cut &ndash; betting on a combination of a very supportive base effect and weakening domestic activity. However, these attempts <strong>are generally met with skepticism</strong> by the market (=weaker currencies), because there are plenty of headline risks (Argentine mega-drought, OPEC&rsquo;s production cuts, El Nino) and policy reversals can be costly (including credibility).</p>
<h2>EM Rate Hikes</h2>
<p>Finally, there are <strong>still some EM rate hikes in the pipeline</strong>. Of course, Argentina&rsquo;s gargantuan +1000bps (!) move yesterday is a sign of desperation (as the underlying reasons for triple-digit inflation and other imbalances are still in place), but the consensus added a more reasonable 25bps &ldquo;insurance&rdquo; rate hike for Colombia in the wake of the cabinet reshuffle. The tightening cycle might also not be over in South Africa and Thailand. <strong>Thailand could be a victim of its own success</strong>, as demand-side price pressures might increase on the back of stronger tourist arrivals (including China) and faster GDP growth. Stay tuned!</p>
<h3>Chart at a Glance: Brazil&rsquo;s Fiscal Path &ndash; A Wrong Turn<sup>1</sup></h3>
<p><img class="img-responsive w-100" src="https://www.vaneck.com/contentassets/5d9a414298964b8b892d32b15dded853/us-natalias-take-2023-04-28.png" alt="Chart at a Glance: Brazil's Fiscal Path - A Wrong Turn" /></p>
<p class="chart-disclosure">Source: Bloomberg LP.</p>
<p class="chart-disclosure"><sup>1</sup>&nbsp;Brazil's Public Primary Budget (BZPBPR Index) balance excludes debt servicing costs (payments of interest and amortizations of the public debt, as well as state and municipal loans).</p>
]]></content:encoded>
</item><item rdf:about="https://www.vaneck.com/us/en/blogs/natural-resources/3-reasons-to-hold-resource-equities/">
  <title>3 Reasons to Hold Resource Equities></title>
  <link>https://www.vaneck.com/us/en/blogs/natural-resources/3-reasons-to-hold-resource-equities/</link>
  <description><![CDATA[Persistent inflation, fiscally responsible resource company management and anticipated company capital returns continue to provide investment opportunities in the resource equity sector.]]></description>
  <dc:creator>Shawn Reynolds</dc:creator>
  <dc:date>04/27/2023 06:30:00</dc:date>
<content:encoded><![CDATA[

<p>Resource equities have experienced a tremendous run over the last several years, with some companies seeing double or even triple-digit gains. For most investors who have been through one or more previous commodity super cycles, this likely feels like an opportune time to take gains and sit back on the sidelines. However, in our view, this is also likely the wrong line of thinking right now from a strategic allocation standpoint. <a href="/us/en/blogs/natural-resources/3-reasons-to-hold-resource-equities/grf-quarterly-commentary-1q-2023.pdf" target="_blank" title="Global Resources Fund: Quarterly Commentary" rel="noopener"><strong>An expanded PDF version of this commentary, including fund specific information can be downloaded here</strong></a>.</p>
<ol class="content-list">
<li><strong>We&rsquo;re not through the woods yet with inflation</strong> &ndash; Despite aggressive attempts by the U.S. Federal Reserve (Fed) to combat it, inflation hasn&rsquo;t fully subsided yet. And while U.S. inflation has come down from highs last seen 40 years ago, it still remains at levels last seen only 32 years ago and well above the Fed&rsquo;s 2% target. Over this inflation cycle, resource equities have proved &ndash; as they have in the past &ndash; that they can be an ideal hedge against steadily rising and/or persistently high prices.</li>
<li><strong>Resource companies are different today</strong> &ndash; Resource companies have gone to great lengths to mitigate some of the operational and business strategies which often subjected them to greater to boom/bust cycles in the past. In particular, managements have become more financially prudent by foregoing outsized capital expenditure programs, deleveraging their balance sheets and carefully managing their hedging strategies.</li>
<li><strong>You&rsquo;re getting paid to wait</strong> &ndash; While some resource equity companies are cutting back on dividends this year, the amount of anticipated capital return in the space is still significant. In fact, as of end-March, Energy and Materials sectors of the S&amp;P Global 1200 Index &ndash; sectors comprising a majority of the resource equity space &ndash; continue to boast the highest estimated dividend yields among all other sectors. For investors waiting to redeploy capital, keeping their money parked in resource equities is akin to getting paid to wait.</li>
</ol>
<h3>S&amp;P Global 1200 Sector Dividend Yields</h3>
<p><img class="img-responsive w-100" src="https://www.vaneck.com/contentassets/58d8d6b34e98438e955f8cb083d2c4d8/3150_grf_chart_01_2023.04_v1_blog.svg" alt="S and P Global 1200 Sector Dividend Yields" /></p>
<p class="chart-disclosure">Source: Bloomberg. Data as of March 31, 2023. Indices are not securities in which investments can be made. Past performance is not indicative of future results.</p>
<p>To receive more <a href="/us/en/insights/natural-resources/" title="Natural Resources Insights"><strong>Natural Resources</strong></a> insights, <a href="https://www.vaneck.com/us/en/subscribe/" title="Subscription Center"><strong>sign up in our subscription&nbsp;center</strong></a>.</p>
]]></content:encoded>
</item><item rdf:about="https://www.vaneck.com/us/en/blogs/economic-trends/will-us-growth-shocks-batter-em/">
  <title>Will U.S. Growth Shocks Batter EM?></title>
  <link>https://www.vaneck.com/us/en/blogs/economic-trends/will-us-growth-shocks-batter-em/</link>
  <description><![CDATA[U.S. growth headwinds might be strong, but EMs&rsquo; trade exposure to the U.S. varies a lot, and many EMs can benefit from China&rsquo;s stronger rebound.]]></description>
  <dc:creator>Natalia  Gurushina</dc:creator>
  <dc:date>04/27/2023 06:30:00</dc:date>
<content:encoded><![CDATA[

<h2>U.S. Slowdown</h2>
<p>The flash estimate for the U.S. Q1 GDP growth was much weaker than expected, slowing to 1.1% quarter-on-quarter annualized vs. 1.9% expected. While the print had no discernible impact on market expectations about next month&rsquo;s rate hike by the U.S. Federal Reserve (88% implied probability or so), it did raise questions about <strong>potential implications for emerging markets (EM), </strong>especially<strong> if U.S. growth weakness persists</strong> due to tightening credit conditions.</p>
<h2>Mexico Nearshoring</h2>
<p>There are various <strong>ways to gauge the impact of exogenous shocks on growth</strong> &ndash; one of them is to look at transmission via trade channels. The chart below shows the share of exports to the U.S. from major EMs as a percentage of their respective GDP. Mexico is a standout on this metric, and it remains to be seen whether the nearshoring story &ndash; which is a great longer-term investment theme &ndash; will help to shield the economy (and the Mexican peso) in the coming months.</p>
<h2>EM Growth and China Rebound</h2>
<p>Central European countries and Brazil look significantly less exposed via trade channels &ndash; the former are joined at the hip with Europe (which is why we keep an eye on tomorrow&rsquo;s Q1 flash GDP print there) and the latter is a more closed economy than Mexico. Several <strong>Asian economies</strong> also have significant trade exposure to the U.S., but their stronger <strong>correlation with China&rsquo;s rebound should help to mitigate the negative impact</strong> of potential growth headwinds from the U.S. Stay tuned!</p>
<h3>Chart at a Glance: EM Exports to the U.S. &ndash; Top 10, Bottom 10</h3>
<p><img class="img-resposive w-100" src="https://www.vaneck.com/contentassets/3f42732161e948ec90f1e1cc607d9f23/us-natalias-take-2023-04-27.png" alt="Chart at a Glance: EM Exports to the U.S. - Top 10, Bottom 10" /></p>
<p class="chart-disclosure">Source: VanEck Research; Bloomberg LP.</p>
]]></content:encoded>
</item><item rdf:about="https://www.vaneck.com/us/en/blogs/economic-trends/even-more-reasons-to-allocate-to-em-debt/">
  <title>Even More Reasons to Allocate to EM Debt></title>
  <link>https://www.vaneck.com/us/en/blogs/economic-trends/even-more-reasons-to-allocate-to-em-debt/</link>
  <description><![CDATA[Majority of investment Grade EMs and several High Yield EMs have a lower perceived risk of default in 1 year than the U.S.]]></description>
  <dc:creator>Natalia  Gurushina</dc:creator>
  <dc:date>04/26/2023 06:30:00</dc:date>
<content:encoded><![CDATA[

<h2>U.S. Debt Ceiling</h2>
<p>There are many good <a href="https://www.vaneck.com/us/en/blogs/emerging-markets-bonds/3-reasons-to-allocate-to-em-bonds-in-2023/" title="3 Reasons to Allocate to EM Bonds in 2023"><strong>reasons to allocate to EM debt</strong></a>, and now you can find another one right on your Bloomberg screens. The U.S. is a AAA-rated economy (the top sovereign rating bracket), and we are seriously discussing a possibility of default in the next few months (the debt ceiling debacle).</p>
<p>The <strong>1-year credit default swap (CDS) spread for the U.S. is currently wider than</strong> 1-year CDS spreads for the majority of lower-rated <strong>Investment Grade emerging markets (EMs)</strong> &ndash; including Uruguay, Peru, Mexico, Chile, Panama, Czech Republic, Kazakhstan, Poland, Qatar, Kuwait, Saudi Arabia, Israel, Bulgaria, Hungary, Romania, Thailand, Philippines, Indonesia, India, China, Malaysia and South Korea (see chart below).</p>
<h2>EM Credit Quality</h2>
<p>The 1-year CDS spread for the U.S. is also wider than 1-year CDS spreads for <strong>the whole bunch of High Yield EMs</strong> &ndash; including Brazil, Costa Rica, Guatemala, Oman, Morocco, South Africa, Bahrain, Serbia and Vietnam.</p>
<p>Let this sink in. Stay tuned!</p>
<h3>Chart at a Glance: Perceived 1-Year Default Risks in U.S. and EMs</h3>
<p><img class="img-responsive w-100" src="https://www.vaneck.com/contentassets/e6261bb8fecb4624879c5cf5535e1215/us-natalias-take-2023-04-26.png" alt="Chart at a Glance: Perceived 1-Year Default Risks in U.S. and EMs" /></p>
<p class="chart-disclosure">Source: Bloomberg LP.</p>
]]></content:encoded>
</item><item rdf:about="https://www.vaneck.com/us/en/blogs/income-investing/safe-and-smart-playbook-helps-cloi-outperform-in-q1/">
  <title>Safe and Smart Playbook Helps CLOI Outperform in Q1></title>
  <link>https://www.vaneck.com/us/en/blogs/income-investing/safe-and-smart-playbook-helps-cloi-outperform-in-q1/</link>
  <description><![CDATA[Portfolio positioning and security selection were key performance drivers for the VanEck CLO ETF in Q1 as the Fund outperformed the J.P. Morgan CLO Index.]]></description>
  <dc:creator> </dc:creator>
  <dc:date>04/25/2023 06:30:00</dc:date>
<content:encoded><![CDATA[

<p>The <strong><a href="/link/593077b21448427e9fc687481484e097.aspx" title="CLOI - VanEck CLO ETF - Overview">VanEck CLO ETF (the &ldquo;Fund&rdquo;)</a></strong> outperformed its benchmark, the J.P. Morgan CLO Index, in the first quarter by 0.47%, and since launching in June 2022 has outperformed by 1.07%, driven by both top-down portfolio positioning by quality and bottom-up security selection. The Fund has achieved performance that is in-line with the BBB-rated subset of its benchmark with a much higher quality tilt (currently nearly 100% of the Fund&rsquo;s portfolio is rated AAA or AA, with no holdings below A), as well as significant outperformance versus the AAA subset.</p>
<p><strong><u>Market Update</u></strong>: Collateralized Loan Obligations (CLOs) generated negative total returns in March as turmoil in the US regional and European banking sectors led to an increase in volatility in both US Treasury rates and risk asset classes, but were up for the quarter. Concerns around banking stability metastasized into other segments of credit, which led to a slowdown in capital market activity. Despite initial concerns that the failures of Silicon Valley Bank and Signature Bank could be the beginning of a more systemic banking contagion, the US Treasury and Federal Reserve took significant steps to guarantee depositors at these failed banks would remain whole and would backstop deposits at other US banks that may experience a contagion effect, helping to calm investor nerves and bring stability back to markets. CLOs rallied towards the end of the month as markets calmed following these actions; however, it was not enough to offset earlier losses. In the face of these challenges, the Fed increased the Federal funds rate by 25 basis points (bps) at its March meeting amid prolonged elevated levels of inflation and a robust labor market.</p>
<div class="wrapped-div">
<table style="width: 750px;">
<tbody>
<tr class="tbl-data">
<td class="tbl-header last">Asset Class</td>
<td class="tbl-header last" style="text-align: center;">Q1 2023 Return (%)</td>
<td class="tbl-header last" style="text-align: center;">Yield to Worst (%)</td>
<td class="tbl-header last" style="text-align: center;">Spreads (bps)</td>
</tr>
<tr class="tbl-data">
<td class="data-td last" style="font-weight: normal;">CLOs</td>
<td class="data-td data last">1.98</td>
<td class="data-td data last">6.67</td>
<td class="data-td data last">265</td>
</tr>
<tr class="tbl-data">
<td class="data-td last" style="font-weight: normal; padding-left: 15px;">AAA</td>
<td class="data-td data last">1.76</td>
<td class="data-td data last">5.95</td>
<td class="data-td data last">184</td>
</tr>
<tr class="tbl-data">
<td class="data-td last" style="font-weight: normal; padding-left: 15px;">AA</td>
<td class="data-td data last">2.34</td>
<td class="data-td data last">6.34</td>
<td class="data-td data last">250</td>
</tr>
<tr class="tbl-data">
<td class="data-td last" style="font-weight: normal; padding-left: 15px;">A</td>
<td class="data-td data last">2.14</td>
<td class="data-td data last">7.24</td>
<td class="data-td data last">349</td>
</tr>
<tr class="tbl-data">
<td class="data-td last" style="font-weight: normal; padding-left: 15px;">BBB</td>
<td class="data-td data last">2.31</td>
<td class="data-td data last">9.09</td>
<td class="data-td data last">533</td>
</tr>
<tr class="tbl-data">
<td class="data-td last" style="font-weight: normal; padding-left: 15px;">BB</td>
<td class="data-td data last">3.58</td>
<td class="data-td data last">14.08</td>
<td class="data-td data last">1016</td>
</tr>
<tr class="tbl-data">
<td class="data-td last" style="font-weight: normal;">Investment Grade Corporates</td>
<td class="data-td data last">3.45</td>
<td class="data-td data last">5.25</td>
<td class="data-td data last">145</td>
</tr>
<tr class="tbl-data">
<td class="data-td last" style="font-weight: normal;">U.S. Agg</td>
<td class="data-td data last">2.97</td>
<td class="data-td data last">4.43</td>
<td class="data-td data last">59</td>
</tr>
<tr class="tbl-data">
<td class="data-td last" style="font-weight: normal;">Leveraged Loans</td>
<td class="data-td data last">3.26</td>
<td class="data-td data last">9.98</td>
<td class="data-td data last">480</td>
</tr>
<tr class="tbl-data">
<td class="data-td last" style="font-weight: normal;">High Yield Bonds</td>
<td class="data-td data last">3.72</td>
<td class="data-td data last">8.49</td>
<td class="data-td data last">458</td>
</tr>
</tbody>
</table>
</div>
<br />
<p class="chart-disclosure">Source: JP Morgan and ICE Data Indices as of 3/31/2023. CLOs represented by J.P. Morgan Collateralized Loan Obligation Index, AAA Rated CLOs represented by J.P. Morgan CLO AAA Index, AA Rated CLOs represented by J.P. Morgan CLO AA Index, A Rated CLOs represented by J.P. Morgan CLO A Index, BBB Rated CLOs represented by J.P. Morgan CLO BBB Index, BB Rated CLOs represented by J.P. Morgan CLO BB Index, Investment Grade Corporates represented by ICE BofA US Corporate Index, US Agg is represented by the ICE BofA US Broad Market, Leveraged Loans represented by JP Morgan Leveraged Loan Index and High Yield Bonds represented by ICE BofA US High Yield Index.</p>
<p>Per Barclays Research, CLO new issue supply decreased month-over-month, with $11.0bn pricing during the month compared to $15.7bn in February. However, year-to-date new issuance of $33.6bn is outpacing year-to-date activity in 2022 and is the second highest on record behind 2021. Refinance and reset activity remained muted with just $0.4bn pricing in March. In the secondary market, TRACE supply was marginally lower at $14.9bn from $15.0bn in February, per Morgan Stanley. Investment grade volumes were roughly flat at $11.8bn while below investment grade volumes decreased to $3.1bn from $3.3bn.</p>
<p>There were three new defaults in the Morningstar U.S. Leveraged Loan Index in March. As a result, the trailing twelve-month default rate by principal increased to 1.32% from 1.02% in February. We anticipate the default rate to remain below historical averages in the near term for the leveraged loan market, notwithstanding ongoing interest rate increases and indications that Fed hikes will maintain higher interest rates throughout 2023. We anticipate the default rate to increase and our expectations are that defaults will increase in 2023-2024 period to 3%-4%, above the long-term historical average of roughly 3%.</p>
<p>From a fundamental standpoint, credit metrics were mostly rangebound to worsened, while market value metrics suffered during the month.</p>
<h2>Portfolio Strategy: Playing Safe and Smart Continues to Outperform</h2>
<p>The Fund returned 2.45% for the first three months of the year, outperforming its benchmark, the J.P. Morgan CLO Index by 0.47%. The Fund shifted within investment grade buckets during the quarter, by increasing exposure to AAA-rated CLOs mid-quarter. The Fund had over 75% of its holdings in AAA-rated CLOs as of March 31, 2023. This top-down positioning by rating bucket was a positive driver of outperformance in the quarter, as was security selection which contributed approximately equally to outperformance. The portfolio also benefited from its spread duration positioning throughout the quarter.</p>
<p>As central banks increased rates in 2022 and have continued to increase thus far in 2023, the borrowing rate for leveraged loan borrowers is anticipated to continue rising. Rating agencies are vigilant and the increased borrowing costs for borrowers means that interest coverage ratios have declined and will continue to do so. As companies report pressures on earnings, borrowers&rsquo; financial positions continue to weaken with higher leverage and lower interest coverage ratios, leading to the risk of downgrade.</p>
<p>As we expect the pace of downgrades to pick up in 2023, we continue to position portfolios conservatively, with the ability to shift into lower-rated tranches as the year progresses. For the start of 2023, we looked to benefit from continued increases in interest rates, allowing for increased coupon income. The positioning in the top part of the capital stack in CLOs (AAA/AA/A) buffers investors from lower tranche downgrades or losses at the equity tranche level. Buying in the primary market allows for wider spreads compared to the secondary market. However, we find much of the secondary market attractive as spreads have widened back to levels from the start of the year and purchases below par provides for attractive positive convexity.</p>
<h3>CLOI Total Return and Credit Allocation</h3>
<p><img class="img-responsive w-100" src="https://www.vaneck.com/contentassets/0f5393aa1bd94dcc970a768a29682993/3134_cloi_chart_01_2023.04_v1_blog.svg" alt="CLOI Total Return and Credit Allocation" /></p>
<p class="chart-disclosure">Source: JP Morgan and Morningstar as of 3/31/2023. AAA Rated CLOs represented by J.P. Morgan CLO AAA Index, AA Rated CLOs represented by J.P. Morgan CLO AA Index, A Rated CLOs represented by J.P. Morgan CLO A Index, BBB Rated CLOs represented by J.P. Morgan CLO BBB Index.</p>
<h2>Outlook Ahead: Still Waiting to Add Risk</h2>
<p>Despite the second and third largest failures in US banking history with Signature and Silicon Valley Bank, larger banks remain well capitalized for the time being and are unlikely to face liquidity issues. Deposits are moving to the larger banks and to money market funds as a result. More broadly, this is another example of the underlying stresses we are seeing emerge due to the pressure of higher rates and shrinking global central bank balance sheets. This combination of stresses has created an environment of heightened depositor concern and higher cost of capital for all banks regardless of size. This has the effect, in our opinion, of further tightening financial conditions in a manner that may slow economic growth more than that has already been imposed by central bank policy.</p>
<p>The team remains of the view that economic growth and corporate earnings will slow over the coming quarters. However, we envision a variety of scenarios, most of which indicate yields and credit spreads will trade flat to wide of current levels before ultimately tightening. While these events decrease the likelihood of high growth scenarios, they do not necessarily result in a classic recession that would materially elevate credit risk. While we believe that the overall health of the US banking sector is robust, we acknowledge that it is an industry that relies very heavily on depositor confidence and that some amount of uncertainty will remain.</p>
<p>At some point, central banks will pause or even pivot, with the market currently pricing in one last increase in May, and interest rates will decline. At that time, we anticipate credit spreads to tighten. This will allow for portfolios constructed with purchases in the secondary market to benefit from the significant redemption optionality in CLOs, which will be refinanced, reset, or outright called once the leveraged loan market recovers in price and CLO spreads tighten. As CLO tranches are priced to worst, the yield to maturity, spread, and convexity are underpriced given the optionality to be redeemed prior to maturity.</p>
<p>Against this backdrop, we continue to position portfolios higher in the capital stack, purchasing attractively priced credits in the secondary market and looking to add relative value at the security and manager selection level. We expect that the backdrop will begin to improve during the second half of the year, at which point we would begin to add risk to portfolios.</p>
<div class="wrapped-div">
<table style="width: 100%;">
<tbody>
<tr class="tbl-data">
<td class="tbl-header last" colspan="9">Average Annual Total Returns (%) as of March 31, 2023</td>
</tr>
<tr class="tbl-data">
<td class="data-head last">&nbsp;</td>
<td class="data-head last">1 Month*</td>
<td class="data-head last">3 Month*</td>
<td class="data-head last">YTD</td>
<td class="data-head last">1 Year</td>
<td class="data-head last">3 Year</td>
<td class="data-head last">5 Year</td>
<td class="data-head last">10 Year</td>
<td class="data-head last">LIFE<br />6/21/2022</td>
</tr>
<tr class="tbl-data">
<td class="data-td last" style="font-weight: normal;">CLOI (NAV)</td>
<td class="data-td data last">-0.08</td>
<td class="data-td data last">2.45</td>
<td class="data-td data last">--</td>
<td class="data-td data last">5.79</td>
</tr>
<tr class="tbl-data">
<td class="data-td last" style="font-weight: normal;">CLOI (Share Price)</td>
<td class="data-td data last">-0.31</td>
<td class="data-td data last">2.28</td>
<td class="data-td data last">--</td>
<td class="data-td data last">5.91</td>
</tr>
<tr class="tbl-data">
<td class="data-td last" style="font-weight: normal;">J.P. Morgan Collateralized Loan Obligation Index</td>
<td class="data-td data last">-0.23</td>
<td class="data-td data last">1.98</td>
<td class="data-td data last">--</td>
<td class="data-td data last">4.72</td>
</tr>
</tbody>
</table>
</div>
<br />
<p class="chart-disclosure">* Returns less than one year are not annualized.</p>
<p class="chart-disclosure"><strong>The performance data quoted represents past performance. Past performance is not a guarantee of future results. Investment return and principal value of an investment will fluctuate so that an investor's shares, when redeemed, may be worth more or less than their original cost. Performance may be lower or higher than performance data quoted. Please call 800.826.2333 or visit vaneck.com for performance current to the most recent month ended.</strong></p>
<p class="chart-disclosure"><strong>The gross expense ratio for CLOI is 0.4%. CLOI Fees &amp; Expenses: Van Eck Associates Corporation (the &ldquo;Adviser&rdquo;) will pay all expenses of the Fund, except for the fee payment under the investment management agreement, acquired fund fees and expenses, interest expense, offering costs, trading expenses, taxes and extraordinary expenses. Notwithstanding the foregoing, the Adviser has agreed to pay the offering costs until at least May 1, 2024.</strong></p>
<p class="chart-disclosure">The "Net Asset Value" (NAV) of a Fund is determined at the close of each business day, and represents the dollar value of one share of the fund; it is calculated by taking the total assets of the fund, subtracting total liabilities, and dividing by the total number of shares outstanding. The NAV is not necessarily the same as the ETF 's intraday trading value. Investors should not expect to buy or sell shares at NAV.</p>
<p>To receive more <a href="https://www.vaneck.com/us/en/insights/income-investing/" title="Income Investing insights"><strong>Income Investing</strong></a> insights, <a href="/us/en/subscribe/" title="Subscription Center"><strong>sign up in our subscription center</strong></a>.</p>
<style type="text/css">
    .wrapped-div {
        max-width: 100%;
    }

    @media (max-width: 1240px) {
        .wrapped-div {
            overflow-x: scroll;
        }


    }
</style>
]]></content:encoded>
</item><item rdf:about="https://www.vaneck.com/us/en/blogs/economic-trends/ems-policy-cushions-and-fear-of-unknown/">
  <title>EM’s Policy Cushions and Fear of Unknown></title>
  <link>https://www.vaneck.com/us/en/blogs/economic-trends/ems-policy-cushions-and-fear-of-unknown/</link>
  <description><![CDATA[The market is nervous about the U.S. debt ceiling debate. Can China&rsquo;s faster rebound and policy cushions shield EMs from adverse effects?]]></description>
  <dc:creator>Natalia  Gurushina</dc:creator>
  <dc:date>04/25/2023 06:30:00</dc:date>
<content:encoded><![CDATA[

<h2>Growth in China, U.S.</h2>
<p>The U.S. debt ceiling debacle continues to drive some market segments (see chart below), but a big question for emerging markets (EM) folks <strong>is which countries might be shielded by a faster recovery in China if U.S. recession concerns stage a comeback</strong> (a scenario under which there is no resolution before the debt ceiling is reached). Various sell-side estimates suggest that Indonesia, South Korea, Thailand, Brazil and Poland might be in a stronger position, whereas the Philippines, Mexico, Turkey and Hungary could face more headwinds.</p>
<h2>Policy Easing</h2>
<p>This configuration <strong>sheds a new light on the inaugural rate cuts in EM</strong>, including Hungary&rsquo;s decision to lower the Lombard rate (top range of the interest rate corridor) from 25% to 20.5% this morning. The market&rsquo;s reaction was much calmer than last week&rsquo;s currency meltdown, because the key rate remained unchanged at 18%, giving the central bank more time/space to evaluate the disinflation progress (which is expected to accelerate in the summer).</p>
<h2>EM External Balances</h2>
<p>EMs with less exposure to the U.S. growth downside might also benefit from the fact that their <strong>external balances are either already strong</strong> (current accounts in Indonesia and Thailand flipped to surplus last year) <strong>or started adjusting</strong> (Poland). Brazil&rsquo;s basic balance (current account and foreign direct investments) also looked rock-solid in March, providing fundamental support for the currency and making it easier for the central bank to start rate cuts, once the fiscal path is clear. Stay tuned!</p>
<h3>Chart at a Glance: U.S. Debt Ceiling Fear In Two Lines</h3>
<p><img class="img-responsive w-100" src="https://www.vaneck.com/contentassets/25edbf791430486f8888949008b068e2/us-natalias-take-2023-04-25.png" alt="Chart at a Glance: U.S. Debt Ceiling Fear In Two Lines" /></p>
<p class="chart-disclosure">Source: Bloomberg LP.</p>
]]></content:encoded>
</item><item rdf:about="https://www.vaneck.com/us/en/blogs/economic-trends/testing-the-status-quo-in-em/">
  <title>Testing the Status Quo in EM></title>
  <link>https://www.vaneck.com/us/en/blogs/economic-trends/testing-the-status-quo-in-em/</link>
  <description><![CDATA[The consensus is optimistic on the pace of disinflation. But is it enough to start rate cuts in EM?]]></description>
  <dc:creator>Natalia  Gurushina</dc:creator>
  <dc:date>04/24/2023 15:00:00</dc:date>
<content:encoded><![CDATA[

<h2>Consensus View on Growth, Inflation</h2>
<p>The softer landing story &ndash; back in vogue after the IMF spring meetings &ndash; continues to drive the near-term market expectations for policy rates in developed markets (DM), with swap curves implying the U.S. &ldquo;farewell&rdquo; rate hike in May, and about 85bps of additional tightening in the Eurozone. The U.S. Federal Reserve (Fed) expectations firmed up quite a bit after the mini-banking crisis in March, but the consensus continues to see room for rate cuts on the 6-12 months horizon<strong>, betting that inflation pressures will continue to subside. The </strong><a href="https://www.vaneck.com/us/en/blogs/emerging-markets-bonds/imf-2023-spring-meetings-a-season-of-wishful-thinking/" title="IMF 2023 Spring Meetings: A Season of Wishful Thinking"><strong>emerging markets (EM) debt team found this to be the common view at the recent spring meetings</strong></a> and we think that the consensus might be too optimistic, albeit higher real interest rates in EMs place them in a fundamentally safer position to start policy easing.&nbsp;</p>
<h2>Rate Pause or Pivot?</h2>
<p>Last week, Uruguay delivered its inaugural rate cut and the Costa Rican central bank cut the policy rate for the second time in a row. The market was not super-excited about the moves, but the reaction was muted compared to what happened to the Hungarian forint after suggestions that the central bank might start cutting some interest rates as soon as tomorrow. <strong>For now, most EM central banks are following the IMF&rsquo;s advice to remain cautious and not communicate rate cuts prematurely</strong>. We expect Colombia to follow suit on Friday with a hawkish hold. Colombia&rsquo;s economy is definitely slowing down, the currency&rsquo;s appreciation should help to cap price pressures going forward, and the fiscal gap is expected to narrow this year, but inflation &ndash; especially core &ndash; is yet to peak.</p>
<h2>Conditions for EM Rate Cuts</h2>
<p>Mexico has even more reasons to pause in May, following softer than expected bi-weekly inflation prints this morning (see chart below). The local swap curve implies that the policy rate has peaked, and that there is room for rate cuts in Q4<strong>. Brazil&rsquo;s example, however, shows that successful disinflation might be enough to pause, but not enough</strong> <strong>to initiate, rate cuts in EM</strong>. Brazil&rsquo;s real policy rate is the highest in EM, and mid-month inflation is expected to fall below 5% year-on-year this Friday. Still, concerns about sticky inflation expectations and the government&rsquo;s fiscal plans keep the central bank on defensive, and the market sees the first rate cut only in the fall.</p>
<h3>Chart at a Glance: Mexico &ndash; Policy Rate Pause at Last?</h3>
<img class="img-responsive w-100" src="https://www.vaneck.com/contentassets/e9e6e06b89104b61aaaad0f4444daa48/us-natalias-take-2023-04-24.png" alt="Chart at a Glance: Mexico &ndash; Policy Rate Pause at Last?" />
<p class="chart-disclosure">Source: Bloomberg LP</p>
]]></content:encoded>
</item><item rdf:about="https://www.vaneck.com/us/en/blogs/thematic-investing/buzz-investing-stock-gains-mask-increasing-volatility-and-narrowing-breadth/">
  <title>BUZZ Investing: Stock Gains Mask Increasing Volatility and Narrowing Breadth></title>
  <link>https://www.vaneck.com/us/en/blogs/thematic-investing/buzz-investing-stock-gains-mask-increasing-volatility-and-narrowing-breadth/</link>
  <description><![CDATA[Domestic equities surged as mega-cap tech stocks drove 50% of S&amp;P 500 gains, but narrow leadership sparked future return concerns.]]></description>
  <dc:creator> </dc:creator>
  <dc:date>04/24/2023 06:30:00</dc:date>
<content:encoded><![CDATA[

<p>Domestic equities rallied during the recent period between Index selection dates (March 9, 2023 to April 13, 2023, the &ldquo;Period&rdquo;). Mega-cap technology-focused stocks, including Alphabet Inc (NASD: GOOGL), Apple Inc (NASD: AAPL), Meta Platforms Inc (NASD: META), NVIDIA Corp (NASD: NVDA), Amazon.com Inc (NASD: AMZN), Microsoft Corp (NASD: MSFT), and Tesla Inc (NASD: TSLA) fueled gains, with those seven stocks accounting for 50% of the gains of the S&amp;P 500 Index during the Period. The aforementioned stocks dominated first-quarter performance, with those seven stocks accounting for over 80% of the S&amp;P 500 Index&rsquo;s Q1 gains. Some market commentators noted the &lsquo;narrow leadership&rsquo; of the group as a troubling indicator for future returns, citing the lack of broad participation in the rally.</p>
<p>The gains achieved during the Period were overshadowed by increased volatility observed across equity markets, as investors considered the impact of a sudden domestic banking crisis relative to ongoing inflationary concerns. The widely followed CBOE Volatility Index (the &ldquo;VIX&rdquo;) soared above 30 during March as investors braced for a potential banking crisis following the collapse of US regional banks SVB Financial Group (formerly NASD: SIVB) and Signature Bank (NASD: SBNY), followed by the fall of Credit Suisse Group AG (SW: CSGN). SIVB, the country's 16th-largest bank by assets and the preferred bank for many technology and venture-backed start-ups, experienced a classic &lsquo;bank-run&rsquo; triggered by depositors who rushed to withdraw funds amidst growing anxiety about the bank&rsquo;s solvency. New York-based SBNY, which focused its activities on the cryptocurrency segment in recent years, fell days later as investors lost confidence and initiated a run on deposits. SIVB and SBNY were subsequently taken over by federal regulators and mark the second and third largest bank failures in US history, trailing Washington Mutual, which collapsed during the 2008 financial crisis.</p>
<p>The sudden collapse of SIVB and SBNY led many to fear contagion may spread across the broader domestic banking ecosystem. Social media fearmongering proliferated, with some highly followed online commentators disparaging fractional reserve banking and suggesting the entire system was &lsquo;technically bankrupt.&rsquo; On Sunday evening, March 12, the U.S. Treasury, the Federal Reserve (the &ldquo;Fed&rdquo;), and the Federal Deposit Insurance Corp. (&ldquo;FDIC&rdquo;) jointly sought to calm investor anxieties by announcing the government would invoke the &ldquo;systemic risk exception&rdquo; and would back SIVB and SBNY customer deposits beyond the federally insured ceiling of $250,000. Calls for the Fed to pause their interest rate hiking program escalated while some market commentators insisted an interest rate &lsquo;cut&rsquo; was now required to stave off a potential banking crisis.</p>
<p>The Fed chose to &lsquo;stay the course,&rsquo; raising its target rate by 25bps during its March 22nd meeting. Following the Fed meeting, Swiss banking giant Credit Suisse Group AG collapsed, forcing Swiss regulators to broker a fire-sale of the storied firm to rival UBS Group AG (SW: UBSG) for CHF $3B. Continued stress in the banking sector contributed to a dramatic repricing of expectations of forward interest rates. At the start of the Period, investor expectations were for the Federal Funds rate to approach 5% through Q3 2023; however, within 10 days of the initial SIVB crisis, expectations were revised lower by over 75 bps. By the Period&rsquo;s end, forward rate expectations rebounded; however, they remain well off their highs, forecasting interest rate cuts in the months ahead.</p>
<p>The BUZZ NextGen AI US Sentiment Leaders Index (the &ldquo;BUZZ Index&rdquo; or &ldquo;Index&rdquo;) returned 5.16% during the month of March compared to a return of 3.67% for the S&amp;P 500 Index during the same period. Year-to-date, the BUZZ Index leads the S&amp;P 500 with returns of 22.76% and 7.50%, respectively, as of the end of March.</p>
<h3>Fed Funds Rate: Forward Expectations</h3>
<p><img class="img-responsive w-100" src="https://www.vaneck.com/contentassets/84f4047f21cc4339b6d7238a84861cd6/3130_buzz_chart-01_2023.04_blog.svg" alt="Fed Funds Rate: Forward Expectations" /></p>
<p class="chart-disclosure">Source: Bloomberg.</p>
<h2>Shares of Gamestop Inc. Pace Advancing Stocks within the BUZZ Index</h2>
<p>Shares of GameStop Inc. (NYSE: GME) paced advancing stocks within the BUZZ Index during the recent Period. Viewed by many as the original &lsquo;meme&rsquo; stock, GME surprised some investors with a strong fourth-quarter earnings report which showed the company&rsquo;s cost reduction plan was progressing while both revenues and earnings exceeded analyst expectations. GME surged by over 35% on the day of the earnings release and gained 28.7% during the Period. Very few traditional analysts cover GME (likely due to its continued perception as a &lsquo;meme&rsquo; stock) with no &ldquo;buy&rdquo; recommendations for the company before the earnings release, one firm rating the stock a &ldquo;hold&rdquo; and two firms rating the stock a &ldquo;sell.&rdquo;</p>
<div class="wrapped-div">
<table style="width: 750px;">
<tbody>
<tr class="tbl-data">
<td class="tbl-header last" colspan="4">Top BUZZ Index Contributors: March 9, 2023 &ndash; April 13, 2023</td>
</tr>
<tr class="tbl-data">
<td class="data-td  last">Company</td>
<td class="data-head last">Ticker</td>
<td class="data-head last">Average Weight (%)</td>
<td class="data-head last">Return Contribution (%)</td>
</tr>
<tr class="tbl-data">
<td class="data-td last" style="font-weight: normal;">GameStop Corp</td>
<td class="data-td data last">GME</td>
<td class="data-td data last">3.38</td>
<td class="data-td data last">0.85</td>
</tr>
<tr class="tbl-data">
<td class="data-td last" style="font-weight: normal;">Meta Platforms Inc</td>
<td class="data-td data last">META</td>
<td class="data-td data last">3.30</td>
<td class="data-td data last">0.68</td>
</tr>
<tr class="tbl-data">
<td class="data-td last" style="font-weight: normal;">Coinbase Global Inc</td>
<td class="data-td data last">COIN</td>
<td class="data-td data last">3.31</td>
<td class="data-td data last">0.61</td>
</tr>
<tr class="tbl-data">
<td class="data-td last" style="font-weight: normal;">Alphabet Inc</td>
<td class="data-td data last">GOOGL</td>
<td class="data-td data last">3.22</td>
<td class="data-td data last">0.50</td>
</tr>
<tr class="tbl-data">
<td class="data-td last" style="font-weight: normal;">Intel Corp</td>
<td class="data-td data last">INTC</td>
<td class="data-td data last">2.06</td>
<td class="data-td data last">0.46</td>
</tr>
<tr class="tbl-data">
<td class="data-td last" style="font-weight: normal;">Microsoft Corp</td>
<td class="data-td data last">MSFT</td>
<td class="data-td data last">2.98</td>
<td class="data-td data last">0.44</td>
</tr>
<tr class="tbl-data">
<td class="data-td last" style="font-weight: normal;">NVIDIA Corp</td>
<td class="data-td data last">NVDA</td>
<td class="data-td data last">3.31</td>
<td class="data-td data last">0.43</td>
</tr>
<tr class="tbl-data">
<td class="data-td last" style="font-weight: normal;">Advanced Micro Devices Inc</td>
<td class="data-td data last">AMD</td>
<td class="data-td data last">3.15</td>
<td class="data-td data last">0.35</td>
</tr>
<tr class="tbl-data">
<td class="data-td last" style="font-weight: normal;">Amazon.com Inc</td>
<td class="data-td data last">AMZN</td>
<td class="data-td data last">3.11</td>
<td class="data-td data last">0.34</td>
</tr>
<tr class="tbl-data">
<td class="data-td last" style="font-weight: normal;">Palantir Technologies Inc</td>
<td class="data-td data last">PLTR</td>
<td class="data-td data last">2.97</td>
<td class="data-td data last">0.33</td>
</tr>
</tbody>
</table>
</div>
<br />
<p class="chart-disclosure">Source: BUZZ Holdings ULC, Bloomberg. Past performance is no guarantee of future results. Index performance is not illustrative of fund performance. Not intended as a recommendation to buy or to sell any of the securities mentioned herein.</p>
<p>The top detractors to performance predominantly featured stocks in the Industrial sector as investors rotated away from the group, favoring the prospects of technology-oriented stocks during the Period. Airline stocks American Airlines Group Inc (NASD: AAL), United Airlines Holdings Inc (NASD: UAL), and Delta Air Lines Inc (NYSE: DAL) were all featured in the top detractors to performance as each fell following disappointing first-quarter earnings, and guidance. The airlines broadly cited increasing costs arising from new pilot labor agreements as a catalyst for the disappointing results.</p>
<div class="wrapped-div">
<table style="width: 750px;">
<tbody>
<tr class="tbl-data">
<td class="tbl-header last" colspan="4">Bottom BUZZ Index Contributors: March 9, 2023 &ndash; April 13, 2023</td>
</tr>
<tr class="tbl-data">
<td class="data-td  last">Company</td>
<td class="data-head last">Ticker</td>
<td class="data-head last">Average Weight (%)</td>
<td class="data-head last">Return Contribution (%)</td>
</tr>
<tr class="tbl-data">
<td class="data-td last" style="font-weight: normal;">Plug Power Inc</td>
<td class="data-td data last">PLUG</td>
<td class="data-td data last">0.82</td>
<td class="data-td data last">-0.29</td>
</tr>
<tr class="tbl-data">
<td class="data-td last" style="font-weight: normal;">Block Inc</td>
<td class="data-td data last">SQ</td>
<td class="data-td data last">1.23</td>
<td class="data-td data last">-0.19</td>
</tr>
<tr class="tbl-data">
<td class="data-td last" style="font-weight: normal;">American Airlines Group Inc</td>
<td class="data-td data last">AAL</td>
<td class="data-td data last">0.66</td>
<td class="data-td data last">-0.16</td>
</tr>
<tr class="tbl-data">
<td class="data-td last" style="font-weight: normal;">United Airlines Holdings Inc</td>
<td class="data-td data last">UAL</td>
<td class="data-td data last">0.13</td>
<td class="data-td data last">-0.12</td>
</tr>
<tr class="tbl-data">
<td class="data-td last" style="font-weight: normal;">Caterpillar Inc</td>
<td class="data-td data last">CAT</td>
<td class="data-td data last">0.65</td>
<td class="data-td data last">-0.10</td>
</tr>
<tr class="tbl-data">
<td class="data-td last" style="font-weight: normal;">Alcoa Corp</td>
<td class="data-td data last">AA</td>
<td class="data-td data last">0.10</td>
<td class="data-td data last">-0.09</td>
</tr>
<tr class="tbl-data">
<td class="data-td last" style="font-weight: normal;">Enphase Energy Inc</td>
<td class="data-td data last">ENPH</td>
<td class="data-td data last">0.97</td>
<td class="data-td data last">-0.09</td>
</tr>
<tr class="tbl-data">
<td class="data-td last" style="font-weight: normal;">Goldman Sachs Group Inc/The</td>
<td class="data-td data last">GS</td>
<td class="data-td data last">0.83</td>
<td class="data-td data last">-0.08</td>
</tr>
<tr class="tbl-data">
<td class="data-td last" style="font-weight: normal;">Delta Air Lines Inc</td>
<td class="data-td data last">DAL</td>
<td class="data-td data last">0.11</td>
<td class="data-td data last">-0.07</td>
</tr>
<tr class="tbl-data">
<td class="data-td last" style="font-weight: normal;">Schlumberger NV</td>
<td class="data-td data last">SLB</td>
<td class="data-td data last">0.11</td>
<td class="data-td data last">-0.07</td>
</tr>
</tbody>
</table>
</div>
<br />
<p class="chart-disclosure">Source: BUZZ Holdings ULC, Bloomberg. Past performance is no guarantee of future results. Index performance is not illustrative of fund performance. Not intended as a recommendation to buy or to sell any of the securities mentioned herein.</p>
<h2>Sentiment Stock Highlight &ndash; Block, Inc.</h2>
<p>On March 23, Hindenburg Research (&ldquo;Hindenburg&rdquo;), a forensic financial research firm focused on activist short selling, released a scathing report on Jack Dorsey&rsquo;s Block, Inc. (NYSE: SQ), accusing the digital payments company of inflating user metrics and intentionally ignoring fraudulent activity on its platform. Recall Hindenburg was the research firm that recently published allegations of fraud against India-based conglomerate Adani Enterprises (IN: ADE), which led to a 70% decline in ADE&rsquo;s stock price. To some market observers, the ADE report bolstered Hindenburg's credibility in the industry. Hindenburg claimed Block disregarded AML/KYC laws in its efforts to report growth at the company, citing interviews with former employees which exposed a poor regulatory culture at the company. Block&rsquo;s stock declined nearly 15% on March 24th, the day Hindenburg released its report, and subsequently traded within a narrow range. Despite the controversy, investor sentiment appears to disagree with the accusations featured in Hindenburg's report, as positive investor sentiment has increased following its release. This month, SQ&rsquo;s stock weight in the BUZZ Index rose from 1.45% to 2.96%.</p>
<h3>Block Stock Price | January 2021 &ndash; April 2023</h3>
<p><strong><img class="img-responsive w-100" src="https://www.vaneck.com/contentassets/84f4047f21cc4339b6d7238a84861cd6/3130_buzz_chart-02_2023.04_blog.svg" alt="Block Stock Price | January 2021 - April 2023" /></strong></p>
<p class="chart-disclosure">Source: BUZZ Holdings ULC, Bloomberg. Past performance is no guarantee of future results. Index performance is not illustrative of fund performance. Not intended as a recommendation to buy or to sell any of the securities mentioned herein.</p>
<h2>BUZZ Index April 2023 Rebalance Highlights</h2>
<p><strong>Financials</strong></p>
<p>Last month, the global financial landscape witnessed a near-banking crisis which some compared to the sector&rsquo;s troubles during the Global Financial Crisis of 2008. The shock announcement by SVB Financial Group (formerly NASD: SIVB) regarding its liquidity issues precipitated massive withdrawals of deposits. This classic bank run left the bank on the brink of insolvency. The rapid pace of interest rate increases over the past year, coupled with a sudden loss of deposits, exposed the vulnerabilities in SIVB&rsquo;s mismanaged bond portfolio and put the spotlight on other regional banks facing similar risks. To restore confidence, the Federal Reserve and CDIC acted swiftly to effectively safeguard deposit structures within the country, quickly quelling the crisis. Many bank stocks plummeted initially before recouping some of the losses as the situation improved. This month, the BUZZ Index contains 17 financials stocks, including regional and niche banks such as New York Community Bancorp (NYSE: NYCB) and Charles Schwab (NYSE: SCHW), bringing the total weight of the sector within the Index to 27%. The jump in the financials weight is the biggest ever for the Index. Increasing positive investor sentiment may suggest that many bank stocks will continue to recover from the latest banking crisis.</p>
<p>For more on rebalancing results and a full breakdown of index constituents added and removed for the month, view the <strong><a href="https://www.vaneck.com/us/en/investments/social-sentiment-etf-buzz/buzz-reconstitution.pdf" target="_blank" rel="noopener" title="BUZZ VanEck Social Sentiment ETF">BUZZ Index reconstitution</a></strong> report.</p>
<p>To receive more <strong><a href="https://www.vaneck.com/us/en/insights/thematic-investing/" title="Thematic Investing Insights">Thematic Investing</a></strong> insights, <strong><a href="https://www.vaneck.com/us/en/subscribe/" title="Subscription Center">sign up in our subscription center</a></strong>.</p>
<style type="text/css">
    .wrapped-div {
        max-width: 100%;
    }

    @media (max-width: 1240px) {
        .wrapped-div {
            overflow-x: scroll;
        }
    }

    .wrapped-div-sector {
        max-width: 100%;
        overflow-x: scroll;
    }
</style>
]]></content:encoded>
</item><item rdf:about="https://www.vaneck.com/us/en/blogs/emerging-markets-bonds/imf-2023-spring-meetings-a-season-of-wishful-thinking/">
  <title>IMF 2023 Spring Meetings: A Season of Wishful Thinking></title>
  <link>https://www.vaneck.com/us/en/blogs/emerging-markets-bonds/imf-2023-spring-meetings-a-season-of-wishful-thinking/</link>
  <description><![CDATA[There was a lot of wishful thinking among policy makers and market participants at the IMF 2023 Spring Meetings, particularly around the global growth and inflation outlook.]]></description>
  <dc:creator>David Austerweil</dc:creator>
  <dc:date>04/21/2023 17:00:00</dc:date>
<content:encoded><![CDATA[

<script>
    //Temporary script
    $(function () {
        $(".popup-youtube, .popup-vimeo, .popup-gmaps").on("click", function (e) {
            e.preventDefault();
            var width = $(window).width();
            if (width > 768) {
                openSimpleIframeModalDialog($(this).attr('href'), "video-modal");
            } else if ($(this).is('.popup-youtube')) {
                var target = $(this).attr('data-video');
                self.location = target;
            }
        });
    });
</script>
<style>
    .modal.fade.video-modal div.modal-dialog {
        margin: 7% auto !important;
    }

    .modal-simple-iframe .close span {
        font-size: 35px;
        line-height: 1;
    }
</style>
<ul>
<li><strong>Wishful thinking from the IMF. </strong>The IMF expects slowing global growth and slowing global inflation to eventually return developed market interest rates down to levels that make sovereign debt sustainable. Any other scenario is unthinkable.</li>
<li><strong>Wishful thinking from markets. </strong>Banking problems in the US and Europe result in slower credit growth, but are otherwise contained; markets can be saved by validating the interest rate cuts currently priced. Unfortunately, growth and inflation data do not corroborate this scenario<strong>.</strong></li>
<li><strong>Wishful thinking on US power relative to China. </strong>China does not want to play along with the IMF&rsquo;s debt restructuring agenda despite the invention of new forums (the Common Framework and the Global Sovereign Debt Roundtable) to coerce it to do so. China has a strong hand, both economically and geopolitically, and the US does not have a good strategic response.</li>
<li><strong>Hope in EM. </strong>There are good reasons for EM debt investors to be optimistic: countries with high real interest rates, declining inflation and strong growth outlooks buoyed by China&rsquo;s reopening and commodity prices. The US may default on its ballooning debt stock, but this isn&rsquo;t an issue for most emerging markets that have low debt and modest fiscal deficits.</li>
</ul>
<p><strong>There was a lot of wishful thinking among policy makers and market participants</strong>. The IMF&rsquo;s April World Economic Outlook paints a picture of still-high global inflation in 2023 of 7% that will only converge to inflation targets in most countries by 2025. The disinflation process is driven by tight monetary policy and a high unemployment rate, but also by lower oil prices. These three assumptions are all wishful thinking. Monetary policy in developed markets is hardly tight with ex-post real rates negative and ex-ante real rates barely positive. Additionally, developed market monetary policy is being effectively neutered by the extraordinary actions of central banks to shield both markets and the real economy from any pain. Labor markets remain extremely tight, not only due to strong demand but also by a shortage of labor supply. Oil prices are buoyed by strong global demand, aided by robust tourism from China and an OPEC that is assertive in its desire to keep oil markets tight.</p>
<p>Policy makers have good reason to wish for inflation to return quickly to target and for interest rates to decline back to pre-COVID levels due to one key initial condition: excessive debt burdens. The IMF dedicates Chapter 2 of the World Economic Outlook to the natural real rate of interest (the interest rate that neither stimulates nor contracts the economy, and the real rate assumption underpinning the IMF&rsquo;s debt sustainability analyses). Debt burdens in advanced economies are unsustainable at higher real interest rates and there is no political will to make the necessary fiscal and structural adjustments. Since the IMF cannot say that its major shareholders are not solvent, the baseline assumption is for interest rates to decline to levels that solve the problem. Any other conclusion would be sacrilege. In fact, the need for global capital to finance investment in the green transition, combined with ageing populations (which tend to consume more than save) will likely raise the global cost of capital for a generation.</p>
<p><strong>There was a lot of hope that a contained banking crisis would solve investors&rsquo; inflation and Federal Reserve concerns. </strong>The failure of Silicon Valley Bank exposed to the US consumer major inconsistencies in central bank policy and regulation that have led depositors to slowly exit zero interest bank deposits in exchange for US Treasury bills yielding over 4%. The &ldquo;hope&rdquo; is that the decline in funding to the banking sector will lead to a decline in lending and a gradual contraction in economic growth. Any bank failures along the way to this desirable soft landing will be contained by extraordinary policy measures by the central bank. The modest growth slowdown will help inflation moderate and the Fed will not need to hike more. In this twisted logic, banking failures lead to goldilocks for markets. But by removing any pain from the economy and market, monetary policy loses effectiveness, while the labor market remains tight and inflation sticky. The Fed will need to hike more to compensate, and the market is not pricing these additional rate hikes.</p>
<p><strong>There was a lot of concern about the looming US debt ceiling deadline and a firm belief in last-minute resolutions. </strong>The market expects politicians to do the right thing for the economy at the last minute, just like in 2011. The problem is that House Speaker McCarthy made extraordinary concessions to secure his position last year, including a provision that allows for any one member to ask for a vote of no confidence. Several congressmen from the far-right wing of the GOP will only vote to increase the debt ceiling if the budget is balanced. If McCarthy were to bring any compromise legislation to increase the debt ceiling up for a vote, the publicity that comes with forcing a default could be more valuable for some of his key supporters than &ldquo;doing the right thing&rdquo; for the economy. The US Treasury will soon provide an update of when it expects to not have enough cash to meet all obligations and if that date is not moved past mid-June due to favorable tax receipts, the market will start to worry. Many speakers viewed the risk of default as greater than 10%. Before defaulting, the US Treasury would cut other expenditures and the immediate fiscal contraction would push the economy into a deep recession. The market implications of an actual default would be even more severe as many institutional investors can not own defaulted debt and there would be panicked selling.</p>
<p><strong>There was a palpable frustration with China&rsquo;s unwillingness to restructure bilateral sovereign debt. </strong>There was talk of a lost decade for debtors stuck in limbo because of China. IMF programs cannot move forward without an agreement from China and private sector investment needs to know how capital will be treated before moving forward. The Paris Club framework took time to develop and there is hope that, as the West better understands China&rsquo;s needs, debt relief agreements that are acceptable to all creditors can be achieved. China is averse to principal haircuts but comparable treatment in net present value terms using maturity extensions is a potential solution. However, China did a lot of its lending to emerging markets for geopolitical influence, specifically to secure access to critical commodities or trade routes, and restructuring its debt gives China&rsquo;s influence away. The Zambia debt restructuring, if and when it arrives, will show the path forward. Zambia has been the perfect student for the IMF, putting the onus to forgive debt squarely on China.</p>
<p><strong>There was a lot of discussion of the US decoupling its trade from China, but little evidence of it. </strong>For national security purposes it makes sense for the US to build supply chains that rely on domestic production or production from close allies. If China were to invade Taiwan, supplies of critical imports such as pharmaceuticals and even some inputs into military aircraft would be at risk. However, China&rsquo;s economy is too large to avoid and it is profoundly expensive to divest from existing production facilities. Even when building new facilities in neighboring countries, a Chinese firm often has some value-added role. The most recent trade data showed the China trade surplus with the US reaching a new record high.</p>
<p>From China&rsquo;s perspective, there are also national security considerations to make regarding its investments in the US. This other side of the coin was surprisingly not discussed at the IMF. China&rsquo;s record US dollar trade surplus needs to be invested somewhere and the one place it is most clearly not being invested is US Treasuries. China watched as the US froze Russia&rsquo;s access to its own holdings of US dollar denominated debt. If China is heading toward conflict with the US, it is simple risk management to decrease its exposure to assets the US could seize first.</p>
<p><strong>There was hope that Japan would finally exit yield curve control and that it would be positive for markets. </strong>Japanese growth is forecasted at 1.3% for 2023, which is above potential growth of 0.5% and the output gap should close this year. The labor market is tight and with inflation above 3%, the Bank of Japan&rsquo;s (BoJ) extremely accommodative stance risks pushing inflation even higher. The market expects the BoJ to drop yield curve control this year. The yen is cheap, and when interest rates on Japanese government bonds (JGBs) rise without the BoJ&rsquo;s intervention, the yen could appreciate substantially. However, the yen&rsquo;s gain is the US dollar credit market&rsquo;s loss as Japanese investors&rsquo; appetite for US credit should decline substantially. China and Japan are the two largest foreign holders of US Treasuries; without their purchases, more US Treasuries will need to be purchased domestically and this should raise the cost of capital for the US private sector.</p>
<p><strong>The Ukraine-Russia war and ESG were out of the limelight. </strong>Frozen conflict was the collective wisdom of how the war would end. There was some skepticism about starting reconstruction while bombing was still taking place. Ukraine sessions were less well attended than in the past as investor focus has shifted.</p>
<p>ESG was also less discussed and where it was, the conversation was more balanced. There were complaints from the rest of the world that the US Inflation Reduction Act was making green investment less competitive in their own country and that the legislation is not consistent with World Trade Organization (WTO) rules.</p>
<p><strong>There was a lot of investor pessimism due to specific bad credit investments and underperformance. </strong>Egypt stood out as having been a consensus favorite overweight by investors that had performed poorly and was now a source of angst. Egypt borrowed an unsustainable amount of external debt while under an IMF program and yet it has been unable to reduce its external financing needs meaningfully. The currency is under large devaluation pressure, but it has no policy anchor as real rates remain extremely negative and there is no one willing to bring new capital onshore. There are major maturities coming due towards the end of the year that could catalyze a default.</p>
<p>Aside from Egypt, many Sub-Saharan Africa sovereigns along with Ecuador, Tunisia, and Pakistan have also disappointed. But the impact on the indices is not material. The performance of the broader EM asset class has been stellar with the GBI-EM up over 5.2% and the EMBIG up 1.9%. Given the strong performance, one would expect investors to be more upbeat. However, the majority are underperforming their benchmarks as they are overallocated to high yield, which has underperformed and under allocated to EM local debt which has outperformed. The outlook for EM local debt is very positive as EM investors view it as being the most likely top performing EM asset class this year and they are underinvested.</p>
<p><strong>Most of Latin America hiked early and high enough to set inflation on a declining path, while also benefiting from improving terms of trade due to high commodity prices. </strong>In Mexico, high real interest rates and the near shoring narrative have attracted a lot of hot money inflows. However, the Mexican peso is expensive and foreign direct investment (FDI) has not lived up to expectations, leaving the currency vulnerable to a downturn in the US economy. The Chilean central bank was more hawkish than market expectations in terms of how long it would keep rates high and when it would undo its FX intervention program as domestic consumption remains uncomfortably strong. Colombia&rsquo;s high growth and high deficits look to be a thing of the past as central bank policy and responsible government policy cool the economy. There is a good chance the Peruvian government survives until 2026 as the population has grown tired of changing its government every year, which is welcome news as the country benefits from higher copper prices and a credible central bank. The Brazilian central bank knows real interest rates are too high, but it is afraid to give in to the Lula administration&rsquo;s pressure for fear of upsetting inflation expectations. The Lula administration is trying to say just enough of the right thing to get the central bank to cut rates without affecting growth too much. The two are still figuring out their relationship, but the market has become accustomed to this dance.</p>
<p><strong>Emerging Europe was harder hit by the fuel price shock emanating from the Russia-Ukraine war and inflation there remains uncomfortably high. </strong>The lack of consistency between Hungary&rsquo;s fiscal, monetary, and regulatory policies could mean higher for longer inflation, while the timing of European Union (EU) fund disbursements remains uncertain. Poland&rsquo;s monetary tightening has started to impact growth, but it remains to be seen whether this is enough to tame inflation. The labor market is structurally tight, and the fiscal gap is likely to widen further in the run up to the elections. Romania contrasts favorably due to its great relations with the EU, which paves the way for very large capital inflows. The key challenge is to address price pressures that go beyond base effect/energy, and stem from stronger GDP growth than in the rest of the region, pro-cyclical fiscal policy, and high real wages.</p>
<p><strong>In contrast to Europe, the most Middle Eastern countries have modest inflation and strong external positions due to high commodity prices. </strong>UAE&rsquo;s fundamental outlook remains very solid, supported by high oil prices, and authorities are using this opportunity to implement structural reforms to diversify the economy in the medium term, implement green transition, and the rest of the ambitious reform agenda for the post-hydrocarbon future. UAE is playing the geopolitical fragmentation card well, including partnerships with China and India. Qatar managed to avoid the World Cup host country curse with continued strong growth along side large fiscal and current account surpluses and debt on a declining trajectory. &nbsp;</p>
<p><strong>While Africa also benefits from strong commodity prices, excessive debt burdens and lack of affordable financing makes the outlook more challenging. </strong>The market is waiting for change to come in Nigeria where the incoming government has promised to raise the value added tax from 5% to 8% and to eliminate fuel subsidies. Still, there are no easy answers to the overvalued exchange rate and a new central bank governor has not yet been appointed. Mozambique&rsquo;s authorities are working hard to keep the IMF program on track &ndash; and they&rsquo;ve been successful so far &ndash; but security risks are non-trivial and hard to predict. The recent OPEC+ move to curb oil production is good news for Angola, albeit a longer-term outlook for the sector is not very optimistic. The government&rsquo;s liability management operations eased near-term concerns for the country&rsquo;s debt. Cote d&rsquo;Ivoire&rsquo;s relatively good performance in 2022 came at a cost of widening &ldquo;twin&rdquo; deficits (fiscal and current account), and the international reserves might have fallen more than desired. The significant upfront fiscal consolidation would be a huge improvement (both near term and structurally), as authorities are scheduled to have their IMF Board review in May. Morocco remains a solid macro story with a good track record in reforms, and it might soon join other countries in getting the IMF&rsquo;s brand-new Resilience and Sustainability Trust (RST) facility.</p>
<p><strong>Emerging Asia benefits from a China that is growing sharply due to a V-shaped consumption led post-COVID recovery. </strong>Thailand benefits the most from surging Chinese tourism, but other regional economies have seen their growth upgraded as well. Indonesia&rsquo;s balance of payments is extremely strong with coal exports to China and nickel exports booming combined with surging FDI and portfolio inflows. The central bank is enjoying the FX strength and the lack of inflation pressures, though there is risk of food inflation if El Nino impacts rice crops adversely. The Philippines is the one ASEAN economy that remains overheated and the central bank has not yet taken forceful enough action. 2022 growth of 7.6% exceeded expectations and 2023 growth is forecasted to be near 6.5%. January inflation came in at 1%, which would be a 12% annualized rate, though the central bank forecasts inflation to slow to 6% for the full year.</p>
<p>To receive more <a href="/us/en/insights/emerging-markets-bonds/" title="Emerging Markets Bonds Insights"><strong>Emerging Markets Bonds</strong></a> insights, <a href="/us/en/subscribe/" title="Subscription Center"><strong>sign up in our subscription center</strong></a>.</p>
]]></content:encoded>
</item><item rdf:about="https://www.vaneck.com/us/en/blogs/economic-trends/ems-breakaway-doves/">
  <title>EM’s Breakaway Doves></title>
  <link>https://www.vaneck.com/us/en/blogs/economic-trends/ems-breakaway-doves/</link>
  <description><![CDATA[We&rsquo;ve got another rate cut in EM today &ndash; justified or reckless, given potential upside inflation risks stemming from stronger global growth and the uncertainty about food disinflation?]]></description>
  <dc:creator>Natalia  Gurushina</dc:creator>
  <dc:date>04/21/2023 15:00:00</dc:date>
<content:encoded><![CDATA[

<h2>Global Rate Cycles</h2>
<p>While advanced economies are still debating the extent of additional monetary tightening &ndash; just check today&rsquo;s services PMIs in Europe/U.S. and think about potential inflation pressures this can generate (see chart below) &ndash; <strong>some emerging markets (EM) already started to cut policy rates</strong>. The central bank of Uruguay surprised with a 25bps rate cut yesterday, and Costa Rica delivered its second rate cut in a row (100bps after 50bps in March). The market still gets apprehensive about premature policy easing in EM &ndash; and there are good reasons for that (such as 20% annual inflation in Hungary, for example). High real rates also helped to shield EMs during this year&rsquo;s market turbulence in Europe/U.S. (mini-banking crisis) &ndash; something to keep in mind as we get closer to the debt ceiling debate in the U.S., which can lead to a spike in FX volatility. Expected U.S. investment curbs against China can affect the market sentiment as well.</p>
<h2>EM Easing Prospects</h2>
<p><strong>EM&rsquo;s &ldquo;dovish rebellion&rdquo; is still small &ndash; many central banks are happy to pause, but not yet ready to pivot. </strong>This was a key message from the Indian central bank&rsquo;s minutes released yesterday, and they came on the heels of an even more hawkish signal from the Chilean central bank&rsquo;s transcript. The Brazilian central bank expressed concerns about sticky inflation expectations, the Malaysian central bank left the door open for more tightening and the Czech national bank warned the market against betting on rate cuts. Rate hikes in EMs are rarity these days, but upside inflation surprises have forced the central bank&rsquo;s hand on more than one occasion &ndash; including South Africa (+50bps in March) and Argentina (+300bps yesterday). Argentina, of course, is a very special case &ndash; the economy is a train wreck &ndash; but it might get interesting because the difficult economic situation improves centrists&rsquo; electoral chances (hence, the outlook for reforms) in October.</p>
<h2>Inflation Risks</h2>
<p>Another reason to keep an eye on Argentina is <strong>mega drought and its potential impact on food prices</strong>, which account for a significant portion of a typical consumer price basket in EM. Stronger than expected domestic activity can also create headache for EM central banks, which look to exit their tightening cycles. Potential spillovers from a faster than expected China recovery fall into this category, and China&rsquo;s comments about the U-shape inflation/credit time lags did not go unnoticed. So, while EM doves&rsquo; policy choices look gutsy, it could be a very bumpy flight.</p>
<h3>Chart at a Glance: Global Growth Drivers &ndash; Services Recovery Continues</h3>
<img class="img-responsive w-100" src="https://www.vaneck.com/contentassets/161dbd161ffd45c7a084855369255304/us-natalias-take-2023-04-21.png" alt="Chart at a Glance: Global Growth Drivers &ndash; Services Recovery Continues" />
<p class="chart-disclosure">Source: Bloomberg LP</p>
]]></content:encoded>
</item><item rdf:about="https://www.vaneck.com/us/en/blogs/model-portfolios/bull-trap-alert-low-breadth-violent-rallies/">
  <title>Bull Trap Alert: Low Breadth &amp; Violent Rallies></title>
  <link>https://www.vaneck.com/us/en/blogs/model-portfolios/bull-trap-alert-low-breadth-violent-rallies/</link>
  <description><![CDATA[The U.S. faces a multitude of economic challenges that lead to recent bank failures. We remain on high alert for a &ldquo;bull trap&rdquo; as we anticipate additional cracks to surface.]]></description>
  <dc:creator>David Schassler</dc:creator>
  <dc:date>04/20/2023 06:30:00</dc:date>
<content:encoded><![CDATA[

<p><strong>Please note that VanEck may have a position(s) in the name(s) described below.</strong></p>
<p>The VanEck Multi-Asset Solutions (&ldquo;MAS&rdquo;) team manages asset allocation portfolios across a wide range of asset classes. Our research process is based on a combination of quantitative and fundamental analysis. While no events are exactly alike, the <a href="https://www.vaneck.com/us/en/blogs/guided-allocation/podcast-battle-tested-assets-for-all-regimes/" title="Podcast: Battle-Tested Assets for All Regimes"><strong>lessons learned from past events</strong></a> can provide us with a roadmap for navigating the current environment.</p>
<p>This commentary focuses on our current views on the economy and asset allocation.</p>
<h2>Macroeconomic Overview</h2>
<p>There is an old story of a little Dutch boy who attempts to save his village from being flooded by plugging a hole in the leaking levee with his finger. In our adaptation, Federal Reserve (Fed) Chairman Jerome Powell is that little Dutch boy and the U.S. economy is his village. The sources of the immense water pressure causing cracks in our economy are high inflation, leading to high-interest rates and too much debt. Rates have been raised at the fastest pace since the great inflation of the 1970s, from 0.25% to 5% in one year. The intended results of these higher rates are to reduce aggregate demand and &ldquo;starve out&rdquo; inflation. The unintended consequences are further &ldquo;cracks&rdquo; that we have lately been experiencing.</p>
<p>Here is our running list of &ldquo;cracks&rdquo; or recently &ldquo;failed&rdquo; banks:</p>
<ul class="content-list">
<li>Silicon Valley Bank (founded October 1983)</li>
<li>Signature Bank (founded May 2001)</li>
<li>Credit Suisse (founded July 1856)</li>
</ul>
<p>To contain contagion risks, the depositors in the &ldquo;failed&rdquo; U.S. banks were fully backstopped by the government. The magnitude of the generosity of U.S. citizens can be seen in the rapid expansion of the Federal Reserve&rsquo;s balance sheet in mid-March.</p>
<h3>The Federal Reserve's Balance Sheet Rose Sharply in March</h3>
<p><img loading="lazy" class="img-responsive w-100" src="https://www.vaneck.com/contentassets/24ff5d107cee4b328320e618a28b30c2/3114_qis_chart_01_2023.04_v1_blog.svg" alt="The Federal Reserve's Balance Sheet Rose Sharply in March" /></p>
<p class="chart-disclosure"><strong>Source: Bloomberg. As of 3/30/2023</strong>.</p>
<p>It would be laughable to argue that financial austerity/future belt-tightening alone can pay that bill (and the massive pile of other bills). Instead, we will just have to shout to the barkeeper: &ldquo;Put it on my tab!&rdquo; Eventually, we will have to pay for them all in unexpected and uncomfortable ways, such as lower future growth and/or inflation. But, of course, that&rsquo;s not a problem today. For now, though, it&rsquo;s a case of: &ldquo;Barkeeper! Another round, please!&rdquo;</p>
<p>Our position has long been that the Fed will eventually pivot on interest rates and choose financial stability over price stability. If the recent bank failures were one-offs and not just the first dominoes to fall, the Fed should be able to keep rates elevated to maintain its inflation fight. However, that seems unlikely. It is more likely that additional &ldquo;cracks&rdquo; will continue to appear across the economy. This will further weaken our fragile economy and eventually force the Fed to pivot.</p>
<p>Inflation is currently falling, and we expect this trend to continue over the near term. The March Consumer Price Index (&ldquo;CPI&rdquo;) report showed a headline month-over-month increase of 0.1% and a year-over-year increase of 5%. However, the recent weakness was due to volatile energy and used car prices. Since the last report, the price of oil is now back above $80 per barrel as OPEC+ announced that it would cut production by 1.6 million barrels per day.</p>
<p>Do <i>not</i> be fooled by the volatility of inflation! We will not know if this inflation regime is finished until many years from now. We expect inflation to remain elevated, on average, at 3-5%, for an extended period of time, but with deflationary pockets. We are currently in such a pocket. Our long-term view on elevated inflation is based on structural supply and demand imbalances, most notably in the commodity markets, that are unlikely to be quickly resolved. History teaches us that inflation comes in waves and lasts a <i>very</i> long time. Here are charts of the previous two major inflation regimes in the U.S.</p>
<h3>Two Major Periods of Inflationary Regimes in the U.S.: (1940 &ndash; 1951) and (1965 &ndash; 1995)</h3>
<p><img loading="lazy" class="img-responsive w-100" src="https://www.vaneck.com/contentassets/24ff5d107cee4b328320e618a28b30c2/3114_qis_chart_02_2023.04_v1_blog.svg" alt="Two Major Periods of Inflationary Regimes in the U.S.: (1940 - 1951)" /></p>
<p><img loading="lazy" class="img-responsive w-100" src="https://www.vaneck.com/contentassets/24ff5d107cee4b328320e618a28b30c2/3114_qis_chart_03_2023.04_v1_blog.svg" alt="Two Major Periods of Inflationary Regimes in the U.S.: (1965 - 1995)
" /></p>
<p class="chart-disclosure"><strong>Source: BLS. As of 10/31/2017</strong>. Past performance is no guarantee of future results.</p>
<p>Both of those events, while different from each other, do share some similarities with today. The inflation of the 1940s was due to the broad money supply increases used to fund industrialization and WWII. Alternatively, the inflation of the 1970s was primarily driven by commodity shortages and social spending. Does any of this sound familiar?</p>
<p>The recent bank &ldquo;failures&rdquo; add pressure on the Fed to pivot on its fight against inflation and increases the likelihood of a recession in late 2023. The recession&rsquo;s severity will depend mainly on the Fed&rsquo;s policy actions going forward.</p>
<h2>Asset Allocation</h2>
<p>The S&amp;P 500<sup>&reg;</sup>&nbsp;Index was up 7.5% in the first quarter of this year thanks to the extreme performance of growth stocks. Two examples of growth stocks that drove the S&amp;P 500 Index higher during this period were Tesla (+68%) and Meta (+76%). Yet the more value-sensitive sectors, such as energy, financial, healthcare, and utilities, were down over the quarter. The low market breadth and a violent rally in heavily beaten-down assets scream &ldquo;bull trap.&rdquo;</p>
<p>Current views:</p>
<ul class="content-list">
<li><strong>Stocks</strong> offer opportunities in the value segments of the market that can either maintain or even expand profit margins during high inflation. These include natural resource equities, infrastructure, and even short-duration REITs. The recent outperformance of growth over value (+12% year-to-date) offers an opportunity to rotate from growth into these segments tactically.</li>
<li><strong>Bonds</strong> rallied, and yields fell in March due to the turmoil in regional banks. Last month, the 10-year U.S. Treasury bond yield fell from over 4% to 3.37%. Yet, we remain in the most attractive yield environment in over a decade. Based on current yields and our outlook for falling interest rates, we are bullish on fixed income. However, a recession will likely bring widening credit spreads. So, be careful! Long-term treasuries, in our view, offer a solid hedge to barbell risk and maintain exposure to the more credit-sensitive segments of the bond market.</li>
<li><strong>Commodities</strong>, in aggregate, have underperformed stocks by over 10% on a one-year and year-to-date basis, despite significant inflationary pressures and long-term structural supply and demand imbalances. Therefore, this may offer an attractive entry point. Additionally, and as one example, the recent output cuts from OPEC+ are bullish for oil prices. The oil futures curves are in backwardation, another bullish indicator confirming our view on the near-term supply issues. While an economic downturn would reduce aggregate demand, supply issues are expected to support prices.</li>
<li><strong>Gold</strong> prices are now near all-time highs, and we expect gold to go much higher, eventually, as financial conditions deteriorate later in the year. Given the recent price strength, near-term price weakness is expected, and a pullback may offer a more attractive entry point. And if our macroeconomic outlook proves incorrect, gold remains an excellent portfolio diversifier!</li>
<li><strong>Bitcoin</strong> started the year just under $17k and is now above $30k! Bitcoin and other digital assets rallied in the first quarter and picked up momentum during the banking crisis in March. Is this a sign that the Bitcoin bulls were correct and, because it is rallying with gold, it is a store of value asset? Unlikely. The chart below demonstrates that, since 2020, there has been a significant uptick in the correlations of growth stocks, as measured by FAANG, and the price of Bitcoin.</li>
</ul>
<h3>Rolling 180-Day Correlation of FAANG stocks vs. Bitcoin</h3>
<p><img loading="lazy" class="img-responsive w-100" src="https://www.vaneck.com/contentassets/24ff5d107cee4b328320e618a28b30c2/3114_qis_chart_04_2023.04_v1_blog.svg" alt="Rolling 180-Day Correlation of FAANG stocks vs. Bitcoin" /></p>
<p class="chart-disclosure"><strong>Source: Bloomberg. As of 3/31/2023</strong>. Past performance is no guarantee of future results.</p>
<p>Growth stocks and Bitcoin rallied in March as interest rates fell due to macroeconomic concerns. We are excited about the long-term potential for Bitcoin and other digital assets but are bearish in the near term. We expect Bitcoin and other digital assets to resume their correction, with growth stocks, in the coming months.</p>
<p>Thank you for taking the time to read our commentary. Each month we will provide our thoughts on recent market developments and offer our views on asset allocation to help you successfully navigate the environment.</p>
<p>For those interested in MAS-managed investment solutions, we encourage you to consider the <strong><a href="/link/6e91eff51c6042ef9f1d5943ffa90a0e.aspx" title="RAAX - VanEck Real Assets ETF - Overview">VanEck Real Assets ETF (RAAX)</a></strong>, the <strong><a href="/link/464b5a544f084a50815b7f92ec61b208.aspx" title="PIT - VanEck Commodity Strategy ETF - Overview">VanEck Commodity Strategy ETF (PIT</a>)</strong>.</p>
<p>To receive more <strong><a href="https://www.vaneck.com/us/en/insights/guided-allocation/" title="Model Portfolio Insights">Model Portfolio</a></strong> insights, <strong><a href="https://www.vaneck.com/us/en/subscribe/" title="Subscription Center">sign up in our subscription center</a></strong>.</p>
]]></content:encoded>
</item><item rdf:about="https://www.vaneck.com/us/en/blogs/natural-resources/beyond-the-trees-behind-the-scenes-with-tom-butcher/">
  <title>Beyond the Trees: Behind the Scenes></title>
  <link>https://www.vaneck.com/us/en/blogs/natural-resources/beyond-the-trees-behind-the-scenes-with-tom-butcher/</link>
  <description><![CDATA[Get a behind-the-scenes look at the making of the documentary &ldquo;Beyond the Trees&rdquo; from Contributing Producer Tom Butcher.]]></description>
  <dc:creator>Tom Butcher</dc:creator>
  <dc:date>04/20/2023 06:30:00</dc:date>
<content:encoded><![CDATA[

<p>Soon to hit the big screens at a number of film festivals will be a great new documentary, <i>Beyond the Trees</i>. The film tells the story of the <strong><a href="/link/fa91f1ee7fb547f693b4f4c078f5834e.aspx" title="The Forest Project">van Eck Forests</a></strong> in northern California and Oregon. It follows a determined team of climate champions&mdash;environmentalists, scientists, and investors&mdash;fighting to restore our native forests by pioneering a unique management model that blends conservation with finance, developed by the Pacific Forest Trust.</p>
<p>Laura Jones, Head of Content Strategy, VP here at VanEck, and I had the honor of spearheading the project for VanEck and seeing it through to its recent completion. (So many films, even those with great concepts and stories behind them, die before ever reaching the screen.)</p>
<p>I believe the true genesis of the inspiration for the film can be traced back to the piece <a href="https://www.vaneck.com/us/en/blogs/investment-outlook/jan-van-eck-visit-to-a-sustainable-redwood-forest/" title="My Visit to a Sustainable Redwood Forest"><strong>My Visit to a Sustainable Redwood Forest</strong></a> that Jan van Eck, our CEO, wrote in September 2019 about his visit with his family to the van Eck Forests in northern California. An additional event of significance was a VanEck board meeting in June 2021 that included a visit to the same forests.</p>
<p>Fast forward to the summer of 2022, Laura and I found ourselves with brief and budget in hand scoping out film production companies. This was something neither she nor I had ever done before (but hope may do so again!).</p>
<p>As the year progressed, we decided on the LA production company, <strong><a href="https://imaginaryforces.com/" title="Imaginary Forces" target="_blank" rel="noopener">Imaginary Forces</a></strong><sup>*</sup>&nbsp;(IF). Laura became immersed in the details of film production, and I, along with Jan, Laurie Wayburn (Co-founder and President of <strong><a href="https://www.pacificforest.org/" title="Pacific Forest Trust" target="_blank" rel="noopener">Pacific Forest Trust</a></strong><sup>*</sup>) and other colleagues began discussing what the film would actually be about. The van Eck Forests, yes. But what to say about them? And how to &ldquo;say&rdquo; it? We had to figure out how to help IF showcase the forests&rsquo; compelling story.</p>
<p>Film production, we all learned, is far from a simple process. Not least when it comes to the budgeting. When filming in the middle of the forest, film and sound crews need to be fed under union rules, and, of course, there needs to be transport to and from locations. And accommodations. And the schlepping of bulky cases of camera and sound equipment subject to airline excess baggage fees&mdash;often not insignificant. Finally, since you really cannot take everything with you to each location, at one stage we had to go to the local Home Depot to buy some plastic chairs to take into the forest with us &hellip; Yes, you have to budget for just about everything!</p>
<p>When it was time to scout and film, Laura got to see the Oregon forests and I got to see those in California. For my two visits West, the excitement began on arrival in CA with a delicious lunch at IF&rsquo;s office on South Sepulveda Boulevard. At the suggestion of IF, I stayed at the Culver Hotel: a 1924 landmark in downtown Culver City. It was right next to the famous Culver Studios where <i>Gone with the Wind</i> (you may recognize the fa&ccedil;ade), <i>Citizen Kane</i> and <i>E.T.</i>, among others, were filmed. And, indeed, the Culver Hotel was where the Munchkins stayed during the filming of the <i>Wizard of Oz</i>, done at another studio down the road!</p>
<h3>The Culver Studios, Culver City, California</h3>
<p><img loading="lazy" class="img-responsive w-100" src="https://www.vaneck.com/contentassets/f651556dcec54b7f9b4aca85de7a8d3d/culver-studios.jpg" alt="The Culver Studios, Culver City, California" /></p>
<p class="chart-disclosure">&copy;&nbsp;2023 Tom Butcher.</p>
<p>Whether scouting suitable locations or filming, the days always started early. On each trip, I was up around 5:30 a.m. every day we went out.</p>
<h3>Early Morning in the Forest in Northern California</h3>
<p><img loading="lazy" class="img-responsive w-100" src="https://www.vaneck.com/contentassets/f651556dcec54b7f9b4aca85de7a8d3d/redwoods.jpg" alt="Early Morning in the Forest in Northern California" /></p>
<p class="chart-disclosure">&copy;&nbsp;2023 Tom Butcher.</p>
<p>I had <i>huge</i> fun being on set and watching how all the moving parts &ldquo;mesh&rdquo; together. It was made all the more enjoyable as I was surrounded by such pleasant company - even when being told off for making unnecessary noise when the cameras were rolling, it couldn't have been done more courteously!</p>
<p>We were often awed by the silence in the forests&mdash;making it that much easier to record on-site interviews and dialogue. Laura and I were also amazed by the dexterity with which the film crews flew their drones and the stunning shots they were able to capture. (Watch for that footage in particular when you see the film.) Being able to mount a high-quality camera on such a fragile-looking bit of kit was incredible. Years ago, if it had even been possible at all, it would have been a helicopter. And hideously expensive.</p>
<p>What not many people realize is how much setup, preparation time and plain hard work is needed before each and every shot when making a professional film (and that's not even including what comes afterwards). If you are doing things properly, this is not confined just to the filming and sound. Every single aspect of a film needs to be carefully considered, from the color palette used to the fonts selected, from the crucially important narrative (not only content, but also pace, cadence, and tone) to the film score, and from the animations to the interviews.</p>
<p>The magic was how Anthony Gibbs, the director, was able to control and orchestrate all of the film's moving parts and create for us a half-hour film out of <i>hours</i> of footage and audio recordings. That said, others are always vital to a film's creation: its editors. In our instance, it was the incomparable Lexi Gunvaldson and Rachel Brewster. I can&rsquo;t leave out the trusty Merlin, Lexi&rsquo;s Australian shepherd, border collie, standard poodle mix! It was always a pleasure to see not only Merlin on many of our Zoom calls but also all the other canine and feline friends who made cameo appearances. Often it was like 'show and tell' time! I know Laura had to shoo away Bella (her cat) a number of times as she made uncalled appearances.</p>
<p>And, of course, there was Roshi Givechi who developed the film&rsquo;s story. Roshi tirelessly helped massage the narrative and guide us in sorting out just what was important to feature. She was also key to the interviews amongst the redwood trees, conducting them all consummately well.</p>
<p>It has been such an honor and joy to have been involved in the making of <i>Beyond the Trees</i>. There are so many people to thank at Imaginary Forces. Whilst I should like to thank everybody there for their kindness (which was universal), I do have special thanks for Ren&eacute;e Robson, our producer at IF, without whom the film could not have been made and the co-founders and co-owners of the company: Chip Houghton and Peter Frankfurt. You have a great &ldquo;shop&rdquo; and a fine, fine crew. My real thanks go to Jan van Eck, for making it all possible, and Laurie, for managing the forests as you do.</p>
<p>I believe <i>Beyond the Trees</i> achieves everything we set out to accomplish. And more.</p>
<p>See what you think. I trust you, too, will enjoy it.</p>
<p>The trailer of <i>Beyond the Trees</i> can be found <a href="/link/fa91f1ee7fb547f693b4f4c078f5834e.aspx" title=" The Forest Project"><strong>here</strong></a>.</p>
<p>To receive more <a href="/us/en/insights/natural-resources/" title="Natural Resources Insights"><strong>Natural Resources</strong></a> insights, <a href="https://www.vaneck.com/us/en/subscribe/" title="Subscription Center"><strong>sign up in our subscription center</strong></a>.</p>
]]></content:encoded>
</item><item rdf:about="https://www.vaneck.com/us/en/blogs/economic-trends/low-rates-the-natural-order-of-things/">
  <title>Low Rates – The Natural Order of Things?></title>
  <link>https://www.vaneck.com/us/en/blogs/economic-trends/low-rates-the-natural-order-of-things/</link>
  <description><![CDATA[The IMF thinks that the spike in real rates is temporary, while some EMs are testing the policy easing waters &ndash; but the market is not sure this is a good idea.]]></description>
  <dc:creator>Natalia  Gurushina</dc:creator>
  <dc:date>04/20/2023 06:30:00</dc:date>
<content:encoded><![CDATA[

<h2>Natural Rates</h2>
<p>The markets are getting increasingly accustomed to the prospect of a 25bps U.S. rate hike in May (90% implied probability as of this morning). Meanwhile, the <strong>IMF</strong> published an interesting <strong>report</strong> in which it<strong> argues that the current spike in real interest rates is likely to prove temporary</strong>, and interest rates are set to return to the pre-pandemic levels &ndash; once inflation is under control, of course. It is reassuring that the report also talks about alternative scenarios (see chart below), including the rising public debt, &ldquo;green transition,&rdquo; and de-globalization. Another important factor is emerging markets (EMs) ability &ndash; and willingness &ndash; to invest their surplus dollars into developed markets (DM) instruments. Many EMs already showed interest in high-quality EM instruments as potential reserve assets. EMs are also eager to accumulate reserve gold, and EMs&rsquo; domestic savings will be increasingly spent to finance the &ldquo;green transition.&rdquo;</p>
<h2>Rate Cuts</h2>
<p>Talking about lower rates, <strong>some EM central banks are getting antsy</strong> &ndash; despite various warnings about premature policy moves/communications. The Hungarian central bank tested the waters yesterday with comments about potential near-term easing, and the central bank of Uruguay surprised with a 25bps &ldquo;proper&rdquo; policy rate cut. Judging by the Hungarian forint&rsquo;s reaction, the market is not yet ready to talk about policy easing in that part of the world, given that both core and headline inflation is still in their 20s. Uruguay&rsquo;s move did not produce a lot of optimism either, even though the real policy rate is high, and both core and headline inflation are on their way down (and much lower than in Hungary). There are concerns that inflation expectations might prove stickier than expected, while mega-drought in neighboring Argentina poses obvious risks to food prices.</p>
<h2>Disinflation</h2>
<p><strong>Most EMs are not yet ready to take the easing plunge</strong>. The Chilean central bank&rsquo;s minutes sounded very hawkish, talking about upside surprises in both inflation and domestic demand and saying there are not enough signs that inflation is indeed converging to the target. Central banks in EM Asia might be better positioned to pause and eventually cut rates safely, as inflation generally peaked at much lower levels, and food prices are moderating at a faster pace. Malaysia&rsquo;s central bank left the door open for another hike at its last meeting, but today&rsquo;s downside inflation surprise (3.4% year-on-year in March) should reassure monetary authorities that the pause can be extended without jeopardizing the disinflation progress. Stay tuned!</p>
<h3>Chart at a Glance: Future Interest Rates &ndash; Alternatives Matter</h3>
<p><img class="img-responsive w-100" src="https://www.vaneck.com/contentassets/ff0481ebd0324d22b73e5edf68f4a4cf/us-natalias-take-2023-04-20.png" alt="Chart at a Glance: Future Interest Rates - Alternatives Matter" /></p>
<p class="chart-disclosure">Source: International Monetary Fund.</p>
]]></content:encoded>
</item><item rdf:about="https://www.vaneck.com/us/en/blogs/emerging-markets-equity/emerging-markets-growth-rotates-to-asia/">
  <title>Growth Rotates to Asia in Emerging Markets></title>
  <link>https://www.vaneck.com/us/en/blogs/emerging-markets-equity/emerging-markets-growth-rotates-to-asia/</link>
  <description><![CDATA[We believe that the impact of lower rates and a weaker U.S. dollar will ultimately prove to be positive for EM, an asset class that has demonstrated an orthodox approach to financial management.]]></description>
  <dc:creator>David Semple</dc:creator>
  <dc:date>04/19/2023 06:30:00</dc:date>
<content:encoded><![CDATA[

<p>The VanEck Emerging Markets Fund (the &ldquo;Fund&rdquo;) returned 1.96% during the first quarter of 2023, underperforming the Fund&rsquo;s benchmark. This underperformance was principally driven by stock selection in China (underweight the outperforming State-Owned Enterprises (SOEs) and Artificial Intelligence (AI) thematics), and weakness out of Turkey and Germany (Delivery Hero). We think that all these factors should reverse in the second and third quarters. We also think China&rsquo;s non-SOE companies will perform better, as it becomes clear that consumer confidence is healing, whilst companies with a whiff of AI are being bid up to unsustainable levels. Emerging markets (EM), in general, are in a relatively good place, with more leeway to deal with inflationary pressures, and generally strong external accounts. The development of geopolitics remains a wild card.</p>
<div class="wrapped-div">
<table width="100%">
<tbody>
<tr class="tbl-data">
<td class="tbl-header last" colspan="9">Average Annual Total Returns (%) as of March 31, 2023</td>
</tr>
<tr class="tbl-data">
<td class="data-head last">&nbsp;</td>
<td class="data-head last">1 Mo<sup>&dagger;</sup></td>
<td class="data-head last">3 Mo<sup>&dagger;</sup></td>
<td class="data-head last">YTD<sup>&dagger;</sup></td>
<td class="data-head last">1 Yr</td>
<td class="data-head last">3 Yr</td>
<td class="data-head last">5 Yr</td>
<td class="data-head last">10 Yr</td>
<td class="data-head last">Life</td>
</tr>
<tr class="tbl-data">
<td class="data-td last">Class A: NAV (Inception 12/20/93)</td>
<td class="data-td data last">0.24</td>
<td class="data-td data last">1.96</td>
<td class="data-td data last">-6.31</td>
<td class="data-td data last">1.72</td>
<td class="data-td data last">-5.25</td>
<td class="data-td data last">0.55</td>
<td class="data-td data last">--</td>
</tr>
<tr class="tbl-data">
<td class="data-td last">Class A: Maximum 5.75% load</td>
<td class="data-td data last">-5.52</td>
<td class="data-td data last">-3.90</td>
<td class="data-td data last">-11.70</td>
<td class="data-td data last">-0.27</td>
<td class="data-td data last">-6.37</td>
<td class="data-td data last">-0.04</td>
<td class="data-td data last">--</td>
</tr>
<tr class="tbl-data">
<td class="data-td last">Class C: NAV (Inception 10/03/03)</td>
<td class="data-td data last">0.19</td>
<td class="data-td data last">1.71</td>
<td class="data-td data last">-7.11</td>
<td class="data-td data last">0.87</td>
<td class="data-td data last">-6.01</td>
<td class="data-td data last">-0.26</td>
<td class="data-td data last">--</td>
</tr>
<tr class="tbl-data">
<td class="data-td last">Class C: 1.00% Redemption Fee</td>
<td class="data-td data last">-0.81</td>
<td class="data-td data last">0.71</td>
<td class="data-td data last">-8.01</td>
<td class="data-td data last">0.87</td>
<td class="data-td data last">-6.01</td>
<td class="data-td data last">-0.26</td>
<td class="data-td data last">--</td>
</tr>
<tr class="tbl-data">
<td class="data-td last">Class I: NAV (Inception 12/31/07)</td>
<td class="data-td data last">0.23</td>
<td class="data-td data last">2.06</td>
<td class="data-td data last">-5.84</td>
<td class="data-td data last">2.20</td>
<td class="data-td data last">-4.78</td>
<td class="data-td data last">1.05</td>
<td class="data-td data last">--</td>
</tr>
<tr class="tbl-data">
<td class="data-td last">Class Y: NAV (Inception 04/30/10)</td>
<td class="data-td data last">0.24</td>
<td class="data-td data last">2.00</td>
<td class="data-td data last">-5.95<span style="white-space: pre;"> </span></td>
<td class="data-td data last">2.10</td>
<td class="data-td data last">-4.88</td>
<td class="data-td data last">0.92</td>
<td class="data-td data last">--</td>
</tr>
<tr class="tbl-data">
<td class="data-td last">Class Z: NAV (Inception 09/16/19)</td>
<td class="data-td data last">0.22</td>
<td class="data-td data last">2.06</td>
<td class="data-td data last">-5.72<span style="white-space: pre;"> </span></td>
<td class="data-td data last">2.31</td>
<td class="data-td data last">--</td>
<td class="data-td data last">-4.41</td>
</tr>
<tr class="tbl-data">
<td class="data-td last">MSCI EM IMI</td>
<td class="data-td data last">2.75</td>
<td class="data-td data last">3.94</td>
<td class="data-td data last">-10.74<span style="white-space: pre;"> </span></td>
<td class="data-td data last">9.18</td>
<td class="data-td data last">-0.58</td>
<td class="data-td data last">2.13</td>
<td class="data-td data last">--</td>
</tr>
<tr class="tbl-data">
<td class="data-td last">MSCI EM Index</td>
<td class="data-td data last">3.03</td>
<td class="data-td data last">3.96</td>
<td class="data-td data last">-10.70<span style="white-space: pre;"> </span></td>
<td class="data-td data last">7.83</td>
<td class="data-td data last">-0.91</td>
<td class="data-td data last">2.00</td>
<td class="data-td data last">--</td>
</tr>
</tbody>
</table>
</div>
<br />
<p class="chart-disclosure"><strong>The table presents past performance which is no guarantee of future results and which may be lower or higher than current performance. Returns reflect applicable fee waivers and/or expense reimbursements. Had the Fund incurred all expenses and fees, investment returns would have been reduced. Investment returns and Fund shares values will fluctuate so that investors&rsquo; shares, when redeemed, may be worth more or less than their original cost. Fund returns assume that dividends and capital gains distributions have been reinvested in the Fund at net asset value (NAV). Index returns assume that dividends of the Index constituents in the Index have been reinvested. Performance information current to the most recent month-end is available by calling 800.826.2333 or by visiting vaneck.com.</strong></p>
<p class="chart-disclosure">Expenses: Class A: Gross 1.45%; Net 1.45%; Class C: Gross 2.25%; Net 2.25%; Class I: Gross 1.14%; Net 1.00%; Class Y: Gross 1.13%; Net 1.10%; and Class Z: Gross 1.08%; Net 0.90%. Expenses are capped contractually until 05/01/23 at 1.60% for Class A, 2.50% for Class C, 1.00% for Class I, 1.10% for Class Y, and 0.90% for Class Z. Caps exclude acquired fund fees and expenses, interest, trading, dividends, interest payments of securities sold short, taxes and extraordinary expenses.</p>
<h2>Market Review</h2>
<p>The MSCI Emerging Markets Investable Market Index (&ldquo;MSCI EM IMI&rdquo;) returned 3.94% during the first quarter of 2023. Below we highlight the main developments that we believe affected the asset class:</p>
<p><i>Resilient EM growth:</i> EM economies continue to be strong, outgrowing developed markets (DM) by a significant margin (on average). At a regional level, EM growth remains particularly resilient in Asia, accelerated by the Chinese growth since the end of its Zero-Covid policy and solid first quarter activity data, as reflected particularly in the services sector. Growth has also been relatively resilient in CEEMEA economies, but it has been lagging in LatAm.<sup>1</sup></p>
<p><i>EM inflation past its peak:</i> Median inflation in EM economies has risen less than in DM economies and we expect headline inflation rates to decline significantly in most EMs over the course of 2023.<sup>2</sup>Please note, the inflation divergence across EM countries is high (every EM country/region is going through its own economic cycle at this point).</p>
<p><i>Monetary policy responses &ndash; different per EM country:</i> Given differences in EM country-specific economic cycles, there are different monetary policy responses. But broadly speaking, less inflationary pressure means that there is definite scope for lower rates, in due course, in a number of key EM economies.</p>
<h2>Fund Review</h2>
<p>On a sector level, consumer discretionary, industrials and utilities contributed to relative performance, whereas health care, energy and communication services detracted. On a country level, Argentina (MercadoLibre), the Philippines and India contributed to performance on a relative basis, while China, Turkey and Germany (Delivery Hero) detracted.</p>
<h2>Top Contributors</h2>
<p>Top contributors to return on an absolute basis during the quarter:</p>
<ul class="content-list">
<li><strong>MercadoLibre, Inc. (&ldquo;MELI&rdquo;)</strong> (4.36% of Fund net assets*) operates an online trading site for Latin American markets. MELI continues to report solid results. The company delivered a solid pace of growth in 4Q2022, with overall gross merchandise value (GMV) expanding 35% Year-over-Year (YoY) and positive results in every country in which they operate. MELI continues to benefit from e-commerce adoption and market share gains. The e-commerce take rate continues to see improvement. MELI also started to be more vocal on advertising revenues, increasing the visibility of the business. As of Q4, it represented 1.4% of GMV but that could more than double over time. Credit quality also showed a positive evolution. MELI continues to present a unique combination of leadership in e-commerce with accelerating growth in fintech.</li>
<li><strong>Taiwan Semiconductor Manufacturing Co., Ltd. (&ldquo;TSMC&rdquo;)</strong> (6.02%of Fund net assets*) &ndash; the thesis for TSMC is very much intact. We strongly believe it will be the leader in semiconductor manufacturing globally for many years to come, benefiting from the next generation of computer growth around large language models and generative AI. The volatility and variability of share price and multiple of the company shares &ndash; over the past year or so has largely flowed from geopolitics &ndash; U.S./China-related issues centrally and specifically as they relate to Taiwan. This quarter those fears and risks abated somewhat and the share price of TSMC reflected that, performing well.</li>
<li><strong>Prosus N.V. Class N </strong>(5.14% of Fund net assets*), a subsidiary and recent spinoff from our long-time holding in South Africa&rsquo;s Naspers, comprises a portfolio of leading internet assets outside of South Africa &ndash; across Asia, emerging Europe, MENA and LatAm. In addition to its 28% stake in Tencent Holdings and 21% stake in Delivery Hero, Prosus is heavily invested in three key e-commerce verticals that are beneficiaries of structural growth in digital trends globally, namely online food delivery, online classifieds and payments &amp; fintech. We remain positive on the company&rsquo;s ex-Tencent assets longer term, and also very much welcome Prosus&rsquo; management and board&rsquo;s recent actions to address the hefty discount of share price to the net asset value (NAV) of the company. Prosus also introduced an unlimited and open-ended share buyback program funded through a simultaneous gradual reduction of the Tencent stake in absolute terms (while actually maintaining or even increasing the exposure to Tencent on a per share basis) to unlock shareholder value, in addition to also providing more concrete guidance on the path towards and timing of profitability. We are also happy to see a recent recovery in Tencent&rsquo;s profitability and a resumption of Tencent&rsquo;s own share buyback program, which supported the share price performance of both Prosus and Tencent.</li>
</ul>
<h2>Top Detractors</h2>
<p>Top detractors to return on an absolute basis during the quarter:</p>
<ul class="content-list">
<li><strong>China Education Group Holdings Limited</strong> (2.81% of Fund net assets*) is a private higher education provider focused on tertiary education in China. The company operates universities and a vocational college and enrolls students across all provinces in mainland China. China Education provides bachelor's degree programs, junior college diploma programs and vocational education programs. We believe that the company should provide around 15% annual organic growth from its existing campuses and, once private valuations adjust, some upside from M&amp;A. We have patience in the process of finding suitable (and suitably priced acquisition targets), but the market appears to have expected some quicker results after recent fundraising. In addition, there is some opacity in the process and consequences of conversion of their assets to full &ldquo;for profit&rdquo; status. Whilst the settling of the regulatory landscape in this regard has been frustrating, we believe that the ultimate effect will be benign.</li>
<li><strong>MLP Saglik Hizmetleri AS Class B (&ldquo;MLP&rdquo;)</strong> (2.35% of Fund net assets*) is the largest private hospital group in Turkey. In addition, the group has a sizable medical tourism business to capitalize on the high-quality and cost-competitive care offered by its hospitals. This business line has shown very strong performance in 2022, driven by growing international demand and increasing MLP&rsquo;s foreign currency revenues against a weakening Turkish lira. Management&rsquo;s successful efforts to deleverage and strengthen its balance sheet have also positioned MLP very favorably for further inorganic expansion and share buybacks, which increases shareholder value. After very strong share price performance in 2022, we believe the recent share price weakness is a reflection of the uncertainty surrounding the political environment and upcoming elections in Turkey but we continue to be excited about the growth outlook for MLP and the upcoming expansion plans.</li>
<li><strong>Delivery Hero SE</strong> (1.10% of Fund net assets*) is a food delivery service listed in Germany. While the company remains headquartered in Germany, most of its actual operations are based in EM, spanning across EMEA, LatAm and Asia and operating in more than 70 countries globally with a leading position in more than 70% of them. During the quarter, Delivery Hero announced slightly lower-than-expected revenues mainly as South Korean growth, which is their most important market, continued to normalize after the relaxation of Covid restrictions. However, we were happy to see operating profits tracking ahead of expectations, which increases our conviction in management&rsquo;s medium-term profitability guidance and reinforces our belief that Delivery Hero is a long-term winner in the space.</li>
</ul>
<h2>Top Buys and Sells</h2>
<p>During the quarter, we established new positions in the following:</p>
<ul class="content-list">
<li><strong>Meituan &ndash; 3690 HK</strong> (0.22% of Fund net assets<sup>*</sup>) is China&rsquo;s leading e-commerce services platform company. Its apps connect consumers, including local businesses, for food delivery, in-store dining and hotel bookings, among other services. Through strong execution on cross-selling an expanding array of lifestyle services to users and its merchant-oriented focus, Meituan has become the largest food delivery network in the world, completing 25 million orders per day. The increase in the Fund&rsquo;s position was primarily driven by an in-specie spinoff from Tencent. In addition, we believe that market concerns about the competitive environment in food delivery are overstated, whilst their hotel and travel segment continues to be well supported by increased consumption.</li>
<li><strong>Eurobank Ergasias Services and &ndash; EUROB GA</strong> (0.17% of Fund net assets*) is one of four leading banks in the Greek banking sector. After nearly a decade of adjustments following the Greek economic crisis, we believe the bank has successfully restructured and cleaned up its balance sheet. In 2022, Eurobank had achieved record high profitability and elevated returns, tracking well above expectations and with further room for increase going forward. We see an exciting growth opportunity for Eurobank to be a key player in financing the new and long overdue investment cycle in Greece across many sectors including renewables, infrastructure, technology and tourism &amp; hospitality with strong backing from the EU. Our view is that Eurobank can continue to grow its lending book while further enhancing profitability and returns, benefiting from significant efficiency gains post-restructuring and sector consolidation.</li>
<li><strong>Sterling and Wilson Renewable &ndash; SWSOLAR IN</strong> (0.16% of Fund net assets<sup>*</sup>) is an India-based turn-key renewable energy EPC provider. We visited the company in Mumbai in the fourth quarter of 2022, and gained a full understanding of competitive and comprehensive service solutions and global reach. We believe strongly that the company will be a dominant player in the India energy transition opportunity with likely strong participation elsewhere in the region including in the Middle East and Africa. We stressed tested margins and risk following a restructuring and are confident in long-term profitability and growth in order books.</li>
</ul>
<p>During the period, we exited the following positions:</p>
<ul class="content-list">
<li><strong>GoerTek Inc &ndash; 002241 C2</strong> (0.00% of Fund net assets*) grew up as a component maker in AV and more recently as a component maker and assembler of AirPods for Apple &ndash; which speaks to qualification levels and execution skills.</li>
<li><strong>China Conch Environment Protec &ndash; 587 HK</strong> (0.00% of Fund net assets*) offers one-stop waste disposal solution services in China, covering collection and transport, testing and storage, compounding and transport, disposal and incineration of waste. The company represented a small position, which we exited as we thought that competition would squeeze markets and there appears to be a significant industry oversupply in the waste treatment industry.</li>
</ul>
<h2>Outlook</h2>
<p>The debate on the trade-off between sticky inflation and concern about economic weakness in DM has impacted the appetite for EM. We think that the impact of lower rates and a weaker U.S. dollar will ultimately prove to be positive in an asset class that has demonstrated its orthodox approach to financial management. With the strong tailwind of building economic confidence in China, the outlook is bright.</p>
<p><a href="/us/en/blogs/emerging-markets-equity/emerging-markets-growth-rotates-to-asia/eme-quarterly-commentary-q1-2023.pdf" title="VanEck Emerging Markets Fund Manager Commentary" target="_blank" rel="noopener"><strong>Download Commentary PDF with Fund specific information and performance.</strong></a></p>
<p>To receive more <a href="/us/en/insights/emerging-markets-equity/" title="Emerging Markets Equity Insights"><strong>Emerging Markets Equity</strong></a> insights, <a href="/us/en/subscribe/" title="Subscription Center"><strong>sign up in our subscription center</strong></a>.</p>
<style type="text/css">
    .wrapped-div {
        max-width: 100%;
    }

    @media (max-width: 768px) {
        .wrapped-div {
            overflow-x: scroll;
        }
    }

    .wrapped-div-sector {
        max-width: 100%;
        overflow-x: scroll;
    }
</style>
]]></content:encoded>
</item><item rdf:about="https://www.vaneck.com/us/en/blogs/emerging-markets-bonds/em-debt-safe-ship-in-stormy-seas/">
  <title>EM Debt: Safe Ship in Stormy Seas></title>
  <link>https://www.vaneck.com/us/en/blogs/emerging-markets-bonds/em-debt-safe-ship-in-stormy-seas/</link>
  <description><![CDATA[A tumultuous few months have strengthened our conviction that money will flow out of developed markets bonds and into emerging markets bonds due to &ldquo;fiscal dominance&rdquo; in developed markets.]]></description>
  <dc:creator>Eric Fine</dc:creator>
  <dc:date>04/19/2023 06:30:00</dc:date>
<content:encoded><![CDATA[

<h2>Overview</h2>
<p>In March, the VanEck Emerging Markets Bond Fund (the Fund) returned 1.50%, compared to 2.54% for its benchmark, the 50% J.P. Morgan Government Bond Index-Emerging Markets (GBI-EM) Global Diversified and 50% J.P. Morgan Emerging Markets Bond Index (EMBI), generating underperformance of 104 basis points (bps). This underperformance was because local currency was the big champion in March, consistent with our outlook. The Fund has a maximum allowed allocation of 60% of AUM to local currency, in line with its benchmark. Year-to-date (YTD), the Fund returned 3.58%, compared to 3.51% for its benchmark, resulting in outperformance of 7 bps. As of end-March, local currency exposure was 55.20%, duration was 5.41 and carry was 6.06%. <a href="/us/en/blogs/emerging-markets-bonds/em-debt-safe-ship-in-stormy-seas/emb-manager-commentary-03-2023.pdf" rel="noopener" target="_blank" title="VanEck Emerging Markets Bond Fund Monthly Manager Commentary - March 2023"><strong>View here for a PDF version of this blog</strong></a>.</p>
<div class="wrapped-div">
<table style="width: 100%;">
<tbody>
<tr class="tbl-data">
<td class="tbl-header last" colspan="8">Average Annual Total Returns (%) as of March 31, 2023</td>
</tr>
<tr class="tbl-data">
<td class="data-td last">&nbsp;</td>
<td class="data-head last">1 Month<sup>&dagger;</sup></td>
<td class="data-head last">3 Month<sup>&dagger;</sup></td>
<td class="data-head last">YTD</td>
<td class="data-head last">1 Year</td>
<td class="data-head last">3 Year</td>
<td class="data-head last">5 Year</td>
<td class="data-head last">10 Year</td>
</tr>
<tr class="tbl-data">
<td class="data-td last">Class A: NAV (Inception 7/9/12)</td>
<td class="data-td data last">1.50</td>
<td class="data-td data last">3.58</td>
<td class="data-td data last">-0.38</td>
<td class="data-td data last">8.30</td>
<td class="data-td data last">0.85</td>
<td class="data-td data last">0.33</td>
</tr>
<tr class="tbl-data">
<td class="data-td last">Class A: Maximum 5.75% load</td>
<td class="data-td data last">-4.34</td>
<td class="data-td data last">-2.38</td>
<td class="data-td data last">-6.11</td>
<td class="data-td data last">6.19</td>
<td class="data-td data last">-0.34</td>
<td class="data-td data last">-0.26</td>
</tr>
<tr class="tbl-data">
<td class="data-td last">Class I: NAV (Inception 7/9/12)</td>
<td class="data-td data last">1.52</td>
<td class="data-td data last">3.42</td>
<td class="data-td data last">-0.04</td>
<td class="data-td data last">8.60</td>
<td class="data-td data last">1.14</td>
<td class="data-td data last">0.63</td>
</tr>
<tr class="tbl-data">
<td class="data-td last">50 GBI-EM GD / 50% EMBI GD</td>
<td class="data-td data last">2.54</td>
<td class="data-td data last">3.51</td>
<td class="data-td data last">-3.81</td>
<td class="data-td data last">0.48</td>
<td class="data-td data last">-1.43</td>
<td class="data-td data last">0.29</td>
</tr>
</tbody>
</table>
</div>
<br />
<div class="wrapped-div">
<table style="width: 100%;">
<tbody>
<tr class="tbl-data">
<td class="tbl-header last" colspan="8">Average Annual Total Returns (%) as of December 31, 2022</td>
</tr>
<tr class="tbl-data">
<td class="data-td last">&nbsp;</td>
<td class="data-head last">1 Month<sup>&dagger;</sup></td>
<td class="data-head last">3 Month<sup>&dagger;</sup></td>
<td class="data-head last">YTD</td>
<td class="data-head last">1 Year</td>
<td class="data-head last">3 Year</td>
<td class="data-head last">5 Year</td>
<td class="data-head last">10 Year</td>
</tr>
<tr class="tbl-data">
<td class="data-td last">Class A: NAV (Inception 7/9/12)</td>
<td class="data-td data last">2.82</td>
<td class="data-td data last">10.32</td>
<td class="data-td data last">-7.73</td>
<td class="data-td data last">-0.64</td>
<td class="data-td data last">0.67</td>
<td class="data-td data last">0.27</td>
</tr>
<tr class="tbl-data">
<td class="data-td last">Class A: Maximum 5.75% Load</td>
<td class="data-td data last">-3.09</td>
<td class="data-td data last">3.98</td>
<td class="data-td data last">-13.04</td>
<td class="data-td data last">-2.58</td>
<td class="data-td data last">-0.52</td>
<td class="data-td data last">-0.33</td>
</tr>
<tr class="tbl-data">
<td class="data-td last">Class I: NAV (Inception 7/9/12)</td>
<td class="data-td data last">2.93</td>
<td class="data-td data last">10.43</td>
<td class="data-td data last">-7.21</td>
<td class="data-td data last">-0.30</td>
<td class="data-td data last">1.00</td>
<td class="data-td data last">0.59</td>
</tr>
<tr class="tbl-data">
<td class="data-td last">50 GBI-EM GD / 50% EMBI GD</td>
<td class="data-td data last">1.24</td>
<td class="data-td data last">8.30</td>
<td class="data-td data last">-14.73</td>
<td class="data-td data last">-5.64</td>
<td class="data-td data last">-1.85</td>
<td class="data-td data last">-0.17</td>
</tr>
</tbody>
</table>
</div>
<br />
<p class="chart-disclosure"><sup>&dagger;</sup>&nbsp;Returns less than one year are not annualized. Effective 4/30/20, all of the Fund&rsquo;s Class C shares were converted to Class A shares. Class C shares are no longer available for sale.</p>
<p class="chart-disclosure"><strong>The table presents past performance which is no guarantee of future results and which may be lower or higher than current performance. Returns reflect temporary contractual fee waivers and/or expense reimbursements. Had the Fund incurred all expenses and fees investment returns would have been reduced. Investment returns and Fund share values will fluctuate so that investors' shares, when redeemed, may be worth more or less than their original cost. Fund returns assume that dividends and capital gains distributions have been reinvested in the Fund at NAV.</strong></p>
<p class="chart-disclosure"><strong>Expenses: Class A: Gross 2.33%, Net 1.28%; Class I: Gross 1.74%, Net 0.96%.</strong> Van Eck Associates Corporation (the &ldquo;Adviser&rdquo;) has agreed to waive fees and/or pay Fund expenses to the extent necessary to prevent the operating expenses of the Fund (excluding acquired fund fees and expenses, interest expense, trading expenses, dividends and interest payments on securities sold short, taxes and extraordinary expenses) from exceeding 1.25% for Class A and 0.95% for Class I of the Fund&rsquo;s average daily net assets per year until May 1, 2023. During such time, the expense limitation is expected to continue until the Board of Trustees acts to discontinue all or a portion of such expense limitation. Please note that, generally, unconstrained bond funds may have higher fees than core bond funds due to the specialized nature of their strategies.</p>
<p><strong>DMs are once again threatening global markets, with the US (and Switzerland) facing a banking crisis. However, while it might appear &ldquo;resolved&rdquo; (due to yet more de-facto guarantees on central bank money liabilities), once again, emerging markets (EM) aren&rsquo;t the problem and were the solution. </strong>A tumultuous few months have strengthened our conviction that money will flow out of DM bonds and toward EM bonds due to &ldquo;fiscal dominance&rdquo; in DM. We continue to ask why non-US-aligned central banks would not seek to reduce their ratio of US treasuries as assets, and replace them with gold and EM local-currency bonds. Do they have a choice, given the politicization of the use of US dollars? Reserve status is a function of underlying geopolitical configurations, more on that &ldquo;most important thing&rdquo; later. EM local currency was a big winner in March. There&rsquo;s really no better argument for our thesis than that outcome. The GBI-EM local currency index was up over 4% in March, in the midst of a still-resolving US (and Swiss) banking crisis.</p>
<h3>Exhibit 1 &ndash; EM Local Currency Went Straight to Winning in Crisis-Driven March</h3>
<p><img class="img-responsive w-100" src="https://www.vaneck.com/contentassets/554c600f16d74115bf298cfce106744c/3108_emb_chart_01_2023.04_v1_blog.svg" alt="Exhibit 1 - EM Local Currency Went Straight to Winning in Crisis-Driven March" /></p>
<p class="chart-disclosure">Source: Bloomberg. Data as of MTD ending 3/31/2023.</p>
<p><strong>As seen on TV! The biggest risk! The advent of a new geopolitical configuration involving an integrating alliance of nations that are:</strong></p>
<ul class="content-list">
<li>Major developed markets (DM) countries are highly indebted, which when combined with recession-aversion means constrains monetary policy (&ldquo;fiscal dominance&rdquo;)</li>
<li>DMs are thus constrained in their ability to hike rates, which would cause recessions and/or ultimately &ldquo;bankrupt&rdquo; their governments</li>
<li>This being unacceptable, thus their currencies will bear the burden</li>
<li>Currency declines in DM may initially appear painless due to ex-post low FX-passthrough-to-inflation and the structural demand form US dollar in risk-off due to most debt being in US dollar terms</li>
<li>Major DM debtors respond to financial crisis or even simple recession risk with liquidity (in DM currencies)</li>
<li>Heavily-indebted DMs are sanctioning their creditors</li>
<li>Economically orthodox EMs are going their own way</li>
<li>EMs have well-capitalized banking systems (common-equity to assets in EMs is two standard deviations superior to DM&rsquo;s&hellip;think about that&hellip;and loan-to-deposit ratios also favor EMs, other than outliers such as South Africa and Chile)</li>
<li>EMs often have strong and improving structural reform from Indonesia to Angola (subsidy reform, tax and regulatory simplification, e-government, etc.), world-class bureaucrats and elites that fluent in multiple languages, and trained in western educational traditions</li>
<li>EMs are DM&rsquo;s best students. As our economist, Natalia Gurushina likes to say: &ldquo;they are the graduates!&rdquo;</li>
</ul>
<p><strong>Too many business models rely on the old geopolitical configuration, which is too bad. Get over it and be positioned, we think. The market is not priced to reality, it is priced to the bureaucratic inertia and natural human denial that characterize western financial centers, to our eye. </strong>This is the biggest mispricing we see in markets. China, Russia, Saudi Arabia, United Arab Emirates, Iran, India, Brazil, South Africa, and more, are increasingly using each other&rsquo;s currencies in trade. Notice, by the way, the confluence of energy-suppliers, to which the Federal Reserve has no tools. Just wait until finance, that is, borrowing in each other&rsquo;s currencies, gets started! This creates secular money demand, which can be met by secular money supply. The result of this non-inflationary expansion of EM balance sheets is massive growth and fiscal space for the EM! This is precisely what the US leveraged the past several decades &ndash; a secular increase in money supply, which was non-inflationary because the money was demanded by orthodox monetary policy (i.e., Volcker providing reserve-currency status to the Saudis), then orthodox fiscal and structural policy (President Reagan&rsquo;s and President Clinton&rsquo;s welfare and structural reforms, but also the fraught increase in financial de-regulation, and the all-stick-no-carrot attitude to the world). And then more, on steroids, under Presidents Bush and President Obama. This process will take a decade, for sure. But it&rsquo;s the major secular trend. And, <em>it&rsquo;s literally on TV - get over it and position.</em></p>
<p><strong>As a result of this history, there is nothing left for US policy other than endless morphine. As in liquidity provision. </strong>The US policy response is limited to pure liquidity provision, which means more un-demanded dollar supply. Everyone can measure money supply, no one can measure money demand other than by observation. Money will flow offshore from the US as a result, in our opinion. Asset quality at the Fed (will it include commercial real estate in some form?) will be the victim on the asset side, and simple money will be the victim on the liability side. Which means endless dollars. This would cause a major, secular dollar deterioration from a money supply perspective. And policy rates can&rsquo;t rise (due to societal rejection of recession as an option, and &ldquo;fiscal dominance&rdquo; in the DM, both of which we&rsquo;ve discussed in previous blogs). Many investors ask about our opinions (to be clear, not portfolio-drivers) on US rates. Here it is: It seems like pure duration is very vulnerable. As a simple thought experiment &ndash; if the Fed hikes today, they cut even more the next day/week/month, and the yield curve steepens. And if they cut, the curve steepens. And, if you tell us the 2-year US Treasury rallies to the 1% handle, we actually see it. <em>It fits our investment process&rsquo;s lower duration. But it&rsquo;s not the reason for it.</em></p>
<h3>Exhibit 2 &ndash; Fed Operating Loss</h3>
<p><img class=" img-responsive w-100" src="https://www.vaneck.com/contentassets/554c600f16d74115bf298cfce106744c/3108_emb_chart_02_2023.04_v1_blog.svg" alt="Exhibit 2 - Fed Operating Loss" /></p>
<p class="chart-disclosure">Source: Bloomberg LP. Data as of April 12, 2023. Past performance is no guarantee of future results.</p>
<p><strong>Without profound structural reform or a reversal of long-in-train geopolitical developments that are only now being acknowledged, DMs are on their heels for a decade. </strong>We see no prospect of any serious structural or fiscal reform in the DMs (perhaps excluding Japan, but monetary and fiscal have more to go, and we&rsquo;ve discussed our views on Japan&rsquo;s yield curve control elsewhere&hellip;maybe Japan is good for Japan, but bad for the west?). Anyway, our theses seem somewhat well-paved at this point.</p>
<h2>Exposure Types and Significant Changes</h2>
<p>The changes to our top positions are summarized below. Our largest positions in March were Indonesia, South Africa, Malaysia, Brazil and Thailand.</p>
<ul class="content-list">
<li>We increased our hard currency sovereign exposure in Ukraine and Turkey. The Ukrainian government consistently shows willingness to honor its debt obligations. We recognize that continuing military actions pose risks and create uncertainty, but Ukraine&rsquo;s relatively light schedule for the next several months bodes well for the technical test score for the country. Turkey&rsquo;s idiosyncratic policy mix is one of the main reasons why we stay away from local debt, but the country&rsquo;s sovereign debt is now attractively valued, while the unorthodox FX framework somewhat reduced pressure on the international reserves. In terms of our investment process, this improved the technical test score for the country.</li>
<li>We also increased our hard currency sovereign exposure in Qatar and Saudi Arabia. Both countries are among the key beneficiaries from higher oil prices due to Russia's invasion of Ukraine - especially as it relates to growth, fiscal positions, and external balances. Saudi Arabia also demonstrates consistent structural efforts to strengthen governance and diversify the economy from oil. In terms of our investment process, this improved the economic, policy, and technical test scores for the country.</li>
<li>We increased our hard currency sovereign exposure in Pakistan, Honduras, and Democratic Republic of the Congo. Pakistan&rsquo;s politics remain volatile, but the country&rsquo;s bonds are attractively valued (the highest initial allocation bucket #1), and it is on track to get an extension of the IMF program until mid-2023. In the meantime, the central bank is trying to maintain a tight monetary policy stance, which should help to alleviate external pressures. In terms of our investment process, this improved the policy test score for the country. In regards to Honduras, the peaceful transition of power and the government&rsquo;s supportive stance towards the private sector (as well as the favorable impression during the IMF meetings) strengthened the policy test score for the country. Democratic Republic of the Congo is making good progress towards an IMF deal, and its bonds were very attractively valued, improving the country&rsquo;s policy and technical test scores.</li>
<li>We reduced our hard currency sovereign exposure in Hungary and local currency exposure in Poland. In Hungary, the ruling party&rsquo;s re-election with a larger-than-expected margin, and signals that it can get embroiled in the Russia/Ukraine war in addition to political/legal complications with the EU - which can potentially cost it disbursements from the EU&rsquo;s recovery funds - worsened the country&rsquo;s policy/politics test score. Poland is very exposed to the fallout from the Russia/Ukraine war. The recent cutoff of Russian gas supplies shows that upside inflation risks can prove more persistent. The government&rsquo;s expansionary fiscal stance can create additional technical issues for local debt. In terms of our investment process, this negatively affected the technical and policy test scores for the country.</li>
<li>We also reduced our local currency exposure in Brazil, hard currency corporate exposure in Moldova, and hard currency sovereign exposure in Angola. The Brazilian r&eacute;al&rsquo;s super-stretched net long positioning means that it can easily get caught in the global sell-off on the back of China growth concerns. Against the backdrop of the deteriorating technical test score, we decided to take partial profits on this position, which worked extremely well early in the year. In Moldova, we sold a corporate bond after the company lost access to the sea after Russia attacked Ukraine.</li>
<li>Finally, we reduced local currency exposure in Malaysia and Thailand. Malaysia can easily be affected by the Chinese renminbi&rsquo;s depreciation, as the ringgit has one of the highest correlations with renminbi on multiple time horizons. This worsened the technical test score for the country. In Thailand, we swapped from local to quasi-sovereign exposure due to &ldquo;twin&rdquo; concerns about the Chinese renminbi&rsquo;s depreciation and the impact of China&rsquo;s zero-COVID policy on tourism. Both factors worsened the country&rsquo;s technical and economic test scores.</li>
</ul>
<p>To receive more <a href="https://www.vaneck.com/us/en/insights/emerging-markets-bonds/" title="Emerging Markets Bonds Insights"><strong>Emerging Markets Bonds</strong></a> insights, <a href="https://www.vaneck.com/us/en/subscribe/" title="Subscription Center"><strong>sign up in our subscription center</strong></a>.</p>
<style>
    .wrapped-div {
        max-width: 100%;
    }

    @media (max-width: 768px) {
        .wrapped-div {
            overflow-x: scroll;
        }
    }

    .wrapped-div-sector {
        max-width: 100%;
        overflow-x: scroll;
    }
</style>
]]></content:encoded>
</item><item rdf:about="https://www.vaneck.com/us/en/blogs/economic-trends/rate-cuts-and-sanity-checks/">
  <title>Rate Cuts and Sanity Checks></title>
  <link>https://www.vaneck.com/us/en/blogs/economic-trends/rate-cuts-and-sanity-checks/</link>
  <description><![CDATA[The Hungarian forint&rsquo;s reaction to suggestions about early rate cuts was a teachable moment. Brazil&rsquo;s room for easing might remain limited until there is more certainty about the fiscal outlook.]]></description>
  <dc:creator>Natalia  Gurushina</dc:creator>
  <dc:date>04/19/2023 06:30:00</dc:date>
<content:encoded><![CDATA[

<h2>Rate Cuts Expectations</h2>
<p>Last week in DC, <strong>the IMF repeatedly cautioned against premature rate cut communications</strong>, but the Hungarian central bank either did not listen carefully, or decided to check what happens anyway. The currency (the Hungarian forint) had a very adverse reaction to an early rate cut suggestion from the deputy governor, weakening the most against the U.S. Dollar compared to emerging markets (EM) peers (as of 10:00am ET, according to Bloomberg LP). We are not saying that the IMF is always right, and we realize that some factors (like the mother of all base effects) argue for faster disinflation in H2. Hungary&rsquo;s case is also quite extreme &ndash; we do not see 20%+ headline and core inflation (vs. 3% inflation target) very often in EM these days. Still, the forint&rsquo;s reaction was a teachable moment, which hopefully got noticed by various EM central banks. High real rates helped to shield many EMs from this year&rsquo;s market turbulence &ndash; and it is not wise to throw this cushion away while there are plenty of bumps on the disinflation road.</p>
<h2>EM Disinflation</h2>
<p>In fact, <strong>it might be prudent for some EMs to raise their policy rates a bit more</strong>. This is what the market currently prices in for South Africa, where headline inflation surprised to the upside in March, re-accelerating to 7.1% year-on-year, and core inflation stayed close to a multi-year high of 5.2% year-on-year. The surprise was mostly due to higher food prices - mega-drought in Argentina, as well as a rising probability of El Nino this year can create headwinds for disinflation not just in South Africa but in wider EM in the coming months.</p>
<h2>LATAM Fiscal Outlook</h2>
<p><strong>Sanity checks for EM rate cuts can also come from the fiscal side.</strong> The market continued to adjust its expectations for policy easing in Brazil in 6-12 months, as it received the final version of the government&rsquo;s new fiscal framework. Many details of the plan were known before, but the document confirmed that the new framework is more convoluted and less enforceable. There is also a lot of uncertainty about generating additional revenue to meet the primary fiscal targets (which might not necessarily stabilize the debt/GDP ratio). So, even though Brazil&rsquo;s real policy rate is the highest among major EMs (around 8.7%), the local swap curve priced out about 50bps of implied rate cuts on a 1-year horizon within the past week (see chart below). It is not the end of Brazil&rsquo;s easing story, but fiscal certainly is key for a big breakthrough. Stay tuned!</p>
<h3>Chart at a Glance: Brazil&rsquo;s Policy Easing Room &ndash; Fiscal Certainty Is Key</h3>
<p><img class="w-100 img-responsive" src="https://www.vaneck.com/contentassets/79b1db2e397242c5a6cc5365f19f587d/us-natalias-take-2023-04-19-b.png" alt="Chart at a Glance: Brazil's Policy Easing Room - Fiscal Certainty Is Key" /></p>
<p class="chart-disclosure">Source: Bloomberg LP.</p>
]]></content:encoded>
</item><item rdf:about="https://www.vaneck.com/us/en/blogs/income-investing/green-bonds-market-growth-continues/">
  <title>Green Bonds: Market Growth Continues></title>
  <link>https://www.vaneck.com/us/en/blogs/income-investing/green-bonds-market-growth-continues/</link>
  <description><![CDATA[Green bond sales just hit an all-time record, reflecting continued demand for sustainable fixed income within a core bond portfolio.]]></description>
  <dc:creator>William Sokol</dc:creator>
  <dc:date>04/18/2023 06:30:00</dc:date>
<content:encoded><![CDATA[

<p>Sustainable fixed income investments, and green bonds in particular, have fared relatively well over the year amid a less favorable environment for other areas of the sustainable finance market. U.S. mutual funds and ETFs that incorporate environmental, social and governance (ESG) factors into their investment strategies suffered their first calendar year net outflow in 2022 since 2016.<sup>1</sup>&nbsp;Most of these funds are underweight or avoid traditional energy sector names altogether, hurting performance given that sector&rsquo;s outperformance. Further, many ESG equity strategies tend to be more growth-oriented, which generally suffered in 2022. Aside from performance, it is also undeniable that sentiment towards ESG investing has had to withstand greater scrutiny on &ldquo;greenwashing&rdquo; as well as increasing politicization.</p>
<h2>A Relative Bright Spot Within Fixed Income</h2>
<p>Unlike equity strategies, fixed income ESG flows were modestly positive for the year, although much lower than 2021&rsquo;s record. In the primary markets, green bonds experienced their busiest quarter ever in terms of new issues, according to Bloomberg, with approximately $164 billion of new issuance representing a 32% year-on-year increase. Many corporate and governmental issuers rushed to market to take advantage of favorable conditions, including continued high demand for sustainable fixed income investments &ndash; particularly those featuring the green &ldquo;use of proceeds&rdquo; structure that defines green bonds.</p>
<p>We believe that the structure of green bonds has made them relatively more resilient to some of the complexities and criticisms of other ESG strategies. This is all the more notable, in our opinion, given the significant volatility in bond markets since the beginning of 2022. Because they only finance environmentally friendly projects, the evaluation of green bonds is more objective and straightforward versus a broader assessment of an issuer&rsquo;s sustainability credentials.</p>
<h2>Avoiding Greenwashing</h2>
<p>Not every &ldquo;green&rdquo; project is unambiguously green, but projects being financed can be assessed against a <strong><a href="https://www.vaneck.com/us/en/offsite-disclaimer/?id=227340&amp;button=no&amp;url=https://www.climatebonds.net/files/files/Taxonomy/CBI_Taxonomy_Tables-08A%20%281%29.pdf" target="_blank" title="Climate Bonds Taxonomy" rel="noopener">taxonomy</a></strong> such as the one maintained by the Climate Bonds Initiative (&ldquo;CBI&rdquo;) to determine whether they are consistent with a low carbon economy and the goals of the Paris Agreement. The CBI has long been a leading voice in the sustainable fixed income market, and their taxonomy is based on climate science and informed by technical experts, as well as ongoing dialog with market participants. In addition, we have observed a notable improvement in the level of disclosure provided by issuers in terms of both the level of detail provided on the projects financed, as well as an increase in the number of issuers providing estimated environmental impact figures (e.g. greenhouse gas avoided). Although more work is needed to enhance and standardize disclosures market-wide, we believe this is a positive development that helps to allay concerns about greenwashing and is another factor that has provided support to the green bond market&rsquo;s continued growth.</p>
<h2>Developments in the Green Bond Market</h2>
<p>The resilience of the green bond market has supported some exciting developments. For example, several new issuers have come to market in the past year while repeat issuers continue to report a positive experience in the market. For example, according to CBI research, numerous repeat issuers emphasized that the green label has supported deal placement, even in the volatile market conditions experienced over the past year. Ireland&rsquo;s sovereign issuance was ten times oversubscribed, for example. India came to market in the first quarter with its first sovereign deal, bringing the number of sovereign green bond issuers to 31. Household U.S. companies like General Motors, Ford, PepsiCo and Comcast have issued USD-denominated green bonds since the start of 2022.</p>
<p>From a return perspective, green bonds continue to perform as expected &ndash; that is, in line with traditional non-green bonds because the risk and return profile of a green bond is generally the same as a non-green bond, all else equal. As shown in the chart below, performance has been highly correlated to a broad aggregate bond exposure, with differences primarily explained by sector differences. In a year such as 2022, that meant similarly dismal performance as other fixed income asset classes. However, longer-term we believe this provides a strong case for including green bonds within a core bond portfolio, especially at today&rsquo;s higher yields. From a yield, duration and quality perspective, an allocation to USD-denominated green bonds does not have a major impact on overall risk and return. At the same time, investors may benefit from more diversified sector exposure and a tilt towards issuers who are proactively addressing sustainability in their operating plans and strategies.</p>
<h3>Performance of Green Bonds vs. Broad Aggregate Bond Exposure</h3>
<p><img loading="lazy" class="img-responsive w-100" src="https://www.vaneck.com/contentassets/69a57d097f0647ae820d7c910838623c/3101_create-green-bond-blog_2023.04_blog.svg" alt="Performance of Green Bonds vs. Broad Aggregate Bond Exposure" /></p>
<p class="chart-disclosure">Source: Morningstar. USD Green Bonds is represented by the S&amp;P Green Bond USD Select Index; US Agg is represented by the ICE BofA US Broad Market Index; US IG Corporates is represented by the ICE BofA US Corporate Index.</p>
<p>To receive more <a href="/us/en/blogs/income-investing/" title="Income Investing Insights"><strong>Income Investing</strong></a> insights, <a href="/link/5f45412c2143400497908cea2897f7d3.aspx" title=" Subscription Center"><strong>sign up in our subscription center</strong></a>.</p>
]]></content:encoded>
</item><item rdf:about="https://www.vaneck.com/us/en/blogs/economic-trends/china-growth-reboot-and-rebalance/">
  <title>China Growth – Reboot and Rebalance></title>
  <link>https://www.vaneck.com/us/en/blogs/economic-trends/china-growth-reboot-and-rebalance/</link>
  <description><![CDATA[China&rsquo;s stronger than expected growth bodes well for many EMs &ndash; but does it also mean additional inflation risks down the road?]]></description>
  <dc:creator>Natalia  Gurushina</dc:creator>
  <dc:date>04/18/2023 06:30:00</dc:date>
<content:encoded><![CDATA[

<h2>Global Growth Outlook</h2>
<p>China&rsquo;s stronger-than-expected Q1 GDP number (4.5% year-on-year) gave more credence to the <strong>&ldquo;two-speed&rdquo; global growth story, which creates more opportunities for emerging markets (EM) assets to perform well in the coming months</strong>. Even though the IMF spring meetings eased concerns about a recession in advanced economies, both the U.S. and the Eurozone are expected to expand by about 1% or so this year in real terms. Meanwhile, China&rsquo;s Q1 GDP print suggests that both the consensus growth forecast for 2023 (5.3%) and the official growth target (about 5%) might be too conservative. The next question is which emerging markets are better positioned to benefit from a stronger rebound in China &ndash; and this is where China&rsquo;s changing growth drivers come into play.</p>
<h2>China Recovery</h2>
<p><strong>China&rsquo;s</strong> Q1 recovery was led by consumption (see chart below), including post-reopening &ldquo;revenge&rdquo; spending on services and travel, among other things. A big upside surprise in March&rsquo;s retail sales (up by 10.6% year-on-year) seconded this conclusion. This, in turn, gave rise to suggestions about the <strong>frontloaded recovery</strong> that might lose steam later in the year. &ldquo;Revenge&rdquo; spending is not going to last forever, of course, but there is also a possibility that housing can pick up the baton in H2 if the current real estate trends &ndash; which show clearer signs of recovery &ndash; continue. Further policy calibration can definitely help to boost property construction, as well as address such obvious weaknesses as private investments, which continued to lag well behind state-owned peers.</p>
<h2>EM Spillovers From China</h2>
<p>China&rsquo;s recovery is now more &ldquo;inward-looking&rdquo;, limiting positive spillovers to EM manufacturing, but still offering support to services (especially tourism) and commodities. And <strong>if growth continues to surprise to the upside, we might see more concerns about potential inflation spillovers</strong> down the road, which can intervene with a super-supportive H2 base effect across EM. Other potential risks that might slow or temporarily disrupt the disinflation process in EM include Argentina&rsquo;s mega-drought and a higher risk of El Nino (a 40% probability, according to a recent report from Deutsche Bank). Stay tuned!</p>
<h3>Chart at a Glance: China Growth &ndash; Services Spring Back To Action</h3>
<p><img class="w-100 img-responsive" src="https://www.vaneck.com/contentassets/33650c068a3448c284989138bafb0106/us-natalias-take-2023-04-18.png" alt="Chart at a Glance: China Growth - Services Spring Back To Action" /></p>
<p class="chart-disclosure">Source: Bloomberg LP.</p>
]]></content:encoded>
</item><item rdf:about="https://www.vaneck.com/us/en/blogs/economic-trends/em-back-to-core-issues/">
  <title>EM - Back to Core Issues></title>
  <link>https://www.vaneck.com/us/en/blogs/economic-trends/em-back-to-core-issues/</link>
  <description><![CDATA[A more solid growth backdrop is a boon to EMs, but can EMs handle potential inflation risks?]]></description>
  <dc:creator>Natalia  Gurushina</dc:creator>
  <dc:date>04/17/2023 15:00:00</dc:date>
<content:encoded><![CDATA[

<h2>Global Recession Risks</h2>
<p>The IMF spring meetings provided <strong>a dose of optimism about the global growth outlook</strong>, including developed markets (DM). The U.S. economy was deemed more resilient &ndash; it might be a sheer coincidence but the U.S. growth forecast for 2023 just got a small upgrade &ndash; leaving more room for the U.S. Federal Reserve to hike again in May (the implied probability rose to 85%). As regards other independent global growth drivers, China&rsquo;s recovery is well underway. China&rsquo;s Q1 GDP and domestic activity indicators for March (retail sales, industrial production) will be released tonight, and the consensus sees further improvements across the board. Some observers suggested that authorities&rsquo; decision to keep the 1-year medium-term lending facility rate unchanged over the weekend (as well as a smaller than expected liquidity injection) was a sign that the growth numbers should look good.</p>
<h2>EM Disinflation</h2>
<p>Fewer global growth concerns is a boon to emerging markets (EM), especially to exporters and lower-income economies. The question is whether stronger activity would generate additional price pressures, making it more difficult for various EM central banks to cut rates. <strong>Headline disinflation in EM is progressing well </strong>&ndash; with some notable exceptions like Argentina -<strong> but core price pressures are more persistent</strong> (see chart below). Today&rsquo;s core inflation print in Poland &ndash; which was above consensus and still accelerating (to 12.3% year-on-year) &ndash; is a good example, and our chart shows that this problem is not unique to Central Europe. We think that EMFX strong year-to-date performance &ndash; despite market turbulence caused by the mini-banking crisis in DM &ndash; should help to alleviate some of these issues going forward. However, we repeatedly heard in country meetings last week that the labor market in many EMs is tight, and it is not uncommon for GDP growth to be above potential. These factors might slow core disinflation, while keeping inflation expectations above central banks&rsquo; comfort zone.</p>
<h2>EM Rate Cut Prospects</h2>
<p>Under these circumstances, <strong>the IMF&rsquo;s message to EMs was clear &ndash; do not communicate rate cuts prematurely</strong>, and the latest changes in the market expectations show that the message is sinking in. Higher-for-longer real EM rates are not necessarily a bad thing. They provide a safety cushion for EMFX during episodes of market turbulence, and they are also supportive of EM local debt &ndash; especially in countries with positive macro and flow stories. Stay tuned!</p>
<h3>Chart at a Glance: EM Core Prices &ndash; Plateau Rather Than Disinflation</h3>
<p><img class="img-responsive w-100" src="https://www.vaneck.com/contentassets/9b86a8391d604a1194e6e4534580e6a0/us-natalias-take-2023-04-17.png" alt="Chart at a Glance: EM Core Prices - Plateau Rather Than Disinflation" /></p>
<p class="chart-disclosure">Source: VanEck Research; Bloomberg LP</p>
]]></content:encoded>
</item><item rdf:about="https://www.vaneck.com/us/en/blogs/income-investing/rating-migrations-shake-up-sector-exposure/">
  <title>Rating Migrations Shake Up Sector Exposure></title>
  <link>https://www.vaneck.com/us/en/blogs/income-investing/rating-migrations-shake-up-sector-exposure/</link>
  <description><![CDATA[Volatility, inverted yield curves and widening credit spreads led the Q1 narrative. Within the fallen angel Index, auto exposure increased while energy exposure decreased.]]></description>
  <dc:creator>Nicolas  Fonseca, CFA</dc:creator>
  <dc:date>04/17/2023 06:30:00</dc:date>
<content:encoded><![CDATA[

<p>Fallen angels (as represented by the ICE US Fallen Angel High Yield 10% Constrained Index, &ldquo;H0CF&rdquo;) outperformed broad HY (as represented by the ICE BofA US High Yield Index, &ldquo;H0A0&rdquo;) by 0.30% (1.43% vs 1.13%) in March, bringing returns in line year to date (3.70% vs 3.72%). Fallen angel&rsquo;s longer duration vs broad HY was a tailwind in March as it contributed to more than 100% of the outperformance, with rates continuing to be very volatile. The bond market was whipsawed by swings in the U.S. Federal Reserve&rsquo;s (Fed&rsquo;s) expectations over the quarter as growth and inflation expectations continued to adjust, while the chaos created by Silicon Valley Bank (SVB) created a banking mini-crisis in March. Short end rates increased, as the Fed maintained its stand and cumulatively raised rates by 0.50% (+0.25% in both meetings) in Q1. During the quarter, the 2s10s yield curve hit its most inverted level in approximately four decades, before sharply steepening as stress in the banking sector intensified (but remained inverted). Volatility was evident in credit spreads as well. Although the first two months of the year saw gradually tightening spreads, the quarter ended with a significant widening as banking sector concerns emerged and the narrative shifted through the quarter from soft landing to no-landing, and back again to some type of bumpier landing.</p>
<h3>U.S. Treasury Curve</h3>
<p><img class="img-responsive w-100" src="https://www.vaneck.com/contentassets/cc5473ba9f524eb19d5b8e845b8ae329/3092_angl_chart_01_2023.04_v1_blog.svg" alt="US Treasury Curve" /></p>
<p class="chart-disclosure">Source: US Treasury. Past performance is no guarantee of future results. Index performance is not representative of fund performance. It is not possible to invest in an index.</p>
<p>In addition to widening credit spreads, the other narrative that may be unfolding revolves around a major shift in the sector allocation of fallen angels. Since index inception in December 2003, fallen angels have been represented in various sectors, and usually, such allocations came with a contrarian view, meaning that investors may have been hesitant to allocate as these were usually under some sort of distress. As a result, significant price adjustments occurred, and issuers who entered the fallen angel index experienced a remarkable recovery, offering considerable upside. During Q1, we saw the biggest allocation change since the wave of downgrades in April, 2020.</p>
<ul class="content-list">
<li><strong><em>Energy</em></strong>: fallen angels&rsquo; highest sector weight dropped to 22% after being as high as 30% in April 2020, as Western Midstream was upgraded. Western Midstream entered the fallen angel index at a par weighted price of $85.54 and exited at $90.44.</li>
<li><strong><em>Autos</em></strong>: exposure increased to 18%, as Nissan was downgraded in early March, joining Ford, which has been in the index with a 10% weight, since April 2020. The last time the fallen angel index had auto exposure of 18% or more was in 2005, when GM and Ford were downgraded.</li>
<li><strong><em>Banking</em></strong>: so far, the mini-crisis in banking has resulted in only one fallen angel: First Republic, which entered the index with a small weight. The pipeline of more banking downgrades is currently limited, despite rating agencies expecting more pressure on the sector as the Fed continues to fight inflation.</li>
</ul>
<p>Over time, sector themes within fallen angels have driven differentiated returns and our expectation is that, with additional systematic or idiosyncratic downgrades, this dynamic will continue.</p>
<h3>Fallen Angel Historical Sector Allocation</h3>
<p><img class="img-responsive w-100" src="https://www.vaneck.com/contentassets/cc5473ba9f524eb19d5b8e845b8ae329/3092_angl_chart_02_2023.04_v1_blog.svg" alt="Fallen Angel Historical Sector Allocation" /></p>
<br />
<div class="wrapped-div-sector">
<table style="width: 100%;">
<tbody>
<tr class="tbl-data">
<td class="tbl-header last" style="white-space: nowrap;">Calendar Year Returns (%)</td>
<td class="tbl-header last" style="text-align: center;">2004</td>
<td class="tbl-header last" style="text-align: center;">2005</td>
<td class="tbl-header last" style="text-align: center;">2006</td>
<td class="tbl-header last" style="text-align: center;">2007</td>
<td class="tbl-header last" style="text-align: center;">2008</td>
<td class="tbl-header last" style="text-align: center;">2009</td>
<td class="tbl-header last" style="text-align: center;">2010</td>
<td class="tbl-header last" style="text-align: center;">2011</td>
<td class="tbl-header last" style="text-align: center;">2012</td>
<td class="tbl-header last" style="text-align: center;">2013</td>
<td class="tbl-header last" style="text-align: center;">2014</td>
<td class="tbl-header last" style="text-align: center;">2015</td>
<td class="tbl-header last" style="text-align: center;">2016</td>
<td class="tbl-header last" style="text-align: center;">2017</td>
<td class="tbl-header last" style="text-align: center;">2018</td>
<td class="tbl-header last" style="text-align: center;">2019</td>
<td class="tbl-header last" style="text-align: center;">2020</td>
<td class="tbl-header last" style="text-align: center;">2021</td>
<td class="tbl-header last" style="text-align: center;">2022</td>
<td class="tbl-header last" style="text-align: center;">YTD</td>
</tr>
<tr class="tbl-data">
<td class="data-td last">Fallen Angel</td>
<td class="data-td data last">11.48</td>
<td class="data-td data last">2.68</td>
<td class="data-td data last">15.23</td>
<td class="data-td data last">0.2</td>
<td class="data-td data last">-25.77</td>
<td class="data-td data last">64.88</td>
<td class="data-td data last">17.95</td>
<td class="data-td data last">3.48</td>
<td class="data-td data last">21.58</td>
<td class="data-td data last">9.25</td>
<td class="data-td data last">7.08</td>
<td class="data-td data last">-3.24</td>
<td class="data-td data last">25.97</td>
<td class="data-td data last">10.42</td>
<td class="data-td data last">-4.78</td>
<td class="data-td data last">17.33</td>
<td class="data-td data last">14.06</td>
<td class="data-td data last">7.72</td>
<td class="data-td data last">-14.0</td>
<td class="data-td data last">3.7</td>
</tr>
<tr class="tbl-data">
<td class="data-td last">Broad HY</td>
<td class="data-td data last">10.87</td>
<td class="data-td data last">2.74</td>
<td class="data-td data last">11.77</td>
<td class="data-td data last">2.19</td>
<td class="data-td data last">-26.39</td>
<td class="data-td data last">57.51</td>
<td class="data-td data last">15.19</td>
<td class="data-td data last">4.38</td>
<td class="data-td data last">15.58</td>
<td class="data-td data last">7.42</td>
<td class="data-td data last">2.5</td>
<td class="data-td data last">-4.64</td>
<td class="data-td data last">17.49</td>
<td class="data-td data last">7.48</td>
<td class="data-td data last">-2.26</td>
<td class="data-td data last">14.41</td>
<td class="data-td data last">6.17</td>
<td class="data-td data last">5.36</td>
<td class="data-td data last">-11.22</td>
<td class="data-td data last">3.72</td>
</tr>
</tbody>
</table>
</div>
<br />
<p class="chart-disclosure">Source: ICE Data Services, VanEck. Past performance is no guarantee of future results. Index performance is not representative of fund performance. It is not possible to invest in an index.</p>
<p><strong><u>Fallen Angels Overall Stats</u>: </strong>Fallen angels bond spreads widened by 30bps in March vs 38bps for broad high yield, but ended the quarter modestly tighter. During the quarter, fallen angel spreads tightened from their year-end levels and hit their lowest level since mid-2022 on March 6, but banking sector stress drove a surge in rate volatility that took spreads from 273 to 375, before tightening back down to 325 as the Fed intervened and alleviated fears of a much wider contagion from the banking sector chaos. Although spreads widened in March, they are still not at recessionary levels. However, absolute yield levels can provide a return cushion if spreads continue to widen.</p>
<div class="wrapped-div">
<table style="width: 100%;">
<tbody>
<tr class="tbl-data">
<td class="tbl-header last" style="text-align: center;">&nbsp;</td>
<td class="tbl-header last" style="border-right: outset; text-align: center;" colspan="2">Fallen Angel</td>
<td class="tbl-header last" style="text-align: center;" colspan="2">Broad HY</td>
</tr>
<tr class="tbl-data">
<td class="data-td last">&nbsp;</td>
<td class="data-td data last">12/31/2022</td>
<td class="data-td data last" style="border-right: outset;">3/31/2023</td>
<td class="data-td data last">12/31/2022</td>
<td class="data-td data last">3/31/2023</td>
</tr>
<tr class="tbl-data">
<td class="data-td last">Yield to Worst</td>
<td class="data-td data last">7.49</td>
<td class="data-td data last" style="border-right: outset;">7.08</td>
<td class="data-td data last">8.89</td>
<td class="data-td data last">8.49</td>
</tr>
<tr class="tbl-data">
<td class="data-td last">Effective Duration</td>
<td class="data-td data last">5.45</td>
<td class="data-td data last" style="border-right: outset;">5.30</td>
<td class="data-td data last">4.04</td>
<td class="data-td data last">3.83</td>
</tr>
<tr class="tbl-data">
<td class="data-td last">Full Market Value ($mn)</td>
<td class="data-td data last">112,854</td>
<td class="data-td data last" style="border-right: outset;">114,776</td>
<td class="data-td data last">1,199,909</td>
<td class="data-td data last">1,234,319</td>
</tr>
<tr class="tbl-data">
<td class="data-td last">OAS</td>
<td class="data-td data last">337</td>
<td class="data-td data last" style="border-right: outset;">325</td>
<td class="data-td data last">481</td>
<td class="data-td data last">458</td>
</tr>
<tr class="tbl-data">
<td class="data-td last">No. of Issues</td>
<td class="data-td data last">212</td>
<td class="data-td data last" style="border-right: outset;">206</td>
<td class="data-td data last">1,927</td>
<td class="data-td data last">1,916</td>
</tr>
</tbody>
</table>
</div>
<br />
<p class="chart-disclosure">Source: ICE Data Services, VanEck. Fallen Angels: ICE US Fallen Angel High Yield 10% Constrained Index. Broad HY: ICE BofA US High Yield Index. OAS refers to &ldquo;option-adjusted spread.&rdquo; Please see definition for this and other terms referenced herein in the disclosures and definitions portion of this blog. Past performance is no guarantee of future results. Index performance is not representative of fund performance. It is not possible to invest in an index.</p>
<p><strong><u>New Fallen Angels</u>: </strong>The first quarter brought four fallen angels into the index in total, adding 9.85%. As mentioned last month, Nissan was downgraded by S&amp;P on March 7, as S&amp;P sees the automotive industry having a tough time over the coming years due to prolonged supply chain disruptions, high costs, a global economic slowdown and rising interest rates, and thus expects Nissan earnings to be weaker than were previously assumed. Nissan is by far the largest fallen angel of 2022 and 2023 combined, followed by Las Vegas Sands (3.32% added in June, 2022), adding 8.06% to the fallen angel index and boosting the auto sector exposure to approximately 18%. First Republic Bank was downgraded to junk by S&amp;P and Fitch on March 15 and by Moody&rsquo;s on March 17, reflecting the pressure on the company following SVB&rsquo;s collapse earlier in March. The two subordinated bonds entered the index at a par weighted average of $54.63, adding only 0.40% of the index market value. Both bonds were trading in the mid-high 70&rsquo;s prior to the SVB collapse.</p>
<div class="wrapped-div">
<table style="width: 100%;">
<tbody>
<tr class="tbl-data">
<td class="tbl-header last">Month-end Addition</td>
<td class="tbl-header last" style="text-align: center;">Name</td>
<td class="tbl-header last" style="text-align: center;">Rating</td>
<td class="tbl-header last" style="text-align: center;">Sector</td>
<td class="tbl-header last" style="text-align: center;">Industry</td>
<td class="tbl-header last" style="text-align: center;">% Mkt Value</td>
<td class="tbl-header last" style="text-align: center;">Price</td>
</tr>
<tr class="tbl-data">
<td class="data-td data last" style="text-align: left;">February</td>
<td class="data-td data last">Entegris Escrow Corp</td>
<td class="data-td data last">BB1</td>
<td class="data-td data last">Technology &amp; Electronics</td>
<td class="data-td data last">Electronics</td>
<td class="data-td data last">1.39</td>
<td class="data-td data last">90.92</td>
</tr>
<tr class="tbl-data">
<td class="data-td data last" style="text-align: left;">March</td>
<td class="data-td data last">First Republic Bank</td>
<td class="data-td data last">B3</td>
<td class="data-td data last">Banking</td>
<td class="data-td data last">0.40</td>
<td class="data-td data last">54.63</td>
</tr>
<tr class="tbl-data">
<td class="data-td data last" style="text-align: left;">March</td>
<td class="data-td data last">Nissan Motor Acceptance</td>
<td class="data-td data last">BB1</td>
<td class="data-td data last">Automotive</td>
<td class="data-td data last">Auto Loans</td>
<td class="data-td data last">2.57</td>
<td class="data-td data last">87.19</td>
</tr>
<tr class="tbl-data">
<td class="data-td data last" style="text-align: left;">March</td>
<td class="data-td data last">Nissan Motor</td>
<td class="data-td data last">BB1</td>
<td class="data-td data last">Automotive</td>
<td class="data-td data last">Automakers</td>
<td class="data-td data last">5.49</td>
<td class="data-td data last">92.98</td>
</tr>
</tbody>
</table>
</div>
<br />
<p class="chart-disclosure">Source: ICE Data Services, VanEck. Past performance is no guarantee of future results. Not a recommendation to buy or sell any of the names/securities mentioned herein.</p>
<p><strong><u>Rising Stars</u>:</strong> A total of three rising stars in the first quarter of 2023 exit the index. Western Midstream was upgraded to investment grade (to Baa3 from Ba1) by Moody&rsquo;s on March 10 and, as expected, exited the index at March month-end. Western Midstream&rsquo;s upgrade reflects a similar rating change to its primary customer and largest equity owner: Occidental Petroleum (OXY), although OXY still has an average rating of BB as Fitch and S&amp;P still rate OXY as high yield. The most recent OPEC+ oil output cut and soaring oil prices could put OXY, alongside the other energy sector issuers, on investment grade status watch in the near term.</p>
<div class="wrapped-div">
<table style="width: 100%;">
<tbody>
<tr class="tbl-data">
<td class="tbl-header last">Month-end Exit</td>
<td class="tbl-header last" style="text-align: center;">Name</td>
<td class="tbl-header last" style="text-align: center;">Rating</td>
<td class="tbl-header last" style="text-align: center;">Sector</td>
<td class="tbl-header last" style="text-align: center;">Industry</td>
<td class="tbl-header last" style="text-align: center;">% Mkt Value</td>
<td class="tbl-header last" style="text-align: center;">Price</td>
</tr>
<tr class="tbl-data">
<td class="data-td data last" style="text-align: left;">February</td>
<td class="data-td data last">Autopistas Metropolitanas de Puerto Rico LLC</td>
<td class="data-td data last">BB1</td>
<td class="data-td data last">Transportation</td>
<td class="data-td data last">Transport Infrastructure/Services</td>
<td class="data-td data last">0.35</td>
<td class="data-td data last">100.49</td>
</tr>
<tr class="tbl-data">
<td class="data-td data last" style="text-align: left;">February</td>
<td class="data-td data last">Nokia Corp</td>
<td class="data-td data last">BB1</td>
<td class="data-td data last">Technology &amp; Electronics</td>
<td class="data-td data last">Tech Hardware &amp; Equipment</td>
<td class="data-td data last">0.47</td>
<td class="data-td data last">97.50</td>
</tr>
<tr class="tbl-data">
<td class="data-td data last" style="text-align: left;">March</td>
<td class="data-td data last">Western Midstream</td>
<td class="data-td data last">BB1</td>
<td class="data-td data last">Energy</td>
<td class="data-td data last">Gas Distribution</td>
<td class="data-td data last">5.27</td>
<td class="data-td data last">90.44</td>
</tr>
</tbody>
</table>
</div>
<br />
<p class="chart-disclosure">Source: ICE Data Services, VanEck. Past performance is no guarantee of future results. Not a recommendation to buy or sell any of the names/securities mentioned herein.</p>
<p><strong><u>Fallen Angels Performance by Sector</u>:</strong> Sector composition underwent major changes over the past month. With the entry of Nissan, auto exposure increased to 18.06% from 10.00%, and is now the second largest sector exposure, despite only having two issuers. Energy saw its largest exposure decrease since the April 2022 wave of downgrades, to 22.16%, as Western Midstream exited the index. Both sectors now dominate the index with a cumulative total at approximately 40%. The banking sector has a relatively low exposure (approximately 4%), but the possibility of additional downgrades is not negligible, as Moody&rsquo;s placed another five regional banks on negative watch (in addition to First Republic), although none of these other banks have been downgraded yet. Some are still a few notches away from becoming high yield and there are relatively few index-eligible bonds among these issuers, so a major increase in banking sector exposure does not appear imminent. Within the banking sector, the index already held a Pacific Western Bank bond that was trading in the mid-90s in early February but has declined to high-60s in the last few days as a result of the mini banking crisis. As far as performance goes, all sectors, except for banking, posted positive returns for Q1. Banking was also the only sector that experienced a price decline (it was also the only one above par on February 28).</p>
<div class="wrapped-div">
<table style="width: 100%;">
<tbody>
<tr class="tbl-data">
<td class="tbl-header last" style="text-align: center;">&nbsp;</td>
<td class="tbl-header last" style="text-align: center; border-right: outset;" colspan="2">Wgt (%)</td>
<td class="tbl-header last" style="text-align: center; border-right: outset;" colspan="2">OAS</td>
<td class="tbl-header last" style="text-align: center; border-right: outset;" colspan="2">Price</td>
<td class="tbl-header last" style="text-align: center; white-space: nowrap;">Total Return (%)</td>
</tr>
<tr class="tbl-data">
<td class="data-head last">&nbsp;</td>
<td class="data-head last">12/31/2021</td>
<td class="data-head last" style="border-right: outset;">3/31/2023</td>
<td class="data-head last">12/31/2021</td>
<td class="data-head last" style="border-right: outset;">3/31/2023</td>
<td class="data-head last">12/31/2021</td>
<td class="data-head last" style="border-right: outset;">3/31/2023</td>
<td class="data-head last">YTD</td>
</tr>
<tr class="tbl-data">
<td class="data-td last">Automotive</td>
<td class="data-td data last">10.00</td>
<td class="data-td data last" style="border-right: outset;">18.06</td>
<td class="data-td data last">262</td>
<td class="data-td data last" style="border-right: outset;">246</td>
<td class="data-td data last">91.35</td>
<td class="data-td data last" style="border-right: outset;">92.21</td>
<td class="data-td data last">3.97</td>
</tr>
<tr class="tbl-data">
<td class="data-td last">Banking</td>
<td class="data-td data last">3.81</td>
<td class="data-td data last" style="border-right: outset;">3.99</td>
<td class="data-td data last">302</td>
<td class="data-td data last" style="border-right: outset;">415</td>
<td class="data-td data last">96.85</td>
<td class="data-td data last" style="border-right: outset;">87.61</td>
<td class="data-td data last">-1.47</td>
</tr>
<tr class="tbl-data">
<td class="data-td last">Basic Industry</td>
<td class="data-td data last">1.36</td>
<td class="data-td data last" style="border-right: outset;">1.33</td>
<td class="data-td data last">226</td>
<td class="data-td data last" style="border-right: outset;">227</td>
<td class="data-td data last">92.17</td>
<td class="data-td data last" style="border-right: outset;">93.85</td>
<td class="data-td data last">3.00</td>
</tr>
<tr class="tbl-data">
<td class="data-td last">Capital Goods</td>
<td class="data-td data last">5.12</td>
<td class="data-td data last" style="border-right: outset;">5.10</td>
<td class="data-td data last">279</td>
<td class="data-td data last" style="border-right: outset;">240</td>
<td class="data-td data last">95.01</td>
<td class="data-td data last" style="border-right: outset;">98.54</td>
<td class="data-td data last">5.08</td>
</tr>
<tr class="tbl-data">
<td class="data-td last">Consumer Goods</td>
<td class="data-td data last">3.07</td>
<td class="data-td data last" style="border-right: outset;">3.00</td>
<td class="data-td data last">275</td>
<td class="data-td data last" style="border-right: outset;">255</td>
<td class="data-td data last">88.90</td>
<td class="data-td data last" style="border-right: outset;">91.27</td>
<td class="data-td data last">4.02</td>
</tr>
<tr class="tbl-data">
<td class="data-td last">Energy</td>
<td class="data-td data last">27.93</td>
<td class="data-td data last" style="border-right: outset;">22.16</td>
<td class="data-td data last">293</td>
<td class="data-td data last" style="border-right: outset;">303</td>
<td class="data-td data last">88.13</td>
<td class="data-td data last" style="border-right: outset;">90.05</td>
<td class="data-td data last">3.66</td>
</tr>
<tr class="tbl-data">
<td class="data-td last">Financial Services</td>
<td class="data-td data last">0.65</td>
<td class="data-td data last" style="border-right: outset;">0.64</td>
<td class="data-td data last">540</td>
<td class="data-td data last" style="border-right: outset;">506</td>
<td class="data-td data last">77.20</td>
<td class="data-td data last" style="border-right: outset;">80.27</td>
<td class="data-td data last">5.48</td>
</tr>
<tr class="tbl-data">
<td class="data-td last">Healthcare</td>
<td class="data-td data last">3.02</td>
<td class="data-td data last" style="border-right: outset;">3.03</td>
<td class="data-td data last">362</td>
<td class="data-td data last" style="border-right: outset;">304</td>
<td class="data-td data last">83.56</td>
<td class="data-td data last" style="border-right: outset;">86.47</td>
<td class="data-td data last">4.89</td>
</tr>
<tr class="tbl-data">
<td class="data-td last">Insurance</td>
<td class="data-td data last">0.85</td>
<td class="data-td data last" style="border-right: outset;">0.82</td>
<td class="data-td data last">347</td>
<td class="data-td data last" style="border-right: outset;">364</td>
<td class="data-td data last">92.10</td>
<td class="data-td data last" style="border-right: outset;">92.99</td>
<td class="data-td data last">2.50</td>
</tr>
<tr class="tbl-data">
<td class="data-td last">Leisure</td>
<td class="data-td data last">7.88</td>
<td class="data-td data last" style="border-right: outset;">7.79</td>
<td class="data-td data last">325</td>
<td class="data-td data last" style="border-right: outset;">243</td>
<td class="data-td data last">89.95</td>
<td class="data-td data last" style="border-right: outset;">93.25</td>
<td class="data-td data last">5.04</td>
</tr>
<tr class="tbl-data">
<td class="data-td last">Real Estate</td>
<td class="data-td data last">5.13</td>
<td class="data-td data last" style="border-right: outset;">4.72</td>
<td class="data-td data last">697</td>
<td class="data-td data last" style="border-right: outset;">701</td>
<td class="data-td data last">79.46</td>
<td class="data-td data last" style="border-right: outset;">80.72</td>
<td class="data-td data last">3.94</td>
</tr>
<tr class="tbl-data">
<td class="data-td last">Retail</td>
<td class="data-td data last">5.67</td>
<td class="data-td data last" style="border-right: outset;">5.49</td>
<td class="data-td data last">471</td>
<td class="data-td data last" style="border-right: outset;">474</td>
<td class="data-td data last">73.75</td>
<td class="data-td data last" style="border-right: outset;">74.72</td>
<td class="data-td data last">2.83</td>
</tr>
<tr class="tbl-data">
<td class="data-td last">Services</td>
<td class="data-td data last">0.38</td>
<td class="data-td data last" style="border-right: outset;">0.37</td>
<td class="data-td data last">388</td>
<td class="data-td data last" style="border-right: outset;">368</td>
<td class="data-td data last">87.11</td>
<td class="data-td data last" style="border-right: outset;">89.89</td>
<td class="data-td data last">4.57</td>
</tr>
<tr class="tbl-data">
<td class="data-td last">Technology &amp; Electronics</td>
<td class="data-td data last">4.20</td>
<td class="data-td data last" style="border-right: outset;">4.67</td>
<td class="data-td data last">327</td>
<td class="data-td data last" style="border-right: outset;">287</td>
<td class="data-td data last">85.47</td>
<td class="data-td data last" style="border-right: outset;">88.19</td>
<td class="data-td data last">5.22</td>
</tr>
<tr class="tbl-data">
<td class="data-td last">Telecommunications</td>
<td class="data-td data last">11.91</td>
<td class="data-td data last" style="border-right: outset;">11.68</td>
<td class="data-td data last">423</td>
<td class="data-td data last" style="border-right: outset;">433</td>
<td class="data-td data last">90.04</td>
<td class="data-td data last" style="border-right: outset;">91.39</td>
<td class="data-td data last">3.45</td>
</tr>
<tr class="tbl-data">
<td class="data-td last">Transportation</td>
<td class="data-td data last">2.10</td>
<td class="data-td data last" style="border-right: outset;">1.78</td>
<td class="data-td data last">279</td>
<td class="data-td data last" style="border-right: outset;">231</td>
<td class="data-td data last">90.49</td>
<td class="data-td data last" style="border-right: outset;">92.69</td>
<td class="data-td data last">5.04</td>
</tr>
<tr class="tbl-data">
<td class="data-td last">Utility</td>
<td class="data-td data last">6.93</td>
<td class="data-td data last" style="border-right: outset;">5.38</td>
<td class="data-td data last">213</td>
<td class="data-td data last" style="border-right: outset;">206</td>
<td class="data-td data last">89.95</td>
<td class="data-td data last" style="border-right: outset;">90.19</td>
<td class="data-td data last">2.57</td>
</tr>
<tr class="tbl-data">
<td class="data-td last">Total</td>
<td class="data-td data last">100</td>
<td class="data-td data last" style="border-right: outset;">100</td>
<td class="data-td data last">337</td>
<td class="data-td data last" style="border-right: outset;">325</td>
<td class="data-td data last">87.91</td>
<td class="data-td data last" style="border-right: outset;">89.51</td>
<td class="data-td data last">3.70</td>
</tr>
</tbody>
</table>
</div>
<br />
<p class="chart-disclosure">Source: ICE Data Services, VanEck. Fallen Angels: ICE US Fallen Angel High Yield 10% Constrained Index. Not a recommendation to buy or sell any of the names/securities mentioned herein. Index performance is not representative of fund performance. It is not possible to invest in an index.</p>
<p><strong><u>Fallen Angels Performance by Rating</u>:</strong> Lower rated bonds outperformed their higher rated peers, mostly due to an outstanding January. There were not many changes in the credit ratings of fallen angels for Q1.</p>
<div class="wrapped-div">
<table style="width: 100%;">
<tbody>
<tr class="tbl-data">
<td class="tbl-header last" style="text-align: center;">&nbsp;</td>
<td class="tbl-header last" style="text-align: center; border-right: outset;" colspan="2">Wgt (%)</td>
<td class="tbl-header last" style="text-align: center; border-right: outset;" colspan="2">OAS</td>
<td class="tbl-header last" style="text-align: center; border-right: outset;" colspan="2">Price</td>
<td class="tbl-header last" style="text-align: center; white-space: nowrap;">Total Return (%)</td>
</tr>
<tr class="tbl-data">
<td class="data-head last">&nbsp;</td>
<td class="data-head last">12/31/2022</td>
<td class="data-head last" style="border-right: outset;">3/31/2023</td>
<td class="data-head last">12/31/2022</td>
<td class="data-head last" style="border-right: outset;">3/31/2023</td>
<td class="data-head last">12/31/2022</td>
<td class="data-head last" style="border-right: outset;">3/31/2023</td>
<td class="data-head last">YTD</td>
</tr>
<tr class="tbl-data">
<td class="data-head last">BB</td>
<td class="data-td data last">87.00</td>
<td class="data-td data last" style="border-right: outset;">87.08</td>
<td class="data-td data last">284</td>
<td class="data-td data last" style="border-right: outset;">281</td>
<td class="data-td data last">90.02</td>
<td class="data-td data last" style="border-right: outset;">91.51</td>
<td class="data-td data last">3.25</td>
</tr>
<tr class="tbl-data">
<td class="data-head last">B</td>
<td class="data-td data last">10.95</td>
<td class="data-td data last" style="border-right: outset;">10.37</td>
<td class="data-td data last">608</td>
<td class="data-td data last" style="border-right: outset;">500</td>
<td class="data-td data last">82.50</td>
<td class="data-td data last" style="border-right: outset;">85.35</td>
<td class="data-td data last">7.01</td>
</tr>
<tr class="tbl-data">
<td class="data-head last">CCC</td>
<td class="data-td data last">1.98</td>
<td class="data-td data last" style="border-right: outset;">2.50</td>
<td class="data-td data last">1,020</td>
<td class="data-td data last" style="border-right: outset;">1,014</td>
<td class="data-td data last">60.88</td>
<td class="data-td data last" style="border-right: outset;">64.60</td>
<td class="data-td data last">5.69</td>
</tr>
<tr class="tbl-data">
<td class="data-head last">CC</td>
<td class="data-td data last">&nbsp;</td>
<td class="data-td data last" style="border-right: outset;">0.04</td>
<td class="data-td data last">&nbsp;</td>
<td class="data-td data last" style="border-right: outset;">6,713</td>
<td class="data-td data last">&nbsp;</td>
<td class="data-td data last" style="border-right: outset;">7.16</td>
<td class="data-td data last">161.59</td>
</tr>
<tr class="tbl-data">
<td class="data-head last">D</td>
<td class="data-td data last">0.07</td>
<td class="data-td data last" style="border-right: outset;">&nbsp;</td>
<td class="data-td data last">4,726</td>
<td class="data-td data last" style="border-right: outset;">&nbsp;</td>
<td class="data-td data last">10.00</td>
<td class="data-td data last" style="border-right: outset;">&nbsp;</td>
<td class="data-td data last">-62.06</td>
</tr>
<tr class="tbl-data">
<td class="data-head last">Total</td>
<td class="data-td data last">100</td>
<td class="data-td data last" style="border-right: outset;">100</td>
<td class="data-td data last">337</td>
<td class="data-td data last" style="border-right: outset;">325</td>
<td class="data-td data last">87.91</td>
<td class="data-td data last" style="border-right: outset;">89.51</td>
<td class="data-td data last">3.70</td>
</tr>
</tbody>
</table>
</div>
<br />
<p class="chart-disclosure">Source: ICE Data Services, VanEck. Fallen Angels: ICE US Fallen Angel High Yield 10% Constrained Index. Past performance is no guarantee of future results. Index performance is not representative of fund performance. It is not possible to invest in an index.</p>
<p>To receive more <a href="https://www.vaneck.com/us/en/insights/income-investing/" title="Income Investing insights"><strong>Income Investing</strong></a> insights, <a href="/link/5f45412c2143400497908cea2897f7d3.aspx" title=" Subscription Center"><strong>sign up in our subscription center</strong></a>.</p>
<style type="text/css">
    .wrapped-div {
        max-width: 100%;
    }

    @media (max-width: 1024px) {
        .wrapped-div {
            overflow-x: scroll;
        }
    }

    .wrapped-div-sector {
        max-width: 100%;
        overflow-x: scroll;
    }
</style>
]]></content:encoded>
</item><item rdf:about="https://www.vaneck.com/us/en/blogs/economic-trends/em-challenging-historical-norms/">
  <title>EM - Challenging Historical Norms></title>
  <link>https://www.vaneck.com/us/en/blogs/economic-trends/em-challenging-historical-norms/</link>
  <description><![CDATA[Can EMs be winners with the changing structure of China&rsquo;s growth spillovers, &ldquo;green transition,&rdquo; and changing geopolitical alliances?]]></description>
  <dc:creator>Natalia  Gurushina</dc:creator>
  <dc:date>04/14/2023 15:00:00</dc:date>
<content:encoded><![CDATA[

<h2>Recession Risks</h2>
<p>Today is our last day at the IMF Spring Meetings in DC, and the release of softer-than-expected March retail sales and industrial production in the U.S., as well as the &hellip;. University of Michigan survey for April, added some fuel to the recession/slowdown debates. The prints came on the heels of surprisingly strong in China&rsquo;s foreign trade numbers, including exports - a sign that the global growth backdrop might be more alive than previously feared (albeit the timing of shutdowns and other base effects argue against projecting 1-month data into the future). China&rsquo;s domestic recovery looks more certain, but the IMF published an interesting chart showing just how different the composition of the rebound spillovers this time compared to &ldquo;typical history&rdquo; (see chart below). And this means a different set of emerging markets (EM) winners.</p>
<h2>Global Disinflation and Rate Cuts</h2>
<p>Slowing growth should, in theory, be disinflation-friendly. However, the problem in many EMs is that even this slower growth runs above potential, and the labor markets are still tight. In some cases - like in Chile - the positive output gap stopped narrowing altogether. So, while a supportive (high) base effect should ensure the continuation of disinflation in 2023, bringing prices further down in 2024 could be a bigger challenge. With that in mind, the IMF is actively telegraphing that EM central banks should not communicate easing just yet and that it might be less costly (in the longer term) to over-tighten monetary policy than under-tighten it. EM central banks do not need a lot of convincing here - most are happy to pause but not in a rush to cut. So, could the EM/DM (developed markets) easing cycle end up being more synchronized than the post-pandemic tightening, during which EMs led the way?</p>
<h2>Global Interest Rates</h2>
<p>Slowing (albeit more resilient than expected) activity, stickier inflation, and high rates that create the potential for more market volatility appear to be a central scenario for many participants of this year&rsquo;s meetings. The question is whether the global economy can return to the low rates regime in the foreseeable future. And this is where the &ldquo;green transition&rdquo; debate comes in, alongside geopolitical shifts and demographic changes. Participants agreed that &ldquo;green transition&rdquo; would require sizable investments - including the U.S. Would capital supply be able to match this demand at a low &ldquo;price point&rdquo; (interest rates)? And would changing geopolitical alliances make this task easier for some EMs?</p>
<h3>Chart at a Glance: China Spillovers - Different Structure, Different Winners<img class="img-responsive w-100" src="https://www.vaneck.com/contentassets/10e9dc68bd1242b9b6555e64e6b22351/us-natalias-take-2023-04-14.png" alt="Chart at a Glance: China Spillovers - Different Structure, Different Winners" /></h3>
<p class="chart-disclosure">Source: International Monetary Fund, World Economic Outlook, Asia-Pacific Regional Economic Outlook October 2022 and IMF staff calculations.</p>
<div class="disclosure">
<p>Note: Typical composition bar is based on the historical (2001-Q1 to 2019-Q4) average spillovers from private consumption and investment.</p>
</div>
]]></content:encoded>
</item><item rdf:about="https://www.vaneck.com/us/en/blogs/economic-trends/em-bonds-place-your-bets/">
  <title>EM Bonds - Place Your Bets></title>
  <link>https://www.vaneck.com/us/en/blogs/economic-trends/em-bonds-place-your-bets/</link>
  <description><![CDATA[EM debt is not a monolith, which creates challenges but also opportunities during volatile times, like the most consequential elections in a generation.]]></description>
  <dc:creator>Natalia  Gurushina</dc:creator>
  <dc:date>04/13/2023 15:00:00</dc:date>
<content:encoded><![CDATA[

<h2>EM Bonds Performance</h2>
<p>The latest IMF projections show that the growth differential between emerging and developed economies should improve noticeably in favor of EMs in 2023 - an additional factor supporting the outlook for the asset class this year. However, EM is not a monolith, and while the market looks with amazement at&nbsp;<strong>super-tight sovereign spreads of &ldquo;EM Graduates,&rdquo; some lower-income EMs appear more distressed.</strong>&nbsp;As the debt restructuring drumbeat is getting stronger, many participants were unhappy about the slow progress in the common framework, especially as regards China&rsquo;s role and the involvement of private creditors. China might be in a unique position to push things ahead. Still, the recent change of leadership and some institutional features inside China can make it more difficult to follow in the Paris Club's footsteps. Geopolitical tensions involving China create an extra layer of uncertainty that can lead to further delays.&nbsp;</p>
<h2>EM Structural Reforms</h2>
<p>These issues define&nbsp;<strong>a broader context for discussions about structural reforms in EM, including fiscal adjustment</strong>. Everybody agrees that exceptional fiscal support during the pandemic was fully justified. Still, now governments have to balance disinflation and financial stability with the need to continue protecting the most vulnerable, especially in low-income countries. Some participants pointed out that aggressive fiscal consolidation in countries with high debt levels might have an offsetting negative impact on GDP, delaying their progress in meeting the UN&rsquo;s sustainable development goals.</p>
<h2>Turkey Elections</h2>
<p>One country that has attracted a lot of attention this year is Turkey.&nbsp;<strong>Turkey is heading for the elections in exactly one month</strong>. The&nbsp;<strong>local bond rout</strong>&nbsp;(see chart below) signals that the market prices in (1) a normalization of the policy rate after the elections, and (2) the central bank having less firepower to support the local bond market, given the need to defend the exchange rate. Investors expect a lot of noise and volatility immediately after the elections, while the new team is put in place and some macro-prudential regulations potentially lifted. Deputy Portfolio Manager David Austerweil visited Turkey recently. He believes that the <strong><a href="https://www.vaneck.com/us/en/blogs/emerging-markets-bonds/time-to-settle-your-tab-president-erdogan/" title="Time to Settle Your Tab, President Erdogan">elections will majorly impact the debt market</a></strong> and that long-dated low-dollar price sovereign bonds look the most attractive given the balance of risks. Stay tuned!</p>
<h3>Chart at a Glance: Turkey Pre-Election Signals - Things Need To Change*</h3>
<img class="img-responsive w-100" src="https://www.vaneck.com/contentassets/6b6e4f2f91fc4b33b608e124ffc3b599/us-natalias-take-2023-04-13.png" alt="Chart at a Glance: Turkey Pre-Election Signals - Things Need To Change*" />
<p class="chart-disclosure">Source: Bloomberg LP</p>
<div class="disclosure">
<p>*J.P. Morgan GBI-EM Global Diversified Composite Unhedged USD Index &ndash; Comprehensive emerging market debt benchmark that track local currency bonds issued by Emerging market governments, denominated in U.S. dollars without any currency hedging.</p>
<p>**J.P. Morgan GBI-EM Turkey Broad USD Unhedged Index &ndash; Tracks the performance of a diversified range of local currency government bonds issued by Turkey, denominated in U.S. dollars without any currency hedging.</p>
</div>
]]></content:encoded>
</item><item rdf:about="https://www.vaneck.com/us/en/blogs/gold-investing/joe-foster-gold-responds-and-reminds-in-march/">
  <title>Gold Responds and Reminds in March></title>
  <link>https://www.vaneck.com/us/en/blogs/gold-investing/joe-foster-gold-responds-and-reminds-in-march/</link>
  <description><![CDATA[The performance of gold and gold stocks in the current chaotic environment reaffirmed our belief in gold&rsquo;s role as a potential safe haven investment and legitimate form of portfolio insurance.]]></description>
  <dc:creator>Imaru Casanova</dc:creator>
  <dc:date>04/13/2023 06:30:00</dc:date>
<content:encoded><![CDATA[

<div>

<script type="text/javascript" src="/static/js/jquery/jquery-3.3.1.min.js"></script>
<script src="/link/b742936896f84e90b35a83fe6173e4bf.aspx"></script>
<script src="https://code.highcharts.com/highcharts.js"></script>
<script src="//code.highcharts.com/modules/exporting.js" type="text/javascript"></script>
<script>
    window.addEventListener("DOMContentLoaded", function () {


        var chartThreeOptions = {
            title: !1,
            subtitle: !1,
            colors: ,
            legend: {
                align: "center",
                verticalAlign: "bottom",
                itemMarginBottom: 10,
                x: 0,
                symbolRadius: 2
            }
            ,

  exporting: {
    enabled: false
  },
            plotOptions: {
                series: {
                    marker: {
                        enabled: !1
                    },
                    lineWidth: 2,
                    allowPointSelect: !0,
                    states: {
                        select: {
                            color: "#EFFFEF",
                            borderColor: "black",
                            dashStyle: "dot"
                        }
                    }
                }
            },
            credits: {
                enabled: !1
            },
            data: {
                complete: !1
            },
            series: [{
                name: "Gold ($/oz)",
                type: "line",
                dashStyle: "Solid",
                data: chartThreeSeriesOne,
                lineWidth: 3,
                dataLabels: {
                    enabled: true,
                    y: -10,
                    formatter: function () {
                        if (this.x == this.series.data.x) {
                            return 'Anlzd Return 8.6%';
                        } else {
                            return null;
                        }
                    }
                },
                tooltip: {
                    valueDecimals: 2
                }
            }, {
                name: "U.S. Bonds",
                type: "line",
                dashStyle: "Solid",
                data: chartThreeSeriesTwo,
                lineWidth: 3,
                dataLabels: {
                    enabled: true,
                    y: 0,
                    formatter: function () {
                        if (this.x == this.series.data.x) {
                            return '3.7%';
                        } else {
                            return null;
                        }
                    }
                },
                tooltip: {
                    valueDecimals: 2
                }
            }, {
                name: "U.S. Stocks",
                type: "line",
                dashStyle: "Solid",
                data: chartThreeSeriesThree,
                lineWidth: 3,
                dataLabels: {
                    enabled: true,
                    y: -10,
                    formatter: function () {
                        if (this.x == this.series.data.x) {
                            return '6.5%';
                        } else {
                            return null;
                        }
                    }
                },
                tooltip: {
                    valueDecimals: 2
                },

            }, {
                name: "U.S. Treasuries",
                type: "line",
                dashStyle: "Solid",
                data: chartThreeSeriesFour,
                lineWidth: 3,
                dataLabels: {
                    enabled: true,
                    y: 0,
                    formatter: function () {
                        if (this.x == this.series.data.x) {
                            return '2.5%';
                        } else {
                            return null;
                        }
                    }
                },
                tooltip: {
                    valueDecimals: 2
                },
            }],
            chart: {
                type: "line",
                height: 500
            },
            yAxis: {
                title: {
                    useHTML: !0,
                    text: "Cumulative Performance (Indexed at 100)",
                    style: {
                        fontFamily: "Open Sans, Arial",
                        color: "#666666",
                        fontSize: "15px",
                        fontWeight: "bold",
                        fontStyle: "normal",
                        textAlign: "center"
                    }
                },
                labels: {
                    format: "{value}",
                    style: {
                        fontFamily: "Open Sans, Arial",
                        color: "#666666",
                        fontSize: "14px",
                        fontWeight: "bold",
                        fontStyle: "normal"
                    }
                }
            },
            xAxis: {
                type: "datetime",
                tickInterval: 2592e6,
                title: {
                    text: !1
                },
                labels: {
                    autorotation: ,
                    rotation: 270,
                    align: "right",
                    format: "{value:%Y}",
                    style: {
                        fontFamily: "Open Sans, Arial",
                        color: "#666666",
                        fontSize: "14px",
                        fontWeight: "bold",
                        fontStyle: "normal"
                    }
                }
            },
            tooltip: {
                enabled: !0,
                xDateFormat: "%b %y"
            },
            stockTools: {
                gui: {
                    enabled: !1
                }
            },
            navigation: {
                events: {},
                bindingsClassName: "tools-container"
            },
            responsive: {
                rules: [{
                    condition: {
                        maxWidth: 500
                    },
                    chartOptions: {
                        chart: {
                            height: 325
                        },

                        yAxis: {
                            title: {
                                style: {
                                    fontFamily: "Open Sans, Arial",
                                    color: "#666666",
                                    fontSize: "13px",
                                    fontWeight: "bold",
                                    fontStyle: "normal"
                                },
                                text: "Cumulative Performance<br/>(Indexed at 100)"
                            }
                        },

                        xAxis: {
                            labels: {
                                autorotation: ,
                                rotation: -45,
                                align: "right",
                                format: "{value:%b %y}",
                                style: {
                                    fontFamily: "Open Sans, Arial",
                                    color: "#666666",
                                    fontSize: "13px",
                                    fontWeight: "bold",
                                    fontStyle: "normal"
                                }
                            }
                        }
                    }
                }]
            }
        };

        var chart1 = new Highcharts.Chart("highcharts-OcRZ3H3Ku", chartThreeOptions);
    });
</script>
<script type="text/javascript">
    $(document).ready(function () {
        Highcharts.chart('highchart-yield', {
            chart: {
                type: 'column',
                style: { fontFamily: "Open Sans, Arial" }
            },

            legend: {
                itemStyle: {

                    fontWeight: 'bold',
                    fontSize: '14px',
                    fontFamily: "Open Sans, Arial"
                }
            },

            title: {
                text: ''
            },
            xAxis: {
                categories: ,
                labels: {
                    style: { fontFamily: "Open Sans, Arial", fontWeight: 'bold', fontSize: '14px' }
                }

            },

            exporting: { enabled: false },

            yAxis: [{
                title: {
                    text: '<span style="font-weight: bold">Free Cash Flow Yield (Average)</span>', style: { fontFamily: "Open Sans, Arial", fontSize: '14px' }
                },
                labels: {
                    format: '{text}%',
                    style: { fontFamily: "Open Sans, Arial", fontWeight: 'bold', fontSize: '14px' }
                },
            },
            {
                title: {
                    text: '<span style="font-weight: bold">Net Debt/EBITDA (Average)</span>', style: { fontFamily: "Open Sans, Arial", fontSize: '14px' },
                    rotation: 270,
                    margin: 20
                },
                                labels: {
                    format: '{text}x',
                    style: { fontFamily: "Open Sans, Arial", fontWeight: 'bold', fontSize: '14px' }
                },

                opposite: true,
            },],

            credits: {
                enabled: false
            },


            plotOptions: {
                column: {

                    dataLabels: {
                        enabled: true,
                        formatter: function () {
                            return '' + this.point.text;
                        }
                    }
                }
            },


            series: [{
                color: '#16488f',

                name: 'Free Cash Flow Yield (Average)',

                tooltip: {
                    valueSuffix: "%"
                },

                data: [
                    { y: 1.8, text: '' },
                    { y: 1.8, text: '' },
                    { y: 1.2, text: '' },
                    { y: 1.9, text: '' },
                    { y: 5.0, text: '' },
                    { y: 7.0, text: '' }],


            },
            {
                color: '#13b3bf',
                name: 'Net Debt/EBITDA (Average)',
                tooltip: {
                    formatter: function () {
                        return '' + this.series.name + ': ' + Highcharts.numberFormat(this.y);
                    }
                },
                yAxis: 1,
                data: [
                    { y: 1.01, text: '' },
                    { y: 0.82, text: '' },
                    { y: 0.90, text: '' },
                    { y: 0.89, text: '' },
                    { y: 0.33, text: '' },
                    { y: 0.14, text: '' },
                ]
            },
            ],

        });

    });
</script>


</div>


<p>Monthly gold market and economic insights from Imaru Casanova, Deputy Portfolio Manager and Joe Foster, Portfolio Manager and Strategist, featuring their unique views on mining and gold&rsquo;s portfolio benefits. <a href="/link/f8074855842d482fa7ce9af4c44aa053.aspx" rel="noopener" target="_blank" title="Gold Monthly Commentary - March 2023"><strong>An expanded PDF version of this commentary, including fund specific information can be downloaded here.</strong></a></p>
<h2>Risks rise, gold goes higher</h2>
<p>Gold set a new high for the year on March 20, trading at $2,009 per ounce. This represented a $200 move from its monthly low of $1,809 on March 8. Gold climbed its way higher as the markets tried to digest the news and assess the ripple effects of the rapid collapse of Silicon Valley Bank (SVB) and Signature Bank over the course of a weekend. The metal found further support as the risks spread to Europe, with major bank Credit Suisse ultimately needing a rescue, which included the surprise wipeout of $17 billion of the bank&rsquo;s AT1 bonds. Panic and fear subsided as governments, regulators and central banks worldwide intervened and/or reassured investors in an effort to restore market confidence.</p>
<p>Next, attention turned to the Federal Open Market Committee (FOMC) rate decision on March 22. The U.S. Federal Reserve (Fed) increased the federal funds rate by 0.25% to 5.0%. Rate increases are generally viewed as negative for gold. However, treasury rates, which fell sharply following the banking turmoil, actually fell further after the Fed&rsquo;s last hike, as did the U.S. dollar. This was positive for gold, which managed to hang on to most of its gains, closing at $1,969 on March 3 &ndash; a $142 per ounce (7.8%) advance for the month.</p>
<p>The U.S. dollar (DXY Index)<sup>1</sup>&nbsp;fell 2.2%, while the 2-year and 10-year treasury rates dropped 0.79% and 0.45% respectively, during March. Gold stocks outperformed the metal. The NYSE Arca Gold Miners Index (GDMNTR)<sup>2</sup>&nbsp;was up 18.7%, and the MVIS Global Juniors Gold Miners Index (MVGDXJTR)<sup>3</sup>&nbsp;was up 18.2% during the month of March.</p>
<h2>Effect of higher rates in full display</h2>
<p>&ldquo;<em>We believe the market is ignoring the negative effect of sustained higher rates on the global financial system.&rdquo; </em>This was the main message of our gold outlook <strong><a href="https://www.vaneck.com/us/en/blogs/gold-investing/joe-foster-gold-m-and-a-a-bright-spot-amid-volatility/" title="Gold M and A a Bright Spot Amid Volatility">in our February commentary</a></strong>. There, we provided an example of the recent defaults by two large office owners caused by this higher interest rate environment, and highlighted potential for more problems from the record levels of debt held globally. The collapse of SVB was triggered by the banks&rsquo; need to recapitalize as its large portfolio of treasury bonds declined in value due to rising rates. Most would agree that this past month&rsquo;s events are textbook examples of why one should own gold, so how did gold do? Here are some of our observations:</p>
<ol class="content-list">
<li><strong>One of the most important observations we can make from the events of the last 3 weeks is that trying to time the gold market is futile.</strong> Because of its attributes, we believe that gold should be considered a core component and enjoy a permanent allocation in any portfolio. In particular, its low correlation with most other asset classes make it an effective portfolio diversifier. Black swan events cannot be predicted, but investors can be proactive and maintain a gold allocation that offers some protection when these events do happen. In a recent meeting, perhaps one of our clients put it best: &ldquo;you always own some gold in case everything else is going down; and when everything else is doing great, that&rsquo;s fine too, because in that scenario you don&rsquo;t need gold to do great.&rdquo;</li>
</ol>
<p style="padding-left: 40px;">With that said, gold&rsquo;s performance over the past +20 years is not too shabby:</p>
<p><img class="img-responsive w-100" alt="Gold Performance in Last 20+ Years" src="https://www.vaneck.com/contentassets/0d0fdf6a1f904f3390cf52ea6a94fec4/4994_gold_chart-1_2024-11_v2_blog.svg" /></p>
<p class="chart-disclosure">Source: FactSet, VanEck. Data as of March 2023. U.S. Stocks represented by S&amp;P<sup>&reg;</sup>&nbsp;500 Index; U.S.Bonds represented by Bloomberg Barclays U.S. Aggregate Bond Index; Gold ($/oz) represented by LBMA PM Gold Price; U.S. Treasuries represented by the Bloomberg Barclays U.S. 1-3 Year Treasury Bond Index.</p>
<ol class="content-list">
<li value="2"><strong>In March, gold did what we would expect it to do in times of crisis. </strong>Gold outperformed the U.S. dollar, the S&amp;P 500, the NASDAQ, crude, copper and bonds.</li>
</ol>
</ol>
<p><img class="img-responsive w-100" src="https://www.vaneck.com/contentassets/0d0fdf6a1f904f3390cf52ea6a94fec4/3069_gold_chart_02_2023.04_v1_blog.svg" alt="3069_Gold_Chart_02_2023.04_V1_Blog.svg" /></p>
<p class="chart-disclosure">Source: Morningstar. Data as of March 31, 2023. U.S. Stocks represented by S&amp;P<sup>&reg;</sup>&nbsp;500 Index; Gold ($/oz) represented by LBMA PM Gold Price; U.S. Treasuries represented by the Bloomberg Barclays U.S. 1-3 Year Treasury Bond Index.</p>
<ol class="content-list">
<li value="3"><strong>Also, as expected, gold stocks demonstrated their leverage to the gold price by significantly outperforming the metal.</strong> It is worth mentioning that gold equities are coming from oversold levels relative to gold over the last two years. Despite the strong performance in March, the equities still have some ways to go to close that gap. For reference, when gold was last $1,970 per ounce in April 2022, GDMNTR was approximately 1,350 vs 1,110 at present.</li>
</ol>
</ol>
<p><img class="img-responsive w-100" src="https://www.vaneck.com/contentassets/0d0fdf6a1f904f3390cf52ea6a94fec4/3069_gold_chart_03_2023.04_v1_blog.svg" alt="3069_Gold_Chart_03_2023.04_V1_Blog.svg" /></p>
<p class="chart-disclosure">Source: Bloomberg. Data as of March 31, 2023. Gold Stocks represented by the NYSE Arca Gold Miners Index (GDMNTR).</p>
<ol class="content-list">
<li value="4"><strong>Gold sustained its gains even as the Fed hiked one more time. </strong>Gold has increased more than 20% over the period of the last three rate hikes &ndash; rallying well ahead of a Fed pause or pivot, as it did during the previous rate hiking cycle.</li>
</ol>
<ol class="content-list">
<li value="5"><strong>Global gold bullion ETF holdings, our best proxy for investment demand, finally registered their first month of net inflows since April 2022, with holdings up almost 1% in March.</strong> There is a strong positive correlation between the gold price and the holdings of gold ETFs. However, up until March, the recent strength in the gold price had been met with persistent outflows from the gold bullion ETFs. March inflows certainly signal improved gold market sentiment, but current holdings are well below historical levels. The last time gold was $1,970 per ounce, in April of 2022, global gold ETF holdings were more than 12% higher than they are today.</li>
</ol>
<ol class="content-list">
<li value="6"><strong>Gold COMEX net long positioning also picked up. </strong>As of March 31, 2023, COMEX net long positions stood at approximately 482 tonnes, according to the World Gold Council. This compares with approximately 819 tonnes in April 2022.</li>
</ol>
<h2>Gold: doing what it&rsquo;s supposed to, when it supposed to</h2>
<p>In short, we would say gold and gold stocks performed precisely how we would expect in this environment. Moreover, we think this performance reaffirms gold&rsquo;s role as a safe haven investment and as a legitimate form of portfolio insurance. Last month&rsquo;s developments should act as a wakeup call to those lacking exposure to the gold sector. And the entry point isn&rsquo;t terrible either. Think about it: despite the heightened level of risk in March, gold didn&rsquo;t even hit its all-time highs.</p>
<p>We don&rsquo;t believe the market is fully reflecting the risks ahead. The Fed came to the rescue once again. The crisis seems contained for now. Consumer confidence actually ticked up in March, and the U.S. stock market managed to finish the month with gains. Complacency set in. This market action would suggest the equity market party isn&rsquo;t over yet. No one wants the party to end, and certainly, no one ever wants to leave too early and miss out. But when there is broken glass on the floor, everyone knows it is time to start figuring out your ride home. Gold may be the perfect vehicle.</p>
<h2>Financial stresses still remain</h2>
<p>We were assured time and again of the strength and resilience of the banking system after the improved regulatory and supervisory regimes that followed the 2008 financial crisis, and yet here we are facing the biggest U.S. banking failure in more than a decade. The resulting banking crisis exposed the fragility and risks facing the global financial system. We believe this is supportive of higher gold prices in the longer term. These risks include (in both the U.S. and globally) persistent and elevated inflation, a weakening economy, debt service strains, elevated geopolitical risks and black swan events.</p>
<p>Last year, we posed these questions:</p>
<ul class="content-list">
<li>Rapidly rising rates bring significant risks to the financial system. The liability-driven investing (LDI) market crisis in the UK is a clear example of this. Could there be more cracks in the system that start to show under the stress of higher rates, increased volatility and market weakness?</li>
<li>The world has been operating in a zero-rate environment for a long time, what do higher and rising rates mean to a world consumed in debt?</li>
<li>How do we service that debt at the same time as we are dealing with slowing growth and high levels of inflation?</li>
</ul>
<p>These questions are more relevant today than ever. They were reasonable questions to ask in 2022 as the Fed embarked on its aggressive rate hiking cycle. There were and there likely continue to be more cracks in the system &ndash; something else could break. A black swan event is generally described as having three main attributes: it is unpredictable; it results in severe and widespread <strong><a href="https://corporatefinanceinstitute.com/resources/knowledge/modeling/scenario-analysis/" title="Scenario Analysis" target="_blank" rel="noopener">consequences</a>;</strong> and after its occurrence people (and markets) will rationalize the event as having been predictable (known as &ldquo;hindsight bias&rdquo;). No one saw the failure of SVB coming, it certainly had severe consequences and, of course, now everyone is wondering how management and regulators could have possibly missed it! There may be more black swans flying or swimming around out there.</p>
<h2>Market&rsquo;s underestimating a hard landing?</h2>
<p>Worsening financial conditions are expected to lead to the end of the Fed&rsquo;s rate hiking cycle. The market is already pricing in cuts in 2023. This is gold positive. However, we believe the market has yet to price in the negative impact of a policy change in the fight against inflation and the increasing likelihood of a hard landing or recession. Gold&rsquo;s appeal increases under these scenarios. As evidenced by the gold ETF and Comex positioning, investors have yet to come back in full force to benefit from gold&rsquo;s role as an inflation hedge, as a safe haven in periods of economic, financial and geopolitical volatility, and importantly, as a portfolio diversifier. What happened in March should crystallize the need to add gold exposure to every portfolio.</p>
<p>To receive more insights to <strong><a href="https://www.vaneck.com/us/en/insights/gold-investing/" title="Gold Investing Insights">Gold Investing</a></strong> insights, <strong><a href="https://www.vaneck.com/us/en/subscribe/" title="Subscription Center">sign up in our subscription center</a></strong>.</p>
]]></content:encoded>
</item><item rdf:about="https://www.vaneck.com/us/en/blogs/natural-resources/index-design-limits-losses-in-q1/">
  <title>Index Design Limits Losses in Q1></title>
  <link>https://www.vaneck.com/us/en/blogs/natural-resources/index-design-limits-losses-in-q1/</link>
  <description><![CDATA[The first quarter of 2023 highlighted CMCI&rsquo;s index design advantages.]]></description>
  <dc:creator>Roland Morris</dc:creator>
  <dc:date>04/12/2023 06:30:00</dc:date>
<content:encoded><![CDATA[

<h2>Macro Outlook: Index Design Mitigated the Potential for Greater Losses</h2>
<p>The UBS Constant Maturity Commodity Index (CMCI) was down slightly in the first quarter of 2023, declining by 1.15%. On a relative basis, CMCI had a good quarter compared to the Bloomberg Commodity Index (BCOM). BCOM declined by 5.36% in the quarter as well.</p>
<p>U.S. natural gas prices fell sharply due to warmer-than-normal winter weather, especially in the Northeast. Most of CMCI&rsquo;s outperformance vs. BCOM came from the different exposures to natural gas. CMCI holds a target weighting of 3.5% in natural gas while BCOM holds 8.5%. Additionally, by design, CMCI is positioned further out the forward curve and rolls its exposure daily. Both of these factors benefited CMCI over BCOM. CMCI&rsquo;s natural gas position lost 32.8% while BCOM&rsquo;s natural gas position lost around 50.4% during the quarter. This important difference was due to curve positioning. BCOM&rsquo;s front-month exposure declined sharply while CMCI&rsquo;s longer duration positioning fell by less.</p>
<p>Another factor that benefited CMCI vs. BCOM during the quarter was curve positioning and roll methodology in WTI Crude oil and Brent Crude oil. Again, this is a result of index design. BCOM holds front-month exposures and the first three months on the forward curve shifted into contango (upward sloping) in the quarter. This resulted in roll losses for BCOM. CMCI is positioned further out the curve, remaining in backwardation (downward sloping). This generated an estimated 1.8% positive roll yield for CMCI while BCOM lost an estimated 1.9% during the quarter in the energy sector.</p>
<p>These factors do not always generate relative outperformance for CMCI. Various market conditions could work in BCOM&rsquo;s favor; however, over the longer term, CMCI has outperformed. Overall, the first quarter of 2023 highlighted CMCI&rsquo;s index design advantages.</p>
<h3>Roll Yield Estimates YTD - March 2023</h3>
<p><img class="img-responsive w-100" src="https://www.vaneck.com/contentassets/50db7e8bd37649078da825b4c676fbe0/2932_cmci_chart-02_2023.03_blog.svg" alt="Roll Yield Estimates YTD - March 2023" /></p>
<p class="chart-disclosure"><strong>Source: Bloomberg. Data as of March 2023</strong>. Past performance is no guarantee of future results. Index performance is not illustrative of fund performance. It is not possible to invest in an index.</p>
<h2>Sector Review: Agriculture and Precious Metals Gains Minimized Overall Index Losses</h2>
<p>The energy sector fell by 7.7% in the quarter. This was partially due to the warmer weather as previously mentioned, as well as disappointing global demand which triggered the decline.</p>
<p>The livestock sector fell by 5.1% due entirely to a sharp decline in live hog prices. Live cattle prices rose slightly during the quarter and remained near historic all-time highs.</p>
<p>Precious metals prices rose during the quarter, led by gold, which advanced by 8.1%, while silver ended the quarter unchanged at 0.9%.</p>
<p>The agriculture sector gained 2.0%. Strong gains in sugar (21%) and cocoa (13%) offset modest declines in grains.</p>
<p>The industrial metals sector was up 1.6% led by solid gains in copper prices but nickel declined by 20% during Q1.</p>
<h3>CMCI Outperformed BCOM in the Agriculture Sector</h3>
<p><strong>Performance by Sector Components</strong></p>
<p><img class="img-responsive w-100" src="https://www.vaneck.com/contentassets/50db7e8bd37649078da825b4c676fbe0/2932_cmci_chart-01_2023.03_blog.svg" alt="CMCI Outperformed BCOM in the Agriculture Sector" /></p>
<p class="chart-disclosure"><strong>Source: Bloomberg. Data as of March 2023</strong>. Past performance is no guarantee of future results. Index performance is not illustrative of fund performance. It is not possible to invest in an index.</p>
<p><a href="/link/9cc454bdc12d49638c0a22783d5a26cf.aspx" title="CMCAX - CM Commodity Index Fund - Class A - Overview"><strong>Learn more about the VanEck CM Commodity Index Fund</strong></a>, which seeks to track, before fees and expenses, the CMCI.</p>
<p>To receive more <a href="/us/en/insights/natural-resources/" title="Natural Resources Insights"><strong>Natural Resources</strong></a> insights, <a href="https://www.vaneck.com/us/en/subscribe/" title="Subscription Center"><strong>sign up in our subscription center</strong></a>.</p>
]]></content:encoded>
</item><item rdf:about="https://www.vaneck.com/us/en/blogs/economic-trends/dc-diaries-markets-china-and-inflation/">
  <title>DC Diaries - Markets, China, and Inflation></title>
  <link>https://www.vaneck.com/us/en/blogs/economic-trends/dc-diaries-markets-china-and-inflation/</link>
  <description><![CDATA[Can China&rsquo;s slowing growth affect its global ambitions? Can EMs withstand drying liquidity and structurally higher inflation?]]></description>
  <dc:creator>Natalia  Gurushina</dc:creator>
  <dc:date>04/12/2023 06:30:00</dc:date>
<content:encoded><![CDATA[

<h2>Market Turmoil</h2>
<p>I had a fonts mishap in yesterday&rsquo;s blog, which I wrote on the run on my cellphone - and a colleague suggested that this must be because I was in another country. Well, this is one way to describe Washington, DC, where we are attending the IMF Spring Meetings this week. Market implications of changing global trends are on everybody&rsquo;s minds, including <strong>concerns that drying liquidity can lead to more episodes of the market volatility</strong> - we are not that far away from the U.S. debt ceiling debate (or debacle?), for example. Emerging markets (EMs) with stronger fundamentals performed admirably during the DM banking turmoil back in March - partly due to protection in the form of higher real interest rates and partly because China&rsquo;s bucking the developed markets (DM) growth trend provided an additional safety net.</p>
<h2>China and Geopolitics</h2>
<p>It is unsurprising that China features prominently in this year&rsquo;s IMF discussions - with topics ranging from the pace of recovery to <strong>China&rsquo;s changing role in the world.</strong> Yesterday&rsquo;s above-consensus credit aggregates reassured participants that the recovery was on track. However, China&rsquo;s potential growth is slowing because China is getting richer and older and has a productivity gap between private companies and state-owned enterprises. A lack of market-oriented reforms can also weigh on productivity. How will this kind of slowdown affect China&rsquo;s geopolitical ambitions? Would China be looking for other sources of strength and leverage in the global economic system - such as supply chains or controls over key technology elements? How will this affect China&rsquo;s ambition to position itself as a security partner of choice, potentially at the expense of the U.S.?</p>
<h2>Global Disinflation</h2>
<p>Another popular topic at the IMF discussions this year is <strong>the importance of global disinflation and whether inflation will be structurally higher in the coming years</strong>. Today&rsquo;s below-consensus headline inflation print in the U.S. sent an encouraging signal regarding the near-term price dynamics. Still, an uptick in core inflation kept the expectations of the &ldquo;farewell&rdquo; rate hike in May (barely) alive. Today&rsquo;s inflation releases in EM showed that various central banks were right to pause - but with some nuances. Hungary&rsquo;s price pressures are still very elevated (25.2% year-on-year in March), so the only option for the central bank is keeping the policy rate very high for longer. By contrast, India&rsquo;s lower than expected print showed that the central bank&rsquo;s surprising pause was fully justified, and that there is indeed room for rate cuts later this year. Stay tuned!</p>
<h3>Chart at a Glance: U.S. Inflation - On the One Hand, On the Other Hand&hellip;</h3>
<p><img class="w-100 img-responive" src="https://www.vaneck.com/contentassets/e096ae01b4e94012b9388438b446c171/us-natalias-take-2023-04-12.png" alt="Chart at a Glance: U.S. Inflation - On the One Hand, On the Other Hand..." /></p>
<p class="chart-disclosure">Source: Bloomberg LP.</p>
]]></content:encoded>
</item><item rdf:about="https://www.vaneck.com/us/en/blogs/moat-investing/decade-of-dominance-the-etf-that-quietly-beats-the-s-and-p-500/">
  <title>Decade of Dominance: The ETF that Quietly Beats the S&amp;P 500></title>
  <link>https://www.vaneck.com/us/en/blogs/moat-investing/decade-of-dominance-the-etf-that-quietly-beats-the-s-and-p-500/</link>
  <description><![CDATA[MarketWatch spotlights VanEck Morningstar Wide Moat ETF (MOAT), consistently outperforming the S&amp;P 500 by targeting companies with long-term competitive advantages or "economic moats."]]></description>
  <dc:creator> </dc:creator>
  <dc:date>04/11/2023 06:30:00</dc:date>
<content:encoded><![CDATA[


<p>In the piece, Brandon Rakszawski, Director of Product Management at VanEck, explained that the <strong><a href="/link/635ccc4bf9134cb9a7fcc80919498eec.aspx" title="MOAT | VanEck Morningstar Wide Moat ETF">MOAT ETF</a></strong> can choose to invest in a select group of about 145 companies with economic moats identified by Morningstar analysts. These companies are narrowed down based on intrinsic value, which is calculated using a long-term discounted cash flow model. The <strong><a href="/link/635ccc4bf9134cb9a7fcc80919498eec.aspx" title="MOAT | VanEck Morningstar Wide Moat ETF">MOAT ETF</a></strong> currently holds 49 stocks, focusing on undervalued companies. Morningstar analysts assign economic moat ratings based on five competitive advantages: switching costs, intangible assets, network effect, cost advantage, and efficient scale. By prioritizing these factors, the <strong><a href="/link/635ccc4bf9134cb9a7fcc80919498eec.aspx" title="MOAT | VanEck Morningstar Wide Moat ETF">MOAT ETF</a></strong> aims to create a well-rounded portfolio that can consistently outperform the S&amp;P 500.</p>
<h2>The Five Sources of Economic Moats</h2>
<p>Economic moats are durable competitive advantages expected to allow companies to fend off competition and sustain profitability into the future. Morningstar has identified five sources of economic moats:</p>
<div class="wrapped-div">
<table style="width: 100%;">
<tbody>
<tr class="tbl-data">
<td class="tbl-header last">Switching Costs</td>
<td class="tbl-header last">Intangible Assets</td>
<td class="tbl-header last">Network Effect</td>
<td class="tbl-header last">Cost Advantage</td>
<td class="tbl-header last">Efficient Scale</td>
</tr>
<tr class="tbl-data">
<td class="data-td data last" style="text-align: left;">Switching costs give a company pricing power by locking customers into its unique ecosystem. Beyond the expense of moving, they can also be measured by the effort, time, and psychological toll of switching to a competitor.</td>
<td class="data-td data last" style="text-align: left;">Though not always easy to quantify, intangible assets may include brand recognition, patents, and regulatory licenses. They may prevent competitors from duplicating products or allow a company to charge premium pricing.</td>
<td class="data-td data last" style="text-align: left;">A network effect is present when the value of a product or service grows as its user base expands. Each additional customer increases the product&rsquo;s or service&rsquo;s value exponentially.</td>
<td class="data-td data last" style="text-align: left;">Companies that are able to produce products or services at lower costs than competitors are often able to sell at the same price as competition and gather excess profit, or have the option to undercut competition.</td>
<td class="data-td data last" style="text-align: left;">In a market limited in size, potential new competitors have little incentive to enter because doing so would lower the industry&rsquo;s returns below the cost of capital.</td>
</tr>
</tbody>
</table>
</div>
<br />
<h2>Are the Companies' Moats Built to Last?</h2>
<p>Companies may demonstrate one or a combination of the five sources of moat. Evaluating a company against these attributes is a key part of how Morningstar&rsquo;s equity research team measures the strength of a company&rsquo;s competitive advantage. Based on this assessment, Morningstar assigns a company one of three economic moat ratings: none, narrow or wide.</p>
<p>In turn, these ratings help inform Morningstar analysts&rsquo; long-term forecasting decisions, which impact bottom-up fair value estimates. A wide moat rating is given to a company that is more likely than not to sustain its competitive advantage for at least the next 20 years, while a narrow moat rating means a company is more likely than not to do so for at least 10 years into the future. A company with no moat has either no advantage or one expected to dissipate relatively quickly.</p>
<p>When companies are successful and earning excess profits, they often become targets for competitors, which may threaten their profits. Companies with a wide moat tend to be best equipped to hold off competitors, which may help defend profitability over the long term.</p>
<p>Over time, this approach has led to attractive long-term returns, making moat strategies an effective component of core portfolio stock allocations.</p>

<p>To receive more <a href="https://www.vaneck.com/us/en/insights/moat-investing/" title="Moat Investing Insights"><strong>Moat Investing</strong></a> insights, <a href="https://www.vaneck.com/us/en/subscribe/" title="Subscription Center"><strong>sign up in our subscription center</strong></a>.</p>
<style type="text/css">
    .wrapped-div {
        max-width: 100%;
    }

    @media (max-width: 1240px) {
        .wrapped-div {
            overflow-x: scroll;
        }


    }
</style>
]]></content:encoded>
</item><item rdf:about="https://www.vaneck.com/us/en/blogs/moat-investing/quality-amid-turmoil-moat-stocks-show-strength-as-q1-ends/">
  <title>Quality Amid Turmoil: Moat Stocks Show Strength as Q1 Ends></title>
  <link>https://www.vaneck.com/us/en/blogs/moat-investing/quality-amid-turmoil-moat-stocks-show-strength-as-q1-ends/</link>
  <description><![CDATA[Bank collapses drove market volatility to end Q1, but Morningstar&rsquo;s Moat and SMID Moat Indexes avoided the failed banks and stayed ahead of their respective broad market benchmarks.]]></description>
  <dc:creator>Coulter Regal, CFA</dc:creator>
  <dc:date>04/11/2023 06:30:00</dc:date>
<content:encoded><![CDATA[

<p>The first quarter of the year is officially complete, and it ended in dramatic fashion with a sudden and unexpected bank crisis. The collapse of several U.S. regional banks, including Silicon Valley Bank, and the fall of Switzerland&rsquo;s Credit Suisse took the markets on a volatile ride to end the quarter. After two weeks of relative market chaos, coordinated efforts by regulators and the big banks to backstop the industry calmed markets.</p>
<p>Despite this crisis, large cap U.S. equities ended the March session up, with a modest gain of 3.67% for the S&amp;P 500 Index during the month. However, smaller cap stocks proved less tolerant, with the S&amp;P SmallCap 600 Index down over 5% during the same period. Notably though, moat stocks outperformed broad benchmarks during the month in both the large cap and small/mid cap segments.</p>
<p>The <strong><a href="/link/9f629c73a31846bb9e480b95e2c7f330.aspx" title="MOAT - VanEck Morningstar Wide Moat ETF - Index">Morningstar Wide Moat Focus Index</a></strong> (the &ldquo;Moat Index&rdquo;) gained 4.68% in March, ahead of the S&amp;P 500 Index by 100 basis points. The <strong><a href="/link/c0c4da50e177415b9f750d3c0eea4e0a.aspx" title="SMOT - VanEck Morningstar SMID Moat ETF - Index">Morningstar US Small-Mid Cap Moat Focus Index</a></strong> (the &ldquo;SMID Moat Index&rdquo;) was down 2.74% during the month, but still demonstrated some resilience compared to the broader universe of small and mid-cap stocks. Year to date, both Moat Indexes maintained their lead versus the respective broad market benchmarks.</p>
<h3>U.S. Equity Performance: Moat Indexes Lead Respective Broad Markets</h3>
<p><img class="img-responsive w-100" src="https://www.vaneck.com/contentassets/9de6c02c8d9744d9893c31162e203a9e/3064_moat_chart_01_2023.04_v1_blog.svg" alt="U.S. Equity Performance: Moat Indexes Lead Respective Broad Markets" /></p>
<p class="chart-disclosure"><strong>Source: Morningstar. As of 3/31/2023.</strong> Past performance is no guarantee of future results. Index performance is not illustrative of Fund performance. Fund performance current to the most recent month end is available by visiting vaneck.com or by calling 800.826.2333. Indexes are unmanaged and are not securities in which an investment can be made.</p>
<h2>Moat Indexes Avoided Failed Banks</h2>
<p>The recent U.S. banking failures had only a limited impact on both the Moat and SMID Moat Indexes, as neither index had exposure to the failed banks. The Moat Index does however have exposure to two diversified national banks. Wells Fargo &amp; Co. (WFC), which has long been an Index component, and U.S. Bancorp (USB), which saw its position in the Index increase this quarter due to attractive valuation.</p>
<p>In the SMID cap segment, where regional banks are more prevalent, the SMID Moat Index had exposure to only one regional bank, Comerica Inc. (CMA), during the onset of the banking crisis. Notably, following much of the turmoil in smaller banks, the SMID Moat Index added two more regional banks given their attractive valuations as part of the March 17 reconstitution. Both M&amp;T Bank Corp (MTB) and Huntington Bancshares (HBAN) entered the SMID Moat index after their share prices had declined by more than 20%. Morningstar analyst Eric Compton, who covers the banking sector, believes much of the selloff in banks is overdone and that sector is currently undervalued. Below are Eric&rsquo;s comments regarding US Bancorp and Comerica.</p>
<p class="px-5"><strong>Morningstar Analyst Comments</strong> | by Eric Compton April 3, 2023</p>
<p class="px-5"><i>Comerica is one of the smaller regional banks we cover. As such, we think the upside could be greater. The bank trades at one of the steepest price/fair value discounts in our coverage, even after we've baked in additional headwinds from funding costs and deposit outflows. Comerica is also the only narrow-moat-rated regional bank among the regionals that have sold off the most this year. As such, we view Comerica as our &ldquo;higher risk, higher reward&rdquo; regional pick for long-term investors. If the deposit base remains even remotely intact after first-quarter earnings, we would expect to see a rerating higher.</i></p>
<p class="px-5"><i>We also like U.S. Bancorp, which has sold off like some of the regionals but is where we see the risk of deposit outflows as being lower given that the bank is the largest regional bank in the U.S. This is our &ldquo;lower risk&rdquo; mega-regional pick.</i></p>
<h2>March Index Reconstitution</h2>
<p>Both the Moat and SMID Moat Indexes underwent quarterly reviews on March 17, 2023. Each quarter they systematically target the most attractively priced U.S. moat companies within their respective universes. Below are a few takeaways from the March reviews and how the indexes are positioned heading into the second quarter. Full results of the most recent quarterly reviews are available here: <strong><a href="https://www.vaneck.com/us/en/investments/morningstar-wide-moat-etf-moat/moat-reconstitution.pdf" title="MOAT - VanEck Morningstar Wide Moat ETF" target="_blank" rel="noopener">Moat Index</a></strong> and <strong><a href="https://www.vaneck.com/us/en/investments/morningstar-smid-moat-etf-smot/smot-reconstitution.pdf" title="SMOT - VanEck Morningstar SMID Moat ETF" target="_blank" rel="noopener">SMID Moat Index</a></strong>.</p>
<h2>Moat Index Highlights</h2>
<p><strong>Valuations Drive Profit Taking in Tech</strong></p>
<p>The Moat Index previously saw its tech exposure increase to the largest overweight in quite some time over the last few quarters of 2022. Exposure came primarily from chip and equipment companies and enterprise software companies. With the rally that many of these companies experienced to begin the year, their valuations became too pricey, allowing the Index to lock in gains in a fairly short period of time. Technology exposure in the Moat Index is now closer to market weight.</p>
<h3>Disciplined Valuation Approach Allowed Semiconductor Companies to Make an Impact</h3>
<div class="wrapped-div">
<table style="width: 100%;">
<tbody>
<tr class="tbl-data">
<td class="tbl-header last">Company</td>
<td class="tbl-header last">Ticker</td>
<td class="tbl-header last">Date Added to Index</td>
<td class="tbl-header last">Dated Removed from Index</td>
<td class="tbl-header last">Total Return for Period</td>
<td class="tbl-header last">P/FV on Added Date</td>
<td class="tbl-header last">P/FV on Remove Date</td>
</tr>
<tr class="tbl-data">
<td class="data-td data last" style="text-align: left;">Nvidia Corp</td>
<td class="data-td data last">NVDA</td>
<td class="data-td data last">9/16/2022</td>
<td class="data-td data last">3/17/2022</td>
<td class="data-td data last">95.00%</td>
<td class="data-td data last">0.66</td>
<td class="data-td data last">1.29</td>
</tr>
<tr class="tbl-data">
<td class="data-td data last" style="text-align: left;">Applied Materials</td>
<td class="data-td data last">AMAT</td>
<td class="data-td data last">9/16/2022</td>
<td class="data-td data last">3/17/2022</td>
<td class="data-td data last">38.61%</td>
<td class="data-td data last">0.63</td>
<td class="data-td data last">1.12</td>
</tr>
<tr class="tbl-data">
<td class="data-td data last" style="text-align: left;">KLA Corporation</td>
<td class="data-td data last">KLAC</td>
<td class="data-td data last">9/16/2022</td>
<td class="data-td data last">3/17/2022</td>
<td class="data-td data last">16.34%</td>
<td class="data-td data last">0.82</td>
<td class="data-td data last">0.95</td>
</tr>
</tbody>
</table>
</div>
<br />
<p class="chart-disclosure"><strong>Source: Morningstar. As of 3/17/2023</strong>. Past performance is no guarantee of future results. Not intended as a recommendation to buy or sell any securities mentioned herein.</p>
<p><strong>Growth Exposure Reined In</strong></p>
<p>After several quarters of increasing growth exposure based on valuation opportunities among oversold growth-oriented stocks, the Moat Index&rsquo;s growth exposure decreased this quarter. The modest reduction in growth stocks was equally redistributed to value stocks and core/blend stocks. Core stock exposure is now the largest style followed by growth and then value. Growth and value stocks are both slight overweight relative to the S&amp;P 500 Index, while core/blend exposure is underweight.</p>
<div class="wrapped-div">
<table style="width: 100%;">
<tbody>
<tr class="tbl-data">
<td class="tbl-header last">Index Style Exposure</td>
<td class="tbl-header last">Current Exposure</td>
<td class="tbl-header last">Rebalance Change</td>
<td class="tbl-header last">Relative to S&amp;P 500</td>
</tr>
<tr class="tbl-data">
<td class="data-td data last" style="text-align: left;">Value</td>
<td class="data-td data last">25.2%</td>
<td class="data-td data last">+2.1%</td>
<td class="data-td data last">+4.0%</td>
</tr>
<tr class="tbl-data">
<td class="data-td data last" style="text-align: left;">Core/Blend</td>
<td class="data-td data last">39.1%</td>
<td class="data-td data last">+2.2%</td>
<td class="data-td data last">-7.9%</td>
</tr>
<tr class="tbl-data">
<td class="data-td data last" style="text-align: left;">Growth</td>
<td class="data-td data last">35.7%</td>
<td class="data-td data last">-4.3%</td>
<td class="data-td data last">+4.1%</td>
</tr>
</tbody>
</table>
</div>
<br />
<p class="chart-disclosure"><strong>Source: Morningstar. As of 3/17/2023</strong>. Not intended as a recommendation to buy or sell any securities mentioned herein.</p>
<p><strong>Valuations Remain Attractive</strong></p>
<p>The weighted average price-to-fair value of the Moat Index fell from 0.78 to 0.74 following the latest review, signaling a 26% discount to Morningstar&rsquo;s fair value estimate. This is in contrast to the S&amp;P 500 Index, which featured a weighted average price-to-fair value ratio of 0.89 as the same date.</p>
<h2>SMID Moat Index Highlights</h2>
<p><strong>Growth Exposure Increases, But Remains an Underweight</strong></p>
<p>Contrary to the Moat index, which saw growth exposure reined in this quarter, the SMID Moat Index&rsquo;s review led to increased growth exposure by nearly 5% relative to last quarter. It is worth noting that growth is much less dominant in the SMID universe compared to the large cap space. Even after this quarter&rsquo;s increase, the SMID Moat Index has just under a 20% exposure to growth while the Moat Index sits at about 35%. Additionally, despite the increase, the SMID Moat Index still remains underweight growth compared to the broad SMID universe, which has about 25% exposure.</p>
<p><strong>SMID Moat Sector Shifts and Relative Weights</strong></p>
<p>This quarterly review the SMID Moat Index saw a notable increase to technology names with the addition of several tech names including Guidewire Software (GWRE), Paycom Software Inc. (LTHM) and Garmin Ltd. (GRMN), among others. The technology sector weighting increased from about 16% to 20% following the index review. On the other end of the spectrum, the Industrials, Healthcare, Financials and Communication services sectors all saw slight decreases in weighting.</p>
<p>In terms of exposure to Financials and the banking industry, the SMID Moat Index is underweight the Financials sector by about 5% and underweight the banking industry by about 2.5% relative to the broad SMID stock universe represented by the Morningstar US Small-Mid Cap Index.</p>
<p><strong>SMID Moat Valuations Remain Attractive</strong></p>
<p>The weighted average price-to-fair value of the SMID Moat Index was 0.74 following the quarterly review, signaling a 26% discount to Morningstar&rsquo;s fair value estimate. This is in contrast to the Morningstar US Small-Mid Cap Index, which featured a weighted average price-to-fair value ratio of 0.90 as of the same date.</p>
<h2>Accessing Moat Stocks</h2>
<p><a href="https://www.vaneck.com/us/en/investments/morningstar-wide-moat-etf-moat/moat-reconstitution.pdf" title="MOAT - VanEck Morningstar Wide Moat ETF" target="_blank" rel="noopener"><strong>VanEck Morningstar Wide ETF (MOAT)</strong></a> seeks to replicate as closely as possible, before fees and expenses the price and yield performance of the Morningstar Wide Moat Focus Index.</p>
<p><strong><a href="/link/589a2bc95c5d48988a7fd0d679aec241.aspx" title="SMOT - VanEck Morningstar SMID Moat ETF - Overview">VanEck Morningstar SMID Moat ETF (SMOT)</a></strong> seeks to track as closely as possible, before fees and expenses, the price and yield performance of the Morningstar US Small-Mid Cap Moat Focus Index.</p>
<p>To receive more <a href="https://www.vaneck.com/us/en/insights/moat-investing/" title="Moat Investing Insights"><strong>Moat Investing</strong></a> insights, <a href="https://www.vaneck.com/us/en/subscribe/" title=" Subscription Center"><strong>sign up in our subscription center</strong></a>.</p>
<style type="text/css">
    .wrapped-div {
        max-width: 100%;
    }

    @media (max-width: 1240px) {
        .wrapped-div {
            overflow-x: scroll;
        }


    }
</style>
]]></content:encoded>
</item><item rdf:about="https://www.vaneck.com/us/en/blogs/economic-trends/should-ems-be-afraid-of-recession-risks/">
  <title>Should EMs Be Afraid of Recession Risks?></title>
  <link>https://www.vaneck.com/us/en/blogs/economic-trends/should-ems-be-afraid-of-recession-risks/</link>
  <description><![CDATA[&ldquo;Bumpy&rdquo; disinflation, and now a &ldquo;rocky&rdquo; road to recovery - how are the global recession risks affecting EMs?]]></description>
  <dc:creator>Natalia  Gurushina</dc:creator>
  <dc:date>04/11/2023 06:30:00</dc:date>
<content:encoded><![CDATA[

<h2>Recession Risks</h2>
<p>We are <strong>at the IMF Spring Meetings this week, and the global slowdown is (naturally) a very popular discussion topic</strong>. The IMF referred to &ldquo;a rocky road to recovery&rdquo; in its new blog, pointing to synchronized policy tightening - especially in developed markets (DM) - as a major risk. As one speaker put it, a big jump in the cost of capital increased the risk of &ldquo;unknown unknowns,&rdquo; raising a question of whether some central banks might have moved too fast and too far in fighting inflation. Slower growth and higher interest rates mean that debt sustainability issues will/should be gaining more attention going forward. The latest IMF projections show that the debt-to-GDP ratio in emerging markets (EM) will remain well below DM&rsquo;s levels in the next few years - a big plus for EM bonds - but some lower-income countries are more vulnerable and might be forced to restructure.</p>
<h2>China Recovery</h2>
<p><strong>Tighter credit conditions in DM are important for global growth, but they are not the only game in town - especially for emerging markets.</strong> China&rsquo;s stronger-than-expected credit aggregates (both aggregate financing and the new town loans) confirmed that the recovery is gaining pace, while a below-consensus inflation print (0.7% year-on-year in March) signaled that there is still room to provide more policy support in sectors that need it the most. A key takeaway for us was a significant rebound in China&rsquo;s medium-term and long-term household lending, which is widely used as a proxy for mortgages (see chart below). The continuation of this trend bodes well for consumer confidence, supporting China&rsquo;s consensus 2023 GDP forecast of 5.3%. This, in turn, might help to shield many EMs from future market turbulence (just as it happened back in March).</p>
<h2>EM Disinflation</h2>
<p>Talking about <strong>central banks&rsquo; (maybe) &ldquo;breaking things&rdquo; with their aggressive policy tightening, some EMs are also on the watchlist</strong>. Brazil&rsquo;s real policy rate rose well above 8% after today&rsquo;s downside inflation surprise (4.65% year-on-year), which brought headline inflation back to the target range. Even though the inflation target is likely to get breached again in the coming months - partly due to base effects and partly due to changes in regulated prices - Brazil&rsquo;s disinflation success leaves plenty of room for rate cuts already in 2023. The pace of easing, however, will be determined by the government&rsquo;s ability to maintain fiscal discipline - not only in 2023 but beyond. Stay tuned!</p>
<h3>Chart at a Glance: China Reopening - Housing On Firmer Ground (Finally)</h3>
<p><img class="img-responsive w-100" src="https://www.vaneck.com/contentassets/88a78ad9383e423884bc0df5fcb22f40/us-natalias-take-2023-04-11.png" alt="Chart at a Glance: China Reopening - Housing On Firmer Ground (Finally)" /></p>
<p class="chart-disclosure">Source: Bloomberg LP.</p>
]]></content:encoded>
</item><item rdf:about="https://www.vaneck.com/us/en/blogs/economic-trends/a-big-week-for-risky-assets/">
  <title>A Big Week for Risky Assets></title>
  <link>https://www.vaneck.com/us/en/blogs/economic-trends/a-big-week-for-risky-assets/</link>
  <description><![CDATA[Will the new &ldquo;IMF consensus&rdquo; overshadow the impact of key economic releases in China and the U.S. on risky assets?]]></description>
  <dc:creator>Natalia  Gurushina</dc:creator>
  <dc:date>04/10/2023 15:00:00</dc:date>
<content:encoded><![CDATA[

<h2>IMF Insights</h2>
<p>The IMF Spring Meetings start today, and various discussion groups and seminars will help to form the market expectations for the next 3-6 months. The&nbsp;<strong>&ldquo;IMF consensus&rdquo; is not always right</strong>&nbsp;&ndash; actually, some consider it a contrarian signal &ndash; but it tells us how &ldquo;we, the market,&rdquo; see the world, what we care about, and what changed since we all got together six months ago. We also hope to gain more insights into how geopolitics and new disruptive technologies/digitalization are transforming the world - and the playing field for EMs. There will be several important data releases in the U.S. and China &ndash; two independent global growth drivers &ndash; making this week even more interesting.&nbsp;</p>
<h2>Global Growth Outlook</h2>
<p><strong>EM risky assets tend to benefit when the U.S. economy is doing well</strong>. Stronger U.S. growth means stronger demand for commodities, a better outlook for EM exports, and larger capital inflows &ndash; all of which are beneficial for EMs, especially lower-income and lower-rated countries. The latest jobs report and the ISM surveys sent mixed signals about the U.S. domestic demand, but the market thinks this should leave room for one last rate hike in May (with the implied probability of 70% or so). The U.S. inflation prints for March (on Wednesday) might cement these expectations or question them again. China will release its latest credit aggregates in the next few days. The consensus expects a noticeable pickup in aggregate financing and the new yuan loans &ndash; in line with seasonal patterns. Details, however, will matter just as much. Nobody disputes the fact that the Chinese economy is rebounding &ndash; we have plenty of high-frequency indicators to confirm this fact. But the housing sector is still slow, which might weigh on consumer confidence, and hence, on this year&rsquo;s growth potential.</p>
<h2>EM Disinflation And Rate Cuts</h2>
<p>Some&nbsp;<strong>EM central banks</strong>&nbsp;were surprisingly relaxed during the last IMF meetings &ndash; pausing or about to pause and hoping for relatively fast disinflation - but the&nbsp;<strong>mood has become more cautious</strong>&nbsp;since then. The road to disinflation turned out to be quite bumpy, while core inflation pressures and expectations are often stickier than expected. Several EMs will release their inflation numbers this week, including Hungary, the Czech Republic, and Brazil. Brazil is the world&rsquo;s disinflation poster kid (see chart below), but we keep wondering whether administration would step up pressure on the central bank to cut rates, if headline inflation drops below 5% year-on-year (as expected), getting back to the target range, and pushing the real policy rate well above 8%.</p>
<h3>Chart at a Glance: Brazil Inflation &ndash; Back to Target Range in March?</h3>
<img class="img-responsive w-100" src="https://www.vaneck.com/contentassets/25bf91ee0a274d83980f747c07539560/us-natalias-take-2023-04-10.png" alt="Chart at a Glance: Brazil Inflation &ndash; Back to Target Range in March?" />
<p class="chart-disclosure">Source: Bloomberg LP</p>
]]></content:encoded>
</item><item rdf:about="https://www.vaneck.com/us/en/blogs/thematic-investing/ibot-question-and-answer/">
  <title>IBOT ETF: Question and Answer></title>
  <link>https://www.vaneck.com/us/en/blogs/thematic-investing/ibot-question-and-answer/</link>
  <description><![CDATA[Demand for robotics and automation extends across industries and continues to grow. We explore the opportunity and how investors can invest in this growing space.]]></description>
  <dc:creator> </dc:creator>
  <dc:date>04/06/2023 06:30:00</dc:date>
<content:encoded><![CDATA[

<p>Demand for robotics and automation has been growing. The pandemic only hastened ongoing trends in changing demographics and technology where robotics and automated systems are poised to become more widely incorporated into business and life. Shifting demographics and an increasing capability at a lower cost is driving the need for robotics at the industrial and service level. Here we address frequently asked questions about investing in robotics and, specifically, about the <a href="/link/45b34d8e49864951b62a653766992734.aspx" title="IBOT - VanEck Robotics ETF - Overview"><strong>VanEck Robotics ETF (IBOT)</strong></a>.</p>
<ul class="content-list">
<li><strong><a href="#point-one">What is a robotics company?</a></strong></li>
<li><strong><a href="#point-two">What is the outlook for the robotics industry?</a></strong></li>
<li><strong><a href="#point-three">What is the investible universe for the VanEck Robotics ETF (IBOT)?</a></strong></li>
<li><strong><a href="#point-four">Is IBOT&rsquo;s exposure purely a domestic focus or is this global?</a></strong></li>
<li><strong><a href="#point-five">What differentiates IBOT from competitors?</a></strong></li>
<li><strong><a href="#point-six">Where does robotics fit inside my portfolio?</a></strong></li>
<li><strong><a href="#point-seven">How can investors buy VanEck ETFs?</a></strong></li>
</ul>
<h2 id="point-one" class="anchored-block">What is a robotics company?</h2>
<p>A robotics company is a company that designs, develops, manufactures or sells robots or robotics systems for various applications. With advancing technology and complexity, robots can be found anywhere from factories to medical centers to households. Robotics companies often specialize in specific features like machine vision or software, while others create and manufacture complete robotic systems.</p>
<h2 id="point-two" class="anchored-block">What is the outlook for the robotics industry?</h2>
<p>The industrial robotics outlook is generally positive, with projections to grow from $50B in 2021 to $90B by 2026.<sup>1</sup>&nbsp;Demand is strong for robotics technology in a variety of industries including manufacturing, healthcare, and logistics. Technological advancements have been driving robotics innovation and making industries more cost effective and efficient. Governments are also investing in the development of robotics technology for economic growth and to sustain labor as shortages become more prevalent.</p>
<h2><span id="point-three" class="anchored-block">What is the investible universe for the</span> <a href="/link/988caafdd1ac45e8ae52f65d9c7aa60c.aspx" title="IBOT - VanEck Robotics ETF - Overview">VanEck Robotics ETF (IBOT)</a>?</h2>
<p>The <a href="/link/ac2a594a30434095bee961adf811f3f5.aspx" title="IBOT - VanEck Robotics ETF - Index"><strong>Bluestar Robotics Index</strong></a> tracks the performance of those companies that are involved in robotics, targeting companies that derive at least 50% of their revenues from one or more of seven subthemes. These themes include robots and manufacturing/industrial automation systems, robotic surgical systems, 3D printing, robotics or manufacturing computer aided design or other software, semiconductor manufacturing systems, machine vision, and embedded machine learning chips. Coverage includes global companies in developed markets, providing exposure to the world&rsquo;s largest markets including China, the world&rsquo;s leader in industrial robotics demand.</p>
<div class="epi-contentfragment">faq-banner-cta</div>
<h2 id="point-four" class="anchored-block">Is IBOT&rsquo;s exposure purely a domestic focus or is this global?</h2>
<p><a href="/link/45b34d8e49864951b62a653766992734.aspx" title="IBOT - VanEck Robotics ETF - Overview"><strong>IBOT</strong></a>&nbsp;has a global focus given the industry. The United States, Japan and Europe make up the majority of regions in focus. There is also high exposure to markets like China, the world&rsquo;s largest market for robots. Many of these companies have had operations set up in China for decades, and they are investing heavily to increase efficiency and productivity.</p>
<h2 id="point-five" class="anchored-block">What differentiates IBOT from competitors?</h2>
<p><a href="/link/45b34d8e49864951b62a653766992734.aspx" title="IBOT - VanEck Robotics ETF - Overview"><strong>VanEck Robotics ETF (IBOT)</strong></a> is constructed using diversified subthemes that encompass the contributing segments that go into building robots. <a href="/link/45b34d8e49864951b62a653766992734.aspx" title="IBOT - VanEck Robotics ETF - Overview"><strong>IBOT</strong></a>&nbsp;focuses on industrial robotic companies and uses strategic weighting to replicate the industrial robotics market. This is done by splitting the portfolio into seven subthemes that are spread across three tiers.</p>
<p><strong><u>Tier One (50%)</u></strong></p>
<p>Robots and Manufacturing/ Industrial Automation Systems<br />Additive Manufacturing (3D Printing)</p>
<p><strong><u>Tier Two (25%)</u></strong></p>
<p>Robotics or Manufacturing Computer Aided Design or Other Software<br />Machine Vision</p>
<p><strong><u>Tier Three (25%)</u></strong></p>
<p>Robotic Surgical Systems<br />Semiconductor Manufacturing Systems<br />Embedded Machine Learning Chips</p>
<p>Each subtheme requires a minimum number of companies (30, 15, and 10, respectively) in order to help reduce concentration risk.</p>
<h2 id="point-six" class="anchored-block">Where does robotics fit inside my portfolio?</h2>
<p><a href="/link/45b34d8e49864951b62a653766992734.aspx" title="IBOT - VanEck Robotics ETF - Overview"><strong>IBOT</strong></a>&nbsp;is set up to capitalize off of long-term trends like shifting labor demographics, advancing technology, and lower costs to build robots.&nbsp;<a href="/link/45b34d8e49864951b62a653766992734.aspx" title="IBOT - VanEck Robotics ETF - Overview"><strong>IBOT</strong></a>&nbsp;should be included in the specialized, growth sector of your portfolio. With a long-term investment horizon, you may consider allocating a portion of your portfolio to benefit from the growth of the robotics industry.</p>
<h2 id="point-seven" class="anchored-block">How can investors buy VanEck ETFs?</h2>
<p><strong><a href="/link/988caafdd1ac45e8ae52f65d9c7aa60c.aspx#how-to-buy-etf&amp;utm=IBOT-Blog" title="How to buy VanEck ETFs?">Learn more here.</a></strong></p>
<p class="d-none d-lg-block"><a href="mailto:askvaneck@vaneck.com" title="Have More Questions? - Ask VanEck" rel="noopener"><img loading="lazy" class="img-responsive" src="https://www.vaneck.com/globalassets/home/us/insights/blogs/bm-blog-images/cta-faq_desktop-02.svg" alt="Have More Questions? - Ask VanEck" /></a></p>
<p class="d-lg-none"><a href="mailto:askvaneck@vaneck.com" title="Have More Questions? - Ask VanEck" rel="noopener"><img loading="lazy" class="img-responsive" src="https://www.vaneck.com/globalassets/home/us/insights/blogs/bm-blog-images/cta-faq_mobile-01.svg" alt="Have More Questions? - Ask VanEck" /></a></p>
<p>To receive more <a href="/us/en/insights/thematic-investing/" title="Income Investing Insights"><strong>Thematic Investing</strong></a> insights, <a href="/link/5f45412c2143400497908cea2897f7d3.aspx" title="Subscription Center"><strong>sign up in our subscription center</strong></a>.</p>
<style type="text/css">
    .wrapped-div {
        max-width: 100%;
    }

    @media (max-width: 768px) {
        .wrapped-div {
            overflow-x: scroll;
        }
    }

    .wrapped-div-sector {
        max-width: 100%;
        overflow-x: scroll;
    }
</style>
]]></content:encoded>
</item><item rdf:about="https://www.vaneck.com/us/en/blogs/digital-assets/matthew-sigel-bitcoin-rises-as-global-sanctions-trigger-resistance-to-us-dollar-hegemony/">
  <title>Bitcoin Rises as Global Sanctions Trigger Resistance to U.S. Dollar Hegemony></title>
  <link>https://www.vaneck.com/us/en/blogs/digital-assets/matthew-sigel-bitcoin-rises-as-global-sanctions-trigger-resistance-to-us-dollar-hegemony/</link>
  <description><![CDATA[Hong Kong's new digital asset framework coincides with U.S. crypto crackdown. Could Bitcoin's rise be driven by state-sponsored buyers &amp; global interest amid deglobalization?]]></description>
  <dc:creator>Matthew  Sigel</dc:creator>
  <dc:date>04/06/2023 06:30:00</dc:date>
<content:encoded><![CDATA[

<p><strong>Please note that VanEck may have a position(s) in the digital asset(s) described below.</strong></p>
<p><em>"There is no subtler, no surer means of overturning the existing basis of society than to debauch the currency. The process engages all the hidden forces of economic law on the side of destruction, and does it in a manner which not one man in a million is able to diagnose." - John Maynard Keynes</em></p>
<ul class="content-list">
<li><strong><a href="#point-one">Macro, Regulation, &amp; Bitcoin</a></strong></li>
<li><strong><a href="#point-two">Layer-1s</a></strong></li>
</ul>
<p>In March, there was a significant variation in digital asset returns, with both <strong>Bitcoin</strong> and <strong>Ethereum </strong>experiencing double-digit percentage increases, even as other sectors we track fell more than 10%. Returns were correlated to size, with the MarketVector digital assets 100 Large-cap index rising 13% while the digital assets 100 small-cap index fell 9%. For the month, Bitcoin +22%, Ethereum +11%, vs. Nasdaq composite +7%, and the S&amp;P 500 +3%.</p>
<h2 id="point-one" class="jump-link-nav anchored-block" data-jumplink-title="Macro, Regulation, &amp; Bitcoin">Macro, Regulation, &amp; Bitcoin</h2>
<p>We highlighted coming into the year that improving liquidity, especially in China, might lead to Bitcoin price strength if past relationships held. Indeed, as both the PBOC&rsquo;s reverse repo hit record levels in Q1 and M2 growth accelerated to 13% y/y, a 5-year high, we observed the Bitcoin price acting better on days with bigger liquidity injections from the PBOC. In addition, with HK set to unveil its digital asset regulatory framework, giving access to retail investors for the first time, Chinese SOE banks have stepped up their relationships with crypto firms in HK and elsewhere, according to multiple media reports. In our opinion, U.S. dollar hegemony is facing its biggest threat in decades as China, Saudi Arabia, India, and now notably Japan, among others, subvert global sanctions on Russia to secure sustainable, affordable energy supplies. Indonesia president Jokowi summarized the backlash to Washington&rsquo;s dollar weaponization on March 22nd when he proposed phasing out <strong>Visa</strong> &amp; <strong>Mastercard</strong>, according to RT, who quoted him as saying: &ldquo;Be very careful. We must remember the sanctions imposed by the U.S. on Russia. Visa &amp; Mastercard could be a problem.&rdquo; During the month, the VanEck research team met with a Chinese Bitcoin mining machine manufacturer who told us that Saudi Arabia and other Middle East countries&rsquo; state-associated funds are currently tendering large Bitcoin ASICS orders, likely to make progress after Ramadan&rsquo;s conclusion on April 20th. We think the Bitcoin price has run up sharply this year partially on expectations of these new state-sponsored Bitcoin buyers, in overt contradiction to the U.S. regulatory agencies&rsquo; hostile approach to the sector. For context, foreign holdings of U.S. treasury securities are languishing at a 10-year low, down 13% in the last 6 months, according to the U.S. Treasury. If deglobalization accelerates, we believe censorship-resistant bearer assets with predictable supply, such as Bitcoin and <strong>Gold</strong>, will comprise an increasing proportion of global reserves.</p>
<h3>Previous Cycles Suggest that Bitcoin will Rally Prior to and After the Next Halving</h3>
<p><img class="img-responsive w-100" src="https://www.vaneck.com/contentassets/0887363bb10c46638ffa812f47089df9/3051_scl_chart-01_2023.04_blog.svg" alt="Previous Cycles Suggest that Bitcoin will Rally Prior to and After the Next Halving" /></p>
<p class="chart-disclosure">Source: Arcana. Data as of 2/4/2023. Past performance is not indicative of future results. Not a recommendation to buy or sell any of the names mentioned herein.</p>
<p>Staying on the topic of regulation, the U.S.&rsquo;s multi-agency crackdown on crypto reached a fever pitch in March with the New York Attorney General (NYAG) suing exchange <strong>Kucoin</strong> over their business practices, the CFTC bringing charges against <strong>Binance</strong> for allegedly operating an unregistered futures exchange, and the SEC issuing <strong>Coinbase</strong> a &ldquo;Wells Notice.&rdquo; To complicate matters further, there is an ongoing turf war between the SEC and the CFTC to determine the crypto regulatory domains of each entity. While the SEC is tasked with overseeing &ldquo;securities,&rdquo; the CFTC is in charge of governing &ldquo;commodities.&rdquo; This divide is settled in traditional finance, but how each agency&rsquo;s regulatory powers relate to various cryptocurrencies is currently undecided despite each agency claiming overlapping suzerainty over crypto. The chief battleground in this fight is whether ETH is a &ldquo;security&rdquo; or &ldquo;commodity,&rdquo; which would determine regulatory jurisdiction.</p>
<p>After a late February assertion by SEC Chairman Gary Gensler that &ldquo;everything else other than Bitcoin is a security&rdquo; and the March 9 declaration by the NYAG that ETH was a security in court documents, it seemed the SEC was winning the battle. However, pushback occurred when the Chairman of the CFTC, Rostin Behnam, said the agency had a &ldquo;direct jurisdictional hook&rdquo; to regulate ETH, the commodity on March 9th and again in the CFTC complaint documents against Binance launched on March 27. While many crypto participants believe the CFTC would be a more accommodating regulator than the SEC, it appears that being caught between two government entities competing through &ldquo;regulation by enforcement&rdquo; is both the &ldquo;rock&rdquo; and the &ldquo;hard place.&rdquo; Settling the matter through legislation is the optimal solution, but this appears unlikely until after the 2024 election. Thus, we expect regulatory limbo and the potential for follow-up &ldquo;tape bombs&rdquo; while reminding investors &amp; regulators alike that the United States of America is still a nation of laws and crypto will have its day in court.</p>
<p>Adding to the regulatory complexity, March also saw the implosion of several important crypto-banking institutions, including <strong>Silvergate</strong> and <strong>Signature Bank,</strong> amid broader banking sector panic. Silvergate failing&rsquo;s is a material loss to the crypto industry as Silvergate&rsquo;s SEN network enabled crypto market makers and related parties to send and receive USD instantly. The result has been a marked decrease in crypto liquidity as the bid/ask spreads increased, and market depth receded. SVB&rsquo;s failure also prompted a dramatic depeg of the much-trusted stablecoin <strong>USDC</strong> from its dollar mark. This result occurred because <strong>Circle</strong>, the company behind USDC, held $3.3B in reserves at Silicon Valley Bank. When U,S. Treasury Secretary Janet Yellen announced that the U.S. government would backstop depositors at SVB, the price of USDC quickly recovered to its peg at $1.00. Still, despite the recoup of the $1.00-mark, faith in USDC has been shaken, and the result has been outflows from USDC of $9.3B since March 9, or around 22.7% of its total supply.</p>
<p>The practical conclusion to the increased regulatory enforcement appears to be the strengthening of certain incumbents, such as <strong>Tether</strong>, Coinbase, and Bitcoin, at the expense of a long tail of crypto exchanges and projects that do not have the resources to fight multiple regulatory battles and would prefer to retrench or go offshore during the crypto winter. Meanwhile, new banks are emerging to service the industry - ask for a list. The next Silvergate is more likely to be offshore, with more fragile correspondent banking relationships in the U.S.</p>
<h3>Market Capitalization USDC vs. Tether</h3>
<p><img class="img-responsive w-100" src="https://www.vaneck.com/contentassets/0887363bb10c46638ffa812f47089df9/3051_scl_chart-02_2023.04_blog.svg" alt="Market Capitalization USDC vs. Tether" /></p>
<p class="chart-disclosure">Source: Arcana as of 3/28/2023. Past performance is not indicative of future results. Not a recommendation to buy or sell any of the names mentioned herein.</p>
<h2 id="point-two" class="jump-link-nav anchored-block" data-jumplink-title="Layer-1s">Layer-1s</h2>
<p>Despite the heated regulatory environment in March, the market capitalization of smart contract platforms rose from $297B to $321B thanks to notable strength from ETH (+11%) &amp; BNB (+4%), and <strong>Cardano</strong> (+6%). The biggest losers of the month were <strong>Near</strong> (-16%) and <strong>Cosmos</strong> (-11%).</p>
<p>While Ethereum usership was flat in the month of March, the ETH token appreciated partly because of the sound execution of the Ethereum roadmap. In this respect, Ethereum&rsquo;s vision of scaling through offboarding transaction execution to layer-2s is progressing well, as the amount of L2 gas usage (how much of Ethereum&rsquo;s blockspace is occupied by L2 transactions) in March reached 17% vs. less than 5% at the end of 2022. In our view, initiatives that significantly enhance user experience will play a crucial role in promoting Ethereum's widespread adoption. This requires infrastructure that enables Ethereum wallets to rival the simplicity of conventional online banking. On that front, we believe the introduction of Ethereum&rsquo;s <strong>ERC-4337</strong> Account Abstraction Upgrade is the second most important Ethereum upgrade (after the Merge) and will be a key contributing factor in boosting confidence in Ethereum's commitment to reaching a larger audience. An audited version of ERC-4337 became available on the Ethereum mainnet in March. It will enable two-factor authentication, setting monthly spending limits on an account, the use of session keys to play blockchain games without constantly having to approve transactions, decentralized recovery of wallets, and configuration to autopay bills and subscriptions.</p>
<h3>L2 Transaction Settlement Share of Ethereum</h3>
<p><img class="img-responsive w-100" src="https://www.vaneck.com/contentassets/0887363bb10c46638ffa812f47089df9/3051_scl_chart-03_2023.04_blog.svg" alt="L2 Transaction Settlement Share of Ethereum" /></p>
<p class="chart-disclosure">Source: Dune as of 4/3/2023. Past performance is not indicative of future results. Not a recommendation to buy or sell any of the names mentioned herein.</p>
<p>Going forward, we are also keeping a close eye on Ethereum Layer-2 scaling solutions that involve a technology called <strong>Zero-Knowledge roll-ups</strong>. Layer-2 roll-ups are a solution that allows the execution of transactions to happen off the Ethereum chain. The data from these transactions is compressed and posted to Ethereum to ensure authenticity and data storage. Currently, the dominant form of L2 roll-ups that exist are called optimistic roll-ups. Optimistic roll-ups post data onto Ethereum, which has a seven-day window that allows outside parties to challenge their authenticity. The result is that the roll-ups and transactions they execute can be rolled back if fraud is detected over that window of seven days. The issue is that users cannot trust their transactions to be truly final until that seven-day challenge period has passed. By contrast, Zero-Knowledge (ZK) roll-ups post proof of accuracy alongside the transaction data. Due to this property, ZK roll-ups are considered more promising over the long-term for scaling Ethereum &ndash; which could result in transaction throughput increases to 1000x what it is today. Two important ZK-roll ups were launched in March, and these are <strong>zkSync&rsquo;s Era</strong> <strong>and Polygon&rsquo;s zkEVM</strong>. Thus far, Era has dominated the ZK landscape with more than 40x the TVL as zkEVM. Still, it is early on in the adoption of ZK-Roll Ups, and many speculate users are migrating assets to Era for airdrops (distribution of rewards to early users). In any case, Era&rsquo;s early lead is immense.</p>
<h3>TVL Comparison: Era vs zkEVM ($M)</h3>
<p><img class="img-responsive w-100" src="https://www.vaneck.com/contentassets/0887363bb10c46638ffa812f47089df9/3051_scl_chart-04_2023.04_blog.svg" alt="TVL Comparison: Era vs zkEVM ($M)" /></p>
<p class="chart-disclosure">Source: Dune as of 3/31/2023. Past performance is not indicative of future results. Not a recommendation to buy or sell any of the names mentioned herein.</p>
<p>As for BNB, we partly attribute the Binance coin&rsquo;s strength in March to a dramatic improvement in daily active addresses, up 28% compared to February, increasing to 1.22M. BNB token price also benefited from the release of BNB&rsquo;s new roadmap, which promises to triple the chain&rsquo;s validator count, enable a 12x transaction throughput increase to 5,000 TPS, deploy ZK roll-ups through <strong>zkBNB</strong>, and launch the BNB Greenfield decentralized storage project. BNB, despite the recent legal action against it, has an intense focus on creating interesting, inexpensive products that copy the best from other ecosystems and bring it to the lower-value users. This approach, mirroring the weapons export business aimed at bargain users of the Soviets during the Cold War, has earned it an average of 1 million daily active users, which is more than double the next highest chain, Ethereum.</p>
<h3>Marketshare Daily Active Layer-1/Layer-2 Blockchains</h3>
<p><img class="img-responsive w-100" src="https://www.vaneck.com/contentassets/0887363bb10c46638ffa812f47089df9/3051_scl_chart-05_2023.04_blog.svg" alt="Marketshare Daily Active Layer-1/Layer-2 Blockchains" /></p>
<p class="chart-disclosure">Source: Dune as of 3/31/2023. Past performance is not indicative of future results. Not a recommendation to buy or sell any of the names mentioned herein.</p>
<h3>Binance Active Addresses - 30 Day Moving Average</h3>
<p><img class="img-responsive w-100" src="https://www.vaneck.com/contentassets/0887363bb10c46638ffa812f47089df9/3051_scl_chart-06_2023.04_blog.svg" alt="Binance Active Addresses - 30 Day Moving Average" /></p>
<p class="chart-disclosure">Source: Dune as of 3/31/2023. Past performance is not indicative of future results. Not a recommendation to buy or sell any of the names mentioned herein.</p>
<p><strong>Cardano</strong>, despite flat usership, outperformed in part due to an important governance upgrade called CIP-1694. This improvement inches Cardano towards an important roadmap mile marker called the Age of Voltaire, which introduces decentralization by enabling a token-based voting system for Cardano treasury management and chain upgrades. Then on March 30, Milkomeda, a Layer-2 to Cardano, launched the capability to deploy smart contracts using Solidity. This layer-2 EVM capability brings smart contract language and functionality &ndash; something sorely lacking in Cardano over the past few years.</p>
<p>Among laggards in March,<strong> Cosmos</strong> and <strong>NEAR</strong> fell 16% and -11%, respectively. NEAR&rsquo;s price is languishing due to a clear loss in adoption despite interesting announcements in March, such as the Blockchain Operating System, which allows a common layer for browsing Web3 applications, and a gaming partnership with South Korean powerhouse <strong>Kakao Games</strong>. Since the beginning of March, NEAR&rsquo;s daily active addresses are down -17.3%, its TVL has dropped -34.9%, and transactions are down -9.1%.</p>
<p>On the other hand, the issues of <strong>Cosmos</strong> relate less to on-chain metrics than they do the continued dysfunction of the Cosmos community combined with the lack of execution and clarity surrounding Cosmos&rsquo;s long-term business model. Despite encouraging developments, such as the announcement of USDC deploying natively to Cosmos and the passage of Cosmos&rsquo;s first iteration of its business model, Replicated Security, community drama drowned out the positive news. Ongoing Twitter spats, notably between Cosmos co-founder Jae Kwon and basically the remainder of the community, have devolved into a legal battle between Kwon&rsquo;s entity and a former employee of Kwon&rsquo;s entity. This lawsuit may extend further to other major Cosmos figures and is indicative of vision disagreement among the major entities in the Cosmos. The most recent spat contributes to a picture of a divided ecosystem many assumed was holding Cosmos back. Specifically, at least eight separate entities are focusing on developing the Cosmos Hub. While most of these organizations share many common goals, they differ markedly on major portions of the Cosmos roadmap, and this was demonstrated when the ATOM 2.0 plan was rejected last year. Despite the stalled progress, we continue to be bulls on the Cosmos as it offers a unique community, value proposition, and architecture that is well-differentiated from Ethereum.</p>
<p>To receive more <strong><a href="https://www.vaneck.com/us/en/insights/digital-assets/" title="Digital Assets Insights">Digital Assets</a></strong> insights, <strong><a href="https://www.vaneck.com/us/en/subscribe/" title="Subscription Center">sign up in our subscription center</a></strong>.</p>
]]></content:encoded>
</item><item rdf:about="https://www.vaneck.com/us/en/blogs/economic-trends/imf-meetings-searching-for-answers/">
  <title>IMF Meetings – Searching for Answers></title>
  <link>https://www.vaneck.com/us/en/blogs/economic-trends/imf-meetings-searching-for-answers/</link>
  <description><![CDATA[Disconnect between the market expectations and central banks&rsquo; messaging is not unique to DMs. Can EMFX strength save the day and open room for more easing?]]></description>
  <dc:creator>Natalia  Gurushina</dc:creator>
  <dc:date>04/06/2023 06:30:00</dc:date>
<content:encoded><![CDATA[

<h2>Top Global Stories</h2>
<p>The International Monetary Fund (IMF) Spring Meetings are upon us again. We&rsquo;ll be on the ground next week &ndash; as usual &ndash; hoping to gain more insight into key global issues and country-specific developments. China&rsquo;s rebound and hard landing in the U.S. are at the top of the list, contributing to the U.S.-Europe growth divergence story, and emerging markets (EM) relative growth performance vs. developed markets (DM). <strong>A stronger correlation of some EMs with China helped to shield EM assets from market turbulence in DM</strong> so far this year, but the uncertainty about the recovery&rsquo;s timeline &ndash; especially as regards domestic demand&rsquo;s ability to compensate for a potentially weaker external growth outlook &ndash; can affect performance going forward.</p>
<h2>Market Expectations for EM Rates</h2>
<p>A series of weaker than expected data points in the U.S. and concerns about tighter credit conditions are driving the market expectations of some kind of a recession in the coming months (Fed Funds Futures imply about 80bps of rate cuts this year &ndash; see chart below). Similar <strong>disconnect between central banks </strong>(more hawkish/cautious) <strong>messaging and the market&rsquo;s more relaxed expectations can be seen in several EMs</strong> as well. Today&rsquo;s surprising policy rate pause in India might be considered (by some) a signal that the market&rsquo;s optimism is justified. The central bank&rsquo;s communications did not strike us as particularly dovish &ndash; it looked more like a hawkish pause - but the anti-inflationary impact of a stronger currency might open more room for easing later this year.</p>
<h2>Room for Rate Cuts In EM</h2>
<p>Most LATAM currencies are also up against the U.S. Dollar, including the Chilean peso &ndash; buoyed by higher carry (thank you, proactive tightening) and better prospects for commodity prices. However, today&rsquo;s inflation print in Chile pointed to <strong>offsetting factors that can easily delay rate cuts</strong>, despite on-going moderation in headline prices. A measure of annual inflation that excludes volatile items remained stuck just under 11%, reinforcing the central bank&rsquo;s hawkish message and its new forecasts that show slower convergence to the inflation target. Stay tuned!</p>
<h3>Chart at a Glance: Market&rsquo;s U.S. Hard Landing Fears Are Back</h3>
<p><img class="img-responsive w-100" src="https://www.vaneck.com/contentassets/4c5febbefcd84c73877ea329efdb7f17/us-natalias-take-2023-04-06.png" alt="Chart at a Glance: Market's U.S. Hard Landing Fears Are Back" /></p>
<p class="chart-disclosure">Source: Bloomberg LP.</p>
]]></content:encoded>
</item><item rdf:about="https://www.vaneck.com/us/en/blogs/thematic-investing/secure-act-2-0-how-it-impacts-the-way-you-save-for-retirement/">
  <title>Secure Act 2.0: How it Impacts the Way You Save for Retirement></title>
  <link>https://www.vaneck.com/us/en/blogs/thematic-investing/secure-act-2-0-how-it-impacts-the-way-you-save-for-retirement/</link>
  <description><![CDATA[The Secure Act 2.0 reshapes retirement savings for IRA and employer-sponsored plan holders. Learn about 6 key aspects that impact your retirement savings potential.]]></description>
  <dc:creator> </dc:creator>
  <dc:date>04/05/2023 06:30:00</dc:date>
<content:encoded><![CDATA[

<p>The Secure Act 2.0, a transformational piece of legislation, aims to enhance the retirement savings landscape in the United States significantly. It introduces new rules and provisions that will impact individuals with individual retirement accounts (IRAs) and employer-sponsored retirement plans, such as 401(k)s. Let's delve into 6 critical aspects of the Secure Act 2.0 that investors should be aware of:</p>
<h2>1. Employer matching contributions are now available for Roth 401(k) accounts</h2>
<p>Previously, 401(k) matching contributions from employers were mandated to be deposited into a pre-tax account. With the Secure Act 2.0, employees can opt to have the matching funds allocated to a Roth 401(k), which may offer some a more tax-efficient way to accumulate wealth over time. A Roth 401(k) and a traditional 401(k) are both retirement plans sponsored by employers, but they have different tax implications. Deciding between the two primarily hinges on a person's present tax circumstances and their anticipated tax bracket upon retirement. Here are a few reasons why someone might opt for a Roth 401(k):</p>
<ul class="content-list">
<li>Tax-exempt withdrawals during retirement: Roth 401(k) contributions are made with after-tax income, meaning you pay taxes on the funds before they are contributed. As a result, qualified distributions in retirement are not subject to taxes. This can be especially advantageous if you believe your tax bracket will be higher during retirement since you won't have to pay taxes on those withdrawals.</li>
<li>No mandatory minimum withdrawals: Unlike traditional 401(k) account holders, who must start taking required minimum distributions (RMDs) at a specific age (72 but rising to 73 and later 75 under the Secure Act 2.0), Roth 401(k) holders are not subject to RMDs.</li>
<li>Tax planning versatility: Having both a conventional 401(k) and a Roth 401(k) allows you to diversify your retirement savings in terms of tax exposure. This adaptability lets you strategically plan your retirement withdrawals, selecting between taxable and non-taxable sources depending on your tax situation each year.</li>
<li>Suitable for younger or lower-earning individuals: If you're in the earlier stages of your career or currently in a lower tax bracket, a Roth 401(k) may be more advantageous. By contributing to a Roth 401(k), you pay taxes on your contributions now, when your tax rate might be lower than in the future. As you advance in your career and potentially earn a higher income, you may be in a higher tax bracket when you retire. Choosing a Roth 401(k) lets you lock in your current lower tax rate and enjoy tax-exempt withdrawals later.</li>
</ul>
<h2>2. Automatic enrollment and contribution rate set by employers</h2>
<p>Starting in 2025, new 401(k) and 403(b) plans will be required to automatically enroll eligible employees, setting an initial contribution rate of at least 3%. This measure aims to streamline the retirement savings process and ensure that workers don't miss out on crucial savings opportunities.</p>
<h2>3. Employer assistance with student loan payments</h2>
<p>Recognizing that student loan debt often hinders retirement savings, the Secure Act 2.0 enables employers to choose to "match" employee student loan payments with corresponding contributions to a retirement account, starting in 2024. This approach offers employees an added incentive to save for retirement while simultaneously tackling their student loan obligations.</p>
<h2>4. Transferring 529 assets to Roth IRAs</h2>
<p>Starting in 2024, individuals who have overfunded their 529 accounts or experienced a change in their children's educational plans can transfer their 529 assets into a Roth IRA for the beneficiary of the 529 plan. The transfers will be subject to annual Roth contribution limits and an aggregate lifetime limit of $35,000, providing a valuable option for reallocating unused education savings.</p>
<h2>5. Gradual increase in required minimum distribution (RMD) age</h2>
<p>The Secure Act 2.0 will gradually raise the age at which retirement account owners must begin taking RMDs. As of January 1, 2023, the RMD age will increase from 72 to 73, followed by another increase to 75 in 2033. This change allows individuals more time to accumulate wealth before mandatory distributions begin.</p>
<h2>6. A boost in catch-up contributions</h2>
<p>Effective January 1, 2025, individuals aged 60 to 63 will be eligible to make catch-up contributions of up to $10,000 annually to workplace retirement plans, compared to the current catch-up limit of $7,500 for those aged 50 and older. This enhancement encourages late-stage retirement savings and offers a valuable opportunity for those nearing retirement to bolster their nest egg.</p>
<p>The Secure Act 2.0 stands to transform the retirement savings landscape by providing new opportunities and incentives for Americans to save for their future. From expanded employer-matching Roth 401(k) contributions to increased catch-up contribution limits, this legislation aims to ease the retirement planning process and promote financial security for millions of hardworking individuals. As these changes take effect, investors should stay informed and adjust their financial strategies to maximize their retirement savings potential.</p>
<p>To receive more <strong><a href="https://www.vaneck.com/us/en/insights/thematic-investing/" title="Thematic Investing Insights">Thematic Investing</a></strong> insights, <strong><a href="https://www.vaneck.com/us/en/subscribe/" title="Subscription Center">sign up in our subscription center</a></strong>.</p>
]]></content:encoded>
</item><item rdf:about="https://www.vaneck.com/us/en/blogs/economic-trends/em-rate-hikes-success/">
  <title>EM Rate Hikes – Success?></title>
  <link>https://www.vaneck.com/us/en/blogs/economic-trends/em-rate-hikes-success/</link>
  <description><![CDATA[EM rate hikes paved the way for disinflation and provided fundamental support for EM bonds. But how bad is collateral damage in the form of weaker growth?]]></description>
  <dc:creator>Natalia  Gurushina</dc:creator>
  <dc:date>04/05/2023 06:30:00</dc:date>
<content:encoded><![CDATA[

<h2>Case for EM Bonds</h2>
<p>Emerging markets (EM) central banks&rsquo; independence and early (credible) responses to the post-pandemic inflation spike boosted EM real yields and carry, <strong>supporting the fundamental case for EM bonds and helping to shield them from recent market turbulence in developed markets (DM)</strong>. EM&rsquo;s disinflation progress keeps the pivot hopes alive, but for now most central banks prefer to stay vigilant. And often this means an extended pause &ndash; like in the case of the Chilean central bank yesterday (higher rates for longer), or Poland&rsquo;s national bank this morning.</p>
<h2>EM Disinflation</h2>
<p>The latest inflation prints in Mexico, Colombia and the Philippines show why many central banks are cautious &ndash; even though <strong>headline inflation has clearly peaked, core price pressures are much more persistent</strong>. Mexico&rsquo;s core inflation slowed less than expected in March &ndash; staying above 8% year-on-year &ndash; and services inflation continued to accelerate. Core inflation in Colombia and the Philippines was also in &ldquo;lift-off&rdquo; mode &ndash; the latter reached a new high since March 1999, leaving room for a small &ldquo;farewell&rdquo; rate hike. The market expects to have more clarity on these issues in three to six months, which explains the timing of priced-in &ldquo;inaugural&rdquo; EM rate cuts. A comment from Poland&rsquo;s central bank Governor Adam Glapinski also drew attention to the disinflationary impact of stronger EM currencies, which might help to bring easing forward in some countries.</p>
<h2>Global Growth Outlook</h2>
<p>As more EMs are exiting their tightening cycle, the attention is shifting to <strong>the impact of high real interest rates on growth</strong>. The chart below plots real policy rates against the latest activity gauges &ndash; and it shows that bringing inflation down can come at a price, as domestic demand slows. The updated World Economic Outlook &ndash; released by the IMF this morning &ndash; reminded that there are additional considerations here, such as the increasingly complicated global backdrop. The report talks about the impact of geopolitical tensions and geo-economic fragmentations, which can &ldquo;reshape the geography of foreign direct investments&rdquo;, especially in strategic sectors. Some EMs will be winners in this brave new world &ndash; but some can become more vulnerable. Stay tuned!</p>
<h3>Chart at a Glance: EM Rate Hikes and Domestic Activity Gauges</h3>
<p><img class="img-responsive w-100" src="https://www.vaneck.com/contentassets/62efcfce514a4c3a9f9140542b4a51dc/us-natalias-take-2023-04-05.png" alt="Chart at a Glance: EM Rate Hikes and Domestic Activity Gauges" /></p>
<p class="chart-disclosure">Source: Bloomberg LP.</p>
]]></content:encoded>
</item><item rdf:about="https://www.vaneck.com/us/en/blogs/economic-trends/rate-cuts-on-the-chopping-block/">
  <title>Rate Cuts – On the Chopping Block?></title>
  <link>https://www.vaneck.com/us/en/blogs/economic-trends/rate-cuts-on-the-chopping-block/</link>
  <description><![CDATA[The market agrees with EM central banks&rsquo; caution on policy easing, but there are factors that can speed up this process.]]></description>
  <dc:creator>Natalia  Gurushina</dc:creator>
  <dc:date>04/04/2023 06:30:00</dc:date>
<content:encoded><![CDATA[

<h2>EM Policy Rate Expectations</h2>
<p>Various <strong>emerging markets (EM) central banks continue to signal that while they are happy to end their tightening cycles, the bar for rate cuts is still high</strong>. The latest monetary policy communications in the Czech Republic, Hungary, Brazil, Malaysia and Thailand were surprisingly hawkish. The Bank of Thailand signaled more tightening as the economy continues to rebound. The Czech National Bank explicitly warned the market against &ldquo;premature&rdquo; bets on rate cuts, even suggesting that that policy rate might not have peaked yet. The Malaysian central bank cautioned that we are &ldquo;not out of the woods on inflation&rdquo;, and South Africa actually re-accelerated the pace of tightening last month.</p>
<h2>EM Disinflation</h2>
<p>The <strong>market seems to be OK with the &ldquo;rate cuts delayed&rdquo; narrative</strong>, seeing no noticeable easing until Q4 (see chart below). Uncertainty about global growth and the impact of geopolitics/China&rsquo;s rebound on commodity prices are good reasons for being vigilant. Uneven or slower than expected disinflation also argues for policy caution. Sticky core inflation/inflation expectations are a problem for many central bankers &ndash; South Korean inflation prints for March illustrate this point really well. Some board members would prefer inflation to get closer to the target range (or the current benchmark rate) before initiating rate cuts &ndash; this was a message from the Romanian central bank earlier today, and we might hear similar undertones from the Chilean central bank in the afternoon.</p>
<h2>EM Rate Cuts</h2>
<p><strong>Some factors, however, might pave the way for earlier/larger rate cuts</strong>. Real policy rates based on expected inflation are getting really high in some EMs, threatening the growth outlook in a situation when fiscal space is getting more limited. The pace of fiscal adjustment is key here (as this might affect inflation expectations) &ndash; with Brazil being a prime candidate for the policy rate re-pricing, if the new fiscal framework is deemed credible. We also keep an eye on &ldquo;the mother of all base effects&rdquo; that should have a stronger anti-inflation impact in the coming months. Finally, EM FX spectacular performance so far this year can also speed up disinflation, easing pressure on EM central banks and opening more room for rate cuts. Stay tuned!</p>
<h3>Chart at a Glance: EM Rate Cuts &ndash; No Rush For Now</h3>
<p><img class="img-responsive w-100" src="https://www.vaneck.com/contentassets/1863f188fffd471c8c2c1b744cc3d2d1/us-natalias-take-2023-04-04.png" alt="Chart at a Glance: EM Rate Cuts - No Rush For Now" /></p>
<p class="chart-disclosure">Source: VanEck Research; Bloomberg LP.</p>
]]></content:encoded>
</item><item rdf:about="https://www.vaneck.com/us/en/blogs/economic-trends/em-a-stagflation-curveball/">
  <title>EM - A Stagflation Curveball></title>
  <link>https://www.vaneck.com/us/en/blogs/economic-trends/em-a-stagflation-curveball/</link>
  <description><![CDATA[OPEC+ production cut decision should keep various EM central banks on the cautious side, despite peaking inflation and growth headwinds.]]></description>
  <dc:creator>Natalia  Gurushina</dc:creator>
  <dc:date>04/03/2023 15:30:00</dc:date>
<content:encoded><![CDATA[

<h2>Oil Production Cuts</h2>
<p>The second quarter began with <strong>a curveball &ndash; a surprising announcement by OPEC+ (Organization of the Petroleum Exporting Countries) about production output cuts</strong> starting in May. Energy importers felt an immediate impact, and global rates initially moved higher, because the OPEC+ move has led to renewed inflation concerns. The OPEC+ supply cuts are taking place against the backdrop of the still uncertain global growth outlook, resurrecting a ghost of stagflation and adding to policy challenges faced by major central banks.</p>
<h2>Global Growth Headwinds</h2>
<p>The <strong>latest activity gauges in independent global growth drivers pointed to more growth headwinds</strong>. The ISM (Institute for Supply Management) manufacturing survey in the U.S. looked ugly across the board &ndash; much weaker than expected (see chart below) and with a worrying drop in new orders. The manufacturing PMIs (Purchasing Managers Indices) in the Eurozone and the U.K. remained stuck in contraction zone. China&rsquo;s surprisingly weak Caixin manufacturing PMI (50.0 &ndash; see chart below)) came on the heels of the more impressive official manufacturing and services PMI surveys, signaling that the pace of recovery in different sectors should not be taken for granted, and that smaller privately-owned companies (with a higher export component) might require additional support. Activity gauges in the rest of emerging markets (EM) were also split. Some Asian economies look strong (India, Indonesia, the Philippines, and Thailand). But others (South Korea and Malaysia) stayed &ldquo;under water&rdquo;. They were joined by Central European economies, South Africa, and Brazil, where the manufacturing PMI moved deeper into contraction zone (47.0).</p>
<h2>EM Disinflation and Oil Prices</h2>
<p><strong>The OPEC+ production cut decision is likely to keep various central banks in EM on the cautious side</strong>, despite peaking inflation and growth headwinds. The market ignored a nice downside surprise in Indonesian inflation this morning (headline CPI dropping below 5% year-on-year, and core below 3%), and it remains to be seen whether further disinflation in South Korea and the Philippines (out later today and tomorrow) will move the &ldquo;easing&rdquo; dial. But EM is not a monolith, and idiosyncratic drivers should not be ignored &ndash; even on days like today. For example, Brazil&rsquo;s new fiscal framework is just as important for the central bank as other inflation drivers &ndash; and a credible progress on the fiscal front can help to compensate for potential upside risks associated with higher energy prices. Stay tuned!</p>
<h3>Chart at a Glance: Global Growth Drivers Checkup*</h3>
<img class="img-responsive w-100" src="https://www.vaneck.com/contentassets/7fa01f82d1b74ccd85a218a426873f32/us-natalias-take-2023-04-03.png" alt="Chart at a Glance: Global Growth Drivers Checkup" />
<p class="chart-disclosure">Source: Bloomberg LP</p>
<div class="disclosure">
<p>*MPMICNMA Index: Caixin China manufacturing index</p>
</div>
]]></content:encoded>
</item><item rdf:about="https://www.vaneck.com/us/en/blogs/natural-resources/a-masterclass-in-sustainable-investing/">
  <title>A Masterclass in Sustainable Investing></title>
  <link>https://www.vaneck.com/us/en/blogs/natural-resources/a-masterclass-in-sustainable-investing/</link>
  <description><![CDATA[Integrating ESG into investment processes means analyzing data and engaging with investee companies through meaningful discussions.]]></description>
  <dc:creator>Shawn Reynolds</dc:creator>
  <dc:date>04/03/2023 06:30:00</dc:date>
<content:encoded><![CDATA[

<h2>ESG Integration in VanEck&rsquo;s Natural Resource Funds</h2>
<p>The need to understand and formally integrate ESG into our investment process became clear in recent years as a strategy that focuses on <strong><a href="/link/2ed6209aa9674070b56e86addc947db6.aspx" title="GHAAX - Global Resources Fund - Class A - Overview">global natural resources</a></strong>. The key to ESG integration is to treat it no differently than how you think about the rest of your investment thesis around a company.</p>
<p>There are operating statistics and financial metrics, and then there are E (environmental), S (social) and G (governance) metrics. In the equity business, you always must think about governance. When investing in natural resources, the environmental side and the social license to practice are important to consider as well.</p>
<p>ESG is an integral part of the investment process for VanEck&rsquo;s natural resource strategies. When engaging with investee companies, we make it clear that we analyze these factors in detail, especially with respect to the targets that they are setting.</p>
<h2>Digging Into the Data to Make ESG Integration Meaningful</h2>
<p>As ESG has become mainstream, there has been an increased need to measure companies&rsquo; ESG performances. While some companies use third-party ESG scoring providers, we prefer to rely on hard data metrics to evaluate a company&rsquo;s ESG performance for VanEck&rsquo;s natural resource strategies. We look at the numbers and incorporate them into discussions we have with management.</p>
<p>When engaging with companies, we discuss their ESG targets, the metrics they use to measure performance, their progress toward meeting these goals, and the dialogue regarding the company&rsquo;s operational and financial performance.</p>
<h2>Opportunities to Invest in the Resource Transition</h2>
<p>The resource transition presents a lot of investment potential, specifically in the growing universe of names that are becoming investible.</p>
<p><strong>Traditional Energy</strong></p>
<p>The traditional resource space has the potential to make an outsized change when it comes to sustainability. Oil and gas companies are some of the top emitters of global greenhouse gases, therefore, reducing their emissions has a large impact on global sustainability. They also have the greatest skillsets to address their emissions through project management and technological capabilities. The VanEck natural resource teams are interested in what can be gained in the future from making these companies more sustainable, rather than only looking at their current operations and impact.</p>
<p><strong>Resource Transition Sector and Disruptors</strong></p>
<p>Many resource transition companies are improving environmental sustainability, including solar companies and wind companies. Disruptive technology companies are also looking to change things dramatically, such as direct air carbon capture or green hydrogen.</p>
<p><strong>Shifting Business Models</strong></p>
<p>Most companies in the world are incrementally improving the environmental sustainability of their operations - for instance, by emitting fewer greenhouse gases or consuming less energy. Other companies are taking the transition a step further by fundamentally changing their behavior to improve the sustainability of their operations.</p>
<h2>More Progress Needed to Meet Global Goals</h2>
<p>Technological advances related to sustainability are progressing, but not nearly at a fast-enough speed to address future sustainability needs. The uptake of EVs, solar panels and wind farms around the world is great and is much faster than overall energy consumption growth, but it's not anywhere close to reaching the global goal of net zero by 2050.</p>
<p>Much larger investments must happen between now and 2050 to reach climate targets. Reports issued by the International Renewable Energy Agency (IRENA) outline the investment and capital expenditures needed in the resource transition. A few years ago, IRENA estimated that $110 trillion was needed to be spent in energy transition technologies to reach net zero by 2050. Recently, IRENA increased this estimate to $131 trillion &ndash; the equivalent of five or six U.S. economies over the next 30 years, or a German economy every year over the next 30 years.</p>
<p>These projections are much larger than what is being spent. In 2021, approximately $850 billion was spent. In 2022, $1.1 trillion was spent, largely on just three technologies: solar, wind, and transportation (which was accounted for mostly by electric vehicles). While this represents progress, it is not nearly strong enough.</p>
<h3>Global Investment in Resource Transition</h3>
<p><img loading="lazy" class="img-responsive w-100" src="https://www.vaneck.com/contentassets/0a47b890b636429db59a3ce014145ba4/3027_asset-tv-esg_chart_01_2023.03_v1_blog.svg" alt="Global Investment in Resource Transition" /></p>
<p class="chart-disclosure"><strong>Source:</strong> BloombergNEF. Energy Transition Investment Trends 2023. Data as of 2023.</p>
<p>Power generation and transport only account for 40% of global greenhouse gas emissions. The sectors that account for the other 60% of emissions need to be addressed and funded through investments. Specifically, the resource transition sectors that are lacking investment are those that are difficult to decarbonize, including steel, cement, chemical and paper and agriculture. Agriculture is one of the largest producers of emissions &ndash; accounting for roughly 20-30%, which is comparable to power generation. Beyond emissions, agriculture has a significant impact on other areas of environmental sustainability, including land use, water use, pollution and biodiversity.</p>
<p>Aside from reducing emissions, we need to think about the investment opportunities associated with climate change mitigation and adaptation as they become a larger part of the discourse and push for global sustainability. While we are a long way away from that, it is on the horizon.</p>
<p>Additional highlights from the masterclass, which can be accessed <strong><a href="https://www.vaneck.com/us/en/offsite-disclaimer/?id=222303&amp;button=no&amp;url=https://www.assettv.com/video/masterclass-esg-march-2023" title="Asset TV - MASTERCLASS: ESG - March 2023" target="_blank" rel="noopener">here</a></strong>, include:</p>
<ul class="content-list">
<li>14:09: Specific areas that are often overlooked in the sustainability discourse</li>
<li>20:20: How to evaluate ESG risks in current or prospective investee companies</li>
<li>41:44: How the global push for net zero greenhouse gas emissions is impacting companies in the natural resources sector</li>
<li>1:00:15: How to think about sustainability in the context of managing a strategy that also invests in fossil fuels</li>
</ul>
<p>To receive more <a href="/us/en/insights/natural-resources/" title="Natural Resources Insights"><strong>Natural Resources</strong></a> insights, <a href="https://www.vaneck.com/us/en/subscribe/" title="Subscription Center"><strong>sign up in our subscription center</strong></a>.</p>
]]></content:encoded>
</item><item rdf:about="https://www.vaneck.com/us/en/blogs/emerging-markets-bonds/em-local-currency-bonds-shine-amid-banking-turmoil/">
  <title>EM Local Currency Bonds Shine Amid Banking Turmoil></title>
  <link>https://www.vaneck.com/us/en/blogs/emerging-markets-bonds/em-local-currency-bonds-shine-amid-banking-turmoil/</link>
  <description><![CDATA[Emerging markets local currency bonds have been resilient amid extreme volatility in U.S. rates, recent banking troubles, and continued uncertainty around inflation and economic growth.]]></description>
  <dc:creator>Fran Rodilosso</dc:creator>
  <dc:date>04/03/2023 06:30:00</dc:date>
<content:encoded><![CDATA[

<p>Where can fixed income investors look for relative stability amid extremely volatile U.S. rates, concerns about the banking system, and continued uncertainty on inflation and economic growth? Perhaps they should consider emerging markets local currency bonds, which have been resilient in this uncertain market environment. As shown below, the asset class has performed well through the mini-banking crisis (mini, at least so far) experienced in March, and has been one of the better performers year-to-date among various fixed income asset classes.</p>
<h3>EM Local Currency Bonds Have Performed Well During Recent Banking Troubles</h3>
<div class="wrapped-div">
<table style="width: 600px;">
<tbody>
<tr class="tbl-data">
<td class="tbl-header last">&nbsp;</td>
<td class="tbl-header last text-center" colspan="4">Total Returns as of 3/28/23</td>
</tr>
<tr class="tbl-data">
<td class="data-head last">&nbsp;</td>
<td class="data-head last">MTD</td>
<td class="data-head last">YTD</td>
<td class="data-head last">1-Year</td>
</tr>
<tr class="tbl-data">
<td class="data-td last">Local Currency EM Sovereigns</td>
<td class="data-td data last">3.11</td>
<td class="data-td data last">4.14</td>
<td class="data-td data last">-0.18</td>
</tr>
<tr class="tbl-data">
<td class="data-td last">USD EM Sovereigns</td>
<td class="data-td data last">0.09</td>
<td class="data-td data last">0.98</td>
<td class="data-td data last">-6.96</td>
</tr>
<tr class="tbl-data">
<td class="data-td last">US IG Corporates</td>
<td class="data-td data last">1.53</td>
<td class="data-td data last">2.40</td>
<td class="data-td data last">-5.01</td>
</tr>
<tr class="tbl-data">
<td class="data-td last">US HY Corporates</td>
<td class="data-td data last">-0.68</td>
<td class="data-td data last">1.87</td>
<td class="data-td data last">-4.23</td>
</tr>
<tr class="tbl-data">
<td class="data-td last">US Treasuries</td>
<td class="data-td data last">2.43</td>
<td class="data-td data last">2.56</td>
<td class="data-td data last">-4.53</td>
</tr>
<tr class="tbl-data">
<td class="data-td last">US Equities</td>
<td class="data-td data last">0.17</td>
<td class="data-td data last">3.87</td>
<td class="data-td data last">-11.71</td>
</tr>
<tr class="tbl-data">
<td class="data-td last">EM Equity</td>
<td class="data-td data last">0.96</td>
<td class="data-td data last">1.89</td>
<td class="data-td data last">-10.77</td>
</tr>
<tr class="tbl-data">
<td class="data-td last">EM Corporates</td>
<td class="data-td data last">0.24</td>
<td class="data-td data last">1.63</td>
<td class="data-td data last">-2.71</td>
</tr>
</tbody>
</table>
</div>
<br />
<p class="chart-disclosure"><strong>Source: Morningstar as of 3/23/2023.</strong> Local Currency EM Sovereigns represented by the J.P. Morgan GBI-EM Global Diversified Index; USD EM Sovereigns represented by the J.P. Morgan EMBI Global Diversified Index; US IG Corporates represented by the ICE BofA US Corporate Index; US HY Corporates represented by the ICE BofA US High Yield Index; US Treasuries represented by the ICE BofA US Treasury Index; US Equities represented by the S&amp;P 500; EM Equity represented by the MSCI EM Index; EM Corporates is represented by the J.P. Morgan CEMBI Broad Diversified Index. Past performance is no guarantee of future results.</p>
<p>Returns have been driven by both local rates (carry and a small decrease in average yield) as well as a modest positive impact from currency appreciation. Notably, the currency impact has been broad based, with 17 of the 20 currencies represented in the J.P. Morgan GBI-EM Global Diversified Index appreciating relative to the U.S. dollar as of March 28, 2023. The most notable exception is the Egyptian pound, which has lost 20% of its value this year following the adoption of a flexible exchange rate earlier this year.</p>
<p>Overall, the asset class has not performed in line with &ldquo;risk-on&rdquo; asset classes such as equities and high yield bonds. We believe this performance reflects EM local currency bonds relative insulation from the issues emanating out of developing markets which have troubled investors. Emerging markets local currency bonds are not directly impacted by U.S. interest rates, so the rapid rate hikes over the past year and volatility in U.S. bond yields have not had the same impact as on U.S. fixed income asset classes. Also, most EM central banks sharply raised policy rates shortly after the pandemic-driven turmoil in 2020, resulting in high real interest rates that have tamed inflation and provide room to ease policy if needed. The story is much different in developed markets, where inflation is still not convincingly under control. While emerging markets have maintained both fiscal and monetary policy discipline, the events following the U.K&rsquo;s mini-budget proposal in 2022 illustrate that developed markets bonds are not immune to bond vigilantes (a bond trader who threatens to sell a large amount of bonds to protest policies of the bond issuer).&mdash;to the detriment of investors in those markets. Most recently, the bank runs in the U.S. and the failure of Credit Suisse have raised concerns about the banking sector&rsquo;s health&mdash;a major concern if not contained. Encouragingly, emerging markets investors have largely shrugged off these concerns, at least for now. With that said, continued stress along with the Fed&rsquo;s ongoing focus on inflation has implications on economic growth in the U.S. and globally, and is a risk that must continue to be monitored.</p>
<p>The turmoil in developed markets has also resulted in a recent increase in the yield pickup over emerging markets local currency bonds versus U.S. rates, following a steady decline this year as U.S. rates rose. With conditions tightening in the U.S. due to the distress in the financial sector, this rate differential may persist or increase, providing further support for the asset class.</p>
<h3>Yield Pickup Over 5-Year UST Increased Sharply in March</h3>
<p><img class="img-responsive w-100" src="https://www.vaneck.com/contentassets/295cc4fd9ad4450ab0a8bcc089a15311/3039_emlc_chart_2023.03_blog.svg" alt="Yield Pickup Over 5-Year UST Increased Sharply in March" /></p>
<p class="chart-disclosure"><strong>Source: J.P. Morgan as of 3/28/2023.</strong> Yield Pickup represents the difference in yield between the on-the-run 5-year U.S. Treasury bond and the J.P. Morgan GBI-EM Global Diversified Index. Past performance is no guarantee of future results.</p>
<p>To receive more <a href="https://www.vaneck.com/us/en/insights/emerging-markets-bonds/" title="Emerging Markets Bonds Insights"><strong>Emerging Markets Bonds</strong></a> insights, <a href="https://www.vaneck.com/us/en/subscribe/" title="Subscription Center"><strong>sign up in our subscription center</strong></a>.</p>
<style type="text/css">
    .wrapped-div {
        max-width: 100%;
    }

    @media (max-width: 768px) {
        .wrapped-div {
            overflow-x: scroll;
        }
    }

    .wrapped-div-sector {
        max-width: 100%;
        overflow-x: scroll;
    }
</style>
]]></content:encoded>
</item><item rdf:about="https://www.vaneck.com/us/en/blogs/digital-assets/matthew-sigel-dydx-the-perpetual-futures-of-trading/">
  <title>dYdX: The Perp(etual) Futures of Trading></title>
  <link>https://www.vaneck.com/us/en/blogs/digital-assets/matthew-sigel-dydx-the-perpetual-futures-of-trading/</link>
  <description><![CDATA[We believe dYdX token, supporting a high-revenue-generating decentralized exchange is undervalued and has immense growth potential; Cosmos migration boosts demand and revenue.]]></description>
  <dc:creator>Matthew  Sigel</dc:creator>
  <dc:date>03/31/2023 06:30:00</dc:date>
<content:encoded><![CDATA[

<p><strong>Please note that VanEck has a position(s) in the dYdX token described below.</strong></p>
<p><i>We believe dYdX token is undervalued relative to its growth potential as it backs an essential product that generates substantial revenue amid a favorable industry backdrop. dYdX has established a strong product market fit while cementing a dominant market position. We observe improving tokenomics and see the planned migration to dYdX&rsquo;s own blockchain in the Cosmos unlocking new revenue lines and greater demand for the native token.</i></p>
<p>dYdX is a decentralized exchange for on-chain derivatives trading. It is currently hosted on an Ethereum Layer-2 blockchain built by StarkWare. dYdX facilitates trading specialized financial derivatives, called perpetual futures, on crypto assets such as ETH and BTC. Perps, as they are called, are similar to traditional futures as both tie their prices to the spot prices of underlying assets. But, unlike traditional futures, perps have no expiry date. As a result, all perpetual futures contracts are cash-settled, and perp prices are tied to spot prices by an interest rate mechanism that charges the in-the-loss parties a penalty interest rate.</p>
<p>Conversely, the in-the-profit parties receive these payments. This interest rate adjusts the further away that the perpetuals prices drift from spot prices. Price convergence happens as the underwater parties liquidate their positions or as market participants step in to move the prices back to spot.</p>
<p>dYdX&rsquo;s business model involves matching buyers and sellers of perpetual futures using the same central limit order book matching engine that is common across the financial industry. Traders onboard onto dYdX by depositing their USDC funds into a smart contract vault that acts as a margin account which mirrors the function of a traditional margin account such as one on the Chicago Mercantile Exchange. Margin is drawn to back trades based on a desired leverage ratio of up to 30x.</p>
<p>dYdX accrues revenues from fees on trading. Currently, fees are tiered by both a participant&rsquo;s trading volume as well as the amount of dYdX tokens they hold &ndash; the higher the trading volume and/or the more tokens held, the lower the trading fees. The dYdX smart contract also dispenses tokens as a reward mechanism to rebate those who trade on the platform. Before there was a token, early users of the exchange received substantial value through an <strong><a href="https://thedefiant.io/dydx-airdrop" title="dYdX Drops Over $1B to Past Users in Airdrop" target="_blank" rel="noopener">airdrop</a></strong> (7.5% of all tokens, worth $800M at the time) to reward their patronage of dYdX. Most importantly, dYdX is used as a tally-marker in governance voting decisions that affect the application. These voting rights allow holders to vote on important governance decisions like token inflation, community treasury spend, and future dYdX direction.</p>
<p>Similar to Uniswap, the fees from trading do not <i>currently </i>accrue directly to the token's value in any form. However, unlike Uniswap, fees are collected by the team behind dYdX - the dYdX foundation. To date, over $400M in fees have been generated on dYdX, and all of them have gone to the dYdX foundation. Using the governance voting rights afforded to the token, some sort of value transfer mechanism is expected to be implemented to give token holders more value eventually. This may take the form of token buybacks or remittances of fees to token holders.</p>
<h2>Thesis:</h2>
<p>In summary, we like the dYdX token for the following reasons:</p>
<ol class="content-list">
<li><strong><a href="#point-one">Consistent Revenue Generation</a></strong></li>
<li><strong><a href="#point-two">Dominant Market Position with Room to Grow</a></strong></li>
<li><strong><a href="#point-three">Strong Product Market Fit with Expansionary TAM</a></strong></li>
<li><strong><a href="#point-four">Migration to Sovereign Blockchain With New Token Sinks and Revenue Possibilities</a></strong></li>
<li><strong><a href="#point-five">Improving Tokenomics</a></strong></li>
</ol>
<h2 id="point-one" class="anchored-block">Consistent Revenue Generation</h2>
<h3>dYdX Market Share</h3>
<p><img class="img-responsive w-100" src="https://www.vaneck.com/contentassets/375578f8e4574e30b0675143b78faee8/3028_dydx-crypto_chart-01_2023.03_blog.svg" alt="dYdX Market Share Decentralized Perps/Futures Volume" /></p>
<p class="chart-disclosure"><strong>Sources: dYdX, GMX, Dune as of 3/19/2023</strong>. Past performance is no guarantee of future results.</p>
<h2 id="point-two" class="anchored-block">Dominant Market Position with Room to Grow</h2>
<p>dYdX is a mature crypto application with a customer base of consistent, high-value users who generate substantial fees for the platform. In 2022, dYdX generated $137M in fees based upon $466.3B in volume from over 33,900 unique traders. By trading volume, dYdX is the clear market leader among on-chain perpetual futures platforms with over 70% market share. While its share of on-chain perps volume is high, when centralized exchange trading volume is added, dYdX retains only 2.96% of ETH and 1.23% of BTC perp market shares. Although the centralized market lead may appear intimidating, it presents a tremendous opportunity that dYdX has already been effectively seizing. This is because centralized crypto exchanges are closed-loop entities whose lack of transparency regarding order execution has led some &ndash; including the CFTC in a recent suit against Binance - to contend that exchanges are trading against customers or advantaging certain customers over others. These fears were partially confirmed amid the fallout of FTX. It was revealed that, FTX trading affiliate, Alameda was afforded trading <strong><a href="https://www.investing.com/news/cryptocurrency-news/alameda-had-unfair-trading-advantage-special-access-to-ftx-funds-cftc-filing-2964302" title="Alameda had 'unfair' trading advantage, special access to FTX funds: CFTC filing" target="_blank" rel="noopener">advantages</a></strong> over other customers when it was exposed that FTX <a href="https://www.cnbc.com/2022/11/13/sam-bankman-frieds-alameda-quietly-used-ftx-customer-funds-without-raising-alarm-bells-say-sources.html" title="Sam Bankman-Fried's Alameda quietly used FTX customer funds for trading, say sources" target="_blank" rel="noopener"><strong>gambled</strong></a> with customer deposits. dYdX, by contrast, offers a more transparent product where fair ordering can be confirmed by confirmable on-chain data and customer funds are protected by verifiable code rather than trust placed in exchange operators. As a result, dYdX perp volume market share grew directly after the collapse of FTX. Perp volume market share grew from 0.9% and 1.8% to 1.23% and 2.96%, for BTC and ETH respectively.</p>
<h2 id="point-three" class="anchored-block">Strong Product Market Fit with Expansionary TAM</h2>
<p>This competitive positioning and product offering must also be viewed against favorable volume growth in crypto and broader financial derivatives. Perpetual futures monthly volume on BTC and ETH alone have grown from $377B in January 2020 to $1254B in January 2023. Meanwhile, the <strong><a href="https://www.fia.org/fia/etd-tracker" title="ETD Tracker - FIA" target="_blank" rel="noopener">volume</a></strong> of all types of exchange-traded derivatives has grown from 18B contracts in 2019 to 61.6B contracts in 2022. Additionally, the use case of crypto derivatives, like perpetual futures, has massively expanded with the growth of Proof of Stake networks and DeFi, where stakers are rewarded with yield in volatile tokens. An increasing number of staking participants will seek hedging mechanisms to enable users to lock in the value of these awards. With the upgrade of Ethereum to a PoS network in September of 2022 and the coming Shanghai upgrade in April 2023, hundreds of billions of dollars can be potentially hedged.</p>
<h3>dYdX Profitability</h3>
<p><img class="img-responsive w-100" src="https://www.vaneck.com/contentassets/375578f8e4574e30b0675143b78faee8/3028_dydx-crypto_chart-02_2023.03_blog.svg" alt="dYdX Profitability" /></p>
<p class="chart-disclosure"><strong>Sources: dYdX, DeFillama, Dune as of 3/23/2023</strong>. Past performance is no guarantee of future results.</p>
<h2 id="point-four" class="anchored-block">Migration to Sovereign Blockchain with New Token Sinks and Revenue Possibilities</h2>
<p>Going forward, our bull thesis on dYdX is supported by the anticipated <strong><a href="https://dydx.exchange/blog/dydx-chain" title="Announcing dYdX Chain" target="_blank" rel="noopener">migration</a></strong> of dYdX to its own Cosmos blockchain alongside continued improvements in tokenomics. The creation of the dYdX chain will not only lead to an improvement in trading throughput by as much as 100x but also new use cases for the token. As the dYdX blockchain will be based upon Proof of Stake, the dYdX token will become more useful as its value can be used to stake the network&rsquo;s validators. Staking rates in similar proof-of-stake networks typically range between 40% and 70%. Likewise, the migration of dYdX to its own Cosmos blockchain enables dYdX to monetize its exchange better, using the data provision and colocation practices of traditional finance exchanges. In practice, this may mean charging for faster order execution, the deployment of trading servers closest to dYdX&rsquo;s order router, or very fine real-time trading data. Building its chain will make it easier for dYdX stakeholders to host or build new applications offering related services - lending, spot trading, fiat-off ramps - with DyDx token holders getting a cut of the action. We observe strong commitments by both the team and the community to improve the tokenomics of dYdX. During the bear market, on-chain governance has reduced dYdX token emissions by decreasing trading rebates that are paid using dYdX tokens. On two <strong><a href="https://docs.dydx.community/dydx-governance/rewards/trading-rewards" title="Trading Rewards" target="_blank" rel="noopener">separate</a></strong> occasions, governance approved a drop in rebates from 3.83M tokens every epoch (28 days) to 1.58M tokens per epoch. Likewise, the founders and investors of dYdX also agreed to push back their token <a href="https://docs.dydx.community/dydx-governance/start-here/dydx-allocations" title="Allocations - Governance Documentation" target="_blank" rel="noopener"><strong>unlocks</strong></a> further into the future to significantly diminish near-term dilution. Most notably for token value accrual, the dYdX team has informed the community that it plans to &ldquo;<strong><a href="https://dydx.exchange/blog/v4-full-decentralization" title="dYdX V4 - Full Decentralization" target="_blank" rel="noopener">decentralize fees,</a></strong>&rdquo; which should tie more systematically the token&rsquo;s value to the production of fees of the decentralized exchange.</p>
<h2 id="point-five" class="anchored-block">Improving Tokenomics</h2>
<p>Finally, we have a favorable outlook on dYdX because the team has effectively iterated on an intuitional grade product that has attracted usage from crypto&rsquo;s most prolific market makers. To entice high-tier users, dYdX changed its fee structure by increasing price taker fees and decreasing market maker fees with an aim to reduce toxic order flow. This tailors its product to institutional market makers to ensure they are not being &ldquo;picked off&rdquo; by aggressive traders with better information. This contributes to a platform with higher order book liquidity. Thus, while other applications may charge higher fees or employ novel mechanisms that appeal to retail users and na&iuml;ve, yield-seeking market markets, dYdX has created an institutional-grade product with the highest capital efficiency among its peers. In this respect, dYdX is set on competing with centralized crypto exchanges, and we believe it has the <strong><a href="https://antonio-dydx.medium.com/the-dydx-community-values-cb6b690712fa" title="The dYdX Community Values" target="_blank" rel="noopener">plan</a></strong> to accomplish it.</p>
<h3>Capital Efficiency: TVL ($) vs. Turnover of TVL (Tx Volume/TVL)</h3>
<p><img class="img-responsive w-100" src="https://www.vaneck.com/contentassets/375578f8e4574e30b0675143b78faee8/3028_dydx-crypto_chart-03_2023.03_blog.svg" alt="Capital Efficiency: TVL ($) vs. Turnover of TVL (Tx Volume/TVL)" /></p>
<p class="chart-disclosure"><strong>Sources: CME, dYdX, Dune, GMX as of 3/25/2023</strong>. Past performance is no guarantee of future results.</p>
<h2>Risks:</h2>
<p>The risks to our thesis include the following:</p>
<ol class="content-list">
<li><strong><a href="#point-six">Transparency Issues</a></strong></li>
<li><strong><a href="#point-seven">Product Delays and Issues</a></strong></li>
<li><strong><a href="#point-eight">Competition</a></strong></li>
<li><strong><a href="#point-nine">Regulation</a></strong></li>
</ol>
<h2 id="point-six" class="anchored-block">Transparency Issues</h2>
<p>While we are bullish on dYdX&rsquo;s ability to gain market share due to better capital efficiency, we find that the most significant risks to our thesis revolve around the opacity of the dYdX Foundation. Practically, this is best exemplified by the dYdX Foundation&rsquo;s secrecy on the utilization of past trading fees, which have amounted to over $400M. The foundation also holds 22.3% of current and future dYdX tokens. Likewise, many in the community are uncertain about the structure of the dYdX foundation, which, while touted as a non-profit, appears to have investors with significant influence over the direction of the application as early investors hold 27.7% of dYdX tokens. We are also not certain of the relationship between the exchange and its major market makers. These transparency issues include exchange practices and statistics. While the future roadmap promises more openness, trade execution ordering is still a bit of a black box, and there is speculation that trading activity statistics are unreliable due to wash trading on the application.</p>
<h2 id="point-seven" class="anchored-block">Product Delays and Issues</h2>
<p>Beyond issues of openness, dYdX has experienced significant product launch delays. Initially, the v4 migration was scheduled by year-end <a href="https://dydx.exchange/blog/v4-full-decentralization" title="dYdX V4 - Full Decentralization" target="_blank" rel="noopener"><strong>2022</strong></a> and has since been pushed back further from 2Q 2023 to the end of 3Q 2023. Further delays would call into question the execution abilities of the team, their ability to scale throughput of trading volume, and their commitment to transparency. Most importantly, any inability to effectively scale dYdX would see its market makers quickly leave for better trading venues.</p>
<p>Additionally, there is some question about the effectiveness of the dYdX liquidation system. This is because dYdX eliminated its Safety Module which effectively backstopped liquidations by providing liquidity in extreme cases where market makers pull orders due to market volatility. In these extreme circumstances, an underwater trader being forced out of a trade could cause a series of cascading liquidations that untethers dYdX derivative prices from spot. This could bankrupt market makers on the platform and lead to a substantial loss of principally important users. In effect, dYdX reduced inflation but may have introduced additional instability in the process. Finally, it is important to note that dYdX&rsquo;s migration to the Cosmos is far from certain. The consensus mechanism that powers Cosmos, Tendermint, will have to undergo profound upgrades to ensure it can handle the demands of dYdX&rsquo;s order book and scaling requirements. Likewise, dYdX must ensure it does not lose users wedded to the Ethereum system when it leaves for the Cosmos.</p>
<h2 id="point-eight" class="anchored-block">Competition</h2>
<p>Because of the competitive landscape taking market share and the consequent move to lower fees, we see greater-than-expected fee deterioration as a potential issue for dYdX. Competition is ample, and on-chain exchanges such as GMX have found product-market fit among na&iuml;ve market makers (and the traders seeking to take advantage of them). While we expect dYdX&rsquo;s fees to converge from an approximate take rate today of around 2.90bps to the CME approximate take rate of 0.03bps over the next 7 years, dramatic moves by competitors to win market share through low fees or massive subsidies could quickly deteriorate dYdX&rsquo;s business. This may extend to better, cheaper competing products from centralized spot exchanges like Coinbase or traditional finance venues like <a href="https://cointelegraph.com/news/nasdaq-to-launch-crypto-custody-services-by-end-of-q2-report" title="Nasdaq to launch crypto custody services by end of Q2: Report" target="_blank" rel="noopener"><strong>Nasdaq</strong></a>. While it is important to note that dYdX&rsquo;s customer base cares about issues beyond price, the competition to become the crypto derivatives price discovery epicenter is intense and crypto derivatives trading is likely a Pareto-type industry.</p>
<h2 id="point-nine" class="anchored-block">Regulation</h2>
<p>Finally, and most importantly, immense regulatory pressures have recently become prominent in the space. The SEC regulates crypto by an exceptionally broad interpretation of existing laws and aggressive enforcement proceedings. Recent enforcement and obstruction action against <a href="https://gizmodo.com/crypto-binance-voyager-changpeng-zhao-1850149403" title="SEC Takes on Binance.US's Voyager Acquisition in New Front to Crypto Regulation" target="_blank" rel="noopener"><strong>Binance</strong></a>, <a href="https://www.cnbc.com/2023/03/22/sec-hits-jake-paul-lindsey-lohan-justin-sun-with-crypto-violations.html" title="SEC charges Tron founder Justin Sun, celebrities Lindsay Lohan, Jake Paul with crypto violations" target="_blank" rel="noopener"><strong>Justin Sun</strong></a>, and <strong><a href="https://www.sec.gov/news/press-release/2023-25" title="Kraken to Discontinue Unregistered Offer and Sale of Crypto Asset Staking-As-A-Service Program and Pay $30 Million to Settle SEC Charges" target="_blank" rel="noopener">Kraken</a></strong> demonstrate an agency committed to asserting its control over the industry, increasingly at the expense of the businesses in crypto. As a result, despite a strong &ldquo;geo-fence&rdquo; to prevent US citizens from accessing dYdX, given that most of the team is based in the US, we believe regulatory action may come at any time.</p>
<h2>Valuation<sup>*</sup></h2>
<p>We base our valuation on a DCF model that estimates cash flow in the year 2030, assigns it an FCF multiple, and discounts back to the present day. In our base case, we estimate FCF to be $1.94B. We apply a terminal multiple of 40x to arrive at a valuation of $77.6B. We discount it back to present at 20% to arrive at a $16.05B valuation. A fully-diluted token count of 1B brings us to a valuation price of $16.05 per token, assuming a 1B supply.</p>
<p>In our valuation model, we estimate revenue by ballparking the total value of the digital asset market - both off-chain and on-chain assets. We then apply an expected crypto asset trading turnover rate of 250% per annum by comparing current tradfi and crypto assets; we also calculate a ratio of expected perpetual futures volume to spot volume to derive perp trading volume. We then factor a take rate on that volume, 0.03 bps, which roughly corresponds to the take rate of the CME. With that volume, we estimate a breakdown between DEX trading and CEX trading, 25/75, respectively, and then approximate the on-chain derivatives market share of dYdX: 75%. We then deduct expenses, taxes, and security fees to arrive at an approximate free cash flow to the token holder. Thereafter, we add an additional 15% of revenue we believe will be derived from data monetization vectors such as colocation, data services, and MEV to the bottom line.</p>
<h3>dYdX Model Flow Chart:</h3>
<div class="desktop-image">
<p><img class="img-responsive w-100" src="https://www.vaneck.com/contentassets/375578f8e4574e30b0675143b78faee8/3028_dydx-crypto_infographic_01_2023.03_v1_blog.svg" alt="dYdX Model Flow Chart" /></p>
</div>
<div class="mobile-image">
<p><img src="https://www.vaneck.com/contentassets/375578f8e4574e30b0675143b78faee8/3028_dydx-crypto_infographic_01_2023.03_v1_mobile.svg" alt="dYdX Model Flow Chart" /></p>
</div>
<p class="chart-disclosure"><strong>Source: VanEck Research as of 3/27/2023.</strong></p>
<p class="chart-disclosure"><strong><sup>*</sup></strong>&nbsp;The above is not intended as financial advice or any call to action, a recommendation to buy or sell dydx, or as a projection of how dydx will perform in the future. These are solely the results of a simulation based on our research, and are for illustrative purposes only. Please conduct your own research and draw your own conclusions.</p>
<p>To receive more <strong><a href="https://www.vaneck.com/us/en/insights/digital-assets/" title="Digital Assets Insights">Digital Assets</a></strong> insights, <strong><a href="https://www.vaneck.com/us/en/subscribe/" title="Subscription Center">sign up in our subscription center</a></strong>.</p>
<style>
    .desktop-image {
        display: block;
    }

    .mobile-image {
        display: none;
    }

    @media screen and (max-width: 425px) {
        .desktop-image {
            display: none;
        }

        .mobile-image {
            display: block;
        }
    }
</style>
<!-- Hide alreat promo banner. Make height 0 to account for the HeaderHeightCalculation scripts -->
<style>
header.site-header .alert-bar {
    display:none!important;
    height: 0!important;
    overflow:hidden!important;
}
</style>
]]></content:encoded>
</item><item rdf:about="https://www.vaneck.com/us/en/blogs/economic-trends/major-narratives-still-intact/">
  <title>Major Narratives Still Intact></title>
  <link>https://www.vaneck.com/us/en/blogs/economic-trends/major-narratives-still-intact/</link>
  <description><![CDATA[Moderating global inflation and China&rsquo;s growth rebound is good news for most EMs, but EM central banks remain vigilant.]]></description>
  <dc:creator>Natalia  Gurushina</dc:creator>
  <dc:date>03/31/2023 06:30:00</dc:date>
<content:encoded><![CDATA[

<h2>Global Drivers for EM Assets</h2>
<p>The last day of March brought more signs that <strong>two major market narratives are still in play</strong>. The global inflation momentum continues to moderate (albeit with some nuances &ndash; like stickier than expected core inflation in Europe and some emerging markets (EM)), while China&rsquo;s recovery keeps gaining traction. This <strong>is good news for EMs</strong> &ndash; as some are more correlated with the U.S. Federal Reserve&rsquo;s rate cycle and others are more correlated with China&rsquo;s rebound/growth cycle.</p>
<h2>China Recovery</h2>
<p><strong>China&rsquo;s latest domestic activity gauges</strong> (Purchasing Managers Indices) <strong>support</strong> the consensus <strong>optimism regarding this year&rsquo;s growth </strong>outlook (5.3% - above the official growth target of about 5%). Key PMI components stayed in expansion zone, with some showing sizable improvements &ndash; including services and construction (see chart below). The surging construction PMI reflects a concerted effort to boost infrastructure investments, but could also be indicative of the stabilizing housing sector (which, in turn, a major supporting factor for consumer confidence). The release, however, showed that external growth headwinds might be getting stronger &ndash; tighter lending conditions in developed markets (DM) is one obvious avenue &ndash; which is why we expect the &ldquo;supportive yet restrained&rdquo; policy stance to remain unchanged for now. We also would like to remind that authorities responded very quickly to potential contagion risks associated with the banking mini-crisis in DMs in the middle of the month (in the form of an earlier than expected cut in the reserve requirements for banks).</p>
<h2>EM Peak Rates</h2>
<p><strong>China&rsquo;s rebound could create additional inflation pressures</strong> going forward &ndash; for example, via commodity prices. Global uncertainties like this widen the range of potential growth and inflation outcomes, and this is a reason that keeps various EM central banks on the cautious side as regards policy easing, even when inflation had already peaked. The Colombian central bank stated yesterday that policy stance will remain restrictive for some time, and the Mexican central bank indicated that the balance of inflation risks is still biased to the upside. Both central banks delivered the expected 25bps rate hikes yesterday, and the market thinks that another small &ldquo;farewell&rdquo; hike might still be on the table. Stay tuned!</p>
<h3>Chart at a Glance: China Activity Gauges Support Optimistic GDP Forecasts</h3>
<p><img class="img-responsive w-100" src="https://www.vaneck.com/contentassets/cb54b19878cf47b2b6948a36e2cbd2c4/us-natalias-take-2023-03-31.png" alt="China Activity Gauges Support Optimistic GDP Forecasts" /></p>
<p class="chart-disclosure">Source: Bloomberg LP.</p>
]]></content:encoded>
</item><item rdf:about="https://www.vaneck.com/us/en/blogs/economic-trends/political-games-vs-macro-who-wins/">
  <title>Political Games vs. Macro – Who Wins?></title>
  <link>https://www.vaneck.com/us/en/blogs/economic-trends/political-games-vs-macro-who-wins/</link>
  <description><![CDATA[Long-term geopolitical objectives and near-term economic dataflow/policy responses &ndash; is this a beneficial configuration for EMs?]]></description>
  <dc:creator>Natalia  Gurushina</dc:creator>
  <dc:date>03/30/2023 06:30:00</dc:date>
<content:encoded><![CDATA[

<h2>China Geopolitical Goals</h2>
<p>Headlines about the <strong>rising tensions between the U.S. and China</strong> continue to flood our Bloomberg screens &ndash; fanning debates about China&rsquo;s long-term geopolitical aspirations and the renminbi&rsquo;s possible (or is it likely?) ascendance as one of the world&rsquo;s reserve currencies at the expense of the good old greenback. Many emerging markets (EM) are watching these developments with great interest &ndash; a possibility of playing China against the U.S. might look attractive going forward &ndash; but for now many seem content with the fact that their economies are arguably more correlated with China&rsquo;s post-pandemic rebound than with the U.S. Federal Reserve&rsquo;s rate cycle or developed markets (DM) banking mayhem. This explains why the next batch of China&rsquo;s activity gauges will be closely watched this evening. The consensus is cautious &ndash; both the services and the manufacturing PMIs are expected to stay in expansion zone, but with no further improvement.</p>
<h2>EM Inflation Risks</h2>
<p>The pace of China&rsquo;s rebound is an important driver for China&rsquo;s inflation outlook (very benign right now) and China&rsquo;s &ldquo;exported&rdquo; inflation &ndash; including a wider impact on global commodity prices, which can affect the disinflation momentum in EM. The latest communications from various EM central banks sounded hawkish (surprisingly so in some instances), with upside inflation risks being a top concern. And <strong>EM hawks continued to dominate the newsflow this morning</strong>. Brazil&rsquo;s quarterly inflation report talked about the need to maintain restrictive policy stance for now, while the South African central bank surprised with a larger than expected +50bps rate hike, raising this year&rsquo;s inflation forecast. The rate-setting meetings in Mexico and Colombia this afternoon now look even more interesting.</p>
<h2>EM Market Performance</h2>
<p>While this is happening, the market continues to price in EM rate cuts in the next six months. These expectations are on the optimistic side, but <strong>EMs&rsquo; &ldquo;cautious for longer&rdquo; policy bias can easily create more room for rate cuts in the fall and beyond</strong>. In the meantime, high real interest rates in EM can improve local bonds&rsquo; valuations and shelter EM currencies from market turmoil in DM. Stay tuned!</p>
<h3>Chart at a Glance: Market Still Sees Rate Cuts in EM</h3>
<p><img class="img-responsive w-100" src="https://www.vaneck.com/contentassets/862c3474de1c46a5b2f3b80a4f7d3f22/us-natalias-take-2023-03-30.png" alt="Chart at a Glance: Market Still Sees Rate Cuts in EM" /></p>
<p class="chart-disclosure">Source: Bloomberg LP.</p>
]]></content:encoded>
</item><item rdf:about="https://www.vaneck.com/us/en/blogs/income-investing/pfxf-preferreds-without-bank-sector-exposure/">
  <title>PFXF: Preferreds Without Bank Sector Exposure></title>
  <link>https://www.vaneck.com/us/en/blogs/income-investing/pfxf-preferreds-without-bank-sector-exposure/</link>
  <description><![CDATA[Volatility in financials may persist due to lingering banking crisis concerns. Investors can avoid this by considering preferred securities not issued by financial companies.]]></description>
  <dc:creator>Coulter Regal, CFA</dc:creator>
  <dc:date>03/29/2023 06:30:00</dc:date>
<content:encoded><![CDATA[

<p>Fears around the banking system following the recent collapse of U.S. regional banks, like Silicon Valley Bank, and the fall of Switzerland&rsquo;s Credit Suisse has left many investors rushing to reconsider exposure to the financial sector in their portfolios. Preferred securities are one area of the market that investors should be mindful of as they are known for significant financial sector concentration, particularly in banks.</p>
<p>Those looking to keep the income potential and portfolio diversification benefits of preferreds while avoiding bank exposure should consider the <strong><a href="/link/5eee0d78a5514abb9d58e9200739d896.aspx" title="PFXF - VanEck Preferred Securities ex Financials ETF - Overview">VanEck Preferred Securities ex Financials ETF (PFXF)</a></strong>. PFXF offers investors assess to the U.S.-listed preferred securities market while excluding banks and other financial issuers.</p>
<h2>Banks Dominate the Preferreds Market</h2>
<p>Following the financial crisis in 2008, banks and other financial institutions began issuing a significant amount of preferred stock to meet the higher capital levels required by regulators. This proliferation of preferreds issuance by financials resulted in the sector's concentration, which now makes up over 75% of the U.S. preferreds market. Drilling down even further, the Banking Industry is specifically responsible for about half of this financial concentration, with the remainder being financial services and insurance companies<sup>1</sup>. This high concentration has become a glaring risk for investors in light of the current events regarding bank failures and possible contagion.</p>
<h3>Broad U.S. Preferreds by Sector</h3>
<p><img class="img-responsive w-100" src="https://www.vaneck.com/contentassets/d53c170aa0ca4e7982120e6101283ff6/3019_pfxf_chart_01_2023.03_v1_blog.svg" alt="Broad U.S. Preferreds by Sector" /></p>
<h3>Broad U.S. Preferreds by Industry</h3>
<p><img class="img-responsive w-100" src="https://www.vaneck.com/contentassets/d53c170aa0ca4e7982120e6101283ff6/3019_pfxf_chart_02_2023.03_v1_blog.svg" alt="Broad U.S. Preferreds by Industry" /></p>
<p class="chart-disclosure">Source: ICE Data Indices. Broad U.S. Preferreds market represented by the ICE Exchange-Listed Fixed &amp; Adjustable Rate Preferred Securities Index (PFAR). As of 2/28/2023.</p>
<h2>Volatility in Financials Could Continue</h2>
<p>While the current banking crisis has been somewhat stabilized, for the time being at least, by a central bank and government backstops, questions still remain. Concerns weighing on investor minds&rsquo; includes possible further contagion, the health of the broader banking industry both domestically and globally, and perhaps even the viability of fractional reserve banking as a system in the modern day where depositors can easily move money with just a few taps on their phone. Because of these uncertainties around the recent bank failures, volatility in financial names has been extreme the last few weeks and could remain elevated.</p>
<p>For preferred security investors looking to avoid some of this volatility, a potential solution is to simply avoid preferreds issued by companies operating in the financial sector. Expectedly, ex-financials preferreds have held up better in this volatile period than the broader financial heavy preferreds universe.</p>
<h3>Preferreds Performance in a Turbulent March</h3>
<p><strong>As of 3/21/2023</strong></p>
<p><img class="img-responsive w-100" src="https://www.vaneck.com/contentassets/d53c170aa0ca4e7982120e6101283ff6/3019_pfxf_chart_03_2023.03_v1_blog.svg" alt="Preferreds Performance in a Turbulent March" /></p>
<p class="chart-disclosure">Source: ICE Data Indices. As of 3/21/2023. Ex Financial U.S. Preferreds market represented by the ICE Exchange-Listed Fixed &amp; Adjustable Rate Non-Financial Preferred Securities Index (PFAN). Broad U.S. Preferreds market represented by the ICE Exchange-Listed Fixed &amp; Adjustable Rate Preferred Securities Index (PFAR). Financial U.S. Preferreds market represented by the ICE Exchange-Listed Fixed Rate Financial Preferred Securities Index (PFAF).</p>
<h2>Is Call Risk Next on The Horizon?</h2>
<p>While the current banking crisis is rightly top of mind for many, there may be another risk just on the horizon that investors may also want to keep their eyes on &ndash; call risk. Many preferred securities feature a call provision allowing an issuer to redeem its preferreds at or near par value prior to maturity. This means that if rates fall, issuers may choose to call their preferreds and issue a new series at more favorable rates. This could be problematic for investors as it can result in 1) lower yields (i.e., reinvesting at lower rates than the called issue) and 2) risk of loss if the issues were purchased at a premium to the call price.</p>
<p>In the near-zero interest rate environment over the last decade, call risk was not much of a problem as issuers hardly had any incentive to call back their securities. However, now that we find ourselves in a more normalized rate environment with yields around 5%, call risk could begin to remerge as new debt is issued at higher rates.</p>
<p>One of the benefits of ex-financial preferreds is lower call risk. This is because preferred securities issued by financial companies tend to include a callable feature more often than those from other issuers. In fact, nearly 100% of preferred securities issued by financial companies are callable, while only about 70% of the preferreds in the ex-financials universe are callable<sup>2</sup>. While exposure to callable securities is not completely removed in ex-financial preferreds, a notable reduction in call risk could help mitigate some of the impacts of any future call events.</p>
<h2>Access to Preferreds Without the Financials</h2>
<p>Those looking to keep the income potential and portfolio diversification benefits of preferreds while also avoiding bank exposure should consider the VanEck Preferred Securities ex Financials ETF (PFXF). PFXF offers investors assess to the U.S.-listed preferred securities market that excludes securities issued by financials, which many might find particularly attractive given the current banking crisis.</p>
<p>Beyond the obvious benefits of excluding financials in the current market, ex-financial preferreds generally also offer a number of other benefits over the broad preferreds market that investors might find beneficial. Higher yields historically, lower call risk, fewer long-dated and perpetual issues (i.e., lower duration), and greater sector diversification are a few of these benefits.</p>
<div class="wrapped-div">
<table style="width: 600px;">
<tbody>
<tr class="tbl-data">
<td class="tbl-header last" style="text-align: center;">&nbsp;</td>
<td class="tbl-header last" style="text-align: center;">Ex Financial<br />U.S. Preferreds</td>
<td class="tbl-header last" style="text-align: center;">Broad<br />U.S. Preferreds</td>
<td class="tbl-header last" style="text-align: center;">Financial<br />U.S. Preferreds</td>
</tr>
<tr class="tbl-data">
<td class="data-td last">Current Yield</td>
<td class="data-td data last">6.81%</td>
<td class="data-td data last">5.82%</td>
<td class="data-td data last">6.03%</td>
</tr>
<tr class="tbl-data">
<td class="data-td last">Callable %</td>
<td class="data-td data last">71.3%</td>
<td class="data-td data last">99.7%</td>
<td class="data-td data last">100%</td>
</tr>
<tr class="tbl-data">
<td class="data-td last">Effective Duration</td>
<td class="data-td data last">4.04</td>
<td class="data-td data last">6.82</td>
<td class="data-td data last">6.88</td>
</tr>
<tr class="tbl-data">
<td class="data-td last">Perpetual %</td>
<td class="data-td data last">43.8%</td>
<td class="data-td data last">71.8%</td>
<td class="data-td data last">100%</td>
</tr>
</tbody>
</table>
</div>
<br />
<p class="chart-disclosure">Source: ICE Data Indices; FactSet. As of 2/28/2023. Ex Financial U.S. Preferreds market represented by the ICE Exchange-Listed Fixed &amp; Adjustable Rate Non-Financial Preferred Securities Index (PFAN). Broad U.S. Preferreds market represented by the ICE Exchange-Listed Fixed &amp; Adjustable Rate Preferred Securities Index (PFAR). Financial U.S. Preferreds market represented by the ICE Exchange-Listed Fixed Rate Financial Preferred Securities Index (PFAF).</p>
<p>The <strong><a href="/link/5eee0d78a5514abb9d58e9200739d896.aspx" title="PFXF - VanEck Preferred Securities ex Financials ETF - Overview">VanEck Preferred Securities ex Financials ETF (PFXF)</a></strong> seeks to replicate as closely as possible, before fees and expenses, the price and yield performance of the ICE Exchange-Listed Fixed &amp; Adjustable Rate Non-Financial Preferred Securities Index (PFAN), which is intended to track the overall performance of U.S. exchange-listed hybrid debt, preferred stock and convertible preferred stock issued by non-financial corporations.</p>
<p>To receive more <a href="https://www.vaneck.com/us/en/insights/income-investing/" title="Income Investing insights"><strong>Income Investing</strong></a> insights, <a href="/link/5f45412c2143400497908cea2897f7d3.aspx" title=" Subscription Center"><strong>sign up in our subscription center</strong></a>.</p>
<style type="text/css">
    .wrapped-div {
        max-width: 100%;
    }

    @media (max-width: 1024px) {
        .wrapped-div {
            overflow-x: scroll;
        }
    }

    .wrapped-div-sector {
        max-width: 100%;
        overflow-x: scroll;
    }
</style>
]]></content:encoded>
</item><item rdf:about="https://www.vaneck.com/us/en/blogs/moat-investing/international-moat-companies-back-in-the-spotlight/">
  <title>International Moat Companies Back in the Spotlight></title>
  <link>https://www.vaneck.com/us/en/blogs/moat-investing/international-moat-companies-back-in-the-spotlight/</link>
  <description><![CDATA[Investors have been turning their attention to international equities. We believe Morningstar&rsquo;s selective approach to identifying quality companies is more prudent than a broad-based approach.]]></description>
  <dc:creator>Brandon Rakszawski</dc:creator>
  <dc:date>03/29/2023 06:30:00</dc:date>
<content:encoded><![CDATA[

<h2>Investors Back at the International Equity Table</h2>
<p>For much of the last fifteen years, many U.S. investors have largely ignored equity investment opportunities outside of the U.S., gravitating to their home country bias through U.S.-focused equity funds. This trend is understandable. The MSCI ACWI ex-USA Index has lagged the S&amp;P 500 Index by over 7% annually for the last 15 years through February 2023 (2.31% vs. 9.76%, respectively).</p>
<p>This year, signs of a reversal are apparent. Investors removed $28.8 billion from U.S.-focused equity mutual funds and ETFs through the first two months of 2023 while international-focused equity funds welcomed $16.8B of new investment, according to Morningstar. With many risks in the market, whether this trend will persist remains to be seen, but multiple forces are positive for international companies: a weakening dollar and expectations for a <strong><a href="/link/775af929d69741efa7729872dda2bfa5.aspx?epsremainingpath=jan-van-eck-why-the-forces-behind-the-january-melt-up-are-temporary" title="Why the Forces Behind the January Melt-Up Are Temporary">sideways and volatile U.S. equity market</a></strong> for the foreseeable future, among others.</p>
<p>Through March 22, 2023, the MSCI ACWI ex-USA Index has posted a slightly better year-to-date return than the S&amp;P 500 Index (3.62% vs. 2.96%, respective). With more investors looking outside of the U.S. in this period of uncertainty, a more selective approach may be prudent.</p>
<h3>Reversal of Fortunes for International Companies</h3>
<p><strong>As of 2/28/2023</strong></p>
<p><img class="img-responsive w-100" src="https://www.vaneck.com/contentassets/028c450b7bed4995adcabc974a383a06/3022_moti_chart-01_2023.03_blog.svg" alt="Reversal of Fortunes for International Companies" /></p>
<p class="chart-disclosure"><strong>Source: Morningstar</strong>. Past performance is no guarantee of future results. Indexes are unmanaged and are not securities in which an investment can be made.</p>
<h2>Quality International Companies for any Market</h2>
<p>There has been a focus on quality companies across the board as investors have navigated inflation, rate hikes, and now a banking crisis. But there is little consensus on what makes for a quality company. For more than 20 years, Morningstar has honed their framework to identify those highly-desirable companies that have built competitive advantages that can last. <strong><a href="https://www.vaneck.com/us/en/blogs/moat-investing/how-a-moat-stock-gets-its-economic-moat/" title="How a Moat Stock Gets Its Economic Moat">Moat-rated companies</a></strong> can tend to survive fads in the market, new competitive pressure and are often better suited to weather market stress.</p>
<p>Looking outside the U.S., the <strong><a href="/link/f783dff26bc742c8bcc55236a14fdbde.aspx" title="MOTI - VanEck Morningstar International Moat ETF - Index">Morningstar Global ex-US Moat Focus Index</a></strong> (&ldquo;International Moat Index&rdquo;) has separated itself from the international markets in recent periods. It reflects the ethos of Morningstar&rsquo;s broader moat investing philosophy: invest in <strong><a href="https://www.vaneck.com/us/en/blogs/moat-investing/moat-investing-powered-by-morningstar/" title="Ditch Style Biases. Choose Stock Selection">quality moat-rated companies that are also trading at attractive prices</a></strong>. This approach has yielded impressive results.</p>
<h3>International Moat Index vs. International Market</h3>
<p><strong>As of 3/22/2023</strong></p>
<p><img class="img-responsive w-100" src="https://www.vaneck.com/contentassets/028c450b7bed4995adcabc974a383a06/3022_moti_chart-02_2023.03_blog.svg" alt="International Moat Index vs. International Market" /></p>
<p class="chart-disclosure"><strong>Source: Morningstar</strong>. Index performance is not illustrative of Fund performance. Fund performance current to the most recent month end is available by visiting vaneck.com or by calling 800.826.2333. Past performance is no guarantee of future results. Indexes are unmanaged and are not securities in which an investment can be made.</p>
<h2>Dollar Reversal Benefitted International Companies</h2>
<p>One catalyst driving international stock performance has been the reversal of the U.S. dollar. After its peak on September 27, 2022, international stocks have outpaced U.S. stocks and the International Moat Index has impressed to the upside.</p>
<h3>International Moats Outpacing U.S. and Broad International Stocks</h3>
<p><img class="img-responsive w-100" src="https://www.vaneck.com/contentassets/028c450b7bed4995adcabc974a383a06/3022_moti_chart-03_2023.03_blog.svg" alt="International Moats Outpacing U.S. and Broad International Stocks" /></p>
<p class="chart-disclosure"><strong>Source: Morningstar. 9/27/2023 &ndash; 3/22/2023</strong>. Index performance is not illustrative of Fund performance. Fund performance current to the most recent month end is available by visiting vaneck.com or by calling 800.826.2333. Past performance is no guarantee of future results. Indexes are unmanaged and are not securities in which an investment can be made.</p>
<h2>Differentiated International Exposure</h2>
<p>The International Moat Index&rsquo;s exposure is often quite differentiated from broad international equity market indexes. This is driven by two factors: Morningstar&rsquo;s equity research coverage universe and its index selection methodology.</p>
<p>In order to qualify for the International Moat Index, a company must be covered by Morningstar&rsquo;s equity research team. While its coverage has evolved and Morningstar has increased research capabilities over time, there are several structural overweights and underweights driven by this coverage. For example, Japan is relatively under covered by Morningstar, reducing the number of eligible companies from Japan.</p>
<p>Equally as influential is the International Moat Index&rsquo;s selection methodology, which is driven in large part by valuations. The index will select attractively priced companies each quarter on a pre-determined schedule, which drives much of the shifts in the index each quarter. The result of the March 2023 index review can be <a href="https://www.vaneck.com/us/en/investments/morningstar-international-moat-etf-moti/moti-reconstitution.pdf" title="MOTI - VanEck Morningstar International Moat ETF" target="_blank" rel="noopener"><strong>viewed here</strong></a>.</p>
<h3>International Moat Index: Relative Regional Exposure</h3>
<p><strong>As of 3/22/2023</strong></p>
<p><img class="img-responsive w-100" src="https://www.vaneck.com/contentassets/028c450b7bed4995adcabc974a383a06/3022_moti_chart-04_2023.03_blog.svg" alt="International Moat Index: Relative Regional Exposure" /></p>
<h3>International Moat Index: Relative Sector Exposure</h3>
<p><strong>As of 3/22/2023</strong></p>
<p><img class="img-responsive w-100" src="https://www.vaneck.com/contentassets/028c450b7bed4995adcabc974a383a06/3022_moti_chart-05_2023.03_blog.svg" alt="International Moat Index: Relative Sector Exposure" /></p>
<p class="chart-disclosure"><strong>Source: Morningstar</strong>. For illustrative purposes only. Relative weights reflects the difference between the International Moat Index weight and MSCI ACWI ex-USA Index.</p>
<p><a href="https://www.vaneck.com/us/en/investments/morningstar-international-moat-etf-moti/moti-reconstitution.pdf" title="MOTI - VanEck Morningstar International Moat ETF" target="_blank" rel="noopener"><strong>VanEck Morningstar International Moat ETF (MOTI)</strong></a> seeks to replicate as closely as possible, before fees and expenses the price and yield performance of the Morningstar<sup>&reg;</sup>&nbsp;Global ex-US Moat Focus Index<sup>SM</sup>.</p>
<p>To receive more <a href="https://www.vaneck.com/us/en/insights/moat-investing/" title="Moat Investing Insights"><strong>Moat Investing</strong></a> insights, <a href="https://www.vaneck.com/us/en/subscribe/" title="Subscription Center"><strong>sign up in our subscription center</strong></a>.</p>
]]></content:encoded>
</item><item rdf:about="https://www.vaneck.com/us/en/blogs/economic-trends/em-hawks-talons-still-out/">
  <title>EM Hawks – Talons Still Out></title>
  <link>https://www.vaneck.com/us/en/blogs/economic-trends/em-hawks-talons-still-out/</link>
  <description><![CDATA[EM monetary policy signals remain cautious, with some alleged doves (Czech National Bank) cautioning against &ldquo;premature&rdquo; bets on rate cuts. EMFX seems to like this policy backdrop a lot.]]></description>
  <dc:creator>Natalia  Gurushina</dc:creator>
  <dc:date>03/29/2023 06:30:00</dc:date>
<content:encoded><![CDATA[

<h2>Global Disinflation</h2>
<p>A concept of &ldquo;transitory disinflation&rdquo; is creating some buzz, and we are wondering whether such <strong>fears keep emerging markets (EM) central banks on the cautious side, despite obvious progress in disinflation</strong>. The mother of all base effects will continue to push inflation down in the coming months, but would this be enough to bring inflation back to targets over the forecast horizons, and, importantly, make sure that inflation stays close to the target for a considerable period of time? Brazil is an important testing ground here &ndash; especially against the backdrop of raging fiscal debates. But some smaller &ldquo;EM Graduates&rdquo; like the Czech Republic or Thailand &ndash; which are closer to DM structurally and institutionally - are in this group as well.</p>
<h2>EM Policy Rates</h2>
<p>Thailand&rsquo;s central bank opted for another measured rate hike today (+25bps), and signaled more tightening as the economy continues to rebound. The Czech National Bank stayed on hold, as expected, and Governor Ale&scaron; Michl &ndash; who was considered a dove until recently &ndash; warned the market against &ldquo;premature&rdquo; bets on rate cuts, and said that the peak rate might not be behind us yet. Other <strong>EM central banks also signal that the bar for easing is high</strong>. Core price pressures are often more sticky than headline inflation, inflation expectations sometimes grind higher even when disinflation is well underway, and there is a lot of uncertainty about the global growth outlook. This was today&rsquo;s message from the Malaysian central bank (&ldquo;not out of the woods on inflation&rdquo;), and these are the reasons why central banks in Mexico, Colombia, and South Africa are likely to tighten more this week (albeit at a slower pace) before considering a pause.</p>
<h2>Market Turbulence and EM</h2>
<p><strong>EM FX certainly does not seem to mind that real rates are high</strong>, as this could be a nice safety cushion in times of market turbulence. The chart below shows major EM currencies&rsquo; performance against the U.S. Dollar in the past month &ndash; we suspect we were not the only ones who was humming R.E.M.&rsquo;s song <i>&ldquo;It&rsquo;s the End of the World as We Know It (And I Feel Fine)&rdquo;</i> when looking at it. Stay tuned!</p>
<h3>Chart at a Glance: EM FX &ndash; Crisis? What Crisis?</h3>
<p><img class="img-responsive w-100" src="https://www.vaneck.com/contentassets/500a26fd681a40f1a295f5cc6671bc01/us-natalias-take-2023-03-29.png" alt="Chart at a Glance: EM FX - Crisis? What Crisis?" /></p>
<p class="chart-disclosure">Source: Bloomberg LP.</p>
]]></content:encoded>
</item><item rdf:about="https://www.vaneck.com/us/en/blogs/model-portfolios/podcast-battle-tested-assets-for-all-regimes/">
  <title>Podcast: Battle-Tested Assets for All Regimes></title>
  <link>https://www.vaneck.com/us/en/blogs/model-portfolios/podcast-battle-tested-assets-for-all-regimes/</link>
  <description><![CDATA[On the Excess Returns Podcast, we discussed a range of topics, with a focus on adapting and adjusting to inflationary regimes.]]></description>
  <dc:creator>David Schassler</dc:creator>
  <dc:date>03/28/2023 06:30:00</dc:date>
<content:encoded><![CDATA[

<p>I recently enjoyed joining Jack Forehand, CFA, and Justin Carbonneau on the <strong><a href="https://www.vaneck.com/us/en/offsite-disclaimer/?id=221920&amp;button=no&amp;url=https://www.youtube.com/watch?v=UTVUplDkjrY" target="_blank" title="YouTube - Building an Inflation Fighting Portfolio With Dave Schassler" rel="noopener">Excess Returns podcast</a></strong> for an engaging discussion. Our conversation touched on a range of topics, including my background in due diligence and a comparison between the situations faced by Paul Volcker and Jerome Powell in their respective tenures as Federal Reserve Chair (Spoiler Alert: Volcker's situation was more manageable).</p>
<p>Below are some highlights from our conversation:</p>
<ul class="content-list">
<li><strong><a href="#point-one">The Value of a Background in Due Diligence and Selecting a Fund Manager</a></strong></li>
<li><strong><a href="#point-two">The Journey to Quantitative Investing</a></strong></li>
<li><strong><a href="#point-three">Adapting to An Inflationary Regime: Investment Options</a></strong></li>
<li><strong><a href="#point-four">Adjusting for Inflationary Conditions</a></strong></li>
<li><strong><a href="#point-five">Comparing Volcker and Powell</a></strong></li>
<li><strong><a href="#point-six">Microsoft and Exxon Mobil: A Tale of the Cyclical Nature of Growth and Value</a></strong></li>
<li><strong><a href="#point-seven">The Most Important Lessons for Investors Today</a></strong></li>
</ul>
<h2 id="point-one" class="anchored-block">The Value of a Background in Due Diligence and Selecting a Fund Manager</h2>
<p>A background in due diligence offers a unique opportunity to engage with accomplished fund managers with impressive track records. Conversations with these successful investment professionals can be invaluable as you can absorb valuable insights and strategies to help shape your own investment philosophies and personal style.</p>
<p>One key aspect to consider when evaluating a fund manager is their long-term track record of success, which demonstrates a sound investment philosophy and a strong investment process.</p>
<h2 id="point-two" class="anchored-block">The Journey to Quantitative Investing</h2>
<p>The blend of art and science in portfolio management can be seen in the balance between quantitative and fundamental strategies. Quantitative investing, which involves a market historian's perspective, allows studying past market performance to understand current trends better and predict future movements.</p>
<p>Quantitative strategies have the advantage of removing the emotional pitfalls that discretionary managers face, as they can sometimes be dogmatic. Merging the informational and behavioral benefits of quantitative investing with the common sense and experience of fundamental investing can create a powerful approach. Understanding that human discretion is always involved in some capacity is essential in recognizing the balance between the two methods.</p>
<h2 id="point-three" class="anchored-block">Adapting to An Inflationary Regime: Investment Options</h2>
<p>Inflation has been a concern for us for some time and the current high levels are expected to persist for an extended period. Historically, once high inflation emerges, it is difficult to resolve. Inflation may experience peaks and troughs, but the average level of inflation over time is critical to consider. The current environment may not be conducive to fighting inflation due to factors such as commodity shortages, ongoing conflicts, and a lack of <strong><a href="https://www.vaneck.com/us/en/blogs/guided-allocation/inflation-fight-night-fed-chair-vs-the-senator/" title="Inflation Fight Night: Fed Chair vs. The Senator">political willpower</a></strong>.</p>
<p>Dealing with elevated inflation requires a change in investment strategies. While investors can manage <strong><a href="https://www.vaneck.com/us/en/blogs/guided-allocation/think-inflations-ending-think-again/" title="Think Inflation's Ending? Think Again.">4 to 5% inflation</a></strong>, anything higher is disruptive. As we enter a new inflationary period, investors must adapt their strategies and consider assets that will perform well in this environment. With the Federal Reserve's efforts to bring inflation down, it is crucial to recognize that other factors are at play, such as global economic conditions and the current state of the commodity market. It is not solely the Fed's actions that will determine the success of investments moving forward.</p>
<p>Investors have various options when investing in assets that may perform well during inflationary times. Some of these include commodities, gold, certain stocks, and real estate. After extensive research on this topic, we believe these are the best assets to invest in during this period:</p>
<ol>
<li value="1"><strong>Resource Assets: Commodities and Natural Resource Equities</strong></li>
</ol>
<p style="margin-left: 40px;">Commodities respond quickly to supply-demand imbalances, and due to the transition from traditional energy to renewables, structural shortages are expected in the commodity complex. This could lead to elevated commodity prices for an extended period of time.</p>
<p style="margin-left: 40px;">Natural resource equities, such as oil services companies and those involved in extracting, producing, and distributing commodities, are also expected to perform well. These companies benefit from higher commodity prices and have shown discipline in capital allocation.</p>
<ol>
<li value="2"><strong>Financial Assets: Gold Bullion and Gold Equities</strong></li>
</ol>
<p style="margin-left: 40px;">Another recommended investment is gold bullion and gold equities. Gold does not have the utility of other commodities, so people must seek it out as a store of value asset for it to work as an investment. In an inflationary environment, gold becomes an attractive option for investors looking to preserve wealth. Historically, gold has performed well during periods of inflation, as seen in the 1970s and mid-2000s. As we move later in the cycle, gold is expected to rally significantly, even independent of interest rates.</p>
<ol>
<li value="3"><strong>Income Assets: Income-Generating Real Assets</strong></li>
</ol>
<p style="margin-left: 40px;">Finally, income-generating real assets such as infrastructure companies, REITs, and MLPs should be considered. These investments can pass along inflation to their customers while maintaining profit margins, making them more attractive in an inflationary environment.</p>
<h2 id="point-four" class="anchored-block">Adjusting for Inflationary Conditions</h2>
<p>Investors should aim to have assets in their portfolios that can perform in various economic environments, including high growth, low growth, high inflation, and low inflation. A balanced portfolio should include an allocation to resource assets, although this allocation should be smaller than the allocation to stocks and bonds.</p>
<p><strong><a href="https://www.vaneck.com/us/en/blogs/guided-allocation/its-shocking-inflations-impact-on-asset-allocation/" title="It's Shocking: Inflation's Impact on Asset Allocation">The traditional 60/40 portfolio of stocks and bonds</a></strong> may not be sufficient to protect against inflationary risks. Investors should consider allocating around 15% of their portfolio to diversified real assets, which can provide a buffer during periods of high inflation while still allowing for growth during periods of low inflation.</p>
<p>In periods of ultra-high inflation, it may be prudent for investors to adjust their portfolio allocations to favor assets particularly effective at protecting against inflation, such as commodities. Strategies like the <strong><a href="/link/6e91eff51c6042ef9f1d5943ffa90a0e.aspx" title="RAAX - VanEck Real Assets ETF - Overview">VanEck Real Assets ETF (RAAX)</a></strong> invest in a mix of resource assets, income-generating real assets, and financial assets while biasing the portfolio towards assets expected to lead the market higher during periods of inflation.</p>
<p>However, during periods of extended low inflation, it may be more appropriate to increase allocations to REITs and infrastructure real assets, which can perform independently of the inflation cycle. While adjusting your portfolio based on inflationary conditions is important, it's equally important not to make drastic changes based on short-term economic forecasts.</p>
<h2 id="point-five" class="anchored-block">Comparing Volcker and Powell</h2>
<p>The current situation is very different from what former Federal Reserve (Fed) Chairman Paul Volcker faced during his tenure. Volcker had the advantage of disinflationary forces like fallen commodity prices and no wars working in his favor. In contrast, current Chair Jerome Powell has these same forces working against him. This makes it challenging for Powell to maintain low inflation while also dealing with the consequences of de-globalization.</p>
<h2 id="point-six" class="anchored-block">Microsoft and Exxon Mobil: A Tale of the Cyclical Nature of Growth and Value</h2>
<p>To better understand the dynamics of free cash flow yields and company performance, examining the contrasting stories of <strong><a href="https://www.vaneck.com/us/en/blogs/guided-allocation/dude-wheres-my-real-assets-exposure/" title="Dude, Where's My Real Assets Exposure?">Microsoft and Exxon Mobil is useful</a></strong>. Microsoft has outperformed the S&amp;P 500 for the decade leading up to this point, while Exxon Mobil has remained relatively flat. This difference can be attributed to the significant disparity in free cash flow yields during various economic regimes.</p>
<p>However, expanding the analysis beyond the last decade reveals a period when Exxon Mobil significantly outperformed Microsoft. This historical context highlights the cyclical nature of growth and value investing.</p>
<p>Both growth and value managers have often claimed that the other investment style is "dead&rdquo; at some point. However, the truth is that growth and value investing work in cycles that typically last five to ten years. We are likely in a continued value environment that will benefit those exposed to commodities.</p>
<p>At present, the free cash flow yields for Exxon Mobil are remarkably high. Historically, such high yields have led to above-market returns. The expectation is that this trend will continue for some time. As more investors recognize the potential in these assets, we'll likely see significant price appreciation in the coming years.</p>
<h2 id="point-seven" class="anchored-block">The Most Important Lessons for Investors Today</h2>
<p>When it comes to investing, there is a wealth of research and experience to draw from. However, if we had to distill all of that knowledge into just one critical lesson for the average investor, it would be this: asset allocation is the most important decision you'll make. To navigate the ever-changing economic landscape, you must understand the four major categories of economic environments &ndash; high inflation, low inflation, high growth, and low growth &ndash; and build a stable asset allocation mix that can handle each of these regimes.</p>
<p>While it's natural to feel the urge to move in and out of asset classes as market conditions change, avoiding being too aggressive with tactical shifts is crucial. Making careless errors in this area can increase the time you'll need to work before achieving your financial goals. The key is to stay strategic, making only minor adjustments at the margins when necessary. Doing so can better position yourself for long-term success in the markets.</p>
<p>One of the most challenging aspects of investing is managing emotions during market volatility. However, it's essential to recognize that volatility is a normal investment process. Rather than being frightened by it and rushing to sell your assets, <strong><a href="https://www.vaneck.com/us/en/blogs/guided-allocation/feds-gambit-inflation-fighting-to-recession-fighting/" title="Fed's Gambit: Inflation-Fighting to Recession-Fighting?">try to see volatile periods as opportunities for growth</a></strong>. By sticking to your strategic asset allocation and riding through these storms, you'll be better equipped to capitalize on market fluctuations and ultimately achieve your financial goals.</p>
<p>Watch the full podcast episode <a href="https://www.vaneck.com/us/en/offsite-disclaimer/?id=221920&amp;button=no&amp;url=https://www.youtube.com/watch?v=UTVUplDkjrY" title="YouTube - Building an Inflation Fighting Portfolio With Dave Schassler" target="_blank" rel="noopener"><strong>here</strong></a>.</p>
<p>To receive more <strong><a href="https://www.vaneck.com/us/en/insights/guided-allocation/" title="Model Portfolio Insights">Model Portfolio</a></strong> insights, <strong><a href="https://www.vaneck.com/us/en/subscribe/" title="Subscription Center">sign up in our subscription center</a></strong>.</p>
]]></content:encoded>
</item><item rdf:about="https://www.vaneck.com/us/en/blogs/economic-trends/slower-growth-forever/">
  <title>Slower Growth Forever?></title>
  <link>https://www.vaneck.com/us/en/blogs/economic-trends/slower-growth-forever/</link>
  <description><![CDATA[Near-term hard landing concerns continue to persist, but should we be more worried about policy&rsquo;s impact on long-term growth prospects?]]></description>
  <dc:creator>Natalia  Gurushina</dc:creator>
  <dc:date>03/28/2023 06:30:00</dc:date>
<content:encoded><![CDATA[

<h2>Hard Landing Concerns</h2>
<p><strong>Financial stability jitters appear to be subsiding for now, but the hard landing concerns in developed markets (DM) refuse to go away</strong> &ndash; the impact of the banking mini-crisis on lending conditions (which have been tightening for some time now) and the deposit flight are partly to blame. One thing that is often obscured by near-term considerations (like the next rate hike or cut) and data noise is the impact of policy decisions on productivity and long-term growth potential. The World Bank issued a very interesting report, which argues (among other things) that policy uncertainty depressed global investments and productivity in the past 10 years (see chart below), dragging potential growth down with it &ndash; both in DM and emerging markets (EM). And it&rsquo;s not just lower potential output per se, it&rsquo;s a slower rate &ldquo;at which an economy can grow without igniting inflation&rdquo;.</p>
<h2>EM Productivity Growth</h2>
<p>The World Bank expects these trends to continue in the current decade, but we think that <strong>EMs might have a fighting chance to escape the negative feedback loop</strong>. First, EM policy framework improved a lot since the 2008-09 global financial crisis, arguably reducing policy uncertainty. EMs are also less &ldquo;allergic&rdquo; to the very idea of structural reforms. Second, a higher (and stable) share of the working-age population in EM point to a relatively more favorable outlook for domestic savings that can support both investments and productivity growth, potentially compensating for falling savings in aging DMs. &ldquo;Getting old before getting rich&rdquo; China adds an element of suspense in the EM case, but India&rsquo;s growing population and a better demographic profile create a potential counterpoint.</p>
<h2>Room for EM Rate Cuts</h2>
<p>Back to the present and a near-term policy impact on growth, we have <strong>several important central bank meetings in EM this week</strong>. Mexico is on the brink of a pause &ndash; aided by the more convincing disinflation progress &ndash; but &ldquo;sticky&rdquo; inflation components signal that a 25bps could be a good idea. The Czech national bank is often considered a testing ground for the anti-inflation battle, with the rapidly slowing domestic demand, a strong currency, and the improving global price backdrop. The market sees Czech rate cuts within the next 3 months &ndash; would the central bank indeed turn dovish or confirm that the bar for cuts is high despite weakening growth, just as its Hungarian counterpart did earlier today? EM&rsquo;s disinflation poster kid &ndash; Brazil &ndash; is also staying put, with minutes revealing ongoing concerns about the fiscal outlook and its impact on inflation expectations. Stay tuned!</p>
<h3>Chart at a Glance: Global Productivity Growth &ndash; Can EMs Reverse the Trend?</h3>
<p><img class="img-responsive w-100" src="https://www.vaneck.com/contentassets/0be43b1646c14282896cb7b6acbf462d/us-natalias-take-2023-03-28.png" alt="Chart at a Glance: Global Productivity Growth - Can EMs Reverse the Trend?" /></p>
<p class="chart-disclosure">Source: World Bank.</p>
<p class="chart-disclosure">Note: (AEs) &ndash; advanced economies; (EMDEs) &ndash; emerging and developing economies.</p>
]]></content:encoded>
</item><item rdf:about="https://www.vaneck.com/us/en/blogs/economic-trends/em-growth-drivers-clash-of-titans/">
  <title>EM Growth Drivers – Clash of Titans></title>
  <link>https://www.vaneck.com/us/en/blogs/economic-trends/em-growth-drivers-clash-of-titans/</link>
  <description><![CDATA[Concerns about the &ldquo;global&rdquo; recession refuse to go away &ndash; Can China be an effective growth &ldquo;booster&rdquo; for EMs?]]></description>
  <dc:creator>Natalia  Gurushina</dc:creator>
  <dc:date>03/27/2023 15:30:00</dc:date>
<content:encoded><![CDATA[

<h2>Recession Concerns</h2>
<p>The market expectations for the U.S. Federal Reserve (Fed) remain stubbornly dovish, with the banking system&rsquo;s turmoil emerging as the main culprit &ndash; especially as regards <strong>the impact of tighter lending conditions on the growth outlook</strong>. The Fed&rsquo;s senior loan officer opinion survey shows that tightening was already underway going into the banking mini-crisis, but the share of &ldquo;considerable tightening&rdquo; was still small &ndash; so this space warrants close attention in the coming weeks. Most observers agree that spillovers from the developed markets (DM) banking turmoil into emerging markets (EM) should be limited &ndash; another supporting factor for the asset class in addition to lower debt ratios and much higher real rates.&nbsp;However, we might need to exercise caution when interpreting the latest EM activity gauges - which are just around the corner &ndash; given the timing of the mini-crisis.&nbsp;&nbsp;</p>
<h2>China Rebound</h2>
<p>Another factor to keep in mind when thinking about the EM growth outlook is that the credit impulse is now negative in about one-half of major EMs (in addition to being &ldquo;barely there&rdquo; in about 1/3, according to the sell-side estimates). This is, of course, a consequence of EM central banks&rsquo; early and aggressive policy tightening in response to the post-pandemic price pressures, but this raises <strong>the importance of China as a potential global growth &ldquo;booster&rdquo;</strong>. The recent sharp increase in China&rsquo;s economic surprise index looks encouraging &ndash; the index is now the highest since 2006 &ndash; but the consensus prefers to be the cautious. Both the services and the manufacturing PMIs are expected to stay comfortably in expansion zone, but without further improvement.</p>
<h2>China Reopening and EM Growth</h2>
<p>The latest signals in EM manufacturing suggest <strong>that China&rsquo;s growth boost to EM growth is likely to materialize later this year</strong> &ndash; for now, numbers show mostly marginal improvements and signs of stabilization. Thailand&rsquo;s tourism arrivals show that the impact of China&rsquo;s reopening on services &ndash; especially in EM Asia &ndash; might also take time. While it is true that the number of Chinese tourists tripled since December, the improvement is from a near-zero base, and well below the pre-pandemic levels (see chart below). Stay tuned!</p>
<h3>Chart at a Glance: China&rsquo;s Growth Boost to EM &ndash; Patience, Please</h3>
<img class="img-responsive w-100" src="https://www.vaneck.com/contentassets/99e302fe57de4430878a6acd0cbce7c0/us-natalias-take-2023-03-27.png" alt="Chart at a Glance: China&rsquo;s Growth Boost to EM &ndash; Patience, Please" />
<p class="chart-disclosure">Source: Bloomberg LP</p>
]]></content:encoded>
</item><item rdf:about="https://www.vaneck.com/us/en/blogs/gold-investing/vaneck-international-investors-gold-strategy-question-and-answer/">
  <title>VanEck International Investors Gold Fund: Question &amp; Answer></title>
  <link>https://www.vaneck.com/us/en/blogs/gold-investing/vaneck-international-investors-gold-strategy-question-and-answer/</link>
  <description><![CDATA[VanEck has long been a leader in gold investing. In this Q&amp;A, we answer questions about our approach to investing in gold miners.]]></description>
  <dc:creator> </dc:creator>
  <dc:date>03/24/2023 06:30:00</dc:date>
<content:encoded><![CDATA[

<p>Gold is one of the most vital metals in the world and a unique asset, with the ability to enhance portfolio diversification, act as store of value, and hedges against systemic risk. VanEck has long been considered a leader in gold-related investments and has been managing gold funds since 1968, including the nation&rsquo;s first open-ended gold equity mutual fund. This blog intends to answer frequently asked questions about investing in gold mining companies, and more specifically, the <strong><a href="/link/44f7b473b01d474080286ad9f3ade614.aspx" title="INIVX - International Investors Gold Fund - Class A - Overview">VanEck International Investors Gold Fund (INIVX)</a></strong>.</p>
<ul class="conent-list">
<li><a href="#point-one"><strong>Why invest in gold?</strong></a></li>
<li><a href="#point-two"><strong>How do you invest in gold?</strong></a></li>
<li><a href="#point-three"><strong>Why invest in gold miners?</strong></a></li>
<li><a href="#point-four"><strong>Are all gold mining companies the same?</strong></a></li>
<li><a href="#point-five"><strong>Who are the members of the Investment Team for the VanEck International Investors Gold Fund?</strong></a></li>
<li><a href="#point-six"><strong>How do you decide which gold companies to invest in?</strong></a></li>
<li><a href="#point-seven"><strong>How can investors buy VanEck Mutual Funds?</strong></a></li>
</ul>
<h2 id="point-one" class="anchored-block">Why invest in gold?</h2>
<p>Gold has staying power, with a history in the international monetary system spanning over 2,500 years. For centuries, gold has served as a form of exchange, a safe haven investment (in times of financial market turmoil) as well as a hedge against severe inflation.</p>
<h2 id="point-two" class="anchored-block">How do you invest in gold?</h2>
<p>Primary ways to invest in gold are via physical bars, coins or jewelry, gold certificates, gold-backed exchange-traded products, or through shares in gold mining stocks (or gold miners).</p>
<h2 id="point-three" class="anchored-block">Why invest in gold miners?</h2>
<p>An investment in gold miners offers several benefits beyond that of other gold-related investments.</p>
<ul class="content-list">
<li><i>Leverage to gold prices</i> &ndash; For most gold miners, profitability is measured by the average cost of production relative to the current price of gold. High or rising gold prices can thus magnify profits earned by gold miners, which often translates to higher share prices.</li>
<li><i>Yield opportunity &ndash; </i>Investors are often being &ldquo;paid&rdquo; to own gold mining stocks, with many gold companies opting to return capital to shareholders in the form of dividends. On the other hand, investors in physical gold often have to pay for ownership (in the form of storage).</li>
<li><i>Idiosyncratic return drivers</i> &ndash; Performance of gold miners is not wholly dependent on the price of gold. Over time, gold miners may exploit efficiency gains from new technologies, capitalize on exploration success or else become the target of a larger acquisition. All of these factors may influence their return prospects regardless of gold prices.</li>
</ul>
<div class="epi-contentfragment">faq-banner-cta</div>
<h2 id="point-four" class="anchored-block">Are all gold mining companies the same?</h2>
<p>No, not all gold mining companies are the same. The gold mining industry can be segmented in various ways. One way is based on the primary business activity of the gold miner. For example, many gold miners are involved in the exploration of quality mine sites as well as development of preliminary mine operations. However, other gold miners may rely on acquisitions to build gold reserves or act as a project financier for several gold mining projects.</p>
<p>Another way gold miners are often segmented is based on their overall mine operation size and gold production levels:</p>
<ul class="content-list">
<li><i>Juniors</i> &ndash; This segment is represented by early-stage explorers and developers with, generally, very little production. While many of these companies demonstrate a high risk of failure, they also offer tremendous upside as targets for acquisition by larger miners.</li>
<li><i>Mid-Tiers</i> &ndash; A mix of companies with sizable and diversified gold production, substantial growth potential, and smaller market capitalization. They tend to exhibit less risk than their exploration peers.</li>
<li><i>Majors</i> &ndash; Tend to be less volatile, more mature mining companies, with larger portfolios than their smaller peers. These are well-capitalized companies with decades of history and world-spanning operations.</li>
</ul>
<h2 id="point-five" class="anchored-block">Who are the members of the Investment Team for the VanEck International Investors Gold Fund?</h2>
<p>Effective May 1, 2023, <strong><a href="https://www.vaneck.com/us/en/news-and-insights/thought-leaders/joe-foster/" title="Joe Foster - Portfolio Manager and Strategist, Gold and Precious Metals">Joe Foster</a></strong> will be stepping back from his current role as Portfolio Manager for the Fund, and <strong><a href="https://www.vaneck.com/us/en/news-and-insights/thought-leaders/imaru-casanova/" title="Imaru Casanova - Deputy Portfolio Manager, Gold and Precious Metals">Imaru Casanova</a></strong>, the Fund&rsquo;s current Deputy Portfolio Manager, will be taking over as Portfolio Manager. Mr. Foster will remain on the Investment Team as Gold Strategist. Adam Graf is a Senior Analyst on the Fund.</p>
<p>The Investment Team reflects the approach initiated by VanEck founder John van Eck at the Fund&rsquo;s launch of including geologists and people with on-the-ground experience to provide unique, differentiated perspectives on company operations and forecasts.</p>
<p>For more details about the transition and the Investment Team, read our <strong><a href="https://www.vaneck.com/us/en/blogs/investment-outlook/gold-portfolio-manager-transition-plans-faq/" title="Gold Portfolio Manager Transition Plans FAQ">Gold Portfolio Manager Transition Plans FAQ</a></strong>.</p>
<h2 id="point-six" class="anchored-block">How do you decide which gold companies to invest in?</h2>
<p>The Fund&rsquo;s investment methodology pairs top-down, macroeconomic assessment of gold bullion markets with bottom-up, fundamental company research.</p>
<ul class="content-list">
<li><i>Top-Down</i> &ndash; Macroeconomic analysis of systemic financial risks, inflation, monetary policy, interest rates, currencies, debt levels and physical supply (among other factors) help the Investment Team identify gold price trends over the medium- to longer-term. A positive or bullish gold price outlook favors overweight allocation to high-cost producers and junior miners while a negative or bearish gold price outlook favors overweight allocation to low-cost producers, senior gold miners, royalty companies and gold bullion. These are well-capitalized companies with decades of history and world-spanning operations.</li>
<li><i>Bottom-Up</i> &ndash; Fundamental security research relies on company analysis, comprehensive modeling and qualitative research. Company analysis takes into consideration factors such as management expertise, reserve location, geopolitics, deposit types, drill results, mine engineering and labor issues. Modeling entails forecasting mine production, sustaining costs, reserves, capital structure, and cash flow, as well as gauging absolute and relative valuations. Qualitative research includes mine site visits and meetings with company management to evaluate project execution, site accessibility, health and safety measures as well as environmental impact.</li>
</ul>
<p>Combining these elements, the Investment Team is able to narrow the field of approximately 400 gold companies to portfolio of around 45-65 companies (ideally, those with the greatest unrealized value potential). Though long-term conviction often has the greatest influence over sizing of individual position within the portfolio, the Investment Team adjusts its portfolio weightings according to changes to their gold price outlook.</p>
<h2 id="point-seven" class="anchored-block">How can investors buy VanEck Mutual Funds?</h2>
<p><strong><a href="/link/44f7b473b01d474080286ad9f3ade614.aspx#how-to-buy-mutual-funds&amp;utm=IIG-Blog" title="How to buy VanEck Mutual Funds?">Learn more here.</a></strong></p>
<p class="d-none d-lg-block"><a href="mailto:askvaneck@vaneck.com" title="Have More Questions? - Ask VanEck" rel="noopener"> <img class="img-responsive" src="https://www.vaneck.com/globalassets/home/us/insights/blogs/bm-blog-images/cta-faq_desktop-02.svg" alt="Have More Questions? - Ask VanEck" /></a></p>
<p class="d-lg-none"><a href="mailto:askvaneck@vaneck.com" title="Have More Questions? - Ask VanEck" rel="noopener"> <img class="img-responsive" src="https://www.vaneck.com/globalassets/home/us/insights/blogs/bm-blog-images/cta-faq_mobile-01.svg" alt="Have More Questions? - Ask VanEck" /></a></p>
<p>To receive more insights to <strong><a href="https://www.vaneck.com/us/en/insights/gold-investing/" title="Gold Investing Insights">Gold Investing</a></strong> insights, <strong><a href="https://www.vaneck.com/us/en/subscribe/" title="Subscription Center">sign up in our subscription center</a></strong>.</p>
]]></content:encoded>
</item><item rdf:about="https://www.vaneck.com/us/en/blogs/economic-trends/em-prepared-for-more-turmoil/">
  <title>EM – Prepared For More Turmoil?></title>
  <link>https://www.vaneck.com/us/en/blogs/economic-trends/em-prepared-for-more-turmoil/</link>
  <description><![CDATA[&ldquo;EM Graduates&rdquo; might be in a better position to deal with market turbulence, but lower-rated frontier market can be hit by another spike in global rates&rsquo; volatility.]]></description>
  <dc:creator>Natalia  Gurushina</dc:creator>
  <dc:date>03/24/2023 06:30:00</dc:date>
<content:encoded><![CDATA[

<h2>Market Expectations for The Fed</h2>
<p>Concerns about &ldquo;dry wood&rdquo; in developed markets (DM) banks refuse to go away, driving <strong>recession fears up and market expectations for the U.S. Federal Reserve (Fed) policy rate down</strong>. However, while short rates are dropping like a stone, very long rates are still range-bound &ndash; an indication that perceived inflation risks are yet to decline. The consensus outlook for emerging markets (EM) inflation is also cautious in the sense that inflation can realistically return to target already this year only in one region &ndash; EM Asia (we should also mention Brazil and South Africa here, but these are exceptions in their respective regions). Still, the timely policy response earlier in this cycle means that EM real policy rates adjusted for expected inflation are much higher than in DM, providing a safety cushion when things get tough. Another differentiator this time around is EMs&rsquo; stronger correlation with China, which is clearly on the rebound and set to grow much faster this year than any DM.</p>
<h2>EM Rate Cut Prospects</h2>
<p>High real policy rates notwithstanding, <strong>EM central banks are not in a rush to cut</strong>. The top domestic reasons include uncertainty about the pace of disinflation and concerns that inflation expectations could remain unanchored if central banks move prematurely. Brazil&rsquo;s disinflation progress has been spectacular &ndash; today&rsquo;s mid-month prints showed further moderation to 5.36% year-on-year &ndash; but waves of political and policy noise keep the central bank on its toes. The presentation of the new fiscal framework was delayed, and President Luiz In&aacute;cio Lula da Silva&rsquo;s (Lula&rsquo;s) renewed attacks on the central bank forced the market to re-adjust expectations for near-term rate cut prospects (as well as preventing the Brazilian real from participating in the post-Fed EM FX rally).</p>
<h2>EM Bonds and Market Volatility</h2>
<p>Of course, EM is not a monolith &ndash; <strong>EM Graduates might be in a better position to deal with market turbulence</strong>, and many EM currencies behaved as safer havens during the previous (banking mini-crisis) episode. However, frontier markets are definitely more exposed. Spreads on lower-rated sovereign bonds show strong correlation with global interest rates&rsquo; volatility (see chart below), and this particular factor was behind EM High Yield sovereign bonds&rsquo; month-to-date underperformance despite a big rally in the treasury portion of their total return. Stay tuned!</p>
<h3>Chart at a Glance: EM High Yield Bonds &ndash; DM Rates Volatility Is A Major Risk Factor</h3>
<p><img class="img-responsive w-100" src="https://www.vaneck.com/contentassets/0b918bb23f7740a6bfc2228b8261bb26/us-natalias-take-2023-03-24.png" alt="EM High Yield Bonds - DM Rates Volatility Is A Major Risk Factor" /></p>
<p class="chart-disclosure">Source: Bloomberg LP.</p>
<p class="chart-disclosure">The <strong>J.P. Morgan EMBI Global Diversified HY Sovereign Spread Index</strong> is a subset of the J.P. Morgan Emerging Market Bond Index Global Diversified (EMBIGD), which is an unmanaged, market-capitalization weighted, total-return index tracking the traded market for U.S.-dollar-denominated Brady bonds, Eurobonds, traded loans, and local market debt instruments issued by sovereign and quasi-sovereign entities.</p>
<p class="chart-disclosure">The <strong>ICE BofA MOVE Index</strong> tracks fixed income market volatility.</p>
]]></content:encoded>
</item><item rdf:about="https://www.vaneck.com/us/en/blogs/gold-investing/the-gold-standard-diversity-matters/">
  <title>The Gold Standard: Diversity Matters></title>
  <link>https://www.vaneck.com/us/en/blogs/gold-investing/the-gold-standard-diversity-matters/</link>
  <description><![CDATA[Ima Casanova recently joined Asset TV&rsquo;s Women in Investing Masterclass to discuss her career and how diversity has evolved in the gold industry over the past two decades.]]></description>
  <dc:creator>Imaru Casanova</dc:creator>
  <dc:date>03/23/2023 06:30:00</dc:date>
<content:encoded><![CDATA[

<p>In addition to serving on VanEck&rsquo;s DEI Committee, <strong><a href="https://www.vaneck.com/us/en/news-and-insights/thought-leaders/imaru-casanova/" title="Imaru Casanova - Deputy Portfolio Manager, Gold and Precious Metals">Ima Casanova</a></strong> has been a member of the investment team for the International Investors Gold Fund and Global Resources Fund since she joined VanEck in 2011. Recently, it was announced that <strong><a href="https://www.vaneck.com/us/en/blogs/investment-outlook/gold-portfolio-manager-transition-plans-faq/" title="Gold Portfolio Manager Transition Plans FAQ">Ima will be taking over as Portfolio Manager for the VanEck International Investors Gold Fund, effective May 1, 2023</a></strong>.</p>
<p>Ima&rsquo;s diverse background includes both BS and MS degrees, as well as industry experience in engineering, which helps to shape her analysis and interactions with prominent and upcoming gold mining companies. Ima&rsquo;s recent discussion with Asset TV includes details of her professional career path, in addition to an overview of how diversity, equity and inclusion factors have evolved in the gold mining space and broader financial services industry.</p>
<h2>Diversity, Equity and Inclusion in the Gold Industry</h2>
<p>Diversity, equity and inclusion (DEI) factors are important to consider when evaluating a company&rsquo;s long-term prospects. From this perspective, we have witnessed significant change in the gold mining industry over the past two decades, as companies have increasingly diversified the composition of their boards. More women are represented on boards and, as large shareholders in several gold mining companies, we can express our support (or lack thereof) for aspects that involve diversity at the board level (36:01).</p>
<p>Other highlights include:</p>
<ul class="content-list">
<li>02:06 &ndash; Ima&rsquo;s decision to pursue a career in finance</li>
<li>10:41 &ndash; Ima&rsquo;s career progression at VanEck</li>
<li>28:31 &ndash; Work/life balance</li>
<li>45:48 &ndash; Overview of VanEck&rsquo;s DEI Committee</li>
<li>48:59 &ndash; Advice for women starting their career: embrace being a woman</li>
</ul>
<p>The full webinar can be accessed here: <strong><a href="https://www.vaneck.com/us/en/offsite-disclaimer/?id=220852&amp;button=no&amp;url=https://www.assettv.com/video/masterclass-women-investing" title="Asset TV - Women in Investing Masterclass with VanEck's Ima Casanova" target="_blank" rel="noopener">Asset TV &ndash; Women in Investing Masterclass</a></strong>.</p>
<p>To receive more insights to <strong><a href="https://www.vaneck.com/us/en/insights/gold-investing/" title="Gold Investing Insights">Gold Investing</a></strong> insights, <strong><a href="https://www.vaneck.com/us/en/subscribe/" title="Subscription Center">sign up in our subscription center</a></strong>.</p>
]]></content:encoded>
</item><item rdf:about="https://www.vaneck.com/us/en/blogs/economic-trends/a-pause-is-nigh/">
  <title>A Pause Is Nigh?></title>
  <link>https://www.vaneck.com/us/en/blogs/economic-trends/a-pause-is-nigh/</link>
  <description><![CDATA[Various EM central banks keep their eyes firmly on inflation, expectations, and factors that influence them (including fiscal). DM central banks&rsquo; motivations are still being questioned by the market.]]></description>
  <dc:creator>Natalia  Gurushina</dc:creator>
  <dc:date>03/23/2023 06:30:00</dc:date>
<content:encoded><![CDATA[

<h2>Fed Rate Cuts</h2>
<p>One big takeaway from yesterday&rsquo;s meeting of the U.S. Federal Reserve (Fed) is that <strong>the Fed and the market still do not see eye to eye</strong> (the chart below is hard to un-see). The market latched onto Chairman Powell&rsquo;s comments about the impact of tighter credit conditions on the growth outlook and inflation and refused to abandon its fairly aggressive easing expectations. Emerging markets (EM) currencies were not particularly upset about this state of affairs, extending the post-Fed rally against the U.S. Dollar this morning. The majority of EM bonds and many EM equities also looked quite happy (judging by the green color on our Bloomberg screens). There might still be &ldquo;dry wood&rdquo; in DM banks (hence, a risk of market turbulence going forward), but commentators agree that EMs passed the latest test with flying colors. This might be a reflection of EMs&rsquo; early policy response to post-pandemic price pressures (=high real rates), but also stronger structural and institutional frameworks, as well China&rsquo;s role as an independent growth driver.</p>
<h2>EM Policy Rate Outlook</h2>
<p>And talking about policies, <strong>price stability (including anchoring inflation expectations) remains a top priority for various EM central banks</strong> - which means some residual rate hikes before it would be safe to take a pause, even in those cases when inflation had peaked. The Philippine central bank raised its policy rate by 25bps this morning and signaled that it might go for another hike if inflation risks remain to the upside. Mexico&rsquo;s latest bi-weekly inflation prints were beautiful &ndash; suggesting that the 6% (headline) and 7% (core) thresholds are within reach, but some inflation components are sticky &ndash; so a 25bps hike next week would be a prudent move. South Africa is likely to do the same, as inflation expectations climbed higher in Q1.</p>
<h2>EM Policy Objectives</h2>
<p>Another strong policy signal in&nbsp;<strong>EMs</strong> is that a rate pause <strong>does not necessarily means that rate cuts are around the corner</strong>. Sometimes this is due to uncertainty about inflation expectations (yesterday&rsquo;s comment from Brazil&rsquo;s central bank). Sometimes, it&rsquo;s a plain fact that inflation is still far from the official target. And sometimes, central banks&rsquo; caution reflects concerns about fiscal consolidation, a lack of which might lead to higher price pressures down the road. The latter is a big issue in Brazil, where the central bank acknowledged some improvements in the fiscal outlook but reiterated that a credible new fiscal framework is an important prerequisite for this year&rsquo;s rate cuts. Stay tuned!</p>
<h3>Chart at a Glance: Fed and Market &ndash; Not Seeing Eye To Eye</h3>
<p><img class="img-responsive w-100" src="https://www.vaneck.com/contentassets/c539173d57f14af2954851eec93d412e/us-natalias-take-2023-03-23.png" alt="Chart at a Glance: Fed and Market - Not Seeing Eye To Eye" /></p>
<p class="chart-disclosure">Source: Bloomberg LP.</p>
]]></content:encoded>
</item><item rdf:about="https://www.vaneck.com/us/en/blogs/natural-resources/get-to-know-green-metals-allkem/">
  <title>Get To Know Green Metals: Allkem></title>
  <link>https://www.vaneck.com/us/en/blogs/natural-resources/get-to-know-green-metals-allkem/</link>
  <description><![CDATA[We believe Allkem is well on track to becoming a major lithium producer in scale and with strategic locations that are close to rapidly growing EV markets.]]></description>
  <dc:creator>Charl Malan</dc:creator>
  <dc:date>03/22/2023 06:30:00</dc:date>
<content:encoded><![CDATA[

<script>
    //Temporary script
    $(function () {
        $(".popup-youtube, .popup-vimeo, .popup-gmaps").on("click", function (e) {
            e.preventDefault();
            var width = $(window).width();
            if (width > 768) {
                openSimpleIframeModalDialog($(this).attr('href'), "video-modal");
            } else if ($(this).is('.popup-youtube')) {
                var target = $(this).attr('data-video');
                self.location = target;
            }
        });
    });
</script>
<style>
    .modal.fade.video-modal div.modal-dialog {
        margin: 7% auto !important;
    }

    .modal-simple-iframe .close span {
        font-size: 35px;
        line-height: 1;
    }
</style>
<h2>Summary</h2>
<p>We review recent market projections for lithium demand and implications for one standout producer, in particular.</p>
<ul class="content-list">
<li>Lithium producers are increasing their demand estimates&mdash;one by as much as 15% for 2030.<sup>1</sup></li>
<li>Some projections indicate 70+ new lithium mines must be built to meet global battery demand by 2035.<sup>2</sup></li>
<li>In our view, Allkem is among the most well-positioned to take advantage of this accelerating demand trend.</li>
</ul>
<h2>Albermarle: Raising the Stakes</h2>
<p>Albermarle, at a market share of 18%, is one of the world's largest lithium producers. A recent strategic update provided by the company indicated that they are more optimistic about the outlook for lithium now than a year ago.<sup>3</sup>&nbsp;For 2023, the company forecasted demand at 1.2 million tonnes (Mt) of Lithium Carbonate Equivalent (LCE) and, for 2030, 3.7 Mt&mdash;a figure nearly 15% higher than last year&rsquo;s forecasts and a compound annual growth rate (CAGR) equating to around 16% between 2025 to 2030. Moreover, these are markedly higher than others&rsquo; estimates.</p>
<p>The increase in demand forecasts is due to the <strong><a href="https://www.vaneck.com/us/en/blogs/sustainable-investing/the-inflation-reduction-act-a-green-catalyst/" title="The Inflation Reduction Act: A Green Catalyst">Inflation Reduction Act</a></strong> and strong <strong><a href="https://www.vaneck.com/us/en/blogs/emerging-markets-equity/the-electric-vehicle-revolution-charges-ahead/" title="The Electric Vehicle Revolution Charges Ahead">electric vehicle</a></strong> (EV) sales. As a result, Albemarle is estimating global EV production will rise from 11.2 million units in 2022 to 25.7 million units in 2025, to 46.9 million units in 2030, compared to its previous estimate of 41 million units in 2030. This translates into an EV penetration rate of 28% in 2025 (compared to 14% in 2022) and 48% in 2030.</p>
<p>As for global supply, Albemarle estimates 2.9 Mt of LCE will be produced in 2030. When combined with its optimistic demand profile, this translates into a lithium shortfall of about 800 Kt, therefore, possibly justifying its and others' continued expansion strategies.</p>
<h3>Albermarle&rsquo;s Lithium Demand Projections (Mt LCE)</h3>
<p><strong>Total Demand</strong></p>
<p><img loading="lazy" class="img-responsive w-100" src="https://www.vaneck.com/contentassets/522189fb1207442fa0b90c3239ed3346/2981_green-metals_chart_01_2023.03_v1_blog.svg" alt="Albermarle's Lithium Demand Projections" /></p>
<p><strong>By Application (MMt LCE)</strong></p>
<p><img loading="lazy" class="img-responsive w-100" src="https://www.vaneck.com/contentassets/522189fb1207442fa0b90c3239ed3346/2981_green-metals_chart_02_2023.03_v1_blog.svg" alt="Albermarle's Lithium Demand Projections" /></p>
<p class="chart-disclosure">Source: Albemarle. Data as of March 2023.</p>
<h2>ALLKEM Ltd: The Making of a Major Global Lithium Company</h2>
<p><strong>Taking Advantage of the Perceived Increased Demand for Lithium</strong></p>
<ul class="content-list">
<li>In our view, few companies are better positioned than Allkem to benefit from the perceived rise in lithium demand resulting from the increasing adoption of clean energy technologies.</li>
<li>The company is headquartered in Buenos Aires, Argentina, and has a global presence, with a diverse portfolio of high-quality lithium assets, in Australia, Argentina, Canada and Japan.</li>
<li>By 2026, the company's production is expected to reach nearly 110 Kt LCE, making it a major lithium producer with, potentially, an attractive gross operating cash margin (82% as of December 2022).<sup>3</sup></li>
<li>Allkem is the result of the merger of Orocobre and Galaxy Resources in 2021 which created a company with exceptional growth prospects.</li>
</ul>
<p><strong>Broad-Based, Near-Term Growth at Scale</strong></p>
<ul class="content-list">
<li>We believe companies with diverse, near-term growth optionality and the opportunity to integrate vertically, like Allkem, are well-placed. Not least as we anticipate permitting and other regulatory issues are becoming bigger conundra.</li>
</ul>
<p><i><u>Diverse Near-Term Growth Opportunities</u></i></p>
<p>Allkem, in our view, has one of the best production profiles with near-term expansion opportunities that could nearly triple production from 40 thousand tonnes per annum (Ktpa) of LCE to 110 Ktpa LCE by 2026 (see chart). Furthermore, its growth profile is broad-based, with options across the Americas in lithium carbonate<sup>i</sup>&nbsp;and spodumene<sup>ii</sup>.</p>
<h3>Allkem&rsquo;s Stellar Production Profile</h3>
<p><img loading="lazy" class="img-responsive w-100" src="https://www.vaneck.com/contentassets/522189fb1207442fa0b90c3239ed3346/2981_green-metals_chart_03_2023.03_v1_blog.svg" alt="Allkem's Stellar Production Profile" /></p>
<p class="chart-disclosure">Source: VanEck, Allkem Ltd, Bloomberg.</p>
<ul class="content-list">
<li><strong>Olaroz</strong> &ndash; The company's flagship asset, Olaroz in Argentina (brine-lithium carbonate), is strategically located within the &ldquo;Lithium Triangle&rdquo; of Argentina, Chile and Bolivia. It markets technical-grade<sup>iii</sup>&nbsp;and battery-grade<sup>iv</sup>&nbsp;lithium carbonate to a diverse customer base in Asia, Europe and North America. Current production is around 13 Ktpa LCE, at a gross cash margin of about 90%<sup>4</sup>&nbsp;(December 2022) and could grow by another 25 Ktpa LCE by 2025, as construction Olaroz Phase 2 nears completion.</li>
<li><strong>Sal de Vida</strong> &ndash; Sal de Vida, also in Argentina (brine-lithium carbonate), is an advanced-stage project with a design capacity of 45 Ktpa LCE of predominantly battery-grade lithium carbonate. Stage 1 of this project is currently under development, with completion estimated in 2024 at 15 Ktpa LCE. Stage 2 could deliver an additional 25 Ktpa around 2028.</li>
<li><strong>James Bay</strong> &ndash; James Bay, in Canada (hard rock-spodumene), is a mid-stage development project. Importantly, it has access to skilled labor and hydroelectricity while also being close to the rapid growth of North American and European EVs. With a 330 Ktpa (63Kt LCE) spodumene concentrate design capacity, it could become a large producer within the North American market. As of recently, material progress has been made regarding detailed engineering and permitting.</li>
<li><strong>Mt. Cattlin</strong> &ndash; Mt. Cattlin, in Australia (hard rock-spodumene), has committed to an extensive exploration and resource drilling program to extend the life of the mine by at least two years.</li>
</ul>
<p><i><u>Vertical Integration Opportunities</u></i></p>
<p>In parallel with its upstream expansions, Allkem is planning on moving "downstream." The aim is to provide battery-grade lithium hydroxide<sup>v</sup>&nbsp;conversion capacity in markets such as Japan and North America. Shifting downstream is a critical step that should boost margins, stabilize cash flow and provide insight into high-end growth markets.</p>
<ul class="content-list">
<li><strong>Naraha</strong> &ndash; Naraha, in Japan, is Allkem's battery-grade lithium hydroxide plant joint venture (75%/25%) with Toyota Tsusho Corporation. Designed to convert 9.5 Kt of technical-grade lithium carbonate from Olaroz into battery-grade lithium hydroxide. It achieved the first production of approximately 200 tonnes of lithium hydroxide at the end of 2022 and expectations are that it will reach a design capacity of 10 Ktpa over the next 12 months.</li>
</ul>
<p>Several additional studies are underway that could potentially increase production capacity beyond 2026. For example, incentives from the U.S. IRA (Inflation Reduction Act) support building a hydroxide conversion plant in North America with feedstock like James Bay. Developing Olaroz (Stage 3) could also increase the company's annual production.</p>
<p><strong>Strong Financial Position</strong></p>
<ul class="content-list">
<li>Unlike many other high-growth mining companies, Allkem has a strong financial profile. With zero debt on the balance sheet<sup>5</sup>&nbsp;and strong cash generation (group gross operating margin at 82%<sup>6</sup>), the company could potentially self-fund its growth plans (capex) of around $1.6B from cash flow. Moreover, capex is projected to peak in the financial year 2026, after which Allkem could return excess free cash flow to shareholders via a dividend or other means.</li>
</ul>
<h3>Allkem&rsquo;s Current Financial Conditions Appear Strong</h3>
<p><img loading="lazy" class="img-responsive w-100" src="https://www.vaneck.com/contentassets/522189fb1207442fa0b90c3239ed3346/2981_green-metals_chart_04_2023.03_v1_blog.svg" alt="Allkem's Current Financial Conditions Appear Strong" /></p>
<p class="chart-disclosure">Source: VanEck, Allkem Ltd, Bloomberg. Data as of March 2023.</p>
<p>The ability to self-fund its production growth is unique as many other emerging lithium companies with similar capex profiles will require external funding.</p>
<p><strong>Pathway to Net Zero by 2035</strong></p>
<ul class="content-list">
<li>The importance of sustainability is evident in that the Chief Sustainability and External Affairs Officer reports directly to the CEO and has access to the Board via the Chair of the Sustainability Committee. Furthermore, the CEO compensation, or at least a significant portion, is directly linked to various ESG targets.</li>
<li>A long-term commitment to sustainability underpins new projects and will enhance the company's international scale and project flexibility. For example, they are implementing renewable (solar) energy at Sal de Vida to cover at least 30% of energy use or sourcing 44% of energy at James Bay from hydroelectricity.</li>
<li>Allkem places a lot of emphasis on its ESG credentials. As such, it has again been included in the Dow Jones Sustainability Indices (2022). We believe lithium producers with accredited ESG credentials will capture a market premium.</li>
</ul>
<h2>Conclusion</h2>
<p>Allkem, we believe, is well on track to becoming a major lithium producer in scale and with strategic locations that are close to rapidly growing EV markets. Its growth profile, in our view, is among the best in the industry and is supported by a substantial resource and reserve base.</p>
<p>The key attributes that set Allkem apart are 1) production growth; 2) attractive margins; 3) self-funded growth; and 4) upside in the resource &amp; reserve base combined with its ESG credentials that could result in it capturing a premium valuation.</p>
<p>To receive more <a href="/us/en/insights/natural-resources/" title="Natural Resources Insights"><strong>Natural Resources</strong></a> insights, <a href="https://www.vaneck.com/us/en/subscribe/" title="Subscription Center"><strong>sign up in our subscription center</strong></a>.</p>
]]></content:encoded>
</item><item rdf:about="https://www.vaneck.com/us/en/blogs/economic-trends/brace-for-impact/">
  <title>Brace for Impact></title>
  <link>https://www.vaneck.com/us/en/blogs/economic-trends/brace-for-impact/</link>
  <description><![CDATA[The Fed might be stealing the limelight today, but the importance of geopolitical factors &ndash; like Chinese President Xi&rsquo;s &ldquo;change is coming&rdquo; visit to Russia &ndash; should not be underestimated.]]></description>
  <dc:creator>Natalia  Gurushina</dc:creator>
  <dc:date>03/22/2023 06:30:00</dc:date>
<content:encoded><![CDATA[

<h2>Fed Rate Hikes</h2>
<p>The focus of the day is the U.S. Federal Reserve (Fed) &rsquo;s rate-setting meeting, and the market expectations are very much in line with a Citi report reminding us that <strong>the Fed does not always stop hiking, when &ldquo;something breaks&rdquo;.</strong> The Fed Funds Futures almost fully price in a 25bps increase in the target rate this afternoon, with a 70% probability that it will be followed by another hike in May. However, the market expectations also reflect a perception that growth headwinds could multiply if financial conditions and lending standards tighten in the wake of the banking mini-crisis. This scenario, however, might not necessarily lead to materially lower inflation pressures, which clouds the outlook for long duration trades.</p>
<h2>EM Policy Rates</h2>
<p>EM watchers keep a close eye on the Fed &ndash; and its peers in developed markets (DM)&ndash; but the current cycle showed that <strong>various EM central banks are no longer joined at the hip with the Fed</strong>, and their monetary policy decisions are increasingly driven by local economic and policy developments. Most EMs started hiking earlier and more aggressively than the Fed after the pandemic, and the latest jumps in the market expectations for the Fed&rsquo;s also had a limited impact on EM. Brazil&rsquo;s example is very telling. The chart below shows the evolution of Brazil&rsquo;s implied policy rate trajectory in the past month and a half. The big shifts down reflected the disinflation progress and hopes that the new fiscal framework would be more reasonable than feared. The changes in Brazilian expectations for 2023 between March 8 and March 21 were barely detectable.</p>
<h2>Geopolitics</h2>
<p><strong>The Fed might be stealing the limelight today, but the importance of certain geopolitical developments</strong> &ndash; like Chinese President Xi&rsquo;s &ldquo;change is coming&rdquo; visit to Russia &ndash; <strong>should not be underestimated</strong>. Our long-standing argument is that <strong><a href="/link/775af929d69741efa7729872dda2bfa5.aspx?epsremainingpath=geopolitical-tailwinds-propel-emerging-markets/" rel="noopener" title="Geopolitical Tailwinds Propel Emerging Markets">new geopolitical alignments can favor many EMs</a></strong> &ndash; especially as regards energy re-orientation and commodity prices. A longer-term prospect of EMs playing China against the U.S. is another important angle, which echoes discussions about the rise of the renminbi and the eventual descent of the petro-dollar. The renminbi&rsquo;s potential role in payments between Russia and countries in Asia, Africa and LATAM even made it into official communiques issued after the China/Russia talks. Stay tuned!</p>
<h3>Chart at a Glance: Brazil&rsquo;s Rate Expectations &ndash; U.S. Fed Is A Side-Show For Now</h3>
<p><img class="img-responsive w-100" src="https://www.vaneck.com/contentassets/91acd32892d747d1b70c1907ba3423ef/us-natalias-take-2023-03-22.png" alt="Chart at a Glance: Brazil's Rate Expectations - U.S. Fed Is A Side-Show For Now" /></p>
<p class="chart-disclosure">Source: Bloomberg LP.</p>
]]></content:encoded>
</item><item rdf:about="https://www.vaneck.com/us/en/blogs/economic-trends/global-rates-approaching-the-endgame/">
  <title>Global Rates – Approaching the Endgame?></title>
  <link>https://www.vaneck.com/us/en/blogs/economic-trends/global-rates-approaching-the-endgame/</link>
  <description><![CDATA[The market feels that stronger growth headwinds will lead to the U.S. Fed rate cuts in 2023. Can China&rsquo;s role as a global growth driver change the outlook for EMs?]]></description>
  <dc:creator>Natalia  Gurushina</dc:creator>
  <dc:date>03/21/2023 06:30:00</dc:date>
<content:encoded><![CDATA[

<h2>Fed Policy Rate Outlook</h2>
<p>The market is in a risk-on mood going into tomorrow's U.S. Federal Reserve (Fed) meeting. <strong>The Fed&rsquo;s</strong> (and the Swiss National Bank&rsquo;s) <strong>response to the banking debacle was deemed effective enough to leave the &ldquo;OMG/SOS&rdquo; narrative behind</strong> (see chart below) and even resurrect one remaining 25bps rate hike as a nod to price stability issues. The emerging new story also features stronger developed markets (DM) growth headwinds stemming from tighter financial and lending conditions, which might necessitate rate cuts before year-end. We&rsquo;ll find out tomorrow whether the market is reading the situation correctly, but a small hike and/or weaker growth prospects might not alleviate all inflation concerns, and this clouds the outlook for duration trades both in emerging markets (EM) and developed markets.</p>
<h2>EM Rate Cuts</h2>
<p><strong>EM reaction to banking turbulence in DM has been orderly so far, with stresses concentrated mainly in sovereign frontier bonds</strong>, which are the most sensitive to higher interest rate volatility. The implied policy reaction by EM central banks also looks quite detached from the Fed. Policy rates in many had already peaked &ndash; a consequence of early and aggressive post-pandemic rate hikes and generally more orthodox policy frameworks, which allow currencies to act as effective shock absorbers, while easing pressure on international reserves. If anything, the latest DM shock led to lower &ndash; not higher! &ndash; expected peak rates in EM Asia, as well as South Africa, Mexico, and Colombia.</p>
<h2>China Rebound</h2>
<p>The mini-crisis also provided more <strong>evidence that some EMs are now more correlated with China than the Fed</strong> &ndash; and the latest activity indicators give reasons to be optimistic about the pace of recovery. China&rsquo;s economic surprise index jumped to the highest level since 2006, outpacing both EM peers and DM counterparts. Suggestions from some Chinese officials to step up support for consumers &ndash; including a direct stimulus package &ndash; show understanding that consumption might continue to lag behind if the housing sector recovery is too slow/timid to boost consumer confidence. Stay tuned!</p>
<h3>Chart at a Glance: Fed Expectations &ndash; Rapidly Changing Narratives</h3>
<p><img class="img-responsive w-100" src="https://www.vaneck.com/contentassets/82c9279f959a4c6a821e9b90f47467b9/us-natalias-take-2023-03-21.png" alt="Chart at a Glance: Fed Expectations - Rapidly Changing Narratives" /></p>
<p class="chart-disclosure">Source: Bloomberg LP.</p>
]]></content:encoded>
</item><item rdf:about="https://www.vaneck.com/us/en/blogs/economic-trends/addressing-contagion-fears/">
  <title>Addressing Contagion Fears></title>
  <link>https://www.vaneck.com/us/en/blogs/economic-trends/addressing-contagion-fears/</link>
  <description><![CDATA[The market thinks that the Fed might pivot due to stronger growth headwinds. EM&rsquo;s reaction looks contained for now &ndash; but keep an eye on the post-Fed central banks&rsquo; meetings for more color.]]></description>
  <dc:creator>Natalia  Gurushina</dc:creator>
  <dc:date>03/20/2023 15:00:00</dc:date>
<content:encoded><![CDATA[

<h2>Global Banking Stresses</h2>
<p>So, it looks like the Credit Suisse &ldquo;fire&rdquo; had been put out by Swiss authorities and the &ldquo;confederation&rdquo; of global banks (including the U.S. Federal Reserve&rsquo;s swap lines), but these moves have not fully alleviated concerns associated with &ldquo;dry wood&rdquo; still left in the system. <strong>There is also a question about broader damage to the U.S. economy</strong> &ndash; due to tighter financial conditions and deposit outflows to larger banks &ndash; which resurrected the recession narrative. These concerns are behind the market expectations that the U.S. Federal Reserve (Fed) will affirm the &ldquo;new normal&rdquo; of lower rates on Wednesday. The implied probability of a 25bps rate hike is still around 70% and the Fed Funds Futures now price in a rate cut in June.</p>
<h2>China Rebound and EM</h2>
<p>Emerging markets (EMs) are following the situation closely &ndash; especially the impact on EM banks &ndash; but there is no sense of panic. Investment grade EM bonds &ndash; both corporate and sovereign &ndash; show no stress (see chart below), with market spillovers (in the form of wider spreads) affecting mainly lower-rated sovereign bonds. Month-do-date total return on EM local debt (J.P. Morgan&rsquo;s GBI-EM Index) is positive, and EMFX performance in March suggests that <strong>the China rebound narrative is alive and well as a global driver</strong> and that many EMs are arguably more correlated with China than with the Fed.</p>
<h2>EM Policy Rates</h2>
<p>Regarding EM policy response; it is telling that China decided to keep the 1-year and 5-year loan prime rates unchanged over the weekend &ndash; after bringing forward the cut in the reserve requirements for banks as a precautionary measure. <strong>The market increasingly treats EM policy outlooks as idiosyncratic stories</strong>, thinking that various EM central banks will be able to pause safely and even cut rates in 2023, irrespective of DM policy tribulations. This line of thinking might get tested in the next week or so. Several EM central banks will be holding their rate-setting meetings after the Fed, including Brazil (expected on hold), Mexico (the market sees +25bps), Colombia (+50bps more would be warranted given the inflation dynamics), the Philippines (+25bps more &ndash; also because of persistent inflation pressures), South Africa (many see a 25bps hike) and Thailand (a pause?). Central banks&rsquo; statements will also be scrutinized for comments about the global environment and how it affects their reaction functions. Stay tuned!</p>
<h3>Chart at a Glance: EM Debt &ndash; Stress Is Localized</h3>
<img class="img-responsive w-100" src="https://www.vaneck.com/contentassets/e65e2bdf32e04f4eb33667440beb3bf2/us-natalias-take-2023-03-20.png" alt="Chart at a Glance: EM Debt - Stress Is Localized" />
<p class="chart-disclosure">Source: Bloomberg LP.</p>
]]></content:encoded>
</item><item rdf:about="https://www.vaneck.com/us/en/blogs/digital-assets/matthew-sigel-why-bitcoin-is-rallying/">
  <title>Why Bitcoin is Rallying></title>
  <link>https://www.vaneck.com/us/en/blogs/digital-assets/matthew-sigel-why-bitcoin-is-rallying/</link>
  <description><![CDATA[Here we highlight macro and technical bull and bear arguments for Bitcoin, focusing specifically on the latter in order to test our conviction for 2023.]]></description>
  <dc:creator>Matthew  Sigel</dc:creator>
  <dc:date>03/20/2023 06:30:00</dc:date>
<content:encoded><![CDATA[

<p><strong>Please note that VanEck may have a position(s) in the digital asset(s) described below.</strong></p>
<p>Watch Matthew Sigel&rsquo;s recent webinar: <a href="https://www.vaneck.com/us/en/webinar-registration/?id=99202892621&amp;utm_source=vaneck&amp;utm_medium=calendar" title="Digital Assets Webinar - Banking Troubles Boost Bitcoin "><strong>Banking Troubles Boost Bitcoin</strong></a></p>
<p><strong>Market Update: Why Did Bitcoin and Other Digital Assets Rally After the Turmoil with U.S. Banks?</strong></p>
<ul class="content-list">
<li>The subsequent bailout of Silicon Valley Bank depositors highlighted the appeal of bearer assets, which can be self-custodied and whose monetary policy is independent of poor central bank policymaking. Ironically, Silicon Valley Bank partially failed due to too-large bets on the perceived safe-haven assets: U.S. Treasuries and U.S. Mortgage-Backed Agency debt.</li>
<li>U.S. CDS spreads rose above their 2011 highs, baking in a bigger fight over legislated bailouts and the looming debt ceiling. With scant political consensus for legislation, we expect more money printing, dollar debasement, and, over the medium term, probably more treasury selling by our significant creditors, several of whom the U.S. government is now sanctioning. It&rsquo;s probably not a great time to be a G7 creditor...</li>
<li>Also, by the way, the Swedish Central Bank recently mentioned it needs a bailout from the Swedish Treasury amidst news that a major Swedish pension fund was a top 6 shareholder in Signature, SVB, and First Republic. We think Bitcoin would be well-positioned if further bank share weakness prompts news flow like that.</li>
</ul>
<h3>Current Bitcoin Cycle Looks Familiar</h3>
<p><img class="img-responsive w-100" src="https://www.vaneck.com/contentassets/f04702fab8b94868a9919bc5494d27da/2976_da_bitcoin-rallying_chart_01_2023.03_v1_blog2.svg" alt="Current Bitcoin Cycle Looks Familiar" /></p>
<p class="chart-disclosure">Source: Arcana. Data as of 2/4/2023. Past performance is no guarantee of future results. Not intended as a prediction of future results.</p>
<h2>Two Macro Bull Arguments for Bitcoin:</h2>
<ul class="content-list">
<li>The U.S. government has amassed an amazing amount of debt and the only way to overcome this, long-term, is to debase the value of the dollar. Whether debt limit and other spending fights or a recession triggers this&mdash;or whether the tipping point happens in the next decades&mdash;is unknowable, but Bitcoin may serve as a hedge to this (as may gold).</li>
<li>Central banks bought record amounts of gold in 2022. Countries on the fringes of the financial system continue to see both economic and negotiating value in adopting private, censorship resistant bearer assets. We expect a &ldquo;big bang&rdquo; at some point, such as Saudi Arabia officially buying Bitcoin for its state reserves.</li>
</ul>
<h2>Seven Technical Arguments for Bitcoin:</h2>
<ul class="content-list">
<li>Bitcoin&rsquo;s 30-day volatility plunged below that of the S&amp;P 500 Index&rsquo;s in early January, as both buyers and sellers looked elsewhere amidst declining liquidity. Given the history of the asset, we don&rsquo;t think this is sustainable.</li>
<li>Historically, Bitcoin has never fallen for two consecutive calendar years.</li>
<li>The current bear market (duration) exceeds the average of 380 days.</li>
<li>The current bear market (magnitude), at 77%, is close enough to the average (-83%) to justify beginning a dollar cost average approach for cyclical bears.</li>
<li>November saw meaningful capitulation from long-term holders (6 months+), who realized two of the largest loss spikes in history, peaking at levels similar to the 2015 and 2018 cycle lows.</li>
<li>Bitcoin is highly correlated to M2 growth, which recently hit 0% y/y in the U.S. for the first time ever. But globally, money supply growth already bottomed in November. In fact, the three-month rate of global money supply change now exceeds the 12-month rate of change, historically a very positive indicator for a Bitcoin bottom (Figure 1). In the U.S., money supply will likely re-accelerate, as government deficits continue. Meanwhile outside the US, China money supply is now growing at 12%, a 5-year high, and the RMB is strengthening. Both are historically a tailwind for the Bitcoin price. Investors focusing only on the Fed may be missing the improving global liquidity (Figure 2).</li>
<li>Bitcoin leverage ratio has fallen sharply, and both calendar futures and perpetual swaps have recently traded in a state of backwardation. This suggests the market was heavily hedged for further downside risk.</li>
</ul>
<h3>Figure 1: Bitcoin Price vs. Global Money Supply Growth</h3>
<p><img class="img-responsive w-100" src="https://www.vaneck.com/contentassets/f04702fab8b94868a9919bc5494d27da/2775_da_bitcoin-rally_chart_2023.2_blog_option_1.svg" alt="Figure 1: Bitcoin Price vs. Global Money Supply Growth" /></p>
<p class="chart-disclosure">Source: Bloomberg. Data as of 1/25/2023. Past performance is no guarantee of future results. Not intended as a recommendation to buy or sell any securities referenced herein.</p>
<h3>Figure 2: Global Money Supply Growth Has Re-Accelerated&mdash;Just Not in the U.S.</h3>
<p><img class="img-responsive w-100" src="https://www.vaneck.com/contentassets/f04702fab8b94868a9919bc5494d27da/2775_da_bitcoin-rally_chart-3_2023.2_blog.svg" alt="Figure 2: Global Money Supply Growth Has Re-Accelerated-Just Not in the U.S." /></p>
<p class="chart-disclosure">Source: Bloomberg, VanEck Research. Past performance is no guarantee of future results.</p>
<h2>Seven Bear Arguments for Bitcoin:</h2>
<ul class="content-list">
<li>Regulation continues to tighten, as the consequences of the Biden executive order work their way through federal agencies. The lack of a Bitcoin spot ETF serves as a powerful symbol from U.S. regulators that the asset is not fit for traditional fiduciaries.</li>
<li>Localities such as New York State and Canada&rsquo;s British Columbia have put moratoriums on fossil-fuel based Bitcoin mining, hoping to restrict Bitcoin&rsquo;s high energy usage.</li>
<li>U.S. stocks and bonds have both fallen in the same calendar year only three times in history. In two of the three (1931 and 1969) the U.S. devalued vs. gold within two years by restricting convertibility. If 2022&rsquo;s losses predict accelerating capital controls, then Bitcoin price may suffer.</li>
<li>Recent Federal Reserve minutes reveal that FOMC members still see risks tilted to inflation (not balanced) and are concerned about &ldquo;an unwarranted easing in financial conditions, especially if driven by a mis-perception by the public of the Committee&rsquo;s reaction function.&rdquo;</li>
<li>Bitcoin mining hash rate is too high relative to the price to provide a profitable backdrop for miners. Thus, in the absence of lower energy prices, miners are likely to continue to sell coins to pay for operating expenses, which is negative for supply/demand balance.</li>
<li>Bitcoin&rsquo;s &ldquo;security budget&rdquo; faces structural issues (in coming decades) as current, low transaction fees provide insufficient motivation for miners to secure the blockchain. As block rewards fall, the network will either become less secure, the price will rise, or the community will agree on a new model increasing the proposed 21M cap.</li>
<li>Bitcoin&rsquo;s lack of smart contract functionality is hindering adoption. Sidechains like Liquid have disappointed. Lightning is interesting, but is not permitted in NY State and overall volumes remain low.</li>
</ul>
<p>Focusing on the more credible medium-term bear cases, we address 1) the mining moratoriums, 2) general regulatory headwinds and 3) Bitcoin&rsquo;s fee problem and disappointing layer 2 traction.</p>
<p>On the <strong>mining </strong>side, we think some of the moratoriums are structural and some are cyclical. For example, Kazakhstan and Iran recently reportedly loosened some Bitcoin mining restrictions and returned some seized mining machines amidst lower energy prices and weaker economic activity. Russia also signaled plans to build more power generation capacity in Siberia in order to satisfy energy demand from Bitcoin miners.</p>
<p>If and as inflation eases and policymakers embrace more pragmatic approaches to energy sustainability (such as an &ldquo;all of the above&rdquo; approach including natural gas and nuclear), innovation and pro-growth perspectives may re-emerge. For context, Bitcoin mining consumes approximately the same amount of energy as U.S. Christmas lights. Traditional payments rails consume 12x more electricity than the Bitcoin network, whose energy usage scales with hash rate (economic security), <em>not</em> with the number of transactions.</p>
<p>The <strong>tighter regulatory environment,</strong> especially in the U.S., is not easily reversed. Specifically, Biden&rsquo;s executive order in January 2022 focused multiple agencies on addressing &ldquo;the risks&hellip;of digital assets&rdquo; with a focus on consumer and investor protection and countering illicit finance. These actions, along with confidence-shattering events like the bankruptcies of FTX, Celsius and 3AC, clearly slowed Bitcoin&rsquo;s market share gains vs. banks. The January 3 joint statement from the Federal Reserve, the FDIC and the OCC punctuated the coordinated regulation with this crucial line: "Based on the agencies&rsquo; current understanding and experience to date, the agencies believe that issuing or holding as principal crypto-assets that are issued, stored, or transferred on an open, public, and/or decentralized network, or similar system is highly likely to be inconsistent with safe and sound banking practices.&rdquo;</p>
<p>Perhaps the best we can hope for this year is a stalemate in Washington, D.C. that prevents harmful over-regulation, while waiting for the market to turn its attention to 2024 and the possibility of the first pro-Bitcoin President in the form of Republican front-runner FL governor Ron DeSantis. One of our predictions in our <a href="https://www.vaneck.com/us/en/blogs/digital-assets/matthew-sigel-11-crypto-predictions-for-2023/" title="11 Crypto Predictions for 2023"><strong>2023 crypto outlook</strong></a> is that SEC Chair Gary Gensler would leave the SEC this year after a victory vs. Ripple in the ongoing case over unregistered securities. While most may consider this a longshot, we note that the median SEC Chair tenure is only two years.</p>
<p>On <strong>Bitcoin&rsquo;s transaction fee problem and disappointing layer 2 progress</strong>: despite sporting the largest market capitalization among cryptocurrencies, Bitcoin&rsquo;s transaction fees rank #4, after Ethereum, Uniswap, and Binance Smart Chain. The fact that people pay fees to use these other blockchains that exceed (by an order of magnitude, in the case of Ethereum), the fees paid to use Bitcoin indicates there&rsquo;s a material, market-based demand for these alternative blockspaces.</p>
<p>Bitcoin maximalists that deny this are denying the markets and clear evidence. Over the long-run, fees will have to rise, the Bitcoin price will have to rise, or the community will have to reconsider the 21M cap. Now, one wrinkle in this bear case to consider is the continued adoption of the Segwit soft fork, which removed Bitcoin transaction malleability (the ability of a transaction to have multiple valid TX IDs) and thus enabled the launch of the Lightning Network as a second layer on top of Bitcoin. Since Segwit and again following the 2021 Taproot upgrade to Segwit, each time Bitcoin transaction fees have spiked, Segwit adoption has risen anew, thanks to cheaper transaction fees for layer 2s. Thus, Lightning network capacity grew 46% in 2022 to 4,400 BTC, or $70M at the current BTC rate, even with lackluster BTC fee growth.</p>
<p>While we are encouraged by recent Lightning network integrations from Twitter and Stripe, it seems that commercial backers of Lightning, such as Jack Mallers&rsquo; Strike, will need to get NY State regulatory approval before onboarding the mass payments market, and this seems a way off. For example, CashApp just enabled Bitcoin payments on top of Lightning for all users except those in NY. One development that may enable an end-run around NYDFS is Fediment, a &ldquo;community custody&rdquo; tool built around Bitcoin that enables users to form groups where members look out for each other&rsquo;s coins. Fediment also provides full anonymity by using blind signatures to ensure users cannot be linked to the minting process that created their tokens. <em>Taro </em>is another Lightning Network upgrade that enables the issuance of assets and collectibile on Bitcoin that may include Tether or other stablecoins. On the back of these upgrades, Lightning may yet find product-market fit in emerging markets where Bitcoin and stablecoin adoption are higher and trust in banking systems is lower. But, that seems increasingly unlikely to be a near-term story in developed markets.</p>
<div class="wrapped-div">
<table style="width: 750px;">
<tbody>
<tr class="tbl-data">
<td class="tbl-header last" colspan="5">Comparison of Different Custody Options</td>
</tr>
<tr class="tbl-data">
<td class="data-head last">&nbsp;</td>
<td class="data-head last">Fedimint</td>
<td class="data-head last">&ldquo;Third Key&rdquo; Holders</td>
<td class="data-head last">Crypto Exchanges</td>
<td class="data-head last">Hardware Wallets</td>
</tr>
<tr class="tbl-data">
<td class="data-td last" style="font-weight: normal;">Multi-party Custody</td>
<td class="data-td data last">✔</td>
<td class="data-td data last">X</td>
</tr>
<tr class="tbl-data">
<td class="data-td last" style="font-weight: normal;">Privacy</td>
<td class="data-td data last">✔</td>
<td class="data-td data last">X</td>
<td class="data-td data last">✔</td>
</tr>
<tr class="tbl-data">
<td class="data-td last" style="font-weight: normal;">Simple</td>
<td class="data-td data last">✔</td>
<td class="data-td data last">X</td>
</tr>
<tr class="tbl-data">
<td class="data-td last" style="font-weight: normal;">Inexpensive</td>
<td class="data-td data last">✔</td>
<td class="data-td data last">X</td>
<td class="data-td data last">✔</td>
<td class="data-td data last">X</td>
</tr>
<tr class="tbl-data">
<td class="data-td last" style="font-weight: normal;">Decentralized</td>
<td class="data-td data last">✔</td>
<td class="data-td data last">X</td>
<td class="data-td data last">✔</td>
</tr>
<tr class="tbl-data">
<td class="data-td last" style="font-weight: normal;">Regulation Unlikely</td>
<td class="data-td data last">✔</td>
<td class="data-td data last">X</td>
<td class="data-td data last">✔</td>
</tr>
</tbody>
</table>
</div>
<br />
<p class="chart-disclosure">Source: VanEck Research. Not intended as a prediction or forecast of a future state or events.</p>
<h2>Our Conclusion: $250K Price Target Remains in Place</h2>
<p>As a call option on an alternative financial future in which U.S. dollar hegemony is decidedly less pronounced, Bitcoin retains attractive properties due to its max decentralization and (currently) fixed supply. While developed markets adoption may decelerate somewhat due to the reverberations of so many bankruptcies, and tighter global liquidity, our research in emerging markets continues to surface strong demand for Bitcoin and stablecoins amidst a generally lighter regulatory touch. We keep our $250k/Bitcoin long-term price target (half the market cap of Gold), pushing the target date to 2028, another halving year. If Bitcoin price does not make a new all-time high by 2026, we would consider our thesis broken. We believe a 1-3% allocation to open-source blockchain-based digital assets, such as Bitcoin and other smart contract protocols, is reasonable at this time given our research.</p>
<h3>Figure 3: Bitcoin&rsquo;s Market-Cap to Realized-Market Cap</h3>
<p><strong>(Value below 1 indicates coins being sold for a loss; typically a bottom indicator, indicating capitulation)</strong></p>
<p><img class="img-responsive w-100" src="https://www.vaneck.com/contentassets/f04702fab8b94868a9919bc5494d27da/2775_da_bitcoin-rally_chart-4_2023.2_blog.svg" alt="Figure 3: Bitcoin's Market-Cap to Realized-Market Cap" /></p>
<p class="chart-disclosure">Sources: Cryptoquant, Cryptofees, Bloomberg, Lyn Alden Investment Strategy, Castle Island Ventures, Obi Nwosu (CEO, Fedi Inc), Michael Khazzaka (ValueChain), VanEck Research. Past performance is no guarantee of future results. Not intended as a recommendation to buy or sell any securities referenced herein.</p>
<p>To receive more <strong><a href="https://www.vaneck.com/us/en/insights/digital-assets/" title="Digital Assets Insights">Digital Assets</a></strong> insights, <strong><a href="https://www.vaneck.com/us/en/subscribe/" title="Subscription Center">sign up in our subscription center</a></strong>.</p>
<style type="text/css">
    .wrapped-div {
        max-width: 100%;
    }

    @media (max-width: 1240px) {
        .wrapped-div {
            overflow-x: scroll;
        }


    }
</style>
<!-- Hide alreat promo banner. Make height 0 to account for the HeaderHeightCalculation scripts -->
<style>
header.site-header .alert-bar {
    display:none!important;
    height: 0!important;
    overflow:hidden!important;
}
</style>
]]></content:encoded>
</item><item rdf:about="https://www.vaneck.com/us/en/blogs/emerging-markets-equity/indias-opportunities-impossible-to-ignore/">
  <title>India’s Opportunities: Impossible to Ignore></title>
  <link>https://www.vaneck.com/us/en/blogs/emerging-markets-equity/indias-opportunities-impossible-to-ignore/</link>
  <description><![CDATA[The momentum built by reforms and innovation, which includes improving logistics and infrastructure and increasing digitalization, are already broadening and democratizing growth in India.]]></description>
  <dc:creator>Angus Shillington</dc:creator>
  <dc:date>03/20/2023 06:30:00</dc:date>
<content:encoded><![CDATA[

<p>The Emerging Markets Investment Team&rsquo;s recent trip to India further reaffirmed our conviction in the investee companies of the <strong><a href="/link/d3bbfae5899e4b0dbbb596fad4befa1a.aspx" title="GBFAX - Emerging Markets Fund - Class A - Overview">VanEck Emerging Markets Equity Strategy</a></strong> that we believe are poised to benefit from the structural growth trends shaping the Indian economy. We are particularly impressed by the speed and scale with which the public and private sector infrastructure spending is transforming the country&rsquo;s business landscape. India is progressing toward its economic goals while the rest of the world battles an economic slowdown. Following a clear implementation of bold policy as well as private sector investment (mostly enabled by those policies), the country is undergoing an unprecedented transformation, catalyzed by a simultaneous combination of social, economic, and political change. A good way to demonstrate this would be, first of all, the FY 2023 forecasted GDP growth of 6.9%.<sup>1</sup>&nbsp;Additionally, tax revenue growth is about 3x that number, giving the current administration considerable optionality to tackle a lot of the friction caused by poor infrastructure and weak fiscal policy.</p>
<h3>India Central Gov't Tax Revenue (Rs, tn)</h3>
<p><img class="img-responsive w-100" src="https://www.vaneck.com/contentassets/621300aef50b4ac096bee56fee2d3b7e/2973_eme_chart-1_2023.03_blog.svg" alt="India Central Government Tax Revenue" /></p>
<p class="chart-disclosure">Source: Macquarie Capital. Data as of March 15, 2023. FY= Fiscal Year; FY2023 and FY2024 = Fiscal Year forecasts. Past performance is no guarantee of future results. Not intended as a prediction of future results.</p>
<p>We believe that the corporate and household balance sheets are strong, the banking system is mostly in good shape, and, as mentioned already, the fiscal situation is improving nicely. In our recent trip to India, we could not help but commend the incredible scale and speed with which recent reforms have been implemented to improve and catalyze most future growth metrics. It appears that improving logistics and infrastructure and eradicating inefficient bureaucracy are already broadening and democratizing growth. We believe the high nominal and the past variance of inflation looks set to be a thing of the past and should ultimately result in structurally lower long-term interest rates &ndash; benefiting many areas of the economy.</p>
<p>India already surpassed China as the world&rsquo;s most populous country this year<sup>2</sup>&nbsp;and has a much younger population with a median age of 27.6 years.<sup>3</sup>&nbsp;Wage growth is at a healthy 8-10%, which means more disposable income in the hands of Indian consumers. The growing scale and efficiency in logistics in India are reducing food basket costs for individual households. These trends make India an attractive economy from a domestic demand perspective.</p>
<p>The demographic backdrop coupled with increased digitalization of the <a href="https://www.vaneck.com/us/en/blogs/trends-with-benefits/trends-with-benefits-66-digital-india-with-angus-shillington/" title="Trends with Benefits #66: Digital India with Angus Shillington"><strong>economy</strong></a> &ndash; the mass adoption of smartphone use with access to digital applications ranging from payment platforms to banking and retail &ndash; is building growth resilience that is likely to persist for some time. We believe our portfolio companies are at the forefront of the transformational change in India and are set to benefit from these forward-looking trends. We would like to highlight a few of the portfolio companies that we analyzed on the ground during our recent trip to India.</p>
<h2>Reliance Industries Limited</h2>
<p>Reliance Industries (4.82% of net assets<sup>*</sup>) is India&rsquo;s most valuable company by most metrics. The conglomerate is at the forefront of transformation focusing on telecommunications, retail and renewable energy industries. More recently, Reliance has doubled down on its commitment to pursue these strategic ventures. In August 2022, Jio Platforms, the internet arm of Reliance Industries bid $11.5 billion for the <a href="https://www.vaneck.com/us/en/blogs/emerging-markets-equity/indias-digital-transformation-powered-by-5g/" title="India's Digital Transformation Powered by 5G"><strong>5G spectrum in India</strong></a>. Mukesh Ambani, the chairman of Reliance Industries, announced a $25 billion commitment to launch 5G in India. Ambani announced that Jio aims to provide 5G service to every district in the country by December 2023.<sup>4</sup>&nbsp;Jio&rsquo;s ambition is to become the world&rsquo;s largest and most advanced 5G network, ahead of China and the United States. A dominant position in this space allows Reliance to build digital, scaled adjacent businesses in e-commerce, entertainment, education, etc.</p>
<p>Reliance Industries has plans to usher in an era of <a href="https://www.vaneck.com/us/en/blogs/emerging-markets-equity/harnessing-growth-indias-transition-reflected-in-sustainability-commitment/" title="Harnessing Growth: India's Transition Reflected in Sustainability Commitment"><strong>renewable energy in India</strong></a> with $75 billion committed to its renewable energy endeavors. Reliance has shared plans to build five mega factories in India for the production of solar panels, energy storage devices, electrolyzes used in green hydrogen, and fuel cell systems and power electronics (used to integrate new energy systems).<sup>5</sup>&nbsp;Perhaps, the most ambitious plan is to be a global leader in green hydrogen production over the next five years with a renewable energy capacity of 100 GW of hydrogen power. Our on-the-ground visit confirmed that Reliance is executing quickly and efficiently in this ambition by backward integrating &ndash; often through the acquisition of U.S./European niche businesses &ndash; at an unbelievable speed. By our estimates, the company has a line of sight on its end goal, as they are already beginning a pilot program to design and manufacture advanced hydrolyzers. Reliance Industries recently announced setting up a 10 GW solar energy power plant in Andhra Pradesh.<sup>6</sup>&nbsp;Reliance Industries has a two-prong goal, a) to be corporate energy independent with 100% reliance on its low-cost renewable power, and b) to become the largest global player in the end-to-end solar and hydrogen capital equipment solutions with strategic partnerships to deploy these solutions in the Middle East and North Africa regions.</p>
<h2>ReNew Energy Global</h2>
<p>We believe ReNew (0.40% of net assets*) is going to be a likely beneficiary of India&rsquo;s plan to boost renewable energy capacity to 500 GW by 2030.<sup>7</sup>&nbsp;BloombergNEF estimates India will need $223 billion over the next eight years just to meet its solar and wind capacity targets.<sup>7</sup>&nbsp;Indian government recently announced U.S. $2.4 billion of financial incentives to expand domestic manufacturing of solar panels.<sup>8</sup></p>
<p>As India&rsquo;s ambitions in renewable energy progress, we expect additional bold and transformative regulatory changes. Much of this trip was spent researching bottlenecks and solutions, as well as confirming ReNew&rsquo;s core skills, financial strength and operating capabilities. Implementation is still quite flawed, from the tender process to local rules that make local component sourcing preferred. This means that the company&rsquo;s investment is likely to be lumpy, but over time we believe that this business will be one of the major winners in India&rsquo;s renewable energy buildout.</p>
<h2>HDFC Bank Limited</h2>
<p>HDFC Bank Limited (4.60% of net assets*) is a private sector bank in India that caters to a range of banking services covering commercial and investment banking as well as transaction or retail banking. In scale, it could be conceptualized as the &ldquo;J.P. Morgan Chase of India.&rdquo; India has a flourishing middle class of 350 million people<sup>9</sup>&nbsp;and we have previously discussed the strength of domestic consumer-led demand growth in the country. Access to credit is an important factor of economic growth, and currently, India is one of the most under-leveraged countries in the world.<sup>10</sup>&nbsp;We believe the strong household and corporate balance sheets put India at the cusp of a new credit cycle taking off and we are already seeing a property boom in the country. HDFC is one of a small number of businesses that grew up in the &ldquo;old India&rdquo; but which was an early adopter of technology and strong corporate governance, likely making it a continued and longer-term winner. HDFC recently used its vast balance sheet to acquire HDFC Ltd, the country&rsquo;s largest housing &amp; mortgage lender. This acquisition brings new skills and customers, and, for shareholders, there are some valuable synergies to be exploited post-acquisition. We view HDFC as a high-quality bank that could offer a persistent high return of equity, per our estimates, up to 23% over the next 2-3 years.<sup>11</sup></p>
<h2>Delhivery Limited</h2>
<p>Delhivery (0.79% of net assets<sup>*</sup>) is India&rsquo;s fastest-growing logistics operator by revenue. The company provides an ultra-low-cost, asset-light software platform for express parcel transportation, partial truckload, cross-border and supply chain services. Delhivery supports India's leading e-commerce marketplaces, direct-to-consumer e-tailers, consumer brands and enterprises across diverse sectors. We met with the company&rsquo;s CEO during our recent trip and collected on-the-ground observational data. We believe Delhivery&rsquo;s competitive moats around integrated logistics networks and low-cost structure largely protect it from competition. The organizational culture, momentum and operational excellence along with adoption speeds continue to impress us. While the short-term market share of the company might be impacted by cyclical factors, we believe Delhivery is competitively positioned to capture India&rsquo;s logistics growth over the long term.</p>
<p>We believe it is <a href="https://www.vaneck.com/us/en/blogs/emerging-markets-equity/indias-economic-ascendance/" title="India's Economic Ascendance"><strong>impossible to ignore India</strong></a> as an emerging market investment destination from a tactical and strategic point of view. While understanding the nuances of India&rsquo;s economy, it might not be too far-fetched to draw a parallel here with China. Many investment themes that have taken off in China over the past decade, such as digitalization, growth of financial services, e-commerce, and growth in industrial and consumer goods, are gaining traction in India. The real takeaway from this trip is that most likely, the broad opportunity for global investors may be even more exciting than we had thought and that the momentum built by reforms and innovation will be difficult to disrupt.</p>
<p>The <a href="/link/d3bbfae5899e4b0dbbb596fad4befa1a.aspx" title="GBFAX - Emerging Markets Fund - Class A - Overview"><strong>VanEck Emerging Markets Fund (GBFAX)</strong></a> offers access to the structural digital growth story of India for investors seeking technology or growth exposures in emerging markets.</p>
<p><a href="/link/e63445bf2a2547bba3f7e363be02016e.aspx" title="DGIN - VanEck Digital India ETF - Overview"><strong>VanEck Digital India ETF (DGIN)</strong></a> offers access to the structural digital growth story of India and could be an appealing investment opportunity for investors looking to seek technology or growth exposure in emerging markets.</p>
<p>To receive more <a href="/us/en/insights/emerging-markets-equity/" title="Emerging Markets Equity Insights"><strong>Emerging Markets Equity</strong></a> insights, <a href="/us/en/subscribe/" title="Subscription Center"><strong>sign up in our subscription center</strong></a>.</p>
]]></content:encoded>
</item><item rdf:about="https://www.vaneck.com/us/en/blogs/economic-trends/risk-control-vs-fundamentals/">
  <title>Risk Control vs. Fundamentals></title>
  <link>https://www.vaneck.com/us/en/blogs/economic-trends/risk-control-vs-fundamentals/</link>
  <description><![CDATA[China cuts reserve requirements &ndash; is this a move to support the nascent recovery or protect the economy from banking turbulence in DM?]]></description>
  <dc:creator>Natalia  Gurushina</dc:creator>
  <dc:date>03/17/2023 15:00:00</dc:date>
<content:encoded><![CDATA[

<h2>Fed Policy Rate</h2>
<p>The <strong>market is still trying to evaluate the effectiveness of the U.S. Federal Reserve&rsquo;s (Fed&rsquo;s) liquidity reprieve for banks</strong>. A Bloomberg chart making rounds this morning shows a huge spike in banks&rsquo; discount window borrowing at the Fed (see below), but some bank credit default swaps (CDS) widened again. A big question is whether the Fed will reaffirm the &ldquo;new normal&rdquo; of lower interest rates at next week&rsquo;s meeting, or follow the European Central Bank (ECB) hawks and prioritize inflation. The expectations are mixed. The implied probability of the full 25bps hike is still around 70%, and the implied peak rate remains below 5%. Today&rsquo;s softer than expected University of Michigan survey &ndash; including short- and long-term inflation expectations &ndash; points to even more uncertainty in the next few days.</p>
<h2>China Recovery</h2>
<p>Most emerging markets (EM) are watching the current situation from the sidelines (policy-wise), but <strong>China decided to respond with a broad-based 25bps cut in its reserve requirement ratios<sup>1</sup></strong> (RRR) &ndash; in addition to liquidity injections through other facilities. The RRR cut was not entirely unexpected &ndash; short rates have been grinding higher for some time now, which is not an ideal backdrop for the nascent recovery &ndash; and the move does not contradict the State Council&rsquo;s &ldquo;supportive yet restrained&rdquo; policy objectives. The timing, however, suggests that risk prevention played a big part.</p>
<h2>EM Reaction to the Banking Crisis</h2>
<p>China&rsquo;s reaction is important because <strong>a number of EMs </strong>&ndash; especially in in Asia &ndash; are arguably<strong> more correlated with the reopening/rebound narrative than with the Fed.</strong> This reflects not only the &ldquo;growth&rdquo; links, but also the fact that inflation had peaked at lower levels than in EM peers, putting less tightening pressure on central banks. The EMFX price action in the past week illustrates the &ldquo;anti-Fed correlation&rdquo; point quite well &ndash; Asian currencies pretty much ignored the banking mini-crisis in developed markets (DM), rising against the U.S. dollar. Other important policy litmus tests in EM include rate-setting meetings in Brazil, Mexico, Colombia, Thailand and South Africa &ndash; all these will take place after the Fed reveals its policy objectives.&nbsp; Stay tuned!</p>
<h3>Chart at a Glance: U.S. Fed&rsquo;s Big Response to Banking Mayhem</h3>
<img class="img-responsive w-100" src="https://www.vaneck.com/contentassets/594b3be83f0e4a58982a5913f7e9cc86/us-natalias-take-2023-03-17.png" alt="Chart at a Glance: U.S. Fed&rsquo;s Big Response to Banking Mayhem" />
<p class="chart-disclosure">Source: Federal Reserve</p>
<div class="disclosure">
<p><sup>1</sup>The &ldquo;reserve requirement ratio&rdquo; (RRR) or cash reserve ratio (CRR) is the percentage of customer deposits and other liquid assets that commercial banks must store, within its own institution or with the central bank.</p>
</div>
]]></content:encoded>
</item><item rdf:about="https://www.vaneck.com/us/en/blogs/natural-resources/stronger-than-ever-steel-rebounds-to-start-the-year/">
  <title>Stronger Than Ever: Steel Rebounds to Start the Year></title>
  <link>https://www.vaneck.com/us/en/blogs/natural-resources/stronger-than-ever-steel-rebounds-to-start-the-year/</link>
  <description><![CDATA[An expected rise in infrastructure spending, increased demand overseas, and a recovery in automotive production all support the steel industry&rsquo;s positive outlook.]]></description>
  <dc:creator>Coulter Regal, CFA</dc:creator>
  <dc:date>03/17/2023 06:30:00</dc:date>
<content:encoded><![CDATA[

<p>The steel industry started the year with a bang. Prices for the commodity have rebounded from the low at the end of last year, with various producers announcing price hikes from December into February. While rebar and plate prices are still off from the extreme levels seen about a year ago, they are up modestly to start the year and may be poised to move higher. Spreads on rebar and plate steel have compressed some with the rise in input prices; however, they are still above historical averages and expected to remain there. With a seasonally stronger period on the horizon and other factors, including the U.S. Infrastructure Act, a recovery in automobile production and demand from overseas, the steel industry is well-positioned for a continued rebound.</p>
<h3>Steel Prices Rebound</h3>
<p><strong>FIBER US Commodity Steel Spot Price | 9/1/22 - 3/12/23</strong></p>
<p><img class="img-responsive w-100" src="https://www.vaneck.com/contentassets/59fc24679a2d4756b13e5be9c39516f1/2965_slx_chart_01_2023.03_v1_blog.svg" alt="FIBER US Commodity Steel Spot Price | 9/1/22 - 3/12/23" /></p>
<p class="chart-disclosure">Source: Bloomberg. FIBER (Foundation for International Business and Economic Research) US Commodity Steel Spot Price Index represents the average steel prices for No.1 heavy melt steel from Chicago, Philadelphia and Pittsburgh. Past performance is no guarantee of future results.</p>
<h2>Increased Infrastructure Spending Provides Boost</h2>
<p>An expected rise in spending on U.S. infrastructure is set to boost the steel industry's outlook in the coming years. The Infrastructure and Jobs Act signed into law last November provides $550 billion in new funding over the next several years. This spending is expected to increase domestic steel consumption by roughly 17%.<sup>1</sup>&nbsp;The boost in U.S. infrastructure spending could help mitigate any moderating economic growth and support demand for steel. Spending on renewable-energy projects, like wind turbines, is also expected to provide additional demand for steel.</p>
<h2>Expected Demand Overseas</h2>
<p>Strong demand from overseas is expected to support the steel industry's positive outlook. Domestic plate prices should be supported by a healthy export market, given Ukraine supplied an estimated 30% of Europe's plate - a void that will need to be filled.<sup>1</sup>&nbsp;It is also expected that the reconstruction plans in Turkey, following the recent earthquakes that decimated the country, will keep prices elevated for the rest of the year. The Turkish government has said it will require over millions of tons of rebar and is expected to begin reconstruction plans in the coming months. Additionally, China's easing of strict Covid-19 measures and its plan for rapid economic recovery is expected to support iron ore prices and steel demand.</p>
<h2>Automotive Recovery to Aid Steel Outlook</h2>
<p>Lastly, the automotive industry, one of the key end-markets for steel with each vehicle using almost a ton, is expected to support demand for the steel industry. The chip shortage over the past year hampered automotive production and related steel demand. However, now the chip shortage is beginning to alleviate, and increased automobile production is expected to boost demand for steel, aiding the steel industry's outlook.</p>
<p>In conclusion, the steel industry is set for a continued rebound, with increased infrastructure spending, expected demand overseas and a recovery in automotive production all contributing to the positive outlook. Investors should keep an eye on the global steel industry as an interesting area of the market.</p>
<h2>Accessing the Steel Industry</h2>
<p>The <a href="/link/410bd48b10ab49819386dfd0080e7210.aspx" title="SLX - VanEck Steel ETF - Overview"><strong>VanEck Steel ETF (SLX)</strong></a> seeks to replicate as closely as possible, before fees and expenses the price and yield performance of the NYSE Arca Steel Index (STEEL), which is intended to track the overall performance of companies involved in the steel sector. SLX is the only ETF covering steel specifically, investing in companies primarily involved in activities related to steel production, including mill operation, steel fabrication, and the extraction and reduction of iron ore.</p>
<p>To receive more <a href="/us/en/insights/natural-resources/" title="Natural Resources Insights"><strong>Natural Resources</strong></a> insights, <a href="/us/en/subscribe/" title="Subscription Center"><strong>sign up in our subscription center</strong></a>.</p>
]]></content:encoded>
</item><item rdf:about="https://www.vaneck.com/us/en/blogs/thematic-investing/buzz-investing-inflationary-concerns-weigh-on-equities/">
  <title>BUZZ Investing: Inflationary Concerns Weigh on Equities></title>
  <link>https://www.vaneck.com/us/en/blogs/thematic-investing/buzz-investing-inflationary-concerns-weigh-on-equities/</link>
  <description><![CDATA[Consumer and producer prices rose above forecasts while retail sales and job growth data remained strong. All eyes are on the upcoming FOMC meeting for the rate hike decision.]]></description>
  <dc:creator> </dc:creator>
  <dc:date>03/17/2023 06:30:00</dc:date>
<content:encoded><![CDATA[

<p>Renewed inflationary concerns weighed on domestic equities during the recent period between the BUZZ NextGen AI US Sentiment Leaders Index (the &ldquo;BUZZ Index&rdquo; or &ldquo;Index&rdquo;) selection dates (February 9, 2023, to March 9, 2023, the &ldquo;Period&rdquo;). Economic reports highlighted consumer and producer prices rising above most forecasts. At the same time, strong retail sales and job growth data signified an economy that remains stronger than many expected following the U.S. Federal Reserve (Fed)&rsquo;s aggressive rate hike program, which saw the upper bound of its Target Rate rise from just 25 bps to 4.75% since March 2022. February&rsquo;s economic reports led several Fed members to note that more rate hikes may be needed, as the narrative shifted to a &lsquo;terminal rate&rsquo; which would likely exceed 5%. On March 7, in his prepared semi-annual testimony before the Senate Banking Committee, Fed Chair Jerome Powell supported his colleague&rsquo;s remarks, noting, &ldquo;The latest economic data have come in stronger than expected, which suggests that the ultimate level of interest rates is likely to be higher than previously anticipated."</p>
<p>The CME FedWatch Tool, which calculates the probabilities of changes to the Fed rate as implied by 30-Day Fed Funds futures pricing data, predicted a nearly 70% probability, following Powell&rsquo;s remarks, for the Fed&rsquo;s target rate to be set in the range of 5.25%-5.50% (a 50bps hike from current levels) at its upcoming March 2023 meeting, up from a 0% probability at the start of the February.</p>
<p>The BUZZ Index returned -1.58% during the month of February compared to a return of -2.44% for the S&amp;P 500 Index during the same period. Year-to-date, the BUZZ Index leads the S&amp;P 500 with returns of 16.74% and 3.69%, respectively, as of the end of February.</p>
<h3>Federal Reserve Target Rate Probability History</h3>
<p><strong>(March 2023 Meeting, 5.00% - 5.25% range)</strong></p>
<p><img class="img-responsive w-100" src="https://www.vaneck.com/contentassets/268ff80014b9492a8e9ca2b3a603bab4/2968_buzz_chart-01_2023.03_blog.svg" alt="Federal Reserve Target Rate Probability History (March 2023 Meeting, 5.00% - 5.25% range)" /></p>
<p class="chart-disclosure">Source: <a href="https://www.cmegroup.com/markets/interest-rates/cme-fedwatch-tool.html" title="CME FedWatch Tool" target="_blank" rel="noopener"><strong>CME FedWatch Tool</strong></a>.</p>
<p class="chart-disclosure">Not intended as a forecast or prediction of future events. For illustrative purposes only.</p>
<h2>Shares of DraftKings, Inc. Pace Advancing Stocks within the BUZZ Index</h2>
<p>Shares of DraftKings Inc. (NASD: DKNG) paced advancing stocks within the BUZZ Index during the recent Period. The popular fantasy sports contest and sports betting company posted fourth-quarter earnings that beat most analyst estimates on the top and bottom line. DKNG further raised its forecast for 2023 revenues to a range of $2.85B - $3.05B, citing additional states&rsquo; plans to legalize sports betting as a key revenue driver. DKNG posted 2022 revenues of $2.24B. Investors cheered the results and subsequent forecast, with shares of DKNG rising more than 15% on the day of the announcement. Traditional analysts were likewise impressed, as a wave of &lsquo;upgrades&rsquo; followed the company&rsquo;s earnings release. After several years of disappointing results, the percentage of analysts rating DKNG&rsquo;s stock a &lsquo;buy&rsquo; had dipped below 50%. Following the ensuing upgrades, the percentage of analysts rating DKNG&rsquo;s stock a &lsquo;buy&rsquo; jumped to 55%, producing the first increase in &lsquo;buy recommendations in over a year.</p>
<div class="wrapped-div">
<table style="width: 750px;">
<tbody>
<tr class="tbl-data">
<td class="tbl-header last" colspan="4">Top BUZZ Index Contributors: February 9, 2023 &ndash; March 9, 2023</td>
</tr>
<tr class="tbl-data">
<td class="data-td  last">Company</td>
<td class="data-head last">Ticker</td>
<td class="data-head last">Average Weight (%)</td>
<td class="data-head last">Return Contribution (%)</td>
</tr>
<tr class="tbl-data">
<td class="data-td last" style="font-weight: normal;">DraftKings Inc</td>
<td class="data-td data last">DKNG</td>
<td class="data-td data last">2.03</td>
<td class="data-td data last">0.23</td>
</tr>
<tr class="tbl-data">
<td class="data-td last" style="font-weight: normal;">NVIDIA Corp</td>
<td class="data-td data last">NVDA</td>
<td class="data-td data last">3.26</td>
<td class="data-td data last">0.15</td>
</tr>
<tr class="tbl-data">
<td class="data-td last" style="font-weight: normal;">ROBLOX Corp</td>
<td class="data-td data last">RBLX</td>
<td class="data-td data last">1.18</td>
<td class="data-td data last">0.11</td>
</tr>
<tr class="tbl-data">
<td class="data-td last" style="font-weight: normal;">Roku Inc</td>
<td class="data-td data last">ROKU</td>
<td class="data-td data last">0.86</td>
<td class="data-td data last">0.10</td>
</tr>
<tr class="tbl-data">
<td class="data-td last" style="font-weight: normal;">General Electric Co</td>
<td class="data-td data last">GE</td>
<td class="data-td data last">0.59</td>
<td class="data-td data last">0.08</td>
</tr>
<tr class="tbl-data">
<td class="data-td last" style="font-weight: normal;">Enphase Energy Inc</td>
<td class="data-td data last">ENPH</td>
<td class="data-td data last">1.40</td>
<td class="data-td data last">0.07</td>
</tr>
<tr class="tbl-data">
<td class="data-td last" style="font-weight: normal;">Meta Platforms Inc</td>
<td class="data-td data last">META</td>
<td class="data-td data last">3.16</td>
<td class="data-td data last">0.05</td>
</tr>
<tr class="tbl-data">
<td class="data-td last" style="font-weight: normal;">Advanced Micro Devices Inc</td>
<td class="data-td data last">AMD</td>
<td class="data-td data last">2.93</td>
<td class="data-td data last">0.04</td>
</tr>
<tr class="tbl-data">
<td class="data-td last" style="font-weight: normal;">Warner Bros Discovery Inc</td>
<td class="data-td data last">WBD</td>
<td class="data-td data last">0.94</td>
<td class="data-td data last">0.04</td>
</tr>
<tr class="tbl-data">
<td class="data-td last" style="font-weight: normal;">Crowdstrike Holdings Inc</td>
<td class="data-td data last">CRWD</td>
<td class="data-td data last">0.62</td>
<td class="data-td data last">0.04</td>
</tr>
</tbody>
</table>
</div>
<br />
<p class="chart-disclosure">Source: BUZZ Holdings ULC, Bloomberg. Past performance is no guarantee of future results. Index performance is not illustrative of fund performance. Not intended as a recommendation to buy or to sell any of the securities mentioned herein.</p>
<p>The top detractors to performance featured several stocks of Electric Vehicle (&ldquo;EV&rdquo;) Manufacturers. The segment, which had posted strong returns to start the year, gave back some of its gains as investors took a cautious stance following the recent rally. Shares of Lucid Group paced decliners in the BUZZ Index during the recent Period, falling 22%, while EV industry leader Tesla Inc. (NASD: TSLA) and upstart EV manufacturer Rivian Automotive Inc. (NASD: RIVN) each featured in the top five detractors to Index performance. Of note was positive investor sentiment toward the segment, which remained elevated despite the sell-off. During the scheduled March BUZZ Index rebalance, TSLA and LCID maintained a maximum 3% weight in the index, while RIVN saw its weight increase from 1.26% to 1.78%.</p>
<div class="wrapped-div">
<table style="width: 750px;">
<tbody>
<tr class="tbl-data">
<td class="tbl-header last" colspan="4">Bottom BUZZ Index Contributors: February 9, 2023 &ndash; March 9, 2023</td>
</tr>
<tr class="tbl-data">
<td class="data-td  last">Company</td>
<td class="data-head last">Ticker</td>
<td class="data-head last">Average Weight (%)</td>
<td class="data-head last">Return Contribution (%)</td>
</tr>
<tr class="tbl-data">
<td class="data-td last" style="font-weight: normal;">Lucid Group Inc</td>
<td class="data-td data last">LCID</td>
<td class="data-td data last">2.94</td>
<td class="data-td data last">-0.66</td>
</tr>
<tr class="tbl-data">
<td class="data-td last" style="font-weight: normal;">Tesla Inc</td>
<td class="data-td data last">TSLA</td>
<td class="data-td data last">3.31</td>
<td class="data-td data last">-0.54</td>
</tr>
<tr class="tbl-data">
<td class="data-td last" style="font-weight: normal;">Netflix Inc</td>
<td class="data-td data last">NFLX</td>
<td class="data-td data last">2.69</td>
<td class="data-td data last">-0.52</td>
</tr>
<tr class="tbl-data">
<td class="data-td last" style="font-weight: normal;">GameStop Corp</td>
<td class="data-td data last">GME</td>
<td class="data-td data last">3</td>
<td class="data-td data last">-0.37</td>
</tr>
<tr class="tbl-data">
<td class="data-td last" style="font-weight: normal;">Rivian Automotive Inc</td>
<td class="data-td data last">RIVN</td>
<td class="data-td data last">1.24</td>
<td class="data-td data last">-0.31</td>
</tr>
<tr class="tbl-data">
<td class="data-td last" style="font-weight: normal;">Walt Disney Co/The</td>
<td class="data-td data last">DIS</td>
<td class="data-td data last">2.29</td>
<td class="data-td data last">-0.31</td>
</tr>
<tr class="tbl-data">
<td class="data-td last" style="font-weight: normal;">Carnival Corp</td>
<td class="data-td data last">CCL</td>
<td class="data-td data last">1.56</td>
<td class="data-td data last">-0.20</td>
</tr>
<tr class="tbl-data">
<td class="data-td last" style="font-weight: normal;">Shopify Inc</td>
<td class="data-td data last">SHOP</td>
<td class="data-td data last">1.45</td>
<td class="data-td data last">-0.19</td>
</tr>
<tr class="tbl-data">
<td class="data-td last" style="font-weight: normal;">Amazon.com Inc</td>
<td class="data-td data last">AMZN</td>
<td class="data-td data last">2.91</td>
<td class="data-td data last">-0.18</td>
</tr>
<tr class="tbl-data">
<td class="data-td last" style="font-weight: normal;">Plug Power Inc</td>
<td class="data-td data last">PLUG</td>
<td class="data-td data last">1.07</td>
<td class="data-td data last">-0.18</td>
</tr>
</tbody>
</table>
</div>
<br />
<p class="chart-disclosure">Source: BUZZ Holdings ULC, Bloomberg. Past performance is no guarantee of future results. Index performance is not illustrative of fund performance. Not intended as a recommendation to buy or to sell any of the securities mentioned herein.</p>
<h2>Sentiment Stock Highlight &ndash; Airbnb, Inc.</h2>
<p>Airbnb, Inc. (NASD: ABNB) completed its initial public offering on December 10, 2020. While the company&rsquo;s choice of timing initially seemed questionable as the travel sector was battered by reduced demand amidst the global COVID-19 pandemic, equity market strength provided ABNB with plenty of investor demand for its offering. Shares of ABNB closed their first day of trading near $145, more than double their $68 offering price. As the pandemic subsided, the reopening of economies around the world, together with loosening travel restrictions, helped ABNB&rsquo;s business recover as people began to leave the isolation of their homes and return to travel routines. Many travelers also preferred the relative safety of staying in Airbnb homes compared to hotels (minimizing exposure to large groups of people). This trend the company believes will remain in place for the foreseeable future.</p>
<p>ABNB recently reported strong Q4 financial results, and management issued positive guidance for the company&rsquo;s prospects. Despite the current macro headwinds and high inflationary environment, bookings, and demand for ABNB rentals, continue to increase. Cultural shifts towards more flexible work conditions have provided a further tailwind for ABNB, as many people are choosing to travel more frequently, able to combine aspects of work and vacation from remote destinations. ABNB&rsquo;s share price is up 60% year-to-date, and both positive investor sentiment and the volume of conversation relating to the company have been climbing in recent months. This month ABNB made a big jump in the Index from a 0.53% weight to a 1.43% weight.</p>
<h3>Airbnb Stock Price | December 2020 &ndash; March 2023</h3>
<p><img class="img-responsive w-100" src="https://www.vaneck.com/contentassets/268ff80014b9492a8e9ca2b3a603bab4/2968_buzz_chart-02_2023.03_blog.svg" alt="Airbnb Stock Price | December 2020 - March 2023" /></p>
<p class="chart-disclosure">Source: BUZZ Holdings ULC, Bloomberg. Past performance is no guarantee of future results. Index performance is not illustrative of fund performance. Not intended as a recommendation to buy or to sell any of the securities mentioned herein.</p>
<h2>BUZZ Index March 2023 Rebalance Highlights</h2>
<p><strong>Twilio Inc.</strong></p>
<p>One of the most discussed cloud computing companies, Twilio (NYSE: TWLO), exemplified both the velocity of the gains and subsequent reversal losses that characterized trading in the sector following the COVID-19 market lows in 2020. After declining to $70 at the height of the pandemic, shares of TWLO subsequently soared, reaching a peak of nearly $450 per share in the span of a single year as cloud-related companies exploded in popularity. Shares of TWLO have since completed their round-trip, trading back at (and below) their pre-pandemic levels. However, like many technology stocks, TWLO has had a great start to 2023, with its share price rising more than 60% year-to-date. In the company&rsquo;s Q4 earnings report, management indicated a shift in strategy, emphasizing margins and profitability instead of maximizing growth. TWLO jumped 20% on the report as investors seemingly supported the strategic shift toward focusing on profitability metrics. Investor sentiment climbed alongside the jump in price, rising more than 300%. After a 5-month absence, TWLO returns to the BUZZ Index this month with a 0.68% weight.</p>
<p>For more on rebalancing results and a full breakdown of index constituents added and removed for the month, view the <strong><a href="https://www.vaneck.com/us/en/investments/social-sentiment-etf-buzz/buzz-reconstitution.pdf" target="_blank" rel="noopener" title="BUZZ VanEck Social Sentiment ETF">BUZZ Index reconstitution</a></strong> report.</p>
<p>To receive more <strong><a href="https://www.vaneck.com/us/en/insights/thematic-investing/" title="Thematic Investing Insights">Thematic Investing</a></strong> insights, <strong><a href="https://www.vaneck.com/us/en/subscribe/" title="Subscription Center">sign up in our subscription center</a></strong>.</p>
<style type="text/css">
    .wrapped-div {
        max-width: 100%;
    }

    @media (max-width: 1240px) {
        .wrapped-div {
            overflow-x: scroll;
        }
    }

    .wrapped-div-sector {
        max-width: 100%;
        overflow-x: scroll;
    }
</style>
]]></content:encoded>
</item><item rdf:about="https://www.vaneck.com/us/en/blogs/economic-trends/too-high-for-too-long-inflation-rates-both/">
  <title>“Too High For Too Long” – Inflation? Rates? Both?></title>
  <link>https://www.vaneck.com/us/en/blogs/economic-trends/too-high-for-too-long-inflation-rates-both/</link>
  <description><![CDATA[The ECB&rsquo;s 50bps rate hike brought inflation back into focus. So, how high is the bar for rate cuts in EM, where disinflation is well underway?]]></description>
  <dc:creator>Natalia  Gurushina</dc:creator>
  <dc:date>03/16/2023 06:30:00</dc:date>
<content:encoded><![CDATA[

<h2>DM Rate Hikes</h2>
<p>The market tried to bounce on the news that Credit Suisse was allowed to borrow from the Swiss National Bank, but <strong>concerns about the debacle&rsquo;s impact on bank lending standards &ndash; and, hence, the growth outlook both in Europe and the U.S.</strong> &ndash; led to some back and forth. The European Central Bank&rsquo;s (ECB&rsquo;s) decision to go for a larger 50bps rate hike refocused the market&rsquo;s attention on economic fundamentals &ndash; specifically, persistent price pressures in developed markets (DM), which, according to the ECB, were &ldquo;projected to remain too high for too long&rdquo;. The consensus expects headline inflation in Europe and the U.S. to remain outside the target until 2025. The question is whether the U.S Federal Reserve (Fed) will follow suit with a hawkish message next week, or will the banking sector anxieties take precedence? As of this morning, the Fed Funds Futures showed around 70% probability of a 25bps rate increase in March, and implied around 90bps of rate cuts in the rest of the year.</p>
<h2>EM Rate Cuts</h2>
<p>The policy landscape in emerging markets (EM) is less dramatic these days &ndash; aggressive post-pandemic policy tightening means that the real rates are high (=a safety cushion for EMFX), and disinflation is underway in most places. As a result, <strong>more and more EM central banks can pause safely</strong> (and enjoy the DM show). The Indonesian central bank did just that earlier today &ndash; keeping the policy rate on hold and main economic forecasts broadly unchanged. And the Brazilian central bank is expected to do the same next week &ndash; with a calmer messaging if the government&rsquo;s new fiscal framework proposals (expected any day now) look orthodox enough.</p>
<h2>EM Disinflation</h2>
<p><strong>We consider it a sign of EM resilience that the market continues to price in rate cuts in the next 12 months, despite recent turbulence in DM</strong> (see chart below). But we have to admit that the bar for policy easing can be (should be?) high &ndash; in part, because the disinflation progress is uneven, core inflation is often sticky and inflation is still far away from the target in many countries. We&rsquo;ve got some reminders today, as Poland&rsquo;s core inflation surprised to the upside in February (accelerating to 12% year-on-year), and South Africa&rsquo;s inflation expectations moved higher in Q1. Actually, several EM central banks might need to tighten a bit more before contemplating a pause &ndash; Mexico, and potentially South Africa. Stay tuned!</p>
<h3>Chart at a Glance: Implied Rate Cuts in EM &ndash; Market Turbulence Notwithstanding</h3>
<p><img class="img-responsive w-100" src="https://www.vaneck.com/contentassets/678c9385b8b64b689f490615786e25b2/us-natalias-take-2023-03-16.png" alt="Chart at a Glance: Implied Rate Cuts in EM - Market Turbulence Notwithstanding" /></p>
<p class="chart-disclosure">Source: Bloomberg LP.</p>
]]></content:encoded>
</item><item rdf:about="https://www.vaneck.com/us/en/blogs/income-investing/rating-migrations-are-coming/">
  <title>Rating Migrations Are Coming></title>
  <link>https://www.vaneck.com/us/en/blogs/income-investing/rating-migrations-are-coming/</link>
  <description><![CDATA[Forecasts for new fallen angels remain low, however the first downgrade of the year occurred in February and March has brought a flurry of rating actions.]]></description>
  <dc:creator>Nicolas  Fonseca, CFA</dc:creator>
  <dc:date>03/15/2023 19:00:00</dc:date>
<content:encoded><![CDATA[

<p>Fallen angels underperformed broad HY by 0.26% (-1.56% vs. -1.29%) in February and now lagged by 0.32% (2.24% vs. 2.56%) YTD. Duration was once again a headwind as rates increased in February, while higher quality bonds underperformed lower quality (opposite of what occurred in January). Investors piled into short-end Treasuries (12-month yields about 5%), pulling money away from high-yield corporate funds, as the Fed raised rates by 25bps in early February (Fed Funds now at 4.50%-4.75%). Some officials signaled that more than the initially expected rate hikes were coming, with the terminal rate closer to 6.00%, and that rates may remain higher for longer as inflation appears to be stickier than originally anticipated causing duration-sensitive asset classes to be down significantly over the past month.</p>
<h3>Total Return and Duration of Fixed Income Asset Classes</h3>
<p><img class="img-responsive w-100" src="https://www.vaneck.com/contentassets/2d964aafb862401cbe9e3c495c664577/2957_angl_chart_01_2023.03_v1_blog.svg" alt="Total Return and Duration of Fixed Income Asset Classes" /></p>
<p class="chart-disclosure">Source: ICE Data Services and VanEck. Past performance is no guarantee of future results. Not intended as a recommendation to buy or sell any securities referenced herein. 3M TBills: ICE BofA US 3-Month Treasury Bill Index. CCC &amp; Lower Bonds: ICE BofA CCC &amp; Lower US High Yield. Index: subset of the ICE BofA US High Yield Index and includes securities rated CCC or lower. Single-B Bonds: ICE BofA Single-B US High Yield Index: subset of the ICE BofA US High Yield Index and includes securities rated single B. Broad HY: ICE BofA US High Yield Index: comprised of below-investment grade corporate bonds (based on an average of various rating agencies) denominated in U.S. dollars. Fallen Angels: ICE US Fallen Angel High Yield 10% Constrained Index: subset of the ICE BofA US High Yield Index and includes securities that were rated investment grade at time of issuance. BB Bonds: ICE BofA BB US High Yield Index: subset of the ICE BofA US High Yield Index and includes securities rated BB. 10Y Treasury: ICE BofA Current 10-Year US Treasury Index. 30Y Treasury: ICE BofA Current 30-Year US Treasury Index.</p>
<p>As of February month end, rating migration forecasts continue to favor rising stars over new fallen angels. Sell-side projections generally range from $60-150bn for rising stars and approximately $30-60bn for new fallen angels. According to J.P. Morgan:</p>
<ul class="content-list">
<li>There are over $1 trillion on bonds rated BBB- by at least one agency, of which $170 billion is on negative watch or outlook.</li>
<li>Despite those large figures, realistically there are only ~$2 billion of issuers being downgrade to HY based. Overall, 2 issuers (GXO Logistics and Open Text) might be on the cusp of being downgraded as only one agency will need to downgrade the for its rating to drop to high yield.</li>
<li>There are +$300 billion of bonds rated BB+ by at least one of the three major rating agencies, of which ~$50 billion could be upgraded to investment grade as a result of at least one agency upgrade.</li>
<li>In our fallen angel index, there is about $20 billion which could be upgraded if one of three agencies upgrade its rating: Western Midstream, FirstEnergy, Apache, Mattel and EnLink Midstream. The two issuers that are mostly watched (Ford and Occidental Petroleum) are rated high yield by all three agencies, and there is potential for them to be upgraded sometime this year.</li>
</ul>
<p>Over the first week of March, we&rsquo;ve seen multiple actions from the rating agencies.</p>
<ul class="content-list">
<li>In the Auto space, Nissan was downgraded to HY on 3/7 by S&amp;P. If it enters the fallen angel index at month end, auto exposure will increase significantly. Nissan was not in most sell side forecasts for potential downgrades.</li>
<li>In the Energy space, Western Midstream and Occidental Petroleum were upgraded to IG by Moody&rsquo;s on 3/10. These two issuers were part of the <strong><a href="https://www.vaneck.com/us/en/blogs/income-investing/new-fallen-angel-bonds-drive-performance/" title="New Fallen Angel Bonds Drive Performance">April 2020 wave of downgrades</a></strong>, and have reduced their debt loads since then. If both exit the index, we expect Energy exposure will decline significantly</li>
</ul>
<p>In the Banking sector, following the collapse of Silicon Valley Bank several regional banks have had their ratings placed under review for possible downgrade.</p>
<p><strong><u>Fallen Angels Overall Stats:</u> </strong>Fallen angels bond spreads tightened this past month by 12bps while broad high yield spreads tightened by 8bps as yields rose by the most since September of last year. Fallen angels yields increased by 40bps and broad high yield by 47bps, in line with the 10Y Treasury which is now hovering 4.00%. Duration shortened for both strategies but was a main detractor for fallen angels, alongside its allocation to higher quality bonds. With fallen angel yields back above 7%, just above its long term average, absolute yield levels continue to offer a potentially attractive entry point in spite of relatively tight spreads, and can provide a return cushion if we see spreads widen.</p>
<div class="wrapped-div">
<table style="width: 100%;">
<tbody>
<tr class="tbl-data">
<td class="tbl-header last" style="text-align: center;">&nbsp;</td>
<td class="tbl-header last" style="border-right: outset; text-align: center;" colspan="3">Fallen Angel</td>
<td class="tbl-header last" style="text-align: center;" colspan="3">Broad HY</td>
</tr>
<tr class="tbl-data">
<td class="data-head last">&nbsp;</td>
<td class="data-head last">12/31/2022</td>
<td class="data-head last">1/31/2023</td>
<td class="data-head last" style="border-right: outset;">2/28/2023</td>
<td class="data-head last">12/31/2022</td>
<td class="data-head last">1/31/2023</td>
<td class="data-head last">2/28/2023</td>
</tr>
<tr class="tbl-data">
<td class="data-td last">Yield to Worst</td>
<td class="data-td data last">7.49</td>
<td class="data-td data last">6.87</td>
<td class="data-td data last" style="border-right: outset;">7.27</td>
<td class="data-td data last">8.89</td>
<td class="data-td data last">8.17</td>
<td class="data-td data last">8.64</td>
</tr>
<tr class="tbl-data">
<td class="data-td last">Effective Duration</td>
<td class="data-td data last">5.45</td>
<td class="data-td data last">5.61</td>
<td class="data-td data last" style="border-right: outset;">5.43</td>
<td class="data-td data last">4.04</td>
<td class="data-td data last">3.94</td>
<td class="data-td data last">3.92</td>
</tr>
<tr class="tbl-data">
<td class="data-td last">Full Market Value ($mn)</td>
<td class="data-td data last">112,854</td>
<td class="data-td data last">114,139</td>
<td class="data-td data last" style="border-right: outset;">112,561</td>
<td class="data-td data last">1,199,909</td>
<td class="data-td data last">1,246,367</td>
<td class="data-td data last">1,232,134</td>
</tr>
<tr class="tbl-data">
<td class="data-td last">OAS</td>
<td class="data-td data last">337</td>
<td class="data-td data last">307</td>
<td class="data-td data last" style="border-right: outset;">295</td>
<td class="data-td data last">481</td>
<td class="data-td data last">430</td>
<td class="data-td data last">422</td>
</tr>
<tr class="tbl-data">
<td class="data-td last">No. of Issues</td>
<td class="data-td data last">212</td>
<td class="data-td data last">210</td>
<td class="data-td data last" style="border-right: outset;">209</td>
<td class="data-td data last">1,927</td>
<td class="data-td data last">1,930</td>
<td class="data-td data last">1,931</td>
</tr>
</tbody>
</table>
</div>
<br />
<p class="chart-disclosure">Source: ICE Data Services and VanEck. Past performance is no guarantee of future results. Fallen Angels: ICE US Fallen Angel High Yield 10% Constrained Index. Broad HY: ICE BofA US High Yield Index. OAS refers to &ldquo;option-adjusted spread.&rdquo; Please see definition for this and other terms referenced herein in the disclosures and definitions portion of this blog.</p>
<p><strong><u>New Fallen Angels</u>: </strong>The first fallen angel of the year came into the index with a 1.39% weight. Entegris was downgraded by S&amp;P from BB+ to BB, with the average rating dropping from IG to HY, due to the weakening macro environment, slowness in the semiconductor industry and company-specific headwinds. Over the last 6 months, Entegris price return -1.13%.</p>
<div class="wrapped-div">
<table style="width: 100%;">
<tbody>
<tr class="tbl-data">
<td class="tbl-header last">Month-end Addition</td>
<td class="tbl-header last" style="text-align: center;">Name</td>
<td class="tbl-header last" style="text-align: center;">Rating</td>
<td class="tbl-header last" style="text-align: center;">Sector</td>
<td class="tbl-header last" style="text-align: center;">Industry</td>
<td class="tbl-header last" style="text-align: center;">% Mkt Value</td>
<td class="tbl-header last" style="text-align: center;">Price</td>
</tr>
<tr class="tbl-data">
<td class="data-td data last" style="text-align: left;">February</td>
<td class="data-td data last">Entegris Escrow Corp.</td>
<td class="data-td data last">BB1</td>
<td class="data-td data last">Technology &amp; Electronics</td>
<td class="data-td data last">Electronics</td>
<td class="data-td data last">1.39</td>
<td class="data-td data last">90.92</td>
</tr>
</tbody>
</table>
</div>
<br />
<p class="chart-disclosure">Source: ICE Data Services and VanEck. Past performance is no guarantee of future results. Not a recommendation to buy or sell any of the names/securities mentioned herein.</p>
<p><strong><u>Rising Stars:</u></strong> There were two issuers upgraded from HY to IG, aka rising stars. Autopistas Metropolitanas de Puerto Rico was downgraded back in mid-2014 and upgraded by Moody&rsquo;s from Ba2 to Ba1 and by S&amp;P from BBB- to BBB, with the average rating upgrading it to investment grade. Nokia was also upgraded by S&amp;P from BB+ to BBB- as it had a strong performance in 2022 across all segments, regaining market share and having successful cost efficiencies. Over the last 12 months, Autopistas Metropolitanas de Puerto Rico posted +5.03% price return while Nokia saw a negative 18.41% price return.</p>
<div class="wrapped-div">
<table style="width: 100%;">
<tbody>
<tr class="tbl-data">
<td class="tbl-header last">Month-end Exit</td>
<td class="tbl-header last" style="text-align: center;">Name</td>
<td class="tbl-header last" style="text-align: center;">Rating</td>
<td class="tbl-header last" style="text-align: center;">Sector</td>
<td class="tbl-header last" style="text-align: center;">Industry</td>
<td class="tbl-header last" style="text-align: center;">% Mkt Value</td>
<td class="tbl-header last" style="text-align: center;">Price</td>
</tr>
<tr class="tbl-data">
<td class="data-td data last" style="text-align: left;">February</td>
<td class="data-td data last">Autopistas Metropolitanas de Puerto Rico LLC</td>
<td class="data-td data last">BB1</td>
<td class="data-td data last">Transportation</td>
<td class="data-td data last">Transport Infrastructure/Services</td>
<td class="data-td data last">0.35</td>
<td class="data-td data last">100.49</td>
</tr>
<tr class="tbl-data">
<td class="data-td data last" style="text-align: left;">February</td>
<td class="data-td data last">Nokia Corp</td>
<td class="data-td data last">BB1</td>
<td class="data-td data last">Technology &amp; Electronics</td>
<td class="data-td data last">Tech Hardware &amp; Equipment</td>
<td class="data-td data last">0.47</td>
<td class="data-td data last">97.50</td>
</tr>
</tbody>
</table>
</div>
<br />
<p class="chart-disclosure">Source: ICE Data Services and VanEck. Past performance is no guarantee of future results. Not a recommendation to buy or sell any of the names/securities mentioned herein.</p>
<p><strong><u>Fallen Angels Performance by Sector</u></strong>: The sector composition didn&rsquo;t have any major changes, however, the Tech sector saw a net increase of 0.84% as there was a fallen angel and rising star this past month. Only three sectors posted positive returns, with Real Estate being the top performance of the index as spreads significantly tightened over this past month (106bps). The index price is back below $90m, still below its long term average of ~$95, with the Banking sector being the only one above par.</p>
<div class="wrapped-div">
<table style="width: 100%; height: 360px;">
<tbody>
<tr class="tbl-data" style="height: 18px;">
<td class="tbl-header last" style="text-align: center; height: 18px;">&nbsp;</td>
<td class="tbl-header last" style="text-align: center; border-right: outset; height: 18px;" colspan="3">Wgt (%)</td>
<td class="tbl-header last" style="text-align: center; border-right: outset; height: 18px;" colspan="3">OAS</td>
<td class="tbl-header last" style="text-align: center; border-right: outset; height: 18px;" colspan="3">Price</td>
<td class="tbl-header last" style="text-align: center; height: 18px;">Total Return (%)</td>
</tr>
<tr class="tbl-data" style="height: 18px;">
<td class="data-head last" style="height: 18px;">&nbsp;</td>
<td class="data-head last" style="height: 18px;">12/31/2021</td>
<td class="data-head last" style="height: 18px;">1/31/2023</td>
<td class="data-head last" style="border-right: outset; height: 18px;">2/28/2023</td>
<td class="data-head last" style="height: 18px;">12/31/2021</td>
<td class="data-head last" style="height: 18px;">1/31/2023</td>
<td class="data-head last" style="border-right: outset; height: 18px;">2/28/2023</td>
<td class="data-head last" style="height: 18px;">12/31/2021</td>
<td class="data-head last" style="height: 18px;">1/31/2023</td>
<td class="data-head last" style="height: 18px; border-right: outset;">2/28/2023</td>
<td class="data-head last" style="height: 18px;">1M</td>
</tr>
<tr class="tbl-data" style="height: 18px;">
<td class="data-td last" style="height: 18px;">Automotive</td>
<td class="data-td data last" style="height: 18px;">10.00</td>
<td class="data-td data last" style="border-right: outset; height: 18px;">10.00</td>
<td class="data-td data last" style="height: 18px;">262</td>
<td class="data-td data last" style="height: 18px;">225</td>
<td class="data-td data last" style="border-right: outset; height: 18px;">227</td>
<td class="data-td data last" style="height: 18px;">91.35</td>
<td class="data-td data last" style="height: 18px;">94.30</td>
<td class="data-td data last" style="height: 18px; border-right: outset;">91.85</td>
<td class="data-td data last" style="height: 18px;">-2.16</td>
</tr>
<tr class="tbl-data" style="height: 18px;">
<td class="data-td last" style="height: 18px;">Banking</td>
<td class="data-td data last" style="height: 18px;">3.81</td>
<td class="data-td data last" style="height: 18px;">3.87</td>
<td class="data-td data last" style="border-right: outset; height: 18px;">3.93</td>
<td class="data-td data last" style="height: 18px;">302</td>
<td class="data-td data last" style="height: 18px;">242</td>
<td class="data-td data last" style="border-right: outset; height: 18px;">230</td>
<td class="data-td data last" style="height: 18px;">96.85</td>
<td class="data-td data last" style="height: 18px;">100.25</td>
<td class="data-td data last" style="height: 18px; border-right: outset;">100.09</td>
<td class="data-td data last" style="height: 18px;">0.33</td>
</tr>
<tr class="tbl-data" style="height: 18px;">
<td class="data-td last" style="height: 18px;">Basic Industry</td>
<td class="data-td data last" style="height: 18px;">1.36</td>
<td class="data-td data last" style="height: 18px;">1.38</td>
<td class="data-td data last" style="border-right: outset; height: 18px;">1.36</td>
<td class="data-td data last" style="height: 18px;">226</td>
<td class="data-td data last" style="height: 18px;">215</td>
<td class="data-td data last" style="border-right: outset; height: 18px;">225</td>
<td class="data-td data last" style="height: 18px;">92.17</td>
<td class="data-td data last" style="height: 18px;">94.36</td>
<td class="data-td data last" style="height: 18px; border-right: outset;">92.11</td>
<td class="data-td data last" style="height: 18px;">-1.97</td>
</tr>
<tr class="tbl-data" style="height: 18px;">
<td class="data-td last" style="height: 18px;">Capital Goods</td>
<td class="data-td data last" style="height: 18px;">5.12</td>
<td class="data-td data last" style="border-right: outset; height: 18px;">5.14</td>
<td class="data-td data last" style="height: 18px;">279</td>
<td class="data-td data last" style="height: 18px;">269</td>
<td class="data-td data last" style="border-right: outset; height: 18px;">243</td>
<td class="data-td data last" style="height: 18px;">95.01</td>
<td class="data-td data last" style="height: 18px;">97.20</td>
<td class="data-td data last" style="height: 18px; border-right: outset;">95.93</td>
<td class="data-td data last" style="height: 18px;">-0.84</td>
</tr>
<tr class="tbl-data" style="height: 18px;">
<td class="data-td last" style="height: 18px;">Consumer Goods</td>
<td class="data-td data last" style="height: 18px;">3.07</td>
<td class="data-td data last" style="height: 18px;">3.11</td>
<td class="data-td data last" style="border-right: outset; height: 18px;">3.11</td>
<td class="data-td data last" style="height: 18px;">275</td>
<td class="data-td data last" style="border-right: outset; height: 18px;">249</td>
<td class="data-td data last" style="height: 18px;">88.90</td>
<td class="data-td data last" style="height: 18px;">91.20</td>
<td class="data-td data last" style="height: 18px; border-right: outset;">89.49</td>
<td class="data-td data last" style="height: 18px;">-1.40</td>
</tr>
<tr class="tbl-data" style="height: 18px;">
<td class="data-td last" style="height: 18px;">Energy</td>
<td class="data-td data last" style="height: 18px;">27.93</td>
<td class="data-td data last" style="height: 18px;">28.35</td>
<td class="data-td data last" style="border-right: outset; height: 18px;">27.83</td>
<td class="data-td data last" style="height: 18px;">293</td>
<td class="data-td data last" style="height: 18px;">278</td>
<td class="data-td data last" style="border-right: outset; height: 18px;">278</td>
<td class="data-td data last" style="height: 18px;">88.13</td>
<td class="data-td data last" style="height: 18px;">91.14</td>
<td class="data-td data last" style="height: 18px; border-right: outset;">88.38</td>
<td class="data-td data last" style="height: 18px;">-2.53</td>
</tr>
<tr class="tbl-data" style="height: 18px;">
<td class="data-td last" style="height: 18px;">Financial Services</td>
<td class="data-td data last" style="height: 18px;">0.65</td>
<td class="data-td data last" style="height: 18px;">0.66</td>
<td class="data-td data last" style="border-right: outset; height: 18px;">0.66</td>
<td class="data-td data last" style="height: 18px;">540</td>
<td class="data-td data last" style="height: 18px;">480</td>
<td class="data-td data last" style="border-right: outset; height: 18px;">465</td>
<td class="data-td data last" style="height: 18px;">77.20</td>
<td class="data-td data last" style="height: 18px;">82.17</td>
<td class="data-td data last" style="height: 18px; border-right: outset;">80.33</td>
<td class="data-td data last" style="height: 18px;">-1.71</td>
</tr>
<tr class="tbl-data" style="height: 18px;">
<td class="data-td last" style="height: 18px;">Healthcare</td>
<td class="data-td data last" style="height: 18px;">3.02</td>
<td class="data-td data last" style="height: 18px;">3.05</td>
<td class="data-td data last" style="border-right: outset; height: 18px;">3.06</td>
<td class="data-td data last" style="height: 18px;">362</td>
<td class="data-td data last" style="height: 18px;">335</td>
<td class="data-td data last" style="border-right: outset; height: 18px;">317</td>
<td class="data-td data last" style="height: 18px;">83.56</td>
<td class="data-td data last" style="height: 18px;">85.38</td>
<td class="data-td data last" style="height: 18px; border-right: outset;">84.22</td>
<td class="data-td data last" style="height: 18px;">-0.88</td>
</tr>
<tr class="tbl-data" style="height: 18px;">
<td class="data-td last" style="height: 18px;">Insurance</td>
<td class="data-td data last" style="height: 18px;">0.85</td>
<td class="data-td data last" style="border-right: outset; height: 18px;">0.85</td>
<td class="data-td data last" style="height: 18px;">347</td>
<td class="data-td data last" style="height: 18px;">349</td>
<td class="data-td data last" style="border-right: outset; height: 18px;">334</td>
<td class="data-td data last" style="height: 18px;">92.10</td>
<td class="data-td data last" style="height: 18px;">94.15</td>
<td class="data-td data last" style="height: 18px; border-right: outset;">92.47</td>
<td class="data-td data last" style="height: 18px;">-1.25</td>
</tr>
<tr class="tbl-data" style="height: 18px;">
<td class="data-td last" style="height: 18px;">Leisure</td>
<td class="data-td data last" style="height: 18px;">7.88</td>
<td class="data-td data last" style="height: 18px;">8.01</td>
<td class="data-td data last" style="border-right: outset; height: 18px;">7.99</td>
<td class="data-td data last" style="height: 18px;">325</td>
<td class="data-td data last" style="height: 18px;">251</td>
<td class="data-td data last" style="border-right: outset; height: 18px;">240</td>
<td class="data-td data last" style="height: 18px;">89.95</td>
<td class="data-td data last" style="height: 18px;">93.46</td>
<td class="data-td data last" style="height: 18px; border-right: outset;">92.36</td>
<td class="data-td data last" style="height: 18px;">-0.70</td>
</tr>
<tr class="tbl-data" style="height: 18px;">
<td class="data-td last" style="height: 18px;">Real Estate</td>
<td class="data-td data last" style="height: 18px;">5.13</td>
<td class="data-td data last" style="height: 18px;">5.28</td>
<td class="data-td data last" style="border-right: outset; height: 18px;">5.43</td>
<td class="data-td data last" style="height: 18px;">697</td>
<td class="data-td data last" style="height: 18px;">576</td>
<td class="data-td data last" style="border-right: outset; height: 18px;">470</td>
<td class="data-td data last" style="height: 18px;">79.46</td>
<td class="data-td data last" style="height: 18px;">83.10</td>
<td class="data-td data last" style="height: 18px; border-right: outset;">84.67</td>
<td class="data-td data last" style="height: 18px;">2.28</td>
</tr>
<tr class="tbl-data" style="height: 18px;">
<td class="data-td last" style="height: 18px;">Retail</td>
<td class="data-td data last" style="height: 18px;">5.67</td>
<td class="data-td data last" style="height: 18px;">5.75</td>
<td class="data-td data last" style="border-right: outset; height: 18px;">5.78</td>
<td class="data-td data last" style="height: 18px;">471</td>
<td class="data-td data last" style="height: 18px;">429</td>
<td class="data-td data last" style="border-right: outset; height: 18px;">406</td>
<td class="data-td data last" style="height: 18px;">73.75</td>
<td class="data-td data last" style="height: 18px;">76.65</td>
<td class="data-td data last" style="height: 18px; border-right: outset;">75.96</td>
<td class="data-td data last" style="height: 18px;">-0.41</td>
</tr>
<tr class="tbl-data" style="height: 18px;">
<td class="data-td last" style="height: 18px;">Services</td>
<td class="data-td data last" style="height: 18px;">0.38</td>
<td class="data-td data last" style="height: 18px;">0.37</td>
<td class="data-td data last" style="border-right: outset; height: 18px;">0.36</td>
<td class="data-td data last" style="height: 18px;">388</td>
<td class="data-td data last" style="height: 18px;">380</td>
<td class="data-td data last" style="border-right: outset; height: 18px;">441</td>
<td class="data-td data last" style="height: 18px;">87.11</td>
<td class="data-td data last" style="height: 18px;">89.27</td>
<td class="data-td data last" style="height: 18px; border-right: outset;">84.42</td>
<td class="data-td data last" style="height: 18px;">-4.95</td>
</tr>
<tr class="tbl-data" style="height: 18px;">
<td class="data-td last" style="height: 18px;">Technology &amp; Electronics</td>
<td class="data-td data last" style="height: 18px;">4.20</td>
<td class="data-td data last" style="height: 18px;">4.33</td>
<td class="data-td data last" style="border-right: outset; height: 18px;">5.17</td>
<td class="data-td data last" style="height: 18px;">327</td>
<td class="data-td data last" style="height: 18px;">276</td>
<td class="data-td data last" style="border-right: outset; height: 18px;">278</td>
<td class="data-td data last" style="height: 18px;">85.47</td>
<td class="data-td data last" style="height: 18px;">89.53</td>
<td class="data-td data last" style="height: 18px; border-right: outset;">87.22</td>
<td class="data-td data last" style="height: 18px;">-2.32</td>
</tr>
<tr class="tbl-data" style="height: 18px;">
<td class="data-td last" style="height: 18px;">Telecommunications</td>
<td class="data-td data last" style="height: 18px;">11.91</td>
<td class="data-td data last" style="height: 18px;">12.14</td>
<td class="data-td data last" style="border-right: outset; height: 18px;">12.03</td>
<td class="data-td data last" style="height: 18px;">423</td>
<td class="data-td data last" style="height: 18px;">408</td>
<td class="data-td data last" style="border-right: outset; height: 18px;">406</td>
<td class="data-td data last" style="height: 18px;">90.04</td>
<td class="data-td data last" style="height: 18px;">93.05</td>
<td class="data-td data last" style="height: 18px; border-right: outset;">90.51</td>
<td class="data-td data last" style="height: 18px;">-2.04</td>
</tr>
<tr class="tbl-data" style="height: 18px;">
<td class="data-td last" style="height: 18px;">Transportation</td>
<td class="data-td data last" style="height: 18px;">2.10</td>
<td class="data-td data last" style="height: 18px;">2.13</td>
<td class="data-td data last" style="border-right: outset; height: 18px;">1.82</td>
<td class="data-td data last" style="height: 18px;">279</td>
<td class="data-td data last" style="height: 18px;">252</td>
<td class="data-td data last" style="border-right: outset; height: 18px;">201</td>
<td class="data-td data last" style="height: 18px;">90.49</td>
<td class="data-td data last" style="height: 18px;">93.04</td>
<td class="data-td data last" style="height: 18px; border-right: outset;">91.63</td>
<td class="data-td data last" style="height: 18px;">0.28</td>
</tr>
<tr class="tbl-data" style="height: 18px;">
<td class="data-td last" style="height: 18px;">Utility</td>
<td class="data-td data last" style="height: 18px;">6.93</td>
<td class="data-td data last" style="height: 18px;">5.61</td>
<td class="data-td data last" style="border-right: outset; height: 18px;">5.50</td>
<td class="data-td data last" style="height: 18px;">213</td>
<td class="data-td data last" style="height: 18px;">196</td>
<td class="data-td data last" style="border-right: outset; height: 18px;">189</td>
<td class="data-td data last" style="height: 18px;">89.95</td>
<td class="data-td data last" style="height: 18px;">91.66</td>
<td class="data-td data last" style="height: 18px; border-right: outset;">88.81</td>
<td class="data-td data last" style="height: 18px;">-2.72</td>
</tr>
<tr class="tbl-data" style="height: 18px;">
<td class="data-td last" style="height: 18px;">Total</td>
<td class="data-td data last" style="height: 18px;">100</td>
<td class="data-td data last" style="border-right: outset; height: 18px;">100</td>
<td class="data-td data last" style="height: 18px;">337</td>
<td class="data-td data last" style="height: 18px;">307</td>
<td class="data-td data last" style="border-right: outset; height: 18px;">295</td>
<td class="data-td data last" style="height: 18px;">87.91</td>
<td class="data-td data last" style="height: 18px;">90.82</td>
<td class="data-td data last" style="height: 18px; border-right: outset;">88.92</td>
<td class="data-td data last" style="height: 18px;">-1.56</td>
</tr>
</tbody>
</table>
</div>
<br />
<p class="chart-disclosure">Source: ICE Data Services and VanEck. Not a recommendation to buy or sell any of the names/securities mentioned herein. Fallen Angels: ICE US Fallen Angel High Yield 10% Constrained Index.</p>
<p><strong><u>Fallen Angels Performance by Rating:</u></strong> Bed, Bath and Beyond missed its 2/1 payment but was able to do so on 2/28, avoiding default and posting outstanding returns of +161%.</p>
<div class="wrapped-div">
<table style="width: 100%;">
<tbody>
<tr class="tbl-data">
<td class="tbl-header last" style="text-align: center;">&nbsp;</td>
<td class="tbl-header last" style="text-align: center; border-right: outset;" colspan="3">Wgt (%)</td>
<td class="tbl-header last" style="text-align: center; border-right: outset;" colspan="3">OAS</td>
<td class="tbl-header last" style="text-align: center; border-right: outset;" colspan="3">Price</td>
<td class="tbl-header last" style="text-align: center;">Total Return (%)</td>
</tr>
<tr class="tbl-data">
<td class="data-head last">&nbsp;</td>
<td class="data-head last">12/31/2022</td>
<td class="data-head last">1/31/2023</td>
<td class="data-head last" style="border-right: outset;">2/28/2023</td>
<td class="data-head last">12/31/2022</td>
<td class="data-head last">1/31/2023</td>
<td class="data-head last" style="border-right: outset;">2/28/2023</td>
<td class="data-head last">12/31/2022</td>
<td class="data-head last">1/31/2023</td>
<td class="data-head last" style="border-right: outset;">2/28/2023</td>
<td class="data-head last">1M</td>
</tr>
<tr class="tbl-data">
<td class="data-td last">BB</td>
<td class="data-td data last">87.00</td>
<td class="data-td data last">86.68</td>
<td class="data-td data last" style="border-right: outset;">86.68</td>
<td class="data-td data last">284</td>
<td class="data-td data last">258</td>
<td class="data-td data last" style="border-right: outset;">254</td>
<td class="data-td data last">90.02</td>
<td class="data-td data last">92.91</td>
<td class="data-td data last" style="border-right: outset;">90.59</td>
<td class="data-td data last">-1.96</td>
</tr>
<tr class="tbl-data">
<td class="data-td last">B</td>
<td class="data-td data last">10.95</td>
<td class="data-td data last">11.18</td>
<td class="data-td data last" style="border-right: outset;">10.66</td>
<td class="data-td data last">608</td>
<td class="data-td data last">543</td>
<td class="data-td data last" style="border-right: outset;">440</td>
<td class="data-td data last">82.50</td>
<td class="data-td data last">85.75</td>
<td class="data-td data last" style="border-right: outset;">87.22</td>
<td class="data-td data last">1.46</td>
</tr>
<tr class="tbl-data">
<td class="data-td last">CCC</td>
<td class="data-td data last">1.98</td>
<td class="data-td data last">2.11</td>
<td class="data-td data last" style="border-right: outset;">2.59</td>
<td class="data-td data last">1,020</td>
<td class="data-td data last">929</td>
<td class="data-td data last" style="border-right: outset;">961</td>
<td class="data-td data last">60.88</td>
<td class="data-td data last">65.49</td>
<td class="data-td data last" style="border-right: outset;">64.62</td>
<td class="data-td data last">-3.26</td>
</tr>
<tr class="tbl-data">
<td class="data-td last">CC</td>
<td class="data-td data last">&nbsp;</td>
<td class="data-td data last">0.03</td>
<td class="data-td data last" style="border-right: outset;">&nbsp;</td>
<td class="data-td data last">&nbsp;</td>
<td class="data-td data last">9,632</td>
<td class="data-td data last" style="border-right: outset;">&nbsp;</td>
<td class="data-td data last">&nbsp;</td>
<td class="data-td data last">5.15</td>
<td class="data-td data last" style="border-right: outset;">&nbsp;</td>
<td class="data-td data last">161.59</td>
</tr>
<tr class="tbl-data">
<td class="data-td last">D</td>
<td class="data-td data last">0.07</td>
<td class="data-td data last">&nbsp;</td>
<td class="data-td data last" style="border-right: outset;">0.08</td>
<td class="data-td data last">4,726</td>
<td class="data-td data last">&nbsp;</td>
<td class="data-td data last" style="border-right: outset;">3,401</td>
<td class="data-td data last">10.00</td>
<td class="data-td data last">&nbsp;</td>
<td class="data-td data last" style="border-right: outset;">13.47</td>
<td class="data-td data last">&nbsp;</td>
</tr>
<tr class="tbl-data">
<td class="data-td last">Total</td>
<td class="data-td data last">100</td>
<td class="data-td data last" style="border-right: outset;">100</td>
<td class="data-td data last">337</td>
<td class="data-td data last">307</td>
<td class="data-td data last" style="border-right: outset;">295</td>
<td class="data-td data last">87.91</td>
<td class="data-td data last">90.82</td>
<td class="data-td data last" style="border-right: outset;">88.92</td>
<td class="data-td data last">-1.56</td>
</tr>
</tbody>
</table>
</div>
<br />
<p class="chart-disclosure">Source: ICE Data Services and VanEck. Past performance is no guarantee of future results. Fallen Angels: ICE US Fallen Angel High Yield 10% Constrained Index.</p>
<p>To receive more <a href="https://www.vaneck.com/us/en/insights/income-investing/" title="Income Investing insights"><strong>Income Investing</strong></a> insights, <a href="/link/5f45412c2143400497908cea2897f7d3.aspx" title=" Subscription Center"><strong>sign up in our subscription center</strong></a>.</p>
<style type="text/css">
    .wrapped-div {
        max-width: 100%;
    }

    @media (max-width: 1024px) {
        .wrapped-div {
            overflow-x: scroll;
        }
    }

    .wrapped-div-sector {
        max-width: 100%;
        overflow-x: scroll;
    }
</style>
]]></content:encoded>
</item><item rdf:about="https://www.vaneck.com/us/en/blogs/model-portfolios/inflation-fight-night-fed-chair-vs-the-senator/">
  <title>Inflation Fight Night: Fed Chair vs. The Senator></title>
  <link>https://www.vaneck.com/us/en/blogs/model-portfolios/inflation-fight-night-fed-chair-vs-the-senator/</link>
  <description><![CDATA[During her questioning of Fed Chair Jerome Powell before the Senate Banking Committee, Senator Elizabeth Warren raised a key issue: can higher interest rates alone tame inflation?]]></description>
  <dc:creator>David Schassler</dc:creator>
  <dc:date>03/15/2023 06:30:00</dc:date>
<content:encoded><![CDATA[

<p>The three-round exhibition fight occurred on Tuesday, March 7, when Federal Reserve Chairman Jerome Powell testified before the Senate Banking Committee. Both opponents arrived well-prepared for the bout, which led to an exciting showdown. Given their influence, this commentary focuses on the main points of the exchange, intending to provide a politically unbiased view of the problems and the possible, appropriate investment solutions.</p>
<p>Here are the issues around which each round was fought.</p>
<h2>Round #1: The Fed cannot tame inflation with higher interest rates alone</h2>
<p>We agree with Senator Elizabeth Warren that the fight against inflation cannot be fought exclusively by wielding the demand destruction that results from higher interest rates. She specifically mentioned &ldquo;price gouging,&rdquo; &ldquo;supply chain kinks,&rdquo; and the &ldquo;war in Ukraine&rdquo; as inflationary forces that cannot be controlled through monetary policy.</p>
<p>The term &ldquo;price gouging&rdquo; is used to vilify companies for passing along increased costs to consumers. The declining profit margins of companies in the S&amp;P 500<sup>&reg;</sup>&nbsp;Index reveal that corporations are <i>not</i> &ldquo;gouging&rdquo; but suffering from high inflation&mdash;just as are individuals.</p>
<h3>S&amp;P 500 Operating Margin vs. CPI</h3>
<p><img loading="lazy" class="img-responsive w-100" src="https://www.vaneck.com/contentassets/bb7c6b91336146ae8e7f17f19238aecf/2962_qis_chart-01_2023.03_blog.svg" alt="S and P 500 Operating Margin vs. CPI" /></p>
<p class="chart-disclosure">Source: Bloomberg, Data as of 3/2023. Past performance is no guarantee of future results.</p>
<p>While &ldquo;supply chain kinks&rdquo; were once a significant source of high prices, the evidence suggests this is no longer true. As measured by the Federal Reserve Global Supply Chain Pressure Index, supply chains have corrected mainly and are now back at pre-COVID-19 levels. Supply chains likely are neither now nor will be a major source of inflation going forward.</p>
<h3>Global Supply Chain Pressure</h3>
<p><img loading="lazy" class="img-responsive w-100" src="https://www.vaneck.com/contentassets/bb7c6b91336146ae8e7f17f19238aecf/2962_qis_chart-02_2023.03_blog.svg" alt="Global Supply Chain Pressure" /></p>
<p class="chart-disclosure">Source: Bloomberg, Data as of 2/2023. Past performance is no guarantee of future results.</p>
<p>We do, though, agree that the war in Ukraine further aggravates inflation and that the economic consequences are likely to last for an extended period. War, in general, is highly inflationary because it diverts away productivity and efficiencies across global economies. The chart below demonstrates how periods of war have historically coincided with higher inflation.</p>
<h3>U.S. CPI YoY Change (%)</h3>
<p><img loading="lazy" class="img-responsive w-100" src="https://www.vaneck.com/contentassets/bb7c6b91336146ae8e7f17f19238aecf/2962_qis_chart-03_2023.03_blog.svg" alt="U.S. CPI YoY Change (%)" /></p>
<p class="chart-disclosure">Source: Bloomberg, Data as of 12/2022. Past performance is no guarantee of future results.</p>
<p>Since restrictions on the availability of commodities have global inflationary implications, this conflict is particularly inflationary given the significance of both Russia and Ukraine as commodity producers. The chart below demonstrates just why Russia is such a commodities powerhouse.</p>
<h3>Top 5 Countries in Global Production (2020 &ndash; 2021, Descending Order)</h3>
<p><img loading="lazy" class="img-responsive w-100" src="https://www.vaneck.com/contentassets/bb7c6b91336146ae8e7f17f19238aecf/2962_qis_table_01_2023.03_v1_blog.svg" alt="Top 5 Countries in Global Production (2020 - 2021, Descending Order)" /></p>
<br />
<p><img loading="lazy" class="img-responsive w-100" src="https://www.vaneck.com/contentassets/bb7c6b91336146ae8e7f17f19238aecf/2962_qis_table_02_2023.03_v1_blog.svg" alt="Top 5 Countries in Global Production (2020 - 2021, Descending Order)" /></p>
<p class="chart-disclosure">Source: Bloomberg, Company Data, Goldman Sachs Global Investment Research, Argus, WoodMac, USDA, USGS. Data as of 1/2022. Past performance is no guarantee of future results. Not intended as a recommendation to buy or sell securities of any sector mentioned herein.</p>
<p>However, we believe Senator Warren left out four very key risks that illustrate why monetary policy alone may not be enough to combat inflation:</p>
<ol class="content-list">
<li>The use of debt monetization to finance government overspending.</li>
<li>The failure to invest in the production of traditional energy.</li>
<li>The fact that &ldquo;social spending&rdquo; increases aggregate demand.</li>
<li>The cost increase resulted from de-globalization (e.g., on-shoring in the U.S.).</li>
</ol>
<p>In the interest of brevity in this piece, we can expand upon these topics in future commentaries.</p>
<h2>Round #2: The Fed will likely cause a severe recession, and many people will lose their jobs</h2>
<p>Senator Warren points out that, since the end of WWII, there have been 12 times when the unemployment rate increased by 1% or more within one year, and each time it resulted in a recession. Furthermore, once the economy starts losing jobs, it typically &ldquo;turns into a runaway train that is very hard to stop.&rdquo; In 11 out of those 12 times, unemployment rose at least another 1% or more after the initial 1%.</p>
<p>We agree and expect a hard landing. The chart below demonstrates the cause-and-effect relationships between inflation, interest rates, and unemployment. The last inflationary event of a similar magnitude was in the 1970s, resulting in a double-digit unemployment rate. While we do not believe such a severe downturn will emerge, the historical data cast heavy doubt on the expectation of a soft landing.</p>
<h3>CPI vs. Fed Funds Rate vs. Unemployment</h3>
<p><img loading="lazy" class="img-responsive w-100" src="https://www.vaneck.com/contentassets/bb7c6b91336146ae8e7f17f19238aecf/2962_qis_chart-4_new_2023.03_blog.svg" alt="CPI vs. Fed Funds Rate vs. Unemployment" /></p>
<p class="chart-disclosure">Source: Bloomberg, Data as of 12/2022. Past performance is no guarantee of future results.</p>
<h2>Round #3: Fire Powell</h2>
<p>Senator Warren concluded her statement: &ldquo;Chairman Powell, you are gambling with people&rsquo;s lives. We need a Fed that will fight for working families. If you are not going to lead that charge then we need someone at the Fed that will.&rdquo;</p>
<p>While this rhetoric may be politically expedient for Senator Warren, firing Chairman Powell will <i>not</i> solve the problem. Higher interest rates, in coordination with the resolution of supply-side bottlenecks, are necessary weapons in the fight against inflation.</p>
<p>The unkind truth is that millions of jobs will likely be sacrificed to ease the inflation burden on over 330 million Americans. The charts below demonstrate that, in the aggregate, the cost of inflation is much more substantial because it impacts everyone, not just those losing their jobs.</p>
<h3>Lost Real Income Per Increase In Unemployment</h3>
<p><img loading="lazy" class="img-responsive w-100" src="https://www.vaneck.com/contentassets/bb7c6b91336146ae8e7f17f19238aecf/2962_qis_chart-04_2023.03_blog.svg" alt="Lost Real Income Per Increase In Unemployment" /></p>
<h3>Lost Real Income Per Increase In Inflation level</h3>
<p><img loading="lazy" class="img-responsive w-100" src="https://www.vaneck.com/contentassets/bb7c6b91336146ae8e7f17f19238aecf/2962_qis_chart-05_2023.03_blog.svg" alt="Lost Real Income Per Increase In Inflation level" /></p>
<p class="chart-disclosure">Source: St. Louis Federal Reserve Bank. Data as of 9/2022. Past performance is no guarantee of future results.</p>
<h2>The Fight Result</h2>
<p>After three rounds of vigorous action, we go to the scorecards and declare the victory to Senator Elizabeth Warren by a slim margin. The most important takeaway was that high inflation must be addressed from <i>both</i> the demand and supply sides. Destroying the economy to bring the balance between demand and supply in line is only a temporary solution, at best. Eventually, the Fed will be required to relent. And, unless the supply-side issues are resolved, specifically in commodities, our expectation is of a resurgence in inflation.</p>
<h2>Investment Solutions</h2>
<p>First, you must stop assuming that inflation will just disappear. The chart below demonstrates how wrong the consensus view on inflation has been by comparing the differences between inflation expectations and inflation. Right now, the expectation is that the inflation rate will be 3.9% in 12 months. Will that prove to be right&mdash;maybe? Even a broken clock is right twice a day. But don&rsquo;t bet your nest egg on it.</p>
<p>Inflationary events of the past have occurred frequently (30% of the time, the CPI&mdash;the consumer price index&mdash;has been above 4%), and globally, on average, these events have lasted well over a decade.</p>
<h3>U.S. Inflation &amp; Expectation 2021-2023</h3>
<p><img loading="lazy" class="img-responsive w-100" src="https://www.vaneck.com/contentassets/bb7c6b91336146ae8e7f17f19238aecf/2962_qis_chart-06_2023.03_v2_blog.svg" alt="U.S. Inflation and Expectation 2021-2023" /></p>
<p class="chart-disclosure">Source: Bloomberg, Data as of 1/2023. Past performance is no guarantee of future results.</p>
<p>Secondly, consider a 10-20% strategic allocation to diversified real assets. Real assets have the ability to outperform during periods of high inflation because of the scarcity of physical goods during inflationary events. Our preferred solution is the Van Eck Real Assets ETF (&ldquo;RAAX&rdquo;). It offers an adaptive allocation across a diversified portfolio of inflation-fighting assets.</p>
<p>The chart below demonstrates the performance of RAAX, relative to both stocks and bonds, since inflation exceeded 2%.</p>
<h3>VanEck Real Assets ETF vs. Stocks/Bonds 2021-2023</h3>
<p><img loading="lazy" class="img-responsive w-100" src="https://www.vaneck.com/contentassets/bb7c6b91336146ae8e7f17f19238aecf/2962_qis_chart-07_2023.03_blog.svg" alt="VanEck Inflation Allocation ETF vs. Stocks/Bonds 2021-2023" /></p>
<p class="chart-disclosure">Source: Bloomberg, Data as of 1/2023. Past performance is no guarantee of future results. Not intended as a recommendation to buy or sell any securities mentioned herein.</p>
<p>Thank you for taking the time to read our commentary. And cross your fingers if you are not invested in diversified, inflation-fighting real assets.</p>
<p>To receive more <strong><a href="https://www.vaneck.com/us/en/insights/guided-allocation/" title="Model Portfolio Insights">Model Portfolio</a></strong> insights, <strong><a href="https://www.vaneck.com/us/en/subscribe/" title="Subscription Center">sign up in our subscription center</a></strong>.</p>
]]></content:encoded>
</item><item rdf:about="https://www.vaneck.com/us/en/blogs/economic-trends/we-are-gonna-need-a-bigger-boat/">
  <title>We’re Gonna Need a Bigger Boat?></title>
  <link>https://www.vaneck.com/us/en/blogs/economic-trends/we-are-gonna-need-a-bigger-boat/</link>
  <description><![CDATA[Global recession concerns are back with the vengeance. Can China&rsquo;s rebound offset risks stemming from DM banking troubles?]]></description>
  <dc:creator>Natalia  Gurushina</dc:creator>
  <dc:date>03/15/2023 06:30:00</dc:date>
<content:encoded><![CDATA[

<h2>Recession Fears and Fed Rates</h2>
<p><strong>Concerns</strong> that the Silicon Valley Bank and Credit Suisse &ldquo;episodes&rdquo; might not be isolated cases, but rather precursors to <strong>a fully-blown banking crisis and a global recession, are not going away</strong>, keeping the market expectations for the U.S. Federal Reserve (Fed) thoroughly depressed. The remaining Fed hikes are pretty much out the window this morning, and the Fed Funds Futures now price in 115-120bps of rate cuts (!) between now and December. The European Central Bank&rsquo;s (ECB&rsquo;s) rate-setting meeting is tomorrow &ndash; policy messaging has been quite hawkish until recently (given a series of upside inflation surprises), but the rate hike expectations are also dwindling as banking concerns jumped from the U.S. to Europe.</p>
<h2>China Rebound</h2>
<p><strong>One counter-point to the global recession narrative is China&rsquo;s reopening and growth rebound.</strong> The latest domestic activity indicators confirmed that even though the recovery is still moderate, it is gaining pace across the board (an encouraging sign for those concerned about China&rsquo;s unbalanced growth). Importantly, property investments are finally started to show signs of stabilization &ndash; a signal that the easing of housing restrictions is bearing fruit. There was nothing to suggest that the economy needs another massive stimulus, but certain sectors and smaller privately-owned companies might require continuing targeted support.</p>
<h2>EM Reaction to Market Turbulence</h2>
<p>Many <strong>emerging markets</strong> (<strong>EM) are expected to benefit from China&rsquo;s improving growth outlook &ndash; especially in Asia &ndash; but the market turbulence in developed markets (DM) is a major risk</strong>. So far, the reaction of EM sovereign bonds was quite logical (see chart below). Investment Grade bonds held on quite well (despite thinner spread &ldquo;cushions&rdquo;), while spread returns on lower-rated bonds were dragged down, in part, by higher U.S. rates&rsquo; volatility. EM FX is under more pressure today, but many local rates rallied in tandem with U.S. Treasuries. A sign of EM resilience so far is that the market continues to price in orderly (and cautious) rate cuts by those central banks that hiked early and aggressively in response to the rising post-pandemic price pressures &ndash; rather than &ldquo;emergency&rdquo; rate hikes to stem depreciation pressures, as was often the case in the past. Stay tuned!</p>
<h3>Chart at a Glance: Market Turbulence and EM Sovereign Bonds &ndash; Logical Reaction</h3>
<p><img class="img-responsive w-100" src="https://www.vaneck.com/contentassets/6e2d92a42b1248d69df780cf27f26785/us-natalias-take-2023-03-15-1.png" alt="Chart at a Glance: Market Turbulence and EM Sovereign Bonds - Logical Reaction" /></p>
<p class="chart-disclosure">Source: Bloomberg LP. Data from 3/9/2023 to 3/14/2023.</p>
]]></content:encoded>
</item><item rdf:about="https://www.vaneck.com/us/en/blogs/economic-trends/lower-rates-higher-risks/">
  <title>Lower Rates, Higher Risks?></title>
  <link>https://www.vaneck.com/us/en/blogs/economic-trends/lower-rates-higher-risks/</link>
  <description><![CDATA[Should the concept of EMs as a safer haven get more acceptance after the latest market &ldquo;hiccup&rdquo;? A growing number of EM Graduates and EMs&rsquo; own independent growth driver (China) point in this direction.]]></description>
  <dc:creator>Natalia  Gurushina</dc:creator>
  <dc:date>03/14/2023 06:30:00</dc:date>
<content:encoded><![CDATA[

<h2>Fed Pivot</h2>
<p>Yesterday&rsquo;s massive short squeeze in global short rates &ndash; which produced the largest daily drop in the 2-year U.S. Treasury yield since 1983 (ahead of the 1987 Black Monday, the aftermath of 9/11, and the 2008 global financial crisis) - seems to be over, but <strong>concerns about the state of the banking system</strong> at large are still here. And this helps to <strong>explain an abrupt shift in the market expectations for major global central banks</strong>, even though inflation pressures are might not be receding fast enough. As of this morning, the Fed Funds Futures were pricing in less than 40bps of remaining rate hikes in the U.S. (in March or May), the implied Fed peak rate stayed below 5%, and the implied H2 rate cuts staged a comeback (see chart below). The U.S. Federal Reserve&rsquo;s meeting next week will be very interesting indeed.</p>
<h2>China Growth Outlook</h2>
<p>It remains to be seen whether the banking sector concerns will affect the growth outlook in DM, but many <strong>emerging markets (EMs) must be grateful to have an independent global growth driver in their midst &ndash; China</strong>. The China commentary focused mostly on political/geopolitical issues and longer-term strategic policy items in the past few days (after the National People&rsquo;s Congress). Still, today&rsquo;s domestic activity indicators (retail sales, investments, industrial production, and residential property sales) will be closely watched for further signs of recovery &ndash; both the speed and the type (consumption-driven or not).</p>
<h2>EM Graduates</h2>
<p>The China factor might have shielded some EMs during the selloff, but the past week's events also raised another &ndash; perhaps even more ambitious &ndash; question. <strong>Should a concept of EMs as a safer haven be getting more acceptance going forward?</strong> Of course, the EM family has its &ldquo;enfants terribles&rdquo; &ndash; just check Argentina&rsquo;s 3-digit inflation numbers this afternoon (if you dare) or look at Turkey&rsquo;s rate cuts &ldquo;shenanigans.&rdquo; However, EM Graduates are growing in numbers, and these are the countries who had done their &ldquo;homework&rdquo; &ndash; including implementing structural reforms, having independent central banks, and targeting international reserves rather than exchange rates - after the past crises. Many of them also pay much higher real rates than DMs. Stay tuned!</p>
<h3>Chart at a Glance: Market Expectations for the Fed &ndash; Running Scared</h3>
<p><img class="img-responsive w-100" src="https://www.vaneck.com/contentassets/3a3ffe34f8fc4c08a1bfc77de385f846/us-natalias-take-2023-03-14.png" alt="Chart at a Glance: Market Expectations for the Fed - Running Scared" /></p>
<p class="chart-disclosure">Source: Bloomberg LP.</p>
]]></content:encoded>
</item><item rdf:about="https://www.vaneck.com/us/en/blogs/economic-trends/us-fed-boxed-in-ems-finally-free/">
  <title>U.S. Fed Boxed In… EMs Finally Free?></title>
  <link>https://www.vaneck.com/us/en/blogs/economic-trends/us-fed-boxed-in-ems-finally-free/</link>
  <description><![CDATA[EMs&rsquo; resilience over the past few days might have looked surprising, but there are fundamental and structural reasons for that.]]></description>
  <dc:creator>Natalia  Gurushina</dc:creator>
  <dc:date>03/13/2023 15:00:00</dc:date>
<content:encoded><![CDATA[

<h2>Fed Policy Rate Outlook</h2>
<p>Bold moves from regulators might have saved the Silicon Valley Bank depositors, but the debacle caused <strong>some wild market moves, including expectations for the U.S. Federal Reserve&rsquo;s (Fed&rsquo;s) policy rate</strong>. Rate hikes have been almost completely priced out this morning, and the implied peak rate dropped well below 5%. The 2-year U.S. Treasury yield recorded one of the largest daily declines since 1983 <a name="_Hlk129598494"></a>&ndash; actually, the second largest at the time of the note &ndash; with many market participants questioning whether the current situation is in the same ballpark as the previous crises. On top of everything else, we have the next inflation print in the U.S. tomorrow. So, the outlook for the Fed&rsquo;s next rate-setting meeting is interesting to say the least.</p>
<h2>EMFX Performance</h2>
<p><strong>How are EMs doing in this environment?</strong> We are seeing a lot of red in various equity markets, but rates are rallying across the board. Many EM currencies are in the black as well (see chart below) &ndash; the Mexican peso being among few EM FX casualties so far this morning, most likely due to &ldquo;nearshoring&rdquo; concerns. We also noted that local swap curves continue to price in orderly and cautious rate cuts in several EMs &ndash; just as they did last week &ndash; showing no signs of panic. There are plenty of uncertainties going forward &ndash; including contagion fears &ndash; but EMs&rsquo; resilience (so far) has attracted attention.</p>
<h2>EM Fundamental Strengths</h2>
<p>Our <strong><a href="https://www.vaneck.com/us/en/blogs/emerging-markets-bonds/3-reasons-to-allocate-to-em-bonds-in-2023/" title="3 Reasons to Allocate to EM Bonds in 2023">long-standing arguments in favor of EM bonds</a></strong> are: (1) independent central banks (EM central banks moved much faster with aggressive rate hikes in the current cycle and now have very high real policy rates); (2) lower debt (hence, fewer concerns about fiscal dominance); and (3) benefits from China&rsquo;s reopening (arguably, many EMs are now more correlated with China than the Fed). Many EMs learned the lessons of the past crises and strengthened their policy frameworks &ndash; both fiscal and monetary (the fact that the market would regularly punish them for policy transgressions definitely helped). It is easy to ignore these factors during &ldquo;everything rallies&rdquo; &ndash; but will this be the moment when EMs will finally come of age? Stay tuned!</p>
<h3>Chart at a Glance: EM FX &ndash; Holding on Well, Despite Market Turbulence</h3>
<img class="img-responsive w-100" src="https://www.vaneck.com/contentassets/4005ac26306d4c8aaa935b9dd469938d/economic-trends-03.13.23b.png" alt="Chart at a Glance: EM FX &ndash; Holding on Well, Despite Market Turbulence" />
<p class="chart-disclosure">Source: Bloomberg LP</p>
]]></content:encoded>
</item><item rdf:about="https://www.vaneck.com/us/en/blogs/gold-investing/joe-foster-gold-m-and-a-a-bright-spot-amid-volatility/">
  <title>Gold M&amp;A a Bright Spot Amid Volatility></title>
  <link>https://www.vaneck.com/us/en/blogs/gold-investing/joe-foster-gold-m-and-a-a-bright-spot-amid-volatility/</link>
  <description><![CDATA[A resilient economy batters gold in February; M&amp;A activity, and with it, the potential of &ldquo;value creation&rdquo;, picks up across the market cap spectrum.]]></description>
  <dc:creator>Imaru Casanova</dc:creator>
  <dc:date>03/13/2023 06:30:00</dc:date>
<content:encoded><![CDATA[

<p>Monthly gold market and economic insights from Imaru Casanova, Deputy Portfolio Manager and Joe Foster, Portfolio Manager and Strategist, featuring their unique views on mining and gold&rsquo;s portfolio benefits. <a href="https://www.vaneck.com/us/en/blogs/gold-investing/joe-foster-gold-m-and-a-a-bright-spot-amid-volatility/gold-monthly-commentary-february-2023.pdf" target="_blank" title="Gold Monthly Commentary - February 2023" rel="noopener"><strong>An expanded PDF version of this commentary, including fund specific information can be downloaded here.</strong></a></p>
<p>Gold hit a yearly high of $1,960 on February 2, only to drop almost $100 per ounce from that level the next day following a stronger than expected January jobs report in the U.S.<sup>i</sup>&nbsp;The rest of the month was dominated by the same narrative: A resilient economy, as further demonstrated by a sharp rebound in U.S. retail sales,<sup>ii</sup>&nbsp;and inflation above estimates,<sup>iii</sup>&nbsp;will keep the U.S. Federal Reserve (Fed) committed to hiking interest rates &ndash; which is viewed as positive for the U.S. dollar and negative for gold. The U.S. Dollar Index (DXY)<sup>1</sup>&nbsp;was up 2.7% in February, while gold was down 5.3%, closing at $1,827 per ounce on February 28.</p>
<p>While gold equities were up almost twice as much as gold in January, they were down more than twice as much in February. The NYSE Arca Gold Miners Index (GDMNTR)<sup>2</sup>&nbsp;was down 14.3%, and the MVIS Global Juniors Gold Miners Index (MVGDXJTR)<sup>3</sup>&nbsp;was down 13.5%.</p>
<h2>Gold moves, misguidance rattle the miners</h2>
<p>The performance of gold stocks is a result of their strong leverage to the gold price, but in February it also reflected underperformance due to reported results and 2023 guidance that were generally below expectations. Operating and capital cost guidance for 2023 was likely the biggest disappointment, with companies still feeling the impact of inflation on their operations and projects, and also perhaps (and hopefully) due to more conservatism built into their estimates.</p>
<p>Gold miners also struggled to maintain and/or increase annual production. Agnico-Eagle (8.53% of Strategy net assets), one of the largest and highest quality companies in the gold sector, has a solid track record of meeting and often beating expectations. In February, the company provided three-year guidance that shows annual production growing 7% by 2025 relative to 2022, but below consensus estimates and at higher costs. Although Agnico&rsquo;s stock fell sharply following the update, it has bounced back since. The company has a strong management team that we are confident can navigate the recent operational challenges, and a low risk, low capital expenditure, organic project pipeline that should support further growth.</p>
<h2>&ldquo;Value creation&rdquo; over &ldquo;growth&rdquo;</h2>
<p>For Newmont (4.22% of Strategy net assets), the world&rsquo;s largest gold miner with 6 million ounces of gold produced in 2022, growing (or even sustaining) production is a formidable task. The company more than replaced all the ounces it mined in 2022, growing reserves from 92.8 million ounces at the end of 2021 to 96.1 million ounces of gold at the end of 2022. Finding or converting 9.3 million ounces of reserves in one year is no easy task, and for Newmont it translates to only 6 months of additional production (net of depletion). This highlights the challenges Newmont and the gold industry face in delivering growth.</p>
<p>And here, we want to go over our definition of growth, which includes not only annual production growth, but also operating margin and reserve growth. If, for example, a company produces 1 million ounces of gold today, and it is projected to produce 1 million ounces of gold next year, many would consider this company to have zero growth. But if next year&rsquo;s ounces are produced at a lower operating or capital cost, then cash flow will grow; this is growth! If the company produces the same number of ounces the following year, but through exploration or acquisitions it manages to sustain this production level by additional years, its net asset value will grow; this is also growth! In other words, we view growth as anything that grows the value of the company over our estimated operating horizon. Thus, &ldquo;value creation&rdquo; rather than &ldquo;growth&rdquo; seems, to us, to be a better term to define the success of a company&rsquo;s strategy.</p>
<h2>Sector consolidation trend: M&amp;A Picking up across the market cap spectrum</h2>
<ul class="content-list">
<li><i>Seniors/Majors:</i> Newmont&rsquo;s management seems to agree with us on this. We met with them at the BMO Capital Markets Global Metals &amp; Mining Conference in Florida last week, and they emphasized that the impetus behind their offer to acquire Newcrest (not held), the largest Australian gold producer, is unquestionably value creation. They referred to it as &ldquo;Value over Volume&rdquo;, to signify that the transaction would seek to grow the value of the combined entities not just the number of ounces Newmont produces. Newcrest has rejected Newmont&rsquo;s offer but is willing to work with Newmont to allow them to advance their due diligence process. Newmont seems committed to exploring the combination, yet not desperate. While in early stages, we expect Newmont to conduct a responsible evaluation that firmly adheres to its promise of value accretion.</li>
<li><i>Mid-Tiers:</i> Mid-tier miner B2Gold (4.32% of Strategy net assets) also sees an opportunity to deliver value creation to the gold industry. On February 13, the company announced an agreement to acquire junior developer Sabina Gold &amp; Silver (1.71% of Strategy net assets) in an all-share transaction.<sup>iv</sup>&nbsp;Sabina owns the Goose asset, a fully permitted, construction ready project in Nunavut, Canada, with mineral reserves of 3.6 million ounces of gold. A feasibility study highlights production of around 200,000 ounces of gold (about 20% of B2Gold&rsquo;s 1 million ounces in 2022) over a 15-year life, at all-in sustaining costs (AISC) of $775 per ounce (compared to B2Gold&rsquo;s AISC of $1,033 per ounce in 2022). We view this combination positively. We expect that B2Gold&rsquo;s proven ability as experienced and successful mine builders and operators should lead to improved returns and significantly reduce construction and start up risks at Goose. The addition of Canada to B2Gold&rsquo;s asset base should also benefit its market valuation multiples.</li>
<li><i>Juniors:</i> It looks like some companies have been listening to our urgent call for consolidation in the junior space (see our <strong><a href="https://www.vaneck.com/us/en/blogs/gold-investing/joe-foster-time-for-golds-juniors-to-grow-up/" title="Time For Gold's Juniors To Grow Up">May 2022 commentary</a></strong>). Integra Resources (not held) and Millennial Precious Metals (not held) entered into an agreement to combine the companies under a no premium, merger of equals transaction that consolidates their assets in Idaho and Western Nevada, creating one of the largest gold-silver endowments in the Great Basin not controlled by a major mining company. The gold mining industry is very fragmented, to its own detriment. We are encouraged by this recent announcement. We reiterate our view that companies need to do more to attract investors to the sector. They must raise their profile and a sure way to do that, in our view, is through consolidation.</li>
</ul>
<h2>Markets overlooking the impact of higher-for-longer rates</h2>
<p>The gold market is pricing in an environment of higher interest rates due to better-than-expected U.S. economic activity and slower-than-expected disinflation. The probability of a June rate hike by the Fed increased from about 4% at the beginning of February to more than 70% at the end of the month. Gold has managed to stay above $1,800 per ounce, relatively unchanged year-to-date, as of end of February, despite expectations for an increasingly more aggressive Fed policy trajectory. The gold price is demonstrating resilience, even when holdings in global gold bullion ETFs, the best proxy for investment demand, continue to decline.</p>
<p>We believe the market is ignoring the negative effect of sustained higher rates on the global financial system. For example, the default by Columbia Property Trust (owned by funds managed by PIMCO) on $1.7 billion in mortgages linked to office buildings,<sup>v</sup>&nbsp;and by Brookfield, one of the largest Downtown L.A. office owners, on over $750 million worth of loans, is a recent example of the significant stress imposed by higher rates.<sup>vi</sup>&nbsp;Bloomberg reports that according to the Mortgage Bankers Association, nearly $92 billion of nonbank office debt is set to mature in 2023.<sup>vii</sup>&nbsp;Approximately 48% of debt on office properties that matures this year has a variable rate, according to Newmark Group Inc., posing a great challenge for this industry.<sup>viii</sup>&nbsp;Office owners will not be alone in their struggle. Interest expense will become a significant problem as record levels of debt across the globe are impacted by higher rates. This increasing debt burden, combined with a slow economy and sticky, elevated inflation, make for an uncertain outlook, in our view. This should be supportive of gold prices in 2023 and longer term.</p>
<p>To receive more insights to <strong><a href="https://www.vaneck.com/us/en/insights/gold-investing/" title="Gold Investing Insights">Gold Investing</a></strong> insights, <strong><a href="https://www.vaneck.com/us/en/subscribe/" title="Subscription Center">sign up in our subscription center</a></strong>.</p>
]]></content:encoded>
</item><item rdf:about="https://www.vaneck.com/us/en/blogs/emerging-markets-bonds/debt-rattle-for-developed-markets-birth-for-emerging-markets/">
  <title>Debt Rattle for Developed Markets, Birth for Emerging Markets></title>
  <link>https://www.vaneck.com/us/en/blogs/emerging-markets-bonds/debt-rattle-for-developed-markets-birth-for-emerging-markets/</link>
  <description><![CDATA[&ldquo;Fiscal dominance&rdquo;, a defining EM term, is driving markets, resulting in many DMs facing higher rates and weaker currencies, while numerous EMs are facing lower rates and stronger currencies.]]></description>
  <dc:creator>Eric Fine</dc:creator>
  <dc:date>03/13/2023 06:30:00</dc:date>
<content:encoded><![CDATA[

<h2>Overview</h2>
<p>In February, the VanEck Emerging Markets Bond Fund (the Fund) returned -2.83%, compared to -2.69% for its benchmark, the 50% J.P. Morgan Government Bond Index-Emerging Markets (GBI-EM) Global Diversified and 50% J.P. Morgan Emerging Markets Bond Index (EMBI), generating underperformance of 14 basis points (bps). Year-to-Date (YTD), the Fund returned 2.05%, compared to 0.95% for its benchmark, resulting in outperformance of 111 bps. We have completed our months-long duration reduction from 8-handle to 4-handle, mostly via reductions in Investment Grade (IG). We also trimmed our overweights in Asian EMFX due to their dramatic repricing, but are looking to reload. We had little high-beta EMFX, such as Brazil and South Africa, but are increasing exposure into their selloffs. As of end-February, local currency exposure was 52.88%, duration was 5.85 and carry was 7.48%. Cash has been a rare high at 5.3%, in anticipation of volatility and buying opportunities. <a href="/us/en/blogs/emerging-markets-bonds/debt-rattle-for-developed-markets-birth-for-emerging-markets/emb-manager-commentary-02-2023.pdf" rel="noopener" target="_blank" title="VanEck Emerging Markets Bond Fund Monthly Manager Commentary - February 2023"><strong>View here</strong></a> for a PDF version of this blog.</p>
<div class="wrapped-div">
<table style="width: 100%;">
<tbody>
<tr class="tbl-data">
<td class="tbl-header last" colspan="8">Average Annual Total Returns (%) as of February 28, 2023</td>
</tr>
<tr class="tbl-data">
<td class="data-td last">&nbsp;</td>
<td class="data-head last">1 Month<sup>&dagger;</sup></td>
<td class="data-head last">3 Month<sup>&dagger;</sup></td>
<td class="data-head last">YTD</td>
<td class="data-head last">1 Year</td>
<td class="data-head last">3 Year</td>
<td class="data-head last">5 Year</td>
<td class="data-head last">10 Year</td>
</tr>
<tr class="tbl-data">
<td class="data-td last">Class A: NAV (Inception 7/9/12)</td>
<td class="data-td data last">-2.83</td>
<td class="data-td data last">4.93</td>
<td class="data-td data last">2.05</td>
<td class="data-td data last">-2.58</td>
<td class="data-td data last">0.09</td>
<td class="data-td data last">0.89</td>
<td class="data-td data last">0.15</td>
</tr>
<tr class="tbl-data">
<td class="data-td last">Class A: Maximum 5.75% Load</td>
<td class="data-td data last">-8.42</td>
<td class="data-td data last">-1.10</td>
<td class="data-td data last">-3.82</td>
<td class="data-td data last">-8.18</td>
<td class="data-td data last">-1.87</td>
<td class="data-td data last">-0.29</td>
<td class="data-td data last">-0.44</td>
</tr>
<tr class="tbl-data">
<td class="data-td last">Class I: NAV (Inception 7/9/12)</td>
<td class="data-td data last">-2.78</td>
<td class="data-td data last">4.85</td>
<td class="data-td data last">1.87</td>
<td class="data-td data last">-2.36</td>
<td class="data-td data last">0.35</td>
<td class="data-td data last">1.19</td>
<td class="data-td data last">0.45</td>
</tr>
<tr class="tbl-data">
<td class="data-td last">50 GBI-EM GD / 50% EMBI GD</td>
<td class="data-td data last">-2.69</td>
<td class="data-td data last">2.20</td>
<td class="data-td data last">0.95</td>
<td class="data-td data last">-7.33</td>
<td class="data-td data last">-4.68</td>
<td class="data-td data last">-1.80</td>
<td class="data-td data last">-0.02</td>
</tr>
</tbody>
</table>
</div>
<br />
<div class="wrapped-div">
<table style="width: 100%;">
<tbody>
<tr class="tbl-data">
<td class="tbl-header last" colspan="8">Average Annual Total Returns (%) as of December 31, 2022</td>
</tr>
<tr class="tbl-data">
<td class="data-td last">&nbsp;</td>
<td class="data-head last">1 Month<sup>&dagger;</sup></td>
<td class="data-head last">3 Month<sup>&dagger;</sup></td>
<td class="data-head last">YTD</td>
<td class="data-head last">1 Year</td>
<td class="data-head last">3 Year</td>
<td class="data-head last">5 Year</td>
<td class="data-head last">10 Year</td>
</tr>
<tr class="tbl-data">
<td class="data-td last">Class A: NAV (Inception 7/9/12)</td>
<td class="data-td data last">2.82</td>
<td class="data-td data last">10.32</td>
<td class="data-td data last">-7.73</td>
<td class="data-td data last">-0.64</td>
<td class="data-td data last">0.67</td>
<td class="data-td data last">0.27</td>
</tr>
<tr class="tbl-data">
<td class="data-td last">Class A: Maximum 5.75% Load</td>
<td class="data-td data last">-3.09</td>
<td class="data-td data last">3.98</td>
<td class="data-td data last">-13.04</td>
<td class="data-td data last">-2.58</td>
<td class="data-td data last">-0.52</td>
<td class="data-td data last">-0.33</td>
</tr>
<tr class="tbl-data">
<td class="data-td last">Class I: NAV (Inception 7/9/12)</td>
<td class="data-td data last">2.93</td>
<td class="data-td data last">10.43</td>
<td class="data-td data last">-7.21</td>
<td class="data-td data last">-0.30</td>
<td class="data-td data last">1.00</td>
<td class="data-td data last">0.59</td>
</tr>
<tr class="tbl-data">
<td class="data-td last">50 GBI-EM GD / 50% EMBI GD</td>
<td class="data-td data last">1.24</td>
<td class="data-td data last">8.30</td>
<td class="data-td data last">-14.73</td>
<td class="data-td data last">-5.64</td>
<td class="data-td data last">-1.85</td>
<td class="data-td data last">-0.17</td>
</tr>
</tbody>
</table>
</div>
<br />
<p class="chart-disclosure"><sup>&dagger;</sup>&nbsp;Returns less than one year are not annualized.</p>
<p class="chart-disclosure"><strong>Expenses: Class A: Gross 2.33%, Net 1.28%; Class I: Gross 1.74%, Net 0.96%.</strong> Van Eck Associates Corporation (the &ldquo;Adviser&rdquo;) has agreed to waive fees and/or pay Fund expenses to the extent necessary to prevent the operating expenses of the Fund (excluding acquired fund fees and expenses, interest expense, trading expenses, dividends and interest payments on securities sold short, taxes and extraordinary expenses) from exceeding 1.25% for Class A and 0.95% for Class I of the Fund&rsquo;s average daily net assets per year until May 1, 2023. During such time, the expense limitation is expected to continue until the Board of Trustees acts to discontinue all or a portion of such expense limitation. Please note that, generally, unconstrained bond funds may have higher fees than core bond funds due to the specialized nature of their strategies.</p>
<p class="chart-disclosure"><strong>The performance data quoted represents past performance. Past performance is not a guarantee of future results. Investment return and principal value of an investment will fluctuate so that an investor&rsquo;s shares, when redeemed, may be worth more or less than their original cost. Performance may be lower or higher than performance data quoted. Please call 800.826.2333 or visit vaneck.com for performance current to the most recent month ended.</strong></p>
<p class="chart-disclosure">The &ldquo;Net Asset Value&rdquo; (NAV) of a Fund is determined at the close of each business day, and represents the dollar value of one share of the fund; it is calculated by taking the total assets of the fund, subtracting total liabilities, and dividing by the total number of shares outstanding. The NAV is not necessarily the same as the ETF&rsquo;s intraday trading value. Investors should not expect to buy or sell shares at NAV.</p>
<p><strong>Why should a central bank buy treasuries, German bunds or Japanese Government Bonds (JGBs)?</strong> Don&rsquo;t ask us. For sure, USD (and EUR and JPY) will remain the name of the ongoing flow game for many years to come. But emerging markets (EM) are already up to their necks in dollars, and more so every month. Every central bank that matters has plenty of dollars and has bought treasuries with them. Good thing rising rates aren&rsquo;t killing those assets (treasuries in dollars, i.e., duration risk) as you slowly run off your treasuries&hellip;oops. Central banks will ramp up the escape plan EM bonds.</p>
<ul class="content-list">
<li>Sanctions by the U.S./Germany/Japan on the Russian central banks&rsquo; treasuries (and bunds and JGBs) held in reserves.</li>
<li>These central banks must re-evaluate the status of these reserves now that they are known to be subject to cancellation over political disagreement.</li>
<li>In this framing, the USD can strengthen against JPY and EUR, simply because it is the last to fall. With most debt in USD and higher-yielding, the demand for USD versus JPY and EUR should win.</li>
<li>Even just looking at the carry of treasuries compared to EM local-currency bonds, and what that means over the next 12 months, shows high-yielding EM bonds are hard to beat in rising or declining risk-free rate environments. The policy rates of EM vs developed markets (DM) show this, too.</li>
</ul>
<h3>Exhibit 1 &ndash; Global Policy Rate Changes &ndash; From COVID Min to Post-Pandemic Max, bps</h3>
<p><img class="img-responsive w-100" src="https://www.vaneck.com/contentassets/135f4dc4ed244ff78581a19421abbfdd/2946_emb_chart_01_2023.01_v1_blog.svg" alt="Exhibit 1 - Global Policy Rate Changes - From COVID Min to Post-Pandemic Max, bps" /></p>
<p class="chart-disclosure">Source: VanEck Research; Bloomberg LP. Data as of March 8, 2023.</p>
<p><strong>The engineering result is many EM bond markets are now reserve assets; high-local-currency-rated Asian, Gulf and Latin American bonds fit the bill perfectly.</strong> China and India (for example) can now (as of last month) pay for Gulf oil with renminbi (CNY) and rupee (INR); this forces those Gulf central banks to use that cash to buy Chinese and Indian bonds. Obviously, in analyzing these developments, you still need to consider central bank independence, carry relative to fundamentals and all the usual properties of bonds that fit a higher or lower status. We don&rsquo;t happen to like the CNY nor INR bonds, but there are tons of great EM bond markets subject to that dynamic. Do developed bond markets still fit this high standard?</p>
<ul class="content-list">
<li>Central bank balance sheets other than these G-3&rsquo;s are reducing their allocation to U.S. treasuries, and increasing their allocations to gold and EM local-currency bonds.</li>
<li>The balance sheets of central bank balance sheets holding treasuries, bunds and JGBs are large, and these countries are borrowers from EM.</li>
<li>The balance sheets of central bank balance sheets looking to hold EM local-currency bonds are large and these countries are all creditors to EM.</li>
<li>Central banks will buy bonds of countries who manage economic affairs similarly to themselves. EM countries with low debts and deficits and high carry will buy local-currency bonds of countries with low debts and deficits and high carry.</li>
<li>DM central banks will still be forced to reward DM countries with high debts and deficits, but will also be buying EM local-currency bonds of countries with low debts and deficits and high carry.</li>
</ul>
<h3>Exhibit 2 &ndash; Fed Operating Loss</h3>
<p><img class="img-responsive w-100" src="https://www.vaneck.com/contentassets/135f4dc4ed244ff78581a19421abbfdd/2946_emb_chart_02_2023.01_v1_blog.svg" alt="Exhibit 2 - Fed Operating Loss" /></p>
<p class="chart-disclosure">Source: Bloomberg LP. Data as of March 8, 2023. Past performance is no guarantee of future results.</p>
<p><strong>The Fed Operating Loss chart, above, is a depressing chart; let&rsquo;s avert our eyes and play a game!</strong> If you are in DM, the game is called <em>Small Pie</em>. If you are in EM, the game is called <em>Big Pie</em>. Play! Terms that define EM, such as &ldquo;fiscal dominance&rdquo;, are driving markets. What that means is many DMs are facing higher rates and weaker currencies, while a lot of EMs are facing lower rates and stronger currencies.</p>
<ul class="content-list">
<li>&ldquo;Fiscal dominance&rdquo; increasingly dominates DM. It is normally created by high levels of debt that mean a country&rsquo;s central bank can no longer increase interest rates (to fight inflation, for example) because doing so would bankrupt the central bank&rsquo;s country.</li>
<li>Many countries in EM have low debts and deficits and independent central banks, and are thus not subject to fiscal dominance.</li>
<li>This means that DM countries might see higher rates and weaker currencies no matter what.</li>
<li>This also means that EM countries might see lower rates and stronger currencies.</li>
<li>This is precisely what happened from 4Q2022 with Asian EM local currency. These bond markets are the most advanced in terms of economic frameworks of low debt and independent central banks, and this component rallied despite DM bond markets suffering.</li>
<li>EMs are opening trade and financing structures and using each other&rsquo;s currencies in trade. DMs are sanctioning creditors.</li>
</ul>
<h3>Exhibit 3 &ndash; Eurasia is Globalizing/West is De-Globalizing</h3>
<p><img class="img-responsive w-100" src="https://www.vaneck.com/contentassets/135f4dc4ed244ff78581a19421abbfdd/2946_emb_image_03_2023.01_v1_blog.svg" alt="Exhibit 3 - Eurasia is Globalizing/West is De-Globalizing" /></p>
<h2>EXPOSURE TYPES AND SIGNIFICANT CHANGES</h2>
<p>The changes to our top positions are summarized below. Our largest positions in February were Indonesia, South Africa, Brazil, Thailand and Malaysia.</p>
<ul class="content-list">
<li>We increased our local currency and hard currency corporate exposure in Brazil. Brazil&rsquo;s local curve looks too "hawkish", given the disinflation progress, albeit we keep an eye on fiscal debates, any downside growth risks that might affect revenue collection and the new administration&rsquo;s stance regarding the central bank&rsquo;s independence. In terms of our investment process, this improves the technical test score for the country. The corporate bond provides a better risk/return profile by not being directly exposed to the policy saga/debate. The bond is also cheap. Although off its mid-2022 lows, it is still in the mid-80s and yields 10.5% for a 2031 amortizing structure (duration of 5.3 years). In early January, the company made a small redemption at USD104 through its cash sweep mechanism, well ahead of its first required payment (Dec 2024). This indicates strong cash flow generation after being taken over by Mubadala in 2022, which we see as a better operator than previous owner Petrobras.</li>
<li>We also increased local currency exposure in Poland and South Africa. Poland&rsquo;s growth outlook might be less dreary due to lower recession risks in the Eurozone and China&rsquo;s reopening. Poland&rsquo;s policy backdrop is also looking more orthodox &ndash; specifically, the central bank is not rushing into rate cuts as inflation is still far away from the target. South Africa is also expected to benefit from China&rsquo;s growth rebound &ndash; against the backdrop of moderating inflation. The central bank&rsquo;s policy stance remains cautious and credible, and the 2023 draft budget did not disappoint. These factors improved the technical and policy test scores for both countries.</li>
<li>Finally, we increased local currency exposure in Peru and hard currency sovereign exposure in the United Arab Emirates (UAE). Peru&rsquo;s political noise obscures the most credible and capable central bank, as well as a fairly stable fiscal outlook (plus, a deep pool of technocrats in the ministry of finance). The country&rsquo;s fundamentals are strong, including moderating price pressures and the narrowing current account gap, while non-resident positioning in local bonds is quite small. In terms of our investment process, this points to stronger economic, policy, and technical test scores. As regards the UAE, respecting our risk limits was made easier by improved valuations (and hence, the stronger technical test score).</li>
<li>We reduced our hard currency quasi-sovereign and corporate exposure in China and local currency exposure in Malaysia and Thailand. We continued to take profits on our positions in China, which rallied substantially during the initial re-opening rally. The market is clamoring for more evidence that the past policy measures are indeed working &ndash; especially in the housing sector &ndash; and that the recovery is progressing as expected. Both Malaysia and Thailand are among the countries that are set to benefit markedly from China&rsquo;s growth rebound, so any concerns about China&rsquo;s recovery timeline are bound to have an impact on local assets. We thought it would be prudent to take partial profits, before re-engaging at better price levels.</li>
<li>We also reduced our hard currency corporate and local currency exposure in Colombia, and local currency exposure in Israel and Hungary. Colombia&rsquo;s policy landscape is getting increasingly convoluted, and this can affect both the inflation and fiscal outlooks, worsening the country&rsquo;s policy test score. In Israel, we decided to take profits after this year&rsquo;s rally due to policy concerns associated with the new cabinet. This worsened the policy test score for the country. In Hungary, we became concerned that inflation might peak at a higher rate, and decided to take partial profits against the backdrop of the worsening economic test scores.</li>
<li>Finally, we reduced our hard currency sovereign exposure in Kenya and Nigeria, and hard currency corporate exposure in Nigeria and India. Even though Nigeria&rsquo;s presidential elections did not result in a worst-case scenario (the runoff), the winner's mandate looks &ldquo;thin&rdquo;, while there are a lot of questions about governability and ability to implement much needed reforms. Kenya&rsquo;s valuations no longer look compelling, while the government&rsquo;s decision to resort to an emergency loan from the central bank over a &ldquo;biting&rdquo; cash crush is set to worsen the country&rsquo;s debt burden, weakening the policy and economic test scores for the country. Our decision to reduce Indian exposure was due to on-going headline risks generated by a specific company.</li>
</ul>
<p>To receive more <a href="https://www.vaneck.com/us/en/insights/emerging-markets-bonds/" title="Emerging Markets Bonds Insights"><strong>Emerging Markets Bonds</strong></a> insights, <a href="https://www.vaneck.com/us/en/subscribe/" title="Subscription Center"><strong>sign up in our subscription center</strong></a>.</p>
<style type="text/css">
    .wrapped-div {
        max-width: 100%;
    }

    @media (max-width: 768px) {
        .wrapped-div {
            overflow-x: scroll;
        }
    }

    .wrapped-div-sector {
        max-width: 100%;
        overflow-x: scroll;
    }
</style>
]]></content:encoded>
</item><item rdf:about="https://www.vaneck.com/us/en/blogs/economic-trends/when-big-stories-collide/">
  <title>When Big Stories Collide></title>
  <link>https://www.vaneck.com/us/en/blogs/economic-trends/when-big-stories-collide/</link>
  <description><![CDATA[Geopolitical twists add to the complicated global economic backdrop, but some EMs look less affected by the latest risk-off episode.]]></description>
  <dc:creator>Natalia  Gurushina</dc:creator>
  <dc:date>03/10/2023 17:00:00</dc:date>
<content:encoded><![CDATA[

<h2>Fed Policy Response</h2>
<p><strong>Geopolitics is moving to the forefront again, &ldquo;colliding&rdquo; with concerns about a mini bank crisis/moral hazard in the U.S. &ndash; but against the backdrop of a strong payrolls number</strong>. The market responded to this new &ldquo;twist&rdquo; with another risk-off episode and some retracement of expectations for the U.S. Federal Reserve&rsquo;s (Fed&rsquo;s) peak rate. Some emerging markets (EM), however, are trying to ignore today&rsquo;s &ldquo;gloom and doom&rdquo; &ndash; including several major currencies and sovereign bonds. And this, of course, invites comments about EMs&rsquo; stronger structural and institutional frameworks (many countries did their homework after the 2008 global financial crisis &ndash; especially &ldquo;EM Graduates&rdquo;), as well as EM central banks&rsquo; timely and aggressive response to the post-pandemic inflation episode.&nbsp;&nbsp;</p>
<h2>EM Disinflation</h2>
<p><strong>The latest data releases confirmed the EM disinflation story</strong>. A pause in the hiking cycle looks increasingly justified in many countries, but the bar for rate hikes is quite high due to concerns about the pace of disinflation (the progress is bumpy), significant distances from official targets and stickier core inflation. The first point (bumpy progress) was on full display today in Brazil, where headline inflation surprised to the upside, and the price diffusion index inched higher. Czech headline inflation eased in February, but many analysts drew attention to the fact that it was narrow-based. The Peruvian central bank confirmed the &ldquo;wait-and-see&rdquo; approach yesterday, in part due to geopolitical risks and uncertainties.</p>
<h2>China Rebound</h2>
<p>China featured prominently in the latest batch of global headlines, including renewed tensions with the U.S., the implications of President Xi Jinping&rsquo;s third term and China&rsquo;s reported role in rapprochement between two major energy players, Saudi Arabia and Iran. But today&rsquo;s <strong>credit and monetary aggregates were just as important for the China rebound story</strong>. The headline numbers were stronger than expected &ndash; both total social financing and new yuan loans. However, details show that recovery is still in the initial stages and might take longer, especially as regards household consumption and housing sector/mortgages, which experienced a setback in February (see chart below). Stay tuned!</p>
<h3>Chart at a Glance: China&rsquo;s Mortgage Growth &ndash; Lower for Longer?</h3>
<img class="img-responsive w-100" src="https://www.vaneck.com/contentassets/ff8bace62a564d2f9587bb65481051fb/us-natalias-take-2023-03-10.png" alt="Chart at a Glance: China&rsquo;s Mortgage Growth &ndash; Lower for Longer?" />
<p class="chart-disclosure">Source: Bloomberg LP</p>
]]></content:encoded>
</item><item rdf:about="https://www.vaneck.com/us/en/blogs/moat-investing/moat-stocks-maintain-lead-through-turbulence/">
  <title>Moat Stocks Maintain Lead Through Turbulence></title>
  <link>https://www.vaneck.com/us/en/blogs/moat-investing/moat-stocks-maintain-lead-through-turbulence/</link>
  <description><![CDATA[Despite the retreat across equities in February, Morningstar&rsquo;s Moat and SMID Moat Indices kept their lead over various market cap segments year-to-date.]]></description>
  <dc:creator>Coulter Regal, CFA</dc:creator>
  <dc:date>03/09/2023 06:30:00</dc:date>
<content:encoded><![CDATA[

<p>After a strong January, where benchmark U.S. stock indices had their best starts to a year in recent memory, investors were decidedly less cheery in February. Equities retreated during the month amid signs that inflation is declining less quickly than anticipated, tight labor markets are not easing and consumer spending has remained robust. All of these factors are helping to maintain price pressures and leading to concerns that we may not be as close to a U.S. Federal Reserve pivot as some initially thought.</p>
<p>The flagship <strong><a href="/link/9f629c73a31846bb9e480b95e2c7f330.aspx" title="MOAT - VanEck Morningstar Wide Moat ETF - Index">Morningstar Wide Moat Focus Index</a></strong> (the &ldquo;Moat Index&rdquo;) and its more nascent small- and mid-cap focused counterpart, the <strong><a href="/link/c0c4da50e177415b9f750d3c0eea4e0a.aspx" title="SMOT - VanEck Morningstar SMID Moat ETF - Index">Morningstar US Small-Mid Cap Moat Focus Index</a></strong> (the &ldquo;SMID Moat Index&rdquo;), did not escape the market volatility. Both the Moat and SMID Moat Indices were down in February (-2.72% and -3.27%, respectively), slightly lagging the broader benchmarks during the month. However, despite the turbulence, both Moat Indices maintained their year-to-date lead over the various market cap segments of the U.S. stock market.</p>
<h3>Moat Stocks Remain Ahead for the Year</h3>
<p><strong>Year-to-Date Total Return as of 2/28/2023</strong></p>
<p><img class="img-responsive w-100" src="https://www.vaneck.com/contentassets/70789bb4ce7e4568bc2b61afe3048b0c/2940_smot_moat_monthly-blog_chart-01_2023.03_blog.svg" alt="Moat Stocks Remain Ahead for the Year" /></p>
<p class="chart-disclosure">Source: Morningstar. As of 2/28/2023. Past performance is no guarantee of future results. Index performance is not illustrative of Fund performance. Fund performance current to the most recent month end is available by visiting <strong><a href="https://www.vaneck.com/us/en//" title="ETF and Mutual Fund Manager">vaneck.com</a></strong> or by calling 800.826.2333. Indexes are unmanaged and are not securities in which an investment can be made.</p>
<h2>Meta Shines in a Turbulent Month</h2>
<p>In the face of a volatile and mostly down market environment, there were still several bright spots within the Moat Index during the month. Most notable is Meta Platforms (META), which was the Moat Index&rsquo;s top contributor in February. META shares soared over 17% in February, following a positive earnings release that saw better than expected revenue and the appearance of a renewed focus on primary business lines instead of CEO Mark Zuckerberg&rsquo;s metaverse future. Other top contributors include cybersecurity corporation Fortinet (FTNT) and software/chip company Nvidia Corp. (NVDA). On the reverse side, detractors to Moat Index February performance landed primarily within the Industrials, Consumer Discretionary and Materials sectors.</p>
<h3>Top Contributors and Detractors from Moat Index - February 2023</h3>
<div class="wrapped-div">
<table style="width: 750px;">
<tbody>
<tr class="tbl-data">
<td class="tbl-header last" colspan="5">Leading Contributors</td>
</tr>
<tr class="tbl-data">
<td class="data-td  last">Company</td>
<td class="data-head last">Ticker</td>
<td class="data-head last">Sector</td>
<td class="data-head last">Avg. Weight (%)</td>
<td class="data-head last">Contribution (%)</td>
</tr>
<tr class="tbl-data">
<td class="data-td last" style="font-weight: normal;">Meta Platforms Inc.</td>
<td class="data-td data last">META</td>
<td class="data-td data last">Communication Services</td>
<td class="data-td data last">3.05</td>
<td class="data-td data last">0.45</td>
</tr>
<tr class="tbl-data">
<td class="data-td last" style="font-weight: normal;">Fortinet Inc.</td>
<td class="data-td data last">FTNT</td>
<td class="data-td data last">Technology</td>
<td class="data-td data last">2.51</td>
<td class="data-td data last">0.31</td>
</tr>
<tr class="tbl-data">
<td class="data-td last" style="font-weight: normal;">Nvidia Corp.</td>
<td class="data-td data last">NVDA</td>
<td class="data-td data last">Technology</td>
<td class="data-td data last">1.79</td>
<td class="data-td data last">0.30</td>
</tr>
<tr class="tbl-data">
<td class="data-td last" style="font-weight: normal;">Monolithic Power Systems Inc.</td>
<td class="data-td data last">MPWR</td>
<td class="data-td data last">Technology</td>
<td class="data-td data last">1.49</td>
<td class="data-td data last">0.18</td>
</tr>
<tr class="tbl-data">
<td class="data-td last" style="font-weight: normal;">MercadoLibre Inc.</td>
<td class="data-td data last">MELI</td>
<td class="data-td data last">Consumer Discretionary</td>
<td class="data-td data last">2.86</td>
<td class="data-td data last">0.10</td>
</tr>
</tbody>
</table>
</div>
<br />
<div class="wrapped-div">
<table style="width: 750px;">
<tbody>
<tr class="tbl-data">
<td class="tbl-header last" colspan="5">Leading Detractors</td>
</tr>
<tr class="tbl-data">
<td class="data-td  last">Company</td>
<td class="data-head last">Ticker</td>
<td class="data-head last">Sector</td>
<td class="data-head last">Avg. Weight (%)</td>
<td class="data-head last">Contribution (%)</td>
</tr>
<tr class="tbl-data">
<td class="data-td last" style="font-weight: normal;">International Flavors &amp; Fragrances Inc.</td>
<td class="data-td data last">IFF</td>
<td class="data-td data last">Materials</td>
<td class="data-td data last">2.10</td>
<td class="data-td data last">-0.40</td>
</tr>
<tr class="tbl-data">
<td class="data-td last" style="font-weight: normal;">Adobe Inc.</td>
<td class="data-td data last">ADBE</td>
<td class="data-td data last">Technology</td>
<td class="data-td data last">2.59</td>
<td class="data-td data last">-0.33</td>
</tr>
<tr class="tbl-data">
<td class="data-td last" style="font-weight: normal;">Etsy Inc.</td>
<td class="data-td data last">ETSY</td>
<td class="data-td data last">Consumer Discretionary</td>
<td class="data-td data last">2.58</td>
<td class="data-td data last">-0.31</td>
</tr>
<tr class="tbl-data">
<td class="data-td last" style="font-weight: normal;">Equifax Inc.</td>
<td class="data-td data last">EFX</td>
<td class="data-td data last">Industrials</td>
<td class="data-td data last">2.52</td>
<td class="data-td data last">-0.23</td>
</tr>
<tr class="tbl-data">
<td class="data-td last" style="font-weight: normal;">TransUnion</td>
<td class="data-td data last">TRU</td>
<td class="data-td data last">Industrials</td>
<td class="data-td data last">2.47</td>
<td class="data-td data last">-0.23</td>
</tr>
</tbody>
</table>
</div>
<br />
<p class="chart-disclosure"><strong>Source: Morningstar, February 2023.</strong> Past performance is no guarantee of future results. Index performance is not illustrative of fund performance. Not intended as a recommendation to buy or to sell any of the securities mentioned herein.</p>
<h2>Moat Stock Highlight: AI Craze Drives Nvidia</h2>
<p>Nvidia Corp. (NVDA)<sup>1</sup>&nbsp;is the top designer of discrete graphics processing units (GPUs) used in a variety of end markets, including PC gaming, data centers and the now extremely fast-growing artificial intelligence (AI) market. It was the top performing stock in the Moat Index for February. Nvidia&rsquo;s wide economic moat stems from its <strong><a href="https://www.vaneck.com/us/en/blogs/moat-investing/intangible-assets-the-leading-source-of-moats2/" title="Intangible Assets: The Leading Source of Moats">intangible assets</a></strong> related to the design of its GPUs. NVDA has captured the lion&rsquo;s share of the GPU market, which has significant barriers to entry in the form of advanced intellectual property, making it unlikely that rivals will be able to compete. Additionally, Nvidia has a large research and development budget relative to AMD and smaller GPU suppliers, which allows it to continuously innovate and fuel a virtuous cycle for its high-margin chips.</p>
<p>NVDA was up during the month following higher quarterly revenues than expected and the recent explosion of popularity in AI models, like OpenAI&rsquo;s ChatGPT, or Google&rsquo;s newly launched competitor, Bard. Artificial intelligence represents one of the biggest growth opportunities for the semiconductor industry, and many believe Nvidia is in a prime position to grow from it.</p>
<p>NVDA&rsquo;s share price gained over 18% in February to end the month at about $230 per share, which now puts the stock above Morningstar&rsquo;s estimate of fair value of $200. NVDA had traded at a 20% discount as recently as December of last year.</p>
<h2>Small-Caps Hold Their Ground</h2>
<p>With small- and mid-cap (SMID-cap) stock valuations at multi-decade lows compared to large-caps and shifting market dynamics, we believe SMID-caps may deliver on this <strong><a href="/link/775af929d69741efa7729872dda2bfa5.aspx?epsremainingpath=why-its-time-to-think-small-and-mid-cap-investing" title="Why It&rsquo;s Time to Think Small- and Mid-Cap Investing">historic return premium</a></strong> over large caps in 2023. In the <strong><a href="https://www.vaneck.com/us/en/blogs/moat-investing/uncover-big-opportunities-in-smaller-companies/" title="Uncover Big Opportunities in Smaller Companies">SMID-cap U.S. equity</a></strong> segment in February, stocks fared in line with or slightly better relative to large-caps. Small-caps, demonstrated by the Russell 2000 Index, actually held up better in the down market this month than both mid-caps and large-caps. This is despite the higher levels of volatility that is generally expected in smaller companies.</p>
<p>Within the SMID Moat Index, top contributors for February include the power management solutions company Monolithic Power Systems (MPWR), the global supply chain solutions provider WESCO International (WCC) and BorgWarner Inc. (BWA), an automotive manufacturer and supplier. Sectors that detracted the most from SMID Moat Index performance during the month were Health Care, Communication Services and Materials.</p>
<h3>Top Contributors and Detractors from SMID Moat Index - February 2023</h3>
<div class="wrapped-div">
<table style="width: 750px;">
<tbody>
<tr class="tbl-data">
<td class="tbl-header last" colspan="5">Leading Contributors</td>
</tr>
<tr class="tbl-data">
<td class="data-td  last">Company</td>
<td class="data-head last">Ticker</td>
<td class="data-head last">Sector</td>
<td class="data-head last">Avg. Weight (%)</td>
<td class="data-head last">Contribution (%)</td>
</tr>
<tr class="tbl-data">
<td class="data-td last" style="font-weight: normal;">Monolithic Power Systems Inc.</td>
<td class="data-td data last">MPWR</td>
<td class="data-td data last">Technology</td>
<td class="data-td data last">1.47</td>
<td class="data-td data last">0.17</td>
</tr>
<tr class="tbl-data">
<td class="data-td last" style="font-weight: normal;">WESCO International Inc.</td>
<td class="data-td data last">WCC</td>
<td class="data-td data last">Industrials</td>
<td class="data-td data last">1.50</td>
<td class="data-td data last">0.16</td>
</tr>
<tr class="tbl-data">
<td class="data-td last" style="font-weight: normal;">BorgWarner Inc.</td>
<td class="data-td data last">BWA</td>
<td class="data-td data last">Consumer Discretionary</td>
<td class="data-td data last">1.49</td>
<td class="data-td data last">0.10</td>
</tr>
<tr class="tbl-data">
<td class="data-td last" style="font-weight: normal;">Omnicom Group Inc.</td>
<td class="data-td data last">OMC</td>
<td class="data-td data last">Communication Services</td>
<td class="data-td data last">1.54</td>
<td class="data-td data last">0.08</td>
</tr>
<tr class="tbl-data">
<td class="data-td last" style="font-weight: normal;">Manhattan Associates Inc.</td>
<td class="data-td data last">MANH</td>
<td class="data-td data last">Technology</td>
<td class="data-td data last">0.74</td>
<td class="data-td data last">0.07</td>
</tr>
</tbody>
</table>
</div>
<br />
<div class="wrapped-div">
<table style="width: 750px;">
<tbody>
<tr class="tbl-data">
<td class="tbl-header last" colspan="5">Leading Detractors</td>
</tr>
<tr class="tbl-data">
<td class="data-td  last">Company</td>
<td class="data-head last">Ticker</td>
<td class="data-head last">Sector</td>
<td class="data-head last">Avg. Weight (%)</td>
<td class="data-head last">Contribution (%)</td>
</tr>
<tr class="tbl-data">
<td class="data-td last" style="font-weight: normal;">Sirius XM Holdings Inc.</td>
<td class="data-td data last">SIRI</td>
<td class="data-td data last">Communication Services</td>
<td class="data-td data last">0.93</td>
<td class="data-td data last">-0.27</td>
</tr>
<tr class="tbl-data">
<td class="data-td last" style="font-weight: normal;">International Flavors &amp; Fragrances Inc.</td>
<td class="data-td data last">IFF</td>
<td class="data-td data last">Materials</td>
<td class="data-td data last">1.12</td>
<td class="data-td data last">-0.21</td>
</tr>
<tr class="tbl-data">
<td class="data-td last" style="font-weight: normal;">LivaNova PLC</td>
<td class="data-td data last">LIVN</td>
<td class="data-td data last">Healthcare</td>
<td class="data-td data last">1.19</td>
<td class="data-td data last">-0.19</td>
</tr>
<tr class="tbl-data">
<td class="data-td last" style="font-weight: normal;">Warner Music Group Corp.</td>
<td class="data-td data last">WMG</td>
<td class="data-td data last">Communication Services</td>
<td class="data-td data last">1.38</td>
<td class="data-td data last">-0.19</td>
</tr>
<tr class="tbl-data">
<td class="data-td last" style="font-weight: normal;">ICU Medical Inc.</td>
<td class="data-td data last">ICUI</td>
<td class="data-td data last">Healthcare</td>
<td class="data-td data last">1.39</td>
<td class="data-td data last">-0.17</td>
</tr>
</tbody>
</table>
</div>
<br />
<p class="chart-disclosure"><strong>Source: Morningstar, February 2023.</strong> Past performance is no guarantee of future results. Index performance is not illustrative of fund performance. Not intended as a recommendation to buy or to sell any of the securities mentioned herein.</p>
<h2>SMID Moat Stock Highlight: Monolithic Power</h2>
<p>One of the few stocks that is currently found in both the Moat and SMID Indices is <strong>Monolithic Power Systems Inc. (MPWR)</strong><sup>2</sup>. As a reminder, the Moat Index is technically an all-cap strategy; however, it tends to bias towards large-caps due to its mandate to target only wide moat companies. MPWR is an analog and mixed-signal chipmaker, specializing in power management solutions. The firm&rsquo;s mission is to reduce total energy consumption in end systems, and it serves the computing, automotive, industrial, communications and consumer end markets. MPWR uses a fabless manufacturing model, partnering with third-party chip foundries to host its proprietary process technology.</p>
<p>Morningstar believes Monolithic Power Systems is a disruptor in the power management chip market, using its proprietary process technology to differentiate from larger competitors. MPWR boasts a wide economic moat, as a result of intangible assets from its innovative chip designs and advancements in manufacturing as well as <a href="https://www.vaneck.com/us/en/blogs/moat-investing/switching-costs-build-moats-and-retain-customers2/" title="Switching Costs Build Moats and Retain Customers"><strong>switching costs</strong></a> for its integrated power management chips.</p>
<p>Monolithic Power Systems was a top performer in both Moat and SMID Moat Indices as its share price gained nearly 14% in February to end the month at about $485 per share. Morningstar currently estimates MPWR&rsquo;s fair value to be $562 per share.</p>
<h2>Accessing Moat Stocks</h2>
<p><strong><a href="https://www.vaneck.com/us/en/investments/morningstar-wide-moat-etf-moat/moat-reconstitution.pdf" title="MOAT - VanEck Morningstar Wide Moat ETF" target="_blank" rel="noopener">VanEck Morningstar Wide ETF (MOAT)</a></strong> seeks to replicate as closely as possible, before fees and expenses the price and yield performance of the Morningstar Wide Moat Focus Index.</p>
<p><a href="/link/589a2bc95c5d48988a7fd0d679aec241.aspx" title="SMOT - VanEck Morningstar SMID Moat ETF - Overview"><strong>VanEck Morningstar SMID Moat ETF (SMOT)</strong></a> seeks to track as closely as possible, before fees and expenses, the price and yield performance of the Morningstar US Small-Mid Cap Moat Focus Index.</p>
<p>To receive more <a href="https://www.vaneck.com/us/en/insights/moat-investing/" title="Moat Investing Insights"><strong>Moat Investing</strong></a> insights, <a href="https://www.vaneck.com/us/en/subscribe/" title=" Subscription Center"><strong>sign up in our subscription center</strong></a>.</p>
<style type="text/css">
    .wrapped-div {
        max-width: 100%;
    }

    @media (max-width: 1240px) {
        .wrapped-div {
            overflow-x: scroll;
        }


    }
</style>
]]></content:encoded>
</item><item rdf:about="https://www.vaneck.com/us/en/blogs/economic-trends/em-policy-rates-steady-now/">
  <title>EM Policy Rates – Steady Now!></title>
  <link>https://www.vaneck.com/us/en/blogs/economic-trends/em-policy-rates-steady-now/</link>
  <description><![CDATA[Many EMs no longer feel the need to follow the Fed. Early policy responses and disinflation help to explain why. What else can influence EM central banks?]]></description>
  <dc:creator>Natalia  Gurushina</dc:creator>
  <dc:date>03/09/2023 06:30:00</dc:date>
<content:encoded><![CDATA[

<h2>EM Central Banks On Hold</h2>
<p>It could have been the shortest emerging markets (EM) daily blog ever. Why are <strong>various EM central banks increasingly staying on hold, despite the rising peak rate expectations for the U.S.</strong> Federal Reserve and the ECB? Just check the chart below. The End. But, of course, we are not that laconic, so let&rsquo;s have a closer look. A big takeaway from today&rsquo;s chart is that EM&rsquo;s aggressive and timely policy response created an impressive policy cushion &ndash; a fundamental &ldquo;positive&rdquo; for EM FX, including carry trades (especially against the backdrop of the improving growth outlook). So, even though the U.S. Dollar is up so far this year, several major EM currencies are up (a lot) against the U.S. Dollar. And this creates room for differentiation in the EM space.</p>
<h2>EM Disinflation Progress</h2>
<p><strong>EM&rsquo;s disinflation progress is the main driving force here</strong>. The high-frequency dataflow can be &ldquo;jumpy&rdquo;, but this week&rsquo;s releases pointed in the right direction &ndash; including today&rsquo;s downside inflation surprise in Mexico. The best part of the release &ndash; from the central bank&rsquo;s point of view in particular &ndash; was further moderation in core inflation. The bi-weekly core inflation print looked especially encouraging, easing from 8.38% year-on-year to 8.21%. We don&rsquo;t think that the Mexican central bank is done hiking yet, but a pause is definitely within reach now. Since we are talking about EM disinflation, we ought to mention China&rsquo;s surprisingly weak February prints (1% year-on-year vs. 1.9% expected). Even though it might be tempting to interpret them solely as a sign of weak domestic demand, there were several factors &ndash; such as seasonality and pork prices (3.8% year-on-year vs. nearly 52% back in October) &ndash; that could have led to February&rsquo;s distortions.</p>
<h2>EM External Balances</h2>
<p><strong>What else can influence EM&rsquo;s doves?</strong> Well, fiscal consolidation is key, especially in big index names like Brazil. As you can see on the chart below, Brazil&rsquo;s room for rate cuts is massive in theory &ndash; and could increase further if tomorrow&rsquo;s inflation print meets expectations &ndash; but the market needs reassurance about the government&rsquo;s spending plans and tax reform. We&rsquo;ll also keep an eye on external balances, as wider current account gaps can increase pressure on FX (and hence on inflation). South Africa&rsquo;s current account deficit widened more than expected in Q4 (2.6% of GDP), and even though the size is not critical yet, further deterioration might require more action on the central bank&rsquo;s part. Stay tuned!</p>
<h3>Chart at a Glance: EM High Real Rates Create Room For Eventual Rate Cuts</h3>
<p><img class="img-responsive w-100" src="https://www.vaneck.com/contentassets/1c511fc5ce494974aa87901dedf05a33/us-natalias-take-2023-03-09.png" alt="Chart at a Glance: EM High Real Rates Create Room For Eventual Rate Cuts " /></p>
<p class="chart-disclosure">Source: VanEck Research; Bloomberg LP.</p>
]]></content:encoded>
</item><item rdf:about="https://www.vaneck.com/us/en/blogs/natural-resources/smarter-index-design-aids-in-peer-outperformance/">
  <title>Smarter Index Design Aids in Peer Outperformance></title>
  <link>https://www.vaneck.com/us/en/blogs/natural-resources/smarter-index-design-aids-in-peer-outperformance/</link>
  <description><![CDATA[CMCI&rsquo;s index construction and roll methodology have driven strong relative performances so far this year.]]></description>
  <dc:creator>Roland Morris</dc:creator>
  <dc:date>03/08/2023 06:30:00</dc:date>
<content:encoded><![CDATA[

<h2>Macro Outlook: Commodities Hold on to Late 2022 Gains</h2>
<p>Commodities pulled back during February as U.S. interest rates rose and the U.S. dollar followed interest rates higher. The U.S. economy has surprised economists with stronger-than-expected growth and stubbornly high inflation. Investors are now expecting higher interest rates for longer periods of time. Considering the shifting interest rate expectations and the stronger U.S. dollar, commodities are still holding onto their late 2022 gains. Most importantly, the UBS Constant Maturity Commodity Index (CMCI) is performing very well versus its peer, the Bloomberg Commodity Index (BCOM). We have always highlighted CMCI&rsquo;s smarter index construction and <strong><a href="https://www.vaneck.com/us/en/investments/cm-commodity-index-fund-cmcax/cmc-overview.pdf" title="Access Commodities  Intelligently" target="_blank" rel="noopener">roll methodology</a></strong> and this year those differences have driven some strong relative performances so far.</p>
<p>We highlight the importance of the year-to-date estimated roll yield to the overall performance of CMCI. The forward curve in crude oil shifted back to upward sloping or contango in the first three months. The rest of the forward curve remained downward sloping or in backwardation. BCOM recently rolled its crude oil position, losing $0.50. CMCI is positioned on the curve from 3 months to 3 years and continued to generate positive roll yield. Additionally, since BCOM has a defined roll period, the market contango steepened during the roll period by $0.20. CMCI rolls its curve position every day to maintain a constant maturity or forward curve positioning. The smarter index design has allowed CMCI to collect a small amount of positive roll yield every day this year. Year-to-date, CMCI has generated an estimated positive 1.3% roll yield in the energy sector. By contrast, BCOM lost an estimated 2.2% roll yield in the energy sector. We believe that CMCI is a little smarter in design.</p>
<h3>Roll Yield Estimates YTD - February 2023</h3>
<p><img class="img-responsive w-100" src="https://www.vaneck.com/contentassets/29956586cb8e47ff9008f41805c5d292/2932_cmci_chart-02_2023.03_blog.svg" alt="Roll Yield Estimates YTD - February 2023" /></p>
<p class="chart-disclosure">Source: Bloomberg. Data as of February 2023.</p>
<p>Another relative year-to-date performance driver has been U.S. natural gas. The warmer than normal winter, especially in the North East, caused a large decline in prices. CMCI by index design has a much smaller exposure to U.S. natural gas, which is rebalanced monthly to a target weighting of 3.5%. BCOM previously held 8.0% U.S. natural gas weighting but fell to 6.0% in February. Adversely, had the winter months been colder than expected, CMCI&rsquo;s relative performance could have suffered. Of utmost importance is the monthly reweighting back to the target weights, which helps relative performance over the longer term. This is evident in a volatile mean-reverting commodity like U.S. natural gas.</p>
<h2>Sector Review: Small Gains in the Livestock Sector</h2>
<p>For the month of February, CMCI lost 3.7% while BCOM lost 4.7%. The livestock sector provided a very small amount of positive performance as both live cattle and hog prices rose slightly. And while the energy, industrial metals and precious metals sectors all declined during February, CMCI&rsquo;s exposure to cocoa helped to reduce the overall decline in the agriculture sector. BCOM had no exposure to cocoa.</p>
<p>Most of CMCI&rsquo;s relative outperformance for the month came from lower exposure to the precious metals sector. Gold fell 5% and silver fell 12% during February.</p>
<h3>CMCI Outperformed BCOM in the Energy and Industrial Metals Sectors</h3>
<p><strong>Performance by Sector Components</strong></p>
<p><img class="img-responsive w-100" src="https://www.vaneck.com/contentassets/29956586cb8e47ff9008f41805c5d292/2932_cmci_chart-01_2023.03_blog.svg" alt="CMCI Outperformed BCOM in the Energy and Industrial Metals Sectors" /></p>
<p class="chart-disclosure">Source: Bloomberg. Data as of February 2023.</p>
<p><a href="/link/9cc454bdc12d49638c0a22783d5a26cf.aspx" title="CMCAX - CM Commodity Index Fund - Class A - Overview"><strong>Learn more about the VanEck CM Commodity Index Fund</strong></a>, which seeks to track, before fees and expenses, the CMCI.</p>
<p>To receive more <a href="/us/en/insights/natural-resources/" title="Natural Resources Insights"><strong>Natural Resources</strong></a> insights, <a href="https://www.vaneck.com/us/en/subscribe/" title="Subscription Center"><strong>sign up in our subscription center</strong></a>.</p>
]]></content:encoded>
</item><item rdf:about="https://www.vaneck.com/us/en/blogs/economic-trends/can-em-rates-defy-the-us-fed/">
  <title>Can EM Rates Defy the U.S. Fed?></title>
  <link>https://www.vaneck.com/us/en/blogs/economic-trends/can-em-rates-defy-the-us-fed/</link>
  <description><![CDATA[Higher risk-free rates are bound to affect EM sovereign bonds, but the market continues to believe that EMs can start easing earlier than the U.S. Fed in the current cycle.]]></description>
  <dc:creator>Natalia  Gurushina</dc:creator>
  <dc:date>03/08/2023 06:30:00</dc:date>
<content:encoded><![CDATA[

<h2>U.S. Fed Rate Hikes</h2>
<p><strong>The U.S. Federal Reserve Chairman&rsquo;s testimony scared the market into pricing even more rate hikes</strong>. The peak rate implied by the Fed Funds Futures reached 5.65%, the implied probability of June&rsquo;s hike is now above 80%, and the market thinks that the Fed might opt for a larger 50bps hike this month. Today&rsquo;s above-consensus ADP employment print (242k) did little to dissuade the market hawks. So, we are waiting for the Fed&rsquo;s Beige Book this afternoon with some trepidation. What does it all mean for emerging markets (EM) bonds? The chart below shows that the rising &ldquo;risk-free&rdquo; rate was the main factor that affected sovereign returns in February and March &ndash; across all rating categories. In addition, the rising volatility of &ldquo;risk-free&rdquo; rates pushed down spread returns on lower-rated EMs &ndash; in part due to concerns about their structural and institutional ability to handle higher global rates.</p>
<h2>EM Disinflation</h2>
<p>What we find quite interesting though is that <strong>the market continues to price in </strong>&ndash; still cautiously &ndash;<strong> policy rate cuts in various EMs, despite the rising expectations for the U.S. peak rate</strong>. Why? Because many EMs tightened early and aggressively in response to rising price pressures (=high real rates), and inflation is clearly moderating (albeit sometimes in a &ldquo;bumpy&rdquo; manner). This week&rsquo;s big inflation data dump in EM looks promising so far &ndash; we had good results in EM Asia yesterday (Philippines and Thailand), which were followed by another downside surprise in LATAM (Chile). If everything goes according to plan, inflation prints in Mexico (Thursday) and Brazil (Friday) should reaffirm the EM disinflation trend.</p>
<h2>EM Fiscal Outlook</h2>
<p><strong>One potential headwind for EM doves is fiscal slippage.</strong> Brazil is a great example to illustrate this point. Brazil&rsquo;s real policy rate based on expected inflation is super-high (around 8%), but the uncertainty about new administration&rsquo;s spending plans kept the market and the central bank on defensive for quite some time. The recent reduction in political noise and a promise of decent tax reform did wonders for the rate cut expectations though &ndash; and there is definitely more to come if the administration stays fiscally responsible. Another example is Hungary, where a surprising fiscal splurge (around 50% of the annual deficit target in the first two months of the year) raised questions about the easing timeline, even though headline inflation finally peaked and food/core services pressures are moderating. Stay tuned!</p>
<h3>Chart at a Glance: U.S. Fed Hawks and EM Sovereign Bonds</h3>
<p><img class="img-responsive w-100" src="https://www.vaneck.com/contentassets/bfbecc200ff24642a20a14d4dffbd694/us-natalias-take-2023-03-08.png" alt="Chart at a Glance: U.S. Fed Hawks and EM Sovereign Bonds" /></p>
<p class="chart-disclosure">Source: Bloomberg LP. Data from 1/31/2023 to 3/7/2023.</p>
]]></content:encoded>
</item><item rdf:about="https://www.vaneck.com/us/en/blogs/natural-resources/eu-joins-the-us-in-the-clean-arms-race/">
  <title>EU Joins the U.S. in the Clean Arms Race></title>
  <link>https://www.vaneck.com/us/en/blogs/natural-resources/eu-joins-the-us-in-the-clean-arms-race/</link>
  <description><![CDATA[The European Commission has proposed the Green Deal Industrial Plan that aims to speed up access to financing for energy transition industries in Europe and incentivize investment.]]></description>
  <dc:creator>VanEck </dc:creator>
  <dc:date>03/07/2023 06:30:00</dc:date>
<content:encoded><![CDATA[

<p>For months, European leaders have voiced concerns about how the U.S.&rsquo;s landmark climate act is threatening to pull clean tech manufacturing jobs and investment from Europe to the U.S. Now, the EU has introduced its own plan to onshore clean tech in Europe by creating a more predictable and simplified regulatory environment that will speed up access to financing for these industries.</p>
<h2>What Does the EU Currently Have in Climate Spending?</h2>
<p>Fit for 55 is a set of proposals that aims to reduce the EU&rsquo;s net greenhouse gas emissions by at least 55% by 2030.<sup>1</sup>&nbsp;It operationalizes the EU Green Deal, which seeks to make Europe the first continent to reach net zero emissions by 2050. As part of this effort, the EU has earmarked more than &euro;1 trillion ($1.1 trillion) into greening the EU&rsquo;s economy over the next 10 years.<sup>2</sup>&nbsp;Several other pieces of legislation are catalyzing the resource transition in the EU alongside Fit for 55, including the REPowerEU Plan and national climate plans.</p>
<h3>Fit for 55 Contains Funding for Many Different Climate Initiatives</h3>
<p><img loading="lazy" class="img-responsive w-100" src="https://www.vaneck.com/contentassets/4a8bf28873cf4c70950ccd582ddf29e4/2904_sustainability-blog_infographic_2023.03.svg" alt="Fit for 55 Contains Funding for Many Different Climate Initiatives" /></p>
<p class="chart-disclosure">Source: European Council of the European Commission, 2022.</p>
<h2>What is in the U.S. Climate Act?</h2>
<p>The <strong><a href="https://www.vaneck.com/us/en/blogs/sustainable-investing/the-inflation-reduction-act-a-green-catalyst/" title="The Inflation Reduction Act: A Green Catalyst">Inflation Reduction Act (IRA)</a></strong> was passed in August 2022 and contains approximately $400 billion in domestic green subsidies over the next 10 years. It aims to secure the U.S. energy supply while also significantly reducing its greenhouse gas (GHG) emissions. The IRA seeks to make the U.S. more energy independent by onshoring and attracting clean energy industries through tax credits and infrastructure funding. For instance, the subsidies for electric vehicles (EVs) only apply to those with final assembly in North America<sup>3</sup>&nbsp;and the tax credits for solar cells, wind turbines and batteries produced in the U.S. are higher than for imported technology.<sup>4</sup></p>
<h2>Beyond the Headlines: Why the IRA is (Currently) More Attractive to Clean Tech</h2>
<p>While the Fit for 55 packages contain more than double the funding for the resource transition than the IRA, the type of funding in the IRA is what makes it so competitive. The IRA&rsquo;s tax credits and subsidies in the U.S. are simple and straightforward for clean tech industries to access relative to navigating the complexity of the incentives offered by Fit for 55, REPowerEU and 27 national climate plans.<sup>5</sup>&nbsp;The IRA also specifically targets boosting the manufacturing and production in resource transition industries, whereas Fit for 55 contains funding for a wider range of climate initiatives.</p>
<h3>Europe Comes up Short in Clean Tech Financing</h3>
<p><strong>Clean technology venture and growth capital funding by region (&euro;B)</strong></p>
<p><img loading="lazy" class="img-responsive w-100" src="https://www.vaneck.com/contentassets/4a8bf28873cf4c70950ccd582ddf29e4/2904_sustainability-blog_chart_2023.03_blog.svg" alt="Europe Comes up Short in Clean Tech Financing" /></p>
<p class="chart-disclosure">Source: Cleantech for Europe, Financial Times, as of February 1, 2023.</p>
<p>The IRA&rsquo;s impacts have been immediate, with nearly $90bn in investment in clean energy projects announced since its passage.<sup>6</sup>&nbsp;Honda and LG Energy announced a $4.4B EV battery factory in Ohio<sup>7</sup>, Enphase announced plans to open multiple new solar inverter factory lines in 2023<sup>8</sup>&nbsp;and Enel indicated its intentions to build one of the largest solar factories in the U.S.<sup>9</sup>&nbsp;As more clean tech manufacturers bid to secure clean energy projects, additional plans can be expected to be announced in the coming months.</p>
<h2>Europe&rsquo;s Response: Calling for its Own IRA</h2>
<p>European leaders have criticized the IRA&rsquo;s onshoring approach, which they argue might disadvantage the EU by pulling manufacturing jobs and investment from the EU to the U.S. In parallel, EU politicians have pushed the European Commission (EC) to lay out a plan to incentivize investment into Europe&rsquo;s energy transition industries.<sup>10</sup>&nbsp;In early February, the EC President unveiled the Green Deal Industrial Plan, an initial proposal that aims to create a predictable and simplified regulatory environment that will speed up access to financing for these industries.<sup>11</sup></p>
<p>While it does not include new spending, the Green Deal Industrial Plan seeks to make existing funds more easily accessible by accelerating permitting, loosening state aid rules and providing grants to clean-tech industries.<sup>12</sup>&nbsp;Further, it aims to enhance global trade cooperation in order to provide the EU with a more secure supply of the critical raw materials needed for clean technology manufacturing.<sup>13</sup></p>
<h2>What&rsquo;s Next</h2>
<p>EU leaders discussed the plan in more detail at the EU Leaders Summit on February 9-10.<sup>14</sup>&nbsp;Funding is proving to be the most debated element of the plan as the two largest economies, Germany and France, may have an outsized benefit from loosening state aid rules and may consequently diminish subsidies offered in other countries. The committee is meeting again in March to propose solutions. While this is a work in progress, we ultimately believe whatever final draft comes from the EU will emphasize simplified regulatory processes and attractive funding structures that make investments competitive with those coming to the U.S.<sup>15</sup></p>
<h2>Impact</h2>
<p>Ultimately, we believe the Green Deal Industrial Plan should markedly amplify the investment opportunities for the clean tech sector in the EU. Combined with the incentives emanating from the IRA, we see a dramatic change in the investment cadence into near-term, transformational projects. We hold a number of names across the VanEck <strong><a href="/link/2ed6209aa9674070b56e86addc947db6.aspx" title="GHAAX - Global Resources Fund - Class A - Overview">Global Resources Fund</a></strong>&nbsp;that benefit.</p>
<p>A few portfolio highlights:</p>
<ol class="content-list">
<li>SolarEdge Technologies<sup>16</sup>&nbsp;is a global solar inverter manufacturer and solutions provider for grid-connected solar + storage. Over the past number of years, it has increasingly shifted toward the European markets, where it enjoys competitive economics as solar + storage has a significantly shorter payback period compared to other geographies, largely due to the ongoing energy crisis. The continued increase in power purchase agreements (PPAs), combined with a potential loosening of permitting timelines and regulatory red tape, should drive further growth in the commercial and industrial solar markets, which comprise ~50% of Solaredge&rsquo;s revenues.</li>
<li>ENGIE SA<sup>17</sup>&nbsp;is a French utility company and a sustainable, reliable provider of renewable energy, natural gas and nuclear energy. Earlier this month it announced its plans to invest &euro;22-25bn in growth spending in the energy transition from 2023 to 2025, up 50% from previous years.<sup>18</sup>&nbsp;A key component to this strategy is investing in renewables projects with high single-digit returns (and in some cases higher), a markedly different perspective than some energy majors who have indicated a step down in renewables investments as they are unable to meet return targets. We think there could be an upward trend in value creation on the back of strong PPA prices in the U.S. and particularly Europe, and with the potential simplifying of the regulatory environment and faster permitting, we believe this positions Engie well to capitalize on these investments in the medium term.</li>
</ol>
<p>To receive more <a href="/us/en/insights/natural-resources/" title="Natural Resources Insights"><strong>Natural Resources</strong></a> insights, <a href="https://www.vaneck.com/us/en/subscribe/" title="Subscription Center"><strong>sign up in our subscription center</strong></a>.</p>
]]></content:encoded>
</item><item rdf:about="https://www.vaneck.com/us/en/blogs/digital-assets/what-is-the-metaverse/">
  <title>What is the Metaverse?></title>
  <link>https://www.vaneck.com/us/en/blogs/digital-assets/what-is-the-metaverse/</link>
  <description><![CDATA[In addition to supporting gaming and social media, the metaverse will combine economies, digital identity, and decentralized governance while bringing people together.]]></description>
  <dc:creator> </dc:creator>
  <dc:date>03/07/2023 06:30:00</dc:date>
<content:encoded><![CDATA[

<p>The metaverse is an online, 3D universe that combines multiple different virtual spaces. You can think of it as a future iteration of the internet. The metaverse will allow users to work, meet, game, and socialize in these 3D spaces.</p>
<p>The metaverse isn&rsquo;t fully in existence, but some platforms contain metaverse-like elements. Video games currently provide the closest metaverse experience available. Developers have pushed the boundaries of the definition of a game by hosting in-game events and creating virtual economies.</p>
<p>Although not required, cryptocurrencies can be a great fit for a metaverse. They allow for the creation of a digital economy with different types of utility tokens and virtual collectibles (NFTs). The metaverse would also benefit from the use of crypto wallets, such as Trust Wallet and MetaMask. Also, blockchain technology can provide transparent and reliable governance systems.</p>
<p>Blockchain, metaverse-like applications already exist and some even provide people with an income. Axie Infinity is one play-to-earn game that many users play to support their income. SecondLive and Decentraland are other examples of successfully mixing the blockchain world with virtual reality apps.</p>
<p>When we look to the future, big tech giants are trying to lead the way. However, the decentralized aspects of the blockchain industry are letting smaller players participate in the metaverse&rsquo;s development as well.</p>
<p>The metaverse may be driven by augmented or virtual reality, with each user controlling a character or avatar. For example, you might take a mixed reality meeting with an Oculus VR headset in your virtual office, finish work and relax in a blockchain-based game, and then manage your crypto portfolio and finances all inside the metaverse.</p>
<p>Some aspects of the metaverse are already existing in virtual video game worlds. Games like Second Life and Fortnite or work socialization tools like Gather.town bring together multiple elements of our lives into online worlds. While these applications are not the metaverse, they are somewhat similar as the metaverse doesn&rsquo;t exist yet.</p>
<p>Besides supporting gaming and social media, the metaverse will combine economies, digital identity, decentralized governance, and other applications. Even today, user creation and ownership of valuable items and currencies help develop a single, united metaverse. All these features provide blockchain the potential to power this future technology.</p>
<h2>How Do You Invest in the Metaverse?</h2>
<p>The best way to gain exposure to the development of the metaverse is to invest in the underlying technologies that make it possible. At its core, the metaverse is created using smart contracts and other distributed infrastructure that blockchain projects provide. VanEck provides a straightforward, diversified and easy way to invest in a broad selection of smart contract platforms that enable the metaverse.</p>
<p>To receive more <strong><a href="https://www.vaneck.com/us/en/insights/digital-assets/" title="Digital Assets Insights">Digital Assets</a></strong> insights, <strong><a href="https://www.vaneck.com/us/en/subscribe/" title="Subscription Center">sign up in our subscription center</a></strong>.</p>
]]></content:encoded>
</item><item rdf:about="https://www.vaneck.com/us/en/blogs/digital-assets/what-is-defi/">
  <title>What is DeFi?></title>
  <link>https://www.vaneck.com/us/en/blogs/digital-assets/what-is-defi/</link>
  <description><![CDATA[DeFi is shifting traditional financial products to the open source and decentralized world, which removes the need for intermediaries, reduces overall costs, and improves security.]]></description>
  <dc:creator> </dc:creator>
  <dc:date>03/07/2023 06:30:00</dc:date>
<content:encoded><![CDATA[

<p><strong>Please note that VanEck has exposure to Ethereum. </strong></p>
<p>DeFi stands for &ldquo;decentralized finance&rdquo; and refers to the ecosystem of financial applications that are being developed on top of blockchain systems. DeFi may be defined as the movement that promotes the use of decentralized networks and open-source software to create multiple types of financial services and products. The idea is to develop and operate financial dApps (decentralized apps) on top of a transparent and trustless framework, such as permissionless blockchains and other peer-to-peer (P2P) protocols.</p>
<h2>DeFi Use Cases</h2>
<p>Currently, the three largest functions of DeFi are:</p>
<ul class="content-list">
<li>Creating monetary banking services (e.g., issuance of stablecoins)</li>
<li>Providing peer-to-peer or pooled lending and borrowing platforms</li>
<li>Enabling advanced financial instruments such as DEX (decentralized exchange), tokenization platforms, derivatives and predictions markets</li>
</ul>
<p>Within those fields, there are several types of DeFi services. A few other examples of products and use cases include funding protocols, software development tools, index construction, subscription payment protocols, and data analysis applications. DeFi dApps may also be used for KYC (know your customer), AML (anti-money laundering), and other identity management services.</p>
<p>Decentralized finance brings numerous benefits compared to traditional financial services. Through the use of smart contracts and distributed systems, deploying a financial application or product becomes less complex and more secure. For instance, many dApps are being developed on top of the Ethereum blockchain, which provides reduced operational costs and lower entry barriers.</p>
<h2>How Do You Invest in DeFi?</h2>
<p>The best way to gain exposure to the growth of DeFi is to invest in the protocols that enable it. At a fundamental level, it starts with smart contract platforms like Ethereum, and at a higher level, there are application-specific protocols in which one can invest. VanEck provides a straightforward, diversified and easy way to invest in a broad selection of smart contract platforms that support DeFi.</p>
<p>To receive more <strong><a href="https://www.vaneck.com/us/en/insights/digital-assets/" title="Digital Assets Insights">Digital Assets</a></strong> insights, <strong><a href="https://www.vaneck.com/us/en/subscribe/" title="Subscription Center">sign up in our subscription center</a></strong>.</p>
]]></content:encoded>
</item><item rdf:about="https://www.vaneck.com/us/en/blogs/economic-trends/rates-and-consequences/">
  <title>Rates and Consequences></title>
  <link>https://www.vaneck.com/us/en/blogs/economic-trends/rates-and-consequences/</link>
  <description><![CDATA[The market expectations for the U.S. Fed peak rate keep grinding up, but on-going disinflation in EM requires a less &ldquo;dramatic&rdquo; policy response, as much of EM &lsquo;homework&rdquo; is already done.]]></description>
  <dc:creator>Natalia  Gurushina</dc:creator>
  <dc:date>03/07/2023 06:30:00</dc:date>
<content:encoded><![CDATA[

<h2>U.S. Fed And Markets</h2>
<p>The morning started with an &ldquo;encouraging&rdquo; paper from the <strong>San Francisco Federal Reserve</strong>, which <strong>argues</strong> that (1)<strong> &ldquo;a loose </strong><strong> stance over an extended period of time leads to increased financial fragility several years down the line</strong>&rdquo;, and (2) that potential short term gains of loose monetary policy should be weighed against &ldquo;potentially adverse medium-term consequences&rdquo;. Are we there yet? We&rsquo;ll be definitely watching the U.S. Federal Reserve Chairman&rsquo;s semi-annual testimony for additional signals/guidance &ndash; the prepared speech was met with the hawkish market reaction (albeit we could not help but notice a lack of response from the U.S. financial conditions to the Fed rate hikes in the current tightening cycle).</p>
<h2>LATAM Disinflation</h2>
<p>The monetary policy transmission mechanism in <strong>emerging markets (EM)</strong> is not always perfect, but financial conditions in Mexico, for example, tightened a lot in the past two years &ndash; as would be expected with the <strong>rising policy rate</strong> &ndash; <strong>supporting the consensus expectations of more entrenched disinflation</strong> going forward, especially against the backdrop of some residual rate hikes (63bps in six months). Mexico&rsquo;s regional neighbor, Brazil, is in a similar situation. The next inflation release on Friday is expected to show Brazil&rsquo;s headline inflation dropping to 5.5% year-on-year, opening more room for the central bank to cut rates already this year, provided there are no negative surprises on the fiscal front (including tax reform).</p>
<h2>Asia Peak Rates</h2>
<p>The latest inflation prints in <strong>EM Asia</strong> also looked encouraging, proving that the region&rsquo;s <strong>price pressures are peaking at lower levels than in the rest of EM</strong> (see chart below). This assessment now includes the Philippines, where we finally got a nice downside inflation surprise last evening. February&rsquo;s numbers also confirmed that Thailand&rsquo;s disinflation is well underway, with core prices rising by less than 2% year-on-year and with headline inflation dropping below 4% year-on-year. This raises a possibility of an earlier than expected policy rate pause (against the consensus expectations of more tightening before year-end), ensuring that the region&rsquo;s interest rate differential with the U.S. remains very tight. The latter point attracted a lot of attention lately &ndash; we think that this reflects the process of re-rating on the back of strong policy frameworks and improving fundamentals. But this view might get tested in the coming months. Stay tuned!</p>
<h3>Chart at a Glance: EM Disinflation &ndash; Asia Is Leading the Way</h3>
<p><img class="img-responsive w-100" src="https://www.vaneck.com/contentassets/13f6e35b717e41a288adbc8434ccde87/us-natalias-take-2023-03-07.png" alt="Chart at a Glance: EM Disinflation - Asia Is Leading the Way" /></p>
<p class="chart-disclosure">Source: VanEck Research; Bloomberg LP.</p>
]]></content:encoded>
</item><item rdf:about="https://www.vaneck.com/us/en/blogs/digital-assets/what-are-nfts/">
  <title>What are NFTs?></title>
  <link>https://www.vaneck.com/us/en/blogs/digital-assets/what-are-nfts/</link>
  <description><![CDATA[Non-fungible tokens (NFTs) represent ownership and authenticity and have many real-world use cases.]]></description>
  <dc:creator> </dc:creator>
  <dc:date>03/06/2023 17:30:00</dc:date>
<content:encoded><![CDATA[

<p><strong>Please note that VanEck has exposure to Bitcoin and holds a position in Ethereum.</strong></p>
<p>A non-fungible token (NFT) is a blockchain-based cryptographic token that cannot be exchanged one-to-one like BTC or ETH. NFTs may be wholly digital assets or tokenized replicas of physical assets. They can serve as evidence of authenticity and ownership in the digital space because they aren't interchangeable with one another.</p>
<p>Fungibility describes the interchangeability and near-identicality of an asset's parts. Fungibility allows for unrestricted trade and since there is theoretically no way to know the past of each unit, it is a desirable quality for currency. That is not a feature that collector things should have though.</p>
<p>These tokens are one-of-a-kind, scarce, and completely recognizable from one another. On the blockchain, NFTs can be used to represent physical items as well as digital collectibles. Other industries that can use NFTs include the metaverse and digital identity.</p>
<p>Additionally, NFTs are associated with a new type of digital art that has gained popularity. However, they also have potential uses in a wide range of industries, including fine art, video games, digital identities, licenses, certificates, and even fractional ownership of goods.</p>
<h2>How Do NFTs Work?</h2>
<p>For the creation and issuance of NFTs, there are several different frameworks. ERC-721, a protocol allowing the creation and exchange of non-fungible assets on the Ethereum blockchain, is the most well-known.</p>
<p>Other standards, such as ERC-1155, have been introduced. It creates a whole new set of possibilities by allowing a single contract to incorporate both fungible and non-fungible tokens. A better level of interoperability is made possible by the standardization of NFT issuance, which ultimately benefits users. It implies that transferring distinctive assets between several applications can be done rather simply.</p>
<p>Your NFT will be stored on an address, much like other blockchain tokens. It's important to remember that NFTs cannot be copied or transferred without the owner's consent, not even by the NFT's issuer. An NFT-enabled wallet like Trust Wallet is a good option if you want to store and access your NFTs.</p>
<p>Open marketplaces like OpenSea on Ethereum allow for the trading of NFTs. NFTs are subject to price variations in reaction to changes in market supply and demand as well as cultural trends to which some NFTs are linked.</p>
<p>The worth is not inherent in the object itself, just like with any other valuable item; rather, it is determined by those who appreciate it. Value is essentially a shared conviction. It makes no difference if it's fiat money, gold, silver, or a car; these items only have value because people think they do. Every desirable item gains value in this manner, so why shouldn't digital collectibles?</p>
<h2>NFT Use Cases</h2>
<p>NFTs can be utilized as investment products, collectibles, or for a variety of other useful uses. One of the main applications of non-fungible tokens is online gaming. Additionally, adopting blockchain to tokenize in-game assets is just going one step further given that many online games already have their own economies. The frequent issue of inflation that many games face might be resolved or at least lessened by the introduction of NFTs.</p>
<p>While virtual worlds are already thriving, tokenizing real-world assets is another fascinating application of NFTs. These NFTs can stand in for pieces of real estate that can be kept and exchanged as tokens on a blockchain. This could introduce some well-needed liquidity to many markets that otherwise wouldn&rsquo;t have much, such as fine art, real estate, and rare collectible items.</p>
<p>Another industry that can profit from the characteristics of NFTs is digital identity. For many people worldwide, increasing privacy and data integrity would be accomplished by storing identification and ownership data on the blockchain. At the same time, friction related to exchanging personal data may be decreased by simple and trustworthy transfers of these assets.</p>
<h2>How Do You Invest in NFTs?</h2>
<p>One way to invest in non-fungible tokens is to buy them on NFT exchanges. NFTs cannot simply be purchased using a credit card or a payment service provider like PayPal. This technique requires both a crypto wallet and some cryptocurrency.</p>
<p>A more diverse way to gain exposure to the development of NFTs is to invest in the underlying technology. NFTs at their core are simply smart contracts that adhere to a certain standard. For a smart contract to exist and execute, it needs a smart contract platform and execution layer. Many NFTs are created using Ethereum. VanEck provides a straightforward, diversified and easy way to invest in a broad and dynamic selection of smart contract platforms that enable NFTs.</p>
<p>To receive more <strong><a href="https://www.vaneck.com/us/en/insights/digital-assets/" title="Digital Assets Insights">Digital Assets</a></strong> insights, <strong><a href="https://www.vaneck.com/us/en/subscribe/" title="Subscription Center">sign up in our subscription center</a></strong>.</p>
]]></content:encoded>
</item><item rdf:about="https://www.vaneck.com/us/en/blogs/economic-trends/china-growth-curb-your-enthusiasm/">
  <title>China Growth - Curb Your Enthusiasm?></title>
  <link>https://www.vaneck.com/us/en/blogs/economic-trends/china-growth-curb-your-enthusiasm/</link>
  <description><![CDATA[China&rsquo;s growth target might look conservative, but it is still good news for growth spillovers into many EMs, while it reduces a risk of &ldquo;runaway&rdquo; inflation.]]></description>
  <dc:creator>Natalia  Gurushina</dc:creator>
  <dc:date>03/06/2023 16:30:00</dc:date>
<content:encoded><![CDATA[

<h2>China Rebound</h2>
<p><strong>China&rsquo;s</strong> growth expectations for 2023 are now the highest in 12 months (5.3%), but further <strong>upgrades might be less forthcoming after the surprisingly conservative growth target </strong>(around 5%) set up by the National People&rsquo;s Congress (NPC) over the weekend. As regards the policy framework to achieve the target, some aspects look comparable to the last year&rsquo;s numbers (the adjusted budget deficit, local government special bond quota &ndash; also with adjustments). The NPC reemphasized support for domestic demand, the housing sector, and private companies. But it&rsquo;s clear that authorities do not want to overstimulate the economy &ndash; anything related to the pandemic-related rise in leverage perhaps?</p>
<h2>EM Growth</h2>
<p><strong>China&rsquo;s growth rebounding to 5%+ this year is still good news for many emerging markets (EM), which are arguably less correlated with risks like higher U.S. policy rates</strong>. And this includes positive growth spillovers, which we expect to be reflected in the updated GDP forecasts published by the IMF around the Spring Meetings in April. In the meantime, the consensus projections keep improving. The share of positive growth revisions in the Bloomberg consensus survey (101 countries) rose to 30% from 8% in December, and the share of large growth downgrades dropped from 50% to 7% over the same period. The composite EM PMI (Purchasing Managers Index) is now well in expansion zone, and the PMI momentum in most EMs showed improvement in the past 3 months &ndash; potentially positive signals for carry trades and sovereign spreads.</p>
<h2>EM Disinflation</h2>
<p><strong>Chinese</strong> authorities&rsquo; measured approach to policy stimulus might also <strong>lower a risk of &ldquo;runaway&rdquo; inflation pressures</strong> that plagued China&rsquo;s EM peers in the past year and a half &ndash; albeit we remain vigilant. China is currently the only major EM, where headline inflation is below the target (see chart below). However, &ldquo;revenge&rdquo; spending could be a powerful inflation driver, pushing peak core inflation higher and making it stickier than expected &ndash; even in EM&rsquo;s disinflation poster kids, like Brazil. This week brings a big inflation data dump in EM, including Mexico, Brazil, the Philippines, Thailand, Hungary &ndash; and China. Are we going to get another &ldquo;underwhelming&rdquo; China&rsquo;s surprise? Stay tuned!</p>
<h3>Chart at a Glance: EM Inflation Still Far From Official Targets &ndash; Except in China</h3>
<img class="img-responsive w-100" src="https://www.vaneck.com/contentassets/a7d56b7d3de0435ea2c4cc598862d8a9/us-natalias-take-2023-03-06.png" alt="Chart at a Glance: EM Inflation Still Far From Official Targets &ndash; Except in China" />
<p class="chart-disclosure">Source: Bloomberg LP</p>
]]></content:encoded>
</item><item rdf:about="https://www.vaneck.com/us/en/blogs/digital-assets/what-is-a-dao/">
  <title>What is a DAO?></title>
  <link>https://www.vaneck.com/us/en/blogs/digital-assets/what-is-a-dao/</link>
  <description><![CDATA[A DAO is a company administered by self-executing smart contracts that operate on a blockchain.]]></description>
  <dc:creator> </dc:creator>
  <dc:date>03/06/2023 07:00:00</dc:date>
<content:encoded><![CDATA[

<p><strong>Please note that VanEck may have a position(s) in the digital asset(s) described below.</strong></p>
<p>A decentralized autonomous organization, or DAO, is an organization run entirely by computer code and accessible to everyone. Being autonomous, smart contracts allow the majority of operations to function without the involvement of humans. A community creates and runs a DAO, managing its resources and initiatives as a whole.</p>
<p>The 2016 launch of Ethereum's venture capital fund "The DAO" helped DAOs gain popularity. Sadly, the project experienced an attack because of a flaw in the code three weeks into the token sale. A hard fork caused the cash to be later restored. Despite the early challenges, the DAO concept has improved over the years, and it is now one of the most popular governance models for decentralized finance (DeFi) projects.</p>
<p>Each DAO is unique, although the majority adhere to the same fundamental ideas. Each holder of the DAO's governance token has a certain number of votes, which is proportional to their token holdings. Holders may also suggest modifications to the DAO's operational procedures.</p>
<p>A DAO is a company administered by self-executing smart contracts that operate on a blockchain. The decisions made by DAO participants are then carried out using these smart contracts. In practice, a DAO can run continually and without human upkeep. Due to its immutable nature, the DAO's framework will continue to exist even if DAO members lose interest in or give up on the project.</p>
<p>Voting systems based on governance tokens are the most typical way that DAOs make decisions. You have more voting power the more of the governance token you own. In some DAOs, any member may submit a proposal, while this ability may only be granted to a select group in others. In the crypto industry, DAOs are frequently used to run DeFi initiatives, blockchains, and other protocols.</p>
<p>For example, an investment DAO often operates based on a broad objective or guiding idea. Some invest in specialized business sectors, such as GameFi or DeFi protocols. Using a proposal procedure, investment decisions are made following these predefined guidelines. Proposals can be made by holders of the governance token for the investment DAO. Some DAOs will restrict this to token holders who own a specific threshold of tokens or to some other segment of the population. This may be done to prevent spam or to restrict the ability to advise investment decisions to members with sufficient stakes.</p>
<p>Users can use their voting rights after the proposition has been made by either staking their tokens or through a Snapshot mechanism. Without locking the tokens, Snapshot divides voting rights based on the number of governance tokens in each wallet. This prevents users from influencing the vote by purchasing more tokens after seeing a proposal. After the voting is completed, the choice is made and put into effect.</p>
<p>Investment gains are distributed to governance token holders either through airdrops or a staking mechanism. They can then obtain a portion of the earnings from the smart contract by staking their governance token.</p>
<p>DAOs frequently host community channels on Telegram and Discord to help organize, inform, and facilitate their proposals. A DAO relies heavily on its community for success.</p>
<h2>Types of DAOs</h2>
<p>There are eight main types of DAOs:</p>
<ul class="content-list">
<li>Protocol DAOs</li>
<li>Grant DAOs</li>
<li>Philanthropy DAOs</li>
<li>Social DAOs</li>
<li>Collector DAOs</li>
<li>Venture/Investment DAOs</li>
<li>Media DAOs</li>
<li>SubDAOs</li>
</ul>
<p>A DAO makes investments collectively. Anyone who holds the governance token for the investment DAO is eligible to vote. Investment DAOs raise money for their treasury by holding token sales, issuing NFTs, and providing services that generate income. The legality of investment DAOs is governed by local legal regulations.</p>
<h2>How Do You Create a DAO?</h2>
<p>You'll need a system for processing votes and proposals on the technical side. Other open-source options can be used. One well-liked option for the Ethereum blockchain is Aragon. Another that operates across many blockchains is Snapshot. However, the methods through which they each give that structure can vary. Some DAO systems use off-chain polling while others use on-chain polling. Your DAO's priorities will determine the specific option you should select.</p>
<h2>How Do You Invest in DAOs?</h2>
<p>You can invest in DAOs by investing in governance tokens, participating in governance and voting or lending crypto to the DAO. However, it is much easier to invest in platforms that allow DAOs to be created. This way, you can invest in the general trend of DAOs. At its core, DAOs are enabled by smart contracts, hence smart contract platforms are needed to support them. VanEck provides a straightforward, diversified and easy way to invest in a broad selection of smart contract platforms that support DAOs.</p>
<p>To receive more <strong><a href="https://www.vaneck.com/us/en/insights/digital-assets/" title="Digital Assets Insights">Digital Assets</a></strong> insights, <strong><a href="https://www.vaneck.com/us/en/subscribe/" title="Subscription Center">sign up in our subscription center</a></strong>.</p>
]]></content:encoded>
</item><item rdf:about="https://www.vaneck.com/us/en/blogs/digital-assets/matthew-sigel-digital-assets-beat-equities-and-bonds-despite-regulatory-actions/">
  <title>Digital Assets Beat Equities and Bonds Despite Regulatory Actions></title>
  <link>https://www.vaneck.com/us/en/blogs/digital-assets/matthew-sigel-digital-assets-beat-equities-and-bonds-despite-regulatory-actions/</link>
  <description><![CDATA[Digital assets, including Bitcoin and Ethereum, outperformed equities and bonds in February despite regulatory actions in the US, with buyers in Asia and the Middle East continuing to invest.]]></description>
  <dc:creator>Matthew  Sigel</dc:creator>
  <dc:date>03/06/2023 06:30:00</dc:date>
<content:encoded><![CDATA[

<p><strong>Please note that VanEck may have a position(s) in the digital asset(s) described below.</strong></p>
<p><em>&ldquo;When you look at the data, it&rsquo;s interesting: The number of active addresses for Bitcoin has stayed relatively constant since really the Three Arrows Capital collapse, even through the FTX issue. That tells you that engagement overall has stayed fairly consistent in a period when a lot of leverage was taken out of the system.&rdquo; John Deters, Chief Strategy Officer CBOE, Q4 earnings call Feb 3rd 2023</em></p>
<ul class="content-list">
<li><a href="#point-one"><strong>Smart Contract Platforms</strong></a></li>
<li><a href="#point-two"><strong>Metaverse &amp; NFTs</strong></a></li>
</ul>
<p>Digital assets outperformed equities and bonds in February despite a cascade of SEC &amp; DOJ regulatory actions in the U.S. that failed to deter buyers in Asia and the Middle East.</p>
<p>Meanwhile, a new Bitcoin narrative emerged as the &ldquo;Ordinals&rdquo; NFT project found a way to monetize under-utilized Bitcoin blockspace, leading to some meaningful pickup in block space demand and fees.</p>
<p>For the month, the S&amp;P 500 fell 2%, Nasdaq -1%, while BTC rose 1% and ETH +3%.</p>
<p>Not only did Bitcoin outperform the Nasdaq again in February, but its 30-day annualized volatility fell again to 40% compared to the S&amp;P energy sector at 45% and S&amp;P tech at 40%. And while February&rsquo;s <em>month-end</em> Bitcoin price was only up 1% from January&rsquo;s, the <em>average</em> Bitcoin price was +15% m/m, providing meaningful relief to financially struggling Bitcoin miners. Indeed, several miners took advantage of more favorable capital markets to announce large mining capacity additions, including Hut Energy, which announced a merger with US Bitcoin Corp and Iris Energy (IREN) and CleanSpark, who announced rig purchases. The Bitcoin network&rsquo;s hash rate, a measure of all computing power working on Bitcoin, rose to another record high, up 9% from January.</p>
<p>Given the restrictive environment that the current US administration has presented for banks, brokers, and other institutions in crypto, we are focused on ex-U.S. adoption to validate our fundamentally bullish view on open-source blockchain-based tokens as alternatives to U.S. dollar hegemony. And while we were disappointed that Nigeria&rsquo;s relatively pro-Bitcoin opposition candidate failed to win in February&rsquo;s presidential election (though Peter Obi did take the capital province of Lagos), we continued to note digital assets adoption in Asia and the Middle East in February: Russia&rsquo;s largest bank Sberbank announced plans to launch an Ethereum-based DeFi platform; the UAE&rsquo;s northernmost emirate Ras Al Khaimah announced plans for a &ldquo;free zone&rdquo; solely dedicated to non-regulated activities in the virtual assets sector; and the government of HK released a plan that would let retail investors trade digital tokens like Bitcoin and Ether on exchanges licensed by the Securities &amp; Futures Exchange, with the implicit backing of the CCP according to the Bloomberg News piece <em>&ldquo;Hong Kong&rsquo;s Crypto Hub Ambitions Win Beijing&rsquo;s Quiet Backing.&rdquo;</em></p>
<div class="wrapped-div">
<table style="width: 600px;">
<tbody>
<tr class="tbl-data">
<td class="tbl-header last" style="text-align: center;">&nbsp;</td>
<td class="tbl-header last" style="text-align: center;" colspan="3">TimeFrame</td>
</tr>
<tr class="tbl-data">
<td class="data-td  last">Asset</td>
<td class="data-head last">February</td>
<td class="data-head last">90 Day</td>
<td class="data-head last">365 days</td>
</tr>
<tr class="tbl-data">
<td class="data-td data last" style="text-align: left;">MarketVector&trade; Infrastructure Application Leaders Index</td>
<td class="data-td data last">14%</td>
<td class="data-td data last">-31%</td>
<td class="data-td data last">-43%</td>
</tr>
<tr class="tbl-data">
<td class="data-td data last" style="text-align: left;">MarketVector&trade; Decentralized Finance Leaders Index</td>
<td class="data-td data last">13%</td>
<td class="data-td data last">-46%</td>
<td class="data-td data last">-41%</td>
</tr>
<tr class="tbl-data">
<td class="data-td data last" style="text-align: left;">Coinbase</td>
<td class="data-td data last">11%</td>
<td class="data-td data last">-39%</td>
<td class="data-td data last">-66%</td>
</tr>
<tr class="tbl-data">
<td class="data-td data last" style="text-align: left;">Ethereum</td>
<td class="data-td data last">3%</td>
<td class="data-td data last">-26%</td>
<td class="data-td data last">-42%</td>
</tr>
<tr class="tbl-data">
<td class="data-td data last" style="text-align: left;">Bitcoin</td>
<td class="data-td data last">1%</td>
<td class="data-td data last">-36%</td>
<td class="data-td data last">-44%</td>
</tr>
<tr class="tbl-data">
<td class="data-td data last" style="text-align: left;">MarketVector&trade; Centralized Exchanges Index</td>
<td class="data-td data last">-1%</td>
<td class="data-td data last">-5%</td>
<td class="data-td data last">-32%</td>
</tr>
<tr class="tbl-data">
<td class="data-td data last" style="text-align: left;">Nasdaq 100 Index</td>
<td class="data-td data last">-1%</td>
<td class="data-td data last">0%</td>
<td class="data-td data last">-17%</td>
</tr>
<tr class="tbl-data">
<td class="data-td data last" style="text-align: left;">MarketVector&trade; Smart Contract Leaders Index</td>
<td class="data-td data last">-2%</td>
<td class="data-td data last">-26%</td>
<td class="data-td data last">-64%</td>
</tr>
<tr class="tbl-data">
<td class="data-td data last" style="text-align: left;">S&amp;P 500 Index</td>
<td class="data-td data last">-2%</td>
<td class="data-td data last">3%</td>
<td class="data-td data last">-9%</td>
</tr>
<tr class="tbl-data">
<td class="data-td data last" style="text-align: left;">MarketVector&trade; Media &amp; Entertainment Leaders Index</td>
<td class="data-td data last">-10%</td>
<td class="data-td data last">-22%</td>
<td class="data-td data last">-78%</td>
</tr>
</tbody>
</table>
</div>
<br />
<p class="chart-disclosure">Source: Bloomberg, MarketVectors as of 2/28/2023. Past performance is not indicative of future results. Not a recommendation to buy or sell any of the names mentioned herein.</p>
<h2 id="point-one" class="jump-link-nav anchored-block" data-jumplink-title="Smart Contract Platforms">Smart Contract Platforms</h2>
<p>Layer-1 Smart Contract platforms, in aggregate, underperformed Bitcoin and other sectors we track in the space, even as ETH, up 4%, continued January&rsquo;s bullish tape. Ethereum&rsquo;s daily issuance was deflationary throughout the entire month, driven by increased activity at the largest 15 dApps (decentralized applications), whose combined ETH fees rose 44% in February, leading to a bigger burn. Specifically, Uniswap fees more than doubled, surging from 6,461 ETH to 12,943 ETH, increasing Uniswap&rsquo;s share of ETH fees from 23% to 33% of the top 15 dApps. OpenSea fees fell slightly in absolute terms, 6,192 ETH to 6,087 ETH, but lost significant relative share declining from 23% to 16%. Meanwhile, Blur, an NFT trading platform geared at active traders, conducted an airdrop and reward campaign; Blue&rsquo;s fees tripled from 1460 ETH to 4698 ETH, and fee share increased from 5% to 12%.</p>
<h3>Ethereum Fees, Top 15 Smart Contracts</h3>
<p><img class="img-responsive w-100" src="https://www.vaneck.com/contentassets/80a9ee15344d4f48a8abcb9efdf4683f/2911_scl_chart-1_2023.03_blog.svg" alt="Ethereum Fees, Top 15 Smart Contracts" /></p>
<p class="chart-disclosure">Source: Dune as of 2/28/2023.</p>
<p class="chart-disclosure">Past performance is not indicative of future results. Not a recommendation to buy or sell any of the names mentioned herein.</p>
<p>Looking ahead, we are closely watching <strong>Ethereum</strong>&rsquo;s Shanghai upgrade, an event that should occur in early spring, allowing staked ETH to be withdrawn. Until this upgrade is released, neither ETH staked to validator nodes nor rewards for staked ETH can be withdrawn to be sold. There is a vigorous debate among many in the broader crypto community about whether the Shanghai upgrade will be bullish or bearish for the price of ETH. With nearly 14.7% of supply staked at an average price of $2,168, representing around 18.1M ETH worth $29.8B, enabling withdrawals could lead to significant sales given that many stakers are underwater since staking their ETH. Others contend that most stakers are committed long-term holders whose purchase prices are much lower than the price where they staked and that the supply that offramps may be counteracted by staking from parties who were previously concerned about the ability to withdraw. Recent action around deposits of ETH into the staking contract, reaching levels not witnessed since March 2022, suggests that many are becoming more comfortable staking ETH, which would counteract any selling pressure.</p>
<h3>Weekly ETH Staked Versus Total Staked ETH</h3>
<p><img class="img-responsive w-100" src="https://www.vaneck.com/contentassets/80a9ee15344d4f48a8abcb9efdf4683f/2911_scl_chart-2_2023.03_blog.svg" alt="Weekly ETH Staked Versus Total Staked ETH" /></p>
<p class="chart-disclosure">Source: Dune as of 2/27/2023.</p>
<p class="chart-disclosure">Past performance is not indicative of future results. Not a recommendation to buy or sell any of the names mentioned herein.</p>
<p>One notable event in February involved the ongoing <strong><a href="https://downloads.coindesk.com/research/Friel_v_Dapper_Labs_Order_on_Motion_to_Dismiss.pdf" title="Friel vs Dapper Labs - Order on Motion to Dismiss" target="_blank" rel="noopener">legal dispute</a> </strong>between <strong>Dapper Labs</strong>, the entity behind the <strong>Flow Blockchain</strong> and <strong>NBA Top Shot</strong>, and a group of individuals who purchased Top Shot NFTs. The plaintiffs allege that Dapper Labs&rsquo; &ldquo;NBA Top Shot Moments&rdquo; are securities and that Dapper violated securities laws by failing to register Top Shots with the SEC. Dapper Labs filed a motion to dismiss the lawsuit in the Southern District of New York. Still, the judge overseeing the case denied the motion on February 22 because the plaintiffs&rsquo; case contained sufficient merit to bring to trial. The result will be that the trial participants will present evidence on whether or not Top Shots are securities by arguing the application of the Howey Test. While the decision from the trial&rsquo;s outcome will be &ldquo;narrow,&rdquo; as cited by the presiding Judge Marrero, meaning that its findings cannot necessarily be applied to all other NFTs, the ruling will still likely inform other cases due to the preeminence of the Southern District of New York in determining securities law precedence. In his decision, the judge also cites the centralization of the Flow Blockchain, created by Dapper Labs, and the value interplay between Dapper offering Top Shots NFTs and Dapper benefitting from FLOW token price appreciation. Specifically, Judge Marrero contends:</p>
<p><em>&ldquo;It follows that, if hypothetically, Dapper Labs went out of business and shut down the Flow Blockchain, the value of all Moments would drop to zero&hellip; While the Howey analysis for Moments is separate from that pertaining to FLOW, the economic realities and technological interplay between FLOW, the Flow Blockchain, and Moments, as alleged by Plaintiffs, are what supports the Court&rsquo;s conclusions.&rdquo; </em></p>
<p>Regardless of the case's outcome, allowing this case to come to trial raises the possibility of future action against Dapper Labs and, if precedent is established, other blockchains and developer teams. In response, Dapper Labs&rsquo; General Counsel Alex Levine appeared on a Bank of America client webinar in February to reiterate that Dapper disputes the ruling, that the FLOW blockchain was originally centralized with Dapper controlling more than 50% of the nodes, but has since decentralized sufficiently with smart contract deployment becoming permissionless and Dapper&rsquo;s node control falling below 50%.</p>
<p>Among specific layer 1 winners in February, notable performers included <strong>Polygon</strong>, +12%, and <strong>Fantom</strong>, +5%. Polygon distinguished itself most notably through a surge in on-chain usage. In February, Polygon announced partnerships with the German financial entity DekaBank and Doritos while also committing to an official release date, March 27, for Polygon ZK Mainnet. Polygon saw a dramatic increase in block space demand, causing fees to increase by nearly 80% as DEX volume doubled and NFT volume quadrupled those of January. This surge in usership on Polygon was partly driven by the fruits of earlier major corporate partnerships as the prices of previously free Starbucks NFTs on Polygon were bid to $2,000. At the same time, over 1.3 million Reddit Superbowl NFTs were minted on Polygon. Meanwhile, Fantom&rsquo;s fees increased nearly 3x amid the announcement of gasless transactions through application subsidies and the launch of new DeFi applications such as Equalizer and Mummy (continuing Fantom&rsquo;s paranormal project name themes). Additionally, the current leader of Fantom, Andrew Cronje, boasts the runway for building FTM is now 45 years after savvy investments and cost-saving measures.</p>
<p>The weakest performers in February were emerging alternate Layer-1s <strong>Aptos</strong>, -30%, and <strong>Avalanche</strong>, -12%. Aptos was a sensational outperformer in January, +492%, partly due to an astonishing short squeeze and strong growth of on-chain user metrics. However, in February, on-chain usership, such as daily active addresses, transactions, and DEX volumes, sagged. While Aptos offers the novel Move language as well as high transaction throughput through parallelized transactions, we are on the sidelines with Aptos until fundamental on-chain metrics improve. For example, TVL on Aptos is only $54M, and DEX daily volume is only $2.2M compared to Polygon&rsquo;s $1.28B and $153M, and Ethereum&rsquo;s $33.5B and $1.5B, respectively. Likewise, we would like to see a greater distribution of APT tokens as the current value of traded APT tokens is only 1/6<sup>th</sup>of its fully diluted value &ndash; meaning that a great deal of supply exists to unlock and dilute existing holders. Finally, we are hesitant to commit capital to APT until more applications emerge on the Aptos blockchain that leverage Aptos&rsquo;s Move language to provide unique applications that cannot be found on other chain.</p>
<h3>Daily DEX Volumes</h3>
<p><img class="img-responsive w-100" src="https://www.vaneck.com/contentassets/80a9ee15344d4f48a8abcb9efdf4683f/2911_scl_chart-3_2023.03_blog.svg" alt="Daily DEX Volumes" /></p>
<p class="chart-disclosure">Source: Artemis.xyz as of 2/27/2023.</p>
<p class="chart-disclosure">Past performance is not indicative of future results. Not a recommendation to buy or sell any of the names mentioned herein.</p>
<p><strong>Avalanche</strong>&rsquo;s AVAX token also had a mammoth January, +86%, on the back of partnership announcements with Amazon and Shopify and a rebound in C-Chain transactions and DEX volume. February saw a partial unwind of that exuberant price action despite positive news such as the release of important network tooling such as Avalanche HyperSDK, a partnership with Tencent to enable node deployments, and the official announcement of a subnet (a blockchain secured by Avalanche) by Indian gaming powerhouse Loco Legends. Avalanche price retracement also reflects flat usership by most metrics in February as the Avalanche ecosystem of applications saw few new compelling deployments. The Avalanche ecosystem also confronted the de-pegging of Platypus Finance&rsquo;s stablecoin as well as drops in weekly active developers and weekly code commits. However, we remain bullish on AVAX because Avalanche has made great strides in technology and tooling that bring Avalanche closer to becoming the valuable epicenter of a multiverse of blockchains. Warp Messaging, released in December, gives Avalanche&rsquo;s web of blockchains the ability to communicate and transfer assets securely. Likewise, HyperSDK gives developers the out-of-the-box tooling to create new blockchains while reducing building costs by thousands of hours of coding and millions of dollars in developer salaries. Likewise, we are encouraged by the potential of Avalanche&rsquo;s gaming use case with subnets under development that will host studio-quality games from Shrapnel, Loco Legends, and Gunzilla. Additionally, we are encouraged by Avalanche President John Wu&rsquo;s commitment to bringing real-world assets on chain, as expressed by Avalanche tokenizing a KKR Private Equity Fund and onboarding Intain Markets, who will host asset-backed securities on a purpose-built subnet.</p>
<h2 id="point-two" class="jump-link-nav anchored-block" data-jumplink-title="Metaverse &amp; NFTs">Metaverse &amp; NFTs</h2>
<p>February was an excellent month for NFT sales as the number of buyers hit levels that haven&rsquo;t been reached since June, and volume matched January&rsquo;s despite February&rsquo;s 3-day deficit. Trading activity was largely driven by a period of hyper-competition between <strong>Blur</strong> and <strong>OpenSea</strong> following the former&rsquo;s token airdrop. For context, Blur launched their NFT marketplace last October with 0% trading fees and has consistently eaten away at OpenSea&rsquo;s market share ever since. Fast-forward to February 14th, Blur launched their token and airdropped 12% of the supply to NFT traders who had used the platform based on the volume traded, and further announced that 10% of the BLUR token will be airdropped to future traders. Following the announcement of a future airdrop, NFT volume on Blur skyrocketed. In response, OpenSea reduced their fees to 0% for the most popular collections for an undefined period of time. OpenSea&rsquo;s efforts to squelch Blur&rsquo;s momentum, however, have initially proved futile as Blur commands a ~75% and growing share of Ethereum NFT trade volume, a stat that OpenSea held just last summer. The BLUR token has been very volatile since its launch with its price initially falling to below $0.50, rallying over $1.30, and eventually settling at its current price of $0.80 as of Feb 28th, representing a fully diluted value of $2.4 billion. OpenSea most recently raised at a $13.3 billion valuation in January of 2022 due to it dominating Ethereum NFT trading market share at the time. Since Blur now holds this title, we believe the market may be undervaluing the BLUR token. Monitoring how many tokens are sold when they unlock to investors will be a big indicator of investor sentiment in BLUR moving forward, and it will be heavily dependent on whether their market share of NFT volume increases or decreases between now and then.</p>
<h3>Historical NFT Sales &amp; Buyers - All Chains</h3>
<p><img class="img-responsive w-100" src="https://www.vaneck.com/contentassets/80a9ee15344d4f48a8abcb9efdf4683f/2911_scl_chart-4_2023.03_blog_v3.svg" alt="Historical NFT Sales &amp; Buyers - All Chains" /></p>
<p class="chart-disclosure">Source: Cryptoslam! As of 2/27/2023.</p>
<p class="chart-disclosure">Past performance is not indicative of future results. Not a recommendation to buy or sell any of the names mentioned herein.</p>
<p>Nevertheless, tokens in the MVIS Media &amp; Entertainment (metaverse) category fell 10% in February and underperformed as the market cooled off from the January rally. Of the largest metaverse tokens, APE faced the most selling pressure and fell 11%, while MANA lost 8% and SAND only dropped 4%. APE&rsquo;s lackluster performance can partially be attributed to the blowback Yuga Labs received for their first Bored Ape community game, <em>Dookey Dash</em>, which was a remake of a 15-year-old game, <em>Missile Game 3D, </em>and quickly became mastered by bots. The <em>Dookey Dash</em> competition concluded mid-month with the golden key prize going to Faze Mongraal, a professional Fortnite streamer and, as the name implies, a member of the infamous Faze Clan esports team. Mongraal then listed the key on OpenSea for 2,222 ETH, with the highest offer coming in at 999 ETH. Other Sewer Pass holders recorded their <em>Dookey Dash</em> achievements in their Sewer Pass metadata, allowing them to &ldquo;summon a power source&rdquo; in the future based on their rank.</p>
<p>February also welcomed the addition of a new chain enabling NFT creation: Bitcoin! The Bitcoin NFTs are known as Ordinal Inscriptions and are created by running a node and using an Ordinals wallet to inscribe the digital content data into the witness of the transaction. Not only does this development create more demand for Bitcoin blockspace, but it is also inspiring teams to build marketplaces and other infrastructure in anticipation of the expansion of Bitcoin use cases. Like every development in crypto, inscriptions have created a divide between network users. Some believe the new use cases will solve the security problem caused by declining network activity, while others subscribe to the belief that Bitcoin blockspace should only be used for BTC transactions and dislike the fact that more Ethereum-like trends continue to find their way to Bitcoin. Who is right? Only time will tell, but Dapper Labs&rsquo; decision at the end of the month to release <em>TwelveFold,</em> a 300-piece generative art collection using Ordinals, adds to the bullish narrative in our opinion.</p>
<h3>Monthly NFT Volume by Chain</h3>
<p><img class="img-responsive w-100" src="https://www.vaneck.com/contentassets/80a9ee15344d4f48a8abcb9efdf4683f/2911_scl_chart-5_2023.03_blog.svg" alt="Monthly NFT Volume by Chain" /></p>
<p class="chart-disclosure">Source: VanEck, CryptoSlam! As of 2/27/2023.</p>
<p class="chart-disclosure">Past performance is not indicative of future results. Not a recommendation to buy or sell any of the names mentioned herein.</p>
<p>Other notable Web3 partnerships &amp; events in February:</p>
<ul class="content-list">
<li>Microsoft &amp; Tencent partner on Web3 infrastructure</li>
<li>Microsoft &amp; Ankr partner on node hosting solution</li>
<li>Spotify testing new NFT service</li>
<li>Luxor Mining acquires Ordinalhub as Bitcoin miners look for new revenue sources</li>
<li>Ava Labs, MultiversX &amp; Tencent Cloud announce partnerships</li>
<li>Legends by Loco NFT marketplace for esports fans on Avalanche</li>
<li>Starbucks NFTs sell for thousands</li>
<li>Sony, Toyota &amp; Astar announce Web3 partnerships in the Polkadot ecosystem</li>
<li>Mysten Labs CEO raising $100m Web3 fund</li>
<li>Square Enix&rdquo;s NFT-based <em>Symbiogenesis </em>on Polygon</li>
<li>Limit Break runs Bitcoin node to make inscriptions for Digi Daigaku holders</li>
<li>Amazon's investment in Superplastic to create NFT TV series</li>
<li>Aptos investment in Chingari to become preferred layer-1</li>
</ul>
<p>To receive more <strong><a href="https://www.vaneck.com/us/en/insights/digital-assets/" title="Digital Assets Insights">Digital Assets</a></strong> insights, <strong><a href="https://www.vaneck.com/us/en/subscribe/" title="Subscription Center">sign up in our subscription center</a></strong>.</p>
<style type="text/css">
    .wrapped-div {
        max-width: 100%;
    }

    @media (max-width: 1240px) {
        .wrapped-div {
            overflow-x: scroll;
        }


    }
</style>
]]></content:encoded>
</item><item rdf:about="https://www.vaneck.com/us/en/blogs/investment-outlook/jan-van-eck-unappreciated-causes-of-the-january-melt-up/">
  <title>Unappreciated Causes of the January Melt-Up></title>
  <link>https://www.vaneck.com/us/en/blogs/investment-outlook/jan-van-eck-unappreciated-causes-of-the-january-melt-up/</link>
  <description><![CDATA[A look under the hood of the global economy shows that monetary conditions were not tight in January. But don&rsquo;t hold your breath if you expect the &ldquo;phantom quantitative tightening&rdquo; to last.]]></description>
  <dc:creator>Jan van Eck</dc:creator>
  <dc:date>03/06/2023 06:30:00</dc:date>
<content:encoded><![CDATA[

<script>
    //Temporary script
    $(function () {
        $(".popup-youtube, .popup-vimeo, .popup-gmaps").on("click", function (e) {
            e.preventDefault();
            var width = $(window).width();
            if (width > 768) {
                openSimpleIframeModalDialog($(this).attr('href'), "video-modal");
            } else if ($(this).is('.popup-youtube')) {
                var target = $(this).attr('data-video');
                self.location = target;
            }
        });
    });
</script>
<style>
    .modal.fade.video-modal div.modal-dialog {
        margin: 7% auto !important;
    }

    .modal-simple-iframe .close span {
        font-size: 35px;
        line-height: 1;
    }
</style>
<p>In <strong><a href="https://www.vaneck.com/us/en/blogs/investment-outlook/jan-van-eck-expect-sideways-in-2023-and-another-untouchable-investment/" title="Expect Sideways in 2023 and Another Untouchable Investment">our 2023 outlook</a></strong>, we said it would be a &ldquo;sideways&rdquo; year for equities. Our base case was that against a backdrop of tight monetary policy, no new fiscal spending, and a weak global economy, investors would be left waiting for the &ldquo;rip&rdquo; in equity markets that never comes. Then we saw stocks come out of the gate hot in January, but a closer look shows that many of the factors driving that rally are temporary. We&rsquo;re holding to our view that markets are in for a sideways year. Here&rsquo;s a quick update on our outlook, including a summary of the under-reported phenomenon we are calling &ldquo;phantom quantitative tightening.&rdquo;</p>
<div class="row">
<div class="col-md-4 col-xs-12"><a href="https://www.youtube.com/embed/-dhPWO4pVL0" data-video="https://youtu.be/-dhPWO4pVL0" class="popup-youtube" title="Watch Video"><img class="img-responsive" style="margin-right: 15px; margin-top: 0px;" src="https://www.vaneck.com/contentassets/b117f7f186bb4817a6329986af0756ff/2883_jve-flash-commentary-video_2023.02_thumbnail_v2.jpg/Download/" alt="Watch Video" align="left" /></a></div>
<div class="col-md-8 col-xs-12"><br /><strong><a href="https://www.youtube.com/embed/-dhPWO4pVL0" data-video=" https://youtu.be/-dhPWO4pVL0" class="popup-youtube" title="Watch Video">Watch Video</a><br /></strong><a href="https://www.youtube.com/embed/-dhPWO4pVL0" data-video="https://youtu.be/-dhPWO4pVL0" class="popup-youtube" title="Watch Video" style="font-size: 16px; font-weight: bold; padding: 10px 0px 0px; margin-right: 20px; width: 202px;">Why the Forces Behind the January Melt-Up Are Temporary</a></div>
</div>
<br />
<h2>Phantom Quantitative Tightening? Why Stocks Rallied in January</h2>
<p>Heading into 2023, consensus thinking seemed to be that we were just one piece of good news away from a Federal Reserve pivot, and a subsequent rally in stocks. Yet, stocks rallied in January with no major news as a catalyst, so what exactly is going on?</p>
<p>The short answer is that there was a surge of money supply globally at year-end that offset the Fed&rsquo;s tightening. However, those forces&mdash;U.S. Treasury buying of bonds, Japan QE, China money supply growth&mdash;are in our view unsustainable. So, we maintain our sideways view.</p>
<p>Here are the three main factors in the January melt-up:</p>
<ol>
<li>For every dollar that the Fed was selling in bonds, the Treasury Department was buying. This mean that quantitative tightening in the U.S. was not actually as tight as one might think.</li>
</ol>
<h3>Phantom Quantitative Tightening?</h3>
<p><img class="img-responsive w-100" src="https://www.vaneck.com/contentassets/b117f7f186bb4817a6329986af0756ff/2923_jve-flash-outlook-blog-chart-1_2023.03_v1.svg" alt="Phantom Quantitative Tightening?" /></p>
<p class="chart-disclosure">Source: St. Louis Federal Reserve. Data as of January 2023. Quantitative tightening (QT) refers to monetary policies that contract, or reduce, the Federal Reserve System (Fed) balance sheet. This process is also known as balance sheet normalization. In other words, the Fed (or any central bank) shrinks its monetary reserves by either selling Treasuries (government bonds) or letting them mature and removing them from its cash balances. This removes liquidity, or money, from financial markets. It is the opposite of quantitative easing (QE).</p>
<ol>
<li value="2">China was expanding its money supply to stimulate its economy, and this led the global money supply to increase sharply heading into the beginning of 2023.</li>
</ol>
<h3>Global Money Supply Surged</h3>
<p><img class="img-responsive w-100" src="https://www.vaneck.com/contentassets/b117f7f186bb4817a6329986af0756ff/2923_jve-flash-outlook-blog-chart-2_2023.03_v1.svg" alt="Global Money Supply Surged" /></p>
<p class="chart-disclosure">Source: Bloomberg. Data as of 2/28/2023. M2 measures the money supply that includes cash, checking deposits, and easily convertible near money.</p>
<ol>
<li value="3">The Bank of Japan expanded its balance sheet by $614B since the start of December 2022, far outstripping other quantitative tightening, which was $357B by U.S., ECB and England.</li>
</ol>
<p>The combination of these factors led to the injection of a lot of money into the world economy and a reprieve from &ldquo;tight&rdquo; monetary conditions, which subsequently supported the equity rally in January. The question investors need to ask is: will these conditions last? We don&rsquo;t think they will.</p>
<p>In the U.S., the Treasury&rsquo;s buying of bonds is not likely to continue at this pace. The growth in Chinese money supply and pace of quantitative easing in Japan are also not sustainable. In our view, a more likely scenario is that the bleak economic picture catches up with equity markets, once investors realize looser monetary policy conditions are temporary.</p>
<h2>Global Economic Outlook Remains Soft</h2>
<p>The world economy is weak. Europe, in particular, is one of the world&rsquo;s &ldquo;weak links&rdquo; in part due to the impact of the Russia/Ukraine war on energy prices and transportation networks (bottlenecks that are not expected to disappear any time soon). Meanwhile, we expect flat growth in the U.S., with corporate earnings remaining under pressure.</p>
<h3>The (Not So Bright) Profit Outlook</h3>
<p><strong>Change in 2023 EPS Estimates</strong></p>
<p><img class="img-responsive w-100" src="https://www.vaneck.com/contentassets/b117f7f186bb4817a6329986af0756ff/2923_jve-flash-outlook-blog-chart-3_2023.03_v1.svg" alt="The (Not So Bright) Profit Outlook" /></p>
<p class="chart-disclosure">Source: Credit Suisse Research. Published in December Navigator; December 5, 2022. An earnings estimate is the estimate of a firm's earnings per share (EPS) for the upcoming quarter or fiscal year and is reported by an analyst. Past performance is not indicative of future results.</p>
<h3>Stay the Course: We Continue to Favor Bonds Over Equities</h3>
<p>With higher income and the ability to withstand any unexpected spikes in interest rates, <strong><a href="https://www.vaneck.com/us/en/blogs/income-investing/income-investing-playbook-2023-its-time-to-invest-in-bonds/" title="Income Investing Playbook 2023: It's Time to Invest in Bonds">bonds</a></strong> continue to offer attractive value compared to stocks. On the equity front, we think <strong><a href="https://www.vaneck.com/us/en/blogs/moat-investing/uncover-big-opportunities-in-smaller-companies/" title="Uncover Big Opportunities in Smaller Companies">small- and mid-cap stocks</a></strong> look relatively attractive. With valuations at 20&ndash;year lows relative to large caps, now may be a compelling time for investors to consider these stocks.</p>
<p>But overall, we believe that the traditional &ldquo;60/40&rdquo; portfolio should be more like &ldquo;40/60&rdquo; in favor of bonds in the current market environment.</p>
<p>To receive more <a href="/us/en/insights/investment-outlook" title="Investment Outlook Insights"><strong>Investment Outlook</strong></a> insights, <a href="https://www.vaneck.com/us/en/subscribe/" title="Subscription Center"><strong>sign up in our subscription center</strong></a>.</p>
]]></content:encoded>
</item><item rdf:about="https://www.vaneck.com/us/en/blogs/economic-trends/market-sees-few-em-rate-cuts-why/">
  <title>Market Sees Few EM Rate Cuts – Why?></title>
  <link>https://www.vaneck.com/us/en/blogs/economic-trends/market-sees-few-em-rate-cuts-why/</link>
  <description><![CDATA[<div>The market prices in relatively few EM rate cuts over the next 12 months despite</div>
<div>obvious disinflation. What&rsquo;s behind such caution &ndash; a fear of a hawkish Fed or local factors?</div>]]></description>
  <dc:creator>Natalia  Gurushina</dc:creator>
  <dc:date>03/03/2023 16:00:00</dc:date>
<content:encoded><![CDATA[

<h2>Hawkish Fed</h2>
<p><strong>Headline inflation had peaked in most emerging markets (EM) by now, but the market expectations for EM rate cuts over the next 12 months look quite &ldquo;stingy&rdquo;</strong> in most regions (see chart below). Further, some analysts are now talking about the need for &ldquo;insurance&rdquo; rate hikes in some EMs. These include South Korea (the local swap curve prices in +40bps more), India (the market sees another 52bps in the current cycle) and South Africa (50bps more or so). Two major LATAM economies are also on the list &ndash; Mexico (+60bps more) and Colombia (+75bps more). An easy explanation is that EMs feel obliged to follow the U.S. Federal Reserve (Fed) &ndash; a more robust 2023 growth outlook and a series of upside inflation surprises pushed the U.S. peak rate forecast to 5.4-5.5% recently. Well, this might be the case in Mexico (a &ldquo;nearshoring&rdquo; argument), but we think local factors play a more important role elsewhere.&nbsp;</p>
<h2>Brazil Fiscal Outlook</h2>
<p><strong>Brazil</strong> is EM&rsquo;s poster kid for successful disinflation (from 12.13% year-on-year to 5.77% in nine months). However, the fiscal policy uncertainty and new administration&rsquo;s <strong>attempts to &ldquo;convince&rdquo; the central bank to lower the policy rate</strong> (in order to prop up growth) <strong>put the market</strong> (and the central bank) <strong>on the defensive</strong>. As of this morning, the local swap curve priced in only 95bps of rate cuts during the rest of the year. It is important to keep an eye on the new fiscal framework &ndash; the draft is expected to be finalized over the weekend &ndash; and what it means for the spending cap. The consensus sees the budget deficit widening from 4.7% of GDP in 2022 to 7.8% of GDP this year. But if the new framework looks credible, the market should see more room for policy easing before the year-end.</p>
<h2>EM Policy Easing</h2>
<p>One (local) reason behind various EM central banks&rsquo; caution is that <strong>underlying price pressures are often more persistent than headline, </strong>and core disinflation can take more time (a reflection of tight labor markets, for example). Central banks are also mindful of subsidy withdrawals, which is a good sign for the fiscal outlook but could result in &ldquo;bumpy&rdquo; disinflation progress. We do not see major problems with EM central banks&rsquo; cautious stance &ndash; especially if the growth outlook continues to improve at the margin. This combo provides a supportive backdrop for carry trades &ndash; additional Fed rate hikes notwithstanding &ndash; and leaves room for rates compression if disinflation progresses as expected (or faster). Stay tuned!</p>
<h3>Chart at a Glance: EM Rate Cuts &ndash; Not Much Priced In</h3>
<img class="img-responsive w-100" src="https://www.vaneck.com/contentassets/2d12b13ee3d94b318ca3f349eb6fd1a7/us-natalias-take-2023-03-03b.png" alt="Chart at a Glance: EM Rate Cuts &ndash; Not Much Priced In" />
<p class="chart-disclosure">Source: VanEck Research; Bloomberg LP.</p>
]]></content:encoded>
</item><item rdf:about="https://www.vaneck.com/us/en/blogs/income-investing/the-power-of-clos-higher-yields-and-built-in-risk-protection/">
  <title>The Power of CLOs: Higher Yields and Built-In Risk Protection></title>
  <link>https://www.vaneck.com/us/en/blogs/income-investing/the-power-of-clos-higher-yields-and-built-in-risk-protection/</link>
  <description><![CDATA[Are CLOs part of your core income portfolio? This white paper explores how CLOs are structured and why we believe they are compelling in the current environment.]]></description>
  <dc:creator>William Sokol</dc:creator>
  <dc:date>03/03/2023 06:30:00</dc:date>
<content:encoded><![CDATA[

<p>Given their higher relative yields, &ldquo;built-in&rdquo; risk protection and historical outperformance in periods of rising rates, now is a good time to better understand collateralized loan obligations (CLOs), how they&rsquo;re structured and how they fit within a fixed income portfolio.</p>
<p>CLOs are securitized, actively managed portfolios of leveraged loans. They have historically offered a compelling combination of both an attractive yield and strong risk profiles. The strong historical performance of the asset class is a testament to the built-in risk protections resulting from how CLOs are structured. In addition, CLOs are floating rate instruments, which means their coupons reset each quarter along with prevailing interest rates, resulting in low price sensitivity to changes in interest rates. This has led to CLOs historically outperforming in periods of rising rates, like the environment we are in today.</p>
<p>Topics in this white paper include:</p>
<ul class="content-list">
<li>The structure of CLOs, including their built-in risk protection</li>
<li>Historical track record relative to other corporate debt categories</li>
<li>What makes CLOs even more compelling in the current environment</li>
<li>An analysis of how CLOs fit into a broader fixed income portfolio</li>
<li>The importance of an actively managed approach</li>
</ul>

<p>To receive more <a href="https://www.vaneck.com/us/en/insights/income-investing/" title="Income Investing insights"><strong>Income Investing</strong></a> insights, <a href="/link/5f45412c2143400497908cea2897f7d3.aspx" title=" Subscription Center"><strong>sign up in our subscription center</strong></a>.</p>
]]></content:encoded>
</item><item rdf:about="https://www.vaneck.com/us/en/blogs/emerging-markets-bonds/emlc-question-and-answer/">
  <title>EMLC ETF: Question and Answer></title>
  <link>https://www.vaneck.com/us/en/blogs/emerging-markets-bonds/emlc-question-and-answer/</link>
  <description><![CDATA[The investment case for EM local currency bonds generally comes down to yield and diversification benefits within a portfolio, in our view.]]></description>
  <dc:creator>William Sokol</dc:creator>
  <dc:date>03/02/2023 06:30:00</dc:date>
<content:encoded><![CDATA[

<p>Emerging markets in general moved much quicker than the U.S. and other developed markets to increase rates to stay ahead of inflation, which has resulted in higher nominal and real yields. In addition, emerging markets local currency investors benefit from a more substantial level of income that is not eroded by loss of purchasing power (through a potentially weaker currency) as well as the potential for rate cuts to stimulate growth if needed. In this Q&amp;A, we answer frequently asked questions about investing in emerging markets local currency bonds and specifically about the <strong><a href="/link/98c7fd49bdbc456294a1eb859ad166f7.aspx" title="EMLC - VanEck J.P. Morgan EM Local Currency Bond ETF - Overview">VanEck J.P. Morgan EM Local Currency Bond ETF (EMLC)</a></strong>.</p>
<ul class="content-list">
<li><strong><a href="#point-one">How big is the market for emerging markets local currency bonds? </a></strong></li>
<li><strong><a href="#point-two">Why do countries issue bonds in local currency? </a></strong></li>
<li><strong><a href="#point-three">What are the benefits of investing in EM local currency bonds?</a></strong></li>
<li><strong><a href="#point-four">What drives the risk and return of EM local currency bonds?</a></strong></li>
<li><strong><a href="#point-five">Are EM local currency bonds a replacement for hard currency EM bonds?</a></strong></li>
<li><strong><a href="#point-six">Why might now be a good time to consider adding exposure to EM local currency bonds?</a></strong></li>
<li><strong><a href="#point-seven">How can investors access EM local currency bonds?</a></strong></li>
<li><strong><a href="#point-eight">How can investors buy VanEck ETFs?</a></strong></li>
</ul>
<h2 id="point-one" class="anchored-block">How big is the market for emerging markets local currency bonds?</h2>
<p>The emerging markets local currency bond market is substantial in size, and larger than many investors who are new to the asset class may realize. EM local currency bonds comprise nearly 60% of the investable emerging markets debt universe and is over 2.5x the size of the U.S. dollar denominated, or &ldquo;hard currency,&rdquo; EM sovereign market. However, nearly 90% of U.S. mutual fund and ETF assets are in hard currency EM bonds, suggesting that investors may be under-allocated to this asset class based on its size. Exposure in global bond benchmarks is also generally low or non-existent, so many investors are not getting exposure to this asset class through global bond funds.</p>
<h3>EM Local Currency Represent Nearly 60% of the EM Debt Universe</h3>
<p><img loading="lazy" class="img-responsive w-100" src="https://www.vaneck.com/contentassets/e0c76048192c454f917e7ed2f87ab0e4/2903_emlc_chart_01_2023.03_v1_blog.svg" alt="EM Local Currency Represent Nearly 60% of the EM Debt Universe" /></p>
<p class="chart-disclosure">Source: J.P. Morgan as of 12/31/2022. EM USD Sovereign represented by J.P. Morgan EMBI Global Index. EM Local Sovereign represented by J.P. Morgan GBI-EM Global Index. EM USD Corporate represented by J.P. Morgan CEMBI Broad Index. Past performance is no guarantee of future results. It is not possible for an investor to invest directly in an index.</p>
<p>The size of the market overall, and the development of individual local markets over the past several decades, has resulted in deep and liquid markets for many countries&rsquo; local currency bonds. Local investors such as banks, pension funds and insurance companies have helped drive active secondary market trading, along with increased offshore investor interest and more recently, an increase in trading activity through <strong><a href="https://www.vaneck.com/us/en/blogs/emerging-markets-bonds/insights-on-accessing-local-bonds-in-emerging-markets/" title="Insights on Accessing Local Bonds in Emerging Markets">electronic trading platforms</a></strong>.</p>
<h2 id="point-two" class="anchored-block"><strong>Why do countries issue bonds in local currency? </strong></h2>
<p>Issuing local currency denominated bonds is an option that many emerging markets have increasingly chosen over the past few decades. There are several reasons for this. First, demand has been increasing from both international investors as well as a growing local investor base in many countries, which has helped boost liquidity.</p>
<p>Second, local currency debt can help make a country more resilient against external shocks in terms of its ability to service its debt. Although hard currency debt may appeal to offshore investors due to the lack of direct currency risk, it can be more costly for the sovereign issuer, if the value of the dollar appreciates relative to their currency. Accordingly, investors in hard currency debt may be taking on higher credit risk in exchange for lower direct EMFX risk. This can be a particular concern in risk-off periods or if an individual country begins to encounter stress. In such a situation, international investors may reduce their exposure to the country, which will generally reduce the value of the local currency (as investors sell local assets) and increase the cost of funding. As a result it becomes more expensive to service hard currency debt. In the worst case, the sovereign may need to seek emergency funding or may even default.</p>
<p>Local currency debt, on the other hand, is much more insulated from these dynamics. Although existing investors may see the value of their holding decline as yields increase and the local currency depreciates, the issuer&rsquo;s ability to service the existing debt is not as impacted by the value of the currency relative to the U.S. dollar. That is not to say that default cannot occur in local currency debt, particularly in unique circumstances such as what happened with Russian debt in 2022 following the invasion of Ukraine. However, generally speaking, the issuer bears less currency risk and as a result is better insulated from external shocks.</p>
<h2 id="point-three" class="anchored-block">What are the benefits of investing in EM local currency bonds?</h2>
<p>We believe the investment case for emerging markets local currency bonds generally comes down to yield and diversification benefits within a broader portfolio. The asset class provides a significant <strong><a href="https://www.vaneck.com/us/en/blogs/emerging-markets-bonds/yield-duration-opportunity-in-em-bonds/" title="Yield-Duration Opportunity in EM Bonds">yield pickup</a></strong> over both U.S. investment grade corporates and global bonds. Although the yield is somewhat lower than U.S. high yield bonds and hard currency sovereign bonds, the local currency universe is primarily investment grade, so should be compared to other asset classes through that lens. Versus other high quality fixed income asset classes, local currency bonds are attractive in terms of yield.</p>
<h3>EM Local Currency Bonds Offer Yield Pickup vs. U.S. IG and Global Bonds</h3>
<p><img loading="lazy" class="img-responsive w-100" src="https://www.vaneck.com/contentassets/e0c76048192c454f917e7ed2f87ab0e4/2903_emlc_chart_02_2023.03_v1_blog.svg" alt="EM Local Currency Bonds Offer Yield Pickup vs. U.S. IG and Global Bonds" /></p>
<p class="chart-disclosure">Source: VanEck, Bloomberg, J.P. Morgan, ICE Data Indices, LLC. Data as of 12/31/2022. US HY is represented by the ICE BofA US High Yield Index. EM LC Sov is represented by the J.P. Morgan GBIEM Global Core Index. EM HY Corp is represented by the ICE BofA Diversified HY US Emerging Markets Corporate Plus Index. EM USD Sov is represented by the JPM EMBI Global Diversified Index. EM Corp is represented by the J.P. Morgan CEMBI Broad Diversified Index. US IG Corp is represented by the ICE BofA US Corporate Index. US Agg is represented by the ICE BofA US Broad Market Index. Global Agg is represented by the ICE BofA Global Broad Market Index. Past performance is no guarantee of future results. Index returns are not fund returns, and do not reflect management fees or brokerage expenses. It is not possible for an investor to invest directly in an index.</p>
<p>Largely due to the EMFX exposure, local currency sovereign bonds exhibit low correlation to U.S. dollar denominated asset classes. EM local currency bonds are less directly impacted by U.S. monetary policy and the movement of U.S. Treasury yields. Accordingly, the correlation between EM local currency bonds and U.S. Treasury bonds over the past decade is 0.10, compared to a 0.90 correlation between U.S. Treasuries and U.S. aggregate bonds<sup>1</sup>. This means that the returns of the asset class may offset poor returns in other asset classes in a given year. For example, 2022 was a very difficult year for most U.S. fixed income asset classes, but EM local currency bonds outperformed U.S. aggregate bonds by approximately 3% during the calendar year. EM local currency bonds also exhibit a lower correlation to &ldquo;risky&rdquo; asset classes such as high yield bonds and U.S. equities versus hard currency emerging markets bonds.<sup>2</sup></p>
<p>Emerging markets local currency bonds can also provide issuer and regional diversification within a portfolio. Compared to the hard currency emerging markets bond universe, the universe of local currency bond issuers is distinct. Generally, to be able to issue in the global market in a local currency, an issuer will have more established legal and regulatory systems, larger economies, higher credit ratings and more developed local capital markets. In addition, compared to emerging markets equities, the regional exposure of local currency bonds is significantly different, with exposure to Asia, Latin America and emerging Europe ranging from 23-36%, versus nearly 80% Asia exposure in the broad emerging markets equity benchmark<sup>3</sup>.</p>
<div class="epi-contentfragment">faq-banner-cta</div>
<h2 id="point-four" class="anchored-block">What drives the risk and return of EM local currency bonds?</h2>
<p>The risk and return of EM local currency bonds is driven by two distinct factors: local interest rates and changes in the value of the currency. The local rates component includes both carry, or the amount earned from holding the bond (i.e. the yield), as well as price appreciation or depreciation as local interest rates change. As mentioned above, yields on emerging markets local currency bonds have historically been significantly higher than other investment grade fixed income asset classes. And for U.S. investors, although the value of local currency bonds will be impacted by changes in local rates, changes in U.S. bond yields will not have a direct effect.</p>
<p>The second component of return, local currencies, is unique to local currency denominated bonds compared to hard currency bonds or other U.S. dollar denominated fixed income asset classes, thus providing diversification benefits within a portfolio. Historically, this component of return has tended to be a bigger driver of volatility, including to the downside. For example, EMFX returns have been negative in 2020, 2021 and 2022 amid relentless U.S. dollar strength, and significantly and negatively impacted total returns in those years. Generally speaking, the most painful years of the past decade for the asset class were a result of EMFX depreciation, not duration, and local rates generally contributed positively to returns in most years. Interestingly, however, in years such as 2016, 2017 and 2019, in which the asset class experienced strong returns, EMFX was not the primary driver and in two of those years contributed only a negligible amount to total return.</p>
<p>Although some investors view emerging markets local currency bonds as primarily a play on the strength of the U.S. dollar, we believe the appeal of the asset class lies largely in the less volatile returns from the relatively high level of carry. Further, strengthening local currencies (or a weakening dollar) are not a condition for attractive returns, which can be achieved in periods with U.S. dollar stability.</p>
<h3>Currencies and Local Rates Drive EM Local Currency Returns</h3>
<p><img loading="lazy" class="img-responsive w-100" src="https://www.vaneck.com/contentassets/e0c76048192c454f917e7ed2f87ab0e4/2903_emlc_chart_03_2023.03_v1_blog.svg" alt="Currencies and Local Rates Drive EM Local Currency Returns" /></p>
<p class="chart-disclosure">Source: VanEck, J.P. Morgan. Chart is based on the J.P. Morgan GBI-EM Global Core Index. Data as of 12/31/2022. Past performance is no guarantee of future results. Index returns are not fund returns, and do not reflect management fees or brokerage expenses. It is not possible for an investor to invest directly in an index.</p>
<h2 id="point-five" class="anchored-block">Are EM local currency bonds a replacement for hard currency EM bonds?</h2>
<p>We believe EM local currency bonds have a role in a diversified global bond portfolio as either a complement or replacement to hard currency EM bonds, depending on an investor&rsquo;s objective. There are reasons to consider an allocation to both asset classes, given the different risk and return profiles. As shown below, hard currency bonds have a much higher tilt towards high yield issuers, resulting in a higher overall yield. Issuing in dollars gives countries the ability to issue longer duration bonds, so a mix of the two asset classes provides exposure to both U.S. rates duration as well as local interest rates. And because of the distinct country exposures, a blended portfolio provides country and regional diversification.</p>
<h3>EM Local Currency Bonds May Complement EM Hard Currency Bonds</h3>
<div class="row">
<div class="col-lg-4 wrapped-div">
<p><img loading="lazy" class="img-responsive w-100" src="https://www.vaneck.com/contentassets/e0c76048192c454f917e7ed2f87ab0e4/2903_emlc_chart_04_1_2023.03_v1_blog.svg" alt="EM Local Currency Bonds May Complement EM Hard Currency Bonds" /></p>
<table style="width: 100%;">
<tbody>
<tr class="tbl-data">
<td class="data-td data last" style="text-align: left;">Yield</td>
<td class="data-td data last">8.60%</td>
</tr>
<tr class="tbl-data">
<td class="data-td data last" style="text-align: left;">Modified Duration (Yrs)</td>
<td class="data-td data last">6.76</td>
</tr>
</tbody>
</table>
<p>&nbsp;</p>
<table style="width: 100%;">
<tbody>
<tr class="tbl-data">
<td class="data-td data last" style="text-align: left;">Investment Grade</td>
<td class="data-td data last">51%</td>
</tr>
<tr class="tbl-data">
<td class="data-td data last" style="text-align: left;">Non-investment Grade</td>
<td class="data-td data last">49%</td>
</tr>
</tbody>
</table>
<p>&nbsp;</p>
<table style="width: 100%;">
<tbody>
<tr class="tbl-data">
<td class="tbl-header last">Top 5 Countries</td>
<td class="tbl-header last" style="text-align: center;">Weight (%)</td>
</tr>
<tr class="tbl-data">
<td class="data-td  last">Mexico</td>
<td class="data-td data last">5.16</td>
</tr>
<tr class="tbl-data">
<td class="data-td  last">Indonesia</td>
<td class="data-td data last">4.99</td>
</tr>
<tr class="tbl-data">
<td class="data-td  last">China</td>
<td class="data-td data last">4.81</td>
</tr>
<tr class="tbl-data">
<td class="data-td  last">United Arab Emirates</td>
<td class="data-td data last">4.55</td>
</tr>
<tr class="tbl-data">
<td class="data-td  last">Turkey</td>
<td class="data-td data last">4.42</td>
</tr>
</tbody>
</table>
</div>
<div class="col-lg-4 wrapped-div">
<p><img loading="lazy" class="img-responsive w-100" src="https://www.vaneck.com/contentassets/e0c76048192c454f917e7ed2f87ab0e4/2903_emlc_chart_04_2_2023.03_v1_blog.svg" alt="EM Local Currency Bonds May Complement EM Hard Currency Bonds" /></p>
<table style="width: 100%;">
<tbody>
<tr class="tbl-data">
<td class="data-td data last" style="text-align: left;">Yield</td>
<td class="data-td data last">7.44%</td>
</tr>
<tr class="tbl-data">
<td class="data-td data last" style="text-align: left;">Modified Duration (Yrs)</td>
<td class="data-td data last">4.66</td>
</tr>
</tbody>
</table>
<p>&nbsp;</p>
<table style="width: 100%;">
<tbody>
<tr class="tbl-data">
<td class="data-td data last" style="text-align: left;">Investment Grade</td>
<td class="data-td data last">72%</td>
</tr>
<tr class="tbl-data">
<td class="data-td data last" style="text-align: left;">Non-investment Grade</td>
<td class="data-td data last">28%</td>
</tr>
</tbody>
</table>
<p>&nbsp;</p>
<table style="width: 100%;">
<tbody>
<tr class="tbl-data">
<td class="tbl-header last">Top 5 Countries</td>
<td class="tbl-header last" style="text-align: center;">Weight (%)</td>
</tr>
<tr class="tbl-data">
<td class="data-td  last">China</td>
<td class="data-td data last">10.00</td>
</tr>
<tr class="tbl-data">
<td class="data-td  last">Indonesia</td>
<td class="data-td data last">9.92</td>
</tr>
<tr class="tbl-data">
<td class="data-td  last">Brazil</td>
<td class="data-td data last">8.19</td>
</tr>
<tr class="tbl-data">
<td class="data-td  last">Mexico</td>
<td class="data-td data last">8.54</td>
</tr>
<tr class="tbl-data">
<td class="data-td  last">Malaysia</td>
<td class="data-td data last">7.66</td>
</tr>
</tbody>
</table>
</div>
<div class="col-lg-4 wrapped-div">
<p><img loading="lazy" class="img-responsive w-100" src="https://www.vaneck.com/contentassets/e0c76048192c454f917e7ed2f87ab0e4/2903_emlc_chart_04_3_2023.03_v1_blog.svg" alt="EM Local Currency Bonds May Complement EM Hard Currency Bonds" /></p>
<table style="width: 100%;">
<tbody>
<tr class="tbl-data">
<td class="data-td data last" style="text-align: left;">Yield</td>
<td class="data-td data last">8.02%</td>
</tr>
<tr class="tbl-data">
<td class="data-td data last" style="text-align: left;">Modified Duration (Yrs)</td>
<td class="data-td data last">5.71</td>
</tr>
</tbody>
</table>
<p>&nbsp;</p>
<table style="width: 100%;">
<tbody>
<tr class="tbl-data">
<td class="data-td data last" style="text-align: left;">Investment Grade</td>
<td class="data-td data last">61%</td>
</tr>
<tr class="tbl-data">
<td class="data-td data last" style="text-align: left;">Non-investment Grade</td>
<td class="data-td data last">39%</td>
</tr>
</tbody>
</table>
<p>&nbsp;</p>
<table style="width: 100%;">
<tbody>
<tr class="tbl-data">
<td class="tbl-header last">Top 5 Countries</td>
<td class="tbl-header last" style="text-align: center;">Weight (%)</td>
</tr>
<tr class="tbl-data">
<td class="data-td  last">China</td>
<td class="data-td data last">7.41</td>
</tr>
<tr class="tbl-data">
<td class="data-td  last">Indonesia</td>
<td class="data-td data last">7.46</td>
</tr>
<tr class="tbl-data">
<td class="data-td  last">Mexico</td>
<td class="data-td data last">6.85</td>
</tr>
<tr class="tbl-data">
<td class="data-td  last">Brazil</td>
<td class="data-td data last">5.77</td>
</tr>
<tr class="tbl-data">
<td class="data-td  last">Malaysia</td>
<td class="data-td data last">5.12</td>
</tr>
</tbody>
</table>
</div>
</div>
<br />
<p class="chart-disclosure">Source: J.P. Morgan as of 12/31/2022. US EM Bonds represented by the J.P. Morgan EMBI Global Diversified Index. EM Local Bonds represented by the J.P. Morgan GBI-EM Global Core Index. Past performance is no guarantee of future results. The statistics above do not reflect those of any funds. It is not possible for an investor to invest directly in an index.</p>
<p>Investors who are primarily seeking to diversify their U.S. dollar denominated income portfolios may choose to overweight or only allocate to EM local currency bonds due to their low correlation. Similarly, investors taking a tactical view on waning U.S. dollar strength may also choose a heavier tilt towards local currency bonds.</p>
<h2 id="point-six" class="anchored-block">Why might now be a good time to consider adding exposure to EM local currency bonds?</h2>
<p>We believe there are several reasons that EM local currency bonds may be attractive now. First, emerging markets generally exhibit better fundamentals versus developed markets, on average, in terms of factors such as debt-to-GDP ratio and expected economic growth. This can provide support to local currencies, and the higher yields of emerging markets make them all the more compelling.</p>
<p>Second, EM central banks were far ahead of the Federal Reserve and other developed markets central banks in hiking rates to get ahead of inflation. Most hiked aggressively, and many countries are now seeing inflation moderate. This has resulted not only in high nominal rates of interest, but also high real yields and that also provides support for local currencies. It also gives EM central banks room to cut rates if needed to boost economic growth, which may also provide support to investors.</p>
<p>Third, after several years of negative returns as the U.S. dollar strengthened, we believe there are reasons EM local currencies may show more strength ahead. They remain undervalued relative to historical levels despite a recent increase in valuations. The China re-opening also has the potential to have a positive impact on many local currencies. We believe the reversal of zero-COVID policies, which took many investors by surprise, will benefit global growth (a positive for emerging markets generally) and in particular, commodity exporters. Commodity sensitive currencies, such as the Brazilian real, Peruvian sol and Colombian peso, may benefit.</p>
<h2 id="point-seven" class="anchored-block">How can investors access EM local currency bonds?</h2>
<p>The&nbsp;<strong><a href="/link/98c7fd49bdbc456294a1eb859ad166f7.aspx" title="EMLC - VanEck J.P. Morgan EM Local Currency Bond ETF - Overview">VanEck J.P. Morgan EM Local Currency Bond ETF (EMLC)</a>&nbsp;</strong>seeks to track the price and yield performance of the J.P. Morgan GBI-EM Global Core Index (GBIEMCOR), which comprises bonds issued by emerging market governments and denominated in the local currency of the issuer. <strong><a href="/link/98c7fd49bdbc456294a1eb859ad166f7.aspx" title="EMLC - VanEck J.P. Morgan EM Local Currency Bond ETF - Overview">EMLC</a></strong>&nbsp;is the largest and most liquid ETF providing access to the local currency sovereign bond market, according to Bloomberg as of 12/31/2022.</p>
<h2 id="point-eight" class="anchored-block">How can investors buy VanEck ETFs?</h2>
<p><strong><a href="/link/86d319914b98480c8196b80f52f9d68f.aspx#how-to-buy-etfs&amp;utm=EMLC-Blog" title="How to buy VanEck ETFs">Learn more here.</a></strong></p>
<p class="d-none d-lg-block"><a href="mailto:askvaneck@vaneck.com" title="Have More Questions? - Ask VanEck" rel="noopener"><img loading="lazy" class="img-responsive" src="https://www.vaneck.com/globalassets/home/us/insights/blogs/bm-blog-images/cta-faq_desktop-02.svg" alt="Have More Questions? - Ask VanEck" /></a></p>
<p class="d-lg-none"><a href="mailto:askvaneck@vaneck.com" title="Have More Questions? - Ask VanEck" rel="noopener"><img loading="lazy" class="img-responsive" src="https://www.vaneck.com/globalassets/home/us/insights/blogs/bm-blog-images/cta-faq_mobile-01.svg" alt="Have More Questions? - Ask VanEck" /></a></p>
<p>To receive more <a href="/us/en/insights/emerging-markets-bonds/" title="Emerging Markets Bonds Insights"><strong>Emerging Markets Bonds</strong></a> insights, <a href="/us/en/subscribe/" title="Subscription Center"><strong>sign up in our subscription center</strong></a>.</p>
<style type="text/css">
    .wrapped-div {
        max-width: 100%;
        padding-top: 1rem;
    }

    @media (max-width: 768px) {
        .wrapped-div {
            overflow-x: scroll;
            
        }
    }

    .wrapped-div-sector {
        max-width: 100%;
        overflow-x: scroll;
    }
</style>
]]></content:encoded>
</item><item rdf:about="https://www.vaneck.com/us/en/blogs/digital-assets/what-is-web3/">
  <title>What is Web3?></title>
  <link>https://www.vaneck.com/us/en/blogs/digital-assets/what-is-web3/</link>
  <description><![CDATA[Web3 seeks to deliver personalized information more quickly and give users more control over their online data.]]></description>
  <dc:creator> </dc:creator>
  <dc:date>03/02/2023 06:30:00</dc:date>
<content:encoded><![CDATA[

<p>The next generation of Internet technology, referred to as Web 3.0 or Web3, mainly utilizes machine learning, artificial intelligence (AI), and blockchain technology. Gavin Wood, the creator of Polkadot and an Ethereum co-founder, coined the phrase. Web3 provides consumers more autonomy over their online data, in contrast to Web2, which is focused on user-generated content hosted on centralized websites.</p>
<p>The objective of the movement is to develop open, interconnected, intelligent websites and online apps with better machine-based data understanding. Decentralization and digital economies are crucial components of Web3 because they allow us to assign value to online information. It's also important to realize that Web3 is a dynamic idea. No single definition exists, and its exact meaning can differ from person to person.</p>
<p>With the aid of AI and cutting-edge machine learning algorithms, Web3 seeks to deliver personalized and pertinent information more quickly. Machines will be able to grasp and recommend material intuitively as a result of improved search algorithms and advances in Big Data analytics. Additionally, Web3 will emphasize user-owned content and support for open digital markets.</p>
<p>Websites today typically present static data or user-generated content, such as forums or social media. This enables data to be sent widely, but it doesn't address the demands of particular consumers. A website should customize the information it offers to each user, much like the fluidity of interpersonal communication in the real world. With Web2, users no longer own or manage this information once it is online.</p>
<p>The creator of the World Wide Web and computer scientist Tim Berners-Lee are both significant figures in the Web3 movement. In 1999, he offered his vision of the future of the web:</p>
<p>&ldquo;I have a dream for the Web  become capable of analyzing all the data on the Web &ndash; the content, links, and transactions between people and computers. A "Semantic Web," which makes this possible, has yet to emerge, but when it does, the day-to-day mechanisms of trade, bureaucracy, and our daily lives will be handled by machines talking to machines.&rdquo;</p>
<p>Since then, Gavin Wood's message and Berners-Lee&rsquo;s vision have come together. Here, websites and applications will have access to a vast ocean of decentralized information. When working with specific users, they will comprehend and effectively utilize that data.</p>
<p>Technology, like the Internet, is always changing and innovating. We have already encountered Web1 and 2, and much discussion surrounds Web3. Users of Web1 received a static experience because they were unable to build modern, content-rich websites. Social media and dynamic websites from Web2 brought us closer together, but at the expense of centralization.</p>
<p>Web3 aims to offer control over the content we access online and to build a semantic web. This implies that computers will have no trouble processing and reading user-generated content. Blockchain will give rise to decentralization, open digital economies, and free digital identities with cryptocurrency wallets.</p>
<p>The availability of 3D alternatives to regular web browsing will change how we connect with the internet. Additionally, advantages to the consumer include effective browsing, pertinent advertising, and enhanced customer service. Virtual assistants driven by AI, like Siri and Alexa, as well as interconnected smart homes could also be part of the broad development of Web2 to Web3.</p>
<h2>Web3 Use Cases</h2>
<p><strong>No Single Point of Control</strong></p>
<p>Since middlemen are no longer involved, user data is no longer under their control. Due to this freedom, there is a lower chance of being subject to corporate or governmental censorship, and cyber-attacks like denial-of-service are less successful.</p>
<p><strong>Increased Interconnectedness of Information</strong></p>
<p>As more items are linked to the Internet, greater data sets provide algorithms with more information to examine. By doing so, they may be able to provide users with information that is more accurate and meets their individual needs.</p>
<p><strong>More Effective Browsing</strong></p>
<p>Choosing the best results from search engines can be difficult. Nevertheless, they have improved over time in locating semantically pertinent items based on search context and metadata. This results in a more convenient web browsing experience that can help anyone find the exact information they need with ease.</p>
<p><strong>Improved Marketing and Advertising</strong></p>
<p>No one enjoys being inundated with web advertisements. However, if the advertisements are helpful rather than annoying, it may be because they are pertinent to your requirements. By utilizing AI systems that are smarter and targeting certain audiences based on consumer data, Web3 seeks to improve advertising.</p>
<p><strong>Better Customer Service</strong></p>
<p>Websites and web applications must provide excellent customer service to ensure a positive user experience. However, many successful web services find it difficult to scale their customer support operations because of the prohibitive prices. Users can benefit from an improved experience when interacting with support professionals thanks to more sophisticated chatbots that can speak to several consumers at once.</p>
<div class="wrapped-div">
<table style="width: 100%;">
<tbody>
<tr class="tbl-data">
<td class="tbl-header last" style="text-align: center;">&nbsp;</td>
<td class="tbl-header last" style="text-align: center;">Web1</td>
<td class="tbl-header last" style="text-align: center;">Web2</td>
<td class="tbl-header last" style="text-align: center;">Web3</td>
</tr>
<tr class="tbl-data">
<td class="data-td  last">Content</td>
<td class="data-td data last">Passive interaction for the user</td>
<td class="data-td data last">Community platforms and user-generated content</td>
<td class="data-td data last">User-ownership for content creators</td>
</tr>
<tr class="tbl-data">
<td class="data-td  last">Technologies</td>
<td class="data-td data last">HTML</td>
<td class="data-td data last">Dynamic HTML, Javascript</td>
<td class="data-td data last">Blockchain, AI, machine learning</td>
</tr>
<tr class="tbl-data">
<td class="data-td  last">Virtual environments</td>
<td class="data-td data last">None</td>
<td class="data-td data last">Some basic 3D use</td>
<td class="data-td data last">3D, VR, AR</td>
</tr>
<tr class="tbl-data">
<td class="data-td  last">Advertising</td>
<td class="data-td data last">Obtrusive (banners, etc.)</td>
<td class="data-td data last">Interactive</td>
<td class="data-td data last">Targeted based on user behavior</td>
</tr>
<tr class="tbl-data">
<td class="data-td  last">Data storage</td>
<td class="data-td data last">Stored on individual websites&rsquo; servers</td>
<td class="data-td data last">Owned by large tech giants</td>
<td class="data-td data last">Distributed across users</td>
</tr>
<tr class="tbl-data">
<td class="data-td  last">Audience</td>
<td class="data-td data last">Individual users</td>
<td class="data-td data last">Specific communities of users</td>
<td class="data-td data last">Interconnected users across multiple platforms and devices</td>
</tr>
</tbody>
</table>
</div>
<br />
<h2>How Do You Invest in Web3?</h2>
<p>At its core, Web3 is driven by artificial intelligence, blockchain, distributed ledgers, and 3D/VR/AR environments. One of the best ways to gain exposure to the development of Web3 is to invest in the underlying technologies that make it possible in the first place. On the blockchain side, that means gaining exposure to smart contract platforms such as Ethereum. VanEck provides a straightforward, diversified and easy way to invest in a broad selection of smart contract platforms that enable Web3.</p>
<p>To receive more <strong><a href="https://www.vaneck.com/us/en/insights/digital-assets/" title="Digital Assets Insights">Digital Assets</a></strong> insights, <strong><a href="https://www.vaneck.com/us/en/subscribe/" title="Subscription Center">sign up in our subscription center</a></strong>.</p>
<style type="text/css">
    .wrapped-div {
        max-width: 100%;
    }

    @media (max-width: 1240px) {
        .wrapped-div {
            overflow-x: scroll;
        }


    }
</style>
]]></content:encoded>
</item><item rdf:about="https://www.vaneck.com/us/en/blogs/economic-trends/inflation-concerns-a-recurring-nightmare/">
  <title>Inflation Concerns – A Recurring Nightmare?></title>
  <link>https://www.vaneck.com/us/en/blogs/economic-trends/inflation-concerns-a-recurring-nightmare/</link>
  <description><![CDATA[Upside inflation surprises in DM push bond yields and expectations for peak rates higher. Can EMs escape the inflation &ldquo;curse&rdquo;?]]></description>
  <dc:creator>Natalia  Gurushina</dc:creator>
  <dc:date>03/02/2023 06:30:00</dc:date>
<content:encoded><![CDATA[

<h2>DM Peak Rate Expectations</h2>
<p><strong>Developed markets (DM) inflation worries are back, and this means that</strong> global rates are under pressure yet again, while the <strong>market expectations for DM peak rates are re-testing the past highs</strong> (see chart below). This week, an upside inflation surprise in the Eurozone (especially in core prices) was probably the most &ldquo;visible&rdquo; indicator. Still, a big jump in the &ldquo;prices paid&rdquo; component of February&rsquo;s ISM manufacturing survey and today&rsquo;s very unfortunate combo of lower Q4 productivity growth and higher unit labor costs added to concerns about the inflation outlook for the U.S... Tomorrow&rsquo;s &ldquo;prices paid&rdquo; sub-index in the ISM survey for services is likely to attract some extra attention as well.</p>
<h2>Inflation Surprises</h2>
<p><strong>The</strong> <strong>inflation surprise index for DMs changed direction recently and started to move higher</strong> &ndash; much more than a similar index for emerging Ms. Does it mean that EMs are better positioned to escape the inflation &ldquo;curse&rdquo;? As you know, we try to look through high-frequency data noise, but we have to admit that the question about potentially diverging longer-term inflation trajectories in EM and DM started to pop up in our discussions more frequently. China aside, EMs&rsquo; demographic situation is more favorable than in DM, which means fewer labor supply constraints and the rising middle class (with a greater pool of savings, including pension funds).</p>
<h2>EM Inflation Outlook</h2>
<p><strong>Another point is that emerging economies, on average, have lower debt/GDP ratios,</strong> and EM governments are aware that the market and rating agencies will notice a lack of fiscal discipline. Arguably, this <strong>reduces the need for fiscal dominance</strong> (which, by the way, tends to produce undesirable side effects), allowing policy rates to do their job properly. Finally, new technologies would require significant future investments both in EM and DM, but many EMs &ndash; especially &ldquo;EM Graduates&rdquo; &ndash; skipped some technological states and have the newer infrastructure (=potentially a better &ldquo;fit&rdquo; between the pool of savings and the need for capital). We know that EMs already pay higher real rates, but aren&rsquo;t recent developments mean further support for EM going forward, not less? Stay tuned!</p>
<h3>Chart at a Glance: DM Peak Rate Expectations &ndash; Re-Testing the Highs</h3>
<p><img class="img-responsive w-100" src="https://www.vaneck.com/contentassets/20b08a534d784ba4851f6b2a96f7bbe9/us-natalias-take-2023-03-02.png" alt="Chart at a Glance: DM Peak Rate Expectations - Re-Testing the Highs" /></p>
<p class="chart-disclosure">Source: VanEck Research; Bloomberg LP.</p>
]]></content:encoded>
</item><item rdf:about="https://www.vaneck.com/us/en/blogs/digital-assets/what-are-smart-contracts/">
  <title>What are Smart Contracts?></title>
  <link>https://www.vaneck.com/us/en/blogs/digital-assets/what-are-smart-contracts/</link>
  <description><![CDATA[Smart contracts are autonomous decentralized programs that have a wide range of use cases.]]></description>
  <dc:creator> </dc:creator>
  <dc:date>03/01/2023 06:30:00</dc:date>
<content:encoded><![CDATA[

<p><strong>Please note that VanEck has exposure to Bitcoin and holds a position in Ethereum.</strong></p>
<p>Smart contracts were first introduced in the 1990s by Nick Szabo. He described a smart contract back then as a device that formalizes and secures computer networks by fusing user interfaces with protocols. Szabo talked about the possible applications of smart contracts in a number of industries that deal with contractual agreements, including payment processing, content rights management, and credit systems.</p>
<p>A smart contract in the context of cryptocurrencies is a blockchain-based application or program. They often function as a digital contract that is upheld by a certain set of guidelines. All network nodes reproduce and execute computer code that contains these established rules.</p>
<p>Smart contracts on the blockchain make it possible to design trustless protocols. This implies that two parties can enter into agreements using blockchain without having any prior acquaintance or confidence. They can be confident that the contract won't be carried out if the requirements aren't met. In addition, the implementation of smart contracts can eliminate the need for middlemen, substantially lowering operating expenses.</p>
<p>Smart contracts have been supported by the Bitcoin protocol for a long time, but Vitalik Buterin, who is also the co-founder of Ethereum, is credited for popularizing them. It's important to keep in mind, though, that each blockchain may offer a unique way to create smart contracts.</p>
<h2>How Do Smart Contracts Work?</h2>
<p>A smart contract functions like a deterministic program. It performs a certain task when and if a set of requirements are met.</p>
<p>As a result, "if... then..." expressions are frequently used in smart contract systems. Contrary to popular belief, smart contracts are neither contracts that are legally binding nor intelligent. They are merely code that is running on a distributed system (blockchain).</p>
<p>The blockchain actions that happen when users (addresses) connect with one another on the Ethereum network are executed and managed by smart contracts. A smart contract-free address is referred to as an externally held account (EOA). EOAs are governed by users, whereas smart contracts are controlled by computer code.</p>
<p>Ethereum smart contracts are made of a contract code and two public keys. The first public key is the one provided by the creator of the contract. The other key represents the contract itself, acting as a digital identifier that is unique to each smart contract.</p>
<p>The deployment of any smart contract is made through a blockchain transaction and can only be activated when called by an EOA (or by other smart contracts). However, the first trigger is always caused by an EOA (user).</p>
<h2>Smart Contracts and Token Standards</h2>
<p>Tokens created on the Ethereum network generally adhere to the ERC-20 standard. The fundamental features of all tokens based on Ethereum are described in the standard. As a result, these digital assets are sometimes referred to as ERC-20 tokens, and they account for a sizable fraction of all currently traded cryptocurrencies.</p>
<p>Smart contracts were used by a lot of blockchain firms and businesses to launch digital tokens on the Ethereum network. The bulk of these businesses distributed their ERC-20 tokens through Initial Coin Offering (ICO) occasions after the issuance. Most of the time, the implementation of smart contracts made it possible to trade money and distribute tokens in an effective and trustless manner.</p>
<p><img class="img-responsive w-100 desktop-image" src="https://www.vaneck.com/contentassets/40ef910ac7934dd6b4e4e73950705bb6/scl_crypto-blog-4-9_2023.02.png" alt="ERC Token Standards List" /></p>
<p><img class="img-responsive w-100 mobile-image" src="https://www.vaneck.com/contentassets/40ef910ac7934dd6b4e4e73950705bb6/scl_crypto-blog-4-9_2023.02-mobile.png" alt="ERC Token Standards List" /></p>
<p class="chart-disclosure">Source: Blockchain Council.</p>
<h2>Smart Contract Use Cases</h2>
<p>Smart contracts are programmable code that may be built in a variety of ways and offer a wide range of services and solutions.</p>
<p>Smart contracts, which are autonomous decentralized programs, might boost accountability and lower expenses. They may also improve efficiency and cut back on administrative costs, depending on how they are implemented.</p>
<p>Smart contracts are very helpful when money is being transferred between two or more parties or exchanged between them.</p>
<p>Smart contracts can therefore be created for a wide range of use cases. Tokenized assets, voting processes, digital wallets, decentralized exchanges, games, and mobile apps are a few examples. They could also be used in conjunction with other blockchain-based solutions tackling the areas of governance, decentralized finance (DeFi), supply chain, healthcare, and philanthropy.</p>
<p>To receive more <strong><a href="https://www.vaneck.com/us/en/insights/digital-assets/" title="Digital Assets Insights">Digital Assets</a></strong> insights, <strong><a href="https://www.vaneck.com/us/en/subscribe/" title="Subscription Center">sign up in our subscription center</a></strong>.</p>
<style>
    .widgetBody .desktop-image {
        display: block;
    }

    .widgetBody .mobile-image {
        display: none;
    }

    @media screen and (max-width: 425px) {
        .widgetBody .desktop-image {
            display: none;
        }

        .widgetBody .mobile-image {
            display: block;
        }
    }
</style>
]]></content:encoded>
</item><item rdf:about="https://www.vaneck.com/us/en/blogs/economic-trends/china-recovery-seeing-is-believing/">
  <title>China Recovery – Seeing Is Believing></title>
  <link>https://www.vaneck.com/us/en/blogs/economic-trends/china-recovery-seeing-is-believing/</link>
  <description><![CDATA[China&rsquo;s activity gauges point to a faster pace of recovery, but the global growth backdrop remains more mixed.]]></description>
  <dc:creator>Natalia  Gurushina</dc:creator>
  <dc:date>03/01/2023 06:30:00</dc:date>
<content:encoded><![CDATA[

<h2>China Reopening</h2>
<p><strong>China&rsquo;s faster recovery thesis got some major support from February&rsquo;s activity gauges</strong>. All PMIs (Purchasing Managers Indices) improved significantly last month, with the vast majority in the expansion zone now &ndash; not only services and manufacturing, but also the new export orders and small companies PMIs (see chart below). Importantly, the construction PMI shot above 60.0, pointing to the ongoing infrastructure push but also a signal that the housing sector might be getting more &ldquo;alive.&rdquo; China&rsquo;s equities and FX &ndash; as well as many risky assets - had a very good day today. China&rsquo;s credit aggregates would be the next important dataset to watch &ndash; especially proxies for mortgage lending, which are vital for consumer confidence and the consumption-led recovery (in addition to the stronger employment PMI).</p>
<h2>EM Growth Outlook</h2>
<p><strong>China&rsquo;s new export orders gains (up from 46.1 to 52.4) sent a positive signal regarding the state of global demand</strong>, albeit the growth &ldquo;landscape&rdquo; looks more mixed on a country level. Emerging markets (EM) Asia mostly stayed in the expansion zone (including Thailand&rsquo;s &ldquo;upgrade&rdquo;), but Central Europe continued to struggle deep in the contraction zone. We were also concerned by a sharp deterioration in two major African economies &ndash; South Africa and Nigeria &ndash; where February&rsquo;s PMIs unexpectedly plunged below 50.0. LATAM&rsquo;s high-frequency growth indicators have shown more signs of life lately &ndash; including today&rsquo;s economic activity proxy in Chile and Brazil&rsquo;s PMI &ndash; but this is an uphill struggle as high real interest rates &ndash; and political noise - continue to bite.</p>
<h2>DM Rates And Inflation</h2>
<p><strong>Even though a recession is no longer the base-case scenario for most developed markets (DMs) this year</strong>, the &ldquo;bumpy&rdquo; activity dataflow in the U.S. &ndash; including February&rsquo;s surprisingly weak consumer confidence index - raised questions about further growth upgrades. Today&rsquo;s mixed ISM survey showed that these concerns might be justified. There were improvements, but one of the strongest upside surprises came in the &ldquo;prices paid&rdquo; category. And this helps to explain why the market continues to price in the higher peak rate in the U.S. and a 74% probability of a rate hike in June. Will China&rsquo;s V-shaped comeback prove a more important global driver for EMs than higher for longer U.S. rates? We this that this is indeed the case for some EMs, especially in EM Asia. Stay tuned!</p>
<h3>Chart at a Glance: China Recovery &ndash; V-Shape After All?</h3>
<p><img class="img-responsive w-100" src="https://www.vaneck.com/contentassets/07b5b2b27cc9497b8a68efcfd81ac286/us-natalias-take-2023-03-01.png" alt="Chart at a Glance: China Recovery - V-Shape After All?" /></p>
<p class="chart-disclosure">Source: Bloomberg LP.</p>
]]></content:encoded>
</item><item rdf:about="https://www.vaneck.com/us/en/blogs/economic-trends/keep-an-eye-on-the-turning-points/">
  <title>Keep an Eye on the Turning Points></title>
  <link>https://www.vaneck.com/us/en/blogs/economic-trends/keep-an-eye-on-the-turning-points/</link>
  <description><![CDATA[The &ldquo;higher for longer&rdquo; rates and the China rebound narratives are still probed/questioned by the market and analysts.]]></description>
  <dc:creator>Natalia  Gurushina</dc:creator>
  <dc:date>02/28/2023 16:00:00</dc:date>
<content:encoded><![CDATA[

<h2>Asset Correlations</h2>
<p>The recession scare in most developed markets (DM) seems to be over (for now), and upside inflation surprises - including today&rsquo;s individual country prints in Europe - are &ldquo;nudging&rdquo; peak rates&rsquo; expectations higher. One <strong>potential regime shift to consider</strong> - if indeed rates and inflation stay higher for longer &ndash; is that a change in the correlation between bonds and equities might accompany this. The correlation is currently in &ldquo;no man&rsquo;s land&rdquo; but drifting higher and becoming positive for the first time in years (see chart below), indicating that equities and bonds are rallying and selling off at the same time, more frequently than in the past two decades.</p>
<h2>China Rebound</h2>
<p>Another part of the global narrative - <strong>the China rebound story - still does not seem very convincing for some market participants</strong> (even though the growth outlook is better than several months ago), which is why today&rsquo;s activity gauges will be closely watched. Observers hope they will shed more light on the &ldquo;revenge vs. precautionary&rdquo; debate regarding the use of &ldquo;excess&rdquo; savings &ndash; this is a big deal for the consumption-driven recovery story. There are also expectations/hopes that the forthcoming &ldquo;two sessions&rdquo;<sup>*</sup>&nbsp;will send a more forceful policy signal (especially for the housing sector). In the meantime, doubts about China&rsquo;s recovery timeline are affecting asset prices in countries expected to benefit the most from the rebound &ndash; including Thailand (exports of services) and South Korea (manufacturing exports). Both the Thai baht and the Korean won found themselves at the bottom of the emerging markets (EM) FX February&rsquo;s &ldquo;league table.&rdquo;</p>
<h2>EM Policy Rates</h2>
<p>One element of the global macro story that does not require any &ldquo;edits&rdquo; is <strong>the cautious policy stance of various central banks in EM</strong>. The main takeaway from today&rsquo;s central bank meeting in Hungary is that the bar for rate cuts is high, despite declining inflation risks. The central bank keeps its eyes on the target &ndash; the inflation target &ndash; and nothing else, and a change in the policy rate (a cut) is not even on the agenda. Several other central banks will have rate-setting meetings in the next 10 days or so &ndash; including Malaysia, Poland, and Peru &ndash; and we are certain that the message will sound very similar. Stay tuned!</p>
<h3>Chart at a Glance: Bonds/Equities Correlation &ndash; Time of Change?</h3>
<p><img class="img-responsive w-100" src="https://www.vaneck.com/contentassets/9f6e40cd088542e1a4f4384779f41bc7/us-natalias-take-2023-02-28.png" alt="Chart at a Glance: Bonds/Equities Correlation - Time of Change?" /></p>
<p class="chart-disclosure">Source: VanEck Research; Bloomberg LP.</p>
<p class="chart-disclosure">Note:&nbsp;<sup>*</sup>&nbsp;- &ldquo;Two sessions&rdquo; are the yearly plenary meetings of the National People&rsquo;s Congress and the Chinese People&rsquo;s Political Consultative Conference.</p>
]]></content:encoded>
</item><item rdf:about="https://www.vaneck.com/us/en/blogs/digital-assets/why-invest-in-digital-assets/">
  <title>Why Invest in Digital Assets?></title>
  <link>https://www.vaneck.com/us/en/blogs/digital-assets/why-invest-in-digital-assets/</link>
  <description><![CDATA[Explore the use cases of digital assets and key considerations when deciding which to invest in.]]></description>
  <dc:creator> </dc:creator>
  <dc:date>02/28/2023 06:30:00</dc:date>
<content:encoded><![CDATA[

<p>Digital assets promise a new way of arriving at a global consensus; a math-based model that can guarantee scarcity while remaining open to anyone with an internet connection. Bitcoin, the best-known digital asset, is regarded as a store of value in an age of uncertainty, a kind of digital gold. Like gold, its supply is limited. There will never be more than 21 million Bitcoins and they will be issued at a known rate. This contrasts with fiat currencies, where an increasing money supply can stoke inflation, devaluing the currency.</p>
<p>The value of newer digital assets &ndash; such as Ethereum, Tron and Solana &ndash; is linked to their rapid growth as platforms for smart contracts. Broadly speaking, digital assets offer diversification from traditional asset classes, as their prices tend to move independently. However, digital asset prices are volatile, subject to rapid price swings. Due to this and the other risks they are linked to, they should only form a limited part of an investor&rsquo;s overall portfolio.</p>
<h2>Deciding Which Digital Assets to Invest In</h2>
<p>The choice of which currency to invest in is up to the individual investor. It is important to keep in mind that cryptocurrencies will change at different points in time and near-term price volatility often depends on shifts in market share or momentum.</p>
<p>Bitcoin is the starting point for many investors because its use case is simple; its network is among the most decentralized, and the long-term price momentum has been strong. Many professional investors, large corporations and even a sovereign nation (El Salvador) have invested in this original cryptocurrency.</p>
<p>However, it is often wise to diversify or spread your bets. While Bitcoin was the first digital asset, newer digital assets offer different use cases. Second or third-generation digital assets like Ethereum and Solana are backed by more advanced technology, which may boost demand for network capacity and their tokens. It is difficult to predict which will be the dominant cryptocurrencies in 20 years. For that reason, it may be wise to invest in a basket of digital assets.</p>
<p>To receive more <strong><a href="https://www.vaneck.com/us/en/insights/digital-assets/" title="Digital Assets Insights">Digital Assets</a></strong> insights, <strong><a href="https://www.vaneck.com/us/en/subscribe/" title="Subscription Center">sign up in our subscription center</a></strong>.</p>
]]></content:encoded>
</item><item rdf:about="https://www.vaneck.com/us/en/blogs/emerging-markets-equity/brazil-beckons-with-low-valuations-and-growth-potential/">
  <title>Brazil Beckons with Low Valuations and Growth Potential></title>
  <link>https://www.vaneck.com/us/en/blogs/emerging-markets-equity/brazil-beckons-with-low-valuations-and-growth-potential/</link>
  <description><![CDATA[We examine Vamos and Rede D&rsquo;Or, two industry leaders with substantial market share, and explore how they are well-positioned to benefit from improving valuations in the Brazilian market.]]></description>
  <dc:creator>Patricia Gonzalez</dc:creator>
  <dc:date>02/28/2023 06:30:00</dc:date>
<content:encoded><![CDATA[

<p>In the fog of domestic political and fiscal uncertainty, investors may still find Brazil equities poised to benefit from structural growth trends within their industries. While historically low valuations of Brazil equities generally provide the potential for greater upside, selection remains key.</p>
<p>The VanEck Emerging Markets Equity Investment Team&rsquo;s recent trip to Brazil in November 2022 was a fascinating time to be in the country, particularly right after the elections. At the time, there was uncertainty concerning Lula&rsquo;s fiscal policy, and the expectation was that a more centrist congress would keep the new president fiscally responsible. The news cycle coming out of the country has led to volatile market movements since our trip in November. However, the good news is that despite the political outlook, our meetings with the companies were reassuring of the positive fundamentals and forward guidance.</p>
<p>Brazil equities are trading at depressed valuations, given the overhang of domestic political and fiscal uncertainty cast by the new government. The external environment for emerging markets equities and global growth expectations have weighed down on Brazil's equities. MSCI Brazil is trading at its lowest P/E multiple since 2010, and the country&rsquo;s equities are trading at among the lowest P/E multiples across emerging markets.<sup>1</sup></p>
<h3>Brazil Equities Trading at Distressed Multiples</h3>
<p><strong>MSCI Brazil - Consensus 12-month forward Price to Earnings<br />(through 31-Jan-2023)</strong></p>
<p><img class="img-responsive w-100" src="https://www.vaneck.com/contentassets/6b2cd796b7624a6aab6a67aa8f7ef907/2881_eme_chart_01_2023.02_v1_blog.svg" alt="Brazil Equities Trading at Distressed Multiples" /></p>
<p class="chart-disclosure">Source: Bradesco BBI data as of 1/31/2023.</p>
<h3>Attractive Valuations Across Emerging Markets</h3>
<p><img class="img-responsive w-100" src="https://www.vaneck.com/contentassets/6b2cd796b7624a6aab6a67aa8f7ef907/2881_eme_chart_02_2023.02_v1_blog.svg" alt="Attractive Valuations Across Emerging Markets" /></p>
<p class="chart-disclosure">Source: HSBC research report as of 12/1/2022.</p>
<p>We believe the tide is turning for Brazil equities, and high-quality companies could benefit the most. The global scenario has been positive for emerging market equities year-to-date, with slower GDP deceleration, more resilient commodity prices, and disinflation underway. The China reopening and the higher demand for Brazil&rsquo;s commodity exports are generally positive for Brazil&rsquo;s currency (BRL) and equities.</p>
<p>Brazil appears to be ahead in its disinflation process compared to developed economies. The central bank could maintain the Selic rate at 13.75% for most of 2023 and start easing by the end of this year. The country&rsquo;s challenge is to put a new fiscal framework that stabilizes and reduces the public debt-to-GDP ratio over time. Finance minister Hadad&rsquo;s economic measures to reduce the primary fiscal deficit for 2023 in half from the expected 46 billion or 2.1% of GDP to $20 billion or 1% of GDP appears to be a net positive for the stock market.<sup>2</sup>&nbsp;These factors appear to be a positive tailwind for Brazil equities, and a possible BRL appreciation could add to the real rates of return for international investors.</p>
<p>We are particularly excited about the prospects of structural growth opportunities for companies in our portfolio that appear to benefit from improving the valuation of Brazilian equities. We want to highlight Vamos and Rede D&rsquo;Or as both companies are leaders in their respective industries and command a sizeable market share.</p>
<h2>Vamos: Brazil's Leading Truck and Equipment Rental Company with Growth Potential and High Profitability</h2>
<p>The company is Brazil's leader in truck, machinery, and equipment rental. Vamos is the most significant player commanding 80% of the market share in its industry. It also benefits from scale, as it is twice as large as its closest competitor and offers a Return on Invested Capital (ROIC) of 16%. We believe the company provides a great combination of growth and profitability. The market for truck rentals in Brazil is underpenetrated at only 0.6% of the size of the United States market. It could grow significantly; to put it in context, it is 20x larger in the U.S. than in Brazil.</p>
<p>The company&rsquo;s large scale allows it to purchase the trucks at a big discount from the original equipment manufacturer, enabling high profitability rates. The revenue stream is pretty steady, with long-term contracts of at least 5 years in place. In addition, the average fleet in Brazil is approximately 20 years old, making it a good market for truck rentals and sales as the fleet needs to be replaced. We believe the current macro situation and the higher price of new trucks are favorable for the Vamos. Most customers are postponing the decision to buy new trucks and are considering rentals as an alternative. Vamos is trading at 16.6X P/E 2023 and 12x P/E 2024, a 17% discount below historical averages and below leading car rental company Localiza despite having higher growth (&gt;40%) and higher profitability.</p>
<h2>Rede D'Or: Brazil's Leading Hospital Operator Poised for Growth and Consolidation</h2>
<p>The company is the largest hospital operator in Brazil, with over 50 hospitals, and focuses on the premium segment. The healthcare market in Brazil is very fragmented, with many players struggling to survive, especially due to the pandemic. Rede D&rsquo;Or is a solid player with extensive knowledge, scale, and a strong balance sheet. Rede D&rsquo;Or has been a market consolidator and currently has a 15% industry market share. The company could double that market share over the next few years. It has a strong record of accomplishment and has one of the best management teams in the industry.</p>
<p>Rede D&rsquo;Or was founded 20 years ago and since then has completed 39 acquisitions, all doing better than expected. Most of the acquisitions have been successful and accretive, and the company has increased margins in every hospital it operates. Currently, Brazil has 2 beds per 1,000 habitants, but the government guideline is to have 5 beds per 1,000 inhabitants. There is an opportunity for growth, and Rede D&rsquo;Or is well-positioned to capture that growth. We believe 2023 could be a good year for the company driven by higher price adjustments, organic growth, M&amp;A opportunities, and scale. RedeD&rsquo;Or is trading at 24.8x P/E 2023 and 16.8x 2024, which is attractive given the strong earnings and growth prospects (with a 3-year CAGR of ~40%) for the company.</p>
<p>Despite Brazil's fiscal and macro overhang, our portfolio companies may benefit from the structural growth trends presented in their respective industries. While selectivity remains key, we believe Brazilian equities look attractive at current valuations. Our trip to Brazil reaffirmed our conviction in our investee companies, and we expect valuations for our portfolio companies to be steady or even rise from here.</p>
<p>To receive more <a href="/us/en/insights/emerging-markets-equity/" title="Emerging Markets Equity Insights"><strong>Emerging Markets Equity</strong></a> insights, <a href="/us/en/subscribe/" title="Subscription Center"><strong>sign up in our subscription center</strong></a>.</p>
]]></content:encoded>
</item><item rdf:about="https://www.vaneck.com/us/en/blogs/economic-trends/all-quiet-on-the-growth-front/">
  <title>All Quiet on the Growth Front?></title>
  <link>https://www.vaneck.com/us/en/blogs/economic-trends/all-quiet-on-the-growth-front/</link>
  <description><![CDATA[The growth backdrop for EMs is not as bad as in the fall, but improvements and GDP upgrades are still very cautious.]]></description>
  <dc:creator>Natalia  Gurushina</dc:creator>
  <dc:date>02/27/2023 16:00:00</dc:date>
<content:encoded><![CDATA[

<h2>China&rsquo;s Rebound</h2>
<p>The <strong>next wave of emerging markets (EM) activity gauges is about to hit the shore</strong>, starting with China&rsquo;s official PMIs (Purchasing Managers Indices) tomorrow evening. China&rsquo;s 2023 growth outlook is bottoming out - the consensus forecast has been raised from 4.8% to 5.2% on the back of reopening news. However, the market now has additional questions regarding the recovery&rsquo;s timeline, whether it will be more unbalanced than previously thought, and how much of &ldquo;excess&rdquo; savings will be used to boost consumption (rather than precautionary savings). The housing sector is still sluggish, which can also weigh on consumer sentiment &ndash; China watchers hope the forthcoming National People&rsquo;s Congress meeting will provide more color regarding additional policy support.</p>
<h2>Global Growth Outlook</h2>
<p><strong>The global growth backdrop for EMs does not look as desperate as in September</strong>. The Bloomberg consensus survey (101 countries) shows that the share of large growth downgrades (-0.5% and more) dropped to 6-7% from about 50% at the end of last year (see chart below). At the same time, the share of large growth upgrades is still very low (5%). The last batch of EM PMIs was also mixed/inconclusive. The ratio of expansion-to-contraction was still below 50% in January, and the ratio of improvements-to-deteriorations looked about the same. As regards market implications, the growth outlook is important not only for EM carry trades (a better outlook can offset the impact of higher Fed rates) but for sovereign spreads as well (helping to cope with &ldquo;risk-free&rdquo; rates&rsquo; volatility &ndash; especially for High Yielding bonds).</p>
<h2>DM GDP Forecasts</h2>
<p><strong>The developing markets (DM) &ldquo;portion&rdquo; of global growth looks more promising</strong>, according to high-frequency data. Downside risks for Europe appear to be contained, with the recession no longer part of the consensus story. The economic surprise index for the U.S. continues to grind higher, supporting the market expectations of the higher peak rate (5.4% or so) and less need for &ldquo;emergency&rdquo; rate cuts in H2 (Fed Funds Futures now imply only 12-13bps). Some EM central banks might feel the need to match the Fed&rsquo;s higher policy rate trajectory (Mexico comes to mind here), but this does not apply to all EMs, many of which hiked early and aggressively and now have very high real policy rates. Stay tuned!</p>
<h3>Chart at a Glance: 2023 Growth Upgrades &ndash; Wait-n-See Mode (For Now)</h3>
<img class="img-responsive w-100" src="https://www.vaneck.com/contentassets/583c480c6cb34dbf8d05615d18b6e0e6/us-natalias-take-2023-02-27.png" alt="Chart at a Glance: 2023 Growth Upgrades - Wait-n-See Mode (For Now)" />
<p class="chart-disclosure">Source: VanEck Research; Bloomberg LP.</p>
]]></content:encoded>
</item><item rdf:about="https://www.vaneck.com/us/en/blogs/economic-trends/drivers-disinflation-debates/">
  <title>Drivers, Disinflation, Debates></title>
  <link>https://www.vaneck.com/us/en/blogs/economic-trends/drivers-disinflation-debates/</link>
  <description><![CDATA[China will return to the center stage next week with important data points and policy announcements. The pace of China&rsquo;s rebound is key for many EMs.]]></description>
  <dc:creator>Natalia  Gurushina</dc:creator>
  <dc:date>02/24/2023 18:00:00</dc:date>
<content:encoded><![CDATA[

<h2>China Recovery</h2>
<p>We&rsquo;ve seen <strong>suggestions that China&rsquo;s reopening was displaced by robust U.S. activity as the leading driver for emerging markets (EM)/risky assets</strong>. Well, we suspect that this might not last long. China will take center stage again next week - with closely-watched activity gauges and the &ldquo;two sessions&rdquo; *, which will be scrutinized for signs of additional policy support (especially for the housing sector) and any top personnel changes in the financial area. The consensus outlook for China&rsquo;s activity gauges is optimistic - the official manufacturing PMI (Purchasing Managers Index) is expected to move deeper into expansion zone, and the services PMI is accelerating to 55.0! J.P. Morgan also made a good point in one of its latest reports that reopening can reduce the volatility of China&rsquo;s growth. This, in turn, can improve business sentiment both in China and EM (=growth/inflows-positive).</p>
<h2>Global Disinflation</h2>
<p><strong>The speed/type of China&rsquo;s reopening can have material implications for commodity prices</strong> and, hence, for the pace of disinflation in EM. We sometimes wonder whether this can partially offset the positive impact of easing global supply chain pressures. The past week brought several downside inflation surprises in EM. The encouraging dataflow continued today with cooling inflation in Malaysia (down to 3.7% year-on-year) and Brazil (down to 5.63% year-on-year in mid-February). Brazil&rsquo;s real policy rate is getting close to 8% - the highest among major EMs - leaving ample room for rate cuts. However, the market only prices 116bps of easing on a 1-year horizon. For this perception to change, the central bank should be left alone, and fiscal noise should subside.</p>
<p>Those of you who are familiar with <strong>our investment philosophy know that we continue debating important issues until we reach consensus</strong> - and this includes stories mentioned in today&rsquo;s blog. But sometimes consensus remains elusive - the picture below shows one such instance. When I showed it to the bearded part of the team, one half said, &ldquo;yep, that&rsquo;s the case,&rdquo; but the other half immediately objected and said that it should be the other way round (&ldquo;my napkin is my beard&rdquo;). The debate continues. Stay tuned!</p>
<h3>A Debatable Point</h3>
<p><img class="img-responsive w-100" src="https://www.vaneck.com/contentassets/d4e1f3d0b93346e9a88425e97f277cc7/us-natalias-take-2023-02-24.png" alt="A Debatable Point" /></p>
<p class="chart-disclosure">Source: Natalia Gurushina.</p>
<p class="chart-disclosure">*Note: The &ldquo;two sessions&rdquo; are the yearly plenary meetings of the National People&rsquo;s Congress and the Chinese People&rsquo;s Political Consultative Conference.</p>
]]></content:encoded>
</item><item rdf:about="https://www.vaneck.com/us/en/blogs/digital-assets/cryptocurrencies/">
  <title>What are Cryptocurrencies?></title>
  <link>https://www.vaneck.com/us/en/blogs/digital-assets/cryptocurrencies/</link>
  <description><![CDATA[Explore cryptocurrencies, how they differ from digital currencies, specific examples, and their use cases.]]></description>
  <dc:creator> </dc:creator>
  <dc:date>02/24/2023 16:30:00</dc:date>
<content:encoded><![CDATA[

<p><strong>Please note that VanEck may have a position(s) in the digital asset(s) described below.</strong></p>
<h2>Cryptocurrencies are a digital means of exchange that use cryptography for security.</h2>
<p>They are represented as tokens or ledger entries on a blockchain network, effectively used to meter the network&rsquo;s capacity for transactions.</p>
<p>Confusingly, the names of cryptocurrency networks are used interchangeably with the tokens that, technically speaking, are the currencies. Three leading examples of cryptocurrencies are:</p>
<ul class="content-list">
<li>Bitcoin (network) has BTC as a token.</li>
<li>Ethereum (network) has Ether as a token.</li>
<li>Solana (network) has SOL as a token.</li>
</ul>
<p>The demand for any specific cryptocurrency increases the more its corresponding blockchain network is used. Greater demand for the token might well increase its price.</p>
<h2>Digital Currencies versus Cryptocurrencies</h2>
<p><strong>Cryptocurrencies are types of digital currency.</strong></p>
<p>However, digital currencies also include stablecoins, which are less volatile as they are linked to the value of an existing currency or commodity. For example, Tether is an independent stablecoin that attempts a US dollar peg. Indeed, many countries&rsquo; central banks are looking into launching stablecoins. Purchasing stablecoins can be considered as a way to invest in cryptocurrencies oriented at minimizing the associated volatility.</p>
<p>While the cryptocurrency universe is evolving quickly, VanEck has identified the following broad classifications:</p>
<ul class="content-list">
<li>Store of Value: Designed to hold or increase purchasing power over time. For example, Bitcoin.</li>
<li>Smart Contract Platform: Blockchain protocol designed to host a variety of self-developed and third party dApps. For example, Ethereum and Solana.</li>
<li>Infrastructure Application: A decentralized computer program designed to perform specific tasks. For example, Polygon.</li>
<li>Stable Coins: Digital currencies that attempt to peg to a reasonably stable asset such as a currency or commodity. For example, Tether.</li>
<li>Exchange: Tokens owned and operated by a centralized cryptocurrency exchange.</li>
<li>Payments: Digital monies operated by a distributed network. For example, Dogecoin.</li>
<li>DeFi: Financial services built on top of distributed networks with no central intermediaries. For example, Uniswap.</li>
<li>Metaverse: A currency used to reward users for content, games, gambling or social media. For example, Axie Infinity.</li>
</ul>
<h2>Cryptocurrencies Offer a Variety of Use Cases</h2>
<p>People who don&rsquo;t understand the need for cryptocurrencies usually just don&rsquo;t see the use cases. What can cryptocurrencies do besides transacting value and data on a global scale?</p>
<p><strong>Capital Asset</strong></p>
<ul class="content-list">
<li>Cryptocurrencies represent not just the value that has accrued over the past but also the value expected to accrue in the future.</li>
<li>It is valued based on the net present value of expected returns and future use of the network.</li>
<li>Owners have a claim on the assets&rsquo; future network fees for as long as they hold their tokens.</li>
</ul>
<p><strong>Access to Infrastructure</strong></p>
<ul class="content-list">
<li>Cryptocurrencies are usually needed to use the network which creates a continuous demand for that currency. The transaction fees are paid out to those who help validate transactions. Cryptocurrency is the highway, the toll is the transaction fee.</li>
<li>Additionally, cryptocurrency owners can earn yield through staking programs by providing infrastructure to network users.</li>
<li>This creates a clear and predictable business model for the network, its node operators and users.</li>
</ul>
<p><strong>Store of Value</strong></p>
<ul class="content-list">
<li>Like social media, whose value is mostly derived from the number of users and the revenue that those users generate of the platform, the value of a cryptocurrency can grow with the number of users and number of transactions.</li>
<li>Many cryptocurrencies can be paired with other assets &amp; &ldquo;locked&rdquo; (used as collateral) on decentralized exchanges or used for lending and borrowing.</li>
</ul>
<p><strong>Network Ownership</strong></p>
<ul class="content-list">
<li>In Proof-of-stake based cryptocurrencies, the native token represents ownership of the network. Token holders may participate in governance by voting for proposals and guiding the path of the network.</li>
<li>Ownership rights can be exercised, delegated or capitalized on by governance mechanisms built on the network. Active participation is usually rewarded, which incentivizes a strong community to be formed.</li>
</ul>
<p><strong>Tokenisation of Anything</strong></p>
<ul class="content-list">
<li>The model behind cryptocurrencies allows for anything that can be owned by a single person, both digitally and physically, can now be owned by a larger number of people.</li>
<li>The token represents a claim on fractional ownership, revenue or interest that the object generates.</li>
<li>Tokenisation allows liquidity to flow into industries that suffer from liquidity problems.</li>
</ul>
<p><strong>Global Reserve Currency</strong></p>
<ul class="content-list">
<li>Cryptocurrencies have the potential, without the need for intermediaries, central banks or traditional fiat currency, to become a universal reserve currency.</li>
<li>Cryptocurrencies possess qualities that enable faster settlement even in a cross-border and cross-currency environment.</li>
</ul>
<p>To receive more <strong><a href="https://www.vaneck.com/us/en/insights/digital-assets/" title="Digital Assets Insights">Digital Assets</a></strong> insights, <strong><a href="https://www.vaneck.com/us/en/subscribe/" title="Subscription Center">sign up in our subscription center</a></strong>.</p>
]]></content:encoded>
</item><item rdf:about="https://www.vaneck.com/us/en/blogs/natural-resources/equinor-profitability-on-the-way-to-net-zero-starting-now/">
  <title>Equinor: Profitability on the Way to Net Zero… Starting Now!></title>
  <link>https://www.vaneck.com/us/en/blogs/natural-resources/equinor-profitability-on-the-way-to-net-zero-starting-now/</link>
  <description><![CDATA[Equinor, an international energy company, is one of the best-positioned companies to transition to a low-carbon future, in our view.]]></description>
  <dc:creator>Antonio  De Pinho</dc:creator>
  <dc:date>02/23/2023 06:30:00</dc:date>
<content:encoded><![CDATA[

<script>
    //Temporary script
    $(function () {
        $(".popup-youtube, .popup-vimeo, .popup-gmaps").on("click", function (e) {
            e.preventDefault();
            var width = $(window).width();
            if (width > 768) {
                openSimpleIframeModalDialog($(this).attr('href'), "video-modal");
            } else if ($(this).is('.popup-youtube')) {
                var target = $(this).attr('data-video');
                self.location = target;
            }
        });
    });
</script>
<style>
    .modal.fade.video-modal div.modal-dialog {
        margin: 7% auto !important;
    }

    .modal-simple-iframe .close span {
        font-size: 35px;
        line-height: 1;
    }
</style>
<p><em>We continue our series on our portfolios companies that we believe are at </em><em>forefront of current trends in their respective areas, characterized by innovation, technological advances and superior management.</em></p>
<p>In our view, there are few companies better strategically positioned than Equinor<sup>1</sup>&nbsp;to be a reliable, sustainable source of natural gas, while also being a first mover into offshore renewable and carbon solution technologies.</p>
<p>Equinor, a Norwegian energy company, has long established itself as one of the most reliable and predictable global suppliers of natural gas while also driving profitability. Critically, it has accomplished this while producing energy with the lowest carbon intensity of any major oil and gas company in the world. At the same time, the company is transforming itself to take center stage in accelerating the energy transition. It is powering its oil and gas production with renewable energy, pioneering offshore wind farms and developing carbon capture utilization and storage (CCUS) technology. The next step is the development of the company&rsquo;s groundbreaking energy hub network that will integrate its oil and gas production, offshore wind energy and low-carbon solutions across borders.</p>
<p>Previously known as Statoil, the company has demonstrated a long track record of superior expertise in supplying natural gas, which it is now leveraging to pioneer new technologies that capitalize on the opportunities presented by the energy transition.</p>
<br />
<h2>Gas as the Keystone in the Energy Transition</h2>
<p>Natural gas will remain an important part of transitioning the world to a lower emissions future. Countries worldwide have set goals to reach net zero greenhouse gas (GHG) emissions,<sup>2</sup>&nbsp;which will require transitioning their respective energy supply from fossil fuels to renewable sources. This shift will be gradual as countries slowly phase out more polluting sources like coal, and eventually oil, while introducing more renewable energy. Natural gas will serve to bridge the gap from &ldquo;dirtier&rdquo; to &ldquo;cleaner&rdquo; sources, as it produces fewer emissions compared to other fossil fuels. The International Energy Agency (IEA) expects the demand for natural gas to stay (approximately) steady until 2050 while it serves as the keystone in the energy transition.<sup>3</sup></p>
<p>For decades, Equinor has established itself as one of the most reliable natural gas suppliers in the world. The company is Europe&rsquo;s largest &ldquo;domestic&rdquo; supplier of natural gas, providing the continent with over 15% of its gas.<sup>4</sup>&nbsp;Equinor has provided an uninterrupted supply of gas at an affordable price to the continent and continues to try to boost supply amid the urgency to replace Russian flows, which have been suspended due to the Russia-Ukraine war.<sup>5</sup></p>
<h3>European Natural Gas Supply Market Share</h3>
<p><img class="img-responsive w-100" src="https://www.vaneck.com/contentassets/96b4905d8af547b0bb03a1f0fa2350d3/equinor_chart_01_v2_2022.12_blog.svg" alt="European Natural Gas Supply Market Share" /></p>
<p class="chart-disclosure">Source: BloombergNEF, VanEck. European Gas Supply Demand Balances. As of September 2022.</p>
<p>Equinor has provided a steady supply of energy while also transforming its operations to make them the cleanest in the world. The company&rsquo;s upstream oil and gas operations have the lowest carbon intensity, i.e., the lowest amount of carbon dioxide (CO<sub>2</sub>) emitted for each unit of energy produced.<sup>6</sup>&nbsp;Since 2015, the company has reduced its upstream carbon intensity by approximately 30%, bringing it below half the current industry average.<sup>7</sup>&nbsp;Equinor has achieved this by using renewable energy as the power source at its offshore platforms, instead of or in addition to gas.<sup>8</sup>&nbsp;This renewable energy comes through power cables from land or from its own offshore wind farms. Beyond reducing its environmental impact, powering its operations with renewable energy also makes Equinor&rsquo;s operations both cheaper and safer.</p>
<h2>Beyond Gas to Wind and CCUS</h2>
<p>Countries around the world are aggressively setting targets to reduce their emissions and are adopting legislation to work towards achieving them. <strong><a href="https://www.vaneck.com/us/en/blogs/sustainable-investing/its-getting-hot-in-here-what-to-know-leading-up-to-cop27/" title="It's Getting Hot in Here: What to Know Leading up to COP27">Annual climate summits</a> </strong>have mobilized more than 70 countries to pledge to reach net zero emissions, including the U.S., Europe and China, which together account for more than 75% of global emissions.<sup>9</sup>&nbsp;In order to meet these goals, countries and regions are passing ambitious legislation that should accelerate the energy transition, including the Green Deal in Europe and the <a href="https://www.vaneck.com/us/en/blogs/sustainable-investing/the-inflation-reduction-act-a-green-catalyst/" title="The Inflation Reduction Act: A Green Catalyst"><strong>Inflation Reduction Act</strong></a> in the U.S. <strong>As an increasing number of countries set climate targets, they can be expected to pass similar legislation that will decarbonize their energy supplies. Equinor will play an important role in helping countries reach these goals through its trailblazing expansion into offshore wind and CCUS.</strong></p>
<p>Equinor&rsquo;s offshore expertise uniquely positions it to pioneer offshore wind energy, allowing it to capitalize on the headwinds of the energy transition. Offshore wind farms are groups of wind turbines placed out at sea where the wind blows faster than on land. Offshore wind is a reliable, emissions free source of energy that is able to provide the same amount of energy per unit as some gas and coal power plants.<sup>10</sup>&nbsp;The IEA estimates that offshore wind will become a $1 trillion industry over the next two decades.<sup>11</sup>&nbsp;The next frontier for offshore wind is floating wind, where turbines are placed even farther offshore where wind blows faster.<sup>12</sup>&nbsp;Equinor installed the world&rsquo;s first floating wind farm off the coast of Scotland in 2017 and is in the process of installing another off the coast of Norway.<sup>13</sup>&nbsp;The project, <strong>Hywind Tampen</strong>, will be the world&rsquo;s largest floating wind farm. It will supply more than a third of the electricity for five of Equinor&rsquo;s oil and gas platforms, which will also make it the world&rsquo;s first floating wind farm to power offshore oil and gas platforms.<sup>14</sup>&nbsp;Once all the wind turbines are installed for <strong>Hywind Tampen</strong>, Equinor will operate nearly half of the world&rsquo;s floating wind capacity.<sup>15</sup>&nbsp;In our view, Equinor&rsquo;s pioneering technology will allow new regions to harness the potential of floating offshore wind, with plans for the company to expand its offshore wind business to South Korea, Vietnam and the U.S.</p>
<p>Beyond its expansion into offshore wind, Equinor is spearheading the development of large-scale CCUS projects. The company&rsquo;s CCUS projects capture carbon dioxide (CO<sub>2</sub>) emissions from its oil and gas production and transport them to be stored permanently underground.<sup>16</sup>&nbsp;Equinor has long been a leader in CCUS, operating multiple projects in Norway for over 26 years.<sup>17</sup>&nbsp;The company continues to be at the frontier of CCUS developments with its new state of the art <strong>Northern Lights</strong> project. The project will be the first open source transport and storage network in the world, capturing emissions from powerplants and factories across Europe and transporting them to be stored under the North Sea.<sup>18</sup>&nbsp;It is scheduled to be operational in 2024,<sup>19</sup>&nbsp;which is earlier than most other major CCUS projects globally, which have targeted timelines beyond 2025.<sup>20</sup>&nbsp;Northern Lights will first capture, transport and store CO<sub>2</sub>&nbsp;from industrial emitters in Norway, with plans to expand to 16 partners across seven European countries in the future.<sup>21</sup></p>
<h3>Companies Leading in CCUS Development in Europe</h3>
<p><img class="img-responsive w-100" src="https://www.vaneck.com/contentassets/96b4905d8af547b0bb03a1f0fa2350d3/equinor_chart_02_v1_2022.12_blog.svg" alt="Companies Leading in CCUS Development in Europe" /></p>
<p class="chart-disclosure">Source: BloombergNEF. 2022 CCUS Market Outlook. October 18, 2022 (Y-Axis = # number of projects).</p>
<p>Now, Equinor is seeking to reshape the way the world addresses its energy needs through the development of its energy hub network. Each energy hub will integrate Equinor&rsquo;s oil and gas operations, renewable energy production and low-carbon solutions in one location. The company will be able to simultaneously power its oil and gas operations with its wind energy and capture and store emissions from its own business as well as those from other industrial emitters. The energy hub network will share infrastructure and capture supply chain synergies across country borders as has never been done before. The first energy hub is planned in the North Sea, placing Norway as Equinor&rsquo;s first stepping stone in expanding this approach to Europe and the U.S. east coast.</p>
<p><img class="img-responsive w-100" src="https://www.vaneck.com/contentassets/96b4905d8af547b0bb03a1f0fa2350d3/equinor_chart_03_v1_2022.12_blog.svg" alt="Norway Energy Hub" /></p>
<p class="chart-disclosure">Source: Equinor. Norway Energy Hub. 2022.</p>
<h2>Stable, Renewable, Profitable</h2>
<p>Equinor has transformed its upstream oil and gas business into the cleanest in the world. In parallel, it is pioneering offshore wind and CCUS technologies to become an early entrant in these high growth markets.</p>
<p>Now, Equinor is taking its approach to the energy transition one step further through the development of energy hubs. These hubs will create a groundbreaking energy network that will integrate the company&rsquo;s oil and gas operations, renewable energy production and low-carbon solutions across borders. By integrating its operations and infrastructure, Equinor can capture supply chain synergies, develop new and material markets and ultimately reshape the way the world addresses its energy needs. Norway and the North Sea are its first stepping stones.</p>
<p>While global climate ambitions grow, energy companies that are supplying secure sources of energy in a more sustainable way, while pioneering new technology, are where we look to be positioned. Equinor is spearheaded by superior management that continues to drive profit and remain competitive in an ever-evolving environment while providing executive compensation that is far below the median of its peers. As a result of its business foresight and management style, we believe that Equinor has much to provide in the energy space.</p>
<p>To receive more <a href="/us/en/insights/natural-resources/" title="Natural Resources Insights"><strong>Natural Resources</strong></a> and <a href="/us/en/insights/sustainable-investing/" title="Sustainable Investing Insights"><strong>Sustainable Investing</strong></a> insights, <a href="https://www.vaneck.com/us/en/subscribe/" title="Subscription Center"><strong>sign up in our subscription center</strong></a>.</p>
]]></content:encoded>
</item><item rdf:about="https://www.vaneck.com/us/en/blogs/income-investing/clos-belong-in-your-core-bond-portfolio/">
  <title>CLOs Belong in Your Core Bond Portfolio></title>
  <link>https://www.vaneck.com/us/en/blogs/income-investing/clos-belong-in-your-core-bond-portfolio/</link>
  <description><![CDATA[Over the past several years, CLOs within a core bond portfolio would have provided additional yield&mdash;without adding duration&mdash;as well as increased returns and lower volatility.]]></description>
  <dc:creator>William Sokol</dc:creator>
  <dc:date>02/23/2023 06:30:00</dc:date>
<content:encoded><![CDATA[

<p>Why do so many active core bond managers invest in collateralized loan obligations (CLOs)? Of the top 20 mutual funds in Morningstar&rsquo;s Intermediate Core Bond and Intermediate Core-Plus Bond categories, representing approximately $750B of assets, all but three had allocations to CLOs.<sup>1</sup>&nbsp;This is notable given that traditional U.S. &ldquo;aggregate&rdquo; bond indices, which represent the broad investment grade investment universe, do not generally include CLOs. Approximately 93% of core bond funds are benchmarked to an aggregate index, which begs the question: why are so many of these managers investing off-benchmark?</p>
<p>We believe the answer is obvious: CLOs may result in better investment outcomes to core bond investors. Based on historical asset class returns, this would have been the case over the past several years, as shown below. CLOs can add additional yield <a href="https://www.vaneck.com/us/en/blogs/income-investing/clos-a-rising-rate-alternative/" title="CLOs: A Rising Rate Alternative"><strong>without added interest rate duration</strong></a>, and historically increased returns and lowered volatility relative to an agg-only index&mdash;and accordingly enhanced risk adjusted returns as measured by the Sharpe ratio.</p>
<h3>CLOs Have Boosted Core Bond Returns</h3>
<div class="wrapped-div">
<table style="width: 100%;">
<tbody>
<tr class="tbl-data">
<td class="tbl-header last">&nbsp;</td>
<td class="tbl-header last" style="text-align: center; border-right: outset;" colspan="6">Total Return</td>
<td class="tbl-header last" style="text-align: center;" colspan="2">Risk</td>
</tr>
<tr class="tbl-data">
<td class="data-head last">&nbsp;</td>
<td class="data-head last">YTD</td>
<td class="data-head last">1 Yr</td>
<td class="data-head last">3 Yrs</td>
<td class="data-head last">5 Yrs</td>
<td class="data-head last">7 Yrs</td>
<td class="data-head last" style="border-right: outset;">Since<br />7/31/2014</td>
<td class="data-head last">Std Dev<br />Since 7/31/2014</td>
<td class="data-head last">Sharpe Ratio<br />Since 7/31/2014</td>
</tr>
<tr class="tbl-data">
<td class="data-td last" style="text-align: left;">100% US Agg</td>
<td class="data-td data last">3.01</td>
<td class="data-td data last">-8.63</td>
<td class="data-td data last">-2.45</td>
<td class="data-td data last">0.86</td>
<td class="data-td data last">1.12</td>
<td class="data-td data last" style="border-right: outset;">1.43</td>
<td class="data-td data last">4.42</td>
<td class="data-td data last">0.12</td>
</tr>
<tr class="tbl-data">
<td class="data-td last" style="text-align: left;">90% US Agg + 10% CLO</td>
<td class="data-td data last">2.87</td>
<td class="data-td data last">-7.64</td>
<td class="data-td data last">-1.98</td>
<td class="data-td data last">1.06</td>
<td class="data-td data last">1.37</td>
<td class="data-td data last" style="border-right: outset;">1.59</td>
<td class="data-td data last">4.08</td>
<td class="data-td data last">0.17</td>
</tr>
<tr class="tbl-data">
<td class="data-td last" style="text-align: left;">75% US Agg + 25% CLO</td>
<td class="data-td data last">2.66</td>
<td class="data-td data last">-6.15</td>
<td class="data-td data last">-1.27</td>
<td class="data-td data last">1.36</td>
<td class="data-td data last">1.74</td>
<td class="data-td data last" style="border-right: outset;">1.83</td>
<td class="data-td data last">3.65</td>
<td class="data-td data last">0.24</td>
</tr>
</tbody>
</table>
</div>
<br />
<p class="chart-disclosure">Source: J.P. Morgan and Morningstar Direct, as of 1/31/2023. CLOs represented by the J.P. Morgan CLO Index; US Agg is represented by ICE BofA US Broad Market Index.</p>
<p>Last year, blending an agg-only index with some portion of CLO returns would have been particularly impactful. For example, a blended benchmark of 25% CLOs, as measured by the J.P. Morgan CLO Index, and 75% core bonds, as measured by the ICE BofA US Broad Market Index, would have increased returns by over 300 basis points relative to 100% core bonds. A 50% / 50% blend would have increased returns by over 650 basis points versus core bonds. Although such a high portion of CLOs is likely unrealistic for many bond investors benchmarked to the agg, this example illustrates the return potential of a tactical overweight in a difficult year such as 2022.</p>
<p>The <a href="https://www.vaneck.com/us/en/blogs/income-investing/why-invest-in-clos/" title="Why Invest in CLOs?"><strong>benefits that CLOs provide</strong></a> in a core bond portfolio are straightforward: yield, quality and diversification. Yields on CLOs are particularly attractive now and significantly above long-term averages and what can be found in other fixed income asset classes. For example, CLOs, on average, provided a yield-to-worst of 6.49% on 1/31/2023, compared to 4.33% on the agg and 5.05% on U.S. corporate bonds.<sup>2</sup></p>
<h3>Higher Yield Without Added Interest Rate Duration</h3>
<p><img class="img-responsive w-100" src="https://www.vaneck.com/contentassets/1f41d44a70ec4766987a12279e91f2d6/2869_cloi_chart_01_2023.02_v1_blog.svg" alt="Higher Yield Without Added Interest Rate Duration" /></p>
<p class="chart-disclosure">Source: J.P. Morgan and ICE Data Indices, as of 1/31/2023. CLOs represented by the J.P. Morgan CLO Index; US Agg is represented by ICE BofA US Broad Market Index.</p>
<p>These high yields are driven by a few factors. For one, short-term rates have risen significantly over the past year as the Federal Reserve continues its current rate hiking cycle. Because CLOs are floating rate, this is reflected in higher coupons. The Fed has indicated that additional hikes are on the way, and although the market appears to doubt the Fed&rsquo;s resolve to maintain high rates for at least the rest of the year, we generally take the Fed at its word and believe that bond investors should be wary of &ldquo;fighting the Fed.&rdquo;</p>
<p>Yields on CLOs are also high because of the spread over the risk-free rate that they provide. CLOs have always provided a spread pickup versus similarly rated bonds and loans, but right now that pickup is particularly compelling relative to historical averages. That suggests that a certain degree of risk is being reflected in CLOs prices currently. Given the possibility of weaker corporate earnings and economic growth ahead, we believe this makes <strong><a href="https://www.vaneck.com/us/en/blogs/income-investing/cloi-outperforms-in-q4-stays-defensive-amid-uncertainty/" title="CLOI Outperforms in Q4, Stays Defensive Amid Uncertainty">CLOs attractive relative to other credit asset classes</a></strong>, such as high yield bonds, where spreads have remained tight versus historical averages.</p>
<p>From a quality perspective, investment grade CLOs do not require a core bond investor to take additional credit risk. The risk of default in senior CLO tranches is extremely low given the many <strong><a href="https://www.vaneck.com/us/en/blogs/income-investing/clos-question-and-answer/#point-three" title="CLOI: Question and Answer">built-in risk protections</a></strong> they offer, such as high levels of subordination. As a result, defaults in the underlying portfolios need to be multiples greater than historical averages for several years in a row to experience a default, even in lower rated investment grade CLO tranches. And CLOs may diversify a core bond portfolio in several ways. First, the floating rate exposure makes them less sensitive to changes in interest rates, and therefore they exhibit low correlation to fixed rate bonds, with a 5-year correlation to core bonds of only 0.25.<sup>3</sup>&nbsp;Second, because CLOs are backed by portfolios of senior secured leveraged loans, the credit exposure is different from the investment grade corporate borrowers that have significant presence in agg benchmarks.</p>
<p>CLOs have historically only been available to large institutional investors such as banks, insurance companies, and asset managers. While active core bond fund managers have used CLOs for many years to potentially beat their benchmark, investors now have the ability to access this $1.2T market directly. We believe that investors should invest <a href="https://www.vaneck.com/us/en/blogs/income-investing/clos-uncover-opportunity-beyond-aaas/" title="CLOs: Uncover Opportunity Beyond AAAs"><strong>beyond AAA CLOs</strong></a> and utilize the full investment grade portion of the CLO capital structure to capture the benefits that this asset class may provide in a core bond portfolio.</p>
<p>To receive more <a href="https://www.vaneck.com/us/en/insights/income-investing/" title="Income Investing insights"><strong>Income Investing</strong></a> insights, <a href="/link/5f45412c2143400497908cea2897f7d3.aspx" title=" Subscription Center"><strong>sign up in our subscription center</strong></a>.</p>
<style type="text/css">
    .wrapped-div {
        max-width: 100%;
    }

    @media (max-width: 960px) {
        .wrapped-div {
            overflow-x: scroll;
        }
    }

    .wrapped-div-sector {
        max-width: 100%;
        overflow-x: scroll;
    }
</style>
]]></content:encoded>
</item><item rdf:about="https://www.vaneck.com/us/en/blogs/natural-resources/how-natural-resources-fit-into-a-2023-portfolio/">
  <title>How Natural Resources Fit into a 2023 Portfolio></title>
  <link>https://www.vaneck.com/us/en/blogs/natural-resources/how-natural-resources-fit-into-a-2023-portfolio/</link>
  <description><![CDATA[Shawn Reynolds talks about the potential benefits of investing in natural resources and commodities in the current market in this episode of Orion&rsquo;s Weighing Machine podcast.]]></description>
  <dc:creator>Shawn Reynolds</dc:creator>
  <dc:date>02/23/2023 06:30:00</dc:date>
<content:encoded><![CDATA[

<p><strong><a href="https://www.vaneck.com/us/en/news-and-insights/thought-leaders/shawn-reynolds/" title="Shawn Reynolds - Portfolio Manager, Global Resources, Environmental Sustainability">Shawn Reynolds</a></strong>, Portfolio Manager for VanEck&rsquo;s Global Resources Strategy, joined an episode of Orion Advisor Solutions&rsquo; Weighing Machine podcast to discuss how natural resources can enhance portfolio diversification, provide access to global growth and help hedge against inflation. Here are some highlights.</p>
<h2>The Role of Natural Resource Stocks in a Portfolio</h2>
<p>From traditional commodities like oil and gas to the <strong><a href="https://www.vaneck.com/us/en/blogs/sustainable-investing/the-top-five-reasons-to-invest-in-the-resource-transition/" title="Five Reasons to Invest in the Resource Transition">ongoing transition to renewables</a></strong>, global resources represent the foundation of economic activity. In addition, over the next several decades, investments in clean technologies are anticipated to rise, as governments and corporations globally commit to long-term carbon-reduction initiatives. We believe that the resulting shift in commodity market supply and demand dynamics will pave the way for new winners to emerge. At the same time, the opportunity set among traditional resources is changing. As these trends continue, investing across the evolving natural resources opportunity set should continue to offer the same benefits it has for decades: enhanced portfolio diversification, access to global growth and a hedge against inflation .</p>
<h2>How VanEck Defines Natural Resources</h2>
<p>VanEck defines natural resources as traditional commodities like oil and gas, base and precious metals, as well as technologies and materials supporting the multi-decade transition to renewables. This broad scope offers a far-ranging opportunity set that extends well beyond traditional commodity markets. For example, agriculture contributes nearly as much to global emissions as electricity and heat production. Accordingly, natural resources covers the broad array of emerging <strong><a href="https://www.vaneck.com/us/en/blogs/trends-with-benefits/trends-with-benefits-69-the-future-of-food-with-ammar-james/" title="Trends with Benefits #69: The Future of Food with Ammar James">agri-food related markets</a></strong>&mdash;including, for example, precision agriculture and alternative proteins&mdash;as companies seek innovative solutions for accessing, producing, distributing, consuming, and optimizing the use of goods and services. VanEck classifies <strong><a href="https://www.vaneck.com/us/en/blogs/natural-resources/our-approach-to-global-resources-question-and-answer/" title="Our Approach to Global Resources: Question and Answer">natural resources</a></strong> into the following categories: renewables &amp; alternatives, base &amp; industrial metals, gold &amp; precious metals, oil &amp; gas, agriculture, paper &amp; forest, and industrials &amp; utilities (14:42).</p>
<h2>Natural Resources Are a Great Inflation Hedge</h2>
<p>Historically, natural resources and commodity investments have been an excellent way to gain access to global growth, diversify broader stock and fixed income portfolios and hedge against inflation. Investors last faced inflation risk in the early-to-mid 2000s with the most notable bout of inflation occurring in the 1970s. Historically, global resource and commodities have acted as a hedge against inflation, outperforming U.S. stocks and bonds. Even in periods of modest inflation (2-6%) global resources and commodities have outperformed U.S. stocks (16:03).</p>
<p><strong>Other highlights include:</strong></p>
<ul class="content-list">
<li>What drew Shawn to the energy industry. (03:02)</li>
<li>How natural resource stocks will fit into portfolios in 2023. (12:39)</li>
<li>Recommendations for a natural resource allocation. (18:03)</li>
<li>How recession can impact natural resource stocks. (21:38)</li>
<li>Do natural resource stocks replace or complement other real assets? (23:51)</li>
<li>Why investors should consider an ETF for their natural resource exposure. (25:11)</li>
<li>Shawn&rsquo;s favorite investment. (32:00)</li>
</ul>
<p>Listen to the full podcast here: <strong><a href="https://www.vaneck.com/us/en/offsite-disclaimer/?id=210484&amp;button=no&amp;url=https://open.spotify.com/episode/7uuf9s52A8qxlxS9G5h1UH?si=0n9PTYrlT7yBxX-qIu4Ztg" title="Orion's The Weighing Machine: The Unique Benefits of Investing in Natural Resources and Commodities with Shawn Reynolds" target="_blank" rel="noopener">Orion's The Weighing Machine: The Unique Benefits of Investing in Natural Resources and Commodities</a></strong>.</p>
<p>To receive more <a href="/us/en/insights/natural-resources/" title="Natural Resources Insights"><strong>Natural Resources</strong></a> insights, <a href="https://www.vaneck.com/us/en/subscribe/" title="Subscription Center"><strong>sign up in our subscription center</strong></a>.</p>
]]></content:encoded>
</item><item rdf:about="https://www.vaneck.com/us/en/blogs/economic-trends/hawks-standing-their-ground/">
  <title>Hawks – Standing Their Ground></title>
  <link>https://www.vaneck.com/us/en/blogs/economic-trends/hawks-standing-their-ground/</link>
  <description><![CDATA[EM&rsquo;s cautious policy stance is very encouraging against the backdrop of the unapologetically hawkish U.S. Fed.]]></description>
  <dc:creator>Natalia  Gurushina</dc:creator>
  <dc:date>02/23/2023 06:30:00</dc:date>
<content:encoded><![CDATA[

<h2>Fed Rate Hike Expectations</h2>
<p>The market raised its peak rate expectations for the U.S. a little bit more, as the <strong>U.S. Federal Reserve&rsquo;s (Fed&rsquo;s) minutes signaled more rate hikes</strong> &ldquo;in order to attain a stance of monetary policy that is sufficiently restrictive to return inflation to 2 percent over time&rdquo;. This morning&rsquo;s secondary estimate of the U.S. Q4 GDP was not incompatible with the &ldquo;somewhat higher peak rate/slower rate cuts&rdquo; scenario. Even though personal consumption was revised down (albeit not recessionary), the upside revision of Q4 GDP deflator was quite meaningful. Higher &ldquo;risk-free&rdquo; rates have a direct impact on emerging markets (EM) debt total return, and if this process is accompanied by higher rates&rsquo; volatility, spread returns on lower-rated EM bonds might get hit as well. This is exactly what happened during the reversal of January&rsquo;s rally.</p>
<h2>EM Monetary Policy Stance</h2>
<p>A perception that a central bank might be falling behind the curve &ndash; or forced to ease prematurely &ndash; can weigh on bonds even during the &ldquo;everything rally&rdquo;. With that in mind, we are happy to report that <strong>EM &ldquo;Alumni&rdquo; echoed the Fed&rsquo;s hawkish sentiment</strong> &ndash; Israel&rsquo;s larger than expected hike a few days ago was followed by South Korea&rsquo;s hawkish hold, which left room for more policy tightening due to high uncertainty about the inflation forecast. Back in &ldquo;EM proper&rdquo;, India&rsquo;s central bank minutes signaled another rate hike in April &ndash; note that this came before January&rsquo;s shocking upside inflation surprise. Mexico&rsquo;s central bank minutes also showed a great deal of caution, with some board members saying that underlying inflation is more persistent than expected and that it might be risky to signal a smaller rate hike in March.</p>
<h2>LATAM Rate Cycle</h2>
<p>Mexico&rsquo;s bi-weekly <strong>inflation prints showed that such caution is totally justified</strong> &ndash; despite a small downside surprise. Disinflation is still slow (see chart below), and both core and headline inflation are well above the target range. Brazil&rsquo;s mid-month inflation release tomorrow will also be closely watched. The consensus sees sizable moderation &ndash; from 5.87% year-on-year to 5.59% &ndash; but (ironically) if this scenario were to materialize, we might end up with more calls from Luiz In&aacute;cio Lula da Silva&rsquo;s (Lula&rsquo;s) administration to lower the policy rate in order to prop up growth. Such demands quieted down lately, and the market was quick to respond by pricing in more rate cuts on a 1-year horizon (131bps). Stay tuned!</p>
<h3>Chart at a Glance: Mexico Disinflation &ndash; Progress Still Slow</h3>
<p><img class="img-responsive w-100" src="https://www.vaneck.com/contentassets/653605e6a1184d6da0b8ccac92488143/us-natalias-take-2023-02-23.png" alt="Chart at a Glance: Mexico Disinflation - Progress Still Slow" /></p>
<p class="chart-disclosure">Source: Bloomberg LP.</p>
<p class="chart-disclosure"><strong>MXBWCORY Index</strong> &ndash; Mexico CPI Core Inflation YoY Percent Change Biweekly.</p>
<p class="chart-disclosure"><strong>MXBWYOY Index</strong> &ndash; Mexico CPI Yearly Percent Change Biweekly.</p>
]]></content:encoded>
</item><item rdf:about="https://www.vaneck.com/us/en/blogs/digital-assets/blockchain-basics/">
  <title>What is Blockchain Technology?></title>
  <link>https://www.vaneck.com/us/en/blogs/digital-assets/blockchain-basics/</link>
  <description><![CDATA[Learn about the basics of blockchain, including types of distributed ledgers, consensus mechanisms, crypto mining, Proof of Work, and crypto staking.]]></description>
  <dc:creator> </dc:creator>
  <dc:date>02/22/2023 06:30:00</dc:date>
<content:encoded><![CDATA[

<p>Blockchain technology, which was developed to enable Bitcoin, is a disruptive force for many current business practices. Blockchain, an open, secure distributed ledger that efficiently and permanently records transactions between two parties, is starting to be used in a variety of industries, from trade finance to law.</p>
<div class="wrapped-div">
<table style="width: 100%;">
<tbody>
<tr class="tbl-data">
<td class="tbl-header last" colspan="4">Types of Distributed Ledgers</td>
</tr>
<tr class="tbl-data">
<td class="data-td  last">&nbsp;</td>
<td class="data-td  last" style="text-align: center;">Public</td>
<td class="data-td  last" style="text-align: center;">Private</td>
<td class="data-td  last" style="text-align: center;">Consortium</td>
</tr>
<tr class="tbl-data">
<td class="data-td last">Participants</td>
<td class="data-td last" style="font-weight: normal;">Permissionless &ndash; (pseudo)-anonymous, public read-write access</td>
<td class="data-td last" style="font-weight: normal;">Permissioned &ndash; relies on identification and trust, no public read-write access</td>
<td class="data-td last" style="font-weight: normal;">Permissioned &ndash; relies on identification and trust, public read access, private write access</td>
</tr>
<tr class="tbl-data">
<td class="data-td last">Consensus mechanism</td>
<td class="data-td last" style="font-weight: normal;">Proof-of-Work (PoW), Proof-of-Stake (PoS), etc.</td>
<td class="data-td last" style="font-weight: normal;">Voting or multi-party consensus algorithm</td>
</tr>
<tr class="tbl-data">
<td class="data-td last">Decentralization</td>
<td class="data-td last" style="font-weight: normal;">High</td>
<td class="data-td last" style="font-weight: normal;">Low</td>
</tr>
<tr class="tbl-data">
<td class="data-td last">USP</td>
<td class="data-td last" style="font-weight: normal;">Disruptive due to disintermediation</td>
<td class="data-td last" style="font-weight: normal;">Cost reduction</td>
</tr>
</tbody>
</table>
</div>
<br />
<p class="chart-disclosure">Source: VanEck, 2022.</p>
<h2>What is a Consensus Mechanism?</h2>
<p>A consensus mechanism is a fault-tolerant mechanism that is used in computer and blockchain systems to achieve the necessary agreement.</p>
<p>In cryptocurrencies, a database known as the blockchain stores information on user balances. Every person (or, more precisely, every node) must keep a duplicate copy of the database. Otherwise, you would quickly have contradicting information, which would defeat the whole point of the Bitcoin network.</p>
<p>By using public-key cryptography, users are prevented from using one another's currencies. To be able to identify whether funds have actually been spent, however, network participants still need to rely on a single source of truth.</p>
<p>Bitcoin's inventor, Satoshi Nakamoto, suggested using a Proof of Work (PoW) scheme to synchronize participants. We'll discuss how PoW functions in a moment, but first, let's look at some of the characteristics that distinguish the various consensus algorithms from one another.</p>
<p>First and foremost, we need validators&mdash;users who want to contribute blocks&mdash;to provide a stake. A validator's ability to act dishonestly is deterred by the stake, which is some sort of value that they are required to present. They will forfeit their stake if they lie. Computer processing power, cryptocurrencies, and even reputation are examples.</p>
<p>Why would they put their own resources at risk? There is, however, a prize as well. This is typically the native cryptocurrency of the protocol and is composed of fees paid by other users, newly created cryptocurrency units, or both.</p>
<p>Transparency is the very last thing we need. We must be able to recognize cheating when it occurs. The blocks should be expensive for them to make but inexpensive for anyone to validate.</p>
<div class="wrapped-div">
<table style="width: 100%;">
<tbody>
<tr class="tbl-data">
<td class="tbl-header last" colspan="2">Types of Consensus Mechanisms</td>
</tr>
<tr class="tbl-data">
<td class="data-td  last">Type</td>
<td class="data-td  last" style="text-align: center;">Description</td>
</tr>
<tr class="tbl-data">
<td class="data-td last" style="font-weight: normal;">Proof-of-Work (PoW)</td>
<td class="data-td last" style="font-weight: normal;">PoW works like a decentralized lottery picking a leader to propose a new block at predictable intervals</td>
</tr>
<tr class="tbl-data">
<td class="data-td last" style="font-weight: normal;">Proof-of-Stake (PoS)</td>
<td class="data-td last" style="font-weight: normal;">PoS works like PoW but uses cost of capital instead of cost of electricity as a resource, making it a greener alternative to PoW</td>
</tr>
<tr class="tbl-data">
<td class="data-td last" style="font-weight: normal;">Delegated-Proof-of-Stake</td>
<td class="data-td last" style="font-weight: normal;">This is an additional layer to PoS that allows users to delegate their voting power to validators without requiring them to validate themselves</td>
</tr>
<tr class="tbl-data">
<td class="data-td last" style="font-weight: normal;">Proof-of-Importance (PoI)</td>
<td class="data-td last" style="font-weight: normal;">PoI rewards users with reputation or importance scores that over time allow them to become increasingly more efficient block producers</td>
</tr>
<tr class="tbl-data">
<td class="data-td last" style="font-weight: normal;">Proof-of-Capacity (PoC)</td>
<td class="data-td last" style="font-weight: normal;">PoC uses cost of storage as resource instead of electricity of capital</td>
</tr>
<tr class="tbl-data">
<td class="data-td last" style="font-weight: normal;">Proof-of-Elapsed-Time (PoET)</td>
<td class="data-td last" style="font-weight: normal;">PoET uses a time-based lottery as a way to provide consensus</td>
</tr>
<tr class="tbl-data">
<td class="data-td last" style="font-weight: normal;">Proof-of-Activity (PoA)</td>
<td class="data-td last" style="font-weight: normal;">PoA uses time as a resource</td>
</tr>
<tr class="tbl-data">
<td class="data-td last" style="font-weight: normal;">Proof-of-Authority (PoA)</td>
<td class="data-td last" style="font-weight: normal;">PoA relies on validators&rsquo; reputation to provide consensus</td>
</tr>
<tr class="tbl-data">
<td class="data-td last" style="font-weight: normal;">Proof-of-Burn (PoB)</td>
<td class="data-td last" style="font-weight: normal;">PoB relies on cost of capital as a resource, burning is similar to staking with an infinite lock-up duration</td>
</tr>
<tr class="tbl-data">
<td class="data-td last" style="font-weight: normal;">Byzantine Fault Tolerance Algorithm (BFT)</td>
<td class="data-td last" style="font-weight: normal;">BFT relies on reputation, voting power and known identities</td>
</tr>
</tbody>
</table>
</div>
<br />
<p class="chart-disclosure">Source: VanEck, 2022.</p>
<h2>What is Crypto Mining?</h2>
<p><strong>The father of blockchain consensus methods is Proof of Work (PoW)</strong></p>
<p>The idea has been known for a while, but Bitcoin was the first to use it. Validators (also known as miners) hash the data they want to contribute in Proof of Work until they find a particular solution.</p>
<p>When data is passed through a hash function, an apparently random string of letters and numbers is produced, known as a hash. But if you use the same data repeatedly, you'll always get the same result. However, even a minor change will result in a completely different hash.</p>
<p>You cannot possibly determine what data was input into the function by looking at the result. They are consequently helpful in demonstrating your prior knowledge of information. When you later release the data, you can give someone its hash, and they can use it to run the function on it to verify that the output is the same.</p>
<h2>Learn More About PoW</h2>
<p>The Proof of Work protocol lays forth the requirements for what constitutes a valid block. For example, it can specify that only blocks whose hash starts with 00 are valid. The miner must use brute-force inputs in order to build one that matches that combination. They can tweak a parameter in their data to produce a different outcome for every guess until they get the right hash.</p>
<p>The standards for major blockchains are rather high. You would require a large warehouse full of specialized hashing equipment (ASICs) to compete with other miners and have a chance of producing a valid block.</p>
<p>When mining, the price of the equipment and electricity needed to power it are your stake. ASICs are designed with only one use in mind, hence they are useless for everything outside cryptocurrency mining. You must mine in order to recover your initial investment, and if you are successful in adding a new block to the blockchain, you will be rewarded handsomely.</p>
<p>The network can easily confirm that you did, in fact, produce the correct block. They just need to run your data through a function once, even though as a miner you tried trillions of different combinations to obtain the proper hash. Your data will be accepted if it generates a legitimate hash, and you'll receive a reward. If not, the network will reject it, costing you time and electricity in vain.</p>
<h2>What is Crypto Staking?</h2>
<p><strong>Staking cryptocurrency entails dedicating one's crypto assets to a blockchain network for a predetermined period of time in order to support the network's transaction confirmation.</strong></p>
<p>Some cryptocurrencies pay significant rates of interest for such a commitment, so staking might be an excellent method to leverage your crypto assets to make money.</p>
<p>In the beginning, Proof of Stake (PoS) was suggested as a Proof of Work substitute for Bitcoin. A PoS system doesn't have the idea of miners, specialized equipment, or high energy usage. All you require is a standard PC.</p>
<h2>Learn More About PoS</h2>
<p>&ldquo;All you require is a standard PC&rdquo; is not the full story. You still need to invest some money. In PoS, you propose an internal resource&mdash;cryptocurrency&mdash;rather than an external one (such as hardware or electricity). Every protocol has its own set of rules, but generally speaking, in order to be eligible for staking, you must hold a certain minimum quantity of money.</p>
<p>After that, you secure your money in a wallet so that it cannot be changed while you are staking. Usually, you and the other validators will agree on which transactions should be included in the upcoming block. You could say that you're making a wager on the block that the protocol will pick.</p>
<p>Depending on your stake, you will receive a share of the transaction fees if your block is chosen. You stand to gain more if you have more money locked up. However, if you try to defraud by submitting fraudulent transactions, you could lose some or all of your interest. As a result, we have a mechanism that is comparable to PoW: being honest is more profitable than being dishonest.</p>
<p>Typically, the compensation for validators does not include newly minted coins. Thus, another method must be used to issue the native money of the blockchain. This can be accomplished either by an initial distribution (such as an ICO or IEO) or by launching the protocol with PoW before switching to PoS later on.</p>
<p>Pure versions of Proof of Stake have primarily only been used in small-cap coins up until now. As a result, it's uncertain if it can be a practical replacement for PoW. Although it seems reasonable in theory, it will work completely differently in actuality.</p>
<p>When PoS is implemented on a network with significant value, the system turns into a game with financial incentives. The only way to determine whether it is possible is on a live network because anyone who has the knowledge to "hack" a PoS system is probably only going to do so if they stand to benefit something from it.</p>
<h2>Use of Cryptography in Distributed Ledgers</h2>
<p><strong>A number of mechanisms, including sophisticated cryptography methods and models of human behavior and decision-making (game-theory), are used to safeguard blockchains.</strong></p>
<p>The majority of cryptocurrency systems are built on the blockchain technology, which makes it impossible for this type of digital currency to be copied or destroyed.</p>
<p>Other applications for blockchain technology are being investigated where data immutability and security are very important. Keeping track of charitable donations, maintaining medical records, and supply chain management are a few examples.</p>
<p>Blockchain security is not, however, a straightforward topic. Understanding the fundamental ideas and procedures that give these cutting-edge systems strong protection is crucial.</p>
<h2>Learn More About Security</h2>
<p>To ensure the security of their data, blockchains mainly rely on cryptography. The so-called cryptographic hashing functions play a crucial role in this context. In the process of hashing, an algorithm (hash function) accepts inputs of arbitrary size and produces outputs (hashes) with predictable and fixed sizes (or length).</p>
<p>The output will always present the same length, regardless of the size of the input. The output, however, will be quite different if the input changes. No matter how many times you run the hash function, if the input doesn't change, the output hash will always be the same.</p>
<p>These output numbers, also referred to as hashes, serve as distinctive identifiers for data blocks within blockchains. A chain of linked blocks is made possible by the fact that each block's hash is computed in respect to the hash of the one before it. The block hash is reliant on the contents in that block, hence any modification to the data would necessitate a modification to the block hash.</p>
<p>As a result, the hash of each block is created using the data in that block as well as the hash of the block before it. The security and immutability of the blockchain are significantly enhanced by these hash identifiers.</p>
<p>The consensus techniques used to verify transactions also make use of hashing. For instance, the Proof of Work (PoW) method on the Bitcoin blockchain uses the SHA-256 hash function. According to its name, SHA-256 generates a hash that is 256 bits, or 64 characters, long from the data given.</p>
<p>Cryptography plays a part in assuring the security of the wallets used to hold cryptocurrency units, in addition to protecting transaction records on ledgers. Asymmetric or public-key cryptography is used to generate the paired public and private keys that allow users to receive and send payments, respectively. Digital signatures for transactions are created using private keys, making it feasible to verify who owns the transmitted money.</p>
<p>Because of the nature of asymmetric cryptography, only the owner of the private key can access the money held in a cryptocurrency wallet, keeping that money secure until the owner decides to spend it (as long as the private key is not shared or compromised).</p>
<p>To receive more <strong><a href="https://www.vaneck.com/us/en/insights/digital-assets/" title="Digital Assets Insights">Digital Assets</a></strong> insights, <strong><a href="https://www.vaneck.com/us/en/subscribe/" title="Subscription Center">sign up in our subscription center</a></strong>.</p>
<style type="text/css">
    .wrapped-div {
        max-width: 100%;
    }

    @media (max-width: 1240px) {
        .wrapped-div {
            overflow-x: scroll;
        }
    }

    .wrapped-div-sector {
        max-width: 100%;
        overflow-x: scroll;
    }
</style>
]]></content:encoded>
</item><item rdf:about="https://www.vaneck.com/us/en/blogs/natural-resources/get-to-know-green-metals-supply-concerns/">
  <title>Get To Know Green Metals: Supply Concerns></title>
  <link>https://www.vaneck.com/us/en/blogs/natural-resources/get-to-know-green-metals-supply-concerns/</link>
  <description><![CDATA[We highlight key factors that may impact the supply of green metals, including copper, lithium and nickel.]]></description>
  <dc:creator>Charl Malan</dc:creator>
  <dc:date>02/22/2023 06:30:00</dc:date>
<content:encoded><![CDATA[

<script>
    //Temporary script
    $(function () {
        $(".popup-youtube, .popup-vimeo, .popup-gmaps").on("click", function (e) {
            e.preventDefault();
            var width = $(window).width();
            if (width > 768) {
                openSimpleIframeModalDialog($(this).attr('href'), "video-modal");
            } else if ($(this).is('.popup-youtube')) {
                var target = $(this).attr('data-video');
                self.location = target;
            }
        });
    });
</script>
<style>
    .modal.fade.video-modal div.modal-dialog {
        margin: 7% auto !important;
    }

    .modal-simple-iframe .close span {
        font-size: 35px;
        line-height: 1;
    }
</style>
<h2>Summary</h2>
<ul class="content-list">
<li>We believe the global resource transition is at an inflection point, creating long-term investment opportunities for several raw materials.</li>
<li>It is essential to recognize the increased risk to the global supply of "green metals."<sup>*</sup></li>
<li>The risk of a weaker supply has the potential to be a defining issue in 2023.</li>
</ul>
<h2>Overview</h2>
<p>In 2023 so far there have been frequent headlines about the risks that social, environmental, and geopolitical issues, ore grade, and drought bring to mining. These headlines span the globe and affect the supply of a number of green metals.</p>
<h2>Copper</h2>
<p>Global copper mine supply estimates for 2023 are approximately 23 million tonnes ("Mt")<sup>1</sup>, but we believe this figure is now under threat. In the past several months, supply estimates have been revised downward by 350 thousand tonnes ("kt"), or 1.5% of global supply. Thus, the supply/demand balance has swung from a 170 kt surplus to a 180 kt deficit.</p>
<p>The threats, by country (and related cause), in order of the severity of their potential risk to supply, are:</p>
<p><u>Peru (Social Unrest)</u>: At 2.4 Mt, or approximately 11% of global supply in 2022, Peru is the world's second-largest copper-producing nation. As the country&rsquo;s worst and most violent political unrest in the past 20 years continues to escalate, mines have been forced either to halt or operate at partial capacity. Accordingly to The National Society of Mining and Energy<sup>2</sup>, about 30% of Peruvian copper production is at risk&mdash;a figure equivalent to approximately 3% of global supply.</p>
<p>This, then, begs the question of how the current instability will impact long-term investment in Peruvian mining as it could place 20 new projects (a combined 1.7 Mt of copper supply) at risk between 2026 and 2028.<sup>3</sup></p>
<h3>Copper Production 2022</h3>
<p><img loading="lazy" class="img-responsive w-100" src="https://www.vaneck.com/contentassets/c2312514efcd44dd8a21f59482cf2700/2865_gmet_chart-01_2023.02_blog.svg" alt="Copper Production 2022" /></p>
<p class="chart-disclosure">Source: BMO Capital Markets as of December 2022.</p>
<p><u>Chile (Operational Concerns)</u>: Chile was the world's largest copper producer in 2022 at 5.3 Mt or approximately 25% of global supply. Operational issues are weighing on supply. Issues such as water shortages, deeper mines and ore grade deterioration have resulted in copper production falling well below the country&rsquo;s prior five-year average (see chart below). The net annual impact on supply is estimated at approximately 350 Kt, equivalent to approximately 1.5% of global supply.</p>
<h3>Chile Copper Production (Kt per Month)</h3>
<p><img loading="lazy" class="img-responsive w-100" src="https://www.vaneck.com/contentassets/c2312514efcd44dd8a21f59482cf2700/2865_gmet_chart-02_2023.02_blog.svg" alt="Chile Copper Production" /></p>
<p class="chart-disclosure">Source Bloomberg, VanEck as of December 2022.</p>
<p>Meanwhile, state-owned Codelco, the world's largest copper producer, reported full-year 2022 copper production of 1.44 Mt, 10% less than in 2021. While, separately, mines such as Los Bronces and Collahausi (4% of global supply combined) have recently reduced their 2023 and 2024 production guidance.</p>
<p><u>Panama (Regulatory Bottlenecks)</u>: In December 2022, the government of Panama demanded that Cobre Panama (accounting for 350 kt or 1.6% of global supply in 2022) halt production after a deadline for a new mining contract and tax/royalty regime expired. Although operations have continued, negotiations are tough and could drag on, increasing the risk to global supply.</p>
<p><u>Zambia (Resource Rationing)</u>: In 2023, the country is projected to produce approximately 950 kt (4% of global supply) of copper. However, little rainfall in the current wet season limits electricity generation as the country derives some 75% of its electricity from hydropower. As a result, severe rationing of electricity supply to households and industries is now being rolled out, putting copper production at risk.</p>
<h2>Lithium</h2>
<p><u>United States (Land Rights Issues)</u>: General Motors announced it would invest $650 million in a U.S.-based lithium project.<sup>4</sup>&nbsp;If built, this could become the largest lithium mine in the country and, on current figures, account for approximately 5% of global supply. It would also be a significant step toward helping secure domestic supply.</p>
<p>But this project, as with 70-95% of all known lithium, cobalt, nickel and copper deposits in the U.S., lies on, or within 35 miles of, Native American-owned land (Reservation).<sup>5</sup>&nbsp;And, as such, it is the ancestral home of local indigenous communities and holds cultural, spiritual and historical significance, not to mention extreme importance as a wildlife habitat.</p>
<p>And, according to Daniel Cardena (CEO of Learning River, a National Native American STEM Initiative): "Having GM  at the party does not alter the fact that this project has some major issues, especially with Native American sacred sites, and is culturally inappropriate.&rdquo; Further, &ldquo;&hellip;if the developers hope that having GM will somehow change the tide, they are really clueless."</p>
<p><u>Zimbabwe (Export Bans)</u>: In the first instance of what we think is a growing global issue, Zimbabwe's government has banned the export of raw lithium. Why? The answer: Beneficiation.<sup>6</sup>&nbsp;As many governments, especially in Africa, export raw (un-beneficiated) minerals, they miss out on an excellent opportunity to create jobs and develop a local processing industry. According to the Zimbabwean government, the country has missed out on approximately EUR1.7B by exporting raw minerals and not processing them within the country. While, today, Zimbabwe is not a significant producer of lithium, it still holds some of the world's largest hard-rock lithium reserves and could become a critical source of new material.</p>
<h2>Nickel</h2>
<p><u>U.S. (Land Rights Issues)</u>: As part of what is being colloquially referred to as &ldquo;NIMBY-ism&rdquo; (&ldquo;NIMBY&rdquo; meaning &ldquo;Not In My Backyard&rdquo;), the Biden Administration has blocked the development of the Twin Metals mine in Minnesota by placing a 20-year moratorium on mining activity in the Superior National Forest. The Twin Metals project was set to produce nickel, copper and cobalt and sits atop one of the world's largest deposits of green metals (in this instance, deposits of nickel, copper and cobalt).</p>
<p><u>Philippines (Potential Export Bans)</u>: The world's second-biggest nickel supplier (11% market share) is contributing to the already-heightened supply uncertainties. Like Zimbabwe, it is considering either a tax or an outright ban on raw nickel exports to potentially develop downstream industries and create domestic employment opportunities.</p>
<p><u>Indonesia (Export Bans)</u>: In 2020, the world's largest nickel producer (22% market share) placed a total ban on nickel ore exports. Under the export ban, China invested heavily in and worked closely with Indonesia to secure refined nickel supply. The U.S. as well as other countries have become severely disadvantaged in achieving supply stability for electric vehicle batteries as a result.</p>
<h2>Conclusion</h2>
<p>Mining has a key role to play in decarbonizing the world. The applications and technology that will drive the transition to clean energy and decarbonization are minerals dependent and minerals intensive. Lithium, nickel, graphite, rare earths and copper are the most notable minerals.</p>
<p>Opening a mine takes many years and the industry is experiencing threats to mine production that have the potential to severely impact the supply of these green metals for some time.</p>
<p>To receive more <a href="/us/en/insights/natural-resources/" title="Natural Resources Insights"><strong>Natural Resources</strong></a> insights, <a href="https://www.vaneck.com/us/en/subscribe/" title="Subscription Center"><strong>sign up in our subscription center</strong></a>.</p>
]]></content:encoded>
</item><item rdf:about="https://www.vaneck.com/us/en/blogs/economic-trends/is-everything-rally-in-trouble/">
  <title>Is “Everything Rally” In Trouble?></title>
  <link>https://www.vaneck.com/us/en/blogs/economic-trends/is-everything-rally-in-trouble/</link>
  <description><![CDATA[U.S. rates&rsquo; January rally is undone and EM returns are feeling the heat. Can rates start decompressing again soon?]]></description>
  <dc:creator>Natalia  Gurushina</dc:creator>
  <dc:date>02/22/2023 06:30:00</dc:date>
<content:encoded><![CDATA[

<h2>Fed Message and the Market</h2>
<p><strong>January&rsquo;s rally in the 10-year U.S. Treasury yield is now completely undone, causing collateral damage in emerging markets (EM) debt</strong>. As you can see on the chart below, EM debt&rsquo;s losses in February are largely the result of higher &ldquo;risk-free&rdquo; rates &ndash; this applies both to sovereign and corporate bonds. Lower-rated bonds were also affected by higher U.S. rates volatility, which has a fairly strong correlation with High Yield EM spreads (this shows as the negative spread return on the chart). The &ldquo;higher for longer U.S. rates&rdquo; narrative is partly driven by a slower pace of disinflation and more robust domestic activity in the U.S. And the market was slow to catch up with the U.S. Federal Reserve&rsquo;s (Fed&rsquo;s) hawkish message. The Fed&rsquo;s minutes this afternoon might well provide an extra push in the hawkish direction.</p>
<h2>Fed, Geopolitics, Macro</h2>
<p><strong>Can U.S. rates start &ldquo;decompressing&rdquo; once the new Fed narrative gets internalized by the market?</strong> Quite possibly. It is not unusual for UST yields to anticipate the Fed&rsquo;s path (the peak rate and eventual easing in this case) well in advance. However, higher geopolitical tensions might complicate things. Will the next leg of Russia&rsquo;s offensive in Ukraine affect Europe&rsquo;s growth prospects (the consensus priced out the 2023 recession) and reaffirm the &ldquo;least bad&rdquo; status of the U.S. dollar and U.S. rates? Or will another debt ceiling debacle (ummm&hellip; debate) in the U.S. &ndash; together with the persistent drumbeat about the end of the petrodollar &ndash; make the greenback&rsquo;s life more difficult this time around?</p>
<h2>China&rsquo;s Recovery</h2>
<p>China is, of course, an integral part of the global geopolitical &ldquo;knot&rdquo;, but we suspect that the market might be paying more attention to the economic data flow in the next few days. <strong>China&rsquo;s high frequency data signals that the recovery might be &ldquo;uneven&rdquo; and perhaps even &ldquo;delayed&rdquo; until H2/early-2024.</strong> There is a sense that perhaps the market&rsquo;s pause is justified after the huge &ldquo;reopening&rdquo; rally, and it&rsquo;s time to wait until the recovery&rsquo;s timeline becomes clearer. The next set of China&rsquo;s activity gauges (out next week) will therefore be closely watched. Stay tuned!</p>
<h3>Chart at a Glance: EM Debt Returns Hit by Higher Risk-Free Rates</h3>
<p><img class="img-responsive w-100" src="https://www.vaneck.com/contentassets/939b0789d3bd45a0bbc172c58940da5b/us-natalias-take-2023-02-22.png" alt="Chart at a Glance: EM Debt Returns Hit by Higher Risk-Free Rates" /></p>
<p class="chart-disclosure">Source: Bloomberg LP.</p>
<p class="chart-disclosure"><strong>CEMBI &ndash; J.P. Morgan Corporate Emerging Markets Bond Index</strong> is a global, liquid corporate emerging markets benchmark that tracks U.S.-denominated corporate bonds issued by emerging markets entities.</p>
]]></content:encoded>
</item><item rdf:about="https://www.vaneck.com/us/en/blogs/emerging-markets-bonds/gale-force-uncertainty-creates-em-debt-tailwinds/">
  <title>Gale Force Uncertainty Creates EM Debt Tailwinds></title>
  <link>https://www.vaneck.com/us/en/blogs/emerging-markets-bonds/gale-force-uncertainty-creates-em-debt-tailwinds/</link>
  <description><![CDATA[Uncertainty abounds in many key global macroeconomic drivers. However, some of this uncertainty, global growth and geopolitics in particular, may provide a strong tailwind for EM debt.]]></description>
  <dc:creator>Eric Fine</dc:creator>
  <dc:date>02/21/2023 06:30:00</dc:date>
<content:encoded><![CDATA[

<p>In January, the Fund returned 5.02%, compared to 3.73% for its benchmark, the 50% J.P. Morgan Government Bond Index-Emerging Markets (GBI-EM) Global Diversified and 50% J.P. Morgan Emerging Markets Bond Index (EMBI), generating outperformance of 129 bps. We are continuously monitoring the market and proactively positioning our portfolio to address changes in the market environment. We completed our months long duration reduction from 8-handle to 4-handle by lowering exposure to investment grade bonds. We also trimmed our EM Asia currency exposure but would likely re-enter at an attractive valuation driven entry point. The Fund has benefitted from our duration reduction in investment grade securities. As of end-January, local currency exposure was 49.68%, duration was 6.63 and carry was 7.26%. <strong><a href="/us/en/blogs/emerging-markets-bonds/gale-force-uncertainty-creates-em-debt-tailwinds/emb-manager-commentary-01-2023.pdf" title="VanEck Emerging Markets Bond Fund Monthly Manager Commentary - January 2023" target="_blank" rel="noopener">View here</a></strong> for a PDF version of this blog.</p>
<div class="wrapped-div">
<table style="width: 100%;">
<tbody>
<tr class="tbl-data">
<td class="tbl-header last" colspan="8">Average Annual Total Returns (%) as of January 31, 2023</td>
</tr>
<tr class="tbl-data">
<td class="data-td last">&nbsp;</td>
<td class="data-head last">1 Month<sup>&dagger;</sup></td>
<td class="data-head last">3 Month<sup>&dagger;</sup></td>
<td class="data-head last">YTD</td>
<td class="data-head last">1 Year</td>
<td class="data-head last">3 Year</td>
<td class="data-head last">5 Year</td>
<td class="data-head last">10 Year</td>
</tr>
<tr class="tbl-data">
<td class="data-td last">Class A: NAV (Inception 7/9/12)</td>
<td class="data-td data last">5.02</td>
<td class="data-td data last">18.84</td>
<td class="data-td data last">5.02</td>
<td class="data-td data last">-1.73</td>
<td class="data-td data last">0.78</td>
<td class="data-td data last">1.34</td>
<td class="data-td data last">0.43</td>
</tr>
<tr class="tbl-data">
<td class="data-td last">Class A: Maximum 5.75% Load</td>
<td class="data-td data last">-1.01</td>
<td class="data-td data last">12.01</td>
<td class="data-td data last">-1.01</td>
<td class="data-td data last">-7.38</td>
<td class="data-td data last">-1.19</td>
<td class="data-td data last">0.15</td>
<td class="data-td data last">-0.16</td>
</tr>
<tr class="tbl-data">
<td class="data-td last">Class I: NAV (Inception 7/9/12)</td>
<td class="data-td data last">4.78</td>
<td class="data-td data last">18.73</td>
<td class="data-td data last">4.78</td>
<td class="data-td data last">-1.48</td>
<td class="data-td data last">1.09</td>
<td class="data-td data last">1.63</td>
<td class="data-td data last">0.72</td>
</tr>
<tr class="tbl-data">
<td class="data-td last">50 GBI-EM GD / 50% EMBI GD</td>
<td class="data-td data last">3.73</td>
<td class="data-td data last">12.75</td>
<td class="data-td data last">3.73</td>
<td class="data-td data last">-10.26</td>
<td class="data-td data last">-4.52</td>
<td class="data-td data last">-1.56</td>
<td class="data-td data last">0.22</td>
</tr>
</tbody>
</table>
</div>
<br />
<div class="wrapped-div">
<table style="width: 100%;">
<tbody>
<tr class="tbl-data">
<td class="tbl-header last" colspan="8">Average Annual Total Returns (%) as of December 31, 2022</td>
</tr>
<tr class="tbl-data">
<td class="data-td last">&nbsp;</td>
<td class="data-head last">1 Month<sup>&dagger;</sup></td>
<td class="data-head last">3 Month<sup>&dagger;</sup></td>
<td class="data-head last">YTD</td>
<td class="data-head last">1 Year</td>
<td class="data-head last">3 Year</td>
<td class="data-head last">5 Year</td>
<td class="data-head last">10 Year</td>
</tr>
<tr class="tbl-data">
<td class="data-td last">Class A: NAV (Inception 7/9/12)</td>
<td class="data-td data last">2.82</td>
<td class="data-td data last">10.32</td>
<td class="data-td data last">-7.73</td>
<td class="data-td data last">-0.64</td>
<td class="data-td data last">0.67</td>
<td class="data-td data last">0.27</td>
</tr>
<tr class="tbl-data">
<td class="data-td last">Class A: Maximum 5.75% Load</td>
<td class="data-td data last">-3.09</td>
<td class="data-td data last">3.98</td>
<td class="data-td data last">-13.04</td>
<td class="data-td data last">-2.58</td>
<td class="data-td data last">-0.52</td>
<td class="data-td data last">-0.33</td>
</tr>
<tr class="tbl-data">
<td class="data-td last">Class I: NAV (Inception 7/9/12)</td>
<td class="data-td data last">2.93</td>
<td class="data-td data last">10.43</td>
<td class="data-td data last">-7.21</td>
<td class="data-td data last">-0.30</td>
<td class="data-td data last">1.00</td>
<td class="data-td data last">0.59</td>
</tr>
<tr class="tbl-data">
<td class="data-td last">50 GBI-EM GD / 50% EMBI GD</td>
<td class="data-td data last">1.24</td>
<td class="data-td data last">8.30</td>
<td class="data-td data last">-14.73</td>
<td class="data-td data last">-5.64</td>
<td class="data-td data last">-1.85</td>
<td class="data-td data last">-0.17</td>
</tr>
</tbody>
</table>
</div>
<br />
<p class="chart-disclosure"><sup>&dagger;</sup>&nbsp;Returns less than one year are not annualized.</p>
<p class="chart-disclosure"><strong>Expenses: Class A: Gross 2.33%, Net 1.28%; Class I: Gross 1.74%, Net 0.96%.</strong> Van Eck Associates Corporation (the &ldquo;Adviser&rdquo;) has agreed to waive fees and/or pay Fund expenses to the extent necessary to prevent the operating expenses of the Fund (excluding acquired fund fees and expenses, interest expense, trading expenses, dividends and interest payments on securities sold short, taxes and extraordinary expenses) from exceeding 1.25% for Class A and 0.95% for Class I of the Fund&rsquo;s average daily net assets per year until May 1, 2023. During such time, the expense limitation is expected to continue until the Board of Trustees acts to discontinue all or a portion of such expense limitation. Please note that, generally, unconstrained bond funds may have higher fees than core bond funds due to the specialized nature of their strategies.</p>
<p class="chart-disclosure"><strong>The performance data quoted represents past performance. Past performance is not a guarantee of future results. Investment return and principal value of an investment will fluctuate so that an investor&rsquo;s shares, when redeemed, may be worth more or less than their original cost. Performance may be lower or higher than performance data quoted. Please call 800.826.2333 or visit vaneck.com for performance current to the most recent month ended.</strong></p>
<p class="chart-disclosure">The &ldquo;Net Asset Value&rdquo; (NAV) of a Fund is determined at the close of each business day, and represents the dollar value of one share of the fund; it is calculated by taking the total assets of the fund, subtracting total liabilities, and dividing by the total number of shares outstanding. The NAV is not necessarily the same as the ETF&rsquo;s intraday trading value. Investors should not expect to buy or sell shares at NAV.</p>
<p><strong>All key global macroeconomic drivers are maximally uncertain &ndash; rates, FX, duration, IG spreads, growth and inflation.</strong> Starting with the driver-<i>de-jour</i>, U.S. 10-year rates could go up or down 50bp easily&hellip;hey, they might be doing it (the up by 50bp part) right now! And we&rsquo;re going to intentionally skip over the inflation story because that topic is divided into inflation versus commodities (which we&rsquo;ve written about) and inflation versus labor (among other basic conflicts), our point being that it is characterized by great uncertainty. We are not going to pound the table on a U.S. inflation view, instead our stance is to insulate our portfolio from possible risks. The most important example of how we&rsquo;re reacting to such risk (if we&rsquo;re correct in seeing it) is noting its incompatibility with near-record-low IG spreads.</p>
<h3>Exhibit 1 &ndash; Near Record Low EM IG Spreads (Sovereign and Corporate) Minus U.S. IG Spreads</h3>
<p><strong>IG EM Debt vs US IG</strong></p>
<p><img class="img-responsive w-100" src="https://www.vaneck.com/contentassets/6f7da8682eac48d387b87c857b1bf9c9/2858_emb_chart_01_2023.02_v1_blog.svg" alt="Near Record Low EM IG Spreads (Sovereign and Corporate) Minus U.S. IG Spreads" /></p>
<p class="chart-disclosure">US IG is represented by J.P. Morgan Global Aggregate IG North America Index.</p>
<p class="chart-disclosure">Source: Bloomberg LP. As of 31 December 2022.</p>
<p class="chart-disclosure">Past performance is not indicative of future results. Please see important index descriptions and disclosures at the end of this commentary.</p>
<p><strong>And just to beat the rates discussion to death &ndash; here&rsquo;s a good one.</strong> We don&rsquo;t know how the U.S. Federal Reserve (Fed) measures financial conditions. The metrics they told us they looked at, the Financial Conditions Index (FCI), are now different. The real policy rate is the &lsquo;thing&rsquo; now, maybe. Don&rsquo;t ask whether you use trailing n-month, or forecast inflation, or contemporaneous inflation, I guess we&rsquo;ll find out? Anyway, with breakevens where they are, the real rate is very positive at the 2-year (and other) points on the yield curve, so that rightly counts as tight. And, it may be! Our point is that we are trying to insulate our portfolio from these uncertainties and basic debates, not base a portfolio on our opinions on them.</p>
<p><strong>Our months-long duration reduction from 8-handle in October 2022 to 4-handle currently, is completed.</strong> IG spreads tightened along with the nominal 10y U.S. yield, and we weren&rsquo;t concerned about risk-free rate rises because the spread cushion was substantial. In the extreme high-quality cases, we&rsquo;re talking Saudi Arabia, Kuwait, UAE, but also strong USD creditors Mexico, Peru and sometimes Brazil. We happened to see a big risk of 10y rates declining back in October, but most importantly we were insulated from being wrong on that view by wide credit spreads (which was awesome, because they absorbed the inevitable volatility of U.S. 10y yields even as they declined). Anyway, the cushion&rsquo;s not there anymore, so we&rsquo;re looking to make our beds elsewhere than IG. Oh, and major bonus! Check out what the survey says on rates expectations (over $1tn in emerging markets (EM) Debt Manager AUM represented in this survey). Nobody sees the terminal rate higher than 5.50-6.00! That result is astounding! Nobody&hellip;and yet the risk of higher is a &lsquo;thing&rsquo; just via observation (i.e., reading newspapers). I mean, you don&rsquo;t need to be a trader to be crazy wary of this technical setup. Seatbelts on.</p>
<h3>Exhibit 2 &ndash; Nobody Fears the Reaper!</h3>
<p><strong>Peak Fed rate in 2023</strong></p>
<p><img class="img-responsive w-100" src="https://www.vaneck.com/contentassets/6f7da8682eac48d387b87c857b1bf9c9/2858_emb_chart_02_2023.02_v1_blog.svg" alt="Nobody Fears the Reaper!" /></p>
<p class="chart-disclosure">Simple count is the count based on the investor. 20 investors out of 100 is 20. AUM weighted is the weight based on the investor&rsquo;s AUM. 20 investors with 40 percent of the AUM counts as 40.</p>
<p class="chart-disclosure">Source: J.P. Morgan February 2023.</p>
<p class="chart-disclosure">The projections, opinions, forecasts and other forward looking statements contained herein do not reflect actual results.</p>
<p>And a simple listicle will suffice to round out this picture of great uncertainty for all key global macroeconomic drivers of asset prices. Some are observations and don&rsquo;t merit prose explanations:</p>
<h2>Exhibit 3 &ndash; Listicle of Uncertainty in Every Important Thing</h2>
<ol class="content-list">
<li><strong>U.S. Rates</strong> &ndash; The turn in rates is viewed as the turn in risk. It is not. And that&rsquo;s just the market having it upside-down. The Fed is changing its metric for financial conditions in the middle of a hiking cycle, to one that shows policy is tight, not loose. Talk about uncertainty. Oh, and it all depends on the labor market and commodities; great that those sectors are so crystal-clear to analyze.</li>
<li><strong>Bank of Japan's Yield Curve Control (BoJ YCC)</strong> &ndash; is it releasing pressure on yields as they go higher&hellip;or is it flooding the market with yen liquidity as they are defending the yield, resulting in leakages/JPY lower? This might push yields higher&hellip;lather-rinse-repeat. We don&rsquo;t know. Big uncertainty.</li>
<li><strong>Euro</strong> &ndash; is it the same old euro of every crisis generating new ECB tools to federalize sovereign debt (and banks and national fiscus), or is the energy and geopolitical challenge an unpriced new state-of-nature? We have opinions on this, actually (see below), but the key is not our opinion, the key is the limited upside (whether nominal yields or other valuation approaches) from a lot of European assets. (Our portfolio is obviously curated, so we&rsquo;ll be biased toward the superior risk/return assets within Europe, which is intended to get around this risk).</li>
<li><strong>Global Growth</strong> &ndash; Is the U.S. recession that the yield curve is pricing the &lsquo;thing&rsquo;, or is it China&rsquo;s re-opening? We don&rsquo;t know. Luckily, EM debt is filled with opportunities geared toward China reopening. <i>Risk for thee, not for me.</i></li>
<li><strong>Revenues vs Earnings</strong> &ndash; I mean, if inflation and growth are subject to great uncertainty, so are revenues and earnings. You don&rsquo;t get more central than that, and there&rsquo;s risk of bad news on <i>both</i> metrics.</li>
<li><strong>Geopolitics are good for EM, even if you don&rsquo;t like why or how it&rsquo;s happening.</strong> Do we even need to write an explanation? The West breaking key strategic guidelines established by Henry Kissinger and Zbigniew Brzezinksi may find out why those guardrails existed (really complicated concepts like&hellip;don&rsquo;t let Russia and China and Iran marry). The rules were there to protect our interests, but different priorities are driving Western policy now. The result is that all the territory between Russia, China and Iran is gone to the west, and we can&rsquo;t play anyone against anyone else anymore. Whether it is &ldquo;worth it&rdquo; from a U.S. strategic perspective is irrelevant to us, we&rsquo;re just EM debt analysts making predictions and trying not to be subject to risks from U.S. strategic decisions (for example, we were the only fund that did not own Russia or Ukraine bonds going into the invasion). Kazakhstan alone provides 40% of global uranium. All Russian pipes are being built eastward, completion 2025. A shutdown of Hormuz (Iran) is not $100 oil, it is $100s oil. Did you hear the one about the end of the petrodollar? I hope so &ndash; China and India can now pay Gulf countries for oil in yuan renminbi (CNY) and rupees (INR). What do you think those countries will do with that cash? They have to buy CNY and INR bonds (those particular bonds are &lsquo;yours&rsquo;, in our opinion, but there are plenty of better-curated EM currencies subject to the same dynamic). None of these geopolitical developments are, when you view them this way, negative for EM. They are all positive for EM, it&rsquo;s just that it may be due to developed markets (DM) countries needing to face inward to address problems, which is never fun when you&rsquo;re in one of those countries. Luckily, EM can access these opportunities &ndash; commodity-price upside risk is <i>positive</i> for our positions (and big chunks of EM debt in local and hard currency). It&rsquo;s one of our themes &ndash; the commodities headwind for DM is a tailwind for EM. Come aboard! That&rsquo;s the beauty of the end of the petrodollar if you have access to EM &ndash; a headwind for DM, a tailwind for EM. Come aboard!</li>
</ol>
<h2>EXPOSURE TYPES AND SIGNIFICANT CHANGES</h2>
<p>The changes to our top positions are summarized below. Our largest positions in December are Indonesia, Malaysia, Colombia, Thailand and South Africa.</p>
<ul class="content-list">
<li>We increased our local currency exposure in Romania, Hungary, the Czech Republic and Israel. EM disinflation is bumpy &ndash; and Central Europe is not an exception &ndash; but moderating energy and food prices, as well as the high base effect, will make sure that price pressures will continue to moderate in the coming months. In addition, the end of the hiking cycles, lower energy prices, and China&rsquo;s rebound also suggest that the growth outlook for Central Europe might not be as dire as previously feared. In terms of our investment process, this improved the technical and economic test scores for Poland, Hungary and the Czech Republic. As regards Romania, an additional supporting factor is an absence of policy disputes with the European Union, which ensures that EU grants continue to flow uninterrupted. Romania is also self-sufficient &ndash; an extra bonus for the country&rsquo;s policy and economic test scores. In Israel, we point to such supporting factors as very attractive valuations, strong external accounts and a credible central bank &ndash; or stronger economic, policy and economic test scores (using our investment process&rsquo;s terminology).</li>
<li>We also increased local currency and hard currency sovereign exposure in South Africa and hard currency quasi-sovereign exposure in Colombia. In Colombia, we added longer-dated (~10y) bonds to express the global duration theme, as global disinflation continues and tightening cycles are coming to an end (including Colombia), improving the technical test score for the country. The South African policy/politics test score looks much better now, as the noise associated with the soft coup against the president and the ANC conference messages is subsiding. The super-credible central bank is &ndash; as usual &ndash; an added bonus.</li>
<li>Finally, we increased hard currency sovereign exposure in Pakistan and Senegal, and hard currency sovereign and corporate exposure in Nigeria. In Senegal we were attracted by cheaper valuations (against the backdrop of a decent policy backdrop), which improved the technical test score for the country. Pakistan avoided a hard default, and is currently trading rich relative to peers &ndash; so, the technical and policy test scores look better. But the situation should be monitored very carefully. In Nigeria, we started to position for the presidential elections &ndash; and a good chance of a new administration, which should result in a better policy framework, improving the respective test score for the country.</li>
<li>We reduced our hard currency quasi-sovereign and corporate exposure in China, taking profits on positions that rallied the most since re-opening, and the new real estate policy support. In terms of our investment process, the technical test score for these positions has deteriorated.</li>
<li>We also reduced our local currency exposure in Brazil and Mexico, and hard currency sovereign exposure in Mexico and Peru. Our main concern in Brazil is the uncertainty about the policy direction (especially on the fiscal front). The January riots might have strengthened President Luiz In&aacute;cio Lula da Silva&rsquo;s (Lula's) stronger political standing, and this can make it easier to push for the populist agenda. President Lula&rsquo;s obsession with the central bank&rsquo;s independence also sends a negative signal, worsening the policy test score for the country. Mexico&rsquo;s valuations are getting really stretched, with the market narrative switching from Mexico to China. In terms of our investment process, this worsened the technical test score for the country. In Peru, we reduced our long duration exposure due to concerns about correlations with U.S. Treasuries, as the market might be getting too optimistic on the disinflation progress and the pace of rate cuts in the U.S.</li>
<li>Finally, we reduced our hard currency sovereign exposure in the United Arab Emirates, Saudi Arabia and Qatar. The reasons were very similar to our reasoning in Peru &ndash; correlation with longer-dated U.S. Treasuries and the market&rsquo;s getting too excited about policy easing in the U.S. In terms of our investment process, this worsened the countries&rsquo; technical test scores.</li>
</ul>
<p>To receive more <a href="/us/en/insights/emerging-markets-bonds/" title="Emerging Markets Bonds Insights"><strong>Emerging Markets Bonds</strong></a> insights, <a href="/us/en/subscribe/" title="Subscription Center"><strong>sign up in our subscription center</strong></a>.</p>
<style type="text/css">.wrapped-div {
    max-width: 100%;
}
@media (max-width: 768px) {
    .wrapped-div {
        overflow-x: scroll;
    }
}
.wrapped-div-sector {
    max-width: 100%;
    overflow-x: scroll;
}
</style>
]]></content:encoded>
</item><item rdf:about="https://www.vaneck.com/us/en/blogs/economic-trends/reviewing-our-2023-em-assumptions/">
  <title>Reviewing Our 2023 EM Assumptions></title>
  <link>https://www.vaneck.com/us/en/blogs/economic-trends/reviewing-our-2023-em-assumptions/</link>
  <description><![CDATA[EM central banks remain super-vigilant, but there are some concerns about the timing of China&rsquo;s rebound, especially in consumption.]]></description>
  <dc:creator>Natalia  Gurushina</dc:creator>
  <dc:date>02/21/2023 06:30:00</dc:date>
<content:encoded><![CDATA[

<h2>EM Tightening Cycle</h2>
<p><strong>Emerging markets&rsquo; (EM&rsquo;s) credible and pro-active policy response to rising price pressures and China&rsquo;s rebound are among key factors underpinning our 2023 outlook for EM bonds</strong>. How have these assumptions been holding so far this year? EM monetary authorities are passing with flying colors. EM inflation is moderating, but various central banks are not taking any chances and staying cautious, as the process of disinflation is rather bumpy and might take longer than previously thought. Mexico and the Philippines raised their respective policy rates by more than expected earlier this month, and even central banks that stayed on hold signaled that the bar for rate cuts is very high. The latest hawkish surprise came from Israel, where the central bank opted for a larger 50bps rate hike yesterday, instead of expected 25bps, and signaled more tightening, because activity and inflation turned out much stronger than expected.</p>
<h2>China Rebound</h2>
<p><strong>EMs&rsquo; relatively high real interest rates </strong>(vs. developed markets (DM)) provide a nice policy cushion against the (potentially) more hawkish U.S. Federal Reserve (Fed), but for this cushion to <strong>translate into actionable trades, a decent growth outlook is often a must</strong>. China&rsquo;s rebound is an important driver here, and various gauges/high frequency indicators show that domestic activity is definitely bottoming out. We are also hearing about additional policy measures to prop up the housing sector and promote bank lending &ndash; such as draft new rules on banks&rsquo; risk-weighting and a pilot scheme to allow real estate investments by private equity funds. Still, there are plenty of questions about the recovery&rsquo;s timeline &ndash; especially as regards consumption. A recent sell-side report suggested that excess savings might be smaller and partly used for precautionary purposes. Further, the use of excess savings might be slower initially, pushing the recovery to H2/early 2024.</p>
<h2>Global Growth Outlook</h2>
<p><strong>China is not the only growth story we are watching </strong>&ndash; the growth outlook in advanced economies is also important, especially for more open EMs (note that the economic surprise index for EM exports is still in the red &ndash; see chart below). February&rsquo;s preliminary activity gauges for the Eurozone (PMIs, or Purchasing Managers Indices) looked mixed &ndash; a very strong reading for the services PMI (53.0), but the manufacturing PMI (48.5) remains contractionary. The U.S. PMIs looked almost as &ldquo;conflicted&rdquo; &ndash; the expansionary services PMI and the contractionary manufacturing PMI &ndash; except that manufacturing was better than expected. There was nothing in the release to suggest that the Fed should stop hiking &ndash; so, it&rsquo;s good that EM central banks are en garde. Stay tuned!</p>
<h3>Chart at a Glance: EM Export Surprises &ndash; Still in the Red</h3>
<p><img class="img-responsive w-100" src="https://www.vaneck.com/contentassets/739964bf4e6a407aad5b6647cf4dcf06/us-natalias-take-2023-02-21.png" alt="Chart at a Glance: EM Export Surprises - Still in the Red" /></p>
<p class="chart-disclosure">Source: Bloomberg LP.</p>
<p class="chart-disclosure"><strong>Citigroup Economic Surprise Index (CESI) </strong>tracks whether a core set of economic data series has been coming in under expectations, at expectations, or over expectations.</p>
]]></content:encoded>
</item><item rdf:about="https://www.vaneck.com/us/en/blogs/economic-trends/sentiment-swings-and-fundamentals/">
  <title>Sentiment Swings and Fundamentals></title>
  <link>https://www.vaneck.com/us/en/blogs/economic-trends/sentiment-swings-and-fundamentals/</link>
  <description><![CDATA[EM selectivity remains key as the market is trying to find a new &ldquo;equilibrium&rdquo; scenario for the Fed.]]></description>
  <dc:creator>Natalia  Gurushina</dc:creator>
  <dc:date>02/17/2023 06:30:00</dc:date>
<content:encoded><![CDATA[

<h2>Fed Rate Expectations</h2>
<p>The market <strong>expectations for the U.S. Federal Reserve policy trajectory continue to adjust higher</strong>, reflecting better than expected domestic activity and slower than expected disinflation. The peak rate implied by Fed Funds Futures rose to 5.3% - with the tail risk extending to 6% and with the probability of the June rate hikes reaching 60% (compared to 4% on February 1). This re-adjustment led to some market movements &ndash; including lower-yielding and higher-rated assets (which often have higher duration as well). Upcoming changes at the Bank of Japan&rsquo;s helm &ndash; with potential implications for inflows into Investment Grade (IG) bonds both in emerging markets (EM) and developed markets (DM) &ndash; present an extra layer of uncertainty, especially as the market is also trying to assess China&rsquo;s ability to deliver on the growth front and turn the housing sector around.</p>
<h2>EM Diversification</h2>
<p>High Yield (HY) bonds in EM might have some insulation in the form of wider spreads (compared to IG), but <strong>spreads show a lot of co-movement with interest rate volatility in the U.S.</strong> (see chart below). So, until the dust settles and the market internalizes a new scenario for the Fed, EM spreads might remain under pressure. Now, a key EM lesson from 2022 is that selectivity pays off &ndash; even in the environment of higher global rates and the strong U.S. dollar. Several LATAM currencies &ndash; with their &ldquo;plush&rdquo; real rate cushions &ndash; outperformed many EM and major FX peers in February. Further, some EMs are arguably less correlated with risks like higher Fed rates, but instead correlated with China reopening (so, keep an eye on the next batch of China&rsquo;s activity gauges).</p>
<h2>Brazil Politics</h2>
<p>One activity the <strong>current environment is not good for is playing with fire in local politics/policy</strong>. Yep, &ldquo;return, I will, to old Brazil&rdquo; saga continues, with President Luiz In&aacute;cio Lula da Silva (Lula) delivering a daily dose of comments on the central bank independence and the inflation target (with other ministers and MPs joining the chorus from time to time). Brazil&rsquo;s economic activity proxy for December was a touch better than expected, but growth is still expected to soften a lot this year, inviting more populist attempts to prop it up &ndash; and not only by putting pressures on the central bank, but also by expanding low-interest lending via the Brazilian Development Bank (BNDES). Both policy options are sub-optimal as regards investors in local bonds. Stay tuned!</p>
<h3>Chart at a Glance: U.S. Rates Volatility and EM Spreads &ndash; A Lot of Co-Movement</h3>
<p><img class="img-responsive w-100" src="https://www.vaneck.com/contentassets/729b307b763a43a38d3149c6b1f083b8/us-natalias-take-2023-02-17.png" alt="Chart at a Glance: U.S. Rates Volatility and EM Spreads - A Lot of Co-Movement" /></p>
<p class="chart-disclosure">Source: Bloomberg LP.</p>
<p class="chart-disclosure"><strong>Ice BofA MOVE Index (MOVE)</strong> is a measure of U.S. interest rate volatility that tracks the movement in U.S. Treasury yield volatility.</p>
]]></content:encoded>
</item><item rdf:about="https://www.vaneck.com/us/en/blogs/moat-investing/uncover-big-opportunities-in-smaller-companies/">
  <title>Uncover Big Opportunities in Smaller Companies></title>
  <link>https://www.vaneck.com/us/en/blogs/moat-investing/uncover-big-opportunities-in-smaller-companies/</link>
  <description><![CDATA[With small&ndash; and mid&ndash;cap stock valuations at 20&ndash;year lows relative to large caps, now may be a compelling time for investors to consider these stocks.]]></description>
  <dc:creator>Coulter Regal, CFA</dc:creator>
  <dc:date>02/16/2023 20:00:00</dc:date>
<content:encoded><![CDATA[

<p>A company&rsquo;s size can play an important role in the type of risk and return profile that a stock may be expected to generate over time. Small&ndash; and mid&ndash;cap (SMID) stocks have exhibited compelling characteristics relative to their larger peers historically that should always keep them in consideration, but right now may be a particularly compelling time to focus on this asset class. SMID cap valuations are at decade lows compared to large caps, and we believe investors should consider this an opportunity to position for long&ndash;term growth.</p>
<h2>Small&ndash; and Mid&ndash;Cap Stock Valuations at Decade Lows</h2>
<p>Despite a long history of outperformance versus large&ndash;caps, valuations for SMID&ndash;cap companies have taken a noticeable haircut relative to large&ndash;caps over the past few years. SMID cap valuations began to diverge back in 2018 and then saw further discounts at the beginning of 2021. Driving forces behind the widening discount during this period include the aging of the previous record&ndash;setting bull market, growing concentration within the equity market in mega&ndash;cap companies, and different sector compositions of the U.S. large and small&ndash;mid cap indices.</p>
<p>Most recently, hawkish monetary policy, fears of recession and a technical bear market for U.S. equities have excessively impacted the share prices of smaller companies. However, investors should consider the change in monetary environment and turmoil in markets as an opportunity to position for long&ndash;term growth. Valuations for small&ndash; and mid&ndash;cap companies, in terms of forward price&ndash;to&ndash;earnings, are now at 20&ndash;year lows relative to large caps. Pair this extreme valuation discount with eventual brighter days in terms of macro backdrop, and we believe SMID cap stocks may prove to be rewarding for patient investors.</p>
<h3>SMID Cap Forward P/E Relative to Large Cap Forward P/E</h3>
<p><strong>January 2004 &ndash; December 2022</strong></p>
<p><img class="img-responsive w-100" src="https://www.vaneck.com/contentassets/afa85d25cda242da87b283cab92f8f98/smot_chart-01_2022.09_blog.svg" alt="SMID Cap Forward P/E Relative to Large Cap Forward P/E / January 2004 - August 2022" /></p>
<p class="chart-disclosure">Source: Bloomberg. SMID Cap Stocks represented by the Russell 2500 Index. Large Cap Stocks represented by the S&amp;P 500 Index. Past performance is no guarantee of future results. See disclaimers and descriptions at the end of this presentation. See disclaimers and descriptions at bottom of page.</p>
<h2>Potential for SMID Caps to Outperform Large Caps</h2>
<p>A seminal paper by Nobel economics laureate Eugene Fama and co&ndash;author Ken French studied equity returns from 1926 through 1992 and found that, over the long&ndash;term, small&ndash; and mid&ndash;cap equities consistently outperformed large&ndash;cap equities during the period.<sup>1</sup>&nbsp;The below chart, which measures the percent of time SMID cap stocks outperformed large&ndash;caps over the last 20 years, shows that this tendency to outperform still persists today. Looking at 10 year monthly rolling periods, SMID&ndash;cap equities have outperformed large&ndash;caps over 70% of the time since January 2000. While past performance is not a predictor of future outcomes, this data provides a favorable historical foundation for assessing the track record of small&ndash; and mid&ndash;cap stocks.</p>
<h3>Percent of Time SMID Caps Outperform Large Caps</h3>
<p><strong>January 2000 &ndash; December 2022</strong></p>
<p><img class="img-responsive w-100" src="https://www.vaneck.com/contentassets/afa85d25cda242da87b283cab92f8f98/smot_chart-02_2022.09_blog.svg" alt="Percent of Time SMID Caps Outperform Large Caps / January 2000 - August 2022" /></p>
<p class="chart-disclosure">Source: Morningstar. Defined time periods roll monthly. Small&ndash;Mid Cap Stocks represented by the Morningstar US Small&ndash;Mid Cap Index. Large Cap Stocks represented by the Morningstar US Large Cap Index. Past performance is no guarantee of future results. See disclaimers and descriptions at bottom of page.</p>
<p>While the performance of SMID cap stocks can be impressive, it is important to note that accompanying this performance can be additional risk. Smaller companies are inherently subject to greater risk than large companies, as they tend to have less diversified business models, limited access to capital and higher leverage, among other factors. These characteristics can lead to underperformance in periods of economic uncertainty.</p>
<h2>Large Universe to Uncover SMID&ndash;Cap Opportunity</h2>
<p>From a total market value perspective, large&ndash;cap stocks account for the majority of the $51 trillion<sup>2</sup>&nbsp;U.S. equity market. However, when viewed in terms of number of stocks, the amount of small&ndash; and mid&ndash;cap companies dwarf that of large&ndash;caps. Looking at the Morningstar US Market Index, which represents 97% market cap coverage of the U.S. equity market, SMID cap stocks account for 85% of the stocks in the public U.S. equity market. There are about five times as many small&ndash;and mid&ndash;cap stocks as there are large&ndash;cap stocks. For investors, this means a significantly larger opportunity set in terms of number of potential winning stocks to identify.</p>
<p>Additionally, in the large&ndash;cap space, information dissemination and absorption has become highly efficient, but this is not the case as one moves down the capitalization scale. This is due, in part, to lower levels of analyst coverage. The average small&ndash; and mid&ndash;cap stock has around eight analysts covering and writing research or recommendations on it, and about one&ndash;fifth of these companies have no more than three analysts covering them. The story is quite different for larger cap companies, where the average stock in the S&amp;P 500 Index has roughly 22 analysts covering it. This lack of analyst coverage results in a potentially greater dispersion between stock prices and fair value that can prove rewarding for investors.</p>
<h3>U.S. Equity Market by Number of Stocks</h3>
<p><strong>As of December 2022</strong></p>
<p><img class="img-responsive" src="https://www.vaneck.com/contentassets/afa85d25cda242da87b283cab92f8f98/smot_chart-03_v1_2022.09_blog.svg" alt="U.S. Equity Market by Number of Stocks, as of July 2022" /></p>
<h3>Average Number of Analyst Coverage Per Security</h3>
<p><strong>As of December 2022</strong></p>
<p><img class="img-responsive w-100" src="https://www.vaneck.com/contentassets/afa85d25cda242da87b283cab92f8f98/smot_chart-04_2022.09_blog.svg" alt="Average Number of Analyst Coverage Per Security, as of July 2022" /></p>
<p class="chart-disclosure">Source: Morningstar; FactSet. Small, Mid, and Large Cap Stocks represents securities within the Morningstar US Market Index categorized by size according to Morningstar. SMID Cap Stocks Represents the S&amp;P 1000 Index. Past performance is no guarantee of future results. See disclaimers and descriptions at bottom of page.</p>
<p>However, for both of these reasons, a large universe and generally lower analyst coverage, investors seeking to make an allocation to small&ndash; and mid&ndash; companies should look for a strategy that does more than just provide broad&ndash;market exposure. We believe a focused approach that selectively identifies companies by considering competition and competitive advantages as well as valuations may be a better choice.</p>
<p>Built around Morningstar&rsquo;s proven moat investing philosophy and equity research, the <a href="/link/589a2bc95c5d48988a7fd0d679aec241.aspx" title="VanEck Morningstar SMID Moat ET"><strong>VanEck Morningstar SMID Moat ETF (SMOT)</strong></a> provides exposure to small- and mid-cap companies with sustainable competitive advantages and attractive valuations.</p>
<p>To receive more <a href="https://www.vaneck.com/us/en/insights/moat-investing/" title="Moat Investing Insights"><strong>Moat Investing</strong></a> insights, <a href="https://www.vaneck.com/us/en/subscribe/" title=" Subscription Center"><strong>sign up in our subscription center</strong></a>.</p>
]]></content:encoded>
</item><item rdf:about="https://www.vaneck.com/us/en/blogs/thematic-investing/buzz-investing-2022s-hard-hit-stocks-continue-to-rebound-in-2023/">
  <title>BUZZ Investing: 2022’s Hard Hit Stocks Continue to Rebound in 2023></title>
  <link>https://www.vaneck.com/us/en/blogs/thematic-investing/buzz-investing-2022s-hard-hit-stocks-continue-to-rebound-in-2023/</link>
  <description><![CDATA[Short covering resulted in dramatic gains for stocks heavily shorted from 2022 in January.]]></description>
  <dc:creator> </dc:creator>
  <dc:date>02/16/2023 06:30:00</dc:date>
<content:encoded><![CDATA[

<p><strong>Key Points</strong></p>
<ul class="content-list">
<li class="mt-2"><strong>Strong Start to 2023:</strong> Domestic equities, particularly technology stocks, posted their best January returns in four years, with the BUZZ Index outperforming major indices.</li>
<li class="mt-2"><strong>Impact of Investor Sentiment:</strong> Positive investor sentiment, fueled by signs of cooling inflation and a strong jobs report, contributed to the rally in technology stocks.</li>
<li class="mt-2"><strong>Performance of EV Manufacturers:</strong> EV manufacturers, including Tesla, Lucid Group, and Rivian, saw significant stock gains, leading contributions to the BUZZ Index's performance.</li>
</ul>
<p>Domestic equities roared out of the gate to start the New Year, with the most widely followed indices posting their best January returns in four years. The BUZZ NextGen AI US Sentiment Leaders Index (the &ldquo;BUZZ Index&rdquo; or &ldquo;Index&rdquo;) outpaced both the Nasdaq Composite Index and the S&amp;P 500 Index during the recent period between Index selection dates (January 11, 2023 to February 9, 2023, the &ldquo;Period&rdquo;) as technology and thematic-oriented equities rallied sharply. Some market commentators attributed the rally to continued signs that inflation may be cooling. This dynamic supports those that foresee a &lsquo;soft-landing&rsquo; outcome more likely than a deep and prolonged domestic recession. Long-duration &lsquo;risky&rsquo; assets paced gains during the month, led by many of the hardest hit stocks during 2022.</p>
<p>The strong start to the year served as a red flag to some market observers who noted that the speculative activity was fueled by investors who willfully disregarded persistent inflationary pressures and a hawkish U.S. Federal Reserve (the Fed), which together may serve as a headwind to corporate profit margins in the coming year. A surprisingly strong Jobs report revealed the domestic unemployment rate fell to 3.4%, the lowest rate since May 1969, while wage growth remained robust. Stocks swooned on the report while 2-yr government bond yields rallied, nearing their recent Q4 2022 peak. The report confirmed to some investors that the Fed might have to raise rates at an aggressive pace to curb employment demand and prevent inflation from rising too quickly.</p>
<p>The BUZZ NextGen AI US Sentiment Leaders Index returned 18.62% during the month of January compared to a return of 6.28% for the S&amp;P 500 Index during the same period.</p>
<h2>Shares of Electric Vehicle (&ldquo;EV&rdquo;) Manufacturers Pace Advancing Stocks within the BUZZ Index</h2>
<p>The January &lsquo;BUZZ Investing&rsquo; blog highlighted EV manufacturers, noting that the weight of Rivian Automotive Inc. (NASD: RIVN) in the Index jumped to 1.38 while shares of Tesla Inc. (NASD: TSLA) and Lucid Group Inc. (NASD: LCID) each carried a maximum 3% weight during the scheduled Index rebalance and reconstitution. We remarked that positive investor sentiment has recently been noticeably increasing toward EV manufacturers and that the surge may foretell that the sector may be close to a bottom. The remarks proved prescient as shares of TSLA, LCID, and RIVEN jumped 68.3%, 30.0%, and 13.7%, respectively, during the Period, returns which served as some of the leading contributors to Index returns.</p>
<div class="wrapped-div">
<table style="width: 750px;">
<tbody>
<tr class="tbl-data">
<td class="tbl-header last" colspan="4">Top BUZZ Index Contributors: January 11, 2023 &ndash; February 9, 2023</td>
</tr>
<tr class="tbl-data">
<td class="data-td  last">Company</td>
<td class="data-head last">Ticker</td>
<td class="data-head last">Average Weight (%)</td>
<td class="data-head last">Return Contribution (%)</td>
</tr>
<tr class="tbl-data">
<td class="data-td last" style="font-weight: normal;">Tesla Inc</td>
<td class="data-td data last">TSLA</td>
<td class="data-td data last">3.26</td>
<td class="data-td data last">1.95</td>
</tr>
<tr class="tbl-data">
<td class="data-td last" style="font-weight: normal;">NVIDIA Corp</td>
<td class="data-td data last">NVDA</td>
<td class="data-td data last">3.27</td>
<td class="data-td data last">1.16</td>
</tr>
<tr class="tbl-data">
<td class="data-td last" style="font-weight: normal;">Coinbase Global Inc</td>
<td class="data-td data last">COIN</td>
<td class="data-td data last">3.72</td>
<td class="data-td data last">1.12</td>
</tr>
<tr class="tbl-data">
<td class="data-td last" style="font-weight: normal;">Meta Platforms Inc</td>
<td class="data-td data last">META</td>
<td class="data-td data last">3.32</td>
<td class="data-td data last">0.98</td>
</tr>
<tr class="tbl-data">
<td class="data-td last" style="font-weight: normal;">Lucid Group Inc</td>
<td class="data-td data last">LCID</td>
<td class="data-td data last">3.36</td>
<td class="data-td data last">0.92</td>
</tr>
<tr class="tbl-data">
<td class="data-td last" style="font-weight: normal;">Advanced Micro Devices Inc</td>
<td class="data-td data last">AMD</td>
<td class="data-td data last">2.84</td>
<td class="data-td data last">0.54</td>
</tr>
<tr class="tbl-data">
<td class="data-td last" style="font-weight: normal;">DraftKings Inc</td>
<td class="data-td data last">DKNG</td>
<td class="data-td data last">1.83</td>
<td class="data-td data last">0.44</td>
</tr>
<tr class="tbl-data">
<td class="data-td last" style="font-weight: normal;">Shopify Inc</td>
<td class="data-td data last">SHOP</td>
<td class="data-td data last">1.47</td>
<td class="data-td data last">0.44</td>
</tr>
<tr class="tbl-data">
<td class="data-td last" style="font-weight: normal;">Apple Inc</td>
<td class="data-td data last">AAPL</td>
<td class="data-td data last">2.92</td>
<td class="data-td data last">0.38</td>
</tr>
<tr class="tbl-data">
<td class="data-td last" style="font-weight: normal;">Microsoft Corp</td>
<td class="data-td data last">MSFT</td>
<td class="data-td data last">2.63</td>
<td class="data-td data last">0.36</td>
</tr>
</tbody>
</table>
</div>
<br />
<p class="chart-disclosure">Source: BUZZ Holdings ULC, Bloomberg. Past performance is no guarantee of future results. Index performance is not illustrative of fund performance. Not intended as a recommendation to buy or to sell any of the securities mentioned herein.</p>
<p>The top detractors to performance featured several stocks from the Healthcare sector during the Period. Moderna Inc. (NASD: MRNA) and Pfizer (NYSE: PFE) each fell following comments from PFE in its 2023 outlook, which detailed softer revenue estimates for its Covid vaccine than some analysts expected. Shares of Intel Corp (NASD: INTC) were a notable detractor to Index performance as its shares fell 6.4% on January 27th, the day after the company reported earnings that vastly missed investor expectations. Waning demand for personal computers continues to weigh on INTC&rsquo;s core business, leading the company to forecast future losses while projecting revenues to be at their lowest levels since 2010. The results and outlook for the storied chipmaker stood in stark contrast to rival NVIDIA Corp (NASD: NVDA), whose lineup of graphic processors is benefitting from increased demand for artificial intelligence applications and gaming platforms. NVDA, a top contributor within the index during the Period, has gained nearly 53% in 2023, compared to just 6% for INTC.</p>
<div class="wrapped-div">
<table style="width: 750px;">
<tbody>
<tr class="tbl-data">
<td class="tbl-header last" colspan="4">Bottom BUZZ Index Contributors: January 11, 2023 &ndash; February 9, 2023</td>
</tr>
<tr class="tbl-data">
<td class="data-td  last">Company</td>
<td class="data-head last">Ticker</td>
<td class="data-head last">Average Weight (%)</td>
<td class="data-head last">Return Contribution (%)</td>
</tr>
<tr class="tbl-data">
<td class="data-td last" style="font-weight: normal;">Moderna Inc</td>
<td class="data-td data last">MRNA</td>
<td class="data-td data last">1.27</td>
<td class="data-td data last">-0.20</td>
</tr>
<tr class="tbl-data">
<td class="data-td last" style="font-weight: normal;">Enphase Energy Inc</td>
<td class="data-td data last">ENPH</td>
<td class="data-td data last">0.91</td>
<td class="data-td data last">-0.13</td>
</tr>
<tr class="tbl-data">
<td class="data-td last" style="font-weight: normal;">Pfizer Inc</td>
<td class="data-td data last">PFE</td>
<td class="data-td data last">1.06</td>
<td class="data-td data last">-0.08</td>
</tr>
<tr class="tbl-data">
<td class="data-td last" style="font-weight: normal;">Walmart Inc</td>
<td class="data-td data last">WMT</td>
<td class="data-td data last">1.38</td>
<td class="data-td data last">-0.07</td>
</tr>
<tr class="tbl-data">
<td class="data-td last" style="font-weight: normal;">Intel Corp</td>
<td class="data-td data last">INTC</td>
<td class="data-td data last">1.09</td>
<td class="data-td data last">-0.06</td>
</tr>
<tr class="tbl-data">
<td class="data-td last" style="font-weight: normal;">Plug Power Inc</td>
<td class="data-td data last">PLUG</td>
<td class="data-td data last">1.13</td>
<td class="data-td data last">-0.06</td>
</tr>
<tr class="tbl-data">
<td class="data-td last" style="font-weight: normal;">Southwest Airlines Co</td>
<td class="data-td data last">LUV</td>
<td class="data-td data last">0.97</td>
<td class="data-td data last">-0.06</td>
</tr>
<tr class="tbl-data">
<td class="data-td last" style="font-weight: normal;">Cisco Systems Inc</td>
<td class="data-td data last">CSCO</td>
<td class="data-td data last">0.26</td>
<td class="data-td data last">-0.05</td>
</tr>
<tr class="tbl-data">
<td class="data-td last" style="font-weight: normal;">Agilent Technologies Inc</td>
<td class="data-td data last">A</td>
<td class="data-td data last">0.43</td>
<td class="data-td data last">-0.05</td>
</tr>
<tr class="tbl-data">
<td class="data-td last" style="font-weight: normal;">Zoom Video Communications Inc</td>
<td class="data-td data last">ZM</td>
<td class="data-td data last">0.28</td>
<td class="data-td data last">-0.05</td>
</tr>
</tbody>
</table>
</div>
<br />
<p class="chart-disclosure">Source: BUZZ Holdings ULC, Bloomberg. Past performance is no guarantee of future results. Index performance is not illustrative of fund performance. Not intended as a recommendation to buy or to sell any of the securities mentioned herein.</p>
<h2>Sentiment Stock Highlight &ndash; Meta Platforms, Inc.</h2>
<p>Meta Platforms, Inc. (NASDAQ: META), whose stock was down 64% in 2022, is a notable example of a technology stock that has rebounded sharply in 2023. Its portfolio of social platforms, which includes Facebook, Instagram, and WhatsApp, has provided META with a dominant market share in the social media landscape. CEO Mark Zuckerberg's heavy spending on the company's "Metaverse" investments over the past year have proved costly, with still no meaningful revenue generated from its virtual reality world dubbed &ldquo;Horizon Worlds.&rdquo; In its most recent earnings, Meta did not emphasize additional spending on the Metaverse, instead focusing on the renewed growth in Facebook&rsquo;s daily active users (DAU), which has surpassed 2 billion and announcing a $40B stock buyback program. The news came as a positive surprise to many investors, and the stock soared over 20% on the day of the announcement.</p>
<p>META has consistently been one of the most talked about stocks across social platforms. Its aggregate conversation volume typically provides enough scale and positive sentiment to allow for its inclusion within the BUZZ Index. Throughout 2022, META was consistently one of the top detractors of BUZZ Index performance. Notable in the chart below, META&rsquo;s weight in the Index began to fall as its share price reached record-high levels in the second half of 2021. In October 2021, the company formally known as Facebook announced it would change its name to Meta Platforms to reflect its commitment to the Metaverse. This ideological pivot proved ominous as users were slow to adopt to the virtual reality platform while advertisers began to drift away from the company&rsquo;s core social platforms. As shares of META fell from their peak, investor sentiment began to increase, buoyed by the company&rsquo;s plans to cut costs and pivot its focus back to its core social platforms. This month, META is the second largest sentiment gainer of all stocks in the Index and maintains its maximum 3% weight in the Index.</p>
<h3>Meta Platforms Stock Price | January 2021 &ndash; February 2023</h3>
<p><img class="img-responsive w-100" src="https://www.vaneck.com/contentassets/792042c6645a4974a9d060128fcbd2e0/2851_buzz_chart_2023.02_blog.svg" alt="Meta Platforms Stock Price | January 2021 - February 2023" /></p>
<p class="chart-disclosure">Source: BUZZ Holdings ULC, Bloomberg. Past performance is no guarantee of future results. Index performance is not illustrative of fund performance. Not intended as a recommendation to buy or to sell any of the securities mentioned herein.</p>
<h2>BUZZ Index February 2023 Rebalance Highlights</h2>
<p><strong>Technology Sector</strong></p>
<p>Equities started the year strong, with a broad-based rally helping to propel many stocks to their best monthly performance in several years. Better-than-expected inflation data and the Fed&rsquo;s acknowledgment of easing price pressures sparked speculation that the tightening cycle could be ending soon. A wave of buying sparked short covering in many of the heavily shorted stocks in the market, and many underperformers from 2022 had big rallies in January. High-beta tech names were the biggest gainers, and positive investor sentiment has risen commensurately. This month, Advanced Micro Devices, Inc. (NASD: AMD) and Netflix, Inc. (NASD: NFLX) are both featured in the Index with a maximum 3% weight. Several other familiar technology stocks, such as Shopify (NYSE: SHOP) and Intel (NASDAQ: INTC), all increased in weight during the February rebalance. Last month's performance was one of the best starts to the year for many of these stocks, and rising investor sentiment may suggest more upside to come.</p>
<p>For more on rebalancing results and a full breakdown of index constituents added and removed for the month, view the <strong><a href="https://www.vaneck.com/us/en/investments/social-sentiment-etf-buzz/buzz-reconstitution.pdf" target="_blank" rel="noopener" title="BUZZ VanEck Social Sentiment ETF">BUZZ Index reconstitution</a></strong> report.</p>
<p>To receive more <strong><a href="https://www.vaneck.com/us/en/insights/thematic-investing/" title="Thematic Investing Insights">Thematic Investing</a></strong> insights, <strong><a href="https://www.vaneck.com/us/en/subscribe/" title="Subscription Center">sign up in our subscription center</a></strong>.</p>
<style type="text/css">
    .wrapped-div {
        max-width: 100%;
    }

    @media (max-width: 1240px) {
        .wrapped-div {
            overflow-x: scroll;
        }
    }

    .wrapped-div-sector {
        max-width: 100%;
        overflow-x: scroll;
    }
</style>
]]></content:encoded>
</item><item rdf:about="https://www.vaneck.com/us/en/blogs/economic-trends/market-vs-macro-misalignment/">
  <title>Market vs. Macro – Misalignment?></title>
  <link>https://www.vaneck.com/us/en/blogs/economic-trends/market-vs-macro-misalignment/</link>
  <description><![CDATA[The market expectations for EM rate cuts do not look overly aggressive. Is it because the post-pandemic policy response in EM was &ndash; by and large &ndash; timely and credible?]]></description>
  <dc:creator>Natalia  Gurushina</dc:creator>
  <dc:date>02/16/2023 06:30:00</dc:date>
<content:encoded><![CDATA[

<h2>2023 Rally</h2>
<p>The <strong>drumbeat about disconnect between fundamentals and year-to-date asset price moves is getting a bit louder</strong>. Investment Grade bonds is one area where this question has been raised on numerous occasions (especially against the backdrop of potential shifts in inflows due to personnel/policy changes in the Bank of Japan). The issue was also mentioned in discussions about China, where the surprising re-opening timeline and the policy U-turn in the real estate sector spurred a huge rally 3.5 months ago. Even though many investors stayed on the sidelines (after being hit in 2022), there is a view that actual economic releases &ndash; domestic activity, and especially the housing sector recovery &ndash; should start &ldquo;delivering&rdquo; (rather than just &ldquo;promising&rdquo;) for the rally to continue. So, the next batch of China&rsquo;s activity gauges (out next week), will invite extra scrutiny.</p>
<h2>Central Banks Policy Message</h2>
<p>An important aspect of this story is <strong>whether central banks&rsquo; messaging/guidance is in alignment with the market expectations for policy rates</strong>. The gap between the two in the U.S. started to narrow lately &ndash; Fed Funds Futures now price in additional 25bps hikes in March and May (and a 54% probability of another hike in June), with implied H2 rate cuts reduced to 20bps. The market expectations for emerging markets (EM) do not look overly aggressive (maybe with a couple of exceptions, like Hungary or Chile, where local swap curves continue to price in north of 400bps of rate cuts in 2023 - see chart below). Is it because the post-pandemic policy response in EM was &ndash; largely &ndash; timely and credible, and EMs did not have to chase the Fed this time around?</p>
<h2>EM Rate Cuts And Disinflation</h2>
<p>The current policy signal in <strong>EM</strong> is clear and simple &ndash; the <strong>tightening cycle might be ending, but the bar for rate cuts is very high</strong>. Uruguay&rsquo;s central bank stayed on hold yesterday, but noted that the policy rate path will depend on the normalization of inflation expectations. Indonesia&rsquo;s central bank also kept the policy rate unchanged, expecting that inflation will return to the target range in H2-2023. In the meantime, the central bank decided to employ several instruments to support the currency and make sure local yields remain attractive. The Philippine central bank followed in Mexico&rsquo;s footsteps, delivering a larger than expected overnight deposit facility rate hike (+50bps) after January&rsquo;s huge upside inflation surprise. A meaningful upward shift in the central bank&rsquo;s 2023 inflation forecast opens the door for further tightening in the coming months. As you can see, individual EM circumstances might vary, but a cautious policy bias should provide a cushion against the more hawkish Fed in the months to come. Stay tuned!</p>
<h3>Chart at a Glance: EM Rate Cut Expectations &ndash; Not Too Outrageous</h3>
<p><img class="img-responsive w-100" src="https://www.vaneck.com/contentassets/f2f929dcf62c4975ace6ec0beb5040bd/us-natalias-take-2023-02-16.png" alt="Chart at a Glance: EM Rate Cut Expectations - Not Too Outrageous" /></p>
<p class="chart-disclosure">Source: Bloomberg LP.</p>
]]></content:encoded>
</item><item rdf:about="https://www.vaneck.com/us/en/blogs/economic-trends/ft-em-fx-and-a-pinch-of-salt/">
  <title>FT, EM FX, and A Pinch of Salt></title>
  <link>https://www.vaneck.com/us/en/blogs/economic-trends/ft-em-fx-and-a-pinch-of-salt/</link>
  <description><![CDATA[EMFX devaluations can be traumatic, but they can also pave the way &ndash; in conjunction with reforms &ndash; to stronger economic backdrop and tighter sovereign spreads.]]></description>
  <dc:creator>Natalia  Gurushina</dc:creator>
  <dc:date>02/15/2023 06:30:00</dc:date>
<content:encoded><![CDATA[

<h2>EM FX Devaluations</h2>
<p>An <strong>FT article</strong> caught our attention this morning &ndash; but it&rsquo;s not the one about the sustainability of Japan&rsquo;s central bank government bond purchases and potential changes in the yield curve control mechanism (YCC) under the new governor (albeit this might have very serious implications for global Fixed Income, especially Investment Grade instruments with their super-tight spreads). &ldquo;Our&rdquo; article <strong>talks about &ldquo;a spate&rdquo; and &ldquo;a further slew&rdquo; of emerging markets (EM) FX devaluations caused by the strong U.S. Dollar</strong>. We are not sure how well this characterizes EM, especially in light of strong performance of many EM currencies last year or a dramatic repricing lower of Asian interest rates. Further, letting currencies go while accelerating structural reforms and engaging multilateral financial support is probably the best thing that can happen to developing economies from the longer-term perspective. This is the lesson learned by their predecessors &ndash; many of whom are now &ldquo;EM Graduates&rdquo; - in the wake of the 1997/98 global financial crisis. Egypt is not doing this &ndash; yet - and therefore still strikes us as vulnerable to such episodes - it&rsquo;s really a &ldquo;classic&rdquo; setup including the part about learning the hard way.</p>
<h2>EM Structural Adjustment</h2>
<p><strong>Using FX as a shock-absorber</strong> &ndash; while relying on interest rates as the primary policy instrument to target inflation &ndash; <strong>helps to initiate a &ldquo;textbook&rdquo; adjustment of the current account balance</strong> (less imports and more competitive exports). With fewer FX interventions, this is the fastest way to start rebuilding the international reserves. Over time, the accumulation of reserves and a stronger structural/institutional backdrop should lead to a major decline in sovereign spreads, limiting the extent of potential &ldquo;flare-ups&rdquo; in the future. The chart below demonstrates all these points very well (higher reserves/tighter spreads/lower peaks). Many EMs are now net sovereign creditors in U.S. dollars!</p>
<h2>EM FX And U.S. Dollar</h2>
<p><strong>EMs that used their past devaluation experiences wisely</strong> &ndash; reforms, accumulation of reserves, inflation-targeting &ndash; <strong>are now less tied up to the U.S. Dollar cycle</strong>. The Brazilian real, the Mexican peso, the Peruvian sol, and the Chilean peso ended up stronger vs. the U.S. Dollar last year. The final point here is that there are different ways to get exposure to emerging markets these days. For example, we don&rsquo;t like Brazil&rsquo;s local market currently (due to policy noise), so we just don&rsquo;t own it&hellip;but the current environment can still be positive for Brazilian credits that pay in real and earn in U.S. Dollar (for example). Stay tuned!</p>
<h3>Chart at a Glance: EM Reserves vs. Sovereign Spreads in Different Regimes</h3>
<p><img class="img-responsive w-100" src="https://www.vaneck.com/contentassets/1015a8010f134bf7a850bd7a4c317464/us-natalias-take-2023-02-15.png" alt="Chart at a Glance: EM Reserves vs. Sovereign Spreads in Different Regimes" /></p>
<p class="chart-disclosure">Source: Bloomberg LP.</p>
]]></content:encoded>
</item><item rdf:about="https://www.vaneck.com/us/en/blogs/natural-resources/commodities-gains-varied-due-to-inflation-and-the-falling-dollar/">
  <title>Commodities Gains Varied Due to Inflation and the Falling Dollar></title>
  <link>https://www.vaneck.com/us/en/blogs/natural-resources/commodities-gains-varied-due-to-inflation-and-the-falling-dollar/</link>
  <description><![CDATA[China&rsquo;s reopening and a declining U.S. dollar contributed to the industrial metals&rsquo; rally which supported commodities in January.]]></description>
  <dc:creator>Roland Morris</dc:creator>
  <dc:date>02/14/2023 06:30:00</dc:date>
<content:encoded><![CDATA[

<h2>Macro Outlook: Industrial Metals Saved the Day</h2>
<p>January was a mixed month for commodities. The energy sector fell mostly due to sharp declines in natural gas because of warm weather in the U.S. Interest rates fell as investors pushed back against the U.S. Federal Reserve&rsquo;s hawkish comments, causing the U.S. dollar to decline slightly during the month. Natural gas waned while the industrial metals&rsquo; rally helped the UBS Constant Maturity Commodity Index (CMCI) outperform its peer, the Bloomberg Commodity Index (BCOM), by a wide margin. CMCI was up 2.58% and BCOM declined by 0.48% during the month.</p>
<h2>Industrial Metals Sector Outperformed, Led to Strong Gains</h2>
<p>The industrial metals sector was up 9% for the month, led by strong gains in aluminum, copper and zinc. China&rsquo;s reopening, along with production concerns in South America, triggered the strong rally. Political upheaval and conflict in Panama and Peru have disrupted production at several important mining operations.</p>
<p>The precious metals sector, led by strong gains in gold, was up 4.9% in January. The declining U.S. dollar, falling U.S. interest rates, and rising global geopolitical conflicts supported the gold rally.</p>
<p>The agriculture sector gained 1.8% in January as coffee and sugar led the rally. The livestock sector declined by 2.6% led by a fall in live hog prices.</p>
<p>The energy sector detracted the most from January&rsquo;s CMCI returns, entirely due to the sharp decline in natural gas prices during the U.S.&rsquo;s warm winter weather.</p>
<h3>CMCI Outperformed BCOM in the Energy and Industrial Metals Sectors in January 2023</h3>
<p><strong>Performance by Sector Components</strong></p>
<p><img class="img-responsive w-100" src="https://www.vaneck.com/contentassets/2267be873416439db137f480c514f6a9/2833_cmci_chart_01_2023.02_v1_blog.svg" alt="CMCI Outperformed BCOM in the Energy and Industrial Metals Sectors in January 2023" /></p>
<p class="chart-disclosure">Source: Bloomberg. Data as of January 2023. Past performance is no guarantee of future results.</p>
<p><strong><a href="/link/9cc454bdc12d49638c0a22783d5a26cf.aspx" title="CMCAX - CM Commodity Index Fund - Class A - Overview">Learn more about the VanEck CM Commodity Index Fund</a></strong>, which seeks to track, before fees and expenses, the CMCI.</p>
<p>To receive more <a href="/us/en/insights/natural-resources/" title="Natural Resources Insights"><strong>Natural Resources</strong></a> insights, <a href="https://www.vaneck.com/us/en/subscribe/" title="Subscription Center"><strong>sign up in our subscription center</strong></a>.</p>
]]></content:encoded>
</item><item rdf:about="https://www.vaneck.com/us/en/blogs/model-portfolios/dude-wheres-my-real-assets-exposure/">
  <title>Dude, Where’s My Real Assets Exposure?></title>
  <link>https://www.vaneck.com/us/en/blogs/model-portfolios/dude-wheres-my-real-assets-exposure/</link>
  <description><![CDATA[Where&rsquo;s your real assets exposure, dude? High inflation is not as rare as you think and take an average of 18 years to resolve.]]></description>
  <dc:creator>David Schassler</dc:creator>
  <dc:date>02/14/2023 06:30:00</dc:date>
<content:encoded><![CDATA[

<p>We have the opportunity to speak with a lot of investors and one question keeps coming up: <i>Should I avoid real assets exposure because inflation is falling?</i></p>
<p>Our short answer is <strong>NO!</strong> That would be akin to cancelling your flood insurance during a hurricane. High inflation is not as rare as you think, and investors should always maintain a strategic allocation to inflation-fighting assets. High inflation events have occurred 30% of the time and, once they begin, have taken on average <strong><a href="https://www.vaneck.com/us/en/blogs/guided-allocation/think-inflations-ending-think-again/" title="Think Inflation's Ending? Think Again.">18 years to resolve</a></strong>.</p>
<p>A thoughtful asset allocation framework should be designed to perform in each of the four major economic regimes. The chart below illustrates how frequently the different economic regimes have occurred.</p>
<h3>Frequency of Historical Economic Regimes Shows High Inflation Is Not That Rare</h3>
<p><strong>Historical Economic Regimes</strong></p>
<p><img loading="lazy" class="img-responsive w-100" src="https://www.vaneck.com/contentassets/6e80598442264c66b8240b5a8cb619e7/2837_qis_chart_01_2023.02_v1_blog.svg" alt="Frequency of Historical Economic Regimes Shows High Inflation Is Not That Rare" /></p>
<p class="chart-disclosure">Source: Bloomberg. GDP scenarios from March 31, 1948 through February 7, 2023. Inflation scenarios from January 31, 2014 to February 7, 2023. Past performance is no guarantee of future results.</p>
<p>The 2010s were hallmarked by low growth and low inflation. As a result, many investors are now conditioned to believe that we will remain in this regime and that any deviation from this path must only be temporary. This is why many investors are not properly allocated for the current environment. Compounding this problem, most investors see slowing inflation as a reason to not protect themselves going forward.</p>
<p>&ldquo;Growth is dead!&rdquo; said the value portfolio manager in 2007 and &ldquo;Value is dead!&rdquo; said the growth portfolio manager in 2020. This reflects how extended economic regimes condition the expectations of investors and only leaves them fighting the last war. Economic cycles change, and the investments that are needed to be successful in those regimes change along with them.</p>
<p>Let&rsquo;s look at two well-known stocks as an example of how a changing macroeconomic environment can impact performance: Microsoft (MSFT) and Exxon Mobile (XOM).</p>
<p>Buy MSFT and go on vacation. This would have been an effective strategy in the previous regime. During the decade ending in 2021, MSFT returned 1,437%, the S&amp;P 500 Index returned 340% and XOM returned 8%. Will this continue into the future? Unlikely.</p>
<p>MSFT is a classic growth stock that was well positioned to perform in a low growth/low inflation environment and XOM is a classic value stock that benefits from higher commodity prices associated with elevated inflation.</p>
<p>The chart below illustrates the free cash flow (FCF) yields, or the relationship between operating performance and forward one-year performance. A positive black line corresponds to periods when XOM&rsquo;s FCF yield is higher than MSFT&rsquo;s FCF yield and vice versa. The blue and gray areas reflect the forward one-year performance for XOM and MSFT, respectfully.</p>
<h3>XOM and MSFT FCF Yields Linked to Performance Across Economic Regimes</h3>
<p><strong>Free Cash Flow Yield &amp; Forward Rolling Return</strong></p>
<p><img loading="lazy" class="img-responsive w-100" src="https://www.vaneck.com/contentassets/6e80598442264c66b8240b5a8cb619e7/2837_qis_chart_02_2023.02_v1_blog.svg" alt="XOM and MSFT FCF Yields Linked to Performance Across Economic Regimes" /></p>
<p class="chart-disclosure">Source: Bloomberg as of 6/30/2022. Past performance is no guarantee of future results. Not intended as a recommendation to buy or sell any securities referenced herein.</p>
<p>Three takeaways from this chart are:</p>
<ol class="content-list">
<li>High relative FCF yields have been associated with strong performance. XOM outperformed MSFT by 10.6%, annually, on average, when XOM had higher FCF yields.</li>
<li>The trends in FCF yields and outperformance correspond to the different economic regimes and typically last for extended periods of time.</li>
<li>The current FCF yields and recent performance of XOM are significantly higher than MSFT and this trend may continue.</li>
</ol>
<p>MSFT and XOM are two examples of how the relative attractiveness of investments change in different economic environments. We are currently in a high inflation regime and the threat of an extended period of high inflation is very real. Investors would be wise to proceed with caution and diversify across stocks, bonds and <a href="https://www.vaneck.com/us/en/blogs/guided-allocation/a-master-class-in-real-assets/" title="A Master Class in Real Assets"><strong>REAL ASSETS</strong></a>. Our <a href="https://www.vaneck.com/us/en/blogs/natural-resources/still-early-innings-for-inflation/" title="Still Early Innings for Inflation"><strong>inflation analysis</strong></a> suggests that a portfolio of stocks and bonds with a dedicated allocation of 15% to a diversified basket of inflation fighting assets may provide the balance needed to perform in each economic regime.</p>
<p>Our preferred investment solution is the <strong><a href="/link/6e91eff51c6042ef9f1d5943ffa90a0e.aspx" title="RAAX - VanEck Real Assets ETF - Overview">VanEck Real Assets ETF (RAAX)</a></strong> because it provides exposure to the key, time-tested <strong><a href="https://www.vaneck.com/us/en/blogs/guided-allocation/raax-question-and-answer/" title="Real Assets ETF (RAAX): Question and Answer">inflation hedges</a></strong> in a risk controlled framework that adapts to changing economic regimes.</p>
<p>To receive more <strong><a href="https://www.vaneck.com/us/en/insights/guided-allocation/" title="Model Portfolio Insights">Model Portfolio</a></strong> insights, <strong><a href="https://www.vaneck.com/us/en/subscribe/" title="Subscription Center">sign up in our subscription center</a></strong>.</p>
]]></content:encoded>
</item><item rdf:about="https://www.vaneck.com/us/en/blogs/economic-trends/peak-rates-and-then-plateau/">
  <title>Peak Rates and then Plateau?></title>
  <link>https://www.vaneck.com/us/en/blogs/economic-trends/peak-rates-and-then-plateau/</link>
  <description><![CDATA[EM central banks are well prepared for a prospect of higher for longer policy rates in DM. Some central banks might see room for cuts limited by government&rsquo;s agenda.]]></description>
  <dc:creator>Natalia  Gurushina</dc:creator>
  <dc:date>02/14/2023 06:30:00</dc:date>
<content:encoded><![CDATA[

<h2>Fed Peak Rate</h2>
<p>The much-anticipated U.S. inflation print is out, signaling that a slower pace of disinflation might justify another Federal Reserve hike in May (Fed Funds Futures are also hinting at a possible rate hike in June &ndash; see chart below). A specter of U.S. recession is still lurking in the shadows, but with the consensus expecting only a tiny 0.2% GDP drop in Q4, a case for a Fed rate cut in the second half of the year is not yet obvious. Meanwhile, the near-term outlook for other independent global growth drivers &ndash; China and the Eurozone &ndash; continues to improve, providing <strong>additional tailwinds for emerging markets (EM) Asia and parts of Central Europe</strong> (Q4 &ldquo;growth cliff&rdquo; prints in the region looked alarming, but most likely marked the trough).</p>
<h2>EM Policy Cushion</h2>
<p>We think that <strong>various central banks in EM are well prepared for the prospect of higher for longer policy rates in major economies</strong>. Most EMs hiked early and aggressively to combat the post-pandemic price pressures (=high ex-ante real rates), and are not in a rush to cut rates even when inflation is already moderating. The focus right now is on the improving balance of risks and a sustainable disinflation progress, as the ride is still rather bumpy &ndash; just check the latest inflation prints in the Czech Republic, India, or the Philippines. In fact, we got a couple of hawkish surprises in EM lately &ndash; including a 50bps rate hike in Mexico &ndash; and there are still residual rate hikes in the pipeline (Philippines, India, Thailand, and more in Mexico).</p>
<h2>LATAM Political Noise</h2>
<p>There are also some unique situations in EM, where a <strong>changing policy agenda might limit the central bank&rsquo;s room for rate cuts. Enter Brazil&rsquo;s policy saga</strong>, which might still be in the early stages. Yesterday, Governor Campos Neto had a chance to respond to administration&rsquo;s comments about the central bank independence and the inflation target. The market was relieved that the interview was not combative &ndash; the local swap curve is not pricing any additional rate hikes, the currency is trading well against the U.S. Dollar &ndash; but there are no indications yet that President Lula would be prepared to meet the central bank on the orthodox ground (so to say). And this means that the headline risk is still high, keeping many potential investors in Brazil&rsquo;s local bonds on the sidelines. Stay tuned!</p>
<h3>Chart at a Glance: Higher Peak Rate, Fewer Rate Cuts in U.S.</h3>
<p><img class="img-responsive w-100" src="https://www.vaneck.com/contentassets/cd11090e29474baca92b782d911db8d9/us-natalias-take-2023-02-14.png" alt="Chart at a Glance: Higher Peak Rate, Fewer Rate Cuts in U.S." /></p>
<p class="chart-disclosure">Source: Bloomberg LP.</p>
]]></content:encoded>
</item><item rdf:about="https://www.vaneck.com/us/en/blogs/economic-trends/em-drivers-global-vs-local/">
  <title>EM Drivers - Global vs. Local></title>
  <link>https://www.vaneck.com/us/en/blogs/economic-trends/em-drivers-global-vs-local/</link>
  <description><![CDATA[Global factors dominate headlines, but local drivers remain important differentiators for EM assets.]]></description>
  <dc:creator>Natalia  Gurushina</dc:creator>
  <dc:date>02/13/2023 16:00:00</dc:date>
<content:encoded><![CDATA[

<h2>Fed Rate Hikes</h2>
<p><strong>Global drivers are of utmost importance for emerging markets (EM) this week.</strong> January&rsquo;s inflation print in the U.S. tomorrow might define expectations for the Federal Reserve&rsquo;s rate hike in May (Fed Funds Futures continued to price in +20bps this morning, on top of +25bps in March). The Eurozone&rsquo;s Q4 GDP release might add to optimism about Europe&rsquo;s dodging the recession bullet, providing a tailwind to European EMs (nearly 20% of J.P. Morgan&rsquo;s EM local debt index, GBI-EM). Finally, global and EM Investment Grade bondholders are watching the Bank of Japan (BoJ) like hawks &ndash; a change at the BoJ&rsquo;s helm might have material implications for inflows into these asset classes (and EM Investment Grade Sovereign spread is already super-tight &ndash; see chart below).</p>
<h2>Brazil Populism</h2>
<p>Still, <strong>idiosyncratic factors in EM should never be dismissed as &ldquo;insignificant&rdquo;.</strong> Populist policy shifts in Brazil is a good example &ndash; these have been weighing heavily on local bonds&rsquo; year-to-date performance, especially as President Lula ramped up his attacks on the central bank&rsquo;s independence. We are sure that Governor Campos Neto will provide a solid and credible &ldquo;riposte&rdquo; in his evening interview, but we have a sneaking suspicion that this will not be the end of it. While this is happening, Brazil&rsquo;s inflation expectations keep grinding higher, limiting room for monetary policy easing later this year.</p>
<h2>Pace of EM Disinflation</h2>
<p>And talking about disinflation, there was another &ldquo;bump&rdquo; in India, where headline inflation unexpectedly re-accelerated to 6.52% year-on-year, breaching the central bank&rsquo;s target range (2%-6%). We have never expected it to be a smooth ride &ndash; especially early in the year, with strong seasonality and regulated price adjustments &ndash; but India&rsquo;s upside surprise also draws attention to the inflationary impact of removing the pandemic price subsidies, which can affect more EMs in the coming months. The latter makes <strong>a case for keeping EM policy rates higher for longer </strong>(a nice policy cushion if the U.S. Fed ends up more hawkish than the market currently expects). In India, fewer subsidies might translate into an additional rate hike to anchor inflation expectations. The Philippine central bank is in the same boat as regards the need for more policy tightening &ndash; this is the only major Asian EM where inflation is yet to peak, so a 50bps rate hike on Thursday would be highly recommended. Stay tuned!&nbsp;</p>
<h3>Chart at a Glance: EM Sovereign Spread &ndash; Too Tight for Comfort?</h3>
<img class="img-responsive w-100" src="https://www.vaneck.com/contentassets/4c7abe7e4290472d9d849e102912a89b/us-natalias-take-2023-02-13.png" alt="Chart at a Glance: EM Sovereign Spread &ndash; Too Tight for Comfort?" />
<p class="chart-disclosure">Source: Bloomberg LP</p>
<div class="disclosure">
<p>Note: J.P. Morgan&rsquo;s EMBI Global Diversified Investment Grade Sovereign Spread (bps)</p>
</div>
]]></content:encoded>
</item><item rdf:about="https://www.vaneck.com/us/en/blogs/income-investing/clos-a-rising-rate-alternative/">
  <title>CLOs: A Rising Rate Alternative></title>
  <link>https://www.vaneck.com/us/en/blogs/income-investing/clos-a-rising-rate-alternative/</link>
  <description><![CDATA[With higher relative yields, a history of strong risk-adjusted returns, and protection against rising rates, we believe this is a great time to make a strategic allocation to CLOs.]]></description>
  <dc:creator>William Sokol</dc:creator>
  <dc:date>02/13/2023 06:30:00</dc:date>
<content:encoded><![CDATA[

<p><strong><a href="https://www.vaneck.com/us/en/blogs/income-investing/clos-question-and-answer/" title="CLOI: Question and Answer">Collateralized loan obligations (CLOs)</a></strong> have historically offered many benefits that make them attractive relative to other fixed income investments like leveraged loans, high yield bonds and investment grade bonds:</p>
<p><strong>Attractive performance.</strong> Over the long term, CLO tranches have performed well relative to other corporate debt categories, including leveraged loans, high yield bonds, and investment grade bonds, and have significantly outperformed at lower rating tiers.<sup>1</sup></p>
<p><strong>Wider yield spreads.</strong> CLO spreads have historically been significantly wider than those of other debt instruments, reflecting both the structured nature of CLO debt, the underlying loan portfolios as well as relatively lower liquidity and certain regulatory requirements. Compared with investment grade corporates, as well as other higher-yielding debt sectors&mdash;notably high yield and leveraged loans&mdash;CLO spreads are especially compelling.</p>
<p><strong>Tested through two major crises</strong>. CLOs have <strong><a href="https://www.vaneck.com/us/en/blogs/income-investing/clos-question-and-answer/#point-three" title="CLOI: Question and Answer">built in risk protection</a></strong>&mdash;which comes from the strength of their underlying collateral as well as structural traits, such as coverage tests to correct collateral deterioration&mdash;that have historically helped them experience lower levels of principal loss when compared with corporate debt and other securitized products. Through both the Global Financial Crisis and COVID-19 drawdown, the asset class ultimately experienced far fewer defaults than corporate bonds of the same rating. For example, of the approximately $500B of U.S. CLOs issued from 1994-2009 and rated by S&amp;P, only 0.88% experienced defaults. And the performance is even better for investment grade CLOs. In the higher rated AAA and AA CLO tranches, there have been zero defaults. We believe this resilience combined with the potential for upside returns makes the asset class compelling for long-term minded investors.</p>
<h2>CLOs Even More Attractive in the Current Market Environment</h2>
<p>In addition to higher yields and stronger risk profiles, CLOs are floating rate instruments, which means their coupons reset each quarter along with prevailing interest rates, resulting in low price sensitivity to changes in interest rates. In a rising rate environment, such as the one we are in currently, CLO investors may actually benefit from higher coupons. As the table below highlights, this feature has helped CLOs historically outperform in periods of rising rates. This includes the most recent period of rising rates beginning in August of 2021 and ending in October of 2022.</p>
<h3>CLOs Historically Outperformed in Rising Rate Environments</h3>
<p><img class="img-responsive w-100" src="https://www.vaneck.com/contentassets/16f542e2652c471ebef1de5629b6d399/cloi-launch-blog_2022.06_v1.svg" alt="CLOs Historically Outperformed in Rising Rate Environments" /></p>
<p class="chart-disclosure">Source: VanEck, Morningstar and JP Morgan as of 12/31/2022. CLOs is represented by the JPM CLOIE Index, US Treasury is the ICE BofA US Treasury Index, US IG is the ICE BofA US Corporate Index and US IG FRN is the MVIS US Investment Grade Floating Rate Index. Past performance is not indicative of future results. This is not an offer to buy or sell, or recommendation to buy or sell any of the securities mentioned herein.</p>
<h2>Choosing the Right CLO Manager</h2>
<p>While CLOs can be an effective hedge against rising interest rates, they remain complex instruments that require a high degree of expertise. Because CLOs are issued and managed by asset managers, the most critical decision a CLO investor can make is the selection of a manager, which isn&rsquo;t an easy decision. Each CLO manager creates their own portfolios using their own investment style. And while historical performance varies greatly among managers, there are several key traits that successful managers share. Experience is the most important. There&rsquo;s no substitute for deep CLO management experience, which provides the combination of credit expertise, access to new deals, trading acumen, risk management, and understanding of the unique needs of CLO tranche and equity investor needs to generate strong returns. The benefit of having managed CLO portfolios before, during, and after the financial crisis is incalculable.</p>
<p>An experienced CLO tranche portfolio manager must perform rigorous due diligence on CLO managers to understand their capabilities and style, and tier them accordingly. However, the analysis does not end there. Each CLO is unique, even those managed by the same CLO manager. CLO tranche portfolio managers must understand the loan collateral and structural features that drive ultimate returns. This involves cashflow modelling and access to underlying CLO portfolio information, as well as real time pricing information to identify potential value.</p>
<p>Lastly, a CLO tranche portfolio manager must take into account overall exposures in terms of vintage, manager, and underlying sector exposure. It is also important to conduct ongoing monitoring to identify potential early warning signs in the CLO portfolios. A CLO tranche portfolio manager who can identify relative value across the CLO capital stack can add value by allocating to more attractively valued segments while avoiding those that are overpriced. Relative value analysis between primary and secondary market deals also plays a role, and a CLO investor must have both access and trading expertise to source attractive deals. From a risk management perspective, the CLO tranche portfolio manager must manage downgrade risk, as well as liquidity and have the ability to &ldquo;de-risk&rdquo; the portfolio in periods of market stress.</p>
<p>In short, a passive approach is simply not feasible in the CLO space, and there is significant room to add value through an <strong><a href="https://www.vaneck.com/us/en/blogs/income-investing/clos-question-and-answer/#point-eight" title="CLOI: Question and Answer">active approach</a></strong> that has flexibility to identify attractive value.</p>
<p>Learn more about the <a href="/link/593077b21448427e9fc687481484e097.aspx" title="CLOI - VanEck CLO ETF - Overview"><strong>VanEck CLO ETF (CLOI)</strong></a>.</p>
<p>To receive more <a href="/us/en/insights/income-investing/" title="Income Investing Insights"><strong>Income Investing</strong></a> insights, <a href="/link/5f45412c2143400497908cea2897f7d3.aspx" title=" Subscription Center"><strong>sign up in our subscription center</strong></a>.</p>
]]></content:encoded>
</item><item rdf:about="https://www.vaneck.com/us/en/blogs/income-investing/clos-uncover-opportunity-beyond-aaas/">
  <title>CLOs: Uncover Opportunity Beyond AAAs></title>
  <link>https://www.vaneck.com/us/en/blogs/income-investing/clos-uncover-opportunity-beyond-aaas/</link>
  <description><![CDATA[An approach that looks beyond AAA CLOs may offer investors exposure to enhanced yield potential and relative value opportunities from a broader investment universe.]]></description>
  <dc:creator>William Sokol</dc:creator>
  <dc:date>02/13/2023 06:30:00</dc:date>
<content:encoded><![CDATA[

<p>Collateralized loan obligations (CLOs), which are securitized pools of leveraged loans, may provide several attractive benefits within an income-oriented portfolio, including <strong><a href="https://www.vaneck.com/us/en/blogs/income-investing/why-invest-in-clos/" title="Why Invest in CLOs?">enhanced yields, structural risk protections and diversification</a></strong>. We believe CLOs are particularly attractive in today&rsquo;s <strong><a href="https://www.vaneck.com/us/en/blogs/trends-with-benefits/trends-with-benefits-82-clos-too-big-to-ignore-with-laila-kollmorgen/" title="Trends with Benefits #82: CLOs: 'Too Big to Ignore' with Laila Kollmorgen">rising rate environment</a></strong>. They pay floating rate coupons that adjust upwards as rates increase and, unlike fixed coupon bonds, won&rsquo;t suffer price declines as a result of higher rates.</p>
<p>The AAA tranche of a CLO typically comprises more than 60% of a CLO and therefore makes up the largest segment of the CLO market. However, we believe an approach beyond AAA CLOs can allow investors to benefit from enhanced yield potential and capture relative value opportunities from a broader investment universe, while maintaining a high quality, investment grade exposure.</p>
<p>As shown below, there is a wide dispersion of risk/return profiles among investment grade CLOs, with AAA rated bonds providing the lowest risk, but also the lowest return historically. Moving into AA and A rated CLOs may provide compelling opportunities. For example, AA rated CLOs have provided significantly higher returns than &ldquo;core&rdquo; U.S. bonds without significantly higher risk. They&rsquo;ve also provided similar returns as leveraged loans with lower risk. This is notable because of both the floating rate nature of these asset classes, as well as the stark difference in credit quality (leveraged loans are typically rated BB and below and an investor in a loan fund has direct exposure to these borrowers). Single A CLOs have provided similar returns to high yield bonds with significantly lower volatility, and significantly higher returns than investment grade corporate bonds with similar volatility.</p>
<h3>Attractive Risk-Adjusted Returns vs. Other Asset Classes</h3>
<p><strong>(10 Years as of 1/31/2023)</strong></p>
<p><img class="img-responsive w-100" src="https://www.vaneck.com/contentassets/d8f8f5fc0ed0434fb85a8d711120b78b/cloi_chart_01_v1_2022.09_blog.svg" alt="Attractive Risk-Adjusted Returns vs. Other Asset Classes" /></p>
<p class="chart-disclosure">Source: Morningstar. CLOs represented by J.P. Morgan CLO Index; AAA Rated CLOs represented by J.P. Morgan CLO AAA Index, AA Rated CLOs represented by J.P. Morgan CLO AA Index, A Rated CLOs represented by J.P. Morgan CLO A Index, BBB Rated CLOs represented by J.P. Morgan CLO BBB Index, BB Rated CLOs represented by J.P. Morgan CLO BB Index, US IG represented by ICE BofA US Corporate Index, US HY represented by ICE BofA US High Yield Index, Agg is represented by the ICE BofA US Broad Market, US IG FRNs represented by MVIS US Investment Grade Floating Rate Note Index, Leveraged Loans represented by S&amp;P/LSTA Leveraged Loan 100 Index. See index descriptions at the end of this presentation. Past performance is not indicative of future results. This is not an offer to buy or sell, or recommendation to buy or sell any of the securities mentioned herein.</p>
<p>Constructing a <a href="https://www.vaneck.com/us/en/blogs/income-investing/clos-question-and-answer/" title="CLOI: Question and Answer"><strong>CLO portfolio</strong></a> that spans this ratings spectrum allows an investor to benefit from the higher yields that exist within each rating category, while also benefiting from opportunities as they arise. For example, each ratings category tends to have a unique investor base and prices can therefore be impacted by different factors. A broad investment mandate can take advantage of any relative value opportunities that emerge across the ratings spectrum.</p>
<p>Dipping further into BBB CLOs (or even BB CLOs in certain periods) suggests much greater return potential, but also significantly greater volatility, emphasizing the need for risk management. The ability to construct a portfolio that can opportunistically add exposure in lower ratings categories when there is attractive value and de-risk ahead of periods of volatility provides another source of return potential.</p>
<p>In short, the ability to utilize the full CLO capital structure allows an <strong><a href="https://www.vaneck.com/us/en/blogs/income-investing/clos-a-rising-rate-alternative/" title="CLOs: A Rising Rate Alternative">active CLO tranche portfolio manager</a></strong> to find the most attractive value from the broad opportunity set, and construct an investment grade portfolio that provides enhanced yields relative to similarly rated bonds or loans. But CLO tranche investing is not simply about ratings buckets. Each CLO is unique, and a manager with deep leveraged finance experience will likely perform loan-level analysis to understand the fundamentals of the portfolio, while also performing cashflow analysis that takes deal specific terms into account along with stress tests within the loan portfolio. CLO market experience and presence is needed to understand whether a deal&rsquo;s terms are more &ldquo;debt friendly&rdquo; or &ldquo;equity friendly.&rdquo;</p>
<p>Assessing the CLO manager is also critical. Each CLO is actively managed, and a manager&rsquo;s style and capabilities can impact performance both overall and on a relative basis between the varying tranches of a particular CLO. This bottom-up security selection is then combined with top-down portfolio construction, which balances the tranche portfolio manager&rsquo;s market outlook with liquidity and diversification considerations. The CLO tranche portfolio management team must also have the trading acumen and relationships to efficiently allocate and rebalance the portfolio. We believe a more passive or ratings-constrained approach means sacrificing the enhanced yield and return potential that a broader investment grade strategy may provide.</p>
<p>VanEck has partnered with PineBridge Investments on the <strong><a href="/link/593077b21448427e9fc687481484e097.aspx" title="CLOI - VanEck CLO ETF - Overview">VanEck CLO ETF (CLOI)</a></strong>, which provides access to investment grade floating-rate CLOs. CLOI benefits from PineBridge&rsquo;s decades of CLO market experience, both as a CLO manager and CLO tranche investor, and deep leveraged finance expertise.</p>
<p>To receive more <a href="/us/en/blogs/income-investing/" title="Income Investing Insights"><strong>Income Investing</strong></a> insights, <a href="/us/en/subscribe/" title=" Subscription Center"><strong>sign up in our subscription center</strong></a>.</p>
]]></content:encoded>
</item><item rdf:about="https://www.vaneck.com/us/en/blogs/income-investing/a-flying-start-for-fallen-angel-bonds/">
  <title>A Flying Start for Fallen Angel Bonds></title>
  <link>https://www.vaneck.com/us/en/blogs/income-investing/a-flying-start-for-fallen-angel-bonds/</link>
  <description><![CDATA[We believe elevated yields and price appreciation from new rising stars will be drivers of total return with higher quality of fallen angels providing some cushion if there is market volatility.]]></description>
  <dc:creator>Nicolas  Fonseca, CFA</dc:creator>
  <dc:date>02/13/2023 06:30:00</dc:date>
<content:encoded><![CDATA[

<p>January 2023 was the strongest start to a calendar year since 2019, where broad HY posted 4.59% and fallen angels 4.67%. Still, CCC &amp; Lower rated bonds took the lead with a 6.22% return, despite the majority of the fixed income ETF sector flows, according to Citi, going to Treasury and investment grade corporates, with a preference for higher quality and intermediate duration. High yields corporate flows were +$0.5bn for January vs. +$5.0bn for Treasury and +$7.2bn for IG corporates. Fallen angels (as represented by the ICE US Fallen Angel High Yield 10% Constrained Index, Ticker: H0CF; subsequently referred to herein as &ldquo;the index&rdquo;) underperformed broad HY (as represented by the ICE BofA US High Yield Index, Ticker: H0A0) by 0.05% (3.86% vs. 3.91%) for the first month of the year due to higher quality composition of the fallen angels.</p>
<h3>High Yield Returns (January 2023)</h3>
<p><img class="img-responsive w-100" src="https://www.vaneck.com/contentassets/ee6d328f9fe8444a8fae78252d8da610/2832_angl_chart-01_2023.02_blog.svg" alt="High Yield Returns (January 2023)" /></p>
<p class="chart-disclosure">Source: ICE Data Services and VanEck. Past performance is no guarantee of future results. Fallen Angels: ICE US Fallen Angel High Yield 10% Constrained Index. Broad HY: ICE BofA US High Yield Index.</p>
<p>How long will the January Effect persist for high yield bonds? The macro-environment remains mixed as the cumulative impacts of Fed tightening continue to work through the economy. However, three consecutive downside inflation metrics, China&rsquo;s reopening, the IMF upgrading its global growth outlook for the year, and the possibility that the Fed, which hiked by the expected 0.25% in their February meeting, will stop soon and maybe even cut at the end of this year have given the &ldquo;soft landing&rdquo; scenario some legs. Since the fallen angel index launched in December 2003, there have been 16 calendar years when its January total return was positive (not including 2023). Of those 16 years, 14 ended the year with positive total returns. We believe that elevated yields and the potential price appreciation from rating migrations, both additional rising stars and potentially an increase in fallen angels, will be the likely drivers of total return this year, with the higher quality of fallen angels providing some cushion if the market experiences volatility ahead.</p>
<div class="wrapped-div">
<table style="width: 100%;">
<tbody>
<tr class="tbl-data">
<td class="tbl-header last" colspan="18">Fallen Angels Index: A Positive January and its Calendar Year Return</td>
</tr>
<tr class="tbl-data">
<td class="data-td last" style="text-align: left;">Calendar Year</td>
<td class="data-head last">2004</td>
<td class="data-head last">2005</td>
<td class="data-head last">2006</td>
<td class="data-head last">2007</td>
<td class="data-head last">2009</td>
<td class="data-head last">2010</td>
<td class="data-head last">2011</td>
<td class="data-head last">2012</td>
<td class="data-head last">2013</td>
<td class="data-head last">2014</td>
<td class="data-head last">2015</td>
<td class="data-head last">2017</td>
<td class="data-head last">2018</td>
<td class="data-head last">2019</td>
<td class="data-head last">2020</td>
<td class="data-head last">2021</td>
<td class="data-head last">2023</td>
</tr>
<tr class="tbl-data">
<td class="data-td data last" style="text-align: left;">January TR</td>
<td class="data-td data last">1.68</td>
<td class="data-td data last">0.31</td>
<td class="data-td data last">2.05</td>
<td class="data-td data last">1.11</td>
<td class="data-td data last">3.39</td>
<td class="data-td data last">2.37</td>
<td class="data-td data last">2.07</td>
<td class="data-td data last">3.70</td>
<td class="data-td data last">2.00</td>
<td class="data-td data last">0.90</td>
<td class="data-td data last">2.00</td>
<td class="data-td data last">2.04</td>
<td class="data-td data last">1.29</td>
<td class="data-td data last">4.67</td>
<td class="data-td data last">0.72</td>
<td class="data-td data last">0.37</td>
<td class="data-td data last">3.86</td>
</tr>
<tr class="tbl-data">
<td class="data-td data last" style="text-align: left;">Year TR</td>
<td class="data-td data last">11.48</td>
<td class="data-td data last">2.81</td>
<td class="data-td data last">12.54</td>
<td class="data-td data last">0.68</td>
<td class="data-td data last">66.36</td>
<td class="data-td data last">17.95</td>
<td class="data-td data last">3.48</td>
<td class="data-td data last">21.58</td>
<td class="data-td data last">9.26</td>
<td class="data-td data last">7.08</td>
<td class="data-td data last">-3.24</td>
<td class="data-td data last">10.42</td>
<td class="data-td data last">-4.78</td>
<td class="data-td data last">17.33</td>
<td class="data-td data last">14.06</td>
<td class="data-td data last">7.72</td>
<td class="data-td data last">&nbsp;</td>
</tr>
</tbody>
</table>
</div>
<br />
<p class="chart-disclosure">Source: ICE Data Services and VanEck. Past performance is no guarantee of future results.</p>
<p><strong><u>Fallen Angels Overall Stats:</u></strong> Yield to worst for both fallen angels and broad high yield have fallen alongside 10Y Treasuries but are still elevated as one year ago, the YTW was 4.33 and 5.31, and the 10Y was 1.79. Duration increased for fallen angels and shortened for broad HY, something that, if it continues, should benefit fallen angels as long duration bonds (measured by the ICE BofA Current 30-Year US Treasury Bonds) posted 6.15% in January.</p>
<div class="wrapped-div">
<table style="width: 100%; height: 126px;">
<tbody>
<tr class="tbl-data" style="height: 18px;">
<td class="tbl-header last" style="height: 18px;">&nbsp;</td>
<td class="tbl-header last" style="border-right: outset; text-align: center; height: 18px;" colspan="2">Fallen Angel</td>
<td class="tbl-header last" style="text-align: center; height: 18px;" colspan="2">Broad HY</td>
</tr>
<tr class="tbl-data" style="height: 18px;">
<td class="data-head last" style="height: 18px;">&nbsp;</td>
<td class="data-head last" style="height: 18px;">12/31/2022</td>
<td class="data-head last" style="height: 18px; border-right: outset;">1/31/2023</td>
<td class="data-head last" style="height: 18px;">12/31/2022</td>
<td class="data-head last" style="height: 18px;">1/31/2023</td>
</tr>
<tr class="tbl-data" style="height: 18px;">
<td class="data-td last" style="height: 18px;">Yield to Worst</td>
<td class="data-td data last" style="height: 18px;">7.49</td>
<td class="data-td data last" style="height: 18px; border-right: outset;">6.87</td>
<td class="data-td data last" style="height: 18px;">8.89</td>
<td class="data-td data last" style="height: 18px;">8.17</td>
</tr>
<tr class="tbl-data" style="height: 18px;">
<td class="data-td last" style="height: 18px;">Effective Duration</td>
<td class="data-td data last" style="height: 18px;">5.45</td>
<td class="data-td data last" style="height: 18px; border-right: outset;">5.61</td>
<td class="data-td data last" style="height: 18px;">4.04</td>
<td class="data-td data last" style="height: 18px;">3.94</td>
</tr>
<tr class="tbl-data" style="height: 18px;">
<td class="data-td last" style="height: 18px;">Full Market Value ($mn)</td>
<td class="data-td data last" style="height: 18px;">112,854</td>
<td class="data-td data last" style="height: 18px; border-right: outset;">114,139</td>
<td class="data-td data last" style="height: 18px;">1,199,909</td>
<td class="data-td data last" style="height: 18px;">1,246,367</td>
</tr>
<tr class="tbl-data" style="height: 18px;">
<td class="data-td last" style="height: 18px;">OAS</td>
<td class="data-td data last" style="height: 18px;">337</td>
<td class="data-td data last" style="height: 18px; border-right: outset;">307</td>
<td class="data-td data last" style="height: 18px;">481</td>
<td class="data-td data last" style="height: 18px;">430</td>
</tr>
<tr class="tbl-data" style="height: 18px;">
<td class="data-td last" style="height: 18px;">No. of Issues</td>
<td class="data-td data last" style="height: 18px;">212</td>
<td class="data-td data last" style="height: 18px; border-right: outset;">210</td>
<td class="data-td data last" style="height: 18px;">1,927</td>
<td class="data-td data last" style="height: 18px;">1,930</td>
</tr>
</tbody>
</table>
</div>
<br />
<p class="chart-disclosure">Source: ICE Data Services, VanEck. Past performance is no guarantee of future results. Fallen Angels: ICE US Fallen Angel High Yield 10% Constrained Index. Broad HY: ICE BofA US High Yield Index. OAS refers to &ldquo;option-adjusted spread.&rdquo; Please see definition for this and other terms referenced herein in the disclosures and definitions portion of this blog.</p>
<p><strong><u>New Fallen Angels</u>: </strong>None</p>
<p><strong><u>Rising Stars:</u></strong> None</p>
<p><strong><u>Fallen Angels Performance by Sector</u></strong>: The sector composition didn&rsquo;t change significantly; however, the Utility sector saw a decrease of 1.32% as Electricite de France was removed from the index as it didn&rsquo;t have at least one-year remaining term to final maturity as of month-end. All sectors posted positive returns, with the Financial Service taking the lead after a 6.82% return and Healthcare at the bottom with 2.64%, and spreads tightened for all sectors except for Consumer Goods, where it was flat. The index price is now above $90m, still below its long-term average of $95.62, but seeing an upward trend since the middle of October when it was in the mid $80s. The Banking sector is the only sector above par, and there is now more than &frac34; of the index in the $90s.</p>
<div class="wrapped-div">
<table style="width: 100%;">
<tbody>
<tr class="tbl-data">
<td class="tbl-header last">&nbsp;</td>
<td class="tbl-header last" style="text-align: center; border-right: outset;" colspan="2">Wgt (%)</td>
<td class="tbl-header last" style="text-align: center; border-right: outset;" colspan="2">OAS</td>
<td class="tbl-header last" style="text-align: center; border-right: outset;" colspan="2">Price</td>
<td class="tbl-header last" style="text-align: center;">Total Return (%)</td>
</tr>
<tr class="tbl-data">
<td class="data-head last">&nbsp;</td>
<td class="data-head last">12/31/2021</td>
<td class="data-head last" style="border-right: outset;">1/31/2023</td>
<td class="data-head last">12/31/2021</td>
<td class="data-head last" style="border-right: outset;">1/31/2023</td>
<td class="data-head last">12/31/2021</td>
<td class="data-head last" style="border-right: outset;">1/31/2023</td>
<td class="data-head last">YTD</td>
</tr>
<tr class="tbl-data">
<td class="data-td last">Automotive</td>
<td class="data-td data last">10.00</td>
<td class="data-td data last" style="border-right: outset;">10.00</td>
<td class="data-td data last">262</td>
<td class="data-td data last" style="border-right: outset;">225</td>
<td class="data-td data last">91.35</td>
<td class="data-td data last" style="border-right: outset;">94.30</td>
<td class="data-td data last">3.78</td>
</tr>
<tr class="tbl-data">
<td class="data-td last">Banking</td>
<td class="data-td data last">3.81</td>
<td class="data-td data last" style="border-right: outset;">3.87</td>
<td class="data-td data last">302</td>
<td class="data-td data last" style="border-right: outset;">242</td>
<td class="data-td data last">96.85</td>
<td class="data-td data last" style="border-right: outset;">100.25</td>
<td class="data-td data last">3.99</td>
</tr>
<tr class="tbl-data">
<td class="data-td last">Basic Industry</td>
<td class="data-td data last">1.36</td>
<td class="data-td data last" style="border-right: outset;">1.38</td>
<td class="data-td data last">226</td>
<td class="data-td data last" style="border-right: outset;">215</td>
<td class="data-td data last">92.17</td>
<td class="data-td data last" style="border-right: outset;">94.36</td>
<td class="data-td data last">2.75</td>
</tr>
<tr class="tbl-data">
<td class="data-td last">Capital Goods</td>
<td class="data-td data last">5.12</td>
<td class="data-td data last" style="border-right: outset;">5.12</td>
<td class="data-td data last">279</td>
<td class="data-td data last" style="border-right: outset;">269</td>
<td class="data-td data last">95.01</td>
<td class="data-td data last" style="border-right: outset;">97.20</td>
<td class="data-td data last">2.74</td>
</tr>
<tr class="tbl-data">
<td class="data-td last">Consumer Goods</td>
<td class="data-td data last">3.07</td>
<td class="data-td data last" style="border-right: outset;">3.11</td>
<td class="data-td data last">275</td>
<td class="data-td data last" style="border-right: outset;">275</td>
<td class="data-td data last">88.90</td>
<td class="data-td data last" style="border-right: outset;">91.20</td>
<td class="data-td data last">3.02</td>
</tr>
<tr class="tbl-data">
<td class="data-td last">Energy</td>
<td class="data-td data last">27.93</td>
<td class="data-td data last" style="border-right: outset;">28.35</td>
<td class="data-td data last">293</td>
<td class="data-td data last" style="border-right: outset;">278</td>
<td class="data-td data last">88.13</td>
<td class="data-td data last" style="border-right: outset;">91.14</td>
<td class="data-td data last">3.84</td>
</tr>
<tr class="tbl-data">
<td class="data-td last">Financial Services</td>
<td class="data-td data last">0.65</td>
<td class="data-td data last" style="border-right: outset;">0.66</td>
<td class="data-td data last">540</td>
<td class="data-td data last" style="border-right: outset;">480</td>
<td class="data-td data last">77.20</td>
<td class="data-td data last" style="border-right: outset;">82.17</td>
<td class="data-td data last">6.82</td>
</tr>
<tr class="tbl-data">
<td class="data-td last">Healthcare</td>
<td class="data-td data last">3.02</td>
<td class="data-td data last" style="border-right: outset;">3.05</td>
<td class="data-td data last">362</td>
<td class="data-td data last" style="border-right: outset;">335</td>
<td class="data-td data last">83.56</td>
<td class="data-td data last" style="border-right: outset;">85.38</td>
<td class="data-td data last">2.64</td>
</tr>
<tr class="tbl-data">
<td class="data-td last">Insurance</td>
<td class="data-td data last">0.85</td>
<td class="data-td data last" style="border-right: outset;">0.85</td>
<td class="data-td data last">347</td>
<td class="data-td data last" style="border-right: outset;">349</td>
<td class="data-td data last">92.10</td>
<td class="data-td data last" style="border-right: outset;">94.15</td>
<td class="data-td data last">2.74</td>
</tr>
<tr class="tbl-data">
<td class="data-td last">Leisure</td>
<td class="data-td data last">7.88</td>
<td class="data-td data last" style="border-right: outset;">8.01</td>
<td class="data-td data last">325</td>
<td class="data-td data last" style="border-right: outset;">251</td>
<td class="data-td data last">89.95</td>
<td class="data-td data last" style="border-right: outset;">93.46</td>
<td class="data-td data last">4.30</td>
</tr>
<tr class="tbl-data">
<td class="data-td last">Real Estate</td>
<td class="data-td data last">5.13</td>
<td class="data-td data last" style="border-right: outset;">5.28</td>
<td class="data-td data last">697</td>
<td class="data-td data last" style="border-right: outset;">576</td>
<td class="data-td data last">79.46</td>
<td class="data-td data last" style="border-right: outset;">83.10</td>
<td class="data-td data last">4.95</td>
</tr>
<tr class="tbl-data">
<td class="data-td last">Retail</td>
<td class="data-td data last">5.67</td>
<td class="data-td data last" style="border-right: outset;">5.75</td>
<td class="data-td data last">471</td>
<td class="data-td data last" style="border-right: outset;">429</td>
<td class="data-td data last">73.75</td>
<td class="data-td data last" style="border-right: outset;">76.65</td>
<td class="data-td data last">4.33</td>
</tr>
<tr class="tbl-data">
<td class="data-td last">Services</td>
<td class="data-td data last">0.38</td>
<td class="data-td data last" style="border-right: outset;">0.37</td>
<td class="data-td data last">388</td>
<td class="data-td data last" style="border-right: outset;">380</td>
<td class="data-td data last">87.11</td>
<td class="data-td data last" style="border-right: outset;">89.27</td>
<td class="data-td data last">2.88</td>
</tr>
<tr class="tbl-data">
<td class="data-td last">Technology &amp; Electronics</td>
<td class="data-td data last">4.20</td>
<td class="data-td data last" style="border-right: outset;">4.33</td>
<td class="data-td data last">327</td>
<td class="data-td data last" style="border-right: outset;">276</td>
<td class="data-td data last">85.47</td>
<td class="data-td data last" style="border-right: outset;">89.53</td>
<td class="data-td data last">5.16</td>
</tr>
<tr class="tbl-data">
<td class="data-td last">Telecommunications</td>
<td class="data-td data last">11.91</td>
<td class="data-td data last" style="border-right: outset;">12.14</td>
<td class="data-td data last">423</td>
<td class="data-td data last" style="border-right: outset;">408</td>
<td class="data-td data last">90.04</td>
<td class="data-td data last" style="border-right: outset;">93.05</td>
<td class="data-td data last">3.94</td>
</tr>
<tr class="tbl-data">
<td class="data-td last">Transportation</td>
<td class="data-td data last">2.10</td>
<td class="data-td data last" style="border-right: outset;">2.13</td>
<td class="data-td data last">279</td>
<td class="data-td data last" style="border-right: outset;">252</td>
<td class="data-td data last">90.49</td>
<td class="data-td data last" style="border-right: outset;">93.04</td>
<td class="data-td data last">3.21</td>
</tr>
<tr class="tbl-data">
<td class="data-td last">Utility</td>
<td class="data-td data last">6.93</td>
<td class="data-td data last" style="border-right: outset;">5.61</td>
<td class="data-td data last">213</td>
<td class="data-td data last" style="border-right: outset;">196</td>
<td class="data-td data last">89.95</td>
<td class="data-td data last" style="border-right: outset;">91.66</td>
<td class="data-td data last">3.42</td>
</tr>
<tr class="tbl-data">
<td class="data-td last">Total</td>
<td class="data-td data last">100</td>
<td class="data-td data last" style="border-right: outset;">100</td>
<td class="data-td data last">337</td>
<td class="data-td data last" style="border-right: outset;">307</td>
<td class="data-td data last">87.91</td>
<td class="data-td data last" style="border-right: outset;">90.82</td>
<td class="data-td data last">3.86</td>
</tr>
</tbody>
</table>
</div>
<br />
<p class="chart-disclosure">Source: ICE Data Services, VanEck. Past performance is no guarantee of future results. Not a recommendation to buy or sell any of the names/securities mentioned herein. Fallen Angels: ICE US Fallen Angel High Yield 10% Constrained Index.</p>
<p><strong><u>Fallen Angels Performance by Rating:</u></strong> Lower-rated bonds outperformed their high-quality peers during this past month. Something to look out for in the coming weeks will be the default of Bed, Bath, and Beyond, which had a weight of 0.03% in the index as of 1/31/2023.</p>
<div class="wrapped-div">
<table style="width: 100%;">
<tbody>
<tr class="tbl-data">
<td class="tbl-header last">&nbsp;</td>
<td class="tbl-header last" style="text-align: center; border-right: outset;" colspan="2">Wgt (%)</td>
<td class="tbl-header last" style="text-align: center; border-right: outset;" colspan="2">OAS</td>
<td class="tbl-header last" style="text-align: center; border-right: outset;" colspan="2">Price</td>
<td class="tbl-header last" style="text-align: center;">Total Return (%)</td>
</tr>
<tr class="tbl-data">
<td class="data-head last">&nbsp;</td>
<td class="data-head last">12/31/2022</td>
<td class="data-head last" style="border-right: outset;">1/31/2023</td>
<td class="data-head last">12/31/2022</td>
<td class="data-head last" style="border-right: outset;">1/31/2023</td>
<td class="data-head last">12/31/2022</td>
<td class="data-head last" style="border-right: outset;">1/31/2023</td>
<td class="data-head last">YTD</td>
</tr>
<tr class="tbl-data">
<td class="data-td last">BB</td>
<td class="data-td data last">87.00</td>
<td class="data-td data last" style="border-right: outset;">86.68</td>
<td class="data-td data last">284</td>
<td class="data-td data last" style="border-right: outset;">258</td>
<td class="data-td data last">90.02</td>
<td class="data-td data last" style="border-right: outset;">92.91</td>
<td class="data-td data last">3.71</td>
</tr>
<tr class="tbl-data">
<td class="data-td last">B</td>
<td class="data-td data last">10.95</td>
<td class="data-td data last" style="border-right: outset;">11.18</td>
<td class="data-td data last">608</td>
<td class="data-td data last" style="border-right: outset;">543</td>
<td class="data-td data last">82.50</td>
<td class="data-td data last" style="border-right: outset;">85.75</td>
<td class="data-td data last">4.44</td>
</tr>
<tr class="tbl-data">
<td class="data-td last">CCC</td>
<td class="data-td data last">1.98</td>
<td class="data-td data last" style="border-right: outset;">2.11</td>
<td class="data-td data last">1,020</td>
<td class="data-td data last" style="border-right: outset;">929</td>
<td class="data-td data last">60.88</td>
<td class="data-td data last" style="border-right: outset;">65.49</td>
<td class="data-td data last">8.40</td>
</tr>
<tr class="tbl-data">
<td class="data-td last">CC</td>
<td class="data-td data last">&nbsp;</td>
<td class="data-td data last" style="border-right: outset;">0.03</td>
<td class="data-td data last">&nbsp;</td>
<td class="data-td data last" style="border-right: outset;">9632</td>
<td class="data-td data last">&nbsp;</td>
<td class="data-td data last" style="border-right: outset;">5.15</td>
<td class="data-td data last">&nbsp;</td>
</tr>
<tr class="tbl-data">
<td class="data-td last">D</td>
<td class="data-td data last">0.07</td>
<td class="data-td data last" style="border-right: outset;">&nbsp;</td>
<td class="data-td data last">4,726</td>
<td class="data-td data last" style="border-right: outset;">&nbsp;</td>
<td class="data-td data last">10.00</td>
<td class="data-td data last" style="border-right: outset;">&nbsp;</td>
<td class="data-td data last">-36.40</td>
</tr>
<tr class="tbl-data">
<td class="data-td last">Total</td>
<td class="data-td data last">100</td>
<td class="data-td data last" style="border-right: outset;">100</td>
<td class="data-td data last">337</td>
<td class="data-td data last" style="border-right: outset;">307</td>
<td class="data-td data last">87.91</td>
<td class="data-td data last" style="border-right: outset;">90.82</td>
<td class="data-td data last">3.86</td>
</tr>
</tbody>
</table>
</div>
<br />
<p class="chart-disclosure">Source: ICE Data Services, VanEck. Past performance is no guarantee of future results. Fallen Angels: ICE US Fallen Angel High Yield 10% Constrained Index.</p>
<p class="chart-disclosure">Data throughout was sourced from ICE Data Services and VanEck as of 1/31/2023.</p>
<p>To receive more <a href="https://www.vaneck.com/us/en/insights/income-investing/" title="Income Investing insights"><strong>Income Investing</strong></a> insights, <a href="/link/5f45412c2143400497908cea2897f7d3.aspx" title=" Subscription Center"><strong>sign up in our subscription center</strong></a>.</p>
<style type="text/css">
    .wrapped-div {
        max-width: 100%;
    }

    @media (max-width: 1024px) {
        .wrapped-div {
            overflow-x: scroll;
        }
    }

    .wrapped-div-sector {
        max-width: 100%;
        overflow-x: scroll;
    }
</style>
]]></content:encoded>
</item><item rdf:about="https://www.vaneck.com/us/en/blogs/gold-investing/joe-foster-will-investors-follow-central-banks-into-gold/">
  <title>Will Investors Follow Central Banks into Gold?></title>
  <link>https://www.vaneck.com/us/en/blogs/gold-investing/joe-foster-will-investors-follow-central-banks-into-gold/</link>
  <description><![CDATA[2022 was the second highest year of net central bank gold buying on record since 1950. Will central banks&rsquo; continued commitment to gold lead to increased investor interest?]]></description>
  <dc:creator>Imaru Casanova</dc:creator>
  <dc:date>02/13/2023 06:30:00</dc:date>
<content:encoded><![CDATA[

<script>
    //Temporary script
    $(function () {
        $(".popup-youtube, .popup-vimeo, .popup-gmaps").on("click", function (e) {
            e.preventDefault();
            var width = $(window).width();
            if (width > 768) {
                openSimpleIframeModalDialog($(this).attr('href'), "video-modal");
            } else if ($(this).is('.popup-youtube')) {
                var target = $(this).attr('data-video');
                self.location = target;
            }
        });
    });
</script>
<style>
    .modal.fade.video-modal div.modal-dialog {
        margin: 7% auto !important;
    }

    .modal-simple-iframe .close span {
        font-size: 35px;
        line-height: 1;
    }
</style>
<p>Monthly gold market and economic insights from Imaru Casanova, Deputy Portfolio Manager and Joe Foster, Portfolio Manager and Strategist, featuring their unique views on mining and gold&rsquo;s portfolio benefits. <a href="https://www.vaneck.com/us/en/blogs/gold-investing/joe-foster-will-investors-follow-central-banks-into-gold/gold-monthly-commentary-january-2023.pdf" target="_blank" title="Gold Monthly Commentary - January 2023" rel="noopener"><strong>An expanded PDF version of this commentary, including fund specific information can be downloaded here.</strong></a></p>
<p>Gold had a strong start to the year. The main headwind for gold for most of 2022 was the strength of the U.S. dollar. However, in January, expectations for a slowdown in the U.S. Federal Reserve&rsquo;s (Fed&rsquo;s) rate hiking pace, combined with increased concerns about economic growth, put pressure on the U.S. dollar and supported gold. As treasury yields plunged, gold rallied, trading above $1,900 per ounce on January 13. Gold held steady at these levels, despite a mix of economic news, quietly trading up to a high of $1,949 on January 26. Gold closed at $1,928 on January 31, up 5.7%, a significant $104 per ounce move during the first month of the year.</p>
<p>Gold equities demonstrated they are a leveraged play on gold. The NYSE Arca Gold Miners Index (GDMNTR)<sup>1</sup>&nbsp;was up 11.4% and the MVIS Global Juniors Gold Miners Index (MVGDXJTR)<sup>2</sup>&nbsp;was up 9.3% for the month. Despite the strong monthly gains, gold equities continue to be undervalued relative to the metal and we expect this to result in their continued outperformance this year. Cost inflation hit the miners hard last year, with all-in sustaining costs increasing by more than 10% in 2022 compared to 2021. In February, gold miners will provide production and cost guidance for 2023. We would not be surprised to see higher operating costs again in 2023, but as inflation pressures abate, we expect the year-on-year increase will be much less than in 2022. Capital expenses related to deferrals in previous years or due to mine sequencing may also contribute to higher all-in sustaining costs in 2023. Higher gold prices this year could defend the miners&rsquo; margins. For example, the current gold price is approximately $125 per ounce higher than the average gold price last year of $1,802 per ounce. If sustained, these gold price gains would significantly exceed estimated cost increases in 2023, leading to margin expansion and higher valuations for gold miners.</p>
<h2>Central banks banking on gold</h2>
<p>The World Gold council published 2022 gold demand statistics that estimated another record quarter of central bank gold purchases in the fourth quarter. Central bank net purchases in Q4 totaled 417 tonnes, taking second half of 2022 total buying to 862 tonnes. At 1,135 tonnes, 2022 was the second highest year of net central bank gold buying on record since 1950. Since 2010 and for 13 consecutive years, central banks have been net buyers of gold.</p>
<h3>Second highest year of central bank net purchases since 1950</h3>
<p><img class="img-responsive w-100" src="https://www.vaneck.com/contentassets/38388b71859e440382b17ce1feffc11c/2812_blog_chart_01_2023.02_v1_blog.svg" alt="Second highest year of central bank net purchases since 1950" /></p>
<p class="chart-disclosure">Source: World Gold Council. Data as of January 2023.</p>
<p>The World Gold Council&rsquo;s most recent central bank gold survey reveals the main reasons behind the banks&rsquo; decisions to own gold: its performance during times of crisis, its role as a long term store of value and its high liquidity. <a href="https://www.vaneck.com/us/en/news-and-insights/thought-leaders/natalia-gurushina/" title="Natalia Gurushina - Chief Economist, Emerging Markets Fixed Income"><strong>VanEck&rsquo;s Chief Economist, Emerging Markets Fixed Income, Natalia Gurushina</strong></a>, recently highlighted in her daily morning note, an IMF research paper on gold that is &ldquo;too good to ignore&rdquo;. The IMF report, <i>Gold as International Reserves: A Barbarous Relic No More?<sup>*</sup></i>, reiterates the argument that this recent impetus by central banks to buy gold derives from gold&rsquo;s appeal as a safe haven in periods of economic, financial and geopolitical volatility. Its role as an inflation hedge, portfolio diversifier and the fact it is favored by custom and tradition are also mentioned. The IMF research also shows that the imposition of financial sanctions (think of those imposed on Russia after its invasion of Ukraine) by the main reserve-issuing economies is also correlated to the increase in the share of central bank reserves held in gold.</p>
<p>We anticipated that central banks would be closely watching Russia&rsquo;s experience as it related to its foreign reserves, and that this would support central bank buying in 2022. The actual figures surpassed our expectations. We expect central banks to remain net buyers of gold in 2023 and longer.</p>
<h2>Gold has held up better than you would think</h2>
<p>During our <strong><a href="https://www.vaneck.com/us/en/webinar-registration/?id=99426434783&amp;utm_source=vaneck&amp;utm_medium=calendar" title="Now's the Time for Gold to Shine">most recent quarterly webinar</a></strong>, we said that it feels as if investors need to be &ldquo;scared into&rdquo; owning gold. What we meant is that most investors seem uninterested in gold until things get ugly. Well, things got really ugly last year, and central banks took note, so you may say that they, too, got scared into owning gold, accelerating their purchases to record levels. Could the attitude of central banks towards gold be paving the way for investors more broadly? A track record of 13 years of consecutive net buying demonstrates that as a group these institutions are not trying to &ldquo;time&rdquo; the gold market. Their commitment to gold appears to be long term and based on gold&rsquo;s key attributes as a safe haven and portfolio diversifier. We, too, believe that gold, rather than being viewed as an asset of last resort, should be considered a core component and enjoy a permanent allocation in any portfolio. In our engagements, we find that many investors are surprised by gold&rsquo;s performance over time. Gold, while no doubt a relic, is hardly barbarous after all.</p>
<h3>Gold has performed well on a relative basis over the last 30-years</h3>
<p><img class="img-responsive w-100" src="https://www.vaneck.com/contentassets/38388b71859e440382b17ce1feffc11c/2812_blog_chart_02_2023.02_v1_blog.svg" alt="Gold and gold miners have performed well on a relative basis over the last 30-years" /></p>
<p class="chart-disclosure">Source: IMF, VanEck. Data as of December 2022. &ldquo;Global Stocks&rdquo; represented by MSCI AC World Index GR<sup>3</sup>. &ldquo;Global Bonds&rdquo; represented by Bloomberg Global Aggregate Bond Index TR<sup>4</sup>. &ldquo;Commodities&rdquo; represented by Bloomberg Commodity Index TR<sup>5</sup>. &ldquo;U.S. Cash&rdquo; represented by ICE BofA U.S. 3-Month Treasury Bill TR<sup>6</sup>.</p>
<h2>Fed policy, recession fears lending further support for gold</h2>
<p>As we enter 2023, it seems the market&rsquo;s concerns around economic growth, both in the U.S. and globally, are starting to intensify, providing support for gold prices. The big problems for gold in 2022 were the Fed and the U.S. dollar. It is fair to say the Fed is likely approaching the end of the hiking cycle and the market is currently pricing in only two more small (25 bps) hikes. This is primarily fueled by inflation appearing to be heading lower, and some weakness in economic indicators suggesting that Fed policies are starting to take hold.</p>
<p>We have been saying that gold can rally well ahead of a Fed pause or pivot as the market becomes more certain that the end of the hike cycle is approaching. That is what we are seeing this year &ndash; gold trading up as the dollar weakens in anticipation of a pause. The reversal of the strong dollar trend of 2022 should be an important driver of gold prices in 2023. China&rsquo;s re-opening is likely another strong driver. Gold stands to benefit from both scenarios: increased demand out of China (the largest consumer of gold) because of a strong economic recovery; or increased investment safe haven demand if the recovery is softer or slower impacting global growth. While an economic recession seems increasingly more likely, several other conditions may be required before we see investors jump to the safety of gold. These include a significantly weaker jobs market and higher unemployment rate; a drop in corporate earnings and a deeper correction of the equity markets; and/or sustained inflation above the Fed&rsquo;s target rate. All of these conditions are supportive of gold.</p>
<h2>What happens when investment demand returns?</h2>
<p>The lack of investment demand for gold is evident by looking at the movements in global gold bullion ETF holdings. There is a strong positive correlation between the gold price and the holdings of gold ETFs. However, since the end of October the gold price has increased $295 per ounce (18%) while ETF holdings have declined by 1.7%.</p>
<h3>Gold has done well recently without any investment demand (which has typically been a significant driver)</h3>
<p><img class="img-responsive w-100" src="https://www.vaneck.com/contentassets/38388b71859e440382b17ce1feffc11c/2812_blog_chart_03_2023.02_v1_blog.svg" alt="Gold has done will recently without any investment demand (which has typically been a significant driver)" /></p>
<p class="chart-disclosure">Source: Bloomberg. Data as of January 2023.</p>
<p>Historically, it is investment demand that drives the gold price higher, with other centers of demand (or supply, for that matter) helping set a floor to the gold price. We view this recent strength in the gold price, despite a lack of ETF demand, as positive for the gold market, in that it sets a very solid level for gold (and importantly for gold miners). Are central banks picking up the gold market slack left by other investors? Will they too become a more influential driver of gold prices as they continue to accumulate gold more actively? While ETF inflows are still lacking, a pick-up in investment demand should intensify gold&rsquo;s breakout. We see potential for gold to reach its all-time highs of over $2,000 per ounce in 2023.</p>
<p>To receive more insights to <strong><a href="https://www.vaneck.com/us/en/insights/gold-investing/" title="Gold Investing Insights">Gold Investing</a></strong> insights, <strong><a href="https://www.vaneck.com/us/en/subscribe/" title="Subscription Center">sign up in our subscription center</a></strong>.</p>
]]></content:encoded>
</item><item rdf:about="https://www.vaneck.com/us/en/blogs/economic-trends/em-surprises-only-skin-deep/">
  <title>EM Surprises – Only Skin Deep?></title>
  <link>https://www.vaneck.com/us/en/blogs/economic-trends/em-surprises-only-skin-deep/</link>
  <description><![CDATA[A steady stream of economic and policy surprises continued this morning. Do they challenge our EM narrative?]]></description>
  <dc:creator>Natalia  Gurushina</dc:creator>
  <dc:date>02/10/2023 17:00:00</dc:date>
<content:encoded><![CDATA[

<h2>China Rebound</h2>
<p>A stream of emerging markets (EM) economic and policy surprises continued this morning with&nbsp;<strong>China&rsquo;s credit aggregates exceeding expectations by a wide margin. China&rsquo;s growth rebound is supposed to be a major tailwind for EM</strong>&nbsp;this year &ndash; potentially offsetting the impact of the more hawkish U.S. Federal Reserve &ndash; so is this driver even stronger than previously thought? As usual, details provide valuable insights. The upside surprise reflected a major jump in corporate lending (well above the multi-year seasonal range) and higher government and corporate bond issuance (quotas). At the same time, household lending &ndash; including a proxy for mortgages &ndash; remained subdued (see chart below). So, while January&rsquo;s credit aggregates are definitely growth-positive, the unbalanced nature of the new loans shows that the housing sector &ndash; and consumption? - recovery will take time.</p>
<h2>EM Disinflation</h2>
<p><strong>On-going disinflation is another key element of our EM narrative</strong>&nbsp;&ndash; how do sizable upside inflation surprises in Hungary and the Czech Republic fit into the equation? The numbers definitely looked scary &ndash; re-accelerating to respective 25.7% and 17.5% year-on-year and coming on the heels of yesterday&rsquo;s upside surprise in Mexico. Our take is simple &ndash; January&rsquo;s increases often reflect seasonal/regulated price adjustments, and focusing on core inflation dynamics gives a better idea about underlying trends. Czech core inflation had peaked but was still high. Hungary&rsquo;s core price pressures are yet to abate. This is in line with our expectations that the policy pause in the region might last longer than the market currently prices in, providing an additional cushion against the potentially higher peak policy rates in the U.S. and the Eurozone.&nbsp;</p>
<h2>EM Tightening Cycle</h2>
<p><strong>The &ldquo;policy cushion&rdquo; thesis was on full display in Mexico yesterday, where the central bank (Banxico) surprised with a larger 50bps rate hike</strong>. The Banxico&rsquo;s analysis suggests that local factors increasingly drive price pressures, and this justifies additional tightening and a higher peak rate. And by the way, Peru&rsquo;s decision to stay on hold &ndash; against the expectation of a 25bps hike &ndash; does not mean that the tightening cycle is over. The political and social noise in the country is high, and the central bank needs time to assess the macroeconomic impact of social unrest. Stay tuned!</p>
<h3>Chart at a Glance: China New Loans &ndash; High But Unbalanced For Now*</h3>
<p><img class="img-responsive w-100" src="https://www.vaneck.com/contentassets/69027c17653c4859b8e657163dfc1a51/us-natalias-take-2023-02-10.png" alt="Chart at a Glance: China New Loans - High But Unbalanced For Now*" /></p>
<p class="chart-disclosure">Source: Bloomberg LP.</p>
<p class="chart-disclosure">CNLNLNHL Index is China domestic CNY loan newly increased (household mid and long-term loans).</p>
]]></content:encoded>
</item><item rdf:about="https://www.vaneck.com/us/en/blogs/economic-trends/policy-tightening-topping-up/">
  <title>Policy Tightening – Topping Up></title>
  <link>https://www.vaneck.com/us/en/blogs/economic-trends/policy-tightening-topping-up/</link>
  <description><![CDATA[Disinflation creates a lot of room for rate cuts, but potentially from higher peak rates and at a later date.]]></description>
  <dc:creator>Natalia  Gurushina</dc:creator>
  <dc:date>02/09/2023 06:30:00</dc:date>
<content:encoded><![CDATA[

<h2>Higher Peak Rates</h2>
<p>Bank of Japan&rsquo;s hawkish turn is an important element of the global policy chatter &ndash; given potential implications for Investment Grade bonds in developed markets (DM) and emerging markets (EM) &ndash; but Sweden&rsquo;s central bank stole the monetary policy limelight this morning with a hawkish QT tweak (in addition to a 50bps rate hike). Sweden&rsquo;s move resonates with <strong>a storyline that global central banks might tighten more and start easing later than currently priced in</strong>. The recent comments from the governor of the Colombian central bank are quite instructive in this regard. Governor Villar said that policy rates in the region should remain &ldquo;relatively restrictive&rdquo; for &ldquo;an important amount of time&rdquo; to bring inflation back to target and anchor expectations.</p>
<h2>Inflation Pressures</h2>
<p>One reason for caution is that - with food and energy prices normalizing &ndash; <strong>the remaining inflation pressures are increasingly considered a locally-driven phenomenon</strong>. This is the view, for example, of some board members of Mexico&rsquo;s central bank, which is meeting later this afternoon (the consensus expects a 25bps rate hike following an upside inflation surprise &ndash; see chart below). The Peruvian central bank is also expected to extend the hiking cycle today (+25bps) &ndash; we would like to know how a bill on another round of private pension withdrawals fits into the equation, given its potential to boost domestic demand.</p>
<h2>Policy Easing</h2>
<p><strong>The situation is not completely hopeless for doves</strong> &ndash; provided disinflation does not stall. For example, the Romanian central bank&rsquo;s new assessment is that the disinflation rate might be faster than expected in H2-2023/H1-2024 (a side note &ndash; the Romanian central bank has been quite hawkish lately, so it is not Poland&rsquo;s &ldquo;perpetual doves&rdquo; situation). Today&rsquo;s move in the market expectations for Brazil&rsquo;s policy rate (after a small downside inflation surprise) shows that successful disinflation creates a nice potential for rate cuts (especially when real rates are very high). However, Brazil&rsquo;s policy space might be constrained by the new administration&rsquo;s attacks on the central bank&rsquo;s independence and attempts to change the inflation target. Stay tuned!</p>
<h3>Chart at a Glance: Mexico&rsquo;s Disinflation &ndash; A Bumpy Ride</h3>
<p><img class="img-responsive w-100" src="https://www.vaneck.com/contentassets/1732705b07454b42a026102cf127ade1/us-natalias-take-2023-02-09.png" alt="Chart at a Glance: Mexico's Disinflation - A Bumpy Ride" /></p>
<p class="chart-disclosure">Source: Bloomberg LP.</p>
]]></content:encoded>
</item><item rdf:about="https://www.vaneck.com/us/en/blogs/moat-investing/smid-cap-moats-lead-in-market-rally/">
  <title>SMID-Cap Moats Lead in Market Rally></title>
  <link>https://www.vaneck.com/us/en/blogs/moat-investing/smid-cap-moats-lead-in-market-rally/</link>
  <description><![CDATA[The January market rally saw small caps leading the way, followed by mid caps. Among small- and mid-cap moat stocks, car businesses lead.]]></description>
  <dc:creator>Brandon Rakszawski</dc:creator>
  <dc:date>02/08/2023 06:35:00</dc:date>
<content:encoded><![CDATA[

<p>The<strong> <a href="/link/c0c4da50e177415b9f750d3c0eea4e0a.aspx" title="SMOT - VanEck Morningstar SMID Moat ETF - Index">Morningstar US Small-Mid Cap Moat Focus Index</a></strong> (the &ldquo;SMID Moat Index&rdquo;) managed to outpaced all three market cap segments of the U.S. stock market in January. The SMID Moat Index tends to provide mostly mid cap exposure along with some small cap exposure among those U.S. companies that benefit from sustainable competitive advantages.</p>
<p>Small caps led the way for the month followed by mid caps. Large caps generally participated least in the January market rally. Despite the SMID Moat Index&rsquo;s relatively lower exposure to small caps, it outperformed them by 2.25% in January. In fact, for those &ldquo;moat heads&rdquo; out there, the SMID Moat Index even outmatched its big sister, the <a href="/link/9f629c73a31846bb9e480b95e2c7f330.aspx" title="MOAT - VanEck Morningstar Wide Moat ETF - Index"><strong>Morningstar Wide Moat Focus Index</strong></a>, <strong><a href="https://www.vaneck.com/us/en/blogs/moat-investing/moat-stocks-take-early-lead-in-2023/" title="Moat Stocks Outperformed in Volatile 2022">which had an equally impressive month</a></strong>.</p>
<h3>Banner January for SMID Moat Investing</h3>
<p><strong>1 Month Total Return as of 1/31/2023</strong></p>
<p><img class="img-responsive w-100" src="https://www.vaneck.com/contentassets/9dc3df9b11b84166a70e96b2427a983e/2794_smot_chart-01_2023.02_blog.svg" alt="Banner January for SMID Moat Investing" /></p>
<p class="chart-disclosure"><strong>Source: Morningstar. As of 1/31/2023</strong>. Past performance is no guarantee of future results. Index performance is not illustrative of Fund performance. Fund performance current to the most recent month end is available by visiting vaneck.com or by calling 800.826.2333. Indexes are unmanaged and are not securities in which an investment can be made.</p>
<h2>Stock Selection a Key Contributor to January Performance</h2>
<p>The SMID Moat Index benefited most from its exposure to consumer discretionary, industrials and information technology companies, while no single sector, as a whole, posted negative returns within the index. With roughly 75% of its exposure in mid-cap stocks, the SMID Moat Index was highly influenced by <strong><a href="https://www.vaneck.com/us/en/blogs/moat-investing/moat-investing-powered-by-morningstar/" title="Ditch Style Biases. Choose Stock Selection">stock selection</a></strong> within that market cap segment. Stock selection within smaller cap stocks, though less exposure, contributed nearly as prominently to January&rsquo;s strong performance.</p>
<p>Notably, only five SMID Moat Index companies posted negative returns for the month: Baxter International, Kellogg Co., Hasbro Inc., Sirius XM Holdings and Zimmer Biomet Holdings.</p>
<p>Some of the leaders are lesser known, and most are in the car business, so let&rsquo;s learn a little about their <strong><a href="https://www.vaneck.com/us/en/blogs/moat-investing/how-a-moat-stock-gets-its-economic-moat/" title="How a Moat Stock Gets Its Economic Moat">economic moat</a></strong> and valuations.</p>
<h2>Top SMID Moat Companies in January</h2>
<p><strong>Adient (ADNT)</strong></p>
<p>Adient PLC is an automotive seating business that was spun off from Johnson Controls in 2016 and has about 33% share of the global seating market, according to Morningstar. While auto parts may not be the most riveting area of the market, competitive advantages make sense here. Morningstar views seating as one of the stickiest areas of the supply chain because automakers need consistent quality that can be delivered with precision all around the world. Stated differently, automakers will generally pay for the right supplier rather than seek out the low-cost provider. In fact, Morningstar notes that it is common for incumbent seating suppliers to get the next generation of a vehicle program nearly 100% of the time.</p>
<p>Adient is assigned a narrow moat rating by Morningstar driven by <strong><a href="https://www.vaneck.com/us/en/blogs/moat-investing/intangible-assets-the-leading-source-of-moats2/" title="Intangible Assets: The Leading Source of Moats">intangible assets</a></strong>, <strong><a href="https://www.vaneck.com/us/en/blogs/moat-investing/cost-leadership-creates-moats2/" title="Cost Leadership Provides Market Control">cost advantage</a></strong> and <strong><a href="https://www.vaneck.com/us/en/blogs/moat-investing/switching-costs-build-moats-and-retain-customers2/" title="Switching Costs Build Moats and Retain Customers">switching costs</a></strong>. While its advantages are strong, it is assigned a narrow moat rather than a wide moat because of automaker customers&rsquo; growing global overcapacity and Adient's lack of immunity to the cyclical nature of the auto industry. Morningstar believes it&rsquo;s more likely than not that Adient can generate economic profit for 10 years, but for the reasons mentioned, they cannot say that it is more likely than not that Adient can generate economic profit for 20 years.</p>
<p>Adient&rsquo;s fair value estimate was increased from $64 per share to $68 in November 2022 to reflect continued operation improvement over time. Adient was a victim of the global chip shortages and high steel and chemical input costs which drove negative sentiment in recent periods, according to Morningstar. The company finished the month at a 30% discount to Morningstar&rsquo;s fair value estimate.</p>
<p><strong>Lithia Motors (LAD)</strong></p>
<p>Lithia Motors is a publicly traded auto dealer that has created a differentiated business as the only public dealer to operate in rural markets. In fact, many Lithia brand stores have no competitors within 100 miles, according to Morningstar. The dealer, like some other publicly traded dealers, benefits from cost advantages and intangible assets. It also enjoys a lack of competition for many vehicle brands given its focus on rural areas. Morningstar believes public dealers enjoy several benefits over private dealers, such as centralized back-office operations and much higher volumes, which brings scale. They are also not dependent on any one vehicle brand as many have a diversified portfolio of dealerships.</p>
<p>Morningstar sees parts and service operations at Lithia as a strong advantage as well. Customers are prone to return to a dealer for service because of warranties or proximity to home and expertise to service a particular vehicle. Obtaining multiple quotes on a vehicle repair can be very time consuming. All of this leads to inelasticity of demand and stronger pricing power for dealers, according to Morningstar.</p>
<p>For the better part of the decade, Lithia has traded close to Morningstar fair value. Outside of the market selloff in March 2022, Lithia shares have not traded at such a steep discount to fair value in the last 10 years. Shares ended January at approximately a 40% discount.</p>
<p><strong>Sensata Technologies (ST)</strong></p>
<p>Staying on the automobile theme, Sensata Technologies is a supplier of sensors and electrical protection, predominantly for the automotive market. It has positioned itself well to participate in secular trends toward electrification, efficiency and connectivity, according to Morningstar.</p>
<p>Sensata&lsquo;s narrow moat rating is attributable primarily to switching costs. Its sensors and controls are often part of mission critical processes related to electric vehicle battery management systems, avionics systems and power grids. As Morningstar explains it, once a supplier&rsquo;s component is designed into an end application, it is likely to remain in the product&rsquo;s entire lifecycle&mdash;ranging from five to seven years in cars and more than 10 years in aerospace applications. Morningstar believes Sensata also boasts robust design and engineering abilities, exhibiting intangible assets that supplement its moat.</p>
<p>After closing January at under $53 per share, Sensata was over 25% discounted relative to its Morningstar fair value estimate.</p>
<p><strong>Asbury Automotive Group (ABG)</strong></p>
<p>ABG, like Lithia Motors, is a publicly traded auto dealer and benefits from similar cost advantages and intangible assets. ABG operates nearly 150 dealerships and generates the overwhelming majority of its revenue from the luxury automobile segment. This makes it slightly more recession proof, as customers of luxury brands tend to have higher-than-average incomes and can often afford new cars and maintenance through economic cycles.</p>
<p>Morningstar raised its fair value estimate substantially in April 2022 from $233 per share to $377 based on the company&rsquo;s growth trajectory. Following a strong fourth quarter 2022, Morningstar has maintained its fair value estimate.</p>
<p><strong>ICU Medical (ICUI)</strong></p>
<p>ICU Medical is a comprehensive infusion and IV provider offering infusion consumables, infusion pumps and IV solution manufacturing. Morningstar believes its unrivaled scale in consumables allows ICU to offer rock-bottom prices that competitors would be hard-pressed to beat and gives them confidence in the firm's ability to generate excess returns over the coming decade. ICU Medical also benefits, to a lesser degree, from switching costs in its infusion systems segment.</p>
<p>Like medical technology firms that benefit from intellectual property and regulatory factors that limit competition, only a handful of competitors in ICU&rsquo;s markets possess meaningful scale. As Morningstar explains, infusion consumables are the relatively commodity like parts that are used in IV administration. They include a wide array of mostly plastic parts such as IV sets, IV connectors, closed system transfer devices, disinfecting caps and more. ICU Medical has the leading U.S. market share in this segment. Morningstar does not see this changing anytime soon, because ICU Medical is able to price its consumables at significant discount to market, attracting hospitals and other health providers.</p>
<p>After trading at a steep discount to fair value throughout much of 2022, ICU Medical is now trading near fair value.</p>
<h3>Top Contributors and Detractors from SMID Moat Index</h3>
<p><strong>January 2023</strong></p>
<div class="wrapped-div">
<table style="width: 750px;">
<tbody>
<tr class="tbl-data">
<td class="tbl-header last" colspan="5">Leading Contributors</td>
</tr>
<tr class="tbl-data">
<td class="data-td  last">Name</td>
<td class="data-head last">Ticker</td>
<td class="data-head last">Sector</td>
<td class="data-head last">Avg. Weight</td>
<td class="data-head last">Contribution (%)</td>
</tr>
<tr class="tbl-data">
<td class="data-td last" style="font-weight: normal;">Adient PLC</td>
<td class="data-td data last">ADNT</td>
<td class="data-td data last">Consumer Discretionary</td>
<td class="data-td data last">1.42</td>
<td class="data-td data last">0.42</td>
</tr>
<tr class="tbl-data">
<td class="data-td last" style="font-weight: normal;">Lithia Motors Inc</td>
<td class="data-td data last">LAD</td>
<td class="data-td data last">Consumer Discretionary</td>
<td class="data-td data last">1.19</td>
<td class="data-td data last">0.34</td>
</tr>
<tr class="tbl-data">
<td class="data-td last" style="font-weight: normal;">Sensata Technologies Holdings</td>
<td class="data-td data last">ST</td>
<td class="data-td data last">Industrials</td>
<td class="data-td data last">1.28</td>
<td class="data-td data last">0.33</td>
</tr>
<tr class="tbl-data">
<td class="data-td last" style="font-weight: normal;">Asbury Automotive Group Inc</td>
<td class="data-td data last">ABG</td>
<td class="data-td data last">Consumer Discretionary</td>
<td class="data-td data last">1.43</td>
<td class="data-td data last">0.32</td>
</tr>
<tr class="tbl-data">
<td class="data-td last" style="font-weight: normal;">ICU Medical Inc</td>
<td class="data-td data last">ICUI</td>
<td class="data-td data last">Health Care</td>
<td class="data-td data last">1.33</td>
<td class="data-td data last">0.30</td>
</tr>
</tbody>
</table>
</div>
<br />
<div class="wrapped-div">
<table style="width: 750px;">
<tbody>
<tr class="tbl-data">
<td class="tbl-header last" colspan="5">Leading Detractors</td>
</tr>
<tr class="tbl-data">
<td class="data-td  last">Name</td>
<td class="data-head last">Ticker</td>
<td class="data-head last">Sector</td>
<td class="data-head last">Avg. Weight</td>
<td class="data-head last">Contribution (%)</td>
</tr>
<tr class="tbl-data">
<td class="data-td last" style="font-weight: normal;">Baxter International Inc</td>
<td class="data-td data last">BAX</td>
<td class="data-td data last">Health Care</td>
<td class="data-td data last">1.22</td>
<td class="data-td data last">-0.13</td>
</tr>
<tr class="tbl-data">
<td class="data-td last" style="font-weight: normal;">Kellogg Co</td>
<td class="data-td data last">K</td>
<td class="data-td data last">Consumer Staples</td>
<td class="data-td data last">1.30</td>
<td class="data-td data last">-0.05</td>
</tr>
<tr class="tbl-data">
<td class="data-td last" style="font-weight: normal;">Sirius XM Holdings Inc</td>
<td class="data-td data last">SIRI</td>
<td class="data-td data last">Communication Services</td>
<td class="data-td data last">1.27</td>
<td class="data-td data last">-0.01</td>
</tr>
<tr class="tbl-data">
<td class="data-td last" style="font-weight: normal;">Zimmer Biomet Holdings Inc</td>
<td class="data-td data last">ZBH</td>
<td class="data-td data last">Health Care</td>
<td class="data-td data last">1.41</td>
<td class="data-td data last">-0.00</td>
</tr>
<tr class="tbl-data">
<td class="data-td last" style="font-weight: normal;">Tyler Technologies</td>
<td class="data-td data last">TYL</td>
<td class="data-td data last">Information Technology</td>
<td class="data-td data last">0.59</td>
<td class="data-td data last">0.00</td>
</tr>
</tbody>
</table>
</div>
<br />
<p class="chart-disclosure"><strong>Source: Morningstar. As of 1/31/2023</strong>. Past performance is no guarantee of future results. Not intended as a recommendation to buy or sell any of the securities mentioned herein.</p>
<p><a href="/link/589a2bc95c5d48988a7fd0d679aec241.aspx" title="SMOT - VanEck Morningstar SMID Moat ETF - Overview"><strong>VanEck Morningstar SMID Moat ETF (SMOT)</strong></a> seeks to track as closely as possible, before fees and expenses, the price and yield performance of the Morningstar US Small-Mid Cap Moat Focus Index.</p>
<p>To receive more <a href="https://www.vaneck.com/us/en/insights/moat-investing/" title="Moat Investing Insights"><strong>Moat Investing</strong></a> insights, <a href="https://www.vaneck.com/us/en/subscribe/" title=" Subscription Center"><strong>sign up in our subscription center</strong></a>.</p>
<style type="text/css">
    .wrapped-div {
        max-width: 100%;
    }

    @media (max-width: 1240px) {
        .wrapped-div {
            overflow-x: scroll;
        }


    }
</style>
]]></content:encoded>
</item><item rdf:about="https://www.vaneck.com/us/en/blogs/moat-investing/moat-stocks-take-early-lead-in-2023/">
  <title>Moat Stocks Take Early Lead in 2023></title>
  <link>https://www.vaneck.com/us/en/blogs/moat-investing/moat-stocks-take-early-lead-in-2023/</link>
  <description><![CDATA[Optimism about a soft landing and slowing interest rate hikes spurred a market rally. The Morningstar Wide Moat Focus Index started the year with its strongest January since inception.]]></description>
  <dc:creator>Coulter Regal, CFA</dc:creator>
  <dc:date>02/08/2023 06:30:00</dc:date>
<content:encoded><![CDATA[

<p>U.S. stock market indices started off the year notably strong as investors were quick to put a bruising 2022 in the rear view. Confidence that interest rates may be nearing their ultimate level and increasing probability of a soft-landing for the economy has boosted stocks, particularly growth segments of the market. The technology focused Nasdaq Composite Index jumped nearly 11% in January, its best start to a year since 2001. However, some would caution that there is still some ways to go in bringing inflation down to the Federal Reserve&rsquo;s target range and that the current market narrative could prove to be a bit rosy.</p>
<p>The <strong><a href="/link/9f629c73a31846bb9e480b95e2c7f330.aspx" title="MOAT - VanEck Morningstar Wide Moat ETF - Index">Morningstar<sup>&reg;</sup>&nbsp;Wide Moat Focus Index<sup>SM</sup></a> </strong>(the &ldquo;Moat Index&rdquo; or &ldquo;Index&rdquo;) also started the year off strong&mdash;its strongest start to a new year ever, actually&mdash;with its best January since its inception in 2007. The Moat Index was up 11.8% for the month, outpacing the S&amp;P 500 Index and even the Nasdaq Composite Index, which returned 6.3% and 10.7% during the same period, respectively.</p>
<p>The Moat Index&rsquo;s outperformance in January, relative to the S&amp;P 500 Index, was driven primarily by <strong><a href="https://www.vaneck.com/us/en/blogs/moat-investing/moat-investing-powered-by-morningstar/" title="Ditch Style Biases. Choose Stock Selection">strong stock selection</a></strong>. This should not be a surprise to the studious readers of this blog, as stock selection has often been highlighted as a notable contributor to relative performance for the Moat Index. This phenomenon is owed to Morningstar&rsquo;s forward-looking and rigorous equity research process, fueled by over 100 analysts, which plays a major role as the inputs driving the investment selections of the Moat Index. Details on the specific companies driving performance during the month are noted in the tables below.</p>
<div class="wrapped-div">
<table style="width: 750px;">
<tbody>
<tr class="tbl-data">
<td class="tbl-header last" colspan="4">Top 5 Moat Index Contributors in January</td>
</tr>
<tr class="tbl-data">
<td class="tbl-header last" style="text-align: left;">Company</td>
<td class="tbl-header last" style="text-align: center;">Ticker</td>
<td class="tbl-header last" style="text-align: center;">Average Weight (%)</td>
<td class="tbl-header last" style="text-align: center;">Return Contribution (%)</td>
</tr>
<tr class="tbl-data">
<td class="data-td data last" style="text-align: left;">MercadoLibre Inc</td>
<td class="data-td data last" style="text-align: center;">MELI</td>
<td class="data-td data last" style="text-align: center;">2.68</td>
<td class="data-td data last" style="text-align: center;">0.94</td>
</tr>
<tr class="tbl-data">
<td class="data-td data last" style="text-align: left;">Salesforce Inc</td>
<td class="data-td data last" style="text-align: center;">CRM</td>
<td class="data-td data last" style="text-align: center;">2.52</td>
<td class="data-td data last" style="text-align: center;">0.64</td>
</tr>
<tr class="tbl-data">
<td class="data-td data last" style="text-align: left;">TransUnion</td>
<td class="data-td data last" style="text-align: center;">TRU</td>
<td class="data-td data last" style="text-align: center;">2.48</td>
<td class="data-td data last" style="text-align: center;">0.60</td>
</tr>
<tr class="tbl-data">
<td class="data-td data last" style="text-align: left;">Meta Platforms Inc Class A</td>
<td class="data-td data last" style="text-align: center;">META</td>
<td class="data-td data last" style="text-align: center;">2.50</td>
<td class="data-td data last" style="text-align: center;">0.56</td>
</tr>
<tr class="tbl-data">
<td class="data-td data last" style="text-align: left;">The Walt Disney Co</td>
<td class="data-td data last" style="text-align: center;">DIS</td>
<td class="data-td data last" style="text-align: center;">2.34</td>
<td class="data-td data last" style="text-align: center;">0.54</td>
</tr>
</tbody>
</table>
</div>
<br />
<div class="wrapped-div">
<table style="width: 750px;">
<tbody>
<tr class="tbl-data">
<td class="tbl-header last" colspan="4">Bottom 5 Moat Index Contributors in January</td>
</tr>
<tr class="tbl-data">
<td class="tbl-header last" style="text-align: left;">Company</td>
<td class="tbl-header last" style="text-align: center;">Ticker</td>
<td class="tbl-header last" style="text-align: center;">Average Weight (%)</td>
<td class="tbl-header last" style="text-align: center;">Return Contribution (%)</td>
</tr>
<tr class="tbl-data">
<td class="data-td data last" style="text-align: left;">Emerson Electric Co</td>
<td class="data-td data last" style="text-align: center;">EMR</td>
<td class="data-td data last" style="text-align: center;">2.55</td>
<td class="data-td data last" style="text-align: center;">-0.17</td>
</tr>
<tr class="tbl-data">
<td class="data-td data last" style="text-align: left;">3M Co</td>
<td class="data-td data last" style="text-align: center;">MMM</td>
<td class="data-td data last" style="text-align: center;">2.35</td>
<td class="data-td data last" style="text-align: center;">-0.10</td>
</tr>
<tr class="tbl-data">
<td class="data-td data last" style="text-align: left;">Kellogg Co</td>
<td class="data-td data last" style="text-align: center;">K</td>
<td class="data-td data last" style="text-align: center;">1.13</td>
<td class="data-td data last" style="text-align: center;">-0.05</td>
</tr>
<tr class="tbl-data">
<td class="data-td data last" style="text-align: left;">Gilead Sciences Inc</td>
<td class="data-td data last" style="text-align: center;">GILD</td>
<td class="data-td data last" style="text-align: center;">1.50</td>
<td class="data-td data last" style="text-align: center;">-0.04</td>
</tr>
<tr class="tbl-data">
<td class="data-td data last" style="text-align: left;">Zimmer Biomet Holdings Inc</td>
<td class="data-td data last" style="text-align: center;">ZBH</td>
<td class="data-td data last" style="text-align: center;">2.45</td>
<td class="data-td data last" style="text-align: center;">0.00</td>
</tr>
</tbody>
</table>
</div>
<br />
<p class="chart-disclosure"><strong>Source: Morningstar, January 2023.</strong> Past performance is no guarantee of future results. Index performance is not illustrative of fund performance. Not intended as a recommendation to buy or to sell any of the securities mentioned herein.</p>
<h2>Wide Moat Stock Highlights: MELI Leads, AAPL Joins Universe</h2>
<p><strong>MercadoLibre Inc. (MELI)<sup>1</sup></strong></p>
<p>Mercado Libre Inc. runs the largest e-commerce marketplace in Latin America, connecting a network of more than 140 million active users and over 1 million active sellers across an 18-country footprint. The company also operates a host of complementary businesses, with shipping solutions, a payment and financing operation, advertisements, classifieds and a turnkey e-commerce solution rounding out its arsenal. MELI generates revenue from final value fees, advertising royalties, payment processing, insertion fees, subscription fees and interest income from consumer and small-business lending. Morningstar attributes MELI&rsquo;s wide moat rating to their strong <strong><a href="https://www.vaneck.com/us/en/blogs/moat-investing/network-effect-a-proven-way-to-create-a-moat/" title="Network Effect: A Proven Way to Create a Moat">network effect</a></strong>, driven by a large pool of users on both sides of the marketplace (buyers and sellers), which encourages even more users to join the platform. This creates a positive feedback loop of better product selection, lower costs and greater user participation.</p>
<p>MELI was the top contributor to performance for the Moat Index in January following supportive forecasts for the e-commerce segment and reports of continued user growth on the platform. MELI&rsquo;s share price gained nearly 40% in January to end the month at about $1,150 per share, which puts the stock right at Morningstar&rsquo;s current estimate of fair value after having traded at a discount since the end of 2021.</p>
<p><strong>Apple Inc. (AAPL)<sup>2</sup></strong></p>
<p>Apple Inc., the well-known designer of a wide variety of popular consumer electronic devices and services, including smartphones (iPhone), tablets (iPad), PCs (Mac), smartwatches (Apple Watch) and AirPod, deserves a highlight, as Morningstar just recently upgraded the company&rsquo;s economic moat rating from narrow to wide. This means that after years of being ineligible for the Moat Index, due to its narrow moat rating, Apple is now joining the eligible universe of wide moat companies that can be selected for inclusion in the Moat Index. Morningstar&rsquo;s reasoning for the upgrade is noted below.</p>
<p><strong>Morningstar Analyst Note</strong>: Abhinav Davuluri, CFA, Strategist, 20 Jan 2023</p>
<p><i>We are upgrading our economic moat rating for Apple to wide from narrow, as we have greater confidence in the firm&rsquo;s competitive advantages stemming from high customer <strong><a href="https://www.vaneck.com/us/en/blogs/moat-investing/switching-costs-build-moats-and-retain-customers2/" title="Switching Costs Build Moats and Retain Customers">switching costs</a></strong>, <strong><a href="https://www.vaneck.com/us/en/blogs/moat-investing/intangible-assets-the-leading-source-of-moats2/" title="Intangible Assets: The Leading Source of Moats"> intangible assets</a></strong>, and network effects associated with its iOS ecosystem. We believe switching costs from iOS are as strong as ever thanks to more auxiliary products and services that make switching away from iOS more difficult over time. Regarding intangible assets, Apple&rsquo;s differentiated user experience via iOS coupled with its expertise in hardware, software and now semiconductor design allows the firm to build vertically integrated products more seamlessly. We also see network effects around iOS and its 1 billion-plus installed base with new app development favoring iOS.</i></p>
<p>While AAPL is now eligible for the Moat Index, to actually be selected for inclusion, it must also clear the hurdle of valuation, as only the top 40 most attractively valued U.S. wide moat companies make the cut each quarter. With Apple currently trading near Morningstar&rsquo;s $150 estimate of fair value, it may be a bit longer before the popular consumer electronics company makes it first appearance in the Moat Index.</p>
<p><strong><a href="https://www.vaneck.com/us/en/investments/morningstar-wide-moat-etf-moat/moat-reconstitution.pdf" title="Morningstar Wide Moat Focus Index Reconstitution" target="_blank" rel="noopener">VanEck Morningstar Wide ETF (MOAT)</a></strong> seeks to replicate as closely as possible, before fees and expenses the price and yield performance of the Morningstar Wide Moat Focus Index.</p>
<p><a href="https://www.vaneck.com/us/en/blogs/moat-investing/access-smid-cap-stocks-with-confidence/" title="Access SMID Cap Stocks with Confidence"><strong>Small- and mid-cap moat stocks</strong></a> also had a strong start to the year, with the <strong><a href="/link/c0c4da50e177415b9f750d3c0eea4e0a.aspx" title="SMOT - VanEck Morningstar SMID Moat ETF - Index">Morningstar US Small-Mid Cap Moat Focus Index</a></strong> actually outpacing the Morningstar Wide Moat Focus Index in January. <a href="/link/c0c4da50e177415b9f750d3c0eea4e0a.aspx" title="SMOT - VanEck Morningstar SMID Moat ETF - Index "><strong>VanEck Morningstar SMID Moat ETF (SMOT)</strong></a> provides exposure to small- and mid-cap companies with sustainable competitive advantages and attractive valuations.</p>
<p>To receive more <a href="https://www.vaneck.com/us/en/insights/moat-investing/" title="Moat Investing Insights"><strong>Moat Investing</strong></a> insights, <a href="https://www.vaneck.com/us/en/subscribe/" title=" Subscription Center"><strong>sign up in our subscription center</strong></a>.</p>
<style type="text/css">
    .wrapped-div {
        max-width: 100%;
    }

    @media (max-width: 1240px) {
        .wrapped-div {
            overflow-x: scroll;
        }


    }
</style>
]]></content:encoded>
</item><item rdf:about="https://www.vaneck.com/us/en/blogs/economic-trends/disinflation-lessons-postcards-from-em/">
  <title>Disinflation Lessons – Postcards from EM></title>
  <link>https://www.vaneck.com/us/en/blogs/economic-trends/disinflation-lessons-postcards-from-em/</link>
  <description><![CDATA[Central banks should be able to look through &ldquo;disinflation turbulence,&rdquo; but a bumpy data flow is a good excuse to stay on hold for longer, defying the market&rsquo;s dovish expectations.]]></description>
  <dc:creator>Natalia  Gurushina</dc:creator>
  <dc:date>02/08/2023 06:30:00</dc:date>
<content:encoded><![CDATA[

<h2>Bumpy Disinflation</h2>
<p><strong>A key lesson from emerging markets (EMs) in the current cycle is that early and aggressive rate hikes pave the way for successful disinflation</strong>. However, the price adjustment process can be &ldquo;turbulent&rdquo; &ndash; sometimes stalling before inflation returns to target (see chart below). January&rsquo;s huge upside surprise in the Philippines startled the market yesterday. Another &ldquo;yellow flag&rdquo; came from Chile this morning, where January&rsquo;s sequential inflation was also higher than expected. The consensus sees inflation upticks in Brazil and Mexico, as well as in Hungary and the Czech Republic, partly due to regulated price adjustments (which usually occur early each year). Another consideration is that if energy and food prices continue to normalize, governments will be withdrawing fiscal support (price subsidies), which can add to price pressures later this year, potentially offsetting the impact of the 2022 high base effect.</p>
<h2>Outlook For EM Rate Cuts</h2>
<p><strong>Disinflation &ldquo;yellow flags&rdquo; </strong>are not the end of the world &ndash; as long as the price moderation trend holds. So, in theory, <strong>central banks should be able to look through such data &ldquo;turbulence.&rdquo;</strong> But this is also an excuse to keep the policy rate higher for longer &ndash; especially if China&rsquo;s rebound improves the EM growth outlook at the margin. The latter might be particularly important for EM Asia, given the strength of economic and financial ties with China. Actually, some regional central banks should probably tighten a bit more. India raised its policy rate by 25bps today, and the market continues to price in another hike because the tone of the statement was decidedly hawkish. The scary Philippine inflation print means that the next week&rsquo;s rate hike is a done deal (and it might not be the last one).</p>
<h2>Market Expectations For EM</h2>
<p><strong>Central banks in emerging Europe also sound more hawkish than the market expectations</strong>. The Czech national bank indicated that rate cuts were not imminent a few days ago. The Hungarian national bank stated that it needs to see a sustained improvement in the balance of risks before contemplating rate cuts. Even the perpetually dovish Polish central bank warned that the return to the target would be gradual (which can limit room for easing this year). Credible and cautious central banks are the first line of defense for EM debt &ndash; high real interest rates are why the more hawkish U.S. Federal Reserve might be less of a driver for EM in the coming months compared to the Euro of the Japanese Yen. Stay tuned!</p>
<h3>Chart at a Glance: Inflation Return to Target &ndash; Slow Progress in Many Places</h3>
<p><img class="img-responsive w-100" src="https://www.vaneck.com/contentassets/bcb4ad4fbf3d4543b1d08ea2677e5e55/us-natalias-take-2023-02-08.png" alt="Chart at a Glance: Inflation Return to Target - Slow Progress in Many Places" /></p>
<p class="chart-disclosure">Source: Bloomberg LP.</p>
]]></content:encoded>
</item><item rdf:about="https://www.vaneck.com/us/en/blogs/digital-assets/matthew-sigel-small-cap-crypto-outperforms-as-risk-appetite-returns/">
  <title>Small-Cap Crypto Outperforms as Risk Appetite Returns></title>
  <link>https://www.vaneck.com/us/en/blogs/digital-assets/matthew-sigel-small-cap-crypto-outperforms-as-risk-appetite-returns/</link>
  <description><![CDATA[Small-Caps stood out amid the January digital assets rally, as emerging markets powered crypto gains to start the year strong.]]></description>
  <dc:creator>Matthew  Sigel</dc:creator>
  <dc:date>02/07/2023 06:30:00</dc:date>
<content:encoded><![CDATA[

<p><strong>Please note that VanEck may have a position(s) in the digital asset(s) described below.</strong></p>
<p>Digital assets rallied sharply in January after the Bitcoin price registered the most severe oversold condition ever. Risk appetite rebounded as inflation fell, the dollar fell, and bonds rallied. For the month, the Nasdaq composite rose 11%, <strong>Bitcoin</strong> +39%, and <strong>Ethereum</strong> +33%. Small-cap crypto assets rallied even more.</p>
<p>We noted last month that Bitcoin&rsquo;s 30-day volatility was abnormally low and likely to mean revert. We highlighted four positive and four negative catalysts. Two of our four negative catalysts appear off the table for now, with the Genesis standalone bankruptcy and CFIUS approving Binance&rsquo;s acquisition of $1B of Voyager customer assets. On the positive side, we had been expecting momentum in the Middle East, which materialized in the form of the largest ever Bitcoin mining project in the region (250MW, $400M0, a joint venture involving publicly traded Marathon Digital in Abu Dhabi). We expect Saudi to follow later this year as crypto licenses may be granted alongside the setup of <strong><a href="https://www.vaneck.com/us/en/blogs/emerging-markets-equity/saudi-arabia-a-rising-investment-destination/" title="Saudi Arabia: A Rising Investment Destination">special economic zones</a></strong>.</p>
<p>We also recently highlighted the <strong><a href="https://www.vaneck.com/us/en/blogs/digital-assets/matthew-sigel-vitalik-unveils-2023-wishlist-as-ethereums-outperformance-continues/" title="Vitalik Unveils 2023 Wishlist as Ethereum's Outperformance Continues">high correlation between RMB strength and the Bitcoin price</a></strong>, which has persisted amidst China&rsquo;s economic rebound. US-based investors seem keenly aware that money supply growth has stagnated stateside. However, global money supply has re-accelerated, driven by Asia, home to six of the top 10 countries on Chainalysis&rsquo; crypto adoption index. Indeed, Bitcoin price returns in January were much more robust during Asia trading hours than U.S. or European, perhaps evidence that liquidity in the region is finding Bitcoin and other digital assets.</p>
<h3>Global Money Supply Growth Re-Accelerated&mdash;but Not in the U.S.</h3>
<p><img class="img-responsive w-100" src="https://www.vaneck.com/contentassets/4b90a7afada24b148b898f7b7d3a0001/2789_scl_chart-01_2023.02_v1_blog.svg" alt="Global Money Supply Growth Re-Accelerated-but Not in the U.S." /></p>
<p class="chart-disclosure">Source: Bloomberg as of 1/26/2023.</p>
<div class="wrapped-div">
<table style="width: 600px;">
<tbody>
<tr class="tbl-data">
<td class="tbl-header last" style="text-align: center;">&nbsp;</td>
<td class="tbl-header last" style="text-align: center;">Market Cap</td>
<td class="tbl-header last" style="text-align: center;">30 days</td>
<td class="tbl-header last" style="text-align: center;">90 days</td>
<td class="tbl-header last" style="text-align: center;">365 days</td>
</tr>
<tr class="tbl-data">
<td class="data-td last">Infrastructure</td>
<td class="data-td data last">$8.3B</td>
<td class="data-td data last">+44%</td>
<td class="data-td data last">+2%</td>
<td class="data-td data last">-55%</td>
</tr>
<tr class="tbl-data">
<td class="data-td last">Exchange</td>
<td class="data-td data last">$21.5B</td>
<td class="data-td data last">+28%</td>
<td class="data-td data last">-9%</td>
<td class="data-td data last">-31%</td>
</tr>
<tr class="tbl-data">
<td class="data-td last">BTC</td>
<td class="data-td data last">$448B</td>
<td class="data-td data last">+39%</td>
<td class="data-td data last">+13%</td>
<td class="data-td data last">-40%</td>
</tr>
<tr class="tbl-data">
<td class="data-td last">ETH</td>
<td class="data-td data last">$195B</td>
<td class="data-td data last">+33%</td>
<td class="data-td data last">+1%</td>
<td class="data-td data last">-41%</td>
</tr>
<tr class="tbl-data">
<td class="data-td last">Defi</td>
<td class="data-td data last">$9.2B</td>
<td class="data-td data last">+51%</td>
<td class="data-td data last">+1%</td>
<td class="data-td data last">-54%</td>
</tr>
<tr class="tbl-data">
<td class="data-td last">Smart Contracts</td>
<td class="data-td data last">$254B</td>
<td class="data-td data last">+52%</td>
<td class="data-td data last">-6%</td>
<td class="data-td data last">-61%</td>
</tr>
<tr class="tbl-data">
<td class="data-td last">Metaverse</td>
<td class="data-td data last">$6.6B</td>
<td class="data-td data last">+80%</td>
<td class="data-td data last">0%</td>
<td class="data-td data last">-77%</td>
</tr>
</tbody>
</table>
</div>
<br />
<p class="chart-disclosure">Source: Bloomberg, MVIS as of 1/31/2023.</p>
<p class="chart-disclosure">Past performance is not indicative of future results. Not a recommendation to buy or sell any of the names mentioned herein.</p>
<h2>Smart Contract Platforms:</h2>
<p>January saw a broad rebound in token prices across the layer 1 blockchain landscape alongside improved fundamental metrics. Compared to the month of December, important indicators of blockchain usage and profitability, such as Daily Active Addresses and Monthly Revenues were up 11% and 44.7% across all blockchains we track. The top price performers of the month included <strong>Aptos</strong>, <strong>Solana</strong>, and <strong>Near,</strong> whose trailing 30-Day returns were 419%, 144%, and 88%, respectively. Amongst the winners, Solana and Near saw significant month-to-month increases in usership, with Solana's Daily Active Addresses up 45% while Near&rsquo;s were up 38%. Price increases also came amid several sustained short squeezes, particularly in Aptos and Solana, which saw the short interest costs approach nearly 100% and 300%, respectively, on an annual basis.</p>
<p>The weakest performers included <strong>Cosmos</strong>, <strong>Ethereum,</strong> and <strong>BNB,</strong> whose gains were 42%, 33%, and 25%, respectively. The price action in Cosmos can be attributed to community disappointment amid the lack of progress toward implementing its value accrual mechanism called ICS (interchain security). On the other hand, Ethereum&rsquo;s price action likely relates to improved risk appetite pushing participants further out the risk curve. Ethereum Daily Active Addresses fell 10% during the month. Binance&rsquo;s BNB token also underperformed as lackluster fee growth (2%) and a 23% drop in Daily Active Addresses marked it as one of the only L1 protocols without improving on-chain fundamentals for the month of January.</p>
<p>In terms of aggregate fees, Ethereum has continued to dominate the market since the Merge (September 15, 2022). In the month following the merge, Ethereum took an average share of 75% of all layer 1 blockchain fees; in January 2023, ETH accounted for 86% of fees. This paradigm not only reflects Ethereum's strength but also shows the relative economic decline of competing L1s due to the cheapness of Ethereum block space and the rise of Ethereum L2s. Binance was a distant second in January with 12% of all fees, while Solana took third place with 0.84% of all fees.</p>
<h3>Layer 1 Monthly Fee Growth</h3>
<p><img class="img-responsive w-100" src="https://www.vaneck.com/contentassets/4b90a7afada24b148b898f7b7d3a0001/2789_scl_chart-03_2023.02_v1_blog.svg" alt="Layer 1 Monthly Fee Growth" /></p>
<p class="chart-disclosure">Source: Artemis as of 1/31/2023.</p>
<p class="chart-disclosure">Past performance is not indicative of future results. Not a recommendation to buy or sell any of the names mentioned herein.</p>
<h3>Change in Monthly Average Daily Active Users</h3>
<p><img class="img-responsive w-100" src="https://www.vaneck.com/contentassets/4b90a7afada24b148b898f7b7d3a0001/2789_scl_chart-04_2023.02_v1_blog.svg" alt="Change in Monthly Average Daily Active Users" /></p>
<p class="chart-disclosure">Source: Artemis as of 1/31/2023.</p>
<p class="chart-disclosure">Past performance is not indicative of future results. Not a recommendation to buy or sell any of the names mentioned herein.</p>
<h3>Market Share of Revenues of Layer 1 Blockchains, Post Ethereum Merge</h3>
<p><img class="img-responsive w-100" src="https://www.vaneck.com/contentassets/4b90a7afada24b148b898f7b7d3a0001/2789_scl_chart-05_2023.02_v1_blog.svg" alt="Market Share of Revenues of Layer 1 Blockchains, Post Ethereum Merge" /></p>
<p class="chart-disclosure">Source: Artemis as of 1/31/2023.</p>
<p class="chart-disclosure">Past performance is not indicative of future results. Not a recommendation to buy or sell any of the names mentioned herein.</p>
<p>When assessing L1 blockchains, it is important to consider if each chain generates more from transaction fees than it emits in inflationary token issuance. If blockchains were considered businesses, transaction fees would constitute revenues, whereas inflationary issuance would be expenses. This is because the main purpose of inflationary issuance is to pay validators for providing security. Thus, transaction fees, less issuance, would approximate profits. Two smart contract blockchains can currently be considered profitable &ndash; Binance Smart Chain (BNB) and Ethereum (ETH). On the other hand, none of the other major chains are even close to covering their security costs at current usage rates.</p>
<p>While <strong>Polkadot </strong>and Cosmos are technically Layer-0s whose tokens accrue value by means other than transaction revenue, the other noteworthy smart contract blockchains are far from covering their costs. The closest smart contract platform to achieving profitability is <strong>Fantom,</strong> whose security budget exceeds its revenue by ~$31.5M per year. Likewise, if we were to consider ROE (which we define as trailing 100-day fees, annualized, divided by current market cap), Fantom would also be the least unprofitable of the bunch, followed by Cardano. Cardano&rsquo;s relatively less negative ROE may explain why it maintains a high market capitalization, ~$13.5B, compared to its relatively small userbase, around 70k Daily Active Addresses. To extend the ROE argument further, it would appear that Cardano and Fantom are two chains that are nearest to profitability. As a result, they merit increased scrutiny as they could be &ldquo;sleeper&rdquo; picks for 2023 if either starts to gain momentum in user traction.</p>
<h3>Yearly Profits/Losses vs. ROE</h3>
<p><img class="img-responsive w-100" src="https://www.vaneck.com/contentassets/4b90a7afada24b148b898f7b7d3a0001/2789_scl_chart-06_2023.02_v1_blog.svg" alt="Yearly Profits/Losses vs. ROE" /></p>
<p class="chart-disclosure">Source: TokenTerminal as of 1/31/2023.</p>
<p class="chart-disclosure">Past performance is not indicative of future results. Not a recommendation to buy or sell any of the names mentioned herein.</p>
<h2>Metaverse:</h2>
<p>January price action finally brought some relief to metaverse investors as token prices soared across the board. <strong>Decentraland&rsquo;s MANA</strong> had the best monthly performance of the top virtual world tokens, notching a 150% gain in January, while <strong>APE</strong> and <strong>SAND</strong> appreciated 60% and 92%, respectively. MANA&rsquo;s lower, fully diluted valuation likely explains its outperformance as it is currently valued 25% lower than SAND despite a roughly equal number of daily users. Gaming tokens also rallied with the rest of the crypto market, with <strong>Treasure DAO&rsquo;s MAGIC</strong> recording a 153% gain in January. Treasure DAO has built a gaming ecosystem on <strong>Arbitrum</strong>. Their token&rsquo;s performance can be attributed to growing investor interest in dapps built on Ethereum scaling solutions and the DAO announcing that it would release 10 new games in 2023.</p>
<p>In previous newsletters, we highlighted that <strong>Yuga Labs</strong> would likely release new developments to prevent APE stakers from dumping their token rewards, and in January, they did that. In the middle of the month, Yuga Labs allowed <em>Bored Ape Yacht Club</em> and <em>Mutant Ape Yacht Club</em> holders to claim a &ldquo;Sewer Pass,&rdquo; which granted them access to a new mini-game coined &ldquo;Dookey Dash.&rdquo; Sewer Pass holders can play the game until February 8th, when the &ldquo;Summoning&rdquo; occurs. Few details have been released on the &ldquo;Summoning,&rdquo; but users anticipate they will likely be rewarded with an NFT that will have an important role in the Otherside metaverse. Since the Sewer Pass is tradable, holders could speculate on the value of the Summoning reward, and some have opted not to play and sold their Sewer Pass, which currently has a floor price of $3,800 on OpenSea. Yuga Labs also announced that their second metaverse demo or &ldquo;trip&rdquo; would be held in March.</p>
<p>NFT markets had an exceptional month, with trading volume up 41% month-over-month and multiple bullish announcements in the space. Last month it was announced that the DeGods and Y00ts NFT collections would migrate to Polygon, and we speculated that more successful collections would launch projects on different blockchains. This month, <em>Doodles </em>announced they would launch their second collection, <em>Doodles 2,</em> on <strong>Flow </strong>and cited that the ease of wallet creation and additional on-chain customizability warranted the decision. Setting up a self-custody wallet has repeatedly been identified as a major pain point for attracting Web2 users. With this move, <em>Doodles</em> hopes to garner wider adoption from non-crypto native users like the <em>NBA Top Shot</em> collection did, which has generated over $1 billion in trade volume. Other notable NFT announcements included PROOF Collective, the brand behind the <em>Moonbird </em>collection, signing a deal with Hollywood&rsquo;s United Talent Agency to help push the <em>Moonbird </em>brand into new markets, according to the project's founder, Kevin Rose. As the month ended, <em>Blockworks </em>reported that <strong>Amazon</strong> would launch a digital assets enterprise and release at least one NFT collection in collaboration with an artist in the spring. Finally, if you will be watching the upcoming NFL Super Bowl, be on the lookout for the Digi Daigaku commercial, as viewers will be able to scan a QR code in the commercial to mint a free Digi Dragon NFT.</p>
<h3>Small-caps Outperform: Gaming and Metaverse Token Performance</h3>
<p><img class="img-responsive w-100" src="https://www.vaneck.com/contentassets/4b90a7afada24b148b898f7b7d3a0001/2789_scl_chart-07_2023.02_v1_blog.svg" alt="Small-caps Outperform: Gaming and Metaverse Token Performance" /></p>
<p class="chart-disclosure">Source: VanEck, Coingecko as of 1/31/2023.</p>
<p class="chart-disclosure">Past performance is not indicative of future results. Not a recommendation to buy or sell any of the names mentioned herein.</p>
<p>To receive more <strong><a href="https://www.vaneck.com/us/en/insights/digital-assets/" title="Digital Assets Insights">Digital Assets</a></strong> insights, <strong><a href="https://www.vaneck.com/us/en/subscribe/" title="Subscription Center">sign up in our subscription center</a></strong>.</p>
<style type="text/css">
    .wrapped-div {
        max-width: 100%;
    }

    @media (max-width: 1240px) {
        .wrapped-div {
            overflow-x: scroll;
        }


    }
</style>
]]></content:encoded>
</item><item rdf:about="https://www.vaneck.com/us/en/blogs/economic-trends/great-expectations-reality-checks/">
  <title>Great Expectations – Reality Checks></title>
  <link>https://www.vaneck.com/us/en/blogs/economic-trends/great-expectations-reality-checks/</link>
  <description><![CDATA[The consensus has high expectations for China&rsquo;s growth drivers, but details are key for a sustainable rebound. The market expectation for EM disinflation hit a major bump in the Philippines.]]></description>
  <dc:creator>Natalia  Gurushina</dc:creator>
  <dc:date>02/07/2023 06:30:00</dc:date>
<content:encoded><![CDATA[

<h2>China Rebound</h2>
<p><strong>China&rsquo;s rebound is a major tailwind for emerging markets (EM) going forward</strong>, which can potentially offset the negative impact of the &ldquo;higher-for-longer&rdquo; policy rate in the U.S. (all eyes on the U.S. Federal Reserve Chairman Powell&rsquo;s revelations this afternoon). China&rsquo;s growth prospects might get an extra boost if the next set of credit aggregates (out any day now) will prove as good as the consensus expects it to be. Analysts see big sequential increases both in total social financing and the new yuan loans &ndash; above the multi-year seasonal ranges (China&rsquo;s state TV had already warned us about a big bank lending boost in January). Of course, details matter &ndash; better housing market proxies would show that the policy U-turn in the real estate is actually working and the growth rebound is on a firmer ground.</p>
<h2>EM Disinflation and Rate Cuts</h2>
<p><strong>Cautious central banks can also cushion EMs from global headwinds</strong> &ndash; especially when countries hit big bumps on the road to disinflation. A huge upside inflation surprise in the Philippines is a case in point. Headline inflation accelerated to 8.7% year-on-on-year in January - instead of moderating to 7.6% - pushing the peso to the bottom of the EM FX daily &ldquo;league table&rdquo;. The Philippines is the top-performing constituent of the J.P. Morgan&rsquo;s EM local debt index (GBI-EM) so far this year, and the central bank&rsquo;s credible response at its next rate-setting meeting (February 16) would be crucial for the continuation of this trend.</p>
<h2>LATAM Policy Noise</h2>
<p><strong>High real interest rates in EM is an argument for considering local bond exposure </strong>(see chart below), <strong>but Brazil&rsquo;s example shows that this might not be enough</strong>. President Lula is spending a lot of time these days attacking the central bank&rsquo;s independence and criticizing the high policy rate &ndash; and this is a reason why many investors prefer to stay on the sidelines (actually reinforcing the negative feedback loop linked to high yields, high interest costs, and a high debt/GDP ratio). A very high carry might entice tactical interest in the Brazilian real/local bonds during global risk-on episodes, but it is difficult to formulate a longer-term positive view on this asset against the backdrop of policy uncertainty (both fiscal and monetary) and elevated headline risks. Stay tuned!</p>
<h3>Chart at a Glance: Real Local Rates in EM and DM</h3>
<p><img class="img-responsive w-100" src="https://www.vaneck.com/contentassets/f5044454c2c44babab303a808fbf469c/us-natalias-take-2023-02-07.png" alt="Chart at a Glance: Real Local Rates in EM and DM" /></p>
<p class="chart-disclosure">Source: VanEck Research; Bloomberg LP.</p>
]]></content:encoded>
</item><item rdf:about="https://www.vaneck.com/us/en/blogs/economic-trends/hopes-for-hawks/">
  <title>Hopes for Hawks?></title>
  <link>https://www.vaneck.com/us/en/blogs/economic-trends/hopes-for-hawks/</link>
  <description><![CDATA[U.S. growth outperformance and the more hawkish Fed could be an obstacle to EM inflows, but there are strong EM tailwinds that are only beginning.]]></description>
  <dc:creator>Natalia  Gurushina</dc:creator>
  <dc:date>02/06/2023 16:00:00</dc:date>
<content:encoded><![CDATA[

<h2>Fed Policy Expectations</h2>
<p>Following the red-hot labor market report, the <strong>U.S. relative economic outperformance story is back in the limelight, challenging the rally in U.S. rates and a weaker dollar</strong>. The discrepancy between the report and the U.S. Federal Reserve&rsquo;s &ldquo;agnostic&rdquo; guidance at its last meeting is a reason why this week&rsquo;s Fed speak will be watched closer than usual. January is a tough month for the labor market assessment, due to various adjustments and seasonality (=a lot of noise), but Fed Funds Futures are now back to pricing in two 25bps rate hikes this year (and a smaller Q4 rate cut), leading to some profit taking in emerging markets (EM).</p>
<h2>EM Disinflation</h2>
<p>A more hawkish Fed might still be a more important headwind for Euro or JPY, while less of a driver for EM, because <strong>various EM central banks sound quite cautious and not in a rush to rate cuts</strong>. Reason #1 is that EM inflation expectations are still high and require hawkish &ldquo;nudging&rdquo; in order to bring them closer to targets. Besides, the process of disinflation can be very bumpy &ndash; especially in the beginning of the year, when many governments adjust regulated tariffs and make methodological changes. For example, Czech headline inflation is expected to jump by 5.8% month-on-month in January, temporarily reversing annual disinflation. Mexico&rsquo;s core and headline inflation are also expected to edge up in January, paving the way for a 25bps rate hike later this week. Brazil&rsquo;s disinflation appears to be stalling as well, justifying the decidedly hawkish message from the central bank (which apparently upset President Lula and his administration).</p>
<h2>Global Growth Outlook</h2>
<p>Reason #2 is that the <strong>EM growth outlook might not be as dire as was expected a few months ago</strong>. China&rsquo;s rebound is well underway, helping to lift the EM composite PMI (Purchasing Managers Index) further into expansion zone, and the Bloomberg consensus growth survey (we have 101 countries in our sample) shows more upgrades/fewer downgrades, compared to December (see chart below). Arguably, the China rebound factor might be more important than the more hawkish Fed in parts of EM with tighter financial and economic ties to China. So, the U.S. data is a possible headwind to global asset prices, but EM has strong tailwinds that are only beginning. Stay tuned!</p>
<h3>Chart at a Glance: Global Growth &ndash; Fewer Clouds on the Horizon</h3>
<img class="img-responsive w-100" src="https://www.vaneck.com/contentassets/7a05a02bfe624e85b3bc3674016afcbf/us-natalias-take-2023-02-06.png" alt="Chart at a Glance: Global Growth &ndash; Fewer Clouds on the Horizon" />
<p class="chart-disclosure">Source: VanEck Research; Bloomberg LP</p>
]]></content:encoded>
</item><item rdf:about="https://www.vaneck.com/us/en/blogs/investment-outlook/jan-van-eck-esg-died-in-2022/">
  <title>ESG Died in 2022: CEO Op-Ed></title>
  <link>https://www.vaneck.com/us/en/blogs/investment-outlook/jan-van-eck-esg-died-in-2022/</link>
  <description><![CDATA[As ESG enters the political realm, it&rsquo;s not a question of &ldquo;if&rdquo; we should have policies that restrict the voting shares of fund companies, but &ldquo;which one.&rdquo;]]></description>
  <dc:creator>Jan van Eck</dc:creator>
  <dc:date>02/06/2023 06:30:00</dc:date>
<content:encoded><![CDATA[

<p>&ldquo;The politicization of American investing just reached a new low,&rdquo; states Eric Pan, head of mutual fund and ETF industry organization ICI.<sup>1</sup>&nbsp;He was referring to Texas pushing back on fund companies that use environmental, social and governance (ESG) factors in their investment strategies and proxy voting. Politicians, Mr. Pan says, should stay out of the business of fund companies.</p>
<p>I disagree. Fund companies now own large percentages of U.S. corporations, and this concentration of power is absolutely a matter of public policy.</p>
<p>The success of index funds and ETFs has led to a few fund companies each owning 10% of many U.S. corporations, and sometimes their combined ownership exceeds 30%. Accordingly, fund companies can tell these investee companies what to do by voting proxies or electing directors who reflect their views. Larry Fink, the CEO of BlackRock, has been explicit in how he would push companies. In his 2018 letter, Fink wrote that companies needed to do more than make profits&mdash;they also needed to contribute to society to receive BlackRock&rsquo;s support.<sup>2</sup>&nbsp;With BlackRock&rsquo;s $10T+ of assets, this &ldquo;support&rdquo; Fink refers to could be interpreted as slightly more heavy handed than a gentle tap on the back.</p>
<p>It has been U.S. policy for 100 years to disperse concentrations of corporate power. In some cases, this has meant restricting anti-competitive practices or even breaking up companies, such as Standard Oil and AT&amp;T. In banking, regulatory oversight and restrictions are triggered for 25% owners to counteract the power of nationwide commercial banks. Securities laws have also required disclosure of <strong><i><u>all</u></i></strong> holdings of institutional investors (even if only 0.001%) or of any investor&rsquo;s ownership level over 5%.</p>
<p>Even in the recent, weak anti-trust era, prosecutors have reviewed concentrations of power and fair trade abuses. Thus, suggesting that politicians stay away from this issue of concentration of voting power is not only a mistake, it is also out of step with our multi-generational public policy of addressing concentrations of economic power. Rather, I think the asset management industry should engage with policymakers to suggest solutions.</p>
<p>Many commentators have worried about this concentration of power in index companies. Poignantly, fund industry titan John Bogle, the founder of Vanguard, wrote about this topic in his last WSJ piece before he passed away.<sup>3</sup>&nbsp;In his November 2018 column, Mr. Bogle offered a list of potential solutions. Some he ruled out as impractical, but most are worth reviewing.</p>
<p>Disclosure of index fund communications is a first potential solution. This would require "timely and full public disclosure by index funds of their voting policies and public documentation of each engagement with corporate managers." As the amount of interaction between proxy voters and company management has skyrocketed, Mr. Bogle&rsquo;s point about engagement is particularly important. However, calibrating which communication would be required seems difficult. Who would determine whether a policy was too abstract? Proxy voting policies including ESG policies are already disclosed, yet this hasn&rsquo;t restrained the exercise of power. At the other extreme, providing a transcript of every discussion would probably chill valuable interactions between companies and their owners.</p>
<p>Next, Mr. Bogle recommends "requir index funds to retain an independent supervisory board with full responsibility for all decisions regarding corporate governance." However, as he noted, this raises the question: would this really improve the existing oversight provided by independent fund directors?</p>
<p>Another idea is to "enact federal legislation making it clear that directors of index funds ... have a fiduciary duty to vote solely in the interest of the funds' shareholders." The problem with this solution is that it doesn't really add protection, and there is no mechanism to stop the politicization of proxy voters.</p>
<p>Mr. Bogle finally addresses my preferred solution of capping the percent of shares that any index fund company could vote of a portfolio company&rsquo;s voting shares&mdash;say, to 5%. The underlying philosophy of this cap is that shareholders who own funds that blindly follow index rules don&rsquo;t deserve the same input into governance as other owners. There is, of course, no magic to this number, and arguments could be made for a lower or higher number. The extra votes held by a fund company could be either not voted, or voted in proportion to those of other investors. Alternatively, the index fund company could create a mechanism to transfer voting rights back to their largest clients, as BlackRock has done.</p>
<p>Mr. Bogle didn&rsquo;t like this solution because he thought index funds were more deserving of corporate input than other shareholders. He saw index funds as desirable "long-term holders" and therefore presumably more virtuous. Other investors were, in his view, only "corporate stock renters.&rdquo; I believe this is an over-simplification&mdash;neither passive/index nor active investors are per se better than the other. Many index funds track indices with high levels of turnover, which means that many index funds are not long-term holders. It is also unlikely that index fund buyers consider, much less are driven by, a fund company&rsquo;s proxy policies. Index fund buyers are by definition buying baskets of stocks: why should they care about their input to specific companies? I don&rsquo;t think looking into the hearts and intentions of index and active shareholders is necessary for our purposes. Rather, we are trying to address the public policy issue of the aggregation of these proxy votes into power.</p>
<p>The last solution would be to break up the index companies. Such a draconian breakup raises a lot of structural issues of how to do this and might undo the lower fees that investors have enjoyed from competition among index fund companies.</p>
<p>The capping proposal tries to reasonably limit index funds without affecting active investors. Limiting an index company&rsquo;s vote to 5% of a company still respects the power of those index investors. 5% of a company is a lot.</p>
<p>The index capping solution also allows activist and other active investors to &ldquo;do their thing&rdquo;&mdash;launch takeovers and mergers, and conduct other types of proxy votes&mdash;just as before. It doesn&rsquo;t inhibit shareholder activism or even prevent index companies from voting along with activists.</p>
<p>Capping can also relieve politicians from having to micromanage the inherently subjective ESG policies<sup>4</sup>. For example, it was &ldquo;S&rdquo; and &ldquo;G&rdquo; that caused Tesla, one of the biggest &ldquo;E&rdquo; companies in the world, to fail to achieve a particular ESG ranking. According to the S&amp;P 500<sup>&reg;</sup>&nbsp;ESG Index, Tesla has a score of 22, the weakest ranking of the five U.S. auto companies in the index. S&amp;P pointed to Tesla&rsquo;s business conduct as justification for the lower score, identifying two separate events centered around claims of racial discrimination and poor working conditions at Tesla&rsquo;s Fremont factory. As another example, should proxy voters be directing whether a particular factory should be built, i.e., making the tradeoff between &ldquo;S&rdquo; (i.e., jobs) and &ldquo;E&rdquo; (i.e., the environment)? Whatever proxy voters decide, their power would be limited under the capping proposal.</p>
<p>In sum, like the trust companies and monopolies of old, some index fund companies have become too large to be left unchecked. Rather than pretending that large index ownership has no policy implications, the investment industry should engage with policymakers to find the best solution. Policies to address the concentration of corporate power are coming one way or another. Without this critical input from the asset management community, we&rsquo;ll be left without a seat at the table&mdash;and we may not like the outcome that the political system comes up with.</p>
<p>To receive more <a href="/us/en/insights/investment-outlook" title="Investment Outlook Insights"><strong>Investment Outlook</strong></a> insights, <a href="https://www.vaneck.com/us/en/subscribe/" title="Subscription Center"><strong>sign up in our subscription center</strong></a>.</p>
]]></content:encoded>
</item><item rdf:about="https://www.vaneck.com/us/en/blogs/economic-trends/central-banks-vs-noise/">
  <title>Central Banks vs. Noise></title>
  <link>https://www.vaneck.com/us/en/blogs/economic-trends/central-banks-vs-noise/</link>
  <description><![CDATA[The U.S. labor market report rattled the market, but some macro trends in EM are longer-lasting, including &ldquo;the mother of all base effects&rdquo;.]]></description>
  <dc:creator>Natalia  Gurushina</dc:creator>
  <dc:date>02/03/2023 16:30:00</dc:date>
<content:encoded><![CDATA[

<h2>U.S. Federal Reserve Outlook</h2>
<p>High-frequency economic indicators are usually quite noisy, but today&rsquo;s <strong>surprisingly strong U.S. labor market report is</strong> also <strong>a reminder that tail risks exist and that they should not be underestimated</strong> (especially if the market is in the status quo mode). The asset price knee-jerk reaction notwithstanding, Fed Funds Futures looked through the upside surprise &ndash; the last time we checked, the implied Fed peak rate was still expected to be under 5%, with about 40bps of rate cuts priced in for the second half of the year.&nbsp;</p>
<h2>Global Disinflation</h2>
<p>Emerging markets (EM) economic landscape is also full of noise, but <strong>some elements are less &ldquo;frothy&rdquo; &ndash; like China&rsquo;s reopening or &ldquo;the mother of all base effects&rdquo; in global inflation</strong>. The latter will be a major driver behind this year&rsquo;s disinflation, and Turkey is a great example that shows that effect in action. Turkey&rsquo;s monthly sequential inflation jumped by 6.65% in January (it was an upside surprise, but annual inflation went down another leg (see chart below). We think that the high base effect will become more pronounced in Central Europe, helping to return headline inflation back to single digits later this year. The question is whether this would be enough to entice the regional central banks to cut rates. The latest policy signals were more hawkish than we expected &ndash; even in the Czech Republic, where the dovish overhaul of the national bank&rsquo;s board raised concerns in the summer.</p>
<h2>Brazil Rate Cuts</h2>
<p>Another trend that &ndash; unfortunately &ndash; might last for a long time is <strong>Brazilian President Luiz In&aacute;cio Lula da Silva&rsquo;s (Lula&rsquo;s) obsession with the central bank&rsquo;s independence</strong> (Mr. President elaborated on the topic once again in his interview yesterday). As far as the market is concerned, 90s band No Doubt may offer the best advice in their song "Don&rsquo;t Speak" (&ldquo;Don't speak; I know what you're thinkin'; I don't need your reasons; Don't tell me 'cause it hurts&rdquo;). But a singalong is not a policy option for the Brazilian central bank. Such statements alter the available policy space, forcing the board to remain hawkish for longer, despite successful disinflation, sky-high real interest rates and the deteriorating growth outlook. Higher rates translate into larger fiscal outlays for debt service, slowing the fiscal adjustment, pushing the debt/GDP ratio up and scaring investors away. Stay tuned!&nbsp;</p>
<h3>Chart at a Glance: Turkey Inflation &ndash; High Base Effect in Action</h3>
<img class="img-responsive w-100" src="https://www.vaneck.com/contentassets/a25ca6040c3c4303bcc1375b78b19316/us-natalias-take-2023-02-03.png" alt="Chart at a Glance: Turkey Inflation &ndash; High Base Effect in Action" />
<p class="chart-disclosure">Source: Bloomberg LP</p>
]]></content:encoded>
</item><item rdf:about="https://www.vaneck.com/us/en/blogs/natural-resources/the-top-five-reasons-to-invest-in-the-resource-transition/">
  <title>Five Reasons to Invest in the Resource Transition></title>
  <link>https://www.vaneck.com/us/en/blogs/natural-resources/the-top-five-reasons-to-invest-in-the-resource-transition/</link>
  <description><![CDATA[The resource transition continues to progress as financing, climate goals and consumer demand drive the shift towards a more sustainable economy.]]></description>
  <dc:creator>VanEck </dc:creator>
  <dc:date>02/02/2023 06:30:00</dc:date>
<content:encoded><![CDATA[

<p>The resource transition spans the entire natural resource sector and includes the energy, mining, agriculture and land use industries. In this quarterly series, we are exploring how this global shift is driving investment opportunities. In each succeeding quarter, we will be updating the major themes that we observe as they continue to evolve.</p>
<h2>1. Ever-Growing Climate Ambitions</h2>
<p>Countries and companies are setting progressively more ambitious climate goals which will support substantial investment into the sectors driving the resource transition. Over 70 countries have pledged net zero greenhouse gas (GHG) targets, including the U.S., Europe and China, which together account for more than 75% of global emissions.<sup>1</sup>&nbsp;In the private sector, over a third of the world&rsquo;s largest companies have a set goal to reach net zero by 2050.<sup>2</sup>&nbsp;Financial actors have also stepped up their climate commitments, including the establishment of the Glasgow Financial Alliance for Net Zero (GFANZ), a global coalition whose members have pledged to transition the emissions of their financed portfolios to net zero by 2050.<sup>3</sup></p>
<p>As climate goals ramp up, the investment to reach them will need to grow. The International Renewable Energy Agency (IRENA) estimates that $131 trillion in cumulative investment is needed to reach net zero by 2050, up from their $110 trillion projection in 2021.<sup>4</sup></p>
<h3>$131 Trillion Total Investment Needed To Achieve Net-Zero by 2050<sup>*</sup></h3>
<p><strong>2020 vs. 2021 Cumulative Investment Projections</strong></p>
<p><img loading="lazy" class="img-responsive w-100" src="https://www.vaneck.com/contentassets/8db9af5a53a04810af4b79a42dccea89/2777_top-five-reasons_chart_01_2023.02_v1_blog.svg" alt=" $131 Trillion Total Investment Needed To Achieve Net-Zero by 2050" /></p>
<p class="chart-disclosure">Source: IRENA. Data as of April 2020 and June 2021.</p>
<p class="chart-disclosure"><sup>*</sup>&nbsp;Projections per IRENA&rsquo;s &rdquo;Transforming Energy Scenario&rdquo;&mdash;an energy transformation pathway based largely on renewable energy sources and steadily improved energy efficiency (though not limited exclusively to these technologies). This would set the energy system on the path needed to keep the rise in global temperatures to well below 2 degree Celsius (&deg;C) and towards 1.5&deg;C during this century.</p>
<h2>2. Government Funding: A Green Catalyst</h2>
<p>In Europe, the Green Deal is expected to mobilize more than &euro;1 trillion towards the resource transition in the coming decade as it aims to make the continent the first to achieve net zero greenhouse gas emissions by 2050.<sup>5</sup>&nbsp;The EU has set an intermediate goal of reducing emissions by 55% by 2030 (from 1990 levels) and has passed a set of policies called Fit for 55 to work towards this target.<sup>6</sup>&nbsp;The UK has also set a net zero by 2050 goal under its Climate Change Act.<sup>7</sup></p>
<p>In the U.S., the funding provided by the Inflation Reduction Act (IRA) is a <strong><a href="https://www.vaneck.com/us/en/blogs/sustainable-investing/the-inflation-reduction-act-a-green-catalyst/sustainability-monthly-the-inflation-reduction-act.pdf" title="The Inflation  Reduction Act:  Accelerating the  Energy Transition  in the U.S." target="_blank" rel="noopener">critical catalyst</a></strong> that will accelerate the development of the resource transition sector. The IRA provides close to $400 billion in tax credits and infrastructure funding in the next decade,<sup>8</sup>&nbsp;which will enhance the economic viability of, and amplify the investment opportunities in, industries across the resource transition ecosystem in the U.S.</p>
<ul class="content-list">
<li>Double the Headline Figures: While the headline figures for the spending included in the IRA are significant, the uncapped nature of the tax credits means that the total public spending could likely reach double the figures. The federal spending will likely catalyze private investment, which may send total climate spending to well over roughly $1.7 trillion over the next decade.<sup>9</sup></li>
</ul>
<h2>3. Company Opportunities Across the Resource Transition Ecosystem</h2>
<p>Opportunities to invest in companies managing their environmental impact, internally and externally: The investment team for the VanEck<a href="/link/2ed6209aa9674070b56e86addc947db6.aspx" title="GHAAX - Global Resources Fund - Class A - Overview"><strong> Global Resources</strong></a>&nbsp;can identify companies that are managing their own environmental impact whilst enabling sustainable development globally.</p>
<ul class="content-list">
<li>Spotlight on Equinor<sup>10</sup>: Historically a traditional energy company, <a href="https://www.vaneck.com/us/en/blogs/natural-resources/equinor-profitability-on-the-way-to-net-zero-starting-now/" title="Equinor: Profitability on the Way to Net Zero... Starting Now!"><strong>Equinor</strong></a> is transforming itself to support and accelerate the energy transition and ensure a competitive and resilient business model in line with the Paris Agreement. It is working to reduce emissions from its oil and gas production, expanding its wind and solar capacity and developing low-carbon solutions, including hydrogen and carbon capture, utilization and storage (CCUS) on an industrial scale.<sup>11</sup></li>
<li>Spotlight on Nouveau Monde<sup>12</sup>: The graphite producer is working towards developing carbon-neutral graphite materials. The company aims to supply to the world&rsquo;s leading battery and automotive manufacturers while promoting sustainability and supply chain traceability within its own business model.<sup>13</sup></li>
</ul>
<h2>4. Made in America: U.S. Poised as the Leading Clean Energy Provider</h2>
<p>Already the largest traditional energy producer,<sup>14</sup>&nbsp;the runway of federal funding combined with the existing competitive advantage of low-carbon energy make the U.S. well-positioned to become a global leader in the clean energy sector.</p>
<ul class="content-list">
<li>The IRA &ndash; Unlocking Opportunities Across the Clean Energy Supply Chain: The funding from the IRA will unlock opportunities for the U.S. to become an exporter of clean energy technology and infrastructure. These opportunities span the clean energy supply chain, beginning with the mining of critical minerals for renewable energy technologies, to the generation of renewable energy from solar modules and wind turbines, to the transportation and storage using battery technologies, all the way to the sequestration of emissions with CCUS.</li>
</ul>
<h3>The Inflation Reduction Act Will Accelerate Clean Energy Investment in the U.S.</h3>
<p><strong>Annual Capital Invested in Energy Supply Related Infrastructure </strong></p>
<p><img loading="lazy" class="img-responsive w-100" src="https://www.vaneck.com/contentassets/8db9af5a53a04810af4b79a42dccea89/2777_top-five-reasons_chart_03_2023.02_v1_blog.svg" alt="The Inflation Reduction Act Will Accelerate Clean Energy Investment in the U.S." /></p>
<p class="chart-disclosure">Source: Princeton University. Data as of August 2022.</p>
<h2>5. Supply Chain Risks Necessitate a Diversified Natural Resources Portfolio</h2>
<p>Supply chains for materials involved in the resource transition face numerous risks, including volume shortages, price volatility and geographical sourcing dependency.<sup>15</sup>&nbsp;In the U.S., the number of critical minerals needed to meet the projected increase in demand for renewable energy technologies cannot be mined with current capacity. Globally, Russia&rsquo;s invasion of Ukraine has resulted in a spike in energy and food prices. Supply chain risks underscore the importance of having a diversified natural resources portfolio while the resource transition powers forward.</p>
<h2>An Active Approach &ndash; Expertise in an Ever-Evolving Environment</h2>
<p><strong>Technical and Financial Expertise Provide Key Insight into Investment Opportunities</strong></p>
<p>The investment team for the VanEck <a href="/link/2ed6209aa9674070b56e86addc947db6.aspx" title="GHAAX - Global Resources Fund - Class A - Overview"><strong>Global Resources</strong></a>&nbsp;has extensive experience in traditional commodities. The investment team includes trained geologists and engineers as well as senior analysts with deep sector experience. Further, the investment team has extensive experience investing in companies in the natural resources sector. Taken together, this technical and financial expertise lends itself well to the investment team having key insights into the risks and opportunities as the sector shifts towards sustainability, not least to meet regulatory mandates and to adapt to changing consumer preferences.</p>
<p><strong>Identifying the Winners: Opportunities to be Captured Across the Market Cap Spectrum</strong></p>
<p>The investment team for the VanEck <a href="/link/2ed6209aa9674070b56e86addc947db6.aspx" title="GHAAX - Global Resources Fund - Class A - Overview"><strong>Global Resources</strong></a>&nbsp;is able to identify and capitalize on the companies that are poised to benefit from the shift towards sustainable development. The strategy allows investors to access opportunities across the market cap spectrum, from innovative disruptor companies which may not be established enough to be captured by indices to well-established companies that are pivoting towards more sustainable business models.</p>
<p><strong>Engagement Drives an Active Approach</strong></p>
<p>The investment team&rsquo;s engagement with companies drives its active approach. The investment team engages with company management on an annual basis, and oftentimes more frequently, to discuss a company&rsquo;s environmental, social and governance risks, track-record and opportunities.</p>
<p>We highlight the most compelling reasons to invest in the resource transition and the expertise of the VanEck Global Resources and Environmental Sustainability investment team in accessing the opportunity presented by the multi-decade transition in its early beginnings. In future quarters, we will continue to explore the themes emerging from this global shift and how they are driving investment opportunities.</p>
<p>To receive more <a href="/us/en/insights/natural-resources/" title="Natural Resources Insights"><strong>Natural Resources</strong></a> insights, <a href="https://www.vaneck.com/us/en/subscribe/" title="Subscription Center"><strong>sign up in our subscription center</strong></a>.</p>
]]></content:encoded>
</item><item rdf:about="https://www.vaneck.com/us/en/blogs/economic-trends/agnostic-fed-bullish-em/">
  <title>“Agnostic” Fed = Bullish EM?></title>
  <link>https://www.vaneck.com/us/en/blogs/economic-trends/agnostic-fed-bullish-em/</link>
  <description><![CDATA[EM assets &ldquo;hi-fived&rdquo; the data-driven message from the U.S. Federal Reserve. Still, local policies can make a lot of difference &ndash; even during the &ldquo;everything rally&rdquo;.]]></description>
  <dc:creator>Natalia  Gurushina</dc:creator>
  <dc:date>02/02/2023 06:30:00</dc:date>
<content:encoded><![CDATA[

<h2>Fed Policy Outlook</h2>
<p>U.S. Federal Reserve (Fed) Chairman Jerome Powell&rsquo;s defense against the market&rsquo;s dovish expectations and easing monetary conditions at yesterday&rsquo;s press conference was not particularly convincing. <strong>The Fed&rsquo;s &ldquo;data-dependent&rdquo; message &ndash; and the mention of disinflation</strong> &ndash; pushed the implied peak rate below 4.9% and reaffirmed the expectation of rate cuts (about 50bps &ndash; see chart below) already this year, <strong>further supporting emerging markets (EM) assets</strong>. There are potential risks on both sides &ndash; a nasty recession in the U.S. could be risk-negative despite lower interest rates and slower disinflation would argue against rate cuts &ndash; but these scenarios might not disturb the status quo for some time.</p>
<h2>Risk-On Fed</h2>
<p>The <strong>&ldquo;everything rally&rdquo; lifts many boats, but a specific set of policies in EM can make a difference</strong> as well. The Brazilian central bank kept the policy rate on hold yesterday and issued a stark warning against the &ldquo;heightened uncertainty&rdquo; on the fiscal framework, which is pushing inflation projections away from the target (&ldquo;no rate cuts for you!&rdquo;). A combination of high carry, the hawkish (=credible) central bank, and the &ldquo;agnostic&rdquo; Fed lifted the Brazilian real to the top of the global FX &ldquo;league table&rdquo; in the morning trade. The Czech national bank also sounded cautious today, saying that the policy rate path might be higher than the market expects.</p>
<h2>Global Disinflation</h2>
<p><strong>EMs&rsquo; bumpy and noisy disinflation</strong> (especially in core prices) <strong>is a reason why various central banks are choosing to stay on the sidelines instead of rushing into rate cuts</strong>. The Czech national bank assumed a big inflation increase in January. South Korean inflation surprised to the upside in January, re-accelerating to 5.2% year-on-year. The forthcoming inflation releases in Thailand, Colombia and the Philippines will also be closely watched. These countries are well positioned to benefit from China&rsquo;s growth rebound &ndash; a major driver for EM assets in the coming months &ndash; but domestic policy agendas will determine whether this potential can be fully realized. Stay tuned!</p>
<h3>Chart at a Glance: Implied U.S. Federal Reserve Rate Cuts &ndash; EMs Are Watching</h3>
<p><img class="img-responsive w-100" src="https://www.vaneck.com/contentassets/a938e9b053de479ca54beb29a19d58b0/us-natalias-take-2023-02-02b.png" alt="Chart at a Glance: Implied U.S. Federal Reserve Rate Cuts - EMs Are Watching" /></p>
<p class="chart-disclosure">Source: Bloomberg LP.</p>
]]></content:encoded>
</item><item rdf:about="https://www.vaneck.com/us/en/blogs/economic-trends/rate-hikes-the-end-is-nigh/">
  <title>Rate Hikes – The End Is Nigh?></title>
  <link>https://www.vaneck.com/us/en/blogs/economic-trends/rate-hikes-the-end-is-nigh/</link>
  <description><![CDATA[EMs keep an eye on changes in the U.S. Federal Reserve&rsquo;s guidance, but domestic fundamentals &ndash; including the pace of disinflation and growth outlook &ndash; are just as important.]]></description>
  <dc:creator>Natalia  Gurushina</dc:creator>
  <dc:date>02/01/2023 06:30:00</dc:date>
<content:encoded><![CDATA[

<h2>Fed Rate Cuts</h2>
<p>The focus of the day is the U.S. Federal Reserve&rsquo;s (Fed&rsquo;s) rate-setting meeting. The U.S. data-flow &ndash; including below-consensus ADP employment change and the ISM survey &ndash; are supportive of a smaller +25bps move, but the main &ldquo;attraction&rdquo; will be the Fed&rsquo;s guidance. The market continues to price in rate cuts in 2023 (around 44bps), despite the fact that the Fed&rsquo;s message has been more hawkish. <strong>The market expectation of policy easing in emerging markets (EM) and developed markets (DM)</strong> set a potentially positive stage for lower interest rates, <strong>driving EM performance</strong> at the end of 2022, and so far this year. And this is the reason why the EM folks will be glued to their Bloomberg screens this afternoon.</p>
<h2>EM Disinflation</h2>
<p><strong>Some fundamental developments in EM argue in favor of ending the tightening cycles.</strong> Peak inflation is already behind in most countries &ndash; today&rsquo;s downside surprises in Indonesia and Peru are good examples. A high base effect will also help to drive inflation down in the coming months &ndash; as will lower energy prices. The latter will have a particularly strong impact in Central Europe, where headline inflation can decline to single digits in Q4. Lower inflation is a boon for EM real yields, which already look attractive compared to their DM peers (see chart below).</p>
<h2>China and EM Growth Tailwinds</h2>
<p>There are risks though &ndash; and this is why <strong>many EM central banks are not in a hurry to open the door for rate cuts</strong>. Inflation is still far from the official targets in most places. Fiscal stimulus might still be positive in several EMs (due to a more populist policy agenda like in Brazil or an election cycle like in Poland). China might rebound at a faster pace &ndash; a potential upside risk for commodity prices, but also a major tailwind for EM growth, especially in countries with strong trade/tourism connections with China. Today&rsquo;s stronger than expected activity gauges (Purchasing Managers Indices) in Thailand, Indonesia and the Philippines gave some food for thought in this regard. In Europe, the manufacturing PMIs in Poland and the Czech Republic continued to bounce from low levels. If the growth outlook continues to improve, EM central banks might feel comfortable staying on the sidelines for longer. Stay tuned!</p>
<h3>Chart at a Glance: EM Real Local Rates &ndash; Nice Lineup!</h3>
<p><img class="img-responsive w-100" src="https://www.vaneck.com/contentassets/e7941f7932e94bc6905888c7cc99b186/us-natalias-take-2023-02-01.png" alt="Chart at a Glance: EM Real Local Rates - Nice Lineup!" /></p>
<p class="chart-disclosure">Source: VanEck Research; Bloomberg LP.</p>
]]></content:encoded>
</item><item rdf:about="https://www.vaneck.com/us/en/blogs/investment-outlook/gold-portfolio-manager-transition-plans-faq/">
  <title>Gold Portfolio Manager Transition Plans FAQ></title>
  <link>https://www.vaneck.com/us/en/blogs/investment-outlook/gold-portfolio-manager-transition-plans-faq/</link>
  <description><![CDATA[We address questions investors may have about Joe Foster stepping back and Imaru Casanova taking over as Portfolio Manager for the VanEck International Investors Gold Fund.]]></description>
  <dc:creator> </dc:creator>
  <dc:date>01/31/2023 06:30:00</dc:date>
<content:encoded><![CDATA[

<p><a>Effective May 1, 2023,</a> <strong><a href="/us/en/news-and-insights/thought-leaders/joe-foster/" title="Joe Foster - Portfolio Manager and Strategist, Gold and Precious Metals">Joe Foster</a></strong> will be stepping back from his current role as Portfolio Manager of the <a href="/link/44f7b473b01d474080286ad9f3ade614.aspx" title="INIVX - International Investors Gold Fund - Class A - Overview"><strong>VanEck International Investors Gold Fund</strong></a>. <a href="/us/en/news-and-insights/thought-leaders/imaru-casanova/" title="Imaru Casanova - Deputy Portfolio Manager, Gold and Precious Metals"><strong>Imaru Casanova</strong></a>, the Fund&rsquo;s current Deputy Portfolio Manager, will be taking over as Portfolio Manager. Mr. Foster will remain on the Investment Team as Gold Strategist.</p>
<ul class="content-list">
<li><strong><a href="#point-one">What are the planned portfolio management changes for the VanEck International Investors Gold Fund?</a></strong></li>
<li><strong><a href="#point-two">When is this change scheduled to be implemented?</a></strong></li>
<li><strong><a href="#point-three">Is Joe Foster retiring after a long and distinguished career?</a></strong></li>
<li><strong><a href="#point-four">Who is on the Investment Team and what are their roles and responsibilities before and after the change?</a></strong></li>
<li><strong><a href="#point-five">How will elements of the Fund&rsquo;s investment process differ with Ms. Casanova as Portfolio Manager?</a></strong></li>
<li><strong><a href="#point-six">How will Mr. Foster&rsquo;s role as Gold Strategist be incorporated into the investment process?</a></strong></li>
<li><strong><a href="#point-seven">How have Ms. Casanova&rsquo;s responsibilities expanded in preparation for her new role as Portfolio Manager?</a></strong></li>
<li><strong><a href="#point-eight">Can you provide some background on Adam Graf and his experience?</a></strong></li>
<li><strong><a href="#point-nine">Given these updates, are there any additional changes to the Investment Team planned?</a></strong></li>
</ul>
<h2 id="point-one" class="anchored-block">What are the planned portfolio management changes for the VanEck International Investors Gold Fund?</h2>
<p>Joe Foster, who joined the Investment Team in 1996 and has acted as Portfolio Manager since 1998, will be stepping back from his current role. Imaru (Ima) Casanova, who joined VanEck in 2011 and has served as Deputy Portfolio Manager since 2014, will be taking over as Portfolio Manager. Mr. Foster will continue to serve as an integral participant and contributor to the management team as Gold Strategist.</p>
<p>In the near-term, there will not be a stated Deputy Portfolio Manager for the Fund. Adam Graf will remain as Senior Analyst for the gold strategy.</p>
<p><a href="/us/en/press-releases/vaneck-announces-portfolio-management-transition-plans-for-active-gold-equity-strategy.pdf" title="VanEck Announces Portfolio Management Transition Plans for Active Gold Equity Strategy" target="_blank" rel="noopener"><strong>View our statement</strong></a> with thoughts from Jan van Eck, Joe Foster, and Ima Casanova.</p>
<h2 id="point-two" class="anchored-block">When is this change scheduled to be implemented?</h2>
<p>The transition will be effective May 1, 2023.</p>
<h2 id="point-three" class="anchored-block">Is Joe Foster retiring after a long and distinguished career?</h2>
<p>No&mdash;Mr. Foster is not retiring.</p>
<p>Mr. Foster wishes to reduce some of the workload incumbent upon lead portfolio managers, and instead, focus on day-to-day aspects of the job that remain important and interesting to him. As Gold Strategist, Mr. Foster will continue to serve as a prominent member of the Investment Team, interacting with clients and portfolio companies and playing a meaningful role in portfolio decision-making responsibilities. Additionally, Mr. Foster will continue working from VanEck&rsquo;s New York City office, maintaining close contact with colleagues and serving as a vital resource for VanEck and others of the firm&rsquo;s investment teams and strategies.</p>
<p>Mr. Foster, Ms. Casanova and VanEck wish to reiterate the viewpoint that this change is ultimately made with shareholders&rsquo; best interests in mind and aimed at ensuring stability and continuity among the Fund&rsquo;s key investment personnel.</p>
<h2 id="point-four" class="anchored-block">Who is on the Investment Team and what are their roles before and after the change?</h2>
<p>An overview of key personnel and their titles are outlined in the following table:</p>
<div class="wrapped-div">
<table style="width: 600px;">
<tbody>
<tr class="tbl-data">
<td class="tbl-header last">Team Member</td>
<td class="tbl-header last">Role in 2022</td>
<td class="tbl-header last">Role as of May 2023</td>
</tr>
<tr class="tbl-data">
<td class="data-td data last" style="text-align: left; vertical-align: top;"><strong>Joe Foster</strong></td>
<td class="data-td data last" style="text-align: left; vertical-align: top;">
<p><strong>Portfolio Manager</strong></p>
</td>
<td class="data-td data last" style="text-align: left; vertical-align: top;">
<p><strong>Gold Strategist</strong></p>
</td>
</tr>
<tr class="tbl-data">
<td class="data-td data last" style="text-align: left; vertical-align: top;"><strong>Imaru Casanova</strong></td>
<td class="data-td data last" style="text-align: left; vertical-align: top;">
<p><strong>Senior Gold Analyst, Deputy PM</strong></p>
</td>
<td class="data-td data last" style="text-align: left; vertical-align: top;">
<p><strong>Portfolio Manager</strong></p>
</td>
</tr>
<tr class="tbl-data">
<td class="data-td data last" style="text-align: left; vertical-align: top;"><strong>Adam Graf</strong></td>
<td class="data-td data last" style="text-align: left; vertical-align: top;">
<p><strong>Senior Analyst</strong></p>
</td>
<td class="data-td data last" style="text-align: left; vertical-align: top;">
<p><strong>Senior Analyst</strong></p>
</td>
</tr>
</tbody>
</table>
</div>
<br />
<h2 id="point-five" class="anchored-block">How will elements of the Fund&rsquo;s investment process differ with Ms. Casanova as Portfolio Manager?</h2>
<p><u>There are no proposed changes to the Fund&rsquo;s principal investment strategies.</u></p>
<ul class="content-list">
<li>The Fund will continue to seek long-term capital appreciation by investing a majority of its assets in common stocks of gold-mining companies.</li>
<li>The Fund&mdash;supported by a seasoned team with field and academic backgrounds in geology and engineering&mdash;will continue to seek to achieve its investment objective through a combination of top-down, macroeconomic assessment of gold markets and bottom-up, fundamental company research.</li>
<li>The Fund will continue to maintain its flexibility to invest across the entire global gold mining universe, from junior developers to senior miners and physical gold bullion (at the discretion of the Portfolio Manager and up to 25% of the portfolio).</li>
</ul>
<p>It is currently anticipated that the core of the Fund&rsquo;s investment approach&mdash;including, but not limited to, macroeconomic, technical and fundamental research, market and company analysis and modeling, on-site visits to company assets and operations and portfolio risk management&mdash;will remain in place as they have for decades preceding even Mr. Foster&rsquo;s time as Portfolio Manager.</p>
<p>At present, the Fund&rsquo;s holdings continue to reflect a portfolio of high-conviction names spanning the entire market capitalization range.</p>
<h2 id="point-six" class="anchored-block">How will Mr. Foster&rsquo;s role as Gold Strategist be incorporated into the investment process?</h2>
<p>A key component of the Investment Team&rsquo;s research process are regular meetings with company managements, discussions with analysts and industry contacts, and site visits to mining properties. Given Mr. Foster&rsquo;s background and experience in geology (and Ms. Casanova&rsquo;s and Mr. Graf&rsquo;s background and experience in engineering and geology, respectively), these interactions have proven to be a hallmark feature of the process and a differentiator among peers. All the team members, including Mr. Foster, are expected to continue to conduct firsthand visits and company engagements as needed and allowable going forward.</p>
<p>Mr. Foster will continue to provide support by way of macroeconomic and technical analysis of gold and gold equity markets, identification and monitoring of developing industry themes and formulation of initial trade ideas.</p>
<p>Final portfolio decisions, both day-to-day and over the long-term, will be determined by Ms. Casanova in her role as Portfolio Manager.</p>
<h2 id="point-seven" class="anchored-block">How have Ms. Casanova&rsquo;s responsibilities expanded in preparation for her new role as Portfolio Manager?</h2>
<p>Ms. Casanova has been an analyst on the Investment Team of the International Investors Gold Fund and Global Resources Fund since she joined VanEck in 2011. She was named Deputy Portfolio Manager of the International Investors Gold Fund in 2014. In addition to her role as Deputy Portfolio Manager, supporting Mr. Foster with portfolio construction and stock selection in terms of coverage, Ms. Casanova primarily focuses on the senior and mid-tier segments of the gold miners universe. Beyond her extensive industry knowledge and experience in mining and metals research, she also has a degree in engineering and started her career as a production technologist, offshore well-site supervisor, and petroleum engineer for Shell Exploration and Production in Venezuela.</p>
<p>In 2022, Ms. Casanova adopted additional responsibilities in marketing and client servicing by authoring a number of monthly commentaries, acting as a key contact on external media requests, participating in more client-facing engagements and, in general, embracing a more prominent, visible role. These types of opportunities have accelerated in frequency and importance, particularly as she became more comfortable with greater responsibility for the day-to-day operations of the strategy.</p>
<h2 id="point-eight" class="anchored-block">Can you provide some background on Adam Graf and his experience?</h2>
<p>Adam Graf joined VanEck in January 2022 as a Senior Analyst on the International Investors Gold Fund and Global Resources Fund. He previously served as a Senior Mining Analyst at Amvest Capital. He has over 15 years&rsquo; experience on both the buy-side and sell-side with a focus on precious metals. Over his career, he&rsquo;s worked at firms including B. Riley FBR, Inc., McKinsey &amp; Co., Balyasny Asset Management, and Federated Global Advisors.</p>
<p>Additionally, of note, pertaining to VanEck philosophical consistency, his addition to the team continues the approach initiated by John van Eck at the Fund&rsquo;s launch of having a geologist on the investment team to provide unique, differentiated perspectives on company operations and forecasts.</p>
<h2 id="point-nine" class="anchored-block">Given these updates, are there any additional changes to the Investment Team planned?</h2>
<p>Beyond what has been discussed in previous responses, there are no other anticipated changes at this time.</p>
<style type="text/css">
    .wrapped-div {
        max-width: 100%;
    }

    @media (max-width: 1240px) {
        .wrapped-div {
            overflow-x: scroll;
        }
    }

    .wrapped-div-sector {
        max-width: 100%;
        overflow-x: scroll;
    }
</style>
]]></content:encoded>
</item><item rdf:about="https://www.vaneck.com/us/en/blogs/emerging-markets-bonds/insights-on-accessing-local-bonds-in-emerging-markets/">
  <title>Insights on Accessing Local Bonds in Emerging Markets></title>
  <link>https://www.vaneck.com/us/en/blogs/emerging-markets-bonds/insights-on-accessing-local-bonds-in-emerging-markets/</link>
  <description><![CDATA[A recent case study explores how VanEck has used MarketAxess&rsquo; electronic trading platform to access liquidity and improve execution across the local currency emerging markets bond universe.]]></description>
  <dc:creator>Fran Rodilosso</dc:creator>
  <dc:date>01/31/2023 06:30:00</dc:date>
<content:encoded><![CDATA[

<p>As we have noted in previous blogs, compared to the U.S. and other developed markets bonds, emerging markets local currency bonds provide <a href="https://www.vaneck.com/us/en/blogs/emerging-markets-bonds/yield-duration-opportunity-in-em-bonds/" title="Yield-Duration Opportunity in EM Bonds"><strong>significantly higher nominal and real yields</strong></a> with lower duration, on average. Emerging markets bonds also historically do well in rising rate environments&mdash;particularly when rates rise due to higher global growth prospects. For a variety of reasons, including rate differentials, the potential end of tightening cycles, a re-acceleration of EM growth led by China, and a possible negative turn for the U.S. dollar, we believe <strong><a href="https://www.vaneck.com/us/en/blogs/trends-with-benefits/trends-with-benefits-91-the-stage-is-set-for-emerging-markets-bonds-with-eric-fine/" title="Trends with Benefits #91: The Stage is Set for Emerging Markets Bonds with Eric Fine">EM bonds should be an area of focus in 2023</a></strong>.</p>
<p>A recent case study produced by the electronic trading platform MarketAxess discusses how VanEck and the platform have grown together in terms of providing access to a variety of local markets, including most recently the Chinese onshore bond market. The case study also highlights the role technology can play when accessing emerging markets, offering potential benefits such as:</p>
<ul class="content-list">
<li><strong>Efficiency</strong>: When trading a list across the curve, by receiving multiple quotes, even if it&rsquo;s just for one or two-line items that are close to what is desired, it&rsquo;s possible to make comparisons and ensure pricing is correct.</li>
<li><strong>Reliability</strong>: Confidence that the system will mitigate post-trade problems and easily resolve any issues that do occur.</li>
<li><strong>Transparency</strong>: From pricing to market depth and data, the right technology provides a level of transparency that is essential for growth.</li>
</ul>
<p><strong><a href="https://www.marketaxess.com/pdf/vaneck-case-study-2023.pdf" title="MarketAxess Case Study - VanEck: Opening trading opportunities in China and emerging markets" target="_blank" rel="noopener">Read Case Study</a></strong></p>
<p>To receive more <a href="/us/en/insights/emerging-markets-bonds/" title="Emerging Markets Bonds Insights"><strong>Emerging Markets Bonds</strong></a> insights, <a href="/us/en/subscribe/" title="Subscription Center"><strong>sign up in our subscription center</strong></a>.</p>
]]></content:encoded>
</item><item rdf:about="https://www.vaneck.com/us/en/blogs/economic-trends/china-rebound-v-shape/">
  <title>China Rebound – V-Shape?></title>
  <link>https://www.vaneck.com/us/en/blogs/economic-trends/china-rebound-v-shape/</link>
  <description><![CDATA[China&rsquo;s activity gauges rebounded strongly in January. What are the implications for China&rsquo;s growth outlook and EM asset prices?]]></description>
  <dc:creator>Natalia  Gurushina</dc:creator>
  <dc:date>01/31/2023 06:30:00</dc:date>
<content:encoded><![CDATA[

<h2>China Growth Outlook</h2>
<p><strong>China&rsquo;s rebound, which has boosted emerging markets (EM) asset prices, is real, and it is led by consumption</strong> &ndash; these are the main takeaways from the latest set of domestic activity gauges (Purchasing Managers Indices<sup>1</sup>). Both the manufacturing and the services PMIs moved back to expansion zone in January (respectively, 50.1 and 54.4 &ndash; see chart below), paving the way for further 2023 growth upgrades (currently 5.1%, according to the Bloomberg consensus forecast). Details show that China&rsquo;s external environment remains challenging &ndash; the new export orders PMI is still contractionary (46.1) &ndash; and that small privately-owned companies are still struggling (47.2). These are good reasons to keep stimulus flowing for now. A sharp improvement in the services PMI (by nearly 13 points) is, however, an encouraging signal for those of us who have been complaining about China&rsquo;s unbalanced growth since the onset of the pandemic. This is also a reason why the consensus sees higher inflation pressures in China down the road, expecting some policy tightening in the second half of the year.</p>
<h2>China Rebound and EM</h2>
<p>The market (both bonds and equities) has been anticipating improvements in China&rsquo;s activity indicators for some time now &ndash; given the U-turn in the housing sector policies and the removal COVID restrictions. An important question now is <strong>what China&rsquo;s growth rebound means for the rest of EM</strong>, which have been plagued by higher inflation and rising interest rates for most of 2022, but had a very good start to the year (so far). The TTC approach &ndash; China&rsquo;s impact on trade (T), tourism (T) and commodity prices (C) &ndash; gives us a broad idea where to look for potential winners in 2023 (both in EM Asia and beyond). Thailand, South Korea and Indonesia are definitely on the list &ndash; as are commodity exporters (Chile).</p>
<h2>Disinflation and Rate Cuts</h2>
<p>It is not entirely clear, though, <strong>how China&rsquo;s reopening will affect the pace of global disinflation and </strong>various<strong> central banks&rsquo; ability to cut rates</strong> in the coming months. Market expectations continue to price in H2 rate cuts across major EMs and in the U.S., setting a potentially positive stage for lower interest rates. But China-related growth tailwinds, as well as a new inflationary impulse, can potentially thwart these plans, leading to a longer pause rather than outright easing. If the U.S. Federal Reserve falls into this category, the market might become more discriminating in its assessment of the 2023 prospects for EM. Stay tuned!</p>
<h3>Chart at a Glance: China Activity Gauges &ndash; A Nice Rebound</h3>
<p><img class="img-responsive w-100" src="https://www.vaneck.com/contentassets/eb1995baa601403e98408c168f4c826e/us-natalias-take-2023-01-31.png" alt="Chart at a Glance: China Activity Gauges - A Nice Rebound" /></p>
<p class="chart-disclosure">Source: Bloomberg LP.</p>
<p class="chart-disclosure"><sup>1</sup>&nbsp;We believe PMIs are a better indicator of the health of the Chinese economy than the gross domestic product (GDP) number, which is politicized and is a composite in any case. The manufacturing and non-manufacturing, or service, PMIs have been separated in order to understand the different sectors of the economy. These days, we believe the manufacturing PMI is the number to watch for cyclicality.</p>
]]></content:encoded>
</item><item rdf:about="https://www.vaneck.com/us/en/blogs/economic-trends/em-gold-action/">
  <title>EM, Gold, Action!></title>
  <link>https://www.vaneck.com/us/en/blogs/economic-trends/em-gold-action/</link>
  <description><![CDATA[EM orthodox policies boosted the international reserves, leading to sovereign spread compression. Now EMs are boosting the share of gold. Why?]]></description>
  <dc:creator>Natalia  Gurushina</dc:creator>
  <dc:date>01/30/2023 16:00:00</dc:date>
<content:encoded><![CDATA[

<h2>EM and Gold Reserves</h2>
<p>We try not to bother our readers with <strong>IMF research papers</strong> &ndash; especially when the market is preoccupied with China&rsquo;s rebound (and the next batch of activity gauges) and the U.S. Federal Reserve&rsquo;s (Fed&rsquo;s) rate-setting meeting (the market expects a slower pace of hikes) &ndash; but this one was too good to ignore. The paper is about monetary gold. The report&rsquo;s title is rather dramatic &ndash; <i>Gold as International Reserves: A Barbarous Relic No More?</i> &ndash; and it is a gold mine of data (no pun intended) on the subject. It also provides <strong>valuable insights into</strong> the impact of crises, geopolitical uncertainty and &ndash; pay attention! &ndash; sanctions on <strong>emerging markets (EM) reserve accumulation and diversification</strong>.</p>
<h2>EM Sovereign Spread</h2>
<p>The 1997 global financial crisis was the turning point in EM&rsquo;s approach to international reserves management. The proliferation of orthodox policies &ndash; especially inflation targeting, fiscal discipline and letting currencies float more freely &ndash; strengthened the external accounts, boosted reserves and led to major EM sovereign debt spread compression. This is behind <strong><a href="/link/775af929d69741efa7729872dda2bfa5.aspx?epsremainingpath=/meet-eric-fine/" title="Meet Eric Fine" rel="noopener">Portfolio Manager Eric Fine&rsquo;s long-standing argument</a></strong> that hard currency debt is particularly well-anchored in EMs with better fundamentals, providing a safer way for investors to express a positive EM view. And now <strong>EM central banks</strong> are taking the reserve accumulation one step further, <strong>being the only &ldquo;active diversifiers&rdquo; into gold</strong>, according to the IMF. How active? VanEck&rsquo;s Deputy Portfolio Manager, Gold and Precious Metals, Imaru Casanova drew my attention to the fact that during the third quarter of 2022, central banks bought 400 tonnes of gold net &ndash; a quarterly record.</p>
<h2>EM Reserves and Sanctions</h2>
<p>So, why this sudden urge to buy even more gold now? Well, the IMF&rsquo;s first argument is perfectly logical &ndash; &ldquo;gold appeals &hellip; as a safe haven in periods of &hellip; volatility&rdquo;. But the IMF also used some statistical techniques to demonstrate that &ldquo;<strong>the imposition of financial sanctions by &hellip; the main reserve-issuing economies is associated with an increase in the share</strong> of central bank reserves held in the form <strong>of gold</strong>&rdquo;. The IMF also presented &ldquo;evidence that multilateral sanctions have a larger impact &hellip; on the share of reserves held in gold&rdquo; than unilateral sanctions. Given that the world geopolitical landscape remains very fluid, the love affair between EMs and gold is unlikely to be over any time soon. Stay tuned!</p>
<h3>Chart at a Glance: Central Banks&rsquo; Gold Purchases &ndash; No End in Sight?</h3>
<p><img class="img-responsive w-100" src="https://www.vaneck.com/contentassets/544a4775bf1b4981a19ce0fffe7e3b35/us-natalias-take-2023-01-30.png" alt="Chart at a Glance: Central Banks' Gold Purchases - No End in Sight?" /></p>
<p class="chart-disclosure">Source: <strong><a href="https://www.imf.org/en/Publications/WP/Issues/2023/01/27/Gold-as-International-Reserves-A-Barbarous-Relic-No-More-528089" title="IMF - Gold as International Reserves: A Barbarous Relic No More?" target="_blank" rel="noopener">IMF&rsquo;s Working Paper (WP/23/14) &ldquo;Gold as International Reserves&rdquo; A Barbarous Relic No More?</a></strong></p>
]]></content:encoded>
</item><item rdf:about="https://www.vaneck.com/us/en/blogs/natural-resources/a-simple-guide-to-the-eu-sustainability-related-finance-regulations/">
  <title>A Simple Guide to the EU Sustainability-Related Finance Regulations></title>
  <link>https://www.vaneck.com/us/en/blogs/natural-resources/a-simple-guide-to-the-eu-sustainability-related-finance-regulations/</link>
  <description><![CDATA[As part of the Action Plan for Sustainable Growth, several pieces of legislation have been passed that impact asset managers and aim to provide more transparency to investors.]]></description>
  <dc:creator>VanEck </dc:creator>
  <dc:date>01/30/2023 06:30:00</dc:date>
<content:encoded><![CDATA[

<h2>Contents</h2>
<ul class="content-list">
<li><strong><a href="#point-one">Summary</a></strong></li>
<li><strong><a href="#point-two">SFDR</a></strong></li>
<li><strong><a href="#point-three">EU Taxonomy</a></strong></li>
<li><strong><a href="#point-four">MiFID II Regulation</a></strong></li>
<li><strong><a href="#point-five">What&rsquo;s Next</a></strong></li>
</ul>
<h2 id="point-one" class="anchored-block">Summary</h2>
<p>The Action Plan for Sustainable Growth was adopted by the European Commission in 2018 and has three main goals: reorienting capital flows towards a more sustainable economy, mainstreaming sustainability into risk management and fostering transparency and long-termism.<sup>1</sup>&nbsp;It is part of the EU Green Deal, which aims to make the continent achieve net zero greenhouse gas emissions by 2050.<sup>2</sup></p>
<p>As part of the Action Plan, several pieces of legislation have been passed that impact asset managers, including the EU Sustainable Finance Disclosure Regulations (SFDR), the EU Taxonomy Regulation (TR) and the EU Market in Financial Instruments Sustainable Preference obligation (MiFID II).<sup>3</sup></p>
<p>These regulations aim to standardize the disclosure of information regarding the sustainability profile of investment products in order to provide more transparency to investors. This allows clients to better understand and compare the sustainability profile of products, which enables asset managers to help them to make decisions aligned with their investing goals and reorient capital flows into investment products that support a more sustainable economy.</p>
<h3>Timeline of Implementation</h3>
<p><img loading="lazy" class="img-responsive w-100" src="https://www.vaneck.com/contentassets/92aefbcdbcaf49d483360a3fc19fae29/2734_sustainability-blog_infographic_v3_2023.01.svg" alt="Timeline of Implementation" /></p>
<p class="chart-disclosure">Source: J.P. Morgan Asset Management, SFDR Explained, 2022; VanEck.</p>
<h2 id="point-two" class="anchored-block">SFDR</h2>
<p><strong>Summary</strong></p>
<p>The SFDR mandates ESG disclosures from asset managers and other financial market participants. These disclosures are intended to make the sustainability profile of funds more transparent, which allows investors to compare investment products on sustainability and aims to reduce &ldquo;greenwashing.&rdquo;<sup>4</sup></p>
<p><strong>Fund Classifications</strong></p>
<p>Under SFDR, funds are classified as Article 6 (grey), Article 8 (light green) or Article 9 (dark green).</p>
<p><img loading="lazy" class="img-responsive w-100" src="https://www.vaneck.com/contentassets/92aefbcdbcaf49d483360a3fc19fae29/2734_sustainability-investing_table_2023.01_blog.svg" alt="Fund Classifications" /></p>
<p class="chart-disclosure">Source: European Commission. Regulation (EU) 2019/2088 of the European Parliament and of the Council of 27 November 2019 on sustainability‐related disclosures in the financial services sector.</p>
<p><strong>Required Disclosures</strong></p>
<p>Asset managers must disclose factors at an entity (firm-wide) and product (fund-specific) level.</p>
<p>Key terms to know:</p>
<p><u>Sustainability Risks</u></p>
<p>A sustainability risk is defined as &ldquo;an environmental, social or governance event or condition that, if it occurs, could cause a negative material impact on the value of the investment.&rdquo;<sup>5</sup>&nbsp;Examples of environmental events include climate change, social events include labor rights and governance events include shareholder rights.</p>
<p><u>PAIs</u></p>
<p>PAIs stand for Principle Adverse Indicators. They describe the negative impacts that a firm or an asset can have on the environment or society.<sup>6</sup>&nbsp;Examples include the energy consumption of a company or exposure to controversial weapons.<sup>7</sup></p>
<p><strong>Entity-Level Disclosure Requirements</strong> include:</p>
<ul class="content-list">
<li>Periodic Disclosures: include disclosures on how the firm incorporates sustainability risks into the investment decision-making process and how the firm identifies PAIs.<sup>8</sup></li>
</ul>
<p><img loading="lazy" class="img-responsive w-100" src="https://www.vaneck.com/contentassets/92aefbcdbcaf49d483360a3fc19fae29/2734_sustainability-investing_image-2_2023.01_blog.svg" alt="Periodic Disclosures" /></p>
<p><strong>Product-Level Disclosures</strong> include:</p>
<ul class="content-list">
<li>Pre-contractual: include disclosure on sustainability risks and PAIs.</li>
<li>Periodic Reporting: include disclosure on PAIs, plus additional disclosures of the sustainability profile for Article 8 and Article 9 products.</li>
<li>Website: additional disclosures of the sustainability profile for Article 8 and Article 9 products.</li>
</ul>
<p><img loading="lazy" class="img-responsive w-100" src="https://www.vaneck.com/contentassets/92aefbcdbcaf49d483360a3fc19fae29/2734_sustainability-investing_image-3_2023.01_blog.svg" alt="Product-Level Disclosures" /></p>
<h2 id="point-three" class="anchored-block">EU Taxonomy</h2>
<p><strong>Summary</strong></p>
<p>The EU Taxonomy Regulation (EU TR) provides a common language for firms and investors to identify which economic activities are &ldquo;environmentally sustainable.&rdquo;<sup>9</sup></p>
<p>Under SFDR (Level II, which came into force in January 2023), asset managers have to report the taxonomy-alignment of their Article 8 and Article 9 products.</p>
<p><strong>Article 8 and Article 9 Product Disclosures </strong>include:</p>
<p>Taxonomy alignment: Asset Managers have to report the proportion (%) of their portfolio invested in activities aligned with the EU taxonomy in SFDR&rsquo;s product-level disclosures.</p>
<p>In order for an economic activity to meet the definition of environmentally sustainable and thus be considered Taxonomy-aligned, amongst other things it must:</p>
<ul class="content-list">
<li>Contribute substantially to one or more of the six environmental objectives:</li>
</ul>
<ol class="content-list" style="margin-left: 40px;">
<li>Climate change mitigation.</li>
<li>Climate change adaptation.</li>
<li>Sustainable use and protection of water and marine resources.</li>
<li>Transition to a circular economy.</li>
<li>Pollution prevention and control.</li>
<li>Protection of healthy ecosystems.</li>
</ol>
<ul class="content-list">
<li>Do no significant harm (DNSH) to any other environmental objective.</li>
<li>Comply with minimum social safeguards.</li>
</ul>
<p><img loading="lazy" class="img-responsive w-100" src="https://www.vaneck.com/contentassets/92aefbcdbcaf49d483360a3fc19fae29/2734_sustainability-investing_image-4_2023.01_blog.svg" alt="Article 8 and Article 9 Product Disclosures" /></p>
<h2 id="point-four" class="anchored-block">MiFID II Regulation</h2>
<p><strong>Summary</strong></p>
<p>The Markets in Financial Instruments regulation (MiFID II) requires asset managers to assess clients&rsquo; sustainability preferences and take them into account when offering investment advice or portfolio management services.<sup>10</sup></p>
<p><strong>Specifics</strong></p>
<p>Sustainability preferences include whether and to what extent a client (or a potential client) wants to invest in environmentally sustainable investments,<sup>11</sup>&nbsp;sustainable investments<sup>12</sup>&nbsp;and investments that consider PAIs on sustainability factors.<sup>13</sup></p>
<h2 id="point-five" class="anchored-block">What&rsquo;s Next</h2>
<p>The EU SFDR, EU TR and MiFID II all contribute towards implementing the goals of the EU Action Plan for Sustainable Growth. They fit into the EU&rsquo;s overarching aim to improve the transparency of the sustainability of investment products and reorient flows towards a more sustainable economy. The EU Commission is expected to roll out more regulations to support the goals of the Action Plan in the future, including potentially rolling out a social taxonomy<sup>14</sup>&nbsp;and an extended environmental taxonomy.<sup>15</sup>&nbsp;As investor interest and demand for ESG and sustainability-related financial products in the EU grow and the EU continues to work towards achieving the goals of the EU Green Deal, the regulation which supports the Action Plan will likely continue to evolve and expand.</p>
<p>To receive more <a href="/us/en/insights/natural-resources/" title="Natural Resources Insights"><strong>Natural Resources</strong></a> insights, <a href="https://www.vaneck.com/us/en/subscribe/" title="Subscription Center"><strong>sign up in our subscription center</strong></a>.</p>
]]></content:encoded>
</item><item rdf:about="https://www.vaneck.com/us/en/blogs/economic-trends/pivot-ready/">
  <title>Pivot-Ready?></title>
  <link>https://www.vaneck.com/us/en/blogs/economic-trends/pivot-ready/</link>
  <description><![CDATA[EM central banks choose caution even though the markets are eager to price rate cuts.]]></description>
  <dc:creator>Natalia  Gurushina</dc:creator>
  <dc:date>01/27/2023 16:00:00</dc:date>
<content:encoded><![CDATA[

<h2>EM Tightening Cycles</h2>
<p>One of this week&rsquo;s lessons is that <strong>many emerging markets (EM) central banks do not act as pivot-ready as the market expects</strong> &ndash; even in places where disinflation is already underway and growth is clearly slowing. South Africa&rsquo;s split decision yesterday (with two out of three board members voting for a 50bps hike) is a good example. Thailand&rsquo;s central bank also sent a hawkish message earlier this week (as a backdrop for a 25bps rate hike). Hungary&rsquo;s central bank raised the reserve requirements for banks (as the effective policy rate is already around 16%). The Chilean central bank stayed on hold yesterday, but its statement drew attention to a wide gap between inflation and the target. Today&rsquo;s rate-setting meeting in Colombia and the next week&rsquo;s policy rate decision in Brazil will also be closely watched (these countries account for about 14% of the J.P. Morgan&rsquo;s EM local bond index). Brazil&rsquo;s policy uncertainty (especially on the fiscal front) and unhelpful comments about the central bank&rsquo;s independence keep many investors on the sidelines.</p>
<h2>FED Rate Expectations</h2>
<p>So, the best way to describe <strong>EM central banks&rsquo; policy stance is &ldquo;prudent&rdquo; rather than &ldquo;pivot-ready&rdquo;.</strong> What about their developed markets (DM) counterparts? We do not have to wait for much longer &ndash; both the U.S. Federal Reserve and the ECB are meeting next week, and today&rsquo;s Personal Consumption Expenditure prints in the U.S. looked consistent with the market expectation of a slower pace of hikes (+25bps). But as long as DM hikes continue, EM&rsquo;s policy cushion (the policy rate differential with DMs) will be getting smaller. The differential between EM local rates and U.S. Treasuries is also narrowing, especially in Asia (J.P. Morgan&rsquo;s GBI-EM Asia yield-to-maturity is mere 3.95%). One can argue that this reflects China&rsquo;s reopening, but the trend is not very new and it might signal that the region is truly re-rating &ndash; with more &ldquo;EM Graduates&rdquo;, orthodox policies, and, yes, tighter spreads.&nbsp;</p>
<h2>EM Inflows</h2>
<p><strong>Massive inflows into EM assets so far this year show that investors are not deterred by the narrowing rate differentials</strong> &ndash; the China&rsquo;s reopening/disinflation/softer landing stories being powerful sentiment &ldquo;boosters&rdquo; (see chart below). Sell-side surveys show that cash balances are still significant, albeit we are mindful of high EM bond issuance, with many governments using this opportunity to pre-finance their 2023 issuance needs. High EM inflows also reflect expectations of the Fed&rsquo;s eventual pivot. The Fed does not seem eager to fall in line with this view &ndash; would next week be different? Stay tuned!</p>
<h3>Chart at a Glance: Huge Pickup in Inflows into EM Assets</h3>
<img class="img-responsive w-100" src="https://www.vaneck.com/contentassets/e3cca64e738744bbaab83447fd05c63a/us-natalias-take-2023-01-27.png" alt="Chart at a Glance: Huge Pickup in Inflows into EM Assets " />
<p class="chart-disclosure">Source: Financial Times</p>
]]></content:encoded>
</item><item rdf:about="https://www.vaneck.com/us/en/blogs/income-investing/cloi-outperforms-in-q4-stays-defensive-amid-uncertainty/">
  <title>CLOI Outperforms in Q4, Stays Defensive Amid Uncertainty></title>
  <link>https://www.vaneck.com/us/en/blogs/income-investing/cloi-outperforms-in-q4-stays-defensive-amid-uncertainty/</link>
  <description><![CDATA[CLOs start 2023 with higher yields and spreads compared to a year ago, and portfolio positioning and security selection were key performance drivers for the VanEck CLO ETF in 2022.]]></description>
  <dc:creator>Fran Rodilosso</dc:creator>
  <dc:date>01/27/2023 06:30:00</dc:date>
<content:encoded><![CDATA[

<p>CLOs and loans significantly outperformed other credit asset classes in 2022, and the asset class enters the new year at materially higher yields and spreads versus one year ago. The <a href="/link/593077b21448427e9fc687481484e097.aspx" title="CLOI - VanEck CLO ETF - Overview"><strong>VanEck CLO ETF (the &ldquo;Fund&rdquo;)</strong></a> outperformed the J.P. Morgan CLO Index in the fourth quarter by 0.13%, and since launching in June 2022 has outperformed by 0.57%, driven by both portfolio positioning and security selection. With credit conditions expected to deteriorate this year, the portfolio remains conservatively positioned.</p>
<h2>Market Update: CLOs Rally Amid Lower Than Expected Inflation</h2>
<p>CLOs continued their fourth quarter rally in December, as easing inflation concerns improved investor sentiment despite the continued hawkish narrative from the Federal Reserve. Inflation was lower than anticipated in November with the narrative shifting during the second half of the month amid hawkish surprises from central banks and weak global economic data, although CLOs held on better than most other risk assets. The Federal Reserve raised interest rates by 50bps during the month, the seventh rate increase in 2022, albeit at a slower pace than the prior four meetings.</p>
<div class="wrapped-div">
<table style="width: 750px;">
<tbody>
<tr class="tbl-data">
<td class="tbl-header last">Asset class</td>
<td class="tbl-header last" style="text-align: center;">Q4 2022 Return (%)</td>
<td class="tbl-header last" style="text-align: center;">2022 Return (%)</td>
<td class="tbl-header last" style="text-align: center;">Yield to Worst (%)</td>
<td class="tbl-header last" style="text-align: center;">Spreads (bps)</td>
</tr>
<tr class="tbl-data">
<td class="data-td last" style="font-weight: normal;">CLOs</td>
<td class="data-td data last">3.03</td>
<td class="data-td data last">0.21</td>
<td class="data-td data last">6.92</td>
<td class="data-td data last">273</td>
</tr>
<tr class="tbl-data">
<td class="data-td last" style="font-weight: normal;"><span style="padding-left: 15px;">AAA</span></td>
<td class="data-td data last">2.54</td>
<td class="data-td data last">1.05</td>
<td class="data-td data last">6.18</td>
<td class="data-td data last">193</td>
</tr>
<tr class="tbl-data">
<td class="data-td last" style="font-weight: normal;"><span style="padding-left: 15px;">AA</span></td>
<td class="data-td data last">3.23</td>
<td class="data-td data last">-0.17</td>
<td class="data-td data last">6.65</td>
<td class="data-td data last">264</td>
</tr>
<tr class="tbl-data">
<td class="data-td last" style="font-weight: normal;"><span style="padding-left: 15px;">A</span></td>
<td class="data-td data last">4.10</td>
<td class="data-td data last">-1.67</td>
<td class="data-td data last">7.50</td>
<td class="data-td data last">353</td>
</tr>
<tr class="tbl-data">
<td class="data-td last" style="font-weight: normal;"><span style="padding-left: 15px;">BBB</span></td>
<td class="data-td data last">4.77</td>
<td class="data-td data last">-2.77</td>
<td class="data-td data last">9.31</td>
<td class="data-td data last">532</td>
</tr>
<tr class="tbl-data">
<td class="data-td last" style="font-weight: normal;"><span style="padding-left: 15px;">BB</span></td>
<td class="data-td data last">6.43</td>
<td class="data-td data last">-3.82</td>
<td class="data-td data last">14.69</td>
<td class="data-td data last">1022</td>
</tr>
<tr class="tbl-data">
<td class="data-td last" style="font-weight: normal;">Investment Grade Corporates</td>
<td class="data-td data last">3.53</td>
<td class="data-td data last">-15.44</td>
<td class="data-td data last">5.51</td>
<td class="data-td data last">138</td>
</tr>
<tr class="tbl-data">
<td class="data-td last" style="font-weight: normal;">U.S. Agg</td>
<td class="data-td data last">1.78</td>
<td class="data-td data last">-13.16</td>
<td class="data-td data last">4.70</td>
<td class="data-td data last">54</td>
</tr>
<tr class="tbl-data">
<td class="data-td last" style="font-weight: normal;">Leveraged Loans</td>
<td class="data-td data last">2.79</td>
<td class="data-td data last">0.06</td>
<td class="data-td data last">10.83</td>
<td class="data-td data last">597</td>
</tr>
<tr class="tbl-data">
<td class="data-td last" style="font-weight: normal;">High Yield Bonds</td>
<td class="data-td data last">3.98</td>
<td class="data-td data last">-11.22</td>
<td class="data-td data last">8.98</td>
<td class="data-td data last">481</td>
</tr>
</tbody>
</table>
</div>
<br />
<p class="chart-disclosure">Source: JP Morgan and ICE Data Indices as of 12/31/2022. CLOs represented by J.P. Morgan Collateralized Loan Obligation Index, AAA Rated CLOs represented by J.P. Morgan CLO AAA Index, AA Rated CLOs represented by J.P. Morgan CLO AA Index, A Rated CLOs represented by J.P. Morgan CLO A Index, BBB Rated CLOs represented by J.P. Morgan CLO BBB Index, BB Rated CLOs represented by J.P. Morgan CLO BB Index, Investment Grade Corporates represented by ICE BofA US Corporate Index, US Agg is represented by the ICE BofA US Broad Market, Leveraged Loans represented by JP Morgan Leveraged Loan Index and High Yield Bonds represented by ICE BofA US High Yield Index. Past performance is no guarantee of future results. Not intended as a recommendation to buy or sell any securities mentioned herein.</p>
<p>Per Barclays Research, CLO new issue supply decreased month-over-month, with $4.7B pricing during the month compared to $8.6B in November. While primary issuance ended the year down 31% from 2021 levels, it was the second highest level on record. Refis and resets ended a five-month streak of none pricing, with $0.4B pricing in December. Total issuance for the year was 65% lower compared to 2021. In the secondary market, TRACE supply decreased to $11.9B in December from $20.9B in November, per Morgan Stanley. Total TRACE volume during 2022 of $200B with investment grade volumes of $153B were records for the CLO 2.0 market.</p>
<p>There were no new defaults in the Morningstar LSTA Leveraged Loan Index in November. As a result, the trailing 12-month default rate, by principal, decreased marginally to 0.72% from 0.73% in November. We anticipate the default rate to remain below historical averages in the near-term for the leveraged loan market, notwithstanding ongoing interest rate increases and indications that Fed hikes will maintain higher interest rates throughout 2023. We anticipate the default rate to increase over the medium-term, though our expectations remain that defaults will stay below the long-term historical average of ~3%.</p>
<h2>Portfolio Strategy: Security Selection and Ratings Exposure Drive Performance</h2>
<p>The Fund returned 3.16% in the quarter ended December 31, 2022, outperforming its benchmark, the J.P. Morgan CLO Index, by 0.13%. The Fund&rsquo;s ability to shift within investment grade buckets, has been a positive driver of outperformance since launching in June 2022. For example, an overweight to BBB rated CLOs provided some outperformance in the less volatile summer months, before shifting to a more conservative allocation as volatility picked up later in the summer. In addition, security selection within rating categories has been a driver of outperformance vs its benchmark, particularly among AA and BBB rated CLOs.</p>
<h3>CLOI Total Return and Credit Allocation</h3>
<p><img class="img-responsive w-100" src="https://www.vaneck.com/contentassets/7f6fb4d048b14252ab9cb4e92b0fe2af/2738_cloi_chart_01_2023.01_v1_blog.svg" alt="CLOI Total Return and Credit Allocation" /></p>
<p class="chart-disclosure">Source: FactSet, JP Morgan and VanEck. CLOIE represented by J.P. Morgan Collateralized Loan Obligation Index and AAA Rated CLOs represented by J.P. Morgan CLO AAA Index. Past performance is no guarantee of future results. Not intended as a recommendation to buy or sell any securities mentioned herein.</p>
<p>While CLO metrics remain strong overall and spreads tightened over the course of the fourth quarter, CLO spreads remain materially wider than both the beginning of the year and the median level seen over the past five years as ongoing geopolitical and economic risks continue to weigh on market sentiment. As we expect the pace of downgrades to pick up in 2023, we continue to shift portfolios higher in the capital stack and out of CLOs with high levels of B- exposure.</p>
<h2>Outlook Ahead: Holding Defensive Position as Uncertainty Continues</h2>
<p>CLOs ended the year on a positive note; however, the Fed quickly warned markets they aren&rsquo;t finished tightening financial conditions, which could result in additional volatility in the first half of 2023. We remain of the view that credit is entering a slowdown from a point of strength. While fundamentals for leveraged finance issuers are starting from a strong position, the macroeconomic environment indicates a flattening of fundamentals at best, with some likely deterioration. We expect leveraged loan default rates to trend higher from here and move towards longer-term asset class averages. A more challenging macroeconomic backdrop, higher Treasury rates, wider spreads and a less receptive capital markets environment all contribute to our expected increase in default rates. From a technical standpoint, we believe demand for CLOs will to continue to be robust as negative real rates will continue to incentivize investors to take advantage of the <strong><a href="https://www.vaneck.com/us/en/blogs/income-investing/why-invest-in-clos/" title="Why Invest in CLOs?">yield pickup and the relative attractiveness of CLOs</a> </strong>compared to other credit assets. As a result, we expect spreads to remain largely range bound, although spreads are currently near the tighter end of our expected range.</p>
<p>With the new year comes one of the most anticipated recessions in history. While we see some opportunities to add risk on the margin, given the level of uncertainty in the market and tight credit spreads, we do not believe this is the time for broad risk-on positioning. Instead, we believe rallies will provide a good opportunity to further reduce risk and favor our prior stance of maintaining marginally defensive positioning, looking to add relative value at the security and manager selection level.</p>
<div class="wrapped-div">
<table style="width: 750px;">
<tbody>
<tr class="tbl-data">
<td class="tbl-header last" colspan="9">Average Annual Total Returns (%) as of December 31, 2022</td>
</tr>
<tr class="tbl-data">
<td class="data-head last">&nbsp;</td>
<td class="data-head last">1 Month*</td>
<td class="data-head last">3 Month*</td>
<td class="data-head last">YTD</td>
<td class="data-head last">1 Year</td>
<td class="data-head last">3 Year</td>
<td class="data-head last">5 Year</td>
<td class="data-head last">10 Year</td>
<td class="data-head last">LIFE<br />6/21/2022</td>
</tr>
<tr class="tbl-data">
<td class="data-td last" style="font-weight: normal;">CLOI (NAV)</td>
<td class="data-td data last">1.06</td>
<td class="data-td data last">3.16</td>
<td class="data-td data last">--</td>
<td class="data-td data last">3.26</td>
</tr>
<tr class="tbl-data">
<td class="data-td last" style="font-weight: normal;">CLOI (Share Price)</td>
<td class="data-td data last">0.88</td>
<td class="data-td data last">2.20</td>
<td class="data-td data last">--</td>
<td class="data-td data last">3.55</td>
</tr>
<tr class="tbl-data">
<td class="data-td last" style="font-weight: normal;">J.P. Morgan Collateralized Loan Obligation Index</td>
<td class="data-td data last">0.81</td>
<td class="data-td data last">3.03</td>
<td class="data-td data last">--</td>
<td class="data-td data last">2.69</td>
</tr>
</tbody>
</table>
</div>
<br />
<p class="chart-disclosure">* Returns less than one year are not annualized.</p>
<p class="chart-disclosure">Van Eck Associates Corporation (the &ldquo;Adviser&rdquo;) will pay all expenses of the Fund, except for the fee payment under the investment management agreement, acquired fund fees and expenses, interest expense, offering costs, trading expenses, taxes and extraordinary expenses. Notwithstanding the foregoing, the Adviser has agreed to pay the offering costs until at least May 1, 2024.</p>
<p class="chart-disclosure"><strong>The performance data quoted represents past performance. Past performance is not a guarantee of future results. Investment return and principal value of an investment will fluctuate so that an investor's shares, when redeemed, may be worth more or less than their original cost. Performance may be lower or higher than performance data quoted. Please call 800.826.2333 or visit vaneck.com for performance current to the most recent month ended.</strong></p>
<p class="chart-disclosure">The "Net Asset Value" (NAV) of a Fund is determined at the close of each business day, and represents the dollar value of one share of the fund; it is calculated by taking the total assets of the fund, subtracting total liabilities, and dividing by the total number of shares outstanding. The NAV is not necessarily the same as the ETF 's intraday trading value. Investors should not expect to buy or sell shares at NAV.</p>
<p>To receive more <a href="https://www.vaneck.com/us/en/insights/income-investing/" title="Income Investing insights"><strong>Income Investing</strong></a> insights, <a href="/us/en/subscribe/" title="Subscription Center"><strong>sign up in our subscription center</strong></a>.</p>
<style type="text/css">
    .wrapped-div {
        max-width: 100%;
    }

    @media (max-width: 1240px) {
        .wrapped-div {
            overflow-x: scroll;
        }


    }
</style>
]]></content:encoded>
</item><item rdf:about="https://www.vaneck.com/us/en/blogs/economic-trends/global-growth-a-thaw/">
  <title>Global Growth – A Thaw?></title>
  <link>https://www.vaneck.com/us/en/blogs/economic-trends/global-growth-a-thaw/</link>
  <description><![CDATA[The diverging growth momentum between China/Eurozone and the U.S. creates opportunities, but can also pose policy challenges for some EMs.]]></description>
  <dc:creator>Natalia  Gurushina</dc:creator>
  <dc:date>01/26/2023 06:30:00</dc:date>
<content:encoded><![CDATA[

<h2>Global Growth</h2>
<p>The <strong>China rebound story is a key driver for this year&rsquo;s financial markets</strong> &ndash; including emerging markets (EM) - but we have to wait for a few more days until the next set of China&rsquo;s activity gauges (which are expected to improve noticeably, reaffirming higher 2023 growth forecasts &ndash; fingers crossed!). In the meantime, the advanced Q4 GDP print for another global growth driver - the U.S. - gave some food for thought. The headline number was stronger than expected but details were soft, including a significant inventory buildup. This is happening against the backdrop of a steadily increasing probability of a recession in the U.S. 12 months from now &ndash; currently at 47% (according to the New York Federal Reserve&rsquo;s model), which is high by historic standards (see chart below). The narrative of diverging recession probabilities/growth momenta in Europe and the U.S. probably got new admirers today. This might not be the best signal for the U.S. Dollar, but EM local debt might appreciate it a bit more.</p>
<h2>China Rebound and EM</h2>
<p><strong>Asian EMs are expected to be among the key beneficiaries of China&rsquo;s rebound &ndash; both via trade and tourism channels</strong>. This is great news for regional economies were the growth momentum is currently stalling and the current account deteriorated in 2022 &ndash; like South Korea. This is even better news for countries like Thailand, where the growth momentum is strengthening and the current account shows signs of improvement. This explains why Thailand is among three best-performing constituents of J.P. Morgan&rsquo;s EM local debt index (GBI-EM) so far this year. However, getting extra &ldquo;fuel&rdquo; from China&rsquo;s recovery can translate into higher price pressures, which is why Thailand&rsquo;s central bank maintained a hawkish rhetoric (in addition to a hike) at its last rate-setting meeting.</p>
<h2>EM Growth Cliff</h2>
<p><strong>The growth outlook in the rest of EM is still wobbly</strong>. The South African central bank just cut the 2023 forecast to mere 0.3% from 1.1%, and used this to justify a slower pace of rate hikes (+25bps earlier today). Central Europe might be joined at the hip with the Eurozone economically and financially, but the consensus forecasts are yet to reflect the Eurozone&rsquo;s activity &ldquo;thaw&rdquo; and the positive impact of lower energy prices. LATAM is also in a tough spot &ndash; the prolonged policy uncertainty in Brazil or political noise in Peru can lead to further growth downgrades, putting investors off despite high carry. Stay tuned!</p>
<h3>Chart at a Glance: U.S. Recession Probability Still Uncomfortably High<sup>*</sup></h3>
<p><img class="img-responsive w-100" src="https://www.vaneck.com/contentassets/2501389ce2aa498bb74802e96d338cff/us-emerging-markets-daily-2023-01-26.png" alt="Chart at a Glance: U.S. Recession Probability Still Uncomfortably High" /></p>
<p class="chart-disclosure">Source: Bloomberg LP.</p>
<p class="chart-disclosure"><strong><sup>*</sup>&nbsp;NYFYPROB Index </strong>&ndash; The New York Fed Recession Probability Index.</p>
]]></content:encoded>
</item><item rdf:about="https://www.vaneck.com/us/en/blogs/digital-assets/matthew-sigel-is-now-the-time-to-start-a-bitcoin-mining-business/">
  <title>Is Now the Time to Start a Bitcoin Mining Business?></title>
  <link>https://www.vaneck.com/us/en/blogs/digital-assets/matthew-sigel-is-now-the-time-to-start-a-bitcoin-mining-business/</link>
  <description><![CDATA[It&rsquo;s often said that a financial crisis is a bad time to be a bank, but a great time to start a bank. Is the same true for Bitcoin miners? We ran the numbers to find out.]]></description>
  <dc:creator>Matthew  Sigel</dc:creator>
  <dc:date>01/25/2023 06:30:00</dc:date>
<content:encoded><![CDATA[

<p><strong>Please note that VanEck has exposure to Bitcoin.</strong></p>
<p><img class="img-responsive w-100" src="https://www.vaneck.com/contentassets/2c7d741fbd6f4a45a1e4438457eeb76f/2709_digital-assets_bitcoin-mining_2023.01_v1_option_1.jpg" alt="Bitcoin miners images generated using AI program DALL-E" /></p>
<p class="chart-disclosure">Images Generated Using AI Program DALL-E.</p>
<p><strong><em>Simulations of a Bitcoin mining business suggest that starting a mining business is a better option than simply buying Bitcoin at current prices.</em></strong></p>
<p>In 2022, Bitcoin miners faced the triple entente of electricity price hikes, substantial hash rate growth and Bitcoin price declines. As a consequence, mining Bitcoin is currently unprofitable for many firms, resulting in a rolling tide of bankruptcies. Industry stalwarts such as Core Scientific and Compute North have declared bankruptcy, while others such as Bitfarms, Argo and Iris Energy have warned of default. Luxor&rsquo;s HI Crypto Mining Stock Index, based upon publicly traded Bitcoin miner stocks, is down 72% year-on-year. Even more dramatically, the price of mining computers themselves has declined more than 86% from the same period last year. This compares to a 58% decline for BTC. Were Baron Rothschild alive today, he might be on CNBC beaming about the crimson color of opportunity presented by the pain of Bitcoin miners. Given the immense fear, uncertainty and doubt across the industry, we assessed whether it was time to don a hard hat and enter the Bitcoin mining business.</p>
<h3>Rolling Week on Week Yearly Returns, BTC vs Mining Rigs</h3>
<p><img class="img-responsive w-100" src="https://www.vaneck.com/contentassets/2c7d741fbd6f4a45a1e4438457eeb76f/2709_digital-assets_chart_01_2023.01_v1_blog.svg" alt="Rolling Week on Week Yearly Returns, BTC vs Mining Rigs" /></p>
<p class="chart-disclosure">Source: Luxor Technologies, VanEck Research, January 2023. Past performance is no guarantee of future results. The joule is the unit of energy in the International System of Units. 1 joule is equal to the energy that is required to raise the temperature of 0.239 g of water from 0 &deg;C to 1 &deg;C.</p>
<p>To analyze the opportunities presented, we compare the projected returns of simply buying BTC on the market versus investing in BTC mining computers to run a mining business. It is important to recall that miner businesses operate similar to farmers in the sense that both derive revenue by harvesting a commodity to sell at market. Of course, miners markedly differ as they run computers to solve a complex cryptography problem to receive a portion of Bitcoin&rsquo;s inflationary block rewards. In the Bitcoin mining business, the more computing power one has relative to the network&rsquo;s computing power, called &ldquo;hash rate,&rdquo; the greater share of Bitcoin block rewards they receive.</p>
<p>We built a conceptual business model for a mining operation hosted in a third-party facility based upon quoted all-in hosting rates and the current market prices of Bitcoin mining rigs. In our business plan, we buy the rigs using brokers and ship them to a company who will run, maintain and optimize the machines on our behalf. In turn, this hosting party passes through the costs of personnel, electricity purchase agreements, and infrastructure in its hosting fee. For our purposes, we are assuming an all-in hosting cost of $0.075 per kw/h of electricity usage. The maximum life of our business is three years.</p>
<p>The endeavor&rsquo;s expenses consist of mining rig acquisition costs, variable costs of hosting the rigs, and asset disposal costs from exiting from the business. The business revenues are based upon projected sales proceeds of the mined Bitcoin and the estimated gain on sale from liquidating the bitcoin miners upon close of the operation. To maximize tax benefits, we double line depreciate over a useful machine life of five years. The greatest factors affecting profitability of our theoretical mining operation are:</p>
<ul class="content-list">
<li>Purchase price of the mining rigs</li>
<li>Efficiency of the mining rigs</li>
<li>Hosting cost (<em>electricity cost)</em></li>
<li>Price of Bitcoin</li>
<li>Growth of the hash rate</li>
<li>Mining rig resale price</li>
</ul>
<p>The base of our model begins by applying live broker quotes for seven different miner rigs of various efficiencies as well as hosting rates from five separate miner data centers. To estimate the price of Bitcoin, price of mining rigs and growth of hashing rate, we use historical data to project future variation. We feed this variation into Monte Carlo simulations to create thousands of hypothetical outcomes to assess profitability of our business across many scenarios. In each situation, we compare the return profile of the mining entity to the returns of Bitcoin. To simplify our model, our business has three potential exit timings as well as two strategies for selling the mined Bitcoins:</p>
<ul class="content-list">
<li>Exit after 1 Year
<ul>
<li>Sell the mined coins at the end of the year alongside mining rigs.</li>
</ul>
</li>
<li>Exit after 2 Years
<ul>
<li>Hold the mined coins until end of year 2 and sell them alongside the mining rigs.</li>
<li>Sell the mined coins continuously throughout operation and the mining rigs at the end of the second year.</li>
</ul>
</li>
<li>Exit after 3 Years
<ul>
<li>Hold the mined coins until end of year 3 and sell them alongside the mining rigs.</li>
<li>Sell the mined coins continuously throughout operation and the mining rigs at the end of the third year.</li>
</ul>
</li>
</ul>
<p>These different strategies are compared in our model against the benchmark of just holding Bitcoin. Basically, our business is run through thousands of hypothetical scenarios where we adjust all the previously mentioned key factors affecting profitability against the various types of mining strategies. Because we do not know what the outcomes will be, these permutations provide an understanding of the profitability of our business over many, many outcomes.</p>
<p>The below table reflects the results of different mining strategies when compared against mining rig beta and hash rate growth. The variable inputs in this table is the yearly average price of Bitcoin in 2023, 2024 and 2025. The prices used to generate the below table are $18k for 2023, $33k for 2024 and $45k for 2025. Eight bitcoin mining strategies were compared - which included holding mined bitcoin for a period of time before selling (1-3 years), selling mined bitcoin as soon as they are mined, or buying and holding bitcoin (1-3 years).</p>
<p><img class="img-responsive w-100" src="https://www.vaneck.com/contentassets/2c7d741fbd6f4a45a1e4438457eeb76f/2709_digital-assets_table_01_2023.01_v1_blog.svg" alt="Best Mining Strategy" /></p>
<p class="chart-disclosure">Source: VanEck Research, January 2023. Please see important disclosures below regarding hypothetical performance. Hypothetical performance is designed with benefit of hindsight. These simulated results have no financial risk, and they do not represent actual trading, and as such, may not account for various market factors that would have impacted the results. Beta of rig price is a measure of the price volatility of a mining rig compared to Bitcoin&rsquo;s price. Hash rate is a measure of the computational power on a blockchain network. The chart represents different hypothetical scenarios comparing mining rig beta to hash rate growth.</p>
<p>The orange dotted box denotes the historical ranges of rig beta and hash rate growth. The shading of the box denotes in each scenario whether mining or holding Bitcoin produces higher returns, with green indicating mining and red holding. Likewise, the text denotes the best strategy to pursue within the broader strategies. The takeaway is that based upon past values of hash rate growth and rig beta, and Bitcoin price as noted, a better risk versus reward is to buy machines and mine BTC. Additionally, the best mining strategy, if the past is any predictor, would be to hold the coins until the end of the business in three years.</p>
<p>Other price outcomes, both the absolute values and the trajectories of those values, will change our sensitivity table outcome. For example, if the Bitcoin price exploded 200% the first year and then cratered to decline 50% in each of the next two years, the best mining strategy would obviously be to sell all the coins as well as the rig after the first year of operation. Clearly, we do not have Congresswoman Pelosi&rsquo;s crystal ball to see future price outcomes, so we employ simulations to inform us which strategy is most profitable, the most number of times, and on average how profitable it is.</p>
<p>The below table reflects the results of a single, hypothetical scenario out of 5,000 using a Monte Carlo simulation. The variable inputs for the simulation included the average price of Bitcoin in future years, the hash rate growth, and the beta of the mining rigs to Bitcoin. From there, the simulation calculates the return of eight different strategies for the miners, which included holding mined bitcoin for a period of time before selling (1-3 years), selling mined bitcoin as soon as they are mined, or buying and holding bitcoin (1-3 years).</p>
<div class="wrapped-div">
<table style="width: 100%;">
<tbody>
<tr class="tbl-data">
<td class="tbl-header last" colspan="9">Monte Carlo Outcome Through 5,000 Scenarios Using Bitcoin Price Historical Distributions of Bitcoin Returns</td>
</tr>
<tr class="tbl-data">
<td class="data-head last">&nbsp;</td>
<td class="data-head last">1 Yr Hold<br />Coins/Exit</td>
<td class="data-head last">2 Yr Hold<br />Coins/Exit</td>
<td class="data-head last">3 Yr Hold<br />Coins/Exit</td>
<td class="data-head last">Sell Coins<br />Continuously,<br />Exit Yr 2</td>
<td class="data-head last">Sell Coins<br />Continuously,<br />Exit Yr 3</td>
<td class="data-head last">Buy/Hold<br />BTC Yr 1</td>
<td class="data-head last">Buy/Hold<br />BTC Yr 2</td>
<td class="data-head last">Buy/Hold<br />BTC Yr 3</td>
</tr>
<tr class="tbl-data">
<td class="data-td last">Mean Return</td>
<td class="data-td data last">70.14%</td>
<td class="data-td data last">233.32%</td>
<td class="data-td data last">544.53%</td>
<td class="data-td data last">172.19%</td>
<td class="data-td data last">316.36%</td>
<td class="data-td data last">71.13%</td>
<td class="data-td data last">195.58%</td>
<td class="data-td data last">421.87%</td>
</tr>
<tr class="tbl-data">
<td class="data-td last">Mean Return When Profitable</td>
<td class="data-td data last">157.93%</td>
<td class="data-td data last">457.78%</td>
<td class="data-td data last">1,006.71%</td>
<td class="data-td data last">336.93%</td>
<td class="data-td data last">577.39%</td>
<td class="data-td data last">163.72%</td>
<td class="data-td data last">371.22%</td>
<td class="data-td data last">729.16%</td>
</tr>
<tr class="tbl-data">
<td class="data-td last">Mean Loss When Unprofitable</td>
<td class="data-td data last">-42.05%</td>
<td class="data-td data last">-66.67%</td>
<td class="data-td data last">-87.98%</td>
<td class="data-td data last">-58.51%</td>
<td class="data-td data last">-74.20%</td>
<td class="data-td data last">-43.79%</td>
<td class="data-td data last">-52.22%</td>
<td class="data-td data last">-56.74%</td>
</tr>
<tr class="tbl-data">
<td class="data-td last">Percentage of Time Profitable</td>
<td class="data-td data last">56.10%</td>
<td class="data-td data last">57.20%</td>
<td class="data-td data last">57.78%</td>
<td class="data-td data last">58.34%</td>
<td class="data-td data last">59.94%</td>
<td class="data-td data last">55.38%</td>
<td class="data-td data last">58.52%</td>
<td class="data-td data last">60.90%</td>
</tr>
<tr class="tbl-data">
<td class="data-td last">Instances Best Strategy</td>
<td class="data-td data last">921</td>
<td class="data-td data last">698</td>
<td class="data-td data last">1,781</td>
<td class="data-td data last">50</td>
<td class="data-td data last">14</td>
<td class="data-td data last">557</td>
<td class="data-td data last">425</td>
<td class="data-td data last">554</td>
</tr>
<tr class="tbl-data">
<td class="data-td last">Percent of Time Best Strategy</td>
<td class="data-td data last">18.42%</td>
<td class="data-td data last">13.96%</td>
<td class="data-td data last">35.62%</td>
<td class="data-td data last">1.00%</td>
<td class="data-td data last">0.28%</td>
<td class="data-td data last">11.14%</td>
<td class="data-td data last">8.50%</td>
<td class="data-td data last">11.08%</td>
</tr>
</tbody>
</table>
</div>
<br />
<p class="chart-disclosure">Source: VanEck Research, January 2023. Please see important disclosures below regarding hypothetical performance. Hypothetical performance is designed with benefit of hindsight. These simulated results have no financial risk, and they do not represent actual trading, and as such, may not account for various market factors that would have impacted the results. The table represents the result of a single Monte Carlo simulation (out of 5,000) showing the result of different strategies that bitcoin miners can employ (hold for pre-determined time/sell continuously/hold).</p>
<p>The key takeaway from our analysis is that from an expected value standpoint, it is more profitable to run a mining business than it is to buy and hold Bitcoin if our main inputs behave as they have historically. Additionally, of all the mining strategies, the highest expected return (mean return) comes from the strategy where a miner holds its coins to sell them when the business is rolled up at the end of three years. Likewise, it is also clear that the downside risk of running a mining business is greater than buying and holding Bitcoin as an investor can easily loser more of his initial investment supporting an unprofitable mining entity. We attribute these findings to two factors. First, the Bitcoin mining rigs trade at prices that are favorable relative to their potential value for appreciation in bullish Bitcoin scenarios. Second, the historical price trajectory of Bitcoin is skewed positive with high kurtosis (fat tails) and it appears this potential is not reflected in the current price of mining rigs. Therefore, the risk-seeking, adventurous investor may want to consider the mining business. Give us a call if you have a site with cheap power!</p>
<p><strong><u>DISCLAIMER</u></strong><em>: The above is not intended as financial advice nor as a recommendation to buy or sell any securities, Bitcoin mining equipment, or to take any other action. These are solely the results of a simulation and are for illustrative purposes only. This simulation projects distributions of BTC based upon the distribution of historical returns as well as the distribution of Bitcoin miner beta and hash rate growth. These historical data points were used as the basis for functions that would output projections based upon the distribution of these historical data points. This is not intended as a projection of what the returns of BTC look will like. Neither we, nor anyone else including Satoshi Nakamoto himself, know what the price of Bitcoin, the hashing rate, the price of miners or the beta of miner to Bitcoin will be in the future. This is simply a mock-up based upon historical inputs. Please conduct your own research. </em></p>
<p>To receive more <strong><a href="https://www.vaneck.com/us/en/insights/digital-assets/" title="Digital Assets Insights">Digital Assets</a></strong> insights, <strong><a href="https://www.vaneck.com/us/en/subscribe/" title="Subscription Center">sign up in our subscription center</a></strong>.</p>
<style type="text/css">
    .wrapped-div {
        max-width: 100%;
    }

    @media (max-width: 1240px) {
        .wrapped-div {
            overflow-x: scroll;
        }


    }
</style>
]]></content:encoded>
</item><item rdf:about="https://www.vaneck.com/us/en/blogs/income-investing/animal-spirits-podcast-talk-your-book-investing-in-fallen-angels/">
  <title>Animal Spirits Podcast – Talk Your Book: Investing in Fallen Angels></title>
  <link>https://www.vaneck.com/us/en/blogs/income-investing/animal-spirits-podcast-talk-your-book-investing-in-fallen-angels/</link>
  <description><![CDATA[Fran Rodilosso, Head of Fixed Income ETF Portfolio Management joins the Animal Spirits podcast to discuss the ins and outs of fallen angels.]]></description>
  <dc:creator>Fran Rodilosso</dc:creator>
  <dc:date>01/25/2023 06:30:00</dc:date>
<content:encoded><![CDATA[

<p>In this episode they cover:</p>
<ul class="content-list">
<li>How the fallen angel idea came about</li>
<li>How the risk of default calculations work</li>
<li>What happens to a bond when it transitions from investment grade to high yield and vice versa</li>
<li>High yield vs the S&amp;P 500</li>
<li>Rising stars vs. fallen angels</li>
<li>Being tactical with fixed income</li>
</ul>
<p><a href="https://www.vaneck.com/us/en/offsite-disclaimer/?id=208117&amp;button=no&amp;url=https://awealthofcommonsense.com/2023/01/talk-your-book-4/" title="Talk Your Book: Investing in Fallen Angels" target="_blank" rel="noopener"><strong>Listen Here</strong></a></p>
<p>To receive more <a href="/us/en/blogs/income-investing/" title="Income Investing Insights"><strong>Income Investing</strong></a> insights, <a href="/us/en/subscribe/" title=" Subscription Center"><strong>sign up in our subscription center</strong></a>.</p>
]]></content:encoded>
</item><item rdf:about="https://www.vaneck.com/us/en/blogs/economic-trends/rate-cut-race-who-goes-first/">
  <title>Rate Cut Race – Who Goes First?></title>
  <link>https://www.vaneck.com/us/en/blogs/economic-trends/rate-cut-race-who-goes-first/</link>
  <description><![CDATA[<p>The market prices in aggressive rate cuts in some EMs &ndash; are these expectations justified?</p>]]></description>
  <dc:creator>Natalia  Gurushina</dc:creator>
  <dc:date>01/25/2023 06:30:00</dc:date>
<content:encoded><![CDATA[

<h2>Rate Cut Expectations</h2>
<p>Global central banks are working hard to bring inflation back to targets. This explains actual rate hikes and more implied tightening in emerging Markets (EM (Thailand&rsquo;s +25bps today, expected +100bps in Colombia later this week)) and developed markets (DM(+25bps by the U.S. Federal Reserve, +50bps by the ECB)). And this is why many central banks remain on high alert (Hungary, Thailand in the past few days) even though peak inflation is behind us. But <strong>rate cuts are re-entering our collective market consciousness</strong> &ndash; and not always to central banks&rsquo; liking (the market&rsquo;s tug-of-war with the Fed). The market expectations for some EMs are also quite aggressive. Hungary and Chile are the frontrunners &ndash; with sizable cuts priced in for the next three months. The Czech Republic, India, the Philippines &ndash; and possibly Poland and Malaysia &ndash; are seen easing in Q2.</p>
<h2>China Reopening and Disinflation</h2>
<p>The <strong>pace of disinflation will be crucial</strong> here &ndash; peaks might be behind us, but inflation targets are still far away, especially in EMEA and LATAM. Many central banks count on a sharp growth slowdown to reduce price pressures in the coming months. We should also mention &ldquo;the mother of all base effects&rdquo; that should provide a powerful technical support to disinflation. The question is whether the consensus underestimates the impact of China&rsquo;s reopening on commodity prices, as well as the inflationary impact of removing fiscal subsidies that were introduced to shield the population from spiking energy/food prices.</p>
<h2>EM Fiscal and External Adjustment</h2>
<p>From the market perspective, an important consideration here is that <strong>EM policy cushions</strong> (the policy rate differentials with the Fed) <strong>should reflect existing macroeconomic imbalances</strong>, such as fiscal and external gaps (a sum of two is called &ldquo;twin&rdquo; deficit). The chart below shows why the market is so preoccupied with Brazil&rsquo;s populist policy shift (which can slow/reverse fiscal adjustment), and why the Brazilian central bank might feel constrained in its ability to cut rates despite successful disinflation and the highest real policy rate in EM. On the other hand, if Chile&rsquo;s current account gap improves faster on the back of China&rsquo;s rebound or we get positive surprises in Hungary&rsquo;s fiscal performance, the market expectations for sizable rate cuts in these countries might turn out realistic after all. Stay tuned!</p>
<h3>Chart at a Glance: Importance of Adequate Policy Cushions</h3>
<p><img class="img-responsive w-100" src="https://www.vaneck.com/contentassets/0d16f61ee4244cc4971ed8e4421c86c7/us-natalias-take-2023-01-25.png" alt="Chart at a Glance: Importance of Adequate Policy Cushions" /></p>
<p class="chart-disclosure">Source: VanEck Research; Bloomberg LP.</p>
]]></content:encoded>
</item><item rdf:about="https://www.vaneck.com/us/en/blogs/thematic-investing/buzz-investing-stocks-rally-to-start-2023/">
  <title>BUZZ Investing: Stocks Rally to Start 2023></title>
  <link>https://www.vaneck.com/us/en/blogs/thematic-investing/buzz-investing-stocks-rally-to-start-2023/</link>
  <description><![CDATA[Equities started the year with impressive gains, despite ending the last year with a whimper. Investors interpreted slower-than-anticipated wage growth as an indication of a potential Fed pivot.]]></description>
  <dc:creator> </dc:creator>
  <dc:date>01/24/2023 06:30:00</dc:date>
<content:encoded><![CDATA[

<p><strong>Key Points</strong></p>
<ul class="content-list">
<li class="mt-2"><strong>Market Rebound:</strong> U.S. equities experienced a strong start in 2023, recovering from previous declines.</li>
<li class="mt-2"><strong>Technology Sector Performance:</strong> Technology stocks, notably Meta Platforms, saw significant gains during this period.</li>
<li class="mt-2"><strong>Investor Sentiment:</strong> Positive investor sentiment was driven by signs of cooling inflation and Federal Reserve policies.</li>
</ul>
<p>Domestic equities were volatile, yet finished little changed, during the recent period between Index selection dates (December 8, 2022 to January 11, 2023, the &ldquo;Period&rdquo;) for the BUZZ NextGen AI US Sentiment Leaders Index. Stocks were broadly lower to close December, with most widely watched indices posting their first annual losses since 2018 and their worst declines since the Global Financial Crisis in 2007-2008. The S&amp;P 500 Index, which set a new all-time high on its first day of trading in 2022, proceeded to fall 18.1% for the year, as positive investor sentiment and optimistic growth expectations quickly gave way to geopolitical instabilities and inflation realities, collectively weighing on asset valuations throughout the year.</p>
<p>While the broader equity markets finished the year with a whimper, they roared out of the gate to start the New Year, with most widely watched benchmarks posting impressive gains. Economic reports released early in January showed signs that inflation might be cooling. Some investors took measures of slower-than-anticipated wage growth as an indication that the Fed&rsquo;s Hawkish pivot, during which time it aggressively raised its target Federal Funds Rate from near zero to 4.5%, may be having its intended effect.</p>
<p>The BUZZ NextGen AI US Sentiment Leaders Index (the &ldquo;BUZZ Index&rdquo; or &ldquo;Index&rdquo;) returned -12.41% during the month of December compared to a return of -5.76% for the S&amp;P 500 Index during the same period. Year-to-date, the BUZZ Index trails the S&amp;P 500 with returns of -47.54% and -18.11%, respectively, as of the end of December.</p>
<h2>Shares of Meta Platforms, Inc. Lead Advancing Stocks within the BUZZ Index</h2>
<p>Shares of Meta Platforms, Inc. (NASD: META), the parent company of Facebook, paced advancing stocks within the BUZZ Index during the recent Period. The social media company that faced a host of challenges during 2022 as it went &lsquo;all-in&rsquo; on its vision for a virtual reality world dubbed &ldquo;Horizon Worlds.&rdquo; Launched in August 2022, the virtual reality space was widely criticized across the internet leaving many to question whether Mark Zuckerberg, the company&rsquo;s founder &amp; CEO, had lost touch with the interests of consumers for its core product offerings. Shares of META fell 64% during 2022, and while they gained over 15% during the Period, they remain far below their all-time high. Investors may be viewing shares of the company as providing &lsquo;value&rsquo; after the dramatic failures and declines of 2022. Zuckerberg has recently pivoted his efforts and focus to cost cutting initiatives and employee layoffs to appease investor concerns.</p>
<div class="wrapped-div">
<table style="width: 750px;">
<tbody>
<tr class="tbl-data">
<td class="tbl-header last" colspan="4">Top BUZZ Index Contributors: December 8, 2022 - January 11, 2023</td>
</tr>
<tr class="tbl-data">
<td class="data-td  last">Company</td>
<td class="data-head last">Ticker</td>
<td class="data-head last">Average Weight (%)</td>
<td class="data-head last">Return Contribution (%)</td>
</tr>
<tr class="tbl-data">
<td class="data-td last" style="font-weight: normal;">Meta Platforms Inc</td>
<td class="data-td data last">META</td>
<td class="data-td data last">3.36</td>
<td class="data-td data last">0.48</td>
</tr>
<tr class="tbl-data">
<td class="data-td last" style="font-weight: normal;">Paramount Global</td>
<td class="data-td data last">PARA</td>
<td class="data-td data last">1.61</td>
<td class="data-td data last">0.27</td>
</tr>
<tr class="tbl-data">
<td class="data-td last" style="font-weight: normal;">Boeing Co/The</td>
<td class="data-td data last">BA</td>
<td class="data-td data last">1.79</td>
<td class="data-td data last">0.27</td>
</tr>
<tr class="tbl-data">
<td class="data-td last" style="font-weight: normal;">Carnival Corp</td>
<td class="data-td data last">CCL</td>
<td class="data-td data last">1.69</td>
<td class="data-td data last">0.21</td>
</tr>
<tr class="tbl-data">
<td class="data-td last" style="font-weight: normal;">Plug Power Inc</td>
<td class="data-td data last">PLUG</td>
<td class="data-td data last">1.11</td>
<td class="data-td data last">0.20</td>
</tr>
<tr class="tbl-data">
<td class="data-td last" style="font-weight: normal;">Amazon.com Inc</td>
<td class="data-td data last">AMZN</td>
<td class="data-td data last">3.02</td>
<td class="data-td data last">0.16</td>
</tr>
<tr class="tbl-data">
<td class="data-td last" style="font-weight: normal;">Walt Disney Co/The</td>
<td class="data-td data last">DIS</td>
<td class="data-td data last">2.88</td>
<td class="data-td data last">0.16</td>
</tr>
<tr class="tbl-data">
<td class="data-td last" style="font-weight: normal;">Salesforce Inc</td>
<td class="data-td data last">CRM</td>
<td class="data-td data last">1.12</td>
<td class="data-td data last">0.14</td>
</tr>
<tr class="tbl-data">
<td class="data-td last" style="font-weight: normal;">Block Inc</td>
<td class="data-td data last">SQ</td>
<td class="data-td data last">1.07</td>
<td class="data-td data last">0.14</td>
</tr>
<tr class="tbl-data">
<td class="data-td last" style="font-weight: normal;">Target Corp</td>
<td class="data-td data last">TGT</td>
<td class="data-td data last">1.32</td>
<td class="data-td data last">0.13</td>
</tr>
</tbody>
</table>
</div>
<br />
<p class="chart-disclosure">Source: BUZZ Holdings ULC, Bloomberg. Past performance is no guarantee of future results. Index performance is not illustrative of fund performance. Not intended as a recommendation to buy or to sell any of the securities mentioned herein.</p>
<p>The top detractors to performance primarily largely featured stocks from the Consumer Discretionary and Information Technology sectors. Shares of industry-leading electric vehicle (EV) manufacturer Tesla Inc. (NASD: TSLA), led decliners within the segment as they fell 29% during the Period. The company, whose share price posted its worst ever annual performance in 2022, falling 65%, continued to struggle into 2023 as it reported less than forecast vehicle deliveries during the fourth quarter. Investors openly questioned Founder &amp; CEO Elon Musk&rsquo;s commitment to the company as distractions relating to his acquisition of Twitter continue to mount. Investors increasingly point to Musk&rsquo;s share sales of Tesla, which have topped $39B since the stock peaked in November 2021, as a sign that he has grown disinterested in the prospects for the automaker, turning his attention to SpaceX and other ventures, including Twitter. Some investors have called for a change in leadership as the company faces increased competition in the EV segment from the likes of General Motors, Ford, Volkswagen, Hyundai, Kia, and Toyota.</p>
<div class="wrapped-div">
<table style="width: 750px;">
<tbody>
<tr class="tbl-data">
<td class="tbl-header last" colspan="4">Bottom BUZZ Index Contributors: December 8, 2022 - January 11, 2023</td>
</tr>
<tr class="tbl-data">
<td class="data-td  last">Company</td>
<td class="data-head last">Ticker</td>
<td class="data-head last">Average Weight (%)</td>
<td class="data-head last">Return Contribution (%)</td>
</tr>
<tr class="tbl-data">
<td class="data-td last" style="font-weight: normal;">Tesla Inc</td>
<td class="data-td data last">TSLA</td>
<td class="data-td data last">2.41</td>
<td class="data-td data last">-0.90</td>
</tr>
<tr class="tbl-data">
<td class="data-td last" style="font-weight: normal;">GameStop Corp</td>
<td class="data-td data last">GME</td>
<td class="data-td data last">2.51</td>
<td class="data-td data last">-0.75</td>
</tr>
<tr class="tbl-data">
<td class="data-td last" style="font-weight: normal;">Enphase Energy Inc</td>
<td class="data-td data last">ENPH</td>
<td class="data-td data last">1.28</td>
<td class="data-td data last">-0.39</td>
</tr>
<tr class="tbl-data">
<td class="data-td last" style="font-weight: normal;">DraftKings Inc</td>
<td class="data-td data last">DKNG</td>
<td class="data-td data last">1.86</td>
<td class="data-td data last">-0.34</td>
</tr>
<tr class="tbl-data">
<td class="data-td last" style="font-weight: normal;">Rivian Automotive Inc</td>
<td class="data-td data last">RIVN</td>
<td class="data-td data last">0.6</td>
<td class="data-td data last">-0.33</td>
</tr>
<tr class="tbl-data">
<td class="data-td last" style="font-weight: normal;">NVIDIA Corp</td>
<td class="data-td data last">NVDA</td>
<td class="data-td data last">2.98</td>
<td class="data-td data last">-0.23</td>
</tr>
<tr class="tbl-data">
<td class="data-td last" style="font-weight: normal;">Crowdstrike Holdings Inc</td>
<td class="data-td data last">CRWD</td>
<td class="data-td data last">1.02</td>
<td class="data-td data last">-0.22</td>
</tr>
<tr class="tbl-data">
<td class="data-td last" style="font-weight: normal;">Apple Inc</td>
<td class="data-td data last">AAPL</td>
<td class="data-td data last">2.97</td>
<td class="data-td data last">-0.21</td>
</tr>
<tr class="tbl-data">
<td class="data-td last" style="font-weight: normal;">Robinhood Markets Inc</td>
<td class="data-td data last">HOOD</td>
<td class="data-td data last">1.39</td>
<td class="data-td data last">-0.12</td>
</tr>
<tr class="tbl-data">
<td class="data-td last" style="font-weight: normal;">Shopify Inc</td>
<td class="data-td data last">SHOP</td>
<td class="data-td data last">1.83</td>
<td class="data-td data last">-0.11</td>
</tr>
</tbody>
</table>
</div>
<br />
<p class="chart-disclosure">Source: BUZZ Holdings ULC, Bloomberg. Past performance is no guarantee of future results. Index performance is not illustrative of fund performance. Not intended as a recommendation to buy or to sell any of the securities mentioned herein.</p>
<h2>Sentiment Stock Highlight &ndash; Warner Bros. Discovery, Inc.</h2>
<p>One of the new additions to the BUZZ Index this month is Warner Bros Discovery (NASDAQ: WBD). WBD was formed as a result of a merger between Discovery, Inc., and WarnerMedia, which was spun-off by AT&amp;T (NYSE: T). The merger, which was completed in April 2022, combined the business units of the two companies to form an impressive portfolio of content and intellectual properties, including Warner Bros films, DC Entertainment, HBO, CNN, and major sports TV networks. The company also owns HBO Max, which is re-positioning itself as a &lsquo;premium&rsquo; streaming service. Its largest streaming rival, Netflix (NASDAQ: NFLX), experienced challenges during 2022, highlighted by declining subscriber growth. Challenges at NFLX led to a negative outlook for the industry which contributed to pressure shares of WBD since their debut. NFLX recently alleviated some investor concerns after reporting better-than-expected subscriber growth. It successfully executed price increases on its ad-free plans and simultaneously rolled out lower-priced ad-supported plans. WBD has pursued a similar strategy for HBO Max, successfully raising the price of its ad-free subscription to $15.99, the highest in the industry. Industry fundamentals have appeared to stabilize, and rising investor sentiment may suggest that shares of WBD now represent a &lsquo;value&rsquo; opportunity, especially across its traditional media assets. This month WBD enters the Index for the first time with a 1.13% weight.</p>
<h3>Warner Brothers Discovery Stock Price | April 2022 &ndash; January 2023</h3>
<p><img class="img-responsive w-100" src="https://www.vaneck.com/contentassets/6a4bf82d6f9a4ee99531b64302e9da8c/2724_buzz_chart_01_2023.01_v1_blog.svg" alt="Warner Brothers Discovery Stock Price | April 2022 - January 2023" /></p>
<p class="chart-disclosure">Source: BUZZ Holdings ULC, Bloomberg. Past performance is no guarantee of future results. Index performance is not illustrative of fund performance. Not intended as a recommendation to buy or to sell any of the securities mentioned herein.</p>
<h2>BUZZ Index January 2023 Rebalance Highlights</h2>
<p><strong>Rivian Automotive, Inc.</strong></p>
<p>Equity markets had a choppy end to 2022 but started the New Year with a broad-based rally. One sector with recent increasing levels of positive investor sentiment has been the hard-hit electric vehicle (EV) space. Industry leader Tesla (NASDAQ: TSLA), whose share price had long withstood the industry downturn, succumb to a host of pressures during the fourth quarter of 2022, coinciding with Elon Musk&rsquo;s acquisition of Twitter which dominated the spotlight and redefined the narrative surrounding the company. Tesla&rsquo;s EV rivals, including Lucid Motors (NASDAQ: LCID) and Rivian Automotive (NASDAQ: RIVN) have been hurt by declining investor enthusiasm toward the segment throughout 2022. LCID is down over 90% since its peak in November 2021, while shares of RIVN have been in a consistent downtrend ever since its November 2021 IPO. While traditional media coverage of Musk, Tesla, and EV manufacturers in general has been overwhelmingly negative, positive investor sentiment has recently been noticeably increasing. The sentiment surge may foretell that the sector may be close to a bottom. Both TSLA and LCID currently have 3% weights in the Index, and this month RIVN&rsquo;s weight jumped to 1.38%.</p>
<p>For more on rebalancing results and a full breakdown of index constituents added and removed for the month, view the <strong><a href="https://www.vaneck.com/us/en/investments/social-sentiment-etf-buzz/buzz-reconstitution.pdf" target="_blank" rel="noopener" title="BUZZ VanEck Social Sentiment ETF">BUZZ Index reconstitution</a></strong> report.</p>
<p>To receive more <strong><a href="https://www.vaneck.com/us/en/insights/thematic-investing/" title="Thematic Investing Insights">Thematic Investing</a></strong> insights, <strong><a href="https://www.vaneck.com/us/en/subscribe/" title="Subscription Center">sign up in our subscription center</a></strong>.</p>
<style type="text/css">
    .wrapped-div {
        max-width: 100%;
    }

    @media (max-width: 1240px) {
        .wrapped-div {
            overflow-x: scroll;
        }
    }

    .wrapped-div-sector {
        max-width: 100%;
        overflow-x: scroll;
    }
</style>
]]></content:encoded>
</item><item rdf:about="https://www.vaneck.com/us/en/blogs/municipal-bonds/municipal-bonds-positioned-to-shine-in-2023/">
  <title>Municipal Bonds Positioned to Shine in 2023></title>
  <link>https://www.vaneck.com/us/en/blogs/municipal-bonds/municipal-bonds-positioned-to-shine-in-2023/</link>
  <description><![CDATA[We break down the challenging 2022 environment for municipal bonds and explain why the asset class is poised to rebound in 2023.]]></description>
  <dc:creator>Michael Cohick</dc:creator>
  <dc:date>01/24/2023 06:30:00</dc:date>
<content:encoded><![CDATA[

<p>On a recent webinar, Michael Cohick, Director of Product Management, and Tamara Lowin, Senior Municipal Credit Analyst, shared their outlook for municipal bonds in 2023. Highlights from their discussion are below.</p>
<h2>Darkest Before the Dawn: A Bright Outlook for Municipal Bonds</h2>
<p>Along with other fixed income asset classes, 2022 was a rough year for municipal bonds. However, yields are now higher for muni bonds than at any other time in the past 15 years. And dating back to 1989, a down year in the municipal bond market has been followed by <strong><a href="https://www.vaneck.com/us/en/blogs/municipal-bonds/muni-investors-top-4-reality-checks/" title="Muni Investors: Top 4 Reality Checks">at least one year (or several) of positive returns</a></strong>.</p>
<h3>Strong Recovery Historically Followed Down Years for Investment Grade Municipal Bonds</h3>
<p><img class="img-responsive w-100" src="https://www.vaneck.com/contentassets/75b305c5dd074b1b8838d5bc035a0086/2725_muni_chart_01_2023.01_v1_blog.svg" alt="Strong Recovery Historically Followed Down Years for Investment Grade Municipal Bonds" /></p>
<p class="chart-disclosure">Source: ICE Data Services. As of 12/31/22. Based on the ICE US Broad Municipal Index, which tracks the performance of U.S. dollar denominated investment grade tax-exempt debt publicly issued by U.S. states and territories, and their political subdivisions, in the U.S. domestic market. You cannot invest directly in an index. Past performance is not a guarantee of future results.</p>
<h2>Muni Bond Default Rates Low and UnLikely to Substantially Increase in 2023</h2>
<p><a href="https://www.vaneck.com/us/en/blogs/municipal-bonds/muni-defaults-should-investors-worry/" title="Muni Defaults: Should Investors Worry?"><strong>Low default rates</strong></a> are a hallmark of the municipal bond asset class. This was reaffirmed in Moody&rsquo;s Investors Service&rsquo;s annual municipal bond market snapshot, <em>U.S. municipal bond defaults, and recoveries, 1970-2021</em>, with updates through 2021. In more good news for muni investors, the report noted that the sector continued to recover from the effects of COVID-19. State tax revenue has recovered and is now higher than its pre-pandemic trajectory.</p>
<p>In addition, while they may have become more common over the past 15 years, municipal defaults and bankruptcies remain rare overall. In fact, there were no new rated municipal bond defaults during the period of significant market stress in 2021 resulting from COVID.</p>
<h3>Municipal Bond Defaults Remain Muted</h3>
<p><img class="img-responsive w-100" src="https://www.vaneck.com/contentassets/75b305c5dd074b1b8838d5bc035a0086/2725_muni_chart_02_2023.01_v1_blog.svg" alt="Municipal Bond Defaults Remain Muted" /></p>
<p class="chart-disclosure">Source: Municipal Market Analytics, as of 12/31/22. Past performance is not a guarantee of future results.</p>
<h2>Favorable Supply/Demand Backdrop</h2>
<p>In 2022 we saw massive outflows from the muni space and severely muted supply. However, in the current environment, <strong><a href="https://www.vaneck.com/us/en/blogs/municipal-bonds/new-municipal-issuance-supply-constraints-to-persist/" title="New Municipal Issuance: Supply Constraints to Persist?">demand for tax-exempt income</a></strong> is expected to outpace the supply of new municipal issuance. This supply constraint may increase the likelihood of solid performance in 2023.</p>
<p>Looking ahead, we believe the long-term prospects of municipal bonds remain compelling. The eventual return of municipal market performance is likely indisputable; the only question is when. While we await dawn, the favorable market backdrop keeps us warm.</p>
<p>Learn more about <a href="https://www.vaneck.com/us/en/blogs/municipal-bonds/municipal-bond-etfs-expect-more-from-your-munis/" title="Municipal Bond ETFs - Expect More from Your Munis"><strong>VanEck&rsquo;s suite of municipal bond ETFs</strong></a>, which offer investors the ability to exercise control over portfolio yield, duration, and credit exposure at different points in the interest rate cycle.</p>
<p>To receive more <a href="https://www.vaneck.com/us/en/insights/municipal-bonds/" title="Municipal Bonds Insights"><strong>Municipal Bonds</strong></a> insights, <a href="https://www.vaneck.com/us/en/subscribe/" title="Subscription Center"><strong>sign up in our subscription center</strong></a>.</p>
]]></content:encoded>
</item><item rdf:about="https://www.vaneck.com/us/en/blogs/economic-trends/disinflation-jitters/">
  <title>Disinflation Jitters></title>
  <link>https://www.vaneck.com/us/en/blogs/economic-trends/disinflation-jitters/</link>
  <description><![CDATA[EM disinflation is underway, but it is bumpy. What does it mean for EM central bank&rsquo;s ability to exit their tightening cycles?]]></description>
  <dc:creator>Natalia  Gurushina</dc:creator>
  <dc:date>01/24/2023 06:30:00</dc:date>
<content:encoded><![CDATA[

<h2>EM Inflation Surprises</h2>
<p>Headline inflation peaked in all emerging markets (EM) regions &ndash; and we have a chart to show that this is indeed the case (see below). However, <strong>disinflation progress can be full of setbacks and anxieties</strong>. Take today&rsquo;s &ldquo;double punch&rdquo; upside inflation surprises in Mexico and Brazil, for example. Mexico&rsquo;s surprise looked more concerning, as it involved a sizable uptick in core prices. Until a few days ago, the market was pricing in only one remaining 25bps rate hike in Mexico. But if the underlying price pressures persist for longer, it would be very difficult for Mexico&rsquo;s central bank to decouple from the U.S. Federal Reserve (Fed), which is expected to hike twice by a total of 50bps, or so.</p>
<h2>Brazil Policy Rate and Politics</h2>
<p><strong>Brazil&rsquo;s</strong> upside inflation surprise was due to just one big category (communications &ndash; which can be jumpy), so in theory, the <strong>central bank should feel more relaxed</strong>. However, political noise and policy uncertainty creates additional challenges, forcing the market to price in a &ldquo;warning shot&rdquo; rate hike sometime in the next 3-6 months. Many observers were concerned by a lack of focus in the latest policy initiatives/announcements in Brazil, which included restoring diplomatic relations with Venezuela and creating a common currency with Argentina. This is nice, but the bond market really wants to get a better understanding of the country&rsquo;s fiscal and debt dynamics, as the budget deficit is expected to widen from 4.7% of GDP in 2022 to 7.8% of GDP this year.</p>
<h2>EM Monetary Policy Stance</h2>
<p><strong>Brazil and Mexico are not the only EMs where central banks are better to remain &ldquo;en garde&rdquo; for now</strong>. Hungary&rsquo;s 24.5% annual inflation is a scary sight, so the central bank&rsquo;s hawkish statement (tight monetary conditions over a prolonged period) &ndash; together with the decision to raise the mandatory reserve requirements to 10% &ndash; was duly noted by the market (the Hungarian forint was the third best-performing currency so far this morning). Hungary is also the best-performing constituent (year-do-date, U.S. dollar unhedged) in the J.P. Morgan&rsquo;s EM local bond index (GBI-EM). Stay tuned!</p>
<h3>Chart at a Glance: Peak EM Inflation, But Uneven Disinflation Progress</h3>
<p><img class="img-responsive w-100" src="https://www.vaneck.com/contentassets/2984d76ec1424f6886ab7a9cc02944e9/us-natalias-take-2023-01-24.png" alt="Chart at a Glance: Peak EM Inflation, But Uneven Disinflation Progress" /></p>
<p class="chart-disclosure">Source: VanEck Research; Bloomberg LP.</p>
]]></content:encoded>
</item><item rdf:about="https://www.vaneck.com/us/en/blogs/economic-trends/global-growth-peak-pessimism/">
  <title>Global Growth – Peak Pessimism?></title>
  <link>https://www.vaneck.com/us/en/blogs/economic-trends/global-growth-peak-pessimism/</link>
  <description><![CDATA[China&rsquo;s policy U-turns are driving 2023 growth revisions. But the outlook for the rest of the world is more complicated, especially when social protests are involved.]]></description>
  <dc:creator>Natalia  Gurushina</dc:creator>
  <dc:date>01/23/2023 16:30:00</dc:date>
<content:encoded><![CDATA[

<h2>FED Rate Cuts</h2>
<p>We are only one week away from the U.S. Federal Reserve&rsquo;s (Fed) rate-setting meeting, and growth is back in focus. The consensus expects a robust Q4 GDP print in the U.S. later this week (2.7% quarter-on-quarter annualized) but not much improvement in more forward-looking activity gauges (Purchasing Managers Indices). The latter explains why this year&rsquo;s growth expectations for the U.S. are still well below 1% (the nascent uptick notwithstanding). The Conference Board&rsquo;s leading index &ndash; which dropped more than expected in December (-1%) - signaled that such caution is not unreasonable. A combo of &ldquo;barely there&rdquo; expansion and continuing disinflation is the reason why&nbsp;<strong>the market&nbsp;(Fed Funds Futures)&nbsp;continues to price in U.S. rate cuts (45-50bps) in the fall &ndash; despite the Fed&rsquo;s protestations.&nbsp;</strong></p>
<h2>China Rebound</h2>
<p><strong>Improvements in the near-term growth outlook for China are more justified, following the policy U-turns&nbsp;</strong>in the pandemic control and the real estate sector. China&rsquo;s economic surprise index went ballistic in the past few weeks, the official manufacturing and services PMIs are expected to move to an expansion zone in January, and the 2023 growth forecast is now back above 5% (see chart below). Emerging market (EM) Asia is widely expected to benefit from China&rsquo;s rebound &ndash; both in terms of growth and capital inflows/tourism recovery &ndash; and these expectations are already driving the regional FX performance, which boosted EM Asia local bonds&rsquo; total return (J.P. Morgan&rsquo;s GBI-EM Index) above higher-yielding LATAM bonds so far this year.&nbsp;</p>
<h2>LATAM Political Noise</h2>
<p><strong>And talking about&nbsp;LATAM, there is never a boring day in the neighborhood.</strong> I am sure many of you were entertained over the weekend by reports that Argentina and Brazil are planning a new common currency (called the sur). But jokes aside, policy and&nbsp;<strong>political developments&nbsp;</strong>in the region<strong>&nbsp;warrant attention because the growth is expected to decelerate very sharply in the coming months</strong>. Uruguay and Peru are the only major regional economies expected to grow by more than 2% in 2023. But if Peru&rsquo;s social protests continue to intensify &ndash; hurting the country&rsquo;s governability and tourism revenue &ndash; the GDP forecast will be cut, and bonds will continue to lag behind regional peers. Stay tuned!</p>
<h3>Chart at a Glance: China 2023 Growth Forecast &ndash; Liftoff</h3>
<img class="img-responsive w-100" src="https://www.vaneck.com/contentassets/34e524201b0245a098da171f58bb5d41/us-natalia-says-2023-01-23.png" alt="Chart at a Glance: China 2023 Growth Forecast &ndash; Liftoff" />
<p class="chart-disclosure">Source: Bloomberg LP</p>
]]></content:encoded>
</item><item rdf:about="https://www.vaneck.com/us/en/blogs/economic-trends/dont-forget-em-is-not-a-monolith/">
  <title>Don’t Forget - EM Is Not A Monolith></title>
  <link>https://www.vaneck.com/us/en/blogs/economic-trends/dont-forget-em-is-not-a-monolith/</link>
  <description><![CDATA[Global drivers helped EM performance so far this year, but there are plenty of &ldquo;demarcation lines&rdquo; in EM &ndash; so pay attention.]]></description>
  <dc:creator>Natalia  Gurushina</dc:creator>
  <dc:date>01/20/2023 06:30:00</dc:date>
<content:encoded><![CDATA[

<h2>EM Performance</h2>
<p>The beginning of the year was great for emerging market (EM) assets, which were lifted by the China reopening story, stabilizing (or maybe even improving) growth expectations, and disinflation getting traction across the globe. However, EM is not a monolith &ndash; something worth remembering when assessing EM&rsquo;s prospects for the rest of 2023. There are numerous &ldquo;demarcation lines&rdquo; in EM &ndash; starting with ratings. The High Yield EM Sovereign Spread (J.P. Morgan&rsquo;s EMBIG Diversified Index) narrowed, but it still looks attractive relative to the recent history. At the same time, the <strong>Investment Grade sovereign spread is only 16bps wider than the post-2008 minimum, effectively trading as a proxy for U.S. Treasuries</strong>.</p>
<h2>EM Peak Rates</h2>
<p><strong>There is also a lot of</strong> <strong>divergence on the regional level &ndash; especially as regards peak inflation and peak policy rates</strong>. A few months ago, the markets were concerned that EM latecomers to the global tightening cycle might be forced to do a lot of rate hike frontloading against the backdrop of softening growth. However, EM Asia might have dodged that bullet. Inflation is moderating from lower levels than in EMEA or LATAM &ndash; today&rsquo;s below-consensus inflation print in Malaysia is a case in point. As a result, Asian central banks are ending rate hikes earlier and with lower peak rates than expected. The regional policy rate differential vis-a-vis the U.S. Federal Reserve is now less than 100bps (see chart below). Would this hurt regional currencies? Not necessarily. EM Asia is uniquely positioned to benefit from China&rsquo;s reopening, and larger capital inflows/improving external positions can easily override the &ldquo;barely there&rdquo; policy differential with the Fed.</p>
<h2>EM Local Debt</h2>
<p><strong>These are some of the reasons why</strong> <strong>rate-setting meetings in Thailand </strong>&ndash; but also in South Africa (which is an inflation outlier in EMEA) - <strong>will be closely watched next week</strong>. Can we get another surprising rate pause in EM Asia, given the Thai baht&rsquo;s spectacular performance so far this year? Will South Africa deliver a smaller-than-expected 25bps hike, given that the inflation target breach was small and inflation might get back to the target range faster - and would that matter given the elevated political risks? These two countries represent nearly 20% of the J.P. Morgan&rsquo;s EM local bond index, so they are important constituents both for passive and active investors. Stay tuned!</p>
<h3>Chart at a Glance: EM Regional Policy Rate Peaks &ndash; Different Height</h3>
<p><img class="img-responsive w-100" src="https://www.vaneck.com/contentassets/252fffe8504848a1b52a100a338c046f/us-natalias-take-2023-01-20.png" alt="Chart at a Glance: EM Regional Policy Rate Peaks - Different Height" /></p>
<p class="chart-disclosure">Source: VanEck Research; Bloomberg LP.</p>
]]></content:encoded>
</item><item rdf:about="https://www.vaneck.com/us/en/blogs/natural-resources/demand-growth-could-keep-resources-on-track/">
  <title>Demand Growth Could Keep Resources on Track></title>
  <link>https://www.vaneck.com/us/en/blogs/natural-resources/demand-growth-could-keep-resources-on-track/</link>
  <description><![CDATA[Resource equities exhibited strong relative gains in Q4, outperforming both global equities and bonds. The most important issue for the resource equity sector may be the path to opening in China.]]></description>
  <dc:creator>Shawn Reynolds</dc:creator>
  <dc:date>01/19/2023 06:30:00</dc:date>
<content:encoded><![CDATA[

<h2>Overview</h2>
<p>Resource equities exhibited strong relative gains this quarter, outperforming both global equities and bonds during the three-month period.<sup>*</sup>&nbsp;Despite reported industry cost inflation, resilient commodity prices, combined with financial prudence, supported healthy free cash flow generation and robust capital returns programs for many producers.</p>
<p>The impacts of aggressive global fiscal tightening measures began to show in the fourth quarter as inflation moderated (albeit slightly), collective economic activity slowed and recessionary fears took hold of equity markets in December. Yet, inflation remained at historically high levels through the end of the year and both commodities and resource equities demonstrated, once more, their ability to act as a sound hedge against inflation.</p>
<h2>Market Recap</h2>
<p><strong>Energy</strong></p>
<p>Intensifying sanctions against Russia compounded global energy supply concerns in the fourth quarter. The European Union&rsquo;s ban on all seaborne oil imports from Russia beginning in December marked one of the most dramatic measures taken against the country since its invasion of Ukraine.</p>
<p>Notably, the move came at a time when both OPEC+ and U.S. oil and gas producers leveled or lowered production in favor of market price stability and capital preservation. A full-on crisis was averted due in part to demand destruction in Asia (from high prices), ample liquid natural gas inventories and milder weather in Europe.</p>
<p>Market optimism for renewables, following the passing of the U.S.&rsquo;s industry-simulative Inflation Reduction Act, was apparent for most of October and November. However, gains were relatively short-lived as growth stocks led the market&rsquo;s risk-off moves in December.</p>
<p><strong>Metals</strong></p>
<p>Supply issues, including disruptions at top-producing copper mines in South America as well as registered low inventories for a number of industrial metals, globally, carried over from the third quarter of 2022. These factors, combined with emerging expectations of increased metals demand following the lifting of China&rsquo;s &ldquo;zero-COVID&rdquo; policy, pushed prices higher across the complex.</p>
<p>Meanwhile, the anticipation of a potential pause in Fed rate hikes and corresponding dollar weakness aided in gold&rsquo;s modest rebound. On the back of gold&rsquo;s moves, the miners were able to partially recover from losses experienced throughout the first three quarters of the year.</p>
<p><strong>Agriculture</strong></p>
<p>Fertilizer prices continued to trend downward off historical highs as 2023 demand forecasts weakened on rising farm costs and easing natural gas prices (natural gas is one of the main inputs into nitrogen-based fertilizers).</p>
<p>Grain prices, on the other hand, became somewhat volatile in the last quarter of the year, as traders weighed the potential impact of disruptions in South American exports&mdash;due to geopolitical infighting and drought&mdash;against ongoing uncertainty around Ukraine.</p>
<p>As was the case throughout much of the year, agricultural producers and fertilizer manufacturers wrestled with, on one hand, healthy margins and, on the other, rising industry costs and an increasingly sour operating environment.</p>
<h2>Performance Review</h2>
<p>During the quarter, the greatest contributions to absolute performance came from the oil &amp; gas sub-sector&mdash;including the top three individual contributors highlighted below. However, the base &amp; industrial metals, gold &amp; precious metals and agriculture sub-sectors were all strong absolute contributors as well.</p>
<p>The largest detractor from absolute and relative performance (versus both the S&amp;P North American Natural Resources Sector Index and the S&amp;P Global Natural Resources Index) was the renewables &amp; alternatives sub-sector.</p>
<div class="wrapped-div">
<table width="100%">
<tbody>
<tr class="tbl-data">
<td class="tbl-header last" colspan="5">Top Contributors</td>
</tr>
<tr class="tbl-data">
<td class="data-td  last">Name</td>
<td class="data-head last">Sub-Sector</td>
<td class="data-head last">Weight (%)</td>
<td class="data-head last">Est. Cont. (bps)</td>
<td class="data-head last" style="text-align: left;">Comment</td>
</tr>
<tr class="tbl-data">
<td class="data-td last" style="font-weight: normal;">Halliburton</td>
<td class="data-td data last">Oil &amp; Gas</td>
<td class="data-td data last">1.96</td>
<td class="data-td data last">+76</td>
<td class="data-td data last" style="text-align: left;">Benefitted from pricing (higher margins) and pick up in drilling activity</td>
</tr>
<tr class="tbl-data">
<td class="data-td last" style="font-weight: normal;">Valero</td>
<td class="data-td data last">Oil &amp; Gas</td>
<td class="data-td data last">3.93</td>
<td class="data-td data last">+73</td>
<td class="data-td data last" style="text-align: left;">Strong middle distillates product profile (diesel, jet fuel) and selling into a tight market</td>
</tr>
<tr class="tbl-data">
<td class="data-td last" style="font-weight: normal;">Hess</td>
<td class="data-td data last">Oil &amp; Gas</td>
<td class="data-td data last">2.85</td>
<td class="data-td data last">+70</td>
<td class="data-td data last" style="text-align: left;">Attractive exploration success (in Guyana) and growth profile</td>
</tr>
</tbody>
</table>
</div>
<br />
<div class="wrapped-div">
<table width="100%">
<tbody>
<tr class="tbl-data">
<td class="tbl-header last" colspan="5">Top Detractors</td>
</tr>
<tr class="tbl-data">
<td class="data-td  last">Name</td>
<td class="data-head last">Sub-Sector</td>
<td class="data-head last">Weight (%)</td>
<td class="data-head last">Est. Cont. (bps)</td>
<td class="data-head last" style="text-align: left;">Comment</td>
</tr>
<tr class="tbl-data">
<td class="data-td last" style="font-weight: normal;">FREYR Battery</td>
<td class="data-td data last">Renewables &amp; Alt.</td>
<td class="data-td data last">0.98</td>
<td class="data-td data last">-59</td>
<td class="data-td data last" style="text-align: left;">Sold off with other growth-oriented companies in December</td>
</tr>
<tr class="tbl-data">
<td class="data-td last" style="font-weight: normal;">Chart Industries</td>
<td class="data-td data last">Indust. &amp; Utilities</td>
<td class="data-td data last">1.35</td>
<td class="data-td data last">-58</td>
<td class="data-td data last" style="text-align: left;">Participated in an uncharacteristic acquisition requiring substantial leverage</td>
</tr>
<tr class="tbl-data">
<td class="data-td last" style="font-weight: normal;">Stem</td>
<td class="data-td data last">Renewables &amp; Alt.</td>
<td class="data-td data last">0.88</td>
<td class="data-td data last">-58</td>
<td class="data-td data last" style="text-align: left;">Sold off with other growth-oriented companies in December</td>
</tr>
</tbody>
</table>
</div>
<br />
<p class="chart-disclosure">Source: VanEck, FactSet. Data as of December 31, 2022. Not a recommendation to buy or sell any security mentioned herein. Estimated contributions are sourced from FactSet and are not intended as a predictor or guarantee of future results, and are for illustrative purposes only.</p>
<div class="wrapped-div">
<table width="600px">
<tbody>
<tr class="tbl-data">
<td class="tbl-header last" colspan="6">Trailing Returns (%, as of December 31, 2022)</td>
</tr>
<tr class="tbl-data">
<td class="data-head last">&nbsp;</td>
<td class="data-head last">QTD</td>
<td class="data-head last">YTD</td>
<td class="data-head last">1 Year</td>
<td class="data-head last">3 Year</td>
<td class="data-head last">5 Year</td>
</tr>
<tr class="tbl-data">
<td class="data-td data last" style="text-align: left;">Global Resources Fund</td>
<td class="data-td data last">&nbsp;</td>
</tr>
<tr class="tbl-data">
<td class="data-td data last" style="padding-left: 45px; text-align: left;">At Net Asset Value</td>
<td class="data-td data last">9.02</td>
<td class="data-td data last">7.74</td>
<td class="data-td data last">14.89</td>
<td class="data-td data last">3.65</td>
</tr>
<tr class="tbl-data">
<td class="data-td data last" style="padding-left: 45px; text-align: left;">At Maximum 5.75% sales charge</td>
<td class="data-td data last">2.75</td>
<td class="data-td data last">1.54</td>
<td class="data-td data last">12.65</td>
<td class="data-td data last">2.43</td>
</tr>
<tr class="tbl-data">
<td class="data-td data last" style="text-align: left;">S&amp;P North American Natural Resources Sector Index</td>
<td class="data-td data last">18.25</td>
<td class="data-td data last">34.07</td>
<td class="data-td data last">14.97</td>
<td class="data-td data last">7.13</td>
</tr>
<tr class="tbl-data">
<td class="data-td data last" style="text-align: left;">S&amp;P Global Natural Resources Index</td>
<td class="data-td data last">17.23</td>
<td class="data-td data last">10.32</td>
<td class="data-td data last">11.62</td>
<td class="data-td data last">7.34</td>
</tr>
</tbody>
</table>
</div>
<br />
<p class="chart-disclosure">Note: Returns less than one year are not annualized. The table presents past performance which is no guarantee of future results and which may be lower or higher than current performance. Returns reflect temporary contractual fee waivers and/or expense reimbursements. Had the Fund incurred all expenses and fees1, investment returns would have been reduced. Expenses: Class A: Gross 1.48% and Net 1.38%. Expenses are capped contractually through 05/01/23 at 1.38% for Class A. Investment returns and Fund share values will fluctuate so that investors' shares, when redeemed, may be worth more or less than their original cost. Fund returns assume that dividends and capital gains distributions have been reinvested in the Fund at NAV.</p>
<h2>Portfolio Positioning</h2>
<p>Notable changes this quarter included a reduction in oil &amp; gas exploration &amp; production (E&amp;P) exposure and increased base &amp; industrial metals and gold &amp; precious metals exposure. Generally speaking, strong performance from the traditional energy sector presented a favorable opportunity to lock in gains and free up capital to allocate to several of the portfolio&rsquo;s other developing themes.</p>
<p>Notable reductions in oil &amp; gas exposure included the full sale of the portfolio&rsquo;s position in Coterra Energy (not held at quarter end). The position was exited on elevated operational risk as the company reported cuts to its proved reserves and exhibited a good mix more heavily weighted towards its lower-quality acreage.</p>
<p>New positions included gold company, Franco-Nevada (1.49% of net assets), and green metals producer, Jervois (0.11%). As a royalty company, Franco-Nevada is uniquely positioned to protect against industry cost inflation while also still offering potential upside to higher gold prices. Meanwhile, Jervois stands to be the only cobalt miner in the U.S. following the commissioning of its Idaho mine in the first quarter of 2023. The company already sees steady cash flow from its refining operations in Finland and the potential for further added value from its Brazilian nickel refinery in 2024.</p>
<h2>Outlook</h2>
<p>The resource equity sector continues to face a number of historically unprecedented issues, including a potential looming recession and the deepening repercussions of the resource crisis associated with Russia&rsquo;s invasion of Ukraine. However, the most important issue may be the path to opening in China.</p>
<p>Relaxation of &ldquo;zero-COVID&rdquo; restrictions should eventually lead to a strong rebound in China&rsquo;s economy, a substantial increase in the demand for commodities and a subsequent positive response from resource equities.</p>
<p>The largest consumer of commodities in the world has been, essentially, in a recession. If this had occurred during the decade of 2010-2020, commodity and resource equity prices would have seen severe underperformance. Instead, outperformance has been strong&mdash;signaling that we currently operate in a structurally tight supply environment. The timing of China&rsquo;s return to the world market may go a long way in offsetting any new recessionary demand impacts that may unfold in OECD countries. China may essentially be a tightly coiled spring that, when released, could be a catalyst for an unparalleled rebound in demand for all commodities.</p>
<p>Perhaps the biggest risk to the resource equity sector is the belief that inflation is conquered and that we may be returning to the low inflationary period seen over the last decade. While it is possible that inflation in most parts of the world has peaked, there is still strong historical evidence showing how once a mid-single digit inflation threshold has been breached, a return to a lower inflationary regime takes many years, if not decades, to attain.</p>
<h3>Historically, global inflation has remained elevated much longer than is currently being forecasted.</h3>
<p><img class="img-responsive w-100" src="https://www.vaneck.com/contentassets/47339cb1e68a4bb7acd34806a98b0ec5/2699_grf_chart_01_2023.01_v1_blog.svg" alt="Historically, global inflation has remained elevated much longer than is currently being forecasted." /></p>
<p class="chart-disclosure">Source: Deutsche Bank. Data as of September 2022.</p>
<p>Hence, the prevailing view that central bankers around the world will be able to quickly drive inflation back to the 2% level while balancing economic growth and employment seems to us extremely unlikely.</p>
<p><a href="/us/en/blogs/natural-resources/demand-growth-could-keep-resources-on-track/grf-quarterly-commentary-4q-2022.pdf" target="_blank" title="Global Resources Fund: Quarterly Commentary" rel="noopener"><strong>Download Commentary PDF with Fund specific information and performance.</strong></a></p>
<p>To receive more <a href="/us/en/insights/natural-resources/" title="Natural Resources Insights"><strong>Natural Resources</strong></a> insights, <a href="https://www.vaneck.com/us/en/subscribe/" title="Subscription Center"><strong>sign up in our subscription center</strong></a>.</p>
<style type="text/css">
.wrapped-div {
    max-width: 100%;
}
@media (max-width: 768px) {
    .wrapped-div {
        overflow-x: scroll;
    }
}
.wrapped-div-sector {
    max-width: 100%;
    overflow-x: scroll;
}
</style>
]]></content:encoded>
</item><item rdf:about="https://www.vaneck.com/us/en/blogs/economic-trends/policy-rates-lower-peaks-after-all/">
  <title>Policy Rates - Lower Peaks After All?></title>
  <link>https://www.vaneck.com/us/en/blogs/economic-trends/policy-rates-lower-peaks-after-all/</link>
  <description><![CDATA[More balanced inflation risks, fiscal adjustment, and &ldquo;China reopening&rdquo; capital inflows open room for earlier exits from tightening cycles in EM.]]></description>
  <dc:creator>Natalia  Gurushina</dc:creator>
  <dc:date>01/19/2023 06:30:00</dc:date>
<content:encoded><![CDATA[

<h2>Pace of Disinflation</h2>
<p>The &ldquo;lower peak rates&rdquo; story is very much on our minds this morning. We&rsquo;ve got a dovish policy surprise in EM Asia. Fed Funds Futures price in only two 25bps rate hikes in the U.S., and the market expectations for the ECB peak rate are grinding lower. <strong>Faster disinflation and more balanced inflation risks</strong> (check today&rsquo;s comments from the Boston Federal Reserve President Collins) is a reasonable <strong>explanation for why central banks might feel under less pressure to continue aggressive hikes</strong>. This is especially the case in emerging market (EM) Asia, where inflation is peaking at much lower levels than in other regions. Today&rsquo;s decision by Malaysia&rsquo;s central bank to stay on hold &ndash; instead of another &ldquo;measured&rdquo; 25bps rate hike &ndash; falls into this category. Indonesia&rsquo;s central bank raised the policy rate by 25bps as expected but signaled that cumulative tightening should be enough to bring inflation back to target.</p>
<h2>China Reopening and EM FX</h2>
<p>Indonesia&rsquo;s central bank also referred to the <strong>recent currency strength as a reason for ending the tightening cycle</strong> &ndash; and this is where China&rsquo;s re-opening and the associated capital inflows (not just to China but to the rest of EM Asia) come into play. Asian currencies have been major beneficiaries of this trade year-to-date (see chart below). Still, commodity exporters can get an extra boost in the coming months if China&rsquo;s rebound is stronger than expected. The consensus is gradually turning in this direction &ndash; China&rsquo;s 2023 consensus GDP forecast is now back to 5%. China&rsquo;s reopening is one of the reasons behind our optimistic outlook for EM Debt this year.</p>
<h2>EM Fiscal Adjustment</h2>
<p><strong>Another important fundamental consideration for EM central banks (and bonds) is the pace of fiscal adjustment</strong> &ndash; albeit it can act both ways. The Bloomberg consensus surveys show smaller 2023 budget deficits in 2/3 of major EMs, but there are exceptions &ndash; like Poland (which is getting closer to the elections) or Brazil (populist policy agenda). However, several fiscal &ldquo;offenders&rdquo; of 2022 (Hungary) appear to be doing better than expected, improving the technical (supply) backdrop for local bonds. We also noticed that some EMs (notably in Central Europe) are using the current market conditions to pre-fund a big portion of their 2023 financial needs. Stay tuned!</p>
<h3>Chart at a Glance: China Re-Opening Lifts EM FX</h3>
<p><img class="img-responsive w-100" src="https://www.vaneck.com/contentassets/cd44198dc9d64f538a80a29160a58fc9/us-natalias-take-2023-01-19.png" alt="Chart at a Glance: China Re-Opening Lifts EM FX" /></p>
<p class="chart-disclosure">Source: Bloomberg LP.</p>
]]></content:encoded>
</item><item rdf:about="https://www.vaneck.com/us/en/blogs/digital-assets/can-illuvium-become-crypto-gamings-aaa-breakthrough/">
  <title>Can Illuvium Become Crypto Gaming’s AAA Breakthrough?></title>
  <link>https://www.vaneck.com/us/en/blogs/digital-assets/can-illuvium-become-crypto-gamings-aaa-breakthrough/</link>
  <description><![CDATA[Can Illuvium live up to its hype and become the biggest crypto game universe with its 2023 full release? We review its positive tailwinds and possible risks.]]></description>
  <dc:creator>John Patrick Lee, CFA</dc:creator>
  <dc:date>01/18/2023 06:30:00</dc:date>
<content:encoded><![CDATA[

<p><strong>Please note that VanEck may have a position(s) in the digital asset(s) described below.</strong></p>
<p>Crypto gaming is set for a breakout year in 2023, and one of the industry leaders is Illuvium. Illuvium is an upcoming series of games and the world's first Interoperable Blockchain Game universe offering a triple-A gaming experience. It includes an open-world exploration creature collector called <i>Overworld</i>, a city-builder called <i>Zero</i>, and auto-battler called <i>Arena. </i>All three games are built on the Ethereum blockchain.</p>
<p>Scheduled for a full release in 2023, Illuvium aims to become the biggest crypto game universe on the market to date. In the face of a bear market in 2022, Illuvium has managed to maintain high expectations and engagement due to its transparent operations and robust team of creators. The Illuvium game universe is a 'game first/crypto second' project, and it boasts a tokenomics model that supports decentralized ownership and staking rewards. Although Illuvium benefits from positive tailwinds, there are also clear headwinds associated with the game launch tied to both crypto and traditional gaming-related risks and challenges.</p>
<ul class="content-list">
<li><strong><a href="#point-one">The Scoop on Illuvium: Interoperability and AAA Gaming</a></strong></li>
<li><strong><a href="#point-two">Illuvium's Successful Fundraising Allows for Focus on Game Development and Art</a></strong></li>
<li><strong><a href="#point-three">Illuvium's Tokenomics Model and the ImmutableX Partnership</a></strong></li>
<li><strong><a href="#point-four">All Aboard the Illuvium Hype Train?</a></strong></li>
<li><strong><a href="#point-five">Investors Still Holding Despite Significant Decline</a></strong></li>
<li><strong><a href="#point-six">Four Possible Risks: Illuvium's Success Remains Uncertain</a></strong></li>
</ul>
<h2 id="point-one" class="anchored-block">The Scoop on Illuvium: Interoperability and AAA Gaming</h2>
<p>We believe Illuvium could become a long-term winner in the crypto gaming ecosystem and even potentially compete directly with traditional AAA web2 games. Illuvium promises to build dynamic and interoperable functionality between three games within its universe, a feat not yet accomplished within the traditional web2 gaming space.</p>
<p><img class="img-responsive w-100" src="https://www.vaneck.com/contentassets/533d2a674c764767bdcf5224e2b9077e/2696_illuvium_infographics-01_2023.01.svg" alt="llluvium Series of Games: Overworld, Zero, and Arena" /></p>
<p class="chart-disclosure">Source: VanEck.</p>
<p>Within the Illuvium ecosystem, interoperability means assets within one game can transfer between other games and therefore impact what happens in those other properties during gameplay. For example, players can collect Illuvials (Pokemon-like creatures that exist in the universe) in the <i>Overworld</i> game and can then use them as playable items in the <i>Arena</i> game. To be able to travel between regions in <i>Overworld</i>, players first need to mine (or buy) fuel in <i>Zero</i>. This would be similar to if items collected in Mario Odyssey could affect the player's race speed in Mario Kart.</p>
<p><strong>&ldquo;Interoperability&rdquo;</strong> is a classic metaverse buzzword with a fair bit of hype but currently lacks execution. Part of the problem is that although the underlying technology of blockchain can prove ownership, the transfer of assets between closed worlds - specifically games from different studios - is not functional. However, the transfer of said assets between games created by one studio - in this case, the studio behind Illuvium - is something that the Illuvium Game Universe aims to pioneer.</p>
<p>We consider this the halfway point between a fully realized, interoperable metaverse experience and the currently siloed platforms that exist today. It&rsquo;s a big step in the right direction.</p>
<p><img class="img-responsive w-100" src="https://www.vaneck.com/contentassets/533d2a674c764767bdcf5224e2b9077e/2696_illuvium_infographics-02_2023.01.svg" alt="Interoperable Metaverse Experience" /></p>
<p class="chart-disclosure">Souce: VanEck.</p>
<h2 id="point-two" class="anchored-block">Illuvium's Successful Fundraising Allows for Focus on Game Development and Art</h2>
<p>The web2 gaming market is loosely bifurcated between triple-A games and indie games. Triple-A games require a much larger budget, development period, and marketing spend, while indie games are cheaper to make and easier to launch. Consider the difference between games like<i> Fortnite</i> or <i>Call of Duty</i> versus low-fi casual games like<i> Among Us</i> or <i>Fall Guys</i>. The vast majority of crypto games launched so far would be considered indie by traditional web2 video game industry standards. We believe Illuvium represents the first true triple-A game to be launched within the crypto game ecosystem. Naturally, this necessitates a longer runway and more funding.</p>
<p>The funding behind Illuvium has come primarily from token issuance and a massively successful NFT land sale. In March 2021, the project raised approximately $5.5 million in a seed round, and $38 million at TGE (Token Generation Event). In June of 2022, Illuvium raised $72 million (amid a bear market) in a land sale of nearly 20,000 NFTs representing plots of land in the game environment. These plots of land hold consumable digital items that need to be mined via <i>Zero</i> to facilitate gameplay in <i>Overworld</i>.</p>
<p>Illuvium&rsquo;s ability to raise such a large war chest gives it a heavy advantage over other crypto-native games. It will allow it to compete directly with the web2 triple-A gaming category. Development and marketing are the two main drivers of the cost that make games so expensive. Because Illuvium has been so successful in its organic marketing strategy, it has allowed the project to focus more on game development and art. Illuvium has 60-70 developers working on gameplay and around 90 artists fleshing out design. Illuvium&rsquo;s advantage against other crypto games cannot be overstated when it comes to development and art, which is a direct result of successful fundraising and a highly talented and skilled team. The question then becomes &ndash; <i>Can Illuvium compete with traditional triple-A video games that are already dominating the market (Fortnite, Pokemon, etc.)?</i></p>
<p><img class="img-responsive w-100" src="https://www.vaneck.com/contentassets/533d2a674c764767bdcf5224e2b9077e/2696_illuvium_image-01_2023.01.jpg" alt="llluvium Series of Games" /></p>
<p class="chart-disclosure">Source: lluvium.</p>
<h2 id="point-three" class="anchored-block">Illuvium's Tokenomics Model and the ImmutableX Partnership</h2>
<p>Illuvium has the potential to be the first blockchain game to successfully create a token economy that thrives and rewards its gaming community for spending more time in the game. Players and investors may benefit from the growth of Illuvium in multiple ways due to the structure of the in-game economy and the characteristics of the gameplay that the Illuvium team has created. Illuvium will attempt to drive value back to the users through both their ILV token holdings and the NFTs that players will accumulate from gameplay.</p>
<p>Illuvium intends to redistribute 100% of the revenue generated by the game back to ILV stakers by using ETH spent in-game to purchase ILV and fund staking rewards. Stakers will also benefit from the revenue generated by trading via the Illuvidex - the game&rsquo;s marketplace - where a 5% fee on volume is used to repurchase ILV and distribute it as staking rewards. There are 10 million ILV, of which 5% went to pre-seed investors, 15% to seed investors, 15% to the team, 15% to the treasury, 10% to the Illuvium launchpad, 30% for staking rewards, and 10% for in-game rewards.</p>
<p>Additionally, players who don&rsquo;t want to buy the ILV token will still be able to profit from their gameplay, thanks to how the Illuvium team has designed gameplay. Unlike other blockchain games that use NFT characters to breed more NFTs (which can be inflationary), Illuvium is implementing a &ldquo;fusing&rdquo; mechanism that allows players to combine three of the same Illuvials into one stronger Illuvial with evolved characteristics (which in turn is deflationary). Furthermore, each type of Illuvial is associated with a bonding curve, making them rarer for every additional illuvial captured. These two mechanisms will help drive the scarcity of Illuvials and bolster Illuvial trading. Eventually, players will seek to buy certain Illuvials rather than capture them due to their rarity in the open world.</p>
<p>Illuvium is also launching via the ImmutableX layer-2 scaling solution for Ethereum. This partnership makes sense for Illuvium in many ways. First, they can avoid paying for minting millions of NFTs, which would be economically impossible on most blockchain - ImmutableX&rsquo;s zero-knowledge rollup technology allows them to provide a gasless blockchain experience for users and supports their goal of becoming the destination for the top web3 games. Second, ImmutableX has partnered with GameStop and their community of over 50 million gamers which can provide Illuvium direct access to one of the largest communities of web2 gamers. Third, ImmutableX is an aggregated liquidity layer for NFTs, meaning NFT items can be sold directly through in-game marketplaces rather than requiring users to purchase or sell their NFT assets in third-party marketplaces such as OpenSea.</p>
<h2 id="point-four" class="anchored-block">All Aboard the Illuvium Hype Train?</h2>
<p>Illuvium is easily one of the most highly anticipated crypto game releases in history. The project has a substantial social media following, its own token, and NFT collections that are actively traded on secondary market websites like OpenSea. Many would argue that Illuvium is the first true triple-A crypto title in that the size and breadth of development far exceed the majority of other live or beta games in development.</p>
<p>Illuvium has managed to build successfully, and maintain, a steady drumbeat of sustained hype and attention in the years the game has been in development. As a result of Illuvium's massive social media following, the game already had an organically built player base before its release<strong>.</strong> According to Illuvium&rsquo;s founder Kieran Warwick, the project&rsquo;s marketing strategy focused on organic growth instead of paid efforts. Illuvium focused specifically on DeFi communities by creating promotional NFTs to entice users to join and engage with the Illuvium community. Illuvium&rsquo;s discord membership grew to over 70,000 members within three months, placing it in the top ten discords of the entire world in 2021.</p>
<p>Since then, Illuvium has maintained a steady drumbeat of anticipation and community-building by building the project out in the open. This equates to regular updates on game mechanics, art, and other development-related teasers to keep the community engaged.</p>
<p>In addition to a strong social media following, Illuvium&rsquo;s token ILV boasts a nearly half-billion-dollar market cap. While the token has fallen significantly from its 2021 highs, a fully diluted valuation of $485m indicates that crypto investors are betting that the game shows serious promise.</p>
<h2 id="point-five" class="anchored-block">Investors Still Holding Despite Significant Decline</h2>
<p><strong>Illuvium (ILV) to USD since 3/31/2021</strong></p>
<p><img class="img-responsive w-100" src="https://www.vaneck.com/contentassets/533d2a674c764767bdcf5224e2b9077e/2696_illuvium_chart-01_2023.01_blog.svg" alt="Illuvium (ILV) to USD since 3/31/2021" /></p>
<p class="chart-disclosure">Source: Coingecko as of 1/6/2023. Past performance is no guarantee of future results. Not intended as a recommendation to buy or sell any securities mentioned herein.</p>
<div class="wrapped-div">
<table width="100%">
<tbody>
<tr class="tbl-data">
<td class="tbl-header last" style="text-align: center;" colspan="8"><strong>Illuvium Competitor Traction</strong></td>
</tr>
<tr class="tbl-data">
<td class="tbl-header last" rowspan="2">Game</td>
<td class="tbl-header last" style="text-align: center;" colspan="5">Fundamental</td>
<td class="tbl-header last" style="text-align: center;" colspan="2">Social</td>
</tr>
<tr class="tbl-data">
<td class="data-head last">Status</td>
<td class="data-head last">Fully Diluted Value ($)</td>
<td class="data-head last">MAUs</td>
<td class="data-head last">F2P Mode?</td>
<td class="data-head last" style="border-right: outset;">Mobile Access</td>
<td class="data-head last">Twitter</td>
<td class="data-head last">Discord</td>
</tr>
<tr class="tbl-data">
<td class="data-td last">Axie Infinity</td>
<td class="data-td data last">Live</td>
<td class="data-td data last">1.8B</td>
<td class="data-td data last">93k</td>
<td class="data-td data last">✔️</td>
<td class="data-td data last" style="border-right: outset;">✔️</td>
<td class="data-td data last">907k</td>
<td class="data-td data last">1M</td>
</tr>
<tr class="tbl-data">
<td class="data-td last">Splinterlands</td>
<td class="data-td data last">Live</td>
<td class="data-td data last">70M</td>
<td class="data-td data last">324k</td>
<td class="data-td data last">✔️</td>
<td class="data-td data last" style="border-right: outset;">✔️</td>
<td class="data-td data last">63k</td>
<td class="data-td data last">176k</td>
</tr>
<tr class="tbl-data">
<td class="data-td last">Alien Worlds</td>
<td class="data-td data last">Live</td>
<td class="data-td data last">123M</td>
<td class="data-td data last">592k</td>
<td class="data-td data last">✔️</td>
<td class="data-td data last" style="border-right: outset;">✔️</td>
<td class="data-td data last">119k</td>
<td class="data-td data last">42k</td>
</tr>
<tr class="tbl-data">
<td class="data-td last">Benji Bananas</td>
<td class="data-td data last">Live</td>
<td class="data-td data last">28M</td>
<td class="data-td data last">395k</td>
<td class="data-td data last">✔️</td>
<td class="data-td data last" style="border-right: outset;">✔️</td>
<td class="data-td data last">15.7k</td>
<td class="data-td data last">2k</td>
</tr>
<tr class="tbl-data">
<td class="data-td last">EV.io</td>
<td class="data-td data last">Live</td>
<td class="data-td data last">-</td>
<td class="data-td data last">260k</td>
<td class="data-td data last">✔️</td>
<td class="data-td data last" style="border-right: outset;">❌</td>
<td class="data-td data last">11.4k</td>
<td class="data-td data last">12k</td>
</tr>
<tr class="tbl-data">
<td class="data-td last">Star Atlas</td>
<td class="data-td data last">Early Access</td>
<td class="data-td data last">102M</td>
<td class="data-td data last">60k</td>
<td class="data-td data last">✔️</td>
<td class="data-td data last" style="border-right: outset;">❌</td>
<td class="data-td data last">315k</td>
<td class="data-td data last">210k</td>
</tr>
<tr class="tbl-data">
<td class="data-td last">Illuvium</td>
<td class="data-td data last">Beta</td>
<td class="data-td data last">394M</td>
<td class="data-td data last">30k+</td>
<td class="data-td data last">✔️</td>
<td class="data-td data last" style="border-right: outset;">✔️</td>
<td class="data-td data last">348k</td>
<td class="data-td data last">193k</td>
</tr>
<tr class="tbl-data">
<td class="data-td last">Big Time</td>
<td class="data-td data last">Early Access</td>
<td class="data-td data last">-</td>
<td class="data-td data last">✔️</td>
<td class="data-td data last" style="border-right: outset;">❌</td>
<td class="data-td data last">255k</td>
<td class="data-td data last">402k</td>
</tr>
<tr class="tbl-data">
<td class="data-td last">Upland</td>
<td class="data-td data last">Live</td>
<td class="data-td data last">-</td>
<td class="data-td data last">129k</td>
<td class="data-td data last">✔️</td>
<td class="data-td data last" style="border-right: outset;">✔️</td>
<td class="data-td data last">96k</td>
<td class="data-td data last">72k</td>
</tr>
<tr class="tbl-data">
<td class="data-td last">Delysium</td>
<td class="data-td data last">Beta</td>
<td class="data-td data last">-</td>
<td class="data-td data last">✔️</td>
<td class="data-td data last" style="border-right: outset;">❌</td>
<td class="data-td data last">116k</td>
<td class="data-td data last">74k</td>
</tr>
<tr class="tbl-data">
<td class="data-td last">DigiDaigaku</td>
<td class="data-td data last">Building</td>
<td class="data-td data last">-</td>
<td class="data-td data last">✔️</td>
<td class="data-td data last" style="border-right: outset;">✔️</td>
<td class="data-td data last">71k</td>
<td class="data-td data last">26k</td>
</tr>
<tr class="tbl-data">
<td class="data-td last">Shrapnel</td>
<td class="data-td data last">Building</td>
<td class="data-td data last">-</td>
<td class="data-td data last">❌</td>
<td class="data-td data last" style="border-right: outset;">❌</td>
<td class="data-td data last">52k</td>
<td class="data-td data last">39k</td>
</tr>
</tbody>
</table>
</div>
<br />
<p class="chart-disclosure">Source: Dappradar and Coinmarketcap as of 1/5/2023. Past performance is no guarantee of future results. Not intended as a recommendation to buy or sell any securities mentioned herein.</p>
<p>The position of Illuvium in comparison with its competition is favorable, especially considering the game hasn't launched yet. In terms of social followers and market cap, Axie Infinity is by far the leader. Still, once Illuvium's games are released in 2023, we believe that it has the potential to become the leader in all categories.</p>
<h2 id="point-six" class="anchored-block">Four Possible Risks: Illuvium's Success Remains Uncertain</h2>
<p>Even though there are many positive tailwinds behind Illuvium, there are still risks inherent to launching a new crypto game. A failed launch can happen even to traditional studios - just look at Cyberpunk 2077 in 2020. We outline four possible challenges that could pose risks to Illuvium&rsquo;s success.</p>
<p><strong> 1. The hype train fails to leave the station.</strong> Two of the proposed three games are now released in beta form, but the full game hasn&rsquo;t yet been launched with full functionality. It's possible that the game won't be well received once it's released in its entirety. The tides of popularity and momentum in gaming can change rapidly, and they can change even more often in the crypto gaming world.</p>
<p><strong>2. Regulation in the U.S. classifies ILV token as a security. </strong>With the collapse of FTX, many crypto analysts predict that new regulations could classify a large swath of non-bitcoin crypto tokens as securities. If this were to happen, Illuvium&rsquo;s tokenomics model could fall apart, and US players would not be able to buy the ILV token for staking purposes.</p>
<p><strong>3. The community onboarded months ago isn&rsquo;t engaged anymore.</strong> Illuvium&rsquo;s token was launched in the first half of 2021, and the NFT land sale occurred in the summer of 2022. Early token holders will be approaching a two-year holding period before a game is launched. Two years of anticipation is standard for triple-A video games, BUT from a metrics point of view, how many of those original players are still engaged? Weekly average users and token price mean much more than social metrics, so the game needs to launch before more meaningful engagement metrics can be analyzed thoroughly.</p>
<p><strong>4. Fortnite (or a web2 equivalent) successfully integrates NFTs. </strong>As we saw with the Reddit NFT integrations late in 2022, a successful launch of a web3 product from a web2 platform is going to attract both new and existing web3 entrants. If an existing web2 game successfully launches an NFT, this could theoretically pull players from the Illuvium ecosystem and reduce engagement.</p>
<h2>Conclusion</h2>
<p>Overall, Illuvium is poised to be a significant player in the world of crypto gaming in 2023. Despite the challenges of a bear market, the game has maintained high levels of interest, an engaged community, and a robust team of creators. If Illuvium is successful in its full release in 2023, it could serve as a model for other game studios looking to create web3 games that can potentially compete with web2, triple-A games. The release of Illuvium will be closely watched by many, as it could have a significant impact on the entire gaming industry.</p>
<p>To receive more <strong><a href="https://www.vaneck.com/us/en/insights/digital-assets/" title="Digital Assets Insights">Digital Assets</a></strong> insights, <strong><a href="https://www.vaneck.com/us/en/subscribe/" title="Subscription Center">sign up in our subscription center</a></strong>.</p>
<style type="text/css">
.wrapped-div {
    max-width: 100%;
}
@media (max-width: 768px) {
    .wrapped-div {
        overflow-x: scroll;
    }
}
.wrapped-div-sector {
    max-width: 100%;
    overflow-x: scroll;
}
</style>
]]></content:encoded>
</item><item rdf:about="https://www.vaneck.com/us/en/blogs/economic-trends/how-much-room-for-rate-cuts/">
  <title>How Much Room for Rate Cuts?></title>
  <link>https://www.vaneck.com/us/en/blogs/economic-trends/how-much-room-for-rate-cuts/</link>
  <description><![CDATA[Established disinflation and high real rates are the main reasons why EM bonds look interesting, and the market continues to price in fairly aggressive rate cuts in EM.]]></description>
  <dc:creator>Natalia  Gurushina</dc:creator>
  <dc:date>01/18/2023 06:30:00</dc:date>
<content:encoded><![CDATA[

<h2>Rate Cut Expectations</h2>
<p>The market expectations for policy rates are often jittery, but the predominant narrative remains intact &ndash; rate cuts are coming because inflation is easing and global growth is slowing. Well, today&rsquo;s combo of lower producer prices and weaker retail sales in the U.S. matched this storyline. However, a possibility of a stronger post-pandemic rebound in China is a force to recon with (both as regards global GDP and inflation). In contrast, the weaker U.S. Dollar could be outright inflationary (via import prices). As of this morning, the market priced in two more small hikes by the U.S. Federal Reserve (Fed). followed by a relatively long pause and a rate cut sometime in the fall. <strong>The market expectations for emerging market (EM) rate cuts are often more aggressive &ndash; and for a good reason</strong>. Disinflation is more established, most EM central banks started to hike earlier than the Fed, and the real policy rates in EM are significantly higher than in all DMs (on a forward-looking basis &ndash; see chart below). The last point is one of the reasons why we are <a href="https://www.vaneck.com/us/en/blogs/emerging-markets-bonds/3-reasons-to-allocate-to-em-bonds-in-2023/" title="3 Reasons to Allocate to EM Bonds in 2023"><strong>optimistic on EM bonds in 2023</strong></a>.</p>
<h2>Global Disinflation</h2>
<p><strong>Today&rsquo;s downside surprise in South Africa (both core and headline) is a good example of EM disinflation gone in right direction</strong>. South Africa&rsquo;s headline inflation eased to 7.2% year-on-year, which brings it closer to the official target, and details of the release suggest that inflation can get back to the target range faster than expected. This, in turn, signals that the central bank might opt for a smaller 25bps rate hike next week and that this hike might be the last in the current cycle. This is not a bad setup for a major constituent of J.P. Morgan&rsquo;s EM local bond index (South Africa&rsquo;s weight in GBI-EM is about ~10%) - albeit whether or not the South African central bank would have room for a rate cut (currently priced in for H2-2023) will depend on fiscal performance, as well as political/policy noise (including calls for the central bank&rsquo;s nationalization).</p>
<h2>China Rebound And EM</h2>
<p>We expect <strong>some residual policy tightening in other parts of EM as well</strong> &ndash; in EM Asia in particular (the region was a latecomer for the global tightening cycle). Both Indonesia and Malaysia have their rate-setting meetings tomorrow, and both are expected to deliver small (&ldquo;farewell&rdquo;?) 25bps rate hikes. With disinflation already underway (and from lower levels than in most EMEA or LATAM) and growth expected to piggyback on China&rsquo;s reopening, Indonesia is considered an attractive destination for EM bond investors this year. Stay tuned!</p>
<h3>Chart at a Glance: EM Real Policy Rates &ndash; Time for a Trim?</h3>
<p><img class="img-responsive w-100" src="https://www.vaneck.com/contentassets/99152bddc8384fcfbb47bc9f2b9a48a3/us-natalias-take-2023-01-18.png" alt="Chart at a Glance: EM Real Policy Rates - Time for a Trim?" /></p>
<p class="chart-disclosure">Source: VanEck Research; Bloomberg LP.</p>
]]></content:encoded>
</item><item rdf:about="https://www.vaneck.com/us/en/blogs/income-investing/can-fallen-angels-soar-again-in-2023/">
  <title>Can Fallen Angels Soar Again in 2023?></title>
  <link>https://www.vaneck.com/us/en/blogs/income-investing/can-fallen-angels-soar-again-in-2023/</link>
  <description><![CDATA[We explore the factors that may contribute to 2023 returns, including interest rate policy and its effect on the real economy, bond market expectations, and the impact of the yield curve.]]></description>
  <dc:creator>Nicolas  Fonseca, CFA</dc:creator>
  <dc:date>01/17/2023 06:30:00</dc:date>
<content:encoded><![CDATA[

<p>Fallen angels (as represented by the ICE US Fallen Angel High Yield 10% Constrained Index, Ticker: H0CF; subsequently referred to herein as &ldquo;the index&rdquo;) underperformed broad HY (as represented by the ICE BofA US High Yield Index, Ticker: H0A0) by 2.78% (-14.00% vs. -11.22%) for 2022, with more than 100% underperformance happening within the year's first four months. Fallen angels were lagging broad HY by 3.19% thru 4/30 (where the Fed had only hiked by 0.25% in their March meeting, but the 10Y had increased by 1.37%), but then outperformed broad HY for the remainder 8 months of the year by 0.34% (with the Fed adding +4.00% and the 10Y increasing by 0.99%).</p>
<p><img class="img-responsive w-100" src="https://www.vaneck.com/contentassets/b4dcf626a09a498f9bda18c2fae78f8d/2687_angl_chart-01_2023.01_blog.svg" alt="Fallen Angels underperformed broad HY" /></p>
<p class="chart-disclosure">Source: ICE Data Services, US Treasury. Past performance is no guarantee of future results. Fallen Angels: ICE US Fallen Angel High Yield 10% Constrained Index. Broad HY: ICE BofA US High Yield Index, 10Y US treasury and Fed Funds.</p>
<h2>2022: Year in Review</h2>
<p>2021 was a <strong><a href="https://www.vaneck.com/us/en/blogs/income-investing/fallen-angel-bonds-outperform-broad-high-yield-in-14-out-of-18-years/" title="Fallen Angel Bonds Outperform Broad High Yield in 14 Out of 18 Years">smooth ride</a></strong> where fallen angels outperformed as the energy sector, alongside oil prices, contributed the most. But 2022 was an entirely different story. We expected rising stars and or the Fed to drive returns and were not completely wrong, as the Federal Reserve (Fed) actions were at center stage. There were rising stars, but the impact on returns was overshadowed by rising interest rates as the market adjusted to persistently high inflation.</p>
<ul class="content-list">
<li>Investors grappled with numerous challenging developments in 2022: 40-year high inflation that led the Fed to +4.00% of rate hikes and the markets taking a big hit; central banks tightening around the world trying to fight inflation; the Russia Ukraine War bringing volatility into oil and commodities; global growth concerns; yield curve inversion, among others.</li>
<li>The 10Y yield continued its 2021 upward trend, starting at 1.52% and rising relatively quickly to 3.12% at the beginning of April. It hit its highest level since the GFC at 4.25% in mid-October and finished the year at 3.88%.</li>
<li>Broad HY and fallen angels had their second to-last worst calendar year since 2004, only outperforming 2008, where returns were in the mid -20%. 10Y+ Treasuries returned -28.15%, US investment grade -15.44%, the US bond broad market return -13.16%, US IG Floating Rates notes +0.48% and 0-3-month Treasuries +1.53%, showing how long duration asset classes did worse.</li>
<li>Broad HY outperformed fallen angels for the fourth time since 2004, adding 2022 to 2007, 2011, and 2018 where broad HY came out on top. For the 2004-2022 calendar year average return, fallen angels are still on top despite 2022 underperformance; fallen angels average 9.53% vs. 7.19% for broad HY.</li>
<li>Overall, interest rate movements explained more than 100% of the fallen angel underperformance. After adjusting for duration, selection and allocation effects contributed positively and partially offset some of the interest rate movements.</li>
</ul>
<p><strong>The yield to worst</strong> for fallen angels (7.49%) is now above the historical average (7.06%), providing a level where adding exposure may be attractive for investors as the higher level of carry offers a significant cushion for returns in a range of potential rate/spread scenarios (including upgrades/downgrades) going forward. Spreads are still under long-term averages, meaning there is room for them to widen, particularly if credit markets price in slowing growth or a recessionary environment which hasn&rsquo;t been the case yet. On the other hand, fundamentals generally remain strong, and current spread levels reflect that. Fallen angel spreads have been oscillating between the low 200s-to lows 400s levels since the end of 2020 but have yet to reach the 500 mark. Wider spread environments with weakening fundamentals would most likely lead to an increase in fallen angel volume, which has driven outperformance of fallen angels versus broad high yield historically. The ability to earn a high level of carry, and the higher overall credit quality of fallen angels, may make fallen angels an attractive place for high yield investors to wait for a turn in the credit cycle.</p>
<h3>Fallen Angels Yield-to-Worst (12/31/2003 &ndash; 12/31/2022)</h3>
<p><img class="img-responsive w-100" src="https://www.vaneck.com/contentassets/b4dcf626a09a498f9bda18c2fae78f8d/2687_angl_chart-02_2023.01_blog.svg" alt="Fallen Angels Yield to Worst (12/31/2003 - 12/31/2022)" /></p>
<p class="chart-disclosure">Source: ICE Data Services, VanEck. Past performance is no guarantee of future results. Fallen Angels: ICE US Fallen Angel High Yield 10% Constrained Index.</p>
<h2>The 2023 Story: Fed, Spreads and Rating Migrations</h2>
<p>We believe there are couple of factors that may drive returns in the coming year.</p>
<ul class="content-list">
<li>Investors will continue to closely watch the Fed. There is currently a disconnect between market expectations for a Fed pivot and recent Fed speak suggesting a higher terminal rate, and staying at that level for an extended period. The impact on the real economy and high yield borrowers is going to be a key driver in high yield bond returns this year.</li>
<li>Bond market expectations and the impact on the yield curve will also be important. The significant increase in longer term rates in 2022 may not be matched in 2023, and even if bond yields do continue to move up, the higher carry helps cushion the impact. Fed hikes and rising bond yields have not necessarily meant underperformance of fallen angels, despite their longer duration. Two periods known and one to be determined, show that fallen angels have yet to underperformed:</li>
<ul class="content-list">
<li>June 2004 to June of 2006:</li>
<ul class="content-list">
<li>Fed Funds were raised from ~1% to ~5.25% while the 10Y change 0.53% (from 4.62% to 5.15%)</li>
<li>Fallen angels outperformed by 1.49% (17.31% vs 15.82%)</li>
</ul>
</ul>
<ul class="content-list">
<li>October 2015 to January 2019:</li>
<ul class="content-list">
<li>Fed Funds were raised from ~0% to ~2.5% while the 10Y change 0.42% (from 2.27% to 2.69%)</li>
<li>Fallen angels outperformed by 9.03% (32.45% vs 23.42%)</li>
</ul>
</ul>
<ul class="content-list">
<li>March 2022 to December 2022:</li>
<ul class="content-list">
<li>Fed Fund were raised from ~0.25% to ~4.25% while the 10Y change 1.56% (from 2.32% to 3.88%)</li>
<li>Fallen angels <i>underperformed</i> by 0.47% (-7.49% vs -7.02%) <strong><u>BUT</u></strong> the expectation is for the Fed to continue raising them so the current cycle is not yet over</li>
</ul>
</ul>
</ul>
<ul class="content-list">
<li>As of the end of last year, fallen angels&rsquo; spreads were at 337 and broad HY at 481 with historical averages of 466 and 521; still tight relative to historical levels. Despite the difference between them being wider than usual, compositional differences help explain it as fallen angels finished the year with an 87% BB rated vs 51% for broad HY.</li>
<li>Sell side forecasts on credit migration (upgrades and downgrades) vary in 2023, reflecting an uncertain macro environment. Downgrades may continue to be more idiosyncratic and less sector specific than what we&rsquo;ve seen over the last few years, looking more like 2022 where all 8 issuers were from different sectors. The corporate fundamental backdrop may become more challenged, translating into sector dispersion and potentially some defaults, with the expected high yield default rate increasing to 2-3% by December of 2023. Upgrades may continue their momentum in 2023 and some issuers (Occidental Petroleum, Ford, etc.) are on a good deleveraging path and will most likely see their credit ratings improve.</li>
<li>Overall, we believe a repeat of 2022 is unlikely given the <strong><a href="https://www.vaneck.com/us/en/blogs/income-investing/carry-boosts-fixed-income-resilience-in-likely-fed-scenarios/" title="Carry Boosts Fixed Income Resilience in Likely Fed Scenarios">support from yields</a></strong>.</li>
</ul>
<p><u><strong>Fallen angels overall stats</strong></u></p>
<p>Duration, the sensitivity of the price of a bond to a change in interest rates, was the major player this year, thus detracting any bond strategy with mid to long term duration. Unfortunately, fallen angels have a slightly longer duration that broad HY, despite cutting it by 22% whereas broad HY remain flat for 2022, so it was hit harder than broad high yield. In terms of yields, fallen angels yield to worst continues to look attractive versus historical averages despite retreating from the yearly highs on mid-October, but are still on the higher end after increasing 119% vs 106% for broad HY from the end of 2021.</p>
<div class="wrapped-div">
<table width="100%">
<tbody>
<tr class="tbl-data">
<td class="tbl-header last">&nbsp;</td>
<td class="tbl-header last" style="text-align: center;" colspan="3" rowspan="1">Fallen Angel</td>
<td class="tbl-header last" style="text-align: center;" colspan="3" rowspan="1">Broad HY</td>
</tr>
<tr class="tbl-data">
<td class="data-head last">&nbsp;</td>
<td class="data-head last">12/31/2021</td>
<td class="data-head last">6/30/2022</td>
<td class="data-head last">12/31/2022</td>
<td class="data-head last">12/31/2021</td>
<td class="data-head last">6/30/2022</td>
<td class="data-head last">12/31/2022</td>
</tr>
<tr class="tbl-data">
<td class="data-head last" style="text-align: left;">Yield to Worst</td>
<td class="data-td data last">3.42</td>
<td class="data-td data last">7.43</td>
<td class="data-td data last">7.49</td>
<td class="data-td data last">4.32</td>
<td class="data-td data last">8.94</td>
<td class="data-td data last">8.89</td>
</tr>
<tr class="tbl-data">
<td class="data-head last" style="text-align: left;">Effective Duration</td>
<td class="data-td data last">6.97</td>
<td class="data-td data last">5.70</td>
<td class="data-td data last">5.45</td>
<td class="data-td data last">4.04</td>
<td class="data-td data last">4.45</td>
<td class="data-td data last">4.04</td>
</tr>
<tr class="tbl-data">
<td class="data-head last" style="text-align: left;">Full Market Value ($mn)</td>
<td class="data-td data last">196,932</td>
<td class="data-td data last">116,331</td>
<td class="data-td data last">112,854</td>
<td class="data-td data last">1,610,169</td>
<td class="data-td data last">1,258,523</td>
<td class="data-td data last">1,199,909</td>
</tr>
<tr class="tbl-data">
<td class="data-head last" style="text-align: left;">OAS</td>
<td class="data-td data last">211</td>
<td class="data-td data last">435</td>
<td class="data-td data last">337</td>
<td class="data-td data last">310</td>
<td class="data-td data last">587</td>
<td class="data-td data last">481</td>
</tr>
<tr class="tbl-data">
<td class="data-head last" style="text-align: left;">No. of Issues</td>
<td class="data-td data last">262</td>
<td class="data-td data last">214</td>
<td class="data-td data last">212</td>
<td class="data-td data last">2,123</td>
<td class="data-td data last">1,996</td>
<td class="data-td data last">1,927</td>
</tr>
</tbody>
</table>
</div>
<br />
<p class="chart-disclosure">Source: ICE Data Services, VanEck. Past performance is no guarantee of future results. Fallen Angels: ICE US Fallen Angel High Yield 10% Constrained Index. Broad HY: ICE BofA US High Yield Index. OAS refers to &ldquo;option-adjusted spread.&rdquo; Please see definition for this and other terms referenced herein in the disclosures and definitions portion of this blog.</p>
<p><u><strong>New fallen angels</strong></u></p>
<p>2022 saw 8 downgrades for a total market value of 8.37% added to the index, with Las Vegas Sands being top weight as there was limited confidence in the recovery of Macau's gaming industry due to very strict governmental Covid policies which have started to shift over the last few weeks of 2022 and should continue in 2023. The last downgrade issuer for the year was Kohl&rsquo;s, as Moody&rsquo;s states that the erosion of market position and the deterioration in their credit metrics does not reflect an IG rating. There is low visibility for fallen angels in 2023, likely reflecting a very uncertain macro environment but we believe there will be some next year.</p>
<div class="wrapped-div">
<table width="100%">
<tbody>
<tr class="tbl-data">
<td class="tbl-header last" style="text-align: left;">Month-end Addition</td>
<td class="tbl-header last" style="text-align: center;">Name</td>
<td class="tbl-header last" style="text-align: center;">Rating</td>
<td class="tbl-header last" style="text-align: center;">Sector</td>
<td class="tbl-header last" style="text-align: center;">Industry</td>
<td class="tbl-header last" style="text-align: center;">% Mkt Value</td>
<td class="tbl-header last" style="text-align: center;">Price</td>
</tr>
<tr class="tbl-data">
<td class="data-td data last" style="text-align: left;">April</td>
<td class="data-td data last">Steelcase Inc</td>
<td class="data-td data last">BB1</td>
<td class="data-td data last">Services</td>
<td class="data-td data last">Support-Services</td>
<td class="data-td data last">0.36</td>
<td class="data-td data last">97.82</td>
</tr>
<tr class="tbl-data">
<td class="data-td data last" style="text-align: left;">June</td>
<td class="data-td data last">Las Vegas Sands</td>
<td class="data-td data last">BB1</td>
<td class="data-td data last">Leisure</td>
<td class="data-td data last">Gaming</td>
<td class="data-td data last">3.32</td>
<td class="data-td data last">89.72</td>
</tr>
<tr class="tbl-data">
<td class="data-td data last" style="text-align: left;">July</td>
<td class="data-td data last">Ohio National Financial Services</td>
<td class="data-td data last">BB1</td>
<td class="data-td data last">Insurance</td>
<td class="data-td data last">Life Insurance</td>
<td class="data-td data last">0.59</td>
<td class="data-td data last">99.87</td>
</tr>
<tr class="tbl-data">
<td class="data-td data last" style="text-align: left;">August</td>
<td class="data-td data last">Pacific Western Bank</td>
<td class="data-td data last">BB1</td>
<td class="data-td data last">Banking</td>
<td class="data-td data last">0.33</td>
<td class="data-td data last">89.61</td>
</tr>
<tr class="tbl-data">
<td class="data-td data last" style="text-align: left;">August</td>
<td class="data-td data last">Toledo Hospital</td>
<td class="data-td data last">BB1</td>
<td class="data-td data last">Healthcare</td>
<td class="data-td data last">Health Facilities</td>
<td class="data-td data last">0.58</td>
<td class="data-td data last">63.58</td>
</tr>
<tr class="tbl-data">
<td class="data-td data last" style="text-align: left;">November</td>
<td class="data-td data last">Office Properties Income Trust</td>
<td class="data-td data last">BB1</td>
<td class="data-td data last">Real Estate</td>
<td class="data-td data last">REITs</td>
<td class="data-td data last">1.54</td>
<td class="data-td data last">79.44</td>
</tr>
<tr class="tbl-data">
<td class="data-td data last" style="text-align: left;">November</td>
<td class="data-td data last">Western Digital Corp.</td>
<td class="data-td data last">BB1</td>
<td class="data-td data last">Technology &amp; Electronics</td>
<td class="data-td data last">Tech Hardware &amp; Equipment</td>
<td class="data-td data last">0.73</td>
<td class="data-td data last">76.91</td>
</tr>
<tr class="tbl-data">
<td class="data-td data last" style="text-align: left;">December</td>
<td class="data-td data last">Kohl's Corp.</td>
<td class="data-td data last">BB1</td>
<td class="data-td data last">Retail</td>
<td class="data-td data last">Department Stores</td>
<td class="data-td data last">0.91</td>
<td class="data-td data last">74.21</td>
</tr>
</tbody>
</table>
</div>
<br />
<p class="chart-disclosure">Source: ICE Data Services, VanEck. Past performance is no guarantee of future results. Not a recommendation to buy or sell any of the names/securities mentioned herein. Fallen Angels: ICE US Fallen Angel High Yield 10% Constrained Index.</p>
<p><u><strong>Rising Stars</strong></u></p>
<p>As mentioned last year, rising stars were a big part of the conversation in 2022, although their impact on returns was overshadowed by rising yields. Overall, there were 8 issuers upgrades to IG from HY that removed 18.36% of market value weight of the index which was higher than 2021 rising stars (12 issuers for a 12.13% weight), although, Kraft account for half of this past year weight.</p>
<div class="wrapped-div">
<table width="100%">
<tbody>
<tr class="tbl-data">
<td class="tbl-header last" style="text-align: left;">Month-end Exit</td>
<td class="tbl-header last" style="text-align: center;">Name</td>
<td class="tbl-header last" style="text-align: center;">Rating</td>
<td class="tbl-header last" style="text-align: center;">Sector</td>
<td class="tbl-header last" style="text-align: center;">Industry</td>
<td class="tbl-header last" style="text-align: center;">% Mkt Value</td>
<td class="tbl-header last" style="text-align: center;">Price</td>
</tr>
<tr class="tbl-data">
<td class="data-td data last" style="text-align: left;">January</td>
<td class="data-td data last">Freeport-Mcmoran Inc</td>
<td class="data-td data last">BB1</td>
<td class="data-td data last">Basic Industry</td>
<td class="data-td data last">Metals/Mining Excluding Steel</td>
<td class="data-td data last">2.73</td>
<td class="data-td data last">111.46</td>
</tr>
<tr class="tbl-data">
<td class="data-td data last" style="text-align: left;">March</td>
<td class="data-td data last">EQT Corporation</td>
<td class="data-td data last">BB1</td>
<td class="data-td data last">Energy</td>
<td class="data-td data last">Energy - Exploration &amp; Production</td>
<td class="data-td data last">2.00</td>
<td class="data-td data last">105.82</td>
</tr>
<tr class="tbl-data">
<td class="data-td data last" style="text-align: left;">March</td>
<td class="data-td data last">Kraft Heinz Foods Company</td>
<td class="data-td data last">BB1</td>
<td class="data-td data last">Consumer Goods</td>
<td class="data-td data last">Food - Wholesale</td>
<td class="data-td data last">9.70</td>
<td class="data-td data last">106.50</td>
</tr>
<tr class="tbl-data">
<td class="data-td data last" style="text-align: left;">April</td>
<td class="data-td data last">Michael Kors (USA) Inc</td>
<td class="data-td data last">BB1</td>
<td class="data-td data last">Retail</td>
<td class="data-td data last">Specialty Retail</td>
<td class="data-td data last">0.35</td>
<td class="data-td data last">97.50</td>
</tr>
<tr class="tbl-data">
<td class="data-td data last" style="text-align: left;">May</td>
<td class="data-td data last">HCA</td>
<td class="data-td data last">BB1</td>
<td class="data-td data last">Healthcare</td>
<td class="data-td data last">Health Facilities</td>
<td class="data-td data last">0.27</td>
<td class="data-td data last">108.75</td>
</tr>
<tr class="tbl-data">
<td class="data-td data last" style="text-align: left;">August</td>
<td class="data-td data last">DCP Midstream</td>
<td class="data-td data last">BB1</td>
<td class="data-td data last">Energy</td>
<td class="data-td data last">Gas Distribution</td>
<td class="data-td data last">1.36</td>
<td class="data-td data last">103.57</td>
</tr>
<tr class="tbl-data">
<td class="data-td data last" style="text-align: left;">October</td>
<td class="data-td data last">Deutsche Bank AG NY Branch</td>
<td class="data-td data last">BB1</td>
<td class="data-td data last">Banking</td>
<td class="data-td data last">1.32</td>
<td class="data-td data last">93.05</td>
</tr>
<tr class="tbl-data">
<td class="data-td data last" style="text-align: left;">December</td>
<td class="data-td data last">Hexcel Corporation</td>
<td class="data-td data last">BB1</td>
<td class="data-td data last">Capital Goods</td>
<td class="data-td data last">Aerospace/Defense</td>
<td class="data-td data last">0.63</td>
<td class="data-td data last">95.02</td>
</tr>
</tbody>
</table>
</div>
<br />
<p class="chart-disclosure">Source: ICE Data Services, VanEck. Past performance is no guarantee of future results. Not a recommendation to buy or sell any of the names/securities mentioned herein. Fallen Angels: ICE US Fallen Angel High Yield 10% Constrained Index.</p>
<p><u><strong>Fallen angels performance by sector</strong></u></p>
<p>No sector posted a positive return this past year with the Insurance sector posting the best total return of all at -7.44% and Retail posting the worst at -23.18%. There were some changes to the sector allocation, but Energy still dominates the fund. With the upgrade of Kraft to investment grade, the Consumer Goods saw its allocation decrease by 9.88% which was then redistributed mostly to Leisure (Las Vegas Sands downgraded) and to the Telecom sector. Spreads, as expected, widened for all sectors but are still on the tighter end. The index price is getting closer to $90 with only 11.45% of the index in the $70s, 53.40% in the $80s and 35.15% in the 90s, allowing for future price appreciation and good entry points as the historical average is still in the mid $90s.</p>
<div class="wrapped-div">
<table style="width: 100%;">
<tbody>
<tr class="tbl-data">
<td class="tbl-header last">&nbsp;</td>
<td class="tbl-header last" style="text-align: center; border-right: outset;" colspan="3">Wgt (%)</td>
<td class="tbl-header last" style="text-align: center; border-right: outset;" colspan="3">OAS</td>
<td class="tbl-header last" style="text-align: center; border-right: outset;" colspan="3">Price</td>
<td class="tbl-header last" style="text-align: center;">YTD TR %</td>
</tr>
<tr class="tbl-data">
<td class="data-head last">&nbsp;</td>
<td class="data-head last">&nbsp;12/31/2021&nbsp;</td>
<td class="data-head last">&nbsp;6/30/2022&nbsp;</td>
<td class="data-head last" style="border-right: outset;">&nbsp;12/31/2022&nbsp;</td>
<td class="data-head last">&nbsp;12/31/2021&nbsp;</td>
<td class="data-head last">&nbsp;6/30/2022&nbsp;</td>
<td class="data-head last" style="border-right: outset;">&nbsp;12/31/2022&nbsp;</td>
<td class="data-head last">&nbsp;12/31/2021&nbsp;</td>
<td class="data-head last">&nbsp;6/30/2022&nbsp;</td>
<td class="data-head last" style="border-right: outset;">&nbsp;12/31/2022&nbsp;</td>
</tr>
<tr class="tbl-data">
<td class="data-td last">Automotive</td>
<td class="data-td data last">10.00</td>
<td class="data-td data last" style="border-right: outset;">10.00</td>
<td class="data-td data last">147</td>
<td class="data-td data last">362</td>
<td class="data-td data last" style="border-right: outset;">262</td>
<td class="data-td data last">109.85</td>
<td class="data-td data last">91.02</td>
<td class="data-td data last" style="border-right: outset;">91.35</td>
<td class="data-td data last">-12.38</td>
</tr>
<tr class="tbl-data">
<td class="data-td last">Banking</td>
<td class="data-td data last">4.07</td>
<td class="data-td data last">4.82</td>
<td class="data-td data last" style="border-right: outset;">3.81</td>
<td class="data-td data last">125</td>
<td class="data-td data last">361</td>
<td class="data-td data last" style="border-right: outset;">302</td>
<td class="data-td data last">114.90</td>
<td class="data-td data last">99.78</td>
<td class="data-td data last" style="border-right: outset;">96.85</td>
<td class="data-td data last">-12.16</td>
</tr>
<tr class="tbl-data">
<td class="data-td last">Basic Industry</td>
<td class="data-td data last">4.25</td>
<td class="data-td data last">1.52</td>
<td class="data-td data last" style="border-right: outset;">1.36</td>
<td class="data-td data last">173</td>
<td class="data-td data last">395</td>
<td class="data-td data last" style="border-right: outset;">226</td>
<td class="data-td data last">112.44</td>
<td class="data-td data last">87.23</td>
<td class="data-td data last" style="border-right: outset;">92.17</td>
<td class="data-td data last">-10.53</td>
</tr>
<tr class="tbl-data">
<td class="data-td last">Capital Goods</td>
<td class="data-td data last">4.12</td>
<td class="data-td data last">5.57</td>
<td class="data-td data last" style="border-right: outset;">5.12</td>
<td class="data-td data last">225</td>
<td class="data-td data last">450</td>
<td class="data-td data last" style="border-right: outset;">279</td>
<td class="data-td data last">110.72</td>
<td class="data-td data last">90.95</td>
<td class="data-td data last" style="border-right: outset;">95.01</td>
<td class="data-td data last">-9.00</td>
</tr>
<tr class="tbl-data">
<td class="data-td last">Consumer Goods</td>
<td class="data-td data last">12.95</td>
<td class="data-td data last">3.05</td>
<td class="data-td data last" style="border-right: outset;">3.07</td>
<td class="data-td data last">142</td>
<td class="data-td data last">329</td>
<td class="data-td data last" style="border-right: outset;">275</td>
<td class="data-td data last">120.43</td>
<td class="data-td data last">91.03</td>
<td class="data-td data last" style="border-right: outset;">88.90</td>
<td class="data-td data last">-19.50</td>
</tr>
<tr class="tbl-data">
<td class="data-td last">Energy</td>
<td class="data-td data last">28.04</td>
<td class="data-td data last">30.14</td>
<td class="data-td data last" style="border-right: outset;">27.93</td>
<td class="data-td data last">240</td>
<td class="data-td data last">405</td>
<td class="data-td data last" style="border-right: outset;">293</td>
<td class="data-td data last">106.42</td>
<td class="data-td data last">87.28</td>
<td class="data-td data last" style="border-right: outset;">88.13</td>
<td class="data-td data last">-12.41</td>
</tr>
<tr class="tbl-data">
<td class="data-td last">Financial Services</td>
<td class="data-td data last">1.03</td>
<td class="data-td data last">0.62</td>
<td class="data-td data last" style="border-right: outset;">0.65</td>
<td class="data-td data last">240</td>
<td class="data-td data last">623</td>
<td class="data-td data last" style="border-right: outset;">540</td>
<td class="data-td data last">101.37</td>
<td class="data-td data last">76.27</td>
<td class="data-td data last" style="border-right: outset;">77.20</td>
<td class="data-td data last">-14.69</td>
</tr>
<tr class="tbl-data">
<td class="data-td last">Healthcare</td>
<td class="data-td data last">1.98</td>
<td class="data-td data last">2.32</td>
<td class="data-td data last" style="border-right: outset;">3.02</td>
<td class="data-td data last">180</td>
<td class="data-td data last">364</td>
<td class="data-td data last" style="border-right: outset;">362</td>
<td class="data-td data last">106.51</td>
<td class="data-td data last">89.91</td>
<td class="data-td data last" style="border-right: outset;">83.56</td>
<td class="data-td data last">-8.66</td>
</tr>
<tr class="tbl-data">
<td class="data-td last">Insurance</td>
<td class="data-td data last">0.46</td>
<td class="data-td data last">0.45</td>
<td class="data-td data last" style="border-right: outset;">0.85</td>
<td class="data-td data last">283</td>
<td class="data-td data last">440</td>
<td class="data-td data last" style="border-right: outset;">347</td>
<td class="data-td data last">104.28</td>
<td class="data-td data last">88.68</td>
<td class="data-td data last" style="border-right: outset;">92.10</td>
<td class="data-td data last">-7.44</td>
</tr>
<tr class="tbl-data">
<td class="data-td last">Leisure</td>
<td class="data-td data last">3.76</td>
<td class="data-td data last">7.58</td>
<td class="data-td data last" style="border-right: outset;">7.88</td>
<td class="data-td data last">269</td>
<td class="data-td data last">497</td>
<td class="data-td data last" style="border-right: outset;">325</td>
<td class="data-td data last">105.75</td>
<td class="data-td data last">89.22</td>
<td class="data-td data last" style="border-right: outset;">89.95</td>
<td class="data-td data last">-7.65</td>
</tr>
<tr class="tbl-data">
<td class="data-td last">Real Estate</td>
<td class="data-td data last">2.72</td>
<td class="data-td data last">3.31</td>
<td class="data-td data last" style="border-right: outset;">5.13</td>
<td class="data-td data last">413</td>
<td class="data-td data last">981</td>
<td class="data-td data last" style="border-right: outset;">697</td>
<td class="data-td data last">97.12</td>
<td class="data-td data last">75.80</td>
<td class="data-td data last" style="border-right: outset;">79.46</td>
<td class="data-td data last">-10.75</td>
</tr>
<tr class="tbl-data">
<td class="data-td last">Retail</td>
<td class="data-td data last">4.78</td>
<td class="data-td data last">5.22</td>
<td class="data-td data last" style="border-right: outset;">5.67</td>
<td class="data-td data last">270</td>
<td class="data-td data last">595</td>
<td class="data-td data last" style="border-right: outset;">471</td>
<td class="data-td data last">101.96</td>
<td class="data-td data last">75.83</td>
<td class="data-td data last" style="border-right: outset;">73.75</td>
<td class="data-td data last">-23.18</td>
</tr>
<tr class="tbl-data">
<td class="data-td last">Services</td>
<td class="data-td data last">0.39</td>
<td class="data-td data last" style="border-right: outset;">0.38</td>
<td class="data-td data last">87</td>
<td class="data-td data last">342</td>
<td class="data-td data last" style="border-right: outset;">388</td>
<td class="data-td data last">103.86</td>
<td class="data-td data last">93.07</td>
<td class="data-td data last" style="border-right: outset;">87.11</td>
<td class="data-td data last">-8.30</td>
</tr>
<tr class="tbl-data">
<td class="data-td last">Technology &amp; Electronics</td>
<td class="data-td data last">3.44</td>
<td class="data-td data last">4.12</td>
<td class="data-td data last" style="border-right: outset;">4.20</td>
<td class="data-td data last">176</td>
<td class="data-td data last">347</td>
<td class="data-td data last" style="border-right: outset;">327</td>
<td class="data-td data last">109.25</td>
<td class="data-td data last">91.82</td>
<td class="data-td data last" style="border-right: outset;">85.47</td>
<td class="data-td data last">-15.27</td>
</tr>
<tr class="tbl-data">
<td class="data-td last">Telecommunications</td>
<td class="data-td data last">9.11</td>
<td class="data-td data last">12.00</td>
<td class="data-td data last" style="border-right: outset;">11.91</td>
<td class="data-td data last">283</td>
<td class="data-td data last">486</td>
<td class="data-td data last" style="border-right: outset;">423</td>
<td class="data-td data last">121.24</td>
<td class="data-td data last">92.68</td>
<td class="data-td data last" style="border-right: outset;">90.04</td>
<td class="data-td data last">-19.74</td>
</tr>
<tr class="tbl-data">
<td class="data-td last">Transportation</td>
<td class="data-td data last">1.66</td>
<td class="data-td data last">2.02</td>
<td class="data-td data last" style="border-right: outset;">2.10</td>
<td class="data-td data last">221</td>
<td class="data-td data last">413</td>
<td class="data-td data last" style="border-right: outset;">279</td>
<td class="data-td data last">104.18</td>
<td class="data-td data last">89.34</td>
<td class="data-td data last" style="border-right: outset;">90.49</td>
<td class="data-td data last">-8.01</td>
</tr>
<tr class="tbl-data">
<td class="data-td last">Utility</td>
<td class="data-td data last">7.24</td>
<td class="data-td data last">6.86</td>
<td class="data-td data last" style="border-right: outset;">6.93</td>
<td class="data-td data last">158</td>
<td class="data-td data last">304</td>
<td class="data-td data last" style="border-right: outset;">213</td>
<td class="data-td data last">109.46</td>
<td class="data-td data last">89.02</td>
<td class="data-td data last" style="border-right: outset;">89.95</td>
<td class="data-td data last">-12.26</td>
</tr>
<tr class="tbl-data">
<td class="data-td last">Total</td>
<td class="data-td data last">100</td>
<td class="data-td data last" style="border-right: outset;">100</td>
<td class="data-td data last">211</td>
<td class="data-td data last">435</td>
<td class="data-td data last" style="border-right: outset;">337</td>
<td class="data-td data last">110.07</td>
<td class="data-td data last">88.47</td>
<td class="data-td data last" style="border-right: outset;">87.91</td>
<td class="data-td data last">-14.00</td>
</tr>
</tbody>
</table>
</div>
<br />
<p class="chart-disclosure">Source: ICE Data Services, VanEck. Past performance is no guarantee of future results. Fallen Angels: ICE US Fallen Angel High Yield 10% Constrained Index.</p>
<p><strong><u>Fallen angels performance by rating</u><br /><br /></strong>Fallen angels have decreased its exposure to BB-rated bonds over the last year but the index is still offering higher quality within high yield. In general, lower rated buckets (single-B and CCC-and-lower) were ahead at the beginning of the year, for the first four months, but it was BBs that ended the year on the top spot.</p>
<div class="wrapped-div">
<table width="100%">
<tbody>
<tr class="tbl-data">
<td class="tbl-header last">&nbsp;</td>
<td class="tbl-header last" style="text-align: center; border-right: outset;" colspan="3">Wgt (%)</td>
<td class="tbl-header last" style="text-align: center; border-right: outset;" colspan="3">OAS</td>
<td class="tbl-header last" style="text-align: center; border-right: outset;" colspan="3">Price</td>
<td class="tbl-header last" style="text-align: center; width: 13.6534%;">YTD TR %</td>
</tr>
<tr class="tbl-data">
<td class="data-head last">&nbsp;</td>
<td class="data-head last">12/31/2021&nbsp;</td>
<td class="data-head last">6/30/2022&nbsp;</td>
<td class="data-head last" style="border-right: outset;">12/31/2021&nbsp;</td>
<td class="data-head last">12/31/2021&nbsp;</td>
<td class="data-head last">6/30/2022&nbsp;</td>
<td class="data-head last" style="border-right: outset;">12/31/2022&nbsp;</td>
<td class="data-head last">12/31/2021&nbsp;</td>
<td class="data-head last">6/30/2022&nbsp;</td>
<td class="data-head last" style="border-right: outset;">12/31/2022&nbsp;</td>
</tr>
<tr class="tbl-data">
<td class="data-td last">BB</td>
<td class="data-td data last">94.49</td>
<td class="data-td data last">90.49</td>
<td class="data-td data last" style="border-right: outset;">87.00</td>
<td class="data-td data last">200</td>
<td class="data-td data last">389</td>
<td class="data-td data last" style="border-right: outset;">284</td>
<td class="data-td data last">110.70</td>
<td class="data-td data last">90.17</td>
<td class="data-td data last" style="border-right: outset;">90.02</td>
<td class="data-td data last">-13.77</td>
</tr>
<tr class="tbl-data">
<td class="data-td last">B</td>
<td class="data-td data last">4.08</td>
<td class="data-td data last">7.35</td>
<td class="data-td data last" style="border-right: outset;">10.95</td>
<td class="data-td data last">319</td>
<td class="data-td data last">887</td>
<td class="data-td data last" style="border-right: outset;">608</td>
<td class="data-td data last">105.75</td>
<td class="data-td data last">76.05</td>
<td class="data-td data last" style="border-right: outset;">82.50</td>
<td class="data-td data last">-17.98</td>
</tr>
<tr class="tbl-data">
<td class="data-td last">CCC</td>
<td class="data-td data last">1.13</td>
<td class="data-td data last">1.65</td>
<td class="data-td data last" style="border-right: outset;">1.98</td>
<td class="data-td data last">425</td>
<td class="data-td data last">726</td>
<td class="data-td data last" style="border-right: outset;">1020</td>
<td class="data-td data last">102.99</td>
<td class="data-td data last">79.92</td>
<td class="data-td data last" style="border-right: outset;">60.88</td>
<td class="data-td data last">-14.63</td>
</tr>
<tr class="tbl-data">
<td class="data-td last">CC*</td>
<td class="data-td data last">0.31</td>
<td class="data-td data last">0.50</td>
<td class="data-td data last" style="border-right: outset;">&nbsp;</td>
<td class="data-td data last">1,346</td>
<td class="data-td data last">1,308</td>
<td class="data-td data last" style="border-right: outset;">&nbsp;</td>
<td class="data-td data last">55.99</td>
<td class="data-td data last">52.79</td>
<td class="data-td data last" style="border-right: outset;">&nbsp;</td>
<td class="data-td data last">22.38</td>
</tr>
<tr class="tbl-data">
<td class="data-td last">C*</td>
<td class="data-td data last">&nbsp;</td>
<td class="data-td data last" style="border-right: outset;">&nbsp;</td>
<td class="data-td data last">&nbsp;</td>
<td class="data-td data last" style="border-right: outset;">&nbsp;</td>
<td class="data-td data last">&nbsp;</td>
<td class="data-td data last" style="border-right: outset;">&nbsp;</td>
<td class="data-td data last">47.80</td>
</tr>
<tr class="tbl-data">
<td class="data-td last">D*</td>
<td class="data-td data last">&nbsp;</td>
<td class="data-td data last" style="border-right: outset;">0.07</td>
<td class="data-td data last">&nbsp;</td>
<td class="data-td data last" style="border-right: outset;">4,726</td>
<td class="data-td data last">&nbsp;</td>
<td class="data-td data last" style="border-right: outset;">10.00</td>
<td class="data-td data last">-28.91</td>
</tr>
<tr class="tbl-data">
<td class="data-td last">Total</td>
<td class="data-td data last">100</td>
<td class="data-td data last" style="border-right: outset;">100</td>
<td class="data-td data last">211</td>
<td class="data-td data last">435</td>
<td class="data-td data last" style="border-right: outset;">337</td>
<td class="data-td data last">110.07</td>
<td class="data-td data last">88.47</td>
<td class="data-td data last" style="border-right: outset;">87.91</td>
<td class="data-td data last">-14.00</td>
</tr>
</tbody>
</table>
</div>
<br />
<p class="chart-disclosure"><sup>*</sup>&nbsp;Rating buckets don&rsquo;t have securities for all periods, so returns are based on partial period data.</p>
<p class="chart-disclosure">Source: ICE Data Services, VanEck. Past performance is no guarantee of future results. Fallen Angels: ICE US Fallen Angel High Yield 10% Constrained Index.</p>
<p>To receive more <a href="/us/en/blogs/income-investing/" title="Income Investing Insights"><strong>Income Investing</strong></a> insights, <a href="/link/5f45412c2143400497908cea2897f7d3.aspx" title=" Subscription Center"><strong>sign up in our subscription center</strong></a>.</p>
<style type="text/css">
.wrapped-div {
    max-width: 100%;
}
@media (max-width: 768px) {
    .wrapped-div {
        overflow-x: scroll;
    }
}
.wrapped-div-sector {
    max-width: 100%;
    overflow-x: scroll;
}
</style>
]]></content:encoded>
</item><item rdf:about="https://www.vaneck.com/us/en/blogs/economic-trends/china-rebound-v-shaped-or-simply-not-as-bad/">
  <title>China Rebound – “V-Shaped” or Simply “Not as Bad”?></title>
  <link>https://www.vaneck.com/us/en/blogs/economic-trends/china-rebound-v-shaped-or-simply-not-as-bad/</link>
  <description><![CDATA[China&rsquo;s rebound is beating expectations right now. Can it be sustained and what are the implications?]]></description>
  <dc:creator>Natalia  Gurushina</dc:creator>
  <dc:date>01/17/2023 06:30:00</dc:date>
<content:encoded><![CDATA[

<h2>China Rebound</h2>
<p>The <strong>main takeaways from China&rsquo;s latest activity indicators</strong> are: (1) the economy is <strong>rebounding faster</strong> than expected, and (2) the recovery is likely to be <strong>driven more by services/consumption</strong> from now on with manufacturing/net exports taking the backseat (for now). All &ldquo;mainstream&rdquo; indicators &ndash; December retail sales, industrial production, fixed assets investments, and real Q4 GDP growth - beat consensus by a wide margin (see chart below). And higher-frequency indicators (flights, subway rides, etc.) point to rapid improvements in mobility in the second half of December after the initial surge in infections. Fewer movement restrictions and huge pent-up demand should boost consumption and its contribution to growth as the re-opening progresses &ndash; but would this be enough to support the V-shaped recovery? Real estate can still be a major drag on growth &ndash; especially in H1 &ndash; as the recent policy support might take some time to sift through.</p>
<h2>Market Reaction to China Reopening</h2>
<p>A prospect of China&rsquo;s faster recovery did not go unnoticed by sell-side analysts - Deutsche Bank has just lifted its 2023 growth forecast from 4.5% to 6%. But there are also plenty of skeptics, who pointed that softer monthly numbers were not entirely consistent with stronger aggregate quarterly data. We totally acknowledge these concerns - China has a certain reputation in the data department. However, what matters from the market perspective right now is that <strong>China is still &ldquo;under-owned&rdquo;</strong>, which is why improving domestic activity and the right type of policy support (especially in the housing sector) continue to drive market inflows (and performance).</p>
<h2>China and Global Growth</h2>
<p>The pace of <strong>China&rsquo;s rebound is an important driver for global commodity prices</strong> and commodity exporters. Asian EMs also stand to benefit from a larger number of Chinese tourists &ndash; the Thai baht&rsquo;s stellar performance so far this year (the second highest spot return) is a reflection of these expectations. Finally, China&rsquo;s faster recovery could also be a boon for Europe &ndash; China accounts for about 7.5% of German exports (in 2021) &ndash; supporting the emerging narrative of softer landing/no recession in 2023, and maybe driving the euro&rsquo;s strength for a little longer. Stay tuned!</p>
<p><strong>Chart at a Glance: China Activity Recovers At A Faster Pace<sup>*</sup></strong></p>
<p><img class="img-responsive w-100" src="https://www.vaneck.com/contentassets/1fb83f8a46b94b969a553f958b915ba6/us-emerging-markets-daily-2023-01-17.png" alt="Chart at a Glance: China Activity Recovers At A Faster Pace" /></p>
<p class="chart-disclosure">Source: Bloomberg LP.</p>
<p class="chart-disclosure"><strong><sup>*</sup>CHVAIOY:</strong> China Value Added of Industry YoY.</p>
]]></content:encoded>
</item><item rdf:about="https://www.vaneck.com/us/en/blogs/model-portfolios/feds-gambit-inflation-fighting-to-recession-fighting/">
  <title>Fed’s Gambit: Inflation-Fighting to Recession-Fighting?></title>
  <link>https://www.vaneck.com/us/en/blogs/model-portfolios/feds-gambit-inflation-fighting-to-recession-fighting/</link>
  <description><![CDATA[A recession may temporarily ease inflation, but it's likely to rebound once the Fed shifts focus to fighting the recession. We examine the implications in our first commentary of the new year.]]></description>
  <dc:creator>David Schassler</dc:creator>
  <dc:date>01/13/2023 19:30:00</dc:date>
<content:encoded><![CDATA[

<p>Happy New Year! Welcome to our first missive of 2023. Generally, we try to keep our updates upbeat and optimistic. Yet, investors have recently found our outlook sobering when tasked with reporting the facts. I picked up the monikers &ldquo;Dark Dave&rdquo; and &ldquo;Doomsday Dave&rdquo; after warning investors about the risks of high inflation over the past two years. These nicknames always deliver on giving my colleagues a good laugh and acknowledging this publicly is sure to make them stick!</p>
<h2>Not out of the woods just yet</h2>
<p>Inflation is finally falling. That is great news. If the peak level of inflation we experienced in 2022 continued, our money would be worth nearly 50% less in five years! This highlights how disruptive inflation is and why investors must protect themselves. We have been warning that stocks and bonds alone will not get the job done during a period of high inflation. Since high inflation has materialized, the negative performance of stocks and bonds and the positive performance of real assets drives this point home.</p>
<p>Risk assets may continue to rally as inflation softens. However, over the medium-term, investors should brace for potential stagflation. There is significant likelihood of a recession in the third or fourth quarter of this year triggered by both restrictive monetary policy and elevated inflation. Inflation is expected to remain significantly above 2% for an extended period of time (think years, not months). The lessons from other high inflationary periods teach us that we are likely to be in an extended period of above-target inflation with several peaks and troughs.</p>
<h2>Stop signs at every corner</h2>
<p>Higher interest rates, by design, are intended to curb economic activity. Not all rate hiking cycles have ended in recessions, but many have. This is especially true during periods of high inflation. The Fed funds rate is at 4.33%, and the Fed is signaling that interest rates of 5% may be &ldquo;sufficiently restrictive&rdquo; to fight inflation.</p>
<h3>Fed Fund Peak vs. U.S. Recessions &ndash; 1954 to 2022</h3>
<p><img loading="lazy" class="img-responsive w-100" src="https://www.vaneck.com/contentassets/8f3bef88ae6c43fcab37110c2fc1ee95/2679_qis_chart-01_2023.01_v1_blog.svg" alt="Fed Fund Peak vs. U.S. Recessions - 1954 to 2022" /></p>
<p class="chart-disclosure">Source: St. Louis Federal Reserve Bank, VanEck. Data as of December 2022. Past performance is not indicative of future results.</p>
<p>Another way to look at this is through the lens of unemployment. On average, recessions occurred five months after the low in unemployment. The current unemployment rate is at a near-term low of 3.5%. Based on the slowdown in corporate earnings and increasing layoff announcements by major corporations, it appears likely to be heading higher.</p>
<h3>Unemployment Rate vs. U.S. Recessions &ndash; 1954 to 2022</h3>
<p><img loading="lazy" class="img-responsive w-100" src="https://www.vaneck.com/contentassets/8f3bef88ae6c43fcab37110c2fc1ee95/2679_qis_chart-02_2023.01_v1_blog.svg" alt="Unemployment Rate vs. U.S. Recessions - 1954 to 2022" /></p>
<p class="chart-disclosure">Source: St. Louis Federal Reserve Bank, VanEck. Data as of December 2022. Past performance is not indicative of future results.</p>
<p>Recessions are a clear negative for most equities. Stock market bottoms occurred, on average, eight months after the start of past recessions.</p>
<h3>S&amp;P 500 vs. U.S. Recessions &ndash; 1954 to 2022</h3>
<p><img loading="lazy" class="img-responsive w-100" src="https://www.vaneck.com/contentassets/8f3bef88ae6c43fcab37110c2fc1ee95/2679_qis_chart-03_2023.01_v1_blog.svg" alt="S and P 500 vs. U.S. Recessions - 1954 to 2022" /></p>
<p class="chart-disclosure">Source: St. Louis Federal Reserve Bank, VanEck. Data as of December 2022. Past performance is not indicative of future results.</p>
<p>A recession should temporarily ease inflation. However, inflation will likely rebound once the Fed pivots from inflation-fighting mode to recession-fighting mode because the structural inflationary forces are expected to take an extended period of time to resolve.</p>
<h2>Approaching things from every direction</h2>
<p>The economic regime that we have outlined is ideal for investments that can generate real positive returns by benefiting from supply and demand imbalances (commodities and natural resource equities), maintaining profit margins (natural resource equities, infrastructure, and other real assets), and generating a yield in excess of the inflation rate (high yield debt and equities).</p>
<p>VanEck has many offerings that provide these exposures. We continue to encourage investors to consider the VanEck <strong><a href="/link/6e91eff51c6042ef9f1d5943ffa90a0e.aspx" title="RAAX - VanEck Real Assets ETF - Overview">Real Assets ETF (RAAX)</a></strong>.</p>
<p>We recently launched the <a href="/link/464b5a544f084a50815b7f92ec61b208.aspx" title="PIT - VanEck Commodity Strategy ETF - Overview"><strong>VanEck Commodity Strategy ETF (PIT)</strong></a>. The ticker PIT is a nod to commodity trading pits of the past, where floor brokers would trade different commodities. This active ETF is designed to outperform by allocating more heavily to the commodities with the most favorable risk and return profiles while simultaneously seeking to benefit from the roll yield or mispricing of individual commodity curves.</p>
<p>We launched this fund based on our view that we are in the early stages of a commodity super cycle, resulting from years of underinvestment in production. The chart below demonstrates that commodities typically experience extended bull and bear markets known as &ldquo;super cycles.&rdquo; On average, these super cycles last 17 years for bull markets and 20 years for bear markets.</p>
<h3>Commodity Super Cycles &ndash; 1800 to 2022</h3>
<p><img loading="lazy" class="img-responsive w-100" src="https://www.vaneck.com/contentassets/8f3bef88ae6c43fcab37110c2fc1ee95/2679_qis_chart-04_2023.01_v2_blog.svg" alt="Commodity Super Cycles - 1800 to 2022" /></p>
<p class="chart-disclosure">Source: National Bureau of Economic Research (NBER), Bureau of Labor Statistics (BLS), St. Louis Federal Reserve Bank (FRED), Commodity Research Bureau (CRB), Bloomberg, S&amp;P Global. Data as of December 2022. Past performance is not indicative of future results.</p>
<p>We appreciate the read! Our promise to you is to continue to report the data as we see it and then use that information to find investments that we believe are well-positioned to thrive in the current environment.</p>
<p>To receive more <strong><a href="https://www.vaneck.com/us/en/insights/guided-allocation/" title="Model Portfolio Insights">Model Portfolio</a></strong> insights, <strong><a href="https://www.vaneck.com/us/en/subscribe/" title="Subscription Center">sign up in our subscription center</a></strong>.</p>
]]></content:encoded>
</item><item rdf:about="https://www.vaneck.com/us/en/blogs/economic-trends/external-balances-china-and-the-rest/">
  <title>External Balances - China and the Rest></title>
  <link>https://www.vaneck.com/us/en/blogs/economic-trends/external-balances-china-and-the-rest/</link>
  <description><![CDATA[China&rsquo;s trade surplus has peaked &ndash; what are the implications? Will capital accounts in other EMs show improvement?]]></description>
  <dc:creator>Natalia  Gurushina</dc:creator>
  <dc:date>01/13/2023 16:00:00</dc:date>
<content:encoded><![CDATA[

<h2>China Foreign Trade</h2>
<p>The <strong>China reopening story is all the rage now, eclipsing the last year&rsquo;s &ldquo;star topic&rdquo; of massive external surpluses</strong>. What to make of it? We do not want to focus too much on year-on-year changes in exports and imports (these can be noisy), but slowing global growth is a headwind for Chinese exports going forward, whereas imports should eventually get a boost from the removal of the COVID restrictions. And this means that China&rsquo;s trade surplus &ndash; which reached USD78bn in December &ndash; had peaked (barring the unexpected &ndash; see chart below). In terms of GDP accounting, narrowing trade surpluses translate into smaller net exports&rsquo; contribution to growth. How much are we talking about? Net exports accounted for about 21% of China&rsquo;s GDP growth in 2021 and for an even larger share in 2022.&nbsp;The question is whether domestic consumption will be strong enough to compensate for a smaller contribution. The consensus is currently in the waiting mode, keeping China&rsquo;s 2023 GDP forecast unchanged at 4.8%.&nbsp;</p>
<h2>China Exchange Rate</h2>
<p>Changes in <strong>China&rsquo;s external surpluses inevitably invite discussions about the exchange rate</strong> &ndash; and it is important not to overlook another component of the country&rsquo;s balance of payments, capital account. The reopening trade is already attracting inflows and many investors &ndash; who were scarred (and scared) by China&rsquo;s handling of the pandemic, as well as tighter real estate/tech controls &ndash; are still waiting on the sidelines. The experience of China&rsquo;s inclusion in global bond indices a few years ago shows that sizable inflows can be very currency-positive, even to the point of offsetting the impact of less &ldquo;friendly&rdquo; interest rate differentials and other fundamentals.&nbsp;</p>
<h2>EM External Adjustment</h2>
<p><strong>China is not the only emerging market (EM) where external balances are watched closely.</strong> A combination of wide current account deficits and uncertain fiscal adjustments &ndash; against the backdrop of higher global interest rates &ndash; in Central Europe and parts of LATAM raised concerns about the size of financing requirements and the cost of debt service going forward. These are the reasons why many observers treated the latest U.S. dollar-denominated bond issues in Central Europe with suspicion (&ldquo;why now?&rdquo;), even though the bonds were quite popular with investors. Today&rsquo;s smaller than expected current account deficit in Poland (November) was a welcome development, as it confirmed the improving trend.&nbsp;But we are yet to see similar signs in Chile (the current account deficit reached 10.7% of GDP in Q3-22) and Colombia (6.7% of GDP in Q3-22). Stay tuned!</p>
<h3>Chart at a Glance: China&rsquo;s Trade Surplus Had Peaked</h3>
<img class="img-responsive w-100" src="https://www.vaneck.com/contentassets/f07433fb6d1a4de9a5a6bc65cf6ac37f/us-natalias-take-2023-01-13.png" alt="Chart at a Glance: China&rsquo;s Trade Surplus Had Peaked" />
<p class="chart-disclosure">Source: Bloomberg LP</p>
<div class="disclosure">
<p>China Imports &amp; Exports Trade Balance Value Index (CNFRBAL$) measures the difference between the movement of merchandise trade leaving a country (exports) and entering a country (imports).</p>
</div>
]]></content:encoded>
</item><item rdf:about="https://www.vaneck.com/us/en/blogs/natural-resources/intelligent-index-design-delivers-in-q4/">
  <title>Intelligent Index Design Delivers in Q4></title>
  <link>https://www.vaneck.com/us/en/blogs/natural-resources/intelligent-index-design-delivers-in-q4/</link>
  <description><![CDATA[CMCI&rsquo;s index design of monthly rebalancing back to its target weightings paid off at the end of 2022. This helped it outperform BCOM, the industry&rsquo;s primary benchmark, in December.]]></description>
  <dc:creator>Roland Morris</dc:creator>
  <dc:date>01/13/2023 06:30:00</dc:date>
<content:encoded><![CDATA[

<h2>Natural Gas Contributes From Rebalance</h2>
<p><strong>December 2022</strong></p>
<p>December was a mixed month for commodity index strategies overall. The UBS Constant Maturity Commodity Index (CMCI) had a good month relative to the industry&rsquo;s primary benchmark, the Bloomberg Commodity Index (BCOM); 0.3% and -2.4%, respectively. BCOM outperformed for most of the year due to its overweight in natural gas. However, CMCI&rsquo;s index design paid off at the end of the year. CMCI has a smaller natural gas position by design, but most importantly, the index rebalances monthly back to its target weightings.</p>
<p><strong>Year-to-Date 2022</strong></p>
<p>Natural gas was the strongest commodity for most index strategies. Not surprisingly, BCOM&rsquo;s weighting grew during the year to over 13%, which was its largest individual commodity exposure by far. Due to some very unseasonably warm weather forecasts for the U.S. northeast, U.S. natural gas prices fell sharply in December. BCOM&rsquo;s natural gas exposure declined by 33%, costing the index 4.5% for the month.</p>
<p>Since CMCI rebalances back to its 3.5% target weighting every month, the index&rsquo;s natural gas position showed losses in December of 24% on the smaller exposure. This cost the index less than 1%. We like to highlight CMCI&rsquo;s rebalancing feature which has been effective in combatting extreme price movements in individual commodities, which very often means reverting. By rebalancing monthly, CMCI lowers overall volatility and often takes profits on extreme price movements.</p>
<h3>Commodity Sector Target Component Weights</h3>
<p><img class="img-responsive w-100" src="https://www.vaneck.com/contentassets/75e0019769904bb581580d88408a821d/2673_cmci_chart_01_2023.01_v1_blog.svg" alt="Commodity Sector Target Component Weights" /></p>
<p class="chart-disclosure">Source: Bloomberg. CMCI&rsquo;s Target Weights as of July 2022; BCOM&rsquo;s Target Weights as of November 2022.</p>
<h2>Index &amp; Sector Review: Energy Led YTD while Precious Metals Rebounded in December</h2>
<p><strong>December 2022</strong></p>
<p>The precious metals sector was the strongest performing sector in December, rising over 5%. This was led by a very strong rally in silver, up 10%. The decline in the U.S. dollar also supported the precious metals rally.</p>
<p>The agriculture, industrial metals and livestock sectors were all modestly higher in December.</p>
<p><strong>Year-to-Date 2022</strong></p>
<p>The energy sector led all sectors, continuing the trend from 2021. The strongest gains for the energy sector came from gasoil and heating oil. Both gained roughly 40% and almost 70%, including roll yield for the year. This is a supply problem that could persist and might keep heating oil and gasoil prices high and rising for a few years.</p>
<p>The agriculture sector gained approximately 17% for the year. The Russia-Ukraine war disrupted global agricultural trades in the production of corn, wheat, and fertilizer.</p>
<p>The livestock sector gained about 9% for the year. Lean hogs were up 18%, but CMCI&rsquo;s monthly rebalancing improved returns. The livestock sector has a small weighting in the index so the overall contribution to the index returns was modest.</p>
<p>The precious metals sector was close to unchanged for the year but also had a volatile roller coaster ride. Gold prices rose early in the year from $1,800 to over $2,000 due to fears of Russia&rsquo;s invasion of Ukraine. Prices peaked shortly after the invasion and declined until early November; bottoming just above $1,600. The U.S. dollar peaked in early September and started to decline in early November, allowing gold to recover losses into year-end, completing the roller coaster ride to finish unchanged at $1,800.</p>
<p>The worst-performing sector for 2022 was the industrial metals sector. This is an important sector for CMCI due to having the highest relative exposure to the sector when compared to other major commodity index products available in the market. Copper, the largest individual commodity exposure in the metals sector, declined by over 10% for the year. This was offset by a very big rally in nickel prices which rose almost 50% in 2022.</p>
<p><strong>Looking Ahead - 2023</strong></p>
<p>Curve positioning, roll methodology and monthly rebalancing all help CMCI outperform BCOM over the long term. In the short term, it can hurt relative performance, as evident in several months in 2022. We anticipate 2023 to be a good year for commodity index products. China&rsquo;s reopening of its economy from the Zero-COVID policies is expected to cause a burst of economic growth in the Spring. Additionally, the U.S. Federal Reserve&rsquo;s aggressive tightening is likely to end in the first half of the year. And finally, as the Russia-Ukraine war prolongs, supply constraints are likely to remain consistent, resulting in positive roll yields.</p>
<h3>Roll Yield Estimates YTD - December 2022</h3>
<p><img class="img-responsive w-100" src="https://www.vaneck.com/contentassets/75e0019769904bb581580d88408a821d/2673_cmci_chart_02_2023.01_v1_blog.svg" alt="Roll Yield Estimates YTD - December 2022" /></p>
<p class="chart-disclosure">Source: Bloomberg. Data as of December 31, 2022.</p>
<p><strong><a href="/link/9cc454bdc12d49638c0a22783d5a26cf.aspx" title="CMCAX - CM Commodity Index Fund - Class A - Overview">Learn more about the VanEck CM Commodity Index Fund</a></strong>, which seeks to track, before fees and expenses, the CMCI.</p>
<p>To receive more <a href="/us/en/insights/natural-resources/" title="Natural Resources Insights"><strong>Natural Resources</strong></a> insights, <a href="https://www.vaneck.com/us/en/subscribe/" title="Subscription Center"><strong>sign up in our subscription center</strong></a>.</p>
]]></content:encoded>
</item><item rdf:about="https://www.vaneck.com/us/en/blogs/emerging-markets-equity/emerging-markets-better-times-appear-ahead/">
  <title>Emerging Markets – Better Times Appear Ahead></title>
  <link>https://www.vaneck.com/us/en/blogs/emerging-markets-equity/emerging-markets-better-times-appear-ahead/</link>
  <description><![CDATA[We believe that a weaker inflationary impulse combined with the rapid reversal of China&rsquo;s Zero-Covid policy set up a favorable environment for the outperformance of emerging markets stocks in 4Q 2022.]]></description>
  <dc:creator>David Semple</dc:creator>
  <dc:date>01/13/2023 06:30:00</dc:date>
<content:encoded><![CDATA[

<p>The VanEck Emerging Markets Fund (the &ldquo;Fund&rdquo;) returned 15.27% during the fourth quarter of 2022, outperforming the Fund&rsquo;s benchmark in a period where navigating the shifting sands of equity markets was a challenge. This outperformance was principally driven by stock selection. We think that we are moving into a very different environment in 2023 for emerging markets. We believe that a weaker inflationary impulse combined with the rapid reversal of China&rsquo;s Zero-Covid policy set up a favorable environment for the outperformance of emerging markets stocks. In addition, within emerging markets, the great reset in growth company valuations bodes particularly well for global growth investors.</p>
<div class="wrapped-div">
<table width="100%">
<tbody>
<tr class="tbl-data">
<td class="tbl-header last" colspan="9">Performance History: Average Annual Total Returns* (%) as of December 31, 2022 (In USD)</td>
</tr>
<tr class="tbl-data">
<td class="data-head last">&nbsp;</td>
<td class="data-head last">1 Mo<sup>&dagger;</sup></td>
<td class="data-head last">3 Mo<sup>&dagger;</sup></td>
<td class="data-head last">YTD<sup>&dagger;</sup></td>
<td class="data-head last">1 Yr</td>
<td class="data-head last">3 Yr</td>
<td class="data-head last">5 Yr</td>
<td class="data-head last">10 Yr</td>
<td class="data-head last">Life</td>
</tr>
<tr class="tbl-data">
<td class="data-td last">Class A: NAV (Inception 12/20/93)</td>
<td class="data-td data last">-1.88</td>
<td class="data-td data last">15.27</td>
<td class="data-td data last">-25.23</td>
<td class="data-td data last">-8.55</td>
<td class="data-td data last">-5.35</td>
<td class="data-td data last">0.87</td>
<td class="data-td data last">--</td>
</tr>
<tr class="tbl-data">
<td class="data-td last">Class A: NAV Maximum 5.75% load</td>
<td class="data-td data last">-7.52</td>
<td class="data-td data last">8.65</td>
<td class="data-td data last">-29.53</td>
<td class="data-td data last">-10.34</td>
<td class="data-td data last">-6.46</td>
<td class="data-td data last">0.27</td>
<td class="data-td data last">--</td>
</tr>
<tr class="tbl-data">
<td class="data-td last">Class C: NAV (Inception 10/03/03)</td>
<td class="data-td data last">-1.85</td>
<td class="data-td data last">15.15</td>
<td class="data-td data last">-25.82</td>
<td class="data-td data last">-9.29</td>
<td class="data-td data last">-6.09</td>
<td class="data-td data last">0.04</td>
<td class="data-td data last">--</td>
</tr>
<tr class="tbl-data">
<td class="data-td last">Class C: 1.00% Redemption Fee</td>
<td class="data-td data last">-2.80</td>
<td class="data-td data last">14.15</td>
<td class="data-td data last">-26.54</td>
<td class="data-td data last">-9.29</td>
<td class="data-td data last">-6.09</td>
<td class="data-td data last">0.04</td>
<td class="data-td data last">--</td>
</tr>
<tr class="tbl-data">
<td class="data-td last">Class I: NAV (Inception 12/31/07)</td>
<td class="data-td data last">-1.77</td>
<td class="data-td data last">15.52</td>
<td class="data-td data last">-24.81</td>
<td class="data-td data last">-8.10</td>
<td class="data-td data last">-4.88</td>
<td class="data-td data last">1.36</td>
<td class="data-td data last">--</td>
</tr>
<tr class="tbl-data">
<td class="data-td last">Class Y: NAV (Inception 04/30/10)</td>
<td class="data-td data last">-1.76</td>
<td class="data-td data last">15.52</td>
<td class="data-td data last">-24.87</td>
<td class="data-td data last">-24.87<span style="white-space: pre;"> </span></td>
<td class="data-td data last">-8.18</td>
<td class="data-td data last">-4.97</td>
<td class="data-td data last">1.23</td>
<td class="data-td data last">--</td>
</tr>
<tr class="tbl-data">
<td class="data-td last">Class Z: NAV (Inception 09/16/19)</td>
<td class="data-td data last">-1.73</td>
<td class="data-td data last">15.51</td>
<td class="data-td data last">-24.73</td>
<td class="data-td data last">-24.73<span style="white-space: pre;"> </span></td>
<td class="data-td data last">-8.00</td>
<td class="data-td data last">--</td>
<td class="data-td data last">-5.32</td>
</tr>
<tr class="tbl-data">
<td class="data-td last">MSCI EM IMI</td>
<td class="data-td data last">-1.36</td>
<td class="data-td data last">9.50</td>
<td class="data-td data last">-19.83</td>
<td class="data-td data last">-19.83<span style="white-space: pre;"> </span></td>
<td class="data-td data last">-1.82</td>
<td class="data-td data last">-1.10</td>
<td class="data-td data last">1.64</td>
<td class="data-td data last">--</td>
</tr>
<tr class="tbl-data">
<td class="data-td last">MSCI EM Index</td>
<td class="data-td data last">-1.41</td>
<td class="data-td data last">9.70</td>
<td class="data-td data last">-20.09</td>
<td class="data-td data last">-20.09<span style="white-space: pre;"> </span></td>
<td class="data-td data last">-2.69</td>
<td class="data-td data last">-1.40</td>
<td class="data-td data last">1.44</td>
<td class="data-td data last">--</td>
</tr>
</tbody>
</table>
</div>
<p>&nbsp;</p>
<p class="chart-disclosure"><strong>The table presents past performance which is no guarantee of future results and which may be lower or higher than current performance. Returns reflect applicable fee waivers and/or expense reimbursements. Had the Fund incurred all expenses and fees, investment returns would have been reduced. Investment returns and Fund shares values will fluctuate so that investor's shares, when redeemed, may be worth more or less than their original cost. Fund returns assume that dividends and capital gains distributions have been reinvested in the Fund at net asset value (NAV). Index returns assume that dividends of the Index constituents in the Index have been reinvested. Performance information current to the most recent month end is available by calling 800.826.2333 or by visiting vaneck.com.</strong></p>
<p class="chart-disclosure">Expenses: Class A: Gross 1.45%; Net 1.45%; Class C: Gross 2.25%; Net 2.25%; Class I: Gross 1.14%; Net 1.00%; Class Y: Gross 1.13%; Net 1.10%; and Class Z: Gross 1.08%; Net 0.90%. Expenses are capped contractually until 05/01/23 at 1.60% for Class A, 2.50% for Class C, 1.00% for Class I, 1.10% for Class Y, and 0.90% for Class Z. Caps exclude acquired fund fees and expenses, interest, trading, dividends, interest payments of securities sold short, taxes and extraordinary expenses.</p>
<h2>Market Review</h2>
<p>As we consider the fourth quarter, we need to extrapolate events into our outlook for 2023. We have long held the view that the secular forces of disinflation would ultimately claw back the Covid-induced inflationary impulse that we have been living through for the past few years. But the price of that will be weaker in developed markets (DM) economies. The fourth quarter broadly supported that view, and it is important to stress that a soft recession in developed markets is usually an environment that supports emerging markets&rsquo; (EM) outperformance.</p>
<p>The second major factor in the fourth quarter was the Covid- and economic-related developments in China. EM needs China to perform for the asset class to really regain favor, in our view. As long-time China observers and investors, we started to see very significant shifts in policy related to re-emphasizing economic growth, downplaying regulation, stabilization of the property market and playing nice on the world stage. As we exited the quarter, these positive changes have been rapidly accelerated, in particular by the abrupt exit from the Zero-Covid policy.</p>
<p>Since Xi Jinping&rsquo;s anointment for a third term, and in particular, after the policy-setting meeting in December, there has been an increased emphasis on pulling growth levers to revive a struggling economy. The usual fiscal and monetary tools have been deployed, but the issue had been two large caps on consumer sentiment &ndash; the travails of the property sector and frustrations around the strict Zero-Covid policy have limited the impact of other easing measures. In addition, whilst it is clear that there has been less regulatory shock, market participants remain wary, and only absence over time will reverse some of that caution. But as we entered the final weeks of the quarter, it has become clear that there is an abrupt U-turn in the country&rsquo;s Covid policy, and increasingly aggressive relaxation of property restrictions is easing the liquidity crunch for developers. Both of these are, without a doubt, positive for equity markets, but also allow prior easing in fiscal and monetary measures to impact the economy more positively, as domestic sentiment rapidly improves.</p>
<p>We think there will be a struggle to catch up with many long-only managers, in terms of their China weightings. Many have been significantly underweight, seduced by the siren song that has an &ldquo;uninvestible&rdquo; chorus. We think this leads to sustained outperformance for this, the largest part, of the asset class. We benefitted from our full weight in China (if we include market proxies, such as <strong>Prosus N.V. Class N</strong> (4.62% of Fund net assets*) and we continue to look for investments to reflect our optimism.</p>
<p>Both South East Asia and Mexico are, and will be, benefitting from efforts to construct a more diverse supply chain for manufactured goods. But this is often focused on incremental investment, a so-called China &ldquo;plus one&rdquo; strategy, and it will take time to play out. The concern lies more in the semiconductor space, where it seems very likely that supply chains will be increasingly bifurcated, and subject to increased subsidy support in both the U.S. and China. We stick to our view that as far as manufacturing is concerned, the companies of North East Asia will continue to dominate the space. At the moment, there is something of a cyclical downturn in the space, but we have started to anticipate better times in the second half of 2023.</p>
<p>India has been the darling of the EM world for some time now. There is no doubt that the economy is strong, reflected in numbers like credit growth and/or Purchasing Managers Index (PMI). Both our largest holdings <strong>Reliance Industries Limited</strong> (5.60% of Fund net assets*) and <strong>HDFC Bank Limited</strong> (4.74% of Fund net assets*) performed well over the quarter. But for the market as a whole, we remain concerned about valuation levels.</p>
<p>Optically, India had a strong fourth quarter. However, most of that was clawing back the miserable performance of the last couple of weeks in September, when volatility rocked markets globally. That said, results for the third quarter were, by and large, stronger and average/market valuations are around the midpoint of the longer-term range (India vs. India) and rates appear to have peaked, with core inflation likely coming down. There&rsquo;s a strong structural disinflation story playing out in India, as the economy continues to become swiftly more efficient. Although there are crazy multiples out there &ndash; it is not necessary to pay them to still get good structural growth exposures in companies, such as Reliance Industries Limited and HDFC Bank Limited.</p>
<p>The Middle Eastern markets have been a focus through the year, due, in large part to the strength of crude and the U.S. dollar. As we move into 2023, we are not so sure that either factor will be strongly positive for another year. That being said, we are impressed by the changes taking place in <strong><a href="https://www.vaneck.com/us/en/blogs/emerging-markets-equity/saudi-arabia-a-rising-investment-destination/" title="Saudi Arabia: A Rising Investment Destination">Saudi Arabia</a></strong> in particular, and we continue to look for reasonably priced opportunities in the region.</p>
<p>Whilst we may have missed out on some of the runs in the Middle Eastern stocks, we fully participated in other EMEA regions that performed very well despite being written off by &ldquo;consensus.&rdquo; Turkey, for example, was definitely the biggest surprise performer. We readily concede that macro-economic policy could be most generously called &ldquo;unorthodox&rdquo;. But at a more micro level, corporates are adapting well and we have been very pleased with their operating performance. In both Georgia and Kazakhstan, our investments &ndash; <strong>Bank of Georgia Group Plc</strong> (3.40% of Fund net assets*), <strong>Georgia Capital Plc</strong> (0.73% of Fund net assets*) and <strong>Kaspi.kz JSC Sponsored GDR RegS</strong> (2.88% of Fund net assets*) &ndash; rounded out the year well, and we are happy holders.</p>
<p>In Latin America, the focus has been firmly on the twists and turns in Brazilian politics. Although Luiz In&aacute;cio Lula da Silva&rsquo;s (Lula&rsquo;s) re-election was widely anticipated, the concern was and remains, what kind of Lula will we actually get? Post-election announcements and cabinet nominations have not been market-friendly, as they indicate a fiscal loosening that Brazil can ill afford. Loose fiscal policy encourages the central bank to tighten further on monetary policy, depressing sentiment and valuations. We have stuck to our investments in Brazil, as we believe, with cynicism born out of experience, that the impact of politics tends to be greater at the start of a new political regime. Gradually, compromise and practical reality will mitigate the grand political promises that are initially articulated. Brazil is very cheap, and a whiff of better local sentiment and/or lower rates should lead to significant performance.</p>
<h2>Fund Review</h2>
<p>As mentioned above, stock selection was the main driver of the Fund&rsquo;s outperformance during the quarter. On a sector level, consumer discretionary, financials and health care contributed to relative performance, whereas industrials, communication services and information technology detracted. On a country level, Turkey, China and Georgia contributed to relative performance, while Brazil, South Africa and South Korea detracted.</p>
<h2>Top Contributors</h2>
<p>Top contributors to return on an absolute basis during the quarter:</p>
<ul class="content-list">
<li><strong>MLP Saglik Hizmetleri AS Class B (&ldquo;MLP&rdquo;) </strong>(3.05% of Fund net assets*) is the largest private hospital group in Turkey. In addition, the group has a sizable medical tourism business to capitalize on the high-quality and cost-competitive care offered by its hospitals. This business line has shown very strong performance in 2022, driven by growing international demand and increasing MLP&rsquo;s foreign currency revenues against a weakening Turkish lira. Management&rsquo;s successful efforts to deleverage and strengthen its balance sheet have also positioned MLP very favorably for further inorganic expansion and share buybacks, which increases shareholder value and has reflected positively on recent share price performance.</li>
<li><strong>China Education Group Holdings Limited </strong>(3.83% of Fund net assets*) is an M&amp;A-focused private higher education provider in China. The company operates universities and a vocational college, and enrolls students across all provinces in mainland China. China Education provides bachelor's degree programs, junior college diploma programs and vocational education programs. Our thesis of this M&amp;A-driven, structural growth business model that should deliver 20% compound annual growth rate (CAGR) over the foreseeable future continues to play out. In addition, the company has definitely been in favor recently as it plays the long-term, structural growth trend of growing private education while avoiding some of the regulatory pressure on the K-12 after school space. The company performed strongly, reflecting its strong fundamental outlook and after, we believe, irrational weakness caused by regulatory changes in the space that should not directly or indirectly effect this company.</li>
<li><strong>Bank of Georgia Group Plc</strong> (3.40% of Fund net assets*) is one of the two largest banks, dominating the Georgian banking system with more than 33% market share. During the quarter, the bank has outperformed on the back of much stronger than expected earnings and returns numbers in 2022, with return on equity exceeding 25%. Bank of Georgia&rsquo;s management has undergone significant digitization efforts, resulting in higher efficiency and a superior customer experience. The stronger-than-expected results were also supported by macro tailwinds, driving very solid lending growth and asset quality numbers for the bank.</li>
</ul>
<h2>Top Detractors</h2>
<p>Top detractors to return on an absolute basis during the quarter:</p>
<ul class="content-list">
<li><strong>Delhivery Limited</strong> (0.77% of Fund net assets*) operates a software-first business model and is the largest logistics operator in India. The business is effectively the operating system for commerce through a combination of world-class infrastructure and logistics operations together with cutting-edge data engineering and technology capabilities. In our thesis, we believe Delhivery&rsquo;s greater scale and full-stack integrated solutions offer a competitive advantage over other companies. It can enter at multiple points in the customer supply chain as well as cross-sell other services, thereby increasing the customer stickiness and breadth, dominating this large high-growth opportunity within a very fragmented industry. The shares were weak this quarter &ndash; partly because it is still 4-6 quarters to profitability &ndash; so Delhivery shares were punished alongside &ldquo;profitless tech&rdquo; globally. In addition, management experienced more problems integrating a recent large acquisition than anticipated. However, the latter problems are now resolved.</li>
<li><strong>Movida Participacoes SA</strong> (1.15% of Fund net assets*) is one of the largest car rental companies in Brazil, operating three primary lines of business: car rental, fleet rental and used car sales (Seminovos). The quarterly results were weaker than expected, as it is seeing the normalization of the Seminovos (used car vehicles) margins happening faster than expected, as well as depreciation and interest expenses increasing. This is happening faster for Movida than its competitors, as it was very aggressive during the pandemic, buying cars at higher prices and purchasing models that were more premium and less popular. The company is at a different point in the renewal cycle when compared to other players. A key factor that accelerated the normalization was demand for cars that softened at the dealers, putting pressure on car prices and leading to those same dealers giving large discounts on car purchases. The changes in Seminovos&rsquo; margins impacted the bottom line. In addition, higher rates also impacted Movida, as it has higher leverage and a more limited balance sheet. Despite the normalization of Seminovos, operationally, results continue to be positive with still good demand and a pricing outlook that remains supportive in the next year for RAC (rent a car) and fleet management. Valuation is also supportive of trading at one standard deviation below historical averages and still at a huge discount to other players.</li>
<li><strong>Wuxi Shangji Automation Co., Ltd. Class A</strong> (0.94% of Fund net assets*) develops and manufactures precision machine tools. Currently, the company is transitioning from a high-end solar equipment maker to a major mono-wafer<sup>1</sup>&nbsp;supplier for 210mm and all other wafer standards. Its global market share could reach 20% with 60GW shipments in 2023 vs. 6.5GW in 2020; competitive production costs and recognized wafer quality should drive these gains and outsized earnings growth. The company&rsquo;s share price pulled back in the quarter, in part due to prior good performance and some concerns in the marketplace about the extent of new capacity coming on stream in 2023.</li>
</ul>
<h2>Top Buys and Sells</h2>
<p>During the quarter, we established new positions in the following:</p>
<ul class="content-list">
<li><strong>KE Holdings Inc - BEKE US</strong> (0.31% of Fund net assets*) operates as a platform for housing-related services, including sales, rentals and renovations, in China. It has both online and offline operations. The company has impressed with resilient profitability through a difficult period in the Chinese property market. Margins have been resilient despite lower property sales, driven by successful cost optimization. We believe that an exit from Zero-Covid policy and even more positive policy measures in the property market will be very beneficial to the company.</li>
<li><strong>Samsung Biologics Co Ltd - 207940 KS</strong> (0.24% of Fund net assets*) is the world&rsquo;s largest biologics contract manufacturing organization (CMO) in terms of production capacity. It currently operates two main businesses: 1) a CMO and 2) development and sales of biosimilars through its 100% owned subsidiary Bioepis. We believe that Samsung Biologics&rsquo; advanced technological capabilities and unmatched scale makes them well-positioned to capitalize on the structural growth of biologics as well as the trend of biotech companies increasingly outsourcing their manufacturing capacity.</li>
<li><strong>Americana Restaurants Internat - AMR UH</strong> (0.24% of Fund net assets*) is the YUM brands master franchisee in the Middle East and North Africa (MENA) and Kazakhstan with the UAE, KSA, Kuwait and Egypt being the core markets, while Saudi Arabia is expected to be the main driver of growth over the next few years. We believe the company offers high-quality growth with attractive returns in underpenetrated markets, where demand for out-of-home dining continues to accelerate. The company has a robust balance sheet and strong cash flow generation that is set to support management&rsquo;s ambitious expansion plans and the company&rsquo;s scale puts it well ahead of the competition.</li>
</ul>
<p>During the period, we exited the following positions:</p>
<ul class="content-list">
<li><strong>NAVER Corp - 035420 KS </strong> (0.00% of Fund net assets*) is a South Korean internet company with five businesses: 1) search platform, 2) Commerce, 3) Fintech, 4) Contents and 5) Cloud. Naver generates more than 90% of operating profits from digital ads, which has been its cash cow business. Naver&rsquo;s platform has been losing engagement and, as a result, its market share in the digital ad space has decreased from 53% in 2019 to less than 40% in 2022. This trend is mainly due to consumer preferences shifting to short video, while reading less text and images. We don&rsquo;t have confidence Naver will be able to adapt in the near term. In addition, Naver also faces significant headwinds in e-commerce, as the market becomes increasingly saturated and competition remains fierce &ndash; boding negatively for growth and margins.</li>
<li><strong>GDS Holdings Ltd - 9698 HK</strong> (0.00% of Fund net assets*) is a developer and operator of high-performance data centers in China. GDS offers colocation and managed services, including cloud solutions and has a presence in most tier-1 cities, including Shanghai, Beijing, Shenzhen and Guangzhou. The Chinese data center market is going through some structural changes that are proving to be challenging for GDS. The aggressive competition from major telecom operators and peers may result in a persistently slower ramp-up of IDCs and thus lower margins for GDS, deterring further investments /acquisitions, especially when the option of external capital raising is limited.</li>
</ul>
<h2><strong>Outlook</strong></h2>
<p>Frankly, like many market participants, we are glad to see the back of 2022. From Russia&rsquo;s provocations prolonging an inflationary cycle, to concerns about China&rsquo;s economy, and Washington&rsquo;s attitude to China&rsquo;s role in the world, there have been many factors that we could have done without.</p>
<p>But we approach 2023 with a remarkably good heart. The conditions are ripe for the outperformance of the asset class. As always, we have hewed closely to our structural growth philosophy and we expect the growthy part of EM to perform at least as well as the more value side of the spectrum. We are encouraged by very broad, solid operating performance from our investee companies, and we expect valuations to be steady or even rise from here. It has become fashionable to write off the asset class. Whilst we don&rsquo;t deny some of the longer-run structural challenges, we are undeniably optimistic about the outlook for the next year.</p>
<p><a href="/us/en/blogs/emerging-markets-equity/emerging-markets-better-times-appear-ahead/eme-quarterly-commentary-q4-2022.pdf" title="VanEck Emerging Markets Fund Manager Commentary" target="_blank" rel="noopener"><strong>Download Commentary PDF with Fund specific information and performance.</strong></a></p>
<p>To receive more <a href="/us/en/insights/emerging-markets-equity/" title="Emerging Markets Equity Insights"><strong>Emerging Markets Equity</strong></a> insights, <a href="/us/en/subscribe/" title="Subscription Center"><strong>sign up in our subscription center</strong></a>.</p>
<style type="text/css">
    .wrapped-div {
        max-width: 100%;
    }

    @media (max-width: 768px) {
        .wrapped-div {
            overflow-x: scroll;
        }
    }

    .wrapped-div-sector {
        max-width: 100%;
        overflow-x: scroll;
    }
</style>
]]></content:encoded>
</item><item rdf:about="https://www.vaneck.com/us/en/blogs/economic-trends/disinflation-narrative-very-much-intact/">
  <title>Disinflation Narrative - Very Much Intact></title>
  <link>https://www.vaneck.com/us/en/blogs/economic-trends/disinflation-narrative-very-much-intact/</link>
  <description><![CDATA[The global disinflation story is intact, but is the market getting ahead of itself pricing in sizable EM rate cuts in the coming months?]]></description>
  <dc:creator>Natalia  Gurushina</dc:creator>
  <dc:date>01/12/2023 06:30:00</dc:date>
<content:encoded><![CDATA[

<h2>Global Disinflation</h2>
<p>The U.S. inflation print dominated the newswires this morning, and perhaps the most surprising aspect of the release was the absence of any surprises (albeit many commentators noted that inflation ex-shelter was lower than expected, and that this is a dovish signal). The U.S. disinflation story remains intact, and <strong>the disinflation process in emerging markets (EM) looks just as established</strong>, despite occasional bumps on the road and some notable exceptions (Hungary, Colombia). India&rsquo;s inflation was fully in line with this argument &ndash; it eased more than expected in December (to 5.72% year-on-year) and stayed within the official target band of 2-6%. Regarding the latter point, India is still in a minority, and inflation in most EMs is well above the respective targets. However, the consensus forecasts are gradually grinding down, and some countries might hit the targets sooner than initially thought (the consensus has been quite excited about Hungary lately, placing it ahead of presumably more &ldquo;orthodox&rdquo; regional peers).</p>
<h2>China Reopening</h2>
<p><strong>China&rsquo;s inflation releases are still flying under the radar</strong> &ndash; nobody seem to care about them because the reopening caused a surge in infections, temporarily weighing on domestic activity. However, we should be paying attention for a number of reasons. Authorities surprised the market with the faster and more comprehensive removal of the COVID restrictions, and there is huge domestic pent-up demand for goods and services. So, even though China&rsquo;s inflation looks benign now (mere 1.8% year-on-year in December), it should accelerate in the coming months. This scenario should lead to higher rates and the improvement of the interest rate differential with the U.S. in favor of China, strengthening the fundamental support for the renminbi, which is an anchor for a number of EM currencies.</p>
<h2>EM Easing Expectations</h2>
<p><strong>China&rsquo;s rebound and EM (global?) rate cuts should be powerful drivers for EM assets </strong>&ndash; especially EM debt &ndash; this year. The question is whether the market is getting ahead of itself in pricing in very sizable EM policy easing in the coming months (see chart below). EMs&rsquo; conservative monetary policy stance in 2021-2022 suggests that central banks (well, most of them) will cut only when it is safe to do so, and they will not necessarily be driven by actions of the U.S. Federal Reserve (Fed). For example, the Governor of the Philippine central bank alluded to rate cuts only in 2024 in his recent comments. Room for rate cuts in Brazil might be affected by the new government&rsquo;s policy agenda (especially as regards the budget). Stay tuned!</p>
<h3>Chart at a Glance: Market Expectations for EM Rate Cuts - Wow!</h3>
<p><img class="img-responsive w-100" src="https://www.vaneck.com/contentassets/76e39365c717410086de1d5a5d1833d3/us-natalias-take-2023-01-12.png" alt="Chart at a Glance: Market Expectations for EM Rate Cuts - Wow!" /></p>
<p class="chart-disclosure">Source: Bloomberg LP.</p>
]]></content:encoded>
</item><item rdf:about="https://www.vaneck.com/us/en/blogs/moat-investing/moat-stocks-outperformed-in-volatile-2022/">
  <title>Moat Stocks Outperformed in Volatile 2022></title>
  <link>https://www.vaneck.com/us/en/blogs/moat-investing/moat-stocks-outperformed-in-volatile-2022/</link>
  <description><![CDATA[Though 2022 ended without a Santa Rally, strong stock selection contributed to the Morningstar Wide Moat Focus Index outperforming the S&amp;P 500 Index for the year.]]></description>
  <dc:creator>Coulter Regal, CFA</dc:creator>
  <dc:date>01/11/2023 06:30:00</dc:date>
<content:encoded><![CDATA[

<p>U.S. equity markets ended 2022 on a down note in December as the typical year-end Santa Rally failed to materialize and stocks could not maintain the positive momentum seen in October and November. December capped off a volatile year as investors dealt with a series of cascading concerns over rising interest rates to curb red-hot inflation, recession fears, Russia&rsquo;s invasion of Ukraine and a resurgence of COVID-19 in China. These concerns led to a year in which previously high-flying mega-caps and growth tech stocks fell back down to earth and the S&amp;P 500 saw its largest annual decline since the 2008 global financial crisis.</p>
<p>The <a href="/link/9f629c73a31846bb9e480b95e2c7f330.aspx" title="MOAT - VanEck Morningstar Wide Moat ETF - Index"><strong>Morningstar<sup>&reg;</sup>&nbsp;Wide Moat Focus Index<sup>SM</sup></strong></a>&nbsp;(the &ldquo;Moat Index&rdquo; or &ldquo;Index&rdquo;) performed largely in line with the S&amp;P 500 Index during the last month of the year (-5.45% vs. -5.76%, respectively). However, for the full 2022 calendar year, the Moat Index&rsquo;s focus on attractively priced companies with durable competitive advantages served it well, as the Index outperformed the S&amp;P 500 by over 500 basis points during the year (-13.08% vs. -18.11%, respectively). The outperformance in 2022 is attributable primarily to strong stock selection relative to the S&amp;P 500 Index. Top contributors to performance for the full year were Cheniere Energy Inc. (LNG), Gilead Sciences Inc. (GILD) and Lockheed Martin (LMT).</p>
<h2>Moat Index Positioning into 2023</h2>
<p>The Moat Index underwent its quarterly review on December 16, 2022. Each quarter it systematically targets the most attractively priced U.S. wide moat companies. The December review resulted in six companies added and removed from the Index. Below are a few takeaways from this review and how the Index is positioned heading into the new year. View the full results of the most recent quarterly review <strong><a href="https://www.vaneck.com/us/en/investments/morningstar-wide-moat-etf-moat/moat-reconstitution.pdf" title="MOAT - VanEck Morningstar Wide Moat ETF" target="_blank" rel="noopener">here</a></strong>.</p>
<h2>Growth Exposure Ticks Up</h2>
<p>In line with the trend over the last few quarterly reviews, the Index&rsquo;s growth exposure increased again this quarter. This notable trend may be attributed, in part, to the volatile 2022 market that slashed prices in many growth names previously viewed as too expensive for inclusion in the Index. A past blog touching on the Moat Index&rsquo;s knack for <strong><a href="https://www.vaneck.com/us/en/blogs/moat-investing/moat-investing-capturing-opportunity-amid-volatility/" title="Moat Investing: Capturing Opportunity Amid Volatility">capturing opportunity in volatile markets</a></strong> may be worth a revisit.</p>
<p>Growth and core style exposures in the Moat Index remain underweight relative to the S&amp;P 500 Index, while value is a notable overweight following the December quarterly review.</p>
<div class="wrapped-div">
<table style="width: 650px;">
<tbody>
<tr class="tbl-data">
<td class="tbl-header last" colspan="4">Moat Index Style Exposures:</td>
</tr>
<tr class="tbl-data">
<td class="data-td  last">Style</td>
<td class="data-head last">Current Exposure</td>
<td class="data-head last">Rebalance Change</td>
<td class="data-head last">Relative to S&amp;P 500</td>
</tr>
<tr class="tbl-data">
<td class="data-td data last" style="text-align: left;">Value</td>
<td class="data-td data last" style="text-align: center;">31.3%</td>
<td class="data-td data last" style="text-align: center;">+0.1%</td>
<td class="data-td data last" style="text-align: center;">+10.2%</td>
</tr>
<tr class="tbl-data">
<td class="data-td data last" style="text-align: left;">Core</td>
<td class="data-td data last" style="text-align: center;">33.1%</td>
<td class="data-td data last" style="text-align: center;">-1.5%</td>
<td class="data-td data last" style="text-align: center;">-7.9%</td>
</tr>
<tr class="tbl-data">
<td class="data-td data last" style="text-align: left;">Growth</td>
<td class="data-td data last" style="text-align: center;">35.6%</td>
<td class="data-td data last" style="text-align: center;">+1.4%</td>
<td class="data-td data last" style="text-align: center;">-2.0%</td>
</tr>
</tbody>
</table>
</div>
<br />
<p class="chart-disclosure">Source: Morningstar. As of 12/16/2022.</p>
<h2>Sector Shifts and Relative Weights</h2>
<p>This quarterly review the Index saw slight decreases in exposure to Health Care and Industrials following the removal of biopharmaceutical Gilead Sciences and the industrial conglomerate Honeywell International from the Index due to rich valuations. On the flip side, increased exposures were seen in the Utilities, Materials and Information Technology sectors.</p>
<p>From a relative sector weight perspective vs. the S&amp;P 500, Industrials (+9.3%) and Information Technology (+6.8%) are the two largest sector overweights in the Moat Index following the quarterly review. Consumer Staples (-5.9%) and Energy (-5.0%) sectors exhibit the greatest underweights.</p>
<h2>Moat Index Valuations Remain Attractive</h2>
<p>As of December 16, 2022, the reconstituted Moat Index exhibited a weighted average Price/Fair Value ratio (P/FV) of 0.72, signaling a 28% discount to Morningstar&rsquo;s assessment of fair value. This is in contrast to the S&amp;P 500, which featured a weighted average P/FV ratio of 0.89 as of the same date.</p>
<h2>Learn More During Our Quarterly Webinar</h2>
<p>For more information on recent Moat Index performance, and to hear directly from Morningstar&rsquo;s equity research team for their perspective on performance trends and the companies they cover, watch our quarterly moat investing webinar on January 10. <strong><a href="https://www.vaneck.com/us/en/webinar-registration/?id=99863979616&amp;utm_source=vaneck&amp;utm_medium=calendar" title="Webinar -  Ditch Style Biases. Choose Stock Selection.">Watch webinar here</a></strong>.</p>
<p><strong><a href="https://www.vaneck.com/us/en/investments/morningstar-wide-moat-etf-moat/moat-reconstitution.pdf" title="MOAT - VanEck Morningstar Wide Moat ETF" target="_blank" rel="noopener">VanEck Morningstar Wide ETF (MOAT)</a></strong> seeks to replicate as closely as possible, before fees and expenses the price and yield performance of the Morningstar Wide Moat Focus Index.</p>
<p>Many of our MOAT clients have expressed interest in applying Morningstar&rsquo;s moat investing philosophy to smaller market cap companies, which led us to launch the <a href="/link/c0c4da50e177415b9f750d3c0eea4e0a.aspx" title="SMOT - VanEck Morningstar SMID Moat ETF - Index"><strong>VanEck Morningstar SMID Moat ETF (SMOT)</strong></a>. SMOT provides exposure to small- and mid-cap companies with sustainable competitive advantages and attractive valuations. To learn more, read our first SMOT monthly update: <a href="https://www.vaneck.com/us/en/blogs/moat-investing/smid-moat-index-starts-strong/" title="SMID Moat Index Starts Strong"><strong>SMID Moat Index Starts Strong</strong></a>.</p>
<p>To receive more <a href="https://www.vaneck.com/us/en/insights/moat-investing/" title="Moat Investing Insights"><strong>Moat Investing</strong></a> insights, <a href="https://www.vaneck.com/us/en/subscribe/" title=" Subscription Center"><strong>sign up in our subscription center</strong></a>.</p>
<style type="text/css">
.wrapped-div {
    max-width: 100%;
}
@media (max-width: 768px) {
    .wrapped-div {
        overflow-x: scroll;
    }
}
.wrapped-div-sector {
    max-width: 100%;
    overflow-x: scroll;
}
</style>
]]></content:encoded>
</item><item rdf:about="https://www.vaneck.com/us/en/blogs/moat-investing/smid-moat-index-starts-strong/">
  <title>SMID Moat Index Starts Strong></title>
  <link>https://www.vaneck.com/us/en/blogs/moat-investing/smid-moat-index-starts-strong/</link>
  <description><![CDATA[The Morningstar US Small-Mid Cap Moat Focus Index, which applies Morningstar&rsquo;s moat investing philosophy to smaller-cap companies, delivered impressive results to end 2022.]]></description>
  <dc:creator>Brandon Rakszawski</dc:creator>
  <dc:date>01/11/2023 06:30:00</dc:date>
<content:encoded><![CDATA[

<p>The challenge many investors face with small- and mid-cap (SMID-cap) investing is that this segment of the market tends to be less efficient. There are far more SMID-cap companies than large-cap companies and significantly less research available on them. That is one of the driving forces behind our excitement with the launch of the <strong><a href="/link/589a2bc95c5d48988a7fd0d679aec241.aspx" title="SMOT - VanEck Morningstar SMID Moat ETF - Overview">VanEck Morningstar SMID Moat ETF (SMOT)</a></strong> last October.</p>
<p>Many of our clients that have invested in the <strong><a href="/link/635ccc4bf9134cb9a7fcc80919498eec.aspx" title="MOAT - VanEck Morningstar Wide Moat ETF - Overview">VanEck Morningstar Wide Moat ETF (MOAT)</a></strong>, which offers large blend U.S. equity exposure, had expressed interest in applying Morningstar&rsquo;s <strong><a href="https://www.vaneck.com/us/en/blogs/moat-investing/how-a-moat-stock-gets-its-economic-moat/" title="How a Moat Stock Gets Its Economic Moat">moat investing philosophy</a></strong> to smaller market cap companies. And we believe there is a strong case for considering <a href="https://www.vaneck.com/us/en/blogs/moat-investing/uncover-big-opportunities-in-smaller-companies/" title="Uncover Big Opportunities in Smaller Companies"><strong>SMID-cap companies now</strong></a>. Valuations relative to large-cap companies are quite attractive on a long-term basis and there has been a return premium offered historically by smaller companies relative to large companies. This premium hasn&rsquo;t been there the last decade, but in light of recent market events, we may very well see that dynamic return to historical norms.</p>
<h2>Early Days, But Strong Start for the SMID Moat Index</h2>
<p>SMOT seeks to track as closely as possible, before fees and expenses, the price and yield performance of the <a href="/link/c0c4da50e177415b9f750d3c0eea4e0a.aspx" title="SMOT - VanEck Morningstar SMID Moat ETF - Index"><strong>Morningstar</strong><sup><strong>&reg;</strong></sup><strong>&nbsp;US Small-Mid Cap Moat Focus Index</strong><sup><strong>SM</strong></sup></a>&nbsp;(the &ldquo;SMID Moat Index&rdquo;). The Index is intended to track the overall performance of small- and mid-cap companies with sustainable competitive advantages and attractive valuations according to Morningstar's equity research team. Stated differently, SMOT investors may benefit from Morningstar&rsquo;s rigorous research process applied to SMID-cap companies, which may be a potentially better alternative to beta indexes or other unproven investment managers.</p>
<p>The SMID Moat Index was formally launched by Morningstar in July 2022. While new, its <a href="https://www.vaneck.com/us/en/blogs/moat-investing/access-smid-cap-stocks-with-confidence/" title="Access SMID Cap Stocks with Confidence"><strong>construction methodology</strong></a> is based largely on the proven track record of the <a href="/link/9f629c73a31846bb9e480b95e2c7f330.aspx" title="MOAT - VanEck Morningstar Wide Moat ETF - Index"><strong>Morningstar</strong><sup><strong>&reg;</strong></sup><strong>&nbsp;Wide Moat Focus Index</strong><sup><strong>SM</strong></sup></a>, which serves as the benchmark index for MOAT. The same attributes derived from Morningstar&rsquo;s equity research team&mdash;economic moat ratings and fair value estimates&mdash;are considered in the construction of the SMID Moat Index.</p>
<p>The SMID Moat Index has historically favored mid-cap companies over small-cap companies, given the tendency for moat-rated companies to be more established, larger companies. With that being said, the SMID Moat Index delivered impressive results to end last year relative to both small- and mid-cap stocks in isolation, as well as a market cap-weighted basket of SMID-cap stocks.</p>
<h2>Leading the Pack: SMID Moat Index Has Strong Start</h2>
<p><strong>Total Return as of 12/31/2022</strong></p>
<p><img class="img-responsive w-100" src="https://www.vaneck.com/contentassets/0d8d99832f50456d986786cf57c8e362/2662_smot_chart-01_2023.01_v1_blog.svg" alt="Leading the Pack: SMID Moat Index Has Strong Start" /></p>
<p class="chart-disclosure">Source: Morningstar. As of 12/31/2022. <strong>Index performance is not illustrative of Fund performance. Fund performance current to the most recent month end is available by visiting vaneck.com or by calling 800.826.2333. Past performance is no guarantee of future results. Indexes are unmanaged and are not securities in which an investment can be made.</strong></p>
<h2>Get to Know SMOT</h2>
<p>Unlike MOAT, SMOT will hold some companies that are not common household names. Below are a sample of those companies with moat ratings that contributed the most to SMID Moat Index performance in the fourth quarter last year as well as those that detracted the most.</p>
<h3>Top Contributors and Detractors from SMID Moat Index</h3>
<p><strong>Fourth Quarter 2022</strong></p>
<div class="wrapped-div">
<table style="width: 750px;">
<tbody>
<tr class="tbl-data">
<td class="tbl-header last" colspan="5">Leading Contributors</td>
</tr>
<tr class="tbl-data">
<td class="data-td  last">Name</td>
<td class="data-head last">Ticker</td>
<td class="data-head last">Sector</td>
<td class="data-head last">Avg. Weight</td>
<td class="data-head last">Contribution (%)</td>
</tr>
<tr class="tbl-data">
<td class="data-td last" style="font-weight: normal;">Warner Music Group Corp</td>
<td class="data-td data last">WMG</td>
<td class="data-td data last">Communication Services</td>
<td class="data-td data last">1.41</td>
<td class="data-td data last">0.66</td>
</tr>
<tr class="tbl-data">
<td class="data-td last" style="font-weight: normal;">Affiliated Managers Group Inc</td>
<td class="data-td data last">AMG</td>
<td class="data-td data last">Financials</td>
<td class="data-td data last">1.44</td>
<td class="data-td data last">0.55</td>
</tr>
<tr class="tbl-data">
<td class="data-td last" style="font-weight: normal;">DuPont de Nemours Inc</td>
<td class="data-td data last">DD</td>
<td class="data-td data last">Materials</td>
<td class="data-td data last">1.39</td>
<td class="data-td data last">0.47</td>
</tr>
<tr class="tbl-data">
<td class="data-td last" style="font-weight: normal;">Tapestry Inc</td>
<td class="data-td data last">TPR</td>
<td class="data-td data last">Consumer Discretionary</td>
<td class="data-td data last">1.29</td>
<td class="data-td data last">0.43</td>
</tr>
<tr class="tbl-data">
<td class="data-td last" style="font-weight: normal;">Omnicom Group Inc</td>
<td class="data-td data last">OMC</td>
<td class="data-td data last">Communication Services</td>
<td class="data-td data last">1.46</td>
<td class="data-td data last">0.42</td>
</tr>
</tbody>
</table>
</div>
<br />
<div class="wrapped-div">
<table style="width: 750px;">
<tbody>
<tr class="tbl-data">
<td class="tbl-header last" colspan="5">Leading Detractors</td>
</tr>
<tr class="tbl-data">
<td class="data-td  last">Name</td>
<td class="data-head last">Ticker</td>
<td class="data-head last">Sector</td>
<td class="data-head last">Avg. Weight</td>
<td class="data-head last">Contribution (%)</td>
</tr>
<tr class="tbl-data">
<td class="data-td last" style="font-weight: normal;">Zscaler Inc</td>
<td class="data-td data last">ZS</td>
<td class="data-td data last">Information Technology</td>
<td class="data-td data last">0.67</td>
<td class="data-td data last">-0.25</td>
</tr>
<tr class="tbl-data">
<td class="data-td last" style="font-weight: normal;">Datadog Inc</td>
<td class="data-td data last">DDOG</td>
<td class="data-td data last">Information Technology</td>
<td class="data-td data last">1.20</td>
<td class="data-td data last">-0.24</td>
</tr>
<tr class="tbl-data">
<td class="data-td last" style="font-weight: normal;">Ionis Pharmaceuticals Inc</td>
<td class="data-td data last">IONS</td>
<td class="data-td data last">Health Care</td>
<td class="data-td data last">1.46</td>
<td class="data-td data last">-0.24</td>
</tr>
<tr class="tbl-data">
<td class="data-td last" style="font-weight: normal;">TripAdvisor Inc</td>
<td class="data-td data last">TRIP</td>
<td class="data-td data last">Communication Services</td>
<td class="data-td data last">0.64</td>
<td class="data-td data last">-0.13</td>
</tr>
<tr class="tbl-data">
<td class="data-td last" style="font-weight: normal;">Equitrans Midstream Corp</td>
<td class="data-td data last">ETRN</td>
<td class="data-td data last">Energy</td>
<td class="data-td data last">1.42</td>
<td class="data-td data last">-0.12</td>
</tr>
</tbody>
</table>
</div>
<br />
<p class="chart-disclosure">Source: Morningstar. As of 12/31/2022. Past performance is no guarantee of future results.</p>
<h2>Positioning Entering 2023</h2>
<p>The SMID Moat Index ended 2022 with a diverse sector representation. No single sector exceeded 20% of its exposure, with consumer discretionary and industrials companies topping the list. As mentioned previously, the SMID Moat Index favors slightly larger companies within the SMID universe. As of December 2022, small-cap stocks represented 23.2% of its exposure according to Morningstar.</p>
<h3>Diverse Sector Exposure</h3>
<p><strong>SMID Moat Index as of 12/31/2022</strong></p>
<p><img class="img-responsive w-100" src="https://www.vaneck.com/contentassets/0d8d99832f50456d986786cf57c8e362/2662_smot_chart-02_2023.01_v1_blog.svg" alt="Diverse Sector Exposure, SMID Moat Index as of 12/31/2022" /></p>
<p class="chart-disclosure">Source: Morningstar. As of 12/31/2022.</p>
<h2>Learn More During Our Quarterly Webinar</h2>
<p>For more information on our suite of moat-driven strategies, and to hear directly from Morningstar&rsquo;s equity research team for their perspective on performance trends and the companies they cover, watch our quarterly moat investing webinar on January 10. <strong><a href="https://www.vaneck.com/us/en/webinar-registration/?id=99863979616&amp;utm_source=vaneck&amp;utm_medium=calendar" title="Webinar - Ditch Style Biases. Choose Stock Selection.">Watch webinar here</a></strong>.</p>
<p>To receive more <a href="https://www.vaneck.com/us/en/insights/moat-investing/" title="Moat Investing Insights"><strong>Moat Investing</strong></a> insights, <a href="https://www.vaneck.com/us/en/subscribe/" title=" Subscription Center"><strong>sign up in our subscription center</strong></a>.</p>
<style type="text/css">
    .wrapped-div {
        max-width: 100%;
    }

    @media (max-width: 1240px) {
        .wrapped-div {
            overflow-x: scroll;
        }


    }
</style>
]]></content:encoded>
</item><item rdf:about="https://www.vaneck.com/us/en/blogs/emerging-markets-bonds/chinas-reopening-good-for-em-debt/">
  <title>China’s Reopening Good for EM Debt></title>
  <link>https://www.vaneck.com/us/en/blogs/emerging-markets-bonds/chinas-reopening-good-for-em-debt/</link>
  <description><![CDATA[China&rsquo;s reopening is supportive of commodity prices, Asian EMFX and specific Chinese credits, and we believe emerging markets debt stands out as potential beneficiaries.]]></description>
  <dc:creator>Eric Fine</dc:creator>
  <dc:date>01/11/2023 06:30:00</dc:date>
<content:encoded><![CDATA[

<p>We see three key U-turns going into 2023: 1) China reopening, 2) a hawkish Federal Reserve (Fed) and 3) a looming U.S. recession.</p>
<p>1) In China, markets spent 2022 digesting the property sector collapse and strategic divorce with the U.S., and are only slowly waking up to China reopening. This is very supportive of commodity prices, Asian EMFX and specific Chinese credits. 2) The U.S. Federal Reserve (Fed) and inflation dominated the bond narrative in 2022, but this was capped by two roughly 100 bps rallies in 10-year yields in the second half of the year, as the bond selloff became exhausted as part of an &ldquo;everything&rdquo; rally&mdash;with &ldquo;everyone&rdquo; now bullish bonds for the new year! This is a setup for another selloff in bonds and a hit to risk-free duration and some spread duration. 3) Growth was not a key market driver in 2022, but despite continued growth momentum in the U.S., 2023 will end up being a discussion of how bad the U.S. recession will be. This argues for caution and selectivity on spreads, spread duration and risk generally.</p>
<p>Overall, the above describes a bumpy world with few obvious thematic opportunities, other than emerging markets (EM) debt. <a href="/us/en/blogs/emerging-markets-bonds/3-reasons-to-allocate-to-em-bonds-in-2023/" title="3 Reasons to Allocate to EM Bonds in 2023"><strong>EM debt stands out</strong></a> with asset prices that can benefit directly from China's reopening. It stands out with its high-carry bonds that can generate a return in a potentially sideways or bumpy bond world. Many EMs stand out as beneficiaries of higher commodity prices, not victims of them. EMs largely have independent central banks that hiked interest rates early and more than developed markets (DM), making inflation less of a worry in EM than in DM. For now, we continue to favor Asian EMFX, China property and selective high-spread sovereigns, and are looking to reduce low-beta duration.</p>
<p>The VanEck Emerging Markets Bond Fund returned 2.93% in December, compared to its benchmark (50% J.P. Morgan Government Bond Index-Emerging Markets (GBI-EM) Global Diversified and 50% J.P. Morgan Emerging Markets Bond Index (EMBI)) returning 1.24%. The Fund benefited once again from our <strong><a href="https://www.vaneck.com/us/en/blogs/emerging-markets-bonds/what-a-difference-one-month-makes-in-em/" title="What a Difference One Month Makes in EM">decision to hold China property names</a></strong>. For detailed Fund performance and EM debt outlook, <strong><a href="/us/en/blogs/emerging-markets-bonds/chinas-reopening-good-for-em-debt/emb-manager-commentary-12-2022.pdf" title="VanEck Emerging Markets Bond Fund Monthly Manager Commentary - December 2022" target="_blank" rel="noopener">download the commentary</a></strong>.</p>
<div class="wrapped-div">
<table style="width: 100%;">
<tbody>
<tr class="tbl-data">
<td class="tbl-header last" colspan="8">Average Annual Total Returns (%)</td>
</tr>
<tr class="tbl-data">
<td class="data-td last">As of December 31, 2022</td>
<td class="data-head last">1 Month<sup>&dagger;</sup></td>
<td class="data-head last">3 Month<sup>&dagger;</sup></td>
<td class="data-head last">YTD</td>
<td class="data-head last">1 Year</td>
<td class="data-head last">3 Year</td>
<td class="data-head last">5 Year</td>
<td class="data-head last">10 Year</td>
</tr>
<tr class="tbl-data">
<td class="data-td last">Class A: NAV (Inception 7/9/12)</td>
<td class="data-td data last">2.82</td>
<td class="data-td data last">10.32</td>
<td class="data-td data last">-7.73</td>
<td class="data-td data last">-0.64</td>
<td class="data-td data last">0.67</td>
<td class="data-td data last">0.27</td>
</tr>
<tr class="tbl-data">
<td class="data-td last">Class A: Maximum 5.75% Load</td>
<td class="data-td data last">-3.09</td>
<td class="data-td data last">3.98</td>
<td class="data-td data last">-13.04</td>
<td class="data-td data last">-2.58</td>
<td class="data-td data last">-0.52</td>
<td class="data-td data last">-0.33</td>
</tr>
<tr class="tbl-data">
<td class="data-td last">Class I: NAV (Inception 7/9/12)</td>
<td class="data-td data last">2.93</td>
<td class="data-td data last">10.43</td>
<td class="data-td data last">-7.21</td>
<td class="data-td data last">-0.30</td>
<td class="data-td data last">1.00</td>
<td class="data-td data last">0.59</td>
</tr>
<tr class="tbl-data">
<td class="data-td last">50 GBI-EM GD / 50% EMBI GD</td>
<td class="data-td data last">1.24</td>
<td class="data-td data last">8.30</td>
<td class="data-td data last">-14.73</td>
<td class="data-td data last">-5.64</td>
<td class="data-td data last">-1.85</td>
<td class="data-td data last">-0.17</td>
</tr>
</tbody>
</table>
</div>
<br />
<div class="wrapped-div">
<table style="width: 100%;">
<tbody>
<tr class="tbl-data">
<td class="tbl-header last" colspan="8">Average Annual Total Returns (%)</td>
</tr>
<tr class="tbl-data">
<td class="data-td last">As of September 30, 2022</td>
<td class="data-head last">1 Month<sup>&dagger;</sup></td>
<td class="data-head last">3 Month<sup>&dagger;</sup></td>
<td class="data-head last">YTD</td>
<td class="data-head last">1 Year</td>
<td class="data-head last">3 Year</td>
<td class="data-head last">5 Year</td>
<td class="data-head last">10 Year</td>
</tr>
<tr class="tbl-data">
<td class="data-td last">Class A: NAV (Inception 7/9/12)</td>
<td class="data-td data last">-6.31</td>
<td class="data-td data last">-2.20</td>
<td class="data-td data last">-16.36</td>
<td class="data-td data last">-17.99</td>
<td class="data-td data last">-2.45</td>
<td class="data-td data last">-1.34</td>
<td class="data-td data last">-0.12</td>
</tr>
<tr class="tbl-data">
<td class="data-td last">Class A: Maximum 5.75% Load</td>
<td class="data-td data last">-11.70</td>
<td class="data-td data last">-7.82</td>
<td class="data-td data last">-21.17</td>
<td class="data-td data last">-22.70</td>
<td class="data-td data last">-4.35</td>
<td class="data-td data last">-2.50</td>
<td class="data-td data last">-0.71</td>
</tr>
<tr class="tbl-data">
<td class="data-td last">Class I: NAV (Inception 7/9/12)</td>
<td class="data-td data last">-5.98</td>
<td class="data-td data last">-1.95</td>
<td class="data-td data last">-15.98</td>
<td class="data-td data last">-17.60</td>
<td class="data-td data last">-2.09</td>
<td class="data-td data last">-1.00</td>
<td class="data-td data last">0.19</td>
</tr>
<tr class="tbl-data">
<td class="data-td last">50 GBI-EM GD / 50% EMBI GD</td>
<td class="data-td data last">-5.62</td>
<td class="data-td data last">-4.63</td>
<td class="data-td data last">-21.27</td>
<td class="data-td data last">-22.44</td>
<td class="data-td data last">-7.06</td>
<td class="data-td data last">-3.21</td>
<td class="data-td data last">-0.63</td>
</tr>
</tbody>
</table>
</div>
<br />
<p class="chart-disclosure"><sup>&dagger;</sup>&nbsp;Returns less than one year are not annualized.</p>
<p class="chart-disclosure"><strong>Expenses: Class A: Gross 2.33%, Net 1.28%; Class I: Gross 1.74%, Net 0.96%.</strong> Van Eck Associates Corporation (the &ldquo;Adviser&rdquo;) has agreed to waive fees and/or pay Fund expenses to the extent necessary to prevent the operating expenses of the Fund (excluding acquired fund fees and expenses, interest expense, trading expenses, dividends and interest payments on securities sold short, taxes and extraordinary expenses) from exceeding 1.25% for Class A and 0.95% for Class I of the Fund&rsquo;s average daily net assets per year until May 1, 2023. During such time, the expense limitation is expected to continue until the Board of Trustees acts to discontinue all or a portion of such expense limitation. Please note that, generally, unconstrained bond funds may have higher fees than core bond funds due to the specialized nature of their strategies.</p>
<p class="chart-disclosure"><strong>The performance data quoted represents past performance. Past performance is not a guarantee of future results. Investment return and principal value of an investment will fluctuate so that an investor&rsquo;s shares, when redeemed, may be worth more or less than their original cost. Performance may be lower or higher than performance data quoted. Please call 800.826.2333 or visit vaneck.com for performance current to the most recent month ended.</strong></p>
<p class="chart-disclosure">The &ldquo;Net Asset Value&rdquo; (NAV) of a Fund is determined at the close of each business day, and represents the dollar value of one share of the fund; it is calculated by taking the total assets of the fund, subtracting total liabilities, and dividing by the total number of shares outstanding. The NAV is not necessarily the same as the ETF&rsquo;s intraday trading value. Investors should not expect to buy or sell shares at NAV.</p>
<p>To receive more <a href="/us/en/insights/emerging-markets-bonds/" title="Emerging Markets Bonds Insights"><strong>Emerging Markets Bonds</strong></a> insights, <a href="/us/en/subscribe/" title="Subscription Center"><strong>sign up in our subscription center</strong></a>.</p>
<style type="text/css">.wrapped-div {
    max-width: 100%;
}
@media (max-width: 768px) {
    .wrapped-div {
        overflow-x: scroll;
    }
}
.wrapped-div-sector {
    max-width: 100%;
    overflow-x: scroll;
}
</style>
]]></content:encoded>
</item><item rdf:about="https://www.vaneck.com/us/en/blogs/economic-trends/em-rate-cuts-past-present-future/">
  <title>EM Rate Cuts - Past, Present, Future></title>
  <link>https://www.vaneck.com/us/en/blogs/economic-trends/em-rate-cuts-past-present-future/</link>
  <description><![CDATA[Czech disinflation is getting entrenched and paving the way for rate cuts. Political considerations can affect the timeline of rate cuts in other EMs.]]></description>
  <dc:creator>Natalia  Gurushina</dc:creator>
  <dc:date>01/11/2023 06:30:00</dc:date>
<content:encoded><![CDATA[

<h2>EM Disinflation</h2>
<p><strong>The pace of emerging markets (EM) disinflation is very uneven</strong>, with trailblazers and laggards in every region. The Czech Republic leads the way in Central Europe &ndash; and today&rsquo;s sizable downside inflation surprise confirmed this status (see chart below). Czech headline inflation eased to 15.8% year-on-year in December, and it is now expected to moderate to 6.5% by the end of the year. We think this should pave the way for policy rate cuts this year, as the Czech economy is expected to slip into recession and might require additional support (the real policy rate adjusted by expected inflation is currently positive = restrictive).</p>
<h2>EM Macro Imbalances</h2>
<p><strong>Czech Republic would not be the first major EM to cut in the current cycle</strong> &ndash; Turkey has already lowered the policy rate from 19% to 9%, trying to boost growth prospects in the run up to the elections. Such dramatic policy easing took place against the backdrop of rapidly accelerating inflation, raising numerous concerns about economic imbalances, including the current account deficit. The current account gap showed signs of improvement in 2022 on the back of lower energy prices and more tourist arrivals, however, core exports are stagnating despite the lira devaluation and stronger domestic credit growth. Gold imports are also quite high due to persistent inflation pressures. A sharp widening of the current account deficit in November is a reminder that rate cuts are not a panacea as long as the overall policy framework remains inadequate.</p>
<h2>EM Rate Cuts</h2>
<p>A <strong>couple of LATAM central banks are also on investors&rsquo; monetary policy radars</strong>. The inflation and growth outlooks in Chile look very similar to the Czech Republic (a combo of disinflation and expected recession). This fact and a significant reduction in political noise after the constitutional referendum support market expectations of sizable rate cuts in the coming months. Brazil&rsquo;s very high real rates also create space for rate cuts. And today&rsquo;s softer than expected retail sales &ndash; as well as weaker domestic activity gauges (now in contraction zone) &ndash; point to significant growth slowdown in 2023. However, the central bank&rsquo;s ability to use this space will be determined by the government&rsquo;s policy agenda &ndash; and this in turn might depend on whether President Luiz In&aacute;cio Lula da Silva&rsquo;s (Lula&rsquo;s) political standing will improve after the weekend&rsquo;s riots. Stay tuned!</p>
<h3>Chart at a Glance: Czech Disinflation - Central European Leader</h3>
<p><img class="img-responsive w-100" src="https://www.vaneck.com/contentassets/45fb2d5a9ec54c368f26e59242b2f837/us-natalias-take-2023-01-11c.png" alt="Chart at a Glance: Czech Disinflation - Central European Leader" /></p>
<p class="chart-disclosure">Source: Bloomberg LP.</p>
<p class="chart-disclosure"><strong>CZCPYOY Index</strong>: Czech Consumer Price Index YOY.</p>
<p class="chart-disclosure"><strong>HUCPIYY Index</strong>: Hungary Consumer Price Index YOY.</p>
<p class="chart-disclosure"><strong>POCPIYOY Index</strong>: Poland Consumer Price Index YOY.</p>
<p class="chart-disclosure"><strong>ROCOPYOY Index</strong>: Romania Consumer Price Index YOY.</p>
]]></content:encoded>
</item><item rdf:about="https://www.vaneck.com/us/en/blogs/economic-trends/disinflation-brace-for-impact/">
  <title>Disinflation - Brace for Impact?></title>
  <link>https://www.vaneck.com/us/en/blogs/economic-trends/disinflation-brace-for-impact/</link>
  <description><![CDATA[The market is positioning for China&rsquo;s reflation despite soft credit aggregates. Some EMs are still chasing peak inflation.]]></description>
  <dc:creator>Natalia  Gurushina</dc:creator>
  <dc:date>01/10/2023 06:30:00</dc:date>
<content:encoded><![CDATA[

<h2>China Credit Growth</h2>
<p>It&rsquo;s a big inflation week, both in emerging and developed markets (EM and DM), with the pace of U.S. disinflation scrutinized especially closely, as there is a persistent disconnect between the U.S. Federal Reserve&rsquo;s (Fed&rsquo;s) hawkish messaging and the market expectations of rate cuts in 2023 (which might get further reinforcement from today&rsquo;s softer than expected small business optimism survey). <strong>China is among the very few countries where the markets are positioning for reflation</strong>, albeit the latest credit aggregates suggest this might take a bit longer due to the post-reopening surge in infections and their impact on economic activity. New yuan loans rebounded for the second month in a row but were still timid, and aggregate financing undershot consensus by a wide margin, with corporate and government bond issuance looking particularly weak. We consider this a temporary setback though &ndash; the newswires are buzzing with reports about a record special bonds quota for 2023, while the central bank is once again urging the banking sector to boost lending to the economy.</p>
<h2>EM Peak Inflation</h2>
<p>Elsewhere in <strong>EM, inflation has mostly peaked, with some notable exceptions such as Hungary and Colombia</strong>. The consensus sees further acceleration in Hungary&rsquo;s headline prices in December (to 25.8% year-on-year &ndash; we&rsquo;ll find out in a few days) &ndash; in part because of sticky food prices. Wider European inflation trends suggest that this might be the &ldquo;last hurrah&rdquo;, pointing to Hungary&rsquo;s regional neighbors like Poland and the Czech Republic, where the latest inflation prints surprised significantly to the downside. But in the meantime, Hungary&rsquo;s emergency rate hikes look fully justified. The Romanian central bank also decided to play it safe today, raising the policy rate by 25bps following a series of upside inflation surprises.</p>
<h2>Rate Cut Prospects in EM</h2>
<p>The weekend&rsquo;s <strong>political unrest overshadowed Brazil&rsquo;s stellar disinflation progress</strong>, but today&rsquo;s inflation surprise should not be ignored &ndash; because it was a meaningful upside surprise. Annual inflation did moderate in December (to 5.79% &ndash; see chart below), but not as fast as expected. Even though super-high real interest rates leave plenty of room for policy easing, the central bank might want to wait and see whether/when disinflation runs out of speed before embarking on rate cuts. Concerns about the policy direction under new administration provide additional incentives for the central bank to remain cautious and keep a &ldquo;warning shot&rdquo; rate hike on the table. Stay tuned!</p>
<h3>Chart at a Glance: Brazil Disinflation - Running Out of Steam?</h3>
<p><img class="img-responsive w-100" src="https://www.vaneck.com/contentassets/2d62e82ea8a84b4e928f6da2b0926e97/us-natalias-take-2023-01-10.png" alt="Chart at a Glance: Brazil Disinflation - Running Out of Steam?" /></p>
<p class="chart-disclosure">Source: Bloomberg LP.</p>
<p class="chart-disclosure">The <strong>Brazil CPI IPCA Index</strong> (the Extended National Consumer Price Index (IPCA)) is the reference for the Brazilian inflation-targeting system.</p>
]]></content:encoded>
</item><item rdf:about="https://www.vaneck.com/us/en/blogs/economic-trends/political-risks-and-em-assets/">
  <title>Political Risks and EM Assets></title>
  <link>https://www.vaneck.com/us/en/blogs/economic-trends/political-risks-and-em-assets/</link>
  <description><![CDATA[Brazil&rsquo;s Sunday riots might be over, but policy uncertainty is not.]]></description>
  <dc:creator>Natalia  Gurushina</dc:creator>
  <dc:date>01/09/2023 16:00:00</dc:date>
<content:encoded><![CDATA[

<h2>Brazil Politics</h2>
<p>It was supposed to be a slow morning, with musings about emerging markets (EM) disinflation and the end of the global tightening cycle. However, politics intervened once again. <strong>Brazil&rsquo;s riots on Sunday </strong>shocked both in scope and violence, raising multiple questions about political polarization and its impact on governability, growth and reforms &ndash; and about the <strong>kind of exposure (if any) investors should have in Brazil going forward</strong>. This is not the first time Brazil&rsquo;s institutions have been tested, but up until now they maintained their credibility &ndash; and there is a good chance the same will happen after Sunday&rsquo;s riots too. The congress stood united in condemning violence and disregard for the rule of law. However, what is good for democracy might not necessarily be good for Brazilian bonds. If President Luiz In&aacute;cio Lula da Silva (Lula) emerges politically stronger after the riots, he might be further emboldened to push forward his populist agenda. And this policy uncertainty could be a big negative for local assets, even if political tensions subside.</p>
<h2>EM Local Bonds Performance</h2>
<p><strong>Brazil is not the only LATAM economy, where politics moves bond/asset prices </strong>&ndash; albeit Brazil is watched very closely because of the market&rsquo;s size and local bonds&rsquo; outperformance last year (despite developed markets (DM) policy tightening). <strong>Colombia</strong> was on the opposite end of the performance spectrum &ndash; unable to recover after the presidential elections and now the only regional economy where inflation is yet to peak, while the current account deficit widened to 6.7% of GDP in Q3. The central bank is under pressure to hike by 75-100bps more at its next meeting, and the market is watching the government&rsquo;s fiscal performance as a hawk (this includes the smaller fiscal deficit target for 2023).</p>
<h2>EM Disinflation</h2>
<p>Brazil&rsquo;s political noise might distract from the country&rsquo;s (stellar) disinflation track record &ndash; the consensus expects headline inflation to moderate to 5.6% year-on-year tomorrow. However, <strong>Mexico&rsquo;s</strong> inflation prints definitely got noticed this morning. The disinflation progress is still wobbly, but both <strong>core and headline price pressures appear to have peaked</strong>. Mexico&rsquo;s policy rate is 10.5% and positive in real terms when adjusted both by trailing and expected inflation. The central bank&rsquo;s minutes sounded cautious, but it can definitely slow the pace of hikes to 25bps if the disinflation trend continues. Stay tuned!</p>
<h3>Chart at a Glance: Mexico - Another Inflation Peak in EM</h3>
<p><img class="img-responsive w-100" src="https://www.vaneck.com/contentassets/63fef16b626c4a468f10f7e6052cf654/us-natalias-take-2023-01-09.png" alt="Chart at a Glance: Mexico - Another Inflation Peak in EM" /></p>
<p class="chart-disclosure">Source: Bloomberg LP.</p>
]]></content:encoded>
</item><item rdf:about="https://www.vaneck.com/us/en/blogs/thematic-investing/investing-in-green-infrastructure-7-themes-to-watch-out-for/">
  <title>Investing In Green Infrastructure: 7 Themes To Watch Out For></title>
  <link>https://www.vaneck.com/us/en/blogs/thematic-investing/investing-in-green-infrastructure-7-themes-to-watch-out-for/</link>
  <description><![CDATA[This <strong><a href="https://www.vaneck.com/us/en/offsite-disclaimer/?id=204389&amp;button=no&amp;url=https://www.indxx.com/" target="_blank" title="Indxx - Indexing Redefined" rel="noopener">Indxx</a></strong> article intends to describe the importance and growth potential of major green infrastructure industries.]]></description>
  <dc:creator>Chandan Kumar GV</dc:creator>
  <dc:date>01/09/2023 06:30:00</dc:date>
<content:encoded><![CDATA[

<p>In the present time, climate change is progressively inflicting cascading shocks on our environment, economies, and society. Sea levels are rising, weather patterns are evolving, and extreme weather events are occurring more frequently.</p>
<p>In light of sustainable environment-friendly infrastructure advancement, the business tycoon Bill Gates has rightly said, &ldquo;We have to replace every single piece of infrastructure dedicated to doing things the old way with infrastructure dedicated to doing things in a new way&mdash;and that doesn&rsquo;t happen instantly, especially considering the mind-boggling scale of the job&rdquo;.</p>
<p>As nations attempt to rebuild their economies in a post-pandemic world, recovery tactics carry the potential for shaping the 21st century economy in ways that are clean, green, healthy, safe, and more resilient. Due to the current crisis, a significant, systemic shift towards a more sustainable economy that benefits both people and the environment is a key focus for governments globally. To accomplish development objectives and build a low-carbon, climate-resilient future, the Organisation for Economic Co-operation and Development (OECD) anticipates that an investment of around $6.9 trillion in infrastructure will be required annually up until 2050.<sup>1</sup></p>
<p>Recognising its value, nations are increasingly investing in green infrastructure projects and implementing policies that support a greener economy. For example, an executive order was recently signed in the US to enhance financial risk disclosure related to climate change which directs the government to take climate-related financial risk into account more comprehensively.</p>
<p>This article intends to describe the importance and growth potential of major green infrastructure industries.</p>
<ol class="content-list">
<li><strong><a href="#green-transportation">Green Transportation</a></strong></li>
<li><strong><a href="#green-energy">Green Energy</a></strong></li>
<li><strong><a href="#green-fuel">Green Fuel</a></strong></li>
<li><strong><a href="#pollution-control">Pollution Control</a></strong></li>
<li><strong><a href="#green-infrastructure-equipment">Green Infrastructure Equipment</a></strong></li>
<li><strong><a href="#waste-management">Waste Management</a></strong></li>
<li><strong><a href="#green-constructions">Green Constructions</a></strong></li>
<li><strong><a href="#conclusion">Conclusion</a></strong></li>
</ol>
<h2 id="green-transportation" class="anchored-block">1. <a href="https://www.vaneck.com/us/en/blogs/sustainable-investing/green-infrastructure-transportation/" title="Green Infrastructure: Transportation">Green Transportation</a></h2>
<p>Green transportation prioritizes the effective use of energy resources through the creation of energy-efficient modes of transportation and the transformation of the current transportation system into an eco-friendly one. A few examples of green transportation choices include hybrid and electric automobiles.</p>
<p>To convert the existing global transport systems to a more efficient electric fleet, administrations would be required to invest an aggregate additional $8.6 trillion. By 2030, it could sustain 3.6 million jobs, and by 2050, it could minimize 0.71 GtCO2-e (GtCO2-e = one billion tonnes of carbon dioxide), and much more with the use of clean electricity.<sup>2</sup></p>
<div class="wrapped-div">
<table style="width: 100%;">
<tbody>
<tr class="tbl-data">
<td class="tbl-header last" colspan="8">Urban Transport Investment Returns</td>
</tr>
<tr class="tbl-data">
<td class="data-head last">&nbsp;</td>
<td class="data-head last">Total Incremental<br />Investment<br />(in USD trillions)</td>
<td class="data-head last" colspan="2">Annual Returns<br />(in USD billions)</td>
<td class="data-head last">Net Present Value<br />(in USD trillions)</td>
<td class="data-head last">Average Payback<br />(in Years)</td>
<td class="data-head last" colspan="2">Jobs Supported<br />(in millions)</td>
</tr>
<tr class="tbl-data">
<td class="data-td last">Measure</td>
<td class="data-td data last">&nbsp;</td>
<td class="data-td data last">2030</td>
<td class="data-td data last">2050</td>
<td class="data-td data last">&nbsp;</td>
<td class="data-td data last">2030</td>
<td class="data-td data last">2050</td>
</tr>
<tr class="tbl-data">
<td class="tbl-header last">TRANSPORT - PASSENGER</td>
<td class="tbl-header last">&nbsp;</td>
</tr>
<tr class="tbl-data">
<td class="data-td last">More efficient &amp; electrical vehicles</td>
<td class="data-td data last">8.61</td>
<td class="data-td data last">320.42</td>
<td class="data-td data last">1,095.59</td>
<td class="data-td data last">3.66</td>
<td class="data-td data last">8</td>
<td class="data-td data last">3.6</td>
<td class="data-td data last">20.4</td>
</tr>
<tr class="tbl-data">
<td class="data-td last">More shift to mass transit</td>
<td class="data-td data last">4.01</td>
<td class="data-td data last">1,024.96</td>
<td class="data-td data last">660.46</td>
<td class="data-td data last">19.62</td>
<td class="data-td data last">1</td>
<td class="data-td data last">2.6</td>
<td class="data-td data last">11.8</td>
</tr>
<tr class="tbl-data">
<td class="data-td last">Reduced motorised travel demand</td>
<td class="data-td data last">0.58</td>
<td class="data-td data last">513.12</td>
<td class="data-td data last">1,762.66</td>
<td class="data-td data last">10.25</td>
<td class="data-td data last">1</td>
<td class="data-td data last">1.1</td>
<td class="data-td data last">3.8</td>
</tr>
<tr class="tbl-data">
<td class="tbl-header last">TRANSPORT - FREIGHT</td>
<td class="tbl-header last">&nbsp;</td>
</tr>
<tr class="tbl-data">
<td class="data-td last">More efficient &amp; electrical vehicles</td>
<td class="data-td data last">0.59</td>
<td class="data-td data last">79.85</td>
<td class="data-td data last">529.2</td>
<td class="data-td data last">2.29</td>
<td class="data-td data last">1</td>
<td class="data-td data last">0.1</td>
<td class="data-td data last">2.4</td>
</tr>
<tr class="tbl-data">
<td class="data-td last">Improved logistics</td>
<td class="data-td data last">1.59</td>
<td class="data-td data last">36.69</td>
<td class="data-td data last">143.93</td>
<td class="data-td data last">0.18</td>
<td class="data-td data last">1</td>
<td class="data-td data last">0.6</td>
<td class="data-td data last">2.7</td>
</tr>
</tbody>
</table>
</div>
<br />
<p class="chart-disclosure">Source: Vivid Economics for the Coalition for Urban Transitions.<sup>2</sup></p>
<h2 id="green-energy" class="anchored-block">2. <a href="https://www.vaneck.com/us/en/blogs/sustainable-investing/green-infrastructure-green-energy/" title="Green Infrastructure: Green Energy">Green Energy</a></h2>
<p>Green energy refers to the generation of electricity using renewable resources like wind, solar, geothermal, hydropower, biogas, biomass, or other such energy sources from household and other wastes. According to a combined annual analysis by BloombergNEF and the Business Council for Sustainable Energy, the investment inflow is 70% higher than it was five years ago and 11% higher than 2020.<sup>3</sup>&nbsp;An estimated 14% of the $755 billion in private investments made globally last year went toward U.S. assets like wind and solar farms.<sup>3</sup>&nbsp;After several years of modest advancement, clean energy investment is predicted to reach $1.4 trillion by the end of 2022.<sup>4</sup></p>
<p>This boom is not only being propelled by investments in renewable energy but also by geopolitical factors. For example, because of the conflict in Ukraine numerous countries, including the EU, the US, and the UK, have lessened their reliance on Russian oil and gas and are investing in alternative green energy systems to support energy demand. The global energy market has been advancing at an average annual pace of 12% since 2020 and now makes for roughly three-quarters of the rise in global energy investment.<sup>5</sup>&nbsp;As evident from the chart below, renewable power and energy efficiency continue to dominate the global annual clean energy investment mix.</p>
<h3>Annual Clean Energy Investment</h3>
<p><img loading="lazy" class="chart-disclosure w-100" src="https://www.vaneck.com/contentassets/e90af1f467ff47a5a98f9f1b7d2fc2d3/2653_rnew_chart-01_2023.01_v1_blog.svg" alt="Annual Clean Energy Investment" /></p>
<p class="chart-disclosure">Source: IEA.<sup>6</sup></p>
<h2 id="green-fuel" class="anchored-block">3. <a href="https://www.vaneck.com/us/en/blogs/sustainable-investing/green-infrastructure-green-fuel/" title="Green Infrastructure: Green Fuel">Green Fuel</a></h2>
<p>Another way to reduce the emissions of greenhouse gases is through the use of green fuels such as biodiesel fuel, hydrogen fuel, fuel cell, ethanol fuel, LNG, CNG, and the like.</p>
<p>Biodiesel, which is domestically manufactured from renewable resources such as animal fats, vegetable oils, etc., is a renewable alternative that can be used in existing diesel engines with no modifications. The demand for clean power generation with low or no emissions is driving the growth of this market. The global biodiesel market was worth $32.09 billion in 2021 and is expected to grow at a CAGR of 10.0% between 2022 and 2030.<sup>6</sup>&nbsp;The global fuel cell market too is anticipated to increase at a 26% CAGR, from $2.9 billion in 2022 to $9.1 billion by 2027.<sup>7</sup></p>
<h2 id="pollution-control" class="anchored-block">4. <a href="https://www.vaneck.com/us/en/blogs/sustainable-investing/green-infrastructure-pollution-control/" title="Green Infrastructure: Pollution Control">Pollution Control</a></h2>
<p>Any method that minimizes or prevents pollution at its source is considered pollution prevention, according to the U.S. Environmental Protection Agency (EPA). These businesses engage in waste-water treatment, the production of pollution-controlling machinery such as automobile emission control systems and septic system sedimentation tanks, as well as the provision of any other good or service that lessens or eliminates the negative impacts of pollution on the air, water, and soil.</p>
<h2 id="green-infrastructure-equipment" class="anchored-block">5. <a href="https://www.vaneck.com/us/en/blogs/sustainable-investing/green-infrastructure-and-equipment/" title="Green Infrastructure and Equipment">Green Infrastructure Equipment</a></h2>
<p>This category consists of companies that build products or provide services for the efficient installation, operation, and upkeep of renewable energy, including but not limited to manufacturers of smart meters, turbines, and PV panels.</p>
<p>In 2021, the market for smart meters was valued at $28.03 billion. By 2030, it is anticipated to grow to $65.6 billion, witnessing a CAGR of 11.5%.<sup>8</sup>&nbsp;The increasing demand for smart electricity meters is propelling the growth of the global smart grid market. The market is estimated to experience a CAGR of 19.1% during the period 2021-2026 and reach $103.4 billion by 2026.<sup>9</sup></p>
<h2 id="waste-management" class="anchored-block">6. <a href="https://www.vaneck.com/us/en/blogs/sustainable-investing/green-infrastructure-waste-management/" title="Green Infrastructure: Waste Management">Waste Management</a></h2>
<p>In terms of businesses that are paving the way for a greener future in the fields of waste management and recycling, investors have a wide range of choices with companies that are involved in the safe disposal, recycling, or treatment of hazardous and non-hazardous wastes such as industrial effluents, radio-active wastes, etc. Owing to the growing awareness amongst consumers, the waste management market is expanding steadily and more and more innovative companies are entering this industry. For instance, in 2020, Waste Management Inc. (WM) managed more than 15.5 million tons of recyclables, more than any other company in North America.<sup>10</sup>&nbsp;The approximate size of the global waste management market, which was valued at $423.4 billion in 2021, is expected to reach $542.7 billion by 2026.<sup>11</sup></p>
<h2 id="green-constructions" class="anchored-block">7. <a href="https://www.vaneck.com/us/en/blogs/sustainable-investing/green-infrastructure-green-construction/" title="Green Infrastructure: Green Construction">Green Constructions</a></h2>
<p>The goal of green construction is to create and use the developed environment in a way that is as ecologically friendly as possible. Green buildings focus on reducing harmful environmental effects and even enhancing some good effects, from the design stage through the assembly stage and the efficiency of the facility after it is finished. These include dams, green streets &amp; alleys, green roofs, permeable pavements, rainwater harvesting, manmade wetlands, sustainable drainage, etc. Before purchasing a home, consumers now check for a variety of government certifications (such as LEED, the Leadership in Energy, and Environmental Design) and ratings related to building construction. This is motivating real estate leaders to focus more on green constructions. By 2030, the size of the worldwide green construction market is anticipated to exceed $774 billion, growing at a CAGR of more than 11.8% during the subsequent eight years.<sup>12</sup></p>
<h2 id="conclusion" class="anchored-block">Conclusion</h2>
<p>Investing heavily in resilient and sustainable infrastructure is necessary to fulfil the Sustainable Development Goals by 2030 and achieve net zero emissions by 2050.</p>
<p>Seeking possibilities for implementing new technology or modifying existing assets is the challenging part. Additionally, businesses need to decide when to get rid of stranded assets, like fossil-fuel power plants, that are getting close to the end of their useful lives due to regulatory or market changes. Asset owners will need to comprehend how the energy transition will impact markets in the upcoming years, make choices based on climate policy and regulation, and pursue public-private alliances.</p>
<p>Investing in renewable and efficient technologies may be a smart financial move and a prerequisite for a healthy world now that institutional investors and governments are supporting "clean tech".</p>
<style type="text/css">
    .wrapped-div {
        max-width: 100%;
    }

    @media (max-width: 1240px) {
        .wrapped-div {
            overflow-x: scroll;
        }
    }

    .wrapped-div-sector {
        max-width: 100%;
        overflow-x: scroll;
    }
</style>
<p>To receive more <a href="https://www.vaneck.com/us/en/insights/thematic-investing/" title="Thematic Investing Insights"><strong>Thematic Investing</strong></a> insights, <a href="https://www.vaneck.com/us/en/subscribe/" title="Subscription Center"><strong>sign up in our subscription center</strong></a>.</p>
]]></content:encoded>
</item><item rdf:about="https://www.vaneck.com/us/en/blogs/gold-investing/joe-foster-gold-solidifying-amid-shaky-macro-outlook/">
  <title>Gold Solidifying Amid Shaky Macro Outlook></title>
  <link>https://www.vaneck.com/us/en/blogs/gold-investing/joe-foster-gold-solidifying-amid-shaky-macro-outlook/</link>
  <description><![CDATA[Gold gained 3.1% in Dec., ending the year at $1,824.02. China made first official gold purchase since 2019, potentially indicating consistent buying in 2023.]]></description>
  <dc:creator>Joe Foster</dc:creator>
  <dc:date>01/09/2023 06:30:00</dc:date>
<content:encoded><![CDATA[

<p>Monthly gold market and economic insights from Joe Foster, Portfolio Manager and Strategist, and Imaru Casanova, Deputy Portfolio Manager, featuring their unique views on mining and gold&rsquo;s portfolio benefits. <a href="https://www.vaneck.com/us/en/blogs/gold-investing/joe-foster-gold-solidifying-amid-shaky-macro-outlook/gold-monthly-commentary-december-2022.pdf" target="_blank" title="Gold Monthly Commentary - December 2022" rel="noopener"><strong>An expanded PDF version of this commentary, including fund specific information can be downloaded here.</strong></a></p>
<h2>December 2022: Hawkish Fed, Sluggish Dollar, and a China Gold Bug</h2>
<p>Gold held on to its November gains, bouncing around the $1,800 per ounce level during December. Twenty to thirty-dollar daily moves were common, moving higher on positive inflation reports or lower on strong economic news and U.S. Federal Reserve (Fed) comments to remain vigilant on inflation. The U.S. Dollar Index (DXY)<sup>1</sup>&nbsp;remained subdued following the drubbing it took in November. This enabled gold to maintain some upward momentum. For the month of December, gold gained $55.50 (3.1%) to end the year at $1,824.02.</p>
<p>The People&rsquo;s Bank of China (PBOC) announced it purchased 32 tonnes of gold in November. This is the first official purchase by the PBOC since 2019. In the past, PBOC had purchased consistently for many months between long periods of inactivity. More purchases in December could indicate consistent buying from China in 2023, which could bode well for the gold market.</p>
<p>The gold miners were mostly quiet in December. The NYSE Arca Gold Miners Index (GDMNTR)<sup>2</sup>&nbsp;gained 1.1%, while the MVIS Global Junior Gold Miners Index (MVGDXJTR)<sup>3</sup>&nbsp;advanced 1.7%.</p>
<h2>Gold in 2022: It&rsquo;s Been a Wild Ride</h2>
<p>For the year, the gold price finished with of loss of just $5.18. While gold ended nearly unchanged, the year was far from calm, with prices dropping $450 from highs to lows before returning to its starting point. Gold saw a maximum drawdown of 11.3% but finished with just a 0.3% loss, which was a very respectable result, given the 18.1% loss for the S&amp;P 500 Index<sup>4</sup>&nbsp;and 64.3% loss for bitcoin.</p>
<p><strong>&ldquo;War Premium&rdquo;</strong></p>
<p>Gold had been trading in a range centered on $1,800 for most of 2021. It broke out in February 2022 as warnings surfaced of a possible attack on Ukraine. However, once Russia&rsquo;s bombing of Ukraine began, gold went on to test its all-time highs on March 8 at $2,070 per ounce. By May, the war premium had faded as it became clear that the fighting was not likely to escalate beyond Ukraine.</p>
<p><strong>Dollar Strength</strong></p>
<p>The war provided a temporary positive catalyst; however, the dominant driver through most of the year was increasing pressure on gold prices from Fed policies and the U.S. dollar. The market underestimated the resolve of the Fed to fight inflation. In early January 2022, interest rate futures were pricing a 0.77% increase in Fed Funds rates by the end of the year. By April 2022, markets were pricing in at least 1.5% in further rate increases. However, Fed Chairman Jerome Powell continued to talk a tough stance on inflation, and the Fed actually increased interest rates by 4.25%, in one of the sharpest raises in history. The war, the rise in rates, and the relative strength of the U.S. economy contributed to the relentless strength in the U.S. dollar, which made new 20-year highs continue from May to September.</p>
<p>The inverse correlation between gold and the U.S. dollar is well established. Real rates and tail risks also influence gold's performance. However, until 2022, we hadn&rsquo;t realized how dominant of a driver the U.S. dollar could be. The great gold bull markets of the seventies and two-thousands were driven by inflation and the dot-com bust/financial crisis, respectively. Each of these also coincided with a secular <i>bear market</i> for the U.S. dollar. While we believe current tail risks (pandemic, inflation, war) are equally as severe as those in past bull markets, the key difference in 2022 was the strong U.S. dollar. This kept the pressure on gold prices, muting the response from inflation, geopolitical turmoil, and other risks.</p>
<p><strong>Physical Demand Support</strong></p>
<p>Amid U.S. dollar strength, gold trended to $1,614 on September 28; its low for the year. Technically, gold was poised to trend as low as $1,400; however, gold prices found support from physical demand in India and China, while retail bar and coin demand was strong in the U.S. and Germany. In addition, central banks bought record amounts in the third quarter, led by Uzbekistan, Qatar, and India. Gold tested its $1,614 low several times before making a significant turn higher in November when inflation came in below expectations and Fed Chairman Powell signaled a possible slowdown in rate increases. The U.S. dollar fell hard, and gold broke out, rising to over $1,800 in December.</p>
<p><strong>Cost Inflation (for Miners)</strong></p>
<p>Gold stocks went on a bigger roller coaster than gold in 2022. The GDMNTR and MVGDXJ had maximum drawdowns of 30.9% and 37.0% but ended the year with 8.6% and 14.3% losses, respectively. Cost increases combined with lower gold prices caused some companies to miss earnings. The industry guided increased costs in the five percent range early in the year, however; higher commodities prices brought on by the Russia-Ukraine war forced many companies to revise costs at a higher rate. It seemed that 2022 costs would have averaged around $1,200 per ounce, up about 10% over 2021. While a few companies planned on trimming dividends, most dividends remained intact, and stock buybacks continued along with healthy margins. The recent positive gold price trend, along with early indications that costs should remain around current levels, bode well for the miners in 2023.</p>
<h2>Gold in 2023: Reemergence Amid a Gloomy Outlook?</h2>
<p>Quite a few things that worked against gold in 2022 turned positive as the ball dropped in Times Square. Inflation peaked around mid-year and appears to be heading lower. Many retailers and manufacturers had bloated inventories, and ports, railroads, and package delivery trucks have spare capacity. These prompted the Fed to reduce the size of its rate hike in December, with further reductions or pauses probable in 2023. The U.S. dollar bull market run may end since U.S. Treasury rates were down from October peaks. The DXY declined 9.8% from its 20-year highs in September, and we expect to see the U.S. dollar weaken further if a recession develops. Several reasons to expect economic weakness in 2023:</p>
<ul class="content-list">
<li>Record yield curve inversion.</li>
<li>A common belief is that the Fed policy is felt in the economy with a lag. In 2023, the economy will feel the force of one of history's most aggressive rate hiking cycles.</li>
<li>A reeling housing market from high mortgage rates and unaffordable pricing. According to Redfin Corp, luxury home sales fell 38% YoY in the three months that ended in November, the most on record since 2012.<sup>*</sup></li>
<li>Consumers projected spending of the last of their pandemic-era stimulus savings in 2023.</li>
</ul>
<p>Geopolitical tensions and deglobalization have many non-western central banks diversifying away from the U.S. dollar. Net central bank gold purchases in 2022 were one of the strongest years on record. There has been a growing reluctance to rely on the U.S. dollar for forex reserves and commerce since Western sanctions have frozen over half of Russia&rsquo;s $500 billion in forex reserves. Many countries see no guarantees that the U.S. won&rsquo;t use the U.S. dollar to retaliate for some future infraction that is less egregious than bombing a neighbor. As this new world order evolves, there could be less demand for the U.S. treasuries that enable the U.S. to maintain its deficit-fueled lifestyle.</p>
<p>The financial system has operated under ultra-easy and unprecedented monetary policies for over a decade, characterized by extremely low-interest rates and massive quantitative easing. With its first rate increase in March, the Fed has just begun to attempt to normalize policies. Inflation remains far above its two percent target, and its balance sheet of treasuries and mortgage-backed securities is over $8 trillion. Just nine months of tightening financial conditions has resulted in the cratering of the housing market, a crash in cryptocurrencies, a derivatives debacle for British pension funds, and the collapse of a major cryptocurrency exchange. What tail risks will the next nine months bring as a slowing economy is likely to be added to the mix?</p>
<h2>Ballooning Deficits and Inflation Waves: Make Gold a Solid Choice?</h2>
<p>Higher interest rates create extraordinary systemic risks as monetary conditions continue to normalize. The monthly federal deficit was a record $249 billion in November. On December 30, President Biden signed a $1.65 trillion omnibus spending bill. The government continues to pile on to its $31.3 trillion national debt, which is equal to 124% of GDP, while debt service is becoming a major expense. Recently, the Wall Street Journal&rsquo;s Greg Ip quoted a 1981 paper by Thomas Sargent and Neil Wallace: &ldquo;A government that runs unsustainable deficits will, one day, fail to sell enough bonds, at which point the central bank will have to finance the shortfall by printing money. The central bank may initially try to control inflation by raising interest rates sharply. But this will widen deficits further and ultimately make inflation even harder to control.&rdquo;<sup>**</sup></p>
<p>The U.S. Consumer Price Index (CPI)<sup>5</sup>&nbsp;has trended from a peak of 9.1% in June to 7.1% in November, indicating that the first inflation wave is ending. Will there be a second wave? In 1974, the CPI peaked at 12.3%, then fell to 4.9% in 1976. Many thought inflation was finished; however, it roared back to peak again at 14.7% in 1980. Today, the labor market remains tight, while trade and supply chains have become more difficult since the pandemic and the Russia-Ukraine war. The current inventory glut should prove temporary as we expect China&rsquo;s economy to emerge from its COVID quagmire eventually. Energy markets will surely see more volatility, while the rush to green technology will keep upward price pressure on many commodities. Once the Fed stops tightening, we will be watching for the next inflation wave. The Fed might find a second wave more difficult or even impossible to deal with.</p>
<p>It looks like gold&rsquo;s competition with bitcoin has ended. It was never clear just how much gold demand, if any, was being siphoned off by cryptocurrencies. The choice is clear for anyone who has contemplated the gold versus bitcoin debate. Bitcoin and other cryptocurrencies are risk assets. On the other hand, gold is a defensive asset, a store of wealth, and a currency alternative with intrinsic value as a central bank asset, as jewelry, and for industrial uses. Its unique role in the financial system has been confirmed once again.</p>
<p>A shift in gold&rsquo;s investment outlook can be seen in bullion ETF flows. Global bullion ETFs experienced heavy outflows from April to November. The outflows have now stopped, and while a stronger catalyst is probably needed to prompt inflows, at least the selling pressure has abated. Perhaps 2023 will bring a renewed focus on the yellow metal.</p>
<p>To receive more insights to <strong><a href="https://www.vaneck.com/us/en/insights/gold-investing/" title="Gold Investing Insights">Gold Investing</a></strong> insights, <strong><a href="https://www.vaneck.com/us/en/subscribe/" title="Subscription Center">sign up in our subscription center</a></strong>.</p>
]]></content:encoded>
</item><item rdf:about="https://www.vaneck.com/us/en/blogs/digital-assets/matthew-sigel-vitalik-unveils-2023-wishlist-as-ethereums-outperformance-continues/">
  <title>Vitalik Unveils 2023 Wishlist as Ethereum&#39;s Outperformance Continues></title>
  <link>https://www.vaneck.com/us/en/blogs/digital-assets/matthew-sigel-vitalik-unveils-2023-wishlist-as-ethereums-outperformance-continues/</link>
  <description><![CDATA[December was a rough month for growth stocks and digital assets. Possible future market catalysts for crypto include industry restructuring, government regulation, and industry bankruptcies.]]></description>
  <dc:creator>Matthew  Sigel</dc:creator>
  <dc:date>01/09/2023 06:30:00</dc:date>
<content:encoded><![CDATA[

<p><strong>Please note that VanEck may have a position(s) in the digital asset(s) described below.</strong></p>
<p>December was another tough month for both growth stocks and digital assets as <strong>Bitcoin</strong> fell 3%, <strong>Ethereum</strong> -7%, the <strong>Nasdaq Composite</strong> -9%, and the <strong>MVIS Smart Contract Leaders Index</strong> -17%.</p>
<p>Notably, Bitcoin's 30-day volatility is now lower than S&amp;P 500 volatility. We think that&rsquo;s unsustainable. Possible upside catalysts include a pre-packaged DCG/Genesis bankruptcy or restructuring with new equity financing, an announcement from Saudi Arabia formalizing Bitcoin mining, regulation &amp; licenses, or a Ripple court victory or settlement. Possible downside catalysts include a disorderly DCG bankruptcy, CFIUS blocking BinanceUS&rsquo;s acquisition of $1B of Voyager crypto assets, hot inflation prints, or a Ripple loss.</p>
<p>On the positive side, we also note the recent strength of the Chinese RMB amidst a CCP U-turn on COVID-19 and other redistributive policies. Historically, sturdier relative economic performance in China has coincided with a strong RMB, less onerous capital controls, and resilient BTC. We think this correlation is something to watch this year.</p>
<h3>CNY vs. BTC (inverted): Falling Lines = Strengthening</h3>
<p><img class="img-responsive w-100" src="https://www.vaneck.com/contentassets/ca3bc120aba549bfbfab15548e64fa6b/2655_scl_chart-01_2023.01_v1_blog.svg" alt="CNY vs. BTC (inverted): Falling Lines = Strengthening" /></p>
<p class="chart-disclosure">Sources: Bloomberg as of 12/31/2022.</p>
<p class="chart-disclosure">Past performance is not indicative of future results. Not a recommendation to buy or sell any of the names mentioned herein.</p>
<p>Lastly, as we hope for better digital assets performance in 2023, we would like to highlight three &ldquo;huge&rdquo; opportunities that Ethereum founder Vitalik Buterin mentioned in a recent blog:</p>
<ol>
<li><strong>Mass wallet adoption</strong>: The development of wallets that are easy for everyday people to use and capable of onboarding billions of users.</li>
<li><strong>Inflation-resistant stablecoins:</strong> The creation of stablecoins that can withstand all types of conditions, including hyperinflation, and are globally accessible.</li>
<li><strong>Ethereum-powered website logins:</strong> Technical developments that enable Ethereum to take login powers away from centralized monopolies like Facebook, Google, and Twitter and capture more market dominance on internet-based applications.</li>
</ol>
<p>As Vitalik wrote in the piece: &ldquo;These are all problems that can be solved, and there is a strong drive to solve them. Rollup technology is rapidly scaling to solve scalability, and transactions already get included much more quickly on-chain than they did three years ago.&rdquo;</p>
<div class="wrapped-div">
<table style="width: 750px;">
<tbody>
<tr class="tbl-data">
<td class="tbl-header last">Digital Asset</td>
<td class="tbl-header last" style="text-align: center;">Market Cap</td>
<td class="tbl-header last" style="text-align: center;">7 Days</td>
<td class="tbl-header last" style="text-align: center;">30 days</td>
<td class="tbl-header last" style="text-align: center;">90 days</td>
<td class="tbl-header last" style="text-align: center;">365 days</td>
</tr>
<tr class="tbl-data">
<td class="data-td last" style="font-weight: normal;">Bitcoin</td>
<td class="data-td data last">$319.53B</td>
<td class="data-td data last">-1.63%</td>
<td class="data-td data last">-3.01%</td>
<td class="data-td data last">-14.62%</td>
<td class="data-td data last">-64.95%</td>
</tr>
<tr class="tbl-data">
<td class="data-td last" style="font-weight: normal;">Ethereum</td>
<td class="data-td data last">$146.76B</td>
<td class="data-td data last">-1.95%</td>
<td class="data-td data last">-7.45%</td>
<td class="data-td data last">-10.07%</td>
<td class="data-td data last">-67.87%</td>
</tr>
<tr class="tbl-data">
<td class="tbl-header last">Digital Asset Index</td>
<td class="tbl-header last" style="text-align: center;">Market Cap</td>
<td class="tbl-header last" style="text-align: center;">7 Days</td>
<td class="tbl-header last" style="text-align: center;">30 days</td>
<td class="tbl-header last" style="text-align: center;">90 days</td>
<td class="tbl-header last" style="text-align: center;">365 days</td>
</tr>
<tr class="tbl-data">
<td class="data-td last" style="font-weight: normal;">MVIS<sup>&reg;</sup>&nbsp;CryptoCompare Infrastructure Application Leaders</td>
<td class="data-td data last">$12.57B</td>
<td class="data-td data last">-4.00%</td>
<td class="data-td data last">-20.50%</td>
<td class="data-td data last">-21.19%</td>
<td class="data-td data last">-78.47%</td>
</tr>
<tr class="tbl-data">
<td class="data-td last" style="font-weight: normal;">MarketVector&trade; Centralized Exchanges</td>
<td class="data-td data last">$43.72B</td>
<td class="data-td data last">0.32%</td>
<td class="data-td data last">-16.72%</td>
<td class="data-td data last">-17.96%</td>
<td class="data-td data last">-58.95%</td>
</tr>
<tr class="tbl-data">
<td class="data-td last" style="font-weight: normal;">MVIS<sup>&reg;</sup>&nbsp;CryptoCompare Decentralized Finance Leaders</td>
<td class="data-td data last">$5.96B</td>
<td class="data-td data last">-5.20%</td>
<td class="data-td data last">-14.52%</td>
<td class="data-td data last">-27.30%</td>
<td class="data-td data last">-81.01%</td>
</tr>
<tr class="tbl-data">
<td class="data-td last" style="font-weight: normal;">MVIS<sup>&reg;</sup>&nbsp;CryptoCompare Smart Contract Leaders</td>
<td class="data-td data last">$181.63B</td>
<td class="data-td data last">-3.82%</td>
<td class="data-td data last">-14.81%</td>
<td class="data-td data last">-33.92%</td>
<td class="data-td data last">-82.55%</td>
</tr>
<tr class="tbl-data">
<td class="data-td last" style="font-weight: normal;">MVIS<sup>&reg;</sup>&nbsp;CryptoCompare Media &amp; Entertainment Leaders</td>
<td class="data-td data last">$3.88B</td>
<td class="data-td data last">-8.77%</td>
<td class="data-td data last">-23.78%</td>
<td class="data-td data last">-48.22%</td>
<td class="data-td data last">-91.53%</td>
</tr>
</tbody>
</table>
</div>
<br />
<p class="chart-disclosure">Sources: Bloomberg, Messari, CryptoCompare, MVIS, VanEck research as of 12/31/2022.</p>
<p class="chart-disclosure">Past performance is not indicative of future results. Not a recommendation to buy or sell any of the names mentioned herein.</p>
<h2>Smart Contract Platforms:</h2>
<p>Most Layer-1 smart contract platforms underperformed Bitcoin &amp; Ethereum in December as investors sold what they could to fund redemptions amidst the overall industry deleveraging. Specifically, the continued fallout from the FTX fraud, multiple Bitcoin miner bankruptcies, and the solvency issues at DCG&rsquo;s lending entity Genesis presented both fundamental and liquidity-based headwinds. Still, despite negative news related to both macroeconomics and digital assets, some key Layer-1s remained remarkably resilient. The top performers for the month, among leading smart contract platforms, included Internet Computer (ICP) +5.3% and Ethereum (ETH) -7.5%</p>
<p>The <strong>ICP</strong> has seen positive price action as the pace of smart contract deployment, called canisters, has accelerated to 16.6% month-to-month in December. Another positive catalyst has been the long-awaited launch of an asset bridge that connects the Ethereum network to the Internet Computer network. Still, the positive price performance was not accompanied by rising volumes. Thus, ICP was dropped from the MVIS Smart Contract Leaders Index for falling under the $25M/day level required for inclusion.</p>
<p><strong>Ethereum</strong> remains the dominant L1 as network usage has remained robust and even grew by some measures in December. For example, unique daily Ethereum ERC-20 users, or wallets that sent an ERC-20 token, have increased by 4.5% on a 30-day moving average basis compared to November. Likewise, L2 settlement activity on Ethereum increased by 13.7% between October and November and a further 7.7% between November and December.</p>
<h3>Unique Daily Ethereum ERC-20 Users</h3>
<p><img class="img-responsive w-100" src="https://www.vaneck.com/contentassets/ca3bc120aba549bfbfab15548e64fa6b/2655_scl_chart-02_2023.01_v1_blog.svg" alt="Unique Daily Ethereum ERC-20 Users" /></p>
<p class="chart-disclosure">Source: Etherscan as of 12/31/2022. Past performance is not indicative of future results. Not a recommendation to buy or sell any of the names mentioned herein.</p>
<p>Among the worst performers in Layer 1 protocols were <strong>Algorand (ALGO)</strong> -31% and <strong>Solana (SOL)</strong> -29.9%. Despite the excitement around Algorand&rsquo;s yearly conference held at the end of November, Decipher, Algorand&rsquo;s daily average transactions fell 25% in December compared to November, while average TVL dropped 29%. Despite the chain&rsquo;s position as FIFA&rsquo;s &ldquo;official blockchain partner,&rdquo; Algo holders saw the World Cup as a &lsquo;sell the news&rsquo; event.</p>
<h3>Algorand 30 Days Moving Average TVL</h3>
<p><img class="img-responsive w-100" src="https://www.vaneck.com/contentassets/ca3bc120aba549bfbfab15548e64fa6b/2655_scl_chart-03_2023.01_v1_blog.svg" alt="Algorand 30 Days Moving Average TVL" /></p>
<p class="chart-disclosure">Source: DeFIllama as of 12/31/2022. Past performance is not indicative of future results. Not a recommendation to buy or sell any of the names mentioned herein.</p>
<p><strong>Solana </strong>continued to dramatically underperform its peers due largely to a decline in usership, network activity, TVL, and selling pressure related to the FTX bankruptcy. Compared to November, total Solana daily active users fell 14.3%, while Solana DeFI daily active users fell 27%, leading to TVL falling 53%. The once popular NFT application <strong>StepN </strong>has seen its inflow of SOL reverse to outflows. Additionally, major Solana NFT projects such as <strong>DeGods</strong> and <strong>y00ts</strong> have left the Solana blockchain to Ethereum and Polygon, respectively. Even with the decline in developers and developer activity, Solana still boasts more developer activity than Polygon, but with a market cap 30% smaller. We expect fundamental momentum to improve in 2023 thanks to still-resilient NFT activity, a rebirth of some DeFi activities driven by projects like <strong>Hero</strong> &amp; <strong>Friktion</strong>, and promising new applications such as <strong>Hivemapper</strong>, a community-owned Google Maps competitor, which is bootstrapping its network on the Solana Layer 1 chain and using Helium (another Solana-based decentralized infrastructure provider) to provide GPS backup location.</p>
<h3>Net SOL Inflow into StepN Application</h3>
<p><img class="img-responsive w-100" src="https://www.vaneck.com/contentassets/ca3bc120aba549bfbfab15548e64fa6b/2655_scl_chart-04_2023.01_v1_blog.svg" alt="Net SOL Inflow into StepN Application" /></p>
<p class="chart-disclosure">Source: Dune as of 12/31/2022. Past performance is not indicative of future results. Not a recommendation to buy or sell any of the names mentioned herein.</p>
<h3>Solana Daily Active Users</h3>
<p><img class="img-responsive w-100" src="https://www.vaneck.com/contentassets/ca3bc120aba549bfbfab15548e64fa6b/2655_scl_chart-05_2023.01_v1_blog.svg" alt="Solana Daily Active Users" /></p>
<p class="chart-disclosure">Source: Dune as of 12/31/2022. Past performance is not indicative of future results. Not a recommendation to buy or sell any of the names mentioned herein.</p>
<p>Meanwhile, Ethereum Layer 2 scaling solutions continue to operate in a league of their own in terms of user adoption momentum: Optimism (OP) had more than a 20x increase in daily active users since the beginning of the year, with 590k active users in December. Arbitrum&rsquo;s growth peaked in November at around 660k active users (almost 10x the number of users in January). Optimism was also the leader in TVL growth, with a 2x increase in TVL since January. Optimism now has $615 million locked in its DeFi ecosystem. Arbitrum and Polygon have $1.11 and $1.16 billion, respectively, in value locked.</p>
<h3>Monthly Active Users Growth (100 = 1/1/22)</h3>
<p><img class="img-responsive w-100" src="https://www.vaneck.com/contentassets/ca3bc120aba549bfbfab15548e64fa6b/2655_scl_chart-06_2023.01_v1_blog.svg" alt="Monthly Active Users Growth (100 = 1/1/22)" /></p>
<p class="chart-disclosure">Source: tokenterminal as of 12/31/2022. Past performance is not indicative of future results. Not a recommendation to buy or sell any of the names mentioned herein.</p>
<p><strong>Polygon </strong>has recently become the Layer 2 choice for an impressive number of globally recognized traditional brands and platforms looking to expand into web3 and NFTs (including companies such as Starbucks, Meta, and Reddit). In December, Donald Trump's NFTs on Polygon broke daily volume records for the chain.</p>
<p>Layer 2 solutions&rsquo; main appeal is low transaction fees. In that regard, Arbitrum and Optimism have performed fairly well. Dune Analytics data suggested that the fees on both layer 2 solutions have plunged substantially. They are set to benefit from even lower fees after the implementation of EIP-4844 or &lsquo;Proto-Danksharding&rsquo; on Ethereum. The upgrade should introduce data availability for rollups, leading to reduced fees and more transaction throughput, opening doors to new use cases like those promised by Vitalik above.</p>
<h3>Transaction Fees</h3>
<p><img class="img-responsive w-100" src="https://www.vaneck.com/contentassets/ca3bc120aba549bfbfab15548e64fa6b/2655_scl_chart-07_2023.01_v1_blog.svg" alt="Transaction Fees" /></p>
<p class="chart-disclosure">Source: Dune Analytics, VanEck Research as of 12/31/2022. Past performance is not indicative of future results. Not a recommendation to buy or sell any of the names mentioned herein.</p>
<div class="wrapped-div">
<table style="width: 750px;">
<tbody>
<tr class="tbl-data">
<td class="tbl-header last" style="text-align: center;">&nbsp;</td>
<td class="tbl-header last" style="text-align: center;">Marketcap</td>
<td class="tbl-header last" style="text-align: center;">30 days</td>
<td class="tbl-header last" style="text-align: center;">365 days</td>
</tr>
<tr class="tbl-data">
<td class="data-td last">ICP</td>
<td class="data-td data last">$1.12B</td>
<td class="data-td data last">0.2%</td>
<td class="data-td data last">-86.29%</td>
</tr>
<tr class="tbl-data">
<td class="data-td last">Cosmos</td>
<td class="data-td data last">$2.84B</td>
<td class="data-td data last">-3.54%</td>
<td class="data-td data last">-74.79%</td>
</tr>
<tr class="tbl-data">
<td class="data-td last">Ethereum</td>
<td class="data-td data last">$148.61B</td>
<td class="data-td data last">-7.45%</td>
<td class="data-td data last">-67.87%</td>
</tr>
<tr class="tbl-data">
<td class="data-td last">Tezos</td>
<td class="data-td data last">$0.68B</td>
<td class="data-td data last">-26.44%</td>
<td class="data-td data last">-84.61%</td>
</tr>
<tr class="tbl-data">
<td class="data-td last">Celo</td>
<td class="data-td data last">$0.24B</td>
<td class="data-td data last">-29.65%</td>
<td class="data-td data last">-90.17%</td>
</tr>
<tr class="tbl-data">
<td class="data-td last">Waves</td>
<td class="data-td data last">$0.15B</td>
<td class="data-td data last">-43.13%</td>
<td class="data-td data last">-91.44%</td>
</tr>
</tbody>
</table>
</div>
<br />
<p class="chart-disclosure">Sources: Bloomberg, Messari, CryptoCompare, MVIS, VanEck research as of 12/31/2022.</p>
<p class="chart-disclosure">Past performance is not indicative of future results. Not a recommendation to buy or sell any of the names mentioned herein.</p>
<h2>DeFi:</h2>
<p>The MVIS DeFi Leaders Index (MVDEFI) fell 14.52% in December, outperforming other categories we track. <strong>THORChain&rsquo;s RUNE</strong> outperformed, falling only 4%.</p>
<p>THORChain is a layer 1, cross-chain, decentralized exchange (DEX) built on the cosmos SDK. The protocol acts as a middle layer that allows users to swap native assets on different blockchains. For example, THORChain allows Ethereum holders to swap ETH they hold in their Ethereum wallet and receive AVAX in their Avalanche wallet. This cross-chain transaction saves users the hassles and fees of sending assets to and trading on centralized exchanges while avoiding the security pitfalls of wrapped assets. Such a transaction is similar to being able to directly trade NYSE Coca-Cola shares for CME soybean futures without having to send money between or make trades on either exchange.</p>
<p>THORChain is similar to other DEXes, where liquidity providers lock liquidity in each asset's respective liquidity pool. These liquidity pools are utilized to swap between various assets. Where THORChain differs is that it coordinates the trading of assets not on one blockchain but across blockchains allowing the traders to always hold native assets rather than wrapped assets. Wrapped assets are synthetic representations of assets that are created when a blockchain-to-blockchain "bridge" locks a native asset in the bridge's smart contract on a source chain and mints a representation of the locked asset on the destination blockchain. These assets, called "non-native" or "wrapped" assets, are bearer assets backed by the locked assets on the source chain and can be considered a derivative whose price may differ from the original asset based on supply and demand on the destination chain. They are riskier than native assets because if the bridge is hacked and the hacker unlocks the asset on the source chain, then the synthetic asset is worthless.</p>
<p>Most blockchain bridges bring assets that only exist on one chain and create a minted representation on another chain by communicating to each blockchain that the backing assets of the minted assets are locked. When a user wants to bring back the bridged assets to the source chain, he utilizes the bridge, which destroys the synthetic asset on the destination chain and unlocks the source asset on the chain of origin. THORChain, by contrast, does not mint synthetic assets based on locked native assets. Rather, it allows a user to exchange one asset that is native to the source chain for an asset that is native to the destination chain. While this eliminates the risk posed by wrapped assets and bridge hacks, it introduces new risks to liquidity providers whose assets could be stolen if THORChain is hacked. THORChain also does not allow users to introduce native assets from one blockchain to a new blockchain. It simply arranges trades across chains which are best classified as a cross-chain liquidity protocol rather than an actual "bridge."</p>
<p>We believe the volatility of RUNE in the past month and a half can be attributed to the launch of &ldquo;Savers Vaults&rdquo; in mid-November. Savers Vaults are a new way to supply single-asset liquidity on THORChain. Users can deposit native Bitcoin, earn in-kind yield, and withdraw their principal at any time. Savers Vaults are available for Layer 1 assets supported by THORChain: BTC, ETH, BNB, BCH, DOGE, LTC, ATOM, and AVAX. There are currently 1705 savers with $8.8 million in value locked. The mean APR across all assets is 7.26% - so far, savers have earned $61k in total since launch. We also believe some market participants may be rallying around THORChain thanks to the endorsement of prominent Bitcoin OG Erik Vorhees, who famously out-debated SBF on the &ldquo;Bankless&rdquo; podcast two weeks before FTX imploded.</p>
<p><strong>Uniswap</strong> was the second-best performer relative to the sector, down 14%. Despite the poor performance of UNI and DeFi coins overall, the protocol has had quite a positive and key role this year, sporting record volumes and taking market share amidst the general distrust in centralized exchanges that ravaged the digital assets market in 2022.</p>
<p>For the year, Uniswap had 410k active users on average every month. From those, 44% were new users (first trade of the year), 36% were retained users (active every month), and 20% used the platform at least in 2022 (non-frequent repeat users). Uniswap has done a good job attracting new users given market conditions in crypto this year. But most of its revenue is derived from repeat users. With a 36% monthly retention rate, the protocol benefits from retained users as they drive a huge portion of the fees and trading volume on the DEX.</p>
<p>In an effort to drive more adoption, Uniswap in December partnered with fintech company Moonpay to allow users to buy cryptocurrency on its web app using debit cards, credit cards, and bank transfers. The bank transfer option is being rolled out for users within most U.S. states, Brazil, the United Kingdom, and the Single Euro Payments Area, also known as SEPA. In the announcement made on Dec. 20, Uniswap <strong><a href="https://uniswap.org/blog/web-fiat-on-ramp" target="_blank" rel="noopener" title="Buy crypto with your card or bank account">shared</a></strong> that its users will now be able to convert fiat to cryptocurrency on the Ethereum mainnet, Polygon, Optimism, and Artibrum.</p>
<h3>Uniswap Monthly Active Users</h3>
<p><img class="img-responsive w-100" src="https://www.vaneck.com/contentassets/ca3bc120aba549bfbfab15548e64fa6b/2655_scl_chart-08_2023.01_v1_blog.svg" alt="Uniswap Monthly Active Users" /></p>
<p class="chart-disclosure">Source: tokenterminal as of 12/31/2022. Past performance is not indicative of future results. Not a recommendation to buy or sell any of the names mentioned herein.</p>
<h3>Fees by User Type</h3>
<p><img class="img-responsive w-100" src="https://www.vaneck.com/contentassets/ca3bc120aba549bfbfab15548e64fa6b/2655_scl_chart-09_2023.01_v1_blog.svg" alt="Fees by User Type" /></p>
<p class="chart-disclosure">Source: Dune Analytics, VanEck Research as of 12/31/2022. <em>Past performance is not indicative of future results. Not a recommendation to buy or sell any of the names mentioned herein.</em></p>
<div class="wrapped-div">
<table style="width: 750px;">
<tbody>
<tr class="tbl-data">
<td class="tbl-header last" style="text-align: center;">&nbsp;</td>
<td class="tbl-header last" style="text-align: center;">Marketcap</td>
<td class="tbl-header last" style="text-align: center;">30 days</td>
<td class="tbl-header last" style="text-align: center;">365 days</td>
</tr>
<tr class="tbl-data">
<td class="data-td last">THORChain</td>
<td class="data-td data last">$0.40B</td>
<td class="data-td data last">-4.30%</td>
<td class="data-td data last">-81.95%</td>
</tr>
<tr class="tbl-data">
<td class="data-td last">Uniswap</td>
<td class="data-td data last">$4.05B</td>
<td class="data-td data last">-14.17%</td>
<td class="data-td data last">-70.86%</td>
</tr>
<tr class="tbl-data">
<td class="data-td last">Compound</td>
<td class="data-td data last">$0.22B</td>
<td class="data-td data last">-15.63%</td>
<td class="data-td data last">-85.57%</td>
</tr>
<tr class="tbl-data">
<td class="data-td last">Aave</td>
<td class="data-td data last">$0.75B</td>
<td class="data-td data last">-17.72%</td>
<td class="data-td data last">-80.18%</td>
</tr>
<tr class="tbl-data">
<td class="data-td last">PancakeSwap</td>
<td class="data-td data last">$0.53B</td>
<td class="data-td data last">-19.97%</td>
<td class="data-td data last">-73.66%</td>
</tr>
<tr class="tbl-data">
<td class="data-td last">Curve</td>
<td class="data-td data last">$0.35B</td>
<td class="data-td data last">-20.73%</td>
<td class="data-td data last">-91.85%</td>
</tr>
<tr class="tbl-data">
<td class="data-td last">Maker</td>
<td class="data-td data last">$0.50B</td>
<td class="data-td data last">-21.22%</td>
<td class="data-td data last">-78.63%</td>
</tr>
</tbody>
</table>
</div>
<br />
<p class="chart-disclosure">Sources: Bloomberg, Messari, CryptoCompare, MVIS, VanEck research as of 12/31/2022.</p>
<p class="chart-disclosure">Past performance is not indicative of future results. Not a recommendation to buy or sell any of the names mentioned herein.</p>
<h2>Infra:</h2>
<p>The MVIS Infra index fell 20.5%, underperforming other digital assets sectors. The Graph&rsquo;s GRT was the best performer in the sector, down 7%, followed by Polygon&rsquo;s MATIC (-15%) and Quant Network&rsquo;s QNT (-16%).</p>
<p><strong>The Graph Network (GRT)</strong> allows developers to search, index, and publish data from public blockchains. The protocol enables developers to browse through APIs, referred to as subgraphs. The amount of such subgraphs increased 116% this year, and active indexers increased 80%, currently at 290 as of December 30th.</p>
<p><strong>Filecoin&rsquo;s FIL</strong> was the worst performer in sector, down 33%. Filecoin lets users rent out or sell spare storage space on their computers in exchange for the network's native token. Filecoin says it has a capacity of 15.34 exbibytes, or 17.6 million terabytes, but lists storage of OpenSea NFT metadata as one of its primary use cases, raising questions about how much of its storage network is truly utilized. Meanwhile, on OpenSea, monthly volume dropped to $159 million in December from around $4.8 billion at the start of the year, a decline of about 97%. Filecoin peaked at $236 when it listed on April 1 but trades at $3 today.</p>
<div class="wrapped-div">
<table style="width: 750px;">
<tbody>
<tr class="tbl-data">
<td class="tbl-header last" style="text-align: center;">&nbsp;</td>
<td class="tbl-header last" style="text-align: center;">Marketcap</td>
<td class="tbl-header last" style="text-align: center;">30 days</td>
<td class="tbl-header last" style="text-align: center;">365 days</td>
</tr>
<tr class="tbl-data">
<td class="data-td last">The Graph</td>
<td class="data-td data last">$0.44B</td>
<td class="data-td data last">-7.49%</td>
<td class="data-td data last">-91.00%</td>
</tr>
<tr class="tbl-data">
<td class="data-td last">Polygon</td>
<td class="data-td data last">$6.82B</td>
<td class="data-td data last">-15.21%</td>
<td class="data-td data last">-67.89%</td>
</tr>
<tr class="tbl-data">
<td class="data-td last">Quant Network</td>
<td class="data-td data last">$1.31B</td>
<td class="data-td data last">-16.04%</td>
<td class="data-td data last">-39.39%</td>
</tr>
<tr class="tbl-data">
<td class="data-td last">VeChain</td>
<td class="data-td data last">$1.17B</td>
<td class="data-td data last">-16.46%</td>
<td class="data-td data last">-81.21%</td>
</tr>
<tr class="tbl-data">
<td class="data-td last">Chainlink</td>
<td class="data-td data last">$2.88B</td>
<td class="data-td data last">-23.74%</td>
<td class="data-td data last">-76.05%</td>
</tr>
<tr class="tbl-data">
<td class="data-td last">Filecoin</td>
<td class="data-td data last">$1.13B</td>
<td class="data-td data last">-33.07%</td>
<td class="data-td data last">-91.01%</td>
</tr>
</tbody>
</table>
</div>
<br />
<p class="chart-disclosure">Sources: Bloomberg, Messari, CryptoCompare, MVIS, VanEck research as of 12/31/2022.</p>
<p class="chart-disclosure">Past performance is not indicative of future results. Not a recommendation to buy or sell any of the names mentioned herein.</p>
<h2>Metaverse:</h2>
<p>NFTs experienced a nice uptick in volume this past month, with total trading across all chains growing 25% compared to November. <strong>Polygon</strong> stood out among the major blockchains last month as the Trump Digital Trading Card collection sold all 45k NFTs in less than a day and accounted for over 60% of the NFT volume on Polygon in December. Additionally, one of the most prominent NFT communities on Solana, <em>y00ts, </em>announced they would be bridging the project over to Polygon. A project of this scale has never bridged chains before and, if done successfully, could spur other NFT projects to contemplate switching blockchains if they think it is in the community's best interest. December also welcomed NFT traders with a new aggregator from <strong>Uniswap</strong> that facilitated about $3.7 million in volume in its first month. Uniswap&rsquo;s aggregator utilizes NFT prices from all of the top NFT marketplaces to provide traders with the best prices on nonfungible digital assets. Despite dominating ERC-20 decentralized exchange volume, Uniswap&rsquo;s NFT aggregator only routed less than 1% of total NFT volume in December.</p>
<p>Metaverse tokens performed significantly worse than their land counterparts in December. <strong>MANA</strong> and <strong>SAND</strong> prices dropped by 24% and 31%, respectively, while the average land sale price for these projects increased 3% and fell by 7%. Meanwhile, <strong>APE</strong> only fell 2% throughout the last month and the average <em>Otherdeed </em>sold for 22% more than in November. Despite the launch of APE staking, the token price has performed surprisingly well as investors appear to be holding their APE in anticipation of the next <em>Otherside </em>metaverse trip announced on the 22nd. In the lead-up to the last <em>Otherside </em>interactive experience, APE price rallied impressively, suggesting savvy APE stakers may be waiting for a similar pump before they sell staking rewards.</p>
<p>Web3 gaming activity also declined in December, as the games we track saw a reduction in monthly users by about 10% compared to November. On the hardware side of the metaverse, <em>CCS Insights</em> reported that worldwide shipments of VR and AR headsets decreased 12% year over year to 9.6 million. While this isn&rsquo;t a positive statistic for metaverse or gaming growth, the decline can partially be attributed to inflation-driven price increases and a lack of product offerings. In 2023, multiple new headsets will come to market from players such as Sony and Apple that will potentially reinvigorate consumer interest in VR and AR devices.</p>
<div class="wrapped-div">
<table style="width: 750px;">
<tbody>
<tr class="tbl-data">
<td class="tbl-header last" style="text-align: center;">&nbsp;</td>
<td class="tbl-header last" style="text-align: center;">Marketcap</td>
<td class="tbl-header last" style="text-align: center;">30 days</td>
<td class="tbl-header last" style="text-align: center;">365 days</td>
</tr>
<tr class="tbl-data">
<td class="data-td last">ApeCoin</td>
<td class="data-td data last">$1.43B</td>
<td class="data-td data last">-2.02%</td>
<td class="data-td data last">NA</td>
</tr>
<tr class="tbl-data">
<td class="data-td last">Axie Infinity</td>
<td class="data-td data last">$0.73B</td>
<td class="data-td data last">-7.16%</td>
<td class="data-td data last">-93.23%</td>
</tr>
<tr class="tbl-data">
<td class="data-td last">Theta Network</td>
<td class="data-td data last">$0.74B</td>
<td class="data-td data last">-16.42%</td>
<td class="data-td data last">-84.16%</td>
</tr>
<tr class="tbl-data">
<td class="data-td last">Decentraland</td>
<td class="data-td data last">$0.58B</td>
<td class="data-td data last">-24.10%</td>
<td class="data-td data last">-90.44%</td>
</tr>
<tr class="tbl-data">
<td class="data-td last">The Sandbox</td>
<td class="data-td data last">$0.64B</td>
<td class="data-td data last">-31.03%</td>
<td class="data-td data last">-92.85%</td>
</tr>
</tbody>
</table>
</div>
<br />
<p class="chart-disclosure">Sources: Bloomberg, Messari, CryptoCompare, MVIS, VanEck research as of 12/31/2022.</p>
<p class="chart-disclosure">Past performance is not indicative of future results. Not a recommendation to buy or sell any of the names mentioned herein.</p>
<h2>Centralized Exchanges:</h2>
<p>Centralized exchanges had a rough year, to say the least. The sector is down 16% month over month, but OKB managed to rise by 35% over the same period. OKC, the EVM and IBC-compatible chain backed by OKX announced the launch of their Liquid Staking protocol, with staking rewards of up to 40% APR. stOKT, the token representing staked OKT, had a market cap of $25.6 million as of writing.</p>
<div class="wrapped-div">
<table style="width: 750px;">
<tbody>
<tr class="tbl-data">
<td class="tbl-header last" style="text-align: center;">&nbsp;</td>
<td class="tbl-header last" style="text-align: center;">Marketcap</td>
<td class="tbl-header last" style="text-align: center;">30 days</td>
<td class="tbl-header last" style="text-align: center;">365 days</td>
</tr>
<tr class="tbl-data">
<td class="data-td last">OKB</td>
<td class="data-td data last">$1.76B</td>
<td class="data-td data last">34.96%</td>
<td class="data-td data last">2.03%</td>
</tr>
<tr class="tbl-data">
<td class="data-td last">Celsius Network</td>
<td class="data-td data last">$0.12B</td>
<td class="data-td data last">-4.92%</td>
<td class="data-td data last">-87.96%</td>
</tr>
<tr class="tbl-data">
<td class="data-td last">Cronos</td>
<td class="data-td data last">$1.46B</td>
<td class="data-td data last">-11.19%</td>
<td class="data-td data last">-89.84%</td>
</tr>
<tr class="tbl-data">
<td class="data-td last">BNB</td>
<td class="data-td data last">$39.29B</td>
<td class="data-td data last">-15.97%</td>
<td class="data-td data last">-52.09%</td>
</tr>
<tr class="tbl-data">
<td class="data-td last">Huobi Token</td>
<td class="data-td data last">$0.79B</td>
<td class="data-td data last">-23.24%</td>
<td class="data-td data last">-45.19%</td>
</tr>
</tbody>
</table>
</div>
<br />
<p class="chart-disclosure">Sources: Bloomberg, Messari, CryptoCompare, MVIS, VanEck research as of 12/31/2022.</p>
<p class="chart-disclosure">Past performance is not indicative of future results. Not a recommendation to buy or sell any of the names mentioned herein.</p>
<p>To receive more <strong><a href="https://www.vaneck.com/us/en/insights/digital-assets/" title="Digital Assets Insights">Digital Assets</a></strong> insights, <strong><a href="https://www.vaneck.com/us/en/subscribe/" title="Subscription Center">sign up in our subscription center</a></strong>.</p>
<style type="text/css">
    .wrapped-div {
        max-width: 100%;
    }

    @media (max-width: 1240px) {
        .wrapped-div {
            overflow-x: scroll;
        }


    }
</style>
]]></content:encoded>
</item><item rdf:about="https://www.vaneck.com/us/en/blogs/emerging-markets-bonds/3-reasons-to-allocate-to-em-bonds-in-2023/">
  <title>3 Reasons to Allocate to EM Bonds in 2023></title>
  <link>https://www.vaneck.com/us/en/blogs/emerging-markets-bonds/3-reasons-to-allocate-to-em-bonds-in-2023/</link>
  <description><![CDATA[Relative to developed markets, emerging markets responded quicker to inflation, remain in better shape financially, and benefit from higher commodity prices.]]></description>
  <dc:creator>Eric Fine</dc:creator>
  <dc:date>01/06/2023 06:30:00</dc:date>
<content:encoded><![CDATA[


<script>
    //Temporary script
    $(function () {
        $(".popup-youtube, .popup-vimeo, .popup-gmaps").on("click", function (e) {
            e.preventDefault();
            var width = $(window).width();
            if (width > 768) {
                openSimpleIframeModalDialog($(this).attr('href'), "video-modal");
            } else if ($(this).is('.popup-youtube')) {
                var target = $(this).attr('data-video');
                self.location = target;
            }
        });
    });
</script>
<style>
    .modal.fade.video-modal div.modal-dialog {
        margin: 7% auto !important;
    }

    .modal-simple-iframe .close span {
        font-size: 35px;
        line-height: 1;
    }
</style>
<p>In our <a href="https://www.vaneck.com/us/en/blogs/investment-outlook/jan-van-eck-expect-sideways-in-2023-and-another-untouchable-investment/" title="Expect Sideways in 2023 and Another 'Untouchable' Investment"><strong>2023 outlook</strong></a>, we highlighted emerging markets bonds as a compelling opportunity. Below we explore three reasons investors should consider allocating to emerging market (EM) bonds in the current market environment. <a href="https://www.vaneck.com/us/en/blogs/emerging-markets-bonds/3-reasons-to-allocate-to-em-bonds-in-2023.pdf" target="_blank" title="3 Reasons to Allocate to EM Bonds in 2023" rel="noopener"><strong>View here</strong></a> for a PDF version of this blog.</p>
<h2>1. Emerging Markets Have Lower Debt</h2>
<p>Notwithstanding China&rsquo;s more recent policy direction, <strong><a href="https://www.vaneck.com/us/en/blogs/emerging-markets-bonds/meeting-demand-for-income-in-a-year-of-rising-rates/" title="Meeting Demand for Income in a Year of Rising Rates">emerging markets, in general, have moved much more quickly to increase interest rates compared to the U.S.</a></strong> and other developed market (DM) rates in order to stay ahead of inflation. For investors, this fundamental backdrop means less issuance and rolling over of debt, a favorable supply/demand dynamic that should help support EM bonds. In addition, if needed, EM central banks can hike interest rates without bankrupting the government (like we saw in the United Kingdom).</p>
<h3>Debt Levels of EM Countries Are Relatively Attractive</h3>
<p><strong>General Government Gross Debt (% GDP)</strong></p>
<p><img class="img-responsive w-100" src="https://www.vaneck.com/contentassets/fa4c9b660ebb431cbd943329ac81368a/emb_chart-01_v1_2023.01_blog.svg" alt="Debt Levels of EM Countries Are Relatively Attractive" /></p>
<p class="chart-disclosure"><strong>Source:</strong> VanEck Research; Bloomberg LP. Data as of December 2022.<br />Past performance is not indicative of future results. Please see important disclosures and definitions at the end of the blog.</p>
<h2>2. EM Has Independent Central Banks</h2>
<p>The primary focus of EM central banks is to focus on controlling inflation, and they do this by maintaining high real interest rates. For investors, the result has been not only higher nominal yields but higher real yields. The benefits to EM local currency investors are a more substantial level of income that is not eroded by the loss of purchasing power (through a potentially weaker currency). Additionally, if the central bank's actions are successful in controlling inflation, it can lead to a stronger and more stable economy.</p>
<h3>EM Central Banks&rsquo; Focus on Inflation Means Higher Income for Investors</h3>
<p><strong>Real Policy Rates in EM and DM (%)</strong><br />12m from now if current expectations for rates and inflation materialize</p>
<p><img class="img-responsive w-100" src="https://www.vaneck.com/contentassets/fa4c9b660ebb431cbd943329ac81368a/emb_chart-02_v1_2023.01_blog.svg" alt="Real Policy Rates in EM and DM (%) 12m from now if current expectations for rates and inflation materialize" /></p>
<p><strong>Real Policy Rates (Trailing) in EM and DM (%)</strong></p>
<p><img class="img-responsive w-100" src="https://www.vaneck.com/contentassets/fa4c9b660ebb431cbd943329ac81368a/emb_chart-03_v1_2023.01_blog.svg" alt="Real Policy Rates (Trailing) in EM and DM, %" /></p>
<p class="chart-disclosure"><strong>Source:</strong> VanEck Research; Bloomberg LP. Data as of November 2022.<br />Past performance is not indicative of future results. Please see important disclosures and definitions at the end of the blog.</p>
<h2>3. EM Benefits from Higher Commodity Prices (with a Boost from China&rsquo;s Reopening)</h2>
<p>Unlike developed markets, which experience higher commodity prices as a price shock, emerging markets export more commodities than they import, which means they benefit from higher prices. This dynamic means emerging markets are good creditors in dollar terms and have dollars on hand to stabilize their local currency if needed.</p>
<p>And for investors choosing between equity and debt exposure in emerging markets, keep in mind that net commodity exporters make up a much more significant portion of most EM local debt indexes than they do of EM equity indexes, which tend to be much more concentrated in the Asian export-led economies.</p>
<p>As it relates to China, global markets spent 2022 digesting the property sector collapse and strategic divorce with the U.S., and are only slowly waking up to China reopening. This is very supportive of commodity prices. After rumors and hints of a change in China&rsquo;s Zero-Covid policy, it now looks like China has significantly loosened controls; this is a clear change in policy. It is also accompanied by an increasingly accommodative macro policy. EM debt stands out as having asset prices that can benefit directly from China reopening with its high-carry bonds that can generate returns in a potentially sideways, choppy or bumpy bond world. Many EMs stand out as beneficiaries of higher commodity prices, not victims of them.</p>
<p>To receive more <a href="/us/en/insights/emerging-markets-bonds/" title="Emerging Markets Bonds Insights"><strong>Emerging Markets Bonds</strong></a> insights, <a href="/us/en/subscribe/" title="Subscription Center"><strong>sign up in our subscription center</strong></a>.</p>
]]></content:encoded>
</item><item rdf:about="https://www.vaneck.com/us/en/blogs/economic-trends/chinas-rebound-who-benefits/">
  <title>China’s Rebound – Who Benefits?></title>
  <link>https://www.vaneck.com/us/en/blogs/economic-trends/chinas-rebound-who-benefits/</link>
  <description><![CDATA[China&rsquo;s rebound and property support are key market drivers &ndash; where does this leave the rest of EM?]]></description>
  <dc:creator>Natalia  Gurushina</dc:creator>
  <dc:date>01/06/2023 06:30:00</dc:date>
<content:encoded><![CDATA[

<h2>China Reopening, Policy Support</h2>
<p>The price action in&nbsp;<strong>China</strong>&nbsp;(see chart below) shows that&nbsp;<strong>the market is still catching up with faster than expected economic re-opening and the concerted effort to support the housing sector</strong>. The latest initiative addresses the so-called &ldquo;Three Red Lines&rdquo; &ndash; property rules that kick-started the real estate meltdown in the first place. Easing restrictions on developers&rsquo; balance sheet leverage and allowing more flexibility in mortgage rates are important pro-growth signals, which should pave the way for 2023 GDP upgrades (from the current 4.8%). The reopening and the more dynamic housing sector should also be reflationary. The renminbi should be expected to benefit from the improving interest rate differential between China and major DMs. If this scenario were to materialize, we should see positive spillovers into regional FX (in part via tourism) and commodity prices.</p>
<h2>LATAM Rate Cuts</h2>
<p><strong>Chile</strong>&nbsp;is a major commodity exporter, and we are happy to report that the country&rsquo;s&nbsp;<strong>political/policy backdrop is getting more supportive&nbsp;</strong>after rejecting the populist constitution draft in the summer. Chile&rsquo;s disinflation is also underway &ndash; today&rsquo;s release showed further moderation in price pressures (headline inflation eased to 12.8% year-on-year), which should allow the central bank to keep the policy rate on hold safely and possibly cut rates in the coming months as growth headwinds are multiplying. The local swap curve prices in around 500bps of cuts in 12 months, which is quite aggressive. But if headline inflation indeed drops to 5.4% by Q4 (Bloomberg consensus), the real policy rate would still be positive.</p>
<h2>South Africa Politics</h2>
<p>We would&nbsp;<strong>normally expect South Africa to be among the major beneficiaries from China&rsquo;s reopening</strong>, but persistent political/policy noise is a complication, while escalating load-shedding by Eskom (national energy company) is clearly growth-negative. Reports that the ruling party (ANC) wants to change the central bank&rsquo;s mandate &ndash; which came after headlines about the central bank&rsquo;s nationalization push &ndash; are not new, but the market does not like to hear about this because the central bank&rsquo;s reputation is stellar and it is one of the most credible institutions globally. So, it is not surprising that the South African rand continued to slide in the morning trade (after dropping by about 160bps against the U.S. Dollar yesterday). Stay tuned!</p>
<h3>Chart at a Glance: China High Yield Bonds &ndash; Going Strong</h3>
<img class="img-responsive w-100" src="https://www.vaneck.com/contentassets/cd726da2c2f442d18cea0ab9d2a2c0b6/us-natalias-take-2023-01-06.png" alt="Chart at a Glance: China High Yield Bonds - Going Strong" />
<p class="chart-disclosure">Source: Bloomberg LP.</p>
]]></content:encoded>
</item><item rdf:about="https://www.vaneck.com/us/en/blogs/economic-trends/rates-what-goes-up-must-go-down/">
  <title>Rates – What Goes Up Must Go Down?></title>
  <link>https://www.vaneck.com/us/en/blogs/economic-trends/rates-what-goes-up-must-go-down/</link>
  <description><![CDATA[Stronger employment indicators in the U.S. challenge the market rate expectations. Upside inflation surprises and policy concerns play a similar role in EM.]]></description>
  <dc:creator>Natalia  Gurushina</dc:creator>
  <dc:date>01/05/2023 06:30:00</dc:date>
<content:encoded><![CDATA[

<h2>Fed Signal To The Market</h2>
<p>Yield curves in key markets bear-flattened (short rates up more than longer ones), following the hawkish U.S. Federal Reserve (Fed) minutes and a huge upside surprise in the ADP employment change (+235K). <strong>The Fed&rsquo;s message to the market is that the rate cuts expectations are too aggressive</strong> (Fed Funds Futures price in 35-40bps of easing in 2023), leading to suggestions that U.S. Dollar might be poised to rally if the market expectations for rates move closer to the Fed projections. We keep an eye on the U.S. labor market report tomorrow, and the December inflation print next week for more color.</p>
<h2>Brazil Policy Agenda</h2>
<p><strong>The policy space debate is very active in emerging markets (EM), especially in countries like Brazil.</strong> Brazil&rsquo;s 10-year bond yield is oscillating around 13%, which means that the real yield adjusted by expected inflation is extremely high. Why the market continues to price in very few rate cuts this year then? The answer lies in the renewed concerns about the policy agenda (reforms rollback, more spending under new administration), which might require either a &ldquo;warning shot&rdquo; rate hike from the central bank or the higher-for-longer policy rate. The new cabinet&rsquo;s inauguration speeches failed to clarify the situation, and even though at some point the market might price in most of the negativity, it does not look like we are there yet.</p>
<h2>EM Disinflation</h2>
<p>An extra policy complication in <strong>EM is that the disinflation process is not just bumpy but that peak inflation is being pushed forward</strong> in several countries. We&rsquo;ve got a serious upside surprise in Colombia this morning, with annual headline inflation rising above 13% and core inflation now approaching 10%. The central bank might need to address this &ldquo;hiccup&rdquo; with another 100bps rate hike. Headline inflation in the Philippines rose less than expected, but it is yet to peak (=more tightening). Some members of Mexico&rsquo;s central bank board suggested that hawkish policy stance should be kept for longer. Even in Thailand &ndash; where the disinflation trend is more established &ndash; headline inflation reaccelerated in December, signaling that it is premature to talk about rate cuts. Unlike EM peers in other regions, however, Thailand might be uniquely positioned to benefit from China&rsquo;s reopening and the resumption of tourism inflows (see chart below), which should strengthen the external balance and allow the central bank to proceed with smaller rate hikes. Stay tuned!</p>
<h3>Chart at a Glance: China Reopening &ndash; A Major Boon for Thailand</h3>
<p><img class="img-responsive w-100" src="https://www.vaneck.com/contentassets/3ecbb36900524f69ad4f743a500765e6/us-emerging-markets-daily-2023-01-05.png" alt="Chart at a Glance: China Reopening - A Major Boon for Thailand" /></p>
<p class="chart-disclosure">Source: Bloomberg LP.</p>
]]></content:encoded>
</item><item rdf:about="https://www.vaneck.com/us/en/blogs/economic-trends/em-bonds-policies-matter/">
  <title>EM Bonds – Policies Matter></title>
  <link>https://www.vaneck.com/us/en/blogs/economic-trends/em-bonds-policies-matter/</link>
  <description><![CDATA[A prospect of more policy support in China is overriding weaker-than-expected activity gauges, while Brazil&rsquo;s solid macro indicators are overlooked due to policy concerns.]]></description>
  <dc:creator>Natalia  Gurushina</dc:creator>
  <dc:date>01/04/2023 06:30:00</dc:date>
<content:encoded><![CDATA[

<h2>China Policy Support</h2>
<p>We had two strong contenders for today&rsquo;s daily chart &ndash; China and Brazil &ndash; <strong>as both countries demonstrate the impact of changing government policies on bond returns.</strong> China&rsquo;s reopening and concerted efforts to support real estate developers after the 20th communist party congress have led to a massive corporate bond rally (High Yield in particular) at the end of 2022. Reports about more support &ndash; especially for systemically important players &ndash; ensured that the rally continued in the early days of 2023, despite surging COVID infections and outright scary domestic activity gauges (such as 41.6 non-manufacturing Purchasing Managers Index).</p>
<h2>Brazil Populism Concerns</h2>
<p><strong>The</strong> <strong>policy U-turn in Brazil, however, is producing the opposite result</strong>. The market initially gave President-elect Luiz In&aacute;cio Lula da Silva the benefit of the doubt, hoping his latest political &ldquo;incarnation&rdquo; would be less populist. But this does not seem to be quite the case &ndash; judging by spending initiatives and inauguration speeches &ndash; which explains the market&rsquo;s concern about reforms rollback and fiscal expansion. These concerns are strong enough to offset the impact of other &ndash; much more positive &ndash; factors, such as Brazil&rsquo;s very high real interest rates, fast disinflation, and solid external accounts (high international reserves, basic balance surplus). Brazil&rsquo;s local bonds underperformed GBI-EM peers by a wide margin so far this year (see chart below), continuing the post-runoff trend. Policy concerns are also a reason why the market prices in only 65bps of rate cuts in Brazil in 2023.</p>
<h2>EM Tightening Exits</h2>
<p><strong>Central Europe&rsquo;s combo of dovish policy shifts (Poland, Czech Republic) and emergency rate hikes (Hungary)</strong> caused heart palpitations on more than one occasion last year. Still, strong institutions and a prospect of cooling inflation helped to reassure the market in Q4.<strong> The region is not yet out of the woods, though.</strong> Hungary&rsquo;s large twin deficit (a sum of fiscal and current account deficits) might require additional bond issuance (including U.S. Dollar denominated bonds) &ndash; especially if there are further delays in the disbursement of the EU funds. Poland&rsquo;s election cycle is expected to widen the budget deficit from estimated 3.9% of GDP in 2022 to 5.4% of GDP this year &ndash; potentially testing the market and the central bank&rsquo;s dovish resolve. Stay tuned!</p>
<h3>Chart at a Glance: Brazil &ndash; At the Bottom of EM Local Debt Pack</h3>
<p><img class="img-responsive w-100" src="https://www.vaneck.com/contentassets/a9cd1809327844d18125f3e917c57b02/us-emerging-markets-daily-2023-01-04.png" alt="Chart at a Glance: Brazil - At the Bottom of EM Local Debt Pack" /></p>
<p class="chart-disclosure">Source: Bloomberg LP.</p>
]]></content:encoded>
</item><item rdf:about="https://www.vaneck.com/us/en/blogs/economic-trends/new-year-old-concerns/">
  <title>New Year, Old Concerns></title>
  <link>https://www.vaneck.com/us/en/blogs/economic-trends/new-year-old-concerns/</link>
  <description><![CDATA[China&rsquo;s rebound might need to wait until Q2-Q3, and the growth outlook in many EMs continues to weaken. Does this imply faster disinflation and more room for policy easing?]]></description>
  <dc:creator>Natalia  Gurushina</dc:creator>
  <dc:date>01/03/2023 06:30:00</dc:date>
<content:encoded><![CDATA[

<h2>China Re-Opening, Growth Rebound</h2>
<p><strong>The market&rsquo;s concerns about the global recession and the pace of disinflation</strong> made a smooth transition from 2022 into the new year. Realization #1 is that China&rsquo;s growth rebound might need to wait until Q2-Q3, as the post-reopening surge in infections weighs on services and consumption. Even though China&rsquo;s Production and Expectations PMI (Purchasing Managers Index) accelerated sharply in December, the non-manufacturing PMI was much weaker than expected and deep in the contraction zone (see chart below). Activity gauges in the rest of the emerging markets (EM) were mixed. There were &ldquo;islands&rdquo; of optimism (Philippines, Mexico, Colombia, and especially India). However, Central European manufacturing PMIs looked very recessionary, and parts of EM Asia (South Korea, Malaysia) showed no signs of improvement from weak levels.</p>
<h2>Brazil Policy Agenda</h2>
<p>Brazil&rsquo;s manufacturing PMI was also depressing &ndash; a mere 44.2 and a significant moderation from 54.0 in May-July. The consensus expects Brazil&rsquo;s real GDP growth to slow from 3% in 2022 to less than 1% this year &ndash; in part due to very high real interest rates. Brazil&rsquo;s new Minister of Finance, Fernando Haddad, described <strong>high real rates as &ldquo;anomalous&rdquo; &ndash; so, how much room does the central bank have for easing?</strong> The pace of disinflation screams &ldquo;a lot,&rdquo; but President Lula&rsquo;s inauguration speech signaled that the market&rsquo;s concerns about the fiscal outlook/policy agenda are fully justified. This is a key reason why the policy rate implied by the local swap curve is expected to remain close to 13% by the end of 2023. This is also a reason why Brazilian equities started the year with a hiccup (down by 342bps year-to-date).</p>
<h2>EM Disinflation</h2>
<p>Brazil continues to lead in the disinflation space, and it is joined by an increasing number of EMs &ndash; often because of a high base effect. Turkey is a great example of the base effect in action &ndash; headline inflation dropped from 84.39% year-on-year in November to 64.27% in December.<strong> Still,</strong> <strong>the disinflation progress is bumpy in many places</strong>. We had a couple of upside surprises (Peru and Indonesia), which should justify additional (small) rate hikes. South Korea&rsquo;s core inflation was also higher than expected, but headline disinflation looks well-established, signaling that the policy rate has most likely peaked. Stay tuned!</p>
<h3>Chart at a Glance: China Rebound &ndash; Patience Please!<sup>*</sup></h3>
<p><img class="img-responsive w-100" src="https://www.vaneck.com/contentassets/ee215311b0e140228b80eae281d7284f/us-emerging-markets-daily-2023-01-03.png" alt="Chart at a Glance: China Rebound - Patience Please!" /></p>
<p class="chart-disclosure">Source: Bloomberg LP.</p>
<p class="chart-disclosure"><sup>*</sup>China Purchasing Managers Index (CPMINDX: Tracks the government-published number that summarizes the results of monthly surveys of enterprise purchasing managers. The PMI tracks and monitors macroeconomic trends, as well as aids in forecasting results. A PMI above 50 would designates an overall expansion of the manufacturing economy, whereas a PMI below 50 signifies a shrinking of the manufacturing economy.</p>
]]></content:encoded>
</item><item rdf:about="https://www.vaneck.com/us/en/blogs/thematic-investing/investing-in-etfs-beginners-guide/">
  <title>Investing in ETFs: Beginner’s Guide></title>
  <link>https://www.vaneck.com/us/en/blogs/thematic-investing/investing-in-etfs-beginners-guide/</link>
  <description><![CDATA[To understand ETFs, it&rsquo;s helpful to get familiar with common investment terms first. This guide is designed to be simple and informative for people who want to get started using ETFs to invest.]]></description>
  <dc:creator>Chelsea  Cines</dc:creator>
  <dc:date>12/28/2022 06:30:00</dc:date>
<content:encoded><![CDATA[

<p>In order to better understand exchange-traded funds (ETFs), it&rsquo;s helpful to first familiarize yourself with some common investment terminology as many of these terms are often used to describe ETFs and their strategies. Getting started with investing can seem intimidating and overwhelming (seemingly by design), which is why this guide aims to be as straightforward and informative as possible. Now, let&rsquo;s get into it!</p>
<ul class="content-list">
<li><strong><a href="#point-one">What is an investment?</a></strong></li>
<li><strong><a href="#point-two">What is an asset class?</a></strong></li>
<li><strong><a href="#point-three">What is an index?</a></strong></li>
<li><strong><a href="#point-four">What is a benchmark?</a></strong></li>
<li><strong><a href="#point-five">What is a sector?</a></strong></li>
<li><strong><a href="#point-six">What is a portfolio?</a></strong></li>
<li><strong><a href="#point-seven">What are exchange-traded funds (ETFs)?</a></strong></li>
<li><strong><a href="#point-eight">What are the benefits of ETFs?</a></strong></li>
<li><strong><a href="#point-nine">What&rsquo;s the difference between passive ETFs and active ETFs?</a></strong></li>
<li><strong><a href="#point-ten">What should I consider when selecting an ETF?</a></strong></li>
<li><strong><a href="#point-eleven">What is an ETF prospectus?</a></strong></li>
<li><strong><a href="#point-twelve">How do I buy an ETF?</a></strong></li>
</ul>
<h2 id="point-one" class="anchored-block">What is an investment?</h2>
<p>An investment is an asset or item that is purchased with the hope that it will appreciate in value or generate income (bring in money on a reoccurring basis). The most common types of investments are stocks, bonds, ETFs, mutual funds, real estate, commodities, cryptocurrencies, and art. Investing involves taking on risks in the hopes of generating a profit in the future.</p>
<h2 id="point-two" class="anchored-block">What is an asset class?</h2>
<p>An asset class is a group of similar types of investments that have similar characteristics and behave similarly in the marketplace. Common asset classes include:</p>
<ol class="content-list">
<li>Equities (stocks)</li>
<li>Fixed income (bonds)</li>
<li>Cash and cash equivalents</li>
<li>Real estate</li>
<li>Commodities (oil, copper, etc.)</li>
<li>Alternative investments (hedge funds, private equity, venture capital, etc.)</li>
<li>Cryptocurrency</li>
</ol>
<h2 id="point-three" class="anchored-block">What is an index?</h2>
<p>An index is a tool that tracks the performance of a group of assets. For example, an index that tracks a basket of stocks will move up or down depending on how those companies perform in the stock market. These indexes help us learn more about the economy and can inform investment decisions. Indexes are often used to track the performance of a group of assets in a standardized way and measure the overall performance of the market or a particular segment. Standard &amp; Poor's 500 Index and Dow Jones Industrial Average are examples of broad-based stock indexes that track the overall market by including the largest stocks. There are also specialized indexes that track specific market segments, such as the Russell 2000 Index, which tracks only small-cap companies. Commonly followed U.S. stock market indexes include:</p>
<ol class="content-list">
<li>Standard &amp; Poor's 500 Index (S&amp;P 500) &ndash; Contains the 500 largest listed companies on U.S. stock exchanges. Most investors look to the index to assess how the overall U.S. stock market is doing.</li>
<li>Nasdaq Composite Index &ndash; Contains over 3,000 U.S. listed companies on Nasdaq&rsquo;s stock market. Commonly referred to as &lsquo;The Nasdaq&rsquo; by the media. Roughly half of the index consists of a technology-related companies.</li>
<li>Dow Jones Industrial Average (DIJA) &ndash; Contains 30 large blue-chip U.S publicly listed companies that are selected by a committee. The DJIA is one of the oldest and most commonly followed equity indexes.</li>
<li>Russell 2000 &ndash; Contains 2,000 of the smaller publicly listed companies (less than $2B in market value) on U.S. stock exchanges. Some investors look to the index to assess how smaller companies' stocks are doing overall.</li>
</ol>
<h2 id="point-four" class="anchored-block">What is a benchmark?</h2>
<p>A benchmark is something that we use to compare other things to. For example, if you want to know if you are taller than your friend, you might use measuring tape to compare both of your heights. In the same way, people use benchmarks to compare how their investments are doing. Even though almost all benchmarks are indexes, not all indexes are used as benchmarks. This is because indexes are created for different reasons by different organizations, while some benchmarks are chosen by people who want to compare their fund&rsquo;s performance to something (like portfolio managers) or by people who do the comparing (like pension plans or consultants). This means that not all indexes are suitable for use as benchmarks. Every ETF has a benchmark index against which its performance is compared over different time periods (one, five, ten years).</p>
<h2 id="point-five" class="anchored-block">What is a sector?</h2>
<p>Sectors are broad segments of an economy, such as technology, energy, or healthcare. These sectors can be divided into sub-sectors or industries, like cloud computing, semiconductors, or biotechnology. Sector-specific indexes follow a representative group of companies in the sector or sub-sector; therefore, they can be used to compare a single stock&rsquo;s performance to the overall index within the single stock&rsquo;s industry. These indexes can be a useful tool for benchmarking data, analyzing economic trends, and informing investment decisions.</p>
<h2 id="point-six" class="anchored-block">What is a portfolio?</h2>
<p>A portfolio is a collection of different investments. It can include investments like individual stocks, ETFs, cryptocurrencies, and cash. It's up to you (and a financial advisor, if you have one!) to determine how to design your portfolio based on your investment goals, risk tolerance and retirement plans.</p>
<h2 id="point-seven" class="anchored-block">What are exchange-traded funds (ETFs)?</h2>
<p><strong><a href="https://www.vaneck.com/us/en/blogs/thematic-investing/etf-101-understanding-the-basics/" title="ETF 101: Understanding the Basics">ETFs are a type of investment fund</a></strong> that holds a collection of assets and can be bought and sold on exchanges like stocks. While many ETFs track an index passively, such as the S&amp;P 500 or the NASDAQ Composite, there are also active ETFs available with holdings selected by a portfolio manager (more on this later). The value of ETFs fluctuates in real-time during normal trading hours, just like stocks. Also, like stocks, each ETF has a unique ticker used to identify it.</p>
<h2 id="point-eight" class="anchored-block">What are the benefits of ETFs?</h2>
<ol class="content-list">
<li>Convenience: ETFs can offer easier accessibility to various asset classes and investment strategies as they are listed on exchanges and can be bought and sold throughout the trading day, just like individual stocks.</li>
<li>Low fees: ETFs typically have much lower <a href="#definition-one"><strong>expense ratios (aka annual fees)</strong></a> than traditional mutual funds.</li>
<li>Transparency: ETFs are required to report holdings daily, providing investors with greater transparency and insight into daily fund investment changes.</li>
<li>Diversification: ETFs often hold a basket of stocks; therefore, investors can gain exposure to a certain market or sector without taking on the same potential level of risk and volatility of holding a single stock.</li>
<li>Tax efficiency: ETFs are generally more tax efficient than mutual funds because they generate fewer capital gains (which means you can keep more of the potential investment profits).</li>
<li>Liquidity: ETFs are typically highly liquid, meaning investors can easily enter and exit their positions (buy or sell the ETF) in response to market conditions or investment objectives.</li>
</ol>
<h2 id="point-nine" class="anchored-block">What&rsquo;s the difference between passive ETFs and active ETFs?</h2>
<p><strong>Passive ETFs (aka index ETFs)</strong></p>
<p>Passive ETFs, also called index ETFs, seek to replicate the performance of certain indexes. A passive ETF tracks the performance of an index and generally only makes changes to the fund whenever the index changes. The most well-known index ETF is the SPDR S&amp;P 500 ETF Trust (Ticker: SPY), which tracks the S&amp;P 500 and therefore the performance of the 500 largest U.S. companies. ETFs that track the S&amp;P 500 give investors a way to gain exposure to the broad U.S. equity market through one product. Investors are also able to get exposure to specific sectors, countries, and themes through specialized index ETFs, including some that offer niche exposure.</p>
<p><strong>Active ETFs</strong></p>
<p>Active ETFs allow investors to buy into a selection of securities chosen by a professional fund manager or a team of managers who seek to outperform their benchmark index. Active ETFs typically have higher <a href="#definition-one"><strong>expense ratios (annual fees).</strong></a></p>
<h2 id="point-ten" class="anchored-block">What should I consider when selecting an ETF?</h2>
<p>When choosing an ETF, there are several things to look at. These include the ETF's investment objective, fees and expenses, performance history, and alignment with your own investment goals. Ultimately, the right ETF for you will depend mostly on your individual investment needs and objectives, as well as your age, income, and retirement plans. Investors might consider the following items, which are found in the <a href="#point-eleven"><strong>ETF's prospectus:</strong></a></p>
<ol class="content-list">
<li>Asset class: ETFs invest in various asset classes, from stocks and bonds to commodities and currencies. Investors should determine which asset class works best with their investment goals and select ETFs concentrated in that asset class. For example, if you seek capital growth or appreciation, you are most likely to consider an equity-based ETF. If you seek income generation (generating money on a reoccurring basis) or capital preservation (avoiding money loss), you are most likely to consider a fixed-income ETF.</li>
<li>Benchmark: Investors should select ETFs that track benchmarks appropriate for their investment goals. For passive ETFs, its benchmark is the index and underlying assets the fund is designed to track. Active ETFs are required to disclose the indexes they select to benchmark their performance to, as Active ETFs seek to outperform their benchmark (aka drive a higher investment return).</li>
<li id="definition-one" class="anchored-block">Expense ratio: The yearly cost that investors pay for the management and operation of a fund. This fee is deducted from the fund&rsquo;s assets, reducing the potential return on the ETF investment. The expense ratio includes various expenses, such as the management fee paid to the investment advisor, the cost of buying and selling securities in the fund, and other administrative expenses. Some ETFs have higher expense ratios than others based on the complexity of the investments in the fund and the level of services provided to investors. <strong>It&rsquo;s important for investors to consider the expense ratio when choosing an ETF because it can have a significant impact on the overall returns of the fund. For example, a fund with a high expense ratio may underperform a similar fund with a lower expense ratio, even if the underlying investments are similar. Therefore, investors should compare the expense ratios of different peer group ETFs before deciding which one to select. </strong></li>
</ol>
<h2 id="point-eleven" class="anchored-block">What is an ETF prospectus?</h2>
<p>A prospectus is a legally required document that provides comprehensive information about the ETF. It gives you information about what the ETF is for, what kinds of risks it has, and how much it costs to be a part of it. The prospectus also tells you what kinds of things the ETF has invested in, like stocks and bonds, and the countries and industries in which it may be invested. The prospectus also includes information about the ETF's management team and the investment advisor responsible for managing the fund. Lastly, the prospectus tells you about the rules that the ETF has to follow and what rights you have as a person who owns part of the ETF.<strong> Before investing in an ETF, you'll want to invest the time in reading and understanding the prospectus. Even though it is typically a lengthy document, you'll thank yourself later!</strong></p>
<h2 id="point-twelve" class="anchored-block">How do I buy an ETF?</h2>
<ol class="content-list">
<li>Choose an ETF: First, decide which ETF you want to buy. Research the ETF and consider the fees and risks associated with the investment by reading the prospectus (just another friendly reminder).</li>
<li>Open a brokerage account: Choose a trading account (Robinhood, Fidelity, E*TRADE, etc.). You&rsquo;ll need to provide personal information and deposit money into your account.</li>
<li>Place the order: Once your account is set up, search for the ETF ticker to place an order and select to buy. This can be done online or through the trading app. Most brokerages do not charge additional fees or commissions for stock or ETF trades anymore. Check with your broker on how to place orders.</li>
<li>Monitor performance: Finally, monitor the performance of your ETFs over time to make sure it&rsquo;s meeting your investment goals.</li>
</ol>
<h2>Explore our ETFs</h2>
<p><strong><a href="/link/d835663826f44348843c6b6c539e877c.aspx?InvType=etf&amp;AssetClass=c,nr,se,t&amp;Funds=emf,esf,grf,iigf,mwmf,emlf,embf,ccif&amp;ShareClass=a,c,i,y,z&amp;tab=ov&amp;Sort=name&amp;SortDesc=true" title="ETF and Mutual Fund Finder">Equity ETFs</a></strong></p>
<p><a href="/link/e1f766c9dc9e4c0a9a629b2e75ebc115.aspx?InvType=etf&amp;AssetClass=cb,ei,ib,mb,fr,ma&amp;Funds=emf,esf,grf,iigf,mwmf,emlf,embf,ccif&amp;ShareClass=a,c,i,y,z&amp;tab=ov&amp;Sort=name&amp;SortDesc=true" title="ETF and Mutual Fund Finder"><strong>Income ETFs</strong></a></p>
<p><a href="/link/e1f766c9dc9e4c0a9a629b2e75ebc115.aspx?InvType=etf&amp;AssetClass=c,nr,se,t,cb,ei,ib,mb,c-da,c-g,c-ra&amp;Funds=emf,esf,grf,iigf,mwmf,emlf,embf,ccif&amp;ShareClass=a,c,i,y,z&amp;tab=ov&amp;sg=c-c&amp;uty=false&amp;min=0&amp;max=10.02&amp;sort=assetClass&amp;asc=true" title="ETF and Mutual Fund Finder"><strong>Commodity ETFs</strong></a></p>
<p>To receive more <strong><a href="https://www.vaneck.com/us/en/insights/thematic-investing/" title="Thematic Investing Insights">Thematic Investing</a></strong> insights, <strong><a href="https://www.vaneck.com/us/en/subscribe/" title="Subscription Center">sign up in our subscription center</a></strong>.</p>
]]></content:encoded>
</item><item rdf:about="https://www.vaneck.com/us/en/blogs/economic-trends/disinflation-bumps-twists-and-turns/">
  <title>Disinflation – Bumps, Twists, and Turns></title>
  <link>https://www.vaneck.com/us/en/blogs/economic-trends/disinflation-bumps-twists-and-turns/</link>
  <description><![CDATA[The global disinflation narrative is firmly in the &ldquo;how fast&rdquo; stage, but the progress is uneven, and some EMs might need to err on the cautious side and hike a bit more.]]></description>
  <dc:creator>Natalia  Gurushina</dc:creator>
  <dc:date>12/23/2022 16:00:00</dc:date>
<content:encoded><![CDATA[

<h2>DM Policy Tightening</h2>
<p>The&nbsp;<strong>global disinflation narrative has shifted from &ldquo;whether/when&rdquo; to &ldquo;how fast,&rdquo;</strong>&nbsp;&ndash; but the slowing trend does not mean &ldquo;smooth sailing.&rdquo; We get an occasional upside surprise &ndash; including the Eurozone&rsquo;s November revision or today&rsquo;s U.S. Personal Consumption Expenditure Core Price Index (core PCE). And sometimes inflation peaks remain elusive, downside surprises notwithstanding &ndash; like in Japan, where November&rsquo;s inflation drew extra attention this morning after the central bank&rsquo;s hawkish yield curve control adjustment a few days ago. These developments explain why the market now expects 44bps of rate hikes in Japan in 2023.</p>
<h2>EM Asia Rate Hikes</h2>
<p><strong>Emerging Markets (EM) disinflation is on firmer ground</strong>&nbsp;&ndash; and with lower (tentative) peaks in the case of EM Asia. However, today&rsquo;s inflation releases in Malaysia and Singapore showed no further progress (in year-on-year terms) in November (contrary to expectations). Further, Malaysia&rsquo;s core inflation continued to grind higher, challenging the market expectation of the peak policy rate and an extended policy rate pause in 2023. Some sell-side commentators suggested that the central bank might err on the side of caution in January and raise the policy rate one more time &ndash; which would be a prudent move, given that the policy rate differential between EM Asia and the U.S. Federal Reserve is very slim now.</p>
<h2>LATAM Disinflation</h2>
<p>Yesterday, Mexico&rsquo;s bi-weekly inflation print was another illustration of the &ldquo;bumpy road&rdquo; price trajectory in EM. However,&nbsp;<strong>Brazil reaffirmed its &ldquo;disinflation poster kid&rdquo; status</strong>&nbsp;this morning, with a nice downside surprise and further moderation in mid-month inflation, which is now below 6% year-on-year (vs 12.2% back in May, see chart below). Easing price pressures mean that Brazil&rsquo;s real policy rate is among the highest in the world &ndash; and this leaves ample room for rate cuts in 2023. Whether or not the central bank would be able to use this policy space is a different question though &ndash; due to fiscal concerns. The fact that the incoming administration&rsquo;s spending waver was approved only for one year is a big plus, but the new cabinet&rsquo;s lineup signals that we might see more populist policy surprises in the coming months. Stay tuned!</p>
<h3>Chart at a Glance: Brazil Disinflation &ndash; Nice and Steady</h3>
<p><img class="img-responsive w-100" src="https://www.vaneck.com/contentassets/b0536b67d5f64931a52d36dceae327d0/us-emerging-markets-daily-2022-12-23.png" alt="Chart at a Glance: Brazil Disinflation &ndash; Nice and Steady" /></p>
<p class="chart-disclosure">Source: Bloomberg LP.</p>
]]></content:encoded>
</item><item rdf:about="https://www.vaneck.com/us/en/blogs/gold-investing/is-it-finally-time-for-gold-to-shine/">
  <title>Is It Finally Time for Gold to Shine?></title>
  <link>https://www.vaneck.com/us/en/blogs/gold-investing/is-it-finally-time-for-gold-to-shine/</link>
  <description><![CDATA[VanEck&rsquo;s Ima Casanova joins Bloomberg to discuss the outlook for gold and the reasons why the asset class may be poised for a rebound in 2023.]]></description>
  <dc:creator>Imaru Casanova</dc:creator>
  <dc:date>12/23/2022 06:30:00</dc:date>
<content:encoded><![CDATA[

<h2>Inflation Has Soared but Gold Hasn&rsquo;t Delivered&hellip;Why?</h2>
<p>Gold is considered a store of value and a safe haven asset, and when investors are worried about the purchasing power of their money, they often turn to gold as a way to protect their wealth. However, in 2022, gold&rsquo;s traditionally positive performance in an inflationary and rising rate environment has been hindered by the strength of the U.S. dollar, which reached 20-year highs during the year. In addition, gold was caught up in a broader commodities selloff as China&rsquo;s worsening COVID outbreak threatened to weaken demand for basic materials (2:50).</p>
<h2>Is Gold Poised for a Rebound in 2023?</h2>
<p>There are a number of catalysts that may enable gold to break out of its narrow trend. As we look ahead to 2023, the Fed has the challenging task of trying to combat inflation without causing a hard economic landing. As the odds of a recession increase, gold will likely benefit as investors flock to safe-haven assets. In addition, geopolitical risk is elevated across the globe, setting the stage for unexpected volatility that may also drive a flight to quality (1:13).</p>
<h2>What Companies are Best Positioned for 2023 and Beyond?</h2>
<p>If a gold catalyst emerges in 2023, gold stocks stand to gain from oversold levels. One simple way of looking at gold stock valuations is to divide the equities by the gold price. From this perspective, junior gold miners' gold price ratios are now at the same levels as the pandemic crash (6:13).</p>
<p>In the current environment, many junior gold miners have attractive projects that are being advanced towards production. However, for these companies to be successful, they must raise their profile and a sure way to do that, in our view, is through consolidation.</p>
<p>We know of junior companies in the same district that would achieve synergies and scale by combining to form larger multi-million ounce resources. Companies across a region could merge multiple properties that create a path to an emerging mid-tier producer. Such opportunities can be found in the Great Basin (Nevada/Idaho/Utah), British Columbia, Quebec, Guyana, Brazil and Western Australia. The potential advantages of scale includes:</p>
<ul class="content-list">
<li>Broader investor base</li>
<li>Increased trading liquidity</li>
<li>Inclusion in exchange-traded funds</li>
<li>Diversified asset base</li>
<li>Increased news flow</li>
<li>Easier/cheaper access to capital</li>
<li>Cost reductions by eliminating corporate redundancies</li>
<li>Ability to attract talent and skills needed to design, develop, and operate mines</li>
</ul>
<p>Watch the full video here: <a href="https://www.vaneck.com/us/en/offsite-disclaimer/?id=197235&amp;button=no&amp;url=https://www.bnnbloomberg.ca/video/gold-stocks-are-trading-at-historically-low-valuations-vaneck-s-ima-casanova~2579240" title="Gold stocks are trading at historically low valuations: VanEck's Ima Casanova" target="_blank" rel="noopener"><strong>Bloomberg &ndash; Gold Stocks Are Trading at Historically Low Valuations</strong></a>.</p>
<p>To receive more insights to <strong><a href="https://www.vaneck.com/us/en/insights/gold-investing/" title="Gold Investing Insights">Gold Investing</a></strong> insights, <strong><a href="https://www.vaneck.com/us/en/subscribe/" title="Subscription Center">sign up in our subscription center</a></strong>.</p>
]]></content:encoded>
</item><item rdf:about="https://www.vaneck.com/us/en/blogs/emerging-markets-bonds/what-a-difference-one-month-makes-in-em/">
  <title>What a Difference One Month Makes in EM></title>
  <link>https://www.vaneck.com/us/en/blogs/emerging-markets-bonds/what-a-difference-one-month-makes-in-em/</link>
  <description><![CDATA[Our decision to retain our China country holdings in October proved astute, as China began reopening and the Fund soared in November.]]></description>
  <dc:creator>Eric Fine</dc:creator>
  <dc:date>12/23/2022 06:30:00</dc:date>
<content:encoded><![CDATA[

<p>Unpriced market drivers, particularly China reopening and <strong><a href="https://www.vaneck.com/us/en/blogs/emerging-markets-bonds/market-tensions-in-em/" title="Market Tensions in EM">Eurasia&rsquo;s potential de-coupling from developed markets</a></strong> (DM) may prove bullish for commodities, Asian growth, and to the extent that supply chains truly revert, disinflation. However, it will not be bullish for U.S. and DM inflation, nor U.S. and DM growth, because U.S., Europe and Japan are excluded from the Eurasian century. As a result, DM may get inflation risk without growth opportunities and face a very real possibility that stagflation could increasingly define DM.</p>
<p>The Emerging Markets Bond Fund (the &ldquo;Fund&rdquo;) was up 10.05% in November; YTD Fund outperformance, as compared to its benchmark, is at 5.52%. Fund outperformance in November was due primarily to our decision to hold onto our China property names (see <strong><a href="https://www.vaneck.com/us/en/blogs/emerging-markets-bonds/market-tensions-in-em/" title="Market Tensions in EM">October Commentary</a></strong>), which proved prescient, as China&rsquo;s reopening and policy support for the sector resulted in large gains for the Fund. For detailed Fund performance and EM debt outlook, <strong><a href="/us/en/blogs/emerging-markets-bonds/closer-to-a-risk-supportive-fed/emb-manager-commentary-11-2022.pdf" title="VanEck Emerging Markets Bond Fund Monthly Manager Commentary - November 2022" target="_blank" rel="noopener">download the commentary</a></strong>.</p>
<p>To receive more <a href="/us/en/insights/emerging-markets-bonds/" title="Emerging Markets Bonds Insights"><strong>Emerging Markets Bonds</strong></a> insights, <a href="/us/en/subscribe/" title="Subscription Center"><strong>sign up in our subscription center</strong></a>.</p>
]]></content:encoded>
</item><item rdf:about="https://www.vaneck.com/us/en/blogs/thematic-investing/buzz-investing-volatility-remains-elevated-in-equity-markets/">
  <title>BUZZ Investing: Volatility Remains Elevated in Equity Markets></title>
  <link>https://www.vaneck.com/us/en/blogs/thematic-investing/buzz-investing-volatility-remains-elevated-in-equity-markets/</link>
  <description><![CDATA[Domestic equities struggled as volatility remained high. Rising prices may be causing a decline in personal savings and a turn to retailers like Walmart.]]></description>
  <dc:creator> </dc:creator>
  <dc:date>12/22/2022 06:30:00</dc:date>
<content:encoded><![CDATA[

<p>Volatility remained elevated as Domestic equities struggled to find direction during the recent period between Index selection dates (November 10, 2022, to December 8, 2022, the &ldquo;Period&rdquo;). The U.S. midterm elections were held on November 8, with the Democrats retaining their slim majority in the Senate and Republicans securing only a narrow majority in the House of Representatives. The results proved confounding to some political prognosticators who called for a &ldquo;Red Wave&rdquo; to sweep across the nation, reshaping the country&rsquo;s legislative branches. Domestic equities fell on the election results yet surged the following day as investors cheered reported levels of consumer inflation that were below most economist projections. The November 10 readings marked the lowest annual increase since January 2022 and stirred a significant rally in both bonds and stocks, which surged on the day of their release. Equities posted their biggest single day returns in over two years, while bond yields posted their biggest single-day declines in more than a decade.</p>
<p>Investor optimism waned throughout the course of the Period as unrest in China relating to the country&rsquo;s lockdown and &ldquo;zero-COVID&rdquo; policies renewed concerns relating to supply chain issues and global growth prospects. The BUZZ NextGen AI US Sentiment Leaders Index (the &ldquo;BUZZ Index&rdquo; or &ldquo;Index&rdquo;) fell 3% during the Period while the S&amp;P 500 Index gained 36 basis points.</p>
<p>The BUZZ NextGen AI US Sentiment Leaders Index (the &ldquo;BUZZ Index&rdquo; or &ldquo;Index&rdquo;) returned 2.26% during the month of November compared to a return of 5.59% for the S&amp;P 500 Index during the same period. Year-to-date, the BUZZ Index trails the S&amp;P 500 with returns of -40.11% and -13.10%, respectively, as of the end of November.</p>
<h2>Shares of Netflix Pace Advancing Stocks within the BUZZ Index</h2>
<p>Shares of Netflix Inc. (NASD: NFLX) paced advancing stocks within the BUZZ Index during the recent Period. The popular streaming company continues to recover following reports of declining subscriber growth earlier this year, contributing to an over 70% fall in its share price. While the stock has bounced over 80% from its low point, including 12.8% during the recent Period, it remains nearly 50% lower year-to-date. Speaking at the DealBook Summit conference on November 30, Reed Hastings, co-founder, and co-CEO of Netflix, surmised that investors remain nervous that the company&rsquo;s primary streaming rivals, including Disney (NYSE: DIS), Warner Bros Discovery (NYSE: WBD), and Paramount (NASD: PARA) may continue to gain market share in the streaming wars, yet the company remains resolute in its commitment to show investors that Netflix will come out on top.</p>
<div class="wrapped-div">
<table style="width: 750px;">
<tbody>
<tr class="tbl-data">
<td class="tbl-header last" colspan="4">Top BUZZ Index Contributors: November 10, 2022&ndash; December 8, 2022</td>
</tr>
<tr class="tbl-data">
<td class="data-td  last">Company</td>
<td class="data-head last">Ticker</td>
<td class="data-head last">Average Weight (%)</td>
<td class="data-head last">Return Contribution (%)</td>
</tr>
<tr class="tbl-data">
<td class="data-td last" style="font-weight: normal;">Netflix Inc</td>
<td class="data-td data last">NFLX</td>
<td class="data-td data last">3.21</td>
<td class="data-td data last">0.36</td>
</tr>
<tr class="tbl-data">
<td class="data-td last" style="font-weight: normal;">NVIDIA Corp</td>
<td class="data-td data last">NVDA</td>
<td class="data-td data last">3.28</td>
<td class="data-td data last">0.27</td>
</tr>
<tr class="tbl-data">
<td class="data-td last" style="font-weight: normal;">DraftKings Inc</td>
<td class="data-td data last">DKNG</td>
<td class="data-td data last">2.73</td>
<td class="data-td data last">0.14</td>
</tr>
<tr class="tbl-data">
<td class="data-td last" style="font-weight: normal;">Advanced Micro Devices Inc</td>
<td class="data-td data last">AMD</td>
<td class="data-td data last">3.33</td>
<td class="data-td data last">0.11</td>
</tr>
<tr class="tbl-data">
<td class="data-td last" style="font-weight: normal;">Pfizer Inc</td>
<td class="data-td data last">PFE</td>
<td class="data-td data last">1.23</td>
<td class="data-td data last">0.11</td>
</tr>
<tr class="tbl-data">
<td class="data-td last" style="font-weight: normal;">Shopify Inc</td>
<td class="data-td data last">SHOP</td>
<td class="data-td data last">1.96</td>
<td class="data-td data last">0.11</td>
</tr>
<tr class="tbl-data">
<td class="data-td last" style="font-weight: normal;">Agilent Technologies Inc</td>
<td class="data-td data last">A</td>
<td class="data-td data last">1.61</td>
<td class="data-td data last">0.10</td>
</tr>
<tr class="tbl-data">
<td class="data-td last" style="font-weight: normal;">Moderna Inc</td>
<td class="data-td data last">MRNA</td>
<td class="data-td data last">0.98</td>
<td class="data-td data last">0.09</td>
</tr>
<tr class="tbl-data">
<td class="data-td last" style="font-weight: normal;">Meta Platforms Inc</td>
<td class="data-td data last">META</td>
<td class="data-td data last">2.93</td>
<td class="data-td data last">0.09</td>
</tr>
<tr class="tbl-data">
<td class="data-td last" style="font-weight: normal;">NIKE Inc</td>
<td class="data-td data last">NKE</td>
<td class="data-td data last">0.34</td>
<td class="data-td data last">0.08</td>
</tr>
</tbody>
</table>
</div>
<br />
<p class="chart-disclosure">Source: BUZZ Holdings ULC, Bloomberg. Past performance is no guarantee of future results. Index performance is not illustrative of fund performance. Not intended as a recommendation to buy or to sell any of the securities mentioned herein.</p>
<p>The top detractors to performance largely featured a range of stocks from the Consumer Discretionary and Information Technology sectors. Shares of electric vehicle (EV) manufacturer Lucid Group Inc. (NASD: LCID), the upstart luxury EV manufacturer with aspirations to compete with industry leader Tesla Inc (NASD: TSLA) was a notable top detractor to performance, falling over 28% during the Period. While TSLA&rsquo;s 2022 share price decline (and the antics of its enigmatic CEO Elon Musk) has captured most of the headlines across the financial press, shares of LCID have performed even worse, falling 80% year-to-date, closing at a new all-time low at the end of the Period as the company continues to miss projections on both the top and bottom lines of its business.</p>
<div class="wrapped-div">
<table style="width: 750px;">
<tbody>
<tr class="tbl-data">
<td class="tbl-header last" colspan="4">Bottom BUZZ Index Contributors: November 10, 2022&ndash; December 8, 2022</td>
</tr>
<tr class="tbl-data">
<td class="data-td  last">Company</td>
<td class="data-head last">Ticker</td>
<td class="data-head last">Average Weight (%)</td>
<td class="data-head last">Return Contribution (%)</td>
</tr>
<tr class="tbl-data">
<td class="data-td last" style="font-weight: normal;">Lucid Group Inc</td>
<td class="data-td data last">LCID</td>
<td class="data-td data last">2.08</td>
<td class="data-td data last">-0.68</td>
</tr>
<tr class="tbl-data">
<td class="data-td last" style="font-weight: normal;">Snap Inc</td>
<td class="data-td data last">SNAP</td>
<td class="data-td data last">2.38</td>
<td class="data-td data last">-0.41</td>
</tr>
<tr class="tbl-data">
<td class="data-td last" style="font-weight: normal;">Coinbase Global Inc</td>
<td class="data-td data last">COIN</td>
<td class="data-td data last">2.36</td>
<td class="data-td data last">-0.41</td>
</tr>
<tr class="tbl-data">
<td class="data-td last" style="font-weight: normal;">Tesla Inc</td>
<td class="data-td data last">TSLA</td>
<td class="data-td data last">2.77</td>
<td class="data-td data last">-0.25</td>
</tr>
<tr class="tbl-data">
<td class="data-td last" style="font-weight: normal;">Plug Power Inc</td>
<td class="data-td data last">PLUG</td>
<td class="data-td data last">1.14</td>
<td class="data-td data last">-0.23</td>
</tr>
<tr class="tbl-data">
<td class="data-td last" style="font-weight: normal;">PayPal Holdings Inc</td>
<td class="data-td data last">PYPL</td>
<td class="data-td data last">1.63</td>
<td class="data-td data last">-0.23</td>
</tr>
<tr class="tbl-data">
<td class="data-td last" style="font-weight: normal;">Affirm Holdings Inc</td>
<td class="data-td data last">AFRM</td>
<td class="data-td data last">0.75</td>
<td class="data-td data last">-0.19</td>
</tr>
<tr class="tbl-data">
<td class="data-td last" style="font-weight: normal;">Amazon.com Inc</td>
<td class="data-td data last">AMZN</td>
<td class="data-td data last">2.8</td>
<td class="data-td data last">-0.18</td>
</tr>
<tr class="tbl-data">
<td class="data-td last" style="font-weight: normal;">Bank of America Corp</td>
<td class="data-td data last">BAC</td>
<td class="data-td data last">1.22</td>
<td class="data-td data last">-0.18</td>
</tr>
<tr class="tbl-data">
<td class="data-td last" style="font-weight: normal;">Palantir Technologies Inc</td>
<td class="data-td data last">PLTR</td>
<td class="data-td data last">2.41</td>
<td class="data-td data last">-0.17</td>
</tr>
</tbody>
</table>
</div>
<br />
<p class="chart-disclosure">Source: BUZZ Holdings ULC, Bloomberg. Past performance is no guarantee of future results. Index performance is not illustrative of fund performance. Not intended as a recommendation to buy or to sell any of the securities mentioned herein.</p>
<h2>Sentiment Stock Highlight &ndash; The Walt Disney Company</h2>
<p>Disney (NYSE: DIS) shocked the media industry last month when it announced the return of Bob Iger, the man widely credited as the driving force behind the company&rsquo;s strategies over a remarkable 15-year period of growth. During his run as CEO beginning in 2005, Iger led the company&rsquo;s acquisitions of Pixar, Marvel, Lucasfilm, and 21st Century Fox, widely known and successful brands that Disney greatly expanded within its platform. Regarded as one of the best leaders in the media industry, Iger was the face behind the company until his retirement in 2020. Since Iger&rsquo;s retirement, Disney shares have declined 50% as the company struggled to meet its growth objectives under new leadership, disappointing investors. The market downturn and losses from its Disney+ streaming service have sent shares of DIS back to their COVID-19 lows. In a surprise announcement last month, Disney announced that Iger would return to the company, replacing current CEO Bob Chapek for at least a 2-year term. Investor sentiment jumped on the news, pushing DIS into the top 10 holdings within the BUZZ Index with a maximum 3% weight.</p>
<h3>Walt Disney Stock Price | January 2020 &ndash; December 2022</h3>
<p><img class="img-responsive w-100" src="https://www.vaneck.com/contentassets/df37d3d1595b44bb91520282d020bb8f/buzz_chart_01_v1_2022.12_blog.svg" alt="Walt Disney Stock Price | January 2020 - December 2022" /></p>
<p class="chart-disclosure">Source: BUZZ Holdings ULC, Bloomberg. Past performance is no guarantee of future results. Index performance is not illustrative of fund performance. Not intended as a recommendation to buy or to sell any of the securities mentioned herein.</p>
<h2>BUZZ Index December 2022 Rebalance Highlights</h2>
<p><strong>Walmart Inc.</strong></p>
<p>Despite headlines of rampant inflation, rising interest rates, and the potential for a recession, domestic consumers have continued to prove resilient. US employment data remains stronger than expected, and consumer spending remains robust. Readings of personal savings have declined, as rising prices may be forcing consumers to spend most of their income. Within this environment, the performance of retailers has been mixed, with apparel and department stores struggling, while general retailers like Costco (NYSE: COST) and Walmart (NYSE: WMT) have fared better. Notably, Walmart appears to manage its inventory better than some of its competitors, resulting in lower-than-expected declines in its operating margins. Its most recent earnings report surprised some analysts to the upside, as the company reported an increase in same-store sales and foot traffic. Shares of WMT have been resilient amidst the equity market downturn, as the stock continues to trade just below its all-time highs. Sentiment on Walmart climbed following its Q3 earnings release last month, and this month WMT&rsquo;s weight in the BUZZ Index increased from 1.1% to 1.96%.</p>
<p>For more on rebalancing results and a full breakdown of index constituents added and removed for the month, view the <a href="/us/en/investments/social-sentiment-etf-buzz/buzz-reconstitution.pdf" rel="noopener" target="_blank" title="BUZZ VanEck Social Sentiment ETF"><strong>BUZZ Index reconstitution</strong></a> report.</p>
<p>To receive more <strong><a href="https://www.vaneck.com/us/en/insights/thematic-investing/" title="Thematic Investing Insights">Thematic Investing</a></strong> insights, <strong><a href="https://www.vaneck.com/us/en/subscribe/" title="Subscription Center">sign up in our subscription center</a></strong>.</p>
<style type="text/css">
    .wrapped-div {
        max-width: 100%;
    }

    @media (max-width: 1240px) {
        .wrapped-div {
            overflow-x: scroll;
        }
    }

    .wrapped-div-sector {
        max-width: 100%;
        overflow-x: scroll;
    }
</style>
]]></content:encoded>
</item><item rdf:about="https://www.vaneck.com/us/en/blogs/economic-trends/how-much-room-for-divergence/">
  <title>How Much Room for Divergence?></title>
  <link>https://www.vaneck.com/us/en/blogs/economic-trends/how-much-room-for-divergence/</link>
  <description><![CDATA[Can EM central banks cut rates safely, if the U.S. Federal Reserve is not as dovish as expected?]]></description>
  <dc:creator>Natalia  Gurushina</dc:creator>
  <dc:date>12/22/2022 06:30:00</dc:date>
<content:encoded><![CDATA[

<h1>U.S. Growth and Rate Hikes</h1>
<p>The <strong>current tightening cycle in emerging markets (EM) is less synchronized with the U.S. than before</strong>, but sizable macro surprises in DM might still have implications for EM central banks. Take, for example, the third revision of the U.S. Q3 GDP growth - it was upgraded from 2.9% quarter-on-quarter annualized to 3.2%, with a notable upside adjustment in personal consumption. The consensus U.S. GDP growth forecast for 2023 is now only 0.3%, and the probability of a recession 12 months ahead is around 38-40% (New York Federal Reserve&rsquo;s estimate) &ndash; and this explains why the market continues to see room for ~45bps of the U.S. rate cuts in H2-2023. But many observers are asking whether this might be too aggressive, if the actual slowdown turns out milder.&nbsp;</p>
<h2>EM Peak Rates</h2>
<p>Central banks in <strong>EM Asia</strong> might be watching the Fed more closely than peers in other regions, as the <strong>average policy rate differential is really quite slim</strong> (less than 100bps now). Indonesia thought that its disinflation &ldquo;buffer&rdquo; was good enough to slow the pace of hikes to 25bps earlier today. The central bank&rsquo;s governor also noted that larger capital inflows eased pressure on the currency &ndash; an important consideration for quite a few EMs going forward. We will keep an eye on Malaysia&rsquo;s inflation print this evening &ndash; further disinflation will reinforce the market expectations of a policy rate pause in 2023.</p>
<h2>EM Disinflation</h2>
<p><strong>LATAM&rsquo;s</strong> policy rate differential with the Fed is the largest, but regional <strong>price pressures look more persistent than in EM Asia</strong>. Mexico&rsquo;s bi-weekly inflation &ndash; both core and headline &ndash; was a touch higher than expected, confirming the &ldquo;bumpy road&rdquo; disinflation narrative. So, even though Mexico&rsquo;s inflation might have peaked (see chart below), the central bank&rsquo;s policy rate might need to go higher yet (albeit at a slower pace). The Chilean central bank&rsquo;s minutes also sounded cautious, signaling that there will be no rush to cut rates even with the rapidly slowing growth. LATAM&rsquo;s prudent monetary policy stance is one of the factors behind local bonds outperformance this year, which is why investors are watching this space very carefully. Stay tuned!</p>
<h3>Chart at a Glance: Mexico&rsquo;s Disinflation &ndash; Bumpy Road<sup>*</sup></h3>
<p><img class="img-responsive w-100" src="https://www.vaneck.com/contentassets/5c2a5558ed86485fb7d38d502473e8d1/us-emerging-markets-daily-2022-12-22.png" alt="Chart at a Glance: Mexico's Disinflation - Bumpy Road" /></p>
<p class="chart-disclosure">Source: Bloomberg LP.</p>
<p class="chart-disclosure"><strong><sup>*</sup>MXBWYOY: </strong>Mexico Bi-Weekly CPI Year over Year</p>
]]></content:encoded>
</item><item rdf:about="https://www.vaneck.com/us/en/blogs/emerging-markets-equity/indias-economic-ascendance/">
  <title>India’s Economic Ascendance></title>
  <link>https://www.vaneck.com/us/en/blogs/emerging-markets-equity/indias-economic-ascendance/</link>
  <description><![CDATA[India appears to be on the cusp of a growth trajectory similar to China propelled forward by domestic demand and the development of digital and manufacturing infrastructure.]]></description>
  <dc:creator>Sunny  Bokhari</dc:creator>
  <dc:date>12/21/2022 06:30:00</dc:date>
<content:encoded><![CDATA[

<p>India is expected to surpass Japan and Germany to become the world&rsquo;s third-largest economy by 2027 and the third-largest stock market by 2030.<sup>1</sup>&nbsp;India appears to be on the cusp of a growth trajectory similar to China propelled forward by domestic demand along with digital and manufacturing infrastructure development supported by the Indian government. Based on these tailwinds, by 2031, India&rsquo;s GDP could surpass $7.5 trillion and its share of global exports could double.<sup>1</sup></p>
<h2>Manufacturing</h2>
<p>India is one of the countries likely to benefit from the shift of global supply chains with corporations diversifying their manufacturing facilities out of China or what&rsquo;s generally referred to as the &lsquo;China Plus One&rsquo; strategy. India&rsquo;s labor costs are one-third of China&rsquo;s, which could attract investment into the country.<sup>2</sup>&nbsp;India&rsquo;s government sees this opportunity and is now spending almost 20% of its budget on capital investments<sup>3</sup>&nbsp;to support manufacturing with its &lsquo;Make in India&rsquo; initiative. The government aims to increase the manufacturing share of GDP to 25% from the current 15% of GDP.<sup>2</sup></p>
<h3>India&rsquo;s Share of Manufacturing is Forecasted to Increase by Over 20% of GDP by 2031</h3>
<p><img class="img-responsive w-100" src="https://www.vaneck.com/contentassets/e7ab7263aaa54dd8b3b9ade0288af16c/india_chart_01_v1_2022.12_blog.svg" alt="India's Share of Manufacturing is Forecasted to Increase by Over 20% of GDP by 2031" /></p>
<p class="chart-disclosure">Source: Morgan Stanley Investment Research. *F2032 is forecasted per Morgan Stanley&rsquo;s research. Past performance is no guarantee of future results. Not intended as a prediction of future results.</p>
<h2>Digitization</h2>
<p>The government of India has been leading the push in <strong><a href="https://www.vaneck.com/us/en/blogs/emerging-markets-equity/a-digital-revolution-made-in-india/" title="A Digital Revolution Made in India">digitization</a></strong> with its &ldquo;Digital India&rdquo; reforms since 2015, with the vision to expand e-governance, empower its citizens with access to government entities and expand digital infrastructure across the country to connect all citizens to the internet. The government of India is hoping to expand access to financial services via digitization by investing in digital payments and 5G infrastructure. An increase in fin-tech applications such as digital payment apps could help democratize the online retail ecosystem in India and help small vendors participate in the documented economy.</p>
<h2>Credit Growth and Consumer Spending</h2>
<p>Digital initiatives are likely to help more of those in lower income brackets participate in the economy, enhancing the quality of growth across the breadth of the economy. By 2030, India could add approximately 140 million middle-income and 21 million high-income households which could help consumer spending grow from $1.5 trillion now to $6 trillion by the end of the decade.<sup>4</sup>&nbsp;Expanded access to financial services could help support credit growth in one of the most under-leveraged countries in the world. India&rsquo;s ratio of credit to GDP could increase from 57% to 100% over the next decade.<sup>1</sup></p>
<h3>India&rsquo;s Consumption Could Double by 2031</h3>
<p><img class="img-responsive w-100" src="https://www.vaneck.com/contentassets/e7ab7263aaa54dd8b3b9ade0288af16c/india_chart_02_v1_2022.12_blog.svg" alt="India's Consumption Could Double by 2031" /></p>
<p class="chart-disclosure">Source: Morgan Stanley Investment Research.&nbsp;<sup>*</sup>F2031 is forecasted per Morgan Stanley&rsquo;s research. Past performance is no guarantee of future results. Not intended as a prediction of future results.</p>
<p>India&rsquo;s domestic consumption could increase with expanded access to financial services and a possible increase in disposable income as manufacturing and exports pick up. As more people move up the income ladder, India&rsquo;s consumption could reach $4.9 trillion by 2030 up from $2 trillion in 2022.<sup>1</sup>&nbsp;It is expected that non-grocery consumer discretionary goods and services could have a high wallet share of the future Indian consumer.<sup>1</sup></p>
<p><a href="/link/e63445bf2a2547bba3f7e363be02016e.aspx" title="DGIN - VanEck Digital India ETF - Overview"><strong>VanEck Digital India ETF (DGIN)</strong></a> offers access to the structural digital growth story of India and could be an appealing investment opportunity for investors looking to seek technology or growth exposure in emerging markets.</p>
<p>The <a href="/link/d3bbfae5899e4b0dbbb596fad4befa1a.aspx" title="GBFAX - Emerging Markets Fund - Class A - Overview"><strong>VanEck Emerging Markets Fund (GBFAX)</strong></a> also offers access to the structural digital growth story of India for investors seeking technology or growth exposures in emerging markets.</p>
<p>To receive more <a href="/us/en/insights/emerging-markets-equity/" title="Emerging Markets Equity Insights"><strong>Emerging Markets Equity</strong></a> insights, <a href="/us/en/subscribe/" title="Subscription Center"><strong>sign up in our subscription center</strong></a>.</p>
]]></content:encoded>
</item><item rdf:about="https://www.vaneck.com/us/en/blogs/emerging-markets-equity/saudi-arabia-a-rising-investment-destination/">
  <title>Saudi Arabia: A Rising Investment Destination></title>
  <link>https://www.vaneck.com/us/en/blogs/emerging-markets-equity/saudi-arabia-a-rising-investment-destination/</link>
  <description><![CDATA[The long-term growth potential and diverse economy of Saudi Arabia is turning the country into a sought-after investment destination.]]></description>
  <dc:creator>Ola  El-Shawarby, CFA</dc:creator>
  <dc:date>12/21/2022 06:30:00</dc:date>
<content:encoded><![CDATA[

<p>The Middle East and North Africa region, and in particular Saudi Arabia, are becoming a bigger and more relevant part of the emerging markets equity investment universe, offering both structural reform and cyclical tailwinds. Saudi Arabia appears committed to diversify its economy away from oil dependence and current economic, and social reforms are shifting Saudi Arabia from an exporter of capital to an investment destination sought after for its long-term growth potential and diverse economy.</p>
<p>The <a href="/link/106898cae90542488044d09a3e8a0ff9.aspx" title="VanEck Emerging Markets Equity Investment Team"><strong>VanEck Emerging Markets Equity Investment Team&rsquo;s</strong></a> recent trip to Saudi Arabia has us excited about the long-term investment prospects of Saudi Arabia and the emerging investment opportunity it presents, though we remain cautious on the punchy valuations the market currently offers. Our visit confirmed that Saudi Arabia&rsquo;s &ldquo;Vision 2030&rdquo; program has moved from being just an ambitious hope to a guiding framework that is being implemented through different realization programs and focus sectors with emphasis on long-term investments.</p>
<h2 id="macro-drivers" class="jump-link-nav anchored-block" data-jumplink-title="Macro Drivers">Saudi Arabia &ndash; Macro-Economic Drivers</h2>
<p>Unlike most of the world right now, we experienced a refreshing buzz on the ground in the Gulf Cooperation Council (GCC), given a favorable combination of structural reform, positive economic spillover from higher oil prices driving stronger government and private sector investments, and a relatively low inflationary environment with USD pegged currencies. It&rsquo;s worth noting that the weight of GCC is now approaching 8% of the MSCI EM index, with Saudi Arabia representing more than half of that<sup>1</sup>.</p>
<h3>Saudi Arabia&rsquo;s Growing Weight in the MSCI EM Index</h3>
<p><img class="img-responsive w-100" src="https://www.vaneck.com/contentassets/3c66b60a65634db4860a97654211d839/saudi-arabia_chart_01_v1_2022.12_blog.svg" alt="Saudi Arabia's Growing Weight in the MSCI EM Index" /></p>
<p class="chart-disclosure">Source: FactSet data for MSCI EM as of 09/30/2022. *2022 represents YTD data as of 09/30/2022.</p>
<h2 id="social-reforms" class="jump-link-nav anchored-block" data-jumplink-title="Social Reforms">Social Reforms and the Rise of New Economy Sectors</h2>
<p>Social reform and loosening up of restrictions are the most visible change. Female empowerment through the increase of female participation in the workforce was one of the explicit goals of Vision 2030, with a target to reach over 30% female labor participation by 2030.<sup>2</sup>&nbsp;Today with all the positive reforms in the country, we have witnessed a very rapid rise of female employment, reaching over 33% of the workforce currently from less than 20% in 2018 and exceeding the 2030 goals significantly ahead of time.<sup>3</sup>&nbsp;One key enabling reform that supported women&rsquo;s mobility and access to workplaces is the lifting of the female driving ban in 2018, granting women in Saudi Arabia the right to drive. We welcomed seeing many women driving their cars around Riyadh during this visit and were particularly pleasantly surprised when we even encountered a female Uber driver.</p>
<p>We believe the social reforms have resulted in the rise of investment opportunities in the entertainment, tourism and leisure sectors. Historically, entertainment options in Saudi Arabia have been limited due to restrictions against movie theaters, music venues and concerts or even allowing social mixing of men and women at restaurants or cafes, with restaurants typically having separate sections for families and women away from male only sections. This meant that shopping for physical goods was the most common way to pass time.</p>
<p>Today, almost all such restrictions have been removed, with the notorious moral police nowhere to be seen anymore. This has opened up the opportunity for investors to take advantage of the &ldquo;new&rdquo; entertainment sector offerings, such as large outdoor seating areas and fine dining options, as well as music festivals that would have been unimaginable only a few years ago. The likes of Cipriani, L &rsquo;Entrecote Caf&eacute; de Paris, Nusr-et and other globally known fine dining establishments were quick to open up in Riyadh &ndash; the largest city in the GCC by population with around 8 million residents and solid purchasing power. There are now long waiting lists to get reservations at these restaurants. While many Saudi women choose to continue wearing the traditional head-cover and &ldquo;abaya&rdquo; (the black traditional over-garment) while going out and at their workplace, this is no longer a requirement, and we have seen women dressed in a variety of fashions around town.</p>
<p>Our visit also coincided with the first week of this year&rsquo;s &ldquo;Riyadh Season&rdquo;, a large state-sponsored annual entertainment festival with a series of music concerts, live performances and pop-up restaurants and shops. As one walks around on the festival grounds and visits some of the restaurants, it feels very much like being in Dubai or any other entertainment hub minus the alcohol, which is a long way away from the not too distant past.</p>
<p><img class="img-responsive w-100" src="https://www.vaneck.com/contentassets/3c66b60a65634db4860a97654211d839/saudi-arabia_image_03_v1_2022.12_blog.jpg" alt="Senior Investment Analyst Ola El-Shawarby at the Riyadh Season 2022" /></p>
<p class="chart-disclosure">Senior Investment Analyst Ola El-Shawarby at the &ldquo;Riyadh Season&rdquo; 2022.</p>
<p>Saudi has one of the youngest populations globally, with around 70% of the population below the age of 34.<sup>4</sup>&nbsp;Most Saudis are happy with the reforms that are creating a positive buzz among consumers and companies alike. What has been interesting so far this year is that despite consumer confidence being at an all-time high, many of the listed &ldquo;traditional&rdquo; consumer companies in the retail space have reported relatively disappointing results. It appears there is an increasing share of the consumer wallet now directed towards the newer entertainment options and even domestic tourism.</p>
<p>We are also seeing positive reforms related to mortgage subsidies to increase home ownership, education, healthcare and insurance, which are all opening up opportunities for banks, private schools, private hospital groups and private insurance companies.</p>
<h2 id="economic-reforms" class="jump-link-nav anchored-block" data-jumplink-title="Economic Reforms">Economic Reforms: Vision 2030, The Public Investment Fund (PIF) and The National Investment Strategy (NIS)</h2>
<p>Vision 2030 (V2030) was launched in 2016 and at a very high level aims to diversify the Saudi economy away from oil.</p>
<p>Following the 2015 decline in oil prices, Saudi spent several years going through fiscal consolidation and expanding the government&rsquo;s non-oil revenue base by introducing initiatives such as VAT for the first time (initially at 5% in 2018 and increased to 15% last year).<sup>5</sup>&nbsp;With the recent rise of oil prices, the government continues to show fiscal discipline and this time around we have not seen the usual cash handouts given to Saudi nationals that we have seen in past boom oil cycles. As a result the 2022 budget is expected to show a sizable budget surplus projected at more than 7%.<sup>6</sup>&nbsp;From our conversations with Saudi&rsquo;s Minister of Investments, it was confirmed that this time around the role of the government as the main driver of growth through direct budget spending has changed with only ~10% of Saudi&rsquo;s $1 trillion budget directed to CAPEX. The rest is focused on OPEX and defense, and the responsibility of boosting economic growth is being shifted to ex-budget state-owned entities and most importantly PIF, Saudi Arabia&rsquo;s sovereign wealth fund.</p>
<p>The PIF was originally established in 1971 as a strategic investment vehicle under the oversight of the Ministry of Finance. However, it was effectively relaunched in its current form in 2015 to now become one of the largest sovereign wealth funds globally under the supervision of Saudi&rsquo;s Council of Economic Development and Affairs, an entity spearheaded directly by Saudi crown prince (Mohamed Bin Salman).</p>
<p>The PIF plays a pivotal role in the execution of V2030 and KSA has announced giga projects like NEOM and The Red Sea. The fund has been empowered by the Saudi leadership to invest domestically and overseas with a private sector mindset driven by risk/reward and governance targets with an aim to invest at least SAR150 billion (~40 billion) in the local economy by 2025.<sup>7</sup></p>
<p>Key sectors identified by PIF for investments to drive higher non-oil revenue growth include technology, financial services, EVs, renewables, food &amp; agriculture, entertainment &amp; leisure, healthcare, consumer, aerospace &amp; defense, metals &amp; mining and real estate. We have seen PIF building &ldquo;national champions&rdquo; in the different sectors like banking, renewables, technology and others to carry out the growth plans, and we have met with the management of several of those companies, including Saudi National Bank (financial services), ACWA Power (renewables and power generation) and Elm (technology and digital solutions).</p>
<p>Since the transformation of PIF in 2016, the fund has received many asset transfers from the government in the form of both cash and companies. Currently, PIF has just over $600 billion of assets and has a target to reach over $1 trillion in assets by 2025.<sup>8</sup>&nbsp;From our conversations with leadership representatives of PIF and the Ministry of Investments during the trip, there is a clear shift in mindset and attitude to reposition Saudi from just an exporter of capital to a welcoming capital destination. Saudi&rsquo;s National Investment Strategy (NIS) was published towards the end of 2021 to help carry out V2030 targets by tripling gross fixed capital formation by 2030 to reach 30% of GDP, while also increasing the share of FDIs from a mere 1.5% of GDP in 2021 to 3.4% by 2025 and further rising to 5.7% by 2030.<sup>9</sup></p>
<p>According to PIF, the fund is looking to crowd in&mdash;not crowd out&mdash;investors by catalyzing and de-risking projects initially then opening them up for private sector investments. We have also seen PIF monetizing assets through a series of IPOs and secondary stake sales on the Saudi stock exchange over the past two years, allowing investors like ourselves the opportunity to &ldquo;partner&rdquo; with the fund.</p>
<p>We also heard about the intention of introducing several special economic zones in the near future that will offer more advantageous pro-business regulations and incentives. While we do not know any details yet, one trend that we have started seeing in the UAE, which has reflected positively on the stock market, is the gradual elimination of foreign ownership limits. If we start seeing similar moves in Saudi, perhaps starting with special economic zones, that would be very positive.</p>
<h2 id="infrastructure-development" class="jump-link-nav anchored-block" data-jumplink-title="Infrastructure Development">Tailwinds from Infrastructure Development</h2>
<p><strong>Large-scale Giga Projects</strong></p>
<p><strong>NEOM<br /></strong>As mentioned PIF is the backer of Saudi&rsquo;s large scale projects with the largest and the most known one being <i>NEOM</i>, an ambitious project spanning ~26,500 square kilometers&mdash;almost the size of Belgium&mdash;by the Red Sea in the northwest of Saudi Arabia. We only visited the headquarters in Riyadh and not the project site given the distance away from Riyadh. While it was hard to get any specific details during our meeting on exact timeline and plan, the project is marketed as a very futuristic and sustainable city with some press articles quoting $500 billion as an estimated development budget.<sup>10</sup>&nbsp;We await more details to be revealed over time, but one data point to keep in mind is that Saudi won the bid to host the 2029 Asian Winter Games at <i>The Trojena Mountain Resort</i> within <i>NEOM<sup>11</sup>.</i> At least that gives some clarity on timeline for part of the project covering an area of nearly 60 square kilometers with elevations ranging from 1,500 meters to 2,600 meters.</p>
<p><strong>Tourism and Entertainment Projects<br /></strong>Saudi has always been a consistent religious tourism destination as home to the two holy sites for the Islamic faith and has been developing the areas around Mekkah and Madinah to accommodate more visitors in the future. More interestingly though, we have seen domestic tourism numbers pick up significantly within the country due to the relaxation of restrictions. Saudis have started to travel within the country more to explore different beach or mountain areas or attend some of the festivals in Riyadh and Jeddah, which has been evident in car rental numbers for example.</p>
<p>Saudi is also developing 2 giga projects by the Red Sea coast named <i>The Red Sea Project</i> and <i>Amaala&mdash;</i> two luxurious tourist beach destinations to capitalize on the virgin untapped shores, dive sites and marine life in the Kingdom and aiming to attract tourists globally. During our visit, we also visited the sites of <i>Qiddiya</i>, another large project under development close to Riyadh, which is meant to be an entertainment city with Six Flags and others announcing plans to build parks there.</p>
<p><strong>Cultural and Historical Projects<br /></strong>Our favorite visit of all was our tour of the <i>Diriyah Gate</i> project, guided by an enthusiastic young Saudi woman. Here, a new cultural city is being built in the traditional architectural style of the area and centered around a 300-year old historic mud-brick city &ndash; now classified as a UNESCO heritage site &ndash; that was the first ruling house of the <i>Al Saud</i> family (after which the Kingdom of Saudi Arabia was named). Aside from the historic site which is very interesting in and of itself, the project will include residential and commercial real estate, including luxury and mid-level hotels to attract both local and international visitors.</p>
<p><img class="img-responsive w-100" src="https://www.vaneck.com/contentassets/3c66b60a65634db4860a97654211d839/saudi-arabia_image_02_v1_2022.12_blog.jpg" alt="Tour of Diriyah Gate conducted by a female tour guide" /></p>
<p class="chart-disclosure">Tour of &lsquo;Diriyah Gate&rsquo; conducted by a female tour guide.</p>
<h2 id="green-energy" class="jump-link-nav anchored-block" data-jumplink-title="Green Energy">Green Energy Transition and ESG Initiatives</h2>
<p>Green energy transition and green initiatives have come up in many of our meetings. As part of V2030, Saudi wants 50% of its power generation coming from renewable energy, as Saudi also has an abundance of solar and wind resources.</p>
<p>The PIF was given the mandate to develop 70% of the country&rsquo;s renewable energy pipeline, which they are doing through majority owned power generation, renewable energy and water desalination national champion <i>ACWA Power</i>, which was listed on the Saudi stock exchange in 2021 (Ticker: ACWA AB).&nbsp;We met with <i>ACWA Power&rsquo;s</i> management, who will be developing, operating and partially owning the bulk of Saudi&rsquo;s renewable energy projects. To put it into context, if we assume that Saudi&rsquo;s capacity goes from ~80 GW today to ~120 GW by 2030, this would suggest an additional ~60 GW coming from renewables by 2030, from only 1 GW today. <i>ACWA Power</i> is expected to develop ~42 GW of those and presents an attractive investment opportunity. <i>ACWA Power</i> is also developing NEOM&rsquo;s 4 GW green hydrogen project, which is supposedly going to be the world&rsquo;s largest utility scale hydrogen facility.</p>
<p>It is also worth mentioning that the PIF invested in US-based listed EV producer Lucid and currently owns more than 60% of the company. The latter is currently in the process of building Saudi&rsquo;s first EV production plant with a capacity of 150,000 vehicles.<sup>12</sup></p>
<p>Saudi is clear that it is not abandoning hydrocarbons but will focus on increasing energy efficiency, reducing emissions and increasing carbon capture through investing in technology and emission tracking tools for the oil industry globally.</p>
<h2>Saudi Arabia: Compelling Investment Opportunity</h2>
<p>We believe the economic and social reforms in Saudi Arabia could present an interesting investment opportunity with the country&rsquo;s transition to a more open society. The infrastructure development coupled with the positive steps towards opening up the economy to foreign investors is a positive development for the country.</p>
<p>The transformation we witnessed in Saudi has been really eye opening and exciting. The significant change in terms of pace and magnitude on the ground is impressive. We walked away from our visit to Riyadh feeling excited about the changes and positive on the outlook and investment case, and looking for better valuation entry points to capture the opportunities we see.</p>
]]></content:encoded>
</item><item rdf:about="https://www.vaneck.com/us/en/blogs/economic-trends/softer-growth-blessing-in-disguise/">
  <title>Softer Growth – Blessing in Disguise?></title>
  <link>https://www.vaneck.com/us/en/blogs/economic-trends/softer-growth-blessing-in-disguise/</link>
  <description><![CDATA[Slower growth can free room for EM rate cuts and potentially lead to better current account outcomes. Still, EM is not a monolith, and slower growth will pose policy challenges for many.]]></description>
  <dc:creator>Natalia  Gurushina</dc:creator>
  <dc:date>12/21/2022 06:30:00</dc:date>
<content:encoded><![CDATA[

<h2>Market Rates Expectations</h2>
<p>The market stepped up its expectations for the implied policy rate in Japan (to &ldquo;mighty&rdquo; 0.3% in one year or so), but the <strong>outlook for many emerging markets (EM) is decidedly less hawkish</strong>. The Czech National Bank kept its policy rate on hold once again &ndash; as expected &ndash; and the market sees room for about 80bps of rate cuts next year on the back of on-going disinflation (to mid-single digits in H2-2023) and a significant growth slowdown (from 2.4% in 2022 to zero next year). Colombia&rsquo;s inflation risks are more persistent &ndash; this fact was reflected in yesterday&rsquo;s central bank minutes &ndash; but the economy is slowing, and this might pave the way for smaller rate hikes in H1-2023 (with some potential for easing in H2, if disinflation allows). The market also started to price in a small H2-2023 rate cut in India &ndash; even though the central bank minutes cautioned against excessive optimism on the disinflation front.</p>
<h2>Milder Recession</h2>
<p><strong>Softer growth</strong> &ndash; both on a country level and global &ndash; <strong>can</strong> <strong>pose policy challenges for those EMs where inflation is the farthest from the target</strong>. The latest data flow, however, suggests that the slowdown might be less dramatic than previously feared. South Korea reported a small pickup in its 20-day exports, while the Conference Board Consumer Confidence Index in the U.S. surprised meaningfully to the upside. Germany&rsquo;s IFO survey was also slightly better than expected. And, of course, we are eagerly awaiting China&rsquo;s domestic activity gauges for December to see whether the reflation narrative is working. The share of negative 2023 growth revisions reached 83% in the past three months (Bloomberg&rsquo;s consensus pool of 101 countries) &ndash; but are we at the bottom of the &ldquo;growth negativity&rdquo; trend?</p>
<h2>External Balances in EM</h2>
<p>One potential silver lining in a <strong>slower growth environment</strong> is that it <strong>can lead to better current account outcomes. </strong>Naturally, this does not apply to all EMs, but the market might appreciate smaller current account deficits in Central Europe (expected 4% of GDP in Poland and 7% of GDP in Hungary in 2022) and Colombia (5.8% of GDP in 2022) &ndash; because the respective fiscal gaps are also wide, translating into additional bond issuance. We also keep an eye on Brazil &ndash; the country&rsquo;s basic balance (current account + foreign direct investments) is very healthy now (see chart below), but incoming administration&rsquo;s spending plans can boost domestic consumption (and, potentially, demand for imports), whereas stalling reforms can discourage capital inflows (including direct). Stay tuned!</p>
<h3>Chart at a Glance: Brazil&rsquo;s External Balance Is Healthy but Will It Last?</h3>
<p><img class="img-responsive w-100" src="https://www.vaneck.com/contentassets/d75669d1fb204d3e87b0704a1a5e1e0c/us-emerging-markets-daily-2022-12-21.png" alt="Chart at a Glance: Brazil's External Balance Is Healthy but Will It Last?" /></p>
<p class="chart-disclosure">Source: Bloomberg LP.</p>
]]></content:encoded>
</item><item rdf:about="https://www.vaneck.com/us/en/blogs/economic-trends/emerging-markets-out-hawked/">
  <title>Emerging Markets — Out-Hawked?></title>
  <link>https://www.vaneck.com/us/en/blogs/economic-trends/emerging-markets-out-hawked/</link>
  <description><![CDATA[<p>EM and DM tightening cycles are getting less synchronized. Can EMs handle earlier exits and rate cuts?</p>]]></description>
  <dc:creator>Natalia  Gurushina</dc:creator>
  <dc:date>12/20/2022 06:30:00</dc:date>
<content:encoded><![CDATA[

<h2>Global Tightening Cycle</h2>
<p>The market is still digesting <strong>the Japanese central bank&rsquo;s (BoJ) unexpected decision to widen the yield curve control band</strong>, which re-set all major rates higher and propelled the Japanese yen 335bps up against the U.S. Dollar. One immediate question is whether today&rsquo;s move and a prospect of further adjustment send a bearish signal for global equities. Even though the outgoing governor Kuroda argues that this is not policy tightening (the BoJ simultaneously pledged to increase bond purchases), the market might be forgiven for thinking that the BoJ will blink again. As regards emerging markets (EM), we have not seen major changes in the market expectations for EM policy rates this morning, and EM FX was doing quite well.</p>
<h2>EM Policy Rate Differentials</h2>
<p>However, Japan&rsquo;s hawkish maneuver draws attention to the fact that the current tightening cycle in EM is not as synchronized with developed markets (DM) as before. Most EM central banks started to tighten much earlier than their DM counterparts, but major central banks gained pace in 2022. The<strong> U.S. Federal Reserve </strong>actually <strong>out-hiked most EMs in Q4</strong>, compressing the policy rate differentials with all EM regions (see chart below). This might be less of a problem in LATAM, where the policy differential is still the widest. However, it remains to be seen whether this would be enough to compensate for the political noise and policy uncertainty in the region. For example, Brazil&rsquo;s swap curve continues to price in a small &ldquo;warning shot&rdquo; rate hike in early 2023 to address new administration&rsquo;s spending plans.</p>
<h2>EM Rates and China Reopening</h2>
<p>The policy rate differential between EM Europe and the Fed is still above the pre-pandemic levels. Central Europe is not in the mood to hike further (Hungary stayed on hold today, and the Czech Republic will most likely follow suit tomorrow), but uncertain disinflation paths, and persistent concerns about the post-election fiscal adjustment in Hungary and pre-election fiscal splurge in Poland introduce additional risks. <strong>EM Asia&rsquo;s policy rate differential with the Fed</strong> is the smallest &ndash; less than 100bps &ndash; and this &ldquo;cushion&rdquo; <strong>might be too thin</strong>, unless we see more capital inflows aiming to benefit from the China reopening theme. Stay tuned!</p>
<h3>Chart at a Glance: EM Policy Rates &ldquo;Cushion&rdquo; &ndash; Large Enough?</h3>
<p><img class="img-responsive w-100" src="https://www.vaneck.com/contentassets/270427138ec042c88a87fa65a7aabd6b/us-emerging-markets-daily-2022-12-20.png" alt="Chart at a Glance: EM Policy Rates Cushion - Large Enough?" /></p>
<p class="chart-disclosure">Source: VanEck Research; Bloomberg LP.</p>
]]></content:encoded>
</item><item rdf:about="https://www.vaneck.com/us/en/blogs/economic-trends/markets-and-mandates/">
  <title>Markets and Mandates></title>
  <link>https://www.vaneck.com/us/en/blogs/economic-trends/markets-and-mandates/</link>
  <description><![CDATA[The latest developments in China, Brazil, Peru, and South Africa underscore the importance of policy mandates for EM asset prices.]]></description>
  <dc:creator>Natalia  Gurushina</dc:creator>
  <dc:date>12/19/2022 15:00:00</dc:date>
<content:encoded><![CDATA[

<h2>EM Local Debt and Politics</h2>
<p>Policy agendas can separate winners from losers in financial markets &ndash; and not just in emerging markets (EM) (August-September mini-crisis in the U.K. is a good example). <strong>Investors&rsquo; perceptions about the shifting policy direction played a big role in LATAM&rsquo;s Fixed Income space</strong> this year &ndash; including Chile&rsquo;s rebound after the benign referendum outcome, Brazil&rsquo;s pause after the presidential runoff, and Colombia&rsquo;s failure to recover after the elections and massive underperformance vs. the rest of the region (see chart below). And the latest news flow raises a lot of questions about the 2023 outlook. In Brazil, President-elect&rsquo;s spending plans and cabinet appointments led to a significant widening of the 2023 consensus budget deficit forecast (to 8.3% of GDP), which can lead to higher bond issuance and less room for central banks&rsquo; rate cuts. Peru&rsquo;s never-ending government reshuffles distract from key structural reforms, putting more pressure on the central bank to act as the only adult in the room.</p>
<h2>EM Debt Sustainability</h2>
<p>Not all &ldquo;policy mandate&rdquo; stories are glum. The <strong>South African rand staged a nice rally in the morning trade, following President Cyril Ramaphosa&rsquo;s re-election as the African National Congress (ANC) leader</strong>. The fact that Ramaphosa&rsquo;s victory margin was broader than expected led to suggestions about a stronger reform mandate going forward. This would be a much-needed development, as the market is still uncertain about the pace of fiscal adjustment and debt sustainability &ndash; the consensus sees very limited improvement in the 2023 budget deficit, and this can weigh on South Africa&rsquo;s local debt performance, despite its high yield.</p>
<h2>China Reopening, Policy Stimulus</h2>
<p><strong>China&rsquo;s</strong> zero-COVID/real estate policy U-turn also did not go unnoticed by the market &ndash; J.P. Morgan&rsquo;s CEMBI High Yield+ China Index returned 66% since November 3. The key <strong>message from the Central Economic Work Conference was encouraging</strong>, especially as regards regulations (pro-growth) and on-going policy support. We also keep an eye on efforts to prop up domestic demand and consumption &ndash; these were mentioned, but a sustained turnaround would be condition on successful reopening. China&rsquo;s activity gauges for December should give us the first &ldquo;taste&rdquo; of the economy&rsquo;s response to lifting the COVID restrictions. Stay tuned!</p>
<h3>Chart at a Glance: LATAM Fixed Income - Diverging Performance</h3>
<img class="img-responsive w-100" src="https://www.vaneck.com/contentassets/22b03a7e7cb140e6a752bd80b0e76613/us-emerging-markets-daily-2022-12-19.png" alt="Chart at a Glance: LATAM Fixed Income - Diverging Performance" />
<p class="chart-disclosure">Source: Bloomberg LP</p>
]]></content:encoded>
</item><item rdf:about="https://www.vaneck.com/us/en/blogs/economic-trends/a-milder-growth-slowdown/">
  <title>A Milder Growth Slowdown?></title>
  <link>https://www.vaneck.com/us/en/blogs/economic-trends/a-milder-growth-slowdown/</link>
  <description><![CDATA[DM activity gauges are still in the contraction zone, weighing on the policy rate expectations. Many EMs can slow tightening safely, but some growth/inflation tradeoffs look less certain.]]></description>
  <dc:creator>Natalia  Gurushina</dc:creator>
  <dc:date>12/16/2022 16:00:00</dc:date>
<content:encoded><![CDATA[

<h2>DM Rate Hikes</h2>
<p><strong>The&nbsp;consensus global growth outlook is quite bleak</strong>&nbsp;&ndash; according to the Bloomberg pool of forecasters, about 1/3 of countries will grow by less than 1% next year (see chart below). This is a very big increase from only three countries back in June. Elevated recession risks are one of the reasons why the market is not fully convinced about the extent of additional policy tightening in developed markets (DM) &ndash; despite major central banks&rsquo; hawkish messaging. The U.S. peak policy rate implied by Fed Funds Futures is still below 5%, and even though the implied ECB peak rate went up after this week&rsquo;s meeting, it is still well below the previous high of 3.65%. Today&rsquo;s preliminary activity gauges in Europe signaled that the slowdown might be milder than expected, but the U.S. PMIs (Purchasing Managers Indices) surprised significantly to the downside, moving deeper into the contraction zone and weighing on the rates expectations.</p>
<h2>EM Tightening Cycles</h2>
<p><strong>The&nbsp;growth outlook for most emerging markets (EMs) is not amazing either, but disinflation is getting more entrenched</strong>, and this should allow to safely slow the pace rate hikes and possibly open room for rate cuts in order to prop up growth going forward. Some central banks are better positioned to do this than others &ndash; they started tightening earlier and government policies (especially fiscal) are less problematic. The Mexican central bank delivered a smaller 50bps hike yesterday, and the local swap curve now prices in only 85bps of additional tightening before reaching the peak rate in Q1-2023. The Colombian central bank, however, is under more pressure to keep frontload rate hikes due to higher inflation risks (headline inflation accelerated more than expected in November to 12.53% year-on-year), questionable policy signals from the government, and a large &ldquo;twin&rdquo; deficit (a sum of fiscal and current account balances). The consensus sees another 100bps hike in Colombia this afternoon.</p>
<h2>EM Disinflation</h2>
<p>The&nbsp;<strong>inflation/growth policy trade-off might be particularly difficult in Central Europe</strong>. Poland, Hungary, and the Czech Republic are likely to grow by less than 1% next year, but headline inflation is still in double digits. An additional complication is that core price pressures &ndash; which should be less dependent on external shocks - are also quite persistent. Poland&rsquo;s core inflation exceeds expectations once again in November, accelerating to 11.4% year-on-year. The market continues to believe that all three central banks will be able to stay on hold, avoiding &ldquo;emergency&rdquo; hikes. The question is whether local bonds &ndash; which staged a nice comeback in Q4 &ndash; will agree with this narrative. Stay tuned!</p>
<h3>Chart at a Glance: More Countries Growing By Less Than 1% Next Year</h3>
<img class="img-responsive w-100" src="https://www.vaneck.com/contentassets/e9eceed433504df3bf8716acb7756251/us-emerging-markets-daily-2022-12-16.png" alt="Chart at a Glance: More Countries Growing By Less Than 1% Next Year" width="1216" height="783" />
<p class="chart-disclosure">Source: Bloomberg LP</p>
]]></content:encoded>
</item><item rdf:about="https://www.vaneck.com/us/en/blogs/moat-investing/is-the-cycle-turning-for-small-cap-stocks/">
  <title>Is the Cycle Turning for Small-Cap Stocks?></title>
  <link>https://www.vaneck.com/us/en/blogs/moat-investing/is-the-cycle-turning-for-small-cap-stocks/</link>
  <description><![CDATA[Current valuations are setting up a potential run of long-term outperformance for small- and mid-cap stocks.]]></description>
  <dc:creator> </dc:creator>
  <dc:date>12/15/2022 06:30:00</dc:date>
<content:encoded><![CDATA[

<h2>The Tide Turns in Favor of Small-Cap Stocks</h2>
<p>Large-cap stocks have had an extended period of outperformance, which has resulted in large-cap indexes becoming concentrated in a few large mega-cap stocks, primarily in the technology sector. Indeed, it&rsquo;s been quite a run for large caps, but this phenomenon of large cap outperformance has created an imbalance in U.S. stock markets. Following the recent period of volatility, large caps (particularly tech) have been hit hard, and small- and mid-caps have started to outperform. And there is good reason to believe that this recent turn in leadership will mark the beginning of a new period of long-term outperformance for small- and mid-cap stocks.</p>
<h2>Relative Valuations for Small-Caps Haven&rsquo;t Been This Attractive Since the &ldquo;Dotcom Bubble&rdquo;</h2>
<p>As Barron&rsquo;s recently explored in the article, <strong><a href="https://www.vaneck.com/us/en/offsite-disclaimer/?id=193123&amp;button=no&amp;url=https://www.barrons.com/articles/small-cap-stocks-funds-51670023712" title="Barron's - Small-Cap Stocks Are Set for Big Gains. 12 Holiday Bargains." target="_blank" rel="noopener">Small-Cap Stocks Are Set for Big Gains</a></strong>, valuations for small- and mid-cap companies are extremely low relative to large caps. In fact, the last time the relative price to earnings for small-caps versus large caps was this low was the &ldquo;Dotcom Bubble&rdquo; of the early 2000s. Pair this extreme valuation discount with eventual brighter days in terms of macro backdrop, and we believe <strong><a href="https://www.vaneck.com/us/en/blogs/moat-investing/uncover-big-opportunities-in-smaller-companies/" title="Uncover Big Opportunities in Smaller Companies">small- and mid-cap (SMID-cap) stocks</a></strong> may prove to be rewarding for patient investors.</p>
<p>Small-cap stocks proved to be a wise investment during the 1970s when the Federal Reserve was battling with rampant inflation. This could paint a promising picture for investors looking to navigate current economic conditions. Small-caps tend to have higher exposure to businesses that benefit from rising inflationary pressure, including energy companies, which are often positively impacted when inflation rises. Additionally, small-cap companies are often domestically based and generally more invested in updating capital spending, which gives them an advantage if manufacturers continue transitioning their factories back into the U.S. While past performance is not a predictor of future outcomes, this data provides a favorable historical foundation for assessing the track record of small- and mid-cap stocks.</p>
<h2>How to Access Small- and Mid-Cap Stocks</h2>
<p>There are about five times as many small- and mid-cap stocks as there are large-cap stocks. Additionally, in the large-cap space, information dissemination and absorption has become highly efficient, but this is not the case as one moves down the capitalization scale. The average small- and mid-cap stock has fewer than eight analysts covering and writing research or recommendations on it, and about one-fifth of these companies have no more than three analysts covering them (the average large-cap company has roughly 21 analysts covering it). This lack of analyst coverage results in a potentially greater dispersion between stock prices and fair value that can prove rewarding for investors. Accordingly, we believe investors seeking to make an allocation to small- and mid-sized companies should look for a strategy that does more than just provide broad-market exposure. We believe a focused approach that selectively identifies companies by considering <strong><a href="https://www.vaneck.com/us/en/blogs/moat-investing/access-smid-cap-stocks-with-confidence/" title="Access SMID Cap Stocks with Confidence">competition and competitive advantages as well as valuations</a></strong> may be a better choice.</p>
<p>The <strong><a href="/link/589a2bc95c5d48988a7fd0d679aec241.aspx" title="SMOT - VanEck Morningstar SMID Moat ETF - Overview">VanEck Morningstar SMID Moat ETF (SMOT)</a></strong> targets SMID-cap companies with <a href="https://www.vaneck.com/us/en/blogs/moat-investing/how-a-moat-stock-gets-its-economic-moat/" title="How a Moat Stock Gets Its Economic Moat"><strong>long-term competitive advantages, known as moats</strong></a>, and attractive valuations. <strong><a href="https://www.vaneck.com/us/en/blogs/moat-investing/smot-question-and-answer/" title="SMOT: Question and Answer">SMOT</a></strong> is currently trading at a weighted avg P/E ratio of roughly 14, which is far below the 20 times earnings of the S&amp;P 500 Index.<sup>1</sup>&nbsp;SMOT&rsquo;s underlying index, <a href="/link/c0c4da50e177415b9f750d3c0eea4e0a.aspx" title="SMOT - VanEck Morningstar SMID Moat ETF - Index"><strong>Morningstar<sup>&reg;</sup>&nbsp;US Small-Mid Cap Moat Focus Index<sup>SM</sup></strong></a>, also exhibits fewer companies with negative earnings, accounting for about 13% of the index, compared to over 30% for the Russell 2000 Index.<sup>2</sup></p>
<p>To receive more <a href="https://www.vaneck.com/us/en/insights/moat-investing/" title="Moat Investing Insights"><strong>Moat Investing</strong></a> insights, <a href="https://www.vaneck.com/us/en/subscribe/" title=" Subscription Center"><strong>sign up in our subscription center</strong></a>.</p>
]]></content:encoded>
</item><item rdf:about="https://www.vaneck.com/us/en/blogs/investment-outlook/2023-outlook-q-and-a-get-fully-invested-now/">
  <title>2023 Outlook Q&amp;A: Get Fully Invested Now></title>
  <link>https://www.vaneck.com/us/en/blogs/investment-outlook/2023-outlook-q-and-a-get-fully-invested-now/</link>
  <description><![CDATA[2023 is the year to think differently about the market. As investors prepare their portfolios, our investment professionals share insights on what to expect in their respective asset classes.]]></description>
  <dc:creator> </dc:creator>
  <dc:date>12/15/2022 06:30:00</dc:date>
<content:encoded><![CDATA[

<p>In 2023, we expect a <strong><a href="https://www.vaneck.com/us/en/blogs/investment-outlook/jan-van-eck-expect-sideways-in-2023-and-another-untouchable-investment/" title="Expect Sideways in 2023 and Another 'Untouchable' Investment">&ldquo;sideways&rdquo; year for equities</a><a> </a></strong>and are bullish on bonds. Since <strong><a href="https://www.vaneck.com/us/en/news-and-insights/thought-leaders/jan-van-eck/" title="Jan van Eck - Chief Executive Officer">CEO Jan van Eck</a></strong>&rsquo;s earlier call to &ldquo;<strong><a href="https://www.vaneck.com/us/en/blogs/investment-outlook/jan-van-eck-what-to-buy-bonds-when-now/" title="What to Buy? Bonds. When? Now.">buy bonds today</a></strong>&rdquo;, the labor market has remained strong, which suggests interest rates stay higher for longer, and quantitative tightening has gone smoothly&mdash;despite being something that has only been done once before in Federal Reserve history.</p>
<p>During a <strong><a href="https://www.vaneck.com/us/en/webinar-registration/?id=95372806538&amp;utm_source=vaneck&amp;utm_medium=calendar" title="Why 2023 Is the Year to Think Differently About the Market">recent webinar</a></strong>, Jan also said to &ldquo;get fully invested now.&rdquo; So what should investors invest in? We gathered insights from a group of our experienced investment professionals on what to expect in 2023 for their respective asset classes to help investors plan their 2023 allocations.</p>
<ul class="content-list">
<li><a class="my-2 d-inline-block" href="#what-to-watch"><strong>What will have the biggest impact on your outlook through the end of the year and for 2023?</strong></a></li>
<li><a class="my-2 d-inline-block" href="#risks-opportunities"><strong>What do you view as the biggest risks and opportunities?</strong></a></li>
<li><a class="my-2 d-inline-block" href="#why-invest"><strong>Why should investors be considering your asset class now?</strong></a></li>
</ul>
<h2 id="what-to-watch" class="jump-link-nav anchored-block" data-jumplink-title="What to Watch">What will have the biggest impact on your outlook through the end of the year and for 2023?</h2>
<p><a href="/link/80e68be8744143d88e29ef67f8b7151c.aspx" title="David Schassler - Head of Multi-Asset Solutions"><strong>DAVID SCHASSLER, HEAD OF MULTI-ASSET SOLUTIONS</strong></a>: The Fed is committed to keeping financial conditions tighter for longer, just as Paul Volcker did in the early 1980s. However, the Fed is hoping to do this without the ugly recession and double digit unemployment that Volcker caused. Chairman Powell is effectively aiming to get drunk while avoiding the hangover. We would love for this to be the case, but this outcome would defy history. The inverted U.S. yield curve seemingly agrees with us and is warning of an impending recession. In fact, the two- and 10-year U.S. Treasury spread is the widest that it has been since Volcker&rsquo;s interest shock forced a deep recession!</p>
<p>Commodity prices are an important and underappreciated variable in the <strong><a href="https://www.vaneck.com/us/en/blogs/natural-resources/still-early-innings-for-inflation/" title="Still Early Innings for Inflation">future path of inflation</a></strong>. Volcker tamed inflation AFTER the oil shocks of the 1970s, as commodity prices fell. This time around, we are facing structural energy shortages, war involving significant commodity producers and their powerful allies, supply disruptions and societal changes from the lingering pandemic, and de-globalization.</p>
<p>The Fed may be successful in lowering inflation in 2023 through demand destruction, which, at these debt levels, is not a sustainable solution. The extreme debt levels have de-fanged the Fed and, therefore, we anticipate an eventual Fed pivot. <strong><a href="/link/9dc0306f791f4f9e845d21f065c50da0.aspx?epsremainingpath=high-inflation-is-likely-here-to-stay" title="High Inflation is Likely Here to Stay">Inflation will likely remain elevated</a></strong> for an extended period of time, in the 4-5% range, on average, with several peaks and troughs, as the world needs time to work through the abundance of inflationary forces.</p>
<p><a href="https://www.vaneck.com/news-and-insights/thought-leaders/fran-rodilosso/" title="Fran Rodilosso - Head of Fixed Income ETF Portfolio Management"><strong>FRAN RODILOSSO, CFA, HEAD OF FIXED INCOME ETF PORTFOLIO MANAGEMENT:</strong></a> For global fixed income markets, the two most glaring issues that could affect returns over the next 12 months are global growth and central bank policies. There appears to be a growing consensus that the U.S. economy will experience something between a &ldquo;soft&rdquo; and a &ldquo;bumpy&rdquo; landing during 2023; the ramifications being that inflation will slow markedly, the Fed will pause somewhere near 5% Fed Funds, and credit markets will avoid a major default/downgrade wave. We believe that while such a scenario is, in fact, possible there remains a significant amount of risk around each of those assumptions. Of course, central bank policies will continue to be set in response to inflation trends, and growth outside the U.S., importantly including China, will have a major impact on credit markets in 2023.</p>
<p><a href="/link/61411bb5bfa94433a91539f2f1352704.aspx" title="EMBAX - Emerging Markets Bond Fund - Class A - Investment Team"><strong>ERIC FINE, PORTFOLIO MANAGER, EMERGING MARKETS BOND STRATEGY</strong></a><strong>:</strong> The outlook for emerging markets bonds in 2023 is positive. Emerging markets countries hiked policy rates early and by more than developed markets countries. Emerging markets countries overall have positive real policy rates. Developed markets countries have sharply negative real policy rates, on the other hand. These high policy rates are generating high carry on local-currency bonds, and are set to stabilize inflation (in the countries with high real rates). This sets up the possibility of sharp declines in market interest rates that would be a further boost. In the event of no sharp declines in interest rates, the carry will also generate superior returns.</p>
<p><a href="https://www.vaneck.com/news-and-insights/thought-leaders/james-colby/" title="James Colby - Portfolio Manager and Strategist, Municipal Bonds"><strong>JIM COLBY, STRATEGIST, MUNICIPAL BONDS:</strong></a> Rates, rates, rates. The biggest concern for <strong><a href="https://www.vaneck.com/us/en/blogs/municipal-bonds/muni-investors-top-4-reality-checks/" title="Muni Investors: Top 4 Reality Checks">municipal bond investors</a></strong> is what the Fed will actually do with rates over the rest of 2022 and all of 2023. The underlying strength of municipalities from the strong economy of Q1 2018 - 2020 and the financial support from the government&rsquo;s COVID-19 response means credit will be fine for a while yet. If the Fed signals that economic expansion has slowed, investors will return for the tax-free income.</p>
<p><a href="/link/b2b937a9c48a476890a9e6e7ad308413.aspx" title="Matthew Sigel - Head of Digital Assets Research"><strong>MATTHEW SIGEL, HEAD OF DIGITAL ASSETS RESEARCH</strong></a><strong>:</strong> The Fed&rsquo;s tighter monetary policy is having an outsized impact on digital asset prices. Bitcoin&rsquo;s correlation with the S&amp;P 500 has averaged 60% year-to-date vs. 33% in 2020-2021 and 4% during the 2010-2019 period. An end to rate hikes and a re-acceleration in money supply might reverse the poor sentiment. As a case in point, global money supply growth has plummeted from 25% in early 2021 to 1.3% today. If and as that reverses, we would expect the Bitcoin price to react positively.</p>
<p><a href="https://www.vaneck.com/us/en/news-and-insights/thought-leaders/imaru-casanova/" title="Imaru Casanova - Deputy Portfolio Manager, Gold and Precious Metals"><strong>IMARU CASANOVA, PORTFOLIO MANAGER, GOLD AND PRECIOUS METALS</strong></a>: Market expectations regarding the Fed&rsquo;s tightening path, inflation and the direction of the U.S. dollar will be the main drivers. We expect gold to continue to trade around the $1,700 to $1,800 range in the near term. If inflation remains at or near current levels, real rates are likely to stay in negative territory, and we would expect this to support gold. A pause in the Fed&rsquo;s tightening program would likely be a strong catalyst for gold. However, gold may rally even ahead of a Fed pause or pivot. The recent <a href="https://www.vaneck.com/us/en/blogs/gold-investing/joe-foster-holiday-surprise-in-store-for-gold/" title="Holiday Surprise in Store for Gold?" rel="noopener"><strong>gold price action</strong></a> following the CPI report for October is a perfect example of this. Gold broke out as the market anticipated that Fed rate increases might soon start to slow down. It now looks like gold may be back on the longer-term bull trend that has been in place since 2016. This is a significant development for gold.</p>
<p><a href="/link/40c04fc77a644565bd503cd0f546317b.aspx" title="CMCAX - CM Commodity Index Fund - Class A - Investment Team"><strong>ROLAND MORRIS, PORTFOLIO MANAGER AND STRATEGIST, COMMODITIES</strong></a><strong>:</strong> U.S. Fed policy and the U.S. dollar are likely to be the most important issues impacting commodities and commodity index products through year end and next year. Commodities had another good year in 2022, holding some of the sharp gains from the <strong><a href="https://www.vaneck.com/us/en/blogs/investment-outlook/what-the-russia-ukraine-crisis-means-for-your-portfolio/" title="What the Russia-Ukraine Crisis Means for Your Portfolio (Updated)">Russian invasion of Ukraine</a></strong> in Q1. Tighter central bank monetary policies and slowing global growth continue to be headwinds. <strong><a href="/link/9cc454bdc12d49638c0a22783d5a26cf.aspx" title="CMCAX - CM Commodity Index Fund - Class A - Overview">Commodity index strategies</a></strong> continue to benefit from positive roll yield and higher risk-free interest rates. That is likely to continue in 2023 and is a very positive environment for commodity index returns. Most importantly, the Fed is expected to slow the pace of monetary policy tightening and pause in the first half of 2023. The U.S. dollar may have already peaked this fall in advance of a shift in U.S. monetary policy. If the Fed does indeed slow the pace and pause monetary tightening next year, the U.S. dollar could fall sharply. 2023 could be a very good year for commodities, if the U.S. dollar falls sharply.</p>
<p><a href="/link/86b7c6b709b04faa957e3d5bd6df938a.aspx" title="GHAAX - Global Resources Fund - Class A - Investment Team"><strong>SHAWN REYNOLDS, PORTFOLIO MANAGER, GLOBAL RESOURCES</strong></a><strong>: </strong>The natural resource equity sector continues to face a number of historically unprecedented issues, including a potential looming recession and the deepening repercussions of the energy/resource crisis associated with Russia&rsquo;s invasion of Ukraine. However, the most important issue is, in our view, the path to opening in China. We believe relaxation of zero-COVID restrictions will eventually lead to a strong rebound in China&rsquo;s economy, a substantial increase in the demand for commodities and a subsequent positive response from resource equities. In fact, we think this is the biggest fundamental supply/demand issue that has been overlooked during the last year&mdash;i.e., the largest consumer of commodities in the world has been, essentially, in a recession. If this had occurred during the decade of 2010-2020, commodity and related equity prices would have seen severe underperformance. Instead, we have had strong outperformance, which we believe is clearly related to a structurally tight supply environment. The timing of China&rsquo;s return to the world market may go a long way to offsetting any new recessionary demand impacts that may unfold in OECD countries. We see China as a tightly coiled spring that, when released, could be a catalyst to an unparalleled rebound in the demand for all commodities.</p>
<p><a href="https://www.vaneck.com/news-and-insights/thought-leaders/david-semple/" title="David Semple - Portfolio Manager, Emerging Markets Equity"><strong>DAVID SEMPLE, STRATEGIST, EMERGING MARKETS EQUITY STRATEGY:</strong></a> Clearly the progression of rate hikes and potential declines amongst central banks, including developed markets, will impact valuations for emerging markets equities, and likely the direction of the dollar, which is very important for emerging markets. We stick to our view here that inflation will decline at a decent clip, opening up opportunities for rate expectations to be lowered. The flip side of this scenario, however, may be slower global growth as economies digest previous hikes, and global growth slow &ndash; important for both commodity demand and demand for manufactured goods. On the other hand, China&rsquo;s swift move away from &ldquo;COVID zero&rdquo; on top of a sluggish economy in 2022, means that it is likely the China will be the only major global economy with accelerating growth in 2023.</p>
<h2 id="risks-opportunities" class="jump-link-nav anchored-block" data-jumplink-title="Risks/Opportunities">What do you view as the biggest risks and opportunities?</h2>
<p><strong>RODILOSSO</strong>: The risks to fixed income markets over the next 12 months include upside inflation surprises, downward growth surprises and the potentially unanticipated effects of quantitative tightening. One obvious risk is that the Fed finds it as difficult to get inflation back down as it did while trying to get inflation higher for most of the QE period. Another is a more pronounced recession than the soft or bumpy landing that the market appears to be anticipating.</p>
<p>Despite the risks, with fixed income markets having repriced in 2022, there are numerous opportunities for investors to consider. A key consideration, of course, is that current income once again can be <strong><a href="https://www.vaneck.com/us/en/blogs/income-investing/income-returns-to-fixed-income-investing/" title="Income Returns to Fixed Income Investing">a key driver of returns</a></strong> and, even if rates rise and/or credit spreads move wider, can act as a buffer against adverse price movements. Given that the market will likely be reacting to news on multiple fronts over the coming months, whether driven by interest rate volatility or other factors, credit spread widening could lead to attractive entry points for adding credit exposure. The same could be said about foreign currency exposure (including in emerging markets) as well as duration. Given our view that there is a wide dispersion of outcomes while market pricing reflects a somewhat benign consensus, we favor adding to <strong><a href="/link/9dc0306f791f4f9e845d21f065c50da0.aspx?epsremainingpath=how-to-construct-a-fixed-income-portfolio-for-2023" title="How to Construct a Fixed Income Portfolio for 2023">fixed income allocations</a></strong> with mix of quality and spread, such as <strong><a href="https://www.vaneck.com/us/en/blogs/income-investing/ig-bonds-valuation-and-selectivity-matters/" title="IG Bonds: Valuation and Selectivity Matters">investment grade corporate bonds</a></strong>, municipal bonds, and <strong><a href="https://www.vaneck.com/us/en/blogs/income-investing/clos-uncover-opportunity-beyond-aaas/" title="CLOs: Uncover Opportunity Beyond AAAs">highly rated CLO tranches</a></strong>. We also favor being tactical about adding duration, and with the two-year to 10-year part of the yield curve inverted by approximately 80 bps as of mid-December, we believe that the short end represents enough relative value to accept the re-investment risk.</p>
<p><strong>COLBY: </strong>The risk to municipal bonds is that the Fed or advisors misread the direction of the economy and create confusion, driving investors away from fixed income. The other risk is global: Will there be a severe economic slowdown due to the prolonged war in the Ukraine, and will China retreat into its own COVID shell and create further economic downturn on a global scale?</p>
<p><strong>SEMPLE:</strong> For emerging markets equities, risks include:</p>
<ul class="content-list">
<li>Inflation and more rate hikes leading to weaker global growth.</li>
<li>USD strength picks up again.</li>
<li>U.S. continues to widen and broaden economic war against China.</li>
</ul>
<p>Opportunities include:</p>
<ul class="content-list">
<li>Lower than expected inflation, particularly in the U.S., leading to lower peak rates, and a weaker dollar</li>
<li>Chinese domestic demand comes back strongly.</li>
<li>Geopolitics calms down as there is more talking, which may mean less precipitate action from Washington.</li>
<li>Some kind of settlement in Ukraine.</li>
</ul>
<p><strong>FINE:</strong> Although inflation is a problem for developed markets (which mostly import commodities), emerging markets tend to be commodity exporters or maintain big external surpluses. Coupled with their high real interest rates, it&rsquo;s reasonable to say that developed markets should benefit from high commodity prices. Commodity prices should remain well-bid, by the way, if there is any pause in Fed tightening. Also, we see the loss of Eurasia as a key unpriced risk. The region is a major resource producer, which will be leveraged as Russia re-directs all oil and gas pipelines toward Asia (which should be finished by 2025). In fact, China and Russia have stated plans to deepen financial infrastructure with ideas such as digital gold, commodity-backed-currencies, and a currency bloc. All of these would attract dollars to emerging markets currencies, especially in Asia and in commodity exporters.</p>
<p><strong>SCHASSLER: </strong>Warren Buffet once described diversification as &ldquo;protection against ignorance.&rdquo; Your strategic asset allocation should include stocks, bonds and <strong><a href="https://www.vaneck.com/us/en/blogs/guided-allocation/a-master-class-in-real-assets/" title="A Master Class in Real Assets">real assets</a></strong> because economic conditions can change quickly and are often hard to predict. We spent a significant portion of time over the past couple of years encouraging investors to diversify into <strong><a href="https://www.vaneck.com/us/en/blogs/guided-allocation/avoid-the-inflation-penalty-box/" title="Avoid the Inflation Penalty Box">inflation-fighting assets</a></strong>. Too many ignored us. This crowd &ldquo;knew&rdquo; that inflation would be either nonexistent, benign or temporary and, therefore, didn&rsquo;t need to diversify. They were wrong and lost money. Do not fall into that trap in 2023!</p>
<p>The risks leading into 2023 are many and this leads to a wide distribution of potential outcomes. This is an ideal environment for diversification. We see opportunities in both real assets and high yielding assets. <strong><a href="https://www.vaneck.com/us/en/blogs/guided-allocation/raax-question-and-answer/" title="Inflation Allocation ETF (RAAX): Question and Answer">Real assets, as time-tested inflation beneficiaries</a></strong>, are expected to continue to outperform as inflation remains stubbornly high. Pay attention to gold. It has lagged other real assets and is expected to rally higher as the inflation cycle matures and there is limited upward mobility in interest rates.</p>
<p><a href="https://www.vaneck.com/us/en/blogs/guided-allocation/inc-question-and-answer/" title="INC: Question and Answer"><strong>High yielding assets</strong></a> are once again compelling. Short-term interest rates went from 0% to 4%. The reset in interest rates has created opportunities to earn yields not seen in over a decade. This offers the potential to generate strong yields from a diversified basket of high yielding assets, such as high yield bonds, REITs and dividend paying equities. To quote your favorite infomercial: &ldquo;But wait, there&rsquo;s more!&rdquo; If the Fed pivots, as we expect, high yielding assets should also benefit from price appreciation.</p>
<p>Risks are high. Play it smart. Diversify beyond the 60/40.</p>
<p><strong>CASANOVA</strong>: We see opportunity for gold&rsquo;s breakout to intensify, propelling it to its all-time highs around the $2,000 per ounce level, but this would require investment demand to pick up. There are many existing risks in the financial system and global landscape that we believe are supportive of higher gold prices in the longer term. These include (in the U.S. and globally) persistent and elevated inflation, a weakening economy, debt service strains, elevated geopolitical risks and black swan events, such as the LDI crisis in the UK. The biggest risk is that the gold market continues to ignore these risks. Market participants may not abandon the safety of the USD and run to the safety of gold until several conditions are present, including a significantly weaker jobs market and higher unemployment rate; a confirmed economic recession; a drop in corporate earnings and a deeper correction of the equity markets; and sustained inflation above the Fed&rsquo;s target rate. How long it may take for these risks to become reality is up for debate, but their increasing likelihood, we believe, will support higher gold prices in 2023 and beyond.</p>
<p><strong>REYNOLDS:</strong> In our view, the biggest risk to the natural resource equity sector is a belief that inflation is conquered and that we are returning to the low inflationary period of the last decade. The past year was an extremely strong testament that &ldquo;resource equities do what they are supposed to do, when they are supposed to do it&rdquo;. Numerous studies (including VanEck&rsquo;s own, <strong><a href="https://www.vaneck.com/us/en/blogs/natural-resources/all-things-reconsidered-in-the-inflation-debate/" title="All Things Reconsidered in the Inflation Debate">All Things Considered in the Inflation Debate</a></strong>) show that resource equities outperform the rest of the equity and fixed income market when inflation is greater than 2%. The fact that 2% inflation was the norm during the last decade and remains the goal belies the fact that this prolonged period was the anomaly since the end of World War II. While we believe inflation in most parts of the world has peaked, we also see very strong historical evidence that once a mid-single digit inflation threshold has been breached, <strong><a href="https://www.vaneck.com/us/en/blogs/guided-allocation/think-inflations-ending-think-again/" title="Think Inflation's Ending? Think Again.">a return to a lower inflationary regime takes many years</a></strong>, if not decades, to attain. Hence, the prevailing view that central bankers around the world will be able to quickly drive inflation back to the 2% level while balancing economic growth and employment seems extremely unlikely, from our perspective. Thus, our view is that moderate inflation will be with us for a while, and this is positive for the potential performance of resource equities.</p>
<p>An important opportunity, that we also highlighted last year, continues to be that the resource sector in general and individual company fundamental profiles continue to look extremely robust from both an absolute and a relative perspective. Valuation remains historically cheap while balance sheets, returns, free cash flow generation and dividend yields are generally more attractive than the rest of the broad equity market and, in many cases, are the best looking that they have ever been.</p>
<p><strong>MORRIS</strong>: The balance between supply and demand usually provides both the risks and opportunities for commodities and commodity index products. Next year and beyond should be no different. First, the opportunity: we believe that supply will continue to be the dominant challenge for commodity markets over the longer term. Underinvestment in exploration and the development of new sources of commodity supply over the last 10 to 15 years has set the stage for persistent long-term shortages. Slowing global trade along with resource security concerns, driven by the Russia-Ukraine war and a breakdown in U.S.-China relations will promote on-shoring and friend-shoring by Western economies. Lastly, the efforts to transition away from traditional energy to renewable energy sources, while being constrained by environmental concerns and &ldquo;not in my back yard&rdquo; local resistance, will be difficult.</p>
<p>All of these factors are likely to constrain supply and raise costs for commodities over the longer term. The big risk is global growth. It is possible that in an over leveraged global economy the U.S. Fed and other central banks already have or will over tighten monetary policy. That could push the global economy into a very serious economic downturn. I think that is a low probability but it&rsquo;s not zero. It seems more likely that the U.S. Fed and other central banks will err on the side of risking/accepting a little more inflation vs. economic depression.</p>
<p><strong>SIGEL</strong>: One of the biggest risks to Bitcoin is that elected officials lean on global institutions like the IMF/World Bank/BIS in a way that makes it harder for citizens and institutions to compliantly access cryptocurrencies, either via higher capital requirements, explicit taxes or outright bans. We are seeing this dynamic in El Salvador, whose government is negotiating to restructure IMF loans and facing an onslaught of negative PR and, so far, no deal. As for the opportunity, crypto and stablecoins are gaining share of payments in high-inflation regimes, particularly in Latin America. We don&rsquo;t believe that the U.S. will be able to hold back sovereign nations from their preferred payments rails over the long run. Meanwhile in the U.S., more than half of the companies in the S&amp;P 500 Index have announced digital asset partnerships. Real-world applications, such as those we highlighted in a <strong><a href="https://www.vaneck.com/us/en/webinar-registration/?id=94746899693&amp;utm_source=vaneck&amp;utm_medium=calendar" title="Hivemapper: A Novel Application of Smart Contract Technology">recent webinar with the founder of Hivemapper</a></strong>, will likely gain increasing traction over the next year, thanks to the coordination offered by smart contracts. The emergence of a killer app built on a major layer 1 smart contract platform would likely re-ignite investor interest in these assets.</p>
<h2 id="why-invest" class="jump-link-nav anchored-block" data-jumplink-title="Why Invest?">Why should investors be considering your asset class now?</h2>
<p><strong>RODILOSSO</strong>: In our view, fixed income has become a far more attractive allocation within diversified portfolios, not only because it has become cheaper but also because it has <strong><a href="https://www.vaneck.com/us/en/blogs/income-investing/carry-boosts-fixed-income-resilience-in-likely-fed-scenarios/" title="Carry Boosts Fixed Income Resilience in Likely Fed Scenarios">&ldquo;normalized&rdquo;</a></strong> to the degree that traditional return drivers and correlations with other asset classes should return. 2022 was the only year in the last 45 when the Bloomberg Barclays US Aggregate Bond Index and the S&amp;P 500 Index both had negative total returns. Zero-rate policy and 1.5% 10-year yields at the end of 2021 left little room for high quality bond allocations to support declining equity portfolios, as they had in the past.</p>
<p>Within fixed income alone, especially as credit spreads have decompressed over the past year, investors also now have <a href="https://www.vaneck.com/us/en/blogs/income-investing/income-investing-playbook-2023-its-time-to-invest-in-bonds/" title="Income Investing Playbook 2023: It's Time to Invest in Bonds"><strong>more choices to express views</strong></a>. Duration and quality may offer a more attractive return profile now versus a year ago for investors whose primary concern is a more dramatic growth slowdown or a deep recession. Current yield and price upside in riskier credit, such a high yield and emerging markets, where valuations are more in line with their long-term histories, may appeal to investors with more optimistic growth outlooks, even if they are concerned with the overall level of rates. We favor balancing the risks as 2023 commences by seeking attractive spreads within higher quality alternatives, such as investment grade credit or <strong><a href="https://www.vaneck.com/us/en/blogs/income-investing/fallen-angel-bonds-higher-quality-high-yield/" title="Fallen Angel Bonds: Higher Quality High Yield">fallen angel high yield bonds</a></strong> (90% BB-rated) versus broad high yield, <strong><a href="https://www.vaneck.com/us/en/blogs/income-investing/clos-a-better-way-to-access-leveraged-loans/" title="CLOs: A Better Way to Access Leveraged Loans">investment grade CLO tranches</a></strong> or <strong><a href="https://www.vaneck.com/us/en/blogs/income-investing/fltr-question-and-answer/" title="FLTR: Question and Answer">investment grade floating rate notes</a></strong> versus leveraged loans. We also believe that opportunities should arise during the first half of 2023 to add even higher carry credit exposure in emerging markets credit and local currency, as well as U.S. high yield.</p>
<p><strong>FINE:</strong> As bonds become the key investor focus for 2023, the discussion will inevitably turn to emerging markets bonds&mdash;not just because of their higher yields in local and hard currency (compared to developed markets or U.S. investment grade and high yield, respectively). Beta, in other words. The high carry in emerging markets debt also cushions returns in rising rate scenarios such that returns could be positive even if risk-free rates rise. The upside-downside for high-yielding emerging markets bonds is arguably superior to the upside/downside of treasuries and U.S. investment grade. When investors examine the return/vol history of emerging markets bonds, based on 19 years of data, the optimum fixed income portfolio should have substantial allocations to emerging markets bonds.</p>
<p><strong>SEMPLE:</strong> Rates lower than expectations, a weaker dollar and China&rsquo;s economy accelerating are a powerful cocktail for emerging markets performance. Our investments have performed and continue to perform well. In particular a number of major companies that emphasized unrelenting growth have scaled back ambitions and focused more on cost control and more conservative capital allocation. This bodes well for investor returns in the medium term.</p>
<p>There has been significant allocation away from the asset class, and positioning is light. There will be FOMO &ndash; fear of missing out.</p>
<p><strong>COLBY</strong>: Tax free income is one of the few remaining shelters investors can employ to buttress their portfolios if equities do not perform. Currently, with no new tax programs emerging in Congress and the Fed raising rates to choke off inflation, <a href="https://www.vaneck.com/us/en/blogs/municipal-bonds/municipal-bond-etfs-expect-more-from-your-munis/" title="Municipal Bond ETFs - Expect More from Your Munis"><strong>municipal bonds</strong></a> should once again become an important staple (core holding) for individuals as well as professionals to generate some positive returns. Yields have been reaching levels not seen in 10 years and investors should consider both investment grade allocations where the curve is steepest along with high yield to augment income. It is far more likely that rates will cease to rise much further and thus stabilize fixed income for decent if not strong returns in the latter half of 2023.</p>
<p><strong>CASANOVA</strong>: <a href="/link/9dc0306f791f4f9e845d21f065c50da0.aspx?epsremainingpath=fed-outlook-and-impact-on-price-of-gold" title="Fed Outlook and Impact on Price of Gold"><strong>Gold may rally ahead</strong></a> of a Fed pivot, as it did during the last tightening cycle. We saw some signs of that in late November and early December. We do not believe the gold price is yet fully reflecting an outlook of sustained higher inflation. Similarly, the gold stocks have been oversold and are trading at valuations that are historically low both for the sector and relative to the gold price. Given the broader market risks we outline, it seems now would be a good time to consider an allocation to gold and gold stocks given their safe haven, inflation protection, and portfolio diversification benefits.</p>
<p><strong>MORRIS</strong>: Why add or invest now in commodities and commodity index products? We believe this new commodity bull market that started in 2020 is likely to be a longer term five to 10 year bull market for the reasons outlined above. This year the market consolidated the gains of the first two years and the Q1 price spike from the Russia-Ukraine war. This consolidation could be the pause that refreshes. Investors may have already priced in the full drop in demand from the global economic downturn. A Fed policy shift and possible U.S dollar decline may make 2023 a very good year for commodities and commodity indexes.</p>
<p><strong>REYNOLDS</strong>: The last 22 years have shown that <strong><a href="https://www.vaneck.com/us/en/blogs/natural-resources/natural-resources-and-commodities-invest-resourcefully/" title="Natural Resources and Commodities: Invest Resourcefully">natural resource investing</a></strong> has a strategic and tactical role in portfolio construction. Over that time period, natural resource equities have outperformed broader market indices while also providing a distinctive diversification component to a more traditional portfolio &ndash; playing the role they are supposed to. From a tactical perspective, we feel that most investors remain under allocated to the space and have not fully benefited from the strong performance over the last two years. The temptation is to feel that the opportunity has passed. However, we firmly believe we are in a multi-year period where moderate inflation will be a norm, companies and industries will remain extremely disciplined with stronger returns and shareholder distributions (dividends and share buybacks) and robust demand for natural resources, the underpinning of an ever-growing global economy, will continue to create a very compelling investment rationale for natural resource equities.</p>
<p><strong>SIGEL:</strong> We see cryptocurrencies as a collection of call options on a different financial future, anchored around Bitcoin, Ethereum and stablecoins. With the top 10 digital assets by marker cap down an average of more than 90% from their peak, and multiple obituaries penned about Bitcoin and crypto in the wake of the FTX bankruptcy, these call options are decidedly cheaper and out of favor right now. At the moment, broadly speaking given where valuations are, we prefer liquid tokens like Ethereum over venture capital, where many down rounds are likely lie ahead.</p>
<p>To receive more <a href="/us/en/insights/investment-outlook" title="Investment Outlook Insights"><strong>Investment Outlook</strong></a> insights, <a href="https://www.vaneck.com/us/en/subscribe/" title="Subscription Center"><strong>sign up in our subscription center</strong></a>.</p>
]]></content:encoded>
</item><item rdf:about="https://www.vaneck.com/us/en/blogs/thematic-investing/pph-question-and-answer/">
  <title>PPH ETF: Question &amp; Answer></title>
  <link>https://www.vaneck.com/us/en/blogs/thematic-investing/pph-question-and-answer/</link>
  <description><![CDATA[In this blog, we answer frequently asked questions about VanEck's Pharmaceutical ETF (PPH), including why the sector may be an attractive value and defensive play during economic slowdowns.]]></description>
  <dc:creator> </dc:creator>
  <dc:date>12/15/2022 06:30:00</dc:date>
<content:encoded><![CDATA[

<h2>Introduction</h2>
<p>Despite the current uncertainty in equity markets, the pharmaceutical industry has remained relatively stable, thanks to the consistent and growing demand for the products pharma companies produce. The global pharmaceutical market is expected to grow at a 15.9% CAGR from 2022 to 2030, reaching $1.599T by 2030.<sup>1</sup>&nbsp;The existing industry leaders are projected to retain and gain share as patents protect their existing intellectual property and companies continue to develop new drugs and vaccines. This blog intends to answer frequently asked questions on the pharmaceutical industry and, more specifically, <strong><a href="/link/08c7d3f4029b4e1a85ec8795516a6f02.aspx" title="PPH - VanEck Pharmaceutical ETF - Overview ">VanEck&rsquo;s Pharmaceutical ETF (PPH)</a></strong>.</p>
<ul class="content-list">
<li><strong><a href="#point-one">What is the general outlook for the pharmaceutical industry?</a></strong></li>
<li><strong><a href="#point-two">Why invest in pharmaceutical companies now?</a></strong></li>
<li><strong><a href="#point-three">How recession-proof is the pharmaceutical industry?</a></strong></li>
<li><strong><a href="#point-four">What impact did the Inflation Reduction Act (IRA) have on the pharmaceutical industry?</a></strong></li>
<li><strong><a href="#point-five">Does PPH offer domestic or global exposure?</a></strong></li>
<li><strong><a href="#point-six">How is the index constructed?</a></strong></li>
<li><strong><a href="#point-seven">How can investors buy VanEck ETFs?</a></strong></li>
</ul>
<h2 id="point-one" class="anchored-block">What is the general outlook for the pharmaceutical industry?</h2>
<p>The pharmaceutical sector&rsquo;s growth has largely been attributed to new, proprietary drug development and rising demand for healthcare.</p>
<p>Between 2008 and 2012, 28 new drugs were approved by the FDA&rsquo;s Center for Drug Evaluation and Research (CDER). That number rose over 80% to 51 approvals per year between 2017 and 2021. Manufacturers of pharmaceuticals can generate an average of $18.6B in global revenues per new drug launch. The average cost of this new drug development has been roughly $2.6B.<sup>2</sup>&nbsp;Between the rising number of new drug approvals and the wildly impressive profit margins on these new pharmaceuticals, there are considerable growth opportunities for the sector.</p>
<h3>Annual approvals of new drugs by the FDA's CDER</h3>
<p><img loading="lazy" class="img-responsive w-100" src="https://www.vaneck.com/contentassets/cb713b7450f64bc8b0eabfc37440dce0/pph_chart-01_2022.12_blog.svg" alt="Annual approvals of new drugs by the FDA's CDER" /></p>
<p class="chart-disclosure">Source: Statista, AHIP, Journal of Health Economics. As of 1/31/2022.</p>
<p>The rising demand portion of the story can primarily be attributed to the aging population that persists. By 2050 the number of people in the US over the age of 60 is projected to double to roughly 2 billion. Since most of the demand for pharmaceuticals comes from the older segments of the population, this aging population is projected to contribute materially to the increased demand over the coming decades.</p>
<h3>U.S. Population Distribution</h3>
<p><img loading="lazy" class="img-responsive w-100" src="https://www.vaneck.com/contentassets/cb713b7450f64bc8b0eabfc37440dce0/pph_chart-02_2022.12_blog.svg" alt="U.S. Population Distribution" /></p>
<p class="chart-disclosure">Source: United States Census Bureau, Center of Disease Control, Bayer. As of 12/31/2018.</p>
<h2 id="point-two" class="anchored-block">Why invest in pharmaceutical companies now?</h2>
<p>Analysts anticipate another shaky year for equity markets in 2023, making defensive and value plays relatively attractive for those interested in pursuing capital appreciation and dividend income. A primary characteristic of the pharmaceutical industry is the inelasticity of demand for pharmaceuticals. Large-cap pharmaceutical companies that can retain consistent earnings and continue to pay healthy dividends tend to be rewarded when there is high volatility in the global equity markets.</p>
<h2 id="point-three" class="anchored-block">How recession-proof is the pharmaceutical industry?</h2>
<p>No industry is entirely immune to economic downturns, but the pharmaceutical industry has historically maintained strong sales during these periods. This is primarily due to the inelasticity of demand for the pharmaceuticals these companies produce. Additionally, many drugs have long patent lives, which can provide a steady revenue stream for pharmaceutical companies even during periods of declining economic growth.</p>
<div class="epi-contentfragment">faq-banner-cta</div>
<h2 id="point-four" class="anchored-block">What impact did the Inflation Reduction Act (IRA) have on the pharmaceutical industry?</h2>
<p>The IRA introduced a new requirement for pharmaceutical companies to adhere to regarding rising drug prices. Companies that manufacture pharmaceuticals are now required to pay rebates for drugs in Medicare Part D when price increases exceed inflation. This portion of the IRA was enacted in October 2022.<sup>3</sup></p>
<h2 id="point-five" class="anchored-block">Does PPH offer domestic or global exposure?</h2>
<p>The VanEck Pharmaceutical ETF only invests in US-listed companies. With that, a fair amount of companies in the investable universe are US-listed, but their operations are not based in the United States. Novo Nordisk (NYSE: NVO), Haleon PLC (NYSE: HLN), and AstraZeneca (NASDAQ: AZN) all have their operations based in Europe but have US-listed securities that are currently held by <strong><a href="/link/08c7d3f4029b4e1a85ec8795516a6f02.aspx" title="PPH - VanEck Pharmaceutical ETF - Overview ">PPH</a></strong>.</p>
<h2 id="point-six" class="anchored-block">How is the index constructed?</h2>
<p>The <strong><a href="/link/08c7d3f4029b4e1a85ec8795516a6f02.aspx" title="PPH - VanEck Pharmaceutical ETF - Overview ">VanEck Pharmaceutical ETF (PPH&reg;)</a></strong>&nbsp;seeks to replicate as closely as possible, before fees and expenses, the price and yield performance of the MVIS<sup>&reg;</sup>&nbsp;US Listed Pharmaceutical 25 Index (MVPPHTR).</p>
<p>In order for a security to be considered part of the investable universe, it must have a full market cap of at least $150M, a 3-month ADV of at least $1M at current and past 2 reviews, at least 250,000 shares traded per month over the past 6 months at current and past 2 reviews and companies must generate at least 50% of revenues from the research, development, production, marketing and/ or sales of pharmaceuticals (excluding pharmacies). The index's components are reviewed semi-annually in March and September. Rebalances occur quarterly in March, June, September, and December.</p>
<p>During the review, the largest 50 stocks by full market cap from the investable universe qualify. Those 50 stocks are then ranked by 3-month ADV in descending order and by free-float market capitalization in descending order. Those 2 rankings are then added, and the 10 highest-ranked companies are automatically included in the index. The remaining 15 companies are selected between those companies given a rank between 11 and 40. It should also be noted that company weightings are capped at 20%.<sup>4</sup></p>
<h2 id="point-seven" class="anchored-block">How can investors buy VanEck ETFs?</h2>
<p><a href="/link/20d5a11c03984f719482677b88e5c6c5.aspx#how-to-buy-etf&amp;utm=PPH-Blog" title="How to buy VanEck ETFs?"><strong>Learn more here</strong></a>.</p>
<p class="d-none d-lg-block"><a href="mailto:askvaneck@vaneck.com" title="Have More Questions? - Ask VanEck" rel="noopener"><img loading="lazy" class="img-responsive" src="https://www.vaneck.com/globalassets/home/us/insights/blogs/bm-blog-images/cta-faq_desktop-02.svg" alt="Have More Questions? - Ask VanEck" /></a></p>
<p class="d-lg-none"><a href="mailto:askvaneck@vaneck.com" title="Have More Questions? - Ask VanEck" rel="noopener"><img loading="lazy" class="img-responsive" src="https://www.vaneck.com/globalassets/home/us/insights/blogs/bm-blog-images/cta-faq_mobile-01.svg" alt="Have More Questions? - Ask VanEck" /></a></p>
<p>To receive more <a href="https://www.vaneck.com/us/en/insights/thematic-investing/" title="Thematic Investing Insights"><strong>Thematic Investing</strong></a> insights, <a href="https://www.vaneck.com/us/en/subscribe/" title=" Subscription Center"><strong>sign up in our subscription center</strong></a>.</p>
]]></content:encoded>
</item><item rdf:about="https://www.vaneck.com/us/en/blogs/economic-trends/higher-for-longer-market-not-so-sure/">
  <title>Higher for Longer - Market Not So Sure></title>
  <link>https://www.vaneck.com/us/en/blogs/economic-trends/higher-for-longer-market-not-so-sure/</link>
  <description><![CDATA[High recession risks explain why the market is skeptical about the hawkish policy message in DM. EMs, however, might be better placed to slow the pace of rate hikes.]]></description>
  <dc:creator>Natalia  Gurushina</dc:creator>
  <dc:date>12/15/2022 06:30:00</dc:date>
<content:encoded><![CDATA[

<h2>Slower Rate Hikes in DM</h2>
<p>The pace of tightening is slower (+50bps is the rate hike &ldquo;du jour&rdquo;), and the central banks&rsquo; message is hawkish, <strong>but the market does not seem to be fully convinced about the &ldquo;higher for longer&rdquo; narrative</strong> &ndash; at least in developed markets (DM). The reaction of U.S. Treasury yields during the U.S. Federal Reserve (Fed) Chairman&rsquo;s press conference was quite telling (down). As of this morning, Fed Funds Futures continued to price the peak rate of less than 5% and about 50bps of rate cuts in H2-2023 (fully offsetting expected H1-2023 rate hikes). One reason is that even though inflation is well above the respective targets, the risk of recession in DM is quite high. The probability of recession in the U.S. 12 months from now, calculated by the New York Federal Reserve, rose to 38% (see chart below). The Bloomberg consensus forecast sees negative 2023 real GDP growth in the Eurozone and the U.K. The next batch of domestic activity gauges in DM &ndash; out tomorrow &ndash; will be closely watched, for sure.</p>
<h2>EM Disinflation</h2>
<p><strong>The pace of hikes in emerging markets (EM) is also slowing</strong> &ndash; the Philippines opted for &ldquo;fashionable&rdquo; 50bps this morning, and the central bank of Mexico is expected to follow suit in the afternoon. Mexico finally started to show signs of disinflation &ndash; the latest set of bi-weekly numbers was particularly encouraging because it showed moderation both in headline and core price pressures. The slower pace of hikes in the U.S. provides a supportive global backdrop &ndash; the market expectations for Mexico&rsquo;s terminal rates have been joined at the hip with the U.S. Fed for some time now. The Philippines is a more difficult case &ndash; headline inflation was still accelerating (and more than expected) in November, making a strong case for more tightening in early 2023.</p>
<h2>China Reopening</h2>
<p><strong>Unlike the rest of the world, China is actively easing</strong> &ndash; and November&rsquo;s dismal domestic activity numbers showed why the policy stimulus had to be complemented by the zero-COVID U-turn. At the same time, weak industrial production, retail sales, and investments are clearly backward-looking. The attention now shifts to the December set of activity gauges because they come after the big policy announcements and should show an improvement (we&rsquo;ve seen several &ldquo;dark before dawn&rdquo; reports this morning) &ndash; the market might appreciate an upside surprise. Stay tuned!</p>
<h3>Chart at a Glance: U.S. Recession Probability &ndash; Uncomfortably High</h3>
<p><img class="img-responsive w-100" src="https://www.vaneck.com/contentassets/f3d14109501043bf9379c79b75833860/us-emerging-markets-daily-2022-12-15-20221215-153243.png" alt="Chart at a Glance: U.S. Recession Probability - Uncomfortably High" /></p>
<p class="chart-disclosure">Source: Bloomberg LP.</p>
]]></content:encoded>
</item><item rdf:about="https://www.vaneck.com/us/en/blogs/investment-outlook/jan-van-eck-expect-sideways-in-2023-and-another-untouchable-investment/">
  <title>Expect Sideways in 2023 and Another “Untouchable” Investment></title>
  <link>https://www.vaneck.com/us/en/blogs/investment-outlook/jan-van-eck-expect-sideways-in-2023-and-another-untouchable-investment/</link>
  <description><![CDATA[CEO Jan van Eck and Portfolio Manager Eric Fine discuss why we expect 2023 to be a &ldquo;sideways&rdquo; year for equities and the promising outlook for emerging markets bonds.]]></description>
  <dc:creator>Jan van Eck</dc:creator>
  <dc:date>12/14/2022 06:30:00</dc:date>
<content:encoded><![CDATA[

<p>On a recent webinar, <strong><a href="https://www.vaneck.com/us/en/webinar-registration/?id=95372806538&amp;utm_source=vaneck&amp;utm_medium=calendar" title="Why 2023 Is the Year to Think Differently About the Market">Why 2023 Is the Year to Think Differently About the Market</a></strong>, CEO <strong><a href="https://www.vaneck.com/us/en/news-and-insights/thought-leaders/jan-van-eck/" title="Jan van Eck - Chief Executive Officer">Jan van Eck</a></strong> and Portfolio Manager Eric Fine discuss why we expect 2023 to be a &ldquo;sideways&rdquo; year for equities and the promising outlook for emerging markets bonds.</p>
<h2>What to Expect in 2023: The &ldquo;Risk On&rdquo; Rip That Never Comes</h2>
<p>For most of the past decade, whenever there was a blip of volatility or uncertainty, markets expected that Federal Reserve (Fed) actions would keep the economy&mdash;and by extension, equities&mdash;on track. As we head into 2023, consensus thinking seems to be that we are just one piece of good news away from a Fed pivot. We don&rsquo;t see it happening. Anyone who is expecting a &ldquo;rip&rdquo; on the back of a Fed policy announcement should take a closer look at current economic and monetary policy conditions. Labor markets remain strong and that won&rsquo;t change overnight. Commodity prices and the Consumer Price Index (CPI) receive a lot of focus, but we think what the Fed is really fighting is wage inflation, which is endemic and hard to manage once it takes hold because it creates a spiraling effect. The Fed is currently in a staring contest with labor markets and after a year of tightening, labor markets aren&rsquo;t blinking. This dynamic suggests higher interest rates for longer (2:20).</p>
<h3>Services Inflation Is Not Under Control</h3>
<p><strong>U.S. Core CPI &ndash; Goods and Services (YoY% Change)</strong></p>
<p><img class="img-responsive w-100" src="https://www.vaneck.com/contentassets/daa4cd6c12db46a8941887fac6d7f179/2023_outlook-webinar_chart_01_v1_2022_blog.svg" alt="Services Inflation Is Not Under Control: U.S. Core CPI, Goods and Services" /></p>
<p class="chart-disclosure">Source: Bureau of Labor Statistics. Data as of October 2022. The "Consumer Price Index for All Urban Consumers: All Items Less Food &amp; Energy" is an aggregate of prices paid by urban consumers for a typical basket of goods, excluding food and energy. This measurement, known as "Core CPI," is widely used by economists because food and energy have very volatile prices.</p>
<h2>If You Like Equities Over Bonds&hellip;Why?</h2>
<p>These conditions are going to be sticking around for a while, and what the markets are looking at now is the pressure on corporate profitability. Stocks are more attractive if companies are more profitable. For those investors who are bullish on equities heading into 2023, our simple question is: why? 2023 corporate earnings projections are expected to decline next year (8:42).</p>
<h2>Emerging Market Debt Poised for a Comeback?</h2>
<p>So where to invest instead? In our view, there are not many super&ndash;cheap valuations at the moment. Monetary and fiscal policy, as well as global growth are all contractionary. However, opportunities we would emphasize in the current environment are fixed income&mdash;based on guidance from the 1970s&mdash;and commodity equities, which are very attractively priced and poised for growth.</p>
<p>As it relates to fixed income, we believe emerging markets are particularly interesting. Emerging markets bonds historically <strong><a href="https://www.vaneck.com/us/en/blogs/emerging-markets-bonds/fortify-your-40-with-emerging-markets-bonds/" title="Fortify Your 40% with Emerging Markets Bonds">do well in rising rate environments</a></strong>&mdash;particularly when rates rise due to higher growth prospects rather than a taper tantrum. In addition, compared to the U.S. and other developed markets bonds, emerging markets bonds not only provide <strong><a href="https://www.vaneck.com/us/en/blogs/emerging-markets-bonds/yield-duration-opportunity-in-em-bonds/" title="Yield-Duration Opportunity in EM Bonds">significantly higher nominal and real yields</a></strong> on average but also shorter durations.</p>
<h3>EM Local Pays High Real Rates; DM Does Not</h3>
<p><strong>Real Policy Rates (Trailing) in EM and DM, %</strong></p>
<p><img class="img-responsive w-100" src="https://www.vaneck.com/contentassets/daa4cd6c12db46a8941887fac6d7f179/2023_outlook-webinar_chart_02_v1_2022_blog.svg" alt="The (Not so Bright) Profit Outlook: Change in 2023 EPS Estimates" /></p>
<p class="chart-disclosure">Source: VanEck Research; Bloomberg LP. Data as of November 2022. Past performance is not indicative of future results.</p>
<p>Notwithstanding China&rsquo;s more recent policy direction, emerging markets in general have <strong><a href="https://www.vaneck.com/us/en/blogs/emerging-markets-bonds/meeting-demand-for-income-in-a-year-of-rising-rates/" title="Meeting Demand for Income in a Year of Rising Rates">moved much more quickly to increase interest rates</a></strong> compared to the U.S. and other developed market rates in order to stay ahead of inflation (14:10). The result has been not only higher nominal yields, but higher real yields. The benefits to emerging markets local currency investors are a more substantial level of income that is not eroded by loss of purchasing power (through a potentially weaker currency) and the potential for rate cuts to stimulate growth, if needed.</p>
<p><strong>Other highlights from the webinar include:</strong></p>
<p>1:10 &ndash; What we got right in 2022.<br />6:55 &ndash; Falling real wages: Shouldn&rsquo;t people be working more?<br />8:01 &ndash; The market expects a Fed pivot (spoiler alert: interest rate futures are never right).<br />9:45 &ndash; What the 2023 market trajectory may look like.</p>
<p>The full webinar replay can be accessed here: <strong><a href="https://www.vaneck.com/us/en/webinar-registration/?id=95372806538&amp;utm_source=vaneck&amp;utm_medium=calendar" title="Why 2023 Is the Year to Think Differently About the Market">Why 2023 Is the Year to Think Differently About the Market</a></strong>.</p>
<p>To receive more <a href="/us/en/insights/investment-outlook" title="Investment Outlook Insights"><strong>Investment Outlook</strong></a> and <a href="/us/en/insights/emerging-markets-bonds" title="Emerging Markets Bonds Insights"><strong>Emerging Markets Bonds</strong></a> insights, <a href="https://www.vaneck.com/us/en/subscribe/" title="Subscription Center"><strong>sign up in our subscription center</strong></a>.</p>
]]></content:encoded>
</item><item rdf:about="https://www.vaneck.com/us/en/blogs/economic-trends/global-rate-hikes-fizzling-out/">
  <title>Global Rate Hikes – Fizzling Out></title>
  <link>https://www.vaneck.com/us/en/blogs/economic-trends/global-rate-hikes-fizzling-out/</link>
  <description><![CDATA[The U.S. Federal Reserve is expected to slow the pace of rate hikes today. How do EM central banks measure up?]]></description>
  <dc:creator>Natalia  Gurushina</dc:creator>
  <dc:date>12/14/2022 06:30:00</dc:date>
<content:encoded><![CDATA[

<h2>Fed Rate Hikes</h2>
<p><strong>It&rsquo;s going to be a tough choice today &ndash; listening to the U.S. Federal Reserve (Fed) Chairman&rsquo;s press conference in the afternoon or watching the second World Cup semi-final</strong> between France and Morocco. The market looks for an orderly slowdown in the pace of the Fed&rsquo;s rate hikes (to 50bps), hoping that further disinflation would allow it to exit the tightening cycle in H1-2023. The outcome of the soccer game is much harder to predict &ndash; but Argentina&rsquo;s &ldquo;Messi rocks!&rdquo; triumph yesterday shows that EM High Yielders have a fighting chance. It would be very nice if Argentina extended its winning streak to structural reforms &ndash; including the unification of the foreign exchange market(s) (President Fernandez alluded a few days ago that authorities are working on this).</p>
<h2>EM Disinflation</h2>
<p><strong>In the meantime, we&rsquo;ve got</strong> <strong>some good news in emerging markets (EM) &ndash; on the inflation front and in external balances</strong>. South Africa&rsquo;s headline and core inflation surprised the downside in November. If the disinflation momentum gains pace, the central bank can safely slow the pace of hikes at its meeting in January and then pause because headline inflation is likely to re-enter the official target range in Q2/Q3-2023 (see chart below). In January, the real policy rate should turn positive (=de-facto restrictive). Several other EMs will release their inflation prints before year-end. We keep an eye on South Korea and Malaysia to confirm the &ldquo;EM Asia dodged the inflation bullet&rdquo; narrative. Mexico&rsquo;s bi-weekly inflation will be closely watched to make sure that it has peaked indeed. Poland&rsquo;s core inflation should be interesting as well &ndash; we doubt it will change the central bank&rsquo;s dovish stance, but if it follows in the Czech Republic&rsquo;s footsteps (=easing), this might give the bond market some peace of mind.</p>
<h2>EM Current Accounts</h2>
<p><strong>Poland might also benefit from</strong> <strong>the improving current account position</strong> following a serious scare earlier in 2022. The October deficit was smaller than expected (in part due to EU transfers), and it showed clearer signs of bottoming out. The reason we are watching these developments is because Poland&rsquo;s fiscal spending might increase in the run-up to the elections, and a large twin deficit (a sum of fiscal and current account deficits) is often frowned upon by the market. Poland&rsquo;s expected 2023 current account turnaround is not unique. The consensus currently sees a meaningful improvement in EM ex-China and Russia, as slowing domestic demand should cap imports. Stay tuned!</p>
<h3>Chart at a Glance: South Africa Inflation &ndash; Back to Target Soon</h3>
<p><img class="img-responsive w-100" src="https://www.vaneck.com/contentassets/9ef10eacc1a64b3886ebe144c8084586/us-emerging-markets-daily-2022-12-14.png" alt="Chart at a Glance: South Africa Inflation - Back to Target Soon" /></p>
<p class="chart-disclosure">Source: Bloomberg LP.</p>
]]></content:encoded>
</item><item rdf:about="https://www.vaneck.com/us/en/blogs/digital-assets/matthew-sigel-11-crypto-predictions-for-2023/">
  <title>11 Crypto Predictions for 2023></title>
  <link>https://www.vaneck.com/us/en/blogs/digital-assets/matthew-sigel-11-crypto-predictions-for-2023/</link>
  <description><![CDATA[Despite the &ldquo;crypto winter&rdquo; and volatility in 2022, we believe crypto&rsquo;s financial disruption will continue. Here are our 2023 crypto predictions.]]></description>
  <dc:creator>Matthew  Sigel</dc:creator>
  <dc:date>12/13/2022 06:30:00</dc:date>
<content:encoded><![CDATA[

<p><strong>Please note that VanEck may have a position(s) in the digital asset(s) described below.</strong></p>
<p>Volatility is a given with crypto. The &ldquo;crypto winter&rdquo; stole most of the digital asset headlines throughout 2022, and the year is closing out with a spate of rapid collapses and bankruptcies. So is crypto done? Not by a longshot. We believe crypto&rsquo;s financial disruption is here to stay. We explore why as we share here our top crypto predictions for 2023.</p>
<ol class="content-list">
<li><strong><a href="#point-one">Bitcoin will test $10-12K in Q1 amid a wave of miner bankruptcies, which will mark the low point of the crypto winter.</a></strong></li>
<li><strong><a href="#point-two">In the second half of 2023, Bitcoin will rise to $30K. Lower inflation, easing energy concerns, a possible truce in Ukraine, and a turnaround in M2 supply will power the start of a new bull market.</a></strong></li>
<li><strong><a href="#point-three">Financial institutions will tokenize more than $10B in off-chain assets.</a></strong></li>
<li><strong><a href="#point-four">Brazil will emerge as one of the most crypto friendly countries of the world and tokenize a portion of sovereign debt offerings on blockchain.</a></strong></li>
<li><strong><a href="#point-five">Twitter will bolster its payment offerings with state money licenses, competing more directly with Venmo and Cash App.</a></strong></li>
<li><strong><a href="#point-six">A nation, most likely one dependent on oil exports, will announce it is adding Bitcoin and other digital assets to its sovereign wealth fund. </a></strong></li>
<li><strong><a href="#point-seven">A new decentralized stablecoin will reach $1B in market cap.</a></strong></li>
<li><strong><a href="#point-eight">Ripple will lose the SEC lawsuit.</a></strong></li>
<li><strong><a href="#point-nine">Gary Gensler will leave the SEC, as proposed legislation fails to gain wide support. </a></strong></li>
<li><strong><a href="#point-ten">Total web3 monthly gamers will rise from 2M to 20M as multiple triple-A games come to market.</a></strong></li>
<li><strong><a href="#point-eleven">Ethereum will enable withdrawals from the Beacon Chain.</a></strong></li>
</ol>
<h2 id="point-one" class="anchored-block">1. Bitcoin will test $10-12K in Q1 amid a wave of miner bankruptcies, which will mark the low point of the crypto winter.</h2>
<p>The <strong><a href="/link/c71bd437f541419a993aa76e2b8a64fd.aspx" title="DAM - VanEck Digital Assets Mining ETF - Index">MVIS<sup>&reg;</sup>&nbsp;Global Digital Assets Mining Index</a></strong> median market cap is now only $180M, with nearly all constituents burning cash and trading well below book value. With Bitcoin mining largely unprofitable given recent higher electricity prices and lower Bitcoin prices, we predict that many miners will restructure or merge. Ripple losing its SEC lawsuit (possible in Q1, more on this below) may coincide with this final downdraft, which would take out nearly the entirety of the post-2020 halving bull market.</p>
<h2 id="point-two" class="anchored-block">2. In the second half of 2023, Bitcoin will rise to $30K. Lower inflation, easing energy concerns, a possible truce in Ukraine, and a turnaround in M2 supply will power the start of a new bull market.</h2>
<p>Bitcoin and the broader crypto ecosystem have suffered through a brutal bear market in 2022. Numerous companies in the space have imploded and sentiment is quite poor. Bitcoin has traded like a risk asset over the prior year and has shown price sensitivity to interest rate hikes.</p>
<p>One reason why Bitcoin has reacted poorly to higher rates is that the political response to higher inflation in developed markets has been to attempt to cap energy prices, widen sanctions, and micro-manage economic activity to facilitate the &ldquo;energy transition.&rdquo; An end to the war in Ukraine would likely reverse at least some of these policies and make Bitcoin mining more politically palatable. On the other hand, the war is also creating a more economically integrated Eurasia with incentives to adopt novel payments methods for cross-border trade, as Russia and China are doing with the digital RMB and possible gold-for-oil swaps.</p>
<p>In developed markets, we think consumers will see Bitcoin act as a store of value over time and a hedge against M2 inflation rather than overt CPI inflation. In emerging markets, the focus is more on remittances and neutral alternatives to dollar hegemony.</p>
<p>Meanwhile, should our recession expectations materialize, the Federal Reserve would likely pause raising rates amidst softening inflation, while money printing and government budget deficits continue. Merely a lack of bad crypto-specific news, under the above scenario, could cause the price of Bitcoin to climb a wall of worry back to $30K again.</p>
<h2 id="point-three" class="anchored-block">3. Financial institutions will tokenize more than $10B in off-chain assets.</h2>
<p>Institutions will employ blockchains to simplify custody and settlement, while reducing costs for customers. KYC/AML will be enabled using identity protocols and permissioned sub-networks/applications. Already, MakerDAO has plans to deploy $1B into U.S. t-bills and other government securities with the help of BlackRock and Coinbase, allowing DAI holders to earn a higher yield on deposits.<sup>1</sup>&nbsp;Real world loans on platforms such as Goldfinch, TrueFi, Maple and Clearpool sum to another $300M+. KKR has tokenized one of its private funds in partnership with Avalanche and Securitize. The Monetary Authority of Singapore&rsquo;s Project <strong><a href="https://www.mas.gov.sg/schemes-and-initiatives/project-guardian" title="Monetary Authority of Singapore - Project Guardian" target="_blank" rel="noopener">Guardian</a></strong> is a collaborative initiative with the financial industry that seeks to test the feasibility of applications in asset tokenization and DeFi. MAS recently participated in transactions against liquidity pools comprising tokenized Singapore Government Securities, Japanese Government Bonds, Japanese Yen and Singapore Dollar.</p>
<p>Among open-source blockchains, we think Ethereum, Polygon, Avalanche, Polkadot and Cosmos are best positioned. We can also predict with high confidence that industry pioneer VanEck will originate real world assets on open-source blockchains in 2023.</p>
<h2 id="point-four" class="anchored-block">4. Brazil will emerge as one of the most crypto friendly countries of the world and tokenize a portion of sovereign debt offerings on blockchain.</h2>
<p>With persistent inflation and a young population, Latin America is seeing the fastest crypto and stablecoin adoption in the world. Brazilian regulators have been aggressive in giving private companies a sandbox to play in this area. Itau Unibanco, the country&rsquo;s largest bank, plans to launch an asset tokenization platform to transform traditional financial products into tokens and offer custody services for clients. Tokenization of sovereign debt may begin in Brazil first.</p>
<h2 id="point-five" class="anchored-block">5. Twitter will bolster its payment offerings with state money licenses, competing more directly with Venmo and Cash App.</h2>
<p>Twitter&rsquo;s current payment abilities are restricted to peer to peer tipping, including Bitcoin over the Lightning Network, but the user experience is poor. We expect Elon Musk to implement payments functionality more akin to WeChat Pay, which would let consumers pay merchants for services. In November, Twitter filed registration paperwork with the Treasury Department&rsquo;s Financial Crimes Enforcement Network (finCEN) to pave the way for it to process payments, according to the New York Times. Such an endeavor is likely to include dollars, Bitcoin, and possibly other crypto assets like Dogecoin.</p>
<h2 id="point-six" class="anchored-block">6. A nation, most likely one dependent on oil exports, will announce it is adding Bitcoin and other digital assets to its sovereign wealth fund.</h2>
<p>We have heard first-hand from multiple crypto companies that Saudi Arabia&rsquo;s sovereign wealth funds are already mining Bitcoin, though at small scale. In addition, Russian government officials have clearly stated intentions to settle cross-border trade in crypto assets. Russia&rsquo;s largest bank Sberbank recently integrated its blockchain platform with MetaMask and the Ethereum blockchain. And multiple Russian media have also reported that Russians have been aggressively buying Bitcoin mining ASICS in November.</p>
<h2 id="point-seven" class="anchored-block">7. A new <i>decentralized</i> stablecoin will reach $1B in market cap.</h2>
<p>A stablecoin is a digital currency that is pegged to a &ldquo;stable&rdquo; reserve asset like the U.S. dollar or gold. Stablecoin projects differ in how they maintain their peg. For example, USDT and USDC are both run by centralized entities who collateralize their tokens with fiat reserves, including cash and government treasuries. DAI, on the other hand, is administered by a decentralized entity whose users deposit ETH into smart contracts to mint the dollar-denominated, over-collateralized DAI. There are more than $5B in DAI outstanding as of 11/17/2022.<sup>2</sup></p>
<p>Algorithmic stablecoins differ in the fact that they are collateralized with digital assets and either under- or over-collateralized. Typically, algorithmic stablecoins maintain their peg with the backing of another digital asset and/or an on-chain algorithm that balances supply and demand. Some applications of algorithmic stablecoins include: use in trading, using them to run Decentralized Autonomous Organizations (DAOs), and providing staking rewards to holders. We continue to observe considerable demand for a censorship resistant stablecoins, which cannot be seized by regulators.</p>
<p>Thus, despite the collapse of LUNA and its associated algorithmic stablecoin UST losing its peg, we see various decentralized stablecoins continuing to launch in 2023, including AAVE&rsquo;s GHO offering, which will employ an overcollateralization strategy and rely on arbitrage and community-led monetary policy to stabilize the token at $1.</p>
<h2 id="point-eight" class="anchored-block">8. Ripple will lose the SEC lawsuit.</h2>
<p>Ripple Labs has been engaged in a legal battle with the SEC since 2020 over their token, XRP. The SEC lawsuit alleges that XRP is an unregistered security. Considering the prominence of Ripple and XRP in the digital asset space, the result of this case could have far-reaching effects throughout the industry and set a precedent for future cases.</p>
<p>Ripple has the support of many large players in the industry, including Coinbase and Blockchain Association. This support has only increased, with 12 independent entities now offering legal support to Ripple. Both the SEC and Ripple have called for a summary judgement from a federal judge in the case, so a decision by end of Q1 is likely.</p>
<p>Unfortunately for crypto bulls, the SEC won its lawsuit against blockchain-based publishing company LBRY in November, with a U.S. district judge in New Hampshire writing that &ldquo;nothing in the case law suggests that a token with both consumptive and speculative use cases cannot be sold as an investment contract.&rdquo; With this case as precedent, we have lowered our probability of a Ripple victory materially. Ripple&rsquo;s CEO has said the crypto company will move to another country if it loses. Significant financial penalties (disgorgement) are also possible.</p>
<h2 id="point-nine" class="anchored-block">9. Gary Gensler will leave the SEC, as proposed legislation fails to gain wide support.</h2>
<p>Crypto enthusiasts had hoped that SEC Chairman Gary Gensler would be a proponent of advancing the digital assets ecosystem in the U.S. However, the SEC has continued to deny or postpone decisions on Bitcoin spot ETFs on grounds of &ldquo;market manipulation&rdquo;. Bizarrely, Bitcoin futures ETFs and even <i>inverse</i> Bitcoin futures ETFs have been approved.</p>
<p>Chairman Gensler has stated on several occasions that he considers Bitcoin to be a commodity, but most other digital assets to be securities. Still, considerable uncertainty remains in regard to which agency will regulate the industry, as the SEC and CFTC jockey over the right to regulate the space. That a spot Bitcoin ETF has been hostage of this dispute is unfortunate, given that proper guidance and regulation may have potentially prevented some of the crypto industry blow-ups from occurring in 2022. Specifically, Grayscale&rsquo;s GBTC Bitcoin trust, which trades at a ~48% discount to NAV, sits at the center of questionable loans made by several market participants.</p>
<p>Thus, we see a rising probability that Chairman Gensler is replaced, now that the 2022 midterm elections have passed, as he faces increasing scrutiny that may become a political liability for the White House. Four U.S. lawmakers sent him a letter on November 8 deriding him for the SEC&rsquo;s double standard when it comes to transparency. New York Democratic Rep. Ritchie Torres also wrote to the U.S. Comptroller in December requesting that the federal legislative watchdog conduct a review of the SEC&rsquo;s failure to protect the public from &ldquo;the egregious mismanagement and malfeasance of FTX.&rdquo; The strongly worded letter also criticized Chairman Gensler&rsquo;s leadership in general. Even the SEC&rsquo;s union of 3,500 staffers is fighting the Chairman over pensions, returning to work and an overly stretched workforce.</p>
<p>Since 1934, the average tenure of an SEC chair is 2.75 years; the median is 2. Our predicted SEC victory over Ripple could provide a graceful face-saving exit.</p>
<h2 id="point-ten" class="anchored-block">10. Total web3 monthly gamers will rise from 2M to 20M as multiple triple-A games come to market.</h2>
<p>The total addressable market (TAM) in traditional gaming is massive, at $300B and 3.2B people globally. Gaming is a digital-native activity, and in-game items (aka digital assets) are already being bought and used by hundreds of millions of gamers around the world. Still, we believe category gaps exist between traditional and crypto games, creating <strong><a href="https://www.vaneck.com/us/en/blogs/digital-assets/matthew-sigel-how-we-invest-in-the-future-of-the-metaverse/" title="How We Invest in the Future of the Metaverse">white space for growth</a></strong>. Specifically, blockchain-enabled games open up the possibility to transfer in-game assets between games, which does not currently exist.</p>
<p>That said, early play-to-earn and play-to-own games have lacked high quality production value and sufficiently large budgets to attract mass market users. A number of traditional &ldquo;triple-A&rdquo; games are aiming to fill that gap with tentpole releases in 2023. We think one of them is likely to go viral.</p>
<p>In defense of this prediction, we observe the traditional gaming industry increasingly excited about the potential of the future of web3. EA CEO Andrew Wilson recently called web3 &ldquo;the future of our industry&rdquo;. The sentiment is echoed by Ubisoft CEO Yves Guillemot, who stated that blockchain gaming is a &ldquo;revolution&rdquo; in the industry and who recently announced plans to develop blockchain games. Microsoft, whose Activision acquisition is now in jeopardy due to an FTC lawsuit, has also been investing in web3 startups as part of their exploration of the space.</p>
<p>Industry-wide, gaming companies have been hiring blockchain, NFT, and crypto experts as they search for the next evolution in gaming. With blockchain games and metaverse platforms on pace to attract $9B in venture capital investment this year, the chances of a breakthrough hit in 2023 are better than ever.</p>
<h2 id="point-eleven" class="anchored-block">11. Ethereum will enable withdrawals from the Beacon Chain.</h2>
<p>The Beacon Chain is the name of the pre-Merge, proof-of-stake Ethereum blockchain. It was created to ensure the proof-of-stake consensus logic was sound and sustainable before enabling it on the Ethereum Mainnet. The Merge took place in September of 2022, resulting in the Ethereum Mainnet merge with the Beacon Chain and transitioning to a singular blockchain with a proof-of-stake consensus mechanism. Stakers are currently receiving ~5% annual interest rates in return for committing ETH. However, withdrawals have not been enabled, potentially hindering adoption. Enabling Beacon Chain withdrawals would give stakers more confidence to commit capital to the protocol. The percentage % of ETH staked could potentially rise from ~13% to above 25%.</p>
<p>To receive more <strong><a href="https://www.vaneck.com/us/en/insights/digital-assets/" title="Digital Assets Insights">Digital Assets</a></strong> insights, <strong><a href="https://www.vaneck.com/us/en/subscribe/" title="Subscription Center">sign up in our subscription center</a></strong>.</p>
]]></content:encoded>
</item><item rdf:about="https://www.vaneck.com/us/en/blogs/gold-investing/joe-foster-holiday-surprise-in-store-for-gold/">
  <title>Holiday Surprise in Store for Gold?></title>
  <link>https://www.vaneck.com/us/en/blogs/gold-investing/joe-foster-holiday-surprise-in-store-for-gold/</link>
  <description><![CDATA[Gold surged 8.3% in November, and bolstered by strong physical demand, resumed its long-term bull trend that began in 2016.]]></description>
  <dc:creator>Imaru Casanova</dc:creator>
  <dc:date>12/13/2022 06:30:00</dc:date>
<content:encoded><![CDATA[

<p>Monthly gold market and economic insights from Joe Foster, Portfolio Manager and Strategist, and Imaru Casanova, Deputy Portfolio Manager, featuring their unique views on mining and gold&rsquo;s portfolio benefits. <a href="/us/en/blogs/gold-investing/joe-foster-holiday-surprise-in-store-for-gold/gold-monthly-commentary-november-2022.pdf" title="Gold Monthly Commentary - November 2022" target="_blank" rel="noopener"><strong>An expanded PDF version of this commentary, including fund specific information can be downloaded here.</strong></a></p>
<h2>Good tidings for gold</h2>
<p>Gold&rsquo;s Christmas came early this year! Yes, gold is still down over 3% year to date, but it is hard not to get excited about a $135 per ounce (8.3%) move in just one month. So, it does feel like an early Christmas present, especially considering that this move places gold right back on the long-term bull trend that has been in place since 2016. Gold fell out of that trend in mid-September this year, when it traded below long-term support of $1,680 per ounce. Although vulnerable at those levels, the gold price showed resilience, supported by strong physical demand, and held firmly around the $1,650 level.</p>
<p>In the first days of November, an eclectic cocktail of news including the Federal Open Market Committee (FOMC) rate hike decision, the jobs report and the U.S. midterm elections led to U.S. dollar weakness, which pushed gold higher. On November 10, the U.S. Consumer Price Index (CPI) for October came in at 7.7% year-on-year, slightly below expectations and lower than the previous month (8.2%). This gave markets renewed hopes that the U.S. Federal Reserve (Fed) may soon slow down the pace of rate hikes, causing the dollar to slide and helping gold trade as high as $1,786 per ounce on November 15. On the last of the day of the month, during his speech at the Brookings Institution, Fed Chairman Jerome Powell put a bow on it by signaling that the Fed may slow down the pace of rate increases as soon as December. Gold responded closing at $1,768.52 per ounce on November 30.<sup>*</sup></p>
<p>Gold equities got a jolly ride in Santa&rsquo;s November sleigh. NYSE Arca Gold Miners Index (GDMNTR)<sup>1</sup>was up 19.0% and MVIS Global Junior Gold Miners Index (MVGDXJTR)<sup>2</sup>&nbsp;was up 19.4%. This strong outperformance by gold equities during the month demonstrates both their leverage to the gold price and how oversold they have been over the past couple of years&mdash;both historically and relative to the gold price. Despite recent cost inflation, which has hit the miners hard this year, the sector remains profitable. At today&rsquo;s gold prices, gold producers enjoy healthy margins, generating substantial free cash flow to allow them to continue to pay dividends and fund future growth.</p>
<h2>Growth challenges for miners</h2>
<p>Growth is hard to come by in the gold space. It is not just a matter of access to capital. The major gold miners have plenty of liquidity. It is a matter of access to large and economic gold deposits. Those do not come easy, as recent sector mergers and acquisitions activity would tell us. This month we saw two gold producers, Agnico-Eagle (9.46% of Strategy net assets) and Pan American Silver (not held by Strategy) teaming up to launch a competing bid against Gold Fields (not held by Strategy) to acquire Yamana Gold (not held by Strategy). The Agnico/Pan American offer had an element that was very hard to compete against: the transaction would see Agnico-Eagle consolidate ownership of the Tier 1 Canadian Malartic mine, which is presently owned 50% by Yamana and 50% by Agnico.</p>
<p>We talk frequently about how fragmented the gold sector is, that is, too many small assets in too many hands. Agnico controlling 100% of Canadian Malartic just makes sense&mdash;a slam-dunk! Pan American would acquire Yamana&rsquo;s Latin American assets, a natural fit within its portfolio of eight producing mines in the region. Yamana&rsquo;s South American assets would have been a stretch for Agnico, which doesn&rsquo;t have operations there at present, so the acquiring partnership is logical. Gold Fields&rsquo; offer, in contrast, while creating a bigger gold major, which we recognized as advantageous, was weighed down by other risks that made it difficult for investors to digest. This illustrates the challenges facing gold producers as they pursue growth. In an industry with so many different sources of risk, investors expect acquisitions to deliver not just production growth and value creation, but a significantly reduction in risk. Gold Fields is a well-run company with good assets which now has a fresh start (and a nice break fee) at fulfilling its growth aspirations.</p>
<p>This month we attended Barrick Gold&rsquo;s (5.76% of Strategy net assets) investor day at the New York Stock Exchange. Barrick&rsquo;s presentations placed the spotlight on the other side of growth, organic growth, much preferred by most investors, as it usually comes at a lower cost. Even factoring in all the recent capital costs escalations, adding ounces through the drill bit is the preferred option, not least because those ounces often come with much lower risk. Expanding the capacity or increasing the life of an existing mine or adding a new mine to an existing district or operational region clearly reduces the associated risks. We were encouraged to see the extensive pipeline of projects and highly prospective grounds that, in our view, will continue to drive Barrick&rsquo;s growth for decades to come.</p>
<h2>Market risks keeping gold in the fold</h2>
<p>In the crypto world, the Grinch stole Christmas early! The sudden collapse of FTX raises many questions about the entire crypto ecosystem and creates much uncertainty in what is still a fairly new asset class. Perhaps it should not surprise us that as this sector grows, invents and defines itself, there are going to be some casualties. We are often asked about the impact bitcoin has had on gold demand, as they are both seen as alternative investments. No doubt, gold has likely lost some investors to bitcoin. However, we believe the core gold investors are generally very different from bitcoin investors. Those investing in gold are looking for the safe haven, inflation protection and portfolio diversification&mdash;benefits that gold has historically offered. It is clearly too early to tell what role bitcoin and crypto assets will play in a portfolio, and this month&rsquo;s developments are a setback in that discovery process. Until this is better understood and corroborated over time, crypto will have a tough time stealing gold&rsquo;s investors.</p>
<p>The real contender for gold this year has been the U.S. dollar. Investors are tasked with deciding whether to hold gold to protect their portfolios from high inflation and geopolitical tensions or to reduce their holdings as global interest rates rise. In an environment of rising rates and a lower outlook for inflation as a result of the monetary tightening programs by Fed and other central banks, investors have chosen the safety of the U.S. dollar, propelling it to 20-year highs, which has been the biggest headwind for gold this year. The U.S. dollar index (DXY)<sup>3</sup>&nbsp;was down 5% during November.</p>
<p>Gold broke out of its recent downward trend trading well above $1,700 per ounce and it now looks like it may be back on the longer-term bull trend that has been in place since 2016. This is a significant development for gold.</p>
<h3>Gold: back on track with its long-term bull trend?</h3>
<p><img class="img-responsive w-100" src="https://www.vaneck.com/contentassets/6f34df86f7f0461281574630955e1f8b/gold_chart-01_2022.12_blog.svg" alt="Gold: back on track with its long-term bull trend?" /></p>
<p class="chart-disclosure">Source: Bloomberg. Data as of December 1, 2022. Past performance is no guarantee of future results. Not intended as a recommendation to buy or sell any securities mentioned herein.</p>
<p>We expect gold to continue to trade around the $1,700 to $1,800 per ounce range in the near term. If inflation remains at or near current levels, real rates are likely to stay in negative territory and we would expect this to support gold. A pause of the Fed&rsquo;s tightening program would likely be a strong catalyst for gold. However, gold may rally even ahead of a Fed pause or pivot. The recent gold price action following the CPI report for October is a perfect example of this. Gold broke out as the market anticipated that Fed rate increases might soon start to slow down. Gold also rallied well ahead of a Fed pause during the last tightening cycle.</p>
<h3>Similar to past cycles rate hiking cycles, gold is likely getting a boost from a potential pause</h3>
<p><img class="img-responsive w-100" src="https://www.vaneck.com/contentassets/6f34df86f7f0461281574630955e1f8b/gold_chart-02_2022.12_blog.svg" alt="Similar to past cycles rate hiking cycles, gold is likely getting a boost from a potential pause" /></p>
<p class="chart-disclosure">Source: FactSet, St. Louis Federal Reserve Bank. Data as of December 1, 2022. Past performance is no guarantee of future results. Not intended as a recommendation to buy or sell any securities mentioned herein.</p>
<p>November&rsquo;s gold price move is fairly unique in that there was not a corresponding increase in gold bullion exchange traded fund (ETF) holdings, the best proxy of investment demand. In fact, gold bullion ETF holdings were down 0.9% during the month, although outflows did slow down. This is a welcomed change in the trend of persistent heavy redemptions since April of this year. Continued strength from other demand centers (central banks, jewelry, bars and coins) is supporting the gold price. We see opportunity for gold&rsquo;s breakout to intensify, propelling it to its all-time highs around the $2,000 per ounce level, but this will require investment demand to increase. So, the question is, what will drive gold investment demand in the medium and longer-term?</p>
<p>We have reviewed at length throughout the year the many risks that we believe are supportive of higher gold prices in the longer term. These include (in the U.S. and globally) persistent and elevated inflation, a weakening economy, debt service strains, elevated geopolitical risks and black swan events, such as the Liability-Driven Investment crisis in the UK. However, the gold market is ignoring these risks for now. It is likely that the market will continue to ignore these risks until:</p>
<ul class="content-list">
<li><strong>Unemployment rates increase significantly:</strong> the jobs market is still showing resilience that the financial markets interpret as contributing to the possibility of a soft landing. Higher rates of unemployment due to Fed induced demand suppression will send a strong signal that the economy is feeling the strain of the tighter policies. Recently, former Treasury Secretary Larry Summers was quoted saying that a U.S. recession and unemployment hitting 6% are what it will take for surging inflation to be brought under control in America.<sup>&dagger;</sup></li>
<li><strong>A recession is confirmed:</strong> it is not enough that most economists are calling for a recession next year, it seems markets want confirmation that we are smack in the middle of it. Even Fed Chairman Powell admitted that the path to a soft landing seems to have narrowed.<sup>&Dagger;</sup>&nbsp;Markets are also ignoring the yield curve inversion, which has consistently been a good recession indicator. Corporates are also sending warning signals. FactSet reported that 179 S&amp;P 500<sup>4</sup>&nbsp;companies cited the term &ldquo;recession&rdquo; during their earnings calls for the third quarter, which is well above the 5-year average of 63 and the 10-year average of 54.<sup>&sect;</sup></li>
<li><strong>Corporate earnings fall:</strong> FactSet also reported that for Q3 2022, the blended earnings growth rate for the S&amp;P 500 was a tepid 2.2%.<sup>**</sup>&nbsp;In addition, for Q4 2022, analysts are projecting an earnings decline of -2.1%. Companies are guiding to falling earnings, yet valuations still look rich. The forward 12-month price-to-earnings (P/E) ratio for the S&amp;P 500 is 17.2. This P/E ratio is below the 5-year average (18.5) but above the 10-year average (17.1).</li>
<li><strong>Equity markets correct further:</strong> share prices need to fall further for market participants to truly appreciate (believe) the impact of tighter financial conditions on corporate profits.</li>
<li><strong>Inflation and inflation expectations stay above the Fed&rsquo;s target rate:</strong> everyone wants to believe that inflation is under control and coming down. It is certainly reassuring to see the downtick in October. Nevertheless, history tells us it can take many years to bring inflation down after it hits the present levels.</li>
</ul>
<p>Market participants may not abandon the safety of the dollar and run to the safety of gold until several of these conditions are present. How long it may take for these risks to become reality is up for debate, but the increasing likelihood, we believe, will support higher gold prices in 2023 and beyond.</p>
<p>To receive more insights to <strong><a href="https://www.vaneck.com/us/en/insights/gold-investing/" title="Gold Investing Insights">Gold Investing</a></strong> insights, <strong><a href="https://www.vaneck.com/us/en/subscribe/" title="Subscription Center">sign up in our subscription center</a></strong>.</p>
]]></content:encoded>
</item><item rdf:about="https://www.vaneck.com/us/en/blogs/economic-trends/pivot-expectations-resurrected/">
  <title>Pivot Expectations Resurrected></title>
  <link>https://www.vaneck.com/us/en/blogs/economic-trends/pivot-expectations-resurrected/</link>
  <description><![CDATA[Global inflation surprises continue to move lower, pulling the market expectations for U.S. rates with them. EM politics can affect room for rate cuts in 2023.]]></description>
  <dc:creator>Natalia  Gurushina</dc:creator>
  <dc:date>12/13/2022 06:30:00</dc:date>
<content:encoded><![CDATA[

<h2>Fed Policy Pivot</h2>
<p>The key events of today and tomorrow are the World Club semi-finals, both of which are &ldquo;Investment Grade vs. High Yield&rdquo; battles. <strong>But Inflation in the U.S. is also of interest to the market, especially when it surprises to the downside.</strong> The surprise pushed the market expectations for the U.S. terminal rate lower (to 4.83%), but this still implies a 50bps hike tomorrow and at least one smaller 25bps hike in Q1-2023. Risky assets staged a nice rally after the release, buoyed by a prospect of the dovish policy pivot. A big question, however, is whether U.S. disinflation would allow the U.S. Federal Reserve (Fed) to cut rates in the second half of the year, which is what Fed Funds Futures currently price in. Another question is whether the U.S. 2023 growth slowdown would be milder than the current consensus forecast of 0.4% - a stronger growth/lower inflation combo would create a bullish backdrop for the market.</p>
<h2>EM Inflation Surprises</h2>
<p><strong>Emerging market (EM) inflation surprises are also trending down </strong>(see chart below), but once we get to the level of individual countries &ndash; there are plenty of bumps on the road. We had three upside inflation surprises in a row in Central Europe &ndash; with Romania following in the footsteps of Hungary and the Czech Republic. A big increase in Romania&rsquo;s energy prices was hardly surprising. Still, core inflation also crept higher (unlike in the Czech Republic), signaling that the central bank can extend its tightening cycle into 2023 &ndash; and this scenario is currently not priced in by the market.</p>
<h2>LATAM Political Noise</h2>
<p>In LATAM, the Governor of the Chilean central bank also sounded cautious, drawing attention to elevated prices and the uncertain timing of returning to the inflation target. One factor that might help to cap inflation pressures stemming from the weaker currency is dissipating political noise. We are seeing reports this morning that Chilean political parties reached an agreement on the new constitutional process and that the risk of an extreme outcome (populist constitution) is lower now. <strong>Politics is also affecting the market expectations for Brazilian rates</strong> &ndash; despite disinflation being well underway. The latest cabinet appointments raised legitimate concerns about the future fiscal trajectory &ndash; and these risks were clearly outlined in today&rsquo;s central bank minutes. Stay tuned!</p>
<h3>Chart at a Glance: Global Inflation Surprises Heading South</h3>
<p><img class="img-responsive w-100" src="https://www.vaneck.com/contentassets/cd9bd2af9d154ae6b2e80a8b824e087e/us-emerging-markets-daily-2022-12-13.png" alt="Chart at a Glance: Global Inflation Surprises Heading South" /></p>
<p class="chart-disclosure">Source: Bloomberg LP.</p>
]]></content:encoded>
</item><item rdf:about="https://www.vaneck.com/us/en/blogs/economic-trends/disinflation-pivots-easy-does-it/">
  <title>Disinflation, Pivots – Easy Does It?></title>
  <link>https://www.vaneck.com/us/en/blogs/economic-trends/disinflation-pivots-easy-does-it/</link>
  <description><![CDATA[Global disinflation is here &ndash; but countries proceed at a different pace. China is among few economies where inflation is expected to accelerate in 2023, and today&rsquo;s credit aggregates show why.]]></description>
  <dc:creator>Natalia  Gurushina</dc:creator>
  <dc:date>12/12/2022 16:00:00</dc:date>
<content:encoded><![CDATA[

<h2>FED Pivot Prospects</h2>
<p>This week, all eyes are on the U.S. inflation print and the Federal Reserve&rsquo;s (Fed) rate-setting meeting. The consensus view is that&nbsp;<strong>further disinflation will allow the Fed to slow the pace of rate hikes</strong>&nbsp;to 50bps, with this cycle&rsquo;s terminal rate peaking at 5%. Fed Funds Futures continue to price in 40-50bps of rate cuts in the second half of 2023, which many consider a stretch, given that U.S. inflation might still be above 3% by the end of the next year (if the current consensus forecast were to materialize).</p>
<h2>EM Disinflation, Rates</h2>
<p><strong>Meanwhile, emerging markets (EM) inflation releases continue to send dovish signals</strong>, starting with a sizable downside surprise in India, where headline inflation actually moved back to the target range in November (5.88% year-on-year). The Indian central bank had just delivered a 35bps rate hike, and today&rsquo;s print raises a possibility of a pause at the next meeting in February. Headline inflation in the Czech Republic exceeded expectations, accelerating to 16.2% year-on-year, but it was well below the peak, and core price pressures are moderating. Against this backdrop, there is no reason for the central bank to get alarmed. The market expectations that the policy pause will be extended into Q1-2023 look reasonable, albeit the pace of subsequent easing will depend on the growth trajectory and the disinflation progress.</p>
<h2>China Stimulus</h2>
<p><strong>China&rsquo;s&nbsp;inflation continued to moderate in November,</strong> but this should be expected to change if reopening gains pace. November&rsquo;s credit aggregates also showed that the&nbsp;<strong>latest policy shift gave a small sequential boost to corporate and household lending</strong>&nbsp;(including mortgages). However, the improvement is very gradual &ndash; both new loans and aggregate financing surprised to the downside &ndash; and it remains to be seen whether (or when) authorities can stop relying on government bond issuance to prop up growth (see chart below), raising a bunch of concerns about leverage (again). Stay tuned!&nbsp;</p>
<h3>Chart at a Glance: China Credit Growth &ndash; Different Dynamics</h3>
<img class="img-responsive w-100" src="https://www.vaneck.com/contentassets/ff462646c5f9446683652656434140da/us-emerging-markets-daily-2022-12-12.png" alt="Chart at a Glance: China Credit Growth &ndash; Different Dynamics" />
<p class="chart-disclosure">Source: Bloomberg LP</p>
]]></content:encoded>
</item><item rdf:about="https://www.vaneck.com/us/en/blogs/natural-resources/climate-finance-takes-center-stage-at-cop27/">
  <title>Climate Finance Takes Center Stage at COP27></title>
  <link>https://www.vaneck.com/us/en/blogs/natural-resources/climate-finance-takes-center-stage-at-cop27/</link>
  <description><![CDATA[The COP27 climate summit established a fund that will compensate developing countries for climate change impacts and laid the groundwork for the implementation of global carbon markets.]]></description>
  <dc:creator>VanEck </dc:creator>
  <dc:date>12/12/2022 06:30:00</dc:date>
<content:encoded><![CDATA[

<p><strong><a href="/us/en/blogs/sustainable-investing/its-getting-hot-in-here-what-to-know-leading-up-to-cop27/" title="It's Getting Hot in Here: What to Know Leading up to COP27">COP27</a> </strong>took place November 6-18 in Sharm El Sheikh, Egypt. The conference convened politicians from nearly 200 nations alongside business leaders, scientists and activists to discuss climate-related issues, solutions and goals.</p>
<h2>The COP of Implementation</h2>
<p>COP27 was dubbed &ldquo;the COP of Implementation&rdquo; as it sought to operationalize climate commitments made at previous global summits. At the COP26 summit last year in Glasgow, countries set new greenhouse gas (GHG) emissions reduction targets, known as Nationally Determined Contributions (NDCs). These NDCs aim to collectively limit the global temperature rise to 1.5 degrees Celsius by the end of the century. COP27 aimed to implement these emissions reduction pledges in order to close the gap between commitment and action, but it did not see countries setting new emissions targets.</p>
<p>In seeking to operationalize the emissions reduction targets, the COP focused largely on the financing needed to implement these changes. The summit established a climate fund in which wealthier nations will pledge money to be paid to developing countries to compensate them for the destructive impacts of climate change. While the COP was momentous in some respects, it did not deliver on stricter climate commitments in the wake of rising inflation, geopolitical conflicts resulting in food and energy shortages, and an energy trilemma of energy reliability, affordability and sustainability.</p>
<p><strong>Historic Establishment of a Loss and Damage Fund</strong></p>
<p>The most notable achievement of COP27 was the establishment of a climate fund to compensate vulnerable nations from loss and damage from climate change. The term &ldquo;loss and damage&rdquo; refers to the impacts of climate change that cannot be avoided by climate change mitigation (reducing emissions) or climate change adaptation (adjusting to the impacts of climate change).<sup>1</sup>&nbsp;It includes impacts such as rising sea levels, prolonged heatwaves, desertification, the acidification of the sea and extreme events like wildfires, flooding and crop failures.<sup>2</sup></p>
<p>The climate fund will provide financial assistance to the most vulnerable developing nations impacted by the effects of climate change.<sup>3</sup>&nbsp;Its establishment is a historic win for developing nations that have been pushing for over 30 years to receive funding from wealthier economies, which are responsible for the majority of historic GHG emissions.<sup>4</sup>&nbsp;At previous COPs, developed nations pledged to provide $100B per year for climate action in developing countries from 2020 to 2025, a goal which has not been met.<sup>5</sup>&nbsp;The climate fund seeks to hold countries accountable for these pledges.</p>
<p>While the establishment of the fund is momentous, how and when it will be implemented has yet to be determined. A committee of countries will determine which countries contribute to the fund and which are recipients of the financing. The fund will be set up in time for next year&rsquo;s summit, COP28.<sup>6</sup></p>
<p><strong>No Hard Commitments to Phase Out Fossil Fuels</strong></p>
<p>The summit did not result in a commitment to phase out, or even phase down, fossil fuel use. Last year&rsquo;s summit, COP26, resulted in a historic commitment to &ldquo;phase down&rdquo; coal use. It was expected that COP27 would build on this to decrease the use of all fossil fuels (coal, oil, natural gas). However, concerns regarding the cost and security of energy resulted in governments&rsquo; hesitation to express clear intentions of completely phasing out fossil fuels.</p>
<p>The summit also did not see strict commitments to reduce fossil fuel use from private actors. COP26 resulted in the formation of a number of industry groups committed to meeting net zero GHG emissions, including the Glasgow Financial Alliance for Net Zero (GFANZ). GFANZ members represent over 550 financial sector members that have pledged to reach net zero emissions by 2050 and represent over $130T in assets under management (AUM).<sup>7</sup>&nbsp;Weeks before the summit, GFANZ announced that it would not require its members to stop financing fossil fuel projects.<sup>8</sup></p>
<p><strong>Spearheading Carbon Market Schemes</strong></p>
<p>The summit unveiled a global voluntary carbon trading market scheme. The Energy Transition Accelerator (ETA) will be a carbon offset credit trading system where countries can buy and sell carbon offset credits. A carbon offset is a reduction in GHG emissions, or an increase in GHG storage through a variety of activities, including the planting of trees and the development of renewable energy facilities. A carbon offset credit is a tradable certificate that represents the offset, which entities can purchase and &ldquo;retire&rdquo; to claim a reduction towards their own net GHG emissions (which can be used to achieve their emissions reduction goals). The ETA specifically focuses on developing countries, which may incentivize them to protect land or roll out clean energy to sell offset credits into the global scheme, which will help deliver the trillions of dollars of investment needed to help developing countries transition to renewables and adapt to the impacts of climate change. While ambitions for the global carbon trading scheme are high, countries still need to agree on the specifics and it may prove controversial over doubts regarding the integrity and effectiveness of existing voluntary offset initiatives.</p>
<p>The summit also saw the formation of several other initiatives to expand the adoption of climate markets. Three Cairns Group and Bloomberg Philanthropies announced the formation of the Global Carbon Trust (GCT), which aims to develop the necessary market infrastructure to scale global voluntary carbon markets.<sup>9</sup>&nbsp;The Africa Carbon Markets Initiative was also launched to dramatically expand Africa&rsquo;s participation in the voluntary carbon market. The initiative aims to produce 300 million carbon credits annually by 2030 from participating African nations.<sup>10</sup></p>
<h2>Good COP or Bad COP?</h2>
<p>While the COP27 climate summit did not deliver on stricter climate action and notably did not result in any explicit commitments to phase out fossil fuels, it made significant progress in other areas. The summit established a climate fund that will compensate developing countries for the destructive impacts of climate change and laid the groundwork for the implementation of global carbon markets.</p>
<p>To receive more <a href="/us/en/insights/natural-resources/" title="Natural Resources Insights"><strong>Natural Resources</strong></a> insights, <a href="https://www.vaneck.com/us/en/subscribe/" title="Subscription Center"><strong>sign up in our subscription center</strong></a>.</p>
]]></content:encoded>
</item><item rdf:about="https://www.vaneck.com/us/en/blogs/economic-trends/disinflation-successes-whats-next/">
  <title>Disinflation Successes – What’s Next?></title>
  <link>https://www.vaneck.com/us/en/blogs/economic-trends/disinflation-successes-whats-next/</link>
  <description><![CDATA[Brazil&rsquo;s disinflation is a major success &ndash; so why the market thinks that room for rate near-term rate cuts is now more limited?]]></description>
  <dc:creator>Natalia  Gurushina</dc:creator>
  <dc:date>12/09/2022 16:00:00</dc:date>
<content:encoded><![CDATA[

<h2>LATAM Policy</h2>
<p><strong>Brazil is the world&rsquo;s #1 disinflation success story</strong>. Annual headline inflation dropped from 12.13% April peak to less than 6% in November, and the Bloomberg consensus expects Brazil to be the first major emerging market (EM) - other than China - to bring inflation back to the target range (in Q1-2023). Brazil also has by far the highest ex-ante real policy rate in EM (north of 8%, when adjusted by expected inflation). So, why the local swap curve pushed the first rate-hike from March/May 2023 to September/November 2023 after the presidential elections runoff? The reason is that the market (and the central bank) are concerned about fiscal risks under new administration &ndash; check today&rsquo;s reports about appointing Fernando Haddad (leftist) as Brazil&rsquo;s new Minister of Finance.</p>
<h2>China Reopening</h2>
<p><strong>China&rsquo;s headline inflation is already below the target</strong> &ndash; and it moderated even more in November (to 1.6% year-on-year &ndash; see chart below). The key reason is soft domestic demand and the prevalence of the supply side stimulus. Authorities started to address the former a bit more aggressively lately &ndash; including a sizable support package for property developers and frequent tweaks in the zero-COVID policy. If these policy shifts are successful, inflation would be expected to go up, potentially leading to some policy tightening in 2023. In the near term, we keep an eye on the next batch of China&rsquo;s credit aggregates &ndash; they should be out any day now &ndash; the consensus expects to see a big increase both in aggregate financing and new yuan loans.&nbsp;</p>
<h2>Fed Policy Pivot</h2>
<p>EM disinflation is great, but the global markets are fixated on the <strong>U.S. price trends, which will determine the timing of the Federal Reserve&rsquo;s policy pivot</strong>. And today&rsquo;s University of Michigan survey provided some food for thought. Both the current conditions and the expectations components were stronger than expected, but there were no changes in the very long-term inflation expectations (3%), whereas short-term (1-year) expectations dropped from 4.9% to 4.6%. This looks consistent with the near-term rate expectations embedded in Fed Funds Futures &ndash; more tightening but at a slower speed, including +50bps next week. However, there are still questions about policy room for Fed rate cuts in H2-2023. Stay tuned!</p>
<h3>Chart at a Glance: China Inflation &ndash; Time to Turn?</h3>
<p><img class="img-responsive w-100" src="https://www.vaneck.com/contentassets/5144e490d60449a991013132ccf8063b/us-emerging-markets-daily-2022-12-09.png" alt="Chart at a Glance: China Inflation - Time to Turn?" /></p>
<p class="chart-disclosure">Source: Bloomberg LP.</p>
]]></content:encoded>
</item><item rdf:about="https://www.vaneck.com/us/en/blogs/natural-resources/november-commodities-gains-set-up-a-strong-finish/">
  <title>November Commodities Gains Set Up a Strong Finish></title>
  <link>https://www.vaneck.com/us/en/blogs/natural-resources/november-commodities-gains-set-up-a-strong-finish/</link>
  <description><![CDATA[As we approach the end of the year, we are hopeful that commodity prices will continue to hold their gains and finish the year strong.]]></description>
  <dc:creator>Roland Morris</dc:creator>
  <dc:date>12/09/2022 06:30:00</dc:date>
<content:encoded><![CDATA[

<h2>Macro Outlook: Commodities on Track for Strong Year-End</h2>
<p>November saw solid gains for commodities. The UBS Constant Maturity Commodity Index (CMCI) gained approximately 4.7%, outperforming Bloomberg Commodity Index (BCOM), which gained 2.7%. The industrial metals sector contributed to most of CMCI&rsquo;s outperformance.</p>
<p>As hope for a relaxation of China&rsquo;s zero-COVID policies intensified this month, so did support for China&rsquo;s demand expectations. After some back and forth and historic public backlash in the form of country-wide protests, the Chinese Communist Party (CCP) started to relax some of the zero-COVID rules by month&rsquo;s end.</p>
<p>A weaker-than-expected U.S. Consumer Price Index (CPI) report and a decline in U.S. interest rates led to a sharp decline in the U.S. dollar. Both falling U.S. interest rates and the declining U.S. dollar supported the precious metals sector.</p>
<h2>Index &amp; Sector Review: Industrial Metals Surged Ahead Led by Nickel</h2>
<p>The industrial metals sector gained 13% for the month led by a 24% jump in nickel prices. Copper, aluminum and lead all gained around 11% in November.</p>
<p>The precious metals sector gained 8% on a strong 13% rally in silver prices. The agriculture sector rose 2% on gains in sugar and cocoa which were partially offset by a decline in wheat prices. The energy sector was flat for the month as gains in natural gas were offset by declines in unleaded gas and heating oil. Brent and WTI Crude oil were flat for the month. The livestock sector was flat for the month.</p>
<p>As we approach the end of the year, we are hopeful that commodity prices will continue to hold their gains and finish the year strong.</p>
<h3>Roll Yield Estimates YTD &ndash; November 2022</h3>
<p><img class="img-responsive w-100" src="https://www.vaneck.com/contentassets/a736d6232e6c47f3807899221470cfe7/cmci_chart_01_v1_2022.12_blog.svg" alt="Roll Yield Estimates YTD - November 2022" /></p>
<p class="chart-disclosure">Source: Bloomberg. Data as of November 2022. Past performance is no guarantee of future results.</p>
<p><strong><a href="/link/9cc454bdc12d49638c0a22783d5a26cf.aspx" title="CMCAX - CM Commodity Index Fund - Class A - Overview">Learn more about the VanEck CM Commodity Index Fund</a></strong>, which seeks to track, before fees and expenses, the CMCI.</p>
<p>To receive more <a href="/us/en/insights/natural-resources/" title="Natural Resources Insights"><strong>Natural Resources</strong></a> insights, <a href="https://www.vaneck.com/us/en/subscribe/" title="Subscription Center"><strong>sign up in our subscription center</strong></a>.</p>
]]></content:encoded>
</item><item rdf:about="https://www.vaneck.com/us/en/blogs/natural-resources/smog-question-and-answer/">
  <title>SMOG ETF: Question &amp; Answer></title>
  <link>https://www.vaneck.com/us/en/blogs/natural-resources/smog-question-and-answer/</link>
  <description><![CDATA[Low carbon energy companies have evolved and are proving extremely innovative as they tackle some of society&rsquo;s most difficult challenges. We explore in this Q&amp;A.]]></description>
  <dc:creator> </dc:creator>
  <dc:date>12/08/2022 06:30:00</dc:date>
<content:encoded><![CDATA[

<p>The energy transition driven by global governmental action and shifting consumer preferences has brought attention to low carbon energy companies. Though not a new area of the market, these companies have evolved and are proving extremely innovative as they tackle some of society&rsquo;s most difficult challenges. This blog is intended to answer frequently asked questions on low carbon energy investing and more specifically, <a href="/link/4b0f56133b4b4a38abc4b8db775983b6.aspx" title="SMOG - VanEck Low Carbon Energy ETF - Overview"><strong>VanEck&rsquo;s Low Carbon Energy ETF (SMOG)</strong></a>.</p>
<ul class="content-list">
<li><strong><a href="#point-one">What are low carbon energy companies?</a></strong></li>
<li><strong><a href="#point-two">What are the common sub-themes within the low carbon energy ecosystem?</a></strong></li>
<li><strong><a href="#point-three">Is low carbon energy strictly a growth investment?</a></strong></li>
<li><strong><a href="#point-four">How do fossil fuel prices influence low carbon energy companies?</a></strong></li>
<li><strong><a href="#point-five">Why does a low carbon energy ETF like SMOG hold electric vehicle companies?</a></strong></li>
<li><strong><a href="#point-six">Is SMOG a global ETF?</a></strong></li>
<li><strong><a href="#point-seven">How can investors buy VanEck ETFs?</a></strong></li>
</ul>
<h2 id="point-one" class="anchored-block">What are low carbon energy companies?</h2>
<p>Low carbon energy companies, often referred to as renewable energy companies, are primarily engaged in wind, solar, hydro, hydrogen, bio-fuel or geothermal technology, lithium-ion batteries, electric vehicles and related equipment, waste-to-energy production, smart grid technologies, or building or industrial materials that reduce carbon emissions or energy consumption, among others.</p>
<h2 id="point-two" class="anchored-block">What are the common sub-themes within the low carbon energy ecosystem?</h2>
<p>The following sub-themes are major contributors to the innovation in this space:</p>
<p><strong>Renewable Power</strong></p>
<p>The renewable power sub-theme includes alternative energy producers directly involved in the generation, transmission and distribution of electricity from wind, solar, hydro, geothermal and renewable energy sources. Whereas alternative energy wholesalers include companies that purchase electricity generated from clean and renewable resources and resell to other companies, districts, etc., often alternative energy producers also engage in wholesaling activities, hence the two are congruent to each other.</p>
<p><strong>Electric Vehicles and Battery Technology</strong></p>
<p>Electric vehicles (EVs) are battery-powered vehicles that do not rely on internal combustion engines powered by fossil fuels. EVs are seen as a low-hanging fruit to curb carbon emissions. The electric vehicle infrastructure primarily consists of automobile, battery and inverter manufacturers. Electric vehicle charging stations and wiring companies are also emerging technologies in this sub-theme.</p>
<p><strong>Solar</strong></p>
<p>The solar industry mainly consists of manufacturers that produce photovoltaic panels and installers that install these devices at residential and commercial facilities.</p>
<p><strong>Wind</strong></p>
<p>Wind power is currently America&rsquo;s largest source of renewable energy and continues to grow as traditional utilities diversify their energy mix.<sup>1</sup>&nbsp;Turbine manufacturers that build the generators, towers and blades that harvest wind dominate this sub-theme.</p>
<p><strong>Hydrogen and Fuel Cell</strong></p>
<p>Hydrogen is the simplest energy-dense element that, if burned for fuel only, produces water as its byproduct. A fuel cell combines hydrogen and oxygen to produce energy. The challenge has been in producing hydrogen fuel cells at scale. Falling costs of production along with government and corporate interest alike are supportive of this nascent technology.</p>
<p><strong>Filtration</strong></p>
<p>Filtration includes products that reduce carbon emissions in industrial and consumer applications, such as innovative building insulation. The concern in curbing carbon emissions has brought prominence to companies manufacturing these products.</p>
<h2 id="point-three" class="anchored-block">Is low carbon energy strictly a growth investment?</h2>
<p>These companies have historically been involved in early-stage, capital-intensive areas of the market. In aggregate, they tend to display traditional characteristics commonly associated with growth companies. However, a sizable portion of <a href="/link/4b0f56133b4b4a38abc4b8db775983b6.aspx" title="SMOG - VanEck Low Carbon Energy ETF - Overview"><strong>SMOG</strong></a>&rsquo;s portfolio is typically considered part of the utilities sector leading to a diverse representation of market characteristics within the ETF.</p>
<div class="epi-contentfragment">faq-banner-cta</div>
<h2 id="point-four" class="anchored-block">How do fossil fuel prices influence low carbon energy companies?</h2>
<p>Historically, higher fossil fuel prices have benefited companies in the renewable energy ecosystem as consumers have sought alternatives to expensive energy sources. When fossil fuel prices subside, as we saw in the 2010s for example, focus can weaken leading to pressure on low carbon energy companies. However, aggressive government initiatives to combat climate change have helped support the industry even in periods of price volatility.</p>
<h2 id="point-five" class="anchored-block">Why does a low carbon energy ETF like SMOG hold electric vehicle companies?</h2>
<p>Electric vehicles are one of the most visible outputs of the global energy transition. While solar panels and wind farms are becoming far more common, it is electric vehicles that consumers likely see on the road every day. Electric vehicles, both consumer and commercial, figure to contribute greatly to reduced emissions and fit well in a portfolio of companies involved in that ecosystem. <a href="/link/4b0f56133b4b4a38abc4b8db775983b6.aspx" title="SMOG - VanEck Low Carbon Energy ETF - Overview"><strong>SMOG</strong></a>&rsquo;s underlying index has strict revenue qualifications which only allow pure-play companies that generate at least 50% of their revenue from electric vehicle production to enter the index.</p>
<h2 id="point-six" class="anchored-block">Is SMOG a global ETF?</h2>
<p><a href="/link/4b0f56133b4b4a38abc4b8db775983b6.aspx" title="SMOG - VanEck Low Carbon Energy ETF - Overview"><strong>SMOG</strong></a>&nbsp;is truly global. Its exposure to U.S. companies has ranged between 30 and 40% of the portfolio in recent years with approximately 20 other countries represented. Other notable exposure in the portfolio has come from China, Italy, South Korea and Spain.</p>
<h2 id="point-seven" class="anchored-block">How can investors buy VanEck ETFs?</h2>
<p><a href="/link/8bf7f7f5f3594a4eae2799c077aaed42.aspx#how-to-buy-etf&amp;utm=SMOG-Blog" title="How to buy VanEck ETFs?"><strong>Learn more here</strong></a>.</p>
<p class="d-none d-lg-block"><a href="mailto:askvaneck@vaneck.com" title="Have More Questions? - Ask VanEck" rel="noopener"><img loading="lazy" class="img-responsive" src="https://www.vaneck.com/globalassets/home/us/insights/blogs/bm-blog-images/cta-faq_desktop-02.svg" alt="Have More Questions? - Ask VanEck" /></a></p>
<p class="d-lg-none"><a href="mailto:askvaneck@vaneck.com" title="Have More Questions? - Ask VanEck" rel="noopener"><img loading="lazy" class="img-responsive" src="https://www.vaneck.com/globalassets/home/us/insights/blogs/bm-blog-images/cta-faq_mobile-01.svg" alt="Have More Questions? - Ask VanEck" /></a></p>
<p>To receive more <a href="/us/en/insights/natural-resources/" title="Natural Resources Insights"><strong>Natural Resources</strong></a> insights, <a href="https://www.vaneck.com/us/en/subscribe/" title="Subscription Center"><strong>sign up in our subscription center</strong></a>.</p>
]]></content:encoded>
</item><item rdf:about="https://www.vaneck.com/us/en/blogs/economic-trends/em-institutions-and-markets/">
  <title>EM Institutions and Markets></title>
  <link>https://www.vaneck.com/us/en/blogs/economic-trends/em-institutions-and-markets/</link>
  <description><![CDATA[Institutional checks and balances allowed to avoid extreme price and policy outcomes in Peru and Brazil. But extreme inflation surprises keep coming.]]></description>
  <dc:creator>Natalia  Gurushina</dc:creator>
  <dc:date>12/08/2022 06:30:00</dc:date>
<content:encoded><![CDATA[

<h2>LATAM Politics</h2>
<p>Very often when we talk about <strong>institutional frameworks in emerging markets (EM)</strong>, it is in a context of their weakness, which can lead to deteriorating economic metrics, rating downgrades, and a loss of investor confidence. But there are other &ndash; much more <strong>encouraging &ndash; examples</strong> (which can also create interesting trade opportunities). Take yesterday&rsquo;s &ldquo;lunchtime&rdquo; coup attempt in Peru. President Pedro Castillo (who is now ex-President) tried to avoid impeachment by unlawfully dissolving the congress. But the congress had none of it, impeaching Castillo anyway, and putting him in jail. The line of succession was clear, and by the early-afternoon Peru had the first ever female president, Dina Boluarte. The currency &ndash; which sold off initially &ndash; ended up stronger against the U.S. Dollar (see chart below), and the central bank matter-of-factly delivered a 25bps &ldquo;farewell&rdquo; policy rate hike. The end.</p>
<h2>EM Rate Cuts</h2>
<p><strong>Institutional constraints also allowed the Brazilian central bank to remain on hold</strong> yesterday &ndash; instead of delivering a &ldquo;warning shot&rdquo; rate hike to address new administration&rsquo;s fiscal expansion plans. President-elect Lula&rsquo;s grand (populist) vision for social spending underwent a reality check in the parliament, and the market responded by pricing out some rate hikes on a 6-month horizon. Fiscal risks are still here &ndash; they featured prominently in the central bank&rsquo;s statement, and they can delay 2023 rate cuts. As of this morning, the local swap curve was seeing no policy easing until September 2023 (compared to March/May 2023 before the elections runoff).</p>
<h2>EM Disinflation</h2>
<p><strong>Institutions is a major discussion topic in Mexico and Hungary, but today&rsquo;s market focus was on inflation</strong>. It looks like Mexico is finally on the disinflation track &ndash; with both core and headline bi-weekly inflation much lower than expected at the end of November. This should allow the central bank to safely slow the pace of rate hikes (to 50bps at the next meeting in a few days). Hungary&rsquo;s case is more complicated. Headline inflation accelerated above consensus in November (to 22.5% year-on-year), and it is now set to get even higher in December (peaking at 25-26%) after the removal of gasoline price caps. The caps removal can actually be beneficial for Hungary&rsquo;s budget (and for bonds&rsquo; technicals), but it is also essential that the central bank maintains a hawkish policy stance until inflation starts rolling over in 2023. Stay tuned!</p>
<h3>Chart at a Glance: EM Asset Prices (Peruvian Sol) &ndash; The Importance of Being Nimble</h3>
<p><img class="img-responsive w-100" src="https://www.vaneck.com/contentassets/7ed3be00ad264493ae161faafd59802f/us-emerging-markets-daily-2022-12-08.png" alt="Chart at a Glance: EM Asset Prices (Peruvian Sol) - The Importance of Being Nimble" /></p>
<p class="chart-disclosure">Source: Bloomberg LP.</p>
]]></content:encoded>
</item><item rdf:about="https://www.vaneck.com/us/en/blogs/thematic-investing/sustainability-simplified-net-zero-vs-carbon-neutral/">
  <title>Sustainability Simplified: Net Zero vs. Carbon Neutral></title>
  <link>https://www.vaneck.com/us/en/blogs/thematic-investing/sustainability-simplified-net-zero-vs-carbon-neutral/</link>
  <description><![CDATA[Many people confuse net zero with carbon neutral, but they are not the same. Here&rsquo;s why.]]></description>
  <dc:creator>VanEck </dc:creator>
  <dc:date>12/07/2022 06:30:00</dc:date>
<content:encoded><![CDATA[

<p>While the terms &ldquo;net zero&rdquo; and &ldquo;carbon neutral&rdquo; are both focused on neutralizing emissions, net zero is expanded in scope and implications.</p>
<p>Neutralizing emissions, or being &ldquo;neutral,&rdquo; refers to the amount of emissions that are emitted being equal to those being removed from the atmosphere (amount out = amount &ldquo;in&rdquo;). Emissions can be removed from the atmosphere via nature-based solutions, such as planting trees, or via technology, such as carbon capture and storage (CCS) technology.</p>
<p>The difference between the two has to do with <i>what</i> is being neutralized. Net zero refers to <strong>all greenhouse gases</strong> (GHGs) being neutralized, whereas carbon neutral refers to <strong>just carbon dioxide</strong> (CO<sub>2</sub>) being neutralized. It is important to keep this difference in mind when analyzing the climate targets being set by countries and companies globally.</p>
<h2>Targeting Net Zero by 2050</h2>
<p>While carbon neutrality refers to the total CO<sub>2</sub>&nbsp;being emitted being equal to the amount of CO<sub>2</sub>&nbsp;being reduced, net zero refers to the total amount of GHG emissions being emitted being equal to the amount of GHG being removed from the atmosphere. GHGs include CO<sub>2</sub>, methane (CH<sub>4</sub>), nitrous oxide (N<sub>2</sub>O), fluorinated gases and more. Global GHG emissions are dominated by CO<sub>2</sub>, which makes up about 75% of the total, followed by methane at around 15%.<sup>1</sup></p>
<p>Many countries and companies have set targets to become net zero by 2050. At the COP 21 meeting in 2015, global governments set a goal to avert more than 1.5&nbsp;<sup>o</sup>C of warming&mdash;also known as the Paris Agreement. Research from scientists and policymakers at the United Nations<sup>2</sup>&nbsp;concluded that the world has to become net zero by 2050 in order to reach the goals of the Paris Agreement.</p>
<p>When referring to net zero targets, there are three scopes of GHG emissions.</p>
<p><img loading="lazy" class="img-responsive w-100" src="https://www.vaneck.com/contentassets/f45da883f02f4d90b66b9986365f2945/infographic_1_sustainable-investing_v1_2022.12_blog_option_2.svg" alt="The Three Scopes of GHG Emissions" /></p>
<p class="chart-disclosure">Source: Anthesis. Understanding Scope 1, 2 and 3 Emissions. 2022.</p>
<h2>Implementing Net Zero and Carbon Neutrality</h2>
<p>When referring to net zero and carbon neutrality, emissions can be associated with many different entities ranging in scale, including a country, local government, company or organization.</p>
<p>Governments or companies will choose to set emissions reductions targets by a specific date. These targets can vary in timeline as well as scope.</p>
<ul class="content-list">
<li><i>Timeline</i>: The timeline refers to the date by which an entity aims to achieve their emissions reductions target. This is often stated as &ldquo;Net zero by X date.</li>
<li><i>Scope</i>: Entities may choose to set their net neutrality targets for Scope 1-3 GHG emissions.</li>
</ul>
<h2>How to Achieve Net Zero and/or Carbon Neutral Goals</h2>
<p><strong>Cap and Trade</strong></p>
<p>Under a cap and trade scheme, a government sets a limit, or &ldquo;cap,&rdquo; on the emissions for a country or region and then issues a set of allowances to companies that permits them to emit a given amount.<sup>3</sup>&nbsp;The total allowances given to the companies add up to the emissions cap. Companies can then buy and sell allowances. If a company is able to reduce its emissions below its allowances, it can sell them to other companies. Conversely, if a company wants to pollute more, it can pay to buy these excess allowances. Therefore, companies are incentivized to reduce their emissions by increasing their energy efficiency or by investing in clean alternatives. This mechanism allows the market to find a price on carbon and reduces emissions in the most cost-effective way. Governments can gradually shrink the cap over time to draw down the total emissions for a country or region in order to meet net zero or carbon neutral targets.</p>
<p><strong>Carbon Offset Credits </strong></p>
<p>A carbon offset is a reduction in GHG emissions, or an increase in GHG storage (known as carbon sequestration). The name is slightly misleading, as carbon offsets refer to CO<sub>2</sub>&nbsp;as well as other GHGs. Carbon storage can occur through a variety of activities and can include planting trees and restoring land.</p>
<p>A carbon offset credit is a tradable certificate that represents the offset (emission reduction), which is usually measured in metric tons of CO<sub>2</sub>&nbsp;or an equivalent amount in other GHGs (often written as CO<sub>2</sub>-e). Entities can purchase and &ldquo;retire&rdquo; carbon offset credits to claim a reduction towards their own net GHG emissions, which can be used to achieve their emission reduction goals.</p>
<p><i>Carbon offset vs credit: The "offset" is a project that removes carbon emissions. The "credit" is tradable certificate that verifies that an offset has happened.</i></p>
<p><strong>Real Emissions Reductions</strong></p>
<p>Entities can work to lower the emissions (CO<sub>2</sub>&nbsp;or other GHGs) from their own operations, energy consumption and/or supply chain.</p>
<h2>Open Issues Relating to Net Zero and Carbon Neutrality</h2>
<p><i>Carbon Avoidance vs Removal</i>: Some are skeptical of how the focus on net zero or carbon neutrality may detract from decarbonizing a company&rsquo;s (or country&rsquo;s) operations, energy consumption or supply chain.</p>
<p><i>Carbon Offsets &ndash; Verifiability and Double Counting</i>: Many companies use carbon offset credits in order to neutralize (offset) their emissions. Carbon offset systems still face issues, including that, at times, carbon offset projects cannot be verified, that the carbon removal capacity of a carbon sink is overestimated and/or that carbon sinks are double counted as offsets (across multiple companies or countries).</p>
<p><i>Challenges with Carbon Capture and Storage:</i> Many companies will have to use carbon capture and storage (CCS) technology to keep CO<sub>2</sub>&nbsp;emissions from reaching the atmosphere. CCS technology captures CO<sub>2</sub>&nbsp;emissions when it is emitted from powerplants and factories and transports them to be stored permanently underground. While CCS is essential in decarbonizing heavy polluting industries, CCS projects face barriers to deployment, including high cost of implementation and transportation challenges.<sup>4</sup></p>
<p><i>Other Emissions Reductions Instruments</i>: There are several other instruments that can be used to offset GHG emissions, which are, at times, confused with carbon offset credits. These other instruments include renewable energy credits (RECs), renewable energy power purchasing agreements (PPAs) and carbon taxes.</p>
<p><i>Meeting Targets</i>: Although many companies, countries and other entities have set targets to become net zero or carbon neutral, many are not on track to meet these goals in their expected timeframe.</p>
<h2>The Bottom Line</h2>
<p>While both net zero and carbon neutral are focused on neutralizing emissions, net zero is expanded in scope. 2050 is the target that many countries and companies have set to become net zero. The annual <a href="https://www.vaneck.com/us/en/blogs/sustainable-investing/its-getting-hot-in-here-what-to-know-leading-up-to-cop27/" title="It's Getting Hot in Here: What to Know Leading up to COP27"><strong>COP meetings</strong></a> provides an opportunity for continued accountability and dialogue towards meeting this goal.</p>
<style type="text/css">
    .wrapped-div {
        max-width: 100%;
    }

    @media (max-width: 1240px) {
        .wrapped-div {
            overflow-x: scroll;
        }
    }

    .wrapped-div-sector {
        max-width: 100%;
        overflow-x: scroll;
    }
</style>
<p>To receive more <a href="https://www.vaneck.com/us/en/insights/thematic-investing/" title="Thematic Investing Insights"><strong>Thematic Investing</strong></a> insights, <a href="https://www.vaneck.com/us/en/subscribe/" title="Subscription Center"><strong>sign up in our subscription center</strong></a>.</p>
]]></content:encoded>
</item><item rdf:about="https://www.vaneck.com/us/en/blogs/digital-assets/matthew-sigel-tumultuous-times-crypto-market-setbacks-and-recoveries/">
  <title>Tumultuous Times: Crypto Market Setbacks and Recoveries></title>
  <link>https://www.vaneck.com/us/en/blogs/digital-assets/matthew-sigel-tumultuous-times-crypto-market-setbacks-and-recoveries/</link>
  <description><![CDATA[November marked an incredibly tumultuous month for digital assets. Despite this, Ethereum did not make a new low in price, offering a possible glimmer of some positivity.]]></description>
  <dc:creator>Matthew  Sigel</dc:creator>
  <dc:date>12/07/2022 06:30:00</dc:date>
<content:encoded><![CDATA[

<p><strong>Please note that VanEck may have a position(s) in the digital asset(s) described below.</strong></p>
<p>It&rsquo;s hard to believe that November was only the fourth worst month of the year for Bitcoin and Ethereum, measured by price return, but such is the sorry state of digital assets price action year-to-date. All major U.S. crypto lenders &ndash; Blockfi, Genesis, Voyager &amp; Celsius - have now suspended withdrawals and are either in bankruptcy or negotiating privately with creditors. Meanwhile, Bitcoin miners with Texas exposure, including: Compute North, Genesis, Iris Energy, Argo Blockchain, Applied Blockchain, and Core Scientific, have all either defaulted on loans or have signaled risks as a &lsquo;going concern.&rsquo; Publicly traded miners continue to sell more than 100% of the Bitcoin they mine, as they have since June, based on public filings. In Canada, Hydro-Quebec and the province of Manitoba moved closer towards enforcing Bitcoin mining moratoriums; NY governor Kathy Hochul also signed a two-year halt on fossil-fuel based proof of work mining. We also observe a record withdrawal of BTC from centralized exchanges to cold wallets. Thus, liquidity in the market has dried up, with the top 5 crypto exchanges facilitating $4B/day in volumes at month-end, down from $8B at the start of the month. Notably, DEX share of crypto volumes rose materially in the month. Still, even DeFi is struggling to match orders efficiently, as flagship lender AAVE faced a market manipulation attack that left the protocol with a small amount of bad debt and led to the halting of lending for 17 different Ethereum-based tokens on AAVE.</p>
<p>For November, the Nasdaq composite rose 5%, Bitcoin -17%, Ethereum -18%, and the MVIS CryptoCompare, Smart Contract Leaders Index, -27%.</p>
<p>On a hopeful note, the fact that Ethereum did not make a new low in price in the face of the most negative news of the year (the likely FTX fraud and bankruptcy) strikes us as somewhat bullish. Additionally, FTX&rsquo;s leaked balance sheet pre-bankruptcy revealed that $2B of the &ldquo;hole&rdquo; was BTC &amp; ETH purportedly owned by clients but loaned to Alameda and ultimately frittered away. Debtors will need to raise BTC &amp; ETH to satisfy creditors before they consider selling these assets for cash. Crypto obituary writers this week, including the FT &amp; the ECB, will be wrong for the simple reason that FTX&rsquo;s bankruptcy may take a decade to resolve.</p>
<div class="wrapped-div">
<table style="width: 750px;">
<tbody>
<tr class="tbl-data">
<td class="tbl-header last">Digital Asset</td>
<td class="tbl-header last" style="text-align: center;">Market Cap</td>
<td class="tbl-header last" style="text-align: center;">7 Days</td>
<td class="tbl-header last" style="text-align: center;">30 days</td>
<td class="tbl-header last" style="text-align: center;">90 days</td>
<td class="tbl-header last" style="text-align: center;">365 days</td>
</tr>
<tr class="tbl-data">
<td class="data-td last" style="font-weight: normal;">Bitcoin</td>
<td class="data-td data last">$329.74B</td>
<td class="data-td data last">3.53%</td>
<td class="data-td data last">-16.57%</td>
<td class="data-td data last">-13.98%</td>
<td class="data-td data last">-69.99%</td>
</tr>
<tr class="tbl-data">
<td class="data-td last" style="font-weight: normal;">Ethereum</td>
<td class="data-td data last">$157.43B</td>
<td class="data-td data last">6.98%</td>
<td class="data-td data last">-17.50%</td>
<td class="data-td data last">-18.14%</td>
<td class="data-td data last">-71.88%</td>
</tr>
<tr class="tbl-data">
<td class="tbl-header last">Digital Asset Index</td>
<td class="tbl-header last" style="text-align: center;">Market Cap</td>
<td class="tbl-header last" style="text-align: center;">7 Days</td>
<td class="tbl-header last" style="text-align: center;">30 days</td>
<td class="tbl-header last" style="text-align: center;">90 days</td>
<td class="tbl-header last" style="text-align: center;">365 days</td>
</tr>
<tr class="tbl-data">
<td class="data-td last" style="font-weight: normal;">MVIS<sup>&reg;</sup>&nbsp;CryptoCompare Infrastructure Application Leaders</td>
<td class="data-td data last">$14.43B</td>
<td class="data-td data last">4.73%</td>
<td class="data-td data last">-8.83%</td>
<td class="data-td data last">0.10%</td>
<td class="data-td data last">-75.96%</td>
</tr>
<tr class="tbl-data">
<td class="data-td last" style="font-weight: normal;">MarketVector&trade; Centralized Exchanges</td>
<td class="data-td data last">$51.74B</td>
<td class="data-td data last">0.46%</td>
<td class="data-td data last">-13.90%</td>
<td class="data-td data last">-1.48%</td>
<td class="data-td data last">-60.45%</td>
</tr>
<tr class="tbl-data">
<td class="data-td last" style="font-weight: normal;">MVIS<sup>&reg;</sup>&nbsp;CryptoCompare Decentralized Finance Leaders</td>
<td class="data-td data last">$6.76B</td>
<td class="data-td data last">4.53%</td>
<td class="data-td data last">-21.32%</td>
<td class="data-td data last">-26.42%</td>
<td class="data-td data last">-80.75%</td>
</tr>
<tr class="tbl-data">
<td class="data-td last" style="font-weight: normal;">MVIS<sup>&reg;</sup>&nbsp;CryptoCompare Smart Contract Leaders</td>
<td class="data-td data last">$194.45B</td>
<td class="data-td data last">1.80%</td>
<td class="data-td data last">-26.81%</td>
<td class="data-td data last">-30.80%</td>
<td class="data-td data last">-83.69%</td>
</tr>
<tr class="tbl-data">
<td class="data-td last" style="font-weight: normal;">MVIS<sup>&reg;</sup>&nbsp;CryptoCompare Media &amp; Entertainment Leaders</td>
<td class="data-td data last">$4.48B</td>
<td class="data-td data last">4.05%</td>
<td class="data-td data last">-27.42%</td>
<td class="data-td data last">-35.35%</td>
<td class="data-td data last">-91.71%</td>
</tr>
</tbody>
</table>
</div>
<br />
<p class="chart-disclosure">Sources: Bloomberg, Messari, CryptoCompare, MVIS, VanEck research as of 11/30/2022.</p>
<p class="chart-disclosure">Past performance is indicative of future results. Not a recommendation to buy or sell any of the names mentioned herein.</p>
<h2>Smart Contract Platforms:</h2>
<p><strong>Ethereum</strong> outperformed other layer 1 smart contract platforms in November, led by strong user adoption of layer 2 protocols such as Abitrum, Optimism, and Polygon on the Ethereum network. <strong>Arbitrum</strong> specifically captured 625k active users in November, up 100% in the last three months. Daily active users of those three L2s have grown by 69% over the last three months, compared to -5% for <strong>Cardano</strong>, -6% for <strong>Ethereum</strong>, -22% for <strong>Avalanche</strong>, and -48% for <strong>Solana</strong>. Ethereum continues to monetize L2 activity successfully with its new post-merge economics, generating $87M in fee revenue this month amidst declining ETH supply. However, ETH&rsquo;s share of smart contract platform network fees has been falling in recent months, from nearly 90% in mid-year to 75%, as the L2s pick up some share. Still, as of this month, Ethereum became the first profitable open-source blockchain, with gas fees paid to the Ethereum network outpacing costs (block reward issuance). We consider this a remarkable accomplishment for an open-source blockchain which will hopefully provide valuation support should it continue.</p>
<div class="wrapped-div">
<table style="width: 750px;">
<tbody>
<tr class="tbl-data">
<td class="tbl-header last" colspan="10">Dev Activity</td>
</tr>
<tr class="tbl-data">
<td class="data-td last" style="font-weight: normal;">&nbsp;</td>
<td class="data-head last">Solana</td>
<td class="data-head last">Ethereum</td>
<td class="data-head last">Polkadot</td>
<td class="data-head last">Cardano</td>
<td class="data-head last">Avalanche</td>
<td class="data-head last">Tron</td>
<td class="data-head last">Cosmos</td>
<td class="data-head last">Near</td>
<td class="data-head last">Algorand</td>
</tr>
<tr class="tbl-data">
<td class="data-td last" style="font-weight: normal;">30D</td>
<td class="data-td data last">30.07%</td>
<td class="data-td data last">124.98%</td>
<td class="data-td data last">9.48%</td>
<td class="data-td data last">17.42%</td>
<td class="data-td data last">84.71%</td>
<td class="data-td data last">178.99%</td>
<td class="data-td data last">74.29%</td>
<td class="data-td data last">-11.23%</td>
<td class="data-td data last">-34.64%</td>
</tr>
<tr class="tbl-data">
<td class="data-td last" style="font-weight: normal;">90D</td>
<td class="data-td data last">-17.28%</td>
<td class="data-td data last">5.68%</td>
<td class="data-td data last">40.82%</td>
<td class="data-td data last">10.76%</td>
<td class="data-td data last">15.58%</td>
<td class="data-td data last">263.21%</td>
<td class="data-td data last">62.33%</td>
<td class="data-td data last">2.73%</td>
<td class="data-td data last">-64.46%</td>
</tr>
<tr class="tbl-data">
<td class="data-td last" style="font-weight: normal;">YTD</td>
<td class="data-td data last">-62.42%</td>
<td class="data-td data last">55.79%</td>
<td class="data-td data last">89.08%</td>
<td class="data-td data last">99.45%</td>
<td class="data-td data last">353.49%</td>
<td class="data-td data last">1183.33%</td>
<td class="data-td data last">170.93%</td>
<td class="data-td data last">50.53%</td>
<td class="data-td data last">-30.50%</td>
</tr>
</tbody>
</table>
</div>
<br />
<div class="wrapped-div">
<table style="width: 750px;">
<tbody>
<tr class="tbl-data">
<td class="tbl-header last" colspan="10">Dev Count Growth</td>
</tr>
<tr class="tbl-data">
<td class="data-td last" style="font-weight: normal;">&nbsp;</td>
<td class="data-head last">Solana</td>
<td class="data-head last">Ethereum</td>
<td class="data-head last">Polkadot</td>
<td class="data-head last">Cardano</td>
<td class="data-head last">Avalanche</td>
<td class="data-head last">Tron</td>
<td class="data-head last">Cosmos</td>
<td class="data-head last">Near</td>
<td class="data-head last">Algorand</td>
</tr>
<tr class="tbl-data">
<td class="data-td last" style="font-weight: normal;">30D</td>
<td class="data-td data last">-43.50%</td>
<td class="data-td data last">15.41%</td>
<td class="data-td data last">5.70%</td>
<td class="data-td data last">-9.44%</td>
<td class="data-td data last">-17.86%</td>
<td class="data-td data last">-11.63%</td>
<td class="data-td data last">-3.67%</td>
<td class="data-td data last">-27.86%</td>
<td class="data-td data last">-43.52%</td>
</tr>
<tr class="tbl-data">
<td class="data-td last" style="font-weight: normal;">90D</td>
<td class="data-td data last">-49.10%</td>
<td class="data-td data last">-2.65%</td>
<td class="data-td data last">25.00%</td>
<td class="data-td data last">-2.42%</td>
<td class="data-td data last">-33.65%</td>
<td class="data-td data last">52.00%</td>
<td class="data-td data last">-14.18%</td>
<td class="data-td data last">-22.04%</td>
<td class="data-td data last">-52.71%</td>
</tr>
<tr class="tbl-data">
<td class="data-td last" style="font-weight: normal;">YTD</td>
<td class="data-td data last">-87.85%</td>
<td class="data-td data last">19.16%</td>
<td class="data-td data last">80.89%</td>
<td class="data-td data last">38.49%</td>
<td class="data-td data last">35.29%</td>
<td class="data-td data last">245.45%</td>
<td class="data-td data last">47.50%</td>
<td class="data-td data last">22.88%</td>
<td class="data-td data last">-31.46%</td>
</tr>
</tbody>
</table>
</div>
<br />
<p class="chart-disclosure">Sources: Santiment, VanEck Research as of 11/30/2022.</p>
<p class="chart-disclosure">Past performance is indicative of future results. Not a recommendation to buy or sell any of the names mentioned herein.</p>
<p>Meanwhile, <strong>Solana</strong> has struggled with user growth following the collapse of <strong>FTX</strong>, with the native SOL token losing 58% in November and the number of developers touching Solana code declining by 44%, according to VanEck analysis of Santiment data. Still, Solana developer <em>activity</em>, measured by commits, pull requests, comments, and other actions, rose 30% in November. Developer participation almost certainly follows a Pareto principle common to many networks, so it&rsquo;s possible that Solana just lost the tail. Thus, given that FTX/Alameda owned just 8% of <em>fully diluted </em>Solana, and considering Solana NFT volumes have been quite strong in recent months, we consider the sell-off to be an overreaction. On the other hand, we also note that Avalanche launched a Rust-based SDK (software development kit), opening a new door for Solana developers looking for a new home.</p>
<h2>DeFi:</h2>
<p>DeFi volumes soared in November, reaching $100B, a 100% increase from October. On the other hand, total value locked (TVL) in DeFi has fallen 25%, with some chains faring much worse depending on proximity to the FTX debacle. Solana was hit the hardest by the fallout, with TVL on the chain decreasing 70% to $282 million. The Solana DeFi ecosystem was heavily intertwined with FTX since the exchange had facilitated many of the funding rounds for Solana flagship DeFi projects such as <strong>Serum</strong> which saw its TVL evaporate from over $100 million to under $1 million throughout the month. Additionally, FTX was supposed to be holding the assets backing Sollet tokens, which are tokenized versions of assets from foreign chains such as soBTC. When it became clear from leaked reports that FTX held no BTC, the Sollet assets de-pegged and are now worth a small fraction of the assets they were supposed to be pegged to.</p>
<h3>November TVL Top 10 Blockchains</h3>
<p><img class="img-responsive w-100" src="https://www.vaneck.com/contentassets/727882a020ac4517aff4a47179b6cdde/scl_chart_1_v1_2022.12_blog.svg" alt="November TVL Top 10 Blockchains" /></p>
<p class="chart-disclosure">Source VanEck, DefiLlama as of 11/30/2022.</p>
<p class="chart-disclosure">Past performance is indicative of future results. Not a recommendation to buy or sell any of the names mentioned herein.</p>
<p>The drop in token price and liquidity has created an environment where large token holders can &ldquo;liquidation hunt&rdquo; in DeFi by deploying large amounts of capital in an attempt to liquidate on-chain lending positions. Avraham Eisenberg (Avi) is one of the key players in this arena who became infamous after he single-handedly exposed and profited from vulnerabilities in Solana-based derivatives platform, <strong>Mango Markets</strong>. Most recently, Avi launched a strategy on the <strong>Aave</strong> lending protocol to liquidate the founder of <strong>Curve</strong>, who had a $48 million position that would be liquidated if the price of $CRV fell below $0.26.</p>
<p>Over a week, Avi built up a $100 million position on Aave by lending an initial $40 million USDC and using a popular DeFi method of leveraging known as looping, in which he borrowed $CRV, swapped it for USDC, and deposited the USDC to his original lending position, rinse and repeat <span style="word-wrap: break-word;">(wallet address: 0x57E04786E231Af3343562C062E0d058F25daCE9E).</span> Combined with the tumultuous crypto market, the constant sell pressure from Avi drove the price of $CRV from $0.60 to $0.40. Since Avi was borrowing so much $CRV, the lending rate to deposit $CRV on Aave rose to over 300%. This created the opportunity for a relatively easy trade to keen market participants whereby they could lend $CRV on Aave and short $CRV on a perpetual futures exchange like Kucoin or Binance, effectively arbitraging the rates until the mayhem subsided. Once other actors in the market caught on to what was happening, they stepped in and bought the cheap $CRV and short-squeezed Avi&rsquo;s position, sending the price of $CRV to almost $0.75 and liquidating Avi&rsquo;s USDC collateral. Avi is reported to have lost ~$10 million from the liquidations. However, it is rumored he planned on people catching on to his trade and entered a long position on $CRV in a separate account. This is unverified.</p>
<p>Due to the slippage incurred by the liquidation, Aave was left with $1.6 million of bad debt in their Curve lending market, which is easily manageable considering their $200 million safety module but highlights the risk that large liquidations in less liquid markets pose for the protocol. Hence, Aave governance has overwhelmingly voted to temporarily freeze 17 volatile Ethereum-based markets on the platform, including $CRV, $MKR, and $YFI. Avi&rsquo;s trades on Mango Markets and now Aave has sparked debate in the DeFi community as to whether these actions are considered an exploit of the protocol, or rather &ldquo;highly profitable trading strategies,&rdquo; the term Avi prefers when describing his methods in DeFi. Going forward, it wouldn&rsquo;t surprise us if we see further stress tests on lending protocols as the cost to engage in &ldquo;highly profitable trading strategies&rdquo; on DeFi projects trends down with the market.</p>
<p>Despite this high-profile hiccup, most ETH-based borrow/lend protocols and automated market makers (AMMs) continue to function normally. Overall, the DEX share of total crypto trading rose from 11% to 16% in November. Aave protocol, which dominates ETH-based lending protocols with nearly 90% market share, just saw daily active users hit an all-time high (of 11k per day), even with total loans down 80% from the peak to $1.6B.</p>
<h2>Metaverse:</h2>
<p>Blockchain gaming activity fell by 9% in November based on the 25 games we track weekly. Despite the lackluster user activity in the month, blockchain games are still on pace to close $9B in VC funding this year, up from $4B in 2021, though Q3 game funding fell sharply from Q2. As an example, <strong>Game7</strong>, a BitDAO-backed gaming accelerator, announced $100 million in grants for open-source Web3 startups in November. Among metaverse platforms, <em><strong>Decentraland</strong> </em>hosted their Metaverse Music Festival this month and saw a brief uptick in users on the platform to 14k. Still, we think the number of daily active users fails to justify the $MANA token&rsquo;s $700 million market cap. On the <em>Otherside </em>of metaverse news, <strong>Ape DAO</strong> has finalized the release of staking for the $APE token. Starting December 7th, investors will be able to stake their $APE tokens on the platform created by Horizon Labs. By staking $APE and a BAYC/MAYC/BAKC, NFT holders will be able to earn bonus staking yields around 340%-480% APY according to early estimates. The $APE token has since rallied 60% from its all-time low of $2.60 to its trading price today, around $4.18. Unless there are any major announcements for the <em>Otherside</em>, the token may face increased selling pressure in December and Q1 2023 from investors selling off staking rewards. Note that Ape staking will not be available to users in the United States, Canada, North Korea, Syria, Iran, Cuba, Russia, Crimea, Donetsk, and Luhansk.</p>
<p>To receive more <strong><a href="https://www.vaneck.com/us/en/insights/digital-assets/" title="Digital Assets Insights">Digital Assets</a></strong> insights, <strong><a href="https://www.vaneck.com/us/en/subscribe/" title="Subscription Center">sign up in our subscription center</a></strong>.</p>
<style type="text/css">
    .wrapped-div {
        max-width: 100%;
    }

    @media (max-width: 1240px) {
        .wrapped-div {
            overflow-x: scroll;
        }


    }
</style>
]]></content:encoded>
</item><item rdf:about="https://www.vaneck.com/us/en/blogs/moat-investing/moat-investing-strong-performance-across-the-board/">
  <title>Moat Investing: Strong Performance Across the Board></title>
  <link>https://www.vaneck.com/us/en/blogs/moat-investing/moat-investing-strong-performance-across-the-board/</link>
  <description><![CDATA[In November, The Moat Index outperformed the S&amp;P 500 by more than 300 bps due to strong stock selections, with Etsy Inc., Boeing Co., and Lam Research Co. as the top contributors for the month.]]></description>
  <dc:creator>Coulter Regal, CFA</dc:creator>
  <dc:date>12/07/2022 06:30:00</dc:date>
<content:encoded><![CDATA[

<p>Despite another 75 basis point rate hike by the Federal Reserve, U.S. equity markets continued their recovery in November off the back of positive macro data released early in the month indicating that inflation may finally be starting to cool. Federal Reserve Chairman Jerome Powell then followed up later in the month with an upbeat and positive tone noting that smaller interest rate increases were likely ahead. The better-than-expected CPI data and more dovish Fed posturing fueled the market&rsquo;s hopes that peak inflation was now behind us and that the end to the rate hiking cycle was not far off, giving stocks a considerable boost.</p>
<p>The <strong><a href="/link/9f629c73a31846bb9e480b95e2c7f330.aspx" title="MOAT - VanEck Morningstar Wide Moat ETF - Index">Morningstar<sup>&reg;</sup>&nbsp;Wide Moat Focus Index<sup>SM</sup></a></strong> (the &ldquo;Moat Index&rdquo; or &ldquo;Index&rdquo;) returned 8.77% in November, leading the S&amp;P 500 index by a little more than 300 basis points during the month (8.77% versus 5.59%, respectively). For the year, the Moat Index remains ahead of the S&amp;P 500 by over 500 basis points year-to-date (-8.05% vs. -13.10%, respectively) as of 11/30/2022.</p>
<p>Outperformance for the Moat Index throughout 2022 is attributable to both strong stock selection and favorable sector allocations relative to the S&amp;P 500. However, in November, it was almost entirely stock selection driving the positive alpha, with overweight&rsquo;s in Etsy Inc. (ETSY), Boeing Co. (BA), and Lam Research Co. (LRCX) as top contributors to performance for the month.</p>
<h2>Moat Strategies Outperform Across the Board</h2>
<p>With more than 15 years of live performance history, the flagship Moat Index&rsquo;s strong performance is <strong><a href="https://www.vaneck.com/us/en/insights/moat-investing/" title="Moat Investing Insights">well documented</a></strong> and often the primary topic of these monthly posts. However, many may overlook, or simply be unaware of, the recent stretch of success posted by Morningstar&rsquo;s other moat-driven indexes, each focusing on a distinct area of the equity market.</p>
<div class="wrapped-div">
<table style="width: 100%;">
<tbody>
<tr class="tbl-data">
<td class="tbl-header last" colspan="6">Moat Suite Success</td>
</tr>
<tr class="tbl-data">
<td class="tbl-header last" style="border-top: 1px solid #b2b3b2;">Region</td>
<td class="data-td last" style="font-weight: normal; line-height: 1.5;">United States</td>
<td class="data-td last" style="font-weight: normal; line-height: 1.5;">International (ex-U.S.)</td>
<td class="data-td last" style="font-weight: normal; line-height: 1.5;">Global</td>
</tr>
<tr class="tbl-data">
<td class="tbl-header last" style="border-top: 1px solid #b2b3b2;">Moat-Driven Index</td>
<td class="data-td last" style="font-weight: normal; line-height: 1.5;">Morningstar<sup>&reg;</sup>&nbsp;Wide Moat Focus Index<sup>SM</sup></td>
<td class="data-td last" style="font-weight: normal; line-height: 1.5;">Morningstar<sup>&reg;</sup>&nbsp;US Small-Mid Cap Moat Focus Index<sup>SM</sup></td>
<td class="data-td last" style="font-weight: normal; line-height: 1.5;">Morningstar<sup>&reg;</sup>&nbsp;Global ex-US Moat Focus Index<sup>SM</sup></td>
<td class="data-td last" style="font-weight: normal; line-height: 1.5;">Morningstar<sup>&reg;</sup>&nbsp;Global Wide Moat Focus Index<sup>SM</sup></td>
</tr>
<tr class="tbl-data">
<td class="tbl-header last" style="border-top: 1px solid #b2b3b2;">Broad Market Benchmark</td>
<td class="data-td last" style="font-weight: normal; line-height: 1.5;">S&amp;P 500 Index</td>
<td class="data-td last" style="font-weight: normal; line-height: 1.5;">Russell 2500 Index</td>
<td class="data-td last" style="font-weight: normal; line-height: 1.5;">MSCI ACWI ex USA</td>
<td class="data-td last" style="font-weight: normal; line-height: 1.5;">MSCI ACWI</td>
</tr>
<tr class="tbl-data">
<td class="tbl-header last" style="border-top: 1px solid #b2b3b2;">November Excess Return</td>
<td class="data-td last" style="font-weight: normal; line-height: 1.5;">3.18%</td>
<td class="data-td last" style="font-weight: normal; line-height: 1.5;">3.90%</td>
<td class="data-td last" style="font-weight: normal; line-height: 1.5;">3.16%</td>
<td class="data-td last" style="font-weight: normal; line-height: 1.5;">1.23%</td>
</tr>
<tr class="tbl-data">
<td class="tbl-header last" style="border-top: 1px solid #b2b3b2;">2022 YTD Excess Return</td>
<td class="data-td last" style="font-weight: normal; line-height: 1.5;">5.06%</td>
<td class="data-td last" style="font-weight: normal; line-height: 1.5;">-</td>
<td class="data-td last" style="font-weight: normal; line-height: 1.5;">8.10%</td>
<td class="data-td last" style="font-weight: normal; line-height: 1.5;">6.24%</td>
</tr>
<tr class="tbl-data">
<td class="tbl-header last" style="border-top: 1px solid #b2b3b2;">Corresponding VanEck ETF</td>
<td class="data-td last" style="font-weight: normal; line-height: 1.5;"><strong><a href="/link/635ccc4bf9134cb9a7fcc80919498eec.aspx" title="MOAT - VanEck Morningstar Wide Moat ETF - Overview">VanEck Morningstar Wide Moat ETF (MOAT)</a></strong></td>
<td class="data-td last" style="font-weight: normal; line-height: 1.5;"><strong><a href="/link/589a2bc95c5d48988a7fd0d679aec241.aspx" title="SMOT - VanEck Morningstar SMID Moat ETF - Overview">VanEck Morningstar SMID Moat ETF (SMOT)</a></strong></td>
<td class="data-td last" style="font-weight: normal; line-height: 1.5;"><strong><a href="/link/973ee43f7890447a9b74c6e2836d1068.aspx" title="MOTI - VanEck Morningstar International Moat ETF - Overview">VanEck Morningstar International Moat ETF (MOTI)</a></strong></td>
<td class="data-td last" style="font-weight: normal; line-height: 1.5;"><strong><a href="/link/2eabda27631643958679a21515cbd2c5.aspx" title="MOTG - VanEck Morningstar Global Wide Moat ETF - Overview">VanEck Morningstar Global Moat ETF (MOTG)</a></strong></td>
</tr>
</tbody>
</table>
</div>
<br />
<p class="chart-disclosure"><strong>Source: Morningstar as of 11/30/22.</strong> <strong>Index performance is not illustrative of Fund performance. Fund performance current to the most recent month end is available by visiting vaneck.com or by calling 800.826.2333. Past performance is no guarantee of future results. Indexes are unmanaged and are not securities in which an investment can be made.</strong></p>
<p>The <strong><a href="/link/c0c4da50e177415b9f750d3c0eea4e0a.aspx" title="SMOT - VanEck Morningstar SMID Moat ETF - Index">Morningstar<sup>&reg;</sup>&nbsp;US Small-Mid Cap Moat Focus Index<sup>SM</sup></a></strong> (the &ldquo;SMID Moat Index&rdquo;) is the newest of the suite but was built using the same time-tested approach of the other moat indexes: <strong><a href="https://www.vaneck.com/us/en/blogs/moat-investing/access-smid-cap-stocks-with-confidence/" title="Access SMID Cap Stocks with Confidence">target moat-rated companies with attractive valuations</a></strong>. The SMID Moat Index was launched in July of 2022 and focuses on moat-rated valuation opportunities, specifically within the small- and mid-cap U.S. equity universe. The Index has impressed since its recent launch, most recently outperforming its broad market benchmark, the Russell 2500 Index, by nearly 400 basis points in November. Given the noteworthy <strong><a href="https://www.vaneck.com/us/en/blogs/moat-investing/uncover-big-opportunities-in-smaller-companies/" title="Uncover Big Opportunities in Smaller Companies">valuation discounts currently seen in small- and mid-cap companies</a></strong>, the SMID Moat Index may be well positioned if the U.S. economic backdrop continues to improve.</p>
<p>To receive more <strong><a href="https://www.vaneck.com/us/en/insights/moat-investing/">Moat Investing</a></strong> insights, <strong><a href="https://www.vaneck.com/us/en/subscribe/">sign up in our subscription center</a></strong>.</p>
<style type="text/css">
    .wrapped-div {
        max-width: 100%;
    }

    @media (max-width: 1240px) {
        .wrapped-div {
            overflow-x: scroll;
        }


    }
</style>
]]></content:encoded>
</item><item rdf:about="https://www.vaneck.com/us/en/blogs/economic-trends/em-disinflation-a-wild-ride/">
  <title>EM Disinflation – A Wild Ride></title>
  <link>https://www.vaneck.com/us/en/blogs/economic-trends/em-disinflation-a-wild-ride/</link>
  <description><![CDATA[EM disinflation is never expected to be smooth, and some central banks fell comfortable looking through upside inflation surprises.]]></description>
  <dc:creator>Natalia  Gurushina</dc:creator>
  <dc:date>12/07/2022 06:30:00</dc:date>
<content:encoded><![CDATA[

<h2>EM Inflation Surprises</h2>
<p>A summer intern candidate asked me yesterday why I chose to be an emerging markets (EM) economist. Part of my answer was &ldquo;because <strong>EM is never boring</strong>&rdquo; &ndash; which turned out &ldquo;prophetic&rdquo; after today&rsquo;s inflation releases. Nice and steady disinflation in Thailand was the &ldquo;snooziest&rdquo; print, compared to a &ldquo;wild ride&rdquo; in the rest of EM. Chile&rsquo;s upside surprise came on the heels of the central bank&rsquo;s decision to stay on hold, which is why it was closely scrutinized. A good thing is that Chilean disinflation is still underway, so it should be OK to extend the policy rate pause, but the market might be too optimistic in pricing 85bps of rate cuts in 3 months with headline inflation running at 13.3% year-on-year. Hungary&rsquo;s headline inflation is already the third highest among major EMs, and today&rsquo;s decision to remove gasoline price caps (due to shortages) can easily push annual inflation to 25% in December. Hungary&rsquo;s ministers and the central bank traded barbs, but do not forget that the central bank did deliver a huge emergency hike in October &ndash; which probably supported local bonds&rsquo; subsequent outperformance.</p>
<h2>China Reopening, Stimulus</h2>
<p><strong>China&rsquo;s inflation outlook might get more interesting as well</strong>. Consumer prices are likely to have moderated in November (consensus sees only 1.6% year-on-year), but &ndash; similar to soft domestic activity gauges or today&rsquo;s weak foreign trade prints &ndash; these are backward-looking numbers, which do not consider the latest shift in the reopening policy or a sizable rescue package for property developers, which can boost domestic activity. A practical question is whether China&rsquo;s bucking the EM (global?) disinflation trend would lead to higher local rates &ndash; the renminbi often responds well to changes in the interest rate differential between China and the U.S. (see chart below).</p>
<h2>The End of EM Tightening Cycle</h2>
<p><strong>EM inflation might be &ldquo;bumpy&rdquo;, but more and more EM central banks are opting for a pause</strong>. We have already mentioned Chile. Brazil and Poland are expected to stay on hold &ndash; Poland is on the edge of disinflation, while the fiscal appetite of Brazil&rsquo;s President-elect Lula might have been &ldquo;tamed&rdquo; by the congress. India was the only EM to hike so far today &ndash; at a slower pace though (35bps). Peru might deliver a &ldquo;farewell&rdquo; 25bps hike in the afternoon &ndash; there was an upside inflation surprise after all &ndash; but the end of the tightening cycle is near. Stay tuned!</p>
<h3>Chart at a Glance: China Reopening=Higher Rates=Stronger Renminbi?</h3>
<p><img class="img-responsive w-100" src="https://www.vaneck.com/contentassets/03808c6a97df4016a37939758c0a1cbc/us-emerging-markets-daily-2022-12-07.png" alt="Chart at a Glance: China Reopening=Higher Rates=Stronger Renminbi?" /></p>
<p class="chart-disclosure">Source: Bloomberg LP.</p>
]]></content:encoded>
</item><item rdf:about="https://www.vaneck.com/us/en/blogs/economic-trends/rate-cut-expectations-overboard/">
  <title>Rate Cut Expectations – Overboard?></title>
  <link>https://www.vaneck.com/us/en/blogs/economic-trends/rate-cut-expectations-overboard/</link>
  <description><![CDATA[The market started to price in 2023 rate cuts both in EM and DM, and some look less justified than the others.]]></description>
  <dc:creator>Natalia  Gurushina</dc:creator>
  <dc:date>12/06/2022 06:30:00</dc:date>
<content:encoded><![CDATA[

<h2>U.S. Fed Hiking Cycle</h2>
<p><strong>Monetary policy pivots are coming in 2023 &ndash; this is the key message from the current set of the market expectations</strong> for interest rates. Is the market running ahead of itself? Well, peak inflation is behind in an increasing number of countries, and the 2023 growth outlook is not getting better. The U.S. real GDP is expected to stagnate next year (the current consensus growth forecast is mere 0.4%), the probability of recession in 12 month is around 23% (New York Federal Reserve estimate), while headline inflation is seen dropping below 3% in Q4-2023. All these expectations feed into the Fed Funds Futures, which price in 40-45bps of the Fed rate cuts in H2-2023.</p>
<h2>EM Rate Cuts</h2>
<p><strong>The expectations for EM are even more aggressive &ndash; EMs are expected to lead in the easing part of the rate cycle</strong>, just as they led in the tightening segment in 2021/22. Hungary and Chile are the two countries, where the market prices in most rate cuts on a 6-month horizon (respective 241bps and 183bps). The outlook for Hungary is not illogical, given that the effective policy rate is close to 16% after the recent emergency hike. But if the central bank&rsquo;s estimates are correct, and average inflation stays in 15-18% range next year, room for near-term easing might be limited even with the rapidly deteriorating growth outlook. Chile is in a better situation inflation-wise (i.e. lower), but inflation is yet to peak, and this can also delay policy rate cuts until later in 2023.</p>
<h2>EM Peak Inflation</h2>
<p><strong>Expected 6-month ahead rate cuts in other EMs</strong> &ndash; Poland, Czech Republic, but also Romania and South Korea &ndash; <strong>look more reasonable</strong> (15-30bps) against the backdrop of peak inflation (already behind) and softer growth. However, Poland&rsquo;s very negative real policy rate (regardless of the metric) is concerning, because the country will be entering the pre-election marathon, which is usually accompanied by additional budget spending. And, of course, there are hawkish &ldquo;holdouts&rdquo;, like the Philippines, where headline inflation unexpectedly accelerated to 8% year-on-year in November (see chart below), leading to calls that the policy rate should rise above 6% (currently at 5%) to look credible. Philippine local bonds rebounded in November (GBI-EM Global Diversified Philippines Index, total return USD unhedged), but they are still in the red year-to-date, so the policy direction matters. Stay Tuned!</p>
<h3>Chart at a Glance: Philippine Disinflation &ndash; Lagging Behind EM Asia</h3>
<p><img class="img-responsive w-100" src="https://www.vaneck.com/contentassets/cfd7e78206a8490baeefa4cec9f59513/us-emerging-markets-daily-2022-12-06.png" alt="Chart at a Glance: Philippine Disinflation - Lagging Behind EM Asia" /></p>
<p class="chart-disclosure">Source: VanEck Research; Bloomberg LP.</p>
]]></content:encoded>
</item><item rdf:about="https://www.vaneck.com/us/en/blogs/economic-trends/pivots-galore/">
  <title>Pivots Galore></title>
  <link>https://www.vaneck.com/us/en/blogs/economic-trends/pivots-galore/</link>
  <description><![CDATA[Peak inflation and growth is the reason why many central banks are slowing the pace of hikes or staying steady. But China might be bucking the trend &ndash; are rate hikes coming in 2023?]]></description>
  <dc:creator>Natalia  Gurushina</dc:creator>
  <dc:date>12/05/2022 16:00:00</dc:date>
<content:encoded><![CDATA[

<h2>China Reopening</h2>
<p><strong>Chinese assets are powering ahead </strong>(see chart below),<strong> boosted by the re-opening expectations</strong> and looking through weak domestic activity gauges (including the below-consensus and contractionary Caixin services PMI). Reports that authorities may announce another set of measures on Wednesday strengthened optimism about the 2023 growth outlook, making China one of the very few economies expected to accelerate next year &ndash; to the point that this might require policy rate hikes (onshore swaps price in +78bps in 12 months, according to Bloomberg LP). As regards other independent global growth drivers, the growth momentum continues to move in the opposite direction, reinforcing the market expectation of smaller rate hikes in the U.S. and the Eurozone.</p>
<h2>EM Disinflation</h2>
<p>The <strong>policy stance in emerging markets (EM) is also getting less hawkish</strong> &ndash; in part because more and more countries leave peak inflation behind. Even Turkey jumped on the bandwagon this morning with annual inflation slowing to 84.39%. EM Asia is well-positioned to disinflate with much lower peaks than in the rest of EM. The Philippines is the only exception in the region &ndash; the consensus sees headline inflation accelerating to 7.8% year-on-year in November, which explains why the market expects 81bps of additional rate hikes in the next 3 months. Peak inflation also seems elusive in Colombia and Hungary. We&rsquo;ve got another upside surprise in Colombia this morning, with November&rsquo;s annual inflation accelerating to 12.53% - this should cement a 100bps rate hike on December 16. Hungary&rsquo;s inflation may reach 22% and average 15-18% in 2023, which explains why the central bank governor slammed the government for a lack of fiscal adjustment.&nbsp;</p>
<h2>EM Rate Hikes</h2>
<p>Peak inflation is the reason why <strong>central banks in Poland, Brazil, and Chile are expected to stay on hold</strong> this week. The market, however, will scrutinize the Brazilian central bank&rsquo;s comments about the country&rsquo;s fiscal outlook under new administration. The head of the transition team is doing his best to project a fiscally responsible image, but the numbers are worrisome. The Peruvian central bank is getting closer to the policy rate &ldquo;plateau&rdquo;, but is likely to deliver a 25bps farewell rate hike on Wednesday, following an upside inflation surprise in November (just as any credible central bank would do). Stay tuned!&nbsp;</p>
<h3>Chart at a Glance: Chinese Renminbi and Re-Opening &ndash; Stronger for Longer?</h3>
<img class="img-responsive w-100" src="https://www.vaneck.com/contentassets/16441bf654db44fc8a4932b757e8e375/us-emerging-markets-daily-2022-12-05.png" alt="Chart at a Glance: Chinese Renminbi and Re-Opening &ndash; Stronger for Longer?" />
<p class="chart-disclosure">Source: Bloomberg LP</p>
]]></content:encoded>
</item><item rdf:about="https://www.vaneck.com/us/en/blogs/income-investing/is-higher-income-for-real/">
  <title>Is Higher Income for Real?></title>
  <link>https://www.vaneck.com/us/en/blogs/income-investing/is-higher-income-for-real/</link>
  <description><![CDATA[VanEck&rsquo;s Fran Rodilosso recently joined Bloomberg Real Yield to discuss inflation, the Fed and the positive outlook for fixed income investors heading into 2023.]]></description>
  <dc:creator>Fran Rodilosso</dc:creator>
  <dc:date>12/05/2022 06:30:00</dc:date>
<content:encoded><![CDATA[

<h2>No Easy Path for the Fed</h2>
<p>As we look ahead to 2023, the Federal Reserve (Fed) has the challenging task of trying to combat inflation without causing a hard economic landing. While the market is excited about the recent pullback in monthly CPI data, it&rsquo;s important to remember that, historically, <a href="/link/775af929d69741efa7729872dda2bfa5.aspx?epsremainingpath=high-inflation-is-likely-here-to-stay" title="High Inflation is Likely Here to Stay"><strong>inflationary events</strong></a> have lasted a long time, going through several peaks and troughs. In addition, government debt is very high and continues to grow, and the cure for inflation (tighter policy) is &ldquo;kryptonite&rdquo; to an overleveraged economy. Accordingly, the Fed faces a very challenging market backdrop as we head into the new year (3:37).</p>
<h2>Higher Yields Here to Stay</h2>
<p>For bond investors, the good news about this market backdrop is that <strong><a href="https://www.vaneck.com/us/en/blogs/income-investing/income-returns-to-fixed-income-investing/" title="Income Returns to Fixed Income Investing">higher yields</a></strong> are here to stay. Carry has come back to the fixed income market, leading <strong><a href="https://www.vaneck.com/us/en/blogs/income-investing/carry-boosts-fixed-income-resilience-in-likely-fed-scenarios/" title="Carry Boosts Fixed Income Resilience in Likely Fed Scenarios">current income</a></strong> to play a more significant role in bond returns (7:06). For example, at current yields, the income earned on the current 10-year Treasury note provides a return buffer even if rates continue to rise next year. For high yield, the carry is even higher by historical standards, and as a result, we are seeing increased demand for high yield strategies (13:44).</p>
<p>All in all, the <strong><a href="https://www.vaneck.com/us/en/blogs/investment-outlook/jan-van-eck-what-to-buy-bonds-when-now/" title="What to Buy? Bonds. When? Now.">market outlook</a></strong> for bonds is positive. Interest rate normalization has returned us to a world where carry is a meaningful component of return, where duration, credit and liquidity risk are priced more appropriately, and where a far greater range of scenarios can lead to positive returns. Looking ahead to 2023, we believe the role of fixed income in diversified portfolios will be as important as ever as correlations also return to normal in the absence of quantitative easing.</p>
<p>The full video can be viewed <a href="https://www.vaneck.com/us/en/offsite-disclaimer/?id=191964&amp;button=no&amp;url=https://www.bloomberg.com/news/videos/2022-11-23/-bloomberg-real-yield-11-23-2022" target="_blank" title="Bloomberg - Watch 'Bloomberg Real Yield'" rel="noopener"><strong>here</strong></a>.</p>
<p>To receive more <a href="https://www.vaneck.com/us/en/insights/income-investing/" title="Income Investing insights"><strong>Income Investing</strong></a> insights, <a href="/us/en/subscribe/" title="Subscription Center"><strong>sign up in our subscription center</strong></a>.</p>
]]></content:encoded>
</item><item rdf:about="https://www.vaneck.com/us/en/blogs/economic-trends/policy-reaction-to-mixed-data-signals/">
  <title>Policy Reaction to Mixed Data Signals></title>
  <link>https://www.vaneck.com/us/en/blogs/economic-trends/policy-reaction-to-mixed-data-signals/</link>
  <description><![CDATA[The global slowdown narrative remains intact. Can economic surprises affect policy responses?]]></description>
  <dc:creator>Natalia  Gurushina</dc:creator>
  <dc:date>12/02/2022 16:00:00</dc:date>
<content:encoded><![CDATA[

<h2>The Pace of Fed Hikes</h2>
<p><strong>The global data flow does not challenge the slowdown narrative, but it also shows that the momentum is very uneven</strong> &ndash; today&rsquo;s strong labor market report in the U.S. could not have looked more different from this week&rsquo;s ISM survey, which sent a much weaker signal. Both releases are, however, consistent with the market view that the U.S. Federal Reserve (Fed) can and should continue raising its policy rate, but at a slower pace (see chart below). At the same time, upside surprises like the strong labor market report raise a question mark as to whether the Fed would indeed have room for around 40bps of rate cuts in H2-2023.&nbsp;</p>
<h2>EM Disinflation</h2>
<p><strong>The data flow in emerging markets (EM) is also not uniform &ndash; especially on the inflation front</strong>. The overall trend in EM inflation surprises is down, but it does not mean that we do not get an occasional above-consensus print, like in Peru. Peruvian headline inflation unexpectedly accelerated to 8.45% year-on-year in November, interrupting the nascent disinflation trend and signaling that the underlying price pressures may prove more persistent than previously thought. The year-to-date total return on Peru&rsquo;s local debt (J.P. Morgan&rsquo;s GBI-EM Peru U.S. Dollar Unhedged Index<sup>1</sup>) is still positive, but future performance will depend on the central bank&rsquo;s ability to navigate the situation credibly (and this includes the expected 25bps rate hike next week). South Korea&rsquo;s inflation print was the opposite of Peru &ndash; a nice downside surprise, which can allow the central bank to pause going forward.</p>
<h2>EM Growth Slowdown</h2>
<p>As regards <strong>upside growth surprises</strong>, some (if not most) of them <strong>require additional context</strong>. For example, Chile&rsquo;s economic activity was stronger than expected in October, but it was still contracting at an accelerated pace (-1.2% year-on-year). In the same vein, today&rsquo;s upside surprise in the Czech Republic&rsquo;s Q3 GDP masked another sequential decline (-0.2% quarter-on-quarter), which might get worse going forward judging by the super-weak November PMI (41.6). There is no question that the central bank will stick to its &ldquo;on hold&rdquo; stance under these circumstances. Finally, Brazil&rsquo;s industrial production growth also beat consensus in October, but the new administration&rsquo;s policy agenda could have an impact (and not necessarily positive) on the business sentiment &ndash; a worrying prospect against the backdrop of a sharp decline in Brazil&rsquo;s manufacturing PMI (to 44.3). Stay tuned!&nbsp;</p>
<h3>Chart at a Glance: Market Sticks to Its Policy Rate Expectations for the Fed</h3>
<img class="img-responsive w-100" src="https://www.vaneck.com/contentassets/190b690fb76640c3bcf07fff494d9b9a/us-emerging-markets-daily-2022-12-02.png" alt="Chart at a Glance: Market Sticks to Its Policy Rate Expectations for the Fed" />
<p class="chart-disclosure">Source: Bloomberg LP</p>
<div class="disclosure">
<p><sup>1</sup>J.P. Morgan GBI-EM Peru U.S. Dollar Unhedged Index is the Peru subset of the GBI-EM Index, defined below.</p>
</div>
]]></content:encoded>
</item><item rdf:about="https://www.vaneck.com/us/en/blogs/emerging-markets-equity/vietnams-bright-macroeconomic-outlook/">
  <title>Vietnam’s Bright Macroeconomic Outlook></title>
  <link>https://www.vaneck.com/us/en/blogs/emerging-markets-equity/vietnams-bright-macroeconomic-outlook/</link>
  <description><![CDATA[In a time when other major world economies are curtailing fiscal and monetary policy support in an effort to contain inflation, Vietnam is in a position to support its growth.]]></description>
  <dc:creator>Sunny  Bokhari</dc:creator>
  <dc:date>12/01/2022 06:30:00</dc:date>
<content:encoded><![CDATA[

<p>The macroeconomic outlook of Vietnam is bright as the country has witnessed strong domestic consumption, received foreign direct investments (FDI) and maintained a surplus in trade balance with other countries. Vietnam&rsquo;s real GDP growth is forecasted to exceed 8% in 2022.<sup>1</sup></p>
<h3>Vietnam Real GDP Growth</h3>
<p><img class="img-responsive w-100" src="https://www.vaneck.com/contentassets/b86a8bdf8466444f8e357cb1871877d1/vnm_chart_01_v1_2022.11_blog.svg" alt="Vietnam Real GDP Growth" /></p>
<p class="chart-disclosure"><sup>*</sup>&nbsp;YTD 2022 is the forecasted GDP growth rate by the World Bank.</p>
<p class="chart-disclosure">Source: CEIC Data, Jefferies as of 9/1/2022.</p>
<p>In a time when other major world economies are curtailing fiscal and monetary policy support in an effort to contain inflation, Vietnam is in a position to support its growth. In January 2022, Vietnam passed a fiscal stimulus package of $15.4 billion at almost 4% of its GDP to support its 8 percent growth target for the year.<sup>2</sup>&nbsp;The stimulus is generally viewed as a positive for the country&rsquo;s GDP growth trajectory for the year.</p>
<p>Vietnam&rsquo;s currency and interest rates also appear relatively stable compared to other countries. The State Bank of Vietnam just recently started tightening monetary policy to contain inflation and plans to keep it at a target rate of under 4% this year.<sup>3</sup>&nbsp;Vietnam&rsquo;s contained inflation at around 4% and low borrowing costs with the central bank discount rate at 4.5% are supporting a domestic consumption rebound as COVID restrictions are easing.<sup>1</sup>&nbsp;A sharp recovery in personal consumption along with strong export growth contributed to the country&rsquo;s impressive Q3 GDP growth of 13.67%.<sup>4</sup>&nbsp;Vietnam&rsquo;s strong macroeconomic position is expected to lift its population out of poverty as more than half of the Vietnamese population is projected to join the global middle class by 2035.<sup>5</sup></p>
<p>Vietnam is generally also seen as a beneficiary of U.S.-China decoupling with multinational companies looking to diversify assets out of China. China&rsquo;s zero-COVID policy appears to be aiding the production shift into Vietnam. The country has been able to remain attractive to foreign investors and received foreign direct investment (FDI) net inflows totaling U.S. $15.3bn in 2021, or 4.2% of GDP, up from 3.2% of GDP in 2013. We believe the strong FDI further solidifies the country&rsquo;s macro outlook.</p>
<p>The country&rsquo;s capital markets appear to be trading at attractive valuations given its strong macroeconomic outlook. Some asset managers expect growth in earnings per share (EPS) of around 20% in 2022 year over year<sup>6</sup>&nbsp;and yet the Ho-Chi Minh stock index is down about 40% YTD<sup>7</sup>. Valuations may be attractive at this level, trading at only about 10x 2022 earnings forecasts.<sup>8</sup></p>
<p>Vietnam&rsquo;s market liquidity has also been improving over the last few years with average daily trading volume rising from U.S. $97 million in 2015 to U.S. $1 billion in 2021. There are now at least fifty listed stocks with a market capitalization of more than U.S. $1 billion, indicating the growth of the market.</p>
<h3>Vietnam Stock Market Average Daily Turnover</h3>
<p><img class="img-responsive w-100" src="https://www.vaneck.com/contentassets/b86a8bdf8466444f8e357cb1871877d1/vnm_chart_02_v1_2022.11_blog.svg" alt="Vietnam Stock Market Average Daily Turnover" /></p>
<p class="chart-disclosure">Includes both Ho Chi Minh City and Hanoi stock exchanges. Source: Bloomberg Data.</p>
<p>Vietnam&rsquo;s Ministry of Finance issued a statement about its focus on strengthening the infrastructure of the stock market and developing, diversifying and increasing the quality of products in the market.<sup>9</sup>&nbsp;The regulators appear to be taking steps to increase corporate governance and upgrade critical financial markets infrastructure. Earlier this year, Vietnamese authorities cracked down on violations in equities, bond and property markets in an effort to establish proper control mechanisms to protect investors.<sup>9</sup>&nbsp;Regulators also sacked the head of the country&rsquo;s main stock exchange in order to strengthen corporate governance and transparency in its financial markets.<sup>10</sup>&nbsp;Vietnam Securities Depository (VSD) recently made changes to the stock settlement cycle to speed up the trade settlement process.<sup>11</sup>&nbsp;VSD is also working to implement a new information technology system that will allow same-day trade settlement and help tackle system overload issues stemming from higher trading volumes. The system will enable regulators to implement meaningful reforms in derivative products, intra-day trading, short selling, foreign access, new listings and adherence to international reporting standards.<sup>12</sup></p>
<p>Vietnam is currently on the secondary emerging markets watch list by FTSE Indices and could be added to MSCI emerging markets watch list in 2023.<sup>7</sup>&nbsp;Vietnam&rsquo;s regulators are vying for an upgrade to emerging markets status by global index providers. Vietnam&rsquo;s Ministry of Finance has included this goal in the project &lsquo;Restructuring the stock market and insurance market&rsquo; and the draft strategy is to help upgrade the stock market from a frontier market status to an emerging markets status by 2025.<sup>13</sup></p>
<p>A key impediment to upgrading is foreign ownership limits (FOLs); typically, FOLs are government-imposed quotas on the percentage of foreign ownership in a company. If a company has reached its FOL, no further investment can be made by foreigners until the level of foreign ownership decreases; these companies are generally excluded from global indices as a result. There have been positive developments since September 2015. Companies are allowed to raise their FOL if they are not in a strategic sector as defined by the government. There are already some companies that have elected to do so. In general, foreign investors may, in aggregate, own up to 100% of a public company. Currently, the limit is 30% for bank stocks and 49% for most other companies such as in the telecom sector or sectors considered strategic by the government.<sup>1</sup>&nbsp;Vietnam&rsquo;s regulators appear determined to help upgrade the country to emerging markets status. The State Securities Commission of Vietnam is working with global agencies such as the World Bank and FTSE as well as Vietnam&rsquo;s ministries, associations and market members to address concerns on foreign ownership limits.<sup>14</sup>&nbsp;</p>
<p>The country&rsquo;s regulators appear willing to make markets more accessible to foreign investors and boost the infrastructure support needed to run a healthy and functioning market. An upgrade to emerging markets status could potentially attract foreign active and passive asset inflows into the local Vietnamese market. <strong><a href="/link/d914a94deb874e2bb6a86cfed8a1e2f9.aspx" title="VNM - VanEck Vietnam ETF - Overview">VanEck Vietnam ETF (VNM)</a></strong> provides access to the growth story of Vietnam and could be an appealing investment for investors seeking growth exposure outside of traditional emerging markets. VNM, the largest and most liquid U.S.-listed Vietnam ETF provides investors one trade access to the Vietnamese market.<sup>15</sup></p>
<p>To receive more <a href="/us/en/insights/emerging-markets-equity/" title="Emerging Markets Equity Insights"><strong>Emerging Markets Equity</strong></a> insights, <a href="/us/en/subscribe/" title="Subscription Center"><strong>sign up in our subscription center</strong></a>.</p>
]]></content:encoded>
</item><item rdf:about="https://www.vaneck.com/us/en/blogs/municipal-bonds/new-municipal-issuance-supply-constraints-to-persist/">
  <title>New Municipal Issuance: Supply Constraints to Persist?></title>
  <link>https://www.vaneck.com/us/en/blogs/municipal-bonds/new-municipal-issuance-supply-constraints-to-persist/</link>
  <description><![CDATA[During the remainder of the year, demand for tax-exempt income is expected to continue to outpace the supply of new municipal issuance, increasing the likelihood of solid performance into 2023.]]></description>
  <dc:creator>Tamara  Lowin</dc:creator>
  <dc:date>12/01/2022 06:30:00</dc:date>
<content:encoded><![CDATA[

<h2>Roadblocks to Refunding Continue to Pressure Tax-Exempt Supply</h2>
<p>The flow of newly issued bonds is the lifeblood of any bond market. For municipals, in particular, refunding deals have played a key role in new issuance. The reliance on refunding debt is so high that in a typical year, it makes up one-third to 40% of supply. As opposed to new money bonds, which are issued for new projects, refunding bonds replace outstanding debt (aka refinancing). Several recent policy decisions have curtailed the use of refunding issuance, severely reducing tax-exempt supply in the market.</p>
<h2>Pre-Refunding Bonds Become Taxable</h2>
<p>In 2018, the Tax Cuts and Jobs Act eliminated tax-exempt pre-refunded debt &ndash; a subset of refunding bonds. As a result, refunding debt dropped to 18% that year, slowly creeping up to 31% in 2020. Low interest rates ensured that refunding outstanding debt still made sense, and even pre-refunding taxable debt could be advantageous.</p>
<h3>A Decade of Municipal Issuance: New Money vs Refunding</h3>
<p><img class="img-responsive w-100" src="https://www.vaneck.com/contentassets/b2a0b452f74c4ae0a82fe7e2b3858780/muni_chart_01_v1_2022.12_blog.svg" alt="A Decade of Municipal Issuance: New Money vs Refunding" /></p>
<p class="chart-disclosure">Source: The Bond Buyer.&nbsp;<sup>*</sup>As of 10/31/2022.</p>
<p>Although refunding debt does not seem likely to reach 40% of new issuance as long as this policy is in place, there does seem to be a new equilibrium. Further, the need for taxable refunding debt fed a growing acceptance of taxable municipal debt in general. The result was taxable new issuance moving from the historically high single-digits to 30% in 2020. Digging into the numbers shows that recent increases in annual municipal issuance are solely due to this taxable issuance. Tax-exempt issuance has been flat.</p>
<h3>A Decade of Municipal Issuance: Taxable vs Tax Exempt</h3>
<p><img class="img-responsive w-100" src="https://www.vaneck.com/contentassets/b2a0b452f74c4ae0a82fe7e2b3858780/muni_chart_02_v1_2022.12_blog.svg" alt="A Decade of Municipal Issuance: Taxable vs Tax Exempt" /></p>
<p class="chart-disclosure">Source: The Bond Buyer.&nbsp;<sup>*</sup>As of 10/31/2022.</p>
<h2>Impact of Rising Interest Rates on New Municipal Issuance</h2>
<p>In a rising rate environment, occasions for cost savings through refunding debt decline. And finding opportunities to pre-refund taxable debt for tax-exempt debt are even more remote. In an effort to reduce annual borrowing costs, refunding bonds are likely to push out maturities &ndash; a position that weakens the long-term borrowing options for an entity.</p>
<p>Higher interest rates will hit all new issuance, of course. Municipal project planning often takes years, and rising rates will increase project costs well above previously approved levels. Projects funded by new money debt can be delayed or reduced in size to make up for increased borrowing costs.</p>
<h2>Refunding Debt Sets the Tone for the Market</h2>
<p>Fewer opportunities for tax-exempt refunding debt suppress new money issuance as well. Refunding bonds reduce annual payments for existing debt, which increases the affordability of new debt. After several years of flat tax-exempt new issuance, 2023 seems unlikely to be the year this trend turns around, as the economic feasibility of refunding will be further out of reach.</p>
<h2>Back to Basics: Demand Expected to Outpace Supply</h2>
<p>Our outlook on supply combined with higher rates means, once again, income investing matters. Yields are now back at much more meaningful levels after being muted by a strong economy and robust demand over the past 3-4 years. As we finish up the year and into 2023, demand for tax-exempt income will likely outpace supply of new issues, setting the market up for solid performance.</p>
<p><strong>Explore our Muni ETFs <a href="https://www.vaneck.com/us/en/etf-mutual-fund-finder/etfs/?InvType=etf&amp;AssetClass=mb&amp;Funds=emf,esf,grf,iigf,mwmf,emlf,embf,ccif&amp;ShareClass=a,c,i,y,z&amp;tab=perf&amp;Sort=name&amp;SortDesc=true" title="ETF and Mutual Fund Finder">here</a>.</strong></p>
<p>To receive more <a href="https://www.vaneck.com/us/en/insights/municipal-bonds/" title="Municipal Bonds Insights"><strong>Municipal Bonds</strong></a> insights, <a href="https://www.vaneck.com/us/en/subscribe/" title="Subscription Center"><strong>sign up in our subscription center</strong></a>.</p>
]]></content:encoded>
</item><item rdf:about="https://www.vaneck.com/us/en/blogs/model-portfolios/a-master-class-in-real-assets/">
  <title>A Master Class in Real Assets></title>
  <link>https://www.vaneck.com/us/en/blogs/model-portfolios/a-master-class-in-real-assets/</link>
  <description><![CDATA[Portfolio Manager David Schassler joined a panel of fellow experts to discuss the current outlook for inflation and how real assets can help offset inflationary pressures.]]></description>
  <dc:creator>David Schassler</dc:creator>
  <dc:date>12/01/2022 06:30:00</dc:date>
<content:encoded><![CDATA[

<h2>Real Assets in Broader Portfolios</h2>
<p>Real assets are physical or intangible items that have intrinsic value and are not subject to inflationary pressures. Examples of real assets include gold, silver, land, and buildings. At VanEck, we categorize real assets into the following three buckets:</p>
<ul class="content-list">
<li>Gold bullion and gold equities</li>
<li>Commodities and natural resource equities</li>
<li>REITS, Infrastructure, and MLPs</li>
</ul>
<p>Historically, real assets have been an effective way to protect broader portfolios from inflation. Going back approximately 50 years, the average annualized real return (adjusting for inflation) of the 60/40 portfolio has been 6%. However, the average annualized real return for the 60/40 portfolio during the high inflation periods of the 1970s and mid-2000s was 0.55%. For that same period, the average annualized return for the inflation protection portfolio (set at 50% commodities and 50% gold: based on data availability and for the sake of simplicity) was 15.97%.</p>
<h2>Deflationary Pockets are Normal During Inflationary Regimes</h2>
<p><strong><a href="/link/775af929d69741efa7729872dda2bfa5.aspx?epsremainingpath=high-inflation-is-likely-here-to-stay" title="High Inflation is Likely Here to Stay">High inflation</a></strong> doesn't come in a straight line. Inflation pops up, and then it comes back down, then it pops up, then it comes back down. We saw this pattern in the 1940s and then again in the 1970s. In both of these periods, high inflation, on average, stayed materially above 2% for an extended period of time, and we believe the current market will endure a similar fate. When contextualizing inflation, it&rsquo;s helpful to focus on the entrenched financial conditions rather than monthly CPI prints:</p>
<ol class="content-list">
<li>Inflation remains very high but is decelerating.</li>
<li>Government debt is very high and continues to grow.</li>
<li>Historically, inflationary events have lasted a long time, with several peaks and troughs within.</li>
<li>The cure for inflation (tighter policy) is &ldquo;kryptonite&rdquo; to an overleveraged economy.</li>
<li>The Federal Reserve (Fed) fights recessions with a looser monetary policy, which is inflationary.</li>
</ol>
<p>Consequently, this leaves the Fed in the most unfortunate economic situation with no great options. We have long said that the <a href="https://www.vaneck.com/us/en/blogs/guided-allocation/avoid-the-inflation-penalty-box/" title="Avoid the Inflation Penalty Box"><strong>idea of a soft landing is a fairytale</strong></a>. Fed Chairman Jerome Powell now seemingly agrees and recently acknowledged that the window for a soft landing has &ldquo;narrowed.&rdquo; The most reasonable outcome, in our view, is that the Fed will become less aggressive in its fight against inflation. More specifically, higher interest rates may eventually have a devastating impact on economic activity and the financial markets. We expect the Fed to be forced to pivot with inflation significantly higher than its 2% target. Ultimately, this inflation cycle will probably follow the predictable path of previous inflation cycles: It will last a long time!</p>
<p>As this inflation environment persists, real assets will continue to provide diversification benefits in broader portfolios.</p>
<p><strong>Additional highlights from the Masterclass include:</strong></p>
<ul class="content-list">
<li>4:40: Overview of the types of real assets</li>
<li>8:20: Inflation outlook</li>
<li>19:00: What we can learn from previous inflation cycles</li>
<li>25:48: The performance of different real assets across inflation regimes</li>
</ul>
<p>The full Masterclass can be accessed <strong><a href="https://www.vaneck.com/us/en/offsite-disclaimer/?id=191877&amp;button=no&amp;url=https://www.assettv.com/video/masterclass-real-assets" title="MASTERCLASS: Real Assets" target="_blank" rel="noopener">here</a></strong>.</p>
<p>To receive more <a href="/us/en/insights/guided-allocation/" title="Asset Allocation Insights"><strong>Asset Allocation</strong></a> insights, <a href="/us/en/subscribe/" title="Subscription Center"><strong>sign up in our subscription center</strong></a>.</p>
]]></content:encoded>
</item><item rdf:about="https://www.vaneck.com/us/en/blogs/economic-trends/markets-react-to-year-end-surprises/">
  <title>Markets React to Year-End Surprises></title>
  <link>https://www.vaneck.com/us/en/blogs/economic-trends/markets-react-to-year-end-surprises/</link>
  <description><![CDATA[Market liquidity will get tighter in the coming weeks, so keep an eye on the market impact of economic and political surprises, which can be plentiful going into the end of the year.]]></description>
  <dc:creator>Natalia  Gurushina</dc:creator>
  <dc:date>12/01/2022 06:30:00</dc:date>
<content:encoded><![CDATA[

<h2>Market Liquidity</h2>
<p>We are getting closer to <strong>year-end</strong>, when <strong>liquidity traditionally gets tighter</strong>, and this means that <strong>economic and political surprises might have a disproportionate impact</strong> on asset prices. We could see this effect yesterday after U.S. Federal Reserve (Fed) Chairman Powell&rsquo;s presentation &ndash; which was not truly surprising substance-wise (given what was priced in by the Fed Funds Futures &ndash; a smaller 50bps hike in December), but which nevertheless spurred a sizable market rally. Today&rsquo;s weaker than expected U.S. ISM survey<sup>1</sup>&nbsp;&ndash; including yet another decline in the prices paid index (to mere 43.0) &ndash; is consistent with the slowing pace of rate hikes in the U.S.</p>
<h2>South Africa Impeachment Crisis</h2>
<p>News reports about <strong>potential impeachment proceedings against South Africa&rsquo;s President</strong> Cyril Ramaphosa also produced an oversized reaction. The rand weakened by 266bps against U.S. dollar (as of 10:00am ET, according to Bloomberg LP &ndash; see chart below), 5-year CDS widened by 27bps, and the 10-year government bond yield jumped by 71bps. Observers are still divided as to whether this is a soft coup attempt or a sign that institutions work, at least in some emerging markets (EM), i.e., politicians/officials face consequences if they transgress. But many see a significant probability that Ramaphosa will not have to resign. Further, South Africa&rsquo;s history shows that even if the president steps down, the transition process should be managed well. One big question &ndash; after the dust settles one way or another &ndash; is whether the current crisis will compromise South Africa&rsquo;s reform agenda to the extent that threatens the country&rsquo;s growth outlook and the fiscal adjustment process and debt sustainability.</p>
<h2>Global Slowdown</h2>
<p>The biggest &ldquo;congregation&rdquo; of today&rsquo;s <strong>economic surprises</strong> was <strong>in the global growth area</strong>. China&rsquo;s Caixin manufacturing PMI<sup>2</sup>&nbsp;(Purchasing Managers Index) actually improved in November &ndash; imagine what could happen if the re-opening gains pace. Activity gauges in parts of EM Asia (India, Philippines, Thailand) looked good, and we also got a major unexpected spike in Hungary (to 54.7), which tells us that the central bank&rsquo;s policy stance should remain tight for the time being. However, the situation in Hungary&rsquo;s regional peers &ndash; Poland and the Czech Republic &ndash; is much more concerning. The November PMIs in both countries stayed deep in contraction zone, putting more pressure on central banks to stay on hold. Another massive downside surprise came from Brazil &ndash; the manufacturing PMI collapsed from 50.8 to 44.3, drawing attention to the elections&rsquo; impact on confidence (and hence, on the government&rsquo;s ability to meet its fiscal targets). Stay tuned!</p>
<h3>Chart at a Glance: South African Currency Hit By Political Turbulence</h3>
<p><img class="img responsive w-100" src="https://www.vaneck.com/contentassets/19bdf9ef8f514c4f8331eb08ea5b4f18/us-emerging-markets-daily-2022-12-01.png" alt="Chart at a Glance: South African Currency Hit By Political Turbulence" /></p>
<p class="chart-disclosure">Source: Bloomberg LP.</p>
<p class="chart-disclosure"><sup>1</sup>&nbsp;The ISM survey is a monthly indicator of U.S. economic activity based on a survey of purchasing managers at more than 300 manufacturing firms. It is considered to be a key indicator of the state of the U.S. economy.</p>
<p class="chart-disclosure"><sup>2</sup>&nbsp;The Caixin manufacturing PMI is a gauge of activity in China's manufacturing sector.</p>
]]></content:encoded>
</item><item rdf:about="https://www.vaneck.com/us/en/blogs/economic-trends/china-growth-weakness-vs-market-optimism/">
  <title>China – Growth Weakness vs. Market Optimism></title>
  <link>https://www.vaneck.com/us/en/blogs/economic-trends/china-growth-weakness-vs-market-optimism/</link>
  <description><![CDATA[China&rsquo;s pre-emptive moves to ease some COVID restrictions and support real estate developers are the reasons why the market chose to look through surprisingly weak domestic activity gauges.]]></description>
  <dc:creator>Natalia  Gurushina</dc:creator>
  <dc:date>11/30/2022 06:30:00</dc:date>
<content:encoded><![CDATA[

<h2>China Slowdown</h2>
<p><strong>China&rsquo;s domestic activity gauges for November were bad</strong>, no question about it. Most indices were well in contraction zone and deteriorating (see chart below). Even the construction PMI<sup>1</sup>&nbsp;(Purchasing Managers Index) &ndash; which benefited from the earlier infrastructure stimulus &ndash; eased from 58.2 to 55.4. So, <strong>why is the market choosing to downplay the weakness?</strong> The answer is that authorities made several pre-emptive policy moves before the release, and, importantly, these initiatives address the underlying reasons of the slowdown &ndash; primarily real estate and re-opening.&nbsp;</p>
<h2>China Real Estate Developers</h2>
<p>The <strong>re-opening is still very tentative</strong> &ndash; the 20-point plan focuses on the optimization of the pandemic control, quarantine times, the frequency of testing and risk area delineations &ndash; <strong>but support for property developers looks more solid</strong>. The real estate package includes &ldquo;stable financing&rdquo; (the resumption of equity funding for listed companies, bond issuance, &ldquo;reasonable&rdquo; loan extension, relending facilities and absolving lenders from personal responsibility if something goes wrong), equal treatment of state-owned and private developers and mortgage support for homebuyers. Given the foregoing, it is not surprising that China&rsquo;s High Yield/developers&rsquo; bonds staged a nice rally in the past week or so.</p>
<h2>China Growth &ndash; Global Implications</h2>
<p>One problem that China cannot fix on its own is weakening global demand &ndash; the new export orders PMI dropped to 46.7, which is the lowest level since May. &ldquo;2023 Growth Cliff&rdquo; is the most likely scenario for China&rsquo;s main trade partners, and this underscores the importance of domestic pro-growth policies and orderly re-opening. Earlier reports about vaccination plans for the elderly and the easing of COVID restrictions in Guangzhou look encouraging, even though the progress will probably be slow and uneven (despite assertions that the anti-lockdown protests might turn out &ldquo;stimulative&rdquo;). The prospect of <strong>China&rsquo;s domestic rebound &ndash; and commodity prices&rsquo; reaction to it &ndash; raises some interesting questions about (a) global disinflation and (b) growth spillovers in emerging markets (EM)</strong> (especially for commodity exporters). But this might be a story for Q2-Q3 next year. Stay tuned!</p>
<h3>Chart at a Glance: China Activity Gauges &ndash; Still Sliding Down</h3>
<p><img class="img responsive w-100" src="https://www.vaneck.com/contentassets/1f4a4c4c876f4c8d8641a76a17fdad45/us-emerging-markets-daily-2022-11-30.png" alt="Chart at a Glance: China Activity Gauges - Still Sliding Down" /></p>
<p class="chart-disclosure">Source: Bloomberg LP.</p>
<p class="chart-disclosure"><sup>1</sup>&nbsp;We believe PMIs are a better indicator of the health of the Chinese economy than the gross domestic product (GDP) number, which is politicized and is a composite in any case. The manufacturing and non-manufacturing, or service, PMIs have been separated in order to understand the different sectors of the economy. These days, we believe the manufacturing PMI is the number to watch for cyclicality.</p>
]]></content:encoded>
</item><item rdf:about="https://www.vaneck.com/us/en/blogs/natural-resources/clouds-lift-on-california-solar/">
  <title>Clouds Lift on California Solar></title>
  <link>https://www.vaneck.com/us/en/blogs/natural-resources/clouds-lift-on-california-solar/</link>
  <description><![CDATA[California&rsquo;s revised net energy metering proposal is more favorable towards solar homeowners than its previous proposal and may create a stronger incentive for adopting solar plus storage.]]></description>
  <dc:creator>VanEck </dc:creator>
  <dc:date>11/29/2022 06:30:00</dc:date>
<content:encoded><![CDATA[

<p>The <strong><a href="https://www.vaneck.com/us/en/blogs/sustainable-investing/the-inflation-reduction-act-a-green-catalyst/" title="The Inflation Reduction Act: A Green Catalyst">passing of the Inflation Reduction Act (IRA)</a></strong> in August cemented a key piece of federal regulation&mdash;one that has the power to spur technological innovation as a pathway to continued growth across sustainability sectors. We believe another noteworthy policy development is likely to set an example for how the U.S. evolves in renewables development on a state and local level.</p>
<p>For nearly a year, a California legislative proposal has threatened the growth of residential solar in the state and, given California&rsquo;s leadership in renewable energy adoption, placed the direction of policy-making for similar solar growth states under scrutiny. A significant redo of the proposal was introduced on November 10, 2022, and the industry breathed a sigh of relief, as the proposed policies were meaningfully less punitive to solar growth.</p>
<h2>What Is NEM, and Why Does It Matter?</h2>
<p>NEM stands for net energy metering and describes how homeowners with solar pay their utility bills. Homeowners with solar are both independent power producers as well as customers of the grid. If a homeowner&rsquo;s solar system generates more electricity than the home consumes, the homeowner can sell the excess electricity back to the grid.</p>
<p>In California, the NEM policy is set by the California Public Utility Commission (CPUC). Previous NEM policies (NEM 1.0 and 2.0) were designed to spur solar adoption. They included incentive structures that paid solar homeowners handsomely to send electricity back to the grid &ndash; while not paying &ldquo;tolls,&rdquo; or fees, for using the electric grid. Utilities argued that under these policies, solar customers were using the grid for free. The structure has come under increased scrutiny over the past few years, as California&rsquo;s solar generation increased significantly, now standing at 25% of the energy mix (well above other leading states, whose solar generation is &gt;6%<sup>1</sup>).</p>
<p>Last December, the initial proposal for NEM 3.0 by the CPUC was published. It levied a fixed fee of $8/kW or ~$60/month, known as the &ldquo;grid access charge,&rdquo; on each solar homeowner. At nearly half the cost of an average homeowner&rsquo;s monthly utility bill,<sup>2</sup>&nbsp;this would have effectively killed rooftop solar. The utilities&rsquo; argument for such severe fees was to disincentivize homeowners from choosing solar standalone, as solar electricity was a high enough part of the energy mix where incentives were no longer needed to encourage adoption. (Furthermore, assumptions used in the proposal for solar cost and project payback periods were highly debatable, casting doubt to the accuracy of the final figures and proposed fees). The initial proposal faced heavy backlash, and a decision was pushed off for nearly 11 months, until now.</p>
<h2>Impact and Outlook on Solar Demand</h2>
<p>The CPUC proposed a new version of NEM 3.0 on November 10, 2022.<sup>3</sup>&nbsp;This draft eliminates the much-scrutinized grid access fee and incorporates a sunset of resale rates to encourage continued solar adoption, while adjusting the economics such that solar plus storage becomes a much more attractive option for homeowners going forward. While NEM 3.0 is still a proposal and is subject to changes by the regulatory committee before being signed into bill mid-December, precedent suggests that revisions made to the policy should be minor in detail.</p>
<p>We expect continued strong demand for solar through the beginning of next year, as customers look to lock in more favorable incentives from NEM 2.0, which will sunset in April 2023. However, the adoption of NEM 3.0 does not imply demand falls off a cliff following implementation. Combined with the IRA&rsquo;s 10-year extension of the Investment Tax Credit at 30%, supply chains and input costs may finally have an opportunity to normalize as consumers will not need to rush to have systems installed before a looming deadline. In addition, while the subsidies toward solar standalone are lower under NEM 3.0, it creates a stronger incentive for pairing solar plus storage, so homeowners could use the electricity they generate instead of sending it back to the grid. Ultimately, this is a win for consumers and a win for utilities.</p>
<p>We examine some of the prevalent trends and how it impacted the Environmental Sustainability Strategy in our <a href="/us/en/blogs/sustainable-investing/clouds-lift-on-california-solar/esf-quarterly-commentary-3q-2022.pdf" title="ESF: Quarterly Commentary" target="_blank" rel="noopener"><strong>latest commentary</strong></a>.</p>
<p>To receive more <a href="/us/en/insights/natural-resources/" title="Natural Resources Insights"><strong>Natural Resources</strong></a> insights, <a href="https://www.vaneck.com/us/en/subscribe/" title="Subscription Center"><strong>sign up in our subscription center</strong></a>.</p>
]]></content:encoded>
</item><item rdf:about="https://www.vaneck.com/us/en/blogs/economic-trends/global-slowdown-uneven-pace/">
  <title>Global Slowdown – Uneven Pace></title>
  <link>https://www.vaneck.com/us/en/blogs/economic-trends/global-slowdown-uneven-pace/</link>
  <description><![CDATA[<p>China's activity gauges might worsen in November, but authorities are now targeting the key factors that weigh on near-term growth. Other EMs might not be so fortunate with policy space.</p>]]></description>
  <dc:creator>Natalia  Gurushina</dc:creator>
  <dc:date>11/29/2022 06:30:00</dc:date>
<content:encoded><![CDATA[

<h2>Global Growth</h2>
<p><strong>Global slowdown is back in focus</strong>, as the market prepares for the release of domestic activity gauges in emerging markets (EM). The preliminary Purchasing Managers Indices (PMIs) in key developed markets (DM) stayed in contraction zone in November (with a big downside across-the-board surprise in the U.S.). Today&rsquo;s Conference Board consumer confidence in the U.S. was also soft, adding to concerns about a hard landing. Last month, only 50% of major EM PMIs stayed in expansion zone &ndash; not the lowest ratio historically (see chart below), but way down from 90% at the end of 2021. And less than a quarter showed an improvement in their respective PMIs in October. All of Central Europe and a big part of LATAM are now expected to expand by less than 1% next year &ndash; and some of these countries have the highest inflation rates in EM.</p>
<h2>China Growth Revisions</h2>
<p><strong>China&rsquo;s</strong> activity gauges will be the first to roll out (in the evening) &ndash; in the meantime, reports of <strong>vaccination plans for the elderly raised hopes for an orderly reopening</strong>, giving a nice boost to Chinese equities, developers&rsquo; bonds/High Yield, and the renminbi. The consensus forecast for China&rsquo;s 2022 GDP growth are still unchanged at 3.3%, but the reopening expectations resulted in a small upside revision of the 2023 growth outlook (to 4.9%). If this scenario were to materialize, China will be among very few countries where the growth rate will strengthen next year.</p>
<h2>EM Inflation Targets</h2>
<p><strong>Thailand is another member of the exclusive &ldquo;2023 growth acceleration&rdquo; club</strong>, and it just happens that the central bank will be holding its rate-setting meeting tomorrow. The expected 25bps rate hike would look perfectly reasonable against this backdrop &ndash; especially as inflation is still above the target range. However, headline inflation is expected to return to target already in Q2-2023 &ndash; a bit earlier than in the rest of EM Asia &ndash; and this can ease pressure on monetary authorities to frontload more rate hikes, while making sure that the real policy rate is slightly positive 12 months from now. Goldilocks?</p>
<h3>Chart at a Glance: EM Activity Gauges - Heading South</h3>
<p class="img-responsive w-100"><img src="https://www.vaneck.com/contentassets/a4fb80a2c4554c77817176bcc03e27fd/us-emerging-markets-daily-2022-11-29.png" alt="EM Activity Gauges - Heading South" /></p>
<p class="chart-disclosure">Source: VanEck Research; Bloomberg LP.</p>
]]></content:encoded>
</item><item rdf:about="https://www.vaneck.com/us/en/blogs/economic-trends/growth-prices-rates-slower-pace/">
  <title>Growth, Prices, Rates – Slower Pace?></title>
  <link>https://www.vaneck.com/us/en/blogs/economic-trends/growth-prices-rates-slower-pace/</link>
  <description><![CDATA[Slower growth and disinflation could free room for rate cuts in 2023. However, fiscal slippages in EM can make central banks more cautious going forward.]]></description>
  <dc:creator>Natalia  Gurushina</dc:creator>
  <dc:date>11/28/2022 16:30:00</dc:date>
<content:encoded><![CDATA[

<h2>Fed Policy Rate Path</h2>
<p>Recession concerns and nascent disinflation explain why the <strong>market is comfortable pricing in smaller rate hikes and even some rate cuts going forward</strong>. The Fed Funds Futures show a 50bps U.S. Federal Reserve (Fed) hike in December, and a total of 38bps of rate cuts in the second half of 2023. It would be interesting to see whether Fed Chairman Powell&rsquo;s presentation on Wednesday will change these expectations. As regards emerging markets (EM), Chile leads the &ldquo;easing&rdquo; pack with around 545bps of rate cuts priced in for the next year. The outlook for other EMs is much less aggressive, but even disinflation laggards like Mexico are expected to make room for rate cuts (to the tune of 90bps) in H2-2023.&nbsp;&nbsp;</p>
<h2>China Reopening</h2>
<p>The latest <strong>China</strong> headlines &ndash; the <strong>anti-lockdown protests and a spike in the number of new COVID cases</strong> &ndash; led to confusion about the pace of re-opening, weighing on near-term growth expectations. The consensus thinks that China&rsquo;s domestic activity gauges will show further deterioration in November. This would explain Friday&rsquo;s pre-emptive cut in the reserve requirements for banks (albeit many observers are skeptical that the move would make a big difference for funding costs, given that the cut was very small &ndash; only 25bps). One possible outcome is that the protests might lead to more policy stimulus to compensate for the re-opening setbacks. Market participants reacted positively to reports of further support for real estate developers, including low interest loans to buy developers&rsquo; onshore bonds.</p>
<h2>Brazil Fiscal Debates</h2>
<p><strong>Brazil is among very few countries where the market continues to price in additional rate hikes</strong> &ndash; after pricing in a decent number of rate cuts going into the presidential elections. The local swap curve added at least one more hike for the next six months (a total of 101bps). This might look excessive/too hawkish, but these expectations reflect concerns about the new administration&rsquo;s spending plans for the next four years, which can reverse the post-pandemic decline in Brazil&rsquo;s debt-to-GDP ratio (see chart below). Fiscal/policy continuity concerns had a major impact on Brazil&rsquo;s local debt performance in November (the only negative total return among all GBI-EM constituents). The damage can be undone, but it would require more certainty and less controversy about the fiscal outlook. Stay tuned!&nbsp;&nbsp;</p>
<h3>Chart at a Glance: Brazil Debt/GDP Ratio &ndash; Lower But Still Very High</h3>
<p><img class="img-responsive w-100" src="https://www.vaneck.com/contentassets/c58df80501974c8d91bf36061bb7386b/us-emerging-markets-daily-2022-11-28.png" alt="Chart at a Glance: Brazil Debt/GDP Ratio &ndash; Lower But Still Very High" /></p>
<p class="chart-disclosure">Source: Bloomberg LP.</p>
<p class="chart-disclosure">BZDPGDT% Index &ndash; Brazil General Government Gross Debt Percentage. Represents Brazil&rsquo;s debt-to-GDP ratio.</p>
]]></content:encoded>
</item><item rdf:about="https://www.vaneck.com/us/en/blogs/economic-trends/thanksgiving-lull-not-in-em/">
  <title>Thanksgiving Lull? Not in EM!></title>
  <link>https://www.vaneck.com/us/en/blogs/economic-trends/thanksgiving-lull-not-in-em/</link>
  <description><![CDATA[China&rsquo;s support for real estate developers, Brazil&rsquo;s politics, and EM inflation keeps the market at the edge of its seat &ndash; despite the holiday mood in the U.S.]]></description>
  <dc:creator>Natalia  Gurushina</dc:creator>
  <dc:date>11/23/2022 06:30:00</dc:date>
<content:encoded><![CDATA[

<p><i>Please note: Emerging Markets Debt Daily will not be published on November 24 - November 25. We look forward to resuming our daily updates on November 28.</i></p>
<h2>LATAM Politics</h2>
<p>The Thanksgiving week is supposed to be a &ldquo;slow&rdquo; one &ndash; but not in emerging markets (EM). We have several important inflation releases tomorrow (including Brazil and Mexico), and the <strong>EM news flow is anything but boring</strong>. Take yesterday&rsquo;s reports about Brazil&rsquo;s outgoing President Jair Bolsonaro ,calling for the annulment of the election results. Scary? Well, the market&rsquo;s reaction was subdued &ndash; in part because Brazil&rsquo;s institutions are pretty robust, despite the highly entertaining political landscape and occasional bouts of political noise. The market is absolutely correct in focusing on the cabinet lineup and fiscal debates &ndash; these will be key drivers for local assets going forward.</p>
<h2>China Policy Support</h2>
<p>EM surprises continued overnight with reports about <strong>Chinese state-owned banks launching new credit lines for embattled real estate developers</strong>. The consensus is not in a hurry to upgrade China&rsquo;s near-term growth outlook, despite the re-opening moves and the earlier rescue packages for the housing sector &ndash; which is understandable, given a spike in the number of COVID cases. However, policymakers are targeting the right areas &ndash; &ldquo;rebuilding&rdquo; (not just infrastructure) and &ldquo;reopening&rdquo; &ndash; both of which are important for domestic sentiment, as the global growth outlook continues to soften (judging by today&rsquo;s weaker-than-expected Purchasing Managers Indices in the U.S.).</p>
<h2>EM Inflation And Rate Hike Frontloading</h2>
<p>Another surprise came from <strong>South Africa</strong>, where both <strong>core and headline inflation accelerated more than expected</strong> in October. South African inflation is still below EMEA peers &ndash; &ldquo;mere&rdquo; 7.6% year-on-year. Further, South Africa is the only country in the region where inflation is expected to return to target in 2023. However, the consensus thinks that the central bank will not be taking any &ldquo;dovish pivot&rdquo; chances and opt for another large 75bps rate hike tomorrow. This move will push the ex-ante real policy rate to 2%+ (see chart below) &ndash; which might be sufficiently restrictive for the slowing economy. Stay tuned!</p>
<h3>Chart at a Glance: Global Real Policy Rates Getting More Positive</h3>
<p><img class="img-responsive w-100" src="https://www.vaneck.com/contentassets/0b94350cc10a4ddf95ac0988c3c03712/us-emerging-markets-daily-2022-11-23.png" alt="Chart at a Glance: Global Real Policy Rates Getting More Positive" /></p>
<p class="chart-disclosure">Source: VanEck Research; Bloomberg LP.</p>
]]></content:encoded>
</item><item rdf:about="https://www.vaneck.com/us/en/blogs/emerging-markets-bonds/market-tensions-in-em/">
  <title>Market Tensions in EM></title>
  <link>https://www.vaneck.com/us/en/blogs/emerging-markets-bonds/market-tensions-in-em/</link>
  <description><![CDATA[While China was the biggest detractor in October, we believe our decision to retain our country holdings will prove prescient as China begins reopening.]]></description>
  <dc:creator>Eric Fine</dc:creator>
  <dc:date>11/22/2022 06:30:00</dc:date>
<content:encoded><![CDATA[

<p>We currently see three key market tensions (as opposed to directions): 1) China reopening vs. the &ldquo;divorce&rdquo;; 2) U.S. Federal Reserve&rsquo;s (Fed&rsquo;s) anti-inflation focus vs. the limpness of higher rates in addressing food and energy prices; and 3) the potential for some near-term thawing in geopolitical tension vs. the fact of the West&rsquo;s loss of Eurasia. We believe these tensions will remain an issue for some time.</p>
<p>While the Emerging Markets Bond Fund (the &ldquo;Fund&rdquo;) was down as compared to its benchmark in October, YTD outperformance is still at 291bps. Our underperformance in October was due primarily to China, but the Fund held on to its China property names (as much as possible, given risk-management constraints), making China&rsquo;s reopening and policy support for the sector a big winner for our view. For detailed Fund performance and EM debt outlook, <strong><a href="/us/en/blogs/emerging-markets-bonds/closer-to-a-risk-supportive-fed/emb-manager-commentary-10-2022.pdf" title="VanEck Emerging Markets Bond Fund Monthly Manager Commentary - October 2022" target="_blank" rel="noopener">download the commentary</a></strong>.</p>
<p>To receive more <a href="/us/en/insights/emerging-markets-bonds/" title="Emerging Markets Bonds Insights"><strong>Emerging Markets Bonds</strong></a> insights, <a href="/us/en/subscribe/" title="Subscription Center"><strong>sign up in our subscription center</strong></a>.</p>
]]></content:encoded>
</item><item rdf:about="https://www.vaneck.com/us/en/blogs/thematic-investing/buzz-investing-equities-rally-amidst-encouraging-inflation-data/">
  <title>BUZZ Investing: Equities Rally Amidst Encouraging Inflation Data></title>
  <link>https://www.vaneck.com/us/en/blogs/thematic-investing/buzz-investing-equities-rally-amidst-encouraging-inflation-data/</link>
  <description><![CDATA[A lower-than-expected CPI report resulted in a dramatic rally in equities. Also contributing to stability was the resilience of US consumer spending and domestic GDP growth.]]></description>
  <dc:creator> </dc:creator>
  <dc:date>11/22/2022 06:30:00</dc:date>
<content:encoded><![CDATA[

<p><strong>Key Points</strong></p>
<ul class="content-list">
<li class="mt-2"><strong>Equity Market Performance:</strong> Equities gained during the period, with the S&P 500 Index moving out of bear market territory.</li>
<li class="mt-2"><strong>Inflation Data:</strong> The Consumer Price Index rose less than forecast, posting its smallest gains since January 2022.</li>
<li class="mt-2"><strong>Federal Reserve Actions:</strong> The Federal Open Market Committee raised the federal funds rate by 75 basis points to 3.75%–4.00% on November 2, 2022.</li>
<li class="mt-2"><strong>Market Contributors:</strong> NVIDIA Corp and Advanced Micro Devices saw significant stock price increases, while Tesla Inc and Meta Platforms Inc experienced declines.</li>
</ul>
<p>Stability seemed to take root across domestic markets during the recent period between Index selection dates (October 13, 2022 to November 10, 2022, the &ldquo;Period&rdquo;), with equities gaining and the surging US dollar pausing its relentless year-to-date advance. Upbeat corporate earnings, resilient US consumer spending, and domestic GDP growth, which beat expectations, overcame earnings disappointments from several mega-cap technology stocks. The S&amp;P 500 Index gained, pulling the widely followed index out of bear market territory for the year. Some market participants cited &lsquo;oversold&rsquo; conditions in both price and sentiment as catalysts for the rebound.</p>
<p>The Federal Open Market Committee (FOMC) hiked its Federal Funds Target Rate by 75bps at its November 2 meeting, marking the fourth consecutive 75bps point hike as the committee continues to pursue its most aggressive pace of monetary policy tightening since it started using the overnight funds rate as its principal policy tool in 1990. Future readings of domestic inflation remain a key focus for many market participants trying to forecast the pace of future interest rate hikes by the Federal Reserve. Recent readings of domestic inflation revealed the consumer price index rose less than forecast, posting its smallest gains since January 2022. The CME FedWatch Tool, which analyzes the probability of FOMC rate moves for upcoming meetings using 30-Day Fed Fund futures pricing data, now indicates an approximate 20% probability of a fifth consecutive 75bps hike while projecting an easing of the pace of future increases into 2023.</p>
<p>The BUZZ NextGen AI US Sentiment Leaders Index (the &ldquo;BUZZ Index&rdquo; or &ldquo;Index&rdquo;) returned 7.00% during the month of October compared to a return of 8.10% for the S&amp;P 500 Index during the same period. Year-to-date, the BUZZ Index trails the S&amp;P 500 with returns of -41.43% and -17.70%, respectively, as of the end of October.</p>
<h2>Shares of Chip Makers Pace Advancing Stocks within the BUZZ Index</h2>
<p>Shares of NVIDIA Corp (NASD: NVDA) and Advanced Micro Devices (NASD: AMD) each surged over 14% on November 10, as investors reacted positively to signs of slowing inflation which sparked speculation the Federal Reserve might become less aggressive with future interest rate hikes. The leading chip makers snap rally helped pace gains within the BUZZ Index during the period; however, both NVDA and AMD remain 50% below their 52-week highs, a telling indicator of the breadth of the technology sell-off of 2022. Shopify Inc. (NYSE: SHOP) was another notable contributor to the BUZZ Index performance during the Period. The Canadian e-commerce company reported Q4 revenue that beat analysts&rsquo; expectations after adding more avenues for its customers to sell and promote their products. Among the hardest hit of thematic and future-growth oriented equities, SHOP gained nearly 40% during the Period, the best-performing stock in the BUZZ Index. Despite the impressive gains, shares of SHOP remain nearly 80% below their 52-week high.</p>
<div class="wrapped-div">
<table style="width: 750px;">
<tbody>
<tr class="tbl-data">
<td class="tbl-header last" colspan="4">Top BUZZ Index Contributors: October 13, 2022 &ndash; November 10, 2022</td>
</tr>
<tr class="tbl-data">
<td class="data-td  last">Company</td>
<td class="data-head last">Ticker</td>
<td class="data-head last">Average Weight (%)</td>
<td class="data-head last">Return Contribution (%)</td>
</tr>
<tr class="tbl-data">
<td class="data-td last" style="font-weight: normal;">NVIDIA Corp</td>
<td class="data-td data last">NVDA</td>
<td class="data-td data last">3.20</td>
<td class="data-td data last">0.97</td>
</tr>
<tr class="tbl-data">
<td class="data-td last" style="font-weight: normal;">Carnival Corp</td>
<td class="data-td data last">CCL</td>
<td class="data-td data last">2.20</td>
<td class="data-td data last">0.68</td>
</tr>
<tr class="tbl-data">
<td class="data-td last" style="font-weight: normal;">Shopify Inc</td>
<td class="data-td data last">SHOP</td>
<td class="data-td data last">1.85</td>
<td class="data-td data last">0.62</td>
</tr>
<tr class="tbl-data">
<td class="data-td last" style="font-weight: normal;">Advanced Micro Devices Inc</td>
<td class="data-td data last">AMD</td>
<td class="data-td data last">2.86</td>
<td class="data-td data last">0.51</td>
</tr>
<tr class="tbl-data">
<td class="data-td last" style="font-weight: normal;">Boeing Co/The</td>
<td class="data-td data last">BA</td>
<td class="data-td data last">1.39</td>
<td class="data-td data last">0.46</td>
</tr>
<tr class="tbl-data">
<td class="data-td last" style="font-weight: normal;">Ford Motor Co</td>
<td class="data-td data last">F</td>
<td class="data-td data last">2.12</td>
<td class="data-td data last">0.44</td>
</tr>
<tr class="tbl-data">
<td class="data-td last" style="font-weight: normal;">JPMorgan Chase &amp; Co</td>
<td class="data-td data last">JPM</td>
<td class="data-td data last">1.89</td>
<td class="data-td data last">0.40</td>
</tr>
<tr class="tbl-data">
<td class="data-td last" style="font-weight: normal;">Netflix Inc</td>
<td class="data-td data last">NFLX</td>
<td class="data-td data last">2.73</td>
<td class="data-td data last">0.35</td>
</tr>
<tr class="tbl-data">
<td class="data-td last" style="font-weight: normal;">Enphase Energy Inc</td>
<td class="data-td data last">ENPH</td>
<td class="data-td data last">1.19</td>
<td class="data-td data last">0.29</td>
</tr>
<tr class="tbl-data">
<td class="data-td last" style="font-weight: normal;">Bank of America Corp</td>
<td class="data-td data last">BAC</td>
<td class="data-td data last">1.36</td>
<td class="data-td data last">0.26</td>
</tr>
</tbody>
</table>
</div>
<br />
<p class="chart-disclosure">Source: BUZZ Holdings ULC, Bloomberg. Past performance is no guarantee of future results. Index performance is not illustrative of fund performance. Not intended as a recommendation to buy or to sell any of the securities mentioned herein.</p>
<p>The top detractors to performance featured a range of stocks from the Communication Services, Consumer Discretionary, and Information Technology sectors together with technology-oriented Financials. Shares of electric vehicle manufacturer Tesla Inc (NASD: TSLA) were among the top detractors to performance, falling nearly 14% during the Period. TSLA CEO Elon Musk sold at least another $3.95 billion worth of TSLA shares in his electric car company after closing his $44 billion acquisition of Twitter. Musk&rsquo;s acquisition of Twitter closed on October 27th. Shares of TSLA have fallen 31.4% from the April 14th announcement of Musk&rsquo;s bid through the closing of the transaction. Meta Platforms, Inc. (NASD: META), the parent company of social media platforms such as Facebook and Instagram, continued to struggle, falling 14.1% during the Period, failing to participate in the broader equity market rally. Investors appear frustrated with META CEO Mark Zuckerberg&rsquo;s seemingly stubborn commitment to the company&rsquo;s 'Long-Term Vision' for its Metaverse vision while simultaneously announcing plans to fire 13% of its workforce in a bid to reduce costs.</p>
<div class="wrapped-div">
<table style="width: 750px;">
<tbody>
<tr class="tbl-data">
<td class="tbl-header last" colspan="4">Bottom BUZZ Index Contributors: October 13, 2022 &ndash; November 10, 2022</td>
</tr>
<tr class="tbl-data">
<td class="data-td  last">Company</td>
<td class="data-head last">Ticker</td>
<td class="data-head last">Average Weight (%)</td>
<td class="data-head last">Return Contribution (%)</td>
</tr>
<tr class="tbl-data">
<td class="data-td last" style="font-weight: normal;">Coinbase Global Inc</td>
<td class="data-td data last">COIN</td>
<td class="data-td data last">1.88</td>
<td class="data-td data last">-0.56</td>
</tr>
<tr class="tbl-data">
<td class="data-td last" style="font-weight: normal;">Tesla Inc</td>
<td class="data-td data last">TSLA</td>
<td class="data-td data last">2.76</td>
<td class="data-td data last">-0.42</td>
</tr>
<tr class="tbl-data">
<td class="data-td last" style="font-weight: normal;">Amazon.com Inc</td>
<td class="data-td data last">AMZN</td>
<td class="data-td data last">2.76</td>
<td class="data-td data last">-0.41</td>
</tr>
<tr class="tbl-data">
<td class="data-td last" style="font-weight: normal;">Meta Platforms Inc</td>
<td class="data-td data last">META</td>
<td class="data-td data last">2.51</td>
<td class="data-td data last">-0.38</td>
</tr>
<tr class="tbl-data">
<td class="data-td last" style="font-weight: normal;">Lucid Group Inc</td>
<td class="data-td data last">LCID</td>
<td class="data-td data last">2.40</td>
<td class="data-td data last">-0.19</td>
</tr>
<tr class="tbl-data">
<td class="data-td last" style="font-weight: normal;">Plug Power Inc</td>
<td class="data-td data last">PLUG</td>
<td class="data-td data last">1.04</td>
<td class="data-td data last">-0.18</td>
</tr>
<tr class="tbl-data">
<td class="data-td last" style="font-weight: normal;">Affirm Holdings Inc</td>
<td class="data-td data last">AFRM</td>
<td class="data-td data last">0.80</td>
<td class="data-td data last">-0.17</td>
</tr>
<tr class="tbl-data">
<td class="data-td last" style="font-weight: normal;">Robinhood Markets Inc</td>
<td class="data-td data last">HOOD</td>
<td class="data-td data last">1.06</td>
<td class="data-td data last">-0.16</td>
</tr>
<tr class="tbl-data">
<td class="data-td last" style="font-weight: normal;">Palantir Technologies Inc</td>
<td class="data-td data last">PLTR</td>
<td class="data-td data last">2.51</td>
<td class="data-td data last">-0.15</td>
</tr>
<tr class="tbl-data">
<td class="data-td last" style="font-weight: normal;">Alphabet Inc</td>
<td class="data-td data last">GOOGL</td>
<td class="data-td data last">2.76</td>
<td class="data-td data last">-0.14</td>
</tr>
</tbody>
</table>
</div>
<br />
<p class="chart-disclosure">Source: BUZZ Holdings ULC, Bloomberg. Past performance is no guarantee of future results. Index performance is not illustrative of fund performance. Not intended as a recommendation to buy or to sell any of the securities mentioned herein.</p>
<h2>Sentiment Stock Highlight &ndash; Coinbase Global, Inc.</h2>
<p>The crypto world was left in shock this month when it was revealed that FTX, the third-largest exchange in the world as measured by trading volume, was facing liquidity issues, and pausing customer withdrawals. Many previously thought it unfathomable that the company, led by Sam Bankman-Fried (&ldquo;SBF&rdquo;), could implode so quickly. SBF, an enigmatic and nerdy savant, amassed a cult-like following by millions of crypto &lsquo;believers&rsquo; who adored his messy mop of hair, T-shirts and shorts attire, and his penchant for playing computer games during pitch meetings. The 30-year-old founder of FTX, who at one time reportedly had a $26 billion net worth, could seemingly do no wrong as his influence and stature extended across celebrities and regulators alike. SBF&rsquo;s unassuming down-to-earth attitude and eccentricities were often cited as proof of his &lsquo;genius.&rsquo;</p>
<p>The decline in value of the FTX&rsquo;s token, dubbed FTT, which served as collateral for most of the company's liabilities, ultimately exposed the company's massive liquidity shortfall. The revelation that FTX sent customer deposits to its related hedge fund platform Alameda Research was shocking. Hanging in the balance is an increasing probability of a near-zero recovery for millions of retail investors who traded on FTX platforms. While damaging to crypto's image, the news may ultimately boost FTX's competitors, namely Coinbase (NASD: COIN), which sought to reassure the public that it did not misuse customer funds and holds ample reserves. Shares of COIN declined on the FTX news along with most crypto-related assets; however, the stock managed to hold its recent June 2022 lows. Of note is that investor sentiment on the stock has been climbing, suggesting investors may not expect contagion to spread from the FTX fallout to COIN. This month, COIN&rsquo;s weight rises almost 1%, achieving a maximum 3% weight within the BUZZ Index.</p>
<h3>Coinbase Global Stock Price | January 2022 &ndash; November 2022</h3>
<p><img class="img-responsive w-100" src="https://www.vaneck.com/contentassets/4ae1fef0cfae431ba730a0fd4c254d33/buzz_chart_01_v1_2022.11_blog.svg" alt="Coinbase Global Stock Price | January 2022 - November 2022" /></p>
<p class="chart-disclosure">Source: BUZZ Holdings ULC, Bloomberg. Past performance is no guarantee of future results. Index performance is not illustrative of fund performance. Not intended as a recommendation to buy or to sell any of the securities mentioned herein.</p>
<h2>BUZZ Index November 2022 Rebalance Highlights</h2>
<p><strong>Snap Inc.</strong></p>
<p>Social media stocks have been among the hardest hit segments of the equity market over the past year. Meta Platforms, Inc. (NASD: META) has garnered much of the financial media&rsquo;s attention as its stock fell nearly 75% from the start of 2022 to its low in early November. Declining revenues have also been a problem for other social media companies, notably Snap (NYSE: SNAP). SNAP's Q3 earnings, released on October 20th, 2022, highlighted revenue growth slowing into the single digits and larger than expected losses. Shares of SNAP sank 28% following the report. To many, the poor results looked like yet another disappointment for the stock, as shares of SNAP declined sharply following each of the company&rsquo;s four previous earnings reports. SNAP&rsquo;s Q3 earnings report did contain several positive signs for the company, including continued daily active user growth, record subscribers in its Snapchat+ subscription service, and a $500 million share buyback program. Investors may be becoming increasingly bullish on the stock, as positive investor sentiment has recently jumped while shares of SNAP have recovered from their post-earnings losses. Previously at a 0.93% weight, this month SNAP joins COIN in ascending to a maximum 3% weight within the BUZZ Index.</p>
<p>For more on rebalancing results and a full breakdown of index constituents added and removed for the month, view the <a href="/us/en/investments/social-sentiment-etf-buzz/buzz-reconstitution.pdf" rel="noopener" target="_blank" title="BUZZ VanEck Social Sentiment ETF"><strong>BUZZ Index reconstitution</strong></a> report.</p>
<p>To receive more <strong><a href="https://www.vaneck.com/us/en/insights/thematic-investing/" title="Thematic Investing Insights">Thematic Investing</a></strong> insights, <strong><a href="https://www.vaneck.com/us/en/subscribe/" title="Subscription Center">sign up in our subscription center</a></strong>.</p>
<style type="text/css">
    .wrapped-div {
        max-width: 100%;
    }

    @media (max-width: 1240px) {
        .wrapped-div {
            overflow-x: scroll;
        }
    }

    .wrapped-div-sector {
        max-width: 100%;
        overflow-x: scroll;
    }
</style>
]]></content:encoded>
</item><item rdf:about="https://www.vaneck.com/us/en/blogs/income-investing/i-bonds-question-and-answer/">
  <title>I Bonds: Question &amp; Answer></title>
  <link>https://www.vaneck.com/us/en/blogs/income-investing/i-bonds-question-and-answer/</link>
  <description><![CDATA[I bonds are a safe and easy way to save for the future and offset the negative impact of inflation over time.]]></description>
  <dc:creator> </dc:creator>
  <dc:date>11/22/2022 06:30:00</dc:date>
<content:encoded><![CDATA[

<p>Inflation is often referred to as a &ldquo;silent thief.&rdquo; And for good reason. If inflation is running at 3% per year and a person has $10,000 in savings, then after one year their savings will be worth $9,700 in terms of purchasing power. In other words, inflation has reduced the real value of their savings by 3%. This can be a particular problem for people who are retired and relying on their savings to support themselves. I bonds are an effective way to help investors mitigate the negative impact of inflation over time.</p>
<ul class="content-list">
<li><strong><a href="#point-one">What are I bonds?</a></strong></li>
<li><strong><a href="#point-two">What are the benefits of I bonds?</a></strong></li>
<li><strong><a href="#point-three">How do interest payments work?</a></strong></li>
<li><strong><a href="#point-four">Are I bonds taxed at the federal level?</a></strong></li>
<li><strong><a href="#point-five">How do you purchase I bonds?</a></strong></li>
</ul>
<h2 id="point-one" class="anchored-block">What are I bonds?</h2>
<p>I bonds are a type of savings bond that are issued by the United States Department of the Treasury. I bonds are unique in that they offer both a fixed rate of interest and an adjustable rate of interest. The fixed rate portion of the I bond is set at the time of purchase and remains fixed for the life of the bond. The adjustable rate portion is based on inflation, as measured by the Consumer Price Index (CPI), and is updated every six months.</p>
<h2 id="point-two" class="anchored-block">What are the benefits of I bonds?</h2>
<p>The fixed rate remains constant for the life of the bond, while the adjustable rate fluctuates in response to changes in inflation as measured by the CPI. So, if inflation ticks up, an I bond will pay a higher interest payment. As a result, I bonds provide a relatively safe way to protect savings from inflation. In addition, I bonds are exempt from state and local taxes, making them an attractive investment for many people.</p>
<h2 id="point-three" class="anchored-block">How do interest payments work?</h2>
<p>Interest accrues monthly and is compounded semiannually. However, investors do not receive interest payments until the bond is redeemed, and you must own an I bond for one year before it can be redeemed. In addition, if you redeem the bond within the first five years after purchase, you will incur a penalty that is equivalent to the last three months of interest on the I bond.</p>
<h2 id="point-four" class="anchored-block">Are I bonds taxed at the federal level?</h2>
<p>I bonds are exempt from state and local taxes. In most cases, investors owe federal taxes on the interest earned from I bonds. However, interest earned on I bonds can be excluded from federal taxes if it is used for qualified education expenses, a feature that makes I bonds a good tool for college savings.</p>
<p>Because interest payments are not made until the bond is redeemed, investors have the option to defer reporting the interest for tax purposes until the year in which interest payments are distributed.</p>
<h2 id="point-five" class="anchored-block">How do you purchase I bonds?</h2>
<p>I-bonds can be purchased in denominations of $50, $75, $100, $200, $500, $1,000, and $5,000. I-bonds have a maximum maturity of 30 years and can be redeemed after one year. Generally, you can purchase up to $10,000 of I-bonds in a calendar year. However, this limit applies to entities, not individuals. If you own different trusts and limited liability companies, each of these entities can purchase $10,000 of I bonds per calendar year. I-bonds can be purchased online, through a bank or broker, or by mail.</p>
<p class="d-none d-lg-block"><a href="mailto:askvaneck@vaneck.com" title="Have More Questions? - Ask VanEck" rel="noopener"> <img class="img-responsive" src="https://www.vaneck.com/globalassets/home/us/insights/blogs/bm-blog-images/cta-faq_desktop-02.svg" alt="Have More Questions? - Ask VanEck" /></a></p>
<p class="d-lg-none"><a href="mailto:askvaneck@vaneck.com" title="Have More Questions? - Ask VanEck" rel="noopener"> <img class="img-responsive" src="https://www.vaneck.com/globalassets/home/us/insights/blogs/bm-blog-images/cta-faq_mobile-01.svg" alt="Have More Questions? - Ask VanEck" /></a></p>
<p>To receive more <a href="/us/en/blogs/income-investing/" title="Income Investing Insights"><strong>Income Investing</strong></a> insights, <a href="/link/5f45412c2143400497908cea2897f7d3.aspx" title=" Subscription Center"><strong>sign up in our subscription center</strong></a>.</p>
<style type="text/css">
    .wrapped-div {
        max-width: 100%;
    }

    @media (max-width: 768px) {
        .wrapped-div {
            overflow-x: scroll;
        }
    }

    .wrapped-div-sector {
        max-width: 100%;
        overflow-x: scroll;
    }
</style>
]]></content:encoded>
</item><item rdf:about="https://www.vaneck.com/us/en/blogs/economic-trends/global-rates-disinflation-and-beyond/">
  <title>Global Rates – Disinflation and Beyond></title>
  <link>https://www.vaneck.com/us/en/blogs/economic-trends/global-rates-disinflation-and-beyond/</link>
  <description><![CDATA[The pace of disinflation is an important driver for peak rates, but fiscal slippages can easily limit the available policy space.]]></description>
  <dc:creator>Natalia  Gurushina</dc:creator>
  <dc:date>11/22/2022 06:30:00</dc:date>
<content:encoded><![CDATA[

<h2>EM Disinflation Signs</h2>
<p>The biggest shock of the day in emerging markets (EM) is Argentina&rsquo;s soccer squad losing to Saudi Arabia in the World Cup &ndash; where&rsquo;s the IMF when one needs it? And the rest of the week can bring more surprises &ndash; especially on the inflation front. South Africa will release its October inflation print tomorrow, Malaysia&rsquo;s inflation will be out on Thursday, and Brazil and Mexico will report mid-month inflation also on Thursday. The <strong>market is on the lookout for (further) disinflation</strong> in all four countries, and there is also an additional fiscal discipline &ldquo;layer&rdquo; in Brazil and Malaysia. The IMF just issued a timely reminder (a blog) about the impact of fiscal tightening on core inflation &ndash; fiscal slippages can impose more pressure on central banks to tighten in a softer growth environment. For example, the market priced out most rate cuts in Brazil in 2023 due to concerns about President-elect&rsquo;s spending plans, adding nearly 70bps of rate hikes in December-March &ndash; despite impressive disinflation.</p>
<h2>EM Asia Peak Inflation</h2>
<p>The Malaysian parliamentary elections (a hung parliament) introduced additional fiscal uncertainty. Still, October&rsquo;s inflation is expected to ease a lot (from 4.5% year-on-year to 3.9%) &ndash; in line with <strong>a thesis that EM Asia can disinflate faster and with much lower peaks than the rest of EM</strong>. In theory, this should leave more policy space to deal with weaker growth going forward. Inflation in most EM Asia is expected to return to target by H2-2023 (see chart below), whereas most of EM Europe and LATAM would have to wait until 2024 to get there.</p>
<h2>EMEA Policy Tightening</h2>
<p><strong>South Africa is the only major EMEA economy which can get back to their inflation target next year</strong>. This is the reason why this week&rsquo;s inflation release and the central bank&rsquo;s rate-setting meeting will be closely watched. The central bank delivered two unusually large (75bps) rate hikes in a row &ndash; and the consensus expects a similar increase on Thursday, believing that the board would err on the side of caution, with the worsening global backdrop and the return of the current account deficits. South African local bonds held on reasonably well so far this year, as high interest return helped to offset a big chunk of currency and price losses. However, the sentiment might turn sour, if the market thinks the (previously super-credible) central bank is falling behind the curve. Stay tuned!</p>
<h3>Chart at a Glance: EM Inflation Target &ndash; Uneven Progress</h3>
<p><img class="img-responsive w-100" src="https://www.vaneck.com/contentassets/abd1ee20873845e3ad4f3f0f67b360f3/us-emerging-markets-daily-2022-11-22.png" alt="Chart at a Glance: EM Inflation Target - Uneven Progress" /></p>
<p class="chart-disclosure">Source: Bloomberg LP.</p>
]]></content:encoded>
</item><item rdf:about="https://www.vaneck.com/us/en/blogs/economic-trends/market-reversals-hopes-concerns-uncertainty/">
  <title>Market Reversals – Hopes, Concerns, Uncertainty></title>
  <link>https://www.vaneck.com/us/en/blogs/economic-trends/market-reversals-hopes-concerns-uncertainty/</link>
  <description><![CDATA[Concerns about China&rsquo;s re-opening soured the sentiment, but Brazilian assets got a reprieve, reflecting hopes that President-elect might not be too populist after all.]]></description>
  <dc:creator>Natalia  Gurushina</dc:creator>
  <dc:date>11/21/2022 16:00:00</dc:date>
<content:encoded><![CDATA[

<h2>Brazil Fiscal Policy</h2>
<p>The U.S. Dollar regained some ground in the risk-off morning trade, with the Brazilian real being the only major emerging market (EM) currency bucking this trend and rallying by 69bps against the greenback (according to Bloomberg LP, as of 10:07am). Why? Brazilian assets took a beating last week as the market got disappointed by President-elect Luiz Inacio Lula da Silva's spending plans (to the tune of 1.7-2% of GDP). The weekend&rsquo;s newswires, however, brought&nbsp;<strong>some hope that Lula-the-pragmatist might be back</strong>. Lula acknowledged the market&rsquo;s negative reaction and suggested that he might follow orthodox economic advice &ndash; provided it is good (whatever &ldquo;good&rdquo; means). Brazil&rsquo;s central bank governor Campos Neto is not in a forgiving mood, though &ndash; he said he watches the fiscal proposals very closely &ndash; and the local swap curve is priced in additional rate hikes for December-March 2023 (73bps).</p>
<h2>China Growth Outlook</h2>
<p><strong>The sentiment reversal in China reflected growing concerns about the COVID flareups</strong>&nbsp;(see chart below) and their impact on the government&rsquo;s re-opening plans. South Korea&rsquo;s 20-day export numbers &ndash; which showed that the decline in exports to China accelerated to -28.3% year-on-year &ndash; did not add much optimism either (even though the print is backward-looking). It remains to be seen whether these developments will have a meaningful impact on the next batch of China&rsquo;s activity gauges (out on November 29). In the meantime, the central bank is nudging local banks to provide more property loans &ndash; the housing sector accounts for a large portion of GDP and is key to consumer sentiment and financial stability.</p>
<h2>EM Asia Policy Tightening</h2>
<p><strong>Policy uncertainty is back in Malaysia</strong>, where the weekend&rsquo;s general elections unexpectedly resulted in a hung parliament. Malaysia is a big liquid market for EM bonds &ndash; it accounts for nearly 10% of the J.P. Morgan&rsquo;s GBI-EM Global Diversified Index &ndash; and this explains why we care about local politics. The issue at hand is that Malaysia&rsquo;s budget deficit got stuck around 6% of GDP since the pandemic, and the expected decline to 5.4% of GDP in 2023 is now less certain. A good thing is that the central bank has been proactively hiking to cap inflation pressures &ndash; but it might need to do more if the government would be slow to adjust its fiscal accounts. Stay tuned!</p>
<h3>Chart at a Glance: China New COVID Cases &ndash; Spiking Again</h3>
<p><img class="img-responsive w-100" src="https://www.vaneck.com/contentassets/9bb9e3a8925c418d87003d33ed6094a8/us-emerging-markets-daily-2022-11-21.png" alt="Chart at a Glance: China New COVID Cases - Spiking Again" /></p>
<p class="chart-disclosure">Source: Bloomberg LP.</p>
]]></content:encoded>
</item><item rdf:about="https://www.vaneck.com/us/en/blogs/emerging-markets-equity/the-power-of-south-koreas-battery-sector-confirmed/">
  <title>The Power of South Korea’s Battery Sector Confirmed></title>
  <link>https://www.vaneck.com/us/en/blogs/emerging-markets-equity/the-power-of-south-koreas-battery-sector-confirmed/</link>
  <description><![CDATA[The VanEck Emerging Markets Equity Investment Team takes a deep dive into the various aspects of South Korea&rsquo;s battery space.]]></description>
  <dc:creator> </dc:creator>
  <dc:date>11/21/2022 06:30:00</dc:date>
<content:encoded><![CDATA[

<p>As the world transitions to a low-carbon future, <a href="https://www.vaneck.com/eme-gha-whitepaper-2021.pdf" title="The Electric Vehicle  Revolution and ESG  Charge Ahead" target="_blank" rel="noopener"><strong>batteries</strong></a> are becoming critically important, given their key role in energy supply and global green transition. With battery supply chains still vulnerable to rising political tensions and China dominating a large part of the supply chain, we believe the U.S. Inflation Reduction Act (&ldquo;IRA&rdquo;) creates a pathway of a strong commitment from the U.S. government to boost battery self-sufficiency globally,<sup>1</sup>&nbsp;emerging markets (&ldquo;EM&rdquo;) included (i.e. South Korea). <strong>From battery chemistry to components to battery recycling, the VanEck Emerging Markets Equity Investment Team&rsquo;s recent trip to South Korea cements our investment thesis in South Korea&rsquo;s battery space as a leading pathway to energy self-sufficiency globally.</strong></p>
<h2>South Korea | Geopolitics</h2>
<p>Investor expectations were buoyed at the beginning of the year with the inauguration of pro-business President Yoon Suk-yeol. He has moved quickly to align South Korea with the U.S. &ndash; President Biden visited South Korea in May, and <strong><i>Samsung Group</i></strong><sup>2</sup>&nbsp;quickly thereafter pledged US$200B in an investment plan geared towards <strong><i>building out critical semiconductor infrastructure in the U.S.</i></strong> At the same time, South Koreans recognize that <strong><i>China remains a key export market for them</i></strong> and they need to keep China engaged as a trade partner.</p>
<p><strong>The U.S. Inflation Reduction Act and Its Impact on South Korea</strong></p>
<p>While more details are needed to understand the full impact of the IRA, underlying tones of protectionism against China are clear. Within our coverage universe, <strong><i>the obvious beneficiary of the IRA policy is the South Korean battery supply chain complex. South Korean battery makers are rapidly expanding capacities in the U.S. after building know-how and also fast enabling localization of the supply chain.</i></strong><sup>3</sup></p>
<p>One part of the Act that is worth highlighting is Section 45X, which covers &ldquo;specifically advanced manufacturing production credits&rdquo;, and allocates $35 per kilowatt-hour in subsidies to battery cell makers. This section will have a material impact on our portfolio company, LG Chem Ltd. (2.31% of Strategy assets), as it means that a 40-gigawatt battery plant in the U.S. would stand to receive approximately $1.5B each year in tax credits between now and 2032 (assuming there is no cap). This amounts to a big subsidy for battery makers with a presence in the U.S. (i.e., South Koreans). By 2026, South Korean battery makers will be operating plants in the U.S., accounting for at least 200-gigawatt hours each year, translating to an annual collective subsidy from the U.S. taxpayer north of $8B (again assuming no cap).</p>
<h3>Chart 1</h3>
<p><strong>More critical minerals and battery components to be brought onshore over time</strong></p>
<p><img class="img-responsive w-100" src="https://www.vaneck.com/contentassets/b3fb2be5eca14b70b590cef32176ac41/eme_chart_01_v1_2022.11.svg" alt="More critical 
minerals and battery components to be brought onshore over time 
" /></p>
<p class="chart-disclosure"><strong>Source: IRA, UBS Research, VanEck Research.</strong> Data as of November 2022.</p>
<p class="chart-disclosure">E is defined as Estimate.</p>
<p class="chart-disclosure"><sup>*</sup>&nbsp;Localization requirement is defined as supply localization. Across the battery value chain, we assess that the U.S. could achieve supply localization in downstream battery cell manufacturing by 2025-27. <strong>Source: Goldman Sachs Global Investment Research. </strong>Data as of November 14, 2022.</p>
<h2>South Korea | Demographic Shifts</h2>
<p>Although aging demographics are a universal dilemma for developed countries, the problem is no more acute than it is in South Korea. Their population is beginning to shrink and it is estimated to more than halve by the end of the century. This poses significant challenges for the country&rsquo;s economy and its ability to grow sustainably over time. In order to increase productivity to make up for this shortfall in labor, <strong><i>South Korea now has the highest robot density in the world, which all require batteries to function.</i></strong></p>
<h2>South Korea | Market Valuations</h2>
<p>The MSCI Korea index, battery names included, is down ~40% since July 2021 and almost ~50% in U.S. dollar terms. Valuations are closing in on 10 years lows, the trade deficit has reached historical highs, retail sales have peaked, GDP estimates are being reduced and foreigners have exited the market in a meaningful way. <strong><i>We believe current valuation levels create an entry point to invest in leading South Korean battery companies.</i></strong></p>
<p>As a result of the above statements and the Investment Team&rsquo;s recent trip to South Korea, we have further solidified our investment thesis in <strong>LG Energy Solution Ltd. (&ldquo;LGES&rdquo;),</strong> which we believe is poised to be the largest battery cell manufacturer in the U.S. by 2025 and will take a large chunk of the South Korean battery supply chain with it. Our portfolio holding <strong>LG Chem Ltd.</strong> (2.31% of Strategy assets) owns 82% stake in <strong>LG Energy Solution Ltd.</strong></p>
<h3>Chart 2</h3>
<p><strong>LGES is targeting c.40-100% localization of its supply chain in North America over the mid to long term</strong></p>
<p><img class="img-responsive w-100" src="https://www.vaneck.com/contentassets/b3fb2be5eca14b70b590cef32176ac41/eme_chart_02_v1_2022.11.svg" alt="LGES is targeting c.40-100% localization of its supply chain in North America over the mid to long term
  " /></p>
<p class="chart-disclosure"><strong>Source: Goldman Sachs Global Investment Research, Company Data.</strong> Data as of November 14, 2022.</p>
<p class="chart-disclosure"><strong>Anode</strong> is the negative electrode. It&rsquo;s usually made of a metal that oxidizes and sends electrons to the cathode (the positive electrode). This is an electrochemical reaction that produces electrons (i.e., electricity).</p>
<p class="chart-disclosure"><strong>Cathode</strong> is the positive electrode. It gains electrons rather than loses them. Therefore, anodes oxidize (lose electrons) while cathodes reduce (gain electrons).</p>
<p class="chart-disclosure"><strong>Electrolyte</strong> is a substance that allows electrical current to flow between the anode and the cathode.</p>
<p class="chart-disclosure"><strong>Critical Minerals</strong> in the battery space are lithium, nickel and cobalt.</p>
<h2>Battery Chemistry Matters</h2>
<p>Diversification of battery chemistries is important, as it will help reduce the dependence on critical, raw minerals.<sup>4</sup>&nbsp;There is no single chemistry that will obtain 100% market share. Rather, different chemistries will serve different applications. <strong><i>Lithium iron phosphate (&ldquo;LFP&rdquo;) battery</i></strong>, for example, will gain share in ex-China markets, as they increase the affordability of mass market vehicles in the short to medium term. Hence, <strong><i>South Korean battery makers have begun to accelerate their capacity expansion plans to accommodate for this technology</i></strong>, especially given that the U.S. has effectively blocked China&rsquo;s participation in their domestic market.</p>
<h3>Chart 3</h3>
<p><strong>We expect LFP to gain market share in ex-China through 2030E and South Korea is well positioned to accomodate for this technology</strong></p>
<p><img class="img-responsive w-100" src="https://www.vaneck.com/contentassets/b3fb2be5eca14b70b590cef32176ac41/eme_chart_03_v1_2022.11.svg" alt="We expect LFP to gain market share in ex-China through 2030E and South Korea is well positioned to accomodate for this technology
" /></p>
<p class="chart-disclosure"><strong>Source: Goldman Sachs Global Investment Research, Company Data, Wood Mackenzie, UBS, VanEck Research.</strong> Data as of November 14, 2022; E is defined as Estimate.</p>
<p>Beyond battery chemistry, we also expect South Korean companies to be leading in the development of battery components (see definitions under Chart 2) as well as in the growth of the battery recycling space.</p>
<h2>Battery Component &ndash; Anodes</h2>
<p>Silicon (&ldquo;Si&rdquo;) anodes are the future, as they possess higher energy densities, allowing for greater range and faster recharge times &ndash; i.e., tangible characteristics that can help automakers differentiate from their peers. Si-anodes are also more environmentally friendly and theoretically cheaper to produce than graphite anodes once scale has been achieved. However, the adoption of this technology faces one key constraint &ndash; Si-anodes swell and deflate when charged and discharged, which can undermine the structural integrity of batteries causing safety/performance issues. We expect South Korean companies to play a prominent role in developing technologies and processes that will allow Si-anodes to be mass produced with improved safety and environmental characteristics.</p>
<h2>Battery Component &ndash; Cathodes</h2>
<p>Driving up the nickel content of cathodes continues to be an area of differentiation for cathode manufacturers, though the maximum theoretical limit is in sight. Creating high nickel content cathodes remains a high barrier to entry business, as it is challenging to mass produce these types of cathodes with high chemical stability. Only South Korean companies are currently dabbling in this space. The next leg of the roadmap will be in transitioning from multi- to single-crystal cathodes, which should extend cathode lifecycle by increasing its stability.</p>
<h2>Battery Recycling</h2>
<p>Battery recycling is a crucial part of the battery supply chain that remains relatively underdeveloped in ex-China markets. The reason is that the number of batteries that are nearing their expiration date is only just starting to reach a scale that would enable recyclers to generate high enough utilization rates to earn sufficient returns on their investments. The addressable market for the battery recycling sector is forecasted to grow from an estimated $400 million in 2022 to $5.3 billion in 2030, an annual rate of 40% over this period.<sup>5</sup>&nbsp;As the overall market grows, we anticipate South Korean companies will seek to develop successful, fully integrated business models within this space.</p>
<h2>Conclusion</h2>
<p>We see the IRA 2022 as a positive for South Korean battery makers who are rapidly expanding capacities in the U.S. after years of building know-how and also fast enabling localization of the supply chain. We believe our portfolio holding <strong>LG Chem, </strong>which owns 82% stake in <strong>LG Energy Solution Ltd.</strong>, is well positioned to benefit from the global battery self-sufficiency trend, given its exposure to high-growth chemicals and materials, delivering one of the highest EBITDA CAGR (32% in 2022E-25E) across global diversified chemicals and EV battery and materials plays while trading at an attractive valuation.<sup>6</sup></p>
<p>To receive more <a href="/us/en/insights/emerging-markets-equity/" title="Emerging Markets Equity Insights"><strong>Emerging Markets Equity</strong></a> insights, <a href="/link/5f45412c2143400497908cea2897f7d3.aspx" title="Subscription Center"><strong>sign up in our subscription center</strong></a>.</p>
]]></content:encoded>
</item><item rdf:about="https://www.vaneck.com/us/en/blogs/investment-outlook/jan-van-eck-todays-outlook-through-a-historical-lens/">
  <title>Today’s Outlook Through a Historical Lens></title>
  <link>https://www.vaneck.com/us/en/blogs/investment-outlook/jan-van-eck-todays-outlook-through-a-historical-lens/</link>
  <description><![CDATA[CEO Jan van Eck joined the Howard Lindzon podcast to discuss what investors should expect in the coming quarters.]]></description>
  <dc:creator> </dc:creator>
  <dc:date>11/21/2022 06:30:00</dc:date>
<content:encoded><![CDATA[

<p>With volatility continuing to whipsaw the market, CEO <strong><a href="https://www.vaneck.com/us/en/news-and-insights/thought-leaders/jan-van-eck/" title="Jan van Eck - Chief Executive Officer">Jan van Eck</a></strong> joined the Howard Lindzon podcast to discuss what investors should expect in the coming quarters. The conversation centered on three key points, with Jan using a historical lens to explain the current market environment and the likely path forward:</p>
<ol class="content-list">
<li>Studying history is valuable because many of the problems we face today have been experienced before, especially from a policy perspective (8:00)</li>
<li>The connection between the current market environment and the 1970s, and the reasons why Jan thinks bonds will outperform (12:15)</li>
<li>Investors should brace themselves for an extended period of rising and falling inflation, with a mean level significantly above the Fed&rsquo;s 2% target (19:25)</li>
</ol>
<h2>What the 1970s Can Teach Us About the Future Path for Bonds</h2>
<p>When interest rates are low, an increase in rates usually does a lot of damage to bonds, which is what we&rsquo;ve seen so far this year. 2022 has been the worst year for bonds since 1976. Looking at the latter half of the 1970s, however, rates increased from 5% to 10%, yet bonds kept making money.</p>
<p>There are two reasons for this. First, an increase in interest rates from 5% to 6% is much less dramatic than a move from 1% to 2%. Second, if you&rsquo;re getting paid a coupon of 6&ndash;7% and you reinvest it, that has a tremendous compounding effect. Based on this, we think bonds are an attractive place to be.</p>
<h2>Don&rsquo;t Expect Current Market Conditions to Change Anytime Soon</h2>
<p>There are three things investors are currently facing:</p>
<ol class="content-list">
<li>Monetary policy is tight.</li>
<li>Fiscal policy is tightening and unlikely to be stimulative.</li>
<li>We&rsquo;re in a major global slowdown, if not a global recession.</li>
</ol>
<p>These conditions are going to be sticking around for a while, and what the markets are looking at now is the pressure on corporate profitability. Stocks are down because the P/E ratios are down, but earnings are still flat. We don&rsquo;t know yet what earnings will be like, so there will be a lot of information for equity investors to gather over the next few quarters.</p>
<p>Monetary and fiscal policy, as well as global growth, are all contractionary. However, we favor fixed income&mdash;based on guidance from the 1970s&mdash;and commodity equities, which are very attractively priced and poised for growth.</p>
<p><strong>Other highlights include:</strong></p>
<ul class="content-list">
<li>Current labor market dynamics (23:10)</li>
<li>The outlook for crypto and digital assets (29:00)</li>
<li>Bitcoin vs. gold (33:00)</li>
</ul>
<p>You can listen to the full podcast here: <a href="https://www.vaneck.com/us/en/offsite-disclaimer/?id=189420&amp;button=no&amp;url=https://podcasts.apple.com/us/podcast/panic-with-friends-howard-lindzon/id1460734936?i=1000586527851" title="Panic with Friends - Howard Lindzon: Jan van Eck of VanEck Funds on Global Markets, Deglobalization, and Rising Interest Rates on Apple Podcasts" target="_blank" rel="noopener"><strong>Panic with Friends - Howard Lindzon: Jan van Eck of VanEck Funds on Global Markets, Deglobalization, and Rising Interest Rates on Apple Podcasts</strong></a>.</p>
<p>To receive more <a href="/us/en/insights/investment-outlook" title="Investment Outlook Insights"><strong>Investment Outlook</strong></a> insights, <a href="https://www.vaneck.com/us/en/subscribe/" title="Subscription Center"><strong>sign up in our subscription center</strong></a>.</p>
]]></content:encoded>
</item><item rdf:about="https://www.vaneck.com/us/en/blogs/economic-trends/economic-policies-keep-it-simple/">
  <title>Economic Policies – Keep It Simple></title>
  <link>https://www.vaneck.com/us/en/blogs/economic-trends/economic-policies-keep-it-simple/</link>
  <description><![CDATA[The market remains nervous about Brazil&rsquo;s fiscal debates &ndash; will the central bank respond with a hike? EM current account narrative is split between concerns and a comeback.]]></description>
  <dc:creator>Natalia  Gurushina</dc:creator>
  <dc:date>11/18/2022 16:00:00</dc:date>
<content:encoded><![CDATA[

<h2>Brazil Fiscal Debates</h2>
<p>I learned two new economic terms this week - &ldquo;macrosynergy&rdquo; and &ldquo;quantamental&rdquo;. They sound remarkably clever, but simple concepts/frameworks work just fine most of the time. For example, if you mess up with fiscal accounts &ndash; your bonds and the currency get hit. One of <strong><a href="https://twitter.com/NGurushina" title="Twitter - Natalia Gurushina" target="_blank" rel="noopener">my Twitter</a></strong> counterparts &ldquo;demanded&rdquo; a multi-factor attribution analysis of Brazil&rsquo;s relative underperformance after the runoff (R-squares and stuff), but I think it boils down to the fact that the market had high expectations (President-elect Lula-the-pragmatist), which got crushed by reality (Lula-the-populist pushing for more spending). The market&rsquo;s elevated positioning in Brazil started to clear off after Lula&rsquo;s victory (see chart below for net longs in the Brazilian real), but there is still room for further unwinding, if policy uncertainty continues. So, we <strong>keep watching Brazil&rsquo;s fiscal debates as hawks</strong>. The probability of a &ldquo;warning shot&rdquo; from the Brazilian central bank (ending the pause and raising the policy rate) is getting higher in this environment.</p>
<h2>EM Growth and Current Account Gaps</h2>
<p>Brazil&rsquo;s saving grace is its external metric &ndash; huge international reserves and a basic balance surplus (a sum of current account and foreign direct investments). But <strong>one regional example shows what could happen when there is too much domestic stimulus amidst slowing external demand</strong>. The Chilean economy already started to cool &ndash; it posted negative sequential and flat annual GDP growth in Q3 &ndash; but imports (fueled by multiple withdrawals from private pension funds) are still at multi-decade highs. As a result, the trailing current account deficit widened to nearly 10% of GDP in Q3. The consensus expects Chile to slide into recession in 2023, which should help to reduce the current account gap. However, Chile&rsquo;s ability to maintain its fiscal discipline will matter even more against this backdrop &ndash; double-digit financing requirements can send a bad signal to the bond market.&nbsp;</p>
<h2>EM External Balances</h2>
<p>Chile&rsquo;s current account deterioration is not the only cautionary tale &ndash; wider external gaps in Central Europe and Turkey are also concerning. South Africa&rsquo;s current account posted a surprising deficit (1.3% of GDP) in Q2 &ndash; a potential challenge for the central bank, which had already accelerated the pace of rate hikes. However, <strong>there are also &ldquo;comeback kid&rdquo; stories in EM</strong> &ndash; Thailand&rsquo;s current account flipped into surplus in September, and the consensus expects a healthy surplus of 2.2% of GDP in 2023 (and an even larger surplus in 2024). Indonesia&rsquo;s current account surplus surprised to the upside in Q3, widening to USD4.4B, providing a nice fundamental support for the currency (in addition to the central bank&rsquo;s proactive tightening). Stay tuned!</p>
<h3>Chart at a Glance: Brazil &ndash; Great Expectations&hellip; Crushed?</h3>
<p><img class="img-responsive w-100" src="https://www.vaneck.com/contentassets/296cbeb593ab40c7b70d2661de217c35/us-emerging-markets-daily-2022-11-18.png" alt="Chart at a Glance: Brazil - Great Expectations Crushed?" /></p>
<p class="chart-disclosure">Source: Bloomberg LP.</p>
<p class="chart-disclosure"><sup>*</sup>GSCPI Index: Global Supply Chain Pressure Index seeks to measure supply chain conditions, created by the Federal Reserve. The index combines variables from several indices in transportation and manufacturing.</p>
]]></content:encoded>
</item><item rdf:about="https://www.vaneck.com/us/en/blogs/emerging-markets-bonds/yield-duration-opportunity-in-em-bonds/">
  <title>Yield-Duration Opportunity in EM Bonds></title>
  <link>https://www.vaneck.com/us/en/blogs/emerging-markets-bonds/yield-duration-opportunity-in-em-bonds/</link>
  <description><![CDATA[Compared to the U.S. and other developed markets bonds, EM bonds not only provide significantly higher nominal and real yields on average but also shorter durations.]]></description>
  <dc:creator>Fran Rodilosso</dc:creator>
  <dc:date>11/17/2022 08:30:00</dc:date>
<content:encoded><![CDATA[

<p>Central bank rate hikes in both emerging and developed markets have led to higher fixed-income yields across the board, providing investors with significantly higher levels of carry compared to the start of the year. Compared to the U.S. and other developed markets bonds, EM bonds not only provide significantly higher nominal and real yields on average but also shorter durations. As shown in the chart below, the yield-per-unit-of-duration ratio for EM bonds is particularly attractive relative to other asset classes among high-yield corporates and local currency sovereigns.</p>
<h3>Yield-Duration Profile</h3>
<p><img class="img-responsive w-100" src="https://www.vaneck.com/contentassets/6ffe748236c346d4a36f2fe305c3db4d/emd_chart_2022.11_blog.svg" alt="Yield-Duration Profile" /></p>
<p class="chart-disclosure">Source: VanEck, ICE Data Indices, LLC., J.P. Morgan Index Research, as of 10/31/2022. EM USD HY Corp is represented by the ICE BofA Diversified HY US Emerging Markets Corporate Plus Index. EM USD Sov is represented by the J.P. Morgan EMBI Global Diversified Index. U.S. HY is represented by the ICE BofA US High Yield Index. EM Local Sov is represented by the J.P. Morgan GBIEM Global Core Index. U.S. AGG is represented by the ICE BofA US Broad Market Index. Global AGG is represented by the ICE BofA Global Broad Market Index. Yield per Duration is expressed by yield-to-worst being divided by effective duration.</p>
<p>As of October 31, 2022, EM USD High Yield Corporate Bonds provided the highest yield among the asset classes shown, at 13.15% or 375bps higher than EM USD Sovereign Bonds and 410bps higher than US High Yield Corporate Bonds. EM Local Currency Sovereign Bonds provided a yield of 8.36%, which is notable given that the asset class is, on average, rated investment grade.</p>
<p>Inflation remains persistently high, and the Federal Reserve has signaled that while it may start to slow the pace it is not yet done with rate hikes. In this environment, EM bonds may be particularly appealing compared to U.S. and global bonds as a source of income. EM USD High Yield Corporate Bonds currently provide the highest yield per unit of duration, substantially above US HY bonds due to both a higher yield and lower duration. This additional &ldquo;carry&rdquo; would enable EM HY corporates to absorb a greater degree of either higher base rates or wider credit spreads. EM Local Currency Sovereign Bonds also provide an attractive yield per duration, with the added benefit of diversification since these bonds are less directly impacted by movements in U.S. interest rates.</p>
<p>To receive more <a href="/us/en/insights/emerging-markets-bonds/" title="Emerging Markets Bonds Insights"><strong>Emerging Markets Bonds</strong></a> insights, <a href="/us/en/subscribe/" title=" Subscription Center"><strong>sign up in our subscription center</strong></a>.</p>
]]></content:encoded>
</item><item rdf:about="https://www.vaneck.com/us/en/blogs/digital-assets/blockchain-bridges-trolling-and-tolling-to-174b-dollars/">
  <title>Blockchain Bridges: Trolling and Tolling to $174B></title>
  <link>https://www.vaneck.com/us/en/blogs/digital-assets/blockchain-bridges-trolling-and-tolling-to-174b-dollars/</link>
  <description><![CDATA[Blockchain bridges allow the exchange of assets, messages, data, and, most importantly, users. In our base case, we value the bridging sector to be worth $174B by 2030.]]></description>
  <dc:creator>Patrick Bush</dc:creator>
  <dc:date>11/17/2022 07:00:00</dc:date>
<content:encoded><![CDATA[

<p><strong>Please note that VanEck may have a position(s) in the digital asset(s) described below.</strong></p>
<ul class="content-list">
<li><a class="my-2 d-inline-block" href="#bridging-goals"><strong>Blockchain Bridging Goals</strong></a></li>
<li><a class="my-2 d-inline-block" href="#security"><strong>Blockchain Bridge Security Key to Growth</strong></a></li>
<li><a class="my-2 d-inline-block" href="#improving-implementation"><strong>Improving Blockchain Bridge Implementation and Design</strong></a></li>
<li><a class="my-2 d-inline-block" href="#base-case"><strong>How We Arrived at Our Bridging Base Case</strong></a></li>
<li><a class="my-2 d-inline-block" href="#projects-to-watch"><strong>Blockchain Bridge Projects to Watch</strong></a></li>
</ul>
<p>The blockchain bridge space is the final frontier in applied blockchain technology. Bridges are gateways that allow the exchange of assets, messages, data and, most importantly, <i>users</i>. While they are the source of tremendous controversy amid <strong><a href="https://www.coindesk.com/layer2/2022/10/14/blockchain-bridges-keep-getting-attacked-heres-how-to-prevent-it/" title="Blockchain Bridges Keep Getting Attacked. Here's How to Prevent It" target="_blank" rel="noopener">billions in hacks</a></strong>, bridges have also been used to great strategic effect. Chains like <strong><a href="https://defillama.com/protocol/portal" title="Portal: TVL and Stats - DefiLlama" target="_blank" rel="noopener">Solana</a></strong> and <a href="https://dune.com/nadimchamoun/Avalanche-Bridge" title="Avalanche Bridge" target="_blank" rel="noopener"><strong>Avalanche</strong></a> have employed bridges to jumpstart their blockchains by onboarding <i>hundreds of thousands new users</i> and <i>billions of dollars</i> in assets in the span of just <i>a few weeks</i>.</p>
<p>Based on our discounted cash flow analysis, our base case is that the blockchain bridging sector will be worth $174.1B by 2030. Here we&rsquo;ll share our insights on the growth, key developments and outlook in this space, as well as how we arrived at our base case.</p>
<h2 id="bridging-goals" class="jump-link-nav anchored-block" data-jumplink-title="Bridging Goals">Blockchain Bridging Goals</h2>
<p>Bridges may present tremendous perils but also high potential rewards to users, investors, applications and entire ecosystems. Because bridges collect tolls on the information shared between blockchains, they stand to benefit enormously in an environment where economic activity is fragmented across many ecosystems. With <strong><a href="https://defillama.com/protocol/portal" title="Portal: TVL and Stats - DefiLlama" target="_blank" rel="noopener">$54.2B</a></strong> in assets spread across more than a dozen major smart contract platforms, we live in a multi-chain world. Blockchains are closed loop systems of value, which means assets are mostly restricted to their native blockchains. The result is that asset prices and asset liquidity vary across ecosystems. Even interest rates for the same asset, within the same application, differ depending upon where they reside. A successful set of blockchain bridges could immediately create higher capital efficiency in DeFi by harmonizing rates according to a more transparent set of variables.</p>
<div class="wrapped-div">
<table style="width: 100%;">
<tbody>
<tr class="tbl-data">
<td class="tbl-header last" colspan="7">Borrowing Rates on AAVE</td>
</tr>
<tr class="tbl-data">
<td class="data-td  last">&nbsp;</td>
<td class="data-head last" style="text-align: center;" colspan="2">USDC Rates</td>
<td class="data-head last" style="text-align: center;" colspan="2">USDT Rates</td>
<td class="data-head last" style="text-align: center;" colspan="2">DAI Rates</td>
</tr>
<tr class="tbl-data">
<td class="data-td  last" style="text-align: left;">Protocol</td>
<td class="data-head last" style="text-align: center;">Borrow</td>
<td class="data-head last" style="text-align: center;">Lend</td>
<td class="data-head last" style="text-align: center;">Borrow</td>
<td class="data-head last" style="text-align: center;">Lend</td>
<td class="data-head last" style="text-align: center;">Borrow</td>
<td class="data-head last" style="text-align: center;">Lend</td>
</tr>
<tr class="tbl-data">
<td class="data-td data last" style="text-align: left;">Arbitrum</td>
<td class="data-td data last" style="text-align: center;">1.45%</td>
<td class="data-td data last" style="text-align: center;">0.45%</td>
<td class="data-td data last" style="text-align: center;">3.22%</td>
<td class="data-td data last" style="text-align: center;">2.24%</td>
<td class="data-td data last" style="text-align: center;">1.76%</td>
<td class="data-td data last" style="text-align: center;">0.57%</td>
</tr>
<tr class="tbl-data">
<td class="data-td data last" style="text-align: left;">Avalanche</td>
<td class="data-td data last" style="text-align: center;">2.26%</td>
<td class="data-td data last" style="text-align: center;">1.01%</td>
<td class="data-td data last" style="text-align: center;">N/A</td>
<td class="data-td data last" style="text-align: center;">2.76%</td>
<td class="data-td data last" style="text-align: center;">2.48%</td>
<td class="data-td data last" style="text-align: center;">1.09%</td>
</tr>
<tr class="tbl-data">
<td class="data-td data last" style="text-align: left;">Optimism</td>
<td class="data-td data last" style="text-align: center;">2.93%</td>
<td class="data-td data last" style="text-align: center;">1.70%</td>
<td class="data-td data last" style="text-align: center;">N/A</td>
<td class="data-td data last" style="text-align: center;">2.20%</td>
<td class="data-td data last" style="text-align: center;">3.28%</td>
<td class="data-td data last" style="text-align: center;">1.89%</td>
</tr>
<tr class="tbl-data">
<td class="data-td data last" style="text-align: left;">Polygon</td>
<td class="data-td data last" style="text-align: center;">2.46%</td>
<td class="data-td data last" style="text-align: center;">1.22%</td>
<td class="data-td data last" style="text-align: center;">2.57%</td>
<td class="data-td data last" style="text-align: center;">1.72%</td>
<td class="data-td data last" style="text-align: center;">2.54%</td>
<td class="data-td data last" style="text-align: center;">1.19%</td>
</tr>
</tbody>
</table>
</div>
<br />
<p class="chart-disclosure">Source: AAVE, as of 11/01/2022.</p>
<p>One major goal of bridging infrastructure is to unify the various blockchain asset markets, much in the same way stock exchanges are connected through electronic trading, to make capital truly interchangeable and transferable. To achieve this goal, bridges (or centralized exchanges, or stablecoin issuers) must implement safe blockchain-to-blockchain asset transfer methods, while reducing the complexity and time spent utilizing bridging applications. The end state should offer a user experience defined by a few clicks, whose safety matches the level of the bridged blockchains. Ultimately, a user should not even have to understand the route that the assets take to perform a desired function nor even which blockchains are being used. If bridges are able to surmount their considerable safety issues and their technology is aptly applied, bridges may render blockspace a <i>commodity.</i></p>
<h2 id="security" class="jump-link-nav anchored-block" data-jumplink-title="Security">Blockchain Bridge Security Key to Growth</h2>
<p>Despite the massive market opportunity, bridges struggle with serious safety issues that have prevented them for reaching their full potential. Due to hacks, more than <strong><a href="https://blog.chainalysis.com/reports/cross-chain-bridge-hacks-2022/" title="Vulnerabilities in Cross-chain Bridge Protocols Emerge as Top Security Risk" target="_blank" rel="noopener">$2B in funds</a></strong> have been lost in the last year alone. Thus, notable figures such as Ethereum co-founder <strong><a href="https://thedefiant.io/vitalik-eth-cross-chain-bridges-security" title="Vitalik Sounds Alarm on Security of Cross-chain Bridges" target="_blank" rel="noopener">Vitalik Buterin</a></strong> continue to raise concerns about bridge safety. Because bridge designs and implementations are cutting edge and because bridges hold large amount of funds, they are prime targets for hacking attacks.</p>
<p>However, the potential value of a successful bridge combined with the greenfield design space has spawned over a hundred bridge projects. The bridge space today resembles that of the early-era crypto exchanges, where many competitors battled for early market share amid uncertainty over safety, practicality and functionality. As a result, the bridging space is one of the most highly fragmented components of the blockchain infrastructure layer.</p>
<p>The presence of so many bridges is simply a transitionary period, in our view. If and when safer, more versatile bridges prove themselves, we believe economic activity is likely to consolidate around a few winners. One of the chief reasons is that each bridge creates its own synthetic assets similar to Liquid Staking synthetic assets. Synthetic asset integration in DeFi drives network effect feedback loops that favor one version of a synthetic asset over others. This is similar to traditional finance, where U.S. Treasury Futures are created by many venues, but the vast majority of usage revolves around CME derivatives. As a result, the top bridge projects will build competitive moats through superior safety, simple user experience, deep application integration and the wide proliferation of their synthetic assets.</p>
<h2 id="improving-implementation" class="jump-link-nav anchored-block" data-jumplink-title="Improving Implementation">Improving Blockchain Bridge Implementation and Design</h2>
<p>Due to the infancy of bridge construction and their enormous complexity, bridge security is difficult to assess by even the most seasoned smart contract developers. Bridges must mathematically prove the recent transaction history of different blockchains, translate that proof data for each blockchain to understand, lock assets, and then safely route and communicate verification of the whole process between blockchains. Each of those steps introduces a new component to the tech stack&mdash;often a brand-new design&mdash;that represents a potential point of bridge failure or hacker attack. In the highly adversarial nature of blockchain, this is akin to airlines flying passengers on never-before-tested airframes using brand new engine types.</p>
<h3>Generalized Bridging Framework</h3>
<p><img class="desktop-image img-responsive" src="https://www.vaneck.com/contentassets/f4b607010e02421d8da6b74de982bc3c/bridging-piece_infographic_1_v1_2022.11_blog.svg" alt="Generalized Bridging Framework" /></p>
<p><img class="mobile-image img-responsive" src="https://www.vaneck.com/contentassets/f4b607010e02421d8da6b74de982bc3c/bridging-piece_infographic_1_v1_2022.11_mobile.svg" alt="Generalized Bridging Framework" /></p>
<p class="chart-disclosure">Source: VanEck Research, as of 10/30/2022.</p>
<p>Bridge implementation will improve as lessons are applied, and bridge development will likely mirror the security improvements seen in DeFi smart contracts. Over time, the best bridge designs will progressively decentralize while also reducing trust assumptions. At the moment, most bridges employ third-party computer node networks to verify bridged blockchains, authenticate transactions and safeguard locked value. While some of these networks approach the level of sophistication of a layer-1 blockchain, nearly all suffer from trust design flaws that rely upon the integrity of these third-party networks.</p>
<p>For many bridges, an attack where a simple majority of a bridge&rsquo;s nodes are compromised means that the attacker can seize all bridge funds or even mint fraudulent assets. In the bridging space, the securest designs mitigate this hazard by relying only upon the trust assumptions of the blockchains being bridged&mdash;the security of the two connecting blockchains rather than a third-party network.</p>
<p>The closest to a &ldquo;trustless&rdquo; roll-up bridge, such as the bridge between a Layer-2 on <strong>Ethereum</strong> and Ethereum, is <strong>Cosmos&rsquo; </strong><a href="https://ibc.cosmos.network/" title="IBC Go Documentation | IBC-Go" target="_blank" rel="noopener"><strong>IBC</strong></a><strong>,</strong> which currently only serves to connect Cosmos blockchains. Though several projects claim to employ IBC technology, the only one that approximates the security of IBC is <a href="https://www.composable.finance/" title="Composable Finance" target="_blank" rel="noopener"><strong>Composable Finance</strong></a>, which we discuss in further detail below.</p>
<h3>Level of Trust Assumption</h3>
<p><img class="desktop-image img-responsive" src="https://www.vaneck.com/contentassets/f4b607010e02421d8da6b74de982bc3c/bridging-piece_infographic_2_v1_2022.11_blog.svg" alt="Level of Trust Assumption" /></p>
<p><img class="mobile-image img-responsive" src="https://www.vaneck.com/contentassets/f4b607010e02421d8da6b74de982bc3c/bridging-piece_infographic_2_v1_2022.11_mobile.svg" alt="Level of Trust Assumption" /></p>
<p class="chart-disclosure">Source: VanEck Research, as of 10/30/2022.</p>
<h2 id="base-case" class="jump-link-nav anchored-block" data-jumplink-title="$174.1B Base Case">How We Arrived at Our Bridging Base Case</h2>
<p>In our base case, we value the bridging sector to be worth $174.1B by 2030 based upon a discounted cash flow analysis. Discounting that back to today&rsquo;s dollars at 27%, we arrive at a valuation of $25.7B. This represents approximately 8.75% of our estimate of smart contract layer blockchains at $2T. Our estimate is based upon a discounted cash flow valuation with a 30.8x exit multiple, a terminal annual cash flow of $5.66B and a terminal growth rate of GDP+20%.</p>
<p>Bridge revenue is composed of two major components: toll fees and maximal extractable value (MEV). We derive these components by estimating their share of projected blockchain revenue and total value locked (TVL). However, as the space matures, there may be dramatic evolution in how fees are assessed and which party pays those fees as the bridges&rsquo; customer focus evolves from the consumer to the blockchains and application (from B2C to B2B). Controversially, we believe bridges will play a roll in MEV because they route assets and messages across chains to take advantage of arbitrage opportunities. Bridges may even integrate directly into the MEV technical stack to bid on blockspace.</p>
<div class="wrapped-div">
<table style="width: 100%;">
<tbody>
<tr class="tbl-data">
<td class="tbl-header last" style="text-align: left;">Bridge Valuation Framework</td>
<td class="tbl-header last" style="text-align: center;">Axelar</td>
<td class="tbl-header last" style="text-align: center;">Composable Finance</td>
<td class="tbl-header last" style="text-align: center;">Stargate (LayerZero)</td>
<td class="tbl-header last" style="text-align: center;">Multichain</td>
<td class="tbl-header last" style="text-align: center;">Portal (Wormhole)</td>
<td class="tbl-header last" style="text-align: center;">Synapse</td>
</tr>
<tr class="tbl-data">
<td class="data-td last">Fully Diluted Valuation ($M)</td>
<td class="data-td data last">$800</td>
<td class="data-td data last">$400</td>
<td class="data-td data last">$532</td>
<td class="data-td data last">$456</td>
<td class="data-td data last">$2500</td>
<td class="data-td data last">$270</td>
</tr>
<tr class="tbl-data">
<td class="data-td last">Est. Fees, Annualized ($M)</td>
<td class="data-td data last">$1,160,931</td>
<td class="data-td data last">N/A</td>
<td class="data-td data last">$750,791</td>
<td class="data-td data last">$5,748,000</td>
<td class="data-td data last">$2,348,308</td>
<td class="data-td data last">$15,500,000</td>
</tr>
<tr class="tbl-data">
<td class="data-td last">Est. Transfer Value, Annualized ($M)</td>
<td class="data-td data last">$1,872</td>
<td class="data-td data last">N/A</td>
<td class="data-td data last">$5,052</td>
<td class="data-td data last">$14,704</td>
<td class="data-td data last">$46,154</td>
<td class="data-td data last">$11,123</td>
</tr>
<tr class="tbl-data">
<td class="data-td last">TVL</td>
<td class="data-td data last">$125</td>
<td class="data-td data last">N/A</td>
<td class="data-td data last">$497</td>
<td class="data-td data last">$1,450</td>
<td class="data-td data last">$477</td>
<td class="data-td data last">$203</td>
</tr>
<tr class="tbl-data">
<td class="data-td last">FDV/Fees</td>
<td class="data-td data last">689.10</td>
<td class="data-td data last">N/A</td>
<td class="data-td data last">708.59</td>
<td class="data-td data last">79.33</td>
<td class="data-td data last">1064.60</td>
<td class="data-td data last">17.42</td>
</tr>
<tr class="tbl-data">
<td class="data-td last">FDV/TVL</td>
<td class="data-td data last">6.42</td>
<td class="data-td data last">N/A</td>
<td class="data-td data last">1.07</td>
<td class="data-td data last">0.31</td>
<td class="data-td data last">5.25</td>
<td class="data-td data last">1.33</td>
</tr>
<tr class="tbl-data">
<td class="data-td last">Blockchains Bridged</td>
<td class="data-td data last">27</td>
<td class="data-td data last">8</td>
<td class="data-td data last">11</td>
<td class="data-td data last">60</td>
<td class="data-td data last">16</td>
<td class="data-td data last">17</td>
</tr>
<tr class="tbl-data">
<td class="data-td last">Tokenomics (1 - Worst, 10 - Best)</td>
<td class="data-td data last">4</td>
<td class="data-td data last">8</td>
<td class="data-td data last">6</td>
<td class="data-td data last">2</td>
<td class="data-td data last">N/A</td>
<td class="data-td data last">3</td>
</tr>
</tbody>
</table>
</div>
<br />
<p class="chart-disclosure">Source: VanEck Research, Coingecko, DeFiLlama, L2Beat.com, Axelar, Composable Finance, Stargate, Multichain, Portal, Synapse, as of 11/05/2022.</p>
<p>In general, we find that the bridging space is currently unfavorable to token investment compared with layer 1 smart contact protocols and other more proven decentralized applications. Simply put, there is still too much competition and uncertainty over safety and tokeconomics. While bridges have sought many avenues of differentiation, the top tier projects currently distinguish themselves by capability, TVL, safety record and fee structure. On those features, no project has achieved a strong moat. Since the design space is immature and no bridge has achieved great user traction nor application integration, we expect numerous projects to deploy over the next year.</p>
<h2 id="projects-to-watch" class="jump-link-nav anchored-block" data-jumplink-title="Projects to Watch">Blockchain Bridge Projects to Watch</h2>
<p>Comparing some of the available options, <strong>Multichain (MULTI)</strong> and <strong>Synapse (SYN)</strong> are consistently generating fees through high usage, but poor token distribution, weak token value accrual and lack of transparency make their projects difficult to value. LayerZero&rsquo;s <strong>Stargate Finance (STG)</strong> token offers clear value accrual and favorable tokeconomics, but its value is tied to the Stargate Finance application utilizing the bridge, rather than the bridge itself. Wormhole has strong user metrics and a stellar team, but it already suffered a major disastrous <a href="https://www.theverge.com/2022/2/3/22916111/wormhole-hack-github-error-325-million-theft-ethereum-solana" title="Wormhole cryptocurrency platform hacked for $325 million after error on GitHub " target="_blank" rel="noopener"><strong>hack</strong> </a>and currently does not have a token. <strong>Axelar (AXL)</strong>, while boasting a token that will attract demand and offering exceptional tooling for developers, also retains an initial unfavorable token distribution and substantial near-term token supply unlocks. Though <strong>Composable Finance (PICA</strong>) offers favorable tokeconomics through a community-focused distribution and a token value accrual mechanism that mirrors <strong>Polkadot</strong>, the project has been delayed to expand its vision and has yet to launch.</p>
<p>Despite to our concerns, we see potential opportunities in <strong><a href="https://axelar.network/" title="Axelar | Secure cross-chain communication for Web3" target="_blank" rel="noopener">Axelar</a></strong> and <strong><a href="https://www.composable.finance/" title="Composable Finance" target="_blank" rel="noopener">Composable Finance</a></strong>, with the latter being particularly interesting, if it can deliver on even part of its stated goals. Axelar looks strong over the medium term, once token unlocks occur, because its bridge is well-positioned in the Cosmos ecosystem with numerous asset integrations in the most important Cosmos DEXes and its strong partnerships with projects like <strong><a href="https://www.theblock.co/post/179072/circle-partners-with-axelar-on-cross-chain-initiative-for-usdc" title="The Block: Circle partners with Axelar on cross-chain initiative for USDC" target="_blank" rel="noopener">USDC</a></strong> and <a href="https://www.coindesk.com/tech/2022/10/26/axelar-and-polygon-supernets-team-up-to-provide-cross-chain-interoperability/" title="Axelar and Polygon Supernets Team Up to Provide Cross-Chain Interoperability" target="_blank" rel="noopener"><strong>Polygon</strong></a>. On the other hand, Composable Finance has tremendous potential due to a top notch team that accomplishes impressive <strong><a href="https://composablefi.medium.com/expanding-centauri-to-the-near-ecosystem-d9e3e9e96bed" title="Expanding Centauri to the NEAR ecosystem | by Composable Finance | Oct, 2022 | Medium" target="_blank" rel="noopener">technical feats</a></strong>, utilizes the most trustless bridge design, and boasts high-utility, integrated applications.</p>
<p>For those who wish to &ldquo;bridge&rdquo; into the realm of the &ldquo;well-informed digital asset investor,&rdquo; the bridging space demands their attention. While rife with security issues, bridges represent a developing and essential part of the blockchain technical stack that could be the source of enormous value. It will also be important for the knowledgeable investor to apply their findings in bridging to the broader debate of centralized versus decentralized custodianship, the future of user interaction with blockchains and &ldquo;ownership&rdquo; of the user.</p>
<p>While users can move assets between blockchains using self-custody wallets and permissionless protocols, they can also simply employ a centralized entity like Coinbase to exchange and hold assets. In fact, the Coinbase application already uses a frontend that connects to backend bridges to transfer assets to different blockchains. In the future, Coinbase may simply employ its own centralized database and deep pool of liquidity to provide users the ability to swap assets across chains. Coinbase could even influence users to employ the Coinbase application to interact with blockchains through a &ldquo;walled garden&rdquo; approach utilizing a semi-self-custody wallet and white-listed (Coinbase Ventures-backed) dApps. This paradigm would clearly threaten not only bridges, but other applications as well, as Coinbase dominates the entire user journey from fiat on-ramp to custody to protocol usage.</p>
<p>It is also worth considering that <strong>Circle</strong> (<strong>USDC</strong> creator) has recently unveiled its <strong><a href="https://www.circle.com/en/pressroom/circle-enables-usdc-interoperability-for-developers-with-the-launch-of-cross-chain-transfer-protocol#:~:text=%E2%80%9CCross%2DChain%20Transfer%20Protocol%20ultimately,VP%20of%20Product%20at%20Circle." title="Circle Enables USDC Interoperability for Developers" target="_blank" rel="noopener">Cross Chain Transfer Protocol</a></strong>, which would utilize the technology of a group of vetted bridging projects for cross-chain USDC usage. This new program allows complete USDC interchangeability across different blockchains using approved bridges. In this dynamic, bridges that meet a certain safety threshold would be approved to transfer USDC. The safety of the bridged USDC tokens would then be reinforced by Circle&rsquo;s centralized USDC database that tracks movement across blockchains as USDC is &ldquo;burned&rdquo; on one chain to be &ldquo;minted&rdquo; on another. The consequence of this decision means that bridge assets, at least USDC, can no longer be the source of bridge differentiation, but also provides guaranteed traffic for bridges from arbitrageurs. At the same time, this would allow users to quickly and safely bring value to connected blockchains to quickly resolve asset price and interest rate differentials, contributing to a unified blockchain financial system.</p>
<p>Paradoxically, bridge projects like Synapse are deploying true multi-chain assets, called <a href="https://docs.synapseprotocol.com/protocol/synapse-bridge/synapse-xassets" title="Synapse xAssets - Synapse Protocol" target="_blank" rel="noopener"><strong>xAssets</strong></a>, to enable canonical tokens of multi-chain applications, like <strong>Sushi</strong>, to be seamlessly deployed across multiple chains. The concept of xAssets would provide applications the ability to tap into users of other blockchains more easily, while also providing bridges with a point of differentiation and guaranteed usage. If successful, concepts like xAssets could enable applications to offload assets, execution and settlement to any blockchain of their choosing, if blockspace becomes too expensive on one blockchain.</p>
<p>To receive more <strong><a href="https://www.vaneck.com/us/en/insights/digital-assets/" title="Digital Assets Insights">Digital Assets</a></strong> insights, <strong><a href="https://www.vaneck.com/us/en/subscribe/" title="Subscription Center">sign up in our subscription center</a></strong>.</p>
<style type="text/css">
    .wrapped-div {
        max-width: 100%;
    }

    @media (max-width: 1240px) {
        .wrapped-div {
            overflow-x: scroll;
        }


    }
</style>
<style>
    .widgetBody .desktop-image {
        display: block;
    }

    .widgetBody .mobile-image {
        display: none;
    }

    @media screen and (max-width: 425px) {
        .widgetBody .desktop-image {
            display: none;
        }

        .widgetBody .mobile-image {
            display: block;
        }
    }
</style>
]]></content:encoded>
</item><item rdf:about="https://www.vaneck.com/us/en/blogs/model-portfolios/avoid-the-inflation-penalty-box/">
  <title>Avoid the Inflation Penalty Box></title>
  <link>https://www.vaneck.com/us/en/blogs/model-portfolios/avoid-the-inflation-penalty-box/</link>
  <description><![CDATA[As part of this commentary, we point out 5 prevailing challenges for the market and inflation outlook and possible Fed actions in response to these challenges.]]></description>
  <dc:creator>David Schassler</dc:creator>
  <dc:date>11/17/2022 07:00:00</dc:date>
<content:encoded><![CDATA[

<script>
    //Temporary script
    $(function () {
        $(".popup-youtube, .popup-vimeo, .popup-gmaps").on("click", function (e) {
            e.preventDefault();
            var width = $(window).width();
            if (width > 768) {
                openSimpleIframeModalDialog($(this).attr('href'), "video-modal");
            } else if ($(this).is('.popup-youtube')) {
                var target = $(this).attr('data-video');
                self.location = target;
            }
        });
    });
</script>
<style>
    .modal.fade.video-modal div.modal-dialog {
        margin: 7% auto !important;
    }

    .modal-simple-iframe .close span {
        font-size: 35px;
        line-height: 1;
    }
</style>
<h2>Don&rsquo;t Focus on The Wrong Things: The Monthly CPI Report Distraction</h2>
<p>Hockey season is here, and my favorite team, the New York Rangers, are off to a lackluster start. While disappointing, this provides a great opportunity to interject a sports analogy: hockey defensemen are taught to keep their eyes on the body, not the puck. The puck moves fast. Instead, focus on the shoulders to know where the puck is going.</p>
<p>Why is this relevant? The market seems to be &ldquo;playing poor defense&rdquo; by watching the puck. Every data point is overanalyzed to the point of exhaustion. The October CPI number came in at 0.40% versus expectations of 0.60%. The &ldquo;better than expected&rdquo; interpretation of the inflation report sent the U.S. 10-year Treasury note yield down from 4.09% to 3.84%, and, as a result, risky assets rallied.</p>
<p>The week before, the Federal Reserve (Fed) increased interest rates by another 75 basis points. Market strategists then feverishly went to work on Fed Chairman Jerome Powell. They dissected his mannerisms, the specific words he used, and the tone in which they were spoken. Mr. Powell&rsquo;s perceived hawkishness sent interest rates higher and risky assets down.</p>
<p>The reality is that both of these events hardly provided any real insights. The uncertainty around inflation, interest rates, and a recession remain. That, however, does not stop the markets from overreacting. We believe the short-term focus of the markets creates opportunities.</p>
<h2>Let&rsquo;s Try It This Way: 5 Prevailing Challenges for the Market and Inflation Outlook</h2>
<p>When contextualizing inflation, put yourself in a defenseman&rsquo;s skates, and do not be mesmerized by the puck. Instead, focus on the body (problems) to anticipate where the puck (market) is going:</p>
<ol class="content-list">
<li>Inflation remains very high but is decelerating</li>
<li>Government debt is very high and continues to grow</li>
<li>Historically, inflationary events have lasted a long time, with several peaks and troughs within</li>
<li>The cure for inflation (tighter policy) is &ldquo;kryptonite&rdquo; to an overleveraged economy</li>
<li>The Fed fights recessions with looser monetary policy, which is inflationary</li>
</ol>
<p>Consequently, this leaves the Fed in the most unfortunate of economic situations with no great options. We have long said that the idea of a soft landing is a fairytale. Fed Powell now seemingly agrees and recently acknowledged that the window for a soft landing has &ldquo;narrowed.&rdquo;</p>
<p>The most reasonable outcome, in our view, is that the Fed will become less aggressive in its fight against inflation. More specifically, higher interest rates may eventually have a devastating impact on economic activity and the financial markets. We expect the Fed to be forced to pivot with inflation significantly higher than its 2% target. Ultimately, this inflation cycle will probably follow the predictable path of previous inflation cycles: It will last a long time!</p>
<h2>The Best Defense is a Good Offense: Real Assets and High-Yielding Investments</h2>
<p>Our preferred investment solutions to navigate the current environment are real assets and high-income generating assets. Real assets are time-tested inflation hedges. VanEck offers a broad suite of inflation-fighting assets. Amongst them, the <strong><a href="/link/6e91eff51c6042ef9f1d5943ffa90a0e.aspx" title="RAAX - VanEck Real Assets ETF - Overview">VanEck Real Assets ETF (RAAX)</a></strong> seeks to provide a &ldquo;one-stop&rdquo; solution to inflation protection.</p>
<p>The recent surge in interest rates has created compelling investment opportunities. The following chart demonstrates the advantages of high-income-generating investments in different inflation regimes.</p>
<h3>Incoming! Average 3-Year Return of High Income Indices at U.S. CPI Above/Below 5%<sup>*</sup></h3>
<p><img loading="lazy" class="img-responsive w-100" src="https://www.vaneck.com/contentassets/6d8481d0228044199e15a97b117fc6f4/qis_chart_01_v1_2022.11_blog.svg" alt="Incoming! Average 3-Year Return of High-Income Indices at U.S. CPI Above/Below 5%" /></p>
<p class="chart-disclosure">Source: Bloomberg. Data as of September 30, 2022.<sup>*</sup>Note: time period of evaluation varies based on each index&rsquo;s respective start date (Bloomberg U.S. Mortgage Backed Securities Index since January 1976; Bloomberg U.S. Corporate High Yield Bond Index since July 1983; J.P. Morgan EMBI Global Diversified Index since December 1993; Alerian MLP Index since December 1995). Benchmark index returns are not Fund returns and do not reflect any management fees or brokerage expenses. Certain indices may take into account withholding taxes. Investors cannot invest directly in the Index. Index descriptions included at the end of this presentation.</p>
<p>High inflation regimes, as defined as 5% or above, are typically associated with higher interest rates. Until recently, we have been critical of most income-generating assets because of low yields and surging interest rates. That has changed. There is likely limited upward mobility in interest rates from here and current yields offer a significant cushion against both inflation and future rate hikes.&nbsp;</p>
<p>Thank you for reading. We aim to provide you with thoughtful market insights and actionable investment ideas. This month&rsquo;s insight was to look beyond the manic behavior of the markets and see the big trends. Remember, raise the cup by focusing on the body and not the puck!</p>
<p>To receive more <strong><a href="https://www.vaneck.com/us/en/insights/guided-allocation/" title="Model Portfolio Insights">Model Portfolio</a></strong> insights, <strong><a href="https://www.vaneck.com/us/en/subscribe/" title="Subscription Center">sign up in our subscription center</a></strong>.</p>
]]></content:encoded>
</item><item rdf:about="https://www.vaneck.com/us/en/blogs/economic-trends/how-to-lose-market-confidence-in-10-days/">
  <title>How to Lose Market Confidence in 10 Days></title>
  <link>https://www.vaneck.com/us/en/blogs/economic-trends/how-to-lose-market-confidence-in-10-days/</link>
  <description><![CDATA[The market continues to vote with its feet against Brazil&rsquo;s more expansive fiscal plans. EM Asia is frontloading more hikes to curb inflation pressures.]]></description>
  <dc:creator>Natalia  Gurushina</dc:creator>
  <dc:date>11/17/2022 06:30:00</dc:date>
<content:encoded><![CDATA[

<h2>LATAM Populism</h2>
<p><strong>Brazil&rsquo;s &ldquo;fall from grace&rdquo; continued to this morning</strong>, as the market got startled by President-elect Luiz In&aacute;cio Lula da Silva&rsquo;s fiscal package, which calls for significant modification of the spending cap and larger social spending. Well, this U-turn should not be completely surprising, given Lula&rsquo;s populist credentials. But the market was hoping that Lula 3.0 would be different, hence a fairly elevated long positioning going into the elections runoff &ndash; which, in turn, explains the extent of the market correction both in local rates (see chart below) and the currency. Given that Lula&rsquo;s fiscal loosening can slow Brazil&rsquo;s disinflation going forward, the central bank might be forced to issue a &ldquo;warning shot&rdquo; in the form of a rate hike in order to reassure the market that the situation is under control. Brazil&rsquo;s local swap curve started to price in this eventuality, with +65bps of tightening in December-March, and the market sees practically no room for rate cuts in 2023.</p>
<h2>Asia Rate Hike Frontloading</h2>
<p><strong>Indonesia</strong> had its fair share of fiscal concerns during the pandemic and immediately after, but its fiscal outlook is currently better than in Brazil (the budget deficit is expected to narrow to less than 3% of GDP in 2023). Still, the <strong>central bank is powering ahead with sizable rate hikes</strong> to bring inflation back to target as soon as possible &ndash; and this includes today&rsquo;s 50bps increase in the 7-day repo rate. The statement sounded hawkish &ndash; signaling another hike in December, and paying special attention to the impact of global uncertainty and rate differentials on the currency (=imported inflation). Indonesia&rsquo;s neighbor &ndash; Philippines &ndash; also opted for a large 75bps hike, as inflation shows few signs of abating.</p>
<h2>EM Policy Coordination</h2>
<p><strong>Local bonds in Central Europe </strong>had a better week than Brazil, but they are<strong> still at the bottom of the GBI-EM year-to-date &ldquo;league table&rdquo;</strong>. The Russia/Ukraine war had a huge impact on the 2022 performance, but fiscal concerns in Hungary and Poland are also to blame. Hungary was slow to implement fiscal adjustment after the pre-election spending spree, and there are legitimate concerns that Poland might re-open fiscal spigots in the run up to the 2023 parliamentary elections. The consensus currently expects Poland&rsquo;s budget deficit to widen by more than 1% of GDP next year &ndash; and this most likely means additional bond issuance. Can local banks and institutions fully absorb this supply? Why Poland decided to issue a U.S. Dollar-denominated bond recently? Importantly, can the central bank afford to remain &ldquo;frozen&rdquo; for longer? Stay tuned!</p>
<h3>Chart at a Glance: Brazil Local Bonds &ndash; Elections Have Consequences</h3>
<p><img class="img-responsive w-100" src="https://www.vaneck.com/contentassets/0469505ef0064a46ba3cc469b247a8fa/us-emerging-markets-daily-2022-11-17.png" alt="Chart at a Glance: Brazil Local Bonds - Elections Have Consequences" /></p>
<p class="chart-disclosure">Source: Bloomberg LP.</p>
]]></content:encoded>
</item><item rdf:about="https://www.vaneck.com/us/en/blogs/economic-trends/global-pressures-pick-a-direction/">
  <title>Global Pressures – Pick a Direction></title>
  <link>https://www.vaneck.com/us/en/blogs/economic-trends/global-pressures-pick-a-direction/</link>
  <description><![CDATA[Global geopolitical risks are elevated, but China&rsquo;s latest policy initiatives and the rapidly easing global supply chain restrictions can create welcome tailwinds on several fronts.]]></description>
  <dc:creator>Natalia  Gurushina</dc:creator>
  <dc:date>11/16/2022 16:00:00</dc:date>
<content:encoded><![CDATA[

<h2>EMEA Political and Policy Risks</h2>
<p>There was <strong>a global sigh of relief that yesterday&rsquo;s missile incident in Poland did not result in the further escalation of the Russia/Ukraine war</strong>. Central European currencies used this occasion to celebrate, bouncing in the morning trade and topping the EMFX daily &ldquo;league table&rdquo;. Some global tension points might have eased lately &ndash; we are talking about China&rsquo;s COVID restrictions and the housing sector support &ndash; but geopolitical risks in Europe remain elevated, dampening the growth outlook and slowing the process of disinflation. This is quite problematic, because domestic price pressures show few signs of abating. Today&rsquo;s microscopic downside surprise in Poland&rsquo;s core inflation is a case in point &ndash; the number might have been a touch lower than expected, but core inflation accelerated to 11% year-on-year in October (which explains why we are uneasy about the planned minimum wage increase and a high likelihood of higher pre-election spending). Against this backdrop, the central bank&rsquo;s aversion to additional rate hikes makes local yields less attractive relative to peers.</p>
<h2>Brazil Fiscal Outlook</h2>
<p>A pre-election spending spree is a legitimate concern anywhere in the world, <strong>but in Brazil the market is fretting about the post-election&rsquo;s fiscal largesse</strong>. President-elect Luiz In&aacute;cio Lula da Silva is lobbying for the removal of a major social program from the spending cap for a number of years, which might help to maintain decent fiscal &ldquo;optics&rdquo;, but it will still create extra stimulus in the economy. The central bank is watching the situation like a hawk, and the market thinks there is a chance of it delivering a &ldquo;warning shot&rdquo; in the form of a small rate hike in the next 3-4 months. Fiscal concerns are weighing on Brazil&rsquo;s local bonds, which underperformed GBI-EM peers by a wide margin in the past week.</p>
<h2>Global Supply Chains</h2>
<p>One question that we have is <strong>whether EM (and DM) policy &ldquo;offenders&rdquo; can be saved by the rapidly easing global supply chain disruptions</strong> (see chart below). The latest reports suggest that the improvements are broad-based, which might be a tailwind for the growth outlook (including rebuilding inventories). Easing supply bottlenecks can also lower input prices and reduce some headline inflation pressures going forward. Stay tuned!</p>
<h3>Chart at a Glance: Global Supply Chain Pressures? What Pressures?<sup>*</sup></h3>
<p><img class="img-responsive w-100" src="https://www.vaneck.com/contentassets/049c16982b4c4fe68506d16c697ab5f1/us-emerging-markets-daily-2022-11-16.png" alt="Chart at a Glance: Global Supply Chain Pressures? What Pressures?" /></p>
<p class="chart-disclosure">Source: Bloomberg LP.</p>
<p class="chart-disclosure"><strong><sup>*</sup>&nbsp;GSCPI Index:</strong> Global Supply Chain Pressure Index seeks to measure supply chain conditions, created by the Federal Reserve. The index combines variables from several indices in transportation and manufacturing.</p>
]]></content:encoded>
</item><item rdf:about="https://www.vaneck.com/us/en/blogs/economic-trends/em-growth-the-big-freeze/">
  <title>EM Growth – The Big Freeze?></title>
  <link>https://www.vaneck.com/us/en/blogs/economic-trends/em-growth-the-big-freeze/</link>
  <description><![CDATA[China pre-empted softer than expected domestic activity with additional policy support. What policy options are open to the rest of EM?]]></description>
  <dc:creator>Natalia  Gurushina</dc:creator>
  <dc:date>11/15/2022 06:30:00</dc:date>
<content:encoded><![CDATA[

<h2>China Slowdown</h2>
<p>The <strong>growth cliff narrative refuses to go away</strong>, and this includes independent global growth drivers, such as China. China&rsquo;s domestic activity indicators were softer than expected in October &ndash; all of them: consumption/retail sales, industrial production, and investments. Property investments and residential property sales contracted further (a lot). The fact that authorities decided to ease some COVID restrictions and introduce additional measures to support the housing sector suggests that negative activity signals were visible well before the official numbers were released. With this in mind, we are leaving today&rsquo;s backward-looking data behind and shift our attention to the new measures&rsquo; impact on the real economy (which might already be visible in the next batch of the activity surveys at the end of the month).</p>
<h2>EM Growth Cliff and Rate Cuts</h2>
<p>We do get an occasional upside growth surprise here or there &ndash; Poland&rsquo;s Q3 GDP growth was stronger than expected at 3.5% year-on-year. This notwithstanding, domestic activity is clearly moderating on the back of higher inflation (erosion of real disposable income), higher rates, and the impact of the Russia/Ukraine war. The expected shallow recession in Poland&rsquo;s main trading partner, the Eurozone, is not helping either. The deteriorating external backdrop will be hurting regional peers - Hungary and the Czech Republic - even more, because they are more open economies. Note that both countries posted weaker than expected Q3 GDP numbers (a technical recession in Hungary). The <strong>extent of the 2023 growth downgrades in Central Europe is quite astonishing</strong> (see chart below), which is why national banks will try to avoid additional rate hikes &ndash; despite very high inflation - and start cutting rates at the earliest opportunity.</p>
<h2>LATAM Growth Outlook</h2>
<p><strong>LATAM&rsquo;s 2023 growth cliff might be quite sharp as well</strong>, with Chile falling into recession, and the Colombian economy expected to slow to 1.9% from 7.3% this year. Colombia&rsquo;s Q3 GDP print will be released later today, and it will give us a better idea about the speed of slowdown. Colombia&rsquo;s inflation was still accelerating in October, but the deteriorating growth outlook &ndash; together with the slower pace of hikes in the U.S. &ndash; cooled the market expectations for additional rate hikes, with the policy rate now expected to peak at 12.4% (vs 13%+ just a couple of weeks ago). Stay tuned!</p>
<h3>Chart at a Glance: Central Europe 2023 Growth Downgrades &ndash; The End In Sight?</h3>
<p><img class="img-responsive w-100" src="https://www.vaneck.com/contentassets/d5b3f391cfc74c1d85946fee50ff6b95/us-emerging-markets-daily-2022-11-15.png" alt="Chart at a Glance: Central Europe 2023 Growth Downgrades - The End In Sight?" /></p>
<p class="chart-disclosure">Source: Bloomberg LP.</p>
<p class="chart-disclosure">ECGDPL 23 Index: Bloomberg consensus forecasts for real GDP growth in 2023 for Poland, Hungary and Czech Republic.</p>
]]></content:encoded>
</item><item rdf:about="https://www.vaneck.com/us/en/blogs/economic-trends/chinas-one-two-policy-punch/">
  <title>China’s One-Two Policy Punch></title>
  <link>https://www.vaneck.com/us/en/blogs/economic-trends/chinas-one-two-policy-punch/</link>
  <description><![CDATA[China&rsquo;s assets high-fived official plans to support the housing sector and ease some COVID restrictions. The rest of the world continues to focus on the pace of disinflation.]]></description>
  <dc:creator>Natalia  Gurushina</dc:creator>
  <dc:date>11/14/2022 16:00:00</dc:date>
<content:encoded><![CDATA[

<h2>China Policy Support</h2>
<p><strong>China&rsquo;s</strong> growth concerns must have been really pressing, because the last week&rsquo;s <strong>20-point plan to ease some COVID restrictions was quickly followed by a 16-point plan to support the real estate sector</strong>. The new plan focuses on &ldquo;stable financing&rdquo; for companies (bond issuance, &ldquo;reasonable&rdquo; extension of existing construction loans, more bank lending &ndash; lenders might be absolved from personal responsibility if something goes wrong), and mortgage support for homebuyers (including &ldquo;reasonable&rdquo; mortgage extension). The plan also calls for equal treatment of state-owned and private real estate developers. It remains to be seen whether the latest policy moves will be true turning points for the growth outlook (see chart below) &ndash; implementation is key, as usual &ndash; but and at the very least they should reduce near-term risks associated with refinancing and liquidity in the housing/banking sector, and hopefully give a boost to consumer sentiment. As would be expected, many China&rsquo;s names were doing really well this morning - but keep an eye on the next batch of China&rsquo;s activity indicators after market close (just in case).</p>
<h2>U.S. Rate Hikes</h2>
<p>The global impact of China&rsquo;s policy announcements was affected by comments made by U.S. Federal Reserve board member Waller, in which he said that <strong>rates should go higher and stay high to bring inflation back to target</strong>. The comment is a reminder that the pace of disinflation is now getting more important than the mere fact of leaving peak inflation behind. And it is reflected in the current market expectations for the Fed - Fed Funds Futures price in close to 100bps of additional rate hikes in the U.S. between now and March-May 2023, with the policy rate staying above 4% well into 2024.</p>
<h2>EM Disinflation</h2>
<p>The <strong>pace of disinflation will be closely watched by emerging markets (EM) central banks</strong> as well &ndash; in addition to other factors, like growth trends/growth cliffs and government policies, especially fiscal discipline. The latter is gaining in importance in Brazil, where President-elect Luiz In&aacute;cio Lula da Silva wants more social spending. Some senior members of the congress are pushing back &ndash; saying that they will support only a 1-year spending increase (2023) &ndash; but the market is not yet convinced: Brazil&rsquo;s local bonds did worse than other GBI-EM constituents so far this month, and the local swap curve started to price in ~50bps of rate hikes in December-March. Stay tuned!</p>
<h3>Chart at a Glance: China Consensus Growth Forecasts &ndash; Time For an Upgrade?</h3>
<img class="img-responsive w-100" src="https://www.vaneck.com/contentassets/fb16a83242a44cb9a8e014fd7e4b3665/us-emerging-markets-daily-2022-11-14.png" alt="Chart at a Glance: China Consensus Growth Forecasts &ndash; Time For an Upgrade?" />
<p class="chart-disclosure">Source: Bloomberg LP</p>
]]></content:encoded>
</item><item rdf:about="https://www.vaneck.com/us/en/blogs/income-investing/ig-bonds-valuation-and-selectivity-matters/">
  <title>IG Bonds: Valuation and Selectivity Matters></title>
  <link>https://www.vaneck.com/us/en/blogs/income-investing/ig-bonds-valuation-and-selectivity-matters/</link>
  <description><![CDATA[With investment grade corporate bond yields providing meaningful income and with elevated market volatility, we believe there are now opportunities in mispriced bonds with attractive valuations.]]></description>
  <dc:creator>William Sokol</dc:creator>
  <dc:date>11/14/2022 06:30:00</dc:date>
<content:encoded><![CDATA[

<p>A significant increase in both interest rates and credit spreads has made for a difficult year for investment grade bond investors. However, we believe the asset class is now attractive as we look ahead to 2023. With higher overall yields, corporate bonds are now providing <a href="https://www.vaneck.com/us/en/blogs/income-investing/income-returns-to-fixed-income-investing/" title="Income Returns to Fixed Income Investing"><strong>significant levels of carry</strong></a>. Investors can once again earn meaningful income from their bond portfolios and expect more robust performance in <a href="https://www.vaneck.com/us/en/blogs/income-investing/carry-boosts-fixed-income-resilience-in-likely-fed-scenarios/" title="Carry Boosts Fixed Income Resilience in Likely Fed Scenarios"><strong>various scenarios</strong>.</a> For investment grade corporates, in particular, we believe current spreads are already pricing in a meaningful probability of a recession. Spreads are above their long-term average going back to 1996, unlike high yield bond spreads which continue to trade tight on that basis. In a slowing growth environment, we believe higher quality bonds may be an attractive option to maintain income while avoiding potential drawdowns, as there is far less spread risk at current levels.</p>
<p>Given the size and diversity within corporate bonds, we believe being selective can provide better outcomes for investors. In particular, focusing on attractively valued bonds has historically provided significant outperformance. The market is not homogenous, and there is significant scope for mispricing to exist. With the rapid and significant tightening of financial conditions this year, we believe additional pricing dispersion can emerge. Both rate hikes and growth concerns may create additional volatility, providing the opportunity for investors to benefit from relative value opportunities.</p>
<p>We define attractively valued bonds as those offering significant &ldquo;excess spread&rdquo; above &ldquo;fair value,&rdquo; meaning they offer a market spread that is greater than what&rsquo;s needed based on the actual embedded risk. Moody&rsquo;s Analytics calculates proprietary credit metrics to determine fair value. Moody&rsquo;s Analytics is the pioneer in credit risk modeling, and is relied upon by hundreds of institutions globally for portfolio risk management and decision-making.</p>
<p>Focusing on high excess spread does not simply mean selecting bonds with the highest yield. Fair value considers factors including the probability of default, expected recovery rate, sector-specific considerations, and the level of systematic risk. Fair value also considers bond-specific factors, including the bond&rsquo;s price, maturity, and seniority. By focusing on bonds with high excess spread, investors may earn a higher level of carry versus the broad market but also benefit from lower overall risk in terms of both the expected probability of default and the probability of being downgraded to high yield (which can have a significantly negative impact on investment grade bond prices).</p>
<p>Below we show a hypothetical strategy that selects the top 40% of bonds each month from the investment grade universe based on the level of excess spread and also a similar strategy focusing on BBB-rated bonds only. Compared to their respective broad market benchmarks, both achieved significant outperformance on an absolute and risk-adjusted basis.</p>
<h3>Valuation Matters in Corporate Bonds - Investment Grade</h3>
<p><img class="img-responsive w-100" src="https://www.vaneck.com/contentassets/e326cd03ba944317a099a5bd47f28aab/ig_chart_01_v1_2022.11_blog.svg" alt="Valuation Matters in Corporate Bonds - Investment Grade" /></p>
<h3>Valuation Matters in Corporate Bonds - BBB</h3>
<p><img class="img-responsive w-100" src="https://www.vaneck.com/contentassets/e326cd03ba944317a099a5bd47f28aab/ig_chart_02_v1_2022.11_blog.svg" alt="Valuation Matters in Corporate Bonds - BBB" /></p>
<div class="wrapped-div">
<table style="width: 100%;">
<tbody>
<tr class="tbl-data">
<td class="tbl-header last" style="text-align: center;">&nbsp;</td>
<td class="tbl-header last" style="text-align: center;" colspan="6">Total Returns</td>
<td class="tbl-header last" style="text-align: center;">&nbsp;</td>
</tr>
<tr class="tbl-data">
<td class="data-head last">&nbsp;</td>
<td class="data-head last">YTD</td>
<td class="data-head last">1-Year</td>
<td class="data-head last">3-Yrs</td>
<td class="data-head last">5-Yrs</td>
<td class="data-head last">10-Yts</td>
<td class="data-head last">Since 4/1/07</td>
<td class="data-head last">10- Yr Std Deviation</td>
<td class="data-head last">10-Yr Sharpe Ratio</td>
</tr>
<tr class="tbl-data">
<td class="data-td last" style="font-weight: normal;">U.S. IG Corporates</td>
<td class="data-td data last">-18.33</td>
<td class="data-td data last">-18.19</td>
<td class="data-td data last">-3.5</td>
<td class="data-td data last">0.06</td>
<td class="data-td data last">1.78</td>
<td class="data-td data last">3.72</td>
<td class="data-td data last">5.88</td>
<td class="data-td data last">0.21</td>
</tr>
<tr class="tbl-data">
<td class="data-td last" style="font-weight: normal;">Attractively Valued IG Corporates</td>
<td class="data-td data last">-18.19</td>
<td class="data-td data last">-17.92</td>
<td class="data-td data last">-2.67</td>
<td class="data-td data last">0.70</td>
<td class="data-td data last">2.43</td>
<td class="data-td data last">5.15</td>
<td class="data-td data last">5.90</td>
<td class="data-td data last">0.32</td>
</tr>
<tr class="tbl-data">
<td class="data-td last" style="font-weight: normal;">U.S. BBB Corporates</td>
<td class="data-td data last">-19.14</td>
<td class="data-td data last">-19.03</td>
<td class="data-td data last">-3.43</td>
<td class="data-td data last">0.19</td>
<td class="data-td data last">2.09</td>
<td class="data-td data last">4.39</td>
<td class="data-td data last">6.64</td>
<td class="data-td data last">0.24</td>
</tr>
<tr class="tbl-data">
<td class="data-td last" style="font-weight: normal;">Attractively Valued BBB Corporates</td>
<td class="data-td data last">-19.69</td>
<td class="data-td data last">-19.45</td>
<td class="data-td data last">-2.55</td>
<td class="data-td data last">1.15</td>
<td class="data-td data last">3.24</td>
<td class="data-td data last">6.41</td>
<td class="data-td data last">6.87</td>
<td class="data-td data last">0.4</td>
</tr>
</tbody>
</table>
</div>
<br />
<p class="chart-disclosure">Source: VanEck and Moody&rsquo;s Analytics as of 9/30/2022. U.S. IG Corporates is represented by the ICE BofA US Corporate Index; U.S. BBB Corporates is represented by the ICE BofA BBB US Corporate Index; &ldquo;Attractively Valued&rdquo; refers to a strategy that selects the top 40% of bonds from each market based on a monthly basis at the end of each month.</p>
<p>Investing in the top 40% of bonds by excess spread each month, however, has practical difficulties in implementation. Because fair value can change rapidly based on market prices, the portfolio needs to be reconstituted frequently. Turnover would be excessively high, and trading costs could erode most or all of the excess returns generated by such a strategy. The <a href="/link/f18528970465402a956ca48773880adc.aspx" title="MIG VanEck Moody's Analytics IG Corporate Bond ETF - Overview"><strong>VanEck IG Corporate Bond ETF (MIG)</strong></a> and <strong><a href="/link/92052de09b4c4edf947da9e38e8b8e36.aspx" title="MBBB - VanEck Moody's Analytics BBB Corporate Bond ETF - Overview">VanEck BBB Corporate Bond ETF (MBBB)</a></strong> track indices that focus on the most attractively valued bonds based on their market spread relative to their fair value, based on metrics calculated by Moody&rsquo;s Analytics. The indices include rules to limit turnover while still focusing on the most attractively valued bonds.</p>
<p>To receive more <a href="https://www.vaneck.com/us/en/insights/income-investing/" title="Income Investing insights"><strong>Income Investing</strong></a> insights, <a href="/us/en/subscribe/" title="Subscription Center"><strong>sign up in our subscription center</strong></a>.</p>
<style type="text/css">
    .wrapped-div {
        max-width: 100%;
    }

    @media (max-width: 1240px) {
        .wrapped-div {
            overflow-x: scroll;
        }


    }
</style>
]]></content:encoded>
</item><item rdf:about="https://www.vaneck.com/us/en/blogs/economic-trends/china-at-the-cusp-of-reopening/">
  <title>China – At the Cusp of Reopening?></title>
  <link>https://www.vaneck.com/us/en/blogs/economic-trends/china-at-the-cusp-of-reopening/</link>
  <description><![CDATA[China&rsquo;s cautious reopening moves were well received by the market. Could this improve the global growth backdrop for EMs, especially when room for near-term easing might still be limited?]]></description>
  <dc:creator>Natalia  Gurushina</dc:creator>
  <dc:date>11/11/2022 16:00:00</dc:date>
<content:encoded><![CDATA[

<h2>China Zero-COVID Policy</h2>
<p>The overnight <strong>news about China&rsquo;s easing some COVID restrictions</strong> <a name="_Hlk119056080"></a>&ndash; which came on the heels of a downside inflation surprise in the U.S. &ndash; were well received by the market. We saw very nice equity indices gains across the board, and some exceptional FX performance, such as a 427bps gain in the Korean won. China&rsquo;s measures to &ldquo;further optimize pandemic control&rdquo; (a total of 20) are cautious, with the main focus on quarantine times, the frequency of testing and risk area delineations. However, the move sends an encouraging signal regarding China&rsquo;s near-term growth outlook, especially as regards demand side (services, consumption) and the efficacy of the already approved policy stimulus. The just-announced measures to help struggling property developers came in handy as well.</p>
<h2>EM Disinflation</h2>
<p>China is the only independent global growth driver in emerging markets (EM), and the <strong>positive growth news is flowing at a time when more and more EMs are leaving peak inflation behind</strong>. Today&rsquo;s downside inflation surprise in Romania is just another example. Disinflation should free up some policy space to deal with softer growth in the rest of EM, but it does not necessarily mean that (all) EMs will stop tightening, as inflation is still too far from the targets in most places and inflation expectations are elevated as well. This was the message sent by central banks in Mexico and Peru yesterday. The market sees at least 125bps more rate hikes in Mexico in the next six months, before there is any room for policy easing.</p>
<h2>EM Rates and Fiscal Policy</h2>
<p>The <strong>pace of easing in EM could also be determined by the policy agenda</strong> &ndash; especially on the fiscal front. This is what drives the market expectations for the policy rate in Brazil right now (and probably makes the central bank very nervous, as well). Brazil&rsquo;s swap curve was pricing some sizable rate cuts (~186-200bps) on a 1-year horizon going into the presidential elections runoff. The 1-year expectations have been adjusted to a mere -8bps in the past week (see chart below), with the market adding nearly 50bps of rate hikes between now and March. These abrupt changes reflect investors&rsquo; concerns about President-elect Luiz In&aacute;cio Lula da Silva&rsquo;s spending plans, as well as the composition of his transition economic team. Stay tuned!</p>
<h3>Chart at a Glance: Brazil&rsquo;s Rapidly Shrinking Space for Rate Cuts</h3>
<img class="img-responsive w-100" src="https://www.vaneck.com/contentassets/fac17ccafeca4f2699b9de3f14b4973a/us-emerging-markets-daily-2022-11-11.png" alt="Chart at a Glance: Brazil&rsquo;s Rapidly Shrinking Space for Rate Cuts" />
<p class="chart-disclosure">Source: Bloomberg LP</p>
]]></content:encoded>
</item><item rdf:about="https://www.vaneck.com/us/en/blogs/natural-resources/commodities-expected-to-hold-gains-during-winter/">
  <title>Commodities Expected to Hold Gains During Winter></title>
  <link>https://www.vaneck.com/us/en/blogs/natural-resources/commodities-expected-to-hold-gains-during-winter/</link>
  <description><![CDATA[Commodity indexes have maintained good gains all year in the face of rising interest rates and the stronger U.S. dollar.]]></description>
  <dc:creator>Roland Morris</dc:creator>
  <dc:date>11/10/2022 06:30:00</dc:date>
<content:encoded><![CDATA[

<h2>Macro Outlook: Commodities Supported by Steady Gains in Energy</h2>
<p>October was a relatively quiet month for most markets, commodities included. The U.S. dollar was slightly lower despite U.S. 2-year yields rising by 20 basis points. The slightly lower dollar supported a small gain for most commodity indexes; the UBS Constant Maturity Commodity Index (CMCI) gained approximately 3.2%.</p>
<p>The U.S. Federal Reserve (Fed) continues to raise interest rates to fight inflation, which has supported the U.S. dollar rally for most of the year. Commodity indexes have maintained good gains all year in the face of rising interest rates and the stronger U.S. dollar.</p>
<p>Once again, the energy sector was the star performer, gaining an estimated 8.8%. Supply constraints have broadly supported commodity markets ever since Russia invaded Ukraine in March. OPEC, plus Russia, surprised investors and the U.S. Administration in early October when they announced a cut in crude oil production.</p>
<h2>Index &amp; Sector Review: Natural Gas Prices Continue to Struggle Amidst Energy Gains</h2>
<p>In the energy sector, WTI crude oil and Brent crude oil, both gained about 10% in October on the OPEC production cuts. However, natural gas prices fell during the month due to storage and pipeline capacity limitations. Europe has reached its LNG (liquified natural gas) import capacity, creating a backlog of tankers that are unable to offload their cargoes. The decline in natural gas prices helped CMCI&rsquo;s relative performance vs the Bloomberg Commodity Index (BCOM); the latter has an outsized exposure to natural gas (approximately 13% vs CMCI&rsquo;s 3%). There is a global shortage of diesel and heating oil and similar products because of limited refining capacity. U.S. heating oil gained 11% in October.</p>
<p>The agriculture and livestock sectors both made small gains for the month. Live hogs were up 11% and soybean oil gained 14%. Coffee and cotton both fell sharply, offsetting some of the gains.</p>
<p>Industrial metals were slightly lower on the month due to the continued China zero COVID policies, and precious metals fell 1% on a drop in gold prices.</p>
<p>As the year wraps up, we expect commodity prices to hold their gains during the winter months, especially if winter is colder than expected in the U.S. and Europe. It&rsquo;s possible for most commodity indexes to trade back up toward the highs of this year.</p>
<h3>CMCI Performance Relative to Bloomberg Commodity</h3>
<p><img class="img-responsive w-100" src="https://www.vaneck.com/contentassets/bb65f7be5a9042a9a96bc011b371a0fe/cmci_chart_01_v1_2022.11_blog.svg" alt="CMCI Performance Relative to Bloomberg Commodity" /></p>
<p class="chart-disclosure">Source: Bloomberg. Data as of October 2022.</p>
<p><strong><a href="/link/9cc454bdc12d49638c0a22783d5a26cf.aspx" title="CMCAX - CM Commodity Index Fund - Class A - Overview">Learn more about the VanEck CM Commodity Index Fund</a></strong>, which seeks to track, before fees and expenses, the CMCI.</p>
<p>To receive more <a href="/us/en/insights/natural-resources/" title="Natural Resources Insights"><strong>Natural Resources</strong></a> insights, <a href="https://www.vaneck.com/us/en/subscribe/" title="Subscription Center"><strong>sign up in our subscription center</strong></a>.</p>
]]></content:encoded>
</item><item rdf:about="https://www.vaneck.com/us/en/blogs/income-investing/carry-boosts-fixed-income-resilience-in-likely-fed-scenarios/">
  <title>Carry Boosts Fixed Income Resilience in Likely Fed Scenarios></title>
  <link>https://www.vaneck.com/us/en/blogs/income-investing/carry-boosts-fixed-income-resilience-in-likely-fed-scenarios/</link>
  <description><![CDATA[What happens to fixed income returns if there is a Fed pause, pivot or hawkish surprise? Thanks to currently attractive carry, we believe fixed income may be resilient in various scenarios.]]></description>
  <dc:creator>Fran Rodilosso</dc:creator>
  <dc:date>11/10/2022 06:30:00</dc:date>
<content:encoded><![CDATA[

<p>In <a href="https://www.vaneck.com/us/en/blogs/income-investing/income-returns-to-fixed-income-investing/" title="Income Returns to Fixed Income Investing"><strong>Income Returns to Fixed Income Investing</strong></a>, we highlighted how the ongoing normalization of interest rates has made carry a meaningful component of return once again. This is enabling fixed income to be more resilient in the face of a wide range of potential market movements, including ones with even higher yields, credit spreads, or volatility. We believe that various fixed income asset classes are more attractive now and can serve as yield enhancers or portfolio diversifiers, or both, in a variety of market environments. In this blog we illustrate how three possible interest rate scenarios&mdash;Federal Reserve (Fed) pause, Fed pivot or hawkish surprise&mdash;may play out across different fixed income asset classes.</p>
<p>For each of the three scenarios, the table below lists estimated fixed income asset class returns over the next 12 months, as well as the yield levels these asset classes would have to exceed in one year in order for total returns to fall below 0%. Scenario 1 would suggest rates moving moderately higher and the Fed pausing in early 2023 amid continued market uncertainly and moderately wider credit spreads. Scenario 2 would suggest a Fed pivot and lower rates amid a moderate to deep recession (though not on the order of the Global Financial Crisis), with spreads settling at a level significantly higher than today. Scenario 3 would suggest the Fed is more aggressive than the market currently anticipates, in part because the economy remains robust, as reflected by tighter credit spreads.</p>
<div class="wrapped-div">
<table style="width: 100%;">
<tbody>
<tr class="tbl-data">
<td class="tbl-header last" style="text-align: center;" colspan="3">&nbsp;</td>
<td class="tbl-header last" style="text-align: center;" colspan="3">Potential Scenarios:</td>
</tr>
<tr class="tbl-data">
<td class="data-td data last" style="text-align: left;">&nbsp;</td>
<td class="data-td data last">&nbsp;</td>
<td class="data-td data last" style="font-weight: bold;">1. Fed Pause</td>
<td class="data-td data last" style="font-weight: bold;">2. Fed Pivot</td>
<td class="data-td data last" style="font-weight: bold;">3. Hawkish Surprise</td>
</tr>
<tr class="tbl-data">
<td class="data-td data last" style="text-align: left;">Asset Class</td>
<td class="data-td data last" style="text-align: left;">YTW Today</td>
<td class="data-td data last" style="text-align: left;">Approximate Break Even Yield at 10/31/23</td>
<td class="data-td data last" style="text-align: left;">Expected Return as of 10/31/23 if 10-year yields at 4%; HY spreads at 600; IG at 180</td>
<td class="data-td data last" style="text-align: left;">Expected Return as of 10/31/23 if 10-year yields at 3%; HY spreads at 750, IG at 225</td>
<td class="data-td data last" style="text-align: left;">Expected Return as of 10/31/23 if 10-year yields at 4.5%; HY spreads at 400, IG at 140</td>
</tr>
<tr class="tbl-data">
<td class="data-td data last" style="text-align: left;">US 10-year</td>
<td class="data-td data last">4.06</td>
<td class="data-td data last">4.56</td>
<td class="data-td data last">13.30</td>
<td class="data-td data last">0.49</td>
</tr>
<tr class="tbl-data">
<td class="data-td data last" style="text-align: left;">IG Corps</td>
<td class="data-td data last">6.00</td>
<td class="data-td data last">6.96</td>
<td class="data-td data last">5.45</td>
<td class="data-td data last">9.58</td>
<td class="data-td data last">4.91</td>
</tr>
<tr class="tbl-data">
<td class="data-td data last" style="text-align: left;">High Yield</td>
<td class="data-td data last">9.06</td>
<td class="data-td data last">11.35</td>
<td class="data-td data last">3.72</td>
<td class="data-td data last">1.83</td>
<td class="data-td data last">9.82</td>
</tr>
<tr class="tbl-data">
<td class="data-td data last" style="text-align: left;">Fallen Angels</td>
<td class="data-td data last">7.68</td>
<td class="data-td data last">9.21</td>
<td class="data-td data last">2.44</td>
<td class="data-td data last">2.11</td>
<td class="data-td data last">7.89</td>
</tr>
<tr class="tbl-data">
<td class="data-td data last" style="text-align: left;">HY EM Corps</td>
<td class="data-td data last">13.15</td>
<td class="data-td data last">17.45</td>
<td class="data-td data last">3.22</td>
<td class="data-td data last">(4.26)</td>
<td class="data-td data last">16.29</td>
</tr>
<tr class="tbl-data">
<td class="data-td data last" style="text-align: left;">IG FRNs</td>
<td class="data-td data last">4.72</td>
<td class="data-td data last">6.64</td>
<td class="data-td data last">4.82</td>
<td class="data-td data last">3.59</td>
<td class="data-td data last">5.94</td>
</tr>
<tr class="tbl-data">
<td class="data-td data last" style="text-align: left;">CLOs</td>
<td class="data-td data last">7.60</td>
<td class="data-td data last">9.71</td>
<td class="data-td data last">4.25</td>
<td class="data-td data last">0.19</td>
<td class="data-td data last">9.60</td>
</tr>
</tbody>
</table>
</div>
<br />
<p class="chart-disclosure">As of 10/31/2022. 10 Year U.S. Treasury represented by ICE BofA Current 10-Year US Treasury Index; IG Corporates represented by ICE BofA US Corporate Index; HY Corporates represented by ICE BofA US High Yield Index; Fallen Angel HY Corporates represented by ICE US Fallen Angel High Yield 10% Constrained Index; EM HY Corporates represented by ICE BofA Diversified High Yield US Emerging Markets Corporate Plus Index; IG FRN represented by MVIS US Investment Grade Floating Rate Index; CLOs represented by J.P. Morgan CLO Index.</p>
<p>Using broad high yield as an example, at current levels the overall yield would need to increase by 2.29% to 11.35% to suffer a loss over the next year. That yield level has only been exceeded during four cycles in the last 25 years &ndash; the dot com bubble, the telecom blow-up, the GFC and COVID. The current yield level provides a substantial cushion to returns going forward, and as a result, high yield may provide positive returns even in a fairly dramatic spread widening environment. In fact, this is true for almost all of the asset classes listed above in almost all scenarios&mdash;although clearly some scenarios are more favorable than others. The key point is, however, that it is difficult to envision another year of returns similar to 2022, given the cushion provided by current yield levels and the significant rate and spread adjustments already experienced over the past several months.</p>
<p>All of the above analysis, of course, concerns nominal rates of return. Real interest rates and real returns in a static scenario, for the moment, remain negative for most bond asset classes. This is also why we believe it will take some time and a much harder turn in either the economic cycle or inflation before the Fed will be compelled to pivot. A deceleration and/or a pause is our default case over the next six months, but we do not see a high probability of both meaningfully lower yields and a soft landing in 2023.</p>
<p>To receive more <a href="https://www.vaneck.com/us/en/insights/income-investing/" title="Income Investing insights"><strong>Income Investing</strong></a> insights, <a href="/us/en/subscribe/" title="Subscription Center"><strong>sign up in our subscription center</strong></a>.</p>
<style type="text/css">
    .wrapped-div {
        max-width: 100%;
    }

    @media (max-width: 1240px) {
        .wrapped-div {
            overflow-x: scroll;
        }


    }
</style>
]]></content:encoded>
</item><item rdf:about="https://www.vaneck.com/us/en/blogs/economic-trends/disinflation-causes-surprises-prospects/">
  <title>Disinflation – Causes, Surprises, Prospects></title>
  <link>https://www.vaneck.com/us/en/blogs/economic-trends/disinflation-causes-surprises-prospects/</link>
  <description><![CDATA[More and more countries are leaving peak inflation behind. Does this mean more room for dovish pivots? It depends&hellip;]]></description>
  <dc:creator>Natalia  Gurushina</dc:creator>
  <dc:date>11/10/2022 06:30:00</dc:date>
<content:encoded><![CDATA[

<h2>Downside Inflation Surprises</h2>
<p>Wow, what a morning! A sizable downside inflation surprise in the U.S. (including core prices), a sharp disinflation move in the Czech Republic, a nervous breakdown in Brazil&rsquo;s currency and rates (despite on-going disinflation) and &ldquo;stingy&rdquo; credit aggregates in China &ndash; and we still have the whole day in front of us. Today&rsquo;s releases confirmed that <strong>disinflation is getting more entrenched in parts of both emerging and developed markets (EM and DM)</strong> &ndash; a fact definitely appreciated by the market. The speed of disinflation, however, will matter more and more going forward. A larger than expected drop in Czech headline inflation (from 18% to 15.1% year-on-year) suggests that prices might indeed return to the target range sooner than in the rest of the region (see chart below), reassuring the market and the central bank that it is safe to remain on hold. Brazil&rsquo;s prices continued to moderate (to 6%-handle<sup>1</sup>), but not as fast as expected, and this upside surprise might have been the &ldquo;last drop&rdquo; for the market, which is getting wary of the &ldquo;chimerical&rdquo; post-election transition team and President-elect spending plans.</p>
<h2>China Growth, Stimulus</h2>
<p><strong>China&rsquo;s domestic inflation pressures remain very low &ndash; and today&rsquo;s surprisingly weak credit aggregates explain why</strong>: there is a lack of stimulus and a lack of demand. In all fairness, the October moderation was partly seasonal, and authorities did approve numerous measures to prop up growth (especially on the supply side), but the impact will remain muted while the COVID restrictions stay in place (there is a lot of buzz about potential changes, but nothing concrete yet). Mortgage lending suffered a major setback in October &ndash; a sizable sequential decline, and a reminder of near-term growth headwinds (real estate and construction account for a significant chunk of gross domestic product).</p>
<h2>Global Policy Rate Outlook</h2>
<p>Now, <strong>what do all these surprises mean for the policy outlook(s)?</strong> The dovish pivot narrative got a boost in the U.S., with the Fed Funds Futures now showing a zero probability of a 75bps hike in the December. The Czech swap curve now prices in about 50bps of cuts in the next 12 months, and today&rsquo;s inflation surprise can encourage Central European neighbors &ndash; specifically Poland - to hold on for a bit longer before disinflation (hopefully) kicks in. Mexico and Peru will announce their policy rate decisions in the afternoon &ndash; nascent disinflation leaves room for slower rate hikes. And how about EM&rsquo;s disinflation trailblazer, Brazil? It looks like concerns about the policy direction started to &ldquo;contaminate&rdquo; market expectations. The local swap curve now sees only 85-90bps of cuts in the next year &ndash; down form 185-200bps just days ago, and compared to ~500bps of cuts priced in for Chile. Stay tuned!</p>
<h3>Chart at a Glance: EM Inflation Targets &ndash; Progressing At Different Speeds</h3>
<p><img class="img-responsive w-100" src="https://www.vaneck.com/contentassets/45f53b94c9ac48efb1a2cfe066f5adcc/us-emerging-markets-daily-2022-11-10.png" alt="Chart at a Glance: EM Inflation Targets - Progressing At Different Speeds" /></p>
<p class="chart-disclosure"><em>Source: Bloomberg LP.</em></p>
]]></content:encoded>
</item><item rdf:about="https://www.vaneck.com/us/en/blogs/economic-trends/em-inflation-changing-narrative/">
  <title>EM Inflation – Changing Narrative></title>
  <link>https://www.vaneck.com/us/en/blogs/economic-trends/em-inflation-changing-narrative/</link>
  <description><![CDATA[Headline inflation has peaked in most EMs. Inflation levels and core price pressures will matter a lot, as the focus shifts to the speed of disinflation.]]></description>
  <dc:creator>Natalia  Gurushina</dc:creator>
  <dc:date>11/09/2022 16:00:00</dc:date>
<content:encoded><![CDATA[

<h2>Peak Inflation</h2>
<p>Today&rsquo;s crop of inflation releases in emerging markets (EM) points to <strong>a shift in the narrative &ndash; from peak inflation to the speed of disinflation</strong>, and what it means for EM policies and EM assets in the slower growth environment. Well, there are some exceptions, of course &ndash; Hungary&rsquo;s inflation accelerated to 21.1% year-on-year, and there is still no end in sight due to surging food prices (40% year-on-year in October &ndash; the third highest among major EMs after Turkey and Argentina). However, China&rsquo;s annual inflation surprised to the downside, easing sharply to 2.1% as domestic demand remains subdued. Mexico&rsquo;s headline inflation might finally be turning after today&rsquo;s small downside surprise. If the trend is confirmed, Mexico will be joining its regional neighbors Brazil, Chile and Peru. The table below shows that headline inflation is now trending down in most EMs.&nbsp;</p>
<h2>EM Tightening Cycles</h2>
<p>What are the policy implications of the narrative shift? There are several additional points to consider here. First, <strong>headline inflation had peaked at very different levels </strong>in different countries. Czech Republic&rsquo;s likely peak at 18% year-on-year is not the same as Thailand&rsquo;s 7.86%, which is much closer to the 1-3% target range (with the &ldquo;re-entry&rdquo; expected in Q2-23 vs. 2024 in the Czech Republic). This means that while Thailand&rsquo;s central bank can continue hiking at a moderate pace, the Czech national bank will have to continue using other measures (such as FX interventions) to keep inflation pressures under control, if it wants to stay on hold. And there is a risk that at some point that the market will start questioning whether it has enough reserves to keep intervening.</p>
<h2>Pace of Rate Hikes</h2>
<p>The second point is that <strong>core price pressures are still rising in many EMs</strong>, even when headline inflation had peaked. Mexico is a good example &ndash; core inflation accelerated to 8.42% year-on-year in October, which means that the central bank has to continue hiking in lockstep with the U.S. Federal Reserve. The consensus expects a 75bps rate hike in Mexico tomorrow. Poland&rsquo;s core inflation reached 10.7% year-on-year &ndash; the highest since the late-1990s &ndash; so the central bank&rsquo;s decision to stay on hold this morning after a very long debate (hence, a slight delay in today&rsquo;s blog) will be considered as an additional signal that the central bank is falling behind the curve, and the bond market might not like it either. Stay tuned!</p>
<h3>Chart at a Glance: EM Peak Inflation &ndash; Almost There!</h3>
<img class="img-responsive w-100" src="https://www.vaneck.com/contentassets/43cf4f84ace54aa78952a139419a4b69/us-emerging-markets-daily-2022-11-09b.png" alt="Chart at a Glance: EM Peak Inflation" />
<p class="chart-disclosure">Source: Bloomberg LP</p>
]]></content:encoded>
</item><item rdf:about="https://www.vaneck.com/us/en/blogs/moat-investing/moat-investing-is-the-party-over-for-big-tech/">
  <title>Moat Investing: Is the Party Over for Big Tech?></title>
  <link>https://www.vaneck.com/us/en/blogs/moat-investing/moat-investing-is-the-party-over-for-big-tech/</link>
  <description><![CDATA[Big tech has been a key driver of broad market returns over the last decade, becoming large weights in major indices. This concentration risk may now spell trouble.]]></description>
  <dc:creator>Coulter Regal, CFA</dc:creator>
  <dc:date>11/09/2022 06:30:00</dc:date>
<content:encoded><![CDATA[

<p>Continuing the theme of volatility that has persisted so far this year, U.S. equity markets rebounded sharply in October off the lows set last month in one of the worst Septembers in recent history. The major indices were all up for the month with the Dow Jones Industrial leading the pack, up 14%, as it saw its largest monthly gain since 1976. The S&amp;P 500 was up roughly 8%, while the tech heavy Nasdaq lagged during the month, posting a more pedestrian return of about 4%. All three major indices remain in the red by double digits year-to-date as of 10/31/2022.</p>
<p>The <a href="/link/9f629c73a31846bb9e480b95e2c7f330.aspx" title="MOAT - VanEck Morningstar Wide Moat ETF - Index"><strong>Morningstar<sup>&reg;</sup>&nbsp;Wide Moat Focus Index<sup>SM</sup></strong></a>&nbsp;(the &ldquo;Moat Index&rdquo; or &ldquo;Index&rdquo;) remains ahead of the S&amp;P 500 index by a little more than 2% in 2022 (-15.5% vs. -17.7%, respectively), as of 10/31/2022. This is despite lagging the S&amp;P 500 in October (6.8% vs. 8.1%, respectively). The Moat Index&rsquo;s outperformance so far this year has been driven by a combination of positive sector allocation and strong stock selection, particularly within the Consumer Staples and Healthcare sectors. However, for the month of October, it was selection effect within technology that contributed the most to underperformance relative to the S&amp;P 500.</p>
<h2>Is the Party over for Big Tech?</h2>
<p>Over the last decade, big technology stocks&mdash;particularly the revered FANMAG stocks (Meta Platforms/Facebook, Amazon, Netflix, Microsoft, Apple and Google/Alphabet)&mdash;have been responsible for a significant portion of broad market returns. They have also grown to become outsized portions of the major market indices that are often the foundation of many investor portfolios. Today, the FANMAG stocks make up nearly 20% of the S&amp;P 500. Now with the prospect of higher rates for longer and a possible recession on the horizon, that concentration risk could spell trouble, as cracks in big tech have begun to appear, revealing that they are no longer sure-fire bets.</p>
<div class="wrapped-div">
<table style="width: 750px;">
<tbody>
<tr class="tbl-data">
<td class="tbl-header last" colspan="5">FANMAG Stocks Falter (%) / As of 10/31/2022</td>
</tr>
<tr class="tbl-data">
<td class="data-td  last">Company</td>
<td class="data-head last">Ticker</td>
<td class="data-head last">1 Month Return</td>
<td class="data-head last">6 Month Return</td>
<td class="data-head last">YTD Return</td>
</tr>
<tr class="tbl-data">
<td class="data-td data last" style="text-align: left;">Meta Platforms Inc</td>
<td class="data-td data last" style="text-align: center;">META</td>
<td class="data-td data last" style="text-align: center;">-31.34</td>
<td class="data-td data last" style="text-align: center;">-53.53</td>
<td class="data-td data last" style="text-align: center;">-72.30</td>
</tr>
<tr class="tbl-data">
<td class="data-td data last" style="text-align: left;">Amazon.com</td>
<td class="data-td data last" style="text-align: center;">AMZN</td>
<td class="data-td data last" style="text-align: center;">-9.35</td>
<td class="data-td data last" style="text-align: center;">-17.57</td>
<td class="data-td data last" style="text-align: center;">-38.55</td>
</tr>
<tr class="tbl-data">
<td class="data-td data last" style="text-align: left;">Netflix Inc</td>
<td class="data-td data last" style="text-align: center;">NFLX</td>
<td class="data-td data last" style="text-align: center;">23.97</td>
<td class="data-td data last" style="text-align: center;">53.33</td>
<td class="data-td data last" style="text-align: center;">-51.55</td>
</tr>
<tr class="tbl-data">
<td class="data-td data last" style="text-align: left;">Microsoft Corp</td>
<td class="data-td data last" style="text-align: center;">MSFT</td>
<td class="data-td data last" style="text-align: center;">-0.33</td>
<td class="data-td data last" style="text-align: center;">-15.97</td>
<td class="data-td data last" style="text-align: center;">-30.52</td>
</tr>
<tr class="tbl-data">
<td class="data-td data last" style="text-align: left;">Apple Inc</td>
<td class="data-td data last" style="text-align: center;">AAPL</td>
<td class="data-td data last" style="text-align: center;">10.96</td>
<td class="data-td data last" style="text-align: center;">-2.46</td>
<td class="data-td data last" style="text-align: center;">-13.29</td>
</tr>
<tr class="tbl-data">
<td class="data-td data last" style="text-align: left;">Alphabet Inc</td>
<td class="data-td data last" style="text-align: center;">GOOG</td>
<td class="data-td data last" style="text-align: center;">-3.09</td>
<td class="data-td data last" style="text-align: center;">-20.31</td>
<td class="data-td data last" style="text-align: center;">-34.86</td>
</tr>
</tbody>
</table>
</div>
<br />
<p class="chart-disclosure">Source: Morningstar. Past performance is no guarantee of future results. Index performance is not illustrative of fund performance. Not intended as a recommendation to buy or to sell any of the securities mentioned herein.</p>
<p>The Moat Index has historically been underweight FANMAG names, given its equal weighting methodology and lack of wide moat ratings for Apple and Netflix. Despite this underweight to some of the market&rsquo;s top performers, the Moat Index has outperformed the S&amp;P 500 by over 250 basis points annually since its inception in February 2007. Today, FANMAG exposure in the Moat Index sits at about 8%, setting up the strategy to potentially benefit on a relative basis versus the broad market if weakness in big tech names continues.</p>
<h2>Wide Moat Stock Highlights</h2>
<p><strong>Emerson Electric Co. (EMR)<sup>1</sup></strong></p>
<p>Emerson Electric (EMR), a multi-industrial conglomerate that operates under the two business platforms of automation solutions and commercial and residential solutions, was a top contributor to performance for the Moat Index in October. EMR&rsquo;s commercial and residential solutions business boasts several household brands, including Copeland and RIDGID. Their automation solutions side is most known for its process manufacturing solutions, which consists of measurement instrumentation, as well as valves and actuators, among other products and services. Morningstar views Emerson Electric as the undisputed powerhouse in process manufacturing on the west side of the Atlantic. Morningstar assigns Emerson Electric a wide economic moat rating, based primarily on <a href="https://www.vaneck.com/us/en/blogs/moat-investing/switching-costs-build-moats-and-retain-customers2/" title="Switching Costs Build Moats and Retain Customers"><strong>switching costs</strong></a>, and secondarily on <a href="https://www.vaneck.com/us/en/blogs/moat-investing/intangible-assets-the-leading-source-of-moats2/" title="Intangible Assets: The Leading Source of Moats"><strong>intangible assets</strong></a>. Despite headwinds in fiscal 2020 given low levels of gross fixed investment amid geopolitical uncertainty and COVID-19-related disruptions, Morningstar believes Emerson is poised for several years of positive organic growth after a slow recovery in early 2021.</p>
<p>Emerson Electric&rsquo;s share price gained over 18% in October to end the month just over $86 per share, while Morningstar currently estimates EMR&rsquo;s fair value to be $113.</p>
<p><strong>Meta Platforms (META)<sup>2</sup></strong></p>
<p>Meta, the largest social network in the world with nearly 3 billion monthly active users, was the bottom contributor to performance for the Moat Index in October. Meta&rsquo;s share price was punished following its mixed third-quarter results and guidance for continued operating expense growth in the coming year. Investor concern is mainly regarding the firm&rsquo;s metaverse strategy, in which the firm plans to continue investing significantly more than many had projected, without much clarity about when any return on this investment could be realized. However, on the positive side, Morningstar notes that Meta&rsquo;s recent results indicate that their wide moat rating, stemming from <strong><a href="https://www.vaneck.com/us/en/blogs/moat-investing/network-effect-a-proven-way-to-create-a-moat/" title="Network Effect: A Proven Way to Create a Moat">network effect</a></strong>, remains intact given the firm&rsquo;s encouraging user count and engagement metrics. Morningstar believes this positions Meta to accelerate revenue growth in late 2023, with the assumption that macro uncertainty eases.</p>
<p>Meta&rsquo;s share price declined 30% in October to end the month around $95 per share, while Morningstar estimates Meta Platform&rsquo;s fair value to be $260.</p>
<p><a href="/link/635ccc4bf9134cb9a7fcc80919498eec.aspx" title="MOAT - VanEck Morningstar Wide Moat ETF - Overview"><strong>VanEck Morningstar Wide Moat ETF (MOAT)</strong></a> seeks to replicate as closely as possible, before fees and expenses, the price and yield performance of the Morningstar Wide Moat Focus Index.</p>
<p>To receive more <a href="https://www.vaneck.com/us/en/insights/moat-investing/" title="Moat Investing Insights"><strong>Moat Investing</strong></a> insights, <a href="https://www.vaneck.com/us/en/subscribe/" title=" Subscription Center"><strong>sign up in our subscription center</strong></a>.</p>
<style type="text/css">
.wrapped-div {
    max-width: 100%;
}
@media (max-width: 768px) {
    .wrapped-div {
        overflow-x: scroll;
    }
}
.wrapped-div-sector {
    max-width: 100%;
    overflow-x: scroll;
}
</style>
]]></content:encoded>
</item><item rdf:about="https://www.vaneck.com/us/en/blogs/gold-investing/joe-foster-glimmer-of-hope-for-golds-rebound/">
  <title>Glimmer of Hope for Gold’s Rebound></title>
  <link>https://www.vaneck.com/us/en/blogs/gold-investing/joe-foster-glimmer-of-hope-for-golds-rebound/</link>
  <description><![CDATA[Physical demand for gold strengthened in 3Q, as growing geopolitical and macro risks may develop into crises that drive gold.]]></description>
  <dc:creator>Joe Foster</dc:creator>
  <dc:date>11/09/2022 06:30:00</dc:date>
<content:encoded><![CDATA[

<p>Monthly gold market and economic insights from Joe Foster, Portfolio Manager and Strategist, and Imaru Casanova, Deputy Portfolio Manager, featuring their unique views on mining and gold&rsquo;s portfolio benefits. <a href="/us/en/blogs/gold-investing/joe-foster-glimmer-of-hope-for-golds-rebound/gold-monthly-commentary-october-2022.pdf" title="Gold Monthly Commentary - October 2022" target="_blank" rel="noopener"><strong>An expanded PDF version of this commentary, including fund specific information can be downloaded here.</strong></a></p>
<h2>Support signs for gold</h2>
<p>While interest rates trended higher and 10-year treasury yields rose above 4% for the first time since 2008, the dollar was unable to make new highs in October. Markets started wondering if rates are reaching a peak, allowing gold prices to stabilize above $1,600 per ounce. Gold reached a monthly high of $1,729 on October 4 amid jitters over Credit Suisse&rsquo;s finances and continued fallout from UK property funds affected by the Liability Driven Investment (LDI) crisis. Gold then trended lower to end the month with a $27.05 (1.63%) loss at $1,633.56.</p>
<p>Historically, physical demand for gold picks up in Asia and the Middle East when the gold price is weak. The current low gold price is no exception, as buyers in China, India, and UAE sense a bargain. According to Bloomberg, gold in Dubai, Istanbul and Shanghai is trading at a premium to spot prices in London. Over 527 tonnes has been moved out of New York and London vaults since April, while Chinese imports reached a four-year high in August. Central Bank demand is also strong, as the World Gold Council reports the banks bought 399 tonnes in the third quarter, the strongest quarter on record. This physical demand may enable gold to find a floor around current levels.</p>
<h2>Miners move the needle on &ldquo;green&rdquo;</h2>
<p>Gold stocks eked out small gains in October, with the NYSE Gold Miners Index (GDMNTR)<sup>1</sup>&nbsp;advancing 0.9% and the MVIS Global Junior Gold Index (MVGDXJTR)<sup>2</sup>&nbsp;increasing 0.8%. There was some interesting news on the miners&rsquo; efforts to lower greenhouse gas emissions. Most mines run diesel equipment to load and haul rock. Underground gold mines use trucks that haul up to 65 tonnes, while open pit trucks can haul up to 300 tonnes. This is often a company&rsquo;s largest source of greenhouse gas emissions, making the development of non-diesel equipment the key to a green mining industry. Australian Mining writes that mining manufacturer Sandvik will begin testing the largest battery electric truck for underground mining at the Sunrise Dam gold mine in Western Australia in December, with hopes of bringing it to market in 2023. Inadequate charging time and battery life have been the main impediments to adopting underground electric haul trucks. Hopefully this truck will meet the miners&rsquo; needs.</p>
<p>On the open pit front, Bloomberg reports members of the International Council on Mining and Metals (ICMM) plan to begin testing hydrogen and other zero-emission technologies at 50 sites by year-end. The CEO of ICMM expects mass availability of hydrogen and electric trucks in 2027, compared with an earlier projection of 2040.</p>
<h2>Wars, inflation and recession: risks are still rising</h2>
<p>Geopolitical risks continue to escalate. In its 2023 index of U.S. Military Strength, the Heritage Foundation downgraded the U.S. military from marginal to weak, citing shrinking shipbuilding, maintenance delays and backlogs, aging aircraft, pilot shortages, very poor pilot training, low munitions inventories and a lack of recruits. The U.S. is spending about 3% of GDP on defense, compared to 5%-6% in the 1980&rsquo;s. Meanwhile, China reiterated its intentions to become a major military power and unify Taiwan Region at its Communist Party Congress.</p>
<p>Several recent measures indicate macro risks are also growing. Both CPI<sup>3</sup>&nbsp;and PPI<sup>4</sup>&nbsp;inflation were again ahead of expectations. The CPI was up 8.5% YOY in September. A study by Deutsche Bank using 126 observations around the globe since 1970 shows that when inflation exceeds 8%, it has always remained above 2% (U.S. Federal Reserve&rsquo;s (Fed&rsquo;s) target) for at least four years.</p>
<p>In a recent Wall Street Journal article the IMF Managing Director said &ldquo;a global recession is very possible&rdquo;. Economists, on average, put the probability of a U.S. recession in the next twelve months at 63%, up from 49% in July.</p>
<h2>Debt may be the most overlooked danger</h2>
<p>Two areas of risk that we believe are being ignored in the markets are debt and international currencies. Last month we mentioned that higher rates are setting U.S. debt service on a path to become the largest item in the federal budget. Natalia Gurushina, VanEck&rsquo;s Chief Economist for Emerging Markets Fixed Income, provides two charts that illustrate that the problem is not limited to the U.S. The first chart shows many countries around the world have been piling on more debt, led by the two largest, the U.S. and China. The second chart indicates that, as existing debt is rolled into higher rates, debt service is set to consume a much larger portion of global GDP. The April 2021 estimate of 2026 G7 interest payments shows that few (if any) have anticipated this increase in debt service. Debt risks will likely rise as economies succumb to tighter central bank policies.</p>
<h3>Piling on the debt: Primary fiscal balances as a % of GDP</h3>
<p><img class="img-responsive w-100" src="https://www.vaneck.com/contentassets/c1bf1ce7b15c4490aa492e64a89f0517/gold_chart_01_v1_2022.11_blog.svg" alt="Piling on the debt: Primary fiscal balances as a % of GDP" /></p>
<p class="chart-disclosure">Source: IMF Fiscal Monitor. Data as of October 2022.</p>
<h3>Bills, bills, bills: Interest payments as % of GDP</h3>
<p><img class="img-responsive w-100" src="https://www.vaneck.com/contentassets/c1bf1ce7b15c4490aa492e64a89f0517/gold_chart_02_v1_2022.11_blog.svg" alt="Bills, bills, bills:  Interest payments as % of GDP" /></p>
<p class="chart-disclosure">Source: VanEck Research, IMF Fiscal Monitor. Data as of October 2022.</p>
<h2>Historic mismatch in local gold prices</h2>
<p>On the currency front, many have been tracking the dizzying rise in the dollar and the relentless declines in many other currencies around the globe. The chart below looks at gold prices in local currencies. The gray line is gold in U.S. dollars, while the teal and blue lines are gold in pound sterling and yen respectively. Gold in local currencies periodically outperforms or underperforms, but historically all three plots tend to move in tandem. The rectangle highlights the remarkable divergence recently between gold in U.S. dollars and the other two currencies. If fact, we looked at this chart back to 1972 and there has never been such a divergence. These are not rogue nations run by a despotic dictator, they are G7 countries with major reserve currencies. These currency dislocations reflect the extraordinary risks faced by the world today. While the U.S. has problems with inflation, debt, divisive politics, crime and a weakening military, other countries have problems that outweigh those in the U.S., allowing gold to trend higher as a local safe haven. How much longer can the U.S. be relatively insulated from the crises that increasingly afflict the rest of the world?</p>
<h3>Mind the gap: Gold returns in dollar, yen and pound terms</h3>
<p><img class="img-responsive w-100" src="https://www.vaneck.com/contentassets/c1bf1ce7b15c4490aa492e64a89f0517/gold_chart_03_v1_2022.11_blog.svg" alt="Mind the gap: Gold returns in dollar, yen and pound terms" /></p>
<p class="chart-disclosure">Source: Bloomberg. Data as of October 2022.</p>
<p>To receive more insights to <strong><a href="https://www.vaneck.com/us/en/insights/gold-investing/" title="Gold Investing Insights">Gold Investing</a></strong> insights, <strong><a href="https://www.vaneck.com/us/en/subscribe/" title="Subscription Center">sign up in our subscription center</a></strong>.</p>
]]></content:encoded>
</item><item rdf:about="https://www.vaneck.com/us/en/blogs/economic-trends/em-inflation-more-turning-points/">
  <title>EM Inflation – More Turning Points></title>
  <link>https://www.vaneck.com/us/en/blogs/economic-trends/em-inflation-more-turning-points/</link>
  <description><![CDATA[Disinflation is gaining pace in parts of EM &ndash; how much policy space can it free up in the slower growth environment?]]></description>
  <dc:creator>Natalia  Gurushina</dc:creator>
  <dc:date>11/08/2022 16:00:00</dc:date>
<content:encoded><![CDATA[

<h2>EM Peak Inflation</h2>
<p>There is growing evidence that <strong>headline inflation pressures are easing in parts of emerging markets (EM)</strong>. Brazil is the disinflation poster child, and we expect to see further price moderation on Thursday (to 6.37% year-on-year, according to the Bloomberg consensus). Brazil&rsquo;s headline inflation can get back to the target range in Q1-23, paving the way for policy rate cuts (the local swap curve prices in around 200bps in one year) in the slower growth environment. The key prerequisite, of course, is the continuation of fiscal discipline (and reforms) under the new administration. The market thinks that Brazil is not the only LATAM economy with significant potential for easing. Chile is now expected to cut by a whopping 417bps in 12 months (!) to prevent the economy from sliding into a recession &ndash; today&rsquo;s huge disinflation surprise (from 13.7% year-on-year to 12.8%) reinforced this view.</p>
<h2>Ending EM Tightening Cycles</h2>
<p>While <strong>LATAM&rsquo;s inflation is turning</strong> (mostly, see chart below), <strong>Central Europe has more challenges on this front</strong>, in part due to the continuation of the Russia/Ukraine war. Average annual headline inflation in the region is getting close to 20%, and the consensus sees practically no improvement in the Czech Republic on Thursday, while Hungarian annual inflation might accelerate further to 21%. Both central banks are keeping their official policy rates on hold &ndash; albeit the Czech national bank is using direct FX interventions to cap imported inflation, whereas Hungary resorted to massive shadow tightening (with mixed success). Poland&rsquo;s rate-setting meeting tomorrow will also be closely watched. The Polish national bank leans dovish (&ldquo;high imported inflation is beyond our control&rdquo; mantra), but today&rsquo;s sizable 50bps rate hike in Romania reminded us to &ldquo;never say never again&rdquo;.</p>
<h2>China Reopening, Growth</h2>
<p><strong>Inflation pressures in EM Asia might fizzle out sooner</strong> &ndash; and at a lower level &ndash; than in other regions. The latest inflation prints in Indonesia and Thailand looked encouraging. China&rsquo;s inflation backdrop also remains benign &ndash; despite rapidly rising pork prices. Under normal circumstances, we would say that this leaves room for additional policy support. But current circumstances are different &ndash; the effectiveness of policy easing is very much conditional on easing of COVID restrictions. It does not mean that we will be ignoring the next set of China&rsquo;s credit and monetary aggregates &ndash; the consensus is super-bearish, expecting a big seasonal slump both in the new yuan loans and aggregate financing. Will the market appreciate an upside surprise? Stay tuned!</p>
<h3>Chart at a Glance: EM Disinflation &ndash; Different Regional Pace</h3>
<p><img class="img-responsive w-100" src="https://www.vaneck.com/contentassets/7190685fd2294d918eef09ae3c1bb513/us-emerging-markets-daily-2022-11-08.png" alt="Chart at a Glance: EM Disinflation - Different Regional Pace" /></p>
<p class="chart-disclosure">Source: VanEck Research; Bloomberg LP.</p>
<p class="chart-disclosure"><strong>CEE-3</strong> represents Central and Eastern European: Poland, the Czech Republic and Hungary.<br /><strong>LATAM-5 (x-Argentina)</strong> represents Brazil, Chile, Colombia, Mexico and Peru.</p>
]]></content:encoded>
</item><item rdf:about="https://www.vaneck.com/us/en/blogs/economic-trends/policy-space-and-politics/">
  <title>Policy Space and Politics></title>
  <link>https://www.vaneck.com/us/en/blogs/economic-trends/policy-space-and-politics/</link>
  <description><![CDATA[China&rsquo;s trade numbers point to persistent growth headwinds &ndash; are authorities ready to remove COVID restrictions? How can politics affect the policy mix in other EMs &ndash; especially with weaker growth?]]></description>
  <dc:creator>Natalia  Gurushina</dc:creator>
  <dc:date>11/07/2022 16:00:00</dc:date>
<content:encoded><![CDATA[

<h2>U.S. Elections, Growth</h2>
<p>This week&rsquo;s newsflow is dominated by the U.S. mid-term elections <strong>&ndash; </strong>the impact on the fiscal outlook (and growth and interest rates) is gaining in importance with the prospect of the higher peak policy rate. <strong>Concerns about policy room in another independent global growth driver &ndash; China &ndash; also refuse to go away</strong>. China has already used a lot of fiscal space &ndash; the government&rsquo;s primary deficit is expected to be the largest among major emerging markets (EM) and developed markets (DM), both in 2022 and in 2023 &ndash; and today&rsquo;s foreign trade numbers point to persistent growth headwinds. China&rsquo;s exports and imports contracted in annual terms in October (see chart below), surprising to the downside and reflecting the combined effect of softer global demand and the weakened renminbi. China&rsquo;s growth is still expected to accelerate in 2023 &ndash; but this will be conditional on the removal of COVID restrictions (a lot of buzz, but no concrete steps/timeline yet).</p>
<h2>EM Growth and Policy Normalization</h2>
<p><strong>The expected growth cliff is already affecting the policy mix in parts of EM</strong>. Central banks in EMEA are becoming increasingly dovish &ndash; Poland&rsquo;s rate-setting meeting would be another important test case later this week. In LATAM, Colombia is in a tough spot &ndash; the real GDP growth is expected to moderate from 7.3% this year to mere 1.9% in 2023, while inflation continues to surprise to the upside (12.22% year-on-year in October). The government&rsquo;s policy agenda &ndash; which is often ideologically-driven and includes a controversial pension reform proposal among other things &ndash; added pressure, both on the currency (the Colombia peso was the worst-performing major EM FX in Q4) and local bonds (the second largest quarter-to-date loss among GBI-EM constituents). And this can limit the central bank&rsquo;s ability to slow the pace of rate hikes to support growth (or worsen the outlook for local debt if it does).</p>
<h2>EM Asia Disinflation, Growth Outlook</h2>
<p>The <strong>growth outlook for EM Asia is not too bad compared to EM peers</strong> &ndash; Indonesia reported a stronger than expected Q3 GDP print (5.72% year-on-year), and the consensus sees another healthy expansion (approximately 4.8%) in 2023. This should reduce pressure on fiscal accounts, while allowing the central bank to continue tightening at a measured pace if disinflation stalls. Thailand&rsquo;s prospects seem to be improving on several fronts at the same time &ndash; headline disinflation, the return of the current account surplus and stronger real GDP growth in 2023 (according to the Bloomberg consensus). However, core inflation is still grinding higher, which means more &ldquo;catching up&rdquo; rate hikes for the central bank including another 25bps move in November. Stay tuned!&nbsp;</p>
<h3>Chart at a Glance: China Foreign Trade &ndash; More External Growth Headwinds</h3>
<img class="img-responsive w-100" src="https://www.vaneck.com/contentassets/75d4a50847d5415ca9cef410c1adf263/us-emerging-markets-daily-chart-2022-11-07-.png" alt="Chart at a Glance: China Foreign Trade &ndash; More External Growth Headwinds" />
]]></content:encoded>
</item><item rdf:about="https://www.vaneck.com/us/en/blogs/natural-resources/its-getting-hot-in-here-what-to-know-leading-up-to-cop27/">
  <title>It’s Getting Hot in Here: What to Know Leading up to COP27></title>
  <link>https://www.vaneck.com/us/en/blogs/natural-resources/its-getting-hot-in-here-what-to-know-leading-up-to-cop27/</link>
  <description><![CDATA[Here&rsquo;s an overview of what to expect from COP27, which will focus on climate change adaptation, climate finance and nature-based solutions.]]></description>
  <dc:creator>VanEck </dc:creator>
  <dc:date>11/04/2022 06:30:00</dc:date>
<content:encoded><![CDATA[

<h2>What is COP27?</h2>
<p>COP stands for Conference of the Parties. COP is the decision-making body of the United Nations Framework Convention on Climate Change (UNFCCC), which is an international environmental treaty designed to mitigate climate change. The parties of the COP are the governments that attend the meetings and that are signatories to the UNFCCC. Corporations, NGOs and activists attend COPs as well.</p>
<p>COP meetings are held on an annual basis. COP26 was held last November in Glasgow, Scotland. Many are familiar with 2015&rsquo;s COP21, which resulted in the Paris Agreement (the first legally binding global treaty on climate change).<sup>1</sup></p>
<p>COP27 is the 27th meeting, taking place November 6-18 in Sharm El Sheikh, Egypt, and will bring together global politicians, business leaders, scientists and activists to discuss climate-related issues, solutions and goals.</p>
<h2>How COP27 Builds on COP26</h2>
<p>In the year that has passed since COP26 in Glasgow, there has been a seismic shift in the global geopolitical agenda for climate and sustainability. Russia&rsquo;s invasion of Ukraine has resulted in soaring energy and crop prices, sending energy and food security to the top of the global agenda.<sup>2</sup>&nbsp;The U.S. and China have suspended climate talks amidst rising political tensions.<sup>3</sup></p>
<p>Meanwhile, natural disasters and other extreme climate events have devastated communities around the world, from Europe&rsquo;s worst drought in 500 years<sup>4</sup>&nbsp;to the floods in Pakistan to the destruction left in the wake of Hurricane Ian in the U.S.</p>
<p>A report from UN Climate Change reveals that countries are mitigating their greenhouse gas (GHG) emissions, but that these efforts remain insufficient to limit the global temperature rise to 1.5 degrees Celsius by the end of the century (which is the ultimate goal of the Paris Agreement). According to the report, only 24 out of 193 countries have increased their climate ambitions this year to work towards their climate pledges, which still puts the world on track for 2.5 degrees of warming in this time period.<sup>5</sup></p>
<p>COP27 has not received nearly as much press or anticipation compared to COP26 in Glasgow a year ago and isn&rsquo;t regarded as high priority by many top-level executives. While last year&rsquo;s meeting had many prominent corporate heads in attendance, many of those notable individuals will not be present at the meeting this November, including BlackRock CEO Larry Fink, Citi Group CEO Jane Fraser and Standard Chartered CEO Bill Winters.<sup>6</sup>&nbsp;The newly appointed UK prime minister Rishi Sunak planned to be absent as well, though he reversed this decision days prior to the start of the summit.<sup>7</sup></p>
<p>The COP26 summit marked a deadline for countries to set new GHG emissions reductions targets, also known as Nationally Determined Contributions (NDCs), under the Paris Agreement. It also finalized the Paris Agreement rulebook, which lays out how countries can be held accountable for their climate pledges. COP27 will focus largely on implementing these emissions reductions in order to operationalize the Paris Agreement.<sup>8</sup></p>
<h2>On the Agenda: Action, Adaptation and Natural Capital</h2>
<p><strong>&ldquo;Mo Commitments, Less Problems?&rdquo; Commitments and Credibility</strong></p>
<p>Countries will report on their progress towards meeting the goals set out in their NDCs. Countries, alongside companies, financial institutions and other private sector actors are expected to announce how they will continue to work towards, and in some cases step up, their climate ambitions. Countries will be expected to demonstrate progress on legislation and policies in operationalizing the Paris Agreement.</p>
<p>The summit with also convene financial industry groups that have made climate commitments, at a time when the credibility of these groups is faltering. COP26 resulted in the formation of a number of industry groups committed to meeting net zero GHG emissions, including the Glasgow Financial Alliance for Net Zero (GFANZ). GFANZ members represent over 500 financial sector members that have pledged to reach net zero emissions by 2050 and represent $135T in assets under management (AUM).<sup>9</sup>&nbsp;While these groups have the potential to mainstream and institutionalize more climate-friendly finance, recent coverage has suggested that some banks and other financial actors are considering &ldquo;quiet quitting&rdquo; their pledges due to the possibility of legal risks<sup>10</sup>&nbsp;and as traditional energy has experienced a market resurgence this year.<sup>11</sup>&nbsp;The conference will reveal the credibility of these industry groups.&nbsp;</p>
<p><strong>Adaptation Is the New Mitigation</strong></p>
<p>While previous COPs have focused mostly on climate change mitigation, or reducing emissions, COP27 will spotlight climate change adaptation like never before. Climate change adaptation covers how countries and communities will adapt to the current and future impacts of climate change&mdash;such as, updating water infrastructure and making agriculture more climate resilient.</p>
<p>At COP26, developed countries agreed to at least double finance for adaptation, and many stakeholders are calling for even greater levels of adaptation funding to match the amounts that are now being spent on mitigation.<sup>12</sup></p>
<p>The 2022 Annual Report from the Intergovernmental Panel on Climate Change (IPCC) found that climate impacts are more widespread and severe than expected. The report also detailed that there is a large gap between current adaptation levels and those needed, which is mostly due to a lack of financing.<sup>13</sup>&nbsp;Mobilizing capital into climate change adaptation projects will be a major focus of COP27 negotiations.</p>
<p><strong>Climate Finance and Loss and Damage</strong></p>
<p>Developing countries can be expected to call on wealthier nations to provide more financing for climate change mitigating and adaptation projects in their respective countries. At COP21 in Paris, developed countries pledged $100B per year for climate action in developing countries from 2020 to 2025, a goal which has not been met.<sup>14</sup>&nbsp;Developing countries will also look for funding to address the costs of loss and damage, which refers to the destructive impacts of climate change that cannot be avoided by mitigation and adaptation.<sup>15</sup></p>
<p><strong>Biodiversity and Natural Capital</strong></p>
<p>COP26 was the first of the meetings to focus extensively on the crucial role that nature-based solutions will play in drawing down emissions and helping countries adapt to the impacts of our changing climate.<sup>16</sup>&nbsp;The summit this year can be expected to build on this focus and call for financing for natural capital and biodiversity projects, including allowing forests to regrow, restoring coastal wetlands and switching to restorative agricultural practices.<sup>17</sup></p>
<h2>The Jury Is Out</h2>
<p>While COP27 has received far less attention and will not deliver on stricter climate action, it will hold countries accountable for their progress (or lack thereof) towards emissions reductions and will focus largely on implementing and operationalizing the goals of the Paris Agreement. The summit will take a special focus on climate change adaptation, climate finance and nature-based solutions that were not considered at previous summits. While it is a less important COP, it provides an opportunity for continued accountability and dialogue as the global community attempts to limit the global temperature rise to 1.5 degrees Celsius by the end of the century.</p>
<p>To receive more <a href="/us/en/insights/natural-resources/" title="Natural Resources Insights"><strong>Natural Resources</strong></a> insights, <a href="https://www.vaneck.com/us/en/subscribe/" title="Subscription Center"><strong>sign up in our subscription center</strong></a>.</p>
]]></content:encoded>
</item><item rdf:about="https://www.vaneck.com/us/en/blogs/digital-assets/matthew-sigel-ethereum-exchange-beacon-chain-and-smart-contract-supplies/">
  <title>Ethereum Exchange, Beacon Chain, and Smart Contract Supplies></title>
  <link>https://www.vaneck.com/us/en/blogs/digital-assets/matthew-sigel-ethereum-exchange-beacon-chain-and-smart-contract-supplies/</link>
  <description><![CDATA[In October, crypto asset prices traded in a tight range, with Ethereum outperforming major stock indices, bonds &amp; most commodities (except heating oil &amp; gasoline).]]></description>
  <dc:creator>Matthew  Sigel</dc:creator>
  <dc:date>11/04/2022 06:30:00</dc:date>
<content:encoded><![CDATA[

<p><strong>Please note that VanEck may have a position(s) in the digital asset(s) described below.</strong></p>
<p>Crypto asset prices traded in a tight range in October, with Ethereum especially outperforming major stock indices, bonds &amp; most commodities (except heating oil &amp; gasoline), even as value stocks beat growth stocks for the month. The most likely reasons for digital assets&rsquo; positive performance were 1) the U.S. dollar DXY index fell in October for only the second month in the last ten months; 2) Elevated short interest and a strong equity market prompted more than $2b in leveraged short ETH &amp; BTC positions to be liquidated on major exchanges during a three day period mid-month, including the largest daily sum since July 2021; 3) Republicans&rsquo; odds to control the Senate rose sharply in October, implying a lower chance of the US congress passing harmful regulation after the midterms; and 4) UK lawmakers voted in favor of adding crypto to the scope of activities to be regulated via a proposed Financial Services and Markets Bill, the first legislative attempt by new, purportedly pro-crypto prime minister Rishi Sunak.</p>
<p>For the month, ETH rose 14%, Nasdaq +4%, the MVIS Smart Contract Leaders Index +4%, and Bitcoin +4.5%.</p>
<p>Staying on the prospects of further dollar weakness, Saudi Arabia and China have reportedly discussed pricing some oil sales in RMB, according to the WSJ. Russia&rsquo;s Secretary of State told a legal forum on October 20th that Russia would &ldquo;bypass&rdquo; the EU&rsquo;s crypto-related sanctions and would &ldquo;provide businesses with the ability to carry out cross-border settlements&rdquo; making use of &ldquo;cryptocurrencies, the digital ruble, or a hybrid.&rdquo; And even as Egypt devalued its pound and sought IMF protection, new central bank governor Hassan Abdalla touted a new currency indicator (including gold but not the USD) meant to wean people off the U.S. dollar: &ldquo;America is not my major trading partner,&rdquo; he lamented. &ldquo;I don&rsquo;t know why people are always fixated on the dollar.&rdquo; Vietnam, Nigeria, Argentina, Lebanon and China all devalued in October; all of them but Lebanon rank in the top 20 for crypto adoption, according to Chainalysis&rsquo; recently updated global crypto adoption index.</p>
<p>Since 2009 and especially post-2020, governments, not corporate or households, have driven most of the growth in global debt. Thus, we continue to believe that government (and thus FX) failures will mark this cycle, highlighting Bitcoin&rsquo;s appeal as a neutral, supply-constrained reserve asset that can be used as both a stranded energy sink and a geopolitical negotiating tool by frontier states with unique domestic politics. We will be speaking on this topic at the <strong><a href="https://adoptingbitcoin.org/2022/schedule" title="Speaker Signup - Adopting Bitcoin - A Lightning Summit 2022" target="_blank" rel="noopener"><i>&ldquo;Adopting Bitcoin&rdquo;</i></a></strong> conference in El Salvador later this month, with the aim of putting some specific probabilities on countries&rsquo; likelihood of adopting Bitcoin as legal tender. (For those still making the argument that digital assets are a Ponzi scheme compared to military-backed Fiat, we note that long-term inflation-linked gilts are now down 79% from their peak, exceeding the peak-to-trough decline in the Bitcoin price. Fourteen major currencies have declined more than 20% vs. the dollar this year.)</p>
<p>Meanwhile, amidst the tailwinds of the weaker dollar in October, we noticed some meaningful examples of mainstream adoption of crypto payment rails in the month.</p>
<ul class="content-list">
<li><strong>Cash App</strong> users can send and receive payments in BTC via the Lightning Network. Previously, the app could only send on-chain BTC payments. (Currently, the feature is available across the U.S., except for New York State.)</li>
<li><strong>Visa</strong> filed several crypto-related trademarks, including one on October 22nd, that would clear the way for Visa&rsquo;s distinctive character mark to be used in software &ldquo;to view, store, monitor, trade, send, receive, transmit and exchange&rdquo; crypto assets and NFTs.</li>
<li><strong>Google</strong> introduced its new &lsquo;blockchain node engine&rsquo; business, which will offer a &ldquo;fully managed node-hosting service,&rdquo; starting with Ethereum; Coinbase was announced as the first major customer in a deal that will see Google accept crypto for some of its cloud computing clients.</li>
<li><strong>Western Union</strong> filed three trademark applications with the US Patent &amp; Trademark Office for cryptocurrency and digital-asset related activities, including management and maintenance of digital currency and electronic wallets, exchange operations, and issuance of &ldquo;tokens of value.&rdquo; A recent IMF report highlighted that the highest remittance fees are paid by the world&rsquo;s poorest citizens.</li>
<li><strong>Fidelity</strong> said it would hire 100 more people in its digital assets division, bringing the total headcount in the group to more than 500 by the end of Q1.</li>
<li><strong>Nubank</strong>, a Brazilian neo-bank listed in New York with a $23B market cap and Berkshire Hathaway as its 5th largest shareholder, announced plans to launch its own cryptocurrency early in 2023. &ldquo;Nucoin&rdquo; will be used as a &ldquo;new way to recognize customer loyalty and encourage engagement with Nubank products.&rdquo; Holders will receive discounts and other perks.</li>
<li><strong>MetaMask</strong>, the leading self-custody wallet with 30 million monthly users as of April 2022, added instant bank transfers according to its key backer ConsenSys. &ldquo;Instant ACH allows orders to complete in minutes instead of days like a standard ACH order and works on holidays, unlike regular ACH,&rdquo; ConsenSys said in introducing the new method. &ldquo;Instant ACH is more likely to work as paying with cards may be declined in 50% of purchases,&rdquo; according to the company.</li>
<li><strong>BNY Mellon</strong>, the nation&rsquo;s oldest bank, said it would begin receiving clients&rsquo; cryptocurrencies in October, becoming the first large US bank to safeguard digital assets alongside traditional investments on the same platform. The bank is using software developed with Fireblocks.</li>
</ul>
<div class="wrapped-div">
<table style="width: 750px;">
<tbody>
<tr class="tbl-data">
<td class="tbl-header last">Digital Asset</td>
<td class="tbl-header last" style="text-align: center;">Market Cap</td>
<td class="tbl-header last" style="text-align: center;">7 Days</td>
<td class="tbl-header last" style="text-align: center;">30 days</td>
<td class="tbl-header last" style="text-align: center;">90 days</td>
<td class="tbl-header last" style="text-align: center;">365 days</td>
</tr>
<tr class="tbl-data">
<td class="data-td last" style="font-weight: normal;">Bitcoin</td>
<td class="data-td data last">$396.1B</td>
<td class="data-td data last">1.9%</td>
<td class="data-td data last">4.5%</td>
<td class="data-td data last">-10.3%</td>
<td class="data-td data last">-66.4%</td>
</tr>
<tr class="tbl-data">
<td class="data-td last" style="font-weight: normal;">Ethereum</td>
<td class="data-td data last">$195.3B</td>
<td class="data-td data last">8.0%</td>
<td class="data-td data last">14.2%</td>
<td class="data-td data last">-2.4%</td>
<td class="data-td data last">-63.5%</td>
</tr>
<tr class="tbl-data">
<td class="tbl-header last" style="border-top: none;">Digital Asset Index</td>
<td class="tbl-header last" style="text-align: center; border-top: none;">Market Cap</td>
<td class="tbl-header last" style="text-align: center; border-top: none;">7 Days</td>
<td class="tbl-header last" style="text-align: center; border-top: none;">30 Days</td>
<td class="tbl-header last" style="text-align: center; border-top: none;">90 Days</td>
<td class="tbl-header last" style="text-align: center; border-top: none;">365 Days</td>
</tr>
<tr class="tbl-data">
<td class="data-td last" style="font-weight: normal;">MVIS<sup>&reg;</sup>&nbsp;CryptoCompare Decentralized Finance Leaders</td>
<td class="data-td data last">$8.7B</td>
<td class="data-td data last">3.44%</td>
<td class="data-td data last">6.00%</td>
<td class="data-td data last">-26.81%</td>
<td class="data-td data last">-78.10%</td>
</tr>
<tr class="tbl-data">
<td class="data-td last" style="font-weight: normal;">MarketVector&trade; Centralized Exchanges</td>
<td class="data-td data last">$57B</td>
<td class="data-td data last">13.40%</td>
<td class="data-td data last">13.20%</td>
<td class="data-td data last">5.40%</td>
<td class="data-td data last">-40.53%</td>
</tr>
<tr class="tbl-data">
<td class="data-td last" style="font-weight: normal;">MVIS<sup>&reg;</sup>&nbsp;CryptoCompare Infrastructure Application Leaders</td>
<td class="data-td data last">$17.9B</td>
<td class="data-td data last">1.06%</td>
<td class="data-td data last">8.00%</td>
<td class="data-td data last">-0.45%</td>
<td class="data-td data last">-74.98%</td>
</tr>
<tr class="tbl-data">
<td class="data-td last" style="font-weight: normal;">MVIS<sup>&reg;</sup>&nbsp;CryptoCompare Media &amp; Entertainment Leaders</td>
<td class="data-td data last">$6.1B</td>
<td class="data-td data last">6.20%</td>
<td class="data-td data last">-9.70%</td>
<td class="data-td data last">-27.20%</td>
<td class="data-td data last">-86.25%</td>
</tr>
<tr class="tbl-data">
<td class="data-td last" style="font-weight: normal;">MVIS<sup>&reg;</sup>&nbsp;CryptoCompare Smart Contract Leaders</td>
<td class="data-td data last">$253.7B</td>
<td class="data-td data last">7.24%</td>
<td class="data-td data last">4.20%</td>
<td class="data-td data last">-12.83%</td>
<td class="data-td data last">-77.14%</td>
</tr>
</tbody>
</table>
</div>
<br />
<p class="chart-disclosure">Source: Bloomberg, Messari, CryptoCompare, MVIS, VanEck research as of 10/31/2022.</p>
<p class="chart-disclosure"><strong>Past performance is not indicative of future results. Not a recommendation to buy or sell any of the names mentioned herein.</strong></p>
<h2>Smart Contract Platforms:</h2>
<p>The MVIS Smart Contract Leaders index rose 4% this month, with most of the gains happening in the last week. <strong>Ethereum</strong> led the sector, up 14%, largely due to short covering, as noted with the liquidation data above. As for fundamentals, despite continued lackluster volumes on-chain (<i>demand</i>), ETH <i>supply</i> has grown only +0.16% since the September migration to proof-of-stake, with negative supply growth in October. This compares to Bitcoin supply +1.7% and a 3.6% ETH inflation rate under the old proof-of-work algorithm. Defi (30%), NFTs (23%), MEV applications (2%), and layer 2s (2%) comprise the largest sources of the ~56,000 ($~84M) ETH gas fees burned in October. Interestingly, since the September merge, an increasing proportion of Ethereum outstanding has either been locked in smart contracts (DeFi, +$3b since the merge) or staked to the Beacon chain (+$1.3B). Ethereum available for sale on exchanges, conversely, has fallen by more than 1%, or $2.5B. In aggregate, Ethereum captured more than 75% of total fees paid for all space on all open-source blockchains in October, and has gained market share since the merge.</p>
<h3>Ethereum Supply</h3>
<p><img class="img-responsive w-100" src="https://www.vaneck.com/contentassets/a4ea1e3cc12148ee8a0a2b6e63039f12/scl_chart_03_v1_2022.11_blog.svg" alt="Ethereum Supply" /></p>
<p class="chart-disclosure">Source: Glassnode, as of 11/1/2022.</p>
<p>Among competing layer 1 protocols, October saw the launch of <strong>Aptos (APT)</strong>, the latest high-profile attempt to build a monolithic blockchain promising a better mix of speed &amp; cost than Ethereum. Founded by Avery Ching and Mo Shaik, who worked on Meta&rsquo;s Diem project. Aptos differentiates itself from competitors by using &ldquo;parallel execution&rdquo; and the Move language. Parallel execution allows for multiple, simultaneous transactions to execute at the same time, allowing&mdash;theoretically&mdash;for faster speed overall. However, there are some tradeoffs to this approach, notably seen in the performance of the similarly parallelized Solana blockchain, which has had several outages this year. One difference is that Aptos smart contracts are natively written in Move, a Rust-based language initially designed for the Diem project. Move prioritizes security and scalability and consistently ranks among developers&rsquo; favorite programming languages.</p>
<p>On the general topic of Layer 1 blockchains and whether the &lsquo;fat protocol thesis&rsquo; is still intact: despite the poor price performance this year of most crypto assets, developers continue to release meaningful upgrades to the open-source code of layer 1 protocols. This developer activity, which can be tracked using public github repositories, has increased year-to-date for every smart contract leader aside from Solana. Indeed, the ratio of developers working on these smart contract leaders, relative to those working on open-source blockchain protocols overall, has recently reached an all-time high, as seen in the below chart. We see this as an indication of consolidation amidst the crypto winter.</p>
<h3>Smart Contract Leaders are Taking Developer Mindshare</h3>
<p><img class="img-responsive w-100" src="https://www.vaneck.com/contentassets/a4ea1e3cc12148ee8a0a2b6e63039f12/scl_chart_01_v1_2022.11_blog.svg" alt="Smart Contract Leaders are Taking Developer Mindshare" /></p>
<p class="chart-disclosure">Source: Artemis, Santiment as of 9/25/22. Past performance is not indicative of future results.</p>
<h3>Smart Contract Activity Scores and Weekly Developers</h3>
<div class="wrapped-div">
<table style="width: 750px;">
<tbody>
<tr class="tbl-data">
<td class="tbl-header last" style="text-align: center;">&nbsp;</td>
<td class="tbl-header last" style="text-align: center;">Dev Activity Score</td>
<td class="tbl-header last" style="text-align: center;">YTD Growth</td>
<td class="tbl-header last" style="text-align: center;">Average Weekly Devs</td>
<td class="tbl-header last" style="text-align: center;">YTD Growth</td>
</tr>
<tr class="tbl-data">
<td class="data-td last" style="font-weight: normal;">Ethereum</td>
<td class="data-td data last">328</td>
<td class="data-td data last">289.98%</td>
<td class="data-td data last">244</td>
<td class="data-td data last">9.09%</td>
</tr>
<tr class="tbl-data">
<td class="data-td last" style="font-weight: normal;">Polkadot</td>
<td class="data-td data last">410</td>
<td class="data-td data last">222.72%</td>
<td class="data-td data last">320</td>
<td class="data-td data last">34.15%</td>
</tr>
<tr class="tbl-data">
<td class="data-td last" style="font-weight: normal;">Cosmos</td>
<td class="data-td data last">355</td>
<td class="data-td data last">1193.23%</td>
<td class="data-td data last">180</td>
<td class="data-td data last">50.00%</td>
</tr>
<tr class="tbl-data">
<td class="data-td last" style="font-weight: normal;">Cardano</td>
<td class="data-td data last">769</td>
<td class="data-td data last">864.16%</td>
<td class="data-td data last">329</td>
<td class="data-td data last">45.02%</td>
</tr>
<tr class="tbl-data">
<td class="data-td last" style="font-weight: normal;">Near</td>
<td class="data-td data last">173</td>
<td class="data-td data last">480.77%</td>
<td class="data-td data last">135</td>
<td class="data-td data last">38.14%</td>
</tr>
<tr class="tbl-data">
<td class="data-td last" style="font-weight: normal;">Tron</td>
<td class="data-td data last">21</td>
<td class="data-td data last">329.41%</td>
<td class="data-td data last">19</td>
<td class="data-td data last">318.18%</td>
</tr>
<tr class="tbl-data">
<td class="data-td last" style="font-weight: normal;">Avalanche</td>
<td class="data-td data last">138</td>
<td class="data-td data last">557.82%</td>
<td class="data-td data last">56</td>
<td class="data-td data last">52.94%</td>
</tr>
<tr class="tbl-data">
<td class="data-td last" style="font-weight: normal;">Solana</td>
<td class="data-td data last">183</td>
<td class="data-td data last">-58.09%</td>
<td class="data-td data last">130</td>
<td class="data-td data last">-82.15%</td>
</tr>
<tr class="tbl-data">
<td class="data-td last" style="font-weight: normal;">Algorand</td>
<td class="data-td data last">80</td>
<td class="data-td data last">14.96%</td>
<td class="data-td data last">70</td>
<td class="data-td data last">3.37%</td>
</tr>
<tr class="tbl-data">
<td class="data-td last" style="font-weight: normal;">Fantom</td>
<td class="data-td data last">6</td>
<td class="data-td data last">114.29%</td>
<td class="data-td data last">8</td>
<td class="data-td data last">-57.14%</td>
</tr>
</tbody>
</table>
</div>
<br />
<p class="chart-disclosure">Sources: Santiment, VanEck Research as of 10/30/2022. Past performance is not indicative of future results. Not a recommendation to buy or sell any of the names mentioned herein.</p>
<div class="wrapped-div">
<table style="width: 750px;">
<tbody>
<tr class="tbl-data">
<td class="tbl-header last" style="text-align: center;">&nbsp;</td>
<td class="tbl-header last" style="text-align: center;">Marketcap</td>
<td class="tbl-header last" style="text-align: center;">30 days</td>
<td class="tbl-header last" style="text-align: center;">365 days</td>
</tr>
<tr class="tbl-data">
<td class="data-td last" style="font-weight: normal;">Cosmos</td>
<td class="data-td data last">$3.99B</td>
<td class="data-td data last">17.30%</td>
<td class="data-td data last">-38.04%</td>
</tr>
<tr class="tbl-data">
<td class="data-td last" style="font-weight: normal;">Ethereum</td>
<td class="data-td data last">$195.26B</td>
<td class="data-td data last">14.3%</td>
<td class="data-td data last">-63.21%</td>
</tr>
<tr class="tbl-data">
<td class="data-td last" style="font-weight: normal;">Avalanche</td>
<td class="data-td data last">$5.45B</td>
<td class="data-td data last">12.92%</td>
<td class="data-td data last">-85.63%</td>
</tr>
<tr class="tbl-data">
<td class="data-td last" style="font-weight: normal;">Waves</td>
<td class="data-td data last">$0.39B</td>
<td class="data-td data last">-8.82%</td>
<td class="data-td data last">-88.59%</td>
</tr>
<tr class="tbl-data">
<td class="data-td last" style="font-weight: normal;">Internet Computer</td>
<td class="data-td data last">$1.44B</td>
<td class="data-td data last">-12.26%</td>
<td class="data-td data last">-75.40%</td>
</tr>
<tr class="tbl-data">
<td class="data-td last" style="font-weight: normal;">NEAR Protocol</td>
<td class="data-td data last">$2.54B</td>
<td class="data-td data last">-13.16%</td>
<td class="data-td data last">-89.17%</td>
</tr>
</tbody>
</table>
</div>
<br />
<p class="chart-disclosure">Source: Bloomberg, Messari, CryptoCompare, MVIS, VanEck research as of 10/31/2022.</p>
<p class="chart-disclosure"><strong>Past performance is not indicative of future results. Not a recommendation to buy or sell any of the names mentioned herein.</strong></p>
<h2>Infrastructure Applications:</h2>
<p>The MV Infrastructure Applications Leaders Index rose 10% in October, led by continued relative strength from Quant Network (+26%) and Polygon&rsquo;s MATIC token (+15%).</p>
<p><strong>Polygon </strong>launched its zkEVM (zero knowledge, Ethereum Virtual Machine) testnet on October 10th. ZkEVMs are a key part of Ethereum&rsquo;s scaling roadmap that improve throughput by transferring computation and state storage off-chain. ZK rollups submit transaction data to Ethereum along with zero-knowledge proofs, which verify the validity of off-chain transaction batches. Early ZK-rollups lacked the ability to execute smart contracts and were constrained to simple token swaps and payments. But, with the introduction of EVM-compatible zero-knowledge virtual machines, ZK-rollups are starting to support Ethereum dApps. Polygon&rsquo;s zkEVM testnet comes amidst heavy competition but few available token options. <strong>ZkSync</strong>, another contender in the zkEVM race, launched an updated version of their scaling solution that is EVM compatible, and has been promoted as the first-ever &ldquo;product-ready&rdquo; rollup with a zkEVM. However, public access will be limited until the end of the year, and there is no token yet.</p>
<p>Polygon also benefited from its partnership with <strong>Reddit</strong>, which introduced the second generation of its NFT avatars in October. Reddit whitelisted independent artists from within the Reddit community to create the avatars and paid a share of all primary and secondary sales to creators. The avatars can be used as profile pictures on the platform and give users access to new profile animations. Reddit&rsquo;s first generation of avatars was released in July and took a few weeks to sell out. Their second collection launched on October 21st and all 40k avatars were sold on the first day. The ability to own an avatar in a password-protected &ldquo;vault&rdquo; rather than a crypto wallet and <i>not</i> marketing the avatars as NFTs are two factors that led to the success of the collections. At the TechCrunch disrupt conference, Reddit chief product officer Pali Bhat revealed that users created more than 3 million Polygon-based Reddit Vault wallets to store their NFTs. The combined market cap of Reddit Avatars now exceeds $100M.</p>
<h3>Infrastructure Application Performance</h3>
<div class="wrapped-div">
<table style="width: 750px;">
<tbody>
<tr class="tbl-data">
<td class="tbl-header last" style="text-align: center;">&nbsp;</td>
<td class="tbl-header last" style="text-align: center;">Marketcap</td>
<td class="tbl-header last" style="text-align: center;">30 days</td>
<td class="tbl-header last" style="text-align: center;">365 days</td>
</tr>
<tr class="tbl-data">
<td class="data-td last" style="font-weight: normal;">Quant Network</td>
<td class="data-td data last">$2.04B</td>
<td class="data-td data last">25.78%</td>
<td class="data-td data last">-40.73%</td>
</tr>
<tr class="tbl-data">
<td class="data-td last" style="font-weight: normal;">Polygon</td>
<td class="data-td data last">$7.94B</td>
<td class="data-td data last">14.53%</td>
<td class="data-td data last">-54.02%</td>
</tr>
<tr class="tbl-data">
<td class="data-td last" style="font-weight: normal;">Arweave</td>
<td class="data-td data last">$0.52B</td>
<td class="data-td data last">12.62%</td>
<td class="data-td data last">-80.83%</td>
</tr>
<tr class="tbl-data">
<td class="data-td last" style="font-weight: normal;">Loopring</td>
<td class="data-td data last">$0.37B</td>
<td class="data-td data last">-6.65%</td>
<td class="data-td data last">-74.10%</td>
</tr>
<tr class="tbl-data">
<td class="data-td last" style="font-weight: normal;">The Graph</td>
<td class="data-td data last">$0.60B</td>
<td class="data-td data last">-14.36%</td>
<td class="data-td data last">-77.75%</td>
</tr>
<tr class="tbl-data">
<td class="data-td last" style="font-weight: normal;">Helium</td>
<td class="data-td data last">$0.53B</td>
<td class="data-td data last">-18.46%</td>
<td class="data-td data last">-86.13%</td>
</tr>
</tbody>
</table>
</div>
<br />
<p class="chart-disclosure">Source: Bloomberg, Messari, CryptoCompare, MVIS, VanEck research as of 10/31/2022.</p>
<p class="chart-disclosure"><strong>Past performance is not indicative of future results. Not a recommendation to buy or sell any of the names mentioned herein.</strong></p>
<h2>DeFi:</h2>
<p>The MV Decentralized Finance Leaders index rose 5.6% in October, with makerDao&rsquo;s MKR (+17%) Uniswap&rsquo;s UNI (+14%) and Aave (+16%) leading gains.</p>
<p><strong>MakerDAO </strong>is the largest defi protocol by TVL ($8.15 billion) and issuer of the DAI stablecoin, which has a $6.2 billion market cap. In October, MakerDAO members voted in favor of an &ldquo;endgame&rdquo; proposal by founder Rune Christensen, who wants to make the protocol more decentralized and resistant to censorship, such as the Tornado Cash sanctions. While the voting process itself was criticized for a lack of decentralization, as Christensen influenced 63% of the votes backing his proposal, it appears likely that MakerDao will vote to split into a number of MetaDAO clusters, each with its own governance token. The &ldquo;endgame&rdquo; also proposes that MakerDao begin to buy <strong>staked Ethereum (stETH)</strong> in order to build a balance sheet that can serve as collateral for a non-dollar-backed algorithmic stablecoin in the future. Note that the Endgame is a long-term gambit; in the short-term, MakerDao delegates recently voted to move $500M worth of DAI tokens into short-term US treasuries and corporate bonds, custodied by Swiss digital asset bank Sygnum, which will issue the funds into a portfolio of BlackRock ETFs. MakerDAO also voted in October to custody $1.6B with of the DAO&rsquo;s USDC coins with Coinbase in return for an annual 1.5% reward, another example of lines blurring between DeFi and real world assets.</p>
<p>In other DeFi news, <strong>Aave</strong> Companies, one of the contributors developing the Aave protocol, has released a technical paper on Aave&rsquo;s upcoming <strong>GHO stablecoin</strong>, along with the results of its first security audit. GHO is a decentralized, over-collateralized stablecoin that was proposed in July. Aave plans to stabilize GHO via algorithm and on-chain governance, depending on the different &ldquo;facilitators&rdquo; minting GHO and on the collateral pledged by borrowers, to set an appropriate rate. Facilitators refer to protocols or entities whitelisted by AAVE governance to mint and burn GHO tokens. Since Aave will employ an overcollateralization strategy, it will rely on arbitrage and monetary policy to stabilize GHO. When GHO is below $1, borrowers will be incentivized to purchase GHO at a discounted price and repay/liquidate, profiting on the difference. Conversely, when GHO is above $1, users are incentivized to borrow GHO and sell it on the market, repaying their loan once GHO stabilizes and profiting from the difference. Because GHO is minted via borrowing on the protocol, GHO cannot be used as an asset on the supply (lending) side. Also, the borrow interest rate will not dynamically adjust by the usual supply and demand mechanics. Instead, Aave Governance will set the GHO interest rate, adjusting the borrow interest rate and the discount rate depending on the collateral pledged in order to expand or contract the GHO supply. GHO is designed to accrue interest when supplied to a liquidity protocol.</p>
<p>GHO will have a lot of ground to cover in order to gain market share over its established competitors like Dai. However, Aave&rsquo;s position as the largest DeFi protocol could help accelerate the growth of GHO&rsquo;s demand and turbocharge the security and decentralization of AAVE since stkAave holders can mint GHO at a reduced interest rate. GHO&rsquo;s first facilitator, the Aave Protocol, will initially allow users to mint GHO using deposited assets on its lending market. This may limit the amount of GHO that can be minted due to overcollateralization requirements. But, once GHO has shown to be stable and having sufficient demand, minting could potentially be carried out using delta neutral positions, real-world assets (RWAs), or automated market operations (AMOs), whether by the Aave Protocol itself or by another facilitator. We look forward to talking with Aave founder Stani Kuchelov at a VanEck event in London on November 9th.</p>
<p>Lastly, in DeFi, <strong>Mango Markets (MNGO)</strong>, a decentralized finance platform hosted on the Solana blockchain, was exploited for over $100 million by DeFi trader Avraham Eisenberg, who called the attack &ldquo;a highly profitable trading strategy.&rdquo; The gambit was enabled by Eisenberg&rsquo;s manipulating the price of the native MNGO token threefold higher on an illiquid venue and then taking out a $116M loan, leaving Mango&rsquo;s treasury with a negative balance. Eisenberg later negotiated a settlement with Mango leadership which enabled depositors to be made whole while Eisenberg kept $47M. The attack raises legal and ethical questions about whether market participants need to consider the intentions of the code-writers and not just the code itself. Blockchain analytics firm Peckshield estimated 44 exploits grabbed $760M in &lsquo;stolen funds&rsquo; in October, a record, bringing the YTD total to $3B, double last year&rsquo;s sumIn a poll on Twitter, podcaster Laura Shin asked, &ldquo;Is code law?&rdquo;: 44% of the respondents voted &ldquo;hell yeah&rdquo; vs. 56%, &ldquo;hell no.&rdquo; In the wake of the Mango Markets attack, Solana&rsquo;s TVL dropped 23% to $997 million from $1.32 billion.</p>
<div class="wrapped-div">
<table style="width: 750px;">
<tbody>
<tr class="tbl-data">
<td class="tbl-header last" style="text-align: center;">&nbsp;</td>
<td class="tbl-header last" style="text-align: center;">Marketcap</td>
<td class="tbl-header last" style="text-align: center;">30 days</td>
<td class="tbl-header last" style="text-align: center;">365 days</td>
</tr>
<tr class="tbl-data">
<td class="data-td last" style="font-weight: normal;">Maker</td>
<td class="data-td data last">$0.89B</td>
<td class="data-td data last">16.62%</td>
<td class="data-td data last">-64.04%</td>
</tr>
<tr class="tbl-data">
<td class="data-td last" style="font-weight: normal;">Aave</td>
<td class="data-td data last">$1.19B</td>
<td class="data-td data last">15.95%</td>
<td class="data-td data last">-73.97%</td>
</tr>
<tr class="tbl-data">
<td class="data-td last" style="font-weight: normal;">Uniswap</td>
<td class="data-td data last">$5.21B</td>
<td class="data-td data last">13.98%</td>
<td class="data-td data last">-72.19%</td>
</tr>
<tr class="tbl-data">
<td class="data-td last" style="font-weight: normal;">Curve</td>
<td class="data-td data last">$0.51B</td>
<td class="data-td data last">3.68%</td>
<td class="data-td data last">-80.11%</td>
</tr>
<tr class="tbl-data">
<td class="data-td last" style="font-weight: normal;">PancakeSwap</td>
<td class="data-td data last">$0.68B</td>
<td class="data-td data last">0.61%</td>
<td class="data-td data last">-75.06%</td>
</tr>
<tr class="tbl-data">
<td class="data-td last" style="font-weight: normal;">Compound</td>
<td class="data-td data last">$0.35B</td>
<td class="data-td data last">-18.77%</td>
<td class="data-td data last">-86.67%</td>
</tr>
</tbody>
</table>
</div>
<br />
<p class="chart-disclosure">Source: Bloomberg, Messari, CryptoCompare, MVIS, VanEck research as of 10/31/2022.</p>
<p class="chart-disclosure"><strong>Past performance is not indicative of future results. Not a recommendation to buy or sell any of the names mentioned herein.</strong></p>
<h2>Metaverse:</h2>
<p>October metaverse land sales reversed lower after a positive September. Aggregate land value fell 8% in October, with APE&rsquo;s <strong>Otherside</strong> continuing to command the highest average sale price of 3.5 ETH, down from the 4.5 ETH it averaged at the start of the month. <strong>Decentraland</strong> and <strong>NFT</strong> <strong>Worlds</strong> were the only metaverses that saw increases in volume (11.6% and 4.8%, respectively) over the past 30 days. Recent news articles have highlighted the lack of users in Decentraland specifically, something the platform hopes to turn around in November with their Metaverse Music Festival from the 10th-13th. These platforms continue to explore product market fit with regard to curated experiences.</p>
<p>NFT trading volume across major blockchains was mixed this month, with only <strong>ImmutableX</strong>,<strong> Polygon</strong>, and <strong>Avalanche</strong> seeing increases in trading volume of 107%, 44%, and 30%, respectively. NFT trading on ImmutableX was mainly driven by their genesis game,<strong> Gods Unchained</strong>, which accounted for over 90% of the $21.4 million of volume. ImmutableX also announced mid-month that they would reward NFT traders up to 100k IMX tokens per day to incentivize activity on the network. The increase of NFT volume on Polygon was largely a result of the popularity of Reddit&rsquo;s Collectible Avatar NFTs discussed above. Avalanche&rsquo;s NFT trading growth was supported by OpenSea integrating Avalanche NFTs in its marketplace and the launch of an NFT farming game, <strong>Chikn Farm</strong>. Despite these developments, the NFT volume on Avalanche was still less than 1% of the total NFT volume over the last 30 days. Solana experienced the largest decline, with NFT trading volume falling by 39%.</p>
<h3>Blockchain Share of Monthly NFT Volume</h3>
<p><img class="img-responsive w-100" src="https://www.vaneck.com/contentassets/a4ea1e3cc12148ee8a0a2b6e63039f12/scl_chart_02_v1_2022.11_blog.svg" alt="Blockchain Share of Monthly NFT Volume" /></p>
<p class="chart-disclosure">Source: Cryptoslam, VanEck as of 10/31/2022. Past performance is not indicative of future results. Not a recommendation to buy or sell any of the names mentioned herein.</p>
<div class="wrapped-div">
<table style="width: 750px;">
<tbody>
<tr class="tbl-data">
<td class="tbl-header last" style="text-align: center;">&nbsp;</td>
<td class="tbl-header last" style="text-align: center;">Marketcap</td>
<td class="tbl-header last" style="text-align: center;">30 days</td>
<td class="tbl-header last" style="text-align: center;">365 days</td>
</tr>
<tr class="tbl-data">
<td class="data-td last" style="font-weight: normal;">Sandbox</td>
<td class="data-td data last">$1.31B</td>
<td class="data-td data last">5.98%</td>
<td class="data-td data last">-59.12%</td>
</tr>
<tr class="tbl-data">
<td class="data-td last" style="font-weight: normal;">Chilliz</td>
<td class="data-td data last">$1.21B</td>
<td class="data-td data last">5.03%</td>
<td class="data-td data last">-49.82%</td>
</tr>
<tr class="tbl-data">
<td class="data-td last" style="font-weight: normal;">Audius</td>
<td class="data-td data last">$0.19B</td>
<td class="data-td data last">1.88%</td>
<td class="data-td data last">-90.78%</td>
</tr>
<tr class="tbl-data">
<td class="data-td last" style="font-weight: normal;">Basic Attention Token</td>
<td class="data-td data last">$0.45B</td>
<td class="data-td data last">1.34%</td>
<td class="data-td data last">-71.11%</td>
</tr>
<tr class="tbl-data">
<td class="data-td last" style="font-weight: normal;">Decentraland</td>
<td class="data-td data last">$1.25B</td>
<td class="data-td data last">-4.49%</td>
<td class="data-td data last">-78.60%</td>
</tr>
<tr class="tbl-data">
<td class="data-td last" style="font-weight: normal;">Axie Infinity</td>
<td class="data-td data last">$0.96B</td>
<td class="data-td data last">-24.88%</td>
<td class="data-td data last">-93.34%</td>
</tr>
</tbody>
</table>
</div>
<br />
<p class="chart-disclosure">Source: Bloomberg, Messari, CryptoCompare, MVIS, VanEck research as of 10/31/2022.</p>
<p class="chart-disclosure"><strong>Past performance is not indicative of future results. Not a recommendation to buy or sell any of the names mentioned herein.</strong></p>
<h2>Centralized Exchanges:</h2>
<p>Centralized exchange tokens continue to perform well, up 6% in October, with low volatility thanks to <strong>FTX </strong>and <strong>BNB</strong>&rsquo;s continued market share gains and attractive buy-back-and-burn tokenomics. In September, Coinbase spot trading volumes fell 18% to the lowest levels since January 2021, while competitors OKX, Binance, and FTX saw their spot volumes rise 24%, 8%, and 5%, respectively.</p>
<p>Meanwhile <strong>Huobi token (HT)</strong> paced sector gains +106% in October after HK-based About Capital announced plans to buy a majority stake in the 8th largest exchange globally. While the transaction of an undisclosed amount crowns About Capital as Huobi&rsquo;s new controlling shareholder, the exchange stated that core operations and the existing management team would remain unchanged. Justin Sun, the Tron co-founder and reportedly a major investor in About Capital, also announced he would be joining Huobi&rsquo;s global advisory board, prompting the Sun&rsquo;s Tron (TRX) token to outperform most layer 1s in the month.</p>
<div class="wrapped-div">
<table style="width: 750px;">
<tbody>
<tr class="tbl-data">
<td class="tbl-header last" style="text-align: center;">&nbsp;</td>
<td class="tbl-header last" style="text-align: center;">Marketcap</td>
<td class="tbl-header last" style="text-align: center;">30 days</td>
<td class="tbl-header last" style="text-align: center;">365 days</td>
</tr>
<tr class="tbl-data">
<td class="data-td last" style="font-weight: normal;">Huobi Token</td>
<td class="data-td data last">$1.39B</td>
<td class="data-td data last">105.81%</td>
<td class="data-td data last">-7.73%</td>
</tr>
<tr class="tbl-data">
<td class="data-td last" style="font-weight: normal;">KuCoin</td>
<td class="data-td data last">$0.97B</td>
<td class="data-td data last">10.22%</td>
<td class="data-td data last">-42.63%</td>
</tr>
<tr class="tbl-data">
<td class="data-td last" style="font-weight: normal;">OKB</td>
<td class="data-td data last">$0.96B</td>
<td class="data-td data last">4.32%</td>
<td class="data-td data last">-33.69%</td>
</tr>
<tr class="tbl-data">
<td class="data-td last" style="font-weight: normal;">BNB</td>
<td class="data-td data last">$45.92B</td>
<td class="data-td data last">4.17%</td>
<td class="data-td data last">-39.83%</td>
</tr>
<tr class="tbl-data">
<td class="data-td last" style="font-weight: normal;">FTX Token</td>
<td class="data-td data last">$3.27B</td>
<td class="data-td data last">1.19%</td>
<td class="data-td data last">-60.96%</td>
</tr>
<tr class="tbl-data">
<td class="data-td last" style="font-weight: normal;">Cronos</td>
<td class="data-td data last">$2.82B</td>
<td class="data-td data last">-3.56%</td>
<td class="data-td data last">-45.10%</td>
</tr>
</tbody>
</table>
</div>
<br />
<p class="chart-disclosure">Source: Bloomberg, Messari, CryptoCompare, MVIS, VanEck research as of 10/31/2022.</p>
<p class="chart-disclosure"><strong>Past performance is not indicative of future results. Not a recommendation to buy or sell any of the names mentioned herein.</strong></p>
<p>To receive more <strong><a href="https://www.vaneck.com/us/en/insights/digital-assets/" title="Digital Assets Insights">Digital Assets</a></strong> insights, <strong><a href="https://www.vaneck.com/us/en/subscribe/" title="Subscription Center">sign up in our subscription center</a></strong>.</p>
<style type="text/css">
    .wrapped-div {
        max-width: 100%;
    }

    @media (max-width: 1240px) {
        .wrapped-div {
            overflow-x: scroll;
        }


    }
</style>
]]></content:encoded>
</item><item rdf:about="https://www.vaneck.com/us/en/blogs/economic-trends/softer-landing-are-we-there-yet/">
  <title>Softer Landing – Are We There Yet?></title>
  <link>https://www.vaneck.com/us/en/blogs/economic-trends/softer-landing-are-we-there-yet/</link>
  <description><![CDATA[The China reopening buzz is moving the markets this morning. What does it mean for the global growth prospects, EM policy space, and China&rsquo;s huge current account surpluses?]]></description>
  <dc:creator>Natalia  Gurushina</dc:creator>
  <dc:date>11/04/2022 06:30:00</dc:date>
<content:encoded><![CDATA[

<h2>China Reopening</h2>
<p>The <strong>China reopening drumbeat is getting stronger this morning</strong>, easing - together with a huge jobs number in the U.S. (261K in October) - some concerns about a global hard landing. The Chinese renminbi was up by 152bps against the U.S. Dollar &ndash; a relatively big daily move for the currency &ndash; and China&rsquo;s major equity indices also posted nice gains. The fact that the U.S. labor market remains relatively healthy justifies the U.S. Federal Reserve (Fed) Chairman&rsquo;s hawkish &ldquo;performance&rdquo; at the press conference earlier this week. A circa 30% probability of a larger 75bps Fed hike in December (implied by the Fed Funds Futures) and the higher 5.2% U.S. peak rate do not look completely out of line either against such labor market backdrop.</p>
<h2>EM Inflation Outlook</h2>
<p>This setup (especially any growth upside) <strong>could make it a bit easier for some emerging markets (EMs) to continue aggressive tightening</strong> and even accelerate the pace of rate hikes. One of these EMs is the Philippines, where inflation surprised massively to the upside this morning. Headline prices accelerated by 7.7% year-on-year in October, and this means that a 75bps hike in the middle of November is pretty much a done deal. The Philippines tightened less than the Fed in the current cycle (225bps vs. Fed&rsquo;s 375bps), bringing the policy rate differential between the two countries to a multi-year low. The deflated policy cushion is simply not enough for the country, which is expected to run a 10% of GDP &ldquo;twin&rdquo; deficit (a combo of the fiscal and current account gaps) next year. These challenges help to explain why the Philippine local bonds are in the bottom half of the EM total return &ldquo;league table&rdquo; (J.P. Morgan&rsquo;s GBI-EM Index) so far this year.</p>
<h2>China External Surpluses</h2>
<p>Circling back to <strong>China</strong>, the recent growth challenges helped to propel the <strong>current account surplus to another historic high in Q3</strong> (see chart below). If the reopening indeed happens, the surplus would be expected to go down due to a rebound in imports. However, the reopening might also bring back capital inflows (especially portfolio) &ndash; an important offsetting factor for the overall balance of payments, as well as for the currency. Stay tuned!</p>
<h3>Chart at a Glance: China Current Account Surplus - Another Historic High</h3>
<p><img class="img-responsive w-100" src="https://www.vaneck.com/contentassets/d81e7f9c66a0401d83e390c3cec549bd/us-emerging-markets-daily-2022-11-04.png" alt="Chart at a Glance: China Current Account Surplus - Another Historic High" /></p>
<p class="chart-disclosure">Source: Bloomberg LP.</p>
]]></content:encoded>
</item><item rdf:about="https://www.vaneck.com/us/en/blogs/economic-trends/global-rates-no-pause-for-you/">
  <title>Global Rates – No Pause For You?></title>
  <link>https://www.vaneck.com/us/en/blogs/economic-trends/global-rates-no-pause-for-you/</link>
  <description><![CDATA[DM hawks are back, but the range is policy signals in EM is much wider, with more central banks contemplating an exit from their tightening cycles.]]></description>
  <dc:creator>Natalia  Gurushina</dc:creator>
  <dc:date>11/03/2022 15:00:00</dc:date>
<content:encoded><![CDATA[

<h2>Global Tightening Cycles</h2>
<p><strong>Developed markets (DM) doves are backing off for now</strong>, following yesterday&rsquo;s 75bps hike by the U.S. Federal Reserve (Fed) and Chairman Powell&rsquo;s &ldquo;I am the boss&rdquo; press conference, which scared the daylights out of many risky assets. The Fed Funds Futures effectively added one more 25bps rate hike in 2023, bringing the expected terminal rate to 5.16%. The European Central Bank (ECB) terminal rate expectations moved above 3%. Several ECB speakers said today that hikes should not be affected by political noise and that the policy rate should rise much higher.</p>
<h2>EM Asia Inflation Pressures</h2>
<p>Against this backdrop, today&rsquo;s&nbsp;<strong>off-cycle central bank meeting in India raised concerns</strong>&nbsp;that there will be another emergency rate hike there. But it turned out that the central bank simply wanted (was asked?) to explain to the government why it missed the inflation target for three quarters in a row. A larger rate hike, however, seems imminent in the Philippines. The central bank signaled once again that it might raise its policy rate by 75bps on November 17 &ndash; moving in step with the Fed &ndash; due to inflation concerns (the October print is out this evening). Unlike the Philippines, central banks in Indonesia and Malaysia might have more policy room for the dovish pivot. The Bank Indonesia pointed out that the second round of inflationary effects was not as strong as initially feared. The central bank of Malaysia stated that it was not on a &ldquo;pre-set course&rdquo; after today&rsquo;s expected 25bps rate hike.</p>
<h2>EM Peak Rates</h2>
<p>The &ldquo;data dependent&rdquo; argument was also made by the governor of the Peruvian central bank, inviting suggestions that it might stay on hold already next week, joining Brazil and (maybe) Chile.&nbsp;<strong>While LATAM is contemplating exits from the tightening cycles, most of EMEA is already there</strong>&nbsp;(see chart below). The region now has only two active &ldquo;hikers&rdquo; &ndash; South Africa and Hungary (shadow hikes) &ndash; and today&rsquo;s &ldquo;on hold&rdquo; decision by the Czech national bank confirmed the status quo. The next important milestone for the region is Poland&rsquo;s rate-setting meeting. The central bank surprised the markets by keeping the policy rate unchanged in September. Still, inflation accelerated more than expected last month, and the market continues to price in more hikes on a 12-month horizon. Stay tuned!</p>
<h3>Chart at a Glance: EMEA Doves Come in Droves</h3>
<img class="img-responsive w-100" src="https://www.vaneck.com/contentassets/7232a0d358b248aeaa3ba0f2d0a50a2e/us-emerging-markets-daily-2022-11-03.png" alt="Chart at a Glance: EMEA Doves Come in Droves" />
<p class="chart-disclosure">Source: VanEck Research; Bloomberg LP</p>
<div class="disclosure">
<p>*Hungary&rsquo;s official policy rate is on hold, but there is massive shadow tightening</p>
<p>**Romania hiked, but indicated that this is likely to be the last hike</p>
</div>
]]></content:encoded>
</item><item rdf:about="https://www.vaneck.com/us/en/blogs/municipal-bonds/muni-investors-top-4-reality-checks/">
  <title>Muni Investors: Top 4 Reality Checks></title>
  <link>https://www.vaneck.com/us/en/blogs/municipal-bonds/muni-investors-top-4-reality-checks/</link>
  <description><![CDATA[Yields, the market for returns in fixed income, are now higher for Municipals than at any time in the past 15 years. We believe the performance opportunity can be meaningful.]]></description>
  <dc:creator>James Colby</dc:creator>
  <dc:date>11/03/2022 06:30:00</dc:date>
<content:encoded><![CDATA[

<p>Here we are in Q4 of 2022, racing toward the end of one of the most difficult years &ndash; in recent history &ndash; for fixed income investors. We are not alone in expressing this view. But, we are also aware that while it might be the &ldquo;darkest before the dawn&rdquo; scenario, we need not rely on old saws to create a reality check for evaluating opportunities. Dawn will likely come before we realize it, so let&rsquo;s look at 4 reality checks regarding the municipal market to ease possible investor concerns.</p>
<h2>Reality #1</h2>
<p>As with all fixed income, municipal bonds are influenced by interest rate decisions and guidance by the Federal Reserve (the Fed). As the Fed moves to combat inflation, interest rates rise, and the municipal market follows.</p>
<h2>Reality #2</h2>
<p>Yes, valuations have sunk, but if you do not sell, you do not experience a loss. The lower value is linked to the increase in rates (interest rate risk) and not a general decline in credit quality (credit risk) in the Municipal market, so there is likely no urgency to sell blindly.</p>
<h2>Reality #3</h2>
<p>Yields, the marker for returns in fixed income, are now higher for Municipals than at any time in the past 15 years. The performance opportunity can be meaningful.</p>
<h2>Reality #4</h2>
<p>Since 1965, a down year in the municipal market has been followed by at least one year (or several) of positive returns<sup>1</sup>.</p>
<p>As the Fed&rsquo;s behavior adds volatility to the municipal market, we believe the long-term prospects remain steady. The eventual return of municipal market performance is likely indisputable; the only question is when. While we await dawn, the realities above keep us warm.</p>
<p>VanEck offers eight municipal bond strategies for a wide variety of investors.</p>
<div class="wrapped-div">
<table style="width: 100%;">
<tbody>
<tr class="tbl-data">
<td class="tbl-header last" style="text-align: left;">Investment</td>
<td class="tbl-header last">Ticker</td>
<td class="tbl-header last">Closing Price</td>
<td class="tbl-header last">YTD Total Return</td>
<td class="tbl-header last">30-Day Yield</td>
<td class="tbl-header last">Assets (mil)</td>
</tr>
<tr class="tbl-data">
<td class="data-td data last" style="text-align: left;">VanEck CEF Muni Income ETF</td>
<td class="data-td data last">XMPT</td>
<td class="data-td data last">$19.94</td>
<td class="data-td data last">-30.03%</td>
<td class="data-td data last">5.86%</td>
<td class="data-td data last">$131</td>
</tr>
<tr class="tbl-data">
<td class="data-td data last" style="text-align: left;">VanEck High Yield Muni ETF</td>
<td class="data-td data last">HYD</td>
<td class="data-td data last">$48.99</td>
<td class="data-td data last">-19.26%</td>
<td class="data-td data last">4.91%</td>
<td class="data-td data last">$2600</td>
</tr>
<tr class="tbl-data">
<td class="data-td data last" style="text-align: left;">VanEck Long Muni ETF</td>
<td class="data-td data last">MLN</td>
<td class="data-td data last">$16.35</td>
<td class="data-td data last">-23.15%</td>
<td class="data-td data last">4.33%</td>
<td class="data-td data last">$206</td>
</tr>
<tr class="tbl-data">
<td class="data-td data last" style="text-align: left;">VanEck Short High Yield Muni ETF</td>
<td class="data-td data last">SHYD</td>
<td class="data-td data last">$21.66</td>
<td class="data-td data last">-11.82%</td>
<td class="data-td data last">4.21%</td>
<td class="data-td data last">$405</td>
</tr>
<tr class="tbl-data">
<td class="data-td data last" style="text-align: left;">VanEck Intermediate Muni ETF</td>
<td class="data-td data last">ITM</td>
<td class="data-td data last">$43.55</td>
<td class="data-td data last">-14.01%</td>
<td class="data-td data last">3.52%</td>
<td class="data-td data last">$1600</td>
</tr>
<tr class="tbl-data">
<td class="data-td data last" style="text-align: left;">VanEck Short Muni ETF</td>
<td class="data-td data last">SMB</td>
<td class="data-td data last">$16.60</td>
<td class="data-td data last">-6.21%</td>
<td class="data-td data last">3.05%</td>
<td class="data-td data last">$333</td>
</tr>
</tbody>
</table>
</div>
<br />
<p class="chart-disclosure">Source: VanEck. As of 10/28/22. The performance data quoted represents past performance. Past performance is not a guarantee of future results. Please <a href="https://www.vaneck.com/us/en/etf-mutual-fund-finder/etfs/?InvType=etf&amp;AssetClass=mb&amp;Funds=emf,esf,grf,iigf,mwmf,emlf,embf,ccif&amp;ShareClass=a,c,i,y,z&amp;tab=perf&amp;Sort=name&amp;SortDesc=true" title="ETF and Mutual Fund Finder"><strong>click here</strong></a> for standardized performance current to the most recent quarter ended.</p>
<p><strong>Explore our Muni ETFs <a href="https://www.vaneck.com/us/en/etf-mutual-fund-finder/etfs/?InvType=etf&amp;AssetClass=mb&amp;Funds=emf,esf,grf,iigf,mwmf,emlf,embf,ccif&amp;ShareClass=a,c,i,y,z&amp;tab=perf&amp;Sort=name&amp;SortDesc=true" title="ETF and Mutual Fund Finder">here</a>.</strong></p>
<p>To receive more <a href="/us/en/insights/municipal-bonds/" title="Municipal Bonds Insights"><strong>Municipal Bonds</strong></a> insights, <a href="https://www.vaneck.com/us/en/subscribe/" title="Subscription Center"><strong>sign up in our subscription center</strong></a>.</p>
<style type="text/css">
    .wrapped-div {
        max-width: 100%;
    }

    @media (max-width: 1240px) {
        .wrapped-div {
            overflow-x: scroll;
        }
    }

    .wrapped-div-sector {
        max-width: 100%;
        overflow-x: scroll;
    }
</style>
]]></content:encoded>
</item><item rdf:about="https://www.vaneck.com/us/en/blogs/economic-trends/evaluating-pivot-prospects/">
  <title>Evaluating Pivot Prospects></title>
  <link>https://www.vaneck.com/us/en/blogs/economic-trends/evaluating-pivot-prospects/</link>
  <description><![CDATA[The U.S. Federal Reserve&rsquo;s meeting will be closely watched in EM, and subsequent EM inflation releases can introduce additional corrections to central banks&rsquo; response functions.]]></description>
  <dc:creator>Natalia  Gurushina</dc:creator>
  <dc:date>11/02/2022 14:30:00</dc:date>
<content:encoded><![CDATA[

<h2>Fed Policy Pivot</h2>
<p>The U.S. Federal Reserve (Fed) is set to announce its verdict in the afternoon. <strong>The expectation is that the Fed will signal a slower pace of hikes after today&rsquo;s +75bps move </strong>(which is fully priced in), ending the current tightening cycle at around 5% in Q1-2023 - with policy space provided by slowing growth and moderating inflation. The outcome of the Fed&rsquo;s meeting will be important for EM (emerging markets) assets. The &ldquo;risk-free rate&rdquo; portion has been deducted from EM sovereign debt&rsquo;s total return so far this quarter (see chart below). Still, in the past week or so, it started to show signs of life &ndash; especially in longer duration &ndash; and the markets are cautiously optimistic.</p>
<h2>EM Asia Inflation Trends</h2>
<p>In local debt, we keep an eye on <strong>a big inflation data dump in EM </strong>in the coming days because it <strong>might introduce corrections both in central banks&rsquo; response functions</strong> and, possibly, EM bonds performance. The price dynamics in EM Asia are of particular interest because the latest numbers support the peak inflation narrative in several countries (including yesterday&rsquo;s release in South Korea). Disinflation is also expected to gain momentum in Thailand, easing pressure on the central bank, which has been a latecomer to the global tightening cycle. The Philippine inflation is not yet peaking, though &ndash; annual headline inflation is expected to rise to 7.1%. The central bank is ready to accelerate the pace of hikes, if upside surprises persist.</p>
<h2>LATAM Peak Rates</h2>
<p><strong>Any changes in the Fed&rsquo;s policy stance will be closely watched in LATAM</strong>. The market expectations for Mexico&rsquo;s terminal rate have followed the Fed&rsquo;s closely in the past couple of months. Mexico&rsquo;s inflation is still red hot, but the latest bi-weekly print showed a tentative peak &ndash; could it be a fundamental reason for the Mexican dovish policy pivot? We&rsquo;ll see next week. Peru&rsquo;s inflation was much lower than expected in October, which raises the possibility of a pause at the central bank&rsquo;s meeting on November 10. Colombia is in a tough spot &ndash; October&rsquo;s inflation might exceed 12% year-on-year, adding to concerns about the central bank&rsquo;s ability to slow rate hikes safely, especially against the backdrop of some questionable policy initiatives (such as a pension reform proposal). Stay tuned!</p>
<h3>Chart at a Glance: EM Debt Total Return, Duration, and &ldquo;Risk-Free Rates&rdquo;</h3>
<p><img class="img-responsive w-100" src="https://www.vaneck.com/contentassets/da3ec1cfc5e24dc395dce658b8dba49a/us-emerging-markets-daily-2022-11-02.png" alt="Chart at a Glance: EM Debt Total Return, Duration, and 'Risk-Free Rates'" /></p>
<p class="chart-disclosure">Source: Bloomberg LP.</p>
]]></content:encoded>
</item><item rdf:about="https://www.vaneck.com/us/en/blogs/economic-trends/em-disinflation-another-success-story/">
  <title>EM Disinflation – Another Success Story?></title>
  <link>https://www.vaneck.com/us/en/blogs/economic-trends/em-disinflation-another-success-story/</link>
  <description><![CDATA[Brazil might be EM&rsquo;s poster kid for disinflation, but EM Asia might be the next disinflation success story.]]></description>
  <dc:creator>Natalia  Gurushina</dc:creator>
  <dc:date>11/01/2022 15:00:00</dc:date>
<content:encoded><![CDATA[

<h2>Global Peak Inflation</h2>
<p>We continue to get upside inflation surprises across the globe, but <strong>the peak inflation drumbeat is getting stronger</strong>. The disinflation poster kid in emerging markets (EM) is, undoubtedly, Brazil &ndash; headline inflation is now in single digits, and, importantly, the price diffusion index is also getting lower (=price pressures are not as widespread as before). Still, the central bank minutes made it very clear that irresponsible fiscal policy may affect inflation and risk premia and that the board would not hesitate to hike again if something goes wrong with the disinflation process. This is a reminder that President-elect Luiz In&aacute;cio Lula da Silva (Lula) should think twice before making any dramatic populist policy U-turns. It would also be nice for the outgoing president Jair Bolsonaro to finally concede so that we all can move on &ndash; but this is a separate story.</p>
<h2>EM Asia Prices And Growth</h2>
<p>We also watch very intently inflation developments in <strong>EM Asia, which might be able to escape the high inflation curse that plagued most of EMEA and LATAM</strong> in the past year and a half. A nascent inflation peak in South Korea should probably survive a small expected uptick in October (out this evening). Today&rsquo;s inflation print in Indonesia also looked promising &ndash; outright headline disinflation and lower-than-expected core prices. If regional prices start moderating at levels well below EM Europe/LATAM (see chart below), this might give central banks more policy room to deal with multiplying growth headwinds. Note that the activity gauges (Purchasing Managers Indices, or PMIs) in South Korea, Malaysia, and Thailand remained in the contraction zone in October.</p>
<h2>EM Growth Cliff</h2>
<p>The <strong>collapse of manufacturing PMIs in Central Europe</strong> raises a question about the eventual impact of the growth cliff on regional prices. Right now, ~20% inflation in the region is the new &ldquo;10%&rdquo; (see chart below) due to the impact of the Russia/Ukraine war on supply chains and energy/commodity prices. But the manufacturing PMI in the Czech Republic is rapidly approaching the COVID levels (it dropped to 41.7 in October), and we are bracing ourselves for tomorrow&rsquo;s PMI releases in Hungary and Poland. The Czech national bank is meeting on Thursday &ndash; and we&rsquo;ll see how the growth outlook factors into its policy rate decisions. The consensus expectation is that the pause will be extended at 7%, despite 18% annual headline inflation. Stay tuned!</p>
<h3>Chart at a Glance: Inflation in EM Regions &ndash; Very Different Patterns</h3>
<p><img class="img-responsive w-100" src="https://www.vaneck.com/contentassets/51b6e6befc12479780ba422db1b921d4/us-emerging-markets-daily-2022-11-01.png" alt="Chart at a Glance: Inflation in EM Regions - Very Different Patterns" /></p>
<p class="chart-disclosure">Source: VanEck Research; Bloomberg LP.</p>
]]></content:encoded>
</item><item rdf:about="https://www.vaneck.com/us/en/blogs/economic-trends/chinas-growth-slump-for-how-much-longer/">
  <title>China’s Growth Slump – For How Much Longer?></title>
  <link>https://www.vaneck.com/us/en/blogs/economic-trends/chinas-growth-slump-for-how-much-longer/</link>
  <description><![CDATA[China&rsquo;s activity surveys point to a weak start to Q4. Can further easing change the growth trajectory if the zero-COVID policy remains in place?]]></description>
  <dc:creator>Natalia  Gurushina</dc:creator>
  <dc:date>10/31/2022 15:00:00</dc:date>
<content:encoded><![CDATA[

<h2>China Growth Outlook</h2>
<p><strong>China&rsquo;s upside growth surprises do not seem to last</strong>. A better-than-expected Q3 GDP print was swiftly followed by the disappointing October activity gauges, most of which ended up in the contraction zone (see chart below). This particular downside surprise was probably not completely unexpected, given that we are dealing with the same set of underlying reasons, including the zero-COVID policy (note that the survey was taken before the latest round of lockdowns) and the housing sector disruptions. The question is what authorities are going to do about it, given (a) that China had already used a lot of policy space (especially on the fiscal side) and (b) that we saw a re-arrangement of priorities during the 20th congress of the communist party (CPC), with security and social stability now ranking higher than the continuity of economic policy (albeit one can argue that growth and social stability are closely related, especially if the labor market pressures persist).</p>
<h2>China Policy Space</h2>
<p><strong>China</strong>&nbsp;<strong>is bucking the global policy-tightening trend &ndash; an exception among systemically important economies</strong>. China is expected to post the largest primary fiscal deficit among major emerging markets (EM) and developed markets (DM) both in 2022 and 2023 (as % of GDP, according to the IMF projections). The central bank made some small interest rate cuts and pledged &ndash; on several occasions - to step up credit support for &ldquo;struggling&rdquo; sectors. The latest &ldquo;crop&rdquo; of weaker-than-expected activity signals generated more calls from observers for &ldquo;comprehensive policy easing&rdquo; (or something along these lines). The central bank can do more, for sure. However, the impact of additional easing on the real economy is likely to be muted as long as the zero-COVID policy stays in place.</p>
<h2>China Growth Targets</h2>
<p>So,&nbsp;<strong>are Chinese authorities OK with a slower growth path?</strong>&nbsp;The next set of official gatherings - including the Central Economic Work Conference in December - should shed more light on the 2023 official growth target. The IMF sees China expanding by 4.4% next year - well below the customary 5-5.5% threshold &ndash; and the CPC&rsquo;s reference to a more challenging global environment and rising geopolitical risks suggest that weaker growth might be tolerated for longer. China&rsquo;s upcoming credit and monetary aggregates (out next week) will be closely watched for signals of whether this is indeed the case. Stay tuned!</p>
<h3>Chart at a Glance: China Activity Gauges &ndash; Stuck in Contraction Zone<sup>1</sup></h3>
<img class="img-responsive w-100" src="https://www.vaneck.com/contentassets/590f8681dbe74d3180849996ee98d35c/us-emerging-markets-daily-2022-10-31.png" alt="Chart at a Glance: China Activity Gauges &ndash; Stuck in Contraction Zone" />
<p class="chart-disclosure">Source: Bloomberg LP</p>
<div class="disclosure">
<p><sup>1</sup>We believe PMIs are a better indicator of the health of the Chinese economy than the gross domestic product (GDP) number, which is politicized and is a composite in any case. The manufacturing and non-manufacturing, or service, PMIs have been separated in order to understand the different sectors of the economy. These days, we believe the manufacturing PMI is the number to watch for cyclicality.</p>
</div>
]]></content:encoded>
</item><item rdf:about="https://www.vaneck.com/us/en/blogs/emerging-markets-bonds/imf-fall-2022-meetings-long-and-wrong/">
  <title>IMF Fall 2022 Meetings: Long and Wrong></title>
  <link>https://www.vaneck.com/us/en/blogs/emerging-markets-bonds/imf-fall-2022-meetings-long-and-wrong/</link>
  <description><![CDATA[Coming out of the Fall 2022 IMF meetings, investor reactions were overwhelmingly dominated by US rates and geopolitics.]]></description>
  <dc:creator>Eric Fine</dc:creator>
  <dc:date>10/31/2022 06:30:00</dc:date>
<content:encoded><![CDATA[

<p>Our emerging markets fixed income investment team recently attended the Fall 2022 IMF meetings, and share their key takeaways and observations. Highlights are below, or <a href="/us/en/investments/emerging-markets-bond-fund-embax/imf-fall-2022-meetings.pdf" title="Long and Wrong" target="_blank" rel="noopener"><strong>view the PDF to see the full report.</strong></a></p>
<h2>Developed Markets/Global Macro</h2>
<p><strong>&ldquo;I don&rsquo;t know&rdquo; was the most popular view. Investors were more focused on US rates and geopolitics for guidance than ever before, and are somewhat bearish verbally, but are only reducing tracking error and hoping to fail conventionally.</strong> Failing conventionally has been a winning strategy for many, particularly if AUM is high. That seemed to be the case at this meeting, though there&rsquo;s nervousness about a) outflows and b) the big dispersion in performance (they fear outflows into competitors and not just into cash, as many also see a big <i>re</i>-flow into bonds coming in the next quarter or so). Too many, in our view, were basing their entire strategy on waiting for a high in US yields, after which all of their investment conclusions would follow. (Our view this year has been that the implication of rising rates is having a low duration, and not extrapolating any further).</p>
<p><strong>Geopolitics took a lot of oxygen out of the room, and the output was only mind-numbing carbon dioxide.</strong> Geopolitical discussions were right off of the television set, meaning superficial to the point of misleading. China was more front-and-center, but too many business models depend on continuity with China/globalization, making it hard to come to conclusions such as &ldquo;yeah, we&rsquo;re done&rdquo;. More specifically on markets, the discussion points were so manifold, investors seemed unable to come to conclusions.</p>
<p><strong>What was clearer is that security considerations are dominating policy in China, the US, Europe, and more.</strong> On Russia, there was great pessimism about the Ukraine war (i.e., longer, expanding, a &ldquo;frozen conflict&rdquo; at best, etc.). There was also ongoing digestion of the fact of the Nordstream pipeline destruction (actually, partial impairment), and the impossibility of any adjustments in German gas imports. There was virtually zero discussion of the new security and economic cooperation zones created by Russia, China, India, Iran, and some even including Turkey. Sanctions on Russia&rsquo;s central bank were almost universally viewed as a failure, if not a <i>boost</i> to solidifying Eurasian groupings.</p>
<p><strong>Everyone was asking when yields were peaking, whether it would be via an &ldquo;accident&rdquo; or inflation progress, and most saw a Fed that is not poised to pivot or pause.</strong> Obviously. Interest rate volatility is the key worry and is legitimately disconcerting, we think. Some saw the UK as the &ldquo;accident&rdquo;, but many did not. We mentioned our suggestion &ndash; that &ldquo;it&rdquo; could come from a big private deal in the US, owned by a big private investor, with no transparency and thus magnified uncertainty &ndash; and this view was welcomed.</p>
<p><strong>Growth is finally a key focus (In our <a href="https://www.vaneck.com/us/en/blogs/emerging-markets-bonds/imf-spring-2022-meetings-emerging-markets-awake-at-the-wheel/" title="IMF Spring 2022 Meetings: Emerging Markets Awake at the Wheel">Spring Takeaways</a> we noted the absence of growth fears), with risks to the downside.</strong> The IMF itself, in its World Economic Outlook (WEO), only took its 2023 global growth forecast down by 0.2% of GDP (to 2.7%). That seems to be inconsistent with the world they describe in the 186-page document. To be fair, they are clear that the risks are almost all to the downside.</p>
<p><strong>Some saw developments in the UK as an example of bad fiscal policy being punished, and as implicitly supportive of EMs and other countries with lower debts, more independent central banks, and greater market-friendliness.</strong> We&rsquo;ll talk about EM later. We&rsquo;re not so sure DMs such as the UK are good guides, but it has been a theme of ours for over a decade that the DMs are becoming EMs and vice-versa. A key reason for our nervousness over what we see in many DMs is that we&rsquo;ve seen these processes in EMs. What&rsquo;s a sustainable level of debt? DM has no idea/EM is <i>defined</i> by knowledge of the level. Why have an independent central bank? DMs have pioneered &ldquo;coordination&rdquo; between fiscal and monetary authorities. EMs have central banks that are <i>solely focused</i> on inflation, leaving markets and government fiscal plans to the fiscal authority. This will be a learning moment, at least, in our view. With the DMs as the students.</p>
<p><strong>USD strength was a big concern; watch JPY and KRW.</strong> Good. But it was the kind of dollar strength that we think is less useful as a guide to investing. The idea that the dollar has higher yields and growth, and will continue to, against a gasping Europe and a Japan for now locked into low yields via yield curve control (YCC) is reasonable. But that says more about Europe&rsquo;s energy and structural problems, and Japan&rsquo;s unique policy mix than it does about the dollar, in our view. Korea will be a great example for DM-focused folks, we think. When and if Japan ends YCC, we see the Yen <i>exploding stronger</i> and the Korean won doing the same. We mention this because the idea seemed to be novel to most participants who were very USD-bullish.</p>
<p><strong>Europe was a &ldquo;downside risks to growth story&rdquo;. </strong>Debt mutualization is seen as the easiest lever to pull if there&rsquo;s a &ldquo;crisis&rdquo;. The fact that Germany will have to shift to much more expensive and inefficient energy sources was seen as just &ldquo;too bad&rdquo;, and many came away reminded that Germany&rsquo;s political system isn&rsquo;t in control of decisions such as where it can purchase its gas, it&rsquo;s military posture, etc. Few saw any reason to care if the Euro kept declining, a view with which we&rsquo;re sympathetic.</p>
<p><strong>No Plaza Accord coming soon; G-7 and G-20 have a role but a weaker one.</strong> Some asked about another Plaza Accord, given USD strength. What we think gets forgotten is that the last Plaza was after the US dollar had already been declining, and was a way to get the US Congress off of its protectionist track. Those conditions don&rsquo;t hold now. Today, it is about interest rate differentials. It will take a far more serious crisis to get rate coordination meetings going; this seemed to be the policy line (and we agree). The Fed is fighting inflation and not worrying about the external sector.</p>
<p><strong>It looks like the G-7 might get a mini-resurrection, given that G-20 now has countries the US considers unfriendly.</strong> There was discussion about the upcoming Bali G-20, whether Zelensky and Putin would be in the same room together, whether countries would walk out, etc., etc. Anyway, with India and then Brazil as presidents of the next G-20 rounds, the US seems to expect little progress toward re-globalization. The US construction is that globalization was great for all, and the only problem was that it generated unequal benefits. For what it&rsquo;s worth, the next G-20 could be the first Biden-Xi meeting (though that also seems subject to political posturing, as we read after our IMF meetings).</p>
<p><strong>There are hints of new facilities to help with hunger and poverty, and accelerate the &ldquo;energy transition&rdquo;, but they are nascent and thin. </strong>The World Bank (the sister organization to the IMF that focuses on structural and project lending) is touting a new emissions-reduction project development program that could provide &ldquo;up to $1tn&rdquo;. The IMF has its Resilience and Sustainability Trust (RST). Fast debt reschedulings where needed were also noted, of course. And, the &ldquo;common framework&rdquo; (getting China to the table with all other creditors in these situations) looks to have gotten nowhere, and there were more references to Chinese state banks &ldquo;pretending&rdquo; to be private creditors to avoid pain at the right moments.</p>
<p><strong>Commodities were presented positively.</strong> Risks to supply were emphasized (and we agree). The Black Sea grain flow was seen as having 0 certainties surrounding it. Natural gas prices were viewed as subject to upward pressure through 2024, but maybe face a glut in 2025 and 2026 when US gas starts to flood the market. Some presenters cited an &ldquo;overdue backlash on ESG&rdquo; due to hunger and energy issues for the poorest countries and individuals.</p>
<h2>Emerging Markets</h2>
<p><strong>USD strength was a big concern here, too.</strong> The IMF certainly pushed that risk, putting in the top 3 challenges to EM generally. We saw the same in our investor discussions &ndash; USD was loved. Brazil was a recent exception as it started its hiking cycle so early and so aggressively. We were struck by how dominant the &ldquo;dollar view&rdquo; was for EM folks who are normally, like ourselves, inclined to ask &ldquo;what dollar cross are you talking about, exactly&rdquo;. EM folks worried about rising US rates, and global growth, and tended to see EMFX as a kind-of monolith.</p>
<p><strong>EM should benefit from &ldquo;friendshoring&rdquo; and be a more prominent geopolitical focus for the US&hellip;but isn&rsquo;t. </strong> We think this view is largely correct (other than the sillier headlines about US rapprochement with Venezuela to replace Russian oil). EM <i>should</i> be targeted by the west for closer relationships, and this doesn&rsquo;t seem to be happening. It&rsquo;s there to be done, in our opinion, and there are plenty of distractions in US politics to explain the lack of US strategy.</p>
<p><strong>EM inflation is more due to an exogenous shock that EM rate hikes can address.</strong> EM can more reasonably be divided between exporters and importers. Europe is facing a long-term energy crisis that is more structural. The US is facing some rise in inflation expectations and the real estate component is not quickly addressed. Anyway, we&rsquo;ve been noting in all of our writing how many EMs hiked earlier and were larger than their DM counterparts.</p>
<p><strong>EM being in &ldquo;good&rdquo; shape was mentioned a lot, despite bearishness (that was mostly related to bearishness on DM growth and interest rates).</strong> It was broadly lauded that EM central banks hiked earlier and larger than DM central banks. And, it was broadly observed that many EMs have excellent external positions.</p>
<p><strong>The China discussion, particularly on politics, became more sophisticated.</strong> President Xi was presented as taking advantage of real populist resentment against the rich, which was politically sustainable. Poverty alleviation is popular. Liberal intellectuals are not an important constituency right now. Military reform was also got discussed. Security, health, and stability struck us as the key watchwords. Xi&rsquo;s political capital seems likely to be invested toward those goals.</p>
<p><strong>Finally, on the relationship with Russia, the (interpreted) line from China seemed to be that &ldquo;if you (the west) win in Ukraine and Russia, you have already told us we are next&rdquo;.</strong> The point is they won&rsquo;t let that happen, though will do their best to not be obvious to avoid sanctions and destabilizing acrimony. Chinese are mostly asking <i>when</i> an attack on Taiwan Region will happen, not <i>whether</i>. The Chinese view the US as the generator of global geopolitical risk, and many other countries and investors appeared to agree with this framing.</p>
<p><strong>Central and Eastern Europe mixed. </strong>Hungary&rsquo;s central bank came off as very hawkish, and as catching up. Yields are high and they are concerned about currency weakness. (We are attracted to local-currency bonds in this setup). Poland came off as very dovish and as risking a currency-inflation spiral. Fiscal policy and monetary policy are too stimulating, it struck us. On Ukraine, the US struck us as very focused on ensuring financing and on supporting the country&rsquo;s domestic spending priorities.</p>
<p><strong>Asia came off well.</strong> Offshore investment in a lot of the EMs here declined significantly (Indonesia is noteworthy) which means that the central bank has a lot more flexibility on exchange rate management. Overall, fiscal policy is good, external accounts are strong, and they are simply following the DMs in their hiking cycles (not going big and early like the Latin American countries), and their currencies are<i> still</i> stable because their fundamentals are strong. They don&rsquo;t need to over-hike to generate credibility.</p>
<p><strong>Latin America was loved, but we think it was not selective enough.</strong> Fairly enough, Brazil was lauded. They hiked way earlier and more than any other central bank, and are already seeing hints of progress on the inflation front. (We had exposure to Brazil locally and closed it simply because it hit our valuation targets and we are awaiting possible opportunities going into the second round of presidential elections). Mexico also got high markets, and we&rsquo;d agree there. Mexico elected a leftist populist who remains very popular, kept to his fiscal targets, and made the central bank&rsquo;s objective function a stable currency. Colombia comes off to us as a possible accident waiting to happen; it was very loved, with no conviction (&ldquo;long and wrong&rdquo;, maybe?). We think there should be much greater worry over the new government&rsquo;s policy inclinations, and see Colombia as closer to a frontier African credit than a double-B Latin American Credit. Peru impressed, as we think it should. Its famed institutions worked and the country has reasonable fiscal and monetary policy despite an arguably market-unfriendly president. Chile seems to be working its way through its political growing pains, and many appreciated that extremely market-unfriendly results from its Constitutional re-think simply haven&rsquo;t materialized.</p>
<p><strong>Turkey was interesting.</strong> But not because it was attractive. We&rsquo;ve criticized its heterodox policy mix for a long time, and only own one unique USD-denominated bond. Turkey was interesting due to the multiple alliances it is joining or courting. Russia and Saudi Arabia are widely viewed as behind the surprise surge in Turkish central bank reserves, which were a key weakness. This is a big, under-noticed development.</p>
<p><strong>Private creditors are a little noisier.</strong> Private creditors are becoming frustrated/panicked/hostile and don't yet realize the full extent to which they have zero power against the IMF and bilateral creditors. The IMF will lend into arrears on private sector debt for longer than the bondholders can keep their jobs. Private creditors were more vocal in getting the public sector to be more transparent. In particular, to share debt sustainability analyses (DSAs) for countries in debt negotiations, and to not present private creditors with <i>fait accomplis</i>. We don&rsquo;t see it.</p>
<p><strong>Illiquidity and &ldquo;frontier&rdquo; EM were disliked&hellip;but it applies to DM bond markets, too. </strong>The terms illiquidity and frontier almost became synonymous. This struck us as an opportunity (our process is very bottom-up and if illiquidity is priced, we&rsquo;re biased to downplay it). Looking at October 13th intraday price move on S&amp;P 500 tells you that everything can be illiquid, so it turned out to be not a major concern for EMs.</p>
<p>To receive more <a href="/us/en/insights/emerging-markets-bonds/" title="Emerging Markets Bonds Insights"><strong>Emerging Markets Bonds</strong></a> insights, <a href="/us/en/subscribe/" title=" Subscription Center"><strong>sign up in our subscription center</strong></a>.</p>
]]></content:encoded>
</item><item rdf:about="https://www.vaneck.com/us/en/blogs/digital-assets/tradfi-meets-crypto-innovative-crypto-solutions/">
  <title>TradFi Meets Crypto - Innovative Crypto Solutions></title>
  <link>https://www.vaneck.com/us/en/blogs/digital-assets/tradfi-meets-crypto-innovative-crypto-solutions/</link>
  <description><![CDATA[On this episode of WEB3 TEA, JP Lee and Matt Bartlett discuss how to empower investors to better understand their crypto portfolios.]]></description>
  <dc:creator>John Patrick Lee, CFA</dc:creator>
  <dc:date>10/31/2022 06:30:00</dc:date>
<content:encoded><![CDATA[

<p>On this episode of <strong><a href="https://youtu.be/29UvyVZfL30" title="TradFi Meets Crypto - Innovative Crypto Solutions" target="_blank" rel="noopener">WEB3 TEA</a></strong>, Product Manager JP Lee and Head of NFT Community and Web3 Matt Bartlett are joined by Miguel Kudry from L1 Advisors and Eric Tomaszewski from Verde Capital Management. L1 Advisors is a non-custodial crypto platform that provides insights and analysis to on-chain crypto portfolios, and Verde Capital Management is a traditional finance registered investment advisor (RIA).</p>
<p>We explore a crypto-native platform that aims to help advisors and clients understand their crypto portfolio to foster better investment decisions. We also discuss the massive educational gap that investors are facing today. Miguel and Eric are actively addressing this gap by building tools (L1 Advisors) and educating clients through engaged conversations and content (Verde).</p>
<p>Finally, it was great to have our first legacy <a href="https://www.vaneck.com/us/en/nftcommunity" title="VanEck Community NFT"><strong>VanEck Community NFT</strong></a> member as a guest on WEB3 TEA. Eric was chosen as a community member in the launch airdrop. We continue to be proud of our NFT community and what we are building.</p>
<p>To receive more <strong><a href="https://www.vaneck.com/us/en/insights/digital-assets/" title="Digital Assets Insights">Digital Assets</a></strong> insights, <strong><a href="https://www.vaneck.com/us/en/subscribe/" title="Subscription Center">sign up in our subscription center</a></strong>.</p>
]]></content:encoded>
</item><item rdf:about="https://www.vaneck.com/us/en/blogs/economic-trends/markets-keep-challenging-policymakers/">
  <title>Markets Keep Challenging Policymakers></title>
  <link>https://www.vaneck.com/us/en/blogs/economic-trends/markets-keep-challenging-policymakers/</link>
  <description><![CDATA[The price action in risky &ndash; and even &ldquo;risk-free&rdquo; &ndash; assets points to multiple concerns about the policy direction, both in EM and DM, as the global growth weakness becomes a factor.]]></description>
  <dc:creator>Natalia  Gurushina</dc:creator>
  <dc:date>10/28/2022 15:00:00</dc:date>
<content:encoded><![CDATA[

<h2>Market Volatility</h2>
<p>We have another busy week ahead of us, with several key central bank meetings (including the U.S. Federal Reserve), important data releases (including emerging markets (EM) activity gauges), and very tight elections (presidential runoff in Brazil on Sunday). The <strong>market is still digesting the ECB&rsquo;s less hawkish attitude</strong> this morning &ndash; with sizable upside inflation surprises in the region challenging this stance, and causing another bout of volatility in rates. Yesterday&rsquo;s 25bps intraday drop in the 10-year German yield was followed by an 18bps increase this morning (at 8:37am ET, according to Bloomberg LP).</p>
<h2>China Developers Rout</h2>
<p><strong>Chinese assets are also under pressure this morning</strong>, despite the central bank&rsquo;s call for more policy support. Chinese developers now go through the third wave of selloffs (see chart below), and the question is whether contagion &ndash; which is now going up the credit curve &ndash; will get dangerous for the key sectors of the economy, including banks. Reports about more partial lockdowns in China&rsquo;s key cities and tighter U.S. export controls on tech items did not help to lift the sentiment. The next batch of China&rsquo;s activity gauges (Purchasing Managers Indices) will be closely watched over the weekend &ndash; but the Q3 GDP print provided a cautionary tale that an upside growth surprise can be totally overshadowed by concerns about the policy direction.</p>
<h2>EM Tightening Cycles</h2>
<p>Finally, the <strong>dovish pivot narrative might get challenged in several major EMs</strong>. Colombia is expected to maintain the pace of tightening with another 100bps rate hike this afternoon. The question is whether this will be enough for investors, who were alarmed by the latest policy initiatives. The market thinks that the policy rate should be raised to at least 12.4% from current 10% over the next twelve months to compensate for policy shortcomings. The policy framework in the Czech Republic is more orthodox, so the central bank might just get away with extending the pause next week (at 7%). The market expectations for Czech rates are quite sanguine &ndash; with a small rate cut being priced in for the next three months, as growth concerns will intensify, while inflation pressures (hopefully) stay moderate. Stay tuned!&nbsp;&nbsp;</p>
<h3>Chart at a Glance: China Developers&rsquo; Selloff &ndash; Third Wave</h3>
<img class="img-responsive w-100" src="https://www.vaneck.com/contentassets/fa7be2e1493446fdac835a15f4230520/us-emerging-markets-daily-2022-10-28.png" alt="Chart at a Glance: China Developers&rsquo; Selloff &ndash; Third Wave" />
<p class="chart-disclosure">Source: Bloomberg LP</p>
]]></content:encoded>
</item><item rdf:about="https://www.vaneck.com/us/en/blogs/emerging-markets-equity/china-still-investible-if-you-know-where-to-look/">
  <title>China Still Investible—If You Know Where to Look></title>
  <link>https://www.vaneck.com/us/en/blogs/emerging-markets-equity/china-still-investible-if-you-know-where-to-look/</link>
  <description><![CDATA[Our main takeaway from China&rsquo;s 20th Party Congress is the emphasis on security, implying further self-sufficiency&mdash;and potential investment opportunity&mdash;in the food, energy and technology sectors.]]></description>
  <dc:creator>David Semple</dc:creator>
  <dc:date>10/27/2022 06:30:00</dc:date>
<content:encoded><![CDATA[

<p>China&rsquo;s 20th Party Congress concluded on October 22, 2022. Most of the commentary focused on the composition of the Standing Committee, the tone of Xi Jinping&rsquo;s speech/opening statement and the amendments to the party constitution.</p>
<p>It&rsquo;s important to remember that this is not the forum for key policy changes, but can set the tone for further action at future policy events, such as the Politburo/Central Economic Workforce Conference meeting in December and the &ldquo;two sessions&rdquo; in March.</p>
<p>On personnel, there was never any doubt that Xi would be effectively in charge. The domination of the Xi camp did surprise some, and had them worrying about &ldquo;checks and balances&rdquo;. I have to say that I don&rsquo;t think one or two outsiders would really make any difference. Hu Jintao being led from the meeting was a strange, atypically unscripted moment, but we don&rsquo;t know, and probably will never know what actually happened. There are rumors that he is ill (Alzheimer&rsquo;s is the scuttlebutt), so it may have been related to that.</p>
<h2>What Are the Equity Implications?</h2>
<p>I think the main takeaway is the emphasis on &ldquo;security&rdquo;&mdash;meaning, the focus on independence in the supply chain and a robust posture to perceived antagonisms from outside China. This implies further development of self-sufficiency in food, energy and technology. Whether this is by choice, or being forced that way by, e.g., Washington hawks or global events (Russia-Ukraine) is relevant, but the key is that the emphasis will be on the development of these sectors.</p>
<p>Meantime, the consumer sector, which is significantly impacted by the difficult property market and Zero-COVID policies, obtained no relief from the Congress, as these were barely touched upon. We didn&rsquo;t expect any commentary/change in that right now, so that doesn&rsquo;t change our emphasis away from pure consumption, in favor of industrials in areas like renewables and industrial automation.</p>
<h2>China: Not Uninvestible</h2>
<p>At the time of writing, Chinese stocks have regained most of the decline immediately following the Congress, a decline precipitated by unreasonable expectations of positive policy change in areas such as Zero-COVID. It&rsquo;s important to note that China already trades on a significantly elevated risk premium compared to history, with some justification, due to structurally lower growth and higher geopolitical tensions. On standard metrics, it trades on approximately 1.5 to 2 standard deviations cheaper versus history. It seems to me that the marginal news in the next few months is likely to be positive for Zero-COVID and property, but patience will be required. For geopolitics, I think we should be studying Washington rather than Beijing because if there is a significant increase in tensions and the &ldquo;balkanization&rdquo; of key industries, it will come from that quarter.</p>
<p>Net/Net, the Congress was just a reflection of realities: that Xi is in control, and that there will be a significant emphasis on key parts of industrialization. This does not make China &ldquo;uninvestible&rdquo;, but rather guides where the best areas to invest are located.</p>
<p>To receive more <a href="/us/en/insights/emerging-markets-equity/" title="Emerging Markets Equity Insights"><strong>Emerging Markets Equity</strong></a> insights, <a href="/link/5f45412c2143400497908cea2897f7d3.aspx" title="Subscription Center"><strong>sign up in our subscription center</strong></a>.</p>
]]></content:encoded>
</item><item rdf:about="https://www.vaneck.com/us/en/blogs/economic-trends/global-growth-reality-bites/">
  <title>Global Growth – Reality Bites?></title>
  <link>https://www.vaneck.com/us/en/blogs/economic-trends/global-growth-reality-bites/</link>
  <description><![CDATA[EM central banks are increasingly thinking about &ldquo;exit strategies&rdquo;. Can the growth outlook derail their plans?]]></description>
  <dc:creator>Natalia  Gurushina</dc:creator>
  <dc:date>10/27/2022 06:30:00</dc:date>
<content:encoded><![CDATA[

<h2>Hard Landing in DM</h2>
<p>An <strong>upside growth surprise in the U.S. failed to dissuade the market&rsquo;s concerns about a hard landing</strong> (just check the latest activity gauges), but it removed any residual doubts about the Federal Reserve&rsquo;s 75bps rate hike next week. Going forward, however, the market does not see much room for additional tightening (only 100bps or so) between December 2022 and March 2023. Further, Fed Funds Futures continue to price in rate cuts in the second half of 2023, as annual GDP growth is expected to drop to mere 0.4%. The European Central Bank (ECB) President Christine Lagarde also acknowledged that the probability of recession has increased and that the slowdown may deepen, but the board nevertheless lifted the key rate by 75bps today and signaled that there&rsquo;s more to come due to high inflation risks.</p>
<h2>EM Growth Outlook</h2>
<p>The <strong>next batch of activity gauges in emerging markets (EM) will be rolled out early next week</strong>, and the market will be paying special attention to independent global growth drivers (China), countries that surprised significantly to the downside last month (Turkey, Czech Republic, South Africa, and Hungary), as well as signals of further regional divergence. The growth outlook &ndash; and especially the impact of the past rate hikes on domestic activity &ndash; featured prominently in the Chilean central bank minutes released this morning. Chile&rsquo;s economic activity indicator dropped to 0% in August, and the economy is now expected to contract by 0.8% in real terms next year. This partly explains why the central bank signaled the end of the tightening cycle at the last meeting &ndash; albeit the market is still not quite convinced that it will be able to do so safely, bringing inflation back to target and re-anchoring inflation expectations.</p>
<h2>End of Brazil&rsquo;s Rate Hikes</h2>
<p>There are exceptions to every rule, and <strong>some EMs are actually bucking the global slowdown trend</strong> for now. Brazil&rsquo;s 2022 GDP projection has been raised to 2.65% - from mere 0.5% six months ago (see chart below) - which is why the central bank&rsquo;s communications still have some hawkish vibes, despite keeping the policy rate on hold yesterday. We don&rsquo;t think that Brazil will be able to avoid the growth slowdown next year, but the very high policy rate &ndash; not just nominal (13.75%), but also real (nearly 8% ex-ante) - would give the central bank plenty of room to support the economy via rate cuts in 2023 (provided inflation continues to converge to the target, and the policy agenda does not take a wrong turn after the presidential runoff on Sunday). Stay tuned!</p>
<h3>Chart at a Glance: Brazil&rsquo;s 2022 GDP Revisions &ndash; Wow!</h3>
<p><img class="img-responsive w-100" src="https://www.vaneck.com/contentassets/99b9d4aff49840a7a0b348d50c4f9240/us-emerging-markets-daily-2022-10-27.png" alt="Chart at a Glance: Brazil's 2022 GDP Revisions - Wow!" /></p>
<p class="chart-disclosure">Source: Bloomberg LP.</p>
]]></content:encoded>
</item><item rdf:about="https://www.vaneck.com/us/en/blogs/income-investing/cloi-defensive-positioning-drives-q3-outperformance/">
  <title>CLOI Defensive Positioning Drives Q3 Outperformance></title>
  <link>https://www.vaneck.com/us/en/blogs/income-investing/cloi-defensive-positioning-drives-q3-outperformance/</link>
  <description><![CDATA[In the current environment, CLOs may provide an attractive return opportunity among credit assets, with demand remaining robust.]]></description>
  <dc:creator>Fran Rodilosso</dc:creator>
  <dc:date>10/26/2022 06:30:00</dc:date>
<content:encoded><![CDATA[

<p>CLOs have outperformed most fixed income asset classes year to date, thanks to their floating nature and the increasing level of income generated as short-term rates continue to rise. Spread widening has created relative value opportunities in the space. Further widening is possible from here, and the <strong><a href="/link/593077b21448427e9fc687481484e097.aspx" title="CLOI - VanEck CLO ETF - Overview">VanEck CLO ETF (CLOI)</a></strong> remains defensively positioned. CLOI&rsquo;s positioning contributed to its outperformance relative to its benchmark in the third quarter.</p>
<h2>Market Update: CLOs Lead Among Credit Asset Classes</h2>
<p>CLOs outperformed investment grade credit, high yield bonds and leveraged loans in September, and CLOs and loans have materially outperformed other credit asset classes in the quarter and year to date (as of 9/30/2022).</p>
<div class="wrapped-div">
<table style="width: 100%; height: 198px;">
<tbody>
<tr class="tbl-data">
<td class="tbl-header last">Asset class</td>
<td class="tbl-header last" style="text-align: center;">QTD Return (%)</td>
<td class="tbl-header last" style="text-align: center;">YTD Return (%)</td>
<td class="tbl-header last" style="text-align: center;">Yield to Worst (%)</td>
<td class="tbl-header last" style="text-align: center;">Spread (bps)</td>
</tr>
<tr class="tbl-data">
<td class="data-td last" style="font-weight: normal;">CLOs</td>
<td class="data-td data last">0.11</td>
<td class="data-td data last">-2.73</td>
<td class="data-td data last">7.36</td>
<td class="data-td data last">327</td>
</tr>
<tr class="tbl-data">
<td class="data-td last" style="font-weight: normal;"><span style="padding-left: 15px;">AAA</span></td>
<td class="data-td data last">0.23</td>
<td class="data-td data last">-1.45</td>
<td class="data-td data last">6.48</td>
<td class="data-td data last">230</td>
</tr>
<tr class="tbl-data">
<td class="data-td last" style="font-weight: normal;"><span style="padding-left: 15px;">AA</span></td>
<td class="data-td data last">0.08</td>
<td class="data-td data last">-3.29</td>
<td class="data-td data last">7.04</td>
<td class="data-td data last">299</td>
</tr>
<tr class="tbl-data">
<td class="data-td last" style="font-weight: normal;"><span style="padding-left: 15px;">A</span></td>
<td class="data-td data last">-1.10</td>
<td class="data-td data last">-5.54</td>
<td class="data-td data last">7.97</td>
<td class="data-td data last">394</td>
</tr>
<tr class="tbl-data">
<td class="data-td last" style="font-weight: normal;"><span style="padding-left: 15px;">BBB</span></td>
<td class="data-td data last">-1.43</td>
<td class="data-td data last">-7.20</td>
<td class="data-td data last">9.83</td>
<td class="data-td data last">579</td>
</tr>
<tr class="tbl-data">
<td class="data-td last" style="font-weight: normal;"><span style="padding-left: 15px;">BB</span></td>
<td class="data-td data last">-2.56</td>
<td class="data-td data last">-9.63</td>
<td class="data-td data last">15.07</td>
<td class="data-td data last">1,084</td>
</tr>
<tr class="tbl-data">
<td class="data-td last" style="font-weight: normal;">Investment Grade Corporates</td>
<td class="data-td data last">-5.11</td>
<td class="data-td data last">-18.33</td>
<td class="data-td data last">5.74</td>
<td class="data-td data last">167</td>
</tr>
<tr class="tbl-data">
<td class="data-td last" style="font-weight: normal;">U.S. Agg</td>
<td class="data-td data last">-4.86</td>
<td class="data-td data last">-14.68</td>
<td class="data-td data last">4.71</td>
<td class="data-td data last">59</td>
</tr>
<tr class="tbl-data">
<td class="data-td last" style="font-weight: normal;">Leveraged Loans</td>
<td class="data-td data last">1.46</td>
<td class="data-td data last">-2.66</td>
<td class="data-td data last">11.04</td>
<td class="data-td data last">727</td>
</tr>
<tr class="tbl-data">
<td class="data-td last" style="font-weight: normal;">High Yield Bonds</td>
<td class="data-td data last">-0.68</td>
<td class="data-td data last">-14.62</td>
<td class="data-td data last">9.57</td>
<td class="data-td data last">543</td>
</tr>
</tbody>
</table>
<br />
<p class="chart-disclosure">Source: J.P. Morgan, ICE Data Indices as of 9/30/2022. CLOs represented by J.P. Morgan CLO Index;, AAA Rated CLOs represented by J.P. Morgan CLO AAA Index, AA Rated CLOs represented by J.P. Morgan CLO AA Index, A Rated CLOs represented by J.P. Morgan CLO A Index, BBB Rated CLOs represented by J.P. Morgan CLO BBB Index, BB Rated CLOs represented by J.P. Morgan CLO BB Index, Investment Grade Corporates represented by ICE BofA US Corporate Index, US Agg is represented by the ICE BofA US Broad Market, Leveraged Loans represented by JP Morgan Leveraged Loan Index and High Yield Bonds represented by ICE BofA US High Yield Index. Leveraged loan yield represents yield modelled to a 3-year maturity. US CLO Yield to Worst represents yield to call for premium priced securities or to maturity when priced at a discount to par based on forward reference rates.</p>
<p>Per Barclays Research, CLO new issue supply increased month-over-month following the summer lull, with $13.3B pricing during the month compared to $7.6B in August. Primary issuance is down 19% from 2021 levels. For the third month in a row, no refis or resets priced in September, following just $0.3B pricing in both May and June. Total issuance for the year is now 60% lower compared to YTD 2021. In the secondary market, TRACE supply increased to $16.1B in September from $11.4B in August, per Morgan Stanley. Investment grade volumes increased to $11.8B from $8.4B in August and below investment grade volumes increased to $4.3B from $3.0B. Total BWIC volumes increased to $5.2B from $3.8B in August.</p>
<p>There were two defaults in the Morningstar/LSTA Leveraged Loan Index in September. As a result, the trailing 12-month default rate, by principal, increased to 0.90% from 0.60% in August. We anticipate the default rate to remain below historical averages in 2022 for the leveraged loan market, notwithstanding ongoing interest rate increases and indications that Federal Reserve (Fed) hikes will continue throughout the calendar year. We anticipate the default rate to increase over the medium-term, though our expectations remain that defaults will stay below the long-term historical average of roughly 3%.</p>
<p>CLO fundamentals were mixed month-over-month, with credit metrics remaining fairly stable, while market value metrics were significantly weaker. Per Barclays Research and Morgan Stanley, the junior overcollateralization cushion decreased 1 bp to 495 bps, CCC/Caa buckets increased from 3.6%/3.2% in August to 3.6%/3.3% in September, weighted average rating factor (which measures overall credit quality by rating) remained constant, weighted average spread increased 2 bps to 350 bps, and the exposure to loans priced below $90 and below $80 increased 10.4% to 20.4% and 1.5% to 5.6%, respectively.</p>
<h2>Portfolio Strategy: Shifting up the Capital Stack</h2>
<p>While CLO metrics remain strong overall, CLO spreads widened to levels last seen during the peak of the COVID-19 crisis in 2020, as ongoing geopolitical and economic risks continue to weigh on market sentiment. Despite their relative strength compared to other fixed income assets to start the year, significant spread widening has created additional relative value opportunities in CLOs in the secondary market. In addition, we believe CLOs will benefit from inflows to the asset class due to very good historical performance of the asset class in increasing default scenarios as well as the floating nature of CLOs. While spreads are at the widest levels of the year, spreads could widen a bit more from here prior to stabilizing. As a result, we continue to shift portfolios higher in the capital stack while adding value via disciplined security selection.</p>
<p>The Fund returned 0.02% in the quarter ended September 30, 2022, outperforming its benchmark, the J.P. Morgan CLO Index, by 0.13%. Outperformance was primarily driven by security selection within the BBB rated bucket. A higher allocation to A and AA rated tranches also contributed positively, as well as an underweight to BB rated CLOs, reflecting currently conservative positioning. The largest detractors from relative performance were selection within the A rated bucket and an underweight to AAA rated tranches.</p>
<h2>Outlook Ahead: Uncertainty Drives Defensive Positioning</h2>
<p>The outlook for the broader U.S. economy remains unclear. The Fed continues to emphasize the tight labor market as the primary catalyst underlying inflation, so a pivot from the central bank remains unlikely in the near term. Job openings still outnumber unemployment claims, which contrasts with easing inflation in other areas of the economy as measured in business surveys and as is evident in the softening housing market, all of which has exacerbated fears of a policy error on the part of the Fed. The higher probability of a recession has contributed to the volatility in financial markets that are already contending with both higher rates and a dearth of liquidity in the current economic environment. Current conditions will likely persist and frustrate forecasts until additional clarity emerges around where rates will peak.</p>
<p>In this environment, higher-yielding floating rate asset classes like CLOs may provide an attractive return opportunity among credit assets while remaining relatively isolated from geopolitical risks. In addition, we believe demand for CLOs will continue to be robust as negative real rates will continue to incentivize investors to take advantage of the yield pickup and the relative attractiveness of CLOs compared to other credit assets.</p>
<p>However, given the level of uncertainty in the market, we do not believe this is the time for broad risk-on positioning. Instead, we believe additional rallies will provide a good opportunity to further reduce risk and favor our prior stance of maintaining marginally defensive positioning, looking to add relative value at the security and manager selection level.</p>
<p>To receive more <a href="https://www.vaneck.com/us/en/insights/income-investing/" title="Income Investing insights"><strong>Income Investing</strong></a> insights, <a href="/us/en/subscribe/" title="Subscription Center"><strong>sign up in our subscription center</strong></a>.</p>
</div>
</div>
<style type="text/css">
    .wrapped-div {
        max-width: 100%;
    }

    @media (max-width: 1240px) {
        .wrapped-div {
            overflow-x: scroll;
        }


    }
</style>
]]></content:encoded>
</item><item rdf:about="https://www.vaneck.com/us/en/blogs/economic-trends/peak-rates-mind-the-fiscal-gap/">
  <title>Peak Rates – Mind the Fiscal Gap></title>
  <link>https://www.vaneck.com/us/en/blogs/economic-trends/peak-rates-mind-the-fiscal-gap/</link>
  <description><![CDATA[Fiscal considerations will be playing a greater role in EM central banks&rsquo; decisions going forward &ndash; giving more room to slow the pace of hikes or leading to more tightening.]]></description>
  <dc:creator>Natalia  Gurushina</dc:creator>
  <dc:date>10/26/2022 06:30:00</dc:date>
<content:encoded><![CDATA[

<h2>The End of EM Tightening Cycles</h2>
<p>Tomorrow&rsquo;s European Central Bank (ECB) rate-setting meeting will be the focal point of the week. A 75bps hike and the terminal rate of 3% are firmly in the price, but the press-conference and guidance will be equally important - both for interest rates (including the shape of the yield curve) and the euro, which staged a mini rally in the past few days. <strong>In emerging markets (EM), all eyes are on Brazil, where the central bank is expected to begin its next chapter</strong> by keeping the policy rate on hold this afternoon at 13.75%. The central bank&rsquo;s pro-active response created a huge policy cushion (Brazil&rsquo;s ex-ante real policy rate is around 8%!) that provided the fundamental support for the currency and local debt this year. The year-to-date total return on the J.P. Morgan&rsquo;s GBI-EM Brazil Index (U.S. Dollar unhedged) is not just positive, but head and shoulders above the rest (except Turkey &ndash; see chart below). However, whether or not this outperformance can be extended going forward will also depend on the outcome of Sunday&rsquo;s runoff (polls show a technical tie) and its impact on the policy agenda - especially on the fiscal front, where Brazil performed admirably in 2022.</p>
<h2>South Africa Fiscal Adjustment</h2>
<p><strong>The market is also closely watching the pace of fiscal adjustment in South Africa</strong>, where the central bank (SARB) is still catching up with the rest of the EM pack. The SARB delivered two large 75bps hikes in a row, bringing the policy rate to 6.25%, and the just-released medium-term budget projections &ndash; especially smaller deficits - should ease the pressure to continue with aggressive hikes. The main concern, as usual, is about the budget execution, as some revenue assumptions look rosy, and spending buffers might not be sufficient, given the global economic and political uncertainties. Still, the market high-fived the headline numbers, with the 10-year yield narrowing by 13bps and the South African rand trading 92bps stronger against the U.S. Dollar (at 10:00am ET, according to Bloomberg LP).</p>
<h2>Colombia Tax Reform</h2>
<p><strong>Fiscal discussions are all the rage in LATAM, where the Colombian congress is expected to approve the new tax bill in the coming days. </strong>What&rsquo;s at stake here is not only the pace of fiscal adjustment, but also tax reform&rsquo;s impact on the oil sector, which accounts for a significant portion of Colombia&rsquo;s export revenue and foreign direct investments. The approval process &ndash; and the market reaction to it - will also determine the central bank&rsquo;s ability to slow the pace of rate hikes. Colombian assets were hit by the recent political and policy noise, with the local debt (J.P. Morgan&rsquo;s GBI-EM Colombia Index) showing the third worst total return (or rather total loss) year-to-date (see chart below). Stay tuned!</p>
<h3>Chart at a Glance: EM Local Debt &ndash; Year-To-Date Tally</h3>
<p><img class="img-responsive w-100" src="https://www.vaneck.com/contentassets/6d4fed5237a045d39e01e20d7bad2851/us-emerging-markets-daily-2022-10-26.png" alt="Chart at a Glance: EM Local Debt - Year-To-Date Tally" /></p>
<p class="chart-disclosure">Source: Bloomberg LP.</p>
]]></content:encoded>
</item><item rdf:about="https://www.vaneck.com/us/en/blogs/economic-trends/global-policy-rates-on-the-crossroads/">
  <title>Global Policy Rates – On the Crossroads></title>
  <link>https://www.vaneck.com/us/en/blogs/economic-trends/global-policy-rates-on-the-crossroads/</link>
  <description><![CDATA[Brazil&rsquo;s impressive disinflation leaves room for policy rate cuts in 2023 &ndash; but the presidential elections outcome on Sunday would be an important qualifier.]]></description>
  <dc:creator>Natalia  Gurushina</dc:creator>
  <dc:date>10/25/2022 06:30:00</dc:date>
<content:encoded><![CDATA[

<h2>Hard Landing and Rate Hikes</h2>
<p>The preliminary activity gauges in Europe and the U.S. raised more <strong>concerns about the global recession/hard landing, and about central bank&rsquo;s ability to continue aggressive policy tightening</strong> under this scenario. The U.S. economy is expected to expand by mere 0.4% next year, while Germany&rsquo;s real GDP is seen contracting by 0.5%. But the market continues to price in 75bps hikes by the U.S. Federal Reserve (Fed) and the ECB at their next meetings &ndash; with more tightening after that. Both central banks are not expected to come to a &ldquo;full stop&rdquo; until sometime in 2023. By contrast, several emerging markets (EM) have already signaled the end of their tightening cycles. The market reaction to these announcements, however, was quite different.</p>
<h2>Brazil Elections and Rate Cuts</h2>
<p><strong>Brazil is probably in the best position to remain on hold and even initiate rate cuts in 2023</strong> &ndash; in part because its disinflation trend looks awesome. Mid-month headline inflation dropped to 6.85% year-on-year from 12.13% in April. Brazil&rsquo;s trailing inflation is now lower than in Europe or the U.S., and Brazil&rsquo;s real policy rate adjusted by expected inflation is hovering around 8% (see chart below). The reason why Brazil&rsquo;s disinflation was not a market mover today is the presidential elections runoff on Sunday (ok-ok, inflation was also a tiny bit higher than expected, and it is in part driven by one-offs/fiscal measures). The recent polls look very tight (technical tie), while the policy implications cannot be more different, depending on who wins.</p>
<h2>EM Tightening Cycles</h2>
<p><strong>EM&rsquo;s less successful &ldquo;exit&rdquo; attempts are Chile and Hungary</strong>. The market is highly skeptical that Chile would be able to stop hiking safely, which is why the Chilean peso underperformed most EM peers after the central bank&rsquo;s announcement on October 11. Hungary is frantically scrambling for alternative policy instruments to reduce pressure on the currency and keep liquidity under control, while keeping the official rate on hold at 13%. The end-result is massive &ldquo;shadow&rdquo; tightening, but a less transparent policy framework (with tenders for some new instruments already suspended). Hungary&rsquo;s next inflation print (trailing inflation is now over 20% year-on-year) will tell us whether the central bank would have to come up with more &ldquo;out of the box&rdquo; solutions (instead of just raising the policy rate). Stay tuned!</p>
<h3>Chart at a Glance: Brazil Inflation &ndash; Global Perspective</h3>
<p><img class="img-responsive w-100" src="https://www.vaneck.com/contentassets/6981ce8dc1cb41f8a4690a958dae8941/us-emerging-markets-daily-2022-10-25.png" alt="Chart at a Glance: Brazil Inflation - Global Perspective" /></p>
<p class="chart-disclosure">Source: VanEck, Bloomberg LP.</p>
]]></content:encoded>
</item></rdf:RDF>